Embed Size (px)
Citation preview
BioMed CentralBMC Public Health
ss
Open AcceResearch articleNeighbourhood socioeconomic status and cardiovascular risk factors: a multilevel analysis of nine cities in the Czech Republic and GermanyNico Dragano*1, Martin Bobak2, Natalia Wege1, Anne Peasey2, Pablo E Verde1, Ruzena Kubinova3, Simone Weyers1, Susanne Moebus4, Stefan Möhlenkamp5, Andreas Stang6, Raimund Erbel5, Karl-Heinz Jöckel4, Johannes Siegrist1 and Hynek Pikhart2Address: 1Department of Medical Sociology, Heinrich-Heine-University Düsseldorf, Germany, 2International Institute for Health and Society, Department of Epidemiology and Public Health, University College London, UK, 3Centre for Environmental Health, National Institute of Public Health, Prague, Czech Republic, 4Institute for Medical Informatics, Biometry and Epidemiology, University Duisburg-Essen, Germany, 5Clinic of Cardiology, West-German Heart Center Essen, University Duisburg-Essen, Germany and 6Institute of Medical Epidemiology, Biometry and Informatics, University Hospital of Halle, Germany
Email: Nico Dragano* - [email protected]; Martin Bobak - [email protected]; Natalia Wege - [email protected]; Anne Peasey - [email protected]; Pablo E Verde - [email protected]; Ruzena Kubinova - [email protected]; Simone Weyers - [email protected]; Susanne Moebus - [email protected]; Stefan Möhlenkamp - [email protected]; Andreas Stang - [email protected]; Raimund Erbel - [email protected]; Karl-Heinz Jöckel - [email protected]; Johannes Siegrist - [email protected]; Hynek Pikhart - [email protected]
* Corresponding author
AbstractBackground: Previous studies have shown that deprived neighbourhoods have highercardiovascular mortality and morbidity rates. Inequalities in the distribution of behaviour relatedrisk factors are one possible explanation for this trend. In our study, we examined the associationbetween cardiovascular risk factors and neighbourhood characteristics. To assess the consistencyof associations the design is cross-national with data from nine industrial towns from the CzechRepublic and Germany.
Methods: We combined datasets from two population based studies, one in Germany ('HeinzNixdorf Recall (HNR) Study'), and one in the Czech Republic ('Health, Alcohol and PsychosocialFactors in Eastern Europe (HAPIEE) Study'). Participation rates were 56% in the HNR and 55% inthe HAPIEE study. The subsample for this particular analysis consists of 11,554 men and womenfrom nine German and Czech towns. Census based information on social characteristics of 326neighbourhoods were collected from local administrative authorities. We used unemployment rateand overcrowding as area-level markers of socioeconomic status (SES). The cardiovascular riskfactors obesity, hypertension, smoking and physical inactivity were used as response variables.Regression models were complemented by individual-level social status (education) and relevantcovariates.
Results: Smoking, obesity and low physical activity were more common in deprivedneighbourhoods in Germany, even when personal characteristics including individual education
Published: 21 September 2007
BMC Public Health 2007, 7:255 doi:10.1186/1471-2458-7-255
Received: 23 May 2007Accepted: 21 September 2007
This article is available from: http://www.biomedcentral.com/1471-2458/7/255
© 2007 Dragano et al; licensee BioMed Central Ltd. This is an Open Access article distributed under the terms of the Creative Commons Attribution License (http://creativecommons.org/licenses/by/2.0), which permits unrestricted use, distribution, and reproduction in any medium, provided the original work is properly cited.
Page 1 of 12(page number not for citation purposes)
BMC Public Health 2007, 7:255 http://www.biomedcentral.com/1471-2458/7/255
were controlled for. For hypertension associations were weak. In the Czech Republic associationswere observed for smoking and physical inactivity, but not for obesity and hypertension whenindividual-level covariates were adjusted for. The strongest association was found for smoking inboth countries: in the fully adjusted model the odds ratio for 'high unemployment rate' was 1.30[95% CI 1.02–1.66] in the Czech Republic and 1.60 [95% CI 1.29–1.98] in Germany.
Conclusion: In this comparative study, the effects of neighbourhood deprivation varied by countryand risk factor; the strongest and most consistent effects were found for smoking. Results indicatethat area level SES is associated with health related lifestyles, which might be a possible pathwaylinking social status and cardiovascular disease. Individual-level education had a considerableinfluence on the association between neighbourhood characteristics and risk factors.
BackgroundSocio-economic inequalities can be analysed at differentlevels, from the individual to urban neighbourhoods upto cities and whole countries. The relationship betweenindividual social characteristics and health is well docu-mented [1]. But even at the aggregate level socioeconomicstatus (SES) seems to be associated with health, as a grow-ing number of studies on relations between neighbour-hood-level SES, mortality and morbidity demonstrate [2].For instance, several studies found a higher all-cause mor-tality in deprived urban neighbourhoods compared toareas with higher social status [3-7]. This relationship isespecially distinct for mortality due to cardiovascularcauses [8-11]. Moreover, indicators of morbidity are alsounequally distributed by neighbourhood SES, for exam-ple non fatal coronary heart disease [12-15] or a self ratedpoor health [16,17].
These effects are usually statistically controlled for indi-vidual-level socioeconomic status and in general the effectof neighbourhood SES persists after adjustment for per-sonal social characteristics [18], indicating an independ-ent influence of area deprivation on health.
A number of intermediate factors linking neighbourhoodSES to individual health have been proposed. Amongsuch factors, there are crime rate, pollution, noise, socialstress and a lack of health related facilities and structures.The promotion of unhealthy lifestyles in an adverse soci-oeconomic environment is another possible pathway.Such an association is documented for smoking, whererates are significantly higher in low SES neighbourhoods,irrespective of personal characteristics [16,19-22]. Otherrisk factors are less frequently analysed, but there is emerg-ing evidence for an association, e.g. for overweight, lowphysical activity and hypertension [23-27].
In this project, we examine the evidence for area-level ine-qualities of health damaging lifestyles by using a set of car-diovascular risk factors in multilevel-analysis. Area levelsocial inequalities in the distribution of behaviour relatedindividual risk factors are of particular interest in this field
of research, because they address a pathway by which thebroader social environment could influence the health ofurban populations. The design of the study is cross-national, since we analyse data from a German and aCzech study with urban populations from nine cities.Comparative analysis allows evaluation of the strength ofassociations between neighbourhood SES and risk factorsin countries that are at different stages of their economicdevelopment [28]. The Czech Republic is a former com-munist country and currently in a fundamental transitionto a market-oriented capitalist society. But irrespective ofan impressive improvement in living conditions, the cur-rent process of transition is still characterized by threats tothe well-being of large population groups who areexposed to material deprivation and social instability[29,30]. No contextual study has been conducted in thisparticular region before, and to our knowledge only onestudy exists in which area-level social inequalities in anEastern Europe country (Moscow, Russia) after the break-down of communism have been investigated [31].
Germany, on the other hand, is a highly developed coun-try and charter member of the European Union, but hasbeen faced with economic decline in the years understudy, especially in the urban region where the study hasbeen conducted. A cross-national and cross-town compar-ison of the results gives an idea about the consistency ofassociations between neighbourhood-level SES and cardi-ovascular risk factors. Such a comparison is useful,because the countries represent different stages of thedevelopment of modern industrialized countries. Theimportance of the characteristics of the place of living forindividual health might vary in relation to the largersocial, cultural and economic context. The present paperexplores the extend to which such a variation exists.
MethodsWe report a comparative analysis of data from the base-line screenings of two longitudinal cohort studies. Bothstudies examined men and women from urban popula-tions, one in Germany (the 'Heinz Nixdorf Recall (HNR)Study'), and one in the Czech Republic (the 'Health, Alco-
Page 2 of 12(page number not for citation purposes)

BMC Public Health 2007, 7:255 http://www.biomedcentral.com/1471-2458/7/255
hol and Psychosocial Factors in Eastern Europe (HAPIEE)Study'). The sample of the HNR study was randomlyselected from population registers of three neighbouringWestern German industrial towns Bochum, Essen, andMülheim. Baseline examination took place during theyears 2000 to 2003. The Czech sample was also drawnrandomly and was based on registers from the six citiesHavirov/Karvina, Hradec, Jihlava, Kromeriz, Liberec andUsti nad Labem Baseline investigations started in 2002and ended in 2005.
Participation rate was 56% in Germany, giving an overallsample size of 4,814, and 55% in the Czech Republic witha resulting sample size of 8,856 participants. Samplingmethods and recruitment are described in detail by Stangand colleagues [32] for the HNR study and by Peasey andcolleagues [33] for the HAPIEE study. To ensure compara-bility of the two studies we restricted our samples to par-ticipants aged 45 to 69 years at baseline, the overlappingage range between the studies. Furthermore, all partici-pants who reported a history of myocardial infarctionwere excluded (171 in HNR; 448 in HAPIEE). Lastly, inthe HAPIEE study it was impossible to merge small-areadata for 645 participants (missing area information orincomplete addresses). Altogether the resulting effectivesample size for this analysis was n = 4,032 for the HNRstudy and n = 7,522 for the HAPIEE study.
In the HNR study, computer-assisted personal interviewswere conducted and supplemented by paper and pencilquestionnaires [34]. Special efforts were invested in qual-ity control of data collection and data handling, as docu-mented in an external certification (DIN EN ISO 9001). Inthe HAPIEE study, data were collected by paper and pencilquestionnaires [[33], for details see [35]]. In addition,physical examinations were conducted in both studies bytrained study personnel which assessed blood pressure,body weight and height and many other parameters. Onlyvariables measured in a comparable way in both studieswere included.
Individual level cardiovascular risk factorsFour established cardiovascular risk factors represent therisk profile of the participants: (1) obesity, (2) hyperten-sion, (3) current smoking and (4) low physical activity.Obesity is defined by a body-mass-index ≥ 30 kg/m2.Blood pressure was measured with an oscillometric device(HNR=Omron HEM-705-CP; HAPIEE=Omron M5-I) andmean values of the 2nd and 3rd measurement taken at leastthree minutes apart were calculated [36]. We classifiedparticipants as hypertensive if they had a systolic value ≥160 mmHg or a diastolic value ≥ 90 mmHg or were takingregular antihypertensive medication. Smoking habits andleisure time physical activities were both assessed bystandardized questionnaires. Current smokers and partic-
ipants with low physical activity (frequency of regular lei-sure time physical activity/sports less than once a week)were defined as being at risk.
Individual-level socioeconomic statusSocioeconomic status of the participants was operational-ised by their educational degrees. The respective variablewas classified according to the International StandardClassification of Education [37]. This classification indi-cates the highest educational degree by combining schooland vocational training. Four categories were defined: pri-mary, vocational, secondary and university degree.
Individual-level covariatesAge and sex were adjusted for in all multivariate analyses.Additionally, economic activity and social isolation wereincluded as covariates. All four variables could be consid-ered as possible mediating or confounding factors in theassociation between neighbourhood-level SES and health.Economic activity is relevant, because it includes individ-ual unemployment. The variable distinguishes fourgroups: participants still working, retired persons, unem-ployed and economically inactive people (i.e. housewife).Social isolation is a strong determinant of health [38] andis influenced by the socioeconomic context in which aperson lives [39]. As the questionnaires about social net-work were not fully identical we used a simple operation-alisation: people who reported to have regular contactwith friends or relatives less than once a month weredefined as socially isolated.
Neighbourhood-level socioeconomic statusTo measure neighbourhood SES, participants were linkedto their area of residence using the baseline home address.Area of residence was defined by existing administrativeboundaries in both countries. In the Czech Republic par-ticipants were nested in 220 neighbourhoods with amedian number of 3517 inhabitants; in Germany a totalof 106 geographical units were linked, with a median sizeof 11,263 inhabitants. In the next step, the area code wasused to merge the neighbourhood data. Two indicators ofneighbourhood level SES were available for this analysis:unemployment rate and overcrowding. Both indicatorsare frequently used in area-level research, e.g. as part of theTownsend or the Carstairs deprivation indexes [40].Unemployment is a strong indicator for material depriva-tion [22] in a neighbourhood, while overcrowding reflectsaspects of social stress and physical hazards due to a highpopulation density [41,42]. Respective information wasobtained from the local census authorities of the towns.The unemployment rate (%) was calculated by dividingthe number of unemployed in the area by the number ofthe economically active population (unemployed + work-ing population). In both studies an indicator of over-crowding was calculated by dividing the total living space
Page 3 of 12(page number not for citation purposes)

BMC Public Health 2007, 7:255 http://www.biomedcentral.com/1471-2458/7/255
(houses/flats) in m2 by the total number of inhabitants.To ensure comparability between the countries we exam-ined relative instead of absolute differences in neighbour-hood SES. Analogous to a recent comparative study of vanLenthe and colleagues [28] the continuous variables weretherefore grouped into four categories by calculatingcountry-specific quartiles. The variables were coded from1 to 4, where group 1 was the reference group with thehighest SES having an unemployment rate in the lowestquartile or a mean number of m2 per inhabitant in thehighest quartile.
Statistical analysisWe used bivariate statistics (proportions/chi2-test; means/t-test) to summarize the characteristics of the samples andthe distribution of the socioeconomic status indicators.Due to the hierarchical structure of the data it was neces-sary to apply multi-level statistical methods for the analy-ses of neighbourhood- and individual-level effects. Thetwo country-datasets were analysed separately, and differ-ences are interpreted qualitatively on the basis of the esti-mates derived by the multi-level regression models. Thefour risk factors were defined as the dependent variablesin the regression models. A logistic regression model withmixed effects was used for statistical analysis. For the fixedeffects the following two sets of variables were used: a)individual characteristics: age, gender, socioeconomic sta-tus, isolation and economic activity; b) contextual charac-teristics: unemployment and overcrowding.
For the random effects we analysed two types of nestedstructure:
1) random variability between cities and between districtswithin cities
2) fixed effects for cities and random effects for districts.
We decided between these possible model structures byevaluating the estimated variance components. If thesemodel parameters were estimated as zero we reduced themodel to a simple model without random effects.
The model parameters were estimated by the PenalizedQuasi Likelihood method [43]. 95% confidence intervalsare reported for odds ratios. The analysis was performedwith fixed effects variables entered sequentially. Missingvalues were excluded. In general the item nonresponsewas low, with the exception of obesity measures in theCzech Republic, where more than 1000 study participantshad missing data.
For each outcome, the analysis was done in three steps.The first model contained only the area-level indicatorand age, sex as covariates. In the second model, individ-
ual-level education was additionally included, and finallyeconomic activity and social isolation were added in thethird model. Analyses revealed only small differences ofresults between men and women. Therefore, numbers aregiven for the total group.
Descriptive statistics were calculated with the SPSS statis-tical package 12.0.1 and multilevel regression modelswith R version 2.3.1 (R Development Core Team 2006).
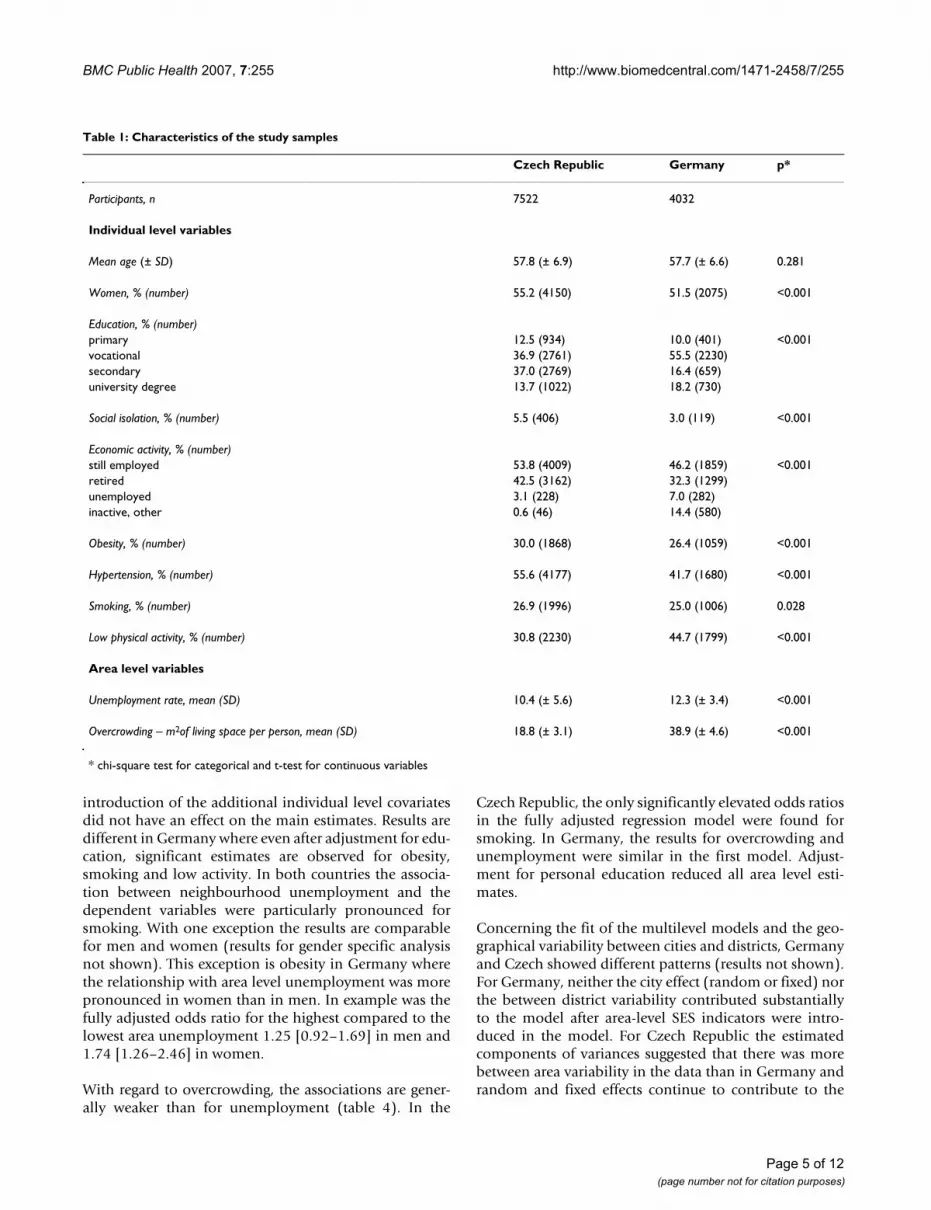
ResultsThe distribution of the study variables in the German andthe Czech sample are described in table 1. With the excep-tion of age, all characteristics vary significantly betweenthe two datasets. Due to different educational systemsvocational degrees are more common in Germany com-pared to the Czech Republic with more secondary educa-tional degrees. Furthermore, in Germany theunemployment rate is higher than in the Czech Republic,but social isolation was more common among Czechs.The risk factor prevalence was higher for three variables inthe Czech Republic (obesity, hypertension, smoking), butthe rate of physically inactive people was higher in Ger-many. The two neighbourhood-level indicators differ intheir distribution too. The unemployment rate was higherin Germany, but the mean living space per person wasnearly twice as high in Germany than in the Czech Repub-lic. As mentioned above, the area-level variables weregrouped according to country specific quartiles of the dis-tribution for the multi-level analyses.
The prevalence of the risk factors by country and level ofneighbourhood deprivation is shown in table 2. With theexception of hypertension in Germany, the prevalenceincreases with an increasing unemployment rate in bothcountries. Some of the differences are considerably high,especially in the German dataset. The second part of thetable demonstrates, that the trend is generally weaker forthe overcrowding indicator.
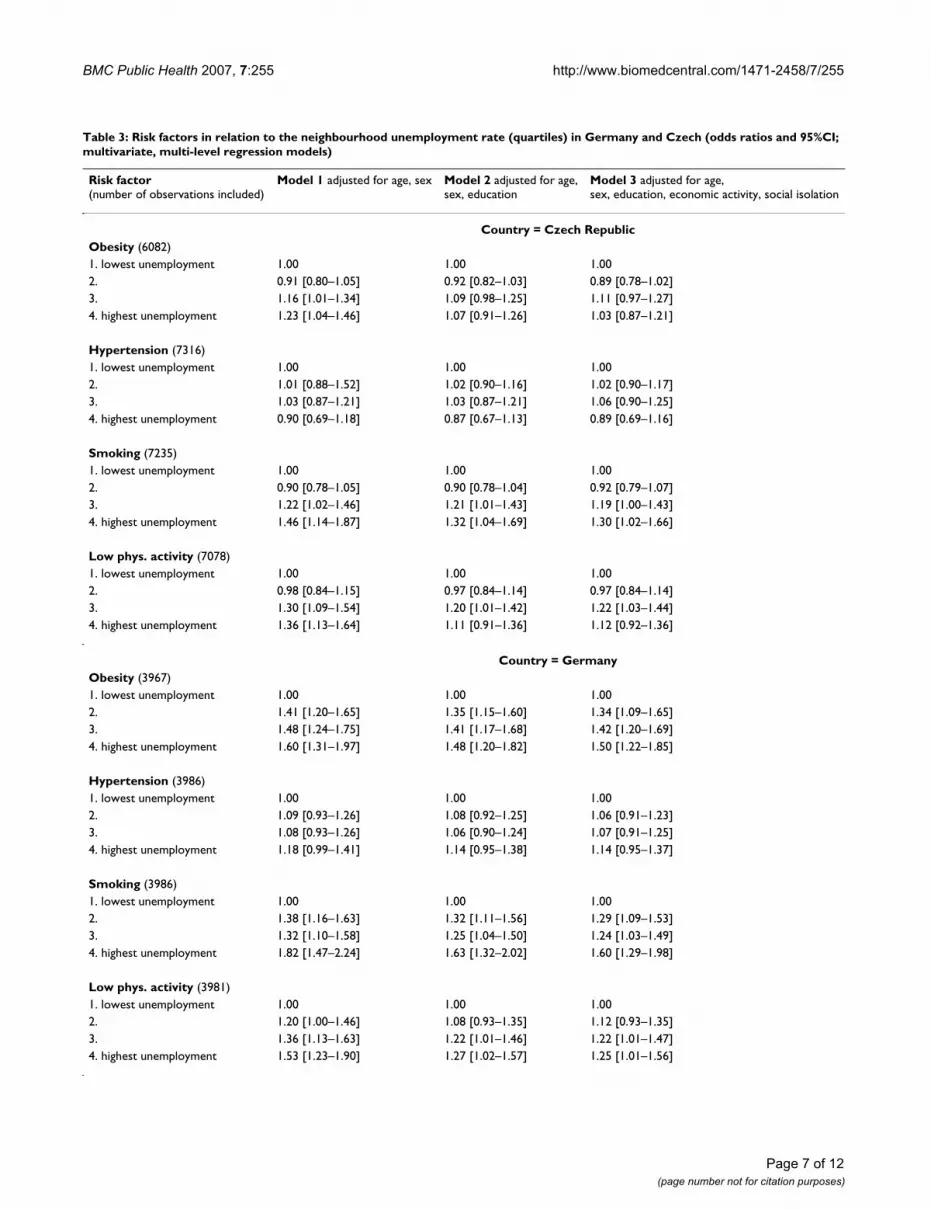
To what extent the bivariate associations are confoundedby covariates was assessed in the multivariate hierarchicalregression analyses. Main results for unemployment arepresented in table 3. In the first age and sex adjustedmodel neighbourhood unemployment shows a small butconsistent association with obesity, smoking and lowphysical activity in both countries. Odds ratios are higherin Germany than in the Czech Republic, a differencewhich persists even after further adjustment for personaleducation and other covariates.
Adjustment for education (model 2) weakened the statis-tical association between unemployment and risk factors.In the Czech Republic odds ratios remained significantlyelevated for smoking and low physical activity only. The
Page 4 of 12(page number not for citation purposes)
BMC Public Health 2007, 7:255 http://www.biomedcentral.com/1471-2458/7/255
introduction of the additional individual level covariatesdid not have an effect on the main estimates. Results aredifferent in Germany where even after adjustment for edu-cation, significant estimates are observed for obesity,smoking and low activity. In both countries the associa-tion between neighbourhood unemployment and thedependent variables were particularly pronounced forsmoking. With one exception the results are comparablefor men and women (results for gender specific analysisnot shown). This exception is obesity in Germany wherethe relationship with area level unemployment was morepronounced in women than in men. In example was thefully adjusted odds ratio for the highest compared to thelowest area unemployment 1.25 [0.92–1.69] in men and1.74 [1.26–2.46] in women.
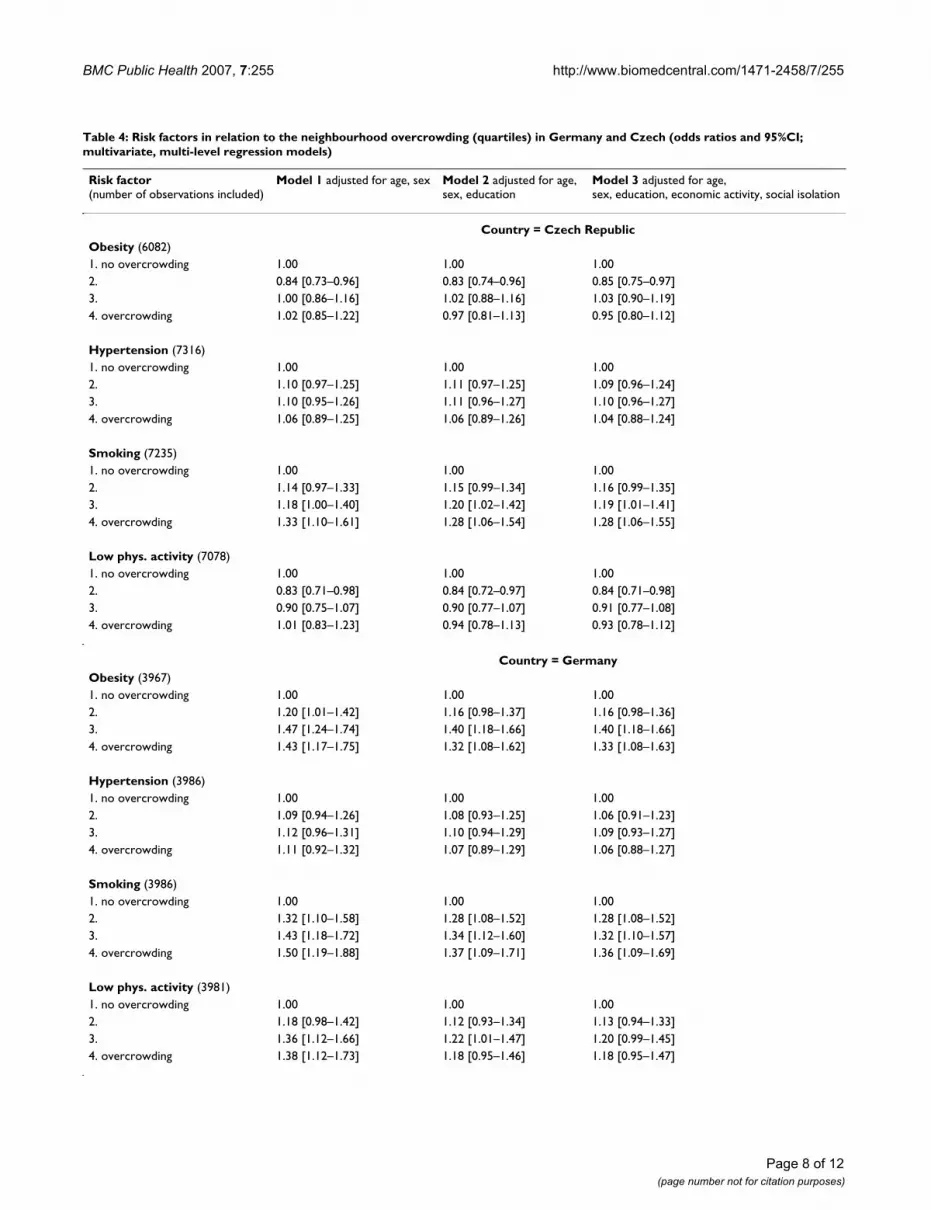
With regard to overcrowding, the associations are gener-ally weaker than for unemployment (table 4). In the
Czech Republic, the only significantly elevated odds ratiosin the fully adjusted regression model were found forsmoking. In Germany, the results for overcrowding andunemployment were similar in the first model. Adjust-ment for personal education reduced all area level esti-mates.
Concerning the fit of the multilevel models and the geo-graphical variability between cities and districts, Germanyand Czech showed different patterns (results not shown).For Germany, neither the city effect (random or fixed) northe between district variability contributed substantiallyto the model after area-level SES indicators were intro-duced in the model. For Czech Republic the estimatedcomponents of variances suggested that there was morebetween area variability in the data than in Germany andrandom and fixed effects continue to contribute to the
Table 1: Characteristics of the study samples
Czech Republic Germany p*
Participants, n 7522 4032
Individual level variables
Mean age (± SD) 57.8 (± 6.9) 57.7 (± 6.6) 0.281
Women, % (number) 55.2 (4150) 51.5 (2075) <0.001
Education, % (number)primary 12.5 (934) 10.0 (401) <0.001vocational 36.9 (2761) 55.5 (2230)secondary 37.0 (2769) 16.4 (659)university degree 13.7 (1022) 18.2 (730)
Social isolation, % (number) 5.5 (406) 3.0 (119) <0.001
Economic activity, % (number)still employed 53.8 (4009) 46.2 (1859) <0.001retired 42.5 (3162) 32.3 (1299)unemployed 3.1 (228) 7.0 (282)inactive, other 0.6 (46) 14.4 (580)
Obesity, % (number) 30.0 (1868) 26.4 (1059) <0.001
Hypertension, % (number) 55.6 (4177) 41.7 (1680) <0.001
Smoking, % (number) 26.9 (1996) 25.0 (1006) 0.028
Low physical activity, % (number) 30.8 (2230) 44.7 (1799) <0.001
Area level variables
Unemployment rate, mean (SD) 10.4 (± 5.6) 12.3 (± 3.4) <0.001
Overcrowding – m2of living space per person, mean (SD) 18.8 (± 3.1) 38.9 (± 4.6) <0.001
* chi-square test for categorical and t-test for continuous variables
Page 5 of 12(page number not for citation purposes)

BMC Public Health 2007, 7:255 http://www.biomedcentral.com/1471-2458/7/255
model fit even after an adjustment for the area-level vari-ables.
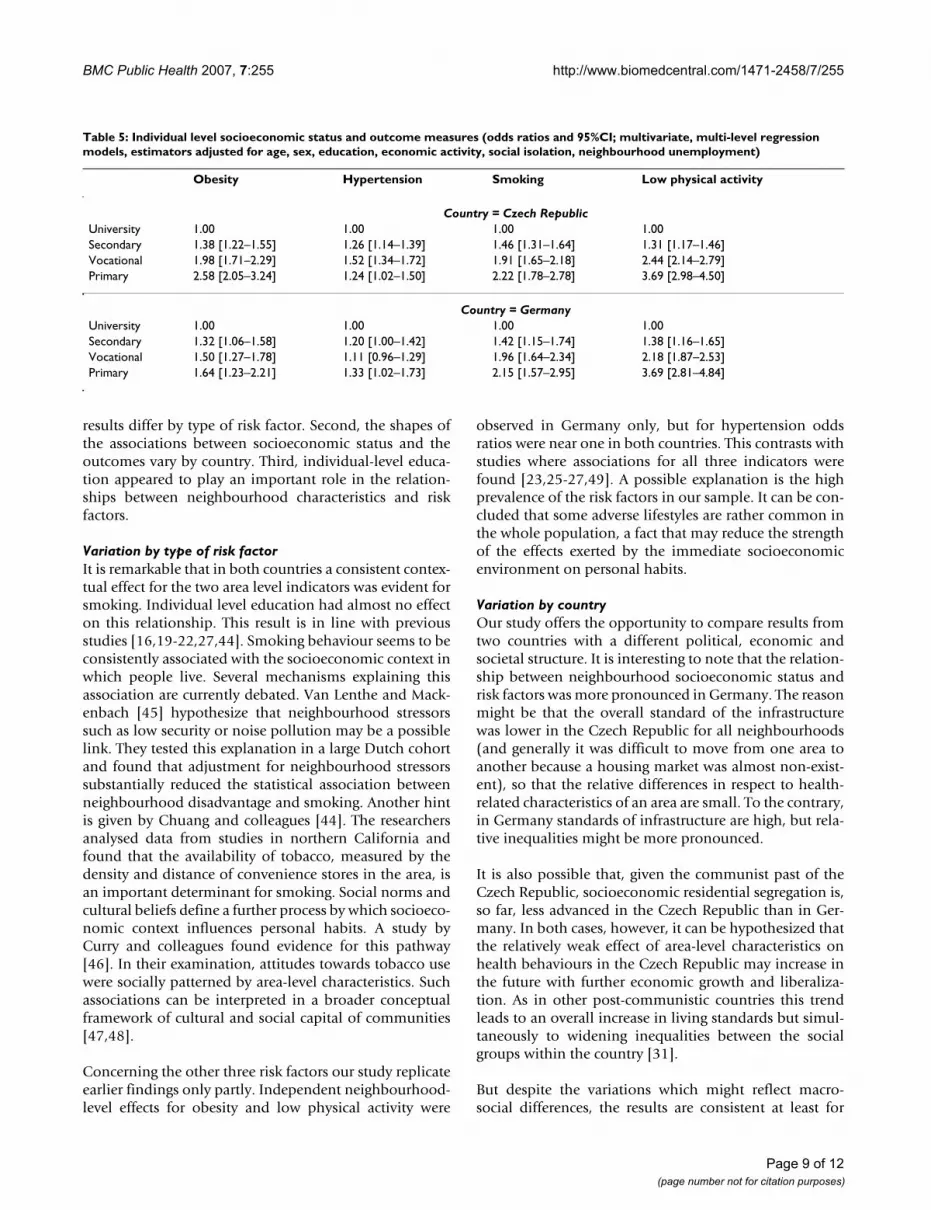
In previous tables, education had a strong effect on therelationship between neighbourhood characteristics andrisk factors. This is consistent with the strong associationsbetween individual-level education and risk factors (table5). In both countries an unhealthy risk factor profile wasmore common in participants with lower education. The
high odds ratios indicate that individual level SES has astronger impact on health risks than area level SES.
DiscussionIn this comparative study, we examined associationsbetween two indicators of neighbourhood socioeconomicstatus and four cardiovascular risk factors. We made threemain observations. First, in both countries, neighbour-hood characteristics were related to the risk factors, but
Table 2: Proportions of participants with risk factors and with low education by quartiles of neighbourhood unemployment and overcrowding in the two countries
Quartiles of neighbourhood unemployment
1 (lowest unemployment) 2. 3. 4. (highest unemployment) p (chi2)
% obesityCzech Republic 29.2 27.2 31.2 32.2 0.010Germany 20.9 27.2 28.1 29.6 <0.001
% hypertensionCzech Republic 51.5 54.5 57.2 59.6 <0.001Germany 39.7 42.1 41.7 43.4 0.392
% current smokingCzech Republic 26.0 23.1 26.9 31.8 <0.001Germany 20.0 25.0 24.4 30.8 <0.001
% low physical activityCzech Republic 28.9 28.1 32.2 34.2 <0.001Germany 39.5 43.7 46.4 49.1 <0.001
% lowest educationCzech Republic 9.2 9.9 11.5 19.5 <0.001Germany 6.2 7.6 11.1 15.1 <0.001
Quartiles of neighbourhood overcrowding
1 (no overcrowding) 2. 3. 4. (overcrowding) p (chi2)
% obesityCzech Republic 30.5 28.1 31.0 30.3 0.307Germany 22.3 25.5 29.2 28.8 <0.001
% hypertensionCzech Republic 55.1 56.0 55.2 56.3 0.875Germany 40.3 42.2 42.2 42.2 0.772
% current smokingCzech Republic 23.8 25.2 26.7 31.8 <0.001Germany 20.2 24.8 27.2 28.0 <0.001
% low physical activityCzech Republic 32.5 28.0 29.7 32.8 0.004Germany 40.3 44.0 46.8 47.7 0.002
% lowest educationCzech Republic 11.0 10.9 10.8 17.2 <0.001Germany 6.8 7.1 11.4 14.7 <0.001
Page 6 of 12(page number not for citation purposes)
BMC Public Health 2007, 7:255 http://www.biomedcentral.com/1471-2458/7/255
Page 7 of 12(page number not for citation purposes)
Table 3: Risk factors in relation to the neighbourhood unemployment rate (quartiles) in Germany and Czech (odds ratios and 95%CI; multivariate, multi-level regression models)
Risk factor (number of observations included)
Model 1 adjusted for age, sex Model 2 adjusted for age,sex, education
Model 3 adjusted for age, sex, education, economic activity, social isolation
Country = Czech RepublicObesity (6082)1. lowest unemployment 1.00 1.00 1.002. 0.91 [0.80–1.05] 0.92 [0.82–1.03] 0.89 [0.78–1.02]3. 1.16 [1.01–1.34] 1.09 [0.98–1.25] 1.11 [0.97–1.27]4. highest unemployment 1.23 [1.04–1.46] 1.07 [0.91–1.26] 1.03 [0.87–1.21]
Hypertension (7316)1. lowest unemployment 1.00 1.00 1.002. 1.01 [0.88–1.52] 1.02 [0.90–1.16] 1.02 [0.90–1.17]3. 1.03 [0.87–1.21] 1.03 [0.87–1.21] 1.06 [0.90–1.25]4. highest unemployment 0.90 [0.69–1.18] 0.87 [0.67–1.13] 0.89 [0.69–1.16]
Smoking (7235)1. lowest unemployment 1.00 1.00 1.002. 0.90 [0.78–1.05] 0.90 [0.78–1.04] 0.92 [0.79–1.07]3. 1.22 [1.02–1.46] 1.21 [1.01–1.43] 1.19 [1.00–1.43]4. highest unemployment 1.46 [1.14–1.87] 1.32 [1.04–1.69] 1.30 [1.02–1.66]
Low phys. activity (7078)1. lowest unemployment 1.00 1.00 1.002. 0.98 [0.84–1.15] 0.97 [0.84–1.14] 0.97 [0.84–1.14]3. 1.30 [1.09–1.54] 1.20 [1.01–1.42] 1.22 [1.03–1.44]4. highest unemployment 1.36 [1.13–1.64] 1.11 [0.91–1.36] 1.12 [0.92–1.36]
Country = GermanyObesity (3967)1. lowest unemployment 1.00 1.00 1.002. 1.41 [1.20–1.65] 1.35 [1.15–1.60] 1.34 [1.09–1.65]3. 1.48 [1.24–1.75] 1.41 [1.17–1.68] 1.42 [1.20–1.69]4. highest unemployment 1.60 [1.31–1.97] 1.48 [1.20–1.82] 1.50 [1.22–1.85]
Hypertension (3986)1. lowest unemployment 1.00 1.00 1.002. 1.09 [0.93–1.26] 1.08 [0.92–1.25] 1.06 [0.91–1.23]3. 1.08 [0.93–1.26] 1.06 [0.90–1.24] 1.07 [0.91–1.25]4. highest unemployment 1.18 [0.99–1.41] 1.14 [0.95–1.38] 1.14 [0.95–1.37]
Smoking (3986)1. lowest unemployment 1.00 1.00 1.002. 1.38 [1.16–1.63] 1.32 [1.11–1.56] 1.29 [1.09–1.53]3. 1.32 [1.10–1.58] 1.25 [1.04–1.50] 1.24 [1.03–1.49]4. highest unemployment 1.82 [1.47–2.24] 1.63 [1.32–2.02] 1.60 [1.29–1.98]
Low phys. activity (3981)1. lowest unemployment 1.00 1.00 1.002. 1.20 [1.00–1.46] 1.08 [0.93–1.35] 1.12 [0.93–1.35]3. 1.36 [1.13–1.63] 1.22 [1.01–1.46] 1.22 [1.01–1.47]4. highest unemployment 1.53 [1.23–1.90] 1.27 [1.02–1.57] 1.25 [1.01–1.56]
BMC Public Health 2007, 7:255 http://www.biomedcentral.com/1471-2458/7/255
Page 8 of 12(page number not for citation purposes)
Table 4: Risk factors in relation to the neighbourhood overcrowding (quartiles) in Germany and Czech (odds ratios and 95%CI; multivariate, multi-level regression models)
Risk factor (number of observations included)
Model 1 adjusted for age, sex Model 2 adjusted for age, sex, education
Model 3 adjusted for age,sex, education, economic activity, social isolation
Country = Czech RepublicObesity (6082)1. no overcrowding 1.00 1.00 1.002. 0.84 [0.73–0.96] 0.83 [0.74–0.96] 0.85 [0.75–0.97]3. 1.00 [0.86–1.16] 1.02 [0.88–1.16] 1.03 [0.90–1.19]4. overcrowding 1.02 [0.85–1.22] 0.97 [0.81–1.13] 0.95 [0.80–1.12]
Hypertension (7316)1. no overcrowding 1.00 1.00 1.002. 1.10 [0.97–1.25] 1.11 [0.97–1.25] 1.09 [0.96–1.24]3. 1.10 [0.95–1.26] 1.11 [0.96–1.27] 1.10 [0.96–1.27]4. overcrowding 1.06 [0.89–1.25] 1.06 [0.89–1.26] 1.04 [0.88–1.24]
Smoking (7235)1. no overcrowding 1.00 1.00 1.002. 1.14 [0.97–1.33] 1.15 [0.99–1.34] 1.16 [0.99–1.35]3. 1.18 [1.00–1.40] 1.20 [1.02–1.42] 1.19 [1.01–1.41]4. overcrowding 1.33 [1.10–1.61] 1.28 [1.06–1.54] 1.28 [1.06–1.55]
Low phys. activity (7078)1. no overcrowding 1.00 1.00 1.002. 0.83 [0.71–0.98] 0.84 [0.72–0.97] 0.84 [0.71–0.98]3. 0.90 [0.75–1.07] 0.90 [0.77–1.07] 0.91 [0.77–1.08]4. overcrowding 1.01 [0.83–1.23] 0.94 [0.78–1.13] 0.93 [0.78–1.12]
Country = GermanyObesity (3967)1. no overcrowding 1.00 1.00 1.002. 1.20 [1.01–1.42] 1.16 [0.98–1.37] 1.16 [0.98–1.36]3. 1.47 [1.24–1.74] 1.40 [1.18–1.66] 1.40 [1.18–1.66]4. overcrowding 1.43 [1.17–1.75] 1.32 [1.08–1.62] 1.33 [1.08–1.63]
Hypertension (3986)1. no overcrowding 1.00 1.00 1.002. 1.09 [0.94–1.26] 1.08 [0.93–1.25] 1.06 [0.91–1.23]3. 1.12 [0.96–1.31] 1.10 [0.94–1.29] 1.09 [0.93–1.27]4. overcrowding 1.11 [0.92–1.32] 1.07 [0.89–1.29] 1.06 [0.88–1.27]
Smoking (3986)1. no overcrowding 1.00 1.00 1.002. 1.32 [1.10–1.58] 1.28 [1.08–1.52] 1.28 [1.08–1.52]3. 1.43 [1.18–1.72] 1.34 [1.12–1.60] 1.32 [1.10–1.57]4. overcrowding 1.50 [1.19–1.88] 1.37 [1.09–1.71] 1.36 [1.09–1.69]
Low phys. activity (3981)1. no overcrowding 1.00 1.00 1.002. 1.18 [0.98–1.42] 1.12 [0.93–1.34] 1.13 [0.94–1.33]3. 1.36 [1.12–1.66] 1.22 [1.01–1.47] 1.20 [0.99–1.45]4. overcrowding 1.38 [1.12–1.73] 1.18 [0.95–1.46] 1.18 [0.95–1.47]
BMC Public Health 2007, 7:255 http://www.biomedcentral.com/1471-2458/7/255
results differ by type of risk factor. Second, the shapes ofthe associations between socioeconomic status and theoutcomes vary by country. Third, individual-level educa-tion appeared to play an important role in the relation-ships between neighbourhood characteristics and riskfactors.
Variation by type of risk factorIt is remarkable that in both countries a consistent contex-tual effect for the two area level indicators was evident forsmoking. Individual level education had almost no effecton this relationship. This result is in line with previousstudies [16,19-22,27,44]. Smoking behaviour seems to beconsistently associated with the socioeconomic context inwhich people live. Several mechanisms explaining thisassociation are currently debated. Van Lenthe and Mack-enbach [45] hypothesize that neighbourhood stressorssuch as low security or noise pollution may be a possiblelink. They tested this explanation in a large Dutch cohortand found that adjustment for neighbourhood stressorssubstantially reduced the statistical association betweenneighbourhood disadvantage and smoking. Another hintis given by Chuang and colleagues [44]. The researchersanalysed data from studies in northern California andfound that the availability of tobacco, measured by thedensity and distance of convenience stores in the area, isan important determinant for smoking. Social norms andcultural beliefs define a further process by which socioeco-nomic context influences personal habits. A study byCurry and colleagues found evidence for this pathway[46]. In their examination, attitudes towards tobacco usewere socially patterned by area-level characteristics. Suchassociations can be interpreted in a broader conceptualframework of cultural and social capital of communities[47,48].
Concerning the other three risk factors our study replicateearlier findings only partly. Independent neighbourhood-level effects for obesity and low physical activity were
observed in Germany only, but for hypertension oddsratios were near one in both countries. This contrasts withstudies where associations for all three indicators werefound [23,25-27,49]. A possible explanation is the highprevalence of the risk factors in our sample. It can be con-cluded that some adverse lifestyles are rather common inthe whole population, a fact that may reduce the strengthof the effects exerted by the immediate socioeconomicenvironment on personal habits.
Variation by countryOur study offers the opportunity to compare results fromtwo countries with a different political, economic andsocietal structure. It is interesting to note that the relation-ship between neighbourhood socioeconomic status andrisk factors was more pronounced in Germany. The reasonmight be that the overall standard of the infrastructurewas lower in the Czech Republic for all neighbourhoods(and generally it was difficult to move from one area toanother because a housing market was almost non-exist-ent), so that the relative differences in respect to health-related characteristics of an area are small. To the contrary,in Germany standards of infrastructure are high, but rela-tive inequalities might be more pronounced.
It is also possible that, given the communist past of theCzech Republic, socioeconomic residential segregation is,so far, less advanced in the Czech Republic than in Ger-many. In both cases, however, it can be hypothesized thatthe relatively weak effect of area-level characteristics onhealth behaviours in the Czech Republic may increase inthe future with further economic growth and liberaliza-tion. As in other post-communistic countries this trendleads to an overall increase in living standards but simul-taneously to widening inequalities between the socialgroups within the country [31].
But despite the variations which might reflect macro-social differences, the results are consistent at least for
Table 5: Individual level socioeconomic status and outcome measures (odds ratios and 95%CI; multivariate, multi-level regression models, estimators adjusted for age, sex, education, economic activity, social isolation, neighbourhood unemployment)
Obesity Hypertension Smoking Low physical activity
Country = Czech RepublicUniversity 1.00 1.00 1.00 1.00Secondary 1.38 [1.22–1.55] 1.26 [1.14–1.39] 1.46 [1.31–1.64] 1.31 [1.17–1.46]Vocational 1.98 [1.71–2.29] 1.52 [1.34–1.72] 1.91 [1.65–2.18] 2.44 [2.14–2.79]Primary 2.58 [2.05–3.24] 1.24 [1.02–1.50] 2.22 [1.78–2.78] 3.69 [2.98–4.50]
Country = GermanyUniversity 1.00 1.00 1.00 1.00Secondary 1.32 [1.06–1.58] 1.20 [1.00–1.42] 1.42 [1.15–1.74] 1.38 [1.16–1.65]Vocational 1.50 [1.27–1.78] 1.11 [0.96–1.29] 1.96 [1.64–2.34] 2.18 [1.87–2.53]Primary 1.64 [1.23–2.21] 1.33 [1.02–1.73] 2.15 [1.57–2.95] 3.69 [2.81–4.84]
Page 9 of 12(page number not for citation purposes)

BMC Public Health 2007, 7:255 http://www.biomedcentral.com/1471-2458/7/255
some of the risk factors. This is remarkable, because thedataset comprises nine towns in two different countries.
Individual-level SESThe associations of socioeconomic status and risk factorswere lower for area level SES than for individual level SES,which corresponds to previous findings [18]. It can beconcluded that individual social background has a largerimpact on lifestyle than the social environment. Espe-cially education is a crucial factor for adopting or avoidingrisk behaviour. But nonetheless our results show that arealevel SES seems to be an independent variable in relationto cardiovascular risk. According to these findings, inter-ventions to reduce social inequalities should be more suc-cessful at individual level, but the highest impact can beexpected for those measures which combine both individ-ual (e.g. information campaigns about the benefit ofphysical activity) and structural prevention (e.g. improve-ment of local sport facilities) in neighbourhoods.
Methodological considerationsWhen interpreting the results we have to be cautiousbecause several aspects of the study design can influencethem. First, the comparability of the analyses for Germanyand the Czech Republic is restricted by the differentmedian size of the administrative districts on which theneighbourhood level indicators rely. In Germany theunits were approximately three times as large as in theCzech Republic. It has to be noted that larger units can beassociated with a higher degree of misclassification ofindividuals with respect to their actual social environ-ment. This effect can result in an underestimation ofstrength of positive associations [27]. However, the effectsof area-level SES characteristics were more pronounced inGermany. This may suggest that the Czech-German differ-ences are even larger.
Second, individual level socioeconomic status was meas-ured by one indicator, because only education wasassessed in a comparable way in HAPIEE and HNR. Thisis a limitation, because there could be a lack of consist-ency in individual and area level measures in terms of theunderlying pathways to unequal health. Unemploymentand overcrowding are primarily related to material cir-cumstances, while education reflects social and culturalcapital. The impact of this inconsistency on our results isprobably limited, however, because participants' employ-ment status, including unemployment, was included inthe regression models. In addition a sensitivity analysis inthe German sample, which contained a personal incomevariable, has shown that while adjustment for individualincome and education reduced the odds ratios for thearea-level variables, they remained significantly elevated.
Third, the response variable physical inactivity covers onlyone aspect of activities as it relies only on sports. Otheraspects like non-sportive physical activities (e.g. workingin the garden) or the daily walking distance to work orshopping are not included. As the importance of theneighbourhood environment may differ for these dimen-sions, further analysis with specific elements of physicalactivity are necessary [50].
Finally, as this study is cross-sectional, the uncertaintyabout the causality of the associations is higher than in alongitudinal design. For example, self selection of peoplewith unhealthy lifestyles into low SES areas is possible,e.g. because of downward mobility. Although this isunlikely, we tried to minimize reverse causation byexcluding all participants with a history of manifest myo-cardial infarction.
The limitations are balanced by strengths of this investiga-tion. Our study comprises datasets from two countriesand from nine cities with highly comparable measures ofindividual- and neighbourhood-level characteristics.Apart from the higher number of observations, the cross-national and cross-city design allows an analysis of differ-ences between units and to assess consistency of associa-tions in different settings. Both studies are sufficientlylarge and both were conducted to a high standard; thisensures a internal and external validity.
ConclusionNeighbourhood-level socioeconomic status was associ-ated with some of the cardiovascular risk factors inde-pendent of individual social position. A strong andconsistent association was found for smoking. Commu-nity based interventions could be seen as an appropriateinstrument to reduce smoking prevalence and thus healthinequalities, between urban neighbourhoods. Nonethe-less, individual inequalities need to be taken into accountwhen designing interventions, because they are stronglyrelated to all types of risk behaviour under study.
Competing interestsThe author(s) declare that they have no competing inter-ests.
Authors' contributionsND coordinated the neighbourhood level investigationfor this paper, conducted data analyses and drafted themanuscript. HP, MB and NW participated in the coordi-nation of this investigation, the data acquisition of theHNR and the HAPIEE Study, conducted analyses andhelped drafting the manuscript. PEV conducted the multi-level analyses and contributed to draft the manuscript. AP,RK, SW, SM, SM and AS participated in data acquisition ofthe HNR and the HAPIEE Study and revised the manu-
Page 10 of 12(page number not for citation purposes)

BMC Public Health 2007, 7:255 http://www.biomedcentral.com/1471-2458/7/255
script. RE, KHJ and JS contributed to the acquisition offunding and revised the manuscript. All authors read andapproved the final manuscript.
Appendix (Advisory board and criteria and endpoint committee of the Heinz Nixdorf Recall Study)Advisory board: T. Meinertz, Hamburg (Chair); M. Blet-tner, Mainz; C. Bode, Freiburg; PJ. de Feyter, Rotterdam,Netherlands; B. Güntert, Hall i.T., Austria; F. Gutzwiller,Switzerland; H. Heinen, Bonn; O. Hess, Bern; Switzer-land; B. Klein, Essen; H. Löwel, Neuherberg; M. Reiser,Munich; G. Schmidt, Essen; M. Schwaiger, Munich; C.Steinmüller, Bonn; T. Theorell, Stockholm, Sweden; S.N.Willich, Berlin.
Criteria and endpoint committee: C. Bode, Freiburg(Chair); K. Berger, Münster; H.R. Figulla, Jena; C. Hamm,Bad Nauheim; P. Hanrath, Aachen; W. Köpcke, Münster;C. Weimar, Essen; A. Zeiher, Frankfurt.
AcknowledgementsThe HAPIEE study is funded by grants from the Wellcome Trust "Determi-nants of Cardiovascular Diseases in Eastern Europe: A multi-centre cohort study" (grant no. 064947/Z/91/Z), a grant from the US National Institute for Aging "Health disparities and aging in societies in transition (the HAPIEE study)" (grant no. 1R01 AG23522-01), and a grant from the MacArthur Foundation (Health and Social Upheaval Network). We thank the Heinz Nixdorf Foundation (Chairman: Dr. jur. G. Schmidt, Essen, Germany) for the sponsoring of the Heinz Nixdorf Recall study. We are indebted to the investigative group and the study personnel of both studies. Finally we thank the German Research Council for sponsoring additional assessment of psy-chosocial factors (DFG; Project SI 236/8-1) in the Heinz Nixdorf Recall Study and for sponsoring the here presented combined analyses of the HAPIEE and the HNR datasets (DFG; Project SI 236/9-1). Also we are grateful to H. Feldmann (City Council Bochum), F. Beyer (City Council Essen) and H.J. Libera (City Council Mülheim an der Ruhr) for their help with the assessment of area level data.
References1. Marmot M, Wilkinson RG: Social deterninants of health 2nd edition.
Oxford: Oxford University Press; 2006. 2. van Lenthe FJ: Aggregate deprivation and effects on health. In
Social inequalities in health Edited by: Siegrist J, Marmot M. Oxford:Oxford University Press; 2006:167-192.
3. Bosma H, van de Mheen HD, Borsboom GJ, Mackenbach JP: Neigh-borhood socioeconomic status and all-cause mortality. Am JEpidemiol 2001, 153:363-371.
4. Marinacci C, Spadea T, Biggeri A, Demaria M, Caiazzo A, Costa G:The role of individual and contextual socioeconomic circum-stances on mortality: analysis of time variations in a city ofnorth west Italy. J Epidemiol Community Health 2004, 58:199-207.
5. Martikainen P, Kauppinen TM, Valkonen T: Effects of the charac-teristics of neighbourhoods and the characteristics of peopleon cause specific mortality: a register based follow up studyof 252,000 men. J Epidemiol Community Health 2003, 57:210-217.
6. Osler M, Prescott E: Educational level as a contextual and prox-imate determinant of all cause mortality in Danish adults. JEpidemiol Community Health 2003, 57:266-269.
7. Sloggett A, Joshi H: Higher mortality in deprived areas: com-munity or personal disadvantage? BMJ 1994, 309:1470-1474.
8. Borrell LN, Diez Roux AV, Rose K, Catellier D, Clark BL, Atheroscle-rosis Risk in Communities Study: Neighbourhood characteristics
and mortality in the Atherosclerosis Risk in CommunitiesStudy. Int J Epidemiol 2004, 33:398-407.
9. Diez Roux AV, Borrell LN, Haan M, Jackson SA, Schultz R: Neigh-bourhood environments and mortality in an elderly cohort:results from the cardiovascular health study. J Epidemiol Com-munity Health 2004, 58:917-923.
10. Engstrom G, Goransson M, Hansen O, Hedblad B, Tyden P, Todt T,Janzon L: Trends in long-term survival after myocardial infarc-tion: less favourable patterns for patients from deprivedareas. J Intern Med 2000, 248:425-434.
11. Macintyre K, Stewart S, Chalmer J, Pell J, Finlayson A, Boyd J, RedpathA, McMurray J, Capewell S: Relation between socioeconomicdeprivation and death from a first myocardial infarction inScotland: population based analysis. BMJ 2001, 322:1152-1153.
12. Diez Roux AV, Merkin SS, Arnett D, Chambless L, Massing M, NietoFJ, Sorlie P, Szklo M, Tyroler HA, Watson RL: Neighborhood ofresidence and incidence of coronary heart disease. N Engl JMed 2001, 345:99-106.
13. Stjärne MK, Fritzell J, De Leon AP, Hallqvist J, SHEEP Study Group:Neighborhood socioeconomic context, individual incomeand myocardial infarction. Epidemiology 2006, 17:14-23.
14. Chaix B, Rosvall M, Merlo J: Recent increase of neighborhoodsocioeconomic effects on ischemic heart disease mortality: amultilevel survival analysis of two large Swedish cohorts. AmJ Epidemiol 2007, 165:22-26.
15. Winkleby M, Sundquist K, Cubbin C: Inequities in CHD incidenceand case fatality by neighborhood deprivation. Am J of PrevMed 2007, 32:97-106.
16. Reijneveld SA: Neighbourhood socioeconomic context and selfreported health and smoking: a secondary analysis of data onseven cities. J Epidemiol Community Health 2002, 56:935-942.
17. Stafford M, Martikainen P, Lahelma E, Marmot M: Neighbourhoodsand self rated health: a comparison of public sector employ-ees in London and Helsinki. J Epidemiol Community Health 2004,58:772-778.
18. Pickett KE, Pearl M: Multilevel analyses of neighbourhood soci-oeconomic context and health outcomes: a critical review. JEpidemiol Community Health 2001, 55:111-122.
19. Chaix B, Guilbert P, Chauvin P: A multilevel analysis of tobaccouse and tobacco consumption levels in France. Are there anycombination risk groups? Eur J Public Health 2004, 14:186-190.
20. Duncan C, Jones K, Moon G: Smoking and deprivation: arethere neighbourhood effects? Soc Sci Med 1999, 48:497-505.
21. Kleinschmidt I, Hills M, Elliott P: Smoking behaviour can be pre-dicted by neighbourhood deprivation measures. J EpidemiolCommunity Health 1995, 49(Suppl 2):S72-7.
22. Reijneveld SA: The impact of individual and area characteris-tics on urban socioeconomic differences in health and smok-ing. Int J Epidemiol 1998, 27:33-40.
23. Cubbin C, Sundquist K, Ahlen H, Johansson SE, Winkleby MA, Sun-dquist J: Neighborhood deprivation and cardiovascular dis-ease risk factors: Protective and harmful effects. Scand J PublicHealth 2006, 34:228-237.
24. Karvonen S, Rimpela A: Socio-regional context as a determi-nant of adolescents' health behaviour in Finland. Soc Sci Med1996, 43:1467-1474.
25. Cubbin C, Hadden WC, Winkleby MA: Neighborhood contextand cardiovascular disease risk factors: the contribution ofmaterial deprivation. Ethnicity & disease 2001, 11:687-700.
26. Sundquist J, Malmstrom M, Johansson SE: Cardiovascular risk fac-tors and the neighbourhood environment: a multilevel anal-ysis. Int J Epidemiol 1999, 28:841-845.
27. Davey Smith G, Hart C, Watt G, Hole D, Hawthorne V: Individualsocial class, area-based deprivation, cardiovascular diseaserisk factors, and mortality: the Renfrew and Paisley study. JEpidemiol Community Health 1998, 52:399-405.
28. van Lenthe FJ, Borrell LN, Costa G, Diez Roux AV, Kauppinen TM,Marinacci C, Martikainen P, Regidor E, Stafford M, Valkonen T:Neighbourhood unemployment and all cause mortality: acomparison of six countries. J Epidemiol Community Health 2005,59:231-237.
29. Bobak M, Pikhart H, Rose R, Hertzman C, Marmot M: Socioeco-nomic factors, material inequalities, and perceived control inself-rated health: cross-sectional data from seven post-com-munist countries. Soc Sci Med 2000, 51:1343-1350.
Page 11 of 12(page number not for citation purposes)

BMC Public Health 2007, 7:255 http://www.biomedcentral.com/1471-2458/7/255
Publish with BioMed Central and every scientist can read your work free of charge
"BioMed Central will be the most significant development for disseminating the results of biomedical research in our lifetime."
Sir Paul Nurse, Cancer Research UK
Your research papers will be:
available free of charge to the entire biomedical community
peer reviewed and published immediately upon acceptance
cited in PubMed and archived on PubMed Central
yours — you keep the copyright
Submit your manuscript here:http://www.biomedcentral.com/info/publishing_adv.asp
BioMedcentral
30. Cornia AG, Paniccia R: The Mortality Crisis in Transitional EconomiesOxford: Oxford University Press; 2001.
31. McKeehan IV: A mulitlevel city health profile of Moscow. SocSci Med 2000, 51:1295-1312.
32. Stang A, Moebus S, Dragano N, Beck E, Möhlenkamp S, SchmermundA, Siegrist J, Erbel R, Jöckel K: Baseline recruitment and analysesof nonresponse of the Heinz Nixdorf Recall Study: Identifia-bility of phone numbers as the major determinant ofresponse. Eur J Epidemiol 2006, 20:489-496.
33. Peasey A, Bobak M, Kubinova R, Malyutina S, Pajak A, Tamosiuna A,Pikhart H, Nicholson A, Marmot M: Determinants of cardiovas-cular disease and other non-communicable diseases in Cen-tral and Eastern Europe: Rationale and design of the HAPIEEstudy. BMC Public Health 2006, 6:255.
34. Schmermund A, Möhlenkamp S, Stang A, Grönemeyer D, Seibel R,Hirche H, Mann K, Siffert W, Lauterbach K, Siegrist J, Jöckel KH, ErbelR: Assessment of clinically silent atherosclerotic disease andestablished and novel risk factors for predicting myocardialinfarctin and cardiac death in healthy middle-aged subjects:Rationale and design of the Heinz Nixdorf Recall Study. AmHeart J 2002, 144:212-218.
35. Pikhart H, Bobak M, Pajak A, Malyutina S, Kubinova R, Topor R, Seba-kova H, Nikitin Y, Marmot M: Psychosocial factors at work anddepression in three countries of Central and Eastern Europe.Soc Sci Med 2004, 58:1475-1482.
36. Stang A, Moebus S, Möhlenkamp S, Dragano N, Schmermund A, BeckEM, Siegrist J, Erbel R, Jöckel KH, on behalf of the Heinz NixdorfRecall Study Investigative Group: Algorithms for convertingHawksley random zero to automated oscillometric bloodpressure values and vice versa. Am J Epidemiol 2006, 164:85-94.
37. UNESCO: International Standard Classification of Education. ISCED 1997Paris: UNESCO; 1997.
38. Berkman L, Glass T: Social integration, social networks, socialsupport, and health. In Social Epidemiology Edited by: Berkman L,Kawachi I. New York: Oxford University Press; 2000:137-173.
39. Berkman LF, Clark C: Neighborhoods and networks: the con-struction of safe places and bridges. In Neighborhoods and healthEdited by: Kawachi I, Berkman LF. Oxford: Oxford University Press;2003:288-302.
40. Morris R, Carstairs V: Which deprivation? A comparison ofselected deprivation indexes. J Public Health Med 1991,13:318-326.
41. Marsella AJ: Urbanization, mental health, and social deviancy.A review of issues and research. Am Psychol 1998, 53:624-34.
42. Chaix B, Rosvall M, Lynch J, Merlo J: Disentangling contextualeffects on cause-specific mortality in a longitudinal 23-yearfollow-up study: impact of population density or socioeco-nomic environment? Int J Epidemiol 2006, 35:633-43.
43. Breslow NE, Clayton DG: Approximate inference in general-ized linear mixed models. J Am Stat Assoc 1993, 88:9-25.
44. Chuang YC, Cubbin C, Ahn D, Winkleby MA: Effects of neighbour-hood socioeconomic status and convenience store concen-tration on individual level smoking. J Epidemiol Community Health2005, 59:568-573.
45. van Lenthe FJ, Mackenbach JP: Neighbourhood and individualsocioeconomic inequalities in smoking: the role of physicalneighbourhood stressors. J Epidemiol Community Health 2006,60:699-705.
46. Curry SJ, Wagner EH, Cheadle A, Diehr P, Koepsell T, Psaty B,McBride C: Assessment of community-level influences onindividuals' attitudes about cigarette smoking, alcohol use,and consumption of dietary fat. Am J Prev Med 1993, 9:78-84.
47. Siegrist J, Marmot M: Social inequalities in health. New evidence and policyimplications Oxford: Oxford University Press; 2006.
48. Sing-Manoux A, Marmot M: Role of socialization in explainingsocial inequalities in health. Soc Sci Med 2005, 60:2129-2133.
49. Chaix B, Chauvin P: Tobacco and alcohol consumption, seden-tary lifestyle and overweightness in France: A multilevelanalysis of individual and area-level determinants. Eur J Epide-miol 2003, 18:531-538.
50. van Lenthe FJ, Brug J, Mackenbach JP: Neighbourhood inequalitiesin physical inactivity: the role of neighbourhood attractive-ness, proximity to local facilities and safety in the Nether-lands. Soc Sci Med 2005, 60:763-775.
Pre-publication historyThe pre-publication history for this paper can be accessedhere:
http://www.biomedcentral.com/1471-2458/7/255/prepub
Page 12 of 12(page number not for citation purposes)