Embed Size (px)
Citation preview
Living cities www.grosvenor.com
NeighbourhoodSeries
The
Hong Kong Neighbourhoods: a "Living cities" Perspective
Foreword
Grosvenor is a property group committed to creating, investing in and managing properties and places that contribute to the enduring success of cities; a commitment laid out through our ©Living cities© philosophy.
Of course, at the heart of all great, successful cities are thriving neighbourhoods. They are where we work, where we go to meet friends, where we spend time with our families... They buzz, they excite, they grow, and they change.
As stewards of the Mayfair and Belgravia estates in London for hundreds of years, Grosvenor has long been aware of the importance of creating - and maintaining - great neighbourhoods.
In Asia, we have been active for over 20 years. Inspired by our ©Living cities© philosophy, we are now looking to delve deeper into the concept of neighbourhoods, exploring what the changing nature of our cities and their most dynamic districts means for our own business as well our broader community.
Foreword
This white paper focuses on Hong Kong, a city with a spectacular collection of varied and unique neighbourhoods; the city where Grosvenor Asia Pacific is headquartered, and where many of us call home.
Though these findings may just begin to scratch the surface - presenting as many questions as they answer - we hope they will further stimulate debate and engagement among a broad and influential group of stakeholders; a group who - though they may disagree, contest or even compete with one another - all have a vested interest in making Hong Kong's neighbourhoods the best that they can be.
Benjamin ChaChief ExecutiveGrosvenor Asia Pacific
1
2 3ContentsContents
Introduction: Hong Kong as a Living City
The Theory: What is a Neighbourhood?
Hong Kong's Neighbourhoods in Context
Defining Hong Kong Neighbourhoods
Public Perceptions of Hong Kong's Neighbourhoods
Conclusions, Further Research and Acknowledgements Appendix: Tables and Charts
- 1. 2. 3. 4. 5. -
05 - 07 08 - 13 14 - 17 18 - 31 32 - 36 37 - 39 40 - 52
Contents
4 5IntroductionKey Findings
Over the last decade there has been a significant move by international real estate investors away from thinking about activity at country level, towards a more city focussed approach. This evolution has been shaped by the realisation that there can be as much, if not more, differentiation between cities within a country as across international borders. Put another way, it can be credibly argued that London has more significant market similarities with New York than Manchester. This shift in thinking has led to an increased focus on economic structure and dynamism, transport provision, and demographics as a way of defining cities which can be expected over the long term to out-perform by a large variety of metrics.
Across each of these eight attributes are 41 sub factors which can be used to give a city a relative rating. Hong Kong is well established as a global city on a number of different metrics and consistently scores highly in surveys of global cities; Table 1 in the appendix shows a selection of various recent City indices where on a simple weighting, Hong Kong ranks 11th. Hong Kong scores highly for economic and competitiveness factors but generally lower on ©liveability© factors such as healthy environment or strong community.
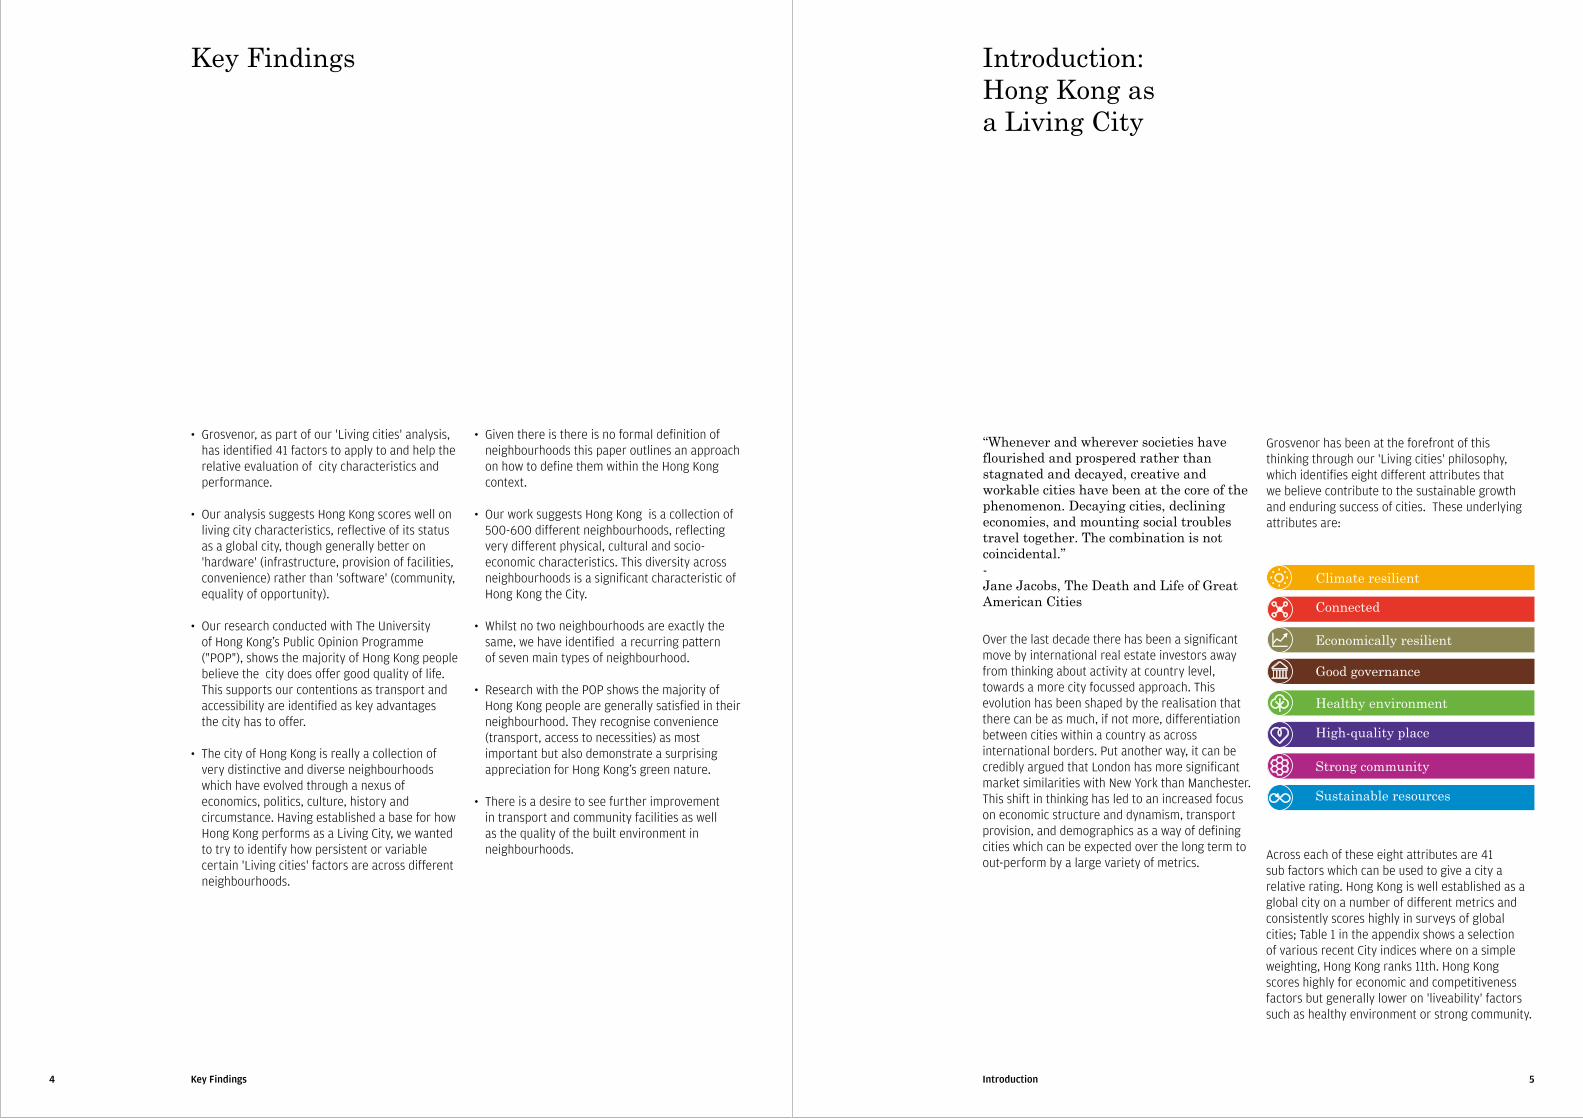
Climate resilient
High-quality place
Connected
Strong community
Sustainable resources
Healthy environment
Economically resilient
Good governance
Introduction: Hong Kong as a Living City
“Whenever and wherever societies have flourished and prospered rather than stagnated and decayed, creative and workable cities have been at the core of the phenomenon. Decaying cities, declining economies, and mounting social troubles travel together. The combination is not coincidental.” - Jane Jacobs, The Death and Life of Great American Cities
Grosvenor has been at the forefront of this thinking through our ©Living cities© philosophy, which identifies eight different attributes that we believe contribute to the sustainable growth and enduring success of cities. These underlying attributes are:
Key Findings
Grosvenor, as part of our ©Living cities© analysis, has identified 41 factors to apply to and help the relative evaluation of city characteristics and performance.
Our analysis suggests Hong Kong scores well on living city characteristics, reflective of its status as a global city, though generally better on ©hardware© (infrastructure, provision of facilities, convenience) rather than ©software© (community, equality of opportunity).
Our research conducted with The University of Hong Kong's Public Opinion Programme ("POP"), shows the majority of Hong Kong people believe the city does offer good quality of life. This supports our contentions as transport and accessibility are identified as key advantages the city has to offer.
The city of Hong Kong is really a collection of very distinctive and diverse neighbourhoods which have evolved through a nexus of economics, politics, culture, history and circumstance. Having established a base for how Hong Kong performs as a Living City, we wanted to try to identify how persistent or variable certain ©Living cities© factors are across different neighbourhoods.
· · · ·
· · · · ·
Given there is there is no formal definition of neighbourhoods this paper outlines an approach on how to define them within the Hong Kong context.
Our work suggests Hong Kong is a collection of 500-600 different neighbourhoods, reflecting very different physical, cultural and socio-economic characteristics. This diversity across neighbourhoods is a significant characteristic of Hong Kong the City.
Whilst no two neighbourhoods are exactly the same, we have identified a recurring pattern of seven main types of neighbourhood.
Research with the POP shows the majority of Hong Kong people are generally satisfied in their neighbourhood. They recognise convenience (transport, access to necessities) as most important but also demonstrate a surprising appreciation for Hong Kong's green nature.
There is a desire to see further improvement in transport and community facilities as well as the quality of the built environment in neighbourhoods.
6 7IntroductionIntroduction
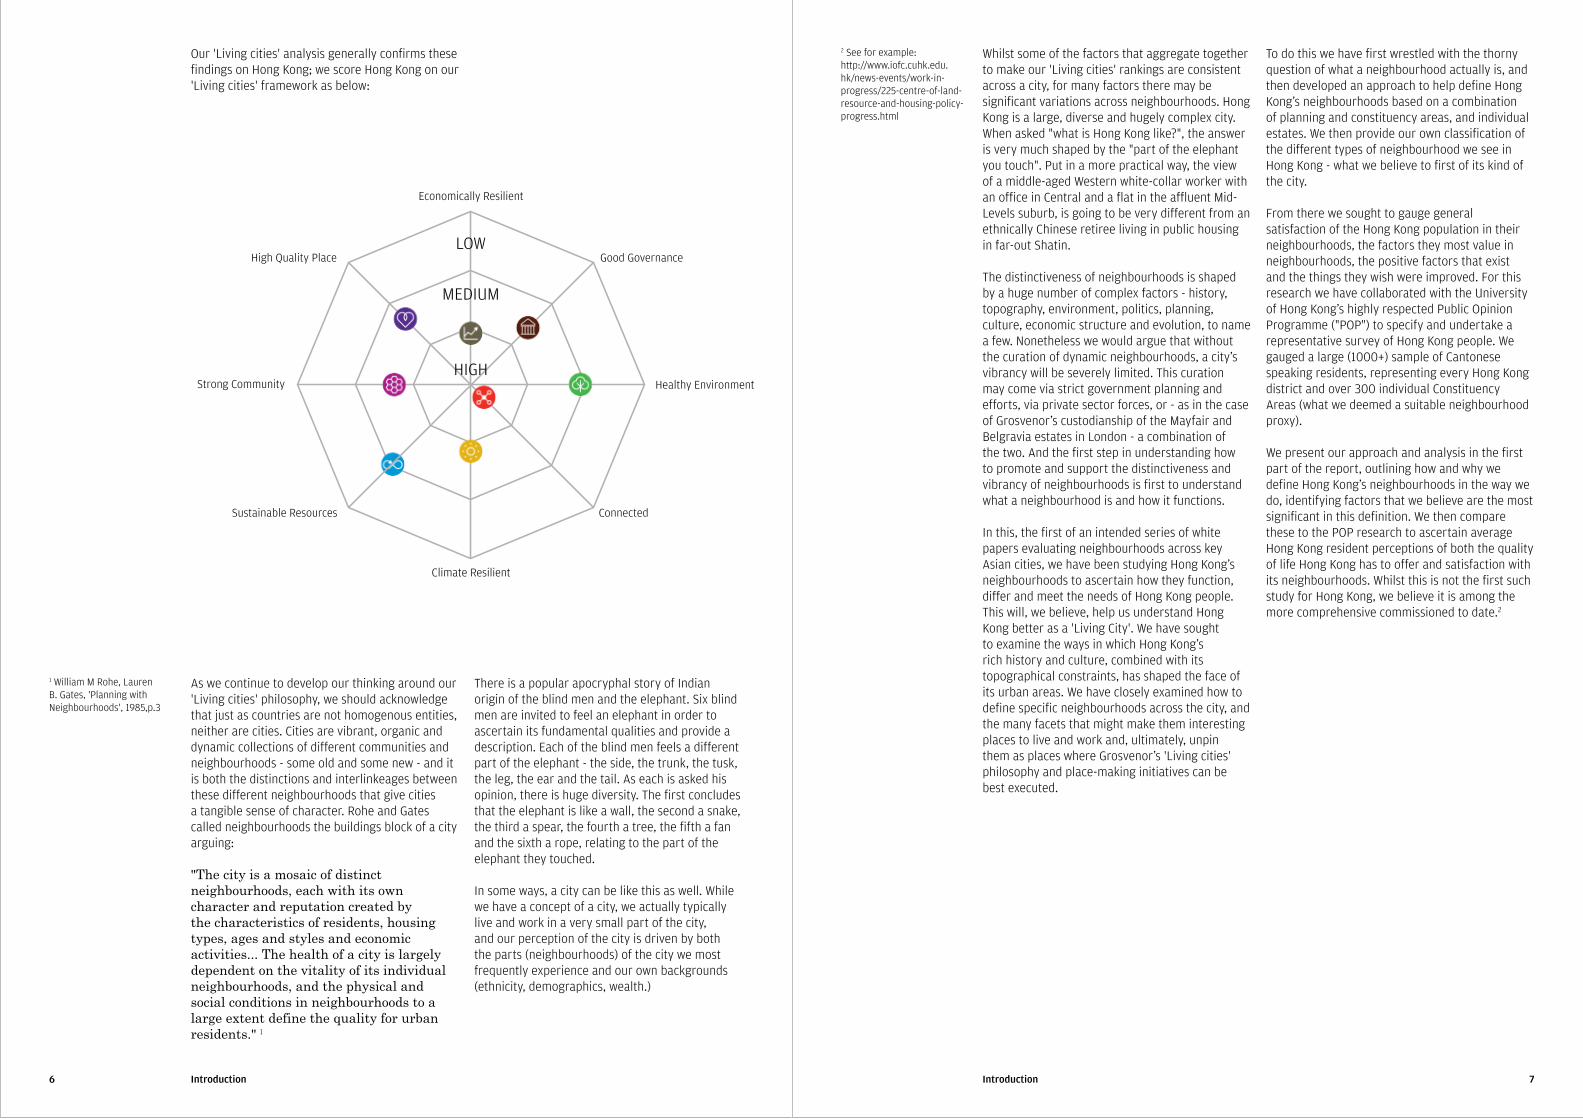
Our ©Living cities© analysis generally confirms these findings on Hong Kong; we score Hong Kong on our ©Living cities© framework as below:
As we continue to develop our thinking around our ©Living cities© philosophy, we should acknowledge that just as countries are not homogenous entities, neither are cities. Cities are vibrant, organic and dynamic collections of different communities and neighbourhoods - some old and some new - and it is both the distinctions and interlinkeages between these different neighbourhoods that give cities a tangible sense of character. Rohe and Gates called neighbourhoods the buildings block of a city arguing:
"The city is a mosaic of distinct neighbourhoods, each with its own character and reputation created by the characteristics of residents, housing types, ages and styles and economic activities... The health of a city is largely dependent on the vitality of its individual neighbourhoods, and the physical and social conditions in neighbourhoods to a large extent define the quality for urban residents." 1
There is a popular apocryphal story of Indian origin of the blind men and the elephant. Six blind men are invited to feel an elephant in order to ascertain its fundamental qualities and provide a description. Each of the blind men feels a different part of the elephant - the side, the trunk, the tusk, the leg, the ear and the tail. As each is asked his opinion, there is huge diversity. The first concludes that the elephant is like a wall, the second a snake, the third a spear, the fourth a tree, the fifth a fan and the sixth a rope, relating to the part of the elephant they touched.
In some ways, a city can be like this as well. While we have a concept of a city, we actually typically live and work in a very small part of the city, and our perception of the city is driven by both the parts (neighbourhoods) of the city we most frequently experience and our own backgrounds (ethnicity, demographics, wealth.)
2 See for example: http://www.iofc.cuhk.edu.hk/news-events/work-in-progress/225-centre-of-land-resource-and-housing-policy-progress.html
1 William M Rohe, Lauren B. Gates, ©Planning with Neighbourhoods©, 1985,p.3
HIGH
MEDIUM
LOW
Economically Resilient
Good Governance
Healthy Environment
Connected
Climate Resilient
Sustainable Resources
Strong Community
High Quality Place
Whilst some of the factors that aggregate together to make our ©Living cities© rankings are consistent across a city, for many factors there may be significant variations across neighbourhoods. Hong Kong is a large, diverse and hugely complex city. When asked "what is Hong Kong like?", the answer is very much shaped by the "part of the elephant you touch". Put in a more practical way, the view of a middle-aged Western white-collar worker with an office in Central and a flat in the affluent Mid-Levels suburb, is going to be very different from an ethnically Chinese retiree living in public housing in far-out Shatin.
The distinctiveness of neighbourhoods is shaped by a huge number of complex factors - history, topography, environment, politics, planning, culture, economic structure and evolution, to name a few. Nonetheless we would argue that without the curation of dynamic neighbourhoods, a city's vibrancy will be severely limited. This curation may come via strict government planning and efforts, via private sector forces, or - as in the case of Grosvenor's custodianship of the Mayfair and Belgravia estates in London - a combination of the two. And the first step in understanding how to promote and support the distinctiveness and vibrancy of neighbourhoods is first to understand what a neighbourhood is and how it functions. In this, the first of an intended series of white papers evaluating neighbourhoods across key Asian cities, we have been studying Hong Kong's neighbourhoods to ascertain how they function, differ and meet the needs of Hong Kong people. This will, we believe, help us understand Hong Kong better as a ©Living City©. We have sought to examine the ways in which Hong Kong's rich history and culture, combined with its topographical constraints, has shaped the face of its urban areas. We have closely examined how to define specific neighbourhoods across the city, and the many facets that might make them interesting places to live and work and, ultimately, unpin them as places where Grosvenor's ©Living cities© philosophy and place-making initiatives can be best executed.
To do this we have first wrestled with the thorny question of what a neighbourhood actually is, and then developed an approach to help define Hong Kong's neighbourhoods based on a combination of planning and constituency areas, and individual estates. We then provide our own classification of the different types of neighbourhood we see in Hong Kong - what we believe to first of its kind of the city. From there we sought to gauge general satisfaction of the Hong Kong population in their neighbourhoods, the factors they most value in neighbourhoods, the positive factors that exist and the things they wish were improved. For this research we have collaborated with the University of Hong Kong's highly respected Public Opinion Programme ("POP") to specify and undertake a representative survey of Hong Kong people. We gauged a large (1000+) sample of Cantonese speaking residents, representing every Hong Kong district and over 300 individual Constituency Areas (what we deemed a suitable neighbourhood proxy).
We present our approach and analysis in the first part of the report, outlining how and why we define Hong Kong's neighbourhoods in the way we do, identifying factors that we believe are the most significant in this definition. We then compare these to the POP research to ascertain average Hong Kong resident perceptions of both the quality of life Hong Kong has to offer and satisfaction with its neighbourhoods. Whilst this is not the first such study for Hong Kong, we believe it is among the more comprehensive commissioned to date.2
9What is a Neighbourhood?
The Theory: What is a Neighbourhood?
1
“We shape our dwellings and our dwellings shape us”. - Winston Churchill As we start a research project to focus on Hong Kong as a collection of neighbourhoods, with distinct though complementary identities, the obvious question is: what is a neighbourhood? The most immediate, if somewhat dissatisfying answer, is to appropriate Judge Potter Stewart's famous US Supreme Court ruling on an entirely different topic: "I know it when I see it." There is simply not an official, unambiguous definition of ©neighbourhood©. The lack of gold standard for defining a neighbourhood results in it meaning quite different things to different people, ranging from a broad district (as large as 500,000 - 1,000,000 people) right down to fewer than a thousand people living in one or two streets. The term can have both geographic concepts and social concepts in that it may really be referring to a collection of a similar type of people. Neighbourhoods can be created or grow organically, can be preserved and repositioned by government activity or by natural forces. The word neighbourhood can be interchangeable with community, though of course it does not have to be. And, in fact, community residents quite frequently have a very different mental map of their neighbourhood than the officially designated neighbourhood areas used by planners and policymakers. It is just as plausible for people to think about their neighbourhood in terms of their social network - i.e. the local people they regularly interact with - which may be more like 50-200 people. This functional neighbourhood is probably equivalent to less than one or two blocks in a typical city.
It is fairly clear that there is no way of unambiguously and meaningfully setting the boundaries of all urban neighbourhoods.
3 George C. Galster: "On the Nature of Neighbourhood", Urban Studies, 2001, Vol. 38, No. 12, 2111-2124, p.3
Nonetheless without a coherent view of neighbourhoods, trying to compare and contrast neighbourhood vibrancy and identify factors that make for neighbourhood success is a challenge and we have therefore attempted to take the most systematic approach possible in thinking about how to look at Hong Kong's neighbourhoods. First and foremost, it is clear that a neighbourhood is a discrete entity, with a distinctive boundary whether it developed based on specific plan or the result of a more organic process: "the characteristics of any [neighbourhood] attribute can be observed only after a particular location has been specified."3 The still influential Chicago school urban theorists Earnest Burgess and Robert Park, defined neighbourhoods largely by topographical features, with divisions by physical features such as rivers, streets, or transport lines. Whilst there was a social element to their definitions, as they believed neighbourhoods were generally composed of people with similar socioeconomic and racial characteristics (which of course can change over time), neighbourhoods by their definitions generally remained relatively static. In their minds, the urban hierarchy did not experience substantial change.
Another very influential American urban theorist was Clarence Perry who in the 1920s developed his Neighbourhood Unit Formula. His ideal neighbourhood was centred around a school with significant open space to allow for social interaction and contained around 5,000-6,000 people. His vision was of a walkable, well-ordered space, representing both physical and social planning concepts. He saw a neighbourhood as self-contained, providing residents with all that's needed for day-to-day living. He was also focused on homogeneity across a range of indicators - social, incomes, ethnic - in order to produce a neighbourhood of genuine community. The main
10 11What is a Neighbourhood?What is a Neighbourhood?
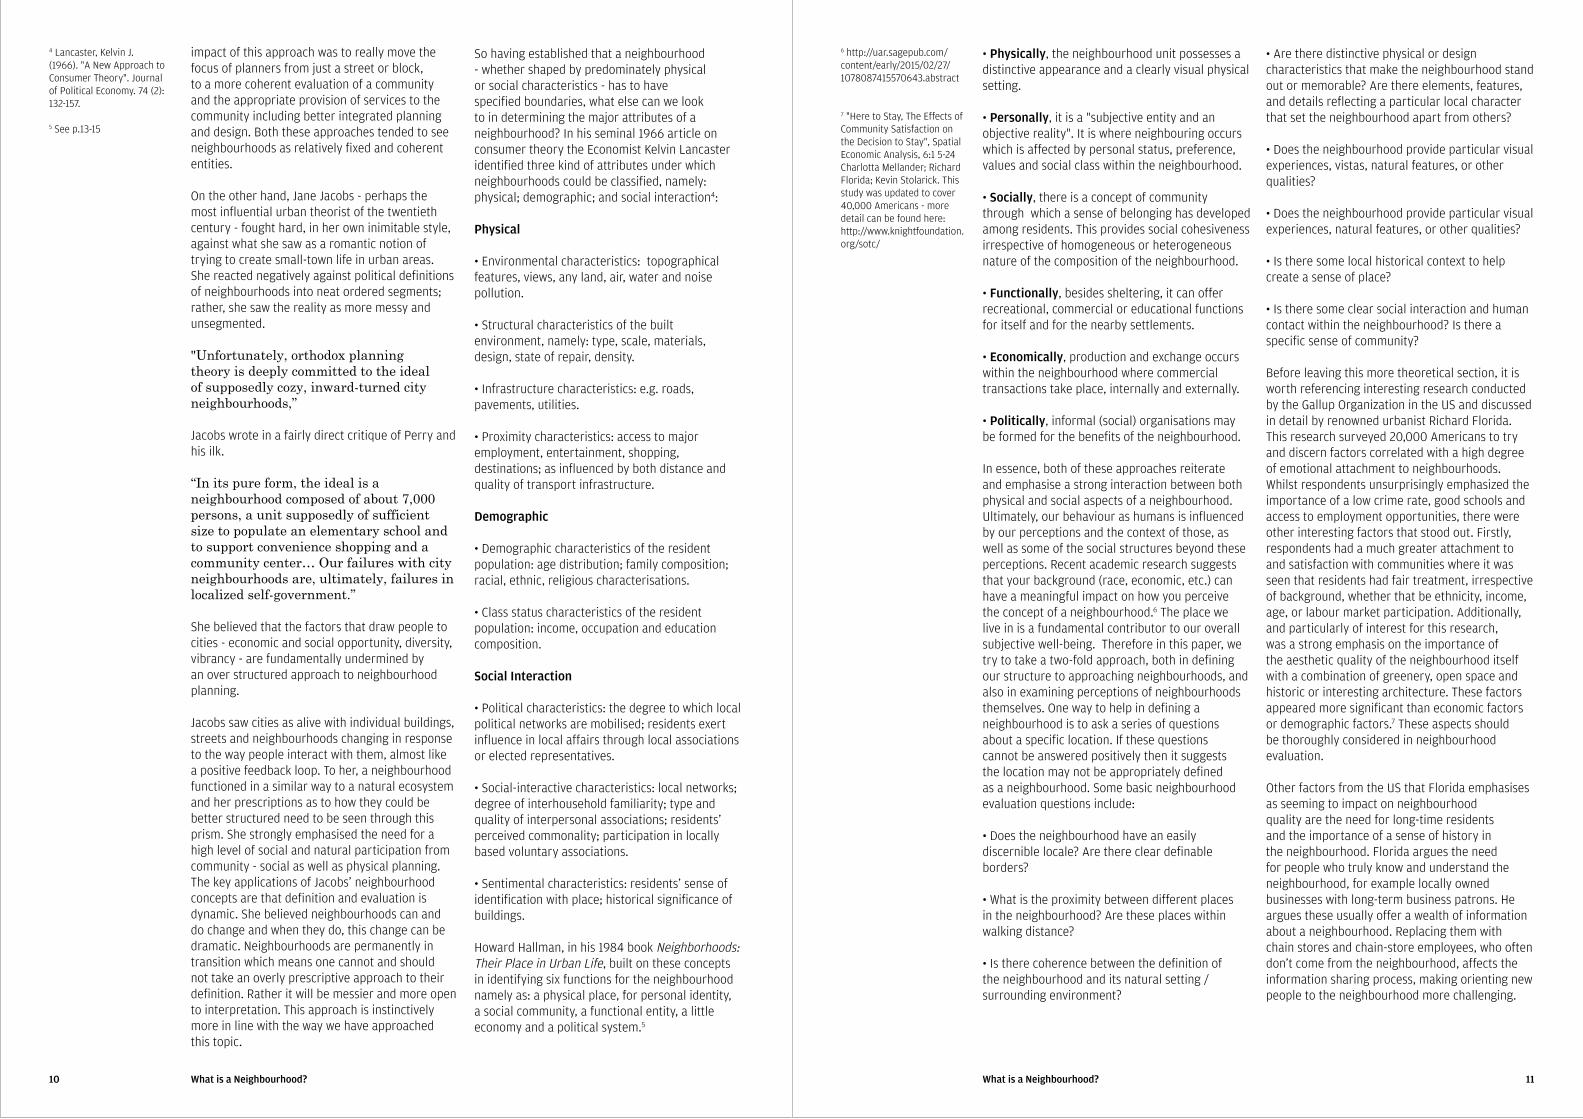
impact of this approach was to really move the focus of planners from just a street or block, to a more coherent evaluation of a community and the appropriate provision of services to the community including better integrated planning and design. Both these approaches tended to see neighbourhoods as relatively fixed and coherent entities.
On the other hand, Jane Jacobs - perhaps the most influential urban theorist of the twentieth century - fought hard, in her own inimitable style, against what she saw as a romantic notion of trying to create small-town life in urban areas. She reacted negatively against political definitions of neighbourhoods into neat ordered segments; rather, she saw the reality as more messy and unsegmented. "Unfortunately, orthodox planning theory is deeply committed to the ideal of supposedly cozy, inward-turned city neighbourhoods,” Jacobs wrote in a fairly direct critique of Perry and his ilk. “In its pure form, the ideal is a neighbourhood composed of about 7,000 persons, a unit supposedly of sufficient size to populate an elementary school and to support convenience shopping and a community center… Our failures with city neighbourhoods are, ultimately, failures in localized self-government.” She believed that the factors that draw people to cities - economic and social opportunity, diversity, vibrancy - are fundamentally undermined by an over structured approach to neighbourhood planning. Jacobs saw cities as alive with individual buildings, streets and neighbourhoods changing in response to the way people interact with them, almost like a positive feedback loop. To her, a neighbourhood functioned in a similar way to a natural ecosystem and her prescriptions as to how they could be better structured need to be seen through this prism. She strongly emphasised the need for a high level of social and natural participation from community - social as well as physical planning. The key applications of Jacobs' neighbourhood concepts are that definition and evaluation is dynamic. She believed neighbourhoods can and do change and when they do, this change can be dramatic. Neighbourhoods are permanently in transition which means one cannot and should not take an overly prescriptive approach to their definition. Rather it will be messier and more open to interpretation. This approach is instinctively more in line with the way we have approached this topic.
So having established that a neighbourhood - whether shaped by predominately physical or social characteristics - has to have specified boundaries, what else can we look to in determining the major attributes of a neighbourhood? In his seminal 1966 article on consumer theory the Economist Kelvin Lancaster identified three kind of attributes under which neighbourhoods could be classified, namely: physical; demographic; and social interaction4: Physical
· Environmental characteristics: topographical features, views, any land, air, water and noise pollution.
· Structural characteristics of the built environment, namely: type, scale, materials, design, state of repair, density.
· Infrastructure characteristics: e.g. roads, pavements, utilities.
· Proximity characteristics: access to major employment, entertainment, shopping, destinations; as influenced by both distance and quality of transport infrastructure.
Demographic
· Demographic characteristics of the resident population: age distribution; family composition; racial, ethnic, religious characterisations.
· Class status characteristics of the resident population: income, occupation and education composition.
Social Interaction
· Political characteristics: the degree to which local political networks are mobilised; residents exert influence in local affairs through local associations or elected representatives. · Social-interactive characteristics: local networks; degree of interhousehold familiarity; type and quality of interpersonal associations; residents' perceived commonality; participation in locally based voluntary associations. · Sentimental characteristics: residents' sense of identification with place; historical significance of buildings.
Howard Hallman, in his 1984 book Neighborhoods: Their Place in Urban Life, built on these concepts in identifying six functions for the neighbourhood namely as: a physical place, for personal identity, a social community, a functional entity, a little economy and a political system.5
· Physically, the neighbourhood unit possesses a distinctive appearance and a clearly visual physical setting.
· Personally, it is a "subjective entity and an objective reality". It is where neighbouring occurs which is affected by personal status, preference, values and social class within the neighbourhood.
· Socially, there is a concept of community through which a sense of belonging has developed among residents. This provides social cohesiveness irrespective of homogeneous or heterogeneous nature of the composition of the neighbourhood.
· Functionally, besides sheltering, it can offer recreational, commercial or educational functions for itself and for the nearby settlements.
· Economically, production and exchange occurs within the neighbourhood where commercial transactions take place, internally and externally.
· Politically, informal (social) organisations may be formed for the benefits of the neighbourhood.
In essence, both of these approaches reiterate and emphasise a strong interaction between both physical and social aspects of a neighbourhood. Ultimately, our behaviour as humans is influenced by our perceptions and the context of those, as well as some of the social structures beyond these perceptions. Recent academic research suggests that your background (race, economic, etc.) can have a meaningful impact on how you perceive the concept of a neighbourhood.6 The place we live in is a fundamental contributor to our overall subjective well-being. Therefore in this paper, we try to take a two-fold approach, both in defining our structure to approaching neighbourhoods, and also in examining perceptions of neighbourhoods themselves. One way to help in defining a neighbourhood is to ask a series of questions about a specific location. If these questions cannot be answered positively then it suggests the location may not be appropriately defined as a neighbourhood. Some basic neighbourhood evaluation questions include:
· Does the neighbourhood have an easily discernible locale? Are there clear definable borders? · What is the proximity between different places in the neighbourhood? Are these places within walking distance?
· Is there coherence between the definition of the neighbourhood and its natural setting / surrounding environment?
· Are there distinctive physical or design characteristics that make the neighbourhood stand out or memorable? Are there elements, features, and details reflecting a particular local character that set the neighbourhood apart from others? · Does the neighbourhood provide particular visual experiences, vistas, natural features, or other qualities? · Does the neighbourhood provide particular visual experiences, natural features, or other qualities? · Is there some local historical context to help create a sense of place?
· Is there some clear social interaction and human contact within the neighbourhood? Is there a specific sense of community? Before leaving this more theoretical section, it is worth referencing interesting research conducted by the Gallup Organization in the US and discussed in detail by renowned urbanist Richard Florida. This research surveyed 20,000 Americans to try and discern factors correlated with a high degree of emotional attachment to neighbourhoods. Whilst respondents unsurprisingly emphasized the importance of a low crime rate, good schools and access to employment opportunities, there were other interesting factors that stood out. Firstly, respondents had a much greater attachment to and satisfaction with communities where it was seen that residents had fair treatment, irrespective of background, whether that be ethnicity, income, age, or labour market participation. Additionally, and particularly of interest for this research, was a strong emphasis on the importance of the aesthetic quality of the neighbourhood itself with a combination of greenery, open space and historic or interesting architecture. These factors appeared more significant than economic factors or demographic factors.7 These aspects should be thoroughly considered in neighbourhood evaluation.
Other factors from the US that Florida emphasises as seeming to impact on neighbourhood quality are the need for long-time residents and the importance of a sense of history in the neighbourhood. Florida argues the need for people who truly know and understand the neighbourhood, for example locally owned businesses with long-term business patrons. He argues these usually offer a wealth of information about a neighbourhood. Replacing them with chain stores and chain-store employees, who often don't come from the neighbourhood, affects the information sharing process, making orienting new people to the neighbourhood more challenging.
4 Lancaster, Kelvin J. (1966). "A New Approach to Consumer Theory". Journal of Political Economy. 74 (2): 132-157. 5 See p.13-15
6 http://uar.sagepub.com/ content/early/2015/02/27/ 1078087415570643.abstract 7 "Here to Stay, The Effects of Community Satisfaction on the Decision to Stay", Spatial Economic Analysis, 6:1 5-24 Charlotta Mellander; Richard Florida; Kevin Stolarick. This study was updated to cover 40,000 Americans - more detail can be found here: http://www.knightfoundation.org/sotc/
12 13What is a Neighbourhood?What is a Neighbourhood?
Florida further says, "Every time we come back to these neighborhoods that are exciting, that are great, there's a long history behind them. We can make the new ones better, but it’s hard to think about a neighborhood that we’ve invented from scratch that has made the list of America’s best neighborhoods. There’s no formula; it may just take a lot of trial and error and evolution to make a great neighborhood. And maybe there has to be some baseline of longstanding relationships in a place. So in essence a neighborhood is not just a set of individuals, but a set of relationships… And the relationships are fluid. Some are longstanding and some you can plug into and play. And the places that enable those relationships to form are the places that do better."
So to summarise, to understand what a neighbourhood is, we need to know the geographic, demographic, and social characteristics. Location, density, street layout and connectivity; economic, social, and ethnic diversity and functionality; these all matter. Further, we need to understand whether a plan or specific planning efforts contributed to or sustained the character of the neighbourhood, or if the neighbourhood formed more organically and not through a formal planning process.
To put it in a more tangible way, we need to know both the neighbourhood ©hardware© - the physical, tangible dimensions - and ©software©, referring to the importance of resident perceptions of the strength of community and neighbourhood. These are concepts to which we will return. It is our contention through our ©Living cities© analysis that Hong Kong does fairly well on the hardware but less so on the software.
It is clear certain attributes of neighbourhoods vary in permanence. Appropriating basic economics language we can quickly gauge
whether a characteristic is elastic or inelastic in supply. Topography is clearly largely fixed i.e. inelastic (though land reclamation exists in Hong Kong); infrastructure inelastic in the short term, elastic in long term while the social status of a neighbourhood can change very quickly i.e. is elastic. Different emphasis on different factors will lead to different conclusions on how rapidly they change.
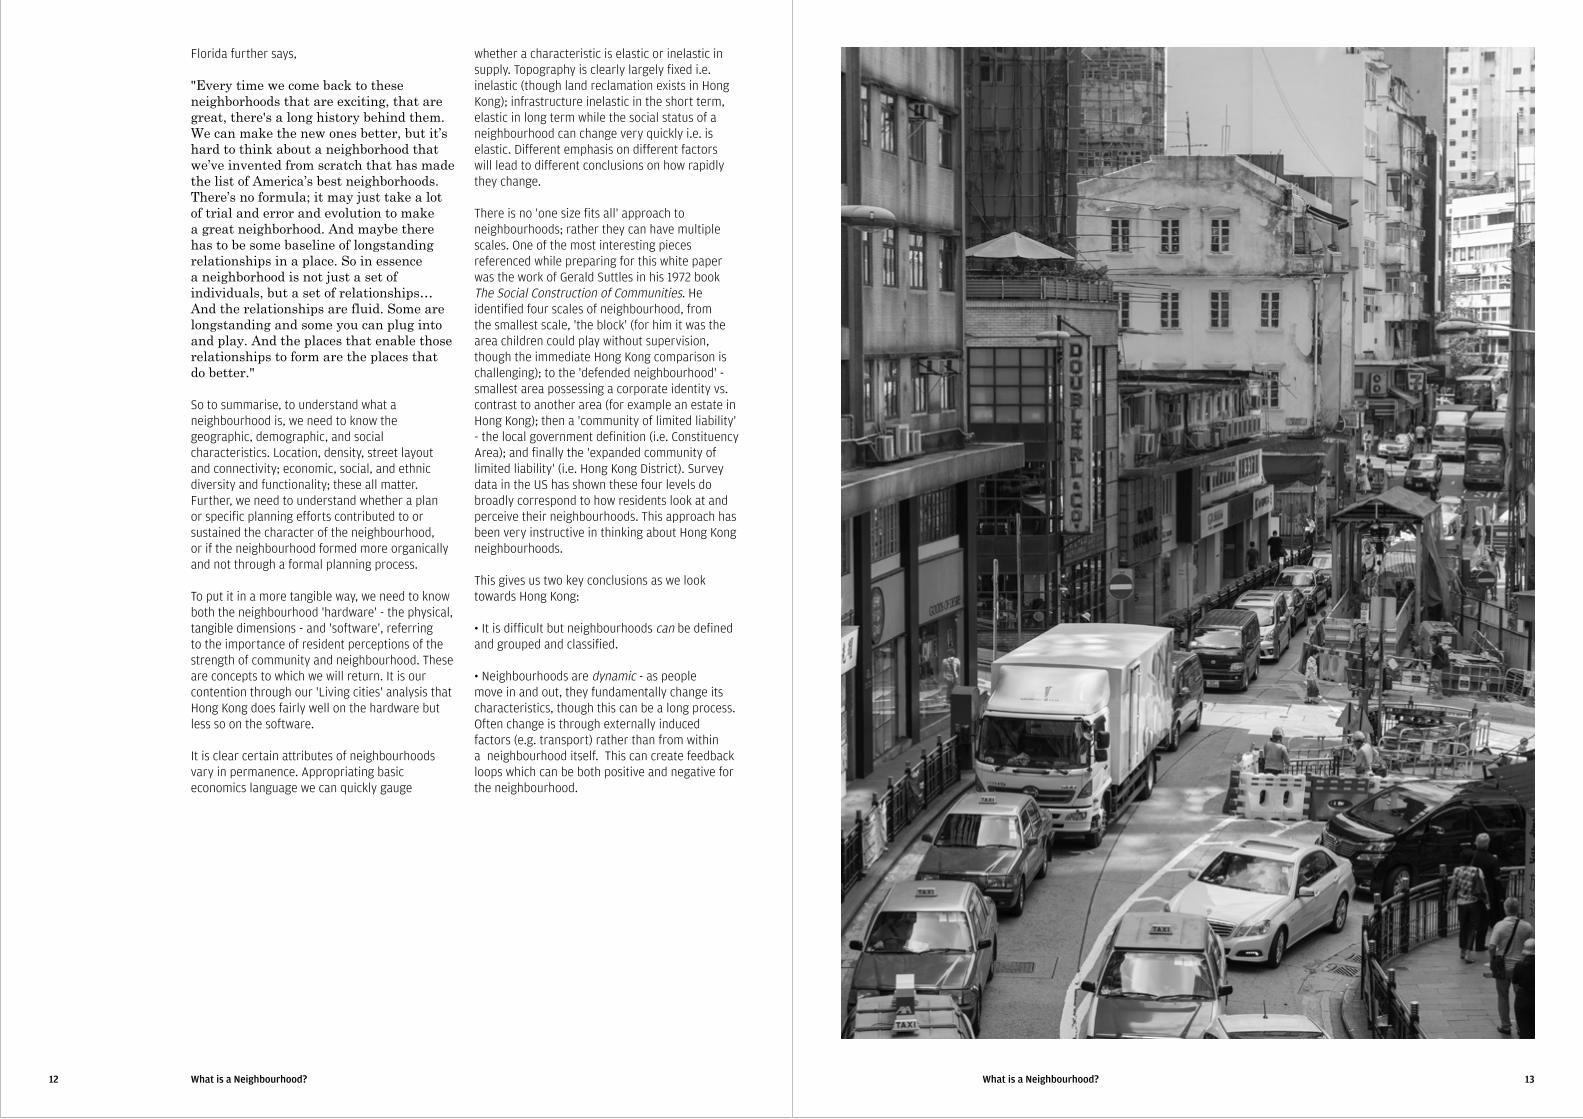
There is no ©one size fits all© approach to neighbourhoods; rather they can have multiple scales. One of the most interesting pieces referenced while preparing for this white paper was the work of Gerald Suttles in his 1972 book The Social Construction of Communities. He identified four scales of neighbourhood, from the smallest scale, ©the block© (for him it was the area children could play without supervision, though the immediate Hong Kong comparison is challenging); to the ©defended neighbourhood© - smallest area possessing a corporate identity vs. contrast to another area (for example an estate in Hong Kong); then a ©community of limited liability© - the local government definition (i.e. Constituency Area); and finally the ©expanded community of limited liability© (i.e. Hong Kong District). Survey data in the US has shown these four levels do broadly correspond to how residents look at and perceive their neighbourhoods. This approach has been very instructive in thinking about Hong Kong neighbourhoods.
This gives us two key conclusions as we look towards Hong Kong:
· It is difficult but neighbourhoods can be defined and grouped and classified. · Neighbourhoods are dynamic - as people move in and out, they fundamentally change its characteristics, though this can be a long process. Often change is through externally induced factors (e.g. transport) rather than from within a neighbourhood itself. This can create feedback loops which can be both positive and negative for the neighbourhood.
15Hong Kong's Neighbourhoods in Context
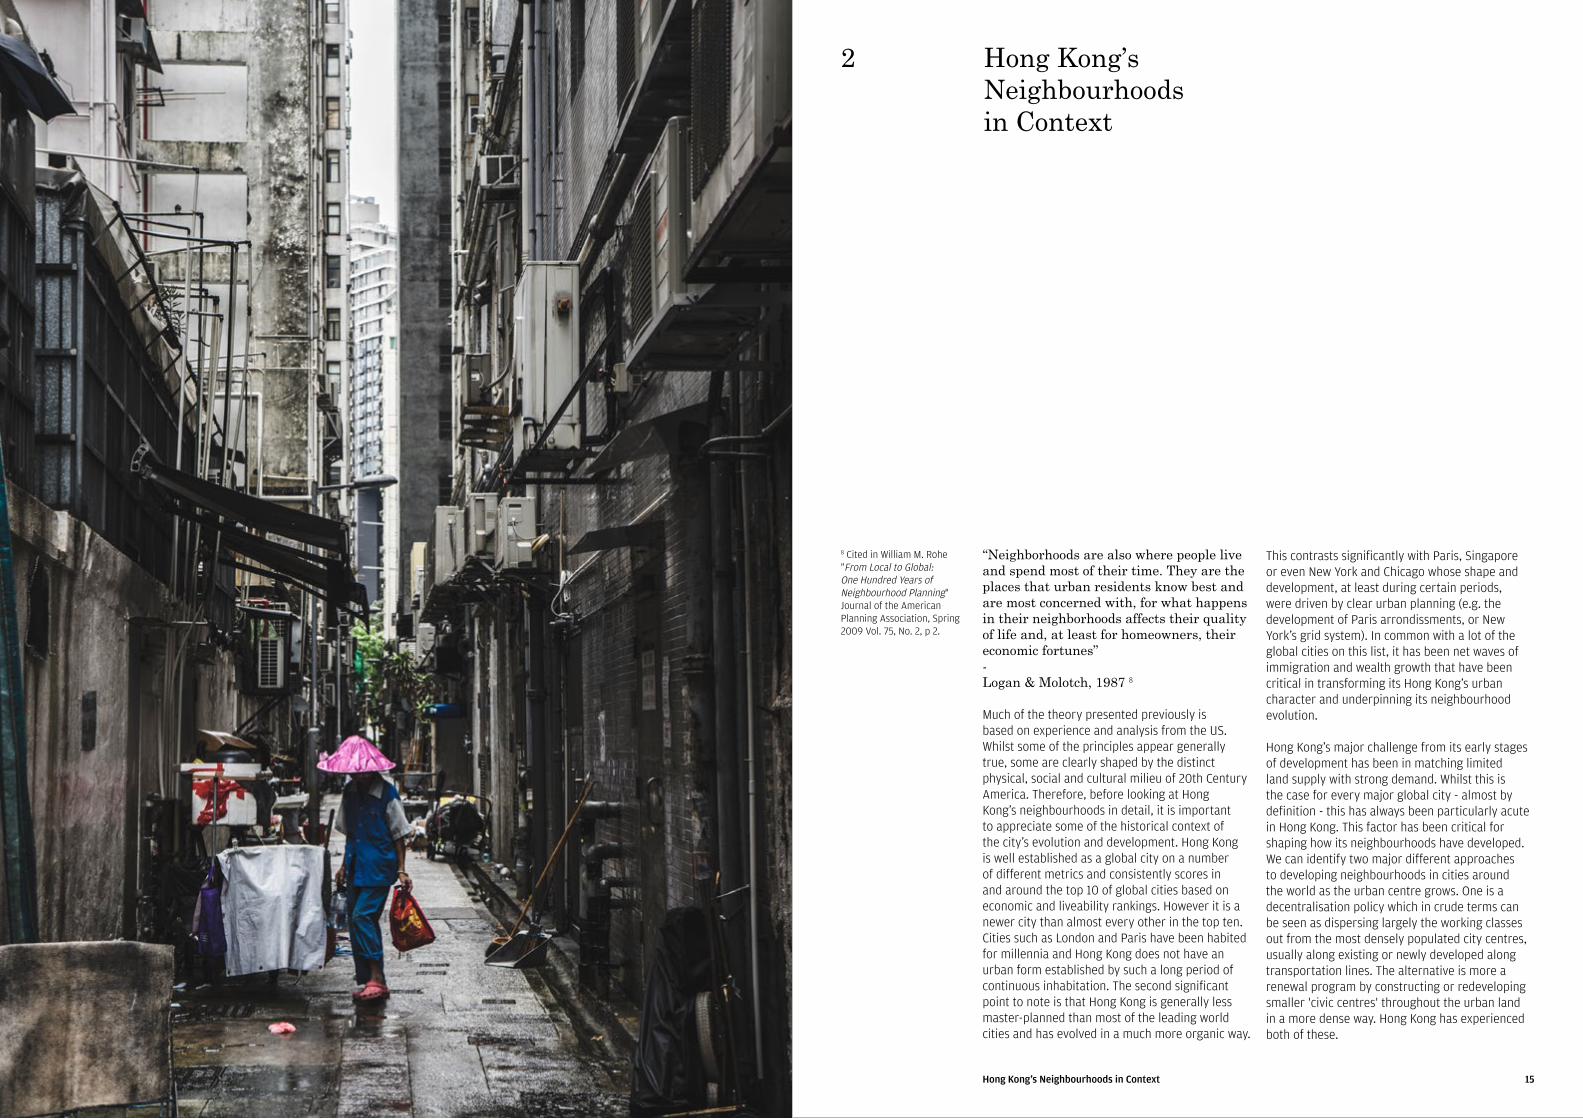
“Neighborhoods are also where people live and spend most of their time. They are the places that urban residents know best and are most concerned with, for what happens in their neighborhoods affects their quality of life and, at least for homeowners, their economic fortunes” - Logan & Molotch, 1987 8
Much of the theory presented previously is based on experience and analysis from the US. Whilst some of the principles appear generally true, some are clearly shaped by the distinct physical, social and cultural milieu of 20th Century America. Therefore, before looking at Hong Kong's neighbourhoods in detail, it is important to appreciate some of the historical context of the city's evolution and development. Hong Kong is well established as a global city on a number of different metrics and consistently scores in and around the top 10 of global cities based on economic and liveability rankings. However it is a newer city than almost every other in the top ten. Cities such as London and Paris have been habited for millennia and Hong Kong does not have an urban form established by such a long period of continuous inhabitation. The second significant point to note is that Hong Kong is generally less master-planned than most of the leading world cities and has evolved in a much more organic way.
8 Cited in William M. Rohe "From Local to Global: One Hundred Years of Neighbourhood Planning" Journal of the American Planning Association, Spring 2009 Vol. 75, No. 2, p 2.
This contrasts significantly with Paris, Singapore or even New York and Chicago whose shape and development, at least during certain periods, were driven by clear urban planning (e.g. the development of Paris arrondissments, or New York's grid system). In common with a lot of the global cities on this list, it has been net waves of immigration and wealth growth that have been critical in transforming its Hong Kong's urban character and underpinning its neighbourhood evolution.
Hong Kong's major challenge from its early stages of development has been in matching limited land supply with strong demand. Whilst this is the case for every major global city - almost by definition - this has always been particularly acute in Hong Kong. This factor has been critical for shaping how its neighbourhoods have developed. We can identify two major different approaches to developing neighbourhoods in cities around the world as the urban centre grows. One is a decentralisation policy which in crude terms can be seen as dispersing largely the working classes out from the most densely populated city centres, usually along existing or newly developed along transportation lines. The alternative is more a renewal program by constructing or redeveloping smaller ©civic centres© throughout the urban land in a more dense way. Hong Kong has experienced both of these.
Hong Kong’s Neighbourhoods in Context
2
16 17Hong Kong's Neighbourhoods in ContextHong Kong's Neighbourhoods in Context
Hong Kong's Historical Development Prior to Hong Kong's initial emergence as an entrepot, the prevailing built forms were a number of somewhat isolated small fishing villages and market towns. Evolution in the geographical pattern of urbanisation was accompanied by clear changes in built forms. In the early years, urban development consisted on expanding established Cantonese, Hakka and Tanka villages with one to two storeys buildings the major type of structure. The arrival and increased interest of the British in Hong Kong in the nineteenth century led to the first makings of a city form, focused on Hong Kong Island. A significiant development under British rule was the breakdown of the North shore (Central to West) into four ©wans©, namely Sai Wan, Sheung Wan, Chung Wan and Ha Wan. These four wan were subsequently further broken down into nine ©yeuks©: Kennedy Town, Shek Tong Tsui, Sai Ying Pun, The Peak, Sheung Wan, Chung Wan, Ha Wan, Wan Chai, Bowrington, Soo Kun Po, and Happy Valley. The majority of these geographical breakdowns still approximate to existing Hong Kong neighbourhood areas. During this time denser forms of development (four - six story buildings) emerged.
A hundred years ago Hong Kong's population was a little more than 500,000 but there was rapid growth in phases, with emigration from the mainland - both nearby Guangdong, as well as from coastal cities -particularly Shanghai - both before, during and after World War 2. The insert below illustrates the historic population growth trends in Hong Kong based on available Census data:
Year Population Annualized Growth Rate
1853 39,017 1901 283,978 4.0%1931 849,800 3.7%1941 1,600,000 6.5%1950 2,360,000 4.0%1960 3,000,000 2.4%1970 3,995,400 2.9%1980 5,109,812 2.5%1991 5,674,114 1.1%2001 6,708,389 1.7%2011 7,071,576 0.5%
Immigrants brought skills and capital and then a large pool of cheap labour helping Hong Kong's development from a trading hub into an industrial / manufacturing centre of international significance. This process saw the rapid development east along the North shore of Hong Kong Island and the Southern Kowloon Peninsula as then into Kwun Tong and Tsuen Wan. Neighbourhoods such as North Point were
established, which became known as Little Shanghai due to the concentration of immigrants relocating from Shanghai.
Political conditions in China and the Great Leap Forward saw strong immigrant flows into Hong Kong through the 1950s and 1960s. In contrast with some of the immigration in the 1920s and 1930s, this was generally less skilled labour with fewer capital resources. This immigrant pool would ultimately form the labour force which transformed Hong Kong's industrial structure. On initial arrival to Hong Kong, many immigrants clustered in squatter housing particularly in Kwun Tong, Tsuen Wan and West Kowloon tenement buildings. In 1953, it was estimated by the government that over 10% of the population was living in this way, with 250,000 squatters out of a population of less than 2,500,000. A series of tragedies in squatter camps, most notoriously the 1953 Shek Kip Mei fire, pushed then Governor Alexander Grantham into major building plans. He instigated a huge programme of public housing development, with initial developments typically proximate to existing housing. Public housing was developed to resettle and re-house hazard victims throughout the 1950s and 1960s, providing better housing for those in poor living conditions. This had significant impacts on the development and shape of Hong Kong. A need for development in the post war years to accommodate this extra demand led to an increase in permissible plot ratio and higher density developments. With the launching of the New Town Programmes, there were more deliberate and organised patterns of development in various parts of the New Territories.
From 1964-65 a formal public housing policy was instigated and demand proved so great that development quickly spread outward to the urban periphery from Kwun Tong and Tsuen Wan towards the new towns. A large pool of available workers encouraged proximate industrial opportunities nearby, which in turn stimulated further development. Hong Kong's population surged as manufacturing became more and more successful, creating significant wealth in the city. The gradual opening up of China from the 1970s further aided Hong Kong's development. In 1972 the new Governor Lord Murray Maclehose initiated a 10-year Housing Programme with the establishment of a new town policy in 1973, followed by the 1976 Home Ownership Scheme. This saw Shatin and Tuen Mun built and the major development of smaller historic market towns - Yuen Long, Fanling, Sheung Shui and Tai Po. Governor Maclehose was generally reform minded and alongside his housing policies put in place a number of policies that created the conditions for Hong Kong's further development from a manufacturing centre towards a global financial
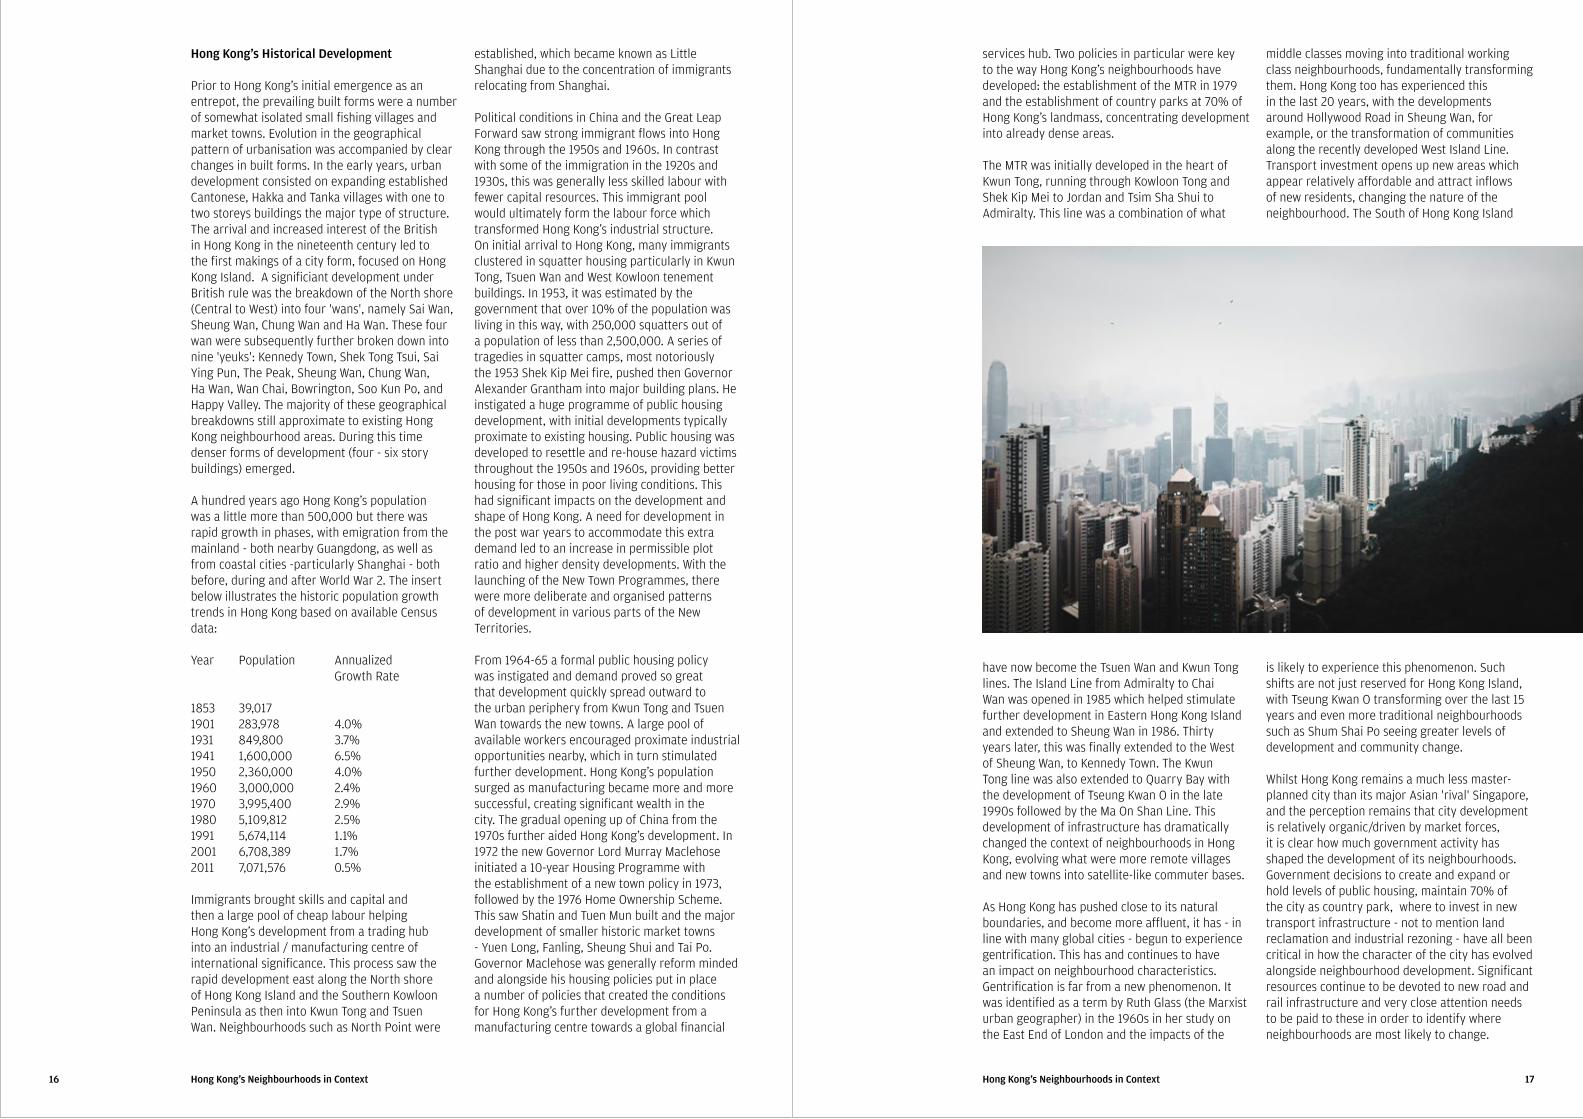
services hub. Two policies in particular were key to the way Hong Kong's neighbourhoods have developed: the establishment of the MTR in 1979 and the establishment of country parks at 70% of Hong Kong's landmass, concentrating development into already dense areas.
The MTR was initially developed in the heart of Kwun Tong, running through Kowloon Tong and Shek Kip Mei to Jordan and Tsim Sha Shui to Admiralty. This line was a combination of what
middle classes moving into traditional working class neighbourhoods, fundamentally transforming them. Hong Kong too has experienced this in the last 20 years, with the developments around Hollywood Road in Sheung Wan, for example, or the transformation of communities along the recently developed West Island Line. Transport investment opens up new areas which appear relatively affordable and attract inflows of new residents, changing the nature of the neighbourhood. The South of Hong Kong Island
have now become the Tsuen Wan and Kwun Tong lines. The Island Line from Admiralty to Chai Wan was opened in 1985 which helped stimulate further development in Eastern Hong Kong Island and extended to Sheung Wan in 1986. Thirty years later, this was finally extended to the West of Sheung Wan, to Kennedy Town. The Kwun Tong line was also extended to Quarry Bay with the development of Tseung Kwan O in the late 1990s followed by the Ma On Shan Line. This development of infrastructure has dramatically changed the context of neighbourhoods in Hong Kong, evolving what were more remote villages and new towns into satellite-like commuter bases.
As Hong Kong has pushed close to its natural boundaries, and become more affluent, it has - in line with many global cities - begun to experience gentrification. This has and continues to have an impact on neighbourhood characteristics. Gentrification is far from a new phenomenon. It was identified as a term by Ruth Glass (the Marxist urban geographer) in the 1960s in her study on the East End of London and the impacts of the
is likely to experience this phenomenon. Such shifts are not just reserved for Hong Kong Island, with Tseung Kwan O transforming over the last 15 years and even more traditional neighbourhoods such as Shum Shai Po seeing greater levels of development and community change.
Whilst Hong Kong remains a much less master-planned city than its major Asian ©rival© Singapore, and the perception remains that city development is relatively organic/driven by market forces, it is clear how much government activity has shaped the development of its neighbourhoods. Government decisions to create and expand or hold levels of public housing, maintain 70% of the city as country park, where to invest in new transport infrastructure - not to mention land reclamation and industrial rezoning - have all been critical in how the character of the city has evolved alongside neighbourhood development. Significant resources continue to be devoted to new road and rail infrastructure and very close attention needs to be paid to these in order to identify where neighbourhoods are most likely to change.
19Defining Hong Kong Neighbourhoods
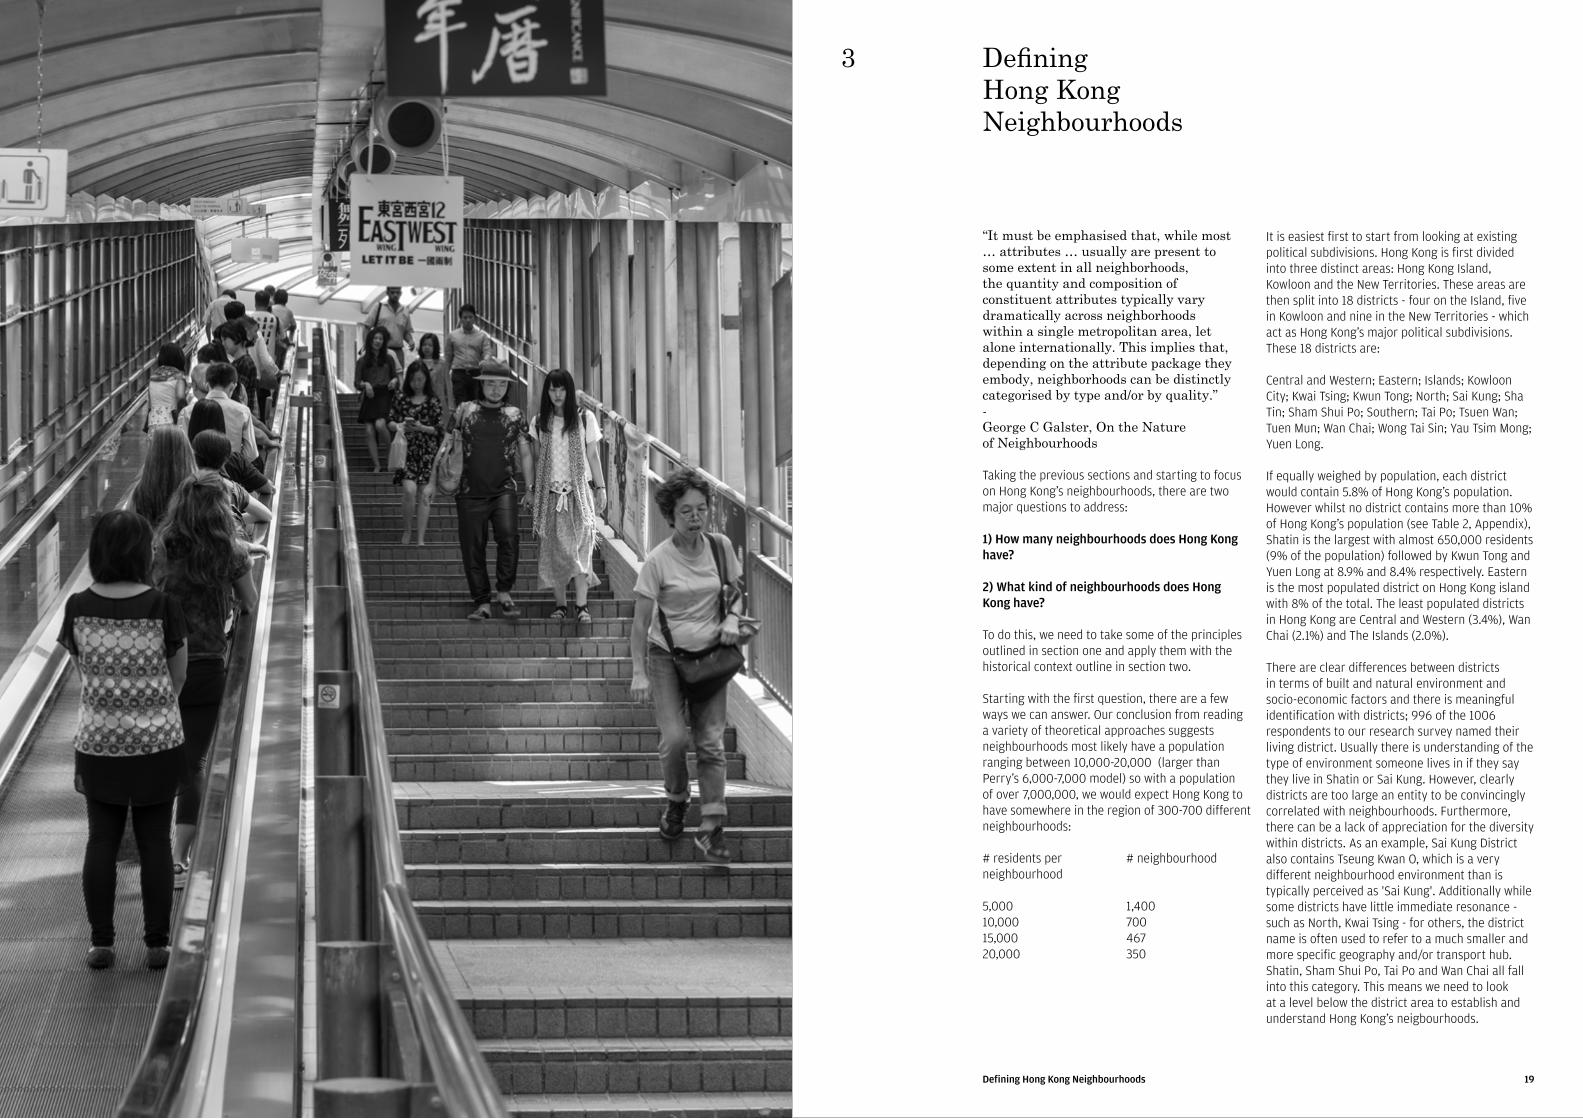
“It must be emphasised that, while most … attributes … usually are present to some extent in all neighborhoods, the quantity and composition of constituent attributes typically vary dramatically across neighborhoods within a single metropolitan area, let alone internationally. This implies that, depending on the attribute package they embody, neighborhoods can be distinctly categorised by type and/or by quality.” - George C Galster, On the Nature of Neighbourhoods
Taking the previous sections and starting to focus on Hong Kong's neighbourhoods, there are two major questions to address:
1) How many neighbourhoods does Hong Kong have?
2) What kind of neighbourhoods does Hong Kong have?
To do this, we need to take some of the principles outlined in section one and apply them with the historical context outline in section two.
Starting with the first question, there are a few ways we can answer. Our conclusion from reading a variety of theoretical approaches suggests neighbourhoods most likely have a population ranging between 10,000-20,000 (larger than Perry's 6,000-7,000 model) so with a population of over 7,000,000, we would expect Hong Kong to have somewhere in the region of 300-700 different neighbourhoods:
# residents per # neighbourhood neighbourhood
5,000 1,40010,000 70015,000 46720,000 350
It is easiest first to start from looking at existing political subdivisions. Hong Kong is first divided into three distinct areas: Hong Kong Island, Kowloon and the New Territories. These areas are then split into 18 districts - four on the Island, five in Kowloon and nine in the New Territories - which act as Hong Kong's major political subdivisions. These 18 districts are:
Central and Western; Eastern; Islands; Kowloon City; Kwai Tsing; Kwun Tong; North; Sai Kung; Sha Tin; Sham Shui Po; Southern; Tai Po; Tsuen Wan; Tuen Mun; Wan Chai; Wong Tai Sin; Yau Tsim Mong; Yuen Long.
If equally weighed by population, each district would contain 5.8% of Hong Kong's population. However whilst no district contains more than 10% of Hong Kong's population (see Table 2, Appendix), Shatin is the largest with almost 650,000 residents (9% of the population) followed by Kwun Tong and Yuen Long at 8.9% and 8.4% respectively. Eastern is the most populated district on Hong Kong island with 8% of the total. The least populated districts in Hong Kong are Central and Western (3.4%), Wan Chai (2.1%) and The Islands (2.0%).
There are clear differences between districts in terms of built and natural environment and socio-economic factors and there is meaningful identification with districts; 996 of the 1006 respondents to our research survey named their living district. Usually there is understanding of the type of environment someone lives in if they say they live in Shatin or Sai Kung. However, clearly districts are too large an entity to be convincingly correlated with neighbourhoods. Furthermore, there can be a lack of appreciation for the diversity within districts. As an example, Sai Kung District also contains Tseung Kwan O, which is a very different neighbourhood environment than is typically perceived as ©Sai Kung©. Additionally while some districts have little immediate resonance - such as North, Kwai Tsing - for others, the district name is often used to refer to a much smaller and more specific geography and/or transport hub. Shatin, Sham Shui Po, Tai Po and Wan Chai all fall into this category. This means we need to look at a level below the district area to establish and understand Hong Kong's neigbourhoods.
Defining Hong Kong Neighbourhoods
3
20 21Defining Hong Kong NeighbourhoodsDefining Hong Kong Neighbourhoods
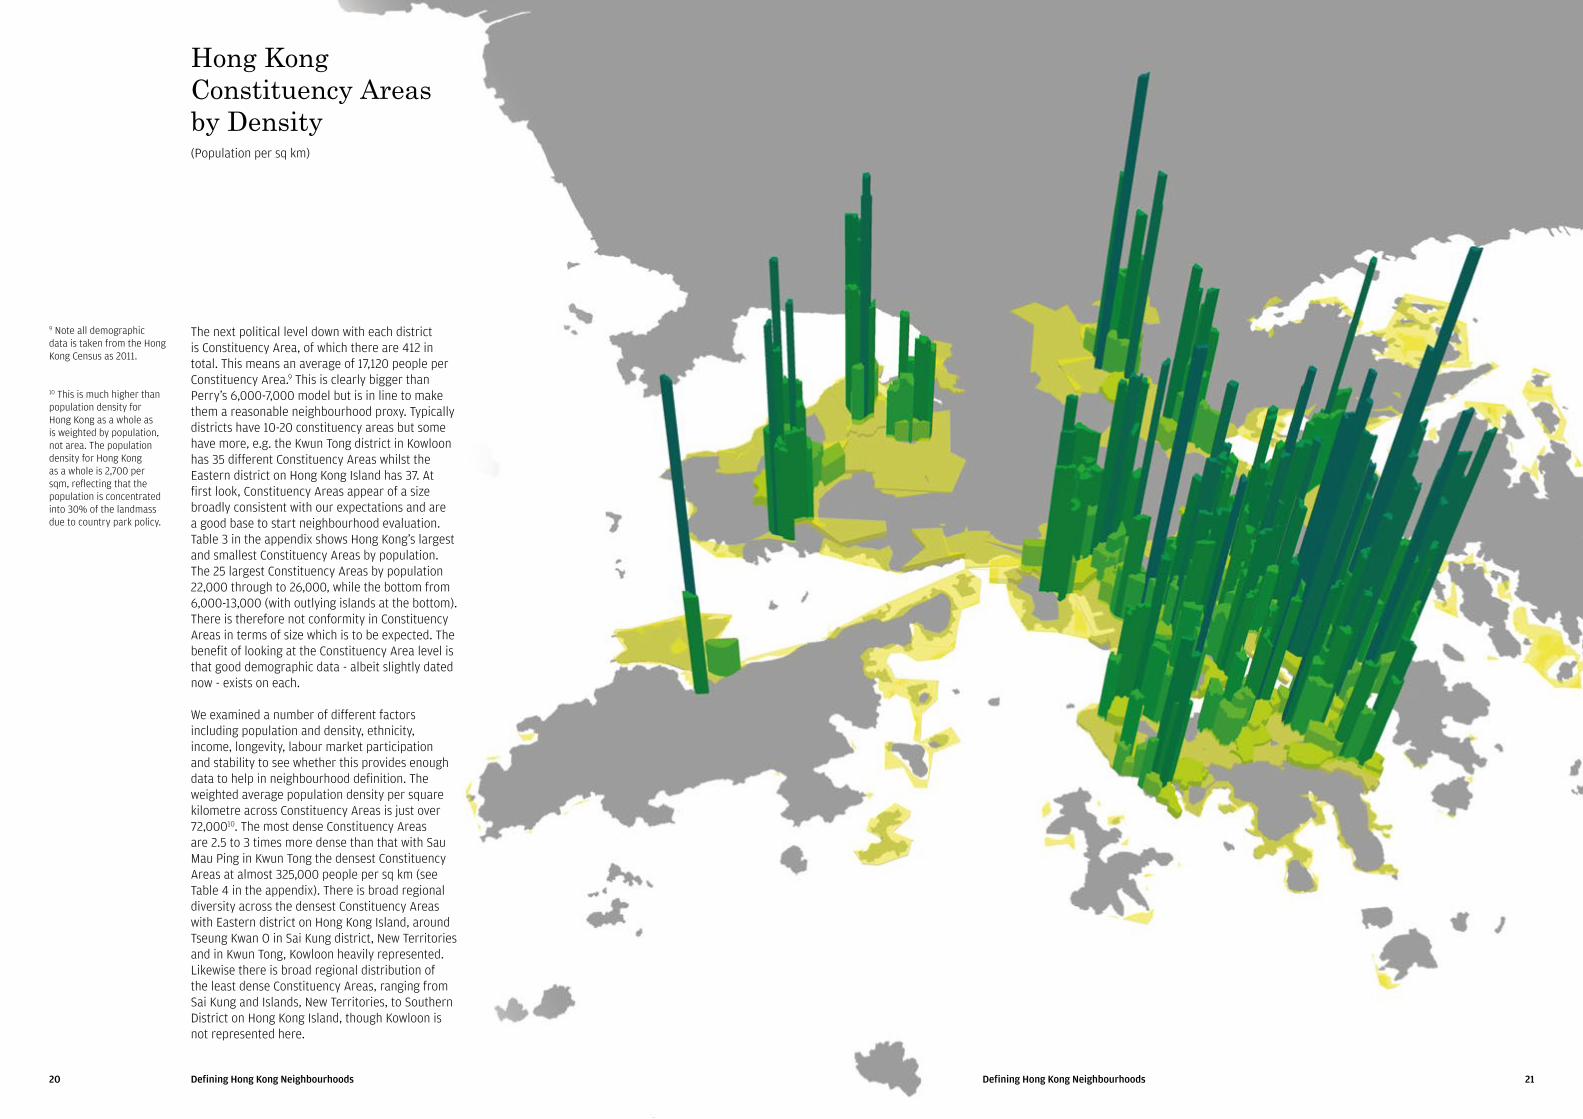
The next political level down with each district is Constituency Area, of which there are 412 in total. This means an average of 17,120 people per Constituency Area.9 This is clearly bigger than Perry's 6,000-7,000 model but is in line to make them a reasonable neighbourhood proxy. Typically districts have 10-20 constituency areas but some have more, e.g. the Kwun Tong district in Kowloon has 35 different Constituency Areas whilst the Eastern district on Hong Kong Island has 37. At first look, Constituency Areas appear of a size broadly consistent with our expectations and are a good base to start neighbourhood evaluation. Table 3 in the appendix shows Hong Kong's largest and smallest Constituency Areas by population. The 25 largest Constituency Areas by population 22,000 through to 26,000, while the bottom from 6,000-13,000 (with outlying islands at the bottom). There is therefore not conformity in Constituency Areas in terms of size which is to be expected. The benefit of looking at the Constituency Area level is that good demographic data - albeit slightly dated now - exists on each. We examined a number of different factors including population and density, ethnicity, income, longevity, labour market participation and stability to see whether this provides enough data to help in neighbourhood definition. The weighted average population density per square kilometre across Constituency Areas is just over 72,00010. The most dense Constituency Areas are 2.5 to 3 times more dense than that with Sau Mau Ping in Kwun Tong the densest Constituency Areas at almost 325,000 people per sq km (see Table 4 in the appendix). There is broad regional diversity across the densest Constituency Areas with Eastern district on Hong Kong Island, around Tseung Kwan O in Sai Kung district, New Territories and in Kwun Tong, Kowloon heavily represented. Likewise there is broad regional distribution of the least dense Constituency Areas, ranging from Sai Kung and Islands, New Territories, to Southern District on Hong Kong Island, though Kowloon is not represented here.
9 Note all demographic data is taken from the Hong Kong Census as 2011.
10 This is much higher than population density for Hong Kong as a whole as is weighted by population, not area. The population density for Hong Kong as a whole is 2,700 per sqm, reflecting that the population is concentrated into 30% of the landmass due to country park policy.
Hong Kong Constituency Areas by Density
(Population per sq km)
22 23Defining Hong Kong NeighbourhoodsDefining Hong Kong Neighbourhoods
<60%
Low (<HK$ 10K)
31
26,000
Proportion of population of Chinese ethnicity (%)
Median Age
Median IncomePopulation (Absolute)
92%
Mid (HK$ 20K-25k)
46
43
41
15,000
100%
High (HK$ 40-70K)
51
<7,000
24 25Defining Hong Kong NeighbourhoodsDefining Hong Kong Neighbourhoods
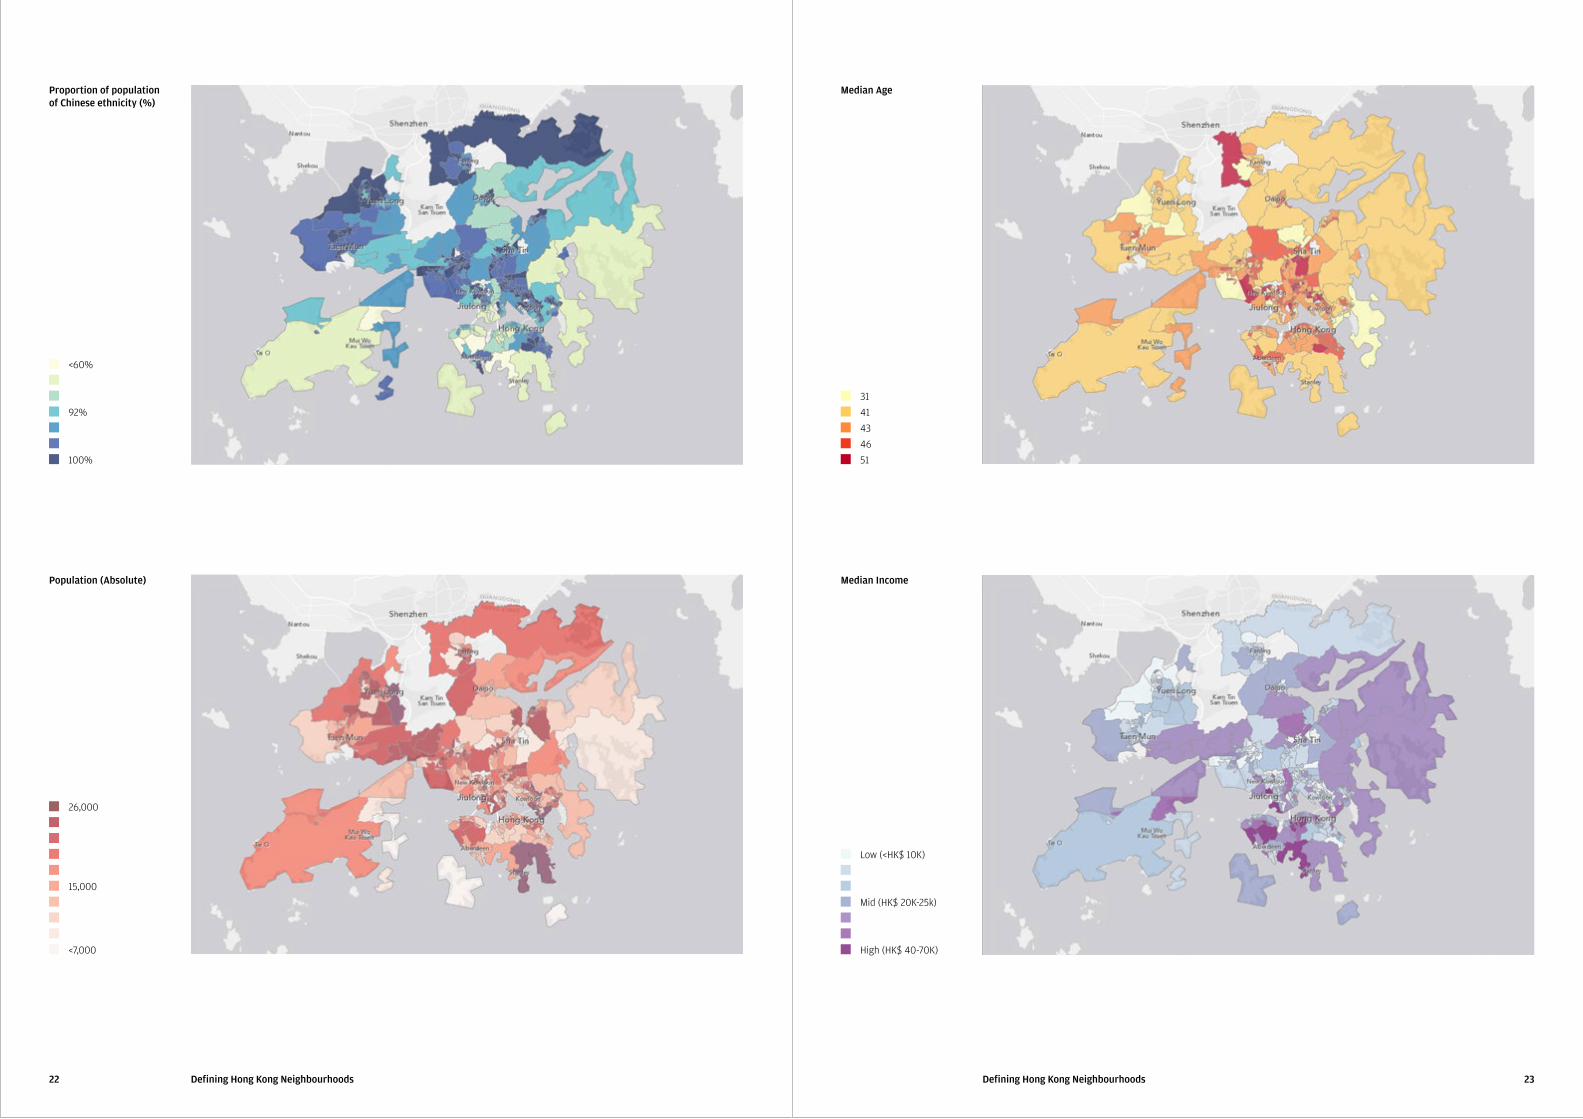
In ethnic diversity terms, the average percentage of Chinese residents in a Constituency Area is 93.6% (Table 5, appendix). The least diverse 25 neighbourhoods all have Chinese populations in excess of 98%. The most diverse 25 Constituency Areas range from 50% through to 81%. Twenty of the 25 least diverse Constituency Areas are in the New Territories with concentrations in Tai Po and Tuen Mun districts, with the remaining five in Kwun Tong and Sham Shui Po, Kowloon. The most diverse Constituency Areas range from 50%-80% Chinese and are spread across Hong Kong Island in all four districts, in Jordan and West Tsim Sha Tsui in Yau Tsim Mong, Kowloon and on Southern Lantau Island and around Clearwater Bay in Sai Kung, New Territories. Another way at looking at diversity is the percentage of a Constituency Area population speaking English as their usual language (Table 6, appendix). The data shows a large range within the top 25 - from 12% through to almost 50% - with the bottom 25 0.1% or lower. The population weighted average across all Constituency Areas for the percentage speaking English as a usual language is 3.4%. The Constituency Areas where English is most used are generally concentrated on Hong Kong Island, with representation from all four districts, with Constituency Areas with the lowest English as a usual language in the New Territories. The median age in Hong Kong as per the 2011 Census was 41.9. The oldest Constituency Areas range from 47 years old to 51 years old, while the youngest range from 28 years old to 37 (Table 7, appendix). The oldest Constituency Areas seem to be concentrated in Kowloon, particularly in Sham Shui Po, Kwun Tong and in Wong Tai Sin. This suggests a more ©sticky© or stable population here who settled in the 1960s and 1970s and haven't moved. The younger Constituency Areas on the other hand are more concentrated in the New Territories, particularly in Yuen Long, Tuen Mun and Kwai Tsing. This suggests younger people have had to be more mobile to find affordable housing options. Across the Constituency Areas, the average percentage of the population aged 20 or above with a post-secondary education is 25.8% (Table 8, appendix). Those Constituency Areas with the highest percentage of post-secondary education range from 49% to 67%, two to almost three times the average. Those Constituency Areas with the lowest percentage of post-secondary educations on the other hand range from 6% to 10% of the population, a quarter to half the average. These Constituency Areas are more generally spread across Kowloon and the New Territories and in Constituency Areas with larger public housing provision.
The average labour force participation rate across Hong Kong, according to the 2011 Census, was 59.7%. The Constituency Areas with the highest % of workers have a labour force participation rate between 68% and 75% while those with the lowest have a range of 46% to 51% (Table 9, appendix). The Constituency Areas with the highest labour force participation rates are spread across 12 different districts, with the largest concentration in and around Tseung Kwan O in Sai Kung. These can be considered as Hong Kong's more ©commuter© type neighbourhoods. On the other hand, Constituency Areas with the lowest labour force participation are concentrated in Shum Shui Po, Wong Tai Sin and Kwun Tong. Data exists to show how many residents of Constituency Areas also work in the same district with the average 17.6% across Hong Kong (Table 10, appendix). Unsurprisingly, the Constituency Areas with the highest percentage are concentrated in Central and Western District, followed by Eastern and Yau Tsim Mong. The Constituency Areas with the lowest percentage living and working in the same district are concentrated in Southern District, Hong Kong Island, Kowloon City in Kowloon and Yuen Long and Shatin in the New Territories. The monthly household median income in Hong Kong based on the 2011 Census data was HK$14,482 (Table 11, appendix). The top 25 Constituency Areas had median incomes ranging from $28,000-$70,000 with the bottom 25 Constituency Areas ranging from $8,100 - $9,000. The majority of the top 25 Constituency Areas were on Hong Kong Island, again spread out across all four districts, with some Constituency Areas in Yau Tsim Mong and Kowloon City and in Shatin and Sai Kung in the New Territories.
The final data set we looked as was population stability, both by % of owner occupiers (excluding Constituency Areas with a very high % of public housing) and the % of the population who moved over the five years before the census, both in terms of address, and from another district (Tables 12 and 13, appendix). The average proportion of domestic households owning the quarters they occupy in Hong Kong is 52.4%. The Constituency Areas with the largest owner-occupation percentage range from 87% - 97% owner-occupation. Generally high owner-occupation correlates with high population stability as owner-occupiers tend to move less frequently than renters. However the calculation of Constituency Areas with the lowest ownership ratio is a bit more challenging due to different forms of public housing in Hong Kong. Public housing has a much higher security of tenure and therefore stability
and a Constituency Area with a low ownership ratio does not necessarily mean a high proportion of private renters. Constituency Areas with the highest proportion of owner-occupation are most concentrated across the five districts in Kowloon, but there are Constituency Areas in Eastern District, Hong Kong Island as well as in Shatin and Sai Kung in the New Territories. In the five years leading up to the 2011 Census, 12.9% of Hong Kong's population moved district. The Constituency Areas which experienced the most population movement generally had 25%-40% of the population moving in. These Constituency Areas were balanced in Kowloon and New Territories, particularly in Yuen Long and Shatin. However there were also some large movements in Yau Tsim Mong. On the other hand, the Constituency Areas with the lowest levels of internal migration (with 3.5% or less of the population migrating in) were concentrated in Tai Po, New Territories, Sham Shui Po, Kowloon and Eastern District, Hong Kong Island. This data can also be expanded and re-presented for the proportion of population who have not moved address over the five years prior to the census (Table 14, appendix). Across Hong Kong, 71% had not moved address in this time period. The Constituency Areas with the highest population stability had at least 90% of the population not moving, while the Constituency Areas with the lowest population stability had 50% or more of the population changing address. Generally stable populations were concentrated in the New Territories, across Tai Po, Sai Kung and Shatin. The least stable populations were spread fairly evenly across 12 districts on Hong Kong Island, Kowloon and the New Territories. The districts without representation in this category are Wan Chai and Eastern, Hong Kong Island, Wong Tai Sin, Kowloon and Tuen Mun and Tai Po in the New Territories.
We found this data to be instructive, illustrating the breadth and range of living environments in Hong Kong. This analysis shows there is just as much diversity within districts as between districts. Constitency areas do allow for some neighbourhood analysis and can act as a good starting proxy. However, there are some challenges with simply correlating constituency areas with neighbourhoods. Whilst it would be too much to say boundaries are arbitrary, a detailed examination of Constituency Areas shows clearly that they do not always represent how people perceive the area in which they live or the natural patterns of life. While constituency areas are generally of a size that reflects a neighbourhood, they don't always have particular resonance,
i.e. it would be unlikely for someone to respond to the question, "where do you live?" with the answer "K11, Tsuen Wan Rural." In addition, some Constituency Areas cover large diverse areas.Examples of this include Chung Wan (A01) i.e. Central, which ranges from Pacific Place in the East, which is really west Wan Chai, all the way to Soho in the West. These are clearly different types of neighbourhood. Elsewhere, the East Rail Line splits Kowloon City and Sham Shui Po districts, but in reality North-East Sham Shui Po and Western Kowloon City (i.e. Kowloon Tong) have more similarities than North-East Sham Shui Po and South-West Sham Shui Po. On the other hand, Taikoo Shing is split into two separate Constituency Areas when it functions as a much more coherent neighbourhood. This means Constituency Areas cannot simply be adopted as interchangeable with neighbourhoods, even though clearly this is the case for some.
So where else can we look? At a government level, in between District and Constituency Areas by size sit the main town planning subdivisions. Hong Kong is divided into 289 Tertiary Planning Units (TPUs) by the Government's Planning Department. These TPUs are aggregated under 52 Secondary Planning Units (SPUs) at the next highest level. The SPUs are further grouped under nine Primary Planning Units (PPUs) at the highest level. Some TPUs are broadly consistent with constituency areas whilst some are aggregates of several constituency areas. In some cases using a TPU is much more reflective of the way people live, as it avoids some of the over specified borders between constituency areas. An example of this would be Kennedy Town in the West of Hong Kong Island. The area many people would understand by ©Kennedy Town© comprises some of three or four constituency areas depending on individual judgement of boundaries (A06, A07, A08 and A09). The TPU 1.1.1 combines these four constituency areas and is a reasonable proxy for the ©Kennedy Town© neighbourhood. Good demographic information exists for TPUs. However the range of population is very large for TPUs which, on average, are twice the size of Constituency Areas at close to 34,000. The smallest TPU's are barely 1,000 residents, while the largest (the memorably named 5.1.0 in Yuen Long) contains almost 290,000 residents. TPUs do have utility but cannot solely be used in neighbourhood definition.
26 27Defining Hong Kong NeighbourhoodsDefining Hong Kong Neighbourhoods
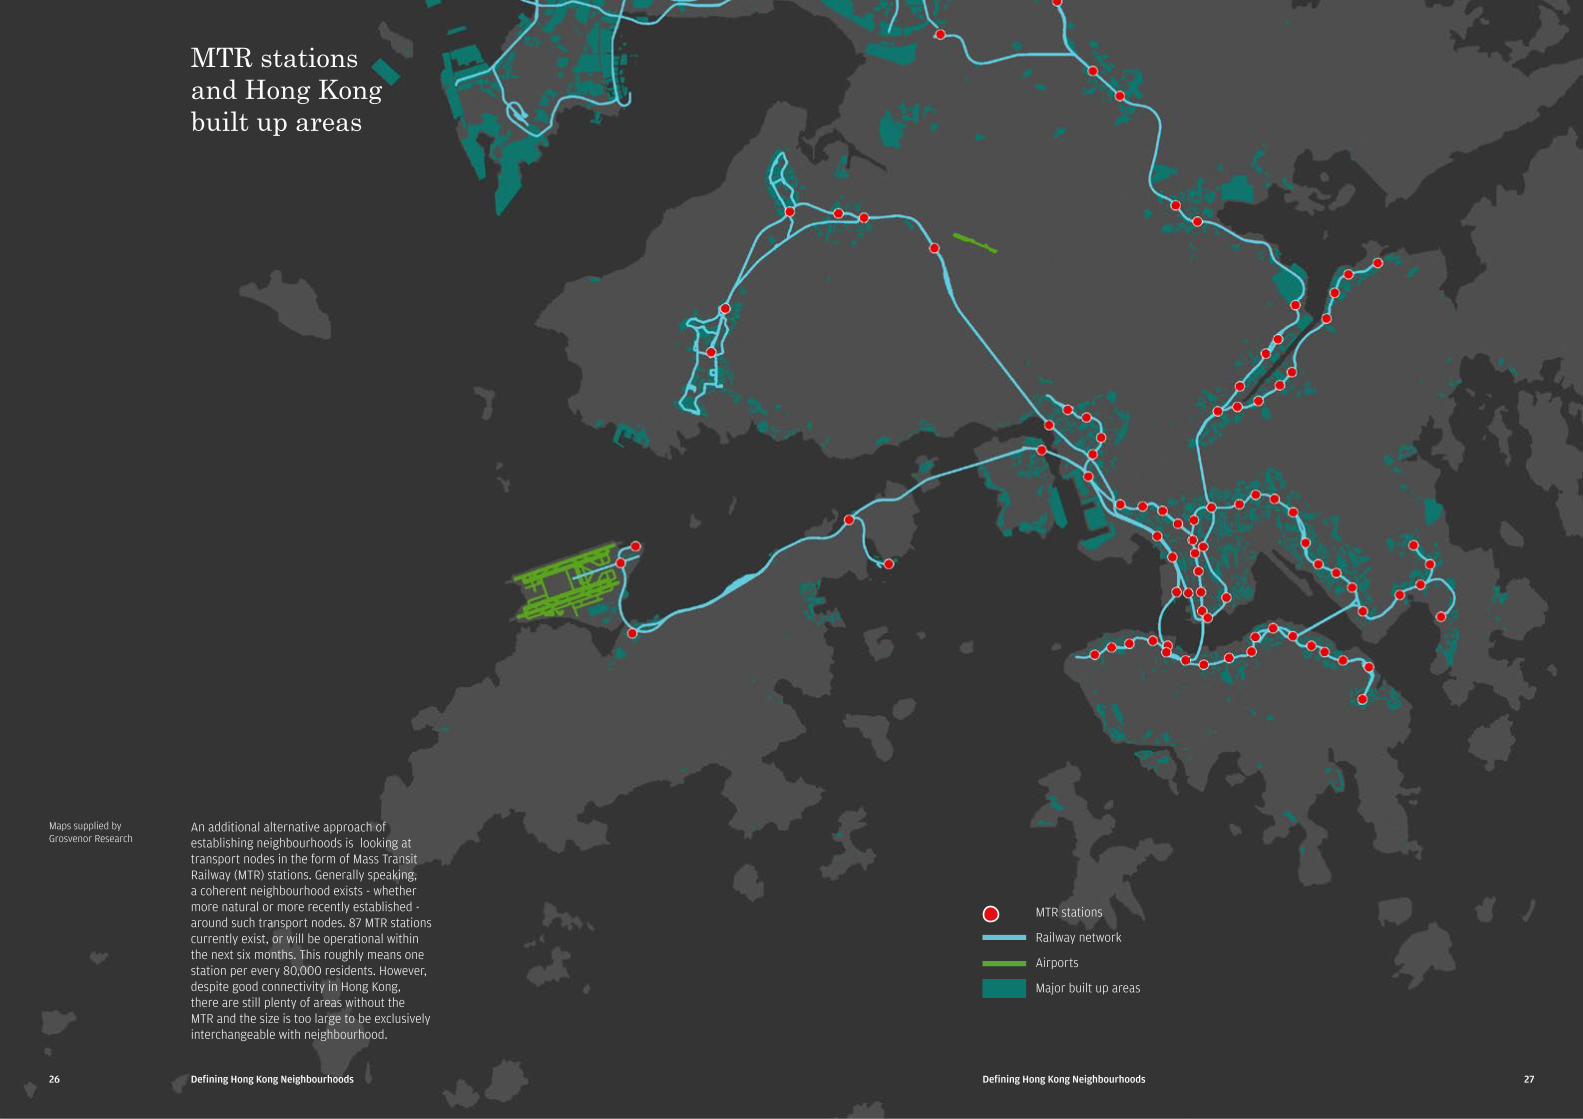
An additional alternative approach of establishing neighbourhoods is looking at transport nodes in the form of Mass Transit Railway (MTR) stations. Generally speaking, a coherent neighbourhood exists - whether more natural or more recently established - around such transport nodes. 87 MTR stations currently exist, or will be operational within the next six months. This roughly means one station per every 80,000 residents. However, despite good connectivity in Hong Kong, there are still plenty of areas without the MTR and the size is too large to be exclusively interchangeable with neighbourhood.
MTR stations
Railway network
Airports
Major built up areas
Maps supplied by Grosvenor Research
MTR stations and Hong Kong built up areas
28 29Defining Hong Kong NeighbourhoodsDefining Hong Kong Neighbourhoods
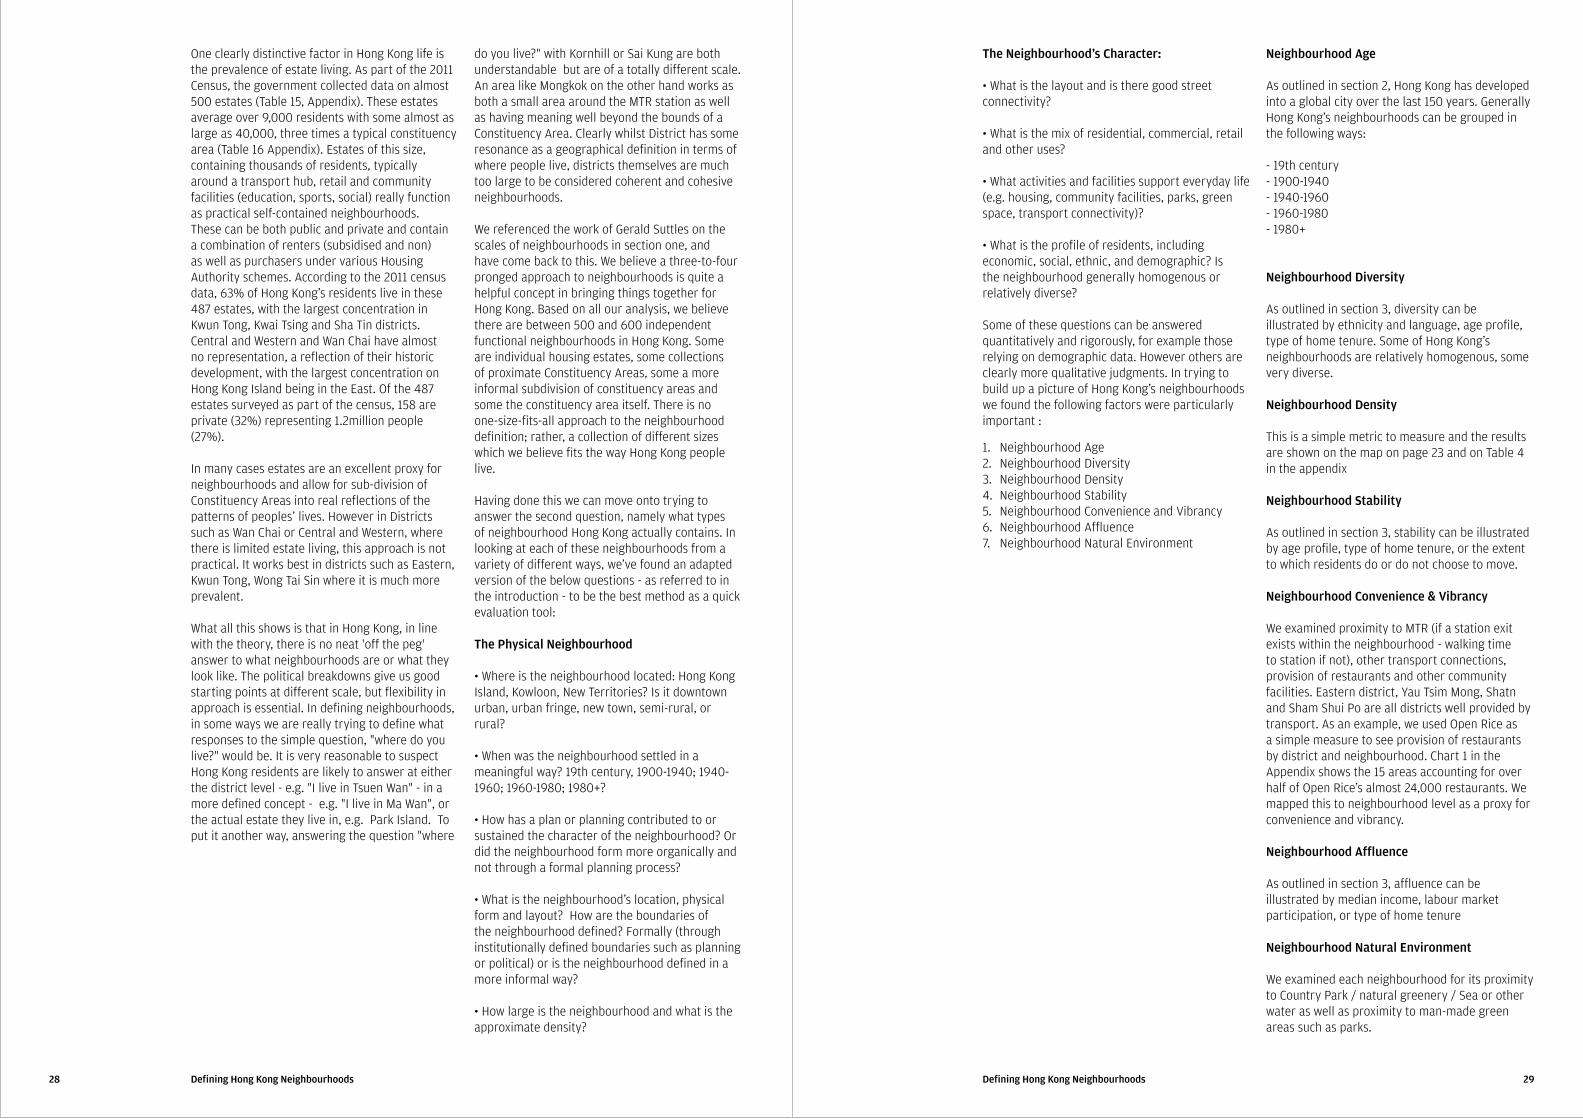
One clearly distinctive factor in Hong Kong life is the prevalence of estate living. As part of the 2011 Census, the government collected data on almost 500 estates (Table 15, Appendix). These estates average over 9,000 residents with some almost as large as 40,000, three times a typical constituency area (Table 16 Appendix). Estates of this size, containing thousands of residents, typically around a transport hub, retail and community facilities (education, sports, social) really function as practical self-contained neighbourhoods. These can be both public and private and contain a combination of renters (subsidised and non) as well as purchasers under various Housing Authority schemes. According to the 2011 census data, 63% of Hong Kong's residents live in these 487 estates, with the largest concentration in Kwun Tong, Kwai Tsing and Sha Tin districts. Central and Western and Wan Chai have almost no representation, a reflection of their historic development, with the largest concentration on Hong Kong Island being in the East. Of the 487 estates surveyed as part of the census, 158 are private (32%) representing 1.2million people (27%). In many cases estates are an excellent proxy for neighbourhoods and allow for sub-division of Constituency Areas into real reflections of the patterns of peoples' lives. However in Districts such as Wan Chai or Central and Western, where there is limited estate living, this approach is not practical. It works best in districts such as Eastern, Kwun Tong, Wong Tai Sin where it is much more prevalent.
What all this shows is that in Hong Kong, in line with the theory, there is no neat ©off the peg© answer to what neighbourhoods are or what they look like. The political breakdowns give us good starting points at different scale, but flexibility in approach is essential. In defining neighbourhoods, in some ways we are really trying to define what responses to the simple question, "where do you live?" would be. It is very reasonable to suspect Hong Kong residents are likely to answer at either the district level - e.g. "I live in Tsuen Wan" - in a more defined concept - e.g. "I live in Ma Wan", or the actual estate they live in, e.g. Park Island. To put it another way, answering the question "where
do you live?" with Kornhill or Sai Kung are both understandable but are of a totally different scale. An area like Mongkok on the other hand works as both a small area around the MTR station as well as having meaning well beyond the bounds of a Constituency Area. Clearly whilst District has some resonance as a geographical definition in terms of where people live, districts themselves are much too large to be considered coherent and cohesive neighbourhoods. We referenced the work of Gerald Suttles on the scales of neighbourhoods in section one, and have come back to this. We believe a three-to-four pronged approach to neighbourhoods is quite a helpful concept in bringing things together for Hong Kong. Based on all our analysis, we believe there are between 500 and 600 independent functional neighbourhoods in Hong Kong. Some are individual housing estates, some collections of proximate Constituency Areas, some a more informal subdivision of constituency areas and some the constituency area itself. There is no one-size-fits-all approach to the neighbourhood definition; rather, a collection of different sizes which we believe fits the way Hong Kong people live.
Having done this we can move onto trying to answer the second question, namely what types of neighbourhood Hong Kong actually contains. In looking at each of these neighbourhoods from a variety of different ways, we've found an adapted version of the below questions - as referred to in the introduction - to be the best method as a quick evaluation tool:
The Physical Neighbourhood
· Where is the neighbourhood located: Hong Kong Island, Kowloon, New Territories? Is it downtown urban, urban fringe, new town, semi-rural, or rural?
· When was the neighbourhood settled in a meaningful way? 19th century, 1900-1940; 1940-1960; 1960-1980; 1980+?
· How has a plan or planning contributed to or sustained the character of the neighbourhood? Or did the neighbourhood form more organically and not through a formal planning process?
· What is the neighbourhood's location, physical form and layout? How are the boundaries of the neighbourhood defined? Formally (through institutionally defined boundaries such as planning or political) or is the neighbourhood defined in a more informal way?
· How large is the neighbourhood and what is the approximate density?
The Neighbourhood's Character:
· What is the layout and is there good street connectivity?
· What is the mix of residential, commercial, retail and other uses?
· What activities and facilities support everyday life (e.g. housing, community facilities, parks, green space, transport connectivity)?
· What is the profile of residents, including economic, social, ethnic, and demographic? Is the neighbourhood generally homogenous or relatively diverse? Some of these questions can be answered quantitatively and rigorously, for example those relying on demographic data. However others are clearly more qualitative judgments. In trying to build up a picture of Hong Kong's neighbourhoods we found the following factors were particularly important :
Neighbourhood Age
As outlined in section 2, Hong Kong has developed into a global city over the last 150 years. Generally Hong Kong's neighbourhoods can be grouped in the following ways: - 19th century- 1900-1940- 1940-1960- 1960-1980 - 1980+
Neighbourhood Diversity As outlined in section 3, diversity can be illustrated by ethnicity and language, age profile, type of home tenure. Some of Hong Kong's neighbourhoods are relatively homogenous, some very diverse.
Neighbourhood Density
This is a simple metric to measure and the results are shown on the map on page 23 and on Table 4 in the appendix
Neighbourhood Stability
As outlined in section 3, stability can be illustrated by age profile, type of home tenure, or the extent to which residents do or do not choose to move.
Neighbourhood Convenience & Vibrancy
We examined proximity to MTR (if a station exit exists within the neighbourhood - walking time to station if not), other transport connections, provision of restaurants and other community facilities. Eastern district, Yau Tsim Mong, Shatn and Sham Shui Po are all districts well provided by transport. As an example, we used Open Rice as a simple measure to see provision of restaurants by district and neighbourhood. Chart 1 in the Appendix shows the 15 areas accounting for over half of Open Rice's almost 24,000 restaurants. We mapped this to neighbourhood level as a proxy for convenience and vibrancy. Neighbourhood Affluence
As outlined in section 3, affluence can be illustrated by median income, labour market participation, or type of home tenure
Neighbourhood Natural Environment
We examined each neighbourhood for its proximity to Country Park / natural greenery / Sea or other water as well as proximity to man-made green areas such as parks.
1.2. 3.4. 5. 6. 7.
Neighbourhood AgeNeighbourhood DiversityNeighbourhood DensityNeighbourhood Stability Neighbourhood Convenience and Vibrancy Neighbourhood AffluenceNeighbourhood Natural Environment
30 31Defining Hong Kong NeighbourhoodsDefining Hong Kong Neighbourhoods
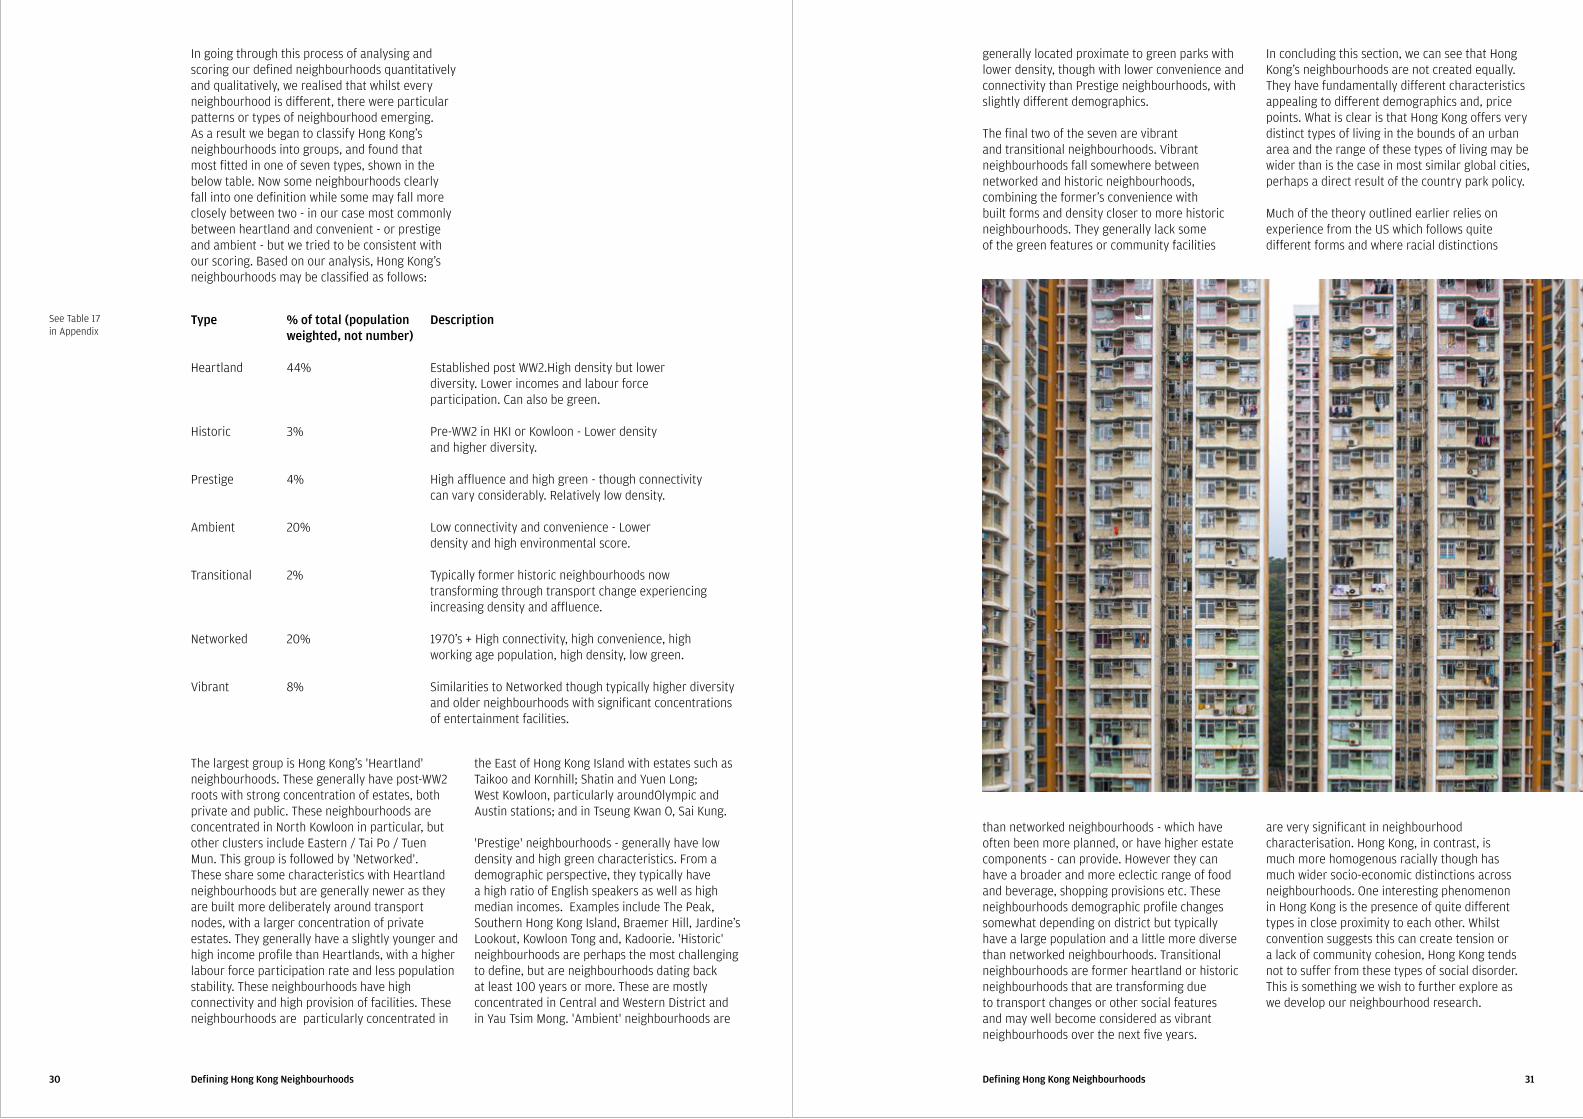
In going through this process of analysing and scoring our defined neighbourhoods quantitatively and qualitatively, we realised that whilst every neighbourhood is different, there were particular patterns or types of neighbourhood emerging. As a result we began to classify Hong Kong's neighbourhoods into groups, and found that most fitted in one of seven types, shown in the below table. Now some neighbourhoods clearly fall into one definition while some may fall more closely between two - in our case most commonly between heartland and convenient - or prestige and ambient - but we tried to be consistent with our scoring. Based on our analysis, Hong Kong's neighbourhoods may be classified as follows:
Type % of total (population Description weighted, not number)
Heartland 44% Established post WW2.High density but lower diversity. Lower incomes and labour force participation. Can also be green.
Historic 3% Pre-WW2 in HKI or Kowloon - Lower density and higher diversity.
Prestige 4% High affluence and high green - though connectivity can vary considerably. Relatively low density.
Ambient 20% Low connectivity and convenience - Lower density and high environmental score.
Transitional 2% Typically former historic neighbourhoods now transforming through transport change experiencing increasing density and affluence.
Networked 20% 1970's + High connectivity, high convenience, high working age population, high density, low green.
Vibrant 8% Similarities to Networked though typically higher diversity and older neighbourhoods with significant concentrations of entertainment facilities.
The largest group is Hong Kong's ©Heartland© neighbourhoods. These generally have post-WW2 roots with strong concentration of estates, both private and public. These neighbourhoods are concentrated in North Kowloon in particular, but other clusters include Eastern / Tai Po / Tuen Mun. This group is followed by ©Networked©. These share some characteristics with Heartland neighbourhoods but are generally newer as they are built more deliberately around transport nodes, with a larger concentration of private estates. They generally have a slightly younger and high income profile than Heartlands, with a higher labour force participation rate and less population stability. These neighbourhoods have high connectivity and high provision of facilities. These neighbourhoods are particularly concentrated in
See Table 17 in Appendix
the East of Hong Kong Island with estates such as Taikoo and Kornhill; Shatin and Yuen Long; West Kowloon, particularly aroundOlympic and Austin stations; and in Tseung Kwan O, Sai Kung.
©Prestige© neighbourhoods - generally have low density and high green characteristics. From a demographic perspective, they typically have a high ratio of English speakers as well as high median incomes. Examples include The Peak, Southern Hong Kong Island, Braemer Hill, Jardine's Lookout, Kowloon Tong and, Kadoorie. ©Historic© neighbourhoods are perhaps the most challenging to define, but are neighbourhoods dating back at least 100 years or more. These are mostly concentrated in Central and Western District and in Yau Tsim Mong. ©Ambient© neighbourhoods are
generally located proximate to green parks with lower density, though with lower convenience and connectivity than Prestige neighbourhoods, with slightly different demographics.
The final two of the seven are vibrant and transitional neighbourhoods. Vibrant neighbourhoods fall somewhere between networked and historic neighbourhoods, combining the former's convenience with built forms and density closer to more historic neighbourhoods. They generally lack some of the green features or community facilities
than networked neighbourhoods - which have often been more planned, or have higher estate components - can provide. However they can have a broader and more eclectic range of food and beverage, shopping provisions etc. These neighbourhoods demographic profile changes somewhat depending on district but typically have a large population and a little more diverse than networked neighbourhoods. Transitional neighbourhoods are former heartland or historic neighbourhoods that are transforming due to transport changes or other social features and may well become considered as vibrant neighbourhoods over the next five years.
In concluding this section, we can see that Hong Kong's neighbourhoods are not created equally. They have fundamentally different characteristics appealing to different demographics and, price points. What is clear is that Hong Kong offers very distinct types of living in the bounds of an urban area and the range of these types of living may be wider than is the case in most similar global cities, perhaps a direct result of the country park policy. Much of the theory outlined earlier relies on experience from the US which follows quite different forms and where racial distinctions
are very significant in neighbourhood characterisation. Hong Kong, in contrast, is much more homogenous racially though has much wider socio-economic distinctions across neighbourhoods. One interesting phenomenon in Hong Kong is the presence of quite different types in close proximity to each other. Whilst convention suggests this can create tension or a lack of community cohesion, Hong Kong tends not to suffer from these types of social disorder. This is something we wish to further explore as we develop our neighbourhood research.
32 33Public Perceptions of Hong Kong's NeighbourhoodsPublic Perceptions of Hong Kong's Neighbourhoods
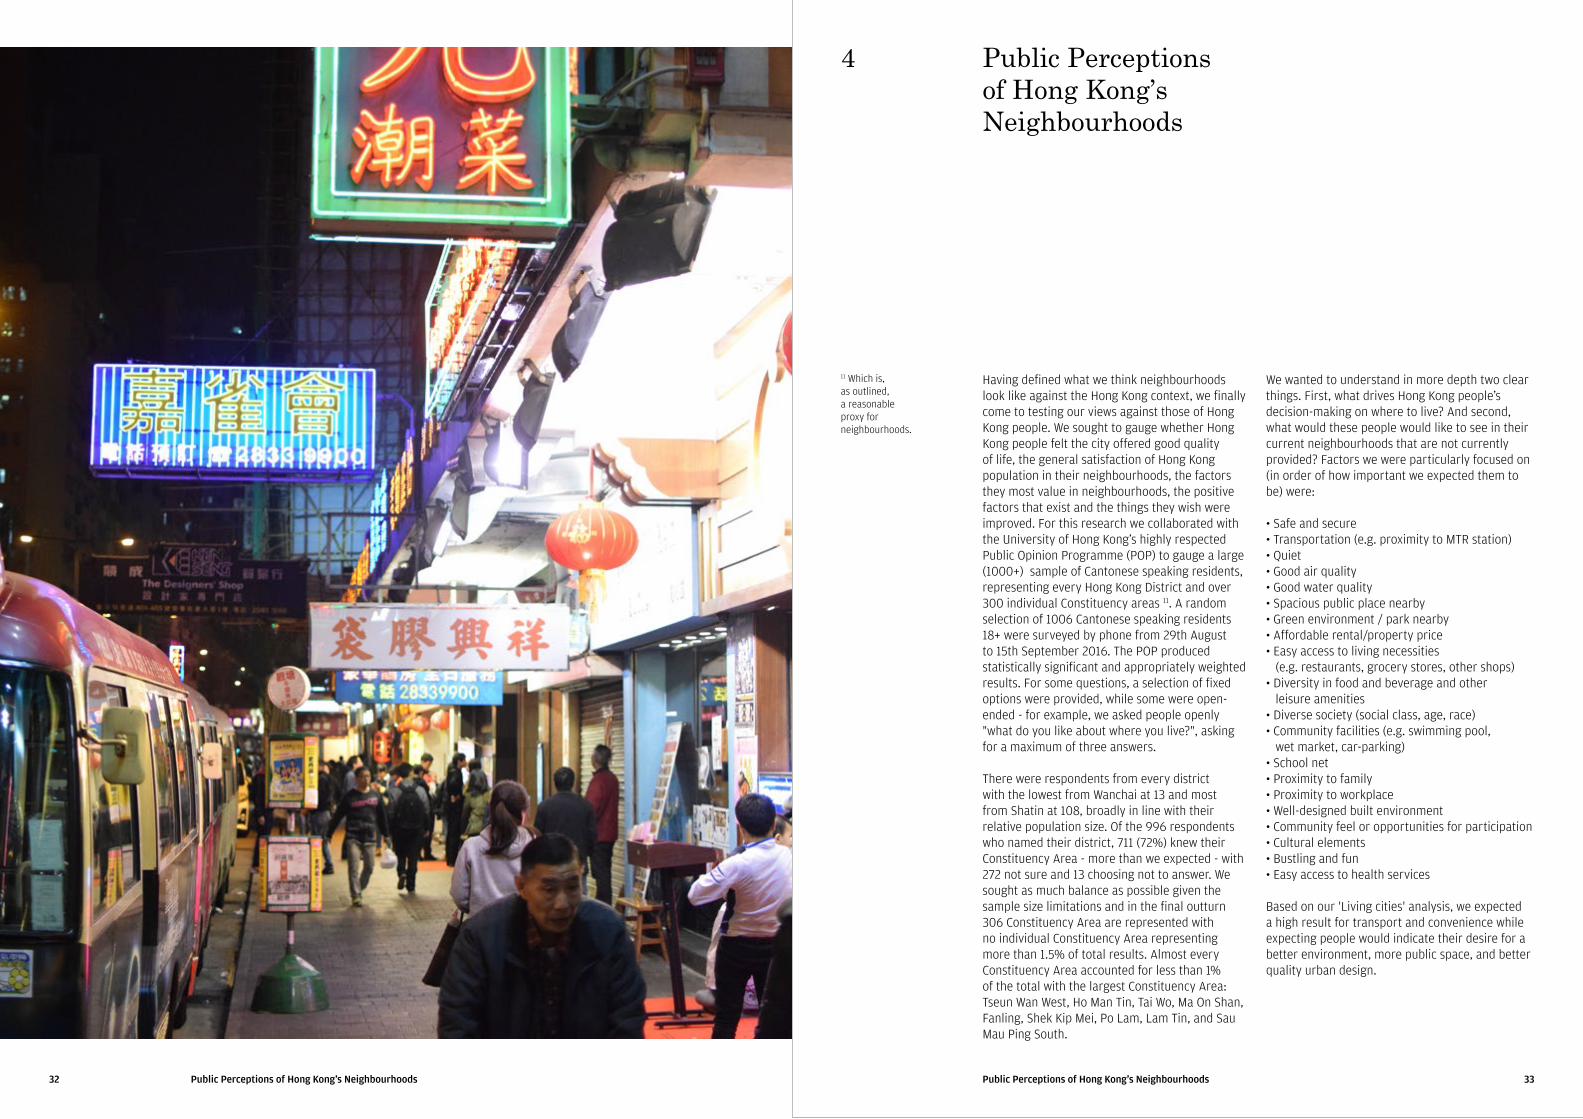
Having defined what we think neighbourhoods look like against the Hong Kong context, we finally come to testing our views against those of Hong Kong people. We sought to gauge whether Hong Kong people felt the city offered good quality of life, the general satisfaction of Hong Kong population in their neighbourhoods, the factors they most value in neighbourhoods, the positive factors that exist and the things they wish were improved. For this research we collaborated with the University of Hong Kong's highly respected Public Opinion Programme (POP) to gauge a large (1000+) sample of Cantonese speaking residents, representing every Hong Kong District and over 300 individual Constituency areas 11. A random selection of 1006 Cantonese speaking residents 18+ were surveyed by phone from 29th August to 15th September 2016. The POP produced statistically significant and appropriately weighted results. For some questions, a selection of fixed options were provided, while some were open-ended - for example, we asked people openly "what do you like about where you live?", asking for a maximum of three answers.
There were respondents from every district with the lowest from Wanchai at 13 and most from Shatin at 108, broadly in line with their relative population size. Of the 996 respondents who named their district, 711 (72%) knew their Constituency Area - more than we expected - with 272 not sure and 13 choosing not to answer. We sought as much balance as possible given the sample size limitations and in the final outturn 306 Constituency Area are represented with no individual Constituency Area representing more than 1.5% of total results. Almost every Constituency Area accounted for less than 1% of the total with the largest Constituency Area: Tseun Wan West, Ho Man Tin, Tai Wo, Ma On Shan, Fanling, Shek Kip Mei, Po Lam, Lam Tin, and Sau Mau Ping South.
11 Which is, as outlined, a reasonable proxy for neighbourhoods.
We wanted to understand in more depth two clear things. First, what drives Hong Kong people's decision-making on where to live? And second, what would these people would like to see in their current neighbourhoods that are not currently provided? Factors we were particularly focused on (in order of how important we expected them to be) were:
· Safe and secure· Transportation (e.g. proximity to MTR station)· Quiet· Good air quality· Good water quality· Spacious public place nearby · Green environment / park nearby· Affordable rental/property price· Easy access to living necessities (e.g. restaurants, grocery stores, other shops)· Diversity in food and beverage and other leisure amenities · Diverse society (social class, age, race) · Community facilities (e.g. swimming pool, wet market, car-parking)· School net· Proximity to family· Proximity to workplace· Well-designed built environment· Community feel or opportunities for participation · Cultural elements· Bustling and fun· Easy access to health services
Based on our ©Living cities© analysis, we expected a high result for transport and convenience while expecting people would indicate their desire for a better environment, more public space, and better quality urban design.
Public Perceptions of Hong Kong’s Neighbourhoods
4
34 35Public Perceptions of Hong Kong's NeighbourhoodsPublic Perceptions of Hong Kong's Neighbourhoods
The research survey produced the following key findings
On Hong Kong as a Living City:
· 59% of respondents think that Hong Kong provides good quality of life (33% no, 8% no response)
· For those which answered positively, the five most emphasised factors (open-ended) were:
Quality of transport links (30%)Safety / Social Order (20%)Community facilities (20%)Environmental Quality (17%)Economic Condition (16%)Governance and political environment (14%)
· For those which Answered negatively, the factors were:
Governance and political environment (31%)Population density (30%)Property affordability prices (26%)Environmental quality (16%)Economic condition (15%)
· 16% of Hong Kong people think quality of life will improve over the next five years; 18% stay the same; 51% get worse
These were generally in line with our expectations though environmental quality factors were generally higher than we expected, which likely reflects the large diversity of living experience across Hong Kong.
On Hong Kong Neighbourhoods:
· Generally Hong Kong people were satisfied with the neighbourhoods in which they live live (Chart 2, appendix). Where 10 represented very happy and 1 very unhappy, only 4% were 4 or under with just under a quarter rating themselves as . 55% rated their satisfaction 6-8 and 15% 9-10. To put another way, only 4% were dissatisfied, 23% neutral and 73% satisfied. The mean response was 6.89 with the median at 7.
· Another question asked how much emphasis people notionally place on individual factors - as shown in the table on this page (see Chart 3, Appendix, for an example). This was used to compare with what people actually like about their neighbourhood (Chart 4, Appendix), helping us identify areas for improvement.
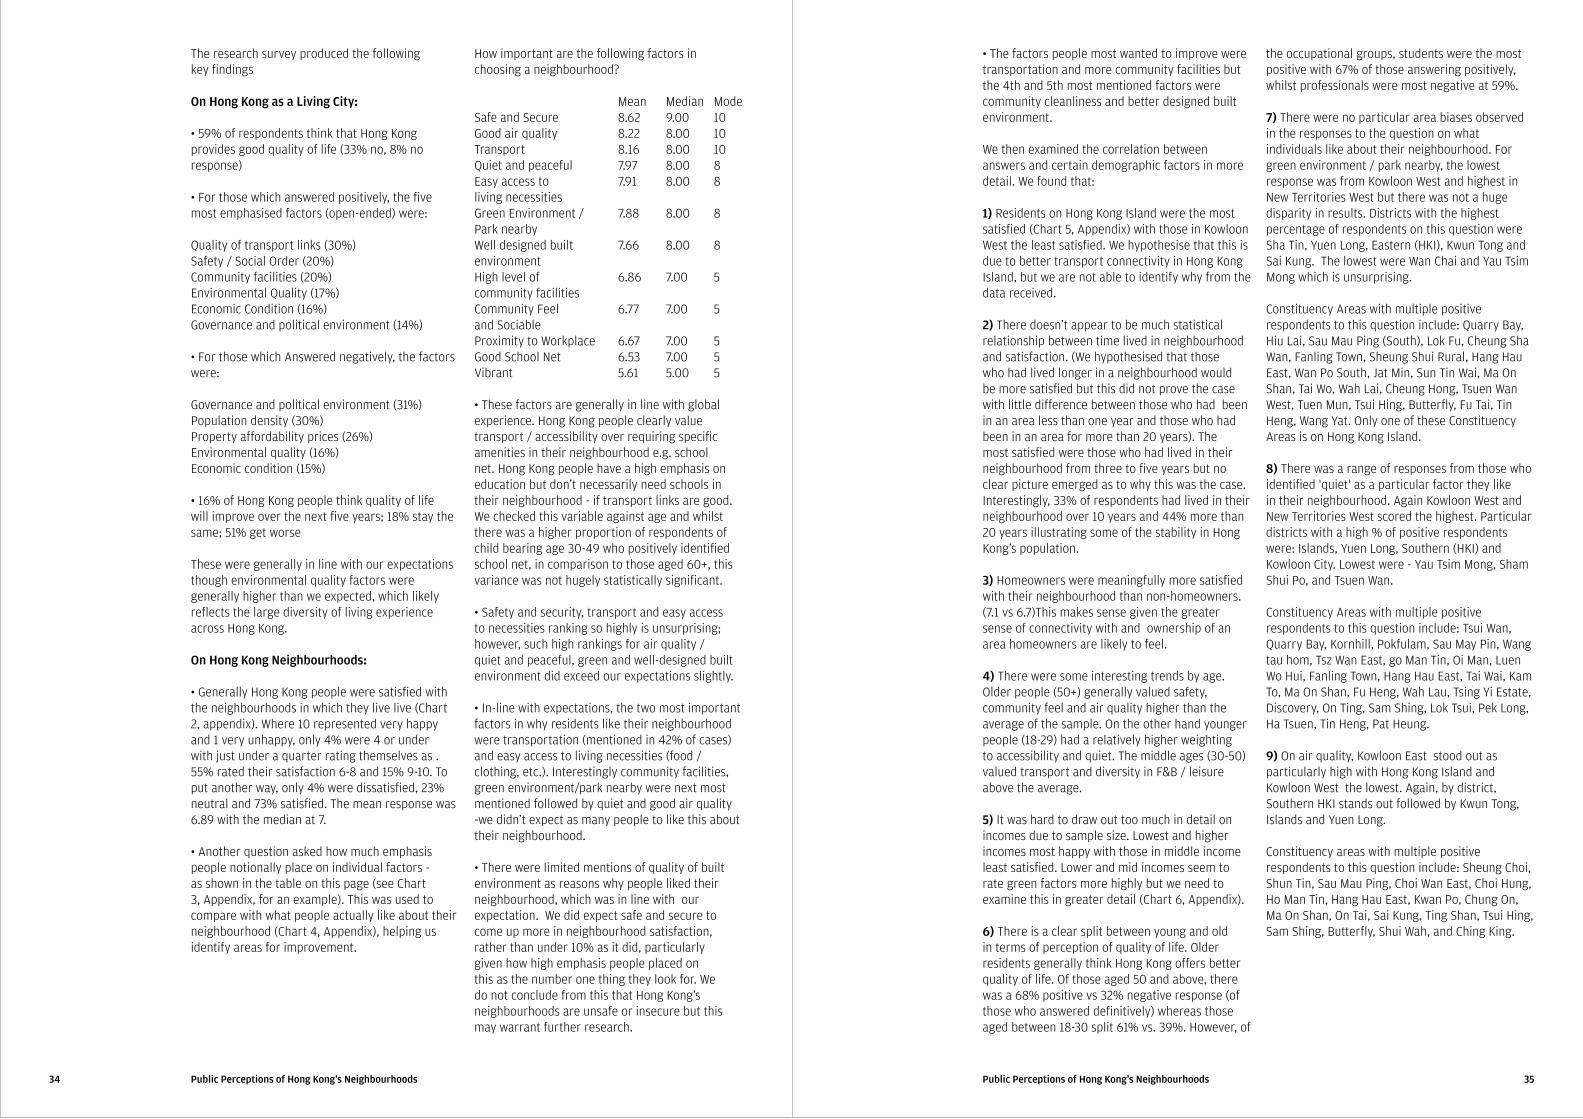
How important are the following factors in choosing a neighbourhood?
Mean Median ModeSafe and Secure 8.62 9.00 10Good air quality 8.22 8.00 10Transport 8.16 8.00 10Quiet and peaceful 7.97 8.00 8Easy access to 7.91 8.00 8 living necessitiesGreen Environment / 7.88 8.00 8 Park nearby Well designed built 7.66 8.00 8 environment High level of 6.86 7.00 5 community facilitiesCommunity Feel 6.77 7.00 5 and SociableProximity to Workplace 6.67 7.00 5Good School Net 6.53 7.00 5Vibrant 5.61 5.00 5 · These factors are generally in line with global experience. Hong Kong people clearly value transport / accessibility over requiring specific amenities in their neighbourhood e.g. school net. Hong Kong people have a high emphasis on education but don't necessarily need schools in their neighbourhood - if transport links are good. We checked this variable against age and whilst there was a higher proportion of respondents of child bearing age 30-49 who positively identified school net, in comparison to those aged 60+, this variance was not hugely statistically significant. · Safety and security, transport and easy access to necessities ranking so highly is unsurprising; however, such high rankings for air quality / quiet and peaceful, green and well-designed built environment did exceed our expectations slightly.
· In-line with expectations, the two most important factors in why residents like their neighbourhood were transportation (mentioned in 42% of cases) and easy access to living necessities (food / clothing, etc.). Interestingly community facilities, green environment/park nearby were next most mentioned followed by quiet and good air quality -we didn't expect as many people to like this about their neighbourhood.
· There were limited mentions of quality of built environment as reasons why people liked their neighbourhood, which was in line with our expectation. We did expect safe and secure to come up more in neighbourhood satisfaction, rather than under 10% as it did, particularly given how high emphasis people placed on this as the number one thing they look for. We do not conclude from this that Hong Kong's neighbourhoods are unsafe or insecure but this may warrant further research.
· The factors people most wanted to improve were transportation and more community facilities but the 4th and 5th most mentioned factors were community cleanliness and better designed built environment. We then examined the correlation between answers and certain demographic factors in more detail. We found that:
1) Residents on Hong Kong Island were the most satisfied (Chart 5, Appendix) with those in Kowloon West the least satisfied. We hypothesise that this is due to better transport connectivity in Hong Kong Island, but we are not able to identify why from the data received.
2) There doesn't appear to be much statistical relationship between time lived in neighbourhood and satisfaction. (We hypothesised that those who had lived longer in a neighbourhood would be more satisfied but this did not prove the case with little difference between those who had been in an area less than one year and those who had been in an area for more than 20 years). The most satisfied were those who had lived in their neighbourhood from three to five years but no clear picture emerged as to why this was the case. Interestingly, 33% of respondents had lived in their neighbourhood over 10 years and 44% more than 20 years illustrating some of the stability in Hong Kong's population.
3) Homeowners were meaningfully more satisfied with their neighbourhood than non-homeowners. (7.1 vs 6.7)This makes sense given the greater sense of connectivity with and ownership of an area homeowners are likely to feel.
4) There were some interesting trends by age. Older people (50+) generally valued safety, community feel and air quality higher than the average of the sample. On the other hand younger people (18-29) had a relatively higher weighting to accessibility and quiet. The middle ages (30-50) valued transport and diversity in F&B / leisure above the average.
5) It was hard to draw out too much in detail on incomes due to sample size. Lowest and higher incomes most happy with those in middle income least satisfied. Lower and mid incomes seem to rate green factors more highly but we need to examine this in greater detail (Chart 6, Appendix).
6) There is a clear split between young and old in terms of perception of quality of life. Older residents generally think Hong Kong offers better quality of life. Of those aged 50 and above, there was a 68% positive vs 32% negative response (of those who answered definitively) whereas those aged between 18-30 split 61% vs. 39%. However, of
the occupational groups, students were the most positive with 67% of those answering positively, whilst professionals were most negative at 59%.
7) There were no particular area biases observed in the responses to the question on what individuals like about their neighbourhood. For green environment / park nearby, the lowest response was from Kowloon West and highest in New Territories West but there was not a huge disparity in results. Districts with the highest percentage of respondents on this question were Sha Tin, Yuen Long, Eastern (HKI), Kwun Tong and Sai Kung. The lowest were Wan Chai and Yau Tsim Mong which is unsurprising.
Constituency Areas with multiple positive respondents to this question include: Quarry Bay, Hiu Lai, Sau Mau Ping (South), Lok Fu, Cheung Sha Wan, Fanling Town, Sheung Shui Rural, Hang Hau East, Wan Po South, Jat Min, Sun Tin Wai, Ma On Shan, Tai Wo, Wah Lai, Cheung Hong, Tsuen Wan West, Tuen Mun, Tsui Hing, Butterfly, Fu Tai, Tin Heng, Wang Yat. Only one of these Constituency Areas is on Hong Kong Island.
8) There was a range of responses from those who identified ©quiet© as a particular factor they like in their neighbourhood. Again Kowloon West and New Territories West scored the highest. Particular districts with a high % of positive respondents were: Islands, Yuen Long, Southern (HKI) and Kowloon City. Lowest were - Yau Tsim Mong, Sham Shui Po, and Tsuen Wan.
Constituency Areas with multiple positive respondents to this question include: Tsui Wan, Quarry Bay, Kornhill, Pokfulam, Sau May Pin, Wang tau hom, Tsz Wan East, go Man Tin, Oi Man, Luen Wo Hui, Fanling Town, Hang Hau East, Tai Wai, Kam To, Ma On Shan, Fu Heng, Wah Lau, Tsing Yi Estate, Discovery, On Ting, Sam Shing, Lok Tsui, Pek Long, Ha Tsuen, Tin Heng, Pat Heung.
9) On air quality, Kowloon East stood out as particularly high with Hong Kong Island and Kowloon West the lowest. Again, by district, Southern HKI stands out followed by Kwun Tong, Islands and Yuen Long.
Constituency areas with multiple positive respondents to this question include: Sheung Choi, Shun Tin, Sau Mau Ping, Choi Wan East, Choi Hung, Ho Man Tin, Hang Hau East, Kwan Po, Chung On, Ma On Shan, On Tai, Sai Kung, Ting Shan, Tsui Hing, Sam Shing, Butterfly, Shui Wah, and Ching King.
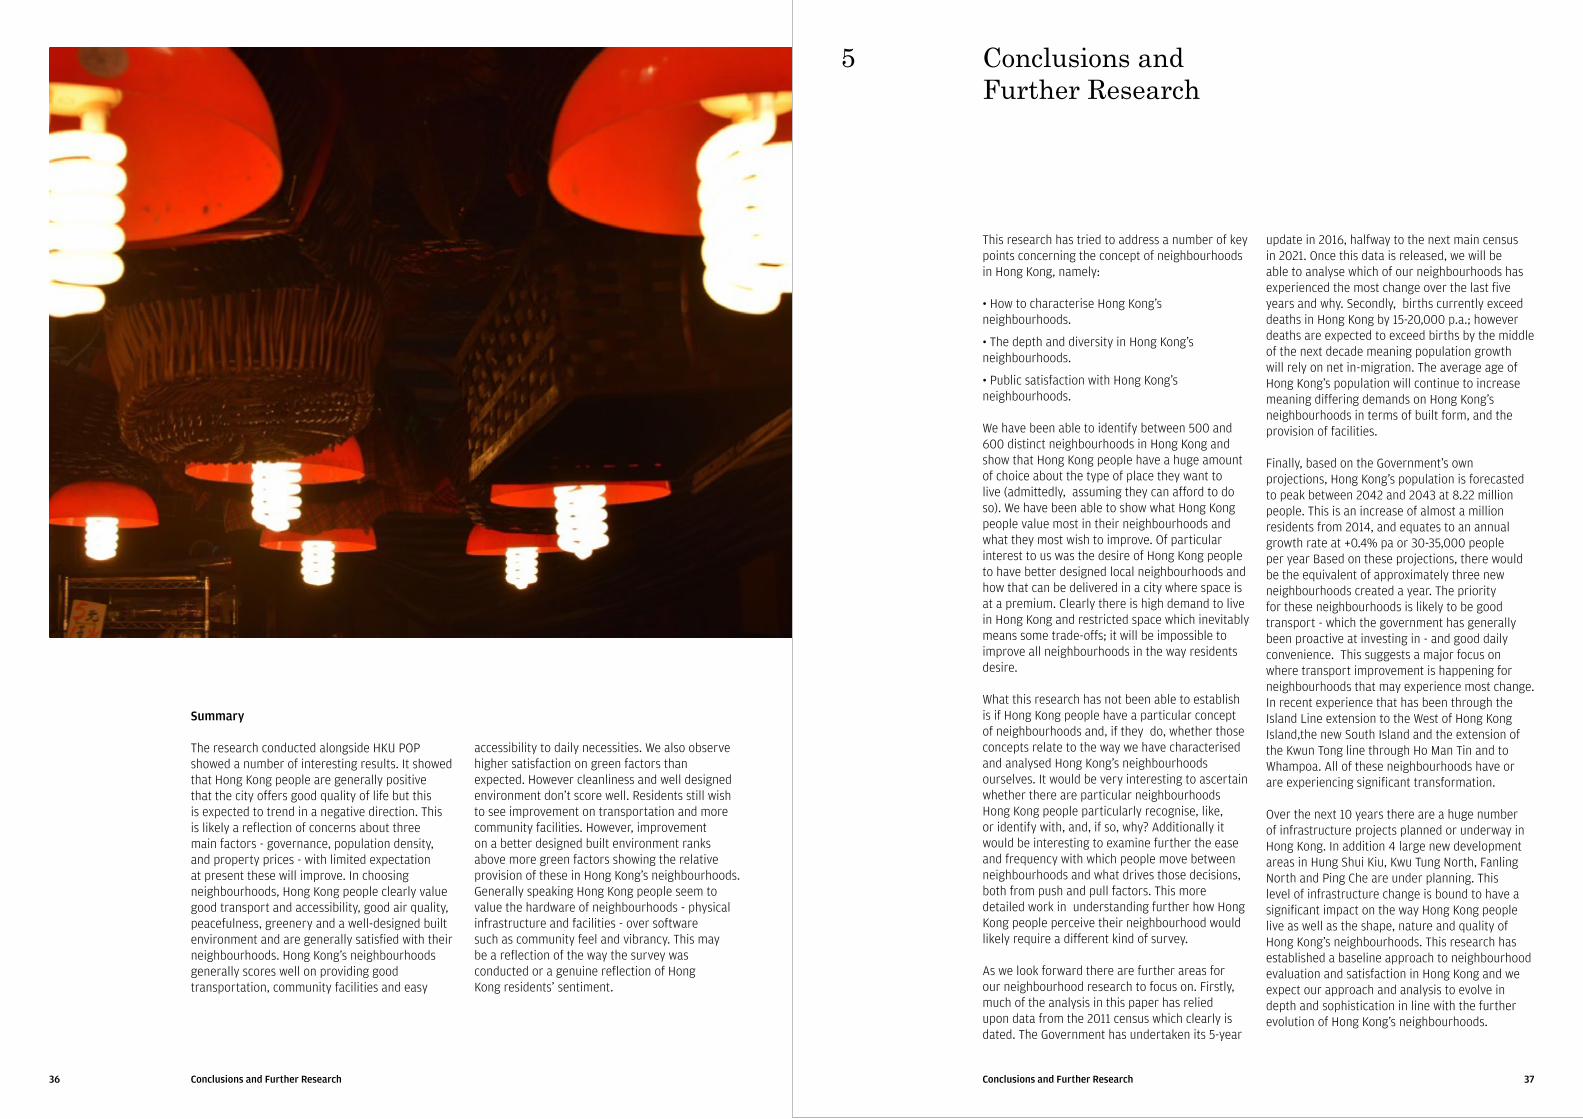
36 37Conclusions and Further ResearchConclusions and Further Research
Summary The research conducted alongside HKU POP showed a number of interesting results. It showed that Hong Kong people are generally positive that the city offers good quality of life but this is expected to trend in a negative direction. This is likely a reflection of concerns about three main factors - governance, population density, and property prices - with limited expectation at present these will improve. In choosing neighbourhoods, Hong Kong people clearly value good transport and accessibility, good air quality, peacefulness, greenery and a well-designed built environment and are generally satisfied with their neighbourhoods. Hong Kong's neighbourhoods generally scores well on providing good transportation, community facilities and easy
5
This research has tried to address a number of key points concerning the concept of neighbourhoods in Hong Kong, namely:
· How to characterise Hong Kong's neighbourhoods.
· The depth and diversity in Hong Kong's neighbourhoods.
· Public satisfaction with Hong Kong's neighbourhoods.
We have been able to identify between 500 and 600 distinct neighbourhoods in Hong Kong and show that Hong Kong people have a huge amount of choice about the type of place they want to live (admittedly, assuming they can afford to do so). We have been able to show what Hong Kong people value most in their neighbourhoods and what they most wish to improve. Of particular interest to us was the desire of Hong Kong people to have better designed local neighbourhoods and how that can be delivered in a city where space is at a premium. Clearly there is high demand to live in Hong Kong and restricted space which inevitably means some trade-offs; it will be impossible to improve all neighbourhoods in the way residents desire.
What this research has not been able to establish is if Hong Kong people have a particular concept of neighbourhoods and, if they do, whether those concepts relate to the way we have characterised and analysed Hong Kong's neighbourhoods ourselves. It would be very interesting to ascertain whether there are particular neighbourhoods Hong Kong people particularly recognise, like, or identify with, and, if so, why? Additionally it would be interesting to examine further the ease and frequency with which people move between neighbourhoods and what drives those decisions, both from push and pull factors. This more detailed work in understanding further how Hong Kong people perceive their neighbourhood would likely require a different kind of survey.
As we look forward there are further areas for our neighbourhood research to focus on. Firstly, much of the analysis in this paper has relied upon data from the 2011 census which clearly is dated. The Government has undertaken its 5-year
Conclusions and Further Research
update in 2016, halfway to the next main census in 2021. Once this data is released, we will be able to analyse which of our neighbourhoods has experienced the most change over the last five years and why. Secondly, births currently exceed deaths in Hong Kong by 15-20,000 p.a.; however deaths are expected to exceed births by the middle of the next decade meaning population growth will rely on net in-migration. The average age of Hong Kong's population will continue to increase meaning differing demands on Hong Kong's neighbourhoods in terms of built form, and the provision of facilities.
Finally, based on the Government's own projections, Hong Kong's population is forecasted to peak between 2042 and 2043 at 8.22 million people. This is an increase of almost a million residents from 2014, and equates to an annual growth rate at +0.4% pa or 30-35,000 people per year Based on these projections, there would be the equivalent of approximately three new neighbourhoods created a year. The priority for these neighbourhoods is likely to be good transport - which the government has generally been proactive at investing in - and good daily convenience. This suggests a major focus on where transport improvement is happening for neighbourhoods that may experience most change. In recent experience that has been through the Island Line extension to the West of Hong Kong Island,the new South Island and the extension of the Kwun Tong line through Ho Man Tin and to Whampoa. All of these neighbourhoods have or are experiencing significant transformation.
Over the next 10 years there are a huge number of infrastructure projects planned or underway in Hong Kong. In addition 4 large new development areas in Hung Shui Kiu, Kwu Tung North, Fanling North and Ping Che are under planning. This level of infrastructure change is bound to have a significant impact on the way Hong Kong people live as well as the shape, nature and quality of Hong Kong's neighbourhoods. This research has established a baseline approach to neighbourhood evaluation and satisfaction in Hong Kong and we expect our approach and analysis to evolve in depth and sophistication in line with the further evolution of Hong Kong's neighbourhoods.
accessibility to daily necessities. We also observe higher satisfaction on green factors than expected. However cleanliness and well designed environment don't score well. Residents still wish to see improvement on transportation and more community facilities. However, improvement on a better designed built environment ranks above more green factors showing the relative provision of these in Hong Kong's neighbourhoods. Generally speaking Hong Kong people seem to value the hardware of neighbourhoods - physical infrastructure and facilities - over software such as community feel and vibrancy. This may be a reflection of the way the survey was conducted or a genuine reflection of Hong Kong residents' sentiment.
38 39AcknowledgementsAcknowledgements
Tim Jowett, Head of Research, Grosvenor Asia Pacific
Tim Jowett joined Grosvenor Asia Pacific as Head of Research in March 2016. Tim is responsible for conducting research related to strategy, investment and execution incorporating macroeconomic, property market, and secular/thematic considerations. Tim was previously at Heitman, where he worked as Director of Asia-Pacific Investment Research. Prior to that he worked at Moonbridge Capital, Abu Dhabi Investment Authority and JP Morgan Asset Management & Colliers CRE in London. Tim holds a Masters & Bachelor of Arts in History from Kings College London.
Acknowledgements
Public Opinion Programme (POP) Public Opinion Programme (POP) at The University of Hong Kong was established in June 1991 to collect and study public opinion on topics which could be of interest to academics, journalists, policy-makers, and the general public. POP was at first under the Social Sciences Research Centre, a unit under the Faculty of Social Sciences of The University of Hong Kong, and was transferred to the Journalism and Media Studies Centre in The University of Hong Kong in May 2000. In January 2002, it was transferred back to the Faculty of Social Sciences in The University of Hong Kong.
Additional thanks Grosvenor Asia Pacific wishes to thank Brian Chung and Kumiko Lau for all their contributions to data collection throughout the duration of this research. Their assistance was invaluable.
Photo credits All imagery used taken by Grosvenor Asia Pacific staff on location in Hong Kong unless listed below. Page 18: Redd Angelo Page 17: Chan Young Lee Page 33: Adam Morse
Map Credits Grosvenor Research with contributions from Open Street Map. All map data taken from the Hong Kong Census.
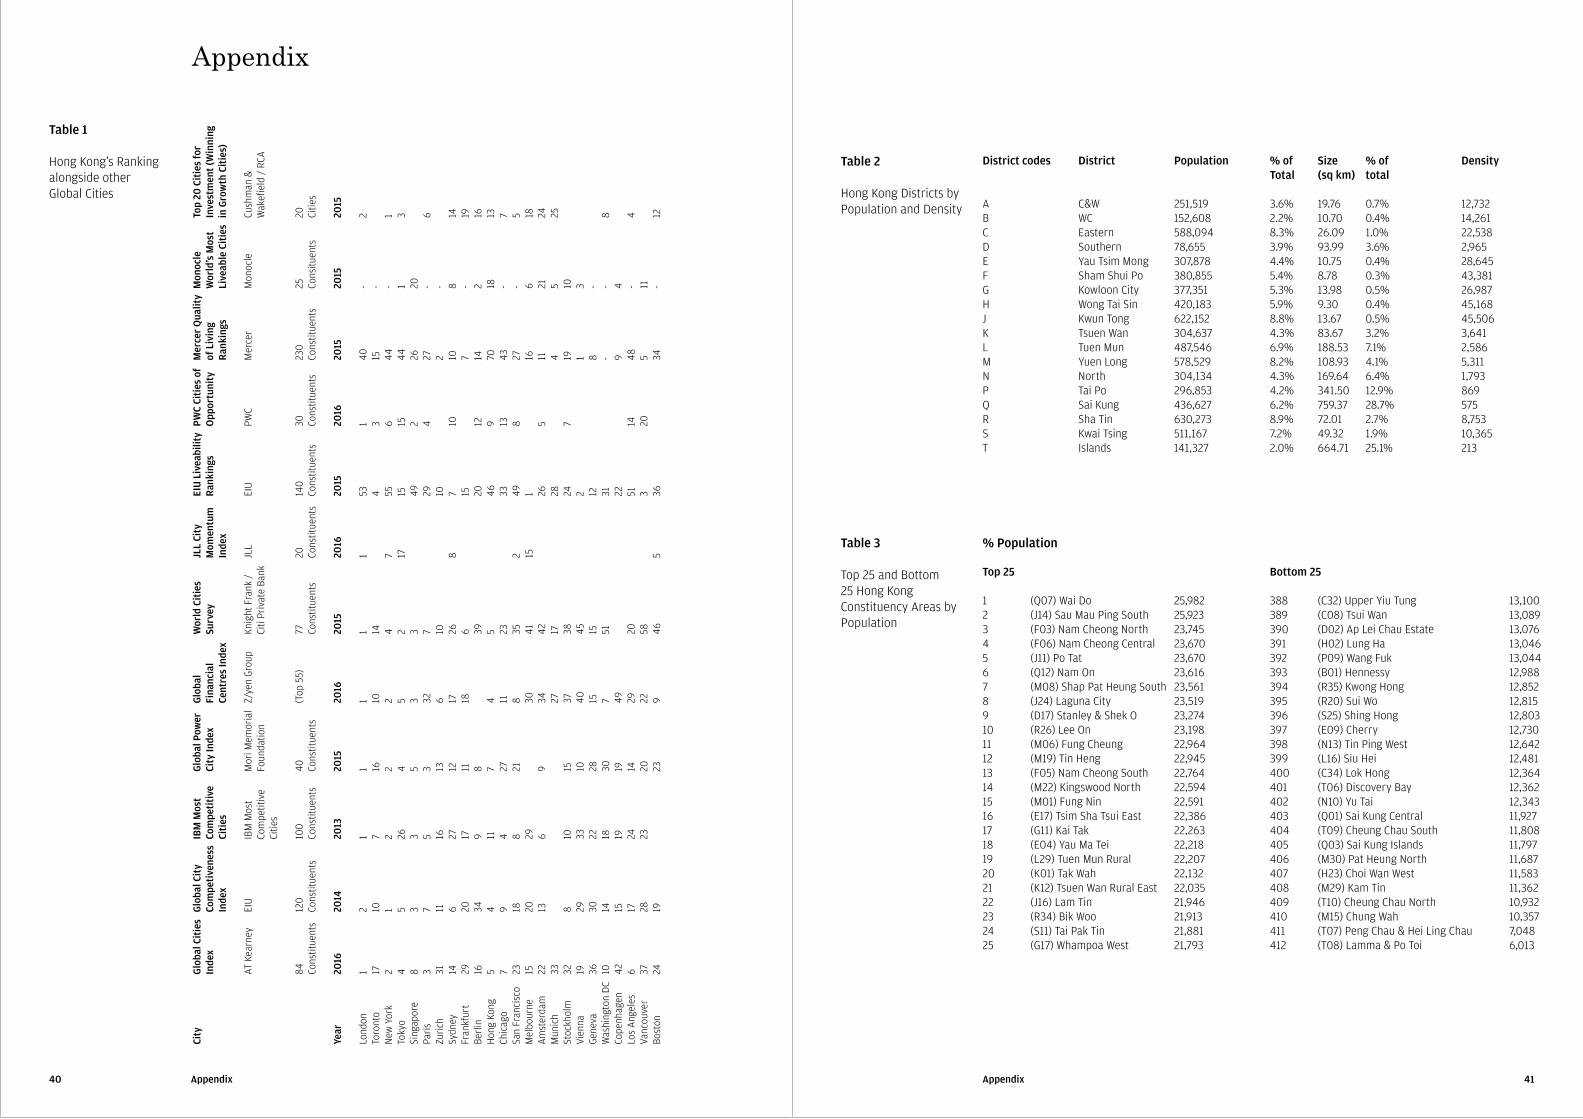
40 41AppendixAppendix
Appendix
Table 1 Hong Kong's Ranking alongside other Global Cities
Table 2 Hong Kong Districts by Population and Density
District codes District Population % of Size % of Density Total (sq km) total
A C&W 251,519 3.6% 19.76 0.7% 12,732 B WC 152,608 2.2% 10.70 0.4% 14,261 C Eastern 588,094 8.3% 26.09 1.0% 22,538 D Southern 78,655 3.9% 93.99 3.6% 2,965 E Yau Tsim Mong 307,878 4.4% 10.75 0.4% 28,645 F Sham Shui Po 380,855 5.4% 8.78 0.3% 43,381 G Kowloon City 377,351 5.3% 13.98 0.5% 26,987 H Wong Tai Sin 420,183 5.9% 9.30 0.4% 45,168 J Kwun Tong 622,152 8.8% 13.67 0.5% 45,506 K Tsuen Wan 304,637 4.3% 83.67 3.2% 3,641 L Tuen Mun 487,546 6.9% 188.53 7.1% 2,586 M Yuen Long 578,529 8.2% 108.93 4.1% 5,311 N North 304,134 4.3% 169.64 6.4% 1,793 P Tai Po 296,853 4.2% 341.50 12.9% 869 Q Sai Kung 436,627 6.2% 759.37 28.7% 575 R Sha Tin 630,273 8.9% 72.01 2.7% 8,753 S Kwai Tsing 511,167 7.2% 49.32 1.9% 10,365 T Islands 141,327 2.0% 664.71 25.1% 213
Top 25 Bottom 25 1 (Q07) Wai Do 25,982 388 (C32) Upper Yiu Tung 13,1002 (J14) Sau Mau Ping South 25,923 389 (C08) Tsui Wan 13,0893 (F03) Nam Cheong North 23,745 390 (D02) Ap Lei Chau Estate 13,0764 (F06) Nam Cheong Central 23,670 391 (H02) Lung Ha 13,0465 (J11) Po Tat 23,670 392 (P09) Wang Fuk 13,0446 (Q12) Nam On 23,616 393 (B01) Hennessy 12,9887 (M08) Shap Pat Heung South 23,561 394 (R35) Kwong Hong 12,8528 (J24) Laguna City 23,519 395 (R20) Sui Wo 12,8159 (D17) Stanley & Shek O 23,274 396 (S25) Shing Hong 12,80310 (R26) Lee On 23,198 397 (E09) Cherry 12,73011 (M06) Fung Cheung 22,964 398 (N13) Tin Ping West 12,64212 (M19) Tin Heng 22,945 399 (L16) Siu Hei 12,48113 (F05) Nam Cheong South 22,764 400 (C34) Lok Hong 12,36414 (M22) Kingswood North 22,594 401 (T06) Discovery Bay 12,36215 (M01) Fung Nin 22,591 402 (N10) Yu Tai 12,34316 (E17) Tsim Sha Tsui East 22,386 403 (Q01) Sai Kung Central 11,92717 (G11) Kai Tak 22,263 404 (T09) Cheung Chau South 11,80818 (E04) Yau Ma Tei 22,218 405 (Q03) Sai Kung Islands 11,79719 (L29) Tuen Mun Rural 22,207 406 (M30) Pat Heung North 11,68720 (K01) Tak Wah 22,132 407 (H23) Choi Wan West 11,58321 (K12) Tsuen Wan Rural East 22,035 408 (M29) Kam Tin 11,36222 (J16) Lam Tin 21,946 409 (T10) Cheung Chau North 10,93223 (R34) Bik Woo 21,913 410 (M15) Chung Wah 10,35724 (S11) Tai Pak Tin 21,881 411 (T07) Peng Chau & Hei Ling Chau 7,04825 (G17) Whampoa West 21,793 412 (T08) Lamma & Po Toi 6,013
% PopulationTable 3 Top 25 and Bottom 25 Hong Kong Constituency Areas by Population
IBM
Mos
t Co
mpe
titi
ve
Citi
es
IBM
Mos
t Co
mpe
titiv
e Ci
ties
100
Cons
titue
nts
2013
1 7 2 26 3 5 16 27 17 9 11 4 8 29 6 10 33 22 18 19 24 23
Glo
bal
Fina
ncia
l Ce
ntre
s In
dex
Z/ye
n Gr
oup
(Top
55)
20
16
1 10 2 5 3 32 6 17 18 4 11 8 30 34 27 37 40 15 7 49 29 22 9
Wor
ld C
itie
s Su
rvey
Kn
ight
Fra
nk /
Ci
ti Pr
ivat
e Ba
nk
77
Cons
titue
nts
2015
1 14 4 2 3 7 10 26 6 39 5 23 35 41 42 17 38 45 15 51 20 58 46
Glo
bal P
ower
Ci
ty In
dex
Mor
i Mem
oria
l Fo
unda
tion
40
Cons
titue
nts
2015
1 16 2 4 5 3 13 12 11 8 7 27 21 9 15 10 28 30 19 14 20 23
Glo
bal C
itie
s In
dex
AT K
earn
ey
84
Cons
titue
nts
2016
1 17 2 4 8 3 31 14 29 16 5 7 23 15 22 33 32 19 36 10 42 6 37 24
City
Ye
ar
Lond
onTo
ront
oN
ew Y
ork
Toky
oSi
ngap
ore
Pari
sZu
rich
Sydn
eyFr
ankf
urt
Berl
inH
ong
Kong
Chic
ago
San
Fran
cisc
oM
elbo
urne
Amst
erda
mM
unic
hSt
ockh
olm
Vien
naGe
neva
Was
hing
ton
DC
Cope
nhag
enLo
s An
gele
sVa
ncou
ver
Bost
on
Glo
bal C
ity
Com
peti
vene
ss
Inde
x
EIU
12
0 Co
nstit
uent
s
2014
2 10 1 5 3 7 11 6 20 34 4 9 18 20 13 8 29 30 14 15 17 28 19
JLL
City
M
omen
tum
In
dex
JLL
20
Cons
titue
nts
2016
1 7 17 8 2 15 5
EIU
Liv
eabi
lity
Ran
king
s EI
U
140
Cons
titue
nts
2015
53 4 55 15 49 29 10 7 15 20 46 33 49 1 26 28 24 2 12 31 22 51 3 36
PW
C Ci
ties
of
Opp
ortu
nity
PW
C 30
Co
nstit
uent
s
2016
1 3 6 15 2 4 10 12 9 13 8 5 7 14 20
Mer
cer
Qua
lity
of L
ivin
g R
anki
ngs
Mer
cer
230
Cons
titue
nts
2015
40 15 44 44 26 27 2 10 7 14 70 43 27 16 11 4 19 1 8 - 9 48 5 34
Mon
ocle
W
orld
's M
ost
Live
able
Cit
ies
Mon
ocle
25
Co
nsitu
ents
2015
- - - 1 20 - - 8 - 2 18 - - 6 21 5 10 3 - - 4 - 11 -
Top
20 C
itie
s fo
r In
vest
men
t (W
inni
ng
in G
row
th C
itie
s)
Cush
man
&
Wak
efie
ld /
RCA
20
Ci
ties
2015
2 1 3 6 14 19 16 13 7 5 18 24 25 8 4 12
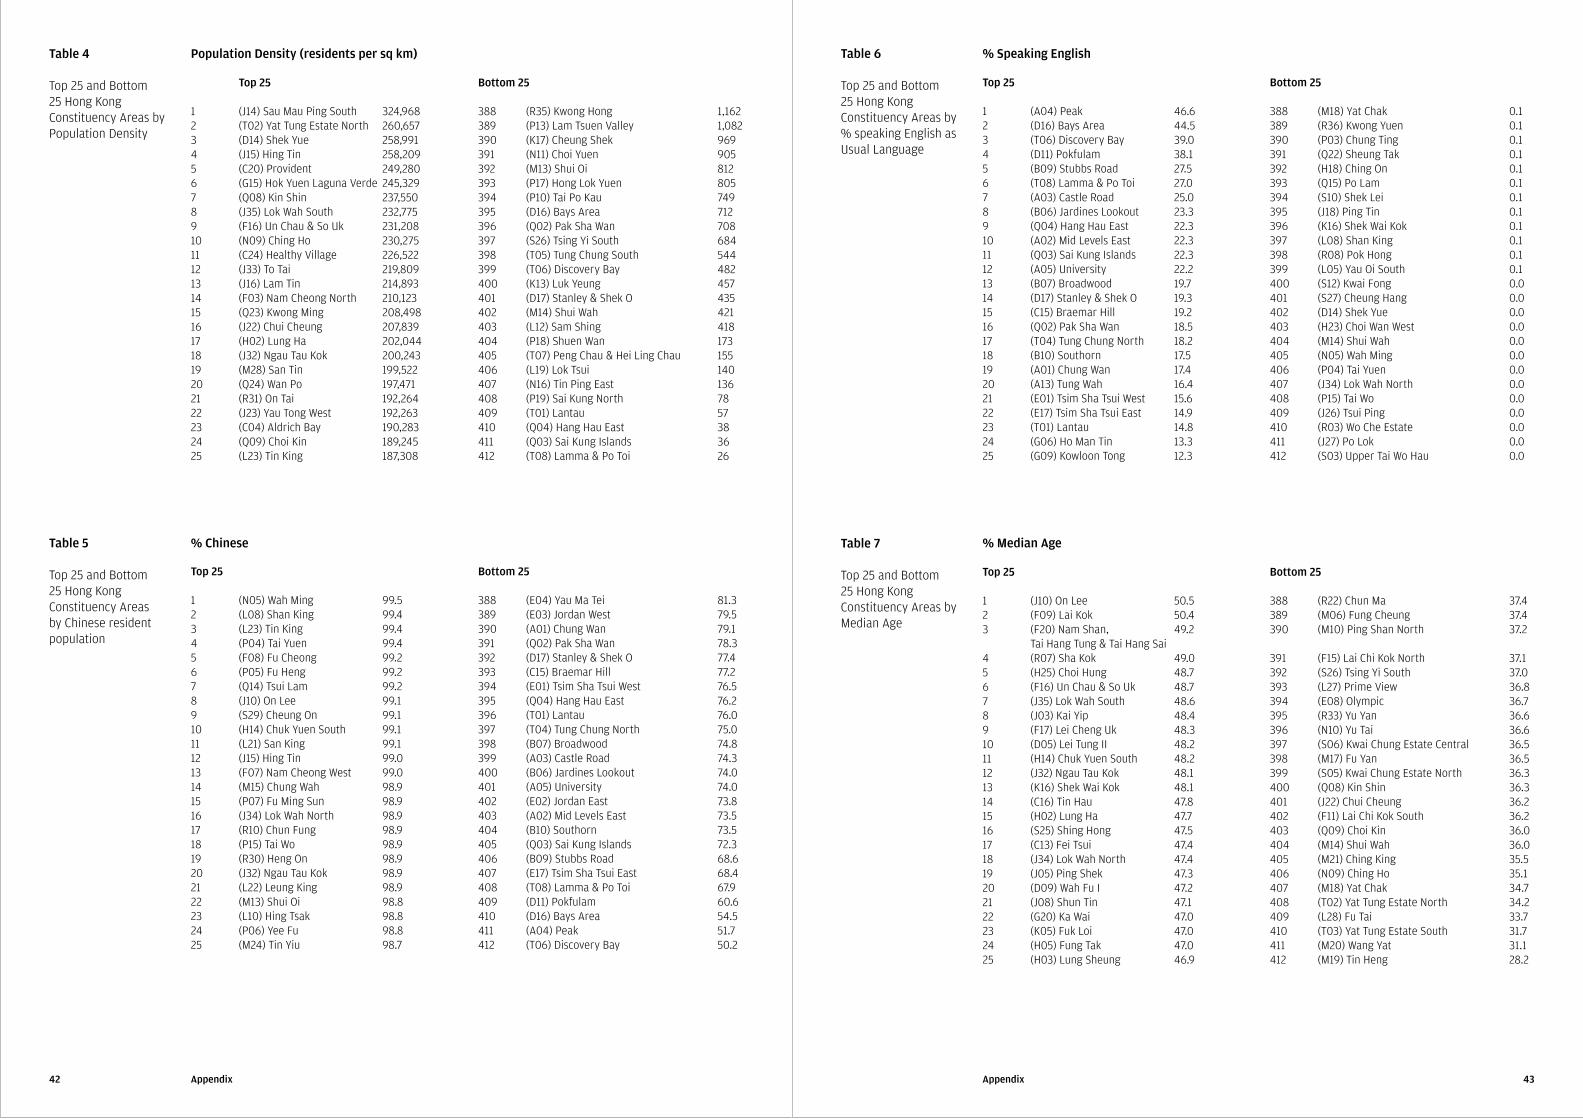
42 43AppendixAppendix
Top 25 Bottom 25 1 (J14) Sau Mau Ping South 324,968 388 (R35) Kwong Hong 1,1622 (T02) Yat Tung Estate North 260,657 389 (P13) Lam Tsuen Valley 1,0823 (D14) Shek Yue 258,991 390 (K17) Cheung Shek 9694 (J15) Hing Tin 258,209 391 (N11) Choi Yuen 9055 (C20) Provident 249,280 392 (M13) Shui Oi 8126 (G15) Hok Yuen Laguna Verde 245,329 393 (P17) Hong Lok Yuen 8057 (Q08) Kin Shin 237,550 394 (P10) Tai Po Kau 7498 (J35) Lok Wah South 232,775 395 (D16) Bays Area 7129 (F16) Un Chau & So Uk 231,208 396 (Q02) Pak Sha Wan 70810 (N09) Ching Ho 230,275 397 (S26) Tsing Yi South 68411 (C24) Healthy Village 226,522 398 (T05) Tung Chung South 54412 (J33) To Tai 219,809 399 (T06) Discovery Bay 48213 (J16) Lam Tin 214,893 400 (K13) Luk Yeung 45714 (F03) Nam Cheong North 210,123 401 (D17) Stanley & Shek O 43515 (Q23) Kwong Ming 208,498 402 (M14) Shui Wah 42116 (J22) Chui Cheung 207,839 403 (L12) Sam Shing 41817 (H02) Lung Ha 202,044 404 (P18) Shuen Wan 17318 (J32) Ngau Tau Kok 200,243 405 (T07) Peng Chau & Hei Ling Chau 15519 (M28) San Tin 199,522 406 (L19) Lok Tsui 14020 (Q24) Wan Po 197,471 407 (N16) Tin Ping East 13621 (R31) On Tai 192,264 408 (P19) Sai Kung North 7822 (J23) Yau Tong West 192,263 409 (T01) Lantau 5723 (C04) Aldrich Bay 190,283 410 (Q04) Hang Hau East 3824 (Q09) Choi Kin 189,245 411 (Q03) Sai Kung Islands 3625 (L23) Tin King 187,308 412 (T08) Lamma & Po Toi 26
Population Density (residents per sq km)Table 4 Top 25 and Bottom 25 Hong Kong Constituency Areas by Population Density
% Chinese
Top 25 Bottom 25 1 (N05) Wah Ming 99.5 388 (E04) Yau Ma Tei 81.32 (L08) Shan King 99.4 389 (E03) Jordan West 79.53 (L23) Tin King 99.4 390 (A01) Chung Wan 79.14 (P04) Tai Yuen 99.4 391 (Q02) Pak Sha Wan 78.35 (F08) Fu Cheong 99.2 392 (D17) Stanley & Shek O 77.46 (P05) Fu Heng 99.2 393 (C15) Braemar Hill 77.27 (Q14) Tsui Lam 99.2 394 (E01) Tsim Sha Tsui West 76.58 (J10) On Lee 99.1 395 (Q04) Hang Hau East 76.29 (S29) Cheung On 99.1 396 (T01) Lantau 76.010 (H14) Chuk Yuen South 99.1 397 (T04) Tung Chung North 75.011 (L21) San King 99.1 398 (B07) Broadwood 74.812 (J15) Hing Tin 99.0 399 (A03) Castle Road 74.313 (F07) Nam Cheong West 99.0 400 (B06) Jardines Lookout 74.014 (M15) Chung Wah 98.9 401 (A05) University 74.015 (P07) Fu Ming Sun 98.9 402 (E02) Jordan East 73.816 (J34) Lok Wah North 98.9 403 (A02) Mid Levels East 73.517 (R10) Chun Fung 98.9 404 (B10) Southorn 73.518 (P15) Tai Wo 98.9 405 (Q03) Sai Kung Islands 72.319 (R30) Heng On 98.9 406 (B09) Stubbs Road 68.620 (J32) Ngau Tau Kok 98.9 407 (E17) Tsim Sha Tsui East 68.421 (L22) Leung King 98.9 408 (T08) Lamma & Po Toi 67.922 (M13) Shui Oi 98.8 409 (D11) Pokfulam 60.623 (L10) Hing Tsak 98.8 410 (D16) Bays Area 54.524 (P06) Yee Fu 98.8 411 (A04) Peak 51.725 (M24) Tin Yiu 98.7 412 (T06) Discovery Bay 50.2
Table 5 Top 25 and Bottom 25 Hong Kong Constituency Areas by Chinese resident population
Table 6 Top 25 and Bottom 25 Hong Kong Constituency Areas by % speaking English as Usual Language
Top 25 Bottom 25 1 (A04) Peak 46.6 388 (M18) Yat Chak 0.12 (D16) Bays Area 44.5 389 (R36) Kwong Yuen 0.13 (T06) Discovery Bay 39.0 390 (P03) Chung Ting 0.14 (D11) Pokfulam 38.1 391 (Q22) Sheung Tak 0.15 (B09) Stubbs Road 27.5 392 (H18) Ching On 0.16 (T08) Lamma & Po Toi 27.0 393 (Q15) Po Lam 0.17 (A03) Castle Road 25.0 394 (S10) Shek Lei 0.18 (B06) Jardines Lookout 23.3 395 (J18) Ping Tin 0.19 (Q04) Hang Hau East 22.3 396 (K16) Shek Wai Kok 0.110 (A02) Mid Levels East 22.3 397 (L08) Shan King 0.111 (Q03) Sai Kung Islands 22.3 398 (R08) Pok Hong 0.112 (A05) University 22.2 399 (L05) Yau Oi South 0.113 (B07) Broadwood 19.7 400 (S12) Kwai Fong 0.014 (D17) Stanley & Shek O 19.3 401 (S27) Cheung Hang 0.015 (C15) Braemar Hill 19.2 402 (D14) Shek Yue 0.016 (Q02) Pak Sha Wan 18.5 403 (H23) Choi Wan West 0.017 (T04) Tung Chung North 18.2 404 (M14) Shui Wah 0.018 (B10) Southorn 17.5 405 (N05) Wah Ming 0.019 (A01) Chung Wan 17.4 406 (P04) Tai Yuen 0.020 (A13) Tung Wah 16.4 407 (J34) Lok Wah North 0.021 (E01) Tsim Sha Tsui West 15.6 408 (P15) Tai Wo 0.022 (E17) Tsim Sha Tsui East 14.9 409 (J26) Tsui Ping 0.023 (T01) Lantau 14.8 410 (R03) Wo Che Estate 0.024 (G06) Ho Man Tin 13.3 411 (J27) Po Lok 0.025 (G09) Kowloon Tong 12.3 412 (S03) Upper Tai Wo Hau 0.0
% Speaking English
Top 25 Bottom 25 1 (J10) On Lee 50.5 388 (R22) Chun Ma 37.42 (F09) Lai Kok 50.4 389 (M06) Fung Cheung 37.43 (F20) Nam Shan, 49.2 390 (M10) Ping Shan North 37.2 Tai Hang Tung & Tai Hang Sai 4 (R07) Sha Kok 49.0 391 (F15) Lai Chi Kok North 37.15 (H25) Choi Hung 48.7 392 (S26) Tsing Yi South 37.06 (F16) Un Chau & So Uk 48.7 393 (L27) Prime View 36.87 (J35) Lok Wah South 48.6 394 (E08) Olympic 36.78 (J03) Kai Yip 48.4 395 (R33) Yu Yan 36.69 (F17) Lei Cheng Uk 48.3 396 (N10) Yu Tai 36.610 (D05) Lei Tung II 48.2 397 (S06) Kwai Chung Estate Central 36.511 (H14) Chuk Yuen South 48.2 398 (M17) Fu Yan 36.512 (J32) Ngau Tau Kok 48.1 399 (S05) Kwai Chung Estate North 36.313 (K16) Shek Wai Kok 48.1 400 (Q08) Kin Shin 36.314 (C16) Tin Hau 47.8 401 (J22) Chui Cheung 36.215 (H02) Lung Ha 47.7 402 (F11) Lai Chi Kok South 36.216 (S25) Shing Hong 47.5 403 (Q09) Choi Kin 36.017 (C13) Fei Tsui 47.4 404 (M14) Shui Wah 36.018 (J34) Lok Wah North 47.4 405 (M21) Ching King 35.519 (J05) Ping Shek 47.3 406 (N09) Ching Ho 35.120 (D09) Wah Fu I 47.2 407 (M18) Yat Chak 34.721 (J08) Shun Tin 47.1 408 (T02) Yat Tung Estate North 34.222 (G20) Ka Wai 47.0 409 (L28) Fu Tai 33.723 (K05) Fuk Loi 47.0 410 (T03) Yat Tung Estate South 31.724 (H05) Fung Tak 47.0 411 (M20) Wang Yat 31.125 (H03) Lung Sheung 46.9 412 (M19) Tin Heng 28.2
% Median AgeTable 7 Top 25 and Bottom 25 Hong Kong Constituency Areas by Median Age
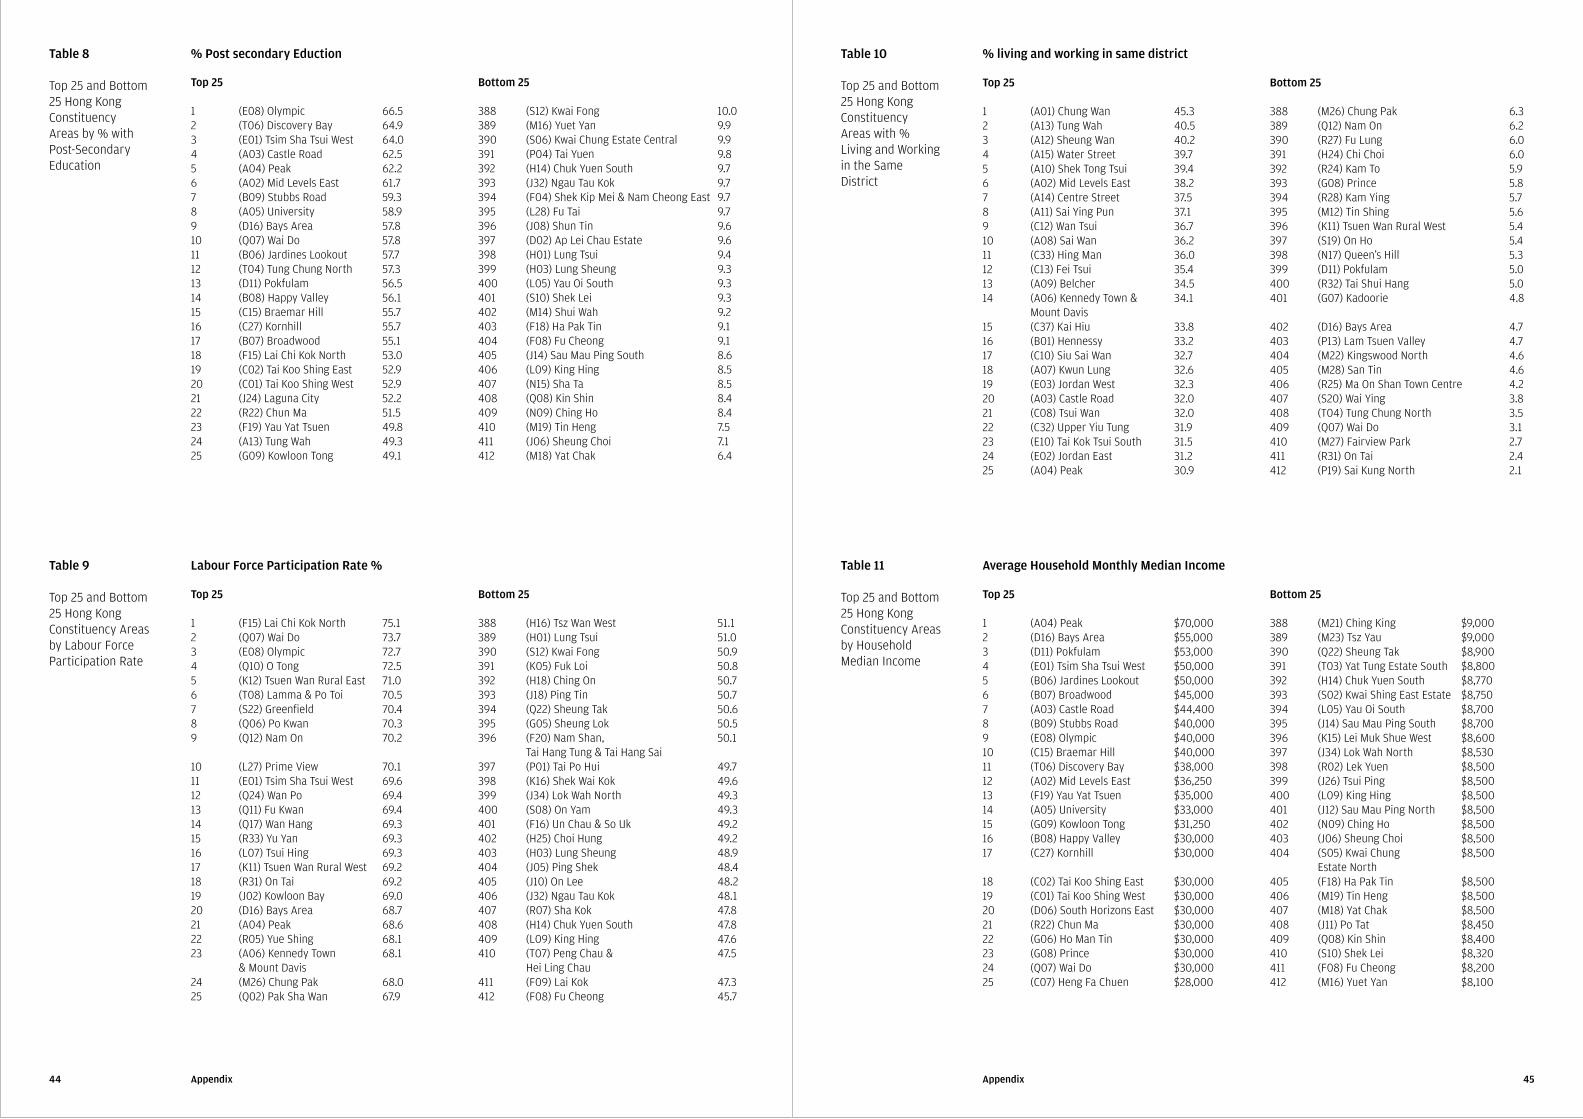
44 45AppendixAppendix
Table 8 Top 25 and Bottom 25 Hong Kong Constituency Areas by % with Post-Secondary Education
Top 25 Bottom 25 1 (E08) Olympic 66.5 388 (S12) Kwai Fong 10.02 (T06) Discovery Bay 64.9 389 (M16) Yuet Yan 9.93 (E01) Tsim Sha Tsui West 64.0 390 (S06) Kwai Chung Estate Central 9.94 (A03) Castle Road 62.5 391 (P04) Tai Yuen 9.85 (A04) Peak 62.2 392 (H14) Chuk Yuen South 9.76 (A02) Mid Levels East 61.7 393 (J32) Ngau Tau Kok 9.77 (B09) Stubbs Road 59.3 394 (F04) Shek Kip Mei & Nam Cheong East 9.78 (A05) University 58.9 395 (L28) Fu Tai 9.79 (D16) Bays Area 57.8 396 (J08) Shun Tin 9.610 (Q07) Wai Do 57.8 397 (D02) Ap Lei Chau Estate 9.611 (B06) Jardines Lookout 57.7 398 (H01) Lung Tsui 9.412 (T04) Tung Chung North 57.3 399 (H03) Lung Sheung 9.313 (D11) Pokfulam 56.5 400 (L05) Yau Oi South 9.314 (B08) Happy Valley 56.1 401 (S10) Shek Lei 9.315 (C15) Braemar Hill 55.7 402 (M14) Shui Wah 9.216 (C27) Kornhill 55.7 403 (F18) Ha Pak Tin 9.117 (B07) Broadwood 55.1 404 (F08) Fu Cheong 9.118 (F15) Lai Chi Kok North 53.0 405 (J14) Sau Mau Ping South 8.619 (C02) Tai Koo Shing East 52.9 406 (L09) King Hing 8.520 (C01) Tai Koo Shing West 52.9 407 (N15) Sha Ta 8.521 (J24) Laguna City 52.2 408 (Q08) Kin Shin 8.422 (R22) Chun Ma 51.5 409 (N09) Ching Ho 8.423 (F19) Yau Yat Tsuen 49.8 410 (M19) Tin Heng 7.524 (A13) Tung Wah 49.3 411 (J06) Sheung Choi 7.125 (G09) Kowloon Tong 49.1 412 (M18) Yat Chak 6.4
% Post secondary Eduction
Table 9 Top 25 and Bottom 25 Hong Kong Constituency Areas by Labour Force Participation Rate
Top 25 Bottom 25 1 (F15) Lai Chi Kok North 75.1 388 (H16) Tsz Wan West 51.12 (Q07) Wai Do 73.7 389 (H01) Lung Tsui 51.03 (E08) Olympic 72.7 390 (S12) Kwai Fong 50.94 (Q10) O Tong 72.5 391 (K05) Fuk Loi 50.85 (K12) Tsuen Wan Rural East 71.0 392 (H18) Ching On 50.76 (T08) Lamma & Po Toi 70.5 393 (J18) Ping Tin 50.77 (S22) Greenfield 70.4 394 (Q22) Sheung Tak 50.68 (Q06) Po Kwan 70.3 395 (G05) Sheung Lok 50.59 (Q12) Nam On 70.2 396 (F20) Nam Shan, 50.1 Tai Hang Tung & Tai Hang Sai10 (L27) Prime View 70.1 397 (P01) Tai Po Hui 49.711 (E01) Tsim Sha Tsui West 69.6 398 (K16) Shek Wai Kok 49.612 (Q24) Wan Po 69.4 399 (J34) Lok Wah North 49.313 (Q11) Fu Kwan 69.4 400 (S08) On Yam 49.314 (Q17) Wan Hang 69.3 401 (F16) Un Chau & So Uk 49.215 (R33) Yu Yan 69.3 402 (H25) Choi Hung 49.216 (L07) Tsui Hing 69.3 403 (H03) Lung Sheung 48.917 (K11) Tsuen Wan Rural West 69.2 404 (J05) Ping Shek 48.418 (R31) On Tai 69.2 405 (J10) On Lee 48.219 (J02) Kowloon Bay 69.0 406 (J32) Ngau Tau Kok 48.120 (D16) Bays Area 68.7 407 (R07) Sha Kok 47.821 (A04) Peak 68.6 408 (H14) Chuk Yuen South 47.822 (R05) Yue Shing 68.1 409 (L09) King Hing 47.623 (A06) Kennedy Town 68.1 410 (T07) Peng Chau & 47.5 & Mount Davis Hei Ling Chau24 (M26) Chung Pak 68.0 411 (F09) Lai Kok 47.325 (Q02) Pak Sha Wan 67.9 412 (F08) Fu Cheong 45.7
Labour Force Participation Rate %
Table 10 Top 25 and Bottom 25 Hong Kong Constituency Areas with % Living and Working in the Same District
Top 25 Bottom 25 1 (A01) Chung Wan 45.3 388 (M26) Chung Pak 6.32 (A13) Tung Wah 40.5 389 (Q12) Nam On 6.23 (A12) Sheung Wan 40.2 390 (R27) Fu Lung 6.04 (A15) Water Street 39.7 391 (H24) Chi Choi 6.05 (A10) Shek Tong Tsui 39.4 392 (R24) Kam To 5.96 (A02) Mid Levels East 38.2 393 (G08) Prince 5.87 (A14) Centre Street 37.5 394 (R28) Kam Ying 5.78 (A11) Sai Ying Pun 37.1 395 (M12) Tin Shing 5.69 (C12) Wan Tsui 36.7 396 (K11) Tsuen Wan Rural West 5.410 (A08) Sai Wan 36.2 397 (S19) On Ho 5.411 (C33) Hing Man 36.0 398 (N17) Queen's Hill 5.312 (C13) Fei Tsui 35.4 399 (D11) Pokfulam 5.013 (A09) Belcher 34.5 400 (R32) Tai Shui Hang 5.014 (A06) Kennedy Town & 34.1 401 (G07) Kadoorie 4.8 Mount Davis15 (C37) Kai Hiu 33.8 402 (D16) Bays Area 4.716 (B01) Hennessy 33.2 403 (P13) Lam Tsuen Valley 4.717 (C10) Siu Sai Wan 32.7 404 (M22) Kingswood North 4.618 (A07) Kwun Lung 32.6 405 (M28) San Tin 4.619 (E03) Jordan West 32.3 406 (R25) Ma On Shan Town Centre 4.220 (A03) Castle Road 32.0 407 (S20) Wai Ying 3.821 (C08) Tsui Wan 32.0 408 (T04) Tung Chung North 3.522 (C32) Upper Yiu Tung 31.9 409 (Q07) Wai Do 3.123 (E10) Tai Kok Tsui South 31.5 410 (M27) Fairview Park 2.724 (E02) Jordan East 31.2 411 (R31) On Tai 2.425 (A04) Peak 30.9 412 (P19) Sai Kung North 2.1
% living and working in same district
Table 11 Top 25 and Bottom 25 Hong Kong Constituency Areas by Household Median Income
Top 25 Bottom 25 1 (A04) Peak $70,000 388 (M21) Ching King $9,0002 (D16) Bays Area $55,000 389 (M23) Tsz Yau $9,0003 (D11) Pokfulam $53,000 390 (Q22) Sheung Tak $8,9004 (E01) Tsim Sha Tsui West $50,000 391 (T03) Yat Tung Estate South $8,8005 (B06) Jardines Lookout $50,000 392 (H14) Chuk Yuen South $8,7706 (B07) Broadwood $45,000 393 (S02) Kwai Shing East Estate $8,7507 (A03) Castle Road $44,400 394 (L05) Yau Oi South $8,7008 (B09) Stubbs Road $40,000 395 (J14) Sau Mau Ping South $8,7009 (E08) Olympic $40,000 396 (K15) Lei Muk Shue West $8,60010 (C15) Braemar Hill $40,000 397 (J34) Lok Wah North $8,53011 (T06) Discovery Bay $38,000 398 (R02) Lek Yuen $8,50012 (A02) Mid Levels East $36,250 399 (J26) Tsui Ping $8,50013 (F19) Yau Yat Tsuen $35,000 400 (L09) King Hing $8,50014 (A05) University $33,000 401 (J12) Sau Mau Ping North $8,50015 (G09) Kowloon Tong $31,250 402 (N09) Ching Ho $8,50016 (B08) Happy Valley $30,000 403 (J06) Sheung Choi $8,50017 (C27) Kornhill $30,000 404 (S05) Kwai Chung $8,500 Estate North18 (C02) Tai Koo Shing East $30,000 405 (F18) Ha Pak Tin $8,50019 (C01) Tai Koo Shing West $30,000 406 (M19) Tin Heng $8,50020 (D06) South Horizons East $30,000 407 (M18) Yat Chak $8,50021 (R22) Chun Ma $30,000 408 (J11) Po Tat $8,45022 (G06) Ho Man Tin $30,000 409 (Q08) Kin Shin $8,40023 (G08) Prince $30,000 410 (S10) Shek Lei $8,32024 (Q07) Wai Do $30,000 411 (F08) Fu Cheong $8,20025 (C07) Heng Fa Chuen $28,000 412 (M16) Yuet Yan $8,100
Average Household Monthly Median Income
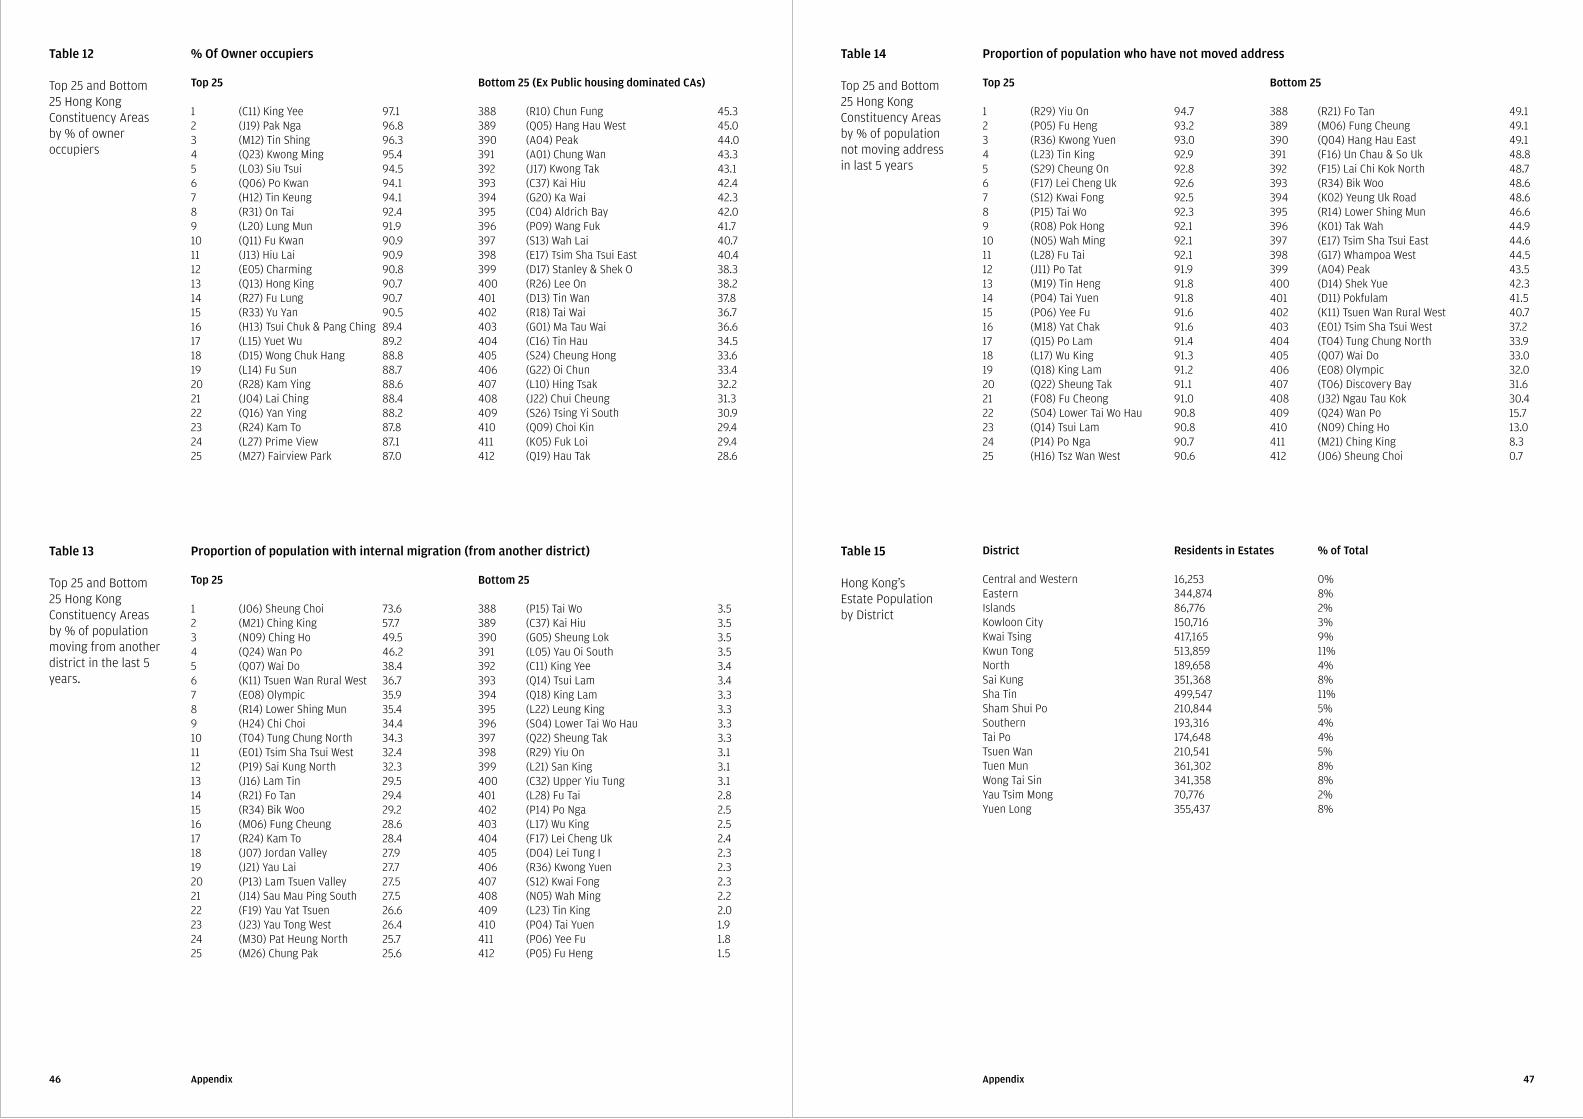
46 47AppendixAppendix
Table 12 Top 25 and Bottom 25 Hong Kong Constituency Areas by % of owner occupiers
Top 25 Bottom 25 (Ex Public housing dominated CAs) 1 (C11) King Yee 97.1 388 (R10) Chun Fung 45.32 (J19) Pak Nga 96.8 389 (Q05) Hang Hau West 45.03 (M12) Tin Shing 96.3 390 (A04) Peak 44.04 (Q23) Kwong Ming 95.4 391 (A01) Chung Wan 43.35 (L03) Siu Tsui 94.5 392 (J17) Kwong Tak 43.16 (Q06) Po Kwan 94.1 393 (C37) Kai Hiu 42.47 (H12) Tin Keung 94.1 394 (G20) Ka Wai 42.38 (R31) On Tai 92.4 395 (C04) Aldrich Bay 42.09 (L20) Lung Mun 91.9 396 (P09) Wang Fuk 41.710 (Q11) Fu Kwan 90.9 397 (S13) Wah Lai 40.711 (J13) Hiu Lai 90.9 398 (E17) Tsim Sha Tsui East 40.412 (E05) Charming 90.8 399 (D17) Stanley & Shek O 38.313 (Q13) Hong King 90.7 400 (R26) Lee On 38.214 (R27) Fu Lung 90.7 401 (D13) Tin Wan 37.815 (R33) Yu Yan 90.5 402 (R18) Tai Wai 36.716 (H13) Tsui Chuk & Pang Ching 89.4 403 (G01) Ma Tau Wai 36.617 (L15) Yuet Wu 89.2 404 (C16) Tin Hau 34.518 (D15) Wong Chuk Hang 88.8 405 (S24) Cheung Hong 33.619 (L14) Fu Sun 88.7 406 (G22) Oi Chun 33.420 (R28) Kam Ying 88.6 407 (L10) Hing Tsak 32.221 (J04) Lai Ching 88.4 408 (J22) Chui Cheung 31.322 (Q16) Yan Ying 88.2 409 (S26) Tsing Yi South 30.923 (R24) Kam To 87.8 410 (Q09) Choi Kin 29.424 (L27) Prime View 87.1 411 (K05) Fuk Loi 29.425 (M27) Fairview Park 87.0 412 (Q19) Hau Tak 28.6
% Of Owner occupiers
Table 13 Top 25 and Bottom 25 Hong Kong Constituency Areas by % of population moving from another district in the last 5 years.
Top 25 Bottom 25 1 (J06) Sheung Choi 73.6 388 (P15) Tai Wo 3.52 (M21) Ching King 57.7 389 (C37) Kai Hiu 3.53 (N09) Ching Ho 49.5 390 (G05) Sheung Lok 3.54 (Q24) Wan Po 46.2 391 (L05) Yau Oi South 3.55 (Q07) Wai Do 38.4 392 (C11) King Yee 3.46 (K11) Tsuen Wan Rural West 36.7 393 (Q14) Tsui Lam 3.47 (E08) Olympic 35.9 394 (Q18) King Lam 3.38 (R14) Lower Shing Mun 35.4 395 (L22) Leung King 3.39 (H24) Chi Choi 34.4 396 (S04) Lower Tai Wo Hau 3.310 (T04) Tung Chung North 34.3 397 (Q22) Sheung Tak 3.311 (E01) Tsim Sha Tsui West 32.4 398 (R29) Yiu On 3.112 (P19) Sai Kung North 32.3 399 (L21) San King 3.113 (J16) Lam Tin 29.5 400 (C32) Upper Yiu Tung 3.114 (R21) Fo Tan 29.4 401 (L28) Fu Tai 2.815 (R34) Bik Woo 29.2 402 (P14) Po Nga 2.516 (M06) Fung Cheung 28.6 403 (L17) Wu King 2.517 (R24) Kam To 28.4 404 (F17) Lei Cheng Uk 2.418 (J07) Jordan Valley 27.9 405 (D04) Lei Tung I 2.319 (J21) Yau Lai 27.7 406 (R36) Kwong Yuen 2.320 (P13) Lam Tsuen Valley 27.5 407 (S12) Kwai Fong 2.321 (J14) Sau Mau Ping South 27.5 408 (N05) Wah Ming 2.222 (F19) Yau Yat Tsuen 26.6 409 (L23) Tin King 2.023 (J23) Yau Tong West 26.4 410 (P04) Tai Yuen 1.924 (M30) Pat Heung North 25.7 411 (P06) Yee Fu 1.825 (M26) Chung Pak 25.6 412 (P05) Fu Heng 1.5
Proportion of population with internal migration (from another district)
Table 14 Top 25 and Bottom 25 Hong Kong Constituency Areas by % of population not moving address in last 5 years
Top 25 Bottom 25 1 (R29) Yiu On 94.7 388 (R21) Fo Tan 49.12 (P05) Fu Heng 93.2 389 (M06) Fung Cheung 49.13 (R36) Kwong Yuen 93.0 390 (Q04) Hang Hau East 49.14 (L23) Tin King 92.9 391 (F16) Un Chau & So Uk 48.85 (S29) Cheung On 92.8 392 (F15) Lai Chi Kok North 48.76 (F17) Lei Cheng Uk 92.6 393 (R34) Bik Woo 48.67 (S12) Kwai Fong 92.5 394 (K02) Yeung Uk Road 48.68 (P15) Tai Wo 92.3 395 (R14) Lower Shing Mun 46.69 (R08) Pok Hong 92.1 396 (K01) Tak Wah 44.910 (N05) Wah Ming 92.1 397 (E17) Tsim Sha Tsui East 44.611 (L28) Fu Tai 92.1 398 (G17) Whampoa West 44.512 (J11) Po Tat 91.9 399 (A04) Peak 43.513 (M19) Tin Heng 91.8 400 (D14) Shek Yue 42.314 (P04) Tai Yuen 91.8 401 (D11) Pokfulam 41.515 (P06) Yee Fu 91.6 402 (K11) Tsuen Wan Rural West 40.716 (M18) Yat Chak 91.6 403 (E01) Tsim Sha Tsui West 37.217 (Q15) Po Lam 91.4 404 (T04) Tung Chung North 33.918 (L17) Wu King 91.3 405 (Q07) Wai Do 33.019 (Q18) King Lam 91.2 406 (E08) Olympic 32.020 (Q22) Sheung Tak 91.1 407 (T06) Discovery Bay 31.621 (F08) Fu Cheong 91.0 408 (J32) Ngau Tau Kok 30.422 (S04) Lower Tai Wo Hau 90.8 409 (Q24) Wan Po 15.723 (Q14) Tsui Lam 90.8 410 (N09) Ching Ho 13.024 (P14) Po Nga 90.7 411 (M21) Ching King 8.325 (H16) Tsz Wan West 90.6 412 (J06) Sheung Choi 0.7
Proportion of population who have not moved address
Table 15 Hong Kong's Estate Population by District
District Residents in Estates % of Total
Central and Western 16,253 0%Eastern 344,874 8%Islands 86,776 2%Kowloon City 150,716 3%Kwai Tsing 417,165 9%Kwun Tong 513,859 11%North 189,658 4%Sai Kung 351,368 8%Sha Tin 499,547 11%Sham Shui Po 210,844 5%Southern 193,316 4%Tai Po 174,648 4%Tsuen Wan 210,541 5%Tuen Mun 361,302 8%Wong Tai Sin 341,358 8%Yau Tsim Mong 70,776 2%Yuen Long 355,437 8%
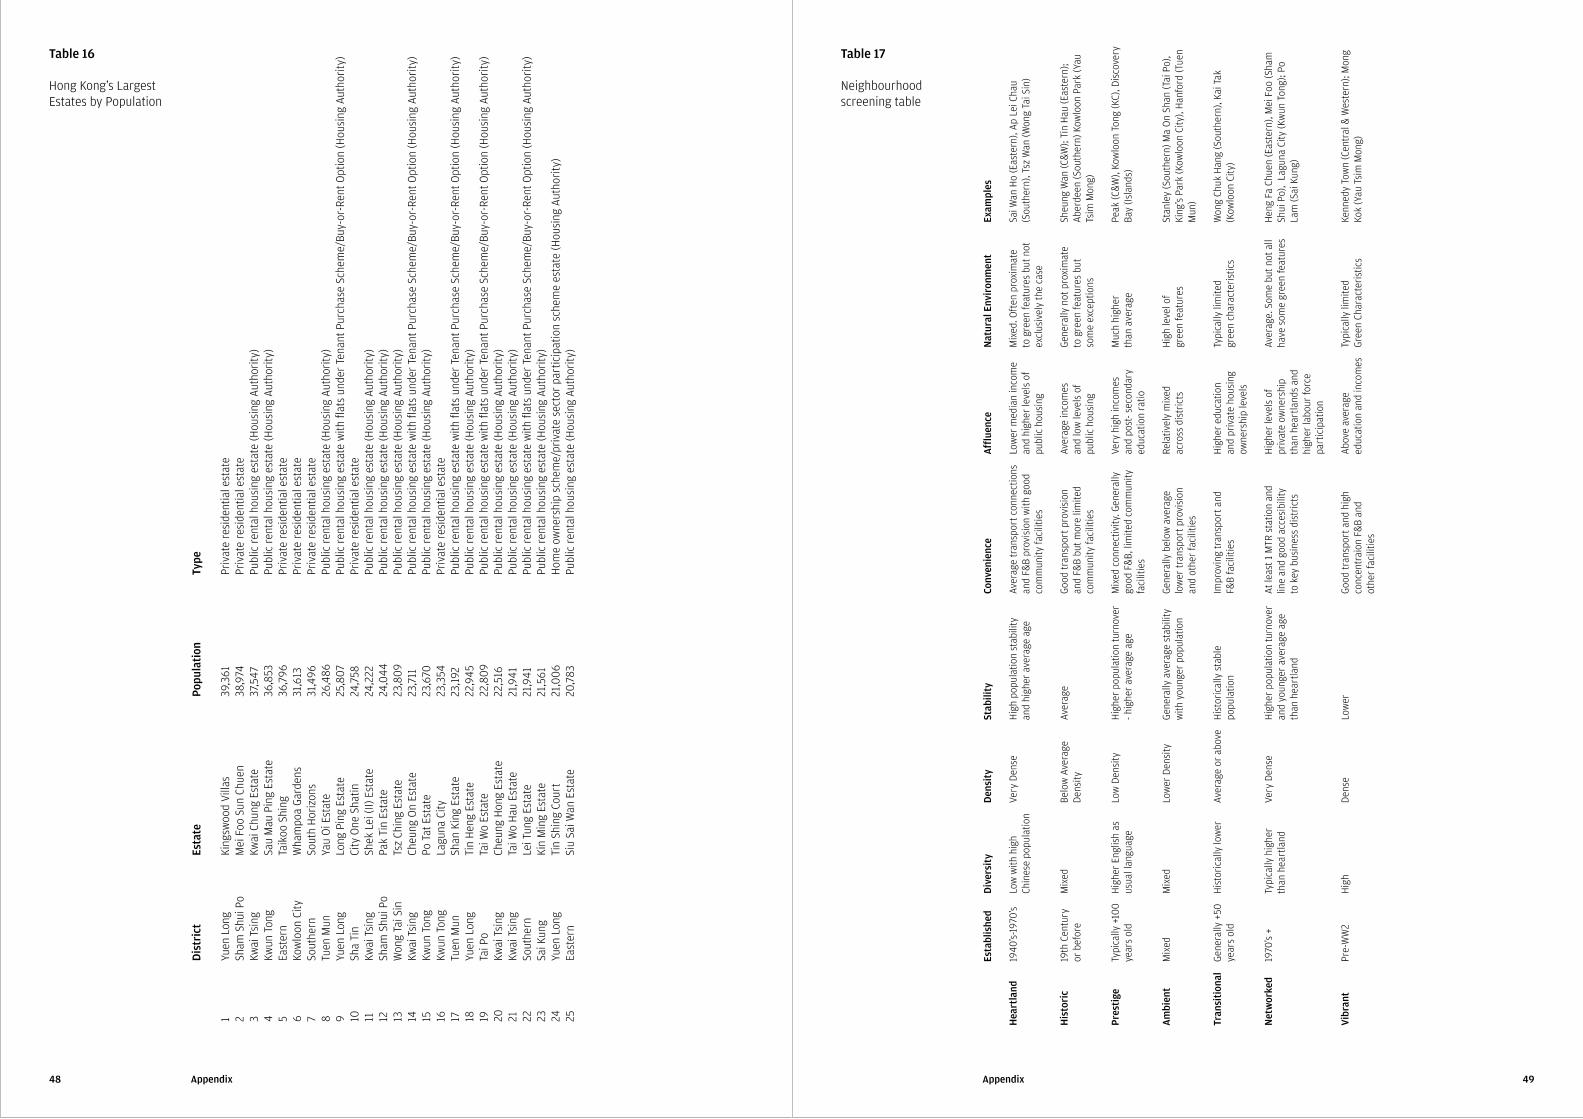
48 49AppendixAppendix
Table 16 Hong Kong's Largest Estates by Population
Table 17 Neighbourhood screening table
Hea
rtla
nd
His
tori
c Pr
esti
ge
Am
bien
t Tr
ansi
tion
al
Net
wor
ked
Vibr
ant
Den
sity
Very
Den
se
Belo
w A
vera
ge
Den
sity
Lo
w D
ensi
ty
Low
er D
ensi
ty
Aver
age
or a
bove
Ve
ry D
ense
D
ense
Popu
lati
on
39,3
6138
,974
37,5
4736
,853
36,7
9631
,613
31,4
9626
,486
25,8
0724
,758
24,2
2224
,044
23,8
0923
,711
23,6
7023
,354
23,1
9222
,945
22,8
0922
,516
21,9
4121
,941
21,5
6121
,006
20,7
83
Conv
enie
nce
Aver
age
tran
spor
t con
nect
ions
an
d F&
B pr
ovis
ion
with
goo
d co
mm
unity
faci
litie
s
Good
tran
spor
t pro
visi
on
and
F&B
but m
ore
limite
d co
mm
unity
faci
litie
s M
ixed
con
nect
ivity
. Gen
eral
ly
good
F&
B, li
mite
d co
mm
unity
fa
cilit
ies
Gene
rally
bel
ow a
vera
ge
low
er tr
ansp
ort p
rovi
sion
an
d ot
her
faci
litie
s
Impr
ovin
g tr
ansp
ort a
nd
F&B
faci
litie
s At
leas
t 1 M
TR s
tatio
n an
d lin
e an
d go
od a
cces
ibili
ty
to k
ey b
usin
ess
dist
rict
s Go
od tr
ansp
ort a
nd h
igh
conc
entr
aion
F&
B an
d ot
her
faci
litie
s
Aff
luen
ce
Low
er m
edia
n in
com
e an
d hi
gher
leve
ls o
f pu
blic
hou
sing
Aver
age
inco
mes
and
low
leve
ls o
f pu
blic
hou
sing
Very
hig
h in
com
es
and
post
- sec
onda
ry
educ
atio
n ra
tio
Rela
tivel
y m
ixed
ac
ross
dis
tric
ts
Hig
her
educ
atio
n an
d pr
ivat
e ho
usin
g ow
ners
hip
leve
ls
Hig
her
leve
ls o
f pr
ivat
e ow
ners
hip
than
hea
rtla
nds
and
high
er la
bour
forc
e pa
rtic
ipat
ion
Abov
e av
erag
e ed
ucat
ion
and
inco
mes
Stab
ility
Hig
h po
pula
tion
stab
ility
an
d hi
gher
ave
rage
age
Av
erag
e H
ighe
r po
pula
tion
turn
over
- h
ighe
r av
erag
e ag
e Ge
nera
lly a
vera
ge s
tabi
lity
with
you
nger
pop
ulat
ion
His
tori
cally
sta
ble
popu
latio
n H
ighe
r po
pula
tion
turn
over
an
d yo
unge
r av
erag
e ag
e th
an h
eart
land
Lo
wer
Type
Pr
ivat
e re
side
ntia
l est
ate
Priv
ate
resi
dent
ial e
stat
ePu
blic
ren
tal h
ousi
ng e
stat
e (H
ousi
ng A
utho
rity
)Pu
blic
ren
tal h
ousi
ng e
stat
e (H
ousi
ng A
utho
rity
)Pr
ivat
e re
side
ntia
l est
ate
Priv
ate
resi
dent
ial e
stat
ePr
ivat
e re
side
ntia
l est
ate
Publ
ic r
enta
l hou
sing
est
ate
(Hou
sing
Aut
hori
ty)
Publ
ic r
enta
l hou
sing
est
ate
with
flat
s un
der
Tena
nt P
urch
ase
Sche
me/
Buy-
or-R
ent O
ptio
n (H
ousi
ng A
utho
rity
)Pr
ivat
e re
side
ntia
l est
ate
Publ
ic r
enta
l hou
sing
est
ate
(Hou
sing
Aut
hori
ty)
Publ
ic r
enta
l hou
sing
est
ate
(Hou
sing
Aut
hori
ty)
Publ
ic r
enta
l hou
sing
est
ate
(Hou
sing
Aut
hori
ty)
Publ
ic r
enta
l hou
sing
est
ate
with
flat
s un
der
Tena
nt P
urch
ase
Sche
me/
Buy-
or-R
ent O
ptio
n (H
ousi
ng A
utho
rity
)Pu
blic
ren
tal h
ousi
ng e
stat
e (H
ousi
ng A
utho
rity
)Pr
ivat
e re
side
ntia
l est
ate
Publ
ic r
enta
l hou
sing
est
ate
with
flat
s un
der
Tena
nt P
urch
ase
Sche
me/
Buy-
or-R
ent O
ptio
n (H
ousi
ng A
utho
rity
)Pu
blic
ren
tal h
ousi
ng e
stat
e (H
ousi
ng A
utho
rity
)Pu
blic
ren
tal h
ousi
ng e
stat
e w
ith fl
ats
unde
r Te
nant
Pur
chas
e Sc
hem
e/Bu
y-or
-Ren
t Opt
ion
(Hou
sing
Aut
hori
ty)
Publ
ic r
enta
l hou
sing
est
ate
(Hou
sing
Aut
hori
ty)
Publ
ic r
enta
l hou
sing
est
ate
(Hou
sing
Aut
hori
ty)
Publ
ic r
enta
l hou
sing
est
ate
with
flat
s un
der
Tena
nt P
urch
ase
Sche
me/
Buy-
or-R
ent O
ptio
n (H
ousi
ng A
utho
rity
)Pu
blic
ren
tal h
ousi
ng e
stat
e (H
ousi
ng A
utho
rity
)H
ome
owne
rshi
p sc
hem
e/pr
ivat
e se
ctor
par
ticip
atio
n sc
hem
e es
tate
(Hou
sing
Aut
hori
ty)
Publ
ic r
enta
l hou
sing
est
ate
(Hou
sing
Aut
hori
ty)
Esta
blis
hed
1940
's-19
70's
19
th C
entu
ry
or b
efor
e Ty
pica
lly +
100
year
s ol
d M
ixed
Gene
rally
+50
ye
ars
old
1970
's +
Pr
e-W
W2
Dis
tric
t
Yuen
Lon
gSh
am S
hui P
oKw
ai T
sing
Kwun
Ton
gEa
ster
nKo
wlo
on C
itySo
uthe
rnTu
en M
unYu
en L
ong
Sha
Tin
Kwai
Tsi
ngSh
am S
hui P
oW
ong
Tai S
inKw
ai T
sing
Kwun
Ton
gKw
un T
ong
Tuen
Mun
Yuen
Lon
gTa
i Po
Kwai
Tsi
ngKw
ai T
sing
Sout
hern
Sai K
ung
Yuen
Lon
gEa
ster
n
1 2 3 4 5 6 7 8 9 10 11 12 13 14 15 16 17 18 19 20 21 22 23 24 25
Div
ersi
ty
Low
with
hig
h Ch
ines
e po
pula
tion
Mix
ed
Hig
her
Engl
ish
as
usua
l lan
guag
e M
ixed
H
isto
rica
lly lo
wer
Ty
pica
lly h
ighe
r th
an h
eart
land
H
igh
Esta
te
King
swoo
d Vi
llas
Mei
Foo
Sun
Chu
enKw
ai C
hung
Est
ate
Sau
Mau
Pin
g Es
tate
Taik
oo S
hing
Wha
mpo
a Ga
rden
sSo
uth
Hor
izon
sYa
u O
i Est
ate
Long
Pin
g Es
tate
City
One
Sha
tinSh
ek L
ei (I
I) Es
tate
Pak
Tin
Esta
teTs
z Ch
ing
Esta
teCh
eung
On
Esta
tePo
Tat
Est
ate
Lagu
na C
itySh
an K
ing
Esta
teTi
n H
eng
Esta
teTa
i Wo
Esta
teCh
eung
Hon
g Es
tate
Tai W
o H
au E
stat
eLe
i Tun
g Es
tate
Kin
Min
g Es
tate
Tin
Shin
g Co
urt
Siu
Sai W
an E
stat
e
Nat
ural
Env
iron
men
t
Mix
ed. O
ften
pro
xim
ate
to g
reen
feat
ures
but
not
ex
clus
ivel
y th
e ca
se
Gene
rally
not
pro
xim
ate
to g
reen
feat
ures
but
so
me
exce
ptio
ns
Muc
h hi
gher
th
an a
vera
ge
Hig
h le
vel o
f gr
een
feat
ures
Ty
pica
lly li
mite
d gr
een
char
acte
rist
ics
Aver
age.
Som
e bu
t not
all
have
som
e gr
een
feat
ures
Ty
pica
lly li
mite
d Gr
een
Char
acte
rist
ics
Exam
ples
Sai W
an H
o (E
aste
rn),
Ap L
ei C
hau
(Sou
ther
n), T
sz W
an (W
ong
Tai S
in)
Sheu
ng W
an (C
&W
); Ti
n H
au (E
aste
rn);
Aber
deen
(Sou
ther
n) K
owlo
on P
ark
(Yau
Ts
im M
ong)
Peak
(C&
W),
Kow
loon
Ton
g (K
C), D
isco
very
Ba
y (Is
land
s)
Stan
ley
(Sou
ther
n) M
a O
n Sh
an (T
ai P
o),
King
's P
ark
(Kow
loon
City
), H
anfo
rd (T
uen
Mun
)
Won
g Ch
uk H
ang
(Sou
ther
n), K
ai T
ak
(Kow
loon
City
) H
eng
Fa C
huen
(Eas
tern
), M
ei F
oo (S
ham
Sh
ui P
o),
Lagu
na C
ity (K
wun
Ton
g); P
o La
m (S
ai K
ung)
Ke
nned
y To
wn
(Cen
tral
& W
este
rn);
Mon
g Ko
k (Y
au T
sim
Mon
g)
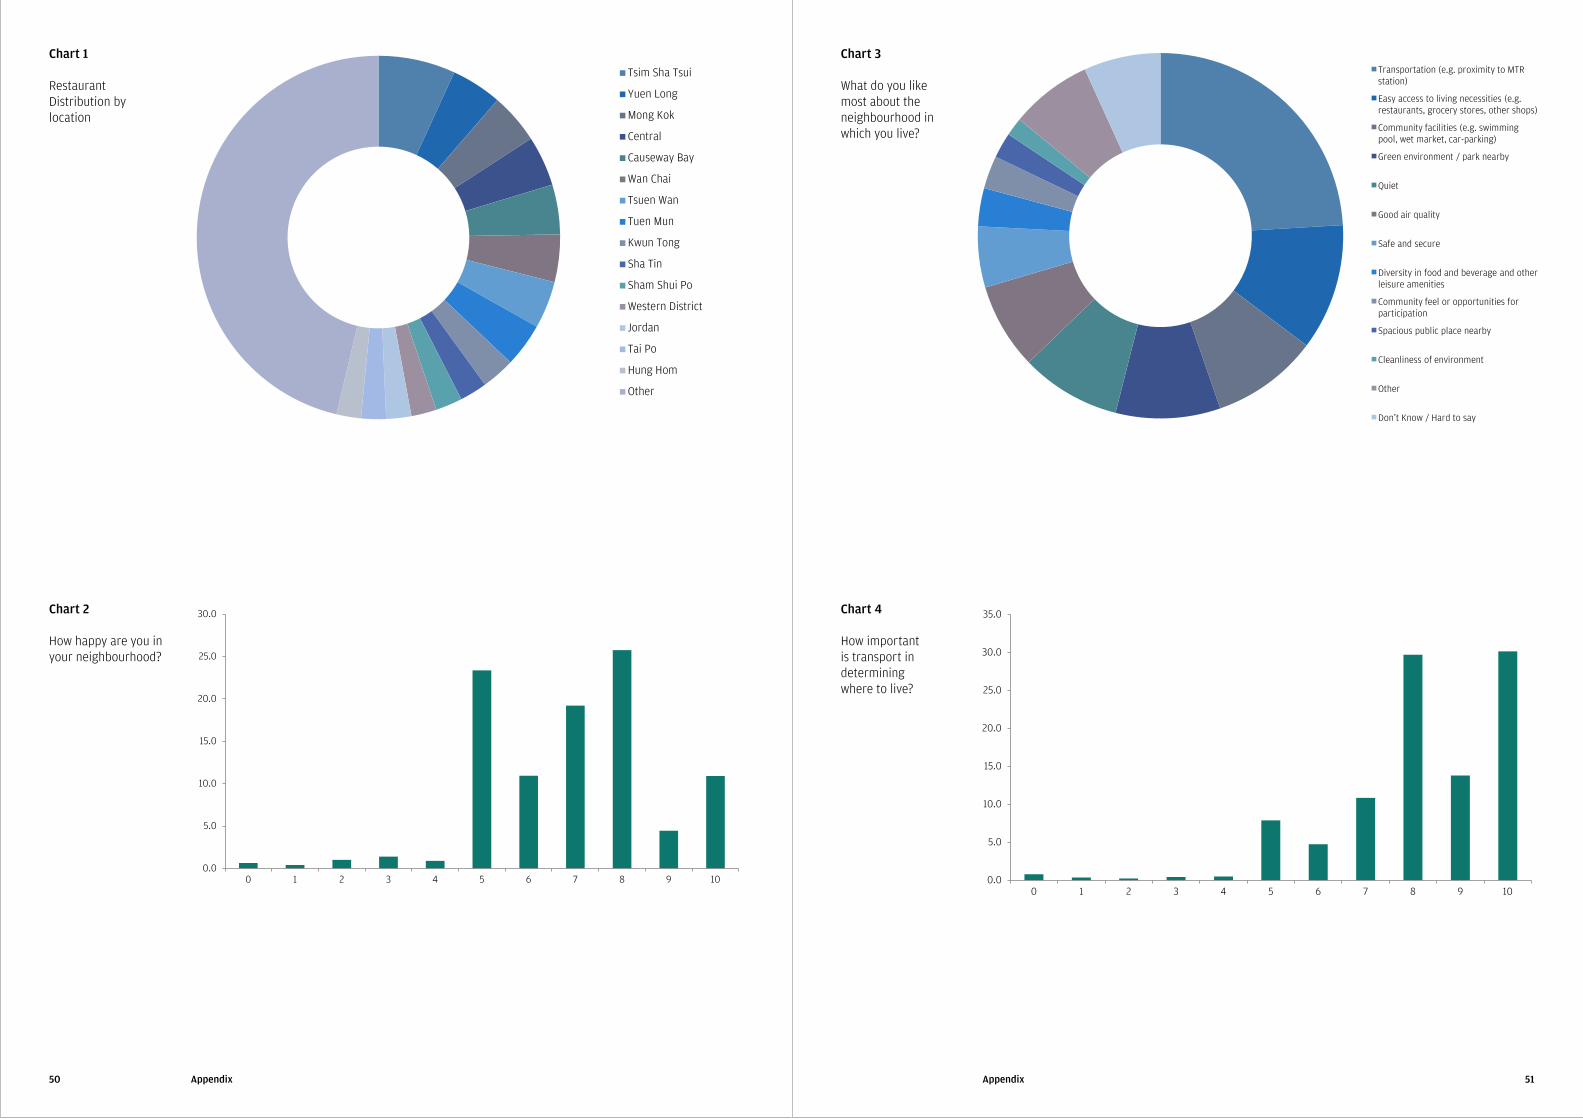
50 51AppendixAppendix
Chart 3 What do you like most about the neighbourhood in which you live?
Chart 4 How important is transport in determining where to live?
0.0
5.0
10.0
15.0
20.0
25.0
30.0
35.0
0 1 2 3 4 5 6 7 8 9 10
Chart 2 How happy are you in your neighbourhood?
0.0
5.0
10.0
15.0
20.0
25.0
30.0
0 1 2 3 4 5 6 7 8 9 10
Transportation (e.g. proximity to MTR station)
Easy access to living necessities (e.g. restaurants, grocery stores, other shops)
Community facilities (e.g. swimming pool, wet market, car-parking)
Green environment / park nearby
Quiet
Good air quality
Safe and secure
Diversity in food and beverage and other leisure amenities
Community feel or opportunities for participation
Spacious public place nearby
Cleanliness of environment
Other
Don't Know / Hard to say
Chart 1 Restaurant Distribution by location
Tsim Sha Tsui
Yuen Long
Mong Kok
Central
Causeway Bay
Wan Chai
Tsuen Wan
Tuen Mun
Kwun Tong
Sha Tin
Sham Shui Po
Western District
Jordan
Tai Po
Hung Hom
Other
Tsim Sha Tsui
Yuen Long
Mong Kok
Central
Causeway Bay
Wan Chai
Tsuen Wan
Tuen Mun
Kwun Tong
Sha Tin
Sham Shui Po
Western District
Jordan
Tai Po
Hung Hom
Other
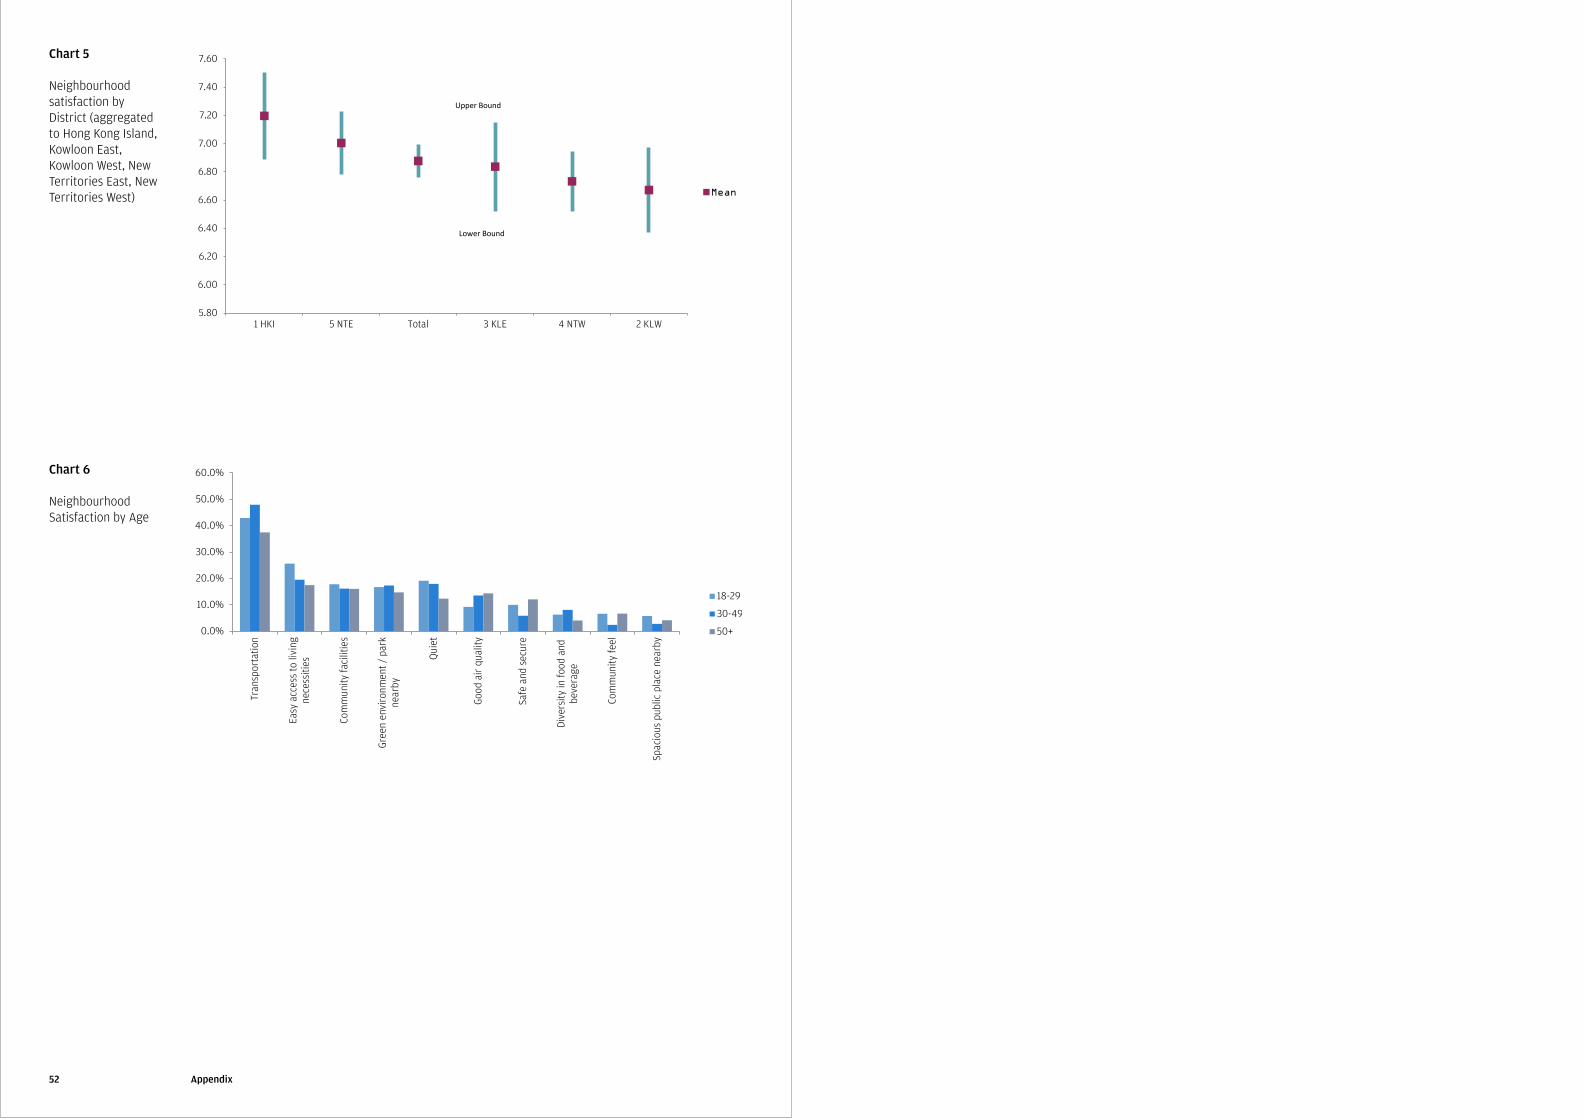
52 Appendix
Chart 6 Neighbourhood Satisfaction by Age
0.0%
10.0%
20.0%
30.0%
40.0%
50.0%
60.0%
Tran
spor
tatio
n
Easy
acc
ess
to li
ving
nece
ssiti
es
Com
mun
ity fa
cilit
ies
Gree
n en
viro
nmen
t / p
ark
near
by
Qui
et
Good
air
qua
lity
Safe
and
sec
ure
Div
ersi
ty in
food
and
beve
rage
Com
mun
ity fe
el
Spac
ious
pub
lic p
lace
nea
rby
18-29
30-49
50+
Chart 5 Neighbourhood satisfaction by District (aggregated to Hong Kong Island, Kowloon East, Kowloon West, New Territories East, New Territories West)
5.80
6.00
6.20
6.40
6.60
6.80
7.00
7.20
7.40
7.60
1 HKI 5 NTE Total 3 KLE 4 NTW 2 KLW
Mean
Upper Bound
Lower Bound