Embed Size (px)
Citation preview

BioMed Central
International Journal of Behavioral Nutrition and Physical Activity
ss
Open AcceResearchSocioeconomic differences in lack of recreational walking among older adults: the role of neighbourhood and individual factorsCarlijn BM Kamphuis*1, Frank J van Lenthe1, Katrina Giskes1,2, Martijn Huisman1,3, Johannes Brug1,4 and Johan P Mackenbach1Address: 1Department of Public Health, Erasmus University Medical Centre, P.O. Box 2040, 3000 CA Rotterdam, The Netherlands, 2School of Public Health/Institute of Health and Biomedical Innovation, Queensland University of Technology, Victoria Park Road, Kelvin Grove, QLD 4059, Brisbane, Queensland, Australia, 3Department of Psychiatry, University Medical Centre Groningen, P.O. Box 30001, 9700 BB Groningen, The Netherlands and 4EMGO Institute, VU University Medical Centre, P.O. Box 7057, 1007 MB Amsterdam, The Netherlands
Email: Carlijn BM Kamphuis* - [email protected]; Frank J van Lenthe - [email protected]; Katrina Giskes - [email protected]; Martijn Huisman - [email protected]; Johannes Brug - [email protected]; Johan P Mackenbach - [email protected]
* Corresponding author
AbstractBackground: People with a low socioeconomic status (SES) are more likely to be physically inactive thantheir higher status counterparts, however, the mechanisms underlying this socioeconomic gradient inphysical inactivity remain largely unknown. Our aims were (1) to investigate socioeconomic differences inrecreational walking among older adults and (2) to examine to what extent neighbourhood perceptionsand individual cognitions regarding regular physical activity can explain these differences.
Methods: Data were obtained by a large-scale postal survey among a stratified sample of older adults (age55–75 years) (N = 1994), residing in 147 neighbourhoods of Eindhoven and surrounding areas, in theNetherlands. Multilevel logistic regression analyses assessed associations between SES (i.e. education andincome), perceptions of the social and physical neighbourhood environment, measures of individualcognitions derived from the Theory of Planned Behaviour (e.g. attitude, perceived behaviour control), andrecreational walking for ≥10 minutes/week (no vs. yes).
Results: Participants in the lowest educational group (OR 1.67 (95% CI, 1.18–2.35)) and lowest incomegroup (OR 1.40 (95% CI, 0.98–2.01)) were more likely to report no recreational walking than their higherstatus counterparts. The association between SES and recreational walking attenuated whenneighbourhood aesthetics was included in the model, and largely reduced when individual cognitions wereadded to the model (with largest effects of attitude, and intention regarding regular physical activity). Theassiation between poor neighbourhood aesthetics and no recreational walking attenuated to (borderline)insignificance when individual cognitions were taken into account.
Conclusion: Both neighbourhood aesthetics and individual cognitions regarding physical activitycontributed to the explanation of socioeconomic differences in no recreational walking. Neighbourhoodaesthetics may explain the association between SES and recreational walking largely via individualcognitions towards physical activity. Intervention and policy strategies to reduce socioeconomicdifferences in lack of recreational walking among older adults would be most effective if they intervene onboth neighbourhood perceptions as well as individual cognitions.
Published: 5 January 2009
International Journal of Behavioral Nutrition and Physical Activity 2009, 6:1 doi:10.1186/1479-5868-6-1
Received: 11 December 2007Accepted: 5 January 2009
This article is available from: http://www.ijbnpa.org/content/6/1/1
© 2009 Kamphuis et al; licensee BioMed Central Ltd. This is an Open Access article distributed under the terms of the Creative Commons Attribution License (http://creativecommons.org/licenses/by/2.0), which permits unrestricted use, distribution, and reproduction in any medium, provided the original work is properly cited.
Page 1 of 11(page number not for citation purposes)

International Journal of Behavioral Nutrition and Physical Activity 2009, 6:1 http://www.ijbnpa.org/content/6/1/1
BackgroundSocioeconomic status (SES) is an important determinantof all cause mortality, mortality from coronary heart dis-eases and morbidity in many countries [1,2]. Several stud-ies have shown that a higher prevalence of unhealthybehaviours among lower socioeconomic groups contrib-ute to the explanation of socioeconomic inequalities inhealth [3-5]. Among those behaviours is physical activity,as people with a low SES are more likely to be physicallyinactive than their higher status counterparts [6,7]. To beable to change unhealthy behaviours in order to improvehealth among low SES groups, one should understandwhich determinants to focus on, or in other words, tounderstand why poor people behave poorly [8]. However, themechanisms underlying the socioeconomic gradient inphysical inactivity remain largely unknown. In the fewstudies that have attempted to explain socioeconomic dif-ferences in physical inactivity, physical environmentalfactors (e.g. poor neighbourhood aesthetics, safety issues,access to facilities [9,10]), social environmental factors(e.g. social participation [11]), and individual cognitions(e.g. self-efficacy or perceived behaviour control [9]) havebeen identified as potential explanatory factors.
Few studies have simultaneously examined influencesfrom both the environmental and individual domains,and therefore, little is known on the interplay betweenenvironmental and individual factors in the SES-inactivityrelationship. As suggested in ecological models of physi-cal activity, environmental factors may influence physicalactivity both directly and indirectly [12,13]. The Theory of
Planned Behaviour (TPB) [14] more specifically hypothe-sizes how environmental factors may indirectly influencebehaviours, namely via individual cognitions such as atti-tude, social norms and perceived behaviour control. Sim-ilarly, as shown in Figure 1, we hypothesize thatenvironmental factors and/or individual cognitions mayexplain the relationship between SES and physical activ-ity, and that environmental factors may contribute to theassociation between SES and physical activity directly (asstated in ecological models) or through individual cogni-tions (as stated in the TPB). For instance, people with alow SES may experience worse neighbourhood safety, andthese safety concerns may reduce their perceived behav-ioural control expectations or have a negative impact ontheir attitude towards physical activity. Thus, unfavoura-ble neighbourhood perceptions may explain the SES-inac-tivity relationship via low perceived behavioural controlor negative attitudes, but could also have a direct effect onbehaviour, e.g. when safety is perceived as barrier fordoing physical activity.
Environmental determinants are likely to differ for spe-cific physical activity behaviours, and explanatory factorsto the SES-inactivity relationship may differ for popula-tion subgroups [15]. Therefore, in this paper we will focuson one specific behaviour, i.e. recreational walking, andone subgroup: older adults. Walking is the most commonleisure-time physical activity among the general popula-tion in developed countries (e.g. the U.S. [16], Australia[17], and the Netherlands [18]). Walking is promising asa focus of public health interventions, due to its accepta-
Conceptual model of associations between socioeconomic status (SES), neighbourhood factors, individual cognitions regarding physical activity, and recreational walkingFigure 1Conceptual model of associations between socioeconomic status (SES), neighbourhood factors, individual cog-nitions regarding physical activity, and recreational walking.
Page 2 of 11(page number not for citation purposes)
International Journal of Behavioral Nutrition and Physical Activity 2009, 6:1 http://www.ijbnpa.org/content/6/1/1
bility and accessibility (e.g. in terms of skills, equipment,and costs), especially among subpopulations who areknown to be sedentary and whose activity should beincreased, e.g. older people and people from a socioeco-nomically disadvantaged background. Older adults are animportant subpopulation for public health interventions,as they represent a rapidly increasing share of the generalpopulation, and physical activity is important to preservetheir health and functioning, and consequently avoidfunctional limitations and disability [19]. Little is knownabout socioeconomic differences in walking (and thedeterminants of these) among older adults.
In this paper we will integrate perceptions of the physical(i.e. perceived neighbourhood safety, aesthetics, andavailability of facilities) and social neighbourhood envi-ronment (i.e. perceived social cohesion, social network,feeling at home in the neighbourhood, social disorganisa-tion), with individual's cognitions regarding physicalactivity (e.g. attitude, perceived behavioural control), todetermine to what extent socioeconomic differences inrecreational walking among older adults can be explainedby neighbourhood perceptions and individual cogni-tions.
MethodsStudy populationData were obtained by a large-scale postal survey, a com-ponent of the new wave of data collection for the longitu-dinal GLOBE study, among a stratified sample of the adultpopulation (age 25–75 years) of Eindhoven (the fifth larg-est city in the Netherlands) and surrounding cities inOctober 2004 (N = 4785; response rate 62%). Participantsresided in 213 neighbourhoods, which are the smallestgeographical units in the Netherlands created for statisti-cal and administrative purposes (with an average popula-tion of about 2000 inhabitants). More about theobjectives, design and results of the GLOBE study can befound in detail elsewhere [20,21]. The use of personaldata in this study is in compliance with the Dutch Per-sonal Data Protection Act and the Municipal DatabaseAct, and has been registered with the Dutch Data Protec-tion Authority (number 1248943).
Participants aged 55–75 years (N = 2345) were selectedfor the current study. Those with missing values for recre-ational walking, education, household income, or sexwere excluded from analyses (n = 265). Furthermore, weremoved participants with missing values for the level-2indicator (neighbourhood) (n = 26), and participantsresiding in neighbourhoods with only one or two partici-pants (n = 60). Therefore, the analytic sample comprisedof 1994 participants, residing in 147 neighbourhoods(mean number of participants per neighbourhood: n= 14,
range 3–80). Demographic characteristics of our sampleare provided in Table 1.
MeasuresAll factors were measured in the GLOBE postal survey in2004. Selection of items to measure salient environmentalfactors was based on an extensive literature review [22-25], expert meetings, and focus groups [26].
Neighbourhood perceptionsThree perceptions of physical neighbourhood factors weremeasured with single items, assessing whether partici-pants agreed or disagreed with the following statements:"My neighbourhood is unsafe" (safety), "My neighbour-hood is unattractive for physical activity" (aesthetics), and"There are insufficient facilities for physical activity in myneighbourhood" (availability of facilities).
Thirteen items asked about social relationships within theneighbourhood (on a five-point scale: totally agree –totally disagree) (α = .86), and these items were repre-sented by three factors, as derived from a factor analysis,e.g. a principal component analysis with varimax rotationand kaiser normalization. We labelled the first factor'social cohesion', i.e. "the extent of connectedness and sol-idarity among groups in society" [27]. Items that loadedon this factor were e.g. 'People in this neighbourhoodagree on norms and values', 'People in this neighbour-hood are willing to help each other', and 'People in thisneighbourhood can be trusted'. The second factor waslabelled 'social network' (i.e. "the presence and nature ofinterpersonal relationships and interactions; extent towhich one is interconnected and embedded in a commu-nity"[28]), representing items such as 'I borrow thingsfrom my neighbours', 'I visit my neighbours in theirhome', and 'I can ask my neighbours for advice'. The thirdfactor was labelled 'feeling at home in one's neighbour-hood', representing items such as "I feel at home in thisneighbourhood", and "I would like to move out of thisneighbourhood". Each factor score was classed into ter-tiles for analytical purposes.
The fourth social neighbourhood factor was derived froma factor analysis that grouped eleven items (α = .94)together in one factor, which we labelled as 'social disor-der', i.e. "a lack of physical and social order in the commu-nity"[29]. These eleven items covered both social andphysical indicators of social disorganization, and askedfor the frequency with which adverse neighbourhoodevents occurred (often, sometimes, (almost) never). Itemsreferred to, for instance, litter on the streets, graffiti, van-dalism, and the presence of people hanging around on thestreets and drinking alcohol. The factor score was classedinto tertiles (high, medium, low).
Page 3 of 11(page number not for citation purposes)

International Journal of Behavioral Nutrition and Physical Activity 2009, 6:1 http://www.ijbnpa.org/content/6/1/1
Individual physical activity cognitionsWe used an adapted version of the Theory of PlannedBehaviour as a framework to measure individual cogni-tions of regular physical activity. This expanded modelincorporated the constructs of attitude, subjective norm,perceived behaviour control, and intention. Two addi-
tional social influences of physical activity were added tothe model, i.e. social support, and modelling by signifi-cant others [24,28]. Items for all constructs were derivedfrom existing scales, or formulated according to the algo-rithms of Conner & Norman [30]. All items were askedwith regard to the behaviour "regular physical activity",
Table 1: Sample characteristics (N = 1994; aged 55–75 years) by educational levela, and univariate associations with no recreational walking (unadjusted).
TOTAL Educational levela Unadjusted ORs for no recreational walkingc
1-low 2 3 4-highNb %c %c %c %c %c
Total sample 1994 100
Recreational walkingYes 1356 68.7 61.5 65.3 77.9 70.8No 638 31.3 38.5 34.7 22.1 29.2
Education1 Primary education 281 12.5 - - - - 1.51 (1.09–2.09)2 Lower secondary 908 43.7 1.29 (1.01–1.64)3 Higher secondary 366 19.8 0.69 (0.50–0.94)4 Tertiary education 439 24.1 1.00
Monthly net household incomeLess than 1200 euro 294 13.8 37.4 15.6 6.2 4.5 1.33 (0.97–1.83)1200–1800 euro 533 23.6 32.1 30.3 21.8 8.3 1.04 (0.79–1.38)1800–2600 euro 503 25.1 11.5 26.2 32.5 24.1 0.93 (0.70–1.23)More than 2600 euro 421 24.5 1.2 13.3 26.8 55.2 1.00Don't want to say/don't know 243 13.0 17.7 14.7 12.7 7.9 1.57 (1.14–2.16)
SexMale 958 47.7 42.6 32.0 59.2 69.1 1.00Female 1036 52.3 57.4 68.0 40.8 30.9 1.06 (0.87–1.28)
Age group55–64 1053 63.5 52.5 64.4 67.4 64.2 1.0065–74 941 36.5 47.5 35.6 32.6 35.8 0.87 (0.71–1.07)
Country of birthNetherlands 1872 93.7 87.5 97.5 95.0 89.0 1.00Other 106 6.3 12.5 2.5 5.0 11.0 0.88 (0.59–1.32)
Marital statusMarried 1589 82.3 78.9 82.2 84.4 82.3 1.00Unmarried/divorced/widowed 390 17.7 21.1 17.8 15.6 17.7 1.20 (0.94–1.53)
General health statusExcellent 93 5.3 4.1 6.1 4.2 5.5 1.00Very good 314 18.6 8.2 15.4 23.4 26.0 1.06 (0.65–1.71)Good 1133 57.0 55.1 58.9 57.1 54.4 1.18 (0.76–1.85)Moderate 378 15.9 26.3 16.0 13.2 12.4 1.03 (0.63–1.69)Poor 27 0.9 2.1 0.8 0.5 0.9 0.86 (0.28–2.62)Missing 49 2.2 4.1 2.7 1.6 0.9 2.17 (1.04–4.52)
aEducational level with 1 = primary education, 2 = lower secondary, 3 = higher secondary, and 4 = tertiary education.b The numbers (N) are unweighted, and reflect the actual numbers of participants in the dataset.c The percentages (%) and odds ratios (OR) are weighted and represent the prevalence rates as they existed in the population of Eindhoven by October 2004, which is the source population. The weight factors are calculated from the distribution of the characteristics in a random sample drawn from the municipal registry in Eindhoven, October 2004.
Page 4 of 11(page number not for citation purposes)

International Journal of Behavioral Nutrition and Physical Activity 2009, 6:1 http://www.ijbnpa.org/content/6/1/1
which was defined in the questionnaire as "being physi-cally active for at least 30 minutes, every day, e.g. cycling,doing sports, gardening".
Attitude was measured with outcome expectancies of reg-ular physical activity, and responses were measured on a5-point Likert-scale from (1) "very important" to (5) "notimportant at all". Participants reported on six itemsregarding negative outcome expectations (e.g. "Regularphysical activity cost too much time", "Regular physicalactivity costs too much energy") and six items for positiveoutcome expectations (e.g. "Regular physical activityreduces my stress levels", "Regular physical activity isgood for my fitness") (α = .77). Items were summed and,based on their specific sum scores, participants weredivided in three groups: (very) positive attitude, positive-neutral, and neutral-negative attitude.
Social influences for regular physical activity wereassessed with three separate items (α = .85) on a three-point scale (true, not true/not false, false): "Most impor-tant others (e.g. partner, children, parents, friends) thinkthat I should be regularly active" (subjective norm), "Mostimportant others support me to be regularly active"(social support), and "Most important others are regularlyactive themselves" (modelling). Items were combinedinto a sum score, and three groups were distinguishedbased on their sum scores: positive social influences, neu-tral, and negative social influences.
Perceived behaviour control was measured by one itemthat asked: "How sure are you that you can be regularlyactive?" (five-point scale, very sure – very unsure). Inten-tion was measured with one item: "Do you plan to be reg-ularly physical active?" (five-point scale, very likely – veryunlikely).
Socioeconomic status and other demographic characteristicsEducational attainment is only one component of thebroad concept of SES, but is considered a good indicatorfor SES in the Netherlands [31]. Four levels of educationwere distinguished ((1) no education or primary educa-tion; (2) lower professional and intermediate general edu-cation; (3) intermediate professional and higher generaleducation; (4) higher professional education and univer-sity). We also measured household income as SES-indica-tor, asking participants to report their net monthlyhousehold income (0–1200 euro, 1200–1800 euro,1800–2600 euro, 2600 euro or more, and 'don't want tosay/don't know'). Other demographic characteristics wemeasured were age (55–65, 65–75 years), sex, country oforigin (Netherlands, other country), marital status (mar-ried/registered partnership, not married), and perceivedgeneral health (excellent, very good, good, moderate,poor).
Recreational walkingWalking in leisure time was measured with the SQUASHquestionnaire – a validated Dutch questionnaire to meas-ure physical activity among an adult population [32]. Par-ticipants reported frequency (times per week), averageduration (minutes per day), and intensity (low, average,high) for recreational walking over the last couple ofmonths. However, as the distribution of the sample washighly skewed with almost one third not reporting anyrecreational walking (and a mean (se) of 231 (5,8) min-utes recreational walking per week among those who didany recreational walking), inactivity rather than a contin-uous outcome measure the focus of the current paper. Thedichotomised outcome we examined was 'no recreationalwalking' (<10 minutes per week) vs. 'any recreationalwalking' (≥10 minutes per week).
Statistical analyses'No recreational walking' was modelled as a binary out-come variable in weighted multilevel logistic regressionmodels of participants nested within neighbourhoods. Totake into account the hierarchical nature of the data,explanatory models were run in MlwiN (version 2.02)using the logit-link function and 2nd order PQL estima-tion methods [33,34]. All analyses were conducted sepa-rately for education and income as SES-indicators, as theyare likely to relate to different causal processes [35]. Themissing value category of many explanatory factorsshowed high odds ratios for no recreational walking, andthe prevalence of missing values was highest among par-ticipants from the lowest SES group. Therefore, to preventoverestimation of the explanatory power of these factorsto SES differences in recreational walking, missing valuesfor explanatory factors were imputed by drawing ran-domly from the distribution of answering categories,using observed prevalences per educational group asprobabilities (analyses with non-imputed data showapproximately the same results – available upon request).All bivariate and multivariate analyses were adjusted forage and sex (unless specified otherwise) and weighted(level-1 weight) to reflect our source population (i.e. olderadults in the region of Eindhoven in October 2004) interms of sex, age and educational level. This type of (sin-gle) imputation was chosen on the assumption of missingat random, dependent on SES only, i.e. Conditional MeanImputation [36].
Firstly, we tested univariate associations of education andincome with no recreational walking. Then, we examinedwhich possible explanatory factors were significantly asso-ciated with no recreational walking (adjusted for SES, ageand sex) (p < 0.05), and whether these factors were une-qually distributed across SES-groups (calculated in SPSSversion 11.0) [37]. Factors associated with no recreationalwalking and with risk categories more prevalent in low
Page 5 of 11(page number not for citation purposes)
International Journal of Behavioral Nutrition and Physical Activity 2009, 6:1 http://www.ijbnpa.org/content/6/1/1
than high SES-groups were included in the followingmodelling sequence in MlwiN.
We examined the contribution of neighbourhood percep-tions and individual cognitions to the associationbetween SES and no recreational walking. Therefore, wefirstly calculated the odds ratios of no recreational walk-ing by socioeconomic groups adjusted for age, and sex(model 1). Then, we added neighbourhood perceptionsseparately (model 2); individual cognitions separately(model 3); and finally neighbourhood perceptions andindividual cognitions simultaneously (model 4). Whenodds ratios for the SES-indicator in model 2–4 reduced(compared to model 1), this was interpreted as the contri-bution of the explanatory factors included in the model tosocioeconomic differences in no recreational walking[38].
Also, we examined whether individual cognitions canexplain the association between neighbourhood percep-tions and no recreational walking. Therefore, we com-pared ORs for neighbourhood perceptions with andwithout controlling for attitude, social influences, per-ceived behaviour control, and intention. When the associ-ation between neighbourhood perceptions and norecreational walking attenuated after inclusion of individ-ual cognitions in the model, we interpreted this as theexplanatory role of individual cognitions to the associa-tion between neighbourhood perceptions and no recrea-tional walking.
ResultsSocioeconomic differences in no recreational walkingAs presented in Table 1, participants in the lowest educa-tional group (OR 1.51 (95% CI, 1.09–2.09)) and lowestincome group (OR 1.33 (95% CI, 0.97–1.83)) were morelikely to do no recreational walking than their higher sta-tus counterparts (unadjusted ORs). Other demographiccharacteristics were not associated with no recreationalwalking.
Selection of explanatory factorsThree out of seven neighbourhood perceptions were sig-nificantly associated with no recreational walking, i.e.poor neighbourhood aesthetics, high social cohesion, anda small social network (see Table 2). As the latter two riskfactors were more prevalent among high SES groups, thesefactors could not serve as possible explanatory factors forthe raised odds for no recreational walking among low SESgroups. All four individual cognitions were significantlyassociated with no recreational walking, and risk catego-ries (i.e. negative attitude, negative social influences, lowperceived behaviour control and no intention to be regu-larly physically active) were most prevalent among thelowest SES groups. Therefore, all individual cognitions
and one neighbourhood perception (neighbourhood aes-thetics) were taken into account in further explanatorymodels.
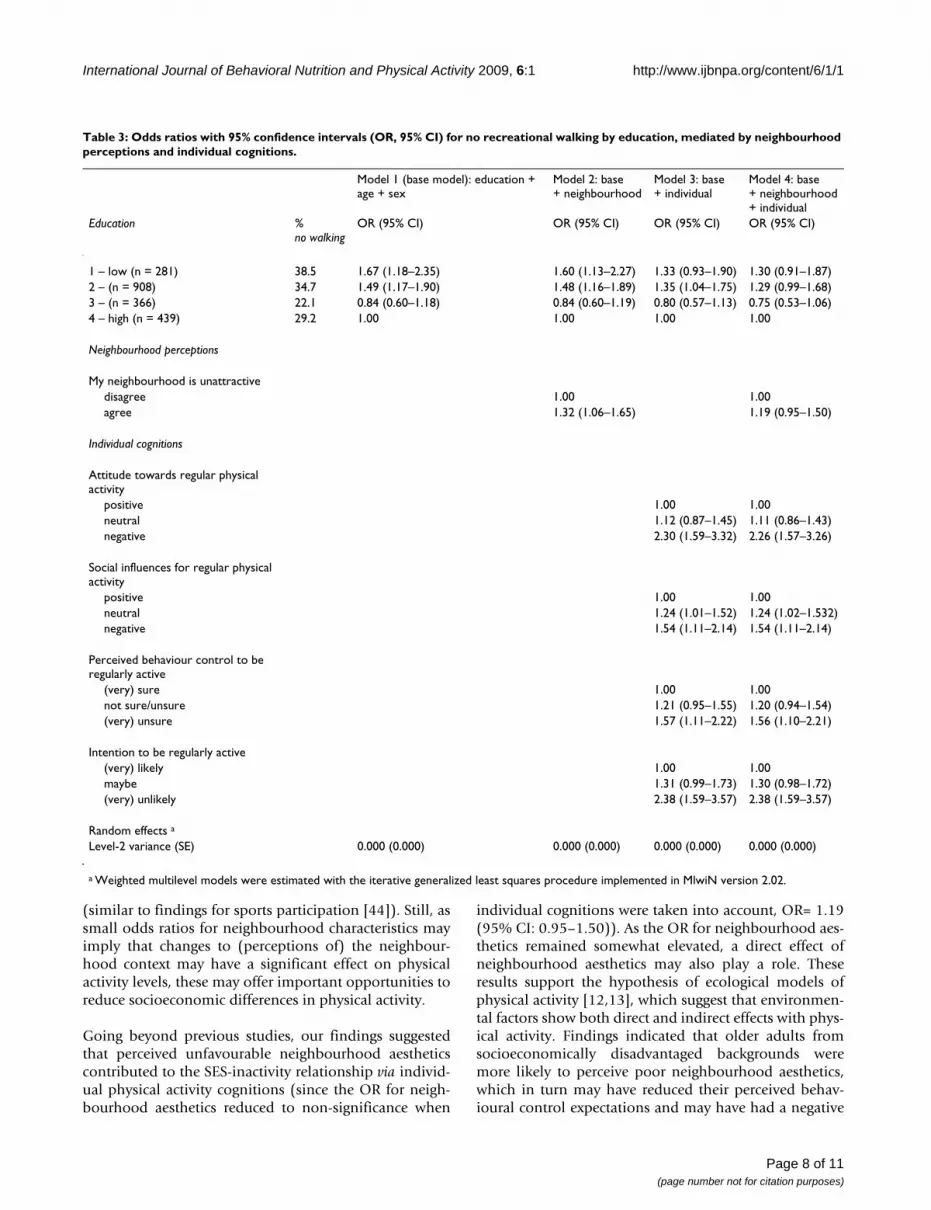
Explaining the 'SES – no recreational walking' associationAs presented in Table 3, the sex- and age-adjusted OR todo no recreational walking for the lowest educationalgroup (OR 1.67 (95% CI, 1.18–2.35) attenuated whenneighbourhood aesthetics was included in the model(model 2), or when individual cognitions were included(model 3), and further reduced when all these factorstogether (model 4) were taken into account (OR 1.30(95% CI, 0.91–1.87). Attitude and intention regardingregular physical activity had the largest effect on the reduc-tion of SES inequalities in recreational walking. The oddsto do no recreational walking were lowest for the second-highest educational group in all models.
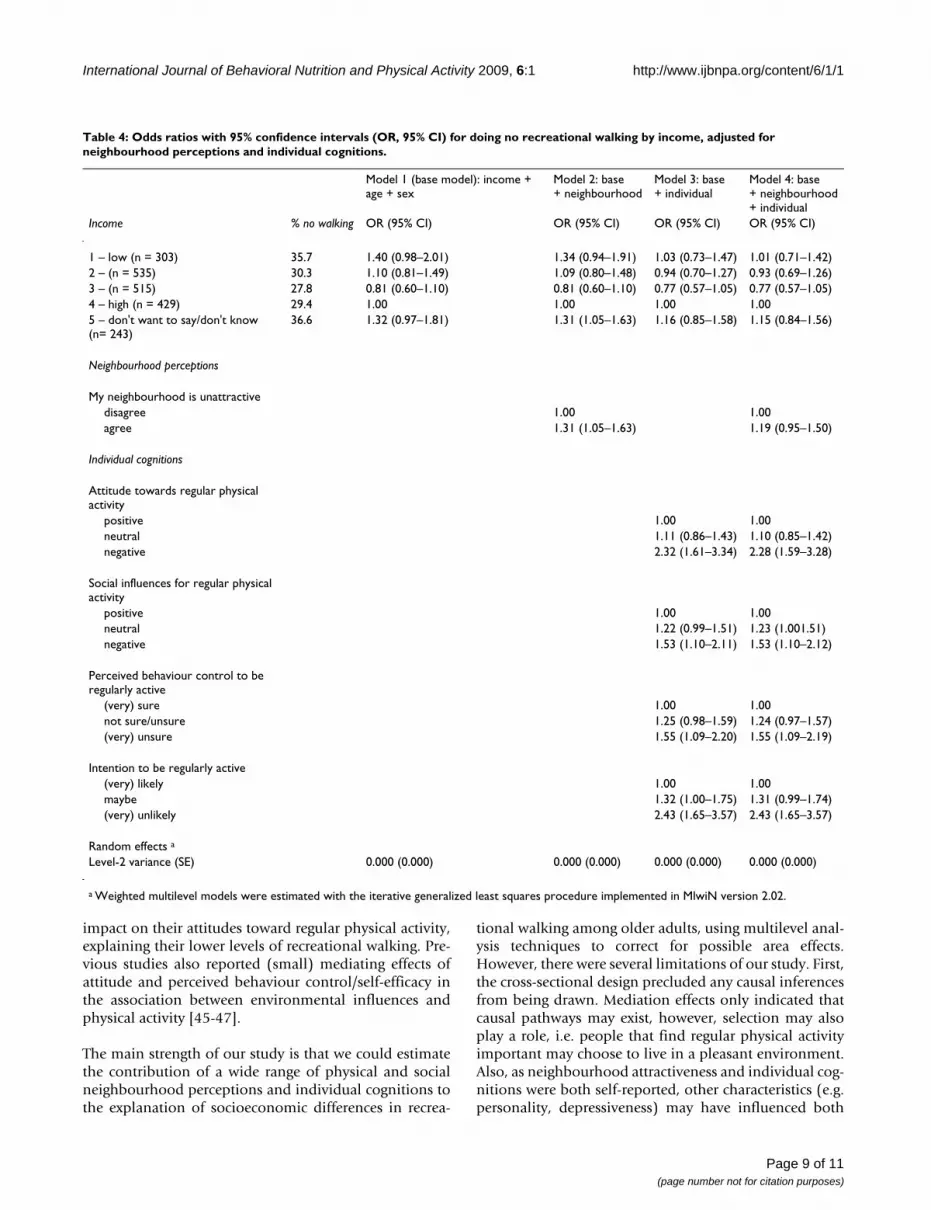
Results of the analyses with income as SES-indicatorshowed the same pattern as those for education. However,there was a smaller socioeconomic gradient for income(see model 1, Table 4), and the socioeconomic differenceswere fully explained when all explanatory factors weretaken into account (model 4, Table 4). People who tickedthe answer category "I do not want to report my income,or I do not know" were most likely not to engage in anyrecreational walking.
Explaining the 'neighbourhood aesthetics- no recreational walking' associationThe association between neighbourhood aesthetics andno recreational walking reduced to non-significance whenindividual cognitions were taken into account (model 4,Table 3 and Table 4), although the OR for no recreationalwalking among those finding their neighbourhood unat-tractive remained elevated (OR 1.19 (95% CI, 0.95–1.50).
DiscussionThis study is among the first to investigate how neigh-bourhood perceptions and individual cognitions contrib-ute to socioeconomic differences in recreational walkingamong older adults using a multilevel design. We foundthe lowest socioeconomic group most likely to be inactiveregarding recreational walking, which is consistent withprevious studies on walking [9,10] and other physicalactivity outcomes [39-43]. Also consistent with other find-ings, we found that neighbourhood perceptions (i.e.neighbourhood aesthetics [9,10,43]) and individual cog-nitions (i.e. attitude, social influences, perceived behav-iour control, and intention [9,43]) were important in theexplanation of socioeconomic differences in recreationalwalking. Associations of neighbourhood factors with rec-reational walking, and their contribution to socioeco-nomic differences in recreational walking were smallerthan the effect and contribution of individual factors
Page 6 of 11(page number not for citation purposes)

International Journal of Behavioral Nutrition and Physical Activity 2009, 6:1 http://www.ijbnpa.org/content/6/1/1
Page 7 of 11(page number not for citation purposes)
Table 2: Adjusted odds ratios (OR)a for no recreational walking, and prevalence rates for response categories of neighbourhood perceptions and individual cognitions by educational level.
Educational levelIndependent factors OR 95% CI p 1
(low)2 3 4
(high)p
NEIGHBOURHOOD perceptions
Physical neighbourhood factorsNeighbourhood is unsafe
disagree 1.00 .636 95.5b 95.9 98.2 98.9 .004agree 0.87 (0.49–1.55) 4.5 4.1 1.8 1.1
Neighbourhood is unattractivedisagree 1.00 .008 72.5 84.3 88.6 86.0 .000agree 1.41 (1.09–1.82) 27.5 15.7 11.4 14.0
Insufficient places for physical activitydisagree 1.00 .256 64.3 75.2 77.5 88.7 .000agree 1.14 (0.91–1.44) 35.7 24.8 22.5 11.3
Social neighbourhood factorsSocial cohesion
high 1.00 .000 38.1 36.3 41.3 40.9 .001medium 0.62 (0.50–0.78) 30.3 37.1 38.2 34.9low 0.82 (0.64–1.05) 31.6 26.6 20.5 24.3
Social networklarge 1.00 .000 34.4 37.4 37.6 29.4 .034medium 1.56 (1.23–1.98) 33.2 32.9 40.9 37.0small 1.59 (1.25–2.04) 32.4 29.7 21.5 33.6
Feeling at home in neighbourhoodhigh 1.00 .120 32.4 35.3 36.4 42.3 .020moderate 0.80 (0.64–1.01) 33.2 38.0 36.6 31.1low 0.99 (0.78–1.26) 34.4 26.7 27.0 26.6
Social disorganisationlow 1.00 .540 45.3 48.4 50.6 54.0 .000medium 0.96 (0.75–1.22) 18.6 24.3 23.5 24.5high 0.86 (0.67–1.12) 36.1 27.3 25.9 21.5
INDIVIDUAL cognitions
Attitude towards regular physical activitypositive 1.00 .000 25.8 32.8 36.0 32.8 .002neutral 1.34 (1.07–1.67) 61.9 54.9 58.5 58.4negative 4.16 (2.96–5.84) 12.3 12.3 5.4 8.7
Social influences for regular physical activitypositive 1.00 .000 54.9 50.1 49.6 53.2 .003neutral 1.62 (1.32–1.99) 30.3 40.3 43.9 38.3negative 1.76 (1.26–2.45) 14.8 9.6 6.5 8.5
Perceived behaviour control to be regularly active(very) sure 1.00 .000 59.2 67.0 70.7 74.2 .001not sure/unsure 1.65 (1.32–2.07) 31.0 25.7 20.5 19.0(very) unsure 2.10 (1.48–2.97) 9.8 7.3 8.8 6.8
Intention to be regularly activeyes 1.00 .000 45.9 55.0 57.3 67.0 .000maybe 1.84 (1.49–2.27) 38.9 38.1 35.2 26.7no 4.41 (3.09–6.29) 15.2 6.9 7.5 6.4
a Models were weighted, and adjusted for age, sex, and educational level.b This is the percentage of respondents in a certain response category per socioeconomic group; for example, 95.5% of those in the lowest group disagreed with the statement "My neighbourhood is unsafe".
International Journal of Behavioral Nutrition and Physical Activity 2009, 6:1 http://www.ijbnpa.org/content/6/1/1
(similar to findings for sports participation [44]). Still, assmall odds ratios for neighbourhood characteristics mayimply that changes to (perceptions of) the neighbour-hood context may have a significant effect on physicalactivity levels, these may offer important opportunities toreduce socioeconomic differences in physical activity.
Going beyond previous studies, our findings suggestedthat perceived unfavourable neighbourhood aestheticscontributed to the SES-inactivity relationship via individ-ual physical activity cognitions (since the OR for neigh-bourhood aesthetics reduced to non-significance when
individual cognitions were taken into account, OR= 1.19(95% CI: 0.95–1.50)). As the OR for neighbourhood aes-thetics remained somewhat elevated, a direct effect ofneighbourhood aesthetics may also play a role. Theseresults support the hypothesis of ecological models ofphysical activity [12,13], which suggest that environmen-tal factors show both direct and indirect effects with phys-ical activity. Findings indicated that older adults fromsocioeconomically disadvantaged backgrounds weremore likely to perceive poor neighbourhood aesthetics,which in turn may have reduced their perceived behav-ioural control expectations and may have had a negative
Table 3: Odds ratios with 95% confidence intervals (OR, 95% CI) for no recreational walking by education, mediated by neighbourhood perceptions and individual cognitions.
Model 1 (base model): education + age + sex
Model 2: base+ neighbourhood
Model 3: base+ individual
Model 4: base+ neighbourhood+ individual
Education %no walking
OR (95% CI) OR (95% CI) OR (95% CI) OR (95% CI)
1 – low (n = 281) 38.5 1.67 (1.18–2.35) 1.60 (1.13–2.27) 1.33 (0.93–1.90) 1.30 (0.91–1.87)2 – (n = 908) 34.7 1.49 (1.17–1.90) 1.48 (1.16–1.89) 1.35 (1.04–1.75) 1.29 (0.99–1.68)3 – (n = 366) 22.1 0.84 (0.60–1.18) 0.84 (0.60–1.19) 0.80 (0.57–1.13) 0.75 (0.53–1.06)4 – high (n = 439) 29.2 1.00 1.00 1.00 1.00
Neighbourhood perceptions
My neighbourhood is unattractivedisagree 1.00 1.00agree 1.32 (1.06–1.65) 1.19 (0.95–1.50)
Individual cognitions
Attitude towards regular physical activity
positive 1.00 1.00neutral 1.12 (0.87–1.45) 1.11 (0.86–1.43)negative 2.30 (1.59–3.32) 2.26 (1.57–3.26)
Social influences for regular physical activity
positive 1.00 1.00neutral 1.24 (1.01–1.52) 1.24 (1.02–1.532)negative 1.54 (1.11–2.14) 1.54 (1.11–2.14)
Perceived behaviour control to be regularly active
(very) sure 1.00 1.00not sure/unsure 1.21 (0.95–1.55) 1.20 (0.94–1.54)(very) unsure 1.57 (1.11–2.22) 1.56 (1.10–2.21)
Intention to be regularly active(very) likely 1.00 1.00maybe 1.31 (0.99–1.73) 1.30 (0.98–1.72)(very) unlikely 2.38 (1.59–3.57) 2.38 (1.59–3.57)
Random effects a
Level-2 variance (SE) 0.000 (0.000) 0.000 (0.000) 0.000 (0.000) 0.000 (0.000)
a Weighted multilevel models were estimated with the iterative generalized least squares procedure implemented in MlwiN version 2.02.
Page 8 of 11(page number not for citation purposes)
International Journal of Behavioral Nutrition and Physical Activity 2009, 6:1 http://www.ijbnpa.org/content/6/1/1
impact on their attitudes toward regular physical activity,explaining their lower levels of recreational walking. Pre-vious studies also reported (small) mediating effects ofattitude and perceived behaviour control/self-efficacy inthe association between environmental influences andphysical activity [45-47].
The main strength of our study is that we could estimatethe contribution of a wide range of physical and socialneighbourhood perceptions and individual cognitions tothe explanation of socioeconomic differences in recrea-
tional walking among older adults, using multilevel anal-ysis techniques to correct for possible area effects.However, there were several limitations of our study. First,the cross-sectional design precluded any causal inferencesfrom being drawn. Mediation effects only indicated thatcausal pathways may exist, however, selection may alsoplay a role, i.e. people that find regular physical activityimportant may choose to live in a pleasant environment.Also, as neighbourhood attractiveness and individual cog-nitions were both self-reported, other characteristics (e.g.personality, depressiveness) may have influenced both
Table 4: Odds ratios with 95% confidence intervals (OR, 95% CI) for doing no recreational walking by income, adjusted for neighbourhood perceptions and individual cognitions.
Model 1 (base model): income + age + sex
Model 2: base+ neighbourhood
Model 3: base+ individual
Model 4: base+ neighbourhood+ individual
Income % no walking OR (95% CI) OR (95% CI) OR (95% CI) OR (95% CI)
1 – low (n = 303) 35.7 1.40 (0.98–2.01) 1.34 (0.94–1.91) 1.03 (0.73–1.47) 1.01 (0.71–1.42)2 – (n = 535) 30.3 1.10 (0.81–1.49) 1.09 (0.80–1.48) 0.94 (0.70–1.27) 0.93 (0.69–1.26)3 – (n = 515) 27.8 0.81 (0.60–1.10) 0.81 (0.60–1.10) 0.77 (0.57–1.05) 0.77 (0.57–1.05)4 – high (n = 429) 29.4 1.00 1.00 1.00 1.005 – don't want to say/don't know (n= 243)
36.6 1.32 (0.97–1.81) 1.31 (1.05–1.63) 1.16 (0.85–1.58) 1.15 (0.84–1.56)
Neighbourhood perceptions
My neighbourhood is unattractivedisagree 1.00 1.00agree 1.31 (1.05–1.63) 1.19 (0.95–1.50)
Individual cognitions
Attitude towards regular physical activity
positive 1.00 1.00neutral 1.11 (0.86–1.43) 1.10 (0.85–1.42)negative 2.32 (1.61–3.34) 2.28 (1.59–3.28)
Social influences for regular physical activity
positive 1.00 1.00neutral 1.22 (0.99–1.51) 1.23 (1.001.51)negative 1.53 (1.10–2.11) 1.53 (1.10–2.12)
Perceived behaviour control to be regularly active
(very) sure 1.00 1.00not sure/unsure 1.25 (0.98–1.59) 1.24 (0.97–1.57)(very) unsure 1.55 (1.09–2.20) 1.55 (1.09–2.19)
Intention to be regularly active(very) likely 1.00 1.00maybe 1.32 (1.00–1.75) 1.31 (0.99–1.74)(very) unlikely 2.43 (1.65–3.57) 2.43 (1.65–3.57)
Random effects a
Level-2 variance (SE) 0.000 (0.000) 0.000 (0.000) 0.000 (0.000) 0.000 (0.000)
a Weighted multilevel models were estimated with the iterative generalized least squares procedure implemented in MlwiN version 2.02.
Page 9 of 11(page number not for citation purposes)
International Journal of Behavioral Nutrition and Physical Activity 2009, 6:1 http://www.ijbnpa.org/content/6/1/1
factors in the same (positive/negative) way. Due to theexclusion of participants with missing values for recrea-tional walking, education, and household income, thisstudy may have underestimated SES-walking associations,as lower SES groups may have been more inclined towardsselective non-response. Furthermore, we could not exam-ine objective, level-2 measures of neighbourhood influ-ences, and therefore, it remains uncertain to what extentSES differences in neighbourhood perceptions reflectobjective differences between neighbourhoods. However,in additional multilevel analyses we found significantclustering of perceived safety, attractiveness and availabil-ity of facilities within neighbourhoods, even when adjust-ing for resident's age, sex, and education. This clusteringof perceptions might indicate true neighbourhood differ-ences (results available on request). Individual cognitionswere not measured behaviour-specific for recreationalwalking, but referred to regular physical activity ("beingphysically active with moderate intensity for at least 30minutes per day"). In addition, neighbourhood percep-tions were not specifically asked in the context of recrea-tional walking. Increased specificity in andcorrespondence between outcome, and individual andneighbourhood variables, may lead to stronger associa-tions and increased explanation of socioeconomic differ-ences in recreational walking [15].
Simple cross tabulations indicated that the proportion ofresidents engaging in recreational walking does signifi-cantly vary by neighbourhood (results available uponrequest). Unexpectedly, we did not find any neighbour-hood variance in recreational walking within our multi-level models (see Table 3 en Table 4), which is difficult toexplain. The multilevel statistical package MlwiN (version2.02) was used nonetheless, as explanatory factors didcluster within neighbourhood.
We found opposite associations of social cohesion andsocial network with recreational walking: both high socialcohesion and a small social neighbourhood network wereassociated with a lower likelihood of recreational walking.The latter association was expected and in line with the lit-erature [28,40]: participants with a small social neigh-bourhood network may find it more difficult to findcompany for recreational walking, or may experience lesssocial support/peer encouragement for physical activity.However, one can only speculate why people who experi-ence high social cohesion (i.e. those who reported thatpeople in the neighbourhood are willing to help eachother, and that people in the neighbourhood agree onnorms and values) are more likely to do no recreationalwalking. Maybe neighbourhoods with high social cohe-sion organized other neighbourhood activities in whichthese participants engaged rather than walking. Or, ifsocial cohesion is high but the social norm is not to engage
in recreational walking, people may find it more difficultto go walking than those living in neighbourhoods withlow social cohesion and no norm regarding walking.
ConclusionThis study is among the first to show that unfavourableneighbourhood perceptions contribute to the explanationof socioeconomic differences in no recreational walkingamong older adults mainly indirectly, i.e. via unfavoura-ble individual cognitions towards regular physical activ-ity. More research into causal pathways between(objective and perceived) neighbourhood influences andindividual cognitions is needed to better understand howsocioeconomic disadvantage leads to physical inactivity.Our results suggest that intervention and policy strategiesto reduce socioeconomic differences in lack of recrea-tional walking among older adults would need to inter-vene on both neighbourhood perceptions as well asindividual cognitions.
Competing interestsThe authors declare that they have no competing interests.
Authors' contributionsCBMK conceived of the specific study as described in thispaper, coordinated data collection, performed the statisti-cal analyses, and drafted the manuscript. FJ designed theGLOBE study, coordinated data collection, had criticalinput in the data analyses, and helped drafting the manu-script. KG coordinated data collection, had critical inputin the data analyses, and helped drafting the manuscript.MH helped drafting the manuscript. JB had critical inputin coordination of the data collection, and drafting themanuscript. JPM designed the GLOBE study, and had crit-ical input in coordination of the data collection, analysesand drafting the manuscript. All authors read andapproved the final manuscript.
AcknowledgementsThe GLOBE study is carried out by the Department of Public Health of the Erasmus University Medical Centre in Rotterdam, in collaboration with the Public Health Services of the city of Eindhoven and region South-East Bra-bant. The authors are thankful to Roel Faber and Frank Santegoeds for con-structing the dataset, and to Caspar Looman for his support on the data weighting procedure and imputation of missing values. The study is sup-ported by grants of the Ministry of Public Health, Welfare and Sport and the Health Research and Development Council (ZON; number 40050009). KG is supported by an Australian National Health and Medical Research Council Sidney Sax Fellowship (ID 290540).
References1. Kunst AE, Bos V, Lahelma E, et al.: Trends in socioeconomic ine-
qualities in self-assessed health in 10 European countries. IntJ Epidemiol 2005, 34:295-305.
2. Mackenbach JP, Stirbu I, Roskam AJR, et al.: Socioeconomic ine-qualities in health in 22 European countries. New England Jour-nal of Medicine 2008, 358:2486-81.
3. Laaksonen M, Talala K, Martelin T, et al.: Health behaviours asexplanations for educational level differences in cardiovascu-
Page 10 of 11(page number not for citation purposes)

International Journal of Behavioral Nutrition and Physical Activity 2009, 6:1 http://www.ijbnpa.org/content/6/1/1
lar and all-cause mortality: a follow-up of 60 000 men andwomen over 23 years. European Journal of Public Health 2007,18:38-43.
4. Lantz PM, Lynch JW, House JS, et al.: Socioeconomic disparities inhealth change in a longitudinal study of US adults: the role ofhealth-risk behaviors. Soc Sci Med 2001, 53:29-40.
5. Schrijvers CT, Stronks K, Mheen HD van de, et al.: Explaining edu-cational differences in mortality: the role of behavioral andmaterial factors. Am J Public Health 1999, 89:535-40.
6. Droomers M, Schrijvers CT, Mackenbach JP: Educational level anddecreases in leisure time physical activity: predictors fromthe longitudinal GLOBE study. J Epidemiol Community Health2001, 55:562-8.
7. Giles-Corti B, Donovan RJ: Socioeconomic status differences inrecreational physical activity levels and real and perceivedaccess to a supportive physical environment. Prev Med 2002,35:601-11.
8. Lynch JW, Kaplan GA, Salonen JT: Why do poor people behavepoorly? Variation in adult health behaviours and psychoso-cial characteristics by stages of the socioeconomic life-course. Soc Sci Med 1997, 44:809-19.
9. Ball K, Timperio A, Salmon J, et al.: Personal, social and environ-mental determinants of educational inequalities in walking:a multilevel study. J Epidemiol Community Health 2007, 61:108-14.
10. Van Lenthe FJ, Brug J, Mackenbach JP: Neighbourhood inequalitiesin physical inactivity: the role of neighbourhood attractive-ness, proximity to local facilities and safety in the Nether-lands. Soc Sci Med 2005, 60:763-75.
11. Lindstrom M, Moghaddassi M, Merlo J: Social capital and leisuretime physical activity: a population based multilevel analysisin Malmo, Sweden. J Epidemiol Community Health 2003, 57:23-8.
12. Kremers SP, de Bruijn GJ, Visscher TL, et al.: Environmental influ-ences on energy balance-related behaviors: A dual-processview. Int J Behav Nutr Phys Act 2006, 3:9.
13. Spence JC, Lee RJ: Toward a comprehensive model of physicalactivity. Psychology of Sport and Exercise 2003, 4:7-24.
14. Ajzen I: "The Theory of Planned Behaviour". OrganizationalBehaviour and Human Decision Processes 1991, 50:179-211.
15. Giles-Corti B, Timperio A, Bull F, et al.: Understanding physicalactivity environmental correlates: increased specificity forecological models. Exerc Sport Sci Rev 2005, 33:175-81.
16. Eyler AA, Brownson RC, Bacak SJ, et al.: The epidemiology ofwalking for physical activity in the United States. Med SciSports Exerc 2003, 35:1529-36.
17. Australian Bureau of Health Statistics: Participation in sport andphysical activities. Canberra: Australian Bureau of Health Statis-tics; 2000.
18. Ooijendijk WTM, Hildebrandt VH, Hopman-Rock M, eds: BewegenGemeten 2000–2004 Leiden: TNO Kwaliteit van Leven; 2006.
19. Centers for Disease Control and Prevention: Physical activity andhealth: a report of the Surgeon General Washington DC: U.S. Depart-ment of Health and Human services; 1996.
20. Van Lenthe FJ, Schrijvers CT, Droomers M, et al.: Investigatingexplanations of socio-economic inequalities in health: theDutch GLOBE study. Eur J Public Health 2004, 14:63-70.
21. Mackenbach JP, Mheen H van de, Stronks K: A prospective cohortstudy investigating the explanation of socio-economic ine-qualities in health in The Netherlands. Soc Sci Med 1994,38:299-308.
22. Bauman AE, Sallis JF, Dzewaltowski DA, et al.: Toward a betterunderstanding of the influences on physical activity: the roleof determinants, correlates, causal variables, mediators,moderators, and confounders. Am J Prev Med 2002, 23:5-14.
23. Humpel N, Owen N, Iverson D, et al.: Perceived environmentattributes, residential location, and walking for particularpurposes. Am J Prev Med 2004, 26:119-25.
24. Trost SG, Owen N, Bauman AE, et al.: Correlates of adults' par-ticipation in physical activity: review and update. Med SciSports Exerc 2002, 34:1996-2001.
25. Brug J, van Lenthe FJ, eds: Environmental determinants and interventionsfor physical activity, nutrition and smoking: a review Den Haag: ZonMW;2005.
26. Kamphuis CBM, van Lenthe FJ, Giskes K, et al.: Perceived environ-mental determinants of physical activity and fruit and vege-table consumption among high and low socioeconomicgroups in the Netherlands. Health Place 2007, 13:493-503.
27. Kawachi I, Berkman L: Social cohesion, social capital, andhealth. In Social Epidemiology Edited by: Berkman L, Kawachi I. NewYork: Oxford University Press; 2000.
28. McNeill LH, Kreuter MW, Subramanian SV: Social environmentand physical activity: a review of concepts and evidence. SocSci Med 2006, 63:1011-22.
29. McCulloch A: An examination of social capital and social dis-organisation in neighbourhoods in the British householdpanel study. Soc Sci Med 2003, 56:1425-38.
30. Conner M, Norman P, eds: Predicting health behaviour: research andpractice with social cognition models Buckingham: Open UniversityPress; 1995.
31. Van Berkel-Van Schaik AB, Tax B: Towards a standard operationalisationof socioeconomic status for epidemiological and socio-medical research [inDutch] Rijswijk: Ministerie van WVC; 1990.
32. Wendel-Vos GC, Schuit AJ, Saris WH, et al.: Reproducibility andrelative validity of the short questionnaire to assess health-enhancing physical activity. J Clin Epidemiol 2003, 56:1163-9.
33. Rasbash J, Steele F, Browne W, et al.: A user's guide to MLwiN Version2.0 Bristol: Centre for multilevel modelling, University of Bristol;2005.
34. Woodhouse G: Multilevel modelling applications. A guide for users ofMLn. Multilevel Models Project Institute of Education London: Univer-sity of London; 1996.
35. Geyer S, Hemstrom O, Peter R, et al.: Education, income, andoccupational class cannot be used interchangeably in socialepidemiology. Empirical evidence against a common prac-tice. J Epidemiol Community Health 2006, 60:804-10.
36. Little RJA, Rubin DB: Statistical Analysis with missing data New Jersey:Wiley; 2002.
37. Statistical Package for Social Sciences version 11. Chicago, IL:SPSS; 1999.
38. Baron RM, Kenny DA: The moderator-mediator variable dis-tinction in social psychological research: conceptual, strate-gic, and statistical considerations. J Pers Soc Psychol 1986,51:1173-82.
39. Droomers M, Schrijvers CT, Mheen H van de, et al.: Educational dif-ferences in leisure-time physical inactivity: a descriptive andexplanatory study. Soc Sci Med 1998, 47:1665-76.
40. Lindstrom M, Hanson BS, Ostergren PO: Socioeconomic differ-ences in leisure-time physical activity: the role of social par-ticipation and social capital in shaping health relatedbehaviour. Soc Sci Med 2001, 52:441-51.
41. Marshall SJ, Jones DA, Ainsworth BE, et al.: Race/ethnicity, socialclass, and leisure-time physical inactivity. Med Sci Sports Exerc2007, 39:44-51.
42. Kamphuis CBM, Giskes K, Kavanagh AM, et al.: Area variation inrecreational cycling in Melbourne: a compositional or con-textual effect? American Journal of Preventive Medicine in press.
43. Kamphuis CBM, Van Lenthe FJ, Giskes K, et al.: Socioeconomic sta-tus, environmental and individual factors, and sports partic-ipation. Med Sci Sports Exerc 2008, 40(1):71-81.
44. Kamphuis CBM, Van Lenthe FJ, Giskes K, et al.: Socioeconomic sta-tus, environmental and individual factors, and sports partic-ipation. Med Sci Sports Exerc 2008, 40(1):71-81.
45. Brassington GS, Atienza AA, Perczek RE, et al.: Intervention-related cognitive versus social mediators of exercise adher-ence in the elderly. Am J Prev Med 2002, 23:80-6.
46. Prodaniuk TR, Plotnikoff RC, Spence JC, et al.: The influence of self-efficacy and outcome expectations on the relationshipbetween perceived environment and physical activity in theworkplace. Int J Behav Nutr Phys Act 2004, 1:7.
47. Rhodes RE, Courneya KS, Blanchard CM, et al.: Prediction of lei-sure-time walking: an integration of social cognitive, per-ceived environmental and personality factors. Int J Behav NutrPhys Act 2007, 4:. doi:10.1186/479-5868-4-51
48. Krull JL, MacKinnon DP: Multilevel modeling of individual andgroup level mediated effects. Multivariate Behavioral Research2001, 36:249-77.
Page 11 of 11(page number not for citation purposes)