Embed Size (px)
Citation preview
Laik
ipia
Cou
nty
ii
Exploring Kenya’s Inequality
A PUBLICATION OF KNBS AND SID
© 2013 Kenya National Bureau of Statistics (KNBS) and Society for International Development (SID)
ISBN – 978 - 9966 - 029 - 18 - 8
With funding from DANIDA through Drivers of Accountability Programme
The publication, however, remains the sole responsibility of the Kenya National Bureau of Statistics (KNBS) and the Society for International Development (SID).
Written by: Eston Ngugi
Data and tables generation: Samuel Kipruto
Paul Samoei
Maps generation: George Matheka Kamula
Technical Input and Editing: Katindi Sivi-Njonjo
Jason Lakin
Copy Editing: Ali Nadim Zaidi
Leonard Wanyama
Design, Print and Publishing: Ascent Limited
All rights reserved. No part of this publication may be reproduced, stored in a retrieval system or transmitted in any form, or by any means electronic, mechanical, photocopying, recording or otherwise, without the prior express and written permission of the publishers. Any part of this publication may be freely reviewed or quoted provided the source is duly acknowledged. It may not be sold or used for commercial purposes or for profit.
Kenya National Bureau of Statistics
P.O. Box 30266-00100 Nairobi, Kenya
Email: [email protected] Website: www.knbs.or.ke
Society for International Development – East Africa
P.O. Box 2404-00100 Nairobi, Kenya
Email: [email protected] | Website: www.sidint.net
Published by
iii
Pulling Apart or Pooling Together?
Table of contents Table of contents iii
Foreword iv
Acknowledgements v
Striking features on inter-county inequalities in Kenya vi
List of Figures viii
List Annex Tables ix
Abbreviations xi
Introduction 2
Laikipia County 9
iv
Exploring Kenya’s Inequality
A PUBLICATION OF KNBS AND SID
ForewordKenya, like all African countries, focused on poverty alleviation at independence, perhaps due to the level of
vulnerability of its populations but also as a result of the ‘trickle down’ economic discourses of the time, which
assumed that poverty rather than distribution mattered – in other words, that it was only necessary to concentrate
on economic growth because, as the country grew richer, this wealth would trickle down to benefit the poorest
sections of society. Inequality therefore had a very low profile in political, policy and scholarly discourses. In
recent years though, social dimensions such as levels of access to education, clean water and sanitation are
important in assessing people’s quality of life. Being deprived of these essential services deepens poverty and
reduces people’s well-being. Stark differences in accessing these essential services among different groups
make it difficult to reduce poverty even when economies are growing. According to the Economist (June 1, 2013),
a 1% increase in incomes in the most unequal countries produces a mere 0.6 percent reduction in poverty. In the
most equal countries, the same 1% growth yields a 4.3% reduction in poverty. Poverty and inequality are thus part
of the same problem, and there is a strong case to be made for both economic growth and redistributive policies.
From this perspective, Kenya’s quest in vision 2030 to grow by 10% per annum must also ensure that inequality
is reduced along the way and all people benefit equitably from development initiatives and resources allocated.
Since 2004, the Society for International Development (SID) and Kenya National Bureau of Statistics (KNBS) have
collaborated to spearhead inequality research in Kenya. Through their initial publications such as ‘Pulling Apart:
Facts and Figures on Inequality in Kenya,’ which sought to present simple facts about various manifestations
of inequality in Kenya, the understanding of Kenyans of the subject was deepened and a national debate on
the dynamics, causes and possible responses started. The report ‘Geographic Dimensions of Well-Being in
Kenya: Who and Where are the Poor?’ elevated the poverty and inequality discourse further while the publication
‘Readings on Inequality in Kenya: Sectoral Dynamics and Perspectives’ presented the causality, dynamics and
other technical aspects of inequality.
KNBS and SID in this publication go further to present monetary measures of inequality such as expenditure
patterns of groups and non-money metric measures of inequality in important livelihood parameters like
employment, education, energy, housing, water and sanitation to show the levels of vulnerability and patterns of
unequal access to essential social services at the national, county, constituency and ward levels.
We envisage that this work will be particularly helpful to county leaders who are tasked with the responsibility
of ensuring equitable social and economic development while addressing the needs of marginalized groups
and regions. We also hope that it will help in informing public engagement with the devolution process and
be instrumental in formulating strategies and actions to overcome exclusion of groups or individuals from the
benefits of growth and development in Kenya.
It is therefore our great pleasure to present ‘Exploring Kenya’s inequality: Pulling apart or pooling together?’
Ali Hersi Society for International Development (SID) Regional Director
v
Pulling Apart or Pooling Together?
AcknowledgementsKenya National Bureau of Statistics (KNBS) and Society for International Development (SID) are grateful
to all the individuals directly involved in the publication of ‘Exploring Kenya’s Inequality: Pulling Apart or
Pulling Together?’ books. Special mention goes to Zachary Mwangi (KNBS, Ag. Director General) and
Ali Hersi (SID, Regional Director) for their institutional leadership; Katindi Sivi-Njonjo (SID, Progrmme
Director) and Paul Samoei (KNBS) for the effective management of the project; Eston Ngugi; Tabitha
Wambui Mwangi; Joshua Musyimi; Samuel Kipruto; George Kamula; Jason Lakin; Ali Zaidi; Leonard
Wanyama; and Irene Omari for the different roles played in the completion of these publications.
KNBS and SID would like to thank Bernadette Wanjala (KIPPRA), Mwende Mwendwa (KIPPRA), Raphael
Munavu (CRA), Moses Sichei (CRA), Calvin Muga (TISA), Chrispine Oduor (IEA), John T. Mukui, Awuor
Ponge (IPAR, Kenya), Othieno Nyanjom, Mary Muyonga (SID), Prof. John Oucho (AMADPOC), Ms. Ada
Mwangola (Vision 2030 Secretariat), Kilian Nyambu (NCIC), Charles Warria (DAP), Wanjiru Gikonyo
(TISA) and Martin Napisa (NTA), for attending the peer review meetings held on 3rd October 2012 and
Thursday, 28th Feb 2013 and for making invaluable comments that went into the initial production and
the finalisation of the books. Special mention goes to Arthur Muliro, Wambui Gathathi, Con Omore,
Andiwo Obondoh, Peter Gunja, Calleb Okoyo, Dennis Mutabazi, Leah Thuku, Jackson Kitololo, Yvonne
Omwodo and Maureen Bwisa for their institutional support and administrative assistance throughout the
project. The support of DANIDA through the Drivers of Accountability Project in Kenya is also gratefully
acknowledged.
Stefano PratoManaging Director,SID
vi
Exploring Kenya’s Inequality
A PUBLICATION OF KNBS AND SID
Striking Features on Intra-County Inequality in Kenya Inequalities within counties in all the variables are extreme. In many cases, Kenyans living within a
single county have completely different lifestyles and access to services.
Income/expenditure inequalities1. The five counties with the worst income inequality (measured as a ratio of the top to the bottom
decile) are in Coast. The ratio of expenditure by the wealthiest to the poorest is 20 to one and above
in Lamu, Tana River, Kwale, and Kilifi. This means that those in the top decile have 20 times as much
expenditure as those in the bottom decile. This is compared to an average for the whole country of
nine to one.
2. Another way to look at income inequality is to compare the mean expenditure per adult across
wards within a county. In 44 of the 47 counties, the mean expenditure in the poorest wards is less
than 40 percent the mean expenditure in the wealthiest wards within the county. In both Kilifi and
Kwale, the mean expenditure in the poorest wards (Garashi and Ndavaya, respectively) is less than
13 percent of expenditure in the wealthiest ward in the county.
3. Of the five poorest counties in terms of mean expenditure, four are in the North (Mandera, Wajir,
Turkana and Marsabit) and the last is in Coast (Tana River). However, of the five most unequal
counties, only one (Marsabit County) is in the North (looking at ratio of mean expenditure in richest
to poorest ward). The other four most unequal counties by this measure are: Kilifi, Kwale, Kajiado
and Kitui.
4. If we look at Gini coefficients for the whole county, the most unequal counties are also in Coast:
Tana River (.631), Kwale (.604), and Kilifi (.570).
5. The most equal counties by income measure (ratio of top decile to bottom) are: Narok, West Pokot,
Bomet, Nandi and Nairobi. Using the ratio of average income in top to bottom ward, the five most
equal counties are: Kirinyaga, Samburu, Siaya, Nyandarua, Narok.
Access to Education6. Major urban areas in Kenya have high education levels but very large disparities. Mombasa, Nairobi
and Kisumu all have gaps between highest and lowest wards of nearly 50 percentage points in
share of residents with secondary school education or higher levels.
7. In the 5 most rural counties (Baringo, Siaya, Pokot, Narok and Tharaka Nithi), education levels
are lower but the gap, while still large, is somewhat lower than that espoused in urban areas. On
average, the gap in these 5 counties between wards with highest share of residents with secondary
school or higher and those with the lowest share is about 26 percentage points.
8. The most extreme difference in secondary school education and above is in Kajiado County where
the top ward (Ongata Rongai) has nearly 59 percent of the population with secondary education
plus, while the bottom ward (Mosiro) has only 2 percent.
9. One way to think about inequality in education is to compare the number of people with no education
vii
Pulling Apart or Pooling Together?
to those with some education. A more unequal county is one that has large numbers of both. Isiolo
is the most unequal county in Kenya by this measure, with 51 percent of the population having
no education, and 49 percent with some. This is followed by West Pokot at 55 percent with no
education and 45 percent with some, and Tana River at 56 percent with no education and 44 with
some.
Access to Improved Sanitation10. Kajiado County has the highest gap between wards with access to improved sanitation. The best
performing ward (Ongata Rongai) has 89 percent of residents with access to improved sanitation
while the worst performing ward (Mosiro) has 2 percent of residents with access to improved
sanitation, a gap of nearly 87 percentage points.
11. There are 9 counties where the gap in access to improved sanitation between the best and worst
performing wards is over 80 percentage points. These are Baringo, Garissa, Kajiado, Kericho, Kilifi,
Machakos, Marsabit, Nyandarua and West Pokot.
Access to Improved Sources of Water 12. In all of the 47 counties, the highest gap in access to improved water sources between the county
with the best access to improved water sources and the least is over 45 percentage points. The
most severe gaps are in Mandera, Garissa, Marsabit, (over 99 percentage points), Kilifi (over 98
percentage points) and Wajir (over 97 percentage points).
Access to Improved Sources of Lighting13. The gaps within counties in access to electricity for lighting are also enormous. In most counties
(29 out of 47), the gap between the ward with the most access to electricity and the least access
is more than 40 percentage points. The most severe disparities between wards are in Mombasa
(95 percentage point gap between highest and lowest ward), Garissa (92 percentage points), and
Nakuru (89 percentage points).
Access to Improved Housing14. The highest extreme in this variable is found in Baringo County where all residents in Silale ward live
in grass huts while no one in Ravine ward in the same county lives in grass huts.
Overall ranking of the variables15. Overall, the counties with the most income inequalities as measured by the gini coefficient are Tana
River, Kwale, Kilifi, Lamu, Migori and Busia. However, the counties that are consistently mentioned
among the most deprived hence have the lowest access to essential services compared to others
across the following nine variables i.e. poverty, mean household expenditure, education, work for
pay, water, sanitation, cooking fuel, access to electricity and improved housing are Mandera (8
variables), Wajir (8 variables), Turkana (7 variables) and Marsabit (7 variables).

xi
Pulling Apart or Pooling Together?
Abbreviations
AMADPOC African Migration and Development Policy Centre
CRA Commission on Revenue Allocation
DANIDA Danish International Development Agency
DAP Drivers of Accountability Programme
EAs Enumeration Areas
HDI Human Development Index
IBP International Budget Partnership
IEA Institute of Economic Affairs
IPAR Institute of Policy Analysis and Research
KIHBS Kenya Intergraded Household Budget Survey
KIPPRA Kenya Institute for Public Policy Research and Analysis
KNBS Kenya National Bureau of Statistics
LPG Liquefied Petroleum Gas
NCIC National Cohesion and Integration Commission
NTA National Taxpayers Association
PCA Principal Component Analysis
SAEs Small Area Estimation
SID Society for International Development
TISA The Institute for Social Accountability
VIP latrine Ventilated-Improved Pit latrine
VOCs Volatile Organic Carbons
WDR World Development Report
2
Exploring Kenya’s Inequality
A PUBLICATION OF KNBS AND SID
IntroductionBackgroundFor more than half a century many people in the development sector in Kenya have worked at alleviating
extreme poverty so that the poorest people can access basic goods and services for survival like food,
safe drinking water, sanitation, shelter and education. However when the current national averages are
disaggregated there are individuals and groups that still lag too behind. As a result, the gap between
the rich and the poor, urban and rural areas, among ethnic groups or between genders reveal huge
disparities between those who are well endowed and those who are deprived.
According to the world inequality statistics, Kenya was ranked 103 out of 169 countries making it the
66th most unequal country in the world. Kenya’s Inequality is rooted in its history, politics, economics
and social organization and manifests itself in the lack of access to services, resources, power, voice
and agency. Inequality continues to be driven by various factors such as: social norms, behaviours and
practices that fuel discrimination and obstruct access at the local level and/ or at the larger societal
level; the fact that services are not reaching those who are most in need of them due to intentional or
unintentional barriers; the governance, accountability, policy or legislative issues that do not favor equal
opportunities for the disadvantaged; and economic forces i.e. the unequal control of productive assets
by the different socio-economic groups.
According to the 2005 report on the World Social Situation, sustained poverty reduction cannot be
achieved unless equality of opportunity and access to basic services is ensured. Reducing inequality
must therefore be explicitly incorporated in policies and programmes aimed at poverty reduction. In
addition, specific interventions may be required, such as: affirmative action; targeted public investments
in underserved areas and sectors; access to resources that are not conditional; and a conscious effort
to ensure that policies and programmes implemented have to provide equitable opportunities for all.
This chapter presents the basic concepts on inequality and poverty, methods used for analysis,
justification and choice of variables on inequality. The analysis is based on the 2009 Kenya housing
and population census while the 2006 Kenya integrated household budget survey is combined with
census to estimate poverty and inequality measures from the national to the ward level. Tabulation of
both money metric measures of inequality such as mean expenditure and non-money metric measures
of inequality in important livelihood parameters like, employment, education, energy, housing, water
and sanitation are presented. These variables were selected from the census data and analyzed in
detail and form the core of the inequality reports. Other variables such as migration or health indicators
like mortality, fertility etc. are analyzed and presented in several monographs by Kenya National Bureau
of Statistics and were therefore left out of this report.
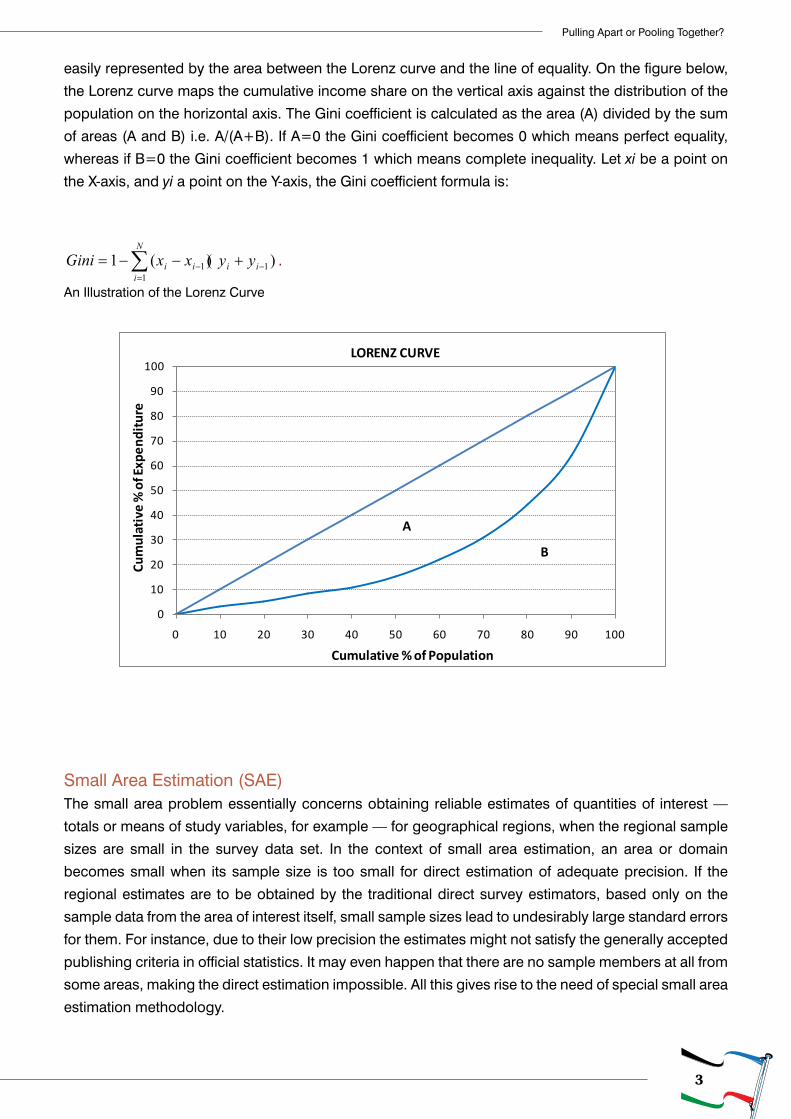
MethodologyGini-coefficient of inequalityThis is the most commonly used measure of inequality. The coefficient varies between ‘0’, which reflects
complete equality and ‘1’ which indicates complete inequality. Graphically, the Gini coefficient can be
3
Pulling Apart or Pooling Together?
easily represented by the area between the Lorenz curve and the line of equality. On the figure below,
the Lorenz curve maps the cumulative income share on the vertical axis against the distribution of the
population on the horizontal axis. The Gini coefficient is calculated as the area (A) divided by the sum
of areas (A and B) i.e. A/(A+B). If A=0 the Gini coefficient becomes 0 which means perfect equality,
whereas if B=0 the Gini coefficient becomes 1 which means complete inequality. Let xi be a point on
the X-axis, and yi a point on the Y-axis, the Gini coefficient formula is:
∑=
−− +−−=N
iiiii yyxxGini
111 ))((1 .
An Illustration of the Lorenz Curve
0
10
20
30
40
50
60
70
80
90
100
0 10 20 30 40 50 60 70 80 90 100
LORENZ CURVE
Cum
ulat
ive
% o
f Exp
endi
ture
Cumulative % of Population
A
B
Small Area Estimation (SAE)The small area problem essentially concerns obtaining reliable estimates of quantities of interest —
totals or means of study variables, for example — for geographical regions, when the regional sample
sizes are small in the survey data set. In the context of small area estimation, an area or domain
becomes small when its sample size is too small for direct estimation of adequate precision. If the
regional estimates are to be obtained by the traditional direct survey estimators, based only on the
sample data from the area of interest itself, small sample sizes lead to undesirably large standard errors
for them. For instance, due to their low precision the estimates might not satisfy the generally accepted
publishing criteria in official statistics. It may even happen that there are no sample members at all from
some areas, making the direct estimation impossible. All this gives rise to the need of special small area
estimation methodology.
4
Exploring Kenya’s Inequality
A PUBLICATION OF KNBS AND SID
Most of KNBS surveys were designed to provide statistically reliable, design-based estimates only at
the national, provincial and district levels such as the Kenya Intergraded Household Budget Survey
of 2005/06 (KIHBS). The sheer practical difficulties and cost of implementing and conducting sample
surveys that would provide reliable estimates at levels finer than the district were generally prohibitive,
both in terms of the increased sample size required and in terms of the added burden on providers of
survey data (respondents). However through SAE and using the census and other survey datasets,
accurate small area poverty estimates for 2009 for all the counties are obtainable.
The sample in the 2005/06 KIHBS, which was a representative subset of the population, collected
detailed information regarding consumption expenditures. The survey gives poverty estimate of urban
and rural poverty at the national level, the provincial level and, albeit with less precision, at the district
level. However, the sample sizes of such household surveys preclude estimation of meaningful poverty
measures for smaller areas such as divisions, locations or wards. Data collected through censuses
are sufficiently large to provide representative measurements below the district level such as divisions,
locations and sub-locations. However, this data does not contain the detailed information on consumption
expenditures required to estimate poverty indicators. In small area estimation methodology, the first step
of the analysis involves exploring the relationship between a set of characteristics of households and
the welfare level of the same households, which has detailed information about household expenditure
and consumption. A regression equation is then estimated to explain daily per capita consumption
and expenditure of a household using a number of socio-economic variables such as household size,
education levels, housing characteristics and access to basic services.
While the census does not contain household expenditure data, it does contain these socio-economic
variables. Therefore, it will be possible to statistically impute household expenditures for the census
households by applying the socio-economic variables from the census data on the estimated
relationship based on the survey data. This will give estimates of the welfare level of all households
in the census, which in turn allows for estimation of the proportion of households that are poor and
other poverty measures for relatively small geographic areas. To determine how many people are
poor in each area, the study would then utilize the 2005/06 monetary poverty lines for rural and urban
households respectively. In terms of actual process, the following steps were undertaken:
Cluster Matching: Matching of the KIHBS clusters, which were created using the 1999 Population and
Housing Census Enumeration Areas (EA) to 2009 Population and Housing Census EAs. The purpose
was to trace the KIBHS 2005/06 clusters to the 2009 Enumeration Areas.
Zero Stage: The first step of the analysis involved finding out comparable variables from the survey
(Kenya Integrated Household Budget 2005/06) and the census (Kenya 2009 Population and Housing
Census). This required the use of the survey and census questionnaires as well as their manuals.
First Stage (Consumption Model): This stage involved the use of regression analysis to explore the
relationship between an agreed set of characteristics in the household and the consumption levels of
the same households from the survey data. The regression equation was then used to estimate and
explain daily per capita consumption and expenditure of households using socio-economic variables
5
Pulling Apart or Pooling Together?
such as household size, education levels, housing characteristics and access to basic services, and
other auxiliary variables. While the census did not contain household expenditure data, it did contain
these socio-economic variables.
Second Stage (Simulation): Analysis at this stage involved statistical imputation of household
expenditures for the census households, by applying the socio-economic variables from the census
data on the estimated relationship based on the survey data.
Identification of poor households Principal Component Analysis (PCA)In order to attain the objective of the poverty targeting in this study, the household needed to be
established. There are three principal indicators of welfare; household income; household consumption
expenditures; and household wealth. Household income is the theoretical indicator of choice of welfare/
economic status. However, it is extremely difficult to measure accurately due to the fact that many
people do not remember all the sources of their income or better still would not want to divulge this
information. Measuring consumption expenditures has many drawbacks such as the fact that household
consumption expenditures typically are obtained from recall method usually for a period of not more
than four weeks. In all cases a well planned and large scale survey is needed, which is time consuming
and costly to collect. The estimation of wealth is a difficult concept due to both the quantitative as well
as the qualitative aspects of it. It can also be difficult to compute especially when wealth is looked at as
both tangible and intangible.
Given that the three main indicators of welfare cannot be determined in a shorter time, an alternative
method that is quick is needed. The alternative approach then in measuring welfare is generally through
the asset index. In measuring the asset index, multivariate statistical procedures such the factor analysis,
discriminate analysis, cluster analysis or the principal component analysis methods are used. Principal
components analysis transforms the original set of variables into a smaller set of linear combinations
that account for most of the variance in the original set. The purpose of PCA is to determine factors (i.e.,
principal components) in order to explain as much of the total variation in the data as possible.
In this project the principal component analysis was utilized in order to generate the asset (wealth)
index for each household in the study area. The PCA can be used as an exploratory tool to investigate
patterns in the data; in identify natural groupings of the population for further analysis and; to reduce
several dimensionalities in the number of known dimensions. In generating this index information from
the datasets such as the tenure status of main dwelling units; roof, wall, and floor materials of main
dwelling; main source of water; means of human waste disposal; cooking and lighting fuels; household
items such radio TV, fridge etc was required. The recent available dataset that contains this information
for the project area is the Kenya Population and Housing Census 2009.
There are four main approaches to handling multivariate data for the construction of the asset index
in surveys and censuses. The first three may be regarded as exploratory techniques leading to index
construction. These are graphical procedures and summary measures. The two popular multivariate
procedures - cluster analysis and principal component analysis (PCA) - are two of the key procedures
that have a useful preliminary role to play in index construction and lastly regression modeling approach.
6
Exploring Kenya’s Inequality
A PUBLICATION OF KNBS AND SID
In the recent past there has been an increasing routine application of PCA to asset data in creating
welfare indices (Gwatkin et al. 2000, Filmer and Pritchett 2001 and McKenzie 2003).
Concepts and definitionsInequalityInequality is characterized by the existence of unequal opportunities or life chances and unequal
conditions such as incomes, goods and services. Inequality, usually structured and recurrent, results
into an unfair or unjust gap between individuals, groups or households relative to others within a
population. There are several methods of measuring inequality. In this study, we consider among
other methods, the Gini-coefficient, the difference in expenditure shares and access to important basic
services.
Equality and EquityAlthough the two terms are sometimes used interchangeably, they are different concepts. Equality
requires all to have same/ equal resources, while equity requires all to have the same opportunity to
access same resources, survive, develop, and reach their full potential, without discrimination, bias, or
favoritism. Equity also accepts differences that are earned fairly.
PovertyThe poverty line is a threshold below which people are deemed poor. Statistics summarizing the bottom
of the consumption distribution (i.e. those that fall below the poverty line) are therefore provided. In
2005/06, the poverty line was estimated at Ksh1,562 and Ksh2,913 per adult equivalent1 per month
for rural and urban households respectively. Nationally, 45.2 percent of the population lives below the
poverty line (2009 estimates) down from 46 percent in 2005/06.
Spatial DimensionsThe reason poverty can be considered a spatial issue is two-fold. People of a similar socio-economic
background tend to live in the same areas because the amount of money a person makes usually, but
not always, influences their decision as to where to purchase or rent a home. At the same time, the area
in which a person is born or lives can determine the level of access to opportunities like education and
employment because income and education can influence settlement patterns and also be influenced
by settlement patterns. They can therefore be considered causes and effects of spatial inequality and
poverty.
EmploymentAccess to jobs is essential for overcoming inequality and reducing poverty. People who cannot access
productive work are unable to generate an income sufficient to cover their basic needs and those of
their families, or to accumulate savings to protect their households from the vicissitudes of the economy. 1This is basically the idea that every person needs different levels of consumption because of their age, gender, height, weight, etc. and therefore we take this into account to create an adult equivalent based on the average needs of the different populations
7
Pulling Apart or Pooling Together?
The unemployed are therefore among the most vulnerable in society and are prone to poverty. Levels
and patterns of employment and wages are also significant in determining degrees of poverty and
inequality. Macroeconomic policy needs to emphasize the need for increasing regular good quality
‘work for pay’ that is covered by basic labour protection. The population and housing census 2009
included questions on labour and employment for the population aged 15-64.
The census, not being a labour survey, only had few categories of occupation which included work
for pay, family business, family agricultural holdings, intern/volunteer, retired/home maker, full time
student, incapacitated and no work. The tabulation was nested with education- for none, primary and
secondary level.
EducationEducation is typically seen as a means of improving people’s welfare. Studies indicate that inequality
declines as the average level of educational attainment increases, with secondary education producing
the greatest payoff, especially for women (Cornia and Court, 2001). There is considerable evidence
that even in settings where people are deprived of other essential services like sanitation or clean
water, children of educated mothers have much better prospects of survival than do the children of
uneducated mothers. Education is therefore typically viewed as a powerful factor in leveling the field of
opportunity as it provides individuals with the capacity to obtain a higher income and standard of living.
By learning to read and write and acquiring technical or professional skills, people increase their chances
of obtaining decent, better-paying jobs. Education however can also represent a medium through
which the worst forms of social stratification and segmentation are created. Inequalities in quality and
access to education often translate into differentials in employment, occupation, income, residence and
social class. These disparities are prevalent and tend to be determined by socio-economic and family
background. Because such disparities are typically transmitted from generation to generation, access
to educational and employment opportunities are to a certain degree inherited, with segments of the
population systematically suffering exclusion. The importance of equal access to a well-functioning
education system, particularly in relation to reducing inequalities, cannot be overemphasized.
WaterAccording to UNICEF (2008), over 1.1 billion people lack access to an improved water source and over
three million people, mostly children, die annually from water-related diseases. Water quality refers
to the basic and physical characteristics of water that determines its suitability for life or for human
uses. The quality of water has tremendous effects on human health both in the short term and in the
long term. As indicated in this report, slightly over half of Kenya’s population has access to improved
sources of water.
SanitationSanitation refers to the principles and practices relating to the collection, removal or disposal of human
excreta, household waste, water and refuse as they impact upon people and the environment. Decent
sanitation includes appropriate hygiene awareness and behavior as well as acceptable, affordable and
8
Exploring Kenya’s Inequality
A PUBLICATION OF KNBS AND SID
sustainable sanitation services which is crucial for the health and wellbeing of people. Lack of access
to safe human waste disposal facilities leads to higher costs to the community through pollution of
rivers, ground water and higher incidence of air and water borne diseases. Other costs include reduced
incomes as a result of disease and lower educational outcomes.
Nationally, 61 percent of the population has access to improved methods of waste disposal. A sizeable
population i.e. 39 percent of the population is disadvantaged. Investments made in the provision of
safe water supplies need to be commensurate with investments in safe waste disposal and hygiene
promotion to have significant impact.
Housing Conditions (Roof, Wall and Floor)Housing conditions are an indicator of the degree to which people live in humane conditions. Materials
used in the construction of the floor, roof and wall materials of a dwelling unit are also indicative of the
extent to which they protect occupants from the elements and other environmental hazards. Housing
conditions have implications for provision of other services such as connections to water supply,
electricity, and waste disposal. They also determine the safety, health and well being of the occupants.
Low provision of these essential services leads to higher incidence of diseases, fewer opportunities
for business services and lack of a conducive environment for learning. It is important to note that
availability of materials, costs, weather and cultural conditions have a major influence on the type of
materials used.
Energy fuel for cooking and lightingLack of access to clean sources of energy is a major impediment to development through health related
complications such as increased respiratory infections and air pollution. The type of cooking fuel or
lighting fuel used by households is related to the socio-economic status of households. High level
energy sources are cleaner but cost more and are used by households with higher levels of income
compared with primitive sources of fuel like firewood which are mainly used by households with a lower
socio-economic profile. Globally about 2.5 billion people rely on biomass such as fuel-wood, charcoal,
agricultural waste and animal dung to meet their energy needs for cooking.

9
Pulling Apart or Pooling Together?
Laikipia County
10
Exploring Kenya’s Inequality
A PUBLICATION OF KNBS AND SID
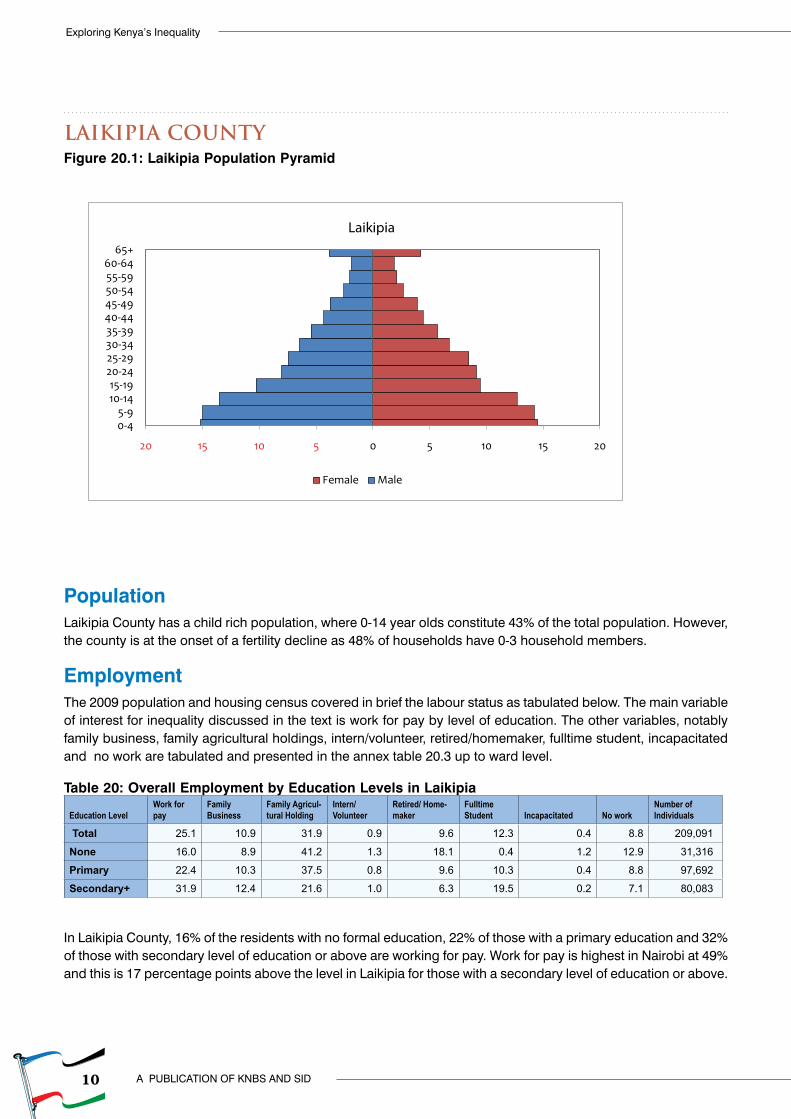
Laikipia CountyFigure 20.1: Laikipia Population Pyramid
Population Laikipia County has a child rich population, where 0-14 year olds constitute 43% of the total population. However, the county is at the onset of a fertility decline as 48% of households have 0-3 household members.
Employment The 2009 population and housing census covered in brief the labour status as tabulated below. The main variable of interest for inequality discussed in the text is work for pay by level of education. The other variables, notably family business, family agricultural holdings, intern/volunteer, retired/homemaker, fulltime student, incapacitated and no work are tabulated and presented in the annex table 20.3 up to ward level.
Table 20: Overall Employment by Education Levels in Laikipia
Education LevelWork for pay
Family Business
Family Agricul-tural Holding
Intern/ Volunteer
Retired/ Home-maker
Fulltime Student Incapacitated No work
Number of Individuals
Total 25.1 10.9 31.9 0.9 9.6 12.3 0.4 8.8 209,091
None 16.0 8.9 41.2 1.3 18.1 0.4 1.2 12.9 31,316
Primary 22.4 10.3 37.5 0.8 9.6 10.3 0.4 8.8 97,692
Secondary+ 31.9 12.4 21.6 1.0 6.3 19.5 0.2 7.1 80,083
In Laikipia County, 16% of the residents with no formal education, 22% of those with a primary education and 32% of those with secondary level of education or above are working for pay. Work for pay is highest in Nairobi at 49% and this is 17 percentage points above the level in Laikipia for those with a secondary level of education or above.
20 15 10 5 0 5 10 15 20
0-45-9
10-1415-19
20-2425-2930-3435-3940-4445-4950-5455-5960-64
65+
Female Male
Laikipia
11
Pulling Apart or Pooling Together?
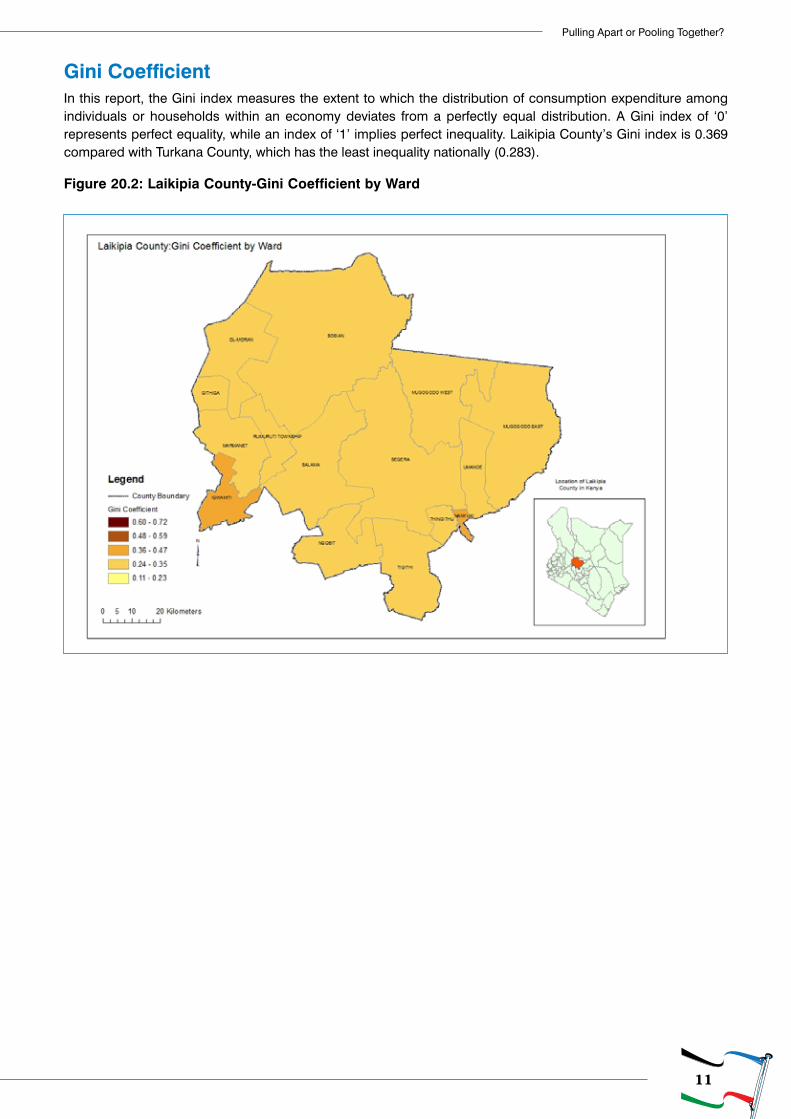
Gini Coefficient In this report, the Gini index measures the extent to which the distribution of consumption expenditure among individuals or households within an economy deviates from a perfectly equal distribution. A Gini index of ‘0’ represents perfect equality, while an index of ‘1’ implies perfect inequality. Laikipia County’s Gini index is 0.369 compared with Turkana County, which has the least inequality nationally (0.283).
Figure 20.2: Laikipia County-Gini Coefficient by Ward
12
Exploring Kenya’s Inequality
A PUBLICATION OF KNBS AND SID
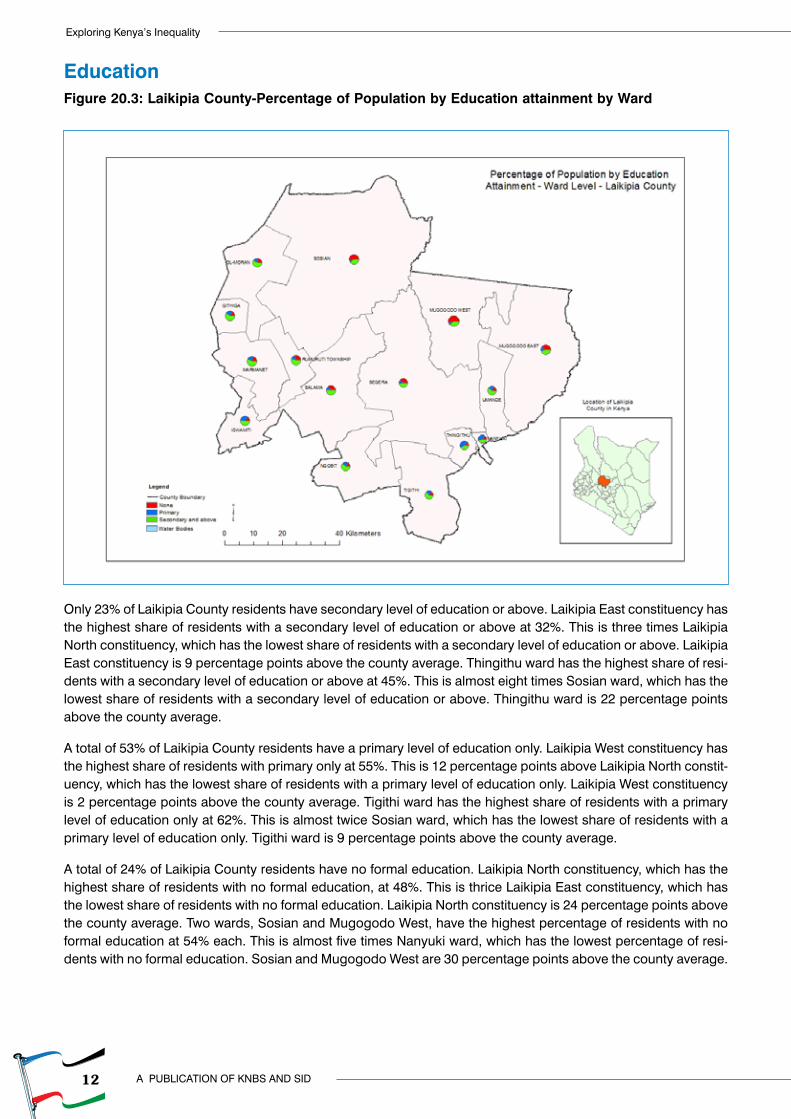
EducationFigure 20.3: Laikipia County-Percentage of Population by Education attainment by Ward
Only 23% of Laikipia County residents have secondary level of education or above. Laikipia East constituency has the highest share of residents with a secondary level of education or above at 32%. This is three times Laikipia North constituency, which has the lowest share of residents with a secondary level of education or above. Laikipia East constituency is 9 percentage points above the county average. Thingithu ward has the highest share of resi-dents with a secondary level of education or above at 45%. This is almost eight times Sosian ward, which has the lowest share of residents with a secondary level of education or above. Thingithu ward is 22 percentage points above the county average.
A total of 53% of Laikipia County residents have a primary level of education only. Laikipia West constituency has the highest share of residents with primary only at 55%. This is 12 percentage points above Laikipia North constit-uency, which has the lowest share of residents with a primary level of education only. Laikipia West constituency is 2 percentage points above the county average. Tigithi ward has the highest share of residents with a primary level of education only at 62%. This is almost twice Sosian ward, which has the lowest share of residents with a primary level of education only. Tigithi ward is 9 percentage points above the county average.
A total of 24% of Laikipia County residents have no formal education. Laikipia North constituency, which has the highest share of residents with no formal education, at 48%. This is thrice Laikipia East constituency, which has the lowest share of residents with no formal education. Laikipia North constituency is 24 percentage points above the county average. Two wards, Sosian and Mugogodo West, have the highest percentage of residents with no formal education at 54% each. This is almost five times Nanyuki ward, which has the lowest percentage of resi-dents with no formal education. Sosian and Mugogodo West are 30 percentage points above the county average.
13
Pulling Apart or Pooling Together?
EnergyCooking Fuel
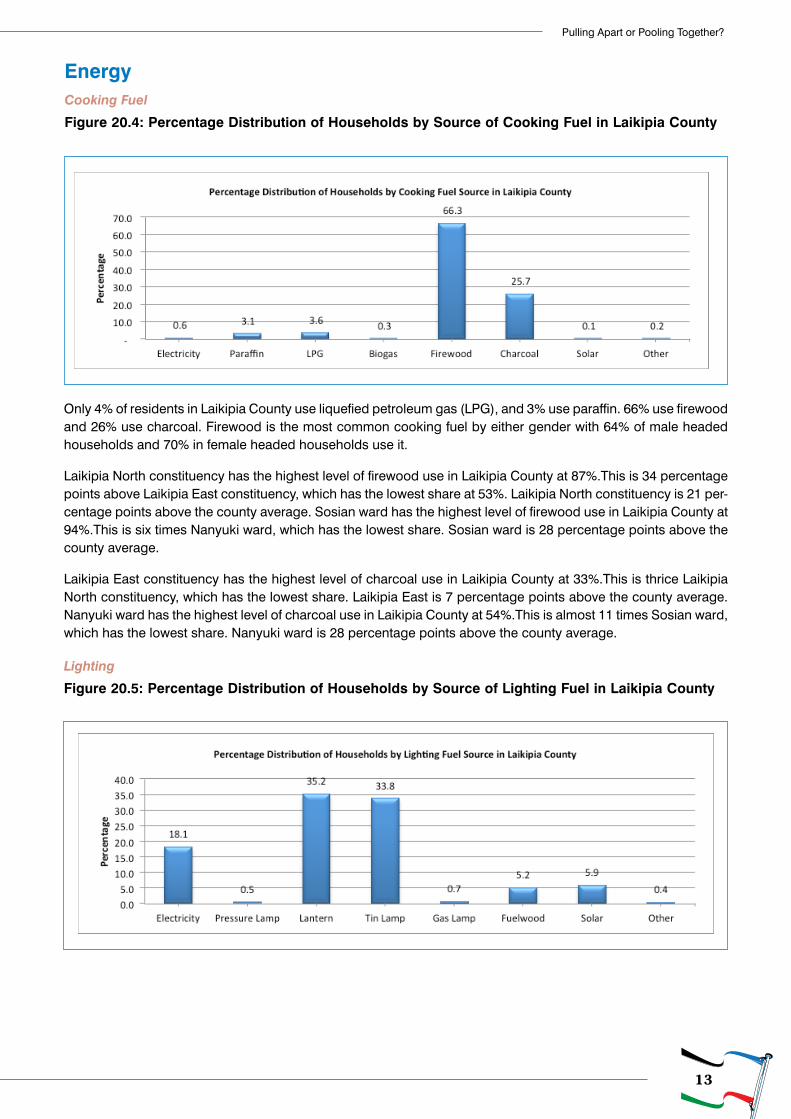
Figure 20.4: Percentage Distribution of Households by Source of Cooking Fuel in Laikipia County
Only 4% of residents in Laikipia County use liquefied petroleum gas (LPG), and 3% use paraffin. 66% use firewood and 26% use charcoal. Firewood is the most common cooking fuel by either gender with 64% of male headed households and 70% in female headed households use it.
Laikipia North constituency has the highest level of firewood use in Laikipia County at 87%.This is 34 percentage points above Laikipia East constituency, which has the lowest share at 53%. Laikipia North constituency is 21 per-centage points above the county average. Sosian ward has the highest level of firewood use in Laikipia County at 94%.This is six times Nanyuki ward, which has the lowest share. Sosian ward is 28 percentage points above the county average.
Laikipia East constituency has the highest level of charcoal use in Laikipia County at 33%.This is thrice Laikipia North constituency, which has the lowest share. Laikipia East is 7 percentage points above the county average. Nanyuki ward has the highest level of charcoal use in Laikipia County at 54%.This is almost 11 times Sosian ward, which has the lowest share. Nanyuki ward is 28 percentage points above the county average.
Lighting
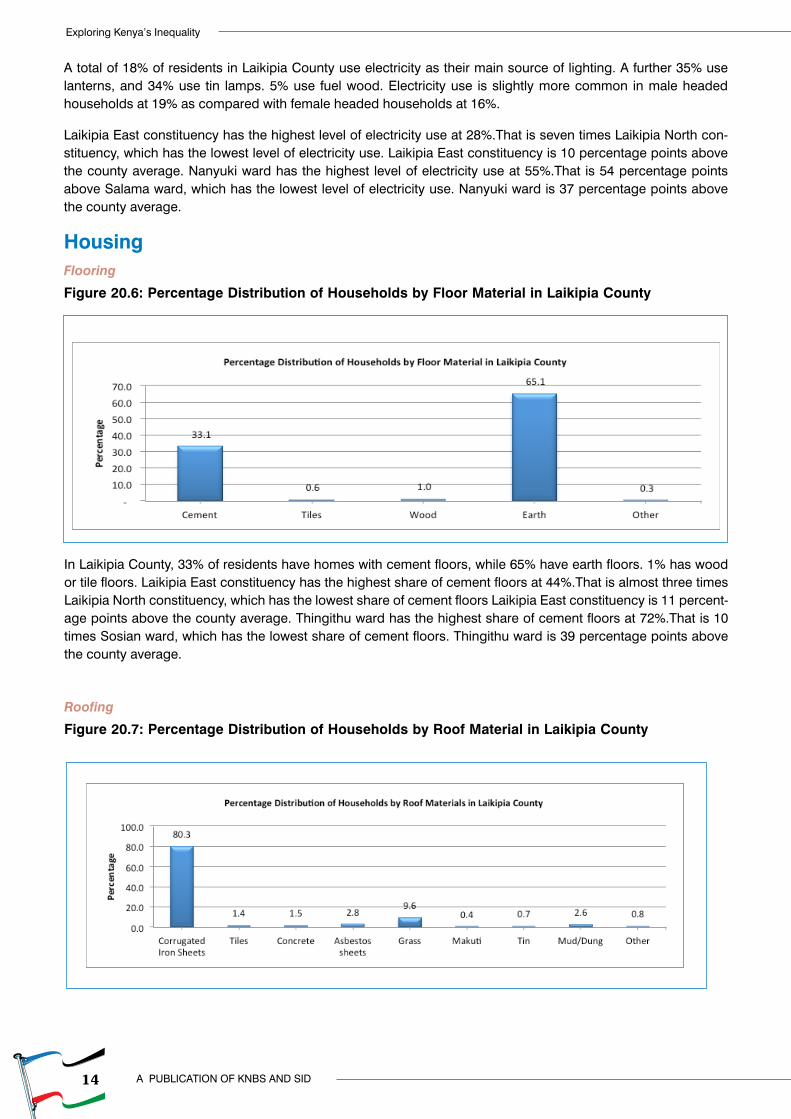
Figure 20.5: Percentage Distribution of Households by Source of Lighting Fuel in Laikipia County
14
Exploring Kenya’s Inequality
A PUBLICATION OF KNBS AND SID
A total of 18% of residents in Laikipia County use electricity as their main source of lighting. A further 35% use lanterns, and 34% use tin lamps. 5% use fuel wood. Electricity use is slightly more common in male headed households at 19% as compared with female headed households at 16%.
Laikipia East constituency has the highest level of electricity use at 28%.That is seven times Laikipia North con-stituency, which has the lowest level of electricity use. Laikipia East constituency is 10 percentage points above the county average. Nanyuki ward has the highest level of electricity use at 55%.That is 54 percentage points above Salama ward, which has the lowest level of electricity use. Nanyuki ward is 37 percentage points above the county average.
HousingFlooring
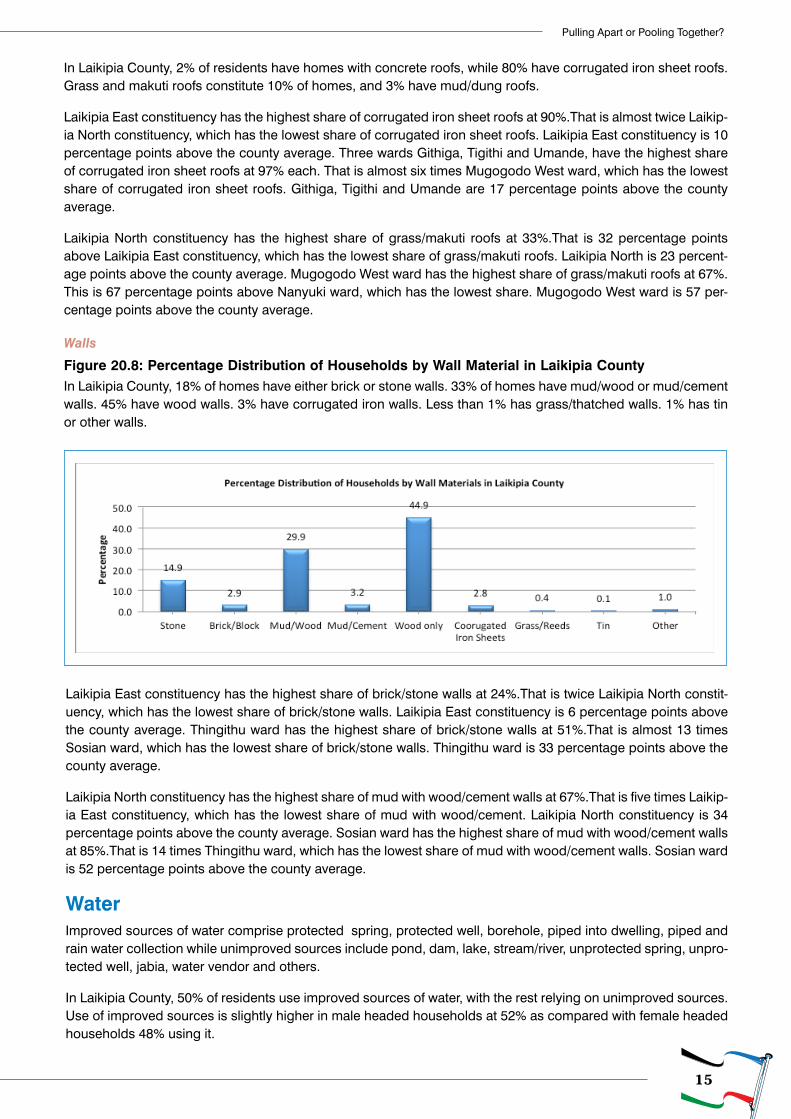
Figure 20.6: Percentage Distribution of Households by Floor Material in Laikipia County
In Laikipia County, 33% of residents have homes with cement floors, while 65% have earth floors. 1% has wood or tile floors. Laikipia East constituency has the highest share of cement floors at 44%.That is almost three times Laikipia North constituency, which has the lowest share of cement floors Laikipia East constituency is 11 percent-age points above the county average. Thingithu ward has the highest share of cement floors at 72%.That is 10 times Sosian ward, which has the lowest share of cement floors. Thingithu ward is 39 percentage points above the county average.
Roofing
Figure 20.7: Percentage Distribution of Households by Roof Material in Laikipia County
15
Pulling Apart or Pooling Together?
In Laikipia County, 2% of residents have homes with concrete roofs, while 80% have corrugated iron sheet roofs. Grass and makuti roofs constitute 10% of homes, and 3% have mud/dung roofs.
Laikipia East constituency has the highest share of corrugated iron sheet roofs at 90%.That is almost twice Laikip-ia North constituency, which has the lowest share of corrugated iron sheet roofs. Laikipia East constituency is 10 percentage points above the county average. Three wards Githiga, Tigithi and Umande, have the highest share of corrugated iron sheet roofs at 97% each. That is almost six times Mugogodo West ward, which has the lowest share of corrugated iron sheet roofs. Githiga, Tigithi and Umande are 17 percentage points above the county average.
Laikipia North constituency has the highest share of grass/makuti roofs at 33%.That is 32 percentage points above Laikipia East constituency, which has the lowest share of grass/makuti roofs. Laikipia North is 23 percent-age points above the county average. Mugogodo West ward has the highest share of grass/makuti roofs at 67%. This is 67 percentage points above Nanyuki ward, which has the lowest share. Mugogodo West ward is 57 per-centage points above the county average.
Walls
Figure 20.8: Percentage Distribution of Households by Wall Material in Laikipia CountyIn Laikipia County, 18% of homes have either brick or stone walls. 33% of homes have mud/wood or mud/cement walls. 45% have wood walls. 3% have corrugated iron walls. Less than 1% has grass/thatched walls. 1% has tin or other walls.
Laikipia East constituency has the highest share of brick/stone walls at 24%.That is twice Laikipia North constit-uency, which has the lowest share of brick/stone walls. Laikipia East constituency is 6 percentage points above the county average. Thingithu ward has the highest share of brick/stone walls at 51%.That is almost 13 times Sosian ward, which has the lowest share of brick/stone walls. Thingithu ward is 33 percentage points above the county average.
Laikipia North constituency has the highest share of mud with wood/cement walls at 67%.That is five times Laikip-ia East constituency, which has the lowest share of mud with wood/cement. Laikipia North constituency is 34 percentage points above the county average. Sosian ward has the highest share of mud with wood/cement walls at 85%.That is 14 times Thingithu ward, which has the lowest share of mud with wood/cement walls. Sosian ward is 52 percentage points above the county average.
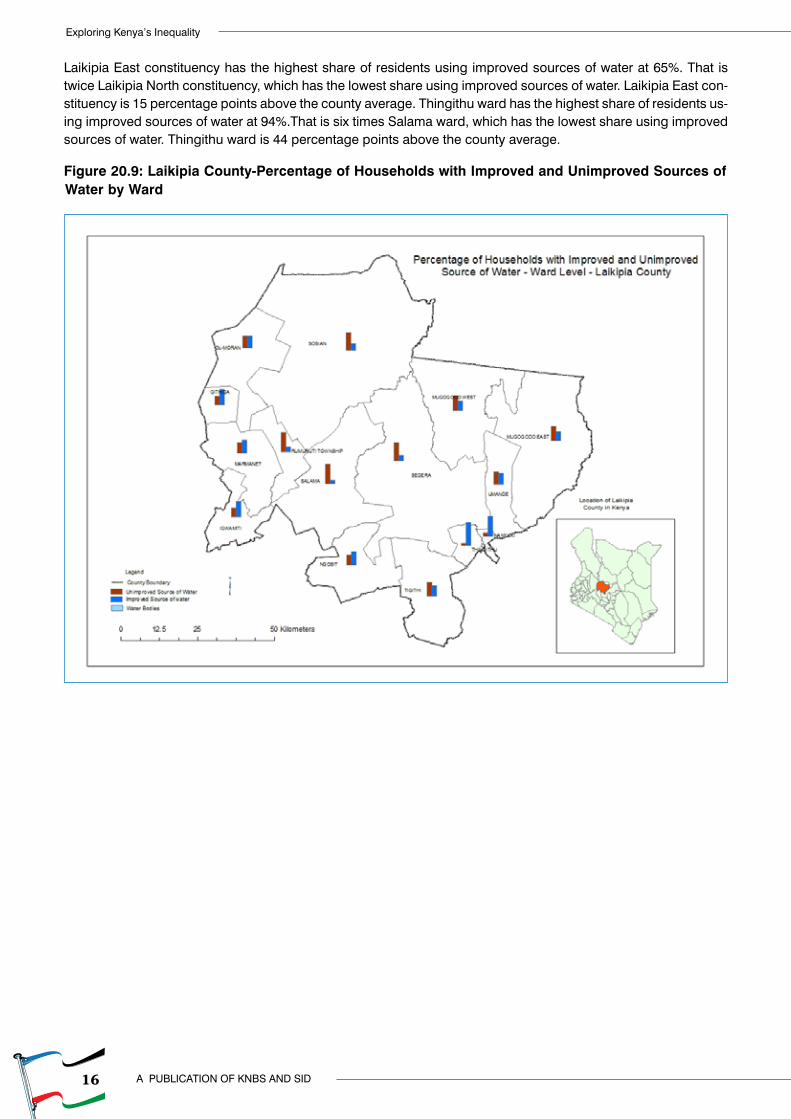
WaterImproved sources of water comprise protected spring, protected well, borehole, piped into dwelling, piped and rain water collection while unimproved sources include pond, dam, lake, stream/river, unprotected spring, unpro-tected well, jabia, water vendor and others.
In Laikipia County, 50% of residents use improved sources of water, with the rest relying on unimproved sources. Use of improved sources is slightly higher in male headed households at 52% as compared with female headed households 48% using it.
16
Exploring Kenya’s Inequality
A PUBLICATION OF KNBS AND SID
Laikipia East constituency has the highest share of residents using improved sources of water at 65%. That is twice Laikipia North constituency, which has the lowest share using improved sources of water. Laikipia East con-stituency is 15 percentage points above the county average. Thingithu ward has the highest share of residents us-ing improved sources of water at 94%.That is six times Salama ward, which has the lowest share using improved sources of water. Thingithu ward is 44 percentage points above the county average.
Figure 20.9: Laikipia County-Percentage of Households with Improved and Unimproved Sources of Water by Ward
17
Pulling Apart or Pooling Together?
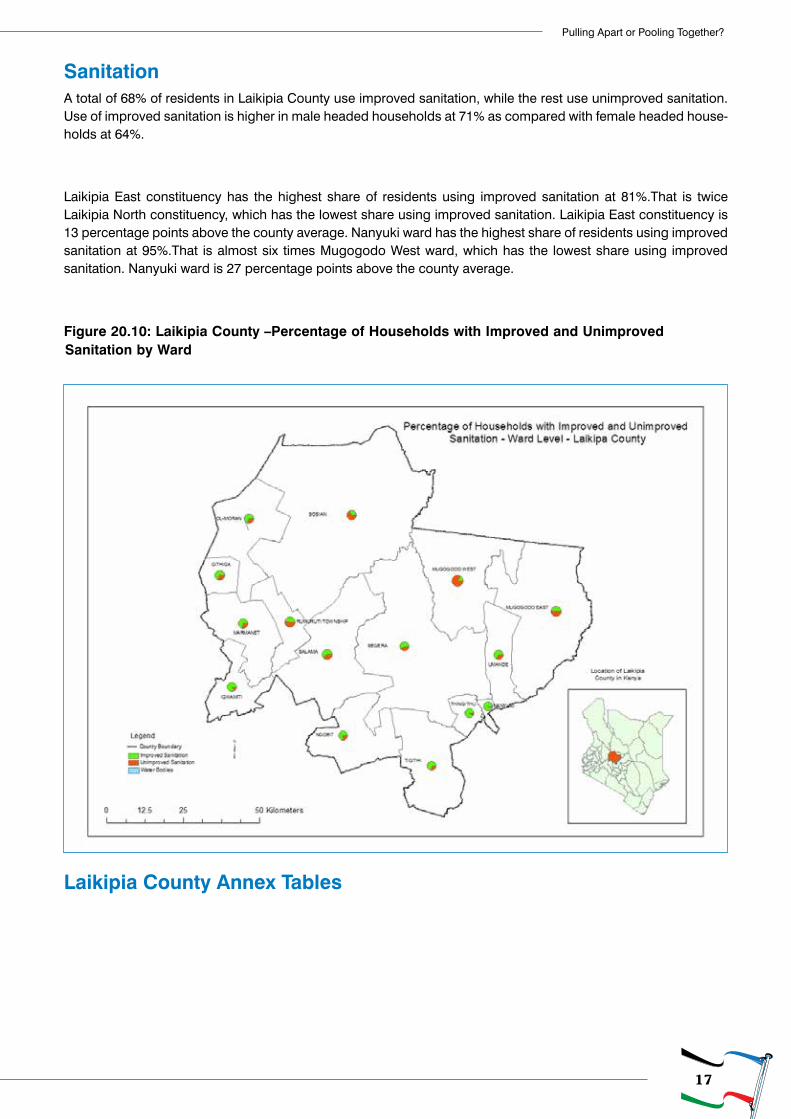
SanitationA total of 68% of residents in Laikipia County use improved sanitation, while the rest use unimproved sanitation. Use of improved sanitation is higher in male headed households at 71% as compared with female headed house-holds at 64%.
Laikipia East constituency has the highest share of residents using improved sanitation at 81%.That is twice Laikipia North constituency, which has the lowest share using improved sanitation. Laikipia East constituency is 13 percentage points above the county average. Nanyuki ward has the highest share of residents using improved sanitation at 95%.That is almost six times Mugogodo West ward, which has the lowest share using improved sanitation. Nanyuki ward is 27 percentage points above the county average.
Figure 20.10: Laikipia County –Percentage of Households with Improved and Unimproved Sanitation by Ward
Laikipia County Annex Tables
18
Exploring Kenya’s Inequality
A PUBLICATION OF KNBS AND SID
20. L
aik
ipia
Tabl
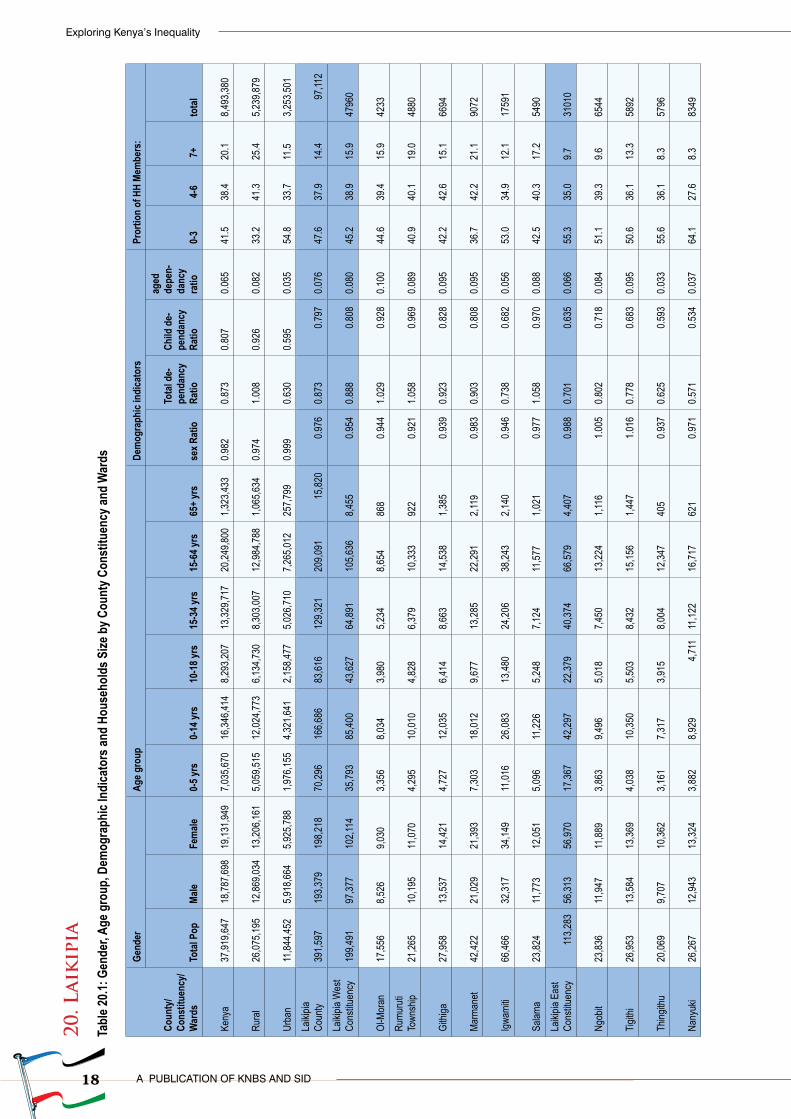
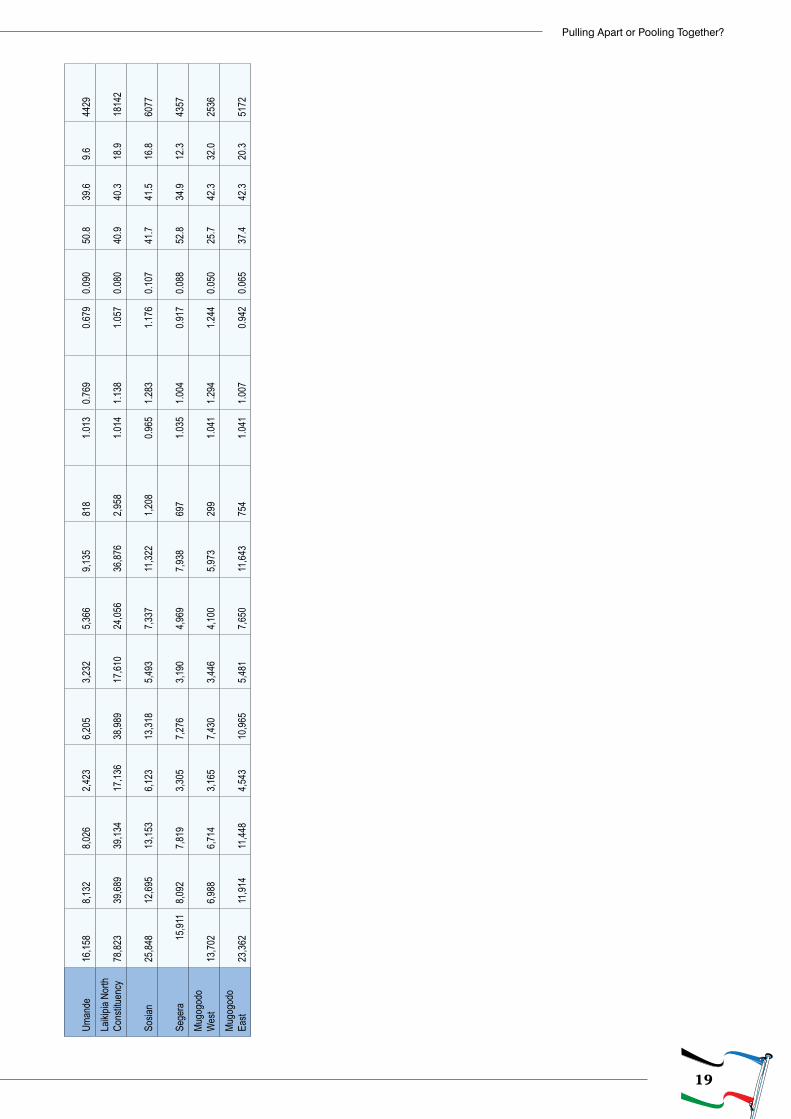
e 20.1
: Gen
der, A
ge g
roup
, Dem
ogra
phic
Indi
cato
rs an
d Ho
useh
olds
Size
by C
ount
y Con
stitu
ency
and
War
ds
Coun
ty/
Cons
titue
ncy/
War
ds
Gend
erAg
e gro
upDe
mog
raph
ic in
dica
tors
Pror
tion
of H
H Me
mbe
rs:
Tota
l Pop
Male
Fem
ale0-
5 yrs
0-14
yrs
10-1
8 yrs
15-3
4 yrs
15-6
4 yrs
65+ y
rsse
x Rat
io
Tota
l de-
pend
ancy
Ra
tio
Child
de-
pend
ancy
Ra
tio
aged
de
pen-
danc
y ra
tio0-
3 4-
6 7+
to
tal
Keny
a
37
,919,6
47
18,78
7,698
19
,131,9
49
7,035
,670
16,34
6,414
8,2
93,20
7
13
,329,7
17
20,24
9,800
1,3
23,43
3
0.982
0.873
0.807
0.065
41
.5
38.4
20
.1
8,4
93,38
0
Rura
l
26
,075,1
95
12,86
9,034
13
,206,1
61
5,059
,515
12,02
4,773
6,1
34,73
0
8,303
,007
12,98
4,788
1,0
65,63
4
0.974
1.008
0.926
0.082
33
.2
41.3
25
.4
5,2
39,87
9
Urba
n
11
,844,4
52
5,918
,664
5,925
,788
1,976
,155
4,321
,641
2,158
,477
5,0
26,71
0
7,2
65,01
2
25
7,799
0.999
0.630
0.595
0.035
54
.8
33.7
11
.5
3,2
53,50
1 La
ikipia
Co
unty
391,5
97
193,3
79
198,2
18
70,29
6
16
6,686
83
,616
12
9,321
20
9,091
15,8
20
0.97
6
0.873
0.
797
0.0
76
47.6
37
.9
14.4
9
7,112
La
ikipia
Wes
t Co
nstitu
ency
199,4
91
97
,377
102,1
14
35,79
3
85,40
0
43
,627
64
,891
105,6
36
8,455
0.
954
0.8
88
0.80
8
0.080
45
.2
38.9
15
.9 47
960
Ol-M
oran
17
,556
8,5
26
9,0
30
3,3
56
8,0
34
3,9
80
5,234
8,654
868
0.94
4
1.029
0.
928
0.1
00
44.6
39
.4
15.9
4233
Rumu
ruti
Town
ship
21
,265
10
,195
11
,070
4,2
95
10
,010
4,8
28
6,379
10,33
3
922
0.92
1
1.058
0.
969
0.0
89
40.9
40
.1
19.0
4880
Githi
ga
27,95
8
13,53
7
14,42
1
4,727
12,03
5
6,414
8,6
63
14
,538
1,385
0.
939
0.9
23
0.82
8
0.095
42
.2
42.6
15
.1 66
94
Marm
anet
42
,422
21
,029
21
,393
7,3
03
18
,012
9,6
77
13
,285
22
,291
2,119
0.
983
0.9
03
0.80
8
0.095
36
.7
42.2
21
.1 90
72
Igwam
iti
66,46
6
32,31
7
34,14
9
11
,016
26
,083
13,48
0
24,20
6
38,24
3
2,1
40
0.94
6
0.738
0.
682
0.0
56
53.0
34
.9
12.1
1759
1
Salam
a
23,82
4
11,77
3
12,05
1
5,096
11,22
6
5,248
7,1
24
11
,577
1,021
0.
977
1.0
58
0.97
0
0.088
42
.5
40.3
17
.2 54
90La
ikipia
Eas
t Co
nstitu
ency
1
13,28
3
56,31
3
56,97
0
17
,367
42
,297
22,37
9
40,37
4
66,57
9
4,4
07
0.98
8
0.701
0.
635
0.0
66
55.3
35
.0
9.7
31
010
Ngob
it
23,83
6
11,94
7
11,88
9
3,863
9,496
5,018
7,4
50
13
,224
1,116
1.
005
0.8
02
0.71
8
0.084
51
.1
39.3
9.6
6544
Tigith
i
26,95
3
13,58
4
13,36
9
4,038
10,35
0
5,503
8,4
32
15
,156
1,447
1.
016
0.7
78
0.68
3
0.095
50
.6
36.1
13
.3 58
92
Thing
ithu
20
,069
9,7
07
10
,362
3,1
61
7,3
17
3,9
15
8,004
12,34
7
405
0.93
7
0.625
0.
593
0.0
33
55.6
36
.1
8.3
57
96
Nany
uki
26
,267
12
,943
13
,324
3,8
82
8,9
29
4,71
1
11,12
2
16,71
7
621
0.97
1
0.571
0.
534
0.0
37
64.1
27
.6
8.3
83
49
19
Pulling Apart or Pooling Together?
Uman
de
16,15
8
8,132
8,026
2,423
6,205
3,232
5,3
66
9,1
35
81
8
1.
013
0.7
69
0.67
9
0.090
50
.8
39.6
9.6
4429
Laiki
pia N
orth
Co
nstitu
ency
78
,823
39
,689
39
,134
17,13
6
38,98
9
17
,610
24
,056
36
,876
2,958
1.
014
1.1
38
1.05
7
0.080
40
.9
40.3
18
.9 18
142
Sosia
n
25,84
8
12,69
5
13,15
3
6,123
13,31
8
5,493
7,3
37
11
,322
1,208
0.
965
1.2
83
1.17
6
0.107
41
.7
41.5
16
.8 60
77
Sege
ra
15
,911
8,0
92
7,8
19
3,3
05
7,2
76
3,1
90
4,969
7,938
697
1.03
5
1.004
0.
917
0.0
88
52.8
34
.9
12.3
4357
Mugo
godo
W
est
13
,702
6,9
88
6,7
14
3,1
65
7,4
30
3,4
46
4,100
5,973
299
1.04
1
1.294
1.
244
0.0
50
25.7
42
.3
32.0
2536
Mugo
godo
Ea
st
23,36
2
11,91
4
11,44
8
4,543
10,96
5
5,481
7,6
50
11
,643
75
4
1.
041
1.0
07
0.94
2
0.065
37
.4
42.3
20
.3 51
72
20
Exploring Kenya’s Inequality
A PUBLICATION OF KNBS AND SID
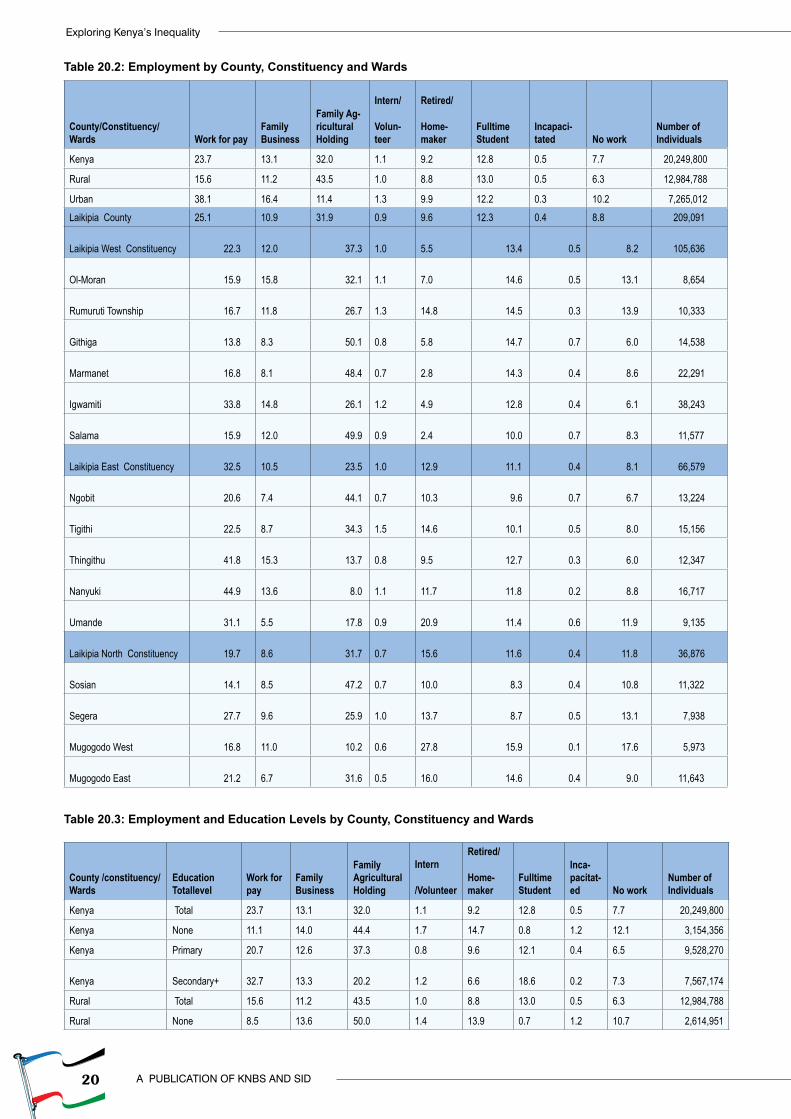
Table 20.2: Employment by County, Constituency and Wards
County/Constituency/Wards Work for pay
Family Business
Family Ag-ricultural Holding
Intern/
Volun-teer
Retired/
Home-maker
Fulltime Student
Incapaci-tated No work
Number of Individuals
Kenya 23.7 13.1 32.0 1.1 9.2 12.8 0.5 7.7 20,249,800
Rural 15.6 11.2 43.5 1.0 8.8 13.0 0.5 6.3 12,984,788
Urban 38.1 16.4 11.4 1.3 9.9 12.2 0.3 10.2 7,265,012 Laikipia County 25.1 10.9 31.9 0.9 9.6 12.3 0.4 8.8 209,091
Laikipia West Constituency 22.3 12.0 37.3
1.0
5.5 13.4 0.5 8.2 105,636
Ol-Moran 15.9 15.8 32.1
1.1
7.0 14.6 0.5 13.1 8,654
Rumuruti Township 16.7 11.8 26.7
1.3
14.8 14.5 0.3 13.9 10,333
Githiga 13.8 8.3 50.1
0.8
5.8 14.7 0.7 6.0 14,538
Marmanet 16.8 8.1 48.4
0.7
2.8 14.3 0.4 8.6 22,291
Igwamiti 33.8 14.8 26.1
1.2
4.9 12.8 0.4 6.1 38,243
Salama 15.9 12.0 49.9
0.9
2.4 10.0 0.7 8.3 11,577
Laikipia East Constituency 32.5 10.5 23.5
1.0
12.9 11.1 0.4 8.1 66,579
Ngobit 20.6 7.4 44.1
0.7
10.3 9.6 0.7 6.7 13,224
Tigithi 22.5 8.7 34.3
1.5
14.6 10.1 0.5 8.0 15,156
Thingithu 41.8 15.3 13.7
0.8
9.5 12.7 0.3 6.0 12,347
Nanyuki 44.9 13.6 8.0
1.1
11.7 11.8 0.2 8.8 16,717
Umande 31.1 5.5 17.8
0.9
20.9 11.4 0.6 11.9 9,135
Laikipia North Constituency 19.7 8.6 31.7
0.7
15.6 11.6 0.4 11.8 36,876
Sosian 14.1 8.5 47.2
0.7
10.0 8.3 0.4 10.8 11,322
Segera 27.7 9.6 25.9
1.0
13.7 8.7 0.5 13.1 7,938
Mugogodo West 16.8 11.0 10.2
0.6
27.8 15.9 0.1 17.6 5,973
Mugogodo East 21.2 6.7 31.6
0.5
16.0 14.6 0.4 9.0 11,643
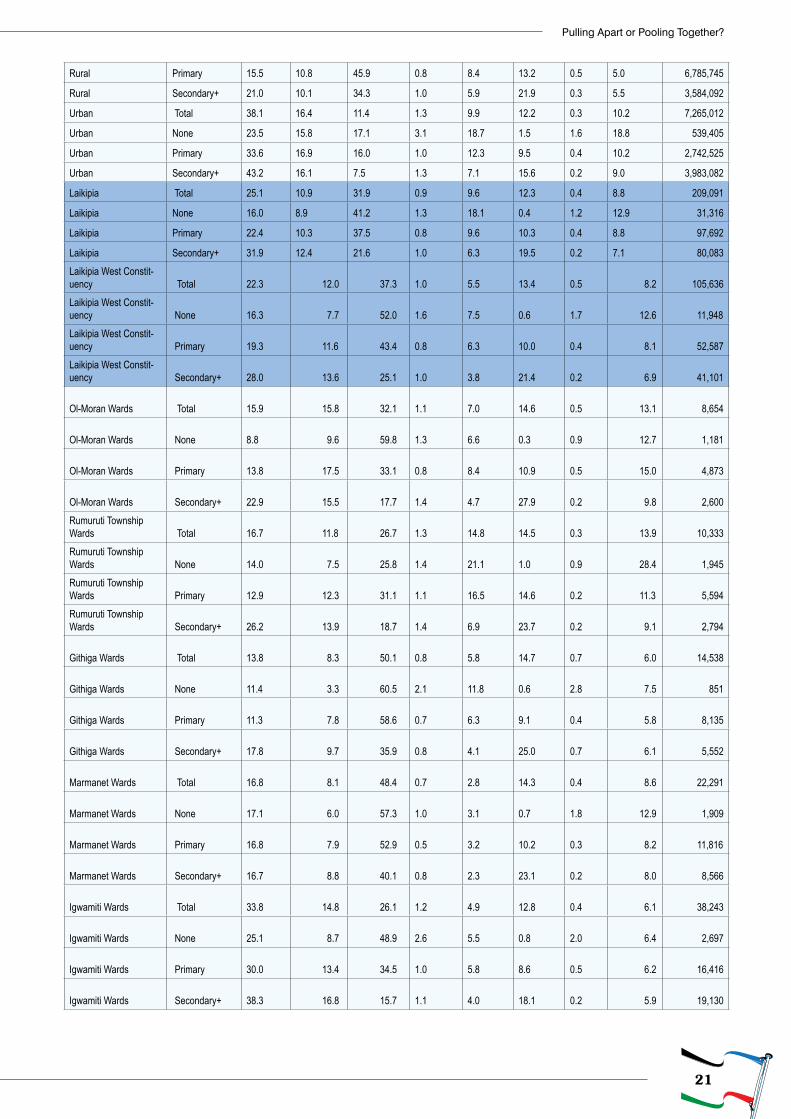
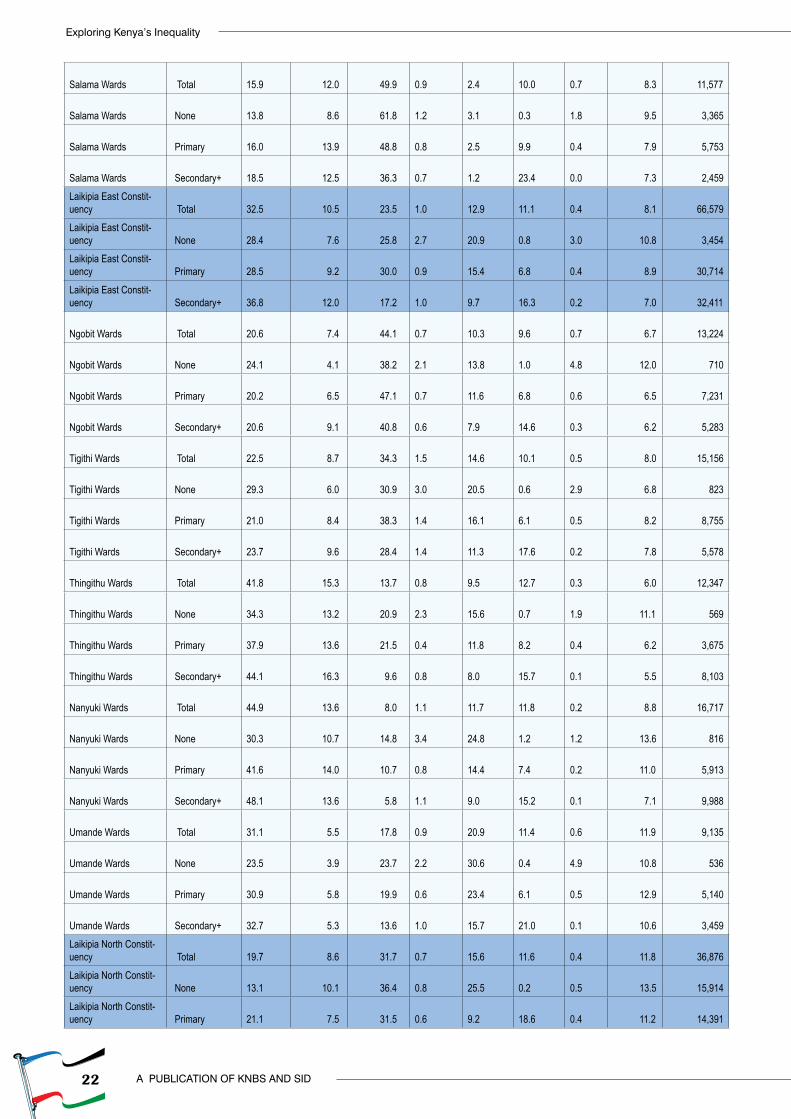
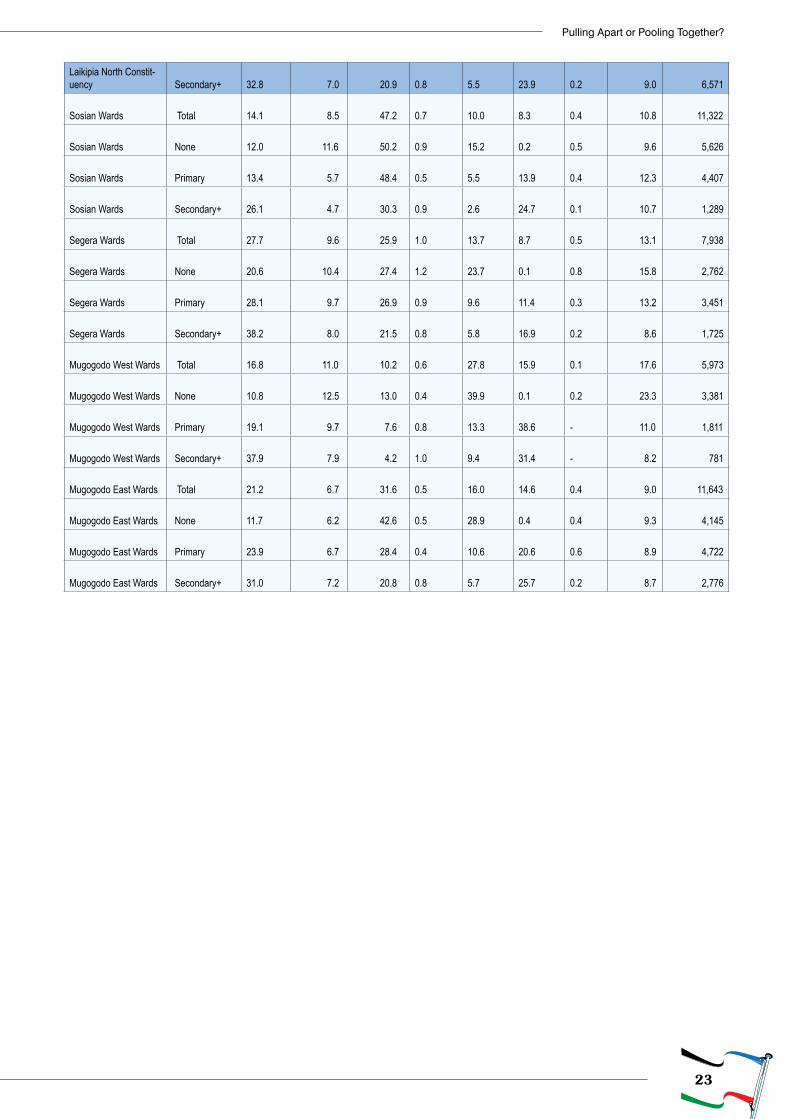
Table 20.3: Employment and Education Levels by County, Constituency and Wards
County /constituency/Wards
Education Totallevel
Work for pay
Family Business
Family Agricultural Holding
Intern
/Volunteer
Retired/
Home-maker
Fulltime Student
Inca-pacitat-ed No work
Number of Individuals
Kenya Total 23.7 13.1 32.0 1.1 9.2 12.8 0.5 7.7 20,249,800
Kenya None 11.1 14.0 44.4 1.7 14.7 0.8 1.2 12.1 3,154,356
Kenya Primary 20.7 12.6 37.3 0.8 9.6 12.1 0.4 6.5 9,528,270
Kenya Secondary+ 32.7 13.3 20.2 1.2 6.6 18.6 0.2 7.3 7,567,174
Rural Total 15.6 11.2 43.5 1.0 8.8 13.0 0.5 6.3 12,984,788
Rural None 8.5 13.6 50.0 1.4 13.9 0.7 1.2 10.7 2,614,951
21
Pulling Apart or Pooling Together?
Rural Primary 15.5 10.8 45.9 0.8 8.4 13.2 0.5 5.0 6,785,745
Rural Secondary+ 21.0 10.1 34.3 1.0 5.9 21.9 0.3 5.5 3,584,092
Urban Total 38.1 16.4 11.4 1.3 9.9 12.2 0.3 10.2 7,265,012
Urban None 23.5 15.8 17.1 3.1 18.7 1.5 1.6 18.8 539,405
Urban Primary 33.6 16.9 16.0 1.0 12.3 9.5 0.4 10.2 2,742,525
Urban Secondary+ 43.2 16.1 7.5 1.3 7.1 15.6 0.2 9.0 3,983,082
Laikipia Total 25.1 10.9 31.9 0.9 9.6 12.3 0.4 8.8 209,091
Laikipia None 16.0 8.9 41.2 1.3 18.1 0.4 1.2 12.9 31,316
Laikipia Primary 22.4 10.3 37.5 0.8 9.6 10.3 0.4 8.8 97,692
Laikipia Secondary+ 31.9 12.4 21.6 1.0 6.3 19.5 0.2 7.1 80,083 Laikipia West Constit-uency Total
22.3 12.0 37.3
1.0
5.5
13.4
0.5 8.2 105,636
Laikipia West Constit-uency None
16.3 7.7 52.0
1.6
7.5
0.6
1.7 12.6 11,948
Laikipia West Constit-uency Primary
19.3 11.6 43.4
0.8
6.3
10.0
0.4 8.1 52,587
Laikipia West Constit-uency Secondary+
28.0 13.6 25.1
1.0
3.8
21.4
0.2 6.9 41,101
Ol-Moran Wards Total 15.9 15.8 32.1
1.1
7.0
14.6
0.5 13.1 8,654
Ol-Moran Wards None 8.8 9.6 59.8
1.3
6.6
0.3
0.9 12.7 1,181
Ol-Moran Wards Primary 13.8 17.5 33.1
0.8
8.4
10.9
0.5 15.0 4,873
Ol-Moran Wards Secondary+ 22.9 15.5 17.7
1.4
4.7
27.9
0.2 9.8 2,600
Rumuruti Township Wards Total
16.7 11.8 26.7
1.3
14.8
14.5
0.3 13.9 10,333
Rumuruti Township Wards None
14.0 7.5 25.8
1.4
21.1
1.0
0.9 28.4 1,945
Rumuruti Township Wards Primary
12.9 12.3 31.1
1.1
16.5
14.6
0.2 11.3 5,594
Rumuruti Township Wards Secondary+
26.2 13.9 18.7
1.4
6.9
23.7
0.2 9.1 2,794
Githiga Wards Total 13.8 8.3 50.1
0.8
5.8
14.7
0.7 6.0 14,538
Githiga Wards None 11.4 3.3 60.5
2.1
11.8
0.6
2.8 7.5 851
Githiga Wards Primary 11.3 7.8 58.6
0.7
6.3
9.1
0.4 5.8 8,135
Githiga Wards Secondary+ 17.8 9.7 35.9
0.8
4.1
25.0
0.7 6.1 5,552
Marmanet Wards Total 16.8 8.1 48.4
0.7
2.8
14.3
0.4 8.6 22,291
Marmanet Wards None 17.1 6.0 57.3
1.0
3.1
0.7
1.8 12.9 1,909
Marmanet Wards Primary 16.8 7.9 52.9
0.5
3.2
10.2
0.3 8.2 11,816
Marmanet Wards Secondary+ 16.7 8.8 40.1
0.8
2.3
23.1
0.2 8.0 8,566
Igwamiti Wards Total 33.8 14.8 26.1
1.2
4.9
12.8
0.4 6.1 38,243
Igwamiti Wards None 25.1 8.7 48.9
2.6
5.5
0.8
2.0 6.4 2,697
Igwamiti Wards Primary 30.0 13.4 34.5
1.0
5.8
8.6
0.5 6.2 16,416
Igwamiti Wards Secondary+ 38.3 16.8 15.7
1.1
4.0
18.1
0.2 5.9 19,130
22
Exploring Kenya’s Inequality
A PUBLICATION OF KNBS AND SID
Salama Wards Total 15.9 12.0 49.9
0.9
2.4
10.0
0.7 8.3 11,577
Salama Wards None 13.8 8.6 61.8
1.2
3.1
0.3
1.8 9.5 3,365
Salama Wards Primary 16.0 13.9 48.8
0.8
2.5
9.9
0.4 7.9 5,753
Salama Wards Secondary+ 18.5 12.5 36.3
0.7
1.2
23.4
0.0 7.3 2,459
Laikipia East Constit-uency Total
32.5 10.5 23.5
1.0
12.9
11.1
0.4 8.1 66,579
Laikipia East Constit-uency None
28.4 7.6 25.8
2.7
20.9
0.8
3.0 10.8 3,454
Laikipia East Constit-uency Primary
28.5 9.2 30.0
0.9
15.4
6.8
0.4 8.9 30,714
Laikipia East Constit-uency Secondary+
36.8 12.0 17.2
1.0
9.7
16.3
0.2 7.0 32,411
Ngobit Wards Total 20.6 7.4 44.1
0.7
10.3
9.6
0.7 6.7 13,224
Ngobit Wards None 24.1 4.1 38.2
2.1
13.8
1.0
4.8 12.0 710
Ngobit Wards Primary 20.2 6.5 47.1
0.7
11.6
6.8
0.6 6.5 7,231
Ngobit Wards Secondary+ 20.6 9.1 40.8
0.6
7.9
14.6
0.3 6.2 5,283
Tigithi Wards Total 22.5 8.7 34.3
1.5
14.6
10.1
0.5 8.0 15,156
Tigithi Wards None 29.3 6.0 30.9
3.0
20.5
0.6
2.9 6.8 823
Tigithi Wards Primary 21.0 8.4 38.3
1.4
16.1
6.1
0.5 8.2 8,755
Tigithi Wards Secondary+ 23.7 9.6 28.4
1.4
11.3
17.6
0.2 7.8 5,578
Thingithu Wards Total 41.8 15.3 13.7
0.8
9.5
12.7
0.3 6.0 12,347
Thingithu Wards None 34.3 13.2 20.9
2.3
15.6
0.7
1.9 11.1 569
Thingithu Wards Primary 37.9 13.6 21.5
0.4
11.8
8.2
0.4 6.2 3,675
Thingithu Wards Secondary+ 44.1 16.3 9.6
0.8
8.0
15.7
0.1 5.5 8,103
Nanyuki Wards Total 44.9 13.6 8.0
1.1
11.7
11.8
0.2 8.8 16,717
Nanyuki Wards None 30.3 10.7 14.8
3.4
24.8
1.2
1.2 13.6 816
Nanyuki Wards Primary 41.6 14.0 10.7
0.8
14.4
7.4
0.2 11.0 5,913
Nanyuki Wards Secondary+ 48.1 13.6 5.8
1.1
9.0
15.2
0.1 7.1 9,988
Umande Wards Total 31.1 5.5 17.8
0.9
20.9
11.4
0.6 11.9 9,135
Umande Wards None 23.5 3.9 23.7
2.2
30.6
0.4
4.9 10.8 536
Umande Wards Primary 30.9 5.8 19.9
0.6
23.4
6.1
0.5 12.9 5,140
Umande Wards Secondary+ 32.7 5.3 13.6
1.0
15.7
21.0
0.1 10.6 3,459
Laikipia North Constit-uency Total
19.7 8.6 31.7
0.7
15.6
11.6
0.4 11.8 36,876
Laikipia North Constit-uency None
13.1 10.1 36.4
0.8
25.5
0.2
0.5 13.5 15,914
Laikipia North Constit-uency Primary
21.1 7.5 31.5
0.6
9.2
18.6
0.4 11.2 14,391
23
Pulling Apart or Pooling Together?
Laikipia North Constit-uency Secondary+
32.8 7.0 20.9
0.8
5.5
23.9
0.2 9.0 6,571
Sosian Wards Total 14.1 8.5 47.2
0.7
10.0
8.3
0.4 10.8 11,322
Sosian Wards None 12.0 11.6 50.2
0.9
15.2
0.2
0.5 9.6 5,626
Sosian Wards Primary 13.4 5.7 48.4
0.5
5.5
13.9
0.4 12.3 4,407
Sosian Wards Secondary+ 26.1 4.7 30.3
0.9
2.6
24.7
0.1 10.7 1,289
Segera Wards Total 27.7 9.6 25.9
1.0
13.7
8.7
0.5 13.1 7,938
Segera Wards None 20.6 10.4 27.4
1.2
23.7
0.1
0.8 15.8 2,762
Segera Wards Primary 28.1 9.7 26.9
0.9
9.6
11.4
0.3 13.2 3,451
Segera Wards Secondary+ 38.2 8.0 21.5
0.8
5.8
16.9
0.2 8.6 1,725
Mugogodo West Wards Total 16.8 11.0 10.2
0.6
27.8
15.9
0.1 17.6 5,973
Mugogodo West Wards None 10.8 12.5 13.0
0.4
39.9
0.1
0.2 23.3 3,381
Mugogodo West Wards Primary 19.1 9.7 7.6
0.8
13.3
38.6
- 11.0 1,811
Mugogodo West Wards Secondary+ 37.9 7.9 4.2
1.0
9.4
31.4
- 8.2 781
Mugogodo East Wards Total 21.2 6.7 31.6
0.5
16.0
14.6
0.4 9.0 11,643
Mugogodo East Wards None 11.7 6.2 42.6
0.5
28.9
0.4
0.4 9.3 4,145
Mugogodo East Wards Primary 23.9 6.7 28.4
0.4
10.6
20.6
0.6 8.9 4,722
Mugogodo East Wards Secondary+ 31.0 7.2 20.8
0.8
5.7
25.7
0.2 8.7 2,776
24
Exploring Kenya’s Inequality
A PUBLICATION OF KNBS AND SID
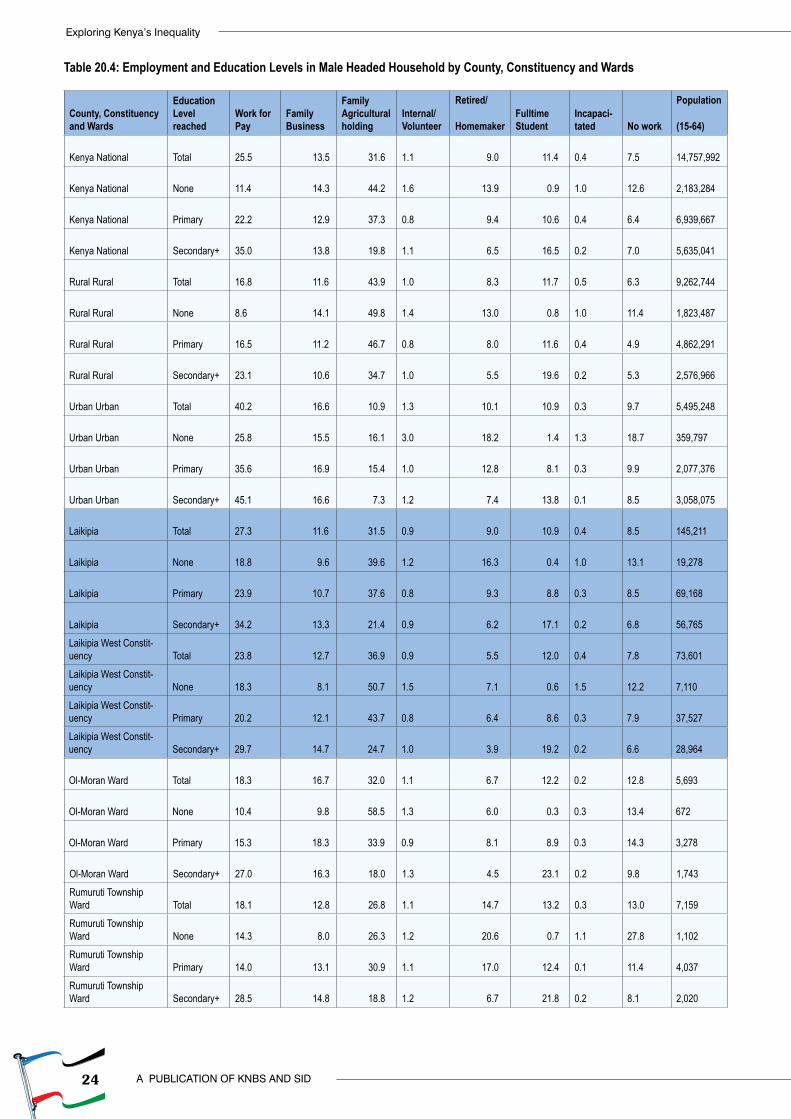
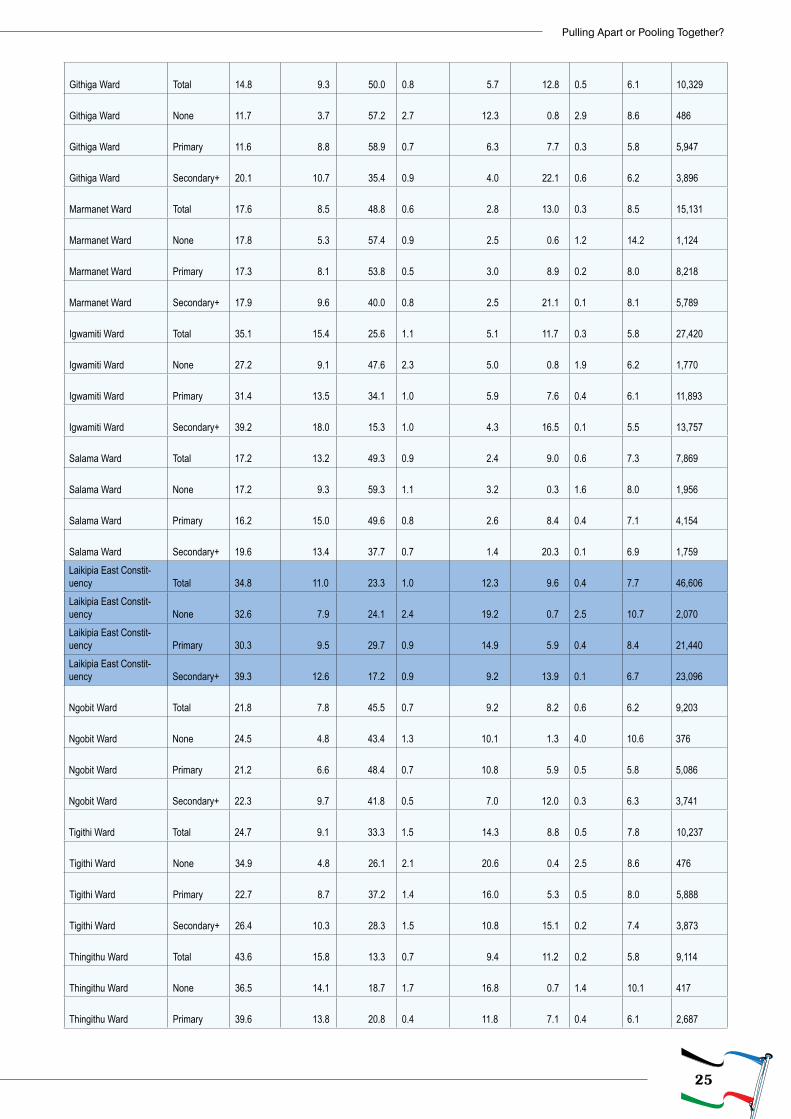
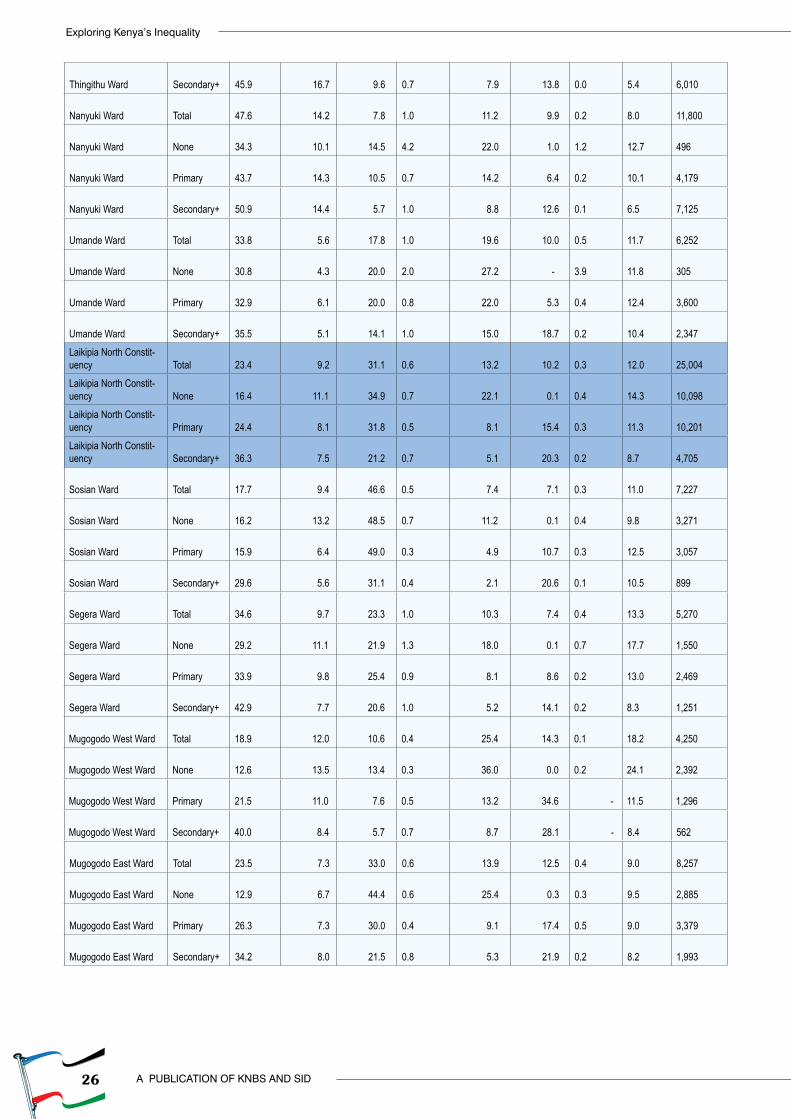
Table 20.4: Employment and Education Levels in Male Headed Household by County, Constituency and Wards
County, Constituency and Wards
Education Level reached
Work for Pay
Family Business
Family Agricultural holding
Internal/ Volunteer
Retired/
HomemakerFulltime Student
Incapaci-tated No work
Population
(15-64)
Kenya National Total 25.5 13.5 31.6
1.1 9.0 11.4
0.4
7.5
14,757,992
Kenya National None 11.4 14.3 44.2
1.6 13.9 0.9
1.0
12.6
2,183,284
Kenya National Primary 22.2 12.9 37.3
0.8 9.4 10.6
0.4
6.4
6,939,667
Kenya National Secondary+ 35.0 13.8 19.8
1.1 6.5 16.5
0.2
7.0
5,635,041
Rural Rural Total 16.8 11.6 43.9
1.0 8.3 11.7
0.5
6.3
9,262,744
Rural Rural None 8.6 14.1 49.8
1.4 13.0 0.8
1.0
11.4
1,823,487
Rural Rural Primary 16.5 11.2 46.7
0.8 8.0 11.6
0.4
4.9
4,862,291
Rural Rural Secondary+ 23.1 10.6 34.7
1.0 5.5 19.6
0.2
5.3
2,576,966
Urban Urban Total 40.2 16.6 10.9
1.3 10.1 10.9
0.3
9.7
5,495,248
Urban Urban None 25.8 15.5 16.1
3.0 18.2 1.4
1.3
18.7
359,797
Urban Urban Primary 35.6 16.9 15.4
1.0 12.8 8.1
0.3
9.9
2,077,376
Urban Urban Secondary+ 45.1 16.6 7.3
1.2 7.4 13.8
0.1
8.5
3,058,075
Laikipia Total 27.3 11.6 31.5
0.9 9.0 10.9
0.4
8.5
145,211
Laikipia None 18.8 9.6 39.6
1.2 16.3 0.4
1.0
13.1
19,278
Laikipia Primary 23.9 10.7 37.6
0.8 9.3 8.8
0.3
8.5
69,168
Laikipia Secondary+ 34.2 13.3 21.4
0.9 6.2 17.1
0.2
6.8
56,765
Laikipia West Constit-uency Total
23.8 12.7 36.9
0.9 5.5 12.0
0.4
7.8
73,601
Laikipia West Constit-uency None
18.3 8.1 50.7
1.5 7.1 0.6
1.5
12.2
7,110
Laikipia West Constit-uency Primary
20.2 12.1 43.7
0.8 6.4 8.6
0.3
7.9
37,527
Laikipia West Constit-uency Secondary+
29.7 14.7 24.7
1.0 3.9 19.2
0.2
6.6
28,964
Ol-Moran Ward Total 18.3 16.7 32.0
1.1 6.7 12.2
0.2
12.8
5,693
Ol-Moran Ward None 10.4 9.8 58.5
1.3 6.0 0.3
0.3
13.4
672
Ol-Moran Ward Primary 15.3 18.3 33.9
0.9 8.1 8.9
0.3
14.3
3,278
Ol-Moran Ward Secondary+ 27.0 16.3 18.0
1.3 4.5 23.1
0.2
9.8
1,743
Rumuruti Township Ward Total
18.1 12.8 26.8
1.1 14.7 13.2
0.3
13.0
7,159
Rumuruti Township Ward None
14.3 8.0 26.3
1.2 20.6 0.7
1.1
27.8
1,102
Rumuruti Township Ward Primary
14.0 13.1 30.9
1.1 17.0 12.4
0.1
11.4
4,037
Rumuruti Township Ward Secondary+
28.5 14.8 18.8
1.2 6.7 21.8
0.2
8.1
2,020
25
Pulling Apart or Pooling Together?
Githiga Ward Total 14.8 9.3 50.0
0.8 5.7 12.8
0.5
6.1
10,329
Githiga Ward None 11.7 3.7 57.2
2.7 12.3 0.8
2.9
8.6
486
Githiga Ward Primary 11.6 8.8 58.9
0.7 6.3 7.7
0.3
5.8
5,947
Githiga Ward Secondary+ 20.1 10.7 35.4
0.9 4.0 22.1
0.6
6.2
3,896
Marmanet Ward Total 17.6 8.5 48.8
0.6 2.8 13.0
0.3
8.5
15,131
Marmanet Ward None 17.8 5.3 57.4
0.9 2.5 0.6
1.2
14.2
1,124
Marmanet Ward Primary 17.3 8.1 53.8
0.5 3.0 8.9
0.2
8.0
8,218
Marmanet Ward Secondary+ 17.9 9.6 40.0
0.8 2.5 21.1
0.1
8.1
5,789
Igwamiti Ward Total 35.1 15.4 25.6
1.1 5.1 11.7
0.3
5.8
27,420
Igwamiti Ward None 27.2 9.1 47.6
2.3 5.0 0.8
1.9
6.2
1,770
Igwamiti Ward Primary 31.4 13.5 34.1
1.0 5.9 7.6
0.4
6.1
11,893
Igwamiti Ward Secondary+ 39.2 18.0 15.3
1.0 4.3 16.5
0.1
5.5
13,757
Salama Ward Total 17.2 13.2 49.3
0.9 2.4 9.0
0.6
7.3
7,869
Salama Ward None 17.2 9.3 59.3
1.1 3.2 0.3
1.6
8.0
1,956
Salama Ward Primary 16.2 15.0 49.6
0.8 2.6 8.4
0.4
7.1
4,154
Salama Ward Secondary+ 19.6 13.4 37.7
0.7 1.4 20.3
0.1
6.9
1,759
Laikipia East Constit-uency Total
34.8 11.0 23.3
1.0 12.3 9.6
0.4
7.7
46,606
Laikipia East Constit-uency None
32.6 7.9 24.1
2.4 19.2 0.7
2.5
10.7
2,070
Laikipia East Constit-uency Primary
30.3 9.5 29.7
0.9 14.9 5.9
0.4
8.4
21,440
Laikipia East Constit-uency Secondary+
39.3 12.6 17.2
0.9 9.2 13.9
0.1
6.7
23,096
Ngobit Ward Total 21.8 7.8 45.5
0.7 9.2 8.2
0.6
6.2
9,203
Ngobit Ward None 24.5 4.8 43.4
1.3 10.1 1.3
4.0
10.6
376
Ngobit Ward Primary 21.2 6.6 48.4
0.7 10.8 5.9
0.5
5.8
5,086
Ngobit Ward Secondary+ 22.3 9.7 41.8
0.5 7.0 12.0
0.3
6.3
3,741
Tigithi Ward Total 24.7 9.1 33.3
1.5 14.3 8.8
0.5
7.8
10,237
Tigithi Ward None 34.9 4.8 26.1
2.1 20.6 0.4
2.5
8.6
476
Tigithi Ward Primary 22.7 8.7 37.2
1.4 16.0 5.3
0.5
8.0
5,888
Tigithi Ward Secondary+ 26.4 10.3 28.3
1.5 10.8 15.1
0.2
7.4
3,873
Thingithu Ward Total 43.6 15.8 13.3
0.7 9.4 11.2
0.2
5.8
9,114
Thingithu Ward None 36.5 14.1 18.7
1.7 16.8 0.7
1.4
10.1
417
Thingithu Ward Primary 39.6 13.8 20.8
0.4 11.8 7.1
0.4
6.1
2,687
26
Exploring Kenya’s Inequality
A PUBLICATION OF KNBS AND SID
Thingithu Ward Secondary+ 45.9 16.7 9.6
0.7 7.9 13.8
0.0
5.4
6,010
Nanyuki Ward Total 47.6 14.2 7.8
1.0 11.2 9.9
0.2
8.0
11,800
Nanyuki Ward None 34.3 10.1 14.5
4.2 22.0 1.0
1.2
12.7
496
Nanyuki Ward Primary 43.7 14.3 10.5
0.7 14.2 6.4
0.2
10.1
4,179
Nanyuki Ward Secondary+ 50.9 14.4 5.7
1.0 8.8 12.6
0.1
6.5
7,125
Umande Ward Total 33.8 5.6 17.8
1.0 19.6 10.0
0.5
11.7
6,252
Umande Ward None 30.8 4.3 20.0
2.0 27.2 -
3.9
11.8
305
Umande Ward Primary 32.9 6.1 20.0
0.8 22.0 5.3
0.4
12.4
3,600
Umande Ward Secondary+ 35.5 5.1 14.1
1.0 15.0 18.7
0.2
10.4
2,347
Laikipia North Constit-uency Total
23.4 9.2 31.1
0.6 13.2 10.2
0.3
12.0
25,004
Laikipia North Constit-uency None
16.4 11.1 34.9
0.7 22.1 0.1
0.4
14.3
10,098
Laikipia North Constit-uency Primary
24.4 8.1 31.8
0.5 8.1 15.4
0.3
11.3
10,201
Laikipia North Constit-uency Secondary+
36.3 7.5 21.2
0.7 5.1 20.3
0.2
8.7
4,705
Sosian Ward Total 17.7 9.4 46.6
0.5 7.4 7.1
0.3
11.0
7,227
Sosian Ward None 16.2 13.2 48.5
0.7 11.2 0.1
0.4
9.8
3,271
Sosian Ward Primary 15.9 6.4 49.0
0.3 4.9 10.7
0.3
12.5
3,057
Sosian Ward Secondary+ 29.6 5.6 31.1
0.4 2.1 20.6
0.1
10.5
899
Segera Ward Total 34.6 9.7 23.3
1.0 10.3 7.4
0.4
13.3
5,270
Segera Ward None 29.2 11.1 21.9
1.3 18.0 0.1
0.7
17.7
1,550
Segera Ward Primary 33.9 9.8 25.4
0.9 8.1 8.6
0.2
13.0
2,469
Segera Ward Secondary+ 42.9 7.7 20.6
1.0 5.2 14.1
0.2
8.3
1,251
Mugogodo West Ward Total 18.9 12.0 10.6
0.4 25.4 14.3
0.1
18.2
4,250
Mugogodo West Ward None 12.6 13.5 13.4
0.3 36.0 0.0
0.2
24.1
2,392
Mugogodo West Ward Primary 21.5 11.0 7.6
0.5 13.2 34.6 -
11.5
1,296
Mugogodo West Ward Secondary+ 40.0 8.4 5.7
0.7 8.7 28.1 -
8.4
562
Mugogodo East Ward Total 23.5 7.3 33.0
0.6 13.9 12.5
0.4
9.0
8,257
Mugogodo East Ward None 12.9 6.7 44.4
0.6 25.4 0.3
0.3
9.5
2,885
Mugogodo East Ward Primary 26.3 7.3 30.0
0.4 9.1 17.4
0.5
9.0
3,379
Mugogodo East Ward Secondary+ 34.2 8.0 21.5
0.8 5.3 21.9
0.2
8.2
1,993
27
Pulling Apart or Pooling Together?
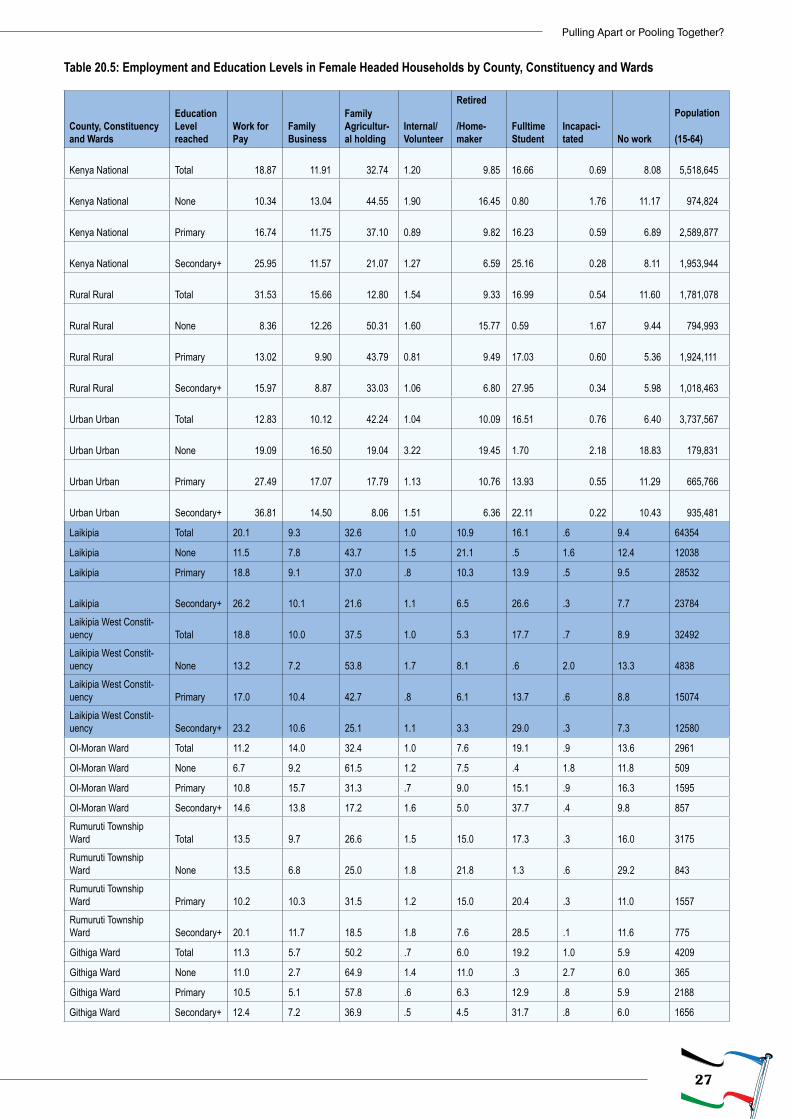
Table 20.5: Employment and Education Levels in Female Headed Households by County, Constituency and Wards
County, Constituency and Wards
Education Level reached
Work for Pay
Family Business
Family Agricultur-al holding
Internal/ Volunteer
Retired
/Home-maker
Fulltime Student
Incapaci-tated No work
Population
(15-64)
Kenya National Total 18.87 11.91 32.74 1.20 9.85
16.66 0.69 8.08 5,518,645
Kenya National None 10.34 13.04 44.55 1.90 16.45
0.80 1.76 11.17 974,824
Kenya National Primary 16.74 11.75 37.10 0.89 9.82
16.23 0.59 6.89 2,589,877
Kenya National Secondary+ 25.95 11.57 21.07 1.27 6.59
25.16 0.28 8.11 1,953,944
Rural Rural Total 31.53 15.66 12.80 1.54 9.33
16.99 0.54 11.60 1,781,078
Rural Rural None 8.36 12.26 50.31 1.60 15.77
0.59 1.67 9.44 794,993
Rural Rural Primary 13.02 9.90 43.79 0.81 9.49
17.03 0.60 5.36 1,924,111
Rural Rural Secondary+ 15.97 8.87 33.03 1.06 6.80
27.95 0.34 5.98 1,018,463
Urban Urban Total 12.83 10.12 42.24 1.04 10.09
16.51 0.76 6.40 3,737,567
Urban Urban None 19.09 16.50 19.04 3.22 19.45
1.70 2.18 18.83 179,831
Urban Urban Primary 27.49 17.07 17.79 1.13 10.76
13.93 0.55 11.29 665,766
Urban Urban Secondary+ 36.81 14.50 8.06 1.51 6.36
22.11 0.22 10.43 935,481
Laikipia Total 20.1 9.3 32.6 1.0 10.9 16.1 .6 9.4 64354
Laikipia None 11.5 7.8 43.7 1.5 21.1 .5 1.6 12.4 12038
Laikipia Primary 18.8 9.1 37.0 .8 10.3 13.9 .5 9.5 28532
Laikipia Secondary+ 26.2 10.1 21.6 1.1 6.5 26.6 .3 7.7 23784Laikipia West Constit-uency Total 18.8 10.0 37.5 1.0 5.3 17.7 .7 8.9 32492Laikipia West Constit-uency None 13.2 7.2 53.8 1.7 8.1 .6 2.0 13.3 4838Laikipia West Constit-uency Primary 17.0 10.4 42.7 .8 6.1 13.7 .6 8.8 15074Laikipia West Constit-uency Secondary+ 23.2 10.6 25.1 1.1 3.3 29.0 .3 7.3 12580
Ol-Moran Ward Total 11.2 14.0 32.4 1.0 7.6 19.1 .9 13.6 2961
Ol-Moran Ward None 6.7 9.2 61.5 1.2 7.5 .4 1.8 11.8 509
Ol-Moran Ward Primary 10.8 15.7 31.3 .7 9.0 15.1 .9 16.3 1595
Ol-Moran Ward Secondary+ 14.6 13.8 17.2 1.6 5.0 37.7 .4 9.8 857Rumuruti Township Ward Total 13.5 9.7 26.6 1.5 15.0 17.3 .3 16.0 3175Rumuruti Township Ward None 13.5 6.8 25.0 1.8 21.8 1.3 .6 29.2 843Rumuruti Township Ward Primary 10.2 10.3 31.5 1.2 15.0 20.4 .3 11.0 1557Rumuruti Township Ward Secondary+ 20.1 11.7 18.5 1.8 7.6 28.5 .1 11.6 775
Githiga Ward Total 11.3 5.7 50.2 .7 6.0 19.2 1.0 5.9 4209
Githiga Ward None 11.0 2.7 64.9 1.4 11.0 .3 2.7 6.0 365
Githiga Ward Primary 10.5 5.1 57.8 .6 6.3 12.9 .8 5.9 2188
Githiga Ward Secondary+ 12.4 7.2 36.9 .5 4.5 31.7 .8 6.0 1656
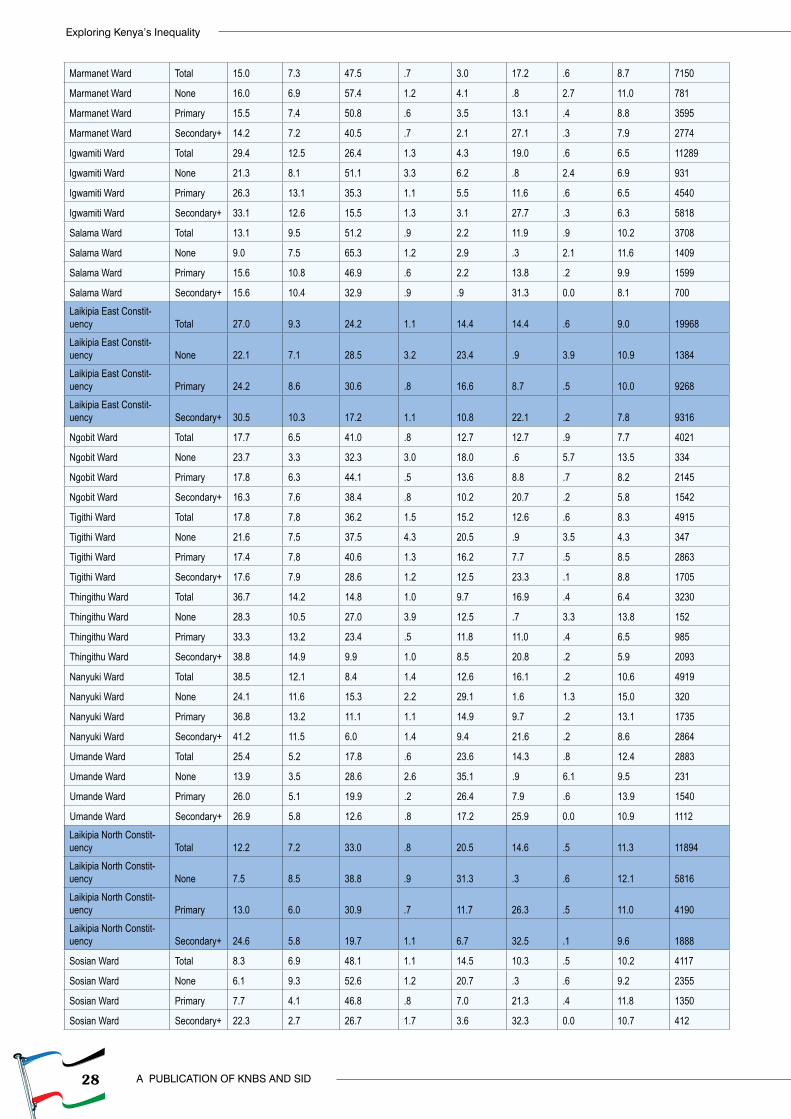
28
Exploring Kenya’s Inequality
A PUBLICATION OF KNBS AND SID
Marmanet Ward Total 15.0 7.3 47.5 .7 3.0 17.2 .6 8.7 7150
Marmanet Ward None 16.0 6.9 57.4 1.2 4.1 .8 2.7 11.0 781
Marmanet Ward Primary 15.5 7.4 50.8 .6 3.5 13.1 .4 8.8 3595
Marmanet Ward Secondary+ 14.2 7.2 40.5 .7 2.1 27.1 .3 7.9 2774
Igwamiti Ward Total 29.4 12.5 26.4 1.3 4.3 19.0 .6 6.5 11289
Igwamiti Ward None 21.3 8.1 51.1 3.3 6.2 .8 2.4 6.9 931
Igwamiti Ward Primary 26.3 13.1 35.3 1.1 5.5 11.6 .6 6.5 4540
Igwamiti Ward Secondary+ 33.1 12.6 15.5 1.3 3.1 27.7 .3 6.3 5818
Salama Ward Total 13.1 9.5 51.2 .9 2.2 11.9 .9 10.2 3708
Salama Ward None 9.0 7.5 65.3 1.2 2.9 .3 2.1 11.6 1409
Salama Ward Primary 15.6 10.8 46.9 .6 2.2 13.8 .2 9.9 1599
Salama Ward Secondary+ 15.6 10.4 32.9 .9 .9 31.3 0.0 8.1 700Laikipia East Constit-uency Total 27.0 9.3 24.2 1.1 14.4 14.4 .6 9.0 19968Laikipia East Constit-uency None 22.1 7.1 28.5 3.2 23.4 .9 3.9 10.9 1384Laikipia East Constit-uency Primary 24.2 8.6 30.6 .8 16.6 8.7 .5 10.0 9268Laikipia East Constit-uency Secondary+ 30.5 10.3 17.2 1.1 10.8 22.1 .2 7.8 9316
Ngobit Ward Total 17.7 6.5 41.0 .8 12.7 12.7 .9 7.7 4021
Ngobit Ward None 23.7 3.3 32.3 3.0 18.0 .6 5.7 13.5 334
Ngobit Ward Primary 17.8 6.3 44.1 .5 13.6 8.8 .7 8.2 2145
Ngobit Ward Secondary+ 16.3 7.6 38.4 .8 10.2 20.7 .2 5.8 1542
Tigithi Ward Total 17.8 7.8 36.2 1.5 15.2 12.6 .6 8.3 4915
Tigithi Ward None 21.6 7.5 37.5 4.3 20.5 .9 3.5 4.3 347
Tigithi Ward Primary 17.4 7.8 40.6 1.3 16.2 7.7 .5 8.5 2863
Tigithi Ward Secondary+ 17.6 7.9 28.6 1.2 12.5 23.3 .1 8.8 1705
Thingithu Ward Total 36.7 14.2 14.8 1.0 9.7 16.9 .4 6.4 3230
Thingithu Ward None 28.3 10.5 27.0 3.9 12.5 .7 3.3 13.8 152
Thingithu Ward Primary 33.3 13.2 23.4 .5 11.8 11.0 .4 6.5 985
Thingithu Ward Secondary+ 38.8 14.9 9.9 1.0 8.5 20.8 .2 5.9 2093
Nanyuki Ward Total 38.5 12.1 8.4 1.4 12.6 16.1 .2 10.6 4919
Nanyuki Ward None 24.1 11.6 15.3 2.2 29.1 1.6 1.3 15.0 320
Nanyuki Ward Primary 36.8 13.2 11.1 1.1 14.9 9.7 .2 13.1 1735
Nanyuki Ward Secondary+ 41.2 11.5 6.0 1.4 9.4 21.6 .2 8.6 2864
Umande Ward Total 25.4 5.2 17.8 .6 23.6 14.3 .8 12.4 2883
Umande Ward None 13.9 3.5 28.6 2.6 35.1 .9 6.1 9.5 231
Umande Ward Primary 26.0 5.1 19.9 .2 26.4 7.9 .6 13.9 1540
Umande Ward Secondary+ 26.9 5.8 12.6 .8 17.2 25.9 0.0 10.9 1112Laikipia North Constit-uency Total 12.2 7.2 33.0 .8 20.5 14.6 .5 11.3 11894Laikipia North Constit-uency None 7.5 8.5 38.8 .9 31.3 .3 .6 12.1 5816Laikipia North Constit-uency Primary 13.0 6.0 30.9 .7 11.7 26.3 .5 11.0 4190Laikipia North Constit-uency Secondary+ 24.6 5.8 19.7 1.1 6.7 32.5 .1 9.6 1888
Sosian Ward Total 8.3 6.9 48.1 1.1 14.5 10.3 .5 10.2 4117
Sosian Ward None 6.1 9.3 52.6 1.2 20.7 .3 .6 9.2 2355
Sosian Ward Primary 7.7 4.1 46.8 .8 7.0 21.3 .4 11.8 1350
Sosian Ward Secondary+ 22.3 2.7 26.7 1.7 3.6 32.3 0.0 10.7 412
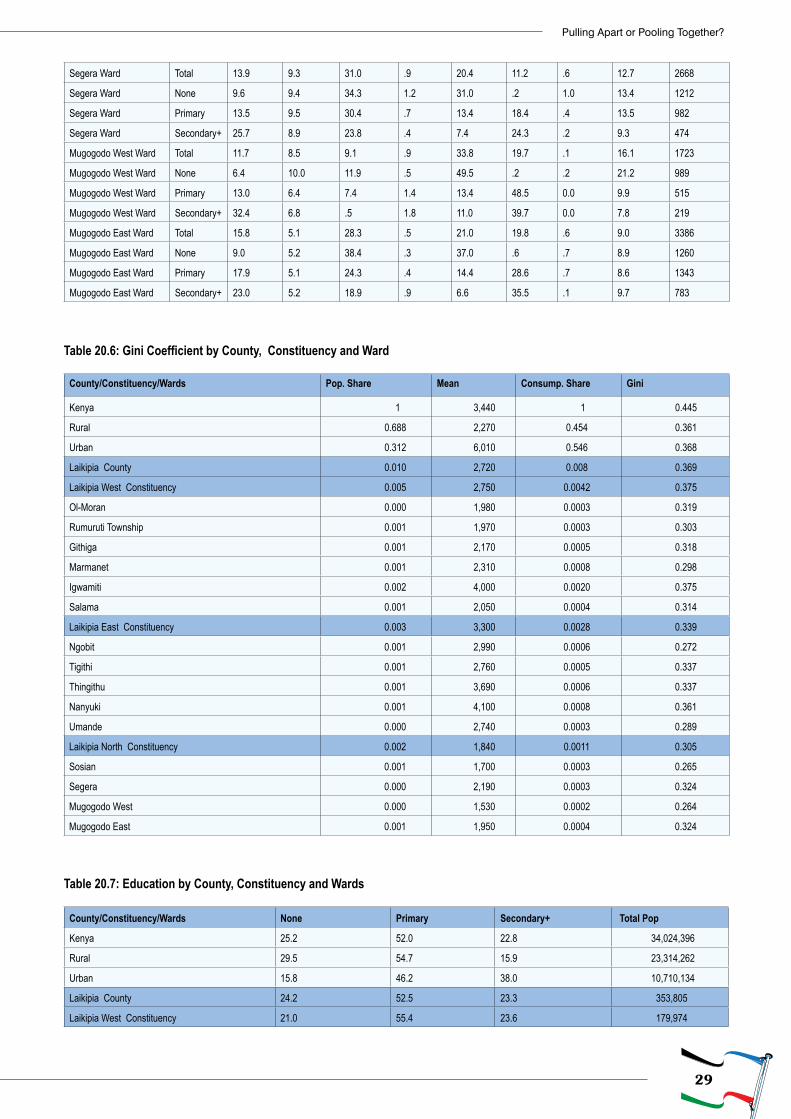
29
Pulling Apart or Pooling Together?
Segera Ward Total 13.9 9.3 31.0 .9 20.4 11.2 .6 12.7 2668
Segera Ward None 9.6 9.4 34.3 1.2 31.0 .2 1.0 13.4 1212
Segera Ward Primary 13.5 9.5 30.4 .7 13.4 18.4 .4 13.5 982
Segera Ward Secondary+ 25.7 8.9 23.8 .4 7.4 24.3 .2 9.3 474
Mugogodo West Ward Total 11.7 8.5 9.1 .9 33.8 19.7 .1 16.1 1723
Mugogodo West Ward None 6.4 10.0 11.9 .5 49.5 .2 .2 21.2 989
Mugogodo West Ward Primary 13.0 6.4 7.4 1.4 13.4 48.5 0.0 9.9 515
Mugogodo West Ward Secondary+ 32.4 6.8 .5 1.8 11.0 39.7 0.0 7.8 219
Mugogodo East Ward Total 15.8 5.1 28.3 .5 21.0 19.8 .6 9.0 3386
Mugogodo East Ward None 9.0 5.2 38.4 .3 37.0 .6 .7 8.9 1260
Mugogodo East Ward Primary 17.9 5.1 24.3 .4 14.4 28.6 .7 8.6 1343
Mugogodo East Ward Secondary+ 23.0 5.2 18.9 .9 6.6 35.5 .1 9.7 783
Table 20.6: Gini Coefficient by County, Constituency and Ward
County/Constituency/Wards Pop. Share Mean Consump. Share Gini
Kenya 1 3,440 1 0.445
Rural 0.688 2,270 0.454 0.361
Urban 0.312 6,010 0.546 0.368
Laikipia County 0.010 2,720 0.008 0.369
Laikipia West Constituency 0.005 2,750 0.0042 0.375
Ol-Moran 0.000 1,980 0.0003 0.319
Rumuruti Township 0.001 1,970 0.0003 0.303
Githiga 0.001 2,170 0.0005 0.318
Marmanet 0.001 2,310 0.0008 0.298
Igwamiti 0.002 4,000 0.0020 0.375
Salama 0.001 2,050 0.0004 0.314
Laikipia East Constituency 0.003 3,300 0.0028 0.339
Ngobit 0.001 2,990 0.0006 0.272
Tigithi 0.001 2,760 0.0005 0.337
Thingithu 0.001 3,690 0.0006 0.337
Nanyuki 0.001 4,100 0.0008 0.361
Umande 0.000 2,740 0.0003 0.289
Laikipia North Constituency 0.002 1,840 0.0011 0.305
Sosian 0.001 1,700 0.0003 0.265
Segera 0.000 2,190 0.0003 0.324
Mugogodo West 0.000 1,530 0.0002 0.264
Mugogodo East 0.001 1,950 0.0004 0.324
Table 20.7: Education by County, Constituency and Wards
County/Constituency/Wards None Primary Secondary+ Total Pop
Kenya 25.2 52.0 22.8 34,024,396
Rural 29.5 54.7 15.9 23,314,262
Urban 15.8 46.2 38.0 10,710,134
Laikipia County 24.2 52.5 23.3 353,805
Laikipia West Constituency 21.0 55.4 23.6 179,974
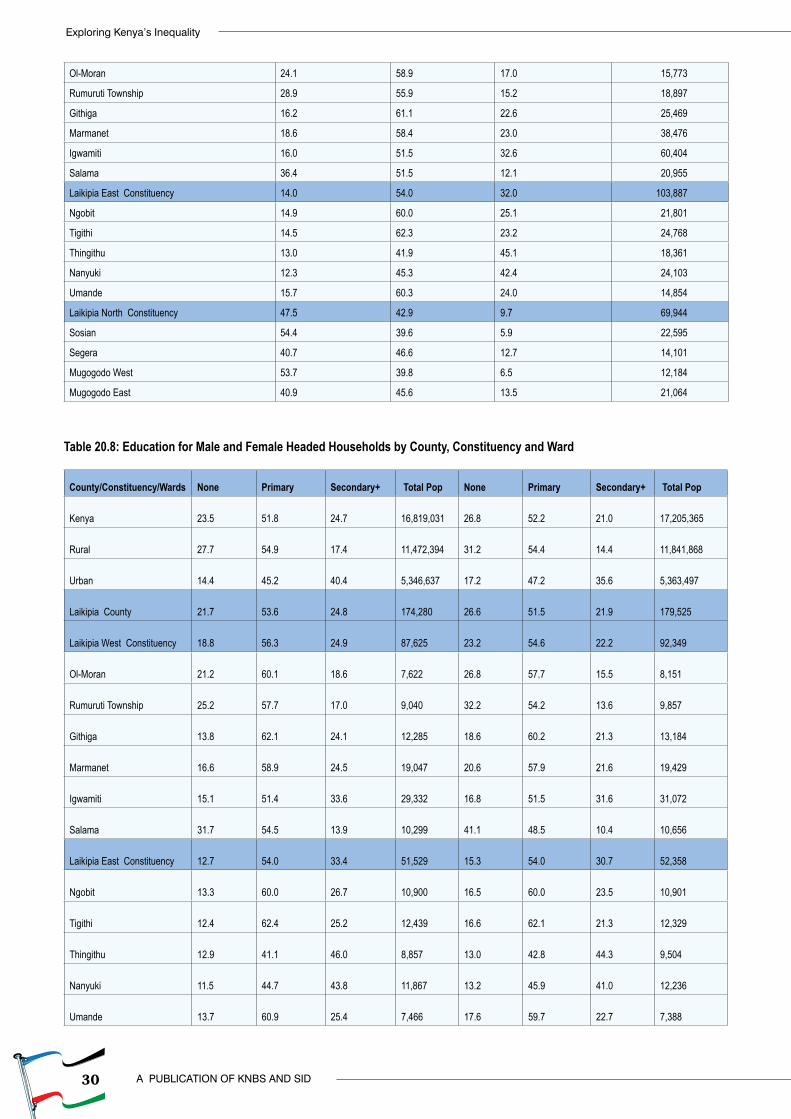
30
Exploring Kenya’s Inequality
A PUBLICATION OF KNBS AND SID
Ol-Moran 24.1 58.9 17.0 15,773
Rumuruti Township 28.9 55.9 15.2 18,897
Githiga 16.2 61.1 22.6 25,469
Marmanet 18.6 58.4 23.0 38,476
Igwamiti 16.0 51.5 32.6 60,404
Salama 36.4 51.5 12.1 20,955
Laikipia East Constituency 14.0 54.0 32.0 103,887
Ngobit 14.9 60.0 25.1 21,801
Tigithi 14.5 62.3 23.2 24,768
Thingithu 13.0 41.9 45.1 18,361
Nanyuki 12.3 45.3 42.4 24,103
Umande 15.7 60.3 24.0 14,854
Laikipia North Constituency 47.5 42.9 9.7 69,944
Sosian 54.4 39.6 5.9 22,595
Segera 40.7 46.6 12.7 14,101
Mugogodo West 53.7 39.8 6.5 12,184
Mugogodo East 40.9 45.6 13.5 21,064
Table 20.8: Education for Male and Female Headed Households by County, Constituency and Ward
County/Constituency/Wards None Primary Secondary+ Total Pop None Primary Secondary+ Total Pop
Kenya 23.5 51.8 24.7 16,819,031 26.8 52.2 21.0
17,205,365
Rural 27.7 54.9 17.4 11,472,394 31.2 54.4 14.4
11,841,868
Urban 14.4 45.2 40.4 5,346,637 17.2 47.2 35.6
5,363,497
Laikipia County 21.7 53.6 24.8 174,280 26.6 51.5 21.9
179,525
Laikipia West Constituency 18.8 56.3 24.9 87,625 23.2 54.6 22.2
92,349
Ol-Moran 21.2 60.1 18.6 7,622 26.8 57.7 15.5
8,151
Rumuruti Township 25.2 57.7 17.0 9,040 32.2 54.2 13.6
9,857
Githiga 13.8 62.1 24.1 12,285 18.6 60.2 21.3
13,184
Marmanet 16.6 58.9 24.5 19,047 20.6 57.9 21.6
19,429
Igwamiti 15.1 51.4 33.6 29,332 16.8 51.5 31.6
31,072
Salama 31.7 54.5 13.9 10,299 41.1 48.5 10.4
10,656
Laikipia East Constituency 12.7 54.0 33.4 51,529 15.3 54.0 30.7
52,358
Ngobit 13.3 60.0 26.7 10,900 16.5 60.0 23.5
10,901
Tigithi 12.4 62.4 25.2 12,439 16.6 62.1 21.3
12,329
Thingithu 12.9 41.1 46.0 8,857 13.0 42.8 44.3
9,504
Nanyuki 11.5 44.7 43.8 11,867 13.2 45.9 41.0
12,236
Umande 13.7 60.9 25.4 7,466 17.6 59.7 22.7
7,388
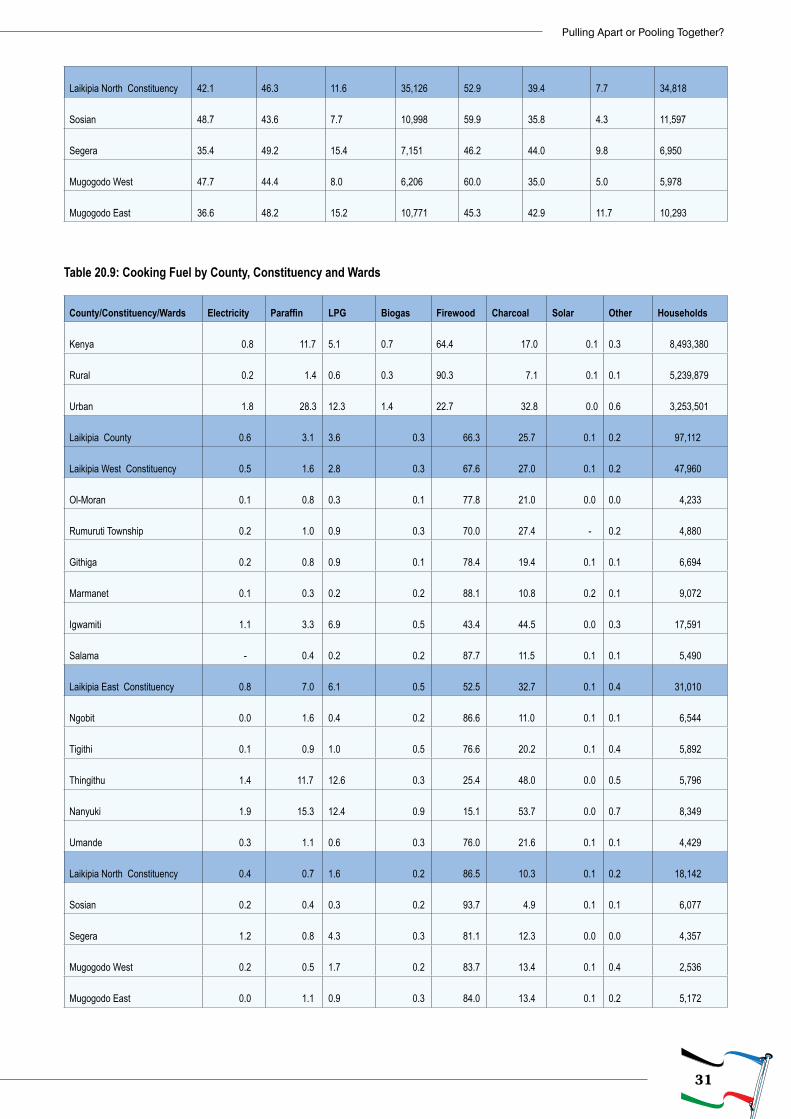
31
Pulling Apart or Pooling Together?
Laikipia North Constituency 42.1 46.3 11.6 35,126 52.9 39.4 7.7
34,818
Sosian 48.7 43.6 7.7 10,998 59.9 35.8 4.3
11,597
Segera 35.4 49.2 15.4 7,151 46.2 44.0 9.8
6,950
Mugogodo West 47.7 44.4 8.0 6,206 60.0 35.0 5.0
5,978
Mugogodo East 36.6 48.2 15.2 10,771 45.3 42.9 11.7
10,293
Table 20.9: Cooking Fuel by County, Constituency and Wards
County/Constituency/Wards Electricity Paraffin LPG Biogas Firewood Charcoal Solar Other Households
Kenya 0.8 11.7 5.1
0.7
64.4 17.0 0.1
0.3 8,493,380
Rural 0.2 1.4 0.6
0.3
90.3 7.1 0.1
0.1 5,239,879
Urban 1.8 28.3 12.3
1.4
22.7 32.8 0.0
0.6 3,253,501
Laikipia County 0.6 3.1 3.6 0.3 66.3 25.7 0.1
0.2 97,112
Laikipia West Constituency 0.5 1.6 2.8 0.3 67.6 27.0 0.1
0.2 47,960
Ol-Moran 0.1 0.8 0.3 0.1 77.8 21.0 0.0
0.0 4,233
Rumuruti Township 0.2 1.0 0.9 0.3 70.0 27.4 -
0.2 4,880
Githiga 0.2 0.8 0.9 0.1 78.4 19.4 0.1
0.1 6,694
Marmanet 0.1 0.3 0.2 0.2 88.1 10.8 0.2
0.1 9,072
Igwamiti 1.1 3.3 6.9 0.5 43.4 44.5 0.0
0.3 17,591
Salama - 0.4 0.2 0.2 87.7 11.5 0.1
0.1 5,490
Laikipia East Constituency 0.8 7.0 6.1 0.5 52.5 32.7 0.1
0.4 31,010
Ngobit 0.0 1.6 0.4 0.2 86.6 11.0 0.1
0.1 6,544
Tigithi 0.1 0.9 1.0 0.5 76.6 20.2 0.1
0.4 5,892
Thingithu 1.4 11.7 12.6 0.3 25.4 48.0 0.0
0.5 5,796
Nanyuki 1.9 15.3 12.4 0.9 15.1 53.7 0.0
0.7 8,349
Umande 0.3 1.1 0.6 0.3 76.0 21.6 0.1
0.1 4,429
Laikipia North Constituency 0.4 0.7 1.6 0.2 86.5 10.3 0.1
0.2 18,142
Sosian 0.2 0.4 0.3 0.2 93.7 4.9 0.1
0.1 6,077
Segera 1.2 0.8 4.3 0.3 81.1 12.3 0.0
0.0 4,357
Mugogodo West 0.2 0.5 1.7 0.2 83.7 13.4 0.1
0.4 2,536
Mugogodo East 0.0 1.1 0.9 0.3 84.0 13.4 0.1
0.2 5,172
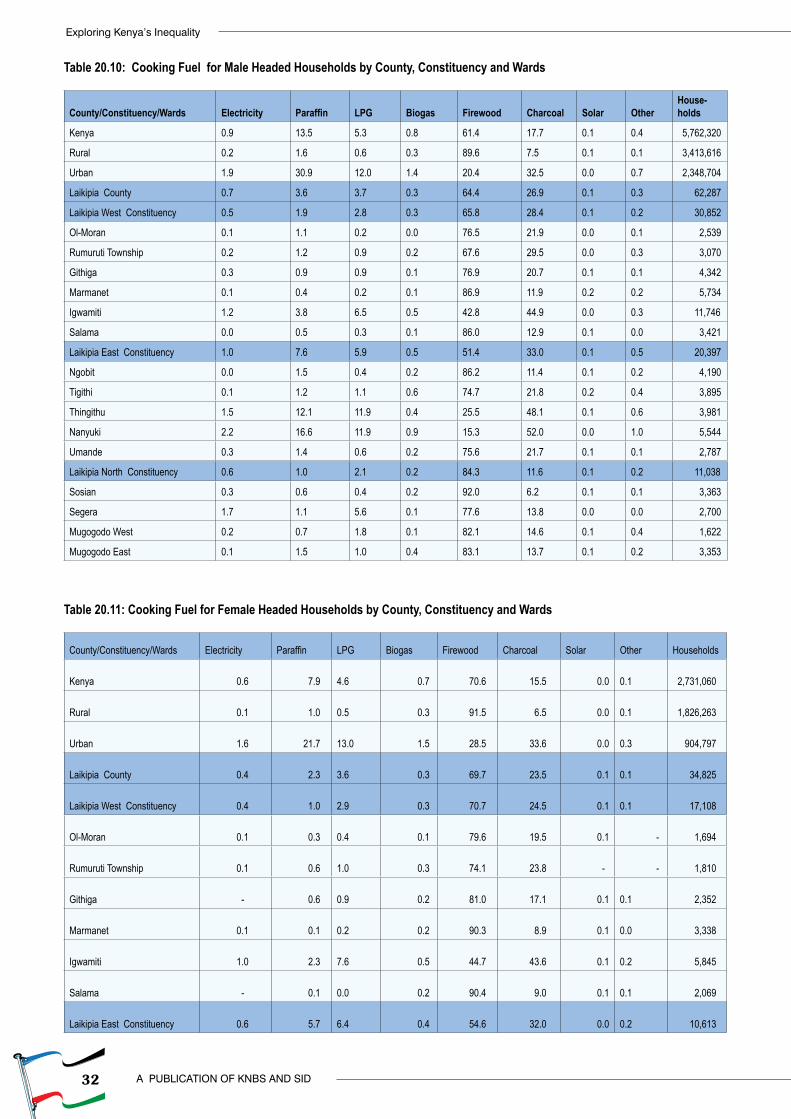
32
Exploring Kenya’s Inequality
A PUBLICATION OF KNBS AND SID
Table 20.10: Cooking Fuel for Male Headed Households by County, Constituency and Wards
County/Constituency/Wards Electricity Paraffin LPG Biogas Firewood Charcoal Solar OtherHouse-holds
Kenya 0.9 13.5 5.3 0.8 61.4 17.7 0.1 0.4 5,762,320
Rural 0.2 1.6 0.6 0.3 89.6 7.5 0.1 0.1 3,413,616
Urban 1.9 30.9 12.0 1.4 20.4 32.5 0.0 0.7 2,348,704
Laikipia County 0.7 3.6 3.7 0.3 64.4 26.9 0.1 0.3 62,287
Laikipia West Constituency 0.5 1.9 2.8 0.3 65.8 28.4 0.1 0.2 30,852
Ol-Moran 0.1 1.1 0.2 0.0 76.5 21.9 0.0 0.1 2,539
Rumuruti Township 0.2 1.2 0.9 0.2 67.6 29.5 0.0 0.3 3,070
Githiga 0.3 0.9 0.9 0.1 76.9 20.7 0.1 0.1 4,342
Marmanet 0.1 0.4 0.2 0.1 86.9 11.9 0.2 0.2 5,734
Igwamiti 1.2 3.8 6.5 0.5 42.8 44.9 0.0 0.3 11,746
Salama 0.0 0.5 0.3 0.1 86.0 12.9 0.1 0.0 3,421
Laikipia East Constituency 1.0 7.6 5.9 0.5 51.4 33.0 0.1 0.5 20,397
Ngobit 0.0 1.5 0.4 0.2 86.2 11.4 0.1 0.2 4,190
Tigithi 0.1 1.2 1.1 0.6 74.7 21.8 0.2 0.4 3,895
Thingithu 1.5 12.1 11.9 0.4 25.5 48.1 0.1 0.6 3,981
Nanyuki 2.2 16.6 11.9 0.9 15.3 52.0 0.0 1.0 5,544
Umande 0.3 1.4 0.6 0.2 75.6 21.7 0.1 0.1 2,787
Laikipia North Constituency 0.6 1.0 2.1 0.2 84.3 11.6 0.1 0.2 11,038
Sosian 0.3 0.6 0.4 0.2 92.0 6.2 0.1 0.1 3,363
Segera 1.7 1.1 5.6 0.1 77.6 13.8 0.0 0.0 2,700
Mugogodo West 0.2 0.7 1.8 0.1 82.1 14.6 0.1 0.4 1,622
Mugogodo East 0.1 1.5 1.0 0.4 83.1 13.7 0.1 0.2 3,353
Table 20.11: Cooking Fuel for Female Headed Households by County, Constituency and Wards
County/Constituency/Wards Electricity Paraffin LPG Biogas Firewood Charcoal Solar Other Households
Kenya 0.6 7.9 4.6 0.7 70.6 15.5 0.0
0.1 2,731,060
Rural 0.1 1.0 0.5 0.3 91.5 6.5 0.0
0.1 1,826,263
Urban 1.6 21.7 13.0 1.5 28.5 33.6 0.0
0.3 904,797
Laikipia County 0.4 2.3 3.6 0.3 69.7 23.5 0.1
0.1 34,825
Laikipia West Constituency 0.4 1.0 2.9 0.3 70.7 24.5 0.1
0.1 17,108
Ol-Moran 0.1 0.3 0.4 0.1 79.6 19.5 0.1 - 1,694
Rumuruti Township 0.1 0.6 1.0 0.3 74.1 23.8 - - 1,810
Githiga - 0.6 0.9 0.2 81.0 17.1 0.1
0.1 2,352
Marmanet 0.1 0.1 0.2 0.2 90.3 8.9 0.1
0.0 3,338
Igwamiti 1.0 2.3 7.6 0.5 44.7 43.6 0.1
0.2 5,845
Salama - 0.1 0.0 0.2 90.4 9.0 0.1
0.1 2,069
Laikipia East Constituency 0.6 5.7 6.4 0.4 54.6 32.0 0.0
0.2 10,613
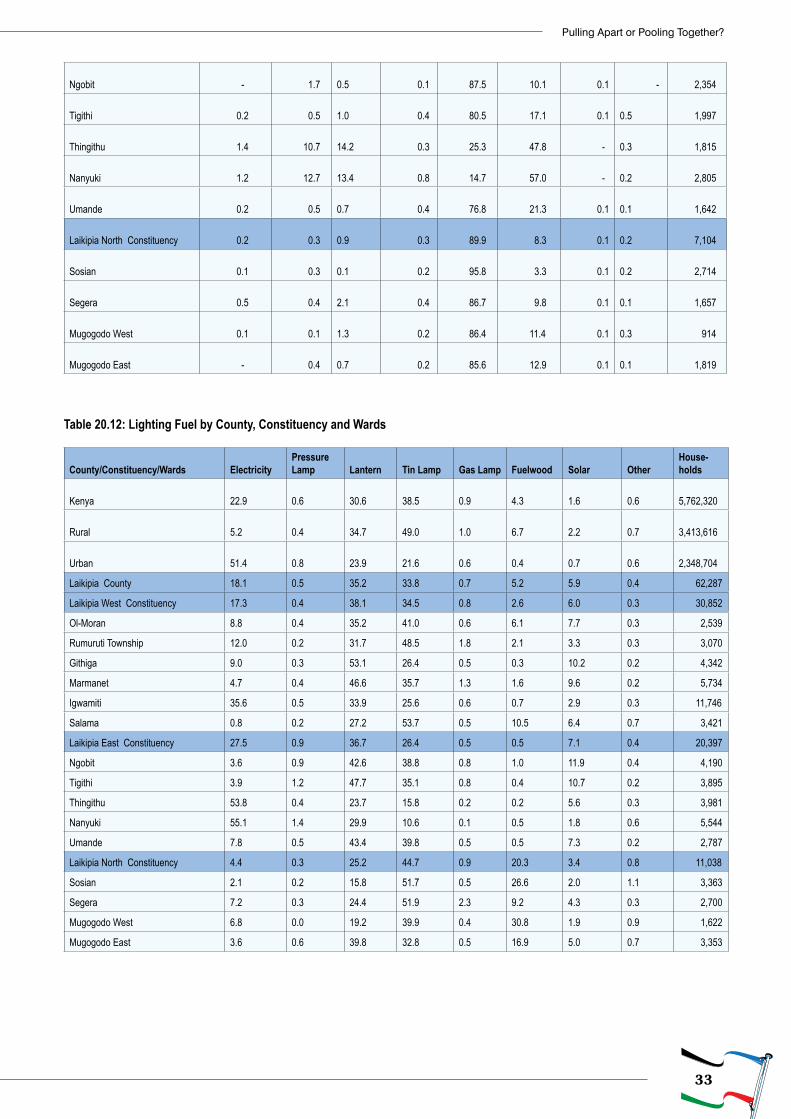
33
Pulling Apart or Pooling Together?
Ngobit - 1.7 0.5 0.1 87.5 10.1 0.1 - 2,354
Tigithi 0.2 0.5 1.0 0.4 80.5 17.1 0.1
0.5 1,997
Thingithu 1.4 10.7 14.2 0.3 25.3 47.8 -
0.3 1,815
Nanyuki 1.2 12.7 13.4 0.8 14.7 57.0 -
0.2 2,805
Umande 0.2 0.5 0.7 0.4 76.8 21.3 0.1
0.1 1,642
Laikipia North Constituency 0.2 0.3 0.9 0.3 89.9 8.3 0.1
0.2 7,104
Sosian 0.1 0.3 0.1 0.2 95.8 3.3 0.1
0.2 2,714
Segera 0.5 0.4 2.1 0.4 86.7 9.8 0.1
0.1 1,657
Mugogodo West 0.1 0.1 1.3 0.2 86.4 11.4 0.1
0.3 914
Mugogodo East - 0.4 0.7 0.2 85.6 12.9 0.1
0.1 1,819
Table 20.12: Lighting Fuel by County, Constituency and Wards
County/Constituency/Wards ElectricityPressure Lamp Lantern Tin Lamp Gas Lamp Fuelwood Solar Other
House-holds
Kenya 22.9 0.6 30.6 38.5 0.9 4.3 1.6 0.6 5,762,320
Rural 5.2 0.4 34.7 49.0 1.0 6.7 2.2 0.7 3,413,616
Urban 51.4 0.8 23.9 21.6 0.6 0.4 0.7 0.6 2,348,704
Laikipia County 18.1 0.5 35.2 33.8 0.7 5.2 5.9 0.4 62,287
Laikipia West Constituency 17.3 0.4 38.1 34.5 0.8 2.6 6.0 0.3 30,852
Ol-Moran 8.8 0.4 35.2 41.0 0.6 6.1 7.7 0.3 2,539
Rumuruti Township 12.0 0.2 31.7 48.5 1.8 2.1 3.3 0.3 3,070
Githiga 9.0 0.3 53.1 26.4 0.5 0.3 10.2 0.2 4,342
Marmanet 4.7 0.4 46.6 35.7 1.3 1.6 9.6 0.2 5,734
Igwamiti 35.6 0.5 33.9 25.6 0.6 0.7 2.9 0.3 11,746
Salama 0.8 0.2 27.2 53.7 0.5 10.5 6.4 0.7 3,421
Laikipia East Constituency 27.5 0.9 36.7 26.4 0.5 0.5 7.1 0.4 20,397
Ngobit 3.6 0.9 42.6 38.8 0.8 1.0 11.9 0.4 4,190
Tigithi 3.9 1.2 47.7 35.1 0.8 0.4 10.7 0.2 3,895
Thingithu 53.8 0.4 23.7 15.8 0.2 0.2 5.6 0.3 3,981
Nanyuki 55.1 1.4 29.9 10.6 0.1 0.5 1.8 0.6 5,544
Umande 7.8 0.5 43.4 39.8 0.5 0.5 7.3 0.2 2,787
Laikipia North Constituency 4.4 0.3 25.2 44.7 0.9 20.3 3.4 0.8 11,038
Sosian 2.1 0.2 15.8 51.7 0.5 26.6 2.0 1.1 3,363
Segera 7.2 0.3 24.4 51.9 2.3 9.2 4.3 0.3 2,700
Mugogodo West 6.8 0.0 19.2 39.9 0.4 30.8 1.9 0.9 1,622
Mugogodo East 3.6 0.6 39.8 32.8 0.5 16.9 5.0 0.7 3,353
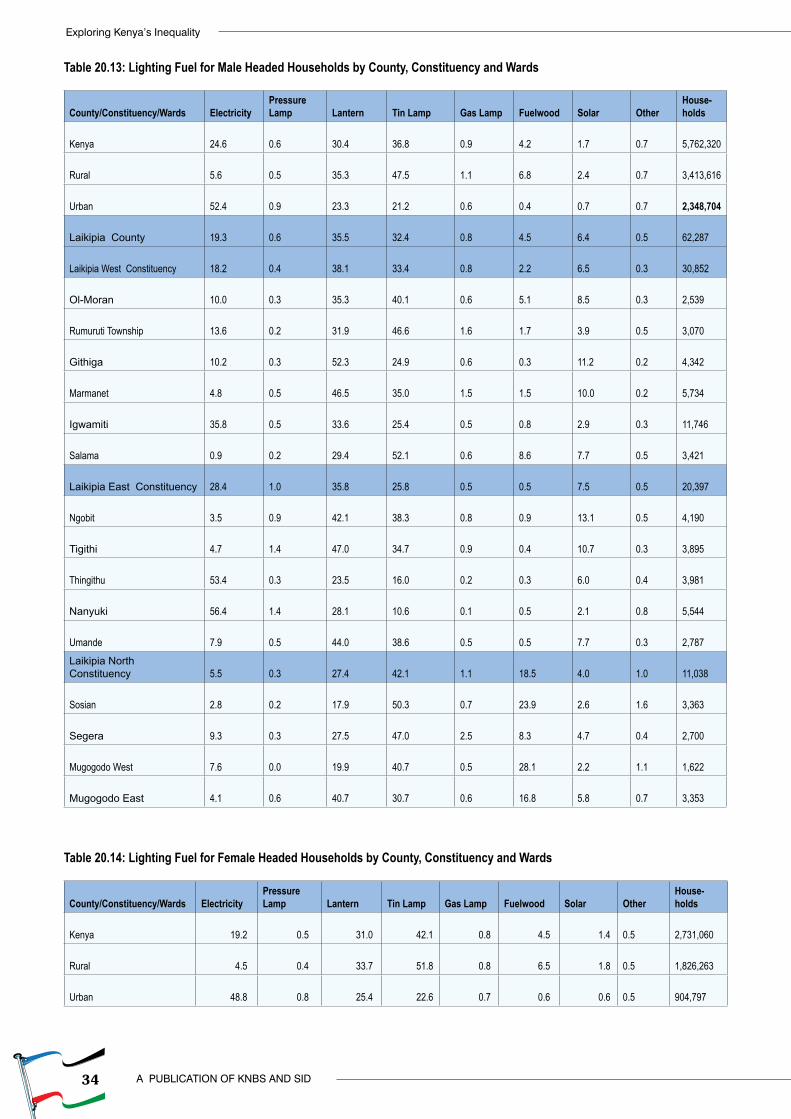
34
Exploring Kenya’s Inequality
A PUBLICATION OF KNBS AND SID
Table 20.13: Lighting Fuel for Male Headed Households by County, Constituency and Wards
County/Constituency/Wards ElectricityPressure Lamp Lantern Tin Lamp Gas Lamp Fuelwood Solar Other
House-holds
Kenya 24.6 0.6 30.4 36.8 0.9 4.2 1.7 0.7 5,762,320
Rural 5.6 0.5 35.3 47.5 1.1 6.8 2.4 0.7 3,413,616
Urban 52.4 0.9 23.3 21.2 0.6 0.4 0.7 0.7 2,348,704
Laikipia County 19.3 0.6 35.5 32.4 0.8 4.5 6.4 0.5 62,287
Laikipia West Constituency 18.2 0.4 38.1 33.4 0.8 2.2 6.5 0.3 30,852
Ol-Moran 10.0 0.3 35.3 40.1 0.6 5.1 8.5 0.3 2,539
Rumuruti Township 13.6 0.2 31.9 46.6 1.6 1.7 3.9 0.5 3,070
Githiga 10.2 0.3 52.3 24.9 0.6 0.3 11.2 0.2 4,342
Marmanet 4.8 0.5 46.5 35.0 1.5 1.5 10.0 0.2 5,734
Igwamiti 35.8 0.5 33.6 25.4 0.5 0.8 2.9 0.3 11,746
Salama 0.9 0.2 29.4 52.1 0.6 8.6 7.7 0.5 3,421
Laikipia East Constituency 28.4 1.0 35.8 25.8 0.5 0.5 7.5 0.5 20,397
Ngobit 3.5 0.9 42.1 38.3 0.8 0.9 13.1 0.5 4,190
Tigithi 4.7 1.4 47.0 34.7 0.9 0.4 10.7 0.3 3,895
Thingithu 53.4 0.3 23.5 16.0 0.2 0.3 6.0 0.4 3,981
Nanyuki 56.4 1.4 28.1 10.6 0.1 0.5 2.1 0.8 5,544
Umande 7.9 0.5 44.0 38.6 0.5 0.5 7.7 0.3 2,787
Laikipia North Constituency 5.5 0.3 27.4 42.1 1.1 18.5 4.0 1.0
11,038
Sosian 2.8 0.2 17.9 50.3 0.7 23.9 2.6 1.6 3,363
Segera 9.3 0.3 27.5 47.0 2.5 8.3 4.7 0.4 2,700
Mugogodo West 7.6 0.0 19.9 40.7 0.5 28.1 2.2 1.1 1,622
Mugogodo East 4.1 0.6 40.7 30.7 0.6 16.8 5.8 0.7 3,353
Table 20.14: Lighting Fuel for Female Headed Households by County, Constituency and Wards
County/Constituency/Wards ElectricityPressure Lamp Lantern Tin Lamp Gas Lamp Fuelwood Solar Other
House-holds
Kenya 19.2 0.5 31.0 42.1 0.8 4.5 1.4 0.5
2,731,060
Rural 4.5 0.4 33.7 51.8 0.8 6.5 1.8 0.5
1,826,263
Urban 48.8 0.8 25.4 22.6 0.7 0.6 0.6 0.5
904,797
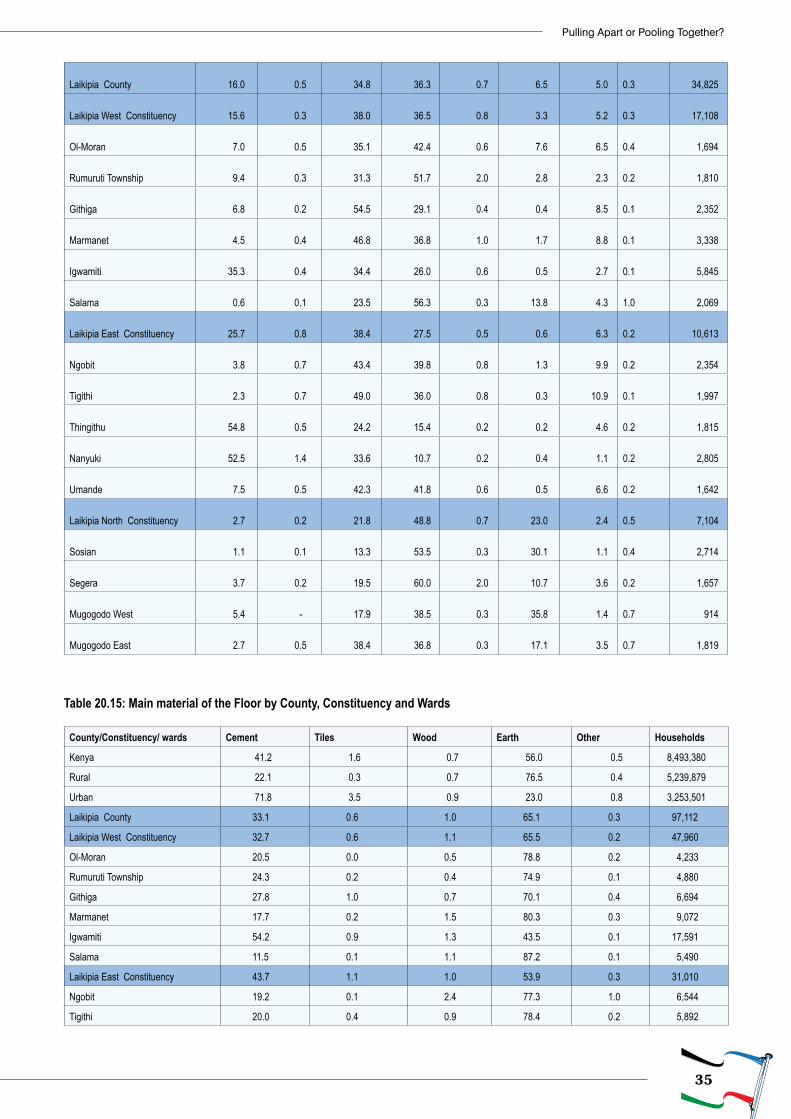
35
Pulling Apart or Pooling Together?
Laikipia County 16.0 0.5 34.8 36.3 0.7 6.5 5.0 0.3 34,825
Laikipia West Constituency 15.6 0.3 38.0 36.5 0.8 3.3 5.2 0.3 17,108
Ol-Moran 7.0 0.5 35.1 42.4 0.6 7.6 6.5 0.4 1,694
Rumuruti Township 9.4 0.3 31.3 51.7 2.0 2.8 2.3 0.2 1,810
Githiga 6.8 0.2 54.5 29.1 0.4 0.4 8.5 0.1 2,352
Marmanet 4.5 0.4 46.8 36.8 1.0 1.7 8.8 0.1 3,338
Igwamiti 35.3 0.4 34.4 26.0 0.6 0.5 2.7 0.1 5,845
Salama 0.6 0.1 23.5 56.3 0.3 13.8 4.3 1.0 2,069
Laikipia East Constituency 25.7 0.8 38.4 27.5 0.5 0.6 6.3 0.2 10,613
Ngobit 3.8 0.7 43.4 39.8 0.8 1.3 9.9 0.2 2,354
Tigithi 2.3 0.7 49.0 36.0 0.8 0.3 10.9 0.1 1,997
Thingithu 54.8 0.5 24.2 15.4 0.2 0.2 4.6 0.2 1,815
Nanyuki 52.5 1.4 33.6 10.7 0.2 0.4 1.1 0.2 2,805
Umande 7.5 0.5 42.3 41.8 0.6 0.5 6.6 0.2 1,642
Laikipia North Constituency 2.7 0.2 21.8 48.8 0.7 23.0 2.4 0.5 7,104
Sosian 1.1 0.1 13.3 53.5 0.3 30.1 1.1 0.4 2,714
Segera 3.7 0.2 19.5 60.0 2.0 10.7 3.6 0.2 1,657
Mugogodo West 5.4 - 17.9 38.5 0.3 35.8 1.4 0.7 914
Mugogodo East 2.7 0.5 38.4 36.8 0.3 17.1 3.5 0.7 1,819
Table 20.15: Main material of the Floor by County, Constituency and Wards
County/Constituency/ wards Cement Tiles Wood Earth Other Households
Kenya 41.2 1.6 0.7 56.0 0.5 8,493,380
Rural 22.1 0.3 0.7 76.5 0.4 5,239,879
Urban 71.8 3.5 0.9 23.0 0.8 3,253,501
Laikipia County 33.1 0.6 1.0 65.1 0.3 97,112
Laikipia West Constituency 32.7 0.6 1.1 65.5 0.2 47,960
Ol-Moran 20.5 0.0 0.5 78.8 0.2 4,233
Rumuruti Township 24.3 0.2 0.4 74.9 0.1 4,880
Githiga 27.8 1.0 0.7 70.1 0.4 6,694
Marmanet 17.7 0.2 1.5 80.3 0.3 9,072
Igwamiti 54.2 0.9 1.3 43.5 0.1 17,591
Salama 11.5 0.1 1.1 87.2 0.1 5,490
Laikipia East Constituency 43.7 1.1 1.0 53.9 0.3 31,010
Ngobit 19.2 0.1 2.4 77.3 1.0 6,544
Tigithi 20.0 0.4 0.9 78.4 0.2 5,892
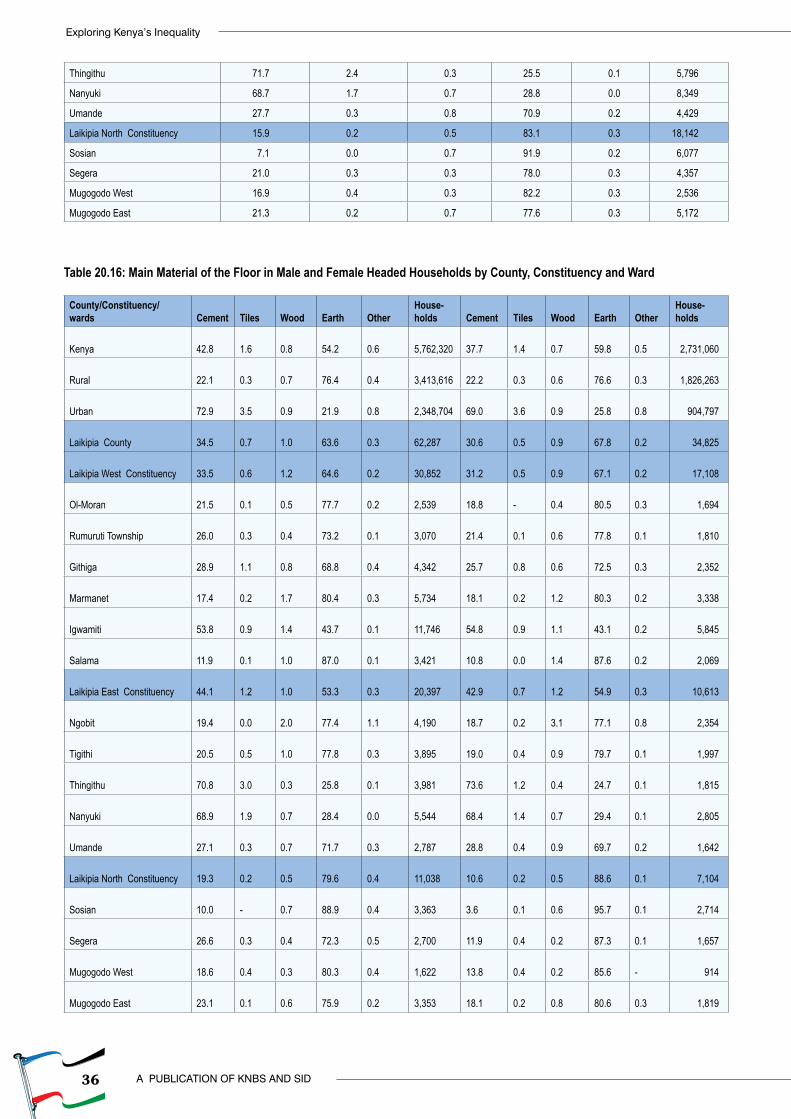
36
Exploring Kenya’s Inequality
A PUBLICATION OF KNBS AND SID
Thingithu 71.7 2.4 0.3 25.5 0.1 5,796
Nanyuki 68.7 1.7 0.7 28.8 0.0 8,349
Umande 27.7 0.3 0.8 70.9 0.2 4,429
Laikipia North Constituency 15.9 0.2 0.5 83.1 0.3 18,142
Sosian 7.1 0.0 0.7 91.9 0.2 6,077
Segera 21.0 0.3 0.3 78.0 0.3 4,357
Mugogodo West 16.9 0.4 0.3 82.2 0.3 2,536
Mugogodo East 21.3 0.2 0.7 77.6 0.3 5,172
Table 20.16: Main Material of the Floor in Male and Female Headed Households by County, Constituency and Ward
County/Constituency/ wards Cement Tiles Wood Earth Other
House-holds Cement Tiles Wood Earth Other
House-holds
Kenya 42.8
1.6
0.8
54.2
0.6
5,762,320
37.7
1.4
0.7
59.8
0.5 2,731,060
Rural 22.1
0.3
0.7
76.4
0.4
3,413,616
22.2
0.3
0.6
76.6
0.3 1,826,263
Urban 72.9
3.5
0.9
21.9
0.8
2,348,704
69.0
3.6
0.9
25.8
0.8 904,797
Laikipia County 34.5
0.7
1.0
63.6
0.3
62,287
30.6
0.5
0.9
67.8
0.2 34,825
Laikipia West Constituency 33.5
0.6
1.2
64.6
0.2
30,852
31.2
0.5
0.9
67.1
0.2 17,108
Ol-Moran 21.5
0.1
0.5
77.7
0.2
2,539
18.8
-
0.4
80.5
0.3 1,694
Rumuruti Township 26.0
0.3
0.4
73.2
0.1
3,070
21.4
0.1
0.6
77.8
0.1 1,810
Githiga 28.9
1.1
0.8
68.8
0.4
4,342
25.7
0.8
0.6
72.5
0.3 2,352
Marmanet 17.4
0.2
1.7
80.4
0.3
5,734
18.1
0.2
1.2
80.3
0.2 3,338
Igwamiti 53.8
0.9
1.4
43.7
0.1
11,746
54.8
0.9
1.1
43.1
0.2 5,845
Salama 11.9
0.1
1.0
87.0
0.1
3,421
10.8
0.0
1.4
87.6
0.2 2,069
Laikipia East Constituency 44.1
1.2
1.0
53.3
0.3
20,397
42.9
0.7
1.2
54.9
0.3 10,613
Ngobit 19.4
0.0
2.0
77.4
1.1
4,190
18.7
0.2
3.1
77.1
0.8 2,354
Tigithi 20.5
0.5
1.0
77.8
0.3
3,895
19.0
0.4
0.9
79.7
0.1 1,997
Thingithu 70.8
3.0
0.3
25.8
0.1
3,981
73.6
1.2
0.4
24.7
0.1 1,815
Nanyuki 68.9
1.9
0.7
28.4
0.0
5,544
68.4
1.4
0.7
29.4
0.1 2,805
Umande 27.1
0.3
0.7
71.7
0.3
2,787
28.8
0.4
0.9
69.7
0.2 1,642
Laikipia North Constituency 19.3
0.2
0.5
79.6
0.4
11,038
10.6
0.2
0.5
88.6
0.1 7,104
Sosian 10.0
-
0.7
88.9
0.4
3,363
3.6
0.1
0.6
95.7
0.1 2,714
Segera 26.6
0.3
0.4
72.3
0.5
2,700
11.9
0.4
0.2
87.3
0.1 1,657
Mugogodo West 18.6
0.4
0.3
80.3
0.4
1,622
13.8
0.4
0.2
85.6
- 914
Mugogodo East 23.1
0.1
0.6
75.9
0.2
3,353
18.1
0.2
0.8
80.6
0.3 1,819
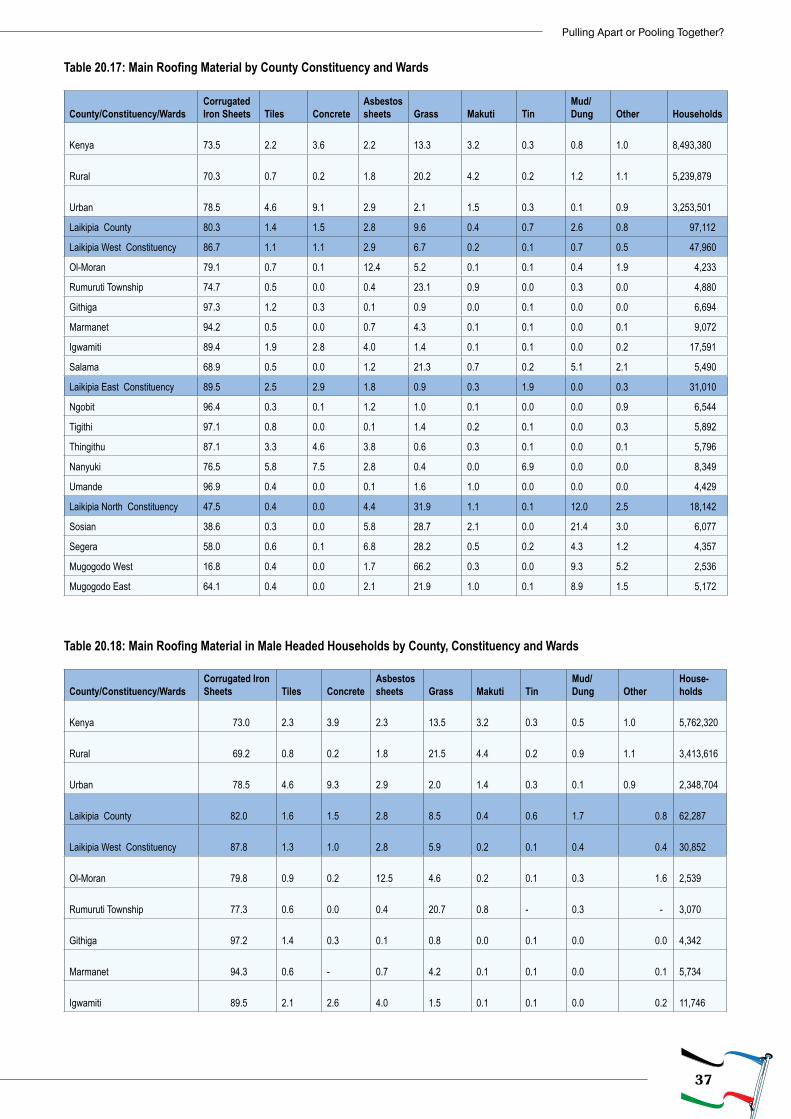
37
Pulling Apart or Pooling Together?
Table 20.17: Main Roofing Material by County Constituency and Wards
County/Constituency/WardsCorrugated Iron Sheets Tiles Concrete
Asbestos sheets Grass Makuti Tin
Mud/Dung Other Households
Kenya 73.5 2.2 3.6 2.2 13.3 3.2 0.3 0.8 1.0 8,493,380
Rural 70.3 0.7 0.2 1.8 20.2 4.2 0.2 1.2 1.1 5,239,879
Urban 78.5 4.6 9.1 2.9 2.1 1.5 0.3 0.1 0.9 3,253,501
Laikipia County 80.3 1.4 1.5 2.8 9.6 0.4 0.7 2.6 0.8 97,112
Laikipia West Constituency 86.7 1.1 1.1 2.9 6.7 0.2 0.1 0.7 0.5 47,960
Ol-Moran 79.1 0.7 0.1 12.4 5.2 0.1 0.1 0.4 1.9 4,233
Rumuruti Township 74.7 0.5 0.0 0.4 23.1 0.9 0.0 0.3 0.0 4,880
Githiga 97.3 1.2 0.3 0.1 0.9 0.0 0.1 0.0 0.0 6,694
Marmanet 94.2 0.5 0.0 0.7 4.3 0.1 0.1 0.0 0.1 9,072
Igwamiti 89.4 1.9 2.8 4.0 1.4 0.1 0.1 0.0 0.2 17,591
Salama 68.9 0.5 0.0 1.2 21.3 0.7 0.2 5.1 2.1 5,490
Laikipia East Constituency 89.5 2.5 2.9 1.8 0.9 0.3 1.9 0.0 0.3 31,010
Ngobit 96.4 0.3 0.1 1.2 1.0 0.1 0.0 0.0 0.9 6,544
Tigithi 97.1 0.8 0.0 0.1 1.4 0.2 0.1 0.0 0.3 5,892
Thingithu 87.1 3.3 4.6 3.8 0.6 0.3 0.1 0.0 0.1 5,796
Nanyuki 76.5 5.8 7.5 2.8 0.4 0.0 6.9 0.0 0.0 8,349
Umande 96.9 0.4 0.0 0.1 1.6 1.0 0.0 0.0 0.0 4,429
Laikipia North Constituency 47.5 0.4 0.0 4.4 31.9 1.1 0.1 12.0 2.5 18,142
Sosian 38.6 0.3 0.0 5.8 28.7 2.1 0.0 21.4 3.0 6,077
Segera 58.0 0.6 0.1 6.8 28.2 0.5 0.2 4.3 1.2 4,357
Mugogodo West 16.8 0.4 0.0 1.7 66.2 0.3 0.0 9.3 5.2 2,536
Mugogodo East 64.1 0.4 0.0 2.1 21.9 1.0 0.1 8.9 1.5 5,172
Table 20.18: Main Roofing Material in Male Headed Households by County, Constituency and Wards
County/Constituency/WardsCorrugated Iron Sheets Tiles Concrete
Asbestos sheets Grass Makuti Tin
Mud/Dung Other
House-holds
Kenya 73.0 2.3
3.9
2.3
13.5
3.2
0.3
0.5
1.0
5,762,320
Rural 69.2 0.8
0.2
1.8
21.5
4.4
0.2
0.9
1.1
3,413,616
Urban 78.5 4.6
9.3
2.9
2.0
1.4
0.3
0.1
0.9
2,348,704
Laikipia County 82.0 1.6
1.5
2.8
8.5
0.4
0.6
1.7 0.8
62,287
Laikipia West Constituency 87.8 1.3
1.0
2.8
5.9
0.2
0.1
0.4 0.4
30,852
Ol-Moran 79.8 0.9
0.2
12.5
4.6
0.2
0.1
0.3 1.6
2,539
Rumuruti Township 77.3 0.6
0.0
0.4
20.7
0.8
-
0.3 -
3,070
Githiga 97.2 1.4
0.3
0.1
0.8
0.0
0.1
0.0 0.0
4,342
Marmanet 94.3 0.6
-
0.7
4.2
0.1
0.1
0.0 0.1
5,734
Igwamiti 89.5 2.1
2.6
4.0
1.5
0.1
0.1
0.0 0.2
11,746
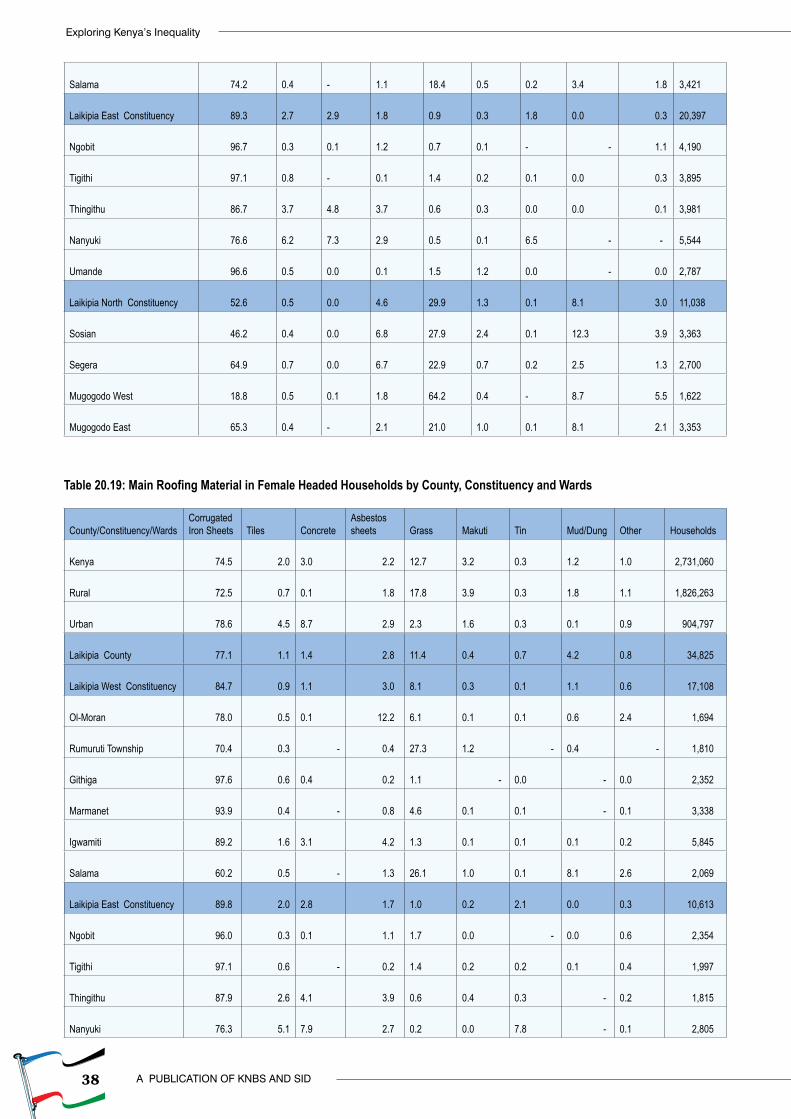
38
Exploring Kenya’s Inequality
A PUBLICATION OF KNBS AND SID
Salama 74.2 0.4
-
1.1
18.4
0.5
0.2
3.4 1.8
3,421
Laikipia East Constituency 89.3 2.7
2.9
1.8
0.9
0.3
1.8
0.0 0.3
20,397
Ngobit 96.7 0.3
0.1
1.2
0.7
0.1
- - 1.1
4,190
Tigithi 97.1 0.8
-
0.1
1.4
0.2
0.1
0.0 0.3
3,895
Thingithu 86.7 3.7
4.8
3.7
0.6
0.3
0.0
0.0 0.1
3,981
Nanyuki 76.6 6.2
7.3
2.9
0.5
0.1
6.5 - -
5,544
Umande 96.6 0.5
0.0
0.1
1.5
1.2
0.0 - 0.0
2,787
Laikipia North Constituency 52.6 0.5
0.0
4.6
29.9
1.3
0.1
8.1 3.0
11,038
Sosian 46.2 0.4
0.0
6.8
27.9
2.4
0.1
12.3 3.9
3,363
Segera 64.9 0.7
0.0
6.7
22.9
0.7
0.2
2.5 1.3
2,700
Mugogodo West 18.8 0.5
0.1
1.8
64.2
0.4
-
8.7 5.5
1,622
Mugogodo East 65.3 0.4
-
2.1
21.0
1.0
0.1
8.1 2.1
3,353
Table 20.19: Main Roofing Material in Female Headed Households by County, Constituency and Wards
County/Constituency/WardsCorrugated Iron Sheets Tiles Concrete
Asbestos sheets Grass Makuti Tin Mud/Dung Other Households
Kenya 74.5 2.0 3.0 2.2
12.7
3.2
0.3
1.2
1.0 2,731,060
Rural 72.5 0.7 0.1 1.8
17.8
3.9
0.3
1.8
1.1 1,826,263
Urban 78.6 4.5 8.7 2.9
2.3
1.6
0.3
0.1
0.9 904,797
Laikipia County 77.1 1.1 1.4 2.8
11.4
0.4
0.7
4.2
0.8 34,825
Laikipia West Constituency 84.7 0.9 1.1 3.0
8.1
0.3
0.1
1.1
0.6 17,108
Ol-Moran 78.0 0.5 0.1 12.2
6.1
0.1
0.1
0.6
2.4 1,694
Rumuruti Township 70.4 0.3 - 0.4 27.3
1.2 -
0.4 - 1,810
Githiga 97.6 0.6 0.4 0.2
1.1 -
0.0 -
0.0 2,352
Marmanet 93.9 0.4 - 0.8 4.6
0.1
0.1 -
0.1 3,338
Igwamiti 89.2 1.6 3.1 4.2
1.3
0.1
0.1
0.1
0.2 5,845
Salama 60.2 0.5 - 1.3 26.1
1.0
0.1
8.1
2.6 2,069
Laikipia East Constituency 89.8 2.0 2.8 1.7
1.0
0.2
2.1
0.0
0.3 10,613
Ngobit 96.0 0.3 0.1 1.1
1.7
0.0 -
0.0
0.6 2,354
Tigithi 97.1 0.6 - 0.2 1.4
0.2
0.2
0.1
0.4 1,997
Thingithu 87.9 2.6 4.1 3.9
0.6
0.4
0.3 -
0.2 1,815
Nanyuki 76.3 5.1 7.9 2.7
0.2
0.0
7.8 -
0.1 2,805
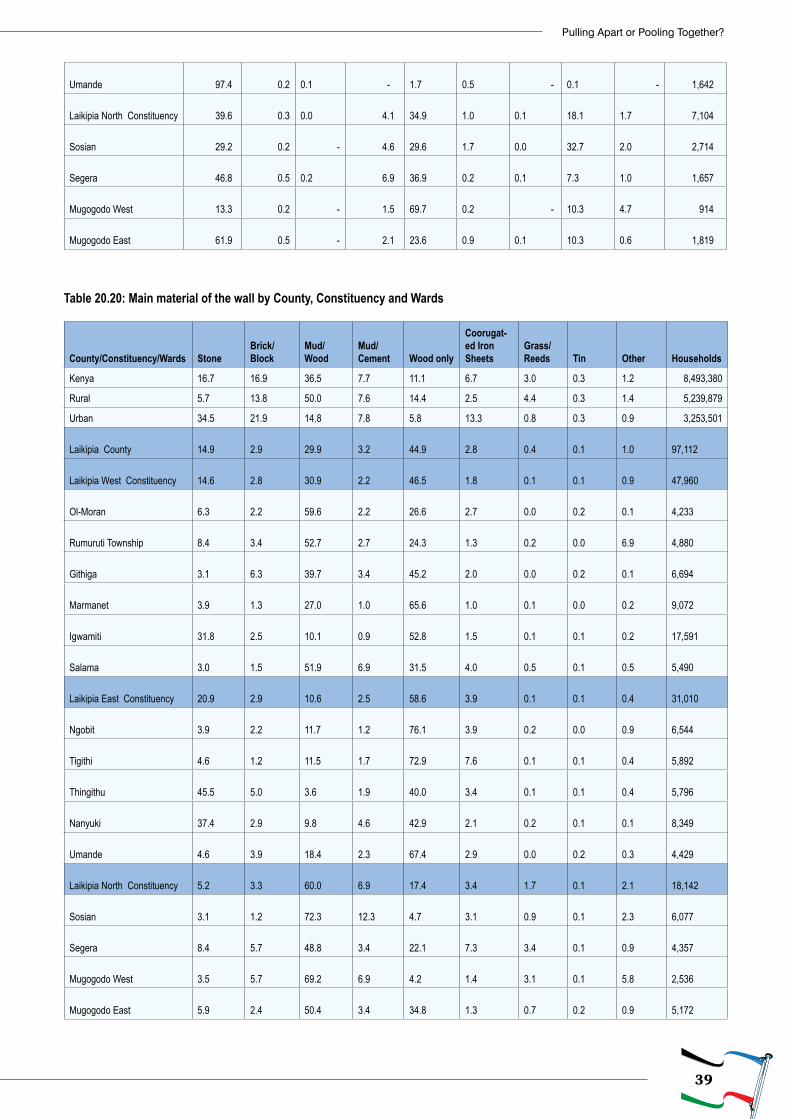
39
Pulling Apart or Pooling Together?
Umande 97.4 0.2 0.1 -
1.7
0.5 -
0.1 - 1,642
Laikipia North Constituency 39.6 0.3 0.0 4.1
34.9
1.0
0.1
18.1
1.7 7,104
Sosian 29.2 0.2 - 4.6 29.6
1.7
0.0
32.7
2.0 2,714
Segera 46.8 0.5 0.2 6.9
36.9
0.2
0.1
7.3
1.0 1,657
Mugogodo West 13.3 0.2 - 1.5 69.7
0.2 -
10.3
4.7 914
Mugogodo East 61.9 0.5 - 2.1 23.6
0.9
0.1
10.3
0.6 1,819
Table 20.20: Main material of the wall by County, Constituency and Wards
County/Constituency/Wards StoneBrick/Block
Mud/Wood
Mud/Cement Wood only
Coorugat-ed Iron Sheets
Grass/Reeds Tin Other Households
Kenya 16.7 16.9 36.5 7.7 11.1 6.7 3.0 0.3 1.2 8,493,380
Rural 5.7 13.8 50.0 7.6 14.4 2.5 4.4 0.3 1.4 5,239,879
Urban 34.5 21.9 14.8 7.8 5.8 13.3 0.8 0.3 0.9 3,253,501
Laikipia County 14.9 2.9 29.9 3.2 44.9 2.8 0.4 0.1 1.0 97,112
Laikipia West Constituency 14.6 2.8 30.9 2.2 46.5 1.8 0.1 0.1 0.9 47,960
Ol-Moran 6.3 2.2 59.6 2.2 26.6 2.7 0.0 0.2 0.1 4,233
Rumuruti Township 8.4 3.4 52.7 2.7 24.3 1.3 0.2 0.0 6.9 4,880
Githiga 3.1 6.3 39.7 3.4 45.2 2.0 0.0 0.2 0.1 6,694
Marmanet 3.9 1.3 27.0 1.0 65.6 1.0 0.1 0.0 0.2 9,072
Igwamiti 31.8 2.5 10.1 0.9 52.8 1.5 0.1 0.1 0.2 17,591
Salama 3.0 1.5 51.9 6.9 31.5 4.0 0.5 0.1 0.5 5,490
Laikipia East Constituency 20.9 2.9 10.6 2.5 58.6 3.9 0.1 0.1 0.4 31,010
Ngobit 3.9 2.2 11.7 1.2 76.1 3.9 0.2 0.0 0.9 6,544
Tigithi 4.6 1.2 11.5 1.7 72.9 7.6 0.1 0.1 0.4 5,892
Thingithu 45.5 5.0 3.6 1.9 40.0 3.4 0.1 0.1 0.4 5,796
Nanyuki 37.4 2.9 9.8 4.6 42.9 2.1 0.2 0.1 0.1 8,349
Umande 4.6 3.9 18.4 2.3 67.4 2.9 0.0 0.2 0.3 4,429
Laikipia North Constituency 5.2 3.3 60.0 6.9 17.4 3.4 1.7 0.1 2.1 18,142
Sosian 3.1 1.2 72.3 12.3 4.7 3.1 0.9 0.1 2.3 6,077
Segera 8.4 5.7 48.8 3.4 22.1 7.3 3.4 0.1 0.9 4,357
Mugogodo West 3.5 5.7 69.2 6.9 4.2 1.4 3.1 0.1 5.8 2,536
Mugogodo East 5.9 2.4 50.4 3.4 34.8 1.3 0.7 0.2 0.9 5,172
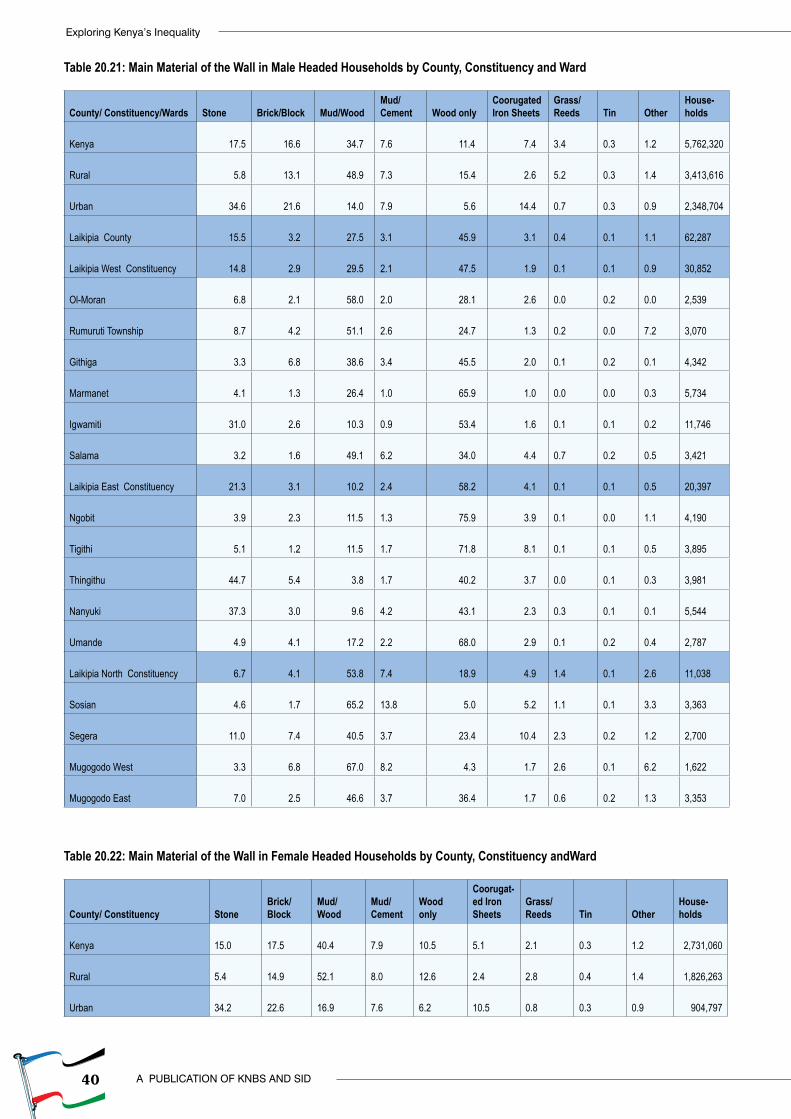
40
Exploring Kenya’s Inequality
A PUBLICATION OF KNBS AND SID
Table 20.21: Main Material of the Wall in Male Headed Households by County, Constituency and Ward
County/ Constituency/Wards Stone Brick/Block Mud/WoodMud/Cement Wood only
Coorugated Iron Sheets
Grass/Reeds Tin Other
House-holds
Kenya 17.5 16.6 34.7 7.6 11.4 7.4
3.4
0.3
1.2
5,762,320
Rural 5.8 13.1 48.9 7.3 15.4 2.6
5.2
0.3
1.4
3,413,616
Urban 34.6 21.6 14.0 7.9 5.6 14.4
0.7
0.3
0.9
2,348,704
Laikipia County 15.5 3.2 27.5 3.1 45.9 3.1
0.4
0.1
1.1
62,287
Laikipia West Constituency 14.8 2.9 29.5 2.1 47.5 1.9
0.1
0.1
0.9
30,852
Ol-Moran 6.8 2.1 58.0 2.0 28.1 2.6
0.0
0.2
0.0
2,539
Rumuruti Township 8.7 4.2 51.1 2.6 24.7 1.3
0.2
0.0
7.2
3,070
Githiga 3.3 6.8 38.6 3.4 45.5 2.0
0.1
0.2
0.1
4,342
Marmanet 4.1 1.3 26.4 1.0 65.9 1.0
0.0
0.0
0.3
5,734
Igwamiti 31.0 2.6 10.3 0.9 53.4 1.6
0.1
0.1
0.2
11,746
Salama 3.2 1.6 49.1 6.2 34.0 4.4
0.7
0.2
0.5
3,421
Laikipia East Constituency 21.3 3.1 10.2 2.4 58.2 4.1
0.1
0.1
0.5
20,397
Ngobit 3.9 2.3 11.5 1.3 75.9 3.9
0.1
0.0
1.1
4,190
Tigithi 5.1 1.2 11.5 1.7 71.8 8.1
0.1
0.1
0.5
3,895
Thingithu 44.7 5.4 3.8 1.7 40.2 3.7
0.0
0.1
0.3
3,981
Nanyuki 37.3 3.0 9.6 4.2 43.1 2.3
0.3
0.1
0.1
5,544
Umande 4.9 4.1 17.2 2.2 68.0 2.9
0.1
0.2
0.4
2,787
Laikipia North Constituency 6.7 4.1 53.8 7.4 18.9 4.9
1.4
0.1
2.6
11,038
Sosian 4.6 1.7 65.2 13.8 5.0 5.2
1.1
0.1
3.3
3,363
Segera 11.0 7.4 40.5 3.7 23.4 10.4
2.3
0.2
1.2
2,700
Mugogodo West 3.3 6.8 67.0 8.2 4.3 1.7
2.6
0.1
6.2
1,622
Mugogodo East 7.0 2.5 46.6 3.7 36.4 1.7
0.6
0.2
1.3
3,353
Table 20.22: Main Material of the Wall in Female Headed Households by County, Constituency andWard
County/ Constituency StoneBrick/Block
Mud/Wood
Mud/Cement
Wood only
Coorugat-ed Iron Sheets
Grass/Reeds Tin Other
House-holds
Kenya 15.0
17.5
40.4
7.9
10.5
5.1
2.1
0.3
1.2 2,731,060
Rural 5.4
14.9
52.1
8.0
12.6
2.4
2.8
0.4
1.4 1,826,263
Urban 34.2
22.6
16.9
7.6
6.2
10.5
0.8
0.3
0.9 904,797
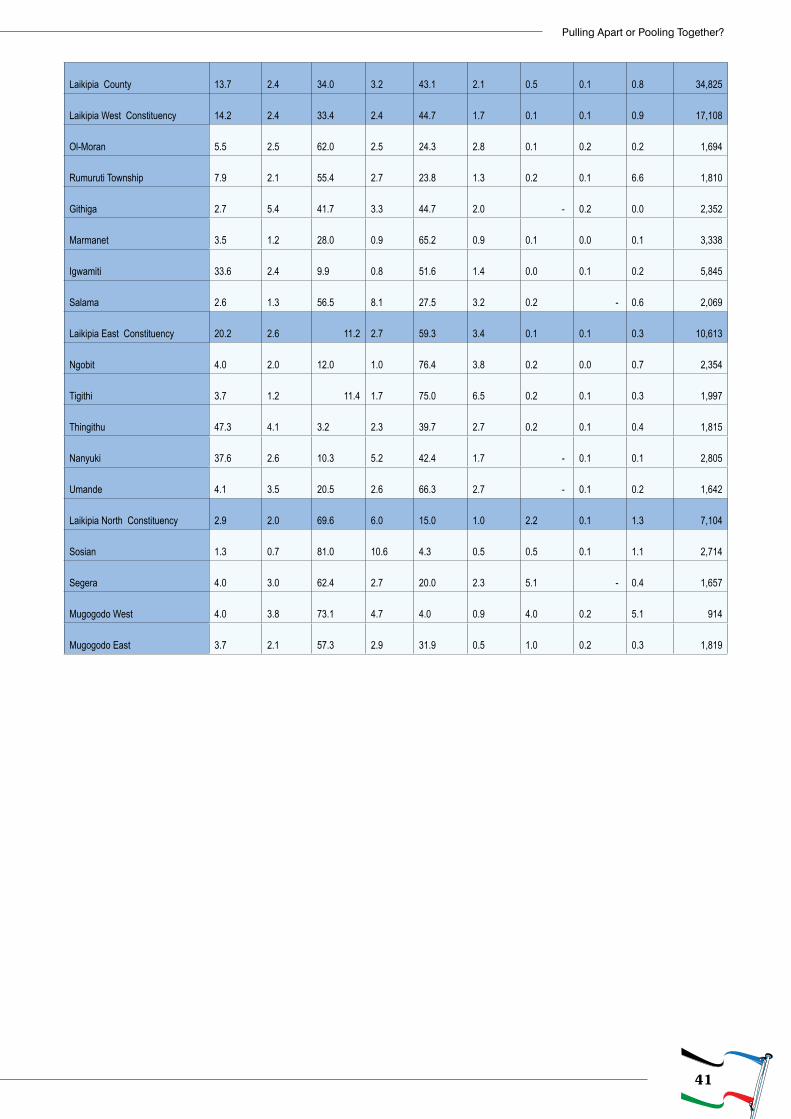
41
Pulling Apart or Pooling Together?
Laikipia County 13.7
2.4
34.0
3.2
43.1
2.1
0.5
0.1
0.8 34,825
Laikipia West Constituency 14.2
2.4
33.4
2.4
44.7
1.7
0.1
0.1
0.9 17,108
Ol-Moran 5.5
2.5
62.0
2.5
24.3
2.8
0.1
0.2
0.2 1,694
Rumuruti Township 7.9
2.1
55.4
2.7
23.8
1.3
0.2
0.1
6.6 1,810
Githiga 2.7
5.4
41.7
3.3
44.7
2.0 -
0.2
0.0 2,352
Marmanet 3.5
1.2
28.0
0.9
65.2
0.9
0.1
0.0
0.1 3,338
Igwamiti 33.6
2.4
9.9
0.8
51.6
1.4
0.0
0.1
0.2 5,845
Salama 2.6
1.3
56.5
8.1
27.5
3.2
0.2 -
0.6 2,069
Laikipia East Constituency 20.2
2.6 11.2
2.7
59.3
3.4
0.1
0.1
0.3 10,613
Ngobit 4.0
2.0
12.0
1.0
76.4
3.8
0.2
0.0
0.7 2,354
Tigithi 3.7
1.2 11.4
1.7
75.0
6.5
0.2
0.1
0.3 1,997
Thingithu 47.3
4.1
3.2
2.3
39.7
2.7
0.2
0.1
0.4 1,815
Nanyuki 37.6
2.6
10.3
5.2
42.4
1.7 -
0.1
0.1 2,805
Umande 4.1
3.5
20.5
2.6
66.3
2.7 -
0.1
0.2 1,642
Laikipia North Constituency 2.9
2.0
69.6
6.0
15.0
1.0
2.2
0.1
1.3 7,104
Sosian 1.3
0.7
81.0
10.6
4.3
0.5
0.5
0.1
1.1 2,714
Segera 4.0
3.0
62.4
2.7
20.0
2.3
5.1 -
0.4 1,657
Mugogodo West 4.0
3.8
73.1
4.7
4.0
0.9
4.0
0.2
5.1 914
Mugogodo East 3.7
2.1
57.3
2.9
31.9
0.5
1.0
0.2
0.3 1,819
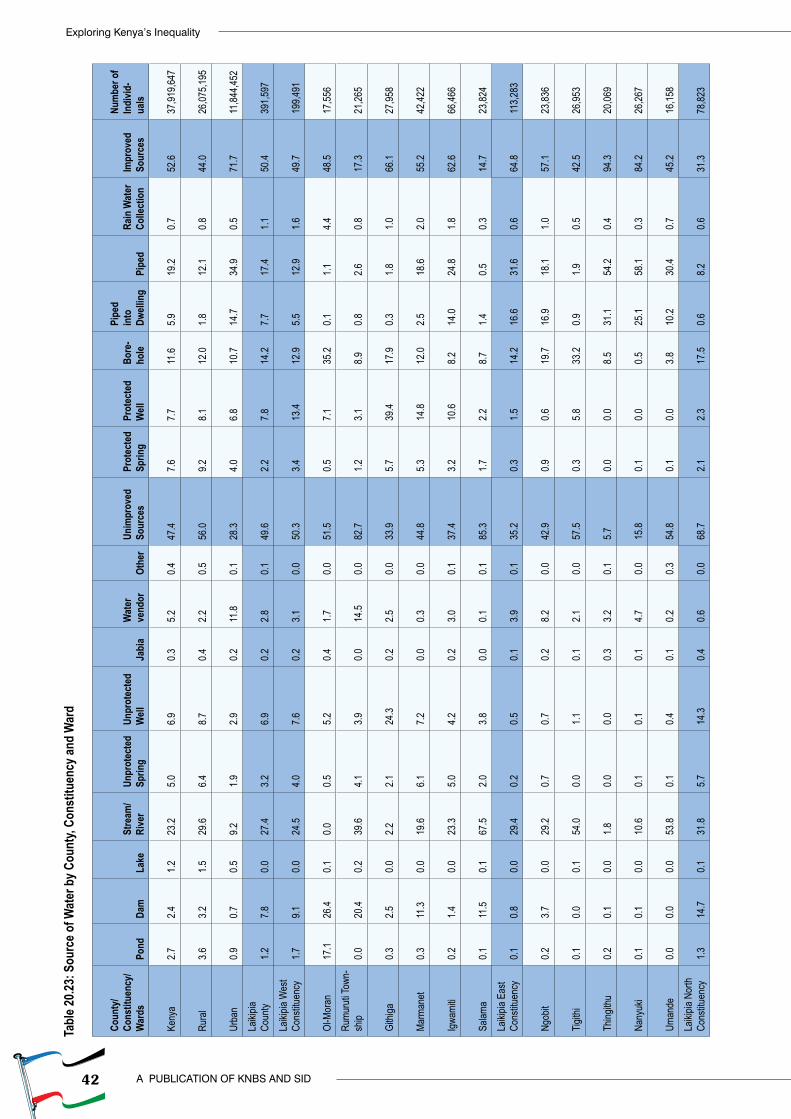
42
Exploring Kenya’s Inequality
A PUBLICATION OF KNBS AND SID
Tabl
e 20.2
3: S
ourc
e of W
ater
by C
ount
y, Co
nstit
uenc
y and
War
d
Coun
ty/
Cons
titue
ncy/
War
dsPo
ndDa
mLa
keSt
ream
/Ri
ver
Unpr
otec
ted
Sprin
gUn
prot
ecte
d W
ellJa
bia
Wat
er
vend
orOt
her
Unim
prov
ed
Sour
ces
Prot
ecte
d Sp
ring
Prot
ecte
d W
ellBo
re-
hole
Pipe
d in
to
Dwell
ing
Pipe
dRa
in W
ater
Co
llect
ion
Impr
oved
So
urce
s
Num
ber o
f In
divid
-ua
ls
Keny
a2.7
2.41.2
23.2
5.06.9
0.35.2
0.447
.47.6
7.711
.65.9
19.2
0.752
.6
37
,919,6
47
Rura
l3.6
3.21.5
29.6
6.48.7
0.42.2
0.556
.09.2
8.112
.01.8
12.1
0.844
.0
26
,075,1
95
Urba
n0.9
0.70.5
9.21.9
2.90.2
11.8
0.128
.34.0
6.810
.714
.734
.90.5
71.7
11,84
4,452
La
ikipia
Co
unty
1.27.8
0.027
.43.2
6.90.2
2.80.1
49.6
2.27.8
14.2
7.717
.41.1
50.4
39
1,597
La
ikipia
Wes
t Co
nstitu
ency
1.79.1
0.024
.54.0
7.60.2
3.10.0
50.3
3.413
.412
.95.5
12.9
1.649
.7
199,4
91
Ol-M
oran
17.1
26.4
0.10.0
0.55.2
0.41.7
0.051
.50.5
7.135
.20.1
1.14.4
48.5
17,55
6 Ru
muru
ti Tow
n-sh
ip0.0
20.4
0.239
.64.1
3.90.0
14.5
0.082
.71.2
3.18.9
0.82.6
0.817
.3
21
,265
Githi
ga0.3
2.50.0
2.22.1
24.3
0.22.5
0.033
.95.7
39.4
17.9
0.31.8
1.066
.1
27
,958
Marm
anet
0.311
.30.0
19.6
6.17.2
0.00.3
0.044
.85.3
14.8
12.0
2.518
.62.0
55.2
42,42
2
Igwam
iti0.2
1.40.0
23.3
5.04.2
0.23.0
0.137
.43.2
10.6
8.214
.024
.81.8
62.6
66,46
6
Salam
a0.1
11.5
0.167
.52.0
3.80.0
0.10.1
85.3
1.72.2
8.71.4
0.50.3
14.7
23,82
4 La
ikipia
Eas
t Co
nstitu
ency
0.10.8
0.029
.40.2
0.50.1
3.90.1
35.2
0.31.5
14.2
16.6
31.6
0.664
.8
113,2
83
Ngob
it0.2
3.70.0
29.2
0.70.7
0.28.2
0.042
.90.9
0.619
.716
.918
.11.0
57.1
23,83
6
Tigith
i0.1
0.00.1
54.0
0.01.1
0.12.1
0.057
.50.3
5.833
.20.9
1.90.5
42.5
26,95
3
Thing
ithu
0.20.1
0.01.8
0.00.0
0.33.2
0.15.7
0.00.0
8.531
.154
.20.4
94.3
20,06
9
Nany
uki
0.10.1
0.010
.60.1
0.10.1
4.70.0
15.8
0.10.0
0.525
.158
.10.3
84.2
26,26
7
Uman
de0.0
0.00.0
53.8
0.10.4
0.10.2
0.354
.80.1
0.03.8
10.2
30.4
0.745
.2
16
,158
Laiki
pia N
orth
Co
nstitu
ency
1.314
.70.1
31.8
5.714
.30.4
0.60.0
68.7
2.12.3
17.5
0.68.2
0.631
.3
78
,823
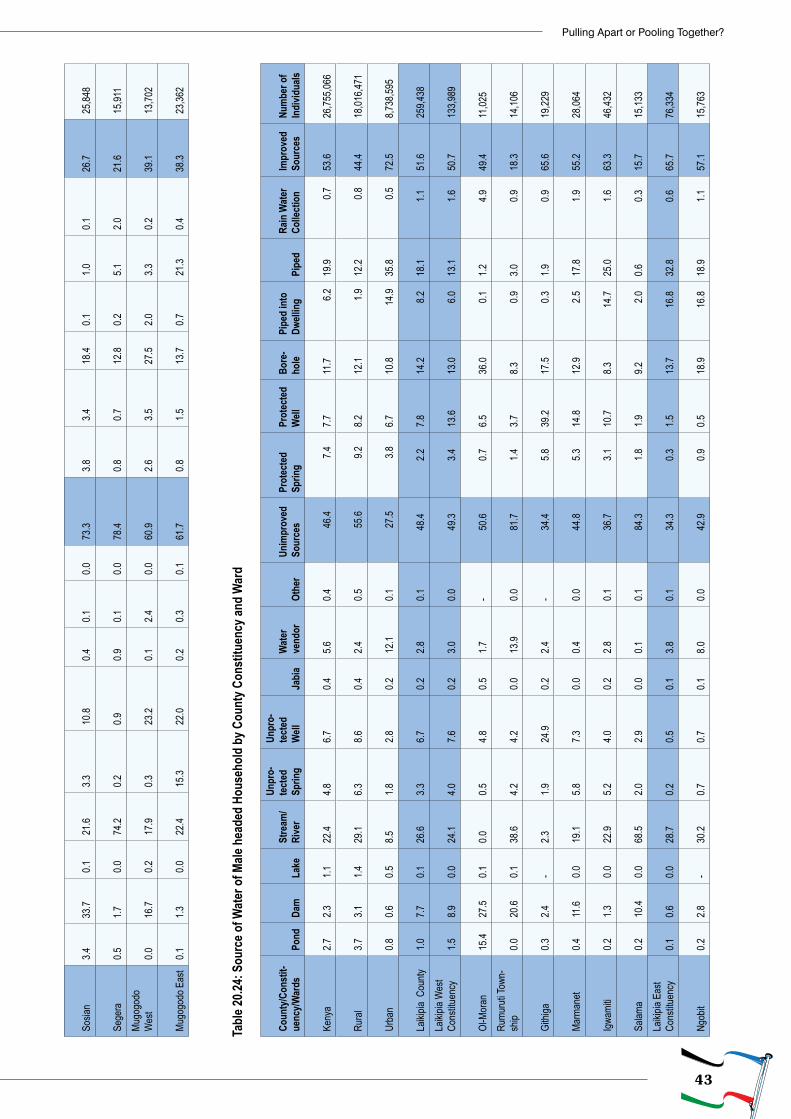
43
Pulling Apart or Pooling Together?
Sosia
n3.4
33.7
0.121
.63.3
10.8
0.40.1
0.073
.33.8
3.418
.40.1
1.00.1
26.7
25,84
8
Sege
ra0.5
1.70.0
74.2
0.20.9
0.90.1
0.078
.40.8
0.712
.80.2
5.12.0
21.6
15,91
1 Mu
gogo
do
Wes
t0.0
16.7
0.217
.90.3
23.2
0.12.4
0.060
.92.6
3.527
.52.0
3.30.2
39.1
13,70
2
Mugo
godo
Eas
t0.1
1.30.0
22.4
15.3
22.0
0.20.3
0.161
.70.8
1.513
.70.7
21.3
0.438
.3
23
,362
Tabl
e 20.2
4: S
ourc
e of W
ater
of M
ale h
eade
d Ho
useh
old
by C
ount
y Con
stitu
ency
and
War
d
Coun
ty/C
onst
it-ue
ncy/W
ards
Pond
Dam
Lake
Stre
am/
Rive
r
Unpr
o-te
cted
Sp
ring
Unpr
o-te
cted
W
ellJa
bia
Wat
er
vend
orOt
her
Unim
prov
ed
Sour
ces
Prot
ecte
d Sp
ring
Prot
ecte
d W
ellBo
re-
hole
Pipe
d in
to
Dwell
ing
Pipe
dRa
in W
ater
Co
llect
ion
Impr
oved
So
urce
sNu
mbe
r of
Indi
vidua
ls
Keny
a
2.7
2.3
1.1
22.4
4.8
6.7
0.4
5.6
0.4
46.4
7
.4
7.7
11.7
6
.2
19.9
0
.7
53.6
26
,755,0
66
Rura
l
3.7
3.1
1.4
29.1
6.3
8.6
0.4
2.4
0.5
55.6
9
.2
8.2
12.1
1
.9
12.2
0
.8
44.4
18
,016,4
71
Urba
n
0.8
0.6
0.5
8.5
1.8
2.8
0.2
12
.1
0.1
27.5
3
.8
6.7
10.8
14
.9
35.8
0
.5
72.5
8,7
38,59
5
Laiki
pia C
ounty
1.0
7.7
0.1
26.6
3.3
6.7
0.2
2.8
0.1
48.4
2.2
7.8
14
.2
8.2
18
.1
1.1
51
.6
259,4
38
Laiki
pia W
est
Cons
tituen
cy
1.5
8.9
0.0
24
.1
4.0
7.6
0.2
3.0
0.0
4
9.3
3.
4
13.6
13
.0
6.0
13
.1
1.6
50
.7
133,9
89
Ol-M
oran
15
.4
27.5
0.1
0.0
0.5
4.8
0.5
1.7
-
50.6
0.7
6.5
36
.0
0.1
1.2
4.
9
49.4
11,02
5 Ru
muru
ti Tow
n-sh
ip
0.0
20
.6
0.1
38.6
4.2
4.2
0.0
13
.9
0.0
8
1.7
1.
4
3.7
8.3
0.9
3.0
0.
9
18.3
14,10
6
Githi
ga
0.3
2.4
-
2.3
1.9
24.9
0.2
2.4
-
34.4
5.8
39
.2
17.5
0.
3
1.9
0.9
65
.6
19
,229
Marm
anet
0.4
11.6
0.0
19
.1
5.8
7.3
0.0
0.4
0.0
4
4.8
5.
3
14.8
12
.9
2.5
17
.8
1.9
55
.2
28
,064
Igwam
iti
0.2
1.3
0.0
22
.9
5.2
4.0
0.2
2.8
0.1
3
6.7
3.
1
10.7
8.3
14.7
25.0
1.
6
63.3
46,43
2
Salam
a
0.2
10
.4
0.0
68.5
2.0
2.9
0.0
0.1
0.1
84.3
1.8
1.9
9.2
2.
0
0.6
0.3
15
.7
15
,133
Laiki
pia E
ast
Cons
tituen
cy
0.1
0.6
0.0
28
.7
0.2
0.5
0.1
3.8
0.1
3
4.3
0.
3
1.5
13.7
16.8
32.8
0.
6
65.7
76,33
4
Ngob
it
0.2
2.8
-
30.2
0.7
0.7
0.1
8.0
0.0
42.9
0.9
0.5
18
.9
1
6.8
18
.9
1.1
57
.1
15
,763
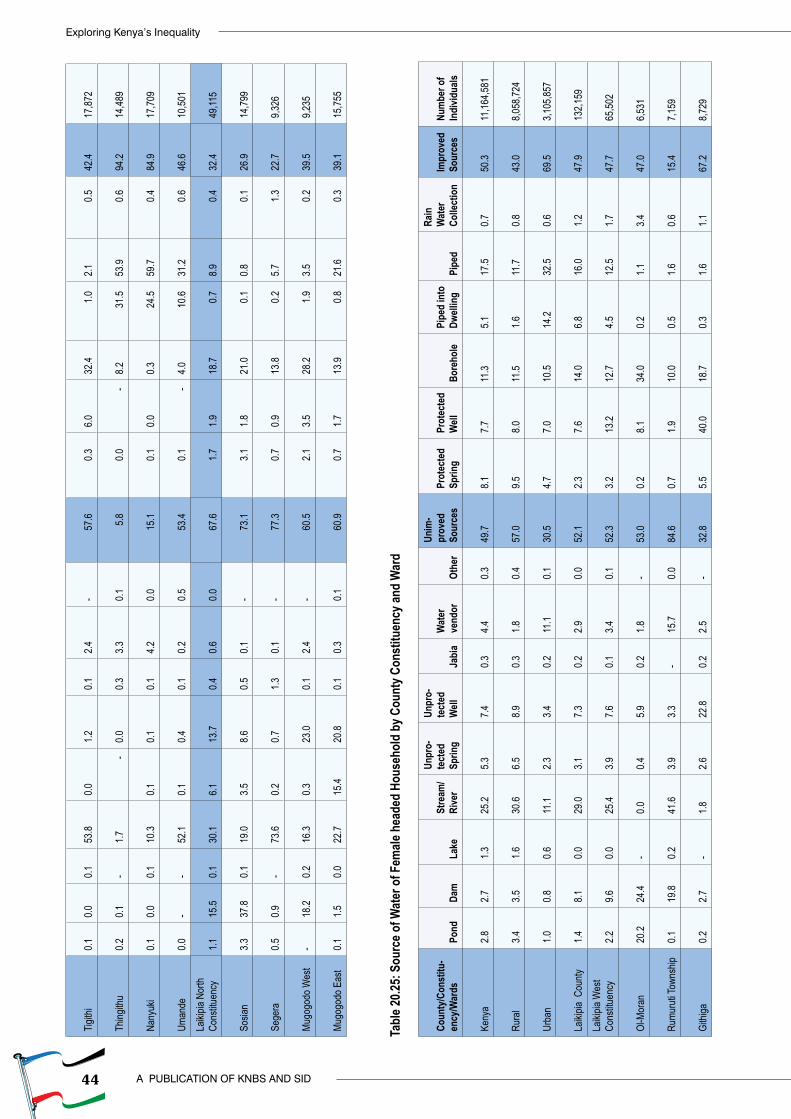
44
Exploring Kenya’s Inequality
A PUBLICATION OF KNBS AND SID
Tigith
i
0.1
0.0
0.1
53
.8
0.0
1.2
0.1
2.4
-
5
7.6
0.
3
6.0
32.4
1.
0
2.1
0.5
42
.4
17
,872
Thing
ithu
0.2
0.1
-
1.7
-
0.0
0.3
3.3
0.1
5.8
0.
0
-
8.2
31.5
53.9
0.
6
94.2
14,48
9
Nany
uki
0.1
0.0
0.1
10.3
0.1
0.1
0.1
4.2
0.0
15.1
0.1
0.0
0.3
24.5
59.7
0.
4
84.9
17,70
9
Uman
de
0.0
-
-
52.1
0.1
0.4
0.1
0.2
0.5
53.4
0.1
-
4.0
1
0.6
31
.2
0.6
46
.6
10
,501
Laiki
pia N
orth
Co
nstitu
ency
1.1
15.5
0.1
30
.1
6.1
13.7
0.4
0.6
0.0
67.6
1.7
1.9
18
.7
0.7
8.9
0.
4
32.4
49,11
5
Sosia
n
3.3
37
.8
0.1
19.0
3.5
8.6
0.5
0.1
-
73.1
3.1
1.8
21
.0
0.1
0.8
0.
1
26.9
14,79
9
Sege
ra
0.5
0.9
-
73.6
0.2
0.7
1.3
0.1
-
77.3
0.7
0.9
13
.8
0.2
5.7
1.
3
22.7
9,326
Mugo
godo
Wes
t
-
18
.2
0.2
16.3
0.3
23
.0
0.1
2.4
-
6
0.5
2.
1
3.5
28.2
1.
9
3.5
0.2
39
.5
9,2
35
Mugo
godo
Eas
t
0.1
1.5
0.0
22
.7
15.4
20
.8
0.1
0.3
0.1
6
0.9
0.
7
1.7
13.9
0.
8
21.6
0.
3
39.1
15,75
5
Tabl
e 20.2
5: S
ourc
e of W
ater
of F
emale
hea
ded
Hous
ehol
d by
Cou
nty C
onst
ituen
cy an
d W
ard
Coun
ty/C
onst
itu-
ency
/War
dsPo
ndDa
mLa
keSt
ream
/Ri
ver
Unpr
o-te
cted
Sp
ring
Unpr
o-te
cted
W
ellJa
bia
Wat
er
vend
orOt
her
Unim
-pr
oved
So
urce
sPr
otec
ted
Sprin
gPr
otec
ted
Well
Bore
hole
Pipe
d in
to
Dwell
ing
Pipe
d
Rain
W
ater
Co
llect
ion
Impr
oved
So
urce
sNu
mbe
r of
Indi
vidua
ls
Keny
a
2.8
2.7
1.3
25.2
5.3
7.4
0.3
4.4
0.3
49.7
8.1
7.7
11
.3
5.1
17.5
0.7
50
.3
11
,164,5
81
Rura
l
3.4
3.5
1.6
30.6
6.5
8.9
0.3
1.8
0.4
57.0
9.5
8.0
11
.5
1.6
11.7
0.8
43
.0
8,0
58,72
4
Urba
n
1.0
0.8
0.6
11.1
2.3
3.4
0.2
11.1
0.1
30
.5
4.7
7.0
10.5
14
.2
32.5
0.6
69
.5
3,1
05,85
7
Laiki
pia C
ounty
1.4
8.1
0.0
29
.0
3.1
7.3
0.2
2.9
0.0
52
.1
2.3
7.6
14.0
6.8
16
.0
1.2
47.9
132,1
59
Laiki
pia W
est
Cons
tituen
cy
2.2
9.6
0.0
25.4
3.9
7.6
0.1
3.4
0.1
52.3
3.2
13
.2
12.7
4.5
12
.5
1.7
47.7
65,50
2
Ol-M
oran
20
.2
24.4
-
0.0
0.4
5.9
0.2
1.8
-
53.0
0.2
8.1
34
.0
0.2
1.1
3.4
47
.0
6,531
Rumu
ruti T
owns
hip
0.1
19.8
0.2
41
.6
3.9
3.3
-
15.7
0.0
84
.6
0.7
1.9
10.0
0.5
1.6
0.6
15.4
7,1
59
Githi
ga
0.2
2.7
-
1.8
2.6
22.8
0.2
2.5
-
32.8
5.5
40
.0
18.7
0.3
1.6
1.1
67.2
8,7
29
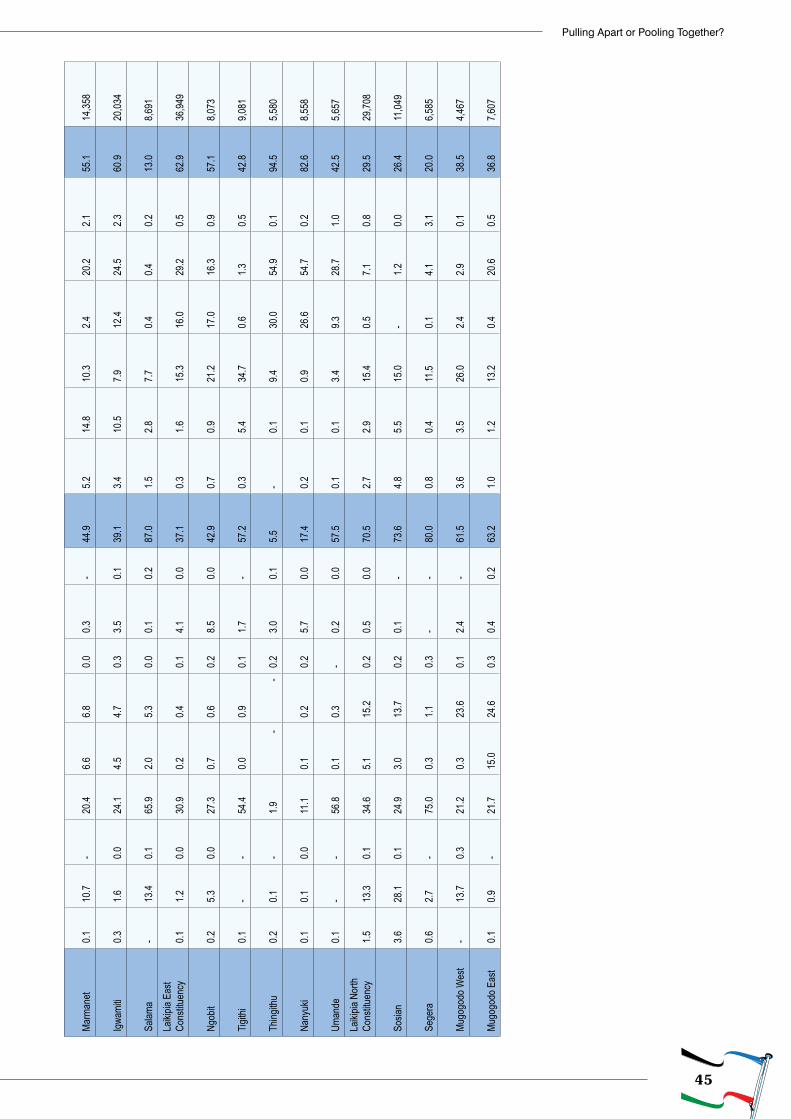
45
Pulling Apart or Pooling Together?
Marm
anet
0.1
10
.7
-
20.4
6.6
6.8
0.0
0.3
-
44.9
5.2
14
.8
10.3
2.4
20
.2
2.1
55.1
14,35
8
Igwam
iti
0.3
1.6
0.0
24.1
4.5
4.7
0.3
3.5
0.1
39.1
3.4
10
.5
7.9
12.4
24
.5
2.3
60.9
20,03
4
Salam
a
-
13.4
0.1
65
.9
2.0
5.3
0.0
0.1
0.2
87
.0
1.5
2.8
7.7
0.4
0.4
0.2
13
.0
8,691
La
ikipia
Eas
t Co
nstitu
ency
0.1
1.2
0.0
30
.9
0.2
0.4
0.1
4.1
0.0
37
.1
0.3
1.6
15.3
16
.0
29.2
0.5
62
.9
36
,949
Ngob
it
0.2
5.3
0.0
27.3
0.7
0.6
0.2
8.5
0.0
42.9
0.7
0.9
21
.2
17.0
16
.3
0.9
57.1
8,0
73
Tigith
i
0.1
-
-
54.4
0.0
0.9
0.1
1.7
-
57.2
0.3
5.4
34
.7
0.6
1.3
0.5
42
.8
9,081
Thing
ithu
0.2
0.1
-
1.9
-
-
0.2
3.0
0.1
5.5
-
0.1
9.4
30
.0
54.9
0.1
94
.5
5,580
Nany
uki
0.1
0.1
0.0
11
.1
0.1
0.2
0.2
5.7
0.0
17
.4
0.2
0.1
0.9
26.6
54
.7
0.2
82.6
8,5
58
Uman
de
0.1
-
-
56.8
0.1
0.3
-
0.2
0.0
57
.5
0.1
0.1
3.4
9.3
28.7
1.0
42
.5
5,657
La
ikipia
Nor
th
Cons
tituen
cy
1.5
13.3
0.1
34
.6
5.1
15.2
0.2
0.5
0.0
70.5
2.7
2.9
15
.4
0.5
7.1
0.8
29
.5
29
,708
Sosia
n
3.6
28.1
0.1
24
.9
3.0
13.7
0.2
0.1
-
73.6
4.8
5.5
15
.0
-
1.2
0.0
26.4
11,04
9
Sege
ra
0.6
2.7
-
75.0
0.3
1.1
0.3
-
-
80
.0
0.8
0.4
11.5
0.1
4.1
3.1
20.0
6,5
85
Mugo
godo
Wes
t
-
13.7
0.3
21
.2
0.3
23.6
0.1
2.4
-
61.5
3.6
3.5
26
.0
2.4
2.9
0.1
38
.5
4,467
Mugo
godo
Eas
t
0.1
0.9
-
21.7
15
.0
24.6
0.3
0.4
0.2
63.2
1.0
1.2
13
.2
0.4
20.6
0.5
36
.8
7,607
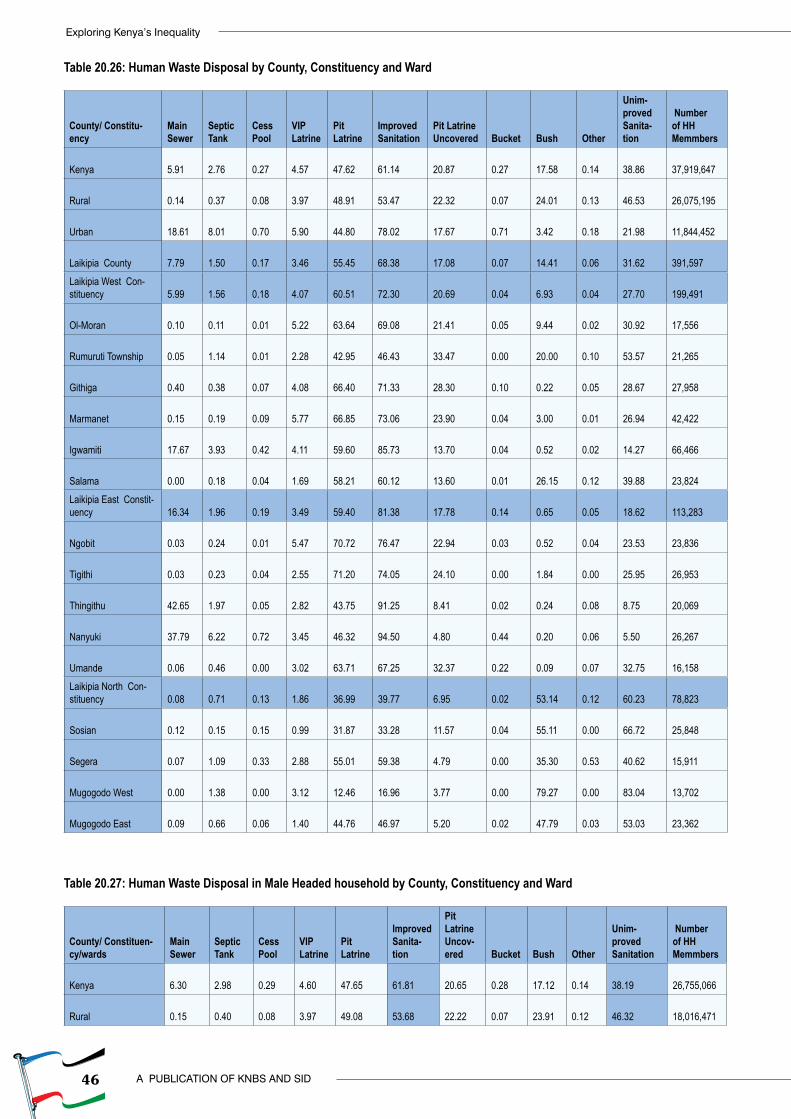
46
Exploring Kenya’s Inequality
A PUBLICATION OF KNBS AND SID
Table 20.26: Human Waste Disposal by County, Constituency and Ward
County/ Constitu-ency
Main Sewer
Septic Tank
Cess Pool
VIP Latrine
Pit Latrine
Improved Sanitation
Pit Latrine Uncovered Bucket Bush Other
Unim-proved Sanita-tion
Number of HH Memmbers
Kenya 5.91 2.76 0.27 4.57 47.62 61.14 20.87 0.27 17.58 0.14 38.86 37,919,647
Rural 0.14 0.37 0.08 3.97 48.91 53.47 22.32 0.07 24.01 0.13 46.53 26,075,195
Urban 18.61 8.01 0.70 5.90 44.80 78.02 17.67 0.71 3.42 0.18 21.98 11,844,452
Laikipia County 7.79 1.50 0.17 3.46 55.45 68.38 17.08 0.07 14.41 0.06 31.62 391,597
Laikipia West Con-stituency 5.99 1.56 0.18 4.07 60.51 72.30 20.69 0.04 6.93 0.04 27.70
199,491
Ol-Moran 0.10 0.11 0.01 5.22 63.64 69.08 21.41 0.05 9.44 0.02 30.92 17,556
Rumuruti Township 0.05 1.14 0.01 2.28 42.95 46.43 33.47 0.00 20.00 0.10 53.57 21,265
Githiga 0.40 0.38 0.07 4.08 66.40 71.33 28.30 0.10 0.22 0.05 28.67 27,958
Marmanet 0.15 0.19 0.09 5.77 66.85 73.06 23.90 0.04 3.00 0.01 26.94 42,422
Igwamiti 17.67 3.93 0.42 4.11 59.60 85.73 13.70 0.04 0.52 0.02 14.27 66,466
Salama 0.00 0.18 0.04 1.69 58.21 60.12 13.60 0.01 26.15 0.12 39.88 23,824
Laikipia East Constit-uency 16.34 1.96 0.19 3.49 59.40 81.38 17.78 0.14 0.65 0.05 18.62
113,283
Ngobit 0.03 0.24 0.01 5.47 70.72 76.47 22.94 0.03 0.52 0.04 23.53 23,836
Tigithi 0.03 0.23 0.04 2.55 71.20 74.05 24.10 0.00 1.84 0.00 25.95 26,953
Thingithu 42.65 1.97 0.05 2.82 43.75 91.25 8.41 0.02 0.24 0.08 8.75 20,069
Nanyuki 37.79 6.22 0.72 3.45 46.32 94.50 4.80 0.44 0.20 0.06 5.50 26,267
Umande 0.06 0.46 0.00 3.02 63.71 67.25 32.37 0.22 0.09 0.07 32.75 16,158
Laikipia North Con-stituency 0.08 0.71 0.13 1.86 36.99 39.77 6.95 0.02 53.14 0.12 60.23
78,823
Sosian 0.12 0.15 0.15 0.99 31.87 33.28 11.57 0.04 55.11 0.00 66.72 25,848
Segera 0.07 1.09 0.33 2.88 55.01 59.38 4.79 0.00 35.30 0.53 40.62 15,911
Mugogodo West 0.00 1.38 0.00 3.12 12.46 16.96 3.77 0.00 79.27 0.00 83.04 13,702
Mugogodo East 0.09 0.66 0.06 1.40 44.76 46.97 5.20 0.02 47.79 0.03 53.03 23,362
Table 20.27: Human Waste Disposal in Male Headed household by County, Constituency and Ward
County/ Constituen-cy/wards
Main Sewer
Septic Tank
Cess Pool
VIP Latrine
Pit Latrine
Improved Sanita-tion
Pit Latrine Uncov-ered Bucket Bush Other
Unim-proved Sanitation
Number of HH Memmbers
Kenya 6.30 2.98 0.29 4.60 47.65 61.81 20.65 0.28 17.12 0.14 38.19 26,755,066
Rural 0.15 0.40 0.08 3.97 49.08 53.68 22.22 0.07 23.91 0.12 46.32 18,016,471
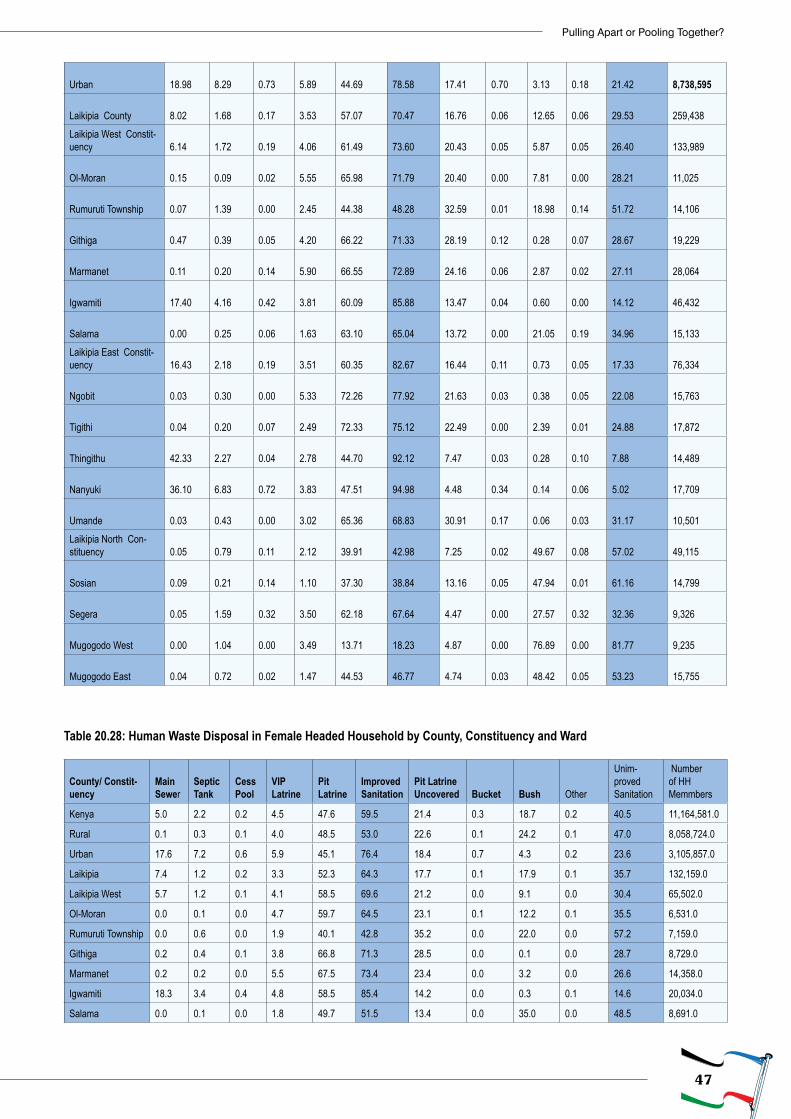
47
Pulling Apart or Pooling Together?
Urban 18.98 8.29 0.73 5.89 44.69 78.58 17.41 0.70 3.13 0.18 21.42 8,738,595
Laikipia County 8.02 1.68 0.17 3.53 57.07 70.47 16.76 0.06 12.65 0.06 29.53 259,438
Laikipia West Constit-uency 6.14 1.72 0.19 4.06 61.49 73.60 20.43 0.05 5.87 0.05 26.40
133,989
Ol-Moran 0.15 0.09 0.02 5.55 65.98 71.79 20.40 0.00 7.81 0.00 28.21 11,025
Rumuruti Township 0.07 1.39 0.00 2.45 44.38 48.28 32.59 0.01 18.98 0.14 51.72 14,106
Githiga 0.47 0.39 0.05 4.20 66.22 71.33 28.19 0.12 0.28 0.07 28.67 19,229
Marmanet 0.11 0.20 0.14 5.90 66.55 72.89 24.16 0.06 2.87 0.02 27.11 28,064
Igwamiti 17.40 4.16 0.42 3.81 60.09 85.88 13.47 0.04 0.60 0.00 14.12 46,432
Salama 0.00 0.25 0.06 1.63 63.10 65.04 13.72 0.00 21.05 0.19 34.96 15,133
Laikipia East Constit-uency 16.43 2.18 0.19 3.51 60.35 82.67 16.44 0.11 0.73 0.05 17.33
76,334
Ngobit 0.03 0.30 0.00 5.33 72.26 77.92 21.63 0.03 0.38 0.05 22.08 15,763
Tigithi 0.04 0.20 0.07 2.49 72.33 75.12 22.49 0.00 2.39 0.01 24.88 17,872
Thingithu 42.33 2.27 0.04 2.78 44.70 92.12 7.47 0.03 0.28 0.10 7.88 14,489
Nanyuki 36.10 6.83 0.72 3.83 47.51 94.98 4.48 0.34 0.14 0.06 5.02 17,709
Umande 0.03 0.43 0.00 3.02 65.36 68.83 30.91 0.17 0.06 0.03 31.17 10,501
Laikipia North Con-stituency 0.05 0.79 0.11 2.12 39.91 42.98 7.25 0.02 49.67 0.08 57.02
49,115
Sosian 0.09 0.21 0.14 1.10 37.30 38.84 13.16 0.05 47.94 0.01 61.16 14,799
Segera 0.05 1.59 0.32 3.50 62.18 67.64 4.47 0.00 27.57 0.32 32.36 9,326
Mugogodo West 0.00 1.04 0.00 3.49 13.71 18.23 4.87 0.00 76.89 0.00 81.77 9,235
Mugogodo East 0.04 0.72 0.02 1.47 44.53 46.77 4.74 0.03 48.42 0.05 53.23 15,755
Table 20.28: Human Waste Disposal in Female Headed Household by County, Constituency and Ward
County/ Constit-uency
Main Sewer
Septic Tank
Cess Pool
VIP Latrine
Pit Latrine
Improved Sanitation
Pit Latrine Uncovered Bucket Bush Other
Unim-proved Sanitation
Number of HH Memmbers
Kenya 5.0 2.2 0.2 4.5 47.6 59.5 21.4 0.3 18.7 0.2 40.5 11,164,581.0
Rural 0.1 0.3 0.1 4.0 48.5 53.0 22.6 0.1 24.2 0.1 47.0 8,058,724.0
Urban 17.6 7.2 0.6 5.9 45.1 76.4 18.4 0.7 4.3 0.2 23.6 3,105,857.0
Laikipia 7.4 1.2 0.2 3.3 52.3 64.3 17.7 0.1 17.9 0.1 35.7 132,159.0
Laikipia West 5.7 1.2 0.1 4.1 58.5 69.6 21.2 0.0 9.1 0.0 30.4 65,502.0
Ol-Moran 0.0 0.1 0.0 4.7 59.7 64.5 23.1 0.1 12.2 0.1 35.5 6,531.0
Rumuruti Township 0.0 0.6 0.0 1.9 40.1 42.8 35.2 0.0 22.0 0.0 57.2 7,159.0
Githiga 0.2 0.4 0.1 3.8 66.8 71.3 28.5 0.0 0.1 0.0 28.7 8,729.0
Marmanet 0.2 0.2 0.0 5.5 67.5 73.4 23.4 0.0 3.2 0.0 26.6 14,358.0
Igwamiti 18.3 3.4 0.4 4.8 58.5 85.4 14.2 0.0 0.3 0.1 14.6 20,034.0
Salama 0.0 0.1 0.0 1.8 49.7 51.5 13.4 0.0 35.0 0.0 48.5 8,691.0
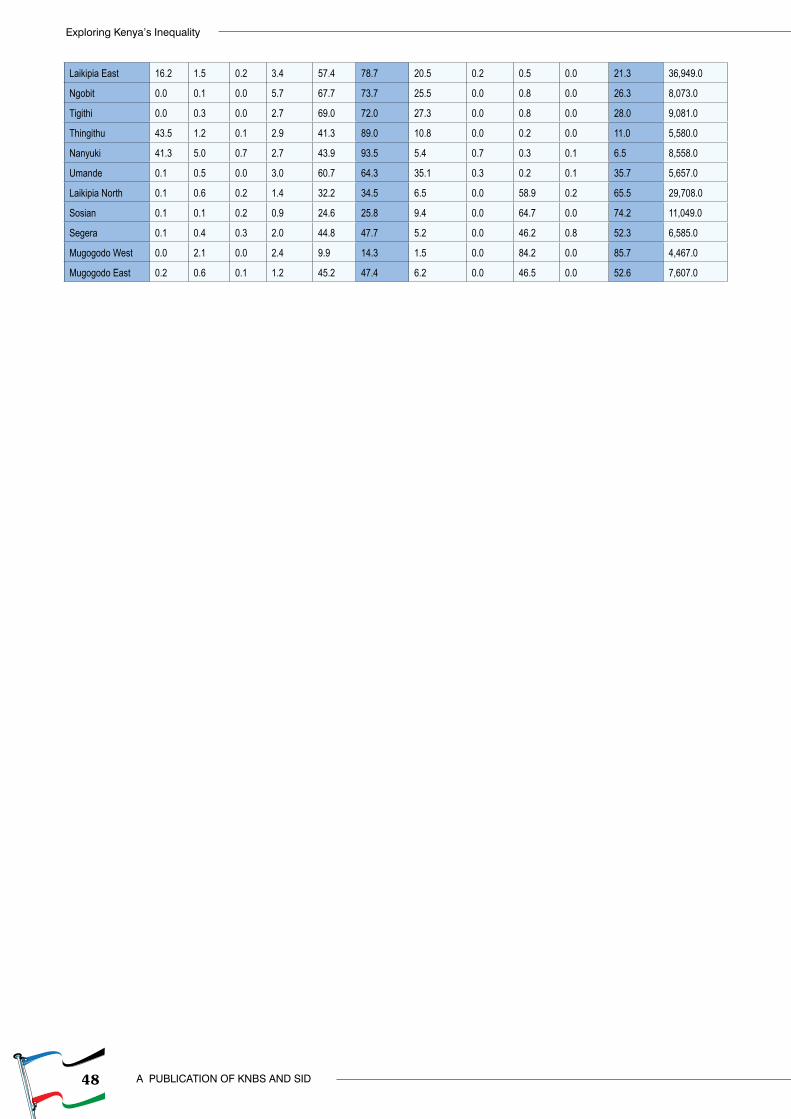
48
Exploring Kenya’s Inequality
A PUBLICATION OF KNBS AND SID
Laikipia East 16.2 1.5 0.2 3.4 57.4 78.7 20.5 0.2 0.5 0.0 21.3 36,949.0
Ngobit 0.0 0.1 0.0 5.7 67.7 73.7 25.5 0.0 0.8 0.0 26.3 8,073.0
Tigithi 0.0 0.3 0.0 2.7 69.0 72.0 27.3 0.0 0.8 0.0 28.0 9,081.0
Thingithu 43.5 1.2 0.1 2.9 41.3 89.0 10.8 0.0 0.2 0.0 11.0 5,580.0
Nanyuki 41.3 5.0 0.7 2.7 43.9 93.5 5.4 0.7 0.3 0.1 6.5 8,558.0
Umande 0.1 0.5 0.0 3.0 60.7 64.3 35.1 0.3 0.2 0.1 35.7 5,657.0
Laikipia North 0.1 0.6 0.2 1.4 32.2 34.5 6.5 0.0 58.9 0.2 65.5 29,708.0
Sosian 0.1 0.1 0.2 0.9 24.6 25.8 9.4 0.0 64.7 0.0 74.2 11,049.0
Segera 0.1 0.4 0.3 2.0 44.8 47.7 5.2 0.0 46.2 0.8 52.3 6,585.0
Mugogodo West 0.0 2.1 0.0 2.4 9.9 14.3 1.5 0.0 84.2 0.0 85.7 4,467.0
Mugogodo East 0.2 0.6 0.1 1.2 45.2 47.4 6.2 0.0 46.5 0.0 52.6 7,607.0
49
Pulling Apart or Pooling Together?
C
M
Y
CM
MY
CY
CMY
K


