Embed Size (px)
Citation preview
The EAAP series is published under the direction of Siem Korver and Jean Boyazoglu
tUROp^
Main sponsor:
hendrix' voeders
Research • Animal feed • Technical advice to farmers
P.O. Box 1 • 5830 MA Boxmeer • The Netherlands Phone .. 31 8855 89911 • Fax .. 31 8855 74518
Financial contributions were further received from:
CAVO-LATUCO, Utrecht CAW TWENTE B.A., Delden CEHAVE N.V., Veghel CHEIL FOODS & CHEMICALS Inc., Seoul
(Korea) COÖPERATIE ABC LOCHEM B.A.,
Lochern COÖPERATIE RIJNVALLEI B.A.,
Wageningen DEGUSSA AG, Hanau (Germany) ELANCO, Nieuwegein FANCOM B.V., Panningen FINN-FEEDS INTERNATIONAL Ltd.,
Wiltshire (UK) KOUDIJS-WOUDA Mengvoeders,
's-Hertogenbosch LODERS-CROKLAAN B.V., Wormerveer LOHMAN-LTE, Cuxhaven (Germany) MINISTRY of Agriculture, Nature
Management and Fisheries, Den Haag ORFFA-NEDERLAND FEED B.V., Giessen PROVIMI B.V., Rotterdam SMITHKLINE BEECHAM, Zoetermeer TRIPLE A, Delft UT-DELFIA B.V., Maarssen
Organizing Committe:
L.A.«den H,artog (chairman), Research Institute for Pig Husbandry, Rosjnalen, The Netherlands
M.W.A. Verstegen (secretary), Department of Animal Nutrition, Wageningen Agricultural University, Wageningen, The Netherlands
S. Bakker (finance), ILOB-TNO Wageningen, Department of Animal Nutrition and Physiology, Toxicology and Nutrition Institute Wageningen, The Netherlands «
A.W. Jongbloed, IVVO-DLO, Research Institute for Livestock Feeding and Nutrition, Lelystad, The Netherlands
G.J.M. Van Kempen, ILOB-TNO Wageningen, Department of Animal Nutrition and Physiology, Toxicology and Nutrition Institute, Wageningen, The Netherlands
J.H.M. Metz, IMAG-DLO, Institute of Agricultural Engineering, Wageningen, The Netherlands
Nitrogen flow in pig
production and
environmental
consequences
Proceedings of the First International Symposium on Nitrogen Flow in Pig Production and Environmental Consequences, Wageningen (Doorwerth), The Netherlands, 8-11 June 1993 (EAAP Publication No. 69, 1993)
M.W.A. Verstegen, L.A. den Hartog, G.J.M. van Kempen and J.H.M. Metz (Editors)
Pudoc Scientific Publishers
Wageningen 1993
! V !. •; u a
t^sr.oiJW'UNivEasnK'-WAC-FJSINGEN
CIP-data Koninklijke Bibliotheek, Printed in the Netherlands
Den Haag
ISBN 90-220-1085-6 NUGI 835
> Centre for Agricultural Publishing and Documentation (Pudoc),
Wageningen, Netherlands 1993
All rights reserved. Nothing from this publicatfon may be reproduced, stored in a computerized system or published in any form or in any, manner, including electronic, mecr^çical, reprographic or photographic, without prior written permission from the publisher, Pudoc, P.O. Box 4, 6700 AA Wageningen, Netherlands. ,
The individual contributions in this publicationgand any liabilities arising from them remain the responsibility of the authors. •
Insofar as photocopies from this publication are permitted by the Copyright Act 1912, Article 16B and Royal Netherlands Decree of 20 June 1974 (Staatsblad 351) as amended in Royal Netherlands Decree of 23 August 1985 (Staatsblad 471) and by Copyright Act 1912, Article 17, the legally defined copyright fee for any copies should be transferred to the Stichting Reprorecht (P.O. Box 882,1180 AW Amstelveen, Netherlands). For reproduction of parts of this publication in compilations such as anthologies or readers (Copyright Act 1912, Article 16), permission must be obtained from the publisher.
Printed in the Netherlands
CONTENTS
Preface
SESSION I OVERVIEW ON INPUT-OUTPUT OF N AND OTHER MINERALS IN LIVESTOCK PRODUCTION AND LEGISLATION.
R.R. Hacker and Z. Du Livestock pollution and politics. 3
A.W. Jongbloed and N.P. Lenis Excretion of nitrogen and some minerals by livestock. 22
SESSION II PROTEIN ABSORPTION AND DIGESTION.
P.J. Moughan Animal factors affecting protein utilisation in the pig. 39
P. Leterme, A. Théwis, L. Genot, E. François and B. Wathelet. Determination of the true ileal digestibility of amino acids in pigs by means of 15N-labelled diets. Preliminary results. 49
J. Huisman, M.W.A. Verstegen, P. van Leeuwen and S. Tamminga Reduction of N pollution by decrease of the excretion of endogenous N in pigs. 55
H. Schulze, CA. Makkink, M.P. Le Guen and M.W.A. Verstegen /
Endogenous N losses as measured by two independent methods. 62 F. Gatel
Dietary factors affecting protein digestibility in pigs. 70 A. Susenbeth
A model to describe the effect of nutrition on growth, body composition and nitrogen excretion in pigs. 90
C.M.C. van der Peet-Schwering, G.F.V. van der Peet, H.J.P.M. Vos, M.W.A. Verstegen, E. Kanis, C.H.M. Smits, A.G. de Vries and N.P. Lenis. Optimisation of the feeding strategy to minimize the N excretion by using the Dutch Technical Pig Feeding Model. 96
P. Bikker, M.W.A. Verstegen and R.G. Campbell Deposition, utilization and requirements of protein in growing pigs: a factorial approach. 102
F. Liebert Possibilities and limitations for a higher efficiency of N utilization in growing pigs. 111
H. Spiekers and E. Niess Free amino acids in protein-reduced cereal based diets for piglets. 116
C.A. Makkink Factors influencing protein digestive capacity in newly weaned piglets.
P. van Leeuwen and G.J.M. van Kempen \^_^ Concept for pig feed formulation based on ileal amino acid digestibility. 125
K. Partanen Meat and bone meal as a protein mineral source for growing pigs. 129
SESSION III NUTRITIONAL POSSIBILITIES FOR REDUCTION OF N.
Y. Henry and J.Y. Dourmad Feeding strategy for minimizing nitrogen output in pigs. 137
r^O
M. Kreuzer and A. Machmüller Reduction of gaseous nitrogen emission from pig manure by increasing the level of bacterially fermentable substrates in the ration. 151
S. Boisen New strategy for optimizing amino acid supply to growing, pigs. 157
P. Lee, R.M. Kay, A. Cullen, P. Fullarton and S. Jagger Dietary manipulation to reduce nitrogen excretion by pigs and its effects on performance. 163
R.A. Easter, H.H. Stein and N.L. Trottier Use of biotechnology and feed additives. 169
H. Everts and R.A. Dekker The effect of nitrogen supply during pregnancy on the nitrogen excretion by breeding sows. 183
J. Noblet, J.Y. Dourmad and S. Dubois The effect of porcine somatotropin on nitrogen utilization and nitrogen losses in growing pigs. 189
R. Scipioni, G. Martelli, S. Marchetti , P. Parisini and A. Piva Nitrogen balance in pigs fed with different amounts of pressed beet pulp silage (PBPS). 195
J. van der Meulen and J. Inborr Gastric and ileal measurements of nitrogen in pigs fed untreated and enzyme-treated wheat bran. • r\ 200
J.Y. Dourmad, Y. Henry, D. Bourdon, N. Quiniou and p. Guillou Effect of growth potential and dietary proteirv input on growth performance, carcass characteristics and nitrogen output in growing-finishing pigs. 206
G. Piva, A. Prandini, F. Ferrarini, M. Morlacchini and G. Varini Low protein diets and performances, carcass quality and nitrogen excretion of typical Italian heavy pigs. 212
J. Valaja and T. Alaviuhkola Reducing crude protein content with supplementation of free lysine and threonine in barley-rapeseed meal-pea diets of growing pigs. 218
M. Nasi Nitrogen utilization responses of growing pigs to suppleméptal lysine in barley-barley protein diet. , » " 224
M. Jost Reduction of protein content in the diet for piglets 'Jo minimize N excretio/i. 230
N. Quiniou, J.Y. Dourmad and J. Noblet ^ Effect of porcine somatotropin and dietary protein level on the 'nitrogen losses of pigs. , 236
P. Latimier and J.Y. Dourmad Effect of three protein feeding strategies, for growing-finishin&pigs, on growth performance and nitrogen output in the slurry and in. the air. 242
Z. Mroz, A.W. Jongbloed, S. Beers, P.A. Kemme, L. de Jonge, A.K. van Berkum and R.A. van der Lee Preliminary studies on excretory patterns of nitrogen and anaerobic deterioration of faecal protein from pigs fed various carbohydrates. 247
N.P. Lenis, J .Th.M. van Diepen, J.B. Schutte and J. de Jong The ideal pattern of ileal digestible amino acids in diets for growing pigs. 253
J.B. Schutte, J. de Jong and G.J.M. van Kempen i ^ Dietary protein in relation to requirement and pollution in pigs during the body weight range of 20 to 40 kg. 259
H. Schulze, M.W.A. Verstegen and S. Tamminga Effect of an increased NDF content in the diet on urinary and faecal nitrogen (N) excretion in young growing pigs. 264
SESSION IV N VOLATILIZATION FROM PIG HOUSING.
L. Christianson. R.H. Zang, D.L. Day and G.L. Riskowski Effects of building design, climate control, housing system, animal behavior and manure management at farm levels on N losses to the air. 271
A. Elzing and D. Swierstra Ammonia emission measurements in a model system of a pig house. 280
A.J.A. Aarnink, M.J.M. Wagemans and A. Keen Factors affecting ammonia emission from housing for weaned piglets. 286
R. Krieger, J. Härtung and A. Pfeiffer Experiments with a feed additive to reduce ammonia emissions from pig fattening housing - preliminary results. 295
P. Hoeksma, N. Verdoes and G.J. Monteny Two options for manure treatment to reduce ammonia emission from pig housing. 301
CM. Groenestein, J. Oosthoek and H.G. van Faassen Microbial processes in deep-litter systems for fattening pigs and emission of ammonia, nitrous oxide and nitric oxide. 307
A. Pfeiffer, F. Arends, H.J. Langholz and G. Steffens The influence of various pig housing systems and dietary protein levels on the amount of ammonia emissions in the case of fattening pigs. 313
J.G.M. Thelosen, B.P. Heitlager and J.A.M. Voermans Nitrogen balances of two deep litter systems for finishing pigs. 318
D. Berckmans, J.Q. Ni and C. Vinckier , Continuous ammonia and ventilation rate measurement to evaluate an ammonia sensor in field conditions. 324
P.A. Kemme, A.W. Jongbloed, B.M. Dellaert and F. Krol-Kramer The use of a Yucca schidigera extract as 'urease inhibitor' in pig slurry. 330
P. Heinrichs and J. Oldenburg Effect of protein feeding on gaseous ammonia emissions and slurry loading with nitrogen in fattening pigs. 336
J. Oldenburg Ammonia emissions from various pig housing systems. 340
PJ.L. Derikx and A.J.A. Aarnink Reduction of ammonia emission from slurry by application of liquid top layers. 344
SESSION V MANURE APPLICATION AND CENTRAL PROCESSING.
S.G. Sommer and I.K. Thomsen Loss of nitrogen from pig slurry due to ammonia volatilization and nitrate leaching. 353
K.C. Cameron and A.W. Rate The fate of nitrogen in pig slurry applied to a pasture soil in New Zealand. 368
O. Schätzchen and H. Kühl The nitrogen flow and ammonia emissions in pig facility and its share in the N load to the agroecosystem. 374
G.M. den Brok Nitrogen balance in the case of slurry separation on the farm. 380
P.J.W. ten Have Nitrogen and the industrial processing of pig manure. 386
J.P.M. Sanders Development of an industrial process technology for the manufacturing of lysine from pig manure. 398
C.H. Burton, R.W. Sneath and J.W. Farrent The effect of continuous aerobic treatment on the fate of the nitrogen component in piggery slurry. 404
A.R. Moen Survival of animal pathogens in slurry. 410
A.J.A. Aarnink, P. Hoeksma and E.N.J, van Ouwerkerk Factors affecting ammonium concentration in slurry from fattening pigs. 413
R.M. de Mol Simulation of manure flows on a farm level. 421
P.C. Scheepens, M.W.M.F. Arts, C.M.J. Bloemhard and A.G. Elema Inactivation of weed seeds during drying and pelleting of pig manure. 427
SESSION VI INTEGRATION AND MODELLING.
J.H.M. Wijnands Economic aspects of N flow manipulation in pig production. 435
G.W.J. Giesen, P.B.M. Berentsen and H. Leneman Costs of reducing nitrogen emission on pig farms in the Netherlands. 449
G.B.C. Backus, A.L.P. van de Sande-Schellekens and J.A.M. Voermans Economics of bioscrubbers to reduce ammonia emission from fattening pig farms. . . 455
W.J.B. Brunnekreef Evaluation of practical applications for an integrated approach on farm level. 460
W.H.M. Baltussen and R. Hoste ' Possibilities and costs of reducing ammonia emission on pig farms in the Netherlands. 463
M.O. van der Veen Reduction of nitrogen in compound feeds in the Netherlands: an economic
' evaluation. 469 W.H.M. Baltussen
A levy on nitrogen to reduce the nitrogen content in compound feed. 475 E. Maathuis and H. Snijders
Mineral book keeping in pig production. ' ' _. * 480 J.A. Zeevalkink and J.B. Schutte
Nutritional possibilities and the Dutch policy on manure surpluses. 484 D.D. Schulte » '
An integrated review of nitrogen management fpr pig manure in the U.S. 488
PREFACE
This book provides a compilation of the papers presented at the First International Congress on "Nitrogen Flow in Pig Production and Environmental Consequences".
In recent years intensification of animal production has become a serious threat to the environment, in the form of ammonia emissions into the air, and nitrate surplusses from manure into the groundwater. This congress was held, to provide an overview of this situation, with special reference to the quantitative aspects of N flow in pig production, and the consequent effects on the environment. This congress aims to update information on N utilization and N excretion in pigs from feed, the influences of housing and management on N losses, the effects of manure treatment and storage, the processing of manure, and the economic and legal aspects of N flow in pig production. Knowledge from various fields will be used in an integrated approach to potential solutions, which could be most effective and practical under existing production conditions. Many countries are being faced with the consequences of intensified livestock production. In recent decades, pig production has become a sector which is no longer confined to the areas where nutrients are produced. In other words, the ingredients for pig rations/diets are no longer necessarily produced in the areas where the pigs are raised. Areas of intensive pig production sometimes have surplusses of minerals in N and P from the manure, which has therefore resulted in imbalances between input and output. Recently, much research has been initiated to quantify the impact of nutrition, animals, housing, the storage and treatment of manure, and economics in relation to the environment. It was our aim to integrate these different approaches at this congress, and thereby to determine the state-of-the-art of the quantitative aspects of N flow. Papers in this symposium have been written by many authoritative workers. They have been organised into six main topics, which deal with various aspects of the N flow in pig production. They range from digestion and utilization of nutrients by the pig, to aspects of housing, and subsequent N volatilization and manure processing. Moreover, integrated approaches are being discussed in the last session. The sessions are as follows: I General overview and regulatory legislation II Protein absorption and digestion in pigs III Nutritional possibilities for reduction of N IV N volatilization from pig housing V Application of manure and central processing VI Integration and modelling We wish to acknowledge the financial support of the organizations listed in the beginning of this book. We would like to give special thanks to Mrs. M. Lippelt-Rutten and J. van de Kraats-Bos who provided such excellent secretarial help. This was essential for the preparation of the congress and the proceedings.
The organizing committee
List of contributors to the scientific program
AUSTRALIA
R.G. Campbell Bunge Meat Industries Ltd. Redlands Road Corowa N.S.W. 2646 AUSTRALIA
BELGIUM
E. François L. Genot P. Le terme A. Théwis B. Wathelet Faculté des Sciences Agronomiques de l'Etat Unité de Zootechnie Passage des Déportés 2 B-5800 Gembloux BELGIUM
D. Berckmans J.Q. Ni C. Vinckier National Fund of Scientific Research Laboratory for Agricultural Buildings Research K.U. Leuven BELGIUM
CANADA
Z. Du R.R. Hacker University of Guelph Department of Animal & Poultry Science Guelph, Ontario NIG 2W1 CANADA
DENMARK
S. Boisen S. Sommer I.K. Thomson National Institute of Animal Science Fors^gsanlaeg Foulum P.O. Box 39 DK-8830 Tjele DENMARK
FINLAND
T. Alaviuhkola M. Nasi K. Partanen J. Valaja University of Helsinki Department of Animal Science P.O. Box 28 Viiki 21, SF-00014 Helsinki FINLAND
FRANCE
F. Gatel Institute Technique des Céréales et des Fourrages Pouline 4100 Villerable FRANCE
M.P. Le Guen ' G.I.E. Euretec 85 rue St. Brieuc 35000 Rennes FRANCE
D. Bourdon J.Y. Dourmad S. Dubois D. Guillou Y. Henry J. Noblet N. Quiniou INRA Station de Recherches Porcines 35590 Saint-Gilles FRANCE
P. Latimier Etablissement Departmental de l'Elevage des Côtes D'Armor B.P. 540, 22195 Plérin Cedex FRANCE
GERMANY
H. Kühl O. Schätzchen University of Rostock Institute for Agrotechnology and Techniques St.-Georg-Straße 21 0-2500 Rostock GERMANY
P. Heinrichs J. Oldenburg Institut für Landwirtschaftliche Verfahrenstechnik der Universität Kiel Olshaussenstraße 40-60 D-2300 Kiel GERMANY
F. Ahrends G. Steffens Landwirtschaftliche Forschungsund Untersuchungsanstalt Oldenburg GERMANY
R. Krieger Abteilung für Tierhaltung und Tierschutz Tierärtzliche Hochschule Hannover Bünteweg 17P D-3000 Hannover 71 GERMANY
M. Kreuzer H. Langholz A. Machmüller A. Pfeiffer Universität Göttingen Forschungs- und Studienzentrum Weser-Ems Driverstraße 22 D-49377 Vechta GERMANY
F. Liebert Leipzig Universität Wissenschaf tsbereichTierernährungsphys. und Futtermittelkunde Gustav Kühnstraße 8 0-7022 Leipzig GERMANY
E. Niess H. Spiekers Landwirtschaftskammer Rheinland Endenicher Allee 60 DW 5300 Bonn 1 GERMANY
A. Susenbeth University of Hohenheim Institute of Animal Nutrition 7000 Stuttgart 70 GERMANY
ITALY
G. Martelli S. Marchetti P. Parisini A. Pi va R. Scipioni University of Bologna --Istituto di Zootecnia e Nutriziorié Animale Via Tblara di Sopra 50 40064 Ozzano Emilia Bologna ITALY
G. Piva A. Prandini Istituto di Scienze della Nutrizione Facoltà di Agraria U.C.S.C. „- . Via E. Parmensé 84 . • ' Piacenza ITALY ,
i 1F. Fewarkii, Istituto Superior Lattiero Caseario Mantova » . ITALY
I M. Morlac'chini Centro de Ricerca sulla Zootecnia e 1'Ambiente Piacenza ITALY
G. Varini Associazione Allevatori **. Mantova ITALY
THE NETHERLANDS
S. Beers A.K. van Berkum R.A. Dekker B.M. Dellaert J.Th.M. van Diepen H. Everts A.W. Jongbloed L. de Jonge P.A. Kemme F. Krol-Kramer R.A. van der Lee N.P. Lenis J. van der Meulen Z. Mroz IVVO-DLO Research Institute for Livestock Feeding and Nutrition Runderweg 2 8200 AD Lelystad THE NETHERLANDS
J. Huisman J. de Jong G.J.M, van Kempen P. van Leeuwen H. Schulze J.B. Schutte ILOB-TNO, Department of Animal Nutrition and Physiology, Toxiology and Nutrition Institute Haarweg 8 P.O. Box 15 6700 AA Wageningen THE NETHERLANDS
J.A. Zeevalkink TNO-IMET, Institute of Environmental and Energy Technology P.O. Box 342 7300 AH,Apeldoorn THE NETHERLANDS
P. Bikker CA. Makkink H. Schulze S. Tamminga M.W.A. Verstegen Agricultural University Wageningen Department of Animal Nutrition Haagsteeg 4 6708 PM Wageningen THE NETHERLANDS
G.B.C. Backus G.M. de Brok L.A. den Hartog B.P. Heitlager C.M.C, van der Peet-Schwering A.L.P. van de Sande-Schellekens J.G.M. Thelosen J.A.M. Voermans N. Verdoes H.J.P.M. Vos Research Institute for Pig Husbandry P.O. Box 83 5240 AB Rosmalen THE NETHERLANDS
W.H.M. Baltussen R. Hoste M. van der Veen J.H.M. Wijnands LEI-DLO Agricultural Economic Research Institute P.O. Box 29703 , 2502 LS Den Haag THE NETHERLANDS
E. Maathuis G.F.V. van der Peet H. Snijders IKC-Veehouderij P.O. Box 328 5240 AH Rosmalen THE NETHERLANDS
W.J.B. Brunnekreef Hendrix' Voeders BV P.O. Box 1 5830 MA Boxmeer THE NETHERLANDS
E. Kanis Agricultural University Wageningen Department of Animal Breeding P.O. Box 338 6709 PH Wageningen THE NETHERLANDS
C.H.M. Smits Institute for Animal Nutrition "De Schothorst" P.O. Box 533 8200 AM Lelystad THE NETHERLANDS
H.G. van Faassen Institute for Soil Fertility Research IB-DLO P.O. Box 30003 9750 RA Haren THE NETHERLANDS
A.G. de Vries IVO-DLO Institute for Animal Production and Nutrition P.O. Box 501 3700 AM Zeist THE NETHERLANDS
C.M.J. Bloemhard P.C. Scheepens DLO-Centre for Agrobiological Research P.O. Box 14 6700 AA Wageningen THE NETHERLANDS
A.G. Elema Research Institute for Arable Farming and Field Production of Vegatables P.O. Box 430 8200 AK Lelystad THE NETHERLANDS
A.J. Aarnink M.W.A.F. Arts P.J.L. Derikx A. Elzing CM. Groenestein P.J.W. ten Have P. Hoeksma A. Keen J.H.M. Metz R. de Mol G.J. Monteny J. Oosthoek E.N.J, van Ouwerkerk D. Swierstra M.J.M. Wagemans IMAG-DLO Institute of Agricultural Engineering P.O. Box 43 6700 AA Wageningen THE NETHERLANDS
»^
P.B.M. Berentsen G.W.J. Giessen H. Leneman Agricultural University Wageningen Department of Farm Management Hollandseweg 1 6706 KN Wageningen THE NETHERLANDS
A.R. Moen Gezondheidsdienst voor Dieren Noord-Nederland P.O. Box 361 9200 AJ Drachten -; THE NETHERLANDS
J.P.M. Sanders Triple A c/o Gist Brocades BV P.O. Box 1 2600 MA Delft THE NETHERLANDS
NEW ZEALAND
P. Mougfyin ' . ' ' Massey University ' Department of Animal Science Palmerston North ' NEW «ZEALAND ,
K.C. Cariteron A.W.Rate Lincoln University • Department of Soil Science Canterbury NEW ZEALAND
SWITZERLAND
M. Jost Swiss Federal Research Institutê*£or Animal Production CH-1725 Posieux SWITSERLAND
UNITED KINGDOM
A. Cullen P. Fullarton Forum Chemicals Brighton Road Redhill UNITED KINGDOM
P. Lee ADAS Reading Coley Park Reading UNITED KINGDOM
L. Christiansen D.L. Day R.A. Easter G.L. Riskowski H.H. Stein N.L. Trottier R.H. Zang University of Illinois Department of Animal Sciences 328 Mumford Hall 1301 W. Gregory Dr. Urbana, Illinois 61801 USA
R.M. Kay ADAS Terrington Terrington St. Clement King's Lynn UNITED KINGDOM
S. Jagger Dalgety Agriculture Ltd. Aztec West Bristol UNITED KINGDOM
C.H. Burton J.W. Farrant J. Härtung R.W. Sneath AFRC Silsoe Research Institute Silsoe Bedford MK45 4HS UNITED KINGDOM
J. Inborr Finnfeeds International Ltd. Marlborough UNITED KINGDOM
USA
D.D. Schulte University of Nebraska Department of Biological Systems Engineering 22 L.W. Chase Hall Lincoln, NE 68583-0726 USA
SESSION 1
Overview on input-output of N and other minerals in livestock production and legislation.
livestock Pollution and Politics
R. R. Hacker and Z. Du
University ofGuelph, Ontario, Canada NIG 2W1
Summary
Pollution of the environment has become one of the very serious problems in the world. There are many factors contributing to these problems both from natural causes and man created activities. As man urbanizes, livestock production intensifies, air and water pollution becomes more noticeable and unfavourable global attention is shifted to the scenario. To prevent the problem from escalating, additional emphasis is placed on research concerning animal waste management and more countries, particulary in the developed world, proceed to create legislation or government policy to control this perceived environmental risk. The main objective of this review paper will be to look at existing legislation, codes and regulations regarding the control of animal waste disposal world wide and to present future prospects for containing this problem.
Key words: Livestock manure, Pollution, Legislation, Guidelines, World.
Introduction
Since the early 1970's, environmental pollution has become one of the most topical issues of the world press. Concern for the quality of the environment increased as people realized the consequences of rapid industrialization and agricultural development. The solution to environmental problems is usually complex. Acceptable tolerance levels are hard to define, and total abatement is often difficult and expensive.
The scale of livestock farming has changed from small to industrial. Thus intensive livestock production has and will receive more attention for its caused environmental pollution. In attempts to address the environmental impact from agricultural sources, many countries have taken measures of legislation and guidelines. However, approaches to controlling the environmental pollution caused by livestock production in different parts of the world are varied. The ultimate sanction is the banning of certain livestock species, for example, pigs in Singapore. Most countries, however, adopt, at least initially, less harsh procedures. These procedures can be divided into two categories, legislation and guidelines. There are not many countries that have strict legislation to control the animal manure pollution such as the Netherlands, Denmark, etc. However, many countries have adapted guidelines instead of legislation. Furthermore, there are still many more countries that have neither legislation nor guidelines. This paper will attempt to review the legislation and guidelines in some countries and regions of the world but not all due to the lack of information and ability to communicate.
Asia-Australasia
Malaysia
One of the industries that has been identified as causing serious water pollution is the pig industry. In 1984, the National Agricultural Policy of Malaysia had already promulgated that pig farming should be carried out in suitably sited areas incorporated with waste treatment. If the existing farms were unable to meet the requirement of the government policy, they had to move to the "Pig Farm Area" in which pollution control measures were mandatory (Ong, 1991).
Evaluation parameters as shown in Tables 1, 2, 3 and 4, are required by environmental protection laws which apply to the pig farm industry.
p^
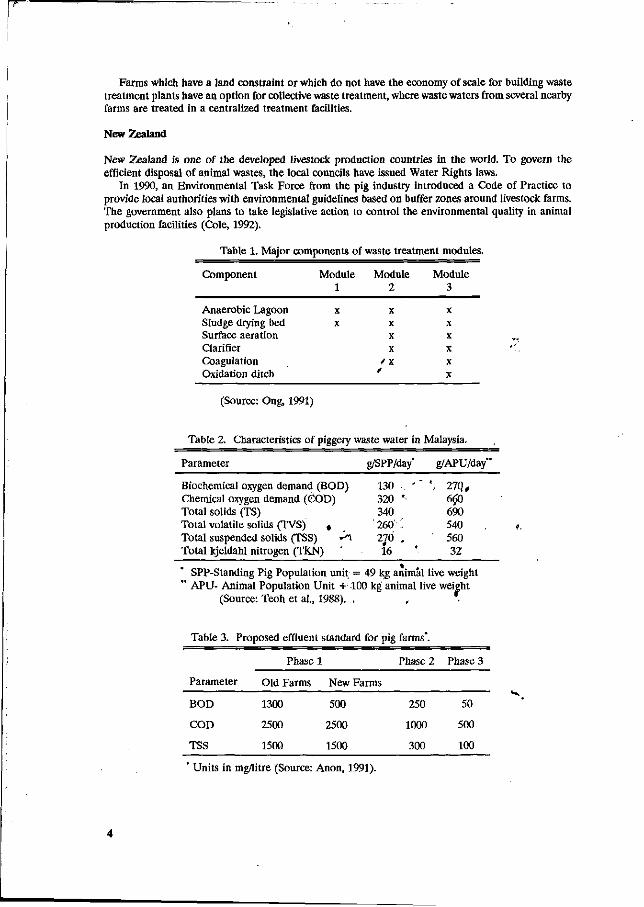
Farms which have a land constraint or which do not have the economy of scale for building waste treatment plants have an option for collective waste treatment, where waste waters from several nearby farms are treated in a centralized treatment facilities.
New Zealand
New Zealand is one of the developed livestock production countries in the world. To govern the efficient disposal of animal wastes, the local councils have issued Water Rights laws.
In 1990, an Environmental Task Force from the pig industry introduced a Code of Practice to provide local authorities with environmental guidelines based on buffer zones around livestock farms. The government also plans to take legislative action to control the environmental quality in animal production facilities (Cole, 1992).
Table 1. Major components of waste treatment modules.
Component Module Module Module 1 2 3
Anaerobic Lagoon Sludge drying bed Surface aeration Clarifier Coagulation Oxidation ditch
X
X
X
X
X
X
/ X
/
X
X
X
X
X
X
(Source: Ong, 1991)
Table 2. Characteristics of piggery waste water in Malaysia.
Parameter g/SPP/day' g/APU/day"
Biochemical oxygen demand (BOD) Chemical oxygen demand (COD) Total solids (TS) Total volatile solids (TVS) , Total suspended solids (TSS) - ^ Total kjeldahl nitrogen (TKN) '
SPP-Standing Pig Population unit = 49 kg animal live weight " APU- Animal Population Unit + 100 kg animal live weight
(Source: Teoh et al., 1988). . , .
Table 3. Proposed effluent standard for pig farms*.
Phase 1 Phase 2 Phase 3
130 • ' 320 *• 340 260'' ' 270 . 16
', 27Q, 660 690 540 560 32
Parameter
BOD
COD
TSS
Old Farms
1300
2500
1500
New Farms
500
2500
1500
250
1000
300
50
500
100
Units in mg/litre (Source: Anon, 1991).
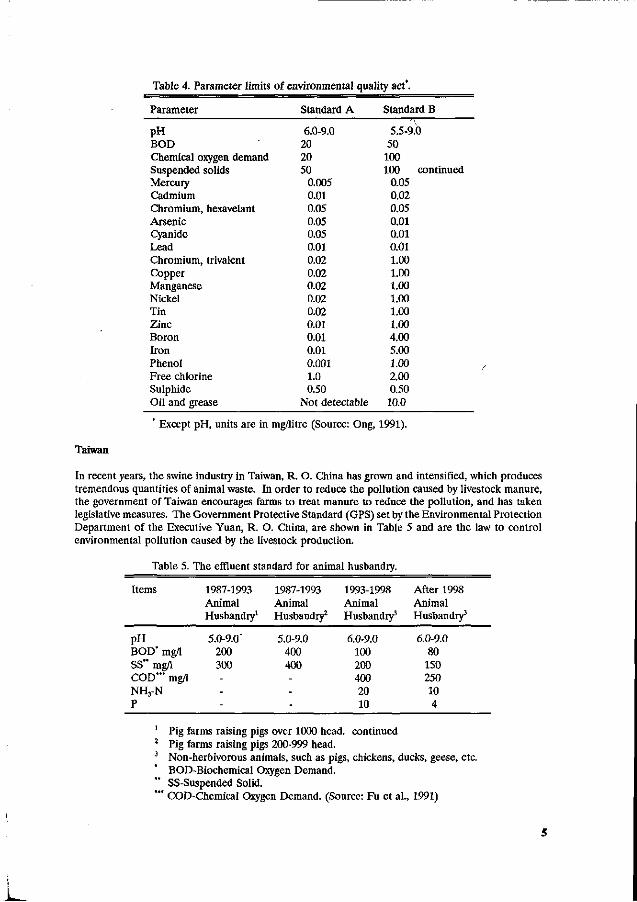
Table 4. Parameter limits of environmental quality act*.
Taiwan
Parameter
pH BOD Chemical oxygen demand Suspended solids Mercury Cadmium Chromium, hexavelant Arsenic Cyanide Lead Chromium, trivalent Copper Manganese Nickel Tin Zinc Boron Iron Phenol Free chlorine Sulphide Oil and grease
Standard A
6.0-9.0 20 20 50
0.005 0.01 0.05 0.05 0.05 0.01 0.02 0.02 0.02 0.02 0.02 0.01 0.01 0.01 0.001 1.0 0.50
Not detectable
Standard B
5.5-9.0 50
100 100 continued
0.05 0.02 0.05 0.01 0.01 0.01 1.00 1.00 1.00 1.00 1.00 1.00 4.00 5.00 1.00 2.00 0.50 10.0
Except pH, units are in mg/litre (Source: Ong, 1991).
In recent years, the swine industry in Taiwan, R. O. China has grown and intensified, which produces tremendous quantities of animal waste. In order to reduce the pollution caused by livestock manure, the government of Taiwan encourages farms to treat manure to reduce the pollution, and has taken legislative measures. The Government Protective Standard (GPS) set by the Environmental Protection Department of the Executive Yuan, R. O. China, are shown in Table 5 and are the law to control environmental pollution caused by the livestock production.
Table 5. The effluent standard for animal husbandry.
Items
pH BOD* mg/1 SS" mg/1 COD*"' mg/1 NH3-N P
1987-1993 Animal Husbandry1
5.0-9.0" 200 300 --
-
1987-1993 Animal Husbandry2
5.0-9.0 400 400 --
-
1993-1998 Animal Husbandry3
6.0-9.0 100 200 400 20 10
After 1998 Animal Husbandry3
6.0-9.0 80
150 250 10 4
Pig farms raising pigs over 1000 head, continued Pig farms raising pigs 200-999 head. Non-herbivorous animals, such as pigs, chickens, ducks, geese, etc. BOD-Biochemical Oxygen Demand. SS-Suspended Solid. COD-Chemical Oxygen Demand. (Source: Fu et al., 1991)
L
Europe and United Kingdom
Belgium
In January, 1991, legislation on manure and fertilizer use came into effect. Maximum levels of fertilizer application were set out: the standard levels are 200 kg P2Os /ha/ year on grass land and maize fields and 150 kg P2Os /hatyear on all other arable lands. Further to these a general norm on nitrogen application of 400 kg /ha^ear is the present maximum allowance on all agricultural lands.
In the future, legislation will reduce these tolerances to 125 kg P205 by the year 2001. While for nitrogen no timetable has been set, studies on a decrease of 75% of the present level have been made.
Manure application time must be followed, such as manure spreading is prohibited on Sundays and official holidays between May 15 to November 1 and between November 2 and February 15 all manure spreading is forbidden.
In January, 1991, the legislature introduced a law on manure surpluses: Belgium livestock farmers producing an excess of manure related to their land availability are taxed. The base tax is 2 Belgian Francs per kg P2Os and cumulative 2 Belgian Francs per kg of excess nitrogen.
If livestock producers can not dispose of excess manure on their lands or on their neighbours lands, they are obliged to bring it to a manure bank. If he/she has to use the bank he/she will have to pay an additional tax of 6 Belgian Francs per kg nitrogen and cumulative 8.5 Belgian Francs per kg P2Os. The calculations of the excretion is done on an outright basis.
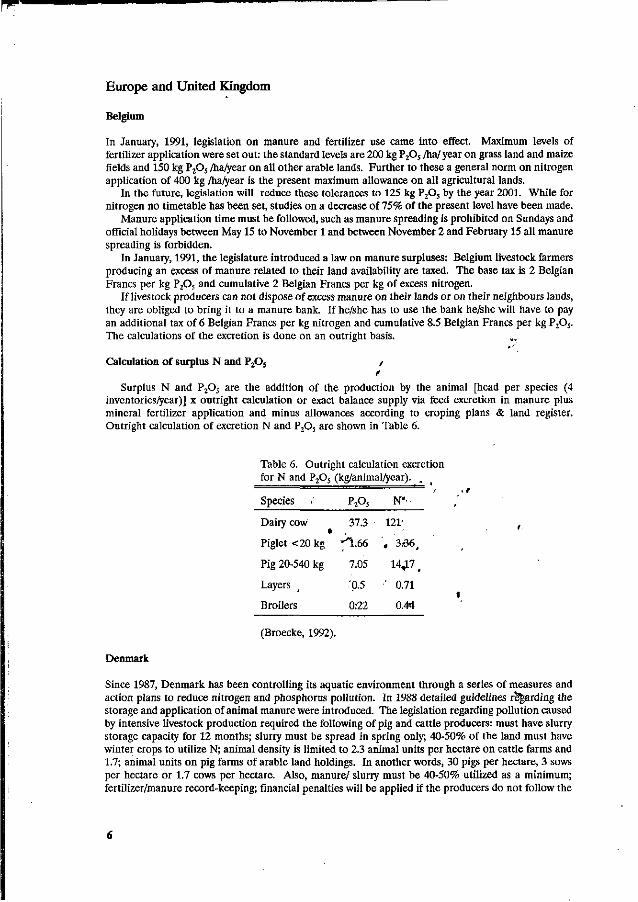
Calculation of surplus N and P2Os /
Surplus N and P205 are the addition of the production by the animal [head per species (4 inventories^ear)] x outright calculation or exact balance supply via feed excretion in manure plus mineral fertilizer application and minus allowances according to croping plans & land register. Outright calculation of excretion N and P205 are shown in Table 6.
Table 6. Outright calculation excretion for N and P205 (kg/animal/year).
Species
Dairy cow
Piglet <20 kg
Pig 20-540 kg
Layers
Broilers
P2o5
37.3 •
-"Ï.66
7.05
0.5
0:22
N*'
121'
, 3.-36,
1 4^7 ,
•' 0.71
0.44
(Broecke, 1992).
Denmark
Since 1987, Denmark has been controlling its aquatic environment through a series of measures and action plans to reduce nitrogen and phosphorus pollution. In 1988 detailed guidelines regarding the storage and application of animal manure were introduced. The legislation regarding pollution caused by intensive livestock production required the following of pig and cattle producers: must have slurry storage capacity for 12 months; slurry must be spread in spring only; 40-50% of the land must have winter crops to utilize N; animal density is limited to 2.3 animal units per hectare on cattle farms and 1.7; animal units on pig farms of arable land holdings. In another words, 30 pigs per hectare, 3 sows per hectare or 1.7 cows per hectare. Also, manure/ slurry must be 40-50% utilized as a minimum; fertilizer/manure record-keeping; financial penalties will be applied if the producers do not follow the
guidelines. ^ It is allowed to go beyond suggested animal density limitations if a contract of redistribution and
utilization of manure is made between neighbouring farmers (Broecke, 1992).
France
The regulations which are applicable to pork farms of more than 450 pigs with regards to protecting the environment was published in March, 1992.
In France, all farms have been divided into two classifications ( Farms subject to "Declaration" and Farms subject to "Authorization") called class D and class A installations. Class D piggeries are open air units or pig houses containing between 50 to 450 pigs, while under class A fall all pig farms keeping over 450 pigs. The regulations for these two types of farms are slightly different.
The decree for class A farms
1. Location Pigs and manure storage tanks must be situated:
a) at least 100 meters from residences b) at least 30 meters from wells or water sources, water sources with open waterflow,
watercatchements underground or semi-covered independently whether the water is destined for drinking purposes or irrigation and riverbanks.
c) at least 200 meters from beaches or swimming areas. d) at least 500 meters from fish farms or shell-fish farms. '
2. Disposition of the buildings and storage equipment. a) all floors of the piggery, the pumping installation and the storage are to be impervious. Inside
the pig house the walls must be impervious up to a height of 1 meter. b) a water volume meter must be installed on the watersupply installation. c) all cleaning and sewage water must be collected in a main draining system for collection into
a storage or effluent treatment installation. d) rain water should not be mixed with sewage waters and separate drainage provisions are to be
made. e) the slop of the floors must permit collection of all effluent water, including cleaning water. f) overflows of the storage tanks into the natural environment is forbidden. Tanks with open
air storage must be fenced.
In the case of manure spreading on agricultural lands, the storage capacity must be adequate to collect all the effluent produced on the farm during at least 4 months.
3. Operating regulations a) effluent and manure must be treated, by spreading manure on agricultural lands
or in a purification plant or any installation registered and accepted by the Administrator of the Government.
b) the minimum distances between manure spreading area and residential areas are established based on the application of odour reducing measures and the maximum time-lag between spreading and plough down of the manure.
c) levels of nitrogen supply on the fields. The nitrogen supply on the fields, of all origins, organic or mineral, must take account of soil type and the rotation of the crops, in any case the following norms can not be exceeded: 350 kg N/ha/tyear on perennial grassland; 200 kg N/ha/tyear on all other cultivation except legum crops; no application on legum crops. Based on the initial state of the lands and a reginal fertilizer balance which figures in observation studies, the administrator can set lower maximum norms. Each year the farmer must provide a manure spreading plan and indicate any changes to the cropping plan, if authorization was previously obtained. In the following cases, manure spreading is forbidden: at least 50 meters away from sources of drinking water supply; at least 200 meters from beaches or swimming areas; at least 500 meters from fish and shell fish farms; at least 35 meters away from a
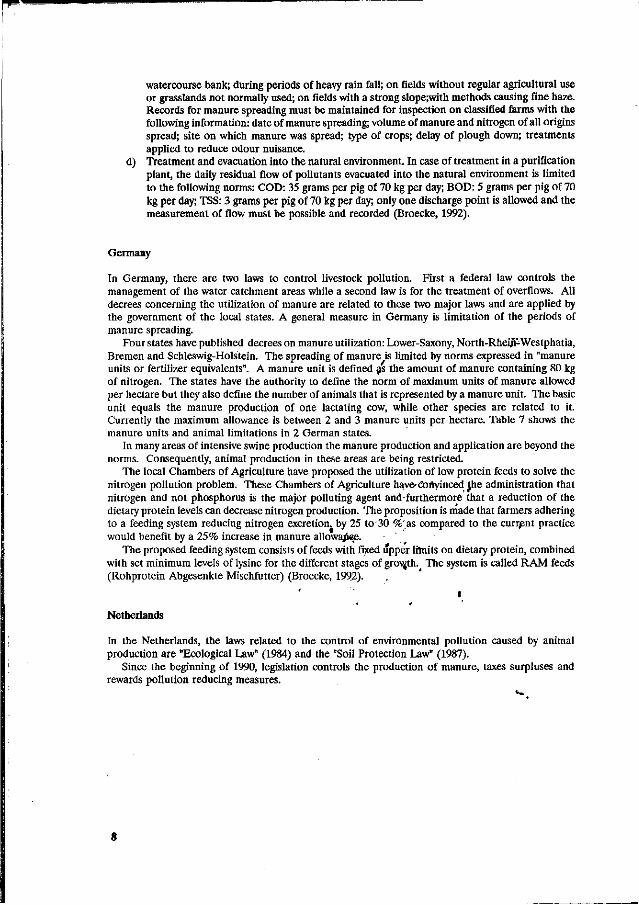
watercourse bank; during periods of heavy rain fall; on fields without regular agricultural use or grasslands not normally used; on fields with a strong slope;with methods causing fine haze. Records for manure spreading must be maintained for inspection on classified farms with the following information: date of manure spreading; volume of manure and nitrogen of all origins spread; site on which manure was spread; type of crops; delay of plough down; treatments applied to reduce odour nuisance,
d) Treatment and evacuation into the natural environment. In case of treatment in a purification plant, the daily residual flow of pollutants evacuated into the natural environment is limited to the following norms: COD: 35 grams per pig of 70 kg per day; BOD: 5 grams per pig of 70 kg per day; TSS: 3 grams per pig of 70 kg per day; only one discharge point is allowed and the measurement of flow must be possible and recorded (Broecke, 1992).
Germany
In Germany, there are two laws to control livestock pollution. First a federal law controls the management of the water catchment areas while a second law is for the treatment of overflows. All decrees concerning the utilization of manure are related to these two major laws and are applied by the government of the local states. A general measure in Germany is limitation of the periods of manure spreading.
Four states have published decrees on manure utilization: Lower-Saxony, North-Rheifif-Westphatia, Bremen and Schleswig-Holstein. The spreading of manure is limited by norms expressed in "manure units or fertilizer equivalents". A manure unit is defined as the amount of manure containing 80 kg of nitrogen. The states have the authority to define the norm of maximum units of manure allowed per hectare but they also define the number of animals that is represented by a manure unit. The basic unit equals the manure production of one lactating cow, while other species are related to it. Currently the maximum allowance is between 2 and 3 manure units per hectare. Table 7 shows the manure units and animal limitations in 2 German states.
In many areas of intensive swine production the manure production and application are beyond the norms. Consequently, animal production in these areas are being restricted.
The local Chambers of Agriculture have proposed the utilization of low protein feeds to solve the nitrogen pollution problem. These Chambers of Agriculture have» convinced Jhe administration that nitrogen and not phosphorus is the major polluting agent and furthermore that a reduction of the dietary protein levels can decrease nitrogen production. The proposition is made that farmers adhering to a feeding system reducing nitrogen excretion, by 25 to 30 %'as compared to the current practice would benefit by a 25% increase in manure allowapqe.
The proposed feeding system consists of feeds with fixed upper limits on dietary protein, combined with set minimum levels of lysine for the different stages of growth. The system is called RAM feeds (Rohprotein Abgesenkte Mischfutter) (Broecke, 1992).
Netherlands
In the Netherlands, the laws related to the control of environmental pollution caused by animal production are "Ecological Law" (1984) and the "Soil Protection Law" (1987).
Since the beginning of 1990, legislation controls the production of manure, taxes surpluses and rewards pollution reducing measures.
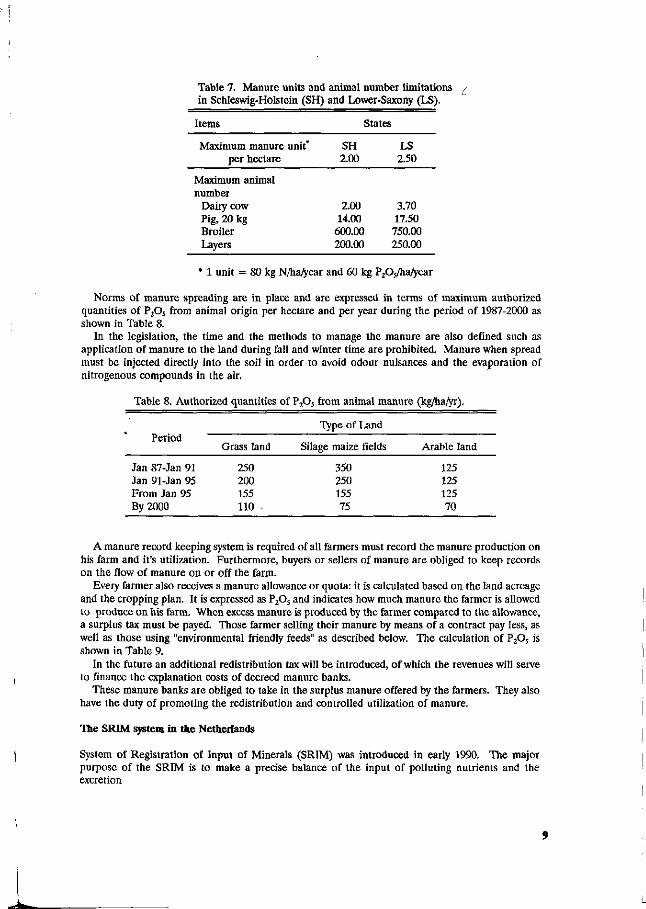
Table 7. Manure units and animal number limitations in Schleswig-Holstein (SH) and Lower-Saxony (LS).
Items
Maximum manure unit* per hectare
Maximum animal number
Dairy cow Pig, 20 kg Broiler Layers
States
SH 2.00
2.00 14.00 600.00 200.00
LS 2.50
3.70 17.50 750.00 250.00
* 1 unit = 80 kg N/ha/year and 60 kg PPj/hatyear
Norms of manure spreading are in place and are expressed in terms of maximum authorized quantities of P205 from animal origin per hectare and per year during the period of 1987-2000 as shown in Table 8.
In the legislation, the time and the methods to manage the manure are also defined such as application of manure to the land during fall and winter time are prohibited. Manure when spread must be injected directly into the soil in order to avoid odour nuisances and the evaporation of nitrogenous compounds in the air.
Table 8. Authorized quantities of P2Os from animal manure (kg/ha/yr).
Type of Land
Period
Jan 87-Jan 91 Jan 91-Jan 95 From Jan 95 By 2000
Grass land
250 200 155 110
Silage maize
350 250 155 75
fields Arable land
125 125 125 70
A manure record keeping system is required of all farmers must record the manure production on his farm and it's utilization. Furthermore, buyers or sellers of manure are obliged to keep records on the flow of manure on or off the farm.
Every farmer also receives a manure allowance or quota: it is calculated based on the land acreage and the cropping plan. It is expressed as P2Os and indicates how much manure the farmer is allowed to produce on his farm. When excess manure is produced by the farmer compared to the allowance, a surplus tax must be payed. Those farmer selling their manure by means of a contract pay less, as well as those using "environmental friendly feeds" as described below. The calculation of P205 is shown in Table 9.
In the future an additional redistribution tax will be introduced, of which the revenues will serve to finance the explanation costs of decreed manure banks.
These manure banks are obliged to take in the surplus manure offered by the farmers. They also have the duty of promoting the redistribution and controlled utilization of manure.
The SRIM system in the Netherlands
System of Registration of Input of Minerals (SRIM) was introduced in early 1990. The major purpose of the SRIM is to make a precise balance of the input of polluting nutrients and the excretion
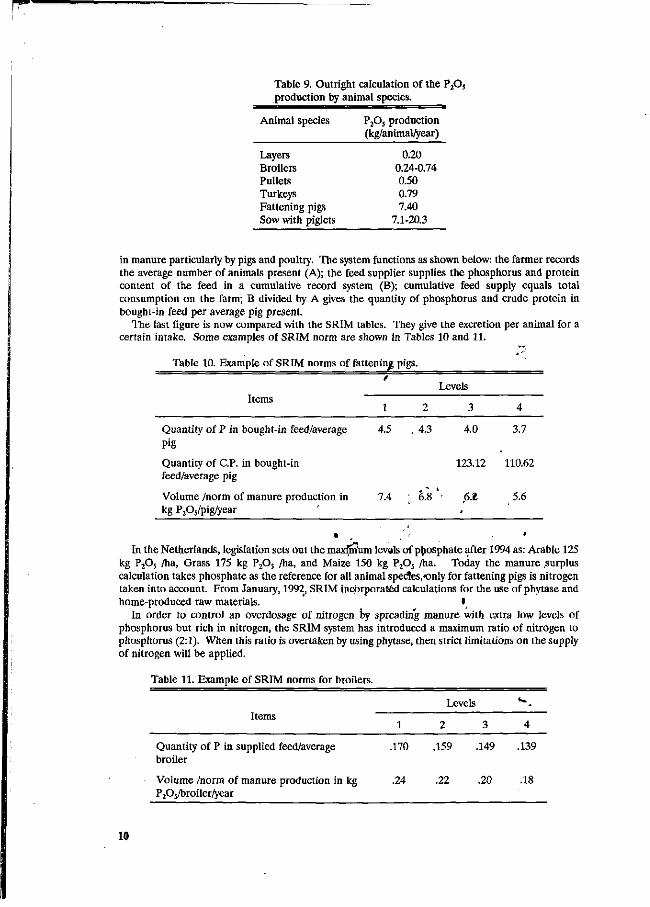
Table 9. Outright calculation of the P205
production by animal species.
Animal species
Layers Broilers Pullets Turkeys Fattening pigs Sow with piglets
PA production (kg/animal/year)
0.20 0.24-0.74 0.50 0.79 7.40
7.1-20.3
in manure particularly by pigs and poultry. The system functions as shown below: the farmer records the average number of animals present (A); the feed supplier supplies the phosphorus and protein content of the feed in a cumulative record system (B); cumulative feed supply equals total consumption on the farm; B divided by A gives the quantity of phosphorus and crude protein in bought-in feed per average pig present.
The last figure is now compared with the SRIM tables. They give the excretion per animal for a certain intake. Some examples of SRIM norm are shown in Tables 10 and 11.
Table 10. Example of SRIM norms of fattening pigs.
Levels Items
Quantity of P in bought-in feed/average 4.5 . 4.3 4.0 3.7 Pig
Quantity of C.P. in bought-in 123.12 110.62 feed/average pig
Volume /norm of manure production in 7.4 " 6.8 • 6.2 5.6 kg P2Os/pig/year
• , ' In the Netherlands, legislation sets out the maxfmW levels of phosphate after 1994 as: Arable 125
kg P2Os /ha, Grass 175 kg P2Os /ha, and Maize 150 kg P2Os /ha. Today the manure .surplus calculation takes phosphate as the reference for all animal specles^nly for fattening pigs is nitrogen taken into account. From January, 1992 SRIM incorporated calculations for the use of phytase and home-produced raw materials. •
In order to control an overdosage of nitrogen by spreading manure with extra low levels of phosphorus but rich in nitrogen, the SRIM system has introduced a maximum ratio of nitrogen to phosphorus (2:1). When this ratio is overtaken by using phytase, then strict limitations on the supply of nitrogen will be applied.
Table 11. Example of SRIM norms for broilers.
Items 1
Levels
2 3
t »
4
Quantity of P in supplied feed/average .170 .159 .149 .139 broiler
Volume /norm of manure production in kg .24 .22 .20 .18 P2Os/broiler/year
10
The present system will be expanded with a premium on nitrogen reduction. This is due to the fact that lowering crude protein levels in feed may lead to a increase of feed cost which may not be compensated by a tax reduction. The Dutch legislation envisages the introduction of a premium on the use of low-protein feeds. Ammonia emitted by the pig farms accounts for 27% of the emmissions of Dutch livestock. Consequently the government has called for a 20% reduction by the end of 1993 and a 70% cutback by the year 2000.
The total manure surplus nationally is requisted to be removed through processing in central drying and treatment plants, and made into pellets for export and internal sale as organic fertiliser. The target set for this process is 6 million tons of manure by 1994 (Pig news and information, 1992).
United Kingdom
The legislation regarding anti-pollution in the United Kingdom is termed the Town and Country Planing Regulation (1988), the Water Act (1989), and the Environmental Protection Act (1990). The Water Act 1989 tries to prevent water pollution from happening and allows people to be prosecuted if they pollute the environment. The Environmental Protection Act 1990 brings in a system of integrated pollution control for the disposal of wastes to land, water and air. It gives Local Authorities powers to control air pollution, provides rules for waste disposal and covers statutory nuisances and clean air. The Town and Country Planning Regulations (1988) set out the requirements for the environmental assessment of certain major developments for which planning permission is needed.
In July, 1991, the Ministry of Agriculture, Fisheries and Food published the "Code of Good Agricultural Practice for the Protection of Water". It is intended that it becomes a Statutory Code under the Water Act 1989.
The following requirements relate to the livestock production in the Code:
1. Manure storage and application a) no spreading within 10 meters of any watercourse. b) no spreading within 50 meters of a spring, well or borehole supplying water for human
consumption. c) nutrient supply must be matched to land area: the total amount of nitrogen in livestock waste
should not exceed 250 kg/ha^r. d) no application in high risk areas under certain conditions, e.g. likehood of flooding, frozen
fields, waterlogged fields next to watercourses, etc. e) limited application in high risk areas: limits of 50 m3/ha of slurry at any one time.
Z Slurries a) apart from construction advices, the code recommends minimum storage capacity equal to 4
months production. b) The code gives advice on slurry treatment methods.
3. Solid manure a) distance of 10 meters from watercourses and 50 meters from a spring are to be respected
4. Nitrate a) total nitrogen application from organic manure should not exceed 250 kg/ha/yr. b) application in autumn or early winter should be avoided.
Pilot Nitrate Scheme (PNS) of 1989
The PNS of 1989 examines the practical implementation of controls on agriculture. It has defined 10 Nitrate Sensitive Areas and 9 Nitrate Advisory Areas, under which the scheme became operational.
In the Nitrate Sensitive Area, farmers entered into a 5-year management plan whereby they receive payments to cover the average costs of meeting the obligations of the NSA which require substantial
11
measures beyond the Codes of Good Agricultural Practice. The emphasis is on inorganic fertilizer use, crop cover, organic manure and management of the
grassland. The premium Scheme requires current arable land to be converted to permanent grass which can be 1) unfertilized, ungrazed, 2) unfertilized, 3) receive up to 150 kg/ha N, and 4) unfertilized with tree planting (Broecke, 1992).
North America
Canada
In Canada, there is no federal legislation regarding environmental pollution caused by livestock production. However, most provinces have their own guidelines or practice codes to govern the problems associated with animal pollution.
Alberta
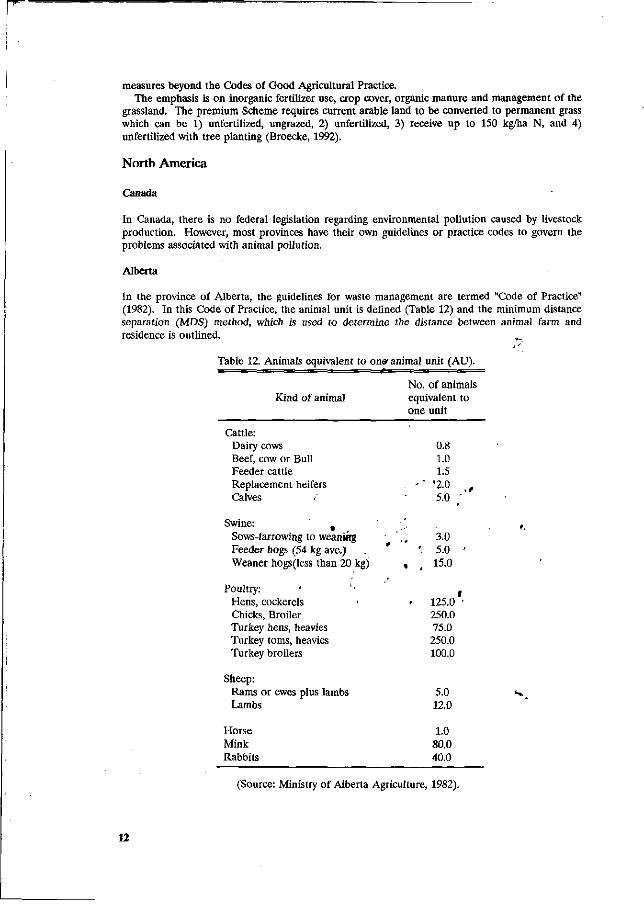
In the province of Alberta, the guidelines for waste management are termed "Code of Practice" (1982). In this Code of Practice, the animal unit is defined (Table 12) and the minimum distance separation (MDS) method, which is used to determine the distance between animal farm and residence is outlined.
Table 12. Animals equivalent to on* animal unit (AU). t
Kind of animal No. of animals equivalent to one unit
Cattle: Dairy cows Beef, cow or Bull Feeder cattle Replacement heifers Calves
Swine: Sows-farrowing to weaniRg Feeder hogs (54 kg ave.) Weaner hogs (less than 20 kg)
Poultry: ' Hens, cockerels « Chicks, Broiler Turkey hens, heavies Turkey toms, heavies Turkey broilers
Sheep: Rams or ewes plus lambs Lambs
Horse Mink Rabbits
0.8 1.0 1.5
- ' " '2.0 t
5.0 ;
,-3.0
' 5.0 ' « , 15.0
f - 125.0 '
250.0 75.0 250.0 100.0
5.0 12.0
1.0 80.0 40.0
(Source: Ministry of Alberta Agriculture, 1982).
12
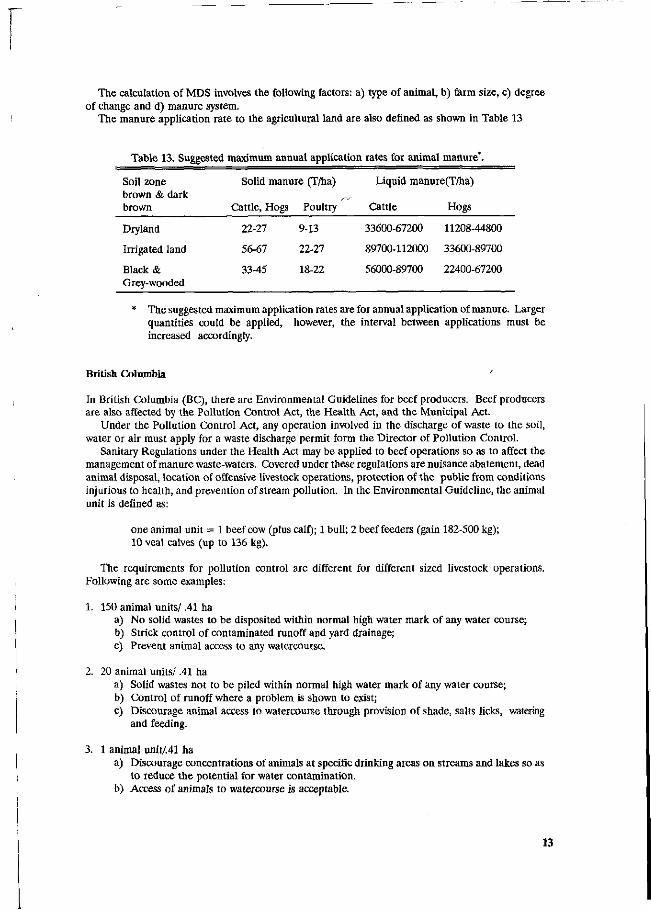
The calculation of MDS involves the following factors: a) type of animal, b) farm size, c) degree of change and d) manure system.
The manure application rate to the agricultural land are also defined as shown in Table 13
Table 13. Suggested maximum annual application rates for animal manure'.
Soil zone brown & dark brown
Solid manure (T/ha)
Cattle, Hogs Poultry
Liquid manure(T/ha)
Cattle Hogs
Dryland
Irrigated land
Black & Grey-wooded
22-27 9-13
56-67 22-27
33-45 18-22
33600-67200 11208-44800
89700-112000 33600-89700
56000-89700 22400-67200
The suggested maximum application rates are for annual application of manure. Larger quantities could be applied, however, the interval between applications must be increased accordingly.
British Columbia /
In British Columbia (BC), there are Environmental Guidelines for beef producers. Beef producers are also affected by the Pollution Control Act, the Health Act, and the Municipal Act.
Under the Pollution Control Act, any operation involved in the discharge of waste to the soil, water or air must apply for a waste discharge permit form the Director of Pollution Control.
Sanitary Regulations under the Health Act may be applied to beef operations so as to affect the management of manure waste-waters. Covered under these regulations are nuisance abatement, dead animal disposal, location of offensive livestock operations, protection of the public from conditions injurious to health, and prevention of stream pollution. In the Environmental Guideline, the animal unit is defined as:
one animal unit = 1 beef cow (plus calf); 1 bull; 2 beef feeders (gain 182-500 kg); 10 veal calves (up to 136 kg).
The requirements for pollution control are different for different sized livestock operations. Following are some examples:
1. 150 animal units/ .41 ha a) No solid wastes to be disposited within normal high water mark of any water course; b) Strick control of contaminated runoff and yard drainage; c) Prevent animal access to any watercourse.
2. 20 animal units/ .41 ha a) Solid wastes not to be piled within normal high water mark of any water course; b) Control of runoff where a problem is shown to exist; c) Discourage animal access to watercourse through provision of shade, salts licks, watering
and feeding.
3. 1 animal unit/.41 ha a) Discourage concentrations of animals at specific drinking areas on streams and lakes so as
to reduce the potential for water contamination. b) Access of animals to watercourse is acceptable.
13
Liquid manure can be stored in clay-lined earthen manure storage, open top concrete walled tanks, below-grade concrete reinforced covered tanks, or below slatted floors. However, the earthen lagoons should: be locate at least 152 m from any residence; be located, or the land so graded that surface drainage from adjacent area is excluded from the lagoons; if constructed in other than clay soils, be lined with an impervious material if seepage is known to be or can be shown to be, a problem; be adequately fenced to prevent the accidental entry of humans, animals or machinery; be constructed with a pumping "dock" to permit people driven pumping equipment for unloading.
Beef manure should not be spread: a) within 15 m of any open watercourse or 30 m from any well or spring used as a domestic water
supply; b) on steep slopes where erosion and/or surface runoff is likely to occur; c) within the high water mark of field depressions that carry running water during snow melt or
heavy rainfall whenever there is danger of direct surface runoff to an open watercourse. d) on frozen of snow covered ground where runoff to open watercourse might occur (Ministry of
Agriculture and Food, province of British Columbia, 1983).
Ontario
In Ontario, both the Ontario Water Resources Act (OWRA) and the Environmental Protection Act (EPA) offer general provisions. Under the EPA, the disposal of animal waste in a manner felt to be normal farm practice is exempted. f
The OWRA deals exclusively with water and offers no exemptions to farmers. It is the most used legislation regarding manure pollution. The EPA has a spills section which requires any spill of a pollutant discharged into the natural environment to be reported, contained and cleaned up quickly by the owner or person in control of the materials.
An "Agricultural Code of Practice" was put in place by the .Ministry of Agriculture and Food, Ministry of the Environment and Ministry of Housing in 1976.
Under this code, farmers must apply for a certificate of compliance before beginning construction of animal housing. This certification is issued jointly by the Ontario Ministry of the Environment and the Ministry of Agriculture and Food.
An animal unit is used and defined as the number of that kind of animal (hat would produce 68-77 kg of manure nitrogen per year. This amount of manure nitrogen is sufficient to provide the requirements for .41 ha of corn. Table 14 shows the animal units of manure production.
The manure management system is critical fgr the control of environmental pollutioa.caused by livestock. The manure system chosen should be afcfô to provide; Protection for ground and surface water; Minimum odour levels; Six months minimum storage capacity to hold 'the manure until it can be efficiently used on the land; Safety and security; Minimum,nutrient losses during storage; Prevention and control of disease in the barn; Minimum storage within the barn.
In this Code, animal manure is divided into three categories, solid, semj solid and, liquid. The requirements for the different manure management systems are as follows: '
Solid manure 1. Solid manure should not be spread when the ground is frozen. It should be incorporated into
the soil within 24 hours if it is applied closer than 183 m from a non-compatible use (such as a building for human occupancy or food preparation).
2. Minimum storage capacity must be at least 6 months. 3. Feedlots and paved yards should be designed to retain near the site all the liquid*"-,
effluent.
In order to minimize the volume and strength of the effluent, the following procedures should be followed: install eavestrough on all barns to keep roof water from yards; keep paved areas per animal to a minimum-e.g. 2.3 m2 / 453 kg steer; divert all outside drainage away from feedlot and yards by installing dykes, ditches and drains; scrap yards often to reduce amount of manure available for runoff; consider roofing over portions of the lot to keep out rainfall.
Table 15 shows the maximum rate of animal manure application.
14
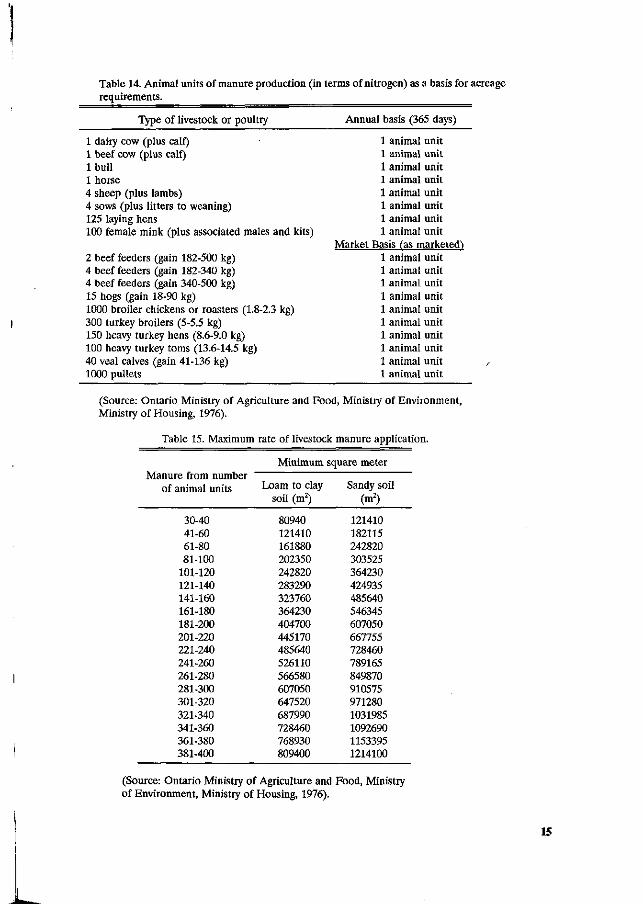
Table 14. Animal units of manure production (in terms of nitrogen) as a basis for acreage requirements.
Type of livestock or poultry Annual basis (365 days)
1 dairy cow (plus calf) 1 animal unit 1 beef cow (plus calf) 1 animal unit 1 bull 1 animal unit 1 horse 1 animal unit 4 sheep (plus lambs) 1 animal unit 4 sows (plus litters to weaning) 1 animal unit 125 laying hens 1 animal unit 100 female mink (plus associated males and kits) 1 animal unit
Market Basis (as marketed-) 2 beef feeders (gain 182-500 kg) 1 animal unit 4 beef feeders (gain 182-340 kg) 1 animal unit 4 beef feeders (gain 340-500 kg) 1 animal unit 15 hogs (gain 18-90 kg) 1 animal unit 1000 broiler chickens or roasters (1.8-2.3 kg) 1 animal unit 300 turkey broilers (5-5.5 kg) 1 animal unit 150 heavy turkey hens (8.6-9.0 kg) 1 animal unit 100 heavy turkey toms (13.6-14.5 kg) 1 animal unit 40 veal calves (gain 41-136 kg) 1 animal unit / 1000 pullets 1 animal unit
(Source: Ontario Ministry of Agriculture and Food, Ministry of Environment, Ministry of Housing, 1976).
Table 15. Maximum rate of livestock manure application.
Manure from number of animal units
30-40 41-60 61-80 81-100
101-120 121-140 141-160 161-180 181-200 201-220 221-240 241-260 261-280 281-300 301-320 321-340 341-360 361-380 381-400
Minimum
Loam to clay soil (m2)
80940 121410 161880 202350 242820 283290 323760 364230 404700 445170 485640 526110 566580 607050 647520 687990 728460 768930 809400
square meter
Sandy soil (m2)
121410 182115 242820 303525 364230 424935 485640 546345 607050 667755 728460 789165 849870 910575 971280 1031985 1092690 1153395 1214100
(Source: Ontario Ministry of Agriculture and Food, Ministry of Environment, Ministry of Housing, 1976).
15
Semi-solid manure systems
If semi-solid manure is stored above ground, then it must be contained by retaining walls or earth dykes. A concrete ramp is required for entry of equipment into the semi-solid storage. If semi-solid manure is spread within 242 m of a neighbouring house or other non-compatible use, then it should be incorporated into the soil within 24 hours.
Liquid manure systems
The requirements for a liquid manure system are more restrictive due to the fact that liquid manure is likely to be more odorous than dry manure. In Ontario, the following guidelines must be followed when handling liquid manure:
1. Sufficient storage capacity for at least 6 months should be provided. On many farms it is necessary to store manure from December until May, especially if the manure is to be applied after corn is planted. Any reduction from this capacity must be evaluated by an Agricultural Engineer or a Soils and Crops Specialist, considering factors such as geographic area, climate, croping program and manure spreading schedule.
2. Untreated liquid manure should be spread when the ground is not frozen. It should be incorporated into the soil within 24 hours if it is applied closer than 303 m from a non-compatible use. The timing requirement depends on factors such as weather conditions, actual distances to neighbours or intensity of odour. The liquid manure must be completely covered by soil, and not left in open furrows. /
3. When building a excavated basins with earth sides, flie following must be considered: sufficient clay content to prevent seepage of nutrients into ground-water, and to prevent the erosion of banks by rainfall.
4. Potential safety hazards associated with liquid manure must be avoided. All accessible liquid manure storage must be protected by either a permanent top or at least a safety fence. Complete ventilation of buildings and manure tanks is a must when pumping liquid manure to prevent toxic gases generated from liquid manure.
In order to protect water quality, the following manure handling practice are recommend: 1. Spread manure at rates according to Table 9 and Table 10. _ 2. Work manure into the soil within 24 hours when possible.' ' - , t 3. Do not spread manure on steeply sloping land, particularly on grassed waterways, and plow
across slopes wherever practical. 4. Prevent runoff from feedlots and manure piles. ". . '• 5. Prevent silage juices from reaching waters (€)htario Ministry of Agriculture and Food, Ministry
of Environment, Ministry of Housing, 1976)
Saskatchewan I
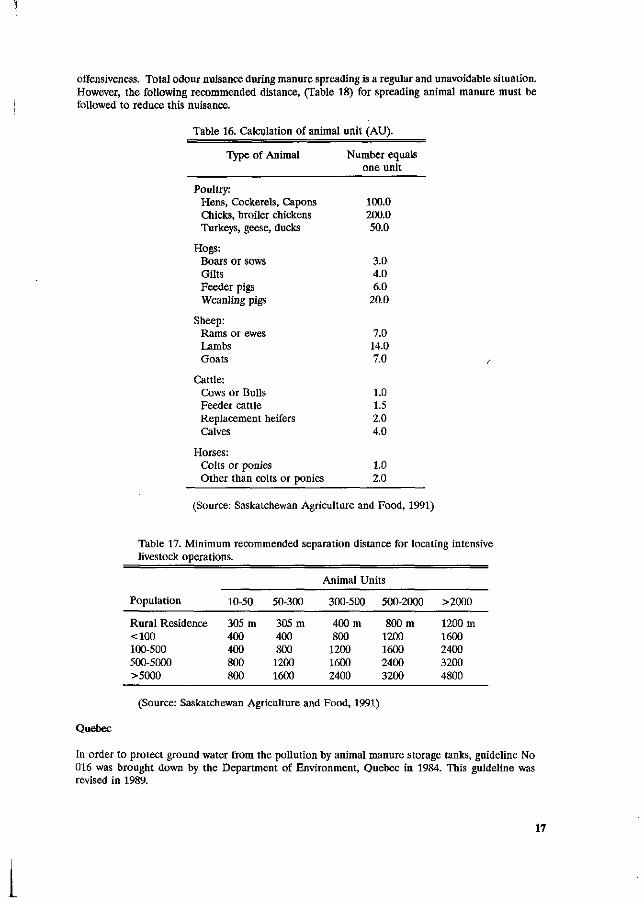
In Saskatchewan, the intensive livestock operations Guide cff Recommended Practice was first published by Saskatchewan Agricultural and Food in 1984. In this Guideline, an intensive livestock operation is broadly defined as "the rearing, confinement or feeding of poultry, hogs, sheep, goats, cattle or horses". The animal unit system is used to describe the size of the different kind of livestock operation as shown in Table 16.
In Saskatchewan, certain Intensive Livestock Operations (ILO) require a permit from an Agricultural Engineer employed by Saskatchewan Rural Development. The permits are issued only if a) the pollution of ground or surface water will not result; b) the ILO will not'tonstitute a nuisance; and c) adequate provision has been made for manure disposal.
An intensive livestock operation must be constructed a certain distance from a foreign residence as required by the Pollution Control Act (1984). The minimum distance required is shown in Table 17..
The recommended separation distance from open liquid manure storage is 1.5 times the above distances.
The effect of an intensive livestock operation on air quality is one of odour nuisance, rather than public safety or health. Odour nuisance can be described by frequency, intensity, duration and
16
offensiveness. Total odour nuisance during manure spreading is a regular and unavoidable situation. However, the following recommended distance, (Table 18) for spreading animal manure must be followed to reduce this nuisance.
Table 16. Calculation of animal unit (AU).
Type of Animal
Poultry: Hens, Cockerels Capons Chicks, broiler chickens Turkeys, geese, ducks
Hogs: Boars or sows Gilts Feeder pigs Weanling pigs
Sheep: Rams or ewes Lambs Goats
Cattle: Cows or Bulls Feeder cattle Replacement heifers Calves
Horses: Colts or ponies Other than colts or ponies
Number equals one unit
100.0 200.0 50.0
3.0 4.0 6.0
20.0
7.0 14.0 7.0
1.0 1.5 2.0 4.0
1.0 2.0
(Source: Saskatchewan Agriculture and Food, 1991)
Table 17. Minimum recommended separation distance for locating intensive livestock operations.
Animal Units
Population
Rural Residence <100 100-500 500-5000 >5000
10-50
305 m 400 400 800 800
50-300
305 m 400 800
1200 1600
300-500
400 m 800 1200 1600 2400
500-2000
800 m 1200 1600 2400 3200
>2000
1200 m 1600 2400 3200 4800
(Source: Saskatchewan Agriculture and Food, 1991)
Quebec
In order to protect ground water from the pollution by animal manure storage tanks, guideline No 016 was brought down by the Department of Environment, Quebec in 1984. This guideline was revised in 1989.
17
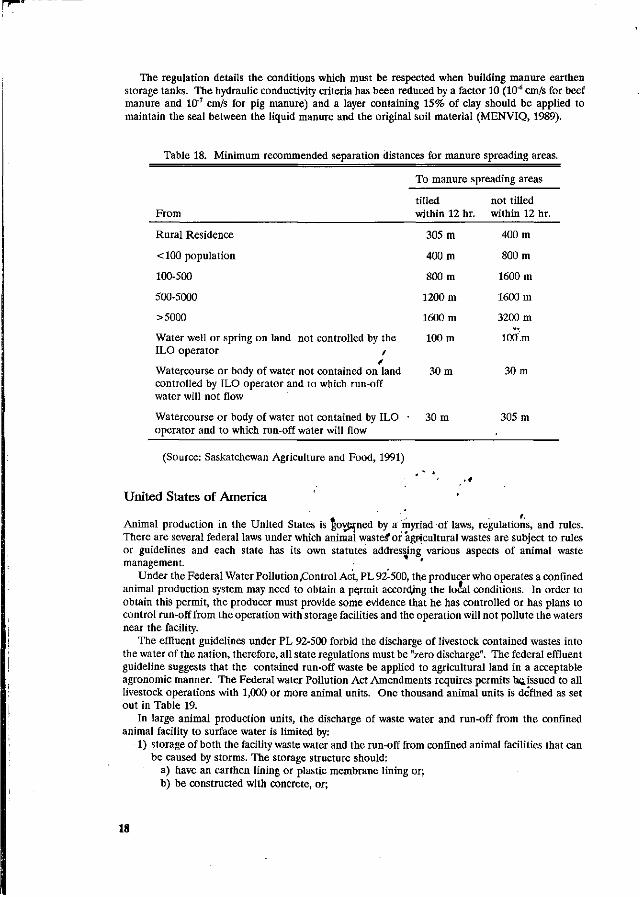
The regulation details the conditions which must be respected when building manure earthen storage tanks. The hydraulic conductivity criteria has been reduced by a factor 10 (ÎO'6 cm/s for beef manure and 10'7 cm/s for pig manure) and a layer containing 15% of clay should be applied to maintain the seal between the liquid manure and the original soil material (MENVIQ, 1989).
Table 18. Minimum recommended separation distances for manure spreading areas.
To manure spreading areas
From tilled within 12 hr.
305 m
400 m
800 m
1200 m
1600 m
100 m
not tilled within 12 hr.
400 m
800 m
1600 m
1600 m
3200 m
10Cf.m
Rural Residence
<100 population
100-500
500-5000
>5000
Water well or spring on land not controlled by the ILO operator /
Watercourse or body of water not contained on land controlled by ILO operator and to which run-off water will not flow
Watercourse or body of water not contained by ILO operator and to which run-off water will flow
30 m
30 m
30 m
305 m
(Source: Saskatchewan Agriculture and Food, 1991)
United States of America
Animal production in the United States is governed by a myriad of laws, regulations, and rules. There are several federal laws under which animal wastes* or agricultural wastes are subject to rules or guidelines and each state has its own statutes addressing various aspects of animal waste management. '
Under the Federal Water Pollution.Control Act, PL 92-500, the producer who operates a confined animal production system may need to obtain a permit according the local conditions. In order to obtain this permit, the producer must provide some evidence that he has controlled or has plans to control run-off from the operation with storage facilities and the operation will not pollute the waters near the facility.
The effluent guidelines under PL 92-500 forbid the discharge of livestock contained wastes into the water of the nation, therefore, all state regulations must be "zero discharge". The federal effluent guideline suggests that the contained run-off waste be applied to agricultural land in a acceptable agronomic manner. The Federal water Pollution Act Amendments requires permits he. issued to all livestock operations with 1,000 or more animal units. One thousand animal units is defined as set out in Table 19.
In large animal production units, the discharge of waste water and run-off from the confined animal facility to surface water is limited by:
1) storage of both the facility waste water and the run-off from confined animal facilities that can be caused by storms. The storage structure should:
a) have an earthen lining or plastic membrane lining or; b) be constructed with concrete, or;
18
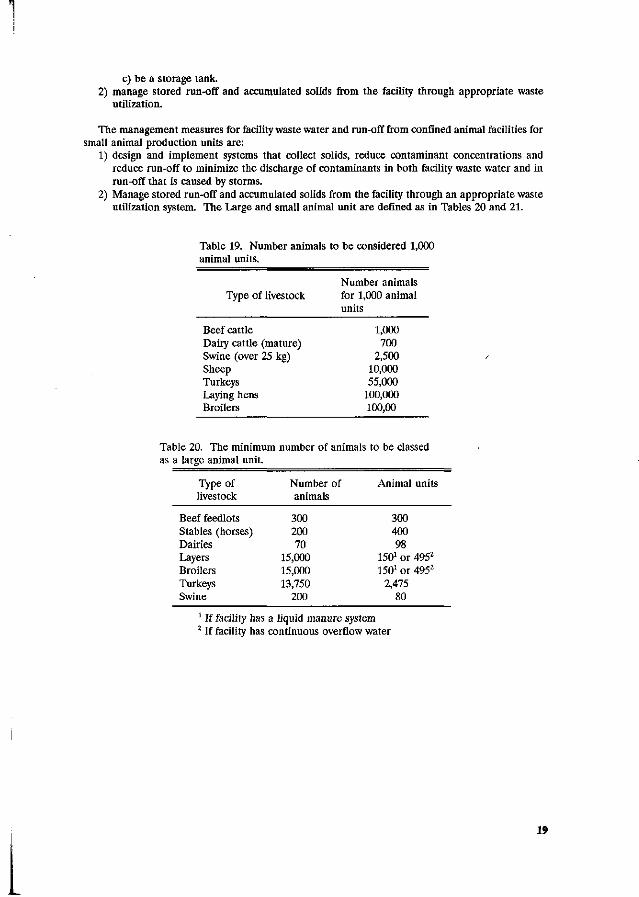
c) be a storage tank. 2) manage stored run-off and accumulated solids from the facility through appropriate waste
utilization.
The management measures for facility waste water and run-off from confined animal facilities for small animal production units are:
1) design and implement systems that collect solids, reduce contaminant concentrations and reduce run-off to minimize the discharge of contaminants in both facility waste water and in run-off that is caused by storms.
2) Manage stored run-off and accumulated solids from the facility through an appropriate waste utilization system. The Large and small animal unit are defined as in Tables 20 and 21.
Table 19. Number animals to be considered 1,000 animal units.
Type of livestock
Beef cattle Dairy cattle (mature) Swine (over 25 kg) Sheep Turkeys Laying hens Broilers
Number animals for 1,000 animal units
1,000 700
2,500 10,000 55,000
100,000 100,00
Table 20. The minimum number of animals to be classed as a large animal unit.
Type of livestock
Beef feedlots Stables (horses) Dairies Layers Broilers Turkeys Swine
Number of animals
300 200 70
15,000 15,000 13,750
200
Animal units
300 400 98
1501 or 4952
1501 or 4952
2,475 80
1 If facility has a liquid manure system 2 If facility has continuous overflow water
19
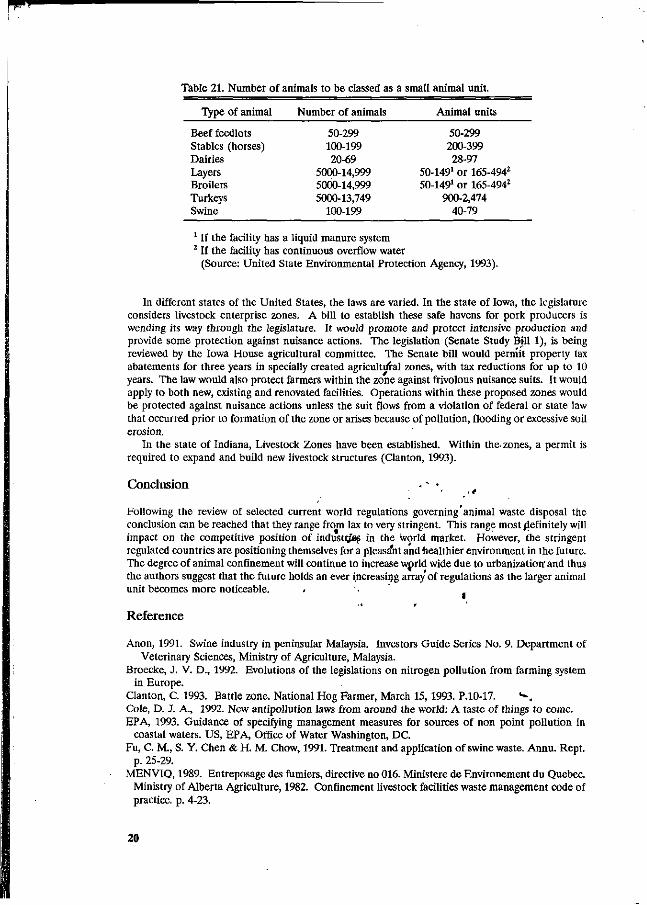
Table 21. Number of animals to be classed as a small animal unit.
Type of animal Number of animals Animal units
Beef feedlots 50-299 50-299 Stables (horses) 100-199 200-399 Dairies 20-69 28-97 Layers 5000-14,999 50-1491 or 165-4942
Broilers 5000-14,999 50-1491 or 165-4942
Turkeys 5000-13,749 900-2,474 Swine 100-199 40-79
1 If the facility has a liquid manure system 2 If the facility has continuous overflow water
(Source: United State Environmental Protection Agency, 1993).
In different states of the United States, the laws are varied. In the state of Iowa, the legislature considers livestock enterprise zones. A bill to establish these safe havens for pork producers is wending its way through the legislature. It would promote and protect intensive production and provide some protection against nuisance actions. The legislation (Senate Study Bill 1), is being reviewed by the Iowa House agricultural committee. The Senate bill would permit property tax abatements for three years in specially created agricultural zones, with tax reductions for up to 10 years. The law would also protect farmers within the zone against frivolous nuisance suits. It would apply to both new, existing and renovated facilities. Operations within these proposed zones would be protected against nuisance actions unless the suit flows from a violation of federal or state law that occurred prior to formation of the zone or arises because of pollution, flooding or excessive soil erosion.
In the state of Indiana, Livestock Zones have been established. Within the- zones, a permit is required to expand and build new livestock structures (Clanton, 1993).
Conclusion - - <
Following the review of selected current world regulations governing animal waste disposal the conclusion can be reached that they range from lax to very stringent. This range most definitely will impact on the competitive position of industries in the world market. However, the stringent regulated countries are positioning themselves for a pleasa'nt and healthier environment in the future. The degree of animal confinement will continue to increase w trld wide due to urbanization' and thus the authors suggest that the future holds an ever increasing array'of regulations as the larger animal unit becomes more noticeable. . • '
Reference
Anon, 1991. Swine industry in peninsular Malaysia. Investors Guide Series No. 9. Department of Veterinary Sciences, Ministry of Agriculture, Malaysia.
Broecke, J. V. D., 1992. Evolutions of the legislations on nitrogen pollution from farming system in Europe.
Clanton, C. 1993. Battle zone. National Hog Farmer, March 15, 1993. P.10-17. *-., Cole, D. J. A., 1992. New antipollution laws from around the world: A taste of things to come. EPA, 1993. Guidance of specifying management measures for sources of non point pollution in
coastal waters. US, EPA, Office of Water Washington, DC. Fu, C. M., S. Y. Chen & H. M. Chow, 1991. Treatment and application of swine waste. Annu. Rept.
p. 25-29. MENVIQ, 1989. Entreposage des fumiers, directive no 016. Ministère de Environement du Quebec.
Ministry of Alberta Agriculture, 1982. Confinement livestock facilities waste management code of practice, p. 4-23.
20
Ministry of Agriculture and Food, Ministry of the Environment, Ministry of Housing, province of Ontario, 1976. Agricultural Code of Practice, p. 14-25.
Ministry of Agriculture and Food, Province of British Columbia, 1983. Environmental Guidelines for Beef Producers, p. 2-22.
Ong, H. K., 1991. Goals, regulations and information needs for waste-managed centralized pig farming areas: a Malaysian perspective. Pig News and Information. 12 (4):541-544.
Pig News and Information, 1992. Environmental policy and pig production in the Netherlands. 13:(4) B9N
Saskatchewan Agriculture and Food, 1991. Intensive livestock operations guide of recommended practice, p. 1-12.
Teoh, S. S., E. P. Taiganides, T. C. Yap, 1988. Engineering design parameters of wastes from pig farms in Malaysia. Biological Wastes 24:95-104.
21
L
Excretion of nitrogen and some minerals by livestock
Age W. Jongbloed & Nico P. Len/'s
Research Institute for Livestock Feeding and Nutrition (IVVO-DLO), P.O. Box 160, NL-8200 AD Lelystad, The Netherlands
Summary
Possible ranges of excretion of nitrogen and such minerals as phosphorus, potassium, copper and zinc in slurry by different categories of pigs, poultry and ruminants are estimated. Also, for pigs, more detailed information is provided from practice about excretory losses at various options of production. Several factors are discussed which should be taken into account to judge excretion of nitrogen and minerals per kg edible meat.
Keywords: Pigs, Nitrogen, Phosphorus, Potassium, Copper, Zinc, Excretion, Cattle, Poultry, Environment, Modelling.
Introduction / /
Livestock production underwent great changes in the last decades in several countries in order to keep production costs as low as possible. The production level per animal and the production of animal product per ha of land increased considerably. This was possible by improvement in genetical potential, better housing systems and mechanisation and the use of compound feeds which originate from imported feedstuffs. Thus, many large confinement systems for l ivestock have been developed on holdings w i th limited amounts of land. In the last decade an increasing interest in, and respect for, th,e, environment can be noticed. This has also consequences for l ivestock production. Air became polluted by noxious odours and it was recognized that animal husbandry causes almost 9 0 % of the total NH3 emission r i the Netherlands (Lenis, 1989). Also, the emission of CH4 for which ruminants are^Phe mgst -responsible animal species is regarded as a threat in relation to the green house effect. Furthermore, accumulation of some minerals like P, Cu and Zn in the soil caft lead to leaching and run-off and to eutrophication of ground water and fresh water sources. Due to the overabundant application of manure and fertilizers per ha êî land and due to surplus of precipitation, N0 3 leaches out and often exceeds tolerated values in fresh water (50 mg N0 3 kg1) . The same is w i th regard to K, so that the tolerated level of 12 mg K I"1 of fresh water is exceeded, although it is not clear at this moment what are its environmental consequences (Van Boheemen et a l . , 1991). In this respect, it should be mentioned that the scientific basis for the limit of 12 mg K I"1 is rather weak from human health point of v iew.
Protein and the minerals like P, K, Cu and Zn are essential dietary nufrfents for maintenance and production of animals. There should be a careful balance between the animal's genetic potential and the quantity and quality of nutrients consumed (Tamminga & Verstegen, 1992).
Goal of this survey is to discuss possible ranges in the excretion of N, P, K, Cu and Zn by catt le, pigs and poultry. Due to the emphasis of this congress on pigs, more detailed information will be presented on this species. Only general aspects
22
will be discussed here, because in some other papers detailed information concerning animal, nutrition, housing and economy are presented.
Estimation of excretion of nitrogen and minerals
Recently, in several countries attempts have been made to estimate the excretion of N and/or P from different farm animals (Coppoolse et al., 1990; Spiekers & Pfeffer, 1991; Kirchgessner & Roth, 1991; Schutte & Tamminga, 1992; Dourmad et al., 1992).
Estimation of excretion of nitrogen and minerals from livestock can be calculated as the difference between dietary intake and the amounts retained in the body of animal or in the product for human consumption. However, large differences can exist in the amount excreted due to factors like animal, feed and environment. With regard to the animal factor, this includes: species (cow, pig or chicken), type (growing pig, breeding sow, mating boar), physiological state (pregnant or lacta-ting sow), between animal variation (different concentrations of minerals per kg of body weight) or type and level of production (lean meat or fat). The compound feed can vary considerably with regard to feedstuff composition and different mineral additions, and so its mineral content. Also different amounts of feed (roughage or concentrates) can be offered, which largely affect the global mineral balance of the farm. Finally environment (housing, management, health status, feeding strategy) may play an important role in the amount of minerals excreted per animal. Another aspect, that should be mentioned, is whether the excretion is expressed per animal or animal place or in case of reproductive animals, excretion due to raising the animals to the reproductive phase is included or not.
Contrary to common expectations, it is difficult to estimate the actual excretion per animal as such. Nevertheless, the basic concept for estimation of the excretion will be outlined. Assumptions for the calculations are given clearly. Most of the examples presented here are based on average conditions and production levels in The Netherlands. Calculations were done about the effect of a feed containing either 10% more or less N and P. With regard to K, calculations were done on a feed containing 10% more but about 20% less K. In relevance to the topic of this congress, this estimation will be presented for pigs only and not for the other species. Additionally, it is demonstrated what excretory effects should be expected at currently applied Cu and Zn levels, and at lowered levels. Furthermore, for piglets and growing pigs, the effect will be presented of a range of a 10% higher or lower feed conversion ratio. For breeding sows, this estimation will also be shown for two options, i.e., when either 10% more or 10% less piglets are weaned.
1 . Excretion of nitrogen and minerals by pigs
Amounts of nitrogen and minerals retained by the pig at a given live weight depends on various factors like breed, sex, concentration of these nutrients in the feed and energy intake. Therefore, it is difficult to give a precise estimate for the amount of N and minerals deposited in the body. Most figures were derived from Jongbloed et al. (1985), Coppoolse et al. (1990), Everts & Dekker (1992) and Jongbloed & Everts (1992).
With regard to the amount of N retained in pigs up to 110 kg, a large variance is indicated by various authors. Coppoolse et al. (1990) estimated a retention of N, which was equal to 0.60 kg in pigs of 25 kg and 2.46 kg in a pig of 106 kg.
23
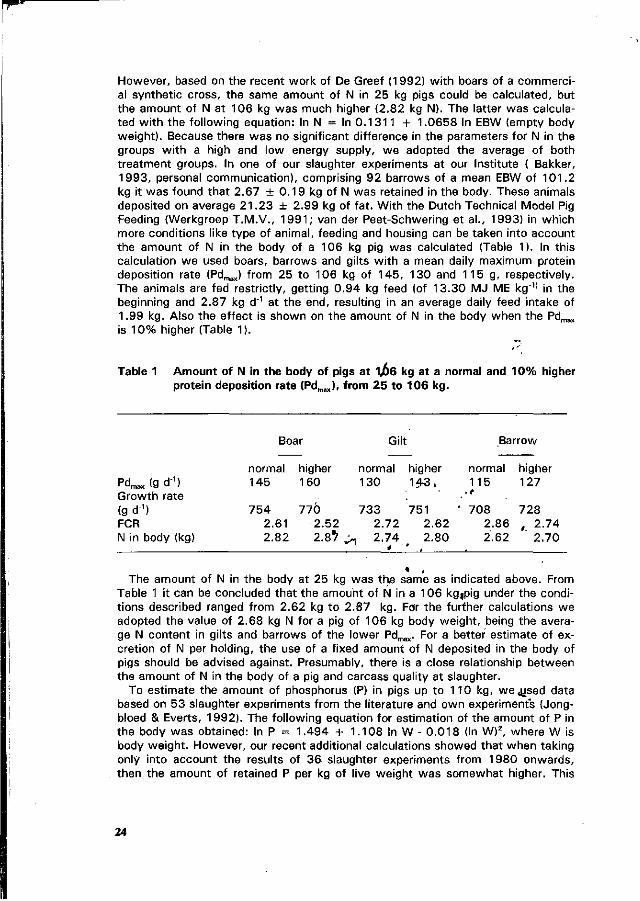
However, based on the recent work of De Greet (1992) with boars of a commercial synthetic cross, the same amount of N in 25 kg pigs could be calculated, but the amount of N at 106 kg was much higher (2.82 kg N). The latter was calculated with the following equation: In N = In 0.1311 + 1.0658 In EBW (empty body weight). Because there was no significant difference in the parameters for N in the groups with a high and low energy supply, we adopted the average of both treatment groups. In one of our slaughter experiments at our Institute ( Bakker, 1993, personal communication), comprising 92 barrows of a mean EBW of 101.2 kg it was found that 2.67 ± 0.19 kg of N was retained in the body. These animals deposited on average 21.23 ± 2.99 kg of fat. With the Dutch Technical Model Pig Feeding (Werkgroep T.M.V., 1991; van der Peet-Schwering et al., 1993) in which more conditions like type of animal, feeding and housing can be taken into account the amount of N in the body of a 106 kg pig was calculated (Table 1). In this calculation we used boars, barrows and gilts with a mean daily maximum protein deposition rate (Pdmax) from 25 to 106 kg of 145, 130 and 115 g, respectively. The animals are fed restrictly, getting 0.94 kg feed (of 13.30 MJ ME kg"11 in the beginning and 2.87 kg d"1 at the end, resulting in an average daily feed intake of 1.99 kg. Also the effect is shown on the amount of N in the body when the Pdmax
is 10% higher (Table 1).
Table 1 Amount of N in the body of pigs at 1,06 kg at a normal and 10% higher protein deposition rate (Pdmax), from 25 to 106 kg.
Pdmax (g d-1) Growth rate (g d"1) FCR N in body (kg)
Boar
normal higher 145 160
754 770 2.61 2.52 2.82 2 .8^
Gilt
normal higher 130 143 .
733 751 2.72 2.62
> , 2 .74 2.80 * ' .
Barrow
normal higher 115 127
,t
708 728 2.86 , 2 .74 2.62 ' 2 .70
The amount of N in the body at 25 kg was the same as indicated above. From Table 1 it can be concluded that the amount of N in a 106 kgtpig under the conditions described ranged from 2.62 kg to 2.87 kg. For the further calculations we adopted the value of 2.68 kg N for a pig of 106 kg body weight, being the average N content in gilts and barrows of the lower Pdmax. For a better estimate of excretion of N per holding, the use of a fixed amount of N deposited in the body of pigs should be advised against. Presumably, there is a close relationship between the amount of N in the body of a pig and carcass quality at slaughter.
To estimate the amount of phosphorus (P) in pigs up to 110 kg, we,ysed data based on 53 slaughter experiments from the literature and own experiment's (Jongbloed & Everts, 1992). The following equation for estimation of the amount of P in the body was obtained: In P = 1.494 + 1.108 In W - 0.018 (In W)2, where W is body weight. However, our recent additional calculations showed that when taking only into account the results of 36 slaughter experiments from 1980 onwards, then the amount of retained P per kg of live weight was somewhat higher. This
24
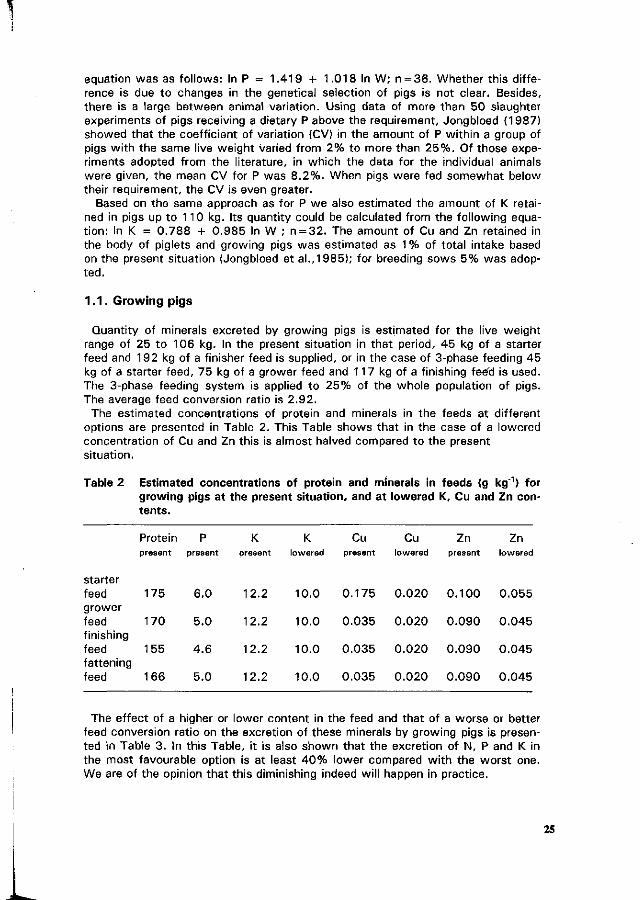
equation was as follows: In P = 1.419 + 1.018 In W; n = 36. Whether this difference is due to changes in the genetical selection of pigs is not clear. Besides, there is a large between animal variation. Using data of more than 50 slaughter experiments of pigs receiving a dietary P above the requirement, Jongbloed (1987) showed that the coefficient of variation (CV) in the amount of P within a group of pigs with the same live weight varied from 2% to more than 25%. Of those experiments adopted from the literature, in which the data for the individual animals were given, the mean CV for P was 8.2%. When pigs were fed somewhat below their requirement, the CV is even greater.
Based on the same approach as for P we also estimated the amount of K retained in pigs up to 110 kg. Its quantity could be calculated from the following equation: In K = 0.788 + 0.985 In W ; n = 32. The amount of Cu and Zn retained in the body of piglets and growing pigs was estimated as 1 % of total intake based on the present situation (Jongbloed et al.,1985); for breeding sows 5% was adopted.
1.1. Growing pigs
Quantity of minerals excreted by growing pigs is estimated for the live weight range of 25 to 106 kg. In the present situation in that period, 45 kg of a starter feed and 192 kg of a finisher feed is supplied, or in the case of 3-phase feeding 45 kg of a starter feed, 75 kg of a grower feed and 117 kg of a finishing feed is used. The 3-phase feeding system is applied to 25% of the whole population of pigs. The average feed conversion ratio is 2.92.
The estimated concentrations of protein and minerals in the feeds at different options are presented in Table 2. This Table shows that in the case of a lowered concentration of Cu and Zn this is almost halved compared to the present situation.
Table 2 Estimated concentrations of protein and minerals in feeds (g kg'1) for growing pigs at the present situation, and at lowered K, Cu and Zn contents.
starter feed grower feed finishing feed fattening feed
Protein present
175
170
155
166
P present
6.0
5.0
4.6
5.0
K present
12.2
12.2
12.2
12.2
K lowered
10.0
10.0
10.0
10.0
Cu present
0.175
0.035
0.035
0.035
Cu lowered
0.020
0.020
0.020
0.020
Zn present
0.100
0.090
0.090
0.090
Zn lowered
0.055
0.045
0.045
0.045
The effect of a higher or lower content in the feed and that of a worse or better feed conversion ratio on the excretion of these minerals by growing pigs is presented in Table 3. In this Table, it is also shown that the excretion of N, P and K in the most favourable option is at least 40% lower compared with the worst one. We are of the opinion that this diminishing indeed will happen in practice.
25
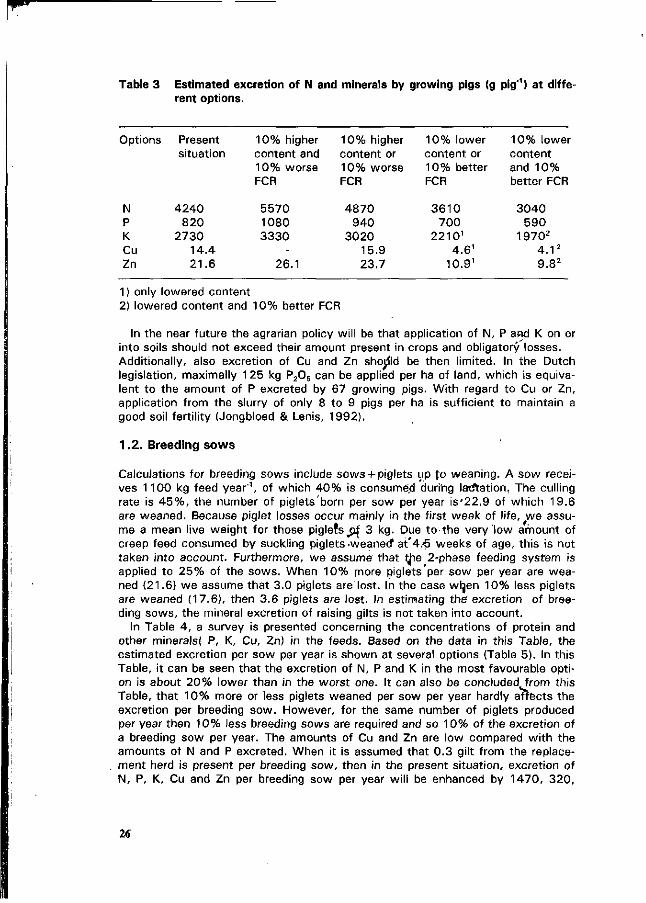
Table 3 Estimated excretion of N and minerals by growing pigs (g pig'1) at different options.
Options
N P K Cu Zn
Present situation
4240 820
2730 14.4 21.6
10% higher content and 10% worse FCR
5570 1080 3330
-26.1
10% higher content or 10% worse FCR
4870 940
3020 15.9 23.7
10% lower content or 10% better FCR
3610 700
2210 1
4.61
10.91
10% lower content and 10% better FCR
3040 590
1970 2
4 . 1 2
9.82
1 ) only lowered content 2) lowered content and 10% better FCR
In the near future the agrarian policy will be that application of N, P and K on or into soils should not exceed their amount present in crops and obligatory losses. Additionally, also excretion of Cu and Zn should be then limited. In the Dutch legislation, maximally 125 kg P206 can be applied per ha of land, which is equivalent to the amount of P excreted by 67 growing pigs. With regard to Cu or Zn, application from the slurry of only 8 to 9 pigs per ha is sufficient to maintain a good soil fertility (Jongbloed & Lenis, 1992).
1.2. Breeding sows
Calculations for breeding sows include sows + piglets up \o weaning. A sow receives 1100 kg feed year"1, of which 40% is consumed during larr/tation, The culling rate is 45%, the number of piglets'born per sow per year is'22.9 of which 19.6 are weaned. Because piglet losses occur mainly in the first week of life, we assume a mean live weight for those piglets pi 3 kg. Due to the very'low amount of creep feed consumed by suckling piglets -weaned1 at'4/5 weeks of age, this is not taken into account. Furthermore, we assume that tjie 2-phase feeding system is applied to 25% of the sows. When 10% more piglets per sow per year are weaned (21.6) we assume that 3.0 piglets are lost. In the case wijen 10% less piglets are weaned (17.6), then 3.6 piglets are lost. In estimating the' excretion of breeding sows, the mineral excretion of raising gilts is not taken into account.
In Table 4, a survey is presented concerning the concentrations of protein and other minerals) P, K, Cu, Zn) in the feeds. Based on the data in this Table, the estimated excretion per sow per year is shown at several options (Table 5). In this Table, it can be seen that the excretion of N, P and K in the most favourable option is about 20% lower than in the worst one. It can also be concluded from this Table, that 10% more or less piglets weaned per sow per year hardly affects the excretion per breeding sow. However, for the same number of piglets produced per year then 10% less breeding sows are required and so 10% of the excretion of a breeding sow per year. The amounts of Cu and Zn are low compared with the amounts of N and P excreted. When it is assumed that 0.3 gilt from the replacement herd is present per breeding sow, then in the present situation, excretion of N, P, K, Cu and Zn per breeding sow per year will be enhanced by 1470, 320,
26
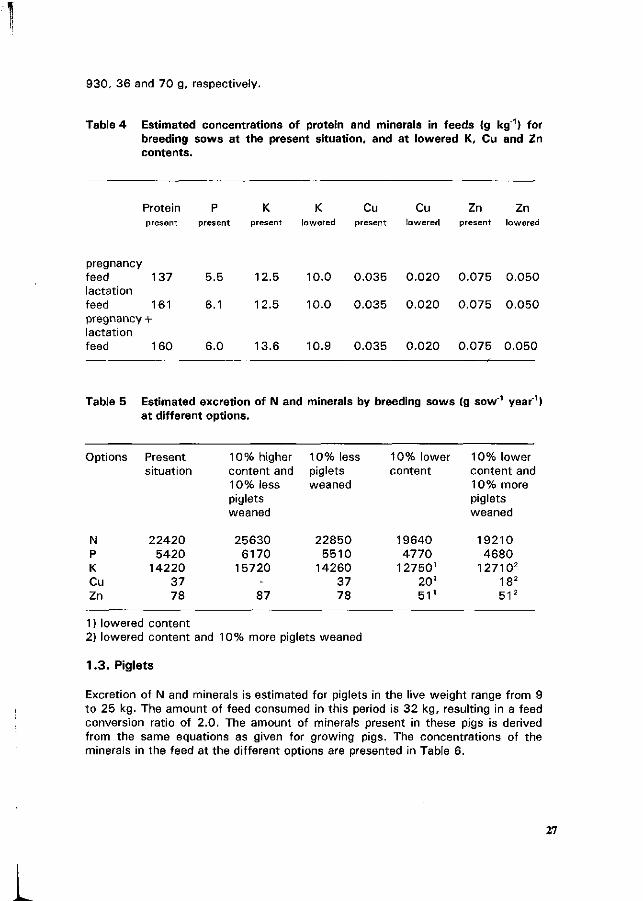
930, 36 and 70 g, respectively.
Table 4 Estimated concentrations of protein and minerals in feeds (g kg'1) for breeding sows at the present situation, and at lowered K, Cu and Zn contents.
Protein P K K Cu Cu Zn Zn present present present lowered present lowered present lowered
pregnancy feed 137 lactation feed 161 pregnancy+ lactation feed 160
5.5 12.5 10.0 0.035 0.020 0.075 0.050
6.1 12.5 10.0 0.035 0.020 0.075 0.050
6.0 13.6 10.9 0.035 0.020 0.075 0.050
Table 5 Estimated excretion of N and minerals by breeding sows (g sow'1 year'1) at different options.
Options
N P K Cu Zn
Present situation
22420 5420
14220 37 78
1 0 % higher content and 10% less piglets weaned
25630 6170
15720 -
87
10% less piglets weaned
22850 5510
14260 37 78
1 0 % lower content
19640 4770
12750 1
20 ' 5 1 1
10% lower content and 10% more piglets weaned
19210 4680
12710 2
182
5 1 2
1) lowered content 2) lowered content and 10% more piglets weaned
1.3. Piglets
Excretion of N and minerals is estimated for piglets in the live weight range from 9 to 25 kg. The amount of feed consumed in this period is 32 kg, resulting in a feed conversion ratio of 2.0. The amount of minerals present in these pigs is derived from the same equations as given for growing pigs. The concentrations of the minerals in the feed at the different options are presented in Table 6.
27
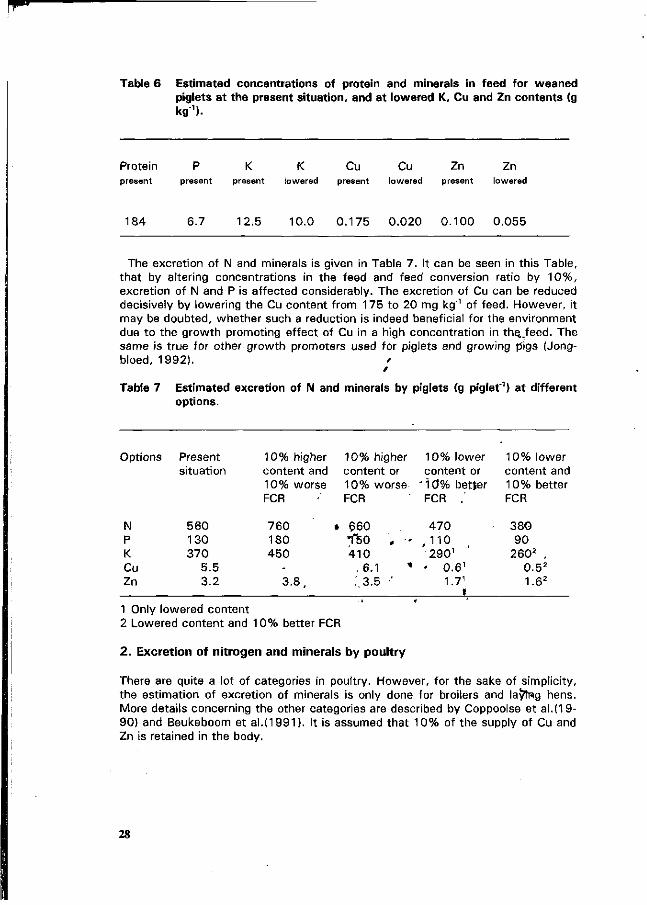
Table 6 Estimated concentrations of protein and minerals in feed for weaned piglets at the present situation, and at lowered K, Cu and Zn contents (g kg"1).
Protein P K K Cu Cu Zn Zn present present present lowered present lowered present lowered
184 6.7 12.5 10.0 0.175 0.020 0.100 0.055
The excretion of N and minerals is given in Table 7. It can be seen in this Table, that by altering concentrations in the feed and feed conversion ratio by 10%, excretion of N and P is affected considerably. The excretion of Cu can be reduced decisively by lowering the Cu content from 175 to 20 mg kg-1 of feed. However, it may be doubted, whether such a reduction is indeed beneficial for the environment due to the growth promoting effect of Cu in a high concentration in the..feed. The same is true for other growth promoters used for piglets and growing pigs (Jongbloed, 1992). /
Table 7 Estimated excretion of N and minerals by piglets (g piglet'1) at different options.
Options
N P K Cu Zn
Present situation
560 130 370
5.5 3.2
1 0 % higher content and 10% worse FCR
760 180 450
-3 . 8 ,
1 0 % higher content or 10% worse FCR
• 660 - f50 , < 410
. 6.1 * : .3.5 •'
1 0 % lower content or
' Î 0 % better FCR .
470 , 110
290 1
• 0 .61
1.71
1
1 0 % lower content and 10% better FCR
380 90
260 2 , 0 .5 2
1.62
1 Only lowered content 2 Lowered content and 10% better FCR
2. Excretion of nitrogen and minerals by poultry
There are quite a lot of categories in poultry. However, for the sake of simplicity, the estimation of excretion of minerals is only done for broilers and laying hens. More details concerning the other categories are described by Coppoolse et al.(19-90) and Beukeboom et al.(1991). It is assumed that 10% of the supply of Cu and Zn is retained in the body.
28
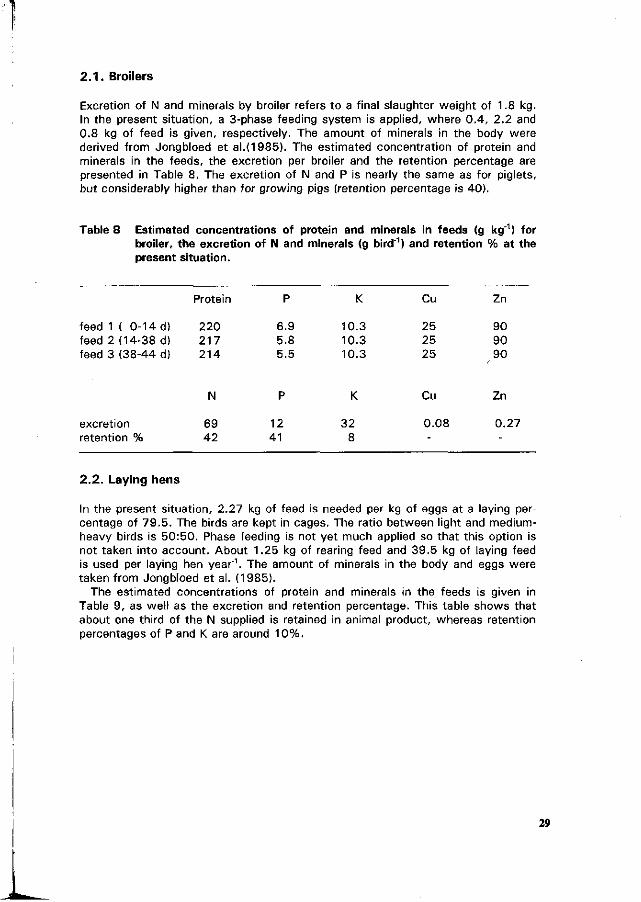
2 . 1 . Broilers
Excretion of N and minerals by broiler refers to a final slaughter weight of 1.8 kg. In the present situation, a 3-phase feeding system is applied, where 0.4, 2.2 and 0.8 kg of feed is given, respectively. The amount of minerals in the body were derived from Jongbloed et al.(1985). The estimated concentration of protein and minerals in the feeds, the excretion per broiler and the retention percentage are presented in Table 8. The excretion of N and P is nearly the same as for piglets, but considerably higher than for growing pigs (retention percentage is 40).
Table 8 Estimated concentrations of protein and minerals in feeds (g kg'1) for broiler, the excretion of N and minerals (g bird'1) and retention % at the present situation.
feed 1 ( 0-14 d) feed 2 (14-38 d) feed 3 (38-44 d)
excretion retention %
Protein
220 217 214
N
69 42
P
6.9 5.8 5.5
P
12 41
K
10.3 10.3 10.3
K
32 8
Cu
25 25 25
Cu
0.08 -
Zn
90 90 90
Zn
0.27
-
2.2. Laying hens
In the present situation, 2.27 kg of feed is needed per kg of eggs at a laying percentage of 79.5. The birds are kept in cages. The ratio between light and medium-heavy birds is 50:50. Phase feeding is not yet much applied so that this option is not taken into account. About 1.25 kg of rearing feed and 39.5 kg of laying feed is used per laying hen year"1. The amount of minerals in the body and eggs were taken from Jongbloed et al. (1985).
The estimated concentrations of protein and minerals in the feeds is given in Table 9, as well as the excretion and retention percentage. This table shows that about one third of the N supplied is retained in animal product, whereas retention percentages of P and K are around 10%.
29
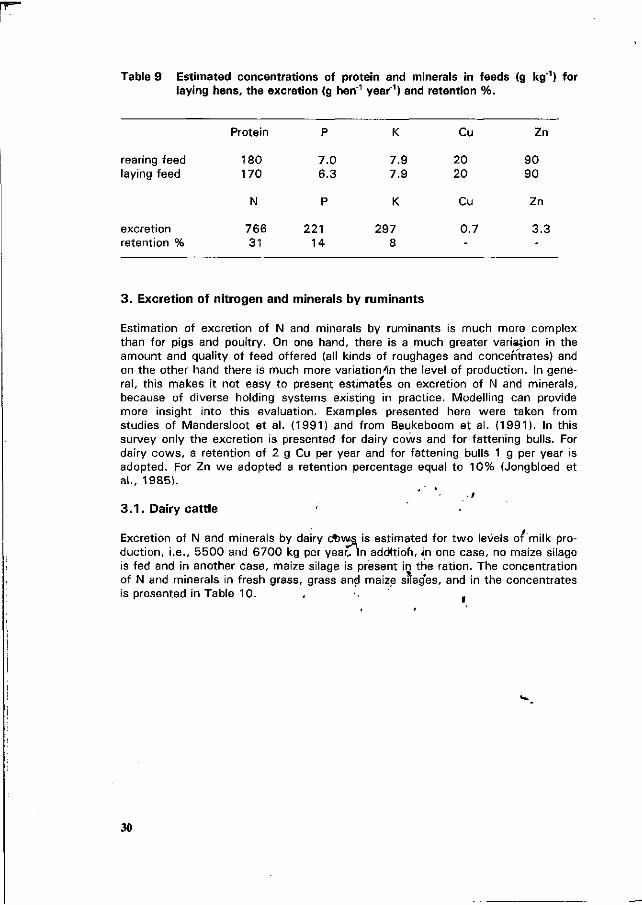
Table 9 Estimated concentrations of protein and minerals in feeds (g kg'1) for laying hens, the excretion (g hen"1 year"1) and retention %.
rearing feed laying feed
excretion retention %
Protein
180 170
N
766 31
P
7.0 6.3
P
221 14
K
7.9 7.9
K
297 8
Cu
20 20
Cu
0.7 -
Zn
90 90
Zn
3.3 -
3. Excretion of nitrogen and minerals by ruminants
Estimation of excretion of N and minerals by ruminants is much more complex than for pigs and poultry. On one hand, there is a much greater variation in the amount and quality of feed offered (all kinds of roughages and concentrates) and on the other hand there is much more Variationen the level of production. In general, this makes it not easy to present estimates on excretion of N and minerals, because of diverse holding systems existing in practice. Modelling can provide more insight into this evaluation. Examples presented here were taken from studies of Mandersloot et al. (1991) and from Beukeboom et al. (1991). In this survey only the excretion is presented for dairy cows and for fattening bulls. For dairy cows, a retention of 2 g Cu per year and for fattening bulls 1 g per year is adopted. For Zn we adopted a retention percentage equal to 10% (Jongbloed et al., 1985).
.f
3 . 1 . Dairy cattle
Excretion of N and minerals by dairy ct>ws is estimated for two levels of milk production, i.e., 5500 and 6700 kg per yearTin addition, in one case, no maize silage is fed and in another case, maize silage is present in the ration. The concentration of N and minerals in fresh grass, grass and maize sllag'es, and in the concentrates is presented in Table 10.
30
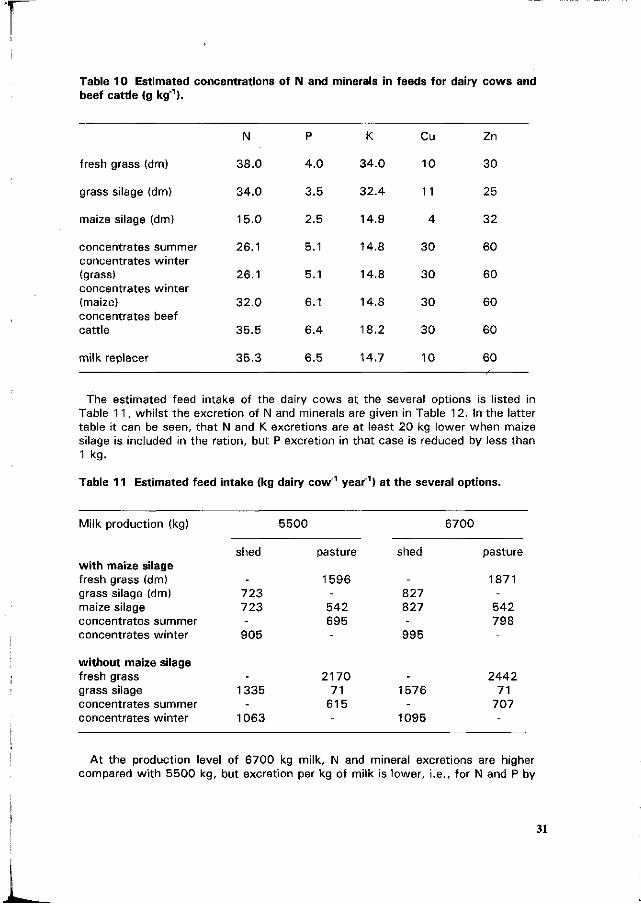
Table 10 Estimated concentrations of N and minerals in feeds for dairy cows and beef cattle (g kg'1).
fresh grass (dm)
grass silage (dm)
maize silage (dm)
concentrates summer concentrates winter (grass) concentrates winter (maize) concentrates beef cattle
milk replacer
N
38.0
34.0
15.0
26.1
26.1
32.0
35.5
35.3
P
4.0
3.5
2.5
5.1
5.1
6.1
6.4
6.5
K
34.0
32.4
14.9
14.8
14.8
14.8
18.2
14.7
Cu
10
11
4
30
30
30
30
10
Zn
30
25
32
60
60
60
60
60
The estimated feed intake of the dairy cows at the several options is listed in Table 1 1 , whi lst the excretion of N and minerals are given in Table 1 2. In the latter table it can be seen, that N and K excretions are at least 20 kg lower when maize silage is included in the ration, but P excretion in that case is reduced by less than 1 kg.
Table 11 Estimated feed intake (kg dairy cow"1 year_1) at the several options.
Milk production (kg)
with maize silage fresh grass (dm) grass silage (dm) maize silage concentrates summer concentrates winter
without maize silage fresh grass grass silage concentrates summer concentrates winter
shed
-723 723 -
905
-1335
-1063
5500
pasture
1596 -
542 695 -
2170 71
615 -
shed
-827 827 -
995
-1576
-1095
6700
pasture
1871 -
542 798 -
2442 71
707 -
At the production level of 6700 kg milk, N and mineral excretions are higher compared w i th 5500 kg, but excretion per kg of milk is lower, i.e., for N and P by
31
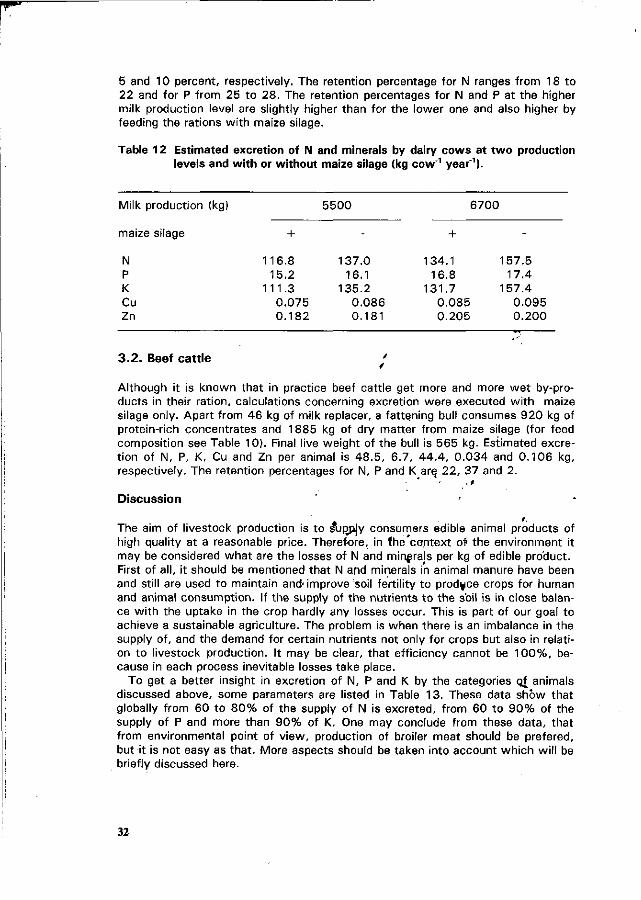
5 and 10 percent, respectively. The retention percentage for N ranges from 18 to 22 and for P from 25 to 28. The retention percentages for N and P at the higher milk production level are slightly higher than for the lower one and also higher by feeding the rations with maize silage.
Table 12 Estimated excretion of N and minerals by dairy cows at two production levels and with or without maize silage (kg cow'1 year1).
Milk
maiz
N P K Cu Zn
3.2.
production (kg)
e silage
Beef cattle
+
116.8 15.2
111.3 0.075 0.182
5500
-
137.0 16.1
135.2 0.086 0.181
•
6700
+
134.1 16.8
131.7 0.085 0.205
-
157.5 17.4
157.4 0.095 0.200
Although it is known that in practice beef cattle get more and more wet by-products in their ration, calculations concerning excretion were executed with maize silage only. Apart from 46 kg of milk replacer, a fattening bull consumes 920 kg of protein-rich concentrates and 1885 kg of dry matter from maize silage (for feed composition see Table 10). Final live weight of the bull is 565 kg. Estimated excretion of N, P, K, Cu and Zn per animal is 48.5, 6.7, 44.4, 0.034 and 0.106 kg, respectively. The retention percentages for N, P and K are, 22, 37 and 2.
Discussion
The aim of livestock production is to sVipjajy consumers edible animal products of high quality at a reasonable price. Therefore, in the'context of the environment it may be considered what are the losses of N and minerals per kg of edible product. First of all, it should be mentioned that N and minerals in animal manure have been and still are used to maintain and-improve soil fertility to produce crops for human and animal consumption. If the supply of the nutrients to the soil is in close balance with the uptake in the crop hardly any losses occur. This is part of our goal to achieve a sustainable agriculture. The problem is when there is an imbalance in the supply of, and the demand for certain nutrients not only for crops but also in relation to livestock production. It may be clear, that efficiency cannot be 100%, because in each process inevitable losses take place.
To get a better insight in excretion of N, P and K by the categories Qf animals discussed above, some parameters are listed in Table 13. These data show that globally from 60 to 80% of the supply of N is excreted, from 60 to 90% of the supply of P and more than 90% of K. One may conclude from these data, that from environmental point of view, production of broiler meat should be prefered, but it is not easy as that. More aspects should be taken into account which will be briefly discussed here.
32
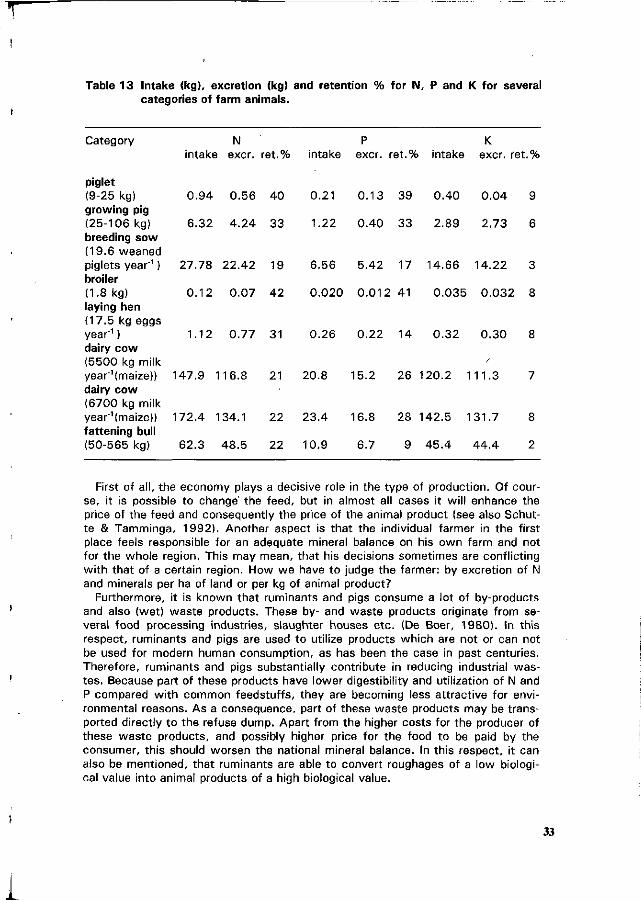
Table 13 Intake (kg), excretion (kg) and retention % for N, P and K for several categories of farm animals.
Category N P K intake excr. ret.% intake excr. ret.% intake excr. ret.%
piglet (9-25 kg) 0 .94 0.56 40 0.21 0.13 39 0 .40 0 .04 9 growing pig (25-106 kg) 6.32 4 .24 33 1.22 0.40 33 2.89 2.73 6 breeding sow (19.6 weaned piglets year1 ) 27 .78 22.42 19 6.56 5.42 17 14.66 14.22 3 broiler (1.8 kg) 0.12 0.07 42 0 .020 0 .012 41 0 .035 0 .032 8 laying hen (17.5 kg eggs year 1 ) 1.12 0.77 31 0.26 0.22 14 0 .32 0 .30 8 dairy cow (5500 kg milk ' year1 (maize)) 147.9 116.8 21 20.8 15.2 26 120.2 111.3 7 dairy cow (6700 kg milk year^maize)) 172.4 134.1 22 23.4 16.8 28 142.5 131.7 8 fattening bull (50-565 kg) 62.3 48.5 22 10.9 6.7 9 45 .4 44 .4 2
First of all, the economy plays a decisive role in the type of production. Of course, it is possible to change' the feed, but in almost all cases it wil l enhance the price of the feed and consequently the price of the animal product (see also Schutte & Tamminga, 1992). Another aspect is that the individual farmer in the first place feels responsible for an adequate mineral balance on his own farm and not for the whole region. This may mean, that his decisions sometimes are conflicting wi th that of a certain region. How we have to judge the farmer: by excretion of N and minerals per ha of land or per kg of animal product?
Furthermore, it is known that ruminants and pigs consume a lot of by-products and also (wet) waste products. These by- and waste products originate from several food processing industries, slaughter houses etc. (De Boer, 1980). In this respect, ruminants and pigs are used to utilize products which are not or can not be used for modern human consumption, as has been the case in past centuries. Therefore, ruminants and pigs substantially contribute in reducing industrial wastes. Because part of these products have lower digestibility and utilization of N and P compared w i th common feedstuffs, they are becoming less attractive for environmental reasons. As a consequence, part of these waste products may be transported directly to the refuse dump. Apart from the higher costs for the producer of these waste products, and possibly higher price for the food to be paid by the consumer, this should worsen the national mineral balance. In this respect, it can also be mentioned, that ruminants are able to convert roughages of a low biological value into animal products of a high biological value.
33
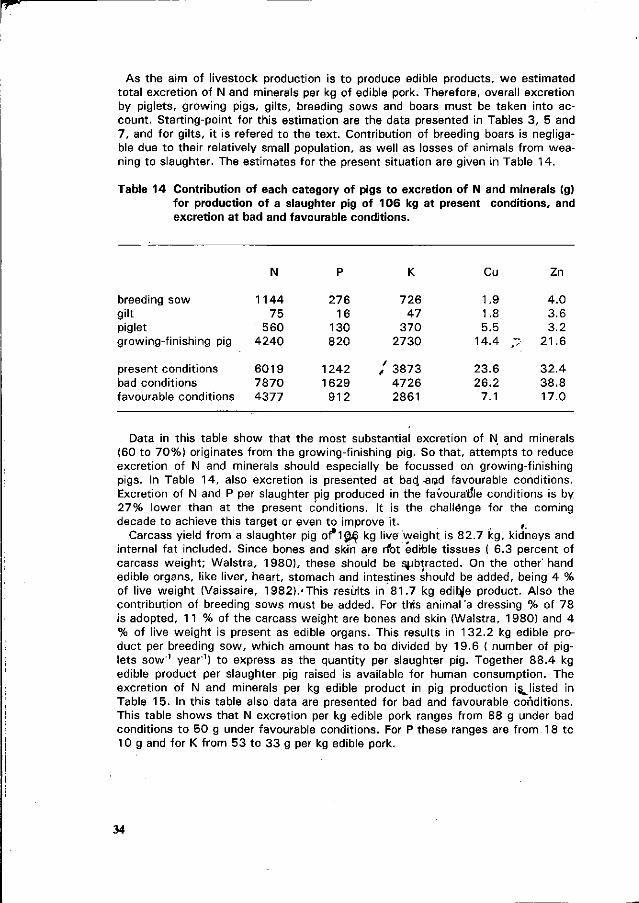
As the aim of livestock production is to produce edible products, we estimated total excretion of N and minerals per kg of edible pork. Therefore, overall excretion by piglets, growing pigs, gilts, breeding sows and boars must be taken into account. Starting-point for this estimation are the data presented in Tables 3, 5 and 7, and for gilts, it is refered to the text. Contribution of breeding boars is negliga-ble due to their relatively small population, as well as losses of animals from weaning to slaughter. The estimates for the present situation are given in Table 14.
Table 14 Contribution of each category of pigs to excretion of N and minerals (g) for production of a slaughter pig of 106 kg at present conditions, and excretion at bad and favourable conditions.
Cu Zn
breeding sow gilt piglet growing-finishing pig
present conditions bad conditions favourable conditions
1144 75
560 4240
6019 7870 4377
276 16
130 820
1242 1629
912
726 47
370 2730
/ 3873 4726 2861
1.9 1.8 5.5
14.4 ; ;
23.6 26.2
7.1
4.0 3.6 3.2
21.6
32.4 38.8 17.0
Data in this table show that the most substantial excretion of N and minerals (60 to 70%) originates from the growing-finishing pig. So that, attempts to reduce excretion of N and minerals should especially be focussed on growing-finishing pigs. In Table 14, also excretion is presented at bad, -and favourable conditions. Excretion of N and P per slaughter pig produced in the favourable conditions is by 27% lower than at the present conditions. It is the challenge for the coming decade to achieve this target or even to improve it. ,
Carcass yield from a slaughter pig of*10y^ kg live' weight is 82.7 kg, kidneys and internal fat included. Since bones and skin are rffat edrble tissues ( 6.3 percent of carcass weight; Walstra, 1980), these should be subtracted. On the other'hand edible organs, like liver, heart, stomach and intestines should be added, being 4 % of live weight (Vaissaire, 1982).'This results in 81.7 kg edibje product. Also the contribution of breeding sows must be added. For this animal'a dressing % of 78 is adopted, 11 % of the carcass weight are bones and skin (Walstra, 1980) and 4 % of live weight is present as edible organs. This results in 132.2 kg edible product per breeding sow, which amount has to be divided by 19.6 ( number of piglets sow"1 year1) to express as the quantity per slaughter pig. Together 88.4 kg edible product per slaughter pig raised is available for human consumption. The excretion of N and minerals per kg edible product in pig production igjisted in Table 15. In this table also data are presented for bad and favourable conditions. This table shows that N excretion per kg edible pork ranges from 88 g under bad conditions to 50 g under favourable conditions. For P these ranges are from 18 tc 10 g and for K from 53 to 33 g per kg edible pork.
34
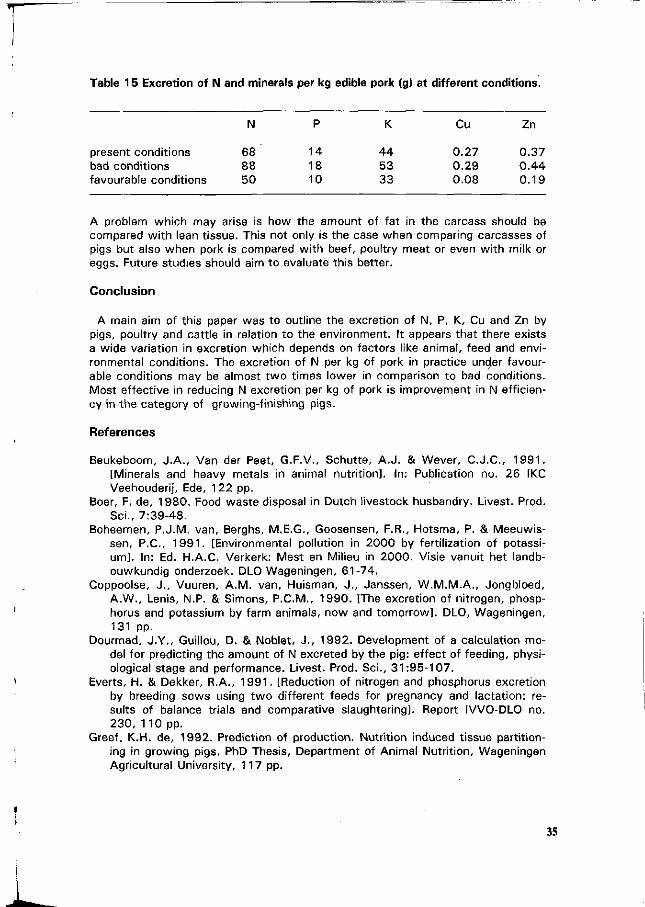
Table 15 Excretion of N and minerals per kg edible pork (g) at different conditions.
present conditions bad conditions favourable conditions
N
68 88 50
P
14 18 10
K
44 53 33
Cu
0.27 0.29 0.08
Zn
0.37 0.44 0.19
A problem which may arise is how the amount of fat in the carcass should be compared with lean tissue. This not only is the case when comparing carcasses of pigs but also when pork is compared with beef, poultry meat or even with milk or eggs. Future studies should aim to evaluate this better.
Conclusion
A main aim of this paper was to outline the excretion of N, P, K, Cu and Zn by pigs, poultry and cattle in relation to the environment. It appears that there exists a wide variation in excretion which depends on factors like animal, feed and environmental conditions. The excretion of N per kg of pork in practice uncjer favourable conditions may be almost two times lower in comparison to bad conditions. Most effective in reducing N excretion per kg of pork is improvement in N efficiency in the category of growing-finishing pigs.
References
Beukeboom, J.A., Van der Peet, G.F.V., Schutte, A.J. & Wever, C.J.C., 1991. [Minerals and heavy metals in animal nutrition]. In: Publication no. 26 IKC Veehouderij, Ede, 122 pp.
Boer, F. de, 1980. Food waste disposal in Dutch livestock husbandry. Livest. Prod. Sei., 7:39-48.
Boheemen, P.J.M. van, Berghs, M.E.G., Goosensen, F.R., Hotsma, P. & Meeuwis-sen, P.C., 1991. [Environmental pollution in 2000 by fertilization of potassium]. In: Ed. H.A.C. Verkerk: Mest en Milieu in 2000. Visie vanuit het landbouwkundig onderzoek. DLO Wageningen, 61-74.
Coppoolse, J., Vuuren, A.M. van, Huisman, J., Janssen, W.M.M.A., Jongbloed, A.W., Lenis, N.P. & Simons, P.C.M., 1990. [The excretion of nitrogen, phosphorus and potassium by farm animals, now and tomorrow]. DLO, Wageningen, 131 pp.
Dourmad, J.Y., Guillou, D. & Noblet, J., 1992. Development of a calculation model for predicting the amount of N excreted by the pig: effect of feeding, physiological stage and performance. Livest. Prod. Sei., 31:95-107.
Everts, H. & Dekker, R.A., 1991. [Reduction of nitrogen and phosphorus excretion by breeding sows using two different feeds for pregnancy and lactation: results of balance trials and comparative slaughtering]. Report IVVO-DLO no. 230, 110 pp.
Greef, K.H. de, 1992. Prediction of production. Nutrition induced tissue partitioning in growing pigs. PhD Thesis, Department of Animal Nutrition, Wageningen Agricultural University, 117 pp.
35
Jongbloed, A .W. , 1987. Phosphorus in the feeding of pigs; effect of the diet on the absorption and retention of phosphorus by growing pigs. PhD Thesis Wageningen Agricultural University, 343 pp.
Jongbloed, A .W. , 1992. [Quantification of the effect of feed additives on the excretion of nitrogen and phosphorus, the amount of slurry and feed consumpt ion]. Mededelingen IVVO-DLO no. 17, 10 pp.
Jongbloed, A .W. , Steg, A . , Simons, P .CM. , Janssen, W.M.M.A. , Lenis, N.P., Meijs, J.A.C. & Vreman, K., 1985. [Calculations about the possible reduction of the excretion of N, P, Cu, Zn and Cd by nutrition by farm animals in the Netherlands]. Mededelingen IVVO no. 3, 46 pp.
Jongbloed, A .W. & Everts, H., 1992. Apparent digestible phosphorus in the feeding of pigs in relation to availability, requirement and environment. 2. The requirement of digestible phosphorus for piglets, growing finishing pigs and breeding sows. Neth. J . Agric. Sei. 40 :123-136.
Jongbloed, A .W. & Lenis, N.P., 1992. Alteration of nutrition as a means to reduce environmental pollution by pigs. Livest. Prod. Sei., 31 :75-94.
Kirchgessner, M. & Roth, F.X., 1 9 9 1 . [Reduction of the excretion of nitrogen by the pig]. VDLUFA-Schriftenreihe 33 /1991:1-23.
Lenis, N.P., 1989. Lower nitrogen excretion in pig husbandry by feeding: current and future possibilities. Neth. J . Agric. Sei., 37 :61-70.
Lenis, N.P., 1992. Digestible amino acids for pigs: assessment of requirements on ileal digestible basis. Pig News and Information, 13:31N-39N.
Mandersloot, F., Scheppingen, A .T.J . Van, Kamp, A. van der & Wellen, G.H.M., 1 9 9 1 . [Reduction of losses of minerals on dairy farm: an integrated approach at the level of the holding]. In: Editor H.A.C. Verkerk: Mest en Milieu in 2000 . Visie vanuit het landbouwkundig onderzoek. DLO, Wageningen, 75-89.
Peet-Schwering, C.M.C, van der. Peet, G.F.V. van der, Vos, H.J.P.M., Verstegen, M.W.A., Kanis, E., Smits, C.H.M., Vries, A.G. de & Lenis, N.P., T993. Optimisation of the feeding strategy to minimize the N excretion by using the Dutch Technical Model Pig Feeding. Paper, this congress.
Schutte, J.B. & Tamminga, S., 1992. [Feeding methods tô reduoe the excretion of N and P by poultry, pigs and catt le], ILOB report ho. I 92 -37926 , Wageningen, 70 pp.
Tamminga, S. & Verstegen, M.W.A., 1§92. Implications of nutrition of arfimals on environmental pollution. In: Editors PTC1. GarrasWorthy, W. ,Haresign & D.J.A. Cole. Recent Advances in Animal Nutrition* Butterworth/Heinemann, Oxford, p. 113-130. " '
Vassaire, J.P., 1982. Normes biolpgiques et hématologie. In: Editors P. Mornet, J . Tournut & B. Toma. Le porc et ses maladies. Maloine S.A., Paris, p. 149-168.
Walstra, P., 1980. Growth and carcass composition from birth to maturity in relation to feeding level and sex in Dutch Landrace pigs. PhD Thesis, IVO Report B-160, Zeist, 270 pp.
Werkgroep T.M.V., 1 9 9 1 . [Technical Model Pig Feeding]. Research report P 1.66. Research Institute for Pig Husbandry, Rosmalen, 96 pp.
36
SESSION 2
Protein absorption and digestion.
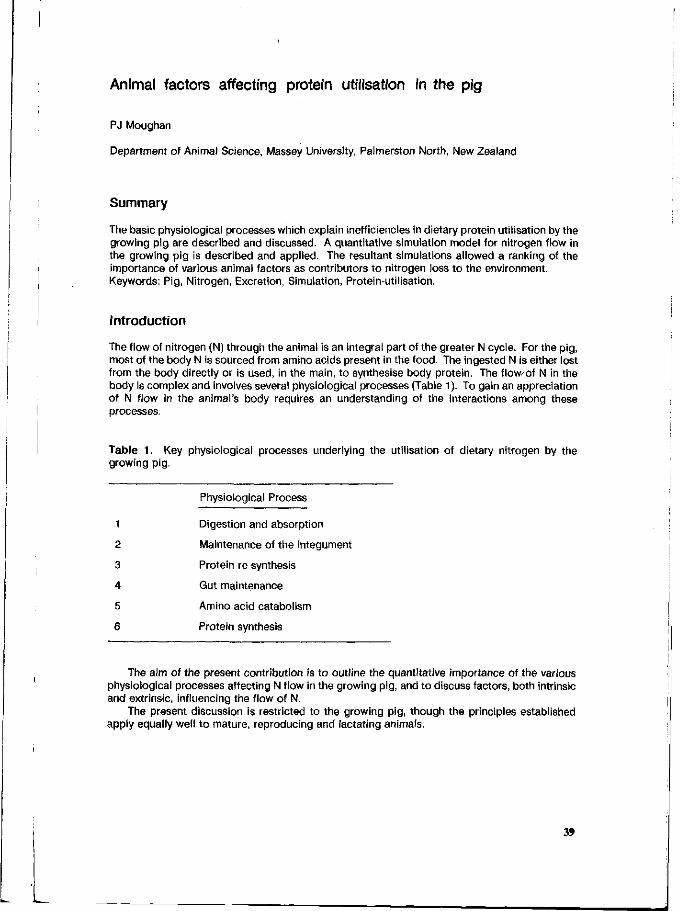
Animal factors affecting protein utilisation in the pig
PJ Moughan
Department of Animal Science, Massey University, Palmerston North, New Zealand
Summary
The basic physiological processes which explain inefficiencies in dietary protein utilisation by the growing pig are described and discussed. A quantitative simulation model for nitrogen flow in the growing pig is described and applied. The resultant simulations allowed a ranking of the importance of various animal factors as contributors to nitrogen loss to the environment. Keywords: Pig, Nitrogen, Excretion, Simulation, Protein-utilisation.
Introduction
The flow of nitrogen (N) through the animal is an integral part of the greater N cycle. For the pig, most of the body N is sourced from amino acids present in the food. The ingested N is either lost from the body directly or is used, in the main, to synthesise body protein. The flow/of N in the body is complex and involves several physiological processes (Table 1). To gain an appreciation of N flow in the animal's body requires an understanding of the interactions among these processes.
Table 1. Key physiological processes underlying the utilisation of dietary nitrogen by the growing pig.
Physiological Process
1 Digestion and absorption
2 Maintenance of the integument
3 Protein re-synthesis
4 Gut maintenance
5 Amino acid catabolism
6 Protein synthesis
The aim of the present contribution is to outline the quantitative importance of the various physiological processes affecting N flow in the growing pig, and to discuss factors, both intrinsic and extrinsic, influencing the flow of N.
The present discussion is restricted to the growing pig, though the principles established apply equally well to mature, reproducing and lactating animals.
39
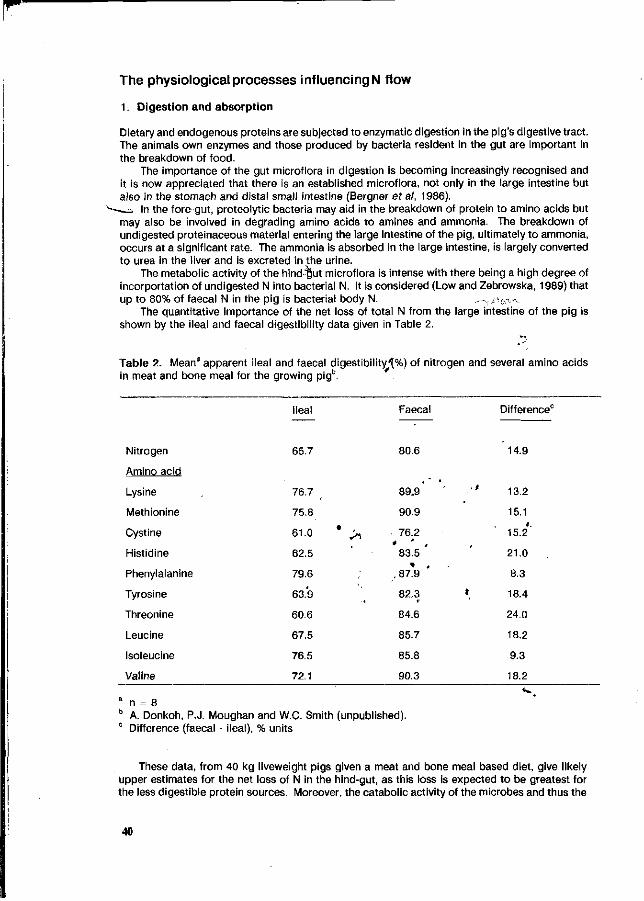
The physiological processes influencing N flow
1. Digestion and absorption
Dietary and endogenous proteins are subjected to enzymatic digestion in the pig's digestive tract. The animals own enzymes and those produced by bacteria resident in the gut are important in the breakdown of food.
The importance of the gut microflora in digestion is becoming increasingly recognised and it is now appreciated that there is an established microflora, not only in the large intestine but also in the stomach and distal small intestine (Bergner et al, 1986).
— A In the fore-gut, proteolytic bacteria may aid in the breakdown of protein to amino acids but may also be involved in degrading amino acids to amines and ammonia. The breakdown of undigested proteinaceous material entering the large intestine of the pig, ultimately to ammonia, occurs at a significant rate. The ammonia is absorbed in the large intestine, is largely converted to urea in the liver and is excreted in the urine.
The metabolic activity of the hind-"§ut microflora is intense with there being a high degree of incorportation of undigested N into bacterial N. It is considered (Low and Zebrowska, 1989) that up to 80% of faecal N in the pig is bacterial body N. ^ i/-G o^
The quantitative importance of the net loss of total N from the large intestine of the pig is shown by the ileal and faecal digestibility data given in Table 2.
Table 2. Mean3 apparent ileal and faecal d igest ibi l i ty^) of nitrogen and several amino acids in meat and bone meal for the growing pig0.
Ileal Faecal Difference0
Nitrogen
Amino acid
Lysine
Methionine
Cystine
Histidine
Phenylalanine
Tyrosine
Threonine
Leucine
Isoleucine
Valine
65.7 80.6 14.9
76.7
75.8
61.0
62.5
79.6
63.9
60.6
67.5
76.5
72.1
•
89.9
90.9
76.2
83.5
,87.9
82.3
84.6
85.7
85.8
90.3
•* 13.2
15.1
15.2
21.0
8.3
18.4
24.0
18.2
9.3
18.2
a n = 8 b A. Donkoh, P.J. Moughan and W.C. Smith (unpublished). 0 Difference (faecal - ileal), % units
These data, from 40 kg liveweight pigs given a meat and bone meal based diet, give likely upper estimates for the net loss of N in the hind-gut, as this loss is expected to be greatest for the less digestible protein sources. Moreover, the catabolic activity of the microbes and thus the
40
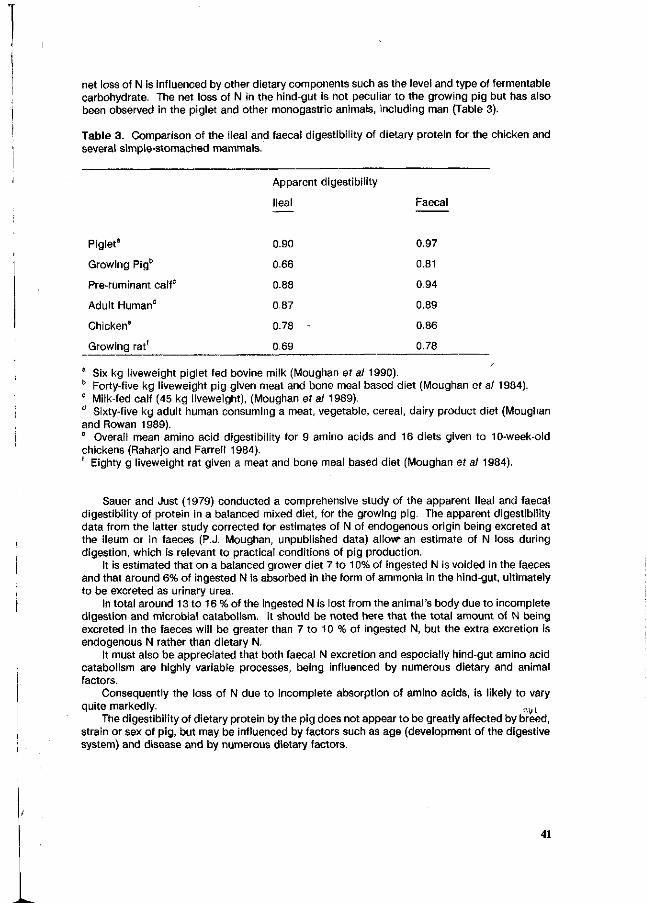
net loss of N is influenced by other dietary components such as the level and type of fermentable carbohydrate. The net loss of N in the hind-gut is not peculiar to the growing pig but has also been observed in the piglet and other monogastric animals, including man (Table 3).
Table 3. Comparison of the ileal and faecal digestibility of dietary protein for the chicken and several simple-stomached mammals.
Piglet3
Growing Pig"
Pre-ruminant calf0
Adult Human"
Chicken6
Growing rat'
Appare
Ileal
0.90
0.66
0.88
0.87
0.78
0.69
nt digestibility
Faecal
0.97
0.81
0.94
0.89
0.86
0.78
a Six kg liveweight piglet fed bovine milk (Moughan ef al 1990). 0 Forty-five kg liveweight pig given meat and bone meal based diet (Moughan ef al 1984). 0 Milk-fed calf (45 kg liveweight), (Moughan ef al 1989). 0 Sixty-five kg adult human consuming a meat, vegetable, cereal, dairy product diet (Moughan and Rowan 1989). 6 Overall mean amino acid digestibility for 9 amino acids and 16 diets given to 10-week-old chickens (Raharjo and Farrell 1984). ' Eighty g liveweight rat given a meat and bone meal based diet (Moughan ef a/ 1984).
Sauer and Just (1979) conducted a comprehensive study of the apparent ileal and faecal digestibility of protein in a balanced mixed diet, for the growing pig. The apparent digestibility data from the latter study corrected for estimates of N of endogenous origin being excreted at the ileum or in faeces (P.J. Moughan, unpublished data) allow an estimate of N loss during digestion, which is relevant to practical conditions of pig production.
It is estimated that on a balanced grower diet 7 to 10% of ingested N is voided in the faeces and that around 6% of ingested N is absorbed in the form of ammonia in the hind-gut, ultimately to be excreted as urinary urea.
In total around 13 to 16 % of the ingested N is lost from the animal's body due to incomplete digestion and microbial catabolism. It should be noted here that the total amount of N being excreted in the faeces will be greater than 7 to 10 % of ingested N, but the extra excretion is endogenous N rather than dietary N.
It must also be appreciated that both faecal N excretion and especially hind-gut amino acid catabolism are highly variable processes, being influenced by numerous dietary and animal factors.
Consequently the loss of N due to incomplete absorption of amino acids, is likely to vary quite markedly. ,,Vj
The digestibility of dietary protein by the pig does not appear to be greatly affected by breed, strain or sex of pig, but may be influenced by factors such as age (development of the digestive system) and disease and by numerous dietary factors.
41
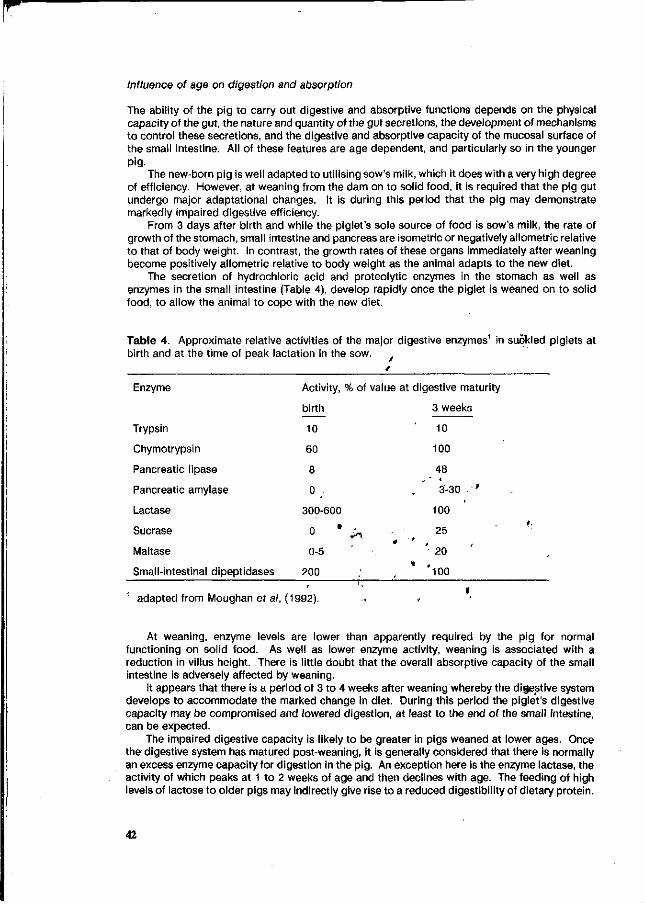
Influence of age on digestion and absorption
The ability of the pig to carry out digestive and absorptive functions depends on the physical capacity of the gut, the nature and quantity of the gut secretions, the development of mechanisms to control these secretions, and the digestive and absorptive capacity of the mucosal surface of the small intestine. All of these features are age dependent, and particularly so in the younger pig-
The new-born pig is well adapted to utilising sow's milk, which it does with a very high degree of efficiency. However, at weaning from the dam on to solid food, it is required that the pig gut undergo major adaptational changes. It is during this period that the pig may demonstrate markedly impaired digestive efficiency.
From 3 days after birth and while the piglet's sole source of food is sow's milk, the rate of growth of the stomach, small intestine and pancreas are isometric or negatively allometric relative to that of body weight. In contrast, the growth rates of these organs immediately after weaning become positively allometric relative to body weight as the animal adapts to the new diet.
The secretion of hydrochloric acid and proteolytic enzymes in the stomach as well as enzymes in the small intestine (Table 4), develop rapidly once the piglet is weaned on to solid food, to allow the animal to cope with the new diet.
Table 4. Approximate relative activities of the major digestive enzymes1 in suckled piglets at birth and at the time of peak lactation in the sow.
Enzyme
Trypsin
Chymotrypsin
Pancreatic lipase
Pancreatic amylase
Lactase
Sucrase
Maltase
Small-intestinal dipeptidases
Activity,
birth
10
60
8
0
300-600
0 *
0-5
200
% of value at digestive maturity
^ " > .
3 weeks
10
100
48
3-30 "
100
. 2 5 '• * • • ,
20
100
1 adapted from Moughan ef a/, (1992).
At weaning, enzyme levels are lower than apparently required by the pig for normal functioning on solid food. As well as lower enzyme activity, weaning is associated with a reduction in villus height. There is little doubt that the overall absorptive capacity of the small intestine is adversely affected by weaning.
It appears that there is a period of 3 to 4 weeks after weaning whereby the digestive system develops to accommodate the marked change in diet. During this period the piglet's digestive capacity may be compromised and lowered digestion, at least to the end of the small intestine, can be expected.
The impaired digestive capacity is likely to be greater in pigs weaned at lower ages. Once the digestive system has matured post-weaning, it is generally considered that there is normally an excess enzyme capacity for digestion in the pig. An exception here is the enzyme lactase, the activity of which peaks at 1 to 2 weeks of age and then declines with age. The feeding of high levels of lactose to older pigs may indirectly give rise to a reduced digestibility of dietary protein.
42
Microbes colonise the gut of the pig soon after birth (Moughan ef ai 1992) and undoubtedly the flora changes at weaning. It is considered that the microflora is relatively more active in mature pigs, which may, though evidence is conflicting, have a greater ability to digest high-fibre foods.
Effect of disease on digestion and absorption
Numerous pathogenic organisms can become established in the pig's digestive tract, and may lead to sub-clinical or clinical enteric infection. At weaning, and with abrupt removal from some degree of maternal immunological protection via milk, the pig is most susceptible to infections. Infection can cause considerable mucosal damage thus leading to lowered nutrient and protein digestibility (Hampson, 1989; Cutler, 1991).
2. Maintenance of the integument ^ , f i l , *
The pig is continuously shedding and replacing cutaneous cells and hair. This material, being keratinised, contains a high amount of protein. The loss of skin and hair protein is considered to be related to body surface area and is often expressed as a function of metabolic body weight (kg 0 75). The loss of N to the environment by this route is relatively minor.
3. Protein re-synthesis
The turnover (breakdown and re-synthesis) of body protein in the pig is considerable. Each day around 5 % of the whole body protein is broken down into its constituent amino acids and then re-synthesised to protein. This means that for a 50 kg liveweight growing pig, containing 8 kg of protein, 400 grams of body protein are broken down and remade daily. Like most biological processes, the latter is not completely efficient and amino acids of body origin are deaminated, with urea being voided in the urine.
It is considered (Moughan, 1989) that the endogenous urea N excreted in the urine daily, represents breakdown of about 4 % of total protein synthesised. So around 20 grams of protein (0.04 x 500 g) is catabolised daily by the growing pig, due to inefficiency in body protein turnover.
The rate of body protein synthesis, and thus amino acid catabolism, is related to the rate of body protein deposition which is influenced by genotype and gender (Moughan, 1989). Body protein synthesis rate may be considerably elevated with systemic disease.
4. Gut maintenance
During digestion large quantities of proteinaceous material (enzymes, cells, mucin, serum albumin etc) are secreted into the gut lumen. This material is subject to digestion and much of the secreted material is re-absorbed. However, some of the endogenous gut protein escapes digestion and is either degraded by the large intestinal microbes with ammonia as an end-product or is voided in the faeces. Thus, N of body origin entering the gut is lost either via the urine (urea) or faeces. The loss of endogenous N via the gut of the pig has often been under-estimated due to inadequacies in the method of measurement (Moughan, 1991). Methods to accurately determine gut endogenous protein loss have only recently become available. Consequently, the factors influencing gut endogenous loss are not well understood.
The level of dietary dry-matter intake has an influence, along with dietary fibre and anti-nutritional factors such as tannins.
5. Amino acid catabolism
Besides the catabolism of amino acids of body origin, absorbed dietary amino acids may be catabolised, with the concomitant excretion of urea in the urine, for a number of reasons. With processed (especially heat-treated) foods, protein may have been damaged and amino acids altered structurally. Some of these amino compounds are absorbed but are metabolised and then excreted in the urine.
43
For most balanced pig diets, this form of nitrogen loss will be minor. Of greater significance is the "inevitable" and "preferential" catabolism of amino acids. Preferential catabolism refers to the catabolism of amino acids for the express purpose of energy supply (ATP generation). Whenever the pig's supply of energy from absorbed glucose, fatty acids and volatile fatty acids is depleted, then amino acids can be catabolised to supply energy. As a result of this, urea will be synthesised and excreted in the urine.
The process of preferential catabolism can be quantitatively very important and is undoubtedly influenced by animal factors such as age, sex and genotype. The process can be minimised by careful attention to diet formulation.
In contrast to "preferential" catabolism, and in the case whereby non-protein energy is supplied well in excess of the animal's metabolic need, there will be some degradation of absorbed amino acids, as an inevitable consequence of the cell possessing a catabolic capacity.
Data on the rate of "inevitable" catabolism in the pig, are sparse. Mean estimates in the literature would indicate that anywhere from between 10 to 40 % of the first limiting amino acid may be inevitably catabolised.
The rate of inevitable catabolism may increase as the supply of absorbed amino acid increases towards maximal protein synthesis.
6. Protein synthesis
Body protein synthesis is an "all or nothing" phenomenon. Moreover the cell canjtot store amino acids for later use. Consequently, if the absorbed amino acids reaching the site of protein synthesis are unbalanced in relation to the synthetic peed, then the unbalanced amino acids will be catabolised.
The cellular requirement for amino acids is affected by age, breed, sex and rate of growth, as well as several dietary factors. In well-formulated diets, the loss of amino acids due to imbalance is minimal. Conversely, in poorly-formulated diets, the loss of urinary N due to this cause may be considerable.
Another characteristic of protein synthesis is that there is an intrinsic upper limit regulated by the ribosomal RNA. This upper limit is clearly affected by age, genotype and gender and may be influenced by an animal's growth history. If balanced available amino acids exceed the animal's capacity to deposit body protein, then the excess supply will bepatabolised. Whittemore (1983) has reviewed studies in which, the upper limit to protein retention (Pdmax) has been determined for growing pigs and cites values ranging from 90 to 175 grams protein per day. The study of Campbell (1985) indicates that for very well-bred entire males Pdmax may exceed 187 grams per day, and estimates as high as .200 grams per day have been reported. The administration of Porcine Somatotropin is considered tó lift'the ceiling to body protein deposition.
Computerised simulation of N f low- the key to understanding
Biological systems, and growth in the pig is no exception, are typified by complex interactions among a myriad of factors, such that it is difficult for the unaided human mind to integrate these processes and gain insight to the system itself. Yet, if the consequences of manipulating aspects of a system are to be fully appreciated, then it is critical that the system per se be understood.
The key to understanding systems is the science of simulation. Complex systems may be simulated by the construction of models. Most simulation models in biology are quantitative and the ready availability of powerful computers has allowed the construction and analysis of often quite intricate models. Pig growth, including a description of N flow, has been simulated. Several pig growth models have been reported in the literature, which describe nutrient partitioning in the pig at the tissue level (Miller and Payne, 1963; Whittemore and Fawcett, 1976; Whittemore 1983, Moughan and Smith, 1984; Black ef al, 1986; Moughan er al, 1987). These models may be used to predict dietary N utilisation and thus N output, in face of variation in factors such as age, genotype, sex of the animal, level and quality of nutrition and physical environment.
Having broadly described the processes inherent in protein digestion and metabolism, a mechanistic model describing N flow in the 50 kg liveweight pig, is now presented and applied to give an overall quantitative appreciation of N flow in the pig.
44

The model used here was based around that described by Moughan (1989), except that in the present version, daily body protein deposition was predicted rather than being given as a model input, and daily food intake was an input with dietary energy partitioning being simulated. The model specifies amino acid intake in terms of total and chemically-available amino acids and predicts absorbed amino acids based on true ileal digestibility co-efficients. It describes cutaneous amino acid loss as a function of metabolic body weight and endogenous gut amino acid loss, determined under protein alimentation, as a function of food dry-matter intake.
The model includes a weighting factor for endogenous amino acid flow to allow expression of the effect of elevated amounts of anti-nutritional factors or dietary fibre. The fractional rate of whole body protein synthesis is given as a function of the mean daily protein deposition rate (Pd) over the 3 days of growth preceding the day of simulation (assumed in the present exercise to equal Pd on the day of simulation). The loss of body protein N in the urine at maintenance is given as a set proportion of whole body protein synthesis and amino acids are assumed to be catabolised in proportion to their occurrence in body protein. Some amino acids (eg lysine) are assumed to be retained in the cell following protein breakdown and their catabolisms are discounted accordingly.
The rates of inevitable catabolism are described as curvilinear functions of the actual amounts of amino acids absorbed expressed relative to potential amino acid depositions (based on the genetic upper limit to protein retention, Pdmax). The model predicts the amount of each amino acid available for growth (after maintenance and inevitable catabolism costs have been met) and the pattern is compared with body protein amino acid composition to identify the first limiting amino acid and to determine the unbalanced amino acids.
In the model, if balanced protein available for growth is greater than Pdmax,'then excess amino acids are catabolised. Net energy yields from amino acid catabolism are predicted, and with the digested non-protein energy, give metabolisable energy (ME).
The daily ME is partitioned, ultimately to protein and lipid, facing a minimal lipid, protein deposition ratio. If ME is limiting for essential lipid deposition (according to the minimum ratio) then amino acids are preferentially catabolised.
The simulated flow of N in the 50 kg liveweight pig given a commercial grower diet (Table 5) is presented in Table 6.
Table 5. Ingredient composition of a commercial barley-based diet3 formulated for growing pigs.
Ingredient
Barley
Peas
Meat and bone meal
Fish meal
Vitamin, mineral premix
Composition
(g/100 g air-dry weight)
73.25
16.50
5.00
5.00
0.25
a Crude protein 17.8 g/100 g Apparent digestible energy 13.26 MJ/kg Total lysine 0.92 g/100 g
The simulated values (Table 6) indicate that even for a properly formulated commercial diet, the pig's utilisation of dietary N is low (27 to 34 %). Still lower utilisation efficiencies may be found in practice (Moughan, 1984).
45
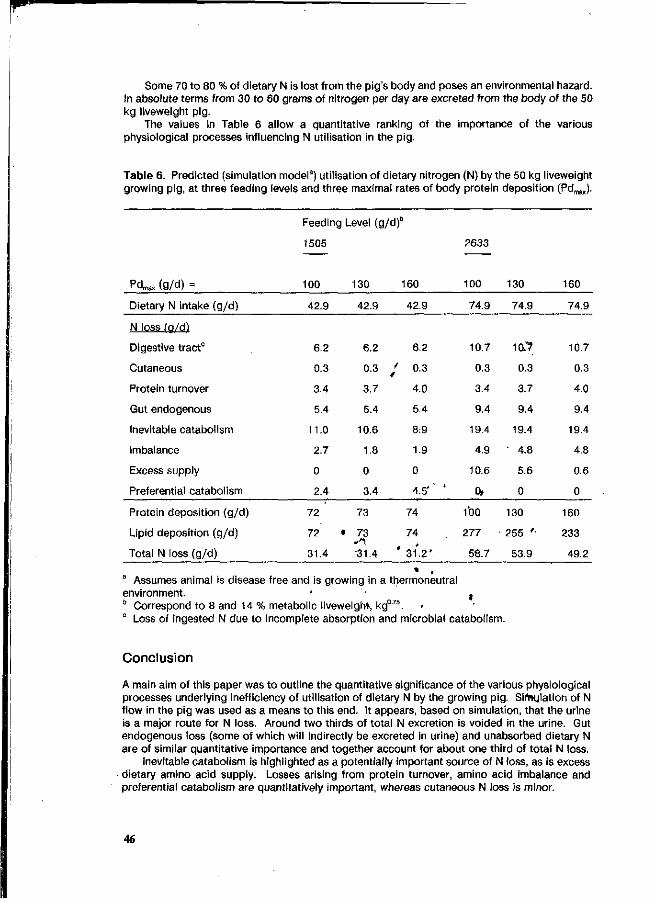
Some 70 to 80 % of dietary N is lost from the pig's body and poses an environmental hazard. In absolute terms from 30 to 60 grams of nitrogen per day are excreted from the body of the 50 kg liveweight pig.
The values in Table 6 allow a quantitative ranking of the importance of the various physiological processes influencing N utilisation in the pig.
Table 6. Predicted (simulation model9) utilisation of dietary nitrogen (N) by the 50 kg liveweight growing pig, at three feeding levels and three maximal rates of body protein deposition (Pdmax).
Pd™, (g/d) =
Dietary N intake (g/d)
N loss (a/dï
Digestive tract0
Cutaneous
Protein turnover
Gut endogenous
Inevitable catabolism
Imbalance
Excess supply
Preferential catabolism
Protein deposition (g/d)
Lipid deposition (g/d)
Total N loss (g/d)
Feeding Level (g/d)
1505
100
42.9
6.2
0.3
3.4
5.4
11.0
2.7
0
2.4
72
72
31.4
130
42.9
6.2
0.3 J
3.7
5.4
10.6
1.8
0
3.4
73
• 73 ^ 1 •31.4 '
)
160
42.9
6.2
0.3
4.0
5.4
8:9
1.9
0
4.5*" '
74
74
31.2'
2633
100
74.9
10.7
0.3
3.4
9.4
19.4
4.9
10.6
0,
100
277
58.7
130
74.9
10."?
0.3
3.7
9.4
19.4
' 4.8
5.6
0
130
255 '•
53.9
160
74.9
10.7
0.3
4.0
9.4
19.4
4.8
0.6
0
160
233
49.2
a Assumes animal is disease free and is growing in a thermoneutral environment. • , ° Correspond to 8 and 14 % metabolic liveweight, kg075. < 0 Loss of ingested N due to incomplete absorption and microbial catabolism.
Conclusion
A main aim of this paper was to outline the quantitative significance of the various physiological processes underlying inefficiency of utilisation of dietary N by the growing pig. Singulation of N flow in the pig was used as a means to this end. It appears, based on simulation, that the urine is a major route for N loss. Around two thirds of total N excretion is voided in the urine. Gut endogenous loss (some of which will indirectly be excreted in urine) and unabsorbed dietary N are of similar quantitative importance and together account for about one third of total N loss.
Inevitable catabolism is highlighted as a potentially important source of N loss, as is excess dietary amino acid supply. Losses arising from protein turnover, amino acid imbalance and preferential catabolism are quantitatively important, whereas cutaneous N loss is minor.
46
The influence that the various processes may have on overall protein metabolism, will of course, vary with the type of diet, age and weight of pig. Nevertheless, application of the above model serves to give a general view of N flow in the pig and allows a ranking of the importance of the respective processes under the administration of a defined diet.
It is suggested that validated models, such as the one briefly described here, are invaluable tools for providing information on the flow of N through the pig and into the environment.
Biological models are the key to understanding the complex animal, feed, environment interactions, which together explain N excretion from the animal.
If diets and animals are going to be manipulated to minimise N loss, it is critical that such an understanding be developed.
References
Bergner, H., Simon, O., Zebrowska, T. & Munchmeyer, R., 1986. Studies on the secretion of amino acids and of urea into the gastrointestinal tract of pigs. 3. Secretion of urea determined by continuous intravenous infusion of 15N-urea. Archiv fur Tierernahrung 36:479-490.
Black, J.L., Campbell, R.G., Williams, I.H., James, K.J. & Davies G.T., 1986. Simulation of energy and amino acid utilisation in the pig. Research and Development in Agriculture 3:121-145.
Campbell, R.G., 1985. Effects of sex and genotype on energy and protein metabolism in the pig. In: R.B. Cumming (ed.): Recent Advances in Animal Nutrition in Australia. University of New England, Armidale, p. 24-29.
Cutler, R.S., 1992. New developments in the understanding of proliferative enteritis. In: E.S. Batterham (ed.): Manipulating Pig Production III. Australasian Pig Science Association, Victoria, Australia, p. 114-137.
Hampson, D.J., 1989. Vaccines and the control of swine dysentery. In: J.L. Barnett & D.P. Hennessy (eds.): Manipulating Pig Production II. Australasian Pig Science Association, Victoria, Australia, p. 246-248.
Low, A.G. & Zebrowska, T., 1989. Digestion in pigs. In: H.D. Bock, B.O. Eggum, A.G. Low, O. Simon & T. Zebrowska, (eds.): Protein Metabolism in Farm Animals. Oxford University Press, Berlin, p. 53-121.
Miller, D.S. & Payne, P.R., 1963. A theory of protein metabolism. Theoretical Biology 5:398-411. Moughan, P. J., 1984. Aspects of dietary protein quality for the growing pig. PhD Thesis, Massey
University, New Zealand. Moughan, P.J., 1989. Simulation of the daily partitioning of lysine in the 50 kg liveweight pig -
A factorial approach to estimating amino acid requirements for growth and maintenance. Research and Development in Agriculture 6:7-14.
Moughan, P.J., 1991. Endogenous amino acid loss in simple-stomached animals. In: D.J. Farrell, (ed.): Recent Advances in Animal Nutrition in Australia, 1991. University of New England, Armidale, Australia, p. 239-242.
Moughan, P.J., Birtles, M.J., Cranwell, P.D., Smith, W.C. & Pedraza, M., 1992. The piglet as a model animal for studying aspects of digestion and absorption in milk-fed human infants. World Review of Nutrition and Dietetics 67:40-113.
Moughan, P.J., Pedraza, M., Smith, W.C, Williams, M. & Wilson, M.N., 1990. An evaluation with piglets of bovine milk, hydrolyzed bovine milk, and isolated soybean proteins included in infant milk formulas. I. Effect on organ development, digestive enzyme activities, and amino acid digestibility. Journal of Pediatric Gastroenterology and Nutrition 10:385-394.
Moughan, P.J. & Rowan, A.M., 1989. The role of the pig as a model animal for use in human nutritional research. Proceedings of the Nutrition Society of New Zealand 14:116-123.
Moughan, P.J. & Smith, W.C, 1984. Prediction of dietary protein quality based on a model of the digestion and metabolism of nitrogen in the growing pig. New Zealand Journal of Agricultural Research 27:501-507.
Moughan, P.J., Smith, W.C. & James, K.A.C, 1984. Preliminary observations on the use of the rat as a model for the pig in the determination of apparent digestibility of dietary protein. New Zealand Journal of Agricultural Research 27:509-512.
47
r Moughan, P.J., Smith, W.C. & Pearson, G., 1987. Description and validation of a model
simulating growth in the pig (20-90 kg liveweight). New Zealand Journal of Agricultural Research 30:481-489.
Moughan, P.J., Stevens, E.V.J., Reisima, I.D. & Rendel, J., 1989. The effect of avoparcin on the ileal and faecal digestibility of nitrogen and amino acids in the milk-fed calf. Animal Production 49:63-71.
Raharjo, Y. & Farrell, D.J., 1984. A new biological method for determining amino acid digestibility in poultry feedstuffs using a simple cannula, and the influence of dietary fibre on endogenous amino acid output. Animal Feed Science and Technology 12:29-45.
Sauer, W.C. & Just, A., 1979. Amino acid digestibilities in rations for growing pigs. In: Annual Feeders Day Report. University of Alberta, Canada, p. 22-25.
Whittemore, CT., 1983. Development of recommended energy and protein allowances for growing pigs. Agricultural Systems 11:159-186.
Whittemore, C.T. & Fawcett, R.H., 1976. Theoretical aspects of a flexible model to simulate protein and lipid growth in pigs. Animal Production 22:87-96.
/
» .
48
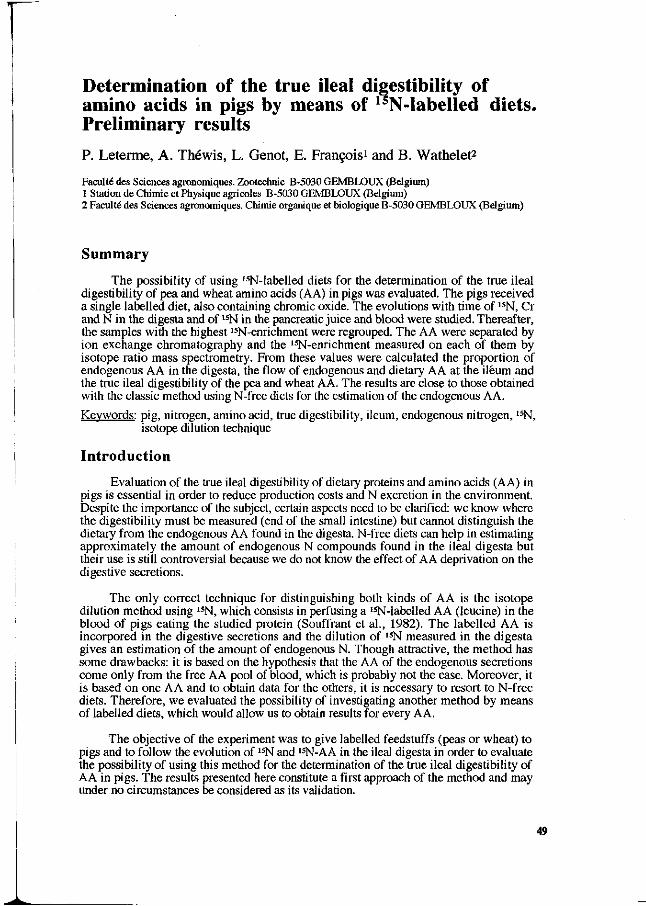
Determination of the true ileal digestibility of amino acids in pigs by means of 15N-Iabelled diets. Preliminary results P. Leterme, A. Théwis, L. Genot, E. François1 and B. Wathelet2
Faculté des Sciences agronomiques. Zootechnie B-5030 GEMBLOUX (Belgium) 1 Station de Chimie et Physique agricoles B-5030 GEMBLOUX (Belgium) 2 Faculté des Sciences agronomiques. Chimie organique et biologique B-5030 GEMBLOUX (Belgium)
Summary
The possibility of using I5N-labelled diets for the determination of the true ileal digestibility of pea and wheat amino acids (AA) in pigs was evaluated. The pigs received a single labelled diet, also containing chromic oxide. The evolutions with time of 15N, Cr and N in the digesta and of 15N in the pancreatic juice and blood were studied. Thereafter, the samples with the highest 15N-enrichment were regrouped. The AA were separated by ion exchange chromatography and the 15N-enrichment measured on each of them by isotope ratio mass spectrometry. From these values were calculated the proportion of endogenous AA in the digesta, the flow of endogenous and dietary AA at the ileum and the true ileal digestibility of the pea and wheat A A. The results are close to those obtained with the classic method using N-free diets for the estimation of the endogenous AA.
Keywords: pig, nitrogen, amino acid, true digestibility, ileum, endogenous nitrogen, 15N, isotope dilution technique
Introduction
Evaluation of the true ileal digestibility of dietary proteins and amino acids (AA) in pigs is essential in order to reduce production costs and N excretion in the environment. Despite the importance of the subject, certain aspects need to be clarified: we know where the digestibility must be measured (end of the small intestine) but cannot distinguish the dietary from the endogenous AA found in the digesta. N-free diets can help in estimating approximately the amount of endogenous N compounds found in the ileal digesta but their use is still controversial because we do not know the effect of AA deprivation on the digestive secretions.
The only correct technique for distinguishing both kinds of AA is the isotope dilution method using 15N, which consists in perfusing a 1SN-Iabelled AA (leucine) in the blood of pigs eating the studied protein (Souffrant et al., 1982). The labelled AA is incorpored in the digestive secretions and the dilution of 15N measured in the digesta gives an estimation of the amount of endogenous N. Though attractive, the method has some drawbacks: it is based on the hypothesis that the AA of the endogenous secretions come only from the free AA pool of blood, which is probably not the case. Moreover, it is based on one AA and to obtain data for the others, it is necessary to resort to N-free diets. Therefore, we evaluated the possibility of investigating another method by means of labelled diets, which would allow us to obtain results for every AA.
The objective of the experiment was to give labelled feedstuffs (peas or wheat) to pigs and to follow the evolution of 15N and 15N-AA in the ileal digesta in order to evaluate the possibility of using this method for the determination of the true ileal digestibility of AA in pigs. The results presented here constitute a first approach of the method and may under no circumstances be considered as its validation.
49
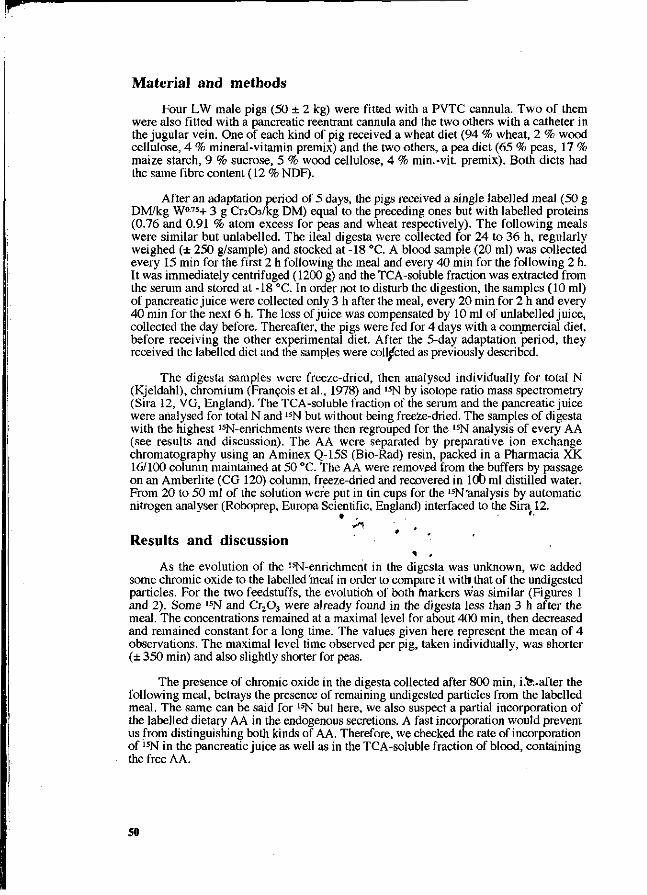
Material and methods
Four LW male pigs (50 ± 2 kg) were fitted with a PVTC cannula. Two of them were also fitted with a pancreatic reentrant cannula and the two others with a catheter in the jugular vein. One of each kind of pig received a wheat diet (94 % wheat, 2 % wood cellulose, 4 % mineral-vitamin premix) and the two others, a pea diet (65 % peas, 17 % maize starch, 9 % sucrose, 5 % wood cellulose, 4 % min.-vit. premix). Both diets had the same fibre content (12 % NDF).
After an adaptation period of 5 days, the pigs received a single labelled meal (50 g DM/kg W075+ 3 g CrzCVkg DM) equal to the preceding ones but with labelled proteins (0.76 and 0.91 % atom excess for peas and wheat respectively). The following meals were similar but unlabelled. The ileal digesta were collected for 24 to 36 h, regularly weighed (± 250 g/sample) and stocked at -18 °C. A blood sample (20 ml) was collected every 15 min for the first 2 h following the meal and every 40 min for the following 2 h. It was immediately centrifuged (1200 g) and the TCA-soluble fraction was extracted from the serum and stored at -18 °C. In order not to disturb the digestion, the samples (10 ml) of pancreatic juice were collected only 3 h after the meal, every 20 min for 2 h and every 40 min for the next 6 h. The loss of juice was compensated by 10 ml of unlabelled juice, collected the day before. Thereafter, the pigs were fed for 4 days with a commercial diet, before receiving the Other experimental diet. After the 5-day adaptation period, they received the labelled diet and the samples were collected as previously described.
The digesta samples were freeze-dried, then analysed individually for total N (Kjeldahl), chromium (François et al., 1978) and 15N by isotope ratio mass spectrometry (Sira 12, VG, England). The TCA-soluble fraction of the serum and the pancreatic juice were analysed for total N and 15N but without being freeze-dried. The samples of digesta with the highest lsN-enrichments were then regrouped for the 1SN analysis of every AA (see results and discussion). The AA were separated by preparative ion exchange chromatography using an Aminex Q-15S (Bio-Rad) resin, packed in a Pharmacia XK 16/100 column maintained at 50 °C. The A A were removed from the buffers by passage on an Amberlite (CG 120) column, freeze-dried and recovered in lOt) ml distilled water. From 20 to 50 ml of the solution were put in tin cups for the 15N'analysis by automatic nitrogen analyser (Roboprep, Europa Scientific, England) interfaced to the Sira 12.
• , . t.
Results and discussion
As the evolution of the 15N-enrichment in the digesta was unknown, we added some chromic oxide to the labelled meal in order to compare it with that of the undigested particles. For the two feedstuffs, the evolution of both fnarkers was similar (Figures 1 and 2). Some 15N and Cr203 were already found in the digesta less than 3 h after the meal. The concentrations remained at a maximal level for about 400 min, then decreased and remained constant for a long time. The values given here represent the mean of 4 observations. The maximal level time observed per pig, taken individually, was shorter (± 350 min) and also slightly shorter for peas.
The presence of chromic oxide in the digesta collected after 800 min, i.fe.after the following meal, betrays the presence of remaining undigested particles from the labelled meal. The same can be said for I5N but here, we also suspect a partial incorporation of the labelled dietary AA in the endogenous secretions. A fast incorporation would prevent us from distinguishing both kinds of A A. Therefore, we checked the rate of incorporation of 15N in the pancreatic juice as well as in the TCA-soluble fraction of blood, containing the free AA.
50
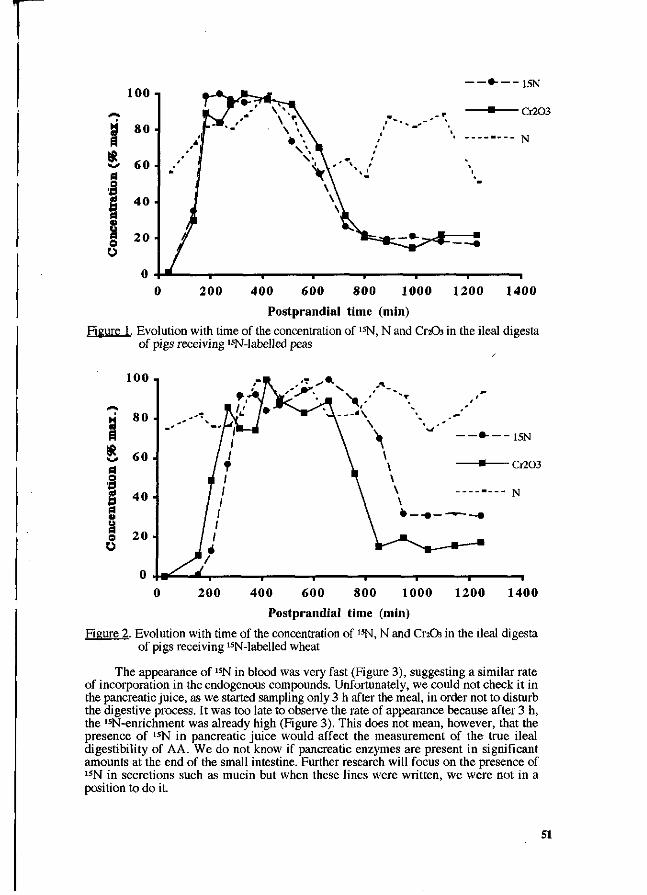
»---15N
• Cr203
N
Postprandial time (min) Figure 1. Evolution with time of the concentration of 15N, N and CtoQ? in the ileal digesta
of pigs receiving 15N-labelled peas
400 600 800 1000 1200 Postprandial time (min)
1400
Figure 2. Evolution with time of the concentration of 15N, N and CtoOs in the ileal digesta of pigs receiving 15N-labelled wheat
The appearance of 15N in blood was very fast (Figure 3), suggesting a similar rate of incorporation in the endogenous compounds. Unfortunately, we could not check it in the pancreatic juice, as we started sampling only 3 h after the meal, in order not to disturb the digestive process. It was too late to observe the rate of appearance because after 3 h, the ,5N-enrichment was already high (Figure 3). This does not mean, however, that the presence of l5N in pancreatic juice would affect the measurement of the true ileal digestibility of AA. We do not know if pancreatic enzymes are present in significant amounts at the end of the small intestine. Further research will focus on the presence of 15N in secretions such as mucin but when these lines were written, we were not in a position to do it.
51
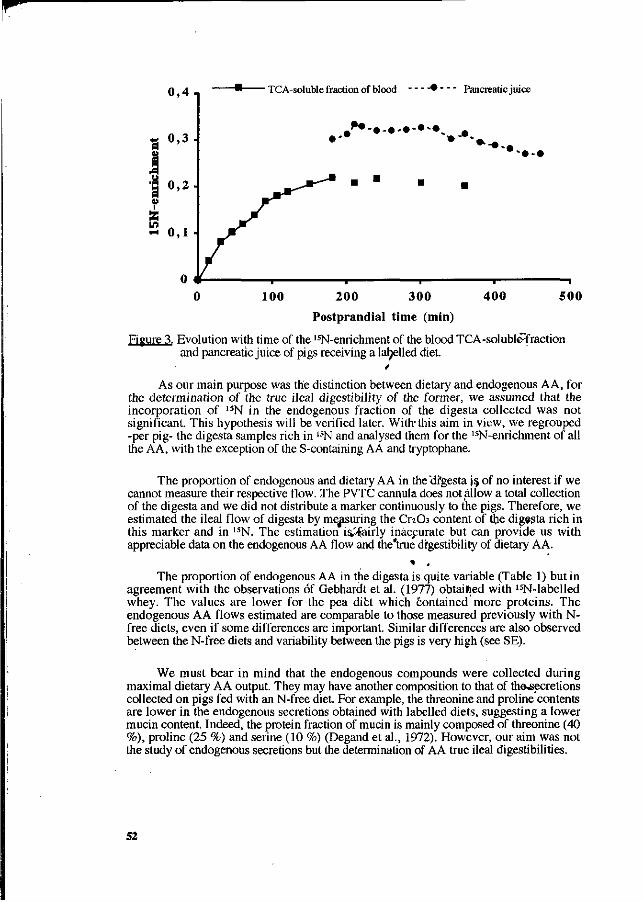
0 , 4 , TCA-soluble fraction of blood Pancreatic juice
• ^ . • - •
200 300 •
400 500
Postprandial time (min)
Figure 3. Evolution with time of the 15N-enrichment of the blood TCA-solublè'fraction and pancreatic juice of pigs receiving a labelled diet.
As our main purpose was the distinction between dietary and endogenous AA, for the determination of the true ileal digestibility of the former, we assumed that the incorporation of 15N in the endogenous fraction of the digesta collected was not significant. This hypothesis will be verified later. With'this aim in view, we regrouped -per pig- the digesta samples rich in 1SN and analysed them for the 15N-enrichment of all the AA, with the exception of the S-containing A A and tryptophane.
The proportion of endogenous and dietary A A in the'drgesta is, of no interest if we cannot measure their respective flow. The PVTC cannula does not allow a total collection of the digesta and we did not distribute a marker continuously to the pigs. Therefore, we estimated the ileal flow of digesta by measuring the Cr2Û3 content of the digesta rich in this marker and in 15N. The estimation is^foirly inaccurate but can provide us with appreciable data on the endogenous AA flow and the'true digestibility of dietary AA.
The proportion of endogenous AA in the digesta is quite variable (Table 1) but in agreement with the observations óf Gebhardt et al. (1977) obtaified with 1SN-Iabelled whey. The values are lower for the pea diet which èontained more proteins. The endogenous AA flows estimated are comparable to those measured previously with N-free diets, even if some differences are important. Similar differences are also observed between the N-free diets and variability between the pigs is very high (see SE).
We must bear in mind that the endogenous compounds were collected during maximal dietary AA output. They may have another composition to that of th&^ecretions collected on pigs fed with an N-free diet. For example, the threonine and proline contents are lower in the endogenous secretions obtained with labelled diets, suggesting a lower mucin content. Indeed, the protein fraction of mucin is mainly composed of threonine (40 %), proline (25 %) and serine (10 %) (Degand et al., 1972). However, our aim was not the study of endogenous secretions but the determination of AA true ileal digestibilities.
52
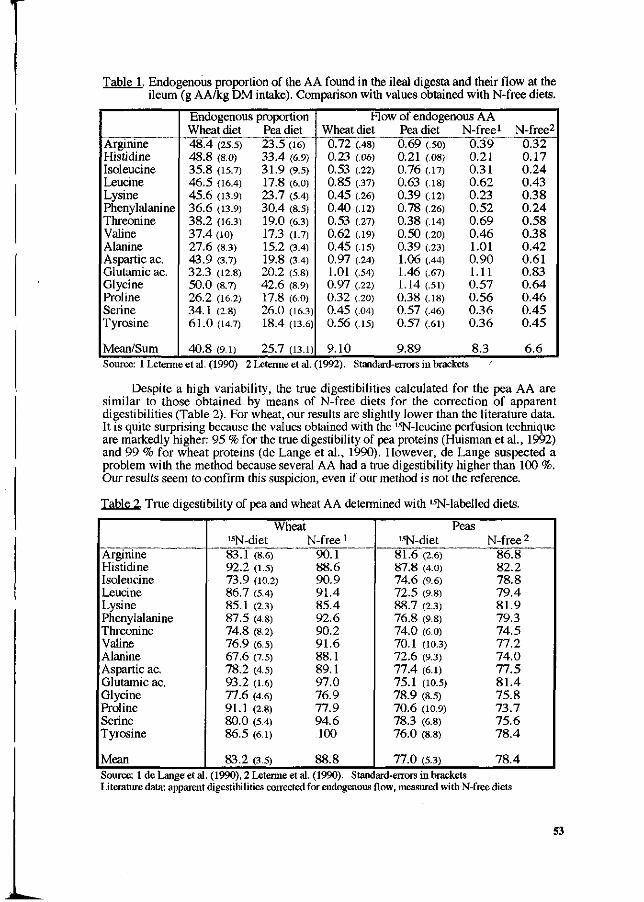
Table 1, Endogenous proportion of the AA found in the ileal digesta and their flow at the ileum (g AA/kg DM intake). Comparison with values obtained with N-free diets.
Arginine Histidine Isoleucine Leucine Lysine Phenylalanine Threonine Valine Alanine Aspartic ac. Glutamic ac. Glycine Proline Serine Tyrosine
Mean/Sum
Endogenous Wheat diet 48.4 (25.5) 48.8 (8.0) 35.8 (15.7) 46.5 (16.4) 45.6 (13.9) 36.6 (13.9) 38.2 (16.3) 37.4 (10) 27.6 (8.3) 43.9 (3.7) 32.3 (12.8) 50.0 (8.7) 26.2 (16.2) 34.1 (2.8) 61.0 (14.7)
40.8 (9.1)
proportion Pea diet 23.5 (16) 33.4 (6.9) 31.9 (9.5) 17.8 (6.0) 23.7 (5.4) 30.4 (8.5) 19.0 (6.3) 17.3 (1.7) 15.2 (3.4) 19.8 (3.4) 20.2 (5.8) 42.6 (8.9) 17.8 (6.0) 26.0 (16.3) 18.4 (13.6)
25.7 (13.1)
How of endogenous A A Wheat diet 0.72 (.48) 0.23 (.06) 0.53 (.22) 0.85 (.37) 0.45 (.26) 0.40 (.12) 0.53 (.27) 0.62 (.19) 0.45 (.15) 0.97 (.24) 1.01 (.54) 0.97 (.22) 0.32 (.20) 0.45 (.04) 0.56 (.15)
9.10
Pea diet 0.69 (.50) 0.21 (.08) 0.76 (.17) 0.63 (.18) 0.39 (.12) 0.78 (.26) 0.38 (.14) 0.50 (.20) 0.39 (.23) 1.06 (.44) 1.46 (.67) 1.14 (.51) 0.38 (.18) 0.57 (.46) 0.57 (.61)
9.89
N-freei 0.39 0.21 0.31 0.62 0.23 0.52 0.69 0.46 1.01 0.90 1.11 0.57 0.56 0.36 0.36
8.3
N-free2
0.32 0.17 0.24 0.43 0.38 0.24 0.58 0.38 0.42 0.61 0.83 0.64 0.46 0.45 0.45
6.6 Source: 1 Leterme et al. (1990) 2 Leterme et al. (1992). Standard-errors in brackets '
Despite a high variability, the true digestibilities calculated for the pea AA are similar to those obtained by means of N-free diets for the correction of apparent digestibilities (Table 2). For wheat, our results are slightly lower than the literature data. It is quite surprising because the values obtained with the 15N-leucine perfusion technique are markedly higher: 95 % for the true digestibility of pea proteins (Huisman et al., 1992) and 99 % for wheat proteins (de Lange et al., 1990). However, de Lange suspected a problem with the method because several AA had a true digestibility higher than 100 %. Our results seem to confirm this suspicion, even if our method is not the reference.
Table 2 True digestibility of pea and wheat AA determined with 15N-labelled diets.
Arginine Histidine Isoleucine Leucine Lysine Phenylalanine Threonine Valine Alanine Aspartic ac. Glutamic ac. Glycine Proline Serine Tyrosine
Mean
Wheat 15N-diet N-free1
83.1 (8.6) 90.1 92.2 (1.5) 88.6 73.9 (10.2) 90.9 86.7 (5.4) 91.4 85.1 (2.3) 85.4 87.5 (4.8) 92.6 74.8 (8.2) 90.2 76.9 (6.5) 91.6 67.6 (7.5) 88.1 78.2 (4.5) 89.1 93.2 (1.6) 97.0 77.6 (4.6) 76.9 91.1 (2.8) 77.9 80.0 (5.4) 94.6 86.5 (6.1) 100
83.2 (3.5) 88.8
Peas lsN-diet
81.6 (2.6) 87.8 (4.0) 74.6 (9.6) 72.5 (9.8) 88.7 (2.3) 76.8 (9.8) 74.0 (6.0) 70.1 (10.3) 72.6 (9.3) 77.4 (6.1) 75.1 (10.5) 78.9 (8.5) 70.6 (10.9) 78.3 (6.8) 76.0 (8.8)
77.0 (5.3)
N-free2
86.8 82.2 78.8 79.4 81.9 79.3 74.5 77.2 74.0 77.5 81.4 75.8 73.7 75.6 78.4
78.4 Source: 1 de Lange et al. (1990), 2 Leterme et al. (1990). Standard-errors in brackets Literature data: apparent digestibilities corrected for endogenous flow, measured with N-free diets
53
The AA flow at the ileum was calculated on the basis of the chromium content of the digesta, following a single Cr-labelled meal. Usually, CTIOÎ is distributed continuously in order to reach a steady state of the marker concentration of the digesta (saturation of all the sites in the digestive tract). An incomplete marking would result in an underestimation of the digestibility. Moreover, a fast l5N-AA recycling would overestimate the proportion of dietary AA in the digesta, with another underestimation of the true digestibility as a consequence.
As a conclusion, the results presented may lack accuracy at the flow estimation level but they question the credibility of the very high true digestibilities obtained with 15N-leucine perfusion (> 95 %). Our data are closer to those obtained by correcting apparent digestibilities with endogenous output measured with N-free diets. Some endogenous compounds which can be easily isolated should be analysed for their 15N-enrichment evolution. New experiments are already in progress with a continuous distribution of markers.
References
de Lange C , Souffrant W. & Sauer W., 1990. Real ileal protein and amino acid digestibilities in feedstuffs for growing pigs as determined with the i5,bf-isotope dilution technique. Journal of Animal Science 68, 409-418
Degand P., Gaveriaux M. & Havez R., 1972. Défiijftion biochimique des sulfomucines et des sialomucines de l'intestin grêle du porc. Comptes rendus de la Société de Biologie 166, 622-627
François E., Thill N. & Thévvis A., 1978. Méthode rapide de dosage de l'oxyde de chrome dans les aliments, les fèces et les contenus digestifs par titrage après oxydation nitroperchlorique. Annales de Zootechnie 27 (3), 355-361
Gebhardt G., Zebrowska T., Souffrant W. & Köhler R., 1977 Determination of nitrogen absorption and endogenous nitrogen secretion in the digestive tract of pigs fed with 15N-labelled dried whey. Stable Isotopes in the Life Sciences, IAEA Ed., Vienna, 383-392
Huisman J., Heinz T., van der Poel A., van Leeuwen P.,-Souffrant W. & Verstegen M., 1992. True protein digestibility and amounts of endogenous protein measured with the 15N-dilution technique in piglets fed on peas (Pisum sativum) and common beans {Phaseolus vulgaris). British Journal of Nutrition 68, 101-110
Leterme P., Théwis A., Beckers Y. & Raudart E., 1990 Apparent and true ileal digestibility of amino acids and nitrogen balance measured in pigs with ileo-rectal anastomosis or T-cannulas, given a diet containing peaS. Journal of the Science of Food and Agriculture 52 (4), 485-497
Leterme P., Pirard L. & Théwis A. 1992 A note on the effect of wobd cellulose level in protein-free diets on the recovery and amino acid composition of endogenous protein collected from the ileum in pigs. Animal Production 54 (1), 163-165
Souffrant W., Köhler R. & Gebhardt G., 1982 Détermination de l'azote endogène dans les contenus digestifs par la technique isotopique (15N). In: Laplace J., Corring T., Rérat A. (Eds) Digestive Physiology in the Pig, INRA Publ., Paris, 175-187
This work was supported by the Institut pour l'Encouragement de la Recherche
scientifique dans l'Industrie et l'Agriculture (IRSIA), Brussels, Belgium
54
Reduction of N pollution by decrease of the excretion of endogenous N in pigs.
1) 2) 1)
J. Huisman , M.W.A. Verstegen , P van Leeuwen , and S. Tamminga
1. ILOB-TNO: Dept of Animal Nutrition and Physiology. P.O. Box 15, 6700 Wageningen, the Netherlands.
2. Agricultural University, Dept. of Animal Nutrition, Haag steeg 4, 67 0 8 PM Wageningen, the Netherlands.
Summary
The results summarised in this paper show that in pigs the true N digestibility of most feedstuff s is high. The lower apparent N digestibility is mainly due to the excretion of endogenous N. The excretion of endogenous N varies considerably between feedstuffs. It is discussed that a major part of the N in urine originates from endogenous N secreted in the gastro-intestinal tract. With reduction of the gastro-intestinal secretion of endogenous N both the excretion of faeces N and the excretion of urine N will be reduced. It is important to study which factors in feedstuffs cause an increased excretion of endogenous N. With NDF isolated from wheat bran and soya trypsin inhibitors, distinct effects on the excretion of endogenous N were found.
Keywords: Endogenous N, pigs, N pollution.
Introduction.
Various steps in N flow from intake to body protein synthesis influence the animals' N excretions. The N excretion with faeces can be reduced by increasing the N digestibility. In various reports it has been shown that due to the reduction of the activity of antinutritional nutritional factors (ANFs) and the use of enzymes to break down non starch polysaccharides (NSPs) the N digestibility can be increased. Van Leeuwen and van Kempen (1993) show that a lower N excretion can be obtained when ileal instead of faecal amino acid digestibilities are used for diet formulation. From an environmental protection point of view increased N digestibility is only advantageous if the increased digestibility is combined with a lowered N input, because otherwise N excretion will only be shifted from faeces to urine. Decrease of the urine N excretion can be achieved in different ways. One step is to decrease the dietary protein content in combination with supplementation of synthetic amino acids. (Schutte et al., 1993; von Essen, 1989). In many publications it has been shown that with this step a significant reduction in N excretion can be achieved. Another step is the use of growth promoting agents such as PST (porcine growth hormone) and ß-agonists which increase the N
55
retention considerably resulting in a reduced excretion of N (Verstegen et al., 1990). However, the use of these agents is not yet allowed due to legislation regulations. A new area of research is focused on the possibility of the reduction of the excretion of endogenous N. This leads to a reduced excretion of both faeces N and urine N. As will be discussed a considerable part of the urine N is of endogenous origin. This indicates that reduction of the excretion of endogenous N is an important aspect for lowering the N losses of animals. In this paper various aspects of this subject will be discussed.
Results
Literature data
The difference between ingested and excreted nutrients with faeces or ileal chyme is called the apparent digestibility. The apparent digestibility is the result of the digestion and absorption of feed N on the one hand and the amount of excreted endogenous N on the other hand. In order to'measure the true N digestibility, the apparent N digestibility has to be corrected for the amount of excreted endogenous N. There are various methods to measure the endogenous N excretion. At present the 15N-dilution technique is qualified as to give the most realistic figures, although there are aspects in this technique which need further validation. In several studies, data about the excretion of endogenous N obtained with the 15N-dilution technique were obtained (De Lange et al., (1990), Huisman et al. (1992), Heinz et al. (1991), Makkink et al. (1991). In Table 1 results obtained with feedstuffs commonly used in pig diets'are.summarised. The amounts of endogenous N in the chyme vary considerably. The lowest values were obtained with skim milk protein and the highest with toasted Phaseolus beans. The feedstufrfs were also tested for apparent ileal iw digestibility - By correcting the apparent ileal N digestibility for the endogenous part, the true ileal N digestibility of these, feedstuffs was calculated. The results are summarised in. Table 2. It is striking that the true N digestibility of-most feedstuf^Es is above 90% while the apparent N digestibility is distinctly lower. The difference between apparent and true digestibility is associated with the excretion of endogenous N. The values for true digestibility indicate that the hydroly-sibility of most proteins by the gastro-intestinal digestive enzymes is high. Exceptions are Phaseolus beans and rape seed meal. The lower true digestibility for Phaseolus beans seems to be associated with insufficient denaturation of the storage protein in the normal toasting process (Van der Poel et al., 1991). The extremely low apparent N digestibility is associated with a hypersecretion of endogenous N. The low true N digestibility in rape seed meal may possibly be related to the high fibre level in this feedstuff. Part of the N is included in the hulls to which digestive enzymes have less access.
56
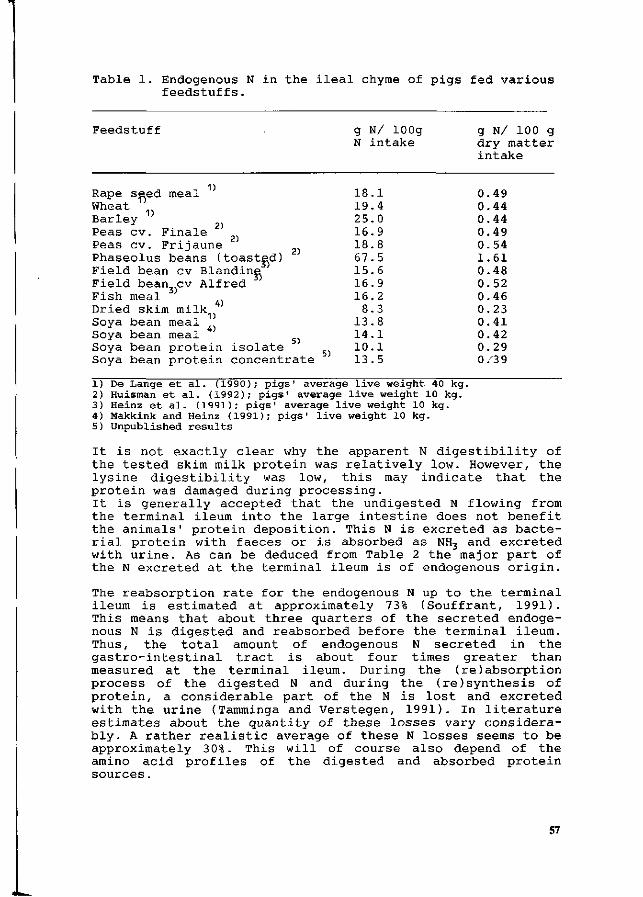
g N/ 100g N intake
18.1 19.4 25.0 16.9 18.8 67.5 15.6 16.9 16.2
8.3 13.8 14.1 10.1
g N/ 100 g dry matter intake
0.49 0.44 0.44 0.49 0.54 1.61 0.48 0.52 0.46 0.23 0.41 0.42 0.29
Table 1. Endogenous N in the ileal chyme of pigs fed various feedstuffs.
Feedstuff
Rape seed meal Wheat Barley Peas cv. Finale Peas cv. Frijaune Phaseolus beans (toasted) Field bean cv Blandine Field bean cv Alfred Fish meal Dried skim mi lk Soya bean meal Soya bean meal Soya bean p r o t e i n i s o l a t e Soya bean p r o t e i n c o n c e n t r a t e 13 .5 0/39
1) De Lange e t a l . (1990); p i g s ' average l i v e weight 40 kg. 2) Huisman e t a l . (1992); p i g s ' average l i v e weight 10 kg. 3) Heinz e t a l . (1991); p i g s ' average l i v e weight 10 kg. 4) Makkink and Heinz (1991); p i g s ' l i v e weight 10 kg. 5) Unpublished results
It is not exactly clear why the apparent N digestibility of the tested skim milk protein was relatively low. However, the lysine digestibility was low, this may indicate that the protein was damaged during processing. It is generally accepted that the undigested N flowing from the terminal ileum into the large intestine does not benefit the animals' protein deposition. This N is excreted as bacterial protein with faeces or is absorbed as NH3 and excreted with urine. As can be deduced from Table 2 the major part of the N excreted at the terminal ileum is of endogenous origin.
The reabsorption rate for the endogenous N up to the terminal ileum is estimated at approximately 73% (Souffrant, 1991). This means that about three quarters of the secreted endogenous N is digested and reabsorbed before the terminal ileum. Thus, the total amount of endogenous N secreted in the gastro-intestinal tract is about four times greater than measured at the terminal ileum. During the (re)absorption process of the digested N and during the (re)synthesis of protein, a considerable part of the N is lost and excreted with the urine (Tamminga and Verstegen, 1991). In literature estimates about the quantity of these losses vary considerably. A rather realistic average of these N losses seems to be approximately 30%. This will of course also depend of the amino acid profiles of the digested and absorbed protein sources.
57
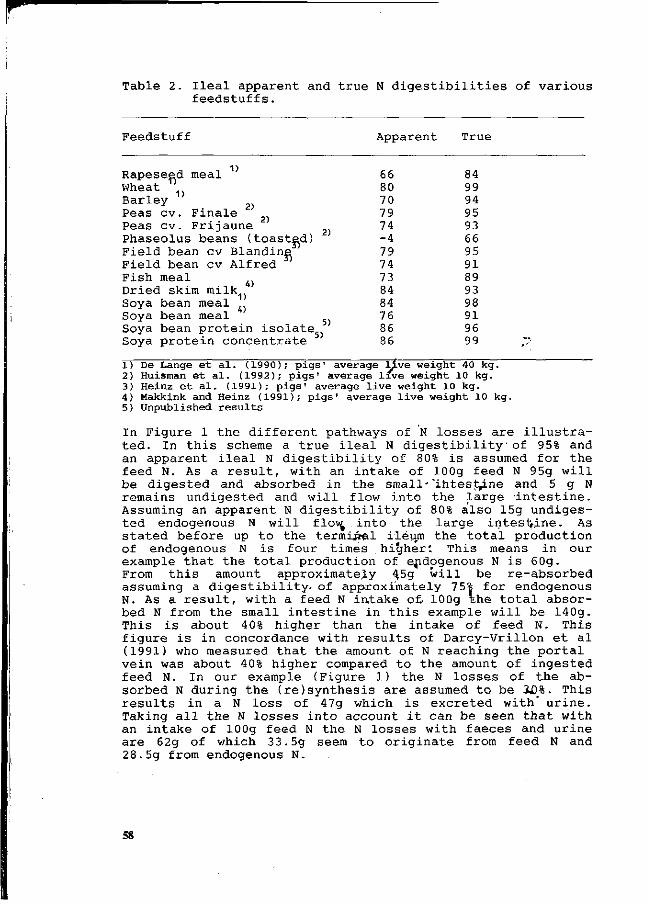
66 80 70 79 74 -4 79 74 73 84 84 76 86 86
84 99 94 95 93 66 95 91 89 93 98 91 96 99
Table 2. Ileal apparent and true N digestibilities of various feedstuffs.
Feedstuff Apparent True
Rapeseed meal Wheat " Barley 2) Peas cv. Finale Peas cv. Frijaune Phaseolus beans (toasted) Field bean cv Blandine Field bean cv Alfred Fish meal Dried skim milk Soya bean meal Soya bean meal Soya bean protein isolate Soya protein concentrate
1) De Lange et al. (1990); pigs' average ]ive weight 40 kg. 2) Huisman et al. (1992); pigs' average live weight 10 kg. 3) Heinz et al. (1991); pigs' average live weight 10 kg. 4) Makkink and Heinz (1991); pigs' average live weight 10 kg. 5) Unpublished results
In Figure 1 the different pathways of N losses are illustrated. In this scheme a true ileal N digestibility• of 95% and an apparent ileal N digestibility of 80% is assumed for the feed N. As a result, with an intake of 100g feed N 95g will be digested and absorbed in the small' "intestine and 5 g N remains undigested and will flow into the large intestine. Assuming an apparent N digestibility of 80% also 15g undigested endogenous N will flov into the large intestine. As stated before up to the termijral ileum the total production of endogenous N is four times higher'. This means in our example that the total production of endogenous N is 60g. From this amount approximately 4,5g will be re-absorbed assuming a digestibility, of approximately 7 5% for endogenous N. As a result, with a feed N intake of» 100g uhe total absorbed N from the small intestine in this example will be 140g. This is about 40% higher than the intake of feed N. This figure is in concordance with results of Darcy-Vrillon et al (1991) who measured that the amount of N reaching the portal vein was about 40% higher compared to the amount of ingested feed N. In our example (Figure 1) the N losses of the absorbed N during the (re)synthesis are assumed to be i0%. This results in a N loss of 47g which is excreted with urine. Taking all the N losses into account it can be seen that with an intake of 100g feed N the N losses with faeces and urine are 62g of which 33.5g seem to originate from feed N and 28.5g from endogenous N.
58
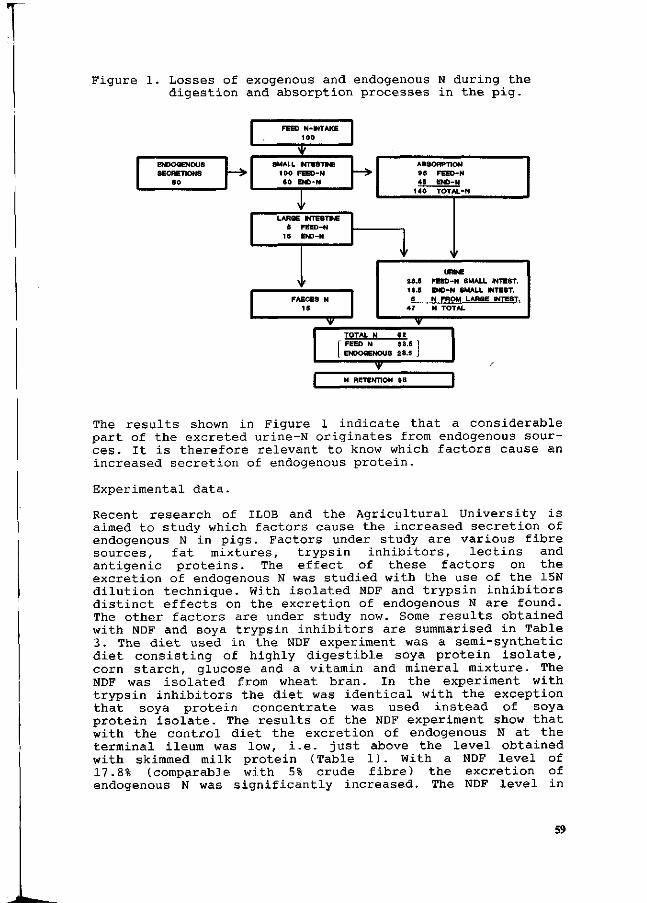
Figure 1. Losses of exogenous and endogenous N during the digestion and absorption processes in the pig.
ENDOGENOUS SECRETIONS
SO
> N-MTAKE 100
SMALL INTESTINE 100 FEEO-N SO END-N
LARQE MTESTME S FEED-N
16 END-N
FAECES N 1S
• v
ABSORPTION 98 FEED-N 45 END-N
140 TOTAL-N
28.S 13.6
S 47
V
URINE FEED-N SMALL INTEST. END-N SMALL MTE8T. N FROM LARQE INTEST. N TOTAL
TOTAL N 62 FEED N 33.6 | EN0O0ENOU8 28.9 j
V | N RETENTION 38 |
The results shown in Figure 1 indicate that a considerable part of the excreted urine-N originates from endogenous sources. It is therefore relevant to know which factors cause an increased secretion of endogenous protein.
Experimental data.
Recent research of IL0B and the Agricultural University is aimed to study which factors cause the increased secretion of endogenous N in pigs. Factors under study are various fibre sources, fat mixtures, trypsin inhibitors, lectins and antigenic proteins. The effect of these factors on the excretion of endogenous N was studied with the use of the 15N dilution technique. With isolated NDF and trypsin inhibitors distinct effects on the excretion of endogenous N are found. The other factors are under study now. Some results obtained with NDF and soya trypsin inhibitors are summarised in Table 3. The diet used in the NDF experiment was a semi-synthetic diet consisting of highly digestible soya protein isolate, corn starch, glucose and a vitamin and mineral mixture. The NDF was isolated from wheat bran. In the experiment with trypsin inhibitors the diet was identical with the exception that soya protein concentrate was used instead of soya protein isolate. The results of the NDF experiment show that with the control diet the excretion of endogenous N at the terminal ileum was low, i.e. just above the level obtained with skimmed milk protein (Table 1). With a NDF level of 17.8% (comparable with 5% crude fibre) the excretion of endogenous N was significantly increased. The NDF level in
59
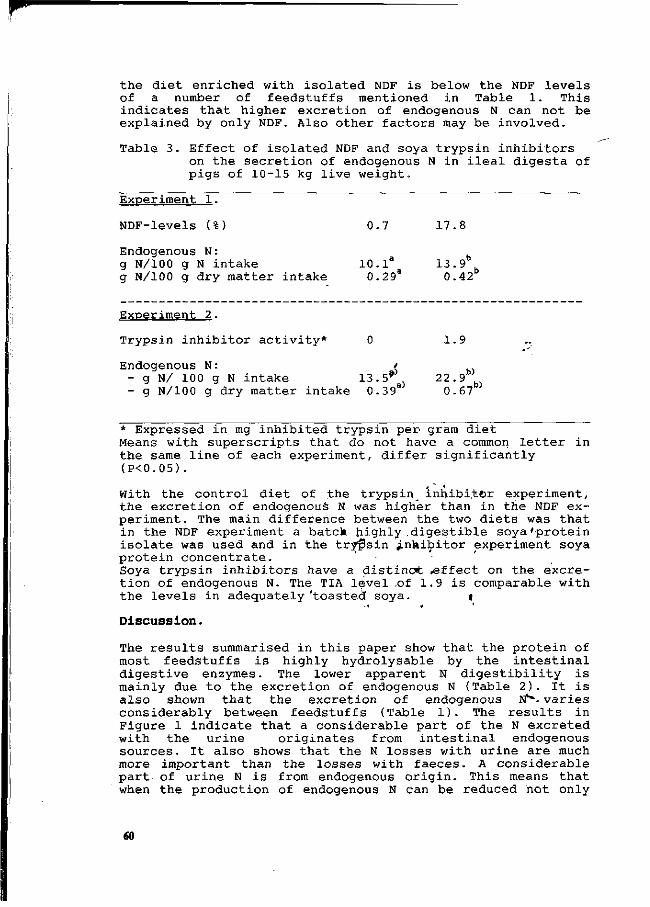
the diet enriched with isolated NDF is below the NDF levels of a number of feedstuffs mentioned in Table 1. This indicates that higher excretion of endogenous N can not be explained by only NDF. Also other factors may be involved.
Table 3. Effect of isolated NDF and soya trypsin inhibitors on the secretion of endogenous N in ileal digesta of pigs of 10-15 kg live weight.
Experiment 1.
NDF-levels (%) 0.7 17.8
b b
Endogenous N: g N/100 g N intake 10.la 13.9 g N/100 g dry matter intake 0.29a 0.42
Experiment 2.
Trypsin inhibitor activity* 0 1.9
Endogenous N: / - g N/ 100 g N intake 13.5* 22.9 - g N/100 g dry matter intake 0.39 0.67
* Expressed in mg inhibited trypsin per gram diet Means with superscripts that do not have a common letter in the same line of each experiment, differ significantly (P<0.05).
With the control diet of the trypsin inhibitor experiment, the excretion of endogenous N was higher than in the NDF experiment. The main difference between the two diets was that in the NDF experiment a batck highly .digestible soya'protein isolate was used and in the trypsin inhibitor experiment soya protein concentrate. Soya trypsin inhibitors have a distinct .effect on the excretion of endogenous N. The TIA level .of 1.9 is comparable with the levels in adequately 'toasted soya. i
Discussion.
The results summarised in this paper show that the protein of most feedstuffs is highly hydrolysable by the intestinal digestive enzymes. The lower apparent N digestibility is mainly due to the excretion of endogenous N (Table 2). It is also shown that the excretion of endogenous N1". varies considerably between feedstuffs (Table 1). The results in Figure 1 indicate that a considerable part of the N excreted with the urine originates from intestinal endogenous sources. It also shows that the N losses with urine are much more important than the losses with faeces. A considerable part of urine N is from endogenous origin. This means that when the production of endogenous N can be reduced not only
60
the N losses with faeces will be decreased but also the excretion of urine N will be reduced. In this paper it is shown that with diet manipulation the excretion of endogenous N can be reduced (Table 3). Isolated NDF from wheat bran and soya trypsin inhibitors were found to cause an increased excretion of endogenous N (Table. 3). However, other factors may be important in this respect. It is, therefore, important to carry out more research in this area.
References.
Darcy-Vrillon, Souffrant, W.B., Laplace, J.P., Rerat, A., Corring, T., Vaugelade, P., Gebhardt, G. and Köhler, R. (1991). Reprod. Nutr. Dev. 31, 561-573.
De Lange, Souffrant, W.B. and Sauer, W.C. (1990). J. Anim. Sc. 68, 409-418.
Heinz, T., Souffrant, W.B., Huisman, J. and Jansman, A.J.M. (1991). In: Proceedings of the 42nd Annual Meeting of the EAAP, Berlin, Germany, paper P3.9.
Huisman J., Heinz, Th, van der Poel, A.F.B., van Leeuwen, P, Souffrant, W.B. and Verstegen, M.W.A. (1992). Br. J. of Nutr., 68, 101-110
Makkink, C.A. and Heinz, T. (1991). In: Proceedings of the Vth International Symposium on Digestive Physiology in Pigs, EAAP publication no.54. Pudoc, Wageningen, the Netherlands, 196-200.
Schutte, J.B., de Jong, J. and van Kempen, G.J.M. (1993). In: Proceedings of the International Congress on "Nitrogen flow in Pig Production and Environmental consequenses". Pudoc, Wageningen, the Netherlands.
Souffrant, W.B. (1991). In: Proceedings of the Vth Internatio nal Symposium on Digestive Physiology in Pigs, EAAP publication no. 54, Pudoc, Wageningen, the Netherlands, 147-166.
Tamminga, S and Verstegen, M.W.A. (1991). In: Proceedings of the 6th International Symposium on Protein Metabolism and Nutrition, Volume 1. Main reports. Herning, Denmark, 23-36.
Van der Poel, A.F.B., Heinz, Th., Verstegen, M.W.A., Huisman, J. and Souffrant, W.B. (1991). In: Vth International symposium on Digestive Physiology in Pigs, EAAP publication no. 54, Pudoc, Wageningen, the Netherlands, 201-206.
Van Leeuwen, P. and Van Kempen. (1993). In: Proceedings of the International congress on "Nitrogen Flow in Pig Production and Environmental Consequences". Pudoc, Wageningen, the Netherlands.
Verstegen, M.W.A., van der Hel, W., Henken, A.M., Huisman, J., Kanis, E., van der Wal, P. and van Weerden E.J. (1990). J. of Anim. S c , 68, 1008-1016.
Von Essen, B. (1989). PhD-thesis University of Göttingen, Germany.
HS9307.pu
61
Endogenous N losses as measured by two independent methods
H. Schulze12, C A . Makkink1, M.P. Le Guen3 & M.W.A. Verstegen1
1 Department of Animal Nutrition, Agricultural University, Haagsteeg 4, 6708 PM Wageningen, The Netherlands.
2 TNO-lLOB, PO Box 15, 6700 AA Wageningen, The Netherlands. 3 G.I.E. EURETEC, 85 rue St Brieuc, 35000 Rennes, France.
ABSTRACT
Two methods were used to estimate the amount of exogenous and endogenous protein in ileal digesta. The first method involved continuous intravenous 15N-L-Leucine infusion at a rate of ± 40 mg 15N-L-Leucine per kg body weight per day. Fourteen piglets, initially weighing 8 kg, were each fitted with a PVTC (Post Valvular T Caecum) cannula and with two catheters, one each in the jugular vein and the carotid artery. Four experimental diets based on different protein sources (skimmilk powder (SMP), soybean meal (SBM), soy isolate (SI) aritl fish meal (FM)) were formulated. The content of endogenous nitrogen (N) of the ileal excreted N was found to be 53.4%, 60.2%, 94 .3% and 60% for the SMP, SBM, SI and FM diets, respectively. The second method (a mathematical model for estimating the proportions of protein of different origin in the ileal digesta) combined a multiple regression analysis and the calculation of the distance of jf2. The content of endogenous protein of the ileal excreted protein was found to be 39%, 50%, '84% and 81 % for the SMP, SBM, SI and FM diets, respectively. Keywords: Pigs, ileal endogenous N, 15N-dilution technique, mathematical model
INTRODUCTION , ,.
Protein in ileal digesta consists of ' a mixture of exogenous and , several endogenous nitrogenous sources. Endogenous pTotein originates from different sources: saliva, gastric and paipcreatic juice, bile, gut wall secretions, sloughed off gut wall cells, and bacteria. Consequently, the 'overal l amino acid composition of the ileal digesta should be considered as a combination of the specific amino acid profiles of these various proteinous sources. Vérité et al. (1977) attempted to determine the origin of protein in the ileal digesta based on the examination of proportions of some characteristic amino acids. This method was improved by Guilloteau et al. (1983) and Duvaux et al. (1990) by taking into account the amino acid profile of endogenous and exogenous sources. They developed a mathematical model to calculate the relative proportio'ns of the different reference proteins (ie dietary protein, and different sources of endogenous protein including bacteria) found in ileal digesta. In addition, this mathematical method quantifies the differences between the calculated and the measured composition (exogenous and endogenous) of the ileal digesta. Recently, the 15N infusion method for labelling the animal body N, has been introduced and evaluated (Souffrante?a/., 1981 , De Langée?al., 1990, Schulze
62
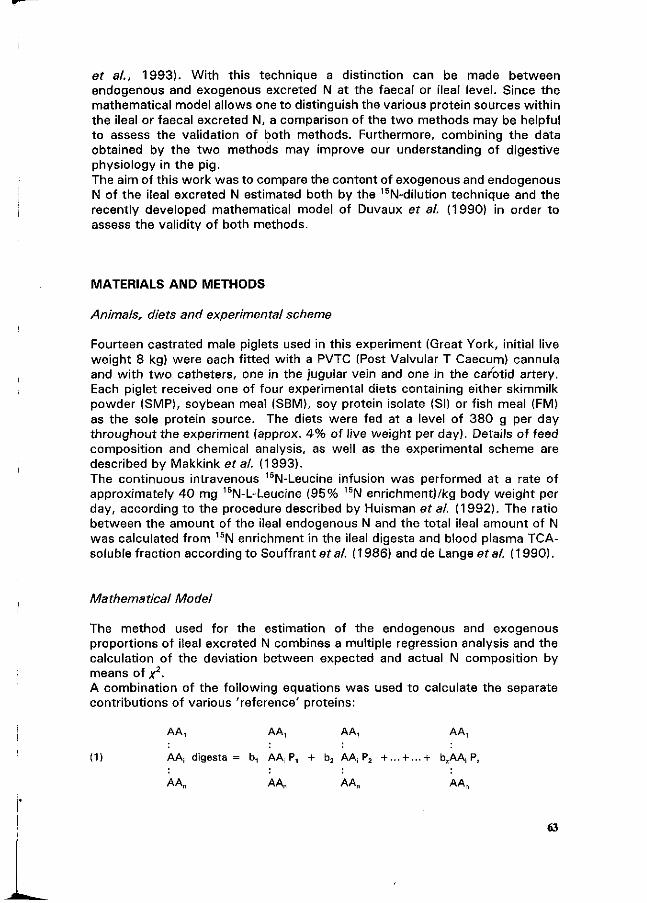
et al., 1993). With this technique a distinction can be made between endogenous and exogenous excreted N at the faecal or ileal level. Since the mathematical model allows one to distinguish the various protein sources within the ileal or faecal excreted N, a comparison of the two methods may be helpful to assess the validation of both methods. Furthermore, combining the data obtained by the two methods may improve our understanding of digestive physiology in the pig. The aim of this work was to compare the content of exogenous and endogenous N of the ileal excreted N estimated both by the 15N-dilution technique and the recently developed mathematical model of Duvaux et al. (1990) in order to assess the validity of both methods.
MATERIALS AND METHODS
Animals, diets and experimental scheme
Fourteen castrated male piglets used in this experiment (Great York, initial live weight 8 kg) were each fitted with a PVTC (Post Valvular T Caecum) cannula and with two catheters, one in the jugular vein and one in the carotid artery. Each piglet received one of four experimental diets containing either skimmilk powder (SMP), soybean meal (SBM), soy protein isolate (SI) or fish meal (FM) as the sole protein source. The diets were fed at a level of 380 g per day throughout the experiment (approx. 4 % of live weight per day). Details of feed composition and chemical analysis, as well as the experimental scheme are described by Makkink era/. (1993). The continuous intravenous 15N-Leucine infusion was performed at a rate of approximately 40 mg 15N-L-Leucine (95% 15N enrichment)/kg body weight per day, according to the procedure described by Huisman et al. (1992). The ratio between the amount of the ileal endogenous N and the total ileal amount of N was calculated from 15N enrichment in the ileal digesta and blood plasma TCA-soluble fraction according to Souffrant et al. ( 1986) and de Lange et al. ( 1990).
Mathematical Model
The method used for the estimation of the endogenous and exogenous proportions of ileal excreted N combines a multiple regression analysis and the calculation of the deviation between expected and actual N composition by means o f / 2 . A combination of the following equations was used to calculate the separate contributions of various 'reference' proteins:
(1) AAi digesta = b, AA: P, + b2 AA; P2 + . . . + . . .+ b.AA, Pz
63
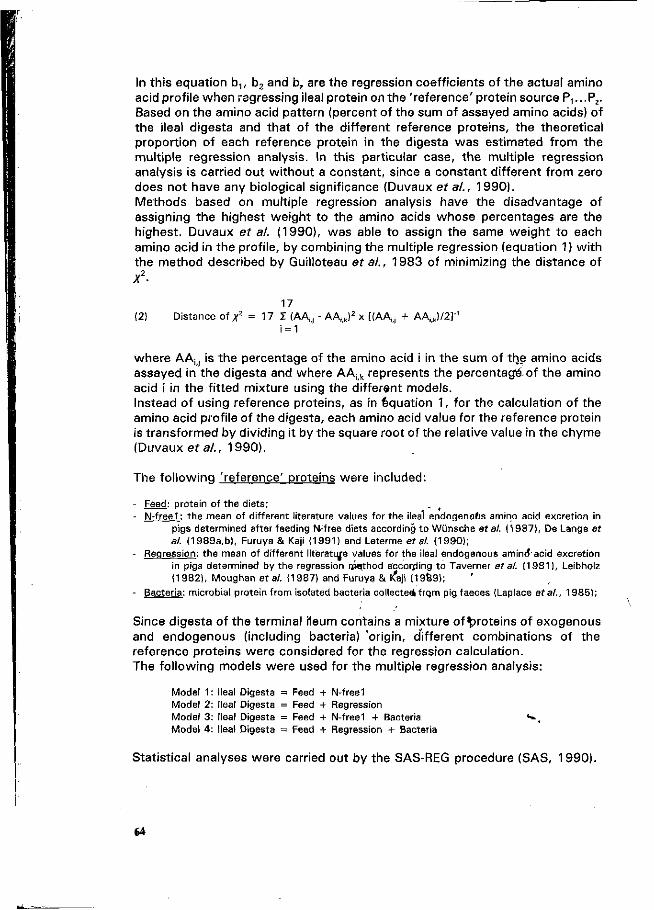
In this equation b,, b2 and bz are the regression coefficients of the actual amino acid profile when regressing ileal protein on the 'reference'protein source PV..PZ. Based on the amino acid pattern (percent of the sum of assayed amino acids) of the ileal digesta and that of the different reference proteins, the theoretical proportion of each reference protein in the digesta was estimated from the multiple regression analysis. In this particular case, the multiple regression analysis is carried out without a constant, since a constant different from zero does not have any biological significance (Duvaux et al., 1990). Methods based on multiple regression analysis have the disadvantage of assigning the highest weight to the amino acids whose percentages are the highest. Duvaux et al. (1990), was able to assign the same weight to each amino acid in the profile, by combining the multiple regression (equation 1) with the method described by Guilloteau et al., 1983 of minimizing the distance of X2.
17 (2) Distance of x2 = 17 I (AAU - AA i k ) 2 x [ (AAU + A A J / 2 ] ' 1
i = 1
where AA f f is the percentage of the amino acid i in the sum of trje amino acids assayed in the digesta and where AA i k represents the percentage of the amino acid i in the fitted mixture using the different models. Instead of using reference proteins, as in équation 1, for the calculation of the amino acid profile of the digesta, each amino acid value for the reference protein is transformed by dividing it by the square root of the relative value in the chyme (Duvaux et al., 1990).
The following 'reference' proteins were included:
- Feed: protein of the diets; . (
- N-free1 : the mean of different literature values for the ileal endogenous amino acid excretion in pigs determined after feeding Nrfree diets according to Wünsche et al. (1987), De Lange er al. (1989a,b), Furuya & Kaji (1991) and Leterme étal. (1990);
- Regression: the mean of different literature values for the ileal endogenous aminrfacid excretion in pigs determined by the regression rjaothod according to Taverner et al. (1981), Leibholz (1982), Moughan étal. (1987) and Furuya & tfaji (1989);
- Bacteria: microbial protein f rom isolated bacteria collecteokfrqm pig faeces (Laplace eta/., 1985);
Since digesta of the terminal ileum contains a mixture of "(proteins of exogenous and endogenous (including bacteria) 'origin, different combinations of the reference proteins were considered for the regression calculation. The following models were used for the multiple regression analysis:
Model 1 : Ileal Digesta = Feed + N-free1 Model 2: Ileal Digesta = Feed + Regression Model 3: Ileal Digesta = Feed + N-free1 + Bacteria *-_ Model 4 : Ileal Digesta = Feed + Regression + Bacteria
Statistical analyses were carried out by the SAS-REG procedure (SAS, 1990).
64
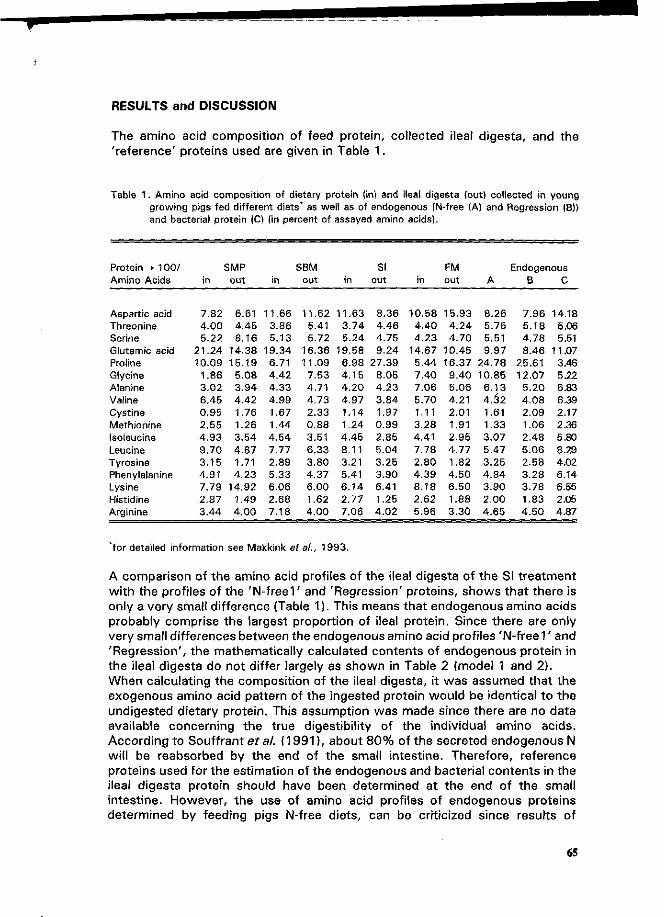
RESULTS and DISCUSSION
The amino acid composition of feed protein, collected ileal digesta, and the 'reference' proteins used are given in Table 1.
Table 1. Amino acid composition of dietary protein (in) and ileal digesta (out) collected in young growing pigs fed different diets* as well as of endogenous (N-free (A) and Regression (B)) and bacterial protein (C) (in percent of assayed amino acids).
Protein » 100/ Amino Acids
Aspartic acid Threonine Serine Glutamic acid Proline Glycine Alanine Valine Cystine Methionine Isoleucine Leucine Tyrosine Phenylalanine Lysine Histidine Arginine
SMP in
7.82 4 .00 5.22
21.24 10.09
1.86 3.02 6.45 0.95 2.55 4 .93 9.70 3.15 4 .91 7.79 2.87 3.44
out
6.61 4.45 8.16
14.38 15.19
5.08 3.94 4 .42 1.76 1.26 3.54 4 .87 1.71 4.23
14.92 1.49 4 .00
in
11.66 3.86 5.13
19.34 6.71 4.42 4.33 4 .99 1.67 1.44 4 .54 7.77 2.89 5.33 6.06 2.68 7.18
SBM out
11.62 5.41 5.72
16.36 11.09
7.53 4.71 4 .73 2.33 0.88 3.51 6.33 3.80 4.37 6.00 1.62 4 .00
in
11.63 3.74 5.24
19.58 6.98 4.15 4 .20 4 .97 1.14 1.24 4.45 8.11 3.21 5.41 6.14 2.77 7.06
SI out
8.36 4 .46 4.75 9.24
27.39 8.05 4 .23 3.84 1.97 0.99 2.85 5.04 3.25 3.90 6.41 1.25 4 .02
in
10.58 4 .40 4.23
14.67 5.44 7.40 7.06 5.70 1.11 3.28 4.41 7.78 2.80 4 .39 8.18 2.62 5.96
FM out
15.93 4 .24 4 .70
10.45 16.37
9.40 5.06 4.21 2.01 1.91 2.95 4 .77 1.82 4 .50 6.50 1.88 3.30
A
8.26 5.75 5.51 9.97
24.78 10.85
6.13 4 J 2 1.61 1.33 3.07 5.47 3.25 4 .84 3.90 2.00 4.65
Endogenous B
7.96 5.18 4.78 8.46
25.61 12.07
5.20 4 .08 2.09 1.06 2.48 5.06 2.58 3.28 3.78 1.83 4 .50
C
14,18 5.06 5.51
11.07 3.46 5.22 6.83 6.39 2.17 2.36 5.80 8.29 4.02 6.14 6.55 2.05 4.87
'for detailed information see Makkink et al., 1993.
A comparison of the amino acid profiles of the ileal digesta of the SI treatment with the profiles of the 'N-free1' and 'Regression' proteins, shows that there is only a very small difference (Table 1). This means that endogenous amino acids probably comprise the largest proportion of ileal protein. Since there are only very small differences between the endogenous amino acid profiles 'N-free 1 ' and 'Regression', the mathematically calculated contents of endogenous protein in the ileal digesta do not differ largely as shown in Table 2 (model 1 and 2). When calculating the composition of the ileal digesta, it was assumed that the exogenous amino acid pattern of the ingested protein would be identical to the undigested dietary protein. This assumption was made since there are no data available concerning the true digestibility of the individual amino acids. According to Souffrant et al. (1991), about 80% of the secreted endogenous N will be reabsorbed by the end of the small intestine. Therefore, reference proteins used for the estimation of the endogenous and bacterial contents in the ileal digesta protein should have been determined at the end of the small intestine. However, the use of amino acid profiles of endogenous proteins determined by feeding pigs N-free diets, can be criticized since results of
65
literature (De Lange et al., 1989b, Darragh et al., 1990) indicate that a quantitative and qualitative relationship between protein supply and endogenous amino acid losses exist. The regression method for calculating endogenous amino acids in the ileal digesta, leads to better results than the method of feeding N-free diets. However, it seems unlikely that a linear relation exists between dietary protein intake and the amount of endogenous amino acids in digesta (Souffrant, 1991). Furthermore, models 3 and 4 for the calculation of the composition of the ileal digesta interact mathematically, because the reference proteins 'N-freeT and 'Regression' already include the bacterial fraction. This may lead to a lower estimation of extra bacterial proteins in the digesta. Since there are no data available about the amino acid profile of bacteria at the terminal ileum, values concerning the amino acid profile of faecal bacteria in young growing pigs given by Laplace et al. (1985), were chosen as reference protein for the bacterial fraction. Furthermore, the precision of the proposed mathematical method is limited by the accuracy of the amino acid analysis (Duvaux et al., 1990). Because the regression is constrained to pass through the origin, a negative regression coefficient might be obtained. However, this indicates that a reference protein has been incorrectly included in the model. The ideal case, that the sum of regression coefficients will be unity, .will not be obtained, because of these analytical errors and assumptions. The amino acid profiles of the 'N-free1 ' and thé 'Regression' proteins are similar, so only minor differences between models 1 and 2 and models 3 and 4 were found. Including a bacterial amino acid profile in the model (model 3 + 4) showed no effect on the calculated exogenous and total endogenous content of the SI and SMP diet. Since there is a considerable similarity between the amino acid profiles of the FM and SBM feed protein and the bacterial amino acid profile, feed proteins can be associated with extra bacterial protein in these models. This phenomen can also be explained physiologically. Differences between the diets consist only of the protein source, thus the bactecial protein With the SBM diet could be related to the non starch polysaccharides in the soybean meal. Amino acid profiles of the FM dietary protein and the bacterial protein are mpre similar than between the other dietary protein® and bacteria, which means that the model may predict a high content of' bacterial protein. The extra bacterial content in the digesta of the FM diet can be derived because of the low apparent ileal protein digestibility (Makkink et al., :1993)'. Undigested dietary FM protein may then be used for extra bacterial growth. , '.
The results of the mathematically calculated composition of the ileal excreted N of the different treatments are given in Table 2.
66
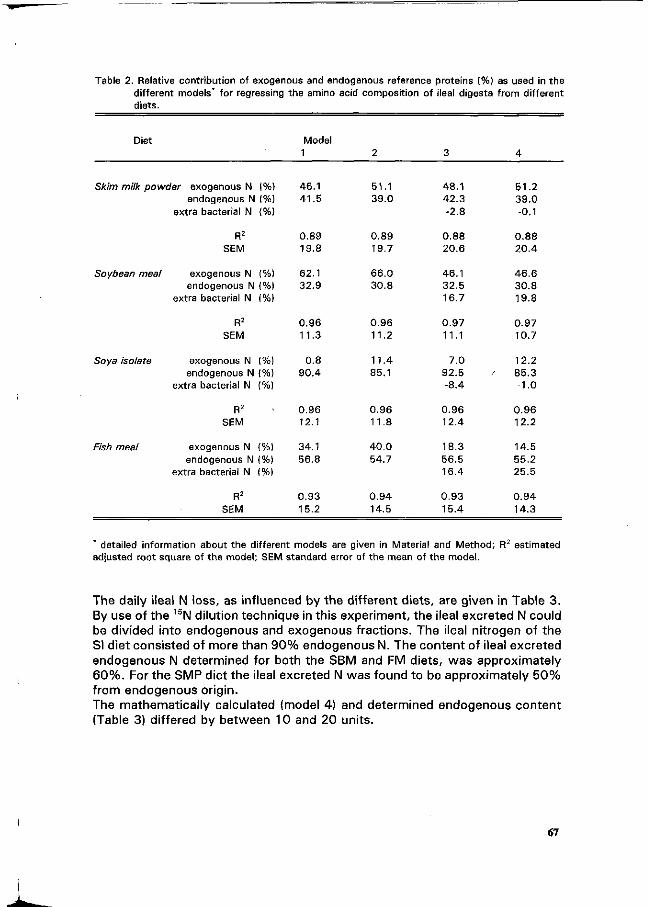
Table 2. Relative contribution of exogenous and endogenous reference proteins (%) as used in the different models* for regressing the amino acid composition of ileal digesta f rom different diets.
Diet Model 1
Skim milk powder exogenous N (%) endogenous N (%)
extra bacterial N (%)
Soybean meal
Soya isolate
Fish meal
R2
SEM
exogenous N (%) endogenous N (%)
extra bacterial N (%)
R2
SEM
exogenous N (%) endogenous N (%)
extra bacterial N (%]
R2
SEM
exogenous N (%) endogenous N (%)
extra bacterial N (%)
R2
SEM
46.1 41.5
0.89 19.8
62.1 32.9
0.96 11.3
0.8 90.4
0.96 12.1
34.1 56.8
0.93 15.2
51.1 39.0
0.89 19.7
66.0 30.8
0.96 11.2
11.4 85.1
0.96 11.8
40.0 54.7
0.94 14.5
48.1 42.3 -2.8
0.88 20.6
46.1 32.5 16.7
0.97 11.1
7.0 92.5 -8.4
0.96 12.4
18.3 56.5 16.4
0.93 15.4
51.2 39.0 -0.1
0.88 20.4
46.6 30.8 19.8
0.97 10.7
12.2 / 85.3
-1.0
0.96 12.2
14.5 55.2 25.5
0 .94 14.3
detailed information about the different models are given in Material and Method; R2 estimated adjusted root square of the model; SEM standard error of the mean of the model.
The daily ileal N loss, as influenced by the different diets, are given in Table 3. By use of the 15N dilution technique in this experiment, the ileal excreted N could be divided into endogenous and exogenous fractions. The ileal nitrogen of the SI diet consisted of more than 90% endogenous N. The content of ileal excreted endogenous N determined for both the SBM and FM diets, was approximately 60%. For the SMP diet the ileal excreted N was found to be approximately 50% from endogenous origin. The mathematically calculated (model 4) and determined endogenous content (Table 3) differed by between 10 and 20 units.
67
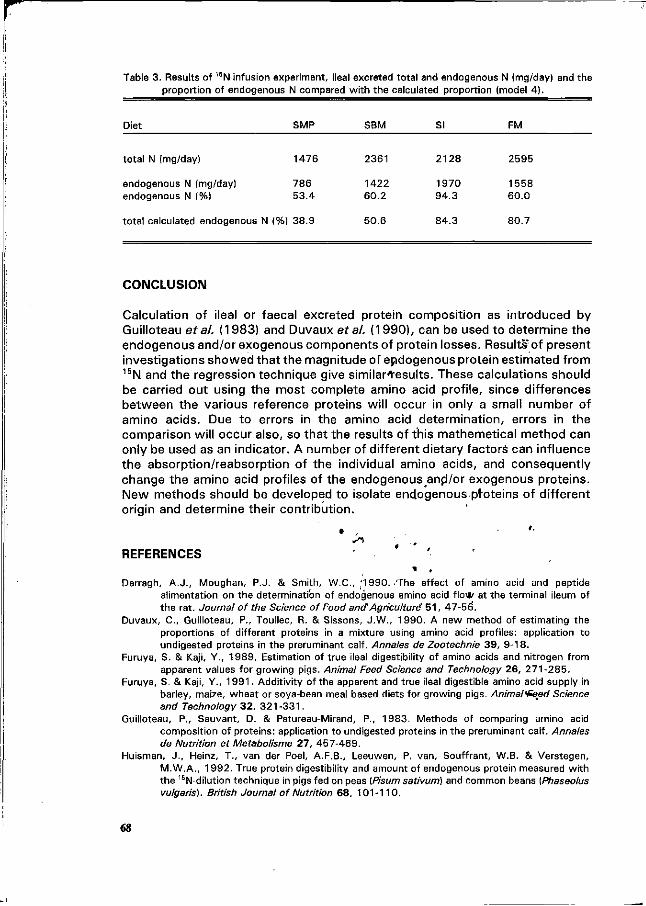
Table 3. Results of 15N infusion experiment, ileal excreted total and endogenous N (mg/day) and the proportion of endogenous N compared wi th the calculated proportion (model 4).
Diet SMP SBM SI FM
total N (mg/day) 1476 2361 2128 2595
endogenous N (mg/day) 786 endogenous N (%) 53.4
total calculated endogenous N (%) 38.9
1422 60.2
50.6
1970 94.3
84.3
1558 60.0
80.7
CONCLUSION
Calculation of ileal or faecal excreted protein composition as introduced by Guilloteau et al. (1983) and Duvaux et al. (1990), can be used to determine the endogenous and/or exogenous components of protein losses. Results'of present investigations showed that the magnitude of endogenous protein estimated from 15N and the regression technique give similar'results. These calculations should be carried out using the most complete amino acid profile, since differences between the various reference proteins will occur in only a small number of amino acids. Due to errors in the amino acid determination, errors in the comparison will occur also, so that the results of this mathemetical method can only be used as an indicator. A number of different dietary factors can influence the absorption/reabsorption of the individual amino acids, and consequently change the amino acid profiles of the endogenousand/or exogenous proteins. New methods should be developed to isolate endogenous ptoteins of different origin and determine their contribution.
REFERENCES ' i ,
Darragh, A .J . , Moughan, P.J. & Smith, W.C., '1990. 'The effect of amino acid and peptide alimentation on the determination of endogenous amino acid f l o * at the terminal ileum of the rat. Journal of the Science of Food and1 Agriculture 5 1 , 47-56.
Duvaux, C , Guilloteau, P., Toullec, R. & Sissons, J.W., 1990. A new method of estimating the proportions of different proteins in a mixture using amino acid profiles: application to undigested proteins in the preruminant calf. Annales de Zootechnie 3 9 , 9-18.
Furuya, S. & Kaji, Y., 1989. Estimation of true ileal digestibility of amino acids and nitrogen from apparent values for growing pigs. Animal Feed Science and Technology 26, 271-285.
Furuya, S. & Kaji, Y., 1991 . Additivity of the apparent and true ileal digestible amino acid supply in barley, maize, wheat or soya-bean meal based diets for growing pigs. Animal'feed Science and Technology 32 , 321 -331 .
Guilloteau, P., Sauvant, D. & Patureau-Mirand, P., 1983. Methods of comparing amino acid composition of proteins: application to undigested proteins in the preruminant calf. Annales de Nutrition et Metabolisme 21, 457-469.
Huisman, J . , Heinz, T., van der Poel, A.F.B., Leeuwen, P. van, Souffrant, W.B. & Verstegen, M.W.A., 1992. True protein digestibility and amount of endogenous protein measured wi th the 15N-dilution technique in pigs fed on peas (Pisum sativum) and common beans (Phaseolus vulgaris). British Journal of Nutrition 68 , 101-110.
68
Lange, C.F.M, de. Sauer, W.C., Mosenthin, R. & Souffrant, W.B., 1989a. The effect of feeding different protein-free diets on the recovery and amino acid composition of endogenous protein collected f rom the distal ileum and feces in pigs. Journal of Animal Science 67(3), 746-754.
Lange, C.F.M, de, Souffrant, W.B. & Sauer, W.C., 1989b. The effect of protein status of the pig on the recovery and amino acid Composition of endogenous protein in digesta collected f rom the distal ileum. Journal of Animal Science 67(2), 755-762.
Lange, C.F.M, de, Souffrant, W.B. & Sauer, W.C., 1990. Real ileal protein and amino acid digestibilities in feedstuffs for growing pigs as determined wi th the 15N-isotope dilution technique. Journal of Animal Science 68(2), 409-418.
Laplace, J.P., Darcy-Vrillon, B., Duval-lflah, Y. & Raibaud, P., 1985. Proteins in the digestion of the pig: amino acid composition of endogenous bacterial and fecal fractions. Reproduction Nutrition et Développement 25, 1083-1099
Leibholz, J . 1982. The f low of endogenous nitrogen in the digestive tract of young pigs. British Journal of Nutrition 4 8 , 509-517.
Leterme, P., Thewis, A., Beckers, Y. & Baudart, E., 1990. Apparent and true ileal digestibility of amino acids and nitrogen balance measured in pigs wi th ileo-rectal anastomosis or T-Cannula, given a diet containing peas. Journal of the Science of Food and Agriculture 52 , 485-497.
Makkink, C A . , Heinz, T., Souffrant, W.B. & Verstegen, M.W.A. 1993. Endogenous N losses at the terminal ileum of young piglets fed diets based on four different protein sources. In: Of piglets, dietary proteins, and pancreatic proteases. PhD Thesis. Chapter 2. Agricultural University Wageningen, The Netherlands.
Moughan, P.J., Smith, W.C. & Kies, A.K., 1987. Comparison of the ileal digestibility o f amino acids in ground barley for the growing rat and pig. New Zealand Journal of Agricultural Research 30, 59-66.
SAS Institute Inc. 1990. SAS User's Guide: Statistics, Version 5 Edition. Cary, NC: SAS Institute Inc., 1290 pp.
Schulze, H., Makkink, C A . , Leeuwen, P. van & Verstegen, M.W.A., 1993. The effect of the level of isotope infusion and the choice of precursor pool on the determination of endogenous ileal nitrogen excretion in the young pig using the 15N-isotope dilution technique. British Journal of Nutrition, submitted.
Souffrant, W.B., Kohler, R., Matkowitz, R., Gebhardt, G. & Schmandke, H., 1981 . Ernährungsphysiologische Untersuchungen an Schweinen zur Beurteilung von modifizierten Proteinen. 2. Bestimmung des endogenen N im Dunndarminhalt mit Hilfe der 15N-Tracertechnik. Archiv für Tierernährung 3 1 , 675-683.
Souffrant, W.B., Darcy-Vrillon, B., Corring, T., Laplace, J.P., Köhler, R., Gebhardt, G. & Rerat, A. (1986). Recycling of endogenous nitrogen in the pig: Preliminary results of a collaborative study. Archives of Animal Nutrition 36 , 269-274.
Souffrant, W.B., 1991 . Endogenous losses during digestion in pigs. Proceedings of the Vth International Symposium on Digestive Physiology in Pigs, Wageningen (Doorwerth), The Netherlands, (EAAP Publication No 54, 19911, edited by M.W.A. Verstegen, J.Huisman and LA. den Hartog, PUDOC, Wageningen, 1991, pp 147-166.
Souffrant, W.B., Rerat, A., Laplace, J.P., Darcy-Vrillon, B. Köhler, R., Corring, T. & Gebhardt, G., 1993. Exogenous and endogenous contributions to nitrogen fluxes in the digestive tract of pigs fed a casein diet. III. Recycling of the endogenous nitrogen. Reproduction Nutrition et Développement 33 , in press.
Tavemer, M.R., Hume, I.D. & Farrell, D.J., 1981 . Availability to pigs of amino acids in cereal grains. 1 . Endogenous levels of amino acids in ileal digesta and faeces of pigs given cereal diets. British Journal of Nutrition 46 , 146-158.
Wünsche, J . , Herrmann, U., Meinl, M., Hennig, U., Kreienbring, F. & Zwierz, P. 1987. Einfluß exogener Faktoren auf die präzäkale Nährstoff- und Aminosäurenresorption, ermittelt an Schweinen mit Ileo-Rektal-Anastomosen. 1 . Mitteilung. Einfluß des Zerkleinungsgrades von Getreide. Archives of Animal Nutrition 37 , 745-764.
Vérité, R., Poncet, C , Chabi, S. & Pion, R., 1977. Utilisation des tourteaux traités au formol par les vaches laitières. I. Aspects digestifs. Annales de Zootechnie 26, 1 67 -181 .
69
D i e t a r y f a c t o r s a f f e c t i n g p r o t e i n d i g e s t i b i l i t y in p i g s
F. Gatel
Institut Technique des Céréales et des Fourrages, Pouline, 41100, Villerable, France
Summary
Protein digestibility is highly variable between feedstuffs or even within samples of the same feedstuff which lead to significant variations in fecal nitrogen excretion. Protein digestion can be limited by a number of factors e.g. resistance to proteolysis, reduced enzyme flow or depressed enzyme activity, duration of the contact between protein and enzymes, absorbtion processes, amount of endogenous secretions and importance of microbial fermentations. Some of these factors are related to the protein itself (in quality and quantjty) whereas others depend on the other components of the diet (other nutrients e. g. suffen, fat, minerals, fibres, occurence qf antinutritionnal factors). Decreased fecal nitrogen flow can be achieved through the choice of those" > raw ingredients which have a high protein and amino acid digestibility, or through improvement of protein and amino acid digestibility of the raw ingredients used by mean of technological or
. enzymatic feedstuffs processing or use» of di gestive enhancers. However, as long as diet will be forh^L
j\^è*n'lfix formulated on a crude rather than on a digestible protein basis, any increase in prqtein digestibility will result in protein oversupply and increased urinary nitrogen excretion. Similarly, since digestibility varies among amino acids, amino acid profile of the absorbed protein can be substantially different from that of the ingested protein and led to amino acid imbalance and urinary excretion of those amino acid which are in too high proportions. Hence the choice of raw ingredients with a high amino acid or protein digestibility, or the ways to improve protein and amino acid digestibility are releavant at the condition that diets be formulated on a digestible protein and amino acid basis. Keywords : Pigs, protein digestibility, protein quality, non starch polysaccharides, antinutritional factors
Why and how should we consider protein digestibility
In most present situations, a pig consumes about 7.5 kg nitrogen during the growing finishing phase, from which 60 to 70 % i.e. 4.5 to'5.3 kg are excreted, through feces (20 % nitrogen intake) and urine (50 % nitrogen intake) (Jongbloed and Lenis, 1992).
Protein digestibility is however highly t r iable between diets, and thus' lead tfo substantially variable nitrogen excretion. For instance, NobleTet al. y 980) recently completed a study over 41 different diets formulated to cover the range df raw ingredients and crude composition found in practice, and to meet essential amino acid and energy requirements These diets were fed to growing pigs kept in metabolism crates. The results for three extreme diets are presented in table 1.
Table 1. Nitrogen balance achieved with 3 extreme diets formulated to meet animal requirements (From Noblet et al., 1989)
Crude composition
1 Crude protein (g/kg DM) N intake (g/d) N ileal digestibility (%) Nfecal digestibility (%) Fecal N excretion (g/d) N excretion (g/d) N retention (g/d)
Wheat, Sugar, Starch, Oil Soyabean isolate Lysine HQ
198 45.0 88.8 94.1 2.65 19.1 25.9
Wheat Soyabean meal Lysine Hcl
176 48.4 75.6 80.9 9.25 23.0 25.4
Maize, Cassava Sweet potato Molasses, Fat Soyabean meal Rapeseed meal Corrîtlistillers
218 56.6 64.2 71.8 16.0 32.6 24.0
70
Similar protein retentions were achieved with the three diets (24 to 26 g nitrogen retained / day) in relation with similar digestible nitrogen intakes (36.5 to 40 g ileal digestible nitrogen/day), while fecal nitrogen excretions ranged from 2.7 to 16.0 g/day. The latter was the result of different nitipgejunia&eiçombjnedj^ "However, although fècaFaTgystibilîtysëëmsmteresting as a mean to control actual fecal excretion, it is well-known that microbial digestion occuring in the hjndgut is of little, if any, ©^cLeW"^ interest for animal maintenance or tissue accretion absorbtion being very low and absorbed +;wU-f,-teMKj c nitrogenic end-products being sofar excreted in urine (Zebrowska, 1973 ; Wünsche et al., 1982). As amino acid profile of the digesta is modified in the hindgut to a variable extent, it is worthwhile to focus on ileal rather than fecal digestibility.
The variation in dietary protein digestibility depends on variations in feedstuffs protein digestibility). Moreover digestibility coefficients differ between crude protein and the different amino acids so that the different feedstuffs will scale in different orders according to the considered component. Digestibility process can thus greatly modify the proportion of the absorbed amino acid and thus inhance or decrease urinary nitrogen excretion related to amino acid imbalance. It appears thus necessary to take into account not only crude protein but also essential amino acid digestibility.
Finally, undigested nitrogen results from both undigested dietary protein and endogenous secretions or microbial activity. We will thus consider apparent ileal digestibility and analyse dietary factors affecting nitrogen digestibility as well as endogenous secretions.
Causes of variation of apparent digestibility of proteins
Protein digestion can be limited by its resistance to proteolysis, unaccessibility to digestive enzymes insufficient quantity of enzymes or depressed enzyme activity, the duration of the contact between protein and enzymes, the absorption (state of the gut wall) and the amount of endogenous secretions. Some of these factors are related to the protein itself whereas others depend on the other components of the diet (other nutrients, antinutritional factors).
Factors related to the protein itself
Qualitative aspects
Some proteins seem more rapidly hydrolysed than others, which, combined with variations in digesta flow rate can results in differences in protein digestibility : for instance, by mean of in vitro simulation of digestion, Savoie et al. (1988) and Galibois et al. (1989) on the one hand showed that ^ casein was rapidely digested, contrarily to rapeseed protein which was digested more gradually, g*>wivi -Similarly, Ivanko et al. (1991) reported a quicker hydjoiy^i^gflegume seeds globulines compared tsJgpl^'e to albumins. In vivo, Asche et al. (1989 a) showed that with weanling pigs, 5 weeks of age, the higher digestibility of dried skim milk protein, compared to soyabean meal or corn gluten meal protein was due to a higher rate of hydrolysis in the stomach and upper small intestine. On the other hand, Darcy et al. (1981) pointed out a higher in vivo protein digestibility with wheat
gluten than with fish meal based diets in relation with digesta flow rate, i. e. a faster (respectively lower) evolution of wet digesta and undigested protein collected at the distal end of the small intestine. With young piglets weaned when 17 day old a lower crude protein digestibility was found for soyabean meal than for casein, in relation with a faster digesta flow rate in the former (Turlington et al., 1989) ; it is worth to note that in this experiment, authors have checked that variation in digesta flow rate and subsequently in crude protein digestibility appeared more dependant on the protein itself than on other components of the diet such as carbohydrates, which, as will be seen later on, can also play a role. Protein hydrolysis is performed by a battery of enzymes, whose specificity vary widely : pepsin A
(prédominent form of gastric pepsin) has greatest preference for peptide bonds between amino acids with aromatic side chains (i. e. tyrosine and phenyl-alanine) followed by glutamic acid and cystine. Within the intestine trypsin is very specific, its activity being limited to those bonds where the carboxyl group belong to arginine or lysine ; the other endopeptidases chymotrypsin and elastase are less specific. Such differences in specificity are also found for the exopeptidases A or B (Longland, 1991). The amino acid sequence of dietary protein may thus partly account for in the explanation of differences in digestibility and rate of amino acid release, as suggested by Brule and Savoie (1988) in a study of a large range of protein sources. However, amino acid sequence does not explain all differences in protein digestibility : for instance, it has been shown that in spite of very high sequence homology between 7 S globulins of various legume seeds (Gueguen, 1989)
71
they exhibit markedly different susceptibilities to trypsin (Nielsen et al., 1988 ; Deshpande and Damodaran, 1989). These differences are likely due to the tertiary structure of the protein itself and protection of proteinase susceptible regions (Romero and Ryan, 1978 ; Reddy et al., 1988) and to the more or less stability or flexibility of this structure (Deshpande and Damodaran, 1989). With other feedstuffs, Masvaure and Miller (1991) confirmed that protein digestibilities although not significantly affected by dietary disulphide bounds ranked in the same order than disulphide bounds digestibility, disulphide bounds being known to stabilize the tertiary structure of proteins.
Once protein has been hydrolysed, end-products of digestion (amino acids, di- tri- or oligopeptides) are cleared from the gut lumen accross the intestinal epithelium. A too high competition for the carrier systems, linked to deficiency or inadequate chronology of the hydrolysis processes can lead to reduced absorbtion of amino acids and peptides and thus impaired amino acid digestibility (Savoie, 1991). For instance, Green et al. (1987) pointed out in cereal grains that threonine which belongs to the most poorly digested essential amino acids has a low affinity for the transport mechanisms and is thus absorbed very slowly.
Finally, it has also been shown that the nature of dietary protein can influence endogenous secretions resulting in either different amounts of endogenous nitrogen in the intestinal chyme (Souffrant, 1991) or modified enzyme activity (Valette et al., 1992). However, this pancreatic response to dietary protein does not seem to affect nitrogen digestibility of various protein sources in the long term (Valette et al., 1991). Moreover, most of the endogenous enzymes seem rapidely hydrolysed (Asche et al., 1989 b). Hence, the actual effect of the nature of the protein on endogenous nitrogen output still remains questionable.
Quantitative aspects
Beside its quality, it is questionable whether the amount of dietary protein can affect its digestibility. This depends upon two factors which must be taken into account, i.e. the protein content of the diet and the feeding level of the animals.
Concerning the latter point, most of the comparisons of different feeding intensities concluded that it does not affect apparent protein or amino acid digestibility at either die fecal level (Peers et al., 1977) or the ileal level (van Leeuwen et al., 1987 ; Sauer et al., 1982 ; Kies et al., 1986). Haydon et al. (1984) however observed slight differences in ileal nitrogen and amino acids apparent digestibility when varying feeding level, with a tendancy toward a decrease of digestibility as feeding level decreased. On the contrary, large variations of dietary protein content seems to affect to a greater extent apparent digestibility of proteins or amino acids, the higher the dietary protein content the higher the ileal digestibility coefficients (Sauer et al., 1980 ; Bell et al., 1983 ; van Leeuwen et al., 1987 ; Fialho and Cline, 1991). Sauer et al. (1980) and van Leeuwen et al. (1987) particularly observed increased apparent ileal nitrogen digestibilities, respectively 12 and 11 points in digestibility percentage units following increased dietary crude protein from 17 to 33 % and 9 to 23 % respectively. • , ' • Part of the observed variation is probably relatSd to dïgt formulation and the substitution in high
protein diets of highly digestible soyabean meal to less digestible cereals (Sauer et al., 1980 ; van Leeuwen et al., 1987). Corring (1979) also reported that when the level of dietary protein increases or decreases, specific activity of proteolytic.' enzymes increases or decreases, in a direct relationship. A third explanation lies in the relative weight of endogenous output and its consequence on apparent digestibility measurements : Zebrowska and Buraczewska (1972) showed that although at a practical protein level (17 %) the dilution of exogenous undigested protein with endogenous nitrogen is negligible, the latter was of significant importance at lower protein levels. This was confirmed when analysing the amino acid profile of undigested nitrogen whose composition in case of low protein diet was close to endogenous secretions. This is also consistant with the positive relationship found by Buraczewska et al. (1987) between ileal apparent nitrogen digestibility and protein content of the diet, in a comparison of barley diets with protein content ranging from 10.8 to 13.5 %, i.e. relatively low. This supports the need to measure nitrogen and amino acid digestibility in diet with a rather steady crude protein content and when-not possible (low protein feedstuffs) to correct the aparent digestibility values according to protein content of the experimental diets (Mariscal Landin, 1992). On the contrary, the effect of feeding level on endogenous ileal nitrogen flow is unclear : for instance, Furuya and Kaji (1991a) found it a constant quantity when expressed as g/day, i. e. a decreasing quantity/kg DM intake when the latter increased, whereas Kies et al. (1986) observed a positive linear relationship between daily endogenous protein ileal excretion and dietary dry matter intake.
72
Role of non starch polysaccharides (NSP)
On the one hand, several authors have shown that within a same feedstuffs, variability in protein or amino acid digestibility is correlated with some NSP criteria (Taverner and Farrel, 1981 ; Gdala et al., 1992 ; Hauschild and Köhler, 1991 ; Jondreville et al., 1992). On the other hand, there is evidence that dietary introduction of NSP, either purified or through fibrous material, generaly modify the apparent digestibility of the different nutrients, including protein (Morgan et al., 1984 ; Fernandez and Jorgensen, 1986 ; Morgan and Whittemore, 1988 ; Mosenthin et al., 1989 ; Potkins et al., 1991). The extent to witch protein digestibility is depressed by NSP depends on the amount and source of NSP. Moreover, in some cases addition of a source of NSP did not affect protein digestibility. This can be explained by the fact that NSP cover an heterogenous group of various molecules with different physico chemical properties and thus effects on digestive physiology.
The extent to which NSP affect protein digestibility is different when considering ileal or fecal digestibility and with the type of NSP used. Sauer et al. (1977b), with wheat, Dierick et al. (1983) and Mosenthin et al. (1989) with pectins observed a greater effect of NSP on ileal than on fecal digestibility and concluded to a buffer effect of hindgut on protein digestion. On the other hand, Just (1982), Sauer et al. (1980), Low et al. (1988), Sauer at al. (1991) reported with respectively cereals, barley straw, cellulose and cellulose or barley straw a greater effect of NSP on fecal digestibility. Finally, the figure can differ markedly between crude protein and the different amino acids. Rerat (1981), among others, hase already reviewed the metabolic processes taking place in the hindgut and the effect of dietary NSP on microbial activity and use of undigested nitrogen arriving in the hindgut. Not only the level but also the nature of NSP entering the hindgut affect microbial fermentations and nitrogen excretion or uptake which can explain the apparent discrepancy observed upthere. However, as stated in the introduction, the ileal rather than fecal protein digestibility is actually releavant and the effect of NSP on protein digestion and amino acid absorbtion has to be taken into account at the ileal level. Several mechanisms can be put forward to explain the effect of dietary NSP
Coating effect
As supported by several authors, NSP could encapsulate nutrients and thus limit the accessibility of protein to digestive enzymes. For instance, Ehle et al. (1982) observed that fecal apparent protein digestibility of diets with various sources of NSP was inversely related to the protein contribution of the fiber source to total dietary protein. This was recently confirmed by Mariscal Landin (1992) who found in an ileal digestibility study of amino acid in wheat milling by-products that amino acid digestibility was inversely correlated with the protein content of the NDF fraction. With cereal grains, Green et al. (1987) and Leterme et al. (1989) reported a higher ileal amino acid or protein digestibility for wheat than maize or barley (respectively triticale or barley) with for the former a higher proportion of protein in the endosperm, which reveal more accessible to digestion than protein located in the aleurone layers. Sauer et al.(1977a) and Wünsche et al. (1987) observed an enhancement of amino acid digestibility of wheat after several fine grindings and attributed it to an increased number of ruptured aleurone cells enabling a more pronounced digestion of the protein encapsulated within these cells. Similarly, Graham and Aman (1987) and Theander et al. (1989) reported with early vs late harvested whole crop pea diets of similar gross composition a higher protein ileal digestibility in the latter in relation with a less proposition of nutrients enclosed within the cell walls of the stems and leaves whereas a higher proportion in the cotyledons. Refering to a slightly different mechanism, Murray et al. (1977) suggested that some soluble NSP
(e. g. pectins) having a high water holding capacity can thus form gels within the intestinal tract which increase viscosity of digesta and limit the contacts between digesta and digestive enzymes or intestinal cells and thus impair protein digestion. Rakowska et al. (1991) found that protein digestibility of rye or triticale was inversely correlated with the amount of high viscous soluble pentosans protein conjugates. In some legume seeds (lupine, phaseolus bean) Chang and Satterlee (1981) and Semino et al. (1985) characterized carbohydrates bound to proteins, resulting in steric hindrance of proteolysis susceptible protein areas. Finally, Bergner et al. (1981) and Howard et al. (1986) pointed out that some NSP i. e. lignin and pectin can bind essential amino acids liberated by digestion and make them escape to intestinal uptake. Although the exact mechanism of binding remains speculative, Howard et al. (1986) related this property to the presence of functional ionic or hydrophobic groups of pectin and lignin and their ability to react with some amino acids.
73
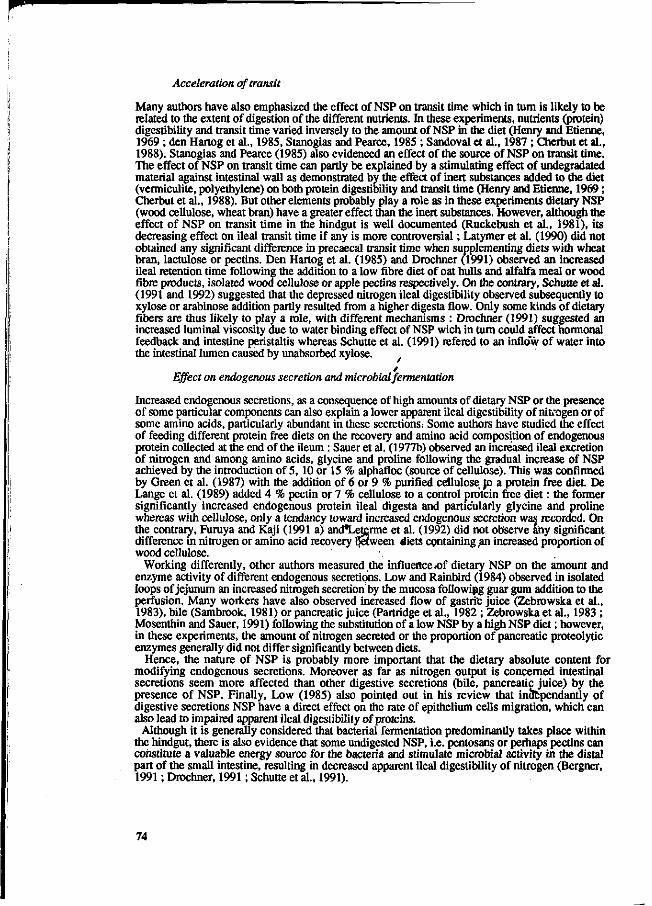
Acceleration of transit
Many authors have also emphasized the effect of NSP on transit time which in tum is likely to be related to the extent of digestion of the different nutrients. In these experiments, nutrients (protein) digestibility and transit time varied inversely to the amount of NSP in the diet (Henry and Etienne, 1969 ; den Hartog et al., 1985, Stanogias and Pearce, 1985 ; Sandoval et al., 1987 ; Cherbut et al., 1988). Stanogias and Pearce (1985) also evidenced an effect of the source of NSP on transit time. The effect of NSP on transit time can partly be explained by a stimulating effect of undegradated material against intestinal wall as demonstrated by the effect of inert substances added to the diet (vermiculite, polyethylene) on both protein digestibility and transit time (Henry and Etienne, 1969 ; Cherbut et al., 1988). But other elements probably play a role as in these experiments dietary NSP (wood cellulose, wheat bran) have a greater effect than the inert substances. However, although the effect of NSP on transit time in the hindgut is well documented (Ruckebush et al., 1981), its decreasing effect on ileal transit time if any is more controversial ; Latymer et al. (1990) did not obtained any significant difference in precaecal transit time when supplementing diets with wheat bran, lactulose or pectins. Den Hartog et al. (1985) and Drochner (1991) observed an increased ileal retention time following the addition to a low fibre diet of oat hulls and alfalfa meal or wood fibre products, isolated wood cellulose or apple pectins respectively. On the contrary, Schutte et al. (1991 and 1992) suggested that the depressed nitrogen ileal digestibility observed subsequently to xylose or arabinose addition partly resulted from a higher digesta flow. Only some kinds of dietary fibers are thus likely to play a role, with different mechanisms : Drochner (1991) suggested an increased luminal viscosity due to water binding effect of NSP wich in turn could affect hormonal feedback and intestine peristaltis whereas Schutte et al. (1991) refered to an inflow of water into the intestinal lumen caused by unabsorbed xylose.
Effect on endogenous secretion and microbial fermentation
Increased endogenous secretions, as a consequence of high amounts of dietary NSP or the presence of some particular components can also explain a lower apparent ileal digestibility of nitrogen or of some amino acids, particularly abundant in these secretions; Some authors have studied the effect of feeding different protein free diets on the recovery and amino acid composition of endogenous protein collected at the end of the ileum : Sauer et al. (1977b) observed an increased ileal excretion of nitrogen and among amino acids, glycine and proline following the gradual increase of NSP achieved by the introduction of 5, 10 or 15 % alphafloc (source of cellulose). This was confirmed by Green et al. (1987) with the addition of 6 or 9 % purified cellulose, Jo a protein free diet. De Lange et al. (1989) added 4 % pectin or 7 % cellulose to a control protein free diet : the former significantly increased endogenous protein ileal digesta and particularly glycine and proline whereas with cellulose, only a tendancy toward increased endogenous secretion was recorded. On the contrary, Furuya and Kaji (1991 a) and*Leterme et al. (1992) did not observe any significant difference in nitrogen or amino acid recovery Between diets containing ,an increased proportion of wood cellulose.
Working differently, other authors measured the influence of dietary NSP on the amount and enzyme activity of different endogenous secretions. Low and Rainbird (1984) observed in isolated loops of jejunum an increased nitrogen secretion by the mucosa following guar gum addition to the perfusion. Many workers have also observed increased flow of gastric juice (Zebrowska et al., 1983), bile (Sambrook, 1981) or pancreatic juice (Partridge et al., 1982 ; Zebrowska et al., 1983 ; Mosenthin and Sauer, 1991) following the substitution of a low NSP by a high NSP diet ; however, in these experiments, the amount of nitrogen secreted or the proportion of pancreatic proteolytic enzymes generally did not differ significantly between diets.
Hence, the nature of NSP is probably more important that the dietary absolute content for modifying endogenous secretions. Moreover as far as nitrogen output is concerned intestinal secretions seem more affected than other digestive secretions (bile, pancreatic juice) by the presence of NSP. Finally, Low (1985) also pointed out in his review that inaependantly of digestive secretions NSP have a direct effect on the rate of epithelium cells migration, which can also lead to impaired apparent ileal digestibility of proteins.
Although it is generally considered that bacterial fermentation predominantly takes place within the hindgut, there is also evidence that some undigested NSP, i.e. pentosans or perhaps pectins can constitute a valuable energy source for the bacteria and stimulate microbial activity in the distal part of the small intestine, resulting in decreased apparent ileal digestibility of nitrogen (Bergner, 1991 ; Drochner, 1991 ; Schutte et al., 1991).
74
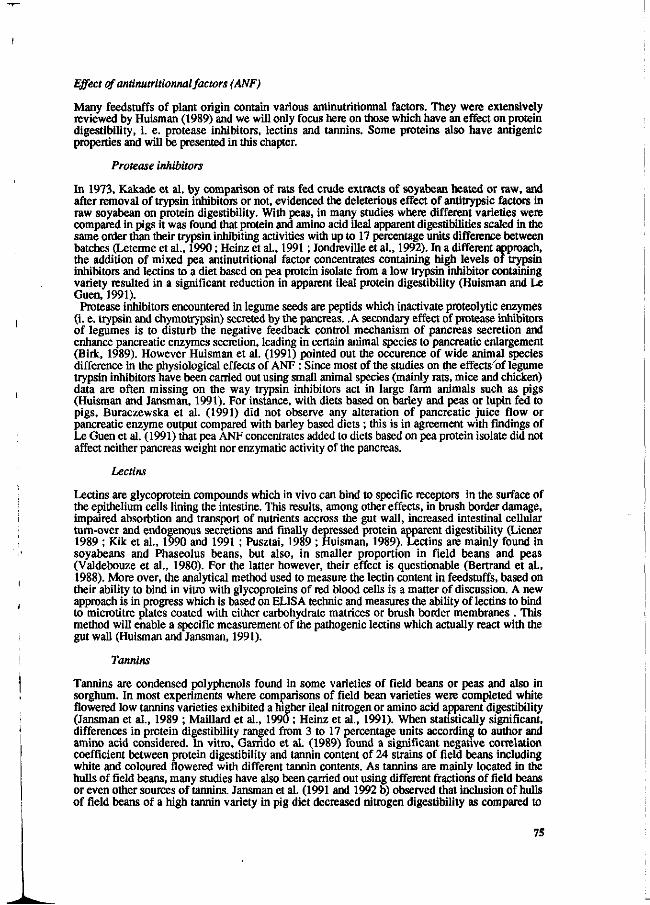
Effect of' antinutritionnal factors (ANF)
Many feedstuffs of plant origin contain various antinutritionnal factors. They were extensively reviewed by Huisman (1989) and we will only focus here on those which have an effect on protein digestibility, i. e. protease inhibitors, lectins and tannins. Some proteins also have antigenic properties and will be presented in this chapter.
Protease inhibitors
In 1973, Kakade et al. by comparison of rats fed crude extracts of soyabean heated or raw, and after removal of trypsin inhibitors or not, evidenced the deleterious effect of antitrypsic factors in raw soyabean on protein digestibility. With peas, in many studies where different varieties were compared in pigs it was found that protein and amino acid ileal apparent digestibilities scaled in the same order than their trypsin inhibiting activities with up to 17 percentage units difference between batches (Leterme et al., 1990 ; Heinz et al., 1991 ; Jondreville et al., 1992). In a different approach, the addition of mixed pea antinutritional factor concentrates containing high levels of trypsin inhibitors and lectins to a diet based on pea protein isolate from a low trypsin inhibitor containing variety resulted in a significant reduction in apparent ileal protein digestibility (Huisman and Le Guen, 1991). Protease inhibitors encountered in legume seeds are peptids which inactivate proteolytic enzymes
(i. e. trypsin and chymotrypsin) secreted by the pancreas. .A secondary effect of protease inhibitors of legumes is to disturb the negative feedback control mechanism of pancreas secretion and enhance pancreatic enzymes secretion, leading in certain animal species to pancreatic enlargement (Birk, 1989). However Huisman et al. (1991) pointed out the occurence of wide animal species difference in the physiological effects of ANF : Since most of the studies on the effects/of legume trypsin inhibitors have been carried out using small animal species (mainly rats, mice and chicken) data are often missing on the way trypsin inhibitors act in large farm animals such as pigs (Huisman and Jansman, 1991). For instance, with diets based on barley and peas or lupin fed to pigs, Buraczewska et al. (1991) did not observe any alteration of pancreatic juice flow or pancreatic enzyme output compared with barley based diets ; this is in agreement with findings of Le Guen et al. (1991) that pea ANF concentrates added to diets based on pea protein isolate did not affect neither pancreas weight nor enzymatic activity of the pancreas.
Lectins
Lectins are glycoprotein compounds which in vivo can bind to specific receptors in the surface of the epithelium cells lining the intestine. This results, among other effects, in brush border damage, impaired absorbtion and transport of nutrients accross the gut wall, increased intestinal cellular turn-over and endogenous secretions and finally depressed protein apparent digestibility (Liener 1989 ; Kik et al., 1990 and 1991 ; Pusztai, 1989 ; Huisman, 1989). Lectins are mainly found in soyabeans and Phaseolus beans, but also, in smaller proportion in field beans and peas (Valdebouze et al., 1980). For the latter however, their effect is questionable (Bertrand et al., 1988). More over, the analytical method used to measure the lectin content in feedstuffs, based on their ability to bind in vitro with glycoproteins of red blood cells is a matter of discussion. A new approach is in progress which is based on ELISA technic and measures the ability of lectins to bind to microtitre plates coated with either carbohydrate matrices or brush border membranes . This method will enable a specific measurement of the pathogenic lectins which actually react with the gut wall (Huisman and Jansman, 1991).
Tannins
Tannins are condensed polyphenols found in some varieties of field beans or peas and also in sorghum. In most experiments where comparisons of field bean varieties were completed white flowered low tannins varieties exhibited a higher ileal nitrogen or amino acid apparent digestibility (Jansman et al., 1989 ; Maillard et al., 1990 ; Heinz et al., 1991). When statistically significant, differences in prctein digestibility ranged from 3 to 17 percentage units according to author and amino acid considered. In vitro, Garrido et al. (1989) found a significant negative correlation coefficient between protein digestibility and tannin content of 24 strains of field beans including white and coloured flowered with different tannin contents. As tannins are mainly located in the hulls of field beans, many studies have also been carried out using different fractions of field beans or even other sources of tannins. Jansman et al. (1991 and 1992 b) observed that inclusion of hulls of field beans of a high tannin variety in pig diet decreased nitrogen digestibility as compared to
75
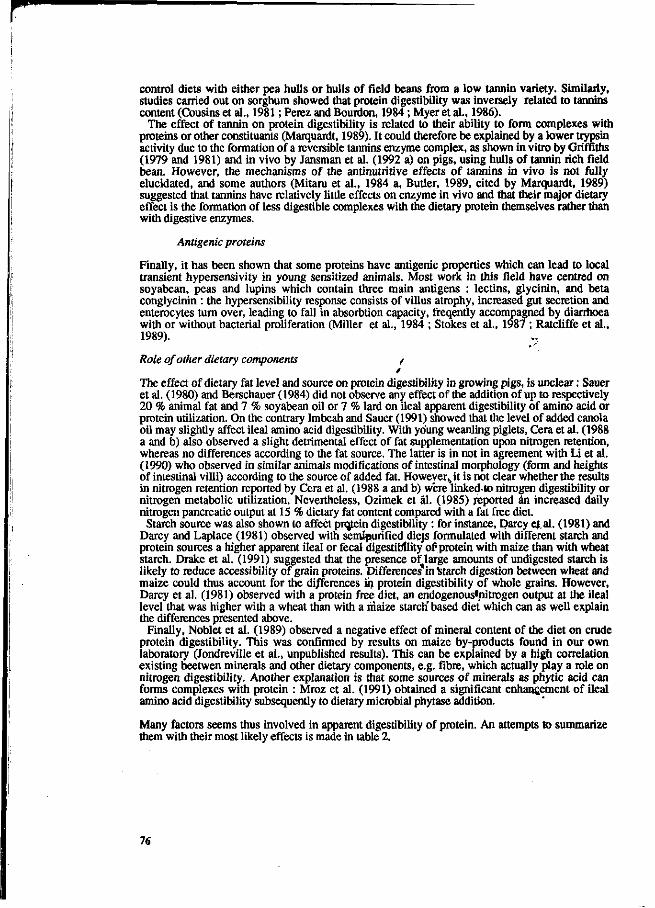
control diets with either pea hulls or hulls of field beans from a low tannin variety. Similarly, studies carried out on sorghum showed that protein digestibility was inversely related to tannins content (Cousins et al., 1981 ; Perez and Bourdon, 1984 ; Myer et al., 1986).
The effect of tannin on protein digestibility is related to their ability to form complexes with proteins or other constituants (Marquardt, 1989). It could therefore be explained by a lower trypsin activity due to the formation of a reversible tannins enzyme complex, as shown in vitro by Griffiths (1979 and 1981) and in vivo by Jansman et al. (1992 a) on pigs, using hulls of tannin rich field bean. However, the mechanisms of the antinutritive effects of tannins in vivo is not fully elucidated, and some authors (Mitaru et al., 1984 a, Butler, 1989, cited by Marquardt, 1989) suggested that tannins have relatively little effects on enzyme in vivo and that their major dietary effect is the formation of less digestible complexes with the dietary protein themselves rather than with digestive enzymes.
Antigenic proteins
Finally, it has been shown that some proteins have antigenic properties which can lead to local transient hypersensivity in young sensitized animals. Most work in this field have centred on soyabean, peas and lupins which contain three main antigens : lectins, glycinin, and beta conglycinin : the hypersensibility response consists of villus atrophy, increased gut secretion and enterocytes turn over, leading to fall in absorbtion capacity, freqenüy accompagned by diarrhoea with or without bacterial proliferation (Miller et al., 1984 ; Stokes et al., 1987 ; Ratcliffe et al., 1989). ._,
Role of other dietary components /
The effect of dietary fat level and source on protein digestibility in growing pigs, is unclear : Sauer et al. (1980) and Berschauer (1984) did not observe any effect of the addition of up to respectively 20 % animal fat and 7 % soyabean oil or 7 % lard on ileal apparent digestibility of amino acid or protein utilization. On the contrary Imbeah and Sauer (1991) snowed that the level of added canola oil may slightly affect ileal amino acid digestibility. With young weanling piglets, Cera et al. (1988 a and b) also observed a slight detrimental effect of fat supplementation upon nitrogen retention, whereas no differences according to the fat source. The latter is in not in agreement with Li et al. (1990) who observed in similar animals modifications of intestinal morphology (form and heights of intestinal villi) according to the source of added fat. However,, it is not clear whether the results in nitrogen retention reported by Cera et al. (1988 a and b) were linked.to nitrogen digestibility or nitrogen metabolic utilization. Nevertheless, Ozimek et al. (1985) reported an increased daily nitrogen pancreatic output at 15 % dietary fat content compared with a fat free diet Starch source was also shown to affect protein digestibility : for instance, Darcy et.al. (1981) and
Darcy and Laplace (1981) observed with semipurified diejs formulated with different starch and protein sources a higher apparent ileal or fecal digestibility ofprotein with maize than with wheat starch. Drake et al. (1991) suggested that the presence of large amounts of undigested starch is likely to reduce accessibility of grain proteins. Differences'in'starch digestion between wheat and maize could thus account for the differences iij protein digestibility of whole grains. However, Darcy et al. (1981) observed with a protein free diet, an endogenous'nitrogen output at the ileal level that was higher with a wheat than with a maize starch' based diet which can as well explain the differences presented above.
Finally, Noblet et al. (1989) observed a negative effect of mineral content of the diet on crude protein digestibility. This was confirmed by results on maize by-products found in our own laboratory (Jondreville et al., unpublished results). This can be explained by a high correlation existing beetwen minerals and other dietary components, e.g. fibre, which actually play a role on nitrogen digestibility. Another explanation is that some sources of minerals as phytic acid can forms complexes with protein : Mroz et al. (1991) obtained a significant enhancement of ileal amino acid digestibility subsequently to dietary microbial phytase addition.
Many factors seems thus involved in apparent digestibility of protein. An attempts to summarize them with their most likely effects is made in table 2.
76
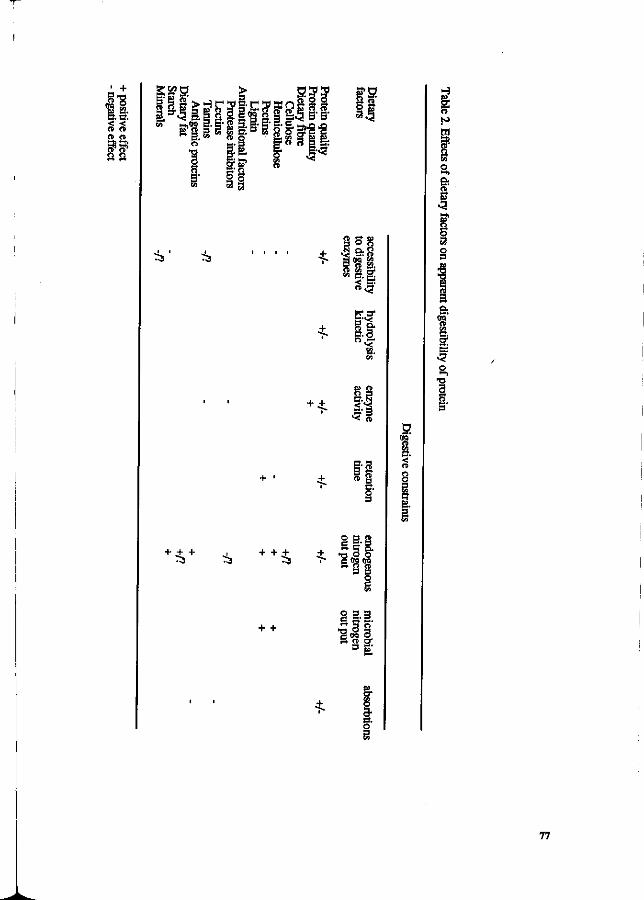
«•8 'S 2. a. o. < < n a o o
B8
PfMfflfiiplï t» w><B 3 . E- g S. g- S- 5. e „ - -j " * S», m S-* as « i r &'—
^ ^ Isa
E * So.
+ + as -•'s. -3 8
g-S 5 §
o s
o. <
i
+ V ^3 + + ^
g a g S J D . flOO gqsoQ ~gg
o c CA
+ + o 3 a
p* ce CT 3 E'
S o
77
Possibilities to improve protein and amino acid apparent digestibility
From the study of the factors which play a role in protein and amino acid digestibility and are susceptible to limit it, it is now possible to imagine ways to improve protein digestibility. These can tike place at different levels : plant breeding, preservation of feedstuffs, feedstuffs and feed processing, enhancement of digestive functions.
Plant breeding
Considering the involvment of ANF in nitrogen digestibility and the genetic variation between different varieties of a same raw ingredient for ANF content, attempts have been made to reduce ANF content by selection. The difficulty lies in that most ANF may have functions in the growth or protection of the plant (Bond and Smith, 1989 ; Birk and Smirnoff, 1992). Any decrease in ANF level must then preserve these functions as well as improve nutritional quality, which makes necessary the cooperation between plant breeders and users to set up nutritional tolerance thresholds which could be used as target by breeding programmes. According to Bond and Smith (1989) selection on trypsin inhibiting activity is possible but will be probably long owing to the lack of associated characters and to the effect of environment on trypsin inhibiting activity (Leterme et al., 1990 ; Grosjean et al., 1993). In peas, it seems however necessary for breeding programs to take into account any parentage with high trypsin inhibitors varieties e.g. Maro, Progreta or most winter smooth seeded varieties. The selection of tannin free field beans is possible and quite more simple on the basis of the white flowers of low tannin varieties. For sorghum, the selection has been completed in the last 10 years toward a reduction in tannin content, so that the sorghums available from European crop are now tannin free (Metayer et al., 1993).
Preservation of feedstuffs
Storage under dry conditions generally does not modify protein digestibility (Peace et al., 1988). The beneficial effect of wet preservation of high tannin feedstuffs (field bean or sorghum) was suggested by Mitaru et al. (1984 a and b) owing to the fact that reconstitution of dry soyabean by adding water and storing anaerobiccaly at 25 °C for 20 days improved protein and amino acid digestibility of high tannin sorghum. However, this is contradicted by van der Poel et al. (1991 a) who did not observe any improvment of in vitro protein digestibility of reconstituted field beans, and by Myer et al. (1986 and 1991) who also did not observe any significant improvment of in vivo protein digestibility of high moisture anaerobiccally stored high tannin sorghum. Sprouting has also been claimed to improve nutritional .quality of seeds. However, although Savelkoul et al. (1992) observed an increased in vitro digestibility of field bean protein after 5 days germination, most authors agree that limited sprouting generally does not modify in vivo digestibility of protein (Plett et al., 1987 ; Chavan and Kadam, 1989 ;-Gatel and Bourdon, 1989 ; Shem ét al., 1990) whereas sprouting for a long time significantly depress it (Jeep and Leeson, 1985).
Feedstuffs and feed processing % ,
Various processings have been tested with the purpose to improve feeding value of feedstuffs or feeds to their full potential particularly through destmction or removal of ANF or other deleterious factors as NSP.
Dehulling has been successfully used to increase protein and amino acid digestibility of various feedstuffs such as sunflower meal (Perez et al., 1986), peas (Grosjean et al., 1992) or field beans (Henry and Bourdon, 1973 ; Maillard et al., 1990 ; Buraczewska et al., 1992). This effect is generally attributed to the removal in processed material of an important part of NSP, but also, for field beans, to the removal of tannins, mainly located in the hulls. Owing to their proteic nature, protease inhibitors and lectins can be inactivated by heat processing
such as extrusion (Bertrand et al., 1982 ; van Zuilichem and van der Poel, 1989 ; Warlier et al. 1989 ; Marquardt et al., 1976 ; Grosjean and Gatel, 1989) infrared radiation (van Zuilichem and van der Poel, 1989), micronizing (Mc Nab and Wilson, 1974), autoclaving (Marquardt et al., 1974, 1976), steam processing (Rodriguez and Bayley, 1987 ; van der Poel et al., 1990) flaking (Marlier et al., 1989) or toasting (Rackis, 1966). Conversely, the potential of pelleting as a mean to inactivate trypsin inhibitors or lectins seems low (Marquardt et al., 1976 ; Grosjean et al., 1989). The effect of treatment on ANF inactivation depends on many parameters e.g., temperature, duration of heating, particle size, moisture (Liener, 1983 ; Griffiths, 1984 ; van Zuilichem and van der Poel, 1989 ; Van der Poel, 1990).
78
Consequently to the reduction in ANF content, protein and amino acid digestibility is generally improved as reported by Harrison et al. (1991) with studies on extrusion of soyabean. Similarly, the high digestibility of protein and amino acid in currently marketed soyabean meal is attributed to the beneficial effect of toasting (Vandergrift, 1985). However, there are sometimes discrepancies between the expected and actual effects of the different processings on in vivo protein or amino acid digestibility : this can be explained by the fact that the threshold value leading to physiological effects vary between feedstuffs ingredients and with animal (species, age...). For instance, with growing finishing pigs fed peas or field beans containing diets, no effect of any technological treatment tested (pelleting, autoclaving, flacking, extrusion) was observed by any authors (Ivan and Bowland, 1976 ; Aherne et al., 1977 ; Bertrand et al., 1982 ; Grosjean et al., 1989 ; Marlier et al., 1989). On the contrary Bengala Freire et al. (1991) observed on early weaned piglets fed diets containing 45 % spring peas either raw or extruded a 4 to 5 % increase in fecal apparent digestibility of protein. A more emphasized increase (13 percentage units) at either the ileal or the fecal stage was observed when using 45 % winter peas : the larger magnitude of the latter difference was probably due to the inactivation of antinutritional factors by extrusion and maybe to an improvement of starch digestion in the small intestine leading to a reduction in the amount of endogenous nitrogen from bacterial fermentation.
Beside their implication in ANF destruction or deactivation, technological treatments can also have a direct effect on protein properties and their susceptibility to digestion : for instance, van der Poel et al. (1991 b) obtained with Phaseolus beans or soyabeans an increased in vivo protein digestibility after processing at high temperature for a short time which could not be attributed to differences in residual levels of ANF but were more likely related to qualitative changes of protein. However, in that field, there are huge variability in reactions between raw ingredients and according to the different technological treatments, which in many cases revealed inefficient on protein digestibility. Moreover, there is evidence that the magnitude of any technological treatment can have, if not adequate, deleterious effects on protein quality through destruction of essential amino acids and formation of unavailable amino acid - carbohydrates complexes (Chang et al., 1987 ; Batterham et al., 1986 ; Knabe et al., 1989 ; Wiseman et al., 1991 ; Barrier-Guillot et al., 1993). This support the need for a better knowledge of process parameters adapted to each feedstuffs, and for quality control criteria based on the nutritional evaluation of processed feedstuffs. Much have been done in that sense for soyabean meal.
Enhancement of digestive functions
As some events can occur within the digestive tract, which result in depressed feeding value, particularly protein digestibility of feedstuffs, some researchs have proposed to use various substances (enzymes, probiotics) to modify digestive environment or enhance digestive functions of the animals.
Effect of enzymes
Pig intestine do not secrete enzymes which break down NSP found in most feedstuffs, and it has been exposed above that some of them can interfere with digestive processes, resulting in poor digestibility. It has thus been proposed to add exogenous enzyme preparations based on beta glucanases, pentosanases, cellulases and alpha amylases and gluco amylases to the diets to counteract these deleterious effects. Although not always observed several papers have effectively reported a positive effect of dietary enzyme supplementation on growth performance (Collier and Hardy, 1986 cited by Rotter, 1990) or incidence and severity of diarrhoea (Inborr and Ogle, 1988), with young piglets fed barley or wheat based diets. Less consistant, if any, results are observed with growing finishing pigs. Results of digestibility studies, carried out with pig fed various enzyme mixture supplemented diets vary : with weanling pigs fed a rye-based diet, pentosanase supplementation did not improve protein digestibility whereas beta glucanase supplementation of a barley based diet significantly improved it (Inborr et al., 1991) ; the latter was in agreement with findings from Graham et al. (1988) and Thacker et al. (1988) whereas not with those from Graham et al. (1989). Finally, Wenk (1992) observed a significant increase in protein digestibility of diets containing wheat bran or whole maize plant supplemented with various commercial enzyme preparations. Effects of enzymes, when observed, can be attributed to the breakdown of the soluble beta glucanes or arabinoxylanes chains, reducing intestinal chyme viscosity and enabling a better contact between substrates and digestive enzymes, and a better diffusion of hydrolysed substances toward the intestinal mucosa. Some additional benefit is also gained by the break down of the endosperm cell-wall and liberation of intracellular nutrients in the digestive tract (Chesson 1987). More work is however needed to more adequately target the enzyme preparations on diet
79
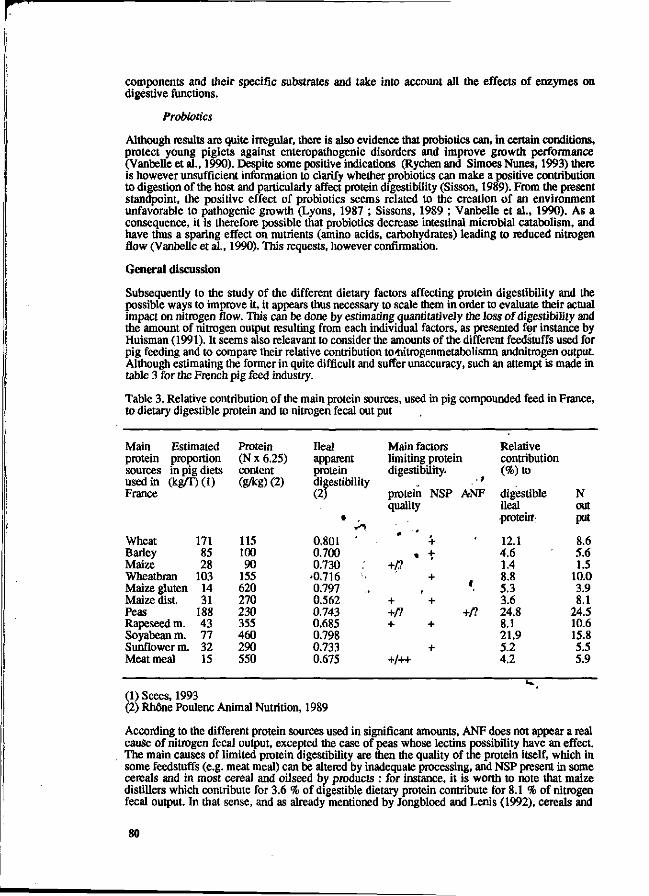
components and their specific substrates and take into account all the effects of enzymes on digestive functions.
Probiotics
Although results are quite irregular, there is also evidence that probiotics can, in certain conditions, protect young piglets against enteropathogenic disorders and improve growth performance (Vanbelle et al., 1990). Despite some positive indications (Rychen and Simoes Nunes, 1993) there is however unsufficient information to clarify whether probiotics can make a positive contribution to digestion of the host and particularly affect protein digestibility (Sisson, 1989). From the present standpoint, the positive effect of probiotics seems related to the creation of an environment unfavorable to pathogenic growth (Lyons, 1987 ; Sissons, 1989 ; Vanbelle et al., 1990). As a consequence, it is therefore possible that probiotics decrease intestinal microbial catabolism, and have thus a sparing effect on nutrients (amino acids, carbohydrates) leading to reduced nitrogen flow (Vanbelle et al., 1990). This requests, however confirmation.
General discussion
Subsequently to the study of the different dietary factors affecting protein digestibility and the possible ways to improve it, it appears thus necessary to scale them in order to evaluate their actual impact on nitrogen flow. This can be done by estimating quantitatively the loss of digestibility and the amount of nitrogen output resulting from each individual factors, as presented for instance by Huisman (1991). It seems also releavant to consider the amounts of the different feedstuffs used for pig feeding and to compare their relative contribution to4iitrogenmetabolismn andnitrogen output. Although estimating the former in quite difficult and suffer unaccuracy, such an attempt is made in table 3 for the French pig feed industry.
Table 3. Relative contribution of the main protein sources, used in pig compounded feed in France, to dietary digestible protein and to nitrogen fecal out put
Main Estimated protein proportion sources in pig diets used in (kg/T)(l) France
Wheat Barley Maize Wheatbran Maize gluten Maize dist. Peas Rapeseed m. Soyabean m. Sunflower m. Meat meal
171 85 28
103 14 31
188 43 77 32 15
(1) Scees, 1993
Protein (N x 6.25) content (g/kg) (2)
115 100 90
155 620 270 230 355 460 290 550
Ileal apparent protein digestibility (2)
•
0.801 ' 0.700 0.730 •0.716 0.797 0.562 0.743 0.685 0.798 0.733 0.675
(2) Rhône Poulenc Animal Nutrition, 1989
Main factors limiting protein digestibility.
. » protein NSP ANF quality
4 ' ,
+ « t
+/? + ,
f
+ + +/? +/? + +
+ +/++
Relative contribution (%)to
digestible ileal •protein"-
12.1 4.6 1.4 8.8 5.3 3.6 24.8 8.1 21.9 5.2 4.2
1 » ^
N out put
8.6 5.6 1.5
10.0 3.9 8.1
24.5 10.6 15.8 5.5 5.9
According to the different protein sources used in significant amounts, ANF does not appear a real cause of nitrogen fecal output, excepted the case of peas whose lectins possibility have an effect. The main causes of limited protein digestibility are then the quality of the protein itself, which in some feedstuffs (e.g. meat meal) can be altered by inadequate processing, and NSP present in some cereals and in most cereal and oilseed by products : for instance, it is worth to note that maize distillers which contribute for 3.6 % of digestible dietary protein contribute for 8.1 % of nitrogen fecal output. In that sense, and as already mentioned by Jongbloed and Lenis (1992), cereals and
80
soyabean meal are interesting feedstuffs which can contribute to the reduction of fecal nitrogen excretion : their contributions to digestible dietary protein are respectively 18.1 and 21.9 % whereas to nitrogen fecal output 15.7 and 15.8 %. The other point which come to discussion is how nitrogen output achieved by pigs is related to the
digestibility of the individual dietary feedstuffs. Least cost formulation hypotheses that digestibility values for individual feedstuffs are additive so that digestible protein or amino acid supply in a diet can be predicted from single ingredients digestibility values. This was confirmed by Imbeah et al. (1988) on a limited number of diets. However, Furuya and Kaji (1991 b) found slight differences between calculated and observed apparent digestibility values. Similarly, Laplace et al. (1989) found the effect of fibre sources on the ileal digestibility of amino acids be additive for most amino acids, whereas significant interactions were found for threonine and methionine particularly. Finally Noblet et al. (1990) observed that protein and amino acids digestibilities of various feedstuffs, measured in complex diets, were slightly lower than those found in feeding tables. Brule and Savoie (1988) who also found in vitro associative effects between some protein sources attributed this fact to varying affinity of digestive enzymes for the proteins. Noblet et al. (1990) pointed out that endogenous secretions can vary widely according to the diet, particularly between simple diets used in screening tests and diets commonly used in practice. He therefore suggested that apparent digestible protein content of any mixed diet should be estimated from additivity of true digestibility values of raw ingredients, corrected by an estimation of actual endogenous output. This is consistant with findings from Furuya and Kaji (1991 b) that true digestibility values were more "additive" than apparent ones ; but further research is needed in order to fînelize a working model.
References
Aherne, F.X., Lewis, A.J., Hardin, R.T., 1977. An evaluation of faba beans (Vicia faba) as a protein supplement for swine. Can. J. Anim. Sei., 57 : 321-328.
Asche, G.L., Lewis, A.J., Peo, E.R.Jr, 1989 a. Protein digestion in weanling pigs : effect of dietary protein source. J. Nutr., 119 :1 093-1 099.
Asche, G.L., Lewis, A.J., Peo, E.R.Jr, 1989 b. Protein digestion in weanling pigs : effect of feeding regimen and endogenous protein secretion. J. Nutr., 119:1 083-1 092.
Barrier-Guillot, B., Zuprizal, Jondreville, C , Chagneau, A.M., Larbier, M., Leuillet, M., 1993. Effect of heat drying temperature on the nutritive value of com in chickens and pigs. Anim. Feed Sei. Technol., in press.
Batterham, E.S., Darnell, R.E., Herbert L.S., Major, E.J., 1986. Effect of pressure and temperature on the availability of lysine in meat and bone meal as determined by slope-ratio assays with growing pigs, rats and chicks and by chemical techniques. Br. J. Nutr. ,55:441-453.
Bell, J.M., Shires, A., Keith, D.M., 1983. Effect of hull and protein contents of barley on protein and energy digestibility and feeding value for pigs. Can. J. Anim. Sei., 63 : 201-211.
Bengala Freire, J., Aumaitre, A., Peiniau, J., 1991. Effects of feeding raw and extruded peas on ileal digestibility, pancreatic enzymes and plasma glucose and insulin in early weaned pigs. J. Anim. Physiol, a. Anim. Nutr., 65 :154-164.
Berschauer, F., 1984. Untersuchungen über Emähsungs physiologische Wirkungen von Futterfetten in Rationen für wachsende Schweine. Archiv Tierernähr, 34 : 123-133.
Bergner, H., Lück, M., Müller, H., 1981. Studies in the sorption of amino acids in diet components from wheat straw meal, alkali lignin and cellulose. Archiv Tieremähr., 31 : 265-271.
Bergner, H., 1991. The problem of estimation of amino acid digestibility in pigs. In Verstegen, M.W.A., Huisman, J„ den Hartog, L.A., Eds. Proceedings of the 5 th International Symposium on Digestive Physiology in Pigs. Wageningen, The Netherlands, 24-26 April, 179-183.
Bertrand, D., Delort-Laval, J., Melcion, J.P., Valdebouze, P., 1982. Influence de 1'extrusion et de 1'infranisation sur les facteurs antinutritionnels et la valeur alimentaire du pois (Pisum sativum L.). Sei. Aliments, 2 (HS II) : 197- 202.
Bertrand, G., Sève, B., Gallant, DJ., Tome, R., 1988. Absence d'effets antinutritionnels des lectines de pois sous forme native ou purifiée, chez le porcelet. Comparaison avec les lectines natives de soja. Sei. Aliments, 8 :187-212.
81
Birk, Y., 1989. Protein protease inhibitors of plant origin and their significance in nutrition. In Huisman, J., van der Poel, A.F.B., Liener, I.E., Eds. Proceedings of the 1st International Workshop on Antinutritional Factors in Legume Seeds, Wageningen, The Netherlands, 23 - 25 November 1988, 83-94.
Birk, Y., Smirnoff, P., 1992. Proteins protease inhibitors from legume seeds and their significance in nutrition, pest control and medicine. In Proceedings of the 1 st European Conference on Grain Legumes. Angers, France, 1-3 June, 391-392.
Bond, D. A., Smith, D.B., 1989. Possibilities for the reduction of antinutritional factors in grain legumes by breeding. In Huisman, J., van der Poel, A.F.B., Liener I.E. Eds. Proceedings of the 1st International Workshop on Antinutritional Factors in Legume. Seeds, Wageningen, The Netherlands, 23 - 25 November 1988,285 - 296.
Brule, D., Savoie, L., 1988. In vitro digestibility of protein and amino acids in protein mixtures. J. Sei. Food Agric, 43 : 361-372.
Buraczewska, L., Schulz, E., Schroder, H., 1987. Ileal digestibility of amino acids in pigs fed barleys differing in protein content. Archiv Anim. Nutr., Berlin, 37 : 861-867.
Buraczewska, L., Pohland, U.; Gdala, J.; Grala, W., Janowska, G., Souffrant, W.B., 1991. Exocrine pancreatic secretion of enzymes in growing pigs given diets based on barley, pea, lupin or field bean. In Verstegen, M.W.A., Huisman, J, den Hartog, L.A. Eds. Proceedings of the 5 th International Symposium on Digestive Physiology in Pigs Wageningen, the Netherlands, 24 - 26 April, 167-172.
Buraczewska, L., Gdala, J., Grala, W., 1992. Ileal digestibility of nutrients in pig fed diets with raw or processed field bean. In Proceedings of the 1 st European Conference on Grain Legumes. Angers, France, 1-3 June, 517-518. "
Cera, K.R., Mahan, D.C., Reinhart, G. A., 1988.a Weekly digestibilities of diets supplemented with corn oil, lard or tallow by weanling swine,7. Anim. Sei., 66 : 1 430-1 437.
Cera, K.R., Mahan, D.C., Reinhart, G.A., 1988 b. Effects of dietary dried whey and com oil on weanling pig performance, fat digestibility and nitrogen utilization. J. Anim. Sei., 66 : 1 438-1 445.
Chang, C.J., Tanksley, T.D., Knabe, D.A.; Zebrowska, T., 1987. Effects of different heat treatments during processing on nutrient digestibility of soyabean meal in growing swine. J. Anim. Sei., 65 : 1 273-1 282.
Chang, K.C., Satterlee, L. D, 1981. Isolation and characterization of the majorprotein from Great Northern beans (Phaseolus Vulgaris). J. Food Sei., 46 : 1 368-1 373.
Cherbut C , Barry, J.L., Wyers, M., Delort-Laval, J., 1988. Effect of the nature of dietary fibre on transit time and faecal excretion in the growing pig. Anim; Feed Sei. Technol., 20 : 327-333. , - • .
Chavan, J.K., Kadam, S.S., 1989. Nutritional improvement of cereals by sprouting. Critical Rev. Food Sei. Nutr., 28 :401-437.
Chesson, A., 1987. Supplementary enzymesto improve the utilization of pig and poultry diets. In Haresign, W., Cole D.J.A. Eds. Rec."Ädv. Anim. Nun-. Butterworths, London, 71-89.
Corring, T., 1979. Endogenous secretions in thé pig. In Low, AG., Partridge, I.G. Eds. Current Concepts of Digestion and Absorbtion in Pigs. Procaedings of a Seminar held at the National Institute for Research in Dairying, Reading, United Kingdom, 19-20 July, 136-150. - ,
Cousins, B.W., Tanksley, T.D. Jr, Knabe, D.A., Zebrowska, T., 1981. Nutrient digestibility and performance of pigs fed sorghum varying in tannin concentration. J. Anim. Sei., 53 : 1 524-1 537.
Darcy, B., Laplace, J.P., 1981. Bilans nutritionnels chez le porc selon la nature de l'amidon (blé ou mais) et la source de protéines (poisson ou gluten) Ann. Zootech., 30,63-76.
Darcy, B., Laplace, J.P., Villiers, P.A., 1981. Digestion dans l'intestin drêle chez le porc. 4. Cinétique de passage des digesta au niveau de la jonction ileo-caeco-colique et bilans de la digestion selon la nature de l'amidon et la source de protéines alimentaires. Ann. Zootech., 30:31-62. *-..
Deshpande, S.S., Damodaran, S., 1989. Structure-digestibility relationship of legume 7S proteins. J. Food Sei., 54 :108-113.
Deshpande, S.S., Damodaran, S., 1990. Food legumes : chemistry and technology. Adv. Cereal Sei. Technol., 10:147-241.
Dierick, N., Vervaeke, I., Decuypere, J., Henderickx, H.K., 1983. Influence de la nature et du niveau des fibres brutes sur la digestibilité iléale et fécale apparente de la matière sèche, des protéines, des acides aminés et sur la rétention azotée chez les porcs. Rev. Agric, 36 : 1 691 -1 712.
82
Drake, A.P., Fuller, M.F., Chesson, A., 1991. Simultaneous estimations of precaecal protein and carbohydrate digestion in the pig. In Fuller, M.F. Ed. In Vitro Digestion for Pigs and Poultry. C.A.B. International, Wallingford, United Kingdom, 162-176.
Drochner.W., 1991. Digestion of carbohydrates in the pig. In Verstegen, M.W.A., Huisman, J., den Hartog, L. A., Eds. Proceedings of the 5 th International Symposium on Digestive Physiology in Pigs. Wageningen. The Netherlands, 24-26 april, 367-388.
Ehle, F.R., Jeraci, J.L., Robertson, J.B., Van Soest, P.J., 1982. The influence of dietary fiber on digestibility, rate of passage and gastrointestinal fermentation in pigs. J. Anim. Sei., 55 : 1071-1 080.
Fernandez, J.A., Jorgensen, J.N., 1986. Digestibility and absorbtion of nutrients as affected by fibre content in the diet of the pig. Quantitative aspects. Livest. Prod. Sei., 15 :53-71.
Fialho, E., Cline, T.R., 1991. Influence of environmental temperature and dietary protein levels on apparent digestibility of protein and amino acids and energy balance in growing pigs. In Verstegen, M.W.A., Huisman, J., den Hartog, L.A. Eds. Proceedings of the 5 th International Symposium on Digestive Physiology in Pigs. Wageningen, The Netherlands, 24-26 April, 132-138.
Furuya, S., Kaji, Y., 1991 a. The effects of feed intake and dietary fibre levels on the endogenous ileal amino acid output in growing pigs. In Verstegen, M.W.A., Huisman, J., den Hartog, L. A., Eds. Proceedings of the 5 th International Symposium on Digestive Physiology in Pigs. Wageningen, The Netherland, 24-26 April, 190-195.
Furuya, S., Kaji, Y., 1991 b. Additivity of the apparent and true ileal digestible amino acid supply in barley, maize, wheat or soya-bean meal based diets for growing pigs. Anim. Feed Sei. Technol., 32: 321-331.
Galibois, I., Savoie, L., Simoes-Nunes, C , Rerat, A., 1989. Relation between in vitro and in vivo assessment of amino acid availability. Reprod. Nutr. Dev., 29 :495-507. ,
Gatel, F., Bourdon, D., 1989. Effects of preharvest sprouting on the feeding value of wheat for pigs. Pig News Inf., 10 :159-160.
Gdala, J., Buraczewska, L., Grala, W., 1992. The chemical composition of different types and varieties of pea and the digestion of their protein in pigs. J. Anim. Feed Sei., 1:71-79.
Graham, H., Aman, P., 1987. Whole crop peas. II Digestion of early and late harvested crops in the gastrointestinal tract of pigs. Anim. Feed Sei. Technol., 17 : 33-43.
Graham, H., Lowgrcn, W., Petterson, D., Aman, P., 1988. Effect of enzyme supplementation on digestion of a barley/polard-based pig diet. Nutr. Rep. Int, 38 : 1 073-1 079.
Graham, H., Fadel, J.G., Newman, C.W., Newman, R.K., 1989. Effect of pelleting and beta glucanase supplementation on the ileal and fecal digestibility of a barley-based diet in the pig. J. Anim. Sei., 67 :1 293-1 298.
Garrido, A., Cabrera, A., Gomez, A., Guerrero, J.E., 1989. Relationship between tannin content and "in vitro" nutritive value in seeds of 24 strains of vicia faba L. In Huisman J., van der Poel, A.F.B., Liener, I.E. Eds. Proceedings of the 1st international Workshop on Antinutritional Factors in Legume seeds. Wageningen, The Netherlands, 23-25 November 1988.160-163
Green, S., Bertrand, S.L., Duron, M.J.C., Maillard, R.A., 1987. Digestibility of amino acids in maize, wheat and barley meal, measured in pigs with ileorectal anastomosis and isolation of the large intestine. J. Sei. Food Agric, 4 1 : 29-43.
Griffiths, D.W., 1979. The inhibition of digestive enzymes by extracts of field bean (Vicia faba). J. Sei. Food Agric, 30:458-462.
Griffiths, D.W., 1981. The polyphenolic content and enzyme inhibitory activity of testas from bean (Vicia faba) and peas (Pisum ssp.) varieties. J. Sei. Food Agric, 32: 797-804.
Griffiths, D.W., 1984. The trypsin and chymotrypsin inhibitor activities of various pea (Pisum ssp.) and field bean (Vicia faba) cultivars. J. Sei. Food Agric, 35 :481-486.
Grosjean, F., Gatel, F., 1989. Feeding value of Pisum sativum for pigs : influence of technology, influence of genotype (trypsin inhibitor activity). In Huisman J., van der Poel, A.F.B., Liener, I.E. Eds. Proceedings of the 1st International Workshop on Antinutritional Factors in Legume Seeds, Wageningen, The Netherlands, 23 - 25 November 1988,239 - 242.
Grosjean, F., Bourdon, D., Theillaud-Ricca, V., Castaing, J., Beague, E., 1989. Comparaison des pois d'hiver et de printemps dans des aliments pour porc charcutier présentés en farine ou en granulés. Journées Rech. Porcine en France, 21:59 - 68.
Grosjean, F., Bourdon, D., Isambert, P., Peyronnet, G, Jondreville, G, 1992. Valeur alimentaire pour le porc charcutier de produits de décorticage du pois. Journées Rech, porcine en France, 24 : 173 -178.
83
Grosjean, F., Metayer, J.P., Peyronnet, G, Carrouee, B., 1993. Variability of trypsin inhibiting activity of peas grown in France. Proceedings of the 2 nd International ANF Workshop. Wageningen, The Netherlands, 1-3 December, In Press.
Gueguen, J., 1989. Pea and faba bean proteins, in Hudson, J.F. Ed. Developments in food proteins. Elsevier, 35-78.
Harrison, M.D., Stilbom, H.I., Ballard, M.R.M., 1991. Effect of extrusion temperature on ileal amino acid digestibility of soyabeans. J. Anim. Sei., 69 (suppl 1), 386 (Abstr.).
Hartog, L.A.den, Boon, P.J., Huisman, J., van Leeuwen, P. van Weerden, E.J., 1985. The effect of crude fibre content on the digestibility and the rate of passage in the small and large intestine of pigs. In Just, A., Jorgensen, H., Fernandez, J. A. Eds. Proceedings of the 3 rd International Seminar on Digestive Physiology in the Pig. Copenhagen, Denmark, 16-18 May, 2:199-202.
Hauschild, A., Köhler, R., 1991. Influence of dietary fibre on digestibility of protein and organic matter of different pea genotypes in growing pigs. In Eggum, B. O., Boisen, S;, Borsting, G, Danfaer, A., Hvelplund, T. Eds. Proceedings of the 6 th International Symposium on Protein Metabolism and nutrition. Heming, Denmark, 9 -14 June, 2 : 21-23.
Haydon, K.D., Knabe, D.A., Tanksley, T.D.Jr., 1984. Effects of level of feed intake on nitrogen, amino acid and energy digestibilities measured at the end of the small intestine and over the total digestive tract of growing pigs. J. Anim. Sei., 59 : 717-724.
Heinz, T., Souffrant, W.B., Huisman, J., Jansman, A.J., 1991. Apparent and true protein digestibility of ANF containing legume seeds measured by ^N-technique. In proceedings of the 42 nd Annual Meeting of the EAAP. Berlin, 8 -12 september, papery 3.9.
Henry, Y., Etienne, M., 1969. Effets nutritionnels de l'incorporation de cellulose purifiée dans le régime du porc en croissance-finition. 1.Influence sur l'utilisation digestive des nutriments. Ann. Zootech., 18 : 337-357. '
Henry, Y., Bourdon, D., 1973. Utilisation digestive de l'énergie et des matières azotées de la féverole sous forme entière ou décortiquée en comparaison avec le tourteau de soja. Journées Rech. Porcine en France, 5 :105 -114.
Howard, P., Mahoney, R.R., Wilder, T., 1986. Binding of amino acids by dietary fibres and wheat bran. Nutr. Rep. Int., 34 :135-140.
Huisman, J., 1989. Antinutritional factors (ANFs) in the nutrition of monogastric farm animals. In van Weerden, E.J., Huisman, J. Eds. Nutrition and Digestive Physiology in Monogastric Farm Animals. Pudoc, Wageningen, The Netherlands, 17-35.
Huisman, J., 1991. Negative effects of antinutritionnal factorain animal feeds on the excretion of nitrogen in the environment and possibilities of reduction. Digestive physiological effects. Tijdschr. Diergeneeskd/116 : 391-395.
Huisman, J., Jansman, A.J.M., 1991. Dietary effects and some analytical aspects of antinutritional factors in peas (Pisum sativum), common bean (Phaseolus Vulgaris) and soyabeans (Glycine max L.) in monogaslric fariji animals. A littérature review. Nutr. AbstrReview.Ser.B., 6 1 : 901-921. ' .
Huisman, J., Le Guen, M.P., 1991. Effects of pea ANFs and pça carbohydrates on ileal protein digestibility of piglets. In Verstegen M.W.A., Huisman J., den Hartog L.A. Eds. Proceedings of the 5 th International Symposium on Digestive Physiology in Pigs. Wageningen, The Netherlands, 24 - 26 April, 60-66.,
Huisman, J., van der Poel, A.F.B., Beynen, A.G, 1991. Animal species difference in antinutritional effects of raw Phaseolus vulgaris beans and Pisum sativum : comparison of piglets, rats, chickens and mice. In Verstegen M.W.A., Huisman J., den Hartog L.A. Eds. Proceedings of the 5 th International Symposium on Digestive Physiology in Pigs. Wageningen, The Netherlands, 24 - 26 april, 108-113.
Imbeah, M., Sauer, W.G, Mosenthin, R., 1988. The prediction of the digestible amino acid supply in barley soyabean meal or canola meal diets and pancreatic enzyme secretion in pigs. J. Anim. Sei., 66 :1 409-1 417. w .
Imbeah, M., Sauer, W.G, 1991. The effect of dietary level of fat on amino acid digestibilities in soyabean meal and canola meal and on rate of passage in growing pigs. Livest. Prod. Sei., 29:227-239.
Inborr, J., Ogle, R.B., 1988. Effect of enzyme treatment of piglet feeds on performance and post weaning diarrhoea. Swed. J. Agric. Res., 18 :129-133.
Inborr, J., Bedford, M.R., Patience, J.F., Classen, H.L., 1991. The influence of supplementary feed enzymes on nutrient disappearance and digesta characteristics in the GI tract of early weaned pigs. In Verstegen, M.W.A., Huisman, J., den Hartog, L.A. Eds. Proceedings of the 5 th International Symposium on Digestive Physiology in Pigs. Wageningen, The Netherlands, 24 - 26 April, 405-410.
84
Ivan, M., Bowland, J.P., 1976. Digestion of nutrients in the small intestine of pigs fed diets containing raw and autoclaved faba beans. Can. J. Anim. Sei., 56 :45M56.
Ivanko.S., Slesarrova, L., Bystricky, P., Chudy, D., 1991. Digestion of legume seed proteins by enzymez of the gastrointestinal tract. In Eggum, B. O., Boisen, S., Borsting, G, Danfaer, A., Hvelplund, T. Eds. Proceedings of the 6 th International Symposium on Protein Metabolism and Nutrition: Heming, Denmark, 9 -14 June, 2:231-233.
Jansman, A.J.M., Huisman, J., Van Der Poel, A.F.B., 1989. Faba beans with different tannin contents : ileal and fecal digestibility in piglets and growth in chicks. In Huisman, J., van der Poel, T.F.B., Liener, LE Eds. Proceedings of the 1st International Workshop on Antinutritional Factors in Legume Seeds, Wageningen, The Netherlands, 23 - 25 November, 176-180.
Jansman, A.J.M., Huiman, J., Verstegen, M.W.A., 1991. The effect of hulls of field beans (Vicia faba L.) with different tannin contents on nutrient digestibility, growth and N balance of piglets. In Eggum, B. O., Boisen, S., Borsting, C , Danfaer, A., Hvelplund, T. Eds. Proceedings of the 6 th International Symposium on Protein Metabolism and Nutrition. Herning, Denmark, 9 -14 June, 2 :216-221.
Jansman, A.J.M., Enting, H., Huisman, J., Verstegen, M.W.A., 1992 a. The effect of condensed tannins in faba bean (Vicia Faba L.) on the activity of trypsin and chymotrypsin in duodenal and ileal chyme in pigs. In proceeding of the 1 st European Conference on Grain Legumes. Angers, France, 1-3 June, 483-484.
Jansman, A.J.M., Huisman, J., Verstegen, M.W.A., 1992 b. The effect of condensed tannins in faba bean hulls (Vicia Faba L.) on the ileal digestibility in piglets of diets containing different protein sources. In proceedings of the 1 st European Conference on Grain Legumes. Angers, France, 1-3 June, 523-524.
Jondreville, C , Grosjean, F., Buron, G., Peyronnet, C , Beneytout, J.L., 1992. Comparison of four pea varieties in pig feeding through digestibility and growth performance results. J. Anim. Physiol, a. Anim. Nutr., 68 : 113-122.
Jongbloed, A.W., Lenis, N.P., 1992. Alteration of nutrition as a means to reduce environmental pollution by pigs. Livest. Prod. Sei., 31:75-94.
Just, A., 1982. The influence of crude fibre from cereals on the net energy value of diets for growth in pigs. Livest Prod. Sei., 9 : 569-580.
Kakade, M.L., Hoffa, D.E., Liener, I.E., 1973. Contribution of trypsin inhibitors to the deleterious effects of untreated soyabeans fed to rats. J. Nutr., 103 :1 772-1 778.
Kies, A.K., Moughan, P.J., Smith, W.C., 1986. The apparent and true ileal digestibility of nitrogen and amino acids in lactic casein for the growing pig. Anim. Feed Sei. Technol., 16 :169-178.
Kik, M.J.L., Huisman, J., van Der Poel, A.F.B., Mouwen, J.M.V.M., 1990. Pathologie changes of the small intestinal mucosa of piglets after feeding of Phaseolus vulgaris beans. Vet. Pathol., 27 :329-334.
Kik, M.J.L., Koninkx, J.F.J.G., van den Muysenberg, A., Hendriksen, F., 1991. Pathological effects of Phaseolus vulgaris isolectins on pig jejunal mucosa in organ culture. Gut, 32, : 886-892.
Knabe, D.A., La Rue, D.C., Gregg, E.J., Martinez, G.M., Tanksley, T.D. Jr., 1989. Apparent digestibility of nitrogen and amino acids in protein feedstuffs by growing pigs. J. Anim. Sei., 67:441-458.
Lange, C.F.M, de, Sauer, W.C., Mosenthin, R., Souffrant, W.B., 1989. The Effect of feeding different protein-free diets on the recovery and amino acid composition of endogenous protein collected from the distal ileum and feces in pigs. J. Anim. Sei., 67 : 746 - 754.
Laplace, J.P., Darcy-Vrillon, B., Perez, J.M., Henry, Y., Giger, S., Sauvant, D., 1989. Associative effects between two fibre sources on ileal and overall digestibilities of amino acids, energy and cell-wall components in growing pigs. Br. J. Nutr., 61:75-87.
Latymer, E.A., Low, A.G., Fadden, K., Sambrook, J.E., Woodley, S.C., Keal, H.D., 1980. Measurement of transit time of digesta through sections of gastrointestinal tract of pigs fed with diets containing various sources of dietary fibre (non starch polysaccharides). Arch. Anim. Nutr., Berlin, 40 : 667-680.
Leeuwen, P.van, Sauer, W.C., Huisman, J., van Weerden, E.J., van Kleef, D., den Hartog, L.A., 1987. Methodological aspects for the determination of amino acid digestibilities in pigs fitted with ileocecal re-entrant cannulas. J. Anim. Physiol, a. Anim. Nutr., 58 :122-133.
Le Guen, M.P., Huisman, J., Makkink, CA., 1991. Effect of Peas and pea isolates on protease activities in pancreatic tissue of piglets. In Verstegen M.W.A., Huisman J., den Hartog L.A. Eds. Proceedings of the 5 th International Symposium on Digestive Physiology in Pigs. Wageningen, The Netherlands, 24 - 26 April, 207-210.
85
Leterme, P., Thielemans, C , Bodart, C , 1989. Valeur nutritive et digestibilité apparente iléale et fécale des acides aminés du triticale, du froment et de l'escourgeon chez le porc. Rev. Agric, 42:305-316.
Leterme, P., Beckers, Y., Thewis, A., 1990. Trypsin inhibitors in peas : varietal effect and influence on digestibility of crude protein by growing pigs. Anim Feed Sei. Technol., 29 : 45-55.
Leterme, P., Pirard, L., Thewis, A., 1992. A note on the effect of wood cellulose level in protein free diets on the recovery and amino acid composition of endogenous protein collected from the ileum in pigs. Anim. Prod., 54:163-165.
Li, D.F., Thaler, R.CNelssen, J.L., Harmon, D.L., Allee, G.L., Weeden, T.L., 1990. Effect of fat sources and combinations on starter pig performance, nutrient digestibility and intestinal morphology. J. Anim. Sei., 68 : 3 694-3 704.
Liener, I.E., 1983. Removal by processing of naturally occuring toxicants and antinutrients. In Shemit, L.W. Ed. Chemistry and World food supplies : the new frontiers. Pergamon Press, New York, USA, 453 - 463.
Liener, I.E., 1989. Antinutritional factors. In Mattews R.H. Ed. Legumes : chemistry, technology and human nutrition. Marcel Dekker Inc., New York, USA, 339 -382.
Longland, A.C., 1991. Digestive enzyme activities in pigs and poultry. In Fuller, M.F., Ed. In Vitro Digestion for Pigs and Poultry. CAB International, Wallingford, United Kingdom, 3-18.
Low, A.G., Rainbird, A.L., 1984. Effect of guar gum on nitrogen secretion into isolated loops of jejunum in conscious growing pigs. Br. J. Nutr., 52 :499-505.
Low, A.G., Partridge, I.G., Taylor, J. A., 1988. Effect of différents types of supplementary non starch polysaccharides on nitrogen and energy digestibility (ileal and overall)-ahd retention in pigs. Wiss. Z. Wilhem Pieck Univ. Restock, Nat Wiss Reihe, 37 : 98-99.
Low, A.G., 1985. Role of dietary fibre in pig diets. In Haiesign, W., Cole, D.J. A. Eds. Rec. Adv. Anim. Nutr. London, Butterworths, 87-112.
Lyons, T.P., 1987. Probiotics : an alternative to antibiotics. Pig News Inf., 8,157-164. Mc Nab, J.M., Wilson, B.J., 1974. Effects of micronizing on the utilization of field beans (Vicia
faba L.) by the young chick. J. Sei. Food Agric, 25 : 395-400. Maillard, R., Kiener, T., Bertrand, S., 1990. Digestibilité réelle; mesurée au niveau iléal des .acides
aminés de la feverole et du lupin. Journées Rech Porcine en France, 22 :223-228. Mariscal landin, G., 1992. Facteurs de variation de l'utilisation digestive des acides aminés chez
le porc. Thèse d'Université. Rennes, France. 135 p Marlier, L., Focant, M., Allart, B., Vanbelle, M., 1989. Effets du floconnage et de l'extrusion
sur la valeur alimentaire du pois proteagineux pour le porc cnarcutiçï. Ann Zootech., 38 : 237-245. . - ,
Marquardt, R.R., Campbell, L.D., Stothers, S.C., Mc Kirdy, J.A., 1974. Growth respenses of chicks and rats fed diets containing four cultivars of raw or autoclaved faba beaps. Can. J. Anim. Sei., 54:177-182. * > .
Marquardt, R.R., 1989. Dietary effects of tannins,, vicine and cônvicine. In Huisman, J., van der Poel, T.F.B., Liener, I.E. Eds. Proceedings of the 1st International Workshop on Antinutritional Factors in Legume Seeds, Wageningen? The Netherlands, 23 - 25 November 1988.141 -155.
Masvaure, S.M., Miller, E.L., 1991. The'digestion of protein and disulphide bonds in protein by growing pigs fed diets containing barley, barley plus fish meal, or barley plus soyabean meal as the sources of protein. In Eggum, B.D., Boisen, S., Borsting, G, Danfaer, A., Hvelplund, T. Eds. Proceedings of the 6 th International Symposium on Protein Metabolism and Nutrition. Henning, Danmark, 9-14 June, 2:15-17.
Metayer, J.P., Castaing, J., Grosjean, F., 1993. Study of variability in French cereals. Anim. Feed Sei. Technol., in press
Miller, B.J., Newby, T.J., Stokes, GR., Hampson, D.J., Brown, P.J., Boume, F.J., 1984 . The importance of dietary antigen in the cause of post weaning diarrhoea in the pig. Am. J. Vet. Res., 45:1730-1 733.
Mitaru, B.N., Reichert, R.D., Blair, R., 1984 a. The binding of dietary protein by sorghum tannins in the digestive tract of pigs. J. Nutr., 114 :1 787-1 796.
Mitaru, B.N., Reichert, R.D., Blair, R., 1984 b. Nutritive value of reconstituted sorghum for weanling pigs. J. Anim. Sei., 58 :1 211-1 215.
Morgan, C.A., Whittemore, CT., Cockburn, J.H.S., 1984. The effect of level and source of protein, fibre and fat in the diet on the energy value of compounded pig feeds. Anim. Feed Sei. Technol., 11:11-34.
Morgan, C.A., Whittemore, CT., 1988. Dietary fibre and nitrogen excretion and retention by pigs. Anim. Feed Sei. Technol., 19:185-189.
86
Mosenthin, R., Sauer, W.C., Ozimeck, L., Ahrens, F., 1989. The effect of dietary pectin on digestibility of protein and amino acids. In 68 th Annual Feeder's Day Report, 44-45.
Mosenthin, R., Sauer, W.C., 1991. The effect of source of fiber on pancreatic secretions and on amino acid digestibility in the pig. J. Anim. Physiol, a. Anim. Nutr., 65 :45-52.
Mroz, Z., Jongbloed, A. W., Kemme, P.A., Lenis, N.P., 1991. Ileal and overall digestibility of nitrogen and amino acids in a diet for pigs as influenced by Aspergillers niger phytase and feeding frequency or levels. In Eggum, B. O., Boisen, S., Borsting, C , Danfaer, A., Hvelplund, T. Eds. Proceedings of the 6 th International Symposium on Protein Metabolism and Nutrition. Herning, Denmark, 9-14 June, 2 : 225-227.
Murray, A.G., Fuller, M.F., Pirie, A.R., 1977. The effect of fibre in form of various poly-sac-charides on the apparent digestibility of protein in the pig. Anim.Prod., 24 :139 (Abstr.).
Myer, R.O., Gorber, D.W., Combs, G.E., 1986. Nutritive value of high-and low-tannin grain sorghums havested and stored in the high moisture state for growing-finishing swine. J. Anim.Sci., 62 :1 290-1 297.
Myer, R.O., Combs, G.E., Gorbet, D.W., 1991. Assessment of two methods to improve the nutritive value of high-tannin grain sorghum for growing finishing swine. In Eggum, B. O., Boisen, S., Borsting, C , Danfaer, A., Hvelplund, T. Eds. Proceeding of the 6 th International Symposium on Protein Metabolism and Nutrition. Herning, Denmark, 9-14 June, 2:213-215.
Nielsen, S.S., Deshpande, S.S., Hermodson, M.A., Scott, M.P., 1988. Comparative digestibility of legume storage proteins. J. Agric. Food Chem., 36 : 896-902.
Noblet, J., Fortune, H„ Dubois, S., Henry, Y., 1989. Nouvelles bases d'estimation des teneurs en energie digestible métabolisable et nette des aliments pour le porc. INRA, Paris, 106 p.
Noblet, J., Dupire, C , Fortune, H., 1990. Valeur nutritionnelle de treize matières premières pour le porc en croissance. 2.Teneur en protéines et acides aminés digestibles. Journées Rech. Porcine en France, 22 :229-236.
Ozimeck, L., Sauer, W.C., Ozimeck, G., 1985. The response of the secretion and activity of pancreatic enzymes to the quality and quantity of fat. In Just, A., Jorgensen, H„ Fernandez, J. A. Eds. Proceedings of the 3 rd International Seminar on Digestive physiology in the Pig. Copenhagen, Denmark, 146-148.
Partridge, I.G., Low, A.G., Sambrook, I.E., Coning, T., 1982. The influence of diet on the exocrine pancreatic secretion of growing pigs. Br. J. Nutr., 48 : 137-145.
Peace, R.W., Keith, M.O., Sarwar, G., Botting, H.G., 1988. Effects of storage on protein nutritional quality of grain legumes. J. Food Sei., 53 : 439-459.
Peers, D.G., Taylor, A.G., Whittemore, CT., 1977. The influence of feeding level and level of dietary inclusion on the digestibility of barley meal in the pig. Anim.Feed Sei. Technol., 2
: 41-47. Peer, D.J., Leeson, S., 1985. Feeding value of hydroponically sprouted barley for poultry and pigs.
Anim. Feed. Sei. Technol., 13 :183-190. Perez, J.M., Bourdon, D., 1984. Prévision de la valeur énergétique et azotée des sorghos à partir
de leurs teneurs en tanins. Journées Rech. Porcine en France, 16 : 293-300. Perez, J.M., Bourdon, D., Baudet, J.J., Evrard, J., 1986. Prévision de la valeur énergétique des
tourteaux de tournesol à partir de leurs teneurs en constituants pariétaux. Journées Rech. Porcine en France, 18 : 35-46.
Plett, D., Aheme, F.X., Hancock, M.J., 1987. Effect of frost damage and preharvest sprouting on the feeding value of barley for pigs. 66 th Annual Feeder's Day Report, 10-12.
Poel, T.F.B.van der, Blonk, J., van Zuilichem, D.J., van Oort, M.G., 1990. Thermal inactivation of lectins and trypsin inhibitor activity during steam processing of dry beans (Phaseolus vulgaris) and effects on protein quality. J. Sei. Food Agric, 53 : 215 -228.
Poel, A.F.B.,van der, 1990. Effect of processing on antinutritional factors and protein nutritional value of dry beans (Phaseolus Vulgaris, L.). A review. Anim. Feed Sei. Technol., 29 :179-208.
Poel, A.F.B.,van der, Gravendeel, S., Boer, H., 1991 a. Effect of different processing methods on tannin content and in vitro protein digestibility of faba bean (Vicia faba L.). Anim. Feed Sei. Technol, 33 :49-58.
Poel, A.F.B.,van der, Kemp, B., Wähle, E.R.,van Zuilichem, D.J., 1991 b. Pig ileal digestibility associated with antinutritional factors and protein quality in Phaseolus beans and soyabeans. In Verstegen M.W.A., Huisman J., den Hartog L.A. Eds. Proceedings of the 5th International Symposium on Digestive Physiology in Pigs. Wageningen, The Netherlands, 24-26 April 1991,50-54.
87
Potkins, Z.V., Lawrence, T.L.J., Thomlinson, J.R., 1991. Effects on ileal apparent digestibility in the growing pig of replacing barley with bran, oatmeal by product, guar gum and pectin. Anim. Feed Sei. Technol., 35 :171-179.
Pusztai, A., 1989. Biological effects of dietary lectins. In Huisman, J., van der Poel, A.F.B., Liener I.E. Proceedings of the 1st International Workshop on Antinutritional Factors in Legume Seeds. Wageningen, The Netherlands, 23 - 25 November 1988,17-29.
Rackis, J.J., 1966. Soyabean trypsin inhibitors : their inactivation during meal processing. Food Technol., 20:1482-1 491.
Rakowska, M., Boros, D., Kupiec, R., Rybka, K., 1991. Protein digestion and the antinutritive compounds in cereal grains. In Eggum, B.D., Boisen, S., Borsting, G, Danfaer, A., Hvelplund, T. Eds. Proceedings of the 6 th International Symposium on Protein Metabolism and Nutrition. Herning, Denmark, 9-14 June, 2:234-236.
Ratcliffe, B., Smith, M.W., Miller, B.G., James, P.S., Bourne, F.J., 1989. Effect of soya-bean protein on the ability of gnotobiotic pig intestine to digest and absorb nutrients. J. Agric. Sei., 112:123-130.
Reddy, I.M., Kella, N.K.D., Kinsella, J.E., 1988. Structural and conformational basis of the resistance of beta lactoglobulin to peptic and chymotryptic digestion. J. Agric. Food Chem., 36:737-741.
Rerat, A., 1981. Contribution du gros intestin à la digestion des glucides et des matières azotées chez le monogastrique omnivore. Reprod. Nutr. Develop., 21 815-847.
Rhone Poulenc Animal Nutrition, 1989. Nutrition guide, 1st edition. Commentry, France, 34 p. Rodriguez, J.P., Bayley, H.S., 1987. Steam heated culled beans : nutritional value artf digestibility
for swine. Can. J. Anim. Sei., 67 : 803-810. Romero, J., Ryan, D.S.; 1978. Susceptibility of the major'storage protein of the bean, Phaseolus
vulgaris L., to in vitro enzymatic hydrolysis. J.Agric. Food Chem., 26 :784-788. Rotter, B.A., 1990. The future of crude enzyme supplements in pig nutrition. Pig news Inf., 11 :
15-17. Ruckebush, Y., Bueno, L., Fioramonti, J., 1981. Constituants alimentaires et motricité digestive.
Reprod. Nutr. Develop., 21 :749-771. Rychen, G., Simoes Nunes, G, 1993. Effets nutritionnels d'un probiotique microbien chez le
porc en croissance-finition. Journées Rech. Porcine en France, 25 :225-228. Sambrook, I.E., 1981. Studies in the flow and composition of bile in growing pigs. J. Sei. Food
Agric, 32:781-791. Sandoval, R.A., Nielsen, T.K., Sorensen, P.H., 1987. Effect of fibres on nutrient digestion and
time of passage in growing pigs. Acta Agric. Scand., 37 : 367-373.' ' Sauer, W.G, Stothers, S.G, Philips, G.D.,1977 a. Apparent availabilities of amino acids in com,
wheat and barley for growing pigs. Can. J. Anim. Sei., 57 :585-597. Sauer, W.G, Stothers, S.G, Parker, R.J., 197?b.,Apparent and true availabilities of amino acids in
wheat and milling by products for growing pigs. Can.-J. Anim. Sei., 57 : 775-784. Sauer, W.G, Just, A., Jorgensen, H.H., Fekadu, M., Eggum, B.O', 1980. The influence of diet
composition on the apparent digestibility of crude protein and amino acids at the terminal ileum and overall in pigs. Acta Agric. Scarid., 30 ; 449-459.
Sauer, W.G, Just, A., Jorgensen, H., 1982. The influence of daily feed injake on the apparent digestibility of crude protein, amino acids, calcium and phosphorus at the terminal ileum and overall in pigs. Z. Tierphysiol., Tieremährg. u. Futtermittelkde., 48 :177-182.
Sauer, W.G, Mosenthin, R., Aniens, F., den Hartog, L.A., 1991. The effect of source of fiber on ileal and fecal amino acid digestibility and bacterial nitrogen excretion in growing pigs. J. Anim. Sei., 69 :4 070-4 077.
Savelkoul, F.H.M.G., Boer, H., Tamminga, S., van Oort, M.G., 1992. Biotechnological degradation of lectins, tannins and trypsin inhibitors in legumes. In proceedings of the 1 st European Conference on Grain Legumes. Angers, France, 1-3 June, 397-398.
Savoie, L., Galibois, I., Parent, G., Charbonneau, R., 1988. Sequential release of amir».acids and peptides during in vitro digestion of casein and rapeseed proteins. Nutr. Res. 8 :1 319-1326.
Savoie, L., 1991. In vitro simulation of protein digestion : an integrated approach. In Fuller, M.F. Ed. In Vitro Digestion for Pigs and Poultry. C.A.B. International, Wallingford, United Kingdom, 146-161.
Schutte, J.B., de Jong, J., Polziehn, R., Verstegen, M.W.A., 1991. Nutritional implications of D-xylose in pigs. Br. J. Nutr., 66 : 83-93.
Schutte, J.B., de Jong, J., Van Weerden, E. J., Tamminga, S., 1992. Nutritional implications of L-arabinose in pigs. Br. J. Nutr., 68 :195-207.
SCEES, 1993. Les matières premières de l'alimentation animale en 1991. A paraître.
88
Semino, G.A., Restans, P., Cerletti, P., 1985. Effect of bound carbohydrate on the action of trypsin on lupin seed glycoproteins. J. Agric. Food Chem., 33 :196-199.
Shem, M.N., Lekule, F.P., Zakayo, G.Z., Eggum, B.O., 1990. Nutritive Value of germinated and ungerminated high tannin sorghum for growing pigs. Acta Agric. Scand., 40:253-258.
Sissons, J.W., 1989. Potential of probiotic organisms to prevent diarrhoea and promote digestion in farm animals. A review. J. Sei. Food Agric. : 49:1-13.
Souffrant, W.B., 1991. Endogenous nitrogen losses during digestion in pigs. In Verstegen, M. W. A., Huisman, J., den Hartog, L.A. Eds. Proceedings of the 5 th International Symposium on Digestive Physiology in Pigs. Wageningen, The Netherlands, 24-26 april, 147-166.
Stanogias, G., Pearce, G.R., 1985. The digestion of fibre by pigs.l.The effect of amount and type of fibre on apparent digestibility, nitrogen balance and rate of passage. Br. J. Nutr, 53 : 513-530.
Stokes,C.R„ Miller, B.G., Bailey, M., Wilson, A.D., Bourne, F.J., 1987. The immune response to dietary antigens and its influence on disease susceptibility in farm animals. Vet Immunol. Immunopathol., 17 :413-423.
Taverner, M.R., Farrell, D.J., 1981. Availibility to pigs of amino acids and energy in grains. Br. J. Nutr., 46:181-192.
Theander, O., Westerlund, E„ Aman, P., Graham, H., 1989. Plant cell walls and monogastric diets. Anim. Feed Sei. Technol., 23 :205-225.
Thacker, P.A., Campbell, G.L., Grootwassink, J.W.D., 1988. The effect of beta glucanase supplementation on the performance of pigs fed hulless barley. Nutr. Rep. Int. 38 :91-99.
Turlington, W.H., Allee, G.L., Nelssen, J.L., 1989. Effects of protein and carbohydrate sources on digestibility and digesta flow rate in weaned pigs fed a high-fat, dry diet. J. Anim.Sci., 67 : 2 333-2 340.
Valdebouze, P., Bergeron, E., Gaborit, T., Delort-Laval, J., 1980. Content and distribution of trypsin inhibitors and hemagglutinins in some legume seeds. Can. J. Plant Sei., 60 : 695 -701.
Valette, P., Malouin, H„ Coning, T., Savoie, L., 1991. Impact of exocrine pancreatic adaptation on in vitro protein digestibility. In Verstegen, M.W.A., Huisman, J., den Hartog, L.A. Eds. Proceedings of the 5 th International Symposium on Digestive Physiology in Pigs. Wageningen, The Netherlands, 24-26 April, 250-253.
Valette, P., Malouin, H., Corring, T., Savoie, L., Gueugneau, A.M., Berot, S., 1992. Effects of diets containing casein and rapeseed on enzyme secretion from the exocrine pancreas in the pig. Br. J. Nutr., 67 :215-222.
Vanbelle, M., Teller, E., Focant, M., 1990. Probiotics in animal nutrition : a review. Arch. Anim. Nutr., Berlin, 40 : 543-567.
Vandergrift, W.L., 1985. Use of soyabeans in pig diets. Pig News Inf. 6 :281-285. Wenk, C., 1992. Enzymes in the nutrition of monogastric farm animals. In Lyons, T.P., Ed.
Proceedings of Alltech's 8 th Annual Symposium. Alltech Technical Publications, Nicholasville, USA, 205-218.
Wiseman, J., Jagger, S., Cole, D.J.A., Haresign, W., 1991. The digestion and utilization of amino acids of heat-treated fishmeal by growing/finishing pigs. Anima.Prod., 53 : 215-225.
Wünsche, J., Henning, U., Meinl, M., Kreisenbring, F., Bock, H.D., 1982. Investigation of the absorbtion and utilization of amino acids infused into the caecum of growing pigs. IN-balance measurement with regard to the utilization of lysine and isoleucine arid requirement of growing pigs. Arch. Tierernähr, 32 : 337-348.
Wünsche, J., Herrmann, U., Meinl, M., Henning, U., Bring, F. K., Zwierz, P., 1987. Influence of endogenous factors on the precaecal nutrient and amino acid absorbtion of pigs with ileo rectal anastomoses. 1. Influence of the fineness of cereal grinding. Arch. Anim. Nutr., Berlin, 9 :745-764.
Zebrowska, T., Buraczewska, L., 1972. [Influence of dietary protein level on the rate of digestion in the small intestine of pigs. 2. The rate of protein digestion and absorbtion of amino acids]. Rocz. nauk Roln., Ser B 94,97-109.
Zebrowska, T., 1973. Digestion and absorbtion of nitrogenous compounds in the large intestine of pigs. Roczniki Nauk Roln., Ser B, 95-3 : 85-90.
Zebrowska, T., Low, A.G., Zebrowska, H., 1983. Studies on gastric digestion of protein and carbohydrate, gastric secretion and exocrine pancreatic secretion in die growing pig. Br. J. Nutr., 49:401-410.
Zuilichem, D.J. van, van der Poel, A.F.B., 1989. Effect of HTST treatment of Pisum sativum on the inactivation of antinutritional factors. In Huisman, J., van der Poel, A.F.B., Liener, I.E. Eds. Proceedings of the 1st International Workshop on Antinutritional Factors in Legume Seeds. Wageningen, The Netherlands, 23 - 25 November 1988,263-267.
Ä model to describe the effect of nutrition on growth, body composition and nitrogen excretion in pigs.
A. Susenbeth
University of Hohenheim, Institute of Animal Nutrition 7000 Stuttgart 70, Germany
Summary
The principles of a model are presented, which predict the effect of nutrition on growth, body composition and nitrogen excretion in pigs. The model is based on the energy and protein metabolism, on which the effects of essential amino acids, energy intake and animal properties are quantified. The constancy of the chemical composition of the fat free body and of the protein partition to several body tissues is used, to predict body mass gain and lean percentage in carcass from protein and fat retention.
/ Key words: Pig, growth, body composition, nitrogen excre
tion, energy metabolism, protein metabolism, essential amino acids, model.
Introduction
The aim of the research presented here is to show the principles of a model, which describes the'relationships between nutrient and energy intake and the response of the animal, which is growth, protein and fat retention, anatomical composition and nutrien^ excretion. The intension is that all relevant influences Mid responses in pig production with regard to nutrition- have 'to' be integrated and linked together within one model. The% model allows to • calculate the effects of nutrition ,in terms of biological responses as well as in-terms of economical benefit and to give information about the amount of nutrients released to the environment.
Results
a) Energy Metabolism
The energy metabolism of an animal can be regarded as" a strong frame of the metabolism, which cannot be transgressed. However within this frame nutrition and animal properties can develop and show their influences, evident for example in the modifications of the protein-fat ratio in gain. The energy metabolism is determined by the amount of energy necessary for maintenance, for physical activity and for interactions with environmental conditions and by the efficiency of energy utilization for growth.
90
- Efficiency of energy utilization for growth
On the basis of a comprehensive literature study it could be demonstrated, that the efficiency of energy utilization for growth is independent of the composition of body gain (fat-protein ratio), of age, breed, sex and of protein or amino acid supply (Susenbeth, 1993). The mean value for this efficiency is 0.70. This means, that the sum of the energetic value of protein and fat retained is always constant at equal energy intake and maintenance metabolism. This fact can be used to simplify growth models, since protein or fat retention respectively can be quantified, when one of both is known, by calculation of the difference to the retained energy.
This observation seems to be in contrast to the fact, that the efficiency of energy utilization for protein retention is lower than that for fat retention. A high protein reten-tion therefore should lead to a lower efficiency for energy retention. However this theoretical relationship cannot be confirmed by experimental results. It can be assumed that the reason for this contrast can be identified as the variation in protein turnover. Therefore a higher accuracy for the calculation of energy utilization cannot be/expected, when constant values for the efficiency for protein and for fat retention, respectively, are used.
- Energy maintenance metabolism
Energy maintenance metabolism related to metabolic body mass is a constant term for different species (Kleiber, 1961). Young animals show higher values as compared to older ones. The experimental measurement of the energy maintenance metabolism of growing animals necessitates a strong feed restriction. The question arises, whether values measured under these conditions can be used for fast growing animals. For example animals subjected to restricted feed intake show increased physical activity. It can be assumed that energy requirement for physical activity is two times higher in animals fed at maintenance level compared to those fed at high feeding level.
It is evident that a number of influences on energy maintenance metabolism is valid at a low feeding level only, which leads to a statistically positive correlation between maintenance metabolism and efficiency of energy utilization for growth. Therefore energy retention at a high feeding level is influenced by less factors and is a parameter of energy metabolism, which shows a higher constancy than values for energy maintenance metabolism.
- Energy retention
On the basis of a comprehensive literature study Susenbeth (1993) described the effect of body mass (W; kg) on energy retention (RE; kJ/kg WA0.75) at 1.2 MJ metabolizable energy intake per kg WA0.75 by the following equation:
91
RE = 537.3 - 4.986 W + 0.10802 WA2 - 0.00055399 WA3,
where values for <30 kg and >100 kg are those for 30 kg and 100 kg body mass. Energy retention at energy intake differing from 1.2 MJ can be calculated by using the mean value of 0.70 for efficiency of energy utilization. Therefore energy retention can be estimated with a relatively high accuracy without assuming any value for energy maintenance metabolism.
b) Protein Retention
- The effect of energy intake and growth potential
The effect of energy intake on protein retention depends on the growth potential of the animal. Therefore the increase of protein retention by energy intake is higher in young than in older animals. The same can be said about the effects of differences in breeds and sex. An equation was developed by Susenbeth (1993), which describes the effect of energy intake (IME; MJ ME/kg WA0.75) on protein -retention (RPE; MJ/kg WA0.75) in dependence on the actual performance level, which is protein retention at a given energy intake (RPEi,IMEi): '
(IME-IMEi) RPE = -0.015 +0.19 IME +(RPEi -0.19 IMEi +0.015) e
Experiments, from which the change in'growth performance during the whole growing period can be derived, are rare. A first estimate can be made on the basis of data of an experiment of Gaus (1984). Animals were fed at two energy levels, where protein retention was not limited by protein and animo acid supply. Protein retention amounted .135 g/d and 160 g/d at 1.15 and 1'.35 MJ ME/kg" WA0.75, repectively, throughout the period between 35 and 110 kg body mass. These results agree well with,the estimated effects*calculated by the equation shown abotfe. , •• ,
- The effect of lysine intake on protein retention
A great number of results of experiments is published, in which the effect of lysine inta*ke on growth is measured. A general evaluation of all data shows, that lysine increases protein retention linearily, when no other nutrient factor or the growth potential limits protein retention. For this case the relationship between lysine intake and lysine retention can be described by following equation:
Lysine retention = 0.5 lysine intake, '"•
where lysine retention is calculated from protein retention assuming a lysine concentration in protein of 6 % for Imbalance experiments and of 7 % for slaughter experiments. Therefore 1 g lysine intake leads to an increase of 7 g protein retention. However this effect is reduced, when other nutrients limit protein retention, i.e. energy or
92
other essential amino acids. In this case protein retention responds to lysine intake in a non-linear matter, and reaches a plateau phase, when other nutrients are first-limiting. The effect of other amino acids and their ratio to lysine is discussed in the next paragraph.
- Optimal amino acid pattern of feed protein
It is well known that the effect of a single essential amino acid (AA) depends on the level of supply of other essential AA. Several estimates were performed to define that ratio between the AA, at which a reduction of any essential AA or of the sum of non-essential AA leads to a lower protein retention. This AA pattern is called 'ideal protein'. One of this proposals is given in the first column of table 1. The criticism on the definition of an ideal protein in this way is focused on two points: (1) The ideal protein gives no information about the quantitative effect of a lower concentration of an essential AA on protein retention or growth. Therefore the "protein value" of the protein of a diet differing from the ideal composition cannot be defined, and an economical calculation for the practical situation cannot be performed. (2) The concentration of the essential AA of the idéal protein is related to that lysine concentration, at which maximum response of lysine is reached. However, when for example threonine concentration is increased up to that level, at which a further increase of threonine has no positive effect on protein retention, an additional lysine supply increases protein retention again to a certain extent.
Therefore three situations have to be distinguished: a) Low level of intake of AA 1, at which this AA is the first limiting AA, and a supply of other AA has no effect on protein retention. b) Medium level of intake of AA 1, at which both a change in the supply of AA 1 and another AA affect protein retention as well. c) High level of intake of AA 1, at which a futher increase of supply has no effect on protein retention, and an other AA than AA 1 becomes first-limiting.
The consequence is, that a pattern of the ideal protein has to be defined for situation A, at which the increase of other AA than lysine leads to no positive effect, and for situation B as well, at which the increase of lysine supply leads to no further effect on protein retention. For practical purposes a situation between A and B is of great relevance. A first estimate, to define ideal protein composition for both situations, is given in table 1, using a quadratic function to describe the non-linear part of the dose-response relationship between AA intake and protein retention, and assuming, that (a) the effect of lysine above level for maximum efficiency is half of that of maximum efficiency and (b) the non-linear part is 10 % of the linear part.
93
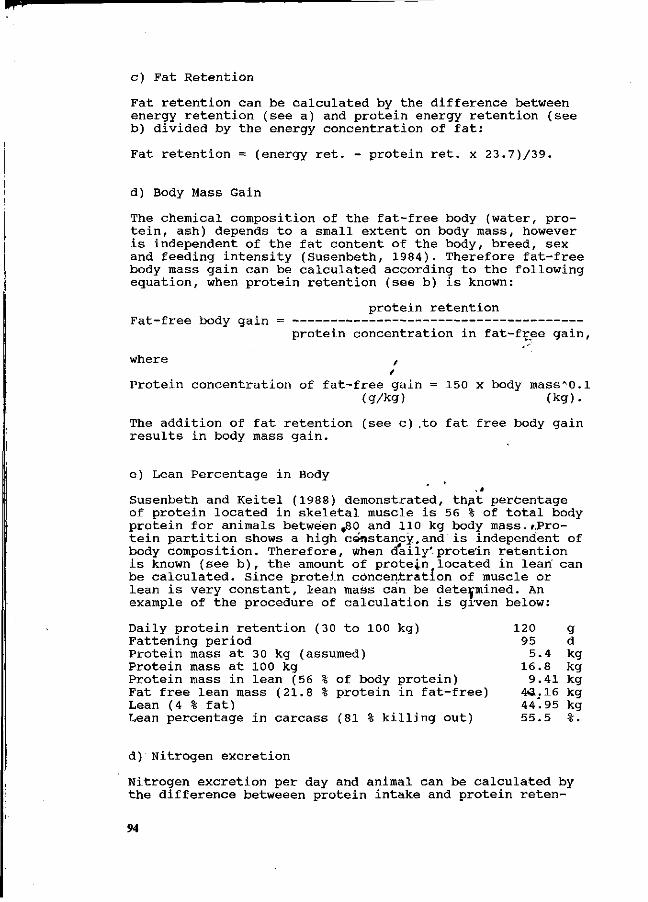
c) Fat Retention
Fat retention can be calculated by the difference between energy retention (see a) and protein energy retention (see b) divided by the energy concentration of fat:
Fat retention = (energy ret. - protein ret. x 23.7)/39.
d) Body Mass Gain
The chemical composition of the fat-free body (water, protein, ash) depends to a small extent on body mass, however is independent of the fat content of the body, breed, sex and feeding intensity (Susenbeth, 1984). Therefore fat-free body mass gain can be calculated according to the following equation, when protein retention (see b) is known:
protein retention Fat-free body gain =
protein concentration in fat-free gain,
where ,
Protein concentration of fat-free gain = 150 x body mass^O.l (g/kg) (kg).
The addition of fat retention (see c) .to fat free body gain results in body mass gain.
e) Lean Percentage in Body , »
Susenbeth and Keitel (1983) demonstrated, that percentage of protein located in skeletal muscle is 56 % of total body protein for animals between ,80 and 110 kg body mass.f.Pro-tein partition shows a high constancy,and is independent of body composition. Therefore, when daily'protein retention is known (see b ) , the amount of protein#located in lean' can be calculated. Since protein concentration of muscle or lean is very constant, lean mass can be determined. An example of the procedure of calculation is grven below:
Daily protein retention (30 to 100 kg) Fattening period Protein mass at 30 kg (assumed) Protein mass at 100 kg Protein mass in lean (56 % of body protein) Fat free lean mass (21.8 % protein in fat-free) Lean (4 % fat) Lean percentage in carcass (81 % killing out)
d) Nitrogen excretion
Nitrogen excretion per day and animal can be calculated by the difference betweeen protein intake and protein reten-
94
120 95
5.4 16.8
9.41 4a.16 44.95 55.5
q d kg kg kg kg kg %.
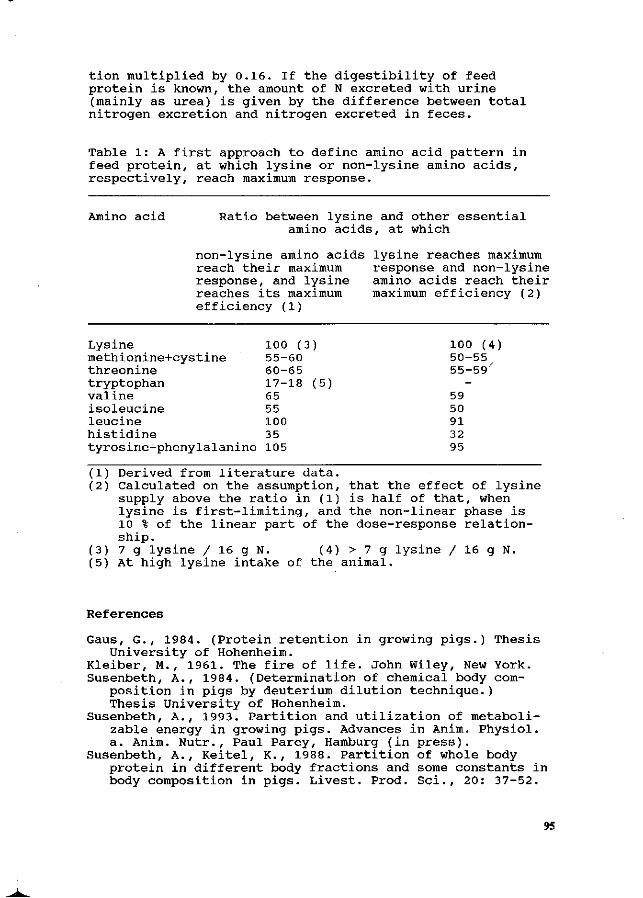
tion multiplied by 0.16. If the digestibility of feed protein is known, the amount of N excreted with urine (mainly as urea) is given by the difference between total nitrogen excretion and nitrogen excreted in feces.
Table 1 : A first approach to define amino acid pattern in feed protein, at which lysine or non-lysine amino acids, respectively, reach maximum response.
Amino acid Ratio between lysine and other essential amino acids, at which
non-lysine amino acids lysine reaches maximum reach their maximum response and non-lysine response, and lysine amino acids reach their reaches its maximum maximum efficiency (2) efficiency (1)
Lysine 100 (3) 100 (4) methionine+cystine 55-60 50-55 threonine 60-65 55-59' tryptophan 17-18 (5) valine 65 59 isoleucine 55 50 leucine 100 91 histidine 35 32 tyrosine+phenylalanine 105 95
(1) Derived from literature data. (2) Calculated on the assumption, that the effect of lysine
supply above the ratio in (1) is half of that, when lysine is first-limiting, and the non-linear phase is 10 % of the linear part of the dose-response relationship.
(3) 7 g lysine / 16 g N. (4) > 7 g lysine / 16 g N. (5) At high lysine intake of the animal.
References
Gaus, G., 1984. (Protein retention in growing pigs.) Thesis University of Hohenheim.
Kleiber, M., 1961. The fire of life. John Wiley, New York. Susenbeth, A., 1984. (Determination of chemical body com
position in pigs by deuterium dilution technique.) Thesis University of Hohenheim.
Susenbeth, A., 1993. Partition and utilization of metaboli-zable energy in growing pigs. Advances in Anim. Physiol, a. Anim. Nutr., Paul Parey, Hamburg (in press).
Susenbeth, A., Keitel, K., 1988. Partition of whole body protein in different body fractions and some constants in body composition in pigs. Livest. Prod. Sei., 20: 37-52.
95
Optimisation of the feeding strategy to minimize the N-excretion by using the Dutch Technical Pig Feeding Model
C.M.C. van der Peet-Schwering1, G.F.V. van der Peet2, H.J. P.M. Vos1,
M.W.A. Verstegen3, E. Kanis4, C.H.M. Smits5, A.G. de Vries6 en N. Lenis7
1Research Institute for Pig Husbandry, POBox 83, 5240 AB Rosmalen; 2IKC department Pig
Husbandry, POBox 328, 5240 AH Rosmalen; 'Wageningen Agricultural University, department
of Animal Nutrition, Haagsteeg 4, 6708 PM Wageningen; 'Wageningen Agricultural
University, department of Animal Breeding, POBox 338, 6708 PM Wageningen; institute for
Animal Nutrition "De Schothorst", POBox 533, 8200 AM Lelystad; 6DLO-Research Institute
for Animal Production, POBox 501, 3700 AM Zeist; 7DLO-Research Institute for Livestock
Feeding and Nutrition, POBox 160, 8200 AD Lelystad. The Netherlands.
Summary
/ The Technical Model Pigfeeding is a modei that predicts the influence
of feed intake, feed composition, genotype, sex and climate on growth
and body composition of healthy growing and finishing pigs and on the
excretion of nitrogen and phosphorus in the manure. The model gives
insight in the possibilities to reduce the nitrogen excretion by feed
intake and feed composition.
Key words: modelling, pig growth, N-excretion, feeding strategy
Introduction
Growth and body composition of 'growing anö fini'shing pigs are
influenced by many factors. The main ones"» are: feed intake, feed
composition, genotype, sex, climate, ho'using, health and stress.
Research usually involves studying the( effect (of one of these factors.
Moreover, the results only apply to the conditions as they have been
used during the experiment. Investigation of the combined effect of all
factors is time consuming and very expensive. Therefore, the working
group "Technical Model Pigfeeding" (TMV) has developed a computer model
to predict the influences of feed intake, feed composition, genotype,
sex and climate on growth and body composition of healthy growing and
finishing pigs (Werkgroep TMV, 1991). It also predicts the influences
on the excretion of nitrogen and phosphorus in the manure and on the
financial results.
96
The model input
For calculating predicted growth, body composition and the excretion of
phosphorus and nitrogen, the model requires the following information:
- live weight at start of the growing period; from this the chemical
composition of the empty body at start is calculated;
- daily feed intake;
- nutrient composition of feed, like energy content and amount of ileal
digestible essential amino acids, protein and total phosphorus;
- maximum capacity for protein deposition;
- minimal fat to protein deposition ratio;
- length of the growing and finishing period in days.
Energy, protein and amino acids for maintenance
A factorial approach is used to predict responses. Every day pigs
consume an amount of energy, protein and amino acids. Energy, protein
and amino acids are used for maintenance and growth. The amount of
energy required for maintenance is calculated daily as: MEm = 0.719 *
kg liveweight0'63 (in MJ) (ARC, 1981) .
Fuller et al. (1989) showed that the ideal amino acid balance for
maintenance is not the same as the ideal balance for growth. In the TMV
the ideal amino acid balance for maintenance (Fuller et al., 1989) is
used to calculate the amount of ileal digestible amino acids required
for maintenance.
Maximum capacity for protein deposition and minimal fat to
protein deposition ratio
Growing and finishing pigs have an intrinsic upper-limit for body
protein deposition which is influenced by genotype and sex (Whittemore,
1983; Moughan et al., 1987; Campbell, 1988; Stranks et al., 1988). In
the pig growth models of Whittemore (1983) and Moughan et al. (1987)
and in the TMV it is assumed that the maximum capacity for protein
deposition (PDmax) is constant between 20 to 110 kg liveweight. PDmax
is only realised when dietary energy and amino acids are not limiting.
There is variation in PDmax between different genotypes and sexes. For
barrows PDmax can range between 100 and 140 g/day, for females between
115 and 155 g/day and for boars between 130 and 175 g/day (Stranks et
al., 1988).
Whittemore & Fawcet (1976) assume that there is a minimal amount of
lipid deposition (LD) accompanying each unit of protein deposition (PD)
below PDmax. Thus, there is a minimal ratio between LD and PD which can
differ between different genotypes and sexes. Below the intrinsic
upper-limit for protein deposition, production energy is partitioned
97
between PD and LD according to this minimal ratio. Above PDmax all
remaining energy is used for lipid deposition.
Energy, protein and amino acids for maximum protein
deposition
The amount of energy for maximum protein deposition is determined by
PDmax, the minimal fat to protein deposition ratio (R) and the
efficiencies of protein and lipid deposition. Lipid is deposited with
an efficiency of 0.75 (ARC, 1981) and protein with an efficiency of
0.45 (Van Es, 1979). This means that 53 MJ ME is necessary for 1 kg of
protein deposition and the same amount of energy for 1 kg of lipid
deposition. The amount of energy for maximum protein deposition is
calculated as: (53 + 53 * R) * PDmax.
A pig also needs amino acids for protein deposition. To calculate the
amount of ileal digestible amino acids for protein deposition the ideal
amino acid balance for growth (Fuller et al., 1989; Wang &»',Fuller,
1990) is used. /
Prediction of performance factors
In the model, each day the protein and lipid déposition are calculated.
Ash deposition is calculated from the protein deposition: ash
deposition = 0.191 * protein deposition (Jongbloed, 1987). The daily
water deposition is also calculated from the daily protein deposition
(Kotarbinska, 1969) . Summation of the daily .protein, 'T-ipid, ash and
water deposition results in the daily empty body weight gain. From the
empty body weight gain the live weight gain and the live body weight at
the end of each day are calculated. Th\s is«repeated every day till the
aimed weight is reached.
The most important results from the model are: live weight at
slaughter, carcass weight, average daily gain, averag^ and total feed
and energy intake, feed and energy conversion ratio, HGP meat
percentage, phosphorus and nitrogen excretion and feeding costs per kg
growth. The nitrogen excretion is calculated as: N-excretion = (protein
provided - protein deposition) / 6.25.
Application of the model ^
The model can be used to develop optimal feeding strategies for growing
and finishing pigs on a specific farm. The feeding strategy has an
effect on the daily gain, the feed conversion ratio, the HGP meat
percentage and also on the N-excretion. Thus, the model can be used to
reduce the N-excretion.
98
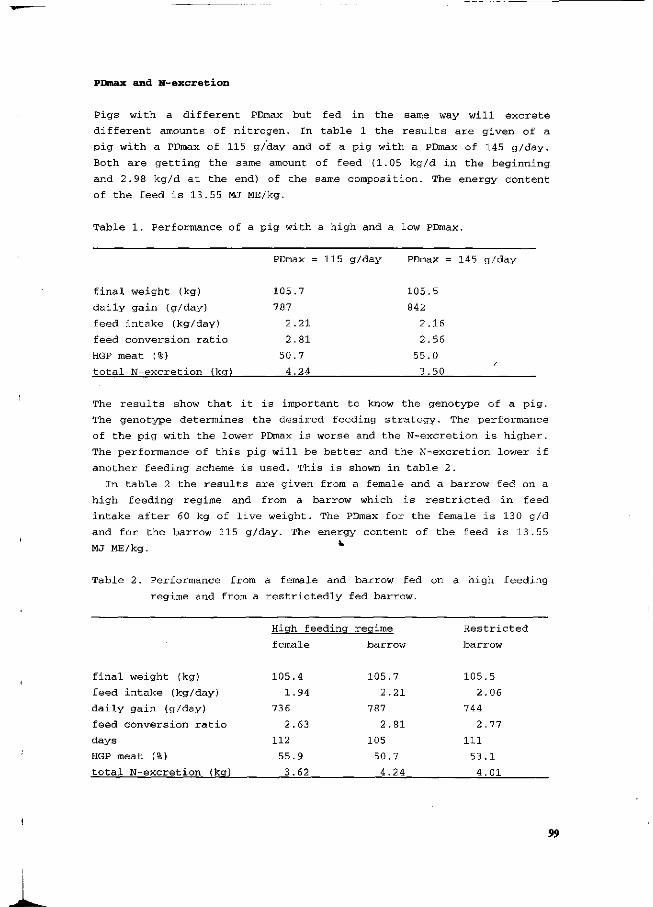
PDmax and N-excretion
Pigs with a different PDmax but fed in the same way will excrete
different amounts of nitrogen. In table 1 the results are given of a
pig with a PDmax of 115 g/day and of a pig with a PDmax of 145 g/day.
Both are getting the same amount of feed (1.05 kg/d in the beginning
and 2.98 kg/d at the end) of the same composition. The energy content
of the feed is 13.55 MJ ME/kg.
Table 1. Performance of a pig with a high and a low PDmax.
PDmax = 115 g/day PDmax = 145 g/day
final weight (kg) 105.7 105.5
daily gain (g/day) 787 842
feed intake (kg/day) 2.21 2.16
feed conversion ratio 2.81 2.56
HGP meat (%) 50.7 55.0
total N-excretion (kg) 4.24 3.50
The results show that it is important to know the genotype of a pig.
The genotype determines the desired feeding strategy. The performance
of the pig with the lower PDmax is worse and the N-excretion is higher.
The performance of this pig will be better and the N-excretion lower if
another feeding scheme is used. This is shown in table 2.
In table 2 the results are given from a female and a barrow fed on a
high feeding regime and from a barrow which is restricted in feed
intake after 60 kg of live weight. The PDmax for the female is 130 g/d
and for the barrow 115 g/day. The energy content of the feed is 13.55
MJ ME/kg. W
Table 2. Performance from a female and barrow fed on a high feeding
regime and from a restrictedly fed barrow.
High feeding regime Restricted
female barrow barrow
final weight (kg)
feed intake (kg/day)
daily gain (g/day)
feed conversion ratio
days
HGP meat (%)
total N-excretion (kg)
105.4
1.94
736
2.63
112
55.9
3.62
105.7
2.21
787
2.81
105
50.7
4.24
105
2
744
2
111
53
4
5
06
77
1
01
99
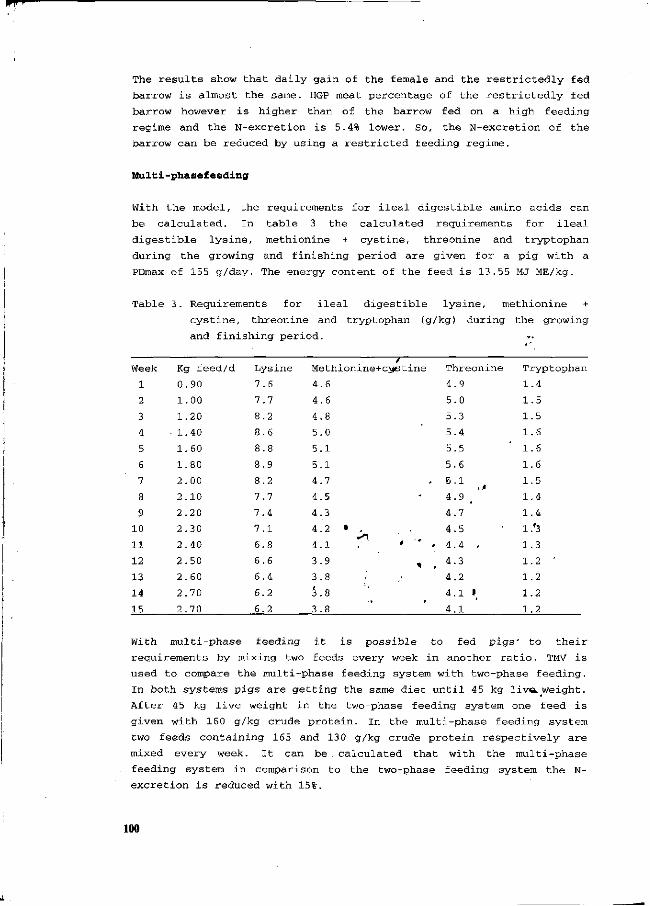
The results show that daily gain of the female and the restrictedly fed
barrow is almost the same. HGP meat percentage of the restrictedly fed
barrow however is higher than of the barrow fed on a high feeding
regime and the N-excretion is 5.4% lower. So, the N-excretion of the
barrow can be reduced by using a restricted feeding regime.
Multi-phasefeeding
With the model, the requirements for ileal digestible amino acids can
be calculated. In table 3 the calculated requirements for ileal
digestible lysine, methionine + cystine, threonine and tryptophan
during the growing and finishing period are given for a pig with a
PDmax of 155 g/day. The energy content of the feed is 13.55 MJ ME/kg.
Table 3. Requirements for ileal digestible lysine, methionine +
cystine, threonine and tryptophan (g/kg) during the growing
and finishing period.
Week
1
2
3
4
5
6
7
8
9
10
11
12
13
14
15
Kg feed/d
0.90
1.00
1.20
1.40
1.60
1.80
2.00
2.10
2.20
2.30
2.40
2.50
2.60
2.70
2.70
Lysine
7.6
7.7
8.2
8.6
8.8
8.9
8.2
7.7
7.4
7.1
6.8
6.6
6.4
6.2
6.2
Methionine+
4.6
4.6
4.8
5.0
5.1
5.1
4.7
4.5
4.3
4.2 •
4.1
3.9
3.8
3.8
3.8
•""!
cyet
*
/
ine
--
" ,
1 ,
Threonine
4.9
5.0
5.3
5.4
5.5
5.6
5.1
4.9 >
4.7
4.5
4.4 ,
4.3
4.2
4.1 »
4.1
Tryptophan
1.4
1.5
1.5
1.6
1.6
1.6
1.5
1.4
1.4
1.'3
1.3
1.2 '
1.2
1.2
1.2
With multi-phase feeding it is possible to fed pigs' to their
requirements by mixing two feeds every week in another ratio. TMV is
used to compare the multi-phase feeding system with two-phase feeding.
In both systems pigs are getting the same diet until 45 kg liv«i. weight.
After 45 kg live weight in the two-phase feeding system one feed is
given with 160 g/kg crude protein. In the multi-phase feeding system
two feeds containing 165 and 130 g/kg crude protein respectively are
mixed every week. It can be calculated that with the multi-phase
feeding system in comparison to the two-phase feeding system the N-
excretion is reduced with 15%.
100
Conclusion
TMV gives insight in the possibilities to reduce the N-excretion by
feed intake and feed composition and can be used to develop optimal
feeding strategies for growing and finishing pigs. For common use in
practice more knowledge of PDmax of the different genotypes is
necessary.
References
Agricultaral Research Council, 1981. The nutrient requirements of pigs.
Technical review by an ARC Working Party. Farnham Royal Slough,
Commonwealth Agricultural Bureaux.
Campbell, R.G., 1988. Nutritional constraints to lean tissue accretion
in farm animals. Nutrition Research Reviews, 1: 233-253.
Es, A.J.H, van, 1979. Energy costs of protein deposition. In: Buttery,
P.J. & Lindsay, D.B. (editors): Protein deposition in animals.
Butterworths, London-Boston, p. 215-224. /
Fuller, M.F., McWilliam, R. , Wang, T.C. & Giles, L.R., 1989. The
optimim dietary amino acid pattern for growing pigs. 2. Requirements
for maintenance and for tissue protein accretion. British Journal of
Nutrition, 62: 255-267.
Jongbloed, A.W., 1987. Phosphorus in the feeding of pigs. PhD Thesis.
Research Institute for Livestock Feeding and Nutrition, Lelystad.
Kotarbinska, M. , 1969. Badania nad przemiana energii u Rosnacych swin.
Institute Zootechnology, Krakow, Wydawn. Wlasne no. 238.
Moughan, P.J., Smith, W.C. & Pearson, G., 1987. Description and
validation of a model simulating growth in the pig (20-90 kg
liveweight). New Zealand Journal of Agricultural Research, 30: 481-
489.
Stranks, M.H., Cooke, B.C., Fairbarn, C.B., Fowler, N.G., Kirby, P.S.,
McCracken K.J., Morgan, CA., Palmer, F.G. & Peers, D.G., 1988.
Nutrient allowances for growing pigs. Research and Development in
Agriculture, 5: 71-88.
Wang, T.C. & Fuller M.F., 1990. The effect of plane of nutrition on the
optimum dietary amino acid pattern for growing pigs• Animal
Production, 50: 155-164.
Werkgroep TMV, 1991. Informatiemodel Technisch Model Varkensvoeding.
Research report P 1.66. Research Institute for Pig Husbandry,
Rosmalen.
Whittemore, C.T., 1983. Development of recommended energy and protein
allowances for growing pigs. Agricultural Systems, 11: 159-186.
Whittemore, C.T. & Fawcett, R.H., 197 6. Theoretical aspects of a
flexible model to simulate protein and lipid growth in pigs. Animal
Production, 22: 87-96.
101
Deposition, utilization and requirements of protein in growing pigs: a factorial approach
P. Bikker, M.W.A. Verstegen and R.G. Campbell1
Wageningen Agricultural University, Department of Animal Nutrition, Haagsteeg 4, 6708 PM
Wageningen, The Netherlands.
Bunge Meat Industries Ltd., Redlands Road, Corowa, N.S.W. 2646, Australia.
Summary
Ninety female pigs were fed rations ranging from 127 to 350 g protein per day in 15 graduated steps
at energy intake levels of 2.5 or 3.0 times energy for maintenance. Protein and lysine deposition rates
increased linearly with increasing protein intake until a plateau in deposition was reached. At protein
deficient diets protein and lysine deposition were independent of energy intake. Marginal efficiencies
of utilization of ileal digestible protein for protein deposition and lysine for lysine .deposition were
.58 and .74 respectively. At adequate protein intake prptein and lysine deposition were related to
energy intake and independent of protein intake. At eacn of the two energy intake levels the plateau
in protein deposition rate was reached at a ratio of .62 g ileal digestible lysine per MJ DE in the diet.
Based on these results a factorial approach is proposed to estimate the required dietary lysine/energy
ratio for maximum protein deposition. Using this approach effects of energy intake, live weight, sex,
and genotype on the lysine/energy ratio have been evaluated.
keywords: pig, protein, lysine, deposition, utilization, requirements, factorial approach.
Introduction
Utilization of dietary protein depends both onthe-composition of the diet, i.e. amino acid pattern and
protein to energy ratio, and the efficiency with' which body protein is being deposited. A correct
estimate of this efficiency is essential for calculation of the pig*s requirements of dietary protein based
on a factorial approach. Whether this efficiency is, affected by protein intake and dietary protein to
energy ratio is still a matter of debate (Fuller, 1991). Furthermore, in 'order to optimize protein
utilization it is necessary to feed the animal a diet with an appropriate protein to energy ratio. This
optimum protein to energy ratio can be affected by feeding level, sex, genotype and live weight of
the animal. The present study was undertaken to elucidate some of these effects. The objectives were
to determine: (1) the relationship between ileal digestible protein and lysine intake and protein and
lysine deposition respectively; (2) the utilization of ileal digestible protein and lysine; («3,) the separate
effects of protein and energy intake on protein and lysine utilization; (4) the optimum dietary ileal
digestible lysine to energy ratio and (5) the effect of energy intake level on this optimum lysine
content. In this paper experimental design and results of this study are reported briefly. In addition
a factorial approach of the required dietary lysine to energy ratio will be proposed. On the basis of
this approach the effect of feed intake, live weight, sex and genotype on the optimal lysine to energy
ratio will be evaluated.
102
Experimental procedures
Animals and design. Ninety five female pigs of a commercial hybrid (VOC Nieuw Dalland) were used
in this study. At an average live weight of 20 kg 90 animals were allocated on the basis of live weight
to 30 treatments in a 2 * 15 factorial arrangement with three pigs per treatment. The respective
treatments were energy intake level, equivalent to 2.5 (2.5*M) and 3.0 (3.0*M) times energy required
for maintenance, and protein intake ranging from 127 to 350 g/day in 15 graduated steps. To enable
the calculation of nutrient retention five animals were sacrificed at commencement of the experiment
for determination of initial body composition at 20 kg live weight.
Diets and feeding. In order to obtain the 15 protein intake steps at the lower energy intake level the
animals were fed rations with a calculated lysine content ranging from .44 to 1.24 g/MJ DE. To
ensure a constant dietary amino acid pattern a protein-rich (Diet 1) and a protein-free diet (Diet 2)
were formulated. Diet 1 mainly consisted of barley, soya bean meal, maize gluten meal, herring meal,
skimmed milk powder, and potato protein whereas maize starch, dextrose, animal fat and soya bean
oil were the main ingredients of Diet 2. The composition of the diets will be published elsewhere
(Bikker et al., in prep.).
It was the aim of this study to determine the efficiency of lysine utilization. Therefore, apart from
lysine, all other essential amino acids were included in Diet 1 at or above contents in ideal protein
(Wang & Fuller, 1990). Lysine in Diet 1 was made the first limiting amino acid by using an amount
of 80% of the lysine in ideal protein. Ileal digestibility of crude protein and amino acids was
determined in a digestibility experiment involving five entire male pigs averaging 28.6±.5 kg live
weight and fitted with Post-Valve T-Caecum (PVTC) cannulas (Van Leeuwen et al., 1991).
At the low energy intake level (2.5*M) animals received on average 15.8 MJ DE per day. To
determine the effect of non-protein energy on protein deposition and utilization independent of protein
intake, a second group of three animals received the same diet with in addition an extra amount of
protein-free energy (Diet 2) of 3.0 MJ per day at each of the 15 protein intake levels. Consequently
lysine/energy ratios at the high intake level were 83% of the ratios at the low intake level and ranged
from .37 to 1.03 g/MJ DE. The animals were fed according to a scale based on metabolic live weight
with maintenance requirements taken as .475 MJ DE/kg75 (ARC, 1981).
Management and carcass analysis. The pigs were housed individually in pens with half slatted floors in an insulated shed. They were fed equal rations twice daily at 800 and 1600. Water was available ad libitum. The animals were weighed twice a week and feed allowances were adjusted accordingly. At 45 kg the animals were sacrificed by electric stunning and exsanguination and dissected. Blood and organs were collected and stored together at -20°C, after emptying the gastrointestinal tract. The eviscerated carcass was split longitudinally and the right halfwas also stored at -20°C. In a later stage these fractions were homogenized and sampled for chemical analyses as described by Bikker et al. (in prep.). In addition defatted carcass and organ samples were ground and amino acid content was determined subsequently at the laboratories of Eurolysine (Paris).
Statistical analysis. Four animals had to be excluded from the experiment. For the remaining animals,
44 and 42 at the low and high energy intake level respectively, the effect of protein and lysine intake
103
on deposition and utilization parameters was analyzed with regression analysis. The effect of energy
intake on the regression parameters was determined using a dummy variable and the method of
backward elimination as described by Kleinbaum et al. (1988) and Bikker et al. (in prep.). Linear,
quadratic and two-phase linear models were used, of which the latter was only used if a significant
quadratic component had been found. To describe a linear-plateau relationship the following model,
based on Van der Peet (1987) was used:
y = A - b * p * elog( 1 + e ( c - x ) / p ) (1)
This equation represents a linear-plateau model in which: y = dependent variable, x = independent
variable, A = level of the dependent variable when a plateau (second phase) is reached, b = slope of
the linear (first) phase, c = level of the independent variable at the point of transition from the first
to the second phase, and p = parameter regulating the smoothness of transition. This model was used
when the slope of the second phase was not significantly different from zero.
Results and discussion
* Production parameters. Live weight gain increased with increasing protein intake (P < .001) from 425
g/d to a plateau of 600 g/d at the low energy intake level and from 480 to 770 g/d at the high energy
intake level. Gain to feed ratio increased with increasing protein intake (P < .001) from 400 g/kg to
a plateau of 560 and 600 g/kg at the low and high energy intake level respectiyely. Consequently
extra energy intake improved both gain (P < .01) and gain/feed ratio (P < .01) at adequate protein
intake.
Protein and lysine deposition and utilization. Protein and lysine deposition increased curvilinearly
(P < .001) with increasing protein intake. Thj relationship was described accurately fey the linear-
plateau model with r2=.91 and r2=.83 for protein (figure l)^nd*lys;ne deposition respectively. Results
of this model showed that protein deposition reached a maximum of 106 and 126 g/d at the low and
high energy level. The ratio between lipid and protein deposition at the point of transition was .54
and .76 at the low and high energy level. Lysine déposition increased with increasing protein intake
up to a maximum of 7.8 and 9.4 g/d. The extra amount of non-protein energy thus increased (P < .01)
protein and lysine deposition rates at high protein intakes. The point of transition between the linear
and the plateau phase was also higher at the higher energy intake level (P < .01) whereas no effect
of energy intake on deposition rates was found when protein intake limited protein deposition.
Consequently the slope of the relation representing the marginal efficiency of protein utilization was
not affected by energy intake. Marginal ef
were .58±.028 and .74±.048 respectively. not affected by energy intake. Marginal efficiencies of utilization of ileal digestible protein and lysine
Lysine requirements. In this paper lysine requirements are defined as the ratio between ileal digestible
lysine and digestible energy in the diet required for maximum protein deposition. The linear-plateau
model was used to determine this ratio which was calculated as the point of transition from the linear
to the plateau phase of the relationship between lysine/DE ratio and protein deposition. No effect of
104
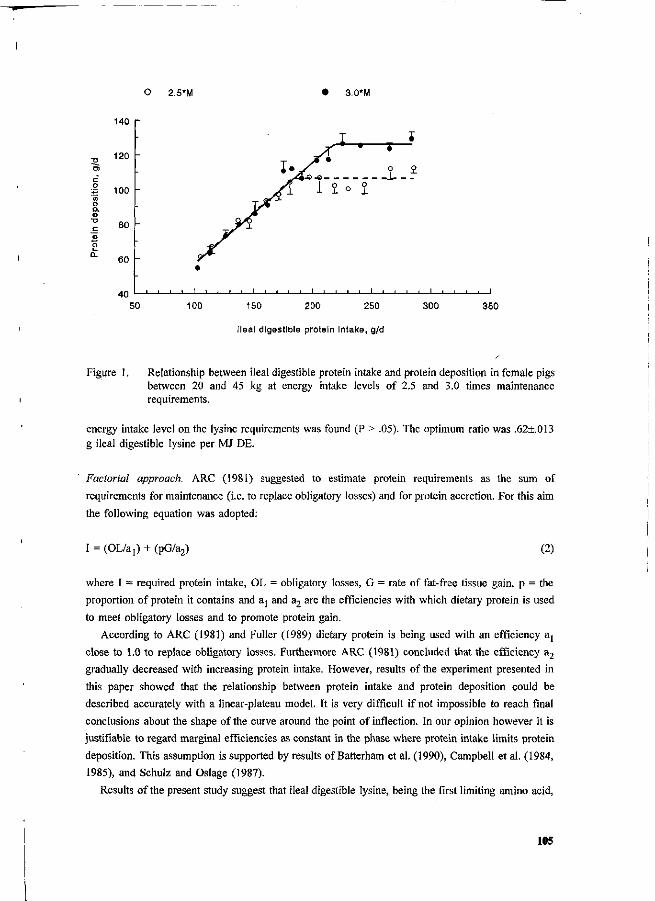
O 2.5*M 3.0*M
140
120
100
80
60
40
I.
T
fjB-©
1 Î o J
T • • 0 O
_j L
50 100 150 200 250
Ileal digestible protein intake, g/d
300 350
Figure 1. Relationship between ileal digestible protein intake and protein deposition in female pigs between 20 and 45 kg at energy intake levels of 2.5 and 3.0 times maintenance requirements.
energy intake level on the lysine requirements was found (P > .05). The optimum ratio was .62±.013 g ileal digestible lysine per MJ DE.
Factorial approach. ARC (1981) suggested to estimate protein requirements as the sum of
requirements for maintenance (i.e. to replace obligatory losses) and for protein accretion. For this aim
the following equation was adopted:
I; (OL/a,) + (pG/a2) (2)
where I = required protein intake, OL = obligatory losses, G = rate of fat-free tissue gain, p = the
proportion of protein it contains and aj and a2 are the efficiencies with which dietary protein is used
to meet obligatory losses and to promote protein gain.
According to ARC (1981) and Fuller (1989) dietary protein is being used with an efficiency aj
close to 1.0 to replace obligatory losses. Furthermore ARC (1981) concluded that the efficiency a2
gradually decreased with increasing protein intake. However, results of the experiment presented in
this paper showed that the relationship between protein intake and protein deposition could be
described accurately with a linear-plateau model. It is very difficult if not impossible to reach final
conclusions about the shape of the curve around the point of inflection. In our opinion however it is
justifiable to regard marginal efficiencies as constant in the phase where protein intake limits protein
deposition. This assumption is supported by results of Batterham et al. (1990), Campbell et al. (1984,
1985), and Schulz and Oslage (1987).
Results of the present study suggest that ileal digestible lysine, being the first limiting amino acid,
105
was used with an efficiency of .74 for deposition (a2). Batterham et al. (1990) calculated a marginal
efficiency of lysine utilization of .85 for male and female pigs as one group. Maximum gross
efficiency of lysine deposition, calculated as deposition divided by intake, in these two studies was
similar suggesting that at least part of the difference in marginal efficiency might be explained by the
regression method. Results of these two studies together suggest that utilization of the first limiting
amino acid is lower than values of .90 to .95 as suggested by Fuller (1991). Possible reasons for this
incomplete utilization of lysine for deposition are discussed elsewhere (Bikker et al., in prep.). Based
on these considerations equation (3) is proposed here to determine the daily ileal digestible lysine
requirements (Lysj, g/d)
Lys; = Lysm + (Pd * .066) / e (3)
where Lysm = lysine for maintenance, estimated as .036 g/kg LW (Fuller et al. (1989), Pd = protein
deposition (g/d), .066 = lysine content of deposited body protein (g/g) (Bikker et al, in prep.) and
e = marginal efficiency of ileal digestible lysine utilization.
In equation (3) requirements are calculated as ileal digestible lysine. Consequently the value of
.036 g lysine per kg LW for maintenance might be tocyhigh because endogenous flow to the large
intestine significantly contributes to these maintenance requirements (Fuller, 1991). These losses are
already accounted for in the usage of apparent ileal digestibility coefficients and consequently can be
subtracted from the maintenance requirements.
To predict the optimum dietary lysine/energy ratio, it is necessary to determine the energy
requirements as well. Kielanowski proposed equation (4) (ARC, 1981):
ME| = MEm + l/kp*P + l/kf*F , . (4)
where MEj = metabolizable energy intake (MJ/d), MEm = ME required for maintenance (MJ/kg
LW ), P and F are energy retained as protein1 and fat and k_ and kf are efficiencies of utilization of
ME for protein and fat accretion. • '
When equation (3) and (4) are combined the optimum rati» Q between ileal digestible lysine and
digestible energy can be estimated: I
\Lysm + {Pd * .066) / e] * (1000 * .96)
MEm + \/kp*Pd *23J + \/kf*Ld *39.6
where Pd and Ld are protein and lipid deposition respectively, 23.7 and 39.6 are energy contents of
body protein and fat respectively (kJ/g), 1000 = factor to calculate MJ from kJ and .96 = factor to
calculate DE from ME (ARC, 1981). <-.
Because protein and lipid deposition at adequate protein intake (plateau in protein deposition) have
been determined in the present experiment, equation (5) can be used to calculate lysine requirements
of the animals at the two energy intake levels. Protein and lipid deposition were 106 and 57 g/d at
the low intake level and 126 and 96 at the high intake level. Values for MEm, k and kf were adopted
from ARC (1981): MEm = 458 kJ/kg LW75, kp = .54 and kf = .74.
Based on these values the required lysine/DE ratios for the pigs at the 2.5*M and 3.0*M energy
106
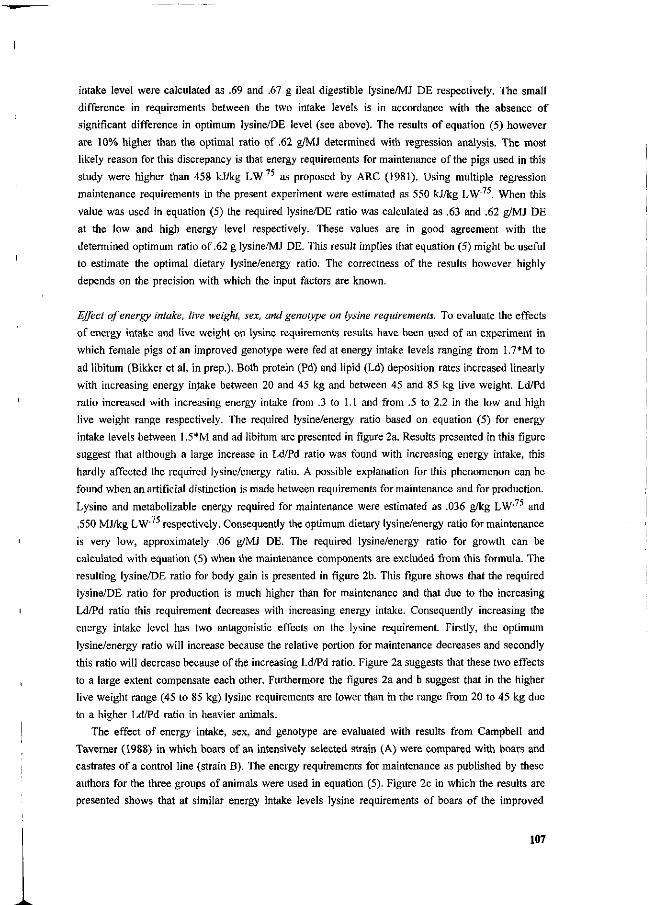
intake level were calculated as .69 and .67 g ileal digestible lysine/MJ DE respectively. The small
difference in requirements between the two intake levels is in accordance with the absence of
significant difference in optimum lysine/DE level (see above). The results of equation (5) however
are 10% higher than the optimal ratio of .62 g/MJ determined with regression analysis. The most
likely reason for this discrepancy is that energy requirements for maintenance of the pigs used in this
study were higher than 458 kJ/kg LW as proposed by ARC (1981). Using multiple regression
maintenance requirements in the present experiment were estimated as 550 kJ/kg LW'75. When this
value was used in equation (5) the required lysine/DE ratio was calculated as .63 and .62 g/MJ DE
at the low and high energy level respectively. These values are in good agreement with the
determined optimum ratio of .62 g lysine/MJ DE. This result implies that equation (5) might be useful
to estimate the optimal dietary lysine/energy ratio. The correctness of the results however highly
depends on the precision with which the input factors are known.
Effect of energy intake, live weight, sex, and genotype on lysine requirements. To evaluate the effects
of energy intake and live weight on lysine requirements results have been used of an experiment in
which female pigs of an improved genotype were fed at energy intake levels ranging from 1.7*M to
ad libitum (Bikker et al, in prep.). Both protein (Pd) and lipid (Ld) deposition rates increased linearly
with increasing energy intake between 20 and 45 kg and between 45 and 85 kg live weight. Ld/Pd
ratio increased with increasing energy intake from .3 to 1.1 and from .5 to 2.2 in the low and high
live weight range respectively. The required lysine/energy ratio based on equation (5) for energy
intake levels between 1.5*M and ad libitum are presented in figure 2a. Results presented in this figure
suggest that although a large increase in Ld/Pd ratio was found with increasing energy intake, this
hardly affected the required lysine/energy ratio. A possible explanation for this phenomenon can be
found when an artificial distinction is made between requirements for maintenance and for production.
Lysine and metabolizable energy required for maintenance were estimated as .036 g/kg LW75 and
.550 MJ/kg LW'75 respectively. Consequently the optimum dietary lysine/energy ratio for maintenance
is very low, approximately .06 g/MJ DE. The required lysine/energy ratio for growth can be
calculated with equation (5) when the maintenance components are excluded from this formula. The
resulting lysine/DE ratio for body gain is presented in figure 2b. This figure shows that the required
lysine/DE ratio for production is much higher than for maintenance and that due to the increasing
Ld/Pd ratio this requirement decreases with increasing energy intake. Consequently increasing the
energy intake level has two antagonistic effects on the lysine requirement. Firstly, the optimum
lysine/energy ratio will increase because the relative portion for maintenance decreases and secondly
this ratio will decrease because of the increasing Ld/Pd ratio. Figure 2a suggests that these two effects
to a large extent compensate each other. Furthermore the figures 2a and b suggest that in the higher
live weight range (45 to 85 kg) lysine requirements are lower than in the range from 20 to 45 kg due
to a higher Ld/Pd ratio in heavier animals.
The effect of energy intake, sex, and genotype are evaluated with results from Campbell and
Taverner (1988) in which boars of an intensively selected strain (A) were compared with boars and
castrates of a control line (strain B). The energy requirements for maintenance as published by these
authors for the three groups of animals were used in equation (5). Figure 2c in which the results are
presented shows that at similar energy intake levels lysine requirements of boars of the improved
107
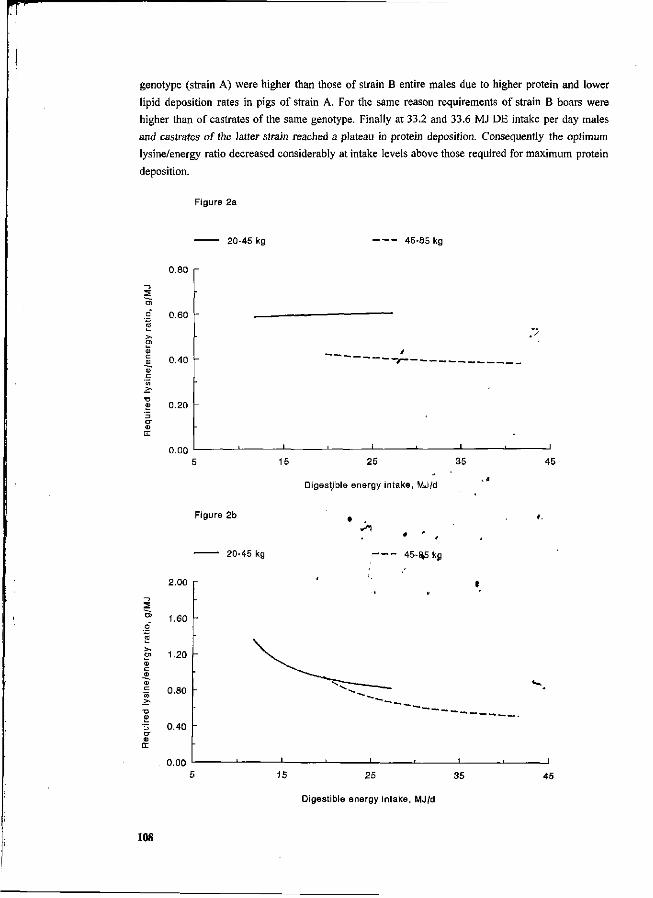
genotype (strain A) were higher than those of strain B entire males due to higher protein and lower
lipid deposition rates in pigs of strain A. For the same reason requirements of strain B boars were
higher than of castrates of the same genotype. Finally at 33.2 and 33.6 MJ DE intake per day males
and castrates of the latter strain reached a plateau in protein deposition. Consequently the optimum
lysine/energy ratio decreased considerably at intake levels above those required for maximum protein
deposition.
Figure 2a
20-45 kg 45-85 kg
0.80 r
0.60
0.40
0.20
0.00 I
45 15 25 35
Digestible energy intake, MJ/d
Figure 2b
20-45 kg 45-^5 kg
2.00
1.60
1.20
0.80
0.40
0.00 15 25 35
Digestible energy intake, MJ/d
45
108
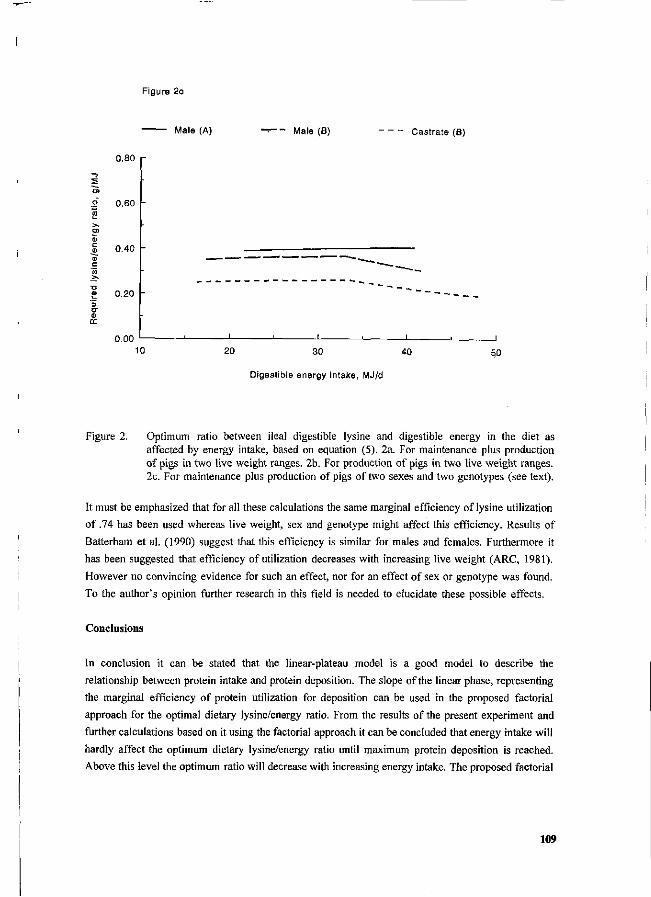
Figure 2c
Male (A) - = - - Male (B) Castrate (B)
0.80
0.60
0.40
0.20
0.00 10 20 30 40 5/)
Digestible energy intake, MJ/d
Figure 2. Optimum ratio between ileal digestible lysine and digestible energy in the diet as affected by energy intake, based on equation (5). 2a. For maintenance plus production of pigs in two live weight ranges. 2b. For production of pigs in two live weight ranges. 2c. For maintenance plus production of pigs of two sexes and two genotypes (see text).
It must be emphasized that for all these calculations the same marginal efficiency of lysine utilization
of .74 has been used whereas live weight, sex and genotype might affect this efficiency. Results of
Batterham et al. (1990) suggest that this efficiency is similar for males and females. Furthermore it
has been suggested that efficiency of utilization decreases with increasing live weight (ARC, 1981).
However no convincing evidence for such an effect, nor for an effect of sex or genotype was found.
To the author's opinion further research in this field is needed to elucidate these possible effects.
Conclusions
In conclusion it can be stated that the linear-plateau model is a good model to describe the
relationship between protein intake and protein deposition. The slope of the linear phase, representing
the marginal efficiency of protein utilization for deposition can be used in the proposed factorial
approach for the optimal dietary lysine/energy ratio. From the results of the present experiment and
further calculations based on it using the factorial approach it can be concluded that energy intake will
hardly affect the optimum dietary lysine/energy ratio until maximum protein deposition is reached.
Above this level the optimum ratio will decrease with increasing energy intake. The proposed factorial
109
approach seems a valuable method to estimate the optimum ratio between amino acids and energy
in the diet, e.g. when multi-phase feeding (frequent adjustment of dietary protein/energy ratio) is
applied. The reliability of this method however needs further validation with regard to other
treatments and other animals whereas the exactness of the outcome highly depends on the precision
with which the input factors are known.
Acknowledgements. The presented experiment is part of a project to determine protein and energy
requirements of growing pigs. The contribution to this project of Eurolysine SA and Orfam BV
(sponsors) and UT-Delfia BV (co-sponsor) is gratefully acknowledged.
References
ARC, 1981. The nutrient requirements of pigs. Commonwealth Agricultural Bureaux, Slough. 307 pp. Batterham, E.S., Andersen, L.M., Baignent, D.R. & White, E., 1990. Utilization of ileal digestible
amino acids by growing pigs: effect of dietary lysine concentration on efficiency of lysine retention. British Journal of Nutrition. 64:81-94.
Campbell, R.Q. & Taverner, M.R., 1988. Genotype and sex effects on the relationship between energy intake and protein deposition in growing pigs. Journal^f Animal Science 66:676-686.
Campbell, R.G., Taverner, M.R. & Curie, D.M., 1984. Effect of feeding level and dietary protein content on the growth, body composition and rate of protein deposition in pigs growing from 45 to 90 kg. Animal Production 38:233-240.
Campbell, R.G., Taverner, M.R. & Curie, D.M., 1985. The influence of feeding level on the protein requirement of pigs between 20 and 45 kg live weight. Animal Production 40:489-496.
Fuller, M.F., 1991. Present knowledge of amino acid requirements for maintenance and production: non-ruminants. In: Eggum, B.O., Boisen, S., Bursting, C, Danfœr, A. & Hvelplund, T.: Protein metabolism and Nutrition. Proceedings of the 6th international symposium on protein metabolism and nutrition, Herning, Denmark. EAAP,-publication no. 59,-vol. 1:116-126.
Fuller, M.F., McWilliam, R., Wang, T.C. & Giles, L.R., 1989. The optimum dietary amino acid pattern for growing pigs. 2. Requirements fo% maintenance and for tissue protein accretion. British Journal of Nutrition 62:255-267. - ^ , .
Kleinbaum, D.G., Kupper, L.L. & Muller, K.E., 1988. Applied regression analysis and other multivariable methods. Second edition. PWS-KENT Publishing'Company, Boston. 718 pp.
Leeuwen, P. van, Kleef, D.J., Kempen, ß.J.M. vanj. Huisman, J. & Verstegen, M.W.A., 1991. The Post-Valve T-Caecum cannulation technique in pigs applicatpd to determine the digestibility of amino acids in maize, groundnut and sunflower meal. Journal of Animal Physiology and Animal Nutrition 65:183-193.
Peet, G.F.V. van der, Verstegen, M.W.A. & Koops, W.J., 1987. A formula to describe the relation between heat production at thermoneutral as well as below thermoneutral temperatures simultaneously. In: Verstegen, M.W.A. & Henken, A.M.: Energy metabolism in farm animals. Martinus Nijhoff Publishers, Dordrecht, pp. 150-163.
Schulz, E., & Oslage, HJ., 1987. In: J. Lehmann: Proceedings of the 5th international symposium on protein metabolism and nutrition, Rostock, GDR. EAAP-publication no. 35, pp. 36-37.
Wang, T.C. & Fuller, M.F., 1990. The effect of plane of nutrition on the optimum dietary amino acid pattern for growing pigs. Animal Production 50:155-164.
110
Possibilities and limitations for a higher efficiency of N utilization in growing pigs
F. Liebert
Leipzig University, Department of Animal Nutrition Physiology and Feed Science, Gustav-Kühn-Str. 8, 0-7022 Leipzig, Germany
Summary Based on data of nitrogen metabolism of growing pigs, derived from N balance experiments, the most important parameters of influence on efficiency of utilization process in pigs are dicussed. The relation N excretion : N retention or N deposition could be an important term for evaluation of efficiency of protein conversion related to minimizing of N pollution. For 40 kg pigs N excretion : N retention = 1 represents a high level of efficiency in this process. Amino acid balance and level of protein intake are the main factors of influence. Changes in protein digestibility are from limited importance.
Modelling of N utilization process seems to be a very useful tool for evaluation the result of utilization process. Important suppositions however are reliable knowledge about breeding effects on relation protein synthesis: breakdown and actual amino acid requirements in terms of utilizable or efficient amino acids.
Introduction Many experiments with growing pigs have shown principal possibilities to reduce N excretion by N reduction in pig feed and higher level of amino acid balance of diet. The level of agreement between the requirement of the animal depending on age, race or genotype and sex as well as the ability of feed to meet this requirement is the main factor also' in connection with minimizing N excretion per unit of animal product. But actual requirement and actual feed quality are the main factors of variance because of limited knowledge and unknown variation. In spite of this fact metabolic parameters in connection with a minimum of N output per unit N retention are not well known. Only modelling of N metabolism in dependence on main dietary factors seems to be a base for such conclusions.
Methods N balance trials with growing female pigs (30...50 kg LW) including wide scale of feed proteins resp. protein mixtures and defined limiting amino acids are the experimental base of our summarized results. Quantification of the relation between intake of limiting amino acid and N retention is described in detail by earlier publications (see Liebert & Gebhardt, 1988; Liebert et al., 1991)
Results Principal relationship between protein quality of diet (mainly amino acid balance) and daily N intake resp. N excretion for an equal protein gain is demonstrated in figure 1. The connection to the protein level of diet, assuming a constant feed intake, is obvious. The reduction of N excretion is mainly a reduction of urine N in connection with a higher percentage of slow released nitrogen. A model calculation in table 1
111
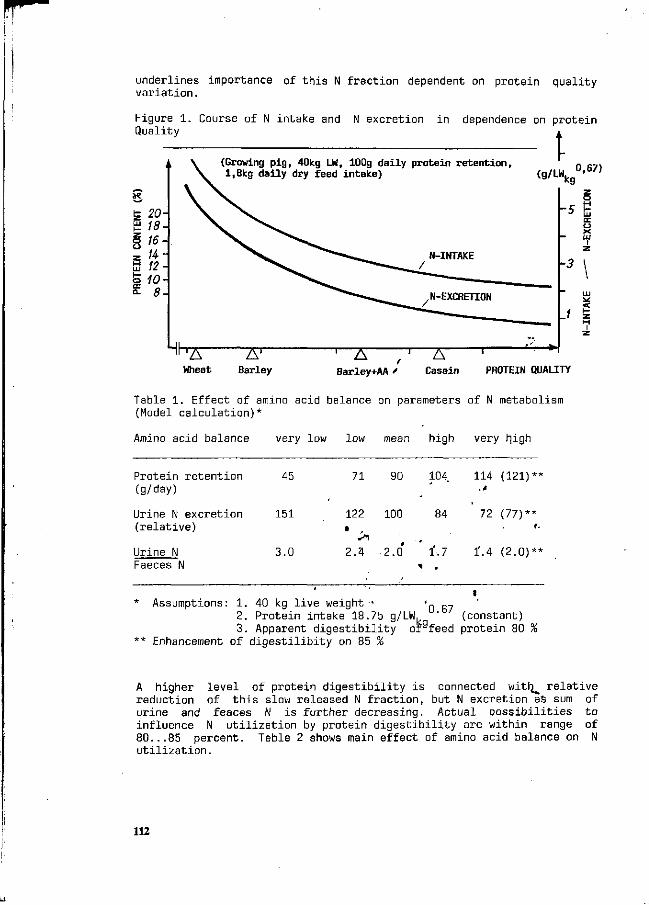
underlines importance of t h i s N f rac t ion dependent on protein qual i ty va r ia t ion .
Figure 1 . Course of N intake and N excretion i n dependence on protein Quality
(Growing pig, 40kg LW, 100g daily protein retention, 1,8kg daily dry feed intake)
É LU
z o u ?: M LU
o CE 0 .
20-18-16-H-12-10-8-
4 -T£ -gr-Wheat Barley
t 0,67)
T—2 -, S ! Barley+AA / Casein PROTEIN QUALITY
Table 1. Effect of amino acid balance on parameters of N metabolism (Model calculation)*
Amino acid balance very low low mean high very high
Protein retention (g/day)
Urine N Faeces N
45
Urine N excretion 151 (relative)
3.0
71 90 104 114 (121) *•*
122 100 84 72 (77)**
2.4 2.0 l'.7 Ï.4 (2.0)**
* Assumptions: 1. 40 kg live weight • «_ „ 2. Protein intake 18.75 g/LW. (constant) 3. Apparent digestibility oryfeed protein 80 %
** Enhancement of digestilibity on 85 %
A higher level of protein digestibility is connected with_^ relative reduction of this slow released N fraction, but N excretion as sum of urine and feaces N is further decreasing. Actual possibilities to influence N utilization by protein digestibility are within range of 80...85 percent. Table 2 shows main effect of amino acid balance on N utilization.
112
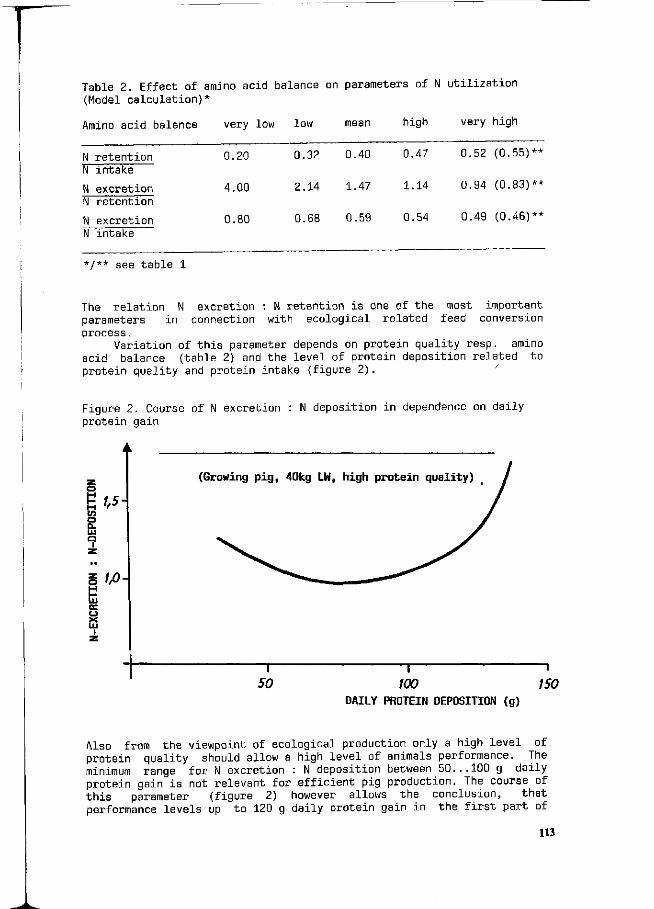
Table 2. Effect of amino acid balance on parameters of N utilization (Model calculation)*
Amino acid balance very low low
N retention N intake
N excretion N retention
N excretion N intake
*/** see table 1
mean high very high
0.20 0.32 0.40 0.47 0.52 (0.55)**
4.00 2.14 1.47 1.14 0.94 (0.83)**
0.80 0.68 0.59 0.54 0.49 (0.46)**
The relation N excretion : N retention is one of the most important parameters in connection with ecological related feed conversion process.
Variation of this parameter depends on protein quality resp. amino acid balance (table 2) and the level of protein deposition related to protein quality and protein intake (figure 2 ) . '
Figure 2. Course of N excretion : N deposition in dependence on daily protein gain
E/,5-to o Q. LU a
i
Ë cc o X
1fi-
(Growing pig, 40kg LH, high protein quality)
—T 50
1 ' 1 tOO 150
DAILY PROTEIN DEPOSITION (g)
Also from the viewpoint of ecological production only a high level of protein quality should allow a high level of animals performance. The minimum range for N excretion : N deposition between 50...100 g daily protein gain is not relevant for efficient pig production. The course of this parameter (figure 2) however allows the conclusion, that performance levels up to 120 g daily protein gain in the first part of
113
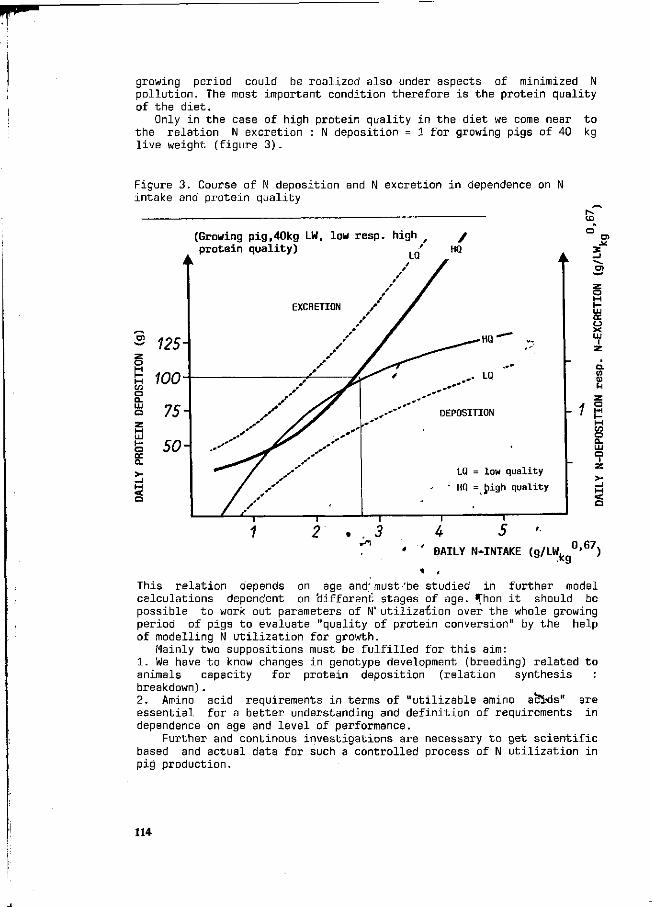
growing period could be realized also under aspects of minimized N pollution. The most important condition therefore is the protein quality of the diet.
Only in the case of high protein quality in the diet we come near to the relation N excretion : N deposition = 1 for growing pigs of 40 kg live weight (figure 3 ) .
Figure 3. Course of N deposition and N excretion in dependence on N intake and protein quality
(Growing pig,40kg LW, low resp. high f /
a> w Z O H 1— H en a a. UJ
a z H UJ H O œ a. > •
_ i M O
i
125-
100-
75-
50-
p r o t e i n q u a l i t y ) / LQ /
/ / s / / A
EXCRETION / /
0 f
/ / S M ^*"**
/ / r0*0^ / f s' & _# .^r
. ' S7 yy
/ /y * / / y / S
-"" ^r y ^^^ r -*
^««^*x y / y
f s / y'
/ s
I L^. ,
/ /
,*" j * * ~
„*•*
L., ,
HQ
^ ^ . ^ H Q ' „ ,
,--. LQ
-** -,»* ^»**
DEPOSITION
LQ = low q u a l i t y
• HQ = jpigh q u a l i t y
—-1 I
r-. to
z o
UJ ce o X UJ
I z a. «i CD
u
' I
. . 3
en o a. UJ a
i
DAILY N-INTAKE (g/LWk 0 , G 7 )
This relation depends on age and: must-'be studied in further model calculations dependent on 'different stages of age. "Then it should be possible to work out parameters of N' utilization over the whole growing period of pigs to evaluate "quality of protein conversion" by the help of modelling N utilization for growth.
Mainly two suppositions must be fulfilled for this aim: 1. We have to know changes in genotype development (breeding) related to animals capacity for protein deposition (relation synthesis : b r e a k d o w n ) . 2. Amino acid requirements in terms of "utilizable amino acids" are essential for a better understanding and definition of requirements in dependence on age and level of performance.
Further and continous investigations are necessary to get scientific based and actual data for such a controlled process of N utilization in pig production.
114
References Liebert, F. & Gebhardt, G., 1988. Ergebnisse zur Wirksamkeit und
zum Bedarf an ausgewählten Aminosäuren beim wachsenden weiblichen Schwein. 6. Mitt., Arch. Anim. Nutr. 38:453-462
Liebert, F., Wecke, Ch., Reinisch, F. & Gebhardt, G., 1991. Neue Ergebnisse und Aufgaben zur Lysinwirksamkeitsbeurteilung in Futtermitteln für Monogastride. Arch. Anim. Nutr. 41:279-294
115
Free amino acids in protein-reduced cereal based diets for piglets
H. Spiekers and E. Niess
Landwirtschaftskammer Rheinland, DW-5300 Bonn 1, Endenicher Allee 60 Institut für Tierernährung; DW-5300 Bonn 1, Endenicher Allee 15
Summary
Feeding experiments were conducted on piglets to determine the required supplementation of free amino acids using a protein-reduced diet based on wheat, barley and soybean meal. The provision of 0.13 g tryptophan and 0.41 g isoleucine per MJ ME from the unsupplemented diet proved to be sufficient. In the concluding experiment the level of supplementation of free lysine, methionine and threonine was tested.
Introduction
Environmental problems in pig rearing haye led to intensive efforts to reduce N- and P-excretion with urine and faeces via the type of feed maintaining constant production levels. One possibility is reducing crude protein contents in feeds and supplementing essential amino acids, which are in deficit.
In previous experiments (SPIEKERS et al. 1991) it was shown*that in cereal based diets for piglets of 10 to 25 kg live weight soybean meal in the diet can be reduced from 33 % to 10 % without loss in performance, if the amino acids lysine, methionine, threonine, tryptophan and isojeucine are supplemented. By lowering the portioji of soybean meal the crude protein content of the diet is reduced by one third from 22 % to 14 h. With regard to the calculated N-excretion there was a reduction of two thirds fron>.36 to 12 g N per kg weight gain. * >!
The corrected utilization of digestible crude Drotein (k t) increases at the same time from approximately 0.6 to 0.96. A further reduction of the soybean meal content whilst supplementing 'additional free amino acids is viewed as being less promising since ,the quoted knt of 0.96 suggests no or only a small chance of further improvement of the N-utilization. The question is raised, however, whether the-same performance can be achieved using decreased amounts of supplemented amino acids.
In the former experiments the recommendations for the provision of amino acids as listed in Table 1 have been assumed as a basis. In using these values in the rearing of piglets, tryptophan proved to be^the fourth limiting essential amino acid after lysine, methionine and threonine when the soybean meal content in the cereal based diet is reduced. Isoleucine is fifth limiting ahead of valine. Therefore it seemed to be of interest to examine the necessary supplementation of tryptophan and isoleucine.
Since KOCH and SCHUTTE (1991) postulate a lower requirement of methionine in protein-reduced diets and this can also be assumed for lysine and threonine, these amino acids were included in the investigation.
116
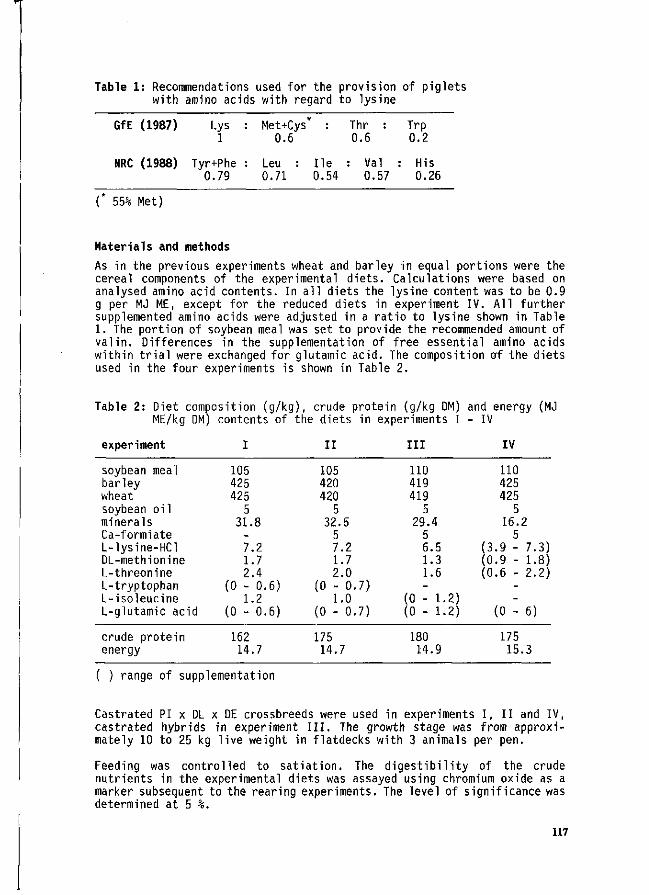
Table 1: Recommendations used for the provision of piglets with amino acids with regard to lysine
GfE (1987)
NRC (1988)
(* 55% Met)
Lys : 1
Tyr+Phe : 0.79
Met+Cys* : Thr : 0.6 0.6
Leu : lie : Val 0.71 0.54 0.57
Trp 0.2
: His 0.26
Materials and methods
As in the previous experiments wheat and barley in equal portions were the cereal components of the experimental diets. Calculations were based on analysed amino acid contents. In all diets the lysine content was to be 0.9 g per MJ ME, except for the reduced diets in experiment IV. All further supplemented amino acids were adjusted in a ratio to lysine shown in Table 1. The portion of soybean meal was set to provide the recommended amount of val in. Differences in the supplementation of free essential amino acids within trial were exchanged for glutamic acid. The composition of the diets used in the four experiments is shown in Table 2.
Table 2: Diet composition (g/kg), crude protein (g/kg DM) and energy (MJ ME/kg DM) contents of the diets in experiments I - IV
experiment
soybean meal barley wheat soybean oil minerals Ca-formiate L-lysine-HCl DL-methionine L-threonine L-tryptophan L-isoleucine L-glutamic acid
crude protein energy
I
105 425 425
5 31.8
-7.2 1.7 2.4
(0 - 0.6) 1.2
(0 - 0.
162 14.7
6)
II
105 420 420
5 32.5
5 7.2 1.7 2.0
(0 - 0. 1.0
7)
(0 - 0.7)
175 14.7
III
110 419 419
5 29.4
5 6.5 1.3 1.6 -
(0 - 1. (0 - 1.
180 14.9
2) 2)
(3 (0 (0
IV
110 425 425
5 16.2
5 .9 - 7.3) .9 - 1.8) .6 - 2.2)
--
(0 - 6)
175 15.3
( ) range of supplementation
Castrated PI x DL x DE crossbreeds were used in experiments I, II and IV, castrated hybrids in experiment III. The growth stage was from approximately 10 to 25 kg live weight in flatdecks with 3 animals per pen.
Feeding was controlled to satiation. The digestibility of the crude nutrients in the experimental diets was assayed using chromium oxide as a marker subsequent to the rearing experiments. The level of significance was determined at 5 %.
117
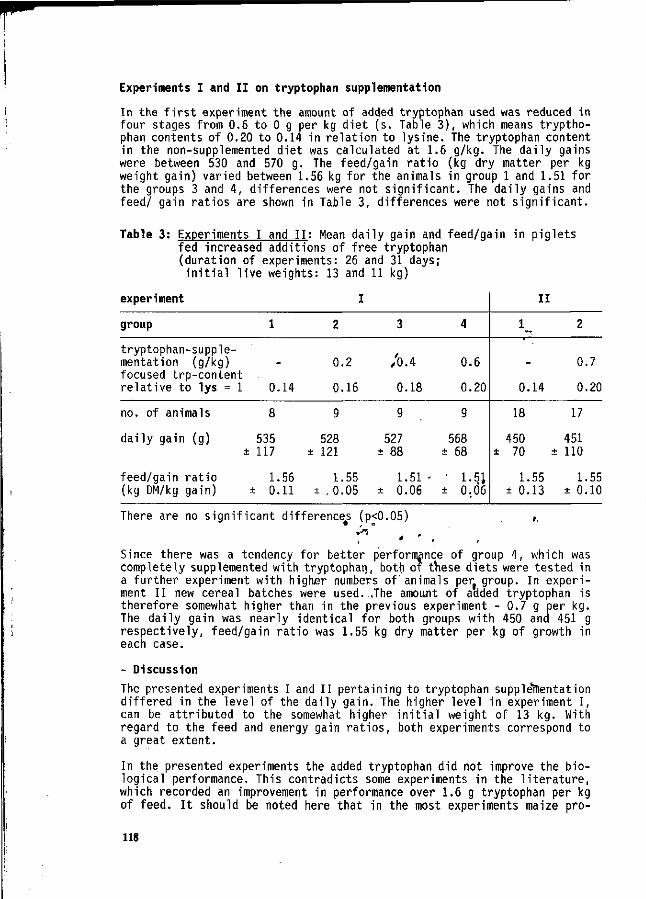
Experiments I and II on tryptophan supplementation
In the first experiment the amount of added tryptophan used was reduced in four stages from 0.6 to 0 g per kg diet (s. Table 3), which means tryptophan contents of 0.20 to 0.14 in relation to lysine. The tryptophan content in the non-supplemented diet was calculated at 1.6 g/kg. The daily gains were between 530 and 570 g. The feed/gain ratio (kg dry matter per kg weight gain) varied between 1.56 kg for the animals in group 1 and 1.51 for the groups 3 and 4, differences were not significant. The daily gains and feed/ gain ratios are shown in Table 3, differences were not significant.
Table 3: Experiments I and II: Mean daily gain and feed/gain in piglets fed increased additions of free tryptophan (duration of experiments: 26 and 31 days;
initial live weights: 13 and 11 kg)
experiment
group
tryptophan-supple-mentation (g/kg) focused trp-content relative to lys = 1
no. of animals
daily gain (g) +
feed/gain ratio (kg DM/kg gain)
1
0.14
8
535 117
1.56 ± 0.11
I
2
0.2
0.16
9
528 ± 121
1.55 ± ,0.05
3
/0.4
0.18
9
527 ± 88
1.51 < ± 0.06
4
0.6
0.20
9
568 ± 68
• 1.51 ± 0.06
II
1_
0.14
18
450 ± 7 0 ±
1.55 ± 0.13
2
0.7
0.20
17
451 110
1.55 ± 0.10
There are no significant differences (p<0.05)
Since there was a tendency for better performance of group 4, which was completely supplemented with tryptophan, both of these diets were tested in a further experiment with higher numbers of'animals per group. In experiment II new cereal batches were used. .The amount of added tryptophan is therefore somewhat higher than in the previous experiment - 0.7 g per kg. The daily gain was nearly identical for both groups with 450 and 451 g respectively, feed/gain ratio was 1.55 kg dry matter per kg of growth in each case.
- Discussion
The presented experiments I and II pertaining to tryptophan supplementation differed in the level of the daily gain. The higher level in experiment I, can be attributed to the somewhat higher initial weight of 13 kg. With regard to the feed and energy gain ratios, both experiments correspond to a great extent.
In the presented experiments the added tryptophan did not improve the biological performance. This contradicts some experiments in the literature, which recorded an improvement in performance over 1.6 g tryptophan per kg of feed. It should be noted here that in the most experiments maize pro-
118
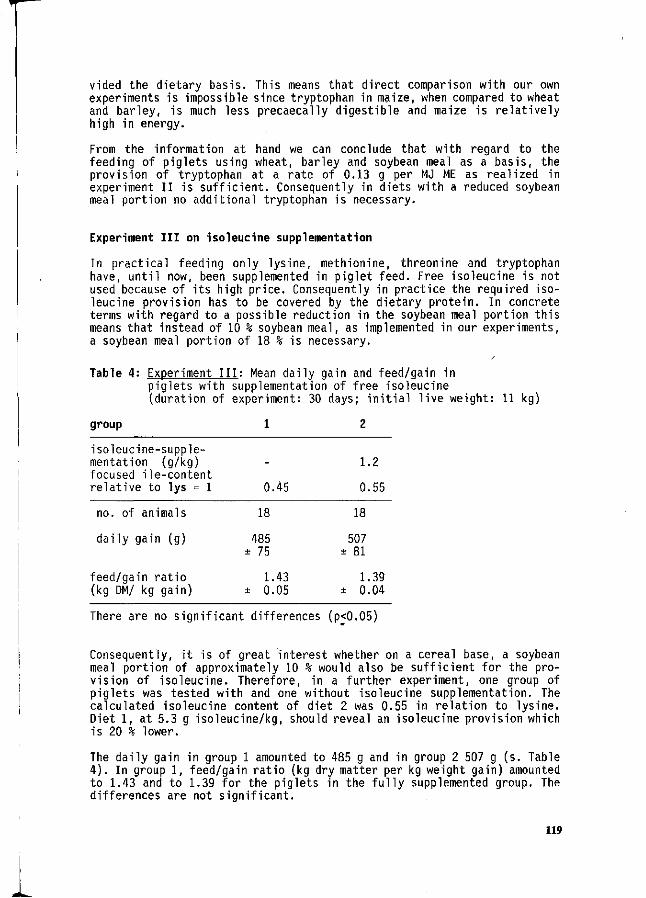
vided the dietary basis. This means that direct comparison with our own experiments is impossible since tryptophan in maize, when compared to wheat and barley, is much less precaecally digestible and maize is relatively high in energy.
From the information at hand we can conclude that with regard to the feeding of piglets using wheat, barley and soybean meal as a basis, the provision of tryptophan at a rate of 0.13 g per MJ ME as realized in experiment II is sufficient. Consequently in diets with a reduced soybean meal portion no additional tryptophan is necessary.
Experiment III on isoleucine supplementation
In practical feeding only lysine, methionine, threonine and tryptophan have, until now, been supplemented in piglet feed. Free isoleucine is not used because of its high price. Consequently in practice the required isoleucine provision has to be covered by the dietary protein. In concrete terms with regard to a possible reduction in the soybean meal portion this means that instead of 10 % soybean meal, as implemented in our experiments, a soybean meal portion of 18 % is necessary.
Table 4: Experiment III: Mean daily gain and feed/gain in piglets with supplementation of free isoleucine ^duration OT
group
isoleucine-supple-mentation (g/kg) focused ile-content relative to lys = 1
no. of animals
daily gain (g)
feed/gain ratio (kg DM/ kg gain)
experiment: s
1
0.45
18
485 ± 75
1.43 ± 0.05
U clays; m i t
2
1.2
0.55
18
507 ± 81
1.39 ± 0.04
There are no significant differences (p<0.05)
Consequently, it is of great interest whether on a cereal base, a soybean meal portion of approximately 10 % would also be sufficient for the provision of isoleucine. Therefore, in a further experiment, one group of piglets was tested with and one without isoleucine supplementation. The calculated isoleucine content of diet 2 was 0.55 in relation to lysine. Diet 1, at 5.3 g isoleucine/kg, should reveal an isoleucine provision which is 20 % lower.
The daily gain in group 1 amounted to 485 g and in group 2 507 g (s. Table 4 ) . In group 1, feed/gain ratio (kg dry matter per kg weight gain) amounted to 1.43 and to 1.39 for the piglets in the fully supplemented group. The differences are not significant.
119
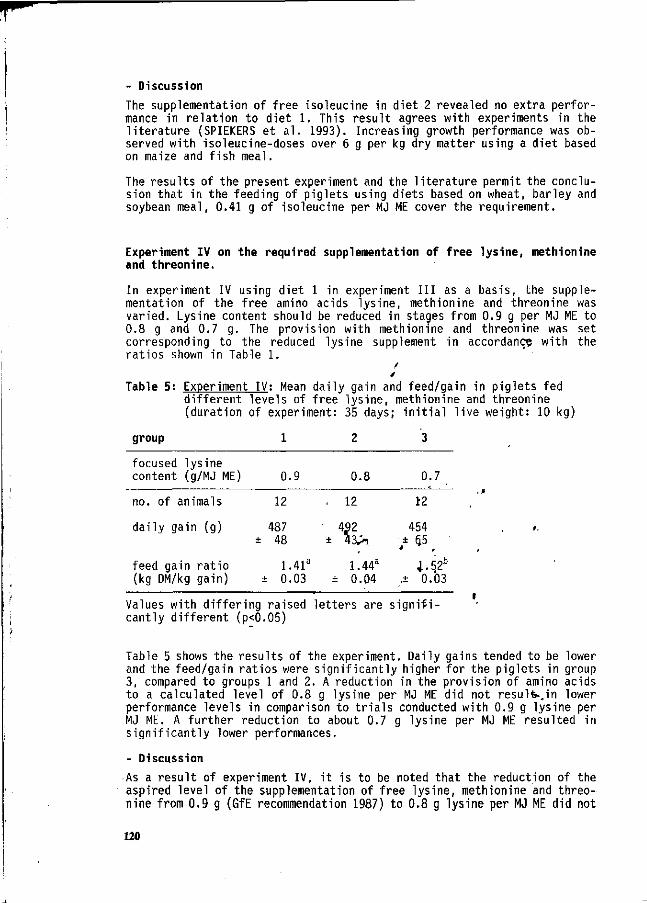
- Discussion
The supplementation of free isoleucine in diet 2 revealed no extra performance in relation to diet 1. This result agrees with experiments in the literature (SPIEKERS et al. 1993). Increasing growth performance was observed with isoleucine-doses over 6 g per kg dry matter using a diet based on maize and fish meal.
The results of the present experiment and the literature permit the conclusion that in the feeding of piglets using diets based on wheat, barley and soybean meal, 0.41 g of isoleucine per MJ ME cover the requirement.
Experiment IV on the required supplementation of free lysine, methionine and threonine.
In experiment IV using diet 1 in experiment III as a basis, the supplementation of the free amino acids lysine, methionine and threonine was varied. Lysine content should be reduced in stages from 0.9 g per MJ ME to 0.8 g and 0.7 g. The provision with methionine and threonine was set corresponding to the reduced lysine supplement in accordance with the ratios shown in Table 1.
/ /
Table 5: Experiment IV: Mean daily gain and feed/gain in piglets fed different levels of free lysine, methionine and threonine (duration of experiment: 35 days; initial live weight: 10 kg)
group 1 2 3
focused lysine content (g/MJ ME)
no. of animals
daily gain (g)
feed gain ratio (kg DM/kg gain)
0.9
12
487 ± 48
1.41a
± 0.03
0.8
- 12
432 ± 43>i
1.44a' ± 0.04
0.7
12
454 ± 5 5
i.52b
,± 0.03
Values with differing raised letters are significantly different (p<0.05)
Table 5 shows the results of the experiment. Daily gains tended to be lower and the feed/gain ratios were significantly higher for the piglets in group 3, compared to groups 1 and 2. A reduction in the provision of amino acids to a calculated level of 0.8 g lysine per MJ ME did not resul^in lower performance levels in comparison to trials conducted with 0.9 g lysine per MJ ME. A further reduction to about 0.7 g lysine per MJ ME resulted in significantly lower performances.
- Discussion
As a result of experiment IV, it is to be noted that the reduction of the aspired level of the supplementation of free lysine, methionine and threonine from 0.9 g (GfE recommendation 1987) to 0.8 g lysine per MJ ME did not
120
result in any reductions in performance. A further reduction to 0.7 g per MJ ME caused significantly lower performances which indicates suboptimal supply.
The result corresponds to the theory of KOCH and SCHUTTE (1991) quoted at the beginning, that the amino acid supplementation can be lower in crude protein reduced diets. KOCH and SCHUTTE (1991) in their experiments, however, only varied the provision of methionine at a normal and at a lowered crude protein level. In the experiment presented, the provision of lysine, methionine and threonine were varied simultaneously but because of reasons of capacity, the control groups at a higher level of crude protein content were non-evident. Consequently it is not possible to make any statement pertaining to an eventual "amino-acid-saving effect" of a reduction in crude protein.
A calculation of the provision with precaecal digestible amino acids gave no explanation for the undepressed performance in group 2. A special effect of the reduction in crude protein on the requirement of amino acids therefore remains to be discussed. Further experiments under the inclusion of differing levels of protein seem necessary to clarify the connections.
Conclusion ,
The feeding experiments presented here and earlier (SPIEKERS et al., 1991) on piglets with a live weight of 10 to 25 kg, using wheat, barley and soybean meal with supplementation of free amino acids as a basis, were conducted in order to investigate a reduction in the N-excretions. The result of the experiments is that a reduction in the calculated N-excretion of approximately 2/3 is possible via the reduction of the soybean meal portion with simultaneous supplementation of free lysine, methionine and threonine.
The data shown are not the basis to give requirement of amino acid supply for piglets. Therefore more experiments with a wider range of amino acid provision are necessary.
Literature
GfE (AUSCHUSS FÜR BEDARFSNORMEN DER GESELLSCHAFT FÜR ERNÄHRUNGSPHYSIOLOGIE), 1987. Energie- und Nährstoffbedarf landwirtschaftlicher Nutztiere;
Nr. 4: Schweine; DLG-Verlag, Frankfurt am Main
KOCH, F., J. B. SCHUTTE, 1991. Einfluß des Futterproteins auf den Methio-ninbedarf des Schweins, in: Umweltaspekte der Tierproduktion, Kongressband 1991, Ulm, VDLUFA-Schriftenreihe 33, 469 - 474
NRC (NATIONAL RESEARCH COUNCIL), 1988. Nutrient requirements of swine, Ninth revised edition; National Academy Press, Washington
SPIEKERS, H., K.-H. GRÜNEWALD, C. SEIWERT R.STRUTH, E. NIESS, 1991. Reduction of N-excretion of Piglets and Fattening Pigs by Feeding Synthetic Amino Acids, Agribiological Research 44, 235 - 246
SPIEKERS, H., K.-H. GRÜNEWALD, C. SEIWERT, 1993. Free amino acids in protein-reduced cereal based diets for piglets Agribiological Research 46, in print
121
Factors influencing protein digestive capacity in newly weaned piglets
Caroline A. Makkink
Dept. of Anim. Nutr., Agric. Univ., Haagsteeg 4, 6708 PM Wageningen, The Netherlands present address: Res. Inst, for Pig Husbandry, P.O. Box 83, 5240 AB Rosmalen, The Netherlands
Summary
This paper summarizes results of experiments performed to study the development of protein digestive capacity in young piglets. It was found that endogenous nitrogen (N) losses play an important role in the relatively low apparent ileal N digestibility of non-milk protein sources in piglet diets.
Experiments with newly weaned piglets revealed that feed intake during the early post-weaning period is more important than the dietary protein source per se for the development of pancreatic protease synthesis and secretion.
keywords: weaned piglets, dietary protein, feed intake
Introduction
The experiments summarized herein were part of a PhD project undertaken to study the development of the protein digestive capacity of young piglets during the post-weaning period. The complete research project is described by„Makkink (1993). Some major results and conclusions from the experiments are given, in this pap'e*r.
Material and methods , . ».
An experiment has been performed to estimate endogenous nitrogen (N) losses (using the 15N-isotope dilution technique) in 7 weeks old piglets «fed diets based on either skim milk powder (SMP), soyabean meaj (SBM) or fish'meal (FM).
In another experiment the role of the pancreas in thp digestion of protein by newly weaned piglets was studied. The post-weaning development of pancreatic trypsin (T) and chymotrypsin (C) activity in pancreatic tissue and jejunal digesta was investigated using newly weaned piglets euthanized and sampled (pancreas and jejunal contents) at weaning (28 days of age, 10 piglets) or 6 days after weaning (34 days of age, 15 piglets). Post-weaning diets were based on either SMP, SBM or FM. Pancreatic tissue and jejunal digesta were analyzed for trypsin and chymotrypsin activities. ^
Results and Discussion
Results of the 15N-experiment are given in Table 1. The apparent ileal N digestibility was lower for the non-milk protein sources than for SMP. This difference was due to differences in endogenous ileal N losses rather than to differences in true ileal N digestibility.
122
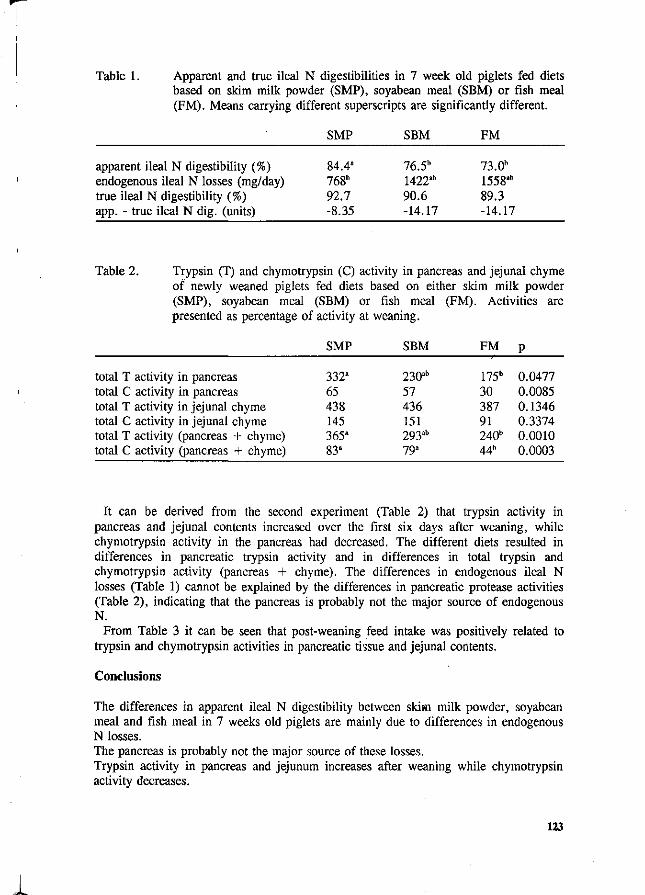
84.4a
768" 92.7 -8.35
76.5" 1422ab
90.6 -14.17
73.0b
1558ab
89.3 -14.17
332a
65 438 145 365"
230* 57 436 151 293ab
175b
30 387 91 240"
0.0477 0.0085 0.1346 0.3374 0.0010
Table 1. Apparent and true ileal N digestibilities in 7 week old piglets fed diets based on skim milk powder (SMP), soyabean meal (SBM) or fish meal (FM). Means carrying different superscripts are significantly different.
SMP SBM FM
apparent ileal N digestibility (%) endogenous ileal N losses (mg/day) true ileal N digestibility (%) app. - true ileal N dig. (units)
Table 2. Trypsin (T) and chymotrypsin (C) activity in pancreas and jejunal chyme of newly weaned piglets fed diets based on either skim milk powder (SMP), soyabean meal (SBM) or fish meal (FM). Activities are presented as percentage of activity at weaning.
SMP SBM FM p
total T activity in pancreas total C activity in pancreas total T activity in jejunal chyme total C activity in jejunal chyme total T activity (pancreas + chyme) total C activity (pancreas + chyme) 83a 79" 44b 0.0003
It can be derived from the second experiment (Table 2) that trypsin activity in pancreas and jejunal contents increased over the first six days after weaning, while chymotrypsin activity in the pancreas had decreased. The different diets resulted in differences in pancreatic trypsin activity and in differences in total trypsin and chymotrypsin activity (pancreas + chyme). The differences in endogenous ileal N losses (Table 1) cannot be explained by the differences in pancreatic protease activities (Table 2), indicating that the pancreas is probably not the major source of endogenous N.
From Table 3 it can be seen that post-weaning feed intake was positively related to trypsin and chymotrypsin activities in pancreatic tissue and jejunal contents.
Conclusions
The differences in apparent ileal N digestibility between skim milk powder, soyabean meal and fish meal in 7 weeks old piglets are mainly due to differences in endogenous N losses. The pancreas is probably not the major source of these losses. Trypsin activity in pancreas and jejunum increases after weaning while chymotrypsin activity decreases.
123
1
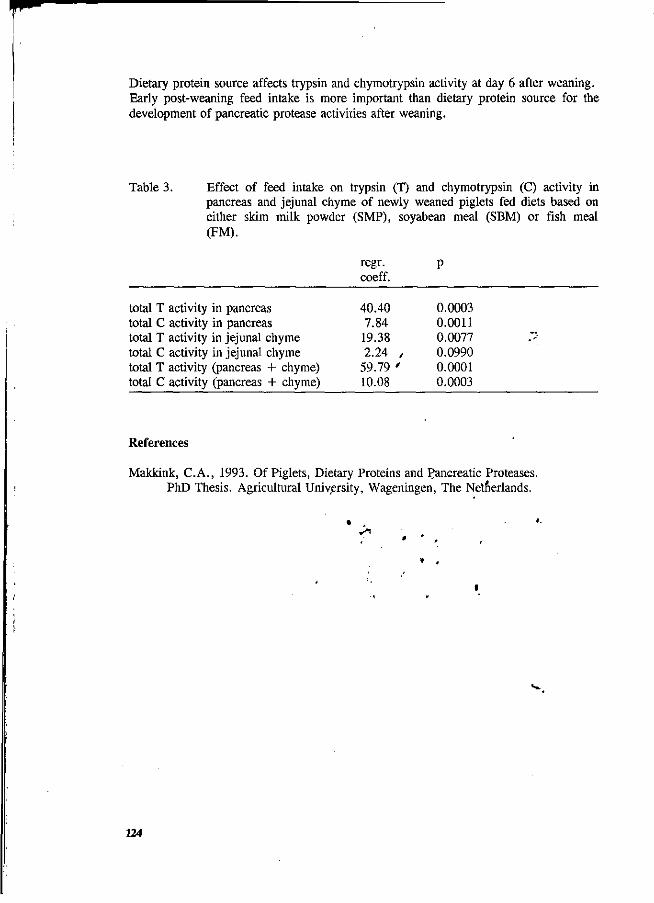
IP
Dietary protein source affects trypsin and chymotrypsin activity at day 6 after weaning. Early post-weaning feed intake is more important than dietary protein source for the development of pancreatic protease activities after weaning.
Table 3. Effect of feed intake on trypsin (T) and chymotrypsin (C) activity in pancreas and jejunal chyme of newly weaned piglets fed diets based on either skim milk powder (SMP), soyabean meal (SBM) or fish meal (FM).
total T activity in pancreas total C activity in pancreas total T activity in jejunal chyme total C activity in jejunal chyme total T activity (pancreas + chyme) total C activity (pancreas + chyme)
References
Makkink, C.A., 1993. Of Piglets, Dietary Proteins and Pancreatic Proteases. PhD Thesis. Agricultural University, Wageningen, The Netherlands.
regr. coeff.
40.40 7.84 19.38 2.24 ,
59.79 ' 10.08
P
0.0003 0.0011 0.0077 0.0990 0.0001 0.0003
124
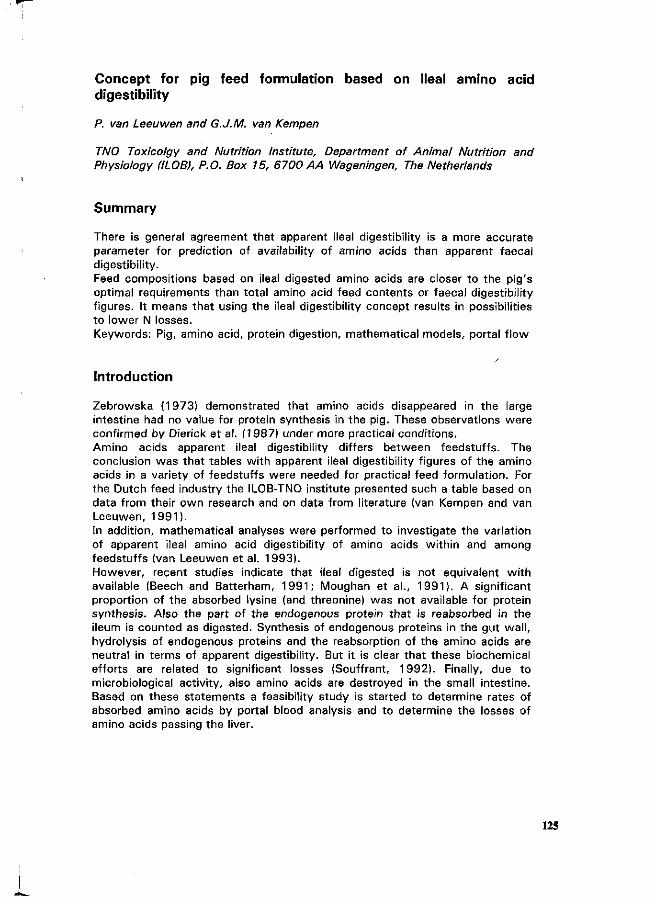
Concept for pig feed formulation based on ileal amino acid digestibility
P. van Leeuwen and G.J.M. van Kempen
TNO Toxicolgy and Nutrition Institute, Department of Animal Nutrition and Physiology (ILOB), P.O. Box 15, 6700 A A Wageningen, The Netherlands
Summary
There is general agreement that apparent ileal digestibility is a more accurate parameter for prediction of availability of amino acids than apparent faecal digestibility. Feed compositions based on ileal digested amino acids are closer to the pig's optimal requirements than total amino acid feed contents or faecal digestibility f igures. It means that using the ileal digestibility concept results in possibilities to lower N losses. Keywords: Pig, amino acid, protein digestion, mathematical models, portal f low
Introduction
Zebrowska (1973) demonstrated that amino acids disappeared in the large intestine had no value for protein synthesis in the pig. These observations were confirmed by Dierick et al. (1987) under more practical conditions. Amino acids apparent ileal digestibility differs between feedstuffs. The conclusion was that tables w i th apparent ileal digestibility figures of the amino acids in a variety of feedstuffs were needed for practical feed formulation. For the Dutch feed industry the ILOB-TNO institute presented such a table based on data from their own research and on data from literature (van Kempen and van Leeuwen, 1991). In addition, mathematical analyses were performed to investigate the variation of apparent ileal amino acid digestibility of amino acids within and among feedstuffs (van Leeuwen et al. 1993). However, recent studies indicate that ileal digested is not equivalent w i th available (Beech and Batterham, 1 9 9 1 ; Moughan et al., 1991). A significant proportion of the absorbed lysine (and threonine) was not available for protein synthesis. Also the part of the endogenous protein that is reabsorbed in the ileum is counted as digested. Synthesis of endogenous proteins in the gut wal l , hydrolysis of endogenous proteins and the reabsorption of the amino acids are neutral in terms of apparent digestibility. But it is clear that these biochemical efforts are related to significant losses (Souffrant, 1992). Finally, due to microbiological activity, also amino acids are destroyed in the small intestine. Based on these statements a feasibility study is started to determine rates of absorbed amino acids by portal blood analysis and to determine the losses of amino acids passing the liver.
125
1
Material & Methods
Data for table on ileal amino acid digestibility
The digestibility of protein and amino acids from feedstuffs were determined at the ILOB institute in experiments w i th in pigs ranging in live weight f rom 40-90 kg. These animals were f i t ted wi th re-entrant cannulas. The results of the experiments were combined w i th literature data to the Dutch table on ileal amino acid digestibility for pigs.
Mathematical analysis
ILOB data and data from literature were combined in one data base. From this data base the apparent ileal digestibility of each amino acid (Y) was estimated using an equation which contained two variables: i.e. apparent ileal digestibility value of protein (X,) and the reciprocal of the relative contribution of each amino acid to the protein in the feedstuff (X2).
[ Y = a * X, + b * X2 + C ]
Models were calculated wi th all available datamand accordingly give a general description of the relations. '
Portal vein experiment
A pilot experiment w i th two groups of each two pigs was executed. One group was provided w i th arterial and portal vein catheters. The second .group was provided w i th f l ow probes around the portal vein. The life weight of the animals was 30-45 kg. The animals were fed rations wi th milk protein mixture diluted w i th starch (ration I), w i th glucose (ration II) and wi th a ^combination of cellulose and fat (ration III).
Results -^ . .
Table ileal digestibility of amino acids in feedstuffs for pigs.
In table 1 , apparent ileal amino acids and protein diçjestibility'.values of the six important feedstuffs are given. The feedstuffs maize, soy bean meal, sunflower meal, meat and bone meal and fish meal represents the main groups of raw materials in pig rations. These data illustrate differences in apparent ileal digestibility values among amino acids. Lysine digestibility in maize is much lower than the digestibility of the crude protein. In soy bean meal, meat and bone meal and in f ish meal contrary differences were found. Also for ileal digestibility of the othef^amino acids, the same kind of incongruities were observed.
126
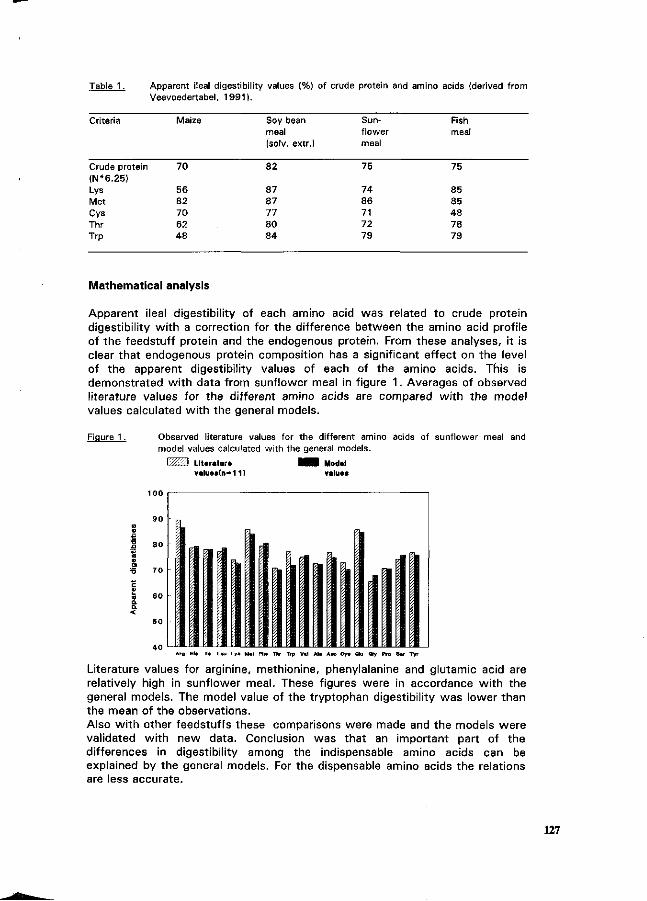
Table 1. Apparent ileal digestibility values (%) of crude protein and amino acids (derived from Veevoedertabel, 1991).
Criteria Maize Soy bean meal (solv. extr.)
Sunflower meal
Fish meal
Crude protein (N»6.25) Lys Met Cys Thr Trp
70
56 82 70 62 48
82
87 87 77 80 84
75
74 86 71 72 79
75
85 85 48 78 79
Mathematical analysis
Apparent ileal digestibility of each amino acid was related to crude protein digestibility w i th a correction for the difference between the amino acid profile of the feedstuff protein and the endogenous protein. From these analyses, it is clear that endogenous protein composition has a significant effect on the level of the apparent digestibility values of each of the amino acids. Tfiis is demonstrated w i th data from sunflower meal in figure 1 . Averages of observed literature values for the different amino acids are compared w i th the model values calculated w i th the general models.
Figure 1. Observed literature values for the different amino acids of sunflower meal and model values calculated with the general models.
Y/M'X Literatur* M i Modal valuaadi-11 ) value«
rk %Ë
Literature values for relatively high in sun general models. The r the mean of the obsei Also w i th other feeds validated w i th new differences in diges explained by the gent are less accurate.
anine and glutamic acid are ere in accordance w i th the digestibility was lower than
made and the models were an important part of the
able amino acids can be le amino acids the relations
127
Portal vein experiment
The first results of the pilot experiment indicated that the portal blood f low is not affected by feed composition. Between animals, distinct differences in blood f low were observed. The mean f low over 24 hours was 32-42 ml/min.kg body weight. Results of analysis in blood plasma concentrations showed significant differences between arterial and portal blood. Preliminary results indicate that these differences depend on feed composition. A high starch content in the feed (ration I) increased ammonia concentration in the portal blood compared to a high glucose ration (II) and a high cellulose+ fat ration (III). Feeding starch (ration I) also increased pC0 2 in portal blood. Both observations have to be verified.
Conclusions
Amino acid breakdown in the hindgut into non-utilisable products generally results in an overestimation when amino acid digestibility is based on faecal analysis. This implies that amino acid digestibility based on analysis of the ileal chyme is more accurate for feed evaluation. For amino acids however, digested in the small intestine does not mean available to the pig. There are some indications'that apparent ileal digestibility distinctly can overestimate availability of particular amino acids. First results of a pilot experiment w i th portal catheterized pigs showed that probably the non nitrogen composition of a ration wil l affect amino acid degradation and C0 2 production in intestine or ' gut wal l . This type of experiments wil l give additional information on amino acid losses due to biochemical processes in intestinal lumen and gut wal l . This information wil l improve interpretation of ileal amino acid digestibility concept.
,» Literature
Beech, S.A. and E.S. Batterham, 19^)1. Util ization of ileal digested I. amino acids by growing pigs; threonine. British JouriMftof Nutrition, 65, 381-390.
Dierick, N.A., I.J. Vervaeke, J.A. Decuypere, H. van der Heyde, H.K' Hendrikx', 1987. Correlations between ileal and faecal digested protein and organic matter to production performances' in growing pigs. Proceedings of the International Symposium' on Protein Metabolism and Nutrition. Rostock, DDR.
Moughan, P.J., W.C. Smith, G. Pearson, K.A.C. James, 1991. Assessment of, apparent ileal lysine digestibility for use in diet formulation for the growing pig. A'nimal Feed and Technology, 34, 95-109.
Souffrant, W.B., 1992. Endogenous nitrogen losses during digestion in pigs. Proceedings of the Vth International Symposium on Digestive Physiology in Pigs, Wageningen, The Netherlands. Editors: M.W.A. Verstegen, J. Huisman, L.A. den Hartog. 147-166.
Van Kempen, G.J.M, and P. van Leeuwen, 1991 . Dutch table of protein and amino acid digestibilities for swine. Proceedings of the 42nd Annual Meeting of the EAAP, Berlin. ^
Van Leeuwen, P., A.J.M. Jansman, G.J.M. van Kempen, M.W.A. Verstegen, J. Huisman, 1993. Mathematical analysis of the apparent ileal digestibility values of amino acids in feedstuffs for pigs. Livestock Production Science. In preparation for press.
Veevoedertabel, June 1991. Edited by Centraal Veevoederbureau, Runderweg 6, 8219 PK, Lelystad, The Netherlands.
Zebrowska, T. 1973. Digestion and absorption of nitrogenous compounds in the large intestine of pigs. Roczn. Nauk. Roln. B-95, 85-90.
128
Meat and bone meal as a protein and mineral source for growing pigs
K. Partanen
Department of Animal Science, P.O. Box 28, SF-00014 Helsinki University, Finland
Summary
Two balance experiments were carried out to study the digestibility and utilization of protein and phosphorus (P) in meat and bone meal by pigs. In the first, meat and bone meal (MBM) was included in barley based diets at two levels to supplement 50 or 100 g crude protein (kg dry matter)"1. In the second experiment, meat and bone meals of low (MBML) and high (MBMH) ash content were compared to soya bean meal (SBM). Each protein source was added to barley based diets at three levels to supplement 20, 45 or 70 g crude protein (kg dry matter)"1. The digestibility coefficient for N was 0.915 in MBM and 0.896, 0.817 and 0.823 in SBM, MBML and MBMH, respectively. The differences in the digestibility of N in meat and bone meals between the experiments were mainly attributed to the differences in the feeding level and the live weight of the pigs. In the second experiment, the total urinary N and urea-N excretion were higher and N retention lower for meat and bone meal diets compared to SBM diets. This indicates that the superiority of SBM over the meat and bone meals as a protein source for growing pigs was attributed to differences in both the balance and the utilization of amino acids in the meals. The faecal and urinary excretion and the retention of P increased with increasing P intake. Despite of higher P intake, the digestibility of P was higher for the meat and bone meal diets compared to the SBM diets. However, the digestibility of P decreased with increasing meat and bone meal supply. Keywords: meat and bone meal, digestibility, utilization, protein, calcium, phosphorus
Introduction
Production of food for human consumption involves a considerable production of byproducts. A variety of by-products originate from slaughter houses and the meat processing industry. Generally, animal by-products have a high content of protein, energy and minerals, and therefore, they have potential as animal feed. However, the availability of nutrients in animal by-products varies considerably depending on the raw materials used, as well as the processing conditions (Miller & De Boer, 1988).
The pollution of the environment with nitrogen (N) and phosphorus (P) from manure has become a serious problem in areas of intensive pig production. For that reason, there has recently been growing interest in reduction of excretion of N and P by pigs. Feeding animal by-products to pigs, instead of dumping them, contributes substantially to reducing wastes. On the other hand, the low digestibility and utilization of N in certain animal byproducts, particularly in meat and bone meals, has made them less attractive for pig feeding. To reduce the excretion by means of nutrition, the supply of N and P should be in accordance with animal's requirements (Jongbloed & Lenis, 1992). The aim of this paper was to study the digestibility and utilization of protein and P in meat and bone meal by pigs.
129
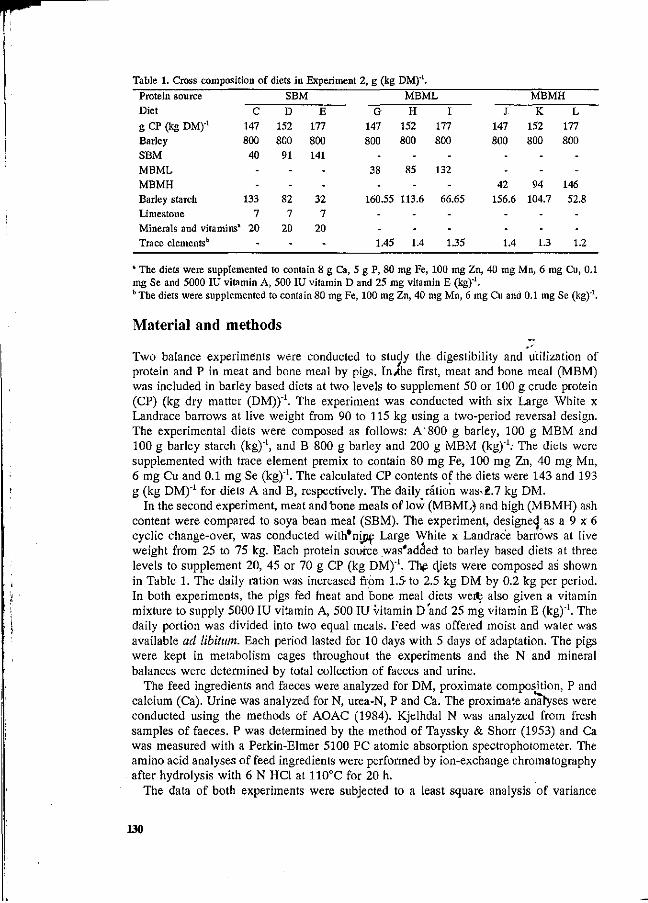
Table 1. Cross composition of diets in Experiment 2, g (kg DM)'1
Protein source Diet
g CP (kg DM)"1
Barley SBM MBML MBMH Barley starch Limestone Minerals and vitamins Trace elementsb
C 147 800 40
--
133 7
20
-
SBM
D 152 800 91
--
82 7
20
-
E 177 800 141
--
32 7
20
-
G 147 800
-38
-160.55
--1.45
MBML
H 152 800
-85
-113.6
--1.4
I 177 800
-132
-66.65
--1.35
J 147 800
--
42 156.6
--1.4
MBMH
K 152 800
--
94 104.7
--1.3
L 177 800
--
146 52.8
--1.2
* The diets were supplemented to contain 8 g Ca, 5 g P, 80 mg Fe, 100 mg Zn, 40 mg Mn, 6 mg Cu, 0.1 mg Se and 5000 IU vitamin A, 500 IU vitamin D and 25 mg vitamin E (kg)'1. b The diets were supplemented to contain 80 mg Fe, 100 mg Zn, 40 mg Mn, 6 mg Cu and 0.1 mg Se (kg)'1.
Material and methods
Two balance experiments were conducted to study the digestibility and utilization of protein and P in meat and bone meal by pigs. In/the first, meat and bone meal (MBM) was included in barley based diets at two levels to supplement 50 or 100 g crude protein (CP) (kg dry matter (DM))'1. The experiment was conducted with six Large White x Landrace barrows at live weight from 90 to 115 kg using a two-period reversal design. The experimental diets were composed as follows: A'800 g barley, 100 g MBM and 100 g barley starch (kg)'1, and B 800 g barley and 200 g MBM (kg)"1.- The diets were supplemented with trace element premix to contain 80 mg Fe, 100 mg Zn, 40 mg Mn, 6 mg Cu and 0.1 mg Se (kg)'1. The calculated CP contents of the diets were 143 and 193 g (kg DM)"1 for diets A and B, respectively. The daily ration was. 1.1 kg DM.
In the second experiment, meat and bone meals of low (MBML) and high (MBMH) ash content were compared to soya bean meal (SBM). The experiment, designed as a 9 x 6 cyclic change-over, was conducted with*nhje Large White x Landrace barrows at live weight from 25 to 75 kg. Each protein source was'added to barley based diets at three levels to supplement 20, 45 or 70 g CP (kg DM)'1. The 4 ' e t s w e r e composed as' shown in Table 1. The daily ration was increased from 1.5 to 2.5 kg DM by 0.2 kg per period. In both experiments, the pigs fed meat and bone meal diets wetffe also given a vitamin mixture to supply 5000 IU vitamin A, 500 IU vitamin D and 25 mg vitamin E (kg)'1. The daily portion was divided into two equal meals. Feed was offered moist and water was available ad libitum. Each period lasted for 10 days with 5 days of adaptation. The pigs were kept in metabolism cages throughout the experiments and the N and mineral balances were determined by total collection of faeces and urine.
The feed ingredients and faeces were analyzed for DM, proximate composition, P and calcium (Ca). Urine was analyzed for N, urea-N, P and Ca. The proximate analyses were conducted using the methods of AOAC (1984). Kjelhdal N was analyzed from fresh samples of faeces. P was determined by the method of Tayssky & Shorr (1953) and Ca was measured with a Perkin-Elmer 5100 PC atomic absorption spectrophotometer. The amino acid analyses of feed ingredients were performed by ion-exchange chromatography after hydrolysis with 6 N HCl at 110°C for 20 h.
The data of both experiments were subjected to a least square analysis of variance
130
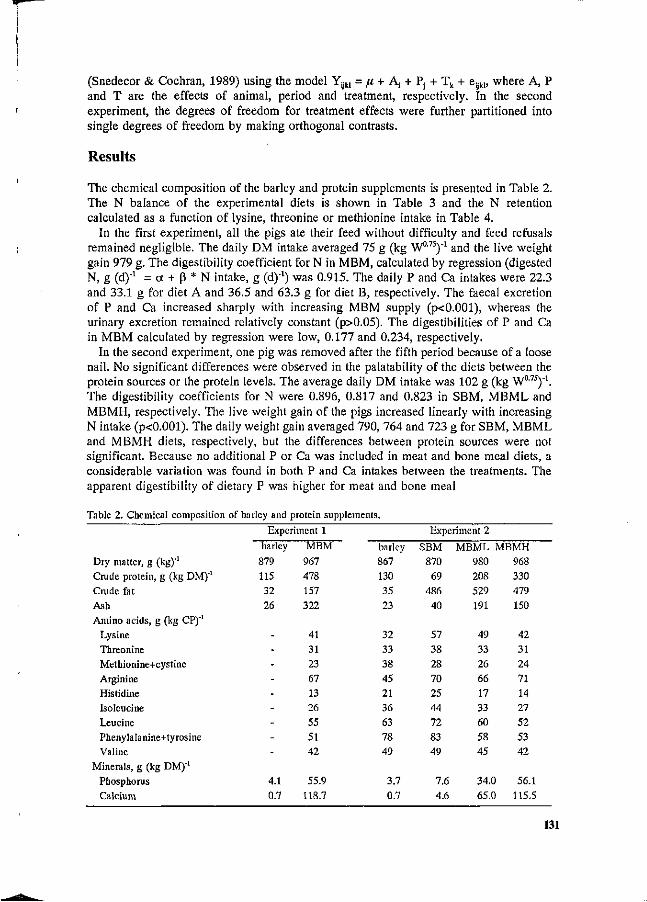
(Snedecor & Cochran, 1989) using the model Yijkl = yu + Ai + Pj + Tk + eijH, where A, P and T are the effects of animal, period and treatment, respectively. In the second experiment, the degrees of freedom for treatment effects were further partitioned into single degrees of freedom by making orthogonal contrasts.
Results
The chemical composition of the barley and protein supplements is presented in Table 2. The N balance of the experimental diets is shown in Table 3 and the N retention calculated as a function of lysine, threonine or methionine intake in Table 4.
In the first experiment, all the pigs ate their feed without difficulty and feed refusals remained negligible. The daily DM intake averaged 75 g (kg W0,75)"1 and the live weight gain 979 g. The digestibility coefficient for N in MBM, calculated by regression (digested N, g (d)-1 = a + ß * N intake, g (d)"1) was 0.915. The daily P and Ca intakes were 22.3 and 33.1 g for diet A and 36.5 and 63.3 g for diet B, respectively. The faecal excretion of P and Ca increased sharply with increasing MBM supply (p<0.001), whereas the urinary excretion remained relatively constant (p>0.05). The digestibilities of P and Ca in MBM calculated by regression were low, 0.177 and 0.234, respectively.
In the second experiment, one pig was removed after the fifth period because of a loose nail. No significant differences were observed in the palatability of the diets between the protein sources or the protein levels. The average daily DM intake was 102 g (kg W075)"1. The digestibility coefficients for N were 0.896, 0.817 and 0.823 in SBM, MBML and MBMH, respectively. The live weight gain of the pigs increased linearly with increasing N intake (p<0.001). The daily weight gain averaged 790, 764 and 723 g for SBM, MBML and MBMH diets, respectively, but the differences between protein sources were not significant. Because no additional P or Ca was included in meat and bone meal diets, a considerable variation was found in both P and Ca intakes between the treatments. The apparent digestibility of dietary P was higher for meat and bone meal
Table 2. Chemical composition of barley and protein supplements.
Dry matter, g (kg)'1
Crude protein, g (kg DM)'1
Crude fat Ash Amino acids, g (kg CP)"1
Lysine Threonine Methionine+cystine
Arginine Histidine Isoleucine Leucine Phenylalanine+tyrosine
Valine Minerals, g (kg DM)"1
Phosphorus
Calcium
Expcri
barley 879 115 32 26
---------
4.1 0.7
ment 1
MBM 967 478 157 322
41 31 23 67 13 26 55 51 42
55.9
118.7
barley 867 130 35 23
32 33 38 45 21 36 63 78 49
3.7
0.7
Experiment 2
SBM 870 69
486 40
57 38 28 70 25 44 72 83 49
7.6 4.6
MBML MBMH 980 208 529
191
49 33 26 66 17 33 60 58 45
34.0 65.0
968 330 479 150
42 31 24 71 14 27 52 53 42
56.1
115.5
131
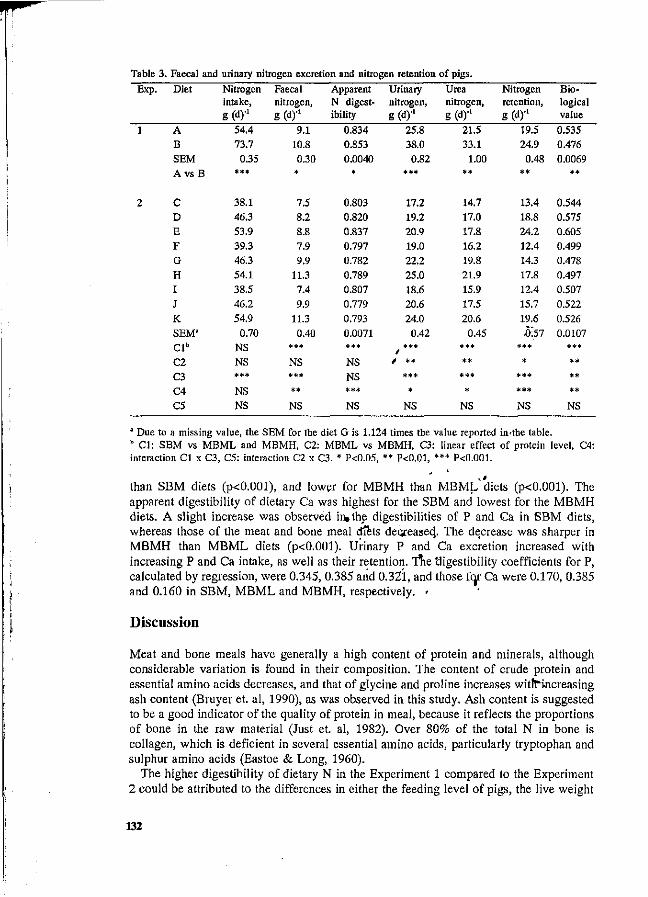
Table 3. Faecal and urinary nitrogen excretion and nitrogen retention of pigs.
Exp. Diet
1 A B SEM A vs B
2 C D E F G H I J K SEM" Clb
C2 C3 C4 C5
Nitrogen intake, g (d)"1
54.4 73.7 0.35
***
38.1 46.3 53.9 39.3 46.3 54.1 38.5 46.2 54.9 0.70
NS NS
*** NS NS
Faecal nitrogen, g (d)"1
9.1 10.8 0.30
*
7.5 8.2 8.8 7.9 9.9
11.3 7.4 9.9
11.3 0.40
*** NS
**# ** NS
Apparent N digestibility
0.834 0.853 0.0040
*
0.803 0.820 0.837 0.797 0.782 0.789 0.807 0.779 0.793 0.0071
#** NS NS *** NS
Urinary nitrogen, g (d)"1
25.8 38.0 0.82
***
17.2 19.2 20.9 19.0 22.2 25.0 18.6 20.6 24.0 0.42
*** / / **
*** *
NS
Urea nitrogen, g (d)"1
21.5 33.1
1.00
**
14.7 17.0 17.8 16.2 19.8 21.9 15.9 17.5 20.6 0.45
*** ** *** *
NS
Nitrogen retention, g (d)"1
19.5 24.9 0.48
**
13.4 18.8 24.2 12.4 14.3 17.8 12.4 15.7 19.6 ft57
*** *
*** *** NS
Biological value
0.535 0.476 0.0069
**
0.544 0.575 0.605 0.499 0.478 0.497 0.507 0.522 0.526
0.0107 *** ** ** ** NS
* Due to a missing value, the SEM for the diet G is 1.124 times the value reported in'the table. b CI: SBM vs MBML and MBMH, C2: MBML vs MBMH, C3: linear effect of protein level, C4: interaction CI x C3, C5: interaction C2 x C3. * P<0.05, ** P<0.01, *** P<0.001.
than SBM diets (p<0.001), and lower for MBMH than MBML diets (p<0.001). The apparent digestibility of dietary Ca was highest for the SBM and lowest for the MBMH diets. A slight increase was observed in» the digestibilities of P and Ca in SBM diets, whereas those of the meat and bone meal diets decreased,. The decrease was sharper in MBMH than MBML diets (p<0.001). Urinary P and Ca excretion increased with increasing P and Ca intake, as well as their retention. TÎie 'digestibility coefficients for P, calculated by regression, were 0.345, 0.385 and 0.32Ï, and those fry Ca were 0.170, 0.385 and 0.160 in SBM, MBML and MBMH, respectively. -
Discussion
Meat and bone meals have generally a high content of protein and minerals, although considerable variation is found in their composition. The content of crude protein and essential amino acids decreases, and that of glycine and proline increases witffincreasing ash content (Bruyer et. al, 1990), as was observed in this study. Ash content is suggested to be a good indicator of the quality of protein in meal, because it reflects the proportions of bone in the raw material (Just et. al, 1982). Over 80% of the total N in bone is collagen, which is deficient in several essential amino acids, particularly tryptophan and sulphur amino acids (Eastoe & Long, 1960).
The higher digestibility of dietary N in the Experiment 1 compared to the Experiment 2 could be attributed to the differences in either the feeding level of pigs, the live weight
132
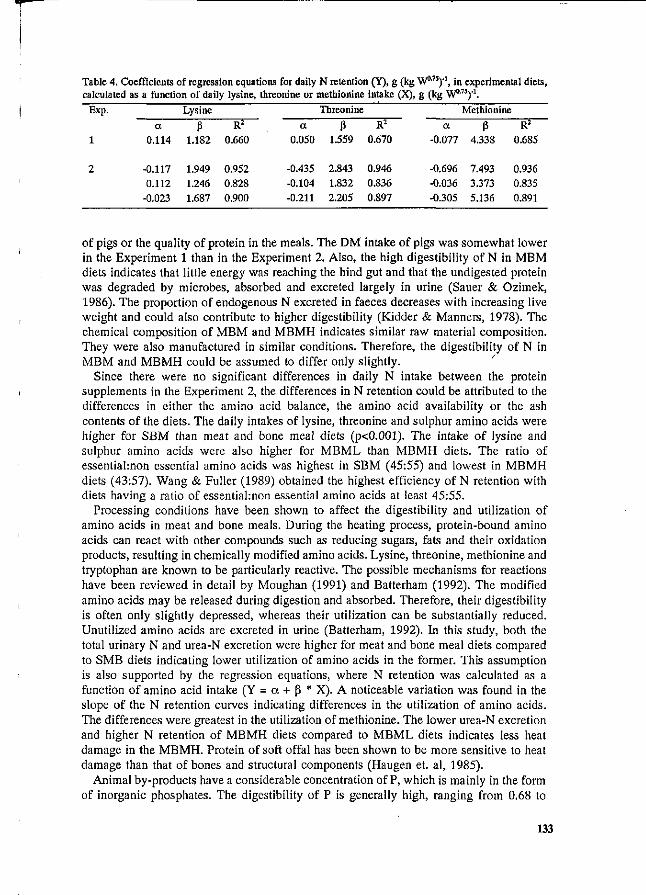
Table 4. Coefficients of regression equations for daily N retention (Y), g (kg W0,75)'1, in experimental diets, calculated as a function of daily lysine, threonine or methionine intake (X), g (kg W0,75)'1.
Exp.
1
2
a 0.114
-0.117 0.112
-0.023
Lysine
ß 1.182
1.949 1.246 1.687
R2
0.660
0.952 0.828 0.900
a 0.050
-0.435 -0.104 -0.211
Threonine
ß 1.559
2.843 1.832 2.205
R2
0.670
0.946 0.836 0.897
a -0.077
-0.696 -0.036 -0.305
Methionine
ß 4.338
7.493 3.373 5.136
R2
0.685
0.936 0.835 0.891
of pigs or the quality of protein in the meals. The DM intake of pigs was somewhat lower in the Experiment 1 than in the Experiment 2. Also, the high digestibility of N in MBM diets indicates that little energy was reaching the hind gut and that the undigested protein was degraded by microbes, absorbed and excreted largely in urine (Sauer & Ozimek, 1986). The proportion of endogenous N excreted in faeces decreases with increasing live weight and could also contribute to higher digestibility (Kidder & Manners, 1978). The chemical composition of MBM and MBMH indicates similar raw material composition. They were also manufactured in similar conditions. Therefore, the digestibility of N in MBM and MBMH could be assumed to differ only slightly.
Since there were no significant differences in daily N intake between the protein supplements in the Experiment 2, the differences in N retention could be attributed to the differences in either the amino acid balance, the amino acid availability or the ash contents of the diets. The daily intakes of lysine, threonine and sulphur amino acids were higher for SBM than meat and bone meal diets (p<0.001). The intake of lysine and sulphur amino acids were also higher for MBML than MBMH diets. The ratio of essentiahnon essential amino acids was highest in SBM (45:55) and lowest in MBMH diets (43:57). Wang & Fuller (1989) obtained the highest efficiency of N retention with diets having a ratio of essentiahnon essential amino acids at least 45:55.
Processing conditions have been shown to affect the digestibility and utilization of amino acids in meat and bone meals. During the heating process, protein-bound amino acids can react with other compounds such as reducing sugars, fats and their oxidation products, resulting in chemically modified amino acids. Lysine, threonine, methionine and tryptophan are known to be particularly reactive. The possible mechanisms for reactions have been reviewed in detail by Moughan (1991) and Batterham (1992). The modified amino acids may be released during digestion and absorbed. Therefore, their digestibility is often only slightly depressed, whereas their utilization can be substantially reduced. Unutilized amino acids are excreted in urine (Batterham, 1992). In this study, both the total urinary N and urea-N excretion were higher for meat and bone meal diets compared to SMB diets indicating lower utilization of amino acids in the former. This assumption is also supported by the regression equations, where N retention was calculated as a function of amino acid intake (Y = a + ß * X). A noticeable variation was found in the slope of the N retention curves indicating differences in the utilization of amino acids. The differences were greatest in the utilization of methionine. The lower urea-N excretion and higher N retention of MBMH diets compared to MBML diets indicates less heat damage in the MBMH. Protein of soft offal has been shown to be more sensitive to heat damage than that of bones and structural components (Haugen et. al, 1985).
Animal by-products have a considerable concentration of P, which is mainly in the form of inorganic phosphates. The digestibility of P is generally high, ranging from 0.68 to
133
0.91 (Jongbloed & Kemme, 1990). In this study, the digestibility of dietary P varied considerably, depending on the source of P and the P and Ca intakes. In the experiments of Jongbloed & Kemme (1990), the level of digestible P in the feed was 1.6 g (kg)"1. This means that only a small amount of meat and bone meal was included in the diet. However, in practical pig feeding higher levels of P are used, which means that the P digestibility decreases, as observed in this study. The optimum Ca:P ratio for maximum P retention is 1.3:1 (Jongbloed, 1987), whereas that of meat and bone meals was 1.9-2.1:1. Processing may also have an effect on the digestibility of P in the meat and bone meals (Jongbloed & Kemme, 1990).
The low utilization of protein and P in meat and bone meals makes them less attractive as a feed ingredient for pigs. To reduce the excretion of N and P by pigs, only low levels of meat and bone meal should be included in diets. However, it should be born in mind that the use of animal by-products reduces wastes. In addition, when meat and bone meal replaces imported feed ingredients, such as soya bean meal, its use improves the national mineral balance (Jongbloed & Lenis, 1990).
References
AOAC 1984. Official methods of analysis. 1141 p. Association of Official Analytical Chemist, Inc., Arlington, Virginia. /
Batterham, E.S. 1992. Availability and utilization of arfiino acids for growing pigs. Nutr. Res. Rev. 5:1-18.
Bruyer, D.C., Foulon, M. & Vanbelle, M. 1990. The amino acid composition of meat and bone meals and its predictability. Arch. Anim. Nutr., Berlin 40:259-265.
Eastoe, J.E. & Long, J.E. 1960. The amino-acid composition' of processed bones and meat. J. Sei. Food Agric. 11:87-92.
Haugen, E.W., Pettigrew, J.E., Cornelius, S.G. & Moser, R.L. 1985. Effects of meat meal manufacturing variations on amino acid bioavailability in pigs. J. Anim. Sei. 61(Supplement 1):100. - ' ( ,
Jongbloed, A.W. 1987. Phosphorus in the feeding of pigs.'Effect of diet on the absorption and retention of phosphorus by growing pigs. Doctoral Thesis, Wageningen Agric. Univ., 343 p.
- & Kemme, P.A. 1990. Apparent digestible phosphorus in the feeding of pigs in relation to availability, requirement and environment, l.îSgestibJe phosphorus in feedstuffs from plant and animal origin. Netherlands J. Agr. Sei. 38:567-575.
- & Lenis, N.P. 1992. Alteration of nutrition as a means to reduce environmental pollution by pigs. Livest. Prod. Sei. 31:75-94.
Just, A., Fernandez, J.A. & Jtfrgensen, H. 1982. KçSdbenmels vœrdi tif, svin. 525. Beretning fra Statens Husdyrbrugs forsçig. 52 p.
Kidder, D.E. & Manners, M.J. 1978. Digestion in the pig. 201 p. Scientechnica, Bristol. Miller, E.L. & De Boer, F. 1988. By-products of animal origin. Livest. Prod. Sei. 19:159-196.
Moughan, P.J. 1991. Towards improved utilization of dietary amino acids by the growing pig. In: Haresign, W. & Cole, D.J.A.: Recent advances in Animal Nutrition, 1991. Butterworth-Heinemann, London, p. 45-64.
Sauer, W.C. & Ozimek, L. 1986. Digestibility of amino acids in swine: results and their practical applications. A review. Livest. Prod. Sei. 15:367-388.
Snedecor, G.W. & Cochran, W.G. 1989. Statistical methods. 503 p. 8th ed. Iowa University Press, Ames, Iowa.
Tayssky, H.H. & Shorr, E. 1953. A microcolorimetric method for the determination of inorganic phosphorus. J. Biol. Chem. 202:675-685.
Wang, T.C. & Fuller, F. 1989. The optimum dietary amino acid pattern for growing pigs. 1. Experiments by amino acid deletion. Br. J. Nutr. 62:77-89.
134
I SESSION 3
Nutritional possibilities for reduction of N.
Feeding strategy for minimizing nitrogen output in pigs
Y. Henry and J.Y. Dourmad
INJIA., Station de Recherches Porcines, 35590 Saint-Gilles, France
Summary
Prevention of excess N output in pig wastes through feeding presupposes to adapt protein and amino acid supply as closely as possible over time to more or less rapidly changing requirements, according to animal potential and stage of production. Feeding strategy for minimizing N output is of special concern for growing - finishing pigs. A first approach was to adjust dietary energy and protein or amino acid supply according to body weight (BW) and growth potential (capacity for protein deposition), through measurable parameters at farm level (daily live weight gain, carcass composition). From the resulting changes in protein or amino acid - energy ratio with live weight or time, it was possible to define a specific strategy of phase feeding, by selecting BW intervals that allow the best adjustment of daily dietary protein flow to requirements with conventional single feeds. Continuous adjustment of protein supply to animal needs was considered with two-feed system, by mixing two balanced feeds differing in their protein contents throughout fattening. Simulation studies comparing different phase feeding strategies were presented by quantifying their impact on N output. Feeding strategy was found to interact with pig potential for growth, with conventional fat type pigs being more reactive to modifications of phase feeding than fast growing lean genotypes. As an alternative solution, self -selection of balanced feeds also differing in protein content was examined as a potential means for adjusting N input to pig requirements to minimize N output. Keywords : pig, protein nutrition, feeding strategy, phase feeding, free choice feeding, nitrogen output, simulation model.
Introduction
Feeding strategy in pig production has been given a new perception with the advent of environmental problems related to pollution with nitrogen from animal manure. Formerly, dietary adjustments to pig requirements were aimed at maximizing production performance without special concern for nutrient oversupply, namely protein and amino acids. The recent environmental constraints have forced to figure protein feeding not only in terms of N retained in animal products but also in terms of non utilized fraction of N ingested. Therefore, a sound management of protein feeding in pigs necessitates nowadays a close adjustment of protein and / or amino acid supply to the requirements so as to obtain the lowest level of N output.
The primary objective of a feeding strategy is to determine the daily amount of feed of a given composition for a specified body weight (BW) or age interval, should it be on one or few days basis, in order to control tissue deposition and obtain a carcass of a given composition at slaughter. With regard major nutrients, this requires a joint fitting of energy and protein (amino acid) supplies, depending on pig potential and stage of production, as well as production objective (type of carcass to be marketed in relation to feeding system, either ad libitum or restricted) and environmental constraints (reduced N output).
The first step is to fit the daily energy supply, according to the energy evaluation system in use (DE, ME or NE). Since dietary energy need corresponds to the overall intake of feed or organic matter, the adequacy of supply to requirement is automatically fulfilled by letting the animals free to fix their own level of feeding or by using a feeding scale in the case of feed restriction. This necessitates to predict daily feed intake over
137
time in ad libitum fed pigs, or the daily feed allocation in restrictively fed pigs, depending on the feeding system.
By contrast, for protein and amino acids, since the daily requirement does not reflect the same changing pattern with time as for energy, the effective adjustment of supply would necessitate constant change in dietary protein (or amino acid) to energy ratio. This is not feasible in practical feeding conditions. The problem we have to face with regard protein feeding strategy is then to know how to adapt protein supply in the most convenient way and with as low oversupply as possible. The most common and practical way is to provide a feed of known protein content and amino acid profile on a weight or age basis, corresponding to the "phase feeding" system. In that case, one has to select the right dietary protein content and body weight or age interval that allow the best fitting of protein supply to actual requirement. The adjustment of protein supply on a daily basis is not practical, but may be attained by mixing two feeds of different protein contents ("two-feed" system). An alternative solution may be to let the pigs to self-select not only dietary energy but also protein when offered a choice between diets differing by their protein contents ("free choice" feeding system).
During the last years, feeding strategy aspects have been dealt with in several reviews referring to the impact of protein nutrition in pigs on N pollution in water (nirates) and the atmosphere (gazeous ammonia), with special concern to preventive solutions through feeding to decrease N excretion : Dourmad et al., 1989 ;.Lenis, 1989 ; Schutte & Bosch, 1990 ; Dourmad & Guillou, 1991 ; Henry, 1991 ; Monjenti & Piva, 1991 ; Tamminga & Verstegen, 1991 ; Dourmad et al., 1992 ; Henry & Dourmad, 1992 ; Dourmad & Henry, 1993 ; Guillou et al., 1993. '
In this presentation, we shall examine first the adjustment of dietary energy and protein supplies over time according to growth potential, in order to derive through simulation the resulting changes in protein (amino acid) / ratio with body weight or time. This will allow to discuss the relevance of phase feeding strategy to reduce N output. The ultimate application of phase feeding strategy will be considered on a short time span with two-feeding system. The last part will be dedicated to free-choice feeding system, as an alternative feeding strategy. According to their major contribution to dietary protein input and N output (more than 75 %) in pork production, special emphasis will be placed on growing-finishing pigs, but the specific features'or protei» feeding strategy in reproductive sows will also be taken into account.
Adjustment of dietary energy and protein supplies over time according to production performance ^\ ,
In order to minimize dietary N output, it is necessary first to achieve an adjustment of protein and amino acid supply over time, that is on a daily basis, as close as possible to the specific requirements of the pig, according to production potential (growth, reproduction) and on the basis of available-, e.g. digestible, amino acids for optimum metabolic utilization. This is now within reach with the use of modelling techniques for predicting the requirements, and a better knowledge of variations of amino acid digestibility in feedstuffs according to their origin and specific compositional characteristics.
Prediction modelling of dietary energy and protein supplies
Until now, dietary allowances for pigs were based on average recommendations that applied to the individuals with the highest requirements within a given population or to the most demanding period within the considered physiological stage. In addition, a wide safety margin was allocated to take into account fluctuations in feed quality, thus resulting in exaggerated output in relation to the real animal needs. Only recently, the development of factorial analytical approach has allowed to predict energy as well as protein and amino acid requirements from maintenance costs and tissue deposits, as a function of production potential, and the efficiencies of nutrient utilization, in order to
138
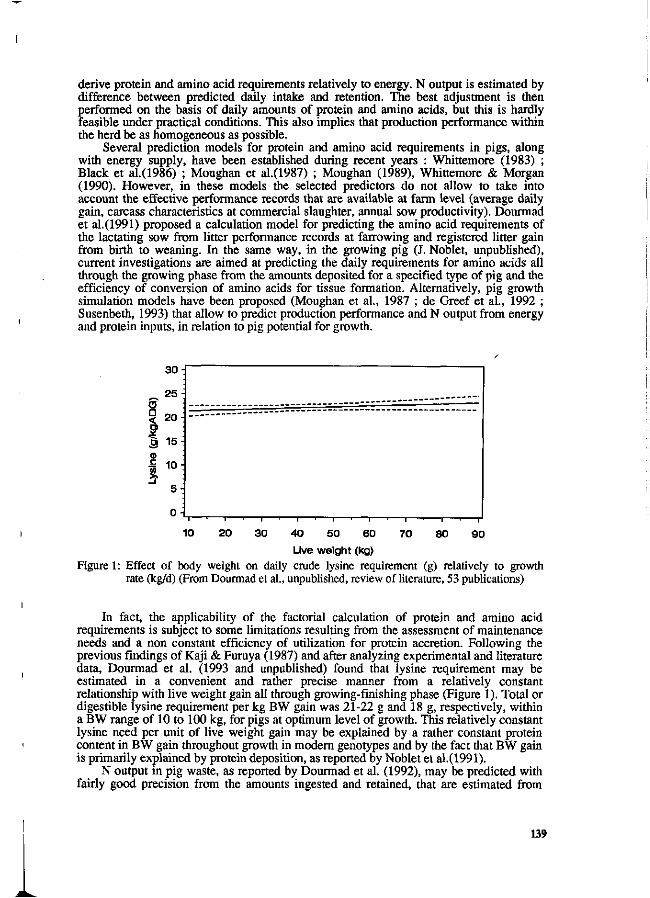
derive protein and amino acid requirements relatively to energy. N output is estimated by difference between predicted daily intake and retention. The best adjustment is then performed on the basis of daily amounts of protein and amino acids, but this is hardly feasible under practical conditions. This also implies that production performance within the herd be as homogeneous as possible.
Several prediction models for protein and amino acid requirements in pigs, along with energy supply, have been established during recent years : Whittemore (1983) ; Black et al.(1986) ; Moughan et al.(1987) ; Moughan (1989), Whittemore & Morgan (1990). However, in these models the selected predictors do not allow to take into account the effective performance records that are available at farm level (average daily gain, carcass characteristics at commercial slaughter, annual sow productivity). Dourmad et al.(1991) proposed a calculation model for predicting the amino acid requirements of the lactating sow from litter performance records at farrowing and registered litter gain from birth to weaning. In the same way, in the growing pig (J. Noblet, unpublished), current investigations are aimed at predicting the daily requirements for amino acids all through the growing phase from the amounts deposited for a specified type of pig and the efficiency of conversion of amino acids for tissue formation. Alternatively, pig growth simulation models have been proposed (Moughan et al., 1987 ; de Greef et al., 1992 ; Susenbeth, 1993) that allow to predict production performance and N output from energy and protein inputs, in relation to pig potential for growth.
(3 a
1 3 o Ç %
3 0 -
2 5 -
2 0 -
15 -
10 -
5 :
0 :
• i ' i ' i ' i
10 20 30 70 80 90 40 50 60 Live weight (kg)
Figure 1 : Effect of body weight on daily crude lysine requirement (g) relatively to growth rate (kg/d) (From Dourmad et al., unpublished, review of literature, 53 publications)
In fact, the applicability of the factorial calculation of protein and amino acid requirements is subject to some limitations resulting from the assessment of maintenance needs and a non constant efficiency of utilization for protein accretion. Following the previous findings of Kaji & Furuya (1987) and after analyzing experimental and literature data, Dourmad et al. (1993 and unpublished) found that lysine requirement may be estimated in a convenient and rather precise manner from a relatively constant relationship with live weight gain all through growing-finishing phase (Figure 1). Total or digestible lysine requirement per kg BW gain was 21-22 g and 18 g, respectively, within a BW range of 10 to 100 kg, for pigs at optimum level of growth. This relatively constant lysine need per unit of live weight gain may be explained by a rather constant protein content in BW gain throughout growth in modern genotypes and by the fact that BW gain is primarily explained by protein deposition, as reported by Noblet et al.(1991).
N output in pig waste, as reported by Dourmad et al. (1992), may be predicted with fairly good precision from the amounts ingested and retained, that are estimated from
139
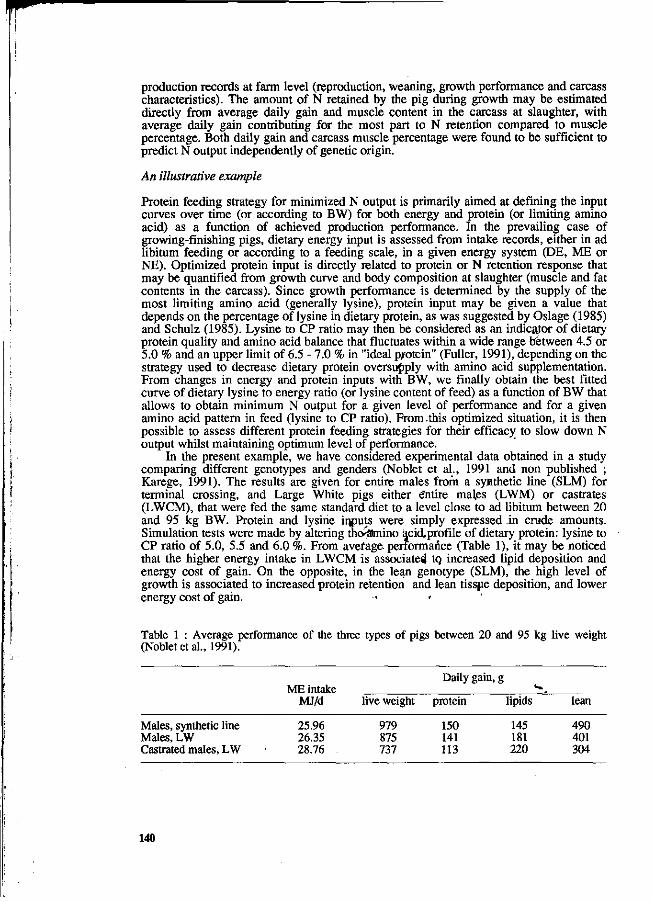
production records at farm level (reproduction, weaning, growth performance and carcass characteristics). The amount of N retained by the pig during growth may be estimated directly from average daily gain and muscle content in the carcass at slaughter, with average daily gain contributing for the most part to N retention compared to muscle percentage. Both daily gain and carcass muscle percentage were found to be sufficient to predict N output independently of genetic origin.
An illustrative example
Protein feeding strategy for minimized N output is primarily aimed at defining the input curves over time (or according to BW) for both energy and protein (or limiting amino acid) as a function of achieved production performance. In the prevailing case of growing-finishing pigs, dietary energy input is assessed from intake records, either in ad libitum feeding or according to a feeding scale, in a given energy system (DE, ME or NE). Optimized protein input is directly related to protein or N retention response that may be quantified from growth curve and body composition at slaughter (muscle and fat contents in the carcass). Since growth performance is determined by the supply of the most limiting amino acid (generally lysine), protein input may be given a value that depends on the percentage of lysine in dietary protein, as was suggested by Oslage (1985) and Schulz (1985). Lysine to CP ratio may then be considered as an indicator of dietary protein quality and amino acid balance that fluctuates within a wide range between 4.5 or 5.0 % and an upper limit of 6.5 - 7.0 % in "ideal pjrotein" (Fuller, 1991), depending on the strategy used to decrease dietary protein oversupply with amino acid supplementation. From changes in energy and protein inputs with BW, we finally obtain the best fitted curve of dietary lysine to energy ratio (or lysine content of feed) as a function of BW that allows to obtain minimum N output for a given level of performance and for a given amino acid pattern in feed (lysine to CP ratio). From .this optimized situation, it is then possible to assess different protein feeding strategies for their efficacy to slow down N output whilst maintaining optimum level of performance.
In the present example, we have considered experimental data obtained in a study comparing different genotypes and genders (Noblet et al., 1991 and non published ; Karege, 1991). The results are given for entire males from a syathetic line (SLM) for terminal crossing, and Large White pigs either e'ntire mal.es (LWM) or castrates (LWCM), that were fed the same standard diet to a level close to ad libitum between 20 and 95 kg BW. Protein and lysine inputs were simply expressed in crude amounts. Simulation tests were made by altering the»-ataino acicLprofile of dietary protein: lysine to CP ratio of 5.0, 5.5 and 6.0 %. From average, performance (Table 1), it may be noticed that the higher energy intake in LWCM is associated tq increased lipid deposition and energy cost of gain. On the opposite, in the lean genotype (SLM), the high level of growth is associated to increased protein retention and lean tissjie deposition, and lower energy cost of gain.
Table 1 : Average performance of the three types of pigs between 20 and 95 kg live weight (Noblet et al., 1991).
Males, synthetic line Males, LW Castrated males, LW
ME intake MJ/d
25.96 26.35 28.76
live weight
979 875 737
Daily gain
protein
150 141 113
g
lipids
145 181 220
lean
490 401 304
140
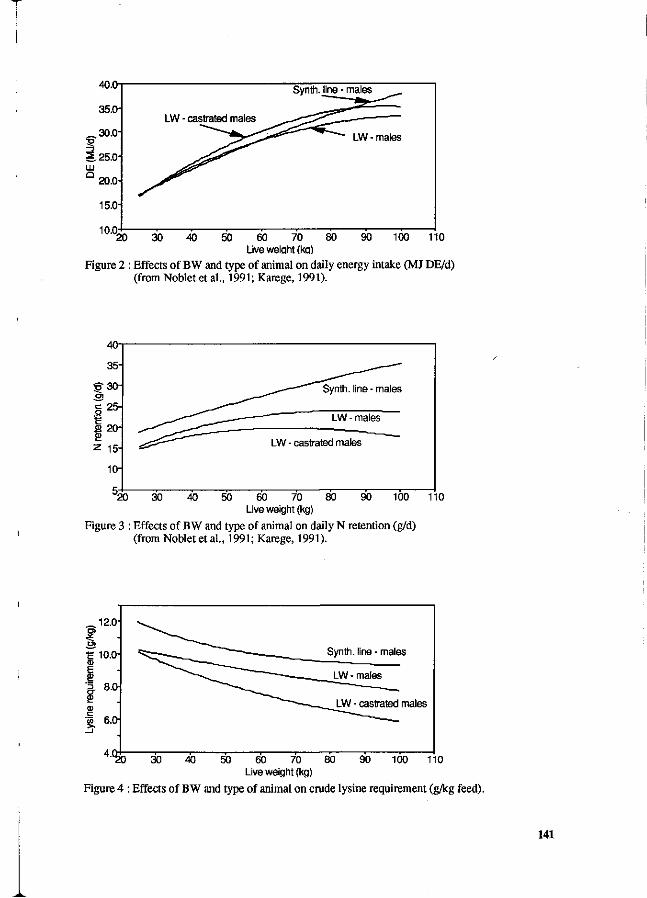
40.0
35.0
„30.0-
1.25.0-LU Q 20.0
15.0
10.0, 20
Synth, line - males
LW - castrated maies
LW - maies
30 40 110 50 60 70 80 90 100 Live weight (kg)
Figure 2 : Effects of BW and type of animal on daily energy intake (MJ DE/d) (from Nobletet al., 1991; Karege, 1991).
40-
35-
5 30-
| 25-
Ü 20-
z 15-
10-
20 30 40 90 50 60 70 80 Live weight (kg)
Figure 3 : Effects of BW and type of animal on daily N retention (g/d) (from Noblet et al., 1991; Karege, 1991).
100 110
12.0
Synth, line - males
LW - males
LW - castrated males
k C £ 30 40 90 100 110 50 60 70 80 Live weight (kg)
Figure 4 : Effects of BW and type of animal on crude lysine requirement (g/kg feed).
141
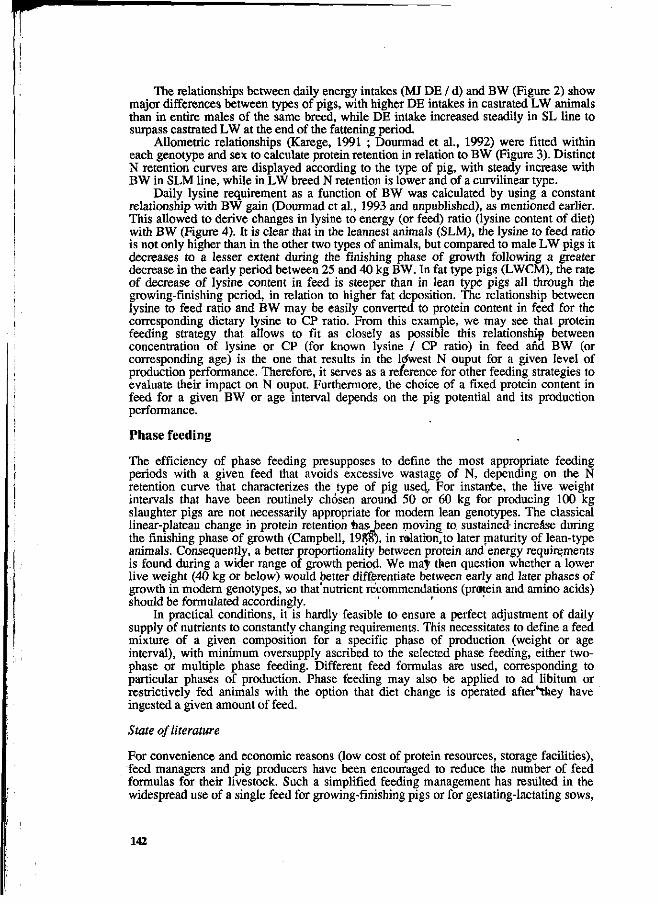
The relationships between daily energy intakes (MJ DE / d) and BW (Figure 2) show major differences between types of pigs, with higher DE intakes in castrated LW animals than in entire males of the same breed, while DE intake increased steadily in SL line to surpass castrated LW at the end of the fattening period.
Allometric relationships (Karege, 1991 ; Dourmad et al., 1992) were fitted within each genotype and sex to calculate protein retention in relation to BW (Figure 3). Distinct N retention curves are displayed according to the type of pig, with steady increase with BW in SLM line, while in LW breed N retention is lower and of a curvilinear type.
Daily lysine requirement as a function of BW was calculated by using a constant relationship with BW gain (Dourmad et al., 1993 and unpublished), as mentioned earlier. This allowed to derive changes in lysine to energy (or feed) ratio (lysine content of diet) with BW (Figure 4). It is clear that in the leannest animals (SLM), the lysine to feed ratio is not only higher than in the other two types of animals, but compared to male LW pigs it decreases to a lesser extent during the finishing phase of growth following a greater decrease in the early period between 25 and 40 kg BW. In fat type pigs (LWCM), the rate of decrease of lysine content in feed is steeper than in lean type pigs all through the growing-finishing period, in relation to higher fat deposition. The relationship between lysine to feed ratio and BW may be easily converted to protein content in feed for the corresponding dietary lysine to CP ratio. From this example, we may see that protein feeding strategy that allows to fit as closely as possible this relationship between concentration of lysine or CP (for known lysine / CP ratio) in feed and BW (or corresponding age) is the one that results in the Wwest N ouput for a given level of production performance. Therefore, it serves as a reference for other feeding strategies to evaluate their impact on N ouput. Furthermore, the choice of a fixed protein content in feed for a given BW or age interval depends on the pig potential and its production performance.
Phase feeding
The efficiency of phase feeding presupposes to define the most appropriate feeding periods with a given feed that avoids excessive wastage of N, depending on the N retention curve that characterizes the type of pig used. For instante, the live weight intervals that have been routinely chosen around 50 or 60 kg for producing 100 kg slaughter pigs are not necessarily appropriate for modern lean genotypes. The classical linear-plateau change in protein retention toas been moving to sustained increase during the finishing phase of growth (Campbell, 198$), in ralatkm.to later maturity of lean-type animals. Consequently, a better proportionality between protein and energy requirements is found during a wider range of growth period. We may then question whether a lower live weight (40 kg or below) would better differentiate between early and later phases of growth in modern genotypes, so that'nutrient recommendations (protein and amino acids) should be formulated accordingly. ' ' *
In practical conditions, it is hardly feasible to ensure a perfect adjustment of daily supply of nutrients to constantly changing requirements. This necessitates to define a feed mixture of a given composition for a specific phase of production (weight or age interval), with minimum oversupply ascribed to the selected phase feeding, either two-phase or multiple phase feeding. Different feed formulas are used, corresponding to particular phases of production. Phase feeding may also be applied to ad libitum or restrictively fed animals with the option that diet change is operated after'they have ingested a given amount of feed.
State of literature
For convenience and economic reasons (low cost of protein resources, storage facilities), feed managers and pig producers have been encouraged to reduce the number of feed formulas for their livestock. Such a simplified feeding management has resulted in the widespread use of a single feed for growing-finishing pigs or for gestating-lactating sows,
142
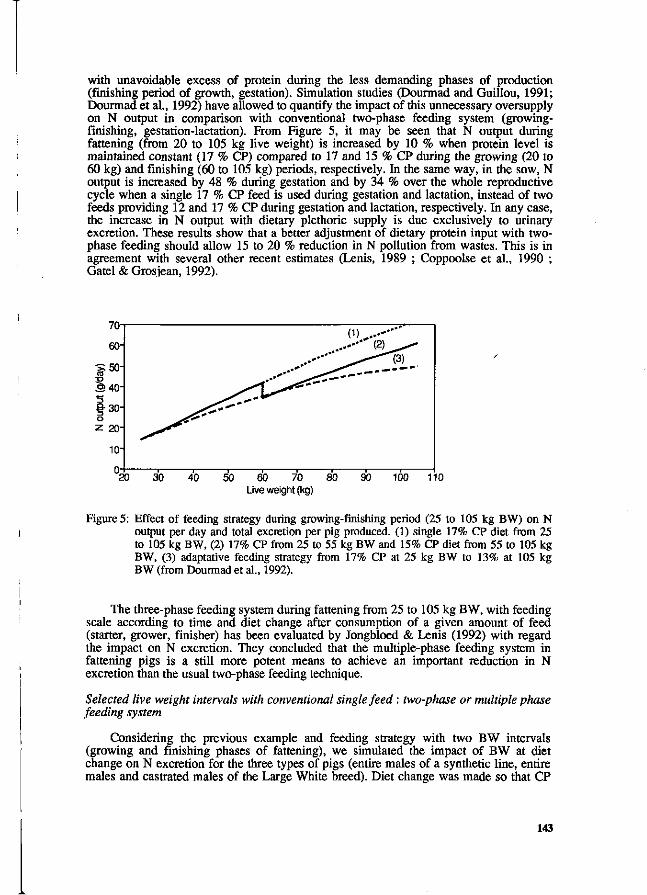
with unavoidable excess of protein during the less demanding phases of production (finishing period of growth, gestation). Simulation studies (Dourmad and Guillou, 1991; Dourmad et al., 1992) have allowed to quantify the impact of this unnecessary oversupply on N output in comparison with conventional two-phase feeding system (growing-finishing, gestation-lactation). From Figure 5, it may be seen that N output during fattening (from 20 to 105 kg live weight) is increased by 10 % when protein level is maintained constant (17 % CP) compared to 17 and 15 % CP during the growing (20 to 60 kg) and finishing (60 to 105 kg) periods, respectively. In the same way, in the sow, N output is increased by 48 % during gestation and by 34 % over the whole reproductive cycle when a single 17 % CP feed is used during gestation and lactation, instead of two feeds providing 12 and 17 % CP during gestation and lactation, respectively. In any case, the increase in N output with dietary plethoric supply is due exclusively to urinary excretion. These results show that a better adjustment of dietary protein input with two-phase feeding should allow 15 to 20 % reduction in N pollution from wastes. This is in agreement with several other recent estimates (Lenis, 1989 ; Coppoolse et al., 1990 ; Gatel & Grosiean, 1992).
20 30 40 50 60 70 80 Live weight (kg)
90 100 110
Figure 5: Effect of feeding strategy during growing-finishing period (25 to 105 kg BW) on N output per day and total excretion per pig produced. (1) single 17% CP diet from 25 to 105 kg BW, (2) 17% CP from 25 to 55 kg BW and 15% CP diet from 55 to 105 kg BW, (3) adaptative feeding strategy from 17% CP at 25 kg BW to 13% at 105 kg BW (from Dourmad et al., 1992).
The three-phase feeding system during fattening from 25 to 105 kg BW, with feeding scale according to time and diet change after consumption of a given amount of feed (starter, grower, finisher) has been evaluated by Jongbloed & Lenis (1992) with regard the impact on N excretion. They concluded that the multiple-phase feeding system in fattening pigs is a still more potent means to achieve an important reduction in N excretion than the usual two-phase feeding technique.
Selected live weight intervals with conventional single feed : two-phase or multiple phase feeding system
Considering the previous example and feeding strategy with two BW intervals (growing and finishing phases of fattening), we simulated the impact of BW at diet change on N excretion for the three types of pigs (entire males of a synthetic line, entire males and castrated males of the Large White breed). Diet change was made so that CP
143
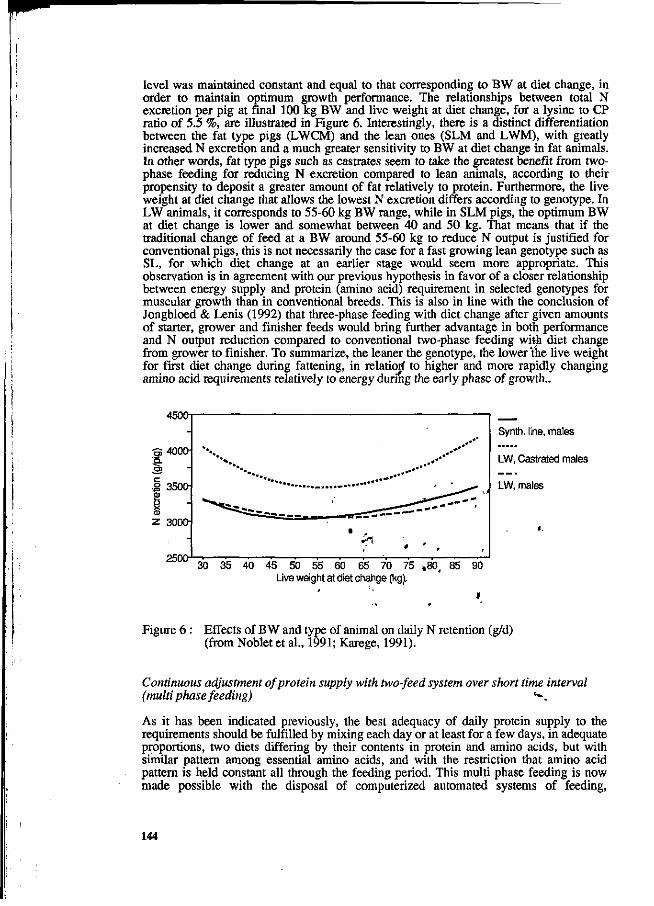
level was maintained constant and equal to that corresponding to BW at diet change, in order to maintain optimum growth performance. The relationships between total N excretion per pig at final 100 kg BW and live weight at diet change, for a lysine to CP ratio of 5.5 %, are illustrated in Figure 6. Interestingly, there is a distinct differentiation between the fat type pigs (LWCM) and the lean ones (SLM and LWM), with greatly increased N excretion and a much greater sensitivity to BW at diet change in fat animals. In other words, fat type pigs such as castrates seem to take the greatest benefit from two-phase feeding for reducing N excretion compared to lean animals, according to their propensity to deposit a greater amount of fat relatively to protein. Furthermore, the live weight at diet change that allows the lowest N excretion differs according to genotype. In LW animals, it corresponds to 55-60 kg BW range, while in SLM pigs, the optimum BW at diet change is lower and somewhat between 40 and 50 kg. That means that if the traditional change of feed at a BW around 55-60 kg to reduce N output is justified for conventional pigs, this is not necessarily the case for a fast growing lean genotype such as SL, for which diet change at an earlier stage would seem more appropriate. This observation is in agreement with our previous hypothesis in favor of a closer relationship between energy supply and protein (amino acid) requirement in selected genotypes for muscular growth than in conventional breeds. This is also in line with the conclusion of Jongbloed & Lenis (1992) that three-phase feeding with diet change after given amounts of starter, grower and finisher feeds would bring further advantage in both performance and N output reduction compared to conventional two-phase feeding with diet change from grower to finisher. To summarize, the leaner the genotype, the lower 'the live weight for first diet change during fattening, in relatiorf to higher and more rapidly changing amino acid requirements relatively to energy durihg the early phase of growth..
4500
3 4000-.Q.
2500-
*si.
Synth, line, males
LW, Castrated males
LW, males
30 35 40 45 50 55 60 65 70 75 ,80, 85 90 Live weight at diet change (kg),
Figure 6 : Effects of B W and type of animal on daily N retention (g/d) (from Noblet et al., 1991; Karege, 1991).
Continuous adjustment of protein supply with two-feed system over short time interval (multiphase feeding) *v
As it has been indicated previously, the best adequacy of daily protein supply to the requirements should be fulfilled by mixing each day or at least for a few days, in adequate proportions, two diets differing by their contents in protein and amino acids, but with similar pattern among essential amino acids, and with the restriction that amino acid pattern is held constant all through the feeding period. This multi phase feeding is now made possible with the disposal of computerized automated systems of feeding,
144

especially for liquid feed. Thus, as shown in Figure 5, a progressive change from 17 % CP at 20 kg BW to 13 % at 105 kg, with a simultaneous combination of two feeds (17 and 13 % CP), would allow to reduce N output by 8 % compared to the growing-finishing sequence in 20 to 105 kg pigs. From the results of our simulation study (Table 2), it appears that weekly mixing of two feeds compared to two-phase feeding (with diet change at 55 kg BW) provides 10 % decrease of N output in Large White male pigs, and still more (almost 20 %) in castrated males of the same breed. In other words, multi phase feeding is the most powerful strategy for reducing N output in pigs, but with greater efficiency in the case of fat type pigs compared to modern lean genotypes.
Table 2 : Effects of phase feeding and dietary amino acid profile on N excretion in LW pigs.
LW males LW castrated males
Protein, % N excretion Protein, % N excretion
kg/pig % 1 2 kg/pig
1 diet / week lys/prot=6.0 17.1 13.1 2.44 100 16.8 9.83 2.56 100 lys/prot = 5.5 18.6 14.3 2.84 116 18.4 10.7 2.96 116 lys/prot = 5.0 20.5 15.8 3.32 136 20.2 11.8 3.44 134
2 successive diets lys/prot=6.0 17.1 14.9 2.72 100(111) 16.8 12.8 3.16 123(123) lys/prot=5.5 18.6 16.3 3.15 116(111) 18.4 13.9 3.61 114(123) lys/prot=5.0 20.5 17.9 3.66 135(111) 20.2 15.3 4.16 132(123)
1 The first diet from 25 to 55 kg live weight and the second from 55 to 100 kg live weight. Figures between brackets are relative values between feeding strategies for a given lysine to protein ratio.
Continuous adjustment of protein and amino acid supply with two-feed system requires to mix two feeds that are adapted to initial and final BW, respectively, with respect to lysine level (as first limiting amino acid) and to the recommended ratios between secondary limiting amino acids and lysine that are relatively constant during growth (Lenis, 1992 ; Henry, 1993). For practical reasons, it is necessarily scheduled according to time interval. The respective proportions of the two feeds are corrected each week or so, in order that lysine content of feed mixture is adequate at the time of distribution. CP contents of the selected feeds are normally related to the level of the limiting amino acid, in the absence of amino acid supplementation in free form. Formulating two separate feeds, compared to the conventional single feed system, may thus have an incidence, in the positive direction, on the choice of feedstuffs, on their level of incorporation and total feed cost, depending on both nutritional constraints and limits of incorporation for hazardous ingredients. This preferential use of feed ingredients is of special concern during the finishing phase of growth, which contributes for most of feed consumption (around two third) during fattening. By the same time, the sanitary problems that may arise from abrupt transition to modified feed are likely to disappear.
Combination of phase feeding strategy and improved dietary amino acid balance
In addition to the adjustment of dietary protein input to the requirement, the improvement of amino acid balance associated to reduced protein input is a potent means to decrease N ouput through feeding by maintaining optimum performance, as it has been reported in several reviews (Henry, 1988, 1993 ; Lenis, 1989 ; Henry & Dourmad, 1992 ; Dourmad & Henry, 1993). It is then possible, with the use of synthetic amino acids or an
145
appropriate combination of feedstuffs, to obtain a progressive reduction of CP content in diet down to the level of ideal protein. This corresponds to a progressive increase of lysine to CP ratio up to 6.5 to 7.0 %, with a perfect balance between essential amino acids and a ratio between essential and non essential amino acids close to 1 (Fuller, 1991 ; Chung & Baker, 1992). But, in this case an economic assessment is necessary in order to find an acceptable compromise between the increased feed cost resulting from amino acid supplementation and the benefit for the environment, at least in the present economic situation. •
In our simulation study, we have compared two feeding strategies (one diet per week, growing-finishing phase feeding) with two different types of animals (Large White entire male and castrated pigs), by using three dietary amino acid pattern (5.0, 5.5 and 6.0 % lysine in CP). The results (Table 2) revealed no interaction between dietary amino acid profile and the type of phase feeding, irrespective of type of pig, so that both diet manipulations produced additive effects on N output. About one third reduction in N output is observed after increasing the percentage of lysine in protein from 5.0 to 6.0 %, along with a reduction in protein input of approximately 17 %. Comparing these different situations, where there is no other protein oversupply than that relating to feeding strategy per se and dietary amino acid pattern, we may see that total N excretion per pig varies from 2.4 kg in LW male pigs fed a balanced diet (6.0 % lysine in CP) on weekly basis to 4.2 kg in LW castrated male pigs that are offered a conventional feed (5.0 % lysine in CP) in a growing-finishing sequence, that is from 1 to 1.75. ».
The combination of phase feeding strategy and amino acid balance improvement, by avoiding excessive overall protein supply, should/ have favorable incidence on dietary energy utilization, in addition to protein saving and less pollution hazards to the environment. With this respect, the impact of environmental constraints on pig feeding should be in favor of net energy system for feed evaluation (Noblet et al., 1989 ; Noblet & Henry, 1991). In addition, the improvement of dietary amino acid balance seems to exert a stimulatory effect on voluntary feed intake, and consequently on growth performance, in modern types of fast growing lean pigs with generally limited appetite (Henry, 1988 ; Henry & Sève, 1993). Ultimately, the economic aspects 'need to be taken into consideration, to weigh the acceptable costs for better balanced feeds and for better benefit to the environment.
Free choice feeding system
Several recent reports (Kyriazakis et'al., .990 ; Kyriazakis & Emmans,.1991 j.Kyriazakis et al., 1991, 1993a ; Rose & Kyriazakis, 19^1 ; Bradford & Gous, 1991) confirmed that the growing pig when given a choice between two feeds of different protein contents selects a diet that meets its protein requirement, from assessment of growth rate and feed efficiency. But, according to the previous authors, the occurrence of such adjustment is associated to the ability of the pig'to have previous experience of the two feeds offered for selection. In addition, the selected protein 'level during growth decreases in a fashion corresponding to changing requirements with age. Further report from Kyriazakis et al.(1993b) indicated that genotype may influence diet selection from two feeds that differ in their CP contents. Thus, self-selected protein level was higher in a rapidly growing lean genotype compared to an unimproved fat breed (Chinese Meishan), and decreased with time as protein requirement relatively to energy was lower. On the other hand, the inclusion of harmful substances in the diet, such as glucosinolates from rapeseed meal (Kyriazakis & Emmans, 1992), results in a preference for non-harmful diets »phoice-fed pigs irrespective of their nutritional characteristics, thus indicating that unpalatable or harmful substances may interfere with dietary protein selection.
In the same way, we have shown (Henry, 1987 and non published) that the growing pig is able to make a selection between diets differing only in the content of their limiting amino acid. When offered a choice between pairs of diets of different lysine concentrations, the pig displayed a preference for an adequate over a lysine-deficient diet. In addition, the selected lysine level in the diet was higher in females than in castrated
146
males, in relation to a higher lysine requirement relatively to energy, as it had been reported previously with diets differing in their protein contents (Henry, 1968). According to Edmonds et al. (1987), self-selection studies with pigs receiving a control diet (corn-soybean meal) and similar diets containing excessive levels of given essential amino acids revealed a strong preference for the control diet. Furthermore, selection of diets with amino acid imbalance displayed differences according to the amino acid in excess.
Despite the fact that the amount of self-selected protein by the pig appears to reflect the requirement for growth, it is also recognized, from studies with rats (Harper and Peters, 1989), that protein intake in free choice conditions is not precisely regulated, although the animal is able to avoid both low and high protein or amino acid diets. As reported previously (Henry, 1985), it would seem that under free-choice feeding there is only a partial adjustment of protein or amino acid intake to the requirement according to the potential for muscular growth and protein quality of the diet. Therefore, we may still wonder about the efficacy of such potential feeding strategy for pigs, to operate a precise enough selection of protein or amino acids to meet their specific needs, as an alternative to the conventional single-feeding system. Nevertheless, when it can be operational, it should be in favor of using properly balanced diets for essential amino acids, only differing by their overall protein content, thus resulting in lowered N pollution. As mentioned by Rose and Kyriazakis (1991), it should also become attractive when the cost of dietary protein is high relatively to energy.
Conclusion /
Feeding strategy in pig production has reached nowadays a stage of great complexity with the necessity to reduce N output in addition to maintaining optimum performance as well as carcass and meat quality, in relation to more severe economical and environmental constraints. According to these complex interrelationships, there is an increasing need to think of feeding strategies through simulation models for optimum decision in each specific situation.
The simulation study presented in this report indicated that the efficacy of phase feeding with diet change at different live weights or ages for decreasing N output depends to a great extent on pig potential for growth. The rate of decrease in protein or amino acid content of feed with increased live weight or age was greater in conventional fat pigs than in modern fast growing lean genotypes. In phase feeding, the optimum live weight at first diet change for minimized N output was lower (around 40 kg BW) for fast growing lean pigs than for conventional animals (55-60 kg BW). This explains that in high performing pigs, phase feeding strategy has less incidence on N output than in fat animals. The impact of improved dietary amino acid balance with concomitant reduction in protein content on N excretion did not interact with phase feeding strategy. Thus, the reduction of protein input through improvement of amino acid balance appears to be the most potent dietary means to decrease N output in lean type pigs, depending on economical considerations. With regard the free choice feeding system, further studies are needed to assess the efficacy of this alternative and promising solution for a self-adjustment of protein and amino acid consumption to changing requirements during fattening.
For the future, further decisive progress is expected with the applications of simulation models that will allow a continuous adjustment of feed composition and allocation, along with the development of computerized automated systems of feed distribution. This will be a new stimulating challenge for research, pig producers and feed industry managers.
Acknowledgments
We wish to thank J. Noblet for providing the experimental data that allowed to conduct the simulation study on protein feeding strategy.
147
Some of the materials used to prepare this review were part of a cooperative european research project 8001 CT 92-0112 "Reduction of nitrogen output in pig effluents through a better control of dietary protein supply : technical and economical aspects", within the EC CAMAR programme.
References
Black, J.L., Campbell R.G., Williams I.H., James K.J. & Davies G.T., 1986. Simulation of energy and amino acid utilisation in the pig. Research and Development in Agriculture 3 : 121-145.
Bradford, M.M.V. & Gous, R.M., 1991. The response of growing pigs to a choice of diets differing in protein content. Anim. Prod. 52 : 185-192.
Campbell, R.G., 1988. Nutritional constraints to lean tissue accretion in farm animals. Nutrition Research reviews 1: 233-253.
Chung, T.K. & Baker, D.H., 1992. Ideal amino acid pattern for 10-kilogram pigs. J.Anim.Sci. 70: 3102-3111.
Coppoolse, J., Van Vuuren, A.M., Huisman, J., Janssen, W.M.M.A., Jongbloed, A.W., Lenis, N.P. & Simons, P.CM., 1990. Emissions of livestock : possibilities to reduce excretion of nitrogen and phosphorus of farm animals. Dienst Landbouwkundig Onderzoek, Wageningen. 131 pp.
Dourmad, J.Y., Etienne, M. & Noblet, J., 1991. Contribution à l'étude des besoins en acides aminés de la truie en lactation. Journées Rech.Porcine en France. 23 : 61-68.
Dourmad, J.Y., Etienne, M. & Prunier, A., 1993? Influence des apports énergétiques et protéiques sur les performances de croissance, la composition corporelle et le développement sexuel de la jeune truie. Journées Rech.Porcine en France 25 : 239-245.
Dourmad, J.Y. & Guillou, D., 1991. Maîtrise de la charge polluante des effluents des élevages porcins : influence du bâtiment, de l'alimentation et des performances. AFMVP - SIMAVIP, Paris, pp. 35-46.
Dourmad, J.Y., Guillou, D. & Noblet, J., 1992. Development of a calculation model for predicting the amount of N excreted by the pig : effect of feeding, physiological stage and performance. Livest.Prod.Sci.31 : 95-107'. ' .»
Dourmad, J.Y. & Henry, Y., 1993. Protein nutrition and nitrogen pollution in pigs. 2n& Belgian Days on Pigs and Poultry. Nitrogen and Phosphorus utilization. Royal Flemish Society of Engineers, 17-^ February, Brugge (Belgium). ».
Dourmad, J.Y., Henry, Y. & Sève, B., 198Ö1 Rejets azotés dans les déjections porcines : importance de l'alimentation. Porc Magazine Î17 : 24-28. '
Edmonds, M.S., Gonyou, H.W. & Baker, D.H., ^987. Effect of excess levels of methionine, tryptophan, arginine, lysine or threonine on growth and dietary choice in the pig. J. Anim. Sei. 65 : -179-185. • ,
Fuller M.F. 1991. Present knowledge of amino acid requirements for maintenance and production : non-ruminants. In : B.O.Eggum, S.Boisen, C.Börsting, A.Danfaer & T.Hvelplund (Ed.) : Proc.6m Internat.Symp.Protein Metabolism and Nutrition. EAAP Pub. N° 59. Nat.Inst.Anim.Sci., Foulum (Denmark). Vol.1. Main reports, p 116-126.
Gatel F. & Grosjean,F., 1992. Effect of protein content of the diet on nitrogen excretion by pigs. Livest.Prod.Sci. 31 : 109-120.
Greef, K.H. de, Verstegen, M.W.A. & Kemp, B., 1992. Validation of a potcine growth model with emphasis on chemical body composition. Livest.Prod.Sci. 32 : 163-180.
Guillou, D., Dourmad, J.Y. & Noblet, J., 1993. Influence de l'alimentation, du stade physiologique et des performances sur les rejets azotés du porc à l'engrais, de la truie et du porcelet. Journées Rech.Porcine en France 25 : 307-313.
Hàrper, A.E. & Peters, J.C., 1989. Protein intake, brain amino acid and serotonin concentrations and protein self-selection. J. Nutr. 119 : 677-689.
148
Henry, Y., 1968. Libre consommation de principes énergétiques et azotés chez le rat et chez le porc selon la nature de la source azotée, sa concentration dans le régime et le mode de présentation. Ann. Nutr. Alim. 22 : 121-140.
Henry, Y., 1985. Dietary factors involved in feed intake regulation in growing pigs : a review. Livest.Prod.Sci. 12 : 339-354.
Henry, Y. 1987. Self-selection by growing pigs of diets differing in lysine content. J. Anim. Sei. 65 : 1257-1265.
Henry Y. 1988. Signification de la protéine équilibrée pour le porc : intérêt et limites. INRA Prod. Anim. 1 : 65-74.
Henry Y. 1991. Répercussions des techniques actuelles de production animale sur l'environnement. Bull. Acad. Vét. de France 64 (supp.au n" 4) : 119-139.
Henry, Y., 1993. Affinement du concept de la protéine idéale pour le porc en croissance. INRA Productions Animales 6 (In press).
Henry, Y. & Dourmad, J.Y., 1992. Protein nutrition and N pollution in pigs. In : G.Piva (Ed.) : 2nc* International Feed Production Conference, February 25-26, Piacenza (Italy).
Henry, Y. & Sève, B., 1993. Feed intake and dietary amino acid balance in growing pigs with special reference to lysine, tryptophan and threonine. Pigs News and Information 14 (In press).
Jongbloed, A.W. & Lenis, N.P., 1992. Alteration of nutrition as a mean to reduce environmental pollution by pigs. Livest.Prod.Sci. 31 : 75-95.
Kaji, Y. & Furuya, S., 1987. Lysine requirement of growing pigs estimated under practical feeding conditions. Jpn.J.Zootech.Sci. 58 : 574-582. /
Karege, C, 1991. Influence de l'âge et du sexe sur l'utilisation de l'énergie et la composition corporelle chez le porc en croissance. Thèse, Univ.Montpellier II, Sciences et Techniques du Languedoc.
Kyriazakis, I. & Emmans G.C., 1991. Diet selection in pigs: dietary choices made by growing pigs following a period of underfeeding with protein. Anim. Prod. 52 : 337-346.
Kyriazakis, I. & Emmans, G.C., 1992. Selection of a diet by growing pigs given choices between foods differing in contents of protein and rapeseed meal. Appetite 19 : 121-132.
Kyriazakis, I., Emmans, G.C.& Taylor, A.J., 1993a. A note on the diets selected by boars given a choice between two foods of different protein concentrations from 44 to 103 kg live weight. Anim.Prod. 56 : 151-154.
Kyriazakis, I., Emmans G.C. & Whittemore CT., 1990. Diet selection in pigs: choices made by growing pigs given foods of different protein concentrations. Anim. Prod. 51 : 189-199.
Kyriazakis, I., Emmans, G.C. & Whittemore, CT., 1991. The ability of pigs to control their protein intake when fed in three different ways. Physiology & Behavior 50 : 1197-1203.
Kyriazakis, L, Leus, K., Emmans, G.C, Haley, C.S.& Oldham, J.D., 1993b. The effect of breed (Large White x Landraeev:purebred Meishan) on the diets selected by pigs given a choice between two foods that differ in their crude protein contents. Anim.Prod. 56 : 121-128.
Lenis, N.P. 1989. Lower nitrogen excretion in pig husbandry by feeding : current and future possibilities. Neth.J.Agric.Sci. 37 : 61-70.
Lenis, N.P., 1992. Digestible amino acids for pigs : assessment of requirements on ileal digestible basis. Pig News and Information 13 : 31N-39N.
Mordend, A. & Piva, G., 1991. Nutrition environment interactions. European Colloquium on Scientific Basis for a Safe and Efficient Management of Livestock Farming, Mantova (Italy).
Moughan, P.J., 1989. Simulation of the daily partitioning of lysine in the 50 kg liveweight pig - A factorial approach to estimating amino acid requirements for growth and maintenance. Research and development in Agriculture 6 : 7-14.
149
Moughan, P.J., Smith, W.C. & Pearson, G., 1987. Description and validation of a model simulating growth in the pig (20-90 kg liveweight). New Zealand J. Agric. Res. 30 : 481-489.
Noblet, J., Fortune, H., Dubois, S. & Henry, Y., 1989. Nouvelles bases d'estimation des teneurs en énergie digestible, métabolisable et nette des aliments pour le porc. INRA, Paris. 106 pp.
Noblet, J. & Henry, Y., 1991. Energy evaluation systems for pig diets. In : E.S.Batterham (Ed.) : Manipulating Pig Production III. Australasian Pig Science Association, Attwood, Victoria (Australia), p.87-110.
Noblet, J., Karege, C. & Dubois, S., 1991. Influence of growth potential on energy requirements for maintenance in growing pigs. In : C.Wenk (Ed.) : Energy Metabolism of Farm Animals. EAAPPub.N" 58. ETH-Ziirich (Switzerland), p. 107-110.
Oslage, HJ., 1985. Ergebnisse aus Schweinespezialberatung und Erzugermeinschaften. Schweine-Report '85, NR 367.BM Betriebswirtschaftliche Mitteilungen, Landwirtschaftskammer Schleswig-Holstein, Deutscland.
Rose, S.P. & Kyriazakis, L, 1991. Diet selection of pigs and poultry. Proc. Nutr. Soc. 50 : 87-98.
Schulz, E., 1985. Ableitung der Energie- und Proteinversorgung von Schweinen während der Mast und einige Konsequenzen für die Rationsgestaltung. Lohmann Information, Mai/Juni, Seite 1, Deutschland. ,*;
Schutte, J.B. & Bosch, M.W., 1990. Nutritional possibilities to reduce nitrogen and phosphorus excretion in pigs and poultry. Manure and Environment, VIV-Europe, Utrecht. Misset Pub. (The Netherlands).
Susenbeth, A., 1993. A model to describe the effect of nutrition on growth, body composition and nitrogen excretion in pigs. International Congress on "Nitrogen Flow in Pig Production and Environmental Consequences". Pudoc Wageningen (The Netherlands).
Tamminga, S. & Verstegen, M.W.A., 1991. Protein nutrition and animal production : consequences for environments and some possible recommendations. In • B.O.Eggum, S.Boisen CBörsting, A.Danfaer & T.Hvelplund (Ed.): Proc. 6 th
Internat. Symp. Protein Metabolism and nutrition. EAAP Publication No 59. Nat.Inst.Anim.Sci., Foulum (Denmark). Vol.1. Main reports, p? 23-36.
Whittemore, C.T. 1983. Development'of recommended energy and protein allowances for growing pigs. Agricultural Systems. 11 : 159-186.
Whittemore, C.T. & Morgan, CA., 1990. Model components for the determination of energy and protein requirements for breeding »owS : ,a review,. Livest.Prod.Sci. 26 : 1-37.
150
Reduction of gaseous nitrogen emission from pig manure by increasing the level of bacterially fermentable substrates in the ration
M. Kreuzer and Andrea Machmüller
Forschungs- und Studienzentrum für Veredelungswirtschaft Weser-Ems, Georg-August-Universität Göttingen, Driverstraße 22, D-49377 Vechta, Germany
Summary
In the present study, the effects of the level of BFS (bacterially fermentable substrates, 10 %, 1 4 % , 18 %, and 22 %) in isocaloric and isonitrogenous diets for fattening pigs were evaluated in a digestibility trial (n=24) and in a growth trial from 26 to 111 kg (n=1 60). The proportion of fecal N as related to N intake increased from 1 9,8 % with 1 0 % BFS to 27.6 % with 22 % BFS, whereas urinary N was reduced from 38.9 % to 34.8 % at an almost con stant N retention. In manure, the initial ratio of ammonia N to total N was reduced by i n creasing BFS contents, whereas the N contents in dry matter were similar between the groups. Manure quantity was lower with 2 2 % BFS. Calculated gaseous N loss during eight weeks of storage accounted for 41.7 %, 38.7 %, 36.9 % and 34.2 % with increasing BFS (i.e. 0.6 % less per additional percentage of BFS, on average). As a conseque/ice, the p roportion of ammonia N was not different anymore after eight weeks. Daily gains were similar With 10 % to 18 % BFS but significantly decreased with 22 % BFS. Dressing percentage was reduced from 82.7 to 81.7. Increasing BFS from 10 %to 18 % did not affect lean meat proportion but significantly improved early post-mortem meat pH and conductivity. The results indicate that feeds rich in BFS are effective in reducing N emission and can be included at a proportion of at least 1 8 % into common pig fattening diets.
Introduction
Gaseous nitrogen emission strongly depends on the proportion of urinary nitrogen in manure. A survey of digestibility trials in pigs (Kirchgeßner et al., 1991c,d,e) as well as cattle (Kirchgeßner et al., 1991a) and poultry (Kirchgeßner & Kreuzer, 1990) revealed favourable feeding strategies which might result in a reduction of the easily-volatile N. In swine, besides reducing N intake, particularly the use of non-starch-non-sugar carbohydrates, i.e., the bacterially fermentable substrates (BFS), have been demonstrated to be effective in this respect, either supplied as pure substrates (Ahrens & Kaufmann, 1985; Kirchgeßner et al., 1989; Kreuzer et al., 1989, 1991) or as composed feedstuffs with higher BFS contents (Kirchgeßner et al., 1991d; Kreuzer et al., 1 992). Theoverall evaluation demonstrated that increasing the dietary BFS by one percentage unit reduces the proportion of urinary N in total N excretion also by one percentage unit on average (Kirchgeßner et al., 1991d). However, in these experiments BFS was not employed in an isonitrogenous and isocaloric manner, and storage characteristics of the manure were not obtained. In most studies, adult sows were employed which might have a higher capacity of fermentation than growing pigs.
The objective of the present investigation was, therefore, to evaluate the effects of increasing BFS contents on manure characteristics as based on the re-distribution in nitrogen metabolism in fattening pigs. Furthermore, restrictions in the practical use of diets rich in BFS should be determined in a growth trial.
Materials and methods
In both trials, four diets of different BFS content differing by steps of 4 % were applied (Table 1). This was mainly achieved by the gradual exchange of wheat and cassava by beetpulp (and maize). The level of low-sugar beet pulp was increased from zero in the 10 %
151
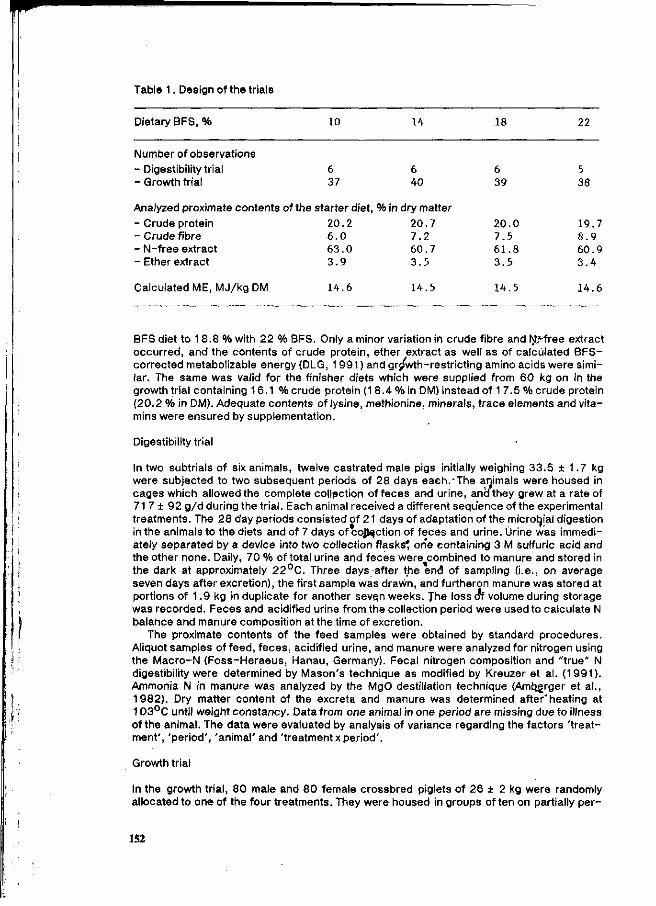
Table 1. Design of the trials
Dietary BFS, %
Number of observations
- Digestibility trial - Growth trial
10
6 37
Analyzed proximate contents of the starter diet, - Crude protein - Crude fibre - N-free extract - Ether extract
Calculated ME, MJ/kg DM
20.2 6 .0 63.0 3.9
14.6
14
6 40
% in dry matter 20.7 7.2 60.7 3.5
14.5
18
6 39
20.0 7.5 61.8 3.5
14.5
22
5 38
19.7 8.9 60.9 3.4
14.6
BFS diet to 18.8 % with 22 % BFS. Only a minor variation in crude fibre and Nf,-free extract occurred, and the contents of crude protein, ether extract as well as of calculated BFS-corrected metabolizable energy (DLQ, 1991 ) and growth-restricting amino acids were similar. The same was valid for the finisher diets which were supplied from 60 kg on in the growth trial containing 16.1 % crude protein (1 8 . 4 % in DM) instead of 1 7.5 % crude protein (20.2 % in DM). Adequate contents of lysine, methionine, minerals, trace elements and vitamins were ensured by supplementation.
Digestibility trial
In two subtrials of six animals, twelve castrated male pigs initially weighing 33.5 + 1.7 kg were subjected to two subsequent periods of 28 days each.'The animals were housed in cages which allowed the complete collection of feces and urine, andthey grew at a rate of 71 7 ± 92 g/d during the trial. Each animal received a different sequence of the experimental treatments. The 28 day periods consisted of 21 days of adaptation of the microbial digestion in the animals to the diets and of 7 days of cojlqction of feces and urine. Urine was immediately separated by a device into two collection flasks^ one containing 3 M sulfuric acid and the other none. Daily, 70 % of total urine and feces were combined to manure and stored in the dark at approximately 22°C. Three days after the end of sampling (i.e., on average seven days after excretion), the firstsample was drawn, and furtheron manure was stored at portions of 1.9 kg in duplicate for another seven weeks. The loss Sf volume during storage was recorded. Feces and acidified urine from the collection period were used to calculate N balance and manure composition at the time of excretion.
The proximate contents of the feed samples were obtained by standard procedures. Aliquot samples of feed, feces, acidified urine, and manure were analyzed for nitrogen using the Macro-N (Foss-Heraeus, Hanau, Germany). Fecal nitrogen composition and " true" N digestibility were determined by Mason's technique as modified by Kreuzer et al. (1991). Ammonia N in manure was analyzed by the MgO destination technique (Amb^rger et al., 1982). Dry matter content of the excreta and manure was determined after'heating at 103°C until weight constancy. Data from one animal in one period are missing due to illness of the animal. The data were evaluated by analysis of variance regarding the factors ' t reatment', 'period', 'animal' and 'treatment x period'.
Growth trial
In the growth trial, 80 male and 80 female crossbred piglets of 26 ± 2 kg were randomly allocated to one of the four treatments. They were housed in groups often on partially per-
152
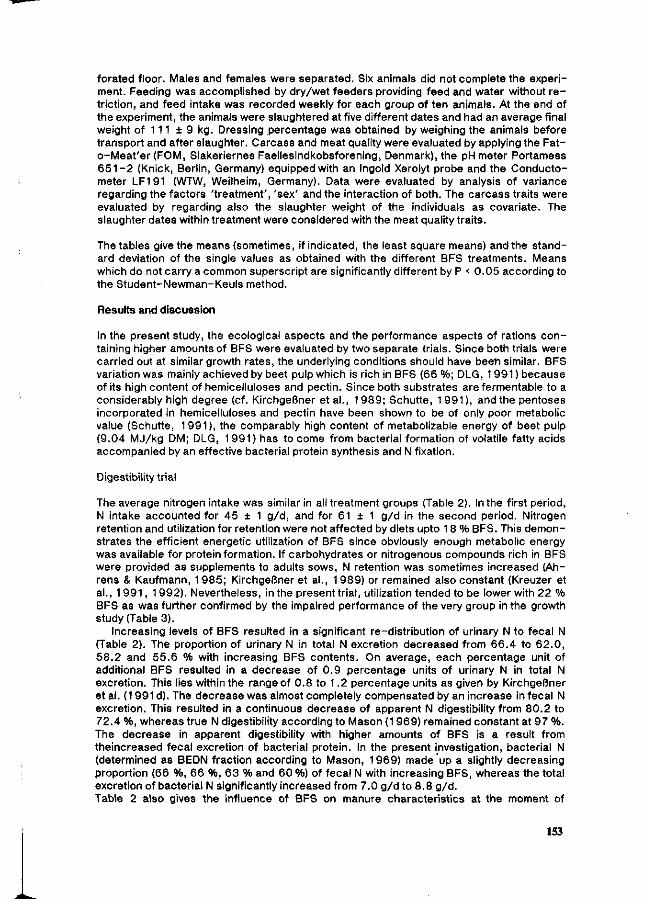
forated floor. Males and females were separated. Six animals did not complete the experiment. Feeding was accomplished by dry/wet feeders providing feed and water without r e -triction, and feed intake was recorded weekly for each group of ten animals. At the end of the experiment, the animals were slaughtered at five different dates and had an average final weight of 111 ± 9 kg. Dressing percentage was obtained by weighing the animals before transport and after slaughter. Carcass and meat quality were evaluated by applying the Fat-o-Meat'er (FOM, Slakeriernes Faellesindkobsforening, Denmark), the pH meter Portamess 6 5 1 - 2 (Knick, Berlin, Germany) equipped with an Ingold Xerolyt probe and the Conducto-meter LF191 (WTW, Weilheim, Germany). Data were evaluated by analysis of variance regarding the factors 'treatment', 'sex' and the interaction of both. The carcass traits were evaluated by regarding also the slaughter weight of the individuals as covariate. The slaughter dates within treatment were considered with the meat quality traits.
The tables give the means (sometimes, if indicated, the least square means) and the standard deviation of the single values as obtained with the different BFS treatments. Means which do not carry a common superscript are significantly different by P < 0.05 according to the Student-Newman-Keuls method.
Results and discussion
In the present study, the ecological aspects and the performance aspects of rations c o n taining higher amounts of BFS were evaluated by two separate trials. Since both trials were carried out at similar growth rates, the underlying conditions should have been similar. BFS variation was mainly achieved by beet pulp which is rich in BFS (66 %; DLG, 1 991 ) because of its high content of hemicelluloses and pectin. Since both substrates are fermentable to a considerably high degree (cf. Kirchgeßner é ta l . , 1989; Schutte, 1991), and the pentoses incorporated in hemicelluloses and pectin have been shown to be of only poor metabolic value (Schutte, 1 991), the comparably high content of metabolizable energy of beet pulp (9.04 MJ/kg DM; DLG, 1 991) has to come from bacterial formation of volatile fatty acids accompanied by an effective bacterial protein synthesis and N fixation.
Digestibility trial
The average nitrogen intake was similar in all treatment groups (Table 2). In the first period, N intake accounted for 45 ± 1 g /d , and for 61 ± 1 g/d in the second period. Nitrogen retention and utilization for retention were not affected by diets upto 1 8 % BFS. This demonstrates the efficient energetic utilization of BFS since obviously enough metabolic energy was available for protein formation. If carbohydrates or nitrogenous compounds rich in BFS were provided as supplements to adults sows, N retention was sometimes increased (Ah-rens & Kaufmann, 1985; Kirchgeßner et al., 1 989) or remained also constant (Kreuzer et al., 1991 , 1992). Nevertheless, in the present trial, utilization tended to be lower with 22 % BFS as was further confirmed by the impaired performance of the very group in the growth study (Table 3).
Increasing levels of BFS resulted in a significant re-distribution of urinary N to fecal N (Table 2). The proportion of urinary N in total N excretion decreased from 66.4 to 62.0, 58.2 and 55.6 % with increasing BFS contents. On average, each percentage unit of additional BFS resulted in a decrease of 0.9 percentage units of urinary N in total N excretion. This lies within the range of 0.8 to 1.2 percentage units as given by Kirchgeßner et al. (1991d). The decrease was almost completely compensated by an increase in fecal N excretion. This resulted in a continuous decrease of apparent N digestibility from 80.2 to 72.4 %, whereas true N digestibility according to Mason (1969) remained constant at 97 %. The decrease in apparent digestibility with higher amounts of BFS is a result from theincreased fecal excretion of bacterial protein. In the present investigation, bacterial N (determined as BEDN fraction according to Mason, 1969) made up a slightly decreasing proportion (66 %, 66 %, 63 % and 60 %) of fecal N with increasing BFS, whereas the total excretion of bacterial N significantly increased from 7.0 g /d to 8.8 g /d . Table 2 also gives the influence of BFS on manure characteristics at the moment of
153
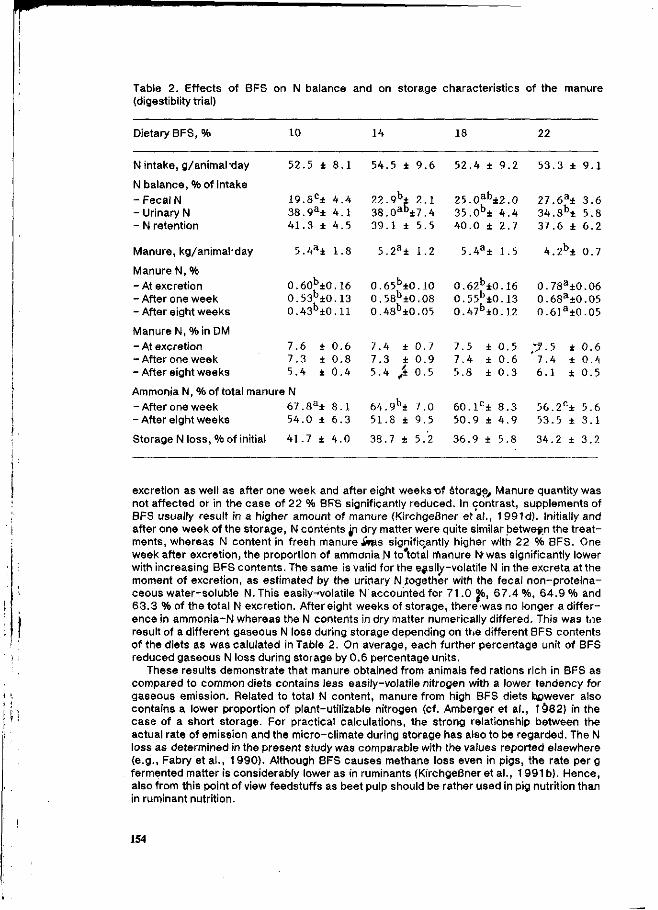
Table 2. Effects of BFS on N balance and on storage characteristics of the manure (digestiblity trial)
Dietary BFS, %
N intake, g/animalxlay
N balance, % of intake - Fecal N - Urinary N - N retention
Manure, kg/animal-day
Manure N, % - At excretion -Af ter one week - After eight weeks
Manure N, %in DM - At excretion - After one week -Af ter eight weeks
10
52.5 ± 8 .1
19.8C± 4 . 4 38.9 a± 4 . 1 41.3 ± 4.5
5.4a± 1.8
0 .60 b ±0.16 0 .53b±0.13 0 .43 b+0.11
7.6 ± 0 .6 7.3 ± 0.8 5 .4 ± 0 .4
Ammonia N, % of total manure N - After one week - After eight weeks
Storage N loss, % of initial
67 .8 a± 8 .1 54.0 ± 6.3
41.7 ± 4 .0
14
54.5 ± 9 .6
22.9 b± 2 .1 38 .0 a b ±7 .4 39 .1 ± 5.5
5 .2a± 1.2
0 .65 b ±0.10 0 .58 b±0.08 0 .48b±0.05
7.4 ± 0.7 7.3 ± 0 .9 5.4 ,± 0.5
64 .9 b ± 7.0 51.8 ± 9.5
38.7 ± 5.2
18
52.4 ± 9.2
25 .0 a b ±2 .0 35.0b± 4 .4 40.0 ± 2.7
5.4a± 1.5
0 .62 b±0.16 0 .55 b±0.13 0 .47b±0.12
7.5 ± 0.5 7.4 ± 0 .6 5.8 ± 0 .3
60 .1 c ± 8.3 50.9 ± 4 .9
36.9 ± 5.8
22
53.3 ± 9 .1
27 .6 a ± 3.6 34 .8 b ± 5.8 37.6 ± 6.2
4 .2 b ± 0.7
0 .78 a ±0.06 0 .68a±0.05 0 .61a±0.05
,-7.5 ± 0 . 6 ' 7 . 4 ± 0 .4
6 .1 ± 0.5
56.2C± 5.6 53.5 ± 3 .1
34.2 ± 3.2
excretion as well as after one week and after eight weeks-of storage. Manure quantity was not affected or in the case of 22 % BFS significantly reduced. In contrast, supplements of BFS usually result in a higher amount of manure (Kirchgeßner et al., 1991d). Initially and after one week of the storage, N contents y i dry matter were quite similar between the treatments, whereas N content in fresh manure Janas significantly higher with 22 % BFS. One week after excretion, the proportion of ammonia N to'total manure M was significantly lower with increasing BFS contents. The same is valid for the easily-volatile N in the excreta at the moment of excretion, as estimated by the urinary N together with the fecal non-proteina-ceous water-soluble N.This easily^volatile N accounted for 71.0 %, 6 7 . 4 % , 6 4 . 9 % and 63.3 % of the total N excretion. After eight weeks of storage, there'was no longer a difference in ammonia-N whereas the N contents in dry matter numerically differed. This was tne result of a different gaseous N loss during storage depending on the different BFS contents of the diets as was calulated in Table 2. On average, each further percentage unit of BFS reduced gaseous N loss during storage by 0.6 percentage units.
These results demonstrate that manure obtained from animals fed rations rich in BFS as compared to common diets contains less easily-volatile nitrogen with a lower tendency for gaseous emission. Related to total N content, manure from high BFS diets bcwever also contains a lower proportion of plant-utilizable nitrogen (cf. Amberger et al., 1982) in the case of a short storage. For practical calculations, the strong relationship between the actual rate of emission and the micro-climate during storage has also to be regarded. The N loss as determined in the present study was comparable with the values reported elsewhere (e.g., Fabry et al., 1990). Although BFS causes methane loss even in pigs, the rate per g fermented matter is considerably lower as in ruminants (Kirchgeßner et al., 1 991 b). Hence, also from this point of view feedstuffs as beet pulp should be rather used in pig nutrition than in ruminant nutrition.
154
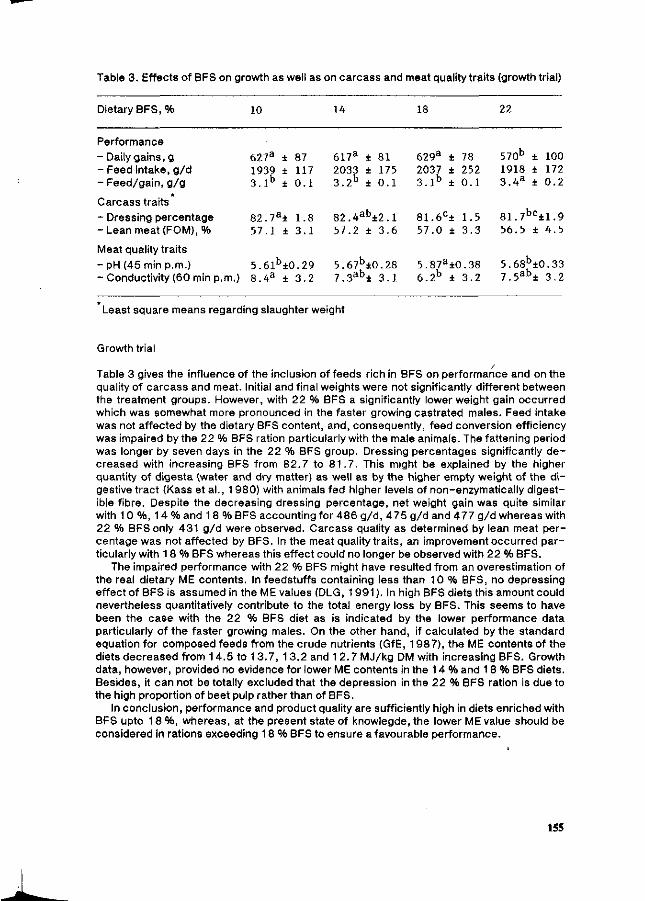
Table 3. Effects of BFS on growth as well as on carcass and meat quality traits (growth trial)
Dietary BFS, %
Performance
- Daily gains, g - Feed intake, g /d - Feed/gain, g /g
* Carcass traits - Dressing percentage - Lean meat (FOM), %
Meat quality traits
- pH (45 min p.m.) - Conductivity (60 min p.m.)
10
627a ± 87 1939 ± 117 3 . 1 b ± 0 .1
82.7a+ 1.8 57 .1 ± 3 .1
5 .61b±0.29 8 . 4 a ± 3.2
14
617a ± 81 2033 ± 175 3 . 2 b ± 0 . 1
8 2 . 4 a b ± 2 . 1 57.2 ± 3.6
5 .67b±0.28 7 .3 a b ± 3 .1
18
629a ± 78 2037 ± 252 3 . 1 b ± 0 .1
81.6C± 1.5 57.0 ± 3.3
5 .87a±0.38 6.2.b + 3.2
22
570b ± 100 1918 ± 172 3 . 4 a ± 0.2
81 .7 b c ±1 .9 56.5 ± 4 .5
5 .68b±0.33 7 .5 a b ± 3.2
Least square means regarding slaughter weight
Growth trial
Table 3 gives the influence of the inclusion of feeds rich in BFS on performance and on the quality of carcass and meat. Initial and final weights were not significantly different between the treatment groups. However, with 22 % BFS a significantly lower weight gain occurred which was somewhat more pronounced in the faster growing castrated males. Feed intake was not affected by the dietary BFS content, and, consequently, feed conversion efficiency was impaired by the 22 % BFS ration particularly with the male animals. The fattening period was longer by seven days in the 22 % BFS group. Dressing percentages significantly de creased with increasing BFS from 82.7 to 81.7. This might be explained by the higher quantity of digesta (water and dry matter) as well as by the higher empty weight of the d i gestive tract (Kass et al., 1 980) with animals fed higher levels of non-enzymatically digestible fibre. Despite the decreasing dressing percentage, net weight gain was quite similar with 1 0 %, 1 4 % and 1 8 % BFS accounting for 486 g /d , 475 g/d and 477 g/d whereas with 22 % BFS only 431 g/d were observed. Carcass quality as determined by lean meat percentage was not affected by BFS. In the meat quality traits, an improvement occurred particularly with 1 8 % BFS whereas this effect could no longer be observed with 22 % BFS.
The impaired performance with 22 % BFS might have resulted from an overestimation of the real dietary ME contents. In feedstuffs containing less than 10 % BFS, no depressing effect of BFS is assumed in the ME values (DLG, 1991). In high BFS diets this amount could nevertheless quantitatively contribute to the total energy loss by BFS. This seems to have been the case with the 22 % BFS diet as is indicated by the lower performance data particularly of the faster growing males. On the other hand, if calculated by the standard equation for composed feeds from the crude nutrients (GfE, 1987), the ME contents of the diets decreased from 1 4.5 to 1 3.7, 1 3.2 and 1 2.7 MJ/kg DM with increasing BFS. Growth data, however, provided no evidence for lower ME contents in the 14 % and 1 8 % BFS diets. Besides, it can not be totally excluded that the depression in the 22 % BFS ration is due to the high proportion of beet pulp rather than of BFS.
In conclusion, performance and product quality are sufficiently high in diets enriched with BFS upto 18 %, whereas, at the present state of knowlegde, the lower ME value should be considered in rations exceeding 18 % BFS to ensure a favourable performance.
155
References
Abrens, F. & Kaufmann, W., 1985. Messungen zur Fermentation im Dickdarm am Modell Miniaturschwein unter besonderer Berücksichtigung der Eiweißumsetzungen. Zeitschrift für Tierphysiologie, Tierernährung und Futtermittelkunde 53:1 5 0 - 1 6 9 .
Amberger, A., Vilsmeier, K. & Gutser, R., 1982. Stickstofffraktionen verschiedener Güllen und deren Wirkung im Pflanzenversuch, Zeitschrift für Pflanzenernährung und Bodenkunde 145 :325-336 .
DLG (Deutsche Landwirtschaftsgesellschaft), 1 9 9 1 . DLG-Futterwerttabellen - Schweine. 6th ed., DLG-Verlag, Frankfurt/Main.
Fabry, H., Leibold, R. & Rüsseler, M., 1990. Emissionen von Amoniak. Quellen-Verbleib-Wirkungen-Schutzmaßnahmen. Arbeitsmaterialien des Bundesamtes für Ernährung und Forstwirtschaft, Frankfurt/Main.
GfE (Gesellschaft für Ernährungsphysiologie, Ausschuß für Bedarfsnormen), 1987. Energie- und Nährstoffbedarf landwirtschaftlicher Nutztiere. No. 4. Schweine. DLG-Verlag, Frankfurt/Main.
Kass, M.L., Van Soest, P.J., Pond, W.G., Lewis, B. & McDowell, R.E., 1980. Utilization of dietary fiber from alfalfa by growing swine. I. Apparent digestibility of diet components in specific segments of the gastrointestinal tract. Journal of Animal Science 50: 1 7 5 - 1 9 1 .
Kirchgeßner, M. & Kreuzer M., 1990. Exkrementmenge und N-Ausscheidung in der Broiler- und Legehennenhaltung bei Variation der Fütterungsintensität an Protein und Energie. Agribiological Research 43 :348 -366 .
Kirchgeßner, M., Kreuzer, M. & Roth, F.X., 1989. Microbial turnover in the hindgut of sows as affected by intracecal infusion of large amourfts of different pure substrates. 2. Eff i ciency of microbial protein synthesis and fermentation capacity of the hindgut. Landwirtschaftliche Forschung 42:11 4 - 1 26.
Kirchgeßner, M., Windisch, W. & Kreuzer, M., 1991a. Stickstoffemission aus der Mi lchviehhaltung in Abhängigkeit von der Leistung. Agribiological Research 44 :1 -1 3.
Kirchgeßner, M., Kreuzer, M., Müller, H.L. & Windisch, W., 1991b. Release of methane and of carbon dioxide by the pig. Agribiological Research 44 :103-11 3.
Kirchgeßner, M., Kreuzer, M. & Roth, F.X., 1991c. Bestimmungsfaktoren der Güllecharakteristik beim Schwein. 1. Einfluß von Leistungsrichtung^ -s.tadium und -intensität sowie Futteraufnahme und Geschlecht unter üblichen Fütterungsbedinaungen. Agribiological Research 44 :299 -324 .
Kirchgeßner, M., Kreuzer, M., Roth-Maier, D.A., Roth, F.X. «.Müller, H.L., 1991d. Bestimmungsfaktoren der Güllecharakteristik Heim Schwein. 2. Einfluß von Fütterurlgsintensität und den Anteilen an unverdaulichen sowie an bakteriell fermentierbaren Substanzen (BFS) im Futter. Agribiological Research 44 :325 -344 .
Kirchgeßner, M., Roth, F.X. & Kreuzer, M., 1 991 e. Bestimmongsfaktoren der Güllecharakteristik beim Schwein. 3. Einfluß von N-Zufuhr uml Aminosäurenzusammensetzung des Futters. Agribiological Research 44 :345 -356 . I
Kreuzer, M., Roth, F.X. & Kirchgeßner, M., 1 989. Mikrowelle Umsetzungen im Enddarm von Sauen bei intracaecaler Infusion hoher Mengen an verschiedenen reinen Substraten. 1. Veränderung der Verdaulichkeit von Stickstoff und Aminosäuren. Landwirtschaftliche Forschung 4 2 : 7 2 - 9 2 .
Kreuzer, M, Heindl.U., Roth-Maier, D.A. & Kirchgeßner, M., 1 991 . Cellulose fermentation capacity of the hindgut and nitrogen turnover in the hindgut of sows as evaluated by oral and intracecal supply of purified cellulose. Archives of Animal Nutrition 41 :359 -372 .
Kreuzer, M., Machmüller, A., Roth-Maier, D.A. & Kirchgeßner M., 1992. Bakterielle Syntheseleistung im Enddarm von Sauen bei Verabreichung hoher Mengen an Luzernegrünmehl und Weizenkleie. Proc. 46. Meeting of the Gesellschaft für Ernährungsphysiologie, DLG-Verlag Frankfurt/Main No. 453646, 1 3 -1 4 .
Mason, V.C., 1 969. Some observations on the distribution and origin of nitrogen in sheep faeces. Journal of agricultural Science, Cambridge, 7 3 : 9 9 - 1 1 1 .
Schutte, J.B., 1 9 9 1 . Nutritional value and physiological effects of D-xylose and L-arabi-nose in poultry and pigs. PhD. Thesis, Landbouwuniversiteit te Wageningen.
156
New strategy for optimizing amino acid supply to growing pigs
Sigurd Boisen
National Institute of Animal Science, Foulum, Denmark
Summary
A strategy for optimizing the amino acid supply and minimizing N-excretion during the production of slaughter pigs is proposed. The strategy involves the formulation of two feeds which correspond to the optimal composition of digestible nutrients at the beginning and at the end of the period, e.g. at 25 and 100 kg live weight, respectively. The composition of digestible nutrients is verified from chemical and in vitro analyses. The protein content is reduced to a minimum by increasing the proportion of ideal protein through supplementation with free amino acids. The pigs are then fed ad libitum with a mixture of the two feeds formulated to satisfy the live weight dependant changes in nutrient requirements. Key words: ideal protein, multi-phase feeding, in vitro digestibility /
Introduction
Adequate supply of amino acids to pigs during the growth period until slaughter is essential for optimal growth and for maximizing meat percentage in the carcass.
The present situation in many European countries is that prize relations between protein and energy sources makes it tempting to use a relatively high protein level in pig feeds and to use the same mixture during the whole growth period although the requirements of amino acids decrease gradually.
The increasing understanding that a protein surplus may have unwanted consequences on the pigs as well as on the environment, actualize the need for developing new strategies for pig feeding in which the amino acid supply is optimized and the nitrogen excretion is minimized.
Optimized amino acid supply
Ideal protein
The requirements of all essential amino acids in relation to protein requirement of growing pigs, can be defined by the amino acid composition of the ideal protein for growing pigs (ARC, 1981). The composition of ideal protein is assumed to be constant through the whole growth period from 25 to 100 kg live weight, but the exact composition is not finally confirmed.
Investigations on 35 samples of sow milk revealed that the amino acid composition was almost independant of feeding and was suggested to reflect closely the amino acid requirements for piglets (Boisen et al., 1988). However, the proposed composition by ARC as well as detailed studies by Fuller and coworkers (Fuller, 1987) indicate relatively higher contribution of threonine and sulphur-containing amino acids than found in sows milk. On
157
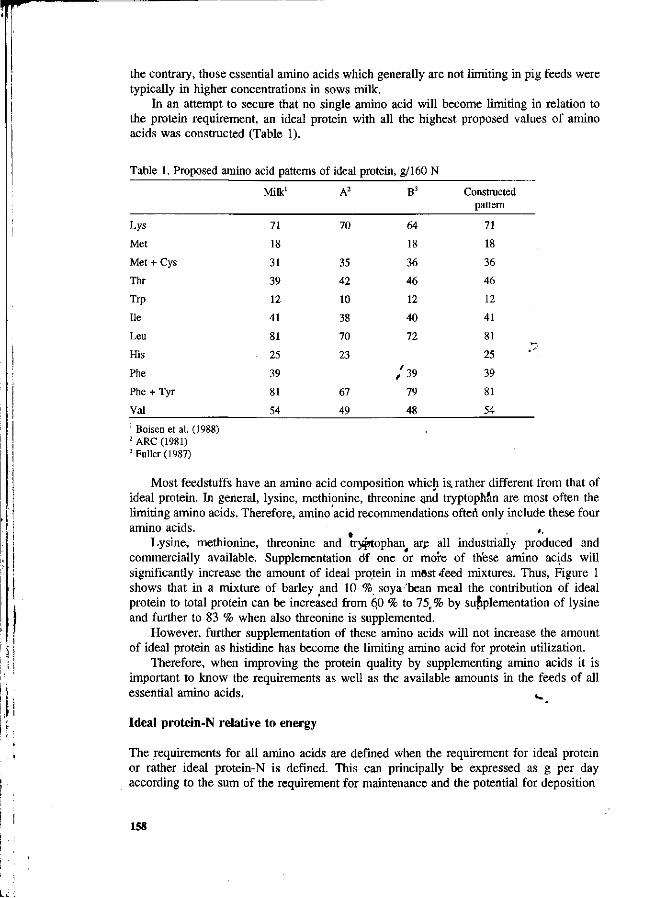
the contrary, those essential amino acids which generally are not limiting in pig feeds were typically in higher concentrations in sows milk.
In an attempt to secure that no single amino acid will become limiting in relation to the protein requirement, an ideal protein with all the highest proposed values of amino acids was constructed (Table 1).
Table 1. Proposed amino acid patterns of ideal protein, g/160 N
Lys
Met
Met + Cys
Thr
Trp
He
Leu
His
Phe
Phe + Tyr
Val
Milk'
71
18
31
39
12
41
81
25
39
81
54
A2
70
35
42
10
38
70
23
67
49
B3
64
18
36
46
12
40
72
/ 3 9
79
48
Constructed pattern
71
18
36
46
12
41
81
25
39
81
54
' Boisen et al. (1988) 2 ARC (1981) 3 Fuller (1987)
Most feedstuffs have an amino acid composition which is. rather different from that of ideal protein. In general, lysine, methionine, threonine and tryptophan are most often the limiting amino acids. Therefore, amino acid recommendations often only include these four amino acids. .
Lysine, methionine, threonine and tryptophan are all industrially produced and commercially available. Supplementation óf one or more of these amino acids will significantly increase the amount of ideal protein in m»st .feed mixtures. Thus, Figure 1 shows that in a mixture of barley and 10 % soya 'bean meal the contribution of ideal protein to total protein can be increased from 60 % to 75, % by supplementation of lysine and further to 83 % when also threonine is supplemented.
However, further supplementation of these amino acids will not increase the amount of ideal protein as histidine has become the limiting amino acid for protein utilization.
Therefore, when improving the protein quality by supplementing amino acids it is important to know the requirements as well as the available amounts in the feeds of all essential amino acids. ^
Ideal protein-N relative to energy
The requirements for all amino acids are defined when the requirement for ideal protein or rather ideal protein-N is defined. This can principally be expressed as g per day according to the sum of the requirement for maintenance and the potential for deposition
158
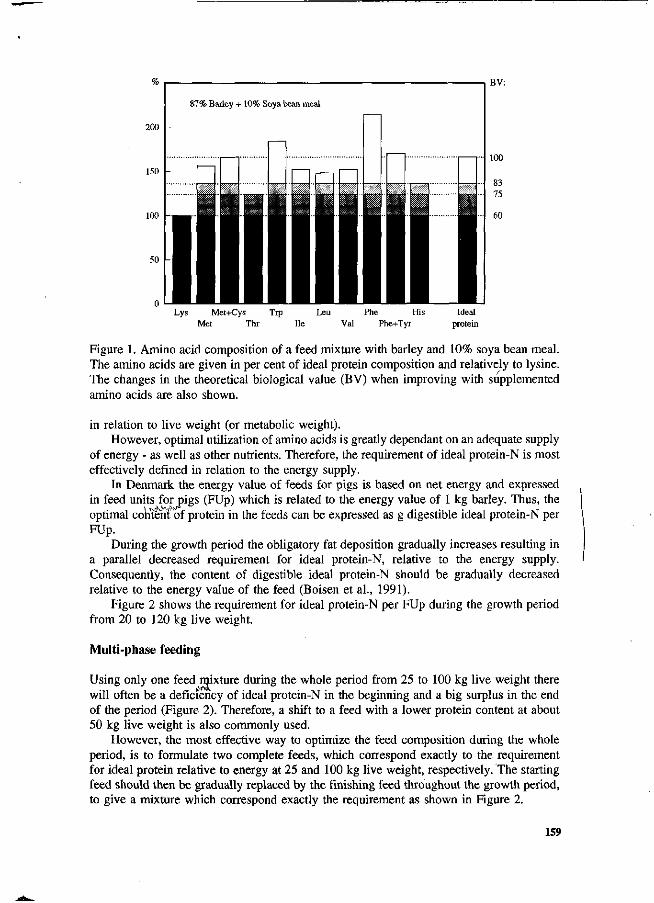
Lys Met+Cys Trp Leu Phe His Met Thr Ile Val Phe+Tyr
Ideal protein
Figure 1. Amino acid composition of a feed mixture with barley and 10% soya bean meal. The amino acids are given in per cent of ideal protein composition and relatively to lysine. The changes in the theoretical biological value (BV) when improving with supplemented amino acids are also shown.
in relation to live weight (or metabolic weight). However, optimal utilization of amino acids is greatly dependant on an adequate supply
of energy - as well as other nutrients. Therefore, the requirement of ideal protein-N is most effectively defined in relation to the energy supply.
In Denmark the energy value of feeds for pigs is based on net energy and expressed in feed units for pigs (FUp) which is related to the energy value of 1 kg barley. Thus, the optimal content of protein in the feeds can be expressed as g digestible ideal protein-N per FUp.
During the growth period the obligatory fat deposition gradually increases resulting in a parallel decreased requirement for ideal protein-N, relative to the energy supply. Consequently, the content of digestible ideal protein-N should be gradually decreased relative to the energy value of the feed (Boisen et al., 1991).
Figure 2 shows the requirement for ideal protein-N per FUp during the growth period from 20 to 120 kg live weight.
Multi-phase feeding
Using only one feed mixture during the whole period from 25 to 100 kg live weight there will often be a deficiency of ideal protein-N in the beginning and a big surplus in the end of the period (Figure 2). Therefore, a shift to a feed with a lower protein content at about 50 kg live weight is also commonly used.
However, the most effective way to optimize the feed composition during the whole period, is to formulate two complete feeds, which correspond exactly to the requirement for ideal protein relative to energy at 25 and 100 kg live weight, respectively. The starting feed should then be gradually replaced by the finishing feed throughout the growth period, to give a mixture which correspond exactly the requirement as shown in Figure 2.
159
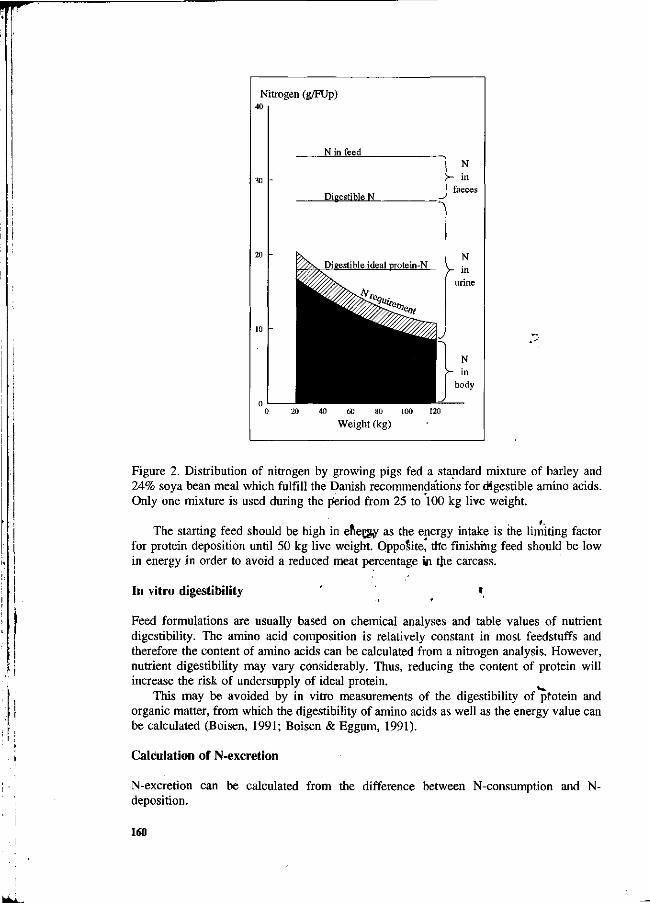
Nitrogen (g/FUp)
N in feed
faeces Digestible N -^
Digestible ideal protein-N V _
0 20 40 60 80 100 120
Weight (kg)
Figure 2. Distribution of nitrogen by growing pigs fed a standard mixture of barley and 24% soya bean meal which fulfill the Danish recommendations for digestible amino acids. Only one mixture is used during the p'eriod from 25 to 100 kg live weight.
The starting feed should be high in energy as the energy intake is the limiting factor for protein deposition until 50 kg live weight. Opposite, the finishing feed should be low in energy in order to avoid a reduced meat percentage iji tjie carcass.
In vitro digestibility ' »
Feed formulations are usually based on chemical analyses and table values of nutrient digestibility. The amino acid composition is relatively constant in most feedstuffs and therefore the content of amino acids can be calculated from a nitrogen analysis. However, nutrient digestibility may vary considerably. Thus, reducing the content of protein will increase the risk of undersupply of ideal protein.
This may be avoided by in vitro measurements of the digestibility of pfotein and organic matter, from which the digestibility of amino acids as well as the energy value can be calculated (Boisen, 1991; Boisen & Eggum, 1991).
Calculation of N-excretion
N-excretion can be calculated from the difference between N-consumption and N-deposition.
160
•' I -f"
feeding period of ( a ) ^ -^^ [ i quality, IP-ratio; and p 4 ^
N-consumption may be described by average values during the digestible ideal protein-N, g per FUp; (b) N-digestibility; (c) protein i (d) feed utilization, FUp per kg gain. N-consumption during the period from 25 to 100 kg can then be calculated by using the formula: 75 * a * d/(1000 * b * c)
In practical pig production, average values for a, b, c and d are assumed to be 16.7, .8, .75 and 2.9, respectively. From these values an average N-consumption of 6.1 kg during the period from 25 to 100 kg live weight can be calculated. However, the values for a, b, c and d may also be 17.5, .76, .6 and 3.2, respectively, resulting in a considerably higher N-consumption of 9.2 kg.
N-deposition can be assumed to have a relatively constant value of 1.9 kg during the period from 25 to 100 kg live weight. Hence, a mean N-excretion for this period in practical pig production can be calculated to about 4.2 kg, but may be as high as 7.3 kg.
The potential for reducing N-excretion can be calculated from the optimal values of a, b, c and d. Realistic improvements of a, b, c, and d are 15.9, .84, .9 and 2.6, respectively, according to a minimum N-consumption of 4.1 kg. Thus, the N-excretion can potentially be reduced to 2.2 kg. This was also confirmed in an experiment with optimized amino acid supply to growing pigs as described recently (Boisen et al., 1991).
Strategy for optimized feeding /
From the above discussion the following strategy for optimal feeding also with respect to obtain minimal N-excretion can be outlined:
1. Estimation of the content of true digestible amino acids at ileal level from nitrogen analyses combined with in vitro measurements of nitrogen digestibility in the actual feedstuffs.
2. Calculation of the optimal combination of the actual feedstuffs and supplemented industrial amino acids in order to maximise the contribution of ideal protein to the true ileal digestible protein. In this way two complete feed mixtures which satisfy the requirement for ideal protein at 25 and 95 kg live weight, respectively, are formulated:
a. Feed A with a high energy concentration (min. 1.3 FUp per kg dry matter) and 19.3 g digestible ideal protein-N per FUp
b. Feed B with a low energy concentration (max. 1.1 FUp per kg dry matter) and 12.6 g digestible idealprotein-N per FUp.
3. Feeding ad libitum starting with feed A only during the first 1 to 2 weeks. Then feed A is gradually replaced by feed B according to a scheme for ideal protein requirement relatively to FUp during the whole growth period. Thus, the feeding is finished with feed B only during the last week before slaughter at about 100 kg live weight.
References
ARC, 1981. The nutrient requirements of pigs. Commonwealth Agricultural Bureaux, Slough.
Boisen, S., 1991. A model for feed evaluation based on in vitro digestible dry matter and protein. In: Digestion in vitro (M.F. Fuller, ed.). Commonwealth Agricultural Bureaux International, Slough, p. 135-145.
161
Boisen, S., Bech-Andersen, S. & Danielsen, V., 1988. The amino acid composition in sows milk compared with the Danish recommendations for essential amino acids in feeds to piglets (in Danish). Commun, no. 737 from the National Institute of Animal Science.
Boisen, S. & Eggum, B.O., 1991. Critical evaluation of in vitro methods for estimating digestibility in simple-stomach animals. Nutr. Res. Rev. 4:141-162.
Boisen, S., Fernandez, J.A. & Madsen, A., 1991. Studies on ideal protein requirement of pigs from 20 to 95 kg live weight. Proc. 6th Int. Symposium on "Protein Metabolism and Nutrition", Herning, Denmark, p. 299-302.
Fuller, M.F., 1987. Galenica Symposium, Billund, Denmark.
V r :
162
T
Dietary manipulation to reduce nitrogen excretion by pigs and its effect on performance
Pauline Lee1, R.M Kay2, A. Cullen3, P. Fullarton3, S. Jagger4.
1. ADAS, Coley Park, Reading, UK. 2. ADAS Terrington, Terrington St. Clement, King's Lynn, UK. 3. Forum Chemicals, Brighton Road, Redhill, UK. 4. Dalgety Agriculture Ltd., Aztec West, Bristol, UK.
Summary
Several publications have shown that reducing dietary crude protein levels while maintaining essential amino acid levels can give significant reductions in nitrogen excretion without reducing pig performance. Three diet specifications were used to manufacture isocaloric diets, containing essential amino acids in an ideal protein ratio, which were suitable for growing and finishing pigs in either a single phase (Sped; lysine to digestible energy (DE) ratio 0.8) or two phase (Spec. 2; lysine to DE ratio 0.9, followed by Spec. 3; lysine to DE ratio 0.7) feeding system. Three diets with differing levels of crude protein (CP) were formulated within each specification. The nine diets were used in nitrogen balance experiments to evaluate their effect on nitrogen excretion (NE) and retention (NR) by growing (30 to 55 kg) and finishing (60 to 95 kg) pigs. Reducing dietary CP reduced daily nitrogen intake (NI) and NE (P<0.001) for each diet specification. In the growing pigs, although the proportion of NI retained increased with decreasing dietary CP level (PO.001) NR decreased (Spec. 1, P<0.01; Spec. 2, P<0.001) as dietary CP was reduced. Finishing pigs offered Spec. 3 diets gave similar results. However, although there were no significant differences in the proportion of NI retained by finishing pigs offered Spec. 1 diets, NR of pigs given the lowest CP diet was reduced (P<0.001). Whilst the results support the theory that reducing the CP content of the diet reduces NE, there was no evidence that phase feeding gave more efficient utilisation of dietary nitrogen in these experiments.
Key words: Pigs, growing pigs, nitrogen excretion, nitrogen retention, crude protein, dietary manipulation, phase feeding.
Introduction
In the UK, pollution of the water system with nitrate nitrogen leaching from the soil is seen as a major problem and has led the government to designate 'Nitrate Sensitive Areas' where the levels of nitrate are being carefully monitored and controlled. In the EC, farm animal effluents have been identified as a major source of nitrate pollution and in some member states legislation has already been introduced to limit the amount of nitrogen from slurry that can be spread onto the land. Council Directive 91/676/EEC(1991) covers the application of nitrogen to the land in an attempt to prevent any further pollution. It involves the designation of 'NitrateVulnerable Zones' and has to be flilly implemented by December 1999. It would, therefore, be beneficial to the livestock producer and to the environment if the nitrogen excretion from animals could be kept to a minimum.
Lenis (1989), in a review on current and future possibilities of reducing nitrogen excretion by feeding, stated that in order to limit the excretion of nitrogen by the pig, it was necessary to supply amino acids in the diet in better agreement with its dietary requirements. This could be achieved either by feeding diets according to the pig's requirements based on age and/or weight (phase feeding) or by improving protein quality. The best protein quality would be that which has the
163
same balance of essential amino acids (EAA) with respect to lysine as that in ideal protein (Wang and Fuller, 1989). Diets formulated on an ideal protein basis, using crystalline EAA, could enable lower crude protein (CP) diets to be offered whilst maintaining nitrogen retention (NR). With diets ranging from 17.7 to 12.0 per cent CP, using wheat and crystalline amino acids to replace soya bean meal, Franz et ai, (1989) reduced nitrogen excretion from pigs between 30 and 100 kg live weight by 37 per cent.
Phase feeding has also been suggested by other workers (Schutte and Bosch, 1989; von Essen and Günther, 1990) as a method of reducing nitrogen excretion by pigs. The present experiment was carried out to determine the effects of combining both of these approaches. The first aim was to determine the effect of diets which differed in CP content but had similar levels of EAA and digestible energy (DE) on the NE and NR of growing and finishing pigs. The second aim was to compare the effects of two levels of dietary lysine to DE ratio on these parameters.
Materials and methods
Diets
Nine diets were evaluated for their effect on NE and NR of growing and finishing pigs. The diets were manufactured to three specifications (Spec. 1, Spec.2, Spec.3). Each specification consisted of the same level of DE (13.9 MJ/kg) and minimum EAA to Lysine ratio (Threonine 0.65, Methionine 0.35, Methionine + Cystine 0.60, Tryptophan 0.18, Histidine 0.33, Leucine 1.10, Isoleucine 0.60, Phenylalanine 0.72, Phenylalanine + Tyrosine 1.20, Valine 0.75) but differed in the Lysine to DE ratio: Sped, 0.8; Spec.2, 0.9; Spec.3, 0.7 (g/MJDE). Spec. 1 was suitable for a diet to be offered to growers and finishers in a single phase system whereas Specs. 2 and 3 were suitable for diets to be offered within a two phase system. There were three diets formulated within each specification: Spec. 1 A, B, C; Spec. 2 D, E, F; Spec. 3 G, H, I; which differed only in the maximum levels of CP, set by the Lysine to CP ratio (0.05, A,D,G; 0.06, B,E,H; 0.07, C,F,I).
Preliminary formulations for the nine diets were computed using nutrient database values to determine the approximate amounts of the major raw materials required. Batches of these raw materials, sufficient for all four experiments, were set aside whilst proximal and total amino acid analyses were carried out on small samples. The diets were"then manufactured to formulations based on the actual nutrient levels in the major raw materials.
• #. Experimental design v ' l
Four nitrogen balance experiments were carried out usTng* a 3x3 Latin Square design. Experiments 1 and 2 compared diets AJ3C and DtjF with' growing pigs, 30 to 55 kg live weight and experiments 3 and 4 compared diets ABC and GH1 with finishing.pigs, 60 to 95 kg live weight. Within the Latin Square design the pigs were given a two day acclimatisation period to the diets followed by a five day total collection period. The amount of feed offered was 95% of the calculated ad lib. intake based on the live weight at the start of the acclimatisation period.
Results
The analyses of the nine diets showed the CP, and DE, lysine and lysine to DE ratio were close to the values expected from the diet formulations (Table 1).
A reduction in dietary CP significantly reduced (P<0.001) daily nitrogen intake (NI) and NE at all three levels of dietary Lysine to DE ratios in both the growing and finishing pigs (Table 2). Although the proportion of NI which was retained was significantly increased (P<0.001) with decreasing dietary CP level (Specs. 1 and 2) in the growing pigs, the increase was not sufficient to maintain the absolute amounts of nitrogen retained. Thus NR decreased significantly (P<0.01,
164
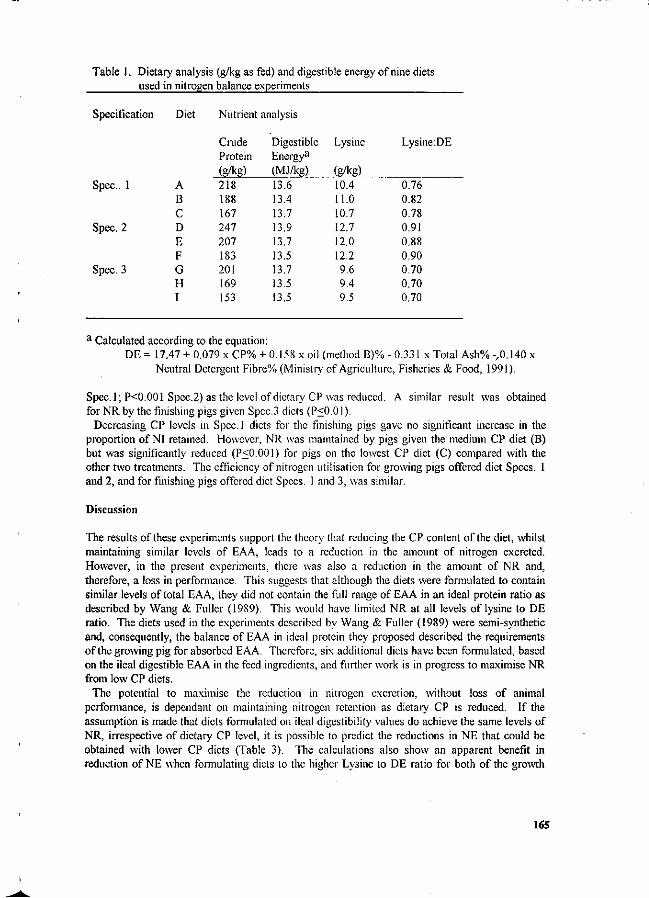
Table 1. Dietary analysis (g/kg as fed) and digestible energy of nine diets used in nitrogen balance experiments
Specification
Spec.. 1
Spec. 2
Spec. 3
Diet
A B C D E F G H I
Nutrient
Crude Protein (g/kg) 218 188 167 247 207 183 201 169 153
analysis
Digestible Energya
(MJ/kg) 13.6 13.4 13.7 13.9 13.7 13.5 13.7 13.5 13.5
Lysine
(g/kg) 10.4 11.0 10.7 12.7 12.0 12.2 9.6 9.4 9.5
Lysine:DE
0.76 0.82 0.78 0.91 0.88 0.90 0.70 0.70 0.70
a Calculated according to the equation: DE = 17.47 + 0.079 x CP% + 0.158 x oil (method B)% - 0.331 x Total Ash% y0.140 x
Neutral Detergent Fibre% (Ministry of Agriculture, Fisheries & Food, 1991).
Spec. 1 ; P<0.001 Spec.2) as the level of dietary CP was reduced. A similar result was obtained for NR by the finishing pigs given Spec.3 diets (P<0.01 ).
Decreasing CP levels in Spec. 1 diets for the finishing pigs gave no significant increase in the proportion of NI retained. However, NR was maintained by pigs given the medium CP diet (B) but was significantly reduced (P<0.001) for pigs on the lowest CP diet (C) compared with the other two treatments. The efficiency of nitrogen utilisation for growing pigs offered diet Specs. 1 and 2, and for finishing pigs offered diet Specs. 1 and 3, was similar.
Discussion
The results of these experiments support the theory that reducing the CP content of the diet, whilst maintaining similar levels of EAA, leads to a reduction in the amount of nitrogen excreted. However, in the present experiments, there was also a reduction in the amount of NR and, therefore, a loss in performance. This suggests that although the diets were formulated to contain similar levels of total EAA, they did not contain the full range of EAA in an ideal protein ratio as described by Wang & Fuller (1989). This would have limited NR at all levels of lysine to DE ratio. The diets used in the experiments described by Wang & Fuller (1989) were semi-synthetic and, consequently, the balance of EAA in ideal protein they proposed described the requirements of the growing pig for absorbed EAA. Therefore, six additional diets have been formulated, based on the ileal digestible EAA in the feed ingredients, and further work is in progress to maximise NR from low CP diets.
The potential to maximise the reduction in nitrogen excretion, without loss of animal performance, is dependant on maintaining nitrogen retention as dietary CP is reduced. If the assumption is made that diets formulated on ileal digestibility values do achieve the same levels of NR, irrespective of dietary CP level, it is possible to predict the reductions in NE that could be obtained with lower CP diets (Table 3). The calculations also show an apparent benefit in reduction of NE when formulating diets to the higher Lysine to DE ratio for both of the growth
165
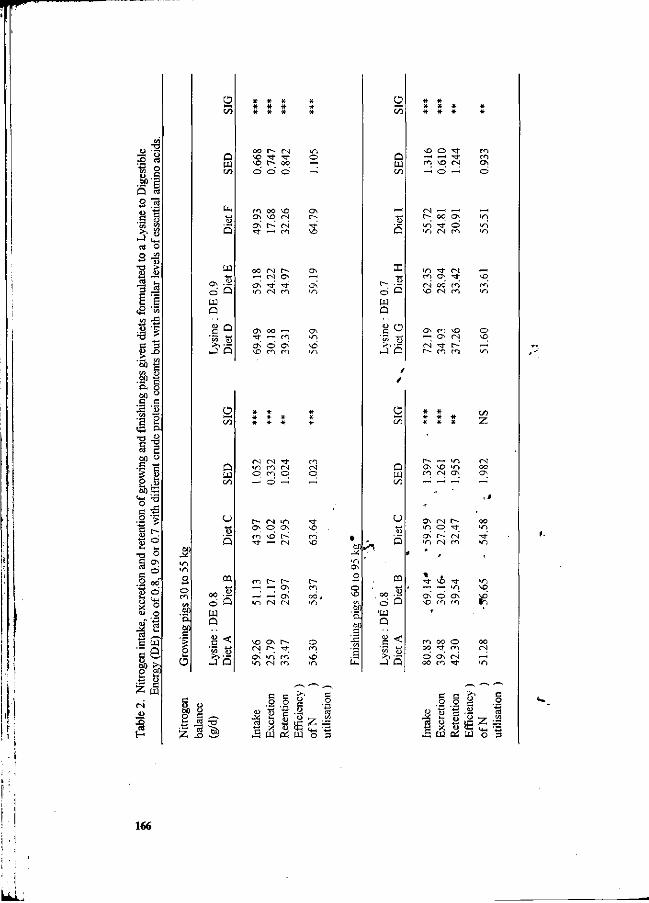
M ' H a * S 13 ë ^ .S <u
s T3 >
M~ 3 J3 Ë s
<a « j2 -s <i> • >
•3 _^ C 3 g -O
- ~ 00 61) •_
. » S D- o on ° c c
•a
g1
•a H
61) <E
'> o' o
ON
ö
o o
il s w 'SB 60 £> O 6!)
S
<*. •! ö Q w Q
u
m 00 Ö U Q
SP s o c ,—v £3 Jtf T3
2 5 ^
Ö O Ö —
ON
Os •3-
oo NO t -
NO <N IN
( N
»n o
( N
m C )
• * ( N O
m ( N
o — o — —<
r- (N »n
n "*•
*?£ J Q
NO ( N
ON ' O
ON
r~-
( N
r^
-* m
X I
u
CD
o •tu D
S a
c c o o >>
£ * cti u £ c Z = " X <U <R « „ \B £ W 0Ä W O 3
NO O
r*-> NO
—' O ( N
—
m ON o
r-ö m Q
Q
Ü
r*N.
NO
ON
ON
oo' C N |
ON
( N
en m
NO
NO
O NO
<N >3- r-r-~ CN, c i
N£> ^
C/2
«
o oo
(D
J2
ON C )
C O
l - l
o
fN l
t
.2 c
S ,-oi lu
,—1
«~>
z. < 4 1
o
c o
'S on
3
166
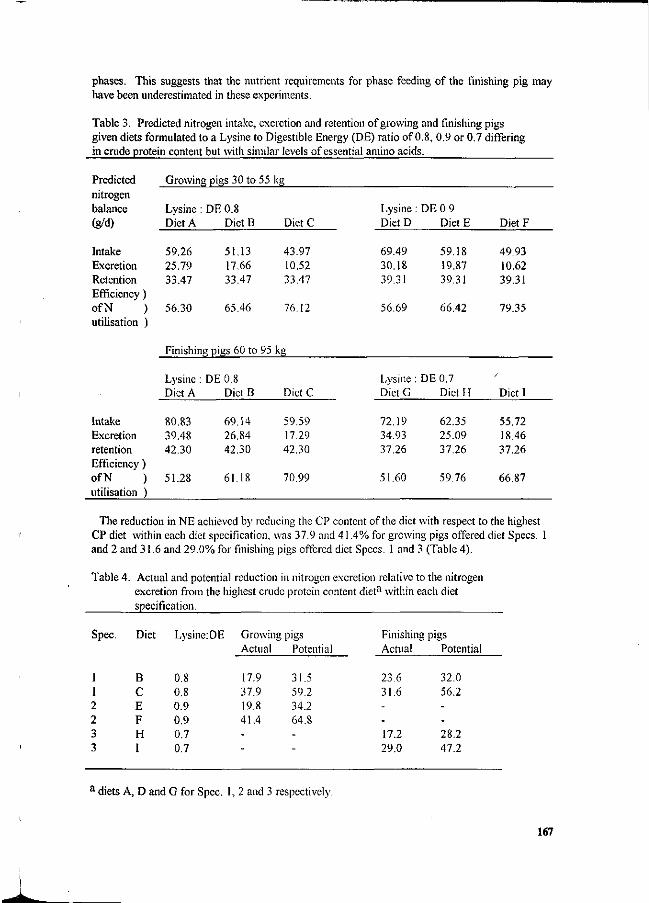
phases. This suggests that the nutrient requirements for phase feeding of the finishing pig may have been underestimated in these experiments.
Table 3. Predicted nitrogen intake, excretion and retention of growing and finishing pigs given diets formulated to a Lysine to Digestible Energy (DE) ratio of 0.8, 0.9 or 0.7 differing in crude protein content but with similar levels of essential amino acids.
Predicted nitrogen balance (g/d)
Intake Excretion Retention Efficiency ) ofN ) utilisation )
Intake Excretion retention Efficiency ) ofN ) utilisation )
Growing pigs 30 to 55 kg
Lysine Diet A
59.26 25.79 33.47
56.30
DE 0.8 DietB
51.13 17.66 33.47
65.46
Finishing pigs 60 to 95
Lysine : Diet A
80.83 39.48 42.30
51.28
DE 0.8 DietB
69.14 26.84 42.30
61.18
DietC
43.97 10.52 33.47
76.12
kg
DietC
59.59 17.29 42.30
70.99
Lysine DietD
69.49 30.18 39.31
56.69
Lysine Diet G
72.19 34.93 37.26
51.60
DE 0.9 Diet E
59.18 19.87 39.31
66.42
DE 0.7 Diet H
62.35 25.09 37.26
59.76
Diet F
49.93 10.62 39.31
79.35
/
Diet I
55.72 18.46 37.26
66.87
The reduction in NE achieved by reducing the CP content of the diet with respect to the highest CP diet within each diet specification, was 37.9 and 41.4% for growing pigs offered diet Specs. 1 and 2 and 31.6 and 29.0% for finishing pigs offered diet Specs. 1 and 3 (Table 4).
Table 4. Actual and potential reduction in nitrogen excretion relative to the nitrogen excretion from the highest crude protein content diet3 within each diet specification.
Spec.
1 1 2 2 3 3
Diet
B C E F H I
Lysine
0.8 0.8 0.9 0.9 0.7 0.7
DE Grow Aetna
17.9 37.9 19.8 41.4 --
ng pigs Potential
31.5 59.2 34.2 64.8 --
Finishing Actual
23.6 31.6 --17.2 29.0
pigs Potential
32.0 56.2 --28.2 47.2
a diets A, D and G for Spec. 1, 2 and 3 respectively.
167
The potential for reduction of nitrogen excretion, assuming NR can be maintained, would be 59.2 and 64.8% (Specs. 1 and 2) and 56.2 and 47.2% (Specs. 1 and 3) for growing and finishing pigs respective
In conclusion, this work shows that formulating diets to an ideal protein ratio on the basis of the amino acid content of feed ingredients can limit NR. However, it is possible, in theory, to manipulate the dietary nitrogen of pigs to reduce NE whilst maintaining NR. It is suggested that it may be necessary to formulate diets on the basis of ileal digestibility of EAA of feed ingredients to maintain NR on low crude protein diets. As better information on digestibility values of EAA in raw materials becomes available it should become easier to formulate such diets.
Acknowledgements
Financial support for some of this work from the Ministry of Agriculture, Fisheries and Food (MAFF) is gratefully acknowledged.
References
von Essen, B. A. Günther, K.D., 1990. Experience with low protein cereal rations in fattening pigs. Lohman Information, Fcb/Mar, p. 9-13.
European Economic Community., 1991. Concerning the protection of waters against pollution caused by nitrates from agricultural sources. / Council Directive 91/676/EEC 12 Dec. 1991.
Franz, P., Dreyer, D., Romberg, F.J. G. Salcwski, A., 1989. Reducing the N-excretion of fattening pigs by adjusting the crude protein and amino acid supply - a step towards environmentally safe animal production. Schweine-Zucht and Schweine-Mast. 37 : 400-402.
Lenis, P.N., 1989. Lower nitrogen excretion in pig husbandly by feeding : current and future possibilities. Net. J. agric. Sei. 37 : 61-70.
Ministry of Agriculture, Fisheries and Food, 1991. Feedingstuffs Regulation^ Statutory Instrument No. 2846 HMSO, London. ^
* • Schutte, J.B. G. Bosch, M.W., 1989. Nutritional possibilitias to reduce nitrogen and phosphorus
excretion in pigs and poultry. TNO-Institute of Animal Nutrition and Physiology (ILOB), Wageningen, The Netherlands. »
Wang, T.C., G. Fuller, M.R., 1989. The optimum dietary amino acid pattern for growing pigs 1 experiments by amino acid deletion. Brit. J. Nutri. 62 : 77-89.
168
Use of biotechnology and feed additives
R. A. Easter, H. H. Stein and N. L. Trottier
Department of Animal Sciences, University of Illinois, 1301 W. Gregory Dr., Urbana, Illinois
Introduction
Nitrogen in swine wastes derives principally from undigested feed residues, urinary losses due to inefficient metabolism and the deamination of excess dietary amino acids, and obligatory losses, e.g., hair, dermal cells and endogenous proteins of alimentary tract origin. Aside from fixed obligatory losses, the sources of unnecessary nitrogen excretion are in large part due to the following: digestive inadequacy, consumption of amino acids in excess of requirements and inefficient assimilation of amino acids into body protein. These problems are not newly identified, but evolving technologies make their solution more feasible than in the past. ,
Fundamentally, two strategies are available to reduce nitrogen output. The first requires modification of the animal through either classical genetic selection procedures or by newer methods (biotechnology) of molecular genetics. The second approach concerns the use of dietary additives to improve the efficiency of protein digestion, amino acid utilization and growth rate. Much preliminary work is being done (McLaren et al., 1990) to map the porcine genome in an effort to identify the genetic base for economically important traits. The successful application of gene manipulation technologies to the problem of nitrogen pollution remains to be realized. Thus, this paper will focus on dietary additives in these categories: amino acids, repartitioning agents, antimicrobials, enzymes and probiotics.
Amino acids
It is understood that nonruminant animals have dietary requirements for 10 essential amino acids and, in addition, a dietary need for a quantity of additional nitrogen that can be employed metabolically to synthesize nonessential amino acids. Unfortunately, no combination of natural feed ingredients provides the exact amounts of each of the necessary nutrients with no excesses. Nitrogen arising metabolically from the consumption of excess amino acids contributes significantly to the daily output. Table 1 provides a perspective on the magnitude of this problem. Shown in the left-hand columns of the table is the makeup and percentage composition of a "typical" corn-soybean meal-based diet for finishing pigs. Note the column headed 14% C.P. (crude protein) diet. All essential amino acids are present in excess of the requirement. In some instances, cf., leucine and arginine, the excess is more than twice the dietary requirement. This represents excess nitrogen consumption that, ultimately, is excreted.
169
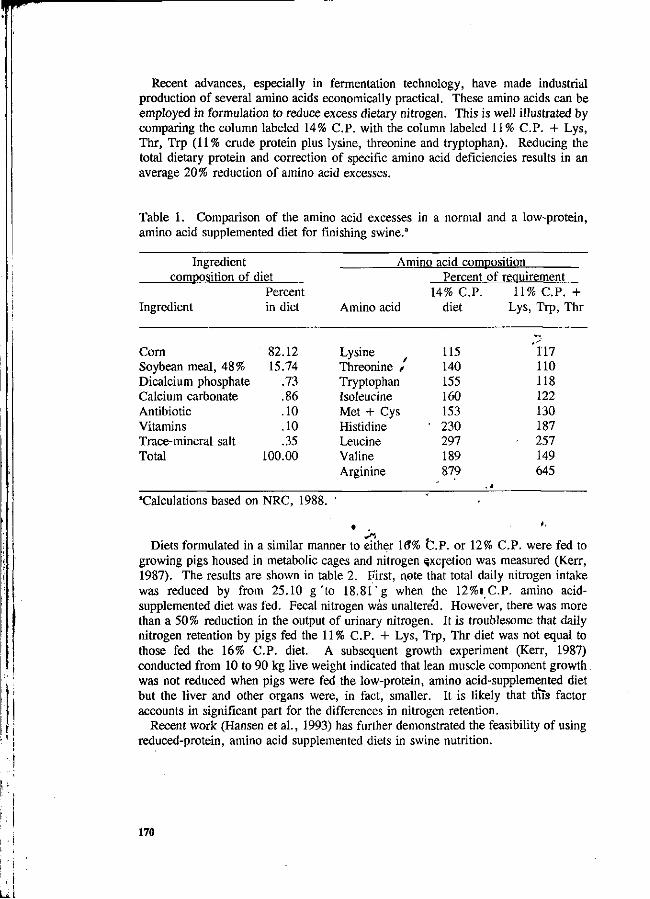
Recent advances, especially in fermentation technology, have made industrial production of several amino acids economically practical. These amino acids can be employed in formulation to reduce excess dietary nitrogen. This is well illustrated by comparing the column labeled 14% C.P. with the column labeled 11% C.P. + Lys, Thr, Trp (11% crude protein plus lysine, threonine and tryptophan). Reducing the total dietary protein and correction of specific amino acid deficiencies results in an average 20% reduction of amino acid excesses.
Table 1. Comparison of the amino acid excesses in a normal and a low-protein, amino acid supplemented diet for finishing swine."
Ingredient composition of <
Ingredient
Corn Soybean meal, 48% Dicalcium phosphate Calcium carbonate Antibiotic Vitamins Trace-mineral salt Total
liet Percent in diet
82.12 15.74
.73
.86
.10
.10
.35 100.00
Amino acid composition
Amino acid
Lysine Threonine / Tryptophan Isoleucine Met + Cys Histidine Leucine Valine Arginine
Percent of reauirement 14% C.P.
diet
115 140 155 160 153
• 230 297 189 879
11% C.P. + Lys, Trp, Thr
'Î17 110 118 122 130 187 257 149 645
"Calculations based on NRC, 1988. '
. . . ».
Diets formulated in a similar manner to either 16*% C.P. or 12% C.P. were fed to growing pigs housed in metabolic cages and nitrogen excretion was measured (Kerr, 1987). The results are shown in table 2. First, note that total daily nitrogen intake was reduced by from 25.10 g ' to 18.81'g when the 12%« C.P. amino acid-supplemented diet was fed. Fecal nitrogen was unaltere'd. However, there was more than a 50% reduction in the output of urinary nitrogen. It is troublesome that daily nitrogen retention by pigs fed the 11% C.P. + Lys, Trp, Thr diet was not equal to those fed the 16% C.P. diet. A subsequent growth experiment (Kerr, 1987) conducted from 10 to 90 kg live weight indicated that lean muscle component growth was not reduced when pigs were fed the low-protein, amino acid-supplemented diet but the liver and other organs were, in fact, smaller. It is likely that this factor accounts in significant part for the differences in nitrogen retention.
Recent work (Hansen et al., 1993) has further demonstrated the feasibility of using reduced-protein, amino acid supplemented diets in swine nutrition.
170
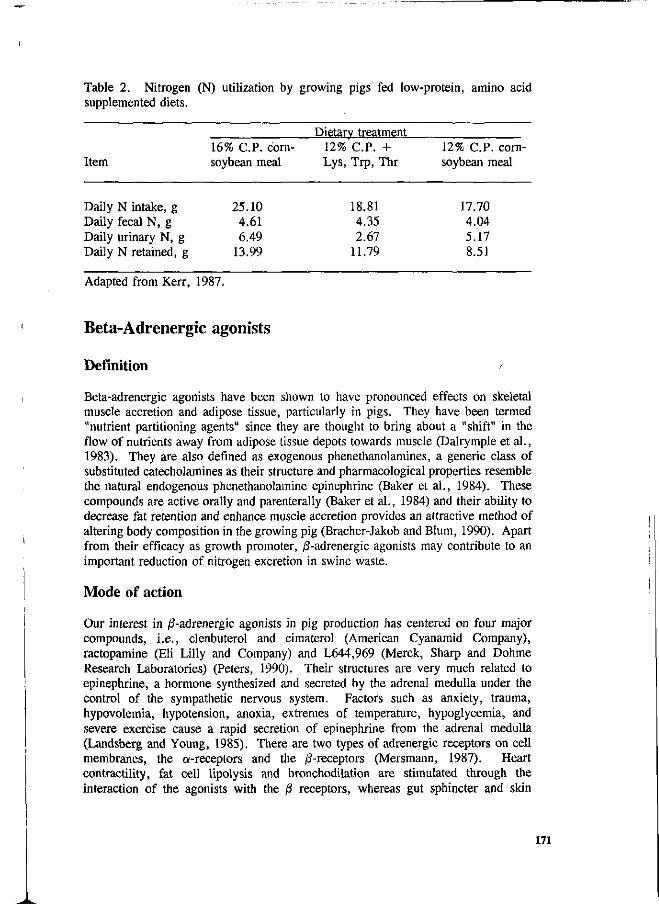
Table 2. Nitrogen (N) utilization by growing pigs fed low-protein, amino acid supplemented diets.
Dietary treatment 16% C.P. corn- 12% C.P. + 12% C.P. corn-
Item soybean meal Lys, Trp, Thr soybean meal
Daily N intake, g Daily fecal N, g Daily urinary N, g Daily N retained, g
25.10 4.61 6.49
13.99
18.81 4.35 2.67
11.79
17.70 4.04 5.17 8.51
Adapted from Kerr, 1987.
Beta-Adrenergic agonists
Definition '
Beta-adrenergic agonists have been shown to have pronounced effects on skeletal muscle accretion and adipose tissue, particularly in pigs. They have been termed "nutrient partitioning agents" since they are thought to bring about a "shift" in the flow of nutrients away from adipose tissue depots towards muscle (Dalrymple et al., 1983). They are also defined as exogenous phenethanolamines, a generic class of substituted catecholamines as their structure and pharmacological properties resemble the natural endogenous phenethanolamine epinephrine (Baker et al., 1984). These compounds are active orally and parenterally (Baker et al., 1984) and their ability to decrease fat retention and enhance muscle accretion provides an attractive method of altering body composition in the growing pig (Bracher-Jakob and Blum, 1990). Apart from their efficacy as growth promoter, 0-adrenergic agonists may contribute to an important reduction of nitrogen excretion in swine waste.
Mode of action
Our interest in ß-adrenergic agonists in pig production has centered on four major compounds, i.e., clenbuterol and cimaterol (American Cyanamid Company), ractopamine (Eli Lilly and Company) and L644.969 (Merck, Sharp and Dohme Research Laboratories) (Peters, 1990). Their structures are very much related to epinephrine, a hormone synthesized and secreted by the adrenal medulla under the control of the sympathetic nervous system. Factors such as anxiety, trauma, hypovolemia, hypotension, anoxia, extremes of temperature, hypoglycemia, and severe exercise cause a rapid secretion of epinephrine from the adrenal medulla (Landsberg and Young, 1985). There are two types of adrenergic receptors on cell membranes, the a-receptors and the ß-receptors (Mersmann, 1987). Heart contractility, fat cell lipolysis and bronchodilation are stimulated through the interaction of the agonists with the ß receptors, whereas gut sphincter and skin
171
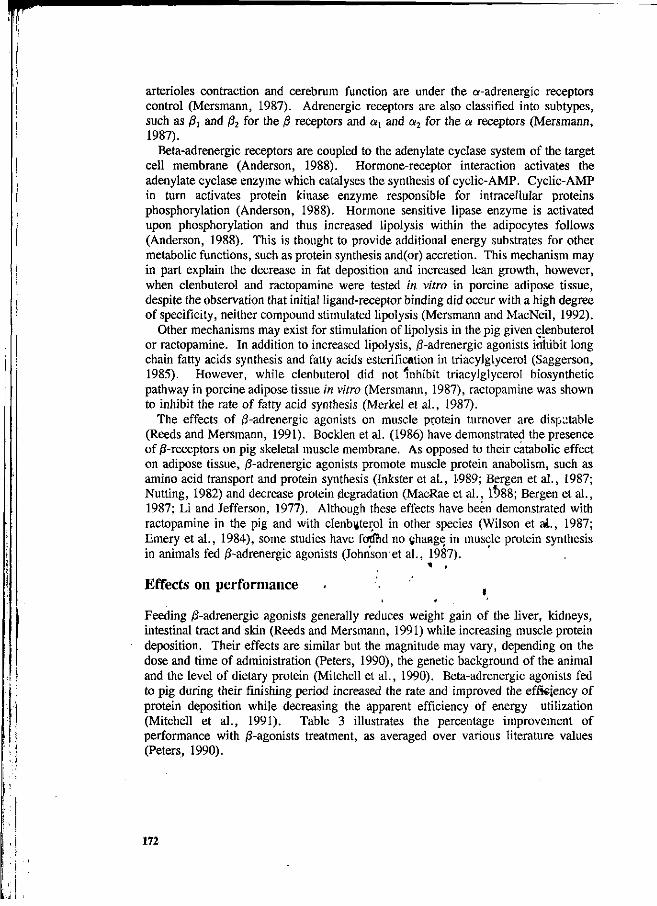
arterioles contraction and cerebrum function are under the a-adrenergic receptors control (Mersmann, 1987). Adrenergic receptors are also classified into subtypes, such as ßi and ß2 for the ß receptors and ax and a2 for the a receptors (Mersmann, 1987).
Beta-adrenergic receptors are coupled to the adenylate cyclase system of the target cell membrane (Anderson, 1988). Hormone-receptor interaction activates the adenylate cyclase enzyme which catalyses the synthesis of cyclic-AMP. Cyclic-AMP in turn activates protein kinase enzyme responsible for intracellular proteins phosphorylation (Anderson, 1988). Hormone sensitive lipase enzyme is activated upon phosphorylation and thus increased lipolysis within the adipocytes follows (Anderson, 1988). This is thought to provide additional energy substrates for other metabolic functions, such as protein synthesis and(or) accretion. This mechanism may in part explain the decrease in fat deposition and increased lean growth, however, when clenbuterol and ractopamine were tested in vitro in porcine adipose tissue, despite the observation that initial ligand-receptor binding did occur with a high degree of specificity, neither compound stimulated lipolysis (Mersmann and MacNeil, 1992).
Other mechanisms may exist for stimulation of lipolysis in the pig given clenbuterol or ractopamine. In addition to increased lipolysis, 0-adrenergic agonists inhibit long chain fatty acids synthesis and fatty acids esterification in triacylglycerol (Saggerson, 1985). However, while clenbuterol did not Inhibit triacylglycerol biosynthetic pathway in porcine adipose tissue in vitro (Mersmann, 1987), ractopamine was shown to inhibit the rate of fatty acid synthesis (Merkel et al., 1987).
The effects of ^-adrenergic agonists on muscle protein turnover are disputable (Reeds and Mersmann, 1991). Bocklen et al. (1986) have demonstrated the presence of 0-receptors on pig skeletal muscle membrane. As opposed to their catabolic effect on adipose tissue, ß-adrenergic agonists promote muscle protein anabolism, such as amino acid transport and protein synthesis (Inkster et aL, 1-989; Bergen et al., 1987; Nutting, 1982) and decrease protein degradation (MacRae et al., Ï988; Bergen et al., 1987; Li and Jefferson, 1977). Although these effects have been demonstrated with ractopamine in the pig and with clenbuterol in other species (Wilson et al., 1987; Emery et al., 1984), some studies have focfFid no change in muscle protein synthesis in animals fed j3-adrenergic agonists (Johnson et al., 1987).
Effects on performance . %
Feeding ^-adrenergic agonists generally reduces weight gain of the liver, kidneys, intestinal tract and skin (Reeds and Mersmann, 1991) while increasing muscle protein deposition. Their effects are similar but the magnitude may vary, depending on the dose and time of administration (Peters, 1990), the genetic background of the animal and the level of dietary protein (Mitchell et al., 1990). Beta-adrenergic agonists fed to pig during their finishing period increased the rate and improved the efficiency of protein deposition while decreasing the apparent efficiency of energy utilization (Mitchell et al., 1991). Table 3 illustrates the percentage improvement of performance with 0-agonists treatment, as averaged over various literature values (Peters, 1990).
172
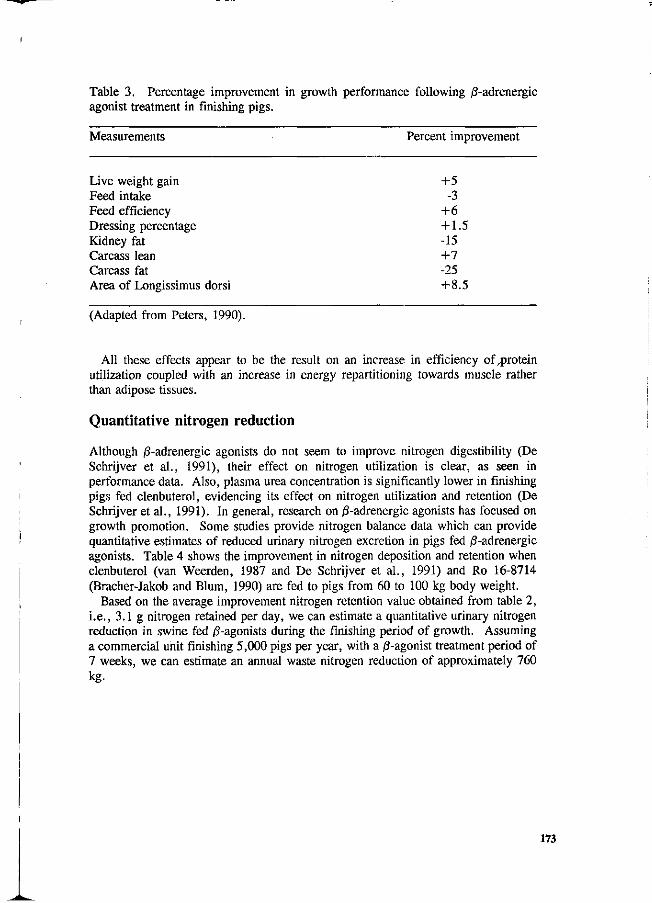
Table 3. Percentage improvement in growth performance following 0-adrenergic agonist treatment in finishing pigs.
Measurements Percent improvement
Live weight gain +5 Feed intake -3 Feed efficiency +6 Dressing percentage +1.5 Kidney fat -15 Carcass lean +7 Carcass fat -25 Area of Longissimus dorsi +8.5
(Adapted from Peters, 1990).
All these effects appear to be the result on an increase in efficiency of^protein utilization coupled with an increase in energy repartitioning towards muscle rather than adipose tissues.
Quantitative nitrogen reduction
Although 0-adrenergic agonists do not seem to improve nitrogen digestibility (De Schrijver et al., 1991), their effect on nitrogen utilization is clear, as seen in performance data. Also, plasma urea concentration is significantly lower in finishing pigs fed clenbuterol, evidencing its effect on nitrogen utilization and retention (De Schrijver et al., 1991). In general, research on jS-adrenergic agonists has focused on growth promotion. Some studies provide nitrogen balance data which can provide quantitative estimates of reduced urinary nitrogen excretion in pigs fed ^-adrenergic agonists. Table 4 shows the improvement in nitrogen deposition and retention when clenbuterol (van Weerden, 1987 and De Schrijver et al., 1991) and Ro 16-8714 (Bracher-Jakob and Blum, 1990) are fed to pigs from 60 to 100 kg body weight.
Based on the average improvement nitrogen retention value obtained from table 2, i.e., 3.1 g nitrogen retained per day, we can estimate a quantitative urinary nitrogen reduction in swine fed 0-agonists during the finishing period of growth. Assuming a commercial unit finishing 5,000 pigs per year, with a /3-agonist treatment period of 7 weeks, we can estimate an annual waste nitrogen reduction of approximately 760 kg-
173
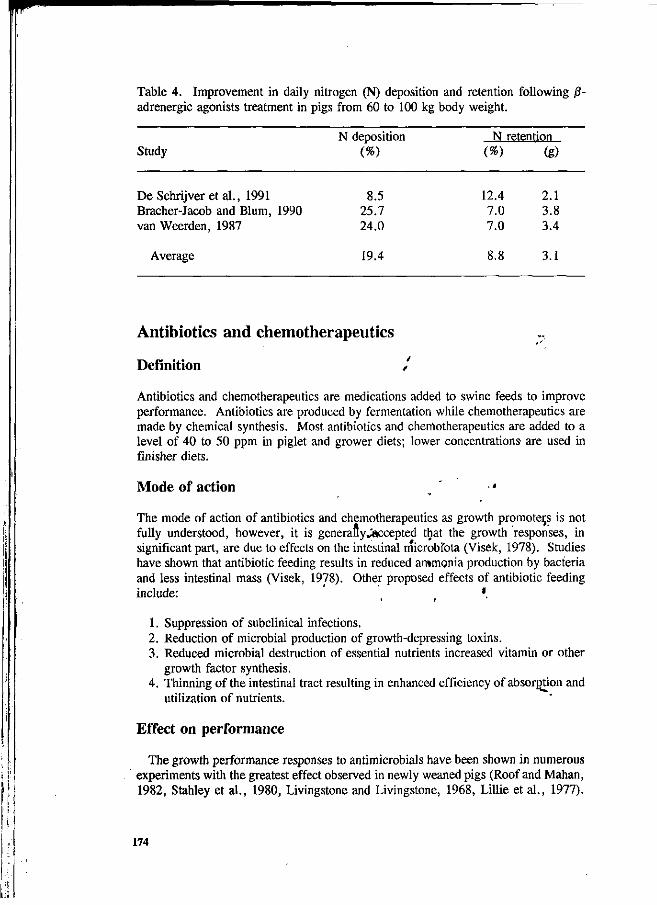
Table 4. Improvement in daily nitrogen (N) deposition and retention following ß-adrenergic agonists treatment in pigs from 60 to 100 kg body weight.
N deposition N retention Study
De Schrijveretal., 1991 Bracher-Jacob and Blum, 1990 van Weerden, 1987
Average
(%)
8.5 25.7 24.0
19.4
(%)
12.4 7.0 7.0
8.8
(g)
2.1 3.8 3.4
3.1
Antibiotics and chemotherapeutics
Definition / /
Antibiotics and chemotherapeutics are medications added to swine feeds to improve performance. Antibiotics are produced by fermentation while chemotherapeutics are made by chemical synthesis. Most antibiotics and chemotherapeutics are added to a level of 40 to 50 ppm in piglet and grower diets; lower concentrations- are used in finisher diets.
Mode of action / •'
The mode of action of antibiotics and chemotherapeutics as growth promoters is not fully understood, however, it is generafly^accepted that the growth responses, in significant part, are due to effects on the intestinal microbtota (Visêk, 1978). Studies have shown that antibiotic feeding results in reduced ammonia production by bacteria and less intestinal mass (Visek, 1978). Other proposed effects of antibiotic feeding include: t f '.
1. Suppression of subclinical infections. 2. Reduction of microbial production of growth-depressing toxins. 3. Reduced microbial destruction of essential nutrients increased vitamin or other
growth factor synthesis. 4. Thinning of the intestinal tract resulting in enhanced efficiency of absorption and
utilization of nutrients.
Effect on performance
The growth performance responses to antimicrobials have been shown in numerous experiments with the greatest effect observed in newly weaned pigs (Roof and Mahan, 1982, Stanley et al., 1980, Livingstone and Livingstone, 1968, Lillie et al., 1977).
174
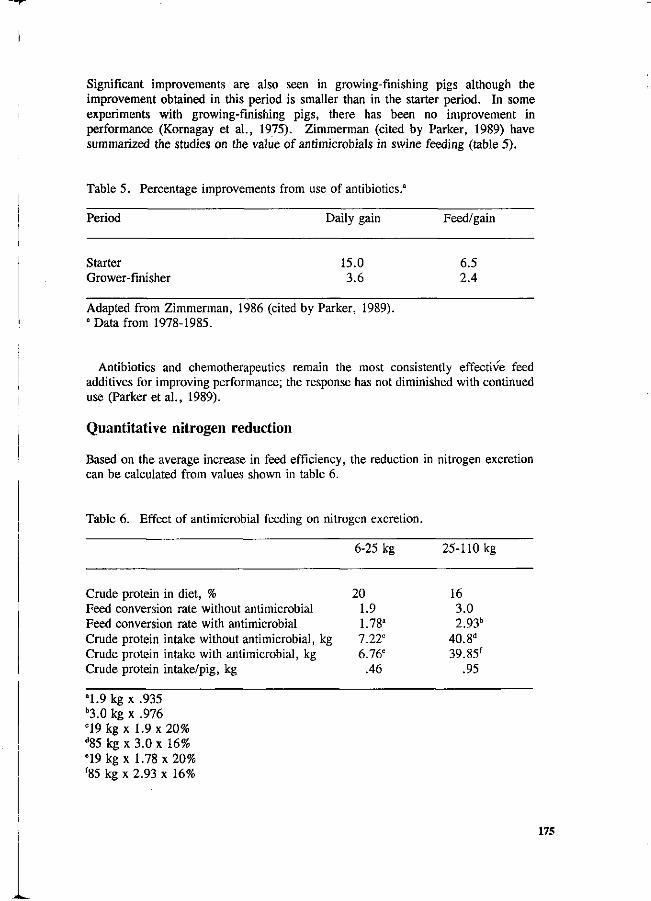
Significant improvements are also seen in growing-finishing pigs although the improvement obtained in this period is smaller than in the starter period. In some experiments with growing-finishing pigs, there has been no improvement in performance (Kornagay et al., 1975). Zimmerman (cited by Parker, 1989) have summarized the studies on the value of antimicrobials in swine feeding (table 5).
Table 5. Percentage improvements from use of antibiotics."
Period Daily gain Feed/gain
Starter 15.0 6.5 Grower-finisher 3.6 2.4
Adapted from Zimmerman, 1986 (cited by Parker, 1989). a Data from 1978-1985.
Antibiotics and chemotherapeutics remain the most consistently effective feed additives for improving performance; the response has not diminished with continued use (Parker et al., 1989).
Quantitative nitrogen reduction
Based on the average increase in feed efficiency, the reduction in nitrogen excretion can be calculated from values shown in table 6.
Table 6. Effect of antimicrobial feeding on nitrogen excretion.
6-25 kg 25-110 kg
Crude protein in diet, % Feed conversion rate without antimicrobial Feed conversion rate with antimicrobial Crude protein intake without antimicrobial, kg Crude protein intake with antimicrobial, kg Crude protein intake/pig, kg
a1.9 kg x .935 b3.0 kg x .976 c19kgx 1.9x20% "85 kg x 3.0 x 16% e19 kg x 1.78 x 20% f85 kg x 2.93 x 16%
0 1.9 1.78" 7.22c
6.76e
.46
16 3.0 2.93b
40.8" 39.85f
.95
175
If it is assumed that the protein accretion in the pig is unaffected by feeding antimicrobials, one can calculate the reduction in nitrogen output simply due to improvements in feed conversion efficiency. Our calculations (Table 6) shown that protein consumption is reduced by .46 kg during the starter period and .95 kg during the growing-finishing period. From weaning to market the total value is 1.41 of protein or .23 kg of nitrogen per pig. In units producing 5,000 pigs per annum, the calculated reduction in feed nitrogen would be 1,150 kg weanling pigs as well as the growing-finishing pigs.
It has been suggested that the an effect of dietary antibiotics is to increase the digestibility of nitrogen and amino acids in the small intestine (Just, 1980, cited by Ellis et al., 1983). In only a few studies has the effect of antibiotic feeding on nitrogen digestibility been evaluated (Thacker et al., 1992, Ellis et al., 1983). In these experiments, a small increase in protein digestibility as well as in protein accretion has been observed. If this is a consistent effect, the overall reduction in the nitrogen excretion could be higher than the amount calculated.
Enzymes
Definition /
These are industrially produced digestive enzymes intended to increase the digestibility of feedstuff s.
Mode of action
Digestive enzymes degrade feedstuffs, however, in many circumstances the pig's natural enzyme levels are too low or the requisite enzymes are, missing. This is especially true in the newly weaned -pigs (Chappie, 1989) where the lack of digestive enzymes is well established. This makes it possible that exogenous dietary enzymes could improve digestibility, particularly of nitrogen-rich proteins. >•
* • Effects on performance
In the chicken, pentosanase and 0-glucanase nave been shçwn to improve the digestibility of pentosans and /3-glucans in barley (Bedford et al., 1992). Both ß-glucans and pentosans are solubilized during digestion resulting in a viscous intestinal fluid that interferes with digestion (Thacker et al., 1992). It has also been suggested that the negative effect of 0-glucans and pentosans in barley and rye results from the polysaccarides encapsulating the endosperm cells. Since they are inert to pancreatic enzyme attack, they prevent physical interaction between the gastrointestinal enzymes and their intended substrates. (Bedford et al., 1992). *-,
Supplementation of a barley- or rye-based diet with 0-glucanase and pentosanase respectively, would be expected to increase the digestibility of the nutrients in the diet and the overall performance. Bedford et al. (1992) found that adding ß-glucanase to a barley-based diet for newly weaned pigs significantly improved performance and increased protein digestibility. In contrast, Graham et al. (1986) found that ß-glucanase supplementation to a barley-based grower diet did not significantly affect
176
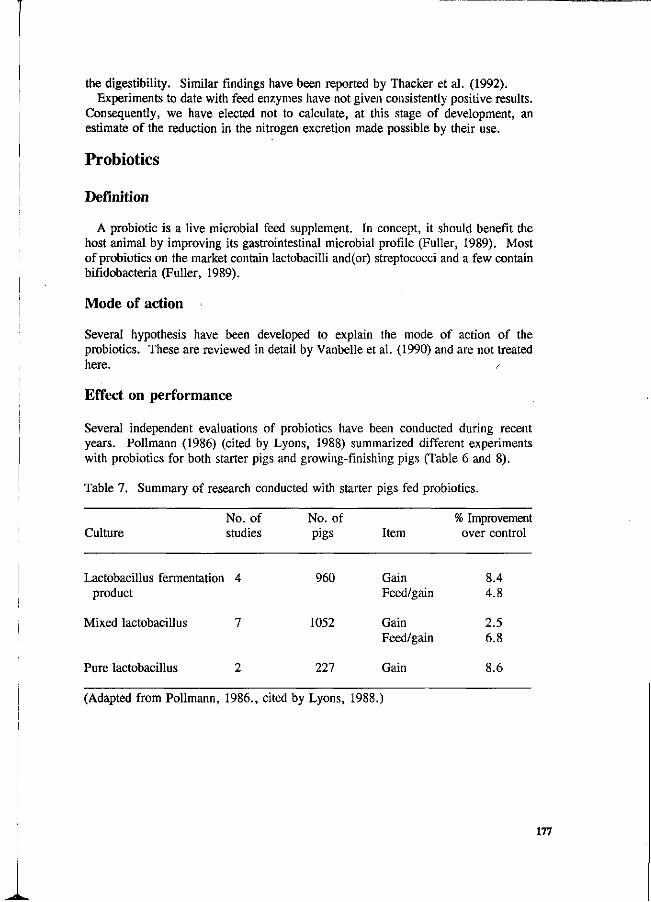
the digestibility. Similar findings have been reported by Thacker et al. (1992). Experiments to date with feed enzymes have not given consistently positive results.
Consequently, we have elected not to calculate, at this stage of development, an estimate of the reduction in the nitrogen excretion made possible by their use.
Probiotics
Definition
A probiotic is a live microbial feed supplement. In concept, it should benefit the host animal by improving its gastrointestinal microbial profile (Fuller, 1989). Most of probiotics on the market contain lactobacilli and(or) streptococci and a few contain bifidobacteria (Fuller, 1989).
Mode of action ••
Several hypothesis have been developed to explain the mode of action of the probiotics. These are reviewed in detail by Vanbelle et al. (1990) and are not treated here. /
Effect on performance
Several independent evaluations of probiotics have been conducted during recent years. Pollmann (1986) (cited by Lyons, 1988) summarized different experiments with probiotics for both starter pigs and growing-finishing pigs (Table 6 and 8).
Table 7. Summary of research conducted with starter pigs fed probiotics.
No. of Culture studies
Lactobacillus fermentation 4 product
Mixed lactobacillus 7
Pure lactobacillus 2
No. of pigs
960
1052
227
Item
Gain Feed/gain
Gain Feed/gain
Gain
% Improvement over control
8.4 4.8
2.5 6.8
8.6
(Adapted from Pollmann, 1986., cited by Lyons, 1988.)
177
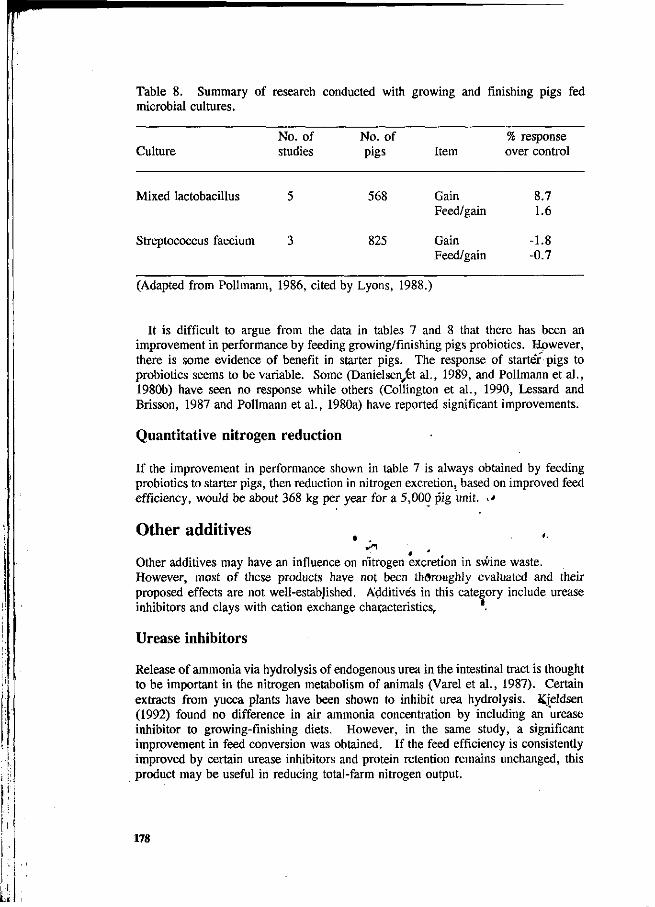
Table 8. Summary of research conducted with growing and finishing pigs fed microbial cultures.
Culture No. of studies
No. of pigs Item
% response over control
Mixed lactobacillus
Streptococcus faecium 3
568
825
Gain Feed/gain
8.7 1.6
Gain -1.8 Feed/gain -0.7
(Adapted from Pollmann, 1986, cited by Lyons, 1988.)
It is difficult to argue from the data in tables 7 and 8 that there has been an improvement in performance by feeding growing/finishing pigs probiotics. However, there is some evidence of benefit in starter pigs. The response of starter pigs to probiotics seems to be variable. Some (Danielse^èt al., 1989, and Pollmann et al., 1980b) have seen no response while others (Collington et al., 1990, Lessard and Brisson, 1987 and Pollmann et al., 1980a) have reported significant improvements.
Quantitative nitrogen reduction
If the improvement in performance shown in table 7 is always obtained by feeding probiotics to starter pigs, then reduction in nitrogen excretion, based on improved feed efficiency, would be about 368 kg per year for a 5,000 pig unit. »
Other additives v"i
Other additives may have an influence on nitrogen excretion in swine waste. However, most of these products have not been thoroughly evaluated and their proposed effects are not well-estabhshed. Additives in this category include urease inhibitors and clays with cation exchange characteristics, '.
Urease inhibitors
Release of ammonia via hydrolysis of endogenous urea in the intestinal tract is thought to be important in the nitrogen metabolism of animals (Varel et al., 1987). Certain extracts from yucca plants have been shown to inhibit urea hydrolysis, Kjeldsen (1992) found no difference in air ammonia concentration by including an urease inhibitor to growing-finishing diets. However, in the same study, a significant improvement in feed conversion was obtained. If the feed efficiency is consistently improved by certain urease inhibitors and protein retention remains unchanged, this product may be useful in reducing total-farm nitrogen output.
178
Clinoptilolite
Clinoptilolite and several other clay minerals are claimed to bind ammonia in the gastrointestinal tract of the pigs and thereby promote the overall performance of the pig (Varel et al., 1987). Although few experiments have demonstrated this effect (Varel et al., 1987, Halama, 1989), further investigations are needed in order to examine the effectiveness of clinoptilolite as a product to decrease the nitrogen excretion in swine waste.
References
Anderson, D. B., 1988. Effect of phenethanolamines on growth and carcass composition of meat animals. National Feed Ingredient Association Proceedings.
Baker, P. K., Dalrymple, R. H., Ingle, D. L. & Ricks, C. A., 1984. Use of a ß-adrenergic agonist to alter muscle and fat deposition in lambs. Journal of Animal Science. 59:1256-1261.
Bedford, M. R., Patience, J. F., Classen, H. L. & Inborr, J., 1992. The effect of dietary enzyme supplementation of rye- and barley-based diets on digestion and subsequent performance in weanling pigs. Canadian Journal of Animal Science. 72:97-105.
Bergen, W. G., Johnson, S. E., Skjaerlund, R. A., Merkel, R. A. & Anderson, D. B., 1987. The effect of ractopamine on skeletal muscle metabolism in pigs. Federation Proceedings. 46:1021.
Bocklen, E., Flad, S., Muller, E., & von Faber, H., 1986. Comparative determination of beta-adrenergic receptors in muscle, heart and backfat of Pietrain and Large White pigs. Animal Production. 43:335.
Bracher-Jacob, A. & Blum, J. W., 1990. Effects of a /3-adrenergic agonist on growth performance, body composition and nutrient retention in finishing pigs fed normal or low amounts of protein. Animal Production. 51:601-611.
Chappie, R. P., Cuaron, J. A. & Easter, R. A., 1989. Effect of glucocorticoids and limiting nursing on the carbohydrate digestive capacity and growth rate of piglets. Journal of Animal Science. 67:2956-2973.
Collington, G. K., Parker, D. S. & Armstrong, D. G., 1990. The influence of inclusion of either an antibiotic or a probiotic in the diet on the development of digestive enzyme activity in the pig. British Journal of Nutrition. 64:59-70.
Dalrymple, R. H., Ricks, C. A., Baker, P. K., Pensack, J. M., Gingher, P. E. & D. L. Ingle., 1983. Use of the ß-agonist clenbuterol to alter carcass composition in poultry. Federation Proceedings. 42:668 (Abstract).
Danielsen, V., Vestergard, E. and Jensen, B., 1989. Malkesyreproducerende bacterier i smagrisefoder. Statens Husdyrbrugsforsog, Meddelelse 752. 4 pp.
De Schrijver, R., Fremaut, D. & Van Den Broeck, M., 1991. Effects of short-term feeding of clenbuterol on nitrogen retention, performance and meat quality in finishing pigs. Journal of Agricultural Science. 116:105-109.
Ellis, M., Davies, M., Brigs, P. A. & Armstrong, D. G., 1983. A note on the influence of Avoparcin on apparent digestibility and nitrogen retention in growing pigs. Animal Production. 36:151-153.
179
Emery, P. W., Rothwell, N. J., Stock, M. J. & Winter, P. D., 1984. Chronic effects of j82-adrenergic agonists on body composition and protein synthesis in the rat. Bioscience Report. 4:83.
Fuller, R., 1989. Probiotics in man and animals. Journal of Applied Bacteriology. 66:365-378.
Graham, H., Hesselmann, K., Jonsson, E. & Aman, P., 1986. Influence ob ß-glucanase supplementation on digestion of a barley-based diet in the pigs gastrointestinal tract. Nutrition Reports International. 34:1089-1097.
Halama, A. K., 1989. Mineralische futtersusatstoffe als ballasttrager. Allgemeine Muhlenmarkt, Wien, Ausgabe April: 105-107.
Hansen, J. A., Knabe, D. A. & Burgoon, K. G., 1993. Amino acid supplementation of low-protein sorghum-soybean meal diets for 20- to 50-kilogram swine. Journal of Animal Science. 71:442-451.
Inkster, J. E., Hovell, F. D. DeB, Kyle, D. J., Brown, D. S. & Lobley, G. E., 1989. The effect of clenbuterol on basal protein turnover and endogenous nitrogen loss of sheep. British Journal of Nutrition. 62:285.
Kerr, B. J., 1987. Considerations in the use of crystalline amino acids in swjne diets. Ph.D. Thesis, University of Illinois.
Kjeldsen, N., 1992. Micro-Aid til slagtesvin. Den Rullende Afprovning, Landsudvalget for svin, Danske slagterier, Meddelelse Nr. 216. Denmark. 4 pp.
Kornagay, E. T., Thomas, H. R. & Kramer, C. Y., 1975. Effect on subsequent feedlot performance of rotating or withdrawing dietary antibiotics from swine growing and finishing rations. Journal of Animal Science. 41:1555-1562.
Landsberg, L. & Young, J. B., 1985. Catecholamines and the adrenal medulla. In: Williams: Textbook of endocrinology. W. B. Saunders Company, Philadelphia, PA, p. 891-965.
Lessard, M. & Brisson, G. J., 1987. Effect of a lactobaciilus fermentation product on growth, immune response and fecal enzyme activity in weaned pig. Canadian Journal of Animal Science. 67:509-516.
Li, J. B. & Jefferson, L. S., 1977. Effect >f isoproterenol on amino acid levels and protein turnover in skeletal muscle. American Jóurnal'of Physiology. 232:E243.
Lillie, R. J., Frobish, L. T., Steele, N. C. & Graber, Q., 1977. Effect of dietary copper and tylosin and subsequent withdrawal on growth, hematology and tissue residues of growing-finishing pigs. Journal of Animal Scienca. 45:100-107.
Livingstone, R. M & Livingstone, D. M. S.,'1968. Copper sulphate and antibiotics as feed additives for early weaned pigs. Journal of Agriculture Science. 71:419-424.
Lyons, T. P., 1988. Probiotics: An alternative to antibiotics. The Bovine Practitioner. 23:64-69.
MacRae, J. C , Skene, P. A., Connel, A., Buchan, V. & Lobley, G. E., 1988. The action of the 0-adrenergic agonist clenbuterol on protein and energy metabolism in fattening wether lambs. British Journal of Nutrition. 59:457.
McLaren, D. G., Fernando, R. L., Lewin, H. A. & Schook, L. B., 1990. Integrated strategies and methodologies for the genetic improvement of animals. Journal of Dairy Science. 73:2647-2656.
180
Merkel, R. A., Dickerson, P. S., Johnson, S. E., Burkett, R. L., Burnett, R. J., Schroeder, A. L., Bergen, W. G. & Anderson, D. B., 1987. The effect of ractopamine on lipid metabolism in pigs. Federal Proceedings. 46:1177 (Abstract).
Mersmann, H. J., 1987. Acute metabolic effects of adrenergic agonists in swine. American Journal of Physiology. 252:E85.
Mersmann, H. J., 1987. Primer on Beta-adrenergic agonists and their effect on the biology of swine. Proceedings of the University of Illinois, Pork Industry Conference, p. 19-31.
Mersmann, H. J. & MacNeil, M. D., 1985. Relationship of plasma lipid concentrations to fat deposition in pigs. Journal of Animal Science. 61:122-128.
Mitchell, A. D., Solomon, M. B. & Steele, N. C , 1990. Response of low and high protein select lines of pigs to the feeding of the beta-adrenergic agonist ractopamine. Journal of Animal Science. 68:3226-3232.
Mitchell, A. D., Solomon, M. B. & Steele, N. C , 1991. Influence of level of dietary protein or energy on effects of ractopamine in finishing swine. Journal of Animal Science. 69:4487-4495.
Nutting, D. F., 1982. Anabolic effects of catecholamines in diaphragm muscle from hypophysectomized rats. Endocrinology. 110:307.
NRC, 1988. Nutrient Requirements of Swine (9th ed.). National Academy Press, Washington, DC.
Parker, G., Cromwell, G., Hays, V. & Mikean, J., 1989. Feed additives for swine. Pork Industry Handbook. PIH-31. Cooperative extension service, University of Illinois at Urbana-Champaign. 4 pp.
Peters, A. R., 1990. 0-Agonists and pig production. Pig news and information. 11:519-522.
Pollmann, D. S., Danielson, D. M. & Peo, E. R. Jr., 1980a. Effects of microbial feed additives on performance of starter and growing-finishing pigs. Journal of Animal Science. 51:577-581.
Pollmann, D. S., Danielson, D. M. & Peo, E. R. Jr., 1980b. Effects of lactobillus acidophilus on starter pigs fed a diet supplemented with lactose. Journal of Animal Science. 51:638-644.
Reeds, P. J. & Mersmann, H. J., 1991. Protein and energy requirements of animals treated with ^-adrenergic agonists: A discussion. Journal of Animal Science. 19:1532-1550.
Roof, M. D. & Mahan, D. C , 1982. Effects of carbadox and various dietary copper levels for weanling swine. Journal of Animal Science. 55:1109-1117.
Saggerson, E. D., 1985. Hormonal regulation of biosynthetic activities in white adipose tissue. In: A Cryer and R.L.R. Van. (Ed.) New Perspectives in Adipose Tissue: Structure, Function and development. Butterworths, London, p. 87.
Stahley, T. S., Cromwell, G. L. & Monegue, H. J., 1980. Effects of dietary inclusion of copper and (or) antibiotics on the performance of weanling pigs. Journal of Animal Science. 51:1347-1351.
Thacker, P. A., Campbell, G. L. & Grootwassink, W. D., 1992. Effect of Salinomycin and enzyme supplementation on nutrient digestibility and the performance of pigs fed barley- or rye-based diets. Canadian Journal of Animal Science. 72:117-125.
181
Vanbelle, M., Tellor, E & Focant, M., 1990. Probiotics in animal nutrition: a review. Archives of Animal Nutrition. 40:543-567.
van Weerden, E, J., 1987. Effects of clenbuterol on N deposition and carcass composition in castrated male pigs. In: J. P. Hanrahan: Beta-agonists and their effects on animal growth and carcass quality. Elsevier Applied Science, New York, NY, p. 152-162.
Varel, V. H., Robinson, I. M. & Pond, W. G., 1987. Effect of dietary copper sulfate, Avreo SP 250, or clinoptilolite on ureolytic bacteria found in the pig large intestine. Applied and Environmental Microbiology. 53:2009-2012.
Visek, W. J., 1978. The mode of growth promoting by antibiotics. Journal of Animal Science. 46:1447-1469.
Wilson, M. A., Forsberg, N. E., Zhong, C , Dalrymple, R. H. & Ricks, C. A., 1987. Protein synthesis and degradation in sheep skeletal muscle: Effects of maturity and of dietary and medium cimaterol. Journal of Animal Science. 65:251 (Abstract).
/
182
The effect of nitrogen supply during pregnancy on the nitrogen excretion by breeding sows
H. Everts and R.A. Dekker
Research Institute for Livestock Feeding and Nutrition (IVVO-DLO), P.O. Box 160, 8200 AD Lelystad, The Netherlands.
Summary
During pregnancy a control treatment C (diet with 24.7 g N.kg'1) was compared to an experimental treatment L (diet with 16.7 g N.kg"1). During lactation both treatments were divided in subgroups: one subgroup (C) had the same diet as the control treatment C during pregnancy and the other subgroup (H) had a diet with a higher nitrogen content (diet with 28.6 g N.kg"1). In this way there were four combinations of treatments during pregnancy and lactation tested: CC, CH, LC and LHvWith the balance technique and with comparative slaughtering the nitrogen retention and excretion was measured during three successive parities using in total 60 sows.
From the results of the balance trials during pregnancy and lactation a total nitrogen excretion of 20.3, 20.7, 14.5 and 15.2 kg N sow"1.year"1 was calculated for the treatments CC, CH, LC and LH, respectively. The reduction in total N excretion using diet L during pregnancy was 25 %. From the comparative slaughter experiment also a reduction in N excretion of 25 % was calculated, when diet L was fed during pregnancy. The reduction in N excretion was mainly due to the reduced N supply during pregnancy. However, it was also clear that the supply of N and lysine during pregnancy on treatment L approached the minimal requirement of sows at the end of pregnancy.
Keywords : sows, nitrogen, retention, excretion, pregnancy, lactation
Introduction
Excretion of nitrogen (N) originating from animal production contributes to the environmental pollution (acid rain and pollution of drinking water). Breeding sows also contribute to a certain extent to this pollution. Jongbloed et al. (1985) and Coppoolse et al. (1990) estimated for Dutch conditions a N excretion of about 22.5 kg per breeding sow per year and expected that a reduction with about 30% is possible due to a decrease in the protein level of the pregnancy diet and the use of synthetic amino acids. Actual data about the N excretion and the effects of a reduction of N supply on the performance and body composition during several parities are very scarce.
A severe N restriction during pregnancy (2-6 g N.d"1) hamper» the nutrient accretion in the products of conception (e.g. Pond, 1973; Atinmo et al., 1974). Above a level of 30 g N.d"1 foetal growth is guaranteed (Duée, 1976). Due to an additional nutrient requirement for growth to maturity (gilts) and compensation for losses during a previous lactation period (multiparous sows) we calculated a N requirement of about 51 g.d1 at the end of pregnancy. With regard to essential amino acids, lysine is often the first limiting amino acid in commercially available diets. A lysine supply of 8.4 to
183
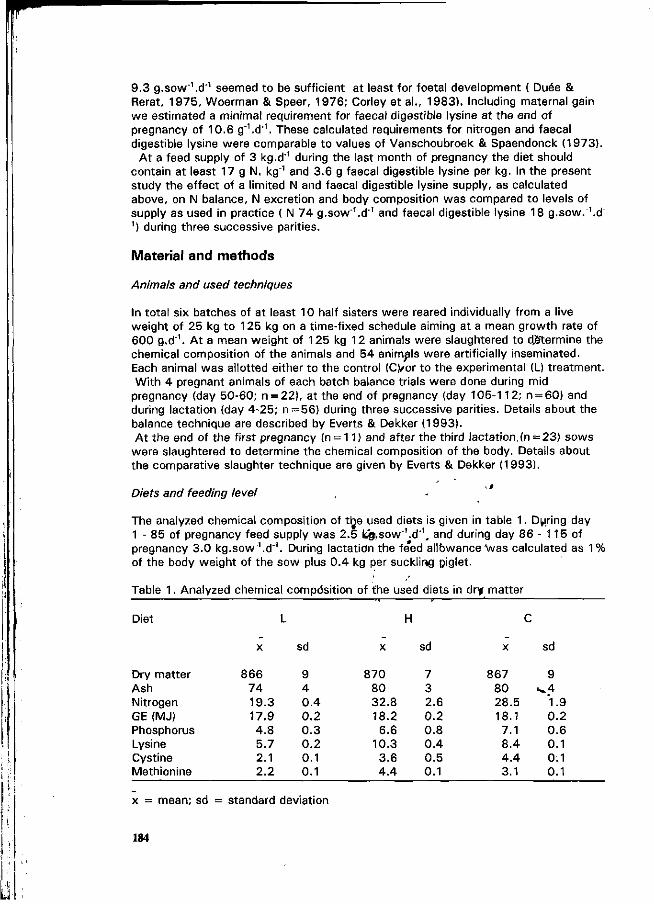
9.3 g.sow'.d'1 seemed to be sufficient at least for foetal development ( Duée & Rerat, 1975, Woerman & Speer, 1976; Corley et al., 1983). Including maternal gain we estimated a minimal requirement for faecal digestible lysine at the end of pregnancy of 10.6 g ' .d 1 . These calculated requirements for nitrogen and faecal digestible lysine were comparable to values of Vanschoubroek & Spaendonck (1973).
At a feed supply of 3 kg.d"1 during the last month of pregnancy the diet should contain at least 17 g N. kg"1 and 3.6 g faecal digestible lysine per kg. In the present study the effect of a limited N and faecal digestible lysine supply, as calculated above, on N balance, N excretion and body composition was compared to levels of supply as used in practice ( N 74 g.sow"\d'1 and faecal digestible lysine 18 g.sow.'.d" 1) during three successive parities.
Material and methods
Animals and used techniques
In total six batches of at least 10 half sisters were reared individually from a live weight of 25 kg to 125 kg on a time-fixed schedule aiming at a mean growth rate of 600 g.d"1. At a mean weight of 125 kg 12 animals were slaughtered to determine the chemical composition of the animals and 54 animals were artificially inseminated. Each animal was allotted either to the control (CVor to the experimental (L) treatment. With 4 pregnant animals of each batch balance trials were done during mid
pregnancy (day 50-60; n = 22), at the end of pregnancy (day 105-112; n = 60) and during lactation (day 4-25; n = 56) during three successive parities. Details about the balance technique are described by Everts & Dekker (1993). At the end of the first pregnancy (n = 11 ) and after the third lactation.(n = 23) sows
were slaughtered to determine the chemical composition of the body. Details about the comparative slaughter technique are given by Everts & Dekker (1993).
Diets and feeding level
The analyzed chemical composition of the used diets is given in table 1. During day 1 - 85 of pregnancy feed supply was 2.5 Itgi.sow'.d"1, and during day 86 - 115 of pregnancy 3.0 kg.sow"1.d"1. During lactation the feed allowance "was calculated as 1% of the body weight of the sow plus 0.4 kg per suckling piglet.
Table 1. Analyzed chemical composition of the used diets in dry matter r, f '
Diet L H C
sd sd sd
Dry matter Ash Nitrogen GE (MJ) Phosphorus Lysine Cystine Methionine
866 74 19.3 17.9 4.8 5.7 2.1 2.2
9 4 0.4 0.2 0.3 0.2 0.1 0.1
870 80 32.8 18.2
6.6 10.3 3.6 4.4
7 3 2.6 0.2 0.8 0.4 0.5 0.1
867 80 28.5 18.1
7.1 8.4 4.4 3.1
9 ^ 4
1.9 0.2 0.6 0.1 0.1 0.1
mean; sd = standard deviation
184
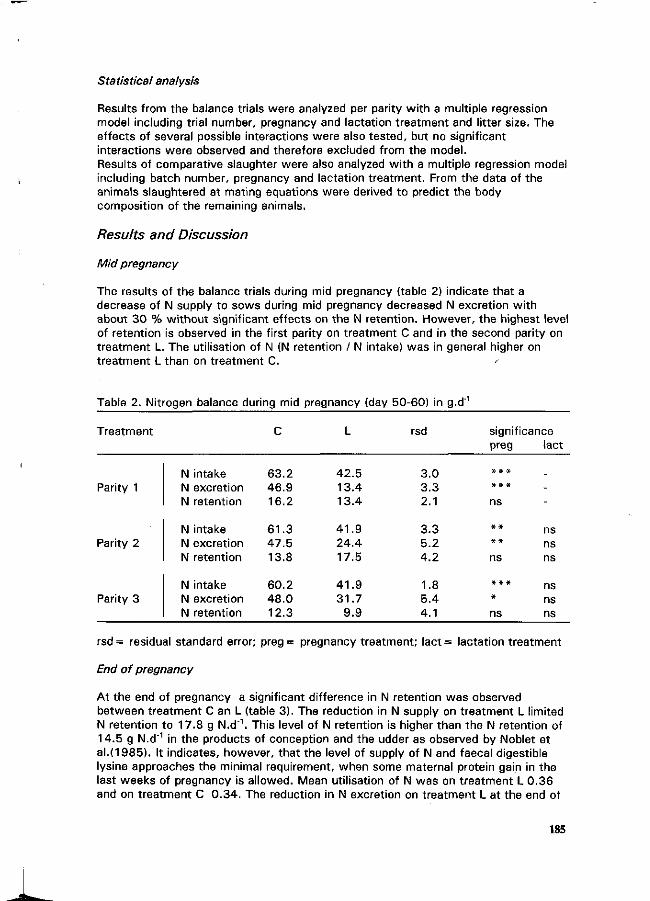
Statistical analysis
Results from the balance trials were analyzed per parity with a multiple regression model including trial number, pregnancy and lactation treatment and litter size. The effects of several possible interactions were also tested, but no significant interactions were observed and therefore excluded from the model. Results of comparative slaughter were also analyzed with a multiple regression model including batch number, pregnancy and lactation treatment. From the data of the animals slaughtered at mating equations were derived to predict the body composition of the remaining animals.
Results and Discussion
Mid pregnancy
The results of the balance trials during mid pregnancy (table 2) indicate that a decrease of N supply to sows during mid pregnancy decreased N excretion with about 30 % without significant effects on the N retention. However, the highest level of retention is observed in the first parity on treatment C and in the second parity on treatment L. The utilisation of N (N retention / N intake) was in general higher on treatment L than on treatment C. '
Table 2. Nitrogen balance during mid pregnancy (day 50-60) in g.d'1
Treatment
Parity 1
Parity 2
Parity 3
N intake N excretion N retention
N intake N excretion N retention
N intake N excretion N retention
C
63.2 46.9 16.2
61.3 47.5 13.8
60.2 48.0 12.3
L
42.5 13.4 13.4
41.9 24.4 17.5
41.9 31.7
9.9
rsd
3.0 3.3 2.1
3.3 5.2 4.2
1.8 5.4 4.1
significance preg
* # *
* # # ns
# #
* * ns
* * #
# ns
lact
. --
ns ns ns
ns ns ns
rsd= residual standard error; preg= pregnancy treatment; lact= lactation treatment
End of pregnancy
At the end of pregnancy a significant difference in N retention was observed between treatment C an L (table 3). The reduction in N supply on treatment L limited N retention to 17.8 g N.d"1. This level of N retention is higher than the N retention of 14.5 g N.d"1 in the products of conception and the udder as observed by Noblet et al.(1985). It indicates, however, that the level of supply of N and faecal digestible lysine approaches the minimal requirement, when some maternal protein gain in the last weeks of pregnancy is allowed. Mean utilisation of N was on treatment L 0.36 and on treatment C 0.34. The reduction in N excretion on treatment L at the end of
185
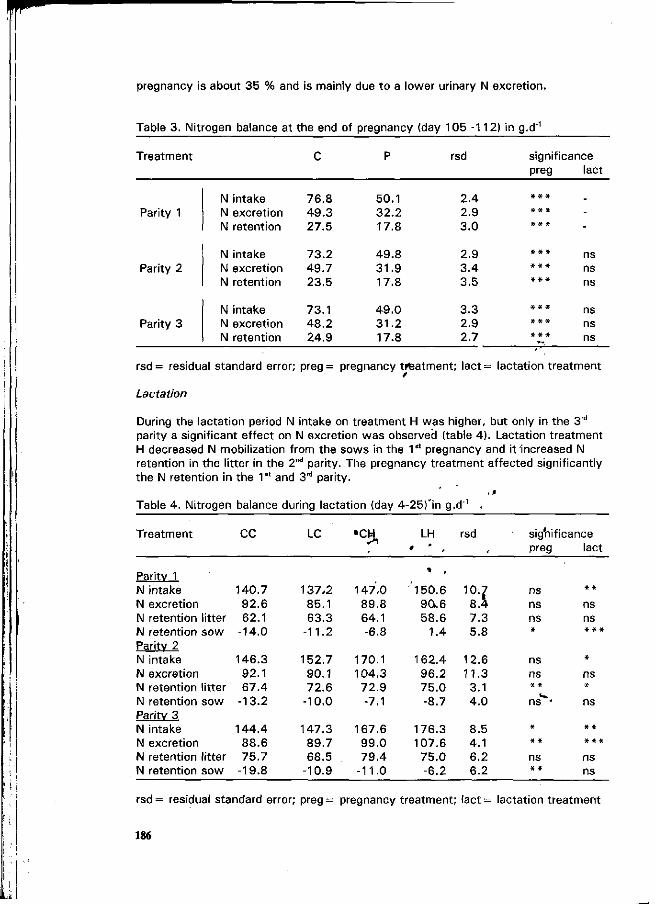
pregnancy is about 35 % and is mainly due to a lower urinary N excretion.
Table 3. Nitrogen balance at the end of pregnancy (day 105 -112) in g.d1
Treatment
Parity 1
Parity 2
Parity 3
N intake N excretion N retention
N intake N excretion N retention
N intake N excretion N retention
C
76.8 49.3 27.5
73.2 49 .7 23.5
73.1 48.2 24.9
P
50.1 32.2 17.8
49.8 31.9 17.8
49 .0 31.2 17.8
rsd
2.4 2.9 3.0
2.9 3.4 3.5
3.3 2.9 2.7
significance preg
* * *
* * * * * *
# * *
* * * * * *
* * *
* * * * # *
lact
.
--
ns ns ns
ns ns ns
rsd= residual standard error; preg= pregnancy tfeatment; lact= lactation treatment
Lactation
During the lactation period N intake on treatment H was higher, but only in the 3rd
parity a significant effect on N excretion was observed (table 4). Lactation treatment H decreased N mobilization from the sows in the 1st pregnancy and it increased N retention in the litter in the 2nd parity. The pregnancy treatment affected significantly the N retention in the 1st and 3rd parity.
,i
Table 4. Nitrogen balance during lactation (day 4-25)~in g.d"1 .
Treatment
Parity 1 N intake N excretion N retention litter N retention sow Paritv 2 N intake N excretion N retention litter N retention sow Paritv 3 N intake N excretion N retention litter N retention sow
CC
140.7 92.6 62.1
-14.0
146.3 92.1 67.4
-13.2
144.4 88.6 75.7
-19.8
LC
137-2 85.1 63.3
-11.2
152.7 90.1 72.6
-10.0
147.3 89.7 68.5
-10.9
•CH *n
147-0 89.8 64.1 -6.8
170.1 104.3
72.9 -7.1
167.6 99.0 79 .4
-11.0
LH « ' ,
» ,
150.6 9G. 6 58.6
1.4
162.4 96.2 75.0 -8.7
176.3 107.6
75.0 -6.2
rsd ,
'°d 7.3 5.8
12.6 11.3
3.1 4.0
8.5 4.1 6.2 6.2
significa preg
ns ns ns *
ns ns * * ns •
* * *
ns # #
nee lact
* * ns ns * * *
* ns * ns
# * * * * ns ns
rsd= residual standard error; preg= pregnancy treatment; lact= lactation treatment
186
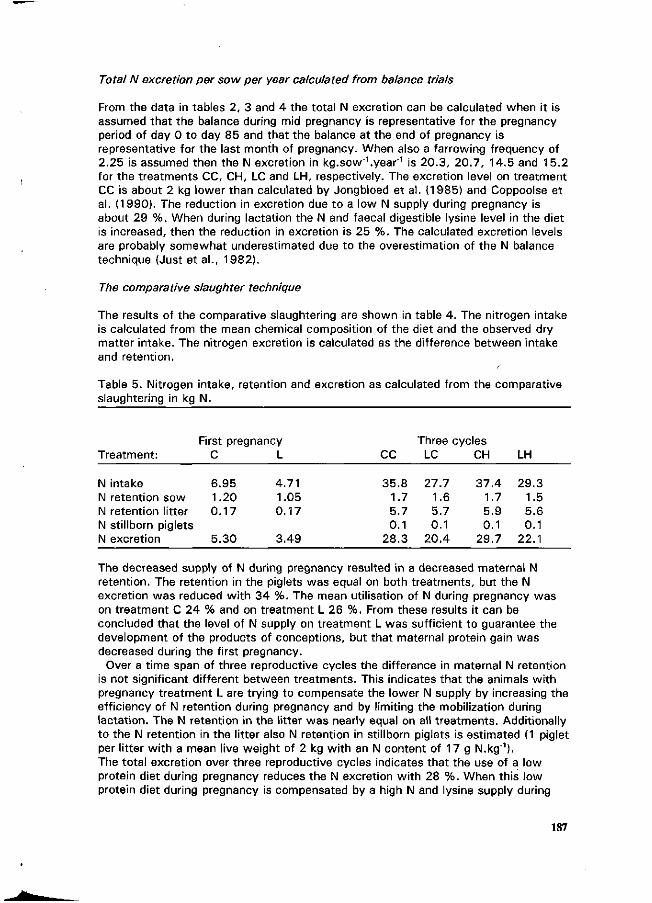
Total N excretion per sow per year calculated from balance trials
From the data in tables 2, 3 and 4 the total N excretion can be calculated when it is assumed that the balance during mid pregnancy is representative for the pregnancy period of day 0 to day 85 and that the balance at the end of pregnancy is representative for the last month of pregnancy. When also a farrowing frequency of 2.25 is assumed then the N excretion in kg.sow"1 .year"1 is 20.3, 20.7, 14.5 and 15.2 for the treatments CC, CH, LC and LH, respectively. The excretion level on treatment CC is about 2 kg lower than calculated by Jongbloed et al. (1985) and Coppoolse et al. (1990). The reduction in excretion due to a low N supply during pregnancy is about 29 %. When during lactation the N and faecal digestible lysine level in the diet is increased, then the reduction in excretion is 25 %. The calculated excretion levels are probably somewhat underestimated due to the overestimation of the N balance technique (Just et al., 1982).
The comparative slaughter technique
The results of the comparative slaughtering are shown in table 4. The nitrogen intake is calculated from the mean chemical composition of the diet and the observed dry matter intake. The nitrogen excretion is calculated as the difference between intake and retention.
Table 5. Nitrogen intake, retention and excretion as calculated from the comparative slaughtering in kg N.
Treatment:
N intake N retention sow N retention litter N stillborn piglets N excretion
First pregnancy C
6.95 1.20 0.17
5.30
L
4.71 1.05 0.17
3.49
CC
35.8 1.7 5.7 0.1
28.3
Three < LC
27.7 1.6 5.7 0.1
20.4
:ycles CH
37.4 1.7 5.9 0.1
29.7
LH
29.3 1.5 5.6 0.1
22.1
The decreased supply of N during pregnancy resulted in a decreased maternal N retention. The retention in the piglets was equal on both treatments, but the N excretion was reduced with 34 %. The mean utilisation of N during pregnancy was on treatment C 24 % and on treatment L 26 %. From these results it can be concluded that the level of N supply on treatment L was sufficient to guarantee the development of the products of conceptions, but that maternal protein gain was decreased during the first pregnancy.
Over a time span of three reproductive cycles the difference in maternal N retention is not significant different between treatments. This indicates that the animals with pregnancy treatment L are trying to compensate the lower N supply by increasing the efficiency of N retention during pregnancy and by limiting the mobilization during lactation. The N retention in the litter was nearly equal on all treatments. Additionally to the N retention in the litter also N retention in stillborn piglets is estimated (1 piglet per litter with a mean live weight of 2 kg with an N content of 17 g N.kg"1). The total excretion over three reproductive cycles indicates that the use of a low protein diet during pregnancy reduces the N excretion with 28 %. When this low protein diet during pregnancy is compensated by a high N and lysine supply during
187
lactation, then the reduction in N excretion is 22 %. To compare these results with results of the balance trials the N excretion over
three reproductive cycles is expressed in kg N.sow"1 .year"1. The N excretion per sow per year was 22.2, 1 6.0, 23.4 and 17.3 for the treatments CC, LC, CH and LH, respectively. The level of N excretion per sow per year on treatment CC as calculated from the comparative slaughter technique is close to the levels as calculated by Jongbloed et al. (1985) and Coppoolse et al. (1990). By reducing the N supply during pregnancy the reduction in N excretion was in line with the possibilities as proposed by Jongbloed et al. (1985) and Coppoolse et al. (1990). However, the reduction in IM excretion was in this experiment possible without the use of synthetic amino acids.
Conclusion
The use of a diet with a low N content (1 6.7 g N.kg"1) during pregnancy and a diet with a higher N content (24.7 - 28.6 g N.kg'1) during lactation can reduce the N excretion with about 25 % compared to the use of one diet for pregnancy and lactation with 24.7 g N.kg'1. After three parities no significant differences in body composition of the sows were observed. However, the development of the protein mass in first parity sows was retarded on the low protein diet and the N supply at the end of pregnancy was close to minimal requirement.
Acknowledgement
This research was financially supported by the Dutch Fund for Manure and Ammonia Research.
References
Atinmo, T., Pond, W.G., Barnes, R.H-, 1974. J. Anim. Sc. 39: 703-711 Coppoolse, J., van Vuuren, A.M., Huisman, J., Janssen, W.M/M.A, Jongbloed, A.W.,
Lenis, N.P., Simons, P.CM., 1990. ^The excretion of nitrogen, phosphorus and potassium by production animals: Now^qnd tomorrow], DLO Wageningen.
Corley, J.R., Esch, M.W., Bahr, J.M., Easter, R .A ' , 1983. J. Anim. Sei. 56: 108-117 Duée, P.H., 1976. Ann. Zootechn. 29: 199-212 « , Duée, P.H. & Rerat, A., 1975. Ann. Zootechn. 24: 447-464 Everts, H. & Dekker, R.A., 1993. '(in press) ' i Jongbloed, A.W., Steg, A., Simons, P.CM.,'Janssen,'W.M.M.À., Lenis, N.P.,
Meijs, J.A.C., Vreman, k., 1985. [Calculations concerning the possible reduction in excretion of N, P, Cu, Zn an Cd by feeding of production animals]. Mededeling IVVO-DLO no. 3 Lelystad
Just, A., Fernandez, J.A., Jorgensen, H., 1982. Nitrogen balance studies and nitrogen retention. In: Digestive physiology in the pig 27-29 oct. 1982, Jouy-en-Josàs (editors: Laplace, J.P, Corring, T., Rerat, A.). Les colloques de li[NRA 12: 111-122
Noblet, J., Close, W.H., Heavens, R.P., 1985. British Journal of Nutrition 53: 251-265
Pond, W.G., 1973. J. Anim. Sei. 36: 175-181 Vanschoubroek, F. & Spaendonck, R. van, 1973. Zeitschrift Tierphysiologie,
Tierernährung und Futtermittelkunde 31 : 71-91 Woerman, R.L. & Speer, V.C., 1976. J. Anim. Sei. 42:114-120
188
The effect of porcine somatotropin on nitrogen utilization and nitrogen losses in growing pigs
J. Noblet, J.Y. Dourmad and S. Dubois
INRA, Station de Recherches Porcines, 35590 St Gilles, France.
Summary
The efficiency of dietary protein for protein gain was measured in pigs fed five daily protein levels (from 11 to 25 g lysine per day) and administered either 3 mg per day recombinant porcine somatotropin (pST) (group 1) or a placebo (group 2). Pigs of groups 1 and 2 were given similar daily energy allowances. A third group (group 3) received a placebo and 13% additional energy. After one week for adaptation to the experimental treatments, energy (indirect calorimetry) and nitrogen (collection of excreta) balances were measured for seven days. The mean body weight during the balance period was 61 kg. Administration of pST did not affect digestive utilization of energy and nitrogen. Energy requirements for maintenance were higher in pST treated pigs (1.11 vs 1.02 M J ME per kg"-60). Nitrogen retention was improved by pST. The efficiency of dietary protein for protein gain estimated as the slope of the relationship between nitrogen gain and nitrogen intake was higher in pST treated animals (0.41 vs 0.30). As a consequence, N losses were significantly reduced by pST. These results indicate that protein requirements in growing pigs depend on both the rates of protein accretion and the metabolic utilization of dietary protein. Nitrogen losses can then be manipulated according to potential of the animals.
Keywords: Pigs, Somatotropin, Energy metabolism, Protein metabolism, N losses.
Introduction
The administration of porcine somatotropin (pST) reduces lipid deposition and stimulates protein accretion in growing pigs (Campbell et al., 1989; Noblet et al., 1992). This variation in deposition rates of nutrients with pST is associated with a reduction of feed intake, in spite of the higher energy requirement for maintenance in pST treated pigs (Noblet et al., 1992). The important increase of protein deposition with pST would logically induce elevated protein requirements, expressed either on a daily basis or as a percentage in the diet. However, daily protein and amino acids requirements depend primarily on both their accretion rates and the efficiency of utilization of dietary amino acids for deposition. Preliminary results of Krick et al. (1990) suggest an improved efficiency of dietary lysine for lysine gain in pST treated pigs. Digestibility of protein is not affected by pST administration (Noblet et al., 1992). Therefore, the objective of the present experiment was to quantify the effect of pST administration on the efficiency of dietary nitrogen for nitrogen gain in 60 kg pigs fed diets containing variable amounts of dietary protein, the first limiting amino acid being lysine in all diets.
Material and methods
Sixty Large White x Retrain castrated males were affected at about 55 kg body-weight (BW) to 15 treatments resulting from the combination of five daily protein levels (PI to P5) and three pST and/or daily energy levels (so-called groups). In group 1, pigs were administered 3 mg per day of recombinant pST. In groups 2 and 3, a placebo was given and the pigs received either the same energy supply as in group 1 (group 2) or 15% additional energy (group 3). From a practical point of view, pigs in groups 1 and 3 were fed close to their ad libitum intake while the effect of pST per se was obtained by comparison of groups
18?
1 and 2. Diets (5 for groups 1 and 2; 5 for group 3) were prepared from a basal diet diluted with variable amounts of corn starch in order to achieve lysine intakes ranging between 11 (PI) and 25 (P5) g per day. The daily supplies of minerals, trace minerals and vitamins were kept constant for all pigs. The higher protein level was expected to meet requirements of placebo pigs. The basal diet was prepared with 47.9% wheat, 14.9% barley, 27.4% soybean meal, 2% cane molasses, 3% wheat bran, 0.12% L-Lysine-HCl, 0.08% DL-Methionine, 0.06% L-Threonine, 2% dicalcium phosphate, 1.5% calcium carbonate, 0.5% salt and 0.5% of a vitamins and trace minerals mixture. This diet fed to pigs of groups 1 and 2 receiving the highest protein levels contained 20.3% crude protein, 6.6% ash, 3.2% crude fibre, 14.8% NDF, 1.7% crude fat, 1.01% lysine, 0.72% sulfur amino acids, 0.76% threonine and 15.36 MJ gross energy per kg.
For one week before the beginning of the experiment, pigs were individually penned and they all received P4 diet, according to a restrictive feeding scale. Seven days after the beginning of the experiment, pigs were moved to digestibility cages which were placed in respiration chambers. Two animals affected to the same treatment whose BW were similar were kept simultaneously in one respiration chamber. Over seven consecutive days, feces and urines of each pig were collected and daily gas exchanges (02 consumption, CÓ2 and CH4 productions) were measured. Nitrogen (N) balance was determined according to routine procedures (Noblet et al., 1992); N losses in the air were considered from determination of N in condensed water and outgoing air from the respiration chamber. Measurement of energy content in feed, feces and urines and energy losses as methane allowed calculation of digestible (DE) and metabolizable (ME) energy 'intakes. Heat production (HP) was calculated from gas exchanges'and urinary N losses; it was supposed to be equivalent for both pigs kept simultaneously in the chamber. Retained energy was obtained as the difference between ME intake and HP; its partition between protein and fat energy was estimated from N balance results (Noblet et al., 1992). Pigs were weighed at the beginning of the experiment and before and after the balance period. Temperature was set at 22 °C all over the experiment.
Data were analyzed by the GLM procedure (SAS, 1988). The model included the effects of group (n=3), protein level (n=5) and the interaction between group and protein level. Specific effects (pST per se: group 1 vs group 2; pST in ad libitum fed animals: group 1 vs group 3; energy level in placebo pigs: group 2 vs groijp 3) were tested with contrast methods. Energy balance data were expressed as MJ per kg BW -60 ahd N balance data as g per day.
Results and discussion • . '
In spite of the small number of pigs per treatment and the short duration of the experiment (14 days), BW gain was significantly affected by protein« level and group (Table 1). In agreement with all literature studies, pST improved'daily BW gain in pigs given similar energy levels (group 2 vs group 1); the difference due to pST is reduced when animals are given ad libitum access to food. In the present experiment, the 13% additional energy supplied to placebo pigs fully compensated the effect of pST (group 3 vs group 1), with regard to BW gain. The average BW during the energy and N balances period was 61 kg.
In connection with differences in chemical composition of diets (i.e., starch content), the digestibility coefficient of energy was higher in group 3 than in groups 1 and 2 (88.1 vs 86.9%; P<0.001) and was reduced (P<0.001) with increase in protein level (89.5 and 85.2% for PI and P5, respectively). The digestibility coefficient of N was comparable in the three groups of pigs (83.1%, on average) and was logically increased (P<0.01)**when daily protein supply was increased. Under similar feeding conditions (groups 1 and 2), pST did not affect digestibility of energy and N. The methane energy loss was comparable in the three groups of pigs (0.63% of DE intake); it was reduced at lower protein levels (0.45% for PI and P2 vs 0.75% in P3, P4 and P5). Similarly, the urinary energy losses (expressed as a percentage of DE) were reduced at low protein levels, so that ME/DE ratio was significantly reduced when protein levels were increased (97.1 and 95.9% for PI and P5,
190
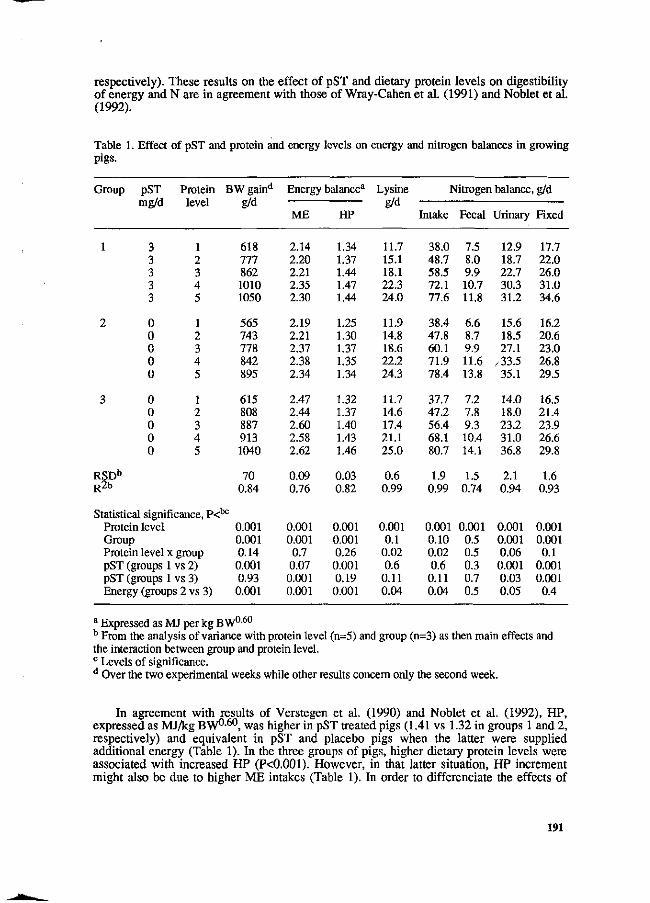
respectively). These results on the effect of pST and dietary protein levels on digestibility of energy and N are in agreement with those of Wray-Cahen et al. (1991) and Noblet et al. (1992).
Table 1. Effect of pST and protein and energy levels on energy and nitrogen balances in growing pigs.
Group
1
2
3
RSDb
R2b
pST mg/d
3 3 3 3 3
0 0 0 0 0
0 0 0 0 0
Protein level
1 2 3 4 5
1 2 3 4 5
1 2 3 4 5
Statistical significance, P< Protein level Group Protein level x pST (groups 1 pST (groups 1 Energy
group vs2) vs3)
(groups 2 vs 3)
BW gaind
g/d
618 777 862 1010 1050
565 743 778 842 895
615 808 887 913 1040
70 0.84
be
0.001 0.001 0.14 0.001 0.93 0.001
Energy balance*
ME
2.14 2.20 2.21 2.35 2.30
2.19 2.21 2.37 2.38 2.34
2.47 2.44 2.60 2.58 2.62
0.09 0.76
0.001 0.001 0.7 0.07 0.001 0.001
HP
1.34 1.37 1.44 1.47 1.44
1.25 1.30 1.37 1.35 1.34
1.32 1.37 1.40 1.43 1.46
0.03 0.82
0.001 0.001 0.26 0.001 0.19 0.001
Lysine g/d
11.7 15.1 18.1 22.3 24.0
11.9 14.8 18.6 22.2 24.3
11.7 14.6 17.4 21.1 25.0
0.6 0.99
0.001 0.1 0.02 0.6 0.11 0.04
Nitrogen balance
Intake
38.0 48.7 58.5 72.1 77.6
38.4 47.8 60.1 71.9 78.4
37.7 47.2 56.4 68.1 80.7
1.9 0.99
0.001 0.10 0.02 0.6 0.11 0.04
Fecal
7.5 8.0 9.9 10.7 11.8
6.6 8.7 9.9 11.6 13.8
7.2 7.8 9.3 10.4 14.1
1.5 0.74
0.001 0.5 0.5 0.3 0.7 0.5
Urinary
12.9 18.7 22.7 30.3 31.2
15.6 18.5 27.1
^33.5 35.1
14.0 18.0 23.2 31.0 36.8
2.1 0.94
0.001 0.001 0.06 0.001 0.03 0.05
,g/d
Fixed
17.7 22.0 26.0 31.0 34.6
16.2 20.6 23.0 26.8 29.5
16.5 21.4 23.9 26.6 29.8
1.6 0.93
0.001 0.001 0.1
0.001 0.001 0.4
a Expressed as MJ per kg BW060
b From the analysis of variance with protein level (n=5) and group (n=3) as then main effects and the interaction between group and protein level. c Levels of significance. d Over the two experimental weeks while other results concern only the second week.
In agreement with results of Verstegen et al. (1990) and Noblet et al. (1992), HP, expressed as MJ/kg BW - O, was higher in pST treated pigs (1.41 vs 1.32 in groups 1 and 2, respectively) and equivalent in pST and placebo pigs when the latter were supplied additional energy (Table 1). In the three groups of pigs, higher dietary protein levels were associated with increased HP (P<0.001). However, in that latter situation, HP increment might also be due to higher ME intakes (Table 1). In order to differenciate the effects of
191
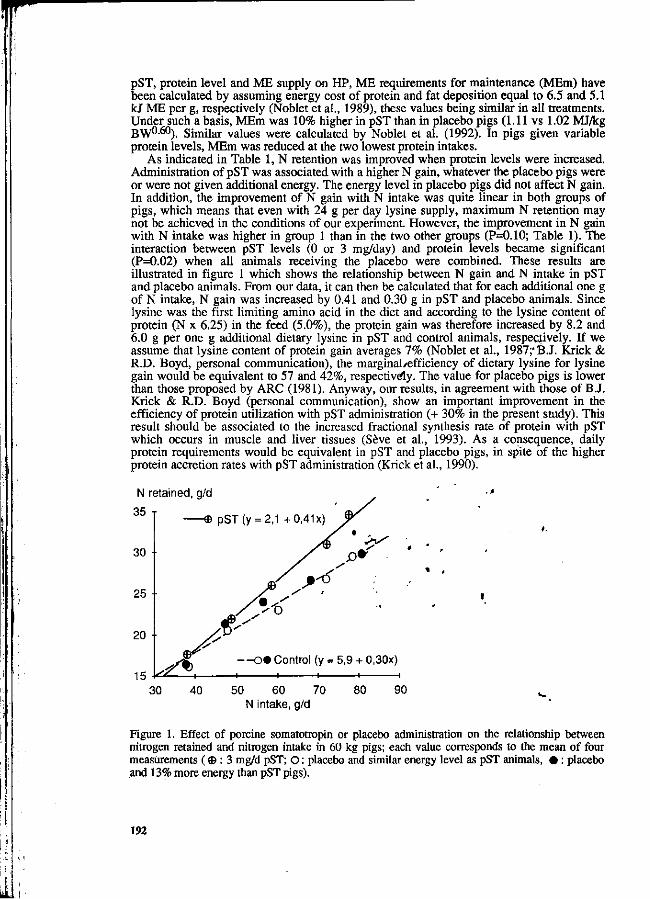
pST, protein level and ME supply on HP, ME requirements for maintenance (MEm) have been calculated by assuming energy cost of protein and fat deposition equal to 6.5 and 5.1 kJ ME per g, respectively (Noblet et al., 1989), these values being similar in all treatments. Under such a basis, MEm was 10% higher in pST than in placebo pigs (1.11 vs 1.02 MJ/kg BW0-60). Similar values were calculated by Noblet et al. (1992). In pigs given variable protein levels, MEm was reduced at the two lowest protein intakes.
As indicated in Table 1, N retention was improved when protein levels were increased. Administration of pST was associated with a higher N gain, whatever the placebo pigs were or were not given additional energy. The energy level in placebo pigs did not affect N gain. In addition, the improvement of N gain with N intake was quite linear in both groups of pigs, which means that even with 24 g per day lysine supply, maximum N retention may not be achieved in the conditions of our experiment. However, the improvement in N gain with N intake was higher in group 1 than in the two other groups (P=0.10; Table 1). The interaction between pST levels (0 or 3 mg/day) and protein levels became significant (P=0.02) when all animals receiving the placebo were combined. These results are illustrated in figure 1 which shows the relationship between N gain and N intake in pST and placebo animals. From our data, it can then be calculated that for each additional one g of N intake, N gain was increased by 0.41 and 0.30 g in pST and placebo animals. Since lysine was the first limiting amino acid in the diet and according to the lysine content of protein (N x 6.25) in the feed (5.0%), the protein gain was therefore increased by 8.2 and 6.0 g per one g additional dietary lysine in pST and control animals, respectively. If we assume that lysine content of protein gain averages 7% (Noblet et al., 1987;* BJ. Kriek & R.D. Boyd, personal communication), the marginal/efficiency of dietary lysine for lysine gain would be equivalent to 57 and 42%, respectively. The value for placebo pigs is lower than those proposed by ARC (1981). Anyway, our results, in agreement with those of B.J. Krick & R.D. Boyd (personal communication), show an important improvement in the efficiency of protein utilization with pST administration (+ 30% in the present study). This result should be associated to the increased fractional synthesis rate of protein with pST which occurs in muscle and liver tissues (Sève et al., 1993). As a consequence, daily protein requirements would be equivalent in pST and placebo pigs, in spite of the higher protein accretion rates with pST administration (Krick et al., 1990).
N retained, g/d
35
30
25
20 •
- e pST(y = 2,i +O,41X)
/ y
1-
ßf ^ AS ' /
— o » Control (y = 1 1 —
_ X
.,
5,9 + 0,30x) 1 1 15
30 40 50 60 70 80 90 ^ N intake, g/d
Figure 1. Effect of porcine somatotropin or placebo administration on the relationship between nitrogen retained and nitrogen intake in 60 kg pigs; each value corresponds to the mean of four measurements ( © : 3 mg/d pST; O : placebo and similar energy level as pST animals, • : placebo and 13% more energy than pST pigs).
192
A major consequence of the increased efficiency of N utilization with pST administration is that urinary N losses were significantly reduced in group 1. But, in agreement with equations reported in figure 1, a significant interaction between protein level and group (n=3) or pST level (n=2) was observed: the difference in urinary N loss was negligible at the lowest protein level and equivalent to about about 4 g per day at the highest protein intake. When pigs of groups 1 and 2 are compared at the highest protein intake, the difference in total daily N loss was equivalent to 13% of the value recorded in control animals. A more pronounced effect was obtained by Quiniou et al. (1993) over the period from 50 to 100 kg BW (-23% on a daily basis). The higher response in the latter study is consistent with the interaction between BW and pST level on N gain, the N gain increment with pST being more pronounced in heavier pigs (Quiniou et al., 1993). Subsequently, reduction of N losses with pST administration is more accentuated when BW of pigs is increased. This effect is further increased when N losses are expressed per kg BW gain since daily BW gain is higher in pST than in placebo animals.
Conclusion
The present study clearly indicates that protein requirements of growing pigs depend on both the rates of protein and amino-acids accretion and the efficiency of utilization of dietary protein. This latter component can be markedly changed by important modifications of the growth potential of the pigs. For instance, results of the present study show that the efficiency is improved by pST administration. Consequently, even pST treated pigs deposit more protein on a daily basis, their daily requirements were comparable to control animals. Even pST pigs represent an extreme model of growth manipulation, our results show that N excretion can be further manipulated when metabolic characteristics of the animal are considered.
References
ARC, 1981. The Nutrient Requirements of Pigs. Commonwealth Agricultural Bureaux, London (UK), 307 pp.
Campbell, R.G., Steele, N.C., Caperna, T.J., McMurtry, J.P., Solomon, B. & Mitchell, A.D., 1989. Interrelationships between sex and exogenous growth hormone administration on performance, body composition and protein and fat accretion of growing pigs. J. Anim. Sei. 67:177-186.
Kriek, B.J., Roneker, K.R., Boyd, R.D., Beermann, D.H. & Ross, A., 1990. Impact of porcine somatotropin on the lysine requirement of a fast-growing pigs genotype from 55 to 100 kg liveweight. J. Anim. Sei. 68 (Suppl. 1: 384 (Abstr.).
Noblet, J., Henry, Y. & Dubois, S., 1987. Effect of protein and lysine levels in the diet on body gain composition and energy utilization in growing pigs. J. Anim. Sei. 65:717-726.
Noblet, J., Karege, C. & Dubois, S., 1989. Influence of sex and genotype on energy utilization in growing pigs. In: Y. van der Honing & W.H. Close, Editors. Energy Metabolism of Farm Animals. Pudoc, Wageningen (NL), p. 57-60.
Noblet, J., Herpin, P. & Dubois, S., 1992. Effect of recombinant porcine somatotropin on energy and protein utilization in growing pigs: interaction with capacity for lean tissue growth. J. Anim. Sei. 70:2471-2484.
Quiniou, N., Noblet, J. & Dourmad, J.Y., 1993. Influence de l'administration de somatotropine porcine et d'une réduction du taux protéique du régime sur les rejets d'azote et de phosphore chez le porc. Journ. Rech. Porcine Fr. 25: 287-294.
SAS, 1988. SAS/STAT User's Guide (Release 6.03). SAS Inst. Inc., Cary, NC (USA). Sève, B., Ballèvre, O., Ganier, P., Noblet, J., Prugnaud, J. & Obled, C, 1993. Interaction
between recombinant porcine somatotropin and dietary protein on protein synthesis of some tissues in growing pigs. J. Nutr. (in press).
193
r~ Verstegen, M.W.A., van der Hel, W., Henken, A.M., Huisman, J., Kanis, E., van der Wal,
P. & van Weerden, E.J., 1990. Effect of exogenous porcine somatotropin administration on nitrogen and energy metabolism in three genotypes of pigs. J. Anim. Sei. 68:1008-1016.
Wray-Cahen, D., Ross, D.A., Baumann, D.E. & Boyd, R.D., 1991. Metabolic effects of porcine somatotropin: nitrogen and energy balance and characterization of the temporal pattern of blood metabolites and hormones. J. Anim. Sei. 69:1503-1514.
/ /
194
T Nitrogen balance in pigs fed with different amounts of pressed beet pulp silage (PBPS)
R.Scipioni, G.Martelli, S.Marchetti, P.Parisini and A.Piva
Istituto di Zootecnia e Nutrizione Animale, University of Bologna, Via Tolara di Sopra 50, 40064 Ozzano Emilia, Bologna, Italy
Summary
Protein digestibility affects the efficiency of protein utilisation and therefore the amount of excreted nitrogen.
Fiber content of the diet interferes with the digestibility of dietary nutrients, including nitrogen. The availability of cheap by-products derived from sugar production led us to evaluate the influence of increasing quantity of pressed beet pulp silage (PBPS) on protein digestibility and on the quality of excreted nitrogen.
Four different amounts of PBPS (0,8,16,24 % of DM) were fed to pigs (approx. 96 kg l.w.) in metabolic cages in a complete randomised block design. Daily diet was calculated as 8% of metabolic weight.
PBPS dosage had no statistically significant effect on the retained/ingested nitrogen ratio (P>0.05), however a considerable variation in urine/faecal nitrogen ratio was observed. Faecal nitrogen (g/d/kg l.w. °-75) increased from 0.208 (0% PBPS) to 0.336 (24% PBPS) (PO.01).
Increasing amounts of PBPS, slightly improved N retention and reduced significantly (P<0.01) the urinary nitrogen fraction that is considered to have a large polluting effect due to its solubility and volatility.
Introduction
Sugar industries by-products are a matter of concern in highly productive areas of northern Italy.
Utilisation of PBPS is common in Po valley in cattle feeding. The possibility of employing this cheap by-product in pig rationing could be an efficient way to reduce PBPS environmental impact.
PBPS is also very interesting from an economical and dietary point of view. PBPS has a considerable content of NSP (non-starch polysaccharides) that
are a very important energy source (Longland & Low, 1989; Chabeauti et al, 1991). NSP, except pectin, are resistant to the endogenous digestive enzymes but may be degraded by microbial activities. The quality of PBPS fiber is excellent: low lignin content and considerable level of pectins.
Traditional Italian ham production requires pig slaughtered at about 150-180 kg l.w.; to reach this weight energy metabolism and protein deposition rates are considerably different from animals killed at 100 kg l.w..
We have poor knowledge about protein turnover in heavy pigs and how it
195
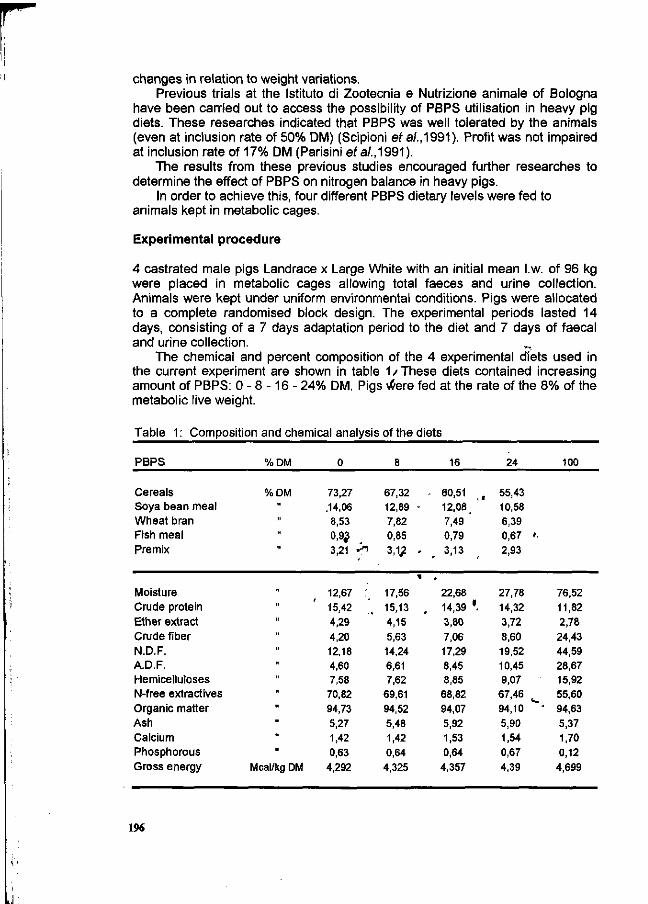
changes in relation to weight variations. Previous trials at the Istituto di Zootecnia e Nutrizione animale of Bologna
have been carried out to access the possibility of PBPS utilisation in heavy pig diets. These researches indicated that PBPS was well tolerated by the animals (even at inclusion rate of 50% DM) (Scipioni et a/., 1991). Profit was not impaired at inclusion rate of 17% DM (Parisini et a/., 1991).
The results from these previous studies encouraged further researches to determine the effect of PBPS on nitrogen balance in heavy pigs.
In order to achieve this, four different PBPS dietary levels were fed to animals kept in metabolic cages.
Experimental procedure
4 castrated male pigs Landrace x Large White with an initial mean l.w. of 96 kg were placed in metabolic cages allowing total faeces and urine collection. Animals were kept under uniform environmental conditions. Pigs were allocated to a complete randomised block design. The experimental periods lasted 14 days, consisting of a 7 days adaptation period to the diet and 7 days of faecal and urine collection.
The chemical and percent composition of the 4 experimental dfets used in the current experiment are shown in table 1 / These diets contained increasing amount of PBPS: 0 - 8 -16 - 24% DM. Pigs were fed at the rate of the 8% of the metabolic live weight.
Table 1: Composition and chemical analysis of the diets
PBPS
Cereals Soya bean meal Wheat bran Fish meal Premix
Moisture Crude protein Ether extract Crude fiber N.D.F. A.D.F. Hemicelluloses N-free extractives Organic matter Ash Calcium Phosphorous Gross energy
%DM
%DM
" " "
.
' 1
' 1
' 1
1
1
* 11
Mcal/kg DM
0
73,27 .14,06 8,53 0,93 3,21 ^i
12,67 : 15,42 4,29 4,20 12,18 4,60 7,58 70,82 94,73 5,27 1,42 0,63
4,292
8
67,32 12,89 -7,82 0,85 3,1^ -
17,56 15,13 , 4,15 5,63 14,24 6,61 7,62
69,61 94,52 5,48 1,42 0,64
4,325
16
60,51 , 12,08 l
7,49 ' 0,79 3,13
22,68 14,39 '. 3,80 7,06 17,29 8,45 8,85 68,82 94,07 5,92 1,53 0,64 4,357
24
55,43 10,58 6,39 0,67 >• 2,93
27,78 14,32 3,72 8,60 19,52 10,45 9,07 67,46 94,10 * 5,90 1,54 0,67 4,39
100
76,52 11,82 2,78 24,43 44,59 28,67 15,92 55,60 94,63 5,37 1,70 0,12
4,699
19«
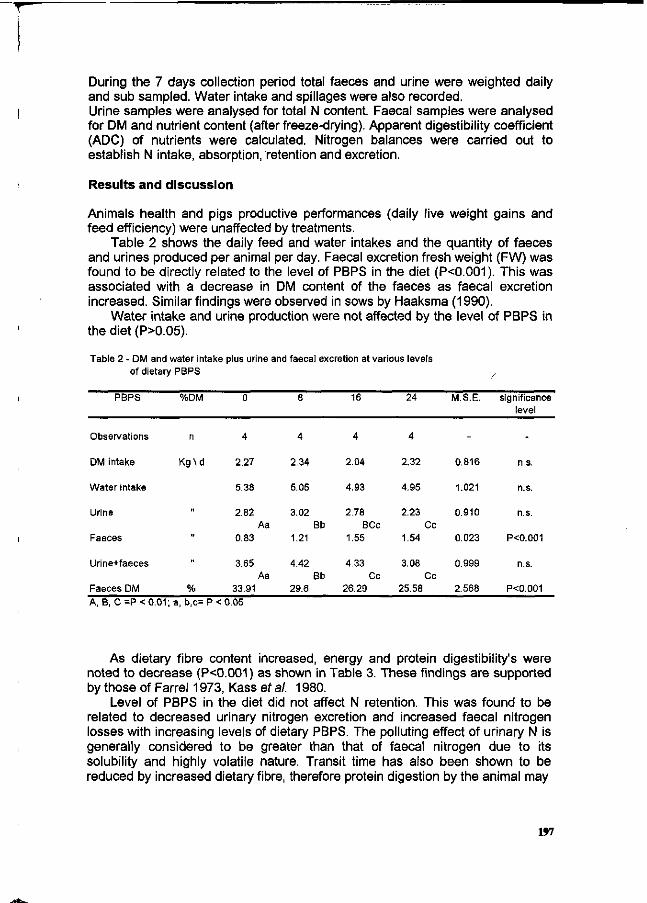
During the 7 days collection period total faeces and urine were weighted daily and sub sampled. Water intake and spillages were also recorded. Urine samples were analysed for total N content. Faecal samples were analysed for DM and nutrient content (after freeze-drying). Apparent digestibility coefficient (ADC) of nutrients were calculated. Nitrogen balances were carried out to establish N intake, absorption, retention and excretion.
Results and discussion
Animals health and pigs productive performances (daily live weight gains and feed efficiency) were unaffected by treatments.
Table 2 shows the daily feed and water intakes and the quantity of faeces and urines produced per animal per day. Faecal excretion fresh weight (FW) was found to be directly related to the level of PBPS in the diet (P<0.001 ). This was associated with a decrease in DM content of the faeces as faecal excretion increased. Similar findings were observed in sows by Haaksma (1990).
Water intake and urine production were not affected by the level of PBPS in the diet (P>0.05).
Table 2 - DM and water intake plus urine and faecal excretion at various levels of dietary PBPS
PBPS
Observations
DM intake
Water intake
Urine
Faeces
Urine+faeces
Faeces DM
%DM
n
K g \ d
»
"
"
%
0
4
2.27
5.38
2.82
0.83
3.65
33.91
Aa
Aa
8
4
2.34
5.05
3.02
1.21
4.42
29.6
Bb
Bb
16
4
2.04
4.93
2.78 BCc
1.55
4.33 Cc
26.29
24
4
2.32
4.95
2.23
1.54
3.08
25.58
Cc
Cc
M.S.E.
-
0.816
1.021
0.910
0.023
0.999
2.568
significance level
-
n.s.
n.s.
n.s.
P<0.001
n.s.
PO.001
A, B, C =P < 0.01; a, b,c= P < 0.05
As dietary fibre content increased, energy and protein digestibility's were noted to decrease (P<0.001) as shown in Table 3. These findings are supported by those of Farrel 1973, Kass et al. 1980.
Level of PBPS in the diet did not affect N retention. This was found to be related to decreased urinary nitrogen excretion and increased faecal nitrogen losses with increasing levels of dietary PBPS. The polluting effect of urinary N is generally considered to be greater than that of faecal nitrogen due to its solubility and highly volatile nature. Transit time has also been shown to be reduced by increased dietary fibre, therefore protein digestion by the animal may
197
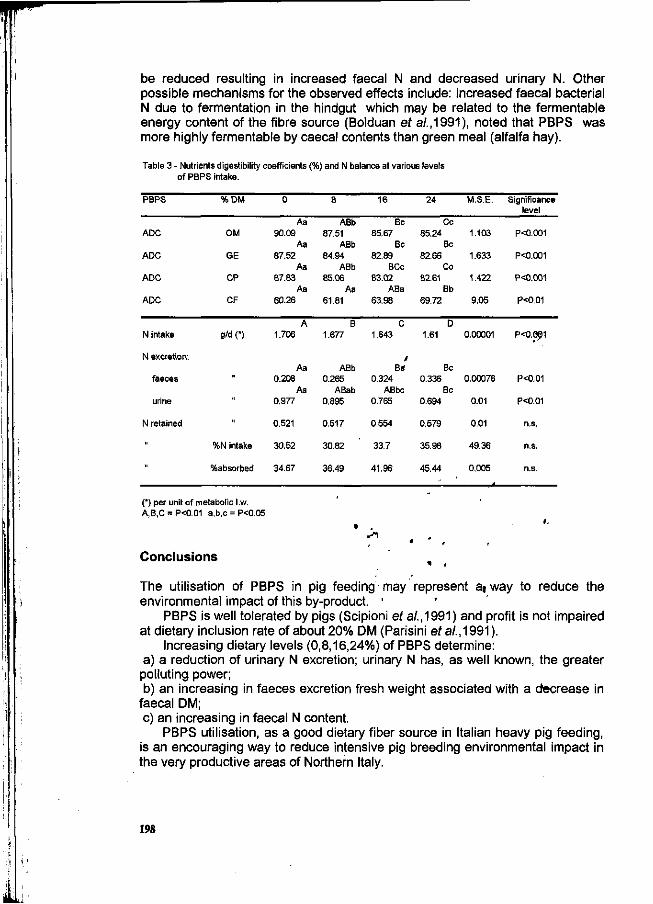
be reduced resulting in increased faecal N and decreased urinary N. Other possible mechanisms for the observed effects include: increased faecal bacterial N due to fermentation in the hindgut which may be related to the fermentable energy content of the fibre source (Bolduan et a/., 1991), noted that PBPS was more highly fermentable by caecal contents than green meal (alfalfa hay).
Table 3 - Nutrients digestibility coefficients (%) and N balance at various levels of PBPS intake.
PBPS
ADC
ADC
ADC
ADC
N intake
N excretion:
faeces
urine
N retained
»
"
%DM
OM
GE
CP
CF
g/d (*)
"
" »
%N intake
%absorbed
0
Aa 90.09
Aa 87.52
Aa 87.83
Aa 60.26
A 1.706
Aa 0.208
Aa 0.977
0.521
30.52
34.67
8
ABb 87.51
ABb 84.94
ABb 85.06
Aa 61.81
B 1.677
ABb 0.265
ABab 0.895
0.517
30.82
36.49
16
Be 85.67
Be 82.89
BCc 83.02
ABa 63.98
C 1.643
/ Be
0.324 ABbe
0.765
0.554
33.7
41.96
24
Cc 85.24
Be 82.66
Cc 82.61
Bb 69.72
D 1.61
Be 0.336
Be 0.694
0.579
35.98
45.44
M.S.E.
1.103
1.633
1.422
9.05
0.00001
0.00076
0.01
0.01
49.36
0.005
Significance level
P<0.001
P<0.001
P<0.001
PO.01
p<o.eei
P<0.01
P<0.01
n.s.
n.s.
n.s.
(*) per unit of metabolic l.w. A,B,C = P<0.01 a,b,c = P<0.05
Conclusions
^i
The utilisation of PBPS in pig feeding may represent a(way to reduce the environmental impact of this by-product. •
PBPS is well tolerated by pigs (Scipioni et a/., 1991) and profit is not impaired at dietary inclusion rate of about 20% DM (Parisini et a/., 1991).
Increasing dietary levels (0,8,16,24%) of PBPS determine: a) a reduction of urinary N excretion; urinary N has, as well known, the greater polluting power; b) an increasing in faeces excretion fresh weight associated with a decrease in
faecal DM; c) an increasing in faecal N content.
PBPS utilisation, as a good dietary fiber source in Italian heavy pig feeding, is an encouraging way to reduce intensive pig breeding environmental impact in the very productive areas of Northern Italy.
198
Literature cited
1) Bolduan G., Schnabel E. & Beck M. ,1981; Results of fermentation in hindgut sections of pigs, Advances in Animal Physiology and Animal Nutrition, (22), 80-83. 2) Chabeauti E., Noblet J. & Carré B., 1991; Digestion of plant cell walls from four different sources in growing pigs, Animal Feed Science and Technology, 32, 207-213. 3) Farrel D.J. ,1973; Digestibility by pigs of the major chemical component of diets high in cell wall constituents, Animal Production, 16, 43-47. 4) Haaksma J. ,1990; Pressed beet pulp silage in diets for pregnant sows, I.R.S., report n 23, NL. 5) Kass M.L., Van Soest P.J. & Pond W.G., 1980; Utilisation of dietary fiber from alfa alfa by growing swine. II. Journal of Animal Science, 50, 192-197. 6) Longland A.C. & Low A.G., 1988; Digestion of diet containing molassed or plain sugar-beet pulp by growing pigs, Animal Feed Science and Technology, 23, 67-78. 7) Parisini P., Sardi L, Mordenti A., Martelli G. & Panciroli A., 1991; Polpe secche e polpe suppressate insilate nell'alimentazione del suino pesante, Rivista di Suinicoltura, 32, (8), 47-52. 8) Scipioni R., Sardi L, Barchi D., Accorsi P.A. & Pacchioli M.T., 1991; Elevate quantité di insilati neN'alimentazione del suino pesante: effetti sulle performance di accrescimento e di macellazione, Rivista di Suinicoltura, 32, (7), 71-78.
199
Gastric and ileal measurements of nitrogen in pigs fed untreated and enzyme-treated wheat bran.
J. van der Meulen1 & J. Inborr2
1 DLO-Research Institute for Livestock Feeding and Nutrition (IVVO-DLO), Lelystad, The Netherlands. 2 Finnfeeds International Ltd, Marlborough, Wiltshire, United Kingdom.
Summary
Growing pigs, f i t ted w i th a stomach and PVTC-cannula, were fed a semi-synthetic diet w i th 4 0 % wheat bran, either untreated or treated w i th cell wall degrading enzymes (a cellulase and a xylanase preparation) twice a day. Gastric digesta was collected once daily at 0 , 2 , 4 and 6 h after feeding, whereas ileal-digesta was collected quantitatively in two-hour intervals for 12 hours and faeces quantitatively for 24 h. Flow of digesta, dry matter and N in^he stomach and i leum, and ileal and faecal digestibility of dry matter and N were determined. There was no significant effect of treating wheat bran w i th cell wall degrading enzymes on dry matter and N f low in stomach and small intestine. The faecal dry matter but not N digestibility was increased by treatment w i th the cellulase preparation. Keywords: pig, wheatbran, enzymes, dm, N, stomach, small intestine
Introduction
Wheat bran is commonly used as an ingredient in pig feeds* However, it is not included in large quantities, known' to adverse effects on digestion and utilisation of nutrients. Incorporation of wheat bran into diets has resulted in reduced apparent faecal gross energy, nitrogen and N9P digestibility (Chabeauti et a l . , Ï 9 9 1 ; Bach Knudsen & Hansen, 1991), reduced ileal,and faacal'dny matter digestibility (Graham et a l . , 1986), increased rate of feed passage (Potkins et a l . , 1991), increased volume and protein output of pancreatic juice (Langloi's et a l . , 1987) and increased bile and cholesterol output (Payne et a l . , 1989). ' Since the pig does not produce enzymes capable of degrading-NSP, it has to rely on fermentation in the gastrointestinal t ract to extract any energy from high fibre feedstuffs. The digestibility of feed containing high levels of NSP may be improved by treatment w i th cell wall degrading enzymes which can hydrolyse the NSP to monosaccharides and release cell contents (protein, mineralsMChesson, 1987). However, the response of pigs to cell wall degrading enzymes is rather variable. In a study by McClean & McCracken (1992), enzyme supplementation of a wheat bran based diet did not affect dry matter, crude protein and gross energy digestibility at ileal and faecal sites in weaned pigs, but did result in improvement of digestibility of cell wall components, protein and fat in a study by Schutte et al. (1990). This study was undertaken to obtain more information on kinetics involved in the digestive process and digestion of nitrogen along the gastrointestinal t ract after feeding a diet based on wheat bran, either untreated or treated w i th cell wall degrading enzymes.
200
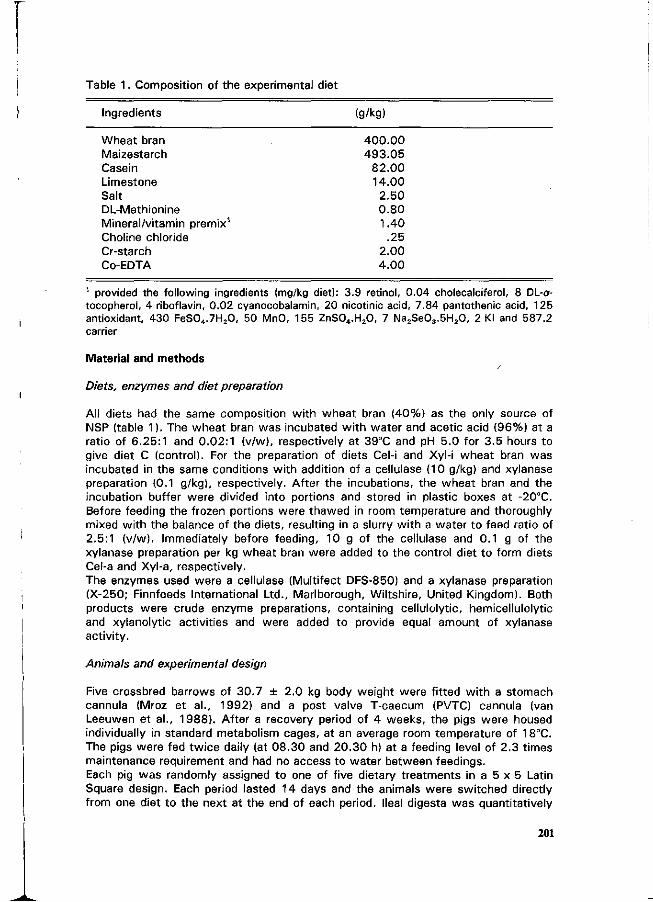
Table 1. Composition of the experimental diet
Ingredients (g/kg)
Wheat bran 400 .00 Maizestarch 493.05 Casein 82.00 Limestone 14.00 Salt 2.50 DL-Methionine 0 .80 Mineral/vitamin premix1 1.40 Choline chloride .25 Cr-starch 2.00 Co-EDTA 4.00
1 provided the following ingredients (mg/kg diet): 3.9 retinol, 0.04 cholecalciferol, 8 DL-a-tocopherol, 4 riboflavin, 0.02 cyanocobalamin, 20 nicotinic acid, 7.84 pantothenic acid, 125 antioxidant, 430 FeS04.7H20, 50 MnO, 155 ZnS04.H20, 7 Na2Se03.5H20, 2 Kl and 587.2 carrier
Material and methods
Diets, enzymes and diet preparation
All diets had the same composition wi th wheat bran (40%) as the only source of NSP (table 1). The wheat bran was incubated w i th water and acetic acid (96%) at a ratio of 6.25:1 and 0.02:1 (v/w), respectively at 39°C and pH 5.0 for 3.5 hours to give diet C (control). For the preparation of diets Cel-i and Xyl-i wheat bran was incubated in the same conditions wi th addition of a cellulase (10 g/kg) and xylanase preparation (0.1 g/kg), respectively. After the incubations, the wheat bran and the incubation buffer were divided into portions and stored in plastic boxes at -20°C. Before feeding the frozen portions were thawed in room temperature and thoroughly mixed w i th the balance of the diets, resulting in a slurry w i th a water to feed ratio of 2.5:1 (v/w). Immediately before feeding, 10 g of the cellulase and 0.1 g of the xylanase preparation per kg wheat bran were added to the control diet to form diets Cel-a and Xyl-a, respectively.
The enzymes used were a cellulase (Multifect DFS-850) and a xylanase preparation (X-250; Finnfeeds International Ltd., Marlborough, Wiltshire, United Kingdom). Both products were crude enzyme preparations, containing cellulolytic, hemicellulolytic and xylanolytic activities and were added to provide equal amount of xylanase activity.
Animals and experimental design
Five crossbred barrows of 30.7 ± 2.0 kg body weight were f i t ted w i th a stomach cannula (Mroz et a l . , 1992) and a post valve T-caecum (PVTC) cannula (van Leeuwen et a l . , 1988). After a recovery period of 4 weeks, the pigs were housed individually in standard metabolism cages, at an average room temperature of 18°C. The pigs were fed twice daily (at 08 .30 and 20 .30 h) at a feeding level of 2.3 t imes maintenance requirement and had no access to water between feedings. Each pig was randomly assigned to one of five dietary treatments in a 5 x 5 Latin Square design. Each period lasted 14 days and the animals were switched directly from one diet to the next at the end of each period. Ileal digesta was quantitatively
201
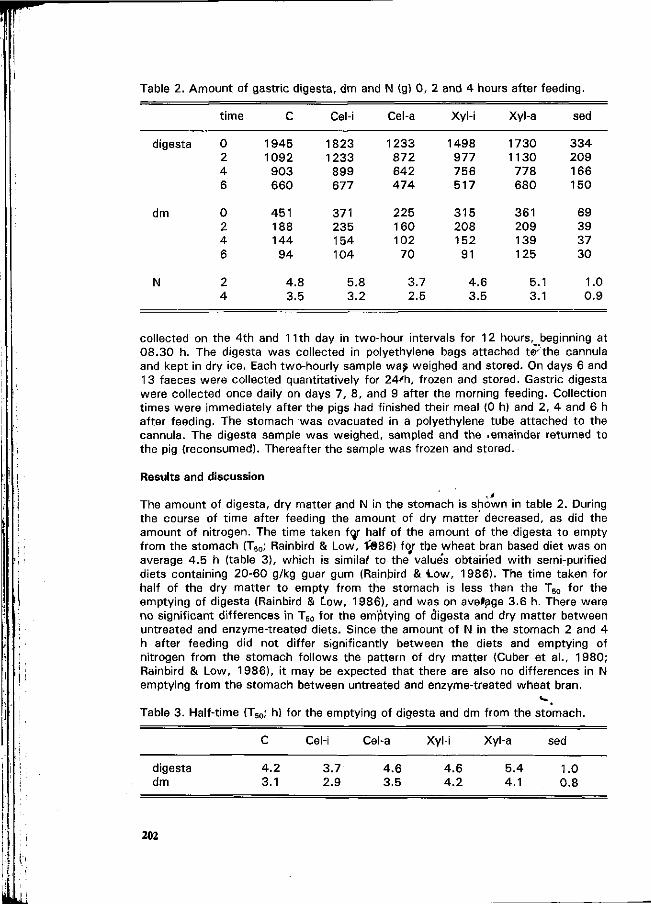
Table 2. Amount of gastric digesta, dm and N (g) 0, 2 and 4 hours after feeding.
digesta
dm
N
t ime
0 2 4 6
0 2 4 6
2 4
C
1945 1092
903 660
451 188 144
94
4.8 3.5
Cel-i
1823 1233
899 677
371 235 154 104
5.8 3.2
Cel-a
1233 872 642 474
225 160 102
70
3.7 2.5
Xyl-i
1498 977 756 517
315 208 152
91
4.6 3.5
Xyl-a
1730 1130
778 680
361 209 139 125
5.1 3.1
sed
334 209 166 150
69 39 37 30
1.0 0.9
collected on the 4th and 11th day in two-hour intervals for 12 hours,_ beginning at 08.30 h. The digesta was collected in polyethylene bags attached terthe cannula and kept in dry ice. Each two-hourly sample was weighed and stored. On days 6 and 13 faeces were collected quantitatively for 24'h, frozen and stored. Gastric digesta were collected once daily on days 7, 8, and 9 after the morning feeding. Collection times were immediately after the pigs had finished their meal (0 h) and 2, 4 and 6 h after feeding. The stomach was evacuated in a polyethylene tube attached to the cannula. The digesta sample was weighed, sampled and the lemainder returned to the pig (reconsumed). Thereafter the sample was frozen and stored.
Results and discussion
The amount of digesta, dry matter and N in the stomach is shown in table 2. During the course of time after feeding the amount of dry matter decreased, as did the amount of nitrogen. The time taken fqr half of the amount of the digesta to empty from the stomach (T50; Rainbird & Low, £986) f(jr tbe wheat bran based diet was on average 4.5 h (table 3), which is similar to the value's obtained with semi-purified diets containing 20-60 g/kg guar gum (Rainbird & l o w , 1986). The time taken for half of the dry matter to empty from the stomach is less than the T50 for the emptying of digesta (Rainbird & Low, 1986), and was on average 3.6 h. There were no significant differences in T50 for the emptying of digesta and dry matter between untreated and enzyme-treated diets. Since the amount of N in the stomach 2 and 4 h after feeding did not differ significantly between the diets and emptying of nitrogen from the stomach follows the pattern of dry matter (Cuber et al., 1980; Rainbird & Low, 1986), it may be expected that there are also no differences in N emptying from the stomach between untreated and enzyme-treated wheat bran.
Table 3. Half-time
digesta dm
(T50; h) for the em
C
4 .2 3.1
Cel-i
3.7 2.9
ptying of digesta and dm
Cel-a
4.6 3.5
Xyl-i
4 .6 4 .2
from the stomach.
Xyl-a
5.4 4.1
sed
1.0 0.8
202
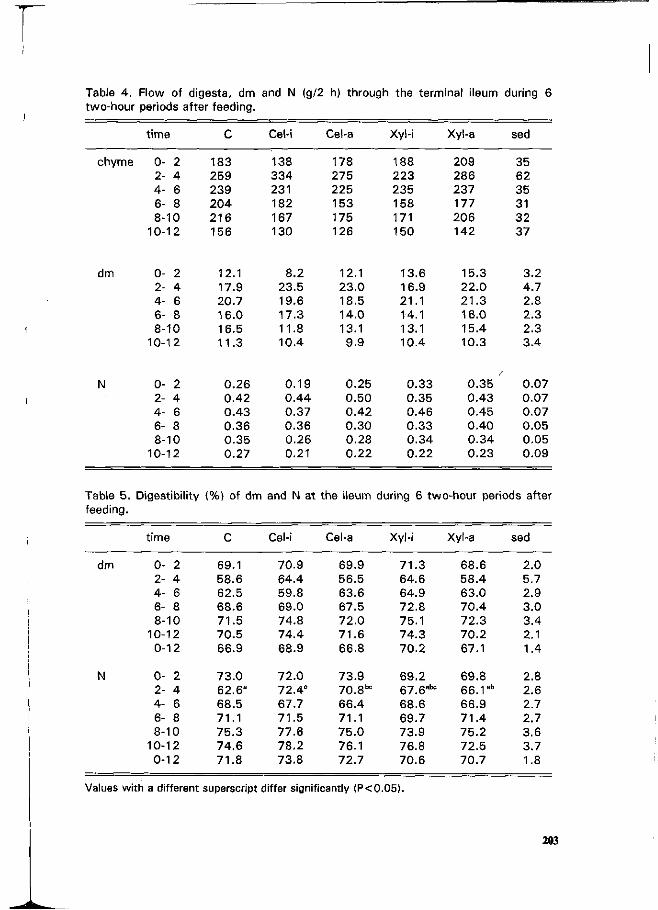
Table 4. Flow of digesta, dm and N (g/2 h) through the terminal ileum during 6 two-hour periods after feeding.
time
chyme 0- 2 2- 4 4- 6 6- 8 8-10
10-12
dm 0- 2 2- 4 4- 6 6- 8 8-10
10-12
N 0 - 2 2- 4 4- 6 6- 8 8-10
10-12
C
183 259 239 204 216 156
12.1 17.9 20.7 16.0 16.5 11.3
0.26 0.42 0.43 0.36 0.35 0.27
Cel-i
138 334 231 182 167 130
8.2 23.5 19.6 17.3 11.8 10.4
0.19 0.44 0.37 0.36 0.26 0.21
Cel-a
178 275 225 153 175 126
12.1 23.0 18.5 14.0 13.1 9.9
0.25 0.50 0.42 0.30 0.28 0.22
Xyl-i
188 223 235 158 171 150
13.6 16.9 21.1 14.1 13.1 10.4
0.33 0.35 0.46 0.33 0.34 0.22
Xyl-a
209 286 237 177 206 142
15.3 22.0 21.3 16.0 15.4 10.3
0.35 0.43 0.45 0.40 0.34 0.23
sed
35 62 35 31 32 37
3.2 4.7 2.8 2.3 2.3 3.4
0.07 0.07 0.07 0.05 0.05 0.09
Table 5. Digestibility (%) of dm and N at the ileum during 6 two-hour periods after feeding.
dm
N
Values
time
0- 2 2- 4 4- 6 6- 8 8-10
10-12 0-12
0- 2 2- 4 4- 6 6- 8 8-10
10-12 0-12
C
69.1 58.6 62.5 68.6 71.5 70.5 66.9
73.0 62.6a
68.5 71.1 75.3 74.6 71.8
Cel-i
70.9 64.4 59.8 69.0 74.8 74.4 68.9
72.0 72.4e
67.7 71.5 77.6 78.2 73.8
Cel-a
69.9 56.5 63.6 67.5 72.0 71.6 66.8
73.9 70.8"° 66.4 71.1 75.0 76.1 72.7
Xyl-i
71.3 64.6 64.9 72.8 75.1 74.3 70.2
69.2 67.6ab<:
68.6 69.7 73.9 76.8 70.6
with a different superscript differ significantly (P<0.05).
Xyl-a
68.6 58.4 63.0 70.4 72.3 70.2 67.1
69.8 66.1ab
66.9 71.4 75.2 72.5 70.7
sed
2.0 5.7 2.9 3.0 3.4 2.1 1.4
2.8 2.6 2.7 2.7 3.6 3.7 1.8
203
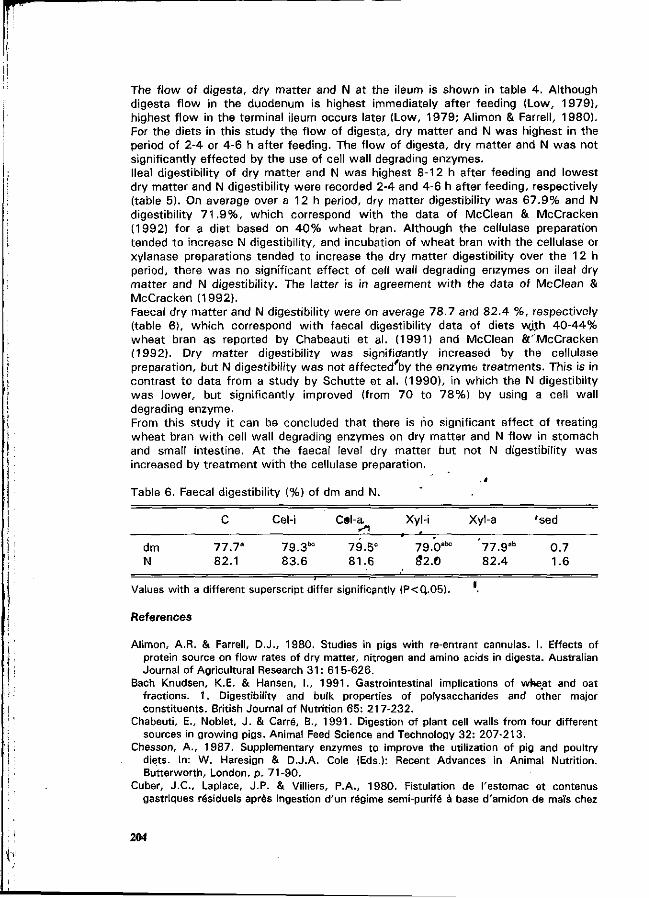
The f low of digesta, dry matter and N at the ileum is shown in table 4 . Although digesta f low in the duodenum is highest immediately after feeding (Low, 1979), highest f low in the terminal ileum occurs later (Low, 1979; Al imon & Farrell, 1980). For the diets in this study the f low of digesta, dry matter and N was highest in the period of 2-4 or 4-6 h after feeding. The f low of digesta, dry matter and N was not significantly effected by the use of cell wall degrading enzymes. Ileal digestibility of dry matter and N was highest 8-12 h after feeding and lowest dry matter and N digestibility were recorded 2-4 and 4-6 h after feeding, respectively (table 5). On average over a 12 h period, dry matter digestibility was 6 7 . 9 % and N digestibility 7 1 . 9 % , which correspond w i th the data of McClean & McCracken (1992) for a diet based on 4 0 % wheat bran. Although the cellulase preparation tended to increase N digestibility, and incubation of wheat bran wi th the cellulase or xylanase preparations tended to increase the dry matter digestibility over the 1 2 h period, there was no significant effect of cell wall degrading enzymes on ileal dry matter and N digestibility. The latter is in agreement w i th the data of McClean & McCracken (1992).
Faecal dry matter and N digestibility were on average 78.7 and 82 .4 %, respectively (table 6), which correspond w i th faecal digestibility data of diets wj,th 40 -44% wheat bran as reported by Chabeauti et al. (1991) and McClean ö 'McCracken (1992). Dry matter digestibility was significantly increased by the cellulase preparation, but N digestibility was not af fected'by the enzyme treatments. This is in contrast to data from a study by Schutte et al. (1990), in which the N digestibilty was lower, but significantly improved (from 70 to 78%) by using a cell wall degrading enzyme. From this study it can be concluded that there is no significant effect of treating wheat bran w i th cell wall degrading enzymes on dry matter and N f low in stomach and small intestine. A t the faecal level dry matter but not N digestibility was increased by t reatment w i th the cellulase preparation.
Table 6.
dm N
Faecal digestibility (%) of dm and N.
C
77.7° 82.1
Cel-i
79.3"° 83.6
C«l-a
79.5° 81.6
Xyl-i
79.0°"° 32.0
Xyl-a
'77.9°b
82.4
'sed
0.7 1.6
Values with a different superscript differ significantly (P<Q.05). '.
References
Alimon, A.R. & Farrell, D.J., 1980. Studies in pigs with re-entrant cannulas. I. Effects of
protein source on flow rates of dry matter, nitrogen and amino acids in digesta. Australian Journal of Agricultural Research 3 1 : 615-626.
Bach Knudsen, K.E. & Hansen, I., 1991. Gastrointestinal implications of wheat and oat fractions. 1. Digestibility and bulk properties of polysaccharides and other major constituents. British Journal of Nutrition 65: 217-232.
Chabeuti, E., Noblet, J . & Carré, B., 1991. Digestion of plant cell walls from four different sources in growing pigs. Animal Feed Science and Technology 32: 207-213.
Chesson, A., 1987. Supplementary enzymes to improve the utilization of pig and poultry diets. In: W. Haresign & D.J.A. Cole (Eds.): Recent Advances in Animal Nutrition. Butterworth, London, p. 71-90.
Cuber, J.C., Laplace, J.P. & Villiers, P.A., 1980. Fistulation de l'estomac et contenus gastriques résiduels après ingestion d'un régime semi-purifé à base d'amidon de maïs chez
204
le porc. Reproduction Nutrition Développement 20: 1161-1172. Graham, H., Hesselman, K. & Aman, P., 1986. The influence of wheat bran and sugar-beet
pulp on the digestibility of dietary components in a cereal-based pig diet. Journal of Nutrition 116: 242-251.
Langlois, A., Corring, T. & Février, C , 1987. Effects of wheat bran on exocrine pancreas secretion in the pig. Reproduction Nutrition Développement 27: 929-939.
Low, A.G., 1979. Studies on digestion and absorption in the intestines of growing pigs. 5. Measurements of the flow of nitrogen. British Journal of Nutrition 4 1 : 137-146.
McClean, D. & McCracken, K.J., 1992. Effects of enzyme supplementation on digestibility of wheat feed by weaned pigs. Proceedings Nutrition Society 51 : 3.
Mroz, Z., van der Meulen, J . , Bruce, J . & Overland, M., 1992. Gastric and ileo-caecal silicone cannulas in pigs. In: 43rd Annual Meeting of the EAAP, Madrid.
Payne, D., Juste, C , Corring, T. & Février, C , 1989. Effects of wheat bran on bile secretion in the pig. Nutrition Reports International 40: 761-771.
Potkins, Z.V., Lawrence, T.L.J. & Thomlinson, J.R., 1991. Effects of structural and nonstructural polysaccharides in the diet of the growing pig on gastric emptying rate and rate of passage of digesta to the terminal ileum and through the total gastrointestinal tract. British Journal of Nutrition 65: 391-413.
Rainbird, A.L. & Low, A.G., 1986. Effect of guar gum on gastric emptying in growing pigs. British Journal of Nutrition 55: 87-98.
Schutte, J.B., van Kempen, G.J.M. & Hamer, R.J., 1990. Possibilities to improve the utilization of feed ingredients rich in non-starch polysaccharides for poultry. In: Proceedings VIII European Poultry Conference, Barcelona, p. 128-135.
van Leeuwen, P., Huisman, J. , Verstegen, M.W.A., Baak, M.J., van Kleef, D.J., van Weerden, E.J. & den Hartog, L.A., 1988. A new technique for collection of ileal chyme in pigs. In: L. Buraczewska, S. Buraczewski, B. Pastuszewska & T. Zebrowska (Eds.): Proceedings 4th International Seminar on Digestive Physiology in the Pig. Polish Academy of Science, Jablonna. p. 289-296.
205
Effect of growth potential and dietary protein input on growth performance, carcass characteristics and nitrogen output in growing-finishing pigs.
J.Y. Dourmada, Y. Henrya, D. Bourdon3, N. Quiniou3 and D. Guilloub.
a Institut National de la Recherche Agronomique, Station de Recherches Porcines, 35590 Saint-Gilles (France).b UNCAA, Division Productions Animales, UCAAB, B.P. 19, 02402 Château-Thierry Cedex (France)
Summary
The effect of decreasing dietary protein level was studied, in combination with different genetic growth potentials, in order to reduce nitrogen (N) output from growing-finishing pigs. One hundred and twenty pigs (30-100 kg live weight) of two genotypes (Large White and crossbred Large White x Retrain) and two sexes (female and castrated males) were fed one of three diets differing in crude protein (CP) content (17.8, 15.5_.and 13.6%, re-equilibrated with industrial amino acids) with the same net energy content/Feed intake, feed conversion ratio, average daily gain and carcass characteristics were affected by genotype and sex, but not by dietary CP content. On average, N output was lower for crossbred than for Large White pigs (-24%) and for females compared to castrated males (-11%). The decrease in dietary protein was associated with an important reduction in N output : -33% and -18% for 13.6 and 15.5% CP diets, respectively, compared to 17.8% CP diet.
Keywords: pig, nutrition, environmental pollution, nitrogen balance.
Introduction
Feeding low protein diets to growing pigs is known to limit Faecal'and urinary nitrogen (N) excretion (Lenis, 1989; Tamminga & Verstegen, 1991; Jongbloed & Lenis, 1992; Gatel & Grosjean., 1992; Dourmad et al., 1992). Reduction of N output can be obtained through a precise adjustment of dietary projçin and amino acid supply to the specific requirements of the pig at the different physiological sfages. The second approach is to improve dietary amino acid balance and consequently reduce protein content of the diet (Henry, 1988). However, such approaches for reducing N output are effective only when growth performance is not reduced. With low, or very low protein diets, feed efficiency was reduced in some studies and N output did not decrease (Latiirlier & Chatelier, 1992; Kies et al., 1992). Associated effects of reducing protein content of the diet on energy utilization, appetite and carcass composition have also to be considered. Feeding high protein diets is known to limit voluntary feed intake in some studies (Henry, 1985) and to decrease carcass fatness, even with restricted feeding (Ivan et Farell, 1975; Noblet et al., 1977; Henry et Perez, 1986; Noblet et al., 1987).
Therefore, the objective of this study was to examine the effect of reducing protein content of the diet on voluntary feed intake, growth performance, carcass composition and N excretion, for pigs of different growth potentials.
Materials and Methods
Experimental design.
In trial 1, one hundred and twenty Large White (LW) and Large White x Piétrain (LWP) pigs, with 60 per genotype, averaging 29.4 + 1.4 kg and including an equal number of
206
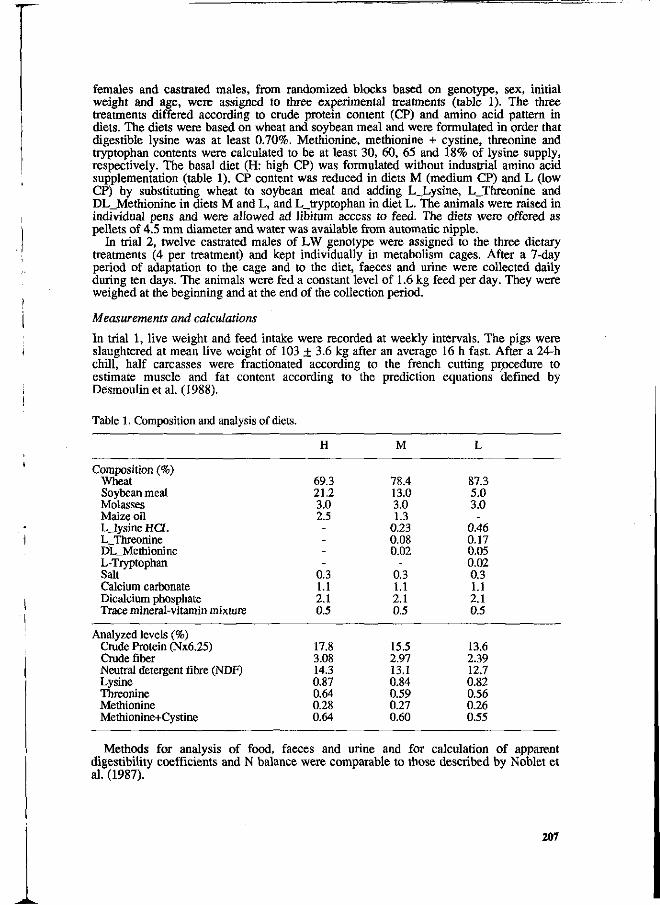
females and castrated males, from randomized blocks based on genotype, sex, initial weight and age, were assigned to three experimental treatments (table 1). The three treatments differed according to crude protein content (CP) and amino acid pattern in diets. The diets were based on wheat and soybean meal and were formulated in order that digestible lysine was at least 0.70%. Methionine, methionine + cystine, threonine and tryptophan contents were calculated to be at least 30, 60, 65 and 18% of lysine supply, respectively. The basal diet (H: high CP) was formulated without industrial amino acid supplementation (table 1). CP content was reduced in diets M (medium CP) and L (low CP) by substituting wheat to soybean meal and adding L_Lysine, L_Threonine and DL_Methionine in diets M and L, and L_tryptophan in diet L. The animals were raised in individual pens and were allowed ad libitum access to feed. The diets were offered as pellets of 4.5 mm diameter and water was available from automatic nipple.
In trial 2, twelve castrated males of LW genotype were assigned to the three dietary treatments (4 per treatment) and kept individually in metabolism cages. After a 7-day period of adaptation to the cage and to the diet, faeces and urine were collected daily during ten days. The animals were fed a constant level of 1.6 kg feed per day. They were weighed at the beginning and at the end of the collection period.
Measurements and calculations
In trial 1, live weight and feed intake were recorded at weekly intervals. The pigs were slaughtered at mean live weight of 103 + 3.6 kg after an average 16 h fast. After a 24-h chill, half carcasses were fractionated according to the french cutting procedure to estimate muscle and fat content according to the prediction equations defined by Desmoulin et al. (1988).
Table 1. Composition and analysis of diets.
Composition (%) Wheat Soybean meal Molasses Maize oil LJysine HCL LJThreonine DL_Methionine L-Tryptophan Salt Calcium carbonate Dicalcium phosphate Trace mineral-vitamin mixture
Analyzed levels (%) Crude Protein (Nx6.25) Crude fiber Neutral detergent fibre (NDF) Lysine Threonine Methionine Methionine+Cystine
H
69.3 21.2 3.0 2.5 ----
0.3 1.1 2.1 0.5
17.8 3.08 14.3 0.87 0.64 0.28 0.64
M
78.4 13.0 3.0 1.3
0.23 0.08 0.02
-0.3 1.1 2.1 0.5
15.5 2.97 13.1 0.84 0.59 0.27 0.60
L
87.3 5.0 3.0 -
0.46 0.17 0.05 0.02 0.3 1.1 2.1 0.5
13.6 2.39 12.7 0.82 0.56 0.26 0.55
Methods for analysis of food, faeces and urine and for calculation of apparent digestibility coefficients and N balance were comparable to those described by Noblet et al. (1987).
207
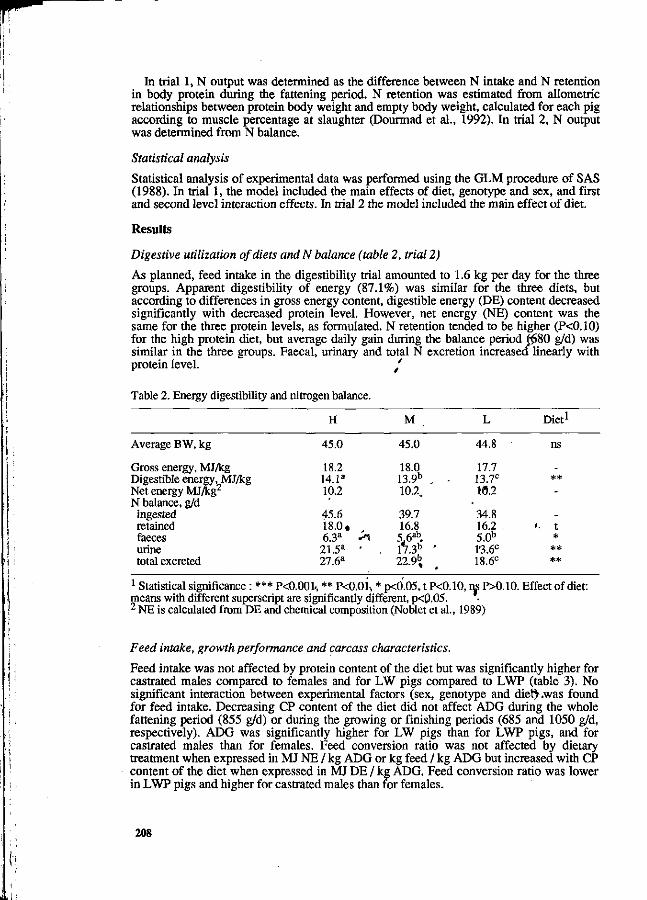
In trial 1, N output was determined as the difference between N intake and N retention in body protein during the fattening period. N retention was estimated from allometric relationships between protein body weight and empty body weight, calculated for each pig according to muscle percentage at slaughter (Dourmad et al., 1992). In trial 2, N output was determined from N balance.
Statistical analysis
Statistical analysis of experimental data was performed using the GLM procedure of SAS (1988). In trial 1, the model included the main effects of diet, genotype and sex, and first and second level interaction effects. In trial 2 the model included the main effect of diet.
Results
Digestive utilization of diets and N balance (table 2, trial 2)
As planned, feed intake in the digestibility trial amounted to 1.6 kg per day for the three groups. Apparent digestibility of energy (87.1%) was similar for the three diets, but according to differences in gross energy content, digestible energy (DE) content decreased significantly with decreased protein level. However, net energy (NE) content was the same for the three protein levels, as formulated. N retention tended to be higher (P<0.10) for the high protein diet, but average daily gain during the balance period (<580 g/d) was similar in the three groups. Faecal, urinary and total N excretion increased* linearly with protein level. /
/
Table 2. Energy digestibility and nitrogen balance.
Average BW, kg
Gross energy, MJ/kg Digestible energy, MJ/kg Net energy MJ/kg2
N balance, g/d ingested retained faeces urine total excreted
H
45.0
18.2 14.1a
10.2
45.6 18.0. 6.3a *"!
21.5a ' 27.6a
M
45.0
18.0 13.9b „ 10.2
39.7 16.8 5.6ab
17.3b ' 22.9^
L
44.8
17.7 13.7C
10.2 • 34.8 16.2 5.0b
13.6C
18.6C
Diet1
ns
-** -
-'• t
* ** **
1 Statistical significance : *** P<0.00L, ** P<0.0U * p<0.05, t P<0.10, ns P>0.10. Effect of diet: means with different superscript are significantly different, p<0.05. 2 NE is calculated from DE and chemical composition (Noblet et al., 1989)
Feed intake, growth performance and carcass characteristics.
Feed intake was not affected by protein content of the diet but was significantly higher for castrated males compared to females and for LW pigs compared to LWP (table 3). No significant interaction between experimental factors (sex, genotype and diet^-was found for feed intake. Decreasing CP content of the diet did not affect ADG during the whole fattening period (855 g/d) or during the growing or finishing periods (685 and 1050 g/d, respectively). ADG was significantly higher for LW pigs than for LWP pigs, and for castrated males than for females. Feed conversion ratio was not affected by dietary treatment when expressed in MJ NE / kg ADG or kg feed / kg ADG but increased with CP content of the diet when expressed in MJ DE / kg ADG. Feed conversion ratio was lower in LWP pigs and higher for castrated males than for females.
208
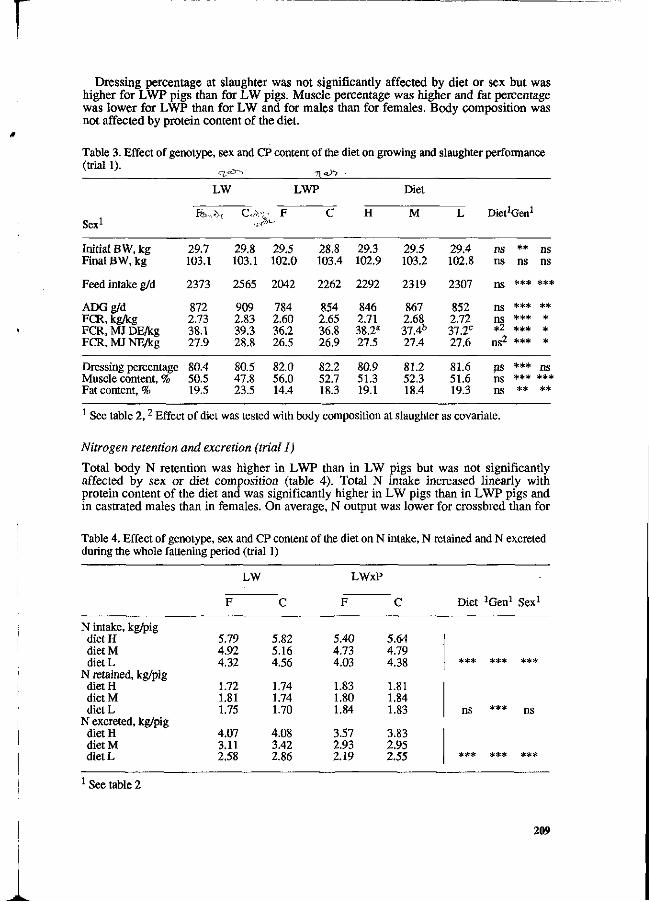
r Dressing percentage at slaughter was not significantly affected by diet or sex but was
higher for LWP pigs than for LW pigs. Muscle percentage was higher and fat percentage was lower for LWP than for LW and for males than for females. Body composition was not affected by protein content of the diet.
Table 3. Effect of genotype, sex and CP content of the diet on growing and slaughter performance (trial 1). _
' - - " - - H a h
Sex1
Initial BW, kg Final BW, kg
Feed intake g/d
ADGg/d FCR, kg/kg FCR, MJ DE/kg FCR, MJ NE/kg
LW
fe.,è(
29.7 103.1
2373
872 2.73 38.1 27.9
C„Y
29.8 103.1
2565
909 2.83 39.3 28.8
LWP
^ F
29.5 102.0
2042
784 2.60 36.2 26.5
C
28.8 103.4
2262
854 2.65 36.8 26.9
H
29.3 102.9
2292
846 2.71 38.2a
27.5
Diet
M
29.5 103.2
2319
867 2.68 37.4b
27.4
L
29.4 102.8
2307
852 2.72 37.2C
27.6
Die^Gen1
ns ** ns ns
ns ***
ns *** ns *** *2 ***
j |g2 ***
ns ns
***
** * * *
Dressing percentage 80.4 80.5 82.0 82.2 80.9 81.2 81.6 Muscle content, % 50.5 47.8 56.0 52.7 51.3 52.3 51.6 Fat content, % 19.5 23.5 14.4 18.3 19.1 18.4 19.3
ns *** ns Tl C • • • +
1 See table 2,2 Effect of diet was tested with body composition at slaughter as covariate.
Nitrogen retention and excretion (trial 1)
Total body N retention was higher in LWP than in LW pigs but was not significantly affected by sex or diet composition (table 4). Total N intake increased linearly with protein content of the diet and was significantly higher in LW pigs than in LWP pigs and in castrated males than in females. On average, N output was lower for crossbred than for
Table 4. Effect of genotype, sex and CP content of the diet on N intake, N retained and N excreted during the whole fattening period (trial 1)
N intake, kg/pig diet H diet M dietL
N retained, kg/pig diet H diet M dietL
N excreted, kg/pig diet H diet M dietL
LW
F
5.79 4.92 4.32
1.72 1.81 1.75
4.07 3.11 2.58
C
5.82 5.16 4.56
1.74 1.74 1.70
4.08 3.42 2.86
LWxP
F
5.40 4.73 4.03
1.83 1.80 1.84
3.57 2.93 2.19
C
5.64 4.79 4.38
1.81 1.84 1.83
3.83 2.95 2.55
Diet ^ e n 1 Sex1
*** *** ***
ns *** ns
*** *** #**
See table 2
209
LW pigs (-24%) and for females compared to castrated males (-11%). The decrease in dietary protein was associated with an important reduction in N output : -33% and -18% for 13.6 and 15.5% CP diets, respectively, compared to 17.8% CP diet. For the overall experiment N output varied between 2.2 kg/pig for crossbred females fed the low protein diet and 4.1 kg/pig for LW females and barrows fed the high protein diet.
Discussion
As already stated by Noblet & Henry (1977, 1987), Cromwell et al. (1988) and Kies et al. (1992), reduction of protein content did not affect ADG and FCR when the diet was supplemented with industrial amino acids. However, with a very low protein diet (10.5%) optimally balanced in amino acids, Kies et al. (1992) reported a reduction in growth performance, suggesting a deficiency in non essential amino acid supply. Henry & Dourmad (1992) suggested that, in growing pigs, the improvement of amino acid balance enables to reduce protein content, and thus N output, down to the ultimate level of "ideal protein", corresponding to 12.5 to 13% CP and 6.5 to 6.8 % lysine in protein, with a perfect balance between essential and non essential amino acids close to 1 (Chung & Baker 1992).
The effects of sex and genotype on voluntary feed intake were consistent with the usual results of literature. Dietary protein content did not affect voluntary feed intake although feeding high protein diets is known to limit voluntary feed intake in some studies (Henry, 1985). For instance, recent findings (Henry et al., 1992) have shown that dietary protein loading relative to tryptophan in growing-finishing'pigs severely depresses voluntary feed intake and performance, via imbalance between excess large neutral amino acids and tryptophan. Unlike tryptophan, lysine level does not interact with additional protein on voluntary feed intake. This was not found in the present study suggesting that protein supply was properly balanced in the three diets.
Carcass composition at slaughter was not affected by protein content of the diet. In several studies (Noblet & Henry, 1977; Henry & Perez, 1986; Noblet et al., 1987; Cromwell et al., 1988) reduction in protein content was associated with an increase in fat content of the carcass at slaughter. It was suggested (Noblet et al., 1987) that degradation of digestible protein in excess for energy purposes resulted in an increased energy loss in urine and an elevated heat loss. Contrarily, energy sparing due to reduced protein content increased fat deposition. In the present study, such an effect was-not found since the diets were calculated to contain the same net energy. Consequently, efficiency of DE utilization for growth decreases when protein content of the diet increases. A better fcontrol of N output through protein feeding in then in farôîur of aet enejgy system.
On average in the four types of pigs, decreasing dietary crude protein content from H to M and L, resulted in 20 and 35 % reduction in N excretion, respectively. This corresponds to 1.35 kg less excretion in group L compared to group H. In finishing pigs weighing 60 kg, Gatel & Grosjean (1992) found a 31% réduction in N excretion when protein content was reduced from 17.4% to 14.8%.
For the high protein diet, N excretion amounted to 70 and 67% of N intake in LW and LWP pig, respectively. For the low protein diet N excretion of females and castrated males was decreased to 60 and 63% of intake, respectively, in LW pigs. The corresponding decrease in LWP pigs was 54 and 58%, respectively. With perfectly balanced and highly digestible protein, Henry & Dourmad (1992) expected that the lowest limit for N excretion in growing-finishing pigs should be of the order of 40% of intake. With 10 to 20 kg pigs, Chung & Baker (1991) reported only 32 % N excretîbn according to intake, after feeding a complete purified amino acid diet with all nutrients totally bioavailable (96 % apparent digestibility for protein) and simulating ideal protein (15 % CP). Decreasing N output below the value of 54% of intake, obtained in the present study, would require to combine the improvement of dietary protein balance with a better adjustment of protein and amino acid supply over time according to changes in protein requirements (Jongbloed & Lenis, 1992, Henry & Dourmad, 1992).
210
Conclusion
In agreement with the prospective view of Jongbloed & Lenis (1992), N output in pigs can be reduced by 1/3 through better feeding management. In addition, the increase in production potential, either by selection or by appropriate environmental conditions, may contribute to reduce still further N output per unit of product formed. This shows that it is possible, with friendly feeding practices, to maintain a good compromise between imperative productivity and environmental constraints.
Acknowledgements
This work was completed within a cooperative European Programme (DG VI, contract N° 910112) "Reduction of Nitrogen output in pig effluents through a better control of dietary protein supply". The authors gratefully acknowledge G. Conseil and associates for technical assistance and animal care, animal slaughter and carcass measurements and Nadine Mézière for feed analysis.
References
Chung, T.K. & Baker, D.H., 1991. A chemically defined diet for maximal growth of pigs. J.Nutr. 121:979-984.
Cromwell, G.L., Cline, T.R., Crenshaw, J.D., Ewan, R.C., Mahan, D.C., Miller, E.R., Pettigrew, J.E. & Wahlstom, R.C., 1988. Effect of dietary protein on performance and carcass traits of barrows and gilts. J. Anim. Sei. 66 (supp. 1): 143, abstract.
Desmoulin, B., Ecolan, P. & Bonneau, M, 1988. Estimation de la composition tissulaire des carcasses de porcs: récapitulatif de diverses méthodes utilisables en expérimentation. INRA Prod. Anim. 1:59-64.
Dourmad, J.Y., Guillou, D. & Noblet, J. 1992. Development of a calculation model for predicting the amount of N excreted by the pig : effect of feeding, physiological stage and performance. Livest. Prod. Sei. 31: 95-107.
Gatel, F. & Grosjean, F., 1992. Effect of protein content of the diet on nitrogen excretion by pigs. Livest. Prod. Sei. 31:109-120.
Henry, Y. & Dourmad, J.Y., 1992. Protein feeding and nitrogen pollution in pigs. International Feed Conference, February 25-26, Piacenza (Italy).
Henry, Y. & Perez, J.M., 1986. Effets de la supplementation en lysine, associée à une réduction du taux de protéines, dans des régimes à base de maïs ou de blé sur les performances de croissance du porc. Journées Rech. Porcine en France, 18,57-66.
Henry, Y., 1985. Dietary factors involved in feed intake regulation in growing pigs: a review. Livest. Prod. Sei., 13: 339-354.
Henry, Y., 1988. Signification de la protéine équilibrée pour le porc : intérêt et limites. INRA Prod. Anim 1:65-74.
Ivan, M. & Farell, D.J., 1975. Nutritional evaluation of wheat. Anim. Prod. 20: 267-276. Jongbloed, A.W. & Lenis, N.P., 1992. Alteration of nutrition as a means to reduce environmental
pollution by pigs. Livest. Prod. Sei. 31: 75-94 Kies, A., Augier, V., Venuat, M. & Grimaldi, J.-L., 1992. Diminution des taux protéiques :
influence sur la quantité d'azote excrété et sur les performances zootechniques du porc charcutier. Journées Rech. Porcine en France 24:219-226.
Latimier, P. & Chatelier, G, 1992. Effet de trois profils azotés sur les performances et les rejets du porc charcutier. Journées Rech. Porcine en France 24: 227-236.
Lenis, 1989. Lower nitrogen excretion in pig husbandry by feeding current and future possibilities. Netherland J. Agric. Sei., 37: 61-70
Noblet J., Fortune, H., Dubois, S. & Henry, Y., 1989. Nouvelles bases d'estimation des teneurs en énergie digestible, métabolisable et nette des aliments pour le porc. INRA, Paris, 106 pp.
Noblet, J. & Henry, Y., 1977. Conséquences d'une réduction du taux de matières azotées sur le niveau de consommation et les performances de croissance chez le porc selon l'équillibre en acides aminés et la concentration en énergie du régime. Ann. Zootech. 26: 379-394.
Noblet, J., Henry, Y., Dubois, S., 1987. Effect of protein and lysine levels in the diet on body gain composition and energy utilization in growing pigs. J. Anim. Sei. 65: 717-726.
SAS, 1988. SAS User's Guide: Statistics. SAS Inst, Inc., Cary, NC. Tamminga S. & Verstegen, M.W., 1991. Protein nutrition and animal production : consequences
for environments and some possible recommendations. In : Proc 6 t h Internat. Symp. Protein Metabolism and nutrition. EAAP Publication No 59. Nat.Inst.Anim.Sci., Foulum, Denmark.
211
Low protein diets and performances, carcass quality and nitrogen excretion of typical italian heavy pigs1
Piva G.2, PrandiniA.2, FerrariniF?, Morlacchini M.01 and Varini G.5
2Istituto di Scienze delta Nutrizione, Facoltà di Agraria, U.C.S.C., Via E. Parmense 84, Piacenza. 3 Istituto Superiore Lattiero Caseario, Mantova. 4 Centro di Ricerca sulla Zootecnia e VAmbiente, Piacenza.5 Associazione Allevatori, Mantova, Italy.
Summary
A trial was conducted to evaluate the effects of low protein diets on heavy pigs (LWxLxD) performances, carcass quality and N excretion, from 40 to 160 kg l.w.. During each growing period (40-80 (I); 80-120 (II) and 120-160 (III) kg l.w.) treatments were: control diet (C) and two LPD (-25% c.p. vs C) .where the aa balance, according to ideal protein (INRA), was obtained adding standard synthetic aa (SSAA) (Lys, Met, Thr, Trp) or slow release aa (SRAA). Protein level of the diets were: 17.5%, 12.75%, 12.75%; 15.35%, 11.10%, 11.30%; 12.9%; 9.6%, 9.65%; respectively for C, SSAA and SRAA during I, II and III growing period. SRAA diet gave better weight gains vs C (+9.83%; P<.05) up to 145 kg l.w.. SSAA and SRAA diets decreased blood urea vs C (-46.7% and -29.8% respectively; P<.01). Lean tissue deposition was higher and backfat thickness was lower for SSAA vs C (+4.92%; P<.01 and -21.9%; P<.05 respectively). SSAA and SRAA diets reduce total N excretion vs C diet, by 43.22% and 40.93% (P<.01); 38.8% and 37.3% (P<.01) and 34.7% and 33.7% (P.<.01) respectively for I, II and III periods. There were no significant effects of SSAA and SRAA diets on N retained vs control diet during every growing periods. • . '•
Introduction i
Water, soil and air pollution is a major problem in highly intensive Italian heavy pigs production areas. Technical knowledges are now available to reduce N pollution through feeding strategy (Jongbloed & Lenis, 1991; Dourmand, 1991; Gatel & Grosjean, 1992; Henry & Bourdon, 1993), without reduction of growth performances and carcass quality. Feeding strategy concerns mainly the reduction of N level of diets through an optimum dietary aminoacid (aa) balance, according to "ideal protein" pattern (Cole, 1978; INRA, 1984; Wang e Fuller, 1989)^Most works concern pigs slaughtered at 100-110 kg l.w„ Less data are available for 150-160 kg
1. Research supported by M.A.F. Research Program "Studio di tecniche alimentari per la riduzione deU'impatto ambientale deU'allevamento suino" D.M. 382/7240/90.
212
l.w. pigs (Parisini et al., 1991; Piva et al., 1993a, 1993b). Slow release aa added to pigs diet show positive effect on growth performances probably due to the most effective rate of absorption in the hindgut. (Walz et al., 1988; Kierczynska, 1988). The aim of this work is to evaluate the effects of low protein diets, supplemented with standard synthetic amino acids (SSAA) or slow release amino acids (SRAA) on performances, carcass quality and N excretion of traditional italian heavy pigs.
Materials and methods
Animals and diets
216 pigs (LWxLxD), averaging 41.63 kg initial weight including an equal number of females and castrated males, were assigned to 3 experimental treatments. Six replicates (12 pigs each one) per treatment were used. Treatments (tab.1) were: basal diet containing corn-barley-soybean meal without standard synthetic amino acids (SSAA) added (Control (C); treatment 1); according to INRA ideal protein (1989), SSAA (treatment 2) or slow release amino acids (SRAA) (treatment 3) L-Lys, DL-Met, DL-Thr and DL-Trp partially substituted soybean meal and fish meal to decrease c.p. content (-25%) vs C diet during the three growing periods. The composition (tab. 2) of the diets were modified according to Lw. of pigs; experimental periods (from 40 to 160 kg l.w.) were divided into three phases: 40-80 (I); 80-120 (II) and 120-160 kg l.w. (III). Restricted diets were offered in liquid form (watenmeal ratio, 3:1). Live weight, daily gain and feed intake was recorded every 28 d. At the end of every experimental period, blood sampling for plasma parameters was carried out on six animals per treatment (3 females and 3 castrated males).
Assessment of carcass composition at slaughter
Pigs were slaughtered at a average l.w. of 161.33 kg. Linear measurements of fat and lean were made with a Fat-O-Meter apparatus (SFK, Denmark). pHl and pHu were recorded on semimembranosus muscle. Color of semimembranosum muscle and backfat consistency was evaluated on trimming hams.
Nitrogen balance
Six pigs were housed individually in metabolic cages. All animals were fed dry twice daily at 8% of metabolic weight; water was ad libitum. After a preliminary period of 10 d, nitrogen balance was measured during a 5 d period.
Statistical analysis
Was performed using the GLM procedure of SAS (1988).
213
Results and discussion
Animals fed low nitrogen level diets (-25% vs control diet) had better or similar performances of those fed the C diets (tab.3). At 112 d of trial animals fed SSAA and SRAA had higher daily gain than those fed C diet (+7.7% and +5.6% respectively; P<.01). SSAA diet gave also better feed efficiency vs C (+7.1% vs C; P<.01). At 169 d, SSAA animals had lower daily gain vs C animals (-11.2%; P<.05). At the end (196 d) of the trial there was no significant difference among treatments for these parameters. According to Kierczynska (1988) and Piva et al. (1993a) animals fed diets containing protected Lys and Met had better performances than those fed C diets at the end of the II growing period. Performance data of our trial are in accordance with the works of Parisini et al. (1991) with 150 kg l.w. pigs, Cinq-Mars et al. (1988) with 100-110 l.w. pigs and Van Wurder & Verstegen (1985) from 20 to 110 kg l.w. pigs. SSAA and SRAA low protein diets reduced (P<0.01) urea blood content by 56.8% and 49.4% at 80 kg l.w., by 60.4% and 39.8% at 120 kg l.w. and by 46.7% and 29.8% at 160 kg l.w., vs C diet, respectively (tab.4). Therefore, there is an energetic saving due to the decrease of urea synthesis. Slaughtering parameters (tab.5) show an higher lean tissue deposition (+5.2%; P < .01), a reduction of backfat thickness (-21.9%; P < .05), for SSAA vs C diet. L,a,b measurements show a lower (P<.05) L value, but an higher (P<0.01) red colour of the meat for SSAA vs C. Fatty acids composition of Parma ham fat was similar among treatments. SRAA and SSAA diets reduced (P<.01) N excretion vs control diet by 43.22% and 40.93%; 37.3% and 38.8%; 33.7% and 34.7% during each growing period, respectively (tab. 6). Pigs fed SRAA and SSAA diets had similar N retention of those fed control diet during every growing periods.
Conclusion
The concept of " ideal protein" pattern widely studied in 100 -110 kg is also effective for traditional italian heavy pigs (150-160 kg) without any negative effect on performances and carcases quality compared to the Control diet with low protein diets. Nitrogen output decreased by 35-43% vs C diet during every growing periods.
References Castaign, J., Grosjean F., 1988. Acide aminés chez le porc charcutier: intérêt dans
des regimes riches en céréales et en pois. In Les acides aminés pour porcs: evolution récents. Table ronde ITCF, 29 septembre, SIMAVIP.
Cinq-Mars D., Goulet G., Brisson G.L., 1988. Response of piglets to suboptimal protein diets supplemented with lysine, methionine, threonine and tryptophan, Can. J. Anim. Sei., 68:311-313.
Cole, DJ.A., 1978. Amino acid nutrition in the pig. In Haresign W., Lewis D.: Recent Advances in Animal Nutrition, Butterworth, London, p. 112-121.
Dourmand J.Y., 1991. Rejets azotés dans les déjections porcines: importance de
214
ti
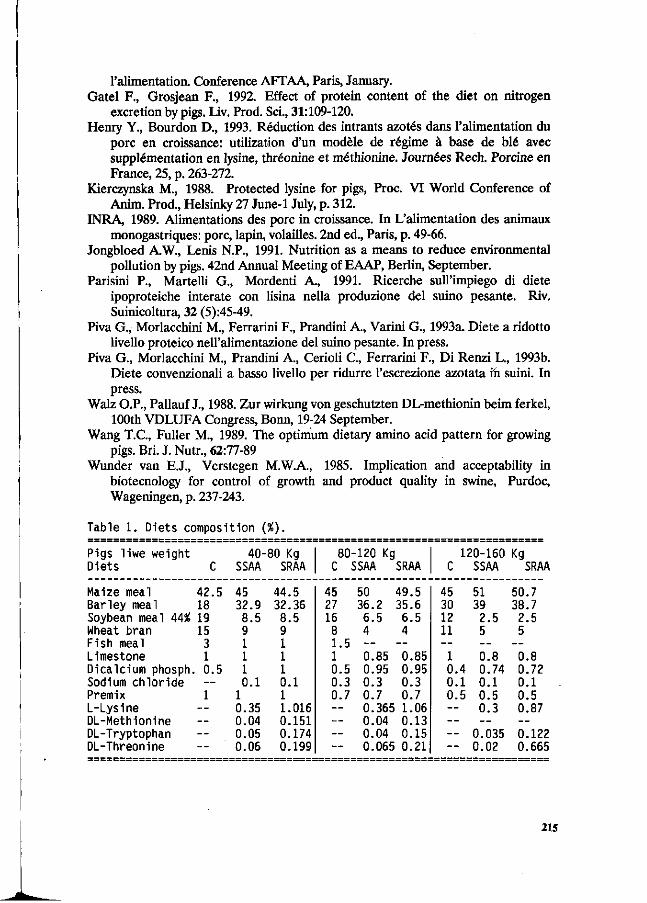
l'alimentation. Conference AFTAA, Paris, January. Gatel F., Grosjean F., 1992. Effect of protein content of the diet on nitrogen
excretion by pigs. Liv. Prod. Sei., 31:109-120. Henry Y., Bourdon D., 1993. Réduction des intrants azotés dans l'alimentation du
porc en croissance: utilization d'un modèle de régime à base de blé avec supplementation en lysine, threonine et methionine. Journées Rech. Porcine en France, 25, p. 263-272.
Kierczynska M., 1988. Protected lysine for pigs, Proc. VI World Conference of Anim. Prod., Helsinky 27 June-1 July, p. 312.
INRA, 1989. Alimentations des porc in croissance. In L'alimentation des animaux monogastriques: porc, lapin, volailles. 2nd ed., Paris, p. 49-66.
Jongbloed A.W., Lenis N.P., 1991. Nutrition as a means to reduce environmental pollution by pigs. 42nd Annual Meeting of EAAP, Berlin, September.
Parisini P., Martelli G., Mordenti A., 1991. Ricerche sulPimpiego di diete ipoproteiche interate con lisina nella produzione del suino pesante. Riv. Suinicoltura, 32 (5):45-49.
Piva G., Morlacchini M., Ferrarini F., Prandini A., Varini G., 1993a. Diete a ridotto livello proteico nell'alimentazione del suino pesante. In press.
Piva G., Morlacchini M., Prandini A., Cerioli C, Ferrarini F., Di Renzi L., 1993b. Diete convenzionali a basso livello per ridurre 1'escrezione azotata ifi suini. In press.
Walz O.P., Pallauf J., 1988. Zur Wirkung von geschützten DL-methionin beim ferkel, 100th VDLUFA Congress, Bonn, 19-24 September.
Wang T.C., Fuller M., 1989. The optimum dietary amino acid pattern for growing pigs. Bri. J. Nutr., 62:77-89
Wunder van E.J., Verstegen M.W.A., 1985. Implication and acceptability in biotecnology for control of growth and product quality in swine, Purdoc, Wageningen, p. 237-243.
Table 1 . Diets composition (%).
Pigs liwe weight Diets
Maize meal Barley meal Soybean meal 44% Wheat bran Fish meal Limestone Dicalcium phosph Sodium chloride Premix L-Lysine DL-Methionine DL-Tryptophan DL-Threonine
C
42.5 18 19 15 3 1 0.5 — 1
— — — —
40-SSAA
45 32.9 8.5 9 1 1 1 0.1
1 0.35 0.04 0.05 0.06
80 Kg SRAA
44.5 32.36 8.5 9 1 1 1 0.1 1 1.016 0.151 0.174 0.199
80-120 Kg C SSAA SRAA
120-160 Kg C SSAA SRAA
45 27 16 8 1.5 1 0.5 0.3 0.7
50 49.5 36.2 35.6 6.5 6.5 4 4
0.85 0.95 0.3 0.7
0.85 0.95 0.3 0.7
0.365 1.06 0.04 0.04
0.13 0.15
065 0.21
45 30 12 11
51 50.7 39 38.7 2.5 2.5 5 5
1 0.4 0.1 0.5
0.8 0.74 0.1 0.5 0.3
0.8 0.72 0.1 0.5 0.87
- 0.035 0.122 - 0.02 0.665
215
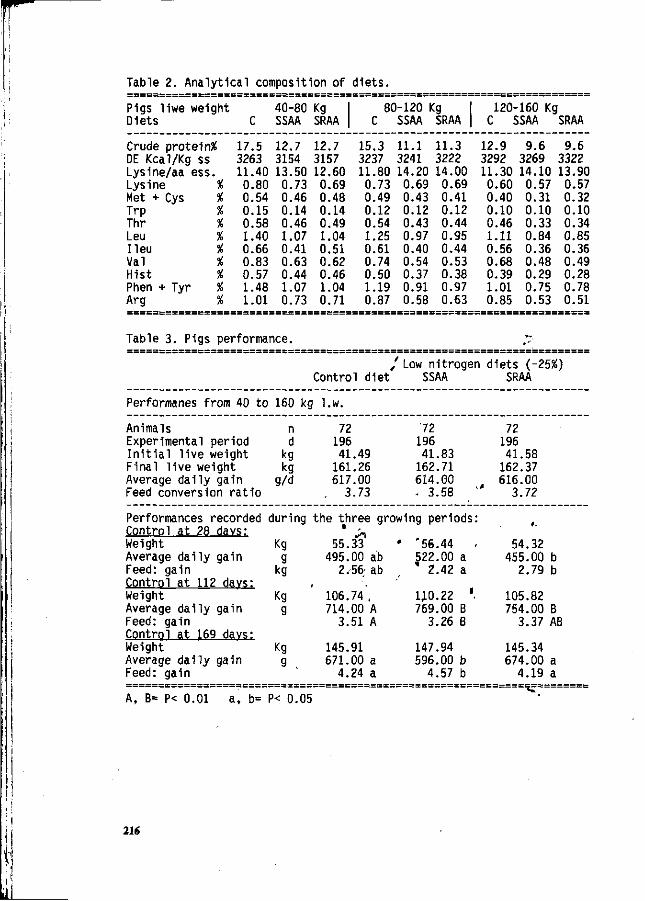
Table 2. Analytical composition of diets.
Pigs liwe wei Diets
qht
Crude protein^ DE Kcal/Kg ss Lysine/aa ess Lysine Met + Cys Trp Thr Leu lieu Val Hist Phen + Tyr Arg
. % % % % % % % % % %
C
17.5 3263 11.40 0.80 0.54 0.15 0.58 1.40 0.66 0.83 0.57 1.48 1.01
40-80 SSAA
12.7 3154 13.50
0.73 0.46 0.14 0.46 1.07 0.41 0.63 0.44 1.07 0.73
Kq SRAA
12.7 3157 12.60 0.69 0.48 0.14 0.49 1.04 0.51 0.62 0.46 1.04 0.71
8C C
15.3 3237 11.80 0.73 0.49 0.12 0.54 1.25 0.61 0.74 0.50 1.19 0.87
-120 Kg SSAA
11.1 3241 14.20
0.69 0.43 0.12 0.43 0.97 0.40 0.54 0.37 0.91 0.58
SRAA
11.3 3222 14.00 0.69 0.41 0.12 0.44 0.95 0.44 0.53 0.38 0.97 0.63
120- 160 Kg C SSAA
12.9 3292 11.30 0.60 0.40 0.10 0.46 1.11 0.56 0.68 0.39 1.01 0.85
9.6 3269 14.10
0.57 0.31 0.10 0.33 0.84 0.36 0.48 0.29 0.75 0.53
SRAA
9.6 3322 13.90
0.57 0.32 0.10 0.34 0.85 0.36 0.49 0.28 0.78 0.51
Table 3. Pigs performance.
/ Low nitrogen diets (-25%) Control diet SSAA SRAA
Performanes from 40 to 160 kg l.w.
Animals Experimental period Initial live weight Final live weight Average daily gain Feed conversion ratio
Performances recorded Control at 28 davs: Weight Average daily gain Feed: gain Control at 112 davs: Weight Average daily gain Feed: gain Control at 169 davs: Weight Average daily gain Feed: gain
n d
kq kq
g/d
during
Kq g
kq
Kq g
Kq g ,
72 196 41.49
161.26 617.00
. 3.73
'72 196 41.83
162.71 614.00 - 3.58 l'
the three growing periods: v*l
55.33 495.00 ab
2.56 ab , ', '
106.74., 714.00 A
3.51 A
145.91 671.00 a
4.24 a
' '56.44 . 522.00 a
2.42 a
110.22 '• 769.00 B
3.26 B
147.94 596.00 b
4.57 b
72 196 41.58
162.37 616.00
3.72
54.32 455.00 b
2.79 b
105.82 754.00 B
3.37 AB
145.34 674.00 a
4.19 a
A, B= P< 0.01 a, b= P< 0.05
216
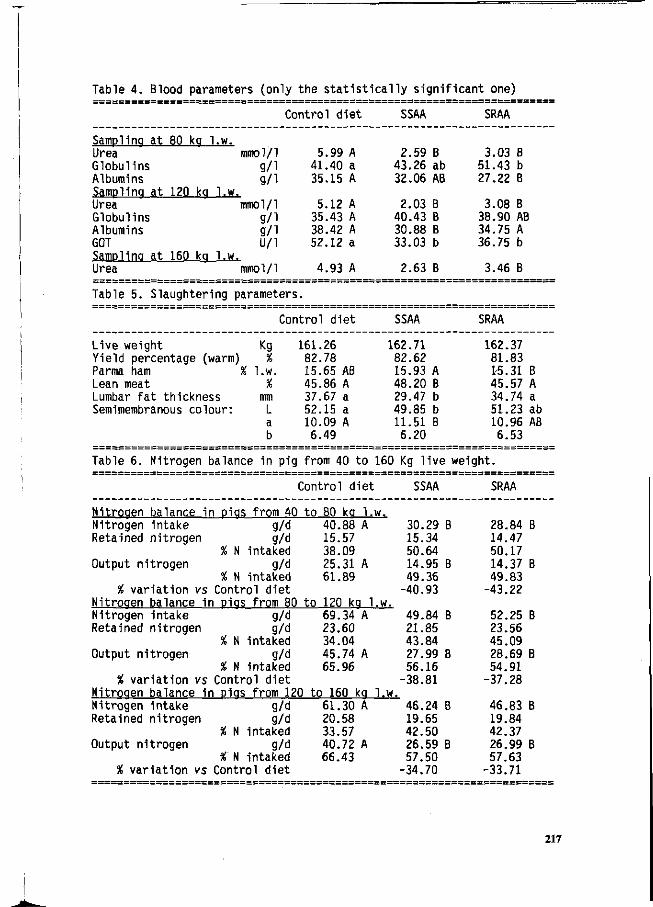
Table 4. Blood parameters (only the statistically significant one)
Control diet
Samplina at 80 kq l.w. Urea mmol/1 Globulins g/1 Albumins g/1 Samplina at 120 ka l.w. Urea mmol/1 Globulins g/1 Albumins g/1 GOT U/l Samplina at 160 ka l.w. Urea mmol/1
Table 5. Slaughtering parameters
5.99 A 41.40 a 35.15 A
5.12 A 35.43 A 38.42 A 52.12 a
4.93 A
•
Control diet
Live weight Kg Yield percentage (warm) % Parma ham % l.w. Lean meat %
i Lumbar fat thickness mm Semimembranous colour: L
a b
Table 6. Nitrogen balance in pig
161.26 82.78 15.65 Aß 45.86 A 37.67 a 52.15 a 10.09 A 6.49
from 40 to
Control diet
Nitroaen balance in Dias from 40 to 80 ka 1. Nitrogen intake g/d Retained nitrogen g/d
% N intaked Output nitrogen g/d
% N intaked % variation vs Control diet
Nitroaen balance in pias from 80 Nitrogen intake g/d Retained nitrogen g/d
% N intaked Output nitrogen g/d
% N intaked % variation vs Control diet
40.88 A 15.57 38.09 25.31 A 61.89
to 120 ka 1 69.34 A 23.60 34.04 45.74 A 65.96
Nitroaen balance in Dias from 120 to 160 ka Nitrogen intake g/d Retained nitrogen g/d
% N intaked Output nitrogen g/d
% N intaked % variation vs Control diet
61.30 A 20.58 33.57 40.72 A 66.43
SSAA
2.59 B 43.26 ab 32.06 AB
2.03 B 40.43 B 30.88 B 33.03 b
2.63 B
SSAA
162.71 82.62 15.93 A 48.20 B 29.47 b 49.85 b 11.51 B 6.20
160 Kg live we-
SSAA
w. 30.29 B 15.34 50.64 14.95 B 49.36
-40.93 .w.
49.84 B 21.85 43.84 27.99 B 56.16
-38.81 l.w.
46.24 B 19.65 42.50 26.59 B 57.50
-34.70
SRAA
3.03 B 51.43 b 27.22 B
3.08 B 38.90 AB 34.75 A 36.75 b
3.46 B
SRAA
162.37 81.83 15.31 B 45.57 A 34.74 a 51.23 ab 10.96 AB 6.53
ght.
SRAA
28.84 B 14.47 50.17 14.37 B 49.83
-43.22
52.25 B 23.56 45.09 28.69 B 54.91
-37.28
46.83 B 19.84 42.37 26.99 B 57.63
-33.71
217
Reducing crude protein content with supplementation of free lysine and threonine in barley-rapeseed meal-pea diets of growing pigs
Jarmo Valaja and Timo Alaviuhkola
University of Helsinki, Department of Animal Science, PO Box 28, SF-00014 University of Helsinki, Finland and Agricultural Research Centre of Finland, Institute of Animal Production, Swine Research Station, SF-05840 Hyvinkää, Finland.
Summary
A feeding strategy to lower nitrogen output with synthetic amino acids was studied in a performance experiment with 130 triplet fed growing pigs. Dietary crude protein was reduced from 163 to 148, 132 and 117 g kg"1, respectively, and the diets were supplemented with free lysine and threonine to keep the level of amino aSds constant. Dietary protein reduction did not affect the growth- performance or feed conversion ratio of the pigs, but it linearly increased the portion offat to lean in the carcass. However, the change in carcass composition was negligible down to the crude protein level of 132 g kg" \ It is concluded, that it is possible to reduce the crude protein content of the diet by up to 20 % with better balancing of dietary protein with synthetic lysine and threonine.
Keywords: growing pig, growth rate, feed conversion ratio, carcass quality, nitrogen output, crude protein, lysine, threonine.
Introduction
Animal production causes serious environmental problems in many Europian countries. The increasing content of nitrogen in the joil, atmosphere and fresh water originating from manure is a real problem in areas of high density, animal production (Lenis 1989, Verstegen & Tammiga 1991).
Much effort has been focused on nutritional means of reducing environmental pollution (Jongbloed & Lenis 1991). The lowering of nitrogen excretion in pig production is related to the protein and amino acid balance of the diet, because oversupply of protein and amino acids is excreted mostly in urine. A closer balance of amino acids in the diet compared to the requirement can be achieved if feeding is based on the requirements depending on age and physiological state or, if the dietary protein is better balanced by improved availability and quality of the protein (Lenis 1989).
The availability of economically viable free amino acids has made them an attractive alternative to balance the dietary amino acid composition of pig feeds. ,A significant reduction in the crude protein content of cereal or corn based diets has been attained with supplementation of free lysine alone without impairing the performance of the pigs (Taylor et al. 1979, Easter & Baker 1980). Furthermore the reduction of dietary protein has also depressed water consumption of the pigs, which leads to a lower volume of excreted urine (Pfeiffer & Henkel 1991).
This experiment was undertaken to compare the present protein feeding recommendations of growing pigs in Finland (Salo et al. 1990) to balancing of essential amino acid content of the diet with respect to the requirements of the growing pigs. The object of the
218
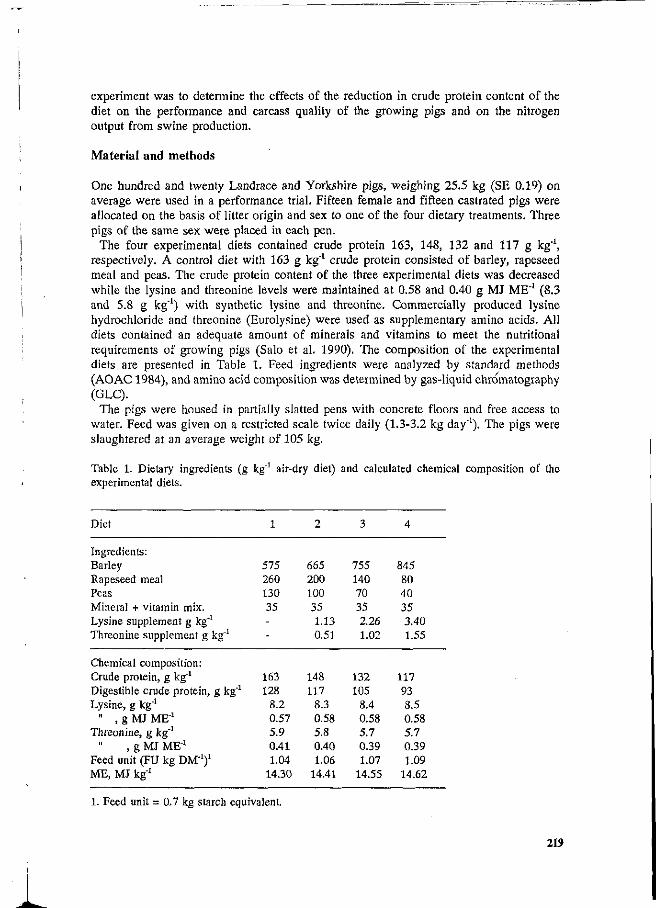
experiment was to determine the effects of the reduction in crude protein content of the diet on the performance and carcass quality of the growing pigs and on the nitrogen output from swine production.
Material and methods
One hundred and twenty Landrace and Yorkshire pigs, weighing 25.5 kg (SE 0.19) on average were used in a performance trial. Fifteen female and fifteen castrated pigs were allocated on the basis of litter origin and sex to one of the four dietary treatments. Three pigs of the same sex were placed in each pen.
The four experimental diets contained crude protein 163, 148, 132 and 117 g kg"1, respectively. A control diet with 163 g kg"1 crude protein consisted of barley, rapeseed meal and peas. The crude protein content of the three experimental diets was decreased while the lysine and threonine levels were maintained at 0.58 and 0.40 g MJ ME"1 (8.3 and 5.8 g kg'1) with synthetic lysine and threonine. Commercially produced lysine hydrochloride and threonine (Eurolysine) were used as supplementary amino acids. All diets contained an adequate amount of minerals and vitamins to meet the nutritional requirements of growing pigs (Salo et al. 1990). The composition of the experimental diets are presented in Table 1. Feed ingredients were analyzed by standard methods (AOAC 1984), and amino acid composition was determined by gas-liquid chromatography (GLC).
The pigs were housed in partially slatted pens with concrete floors and free access to water. Feed was given on a restricted scale twice daily (1.3-3.2 kg day"1). The pigs were slaughtered at an average weight of 105 kg.
Table 1. Dietary ingredients (g kg"1 air-dry diet) and calculated chemical composition of the experimental diets.
Diet
Ingredients: Barley Rapeseed meal Peas Mineral + vitamin mix. Lysine supplement g kg"1
Threonine supplement g kg"1
Chemical composition: Crude protein, g kg"1
Digestible crude protein, g kg"1
Lysine, g kg"1
" , g MJ ME"1
Threonine, g kg'1
, g MJ ME"1
Feed unit (FU kg DM"1)1
ME, MJ kg"1
1
575 260 130 35 --
163 128
8.2 0.57 5.9 0.41 1.04
14.30
2
665 200 100 35 1.13 0.51
148 117
8.3 0.58 5.8 0.40 1.06
14.41
3
755 140 70 35 2.26 1.02
132 105
8.4 0.58 5.7 0.39 1.07
14.55
4
845 80 40 35 3.40 1.55
117 93 8.5 0.58 5.7 0.39 1.09
14.62
1. Feed unit = 0.7 kg starch equivalent.
219
The carcass weight was recorded 24 h after slaughter. The left half of the cold carcass of each pig was cut to valuable cuts and the cuts were trimmed to determine lean and fat. The proportion of lean and fat was calculated from the ham joint, valuable cuts and whole carcass. A tracing was taken from the longissimus dorsi muscle with the covering subcutaneous fat layer and skin posterior from the last rib. The area of the longissimus dorsi muscle was determined from the tracing with a planimeter. Thickness of back fat was a mean of shoulder (maximum thickness), middle (minimum thickness) and ham measurements while thickness of side fat was determined from the tracing of longissimus dorsi.
The data were analyzed by GLM procedure of SAS (1990). The model used to analyse the data was: yijk,= ju + dj + s- + (ds)^ + pk(ds)ij + eijk, where d, s and p are diet, sex and pen effects, respectively and ds is the effect of diet*sex and e^ is the error. Slaughter weight was used as a covariante in the testing of carcass trait measurements. The diet effect was further partioned into single degrees of freedom to test the linear, quadratic and cubic effect of the crude protein level.
Results
One female pig from diet 4 was excluded from Jhe trial for a reason unrelated to the treatment and the missing values were fitted for hér. Otherwise the pigs completed the experiment successfully. Refusals of the diets were negligible. The overall results of the experiment are given in Table 2.
Growth performance of the pigs was good over the whole experimental period averaging 880 g/day. the daily gain (DG) and feed conversion ratio (FCR) of the pigs were unaffected by the reduction of the dietary crude protein level. There was a significant difference in the carcass weight (p<0.05), which also produced a difference in the corrected final weight (p<0.05). The carcass composition of the pigs changed'from lean to fat, when the crude protein content in the diet decreased, while a significant linear increase was found in the back fat (p<0.001) and s de fat (p<0.05) thickness. The lea# content in valuable cuts, in carcass and in ham joint «tso decreased linearly (p<0.05). However, no signicant differences were found in the area of longissimus dorsi and in the fat content of ham joint between the diets. No significant interaction^ were found between the sex and the reduction of dietary crude protein.
i
Discussion
The results of this study clearly show one possible feeding strategy to reduce nitrogen excretion from swine production. In our experiment the supplementary amino acids chosen, were lysine and threonine, because they are commonly the two most limiting amino acids in barley based diets (Fuller et al. 1979a, 1979b). Similar results have been also obtained in other performance (Taylor et al. 1979, Easter & Baker 1980) 'and balance trials (Gatel & Grosjean 1991, Nasi 1985) with supplementation of only lysine. Easter & Barker (1980) reduced the dietary crude protein content of a corn-soya bean diet by 10 % without any negative effects on the performance of the pigs. In addition to this, Taylor et al. (1979) showed that the crude protein content of barley-soya bean meal diet could be lowered from 17.6 to 14.5 % , but at lower levels of dietary protein, the performance of the pigs started to deteriorate. Gatel & Grosjean (1991) reported that a 7.5 % decrease in nitrogen intake resulted in a 15 to 20 % decrease in nitrogen excretion in a balance trial.
220
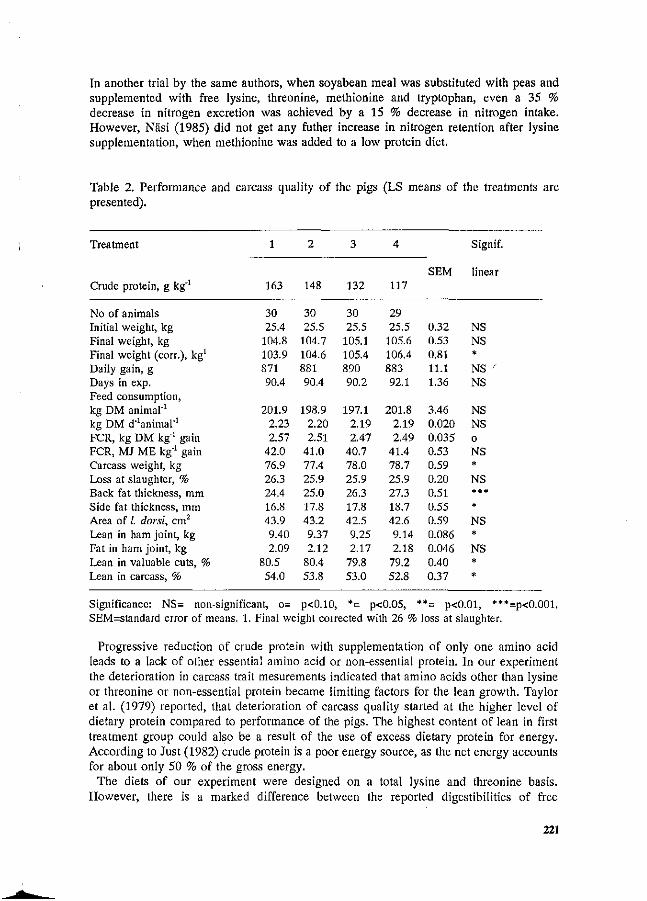
In another trial by the same authors, when soyabean meal was substituted with peas and supplemented with free lysine, threonine, methionine and tryptophan, even a 35 % decrease in nitrogen excretion was achieved by a 15 % decrease in nitrogen intake. However, Nasi (1985) did not get any futher increase in nitrogen retention after lysine supplementation, when methionine was added to a low protein diet.
Table 2. Performance and carcass quality of the pigs (LS means of the treatments are presented).
Treatment
Crude protein, g kg"1
No of animals Initial weight, kg Final weight, kg Final weight (corr.), kg1
Daily gain, g Days in exp. Feed consumption, kg DM animal"1
kg DM d^animal"1
FCR, kg DM kg"1 gain FCR, MJ ME kg"1 gain Carcass weight, kg Loss at slaughter, % Back fat thickness, mm Side fat thickness, mm Area of /. dor si, cm2
Lean in ham joint, kg Fat in ham joint, kg Lean in valuable cuts, % Lean in carcass, %
1
163
30 25.4
104.8 103.9 871 90.4
201.9 2.23 2.57
42.0 76.9 26.3 24.4 16.8 43.9 9.40 2.09
80.5 54.0
2
148
30 25.5
104.7 104.6 881 90.4
198.9 2.20 2.51
41.0 77.4 25.9 25.0 17.8 43.2 9.37 2.12
80.4 53.8
3
132
30 25.5
105.1 105.4 890 90.2
197.1 2.19 2.47
40.7 78.0 25.9 26.3 17.8 42.5 9.25 2.17
79.8 53.0
4
117
29 25.5
105.6 106.4 883 92.1
201.8 2.19 2.49
41.4 78.7 25.9 27.3 18.7 42.6 9.14 2.18
79.2 52.8
SEM
0.32 0.53 0.81 11.1 1.36
3.46 0.020 0.035 0.53 0.59 0.20 0.51 0.55 0.59 0.086 0.046 0.40 0.37
Signif.
linear
NS NS
* NS ' NS
NS NS 0
NS * NS #*# * NS * NS * *
Significance: NS= non-significant, o= p<0.10, *= p<0.05, **= p<0.01, ***=p<0.001. SEM=standard error of means. 1. Final weight corrected with 26 % loss at slaughter.
Progressive reduction of crude protein with supplementation of only one amino acid leads to a lack of other essential amino acid or non-essential protein. In our experiment the deterioration in carcass trait mesurements indicated that amino acids other than lysine or threonine or non-essential protein became limiting factors for the lean growth. Taylor et al. (1979) reported, that deterioration of carcass quality started at the higher level of dietary protein compared to performance of the pigs. The highest content of lean in first treatment group could also be a result of the use of excess dietary protein for energy. According to Just (1982) crude protein is a poor energy source, as the net energy accounts for about only 50 % of the gross energy.
The diets of our experiment were designed on a total lysine and threonine basis. However, there is a marked difference between the reported digestibilities of free
221
(Leibholz et al. 1986) and protein-bound lysine and threonine (Sauer & Thacker 1986, Buraczewska et al. 1989), which resulted different amounts of digestible lysine and threonine in the experimental diets. Our performance results indicate that the difference in the utilization of free and protein-bound amino acids is much less than assumed, as confirmed in the recent studies of Susenbeth et al. (1991) and Matre & Homb (1991).
Our calculations concerning the reduction in the nitrogen excretion showed about 1.29 kg or 35 % difference in nitrogen excretion per pig between treatments 1 and 3, if the daily nitrogen retention was estimated to be similar in both treatments (about 27 g day"1). The result is in close agreement with the calculations of Lenis (1989), which showed that 2 percentage units reduction in the crude protein content of the diets of growing pigs resulted in about 25 % reduction in nitrogen excretion per pig.
In conclusion, it is possible to reduce crude protein content of the growing-finishing pigs by up to 20 % with addition of free lysine and threonine. However, the practical implementations of the feeding strategy depends on the price difference between the protein and energy feedstuffs and the availability of synthetic amino acids at competitive prices.
References
AOAC, 1984. Official methods of analysis. 14th édition. Association of Official Analytical Chemist. Arlington, Virginia.
Buraczewska, L., Gdala, J., & Grala, W., 1989. Ileal digestibility of protein in pigs fed diets with peas of variable content of protein and tannins. In: J. Huisman, T.F.B, van der Poel & I.E. Liener (Eds.). Recent advantages of research in antinutritional factors in legume seeds. Proc. 1st Int. Workshop on Antinutritional Factors in Legume Seeds, Wageningen, Netherlands, p. 181-184.
Easter, R.A., & Barker, D.H., 1980. Lysine and protein lçvels in corn-soybean meal diets for growing-finishing swine. J. Anim. Sei. 50: 467*471.
Fuller, M.F., Livingstone, R.M., Baird, B.A., & Atkinson, T., 1979a. The optimal amino acid supplementation of barley for growing pig. 1. Response of nitrogen<jnetabolism to progressive supplementation. Br. J. Nlîtr. 41;, 321-331.
- , Mennie, I., & Crofts, R.M.J., 1979b. 'The optimal amino acid supplementation of barley for growing pigs. 2. Optimal additions of lysine and threonine for growth. Br. J. Nutr. 41: 333-340.
Gatel, F., & Grosjean, F., 1991. Effect of protein content of the diet on nitrogen excretion by pigs. 42 nd Annual Meeting of the EAAP, 8.-12.9.1991, Berlin, Germany. 17 p.
Jongbloed, A.W., & Lenis, N.P., 1991. Nutrition as a means to reduce environmental pollution by pigs. 42 nd Annual Meeting of the EAAP, 8.-12.9.1991, Berlin, Germany. 24 p.
Just, A., 1982. The net energy value of crude (catabolized) protein for growth in pigs. Livest. Prod. Sei. 9: 349-360. ^
Leibholz, J., Love, R.J., Mollah, Y., & Carter, R.R., 1986. The absorption of dietary L-lysine and extruded L-lysine in pigs. Anim. Feed. Sei. Technol. 15: 141-148.
Lenis, N.P., 1989. Lower nitrogen excretion in pig husbandry by feeding: current and future possibilities. Neth. J. of Agric. Sei. 37: 71-74.
Matre, T. & Homb, T., 1991. Synthetic amino acids as supplements to a bar-ley/oat/soyabean based ration for growing pigs. Proc. 6th Int. Symp. Protein Metabolism and Nutrition, Herning, Denmark, p.265-267.
222
•8 Lin
Nasi, M., 1985. Replacing protein supplements in barley-based diets for growing pigs with free lysine and methionine. J. Agric. Sei. Fini. 57: 245-253.
Pfeffer, A., & Henkel, H., 1991. The effect of different dietary protein levels on water intake and water excretion of growing pigs. In: M.W.A. Verstegen, J. Huisman & L.A. den Hartog (Eds.). Proc. 5th Int. Symp. on Digestive Physiology in Pigs, Wageningen, Netherlands p. 126-131.
Salo, M-L., Tuori, M. & Kiiskinen, T., 1990. Rehutaulukot ja ruokintanormit. 70 p. Helsinki.
Sauer, W.C., & Thacker, P.A:, 1986. Apparent ileal and faecal digestibility of amino acids in barley-based diets supplemented with soya bean meal or canola meal for growing pigs. Anim. Feed. Sei. Technol. 14: 183-192.
SAS, 1990. SAS/STAT User's Guide, Version 6, 5 th Ed., Vol. 2. 795 p. SAS Institute Inc, Cary, NC, USA.
Susenbeth, A., Schneider, R., & Menke, K.H., 1991. The effect of protein-bound lysine versus free lysine on protein retention in growing pigs. Proc. 6th Int. Symp. Protein Metabolism and Nutrition, Herning, Denmark, p. 18-20.
Taylor, A.J., Cole, D.J.A. & Lewis, D., 1979. Amino acid requirements of growing pigs. 1. Effects of reducing protein level in diets containing high levels of lysine. Anim. Prod. 29: 327-338.
223
NITROGEN UTILIZATION RESPONSES OF GROWING PIGS TO SUPPLEMENTAL LYSINE IN BARLEY-BARLEY PROTEIN DIET
Matti Nasi
University of Helsinki, Department of Animal Science SF-00014 HELSINKI UNIVERSITY, Finland
Summary
The influence of increasing dietary supplements of liquid compared to crystalline lysine on nitrogen (N) balance and utilization in growing pigs (30-100 kg LW) was studied in a 8*8 Latin square. Eight isonitrogenous diets with 25 g N/kg diet were formulated from barley and barley protein (BP) from integrated starch-ethanol process by supplementing with the two lysine sources at levels of zero, 1, 2 and 3 g to provide 5.5, 6.5, 7.5 and 8.5 g/kg, respectively, total dietary lysine. Barley-SBM served as a control diet. Thefe was a linear response of N-retention, urinary-N and urea-N excretion and apparent biological value (P<0.001) to the lysine supply level. As the lysinef concentration was gradually increased, the efficiency of N retention in relation to N intake and absorbed N increased linearly. No difference was found in N balance parameters between the two lysine sources, liquid vs. crystalline form, being equal in their response. Pigs fed the SBM-diet compared to the BP-diet fortified with lysine did not differ in response concerning N retention or utilization, but SBM lead to lower urinary-N excretion in the equal lysine supply.
Introduction
The cereal diets for pigs are supplemented with protein sources to increase the total protein content and to counteract any essential amino acid deficiency. When the die^s are supplemented with protein sources, with the aim oi reaching Jevels of lysine optimal for protein synthesis, the amounts of other amino acids may become excessive. A surplus of amino acids to the pig's requirement are catabolized causing»N.and urea losses in urine. Increasing amounts of digestible protein in the' diet enhance the energy loss in the urine, decrease metabolizable energy (ME) in relation to digestible enei*gy and also decrease the efficiency of utilization of ME. Thus, the catabolism of excess protein reduces net energy available for pig growth (Just 1982). By using synthetic amino acids in the pig diets, it is possible to reduce CP levels and reduce the cost of the diets without deteriorating pig performances. Lysine and methionine are two amino acids which are commonly used in pig diets to replace or supplement natural intact protein sources of lysine and methionine.
Cereal protein after starch and ethanol process (Nasi 1988) has a low quality of protein (Linko et al. 1989, Nasi 1989), when considering the degree to which the composition of the absorbed amino acids is in accordance with the balance that is required by the pig (ARC 1981, Wang & Fuller 1989). The amino acid composition of barley protein can be improved as a protein source for pig feeding by fortification with pure lysine (Nasi 1989, Nasi & Aimonen 1992). Barley feed fractions to the pig farms are delivered commonly in a liquid form, which reduces the feed cost due to dehydration and eliminates deterioration of the protein quality in drying process. Lysine supplementation to wet barley protein
224
could be employed as liquid form, which would reduce the production costs of the lysine process and would avoid to a greater extent the environmental problems of waste waters in crystallization and purification of crystalline lysine.
The present paper reports an experiment which was conducted to determine the efficiency of the liquid lysine product compared to the crystalline form in the protein utilization of growing pigs as affected by the dietary lysine concentration in a barley-barley protein lysine deficient diet.
Material and methods
Eight dietary treatments were used in comparisons of the lysine forms and levels of supply. The barley based diets were formulated isonitrogenous to supply 25 g N/kg feed supplemented with barley protein derived from integrated starch-ethanol process (Alko Ltd. Koskenkorva) as described by Nasi (1988). As the (positive) control diet served barley supplemented with soybean meal to yield equal protein supply. Lysine supplementation of the diets (1,2, and 3 g pure lysine/kg) was made using a liquid product from fermentation with Brevibacterium flavum (Beker et al. 1971). The culture liquid was sterilized and dehydrated in a vacuum-vapour evaporator up to a DM content of 400 g/kg. This product was stabilized by adding hydrochloric acid to pH 5.1. The crystalline lysine was a commercial product, L-lysine monohydrochloride. ,
The experiment was designed as an 8 x 8 balanced Latin square with growing pigs of castrated males (Landrace x Large White) with initial weight of 30.4 (se 0.39) kg and final weight of 101.3 (se 0.41) kg. The pigs were kept during the whole experiment in metal metabolism cages equipped for separate collection of faeces and urine. Each period comprised 5 days of adjustment and 5 days of total collection. The pigs were fed twice daily according to a restricted feeding regime and their diets were adequately fortified with minerals and vitamins. All animals completed the experiment successfully and the average daily weight gain during the entire experiment was 814 g.
Pig response to graded levels of the two sources of supplemental lysine was assessed in terms of N balance, urinary-N and urea excretion, biological value and daily gain. The results were analysed by analysis of variance for Latin Square experiments and linear and quadratic functions were fitted to describe the response of lysine supplementation.
Results and discussion
The liquid lysine product contained 67.9 g/kg pure lysine and by adding one gram of lysine to the diet 0.52 g N was supplied, which is shown as a small increase of N supply in the diets. But, the addition of liquid lysine had a negligible effect on the supply of other amino acids to the diet due to their low concentration levels. The average daily DM intake was 93 g/W°'75/d during the trial. Refusals of the diet were negligible. OM digestibility of the diets was on average 0.852 with the coefficient of variation (CV) 0.0088. Average CP digestibility of the diets increased from 0.809 to 0.862 (P<0.001) during the trial. The CV of CP-digestibility was as low as 0.013, indicating a very high precision of the experimental techniques.
Lysine concentration in protein was calculated to be 46, 34, 41, 47 and 53 g/kg protein in diets with SBM addition, without lysine supplementation and with 1, 2, and 3 g pure lysine/kg, respectively. The diets containing lysine 5.5-8.5 g/kg supplied total dietary lysine from 8.3 to 24.7 g/d during the experimental period and averaged 12.1, 14.3, 16.5 and 18.7 g/d for diets with different lysine concentrations.
225
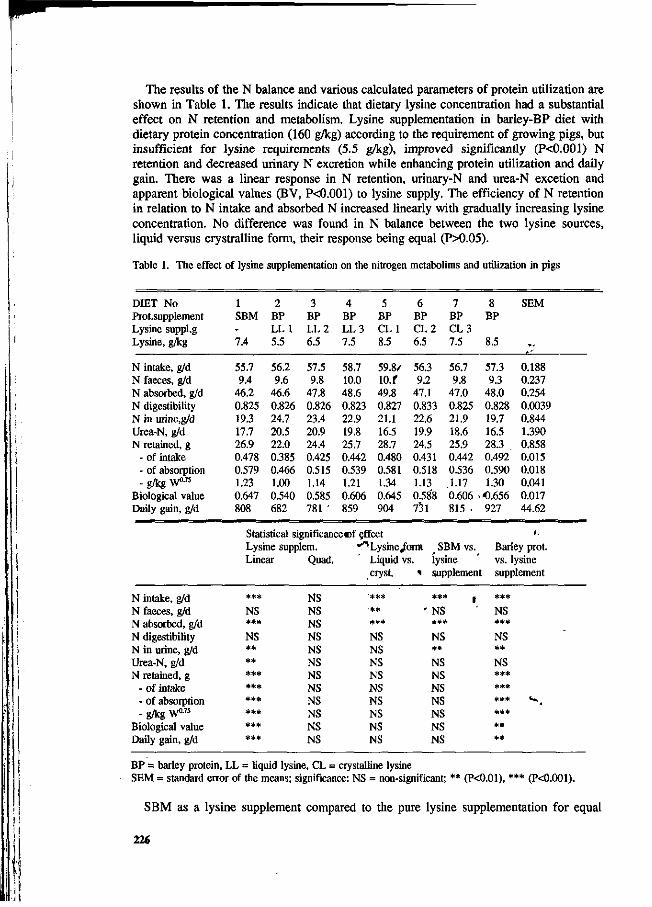
The results of the N balance and various calculated parameters of protein utilization are shown in Table 1. The results indicate that dietary lysine concentration had a substantial effect on N retention and metabolism. Lysine supplementation in barley-BP diet with dietary protein concentration (160 g/kg) according to the requirement of growing pigs, but insufficient for lysine requirements (5.5 g/kg), improved significantly (P<0.001) N retention and decreased urinary N excretion while enhancing protein utilization and daily gain. There was a linear response in N retention, urinary-N and urea-N excetion and apparent biological values (BV, P<0.001) to lysine supply. The efficiency of N retention in relation to N intake and absorbed N increased linearly with gradually increasing lysine concentration. No difference was found in N balance between the two lysine sources, liquid versus crystralline form, their response being equal (P>0.05).
Table 1. The effect of lysine supplementation on the nitrogen metabolims and utilization in pigs
DIET No Prot.supplement Lysine suppl.g Lysine, g/kg
N intake, g/d N faeces, g/d N absorbed, g/d N digestibility N in urine,g/d Urea-N, g/d N retained, g
- of intake - of absorption - g/kg W°"
Biological value Daily gain, g/d
N intake, g/d N faeces, g/d N absorbed, g/d N digestibility N in urine, g/d Urea-N, g/d N retained, g
- of intake - of absorption - g/kg W-75
Biological value Daily gain, g/d
1 SBM -7.4
55.7 9.4
46.2 0.825 19.3 17.7 26.9 0.478 0.579 1.23 0.647 808
2 BP LL1 5.5
56.2 9.6
46.6 0.826 24.7 20.5 22.0 0.385 0.466 1.00 0.540 682
3 BP LL2 6.5
57.5 9.8
47.8 0.826 23.4 20.9 24.4 0.425 0.515 1.14 0.585 781 '
4 BP LL3 7.5
58.7 10.0 48.6 0.823 22.9 19.8 25.7 0.442 0.539 1.21 0.606 859
5 BP CL1 8.5
59.8/ 10. f 49.8 0.827 21.1 16.5 28.7 0.480 0.581 1.34 0.645 904
Statistical significance ef effect Lysine supp Linear
*** NS *** NS ** ** *** *** *** *** *** ***
em. Quad.
NS NS NS NS NS NS NS NS NS NS NS NS
•^Lysine/
6 BP CL2 6.5
56.3 9.2
47.1 0.833 22.6 19.9 24.5 0.431 0.518 1.13 0.588 731
7 BP CL3 7.5
56.7 9.8
47.0 0.825 21.9 18.6 25.9 0.442 0.536 .1.17 0.606 815 .
orra SBM vs. Liquid vs. lysine cryst.
•*** ** *** NS NS NS NS NS NS NS NS NS
8 BP
8.5
57.3 9.3
48.0 0.828 19.7 16.5 28.3 0.492 0.590 1.30
«.656 927
SEM
-.
0.188 0.237 0.254 0.0039 0.844 1.390 0.858 0.015 0.018 0.041 0.017 44.62
t.
Barley prot. vs. lysine
« supplement supplement
*** ' NS
**» NS ** NS NS NS NS NS NS NS
1 *** NS *** NS ** NS *** *** *** *** ** **
v»4
BP = barley protein, LL = liquid lysine, CL = crystalline lysine SEM = standard error of the means; significance: NS = non-significant; ** (P<0.01), *** (P<0.001).
SBM as a lysine supplement compared to the pure lysine supplementation for equal
22«
dietary supply did not differ in response in N retention and protein utilization (P>0.05), but led to lower urinary-N excretion (P<0.01) and tended to achieve a little higher N retention in relation to N intake and BV (P<0.06). The observation is similar to the previous study in which soybean meal was isonitrogenously replaced by BP fortified with lysine (Nasi 1989). Since the threonine and sulphur-containing amino acid contents of the diets were marginally low, it is possibile that these amino acids could be the limiting factors on the addition of lysine. Further fortification of the diet with methionine and threonine did not have any effect in the trial conducted by Nasi (1989). Thus, lysine was the limiting amino acid here in accordance with the observations of replacement studies by Low et al. (1980) and Fuller et al. (1986). Contrary to these results, however, Fuller et. al. (1979) found improvements of protein utilization with threonine supplementations to barley diets.
N retention in this trial averaged 1.20 g/kgW°'75/d (CV 0.095) showing the highest value (1.34) in the middle of the trial and lowest value at the end (1.10). Similar retentions have been noted by Thorbek et al. (1984) for pigs at 25-80 kg live weight (1.2 g/kgW°75/d) but much lower in heavier pigs (0.80 g/kgW°75/d). Berschauer et al. (1983) gave wider values of N-retention 0.46-1.85 g/kgW°75/d. The regression equations for N retention g/kgW°'75/d as a function of lysine supplementation, g/kg feed, were
0.920 (se 0.0407) + 0.098 (SE 0.0140) * X, R2=0.706 The regression equation relating N-retention to dietary lysine supplementation indicates
that lysine was used with a constant efficiency up to a supply of 8.5 g/kg. The response in daily gains of the pigs was in accordance with the N-retention results indicating that nitrogen balance can reasonably explain the protein accretion in the body.
Lysine supplementation of 1 g/kg feed achieved 0.1 increase in N retention in this study. Low & Pittman (1979) found N retention to improve significantly, by 0.106, in response to 0.2 increase of extra lysine with total lysine being from 7.0 to 8.4g/kg, but further supplementation was of no benefit. As in present study, a somewhat similar response to N retention has been found in boars when lysine was supplemented 1.5 and 3.0 g/kg (total lysine 4.7 - 7.7 g/kg). However, in barrows, only supplements up to 1.5 g/kg improved retention (Williams et al. 1984). The present observations in the response of protein utilization to supplemental lysine are in close agreement with the results given by Fuller et al. (1974) where it was found that a minimum urinary N excretion was obtained when L-lysine was added to barley at a rate of 3.6 g/kg. Further additions of lysine, methionine, isoleucine or tryptophan had no effect but additon of threonine reduced N excretion substantially, demonstrating it to be the second limiting amino acid.
N retention in relation to absorbed N was low (0.466) in pigs fed diet, in which protein was provided by cereal protein only. Although BP derived in the starch ethanol process has a high digestibility of crude protein, 0.92 (Nasi 1989), its potential as a protein source is rather low because it is composed of the storage protein fractions of a seed having a low unbalanced lysine content of 30-35 g/kg CP (Linko et al. 1989). Lysine supplementation improved the value up to 0.59, which is a similar value to that in a diet supplemented by lysine from SBM. Equal efficiencies of protein utilization have also been reported by Thorbek et al. (1984) in pigs on barley soybean diets. Protein utilization expressed as the ratio of retained N to absorbed N as function of lysine supplementation, g/kg feed were
0.434 (SE 0.0177) +0.037 (SE 0.0061) * X, R2=0.618 The response in efficiency of N retention in relation to absorbed N to supplemental
lysine decreased with the development of the pig and with diets having higher lysine concentration. This is in line with the data presented by Thorbek et al. (1984), who found 0.16 lower efficiency in pigs 80-120 kg live weight compared to pigs weighing 25 - 80 kg. Under practical conditions, growing pigs retain about 0.45 of N fed with typical diets
227
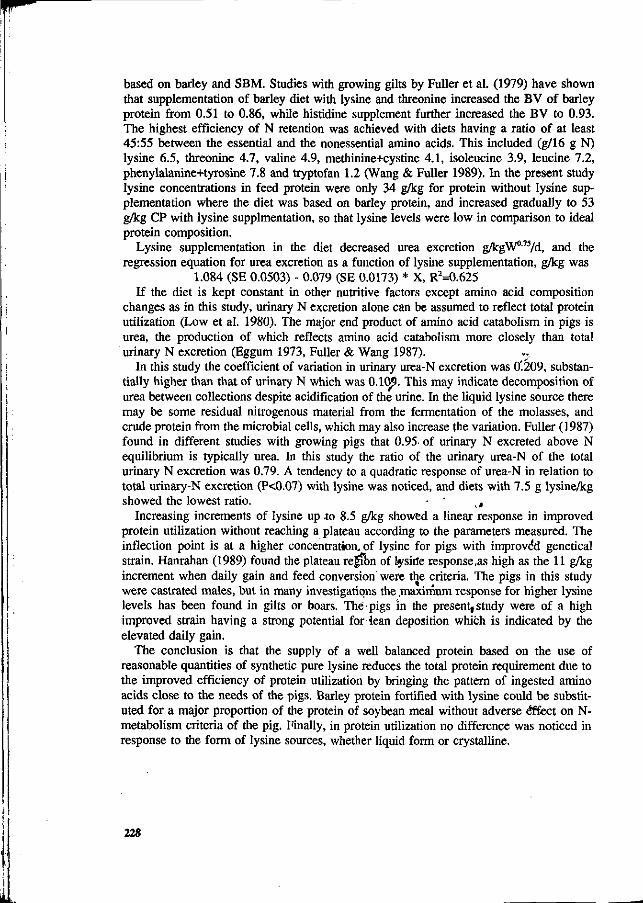
based on barley and SBM. Studies with growing gilts by Fuller et al. (1979) have shown that supplementation of barley diet with lysine and threonine increased the BV of barley protein from 0.51 to 0.86, while histidine supplement further increased the BV to 0.93. The highest efficiency of N retention was achieved with diets having a ratio of at least 45:55 between the essential and the nonessential amino acids. This included (g/16 g N) lysine 6.5, threonine 4.7, valine 4.9, methinine+cystine 4.1, isoleucine 3.9, leucine 7.2, phenylalanine+tyrosine 7.8 and tryptofan 1.2 (Wang & Fuller 1989). In the present study lysine concentrations in feed protein were only 34 g/kg for protein without lysine supplementation where the diet was based on barley protein, and increased gradually to 53 g/kg CP with lysine supplmentation, so that lysine levels were low in comparison to ideal protein composition.
Lysine supplementation in the diet decreased urea excretion g/kgW°75/d, and the regression equation for urea excretion as a function of lysine supplementation, g/kg was
1.084 (SE 0.0503) - 0.079 (SE 0.0173) * X, R2=0.625 If the diet is kept constant in other nutritive factors except amino acid composition
changes as in this study, urinary N excretion alone can be assumed to reflect total protein utilization (Low et al. 1980). The major end product of amino acid catabolism in pigs is urea, the production of which reflects amino acid catabolism more closely than total urinary N excretion (Eggum 1973, Fuller & Wang 1987).
In this study the coefficient of variation in urinary urea-N excretion was 0'.209, substantially higher than that of urinary N which was 0.109. This may indicate decomposition of urea between collections despite acidification of the urine. In the liquid lysine source there may be some residual nitrogenous material from the fermentation of the molasses, and crude protein from the microbial cells, which may also increase the variation. Fuller (1987) found in different studies with growing pigs that 0.95. of urinary N excreted above N equilibrium is typically urea. In this study the ratio of the urinary urea-N of the total urinary N excretion was 0.79. A tendency to a quadratic response of urea-N in relation to total urinary-N excretion (P<0.07) with lysine was noticed, and diets with 7.5 g lysine/kg showed the lowest ratio. j ,
Increasing increments of lysine up .to 8.5 g/kg showed a linear response in improved protein utilization without reaching a plateau according to the parameters measured. The inflection point is at a higher concentration, of lysine for pigs with improved genetical strain. Hanrahan (1989) found the plateau region of lysine response,as high as the 11 g/kg increment when daily gain and feed conversion were the criteria. The pigs in this study were castrated males, but in many investigations the .maximum response for higher lysine levels has been found in gilts or boars. The pigs in the present study were of a high improved strain having a strong potential for lean deposition which is indicated by the elevated daily gain.
The conclusion is that the supply of a well balanced protein based on the use of reasonable quantities of synthetic pure lysine reduces the total protein requirement due to the improved efficiency of protein utilization by bringing the pattern of ingested amino acids close to the needs of the pigs. Barley protein fortified with lysine could be substituted for a major proportion of the protein of soybean meal without adverse effect on N-metabolism criteria of the pig. Finally, in protein utilization no difference was noticed in response to the form of lysine sources, whether liquid form or crystalline.
228
References
ARC. 1981. Agricultural Research Council. The Nutrient requirements of farm livestock. Commonwealth Agricultural Bureaux. Slough.
Beker, M.E., Wiestur, U.E., Latsars, A.A., Mezhinya, G.R. & Paberzs, A.O. 1971. Verfahren zur Herstellung des Futterkonzentrates von L-Lysin. Institut Mikrobiologii imeni A. Kirhensteina Akademii Nauk Latvijskoi SSR. Pat. 93704.
Berschauer, F., Gaus, G. & Menke, K.H. 1980. Effect of body weight on efficiency of utilization of energy and protein in pigs. Proc. 8th Symp. on Energy Metabolism, Cambridge. EAAP Publ. No 26: 101-105.
Fuller, M.F, Livingstone, R.M., Baird, B.A. & Atkinson, T. 1979 a. The optimal amino acid supplementation of barley for the growing pig. 1. Response of nitrogen metabolism to progressive supplementation. Br. J. Nutr. 41: 321-331.
Fuller, M.F, Mennie, I. & Crofts, R.M.T. 1979 b. The optimal amino acid supplementation of barley for the growing pig. 2. Optimal additions of lysine and threonine for growth. Br. J. Nutr. 41: 333-340.
Fuller, M.F, Wang, T.C. 1987. Amino acid requirements of the growing pig. In Manipulating Pig Production, p. 97-111. Australasian Pig Science Association. Werribee, Australia.
Fuller, M.F. Wood, J., Brewer, A.C., Pennie, K. & MacWilliam, R. 1986. Ttye responses of growing pigs to dietary lysine, as free lysine hydrochloride or in soy-bean meal, and the influence of food intake. Anim. Prod. 43: 477-484.
Hanrahan, TJ. 1989. The response of growing pigs to lysine. The Feed Compounder No 7: 32-39.
Just, A. 1982. The net energy value of crude catabolizes protein for growth in pigs. Livestock Prod. Sei. 9: 349-360.
Linko, R, Lapveteläinen, A., Laakso, P. & Kallio, H. 1989. Protein composition of a high-protein barley flour and barley grain. Cereal Chem. 66: 478-482.
Low, A.G., Pittman, RJ. 1979. Responses of growing male pigs to practical diets supplemented with amino acids. Anim. Prod. 28: 435-436.
Low, A.G., Pittman, R.J. & Fulford, R.J. 1980. Studies on the optimum amino acid composition of practical diets for growing pigs using changeover nitrogen balance method. Proc. EAAP Symp. on Protein Metabolism and Nutrition, p. 680-687. Braunschweig.
Nasi, M. 1988. Evaluating barley feed fractions from integrared ethanol-starch production in diets of ruminants. J. Agric. Sei. Fini. 60: 701-709.
Nasi, M. 1989. Barley feed fractions from integrared ethanol-starch process in diets of pigs. J. Agric. Sei. Fini. 61: 441-450.
Nasi, M. & Aimonen, E. 1992. Evaluation of undehydrated barley feed fractions and dried oat feed fractions from integrated starch-ethanol process in diets of growing pigs. Agric. Sei. Fini. 1: 291-301.
Thorbek, G., Chwalibog, A. & Henkel, S. 1984. Nitrogen and energy metabolism in pigs of Danish Landrace from 20 to 120 kg live wight. Norm for protein and enenrgy requirements for maintenance and growth. Ber. Stat. Husbyrbr.fors. 563: 1-114.
Wang, T.C. & Fuller, M.F. 1989. The optimum dietary amino acid pattern for growing pigs. 1. Experiments by amino acid deletion. Br. J. Nutr. 62: 77-89.
229
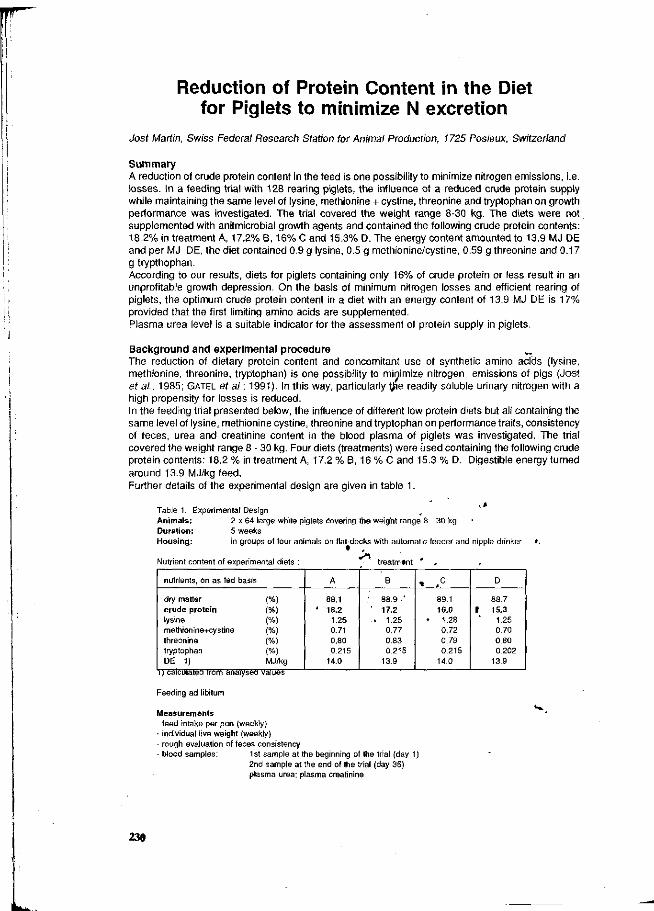
Reduction of Protein Content in the Diet for Piglets to minimize N excretion
Jost Martin, Swiss Federal Research Station for Animal Production, 1725 Posieux, Switzerland
Summary A reduction of crude protein content in the feed is one possibility to minimize nitrogen emissions, i.e. losses. In a feeding trial with 128 rearing piglets, the influence of a reduced crude protein supply while maintaining the same level of lysine, methionine + cystine, threonine and tryptophan on growth performance was investigated. The trial covered the weight range 8-30 kg. The diets were not supplemented with anitmicrobial growth agents and contained the following crude protein contents: 18.2% in treatment A, 17.2% B, 16% C and 15.3% D. The energy content amounted to 13.9 MJ DE and per MJ DE, the diet contained 0.9 g lysine, 0.5 g methionine/cystine, 0.59 g threonine and 0.17 g trypthophan. According to our results, diets for piglets containing only 16% of crude protein or less result in an unprofitable growth depression. On the basis of minimum nitrogen losses and efficient rearing of piglets, the optimum crude protein content in a diet with an energy content of 13.9 MJ DE is 17% provided that the first limiting amino acids are supplemented. Plasma urea level is a suitable indicator for the assessment of protein supply in piglets.
Background and experimental procedure The reduction of dietary protein content and concomitant use of synthetic amino acids (lysine, methionine, threonine, tryptophan) is one possibility to minimize nitrogen emissions of pigs (Jost et al., 1985; GATEL et al ; 1991). In this way, particularly tjFie readily soluble urinary nitrogen with a high propensity for losses is reduced. In the feeding trial presented below, the influence of different low protein diets but all containing the same level of lysine, methionine cystine, threonine and tryptophan on performance traits, consistency of feces, urea and creatinine content in the blood plasma of piglets was investigated. The trial covered the weight range 8 - 30 kg. Four diets (treatments) were used containing the following crude protein contents: 18.2 % in treatment A, 17.2 % B, 16 % C and 15.3 % D. Digestible energy turned around 13.9 MJ/kg feed. Further details of the experimental design are given in table 1.
Table 1. Experimental Design Animals: 2 x 64 large white piglets covering the weight range 8 - 30 kg Duration: 5 weeks Housing: in groups of four animals on flat-decks with automatic feeder and nipple drinker
Nutrient content of experimental diets :
nutrients, on as fed basis
dry matter (%) crude protein (%) lysine (%) methionine+cystine (%) threonine (%) tryptophan {%) DE 1) MJ/kg
i) calculated rrom anaiysea values
A
89.1 ' 18.2
1.25 0.71 0.80 0.215
14.0
B
' 88.9 •' ' 17.2 . 1.25
0.77 0.83 0.215
13.9
» ,C
89.1 16.0
• 1.28 0.72 0 79 0.215
14.0
D
88.7 1 15.3
1.25 0.70 0.80 0.202
13.9
Feeding ad libitum
Measurements - feed intake per pen (weekly) - individual live weight (weekly) - rough evaluation of feces consistency - blood samples: 1st sample at the beginning of the trial (day 1)
2nd sample at the end of the trial (day 35) plasma urea; plasma creatinine
230
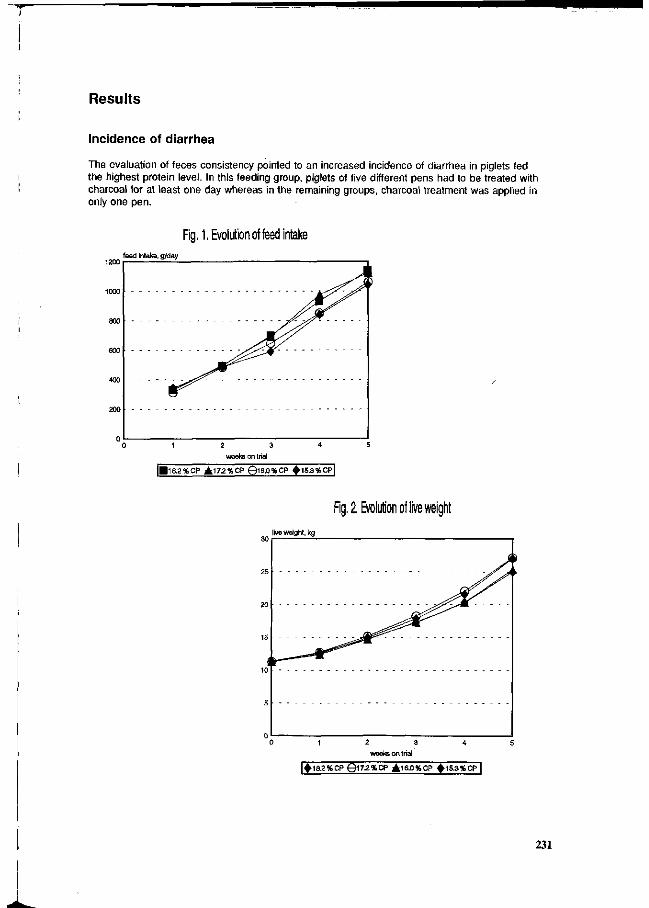
Results
Incidence of diarrhea
The evaluation of feces consistency pointed to an increased incidence of diarrhea in piglets fed the highest protein level. In this feeding group, piglets of five different pens had to be treated with charcoal for at least one day whereas in the remaining groups, charcoal treatment was applied in only one pen.
Fig. I.Evolution of feed intake feed intake, g/day
|B1S.2%CP A17.2%CP Q16,0%CP +1S.3%CPl
Rg. 2. Evolution of live weight
live weight, kg
2 3 weeks on trial
|+18,2%CP Ql7.2%CP A16.0%CP +15,3%CP |
231
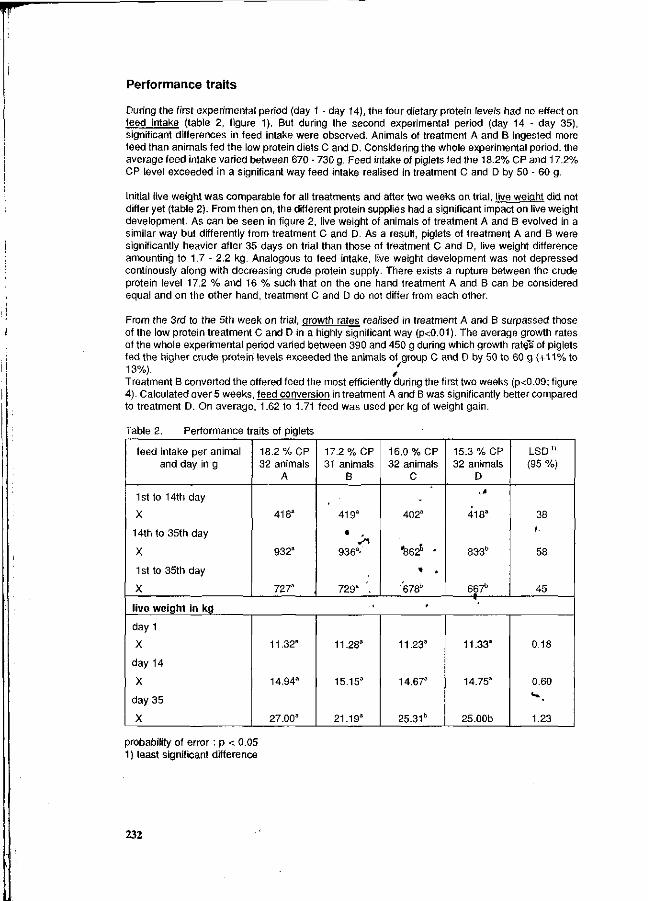
Performance traits
During the first experimental period (day 1 - day 14), the four dietary protein levels had no effect on feed intake (table 2, figure 1). But during the second experimental period (day 14 - day 35), significant differences in feed intake were observed. Animals of treatment A and B ingested more feed than animals fed the low protein diets C and D. Considering the whole experimental period, the average feed intake varied between 670 - 730 g. Feed intake of piglets fed the 18.2% CP and 17.2% CP level exceeded in a significant way feed intake realised in treatment C and D by 50 - 60 g.
Initial live weight was comparable for all treatments and after two weeks on trial, live weight did not differ yet (table 2). From then on, the different protein supplies had a significant impact on live weight development. As can be seen in figure 2, live weight of animals of treatment A and B evolved in a similar way but differently from treatment C and D. As a result, piglets of treatment A and B were significantly heavier after 35 days on trial than those of treatment C and D, live weight difference amounting to 1.7 - 2.2 kg. Analogous to feed intake, live weight development was not depressed continously along with decreasing crude protein supply. There exists a rupture between the crude protein level 17.2 % and 16 % such that on the one hand treatment A and B can be considered equal and on the other hand, treatment C and D do not differ from each other.
From the 3rd to the 5th week on trial, growth rates realised in treatment A and B surpassed those of the low protein treatment C and D in a highly significant way (p<0.01). The average growth rates of the whole experimental period varied between 390 and 450 g during which growth rates of piglets fed the higher crude protein levels exceeded the animals of group C and D by 50 to 60 g (+11% to 13%). / Treatment B converted the offered feed the most efficiently during the first two weeks (p<0.09; figure 4). Calculated over 5 weeks, feed conversion in treatment A and B was significantly better compared to treatment D. On average, 1.62 to 1.71 feed was used per kg of weight gain.
Table 2. Performance traits of piglets
feed intake per animal and day in g
1st to 14th day
X
14th to 35th day
X
1st to 35th day
X
live weight in kg
day 1
X
day 14
X
day 35
X
18.2 % CP 32 animals
A
418a
932a
727a
11.32a
14.94a
27.00a
17.2 %CP 31 animals
B
419a
*
936a-
729a '. • <
11.28'
15.15'
21.19'
16.0 %CP 32 animals
C
* 402a
%62b *
» .
'678b
V
11.23'
14.67'
25.31b
15.3 % CP 32 animals
D yt
418a
83<3b
667b
11.33a
14.75a
25.00b
L S D " (95 %)
38
».
58
45
0.18
0.60 i »
1.23
probability of error : p < 0.05 1 ) least significant difference
232
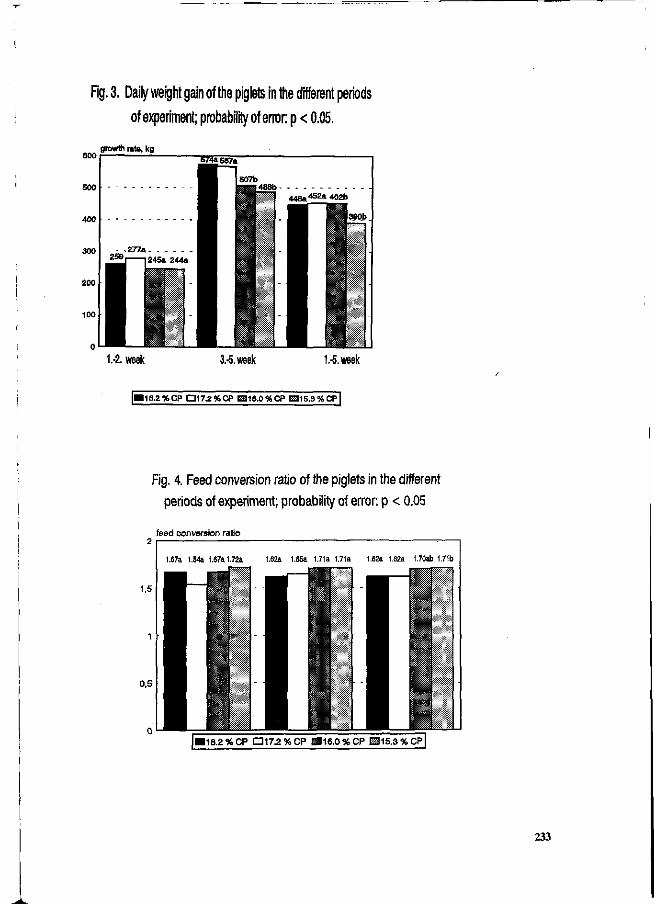
Fig. 3. Daily weight gain of the piglets in the different periods
of experiment; probability of error: p < 0.05.
growth rate,
500
400
1.-2. week 1.-5. week
|Mia.2%CP •17.2%CP mi6.0%CP E11S.3%CP|
Fig. 4. Feed conversion ratio of the piglets in the different
periods of experiment; probability of error: p < 0.05
feed conversion ratio
233
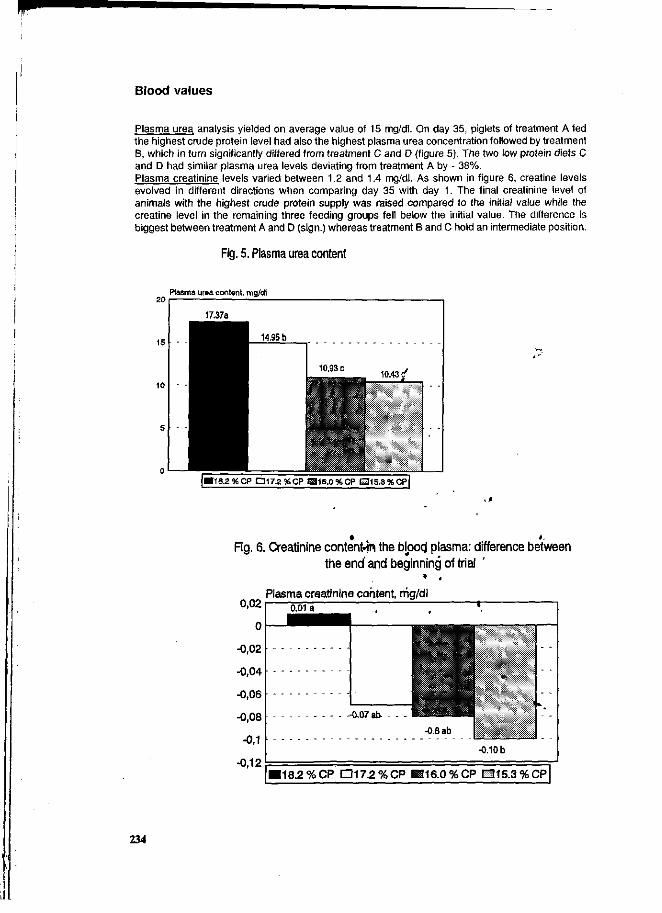
Blood values
Plasma urea analysis yielded on average value of 15 mg/dl. On day 35, piglets of treatment A fed the highest crude protein level had also the highest plasma urea concentration followed by treatment B, which in turn significantly differed from treatment C and D (figure 5). The two low protein diets C and D had similar plasma urea levels deviating from treatment A by - 38%. Plasma creatinine levels varied between 1.2 and 1.4 mg/dl. As shown in figure 6, creatine levels evolved in different directions when comparing day 35 with day 1. The final creatinine level of animals with the highest crude protein supply was raised compared to the initial value while the creatine level in the remaining three feeding groups fell below the initial value. The difference is biggest between treatment A and D (sign.) whereas treatment B and C hold an intermediate position.
Fig. 5. Plasma urea content
Plasma urea content, mg/di
17.37a
^ ^ ^ ^ H 14.95 b l 1093 c , 10.43/
|MIB.2%CP •i7.2%cp ms.o%cp iais.3%cp|
Fig. 6. Creatinine contents the blood plasma: difference between the end and beginning of trial
0,02
o
-0,02
-0,04
-0,06
-0,08
-0,1
-0,12
Plasma creatinine content, mg/dl o.oia
-0,07 ab-
i,',x"".t""iK"'-ïa"
-•aim -0.8 ab
-0.10 b
I18.2%CP IZ]17.2%CP ^ 1 6 . 0 % C P • 1 5 . 3 % C P
234
Discussion
During the first two weeks on trial, no difference between treatments were observed with respect to performance. In treatment A, the increased incidence of visible diarrhea had apparently a negativ effect on performance during this initial rearing period. It can be assumed that piglets of treatment B suffered from subclinical diarrhea. The lowest crude protein supply did not result in better growth which is probalbly due to further limiting amino acids. All piglets were fed approximately the same amount of energy and the same proportion of first limiting amino acids. Feed conversion ratio in treatment A was improved to the initial period. This finding can again be related to the observed increased incidence of diarrhea. A close relationship between blood urea levels and crude protein supply was found. Urea levels fell linearly along with decreasing dietary crude protein content. Final creatinine concentration in the blood plasma sank below initial values except for animals fed the highest crude protein level. Creatinine levels of healthy animals are apparently closer related to protein turnover than to renal function.
Conclusion
A reduction of crude protein content with concomitant supplementation with the first limiting amino acids lysine, methionine cystine, threonine and trypthophan in the diet of piglets is possible to a limited extent. According to our results, diets containing less than 17% crude protein resulted in growth depression and impaired feed conversion. We explain this findings with the probably limiting effect of isoleucine and further amino acids. For a profitable rearing of piglets with normal growth and minimum nitrogen excretion, a diet having an energy content of 13.9 g MJ DE should contain approx. 17% of crude protein. This holds true as long as no antimicrobial growth promoters are used and provided that the first limiting amino acids are supplemented. Growth promoters improve protein and energy digestibility (Jost, 1992). In this case, the minimum dietary protein for optimum performance could be reduced further. Plasma urea level is, according to our results, a suitable indicator for the assessment of protein supply in piglets.
Literature
GATEL F., BERTIN J.M. et GROSJEAN F., 1991. Effets de la teneur en protéines et en acides aminés du régime sur l'excrétion azotée des porcs. Journées Rech, porcine en France 23, 85-90.
JOST M., FÉVRIER C. ET CHENUZ M., 1985. Effets de niveaux élevés de protéines et de lysine pour la complémentation du lactosérum chez le porc en croissance-finition. Recherce agronom. en Suisse 24, 215-235.
JOST M., 1992. Stratégie pour une alimentation des porcs respectueuse de l'environnement. Rev. suisse Agric. 24 (5), 309-313.
235
Effect of porcine somatotropin and dietary protein level on the nitrogen losses of pigs.
N. Quiniou, J.-Y. Dourmad, J. Noblet
Station de Recherches Porcines, Institut National de la Recherche Agronomique, 35590 Saint-Gilles, France.
Summary
Twenty crossbred barrows were used to investigate the effect of two dietary crude protein levels (18.6 %: level H and 15.7 %: level L; same levels of essential amino acids) and porcine somatotropin (pST) administration (0 or 3 mg/d) on growth performance and N output between 51 and 101 kg live weight, and on carcass characteristics at slaughter. Pigs were individually penned and N balance was measured three times over the experiment. Daily N retention was improved (+35%) by pST, and daily N output was reduced (-25%) through a decrease in urinary losses (P<0.001), whereas fecal losses were unchanged. The reduction of dietary protein level was associated with a decreased daily fecjli (-28%) and urinary (-26%) losses, with no significant change in growth performances and N retention. The pST pigs fed the L diet excreted 54% less N tjfan the control ones fed the H diet over the whole experiment.
Key Words: pig, nitrogen losses, porcine somatotropin, dietary crude protein level.
Introduction
Recombinant porcine somatotropin (pST) has marked effects on growth and carcass characteristics of pigs. With regard to nitrogen (N), results available in littérature suggest an improved efficiency of utilization of dietary nitrogen for body protein deposition (Noblet et al., 1992a); N output is then reduced. An other factor influencing N losses is the feeding strategy, and especially the adequation between nutrient supply and animals' requirements. Therefore, the main objective of this study was to quantify the effects of pST on N balance, according to live werght^LW) of the animals, and to level of dietary protein when essential amino acids were kept constant. ' .
Materials and methods: ' '
Experimental design: ',
Five litters of four crossbred barrows (Large White x Piétrain) were used in the experiment. Within a litter (so-called replicate), pigs were allocated to four treatments resulting from the combination of two pST levels (0 and 3 mg/d) and two levels of crude protein (CP) in the diet (18.6 and 15.7%, so-called H and L, respectively; Table 1). The four treatments will be subsequently abreviated as 0/H (no pST and 18.6% CP), 3/H (3 mg/d pST and 18.6% CP), 0/L (no pST and 15.7% CP) and 3/L (3 mg/d pST and 15.7% CP). ' v The experiment started at an initial LW of 51.0+1.5 kg, after one week for adaptation to
the metabolism crates and the experimental diet. Within each replicate, feeding level was equivalent to ad libitum feed intake of 3/H pigs, on a LW basis. Diets were offered twice daily as pellets (8:00 and 15:30) and water was available ad libitum. pST was administered intra-muscularly during the morning meal. Pigs were slaughtered at an average LW of 101.3+2.1 kg (Table 2).
23«
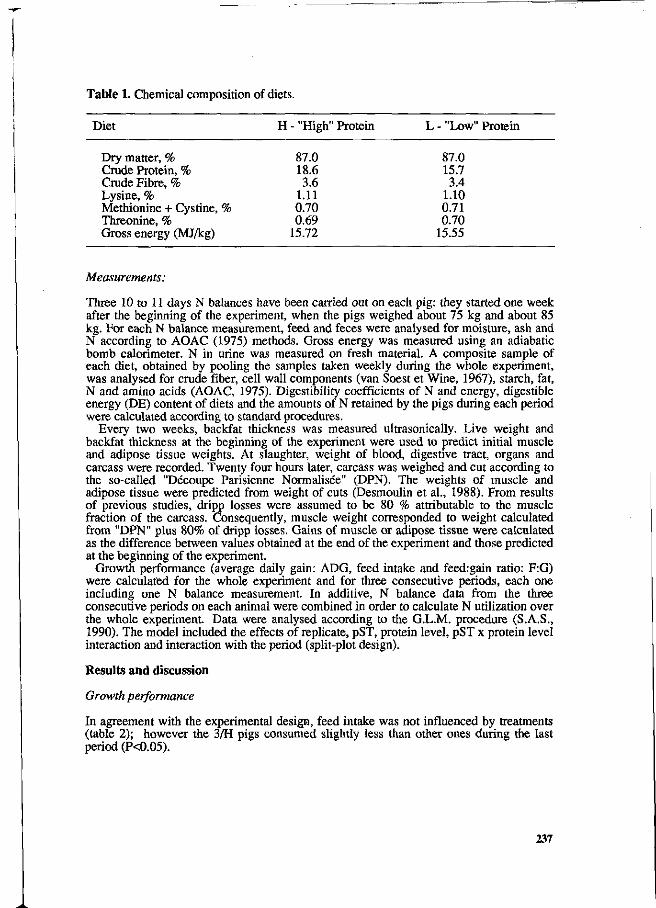
Table 1. Chemical composition of diets.
Diet
Dry matter, % Crude Protein, % Crude Fibre, % Lysine, % Methionine + Cystine, Threonine, % Gross energy (MJ/kg)
%
H - "High" Protein
87.0 18.6 3.6
1.11 0.70 0.69
15.72
L - "Low" Protein
87.0 15.7 3.4
1.10 0.71 0.70
15.55
Measurements:
Three 10 to 11 days N balances have been carried out on each pig: they started one week after the beginning of the experiment, when the pigs weighed about 75 kg and about 85 kg. For each N balance measurement, feed and feces were analysed for moisture, ash and N according to AOAC (1975) methods. Gross energy was measured using an adiabatic bomb calorimeter. N in urine was measured on fresh material. A composite sample of each diet, obtained by pooling the samples taken weekly during the whole experiment, was analysed for crude fiber, cell wall components (van Soest et Wine, 1967), starch, fat, N and amino acids (AOAC, 1975). Digestibility coefficients of N and energy, digestible energy (DE) content of diets and the amounts of N retained by the pigs during each period were calculated according to standard procedures.
Every two weeks, backfat thickness was measured ultrasonically. Live weight and backfat thickness at the beginning of the experiment were used to predict initial muscle and adipose tissue weights. At slaughter, weight of blood, digestive tract, organs and carcass were recorded. Twenty four hours later, carcass was weighed and cut according to the so-called "Découpe Parisienne Normalisée" (DPN). The weights of muscle and adipose tissue were predicted from weight of cuts (Desmoulin et al., 1988). From results of previous studies, dripp losses were assumed to be 80 % attributable to the muscle fraction of the carcass. Consequently, muscle weight corresponded to weight calculated from "DPN" plus 80% of dripp losses. Gains of muscle or adipose tissue were calculated as the difference between values obtained at the end of the experiment and those predicted at the beginning of the experiment.
Growth performance (average daily gain: ADG, feed intake and feed:gain ratio: F:G) were calculated for the whole experiment and for three consecutive periods, each one including one N balance measurement. In additive, N balance data from the three consecutive periods on each animal were combined in order to calculate N utilization over the whole experiment. Data were analysed according to the G.L.M. procedure (S.A.S., 1990). The model included the effects of replicate, pST, protein level, pST x protein level interaction and interaction with the period (split-plot design).
Results and discussion
Growth performance
In agreement with the experimental design, feed intake was not influenced by treatments (table 2); however the 3/H pigs consumed slightly less than other ones during the last period (P<0.05).
237
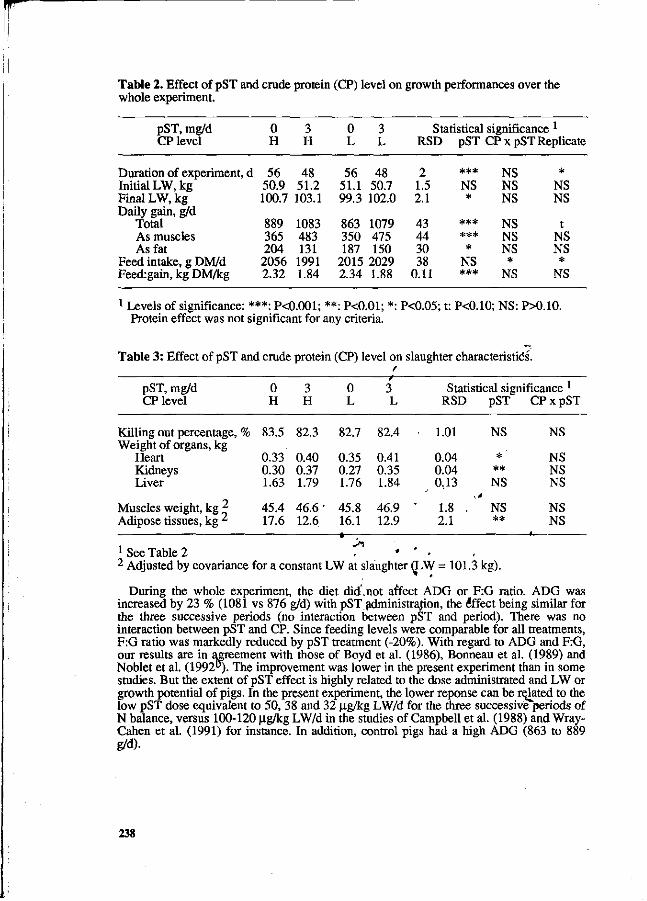
Table 2. Effect of pST and erode protein (CP) level on growth performances over the whole experiment.
pST, mg/d CP level
Duration of experiment, d Initial LW, kg Pinal LW, kg Daily gain, g/d
Total As muscles As fat
Feed intake, g DM/d Feedrgain, kg DM/kg
0 H
56 50.9 100.7
889 365 204 2056 2.32
3 H
48 51.2 103.1
1083 483 131 1991 1.84
0 3 L L
56 48 51.1 50.7 99.3 102.0
863 1079 350 475 187 150
2015 2029 2.34 1.88
Statistical significance RSD
2 1.5 2.1
43 44 30 38
0.11
pST
*** NS *
*** **# *
NS ***
1 CPxpST Replicate
NS NS NS
NS NS NS *
NS
* NS NS
t NS NS *
NS
1 Levels of significance: ***: P<0.001; **: P<0.01; *: P<0.05; t: P<0.10; NS: P>0.10. Protein effect was not significant for any criteria.
Table 3: Effect of pST and crude protein (CP) level on slaughter characteristic's.
pST, mg/d CP level
Killing out percentage, % Weight of organs, kg
Heart Kidneys Liver
Muscles weight, kg 2 Adipose tissues, kg
0 H
83.5
0.33 0.30 1.63
45.4 17.6
3 H
82.3
0.40 0.37 1.79
46.6' 12.6
0 L
82.7
0.35 0.27 1.76
45.8 16.1
3 L
82.4
0.41 0.35 1.84
46.9 " 12.9
Statistical sig RSD pST
1.01
0.04 0.04 0..13
1.8 . 2.1
NS
* ** NS
NS **
nificance 1
CPxpST
NS
NS NS NS
NS NS
.— t r
1 See Table 2 T • ' -2 Adjusted by covariance for a constant LW at slaughter (LW = 101.3 kg).
During the whole experiment, the diet did.not affect ADG or F:G ratio. ADG was increased by 23 % (1081 vs 876 g/d) with pST administrajion, the effect being similar for the three successive periods (no interaction between pST and period). There was no interaction between pST and CP. Since feeding levels were comparable for all treatments, F:G ratio was markedly reduced by pST treatment (-20%). With regard to ADG and F:G, our results are in agreement with those of Boyd et al. (1986), Bonneau et al. (1989) and Noblet et al. (1992°). The improvement was lower in the present experiment than in some studies. But the extent of pST effect is highly related to the dose administrated and LW or growth potential of pigs. In the present experiment, the lower réponse can be reflated to the low pST dose equivalent to 50, 38 and 32 H-g/kg LW/d for the three successive periods of N balance, versus 100-120 M-g/kg LW/d in the studies of Campbell et al. (1988) and Wray-Cahen et al. (1991) for instance. In addition, control pigs had a high ADG (863 to 889 g/d).
238
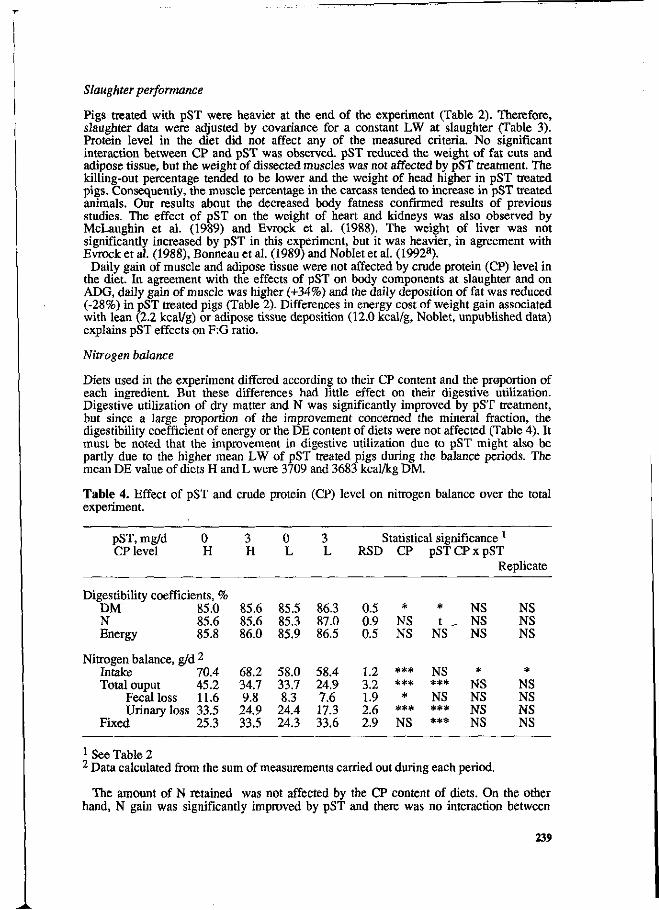
Slaughter performance
Pigs treated with pST were heavier at the end of the experiment (Table 2). Therefore, slaughter data were adjusted by covariance for a constant LW at slaughter (Table 3). Protein level in the diet did not affect any of the measured criteria. No significant interaction between CP and pST was observed. pST reduced the weight of fat cuts and adipose tissue, but the weight of dissected muscles was not affected by pST treatment. The killing-out percentage tended to be lower and the weight of head higher in pST treated pigs. Consequently, the muscle percentage in the carcass tended to increase in pST treated animals. Our results about the decreased body fatness confirmed results of previous studies. The effect of pST on the weight of heart and kidneys was also observed by McLaughin et al. (1989) and Evrock et al. (1988). The weight of liver was not significantly increased by pST in this experiment, but it was heavier, in agreement with Evrock et al. (1988), Bonneau et al. (1989) and Noblet et al. (1992a).
Daily gain of muscle and adipose tissue were not affected by crude protein (CP) level in the diet. In agreement with the effects of pST on body components at slaughter and on ADG, daily gain of muscle was higher (+34%) and the daily deposition of fat was reduced (-28%) in pST treated pigs (Table 2). Differences in energy cost of weight gain associated with lean (2.2 kcal/g) or adipose tissue deposition (12.0 kcal/g, Noblet, unpublished data) explains pST effects on F:G ratio.
Nitrogen balance
Diets used in the experiment differed according to their CP content and the proportion of each ingredient. But these differences had little effect on their digestive utilization. Digestive utilization of dry matter and N was significantly improved by pST treatment, but since a large proportion of the improvement concerned the mineral fraction, the digestibility coefficient of energy or the DE content of diets were not affected (Table 4). It must be noted that the improvement in digestive utilization due to pST might also be partly due to the higher mean LW of pST treated pigs during the balance periods. The mean DE value of diets H and L were 3709 and 3683 kcal/kg DM.
Table 4. Effect of pST and crude protein (CP) level on nitrogen balance over the total experiment.
pST, mg/d 0 CP level H
Digestibility coefficients, % DM 85.0 N 85.6 Energy 85.8
Nitrogen balance, g/d 2
Intake 70.4 Total ouput 45.2
Fecal loss 11.6 Urinary loss 33.5
Fixed 25.3
3 H
85.6 85.6 86.0
68.2 34.7 9.8 24.9 33.5
0 L
85.5 85.3 85.9
58.0 33.7 8.3
24.4 24.3
3 L
86.3 87.0 86.5
58.4 24.9 7.6 17.3 33.6
Statistical significance 1
RSD
0.5 0.9 0.5
1.2 3.2 1.9 2.6 2.9
CP
* NS NS
*** *** *
*** NS
pST
* t _
NS
NS *** NS *** ##*
CP x pST Replicate
NS NS NS
* NS NS NS NS
NS NS NS
* NS NS NS NS
1 See Table 2 2 Data calculated from the sum of measurements carried out during each period.
The amount of N retained was not affected by the CP content of diets. On the other hand, N gain was significantly improved by pST and there was no interaction between
239
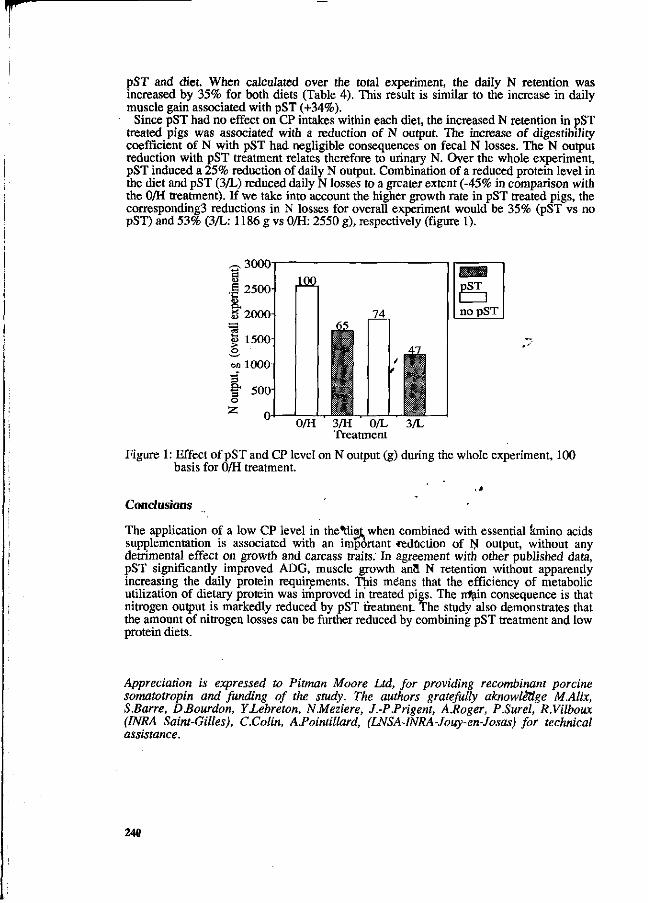
pST and diet. When calculated over the total experiment, the daily N retention was increased by 35% for both diets (Table 4). This result is similar to the increase in daily muscle gain associated with pST (+34%).
Since pST had no effect on CP intakes within each diet, the increased N retention in pST treated pigs was associated with a reduction of N output. The increase of digestibility coefficient of N with pST had negligible consequences on fecal N losses. The N output reduction with pST treatment relates therefore to urinary N. Over the whole experiment, pST induced a 25% reduction of daily N output. Combination of a reduced protein level in the diet and pST (3/L) reduced daily N losses to a greater extent (-45% in comparison with the 0/H treatment). If we take into account the higher growth rate in pST treated pigs, the corresponding3 reductions in N losses for overall experiment would be 35% (pST vs no pST) and 53% (3/L: 1186 g vs 0/H: 2550 g), respectively (figure 1).
3/H 0/L Treatment
Figure 1: Effect of pST and CP level on N output (g) during the whole experiment, 100 basis for 0/H treatment.
Conclusions
The application of a low CP level in theMiet when combined with essential amino acids supplementation is associated with an important reduction of N output, without any detrimental effect on growth and carcass traits. In agreement with other published data, pST significantly improved ADG, muscle growth anfl N retention without apparently increasing the daily protein requirements. This means that the efficiency of metabolic utilization of dietary protein was improved in treated pigs. The rrfain consequence is that nitrogen output is markedly reduced by pST treatment. The study also demonstrates that the amount of nitrogen losses can be further reduced by combining pST treatment and low protein diets.
Appreciation is expressed to Pitman Moore Ltd, for providing recombinant porcine somatotropin and funding of the study. The authors gratefully aknowlêSge M Alix, SBarre, DJSourdon, YLebreton, NMeziere, J.-P.Prigent, A.Roger, PSurel, R.Vilboux (INRA Saint-Gilles), C.Colin, A.Pointillard, (LNSA-INRA-Jouy-en-Josas) for technical assistance.
240
References
AOAC, 1975. Official methods of analysis (12th Ed.), Association of official Analytical Chemists, Washington, DC.
Bonneau, M., Lefaucheur, L. & Mourot, J., 1989. Influence de l'administration de somatotropine porcine (pST) sur les performances de croissance, la composition corporelle et la qualité de la viande. Journées de la Recherche Porcine en France 21: 31-37.
Boyd, R.D., Bauman, D.E., Beerman, D.H., De Neergaard, A.F., Souza, L. & Butler, W.R., 1986. Titration of the porcine growth hormone dose which maximizes growth performance and lean deposition in swine. Journal of Animal Science 63 (1) : 219, Abstract.
Desmoulin, B., Ecolan, P. & Bonneau, M., 1988. Estimation de la composition tissulaire des carcasses de porc: récapitulatif de diverses méthodes utilisables en expérimentation. INRA Productions Animales 1 (1): 59-64.
Noblet, J. & Henry, Y., 1987. Effect of protein and lysine levels in the diet on body gain composition and energy utilisation in growing pigs. Journal of Animal Science 65: 717-726.
Noblet, J., Dubois, S., Herpin, P. & Sève, B., 1992a. Influence de l'utilisation de la somatotrotine porcine sur l'utilisation de l'énergie et des protéines chez le porc: conséquences sur les besoins nutritionnels. Journées de la Recherche Porcine en France 24: 237-258.
Noblet, J., Herpin, P. & Dubois, S., 1992". Effect of recombinant porcine somatotropin on energy and protein utilization by growing pigs: interaction with capacity for lean tissue growth. Journal of Animal Science 70: 2471-2484.
S.A.S., 1990. User guide: statistics. Statistical Analysis Systems Institute, Inc, Cary, NC. Van Soest, P.H. & Wine, R.R., 1967. Use of detergents in the analysis constituents.
Association of official Analytical Chemists, Washington, DC, 50: 50.
241
Effect of three protein feeding strategies, for growing-finishing pigs, on growth performance and nitrogen output in the slurry and in the air.
P. Latimiei3 & J.Y. Dourmadb
a Etablissement Départemental de l'Elevage des Côtes D'Armor, B.P. 540,22195 Plérin Cedex (France).b Institut National de la Recherche Agronomique, Station de Recherches Porcines, 35590 Saint-Gilles (France).
Summary
The aim of the present study was to evaluate the effect, on growth performance and nitrogen (N) output, of three feeding strategies in growing-finishing pigs : (SI) 17.8% and 17.1% crude protein (CP) during the growing and finishing periods, respectiyely, (S2) 17.8% and 15.4% CP during the growing and finishing periods, respectively and, (S3) 16.2% and 13.5% CP during the growing and finishing periods, respectively. Industrial lysine was added in order to get 8.5 and 7.5 g lysine / kg of diet during growing and finishing periods, respectively. Growth rate (790 g/dfon average) and feed conversion ratio (2.91 kg/kg) were similar in the three groups. Dressing percentage decreased when protein content of the diet increased, but muscle percentage at slaughter (54.5 % on average) was not affected. The amount of N produced in slurry was 2.85, 2.64 and 2.10 kg/pig, and estimated gaseous N emission amounted to 1.10, 0.97 and 0.83 kg/pig for SI, S2 and S3, respectively.
Key words: pig, nutrition, nitrogen excretion, protein content, gaseous emissions.
Introduction ,.*
Feeding growing pigs with low protein, diets is known to* limit faecal and urinary nitrogen (N) excretion (Tamminga & Verstegen, 1991; Jongbloed & Lenis, 1992; Gatel et al., 1992; Dourmad et al., 1992). However rijpst of the results have been obtained in short term balance trials or modelling studies stod few results are available in practical conditions with real measurement of slurry production" and composition.
Therefore, the objective of this study was to examine, in growing pigs, the effect of protein feeding strategy on growth performance and carcass traits and to measure the amount and composition of the slurry produced-during the whole fattening period.
t e
Material and methods
Experimental design.
One hundred and eight pigs, born from Large White x Landrace sows mated with Large White x Piétrain boars were assigned, according to their initial weight and genetic origin, to 18 blocks of 3 castrated males and 3 females each. Pigs were then assigneekat random to three protein feeding strategies during growing (42 days) and finishing (until slaughter) periods: (51) 17.5% crude protein (CP) with 0.93% crude lysine during the growing and finishing periods, (52) 17.5% CP with 0.93% lysine and 15.0% CP with 0.80% lysine during the growing and finishing periods, respectively,
242
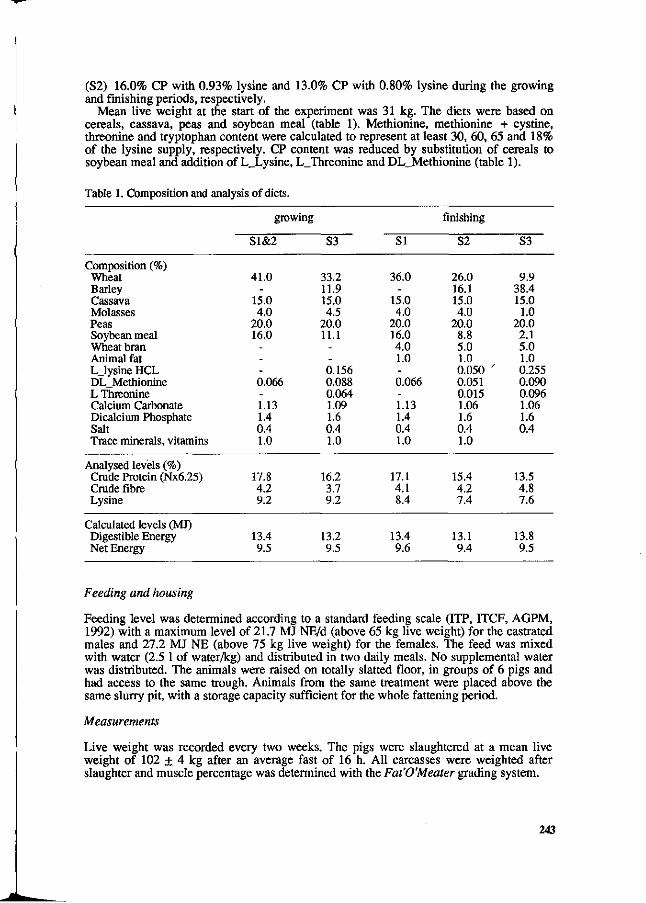
(S2) 16.0% CP with 0.93% lysine and 13.0% CP with 0.80% lysine during the growing and finishing periods, respectively.
Mean live weight at the start of the experiment was 31 kg. The diets were based on cereals, cassava, peas and soybean meal (table 1). Methionine, methionine + cystine, threonine and tryptophan content were calculated to represent at least 30, 60, 65 and 18% of the lysine supply, respectively. CP content was reduced by substitution of cereals to soybean meal and addition of L_Lysine, L_Threonine and DL_Methionine (table 1).
Table 1. Composition and analysis of diets.
Composition (%) Wheat Barley Cassava Molasses Peas Soybean meal Wheat bran Animal fat LJysine HCL DL_Methionine L Threonine Calcium Carbonate Dicalcium Phosphate Salt Trace minerals, vitamins
Analysed levels (%) Crude Protein (Nx6.25) Crude fibre Lysine
Calculated levels (MJ) Digestible Energy Net Energy
growing
S1&2
41.0 -
15.0 4.0
20.0 16.0
---0.066 -1.13 1.4 0.4 1.0
17.8 4.2 9.2
13.4 9.5
S3
33.2 11.9 15.0 4.5
20.0 11.1
--0.156 0.088 0.064 1.09 1.6 0.4 1.0
16.2 3.7 9.2
13.2 9.5
SI
36.0 -
15.0 4.0
20.0 16.0 4.0 1.0 -0.066 -1.13 1.4 0.4 1.0
17.1 4.1 8.4
13.4 9.6
finishing
S2
26.0 16.1 15.0 4.0
20.0 8.8 5.0 1.0 0.050 ' 0.051 0.015 1.06 1.6 0.4 1.0
15.4 4.2 7.4
13.1 9.4
S3
9.9 38.4 15.0 1.0
20.0 2.1 5.0 1.0 0.255 0.090 0.096 1.06 1.6 0.4
13.5 4.8 7.6
13.8 9.5
Feeding and housing
Feeding level was determined according to a standard feeding scale (ITP, ITCF, AGPM, 1992) with a maximum level of 21.7 MJ NE/d (above 65 kg live weight) for the castrated males and 27.2 MJ NE (above 75 kg live weight) for the females. The feed was mixed with water (2.5 1 of water/kg) and distributed in two daily meals. No supplemental water was distributed. The animals were raised on totally slatted floor, in groups of 6 pigs and had access to the same trough. Animals from the same treatment were placed above the same slurry pit, with a storage capacity sufficient for the whole fattening period.
Measurements
Live weight was recorded every two weeks. The pigs were slaughtered at a mean live weight of 102 + 4 kg after an average fast of 16 h. All carcasses were weighted after slaughter and muscle percentage was determined with the Fat'O'Meater grading system.
243
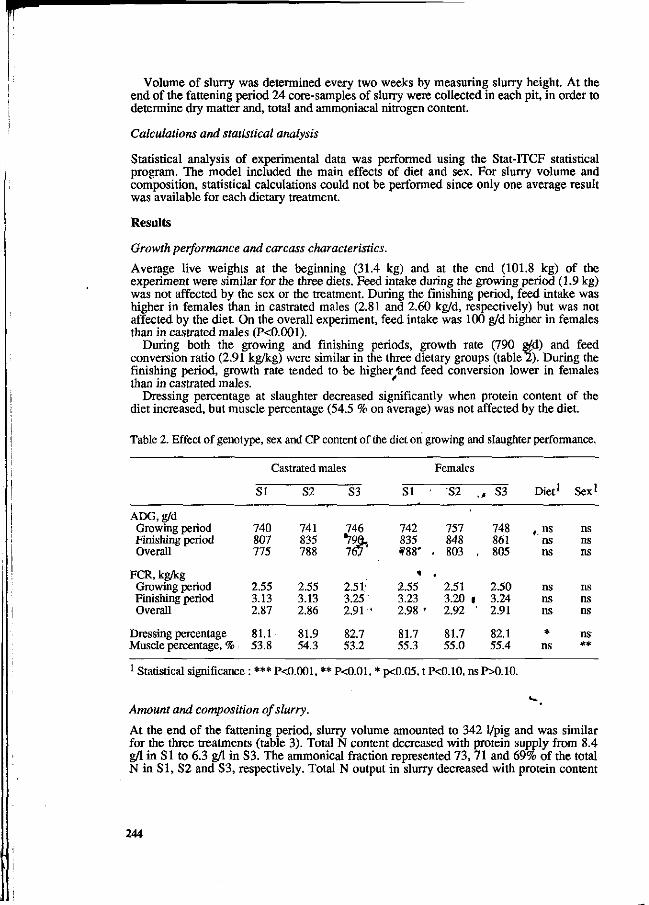
Volume of slurry was determined every two weeks by measuring slurry height. At the end of the fattening period 24 core-samples of slurry were collected in each pit, in order to determine dry matter and, total and ammoniacal nitrogen content.
Calculations and statistical analysis
Statistical analysis of experimental data was performed using the Stat-ITCF statistical program. The model included the main effects of diet and sex. For slurry volume and composition, statistical calculations could not be performed since only one average result was available for each dietary treatment.
Results
Growth performance and carcass characteristics.
Average live weights at the beginning (31.4 kg) and at the end (101.8 kg) of the experiment were similar for the three diets. Feed intake during the growing period (1.9 kg) was not affected by the sex or the treatment. During the finishing period, feed intake was higher in females than in castrated males (2.81 and 2.60 kg/d, respectively) but was not affected by the diet. On the overall experiment, feed intake was 100 g/d higher in females than in castrated males (P<0.001).
During both the growing and finishing periods, growth rate (790 g/d) and feed conversion ratio (2.91 kg/kg) were similar in the three dietary groups (table 2). During the finishing period, growth rate tended to be higher &nd feed conversion lower in females than in castrated males. '
Dressing percentage at slaughter decreased significantly when protein content of the diet increased, but muscle percentage (54.5 % on average) was not affected by the diet.
Table 2. Effect of genotype, sex and CP content of the diet on growing and slaughter performance.
ADG,g/d Growing period Finishing period Overall
FCR, kg/kg Growing period Finishing period Overall
Dressing percentage Muscle percentage, %
Castrated males
SI
740 807 775
2.55 3.13 2.87
81.1 53.8
S2
741 835 788
2.55 3.13 2.86
81.9 54.3
S3
746
2.51' 3.25' 2.91 •
82.7 53.2
SI
742 835 988'
2.55 3.23 2.98 *
81.7 55.3
Females
J 'S2
757 848
. 803 ,
* 2.51 3.20 ( 2.92 '
81.7 55.0
, S3
748 861 805
2.50 3.24 2.91
82.1 55.4
Diet1
t. n s
ns ns
ns ns ns
* ns
Sex1
ns ns ns
ns ns ns
ns **
1 Statistical significance : *** P<0.001, ** P<0.01, * p<0.05, t P<0.10, ns P>0.10.
Amount and composition of slurry.
At the end of the fattening period, slurry volume amounted to 342 1/pig and was similar for the three treatments (table 3). Total N content decreased with protein supply from 8.4 g/1 in SI to 6.3 g/1 in S3. The ammonical fraction represented 73, 71 and 69% of the total N in SI, S2 and S3, respectively. Total N output in slurry decreased with protein content
244
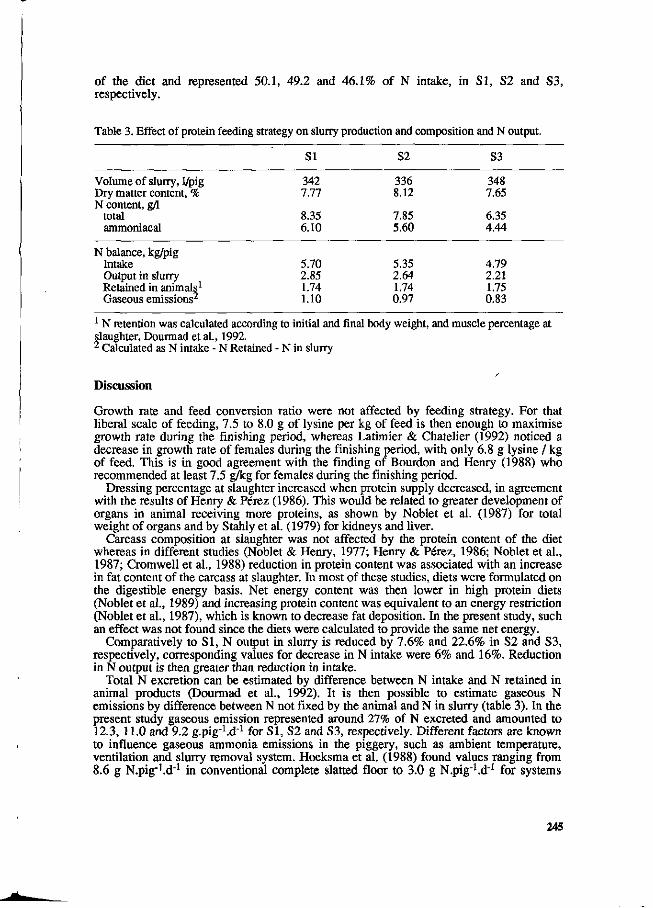
of the diet and represented 50.1, 49.2 and 46.1% of N intake, in SI, S2 and S3, respectively.
Table 3. Effect of protein feeding strategy on slurry production and composition and N output.
SI S2 S3
Volume of slurry, 1/pig Dry matter content, % N content, g/1
total ammoniacal
N balance, kg/pig Intake Output in slurry Retained in animals1
Gaseous emissions2
1 N retention was calculated according to initial and final body weight, and muscle percentage at slaughter, Dourmad et al., 1992.
342 7.77
8.35 6.10
5.70 2.85 1.74 1.10
336 8.12
7.85 5.60
5.35 2.64 1.74 0.97
348 7.65
6.35 4.44
4.79 2.21 1.75 0.83
2 Calculated as N intake - N Retained - N in slurry
Discussion
Growth rate and feed conversion ratio were not affected by feeding strategy. For that liberal scale of feeding, 7.5 to 8.0 g of lysine per kg of feed is then enough to maximise growth rate during the finishing period, whereas Latimier & Chatelier (1992) noticed a decrease in growth rate of females during the finishing period, with only 6.8 g lysine / kg of feed. This is in good agreement with the finding of Bourdon and Henry (1988) who recommended at least 7.5 g/kg for females during the finishing period.
Dressing percentage at slaughter increased when protein supply decreased, in agreement with the results of Henry & Perez (1986). This would be related to greater development of organs in animal receiving more proteins, as shown by Noblet et al. (1987) for total weight of organs and by Stahly et al. (1979) for kidneys and liver.
Carcass composition at slaughter was not affected by the protein content of the diet whereas in different studies (Noblet & Henry, 1977; Henry & Perez, 1986; Noblet et al., 1987; Cromwell et al., 1988) reduction in protein content was associated with an increase in fat content of the carcass at slaughter. In most of these studies, diets were formulated on the digestible energy basis. Net energy content was then lower in high protein diets (Noblet et al., 1989) and increasing protein content was equivalent to an energy restriction (Noblet et al., 1987), which is known to decrease fat deposition. In the present study, such an effect was not found since the diets were calculated to provide the same net energy.
Comparatively to SI , N output in slurry is reduced by 7.6% and 22.6% in S2 and S3, respectively, corresponding values for decrease in N intake were 6% and 16%. Reduction in N output is then greater than reduction in intake.
Total N excretion can be estimated by difference between N intake and N retained in animal products (Dourmad et al., 1992). It is then possible to estimate gaseous N emissions by difference between N not fixed by the animal and N in slurry (table 3). In the present study gaseous emission represented around 27% of N excreted and amounted to 12.3, 11.0 and 9.2 g.pig^.d1 for SI , S2 and S3, respectively. Different factors are known to influence gaseous ammonia emissions in the piggery, such as ambient temperature, ventilation and slurry removal system. Hoeksma et al. (1988) found values ranging from 8.6 g N.pig^.d"1 in conventional complete slatted floor to 3.0 g N.pig^.d"1 for systems
245
with daily flushing of the slurry. Pessara et al. (1992) measured similar values, 6.5 g.pig"\d_1 with roof ventilation and 9.6 g.pig^.d"1 with a floor ventilation.
Conclusion
Lowering protein supply in growing-finishing pigs, through improvement of the amino acid balance and adaptation of feeding strategy, is an efficient way for decreasing N output in the slurry (-23 % in the present study) and also gaseous N emission from the building (-25 %).
Acknowledgements
This work has been completed within the Brittany Regional program with funding of the "Conseil régional de Bretagne". The authors gratefully acknowledge A. Corlouer for carrying out the experiment and to C. Calvar, J Dumortier and A Monfront for their efficient help.
References
Bourdon, D. & Henry, Y., 1988. Besoin en lysine, selon le sexe, du porc en finition. Journées Rech. Porcine en France, 20: 409-414.
Cromwell, G.L., Cline, T.R., Crenshaw, J.D., Ewan, R.C., Mahan, D.C., Miller, E.R., Pettigrew, J.E. & Wahlstom, R.C., 1988. Effect of dietary protain on performance and carcass traits of barrows and gilts. J. Anim. Sei. 66 (supp. 1): 143, abstract.
Dourmad, J.Y., Guillou, D. & Noblet, J. 1992. Development of a calculation model for predicting the amount of N excreted by the pig : effect of feeding, physiological stage and performance. Livest.Prod. Sei. 31:95-107.
Gatel, F. & Grosjean, F., 1992. Effect of protein content of the diet on nitrogen excretion by pigs. Livest. Prod. Sei. 31:109-120.
Henry, Y. & Pérez.J.M., 1986. Effets de la supplementation en lysine, associée à une réduction du taux de protéines, dans des régimes à base de maïs ou de blé sur les performances de croissance du porc. Journées Rech. Porcine en France 18: 57-66.
Hoeksma, P., Verdoes, N., Oosthoek, J. & Voermans, J.A.M., 1992. Reduction of ammonia volatilization from pig houses using aerated slurry as recirculation liquid. Livest. Prod. Sei. 31: 121-132.
ITP, ITCF & AGPM, 1992. Tables d'alimentation pour les porcs. Paris, 27 pp. ' Jongbloed, A.W. & Lenis, N.P., 1992. Alteration^ nutrition as a means to reduce environmental
pollution by pigs. Livest. Prod. Sei. 31: 75-94 " Latimier, P. & Chatelier, C, 1992. Effet de trois profils azotés»sus les performances et les rejets du
porc charcutier. Journées Rech. Porcine en France 24: 2-27-236. Noblet J., Fortune, H., Dubois, S. & Hehry, Y., 1989. Nouvelles bases d'estimation des teneurs en
énergie digestible, métabolisable et nette des aliments pour lé porc. INRA, Paris, 106 pp. Noblet, J. & Henry, Y., 1977. Conséquences d'une réduction du taux de matières azotées sur le
niveau de consommation et les performances de croissance chez le porc selon l'équillibre en acides aminés et la concentration en énergie du régime. Ann. Zootech. 26: 379-394.
Noblet, J., Henry, Y. & Dubois, S., 1987. Effect of protein and lysine levels in the diet on body gain composition and energy utilization in growing pigs. J. Anim. Sei. 65: 717-726.
Pessara, H„ Oldenburg, J & Brenner, K.V., 1992. Läßt sich die Ammoniakemission senken. Deutche Geflügelwirtschaft und Schweineproduction 5:144-146. *-.
Stanly, T.S., Cromwell, G.L. & Aviotti, M.P., 1979. The effect of environmental temperature and dietary lysine source and level on the performance and carcass characteristics in growing swine. J. Anim. Sei., 49:1242-1251.
Tamminga, S. & Verstegen, M.W., 1991. Protein nutrition and animal production : consequences for environments and some possible recommendations. In : Proc 6"1 Internat. Symp. Protein Metabolism and nutrition. EAAP Publication No 59. Nat.Inst.Anim.Sci., Foulum, Denmark.
246
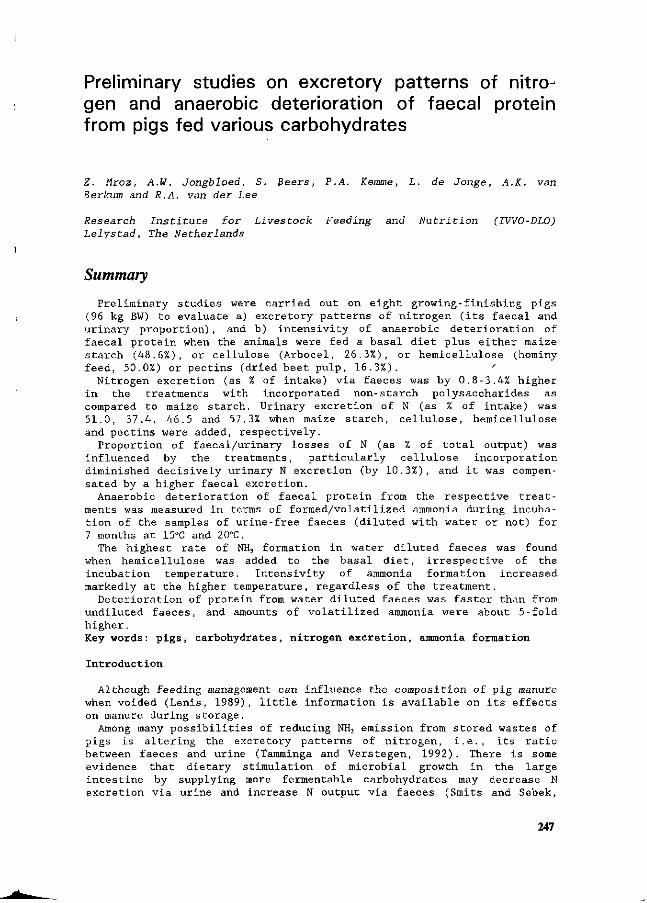
Preliminary studies on excretory patterns of nitrogen and anaerobic deterioration of faecal protein from pigs fed various carbohydrates
Z. Mroz, A.W. Jongbloed, S. Beers, P.A. Kemme, L. de Jonge, A.K. van Berkum and R.A. van der Lee
Research Institute for Livestock Feeding and Nutrition (IVVO-DLO) Lelystad, The Netherlands
Summary
Preliminary studies were carried out on eight growing-finishing pigs (96 kg BW) to evaluate a) excretory patterns of nitrogen (its faecal and urinary proportion), and b) intensivity of anaerobic deterioration of faecal protein when the animals were fed a basal diet plus either maize starch (48.6%), or cellulose (Arbocel, 26.3%), or hemicellulose (hominy feed, 50.0%) or pectins (dried beet pulp, 16.3%). '
Nitrogen excretion (as % of intake) via faeces was by 0.8-3.4% higher in the treatments with incorporated non-starch polysaccharides as compared to maize starch. Urinary excretion of N (as % of intake) was 51.0, 37.4, 46.5 and 57.3% when maize starch, cellulose, hemicellulose and pectins were added, respectively.
Proportion of faecal/urinary losses of N (as % of total output) was influenced by the treatments, particularly cellulose incorporation diminished decisively urinary N excretion (by 10.3%), and it was compensated by a higher faecal excretion.
Anaerobic deterioration of faecal protein from the respective treatments was measured in terms of formed/volatilized ammonia during incubation of the samples of urine-free faeces (diluted with water or not) for 7 months at 15°C and 20°C.
The highest rate of NH3 formation in water diluted faeces was found when hemicellulose was added to the basal diet, irrespective of the incubation temperature. Intensivity of ammonia formation increased markedly at the higher temperature, regardless of the treatment.
Deterioration of protein from water diluted faeces was faster than from undiluted faeces, and amounts of volatilized ammonia were about 5-fold higher. Key words: pigs, carbohydrates, nitrogen excretion, ammonia formation
Introduction
Although feeding management can influence the composition of pig manure when voided (Lenis, 1989), little information is available on its effects on manure during storage.
Among many possibilities of reducing NH3 emission from stored wastes of pigs is altering the excretory patterns of nitrogen, i.e., its ratio between faeces and urine (Tamminga and Verstegen, 1992). There is some evidence that dietary stimulation of microbial growth in the large intestine by supplying more fermentable carbohydrates may decrease N excretion via urine and increase N output via faeces (Smits and Sebek,
247
1987). Urinary N is mainly present in the form of urea, which is easily decomposed by urease and two NH4-ions are liberated (Headon and Dawson, 1990). Faecal N is mainly of bacterial origin (up to 94%), which is less susceptible for a rapid deamination in comparison to urinary urea.
No specific information is available on ammonia formation and volatilization from faecal protein obtained from pigs fed various carbohydrates during storage for a long time.
Therefore, the present preliminary studies were carried out to evaluate: 1) excretory patterns of nitrogen in pigs fed various carbohydrates (maize starch, cellulose, hemicellulose and pectins); 2) effects of anaerobic deterioration of faecal protein during storage on ammonia formation in sewage and ammonia volatilization using urine-free faeces of pigs fed the above mentioned sources of carbohydrates.
Measurements of excretory patterns of nitrogen in pigs fed various carbohydrates
A balance experiment was carried out on eight pigs of 96 kg initial BW, which were assigned to four treatments and fed a basal diet with addition of either maize starch (Treatment 1-control), or cellulose - Arbocel (Treatment 2) , or hominy feed, rich in hemicellulose (Treatment 3) or beet pulp, rich in pectins (Treatment 4) as presented in Table 1.
Table 1. Composition of daily rations for pigs to study excretory patterns of nitrogen and ammonia formation in relation to dietary carbohydrates
Treatment 1 2 Maize starch Cellulose Hemicellulose
4 Pectins
Daily ration (g/kg)
Basal diet" Maize starch Cellulose2' Hominy feed Beet pulp
514 486
417 320 263
^i
Analyzed composition (g/kg as-fed basis) DM 875 892 N 24.6 20.5 CF 23.2 207.9 NDF 70.4 316.5 ADF 32.8 257.2 ADL 6.9 8.0 Pectins 13.6 8.7 Starch 533.4 304.7
424 76
500
'870 29 .p 48.6
174.4 66.3 11.0 14.2
309.2
'fol
163
880 42.3 71.9
192.6 96.5 17.5 30.0
143.9
" Basal diet (g/kg): barley, 274; soybean flour, 263; potato 'protein, 107; wheat middlings, 195; soybean oil, 18; molasses, 58.0; lucerne meal, 39.0; limestone, 19.0; monocalcium phosphate, 16; NaCl, 4; trace min.-vit. premix, 4; DL-methionine, 1; L-lysine, 1 and Cr-,03, 1.
:> Arbocel.
Daily rations were formulated to meet 90% of pigs requirement for NEr
(CVB, 1991) and given twice daily. After adapting the pigs to the experimental treatments during 8 weeks, faeces and urine were collected
248
quantitatively and analysed to determine excretory patterns of nitrogen, i.e., a partition of nitrogen excretion between faeces and urine (Table 2).
Table 2. Composition of fresh faeces and the excretory patterns of nitrogen in relation to dietary carbohydrates
Treatment
Composition
DM N CF NDF ADF ADL Pectins Lactic acid DAPA"
of
Maize
faeces
1 starch
(g/kg)
308 10.4 55.7
119.6 67.9 16.0 1.8 0.4 0.29
2 Cellulose
351 5.6
194.5 253.6 226.6
4.7 1.0 0.5 0.33
3 Hemicellulose
236 10.3 36.6 80.2 47.2 10.7 1.4 0.6 0.31
4 Pectins
295 9.6
44.0 129.0 56.0 9.1 1.6 0.4 0.31
27.3 72.7
37.6 62.4
30.2 69.8
25.9 74.1
19.2 51.0
22.6 37.4
20.2 46.5
20.0 57.3
Excretory patterns of nitrogen (% of total output)
Via faeces Via urine
Excretory patterns of nitrogen (% of intake)
Via faeces Via urine
"Di-amino pimelic acid.
Concentration of nitrogen in fresh faeces was similar when the pigs were fed maize-starch (Treatment 1) , hemicellulose (Treatment 3) and pectins (Treatment 4), i.e., from 9.6 to 10.4 g/kg. By feeding cellulose (Treatment 4), N concentration in fresh faeces diminished to 5.6 g/kg.
Excretory patterns of nitrogen (expressed as % of total output) were found to be influenced by the treatments. For this criterion, the highest value of faecal nitrogen was recorded in pigs fed cellulose (37.6%), whereas the lowest value was noted by feeding pectins (25.9%).
However, the partition of nitrogen losses (expressed as % of intake) was less related to the treatments. Nevertheless, it could be seen that by adding the non-starch polysaccharides (cellulose, hemicellulose or pectins) to the basal diet for fattening pigs, the faecal losses of nitrogen were by 0.8 - 2.4% higher. These results are in agreement with conclusions reached by Etienne (1987) and Mroz et al. (1986, 1991) that fibrous products may decrease N digestibility due to an inhibition of protein hydrolysis, a higher passage rate and an increased output of endogenous and bacterial protein. On the other hand, Mosenthin et al.(1992) reported, that the type of diet (maize starch vs maize starch + 15% beet pulp) did not affect faecal output of endogenous nitrogen, but by infusion of starch at the distal ileum, amounts of urinary N decreased at a simultanous increase of faecal protein of bacterial origin.
249
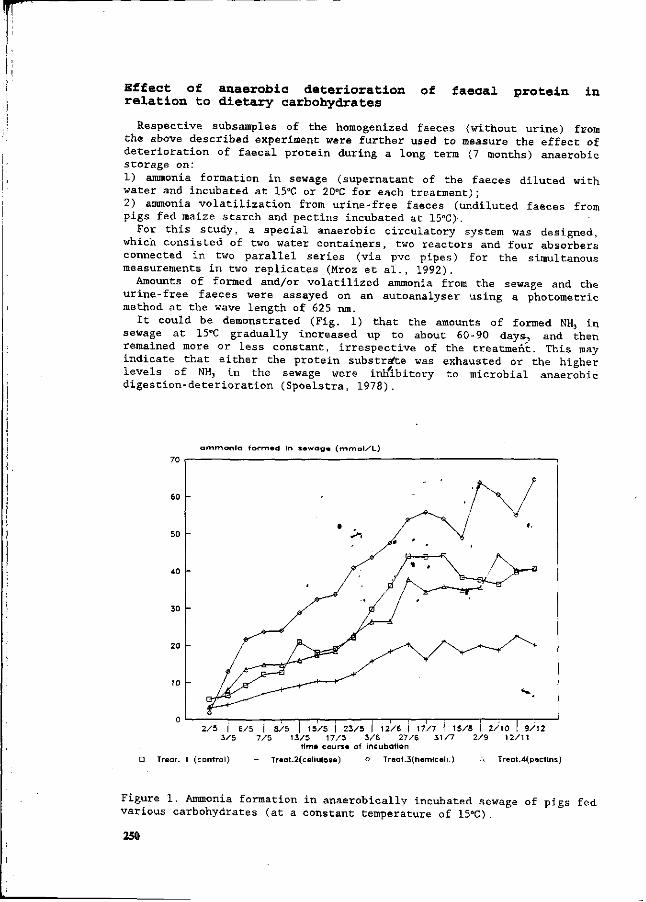
Effect of anaerobic deterioration of faecal protein in relation to dietary carbohydrates
Respective subsamples of the homogenized faeces (without urine) from the above described experiment were further used to measure the effect of deterioration of faecal protein during a long term (7 months) anaerobic storage on: 1) ammonia formation in sewage (supernatant of the faeces diluted with water and incubated at 15°C or 20°C for each treatment) ; 2) ammonia volatilization from urine-free faeces (undiluted faeces from pigs fed maize starch and pectins incubated at 15°C) .
For this study, a special anaerobic circulatory system was designed, which consisted of two water containers, two reactors and four absorbers connected in two parallel series (via pvc pipes) for the simultanous measurements in two replicates (Mroz et al., 1992).
Amounts of formed and/or volatilized ammonia from the sewage and the urine-free faeces were assayed on an autoanalyser using a photometric method at the wave length of 625 nm.
It could be demonstrated (Fig. 1) that the amounts of formed NH3 in sewage at 15°C gradually increased up to about 60-90 days, and then remained more or less constant, irrespective of the treatment. This may indicate that either the protein substrate was exhausted or the higher levels of NHj in the sewage were inhibitory to microbial anaerobic digestion-deterioration (Spoelstra, 1978).
ammonia form»d In sawag« ( m m o l / L )
2/5 | 6/5 I 8/5 I 15/5 I 23/5 I 12/6 I 17/7 I 1S/8 I 2/10 I 9/12 3/5 7/5 13/5 17/5 3/6 27/6 31/7 2/9 12/11
time course of incubation a Treat. 1 (control) - Treat.2(cellulose) o Treat.3(hemicell.) Treat.4(pectins)
Figure 1. Ammonia formation in anaerobically incubated sewage of pigs fed various carbohydrates (at a constant temperature of 15°C) .
250
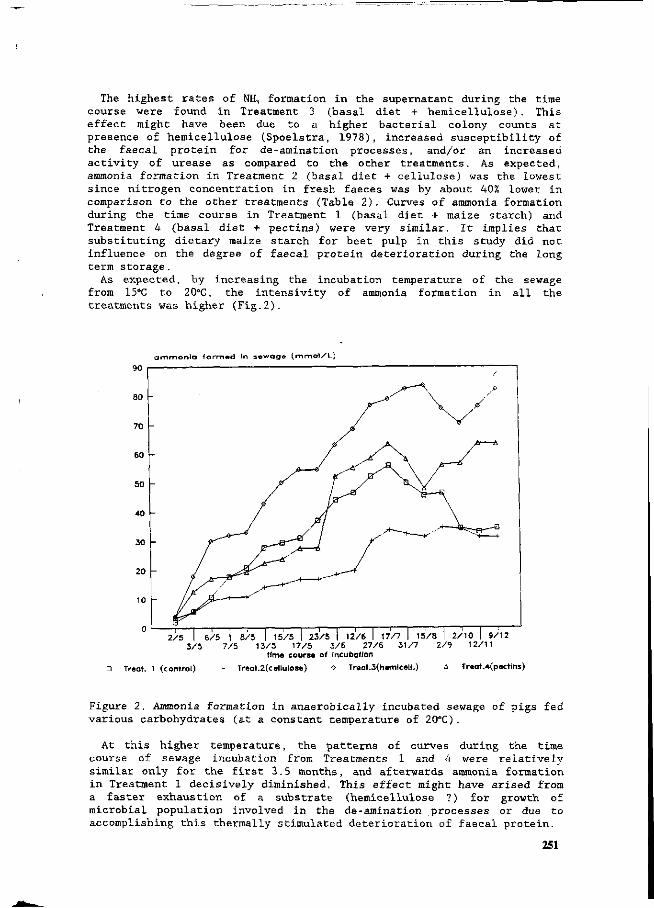
The highest rates of NH3 formation in the supernatant during the time course were found in Treatment 3 (basal diet + hemicellulose). This effect might have been due to a higher bacterial colony counts at presence of hemicellulose (Spoelstra, 1978), increased susceptibility of the faecal protein for de-amination processes, and/or an increased activity of urease as compared to the other treatments. As expected, ammonia, formation in Treatment 2 (basal diet + cellulose) was the lowest since nitrogen concentration in fresh faeces was by about 40% lower in comparison to the other treatments (Table 2). Curves of ammonia formation during the time course in Treatment 1 (basal diet + maize starch) and Treatment 4 (basal diet + pectins) were very similar. It implies that substituting dietary maize starch for beet pulp in this study did not influence on the degree of faecal protein deterioration during the long term storage.
As expected, by increasing the incubation temperature of the sewage from 15"C to 20°C, the intensivity of ammonia formation in all the treatments was higher (Fig.2).
ammonia formed In sewage ( m m o t / L )
2 / 5 I 6 / 5 | 8 /5 I 15 /5 I 2 3 / 5 I 12 /6 I 17 /7 | 1 5 /8 I 2 / 1 0 I 9 /12 3 / 5 7 / 5 13 /5 17 /5 3 / 6 2 7 / 6 3 1 / 7 2 / 9 12 /11
time coursa of incubation
D Treat. 1 (control) Treat. 2(cellulose) Treat.3(hemlcell.; Treat.4(pectlns)
Figure 2. Ammonia formation in anaerobically incubated sewage of pigs fed various carbohydrates (at a constant temperature of 20°C) .
At this higher temperature, the patterns of curves during the time course of sewage incubation from Treatments 1 and 4 were relatively similar only for the first 3.5 months, and afterwards ammonia formation in Treatment 1 decisively diminished. This effect might have arised from a faster exhaustion of a substrate (hemicellulose ?) for growth of microbial population involved in the de-amination processes or due to accomplishing this thermally stimulated deterioration of faecal protein.
251
Effects of anaerobic deterioration of faecal protein from urine-free faeces in relation to dietary carbohydrates
When undiluted faeces (without water and urine) from pigs given maize starch (Treatment 1) and pectins (Treatment 4) were incubated anaerobi-cally at 15°C, the amounts of ammonia volatilized after 7 months were substantially lower (<12 mmol/L) as comparing to the respective treatments with diluted faeces (50-60 mmol/L). In this case, nearly two months were needed to detect a presence of ammonia in the absorbers.
Comparing both treatments, less ammonia was emitted from faeces of pigs fed the basal diet with added beet pulp. This finding is in line with numerous reports of carbohydrate fermentation inhibiting amino acid deaminases of gram-negative anaerobic bacteria, which are known to be responsible for the formation of a substantial proportion of the total ammonia generated from the non-urea sources in vivo (Vince and Burridge, 1980).
References
CVB, 1991. Centraal Veevoederbureau. Veevoedertabel - gegevens».over chemische samenstelling, verteerbaarheid en voederwaarde varf'voedermi-ddelen. Lelystad. f
Etienne, M., 1987. Utilization of high flore feeds and cereals by sows, a review. Livest. Prod. Sei. 16:229-242.
Headon, D.R. & Dawson, K.A., 1990. Yucca extract controls atmospheric ammonia levels. Feedstuffs 62, 29:15-16.
Lenis, N.P., 1989. Lower nitrogen excretion in pig husbandry by feeding: current and future possibilities. Neth. J. Agric. Sei., 37:61-70.
Mosenthin, R., Sauer, W.C., Henkel, H., Ahrens, F. & de Lange, C.F.M., 1992. Tracer studies of urea kinetics in growing pigs: II. The effect of starch infusion at the distal ileum on urea recycling and bacterial nitrogen excretion. J. Anim. Sei 70:3467-3472.
Mroz, Z., Partridge, I.G., Mitchell, K.G. & Keal, H.D-. , 1986. The effect of oat hulls, added to the basal ration for pregnant sows on reproduc tive performance, apparent digestibility, rate of passage and"-plasma parameters. J. Sei. Food Agric. 23T-247.» * ,
Mroz, Z. & Tarkowski, A., 1991. The effects of the dietary inclusion of sida meal (Malvaceae) for gilts on the reproductive performance, apparent digestibility, rate of passage -and plasma parameters. Livest. Prod. Sei. 27:199-210. ' ' I
Mroz, Z., Jongbloed, A.W. , Kemme, P.A.', Beers,' S. & de' Jonge, L. , 1992. Preliminary studies on ammonia formation and volatilization from faecal protein and excretory patterns of nitrogen in pigs fed various carbohy drates. Internal Report IWO-DLO No 355, pp. 27.
Smits, B. & Sebek, L.B.J., 1987. Perspulpsilage in de varkensvoeding: voeder- en gebruikswaarde. Rapport IWO No 183, pp. 53.
Spoelstra, S.F., 1978. Microbial aspects of the formation of malodorous compounds in anaerobically stored piggery wastes. PhD Thesis, -Agricultural University of Wageningen, pp. 91.
Tamminga, S. & Verstegen, M.V.A., 1992. Implications of nutrition of animals on environmental pollution. In: Recent Advances in Animal Nutrition, Ed. by P.C. Garnsworthy, W. Haresign & D.J.A. Cole, Butterworth-Heinemann, p. 113-130.
Vince, A.J. & Burridge, S.M., 1980. Ammonia production by intestinal bacteria: the effects of lactose, lactulose and glucose. J. Med. Microbiol. 13, 2:177-191.
252
The ideal pattern of ileal digestible amino acids in diets for growing pigs
N.P. Lenis1, J.Th.M. van Diepen1, J.B. Schutte2 and J. de Jong2
1. Research Institute for Livestock Feeding and Nutrition (IVVO-DLO), P.O. Box 160, NL-8200 AD Lelystad, The Netherlands
2. Institute of Animal Nutrition and Physiology (ILOB-TNO), Wageningen, P.O. Box 15, NL-6700AA, The Netherlands
Summary
Based upon a series of performance and digestibility experiments with pigs at live weight ranges between 20-105 kg, and on some literature data, the dietary ideal pattern of ileal apparent digestible amino acids for maximum performance of pigs was assessed. This was done for lysine, methionine, methionine + cystine, threonine and tryptophan. Data were compared with average dietary concentrations of these amino acids in Dutch commercial compound feeds for pigs, Besides the Dutch minimum allowances in practice are given. From a recent experiment additional information is supplied about the requirement for ileal digestible isoleuci-ne of starter pigs. Finally, amino acid recommendations are compared with data from the Dutch computer model "Technical Model Pig Feeding".
Key words: pigs, amino acids, ideal protein, ileal digestibility, isoleucine, modelling.
Introduction
For improvement of nitrogen utilization and reduction of nitrogen excretion by pigs dietary amino acid supply should be in better agreement with the animal's requirement (Jongbloed & Lenis, 1992). Expressing both amino acid requirements and dietary amino acid supply in "ideal ileal digestible protein" (Fuller & Wang, 1990; de Lange, 1992) will help to achieve this goal.
In this paper the ileal apparent digestibility of amino acids is discussed and an assessment is given for the ideal apparent ileal digestibile amino acid pattern for growing pigs (including isoleucine), based upon performance and digestibility experiments and on some literature data. Recommendations are compared with dietary concentrations in practice and data from computer modelling.
Ileal digestibility
In the eighties, there was increasing evidence that the ileal level for determining dietary amino acid digestibility in the growing pig was more suitable as a basis for diet formulation than the faecal (overall) level. Using ileal digestibility will improve accuracy of amino acid balance, especially for threonine and tryptophan, since both amino acids in several feedstuffs are poorer digested at the ileal level than lysine (Lenis, 1983). The usefulness of faecal and ileal apparent amino acid
253
digestibilities in diet formulation has been discussed in detail by Lenis (1992). Recently Southern (1991) comprehensively reviewed both ileal amino acid digestibility and requirements.
In the Netherlands, the results of extensive studies to determine ileal digestibility of amino acids in feedstuffs for pigs, determined using the re-entrant cannulation technique (van Leeuwen et al., 1989), were compiled for practical implementation (CVB, 1990), and in 1991 they were integrated in the revised Dutch Feedstuff Table (CVB, 1991). In composing the table, also some literature data were used. From that time, the apparent ileal digestibility system replaced the previous system based on the faecal digestibility in the Netherlands (Lenis, 1989). In the new table, apparent ileal digestible values are given for lysine, methionine, cystine, threonine and tryptophan of all important feedstuffs for pigs. Isoleucine is not included in the table, but information about its ileal digestibility is available from the study of Van Leeuwen et al. (1989).
Assessment of the ideal pattern
Assessment of the ideal ileal digestible amino acid pattern for pigs was a subject of coordinated studies at the Research Institute for Livestock Feeding and Nutrition (IVVO-DLO) in Lelystad and at the TNO-lnstitute of Animal Nutrition and Physiology (ILOB-TNO) in Wageningen (Lenis e ta l . , 1990; Lenis, 1992). In these studies, ileal digestible requirements for lysine/methionine + cystine, threonine and tryptophan for maximum performance of pigs were deduced and expressed as concentrations of apparent ileal digestible amino acids in different types of pig feeds. 'Requirement' was defined as the marginal value above which additional supplementation of the amino acid in question does not further improve performance of pigs. The estimates derived from performance and digestibility trials in both institutes and from selected experiments in literature, which have been recalculated to obtain ileal digestibility data by means of tabulated ileal digestible amino acid values for the ingredients used (CVB, 1990).'Calculations were made for several classes of pigs (piglets and growing pigs) in accordance with the live weight based classification of pig diets mostly used in practice. Figures were corrected for the common energy content of the type of the feed. «
Recommendations
Despite several experiments described in', the literature have been carried out without balancing the remaining essential amino acids, the information gathered was considered to be sufficient for establishing recommendations in terms of concentrations of ileal digestible amino acids for maximum performance in feeds for piglets, starter pigs and growing-finishing pigs (Table 1). In this table however, no data for growing pigs (40-70 kg) are given, because of insufficient information about their lysine requirement. The recommendations for threonine and tryptophan are almost entirely based upon the ILOB/IVVO experiments.
The table shows almost constant ratios for the requirements of the four most essential amino acids, except of tryptophan. The requirement for ileal digestible tryptophan, relative to lysine, was found to be 19% in growing-finishing pigs and 21 % in piglets. The latter value is considerably higher than the relative tryptophan requirement of 18% found by Wang & Fuller (1989) in nitrogen balance studies, but shows better agreement with later estimates (19 and 20%) of the same re-
254
search group (Fuller et a l . , 1989; Wang & Fuller, 1990). Recently, Fremaut & De Schrijver (1990) stated on the basis of daily gain, that total t ryptophan requirement of growing pigs (25-50 kg) was even higher (23% of total lysine requirement), whi lst for finishing pigs, it was 18%. Possibly, in our study, the difference between piglets and growing-finishing pigs may be linked to the uncertainty about the requirement for ileal digestible lysine by piglets and young pigs. Lysine requirement should be determined more precisely, as it is the basis of the ideal protein system, and because the genetic potential of pigs is increasing.
Concerning methionine + cystine, it is advisable to indicate the minimum share of methionine, because cystine can meet the requirement for total sulphur containing amino acids for 5 0 % at most (Schutte, 1989). The utilisation of cystine by pigs has been shown to be related to the dietary methionine level (Schutte, 1989). The requirements for ileal digestible methionine + cystine and threonine, relative to ileal digestible lysine (59 and 6 3 % , respectively) are higher than the estimates of ARC (1981), being 50 and 6 0 % on a total basis. Our estimate of ileal digestible methionine + cystine requirement corresponds very well w i th the recent estimate on ileal digestible basis by Wang & Fuller (1990), being 6 0 % . For ileal digestible threonine requirement, their estimate was 6 6 % . It is worthwi le to mention that in the ILOB/IVVO experiments a sub-optimal supply of t ryptophan and isoleucine had a negative effect on feed intake of the pigs.
Amino acids in practice '
Comparing the recommended concentrations wi th concentrations in commercial pig feeds, calculated on the basis of feed composit ion, obtained from the Dutch feed manufacturing industry and on CVB estimates for ileal amino acid digestiblity, it appeared that all commercial feeds for piglets and starter pigs were more or less deficient in tryptophan (Lenis, 1992). Many of these feeds as well as some feeds for older pigs are also deficient in threonine, if Table 1 is taken as the basis.
The recommendations for ileal digestible amino acid requirements have been used by CVB (1990) to derive allowances for pig feeds in practice. Because of economic reasons, CVB (1990) did not apply the requirements for maximum performance for threonine and tryptophan. As presented in Table 2, the minimum allowances for ileal digestible methionine, methionine + cystine, threonine and t ryptophan, relative to ileal digestible lysine, applied by CVB (1990) are 32 , 59 , 60 and 1 8 % , respectively.
Isoleucine
Information about the requirement for ileal digestible isoleucine was not included in the study of Lenis et al. (1990). Such information is scarce. However, recently Lenis & Van Diepen (unpublished data) gathered this information in a performance experiment w i th 276 ad libitum fed pigs in the live weight range 18-40 kg, involving also complementary digestibility trials. They concluded that in these pigs, the requirement for ileal digestible isoleucine for maximum daily gain was 5.5 g k g 1 , and for maximum feed conversion ratio 5.9 g kg"1 in a diet w i th a net energy content of 9.58 MJ NE, kg"1. Corrected to a net energy content of 9.49 MJ NE, kg'1, the requirement for ileal digestible isoleucine of starter pigs is 62 -66% of the requirement for ileal digestible lysine (8.8 g kg'1).
255
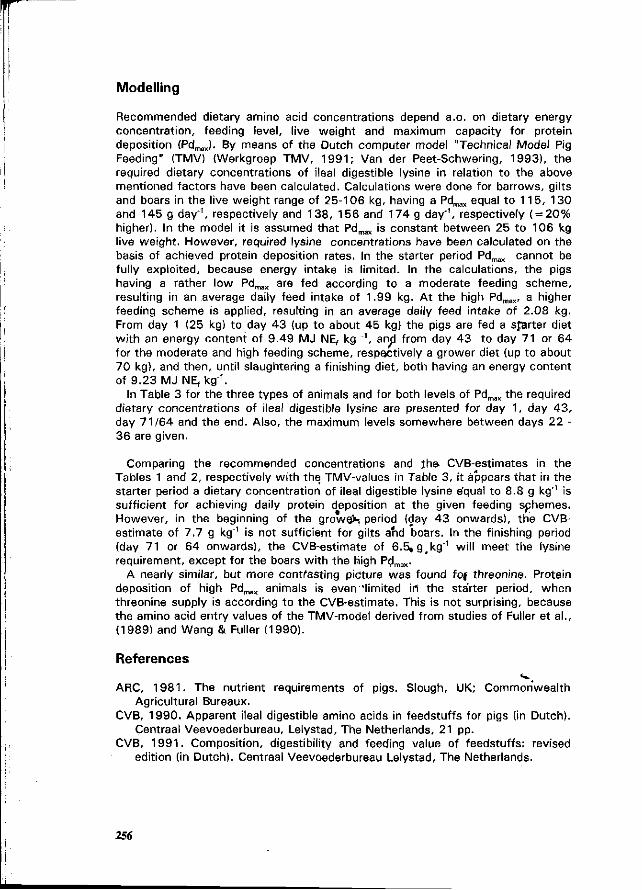
Modelling
Recommended dietary amino acid concentrations depend a.o. on dietary energy concentration, feeding level, live weight and maximum capacity for protein deposition (Pdmax). By means of the Dutch computer model "Technical Model Pig Feeding" (TMV) (Werkgroep TMV, 1 9 9 1 ; Van der Peet-Schwering, 1993), the required dietary concentrations of ileal digestible lysine in relation to the above mentioned factors have been calculated. Calculations were done for barrows, gilts and boars in the live weight range of 25-106 kg, having a Pdmax equal to 115, 130 and 145 g d a y ' , respectively and 138, 156 and 174 g d a y ' , respectively ( = 2 0 % higher). In the model it is assumed that Pdmax is constant between 25 to 106 kg live weight. However, required lysine concentrations have been calculated on the basis of achieved protein deposition rates. In the starter period Pdmax cannot be fully exploited, because energy intake is l imited. In the calculations, the pigs having a rather low Pdmax are fed according to a moderate feeding scheme, resulting in an average daily feed intake of 1.99 kg. A t the high Pdmax, a higher feeding scheme is applied, resulting in an average daily feed intake of 2.08 kg. From day 1 (25 kg) to day 43 (up to about 45 kg) the pigs are fed a smarter diet w i th an energy content of 9.49 MJ NEf kg "', and from day 43 to day 71 or 64 for the moderate and high feeding scheme, respectively a grower diet (up to about 70 kg), and then, until slaughtering a finishing diet, both having an energy content of 9.23 M J NEf kg"1.
In Table 3 for the three types of animals and for both levels of Pdmax the required dietary concentrations of ileal digestible lysine are presented for day 1 , day 4 3 , day 71 /64 and the end. Also, the maximum levels somewhere between days 22 -36 are given.
Comparing the recommended concentrations and ihe- CVB-estimates in the Tables 1 and 2, respectively w i th the TMV-values in Table 3, it appears that in the starter period a dietary concentration of ileal digestible lysine e'qual to 8.8 g kg'1 is sufficient for achieving daily protein deposition at the given feeding schemes. However, in the beginning of the growe>s period (day 43 onwards), the CVB-estimate of 7.7 g kg"1 is not sufficient for gilts and boars. In the finishing period (day 71 or 64 onwards), the CVB-estimate of 6 .5 ,g ( kg" ' wi l l meet the lysine requirement, except for the boars w i th the high Pdmax.
A nearly similar, but more contrasting picture was found fof threonine. Protein deposition of high Pdmax animals is even ' l imited in the starter period, when threonine supply is according to the CVB-estimate. This is not surprising, because the amino acid entry values of the TMV-model derived from studies of Fuller et a l . , (1989) and Wang & Fuller (1990).
References
ARC, 1 9 8 1 . The nutrient requirements of pigs. Slough, UK; Commonwealth Agricultural Bureaux.
CVB, 1990. Apparent ileal digestible amino acids in feedstuffs for pigs (in Dutch). Centraal Veevoederbureau, Lelystad, The Netherlands, 21 pp.
CVB, 1 9 9 1 . Composit ion, digestibility and feeding value of feedstuffs: revised edition (in Dutch). Centraal Veevoederbureau Lelystad, The Netherlands.
256
Fremaut, D. & Schrijver, R. de, 1990. Tryptophan supplementation of diets for growing-finishing pigs. Landbouwtijdschrift/Revue de l 'Agriculture, 4 3 : 7 6 1 -768 .
Fuller, M.F., McWil l iam, R., Wang T.C. & Giles, L.R., 1989. The optimum dietary amino acid pattern for growing pigs. 2. Requirements for maintenance and for tissue protein. British Journal of Nutrit ion, 62 :255-267.
Lange, C.F.M, de, 1992. A look at ideal protein for swine: a practical v iewpoint. Annual Biokyowa Amino Acid Meeting, Toronto, June 18-19, 1992, 14pp.
Fuller, M.F. & Wang, T.C., 1990. Digestible ideal protein - a measure of dietary protein value. Pig News and Information, 11 :353-357.
Jongbloed, A .W. & Lenis, N.P., 1992. Alteration of nutrition as a means to reduce environmental pollution by pigs. Livestock Production Science, 31 :75-94.
Leeuwen, P. van, Slump, P., Weerden, E.J. van, Huisman, J . , Tolman, G.H. & Kempen, G.J.M, van, 1989. Table of ileal digestible amino acids for pigs (in Dutch). Report ILOB-TNO no.I 8 9 - 3 6 4 1 , Wageningen, The Netherlands, 41 pp.
Lenis, N.P., 1983. Faecal amino acid digestibility in feedstuffs for pigs. In: Proceedings of the 4 th International Symposium on Protein Metabolism and Nutrit ion, Vol . 2 , Clermont-Ferrand, France (edited by R. Pion, M. Arnal & D. Bonin). Paris, France, Institut National de la Recherche Agronomique, pp. 385-389 .
Lenis, N.P., 1989. Lower nitrogen excretion in pig husbandry by feedirig: current and future possibilities. Netherlands Journal of Agricultural Science, 37:61-70.
Lenis, N.P., 1992. Digestible amino acids for pigs: assessment of requirements on ileal digestible basis. Pig News and Information, 13 (1) 31N-39N.
Lenis, N.P., Coppoolse, J . , Schutte, J.B., Fentener van Vlissingen, J .M. & Beelen, G.M., 1990. Ileal digestible amino acids in pig feeds (in Dutch). Report IVVO no. 215 , Lelystad, The Netherlands, 20 pp.
Peet-Schwering, C.M.C. van der. Peet, G.F.V. van der, Vos, H.J.P.M., Verstegen, M.W.A., Kanis, E., Smits, C.H.M., Vries, A.G. de & Lenis, N.P., 1993. Optimisation of the feeding strategy to minimize the N excretion by using the Dutch Technical Model Pig Feeding. Paper, this congress.
Schutte, J.B., 1989. Practical applications of (bio)synthetic amino acids in poultry and pig diets. In: Nutrition and Digestive Physiology in Monogastric Farm Animals (edited by E.J. van Weerden & J . Huisman). Wageningen, The Netherlands, Pudoc, pp. 75-88.
Southern, L.L., 1 9 9 1 . Digestible amino acids and digestible amino acid requirements for swine. Kyowa Hakko Technical Review - 2. Nutri-Quest Inc., Chesterfield, USA, 16 pp.
Wang, T.C. & Fuller, M.F., 1989. The optimum dietary amino acid pattern for growing pigs. 1. Experiments by amino acid deletion. British Journal of Nutri t ion, 62 :77-89.
Wang, T.C. & Fuller, M.F., 1990. The effect of the plane of nutrition on the optimum dietary amino acid pattern for growing pigs. Animal Production, 50 :155-164 .
Werkgroep T.M.V., 1 9 9 1 . Technical Model Pig Feeding (in Dutch). Research report P. 1.66. Research Institute for Pig Husbandry, Rosmalen, The Netherlands, 96
PP.
257
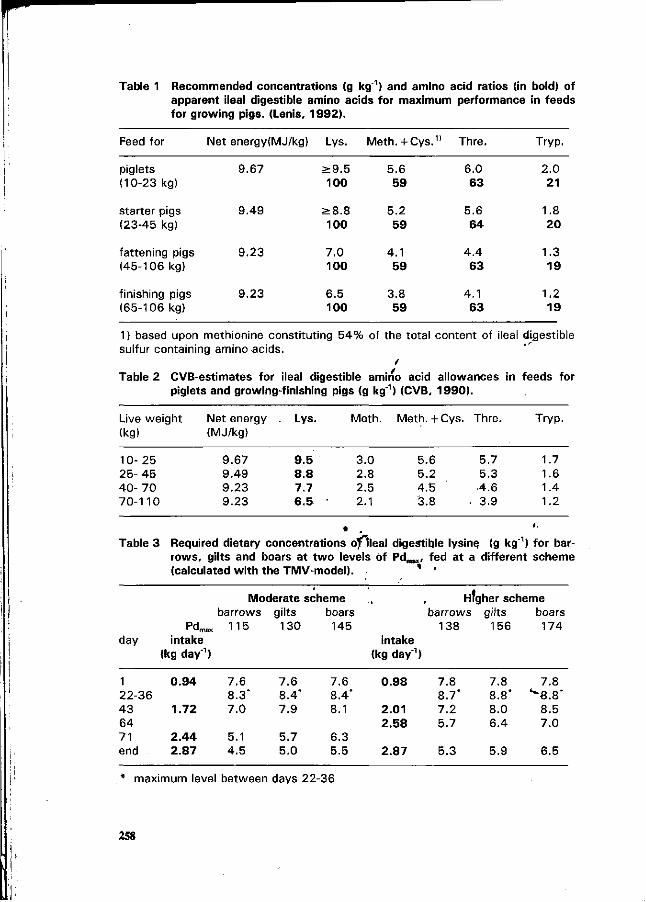
Table 1 Recommended concentrations (g kg'1) and amino acid ratios (in bold) of apparent ileal digestible amino acids for maximum performance in feeds for growing pigs. (Lenis, 1992).
Feed for Net energy(MJ/kg) Lys. Meth.+Cys. 1 1 Thre. Try p.
piglets (10-23 kg)
starter pigs (23-45 kg)
fattening pigs (45-106 kg)
finishing pigs (65-106 kg)
9.67
9.49
9.23
9.23
> 9 . 5 100
> 8 . 8 100
7.0 100
6.5 100
5.6 59
5.2 59
4.1 59
3.8 59
6.0 63
5.6 64
4 .4 63
4.1 63
2.0 21
1.8 20
1.3 19
1.2 19
1) based upon methionine constituting 5 4 % of the total content of ileal digestible sulfur containing amino acids.
i
Table 2 CVB-estimates for ileal digestible amino acid allowances in feeds for piglets and growing-finishing pigs (g kg"1) (CVB, 1990).
Live we (kg)
10- 25 2 5 - 4 5 40- 70 70-110
Table 3
day
1 22-36 43 64 71 end
ght
Requi rows.
Net energy (MJ/kg)
9.67 9.49 9.23 9.23
Lys.
9.5 8.8 7.7 6 .5
t
red dietary concentrations
Meth
3.0 2.8 2.5 2.1
Meth. + Cys.
5.6 5.2 4.S 3.8
Df"ileal digestible lys gilts and boars at two levels of Pdm„, fed at
(calculated with the TMV-model)
Moderate scheme barrows
Pdma>( 115 intake
kg day"
0 .94
1.72
2 .44 2.87
')
7.6 8 .3 ' 7.0
5.1 4.5
gilts 130
7.6 8 .4 ' 7.9
5.7 5.0
boars 145
7.6 8.4* 8.1
6.3 5.5
,
intake
» .
,
Thre.
5.7 5.3 •4.6
• 3.9
ne (g kg"
Try p.
1.7 1.6 1.4 1.2
4.
') for bar a different schem
Higher scheme barrows gilts
138
(kg day"1)
0 .98
2.01 2.58
2.87
7.8 8.7* 7.2 5.7
5.3
156
7.8 8.8* 8.0 6.4
5.9
boars 174
7.8 ^ 8 . 8 *
8.5 7.0
6.5
maximum level between days 22-36
258
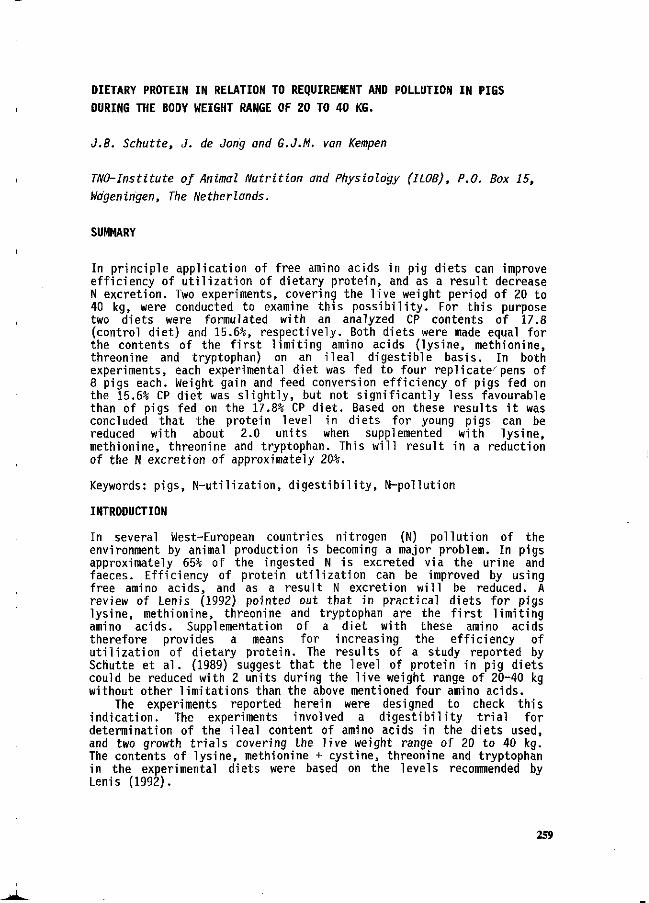
DIETARY PROTEIN IN RELATION TO REQUIREMENT AND POLLUTION IN PIGS
DURING THE BODY WEIGHT RANGE OF 20 TO 40 KG.
J.B. Schutte, J. de Jong and G.J.M. van Kempen
TNO-Institute of Animal Nutrition and Physiology (ILOB), P.O. Box 15,
Mgeningen, The Netherlands.
SUMMARY
In principle application of free amino acids in pig diets can improve efficiency of utilization of dietary protein, and as a result decrease N excretion. Two experiments, covering the live weight period of 20 to 40 kg, were conducted to examine this possibility. For this purpose two diets were formulated with an analyzed CP contents of 17.8 (control diet) and 15.6%, respectively. Both diets were made equal for the contents of the first limiting amino acids (lysine, methionine, threonine and tryptophan) on an ileal digestible basis. In both experiments, each experimental diet was fed to four replicate/pens of 8 pigs each. Weight gain and feed conversion efficiency of pigs fed on the 15.6% CP diet was slightly, but not significantly less favourable than of pigs fed on the 17.8% CP diet. Based on these results it was concluded that the protein level in diets for young pigs can be reduced with about 2.0 units when supplemented with lysine, methionine, threonine and tryptophan. This will result in a reduction of the N excretion of approximately 20%.
Keywords: pigs, N-utilization, digestibility, N-pollution
INTRODUCTION
In several West-European countries nitrogen (N) pollution of the environment by animal production is becoming a major problem. In pigs approximately 65% of the ingested N is excreted via the urine and faeces. Efficiency of protein utilization can be improved by using free amino acids, and as a result N excretion will be reduced. A review of Lenis (1992) pointed out that in practical diets for pigs lysine, methionine, threonine and tryptophan are the first limiting amino acids. Supplementation of a diet with these amino acids therefore provides a means for increasing the efficiency of utilization of dietary protein. The results of a study reported by Schutte et al. (1989) suggest that the level of protein in pig diets could be reduced with 2 units during the live weight range of 20-40 kg without other limitations than the above mentioned four amino acids.
The experiments reported herein were designed to check this indication. The experiments involved a digestibility trial for determination of the ileal content of amino acids in the diets used, and two growth trials covering the live weight range of 20 to 40 kg. The contents of lysine, methionine + cystine, threonine and tryptophan in the experimental diets were based on the levels recommended by Lenis (1992).
259
MATERIALS AND METHODS
Two diets were formulated, one diet with a normal dietary level of crude protein (CP) of 17.5% and one diet with a reduced CP level of 15.5%. By analysis the two diets contained 17.8 and 15.6 % CP, respectively. Both diets were adequately supplemented with lysine and methionine, and the low protein diet also with threonine and tryptophan. Before inclusion in the diets, all feed ingredients, tapioca and alfalfa excepted, were analysed for the contents of amino acids. Based on these figures the two diets were composed in such a way that the calculated contents of lysine, methionine, + cystine, threonine and tryptophan were similar. This was verified by analysis (Table 1). In addition, the ileal digestibility of the amino acids was measured in four castrated male pigs. [GY x (NL x FL)] per diet. The pigs were provided with a post-valvular T-caecum cannula (PVTC) according to the procedure described by Van Leeuwen et al. (1991). The mean weight of the animals during the experimental period was approximately 30 kg. Post-operative care included keeping the pigs warm (23°C) and witholding feed for 24 h. Ileal digesta were collected quantitatively from individual animals for four times 12 h on alternate days. Digestibilities of the diets were calculated"'with the formula described by wünsche et al. (/1984), using chromium oxide (Cr?03) as a marker. The results of fhe determinations (Table 2) indicate that the contents of ileal digestible lysine, methionine + cystine, threonine and tryptophan were almost similar in both diets.
Two growth trials with pigs [GY x (NL x FL)] were carried out consecutively. The animals were group-housed in an artificially heated, ventilated and lighted pig unit. After an acclimatization period of 14 days the animals were allotted to the two treatments, based on live weight, origin, sex and weight gain during the acclimatization period. In both trials, each experimental diet was fed to four replicate pens of 8 pigs each; two jjens with-barrows and two with gilts. The mean weight' of the animals at the start of the experimental period was 22.1 and 19.7 kg in the first (Trial 1) and second trial (Trial 2 ) , respectivtly. •
The experimental diets were fecrad libitum,as pellets for a period of four weeks. Water was also available ad libitum. Animals were weighed individually at the end of the trials, and feed consumption for each pen was recorded.
STATISTICAL ANALYSIS
The results for weight gain, feed intake and feed conversion efficiency were analyzed according to a randomized-block design with trial, sex and treatment as factors. The computer program Genstat 5 (Reference Manual 1987, Oxford University Press, New York) was used to calculate the analysis of variances. Statements of statistical significance were based on P < 0.05. w .
260
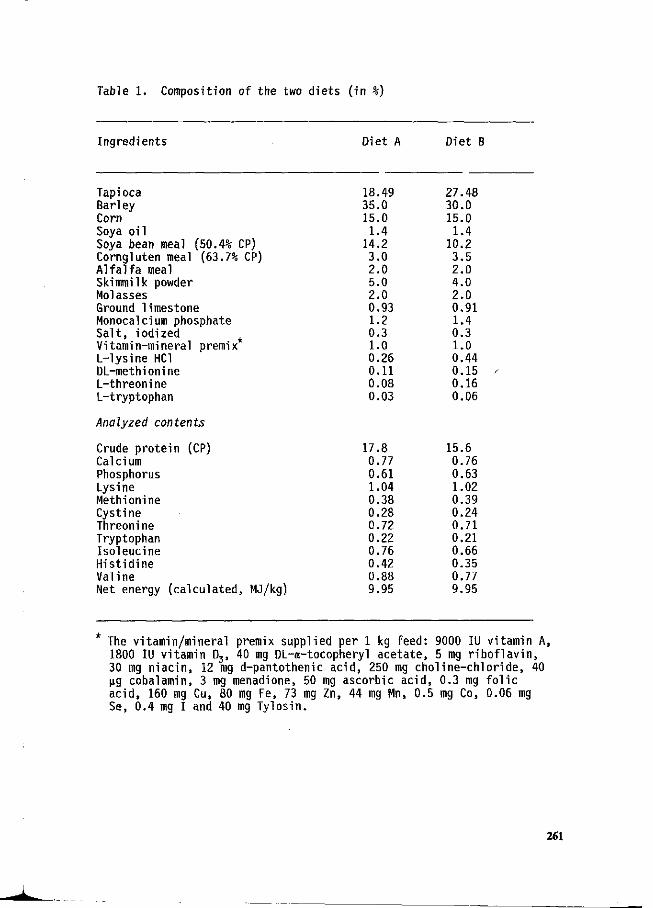
Table 1. Composition of the two diets (in %)
Ingredients Diet A Diet B
Tapioca Barley Corn Soya o i l Soya bean meal (50.4% CP) Corngluten meal (63.7% CP) A l f a l f a meal Ski mini Ik powder Molasses Ground limestone Monocalcium phosphate Sa l t , iodized Vitamin-mineral premix L-lysine HCl DL-methionine L-threonine L-tryptophan
Analyzed contents
Crude protein (CP) Calcium Phosphorus Lysine Methionine Cystine Threonine Tryptophan Isoleucine Histidine Valine Net energy (calculated, MJ/kg)
18.49 35.0 15.0 1.4
14.2 3.0 2.0 5.0 2.0 0.93 1.2 0.3 1.0 0.26 0.11 0.08 0.03
17.8 0.77 0.61 1.04 0.38 0.28 0.72 0.22 0.76 0.42 0.88 9.95
27.48 30.0 15.0 1.4
10.2 3.5 2.0 4,0 2.0 0.91 1.4 0.3 1.0 0.44 0.15 / 0.16 0.06
15.6 0.76 0.63 1.02 0.39 0.24 0.71 0.21 0.66 0.35 0.77 9.95
* The vitamin/mineral premix supplied per 1 kg feed: 9000 IU vitamin A, 1800 IU vitamin D3, 40 mg DL-a-tocopheryl acetate, 5 mg riboflavin, 30 mg niacin, 12 mg d-pantothenic acid, 250 mg choline-chloride, 40 ng cobalamin, 3 mg menadione, 50 mg ascorbic acid, 0.3 mg folic acid, 160 mg Cu, 80 mg Fe, 73 mg Zn, 44 mg Mn, 0.5 mg Co, 0.06 mg Se, 0.4 mg I and 40 mg Tylosin.
261
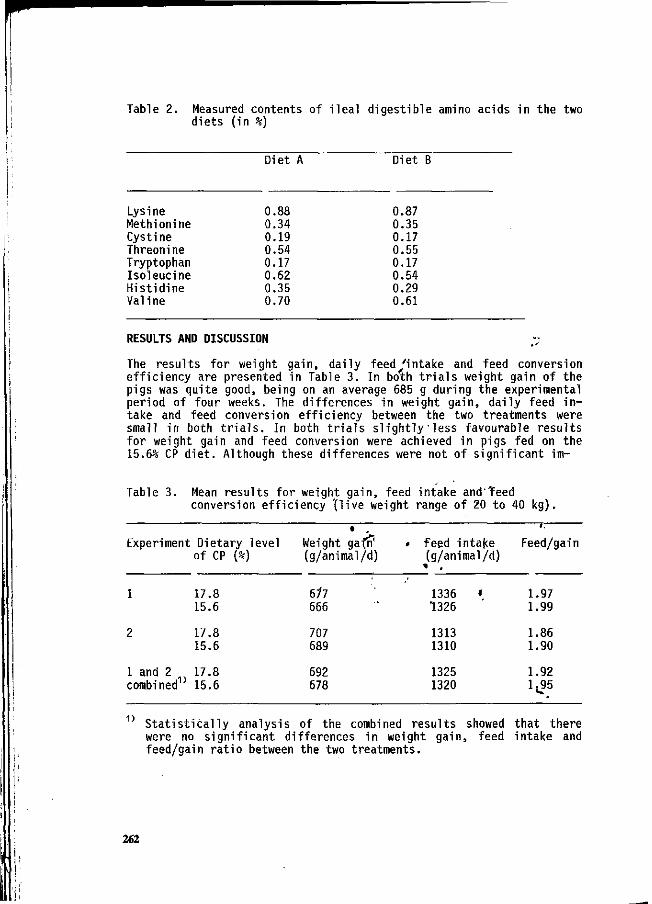
Table 2. Measured contents of ileal digestible amino acids in the two diets (in %)
Diet A Diet B
Lysine Methionine Cystine Threonine Tryptophan Isoleucine Histidine Valine
0.88 0.34 0.19 0.54 0.17 0.62 0.35 0.70
0.87 0.35 0.17 0.55 0.17 0.54 0.29 0.61
RESULTS AND DISCUSSION
The results for weight gain, daily feed 'intake and feed conversion efficiency are presented in Table 3. In both trials weight gain of the pigs was quite good, being on an average 685 g during the experimental period of four weeks. The differences in weight gain, daily feed intake and feed conversion efficiency between the two treatments were small in both trials. In both trials slightly less favourable results for weight gain and feed conversion were achieved in pigs fed on the 15.6% CP diet. Although these differences were not of significant im-
Table 3. Mean results for weight gain, feed intake and Teed conversion efficiency '(live weight range of 20 to 40 kg).
Experiment
1
2
1 and 2 combined
Dietary level of CP (%)
17.8 15.6
17.8 15.6
17.8 15.6
• Weight gai r? (g/animal/d)
6/7 666
707 689
692 678
• •
» Feed intake (g/animal/d)
1336 1326
1313 1310
1325 1320
•
Feed/gain
1.97 1.99
1.86 1.90
1.92 1,95
1) Statistically analysis of the combined results showed that there were no significant differences in weight gain, feed intake and feed/gain ratio between the two treatments.
262
portance, there was a trend that pigs fed on the 15.6% CP diet will not produce the same performance as pigs fed on the 17.8% CP diet. Schutte et al. (1990) reported equal performance in young pigs fed on diets containing 18.5 and 16.0% CP, respectively, provided the 16.0% CP diet was, in addition to threonine and tryptophan, also supplemented with isoleucine, histidine and valine. In an other study, Schutte et al. (1989) reported that valine and histidine will not become limiting when the CP level in a diet of similar composition as used in the present study was reduced to 15.5% during the live weight range of 20 to 40 kg. Indications, however, were achieved that isoleucine may become limiting at this CP level. Lenis et al. (1993) estimated the requirement for ileal digestible isoleucine to be between 0.54 and 0.59% in a diet for pigs in the live weight range of 18 to 38 kg. Based on their data, it might be possible that in the present study isoleucine in the low protein diet, being 0.54% ileal digestible, was slightly limiting. However, the results of this study have clearly demonstrated that with an application of lysine, methionine, threonine and tryptophan the efficiency of protein utilization can be improved and, as a result N-excretion will decrease. Assuming that in diets for young pigs the dietary level of CP can be reduced with about 2.0 units when these four amino acids are supplemented, this will result in a reduction of the N excretion with appproximately 20%. '
REFERENCES
Leeuwen, P. van, Kleef, D.J. van, Kempen, G.J.M, van, Huisman, J. & Verstegen, M.W.A., 1991. The post valve T-caecum cannulation technique in pigs applicated to determine the digestibility of amino acids in maize, groundnut and sunflower. J. Anim. Physiol. Anim. Nutr. 65: 183-193.
Lenis, N.P., Diepen, J.T.M, van & Kogut, J., 1993. Requirement for apparent digestible isoleucine of pigs in the live weight range of 18 to 40 kg. IVV0 report No. 356, Lelystad, The Netherlands.
Lenis, N.P., 1993. Digestible amino acids for pigs: assessment of requirements on ileal digestible basis. Pig News Information 13: 31N-39N.
Schutte, J.B., Lenis, N.P., De Jong, J. & Diepen, J.T.M, van, 1989. Tryptophan requirement of pigs in the body weight range of 20 to 40 kg. IL0B-TN0 report No. 8907, Wageningen, The Netherlands.
Schutte, J.B., Bosch, M.W., Lenis, N.P., De Jong, J. & Diepen, J.T.M, van, 1990. Amino acid requirements of pigs. 2. Requirement for apparent digestible threonine in young pigs. Neth. J. Agr. Sei. 38: 597-607.
Wünsche, J., Borgmann, E., Hennig, U., Kreienbring, F. & Bock, H.D., 1984. Application of the HCl-insoluble ash as an indicator for the determination of nutrients including amino acid digestibility at the end of the small intestine and the whole digestive tract of pigs. Arch. Tierernähr. 12: 817-831.
263
Effect of an increased NDF content in the diet on urinary and faecal nitrogen (N) excretion in young growing pigs
H.Schulze1'2; M.W.A.Verstegen1 ; S.Tamminga1
' Department of Animal Nutrition, Agricultural University, Haagsteeg 4, 6708 PM Wageningen, The Netherlands.
2 TNO-ILOB, PO Box 15, 6700 AA Wageningen, The Netherlands.
ABSTRACT
Ten piglets, initially weighing 9kg, were used in this experiment. The pigs, f i t ted w i th a post-valvular T caecum (PVTC) cannula, were individually fed a cornstarch-based semi-synthetic diet, formulated to contain equal amounts of protein and starch, and w i th 0 and 2 0 % NDF-concentrate, included at the expense of glucose. The NDF-concentrate was isolated from wheat bran using an incubation procedure w i th pancreatin. In the context of studying the effects of purified NDF in the diet, the effect on the faecal and urinary excretion of N as well as the N-balance was investigated. Faecal N excretion was significantly increased if NDF-concentrate was included in the diet. Urinary N losses decreased significantly whe/i a high amount of NDF-concentrate was included. The proportion of N intake that was retained was not significantly influenced by the high NDF content in the diet. Keywords: Pigs, NDF, faecal and urinary N excretion, N-balance
INTRODUCTION
Large fractions of protein in the feed are not used for deposition into desired animal products, but wasted in animal manure as a mixture of faeces and urine. Due to the presence of ureolytic bacteria in faeces and large amounts o f urea in urine, NH3 is produced very rapidly during storage (Klarenbeek and Bruins, 1988). Compared w i th urea N in urine, faecal N is more resistant Jfes volatilization as ammonia. According to Tamminga & Verstegen (1992) it can be expected tt iat srfort term'volatil ization of NH3
f rom pig manure can be reduced, by altering the ratio qf N losses between faeces and urine. The long term effect is more difficult to predict. According to Low (1985) different dietary fibres can have different effects on the overall digestibility of N. However, an often reported increased N'output in the faeces may be compensated by a reduced N output in the urine (Low, 1985; Morgan & Whit temore, 1988). Due to the great variety of dietary f ibre, it is diff icult to predict the exact effect. Each type of fibre has its own structural and physical characteristics, thus each type of fibre may have a different effect. Different effects can occur depending on the type of fibre source, their proportions and their associations wi th other dietary constituents (Laplace et al., 1989). v^ In the present investigation, an isolated complex of water insoluble, neutral detergent f ibre, was prepared from wheat bran. This water insoluble, neutral detergent f ibrous complex (NDF-concentrate) was purified to remove other factors that could possibly influence the faecal and urinary excretion of nitrogen. In the context of studying the effects of purified NDF in the diet, the effect on the faecal and urinary excretion of N as well as the N-balance was investigated.
264
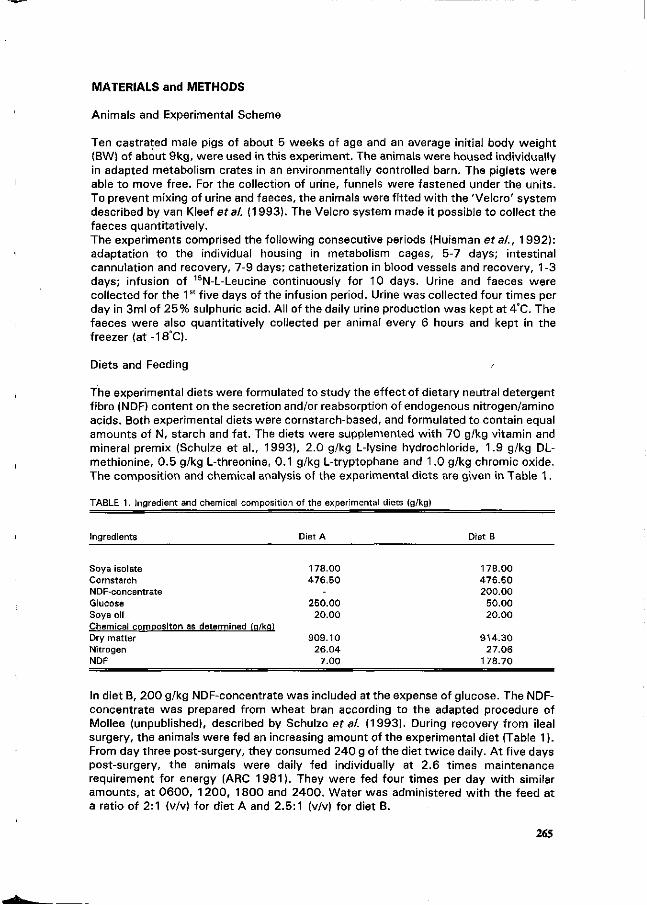
MATERIALS and METHODS
Animals and Experimental Scheme
Ten castrated male pigs of about 5 weeks of age and an average initial body weight (BW) of about 9kg, were used in this experiment. The animals were housed individually in adapted metabolism crates in an environmentally controlled barn. The piglets were able to move free. For the collection of urine, funnels were fastened under the units. To prevent mixing of urine and faeces, the animals were f i t ted w i th the 'Velcro' system described by van Kleef et al. (1993). The Velcro system made it possible to collect the faeces quantitatively. The experiments comprised the fol lowing consecutive periods (Huisman et al., 1992): adaptation to the individual housing in metabolism cages, 5-7 days; intestinal cannulation and recovery, 7-9 days; catheterization in blood vessels and recovery, 1-3 days; infusion of 15N-L-Leucine continuously for 10 days. Urine and faeces were collected for the 1 s t f ive days of the infusion period. Urine was collected four t imes per day in 3ml of 2 5 % sulphuric acid. All of the daily urine production was kept at 4°C. The faeces were also quantitatively collected per animal every 6 hours and kept in the freezer (at -18°C).
Diets and Feeding /
The experimental diets were formulated to study the effect of dietary neutral detergent fibre (NDF) content on the secretion and/or reabsorption of endogenous nitrogen/amino acids. Both experimental diets were cornstarch-based, and formulated to contain equal amounts of N, starch and fat. The diets were supplemented w i th 70 g/kg vitamin and mineral premix (Schulze et al., 1993), 2.0 g/kg L-lysine hydrochloride, 1.9 g/kg DL-methionine, 0.5 g/kg L-threonine, 0.1 g/kg L-tryptophane and 1.0 g/kg chromic oxide. The composition and chemical analysis of the experimental diets are given in Table 1 .
TABLE 1. Ingredient and chemical composition of the experimental diets (g/kg)
Ingredients Diet A Diet B
178.00 476.50 200.00
50.00 20.00
914.30 27.06
178.70
In diet B, 200 g/kg NDF-concentrate was included at the expense of glucose. The NDF-concentrate was prepared from wheat bran according to the adapted procedure of Mollee (unpublished), described by Schulze et al. (1993). During recovery from ileal surgery, the animals were fed an increasing amount of the experimental diet (Table 1). From day three post-surgery, they consumed 240 g of the diet tw ice daily. A t f ive days post-surgery, the animals were daily fed individually at 2.6 t imes maintenance requirement for energy (ARC 1981). They were fed four t imes per day w i th similar amounts, at 0 6 0 0 , 1200, 1800 and 2400 . Water was administered w i th the feed at a ratio of 2:1 (v/v) for diet A and 2.5:1 (v/v) for diet B.
265
Soya isolate Cornstarch NDF-concentrate Glucose Soya oil Chemical comcositon as determined (q/kq) Dry matter Nitrogen NDF
178.00 476.50
-250.00
20.00
909.10 26.04
7.00
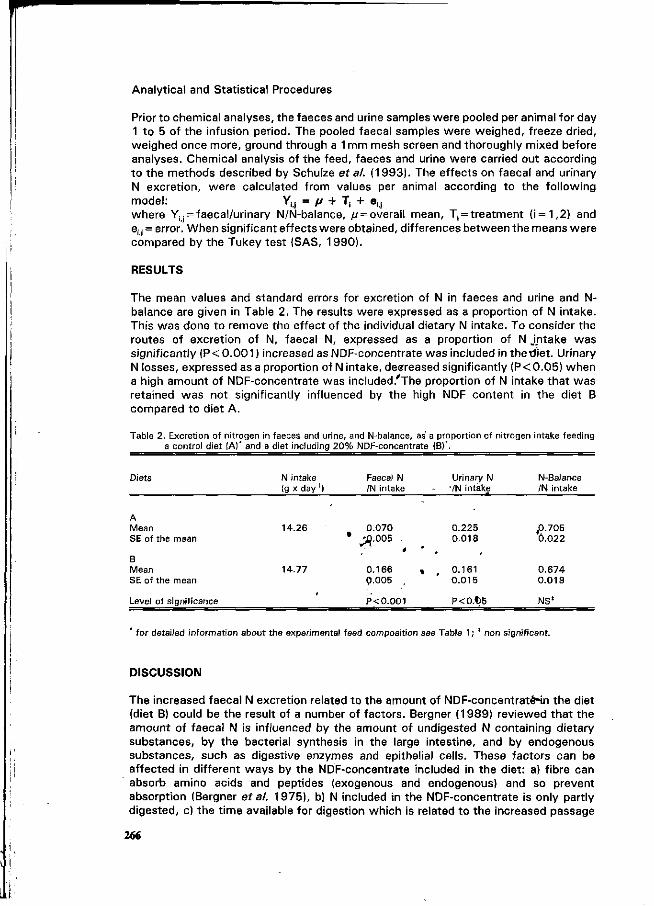
Analytical and Statistical Procedures
Prior to chemical analyses, the faeces and urine samples were pooled per animal for day 1 to 5 of the infusion period. The pooled faecal samples were weighed, freeze dried, weighed once more, ground through a 1mm mesh screen and thoroughly mixed before analyses. Chemical analysis of the feed, faeces and urine were carried out according to the methods described by Schulze et al. (1993). The effects on faecal and urinary N excretion, were calculated from values per animal according to the following model: Y^ = (/ + 1, + e^ where Y i j = faecal/urinary N/N-balance, // = overall mean, T^treatment (i = 1,2) and ei#] = error. When significant effects were obtained, differences between the means were compared by the Tukey test (SAS, 1990).
RESULTS
The mean values and standard errors for excretion of N in faeces and urine and N-balance are given in Table 2. The results were expressed as a proportion of N intake. This was done to remove the effect of the individual dietary N intake. To consider the routes of excretion of N, faecal N, expressed as a proportion of N .intake was significantly (P<0.001 ) increased as NDF-concentrate was included in theidiet. Urinary N losses, expressed as a proportion of N intake, deereased significantly (P< 0.05) when a high amount of NDF-concentrate was included.'The proportion of N intake that was retained was not significantly influenced by the high NDF content in the diet B compared to diet A.
Table 2. Excretion of nitrogen in faeces and urine, and N-balance, as' a proportion of nitrogen intake feeding a control diet (A)' and a diet including 20% NDF-concentrate (B)*.
Diets N intake Faecal N Urinary N N-Balance (g x day1) /N intake 7N intake /N intake
A Mean 14.26 SE of the mean
B Mean 14.77 SE of the mean
Level of significance
" for detailed information about the experimental feed composition see Table 1 ; ' non significant.
DISCUSSION
The increased faecal N excretion related to the amount of NDF-concentraténn the diet (diet B) could be the result of a number of factors. Bergner (1989) reviewed that the amount of faecal N is influenced by the amount of undigested N containing dietary substances, by the bacterial synthesis in the large intestine, and by endogenous substances, such as digestive enzymes and epithelial cells. These factors can be affected in different ways by the NDF-concentrate included in the diet: a) fibre can absorb amino acids and peptides (exogenous and endogenous) and so prevent absorption (Bergner et al. 1975), b) N included in the NDF-concentrate is only partly digested, c) the time available for digestion which is related to the increased passage
266
0.070 * ^ . 0 0 5
0.166 Q.005 ,
P<0.001
,
1
0.225 0.018
, 0.161 0.015
P<0.t)5
p.705 Ó.022
0.674 0.019
NS'
rate is decreased, and d) an increased endogenous N excretion. The increase in the
fibre content of the diet certainly results in an increased supply of fermentable organic
matter to the microbes of the large intestine. Related to the raised increased energy
supply to the microbes they may incorporate more ileal excreted N, i.e. urea (Mosenthin
& Henkel, 1978). Consequently, ammonia absorption from the colon would be
suppressed and thereby the urinary N excretion reduced (Malmlöf and Hakansson,
1984). Malmlöf & Simones Nunes (1985) support this contention. They found a
significantly decreased concentration of urea and ammonia-N in the portal blood.
In conclusion, the increased microbial activity in the large intestine affected by the NDF-
concentrate included in diet B, may be responsible for the decreased urinary N excretion
and the increased faecal N loss. The increased faecal N excretion and decreased urinary
N loss when large amounts of fibre were included in the diet, confirmed the results
found by Malmlöf & Hakansson (1984) and Morgan & Whittemore (1988).
The inclusion of a large amount of NDF-concentrate in the diet, did not significantly
affect the N-balance. It can be assumed that the lower amount of aborbed N was used
in the internal N metabolism wi th greater effectiveness. The inclusion of 2 0 % NDF-
concentrate in the diet had no influence on N retention and led to decreased urinary N
losses. This implies that short-term volatilization of NH3 can be reduced wi thout
negative effects on the growth of the pigs. However, potential influences of the
increased dietary fibre content on the lean production wil l have to be investigated, since
results from the literature have shown that the gut size increased when fibrous diets
were consumed (Low, 1985).
REFERENCES
Agricultural Research Council (ARC) (1981). The nutrient requirement of pigs. Commonwealth Agricultural Bureaux, Farnham Royal, UK.
Bergner, H., Simon, O. & Zimmer, M. (1975). Crude fibre content of the diet as affecting the process of amino acid absorption in rats. Archiv of Animal Nurtition, 25: 95-104.
Bergner, H. (1989). N-Stoffwechsel und seine Regelmechanismen. Archiv of Animal Nutrition, 39: 377-392.
Huisman, J., Heinz, T., Van der Poel, A.F.B., Van Leeuwen, P..Souffrant, W.B. & Verstegen, M.W.A. (1992). True protein digestibility and amounts of endogenous protein measured with the 1BN-dilution technique in piglets fed on peas {Pisum sativum) and common beans (Phaseolus vulgaris). British Journal of Nutrition 68, 101-110.
Klarenbeek, J.V. & Bruins, M.A. van (1988). In: Volatile Emissions from Livestock Farming and Sewage Operations, pp. 73-84. [Nielsen, V.C., Voorburg, J.H. & L'Hermite, P.: editors]. Elsevier Applied Science, London, UK.
Kleef, D. van, Deuring, K. & Leeuwen, P. van (1993). A new method (ILOB-System) for faeces collection in pigs. Laboratory Animals, accepted for publication.
Laplace, J.P., Darcy-Vrillon, B., Perez, J.M., Henry, Y., Giger, S. & Sauvant, D., (1989). Associative effects between two fibre sources on ileal and overall digestibilities of amino acids, energy and cell-wall components in growing pigs. British Journal of Nutrition, 6 1 : 75-87.
Low, A.G., (1985). Role of dietary fibre in pig diets. In: Recent Advances in Animal Nutrition, pp. 87-112 [W.Haresign and D.J.A.Cole: editors]. London: Butterworth.
Malmlöf, K. & Simones Nunes, C. (1985). Effect of wheat straw meal on portal plasma concentrations of urea and ammonia-N in the growing pig. In: Digestive physiology in the pig. statens husdyrbrugsfors. 580:223-226 [Just, A., J0rgensen, H., Fernandez, J.A. editors]. Copenhagen.
Malmlöf, K. & Hakansson, J. (1984). The effect of dietary fibre level on the diurnal pattern of urinary nitrogen excretion in swine. Swedish Journal of Agricultural Research, 14: 53-57.
Morgan, C.A. & Whittemore, C.T. (1988). Dietary fibre and nitrogen excretion and retention by pigs. Animal Feed Science and Technology, 19: 185-189.
Mosenthin, R. & Henkel, H. (1978). Der Einfluß pflanzlicher Gerüstsubstanzen im Futter auf die N-Ausscheidungen im Kot beim Schwein. Zeitschrift für Tierphysiology, Tierernährung und Futtermittelkunde, 40: 122-132.
SAS (1990). SAS User's Guide: Statistics. SAS Institute, Inc., Cary, NC. Schulze, H., Leeuwen, P. van, Verstegen, M.W.A., Souffrant, W.B. & Berg, J.O.W, van den, (1993).
Endogenous nitrogen as affected by level of dietary fibre (NDF) in young growing pigs, in preparation Tamminga, S. & Verstegen, M.W.A. (1992). Implications of nutrition of animals on environmental
pollution. In: Recent Advances in Animal Nutrition, pp. 113-130 [Gransworth, D.C., Haresign,W. & Cole, D.J.A.: editors]. Butterworth - Heinemann Ltd., Linacre House, Jordan Hill, Oxford, UK.
267
SESSION 4
N Volatilization from pig housing
Effects of building design, climate control, housing system, animal behavior and manure management at farm levels on N-losses to the air
L.L. Christiansen, R.H. Zhang, D.L. Day and G.L. Riskowski
Agricultural Engineering Department, University of Illinois, Urbana, IL, U.S.A.
Summary
Nitrogen is a valuable nutrient for animal and crop production. Loss of nitrogen into the environment causes air and water pollution. Best practices need to be developed at farm levels to manage the N-flow productively to minimize nitrogen losses. Building designs, climatic conditions, housing systems, animal feeding and behavior, and manure management practices are all important factors affecting nitrogen losses into the air in the form of ammonia release. This paper reviews the research program of the University of Illinois in the U.S.A. on the measurement and modelling of ammonia production and release from manure sources. A convective emission chamber and a room ventilation simulator have been developed and used for measurement of ammonia release rates and distribution of ammonia in ventilated animal rooms. A computer model developed for predicting ammonia release rates from in-building deep manure storage showed that air movement over the manure and manure temperature had significant effects on ammonia release. Further work is in progress to relate the design and management of the ventilation system to ammonia release from various sources and the ammonia concentrations that will result in the animal occupied zones. As a result, the production, release and ultimate concentrations of ammonia in animal buildings can be predicted using an integrated ammonia release and distribution model. Keywords: indoor air quality, ventilation, ammonia, source characteristics, ventilation effectiveness
Introduction
"N-flow" is an important issue internationally because it is a valuable resource to conserve when it is in a form utilizable as fertilizer or feed protein. Conversely, it can be an important indoor air quality pollutant and atmospheric pollutant in the form of ammonia and an important ground and surface water pollutant in the form of nitrates.
In this paper we first visualize the N-flow in animal production, with emphasis on the release of ammonia from manure into room air and the factors that affect the ammonia release rates and ammonia levels in rooms. Second, we explain the University of Illinois research to measure and model the release of ammonia from manure into rooms and the resultant flow and concentrations of ammonia in animal rooms. Third, we identify opportunities for limiting ammonia release and recapturing ammonia from room air.
We have included no literature review and we have greatly limited our citation of other researchers' work. This conference and the resultant proceedings serve as a literature review and the most significant research related to N-flow are presented directly by
271
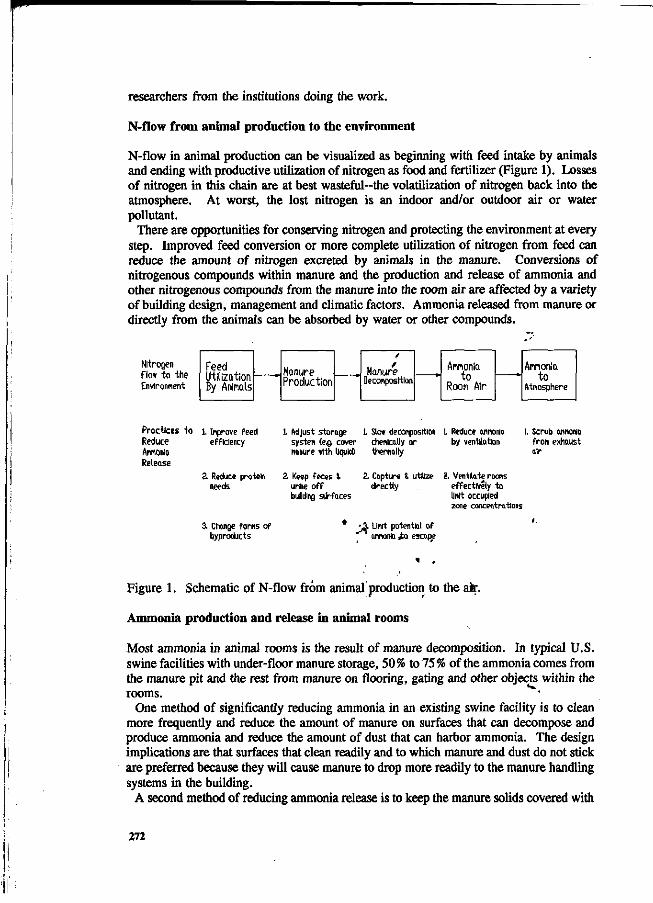
researchers from the institutions doing the work.
N-flow from animal production to the environment
N-flow in animal production can be visualized as beginning with feed intake by animals and ending with productive utilization of nitrogen as food and fertilizer (Figure 1). Losses of nitrogen in this chain are at best wasteful—the volatilization of nitrogen back into the atmosphere. At worst, the lost nitrogen is an indoor and/or outdoor air or water pollutant.
There are opportunities for conserving nitrogen and protecting the environment at every step. Improved feed conversion or more complete utilization of nitrogen from feed can reduce the amount of nitrogen excreted by animals in the manure. Conversions of nitrogenous compounds within manure and the production and release of ammonia and other nitrogenous compounds from the manure into the room air are affected by a variety of building design, management and climatic factors. Ammonia released from manure or directly from the animals can be absorbed by water or other compounds.
Nitrogen Flo» to the Environnent
Practices to Reduce Annonia Release
Feed Utilization By Anlmls
1. Inprove feed efficiency
2. Reduce protein needs
3. Change forr byproducts
s of
Manure Production
Manure Décomposition
1 Adjust storage L Slew decomposition systen (eo cover chenically or nanure *lth liquid) thernally
2, Keep feces S. 2. Capture i utilize urhe o f f directly buiding siWoces
* -2. Unit potential of ainonla to escape
Annonia to
Room Air
1. Reduce annonia by ventilation
2, Ventilate roots effectlvfly to Unit occupied zone concentrations
Annonia to
Atnosphere
1, Scrub annonia f ron exhaust air
i.
Figure 1. Schematic of N-flow from animal production to the air.
Ammonia production and release in animal rooms
Most ammonia in animal rooms is the result of manure decomposition. In typical U.S. swine facilities with under-floor manure storage, 50% to 75% of the ammonia comes from the manure pit and the rest from manure on flooring, gating and other objects within the rooms.
One method of significantly reducing ammonia in an existing swine facility is to clean more frequently and reduce the amount of manure on surfaces that can decompose and produce ammonia and reduce the amount of dust that can harbor ammonia. The design implications are that surfaces that clean readily and to which manure and dust do not stick are preferred because they will cause manure to drop more readily to the manure handling systems in the building.
A second method of reducing ammonia release is to keep the manure solids covered with
272
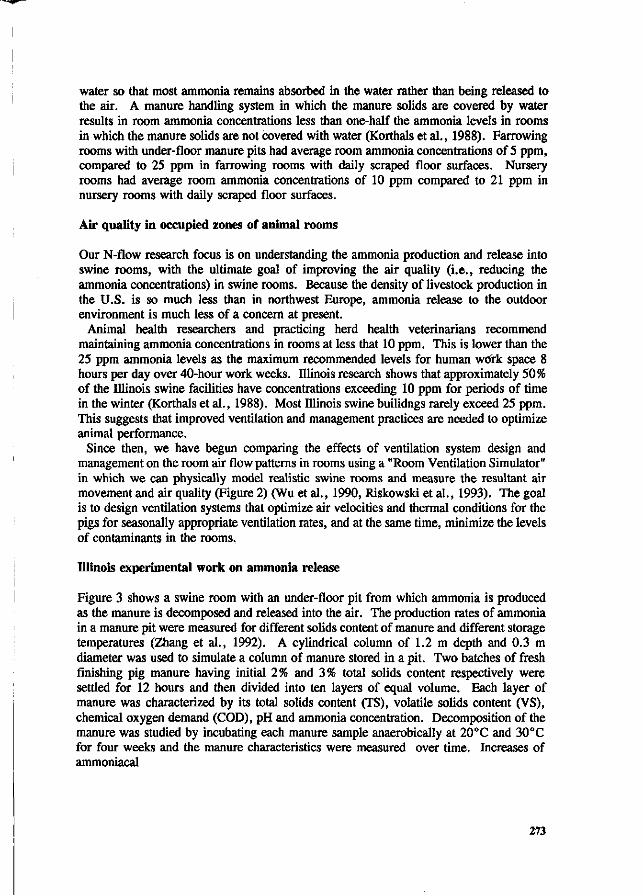
water so that most ammonia remains absorbed in the water rather than being released to the air. A manure handling system in which the manure solids are covered by water results in room ammonia concentrations less than one-half the ammonia levels in rooms in which the manure solids are not covered with water (Korthals et al., 1988). Farrowing rooms with under-floor manure pits had average room ammonia concentrations of 5 ppm, compared to 25 ppm in farrowing rooms with daily scraped floor surfaces. Nursery rooms had average room ammonia concentrations of 10 ppm compared to 21 ppm in nursery rooms with daily scraped floor surfaces.
Air quality in occupied zones of animal rooms
Our N-flow research focus is on understanding the ammonia production and release into swine rooms, with the ultimate goal of improving the air quality (i.e., reducing the ammonia concentrations) in swine rooms. Because the density of livestock production in the U.S. is so much less than in northwest Europe, ammonia release to the outdoor environment is much less of a concern at present.
Animal health researchers and practicing herd health veterinarians recommend maintaining ammonia concentrations in rooms at less that 10 ppm. This is lower than the 25 ppm ammonia levels as the maximum recommended levels for human work space 8 hours per day over 40-hour work weeks. Illinois research shows that approximately 50% of the Illinois swine facilities have concentrations exceeding 10 ppm for periods of time in the winter (Korthals et al., 1988). Most Illinois swine builidngs rarely exceed 25 ppm. This suggests that improved ventilation and management practices are needed to optimize animal performance.
Since then, we have begun comparing the effects of ventilation system design and management on the room air flow patterns in rooms using a "Room Ventilation Simulator" in which we can physically model realistic swine rooms and measure the resultant air movement and air quality (Figure 2) (Wu et al., 1990, Riskowski et al., 1993). The goal is to design ventilation systems that optimize air velocities and thermal conditions for the pigs for seasonally appropriate ventilation rates, and at the same time, minimize the levels of contaminants in the rooms.
Illinois experimental work on ammonia release
Figure 3 shows a swine room with an under-floor pit from which ammonia is produced as the manure is decomposed and released into the air. The production rates of ammonia in a manure pit were measured for different solids content of manure and different storage temperatures (Zhang et al., 1992). A cylindrical column of 1.2 m depth and 0.3 m diameter was used to simulate a column of manure stored in a pit. Two batches of fresh finishing pig manure having initial 2% and 3% total solids content respectively were settled for 12 hours and then divided into ten layers of equal volume. Each layer of manure was characterized by its total solids content (TS), volatile solids content (VS), chemical oxygen demand (COD), pH and ammonia concentration. Decomposition of the manure was studied by incubating each manure sample anaerobically at 2 0 C and 30°C for four weeks and the manure characteristics were measured over time. Increases of ammoniacal
273
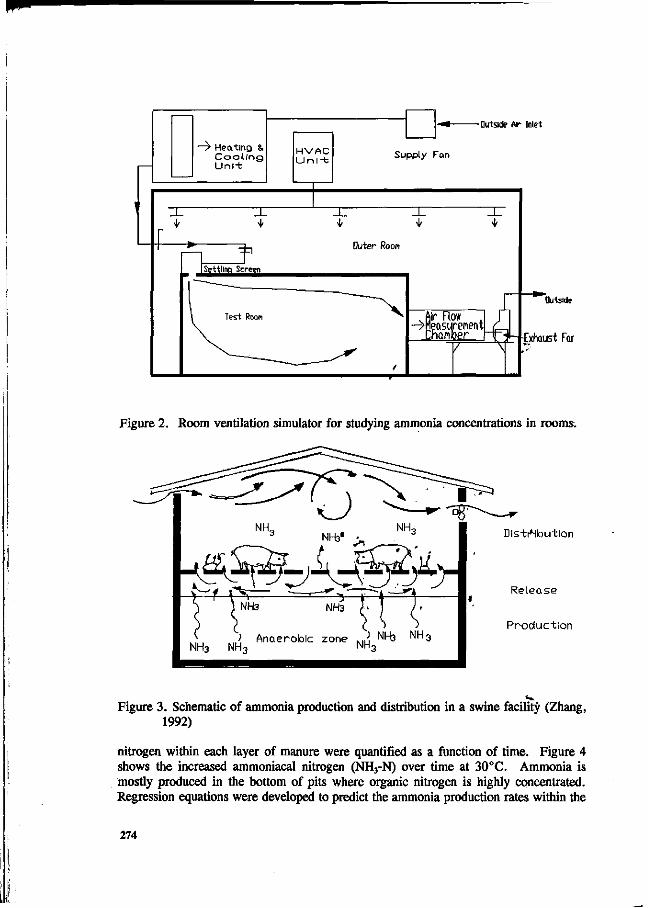
—^ Heating & C o o l i n g U n l - t
H V A C U n l - t
Supply Fan
- Du-tsufc Ar Inlet
Du-tslde
Exhaust Far
Figure 2. Room ventilation simulator for studying ammonia concentrations in rooms.
NH3 NH3
> Anaerobic zone .„} NH3 N H 3 NH,
Distribution
Release
Production
Figure 3. Schematic of ammonia production and distribution in a swine facility (Zhang, 1992)
nitrogen within each layer of manure were quantified as a function of time. Figure 4 shows the increased ammoniacal nitrogen (NH3-N) over time at 30°C. Ammonia is mostly produced in the bottom of pits where organic nitrogen is highly concentrated. Regression equations were developed to predict the ammonia production rates within the
274
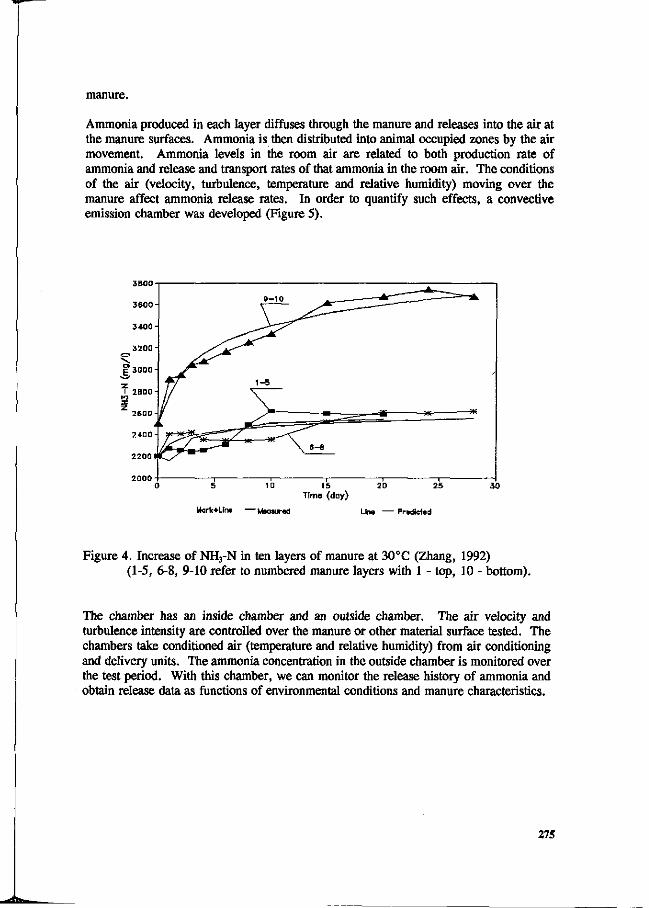
manure.
Ammonia produced in each layer diffuses through the manure and releases into the air at the manure surfaces. Ammonia is then distributed into animal occupied zones by the air movement. Ammonia levels in the room air are related to both production rate of ammonia and release and transport rates of that ammonia in the room air. The conditions of the air (velocity, turbulence, temperature and relative humidity) moving over the manure affect ammonia release rates. In order to quantify such effects, a convective emission chamber was developed (Figure 5).
Time (day)
Mqrk+Un« Line — Predicted
Figure 4. Increase of NH3-N in ten layers of manure at 30°C (Zhang, 1992) (1-5, 6-8, 9-10 refer to numbered manure layers with 1 - top, 10 - bottom).
The chamber has an inside chamber and an outside chamber. The air velocity and turbulence intensity are controlled over the manure or other material surface tested. The chambers take conditioned air (temperature and relative humidity) from air conditioning and delivery units. The ammonia concentration in the outside chamber is monitored over the test period. With this chamber, we can monitor the release history of ammonia and obtain release data as functions of environmental conditions and manure characteristics.
275
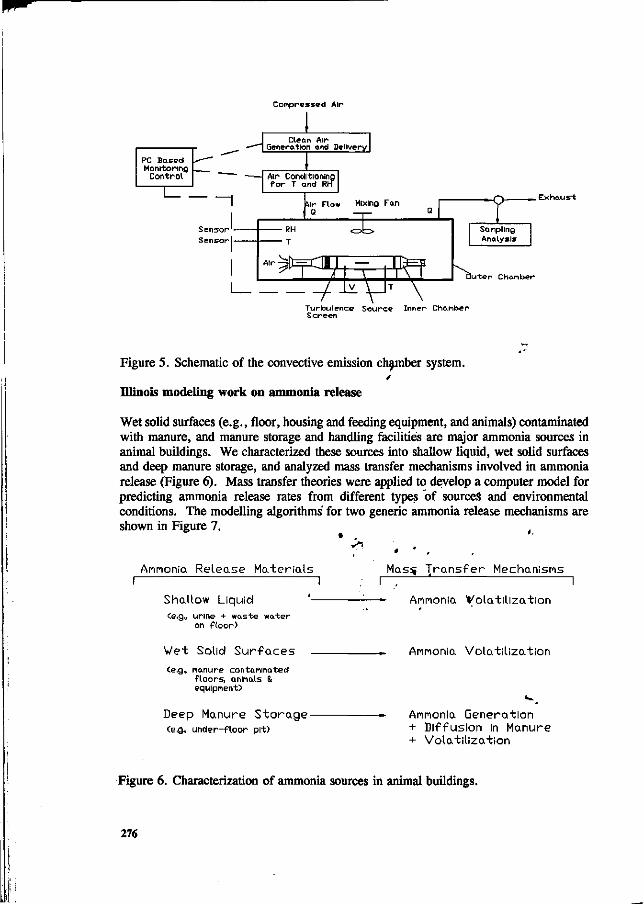
Compressed Air
PC Based Monitoring
C o n t r o l
Clean Air Generation and Delivery
Sensor-Sensor I-
A\r Conditioning f o r T and RH
*lr Flow Mixing Fan 0
• RH
• T
*
zS2 ^7^P\
Q-
Sampling Analysis
O u t e r
Turbulence Source Inner Chamber Screen
Figure 5. Schematic of the convective emission chamber system.
Illinois modeling work on ammonia release
Wet solid surfaces (e.g., floor, housing and feeding equipment, and animals) contaminated with manure, and manure storage and handling facilities are major ammonia sources in animal buildings. We characterized these sources into shallow liquid, wet solid surfaces and deep manure storage, and analyzed mass transfer mechanisms involved in ammonia release (Figure 6). Mass transfer theories were applied to develop a computer model for predicting ammonia release rates from different types of sources and environmental conditions. The modelling algorithms for two generic ammonia release mechanisms are shown in Figure 7.
Annonia Release Mater ials Mas5 T r a n s f e r Mechanises
Shallow Liquid «Ce.g., u r ine + w a s t e w a t e r
on f l o o r )
Annonia Volat i l izat ion
Wet Solid Su r f aces
Ce.g., manure con taminated f l o o r s , animals & equipment)
Deep Manure S to rage -<e.g„ u n d e r - f l o o r p i t )
Annonia Volatilization
Annonia Generation + Di f fusion In Manure + Vo la t i l i za t ion
Figure 6. Characterization of ammonia sources in animal buildings.
276
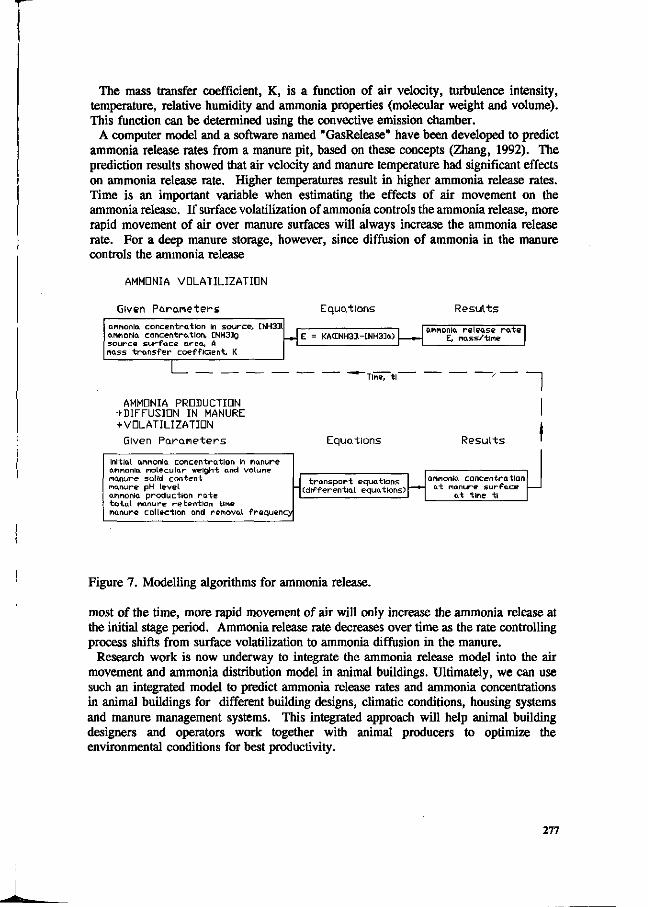
The mass transfer coefficient, K, is a function of air velocity, turbulence intensity, temperature, relative humidity and ammonia properties (molecular weight and volume). This function can be determined using the convective emission chamber.
A computer model and a software named "GasRelease" have been developed to predict ammonia release rates from a manure pit, based on these concepts (Zhang, 1992). The prediction results showed that air velocity and manure temperature had significant effects on ammonia release rate. Higher temperatures result in higher ammonia release rates. Time is an important variable when estimating the effects of air movement on the ammonia release. If surface volatilization of ammonia controls the ammonia release, more rapid movement of air over manure surfaces will always increase the ammonia release rate. For a deep manure storage, however, since diffusion of ammonia in the manure controls the ammonia release
AMMDNIA VOLATILIZATION
Given Parameters Equations Resul ts
ammonia concent ra t ion In source , CNH3]l annonla concent ra t ion, CNH3]g sou rce s u r f a c e area, A nass t r a n s f e r coe f f i c ien t , K
E = KACCNH3]l-CNH3]a) annonla re lease r a t e
E, mass/time
Time, t l 1 AMMONIA PRODUCTION
^DIFFUSION IN MANURE + VDLATILIZATIDN
Given Parameters Equations Resul ts
Initial annonla concent ra t ion in manure ammonia molecular weight and volune manure solid con ten t manure pH level ammonia p roduc t ion r a t e t o t a l nanure r e ten t i on t ine manure col lect ion and rénova i f requency
t r a n s p o r t equat ions ( d i f f e ren t i a l equations)
annonla concent ra t ion at: manure s u r f a c e
a t t ine t l
Figure 7. Modelling algorithms for ammonia release.
most of the time, more rapid movement of air will only increase the ammonia release at the initial stage period. Ammonia release rate decreases over time as the rate controlling process shifts from surface volatilization to ammonia diffusion in the manure.
Research work is now underway to integrate the ammonia release model into the air movement and ammonia distribution model in animal buildings. Ultimately, we can use such an integrated model to predict ammonia release rates and ammonia concentrations in animal buildings for different building designs, climatic conditions, housing systems and manure management systems. This integrated approach will help animal building designers and operators work together with animal producers to optimize the environmental conditions for best productivity.
277
Opportunities to control ammonia in rooms through building design and management
The most direct way to control ammonia in rooms and in the atmosphere is to limit the release of ammonia from manure. This can be accomplished by keeping manure solids covered and by limiting the air movement over the liquid surface. Limited porosity manure covers may be an economically practical means of the latter. Reducing the temperature of stored liquid manure slows the manure decomposition and thus also reduces the ammonia production from manure. Although there seems to be considerable theoretical promise for chemical additives to control ammonia release from manure, none has clearly established their economic practicality for the U.S. swine industry. In addition, a standard procedure is needed to measure the odor levels and evaluate the commercially available odor reducing agents (Riskowski et al., 1991).
A second important means of controlling ammonia in rooms is to limit the potential for manure to accumulate on surfaces in the rooms. This is especially important for flooring and pen partitions, which are in direct contact with the manure. There are already finishes for concrete and plastic coatings from which manure easily slides, and surfaces can be shaped to maximize the flow of the manure directly to the manure storage.
Ventilation is a third important means of controlling ammonia level's in rooms. However, ventilation does not lessen the net ammon/a release to the outdoor environment. Effective ventilation limits the ammonia concentration in the occupied zones by extracting ammonia directly as produced and exhausting from the building and by simply diluting the ammoniated air with fresh air. Increasing the fresh air ventilation directly reduces the room ammonia levels.
Lastly, ammonia can be controlled by extracting it from the room air into solution. Research is already underway to design ammonia scrubbing systems for swine facilities. Scrubbing technology has been applied to numerous industrial applications effectively, and scrubbing ammonia is especially promising because ammonia is highly water soluble.
References
Korthals, R.L., Christiansen, L.L. & Mueflïîng, A J.,'1988. Assessing and improving environmental conditions in commercial swine facilities. Proceedings of the International Livestock Environment Symposium III, Toronto, Canada. '
i Riskowski, G.L., Chang, A.C., Steinberg, M.P. & Day, D.L.; 1991. Methods for evaluating odor from swine manure. Applied Engineering in Agriculture. 7(2): 248-253.
Riskowski, G.L., Priest, J.B., Ford, S.E. & Christiansen, L.L., 1993. Commercial ventilation inlet influence on thermal environment in animal occupied regions. Proceedings of the International Livestock Enviornment Symposium IV, England.
Wu, G.J., Christiansen, L.L, Zhang, J.S. & Riskowski, G.L., 1990. Adjustable dimension room ventilation simulator for room air and air contaminant distribution modeling. Proceedings IAQ, Toronto, Canada. Vol 4, pp237-242.
Zhang, R.H., 1992. Degradation of swine manure and a computer model for predicting the desorption rate of ammonia from an under-floor pit. Doctoral dissertation, University of Illinois, Urbana, IL 61801.
278
Zhang, R.H., Day, D.L., Christiansen, L.L. & Ishibashi, K., 1992. A computer model for predicting ammonia release rates from swine manure pits. ASAE Paper 92-4518, American Society of Agricultural Engineers.
279
Ammonia emission measurements in a model system of a pig house
A. Elzing and D. Swierstra
IMAG-DLO Wageningen (The Netherlands)
Summary
The influence of the manner of floor befouling and of floor type on ammonia emission was investigated w i th the use of a model system for a pig house.The measurements consisted of the recording of the emission during twenty-four hours after the applying of urine and/or faeces on the slatted floor surface.
Three methods of befouling were involved in the investigation. The sprinkling of urine over a clean slatted floor surface for ten days wi th a frequency of one t ime per day did not result in ammonia emission from the slatted floor surface. When, as in the second method, faeces were applied on the slatted floor surface before ^he sprinkling of urine then ammonia emission was observed from the floor surface. The third method of befouling was identical to the secoiad one except that only urine was sprinkled over the slatted floor surface from the* sixth to the tenth day. In this case also ammonia emission from the floor surface was observed.
Emission reduction wi th respect to a standard concrete pig slatted floor was measured for the following floor types : a very smoothly coated slatted floor, a slatted floor w i th narrow bars and a steel slatted floor. For these measurements, the third method of befouling was used. The emission reduction as compared to the standard slatted floor depended on the time which passed after the sprinkling of urine. Only the smoothly coated slatted floor had a significant reduction at both 2 hours and 20 hours after applicating of the urine (35% ^nd 8%,.tespectively). For the floor w i th narrower bars the reductions measured at the same .times were respectively 1 1 % and - 4 % (an increase in emission). For the steel slatted floor these percentages were respectively 2 5 % a n d - 1 7 % . • '•
r < -. Introduction
In the Netherlands, the government demands that measures be taken to reduce ammonia emission from livestock buildings for pigs. Tbe ammonia, which is released, contributes indirectly to acidification of the environment (Heij & Schneider, 1991).
To develop low emission building types and low emission manure treatment techniques, research has been started on the factors which play an important role in the process of ammonia emission from a livestock building. With respect to th is, it is important to have knowledge about the influence of floor befouling and of floor type on the ammonia emission.
It is complicated to measure this influence in detail in a regular l ivestock'txji lding for pigs because it is hard to hold the (micro) climate constant over a long period. Besides this, in regular animal housings, all kinds of processes can overshadow the effect of floor befouling and of floor type on the ammonia emission. As an alternative to regular housings a model system can be used (Elzing et a l . , 1992). In this model system physical conditions like temperature, air speed and air humidity can be easily kept constant.
The fol lowing aims were formulated for this study: 1) The determination of the effect of floor befouling on ammonia emission for a standard floor type and 2) The
280
measurement of emission reduction of alternative floor types w i th respect to a standard floor type.
Materials and methods
Experimental setup
The experimental setup consisted of a container of about 2 m3 , which could be filled w i th manure. Floor elements such as slatted floors were placed above this container. The total floor surface had dimensions of 2.2 by 1.1 m. A so-called Lindvall box (Lindvall et a l . , 1974) was placed over this floor surface. Via this box air f low was guided over the floor surface. The whole setup was placed in a climate room, so that the temperature and humidity of the air which was drawn over the floor surface could be controlled.
The air from the outlet of the Lindvall box was sampled. The ammonia (NH3) was converted to nitrogen oxide (NO) by using stainless steel at a temperature of about 775 °C and the NO concentration was determined wi th an NOx-analyzer. The ammonia emission was calculated by multiplying the air f low, which was also measured, and the ammonia concentration. This method is described in more detail by Scholtens (1990).
Befouling methods
The influence on the ammonia emission of three different methods of befouling was investigated. Standard concrete slatted floors for pigs (NEN 3873) were used for all three befouling methods. At the start of a befouling method new, thus clean, slatted floors were used. Every befouling method consisted of sprinkling urine over the slatted floor, but they differ from each other in the way faeces were applied on the surface.
The first method consisted of sprinkling 2 kg urine homogeneously over clean slatted floors for 10 days wi th a frequency of once per twenty-four hours. This method is called the "clean" method.
For the second method, 3 kg faeces was mixed w i th 3 kg water. The resulting mixture had a dry matter content of 150 to 200 g/kg. This mixture was homogeneously spread over the slatted floor surface. Immediately thereafter the mixture was removed wi th a floor scraper, leaving a thin wet layer of faeces behind. Over this layer 2 kg urine was sprinkled using a watering can. This manner of befouling was repeated on ten successive days. The method is called the "faeces" method.
The third befouling method was identical to the second one from the first to the f i f th day but from the sixth to the tenth day only urine was sprinkled over the already dirty surface. In this paper this method is called the "dirty" method. This last method was also used during the study of the effect of floor type on emission of ammonia.
Floor variants
The fol lowing floor types were investigated: - a standard concrete slatted floor for pigs w i th 10 cm bar - a smoothly coated, concrete slatted floor for pigs w i th 10 cm bar - a concrete slatted floor for pigs w i th 7 cm instead of 10 cm bar - a steel slatted floor, w i th bars and chinks of 1 cm
These slatted floor were placed in the setup in such a way that the direction of the air f low through the Lindvall box was at right angles to the direction of the chinks and bars of the slatted floors.
281
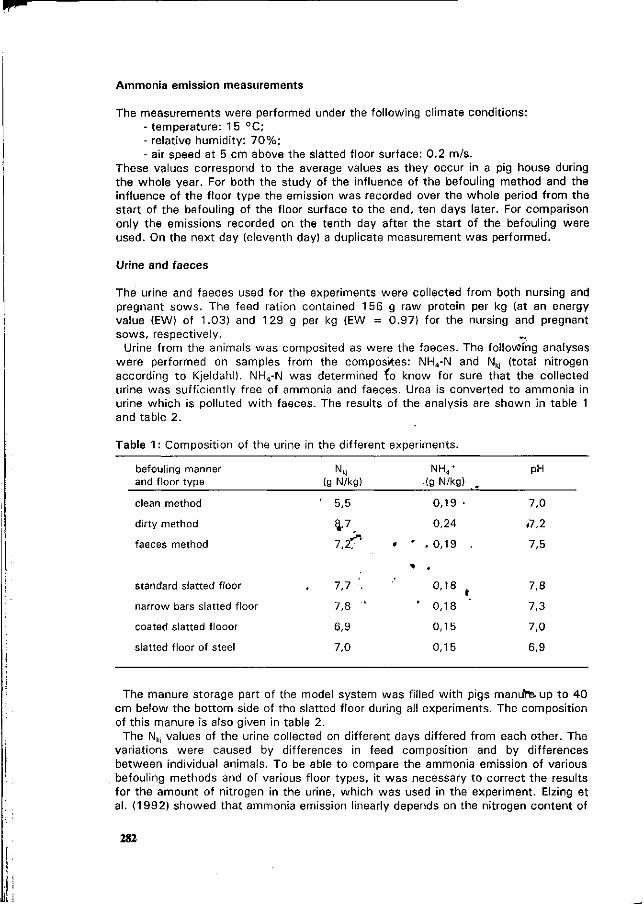
Ammonia emission measurements
The measurements were performed under the following climate conditions: - temperature: 1 5 °C; - relative humidity: 7 0 % ; - air speed at 5 cm above the slatted floor surface: 0.2 m/s.
These values correspond to the average values as they occur in a pig house during the whole year. For both the study of the influence of the befouling method and the influence of the floor type the emission was recorded over the whole period from the start of the befouling of the floor surface to the end, ten days later. For comparison only the emissions recorded on the tenth day after the start of the befouling were used. On the next day (eleventh day) a duplicate measurement was performed.
Urine and faeces
The urine and faeces used for the experiments were collected from both nursing and pregnant sows. The feed ration contained 156 g raw protein per kg (at an energy value (EW) of 1.03) and 129 g per kg (EW = 0.97) for the nursing and pregnant sows, respectively.
Urine from the animals was composited as were the faeces. The followfng analyses were performed on samples from the composkes: NH4-N and Nkj (total nitrogen according to Kjeldahl). NH4-N was determined io know for sure that the collected urine was sufficiently free of ammonia and faeces. Urea is converted to ammonia in urine which is polluted w i th faeces. The results of the analysis are shown in table 1 and table 2.
Table 1 : Composition of the urine in the different experiments.
befouling manner and floor type
clean method
dirty method
faeces method
standard slatted floor
narrow bars slatted floor
coated slatted flooor
slatted floor of steel
(g N/kg)
' 5,5
V. 7 , 2 ^
7,7 ;.
7,8 "
6,9
7,0
NH4 + AgN/kg) m
0,19 •
0,24
• ' . 0,19 ,
0,18
' 0,18
0,15
0,15
pH
7,0
«7,2
7,5
7,8
7,3
7,0
6,9
The manure storage part of the model system was filled w i th pigs manure, up to 40 cm below the bottom side of the slatted floor during all experiments. The composition of this manure is also given in table 2.
The Nkj values of the urine collected on different days differed from each other. The variations were caused by differences in feed composition and by differences between individual animals. To be able to compare the ammonia emission of various befouling methods and of various floor types, it was necessary to correct the results for the amount of nitrogen in the urine, which was used in the experiment. Elzing et al. (1992) showed that ammonia emission linearly depends on the nitrogen content of
282
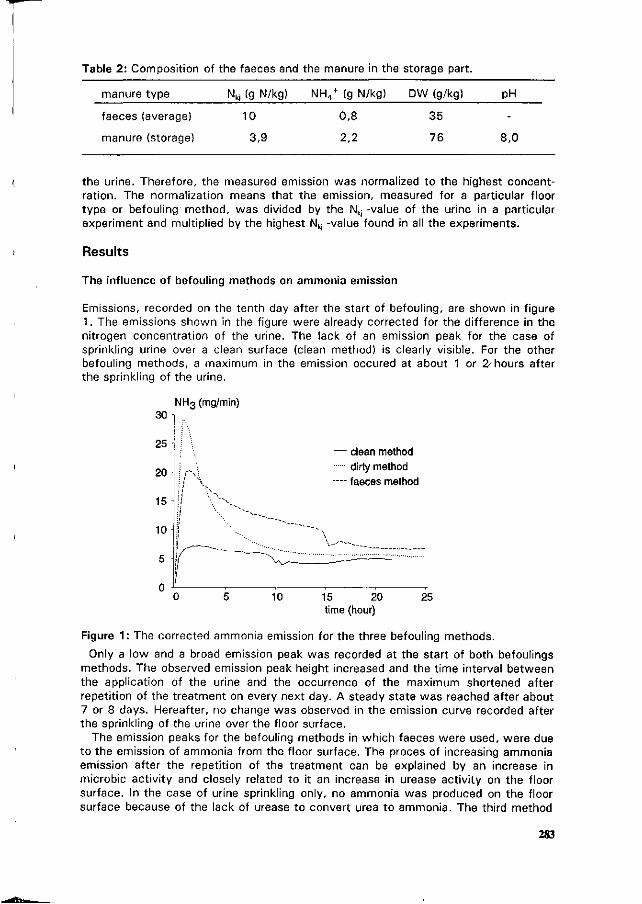
Table 2: Composition of the faeces and the manure in the storage part.
manure type Nki (g N/kg) NH 4+ (g N/kg) DW (g/kg) pH
faeces (average) 10
manure (storage) 3,9
0,8
2,2
35
76 8,0
the urine. Therefore, the measured emission was normalized to the highest concentration. The normalization means that the emission, measured for a particular floor type or befouling method, was divided by the Nkj -value of the urine in a particular experiment and multiplied by the highest Nk| -value found in all the experiments.
Results
The influence of befouling methods on ammonia emission
Emissions, recorded on the tenth day after the start of befouling, are shown in figure 1. The emissions shown in the figure were already corrected for the difference in the nitrogen concentration of the urine. The lack of an emission peak for the case of sprinkling urine over a clean surface (clean method) is clearly visible. For the other befouling methods, a maximum in the emission occured at about 1 or 2- hours after the sprinkling of the urine.
30 -
25 -
20
15
10
5
NH3 (mg/min)
\r\ • ' '• " \
I ''•-.. ""
— clean method dirty method
•— faeces method
V - ' ~ -
10 15 20 time (hour)
25
Figure 1 : The corrected ammonia emission for the three befouling methods.
Only a low and a broad emission peak was recorded at the start of both befoulings methods. The observed emission peak height increased and the time interval between the application of the urine and the occurrence of the maximum shortened after repetition of the treatment on every next day. A steady state was reached after about 7 or 8 days. Hereafter, no change was observed in the emission curve recorded after the sprinkling of the urine over the floor surface.
The emission peaks for the befouling methods in which faeces were used, were due to the emission of ammonia from the floor surface. The proces of increasing ammonia emission after the repetition of the treatment can be explained by an increase in microbic activity and closely related to it an increase in urease activity on the floor surface. In the case of urine sprinkling only, no ammonia was produced on the floor surface because of the lack of urease to convert urea to ammonia. The third method
283
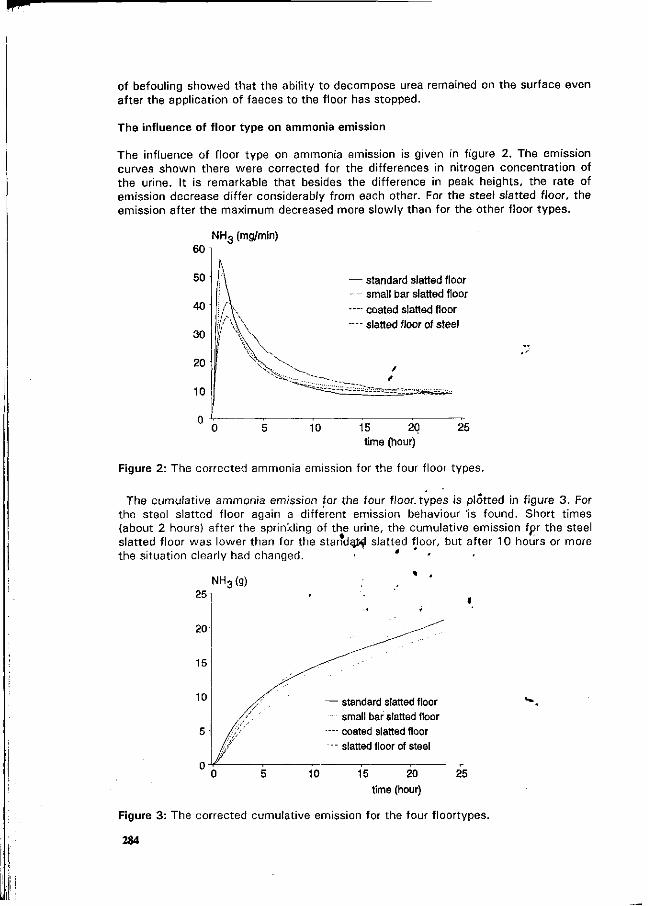
of befouling showed that the ability to decompose urea remained on the surface even after the application of faeces to the floor has stopped.
The influence of floor type on ammonia emission
The influence of floor type on ammonia emission is given in figure 2. The emission curves shown there were corrected for the differences in nitrogen concentration of the urine. It is remarkable that besides the difference in peak heights, the rate of emission decrease differ considerably from each other. For the steel slatted floor, the emission after the maximum decreased more slowly than for the other floor types.
10
60
50
40
30
20
10
NH3 (mg/min)
• ' " ' \
'if y\ \ i \ \ \
\ v \
I
— standard slatted floor small bar slatted floor
—- coated slatted floor -— slatted floor of steel
- ^ ^ - — ^ i ï i ù ; ^ ^
15 20 time (hour)
25
Figure 2 : The corrected ammonia emission for the four floor types.
The cumulative ammonia emission for the four f loor types is plotted in figure 3. For the steel slatted floor again a different emission behaviour 'is found. Short t imes (about 2 hours) after the sprinkling of the urine, the cumulative emission fpr the steel slatted floor was lower than for the standard slatted floor, but after 10 hours or more the situation clearly had changed. '
NH3(g)
10
5
— standard slatted floor small bar slatted floor
—- coated slatted floor --- slatted floor of steel
15 20
time (hour)
25
Figure 3: The corrected cumulative emission for the four f loortypes.
284
It is possible to derive from figure 3 the emission reduction percentages w i th respect to the standard slatted floor at different t ime intervals after the sprinkling of the urine over the floor surface. In table 3 the emission reduction is given for 2 and 20 hours after the sprinkling of the urine. Shortly after the sprinkling of the urine, all alternative floor types showed an emission reduction w i th respect to the standard slatted floor. After 20 hours only the smoothly coated slatted floor still showed an emission reduction.
Table 3: The emission reduction wi th respect to the standard slatted floor.
floor type red. after 2 hours red. after 20 hours
small bar slatted floor 11 -4
coated slatted floor 35 8
slatted floor of steel 25 -17
The exceptional behaviour of the steel slatted floor was probably due to the fact that many urine drops adhered to the bottom side of the thin metal bars. A t this position under the metal bars the air speed was lower than over the surface and this probably resulted in a slower ammonia emission. The total amount of urine which adhered to the metal bars was greater than the amount of urine which stayed as puddles on the standard concrete slatted floor, because as t ime went the cumulative emission was higher than for the standard slatted floor, while the emission of the manure storage under the floor was almost equal in both cases.This last statement can be concluded from figure 2. In this figure an equal emission was observed for all cases after 20 hours after the sprinkling of urine.
For extrapolation of the results to pig houses, it is important to know the frequency of urine passes per unit surface area. From figure 3, it can be derived that when the frequency is less than one time per 5 hours only the smoothly coated slatted floor clearly resulted in an emission reduction. Unfortunately, the tread of this slatted floor was so smooth that it may not applicable in a pig house. Pigs use only a small part of the floor as place for manure and urine. This combined wi th the fact than during certain t imes the frequency of urine passes is higher, as for example the feeding of the animals, can result in a frequency of urine passes for parts of the floor surface that is clearly greater than once per 5 hours. Under these circumstances the steel slatted floor and the slatted floor w i th small bars could also result in an emission reduction.
References
Elzing, A. , Kroodsma, W., Scholtens, R. & Uenk, G. H., 1992. Ammonia emission measurements in a model system of a dairy cattle housing: Theoretical considerations. IMAG-DLO Wageningen, rapport 92-3, pp 23.
Heij, G.J. & Schneider, T., 1 991 . Dutch Priority Programme on Acidif ication, Final Report Second Phase Dutch Priority Programme on Acidif ication. RIVM no 200-0 9 , pp 24.
Lindvall, T., Noren, O. & Thyselius, L , 1974. Odor reduction for liquid manure syst ems. Transactions of the ASAE, Vol. 17, p. 510-512.
Scholtens, R., 1990. Ammoniakemissionsmessungen in zwangsbelüfteten Ställen. In: Ammoniak in der Umwelt, Proceedings Symposium, Braunschweig, KBTL, Darmstadt, Beitrag Nr. 20, pp 9.
285
Factors affecting ammonia emission from bousing for weaned piglets
A.J.A. Aarnink, M.J.M. Wagemans and A. Keen
Institute of Agricultural Engineering, IMAG-DLO Wageningen, the Netherlands
Abstract
It is environmentally desirable to reduce ammonia emission from major sources such as piggeries. To do this, the effect of various factors on ammonia emission need to be known. This study quantified the effects of percentage of slatted floor, ambient temperature, slurry temperature, ventilation rate, slurry pH and ammonium content, and pen fouling, in a shed for weaned piglets. Data were collected from four compartments, each housing 40 piglets. In two compartments 25% of the floor was slatted and in the other two 50% of the floor area was slatted. The experiment was done twice. During ,the weekly measuring period of three days the ambient temperature and ventilation rate were kept as coo'stant as possible. The results show that percentage of slatted floor significantly (p<0.05) affected emission. Emission can be cut by about 20% by reducing the area slatted from 50% to 25%. Slurry temperature had a statistically significant positive effect on emission, but ambient temperature had a statistically significant negative effect (p<0.001). Ventilation rate had no effect (p>0.05). The theoretically expected linear effects of ammonium content on ammonia emission and of slurry pH on the logarithm of ammonia emission were confirmed by this experiment. Pen fouling also had a statistically significant effect on ammonia emission (p<0.001). The results show that various factors influence ammonia emission. Emitting area, ,air movement and the temperature, *pJJ, and ammonium content of the slurry seem to be the most important. ' .
KEYWORDS, pigs, ammonia emission, emitting area, temperature, ventilation rate, pH, ammoniVmf, pen fouling
I
Introduction
Ammonia is one of the components in the atmosphere that is important in acid deposition. Slurries from intensive livestock farming are the main source of this ammonia. Research on reducing ammonia emission from slurry is being done in various countries. This paper reports the results of a stud_y done in the Netherlands to quantify the factors that affect ammonia emission from pig shed.
Theoretical models predict effects of temperature, pH and ammonium content of the ammonia source, area of that source and air speed above it (Muck and Steenhuis, 1981; Elzing et al., 1992). In an animal shed ammonia is mainly formed by the breakdown of the urea from the urine. This breakdown is catalysed by the bacterial enzyme urease. Urease bacteria are present in faeces and on soiled floors. Temperature affects
286
three steps in the process of ammonia volatilization. A higher temperature gives a faster breakdown of urea to ammonia and carbon dioxide. It also increases the fraction of non-ionized ammonia and speeds up the volatilization. Air speed also influences the rate of ammonia volatilization. The pH mainly affects the fraction of non-ionized ammonia, while the ammonium content influences the amount of non-ionized ammonia. Whereas ammonia volatilization is a slow process, the ammonia emission in a system where new ammonia is continuously forming depends mainly on the area of the ammonia source, rather than on its volume.
In this study the effects of the abovementioned factors were quantified under practical circumstances in a shed for weaned piglets. In normal pig husbandry, factors like temperature, ventilation rate and animal weight are often mutually related and therefore their individual effects are difficult to estimate. In this study temperature and ventilation rate were varied independently from each other and from animal weight in order to enable these factors to be estimated more accurately. The effect of emitting area was estimated by comparing pens with 50% slatted floor area with pens with 25% of slatted floor area. The area of floor fouled with urine and /faeces was estimated and assigned a score. The effect of this fouling score on the emission was also estimated. Neither the pH nor the ammonium concentration were varied deliberately, they were measured and their effects on the emission were estimated.
Experimental Procedures
Housing Four compartments, each for forty weaned piglets, were used in the research. Each compartment had two pens. The proportion of slatted floor in the pens was 50% in two compartments and 25% in the other two (Fig. 1). The metal slats were 1 cm wide and spaced 1 cm apart. Each pen had its own slurry gutter (1 m deep) . The 50% pens had a domed solid concrete floor in the lying area, whereas in the 25% pens the floor of the lying area was sloping. A fan sucked in air from outside; this first passed through underground ducts 30 m long which discharged into the ventilation chamber of the pigsty, where the air could be preheated before being divided over two compartments. The air entered the compartment via a ceiling of perforated plastic sheeting. An extractor fan in the compartment removed the stale air. This system enabled the temperature of the incoming air to be kept fairly stable. No bedding straw was used.
287
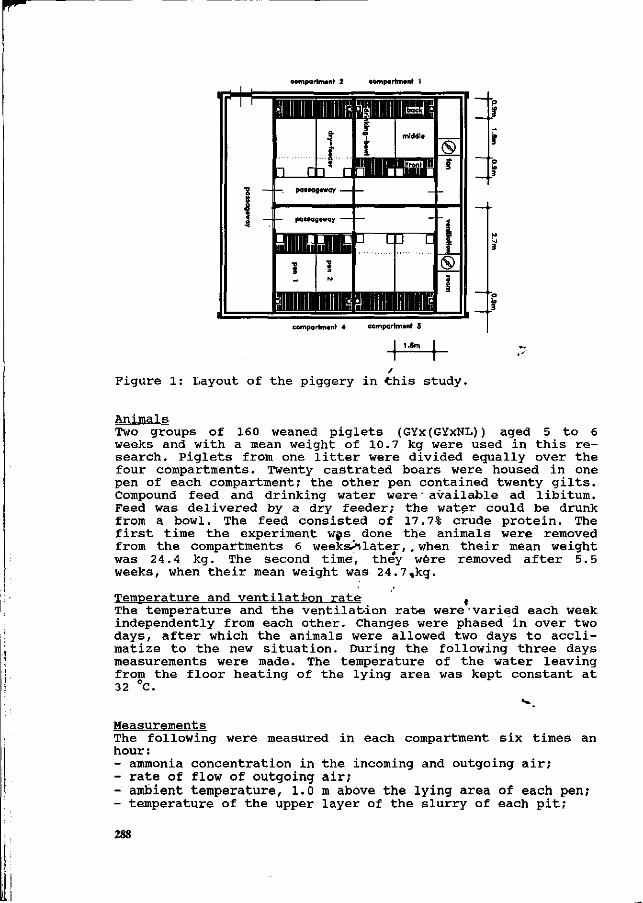
compartment 2 comportment 1
iiiiiiiBiimpiypB
m* nii iBBE
c—rp q | ®
compartment 4 compartmont 3
Figure 1: Layout of the piggery in this study.
Animals Two groups of 160 weaned piglets (GYx(GYxNL)) aged 5 to 6 weeks and with a mean weight of 10.7 kg were used in this research. Piglets from one litter were divided equally over the four compartments. Twenty castrated boars were housed in one pen of each compartment; the other pen contained twenty gilts. Compound feed and drinking water wereJ available ad libitum. Feed was delivered by a dry feeder; the water could be drunk from a bowl. The feed consisted of 17.7% crude protein. The first time the experiment was done the animals were removed from the compartments 6 weekstlater, , when their mean weight was 24.4 kg. The second time, they were removed after 5.5 weeks, when their mean weight was 24.7,kg.
Temperature and ventilation rate , The temperature and the ventilation rate were varied each week independently from each other. Changes were phased in over two days, after which the animals were allowed two days to acclimatize to the new situation. During the following three days measurements were made. The temperature of the water leaving from the floor heating of the lying area was kept constant at 32 °C.
Measurements The following were measured in each compartment six times an hour: - ammonia concentration in the incoming and outgoing air; - rate of flow of outgoing air; - ambient temperature, 1.0 m above the lying area of each pen; - temperature of the upper layer of the slurry of each pit;
288
- relative humidity of outgoing air. Mean hourly values were collected by a data logger.
Ammonia concentrations were measured with an NO analyser (model ML 8840, Monitor Labs) in combination with an NH3 convertor. See Scholtens (1990) for details of this method.
Once a week the monitor was standardized with a gas of 40 ppm NO in N and the flow of the different channels was checked. Dust filters were changed when necessary. In normal situations the value measured with the analyser differed from the concentration of the standard gas by no more than 5%.
The rate of flow of outgoing air was measured with an anemometer with the same diameter as the fan channel. These measuring fans were standardized in a wind tunnel. This experimental equipment was built in accordance with NEN Norm 1048-11.
The temperature was measured with AD-592 sensors. The temperature of the upper layer of the slurry was measured by a sensor under a floater. The relative humidity was measured with a C80-Hygromer humidity sensor (Rotronic-Hygromer, serie 1-100).
Fouling score / On the first and last days of the weekly measuring periods of 3 days, the fouling was visually assessed and scored. Scores were given for the front, the middle and the back part of the pen (Fig. 1), and for the animals. The scores ranged from 0 to 5; 0 being very clean, no fouling with faeces and urine; 5 being very dirty; large areas fouled with urine and faeces. From these scores a total score per pen was calculated as follows:
pen score = 1 x score front + 2 x score middle + 1 x score back + 1 x score animal
The compartment score was calculated by summing the pen scores.
pH and ammonium content of the slurry After each of the two runs of this experiment the slurry from each compartment was removed to a pit outside the shed. It was then agitated thoroughly and a sample was taken and analysed for pH and ammonium.
Data analysis The ammonia emission was calculated as the product of concentration and the rate of flow of outgoing air. The ambient temperature and the temperature of the upper layer of the slurry were calculated as the mean of the values per pen and values per pit respectively. The data were analysed with the REML procedure of the Genstat 5 statistical package (1987). The ammonia emission (NH3) was the dependent variable in the model. Because most factors have a relative effect on the emission, both fixed and random effects (excluding the residual error) were defined on a logarithmic scale. The fixed effects included in the model were the linear effects of percentage of slatted floor, ambient temperature, slurry tempera-
289
ture, ventilation rate, slurry pH and ammonium content (NH4) and fouling score. Random effects included in the model were the effects of compartment and the effects of compartments within animal groups. Constant coefficient of variation was assumed for the residual error. The method closely resembles the application of REML with response variate log(NH3) and has been described by Engel and Keen (1993) . On the basis of theory the NH4 was expected to have a linear effect, therefore the logarithm of this factor was used in the model as well. The mean values per measuring period of three days were the experimental units with a total of 44. The effects of percentage of slatted floor, pH and NH4 were estimated on the basis of 8 observations (two runs of the experiment in 4 compartments) .
Results and discussion
Figure 2 shows the mean ambient and slurry temperatures, the ventilation rates and ammonia emissions per period in the two runss of the experiment and in the four compartments'. Because of the high outside temperature in the first run, the ventilation rate could not be decreased/ when the animals became heavier. The pH of the slurry varied from 6.65 to 7.0 between the two runs and between the different compartments, the ammonium content varied between 2.09 and 3.37 g/kg and the fouling score between 3.5 and 21.
Corrected for the mean value of all other factors in the model the mean ammonia emission of the 25% slatted floor compartments was 1.36 g/h compared to 1.84 g/h for the compartments with 50% slatted floor area. This difference i,s statistically significant at the 0.05 level. The mean pen fouling score was higher for the 25% compartments (11.5) than 'for the 50% compartments (7.5). When pen fouling was left out of the analysis, the mean emissions were ^.43 and 1.67 g/h respectively for the 25% and 50% compartments.' this difference is not statistically significant (p>0.05). Although it was expected that the 25% pens would be slightly more fouled than the 50% pens, the difference in pen fouling score found in this study may not occur under normal cirçumstanqes. In*, certain periods of the experiment ambient temperatures were kept rather high (Fig. 2) . This could have caused more pen fouling, especially in combination with higher animal weights. Under the conditions of a good climate and a good pen layout in the shed, reducing the percentage of slatted floor from 50% to 25% will reduce ammonia emission by about 20%.
290
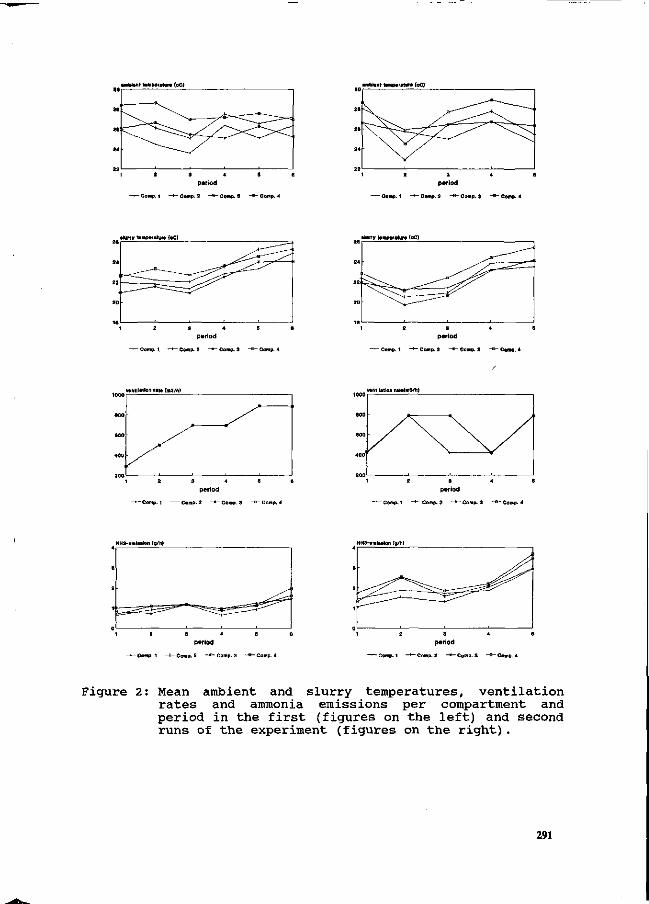
ambtonl tamparatura (oC) ambient temparatwre (oC)
«farty taiapefature (oC) •lurry temperature toC)
ventilation rate (ma/n) ventilation rate4ff3/h}
NHS-amiaakm (g/n) NH3-ei»laalon {g/h)
Figure 2 : Mean ambient and slurry temperatures, ventilation rates and ammonia emissions per compartment and period in the first (figures on the left) and second runs of the experiment (figures on the right).
291
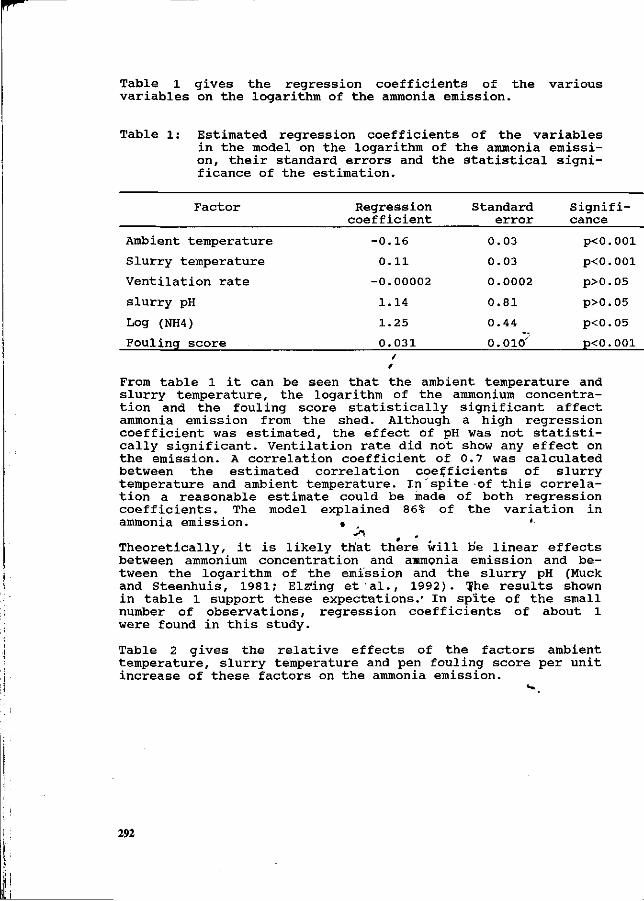
Table l gives the regression coefficients of the various variables on the logarithm of the ammonia emission.
Table l: Estimated regression coefficients of the variables in the model on the logarithm of the ammonia emission, their standard errors and the statistical significance of the estimation.
Factor
Ambient temperature
Slurry temperature
Ventilation rate
slurry pH
Log (NH4)
Fouling score
Regression coefficient
-0.16
0.11
-0.00002
1.14
1.25
0.031
Standard error
0.03
0.03
0.0002
0.81
0.44
0.010'
Significance
p<0.001
p<0.001
p>0.05
p>0.05
p<0.05
p<0.001
/ From table 1 it can be seen that the ambient temperature and slurry temperature, the logarithm of the ammonium concentration and the fouling score statistically significant affect ammonia emission from the shed. Although a high regression coefficient was estimated, the effect of pH was not statistically significant. Ventilation rate did not show any effect on the emission. A correlation coefficient of 0.7 was calculated between the estimated correlation coefficients of slurry temperature and ambient temperature. In spite of this correlation a reasonable estimate could be made of both regression coefficients. The model explained 86% of the variation in ammonia emission. • '
Theoretically, it is likely that there will be linear effects between ammonium concentration and a»mpnia emission and between the logarithm of the emission and the slurry pH (Muck and Steenhuis, 1981; Elz'ing etal., 1992). Ihe results shown in table 1 support these expectations.' In spite of the small number of observations, regression coefficients of about 1 were found in this study.
Table 2 gives the relative effects of the factors ambient temperature, slurry temperature and pen fouling score per unit increase of these factors on the ammonia emission.
292
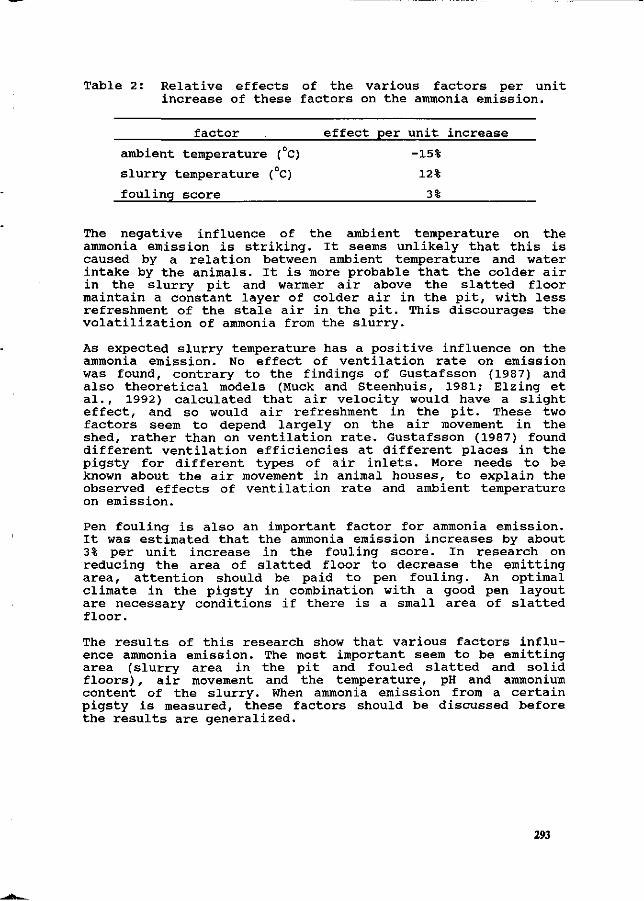
Table 2 : Relative effects of the various factors per unit increase of these factors on the ammonia emission.
factor effect per unit increase
ambient temperature (°C) -15%
slurry temperature (°C) 12%
fouling score 3%
The negative influence of the ambient temperature on the ammonia emission is striking. It seems unlikely that this is caused by a relation between ambient temperature and water intake by the animals. It is more probable that the colder air in the slurry pit and warmer air above the slatted floor maintain a constant layer of colder air in the pit, with less refreshment of the stale air in the pit. This discourages the volatilization of ammonia from the slurry.
As expected slurry temperature has a positive influence on the ammonia emission. No effect of ventilation rate on emission was found, contrary to the findings of Gustafsson (1987) and also theoretical models (Muck and Steenhuis, 1981; Elzing et al., 1992) calculated that air velocity would have a slight effect, and so would air refreshment in the pit. These two factors seem to depend largely on the air movement in the shed, rather than on ventilation rate. Gustafsson (1987) found different ventilation efficiencies at different places in the pigsty for different types of air inlets. More needs to be known about the air movement in animal houses, to explain the observed effects of ventilation rate and ambient temperature on emission.
Pen fouling is also an important factor for ammonia emission. It was estimated that the ammonia emission increases by about 3% per unit increase in the fouling score. In research on reducing the area of slatted floor to decrease the emitting area, attention should be paid to pen fouling. An optimal climate in the pigsty in combination with a good pen layout are necessary conditions if there is a small area of slatted floor.
The results of this research show that various factors influence ammonia emission. The most important seem to be emitting area (slurry area in the pit and fouled slatted and solid floors), air movement and the temperature, pH and ammonium content of the slurry. When ammonia emission from a certain pigsty is measured, these factors should be discussed before the results are generalized.
293
References
Elzing, A., W. Kroodsma, R. Scholtens & G.H. Uenk, 1992. Ammonia emission measurements in a model system of a dairy cattle housing: Theoretical considerations [in Dutch, with English summary]. IMAG-DLO rapport 92-3, Wageningen, 25 pp.
Engel, B. & A. Keen, 1993. A simple approach for the analysis of Generalized Linear Mixed Models. Statistica Neerlandica, in press.
Gustafsson G., 1987. Reduction of ammonia in swine houses. Latest Developments in livestock housing, ASAE, pp. 9-22.
Muck, R.E. & T.S. Steenhuis, 1981. Nitrogen losses in free stall dairy barns. In: Proc. 4th Int. Symp. Livestock Waste: A Renewable Resource, ASAE, St. Joseph, Mich., pp. 163-166, 169.
Scholtens, R. Ammoniakemissionsmessungen in zwangbelufteten Stallen. In: Ammoniak in der Umwelt; Kreislaufe, Wirkungen, Minderung. KTBL, Darmstadt-Kranichstein, pp. 20.1-20.9.
/ /
t
I
294
Experiments with a feed additive to reduce ammonia emissions from pig fattening housing - preliminary results
R. Krieger1, J. Härtung2 and A. Pfeiffer3
1 Institut für Tierhygiene und Tierschutz, Tierärztliche Hochschule, Bünteweg 17p, 3000 Hannover 71 (Germany)
2 Silsoe Research Institute, Wrest Park, Silsoe, Bedford (United Kingdom) 3 Forschungs- und Studienzentrum Weser-Ems , Vechta (Germany)
Summary
The feed additive "Klinofeed", a natural processed clinoptilolite which is said to reduce the emission of ammonia from pig excreta, was tested in a pig fattening house with 130 pigs during a fattening period of 5 months. An identical piggery was used as a control. Preliminary results show that daily gain, feed conversion and lean pore ratio do not differ between the experimental group and the control. Daily average ammonia emissions were estimated in both piggeries during a three months period. In the first four weeks the ammonia emissions from the control (720 g NH4-N per day) were significantly higher than from the experimental piggery (487 g NH4-N per day). In the second and third months ammonia emissions were significantly (p < 0.05) higher from the experimental piggery (970 vs 639 g NH4-N per day). The total mean values did not differ significantly between experiment (752 g NH4-N per day) and control (676 g NH4-N per day). More investigations are needed to verify these preliminary results. A survey of literature reports on the use of mineral feed additives with pigs is given.
Introduction
Since a couple of years additives for feed and slurry are offered which are said to reduce ammonia emissions from pig houses and slurry stores (Steffens et al., 1990). Some of these additives are clay minerals, which also are said to improve pig performance. However, neither bilaminar (e.g. kaolinite) nor multilayer clay minerals (e.g. montmorillonite) showed an increased binding activity for ammonium ions (Hartfiel & Riess, 1990). This situation seems to be different for the clinoptilolites, which are three-dimensional constructed natural zeolites. As early as 1977 Mumpton & Fishman described the clinoptilolite's attribute to extract ammonium from animal feces and to reduce odour. They furthermore reported on favourable influences on the feed utilisation by the use of clinoptilolites in Japanese investigations. It seems that the effect depends on concentration, particle size and the geographical origin of the used clinoptilolite (Pond et al., 1980).
The following paper gives a brief survey of reports on the use of mineral feed additives in fattening pigs. These are listed in Table 1. Preliminary results of own experiments are shown with the feed additive "Klinofeed" and its influence on the reduction of ammonia emissions from a piggery and on pig performance.
295
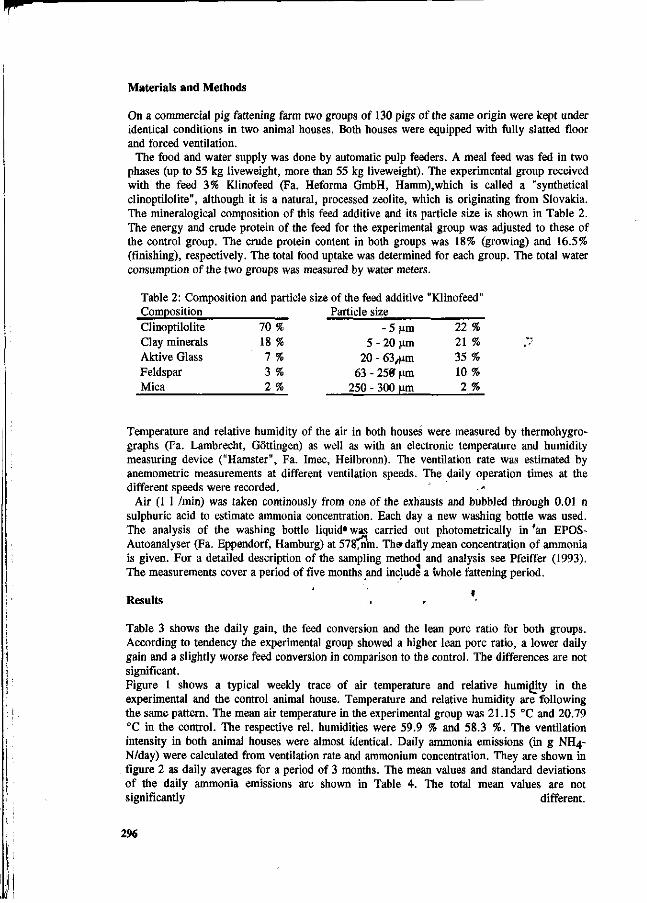
Materials and Methods
On a commercial pig fattening farm two groups of 130 pigs of the same origin were kept under identical conditions in two animal houses. Both houses were equipped with fully slatted floor and forced ventilation.
The food and water supply was done by automatic pulp feeders. A meal feed was fed in two phases (up to 55 kg liveweight, more than 55 kg liveweight). The experimental group received with the feed 3% Klinofeed (Fa. Heforma GmbH, Hamm),which is called a "synthetical clinoptilolite", although it is a natural, processed zeolite, which is originating from Slovakia. The mineralogical composition of this feed additive and its particle size is shown in Table 2. The energy and crude protein of the feed for the experimental group was adjusted to these of the control group. The crude protein content in both groups was 18% (growing) and 16.5% (finishing), respectively. The total food uptake was determined for each group. The total water consumption of the two groups was measured by water meters.
Table 2: Composition and particle size of the feed additive "Klinofeed" Composition Clinoptilolite Clay minerals Aktive Glass Feldspar Mica
70 % 18 % 7 % 3 % 2 %
Particle size - 5 urn
5 - 20 urn 20 - 63,um
63 - 250 urn 250 - 300 urn
22 % 21 % 35 % 10% 2 %
Temperature and relative humidity of the air in both houses were measured by thermohygro-graphs (Fa. Lambrecht, Göttingen) as well as with an electronic temperature and humidity measuring device ("Hamster", Fa. Imec, Heilbronn). The ventilation rate was estimated by anemometric measurements at different ventilation speeds. The daily operation times at the different speeds were recorded.
Air (1 1 /min) was taken continously from one of the exhausts and bubbled through 0.01 n sulphuric acid to estimate ammonia concentration. Each day a new washing bottle was used. The analysis of the washing bottle liquid» was carried out photometrically in 'an EPOS-Autoanalyser (Fa. Eppendorf, Hamburg) at 578, nm. Th» daily mean concentration of ammonia is given. For a detailed description of the sampling method and analysis see Pfeiffer (1993). The measurements cover a period of five months and include a whole fattening period.
Results . .
Table 3 shows the daily gain, the feed conversion and the lean pore ratio for both groups. According to tendency the experimental group showed a higher lean pore ratio, a lower daily gain and a slightly worse feed conversion in comparison to the control. The differences are not significant. Figure 1 shows a typical weekly trace of air temperature and relative humidity in the experimental and the control animal house. Temperature and relative humidity are following the same pattern. The mean air temperature in the experimental group was 21.15 °C and 20.79 °C in the control. The respective rel. humidities were 59.9 % and 58.3 %. The ventilation intensity in both animal houses were almost identical. Daily ammonia emissions (in g NH4-N/day) were calculated from ventilation rate and ammonium concentration. They are shown in figure 2 as daily averages for a period of 3 months. The mean values and standard deviations of the daily ammonia emissions are shown in Table 4. The total mean values are not significantly different.
2%
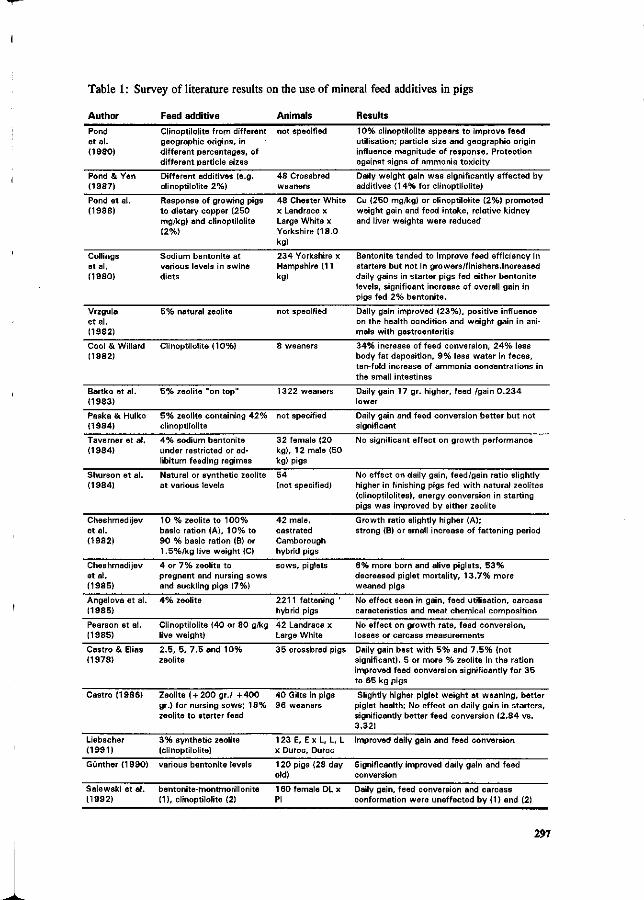
Table 1: Survey of literature results on the use of mineral feed additives in pigs
Author Feed additive Animals Results
Pond Clinoptilolite from different et al. geographic origins, in (1980) different percentages, of
different particle sizes
not specified 10% clinoptilolite appears to improve feed utilisation; particle size and geographic origin influence magnitude of response. Protection against signs of ammonia toxicity
Pond & Yen (1987)
Different additives (e.g. clinoptilolite 2%)
48 Crossbred weaners
Daily weight gain was significantly affected by additives (14% for clinoptilolite)
Pond et al. (1988)
Collings et al. (1980)
Response of growing pigs to dietary copper (250 mg/kg) and clinoptilolite (2%)
Sodium bentonite at various levels in swine diets
48 Chester White x Landrace x Large White x Yorkshire (18.0 kg)
234 Yorkshire x Hampshire (11 kg)
Cu (250 mg/kg) or clinoptilolite (2%) promoted weight gain and feed intake, relative kidney and liver weights were reduced
Bentonite tended to improve feed efficiency in starters but not in growers/finishers.Increased daily gains in starter pigs fed either bentonite levels, significant increase of overall gain in pigs fed 2 % bentonite.
Vrzgula 5% natural zeolite not specified Daily gain improved (23%), positive influence et al. on the health condition and weight gain in ani-(1982) mals with gastroenteritis
Cool & Willard (1982)
Clinoptilolite (10%) 34% increase of feed conversion, 2 4 % less body fat deposition, 9 % less water in feces, ten-fold increase of ammonia concentrations in the small intestines
Bartko et al. (1983)
5% zeolite "on top" 1322 weaners Daily gain 17 gr. higher, feed /gain 0 .234 lower
5% zeolite containing 4 2 % not specified clinoptilolite
Paska & Hulko (1984)
Daily gain and feed conversion better but not significant
Taverner et al. (1984)
4 % sodium bentonite under restricted or ad-libitum feeding regimes
32 female (20 kg), 12 male (50 kg) pigs
No significant effect on growth performance
Shurson et al. (1984)
Natural or synthetic zeolite at various levels
54 No effect on daily gain, feed/gain ratio slightly (not specified) higher in finishing pigs fed with natural zeolites
(clinoptilolites), energy conversion in starting pigs was improved by either zeolite
Cheshmedijev et al. (1982)
10 % zeolite to 100% basic ration (A), 10% to 90 % basic ration (B) or 1.5%/kg live weight (C)
42 male, castrated Camborough hybrid pigs
Growth ratio slightly higher (A); strong (B) or small increase of fattening period
Cheshmedijev et al. (1985)
4 or 7% zeolite to pregnant and nursing sows and suckling pigs (7%)
sows, piglets 6% more born and alive piglets, 5 3 % decreased piglet mortality, 13 .7% more weaned pigs
Angelova et al. (1985)
4 % zeolite 2211 fattening ' hybrid pigs
No effect seen in gain, feed utilisation, carcass caracteristics and meat chemical composition
Pearson et al. (1985)
Clinoptilolite (40 or 80 g/kg live weight)
42 Landrace x Large White
No effect on growth rate, feed conversion, losses or carcass measurements
Castro & Elias (1978)
2.5, 5, 7.5 and 10% zeolite
35 crossbred pigs Daily gain best with 5% and 7 .5% (not significant). 5 or more % zeolite in the ration improved feed conversion significantly for 35 to 65 kg pigs
Castro (1986) Zeolite ( + 200 gr./ + 4 0 0 40 Gilts in pigs gr.) for nursing sows; 18% 96 weaners zeolite to starter feed
Slightly higher piglet weight at weaning, better piglet health; No effect on daily gain in starters, significantly better feed conversion (2.84 vs. 3.32)
Liebscher (1991)
3 % synthetic zeolite (clinoptilolite)
123 E, E x L , L, L x Duroc, Duroc
Improved daily gain and feed conversion
Günther (1990) various bentonite levels 120 pigs (28 day old)
Significantly improved daily gain and feed conversion
Salewski et al. (1992)
bentonite-montmorillonite (1), clinoptilolite (2)
160 female DL x PI
Daily gain, feed conversion and carcass conformation were uneffected by (1) and (2)
297
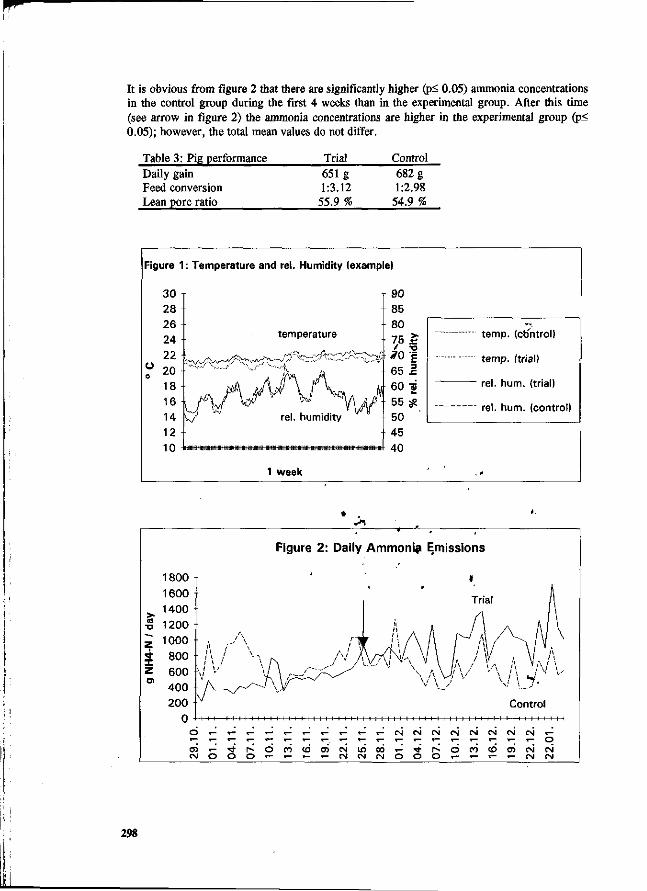
It is obvious from figure 2 that there are significantly higher (p< 0.05) ammonia concentrations in the control group during the first 4 weeks than in the experimental group. After this time (see arrow in figure 2) the ammonia concentrations are higher in the experimental group (p< 0.05); however, the total mean values do not differ.
Table 3: Pig performance Trial Control Daily gain Feed conversion Lean pore ratio
651 g 1:3.12
55.9 %
682 g 1:2.98
54.9 %
Figure 1 : Temperature and rel. Humidity (example)
O
1 week
temp, (cb'ntrol)
temp, (trial)
rel. hum. (trial)
rel. hum. (control)
200
Figure 2: Daily Ammoni? Emissions
Control i i i i i i i
o «- *- «- C N C M C M ( N C M C N C M C N > -
OTi-'<*r*.OMCOC)CNmOOT-'>*[vOCOCOC5CSICN C N O O O * - « - " - > - C N C \ | C M O O O * - ' - T - " - C S | C N
298
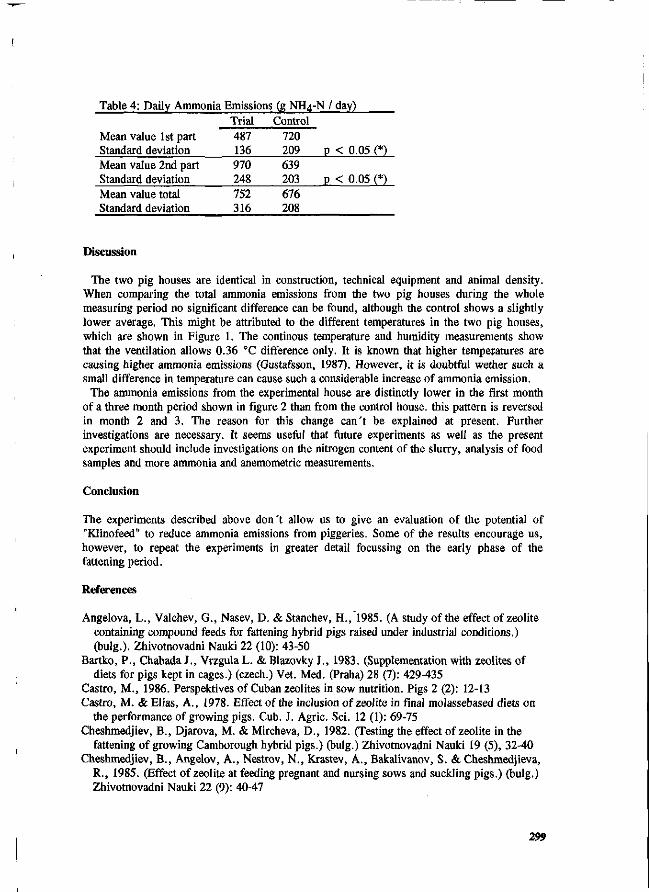
Table 4: Daily Ammonia Emissions (g NH4-N / day) Trial Control
Mean value 1st part 487 720 Standard deviation 136 209 p < 0.05 (*) Mean value 2nd part 970 639 Standard deviation 248 203 p < 0.05 (*) Mean value total 752 676 Standard deviation 316 208
Discussion
The two pig houses are identical in construction, technical equipment and animal density. When comparing the total ammonia emissions from the two pig houses during the whole measuring period no significant difference can be found, although the control shows a slightly lower average. This might be attributed to the different temperatures in the two pig houses, which are shown in Figure 1. The continous temperature and humidity measurements show that the ventilation allows 0.36 °C difference only. It is known that higher tempepatures are causing higher ammonia emissions (Gustafsson, 1987). However, it is doubtful wether such a small difference in temperature can cause such a considerable increase of ammonia emission.
The ammonia emissions from the experimental house are distinctly lower in the first month of a three month period shown in figure 2 than from the control house, this pattern is reversed in month 2 and 3. The reason for this change can't be explained at present. Further investigations are necessary. It seems useful that future experiments as well as the present experiment should include investigations on the nitrogen content of the slurry, analysis of food samples and more ammonia and anemometric measurements.
Conclusion
The experiments described above don't allow us to give an evaluation of the potential of "Klinofeed" to reduce ammonia emissions from piggeries. Some of the results encourage us, however, to repeat the experiments in greater detail focussing on the early phase of the fattening period.
References
Angelova, L., Valchev, G., Nasev, D. & Stanchev, H., 1985. (A study of the effect of zeolite containing compound feeds for fattening hybrid pigs raised under industrial conditions.) (bulg.). Zhivotnovadni Nauki 22 (10): 43-50
Bartko, P., Chabada J., Vrzgula L. & Blazovky J., 1983. (Supplementation with zeolites of diets for pigs kept in cages.) (czech.) Vet. Med. (Praha) 28 (7): 429-435
Castro, M., 1986. Perspektives of Cuban zeolites in sow nutrition. Pigs 2 (2): 12-13 Castro, M. & Elias, A., 1978. Effect of the inclusion of zeolite in final molassebased diets on
the performance of growing pigs. Cub. J. Agric. Sei. 12 (1): 69-75 Cheshmedjiev, B., Djarova, M. & Mircheva, D., 1982. (Testing the effect of zeolite in the
fattening of growing Camborough hybrid pigs.) (bulg.) Zhivotnovadni Nauki 19 (5), 32-40 Cheshmedjiev, B., Angelov, A., Nestrov, N., Krastev, A., Bakalivanov, S. & Cheshmedjieva,
R., 1985. (Effect of zeolite at feeding pregnant and nursing sows and suckling pigs.) (bulg.) Zhivotnovadni Nauki 22 (9): 40-47
299
Collings, G.F., Thomasson, S.A., Ku, K. & Miller, E.R., 1980. Sodium bentonite in swine diets. Journal of Animal Science 50, (2): 272-277
Cool, W.M. & Willard, J., 1982. Effect of clinoptilolite on swine nutrition. Nutrition Reports International 26: 759
Günther, K.D., 1990. Zum Einsatz von Bentoniten in der Schweineernährung. Schweinezucht u. Schweinemast 38 (5): 144-147
Gustafsson, G., 1987. Reduction of ammonia in swine houses. C.I.G.R. Urbana-Champaign Rep. 1987, 9-22.
Liebscher, A., 1991. Einfluß der Futterkomponente Heulandit (Zeolith) auf Mast- und Schlachtleistung in der Geschwisterprüfung. Die Bodenkultur 42 (4)
Paska, I. & Hulko, R., 1984. (The effect of zeolite in pig fattening) (poln.) Polnohospodarstvo 30 (6): 565-569
Pearson, G., Smith, W.C. & Fox, J.M., 1985. Influence of dietary zeolite on pig performance over the liveweight range 25-87 kg. New Zealand J. Exp. Agriculture 13 (2): 151-154
Pfeiffer, A., Ahrends, F., Steffens, G. & Langholz, H.J., 1993. The Influence of various pig housing systems and protein levels on the amount of ammonia emissions in the case of fattening pigs. Proc. Int. Congress on nitrogen flow in pig production and environmental consequences
Pond, W.G. & Yen, J.T., 1980. Response of growing pigs to dietary zeolite. Proc; IPVS Congress, Copenhagen: 297 /
Pond, W.G. & Yen, J.T., 1987. Effect of supplemental carbadox, an antibiotic combination, or clinoptilolite on weight gain and organ weights of growing swine fed maize or rye as the grain sources. Nutrition Reports International 35 (4): 801-809
Pond, W.G., Yen, J.T. & Varel, V.H., 1988. Response of growing swine to dietary copper and clinoptilolite supplementation. Nutrition Reports International 37 (4): 795-803
Salewski, A., Dreyer D. & Weiser P., 1992. Tonminerale und Algenkalk im Futter? Top Agrar 1/92: 26
Shurson, G.C., Ku, P.K., Miller, E.R. & Yokoyama, M.T., 1984. Effects of zeolite A or clinoptilolite in diets of growing swine. Journal of Animal Science 59 (6): 1536-1545
Steffens, G., Klasing, A. & Lorenz, F.,'1990. Ammoniakfreisetzung aus Flüssigmistlagerbehältern und nach Gülleausbringung bei unterschiedlichen Güllezusätzen. In: Härtung, J., Paduch, M., Schirz, S., Böhler, H. & Van den Weghe, H. (edsf. Ammoniak in der Umwelt. Landwirtschaftsv.erlag GmbH? D.-Münster, 1990, 36.1-7
Taverner, M.R., Cambell, R.G. & Biden, R.S., 1984. A note on sodium bentonite as an additive to grower pig diets. Animal Production 38 (1): F37-139
Vrzgula, L., Bartko, P., Blazowsky J» & Kozac J., 1982. (The effect of feeding clinoptilolite on the health status, blood picture and weight gain in pig.) (czech.) Vet. med. (Praha) 27 (5): 267-274
300
Two options for manure treatment to reduce ammonia emission from pig housing
P. Hoeksma', N. Verdoe? & G.J. Montenf
' Institute of Agricultural Engineering (IMAG-DLO), Postbox43, 6700 AA Wageningen, The Netherlands " Research Institute for Pig Husbandry, Postbox 59, 4250 AB Rosmalen, The Netherlands
Summary
The need for reducing ammonia emission from animal husbandry in the Netherlands has led to the development of several slurry removal and treatment systems. Two treatment systems for pig slurry were tested under practical farm conditions. In particular their effect on the ammonia emission from the pig house was studied. In both systems the ammonia emission was reduced by frequent hydraulic slurry removal from shallow channels under the pig pens, using treated slurry as buffer and recirculation liquid. The difference between the two treatment systems concerned one step in the treatment process by which the recirculation liquid was prepared from the pig slurry. In treatment SYSTEM I the slurry from the pig house is separated; the separated liquid was aerated. Ammonia was biologically converted into nitrate, thus providing an ammonia free liquid. In treatment SYSTEM II acid was added to the separated liquid to lower the pH, prevening the release of ammonia from the liquid.
Both treatment systems showed the potention to reduce the ammonia emission from the pig house by about 70 %. In SYSTEM I nitrogen was lost as a consequence of biological denitrification, whereas in SYSTEM II ammonia nitrogen was preserved, meaning that there will be no loss of nitrogen before applying the slurry on the field.
keywords: pig housing - ammonia - emission - biological treatment - aeration - acidity - flushing
Introduction
Emission of ammonia from animal husbandry has to be reduced drastically in order to minimize the impact of ammonia on the environment to an acceptable level. Pig husbandry contributes for approx. 30 % to ammonia emission from live-stock farming in the Netherlands.
Ammonia is formed by enzymatic conversion of urea and other nitrogen compounds in urine. As soon as urine comes into contact with faeces, which contains the enzyme urease, the conversion of urea starts (Elzing et ai, 1992). The conversion rate of urea into ammonia is temperature dependent. The volatilization of ammonia from slurry is determined by the ammonia concentration. In the slurry, ammonia (NH3) is in equilibrium with ammonium (NH4*). The ratio between NH3 and NH4* is influenced by pH and temperature (Srinath & Loehr, 1974). The driving force of volatilization of ammonia is the difference between NH3 partial pressure in the slurry and in the ambient atmosphere (Freney ef a/., 1983). Ammonia volatilization will increase with increasing ammonia concentration, pH and temperature. The influence of ammonia concentration and pH on ammonia volatilization from pig slurry were the starting-points for the development of the two respective slurry treatment systems described in this paper. In SYSTEM I the ammonia concentration was reduced by collecting the fresh slurry underneath the pens in a layer of biologically treated slurry, as reported by Hoeksma ef a/. (1992). In SYSTEM II the fresh slurry was collected in a layer of liquid with low pH, achieved by adding acid.
The objective of the work described in this paper was to determine the ammonia reduction potentials of the two treatment systems under practical farm conditions.
301
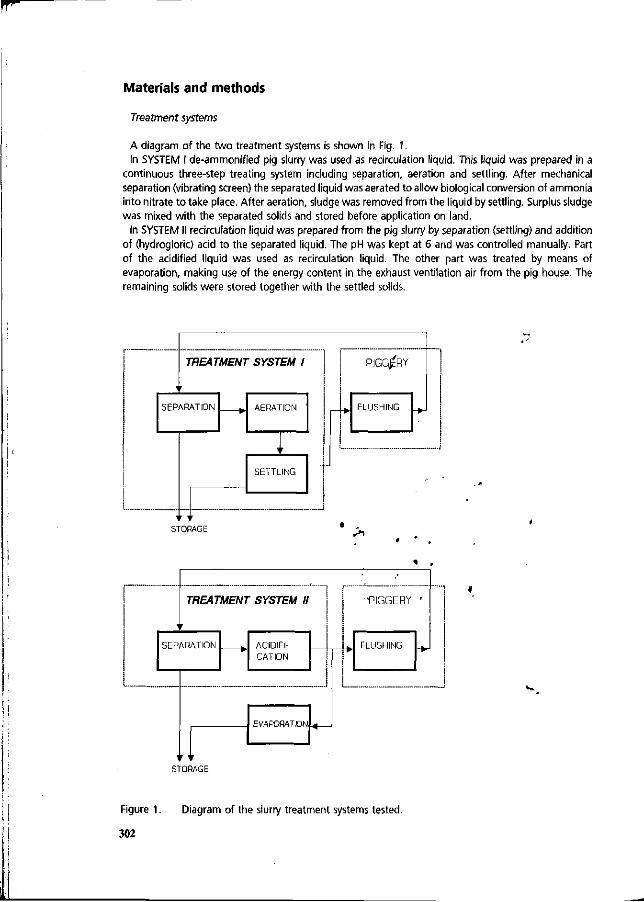
Materials and methods
Treatment systems
A diagram of the two treatment systems is shown in Fig. 1. In SYSTEM I de-ammonified pig slurry was used as recirculation liquid. This liquid was prepared in a
continuous three-step treating system including separation, aeration and settling. After mechanical separation (vibrating screen) the separated liquid was aerated to allow biological conversion of ammonia into nitrate to take place. After aeration, sludge was removed from the liquid by settling. Surplus sludge was mixed with the separated solids and stored before application on land.
In SYSTEM II recirculation liquid was prepared from the pig slurry by separation (settling) and addition of (hydrogloric) acid to the separated liquid. The pH was kept at 6 and was controlled manually. Part of the acidified liquid was used as recirculation liquid. The other part was treated by means of evaporation, making use of the energy content in the exhaust ventilation air from the pig house. The remaining solids were stored together with the settled solids.
'
TREATMENT SYSTEM 1
SEPARATION
y ' ' r
AERATION
' '
SETTLING
PIGGERY
FLUSHING "J
-•
STORAGE
^
TREATMENT SYSTEM II
SEPARATION
' ' ' '
ACIDIFICATION
EVAPORATION
» •
"PIGGERY
FLUSHING
'
STORAGE
Figure 1. Diagram of the slurry treatment systems tested.
302
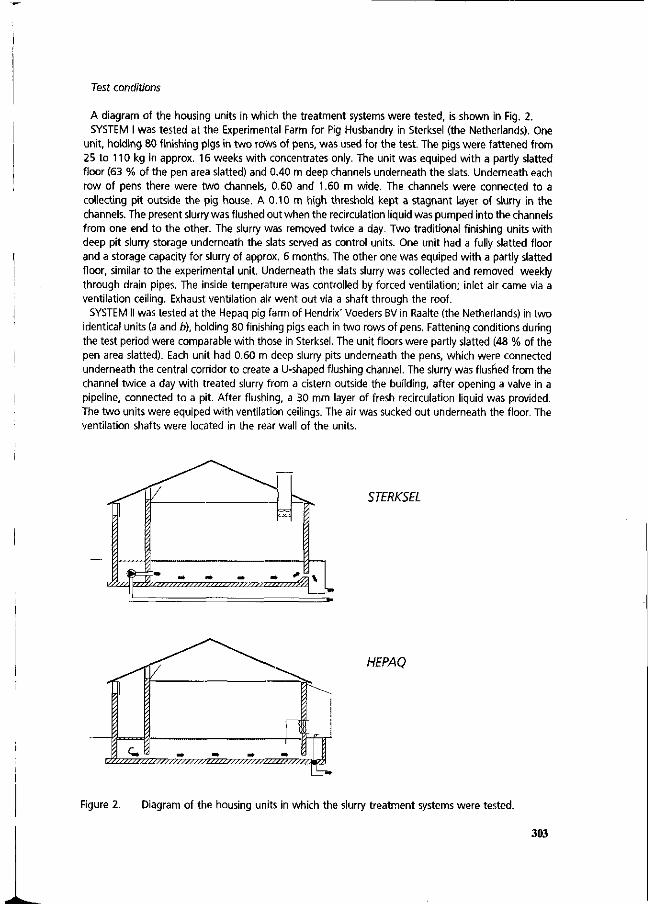
Test conditions
A diagram of the housing units in which the treatment systems were tested, is shown in Fig. 2. SYSTEM I was tested at the Experimental Farm for Pig Husbandry in Sterksel (the Netherlands). One
unit, holding 80 finishing pigs in two rows of pens, was used for the test. The pigs were fattened from 25 to 110 kg in approx. 16 weeks with concentrates only. The unit was equiped with a partly slatted floor (63 % of the pen area slatted) and 0.40 m deep channels underneath the slats. Underneath each row of pens there were two channels, 0.60 and 1.60 m wide. The channels were connected to a collecting pit outside the pig house. A 0.10 m high threshold kept a stagnant layer of slurry in the channels. The present slurry was flushed out when the recirculation liquid was pumped into the channels from one end to the other. The slurry was removed twice a day. Two traditional finishing units with deep pit slurry storage underneath the slats served as control units. One unit had a fully slatted floor and a storage capacity for slurry of approx. 6 months. The other one was equiped with a partly slatted floor, similar to the experimental unit. Underneath the slats slurry was collected and removed weekly through drain pipes. The inside temperature was controlled by forced ventilation; inlet air came via a ventilation ceiling. Exhaust ventilation air went out via a shaft through the roof.
SYSTEM II was tested at the Hepaq pig farm of Hendrix' Voeders BV in Raalte (the Netherlands) in two identical units (a and b), holding 80 finishing pigs each in two rows of pens, Fattening conditions during the test period were comparable with those in Sterksel. The unit floors were partly slatted (48 % of the pen area slatted). Each unit had 0.60 m deep slurry pits underneath the pens, which were connected underneath the central corridor to create a U-shaped flushing channel. The slurry was flushed from the channel twice a day with treated slurry from a cistern outside the building, after opening a valve in a pipeline, connected to a pit. After flushing, a 30 mm layer of fresh recirculation liquid was provided. The two units were equiped with ventilation ceilings. The air was sucked out underneath the floor. The ventilation shafts were located in the rear wall of the units.
STERKSEL
HEPAQ
Figure 2. Diagram of the housing units in which the slurry treatment systems were tested.
303
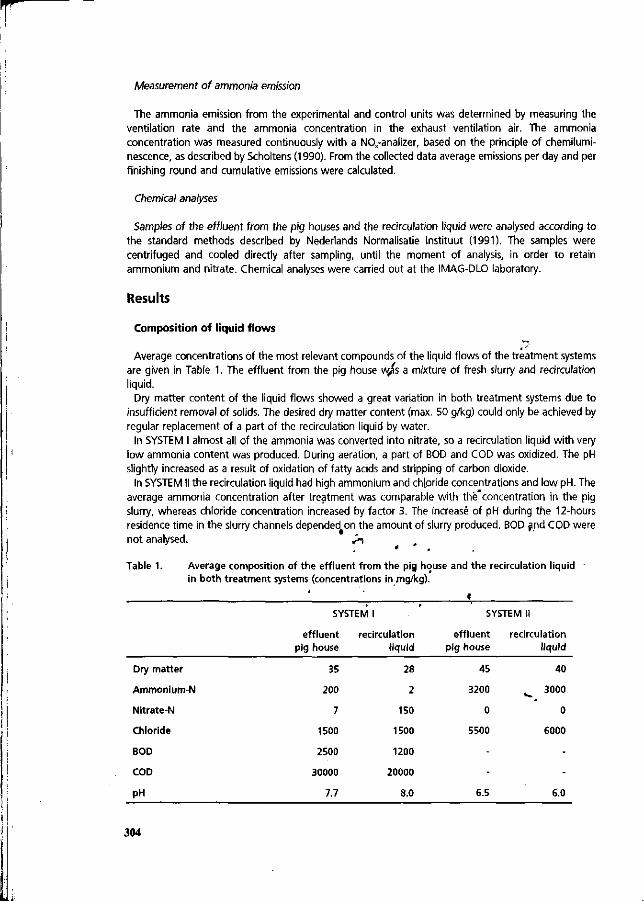
Measurement of ammonia emission
The ammonia emission from the experimental and control units was determined by measuring the ventilation rate and the ammonia concentration in the exhaust ventilation air. The ammonia concentration was measured continuously with a NOx-analizer, based on the principle of chemilumi-nescence, as described by Scholtens (1990). From the collected data average emissions per day and per finishing round and cumulative emissions were calculated.
Chemical analyses
Samples of the effluent from the pig houses and the recirculation liquid were analysed according to the standard methods described by Nederlands Normalisatie Instituut (1991). The samples were centrifuged and cooled directly after sampling, until the moment of analysis, in order to retain ammonium and nitrate. Chemical analyses were carried out at the IMAG-DLO laboratory.
Results
Composition of liquid flows
Average concentrations of the most relevant compounds of the liquid flows of the treatment systems are given in Table 1. The effluent from the pig house w/s a mixture of fresh slurry and recirculation liquid.
Dry matter content of the liquid flows showed a great variation in both treatment systems due to insufficient removal of solids. The desired dry matter content (max. 50 g/kg) could only be achieved by regular replacement of a part of the recirculation liquid by water.
In SYSTEM I almost all of the ammonia was converted into nitrate, so a recirculation liquid with very low ammonia content was produced. During aeration, a part of BOD and COD was oxidized. The pH slightly increased as a result of oxidation of fatty acids and stripping of carbon dioxide.
In SYSTEM II the recirculation liquid had high ammonium and chloride concentrations and low pH. The average ammonia concentration after treatment was comparable with the*concentration in the pig slurry, whereas chloride concentration increased by factor 3. The increase of pH during the 12-hours residence time in the slurry channels depended on the amount of slurry produced. BOD and COD were not analysed. J^
* * » Table 1. Average composition of the effluent from the pig house and the recirculation liquid
in both treatment systems (concentrations in mg/kg).
[ ; « SYSTEM I " SYSTEM II
effluent recirculation effluent recirculation pig house liquid pig house liquid
Dry matter
Ammonium-N
Nitrate-N
Chloride
BOD
COD
pH
304
35
200
7
1500
2500
30000
7.7
28
2
150
1500
1200
20000
8.0
45
3200
0
5500
-
-
6.5
40
^ 3000
0
6000
-
-
6.0
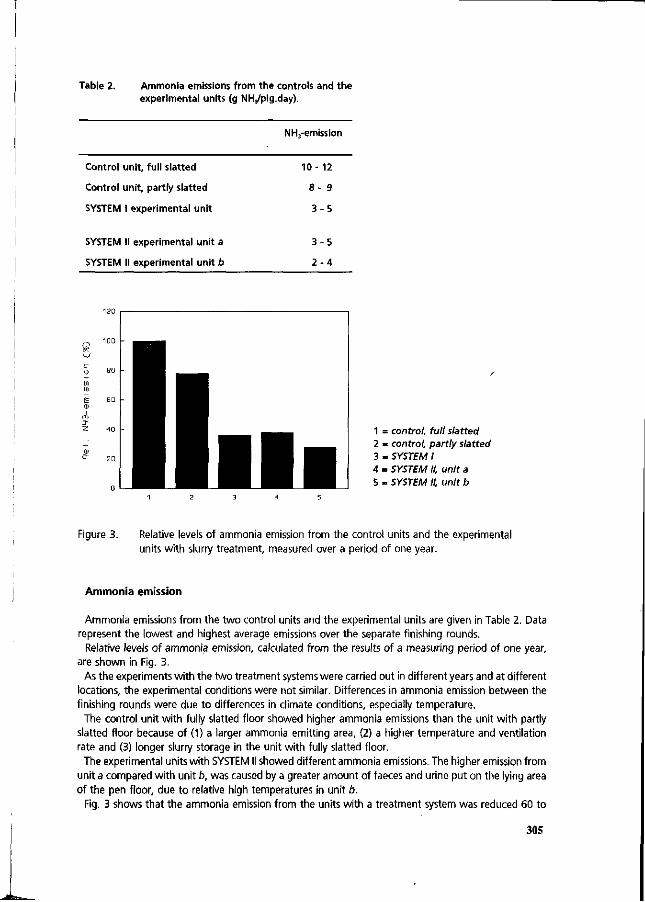
able 2. Ammonia emissions from the controls and the experimental units (g NHj/pig.day).
Control unit, full slatted
Control unit, partly slatted
SYSTEM 1 experimental unit
NH3 -emission
10- 12
8- 9
3 -5
SYSTEM II experimental unit a
SYSTEM II experimental unit b
3-5
2 -4
1 = control, full slatted 2 = control, partly slatted 3 = SYSTEM I 4 = SYSTEM II, unit a 5 = SYSTEM II, unit b
Figure 3. Relative levels of ammonia emission from the control units and the experimental units with slurry treatment, measured over a period of one year.
Ammonia emission
Ammonia emissions from the two control units and the experimental units are given in Table 2. Data represent the lowest and highest average emissions over the separate finishing rounds.
Relative levels of ammonia emission, calculated from the results of a measuring period of one year, are shown in Fig. 3.
As the experiments with the two treatment systems were carried out in different years and at different locations, the experimental conditions were not similar. Differences in ammonia emission between the finishing rounds were due to differences in climate conditions, especially temperature.
The control unit with fully slatted floor showed higher ammonia emissions than the unit with partly slatted floor because of (1) a larger ammonia emitting area, (2) a higher temperature and ventilation rate and (3) longer slurry storage in the unit with fully slatted floor.
The experimental units with SYSTEM II showed different ammonia emissions. The higher emission from unit a compared with unit b, was caused by a greater amount of faeces and urine put on the lying area of the pen floor, due to relative high temperatures in unit b.
Fig. 3 shows that the ammonia emission from the units with a treatment system was reduced 60 to
305
70 % compared with the emission from the control unit with full slatted floor and 50 - 60 % compared with the control unit with partly slatted floor.
Discussion and conclusions
In general the two slurry treatment systems showed similar effects on the ammonia emission from traditional pig houses. With the achieved reductions of ammonia emissions the two systems meet the Dutch standard to be considered for a "Green label".
In SYSTEM I nitrification of ammonia into nitrate (N03) is followed by denitrification into nitrogen gas (N2) and an unknown amount of nitrous oxide (N20) as soon as aeration is stopped. This means that aerobic treatment does not reduce nitrogen loss from the slurry, as with treatment SYSTEM II. As low pH strongly reduces the concentration of free ammonia in the slurry, nitrogen loss is prevented.
Biological treatment of slurry is costly in terms of energy input. A substantial part of the energy input is consumed for the oxidation of easily degradable organic material. It is very dufficult to separate this material mechanically. Separation by centrifuges would not be interesting from an economic point of view. For this reason a study is made to collect faeces and urine separately in the pig house and treat only the urine.
The addition of hydrochloric acid in SYSTEM II increases the chloride concentration in the slurry to a critical level in respect to application as a fertilizer for some crops, particularly potatoes. Anorganic acids like sulphuric acid and phosphorus acid are not usefull with respect to costs. Organic acids are easily biologically degradable. Nitric acid is not considered for Jfiis application for the same reason. Yet, an alternative for hydrochloric acid has to be found to be able to offer crop farmers a slurry of good fertilizing quality.
Acknowledgement
The experimental work was financially supported by the Financing Board for Manure and Ammonia Research (FOMA) and the Dutch Organisation for Energy and Environment (NOVEM).
References
Elzing, A., Kroodsma, W., Scholtens, R. & Uenk» G JH., 1992. Ammoniakmetingen in een tnodelsysteem van een rundveestal: Theoretische beschouwing^. IMAG/-DLG rapport 92 - 3, Wageningen.
Freney, J.R., Simpson, J.R. & Denmead, O.T., 1983. Volatilization of ammonia. In: Gaseous Loss of Nitrogen in Plant-soil Systems. Martinus Nijhoff, The Hague, jb. Î - 33.
Hoeksma, P., Verdoes, N, Oosthoek, J. $ Voermans.J.A.M.',' 1992. Reduction of ammonia volatilization from pig houses using aerated slurry as recirculation liquid. Livpst. Prod, bei., 31: 121 - 132.
Nederlands Normalisatie Instituut, 1991. Overzicht van normen op het gebied van milieu. SPE 90097, Delft.
Scholtens, R., 1990. Ammoniakmessungen in zwangbelufteten Stallen. In: Ammoniak in der Umwelt, Proceedings of Sysmposium in Braunschweig, 10-12 October 1990. KTBL Darmstadt, p. 20.1 - 20.9.
Srinath, E.G. & Loehr, R.C., 1974. Ammonia desorption by diffused aeration. J. Water Pollut. Control Fed, 46: 1939- 1957.
306
Microbial processes in deep-litter systems for fattening pigs and emission of ammonia, nitrous oxide and nitric oxide.
CM. Groenestein', J. Oosthoek' & H.G. van Faassen"
* Institute of Agricultural Engineering (IMAG-DLO), P.O. Box 43, 6700 AA Wageningen, NL ** Institute for Soil Fertility Research (IB-DLO), P.O. Box 30003, 9750 RA Haren, NL
Summary
A deep-litter system is a housing system in which slurry is mixed with sawdust, straw or woodshavings. Sawdust was used for the deep-litter systems for fattening pigs in this study. High temperatures in the bed indicate (aerobic) microbial activity and enhance decomposition of the organic waste. Among other processes, nitrification and denitrification occur. This can prevent emission of ammonia by producing N2 (nitrogen) from NH4* (ammonium). Intermediates of these processes are the volatile pollutants N20 (nitrous oxide) and NO (nitric oxide). Samples of deep-litter beds were characterized physico-chemically and incubated under various conditions in the laboratory to study the processes. Field studies were carried out to measure the concentrations of NH3, N20, NO and water in the exhaust air in situ. Ventilation rates were measured and emissions were calculated. The results were related to emissions of traditional systems. The laboratory study showed that it is difficult to optimize the transformation processes in the deep-litter bed. Important factors are the moisture content, the oxygen pressure and the high concentration of N03 (nitrate) produced. The field study showed that the emission of NH3
can be halved compared with traditional housing systems. However total emission of nitrogen was considerably higher, mainly caused by emission of N20. KEYWORDS: fattening pigs; emission; acidification; greenhouse effect; microbial decomposition; nitrification; denitrification; ammonia; nitrous oxide; nitric oxide; water evaporation.
Introduction
In the Netherlands 46% of environmental acidification is caused by emission of ammonia (NH3). The main source is agriculture (94%) (Heij & Schneider, 1991). The aim of Dutch legislation is to reduce emissions in the year 2000 by 50-70% with respect to 1980. New types of housing systems and slurry-handling techniques should meet these environmental demands. In a deep-litter system animals are kept on a thick layer of a mixture of faeces, urine and sawdust, straw or woodshavings. Because of the microbial processes involved in the litter bed two other volatile nitrogen compounds nitric oxide (NO) and nitrous oxide (N20), have to be taken into consideration. These are intermediates of nitrification and denitrification. Both NO and NH3
cause acidification. N20 has a greenhouse effect (Wang et al., 1976) and affects the ozone layer (Crutzen, 1976). This paper describes a laboratory study that examined microbial processes in the deep-litter bed and a field study that quantified emission of nitrogen gases and water from deep-litter systems. The emission of nitrogenous gases was compared with emissions of traditional housing systems for fattening pigs as given in The Directives Ammonia and Livestock Farming 1991.
Material and methods
Laboratory study
Preliminary studies were made on nitrogen turnover in deep litter by incubation of samples from two systems (System I and System II; see field study) at 30°C, in closed or partially closed bottles or with an air f low led over the surface. A 45 cm deep model was made in a column packed layerwise with samples from System II. The gas-phase above the samples was analyzed
307
periodically for 02, N2, C02 and N20 by gas chromatography, using a thermal conductivity and an Electron Capture Detector (ECD). The gas-phase of the column was also analyzed at different depths.
Samples from various depths in the deep-litter beds of System I and II were extracted with 0.1 M CaCI2 solution and analyzed for NH,* (ammonium), nitrate (NO,) and nitrite (N02), using colorimetric autoanalyzer methods.
Field study
Two deep-litter systems were examined. The main differences between the two systems were size of the sawdust particles, amount of litter per pig and the weekly treatment of the bed.
System I
The measuring period lasted one fattening period from 18 October 1991 until 7 February 1992 with 108 pigs, each with 1 m2 of floor space (traditional systems would have 0.6-0.7 m2 per pig). Liveweight ranged from 31 to 110 kg per pig. The pigs were fed ad libitum with two phases of dry feeding; per pig 45 kg of feed with a nitrogen content (N) = 2.70% and 174 kg with N = 2.84% respectively. Feed conversion was 2.84. To limit the amount of water consumed while it was supplied ad libitum the pressure of the water pipe was low. Water consumption was 2.0 litres per kg of feed.
There had been only one fattening period previously on the same deep-litter bed. The thickness of the sawdust bed was 40-50 cm. Of the saVvdust particles 24% were smaller than 1 mm and 38% were bigger than 2 mm. The bed was treated once a week by spreading the slurry over the bed, loosening the bed to a depth of 40 cm and sprinkling it wi th the additive Envistim, a microbial preparation.
System II
The measuring period lasted one fattening period from 12 December 1991 until 13 April 1992 with 288 pigs, each with 1 m2 of floor space. Liveweight ranged from 26 to 107 kg per pig. The pigs were fed ad libitum with three phases of dry feeding;, per pig 21 kg of feed with N = 2.96%, 49 kg with N = 2.72% and 171 kg with N = 2.56% respectively. Feed conversion was 2.95. As in System I water was administered ad libitum with low water pressure. Water consumption was not measured but was estimated 2.0-2.5 litres per kg of feed.
As for System I, there had been one previftus-fattening period. The thickness of'the sawdust bed was about 70 cm. Of the sawdust particles 21% werersrgaller tha,n 1 mm and 47% were bigger than 2 mm. The bed was treated once a week by burying the manure, mixing the top layer and sprinkling it w i th the additive Bactostim to stimulate microbial activity.
Measuring methods ' .
The following variables were continuously measured: - concentrations of NH3 and NO in the exhaust air (mg/m3) - ventilation rate (mVh) - temperature, T (°C) - relative humidity, RH (%)
The concentrations of NH3 and NO of the exhaust air were measured with a NOx analyzer. This method is based on the principle of chemiluminescence (Scholtens, 1990). The buildings were mechanically ventilated. Ventilation rate was measured with an anemometer wi th the same diameter as the ventilation shaft. The emissions were calculated as the product of concentration and ventilation rate. The RH and T of inside and outside air were measured with a sensor (C80 Hygromer of Rotronic) and emission of water was calculated. Table 1 shows average climatic conditions during the trials of the two systems. Average outside temperature was the same. The temperature range of both periods (between -5 and 10°C) was comparable and the lowest temperatures occurred in System I during the second half of the fattening period and in System II during the first half.
308
18.4
4.1
65
89
32
16.2
4.0
71
87
41
A sample was taken weekly of the exhaust air to determine the concentration of N20 on a gas Chromatograph with an ECD. Measuring equipment was checked every week and the situation in the unit was noted. (See further Groenestein & Reitsma (1992) and Groenestein & Montsma (1992)).
Table 1. Average climatic conditions and ventilation rate during the fattening period in both systems.
System I System II
Temperature inside (°C)
Temperature outside (°C)
Relative humidity inside (%)
Relative humidity outside (%)
Ventilation rate per pig (m7h)
Results
Laboratory study
Closed incubation of litter-bed samples under anoxic conditions gave rise to N20 accumulation up to 20 000 ppm(v/v), followed by rapid reduction to N2. Partially closed incubation at 3-8 volume% 02 gave rise to concentrations of N20 of 10 to 10 000 ppm(v/v) over periods of several days. Compaction of a 45 cm column of deep-litter to 40 cm increased N20 in the airflow over the surface to 60 ppm(v/v), followed by a decrease.
Concentrations of 300 to 4500, 0 to 10 and 0 to 4700 mg/l of NH4*-N, N02-N and N03N, respectively, were found for various depths within the deep-litter bed. The concentration of NCy often decreased with depth whereas the concentration of NH4* often increased with depth.
Field study
Emissions of NH3, NO and N20 from both systems are presented in Figure 1. The sudden decline of emission of ammonia on day 78 in System I is due to different treatment of the bed. The manure was not spread out but removed and 6 mä new sawdust was added. Immediately after the decline, emission started to increase again. It did not reach the level that had occurred before removal of the manure but that may be due to the delivering of 21 pigs on day 84 and 32 on day 98. System II also had an irregular treatment of the bed. On day 75, 10 m3 sawdust was added to reduce moisture content. The effect is not visible in Figure 1.
The weekly treatment of the bed is visible in both systems as peaks in the emission of NH3. This was caused by stirring up the bed and thus stimulating volatilization of NH3. In general, emission of NH3 increased as the fattening period continued. This was related to the increasing amount of manure or NH3 source present.
Emission of NO stayed at a constant level. Compared to NH3 its relevance diminished over the fattening period. As with NH3, NO shows a peak at the weekly treatments of the bed, although it is relatively smaller. Part of the NO peak could have been produced by the exhaust gases of the diggers with which the beds were treated.
The mean emission of N20 of both systems was high relative to NH3, although with great variation (Figure 1), especially in System I. This is in agreement with the findings of Van Faassen (1992). In System II N20 emission showed a tendency to increase.
Table 2 presents the total emissions of NH3, NO and N20 per animal during the fattening periods. Most of the nitrogen emits as N20. The calculation of the cumulative emission of N20 is based on a mean of 0.30 and 0.22 g N/h per animal in respectively System I and II (Figure 1). With the zoötechnical data of this study and the model MESPRO (Aarnink et al., 1992) can be calculated that the fresh slurry contained 3.88 and 4.06 kg N per pig in System I and II respectively.
309
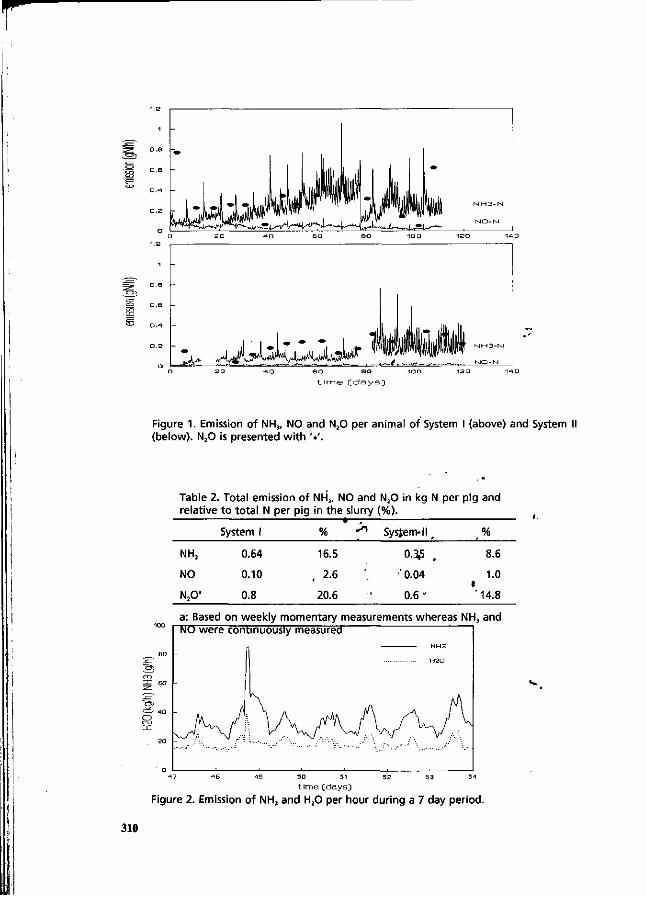
-1
o,e
o.e
0.4
Q . 2
"•
-_
- •J " "J L
m i ffr liilllf \|p1lWP i \fm
-
i
11 M H 3 - M
M O - M
2 0 4 0 SO SO 10 0 1 2 0 14 0
AJ^J^'ÎA««^^ Mmêà s a B O i a o
Figure 1. Emission of NH3, NO and N20 per animal of System I (above) and System (below). N20 is presented with '•'.
Table 2. Total emission of NH3, NO and N20 in kg N per pig and relative to total N per pig in the slurry (%).
System System-11
NH3
NO
N20a
0.64
0.10
0.8
16.5
, 2 -6
20.6
0 . $ .
'0.04
0 .6 '
8.6
1.0 I '14.8
a: Based on weekly momentary measurements whereas NH3 and NO were continuously measured
NH3
H 2 0
t ime (days) Figure 2. Emission of NH3 and H20 per hour during a 7 day period.
310
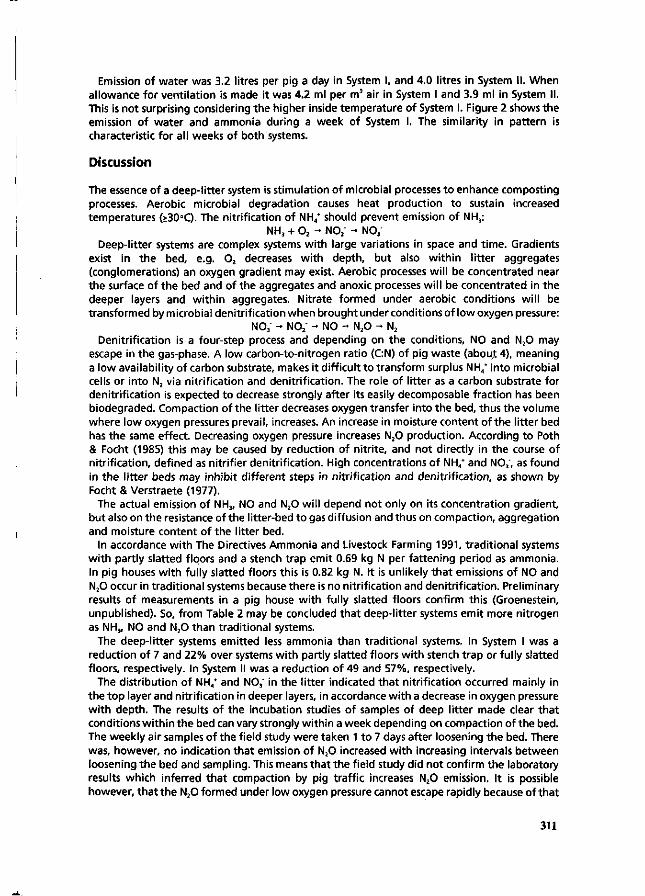
Emission of water was 3.2 litres per pig a day in System I, and 4.0 litres in System II. When allowance for ventilation is made it was 4.2 ml per m3 air in System I and 3.9 ml in System II. This is not surprising considering the higher inside temperature of System I. Figure 2 shows the emission of water and ammonia during a week of System I. The similarity in pattern is characteristic for all weeks of both systems.
Discussion
The essence of a deep-litter system is stimulation of microbial processes to enhance composting processes. Aerobic microbial degradation causes heat production to sustain increased temperatures (>30°C). The nitrification of NH„* should prevent emission of NH3:
NH3 + 02 -> N02- - NO; Deep-litter systems are complex systems with large variations in space and time. Gradients
exist in the bed, e.g. 02 decreases with depth, but also within litter aggregates (conglomerations) an oxygen gradient may exist. Aerobic processes will be concentrated near the surface of the bed and of the aggregates and anoxic processes will be concentrated in the deeper layers and within aggregates. Nitrate formed under aerobic conditions will be transformed by microbial denitrif ication when brought under conditions of low oxygen pressure:
NO/ - N02' - NO - N20 - N2
Denitrification is a four-step process and depending on the conditions, NO and N20 may escape in the gas-phase. A low carbon-to-nitrogen ratio (C:N) of pig waste (abouj 4), meaning a low availability of carbon substrate, makes it difficult to transform surplus NH4* into microbial cells or into N2 via nitrification and denitrification. The role of litter as a carbon substrate for denitrification is expected to decrease strongly after its easily decomposable fraction has been biodegraded. Compaction of the litter decreases oxygen transfer into the bed, thus the volume where low oxygen pressures prevail, increases. An increase in moisture content of the litter bed has the same effect. Decreasing oxygen pressure increases N20 production. According to Poth & Focht (1985) this may be caused by reduction of nitrite, and not directly in the course of nitrification, defined as nitrifier denitrification. High concentrations of NH„* and N03', as found in the litter beds may inhibit different steps in nitrification and denitrification, as shown by Focht & Verstraete (1977).
The actual emission of NH3, NO and N20 will depend not only on its concentration gradient, but also on the resistance of the litter-bed to gas diffusion and thus on compaction, aggregation and moisture content of the litter bed.
In accordance with The Directives Ammonia and Livestock Farming 1991, traditional systems with partly slatted floors and a stench trap emit 0.69 kg N per fattening period as ammonia. In pig houses with fully slatted floors this is 0.82 kg N. It is unlikely that emissions of NO and N20 occur in traditional systems because there is no nitrification and denitrification. Preliminary results of measurements in a pig house with fully slatted floors confirm this (Groenestein, unpublished). So, from Table 2 may be concluded that deep-litter systems emit more nitrogen as NH3, NO and N20 than traditional systems.
The deep-litter systems emitted less ammonia than traditional systems. In System I was a reduction of 7 and 22% over systems with partly slatted floors with stench trap or fully slatted floors, respectively. In System II was a reduction of 49 and 57%, respectively.
The distribution of NH„* and N03' in the litter indicated that nitrification occurred mainly in the top layer and nitrification in deeper layers, in accordance with a decrease in oxygen pressure with depth. The results of the incubation studies of samples of deep litter made clear that conditions within the bed can vary strongly within a week depending on compaction of the bed. The weekly air samples of the field study were taken 1 to 7 days after loosening the bed. There was, however, no indication that emission of N20 increased with increasing intervals between loosening the bed and sampling. This means that the field study did not confirm the laboratory results which inferred that compaction by pig traffic increases N20 emission. It is possible however, that the N20 formed under low oxygen pressure cannot escape rapidly because ofthat
311
1
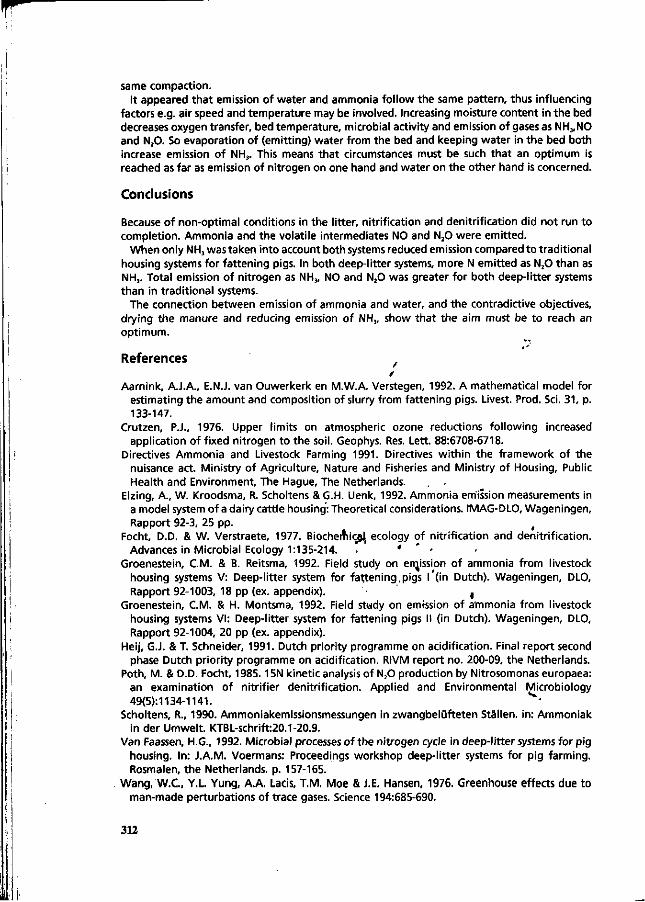
same compaction. It appeared that emission of water and ammonia follow the same pattern, thus influencing
factors e.g. air speed and temperature may be involved. Increasing moisture content in the bed decreases oxygen transfer, bed temperature, microbial activity and emission of gases as NH3,NO and N20. So evaporation of (emitting) water from the bed and keeping water in the bed both increase emission of NH3. This means that circumstances must be such that an optimum is reached as far as emission of nitrogen on one hand and water on the other hand is concerned.
Conclusions
Because of non-optimal conditions in the litter, nitrification and denitrification did not run to completion. Ammonia and the volatile intermediates NO and N20 were emitted.
When only NH3 was taken into account both systems reduced emission compared to traditional housing systems for fattening pigs. In both deep-litter systems, more N emitted as N20 than as NH3. Total emission of nitrogen as NH3, NO and N20 was greater for both deep-litter systems than in traditional systems.
The connection between emission of ammonia and water, and the contradictive objectives, drying the manure and reducing emission of NH3, show that the aim must be to reach an optimum.
References f *
Aarnink, A.J.A., E.N.J, van Ouwerkerk en M.W.A. Verstegen, 1992. A mathematical model for estimating the amount and composition of slurry from fattening pigs. Livest. Prod. Sei. 31, p. 133-147.
Crutzen, P.J., 1976. Upper limits on atmospheric ozone reductions following increased application of fixed nitrogen to the soil. Geophys. Res. Lett. 88:6708-6718.
Directives Ammonia and Livestock Farming 1991. Directives within the framework of the nuisance act. Ministry of Agriculture, Nature and Fisheries and Ministry of Housing, Public Health and Environment, The Hague, The Netherlands.
Elzing, A., W. Kroodsma, R. Scholtens & G.H. Uenk, 1992. Ammonia emission measurements in a model system of a dairy cattle housing: Theoretical considerations. fMAG-DLO, Wageningen, Rapport 92-3, 25 pp. #
Focht, D.D. & W. Verstraete, 1977. BiocherrticaJ, ecology of nitrification and denitrification. Advances in Microbial Ecology 1:135-214. . * ' •
Groenestein, CM. & B. Reitsma, 1992. Field study on emission of ammonia from livestock housing systems V: Deep-litter system for fattening,pigs I "(in Dutch). Wageningen, DLO, Rapport 92-1003, 18 pp (ex. appendix). ,
Groenestein, CM. & H. Montsma, 1992. Field study on emission of ammonia from livestock housing systems VI: Deep-litter system for fattening pigs II (in Dutch). Wageningen, DLO, Rapport 92-1004, 20 pp (ex. appendix).
Heij, G.J. & T. Schneider, 1991. Dutch priority programme on acidification. Final report second phase Dutch priority programme on acidification. RIVM report no. 200-09, the Netherlands.
Poth, M. & D.D. Focht, 1985.15N kinetic analysis of N20 production by Nitrosomonas europaea: an examination of nitrifier denitrification. Applied and Environmental Microbiology 49(5):1134-1141. ' v
Scholtens, R., 1990. Ammoniakemissionsmessungen in zwangbelüfteten Ställen, in: Ammoniak in der Umwelt. KTBL-schrift:20.1-20.9.
Van Faassen, H.G., 1992. Microbial processes of the nitrogen cycle in deep-litter systems for pig housing. In: J.A.M. Voermans: Proceedings workshop deep-litter systems for pig farming. Rosmalen, the Netherlands, p. 157-165.
Wang, W.C., Y.L Yung, A.A. Lacis, T.M. Moe & J.E. Hansen, 1976. Greenhouse effects due to man-made perturbations of trace gases. Science 194:685-690.
312
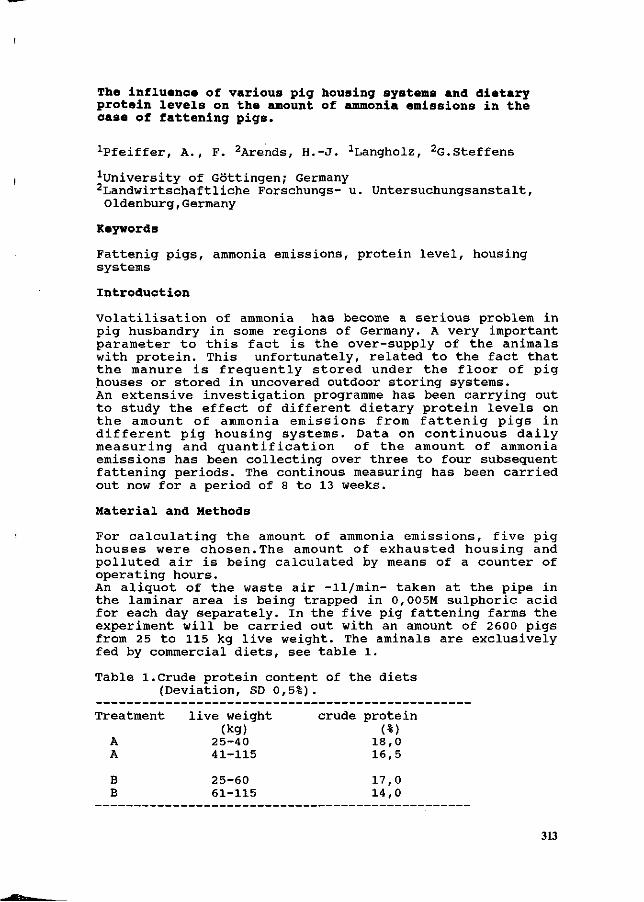
The influence of various pig housing systems and dietary protein levels on the amount of ammonia emissions in the case of fattening pigs.
1Pfeiffer, A., F. 2Arends, H.-J. 1Langholz, 2G.Steffens
university of Göttingen; Germany landwirtschaftliche Forschungs- u. Untersuchungsanstalt, Oldenburg,Germany
Keywords
Fattenig pigs, ammonia emissions, protein level, housing systems
Introduction
Volatilisation of ammonia has become a serious problem in pig husbandry in some regions of Germany. A very important parameter to this fact is the over-supply of the animals with protein. This unfortunately, related to the fact that the manure is frequently stored under the floor of pig houses or stored in uncovered outdoor storing systems. An extensive investigation programme has been carrying out to study the effect of different dietary protein levels on the amount of ammonia emissions from fattenig pigs in different pig housing systems. Data on continuous daily measuring and quantification of the amount of ammonia emissions has been collecting over three to four subsequent fattening periods. The continous measuring has been carried out now for a period of 8 to 13 weeks.
Material and Methods
For calculating the amount of ammonia emissions, five pig houses were chosen.The amount of exhausted housing and polluted air is being calculated by means of a counter of operating hours. An aliquot of the waste air -11/min- taken at the pipe in the laminar area is being trapped in 0,005M sulphoric acid for each day separately. In the five pig fattening farms the experiment will be carried out with an amount of 2600 pigs from 25 to 115 kg live weight. The aminals are exclusively fed by commercial diets, see table 1.
Table 1.Crude protein content of the diets (Deviation, SD 0,5%).
Treatment live weight crude protein (kg) (%)
A 25-40 18,0 A 41-115 16,5
B 25-60 17,0 B 61-115 14,0
313
After an adaptation period of five days, the air collection period is being started. On each farm there are existing different systems for supplying the pig compartments with fresh air. Moreover on two farms of these where the waste air is being removed from from underneath the floor and on three of them the polluted air is removed from above floor-level.
Air Collecting Procedure
During 24 hours, the emitted ammonia -11/min- waste air is being collected by an air collection system called VECHTA (PFEIFFER & GERAETS,1992) modified according to the MERRY GO ROUND SYSTEM and trapped in 0,005M sulphoric acid for each day separately. The apparatus which is pumping the ammonia loaded air out of the pig house consists of a so-called MEASURING-BOX which contains a system has a capacity for eight bottles attached to it; one bottle for each day. The operating procedure for each bottle is being controlled by a valve which allows a 24 hours' air passage into ."the same bottle. A timer switch which is ,located in the so-called PUMP-BOX initiates the next valve (day 2) for the next 24 hours and so on. The vacuum pump is also located in the PUMP-BOX and carries an exactly quantified amount of air through a "critical capillary". This is a special tube which allows to transport 1 litre of air per minute. That capillary is controlled by a special gas counter.
Analytical Procedures
After a collection period of one week data on the weight of the bottles is used to estimate the amount of evaporation. Afterwards, the ammonium sulphate is being quantitatively analyzed by forming blue cóioured,complex and measured (MERCK Spectroquant-Test combination 14752) by a wave length of 578nm with a continuous-flowing photometer (EPPENDORF). Data were analyzed by analyses of, variance with LSD-Test, SAS Programme (GLM Procedure, 1988).
Results and Discussion
In literature, differnt techniques describing the removal of polluted air and suppling with fresh air respectively resulting in differing amounts of ammonia emissions (JANSSEN & KRAUSE, 1990). In addition housing system like tha^kind of floor slatted or partly slatted show an effet on the' extent of amonia emissions (OOSTHOEK et al., 1990). Table 2 provides the data on the amount of NH4-N emission per animal and day.
314
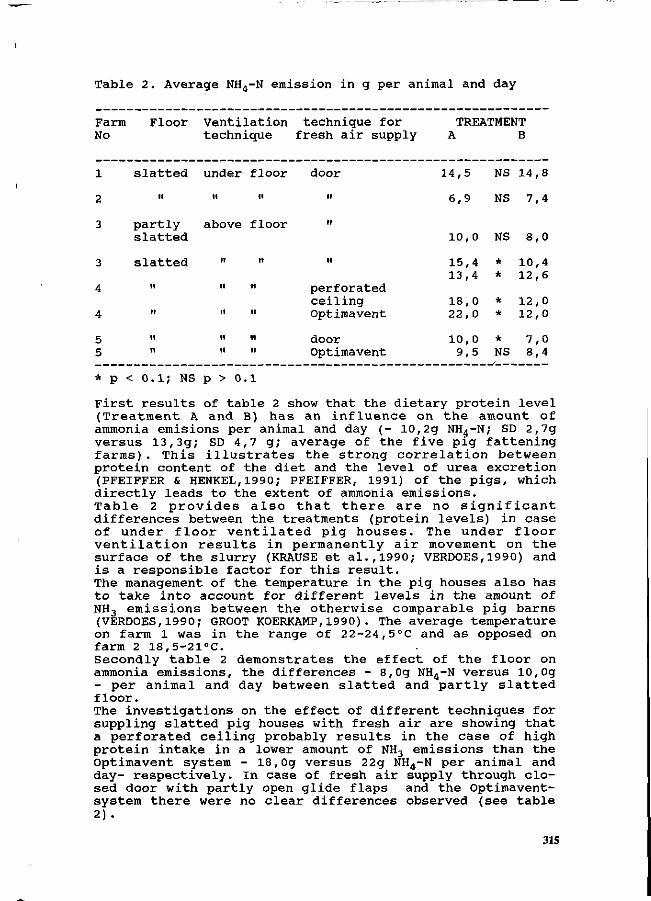
Table 2. Average NH4-N emission in g per animal and day
Farm Floor Ventilation technique for TREATMENT No technique fresh air supply A B
1
2
3
3
4
4
5 5
slatted
M
partly slatted
slatted
H
H
H
H
under
H
above
H
H
H
H
floor
H
floor
H
H
H
H
H
door
H
ii
H
perforated ceiling Optimavent
door Optimavent
14,5
6,9
10,0
15,4 13,4
18,0 22,0
10,0 9,5
NS
NS
NS
* *
* *
* NS
14,8
7,4
8,0
10,4 12,6
12,0 12,0
7,0 8,4
* p < 0.1; NS p > 0.1
First results of table 2 show that the dietary protein level (Treatment A and B) has an influence on the amount of ammonia émisions per animal and day (- 10,2g NH4-N; SD 2,7g versus 13,3g; SD 4,7 g; average of the five pig fattening farms) . This illustrates the strong correlation between protein content of the diet and the level of urea excretion (PFEIFFER & HENKEL,1990; PFEIFFER, 1991) of the pigs, which directly leads to the extent of ammonia emissions. Table 2 provides also that there are no significant differences between the treatments (protein levels) in case of under floor ventilated pig houses. The under floor ventilation results in permanently air movement on the surface of the slurry (KRAUSE et al.,1990; VERDOES,1990) and is a responsible factor for this result. The management of the temperature in the pig houses also has to take into account for different levels in the amount of NH3 emissions between the otherwise comparable pig barns (VERDOES,1990; GROOT KOERKAMP,1990). The average temperature on farm 1 was in the range of 22-24,5°C and as opposed on farm 2 18,5-21°C. Secondly table 2 demonstrates the effect of the floor on ammonia emissions, the differences - 8,0g NH4-N versus 10,Og - per animal and day between slatted and partly slatted floor. The investigations on the effect of different techniques for suppling slatted pig houses with fresh air are showing that a perforated ceiling probably results in the case of high protein intake in a lower amount of NH3 emissions than the Optimavent system - 18,0g versus 22g NH4-N per animal and day- respectively. In case of fresh air supply through closed door with partly open glide flaps and the Optimavent-system there were no clear differences observed (see table 2).
315
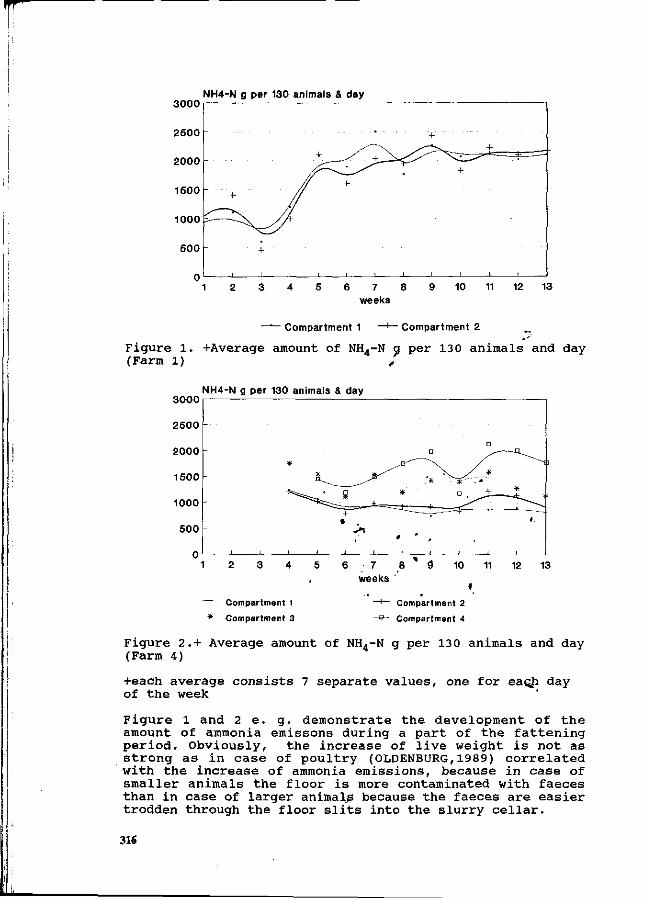
3000
2500
2000
1500
1000
500
NH4-N g per 130 animals & day
. . . . . . .
- •• • t — ' ^ > ^
// +
+ //
^™~^v yA
- +
+
+
+ __
i »
6 7 8 weeks
10 11 12 13
Compartment 1 Compartment 2
F i g u r e 1 . +Average amount of NH4-N g p e r 130 a n ima l s and day (Farm 1) ƒ
3000 NH4-N g per 130 animals & day
12 13
~~~ Compartment 1
* Compartment 3
Compartment 2
Compartment 4
Figure 2.+ Average amount of NH4-N g per 130 animals and day (Farm 4)
+each average consists 7 separate values, one for each day of the week
Figure 1 and 2 e. g. demonstrate the development of the amount of ammonia emissons during a part of the fattening period. Obviously, the increase of live weight is not as strong as in case of poultry (OLDENBURG,1989) correlated with the increase of ammonia emissions, because in case of smaller animals the floor is more contaminated with faeces than in case of larger animals because the faeces are easier trodden through the floor slits into the slurry cellar.
316
Acknowleâgements
The authors greatfully acknowledge the scientific support provided by Dr. P. Hugenroth, University of Göttingen. The technical support and assistence of Mr. H. Arnold is greatly appreciated.
References
Groot Koerkamp, P.W.G.; N.Verdoes & L. Snel, 1990. In: Naar stallen met beperkte ammoniak-uitsoot. Eds. T. de Haan & G.J. Monteny, Wageningen 21-34
Janssen, J.& K.-H. Krause, 1990. Gemeins. Symposium. Ammoniak in der Umwelt, KTBL, Braunschweig, Beitrag 21.1
Oldenburg, J., 1989. Geruchs- und Ammoniak-Emissionen aus der Tierhaltung. KTBL Schrift 333, Darmstadt, ppl58
Oosthoek, J. ; W.Kroodsma & P. Hoeksma, 1990: Ammonia emission from dairy and pig housing systems. Proc.of Semiar Odour and Ammonia Emissions from Livestock Farming,/ Silsoe, 31-49
Pfeiffer, A. & H.Henkel, 1990. The effect of different dietary protein levels on water intake and water excretion of growing pigs. Proc. 5th Int. Symposium Digestive Physiology in the Pigs, Wageningen, 12 6-131
Pfeiffer, A. ,1991. Untersuchungen über den Einfluß proteinreduzierter Rationen auf die Stickstoff- und Wasserbilanzen sowie die Mastleistungen an wachsenden Schweinen, P.H.D.Thesis., Univ. of Kiel, ppl74
Pfeiffer, A. & W.Geraets, 1992. Unpublished
Verdoes, N. , 1990. In: Naar stallen met beperkte ammoniak -uitstoot. Eds. T. de Haan, Wageningen 42-43
317
Nitrogen balances of two deep litter systems for finishing pigs
J.G.M. Thelosen, B.P. Heitlager & J.A.M. Voermans
Research Institute for Pig Husbandry, P.O. Box 83, 5240 AB Rosmalen, the Netherlands
Summary
Deep litter systems for finishing pigs were introduced in the Netherlands. Two different deep litter systems were taken into research. A balance was made for phosphorus, potassium and nitrogen. NH3 and N20 emissions were measured. A nitrogen balance was calculated and compared to results of other experiments. About 3 kg nitrogen per pig is lost in deep litter systems. The nitrogen lost as NH3 and N20 per pig place is 0,7 kg and 0,2 kg for the Ecopor deep litter system" The remaining nitrogen could be released as N2. /
Keywords: Pigs, nitrogen, ammonia, N20, litter^ mineral balance.
Introduction
The pig industry in the Netherlands is searching for structural solutions for forthcoming environmental and animal health and welfare legislation. In some regions of the Netherlands there is a surplus, of minerals due to the high density of pigs and poultry. The slurry produced has to be transported over long distances to other regions or has to be processed in indusriàl manure plants. The transport of slurry is most common and \s expensive especially related to the» amount of minerals and dry matter percentage in it. Apart frpm.the surplus of minerals there is also a need to reduce the ammonia volatilization in the Netherlands. In 1980 about 235,000 tons of ammonia were volatilized from livestock »farms and agricultural land in the Netherlands (Anonymus, 1989). The ammonia 'emissions from livestock units have to be reduced with 70% before the year 2000- Some legislation for animal health and welfare is mandated and this means a minimum surface per animal (for a finishing pig this will be 0.7 m2 of which 0.4 m2 as a solid part). Also straw, sawdust or other roughage have to be provided in future. This means better possibilities for explorative behaviour of the pigs and some intake of roughage (Bakker et al, 1988). Deep litter systems were introduced in the Netherlands in 1988 as a possible solution for all the "problems" mentioned. A reduction seems to be obtainable of^the slurry volume, the ammonia and odour emission. Also the animal welfare will be improved. Research was started at different places in Europe.
Principle of deep litter systems
Composting processes are the basic processes in deep litter systems. Oxidation of organic matter takes place. Water, carbondioxide and heat are produced. The daily added urine and faeces are also transformed by these composting processes. The heat
318
produced causes an evaporation of water (from urine) and a stabilization of the microbiological activity. Nitrogen, carbon and water are also used in the microbiological biomass synthesis. Urea can be transformed quickly in ammonium. Ammonium will be used for nitrification and denitrification processes. All these processes will occur and will influence the nitrogen balance. Nitrogen is involved in the following transformations during composting:
1. Urine transformation to ammonium. H2N-CO-NH2 + H20 —> NH/ + C02 + OH" 2. Oxidation of ammonium to nitrite. NH4
+ + 0 2 + H2nCnO —> N02 +H 20 + C02
3. Oxidation of nitrite to nitrate. N02 + 0 2 —> N03
4. Reduction of nitrate to nitrite. N03 +H2nC„OH —> N02 +H 20 + C02
5. Reduction of nitrite to nitrogen gas. N02 + H2„C„OH + C02 - -> N2 + H20 + H2nCnO
Different forms of nitrogen gases are produced and possibly emitted /during the mentioned processes. NH4
+ —-> NH 3
N03 —-> N02 —> NO —> N 2 0 —-> N2
Materials and methods
At the Research Institute for Pig Husbandry two similar rooms, each for 80 finishing pigs, were used. The pigs were kept from 25 kg to 105 kg live weight. The pigs were fed with a starter diet and from a live weight of 40-50 kg onwards with a finishing diet. The pigs had ad lib. acces to feed in two dry/wet feeders in each pen. The total feed intake is registrated. In each pen 20 pigs were kept, the surface was 20 m2 litter. In both rooms an automatically controlled natural ventilation system was installed. The incoming air could be heated. After three and four batches the complete bedding material was taken out, weighted and sampled. Two well mixed samples of both systems were analysed in the Imag-Dlo laboratory. Analyses were done for phosporus, potassium and total-nitrogen. Phosphorus and potassium will accumulate in the bedding and are used for control. The retention of the minerals by the animals were assumed to be 1.86 kg nitrogen, 0.4 kg phosphorus and 0.16 kg potassium per slaughtered pig (Coppoolse et al., 1990).
Deep litter systems
The two deep litter systems taken into research were Ecopor and Envistim (Finnfeeds). The differences between both litter systems are given in table 1. The main differences concern the layer thichness, the additive used and the littermanagement. The additives will controll the composting processes.
319
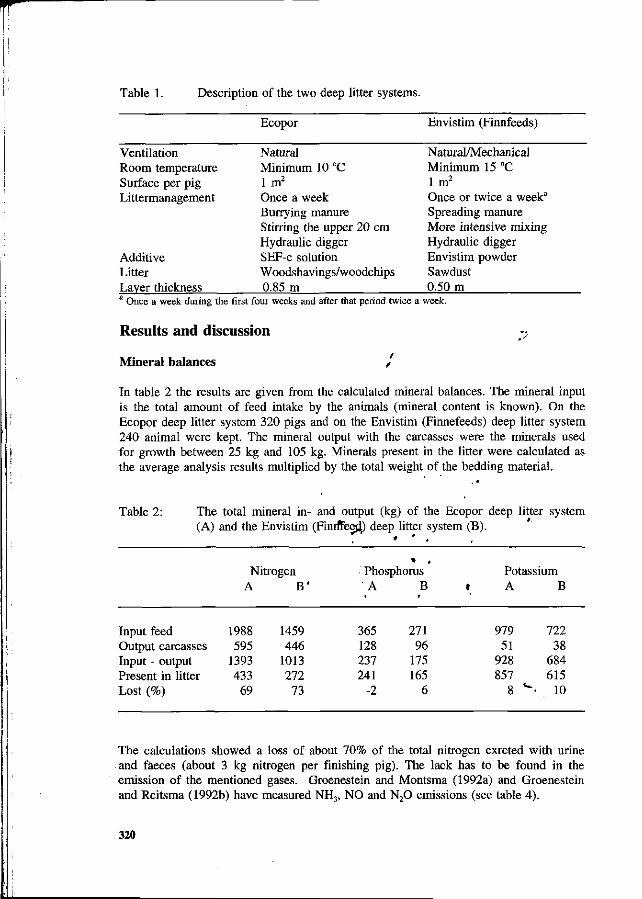
Table 1. Description of the two deep litter systems.
Ecopor Envistim (Finnfeeds)
Ventilation Room temperature Surface per pig Littermanagement
Additive Litter Layer thickness
Natural Minimum 10 °C lm 2
Once a week Burrying manure Stirring the upper 20 cm Hydraulic digger SEF-c solution Woodshavings/woodchips 0.85 m
Natural/Mechanical Minimum 15 °C 1 m2
Once or twice a week3
Spreading manure More intensive mixing Hydraulic digger Envistim powder Sawdust 0.50 m
Once a week during the first four weeks and after that period twice a week.
Results and discussion
Mineral balances /
In table 2 the results are given from the calculated mineral balances. The mineral input is the total amount of feed intake by the animals (mineral content is known). On the Ecopor deep litter system 320 pigs and on the Envistim (Finnefeeds) deep litter system 240 animal were kept. The mineral output with the carcasses were the minerals used for growth between 25 kg and 105 kg. Minerals present in the litter were calculated as the average analysis results multiplied by the total weight of the bedding material.
Table 2: The total mineral in- and output (kg) of the Ecopor deep litter system (A) and the Envistim (Finrrfee-jfj deep litter system (B).
Input feed Output carcasses Input - output Present in litter Lost (%)
Nitrogen A
1988 595
1393 433 69
B '
1459 446
1013 272 73
• Phosph 'A
365 128 237 241
-2
» . orus
B
271 96
175 165
6
Potassium I A B
979 722 51 38
928 684 857 615
8 ^- 10
The calculations showed a loss of about 70% of the total nitrogen exreted with urine and faeces (about 3 kg nitrogen per finishing pig). The lack has to be found in the emission of the mentioned gases. Groenestein and Montsma (1992a) and Groenestein and Reitsma (1992b) have measured NH3, NO and N20 emissions (see table 4).
320
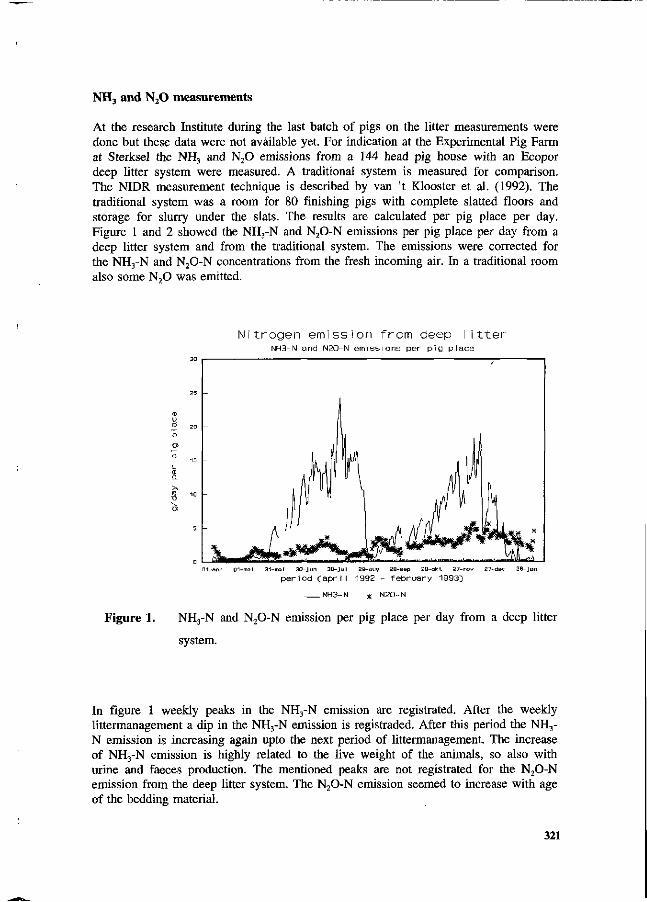
NH3 and N20 measurements
At the research Institute during the last batch of pigs on the litter measurements were done but these data were not available yet. For indication at the Experimental Pig Farm at Sterksel the NH3 and N20 emissions from a 144 head pig house with an Ecopor deep litter system were measured. A traditional system is measured for comparison. The NIDR measurement technique is described by van 't Klooster et al. (1992). The traditional system was a room for 80 finishing pigs with complete slatted floors and storage for slurry under the slats. The results are calculated per pig place per day. Figure 1 and 2 showed the NH3-N and N20-N emissions per pig place per day from a deep litter system and from the traditional system. The emissions were corrected for the NH3-N and N20-N concentrations from the fresh incoming air. In a traditional room also some N20 was emitted.
Nitrogen emission from deep litter NH3-N and N20-N emissions per pig place
j i i _
nel 30-jun 30-jul 29-aug 28-sep 28-ofct 27-nov 27-dec 26-ja period Çapr iI 1992 - february 1993J
Figure 1. NH3-N and N20-N emission per pig place per day from a deep litter
system.
In figure 1 weekly peaks in the NH3-N emission are registrated. After the weekly littermanagement a dip in the NH3-N emission is registraded. After this period the NH3-N emission is increasing again upto the next period of littermanagement. The increase of NH3-N emission is highly related to the live weight of the animals, so also with urine and faeces production. The mentioned peaks are not registrated for the N20-N emission from the deep litter system. The N20-N emission seemed to increase with age of the bedding material.
321
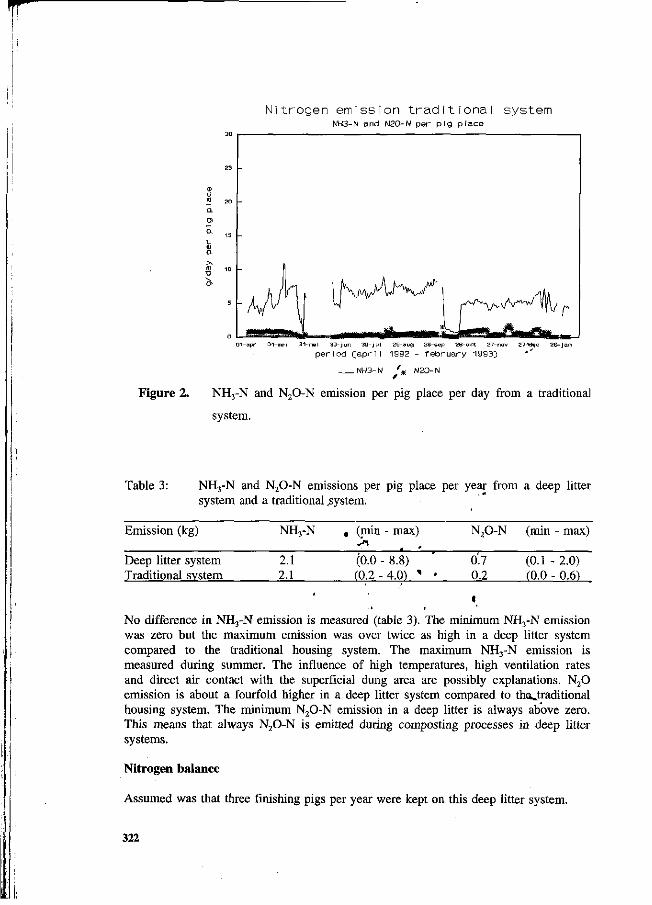
Nitrogen emission traditional system NH3-N and N20-N per pig place
O-l-apr 01-mei 31-mei 30-jun 30-jui 29-aug 28-sep 2B-okt 27-nov 27Jdec 26-jan
period Capri I 1992 - february -1993}
NH3-N ' * N20-N
Figure 2. NH3-N and N20-N emission per pig place per day from a traditional
system.
Table 3: NH3-N and N20-N emissions per pig place per year from a deep litter system and a traditional .system.
Emission (kg)
Deep litter system Traditional system
NH3-N
2.1 2.1
t (min - max)
(0.0 - 8.8) (0.2-4.0) * '
N20-N
0.7 0.2
(min - max)
(0.1 - 2.0) (0.0 - 0.6)
No difference in NH3-N emission is measured (table 3). The minimum NH3-N emission was zero but the maximum emission was over twice as high in a deep litter system compared to the traditional housing system. The maximum NH3-N emission is measured during summer. The influence of high temperatures, high ventilation rates and direct air contact with the superficial dung area are possibly explanations. N20 emission is about a fourfold higher in a deep litter system compared to thajtraditional housing system. The minimum N20-N emission in a deep litter is always above zero. This means that always N20-N is emitted during composting processes in deep litter systems.
Nitrogen balance
Assumed was that three finishing pigs per year were kept on this deep litter system.
322
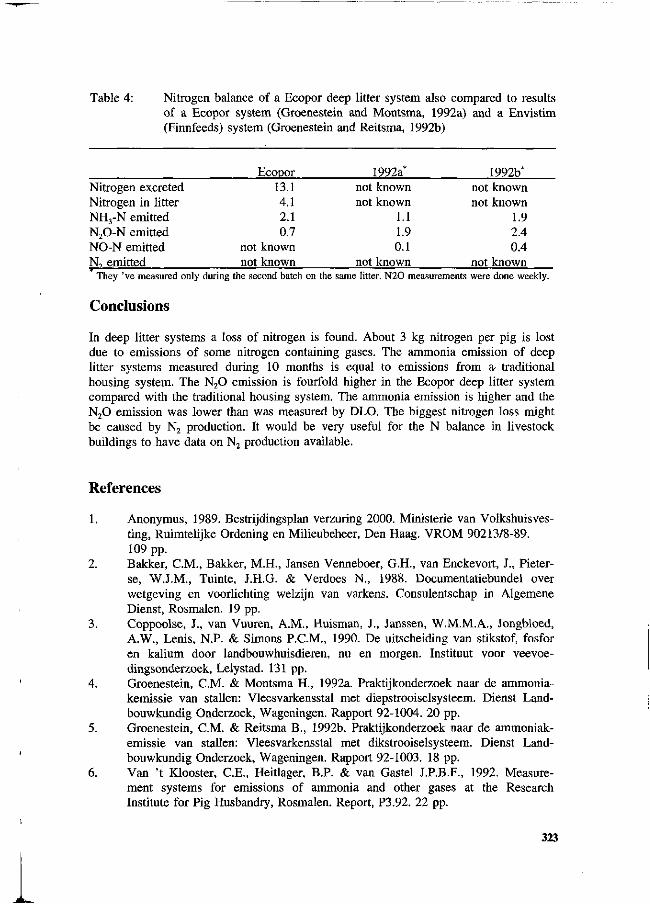
Table 4: Nitrogen balance of a Ecopor deep litter system also compared to results of a Ecopor system (Groenestein and Montsma, 1992a) and a Envistim (Finnfeeds) system (Groenestein and Reitsma, 1992b)
Nitrogen excreted Nitrogen in litter NH3-N emitted N20-N emitted NO-N emitted N, emitted
Ecopor 13.1 4.1 2.1 0.7
not known not known
1992a* not known not known
1.1 1.9 0.1
not known
1992b* not known not known
1.9 2.4 0.4
not known They 've measured only during the second batch on the same litter. N20 measurements were done weekly.
Conclusions
In deep litter systems a loss of nitrogen is found. About 3 kg nitrogen per pig is lost due to emissions of some nitrogen containing gases. The ammonia emission of deep litter systems measured during 10 months is equal to emissions from a- traditional housing system. The N20 emission is fourfold higher in the Ecopor deep litter system compared with the traditional housing system. The ammonia emission is higher and the N20 emission was lower than was measured by DLO. The biggest nitrogen loss might be caused by N2 production. It would be very useful for the N balance in livestock buildings to have data on N2 production available.
References
1. Anonymus, 1989. Bestrijdingsplan verzuring 2000. Ministerie van Volkshuisvesting, Ruimtelijke Ordening en Milieubeheer, Den Haag. VROM 90213/8-89. 109 pp.
2. Bakker, C.M., Bakker, M.H., Jansen Venneboer, G.H., van Enckevort, J., Pieter-se, W.J.M., Tuinte, J.H.G. & Verdoes N., 1988. Documentatiebundel over wetgeving en voorlichting welzijn van varkens. Consulentschap in Algemene Dienst, Rosmalen. 19 pp.
3. Coppoolse, J., van Vuuren, A.M., Huisman, J., Janssen, W.M.M.A., Jongbloed, A.W., Lenis, N.P. & Simons P.C.M., 1990. De uitscheiding van stikstof, fosfor en kalium door landbouwhuisdieren, nu en morgen. Instituut voor veevoedingsonderzoek, Lelystad. 131 pp.
4. Groenestein, C.M. & Montsma H., 1992a. Praktijkonderzoek naar de ammonia-kemissie van stallen: Vleesvarkensstal met diepstrooiselsysteem. Dienst Landbouwkundig Onderzoek, Wageningen. Rapport 92-1004. 20 pp.
5. Groenestein, C.M. & Reitsma B., 1992b. Praktijkonderzoek naar de ammoniak-emissie van stallen: Vleesvarkensstal met dikstrooiselsysteem. Dienst Landbouwkundig Onderzoek, Wageningen. Rapport 92-1003. 18 pp.
6. Van 't Klooster, CE., Heitlager, B.P. & van Gastel J.P.B.F., 1992. Measurement systems for emissions of ammonia and other gases at the Research Institute for Pig Husbandry, Rosmalen. Report, P3.92. 22 pp.
323
Continuous ammonia and ventilation rate measurement to evaluate an ammonia sensor in field conditions
D. Berckmans^2\ J.-Q. NiV\ C. VinckierQ-V
C ' ) National Fund of Scientific Research, Belgium (2) Laboratory for Agricultural Buildings Research, K. U. Leuven, Belgium (3) Laboratory for Analytical andInorganic Chemistry, K.U. Leuven, Belgium
Summary
An ammonia sensor is under development and it is tried to evaluate the performances of this sensor in hard field conditions of a commercial pig house. As a reference of the ammonia measurement, the technique of in situ conversion of NH3 to NOx with subsequent analysis by NOx detector is used to measure the ammonia, concentration in the exhaust air. To measure the ventilation rate a ventilation rate sensor'is installed in the exhaust chimney. The data logger in the field is connected with the central laboratory computer by using a telemetering system. In this way the behaviour of the ammonia sensor is monitored continuously and can be analysed. When an ammonia sensor can become operational in field conditions it might be integrated in the control system to reduce ammonia emission by using an appropriate ventilation rate.
Introduction
Ammonia plays an important role in the nitrogen cycle. It is now understood that there is an obvious increase of ammonia emission caused, by human activities. From 1870 to 1980 the annual total NH3 emission in Europe fronf'livestoek wastes, fertiliser application and fertiliser factories had augmented from 2.2 to 4.7 Mt (Asman et al., 1988). From 1960-1980, the wet deposition flux of ammonia increased by approximately 25% in Europe (Buijsman and Erisman, 1988). < ,
In Belgium, the calculated atmospheric NH3 -was 1.5 ug nr3 in 1870 and 3.7 ug nr3 in 1980, increased about 146%. The figure in 1980 is the second highest among the European countries, next to the Netherlands that is 5.9 ug nr3. A total amount of 82 x 1031NH3 is emitted annually in Belgium (Asman et al., 1988). About 90% is produced from livestock wastes (Buijsman et al., 1987).
It is believed that the excess emissions of ammonia to the atmosphere are associated with environmental and ecological damage (Buijsman and Erisman, 1988)^-Ammonia emissions also result in significant reductions in the value of slurries as fertilisers when they are applied in the field (Pain et al., 1989). Moreover, some studies demonstrate that there exist certain relationships between ammonia and mal-odour emission that is one of the major air pollution complaints received by local authorities in some countries (Pain and Misselbrook, 1991). On the other hand, ammonia concentration in animal houses has increased in the past few years. It represents potential health hazard to animals and workers (Carretal., 1990).
324
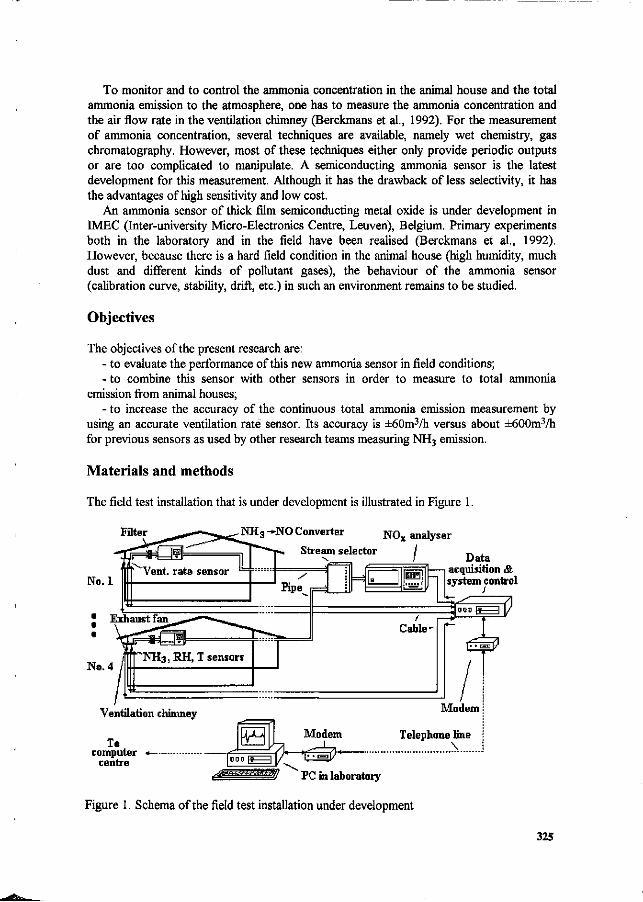
To monitor and to control the ammonia concentration in the animal house and the total ammonia emission to the atmosphere, one has to measure the ammonia concentration and the air flow rate in the ventilation chimney (Berckmans et al., 1992). For the measurement of ammonia concentration, several techniques are available, namely wet chemistry, gas chromatography. However, most of these techniques either only provide periodic outputs or are too complicated to manipulate. A semiconducting ammonia sensor is the latest development for this measurement. Although it has the drawback of less selectivity, it has the advantages of high sensitivity and low cost.
An ammonia sensor of thick film semiconducting metal oxide is under development in IMEC (Inter-university Micro-Electronics Centre, Leuven), Belgium. Primary experiments both in the laboratory and in the field have been realised (Berckmans et al., 1992). However, because there is a hard field condition in the animal house (high humidity, much dust and different kinds of pollutant gases), the behaviour of the ammonia sensor (calibration curve, stability, drift, etc.) in such an environment remains to be studied.
Objectives
The objectives of the present research are: - to evaluate the performance of this new ammonia sensor in field conditions; - to combine this sensor with other sensors in order to measure to total ammonia
emission from animal houses; - to increase the accuracy of the continuous total ammonia emission measurement by
using an accurate ventilation rate sensor. Its accuracy is ±60m3/h versus about ±600m3/h for previous sensors as used by other research teams measuring NH3 emission.
Materials and methods
The field test installation that is under development is illustrated in Figure 1.
Filter ^ - ^ N H 3 - N O Converter NOx analyser
Stream selector / _ , ; Data
acquisition & No. 1
* Exhaust fan
No. 4
system control
Ventilation chimney
To computer
centre FC in laboratory
Figure 1. Schema of the field test installation under development
325
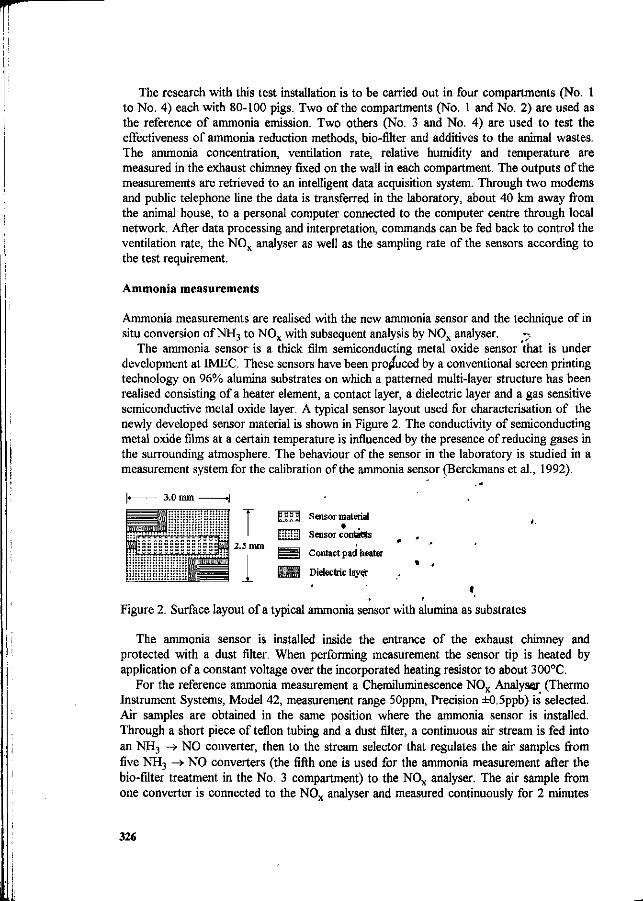
The research with this test installation is to be carried out in four compartments (No. 1 to No. 4) each with 80-100 pigs. Two of the compartments (No. 1 and No. 2) are used as the reference of ammonia emission. Two others (No. 3 and No. 4) are used to test the effectiveness of ammonia reduction methods, bio-filter and additives to the animal wastes. The ammonia concentration, ventilation rate, relative humidity and temperature are measured in the exhaust chimney fixed on the wall in each compartment. The outputs of the measurements are retrieved to an intelligent data acquisition system. Through two modems and public telephone line the data is transferred in the laboratory, about 40 km away from the animal house, to a personal computer connected to the computer centre through local network. After data processing and interpretation, commands can be fed back to control the ventilation rate, the NOx analyser as well as the sampling rate of the sensors according to the test requirement.
Ammonia measurements
Ammonia measurements are realised with the new ammonia sensor and the technique of in situ conversion of NH3 to NOx with subsequent analysis by NOx analyser.
The ammonia sensor is a thick film semiconducting metal oxide sensor that is under development at IMEC. These sensors have been produced by a conventional screen printing technology on 96% alumina substrates on which a patterned multi-layer structure has been realised consisting of a heater element, a contact layer, a dielectric layer and a gas sensitive semiconductive metal oxide layer. A typical sensor layout used for characterisation of the newly developed sensor material is shown in Figure 2. The conductivity of semiconducting metal oxide films at a certain temperature is influenced by the presence of reducing gases in the surrounding atmosphere. The behaviour of the sensor in the laboratory is studied in a measurement system for the calibration of the ammonia sensor (Berckmans et al., 1992).
3.0 mm
f r r
; ; : J : ; ; ; ; : ; ; : : ; : : : : : .
Hi::::::::::::::::::
r r t
E 5 5 51 Sensor material * -
Ijjjjjjjl Sensor contacts 2.5 mm , ,
I I Contact pad heater
I :'.-[ -I Dielectric layer
Figure 2. Surface layout of a typical ammonia sensor with alumina as substrates
The ammonia sensor is installed inside the entrance of the exhaust chimney and protected with a dust filter. When performing measurement the sensor tip is heated by application of a constant voltage over the incorporated heating resistor to about 300°C.
For the reference ammonia measurement a Chemiluminescence NOx Analyser (Thermo Instrument Systems, Model 42, measurement range 50ppm, Precision ±0.5ppb) is selected. Air samples are obtained in the same position where the ammonia sensor is installed. Through a short piece of teflon tubing and a dust filter, a continuous air stream is fed into an NH3 —» NO converter, then to the stream selector that regulates the air samples from five NH3 -» NO converters (the fifth one is used for the ammonia measurement after the bio-filter treatment in the No. 3 compartment) to the NOx analyser. The air sample from one converter is connected to the NOx analyser and measured continuously for 2 minutes
326
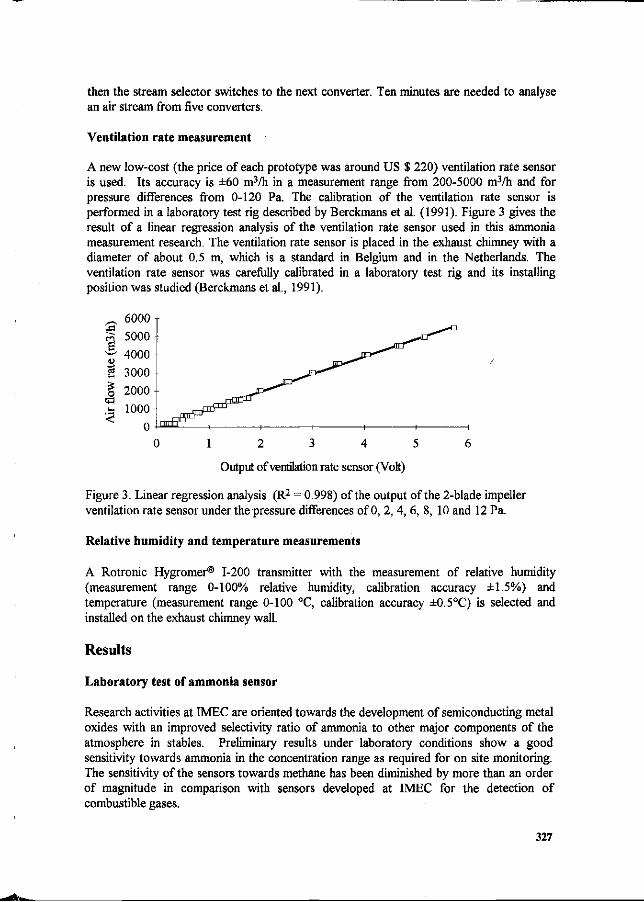
then the stream selector switches to the next converter. Ten minutes are needed to analyse an air stream from five converters.
Ventilation rate measurement
A new low-cost (the price of each prototype was around US $ 220) ventilation rate sensor is used. Its accuracy is ±60 m3/h in a measurement range from 200-5000 m3/h and for pressure differences from 0-120 Pa. The calibration of the ventilation rate sensor is performed in a laboratory test rig described by Berckmans et al. (1991). Figure 3 gives the result of a linear regression analysis of the ventilation rate sensor used in this ammonia measurement research. The ventilation rate sensor is placed in the exhaust chimney with a diameter of about 0.5 m, which is a standard in Belgium and in the Netherlands. The ventilation rate sensor was carefully calibrated in a laboratory test rig and its installing position was studied (Berckmans et al., 1991).
^ 6000 T
^ 5000 & 4000 S 3000 % 2000 % 1000
1 2 3 4 5 6
Output of ventilation rate sensor (Volt)
Figure 3. Linear regression analysis (R2 = 0.998) of the output of the 2-blade impeller ventilation rate sensor under the pressure differences of 0, 2, 4, 6, 8, 10 and 12 Pa.
Relative humidity and temperature measurements
A Rotronic Hygromer® 1-200 transmitter with the measurement of relative humidity (measurement range 0-100% relative humidity, calibration accuracy ±1.5%) and temperature (measurement range 0-100 °C, calibration accuracy ±0.5°C) is selected and installed on the exhaust chimney wall.
Results
Laboratory test of ammonia sensor
Research activities at IMEC are oriented towards the development of semiconducting metal oxides with an improved selectivity ratio of ammonia to other major components of the atmosphere in stables. Preliminary results under laboratory conditions show a good sensitivity towards ammonia in the concentration range as required for on site monitoring. The sensitivity of the sensors towards methane has been diminished by more than an order of magnitude in comparison with sensors developed at IMEC for the detection of combustible gases.
327
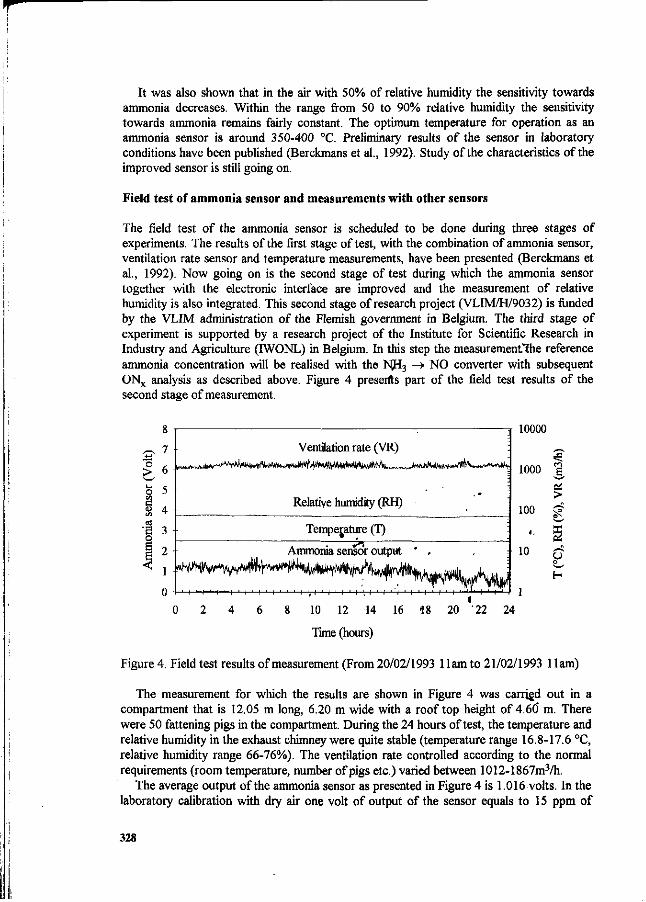
It was also shown that in the air with 50% of relative humidity the sensitivity towards ammonia decreases. Within the range from 50 to 90% relative humidity the sensitivity towards ammonia remains fairly constant. The optimum temperature for operation as an ammonia sensor is around 350-400 °C. Preliminary results of the sensor in laboratory conditions have been published (Berckmans et al., 1992). Study of the characteristics of the improved sensor is still going on.
Field test of ammonia sensor and measurements with other sensors
The field test of the ammonia sensor is scheduled to be done during three stages of experiments. The results of the first stage of test, with the combination of ammonia sensor, ventilation rate sensor and temperature measurements, have been presented (Berckmans et al., 1992). Now going on is the second stage of test during which the ammonia sensor together with the electronic interface are improved and the measurement of relative humidity is also integrated. This second stage of research project (VLIM/H/9032) is funded by the VLIM administration of the Flemish government in Belgium. The third stage of experiment is supported by a research project of the Institute for Scientific Research in Industry and Agriculture (IWONL) in Belgium. In this step the measurement'fhe reference ammonia concentration will be realised with the NFI3 —» NO converter with subsequent ONx analysis as described above. Figure 4 presents part of the field test results of the second stage of measurement.
o >
•a o E
Ventilation rate (VR)
?• 1000
Relative humidity (RH)
Temperature (T)
Ammonia sensor output
10000
= 100
I ' I ' I ' I ' I ' I ' I ' I ' , I ' I ' I ' I • ', I ' I ' I ' I ' I ' I ' I
>
u o
H
0 2 4 6 8 10 12 14 16 18 20 '22 24
Time (hours)
Figure 4. Field test results of measurement (From 20/02/1993 1 lam to 21/02/1993 1 lam)
The measurement for which the results are shown in Figure 4 was carried out in a compartment that is 12.05 m long, 6.20 m wide with a rooftop height of 4.60' m. There were 50 fattening pigs in the compartment. During the 24 hours of test, the temperature and relative humidity in the exhaust chimney were quite stable (temperature range 16.8-17.6 °C, relative humidity range 66-76%). The ventilation rate controlled according to the normal requirements (room temperature, number of pigs etc.) varied between 1012-1867m3/h.
The average output of the ammonia sensor as presented in Figure 4 is 1.016 volts. In the laboratory calibration with dry air one volt of output of the sensor equals to 15 ppm of
328
ammonia concentration. However, the conversion of this voltage into ammonia concentration needs to take into account the interferences resulted from the hard field conditions, namely relative humidity and other gases. Therefore calibration of the sensor and measurement of reference ammonia concentration in the field conditions are prepared.
Conclusions
Ammonia sensor provides a possibility of continuous and low cost measurement of ammonia concentration. The combination of such a sensor with ventilation rate, relative humidity and temperature sensors can be integrated into the control system to reduce ammonia emission by using an appropriate ventilation rate.
In the laboratory study the ammonia sensor under development shows a good sensitivity towards ammonia. Relative humidity has influence on the sensitivity of the ammonia sensor. However, within the range from 50-90% of relative humidity, that is the normal range in commercial animal houses, the sensitivity towards ammonia remains fairly constant.
In the field test, the conversion of ammonia sensor output of electric signals into ammonia concentration needs to take into account the influence of relative humidity and main gas components in the animal house. Calibration and evaluation of the sensor under field conditions are needed. '
Reference ammonia measurement using a precise method of NH3 -» NO converter with subsequent ONx analyser can be a necessary and effective way for studying the behaviour of ammonia sensor in field conditions.
References
Asman, W. A. H., Drukker, B. and Janssen, A.J., 1988. Modelled historical concentrations and depositions of ammonia and ammonium in Europe. Atmos Envir. 22: 725-735.
Berckmans, D., Vandenbroeck, P. and Goedseels, V., 1991. Sensor for continuous ventilation rate in livestock buildings. Indoor Air. (3): 323-336.
Berckmans, D., Ni, J.Q., Roggen, J. and Huyberechts, G., 1992. Testing an ammonia-sensor for livestock buildings. In: 1992 Int Winter Meeting of ASAE, Nashville, Tennessee, 15-18 December 1992. Paper No. 924552. 21p.
Buijsman, E. and Erisman, J.-W., 1988. Wet deposition of ammonium in Europe. Journal of Atmos Chemistry. (6): 265-280.
Buijsman, E., Maas, H. F. M. and Asman, W. A. H., 1987. Anthropogenic NH3 emissions in Europe. Atmos Envir. 21: 1009-1022.
Carr, L. E., Wheaton, F. W. and Douglass, L. W., 1990. Empirical models to determine ammonia concentrations from broiler chicken litter. Trans of the ASAE. 33: 1337-1342.
Pain, B. F., Phillips, V. R., and Klarenbeek, J. V., 1989. Loss of nitrogen through ammonia volatilisation during and following the application of pig or cattle slurry to grassland. J Sei Food Agric. 47: 1-12.
Pain, B. F. and Misselbrook, T. H., 1991. Relationships between odour and ammonia emission during and following the application of slurries to land. In: V. C. Nielsen et al. (Eds.), Elsevier Applied Sei, London and New York. p. 17-21.
329
The use of a Yucca schidigera extract as 'urease inhibitor' in pig slurry
P.A. Kemme, A.W. Jongbloed, B.M. Dellaert and F. Krol-Kramer
Research Institute for Livestock Feeding and Nutrition (IVVO-DLO) Lelystad, The Netherlands
Summary
Six trials were carried out to test the effect of a Yucca schidigera extract (MICROAID [MA]) as urease inhibitor on urea degradation and ammonia formation. In trials 1 to 5, samples were incubated in vitro for up to 24 h at 40 °C, with water or a urea solution (12.9 g.1"1)- Aim of trial 1 was to test the effect of addition of MA on synthetic urease; maximal response was a reduction in ammonia production of 99% at a dose of 6000 ppm. In trials 2 and 3, MA was added directly to fresh faeces, in trials 4 and 5, MA was added to a protein rich diet and fed to pigs, of which faeces were incubated. Ammonia production was not reduced at the recommended doses in these trials. At higher doses the maximal' reduction in ammonia production was 22%. Urea degradation occurred to be a rapid process. The mode of action of the Yucca extract relies on binding or converting ammonia rather than on inhibiting the enzyme urease. In trial 6, in vivo ammonia production from faeces and urine, cumulated for 10 consecutive days, was measured. In contrast to results obtained in the USA, ammonia production was not reduced by the Yucca extract. In Dutch practical conditions ammonia concentrations in ventilated air are lower and the presence of urease of plant origin is of minor importance, as compared to the USA. Under Dutch practical conditions Yucca extracts will not provide a relevant contribution to the reduction of ammonia emission. Keywords: pigs, ammonia, urea, urease ' .«
Introduction
The ammonia emission contributes substantially, to environmental pollution and causes severe acidification of the soil by atmospheric ammonium sulphate, often named 'acid rain'. In pig h»sb,andry in the Netherlands the total N excretion in 1988 was almost 1-50,000 tons (Coppoolse et al., 1990), resulting in an estimated ammonia emission of 7 3,000 tons per year (Den Hartog, 1992). Various means have been described'to reduce N losses by nutrition (Jongbloed & Lenis, 1992), resulting in a lower ammonia emission. However, a surplus of crude protein will always be present in the diet and therefore in faeces and urine. To diminish ammonia volatilization from pig slurry various methods have been reported (Stevens et al., 1989; Beaudet et al., 1990; Headon & Dawson, 1990).
A promising method seems to be the inhibition of the enzym urease, which is present in animal's faeces and causing ammonia volatilization from urea, present in urine, the latter comprising 50% of the total N intake (Coppoolse et al., 1990). In poultry, addition to the diet of extracts of the Yucca schidigera plant decreased ammonia emission, both in vivo and in vitro (Rowland et al.,1976; Smith, 1980; Goodall et al., 1988), although trials of Johnston et al. (1981) showed no effect. Research on pigs on the effects of urease inhibitors has mainly been focused on performance (Foster, 1983; Cromwell et al., 1985; Mader &. Brumm, 1985; Bourne, 1990). In our trials, the effects of addition of the urease inhibitor MICROAID (MA) to diet and faeces on urea degradation and ammonia formation in pig slurry have been studied.
330
Materials and methods
Experimental designs
Aim of trial 1 was to test the effect of addition of MA (0, 600, or 6000 ppm) on a solution of synthetic urease and urea. Two duplicate samples for each period were incubated for 0, 3, 6 or 24 h.
In trials 2 and 3, MA was added to faeces of pigs that did not receive MA with the diet. In trial 2, addition of MA was 0, 200 or 600 ppm.DM"1, in trial 3 the doses were 0, 600, 1200, 2400 or 4800 ppm. DM'1. Duplicate samples of fresh faeces were incubated either with urea solution or with water for 0, 7, 14 or 24 h in trial 2 and for 0, 6 or 24 h in trial 3.
In trials 4 and 5, MA was added to the diet of pigs. In trial 4, addition of MA was 0 or 120 ppm, in trial 5 the doses were 0, 240, 720 or 1200 ppm. After a preliminary period of two weeks, in which the pigs were fully adapted to the diets, faeces were collected. Duplicate samples of fresh faeces were incubated either with urea solution or with water for 0, 7, 14 or 24 h in trial 4 and for 0, 3 or 6 h in trial 5.
In trial 6, addition of MA to the diet was 0 or 120 ppm. The trial was set up according to a cross-over design. After a preliminary period of two weeks, in which the pigs were fully adapted to the diets, they were kept two by two in respiratory chambers. On day 3 and 4 and day 9 and 10 of the collection period, the ammonia concentration of ventilated air and condensed water was measured. Throughout the collection period the total production of faeces and urine was cumulated in big plastic carriers that remained in the chambers for 10 consecutive days.
Animals, diets and feeding
For trials 2, 4 and 6, four barrows in the live weight range from 35 to 70 kg were used. In trial 3, faeces were collected from two breeding sows of approx. 190 kg body weight. In trial 5 four barrows in the live weight range from 70 to 115 kg were used.
All pigs were fed standard practical diets. Tapioca (80 g.kg"1) was substituted for extracted soybean meal (3.5-7% XF) in order to supply a surplus of protein. Average XP and dig. XP content in the diets were 177 and 154 g.kg"1, respectively. Feeding level was 2.8 * maintenance requirement (equal to 418 kJ ME.W"3'4). Water intake was 2.5 1 per kg of feed.
Used incubation materials and underlying conditions
In trials 2, 4 and 6 the solid form of MA (Distributors Processing Inc. (DPI), Porterville, USA) was used, in trials 1, 3 and 5 the liquid form. MA consisted of 30% Yucca schidigera extract (sarsaponi'n) , 35.4% CaC03l
0.3% sodium formate, 0.2% mineral oils, 0.06% CuS04, 0.02% anti oxidant and 34% carrier. Recommended addition for both forms to the diet is 120 ppm. Assuming that MA is not digested by the animal and the average DM digestibility of the diet is 80%, 600 ppm MA will be present in faeces on DM basis. Additions exceeding these levels will not be used in practice.
Urine of pigs fed a protein rich diet contains approx. 6 g N.l"1, mainly present as urea. The chosen urea solution had an equivalent concentration, being 12.9 g urea.1"1. The ratio urea solution: faeces in incubation fluid was 2:1 w/w, equivalent to production of urine per kg of faeces.
Perchloric acid (HC104 60 %) , 83 ml.kg'1 of incubation fluid, was used to stop urea hydrolysis.
Synthetic urease originating from Canavalia ensiformis (Boehringer) was used at an activity of 300 /xmol .min"1.1'1, i.e. the average urease activity of faeces measured in this experiment.
331
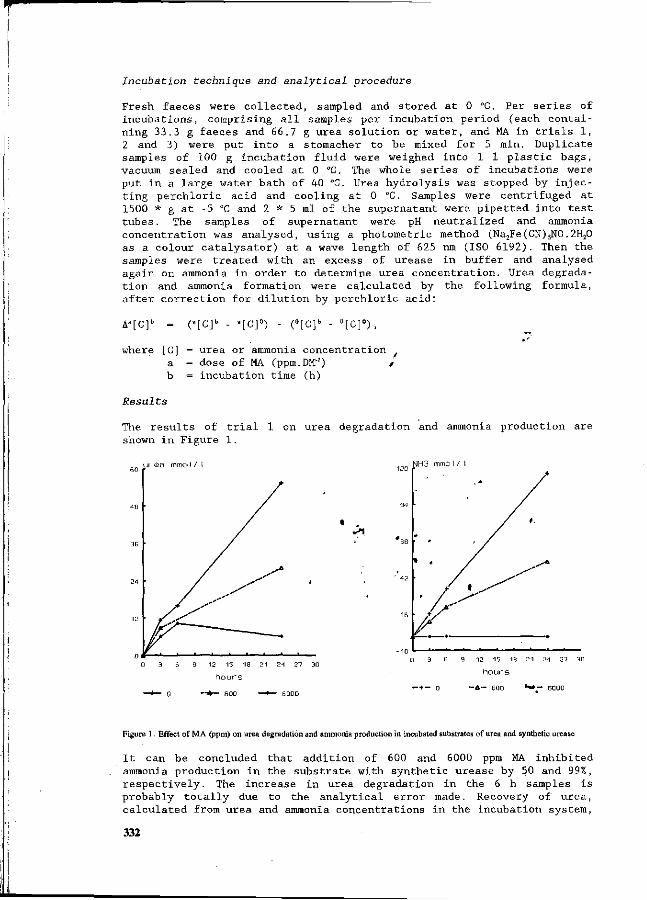
Incubation technique and analytical procedure
Fresh faeces were collected, sampled and stored at 0 °C. Per series of incubations, comprising all samples per incubation period (each containing 33.3 g faeces and 66.7 g urea solution or water, and MA in trials 1, 2 and 3) were put into a stomacher to be mixed for 5 min. Duplicate samples of 100 g incubation fluid were weighed into 1 1 plastic bags, vacuum sealed and cooled at 0 "G. The whole series of incubations were put in a large water bath of 40 °C. Urea hydrolysis was stopped by injecting perchloric acid and cooling at 0 °C. Samples were centrifuged at 1500 * g at -5 °C and 2 * 5 ml of the supernatant were pipetted into test tubes. The samples of supernatant were pH neutralized and ammonia concentration was analysed, using a photometric method (Na2Fe(CN)5N0. 2H20 as a colour catalysator) at a wave length of 625 nm (ISO 6192). Then the samples were treated with an excess of urease in buffer and analysed again on ammonia in order to determine urea concentration. Urea degradation and ammonia formation were calculated by the following formula, after correction for dilution by perchloric acid:
A*[C] C [ c ] b - ' [ c ]» ) - ( ° [ c ] b - ° [ c ] ° ) ,
where [C] = urea or ammonia concentration a = dose of MA (ppm. DM"') / b = incubation time (h)
Results
The results of trial 1 on urea degradation and ammonia production are shown in Figure 1.
ui ' e a mmo I / I
***
20
94
68
42
16
IH3 mmo 1 /
; ,
» .
+
/ * •
. /
0 3 G 9 12 15 18 21 24 27 30
hours
—+ — 0 - A — 6QQ * * » — 6000
Figure 1. Effect of MA (ppm) on urea degradation and ammonia production in incubated substrates of urea and synthetic urease
It can be concluded that addition of 600 and 6000 ppm MA inhibited ammonia production in the substrate with synthetic urease by 50 and 99%, respectively. The increase in urea degradation in the 6 h samples is probably totally due to the analytical error made. Recovery of urea, calculated from urea and ammonia concentrations in the incubation system,
332
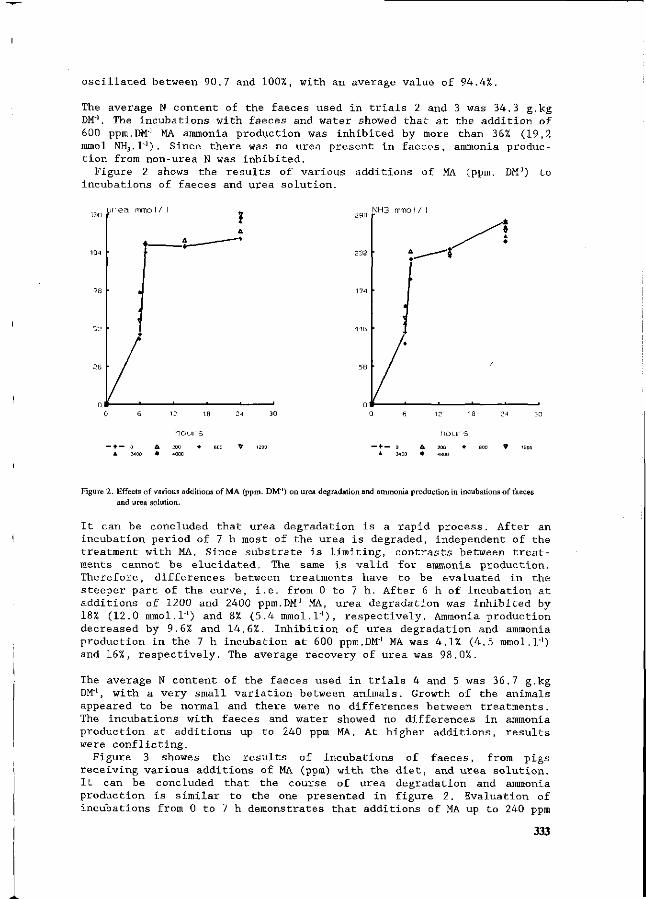
oscillated between 90.7 and 100%, with an average value of 94.4%.
The average N content of the faeces used in trials 2 and 3 was 34.3 g.kg DM"'. The incubations with faeces and water showed that at the addition of 600 ppm.DM"1 MA ammonia production was inhibited by more than 36% (19,2 mmol NH3.1"'). Since there was no urea present in faeces, ammonia production from non-urea N was inhibited.
Figure 2 shows the results of various additions of MA (ppm. DM"1) to incubations of faeces and urea solution.
urea mmoI/I 290
232
174
1 16
58
>IH3 mmo I / !
+ / •
-%
f
St
•
A 000 • ËGQ V 1200 • 4S00
Figure 2. Effects of various additions of MA (ppm. DM"1) on urea degradation and ammonia production in incubations of faeces and urea solution.
It can be concluded that urea degradation is a rapid process. After an incubation period of 7 h most of the urea is degraded, independent of the treatment with MA. Since substrate is limiting, contrasts between treatments cannot be elucidated. The same is valid for ammonia production. Therefore, differences between treatments have to be evaluated in the steeper part of the curve, i.e. from 0 to 7 h. After 6 h of incubation at additions of 1200 and 2400 ppm.DM"1 MA, urea degradation was inhibited by 18% (12.0 mmol.1"1) and 8% (5.4 mmol.1"1), respectively. Ammonia production decreased by 9.6% and 14.6%. Inhibition of urea degradation and ammonia production in the 7 h incubation at 600 ppm.DM"1 MA was 4.1% (4.5 mmol.r1) and 16%, respectively. The average recovery of urea was 98.0%.
The average N content of the faeces used in trials 4 and 5 was 36.7 g.kg DM"1, with a very small variation between animals. Growth of the animals appeared to be normal and there were no differences between treatments. The incubations with faeces and water showed no differences in ammonia production at additions up to 240 ppm MA. At higher additions, results were conflicting.
Figure 3 showes the results of incubations of faeces, from pigs receiving various additions of MA (ppm) with the diet, and urea solution. It can be concluded that the course of urea degradation and ammonia production is similar to the one presented in figure 2. Evaluation of incubations from 0 to 7 h demonstrates that additions of MA up to 240 ppm
333
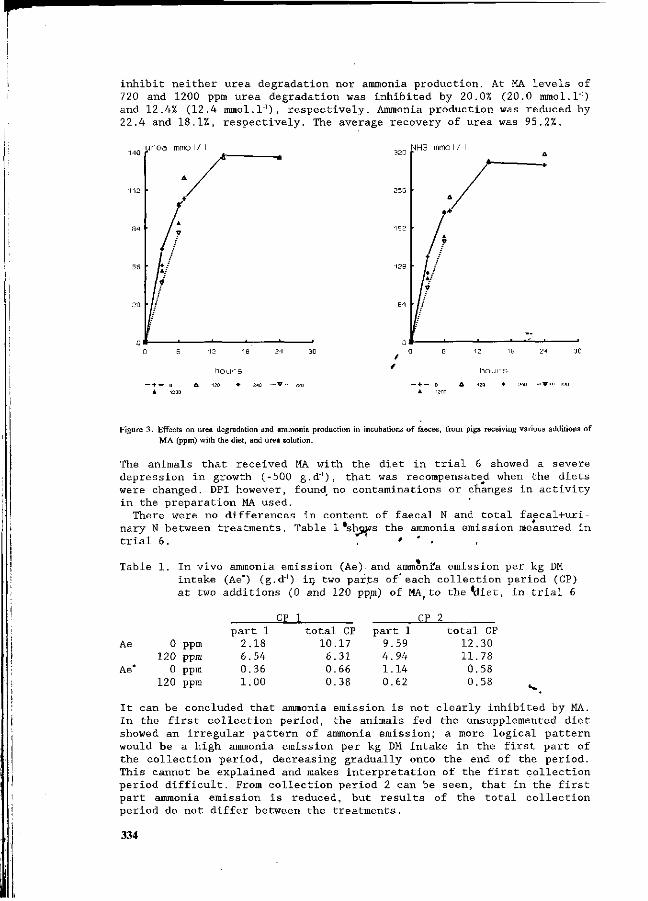
inhibit neither urea degradation nor ammonia production. At MA levels of 720 and 1200 ppm urea degradation was inhibited by 20.0% (20.0 mmol.1"1) and 12.4% (12.4 mmol.1"1), respectively. Ammonia production was reduced by 22.4 and 18.1%, respectively. The average recovery of urea was 95.2%.
urea mmoI/I NH3 mmo1/1
& /
/
' / ' / ; * ; Ik:
t>
A
Figure 3 . Effects on urea degradation and ammonia production in incubations of faeces, from pigs receiving various additions of
MA (ppm) with the diet, and urea solution.
The animals that received MA with the diet in trial 6 showed a severe depression in growth (-500 g.d"'), that was recompensated when the diets were changed. DPI however, found_ no contaminations or changes in activity in the preparation MA used.
There were no differences in content of faecal N and total faecal+uri-nary N between treatments. Table 1 *shows the ammonia emission measured in trial 6. , » ' . ,
Table 1. In vivo ammonia emission (Ae) and ammoni'a emission per kg DM intake (Ae*) (g.d"1) in two parts of'each collection period (CP) at two additions (0 and 120 ppm) of MAr to the'diet, in trial 6
CP 1 CP 2
Ae
Ae*
0 ppm 120 ppm
0 ppm 120 ppm
part 1 2.18 6.54 0.36 1.00
total CP 10.17 6.31 0.66 0.38
part 1 9.59 4.94 1.14 0.62
total CP 12.30 11.78 0.58 0.58
It can be concluded that ammonia emission is not clearly inhibited by MA. In the first collection period, the animals fed the unsupplemented diet showed an irregular pattern of ammonia emission; a more logical pattern would be a high ammonia emission per kg DM intake in the first part of the collection period, decreasing gradually onto the end of the period. This cannot be explained and makes interpretation of the first collection period difficult. From collection period 2 can be seen, that in the first part ammonia emission is reduced, but results of the total collection period do not differ between the treatments.
334
Discussion and conclusions
From the high recoveries of urea in the incubation bags and the low variation in duplicate samples, it can be concluded that the anaerobic incubation technique used is. suitable for measuring urea degradation and ammonia production. Furthermore, the results obtained with the in vitro system are in line with those obtained in vivo.
Incubations of faeces and water supplemented with 600 ppm. DM"1 MA showed a reduction of ammonia production by 36% (19.2 mmol.1"'). Since there is no urea present in faeces, ammonia production from non-urea N is reduced. This means that the mode of action of the Yucca extract relies on binding ammonia by some components of the extract or by conversion of ammonia to other compounds (Headon & Dawson, 1990), rather than on inhibiting the enzyme urease (Preston et al., 1987). It remains unclear, why ammonia production from free plant urease can be reduced, where ammonia production from incapsulated bacterial urease cannot. It seems unlikely that the Yucca extract interfers in the urea cycle, because the ratio urinary N:faecal N did not alter when the extract was added to the diet.
In contrast to results obtained in the USA, in this study only at additions that exceeded practical doses (i.e. 120 ppm in feed or 600 ppm in faeces) effects of .the Yucca extract could be detected (maximal reduction in urea degradation by 20% and in ammonia production by 22% at supplementation of 720 ppm to the diet). The probable explanation for this contradiction is that in the American studies initial ammonia concentrations in ventilated air were about 22 ppm, even higher than in their practice (14-15 ppm, Gerber et al., 1989), whereas Dutch standards are below 10 ppm. Also, the presence of urease of plant origin due to inpropriate toasting is very likely in American maize soybean based diets, whereas in Dutch conditions it is of minor importance. In consequence, this leads to the conclusion that Dutch conditions are not optimal for an effective use of Yucca extracts, so, Yucca extracts will not provide a relevant contribution to the reduction of ammonia emission.
References
Beaudet, R., Gagnon, C , Bisaillon, J.G. & Ishaque, M. 1990. Microbiological aspects of aerobic thermophilic treatment of swine waste. Applied and Environmental Microbiology 56, 4: 971-976
Bourne, S. 1990. Effect of Deodorase on ammonia levels at a commercial pig farm. In: Proc. Alltech fifth annual symposium,
Biotechnology in the feed industry, Lexington, Ky. USA Coppoolse, J., van Vuuren, A.M., Huisman, J., Janssen, W.M.M.A., Jongbloed, A.W., Lenis, N.P. & Simons, P . C M . 1990. De
uitscheiding van stikstof, fosfor en kalium door landbouwhuisdieren. Nu en morgen. Wageningen (DLO). 131 pp. (in Dutch) Cromwell, G.L., Stahley , T.S. & Monegue, H.J. 1985. Efficacy of sarsaponin for weanling and growing-finishing swine housed at
two animal densities. J.Anim. Sei. 57 (suppl. 1): 111 Den Hartog, L.A. 1992. Towards integrated pig production in the Netherlands. Neth. J. Agric. Sei. 40: 315-325 Foster, J.R. 1983. Effects of sarsaponin in growing-finishing swine diets. J. Anim. Sei. 57 (suppl. 1): 94 Gerber, D.B., G.C. Shurson & K.M. Mancl 1989. Summary of results from a field study of ammonia, carbon dioxide and carbon
monoxide levels in Ohio swine farrowing and nursery facilities. J. Anim. Sei. 67 (suppl. 1): 97 (abstr.) Goodall, S.R., Curtis, S.E. & McFarlane J.M. 1988. Reducing aerial ammonia by adding MICROAID to poultry diets: laboratory
and on-farm evaluations. Proc. third int. livestock environment symposium, Toronto, Canada, 286-290. Headon, D.R. & Dawson, K.A 1990. Yucca extract controls atmospheric ammonia levels. Feedstuffs 62, 29: 15-16 Johnston, N.L. , Quarles, C.L., Fagerberg, D.J. & Caveny D.D. 1981. Evaluation of Yucca saponin on broiler performance and
ammonia suppression. Poultry Sei. 60: 2289-2292 Jongbloed, A.W. & Lenis, N.P. 1992. Alteration of nutrition as a means to reduce environmental pollution by pigs. Livest. Prod.
Sei. 31 : 75-94 Mader, T.L. & Brumm, M.C. 1987. Effect of feeding sarsaponin in cattle and swine diets. J. Anim. Sei. 65: 9-15 Preston, R.L., Bartle, S.J., May, T. & Goodall, S.R. 1987. Influence of sarsaponin on growth, feed and nutrogen utilization in
growing male rats fed diets with added urea or protein. J. Anim. Sei. 65: 481-487 Rowland, L.O., Plyler, J.E. & Bradley, J.W. 1976. Yucca schidigera extract effect on egg production and house ammonia levels.
Poultry Sei. 55 (suppl. 1): 2086 Smith, R. 1980. Yucca saponin explained as that litter deammoniant. Feedstuffs 52, 5: 20-21 Stevens, R.J., Laughlin, R.J. & Frost, J .P. 1989. Effect of acidification with sulphuric acid on the volatilization of ammonia from
cow and pig slurries. J. Agric. Sei., Cambridge, 113: 389-395
335
Effect of protein feeding on gaseous ammonia emissions and slurry loading with nitrogen in fattening pigs
P. Heinrichs and J. Oldenburg
Institut für landwirtschaftliche Verfahrenstechnik, Universität Kiel,
Olshausenstraße 40-60, Germany
Summary
The effects of different protein levels in the feed on gaseous ammonia losses will be
tested in several feeding trials. The animal performances were not the same (results of
the 1st trial). The protein reduced group had a higher daily gain and a lower muscle
content in the bodies.
In the slurry of the protein reduced group the nitrogen content was only 82% of the
nitrogen of the control group. The results of the exhausted ammonia are in progress, the
concentration of ammonia in the exhausted air was higher in the control group.
Introduction
A reduced protein supply combined with an optimal amino acid balance will induce a
reduction of urea in the excreta. This reduced urea content of excreta'Should then be
associated with lower ammonia emissions from pig industry.
The task is to investigate the effects of dietftry-optimal protein supply on gaseouâ
ammonia emissions in pig fattening. The project intends to solve the question of gaseous
losses during housing of animals, slurry storage, and spreading of excreta. The main
question is to find how to reduce gaseous emissions through feeding.
The pigs will be fed with diets containing different protein levels. They will be housed in
an experimental pig unit on a real farm. The investigations will include the analysis of the
amount and composition of N excreted by the animals. The composition of N fraction in
excreta (urea, protein) will be set in the piggery, during storage and spreading, in relation
to the gaseous losses.
The first trial started in a (under the conditions of northern Germany) very hot period
with fresh air temperatures of nearly 30°Celsius and ended in December with calm
temperatures of around 5°Celsius with only two frosty nights.
The second parallel trial for different feeding strategies started in the last week of
December 1992. The second trial shall be like the first trial but under winter weather
conditions and with another threonin content of the foodstuffs for the younger pigs
336
(under a middle body weight of 50kg).
Materials
Pigs Every group had 121 pigs. There were two randomised groups with 68 castrated males
and 53 females in the protein reduced group (average body weight 24.76kg) and with 65
castrated males and 56 females in the control group (average body weight 24.85kg).
The genetic basis was a four breed crossing. In the protein reduced group 6 pigs died
during the fattening period, in the control group we had 8 total losses.
Foodstuffs In the first 3 fattening weeks both groups were fed the same feed with 16% protein
(cereal basis). The feeds for starting the fattening period had a low protein content to
prevent diarrhoea. From the 4th week the pigs were fed different feeds for each group.
Control: 17.0% Protein, 4% Fat, including extracted soybean meal '
Protein reduced: 13.5% Protein, 4.5% Fat, without extracted soybean meal,
added Lysine (1kg per ton) and Threonin (200g per ton).
Parameters
Parameters are body weights, feed intake, water intake and slurry production. The slurry
production was measured 8 times in the fattening period. The volume measurements
were level measurements. The dry matter, whole nitrogen content and pH were
measured in the laboratories of the Institute of Animal Nutrition of the University of
Kiel.
The ventilated air in each group was measured with two anemometers in every exhausted
air. The ammonia content in the exhausted air was measured discontinuously with acid
traps and continuously with a new DRÄGER®-apparatus. The temperature and moisture
of the exhausted air and the fresh air was measured.
Results (1st trial)
Daily gain The average daily gain per pig of the protein reduced group was 707g/d and 660g/d in
the control group. Including the total losses of animals the protein reduced group
needed 2.91kg feed per kg carcass weight, the control group needed 2.99kg feed per kg
carcass weight.
337
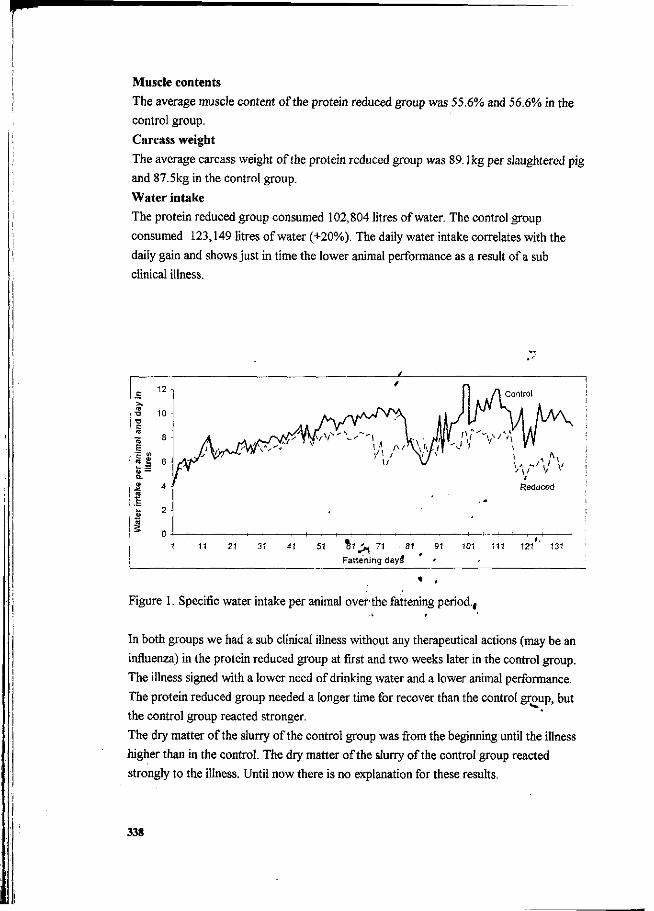
Muscle contents
The average muscle content of the protein reduced group was 55.6% and 56.6% in the
control group.
Carcass weight
The average carcass weight of the protein reduced group was 89.1kg per slaughtered pig
and 87.5kg in the control group.
Water intake The protein reduced group consumed 102,804 litres of water. The control group
consumed 123,149 litres of water (+20%). The daily water intake correlates with the
daily gain and shows just in time the lower animal performance as a result of a sub
clinical illness.
11 21 31 41 51 81 > j 71 81 91 101 111 121 131 Fattening dayS »
Figure 1. Specific water intake per animal overthe fattening period.,
In both groups we had a sub clinical illness without any therapeutical actions (may be an
influenza) in the protein reduced group at first and two weeks later in the control group.
The illness signed with a lower need of drinking water and a lower animal performance.
The protein reduced group needed a longer time for recover than the control group, but
the control group reacted stronger.
The dry matter of the slurry of the control group was from the beginning until the illness
higher than in the control. The dry matter of the slurry of the control group reacted
strongly to the illness. Until now there is no explanation for these results.
338
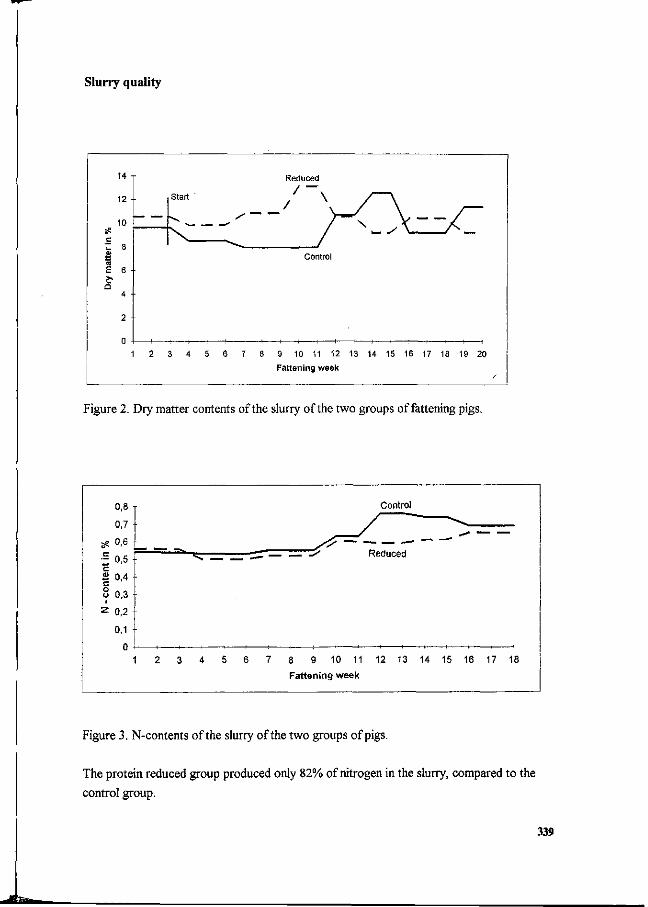
Slurry quality
14 -
12 -
10 -
~ 8 • ax
E 6 •
a 4 •
2
Start
1 2 3 4 5 6 7 8
Reduced
' / _ W^\ " /~^-V / ,„.,. / Control
9 10 11 12 13 14 15 16
Fattening week
—
17
- /
18 19 20
Figure 2. Dry matter contents of the slurry of the two groups of fattening pigs.
0,8
0,7 -
g9 0,6
•- 0,5 1
| 0,4
I 0,3 Z 0,2
0,1
1
• _
2 3 4 5
Control
/ " < . s<r=S
6 7 8 9 10 11 12 13 14 15 16 17 18
Fattening week
Figure 3. N-contents of the slurry of the two groups of pigs.
The protein reduced group produced only 82% of nitrogen in the slurry, compared to the
control group.
339
Ammonia emissions from various pig housing systems
J. Oldenburg
Institut für landwirtschaftliche Verfahrenstechnik, Universität Kiel, Olshausenstraße 40-60, Germany
Summary In systematic emission measurements in pig houses, the various parameters on ammonia
emissions were determined by measurements of the exhausted air speed and ammonia
concentration (discontinuously by DRÄGER-tubes and nearly continuously by an
electric-chemical system) and the emissions from different pig housing systems were
compared.
Swinging ammonia emissions of pig houses are a problem for the development and the
long term use of air cleaning technologies.
Introduction / Ammonia emissions are a source for N-nutrients in the atmosphere. They are in
discussion with ecological problems, especially with the eutrophication of water and
other surfaces. For decreasing the ammonia emission of pig housing systems with air
cleaning technologies like biofilters, bioscrabbers or biotrickling filters one need
informations about the level and the progress of the concentrations and emissions of
ammonia from different housing systems. j
Especially for biofilters the swinging ammonia intake makes problems by the permanent
concentrating of nitrogen in the filter materials (Demmers, 1989; Jol, 1989). ,
Results , The ammonia emissions are increasing with the emitting surface in the stable and the
storage duration of slurry or manure. Temperature of the environmental air and exposure
of the emitting surfaces to the airstream affect the emissions too.
Daily emissions In an existing animal house the behaviour of the animals depending on daytime (light)
and feeding actions is a factor for influence the daily ammonia emission (see figure
l).The ammonia emissions are correspondending with the fresh air temperature of the
environment. The highest emissions from 10 to 12 a.m. are results of high ventilation
rates in dependence of an increasing air temperature and a high activity of the animals
after feeding actions in the morning.
340
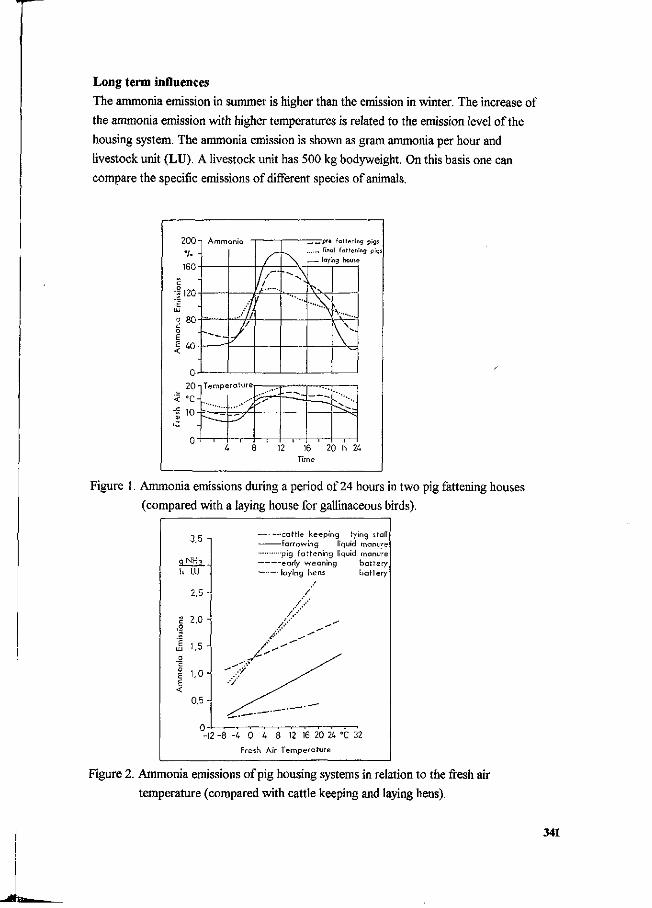
Long term influences
The ammonia emission in summer is higher than the emission in winter. The increase of
the ammonia emission with higher temperatures is related to the emission level of the
housing system. The ammonia emission is shown as gram ammonia per hour and
livestock unit (LU). A livestock unit has 500 kg bodyweight. On this basis one can
compare the specific emissions of different species of animals.
200
160
c 1120 'e
£ £ 4 0 - -
A m m o n i a pre fattening pigs final fattening pig
, laying house
12 16 20 h 24 Time
Figure 1. Ammonia emissions during a period of 24 hours in two pig fattening houses
(compared with a laying house for gallinaceous birds).
a_ h
c .0
'1 UJ
g 0 E £ <
3,5 -1
NH3
LU
2.5 -
2.0 -
1.5 -
1,0-
0.5-
o--1
—cattle keeping tying stall farrowing liquid manure
early weaning battery • laying hens battery
/ . • • '
V / ^ ^
^
2 -8 -U 0 U 8 12 16 20 24 °C 32
Fresh Air Temperafure
Figure 2. Ammonia emissions of pig housing systems in relation to the fresh air
temperature (compared with cattle keeping and laying hens).
341
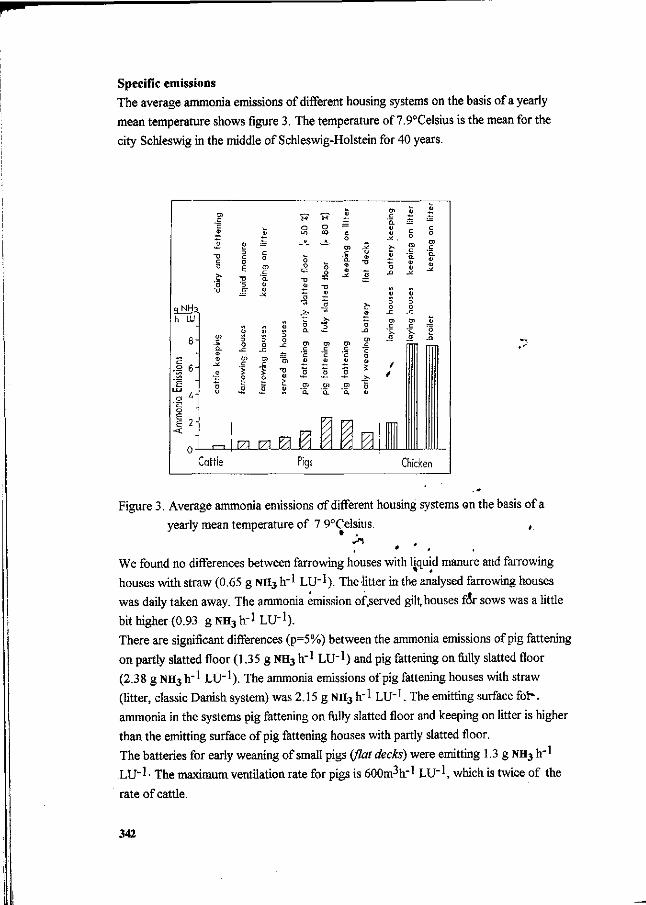
Specific emissions The average ammonia emissions of different housing systems on the basis of a yearly
mean temperature shows figure 3. The temperature of 7.9°Celsius is the mean for the
city Schleswig in the middle of Schleswig-Holstein for 40 years.
Figure 3. Average ammonia emissions of different housing systems on the basis of a
yearly mean temperature of 7.9°Celsius. ,
We found no differences between farrowing houses with Hquid manure and farrowing
houses with straw (0.65 g NH3 tr * LU" 1 ). The litter in the analysed farrowing houses
was daily taken away. The ammonia emission of .served gilt, houses fér sows was a little
bit higher (0.93 g NH3 t rl LU"l ).
There are significant differences (p=5%) between the ammonia emissions of pig fattening
on partly slatted floor (1.35 g NH3 h"1 LU-1) and pig fattening on fully slatted floor
(2.38 g NH3 h"1 LU-1). The ammonia emissions of pig fattening houses with straw
(litter, classic Danish system) was 2.15 g NH3 t r1 LU"1. The emitting surface fotv
ammonia in the systems pig fattening on fully slatted floor and keeping on litter is higher
than the emitting surface of pig fattening houses with partly slatted floor.
The batteries for early weaning of small pigs (flat decks) were emitting 1.3 g NH3 h"1
LU-1 • The maximum ventilation rate for pigs is 600m3 t r1 LU"1, which is twice of the
rate of cattle.
342
AJ1 in - al! out systems
All in - all out systems especially in pig fattening have an increasing ammonia emission
over the fattening period. The animal mass is increasing from 25kg per pig up to 110kg
per pig. The whole animal mass in a stable is increasing in the same way. The surface per
animal do not change over the fattening period, the specific surface per livestock unit is
decreasing such as the animals are growing. An increasing animal mass in a stable needs
an increasing ventilation. An increasing ventilation and air stream is a factor for
increasing ammonia emissions per stable over the fattening period and a big economical
problem for planning an air cleaning system.
References Demmers, T.G.M., 1989. Ammoniakabsorption und Nitrifikation in einem Biowäscher.
VDI-Bericht 735, Köln, p. 147-160.
Jol, A., 1989. Eliminierung von Ammoniak aus der Stalluft eines Tierhaltungsbetriebes
mit Hilfe eines Biofilters. VDI-Bericht 735, Köln, p. 267-276.
343
Reduction of ammonia emission from slurry by application of liquid top layers
P.J.L. Derikx and A.J.A. Aarnink
Division of Buildings and Environmental Technology, Institute of Agricultural Engineering (IMAG-DLO), P.O. Box 43, NL-6700 AA Wageningen, The Netherlands.
Summary
Ammonia emission from livestock production has obtained considerable attention during the last decade in the Netherlands because of its coolribution to acid rain and the unintended fertilization of natural environments. Apart from developing new housing systems, attemr/ts are made to reduce ammonia emission by improvements on existing systems.
Application of mineral and vegetable oil as a liquid top layer on the slurry surfaces inhibited diffusion of ammonia from the slurry to the gas phase above. In laboratory tests a 90 to 95 % reduction of ammonia emission was achieved compared to an untreated control depending on the type of liquid used. Thickness of the top layer may be as little as 2.5 mm under static conditions. The use of liquid top layers offers the opportunity to reduce the ammonia emission of existing livestock housing syste.ms without the requirement of extended changesi
Keywords: Ammonia - emission - liqaid.top layers - oil - slurry '
Introduction
The Dutch government sets a reduction of 70 % of the ammonia emission by agricultural activities as its goal for the year 2000 using ammonia emissions of 1980 as a reference. The reason for this action is the contribution of ammonia to both acid rain and uncontrolled deposition of nitrogen in the surroundings, leading to unintended fertilization of natural environments.
In order to meet this restriction attempts have been made on different levels to reduce the ammonia emission from manure, ranging from the mcfment of production, via storage to the final application of manure on the land. Good results have been obtained by covering on farm storage facilities [De Bode, 1991] and using injection techniques when slurry is applied on the land [Bussink & Bruins, 1992, Klarenbeek & Bruins, 1991].
Contributions to ammonia emission from livestock buildings are made by
344
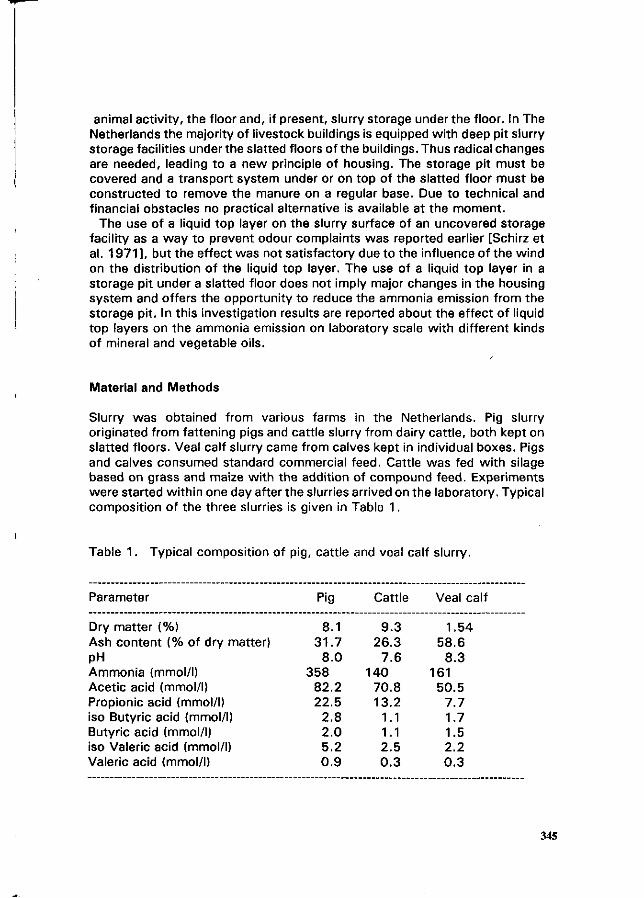
animal activity, the floor and, if present, slurry storage under the floor. In The Netherlands the majority of livestock buildings is equipped with deep pit slurry storage facilities under the slatted floors of the buildings. Thus radical changes are needed, leading to a new principle of housing. The storage pit must be covered and a transport system under or on top of the slatted floor must be constructed to remove the manure on a regular base. Due to technical and financial obstacles no practical alternative is available at the moment.
The use of a liquid top layer on the slurry surface of an uncovered storage facility as a way to prevent odour complaints was reported earlier [Schirz et al. 1971 ] , but the effect was not satisfactory due to the influence of the wind on the distribution of the liquid top layer. The use of a liquid top layer in a storage pit under a slatted floor does not imply major changes in the housing system and offers the opportunity to reduce the ammonia emission from the storage pit. In this investigation results are reported about the effect of liquid top layers on the ammonia emission on laboratory scale with different kinds of mineral and vegetable oils.
Material and Methods
Slurry was obtained from various farms in the Netherlands. Pig slurry originated from fattening pigs and cattle slurry from dairy cattle, both kept on slatted floors. Veal calf slurry came from calves kept in individual boxes. Pigs and calves consumed standard commercial feed. Cattle was fed with silage based on grass and maize wi th the addition of compound feed. Experiments were started within one day after the slurries arrived on the laboratory. Typical composition of the three slurries is given in Table 1.
Table 1. Typical composition of pig, cattle and veal calf slurry.
Parameter
Dry matter (%) Ash content (% of dry matter) pH Ammonia (mmol/l) Acetic acid (mmol/l) Propionic acid (mmol/l) iso Butyric acid (mmol/l) Butyric acid (mmol/l) iso Valeric acid (mmol/l) Valeric acid (mmol/l)
Pig
8.1 31.7
8.0 358
82.2 22.5
2.8 2.0 5.2 0.9
Cattle
9.3 26.3
7.6 140
70.8 13.2
1.1 1.1 2.5 0.3
Veal calf
1.54 58.6
8.3 161
50.5 7.7 1.7 1.5 2.2 0.3
345
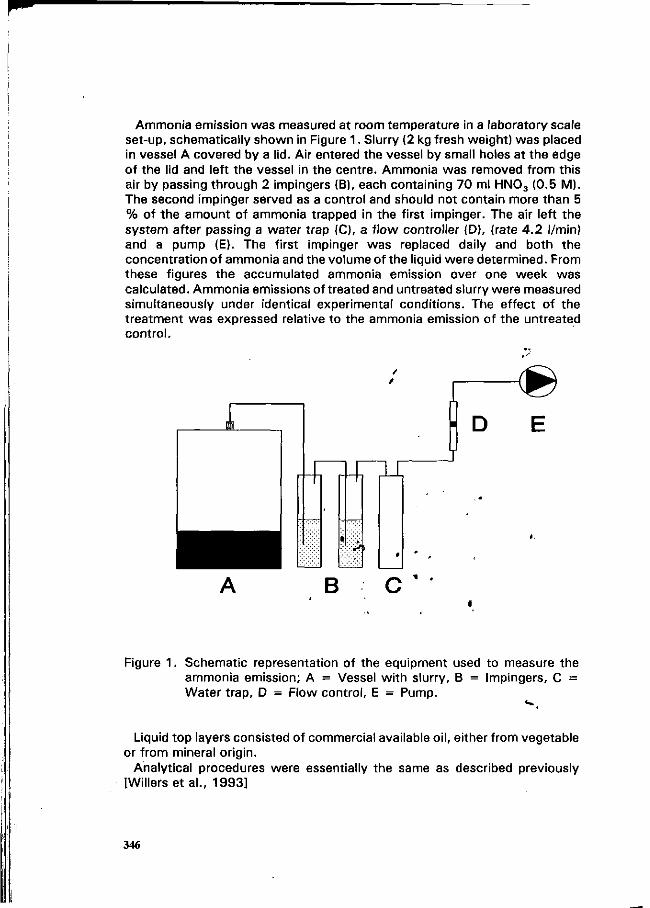
Ammonia emission was measured at room temperature in a laboratory scale set-up, schematically shown in Figure 1. Slurry (2 kg fresh weight) was placed in vessel A covered by a lid. Air entered the vessel by small holes at the edge of the lid and left the vessel in the centre. Ammonia was removed from this air by passing through 2 impingers (B), each containing 70 ml HN03 (0.5 M). The second impinger served as a control and should not contain more than 5 % of the amount of ammonia trapped in the first impinger. The air left the system after passing a water trap (C), a flow controller (D), (rate 4.2 l/min) and a pump (E). The first impinger was replaced daily and both the concentration of ammonia and the volume of the liquid were determined. From these figures the accumulated ammonia emission over one week was calculated. Ammonia emissions of treated and untreated slurry were measured simultaneously under identical experimental conditions. The effect of the treatment was expressed relative to the ammonia emission of the untreated control.
H D E
B C '
Figure 1. Schematic representation of the equipment used to measure the ammonia emission; A = Vessel with slurry, B = Impingers, C = Water trap, D = Flow control, E = Pump.
Liquid top layers consisted of commercial available oil, either from vegetable or from mineral origin.
Analytical procedures were essentially the same as described previously [Willers et al., 1993]
346
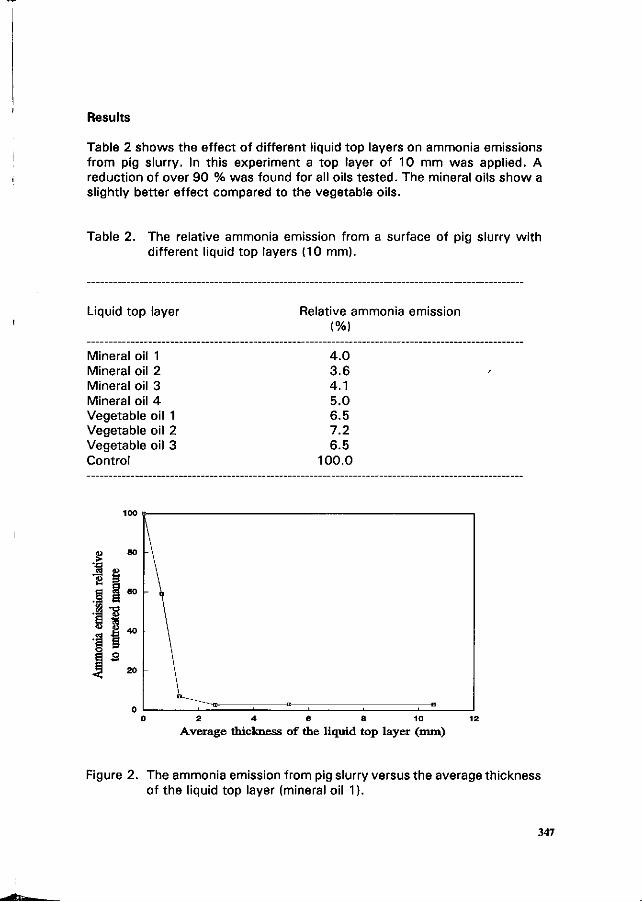
Results
Table 2 shows the effect of different liquid top layers on ammonia emissions from pig slurry. In this experiment a top layer of 10 mm was applied. A reduction of over 90 % was found for all oils tested. " slightly better effect compared to the vegetable oils.
Table 2. The relative ammonia emission from a surface of pig slurry with different liquid top layers (10 mm).
Liquid top layer Relative ammonia emission (%)
Mineral oil 1 Mineral oil 2 Mineral oil 3 Mineral oil 4 Vegetable oil 1 Vegetable oil 2 Vegetable oil 3 Control
4.0 3.6 4.1 5.0 6.5 7.2 6.5
100.0
2 4 6 8 10 12 Average thickness of the liquid top layer (mm)
Figure 2. The ammonia emission from pig slurry versus the average thickness of the liquid top layer (mineral oil 1).
347
The influence of the thickness of a liquid top layer consisting of mineral oil 1 on the ammonia emission from pig slurry is shown in Figure 2. An average layer thickness of 2.5 mm reduced the ammonia emission over 95 %. A similar tendency was observed with cattle slurry, but here an average thickness of 5 mm was necessary to get the same reduction (data not shown). The origin of the slurry proved to have no effect as can be seen in Table 3. In the tests with a liquid top layer of 10 mm of mineral oil 1 a reduction of ammonia emission of over 95 % was obtained.
Table 3. The relative ammonia emission from slurries of various origins covered with a 10 mm liquid top layer consisting of mineral oil 1.
Type of slurry Relative ammonia emission (%)
-r
Pig slurry 4.0 Cattle slurry 3.7 Veal calf slurry 3.6 Controls 100.0
Discussion
The experimental set-up proved to be extremely helpful in evaluating the effect of different treatments on ammonia emission from slurry surfaces. An almost unlimited number of experiments carf be' performed simultaneously under identical experimental conditions. Neverthajes,s, caution must be taken when translating the results to practical'circumstances. Influences of animal behaviour and building design'are not taken into accoutit. Therefore only relative effects are given here.
From Table 2 it can be seen that all products tested reduced the emission of ammonia from slurry remarkably. The best results were obtained with the mineral products. The slightly higher ammonia emission with vegetable oil top layers may be caused by the presence of ionic compounds such as emulsifiers in these products. The solubility of ammonia in such a less hydrophobic environment will be slightly higher, resulting in a higher ammonia concentration in the top layer. The reduction obtained with the vegetable products are within the range reported by Sommer [1991] with rape oil.
The minimal thickness of a top layer to obtain a desired reduction of ammonia emission under laboratory conditions can be derived from Figure 2. Here an effect of the origin of the slurry was noticed. Due to the higher
348
content of fibres the surface of cattle slurry was less smooth compared to pig slurry, resulting in an increase of the average thickness of the top layer needed to obtain the same reduction of ammonia emission.
Not included in this investigation is the effect of a liquid top layer on the total ammonia emission of livestock buildings, but as it the contribution of ammonia emission from storage pits below the floor amounts up to 70 % [Hoeksma et al., 1992], it is tempting to conclude that application of a liquid top layer in the storage pit may reduce the ammonia emission from livestock buildings by over 50 %. Investigations to prove this statement are on their way, together wi th the development of a practical system to retain the liquid top layer in the pit during emptying. The final choice of the type of liquid to be used will be governed by its economic availability and its environmental impact. Furthermore, liquid top layers may be used on slurry storages in combination with a simple roof to eliminate the influence of wind and rain.
Literature
Bussink, D.W. & Bruins, M.A. 1992. Beperking van NH3-emissie bij verschillende toedieningstechnieken voor dunne mest op grasland. Meststoffen, 92: 31-37.
De Bode, M.J.C. 1991 . Odour and ammonia emissions from manure storage. In: Nielsen, V.C., Voorburg, J.H. & L'Hermite, P. Odour and ammonia emissions from livestock farming. Elsevier Applied Science, London, 59-66.
Hoeksma, P., Verdoes, N., Oosthoek, J . & Voermans, J .A.M. 1992. Reduction of ammonia volatilization from pig houses using aerated slurry as recirculation liquid. Livestock Production Science, 3 1 : 121-132.
Klarenbeek, J.V. & Bruins, M.A. 1991. Ammonia emissions after land spreading of animal slurries. In: Nielsen, V.C., Voorburg, J .H. & L'Hermite, P. Odour and ammonia emissions from livestock farming. Elsevier Applied Science, London, 107-115.
Schirz, S.A., Blanken, G., Kunze, D.M., Priewasser, J . , Sebastian, D. & Wolfermann H.F. 1971. Geruchsbelästigung durch Nutztierhaltung und die Möglichkeiten der Vermeidung und Abhilfe. KTBL-Bauschriften, Heft 13. Herbert Maurer, Frankfurt am Main. pp. 110.
Sommer, S.G. 1991. Ammonia volatilization from slurry tanks with different surface coverings. In: The N, P and organic matter research program 1985-1990. Ministry of the Environment, Denmark. 213-229.
Willers, H.C., ten Have, P.J.W., Derikx, P.J.L. & Arts, M.W. 1993. Temperature-dependency of nitrification and required anoxic volume for denitrification in the biological treatment of veal calf manure. Bioresource Technology, 43: 47-52.
349

SESSION 5
Manure application and central processing.
Loss of Nitrogen from Pig Slurry due to Ammonia Volatilization and Nitrate Leaching
S.G. Sommer & I.K. Thomsen
Department of Plant Nutrition and Physiology, Research Centre Foulum, P.O. Box 23, DK-8830 Tjele, Denmark
Summary
Ammonia volatilization and nitrate leaching reduce the fertilizer value of pig slurry in plant production, and may be injurious to the environment. Ammonia volatilization from slurry storages may be reduced by covering the slurry either with natural surface crust, straw, floating covers or roofings. Great leaching losses occur from fields where slurry is applied during autumn and winter. The slurry application period should therefore be restricted to the growth season. This poses restrictions for the techniques which may be used to reduce ammonia volatilization from slurry applied in the field. Considering ammonia losses should be small and the period of slurry application as long as possible (i.e. reducing the need of storage capacity) a scheme for application of slurry during the growth season has been developed. The proposals involves injection, incorporation, and use of the trail hose application technique.
Key words: Nitrate, leaching, ammonia, volatilization, loss reduction.
Introduction
In Denmark nearly 330.000 tonnes of N are annually collected in the form of animal manure from housed cattle and pigs. About 40% of this amount is derived from pig production. More than half of the N content is ammoniacal N, which is plant available, but also at risk of being lost by NH3 volatilization or by nitrate leaching after nitrification. Losses of inorganic nitrogen may reduce the value of the slurry for plant production significantly.
Animal production systems are recognised as the major source of atmospheric NH3
in Europe (Buijsman et al., 1987). Wet or dry deposition of the emitted NH3 may contribute to undesired changes in oligotrophic ecosystems. Much work has therefore been done to increase the understanding of ammonia volatilization from animal manure and to reduce ammonia loss from stored and applied animal slurry.
Leaching losses of nitrate from arable soils are held responsible for increasing concentrations of nitrate in surface and ground waters. To decrease such loss from intensively managed soils, it is essential to extend our knowledge on how different farming systems influence nitrate leaching during autumn and winter periods, and to identify specific measures which will retain more nitrate nitrogen in the soil-plant system. One main objective is to synchronize nitrogen mineralization in the soil and consumption of mineral nitrogen by plant uptake or immobilization better.
In the eighties techniques for handling slurry have been improved in order to reduce
353
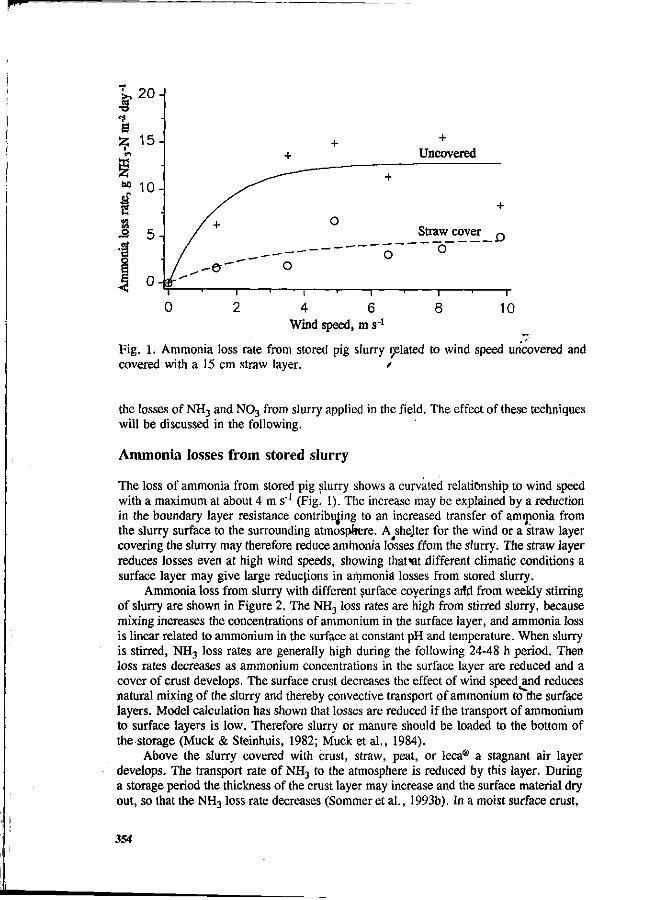
+ Uncovered
0 - [ - i [ -
4 6 Wind speed, m s-1
T 10
Fig. 1. Ammonia loss rate from stored pig slurry Related to wind speed uncovered and covered with a 15 cm straw layer. /
the losses of NH3 and N03 from slurry applied in the field. The effect of these techniques will be discussed in the following.
Ammonia losses from stored slurry
The loss of ammonia from stored pig slurry shows a curvated relationship to wind speed with a maximum at about 4ms"1 (Fig. 1). The increase may be explained by a reduction in the boundary layer resistance contributing to an increased transfer of ammonia from the slurry surface to the surrounding atmosphere. A shejter for the wind or a straw layer covering the slurry may therefore reduce ammonia losses ffom the slurry. The straw layer reduces losses even at high wind speeds, showing thafat different climatic conditions a surface layer may give large reductions in ammonia losses from stored slurry.
Ammonia loss from slurry with different surface coverings ai!d from weekly stirring of slurry are shown in Figure 2. The NH3 loss rates are high from stirred slurry, because mixing increases the concentrations of ammonium in the surface layer, and ammonia loss is linear related to ammonium in the surface at constant pH and temperature. When slurry is stirred, NH3 loss rates are generally high during the following 24-48 h period. Then loss rates decreases as ammonium concentrations in the surface layer are reduced and a cover of crust develops. The surface crust decreases the effect of wind speed and reduces natural mixing of the slurry and thereby convective transport of ammonium to the surface layers. Model calculation has shown that losses are reduced if the transport of ammonium to surface layers is low. Therefore slurry or manure should be loaded to the bottom of the storage (Muck & Steinhuis, 1982; Muck et al., 1984).
Above the slurry covered with crust, straw, peat, or leca® a stagnant air layer develops. The transport rate of NH3 to the atmosphere is reduced by this layer. During a storage period the thickness of the crust layer may increase and the surface material dry out, so that the NH3 loss rate decreases (Sommer et al., 1993b). In a moist surface crust,
354
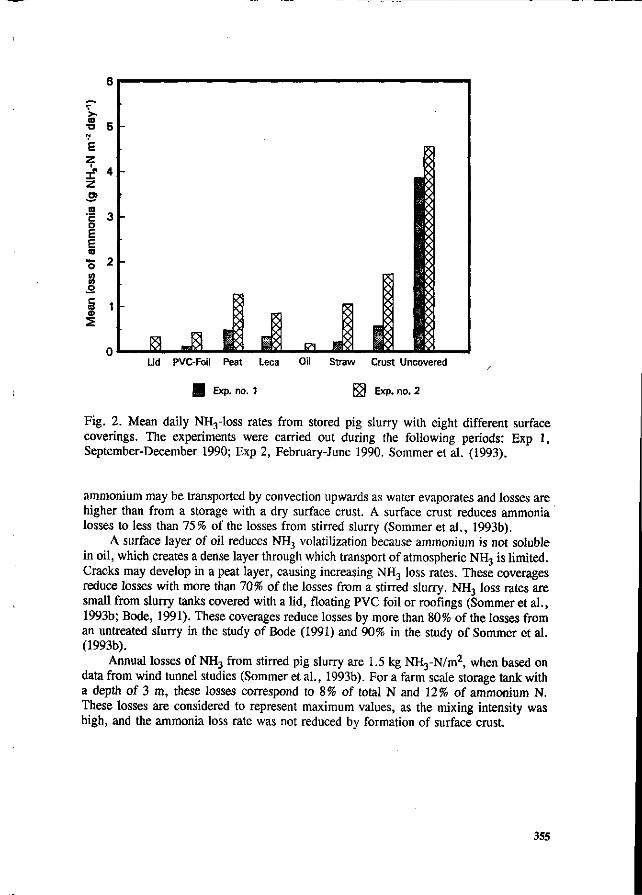
Straw Crust Uncovered
Exp. no. 1 Exp. no. 2
Fig. 2. Mean daily NH3-loss rates from stored pig slurry with eight different surface coverings. The experiments were carried out during the following periods: Exp 1, September-December 1990; Exp 2, February-June 1990. Sommer et al. (1993).
ammonium may be transported by convection upwards as water evaporates and losses are higher than from a storage with a dry surface crust. A surface crust reduces ammonia losses to less than 75% of the losses from stirred slurry (Sommer et al., 1993b).
A surface layer of oil reduces NH3 volatilization because ammonium is not soluble in oil, which creates a dense layer through which transport of atmospheric NH3 is limited. Cracks may develop in a peat layer, causing increasing NH3 loss rates. These coverages reduce losses with more than 70% of the losses from a stirred slurry. NH3 loss rates are small from slurry tanks covered with a lid, floating PVC foil or roofings (Sommer et al., 1993b; Bode, 1991). These coverages reduce losses by more than 80% of the losses from an untreated slurry in the study of Bode (1991) and 90% in the study of Sommer et al. (1993b).
Annual losses of NH3 from stirred pig slurry are 1.5 kg NH3-N/m2, when based on data from wind tunnel studies (Sommer et al., 1993b). For a farm scale storage tank with a depth of 3 m, these losses correspond to 8% of total N and 12% of ammonium N. These losses are considered to represent maximum values, as the mixing intensity was high, and the ammonia loss rate was not reduced by formation of surface crust.
355
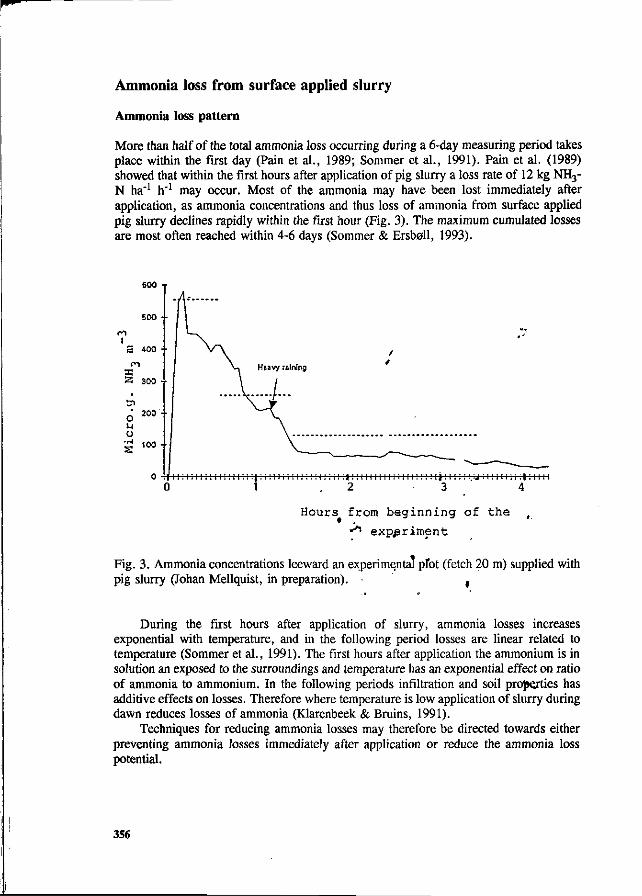
Ammonia loss from surface applied slurry
Ammonia loss pattern
More than half of the total ammonia loss occurring during a 6-day measuring period takes place within the first day (Pain et al., 1989; Sommer et al., 1991). Pain et al. (1989) showed that within the first hours after application of pig slurry a loss rate of 12 kg NH3-N ha"1 h"1 may occur. Most of the ammonia may have been lost immediately after application, as ammonia concentrations and thus loss of ammonia from surface applied pig slurry declines rapidly within the first hour (Fig. 3). The maximum cumulated losses are most often reached within 4-6 days (Sommer & Erstell, 1993).
600 T
Hours from beginning of the ,
• experiment
Fig. 3. Ammonia concentrations leeward an experimental pfot (fetch 20 m) supplied with pig slurry (Johan Mellquist, in preparation). ,
During the first hours after application of slurry, ammonia losses increases exponential with temperature, and in the following period losses are linear related to temperature (Sommer et al., 1991). The first hours after application the ammonium is in solution an exposed to the surroundings and temperature has an exponential effect on ratio of ammonia to ammonium. In the following periods infiltration and soil properties has additive effects on losses. Therefore where temperature is low application of slurry during dawn reduces losses of ammonia (Klarenbeek & Bruins, 1991).
Techniques for reducing ammonia losses may therefore be directed towards either preventing ammonia losses immediately after application or reduce the ammonia loss potential.
356
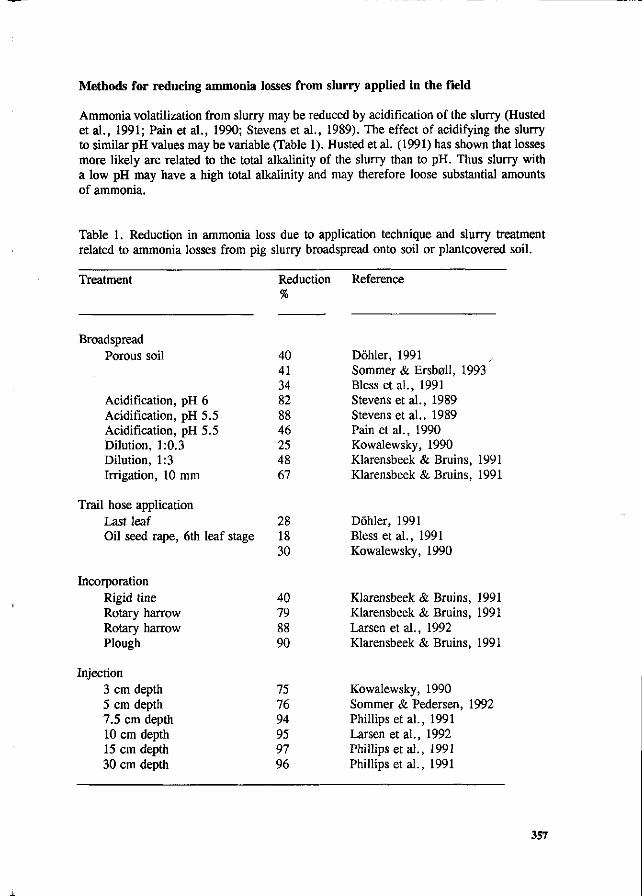
Methods for reducing ammonia losses from slurry applied in the field
Ammonia volatilization from slurry may be reduced by acidification of the slurry (Husted et al., 1991; Pain et al., 1990; Stevens et al., 1989). The effect of acidifying the slurry to similar pH values may be variable (Table 1). Husted et al. (1991) has shown that losses more likely are related to the total alkalinity of the slurry than to pH. Thus slurry with a low pH may have a high total alkalinity and may therefore loose substantial amounts of ammonia.
Table 1. Reduction in ammonia loss due to application technique and slurry treatment related to ammonia losses from pig slurry broadspread onto soil or plantcovered soil.
Treatment
Broadspread Porous soil
Acidification, Acidification, Acidification,
pH6 pH5.5 pH5.5
Dilution, 1:0.3 Dilution, 1:3 Irrigation, 10
Trail hose applicati Last leaf Oil seed rape,
Incorporation Rigid tine Rotary harrow Rotary harrow Plough
Injection 3 cm depth 5 cm depth 7.5 cm depth 10 cm depth 15 cm depth 30 cm depth
mm
on
6th leaf stage
Reduction %
40 41 34 82 88 46 25 48 67
28 18 30
40 79 88 90
75 76 94 95 97 96
Reference
Döhler, 1991 Sommer & Ersball, 1993 Blessetal., 1991 Stevensetal., 1989 Stevensetal.. 1989 Pain et al., 1990 Kowalewsky, 1990 Klarensbeek & Bruins, 1991 Klarensbeek & Bruins, 1991
Döhler, 1991 Blessetal., 1991 Kowalewsky, 1990
Klarensbeek & Bruins, 1991 Klarensbeek & Bruins, 1991 Larsen et al., 1992 Klarensbeek & Bruins, 1991
Kowalewsky, 1990 Sommer & Pedersen, 1992 Phillips et al., 1991 Larsen et al., 1992 Phillips et al., 1991 Phillips et al., 1991
357
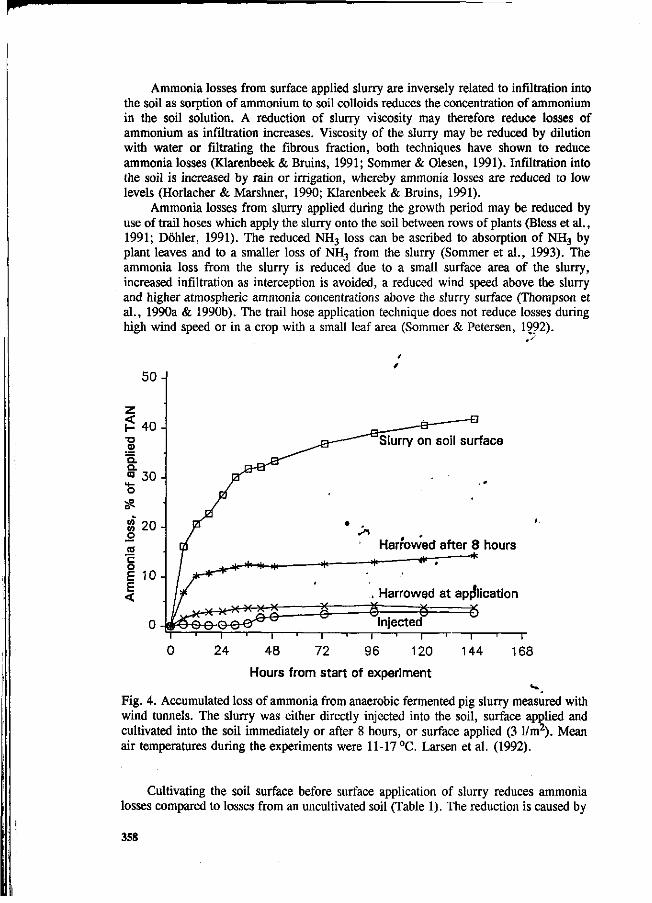
Ammonia losses from surface applied slurry are inversely related to infiltration into the soil as sorption of ammonium to soil colloids reduces the concentration of ammonium in the soil solution. A reduction of slurry viscosity may therefore reduce losses of ammonium as infiltration increases. Viscosity of the slurry may be reduced by dilution with water or filtrating the fibrous fraction, both techniques have shown to reduce ammonia losses (Klarenbeek & Bruins, 1991; Sommer & Olesen, 1991). Infiltration into the soil is increased by rain or irrigation, whereby ammonia losses are reduced to low levels (Horlacher & Marshner, 1990; Klarenbeek & Bruins, 1991).
Ammonia losses from slurry applied during the growth period may be reduced by use of trail hoses which apply the slurry onto the soil between rows of plants (Bless et al., 1991; Döhler, 1991). The reduced NH3 loss can be ascribed to absorption of NH3 by plant leaves and to a smaller loss of NH3 from the slurry (Sommer et al., 1993). The ammonia loss from the slurry is reduced due to a small surface area of the slurry, increased infiltration as interception is avoided, a reduced wind speed above the slurry and higher atmospheric ammonia concentrations above the slurry surface (Thompson et al., 1990a & 1990b). The trail hose application technique does not reduce losses during high wind speed or in a crop with a small leaf area (Sommer & Petersen, 1992).
168
Hours from start of experiment
Fig. 4. Accumulated loss of ammonia from anaerobic fermented pig slurry measured with wind tunnels. The slurry was either directly injected into the soil, surface applied and cultivated into the soil immediately or after 8 hours, or surface applied (3 1/rrr). Mean air temperatures during the experiments were 11-17°C. Larsen et al. (1992).
Cultivating the soil surface before surface application of slurry reduces ammonia losses compared to losses from an uncultivated soil (Table 1). The reduction is caused by
358
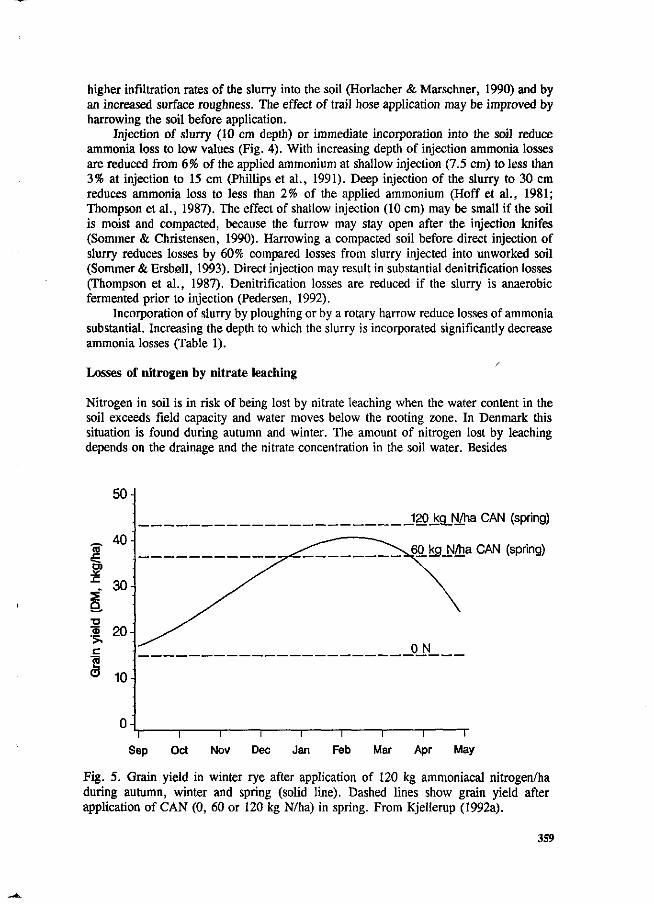
higher infiltration rates of the slurry into the soil (Horlacher & Marschner, 1990) and by an increased surface roughness. The effect of trail hose application may be improved by harrowing the soil before application.
Injection of slurry (10 cm depth) or immediate incorporation into the soil reduce ammonia loss to low values (Fig. 4). With increasing depth of injection ammonia losses are reduced from 6% of the applied ammonium at shallow injection (7.5 cm) to less than 3% at injection to 15 cm (Phillips et al., 1991). Deep injection of the slurry to 30 cm reduces ammonia loss to less than 2% of the applied ammonium (Hoff et al., 1981; Thompson et al., 1987). The effect of shallow injection (10 cm) may be small if the soil is moist and compacted, because the furrow may stay open after the injection knifes (Sommer & Christensen, 1990). Harrowing a compacted soil before direct injection of slurry reduces losses by 60% compared losses from slurry injected into unworked soil (Sommer & Ersboll, 1993). Direct injection may result in substantial denitrification losses (Thompson et al., 1987). Denitrification losses are reduced if the slurry is anaerobic fermented prior to injection (Pedersen, 1992).
Incorporation of slurry by ploughing or by a rotary harrow reduce losses of ammonia substantial. Increasing the depth to which the slurry is incorporated significantly decrease ammonia losses (Table 1).
Losses of nitrogen by nitrate leaching
Nitrogen in soil is in risk of being lost by nitrate leaching when the water content in the soil exceeds field capacity and water moves below the rooting zone. In Denmark this situation is found during autumn and winter. The amount of nitrogen lost by leaching depends on the drainage and the nitrate concentration in the soil water. Besides
50
^ 40 CO
.*: £ . 30 2 T3
1 20
1 O 10-
J20J<g_N/ha CAN (spring)
60_kg_N/ha CAN (spring)
ON
Sep Oct Nov Dec Jan — i 1 1 r Feb Mar Apr May
Fig. 5. Grain yield in winter rye after application of 120 kg ammoniacal nitrogen/ha during autumn, winter and spring (solid line). Dashed lines show grain yield after application of CAN (0, 60 or 120 kg N/ha) in spring. From Kjellerup (1992a).
359
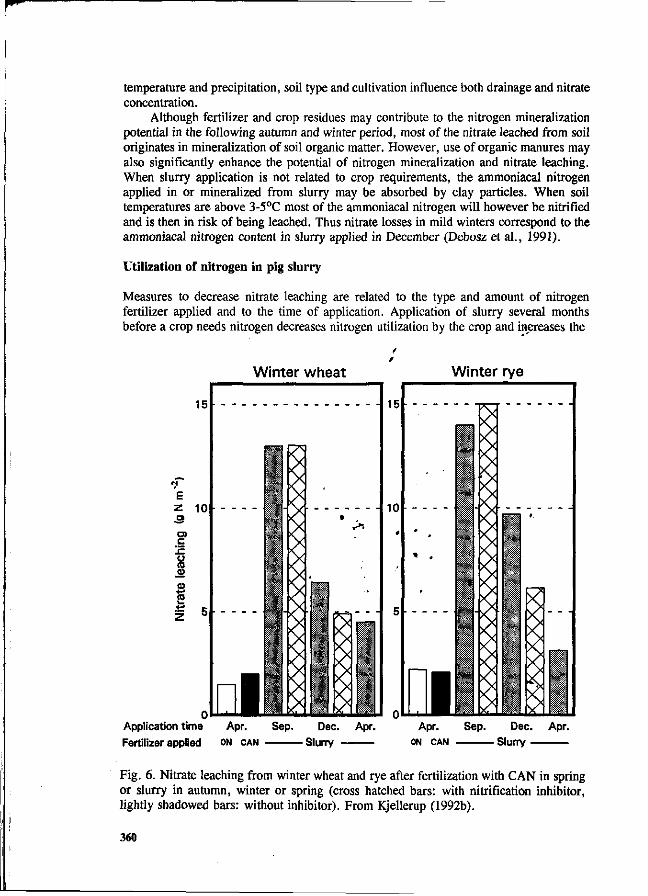
temperature and precipitation, soil type and cultivation influence both drainage and nitrate concentration.
Although fertilizer and crop residues may contribute to the nitrogen mineralization potential in the following autumn and winter period, most of the nitrate leached from soil originates in mineralization of soil organic matter. However, use of organic manures may also significantly enhance the potential of nitrogen mineralization and nitrate leaching. When slurry application is not related to crop requirements, the ammoniacal nitrogen applied in or mineralized from slurry may be absorbed by clay particles. When soil temperatures are above 3-5°C most of the ammoniacal nitrogen will however be nitrified and is then in risk of being leached. Thus nitrate losses in mild winters correspond to the ammoniacal nitrogen content in slurry applied in December (Debosz et al., 1991).
Utilization of nitrogen in pig slurry
Measures to decrease nitrate leaching are related to the type and amount of nitrogen fertilizer applied and to the time of application. Application of slurry several months before a crop needs nitrogen decreases nitrogen utilization by the crop and increases the
Winter wheat Winter rye
D3 Ç o (0
Application time
Fertilizer applied
Fig. 6. Nitrate leaching from winter wheat and rye after fertilization with CAN in spring or slurry in autumn, winter or spring (cross hatched bars: with nitrification inhibitor, lightly shadowed bars: without inhibitor). From Kjellerup (1992b).
360
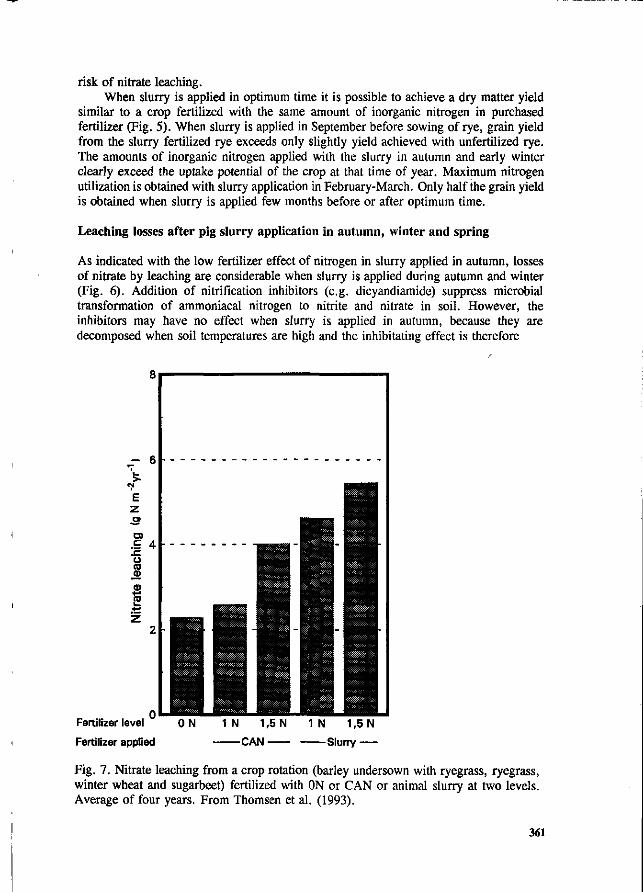
risk of nitrate leaching. When slurry is applied in optimum time it is possible to achieve a dry matter yield
similar to a crop fertilized with the same amount of inorganic nitrogen in purchased fertilizer (Fig. 5). When slurry is applied in September before sowing of rye, grain yield from the slurry fertilized rye exceeds only slightly yield achieved with unfertilized rye. The amounts of inorganic nitrogen applied with the slurry in autumn and early winter clearly exceed the uptake potential of the crop at that time of year. Maximum nitrogen utilization is obtained with slurry application in February-March. Only half the grain yield is obtained when slurry is applied few months before or after optimum time.
Leaching losses after pig slurry application in autumn, winter and spring
As indicated with the low fertilizer effect of nitrogen in slurry applied in autumn, losses of nitrate by leaching are considerable when slurry is applied during autumn and winter (Fig. 6). Addition of nitrification inhibitors (e.g. dicyandiamide) suppress microbial transformation of ammoniacal nitrogen to nitrite and nitrate in soil. However, the inhibitors may have no effect when slurry is applied in autumn, because they are decomposed when soil temperatures are high and the inhibitating effect is therefore
Fertilizer level
Fertilizer applied
1N 1,5 N
CAN
I N 1,5 N
— Slurry —
Fig. 7. Nitrate leaching from a crop rotation (barley undersown with ryegrass, ryegrass, winter wheat and sugarbeet) fertilized with ON or CAN or animal slurry at two levels. Average of four years. From Thomsen et al. (1993).
361
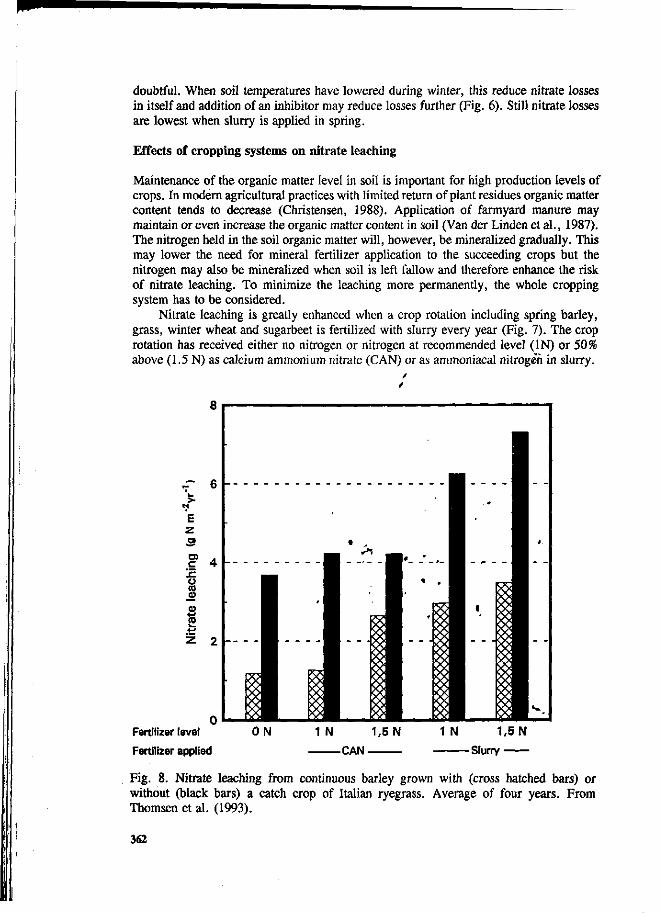
doubtful. When soil temperatures have lowered during winter, this reduce nitrate losses in itself and addition of an inhibitor may reduce losses further (Fig. 6). Still nitrate losses are lowest when slurry is applied in spring.
Effects of cropping systems on nitrate leaching
Maintenance of the organic matter level in soil is important for high production levels of crops. In modern agricultural practices with limited return of plant residues organic matter content tends to decrease (Christensen, 1988). Application of farmyard manure may maintain or even increase the organic matter content in soil (Van der Linden et al., 1987). The nitrogen held in the soil organic matter will, however, be mineralized gradually. This may lower the need for mineral fertilizer application to the succeeding crops but the nitrogen may also be mineralized when soil is left fallow and therefore enhance the risk of nitrate leaching. To minimize the leaching more permanently, the whole cropping system has to be considered.
Nitrate leaching is greatly enhanced when a crop rotation including spring barley, grass, winter wheat and sugarbeet is fertilized with slurry every year (Fig. 7). The crop rotation has received either no nitrogen or nitrogen at recommended level (IN) or 50% above (1.5 N) as calcium ammonium nitrate (CAN) or as ammoniacal nitrogen in slurry.
- 6 -
E z
CD
c 'Z. u CO CD
CO
4 -
Z 2
Fertilizer level
Fertilizer applied
ON 1N 1,5 N
CAN
1 N 1,5 N
Slurry
Fig. 8. Nitrate leaching from continuous barley grown with (cross hatched bars) or without (black bars) a catch crop of Italian ryegrass. Average of four years. From Thomsen et al. (1993).
362
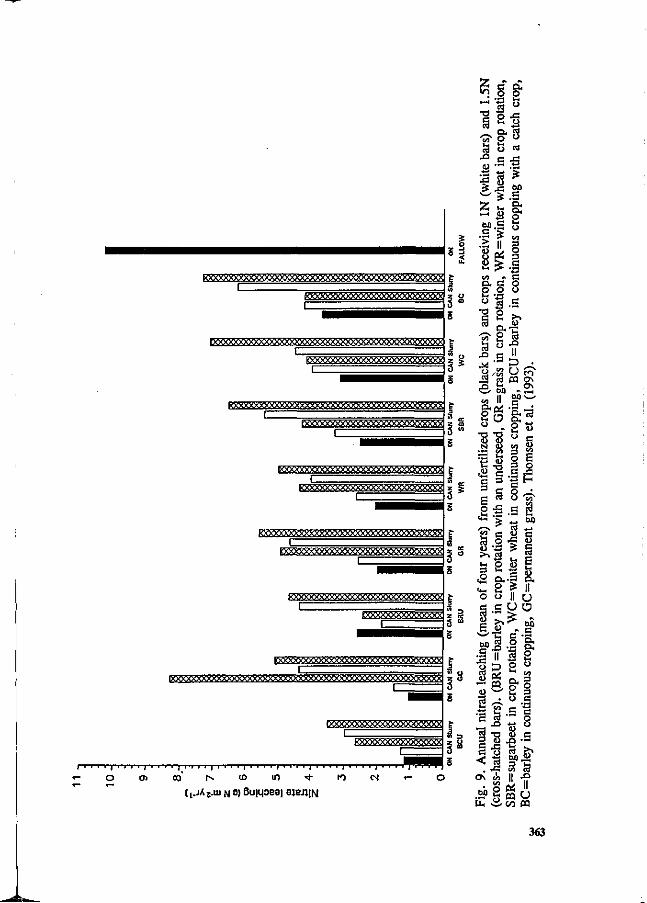
Kxxxyxxxxxxxxxxxxxxxxxxxxxx
rXXXtt66ö6i<tt06000M606XX>6<SÖ^^ I
l50OO0OOO0<XxraXXXrtö6öflg555:
I ~ ~
^öQ^xxxxyvxx»<XXXX><XXXX>öa<yxvyyx
KXWWWWCWCWQW^^
^*X»0666a6ft&frXXXXXXyXXy^^
iso«>ooooó60ooooóooaóaoooooöooo^
R?aö0ó0o0ó0ó66<vxyyxy>a<xxwvyyy
EXXXXXXXXXXXXXX%
(506a«^5600600060<X>OOOOOô060<XVSS
KXttOÖÖOOOÖ&KXXXttaöOOOÖO^^
OOOOOOOCXXXXXXXXXXXXXXX r
KX>ÖOOO<XX»6Ö6ÖÖÖ<
' I ' • ' I I I I I I I I I I I I 1 I
W •+ to CO IV (O
( [ . JAJ .U I M 0) ßuiqoeai OIBJJIN
cs
z o s m
s
Z CÛ
3 °
1°
3° s
<- o ON
363
Nitrate leaching from crops fertilized at recommended level with CAN is at the same level as from unfertilized crops otherwise nitrate leaching clearly reflects the fertilization. Mineralization of the organic nitrogen applied in slurry induces a greater leaching from the crops fertilized with slurry compared with crops fertilized with the same amount of nitrogen in CAN.
The presence of a crop in autumn and winter may greatly decrease nitrate leaching as the crop absorbs nitrate from the soil and decrease the amount left exposed for leaching. An early-sown catch crop can take up a substantial amount of nitrogen and thereby decrease nitrate losses from spring cereals (Fig. 8). The catch crop (Italian ryegrass) keeps at all fertilizer levels the nitrate losses below the losses achieved from barley fertilized with recommended levels of CAN but grown without a catch crop.
Nitrate leaching from a crop may vary depending on whether the crop is grown continuously or in a crop rotation. When spring barley, winter wheat and grass grown either continuously or in a crop rotation including sugarbeet, crops from the two cropping systems can be ranked in relation to nitrate leaching (Fig. 9). The crops are arranged in ascending order from the amounts of nitrate leached after fertilization with CAN at the recommended rate (IN). Under this fertilization regime nitrate losses are smallest after spring barley grown continuously and undersown with Italian ryegrass; Spring barley grown continuously but without a nitrogen catch/crop shows the largest loss. Nitrate leaching from winter wheat grown continuously'differs only slightly from continuous barley. The nitrogen uptake potential for winter wheat during autumn and winter apparently cannot counterbalance the extra mineralization induced of the soil cultivation before sowing of winter wheat. Unfertilized fallow peaks with a loss of exceeding 10 g N/m2/yr. For crops grown in rotation, the ranking depends on the position of each crop within the sequence. Another cropping sequence may well have resulted in a different ranking of nitrate leaching potential because the nitrate loss under one crop is influenced both by the previous and the succeeding crop.
Conclusion
Techniques for handling slurry are betftg improved in order to reduce the losses of inorganic nitrogen from slurry.
During storage ammonia volatilization may be réüueed by a surface cover in form of a straw or a crust layer, roofings or floating covers.
Application of animal slurry during autumn and winter may r5e convenient but causes great leaching losses. This practice therefore is unacceptable from an environmental and a resource point of view. Even if the soil is covered by a winter cereal and a nitrification inhibitor has been added to the slurry, crop utilization of the nitrogen is low and the risk of nitrate leaching high. To increase crop uptake of nitrogen and reduce nitrate leaching slurry should be applied in spring. Furthermore, after slurry application the mineralization potential of a soil increases and in the years after application it is therefore,iinportant to keep the soil covered e.g. by catch crop.
The slurry application period is thus restricted to the growth season. This poses restrictions for the techniques which may be used to reduce ammonia volatilization from slurry applied in the field. The need for storage capacity can be reduced, if slurry can be spread during the entire growth season without substantial ammonia losses.
Before planting slurry could be applied either onto the soil surface followed by incorporation or by direct injection into the soil. Direct injection may also be used in
364
spring to cereals or beets at an early growth stage, but later in the growth period direct injection may reduce crop yield due to destruction of roots. Alternatively slurry may be applied during the growth period by use of trail hoses, the effect of the trail hose application technique could be improved by shallow soil tillage before slurry application. During the entire growth season slurry may be applied to grass by injection into the soil or by trail hose application.
Volatilization of NH3 from surface applied slurry may be reduced if infiltration of the slurry is increased either by diluting the slurry or filtration. Application of slurry before or during rain, or in periods with low temperatures also reduces volatilization losses. Reducing the alkalinity of the slurry may reduce ammonia losses substantially.
References
Bless, H.G., Beinhauer, R. & Sattelmacher, B., 1991. Ammonia emission from slurry applied to wheat stubble and rape in North Germany. Journal of Agricultural Science, Cambridge 117:225-231.
de Bode, M.J.C., 1991. Odour and ammonia emissions from manure storage. In: Ammonia and Odour Emissions from Livestock Production (Eds. V.C. Nielsen, J.H. Voorburg & P. L'Hermité). London & New York. Elsevier Applied Science Publishers, p. 59-66. '
Buijsman, E., Maas, H.F.M. & Asman, W.A.H., 1987. Antropogenic NH3 emissions in Europe. Atmospheric Environment 21:1009-1022.
Christensen, B.T., 1988. Effect of cropping system on soil organic matter content. I. Small-plot experiments with incorporation of straw and animal manure, 1956-1986. Tidsskrift for Planteavl 92:295-305. (In Danish with English summary).
Debosz K, Djuurhus J, Maag, M. & Lind, A., 1991. Studies of N-transformations in arable soils. N-minetalization, denitrification and N-leaching. In: Nitrogen and phosphorus in soil and air. A-abstracts. MilJ0ministeriet, Miljostyrelsen, p. 149-165.
Döhler, H., 1991. Laboratory and field experiments for estimating ammonia losses from pig and cattle slurry following application. In: Ammonia and Odour Emissions from Livestock Production (Eds. V.C. Nielsen, J.H. Voorburg & P. L'Hermité). London & New York. Elsevier Applied Science Publishers, p. 132-140.
Hoff, J.D., Nelson, D.W. & Sutton, A.L., 1981. Ammonia volatilization from liquid swine manure applied to cropland. Journal of Environmental Quality, 10:90-95.
Horlacher, D. & Marschner, H., 1990. Schätzrahmen zur beurteilung von ammoniakverlusten nach ausbringung von rinderflüssigmist. Z. Pflanzenernähr. Bodenk. 153:107-115.
Husted, S., Jensen, L.S. & J0rgensen, S. Storgârd, 1991. Reducing Ammonia loss from cattle slurry by the use of acidifying additives: the role of the buffer system. Journal of the Science of Food and Agriculture 57:335-349.
Kjellerup, V., 1992a. Surface application of pig slurry to winter wheat and winter rye: effect of application time. Tidsskrift for Planteavl 96:245-255. (In Danish with English summary).
Kjellerup, V., 1992b. Svinegylle og inhibitorer til vintersœd. Gran Viden nr. 94. (In Danish).
Klarenbeek, J.V. & Bruins, M.A., 1991. Ammonia emission after land spreading of animal slurries. In: Ammonia and Odour Emissions from Livestock Production (Eds. V.C. Nielsen, J.H. Voorburg & P. L'Hermité). London & New York. Elsevier
365
Applied Science Publishers, p. 107-115. Kowalewsky, H.-H., 1990. Vergleich neuer ausbringtechniken zur Verminderung der
ammoniakfreisetzung bei der ausbringung von flüssigmist auf gründland. In: Ammoniak in der umweit- Kreisläufe, Wirkungen, Minderung (Eds. H. Dehler & H. van den Weghe) KTBL, Darmstadt, p. 43.1-43.5.
Larsen, K.E., Petersen, J., Hansen, J.F. & Sommer, S.G., 1992. Kvaelstofvirkning af ubehandlet og afgasset gylle efter overfladeudbringning og nedfaeldning. (Nitrogen effect of raw and fermented slurry after surface spreading and direct injection). Tidsskrift Planteavl 96:223-243. (Summary and legends in English).
Van der Linden, A.M.A., Van Veen, J.A. & Frissel, M.J., 1987. Modelling soil organic matter levels after long-term applications of crop residues, and farmyard and green manures. Plant and Soil 101:21-28.
Muck, R.E. & Steenhuis, T.S., 1982. Nitrogen losses from manure storages. Agricultural Wastes 4:41-54.
Muck, R.E., Guest, R.W. & Richards, B.K., 1984. Effects of manure storage design on nitrogen conservation. Agricultural Wastes 10:205-220.
Pain, B.F., Phillips, V.R., Clarkson, CR. & Klarenbeek, J.V., 1989. Loss of nitrogen through ammonia volatilisation during and following application of pig or cattle slurry to grassland. Journal of the Science of Food and Agriculture 47:1-12.
Pain, B.F., Thompson, R.B., Rees, Y.J. & Skinner/J.H., 1990. Reducing gaseous losses of nitrogen from cattle slurry applied to grassland by the use of additives. Journal of the Sciences of Food and Agriculture 50:141-153.
Pedersen, J.O., 1992. Nitrification and denitrification after direct injection of liquid cattle manure. Acta Agricultura Scandinavia, Section B, Soil and Plant Science 42:94-99.
Phillips, V.R., Pain, B.F. & Klarenbeek, J.V., 1991. Factors affecting the odour and ammonia emissions during and after land spreading of animal slurries. In: Ammonia and Odour Emissions from Livestock Production (Eds. V.C. Nielsen, J.H. Voorburg & P. L'Hermité). London & New York. Elsevier Applied Scienee Publishers, p. 98-106.
Sommer, S.G. & Christensen, B.T., 1990. Ammoniakfordampning fra fast husdyrgodning samt ubehandlet afgasset og filtreret gylis efter overfladeudbringning, nedfasldning, nedharvning og vanding. (Ammonia volatilization from solid manure and raw, fermented and separated slurry after surface application,, injection, incorporation into the soil and irrigation). Tidsskrift for Planteavl.94:497-417. (Summary and legends in English). ' i
Sommer, S.G. & Olesen, J.E., 1991. Effect óf dry matter content and temperature on ammonia loss from surface-applied cattle slurry. J. Environmental Quality 20:679-683.
Sommer, S.G., Olesen, J.E. & Christensen, B.T., 1991. Effects of temperature, wind speed and air humidity on ammonia volatilization from surface applied cattle slurry. Journal of Agricultural Science, Cambridge 117:91-100.
Sommer, S.G. & Ersboll, A.K., 1993. Effect of Soil Tillage on Ammonia Volatilization from Surface Applied or Injected Animal Slurry. Submitted.
Sommer, S.G., Jensen, E.S. & Schjorring, J.K., 1993a. Leaf absorption of atmospheric ammonia emitted from pig slurry applied beneath the canopy of winter wheat. Acta Agricultura Scandinavia, Section B. Plant and Soil. In press.
Sommer, S.G., Christensen, B.T., Nielsen, N.E. & Schjcrrring, J.K., 1993b. Ammonia Volatilization During Storage of Cattle and Pig Slurry: Effect of Surface Cover. Journal of Agricultural Science, Cambridge. In Press.
366
Sommer, S.G. & Petersen, J., 1992. Maling af ammoniakfordampning fra udbragt gylle bestemt med en ny mikrometeorologisk massebalancemetode: Effekt af overfladeudbringning, nedfaddning og udbringning med slaebeslange pâ ammoniaktabet fra ubehandlet svinegylle og opkoncentreret biogasgylle. (Ammonia volatilization from slurry in the field measured by a new micrometeorological mass-balance technique: Ammonia loss from direct injected and drag hose applied pig slurry and concentrated anaerobic fermented slurry). Tidsskrift for Planteavl. S. In press. (Summary and legends in English).
Stevens, R.J., Laughlin, R.J. & Frost, LP., 1989. Effects of acidification with sulphuric acid on the volatilization of ammonia from cow and pig slurries. Journal of Agricultural Science, Cambridge 113:389-395.
Thompson, R.B., Ryden, J.C. & Lockyer, D.R., 1987. Fate of nitrogen in cattle slurry following surface application or injection to grassland. Journal of Soil Science 38:689-700.
Thompson, R.B., Pain, B.F. & Lockyer, D.R., 1990a. Ammonia volatilization from cattle slurry following surface application to grassland. Influence of mechanical separation, changes in chemical composition during volatilization and the presence of the grass sward. Plant and Soil 125:109-117.
Thompson, R.B., Pain, B.F. & Rees, Y.J., 1990b. Ammonia volatilization from cattle slurry following surface application to grassland. II. Influence of application rate, wind speed and applying slurry in narrow bands. Plant and Soil 125:119-128.
Thomsen, I.K., Hansen, J.F., Kjellerup, V. & Christensen, B.T., 1993. Effects of cropping system and rates of nitrogen in animal slurry and mineral fertilizer on nitrate leaching from a sandy loam. Soil Use and Management. In press.
367
The fate of nitrogen in pig slurry applied to a pasture soil in New Zealand
K.C. Cameron & A.W. Rate
Department of Soil Science, Lincoln University, Canterbury, New Zealand.
Summary
Pig slurry was applied at three rates (0,200,600 kg N ha"1) to twelve soil monolith lysimeters (500 mm diameter x 450 mm deep) during March 1991 (autumn). Each lysimeter comprised of 250 mm of silt loam topsoil above free draining gravels. The lysimeters were installed in the field and received natural rainfall, plus simulated rainfall to ensure that worst-case leaching conditions occurred. The results show that after 14 months only a small fraction (5%) of the 200 kg N ha"1 slurry application was leached (equivalent to 11 kg N ha"1), 10% was lost by ammonia volatilisation, and 47% of applied N was taken up by the pasture plants. At the 600 kg N ha"1 application rate the leaching loss was higher (20% of N applied) and the efficiency of plant recovery lower (27% of N applied). Application of slurry at either rate resulted in considerable increases (> 1.7 fold) in pasture production, which was attributed to impcoved plant nutrition.
/ Introduction '
One of the main environmental concerns about land spreading of piggery waste is the risk of groundwater contamination through nitrate (N03") leaching (Cameron & Haynes, 1986). Nitrate concentrations in some aquifers in Canterbury, New Zealand already exceed the WHO limit for potable water of 10 mg N L"1. While this contamination largely originated from grazed pasture and cropland, point sources of nitrate contamination such as piggeries are more easily identified and controlled (Burden, 1984). A number of studies in Europe and the United States of America (for example: O'Callaghan and Florers, 1981; Sherwood, 1986; Spallacci, 1989; Vetter and Steffens, 1981 ; have examined nitrate leaching and/or nitrogen uptake by crops after land application of piggery wastes. However, the fate of nitrogen in pig slurry applied to New Zealand soils does not appear to have been studied in detail and direct measurements of nitrate leaching losses have not been published. The objectives ofThis stu<Jy were therefore: (i) to make direct measurements of the amount and concentration of nitrogen leached from soil following the application of different rates of pig slurry to pasture; (ii) to measure the amount of nitrogen retained by plants and soil following such an application; and (iii) to measure the volatilisation loss of nitrogen following the application of pig slurry. *.
Materials and methods
Lysimeter collection
Twelve undisturbed soil lysimeters (500 mm diameter x 450 mm deep) were collected from shallow stony silt loam (Lismore silt loam, Kear et al. 1967) at Bumham, Canterbury, New Zealand. Lysimeter sampling methods followed the procedure described by Cameron et al. (1990). Briefly, a trench was dug around each cylinder to expose a small depth of soil monolith (50 mm) below the cylinder cutting edge. The cylinder was then gently pushed over the exposed depth of soil and the process repeated. Each lysimeter cylinder had an internal cutting ring at the base which allowed an annular gap (5 mm) to be produced between the soil monolith and the cylinder wall. This gap was essential to allow the edge of the lysimeter to be sealed with
368
petroleum jelly and thus prevent edge-flow of drainage water. Once the full depth of soil monolith had been collected a sharp edge steel cutting-plate with a central port was pushed under the lysimeter using a hydraulic ram. This steel plate allowed the lysimeter to be removed from the ground and was later sealed to the bottom edge of the cylinder to act as a drainage base. At Lincoln, the lysimeters were installed in an underground facility with their top level with the ground surface of the field site. This ensured that the pasture plants grew under normal environmental conditions. Drainage water from the base of each lysimeter was collected in sealed vessels located in the underground collection facility.
Slurry composition and application
Samples of unscreened pig slurry were collected from the Burnham piggery and analysed (Bremner & Mulvaney, 1982). A detailed analysis of the slurry is given in Rate & Cameron (1992), the total-N concentration was 1420 mg N kg'1 slurry; ammonium-N was 1200 mg kg_1; nitrate-N was 0 mg kg"1.
Slurry was applied to the lysimeters on 11 March 1991 at three rates, with four replicate lysimeters at each rate: 0 kg N ha"1 (control treatment); 200 kg N ha'1 - current recommended maximum annual application rate for Canterbury (Fietje, 1988) (termed the 'low-rate'); 600 kg N ha"1 (termed the 'high-rate').
Lysimeter leaching conditions
The lysimeters were leached under controlled conditions simulating a realistic wet period, or worse-case leaching scenario. Meteorological records for the past twenty-five years at Lincoln were used to establish the conditions of this scenario. Natural rainfall received by the lysimeters was supplemented each month by simulated rainfall, to bring the total input up to the 75 percentile of the monthly rainfall over the twenty-five year period.
Ammonia gas volatilisation measurements
Immediately after slurry application, ammonia gas volatilisation losses were monitored using an enclosure system over each lysimeter (Black et al. 1985). Volatilisation loss measurements were conducted until the amount of loss became negligible, a time period of two weeks.
Leaching loss measurements
Leachate was collected from each lysimeter in small drainage increments of approximately 10 mm. Subsamples of the leachate were spiked with a urease/nitrification inhibitor and stored in tightly stoppered plastic bottles until chemical analyses were performed. Leachate samples were analysed for nitrate (N03"), nitrite (N02") using ion exchange chromatography (Waters, USA) and ammonium (NH4+) using an ion specific electrode (HNU Systems Inc., USA).
Pasture measurements
The pasture on each lysimeter was harvested when it reached a height of approximately 20 cm on the most productive lysimeter. Pasture samples were dissected to determine their general botanical composition and dried for analysis. Pasture dry matter production was recorded and subsamples of material used to determine the total nitrogen content (Blakemore et al. 1987).
369
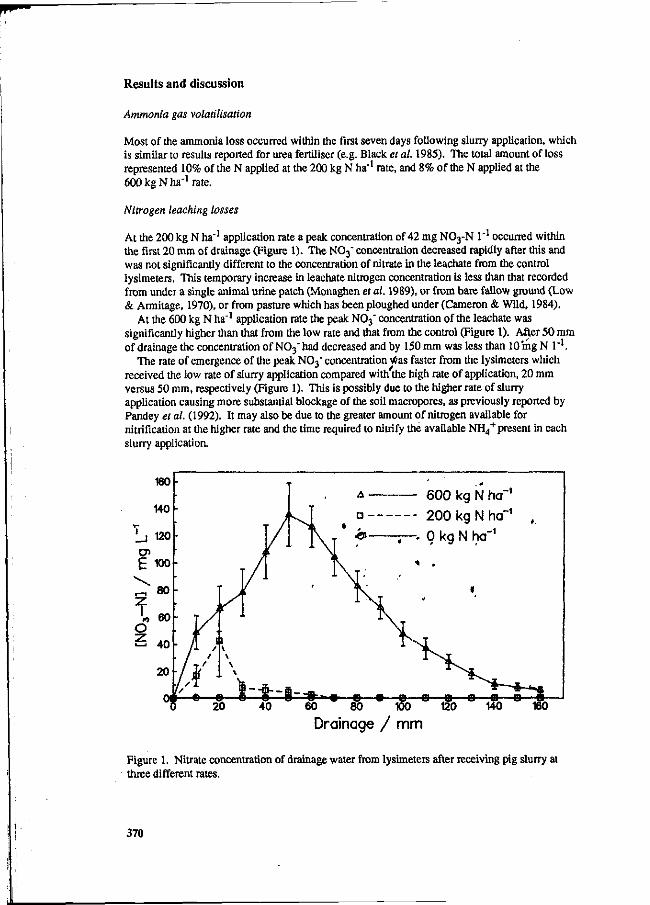
Results and discussion
Ammonia gas volatilisation
Most of the ammonia loss occurred within the first seven days following slurry application, which is similar to results reported for urea fertiliser (e.g. Black et al. 1985). The total amount of loss represented 10% of the N applied at the 200 kg N ha"1 rate, and 8% of the N applied at the 600 kg N ha"1 rate.
Nitrogen leaching losses
At the 200 kg N ha"1 application rate a peak concentration of 42 mg N03-N l"1 occurred within the first 20 mm of drainage (Figure 1). The N03" concentration decreased rapidly after this and was not significantly different to the concentration of nitrate in the leachate from the control lysimeters. This temporary increase in leachate nitrogen concentration is less than that recorded from under a single animal urine patch (Monaghen et al. 1989), or from bare fallow ground (Low & Armitage, 1970), or from pasture which has been ploughed under (Cameron & Wild, 1984).
At the 600 kg N ha"1 application rate the peak N0 3 ' concentration of the leachate was significantly higher than that from the low rate and that from the control (Figure 1). After 50 mm of drainage the concentration of N03 ' had decreased and by 150 mm was less than 10 mg N l"1.
The rate of emergence of the peak N0 3 ' concentration was faster from the lysimeters which received the low rate of slurry application compared with the high rate of application, 20 mm versus 50 mm, respectively (Figure 1). This is possibly due to the higher rate of slurry application causing more substantial blockage of the soil macropores, as previously reported by Pandey et al. (1992). It may also be due to the greater amount of nitrogen available for nitrification at the higher rate and the time required to nitrify the available NH4
+ present in each slurry applicatioa
- 600 kg N ha~' - 200 kg N ha"1
— . Q kg N ha"1
60 80 100 120 Drainage / mm
160
Figure 1. Nitrate concentration of drainage water from lysimeters after receiving pig slurry at three different rates.
370
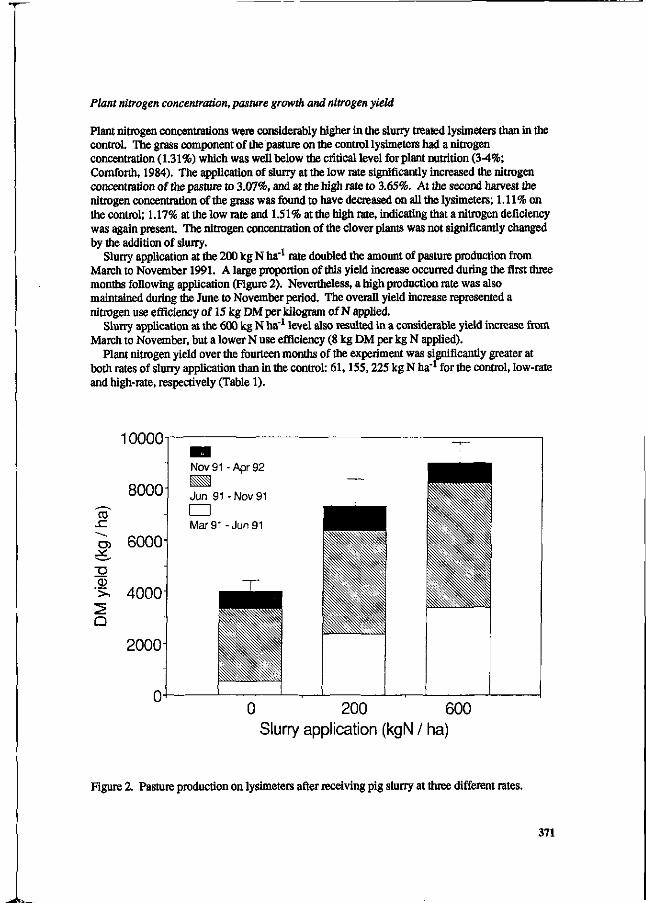
Plant nitrogen concentration, pasture growth and nitrogen yield
Plant nitrogen concentrations were considerably higher in the slurry treated lysimeters than in the control. The grass component of the pasture on the control lysimeters had a nitrogen concentration (1.31%) which was well below the critical level for plant nutrition (3-4%; Comforth, 1984). The application of slurry at the low rate significantly increased the nitrogen concentration of the pasture to 3.07%, and at the high rate to 3.65%. At the second harvest the nitrogen concentration of the grass was found to have decreased on all the lysimeters; 1.11 % on the control; 1.17% at the low rate and 1.51% at the high rate, indicating that a nitrogen deficiency was again present The nitrogen concentration of the clover plants was not significantly changed by the addition of slurry.
Slurry application at the 200 kg N ha"1 rate doubled the amount of pasture production from March to November 1991. A large proportion of this yield increase occurred during the first three months following application (Figure 2). Nevertheless, a high production rate was also maintained during the June to November period. The overall yield increase represented a nitrogen use efficiency of 15 kg DM per kilogram of N applied.
Slurry application at the 600 kg N ha"1 level also resulted in a considerable yield increase from March to November, but a lower N use efficiency (8 kg DM per kg N applied).
Plant nitrogen yield over the fourteen months of the experiment was significantly greater at both rates of slurry application than in the control: 61,155,225 kg N ha"1 for the control, low-rate and high-rate, respectively (Table 1).
sz
O)
Q
10000
8000
6000
4000
2000
0
Nov 91 - Apr 92
Jun 91 - Nov 91
n Mar 91 -Jun 91
0 200 600 Slurry application (kgN / ha)
Figure 2. Pasture production on lysimeters after receiving pig slurry at three different rates.
371
Nitrogen budget
The nitrogen mass balance sheet for the first fourteen months of the experiment is given in Table 1 and the fractional recoveries (%) of applied nitrogen are given in Table 2. The application of slurry at 200 kg N ha"1 resulted in: (i) Only a small leaching loss (5%) of the applied nitrogen even under a worst-case rainfall input scenario. This represents a leaching loss of only 10.3 kg N ha"1 above the background loss. (ii) A small amount of volatilisation loss occurred (10% of that applied) despite the warm, moist soil conditions which occurred. (iii) A large amount of applied nitrogen was recovered (47%) by the pasture plants. (iv) Approximately 38% of the applied nitrogen remains unaccounted for at this stage.
The application of 600 kg N ha'1 of slurry resulted in: (i) A leaching loss of 121 kg N ha"1, equivalent to 20% ofthat applied, (ii) an ammonia volatilisation loss of 45 kg N ha"1 (8% ofthat applied), (iii) A plant nitrogen yield equivalent to 27% of the N applied, (iv) Approximately 45% of applied nitrogen remains unaccounted for at this stage.
Table 1. Amounts of nitrogen (kg N ha'1) recovered from the lysimeters during the'period: March 1991 - April 1992. Recovery is calculated as the/amount of N measured in the treated lysimeter minus the amount in the control, and expressed as a ratio to the amount applied.
Treatment (kgNha'1)
0 200 600
Ammonia gas loss
0.75 ± 0.04 20 ± 5 . 45 * 4
Leaching loss
0.7 ± 0.2 • 11 ± 5
121 ± 23 •
Plant uptake
61 i 9 155, ± 34 225 ± 20
Total amount
62 186 391
Table 2. Fractional recovery (%) of applied nitrogen in each\x>mponent during the period: March 1991 - April 1992.
Treatment (kgNha'1)
200 600
Ammonia loss
10 8
gas
~ V-
Leaching loss
5 20
Plant uptake
47 27
Total recovery
62 ^ . 5 5
Acknowledgement
We would like to thank the NZ Pork Industry Board for funding the study; Neil Smith and Maureen McQoy for technical assistance; and Steven Glass for allowing collection of the slurry and soil samples.
372
References
Black, A.S., Sherlock, R.R., Smith, N.P., Cameron, K.C. & Goh, K.M., 1985. Comparison of three field methods for measuring ammonia volatilisation from urea granules broadcast onto pasture. Journal of Soil Science 36:271-280.
Blakemore, L.C., Searle, P.L. & Daly, B.K., 1987. Methods for Chemical Analysis of Soil. New Zealand Soil Bureau Report 80, D.S.I.R., Lower Hutt
Bremner, J.M. & Mulvaney, CS., 1982. Nitrogen-total. In: Page, A.L., Ed: Methods of Soil Analysis. Agronomy 9 (Part 2). American Society of Agronomy, Wisconsin, p. 496-622.
Burden, R.J., 1984. Chemical zonation in groundwater of the Central Plains, Canterbury. N.Z. Journal of Hydrology 23:100-119.
Cameron, K.C. & Wild, A., 1984. Potential aquifer pollution from nitrate leaching following the ploughing of temporary grassland. Journal of Environmental Quality 13:274-278.
Cameron, K.C. & Haynes, R.J., 1986. Retention and movement of nitrogen in soils In: R.J. Haynes, K.C. Cameron, K.M. Goh & R.R. Sherlock: Mineral Nitrogen in the Plant-Soil System. Academic Press, Orlando, p. 166-220.
Cameron, K.C, Harrison, D.F., Smith, N.P. & McLay, C.D.A., 1990. A method to prevent edge-flow in undisturbed soil cores and lysimeters. Australian Journal of Soil Research 28: 879-886.
Cornforth, I.S., 1984. Plant analysis. In: Fertilizer and Lime Recommendations forPastures and Crops in New Zealand. MAF, Wellington, p. 40-42.
Fietje, L., 1988. Profitable Management of Piggery Wastes. North Canterbury Catchment Board, Christchurch, p. 20.
HNU Systems Inc. Ammonia Electrode Manual, Newton, MA, USA. Kear, B.S., Gibbs, H.S. & Miller, R.B., 1967. Soils of the Plains and Downs Canterbury and
North Otago, New Zealand. DSIR, Wellington. Low, A.J. & Armitage, E.R., 1970. The composition of the leachate through cropped and
uncropped soils in lysimeters compared with that of rain. Plant and Soil 33:393-411. Millipore Corporation, 1989. Waters Ion Chromatography Cookbook, Milford, MA, USA. Monaghen, R.M., Cameron, K.C. & McLay, C.D.A., 1989. Leaching losses of nitrogen from
sheep urine patches. New Zealand Journal of Agricultural Research 32:237-244. O'Callaghan, J.R. & Flowers, T.H., 1981. Nutrient uptake from pig slurry by a grass crop. In:
Brogan, J.C, Ed: Nitrogen Losses and Surface Run-off from Landspreading of Manures. Developments in Plant and Soil Sciences Vol. 2, Martinus Nijhoff/Dr W. Junk Publishers, The Hague, p. 167-180.
Pandey, S.P., Cameron, K.C. & Dakers, A.J., 1992. Nitrogen leaching losses from pig slurry applied to a shallow soil. Bioresource Technology 41:251-258.
Rate, A.W. & Cameron, K.C, 1992. Nutrient mineralisation from soil amended with pig slurry: an incubation study. In: Gregg, P.E.H. and Currie, L.D., Eds: The Use of Wastes and Byproducts as Fertilisers and Soil Amendments for Pastures and Crops. Occasional Report No. 6, Fertilizer and Lime Research Centre, Massey University, New Zealand, p. 261-269.
Sherwood, M., 1986. Nitrate leaching following application of slurry and urine to field plots. In: Efficient Land Use of Sludge and Manure, Elsevier Applied Science, London, p. 150-157.
Spallacci, P., 1989. Soil application of slurries from livestock farms: nitrogen uptake by crops and nitrate in soil and leachate. In: German, J.C, Ed: Management Systems to Reduce the Impact of Nitrates. Elsevier Applied Science, London; p. 45-54.
Vetter, H. & Steffens, G., 1981. Leaching of nitrogen after the spreading of slurry. In: Brogan, J.C, Ed: Nitrogen Losses and Surface Run-off from Landspreading of Manures. Developments in Plant and Soil Sciences Vol. 2, Martinus Nijhoff/Dr W. Junk Publishers, The Hague, p. 274-283.
373
The nitrogen flow and ammonia emissions in a pig facility and its share in the N-load to the agroecosystem
Olaf Schätzchen, Heinz Kühl
University Rostock, Institute for Agrotechnology and Techniques, Germany
Summary
The N-Flow in a pig facility with approximately 75,000 pigs from feed input to storage of treated wastes was investigated. The investigations were carried out by input/output relations in every stage of pig production including the mechanical and biological treatment of slurry accompanied with chemical analysis of matter.
The N-utilization in liveweight production was ,found to be 2 4 % of the feed nitrogen input. At the end of the process, 29 % of the N-input was fqund in treated slurry and sludge, 7 % in solid manure and 40'% in gaseous N-compounds as ammonia (19 %) and molecular N (21 %) . The specific ammonia-N emission per pig was found to be 1/5 lower than the average in livestock husbandry.
The share of the pig facility in the N-input to the agroecosystem of a plant production farm (appr. 8,360 ha) was 25 % of the total N-input. The pollution potential to the runoff waters effected by mobile N-compounds came to 19 % from the pig facility but to 61 % from the applied mineral fertilizers.
Introduction
The industrially organized pig' husbandries in'Germany (East) with their high output of wastes and emissions were seen as one of the main sources of environmental problems caused by agriculture. The Losten pig facility with 75,p00 breeding and fattening pigs is situated in the county Wismar in the immediate vicinity to the Baltic Sea.
Pollution by the N-load may be effected by the output of wastes and emissions from the pig facility as well as by the activities of the crop farming. The investigations in the pig facility were intended to provide results showing the efficiency of N-utilization and the effects of waste treatment on the N-output to the agroecosystem. A comparison of the N-balance of the plant production farm and the pig facility will allow to point out the main sources and amounts of the N-load and the pollution potential to the runoff waters.
374
Material and methods
The nitrogen flow in the pig facility was investigated by the input/output relations in the stages
- feed consumption and liveweight production, - slurry sampling in the sties, - slurry storage, - slurry separation, - aeration of the liquid slurry phase, - long term storage of the treated slurry in a lagoon.
The N-flow is shown as a result of a mass balance of the N-content of feed, liveweight and wastes. The investigations were accompanied with chemical analysis of matter in every stage. The amount of gaseous N-compounds in the balance were obtained as the difference between measured input/output of N in solid and liquid matter.
The N-balance of the plant production farm was obtained by statistical data for manure and fertilizer application, crop sequences and yields as well as general data for soil-N dynamics and rainfall-N inputs.
Results and discussion
Pig facility
Feed consumption and liveweight production
The N-input to the pig facility was about 1224 Mg/a protein nitrogen. This amount was utilized by the pigs to about 24 % in the average of the whole stock. The rate ranged from 19 % (gravide sows) to 29 % (growing pigs). Fattening pigs were found with 22 %. These levels are significantly lower as possible in pig production. The main reasons may be seen in differences between recommended and applied rations, the used genetic material and the feed losses caused by the used techniques for feed application.
The utilization rate of 24 % led to an excretion of about 76 % (934 Mg/a).
Slurry sampling
The slurry was sampled under the perforated floors in the sties. (Only a share of suckling sows was held on litter, the liquid manure was part of the slurry. The amounts of solids are included in the paragraphs on separation). During the sampling of slurry, losses of 11 % (breeding pigs) and 19 % (fattening pigs) of the excreted N were found. The storing time in the sties (breeding pigs: 1 day; fattening pigs: 30 days) is to be seen as the main influence for the differences in the N-losses. The conditions for the emission of ammonia such as temperature, pH of the slurry, ventilation rate and emitting surfaces were significantly higher in the breeding plant. The amount of nitrogen emitted from the sties was about 90 Mg/a from the fattening and 46 Mg/a from the
375
breeding plant. That meant approximately 3.6 kg/a and 0.9 kg/a N-emission per pig respectively.
Slurry storage
The storage of the slurry including the liquid manure from the sows outside the sties in a 5,000 m3 basin caused no N-losses. The storing time was at most 5 days. A surface layer of drifting solids covered the slurry. An influence of the mixing intervals for about 4 h/d with hydromechanical technique was not found. The biochemical conditions, e.g. the pH less than 7, did not support the emission of ammonia.
Separation
A separation of solid and liquid manures was reached in the sties for suckling sows with the separate effluent of liquid manure and by the separation of the slurry including the liqid manure with vertical strainers.
The solid manure from the sows contained about 5 % of the total excreted N. The rotting processes led to 2ß % N-loss from the heap. /
The slurry separation caused a/ N-separation to about 6 % of the slurry-N. Mostly organic N-compounds were separated. The rotting processes of the separated organic N led to 9 % N-loss from the heap.
The separated liquid phase was stored for about 1 day in a 5,000 m3 basin. N-losses were not found.
Aeration
Long term aeration of the liquid slurry phase .for 11 days in a two-step plant led to a 27 % reduction of the N-content in the liquid slurry phase. The first step effected a conversion of ammonia into growing sludge biomass. The nitrification /denitrification was reached iiwthe second step.
The main way of reduction'was by the production of elementary nitrogen (16 % of the liquid slurry phase nitrogen). 11 % of the N-content in .the liquid slurry phase was reduced due to the emission of ammoniacal,nitrogen and aerosols. That meant about 0.7 Mg ammonia was emitted per 1 Mg elementary nitrogen emission. The main reason is to be seen in the used technique of aeration with swimming propellers.
Lagoon
Long term lagoon storage of the treated slurry and sludge for about 1 year led to further N-reduction. As the main process, nitrification and denitrification of ammoniacal nitrogen was found to reduce the nitrogen in the lagoon by 30 %. These processes were effected by the wind aeration supported by the large surface of the lagoon with 10...15 ha. The processes were found to be similar to those in natural limnic waters. The emission of ammonia was insignificant, beeing about 0.8 % of the input to the lagoon. These results do not agree with
376
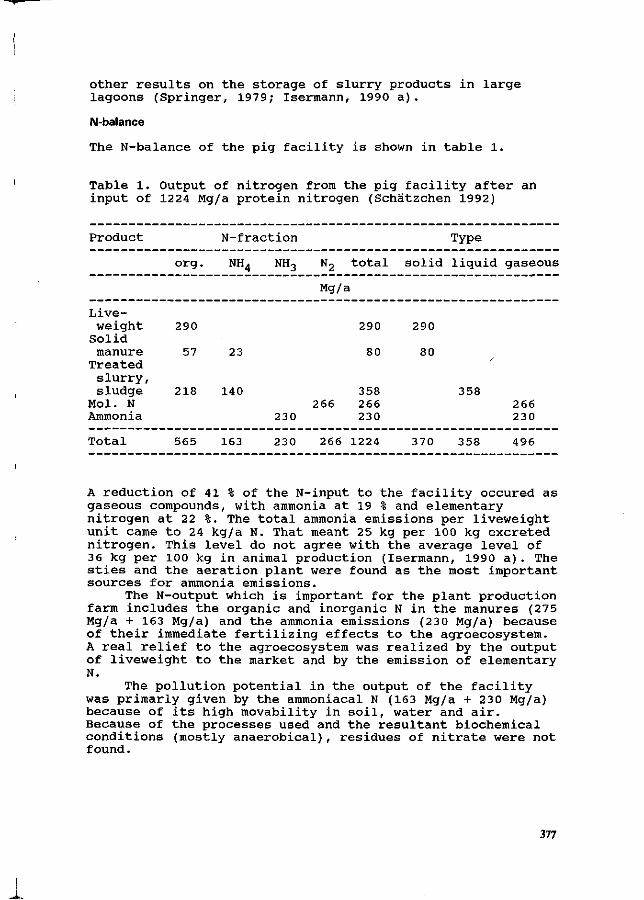
other results on the storage of slurry products in large lagoons (Springer, 1979; Isermann, 1990 a).
N-balance
The N-balance of the pig facility is shown in table 1.
Table 1. Output of nitrogen from the pig facility after an input of 1224 Mg/a protein nitrogen (Schätzchen 1992)
Product N-fraction Type
org. NH4 NH3 N2 total solid liquid gaseous
Mg/a
23
Live-weight
Solid manure
Treated slurry, sludge
Mol. N Ammonia
290
57
218 140 266
230
230
290
80
358 266 230
290
80 /
358 266 230
Total 565 163 266 1224 370 358 496
A reduction of 41 % of the N-input to the facility occured as gaseous compounds, with ammonia at 19 % and elementary nitrogen at 22 %. The total ammonia emissions per liveweight unit came to 24 kg/a N. That meant 25 kg per 100 kg excreted nitrogen. This level do not agree with the average level of 36 kg per 100 kg in animal production (Isermann, 1990 a). The sties and the aeration plant were found as the most important sources for ammonia emissions.
The N-output which is important for the plant production farm includes the organic and inorganic N in the manures (275 Mg/a + 163 Mg/a) and the ammonia emissions (230 Mg/a) because of their immediate fertilizing effects to the agroecosystem. A real relief to the agroecosystem was realized by the output of liveweight to the market and by the emission of elementary N.
The pollution potential in the output of the facility was primarly given by the ammoniacal N (163 Mg/a + 230 Mg/a) because of its high movability in soil, water and air. Because of the processes used and the resultant biochemical conditions (mostly anaerobical), residues of nitrate were not found.
377
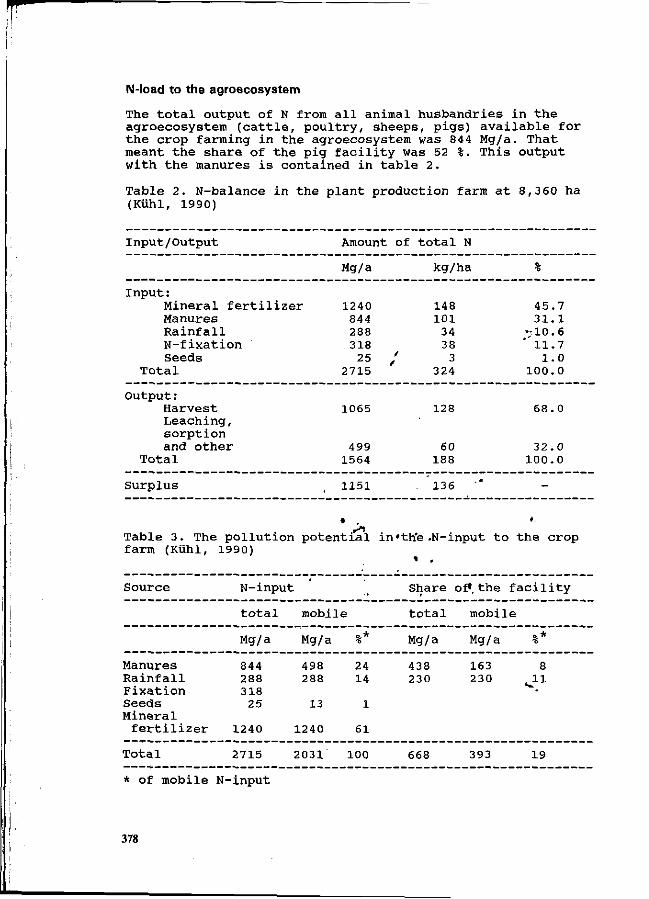
N-load to the agroecosystem
The total output of N from all animal husbandries in the agroecosystem (cattle, poultry, sheeps, pigs) available for the crop farming in the agroecosystem was 844 Mg/a. That meant the share of the pig facility was 52 %. This output with the manures is contained in table 2.
Table 2. N-balance in the plant production farm at 8,360 ha (Kühl, 1990)
Input/Output
Input: Mineral fertilizer Manures Rainfall N-fixation Seeds
Total
Output : Harvest Leaching, sorption and other
Total
Surplus
Amount of
Mg/a
1240 844 288 318
25 / 2715
1065
499 1564
1151
total N
kg/ha
148 101
34 38
3 324
128
60 188
136
%
45.7 31.1
V-10.6 11.7
1.0 100.0
68.0
32.0 100.0
-
Table 3. The pollution potential in*th'e .N-input to the crop farm (Kühl, 1990)
Source
Manures Rainfall Fixation Seeds Mineral
fertilizer
Total
N-input
total
Mg/a
844 288 318
25
1240
2715
mobil
Mg/a
498 288
13
1240
2031
.,
e
%*
24 14
1
61
100
Share
total
Mg/a
438 230
668
of. the
mobi]
Mg/a
163 230
393
facility
e
S-* 'S
8
19
* of mobile N-input
378
The balance shows a surplus of 136 kg/ha. This is significantly lower than average surpluses in the Netherlands (367 kg/ha); Denmark, Switzerland and F.R.G. (167...193 kg/ha) (Isermann, 1990 b). The requirement of the plant production farm could be covered to about 73 % with the use of manures. The similar level of the surplus and the applied mineral N-fertilizer should be pointed out.
Table 3 shows the amounts and shares of the total and mobile N in the input to the farm. The share of the livestock in the pollution potential of 2031 Mg was about 38 % caused by organic manures with 24 % and ammonia emission with 14 %. The share of the pig facility in the pollution potential was 19 %.
As shown in table 3 the highest share in the pollution potential was given by the mineral fertilizer with 61 %.
Conclusion
The share of animal husbandries in the endangerous potential in the N-load to an agroecosystem was 38 %, including the pig facility with the highest concentration of animals and wastes with 19 %. Waste treatment offers a possibility to reduce the N-output which needs to be utilized in the crop farming.
The case of the region investigated showed, that using animal concentration as the only base for the evaluation of the N-load in a ecosystem is not sufficient. As follows it is necessary to consider all agricultural sources of nitrogen as demanded in the Direction of the EC concerning the water protection by nitrate (Rat der EG, 1991) .
References
Isermann,K.,1990 a. Ammoniakemissionen der Landwirtschaft als Bestandteil ihrer N-Bilanz. Ammoniak in der Umwelt. VDI/LTBL-Symposium Braunschweig.
Isermann,K.,1990 b. Share of agriculture in nitrogen and phosphorus emissions into surface waters of Western Europe against the background of their eutrophication. Fertilizer Research 26 (1990), 253-269, Kluwer Acad. Publ., Netherlands
Kühl,H.,1990. Abschätzung einer möglichen Stickstoffbelastung der Ostsee durch die Landwirtschaft. Wasserwirtschaft-
Wassertechnik 8 (1990) 214-216, Berlin Schätzchen,O.,1992. Untersuchungen zum N-Fluß einer
Schweineproduktionsanlage mit mechanisch-biologischer Gülleaufbereitung. Univ. Rostock, Diss. A, unveröffentlicht.
Rat der EG,1991. Richtlinie des Rates zum Schutz der Gewässer vor Verunreinigung durch Nitrat aus landwirtschaftlichen Quellen. Brüssel,Amtsblatt der EG, L 375/1, Nr. 91/676/EWG
Springer,J.,1979. Animal Waste Treatment and Recycling Systems. Univ. of Kentucky, Coll. of Agric., Agric. Exp. Stat., Lexington, Southern Coop. Series Bull. 242
379
Nitrogen balance in the case of slurry separation on the farm
G.M. den Brok Research Institute for Pig Husbandry, P.O. Box 83, 5240 AB Rosmalen, the Netherlands.
Summary
In the Netherlands, three different slurry separation systems were tested: (1) sedimentation (sow slurry), (2) mechanical separation (various types of pig slurry) and (3) separation under slats (fattening pigs).
After sedimentation of sow slurry with poly-electrolyte, the volume of the liquid fraction was 72% of the volume of the influent. The N content of the liquid fraction was 56% of the N content of the influent.
After mechanical separation of sow slurry the average volume and N contents were 90% and 88% of the contents of the influent. Afte/ mechanical separation of slurry of fattening pigs the average volume and N-contents'were 80% and 74% of the contents of the influent, respectively.
For separation under the slats, a scraping system was used. A maximum reduction of ammonia emission of 40% was measured.
In conclusion, the present systems for slurry separation are promising; however they need to be improved before used on farms. Keywords: Slurry, pigs, separation, nitrogen, dry matter.
Introduction
In the future slurry treatment on intensive^pig farjns.will become more and more a necessity. On the one hand to lower the costs of slurry distribution. On the other hand to prevent leakage of nitrogen and other minerals into the« groundwater and to diminish air pollution, by reducing ammonia.emission.'.
The last few years research at the Experimental Pig Farm in ^»terksel (The Netherlands) was conducted to evaluate slurry separation by sedimentation of sow slurry (De Kleijn and Voermans, 1991) and by mechanical separation of pig slurry of different qualities (Verdoes et al., 1992). At the Research Institute for Pig Husbandry in Rosmalen, research was conducted to evaluate a scraper system, that removes urine and solids seperately, and is located under the slatted floor of a room for fattening pigs (Voermans and Van Asseldonk, 1990). ^
The objective of all three studies was to establish whether the separation systems are ready for on-farm use.
Material and Methods
Sedimentation of sow slurry The sedimentation plant is designed for a sow unit housing 400 sows. A sedimentation
380
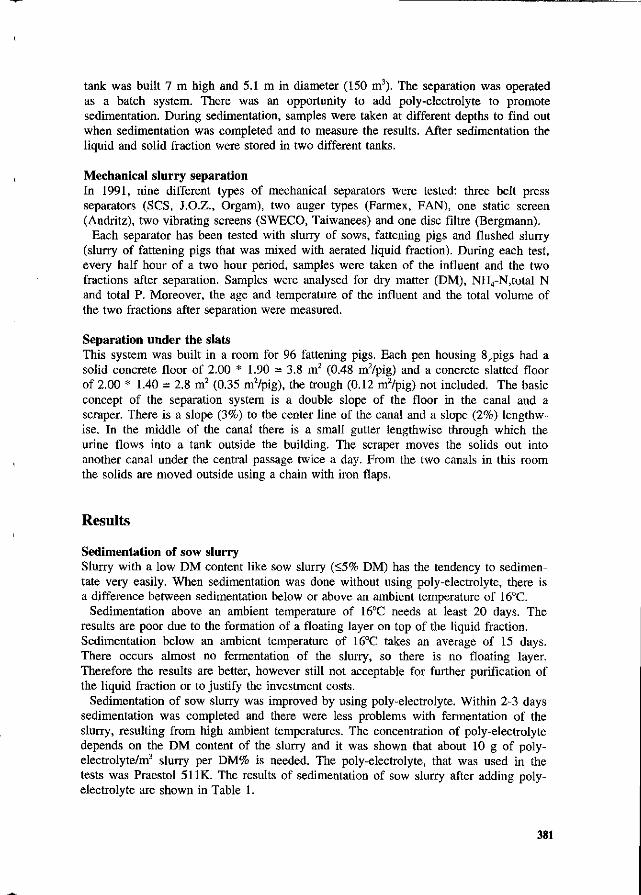
tank was built 7 m high and 5.1 m in diameter (150 m3). The separation was operated as a batch system. There was an opportunity to add poly-electrolyte to promote sedimentation. During sedimentation, samples were taken at different depths to find out when sedimentation was completed and to measure the results. After sedimentation the liquid and solid fraction were stored in two different tanks.
Mechanical slurry separation In 1991, nine different types of mechanical separators were tested: three belt press separators (SCS, J.O.Z., Orgam), two auger types (Farmex, FAN), one static screen (Andritz), two vibrating screens (SWECO, Taiwanees) and one disc filtre (Bergmann).
Each separator has been tested with slurry of sows, fattening pigs and flushed slurry (slurry of fattening pigs that was mixed with aerated liquid fraction). During each test, every half hour of a two hour period, samples were taken of the influent and the two fractions after separation. Samples were analysed for dry matter (DM), NH4-N,total N and total P. Moreover, the age and temperature of the influent and the total volume of the two fractions after separation were measured.
Separation under the slats This system was built in a room for 96 fattening pigs. Each pen housing 8^pigs had a solid concrete floor of 2.00 * 1.90 = 3.8 m2 (0.48 m2/pig) and a concrete slatted floor of 2.00 * 1.40 = 2.8 m2 (0.35 m2/pig), the trough (0.12 m2/pig) not included. The basic concept of the separation system is a double slope of the floor in the canal and a scraper. There is a slope (3%) to the center line of the canal and a slope (2%) lengthwise. In the middle of the canal there is a small gutter lengthwise through which the urine flows into a tank outside the building. The scraper moves the solids out into another canal under the central passage twice a day. From the two canals in this room the solids are moved outside using a chain with iron flaps.
Results
Sedimentation of sow slurry Slurry with a low DM content like sow slurry (<5% DM) has the tendency to sedimen-tate very easily. When sedimentation was done without using poly-electrolyte, there is a difference between sedimentation below or above an ambient temperature of 16°C.
Sedimentation above an ambient temperature of 16°C needs at least 20 days. The results are poor due to the formation of a floating layer on top of the liquid fraction. Sedimentation below an ambient temperature of 16°C takes an average of 15 days. There occurs almost no fermentation of the slurry, so there is no floating layer. Therefore the results are better, however still not acceptable for further purification of the liquid fraction or to justify the investment costs.
Sedimentation of sow slurry was improved by using poly-electrolyte. Within 2-3 days sedimentation was completed and there were less problems with fermentation of the slurry, resulting from high ambient temperatures. The concentration of poly-electrolyte depends on the DM content of the slurry and it was shown that about 10 g of poly-electrolyte/m3 slurry per DM% is needed. The poly-electrolyte, that was used in the tests was Praestol 51 IK. The results of sedimentation of sow slurry after adding poly-electrolyte are shown in Table 1.
381
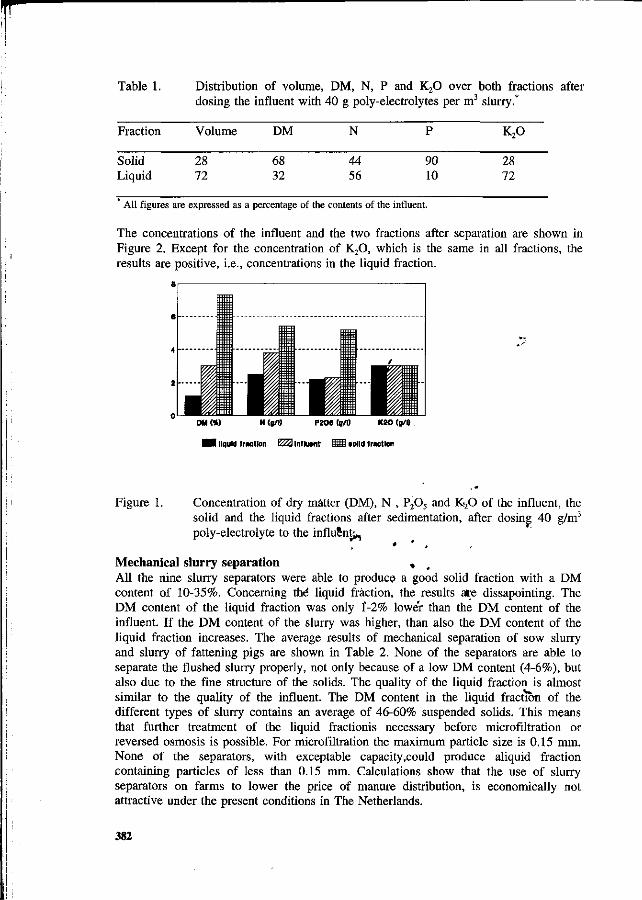
Table 1. Distribution of volume, DM, N, P and K20 over both fractions after dosing the influent with 40 g poly-electrolytes per m3 slurry.*
Fraction
Solid Liquid
Volume
28 72
DM
68 32
N
44 56
P
90 10
K20
28 72
All figures are expressed as a percentage of the contents of the influent.
The concentrations of the influent and the two fractions after separation are shown in Figure 2. Except for the concentration of K20, which is the same in all fractions, the results are positive, i.e., concentrations in the liquid fraction.
DM («) N (g/l) P206 (g/D K20 (g/l) .
• I liquid fraction E23 Intluwit B S solid traction
the 3
Figure 1. Concentration of dry matter (DM), N , P205 and K20 of the influent. solid and the liquid fractions after sedimentation, after dosing 40 g/m poly-electrolyte to the influent^,
Mechanical slurry separation , All the nine slurry separators were able to produce a good solid fraction with a DM content of 10-35%. Concerning thé liquid fraction, the results are dissapointing. The DM content of the liquid fraction was only 1-2% lower than the DM content of the influent. If the DM content of the slurry was higher, than also the DM content of the liquid fraction increases. The average results of mechanical separation of sow slurry and slurry of fattening pigs are shown in Table 2. None of the separators are able to separate the flushed slurry properly, not only because of a low DM content (4-6%), but also due to the fine structure of the solids. The quality of the liquid fraction is almost similar to the quality of the influent. The DM content in the liquid fraction of the different types of slurry contains an average of 46-60% suspended solids. This means that further treatment of the liquid fractionis necessary before microfiltration or reversed osmosis is possible. For microfiltration the maximum particle size is 0.15 mm. None of the separators, with exceptable capacity,could produce aliquid fraction containing particles of less than 0.15 mm. Calculations show that the use of slurry separators on farms to lower the price of manure distribution, is economically not attractive under the present conditions in The Netherlands.
382
Table 2. Distribution of volume, dry matter(DM), NH4-N, N and P after mechanical separation.*
Slurry
Sows
Fattening pigs
Fraction
Solid Liquid
Solid Liquid
Volume
10 90
20 80
DM
28 72
38 62
NH4-N
15 85
25 75
N
12 88
26 74
P
18 82
26 74
All figures are expressed as a percentage of the contents of the influent.
Separation under slats At the start there were some technical problems with the scrapers. The steel cable broke twice. During the period the pit floor was treated with synthetic materials to make it more smoothly. This is important to improve the removal of the solids. These improvments could not prevent that a layer of solid fraction stuck to the floor of the canal during a fattening period. The outlet of the urine was often clogged up, which caused problems for a proper separation.
The urine had an average DM content of 2.4%; P content was 0.40 g/1; NH4-N content of 3.73 g/1 and N content of 4.97 g/1. The solids have a DM content of 26.8%; P content of 3.39 g/1; NH4-N content of 2.83 g/1 and N content of 11.73 g/1.
Ammonia (NH3) origanates especially from urine, which contains urea. Under the influence of the enzyme urease present in faeces, urea is converted to ammonium (NH4
+). This conversion happens within a very short time after the urine is produced. About 85% of the the ammonia volatilization in pig houses orginates from the urine. The other source is decomposition of the non-digested proteins in faeces. These products are also converted to ammonium, but this process occurs at a slow rate.
By separating urine and faeces under the slats, urease activity can be reduced. As a result, reduction of ammonia emission should be possible. However this was disturbed by pollution of the solid pen floor, during periods with high ambient temperatures. At low ambient temperatures, the achieved reduction in emission was about 40%.
Nitrogen flow
The results are varying and depend not only on the method of separation, but also on the structure, the age and the temperature of the slurry. The average total nitrogen content of the solid and the liquid fraction, are briefly summarised in Table 3.
Examples Starting point; 100 1 slurry of sows, N content of 4 g/1 (=400 g). Sedimentation with 40 g poly-electrolyte/m3: Solid fraction is 28 1 containing 44% of 400 g = 176 g N = 6.3 g/1. Liquid fraction is 72 1 containing 56% of 400 g = 224 g N = 3.1 g/1.
383
Table 3. Average total N content of solid and liquid fraction, using different methods of manure separation.
% of the total nitrogen in solid fraction liquid fraction
sedimentation of sow slurry without poly-electrolyte with 40 g poly-electrolyte/m3
mechanical separation sow slurry slurry of fattening pigs
separation under the slats slurry of fattening pigs
38 44
12 26
58
(24-59)* (43-57)
(4 -35) (15-40)
62 56
88 74
42
(41-76) (43-57)
(65-96) (60-85)
* Minimum and maximum N contents are shown in between brackets. ,*"-
Mechanical separation of sow slurry: / Solid fraction is 10 1 containing 12% of 400 g = 48 g N = 4.8 g/l. Liquid fraction is 90 1 containing 88% of 400 g = 352 g N = 3.9 g/1.
The results of sedimentation of N are much better than mechanical separation, as far as the liquid fraction is concerned. The example shows that concentration of N in the liquid fraction are similar before and after mechanical separation. Mechanical separation of slurry of fattening pigs shows just slightly better results. Starting point; 100 1 slurry, N content of 7 g/1 (=700 g). Mechanical separation of slurry of fattening pigs: Solid fraction is 20 1 containing 26% óf 700 g = 182 g N = 9.1 g/1. Liquid fraction is 80 1 containing 74% of 700 g = 518 g N s 6.4 g/1. t
These examples show that it is not easy^) lower the content of N in slurry using mechanical separation and, to a lesser extent, by seâimenfation. A' proper separation of urine and faeces under the slatted floor of fattening pighouses, (slurry with an average N content of 7 g/1) gives the best results, however the N content of the urine is still ± 5 g/1- ' '.
Discussion
The discribed separation systems have some flaws. The sedimentation plant has operated as a batch system. This system is inefficient, because it is difficul^to dévide the two fractions after sedimentation is completed. A better way to sedimentate is by using an overflow-system of 2-4 sedimentation tanks. During the tests of the different types of separators, the slurry was mixed thoroughly by 4 pumps that were placed in the tank. This was done to have a constant quality of the influent pumped into the separator. As a result the structure of the slurry changed and due to that it could be possible that the separation was not as good as was indicated by the different companies. On the other hand, the separators should be able to separate properly, also after
384
mixing. Almost every mechanical separator suffers from technical problems. In the separation system under the slats, the scraper left over the whole surface of the
floor in the canal a thin layer of manure. When urine makes this surface wet, there is a great emitting area. The pigs always polluted the solid floor. This means that the effect of the scraper system on the reduction of ammonia emission can not be assessed. In spite of these problems, the best results show a reduction of 40 % compared with storage of slurry under slatted floors of a fattening room. For scraper systems, it is very important that: -the solid floor does not become dirty
-the floor of the canal is very smooth -the urine can not penetrate the floor and -the slats have a good throughput for the faeces.
It might be possible to improve separation quality by using a combination of separation systems. If slurry with a low DM content (<5%) must be separated, the best way is sedimentation with a poly-electrolyte. The solid fraction after sedimentation has a DM content of only 7-12%. If we separate these solids again mechanically, the quality of the solid fraction can improve. Pig slurry with a DM content higher than 5%, even with poly-electrolyte, hardly sedimentates. Therefore mechanical separation is a better way to separate. After separation, the liquid fraction still has a high DM content. Sedimentation of this liquid fraction could be a possibility for further improvement.
Conclusions
The three different separation systems can be useful in a slurry treatment system, but the present results are disappointing and are not ready for on-farm use. At the moment none of the systems are able to produce a liquid fraction of acceptable quality, i.e. with a sufficent low DM or N content. Thus far, the results do not justify the investment costs.
At the moment new scraper systems that more or less meet the conditions discribed in the discussion are evaluated. Using modified scraping systems, it may be possible to achieve the 70% reduction in ammonia emission that is mandated by the Dutch government.
References
Kleijn, J.P.L.de, & Voermans, J.A.M., 1991. Separation of sowmanure by sedimentation. Experimental Pig Farm Sterksel (The Netherlands). Report P 1.62.
Verdoes, N., Brok, G.M. den, & Cuyck, J.H.M, van, 1992. Mechanical slurry separators in the on-farm slurry handling. Experimental Pig Farm Sterksel (The Netherlands). Report P 1.77.
Voermans, J.A.M., & Asseldonk, M.M.L. van, 1990. Separation of Pig manure under a slatted floor. Research Institute for Pig Husbandry, Rosmalen (The Netherlands). Report P 1.51.
385
Nitrogen and the industrial processing of pig manure
P.J. W. ten Have
Institute of Agricultural Engineering IMAG-DLO P.O. Box 43, 6700 A A Wageningen, The Netherlands
Summary
In various countries, but especially in The Netherlands, systems are being developed for the industrial processing of pig slurry. The state of the art is discussed with emphasis on the control and conversion of nitrogen. Dried fertilizers is the main product. The costs of processing under strict emission standards is a source of concern. New processes are under development. Improved utilization of organic material may be a future possibility J'
Keywords: costs, emission, feedstuff, nitrogen, pig manure, processing.
In t roduct ion
Since ancient times farmers have used animal excrements (faeces and urine) as a source of minerals and organic matter for plant production. However, in recent years some negative aspects regarding the influence of the use of animal manure on the environment have become apparent. Several of these negative aspects are related to a large increase of meat production in certain areas. The import of feed ingredients from other countries or regions has resulted in surpluses of animal manure in a number of regions, leading to an overdose of minerals such as phosphorate and/i i t /ogen to the soil. These overdoses may result in the pollution of ground- and surfacewater. Moreover, the emission of odours is becoming less acceptefl. A relatively new problem is the emission of ammonia which contributes to acid-forming precipitation.
Farmers wi th a manure surplus have,, on short term, only one environmentally sound solution available: use on other farms. In regions wi th a high density of meat production this option may mean transport over large distances to areas with a potential use for this type of fertilizer. This leads to increased costs and requires organizations like manure banks. In The Netherlands manure banks are in operation since 1972 and have increased their production considerably over the years. In 1991 the manure banks djstributed 3.8 million tonnes. Similar developments have taken place in other countries w i th regional surpluses, like Belgium and Italy. However, in the last decade industrial processing of manure has been developed as an alternative solution.
Nitrogen plays an important role in manure processing. It has a positive value in the endproduct. Emission to atmosphere and water should be restricted. About 60-70% of the N in stored pig slurry is NH4
+ /NH3 . At high temperatures and pH gaseous ammonia is emitted. The control of
386
ammonium/ammonia, the final use and the conversion to other components is an important item in the development of manure processes. This paper focusses on nitrogen in the processing of pig manure and is mainly based on the results of Dutch research.
Development of treatment systems since the sixties
The past decades have shown the development of systems for the treatment and disposal as an alternative for long-distance transport. In the period 1965 to 1975 waste water purification systems on farm level were introduced in The Netherlands (Ten Have, 1971). The aim was the discharge to open water. However, the results were disappointing, mainly because of the lack of consistency in the quality of the effluent and the relatively large volume of sludge, that has to be disposed of. Therefore, purification on farm level was abandoned in The Netherlands, but is still used in other countries. Large-scale purification in centralised plants gives better possibilities for the control of effluent quality and the reduction of the volume of surplus sludge. Today in Holland 360,000 m3 per year veal calf manure is purified in three plants (Ten Have et al., 1990). Since 1987 four large-scale plants have been built in Italy, while three more plants are under construction or planned (Chiappirfi, 1991). The capacities range from 18,000 to 1,000,000 m3/year. In both cases the influent has a relatively low dry matter content (approximately 1.5-3%) which results in a small volume of surplus sludge. In Germany, the county Niedersachsen started a project for the development of the centralised purification of pig manure near lake Dümmer. A pilot plant wi th a capacity of 10,000 m3/year has been in operation since 1990.
Since 1980 other concepts for pig manure processing have been developed in The Netherlands. Pig manure, due to its minerals and organic matter, is useful as a fertilizer. Holland has a national surplus, however, so farms in other countries have to be involved in the use of the surplus minerals. The main concept is to dry the manure in order to reduce the transport costs and to keep the minerals in the final product. The product can be mixed with other ingredients for an optimum N-P-K-organic matter ratio and pelletized for accurate spreading. In this way the manure should be more attractive for potential buyers. The elevated temperature during the drying process will reduce the number of pathogens and weeds (Bloemhard et al., 1992). Strict emission standards (see Table 1) lead to the discharge of practically solids-free effluent. The production of feedstuff from manure has also been an objective in the development of processing concepts. At this moment a plant for the conversion of 600,000 rrrVyear of pig manure into a dried fertilizer is being commissioned by Promest at Helmond. Several other projects are in various stages of development.
387
20
10
1
200
30,000
9,000
2,000
2,000
Emission s tandards
The standards for emission of material from manure processing plants to water and the atmosphere have been tightened considerably in The Netherlands during the last decade. Table 1 shows the latest guidelines for effluent quality f rom manure processing together with average values in untreated manure. The concentration of Biochemical Oxygen Demand, N and P has to be reduced by 3 decimals; a task hardly achievable wi th standard biological and chemical purification techniques. The chloride level has to be reduced by a factor 10. As this very soluble ion is not removed by biological treatment unit operations like reverse osmosis and distillation have to be applied. In other countries the effluent standards are mostly restricted to BOD, N and P.
Table 1. Standards for effluent discharge and the average chemical composition of pig manure in The Netherlands (all values in mg/l)
1
Component Maximum effluent value Pig manure
Biochemical Oxygen Demand
N total
P total
ci-
The emission of gaseous material'to the atmosphere is also restricted. Odour levels should not be increased by more than 1 odour unit/m3 near neigbouring buildings during 0.5-5% of the t ime,'defending on the situation. For* gases from buildings and equipment like dryers Dutcti guidelines allow not more than 5 mg NH3/m3. Both standards result in the ajapjication of expensive equipment.
t
General trends in processing
In The Netherlands, all available systems are focussed on the production of an organic-mineral fertilizer. In order to achieve this, water has to be removed wi th a minimum amount of energy and with minimum emissions to water and air. The general approach is the use of evaporators and dryers for the removal of water. Evaporators have the advantage of a low energy consumption due to the use of multi stages or vapour recompression, but they cannot concentrate to further than a free f lowing liquid. So pig slurry is separated into a liquid (about 2-4% DM) and a solid fraction (25-35% DM) and only the liquid part is used in the evaporator. Separation can be performed by centrifuges and filtration equipment. The low requirement for cleaning-water by centrifuges is an important advantage over belt presses and other filtration units. The mixture of concentrate of the evaporator (maximum about 5 0 %
388
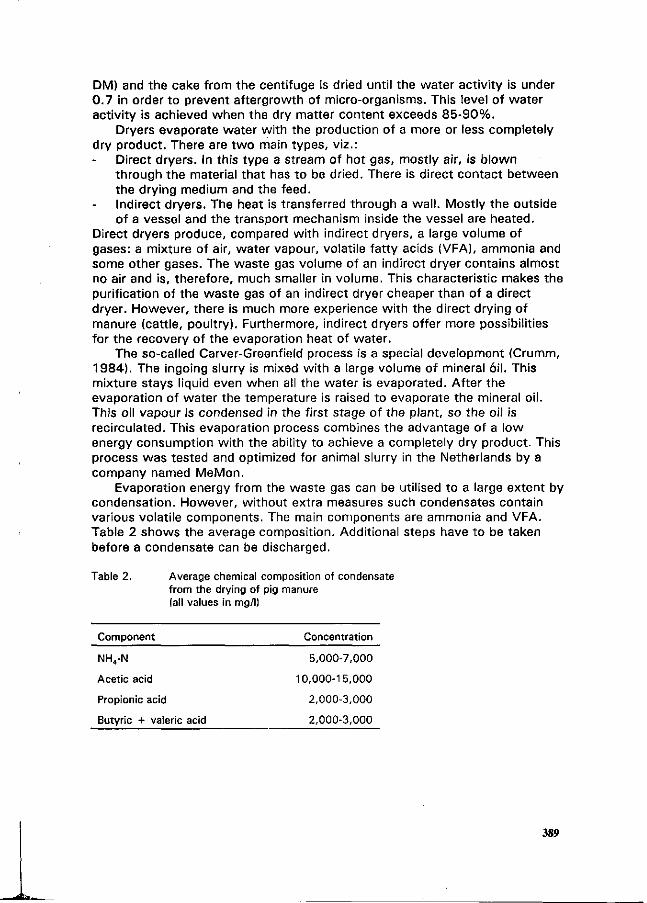
DM) and the cake from the centifuge is dried until the water activity is under 0.7 in order to prevent aftergrowth of micro-organisms. This level of water activity is achieved when the dry matter content exceeds 85-90%.
Dryers evaporate water with the production of a more or less completely dry product. There are two main types, viz.:
Direct dryers. In this type a stream of hot gas, mostly air, is blown through the material that has to be dried. There is direct contact between the drying medium and the feed. Indirect dryers. The heat is transferred through a wall. Mostly the outside of a vessel and the transport mechanism inside the vessel are heated.
Direct dryers produce, compared with indirect dryers, a large volume of gases: a mixture of air, water vapour, volatile fatty acids (VFA), ammonia and some other gases. The waste gas volume of an indirect dryer contains almost no air and is, therefore, much smaller in volume. This characteristic makes the purification of the waste gas of an indirect dryer cheaper than of a direct dryer. However, there is much more experience with the direct drying of manure (cattle, poultry). Furthermore, indirect dryers offer more possibilities for the recovery of the evaporation heat of water.
The so-called Carver-Greenfield process is a special development (Crumm, 1984). The ingoing slurry is mixed with a large volume of mineral oil. This mixture stays liquid even when all the water is evaporated. After the evaporation of water the temperature is raised to evaporate the mineral oil. This oil vapour is condensed in the first stage of the plant, so the oil is recirculated. This evaporation process combines the advantage of a low energy consumption with the ability to achieve a completely dry product. This process was tested and optimized for animal slurry in the Netherlands by a company named MeMon.
Evaporation energy from the waste gas can be utilised to a large extent by condensation. However, without extra measures such condensates contain various volatile components. The main components are ammonia and VFA. Table 2 shows the average composition. Additional steps have to be taken before a condensate can be discharged.
Table 2. Average chemical composition of condensate from the drying of pig manure (all values in mg/l)
Component Concentration
NH4-N 5,000-7,000
Acetic acid 10,000-1 5,000
Propionic acid 2,000-3,000
Butyric + valeric acid 2,000-3,000
389
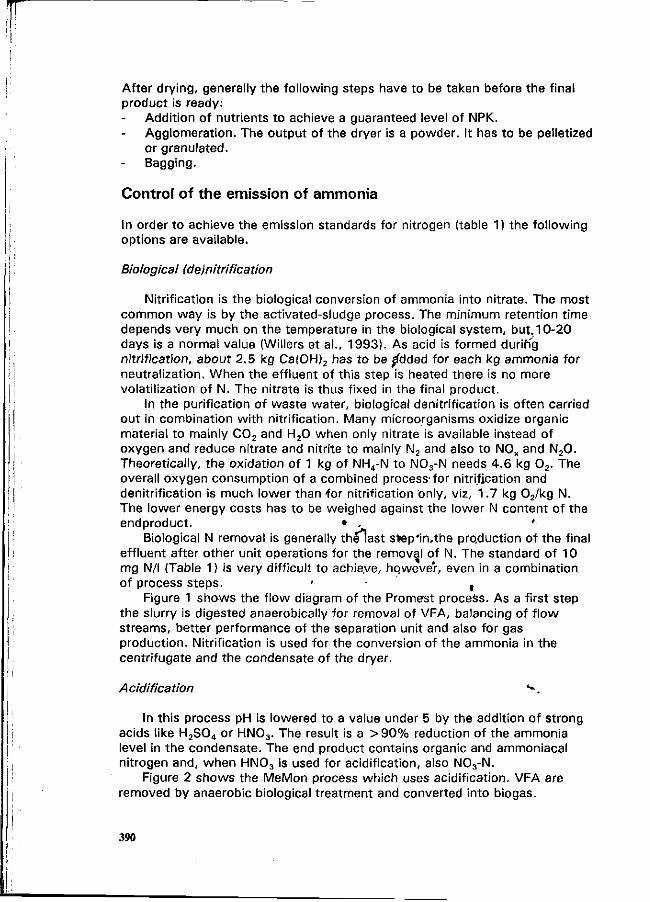
After drying, generally the following steps have to be taken before the final product is ready:
Addition of nutrients to achieve a guaranteed level of NPK. Agglomeration. The output of the dryer is a powder. It has to be pelletized or granulated.
- Bagging.
Control o f t he emission of ammonia
In order to achieve the emission standards for nitrogen (table 1) the following options are available.
Biological (dejnitrifica tion
Nitrification is the biological conversion of ammonia into nitrate. The most common way is by the activated-sludge process. The minimum retention time depends very much on the temperature in the biological system, but.10-20 days is a normal value (Willers et al., 1993). As acid is formed duriffg nitrification, about 2.5 kg Ca(OH)2 has to be a'dded for each kg ammonia for neutralization. When the effluent of this step is heated there is no more volatilization of N. The nitrate is thus fixed in the final product.
In the purification of waste water, biological denitrification is often carried out in combination with nitrification. Many microorganisms oxidize organic material to mainly C0 2 and H20 when only nitrate is available instead of oxygen and reduce nitrate and nitrite to mainly N2 and also to NOx and N20. Theoretically, the oxidation of 1 kg of NH4-N to N03-N needs 4.6 kg 0 2 . The overall oxygen consumption of a combined process-for nitrification and denitrification is much lower than for nitrification only, viz, 1.7 kg 02 /kg N. The lower energy costs has to be weighed against the lower N content of the endproduct. • . '
Biological N removal is generally thelast step'in.the production of the final effluent after other unit operations for the removal of N. The standard of 10 mg N/l (Table 1) is very difficult to achieve, hqwever, even in a combination of process steps. • f
Figure 1 shows the f low diagram of the Promerst process. As a first step the slurry is digested anaerobically for removal of VFA, balancing of f low streams, better performance of the separation unit and also for gas production. Nitrification is used for the conversion of the ammonia in the centrifugate and the condensate of the dryer.
Acidification * v
In this process pH is lowered to a value under 5 by the addition of strong acids like H2S04 or HN03 . The result is a > 9 0 % reduction of the ammonia level in the condensate. The end product contains organic and ammoniacal nitrogen and, when HN03 is used for acidification, also N03-N.
Figure 2 shows the MeMon process which uses acidification. VFA are removed by anaerobic biological treatment and converted into biogas.
390
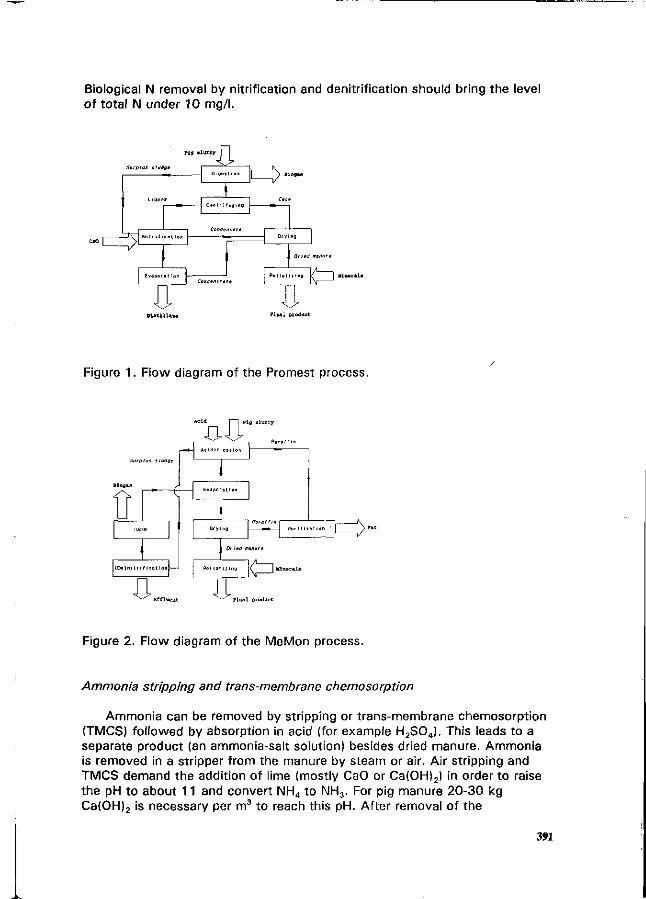
Biological N removal by nitrification and denitrification should bring the level of total N under 10 mg/l.
Surplus sludge
-=T=TJ N i t r i f i c a t i o n
•D, > = > •
Dis t i lUto
0 „ „
< = > •
Final product
Figure 1. Flow diagram of the Promest process.
Surplus sludge
(De )n i t f i N c a u c
Ü.
Acid
-a r . . „ n e u
I
r™. „,
E,.M,. t,.„
Drying P u r i f i c a t i o n '
& .
Figure 2. Flow diagram of the MeMon process.
Ammonia stripping and trans-membrane chemosorption
Ammonia can be removed by stripping or trans-membrane chemosorption (TMCS) followed by absorption in acid (for example H2S04). This leads to a separate product (an ammonia-salt solution) besides dried manure. Ammonia is removed in a stripper from the manure by steam or air. Air stripping and TMCS demand the addition of lime (mostly CaO or Ca(OH)2) in order to raise the pH to about 11 and convert NH4 to NH3. For pig manure 20-30 kg Ca(OH)2 is necessary per m3 to reach this pH. After removal of the
391
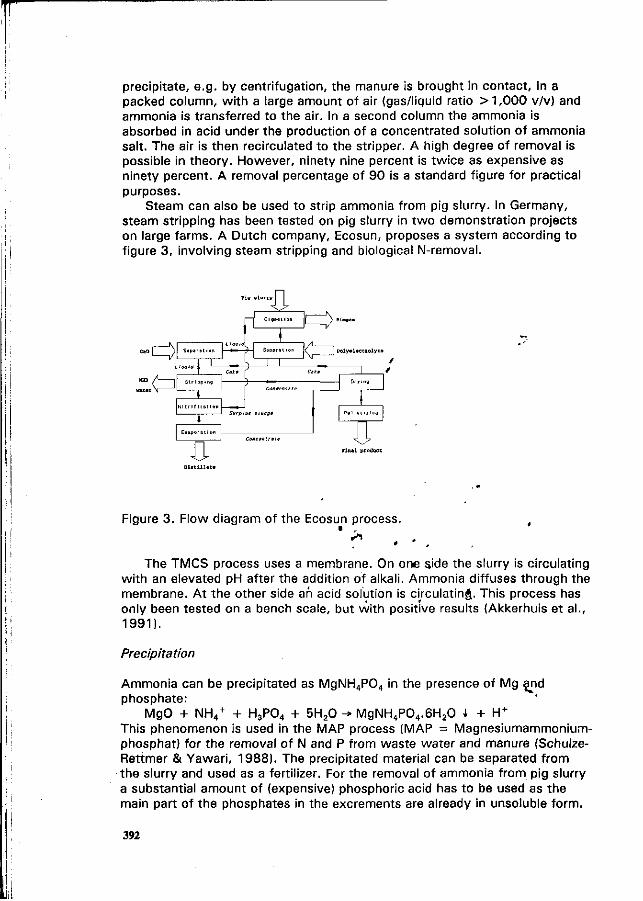
precipitate, e.g. by centrifugation, the manure is brought in contact, in a packed column, w i th a large amount of air (gas/liquid ratio > 1,000 v/v) and ammonia is transferred to the air. In a second column the ammonia is absorbed in acid under the production of a concentrated solution of ammonia salt. The air is then recirculated to the stripper. A high degree of removal is possible in theory. However, ninety nine percent is twice as expensive as ninety percent. A removal percentage of 90 is a standard figure for practical purposes.
Steam can also be used to strip ammonia from pig slurry. In Germany, steam stripping has been tested on pig slurry in two demonstration projects on large farms. A Dutch company, Ecosun, proposes a system according to figure 3, involving steam stripping and biological N-removal.
Final product
Dist i l late
Figure 3. Flow diagram of the Ecosun process.
The TMCS process uses a membrane. On one side the slurry is circulating with an elevated pH after the addition of alkali. Ammonia diffuses through the membrane. At the other side an acid solution is circulating. This process has only been tested on a bench scale, but with positive results (Akkerhuis et al., 1991).
Precipitation
Ammonia can be precipitated as MgNH4P04 in the presence of Mg ajid phosphate:
MgO + NH4+ + H3P04 + 5H20 -* MgNH4P04.6H20 I + H +
This phenomenon is used in the MAP process (MAP = Magnesiumammoniumphosphat) for the removal of N and P from waste water and manure (Schulze-Rettmer & Yawari, 1988). The precipitated material can be separated from the slurry and used as a fertilizer. For the removal of ammonia from pig slurry a substantial amount of (expensive) phosphoric acid has to be used as the main part of the phosphates in the excrements are already in unsoluble form.
392
The CAFR process (CAFR = chemische Ammoniumfällung und Rückgewinnung) is a variation of the MAP process (Lehmkuhl, 1990). Mg and P are added as MgHP04 :
MgHP04 + NH40H + 5H20 -» MgNH4P04.6H20 1 The precipitate will be transported to central plants where the product is thermally treated. The result is magnesiummonophosphate and ammonia. The first component can be reused. Ammonia is collected and used elsewhere; preferably for the removal of NOx f rom waste gases.
Gas purification
The general trend in the purification of the gases from tanks, buildings, evaporators and dryers is to use a treatment line consisting of washing followed by biofiltration. Washing with acid removes most of the dust and the ammonia. Subsequent treatment by biofiltration reduces the level of odour and of remaining ammonia. Above about 40 mg NH3/m3 the concentration of ammonia is toxic for a biofilter.
Because the Dutch standard of 5 mg NH3/m3 is not always achievable with the system described above, attention is now paid to incineration of concentrated waste gases. Such a system was tested on a dryer for poultry manure. Reduction percentages of 9 8 % for ammonia and 9 9 % for odour were reported (Roos, 1992).
Production of feedstuff
Several literature sources describe systems for the production of biomass from pig slurry. This biomass is claimed to be useful as a feed ingredient. Harmon & Day (1974) reported about the use of mixed liquor of an oxidation ditch fed with pig manure as the only source of water supply for the same pigs that produced the slurry for the ditch. Control swine had unlimited access to tap water. Average daily gain were 0.67 kg compared with 0.64 for the control group. The efficiency (kg gain per kg feed) was the same for both groups. Earlier attempts in which corn-soybean in the diet of pigs was substituted with solids from an oxidation dith fed with pig slurry, showed a reduced gain and efficiency, however. Kirchhof & Poppinghaus (1985) purified pig slurry in a two-stage activated-sludge process: a high-rate first stage and a low-rate second step. The aim was to purify the slurry for discharge to open water and to use the surplus sludge as a protein source in animal feed. Various systems for devitalisation of the biomass were tested. Treatment by ultrasonic sound showed effective devitalisation with low energy consumption, without adverse effects on the amino-acid spectre. The biomass contained about 3 0 % amino-acids (basis dry mass). In this country Schutte (1977) reported preliminary measurements of the nutritional value of a) surplus sludge from an activated-sludge process fed with pig slurry and b) the non-soluble ( < 180 //m) fraction of pig slurry. The digestibility of the biomass was tested on rats. The result was an apparent digestibility of the organic matter of 8%. Feeding trials with chickens, with 2 0 % biomass or
393
manure fraction, showed a slight adverse effect on growth. These results were not encouraging enough to carry on with research in this direction.
Ringpfeil & Heinritz (1983) suggested a mixed fermentation process at pH 4 (addition of H3P04) wi th endogenous micro-organisms and an acidophilic bacteria (Strain MB 58 from a collection in Leipzig) in pig slurry enriched with methanol. The biomass was treated with alkali at high temperature to kill all organisms and to disrupt the cell walls for better digestibilty.
The experiments discussed above are just examples taken from the literature about the production of biomass from biological treatment processes for feeding purposes. However, no information is available that this type of material is actually in use for feeding on a practical scale.
In 1988 Van Kemenade (unpublished results) developed a system for the separation of protein from anaerobically digested pig slurry. The basis of the process is electrophoresis. About 6 kg protein per m3 pig slurry was produced wi th 4 , 8 % lysin and 4 0 % essential amino acids. The project was stopped last year due to lack of funds.
Several research projects have been carried out on the production of algae on pig slurry in moderate climates (Fallowfield & Garrett, 1985; Groeneweg, 1980). The lack of sunshine, the relatively low temperature and the brown colour are important obstacles for an economically attractive process in The Netherlands. However, algae are a potentiafsource of feedstuff.
In The Netherlands existing plans for the production of biomass for feeding were recently abandoned when it became apparent that EC approval would take several years and substantial funds.
The Dutch company Triple A, a daughter of Gist-brocades, develops a process for the production of lysine from pig manure. Lysine is an essential amino acid. The value of N as a fertilizer is about 0.5 ECU/kg but 9 ECU/kg in lysine, so conversion of ammonia into amino acid is worthwile to consider. The process uses the main part of the N in the slurry and part of the organic matter and nutrients. After conversion into lysine the main stream of the slurry remains to be processed into flried fertilizer. Details will be pBesented at this Congress by Mr. J.P.M. Sanders el* Triple A.
There can be concluded that, although much experimental work has been done, the efforts to introduce feeding of material derived from pig manure have not been successful. Moreover, the perspectives are also bleak due to increased safety regulations, possibly with the exception'of well-defined products of high purity.
Costs
The investment costs of a factory for the production of granulated fertilizer, wi th an annual capacity of 500,000 m3, is roughly equal to 50 million ECU. The gross operational costs are about 25 ECU/m3. Based on the production of 0.4 m3 slurry (11 % DM) per fattening pig, the gross costs are 10 ECU/pig. There is still much uncertainty about the profits from product sales. Table 3 shows the net costs dependent on two extremes of possible income (20 and 120 ECU/tonne endproduct). A production of 150 kg per m3 slurry is assumed.
394
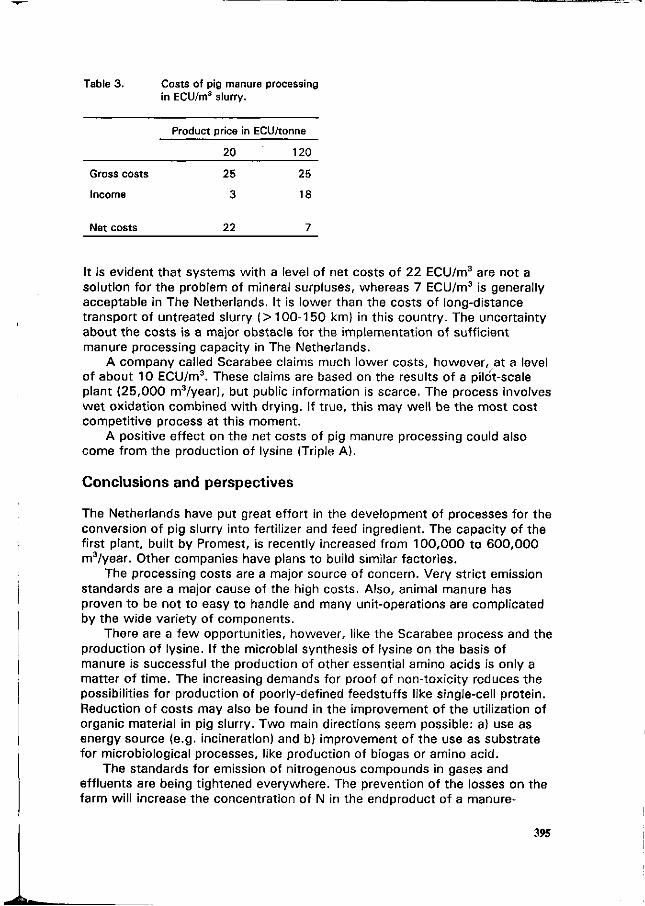
Table 3. Costs of pig manure processing in ECU/m3 slurry.
Product price in ECU/tonne
Gross costs
Income
Net costs
20
25
3
22
120
25
18
7
It is evident that systems with a level of net costs of 22 ECU/m3 are not a solution for the problem of mineral surpluses, whereas 7 ECU/m3 is generally acceptable in The Netherlands. It is lower than the costs of long-distance transport of untreated slurry ( > 100-150 km) in this country. The uncertainty about the costs is a major obstacle for the implementation of sufficient manure processing capacity in The Netherlands.
A company called Scarabée claims much lower costs, however, at a level of about 10 ECU/m3. These claims are based on the results of a pilot-scale plant (25,000 m3/year), but public information is scarce. The process involves wet oxidation combined wi th drying. If true, this may well be the most cost competitive process at this moment.
A positive effect on the net costs of pig manure processing could also come from the production of lysine (Triple A).
Conclusions and perspectives
The Netherlands have put great effort in the development of processes for the conversion of pig slurry into fertilizer and feed ingredient. The capacity of the first plant, built by Promest, is recently increased from 100,000 to 600,000 m3/year. Other companies have plans to build similar factories.
The processing costs are a major source of concern. Very strict emission standards are a major cause of the high costs. Also, animal manure has proven to be not to easy to handle and many unit-operations are complicated by the wide variety of components.
There are a few opportunities, however, like the Scarabée process and the production of lysine. If the microbial synthesis of lysine on the basis of manure is successful the production of other essential amino acids is only a matter of t ime. The increasing demands for proof of non-toxicity reduces the possibilities for production of poorly-defined feedstuffs like single-cell protein. Reduction of costs may also be found in the improvement of the utilization of organic material in pig slurry. Two main directions seem possible: a) use as energy source (e.g. incineration) and b) improvement of the use as substrate for microbiological processes, like production of biogas or amino acid.
The standards for emission of nitrogenous compounds in gases and effluents are being tightened everywhere. The prevention of the losses on the farm will increase the concentration of N in the endproduct of a manure-
395
processing facility. This effect will be reduced by better use of nitrogenous compounds in the feed, in order to diminish emissions. There will be a conflict of interest between the final users of the slurry: the farmer with too much N for an environmentally safe use versus the user who wants to buy N as a plant nutrient or a feed ingredient.
When processed fertilizers from pig slurry are introduced to the market, producers have to respond to wishes for changes in composition and performance. For example with nitrogen: when does it have to be available for the crop wi th minimal loss to the environment? This may lead to changes in and additions to the processes outlined above.
References
Akkerhuis, J .J . , Klaasen, R. & Van Voorneburg, F., 1991 . Verwijdering van ammoniak uit mestvloeistoffen door middel van transmembraan-chemosorptie (TMCS). Institute for Environmental and Energy Technology IMET-TNO, Report 91-219, Apeldoorn, The Netherlands.
Bloemhard, C M . J . , Arts, M.W.M.F., Scheepens, P.C. & Elema, AJ3., 1992. Thermal activation of weed seeds and tubers during drying of pig manure. Netherlands Journal of Agricultural Science 40 , 11-19.
Chiappini, U., 1991 . Personal communication. Crumm, C.J. & Pluenneke, K.A., 1984. Development of an efficient biomass
drying process and its commercial use for energy recovery. In Energy from biomass and wastes VIII, Proc. Symp. Inst, of Gas Technology , Orlando, USA.
Day, D.L. & Harmon, B.G., 1974. A recycled feed source from aerobically processed swine wastes. Transactions of the ASAE 17, 82-87.
Fallowfield, H.J. & Garrett, M.K., 1985. The phototsynthetic treatment of piggery slurry in temperate climatic conditions: a pilot plant study. Agricultural Wastes 12, 111-136.
Groeneweg, J . , 1980. Behandlung ^ori Abwasser aus Massentierhaltungen in Algengräben. Wissenschaft und Umwelt 4 , T6S-170. ,
Lehmkuhl, J . , 1990. Verfahren für die Ammoniiyn-Elimination. Wasser, Luft und Boden. Nr. 11-12, 46-48.
Ringpfeil, M. & Heinritz, H.J., 1983. Möglichkeiten und P/obleme der Gewinnung von Bakterielle Biomassen aus landwirtschaftlichen Abwässern für Futterzwecke. Wissenschaft und Umwelt nr. 4 , 247-251.
Roos, C , 1992. Afgasbehandeling bij centrale mestverwerking. In Mestverwerking. Ontwikkelingen in onderzoek en praktijk, ed. H.A.C. Verkerk, Veenendaal, The Netherlands, 15 April 1992, Publication Information Centre Manure Processing, ISBN 90-800913-1-6, pp. 73-84.
Schulze-Rettmer, R. & Yawari, T., 1988. Verfahren zur Reduzierun^-des Stikstoffgehaltes der Gülle. Wohnung + Gesundheit 10, nr. 7, 31-32.
Schutte, J.B., 1977. Enkele gegevens over de voederwaarde van twee Produkten bereid uit varkensdrijfmest. Report Instituut voor landbouwkundig Onderzoek van Biochemische Produkten, Wageningen, The Netherlands.
396
Ten Have, P.J.W., 1971. Aerobic biological breakdown of farm waste. In Livestock waste management and pollution abatement. Proc. Int. Symp. Livestock Wastes, Ohio, USA, pp. 275-278.
Ten Have, P.J.W., Willers, H.C. & Van Tongeren, W.G.J.M., 1991 . Purification of veal calf manure. In Proceedings of the International Symposium on Veal Calf Production, eds J.H.M. Metz & C M . Groenestein, Wageningen, The Netherlands, 14-16 March 1990, EAAP Publication no.52, pp. 95-99.
Willers, H.C., Ten Have, P.J.W., Derikx, P.J.L. & Arts, M.W., 1993. Temperature-dependency of nitrification and required anoxic volume for denitrification in the biological treatment of veal calf manure. Bioresource Technology 43 , 47-52.
397
Development of an industrial process technology for the manufacturing of lysine from pig manure
J.P.M. Sanders Triple A Agro Amino Acids, c/o Gist-brocades BV, PO Box 1, 2600 MA Delft, the Netherlands
Summary
In order to cope with environmental problems in an economical way, manure should not be regarded as a waste stream with negative value only, but in a positive way that various components in manure can be used as raw materials for the production of valuable compounds. The lysine fermentative production using the ammonia from manure as a raw material has been developed in a small pilot plant facility. The process, once it is operated at 500.000 mVyear will enable the costeffective treatment of pig manure. Furthermore the separation of minerals present in manure will enable their jeutiliza-tion as high value fertilizer substitutes. The problems met in the efforts to export the excess of minerals can thereby be prevented. '
Keywords: lysine, fermentation process, pig manure, cost-effective, mineral balance
The nitrogen balance in agricultural Netherlands
Coping with environmental problems can be done in many distinctive ways, e.g.: 1. Ignore 5. Dilute 2. Hide 6. Transform 3. Wait 7. Prevent 4. Cure 8. Improve
• • It will be evident that in the order they have been mentioned the efforts and technological input required will increase. From the ooint of view of a sustainable agriculture only the last three options are viable, although* they may initially require considerable investment. However', compared to the environme|ital costs that may be attributed to the other methods they will be more economic in the longer term. The agricultural nitrogen cycle in the Netherlands provides an excellent analysis as a starting point to design valuable technical solutions. From figure 1 it can be deducted that approx. 70% of the nitrogen that is imported in the Netherlands, is converted into waste products and thus causes enormous problems. It should be realized that most of the nitrogen is produced from nitrogen from the air at high energy costs and high C02 production levels. The mere^alue of this energy should enable us to recycle the fixed nitrogen back into the sytem and thereby reducing the overall costs made in the long cycle from nitrogen fixation to consumable animal products. This can be done by applying the nitrogen waste stream to substitute 'fresh nitrogen' applications such as the raw material for fertilizer, but also e.g. for fermentations. How should we proceed?
398
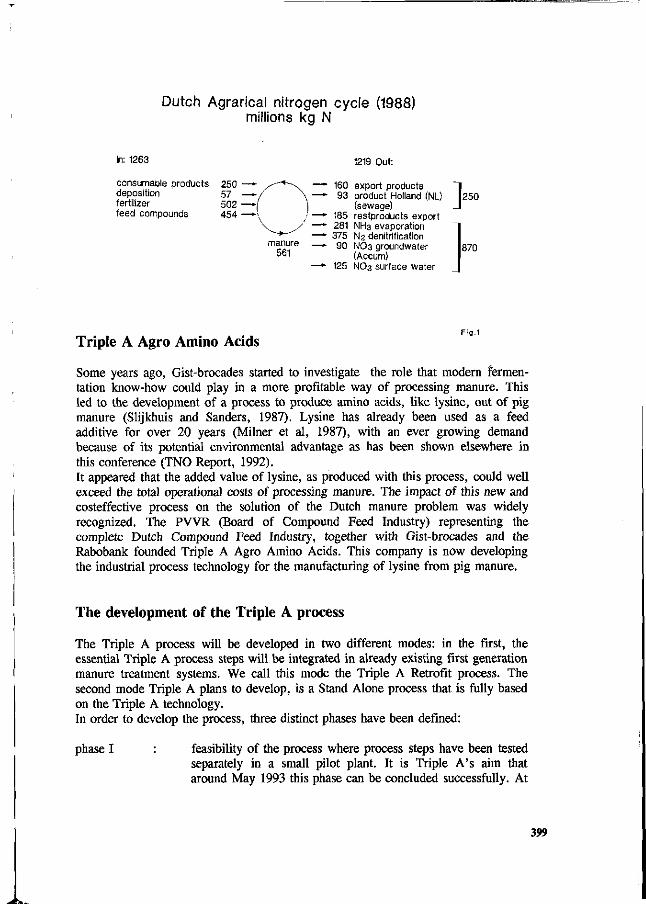
Dutch Agrarical nitrogen cycle (1988) millions kg N
In: 1263
consumable products deposition fertilizer feed compounds
1219 Out:
160 export products 93 product Holland (NL)
(sewage) 185 restproducts export 281 NH3 evaporation 375 N2 denitrificafion 90 NO3 groundwater
(Accum) 125 NO3 surface water
] 250
870
Triple A Agro Amino Acids Flg.1
Some years ago, Gist-brocades started to investigate the role that modern fermentation know-how could play in a more profitable way of processing manure. This led to the development of a process to produce amino acids, like lysine, out of pig manure (Slijkhuis and Sanders, 1987). Lysine has already been used as a feed additive for over 20 years (Milner et al, 1987), with an ever growing demand because of its potential environmental advantage as has been shown elsewhere in this conference (TNO Report, 1992). It appeared that the added value of lysine, as produced with this process, could well exceed the total operational costs of processing manure. The impact of this new and costeffective process on the solution of the Dutch manure problem was widely recognized. The PVVR (Board of Compound Feed Industry) representing the complete Dutch Compound Feed Industry, together with Gist-brocades and the Rabobank founded Triple A Agro Amino Acids. This company is now developing the industrial process technology for the manufacturing of lysine from pig manure.
The development of the Triple A process
The Triple A process will be developed in two different modes: in the first, the essential Triple A process steps will be integrated in already existing first generation manure treatment systems. We call this mode the Triple A Retrofit process. The second mode Triple A plans to develop, is a Stand Alone process that is fully based on the Triple A technology. In order to develop the process, three distinct phases have been defined:
phase I feasibility of the process where process steps have been tested separately in a small pilot plant. It is Triple A's aim that around May 1993 this phase can be concluded successfully. At
399
the end of the successful phase I the manure treatment costs would be DFL 5/m3 of manure treated, using the available technology, however, assuming the economy of scale of a 500.000 mVyear Stand Alone factory. If a Retrofit installation will be used, the Triple A technology will not reduce or increase the treatment costs of the first generation process if operated in an integrated way. We judge this stage of development as a good starting point for phase II.
phase II : A large pilot plant (25.000 m'/year) will be constructed as a Retrofit installation in order to test the core of the process in its integrated form. Furthermore the process will be optimized so that at the end of phase II the treatment of manure will have a nett result of DFL 5/m3 manure taking into account the economy of scale as indicated above. The Retrofit installation will reduce the first generation cost with DFL 10/m3 of manure treated.
phase III : Once the technology has been proven in the pilot plant, which is foreseen at the end of 1994, a large scale Retrofit will be constructed. This Retrofit pjocess should be started up in the first half of 1996. <-During the construction but especially after the start up of the large scale process the treatment cost of our first process will be reduced with another DFL 10-15/m3, so DFL 20-25/m3 in total. Later large scale Retrofit processes will be more advantageous because less investment cost will be required. In the Stand Alone mode that will be built after we will have experience with the Retrofit, we hope to obtain a process that has DFL 15-20 nett result per m3 manure treated.
The principles of the Triple A process
Figure 2 shows a simplified scheme of the first generation process and the Retrofit installation coupled thereto. Anaerobically prefermented manure is separated in a solid and*a liquid phase. The solid phase is handled in the first generation process. The liquid phase is sterilized by an continuous heatshock system. Then in a 'continuous' fermentation process to which as the only nutrient, sterilized molasses are added, a high producing bacterium strain of the species Corynebacterium is secreting the lysine into the broth. 'Continuous' means a fermentation process of about two weeks (Hirao et al, 1989). After a centrifugation step the lysine is being recovered from the liquid phrase by an continuous Ion Exchange system. The recovered lysine is then further purified to meet the standards of the lysine, now available on the European markets. In the Retrofit process all the waste streams are fed back into the first generation process. The Stand Alone process will cope with these streams on its own.
400
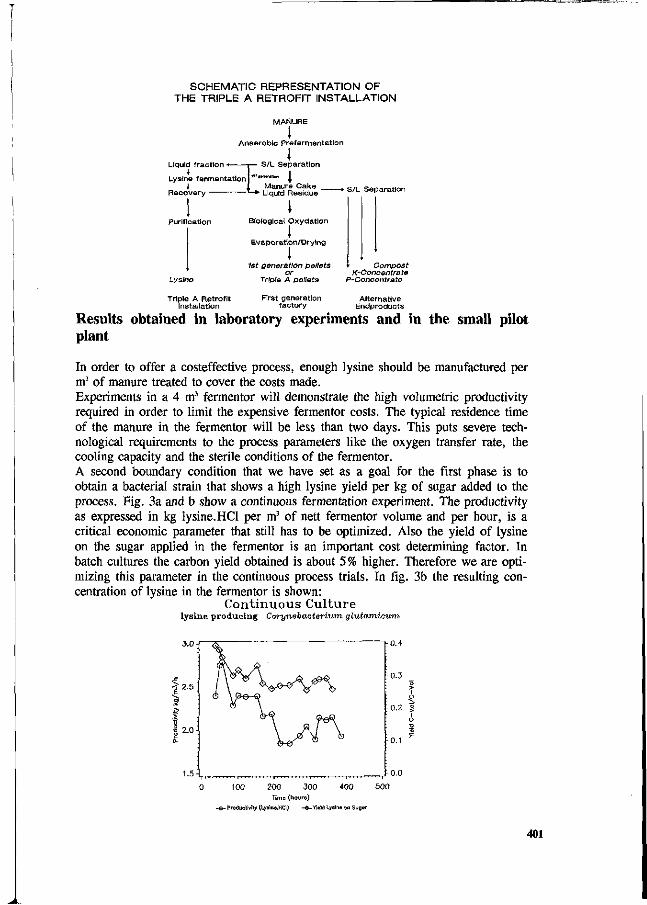
SCHEMATIC REPRESENTATION OF THE TRIPLE A RETROFIT INSTALLATION
MANURE
1 Anaerobic Prefermentation
1 S/L Separation
Liquid fraction •* i
Lysine fermentation I
Recovery I Manure Cake
• Liquid Residue " * S/L Separation
Lysine
Triple A Retrofit Installation
I Biological Oxydation
I Evaporation/Drying I
1st generation pellets or
Triple A pellets
First generation factory
Compost K-Concentrate
P-Concentrate
Alternative EndproduGts
Results obtained in laboratory experiments and in the small pilot plant
In order to offer a costeffective process, enough lysine should be manufactured per m3 of manure treated to cover the costs made. Experiments in a 4 m3 fermentor will demonstrate the high volumetric productivity required in order to limit the expensive fermentor costs. The typical residence time of the manure in the fermentor will be less than two days. This puts severe technological requirements to the process parameters like the oxygen transfer rate, the cooling capacity and the sterile conditions of the fermentor. A second boundary condition that we have set as a goal for the first phase is to obtain a bacterial strain that shows a high lysine yield per kg of sugar added to the process. Fig. 3a and b show a continuous fermentation experiment. The productivity as expressed in kg lysine. HCl per m3 of nett fermentor volume and per hour, is a critical economic parameter that still has to be optimized. Also the yield of lysine on the sugar applied in the fermentor is an important cost determining factor. In batch cultures the carbon yield obtained is about 5 % higher. Therefore we are optimizing this parameter in the continuous process trials. In fig. 3b the resulting concentration of lysine in the fermentor is shown:
Cont inuous Cul ture lysine producing Corynebacterium glutamicum
100 200 Timo (ho
t~ Productivity (Lysina.HCI)
300 400 i r . )
-©-Yield LyBin« on Sugar
5 0 0
401
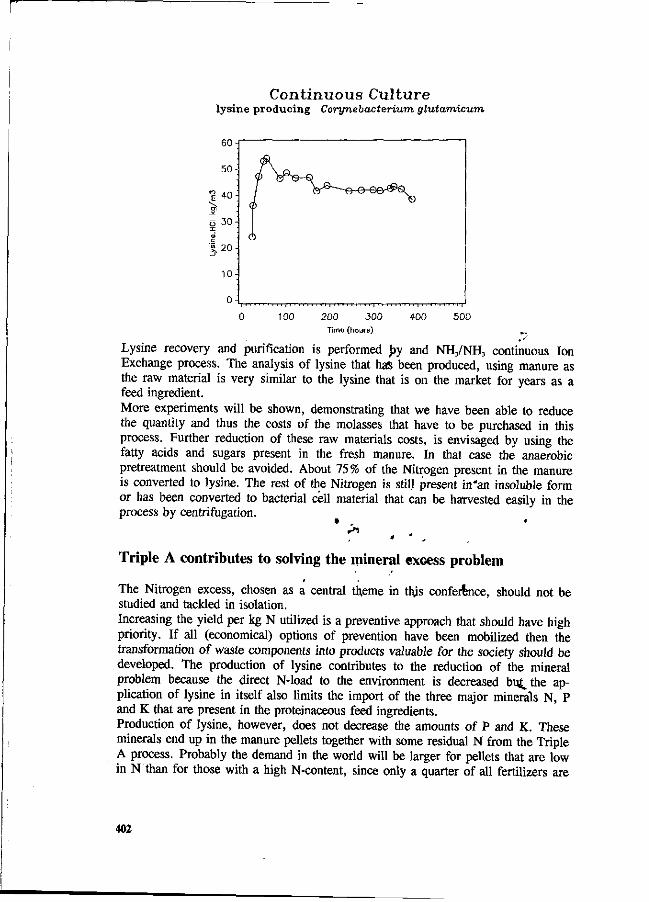
Continuous Culture lysine producing Corynebacterium glutamicum
6 0 -
50-;
1 40-en
Lysi
ne.H
CI
to
OJ
O
O
10-
0-
c / Wä~~~i3-e-e&&<K
0
100 200 300 Time (hours)
400 500
Lysine recovery and purification is performed by and NH3/NH3 continuous Ion Exchange process. The analysis of lysine that has been produced, using manure as the raw material is very similar to the lysine that is on the market for years as a feed ingredient. More experiments will be shown, demonstrating that we have been able to reduce the quantity and thus the costs of the molasses that have to be purchased in this process. Further reduction of these raw materials costs, is envisaged by using the fatty acids and sugars present in the fresh manure. In that case the anaerobic pretreatment should be avoided. About 75% of the Nitrogen present in the manure is converted to lysine. The rest of the Nitrogen is still present in'an insoluble form or has been converted to bacterial cell material that can be harvested easily in the process by centrifugation.
Triple A contributes to solving the mineral excess problem
The Nitrogen excess, chosen as a central theme in tltis conference, should not be studied and tackled in isolation. Increasing the yield per kg N utilized is a preventive approach that should have high priority. If all (economical) options of prevention have been mobilized then the transformation of waste components into products valuable for the society should be developed. The production of lysine contributes to the reduction of the mineral problem because the direct N-load to the environment is decreased but, the application of lysine in itself also limits the import of the three major minerals N, P and K that are present in the proteinaceous feed ingredients. Production of lysine, however, does not decrease the amounts of P and K. These minerals end up in the manure pellets together with some residual N from the Triple A process. Probably the demand in the world will be larger for pellets that are low in N than for those with a high N-content, since only a quarter of all fertilizers are
402
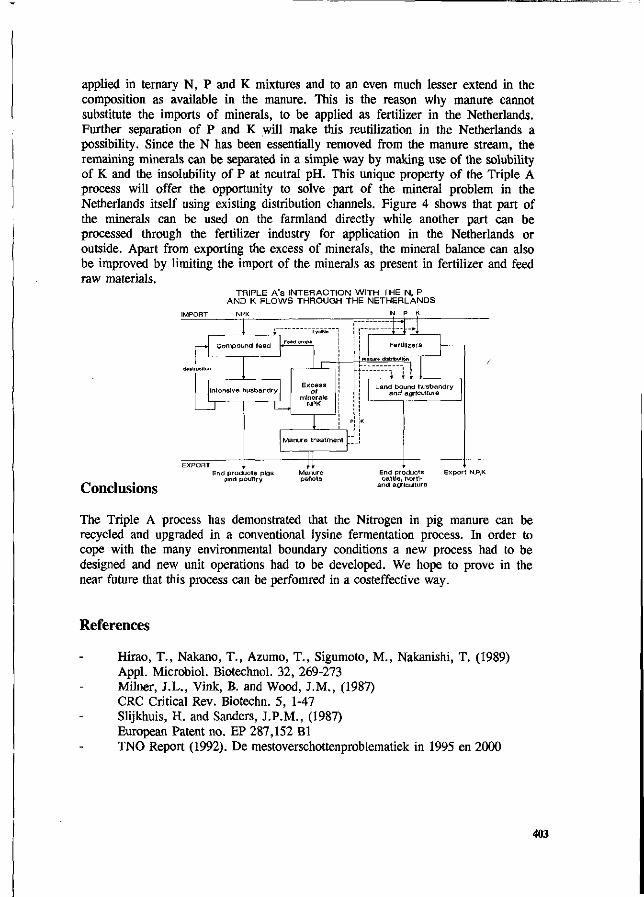
applied in ternary N, P and K mixtures and to an even much lesser extend in the composition as available in the manure. This is the reason why manure cannot substitute the imports of minerals, to be applied as fertilizer in the Netherlands. Further separation of P and K will make this reutilization in the Netherlands a possibility. Since the N has been essentially removed from the manure stream, the remaining minerals can be separated in a simple way by making use of the solubility of K and the insolubility of P at neutral pH. This unique property of the Triple A process will offer the opportunity to solve part of the mineral problem in the Netherlands itself using existing distribution channels. Figure 4 shows that part of the minerals can be used on the farmland directly while another part can be processed through the fertilizer industry for application in the Netherlands or outside. Apart from exporting the excess of minerals, the mineral balance can also be improved by limiting the import of the minerals as present in fertilizer and feed raw materials.
TRIPLE A 's INTERACTION WITH THE N, P AND K FLOWS THROUGH THE NETHERLANDS
h Compound feed
Intensive husbandry
Manure treatment
End products pigs I *
Manure
Conclusions
Land bound husbandry and agriculture
End products cattle, hortl-
and agriculture
The Triple A process has demonstrated that the Nitrogen in pig manure can be recycled and upgraded in a conventional lysine fermentation process. In order to cope with the many environmental boundary conditions a new process had to be designed and new unit operations had to be developed. We hope to prove in the near future that this process can be perfomred in a costeffective way.
References
Hirao, T., Nakano, T., Azumo, T., Sigumoto, M., Nakanishi, T. (1989) Appl. Microbiol. Biotechnol. 32, 269-273 Milner, J.L., Vink, B. and Wood, J.M., (1987) CRC Critical Rev. Biotechn. 5, 1-47 Slijkhuis, H. and Sanders, J.P.M., (1987) European Patent no. EP 287,152 Bl TNO Report (1992). De mestoverschottenproblematiek in 1995 en 2000
403
rr
The effect of continuous aerobic treatment on the fate of the nitrogen component in piggery slurry
C.H. Burton R.W. Sneath J.W. Fanent
AFRC Silsoe Research Institute, Silsoe, Bedford, MK45 4HS, UK
Summary
Aerobic treatment of pig slurry almost invariably resulted in gaseous losses of some of the nitrogen component. The type and quantity of the gases depended on the treatment regime. Where nitrifying-denitrifying conditions were encouraged (4 day treatment time and aeration to a redox potential above -100 mV EMl), large concentrations of nitrous oxide, N20, were measured (up to 750 1/m3 slurry), accounting for 4 to 11% of the nitrogen content of the raw slurry. Relatively little ammonia was found with such treatments and it is presumed that the unaccounted nitrogen loss was as di-nitrogen gas. However, a more direct measurement of this component, (using 0.5% acetylene to inhibit full denitrification), was inconclusive. Quantities/of nitric oxide, NO, (up to 110 1/m3
slurry) and nitrogen dioxide, N02, (up to 7 1/m3 slurry) were also detected. Higher concentrations of ammonia (up to 1001/m3 slurry) occurred during the shorter
treatments (1.5 days) where no nitrates were found and nitrifying activity would not normally be expected. Nonetheless, small concentrations of N20 (up to 22 1/m3 slurry) were still found in the effluent gases; this may be the result of partial nitrification.
Introduction
The use of aerobic methods for treating liquid wastes is an increasingly popular option in response to disposal problems. Animal slurries are usually land spread and are treated mostly to minimise odour problems. However, interest in the nitrogen component of such wastes is increasing both for reasons of air and water pollution^ and for its potential utilization by a growing crop. In the sewage industry, aerobic treatment is used primarily to remove the BOD5 (biochemical oxygen demand).from the water phase and, to a lesser extent, to remove nitrate (by subsequent anoxic denitrification) (Gray, 1989).
A common understanding of the nitrogen cycle is 'that nitrogen compounds in the aqueous phase return to the atmosphere either as di-nitrogen gas (following denitrification) or as ammonia. Even quite recent publications on the subject concur with this view (Barnes & Bliss, 1983). However, in the last few years, it has become increasingly accepted that this is an oversimplification and that other nitrogen gases may result from denitrification. Several workers have reported that nitrous oxide, (an important greenhouse gas which also damages the ozone layer), is produced, following the breakdown of nitrogen compounds in fertilizer (Firestone & Davidstone, 1989) and animal waste that have been spread on the soil (Comfort et al., 1990). It logically follows that such emissions could also result from aerobic treatments of liquid biological wastes. A series of studies based on pig slurry was initiated to investigate this hypothesis, and the principal findings are reported here.
404
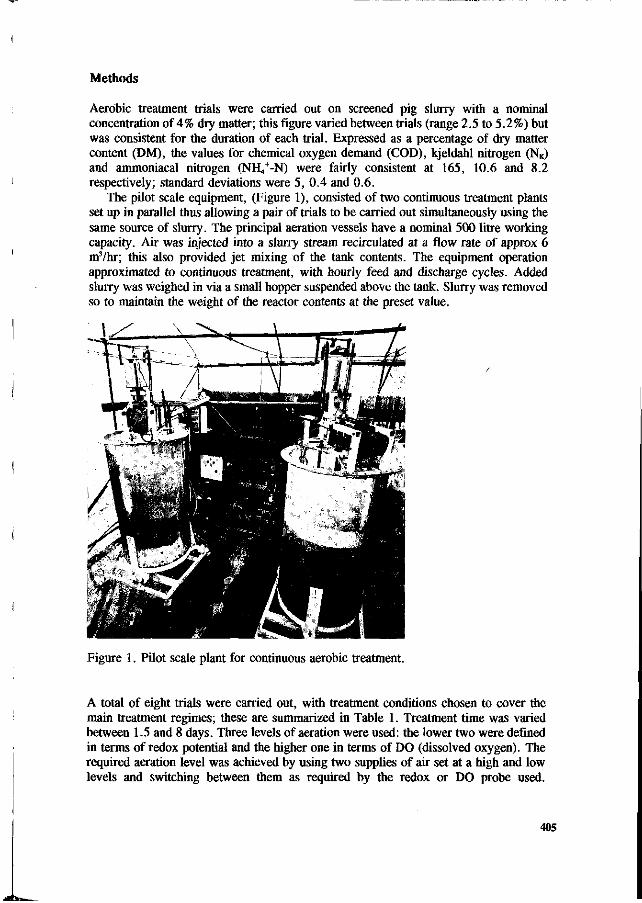
Methods
Aerobic treatment trials were carried out on screened pig slurry with a nominal concentration of 4% dry matter; this figure varied between trials (range 2.5 to 5.2%) but was consistent for the duration of each trial. Expressed as a percentage of dry matter content (DM), the values for chemical oxygen demand (COD), kjeldahl nitrogen (NK) and ammoniacal nitrogen (NH4
+-N) were fairly consistent at 165, 10.6 and 8.2 respectively; standard deviations were 5, 0.4 and 0.6.
The pilot scale equipment, (Figure 1), consisted of two continuous treatment plants set up in parallel thus allowing a pair of trials to be carried out simultaneously using the same source of slurry. The principal aeration vessels have a nominal 500 litre working capacity. Air was injected into a slurry stream recirculated at a flow rate of approx 6 m3/hr; this also provided jet mixing of the tank contents. The equipment operation approximated to continuous treatment, with hourly feed and discharge cycles. Added slurry was weighed in via a small hopper suspended above the tank. Slurry was removed so to maintain the weight of the reactor contents at the preset value.
Figure 1. Pilot scale plant for continuous aerobic treatment.
A total of eight trials were carried out, with treatment conditions chosen to cover the main treatment regimes; these are summarized in Table 1. Treatment time was varied between 1.5 and 8 days. Three levels of aeration were used: the lower two were defined in terms of redox potential and the higher one in terms of DO (dissolved oxygen). The required aeration level was achieved by using two supplies of air set at a high and low levels and switching between them as required by the redox or DO probe used.
405
rr-
Temperature control was used to keep the slurry in the range 25 to 40°C, thus ensuring mesophilic microbial activity. Each trial was run for a period equal to approximately three residence times before sampling for analysis commenced. Raw and treated slurry samples were taken daily throughout a 5 to 10 day monitoring period and analyzed for DM, NK, NH/-N and COD using standard analytical methods (APHA, 1985). Due to their rapid breakdown in active slurry, nitrates and nitrites were measured at the plant site using indicator sticks.
Table 1. Summary of treatment environments.
Trial
1 2 3 4 5 6 7 8
Nominal treatment time (days)
1.5 1.5 1.5 4.0 4.0 4.0 4.0 8.0
Aeration level"
A B C A B B C C
Mean pH
i
8.1 7.3 8.5 7.9 7.1 6.8 6.6 6.7
Mean airflow mVhr (NTP)
1.6 1.0 3.6 0.6.. 2 .5" 2.0 5.3 1.6
A: aerated to a redox potential between -200 and -120 mV Eral
B: aerated to a redox potential between -70 and -30 mV E^ C: aerated to a dissolved oxygen value between 10 and 30% of saturation
The effluent gas was monitored continuously for C02, N20 and Q2. Infrared analyzers (ADC, Hoddesdon, UK) were used for the C02 and 02 and a Makareth type electrode for the oxygen (Neotronics Ltd). Three calibration gases were used: 8% C02 hf nitrogen (oxygen free), 400ppm N20 in air and air alÇne. Th» effects of cross interference were accounted for by calibrating each of the gas analyzers with all calibration gases. Samples of effluent gas were also sent to independent laboratories to collaborate the levels of N20 subsequently found in the effluent gases. Spot analyses were done fijr NH3 (acid bubblers and indicating tubes) and for N02 and NO (indicating tubes).
Results and discussions
Table 2 summarizes the effect of each treatment on the nitrogen component of the slurry.
Non-nitrifying treatments
As observed by other workers (Smith & Evans, 1982; Evans et al., 1986), treatments of longer than three days are necessary for nitrification to occur. In consequence, a high proportion ( > 85 % ) of the slurry nitrogen remained in the reduced form after the 1.5 day treatments. Gaseous losses were mostly as ammonia, with the largest amounts occurring
406
with the high aeration treatment. All treatments four days and more resulted in nitrification except trial 4, in which a
low level of aeration was maintained. The presence of small amounts of nitrous oxide from this and the 1.5 day treatment trials is considered significant. Although relatively small, the production of the gas from an environment which is producing no nitrates or nitrites suggests that it may be the product of a partial nitrification process rather than of denitrification.
Table 2. Summary of the effects of treatments.
Trial
1 2 3 4 5 6 7 8
Reduction U I N K ,
5 6 13 27 70 34 70 60
% Nitrates kg/m3b
none none none none none none none 1.7
Nitrites kg/m31"
none none none none 1.7 1.9 2.0
none
N20 2 2
22 15
750 220 380 51
Mean gas emissions 1/m3 of treated slurry"
NO none none none
0.1 32 24 110
1
N02
none none none none
1 none
7 none
NH3
20 13 94 16
, 8 2
38 30
bMeasured by indicator stick 'Standardized to 4% dry matter
Nitrifying treatments
The nitrifying environment of trials 5 to 8 led to a large amount (up to 70%) of the original nitrogen being oxidized. Simultaneous denitrification occurred in varying amounts in all of these trials, producing large quantities of nitrogen oxide gases, in particular, N20. Di-nitrogen gas is normally also expected under such conditions: however, this is difficult to measure. Methods that assume N2 is accounted for by the gap in the nitrogen mass balance are likely to be inaccurate because of accumulating errors, in particular from the indicator sticks used for the nitrates and nitrites. A more direct measurement for N2 was tried using a technique based on the work of Ryden et al. (1982) on inhibiting complete denitrification by adding 0.5% acetylene to the air. Following this method, any di-nitrogen gas which would otherwise have been produced, is released as the more measurable N20. However, results achieved during the trials were inconclusive beyond confirming that quantities of N2 are produced during denitrification.
The main nitrogen oxide component in the effluent gas from the longer treatment trials was N20, with peak concentrations exceeding 2000 ppm at some times. In trial 5, the mean emission of this gas was 750 1/m3 of treated slurry (at 4% DM). This is equivalent to 11 % of the initial nitrogen content of the slurry. The presence of the small but significant quantities of NO and in particular, N02 was unexpected and indicates further complexity in the chemistry of the transformations that happen to the nitrogen in
407
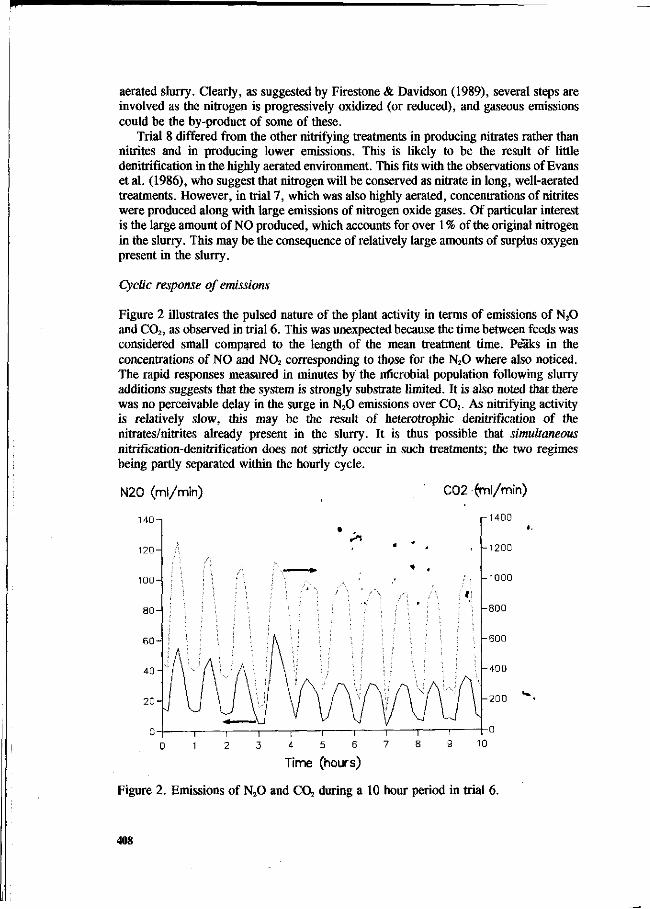
aerated slurry. Clearly, as suggested by Firestone & Davidson (1989), several steps are involved as the nitrogen is progressively oxidized (or reduced), and gaseous emissions could be the by-product of some of these.
Trial 8 differed from the other nitrifying treatments in producing nitrates rather than nitrites and in producing lower emissions. This is likely to be the result of little denitrification in the highly aerated environment. This fits with the observations of Evans et al. (1986), who suggest that nitrogen will be conserved as nitrate in long, well-aerated treatments. However, in trial 7, which was also highly aerated, concentrations of nitrites were produced along with large emissions of nitrogen oxide gases. Of particular interest is the large amount of NO produced, which accounts for over 1 % of the original nitrogen in the slurry. This may be the consequence of relatively large amounts of surplus oxygen present in the slurry.
Cyclic response of emissions
Figure 2 illustrates the pulsed nature of the plant activity in terms of emissions of N20 and C02, as observed in trial 6. This was unexpected because the time between feeds was considered small compared to the length of the mean treatment time. Peaks in the concentrations of NO and N02 corresponding to those for the N20 where also noticed. The rapid responses measured in minutes by the microbial population following slurry additions suggests that the system is strongly substrate limited. It is also noted that there was no perceivable delay in the surge in N20 emissions over C02. As nitrifying activity is relatively slow, this may be the result of heterotrophic denitrification of the nitrates/nitrites already present in the slurry. It is thus possible that simultaneous nitrification-denitrification does not strictly occur in such treatments; the two regimes being partly separated within the hourly cycle.
N20 (ml/min)
140-1
120-
100-
8 0 -
6 0 -
4 0 -
2 0 -
u (- |
0 1
I 2
I 3
I 4
Time
(
•
i 5
> i
i
6
(hours)
*
I 7
« .
I
S
C02 (ml/min
p1400
-
\%\
-1200
- 1000
- 800
- 600
- 4 0 0
- 2 0 0
- n \ 9 10
Figure 2. Emissions of N20 and C02 during a 10 hour period in trial 6.
408
Conclusions
(i) Aerobic treatments of animal slurries can result in the loss of up to 70% of the original nitrogen content. If nitrification does not occur, (e.g. treatments of less than three days), any nitrogen loss will be from ammonia emissions. These generally increase with the air flow rate.
(ii) Nitrifying activity in aerated slurry is encouraged by long treatments (over three days) and sufficient oxygen (redox potential above -100 mV EJ). Up to 70% of the original nitrogen in the slurry can be nitrified and will be conserved as nitrates (or nitrites) if a well aerated environment is maintained, (D.O. value of over 10% of saturation). Otherwise, denitrification can be expected with gaseous losses of nitrogen in the form of di-nitrogen and nitrogen oxides.
(iii) The use of denitrification as a means to remove nitrates from animal slurries (and also from waste water), can be responsible for significant emissions of nitrogen oxide gases, in particular nitrous oxide, which can account for over 10% of the original nitrogen in the slurry. Smaller quantities of nitric oxide and even nitrogen dioxide can also be produced as by-products of this process. The presence of these gases underlines the complexity of the chemistry of this part of the nitrogen cycle. /
References
American Public Health Association, 1985. Standard Methods for the Examination of Waters and Waste Water. 16th edition. American Public Health Association, Washington DC.
Barnes, D. & Bliss, P.J., 1983. Biological Control of Nitrogen in Waste Water Treatment. E. & F. N. Spon Ltd., London, 146p.
Comfort, S.D., Keiling, K.A., Keeny, D.R. & Converse, J.C., 1990. Nitrous oxide production from injected liquid dairy manure. Journal of the American Society of Soil Science 54:421-427
Evans, M.R., Smith, M.P.W., Deans, E.A. & Svoboda, I.F., 1986. Nitrogen and aerobic treatment of slurry. Agricultural Wastes 15:205-213
Firestone, M.K. & Davidstone, E.A., 1989. Microbiological basis of NO and N02
production and consumption in soil. In: Andreae, M. O., Schimel, D.S.: Exchange of trace gases between terrestrial ecosystems and the atmosphere. Wiley, Chichester, UK, p.7-21.
Gray, N.F., 1989. Biology of Waste Water Treatment. Oxford University Press, Oxford, 828p.
Ryden, J.C. & Dawson, K.P., 1982. Evaluation of the acetylene-inhibition technique for the measurement of denitrification in grassland soils. Journal of the Science of Food and Agriculture 33:1197-1206
Smith, M.P.W. & Evans, M.R., 1982. The effects of low dissolved oxygen tension during the aerobic treatment of piggery slurry in completely mixed reactors. Journal of Applied Bacteriology 53:117-126
409
Survival of animal pathogens in slurry
A.R. Moen
Veterinary Health Service Northern Provinces, Postbus 361, 9200 A3 Drachten, The Netherlands.
Summary
From a veterinary and public health point of view the transport and application of untreated manure must be condemned as it potentially increases the spread of disease. Several types of treatment for sanitation can be applied. The method of choice however is anaerobic digestion because the environment is served in three ways; pathogen content will be reduced to an acceptable level, renewable eflergy is produced (biogas) and finally various other types of biological waste products can be includend; this will boost biogasproduction.
Introduction
According to the 1992 annual report of the Dutch national manure bank a total of 15 million tonnes of registered surplus manure was dispatched from the production farms. Due to more strict rules on phosphate use, in the near future, less slurry can be applied per hectare. Hence the quantity of slurry to be removed from the production«farm/will increase. Little is known about the exact pathogen content of slurry.
Principles ' «.
It long has been recognized that the occurence of disease is a result of interactions between components of the famous agent - host - environment complex.
At livestock farms where food is produced the veterinary practitioner and health service will take care of the health condition of food producing livestock. In case of important contagious diseases eradication programs are organised. The public health service is in charge of inspection and supervision of the establishments where food of animal origin is produced.
410
Products like milk, eggs or slaughter animals etc.... can be used with a minimum risk for the consumer if monitoring programs are well performed. To be able to trace the origin of a contagious disease outbreak an identification and registration system for live animals is being implemented at the moment.
The causative agent of many infectious diseases are excreted in faeces. In all types of livestock-housing all or, if a pathogen is not excreted in faeces, some will inevitably enter the manure collecting system. Therefore slurry must be considered as an infectious and inanimate vector for pathogens. Since manure is carrying potentially pathogenic organisms spread must be prevented. Slurry should not be removed from a farm, mixed with slurry from other farms, as is often the case, and transported to farmed land without prior treatment.
Solutions
A considerable amount of data on survival of pathogens in manure has been published. It is not easy, however, to compare these data without laboriously searching the relevant papers and transforming information into a 'ready to use' form. Even then analysis of the information can be time consuming. We developed a computer databank in which published information on the survival of pathogens in slurry is stored. Current knowledge on survival appears to be fragmented and fragments differ widely according to the infectious agent.
The single most important factor in pathogen reduction is heat treatment. Almost all pathogens are sensitive to this type of treatment even at temperatures way below the 100°C, provided the temperature is applied for a certain period of time.
A variety of types of slurry treatment is available to the individual farmer or responsible authorities, these include; aerobic treatment like composting or airation of slurry (liquid composting), anaerobic treatment like long term storage, psychrophilic -, mesophilic -, thermophilic digestion and accepted principles for sanitation of wastes like boiling, rendering, incinerating or chemical disinfection can also be used. All these methods have pros and cons as to their effectiveness in pathogen reduction and the costs involved. The method of choice should be based on expected pathogen load, production animal involved, farm situation etc.... Hygiene standards for slurry will vary according to its pathogen content but because
411
healthy carriers can also produce infected manure, handling manure always involves a risk. The traditional ways of treatment of rural, urban or industrial waste has been invaluable in conquering disease. Chemical disinfection is no longer preferred because of ecotoxicological reasons.
Collective treatment plants must adopt veterinary principles of infrastructural and productional nature. In that case the proces can be certified and quality control can be kept to a minimum. Contamination of the end product should be prevented.
It is recommended to adopt known food microbiology principles and procedures in sampling, culturing and quality - and risk assessment of slurry.
References
Bendixen, HJ. , Ammendrup, S., 1992. Safeguards against pathogens in biogas plants. The Danish veterinary service, p.47.
Böhm, R., Phillip, W., Strauch, D., 1992. Neuere Erkenntnisse zu einigen Aspecten der Tierseuchendesinfection. Berl. Münch. Tierärztl. Wschr. 105:55-61.
Mossel, D.A.A., 1991. Food microbiology: an authentic academic discipline with substantial potential benefits for science and society. J. Assoc. Off. Anal. Chem. 74:420-432.
Wray, C , Wadsworth, Q.C., Richards, D.W., Morgan, LH., 1989. A three-year study of Salmonella dublin infection in a closed dairy herd. Vet. Rec. 124:532-535.* ^
412
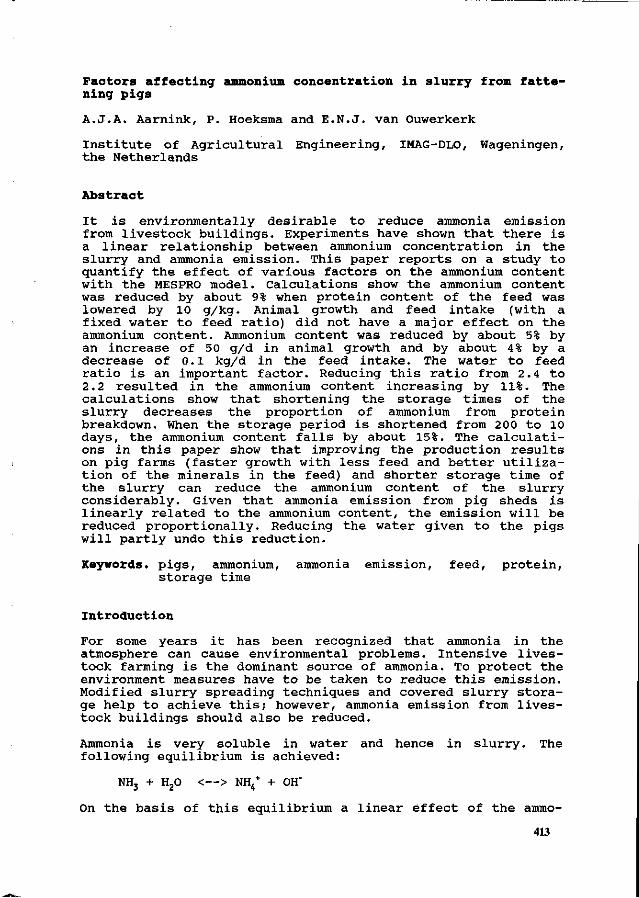
Factors affecting ammonium concentration in slurry from fattening pigs
A.J.A. Aarnink, P. Hoeksma and E.N.J, van Ouwerkerk
Institute of Agricultural Engineering, IMAG-DLO, Wageningen, the Netherlands
Abstract
It is environmentally desirable to reduce ammonia emission from livestock buildings. Experiments have shown that there is a linear relationship between ammonium concentration in the slurry and ammonia emission. This paper reports on a study to quantify the effect of various factors on the ammonium content with the MESPRO model. Calculations show the ammonium content was reduced by about 9% when protein content of the feed was lowered by 10 g/kg. Animal growth and feed intake (with a fixed water to feed ratio) did not have a major effect on the ammonium content. Ammonium content was reduced by about 5% by an increase of 50 g/d in animal growth and by about 4% by a decrease of 0.1 kg/d in the feed intake. The water to feed ratio is an important factor. Reducing this ratio from 2.4 to 2.2 resulted in the ammonium content increasing by 11%. The calculations show that shortening the storage times of the slurry decreases the proportion of ammonium from protein breakdown. When the storage period is shortened from 200 to 10 days, the ammonium content falls by about 15%. The calculations in this paper show that improving the production results on pig farms (faster growth with less feed and better utilization of the minerals in the feed) and shorter storage time of the slurry can reduce the ammonium content of the slurry considerably. Given that ammonia emission from pig sheds is linearly related to the ammonium content, the emission will be reduced proportionally. Reducing the water given to the pigs will partly undo this reduction.
Keywords, pigs, ammonium, ammonia emission, feed, protein, storage time
Introduction
For some years it has been recognized that ammonia in the atmosphere can cause environmental problems. Intensive livestock farming is the dominant source of ammonia. To protect the environment measures have to be taken to reduce this emission. Modified slurry spreading techniques and covered slurry storage help to achieve this; however, ammonia emission from livestock buildings should also be reduced.
Ammonia is very soluble in water and hence in slurry. The following equilibrium is achieved:
NH3 + H20 <—> NH4+ + OH"
On the basis of this equilibrium a linear effect of the ammo-
413
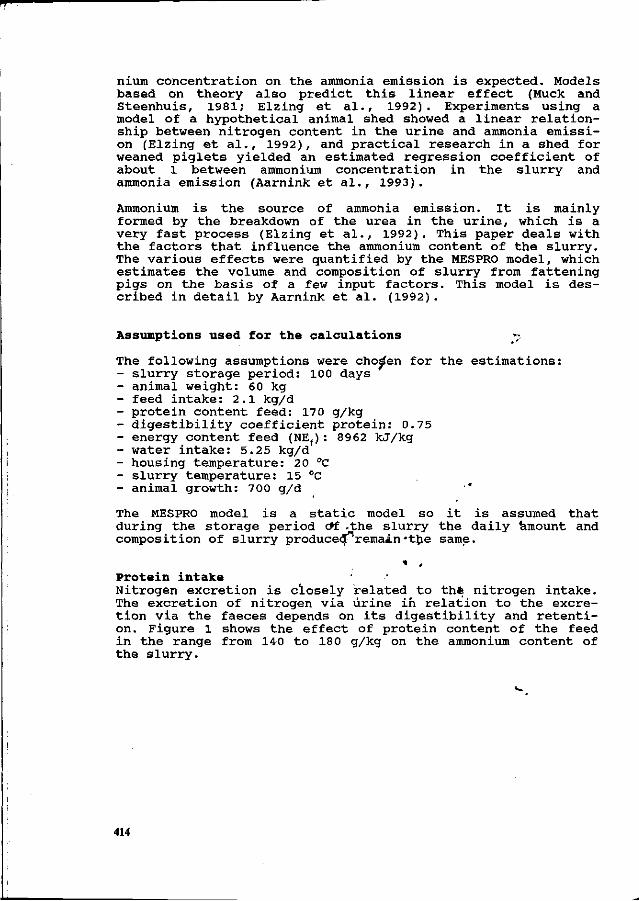
nium concentration on the ammonia emission is expected. Models based on theory also predict this linear effect (Muck and Steenhuis, 1981; Elzing et al., 1992). Experiments using a model of a hypothetical animal shed showed a linear relationship between nitrogen content in the urine and ammonia emission (Elzing et al., 1992), and practical research in a shed for weaned piglets yielded an estimated regression coefficient of about 1 between ammonium concentration in the slurry and ammonia emission (Aarnink et al., 1993).
Ammonium is the source of ammonia emission. It is mainly formed by the breakdown of the urea in the urine, which is a very fast process (Elzing et al., 1992). This paper deals with the factors that influence the ammonium content of the slurry. The various effects were quantified by the MESPRO model, which estimates the volume and composition of slurry from fattening pigs on the basis of a few input factors. This model is described in detail by Aarnink et al. (1992).
Assumptions used for the calculations _-,-
The following assumptions were chosen for the estimations: - slurry storage period: 100 days - animal weight: 60 kg - feed intake: 2.1 kg/d - protein content feed: 170 g/kg - digestibility coefficient protein: 0.75 - energy content feed (NEf) : 8962 kJ/kg - water intake: 5.25 kg/d - housing temperature: 20 "C - slurry temperature: 15 °C - animal growth: 700 g/d
The MESPRO model is a static model so it is assumed that during the storage period &f -the slurry the daily amount and composition of slurry producedfremain'the same.
Protein intake Nitrogen excretion is closely related to the nitrogen intake. The excretion of nitrogen via urine in relation to the excretion via the faeces depends on its digestibility and retention. Figure 1 shows the effect of protein content of the feed in the range from 140 to 180 g/kg on the ammonium content of the slurry.
414
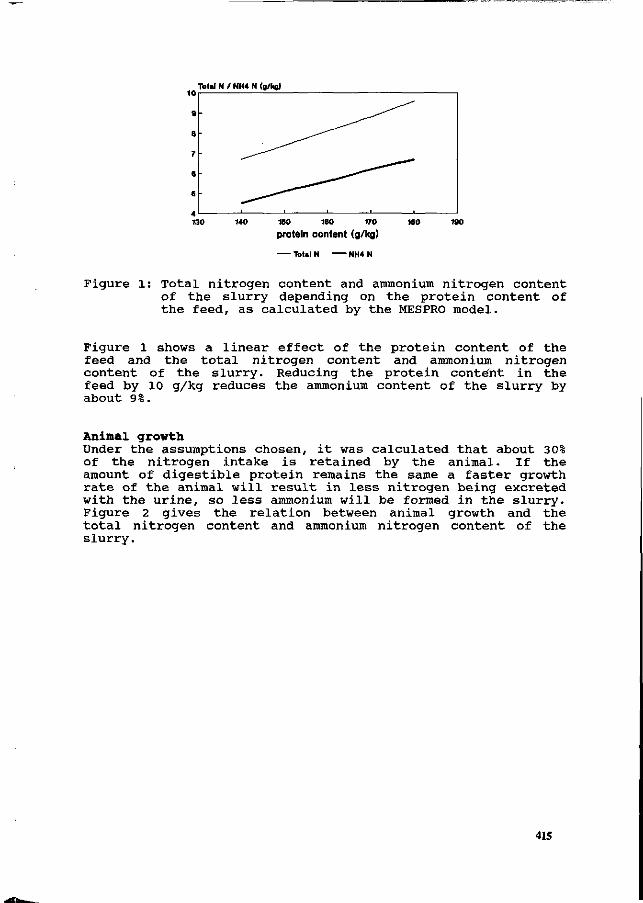
Total N / NH4 N (g/ko)
180 160 170
protein content (g/kg)
Total N NH4 N
Figure 1: Total nitrogen content and ammonium nitrogen content of the slurry depending on the protein content of the feed, as calculated by the MESPRO model.
Figure 1 shows a linear effect of the protein content of the feed and the total nitrogen content and ammonium nitrogen content of the slurry. Reducing the protein content in the feed by 10 g/kg reduces the ammonium content of the slurry by about 9%.
Animal growth Under the assumptions chosen, it was calculated that about 30% of the nitrogen intake is retained by the animal. If the amount of digestible protein remains the same a faster growth rate of the animal will result in less nitrogen being excreted with the urine, so less ammonium will be formed in the slurry. Figure 2 gives the relation between animal growth and the total nitrogen content and ammonium nitrogen content of the slurry.
415
Total N / NH4 N (g/kg)
600 660 700 760 800 660
animal growth (g/d)
Total N — NH4 N
Figure 2 : Total nitrogen content and ammonium nitrogen content of the slurry depending on animal growth, as calculated by the MESPRO model.
As shown in figure 2, the effect of animal grow'th on the ammonium content of the slurry is not very large. An increase in animal growth of 50 g/d reduces the ammonium content by about 5%.
Feed and water intake Feed intake has also little effect on the ammonium content of the slurry at a constant water to feed ratio. For every 0.1 kg more or less feed intake the ammonium content of the slurry increases or decreases by about 4%. The effect of the water to feed ratio is much larger, as is shown in figure 3.
Total N / NH* N (a/kg)
2.2 2.4 2.6 2.8
watenfeed (kg/kg)
- Total N -NH4N
Figure 3 : Total nitrogen content and ammonium nitrogen content of the slurry depending on the water to feed ratio, as calculated by the MESPRO model.
416
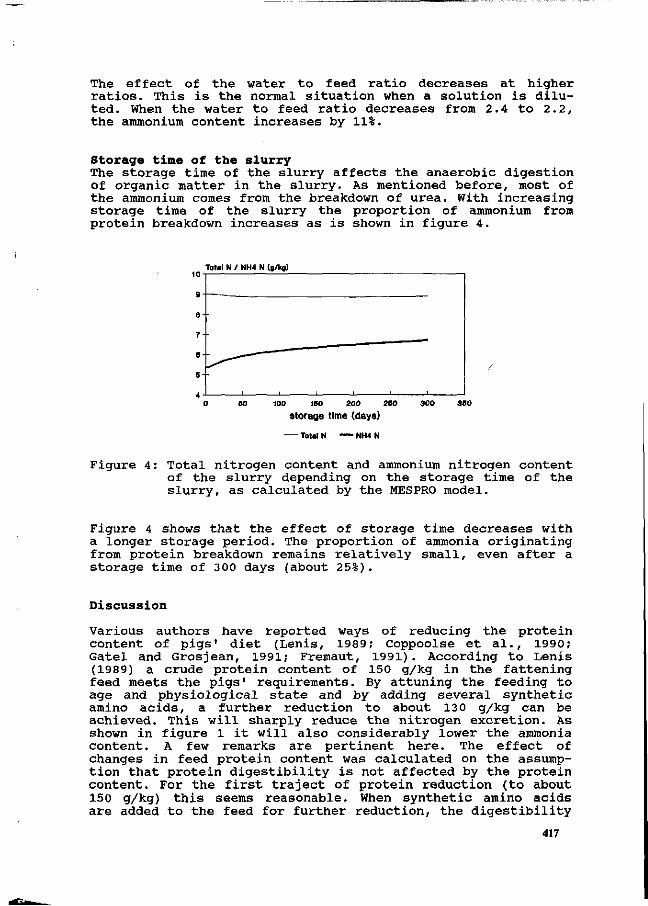
The effect of the water to feed ratio decreases at higher ratios. This is the normal situation when a solution is diluted. When the water to feed ratio decreases from 2.4 to 2.2, the ammonium content increases by 11%.
Storage time of the slurry The storage time of the slurry affects the anaerobic digestion of organic matter in the slurry. As mentioned before, most of the ammonium comes from the breakdown of urea. With increasing storage time of the slurry the proportion of ammonium from protein breakdown increases as is shown in figure 4.
8
7 -
6 -
6-
Total N / NH4 N (g/kg)
0 50 100 ISO 200 260
storage time (days) 300 se
Figure 4: Total nitrogen content and ammonium nitrogen content of the slurry depending on the storage time of the slurry, as calculated by the MESPRO model.
Figure 4 shows that the effect of storage time decreases with a longer storage period. The proportion of ammonia originating from protein breakdown remains relatively small, even after a storage time of 300 days (about 25%).
Discussion
Various authors have reported ways of reducing the protein content of pigs' diet (Lenis, 1989; Coppoolse et al., 1990; Gatel and Grosjean, 1991; Fremaut, 1991). According to Lenis (1989) a crude protein content of 150 g/kg in the fattening feed meets the pigs' requirements. By attuning the feeding to age and physiological state and by adding several synthetic amino acids, a further reduction to about 130 g/kg can be achieved. This will sharply reduce the nitrogen excretion. As shown in figure 1 it will also considerably lower the ammonia content. A few remarks are pertinent here. The effect of changes in feed protein content was calculated on the assumption that protein digestibility is not affected by the protein content. For the first traject of protein reduction (to about 150 g/kg) this seems reasonable. When synthetic amino acids are added to the feed for further reduction, the digestibility
417
of the crude protein will probably change, because these amino acids are very digestible. Furthermore; calculations were made with the same water to feed ratio. Pfeiffer and Henkel (1991) found a lower water intake at a lower protein intake. So the effect of lower protein contents in the feed on the ammonium content of the slurry may be partly undone by a lower water intake and excretion.
Not much improvement from improved animal growth can be expected in the short term. Assuming a big increase in animal growth of 100 g/d reduces the ammonium content of the slurry by about 11%.
The daily feed intake has a large effect on the daily excretion of minerals, with a fixed water to feed ratio only a minor effect can be expected on the mineral contents. The water intake is far more important. An increase of 0.2 kg/kg in the ratio reduces the ammonium content by about 10%. The problem is that a higher water to feed ratio gives more slurry with lower dry matter and mineral contents. In areas of intensive livestock farming the removal of the slurry is very^costly, so farmers are far more interested in lower water to 'feed ratios than in higher water to feed ratiod. In the Netherlands, water use by pigs has already decreased considerably during the last few years. The calculations in this research show that this will give higher ammonium concentrations in the slurry and increased emissions of ammonia.
Reducing the storage time of the slurry reduces the ammonium content of the slurry. In the Netherlands there is a trend to shallow pits and short slurry storage times. Reducing the storage time from 200 days to 10 days reduces the ammonium content of the slurry by about 15%. Only the émission from the slurry pit is affected by' storage time. Hoeksma et al. (1992) estimated a ratio of 7 to 3 between slurry pit and floor emissions. In that case the» ammonia emission will Be reduced by about 10% when storage timers reduced from 2 00 to 10 days.
Different factors seem to affect the* ammonium content of the slurry. Faster animal growth with less feed, better utilisation of the minerals in'the feed and shortetf storage times of the slurry promote lower ammonium concentrations in the slurry, which will reduce ammonia emissions. Compared with the assumptions used in this study, reducing the protein content of the feed by 30 g/kg, increasing in animal growth of 50 g/d and reducing storage time to 10 days will decrease the ammonium content of the slurry from 6.2 to 3.6 g/kg. This is a reduction of more than 40 %. On the other hand, a further improvement of the slurry quality by reducing the w'äter given to the pigs will increase both the ammonium content of the slurry and ammonia emission.
418
Conclusion
The calculations in this paper show that improving the production results on pig farms (faster growth with less feed and better utilization of the minerals in the feed) in combination with a shorter storage time of the slurry can reduce the ammonium content of the slurry considerably. Because ammonia emission from pig sheds seems to be linearly related to the ammonium content, the emission will be reduced to the same extent. Reducing the water given to the pigs will partly undo this reduction.
References
Aarnink, A.J.A., E.N.J, van Ouwerkerk and M.W.A. Verstegen, 1992.
A mathematical model for estimating the amount and composition of slurry from fattening pigs. Livest. Prod. Sei. 31, pp. 133-147.
Aarnink, A.J.A., M.J.M. Wagemans & A. Keen, 1993. Factors affecting ammonia emission from houses for weaned piglets. Proceedings Congress on nitrogen flow ip pig production and environmental consequences, Wageningen, 8-11 June, [in press]
Coppoolse, J., A.M. van Vuuren, J. Huisman, W.M.M.A. Janssen, A.W. Jongbloed, N.P. Lenis & P.C.M. Simons, 1990.
De uitscheiding van stikstof, fosfor en kalium door landbouwhuisdieren Nu en Morgen. Onderzoek inzake de mest- en ammoniakproblematiek in de veehouderij 5, Financieringsover-leg Mest- en Ammoniakonderzoek, 131 pp.
Elzing, A., W. Kroodsma, R. Scholtens & G.H. Uenk, 1992. Ammoniakemissiemetingen in een modelsysteem van een rundveestal: theoretische beschouwingen. IMAG-DLO rapport 92-3, Wageningen, 25 pp.
Fremaut, D.J., 1991. Vermindering van de stikstofexcretie bij vleesvarkens door verlaging van het eiwitniveau in de voeding. In: 100 jaar IWO, Toekomst van de veevoeding en de kwaliteit van de dierlijke produktie, S.F. Spoelstra (Ed.), pp. 94 - 98.
Gatel, F. & F. Grosjean, 1991. Effect of protein content of the diet on nitrogen excretion by pigs. Paper 42nd EAAP-congres, Berlin September 8-12.
Hoeksma, P., N. Verdoes, J. Oosthoek & J.A.M. Voermans, 1992. Reduction of ammonia volatilization from pig houses using aerated slurry as recirculation liquid. Livest. Prod. Sei. 31, pp. 121-132.
Lenis, 1989. Lower nitrogen excretion in pig husbandry by feeding: current and future possibilities. Neth. J. Agric. Sei. 37, pp. 61-70.
Muck, R.E. & T.S. Steenhuis, 1981. Nitrogen losses in free stall dairy barns. In: Proc. 4th Int. Symp. Livestock Waste: A Renewable Resource, ASAE, St. Joseph, Mich., pp. 163-166, 169
419
Pfeiffer, A. & H. Henkel, 1991. The effect of different dietary protein levels on water intake and water excretion of growing pigs. In: Proceedings of the Vth International Symposium on Digestive Physiology in Pigs, M.W.A. Verstegen, J. Huisman and L.A. den Hartog (Ed.). EAAP-publication no. 54, Wageningen, pp. 126-131.
/ /
420
Simulation of manure flows on a farm level
R.M. de Mol
DLO Institute of Agricultural Engineering (IMAG-DLO), P.O. Box 43, 6700 AA Wageningen, The Netherlands
Summary
In the Netherlands the use of manure is submitted to new legislation. The amount, the period and the method for the application of manure are, and will be more, restricted. This has consequences for the farm management. A simulation model is being developed to gain better insight into these effects. All components of the manure logistics -production, treatment, storage, supply, conveyance and application- are integrated into the farm model. Attention is directed to farms where application is a major component, e.g. dairy or arable farms. Important aspects of the application are land use, manuring plans, scheduling and application methods.
Keywords: manure, simulation, logistics, farm model, scheduling '
Introduction
The Netherlands has experienced a large growth in livestock farming in the last decades. Especially the pigs and poultry numbers have strongly increased; there are almost as many pigs as people. This was made possible by feedstuff imports, which made animal production independent of the agricultural area available. The growth in manure production was proportional to this increase in livestock numbers. The excessive fertilization with this manure has caused an environmental problem. Leaching to groundwater and surface runoff of minerals and nutrients result in polluted groundwater and eutrophication. The emission of ammonia in manure is regarded as one of the causes of the acid rain problem. Therefore the Dutch government has imposed several restrictions concerning the application of manure, dealing with: - Amounts applied: The annual application of phosphate in manure is limited to a maximum per
hectare, dependent on the type of land use: grassland, forage maize or arable land. These phosphate limits are being introduced gradually.
- Periods for application: The spreading of manure in the autumn and winter is restricted. These restrictions will be strengthened until only application in the growing season is allowed.
- Application methods: Spread manure must be incorporated into the soil to reduce the emission of ammonia. This is possible by using low emission methods such as injection. It will be obliged for the different soil types when suitable methods have been developed.
The consequences of these restrictions for the farm management are not always clear. The rules will be strengthened and the final terms are not yet determined. Insight into the interdependence between production, storage and application of manure is necessary to be able to judge the effects.
A simulation model for the manure flows on a farm can be helpful to determine the effects of the restrictions. Therefore, a farm model for manure logistics is being developed at IMAG-DLO. The model is directed to the consequences of new methods or restrictions for the storage and application of manure. New techniques or laws influence the scheduling of operations which have to be performed, taking into account the dependency on weather circumstances, the place in the chain of operations and the claims on men and machinery. All these aspects influence the application of manure and the storage capacity needed on a farm, especially when all produced
421
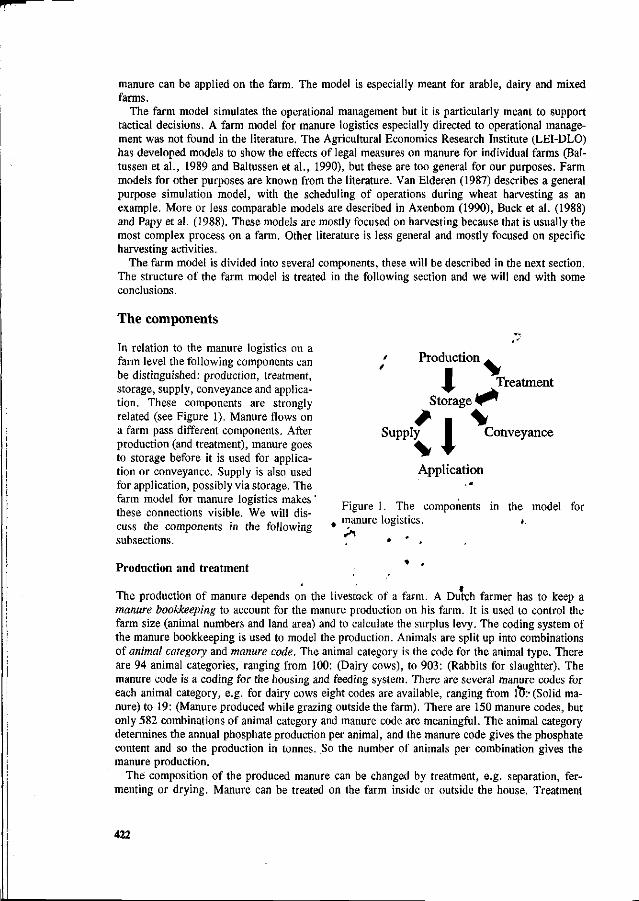
manure can be applied on the farm. The model is especially meant for arable, dairy and mixed farms.
The farm model simulates the operational management but it is particularly meant to support tactical decisions. A farm model for manure logistics especially directed to operational management was not found in the literature. The Agricultural Economics Research Institute (LEI-DLO) has developed models to show the effects of legal measures on manure for individual farms (Bal-tussen et al., 1989 and Baltussen et al., 1990), but these are too general for our purposes. Farm models for other purposes are known from the literature. Van Elderen (1987) describes a general purpose simulation model, with the scheduling of operations during wheat harvesting as an example. More or less comparable models are described in Axenbom (1990), Buck et al. (1988) and Papy et al. (1988). These models are mostly focused on harvesting because that is usually the most complex process on a farm. Other literature is less general and mostly focused on specific harvesting activities.
The farm model is divided into several components, these will be described in the next section. The structure of the farm model is treated in the following section and we will end with some conclusions.
The components
' Production / S
In relation to the manure logistics on a farm level the following components can be distinguished: production, treatment, I ^L storage, supply, conveyance and applica- • ^ ^ tion. These components are strongly Storage '^^ related (see Figure 1). Manure flows on ^ _ ^ ^ a farm pass different components. After Supply I Conveyance
\ \ production (and treatment), manure goes to storage before it is used for application or conveyance. Supply is also used Application for application, possibly via storage. The farm model for manure logistics makes _. . „, • . , , , ,, ., .. . ... ° ... ,. Figure 1. The components in the model for these connections visible. We will dis- , . .
.. „ . ,, £ ., « manure logistics. • cuss the components in the following • -subsections. , * ' .
Production and treatment *
The production of manure depends on the livestock of a farm. A Dutch farmer has to keep a manure bookkeeping to account for the manure production on his farm. It is used to control the farm size (animal numbers and land area) and to calculate the surplus levy. The coding system of the manure bookkeeping is used to model the production. Animals are split up into combinations of animal category and manure code. The animal category is the code for the animal type. There are 94 animal categories, ranging from 100: (Dairy cows), to 903: (Rabbits for slaughter). The manure code is a coding for the housing and feeding system. There are several manure codes for each animal category, e.g. for dairy cows eight codes are available, ranging from ÏÏÏ:- (Solid manure) to 19: (Manure produced while grazing outside the farm). There are 150 manure codes, but only 582 combinations of animal category and manure code are meaningful. The animal category determines the annual phosphate production per animal, and the manure code gives the phosphate content and so the production in tonnes. So the number of animals per combination gives the manure production.
The composition of the produced manure can be changed by treatment, e.g. separation, fermenting or drying. Manure can be treated on the farm inside or outside the house. Treatment
422
inside the house is possible by some housing systems, for example tying stalls with liquid and solid manure, acidification or drying of poultry manure in battery houses. Some of these housing systems can be included in the model as a specific type of manure code. Housing systems which are not included in the manure bookkeeping cannot yet be used directly in the model. Treatment outside the house can be done by special equipment such as a separation or a fermentation installation. Only the possibilities which are included in the manure bookkeeping can be used in the model yet.
If necessary the coding of the manure bookkeeping can be extended with new combinations to model other animal types or housing systems, e.g. in case of new experimental treatment systems.
Storage
Storage of manure is needed because production continues whereas application has been disconnected. Storage can be realized by slurry cellars, tanks, lagoons and the like. The storage needs of a farm depend on the restrictions for manure use; smaller periods for application lead to a larger storage requirement. Also the destination of the produced manure is important: manure applicable on the farm has to be stored whereas surplus manure must be taken off the farm to other farms or to a processing plant and, as a result of the latter, smaller storage capacity is sufficient. The farm model gives insight into the storage needs. The storage of a farm consists of different storage facilities, each with its own form and capacity. Some storage facilities can serve as an overflow storage as with a tank which is used for manure from slurry cellars. The farm model gives the course of the contents of each facility.
Supply and conveyance
When the manure production on a farm is relatively small, compared with the land to which it can be applied, supply from outside the farm can be relevant. In that case supply options have to be defined. Each option is determined by a manure type, supply method and date. This supply date can be fixed or variable. A fixed date corresponds with supply to a storage facility; a variable date indicates supply with immediate application on a plot if the circumstances are acceptable.
In some cases, conveyance off the farm can be necessary: - A manure surplus: Not all produced manure can be applied to the original farm because of legal
or agricultural restrictions. The surplus must find a destination outside the farm (application to another farm or processing). The conveyance dates will be fixed in this case.
- A storage shortage: Inflow to a storage facility makes the contents more than the capacity while outflow is not yet possible. An example is the situation where production continues while the weather circumstances prohibit application. Conveyance is necessary if it is not desirable to exceed the capacity limits in the farm model. The conveyance date is variable because it is not predictable when transport will happen. The date varies between a minimum and a maximum date.
- Manure exchange: It can be profitable to exchange manure between two farms. For example, one farm with a breeding pig manure surplus which is expensive to process in a plant and another farm which produces poultry manure and has enough land to apply all manure. It will then be profitable to exchange the pig manure with the poultry manure because the poultry manure can be placed elsewhere much cheaper. The conveyance dates are supposed to be fixed.
The method and dates for each conveyance option should be defined in the farm model.
Application
The application of manure on a farm is the major component of the farm model. It is directed to the effects of changing circumstances on the application of manure on farms, taking into account the outcomes of the other components.
423
The application of manure is based upon the possibilities: - Land use of the farm: The land use of a farm consists of different plots each with a certain
acreage, distance from the farm, type of land use and type of soil. A plot is cultivated with a certain crop.
- Restrictions: The legal restrictions can refer to the amount of applied manure, the period of application or the method of application, as described in the introduction.
- Manure application plans: A farmer has to plan how he wants to use his manure and which manure should be applied to each plot. A manure application plan is determined by the plot, the amount of manure, the period in which it can be carried out, the application method and the storage facility or the supply option where the manure comes from.
- Men and machinery: These are necessary to perform operations. Machinery can be distinguished into tractors and implements. An implement can be a plough, a slurry tank, a harvester etc.
- Operations: An operation is an activity which has to be performed on a certain plot. An operation can be the application of manure; in this case it refers to a manure application plan. But other activities on the same plot are also included in the farm model because they lay claim to the same men, machinery and time. The operations on a plot refer to the crop and are automatically generated by the use of work packages (Kroeze, 1978), A work package is a list of operations for a crop during one production cycle. For each operation, there are time boundaries, a task time and a workability class. The time boundaries indicate in-which period the operation has to be performed. The task time is the time needed to perform the operation, included failure time and transport time to and from^the plot.
- Workability: The workability is the possibility that an operation can be performed based on weather, product or soil circumstances. In the farm model workability is mostly based on the soil moisture content. There are two ways to determine this workability: - Use historical observations of workability. These are easy to use but only valid for a re
stricted region. Observations of workability from 1945 until 1974 in 'De Hoekse Waard' area (in the south-west of The Netherlands) are available. For every day the soil moisture content is classified: frozen, flooded, soaking, very wet, wet, moist, dry, very dry or parched.
- Use historical weather reports to calculate the soil moisture content with a soil moisture model (as in Augter, 1990 and Belmans et al., 1983). This method can be used if the soil characteristics are known and weather reports are available, but (complicated) calculations are needed to establish the workability.
The first way is already implemented in tlfe model, the second will be added. ' • * ,
The farm model
The farm model is implemented as a computer program which runs on a, Personal Computer. The program is divided into two parts: an initialization and a simulation part.
Initialization
The initialization part of the farm model is used to define the actual situation on a particular farm. The cattle, type of housing and the like have to be defined to calculate the production and treatment of manure. The possibilities for supply and conveyance must be specified as well as the plans and restrictions for the application of manure. Thus the components as described in the previous section should be filled in. The data are stored in a database, realized with the DBMS DataFlex (Dataflex, 1987). A user-friendly interface has been developed to work with this database. All information of a farm can be written to a file which is used as input for the simulation part of the farm model.
424
Simulation
The Simulation part gives a view on the manure logistics in the course of time. It is developed with the use of the simulation package Personal Prosim (Personal, 1990). Personal Prosim can be used for combined discrete/continuous simulation. Production (and treatment) of manure is a continuous process. In the model, produced manure is transferred to the related storage facility once a day. The processes in the other components can be viewed as discrete processes. The supply options are realized at the fixed dates (to storage) or at variable dates if immediate application is possible. The conveyance options are realized at fixed dates in case of a manure surplus or manure exchange or at variable dates if needed in case of supply shortage. The storage processes depend on the other components, there may be a daily inflow as well as inflow or outflow at discrete moments due to supply, conveyance or application.
The simulation of the application is the most complex section. Application of manure is only one of the activities a farmer has to perform. Manuring has to compete with other activities such as ploughing, sowing, and so on. The scheduling of operations in the farm model is based on Van Elderen (1987). Every simulated working day, the operations which can be performed are chosen. Criteria for this selection are: - Time boundaries of operations: For every operation there is a period in which it should be
performed. An operation can only be chosen if the simulation date falls within this period. - Workability: Every operation belongs to a workability class. The workability on the given day
should be at least as good as the required workability class. Better circumstances/are allowed. - Availability of men and machinery: The men, tractors and implements required to perform an
specific operation are called a gang (Oving, 1989). Every operation refers to a gang; the elements of this gang should be available.
- Availability of materials: Some operations require materials; in particular for a manuring operation enough manure should be available. Operations cannot be performed in case of a lack of materials.
- Sequence of operations: Most operations should be performed in a given sequence. An operation cannot be chosen if a necessary preceding operation is not yet completed. These criteria lead to a set of operations which can be performed. A selection from this set is
made by calculating the urgency of the operations in the set. Urgency depends mostly on the deadline of the operation, if needed the workability requirements are also taken into account. The selected operation will be performed, the duration of an operation is determined by its task time. This selection procedure will be repeated until all operations have been selected or the simulation period has expired. One year is taken as the simulation period. It is possible to repeat the simulation with other assumptions about the weather or the farm situation. The simulation results in an image of performable operations during the year. In this way also the possibilities for manure application become visible. One can see whether the manuring plans are carried out or cancelled due to lack of time or weather circumstances.
The costs are also included in the farm model. For production and treatment only the extra costs for treatment or adjusted feeding with a lower phosphate content are included. The costs for storage, supply, conveyance and application are fully included. The ammonia emission will also be included in the model.
Conclusion
A farm model can be used to simulate manure logistics on a farm. The effects of more restrictions and new techniques can be indicated. The relations between the different components of the manure logistics become visible. The application has received much attention. Manuring is only one of the many activities. All operations are scheduled in the model in view of workability, sequencing and work organization.
425
The farm model can be used by: - Policymakers: To visualize the consequences of new rules, for example the effects of a prohib
ition to apply manure during the breeding season of meadow birds. - Researchers: To estimate the effects of new technical developments, e.g. new application tech
niques or housing systems. - Advisers: To help farmers to optimize their manure management and visualize the consequences
of possible modifications in farm management. The development of the farm model has been started in 1991 and will be completed at the end
of 1993.
Acknowledgements
This research has been supported by the FOMA (the Dutch finance organization for manure and ammonia research).
References
Augter, G. (1990). Neue Daten zu verfügbaren Feldarbeitstagen. Landtechnik, 45..305-307. Axenbom, Â. (1990). A base model for discrete event simulation of field operations using Simula
and Demos. Uppsala, Report 143, Department op Agricultural Engineering, Swedish University of Agricultural Sciences. '
Baltussen, W.H.M., Broekhuis, W.A.J. &Venema, G.S. (1989). Gevolgen van de mestwetgeving voor veehouderijbedrijven. Den Haag, LEI, Publikatie 3.143.
Baltussen, W.H.M., van Hörne, P.L.M., Os, J. van & Altena, H. (1990). Gevolgen van beperking van de ammoniakemissie voor veehouderijbedrijven. Den Haag, LEI, Publikatie 3.147.
Belmans, C., Wesseling, J.G. & Feddes, R.A. (1983). Simulation model of the water balance of a cropped soil: SWATRE. Journal of Hydrology, 63, 271-286.
Buck, N.L., Vaughan, D.H. & Hughes, H.A. (1988). A genera!-purpose.simulation program for agricultural operations. Computers and Electronics in Agriculture, 3,, 29-44.
Dataflex, (1987). TheDataFlex USER'S GUIDE (Revision 2.3). Miami, USA, DATA ACCESS Corporation. • , '
Eideren, E. van (1987). Scheduling farm operations:,a simulation model. Wageningen, The Netherlands, Pudoc.
Kroeze. G.H. (1978). Farm labour planning and workabifity» CIGR Symposium Ermatingen, Schweiz.
Oving, R.K. (1989). Farm machinery selection. In Agricultural Engineering Volume 4 Power, processing and systems, eds V.A. Dodd & P.M. Grace. Rotterdam, A.A. Balkema.
Papy, F., Attonaty, J-M., Laporte, C. & Soler, L-G. (1988). Work organization simulation as a basis for farm management advice (equipment and manpower, levels against climatic variability). Agricultural Systems, 27, 295-314.
Personal (1990). PERSONAL PROSIM REFERENCE MANUAL. Waddinxveen, The Netherlands, Sierenberg & de Gans bv.
426
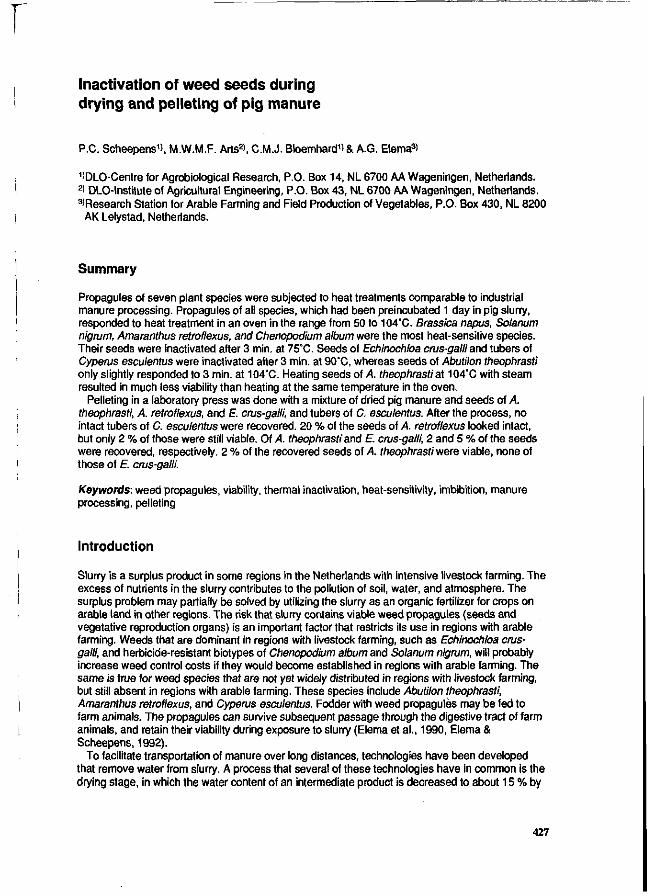
Inactivation of weed seeds during drying and pelleting of pig manure
P.C. Scheepens1», M.W.M.F. Arts2», C.M.J. Bloemhard1> & A.G. Elema3»
1'DLO-Centre for Agrobiological Research, P.O. Box 14, NL 6700 AA Wageningen, Netherlands. 2' DLO-lnsthute of Agricultural Engineering, P.O. Box 43, NL 6700 AA Wageningen, Netherlands. 3>Research Station for Arable Farming and Field Production of Vegetables, P.O. Box 430, NL 8200
AK Lelystad, Netherlands.
Summary
Propagules of seven plant species were subjected to heat treatments comparable to industrial manure processing. Propagules of all species, which had been preincubated 1 day in pig slurry, responded to heat treatment in an oven in the range from 50 to 104°C. Brassica napus, Solanum nigrum, Amaranthus retroflexus, and Chenopodium album were the most heat-sensitive species. Their seeds were inactivated after 3 min. at 75°C. Seeds of Echinochloa crus-galli and tubers of Cyperus esculentus were inactivated after 3 min. at 90°C, whereas seeds of Abutilon theophrasti only slightly responded to 3 min. at 104°C. Heating seeds of A. theophrasti at 104°C with steam resulted in much less viability than heating at the same temperature in the oven.
Pelleting in a laboratory press was done with a mixture of dried pig manure and seeds of A. theophrasti, A. retroflexus, and E. crus-galli, and tubers of C. esculentus. After the process, no intact tubers of C. esculentus were recovered. 20 % of the seeds of A. retroflexus looked intact, but only 2 % of those were still viable. Of A. theophrasti and £ crus-galli, 2 and 5 % of the seeds were recovered, respectively. 2 % of the recovered seeds of A. theophrasti were viable, none of those of E. crus-galli.
Keywords: weed propagules, viability, thermal inactivation, heat-sensitivity, imbibition, manure processing, pelleting
Introduction
Slurry is a surplus product in some regions in the Netherlands with intensive livestock farming. The excess of nutrients in the slurry contributes to the pollution of soil, water, and atmosphere. The surplus problem may partially be solved by utilizing the slurry as an organic fertilizer for crops on arable land in other regions. The risk that slurry contains viable weed propagules (seeds and vegetative reproduction organs) is an important factor that restricts its use in regions with arable farming. Weeds that are dominant in regions with livestock farming, such as Echinochloa crus-galli, and herbicide-resistant biotypes of Chenopodium album and Solanum nigrum, will probably increase weed control costs if they would become established in regions with arable farming. The same is true for weed species that are not yet widely distributed in regions with livestock farming, but still absent in regions with arable farming. These species include Abutilon theophrasti, Amaranthus retroflexus, and Cyperus esculentus. Fodder with weed propagules may be fed to farm animals. The propagules can survive subsequent passage through the digestive tract of farm animals, and retain their viability during exposure to slurry (Elema et al., 1990, Elema & Scheepens, 1992).
To facilitate transportation of manure over long distances, technologies have been developed that remove water from slurry. A process that several of these technologies have in common is the drying stage, in which the water content of an intermediate product is decreased to about 15 % by
427
heat treatment. This heat treatment may inactivate viable weed propagules that are present in the intermediate product.
Dry seeds may be quite resistant to heat. For instance, 94 % of seeds of Avena fatua were still viable after heating 1 hour at 100°C in an oven, whereas all seeds were dead only after heating 1 hour at 140°C (Metz, 1970). Maun (1977) found similar results for seeds of E. crus-galli and Poa pratensis. Hopkins (1936) imbibed weed seeds at 25°C and 50 % relative humididy (RH) before heating them 15 minutes in closed tubes. Under these conditions, the lethal temperature for seeds of A. fatua was 105°C, for seeds of C. album 95'C, and for seeds of A. retroflexus and Thlaspi arvensis 85°C. Horowitz & Taylorson (1984) heated seeds of A. theophrasti 1 hour, and found a decrease in the germination rate at 70°C and higher temperatures. The effect of heat was larger if the seeds were heated at high RH than in a dry atmosphere. Immersion in hot water was more effective than dry or humid heat. Under all these conditions, the seeds had lost their viability after treatment at 100°C. Thermal inactivation was preceded by breaking of dormancy at temperatures of 70°C and higher. From the available data can be concluded that the effect of heat treatment on seeds is greatly affected by the moisture content of the seeds, and/or moisture in the environment.
In addition to heat treatment to dry the manure, the intermediate product may be pelleted. In this process, friction forces are involved that may have a detrimental effect on weed seeds and tubers.
Aim of our investigations was to measure the effect of heat treatments and pelleting of manure on weed propagules under circumstances that are comparable to those in experimental plants for manure processing. We assumed that weed propagules will have imbibed at least 1 day in the slurry before processing. The intermediate product may be heated at 130-150°C 1or<at least 1 hour. Other heating processes are feasible with temperatures between 75°C and just above 100°C, and a duration of heat treatment of 15 minutes a/the utmost.
Our experiments were done under laboratory conditions with pig manure. In addition to the six weed species mentioned above, Brassica napus (a crop species) was included in the heating experiments to represent Cruciferous weeds with oil-containing seeds.
Materials and Methods
Seeds and tubers; manure
Seeds of Abutilon theophrasti Med. were.imported from the USA in 1985. Seeds of Amaranthus retroflexus L, Chenopodium album L, Echinochloa crus-galli(L.) Beauv., and Solanum nigrum L, and tubers of Cyperus esculentus L. were cojected in the vicinity of Wageningen in 1J988 and 1989. After collection, the seeds and tubers weçèidried at room temperature and stored under dry conditions at 4°C. Seeds of Brassica napus L. were comfnerciatly available.
The pig slurry used for preincubation of seeds and tubers contained 3.2 % inorganic and 6.4 % organic dry matter. The intermediate product from one of, the experimental manure processing plants used for the heat treatments of seeds and tubers contained 24 % inorganic and 37 % organic dry matter.
Measuring the vitality of seeds and germination of tubers
The viability of seeds was estimated by measuring their vitality with the tetrazolium test (MacKay, 1972). Seeds that felt softly were regarded as non-vital. The other seeds were placed between moist blotting paper for 18 hours. After piercing the seed-coat with a needle, the seeds were put into a solution of 1 % 2,3,5-trifenyltetrazoliumchloride (TTC), and stored 48 hours aU30°C in the dark. To determine the vitality of the seeds, the colouring of the seed embryos was examined. A seed was considered to be vital if more than half of the embryo was red, or if the whole embryo was pale red. They were considered to be non-vital if more than half of the embryo was uncoloured, or if the embryo was coloured only pinkish. Tubers of C. esculentus have no embryo. Their viability was measured in a germination test. Tubers were placed on blotting paper moistened with water in Petri dishes and incubated during 4 weeks at alternating temperatures of 15'C for 10 hours in the dark and 25'C for 14 hours in the light.
428
During the experiments, the germinal force of untreated tubers of C. esculentus was about 80 %, and the vitality of untreated seeds ranged from 95 to 100 % for all species.
Realization of heat treatments in an oven and in a pressure vessel
After incubation in pig slurry, the seeds and tubers were exposed to various temperatures in a convection oven (GFL, type 7106) or in a pressure vessel (toaster). In the oven, glass pots of 0.51 with 75 g of the intermediate product were placed in a buffer of sand. A polyester mesh filter (0 83 mm, height 50 mm) was put on top of the manure. The lids of the pots were closed, and the pots conditioned 24 hours at the heating temperature. The pots were then opened, the seeds or tubers were placed in the polyester mesh filter and covered with a preheated stainless steel plate (425 g). The purpose of the steel plate was to ensure rapid heat transmission to the seeds and tubers (cf. Scherer & Kutzbach, 1980). One pot, containing seeds or tubers of one species, was treated at a time. All treatments at one temperature of one replicate were done on a single day.
In the toaster, seeds and tubers were heated with saturated steam. Seeds and tubers in polyester mesh bags were placed in a perforated cilinder of metal. The cilinder was placed in the toaster (0 260 mm, height 780 mm). The pressure was set at 116 kPa (abs.), corresponding with a temperature of 104'C. After the treatment, the steam was blown off rapidly. No manure was present in the toaster. Seeds and tubers for one replicate were treated together.
Pelleting of dried manure
Known numbers of seeds of A. theophrasti, A. retroflexus, and E. crus-galli, and tubers of C. esculentus were added to dried manure. Two samples of dried manure were pelleted in a CPM laboratory press. On average, the specific energy input was 18 kWh per 1000 kg. Seeds and tubers that looked undamaged were collected from the pellets, and their viability was tested.
Results
Effects of heat treatments
Experiments on heat treatments are described in more detail elsewhere (Bloemhard et al., 1992). The results of two experiments are presented here. In Table 1, viability after heat treatment during 3 minutes at different temperatures is shown for the seven species. In general, the higher the temperature of the heat treatment, the less propagules remained viable, but large differences were found between the species. The species are ranked according to their heat-resistance, with ß. napus, S. nigrum, A. retroflexus, and C. album being the most sensitive species, and A. theophrasti \he most resistant one.
The second heating experiment that is shown here, was done with the three species that could survive 3 minutes heat treatment at 75 °C. Aim of this experiment was to establish the conditions that would inactivate the seeds or tubers of these species. The results are shown in Table 2. In addition to the heat treatments, preincubation time in pig slurry was varied. Seeds of E. crus-galli could survive heat treatment at 75°C. The survival rate at this temperature decreased with increasing preincubation time. At temperatures above 75°C, seeds of this species did not survive. Tubers of C. esculentus could also survive heat treatment at 75°C. Preincubation time also affected the results for this species at 75°C. At temperatures above 75°C, tubers of this species also did not survive except for 1 % in one case (at 90°C). With seeds of A. theophrasti, the effect of heat treatments at 90°C did not differ from treatments at 75°C. The effect of heat treatments at 104°C differed from treatments at 90°C. Treatments at 104°C in the toaster resulted in less vitality than treatments at the same temperature in the oven. Preincubation time had no effect on the results for A. theophrasti.
429
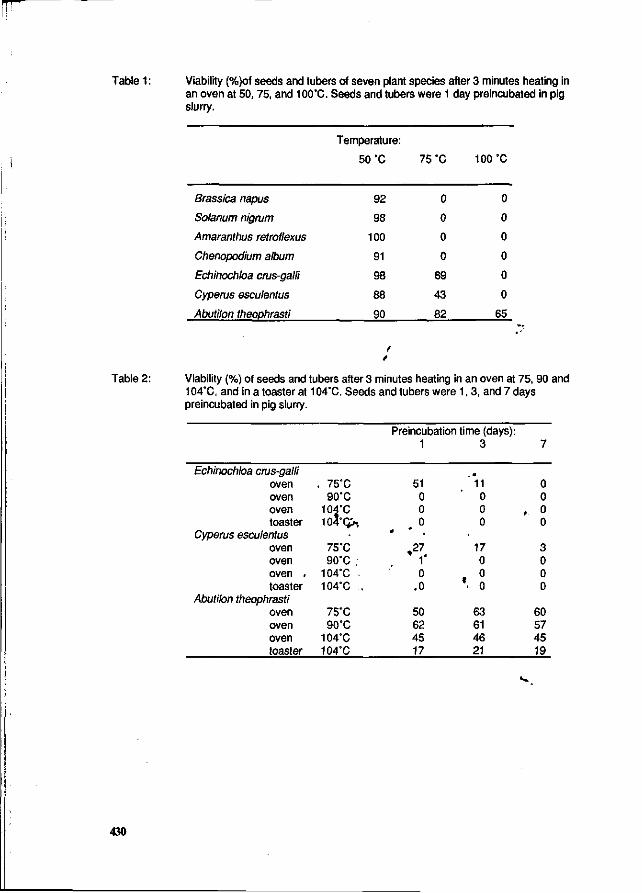
HT
Table 1 : Viability (%)of seeds and tubers of seven plant species after 3 minutes heating in an oven at 50, 75, and 100°C. Seeds and tubers were 1 day preincubated in pig slurry.
Brassica napus
Solanum nigrum
Amaranthus retroflexus
Chenopodium album
Echinochloa crus-galli
Cyperus esculentus
Abutilon theophrasti
Temperature:
50 'C
92
98
100
91
98
88
90
75 °C
0
0
0
0
69
43
82
100 °C
0
0
0
0
0
0
65
Table 2: Viability (%) of seeds and tubers after 3 minutes heating in an oven at 75, 90 and 104°C, and in a toaster at 104°C. Seeds and tubers were 1, 3, and 7 days preincubated in pig slurry.
Echinochloa crus-galli oven oven oven toaster
Cyperus esculentus oven oven oven . toaster
Abutilon theophrasti oven oven oven toaster
. 75"C 90°C
104'C 104°<>,
• 75'C 90°C ,
104'C -104'C .
75°C 90°C
104'C 104°C
Preincubation time (days): 1
51 0 0 0
* * „
, 2 7
1' 0
,0
50 62 45 17
3
M 11 0 0 0
17 0
•. !
63 61 46 21
7
0 0
, o 0
3 0 0 0
60 57 45 19
430
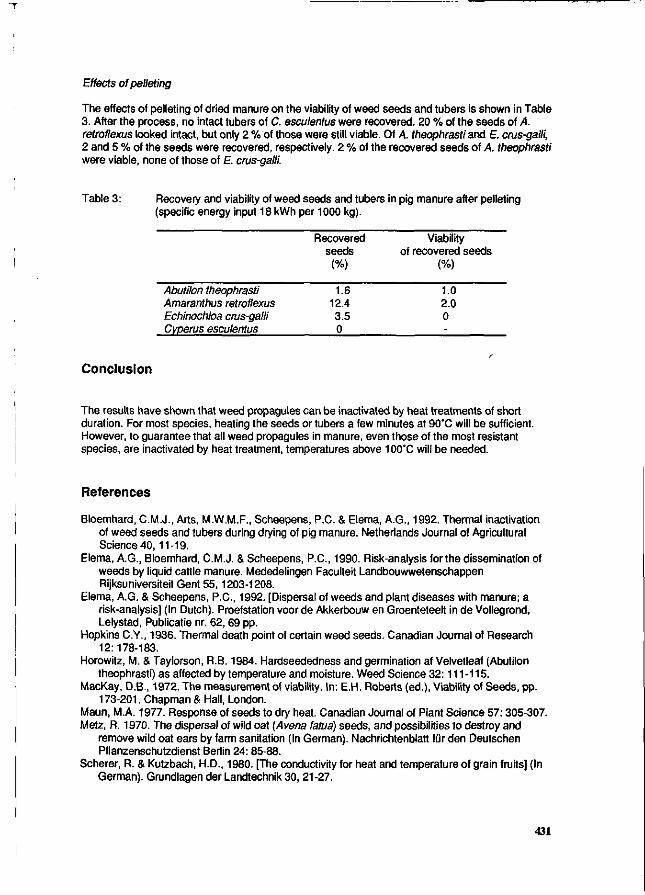
Effects of pelleting
The effects of pelleting of dried manure on the viability of weed seeds and tubers is shown in Table 3. After the process, no intact tubers of C. esculentus were recovered. 20 % of the seeds of A. retroflexus looked intact, but only 2 % of those were still viable. Of A. theophrasti and E. crus-galli, 2 and 5 % of the seeds were recovered, respectively. 2 % of the recovered seeds of A. theophrasti were viable, none of those of E. crus-galli.
Table 3: Recovery and viability of weed seeds and tubers in pig manure after pelleting (specific energy input 18 kWh per 1000 kg).
Recovered Viability seeds of recovered seeds (%) (%)
Abutilon theophrasti 1.6 1.0 Amaranthus retroflexus 12.4 2.0 Echinochloa crus-galli 3.5 0 Cyperus esculentus 0 ;
Conclusion
The results have shown that weed propagules can be inactivated by heat treatments of short duration. For most species, heating the seeds or tubers a few minutes at 90°C will be sufficient. However, to guarantee that all weed propagules in manure, even those of the most resistant species, are inactivated by heat treatment, temperatures above 100°C will be needed.
References
Bloemhard, C.M.J., Arts, M.W.M.F., Scheepens, P.C. & Elema, A.G., 1992. Thermal inactivation of weed seeds and tubers during drying of pig manure. Netherlands Journal of Agricultural Science 40,11-19.
Elema, A.G., Bloemhard, C.M.J. & Scheepens, P.C., 1990. Risk-analysis for the dissemination of weeds by liquid cattle manure. Mededelingen Faculteit Landbouwwetenschappen Rijksuniversiteit Gent 55,1203-1208.
Elema, A.G. & Scheepens, P.C., 1992. [Dispersal of weeds and plant diseases with manure; a risk-analysis] (In Dutch). Proefstation voorde Akkerbouw en Groenteteelt in de Vollegrond, Lelystad, Publicatie nr. 62, 69 pp.
Hopkins C.Y., 1936. Thermal death point of certain weed seeds. Canadian Journal of Research 12:178-183.
Horowitz, M. & Taylorson, R.B. 1984. Hardseededness and germination af Velvetleaf (Abutilon theophrasti) as affected by temperature and moisture. Weed Science 32:111 -115.
MacKay, D.B., 1972. The measurement of viability. In: E.H. Roberts (ed.), Viability of Seeds, pp. 173-201. Chapman & Hall, London.
Maun, M.A. 1977. Response of seeds to dry heat. Canadian Journal of Plant Science 57:305-307. Metz, R. 1970. The dispersal of wild oat (Avena fatua) seeds, and possibilities to destroy and
remove wild oat ears by farm sanitation (In German). Nachrichtenblatt für den Deutschen Pflanzenschutzdienst Berlin 24: 85-88.
Scherer, R. & Kutzbach, H.D., 1980. [The conductivity for heat and temperature of grain fruits] (In German). Grundlagen der Landtechnik 30, 21-27.
431

SESSION 6
Integration and modelling.
ECONOMIC ASPECTS OF N FLOW MANIPULATION IN PIG PRODUCTION
J . H. M. Wij nands
Agricultural Economics Research Institute (LEI-DLO), P.O.Box 29703, 2502 LS The Hague, The Netherlands
SUMMARY
Economic evaluation of environmental pollution caused by the livestock sector is mostly restricted to (minimal) cost calculation for given standards of environmental qualities. First at farm level the minimal costs of the possibilities of abating the environmental pollution are calculated mostly by using farm models based on linear programming. The costs increase exponentially with stricter standards. Secondly at regional level the structure of the agricultural sector determines largely the environmental problem. The manure surpluses should be balanced by using the manure as fertilizers on farms with a deficit or by processing it. Because of the additional costs for preventing pollution some farms are forced to stop their business and this will change the structure of the agricultural sector. The costs of abating the environmental pollution in the Netherlands are about fifty percent of the net value added of the pig and poultry farmers. Thirdly the costs of adapting the compound feed should be calculated at (inter-)national level, because of limited availability of feed commodities. Furthermore a decrease of the livestock sector also will influence the suppliers of e.g. equipment and compound feed and the processors of food. Keywords: Economic evaluation, environment, livestock, models
1 INTRODUCTION AND AIM
1.1 Aim
In several regions of the European Community the number of livestock has increased considerably. The availability of animal manure -a by-product of animal husbandry- increased simultaneously. The need for it, however has decreased because the farmers prefer inorganic fertilizers that are relatively cheap and more convenient. Besides that the number of livestock in a particular region does not have a strong relation with the feed production in that same region any more. Especially commodities for compound feed, which is the major feed for pigs and poultry, are not grown in the same region as where the livestock husbandry is located. Large quantities of these commodities are imported from other countries. Consequently many farmers want to dispose of their larger quantities of manure as cheaply as possible. Their guidance is not the effective use of the minerals by the crop but the disposal of manure within the limits of crop tolerances. This causes the environmental problem of leaching of minerals to the groundwater. Secondly the ammonia emission contributes to the acidification. The awareness of several environmental problems related to the production and to the use of animal manures stimulates the interests in the possibilities of using or handling manures with less pollution. These adapted possibilities will change the costs and therefore the economic prospects of animal husbandry or of the utilization of manures. These economic aspects are the scope of this report.
435
The objective of the report is to give a survey of economic evaluation methods and results of measures and techniques that are aiming to attain environmental standards in respect of production and utilization of animal manure. The key words are economic evaluation.
In section 1.2 the abatement possibilities are mentioned. A lot of the reviewed research is based on the Dutch livestock sector, therefore some information about its position in Europe is given in section 1.3.
In section 2 the economic theory will be discussed. This framework is aiming to give a global overview of the economic aspects concerning the environmental problems related to the production and handling of animal manures.
The composition of the consumed feed largely determines the nutrient contents of manure. The impact on the environment is smaller if the excretion of nutrients is lower. In the section 3 the economic possibilities of adapting compound feed will be discussed.
Section 4 deals with the economic consequences at farm level of the abatement possibilities. However, it is not sufficient to make only analyses at farm level for a clear judgement about the environmental problems and for the possibilities of preventing environmental damage. Just a few farms with livestock in one region, even if they have huge manure surpluses and a relatively high level of losses, will hardly ïrîfluence the environment. No or only moderate measures for preventing nutrient losses will be necessary. The costs for tnese farms will therefore also be moderate. A concentration of specific types of farms (for instance pig farms) in one region can however cause severe environmental damage, perhaps even at relatively low nutrient losses per farm. After the analyses at farm level first an aggregation of the results should take place. The outcome will give insight in the manure surpluses and deficits and in the level of several emissions. From this information the measures for preventing damage through emissions, which should be taken can be derived.
In section 5 the possibilities of balancing the manure surpluses and deficits, a regional model for 'analyzing the ammonia emission and the costs for the livestock sector will be discussed.
The activity level of the suppliers and processors has to change if the level of the livestock sector changes.#In.section 6 some results from the economic literature will be* elaborated.
Section 7 will contain the discussion. » ,
1.2 Abatement possibilities ' '
On pig farms feeds are the main input and livestock products (meat or piglets) are the main economic output. Manure is a by-product with either an economic value or it will lead to expenses for disposing of it as waste. The farmer can decrease the level of pollution per unit of production by adapting the production process or the level of his production. In general the possibilities of adapting the production.process are: 1) adapting the feed or the feeding system in order to decrease the mineral excretion or the manure production per unit of final product; 2) adapting the housing or storage system in order to reduce the emission or the volume of the manure; 3) adapting the application method of manure and 4) disposing of manure outside the farm.
ad 1 adapting feeds The nutrient content of manure is the source of manure surpluses and
ammonia volatilization. A decrease of the excretion of minerals by
436
animals will mitigate the environmental problem caused by livestock. The nutrient content in manure may be reduced by adapting the feeding of the animals. In section 3 some economic research will be discussed.
ad 2 adapting the housing and storage system At this moment research is going on to develop methods to reduce
emission from the stables. According to Monteny (1991) and Voermans (1992) a 50 per cent reduction of ammonia emission from buildings is within reach. Adapting the housing system will rise the production costs. The amount of Nitrogen in manure will increase. The economic consequences will be discussed in the next sections.
ad 3 adapting the application method Several emission low application techniques are available. (Havinga,
1992; Monteny, 1991). Reductions up to 90 per cent are possible. The additional costs are moderate. In section 4 some economic results will be mentioned. Prevention of emission also will restrict the utilization of manure, because of the higher efficiency of the Nitrogen. In order to prevent leaching of nitrate the quantity of manure applied should be adapted to the crop requirements. The growing period limits then the application period. The consequence is that a smaller quantity of manure can be applied in a shorter period. This better tuning needs a sufficient storage capacity, which is mostly larger than the present capacity on farms.
ad 4 Disposing of manure outside the farm. The manure surpluses can be transported and be used on other farms in
the neighbourhood, in other regions or countries. Processing the manure and a temporary storage in deficit regions can be economic efficient. This balancing and optimal allocation of the surpluses are subjects of section 5.
1.3 Dutch livestock in Europe
To set the aim and results of this study in a broader perspective some background information about the position of the Dutch livestock sector within Europe is necessary. In Table 1.1 the livestock numbers and the land use in Europe and the Netherlands are given.
The Netherlands have a share of about 1 per cent of the area arable land and about 1.5 per cent of the permanent grassland in (Western) Europe. The shares of the livestock numbers, especially pigs and poultry, are rather high compared with the area agricultural land. It will be clear that the livestock sector is relatively important in the Netherlands . Furthermore the number of pigs and poultry grew more in the Netherlands than in (Western) Europe. The possibilities of abating environmental pollution depend on the numbers of the different animal species. A comparison between countries will show that the agricultural sector differ considerably. However the Dutch agriculture sector is more or less comparable with smaller regions, for instance the Po-valley in Italy and Brittany in France.
437
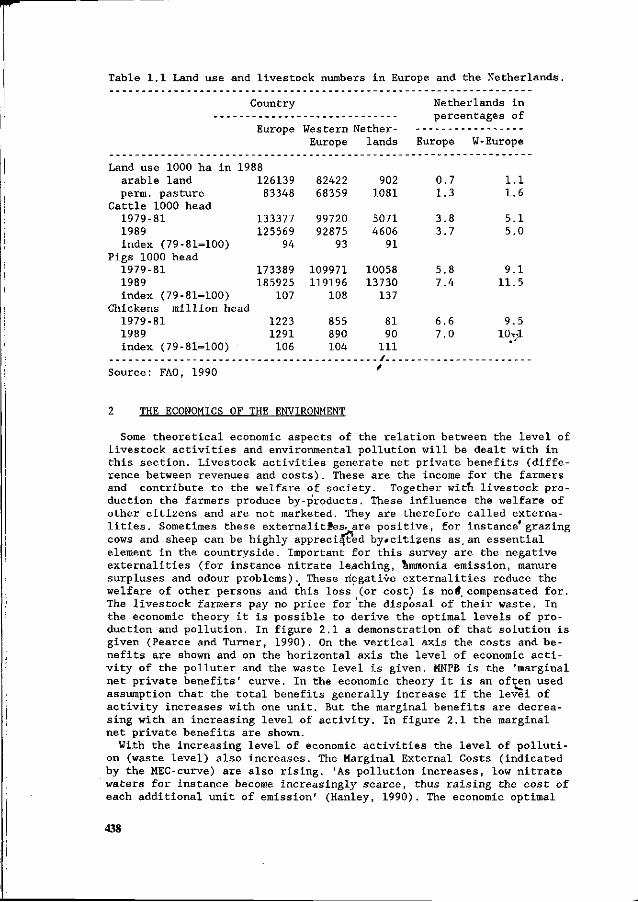
Table 1.1 Land use and livestock numbers in Europe and the Netherlands.
Country Netherlands in percentages of
Europe Western Nether Europe lands Europe W-Europe
Land use 1000 ha in 1988 arable land 126139 82422 902 0.7 1.1 perm, pasture 83348 68359 1081 1.3 1.6
Cattle 1000 head 1979-81 133377 99720 5071 3.8 5.1 1989 125569 92875 4606 3.7 5.0 index (79-81=100) 94 93 91
Pigs 1000 head 1979-81 173389 109971 10058 5.8 9.1 1989 185925 119196 13730 7.4 11.5 index (79-81=100) 107 108 137
Chickens million head 1979-81 1223 855 81 6.6 9.5 1989 1291 890 90 7.0 lOr-l index (79-81=100) 106 104 111
/ Source: FAO, 1990 *
2 THE ECONOMICS OF THE ENVIRONMENT
Some theoretical economic aspects of the relation between the level of livestock activities and environmental pollution will be dealt with in this section. Livestock activities generate net private benefits (difference between revenues and costs). These are the income for the farmers and contribute to the welfare of society. Together with livestock production the farmers produce by-p'roducts. These influence the welfare of other citizens and are not marketed. They are therefore called externalities. Sometimes these externalitfes. are positive, for instance'grazing cows and sheep can be highly appreciated by#citizens as, an essential element in the countryside. Important for this survey are the negative externalities (for instance nitrate leaching, ammonia emission, manure surpluses and odour problems). These negative externalities reduce the welfare of other persons and this loss (or cost) is noil, compensated for. The livestock farmers pay no price for the disposal of their waste. In the economic theory it is possible to derive the optimal levels of production and pollution. In figure 2.1a demonstration of that solution is given (Pearce and Turner, 1990). On the vertical axis the costs and benefits are shown and on the horizontal axis the level of economic activity of the polluter and the waste level is given. MNPB is the 'marginal net private benefits' curve. In the economic theory it is an often used assumption that the total benefits generally increase if the level of activity increases with one unit. But the marginal benefits are decreasing with an increasing level of activity. In figure 2.1 the marginal net private benefits are shown.
With the increasing level of economic activities the level of pollution (waste level) also increases. The Marginal External Costs (indicated by the MEC-curve) are also rising. 'As pollution increases, low nitrate waters for instance become increasingly scarce, thus raising the cost of each additional unit of emission' (Hanley, 1990). The economic optimal
438
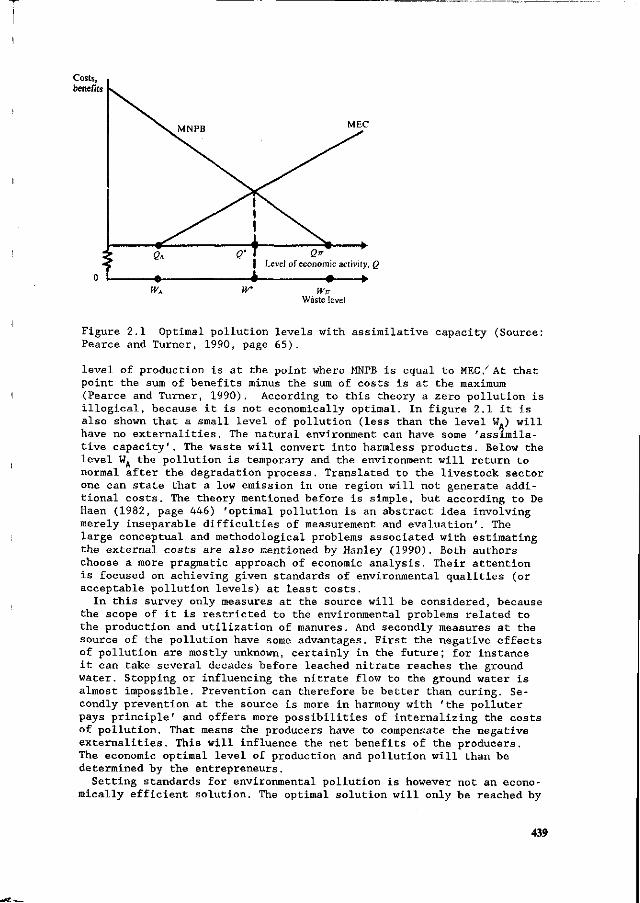
Costs, benefits
MEC
Figure 2.1 Optimal pollution levels with assimilative capacity (Source: Pearce and Turner, 1990, page 65).
level of production is at the point where MNPB is equal to MEC / At that point the sum of benefits minus the sum of costs is at the maximum (Pearce and Turner, 1990). According to this theory a zero pollution is illogical, because it is not economically optimal. In figure 2.1 it is also shown that a small level of pollution (less than the level W.) will have no externalities. The natural environment can have some 'assimilative capacity'. The waste will convert into harmless products. Below the level WA the pollution is temporary and the environment will return to normal after the degradation process. Translated to the livestock sector one can state that a low emission in one region will not generate additional costs. The theory mentioned before is simple, but according to De Haen (1982, page 446) 'optimal pollution is an abstract idea involving merely inseparable difficulties of measurement and evaluation'. The large conceptual and methodological problems associated with estimating the external costs are also mentioned by Hanley (1990). Both authors choose a more pragmatic approach of economic analysis. Their attention is focused on achieving given standards of environmental qualities (or acceptable pollution levels) at least costs.
In this survey only measures at the source will be considered, because the scope of it is restricted to the environmental problems related to the production and utilization of manures. And secondly measures at the source of the pollution have some advantages. First the negative effects of pollution are mostly unknown, certainly in the future; for instance it can take several decades before leached nitrate reaches the ground water. Stopping or influencing the nitrate flow to the ground water is almost impossible. Prevention can therefore be better than curing. Secondly prevention at the source is more in harmony with 'the polluter pays principle' and offers more possibilities of internalizing the costs of pollution. That means the producers have to compensate the negative externalities. This will influence the net benefits of the producers. The economic optimal level of production and pollution will than be determined by the entrepreneurs.
Setting standards for environmental pollution is however not an economically efficient solution. The optimal solution will only be reached by
439
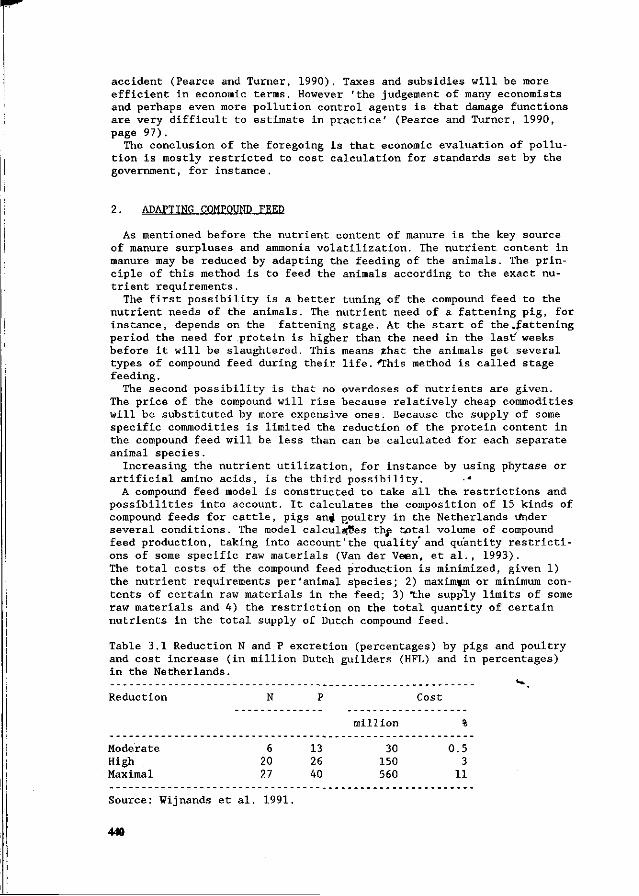
accident (Pearce and Turner, 1990). Taxes and subsidies will be more efficient in economic terms. However 'the judgement of many economists and perhaps even more pollution control agents is that damage functions are very difficult to estimate in practice' (Pearce and Turner, 1990, page 97).
The conclusion of the foregoing is that economic evaluation of pollution is mostly restricted to cost calculation for standards set by the government, for instance.
2. ADAPTING COMPOUND FEED
As mentioned before the nutrient content of manure is the key source of manure surpluses and ammonia volatilization. The nutrient content in manure may be reduced by adapting the feeding of the animals. The principle of this method is to feed the animals according to the exact nutrient requirements.
The first possibility is a better tuning of the compound feed to the nutrient needs of the animals. The nutrient need of a fattening pig, for instance, depends on the fattening stage. At the start of the»fattening period the need for protein is higher than the need in the last' weeks before it will be slaughtered. This means that the animals get several types of compound feed during their life. This method is called stage feeding.
The second possibility is that no overdoses of nutrients are given. The price of the compound will rise because relatively cheap commodities will be substituted by more expensive ones. Because the supply of some specific commodities is limited the reduction of the protein content in the compound feed will be less than can be calculated for each separate animal species.
Increasing the nutrient utilization, for instance by using phytase or artificial amino acids, is the third possibility. •"
A compound feed model is constructed to take all the. restrictions and possibilities into account. It calculates the composition of 15 kinds of compound feeds for cattle, pigs an# poultry in the Netherlands linder several conditions. The model calculates the total volume of compound feed production, taking into account'the quality'and quantity restrictions of some specific raw materials (Van der Veen, et al., 1993). The total costs of the compound feed production is minimized, given 1) the nutrient requirements per'animal species; 2) maxinnjm or minimum contents of certain raw materials in the feed; 3) The supply limits of some raw materials and 4) the restriction on the total quantity of certain nutrients in the total supply of Dutch compound feed.
Table 3.1 Reduction N and P excretion (percentages) by pigs and poultry and cost increase (in million Dutch guilders (HFL) and in percentages) in the Netherlands.
Reduction
Moderate High Maximal
N
6 20 27
P
13 26 40
million
30 150 560
Cost
%
0.5 3
11
Source: Wijnands et al. 1991.
440
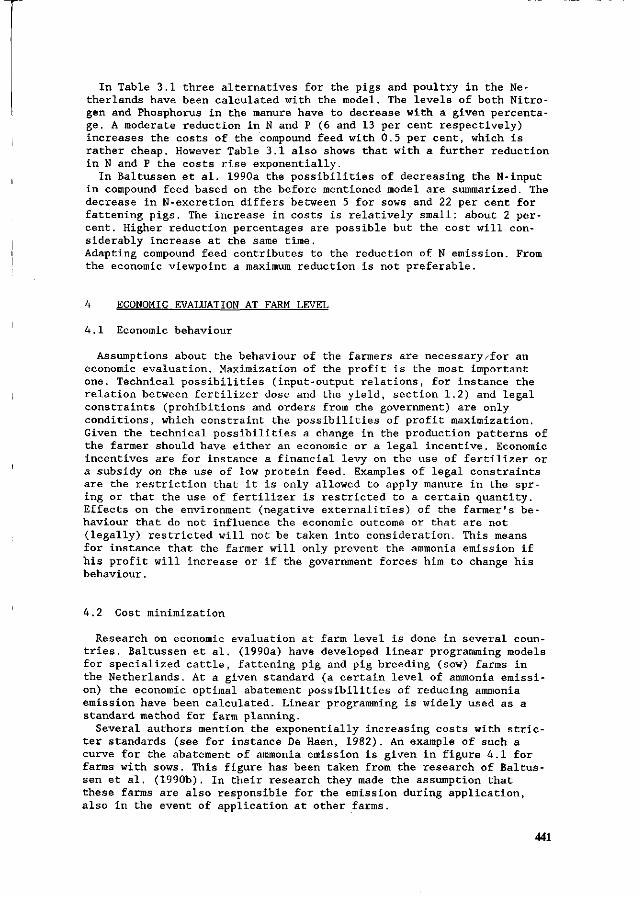
In Table 3.1 three alternatives for the pigs and poultry in the Netherlands have been calculated with the model. The levels of both Nitrogen and Phosphorus in the manure have to decrease with a given percentage. A moderate reduction in N and P (6 and 13 per cent respectively) increases the costs of the compound feed with 0.5 per cent, which is rather cheap. However Table 3.1 also shows that with a further reduction in N and P the costs rise exponentially.
In Baltussen et al. 1990a the possibilities of decreasing the N-input in compound feed based on the before mentioned model are summarized. The decrease in N-excretion differs between 5 for sows and 22 per cent for fattening pigs. The increase in costs is relatively small: about 2 percent. Higher reduction percentages are possible but the cost will considerably increase at the same time. Adapting compound feed contributes to the reduction of N emission. From the economic viewpoint a maximum reduction is not preferable.
4 ECONOMIC EVALUATION AT FARM LEVEL
4.1 Economic behaviour
Assumptions about the behaviour of the farmers are necessary/for an economic evaluation. Maximization of the profit is the most important one. Technical possibilities (input-output relations, for instance the relation between fertilizer dose and the yield, section 1.2) and legal constraints (prohibitions and orders from the government) are only conditions, which constraint the possibilities of profit maximization. Given the technical possibilities a change in the production patterns of the farmer should have either an economic or a legal incentive. Economic incentives are for instance a financial levy on the use of fertilizer or a subsidy on the use of low protein feed. Examples of legal constraints are the restriction that it is only allowed to apply manure in the spring or that the use of fertilizer is restricted to a certain quantity. Effects on the environment (negative externalities) of the farmer's behaviour that do not influence the economic outcome or that are not (legally) restricted will not be taken into consideration. This means for instance that the farmer will only prevent the ammonia emission if his profit will increase or if the government forces him to change his behaviour.
4.2 Cost minimization
Research on economic evaluation at farm level is done in several countries. Baltussen et al. (1990a) have developed linear programming models for specialized cattle, fattening pig and pig breeding (sow) farms in the Netherlands. At a given standard (a certain level of ammonia emission) the economic optimal abatement possibilities of reducing ammonia emission have been calculated. Linear programming is widely used as a standard method for farm planning.
Several authors mention the exponentially increasing costs with stricter standards (see for instance De Haen, 1982). An example of such a curve for the abatement of ammonia emission is given in figure 4.1 for farms with sows. This figure has been taken from the research of Baltussen et al. (1990b). In their research they made the assumption that these farms are also responsible for the emission during application, also in the event of application at other farms.
441
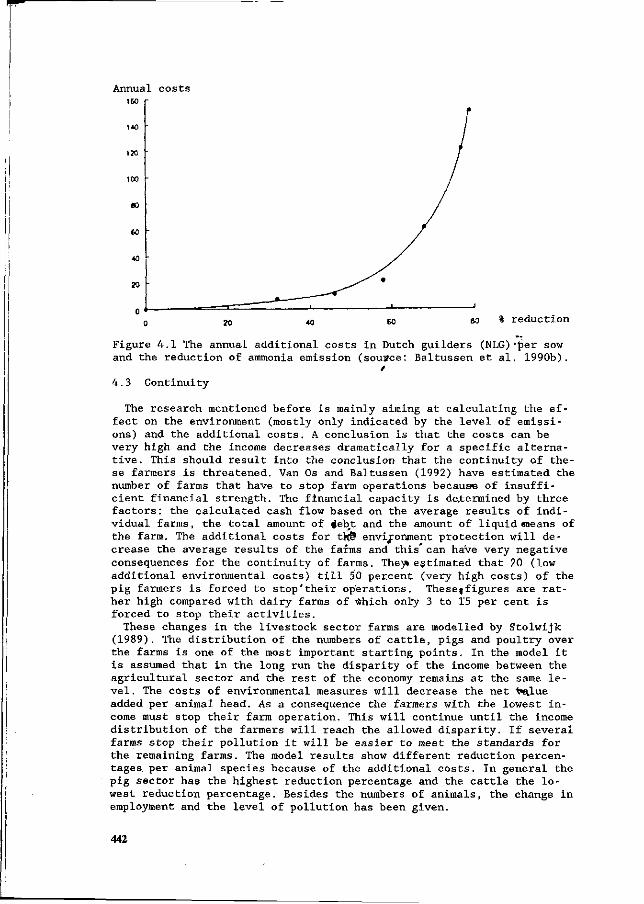
Annual costs 160
% reduction
Figure 4.1 The annual additional costs in Dutch guilders (NLG)'fer sow and the reduction of ammonia emission (souyce: Baltussen et al. 1990b).
4.3 Continuity
The research mentioned before is mainly aiming at calculating the effect on the environment (mostly only indicated by the level of emissions) and the additional costs. A conclusion is that the costs can be very high and the income decreases dramatically for a specific alternative. This should result into the conclusion that the continuity of these farmers is threatened. Van Os and Baltussen (1992) have estimated the number of farms that have to stop farm operations because of insufficient financial strength. The financial capacity is determined by three factors: the calculated cash flow based on the average results of individual farms, the total amount of #ebt and the amount of liquid «leans of the farm. The additional costs for tVfê environment protection will decrease the average results of the farms and this' can have very negative consequences for the continuity of farms. They« estimated that 20 (low additional environmental costs) till 50 percent (very high costs) of the pig farmers is forced to stop'their operations. These|figures are rather high compared with dairy farms of which only 3 to 15 per cent is forced to stop their activities.
These changes in the livestock sector farms are modelled by Stolwijk (1989). The distribution of the numbers of cattle, pigs and poultry over the farms is one of the most important starting points. In the model it is assumed that in the long run the disparity of the income between the agricultural sector and the rest of the economy remains at the same level. The costs of environmental measures will decrease the net lue added per animal head. As a consequence the farmers with the lowest income must stop their farm operation. This will continue until the income distribution of the farmers will reach the allowed disparity. If several farms stop their pollution it will be easier to meet the standards for the remaining farms. The model results show different reduction percentages per animal species because of the additional costs. In general the pig sector has the highest reduction percentage and the cattle the lowest reduction percentage. Besides the numbers of animals, the change in employment and the level of pollution has been given.
442
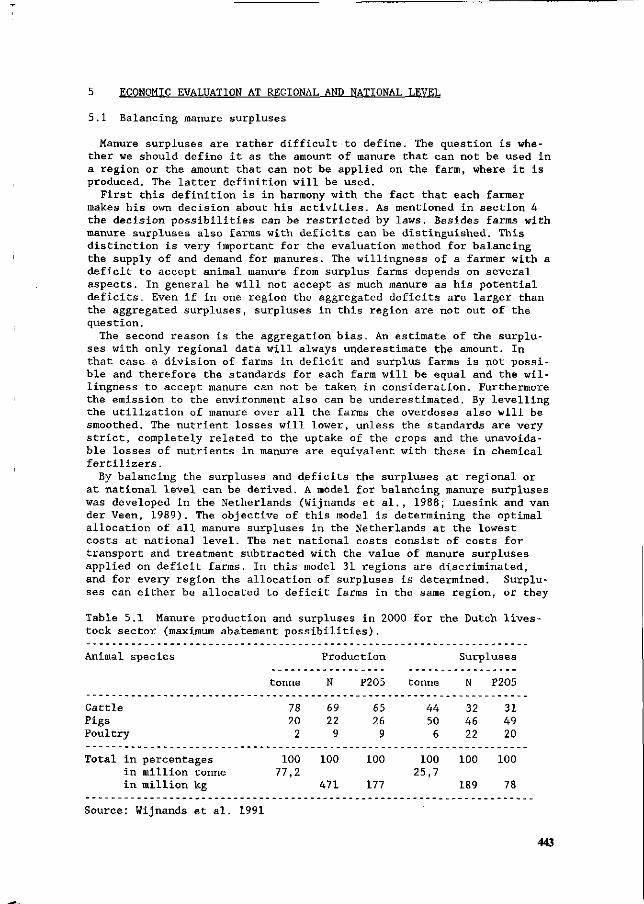
5 ECONOMIC EVALUATION AT REGIONAL AND NATIONAL LEVEL
5.1 Balancing manure surpluses
Manure surpluses are rather difficult to define. The question is whether we should define it as the amount of manure that can not be used in a region or the amount that can not be applied on the farm, where it is produced. The latter definition will be used.
First this definition is in harmony with the fact that each farmer makes his own decision about his activities. As mentioned in section 4 the decision possibilities can be restricted by laws. Besides farms with manure surpluses also farms with deficits can be distinguished. This distinction is very important for the evaluation method for balancing the supply of and demand for manures. The willingness of a farmer with a deficit to accept animal manure from surplus farms depends on several aspects. In general he will not accept as much manure as his potential deficits. Even if in one region the aggregated deficits are larger than the aggregated surpluses, surpluses in this region are not out of the question.
The second reason is the aggregation bias. An estimate of the surpluses with only regional data will always underestimate the amount. In that case a division of farms in deficit and surplus farms is not possible and therefore the standards for each farm will be equal and the willingness to accept manure can not be taken in consideration. Furthermore the emission to the environment also can be underestimated. By levelling the utilization of manure over all the farms the overdoses also will be smoothed. The nutrient losses will lower, unless the standards are very strict, completely related to the uptake of the crops and the unavoidable losses of nutrients in manure are equivalent with these in chemical fertilizers.
By balancing the surpluses and deficits the surpluses at regional or at national level can be derived. A model for balancing manure surpluses was developed in the Netherlands (Wijnands et al., 1988; Luesink and van der Veen, 1989). The objective of this model is determining the optimal allocation of all manure surpluses in the Netherlands at the lowest costs at national level. The net national costs consist of costs for transport and treatment subtracted with the value of manure surpluses applied on deficit farms. In this model 31 regions are discriminated, and for every region the allocation of surpluses is determined. Surpluses can either be allocated to deficit farms in the same region, or they
Table 5.1 Manure production and surpluses in 2000 for the Dutch livestock sector (maximum abatement possibilities).
Animal species
Cattle Pigs Poultry
Total in percentages in million tonne in million kg
tonne
78 20 2
100 77,2
Production
N
69 22 9
100
471
P205
65 26 9
100
177
tonne
44 50 6
100 25,7
Surpluses
N
32 46 22
100
189
P205
31 49 20
100
78
Source: Wijnands et al. 1991
443
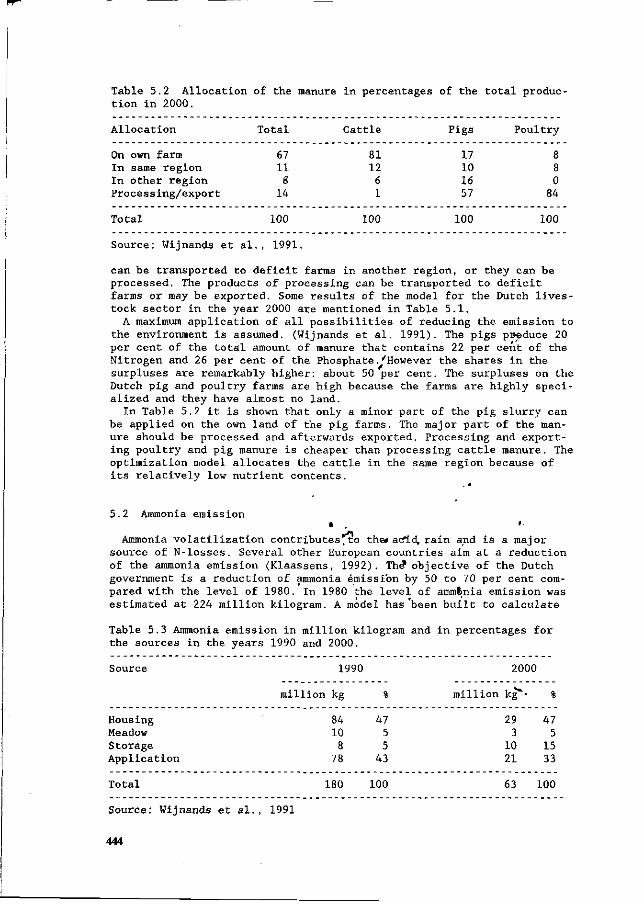
Table 5.2 Allocation of the manure in percentages of the total production in 2000.
Allocation Total Cattle Pigs Poultry
On own farm 67 81 17 8 In same region 11 12 10 8 In other region 8 6 16 0 Processing/export 14 1 57 84
Total 100 100 100 100
Source: Wijnands et al., 1991.
can be transported to deficit farms in another region, or they can be processed. The products of processing can be transported to deficit farms or may be exported. Some results of the model for the Dutch livestock sector in the year 2000 are mentioned in Table 5.1.
A maximum application of all possibilities of reducing the emission to the environment is assumed. (Wijnands et al. 1991). The pigs produce 20 per cent of the total amount of manure that contains 22 per cent of the Nitrogen and 26 per cent of the Phosphate.'However the shares in the surpluses are remarkably higher: about 50 per cent. The surpluses on the Dutch pig and poultry farms are high because the farms are highly specialized and they have almost no land.
In Table 5.2 it is shown that only a minor part of the pig slurry can be applied on the own land of the pig farms. The major part of the manure should be processed and afterwards exported. Processing and exporting poultry and pig manure is cheaper than processing cattle manure. The optimization model allocates the cattle in the same region because of its relatively low nutrient contents.
5.2 Ammonia emission
Ammonia volatilization contributes, to the» add, rain and is a major source of N-losses. Several other European countries aim at a reduction of the ammonia emission (Klaassens, 1992). The* objective of the Dutch government is a reduction of ammonia emission by 50 to 70 per cent compared with the level of 1980. In 1980 the level of ammfcnia emission was estimated at 224 million kilogram. A model has been built to calculate
Table 5.3 Ammonia emission in million kilogram and in percentages for the sources in the years 1990 and 2000.
Source 1990 2000
Housing Meadow Storage Application
Total 180 100 63 100
Source: Wijnands et al., 1991
444
million kg
84 10 8
78
%
47 5 5
43
mi 11 ion kg--
29 3
10 21
%
47 5
15 33
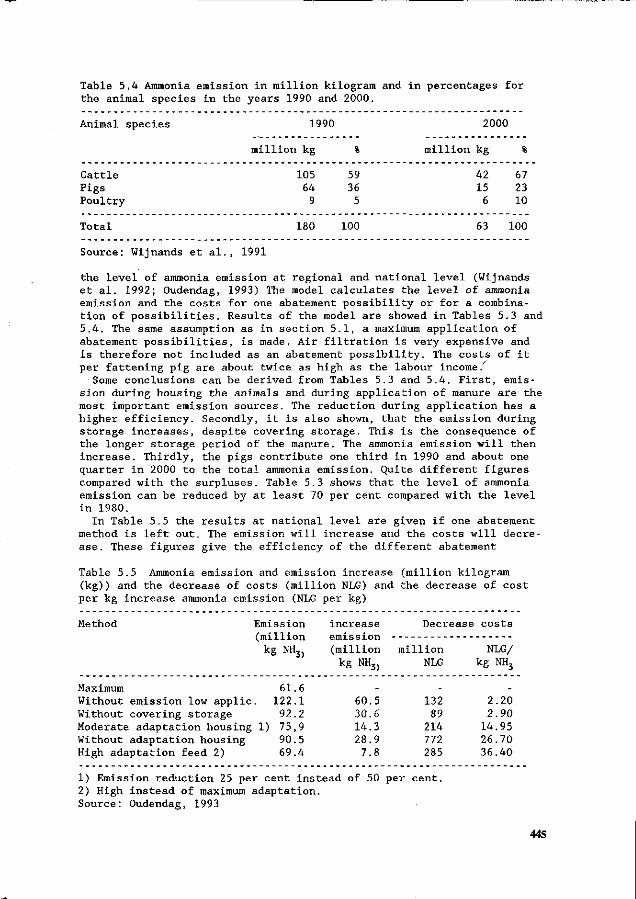
Table 5.4 Ammonia emission in million kilogram and in percentages for the animal species in the years 1990 and 2000.
Animal species 1990
million kg
105 64 9
%
59 36 5
2000
million kg %
42 67 15 23 6 10
Cattle Pigs Poultry
Total 180 100 63 100
Source: Wijnands et al., 1991
the level of ammonia emission at regional and national level (Wijnands et al. 1992; Oudendag, 1993) The model calculates the level of ammonia emission and the costs for one abatement possibility or for a combination of possibilities. Results of the model are showed in Tables 5.3 and 5.4. The same assumption as in section 5.1, a maximum application of abatement possibilities, is made. Air filtration is very expensive and is therefore not included as an abatement possibility. The costs of it per fattening pig are about twice as high as the labour income.
Some conclusions can be derived from Tables 5.3 and 5.4. First, emission during housing the animals and during application of manure are the most important emission sources. The reduction during application has a higher efficiency. Secondly, it is also shown, that the emission during storage increases, despite covering storage. This is the consequence of the longer storage period of the manure. The ammonia emission will then increase. Thirdly, the pigs contribute one third in 1990 and about one quarter in 2000 to the total ammonia emission. Quite different figures compared with the surpluses. Table 5.3 shows that the level of ammonia emission can be reduced by at least 70 per cent compared with the level in 1980.
In Table 5.5 the results at national level are given if one abatement method is left out. The emission will increase and the costs will decrease. These figures give the efficiency of the different abatement
Table 5.5 Ammonia emission and emission increase (million kilogram (kg)) and the decrease of costs (million NLG) and the decrease of cost per kg increase ammonia emission (NLG per kg)
Method Emission increase Decrease costs (million emission
kg NH3) (million million NLG/ kg NH3) NLG kg NH3
Maximum 61.6 Without emission low applic. 122.1 60.5 132 2.20 Without covering storage 92.2 30.6 89 2.90 Moderate adaptation housing 1) 75,9 14.3 214 14.95 Without adaptation housing 90.5 28.9 772 26.70 High adaptation feed 2) 69.4 7.8 285 36.40
1) Emission reduction 25 per cent instead of 50 per cent. 2) High instead of maximum adaptation. Source: Oudendag, 1993
445
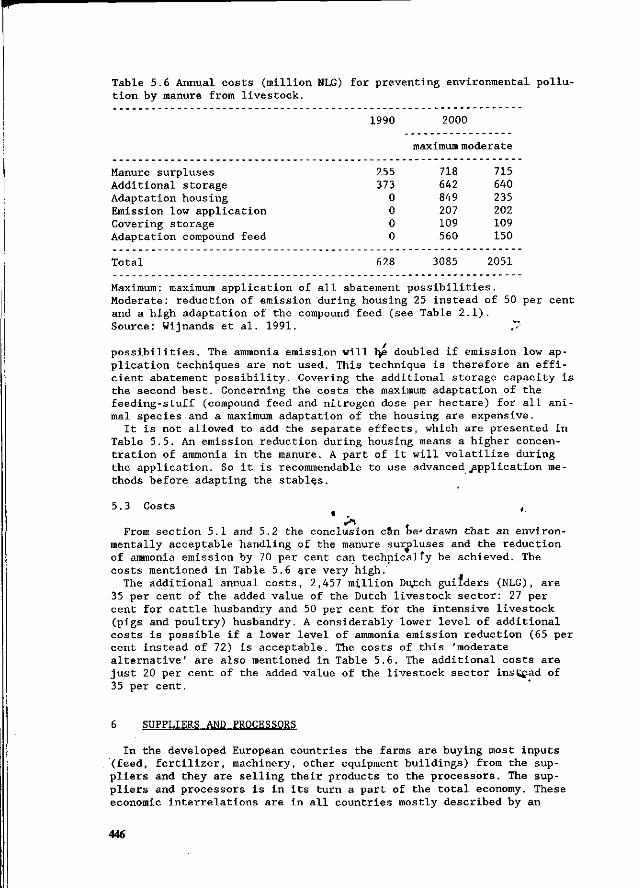
Table 5.6 Annual costs (million NLG) for preventing environmental pollution by manure from livestock.
Manure surpluses Additional storage Adaptation housing Emission low application Covering storage Adaptation compound feed
Total
1990 2000
255 373
0 0 0 0
maximum moderate
718 715 642 640 849 235 207 202 109 109 560 150
628 3085 2051
Maximum: maximum application of all abatement possibilities. Moderate: reduction of emission during housing 25 instead of 50 per cent and a high adaptation of the compound feed (see Table 2.1). Source: Wijnands et al. 1991.
possibilities. The ammonia emission will bye doubled if emission low application techniques are not used. This technique is therefore an efficient abatement possibility. Covering the additional storage capacity is the second best. Concerning the costs the maximum adaptation of the feeding-stuff (compound feed and nitrogen dose per hectare) for all animal species and a maximum adaptation of the housing are expensive.
It is not allowed to add the separate effects, which are presented in Table 5.5. An emission reduction during housing means a higher concentration of ammonia in the manure. A part of it will volatilize during the application. So it is recommendable to use advanced application methods before adapting the stables.
5.3 Costs .
From section 5.1 and 5.2 the conclusion can be-drawn that an environmentally acceptable handling of the manure surpluses and the reduction of ammonia emission by 70 per cent can technically be achieved. The costs mentioned in Table 5.6 are very high.
The additional annual costs, 2,457 million Du,tch guilders (NLG), are 35 per cent of the added value of the Dutch livestock sector: 27 per cent for cattle husbandry and 50 per cent for the intensive livestock (pigs and poultry) husbandry. A considerably lower level of additional costs is possible if a lower level of ammonia emission reduction (65 per cent instead of 72) is acceptable. The costs of this 'moderate alternative' are also mentioned in Table 5.6. The additional costs are just 20 per cent of the added value of the livestock sector instead of 35 per cent.
6 SUPPLIERS AND PROCESSORS
In the developed European countries the farms are buying most inputs (feed, fertilizer, machinery, other equipment buildings) from the suppliers and they are selling their products to the processors. The suppliers and processors is in its turn a part of the total economy. These economic interrelations are in all countries mostly described by an
446
input-output-table. The input of one sector is the output of another one. And the output can be the input for another sector or will be for the final demand (or consumers demand). In the Netherlands the employment on farms is almost as high as in the suppliers and processors. The net value added is even higher on these firms than the total value added on farms. A reduction in the livestock numbers will influence the size of the suppliers and processors. The change in employment and in the national incomes are very important facts for government policy.
Post et al. (1985) have estimated the effect on the employment and on the income of a decrease of the livestock sector for several situations. A decrease of the livestock sector by 20 percent for instance will decrease the income of the total Dutch livestock agribusiness complex (farms and industry) with by 17 percent. About one quarter of this loss comes from the farmers and the other three quarters from the industry that delivers goods to the farmers (for instance compound feed), that processes the agricultural products (for instance slaughter houses) or that distributes the products. The employment decreases by about 16 percent almost equally distributed over the farmers and the industry. A change in the livestock sector also will influence the balance of payments (also an important item for the government policy). The exports will decrease, the imports or prices of food will increase as the livestock number will decrease. ,
7 DISCUSSION
Even if the additional costs of preventing environmental pollution by one particular measure are lower than the costs of preventing environmental damage by other measures, the utilization at farm level of such a measure is not always preferable. The costs are too high or a 'free riders principle' is more profitable. An example can illustrate this contradiction. The utilization of low nutrient feed by all farms can bring the losses to the environment to an acceptable level within reach. At national level the additional costs of the adapted feed will be lower than the costs of other measures with the comparable effect. The contribution of one single farm to the environmental pollution is very small. In general the activities of one single farm have no influence on the pollution level or the surpluses in the region. At farm level the costs of nutrient low feed can therefore be too high because it hardly influences the costs of other measures. And what is more if all other farms are using the adapted feed, the costs for the environmental protection decrease, also for the farm that does not use that feed. That farm has two advantages: no increase in the feeding costs and lower costs for the environmental protection. It will be clear that without an authority, who influences the behaviour of all farms by orders, levies, subsidies or other measures no farmer will use adapted feed. With this example it is illustrated that a central organisation for regulating is compulsory to tackle the problems related to manure.
The costs of disposing of manure are almost proportional with the quantity. An efficient use of drinking water will decrease the volume of manure. The nutrient excretion will of course not change. A lower volume means lower costs for storage, handling and treatment of manure.
447
REFERENCES
Os, J. van, and W.H.M., Baltussen, 1992. Gevolgen van milieumaatregelenen voor de continuiteit van veehouderijbedrijven. Den Haag, LEI-DLO.
Baltussen, W.H.M., P.L.M, van Horne, J. van Os en H. Altena, 1990a Gevolgen van beperking van ammoniakemissie voor veehouderijbedrijven. Den Haag, LEI.
Baltussen, W.H.M., P.L.M, van Horne, J. van Os en H. Altena, 1990b. Gevolgen van een beperking van ammoniakemissie voor veehouderijbedrij -ven, In: F.M. Brouwer en A.J. Reinhard, (eds). Landbouw, Milieu en Ruimte. Den Haag, LEI, 81-87.
FAO, 1990. FAO yearbook, Production 1990, Vol. 43. Rome, Food and agriculture organization of the United Nations.
Haen, H. de, 1982. Economic aspects of policies to control nitrate contamination resulting from agricultural production. European Review of Agricultural Economics, 9 (1982), page 443-465
Hanley, N., 1990. The economics of nitrate pollution. European Review of Agricultural Economics, 17 (1990) 2, page 129-152.
Havinga, H., 1992. Costs of emission poor manure apllication in the Netherlands. In: Klaassens, 1992.
Klaassen, G., 1992. Ammonia emission in Europe: Emission Coefficients and abatement costs. Laxenburg (Austria)y IIASA
Luesink, H.H. en M.Q. van der Veen, 1989. Äwee modellen voor de economische evaluatie van de mestproblematiek. Den Haag, LEI
Monteny, G.J., 1991. Stand van zaken onderzoek vermindering NH3 emissie: perspectieven voor de toekomst. In: Verkerk, H.A.C., (1991)
Oudendag, D.A., 1993. Reductie van ammoniakemissie. Mogelijkheden en kosten van beperking van ammoniakemissie op nationaal en regionaal niveau. Den Haag, LEI-DLO.
Pearce, D.W. and R.K. Turner, 1990. Economics of natural resources and the environment. New York, Harvester Wheatsheaf.
Post, J.H., J. Wijnands, H.H. Luesink, J. Breedveld en D» Strijker, 1985. Mestnormen: enkele nationaal-economische gevolgen. Den Haag, LEI.
Stolwijk, H.J.J., 1989. Economische gevolgen voor de veehouderij«,van een drietal milieuscenario's. Den Haag^CPB.
Veen, M.Q. van der, J.C. Blom en H.H.' Luesink, 1992. Verlaging van fosfor- en stikstofgehaltes in mengvoeders. Een,economische evaluatie. Den Haag, LEI-DLO.
Verkerk, H.A.C., 1991. Mest en Milieu in 2000. Visie vanuit het landbouwkundig onderzoek. Wageningen, Dienst Landbouwkundig Onderzoek.
Voermans, J.A.M., 1992. Reduction of ammonia volatilization from animal houses. In: Klaasens, G. (1992).
Wijnands, J., H. Luesink, and M. van der Veen, 1988. Impact of manure laws in the Netherlands. Tijdschrift voor sociaal wetenschappelijk onderzoek van de landbouw. (3):242-262.
Wijnands, J.H.M., D.A. Oudendag, H.H. Luesink en M.Q. van der Veen. 1991. Veehouderij en milieu: een economische evaluatie. In: Vackerk, H.A.C., (1991).
Wijnands, J.H.M., W.H.M. Baltussen, J. van Os en D.A. Oudendag, 1992. Ammonia emmission in the Dutch livestock sector: abatement possibilities and costs. Tijdschrift voor sociaal wetenschappelijk onderzoek van de landbouw. (7):321-342.
448
Costs of reducing nitrogen emission on pig farms in the Netherlands
G.W.J. Giesen, P.B.M. Berentsen and H. Leneman
Department of Farm Management, Wageningen Agricultural University, Hollandseweg 1, 6706 KN Wageningen, the Netherlands.
Summary
Pig production contributes substantially to Dutch environmental problems. This paper focuses on the possibilities of reducing nitrogen emission on individual pig farms. Results show that measures to reduce nitrogen content in the diet produce low costs per unit emission reduction. Measures to reduce ammonia volatilization from pig houses are costly. Manure processing at central plants combined with measures in the pig house is very effective in reducing emission on pig farms.
Keywords: pig farming, nitrogen, emission reduction, economic effects.
Introduction
Agriculture, and in particular animal production, contributes substantially to environmental problems in the Netherlands, i.e. acidification of the environment and pollution of ground water and surface water. Acidification is mainly caused by emission of sulphurous oxides (SOx), nitrogen oxides (NO,) and ammonia (NH3) (Erisman and Heij, 1991). Animal production contributes to 94% of the total ammonia emission in the Netherlands; dairy farming accounting for 60%, pig production for 30% and poultry production for 10% of the ammonia emission (Groot Koerkamp et al., 1990). Pollution of ground water and surface water is caused by the application of high levels of manure and fertilizer to farmland. Nitrogen concentrations in ground water are very high in some areas ranging from 44 up to 112 mg/1 (Goossensen and Meeuwissen, 1990). These concentrations exceed the maximum concentration allowed for drinking-water i.e. 11,3 mg N/1 (Anonymous, 1980).
The government has basically three types of policy instruments to tackle the environmental problems: education and extension, legal regulations and financial incentives by way of levies or subsidies. At the moment, the first two instruments are mainly used. The research reported here must be seen against the background of a levy on emission of nitrogen by individual pig farms. The study focuses on the possible measures for these farms to reduce emissions from pig farming. The main question to be answered is: What are the costs per unit emission reduction of nitrogen on pig farms in the Netherlands brought about by these measures.
Method
Definition of nitrogen emission
In figure 1 the nitrogen flow of a pig farm is given in diagram. The farm as a whole contains three subsystems, viz. animals, manure storage and soil or, in the case of pig farms without land, only the first two of them. Emissions from a subsystem leave the system farm or are (part of) the input of the following subsystem within the farm.
449
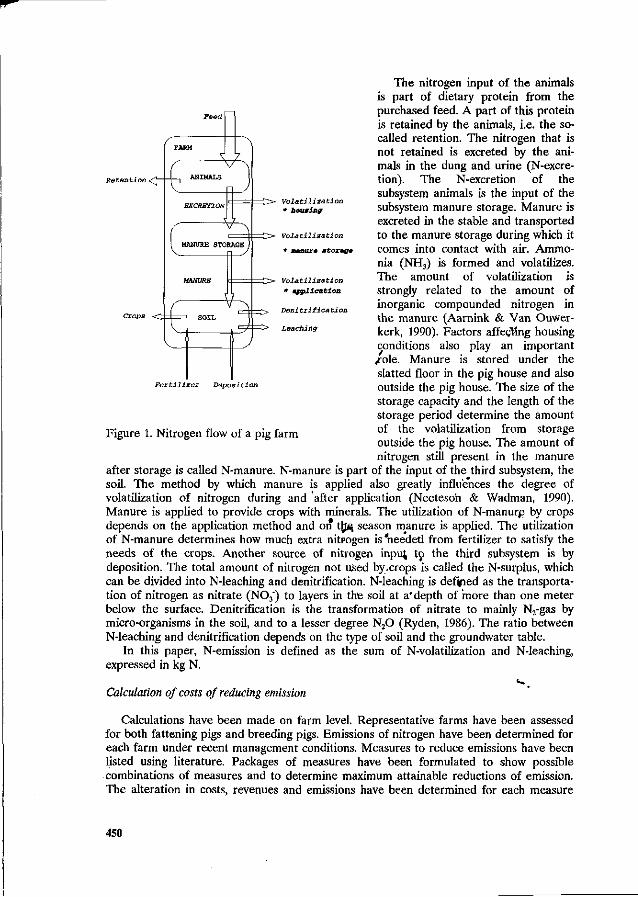
Retention <^i V
EXCRETION
V I MAHURE STORAGE
= 0 Volatilization * housing
Volatilization
* aanur« mtormgm
Volatilization * application
Denitrification
The nitrogen input of the animals is part of dietary protein from the purchased feed. A part of this protein is retained by the animals, i.e. the so-called retention. The nitrogen that is not retained is excreted by the animals in the dung and urine (N-excre-tion). The N-excretion of the subsystem animals is the input of the subsystem manure storage. Manure is excreted in the stable and transported to the manure storage during which it comes into contact with air. Ammonia (NH3) is formed and volatilizes. The amount of volatilization is strongly related to the amount of inorganic compounded nitrogen in the manure (Aarnink & Van Ouwer-kerk, 1990). Factors affecting housing conditions also play an important fo\e. Manure is stored under the slatted floor in the pig house and also outside the pig house. The size of the storage capacity and the length of the storage period determine the amount of the volatilization from storage outside the pig house. The amount of nitrogen still present in the manure
after storage is called N-manure. N-manure is part of the input of the third subsystem, the soil. The method by which manure is applied also greatly influences the degree of volatilization of nitrogen during and after application (Neetesoh & Wadman, 1990). Manure is applied to provide crops with minerals. The utilization of N-manure by crops depends on the application method and on th^ season manure is applied. The utilization of N-manure determines how much extra nitrogen is 'needed from fertilizer to satisfy the needs of the crops. Another source of nitrogen inpuj to the third subsystem is by deposition. The total amount of nitrogen not used by.crops is called the N-surplus, which can be divided into N-leaching and denitrification. N-leaching is defjped as the transportation of nitrogen as nitrate (N0 3) to layers in the soil at a'depth of more than one meter below the surface. Denitrification is the transformation of nitrate to mainly N2-gas by micro-organisms in the soil, and to a lesser degree N20 (Ryden, 1986). The ratio between N-leaching and denitrification depends on the type of soil and the groundwater table.
In this paper, N-emission is defined as the sum of N-volatilization and N-leaching, expressed in kg N.
Fertilize! Deposition
Figure 1. Nitrogen flow of a pig farm
Calculation of costs of reducing emission
Calculations have been made on farm level. Representative farms have been assessed for both fattening pigs and breeding pigs. Emissions of nitrogen have been determined for each farm under recent management conditions. Measures to reduce emissions have been listed using literature. Packages of measures have been formulated to show possible combinations of measures and to determine maximum attainable reductions of emission. The alteration in costs, revenues and emissions have been determined for each measure
450
and package of measures, producing the costs per unit emission reduction. This data was derived from literature. Where necessary, extra assumptions have been made. In particular, the effect of a preceding measure on the reduction of a particular measure within packages has been taken into account. The costs of packages have been calculated as the sum of the costs of the individual measures.
Results
Table 1 shows some technical information of the representative fattening pig farm and breeding pig farm. The computation of the level of nitrogen emission has been provided by Leneman et al.(1992). Table 2 shows several measures and packages of measures per subsystem to reduce nitrogen emission on pig farms. The costs, the proportional emission reductions and the costs per unit of emission reduction are shown for each measure or package of measures.
Table 1. Farm size and calculated emission levels on representative pig farms.
Fattening pigs Breeding pigs Number of pig places Number of sows Silage maize (ha) Emission on farm level (kg/year): - N-excretion - N-volatilization total - N-leaching
640
9.8
8355 2685 2024
120 6.8
4036 1541 840
Measures
Measures , which affect the first subsystem, the animals ,are aimed at reducing the dietary nitrogen. The input of the system decreases, so emissions will also decrease. Using more phases in feeding regimes enables the protein needs of the animals to be met more accurately. Feeding in three instead of two phases (3-feed system) on the fattening pig farm leads to a decrease of N-volatilization by 3%. N-leaching drops by 4%. By feeding breeding sows in two phases (2-feed system) instead of one N-volatilization drops by 8%, N-leaching by 9%. As a result of this measure, costs on the fattening pig farm decrease, while costs on the breeding pig farm increase. An upper limit of the protein content of the feed, a so-called protein restriction, in combination with feeding in more phases leads to a higher reduction of the intake of nitrogen. On both farms , the decrease of N-volatilization and N-leaching varies between 16 and 19%. This measure results in lower costs on fattening pig farms and higher costs on the breeding pig farm. By adding new synthetic essential amino acids to the diets an additional reduction of N-emission can be achieved. Together with the measures mentioned before, a reduction of the volatilization and leaching of about 25% can be achieved. A selection of feed stuffs with a low protein content can reduce volatilization and leaching even further to about 33 %. Costs of the last two measures are not yet known.
In the second subsystem manure storage, three kinds of measures can be differentiated: measures to reduce the N-volatilization in the pig house; measures to remove ammonia from air, expelled from the pig house; and measures to reduce N-volatilization from the manure storage outside the pig house. Housing adjustments is a measure to reduce the N-volatilization in the pig house. It also includes the construction of a flushing
451
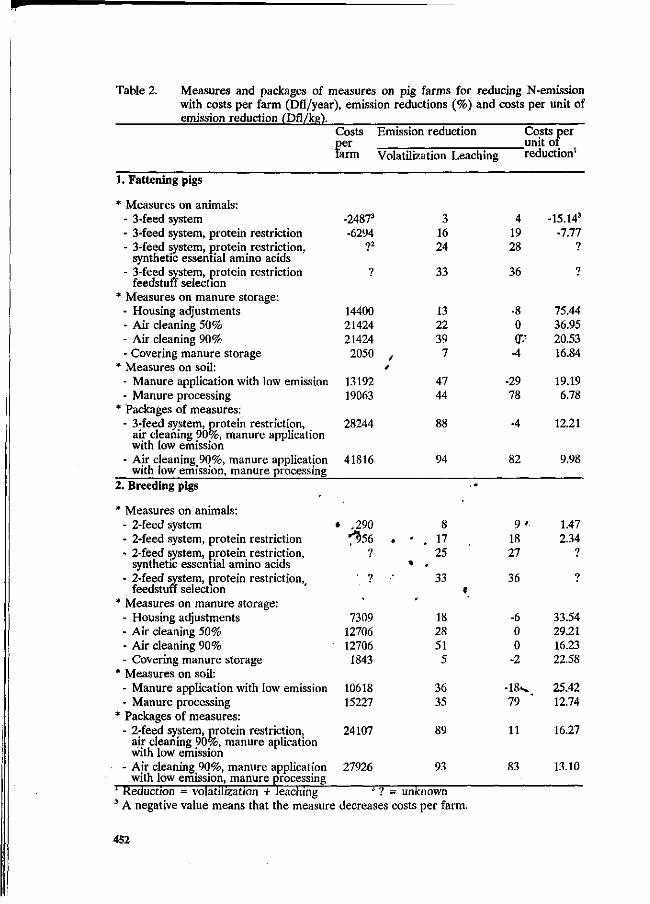
Table 2. Measures and packages of measures on pig farms for reducing N-emission with costs per farm (Dfl/year), emission reductions (%) and costs per unit of emission reduction (Dfl/kg').
Costs Emission reduction per farm Volatilization Leaching
Costs per _unit of "reduction1
1. Fattening pigs
* Measures on animals: - 3-feed system - 3-feed system, protein restriction - 3-feed system, protein restriction,
synthetic essential amino acids - 3-feed system, protein restriction
feedstuff selection * Measures on manure storage:
- Housing adjustments - Air cleaning 50% - Air cleaning 90% - Covering manure storage
* Measures on soil: - Manure application with low emission - Manure processing
* Packages of measures: - 3^feed system, protein restriction,
air cleaning 90%, manure application with low emission
- Air cleaning 90%, manure application with low emission, manure processing
-24873
-6294 ?2
3 16 24
4 19 28
-15.143
-7.77 ?
33
28244
41816 94
33
24107
27926
89
93
36
14400 21424 21424
2050 ,
13192 19063
13 22 39 7
47 44
-8 0 <P -4
-29 78
75.44 36.95 20.53 16.84
19.19 6.78
-4
82
36
11
83
12.21
9.98
.290 ^956 .
?
8 • . 17
25
9 >•
18 27
1.47 2.34
?
2. Breeding pigs
* Measures on animals: - 2-feed system - 2-feed system, protein restriction - 2-feed system, protein restriction,
synthetic essential amino acids - 2-feed system, protein restriction,,
feedstuff selection * Measures on manure storage:
- Housing adjustments - Air cleaning 50% - Air cleaning 90% - Covering manure storage
* Measures on soil: - Manure application with low emission - Manure processing
* Packages of measures: - 2-feed system, protein restriction,
air cleaning 90%, manure aplication with low emission
- Air cleaning 90%, manure application with low emission, manure processing
1 Reduction = volatilization + leaching i ? = unknown 3 A negative value means that the measure decreases costs per farm.
7309 12706 12706
1843
10618 15227
18 28 51 5
36 35
-6 0 0
-2
-18^ 79
33.54 29.21 16.23 22.58
25.42 12.74
16.27
13.10
452
system. These adjustments lead to a reduction of the N-volatilization from the pig house of 50% (Baltussen et al , 1990). Consequently, the N-volatilization from the manure storage outside the pig house and at the application of manure increases. The volatilization on farm level decreases by 13% on the fattening pig farm and by 18% on the breeding pig farm. N-leaching increases by 8% and 6% respectively, due to the higher N-manure. The principle of air cleaning systems is the transportation of expelled air through a cleaning medium which removes (part of) the ammonia. The efficiency of these systems cannot be precisely given yet. So, two levels of efficiency have been assumed (50 and 90% reduction of N-volatilization from the pig house). The N-manure does not alter because the water containing the nitrogen expelled from the cleaning system is discharged into the sewer. Thus N-volatilization due to applying manure and N-leaching are not affected. Costs for air cleaning systems consists of fixed costs for investments and variable costs for water, energy and sewage disposal. Covering the manure storage outside the pig house reduces N-volatilization from the storage by about 90%. Because N-manure increases, N-volatilization during application and N-leaching also increase.
Measures directed at the third subsystem, the soil, affect the method and the season of manure application. The amount of manure application can also be decreased. Manure application with low emission means that the manure is spread on the surface and is then ploughed under directly after application. The application is done from February till May instead of from November till May. A shorter period of application means that an extra manure storage outside the pig house is necessary. This storage must be covered, likewise the already existing storage. By ploughing directly, N-volatilization due to applying manure is decreased by 85% (Baltussen et al, 1990). This measure results in a decrease of N-volatilization on farm level of 36% on the breeding pig farm and 47% on the fattening pig farm. N-leaching increases by 18% and 29% respectively. The costs result from covering the present manure storage, building and covering a new manure storage and extra costs for ploughing. The measure manure processing limits the amount of phosphate from manure on silage maize to a maximum of 90 kg per hectare. Surplus manure is transported to a processing plant, therefore a manure storage outside the pig house is not necessary. This measure results in a decrease of N-volatilization on farm level of 35% on the breeding pig farm and 44% on the fattening pig farm. N-leaching decreases by about 78% on both farms. Costs of this measure consist of costs for extra fertilizer and costs for manure processing. The latter are estimated to be Dfl. 30,- per ton manure. The costs for spreading manure decrease because less manure is applied on the land.
Packages of measures
There are two packages: one with, and one without manure processing. The latter package leads to a high reduction of the N-volatilization (almost 90%), but results in an increase (4%) of N-leaching on the fattening pig farm and only a small decrease (11%) of N-leaching on the breeding pig farm. The package with manure processing results in high costs per farm. However, the reduction of both N-volatilization and N-leaching is sizeable (more than 90% and 80% respectively). Costs per unit emission reduction are lower compared to the package without manure processing.
Discussion
Results show that measures to reduce nitrogen content in the diet produce low costs per unit emission reduction. Measures to reduce ammonia volatilization from pig houses are costly. Manure processing at central plants combined with measures in the pig house are very effective in reducing emission on pig farms.
453
In general it should be mentioned that research on environmental techniques in agriculture is still in full swing. So far, little has been published in scientific journals. In some cases effects of measures on emission are still uncertain. This also holds for the costs of the measures. New technical possibilities can be discovered, while newly developed techniques may turn out to be less successful than expected.
An important assumption in this study is that measures do not influence the performance of the animals. This assumption needs a critical observation. Some measures reduce safety margins of animal production thereby increasing the risk of declining performance of the animals. This counts in particular for the measures that reduce the nitrogen content in the diet. Consequently, the risk of protein deficiencies increases and therefore the risk of adverse technical and economical results.
The costs and effects of measures have been calculated according to existing farms and farm plans. Implementation of a measure can result in a suboptimal farm plan. So costs per unit emission reduction may be lower than those given in tables 2.
This study aims at reducing the total amount of nitrogen emitted by individual farms. Measures which reduce the N-volatilization only, such as manure application with low emission, are not judged very positively. If the goal is a reduction of N-volatilization or if N-volatilization gets more weight than N-leaching, these measures certainfy receive a more positive judgement. ,
References
Aarnink, AJ.A. & Ouwerkerk, E.N.J, van, 1990. Model voor de berekening van het volume en de samenstelling van vleesvarkensmest (MESPRO). Report 229. Wageningen: Institute of Agricultural Engineering (in Dutch). 58pp.
Anonymous, 1980. Council directive on the quality of water for human consumption. Official Journal of the European Economic Community 23, 80/778 EECL 229:11-29.
Baltussen, W.H.M., Os, J. van & Altena, H., 1990. Gevolgen van beperking van ammo-niakemissie voor varkensbedrijven.' Research Report 62. The Hague: Agricultural Economics Research Institute (in Dutch). 77 pp.
Erisman, J.W. & Hey, G.J., 1991. Concent*ation and deposition of acidifying compounds. In Dutch priority program on acidificatiorfTÏJeij, Q.J. «& Schneider, T., eds.), pp. 51-95. Bilthoven: National Institute for Public Heath and Environmental Protection. 214 pp.
Groot Koerkamp, P.W.G., Verdoes, N., & Monteny, G.J.* 1990. Naar stallen met beperkte ammoniakuitstoot-Deelrapport Bronnen, Processen en Factoren. Onderzoek inzake de mest- en ammoniakproblematiek in de veehouderij,, 8a. Wapeningen: Ministry of Agriculture, Nature Management and Fisheries (in Dutch). 83 pp.
Goossensen, F.R. & Meeuwissen, P.C. (eds.), 1990. Advies van de Commissie Stikstof. Onderzoek inzake de mest- en ammoniakproblematiek in de veehouderij, 9. Ede: Ministry of Agriculture, Nature Management and Fisheries (in Dutch). 93 pp.
Leneman, H., Giesen, G.W.J. & Berentsen, P.B.M., 1992. Kosten van reduktie van stikstof- en fosforemissie op landbouwbedrijven. Report. Wageningen: Agricultural University, Department of Farm Management (in Dutch). 132 pp. ' v
Neeteson, J,J. & Wadman, W.P. (1990). Ammonia emission volatilization and nitrate leaching after animal manure application to agricultural crops. In: Dierlijke mestproblemen en oplossingen (Del Castilho, P., Rulkens, W.H. & Salomons, W., cds.), pp 95-108. Utrecht: Proceedings Symposium Royal Dutch Union of Chemists, Environmental Chemistry section. 477 pp.
Ryden, J.C., 1986. Gaseous losses of nitrogen from grassland. In Nitrogen fluxes in intensive grassland systems (Meer, H.G. van der, Ryden, J.C. & Ennik, G.C., eds), pp. 59-74. Dordrecht: Martinus Nijhoff. 113 pp.
454
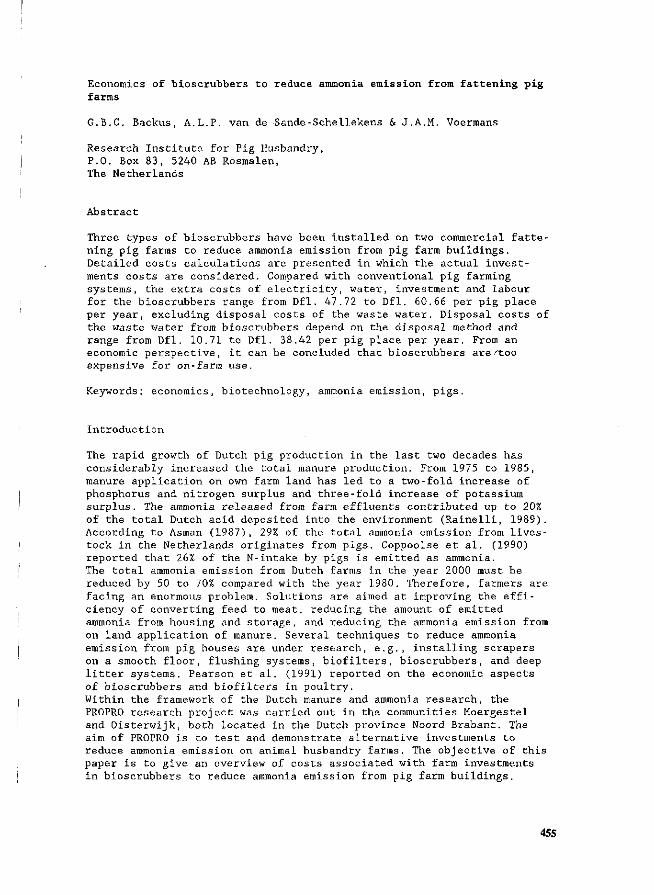
Economies of bioscrubbers to reduce ammonia emission from fattening pig farms
G.B.C. Backus, A.L.P. van de Sande-Schellekens & J.A.M. Voermans
Research Institute for Pig Husbandry, P.O. Box 83, 5240 AB Rosmalen, The Netherlands
Abstract
Three types of bioscrubbers have been installed on two commercial fattening pig farms to reduce ammonia emission from pig farm buildings. Detailed costs calculations are presented in which the actual investments costs are considered. Compared with conventional pig farming systems, the extra costs of electricity, water, investment and labour for the bioscrubbers range from Df1. 47.72 to Df1. 60.66 per pig place per year, excluding disposal costs of the waste water. Disposal costs of the waste water from bioscrubbers depend on the disposal method and range from Df1. 10.71 to Dfl. 38.42 per pig place per year. From an economic perspective, it can be concluded that bioscrubbers are^too expensive for on-farm use.
Keywords: economics, biotechnology, ammonia emission, pigs.
Introduction
The rapid growth of Dutch pig production in the last two decades has considerably increased the total manure production. From 1975 to 1985, manure application on own farm land has led to a two-fold increase of phosphorus and nitrogen surplus and three-fold increase of potassium surplus. The ammonia released from farm effluents contributed up to 20% of the total Dutch acid deposited into the environment (Rainelli, 1989). According to Asman (1987), 29% of the total ammonia emission from livestock in the Netherlands originates from pigs. Coppoolse et al. (1990) reported that 26% of the N-intake by pigs is emitted as ammonia. The total ammonia emission from Dutch farms in the year 2000 must be reduced by 50 to 70% compared with the year 1980. Therefore, farmers are facing an enormous problem. Solutions are aimed at improving the efficiency of converting feed to meat, reducing the amount of emitted ammonia from housing and storage, and reducing the ammonia emission from on land application of manure. Several techniques to reduce ammonia emission from pig houses are under research, e.g., installing scrapers on a smooth floor, flushing systems, biofilters, bioscrubbers, and deep litter systems. Pearson et al. (1991) reported on the economic aspects of bioscrubbers and biofilters in poultry.
Within the framework of the Dutch manure and ammonia research, the PROPRO research project was carried out in the communities Moergestel and Oisterwijk, both located in the Dutch province Noord Brabant. The aim of PROPRO is to test and demonstrate alternative investments to reduce ammonia emission on animal husbandry farms. The objective of this paper is to give an overview of costs associated with farm investments in bioscrubbers to reduce ammonia emission from pig farm buildings.
455
Bioscrubbers
From 1990 to 1993, two commercial fattening pig farms equipped with three types of emission control devices participated in the study. The devices were of commercial-available designs, Roma-Bionet, MKS 6 and BTW 6, and operated as stated in their respective design conditions. The Roma-Bionet type was designed for treating up to 9000 m3/h of air. Both the MKS 6 and BTW 6 type were designed for treating up to 6000 m3/h of air. In 1990, 7 Roma Bionet bioscrubbers were installed on farm A. On farm A are on 680 fattening pigs housed. The bioscrubbers were placed nearby a building for fattening pigs with 8 compartments of 80 places each. The eight compartment of the pig house was used as a control. Also in 1990, 3 MKS 6 and 3 BTW 6 bioscrubbers were installed on farm B. On farm B are 360 fattening pigs housed. The bioscrubbers were placed nearby a building for fattening pigs with 6 compartments. Each compartment contained 7 pens for 9 fattening pigs each. From October 1991 to September 1992, the farms were visited onqe every three weeks. Information was collected about: investment costs*'(based on specifications from the supplier), labour Requirements, pig performance, climate, and miscellaneous costs related to the investment in bioscrubbers. In addition to the investment costs, costs of electricity, water, labour, and disposal of waste water were computed.
Electricity On average the Roma-Bionet bioscrubber required 23.8 kWh per day, or 108.6 kWh per pig place per year. This is 87.5 kWh more per pig place per year compared with the electricity used by a conventional system. The difference in electricity use means an extra costs of Dfl. 15.77 per pig place per year for the Roma-Bionet bioscrubber. Average daily use of electricity for the MKS 6 and BTW 6 bioscrubbers was 1,2.6 kWh or 0.2 kWh per pig place per day. Annualy, the extra use of electricity was 51.8 kWh which means an extra cost for electricity of Dfl. 9.32 per pig place per year. Extra costs for electricity/>1were omewhat lower for the BTW 6 compared with the MKS 6 bioscrubber,'because the' BTW 6 'can be installed partly within the pig house. This saves electricity required for the heating lint of the MKS 6.
» Water • » On average, the amount of water, expressed per bioscrubber, used by the Roma-Bionet, MKS 6, and BTW 6 was 15.4 1/h, 13.3 1/h and 10 1/h, respectively. This means extra costs of Dfl. 2.02, Dfl. 2.22 and Dfl. 1.68 for the Roma-Bionet, MKS 6 and BTW 6 bioscrubbers, respectively.
Labour Required labour time consists of time necessary for control andHf,or cleaning the netting packing. It was found that the Roma-Bionet had to be cleaned about once every 3.5 months. With an hourly wage rate of Dfl. 32.52 this amounts to extra labour costs for the Roma-Bionet bioscrubber of Dfl. 5.69. The MKS 6 and BTW 6 have to be cleaned once every 2 to 3 months during summer periods and once every 5 months during winter periods.
Investment costs of bioscrubbers The investment costs for the bioscrubber is based on the price of the bioscrubber, except the ventilator. It was necessary to install ventilators with a higher capacity than those already present on the farms.
456
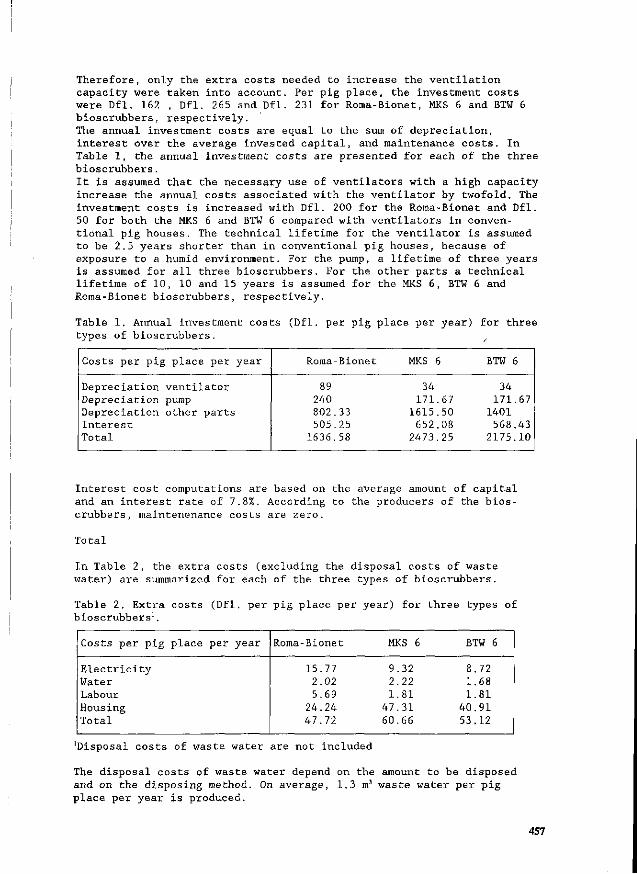
Therefore, only the extra costs needed to increase the ventilation capacity were taken into account. Per pig place, the investment costs were Dfl. 162 , Dfl. 265 and Df1. 231 for Roma-Bionet, MKS 6 and BTW 6 bioscrubbers, respectively. The annual investment costs are equal to the sum of depreciation, interest over the average invested capital, and maintenance costs. In Table 1, the annual investment costs are presented for each of the three bioscrubbers.
It is assumed that the necessary use of ventilators with a high capacity increase the annual costs associated with the ventilator by twofold. The investment costs is increased with Dfl. 200 for the Roma-Bionet and Dfl. 50 for both the MKS 6 and BTW 6 compared with ventilators in conventional pig houses. The technical lifetime for the ventilator is assumed to be 2.5 years shorter than in conventional pig houses, because of exposure to a humid environment. For the pump, a lifetime of three years is assumed for all three bioscrubbers. For the other parts a technical lifetime of 10, 10 and 15 years is assumed for the MKS 6, BTW 6 and Roma-Bionet bioscrubbers, respectively.
Table 1. Annual investment costs (Dfl. per pig place per year) for three types of bioscrubbers.
Costs per pig place per year Roma-Bionet
89 240 802.33 505.25
1636.58
MKS (
34 171
1615 652
2473
67 50 08 25
BTW (
34 171
1401 568
2175
67
43 10
Depreciation ventilator Depreciation pump Depreciation other parts Interest Total
Interest cost computations are based on the average amount of capital and an interest rate of 7.8%. According to the producers of the bioscrubbers, maintenenance costs are zero.
Total
In Table 2, the extra costs (excluding the disposal costs of waste water) are summarized for each of the three types of bioscrubbers.
Table 2. Extra costs (Dfl. per pig place per year) for three types of bioscrubbers'.
Costs per pig place per year Roma-Bionet
15.77 2.02 5.69
24.24 47.72
MKS 6
9.32 2.22 1.81
47.31 60.66
BTW
8.72 1.68 1.81
40.91 53.12
Electricity Water Labour Housing Total
'Disposal costs of waste water are not included
The disposal costs of waste water depend on the amount to be disposed and on the disposing method. On average, 1.3m3 waste water per pig place per year is produced.
457
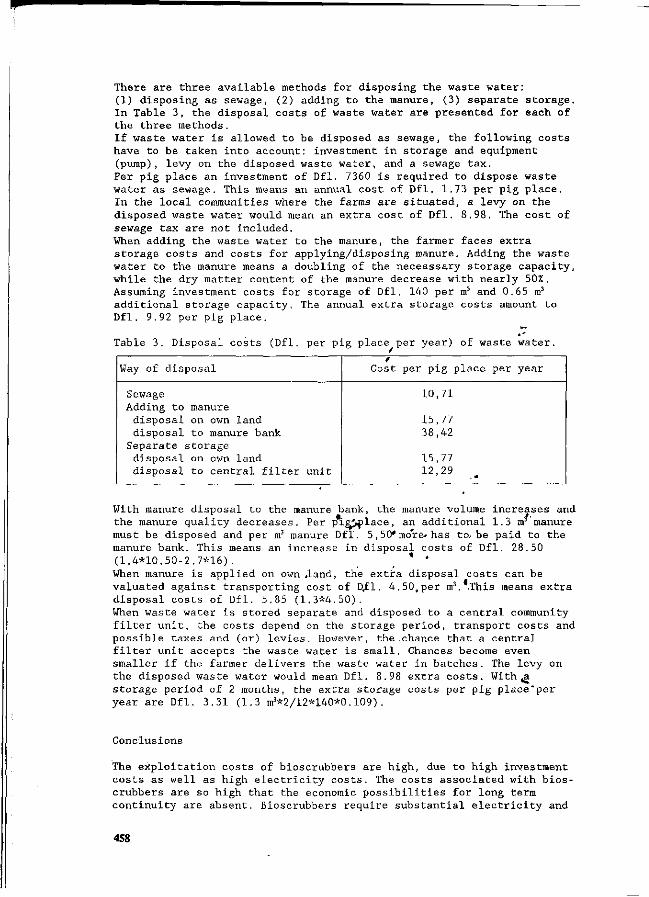
There are three available methods for disposing the waste water: (1) disposing as sewage, (2) adding to the manure, (3) separate storage. In Table 3, the disposal costs of waste water are presented for each of the three methods. If waste water is allowed to be disposed as sewage, the following costs have to be taken into account: investment in storage and equipment (pump), levy on the disposed waste water, and a sewage tax. Per pig place an investment of Df1. 7360 is required to dispose waste water as sewage. This means an annual cost of Dfl. 1.73 per pig place. In the local communities where the farms are situated, a levy on the disposed waste water would mean an extra cost of Dfl. 8.98. The cost of sewage tax are not included. When adding the waste water to the manure, the farmer faces extra storage costs and costs for applying/disposing manure. Adding the waste water to the manure means a doubling of the necesssary storage capacity, while the dry matter content of the manure decrease with nearly 50%. Assuming investment costs for storage of Dfl. 140 per m3 and 0.65 m3
additional storage capacity. The annual extra storage costs amount to Dfl. 9.92 per pig place.
Table 3. Disposal costs (Dfl. per pig place per year) of waste water.
Way of disposal
Sewage Adding to manure
disposal on own land disposal to manure bank
Separate storage disposal on own land disposal to central filter unit
Cost per pig place per year
10,71
15,77 38,42
15,77 12,29
With manure disposal to the manure bank, the manure volume increases and the manure quality decreases. Per pig^place, an additional 1.3 m manure must be disposed and per m3 manure Dfl. 5,50* more-has to.be paid to the manure bank. This means an increase in disposal costs of Dfl. 28.50 (1.4*10.50-2.7*16). * ' When manure is applied on own .land, the extra disposal costs can be valuated against transporting cost of D,f 1. 4.50, per m3. .This means extra disposal costs of Dfl. 5.85 (1.3*4.50). When waste water is stored separate and disposed to a central community filter unit, the costs depend on the storage period, transport costs and possible taxes and (or) levies. However, the chance that a central filter unit accepts the waste water is small. Chances become even smaller if the farmer delivers the waste water in batches. The levy on the disposed waste water would mean Dfl. 8.98 extra costs. With ,a storage period of 2 months, the extra storage costs per pig place'per year are Dfl. 3.31 (1.3 m3*2/12*140*0.109).
Conclusions
The exploitation costs of bioscrubbers are high, due to high investment costs as well as high electricity costs. The costs associated with bioscrubbers are so high that the economic possibilities for long term continuity are absent. Bioscrubbers require substantial electricity and
458
contribute therefore to the Carbon Oxide pollution. Also, substantial amounts of waste water are associated with the use of bioscrubbers. In summary, bioscrubbers generally are too expensive for on-farm use.
References
Asman, W.H. (1987) Atmospheric behaviour of ammonia and ammonium. Ph.D. Thesis, Wageningen Agricultural University, The Netherlands.
Coppoolse, J., Vuuren, A.M. van, Huisman, J., Janssen, W.H.M.A., Jongbloed, A.W., Lenis, N.P., & Simons, P.CM. (1990) De uitscheiding van stikstof, fosfor en kalium door landbouwhuisdieren, Nu en Morgen, The Netherlands.
Pearson, C.C. , Phillips, V.R. Green, G. & Scotford, I.M. (1991) A minimumcost biofilter for reducing aerial emissions from a briler chicken house. In:Biotechniques for air pollution abatement and odour control policies. Maastricht, The Netherlands. 28-29 October 1991.
Rainelli, P. (1989) Intensive animal production and management of animal manure. In: Agricultural and environmental policies: opportunities for integration, Paris: OECD.
459
Evaluation of practical applications for an integrated approach on farm level.
W.J.B. Brunnekreef
Hendrix' voeders B.V., R &D Dept., P.O.Box 1, 5830 MA Boxmeer, The Netherlands.
Summary
The environmental problems in intensive animal production of NH3-emission and surplus of minerals can be solved in different ways. The optimum solution in most cases is a combination of reducing input, distribution to arable areas, processing into fertilizers or other products and changing the husbandry systems on the farm. The situation of the farm like available land, presence of sensitive nature and manure market-possibilities determine the most desirable approach.
Introduction '
Modern pig-farms in intensive regions are confrontated with environmental problems. This concerns NH3-emissions from houses, storage and application on the field and a surplus of minerals N (and P) on the available land on farm- or regional level. During the last decade intensive research has taken place as well in the research institutes as in the industry involved in the animal-production chain. Particularly the feed-industry has been active since the input via feed is one of the main sources for the surplus of minerals. This means that at the same time the problem can partly be controlled by altering the feed consumption and systems. Hendrix' voeders B.V. is also active, in developing new environmental friendly housing systems for the different animal species.
Different ways for solution »*»
In general there are two principle solutions. « , 1. Spreading the animals over a larger area with enough land to use the manure at
acceptable levels. For intensive regions like Holland this is not a useful solution. Because of the advantage of specialisation and other reasons like infrastructure, knowledge, skill, positioning towards consumer concentrations or raw material supply the process of concentration even continues. Spreading is also not a solution for the NH3-emission; it only delutes the problem and makes it more difficult to tackle.
2. Technical solutions. The situation is comparable to horticulture, where also intensive productions are more and more carried out in glasshouses on substrate systems with recycling minerals to avoid pollution. The aim should be controlling the mineral streams through the farm. The farmer has to prove where to go to with the surplus minerals via a special mineral bookkeeping-system combined with the financial bookkeeping. The following possibilities are available: a. Lowering the input via feed. b. Distribution of surplus manure to arable areas. c. Processing manure into fertilizers or other useful products. d. Changing the husbandry and storage systems including on farm treatment of manure
and special applications in the field.
460

In most cases a combination of the different possibilities is necessary to tackle the NH3-emission as well as the surplus of minerals on farm level.
Optimal solution depends on situation
The most effective approach to solve the problem depends very much on the situation of the pigfarm. 1. Presence of preserved nature.
If the farm is situated close to a sensitive, valuable nature-area maximum attention must be payed to avoid NH3-emission. Housing will have to be altered towards environmental friendly systems. At this moment the most practical possibilities are: a. Flushing with treated liquid (low pH) in 1 - 2 times per day and stockage in close
manure-tanks. Systems with minimum flush-volumes are most desirable. b. Scraping manure with or without separating liquid several times per day out of the
pit under the slats into closed storage-tanks. Special coatings are necessary to avoid building up manure which might cause NH3-emission. Also belt-systems can be used for the same results.
Both systems are based on prevention of NH3-building in the houses. Part of the extra cost can be payed by better technical results (growth, f .c, health) caused by better climatical conditions. In an experiment with the HepaQ-house for fattening pigs with flushing compared to normal housing, this was shown. The HepaQ department with 80 pigs was compared to fully slatted housing within the same house and equal ventilation systems. The feed was restricted, based on weight and appetite of the animals.
Starter weight (kg) Slaughter weight (kg) Days Growth/day Feed conversion
HepaQ
25.5 82.8 106 111 98
Control
25.8 81.8 118 100 100
Table 1. Comparison HepaQ-system with normal slatted floor and storage manure underneath; Hendrix' voeders B.V. 1990.
Specially the better growth is expected to be caused by the improved climate at the same time leading to 70 % less NH3-emission. Special designed slatted floors and optimum climate control in warm periods are also critical elements in avoiding NH3-emission in pighouses. Reducing N via input has only limited influence on NH3-emission (max 25 - 30 %) and is even less effective in systems like described above (Infobulletin Varkenshouderij 5-92).
Availability of land. The following situations can occur: a. Farm with no land in area with a few animals.
A simple arrangement with neighbour farms can be made to use the manure on their land in accordance to acceptable fertilizing levels. Sufficient stockade for optimum application is desirable.
b. Farm with partly available land (or contracted) in intensive animal area. In this case lowering of input can be very effective. Since the volume of manure is hardly effected by lowering the input, it is allowed to bring more manure with lower levels
461
of minerals N + P) on the land. A surplus of 20 - 30 % might be solved effectively via reduction of input.
c. Farm with no land in intensive animal area. In general the manure has to be transported for further distances. Lowering input is in general not effective, since the value of the manure is decreased and the volume unchanged) in many cases on farm treatment might be more interesting, like: * separating * drying * composing The possible ways of disposal of the liquid fraction and the solids have to be leading in finding the optimal approach.
3. Possibilities of the manure market. For the most intensive areas it will be necessary to ship manure/minerals to other regions or to process the surplus into other products. Critical success factors in this area are: * Quality of the products. * Constant and known composition. * Low cost-treatment. * Delivery at the right moment. /
(sufficient storage) For long distance shipment as well as for treatment plants high DM-contents are very important. For certain processes it is calculated that the negative value of f 35,00/ton manure at 12 % DM is coming down to zero at ± 55 % DM. Also for using dry manure (> 60 % DM) as energy source for electricity plants the value compensates the cost of disposal. Acidifying manure can prevent NH3-emission and at the same time being a positive element in further processing. Specially the use of organic acids offers interesting possibilities without the problem of residues. Separation in liquid and firm fractions' might be of interest. In this case the liquid fraction can be used as: * Flushing-liquid after treatment. * -^ * Fertilizer with good N support via spraying-systems- with water mixed-up. If the
liquid fraction is not usable it is interesting to evaporate it with the ventilation-air (HepaQ). Filtration systems like reversed osmosis seem to be rather costly and too complicated up till now. Algae production may offer also interesting possibilities. The firm fraction (25 - 40 % DM) can be composted or further dried to fertilizer pellets.
Manure-marketing is the key
The basis for solution of the environmental problems of intensive animal production will be: * Housing systems without NH3-emission (and smell). * Producing manure, suitable for the market (as fertilizer or for further processing}.-In different situations different approaches are necessary. Also for the image of animal products, altering the production systems towards environmental friendly with manure produced in a marketable form is very important for the future of intensive animal production.
References
1. Internal report HepaQ-milieustal Hendrix' voeders B.V., April 1990. 2. Infobulletin Varkenshouderij 5-92.
462
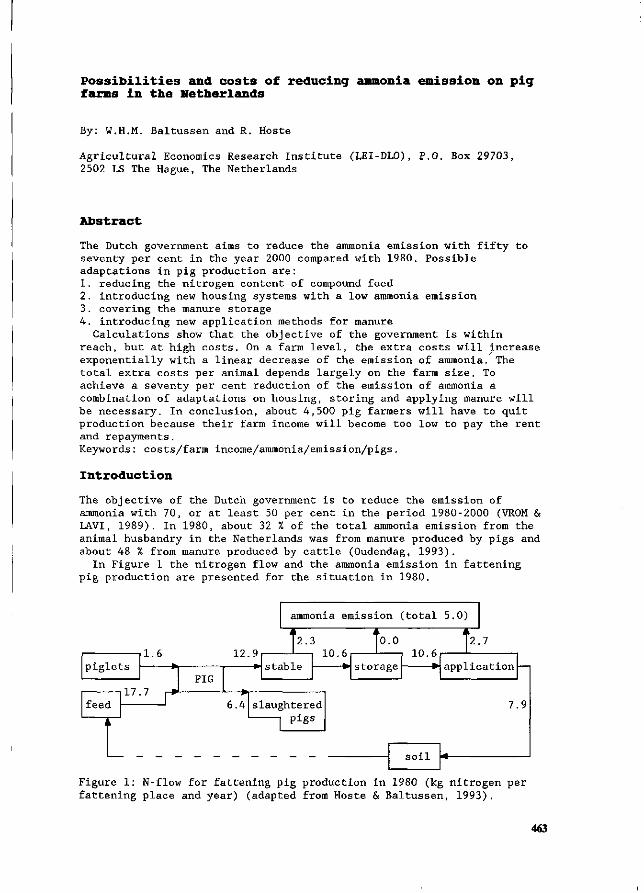
Possibilities and costs of reducing ammonia emission on pig farms in the Netherlands
By: W.H.M. Baltussen and R. Hoste
Agricultural Economics Research Institute (LEI-DLO), P.O. Box 29703, 2502 LS The Hague, The Netherlands
Abstract
The Dutch government aims to reduce the ammonia emission with fifty to seventy per cent in the year 2000 compared with 1980. Possible adaptations in pig production are: 1. reducing the nitrogen content of compound feed 2. introducing new housing systems with a low ammonia emission 3. covering the manure storage 4. introducing new application methods for manure
Calculations show that the objective of the government is within reach, but at high costs. On a farm level, the extra costs will increase exponentially with a linear decrease of the emission of ammonia. The total extra costs per animal depends largely on the farm size. To achieve a seventy per cent reduction of the emission of ammonia a combination of adaptations on housing, storing and applying manure will be necessary. In conclusion, about 4,500 pig farmers will have to quit production because their farm income will become too low to pay the rent and repayments. Keywords: costs/farm income/ammonia/emission/pigs.
Introduction
The objective of the Dutch government is to reduce the emission of ammonia with 70, or at least 50 per cent in the period 1980-2000 (VROM & LAVI, 1989). In 1980, about 32 % of the total ammonia emission from the animal husbandry in the Netherlands was from manure produced by pigs and about 48 % from manure produced by cattle (Oudendag, 1993).
In Figure 1 the nitrogen flow and the ammonia emission in fattening pig production are presented for the situation in 1980.
piglets
feed
, k
1 6
PIG
12.9
6.4
ammonia emission (total 5.0)
i 1
2.3
stable
pigs
i
0.0
storage 10.6
i i 2 7
application
7.9
Figure 1: N-flow for fattening pig production in 1980 (kg nitrogen per fattening place and year) (adapted from Hoste & Baltussen, 1993).
463
Figure 1 shows that there are four possible ways to reduce the ammonia emission: -reducing the N-intake from feed -reducing the ammonia emission from stables -covering the manure storage outside the stables -reducing the ammonia emission by better application of manure.
The objective of this paper is to give an overview of some alternatives to reduce ammonia emission, to present a calculation of the extra costs on farm level and to determine the effect on farm income. In this paper only the figures for a fattening pig farm are presented.
Method
For the situation in 1980 and 2000 a balance of mineral input and mineral output is calculated. Between 1980 and 2000 several autonomous developments (will) take place. The main developments are: better technical performance (feed conversion ratio decreases from 3.16 in 1980 to 2.75 in 2000 and the growth rate increases from 643 to 753 g/day in 2000); the period of manure storage increases from 6 months in 1980 to about 12 months in 2000; the amount of manure produced per fattening place decreases from 1.7 m3 in 1980 to 0.9 m3 in 2000; the cerea'1 prices, and therefore the feed prices, will/decrease substantially as a result of the Mac Sharry measures (BEF, 19^1). These developments will influence the mineral balance and the ammonia emission.
For the situation in 2000 the effects of on farm level measures on ammonia emission and costs are calculated in two steps: -what level of reduction of ammonia emission can be achieved by adapting one single technique (feed, stable, storage or application) and what are the extra costs per fattening place and year?; -which combination of measures may reduce the emission of ammonia to a satisfying degree with the lowest extra costs on a farm level?
To calculate the reduction of ammonia emission and the'extra costs, many technical and economical data were collected. At this moment a part of the new techniques are still in development (especially stables with low emission) . This means that the «reduction of the ammonia emission and the extra costs are rough estimates. •" , •
Results * .
For the situation in 1980 the emission'of ammonia is estimated at a level of 5.0 kg N per fattening place and year (see Figure 1). Due to the autonomous developments this will decrease to a level of 4.7 kg in 2000. The decrease is mainly due to an improvement of the feed conversion ratio by 13 %.
According to Schutte & Tamminga (1992) the N-intake of animals in 2000 can be lowered by changing the feeding system (i.e., more feedtypes or blend feeding) and by reducing the N-content of the feed. In total, these changes can reduce the N-excretion and the ammonia emissidft.with up to 18 1 (see Table 1). The extra costs are about 3 to 4 guilders per fattening place and year. The variation in extra costs results from the need of extra investments for blend feeding.
464
At this moment two possible adaptations seem to reduce the ammonia emission from the stable with at least 50 per cent (Verdoes, 1990): -a scraper system -a flushing system For each of these adaptations, • an undeep manure pit is needed. Therefore, in our calculations, it is assumed that all the manure is stored outside the stable in a covered storage. The expected reduction of the ammonia emission from the stable is about 50 to 65 %. Covering the storage reduces its ammonia emission with 90 %. The extra costs largely depend on the number of fattening places. For example the extra costs are about 17 guilders per place and year for a farm with 1,500 places, and 31 guilders for a farm with 500 places.
It is assumed that with small adaptations of the stable (i.e. small changes in floor design, but also better climate and better management) (Hoste & Baltussen, 1993) a reduction of maximum 25 per cent can be achieved. The total extra costs of these changes are about 4 to 5 guilders per place and year. It is assumed that the ammonia emission and the costs of big and small adaptations can be cumulated.
Another time ammonia emission can be reduced is at application. Using application methods with a low emission (putting the manure directly into the soil), a reduction can be achieved of 65 to 90 per cent. The extra costs will be 2 to 4 guilders per m3, depending on the method used. x
In Table 1 each of the adaptations, its contribution to the decrease in ammonia emission, and its extra costs are presented.
Table 1. The reduction of ammonia emission (in % of the total e m i s s i o n ) , the total extra costs and the extra costs per kg reduction (in Dfl/fattening place and year) for different single adaptations on farm level on a farm with 1000 fattening places
Adaptation Reduction of Total extra Extra costs per emission (%) costs kg reduction
Feed -moderately 9 -strong 18
Stable -small 6 -biga 10
Application manure 43 2 . 93 1.44 a combined with a covered storage outside the stable
From Table 1 it can be concluded that: -per kg N reduction, the extra costs are relatively low for either manure application or feed adaptation measures and relatively high for big stable adaptations; -there is not one individual adaptation which can reduce the total ammonia emission with more than 50 %. To achieve the objective of the government, farmers have to use more than one adaptation.
Therefore, the effects are calculated for the following three combinations of measures: 1) better application of manure with strong feed adaptation 2) better application of manure with moderate feed adaptation and small adaptations in the stable 3) better application of manure with small and big adaptations in the stable The reduction of ammonia emission in these three cases is about 53, 58 and 72 per cent, respectively. The extra costs are Df1. 6, 9 and 30 per place and year, respectively.
465
0.97 3.05 4.42
22.43
2.28 3.58
15.57 47.42
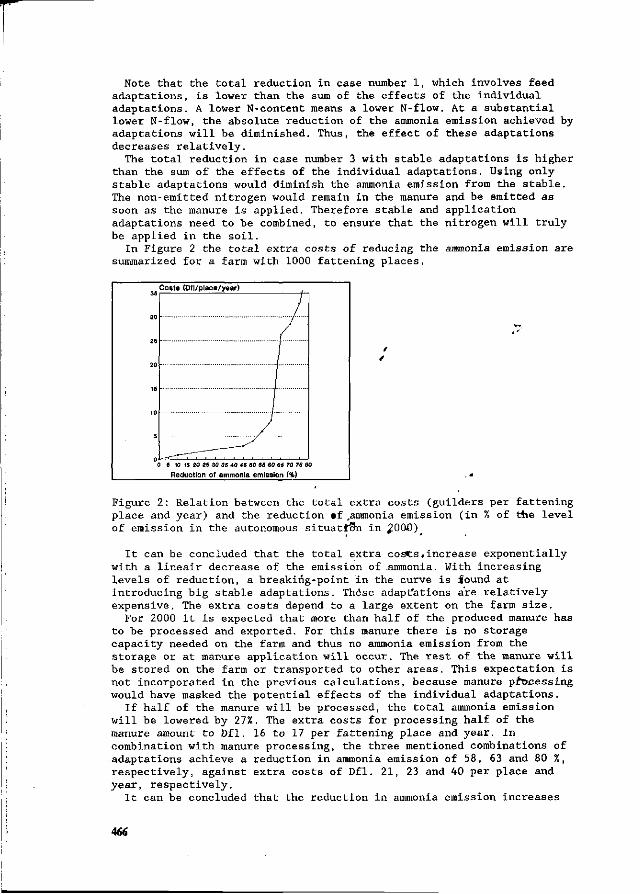
Note that the total reduction in case number 1, which involves feed adaptations, is lower than the sum of the effects of the individual adaptations. A lower N-content means a lower N-flow. At a substantial lower N-flow, the absolute reduction of the ammonia emission achieved by adaptations will be diminished. Thus, the effect of these adaptations decreases relatively.
The total reduction in case number 3 with stable adaptations is higher than the sum of the effects of the individual adaptations. Using only stable adaptations would diminish the ammonia emission from the stable. The non-emitted nitrogen would remain in the manure and be emitted as soon as the manure is applied. Therefore stable and application adaptations need to be combined, to ensure that the nitrogen will truly be applied in the soil.
In Figure 2 the total extra costs of reducing the ammonia emission are summarized for a farm with 1000 fattening places.
30
25
20
16
10
5
0 I
Costs (Dfl/place/year)
J "7 1 j J
-:^7zJ-5 10 15 20 25 30 35 40 45 60 55 60 GS 70 75 8
Reduction of ammonia emission (%) 0
Figure 2: Relation between the total extra costs (guilders per fattening place and year) and the reduction »f ,ammonia emission (in % of the level of emission in the autonomous situation in 00û)_
It can be concluded that the total extra costs.increase exponentially with a lineair decrease of the emission of .ammonia. With increasing levels of reduction, a breaking-point 'in the curve is found at introducing big stable adaptations. These adaptations are relatively expensive. The extra costs depend to a large extent on the farm size.
For 2000 it is expected that more than half of the produced manure has to be processed and exported. For this manure there is no storage capacity needed on the farm and thus no ammonia emission from the storage or at manure application will occur. The rest of the manure will be stored on the farm or transported to other areas. This expectation is not incorporated in the previous calculations, because manure processing would have masked the potential effects of the individual adaptations.
If half of the manure will be processed, the total ammonia emission will be lowered by 27%. The extra costs for processing half of the manure amount to Df 1. 16 to 17 per fattening place and year. In combination with manure processing, the three mentioned combinations of adaptations achieve a reduction in ammonia emission of 58, 63 and 80 %, respectively, against extra costs of Dfl. 21, 23 and 40 per place and year, respectively.
It can be concluded that the reduction in ammonia emission increases
466
with about 5 to 8 per cent, when half of the manure is centrally processed. Although the total costs increase, the big difference in costs between relatively 'cheap' adaptations and big stable adaptations become smaller.
Discussion
The results of adaptations to reduce the ammonia emission in sow husbandry are similar to those presented for fattening pigs. Almost the same type of measures can be taken with comparable effects on ammonia emission. To achieve a 70 % reduction in ammonia emission, the extra costs are about 100 to 160 guilders per sow place and year. Like for fattening pigs, a combination of adaptations on stables, storage and application of manure is necessary.
Feed adaptation can reduce the emission with up to 18 per cent and is relatively cheap. However, in combination with adaptations on stable, storage and manure application, the marginal effect of feed adaptations on ammonia emission is only 2 to 6 per cent units. That is the reason why it is not useful to combine feed and other adaptations when a reduction rate of 70 per cent of more has to be achieved.
The extra costs of about 125 guilders per sow place and year and about 30 guilders per fattening place and year (at an average farm size of 200 sow places or 1000 fattening places, respectively) as calculated^ in this paper mean a reduction of farm income. No positive effects on product prices are expected. For 2000, a gross margin (apart from the mentioned extra costs) of 700 guilders per sow and year and 70 guilders per fattening place and year are calculated. These figures show that a lot of farmers can not bear these extra costs. Calculations for specialized pig farmers indicate that about 20 % of these farmers, in the autonomous situation, do not earn enough to pay the rent and the repayments. With the calculated environmental costs, this figure will increase to about 50% (Van Os & Baltussen, 1992). This means that about 4,500 specialized pig farmers will have to quit production. For the farmers which are not specialized the situation is even worse. This will mean that the total pig production in The Netherlands will decrease in the next 10 years.
A decrease in the total pig production does not mean that the total costs for environmental adapatations will decrease much because the national pig population increased with 30 % between 1980 and 1990 (Landbouwcijfers, 1992). An estimated decrease in number of animals with 15 % (Baltussen & Van H o m e , 1993) and a decrease in ammonia emission of 6 % (autonomous developments) are not sufficient to reduce the need for far-reaching and expensive adaptations (i.e., big stable adaptations) on a farm level.
As stated in the introduction a lot of the innovations are still in development. This may mean that, at this moment, the extra costs of reduction of the ammonia emission are overestimated. However, the estimated costs for central processing of manure and for reducing the emission from the stable have increased during the last five years. Of the total estimated environmental costs the extra costs for manure processing and adaptations in the stable are at least 60 to 70 %. In conclusion, in the short term cheap solutions for reducing the ammonia emission are necessary, especially for adaptations in the stable and for central processing of manure.
467
conclusions
A combination of measures has to be taken to achieve a 70 % reduction of the ammonia emission in pig production. These measures will increase the on farm level costs substantially. For about half of the pig farmers these present estimated costs are too high to continue the production in the long term. Especially the costs for manure processing are high and uncertain. During the last five years these costs have increased. In this situation the international competitiveness of the Dutch pig production is getting worse. In the short term there is a need for good and cheap methods to reduce the emission of ammonia. Only then pig production can be maintained at its current level.
References
Baltussen, W.H.M. & H o m e , P.L.M. van (red.), 1993. Milieubeleid en omvang van de intensieve veehouderij ; Ontwikkelingen in aantallen bedrijven en dieren tot het jaar 2000 bij drie milieubeleidsvarianten. Mededeling 483. LEI-DLO/IKC-Veehouderij, Den Haag.
BEF, Bedrij fsuitkomsten en financiële positie 1990/91, 1991. Periodieke Rapportage 13-90/91. LEI-DLO, Den Haag.
Hoste, R. & Baltussen, W.H.M., 1993. Beperking van de ammoniakemissie op varkensbedrijven; Actualisatie 1993. Publication in press. LEI-DLO, Den Haag.
Landbouwcijfers 1992, 1993. CBS/LEI-DLO, Rijswijk. Os, J. van & Baltussen, W.H.M., 1992. Gevolgen van milieumaatregelen
voor de continuïteit van veehouderijbedrijven. Publikatie 3.150, LEI-DLO, Den Haag.
Oudendag, D.A., 1993. Reductie van ammoniakemissie; Mogelijkheden en kosten van beperking van ammoniakemissie op nationaal en regionaal niveau. Onderzoekverslag 102. Den Haag, LEI-DLO.
Schutte, J.B. & Tamminga, S., 1992. Veevoedkundige methoden om de N- en P-uitscheiding door pluimvee, varkens en rundvee te'beperken. ILOB-report I 92-3792b. ILOB-TNO/LUW-W, Wageningen.
Timmers, J. (red.) 1993. Ontwikkelingen in de varkenshouderij naar het jaar 2005. Report in press. Projectgroep«visia varkenshouderij 2005, IKC-Varkenshouderij, Rosmalen.
Verdoes, N., 1990. Naar stallen met beperkte ammtmiakuitstoot; Deelrapport varkens. Onderzpek inzake de 'mest- en ammoniakproblematiek in de veehouderij 8C. Stuurgroep emissiearme huisves^ingssystemen, werkgroep varkens. Ministerie van Landbouw, Natuurbeheer en Visserij, Wageningen.
VROM & LAVI, 1989. Plan van aanpak beperking ammoniakemissie van de landbouw. Ministerie van volkshuisvesting, ruimtelijke ordening en milieubeheer, Den Haag.
468
Reduction of Nitrogen in compound feeds in the Netherlands: an economic evaluation
Marianne van der Veen
Agricultural Economics Research Institute, PO Box 29703, 2502 LS Den Haag, the Netherlands
Summary
The nutrient content in manure is the key problem of manure surpluses and ammonia volatilisation. The nutrient content in manure may be reduced by adaptation of compound feeds. The principle of this method is to feed animals according to the exact nutrient requirements.
The Dutch Compound Feed Model is developed in order to calculate costs of reduction of Nitrogen and Phosphorus in compound feeds on a national level. The model calculates the composition of the total annual production of 17 compound feeds by linear programming.
In this paper the costs are described of reducing Nitrogen levels in the total volume of compound feed production in the Netherlands. Two techniques to reduce Nitrogen are evaluated. First the effect of a reduction of amino acid and crude protein requirements in pig feeds is evaluated. Secondly, given the requirements of amino acids, the total Nitrogen content of compound feeds in maximized and forced down, which enforces a change in raw material composition of the compound feeds. The amino acid and Nitrogen requirements used are as follows: A. The original set of protein and amino acid requirements; B. A set with a 5% reduction of amino acid requirements; C. A set with a 5% reduction of amino acid requirements and crude protein requirements.
The second set of requirements gives a reduction of 4 million kilo in the total Nitrogen content of pig feeds, which corresponds with 1% in all feeds, and reduces the yearly costs for all compound feeds with 8 million ECU (0.3%). A further reduction of Nitrogen levels is forced by a change in composition of raw materials. With the original set of protein and amino acid requirements, a forced Nitrogen reduction of 40 million kilo (about 10%) in all compound feeds leads to a rise in total costs for raw materials of 58 million ECU.
If requirements for amino acids for pig feeds are lowered with 5% (scenario B ) , a forced reduction of 40 million kilo of Nitrogen above the 4 million kilo reduction reached already by lowering amino acid requirements, increases the costs for raw materials with 77 million ECU. In scenario C, a 40 million kg reduction of total Nitrogen leads to a cost rise of 33 million ECU.
So, research leading to a decrease of amino acid requirements in pig feeds reduces the costs for raw materials of compound feeds and also the Nitrogen contents of feeds. The costs of further (forced) reductions of the Nitrogen content are only decreased if crude protein requirements are lowered as well as amino acid requirements. Keywords : Economic evaluation, Compound feeds, Models, Nutrition
Introduction and aim
The nutrient content in manure is the key problem of manure surpluses and ammonia volatilisation. The nutrient content in manure may be reduced by
469
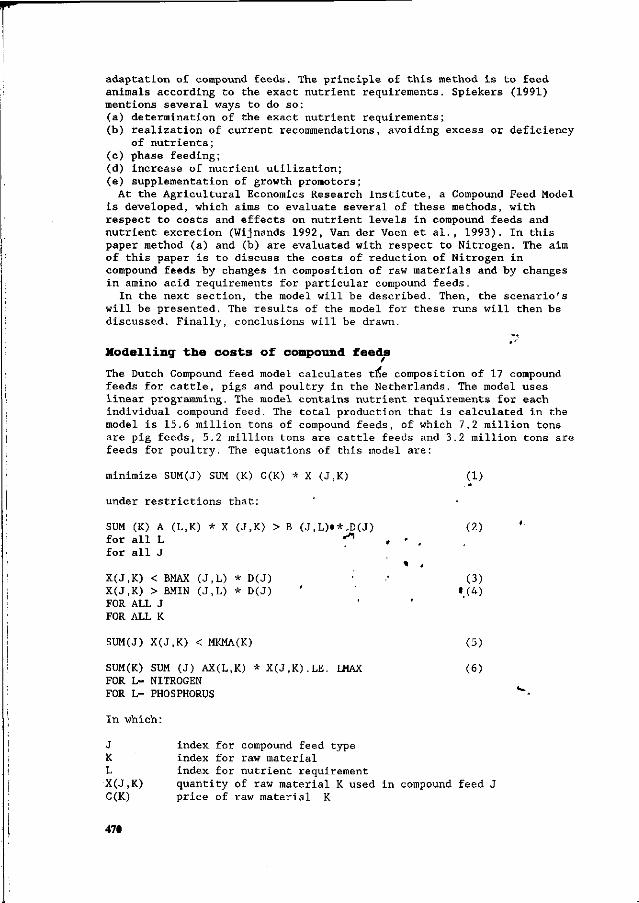
adaptation of compound feeds. The principle of this method is to feed animals according to the exact nutrient requirements. Spiekers (1991) mentions several ways to do so : (a) determination of the exact nutrient requirements; (b) realization of current recommendations, avoiding excess or deficiency
of nutrients ; (c) phase feeding; (d) increase of nutrient utilization; (e) supplementation of growth promotors;
At the Agricultural Economics Research Institute, a Compound Feed Model is developed, which aims to evaluate several of these methods, with respect to costs and effects on nutrient levels in compound feeds and nutrient excretion (Wijnands 1992, Van der Veen et al., 1993). In this paper method (a) and (b) are evaluated with respect to Nitrogen. The aim of this paper is to discuss the costs of reduction of Nitrogen in compound feeds by changes in composition of raw materials and by changes in amino acid requirements for particular compound feeds.
In the next section, the model will be described. Then, the scenario's will be presented. The results of the model for these runs will then be discussed. Finally, conclusions will be drawn.
Modelling the costs of compound feeds
The Dutch Compound feed model calculates the composition of 17 compound feeds for cattle, pigs and poultry in the Netherlands. The model uses linear programming. The model contains nutrient requirements for each individual compound feed. The total production that is calculated in the model is 15.6 million tons of compound feeds, of which 7.2 million tons are pig feeds, 5.2 million tons are cattle feeds and 3.2 million tons are feeds for poultry. The equations of this model are:
minimize SUM(J) SUM (K) C(K) * X (J,K) (1)
under restrictions that:
SUM (K) A (L,K) * X (J,K) > B (J,L)»*,D(J) for all L •^ for all J
(2)
X(J,K) < BMAX (J,L) * D(J) X(J,K) > BMIN (J,L) * D(J) FOR ALL J FOR ALL K
(3) 1(4)
SUM(J) X(J,K) < MKMA(K)
SUM(K) SUM (J) AX(L,K) * X(J,K).LE. LMAX FOR L= NITROGEN FOR L= PHOSPHORUS
(5)
(6)
In which:
J index for compound feed type K index for raw material L index for nutrient requirement X(J,K) quantity of raw material K used in compound feed J C(K) price of raw material K
470
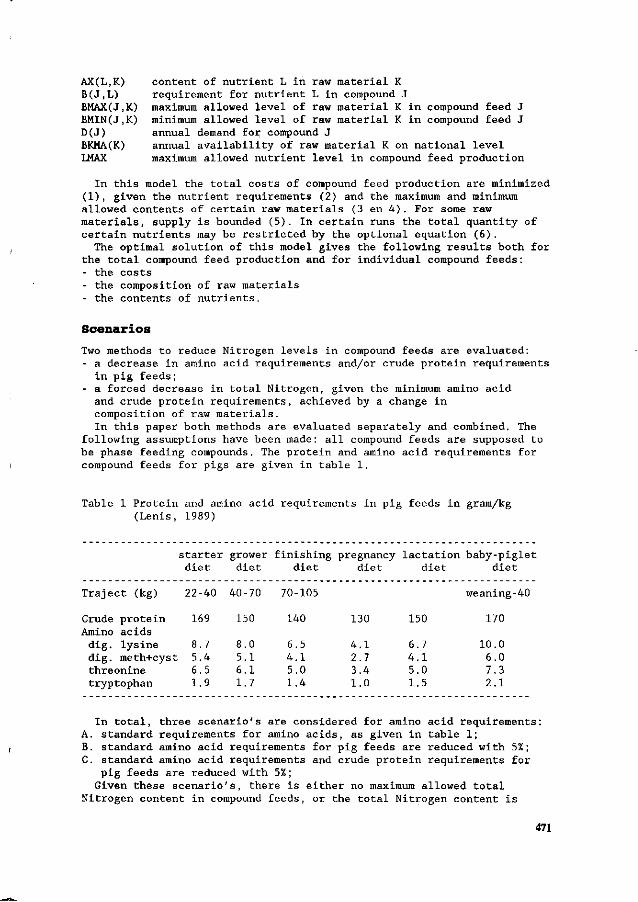
AX(L,K) content of nutrient L in raw material K B(J,L) requirement for nutrient L in compound J BMAX(J,K) maximum allowed level of raw material K in compound feed J BMIN(J.K) minimum allowed level of raw material K in compound feed J D(J) annual demand for compound J BKMA(K) annual availability of raw material K on national level LMAX maximum allowed nutrient level in compound feed production
In this model the total costs of compound feed production are minimized (1), given the nutrient requirements (2) and the maximum and minimum allowed contents of certain raw materials (3 en 4 ) . For some raw materials, supply is bounded (5). In certain runs the total quantity of certain nutrients may be restricted by the optional equation (6).
The optimal solution of this model gives the following results both for the total compound feed production and for individual compound feeds : - the costs - the composition of raw materials - the contents of nutrients.
Scenarios
Two methods to reduce Nitrogen levels in compound feeds are evaluated: - a decrease in amino acid requirements and/or crude protein requirements
in pig feeds ; - a forced decrease in total Nitrogen, given the minimum amino acid
and crude protein requirements, achieved by a change in composition of raw materials. In this paper both methods are evaluated separately and combined. The
following assumptions have been made: all compound feeds are supposed to be phase feeding compounds. The protein and amino acid requirements for compound feeds for pigs are given in table 1.
Table 1 Protein and amino acid requirements in pig feeds in gram/kg (Lenis, 1989)
starter grower finishing pregnancy lactation baby-piglet diet diet diet diet diet diet
Traject (kg)
Crude protein Amino acids
dig. lysine dig. meth+cyst threonine tryptophan
22-40
169
8.7 5.4 6.5 1.9
40-70
150
8.0 5.1 6.1 1.7
70-105
140
6.5 4.1 5.0 1.4
130
4.1 2.7 3.4 1.0
150
6.7 4.1 5.0 1.5
weaning-40
170
10.0 6.0 7.3 2.1
In total, three scenario's are considered for amino acid requirements: A. standard requirements for amino acids, as given in table 1; B. standard amino acid requirements for pig feeds are reduced with 5%; C. standard amino acid requirements and crude protein requirements for
pig feeds are reduced with 5%; Given these scenario's, there is either no maximum allowed total
Nitrogen content in compound feeds, or the total Nitrogen content is
471
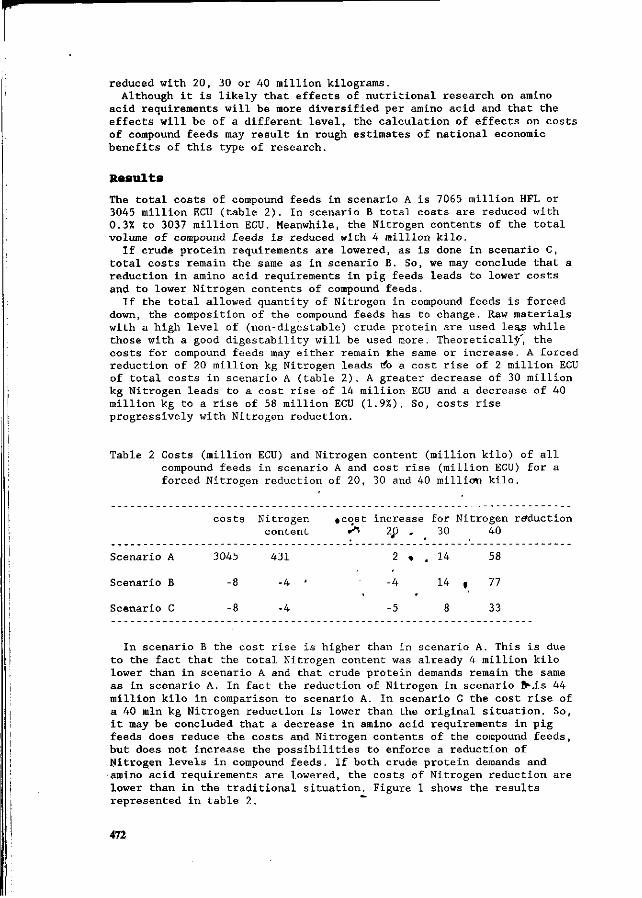
reduced with 20, 30 or 40 million kilograms. Although it is likely that effects of nutritional research on amino
acid requirements will be more diversified per amino acid and that the effects will be of a different level, the calculation of effects on costs of compound feeds may result in rough estimates of national economic benefits of this type of research.
Results
The total costs of compound feeds in scenario A is 7065 million HFL or 3045 million ECU (table 2). In scenario B total costs are reduced with 0.3% to 3037 million ECU. Meanwhile, the Nitrogen contents of the total volume of compound feeds is reduced with 4 million kilo.
If crude protein requirements are lowered, as is done in scenario C, total costs remain the same as in scenario B. So, we may conclude that a reduction in amino acid requirements in pig feeds leads to lower costs and to lower Nitrogen contents of compound feeds.
If the total allowed quantity of Nitrogen in compound feeds is forced down, the composition of the compound feeds has to change. Raw materials with a high level of (non-digestable) crude protein are used les s while those with a good digestability will be used more. Theoretically', the costs for compound feeds may either remain Jfche same or increase. A forced reduction of 20 million kg Nitrogen leads rfb a cost rise of 2 million ECU of total costs in scenario A (table 2). A greater decrease of 30 million kg Nitrogen leads to a cost rise of 14 miliion ECU and a decrease of 40 million kg to a rise of 58 million ECU (1.9%). So, costs rise progressively with Nitrogen reduction.
Table 2 Costs (million ECU) and Nitrogen content (million kilo) of all compound feeds in scenario A and cost rise (million ECU) for a forced Nitrogen reduction of 20, 30 and 40 million kilo.
costs Nitrogen »cost increase for Nitrogen reduction content ^ 2j) . 30 40
Scenario A 3045 431
Scenario B -8 -4 '
Scenario C -8 -4
In scenario B the cost rise is higher than in scenario A. This is due to the fact that the total Nitrogen content was already 4 million kilo lower than in scenario A and that crude protein demands remain the same as in scenario A. In fact the reduction of Nitrogen in scenario fr-.is 44 million kilo in comparison to scenario A. In scenario C the cost rise of a 40 mln kg Nitrogen reduction is lower than the original situation. So, it may be concluded that a decrease in amino acid requirements in pig feeds does reduce the costs and Nitrogen contents of the compound feeds, but does not increase the possibilities to enforce a reduction of Nitrogen levels in compound feeds. If both crude protein demands and amino acid requirements are lowered, the costs of Nitrogen reduction are lower than in the traditional situation. Figure 1 shows the results represented in table 2. ""
472
2 ,
- 4
-5
. 14
14
8
1
58
77
33
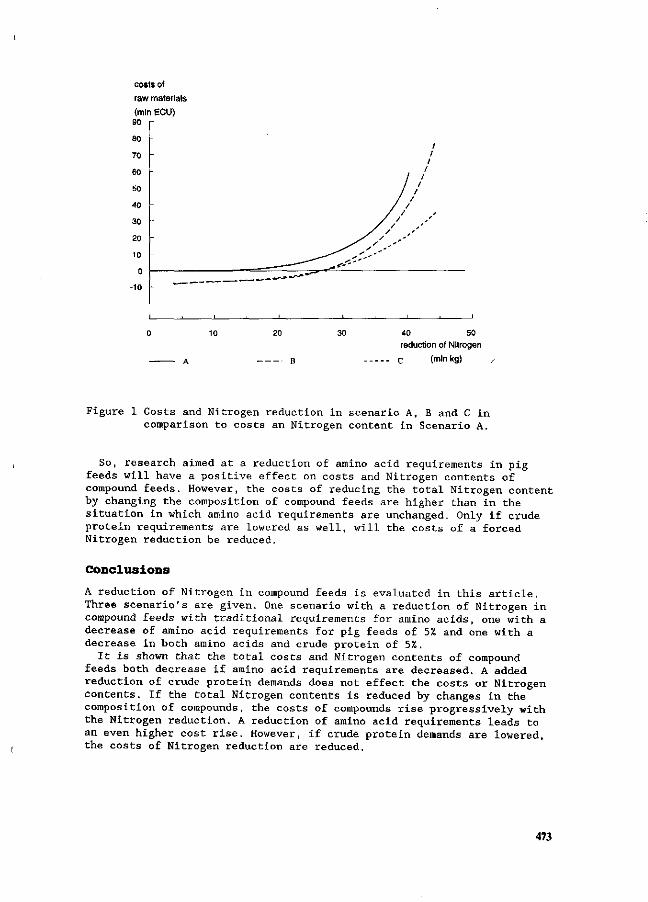
costs of raw materials
(mln ECU) 90
80
70
60
50
40
30
20
10
0
-10
40 50 reduction of Nitrogen
C (m|n kg)
Figure 1 Costs and Nitrogen reduction in scenario A, B and C in comparison to costs an Nitrogen content in Scenario A.
So, research aimed at a reduction of amino acid requirements in pig feeds will have a positive effect on costs and Nitrogen contents of compound feeds. However, the costs of reducing the total Nitrogen content by changing the composition of compound feeds are higher than in the situation in which amino acid requirements are unchanged. Only if crude protein requirements are lowered as well, will the costs of a forced Nitrogen reduction be reduced.
Conclusions
A reduction of Nitrogen in compound feeds is evaluated in this article. Three scenario's are given. One scenario with a reduction of Nitrogen in compound feeds with traditional requirements for amino acids, one with a decrease of amino acid requirements for pig feeds of 5% and one with a decrease in both amino acids and crude protein of 5%.
It is shown that the total costs and Nitrogen contents of compound feeds both decrease if amino acid requirements are decreased. A added reduction of crude protein demands does not effect the costs or Nitrogen contents. If the total Nitrogen contents is reduced by changes in the composition of compounds, the costs of compounds rise progressively with the Nitrogen reduction. A reduction of amino acid requirements leads to an even higher cost rise. However, if crude protein demands are lowered, the costs of Nitrogen reduction are reduced.
473
References
Lenis, N.P., 1989. Lower Nitrogen in pig husbandry by feeding: current and future possibilities. In: Netherlands Journal of Agricultural science 37 (61-70).
Spiekers,H., 1992. Possibilities and costs of Nitrogen reduction through adapted feeding. In: G. Klaassen (ed) , Ammonia emissions in Europe: Ammonia emission coefficients and abatement costs. Proceedings of a workshop held 4-6 february 1991 at IIASA, IIASA, Laxenburg, Austria
Veen, M.Q. van der, J.C. Blom and H.H. Luesink, 1993. Verlaging van fosfor en stikstofgehaltes in mengvoerders: een economische evaluatie. Den Haag, The Netherlands, LEI-DLO.
Wijnands, J.H.M., 1992. Costs of controlling ammonia emission in the Dutch livestock sector. In: G. Klaassen (ed), Ammonia emissions in Europe: Ammonia emission coefficients and abatement costs. Proceedings of a workshop held 4-6 february 1991 at IIASA, IIASA, Laxenburg, Austria
474
A levy on nitrogen to reduce the nitrogen content in compound feed
W.H.M. Baltussen
Agricultural Economics Research Institute (LEI-DLO), P.O.Box 29703, 2502 LS The Hague, The Netherlands.
Abstract
By introducing a mineral account and a levy of two guilders per kg nitrogen surplus, the use of nitrogen in Dutch agriculture can be reduced substantially. In intensive livestock production, however, the introduction of a levy on nitrogen will only slightly reduce the content of minerals in compound feed.
The reasons for this low reduction are : -the loss of nitrogen in intensive livestock production is small relative to the nitrogen input. -a linear decrease of the nitrogen content in compound feed is/associated with an exponential increase in the feed price due to the necessity of including synthetic amino acids in the diets. -modification in housing systems, storage of manure and adaptation of techniques for applying manure are necessary to achieve the objectives of the government. These novel techniques will reduce the efficacy of the environmental effects of low nitrogen content in compound feed.
In the short term, a low nitrogen content may be effective as long as other measures have not been taken. In the long term, a low nitrogen content of compound feed may have a negligible effect on the environment and a strong negative effect on farmers income. Thus, it can be concluded that lowering the nitrogen content of compound feed appears to be an inappropriate measure for confronting the environmental problems. Keywords: levies/compound feed/nitrogen/farm income/pigs.
Introduction
The present environmental policy of the Dutch government does not stimulate farmers to use compound feed with reduced N-content. To achieve the objectives of the government without reducing the number of animals a reduction of the N-content of compound feed in the Dutch livestock production seems to be necessary. For dairy and arable farms, a reduction in the use of fertilizer is necessary. One of the ways to stimulate farmers to diminish N-input is the introduction of a levy on nitrogen.
The Dutch government is investigating the possibilities to introduce financial instruments in the environmental policy. One of the aspects of introduction that has to be evaluated, is the technical effect that can be expected from the introduction of a financial instrument in agriculture. Other aspects are competitiveness, employment, juridical aspects, the costs of introduction and control, EC-policy and EC-rules.
The objective of this paper is to assess the technical effect of two different levy systems on the N-content of compound feed in Dutch pig farming.
475
Method
In this study seven compositions of compound feed different in N and/or P content were calculated using a linear programming model (Van der Veen, 1993). The N- and P-input and the mean feed price per 100 kg were calculated for fattening pigs (Table 1) and for sows (Table 2).
Table 1: N-input (kg N per place per year), P-input (kg P per place per year) and mean feed price (guilders per 100 kg) of seven different feed compositions for fattening pigs in the year 2000.
Feed composition 1 2 3 4 5 6 7
N-input 19.3 17.1 16.4 16.4 19.1 17.2 16.4 P-input 3.7 3.4 3.1 2.9 2.9 3.3 3.4 Mean feed price 46.81 46.93 47.86 48.15 47.02 46.95 47.73 (Baltussen & Van Home, 1992)
Table 2: N-input (kg N per sow per year), P-input (kg P per sow per year) and mean feed price (guilders per 100 kg),of seven different feed compositions for pig husbandry*) in the year 2000.
Feed composition 1 2 3 4 5 6 7
N-input 46.79 45.65 45.07 44.34 47.89 45.84 44.73 P-input 12.04 10.98 10.09 8.71 8.71 9.73 11.62 Mean feed price 48.58 48.70 49.48 51.01 49.12 48.85 49.84 *) piglets are included (Baltussen & Van Home, 1992)
For ten different types of pig farms and three levels of technical performance the following costs were calculated for each of the s,even compositions of feed in the year 20u0v -total feed costs; ' -a tax on surplus of phosphorus on farm level ("overschotheffing") in the Netherlands; * -the total costs for disposal pf manure; -a tax on nitrogen. _ r
It was assumed that the technical performance of pigs and sows, the pig prices, the amount of manure and other costs are not influenced by the feed composition. A further assumption is that farmers will use the compound feed that will lead to the lowest total costs on a farm level.
In this study two levy systems on nitrogen were considered: a. a levy of one guilder per kg N-input from feed. b. a levy of two guilders per kg N-surplus on a farm level. w
The surplus is defined as the difference between the total input and the total output of nitrogen on a farm level (the manure included). This means that the surplus will be defined as equal to the ammonia emission in the case that no manure is used on the farm.
Results
Improvements in technical performance and the expected increase of the price for disposal of manure do not change the optimal feed composition
476
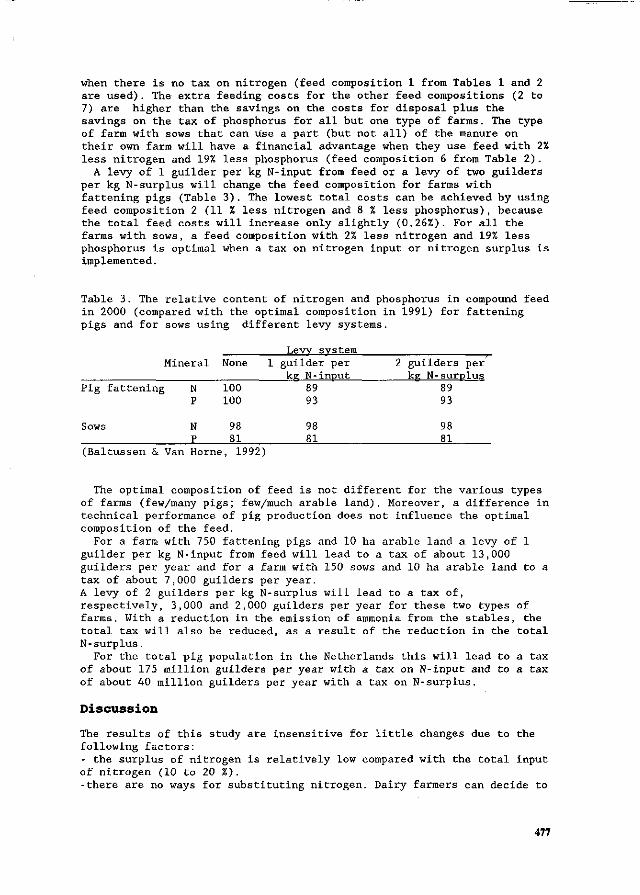
when there is no tax on nitrogen (feed composition 1 from Tables 1 and 2 are used). The extra feeding costs for the other feed compositions (2 to 7) are higher than the savings on the costs for disposal plus the savings on the tax of phosphorus for all but one type of farms. The type of farm with sows that can use a part (but not all) of the manure on their own farm will have a financial advantage when they use feed with 2% less nitrogen and 19% less phosphorus (feed composition 6 from Table 2).
A levy of 1 guilder per kg N-input from feed or a levy of two guilders per kg N-surplus will change the feed composition for farms with fattening pigs (Table 3). The lowest total costs can be achieved by using feed composition 2 (11 % less nitrogen and 8 % less phosphorus), because the total feed costs will increase only slightly (0.26%). For all the farms with sows, a feed composition with 2% less nitrogen and 19% less phosphorus is optimal when a tax on nitrogen input or nitrogen surplus is implemented.
Table 3. The relative content of nitrogen and phosphorus in compound feed in 2000 (compared with the optimal composition in 1991) for fattening pigs and for sows using different levy systems.
Lew system Mineral None 1 guilder per 2 guilders per
kg N-input kfî N- surplus Pig fattening N 100 89 89
P 100 93 93
Sows N 98 98 98 P 81 81 81
(Baltussen & Van Home, 1992)
The optimal composition of feed is not different for the various types of farms (few/many pigs; few/much arable land). Moreover, a difference in technical performance of pig production does not influence the optimal composition of the feed.
For a farm with 750 fattening pigs and 10 ha arable land a levy of 1 guilder per kg N-input from feed will lead to a tax of about 13,000 guilders per year and for a farm with 150 sows and 10 ha arable land to a tax of about 7,000 guilders per year. A levy of 2 guilders per kg N-surplus will lead to a tax of, respectively, 3,000 and 2,000 guilders per year for these two types of farms. With a reduction in the emission of ammonia from the stables, the total tax will also be reduced, as a result of the reduction in the total N-surplus.
For the total pig population in the Netherlands this will lead to a tax of about 175 million guilders per year with a tax on N-input and to a tax of about 40 million guilders per year with a tax on N-surplus.
Discussion
The results of this study are insensitive for little changes due to the following factors: - the surplus of nitrogen is relatively low compared with the total input of nitrogen (10 to 20 % ) . -there are no ways for substituting nitrogen. Dairy farmers can decide to
477
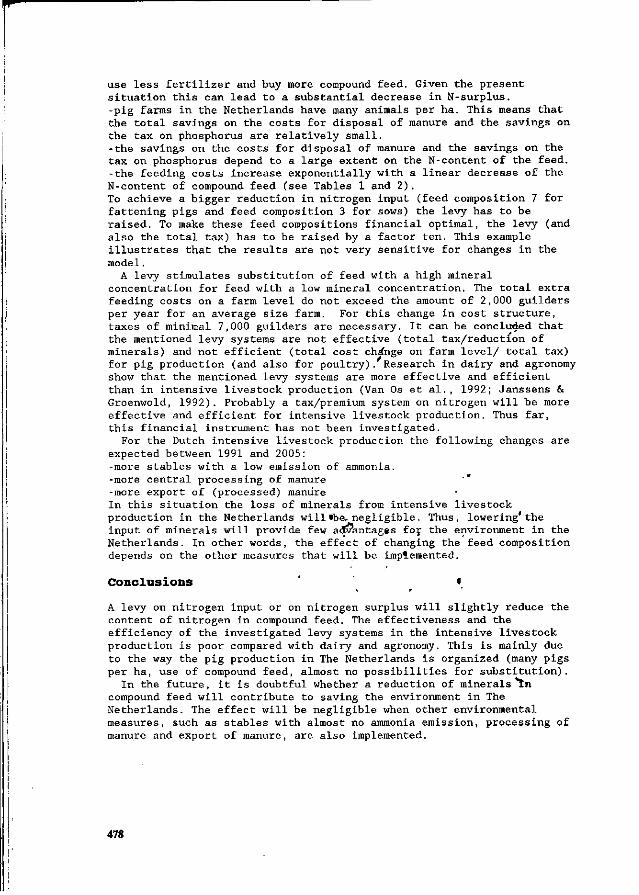
use less fertilizer and buy more compound feed. Given the present situation this can lead to a substantial decrease in N-surplus. -pig farms in the Netherlands have many animals per ha. This means that the total savings on the costs for disposal of manure and the savings on the tax on phosphorus are relatively small. -the savings on the costs for disposal of manure and the savings on the tax on phosphorus depend to a large extent on the N-content of the feed. -the feeding costs increase exponentially with a linear decrease of the N-content of compound feed (see Tables 1 and 2). To achieve a bigger reduction in nitrogen input (feed composition 7 for fattening pigs and feed composition 3 for sows) the levy has to be raised. To make these feed compositions financial optimal, the levy (and also the total tax) has to be raised by a factor ten. This example illustrates that the results are not very sensitive for changes in the model.
A levy stimulates substitution of feed with a high mineral concentration for feed with a low mineral concentration. The total extra feeding costs on a farm level do not exceed the amount of 2,000 guilders per year for an average size farm. For this change in cost structure, taxes of minimal 7,000 guilders are necessary. It can be concluded that the mentioned levy systems are not effective (total tax/reduction of minerals) and not efficient (total cost châ'nge on farm level/ total tax) for pig production (and also for poultry). Research in dairy and agronomy show that the mentioned levy systems are more effective and efficient than in intensive livestock production (Van Os et al., 1992; Janssens & Groenwold, 1992). Probably a tax/premium system on nitrogen will be more effective and efficient for intensive livestock production. Thus far, this financial instrument has not been investigated.
For the Dutch intensive livestock production the following changes are expected between 1991 and 2005: -more stables with a low emission of ammonia, -more central processing of manure -more export of (processed) manure
In this situation the loss of minerals from intensive livestock production in the Netherlands will «be, negligible. Thus, lowering'the input of minerals will provide few advantages for the environment in the Netherlands. In other words, the effect of changing the feed composition depends on the other measures that will be implemented.
Conclusions ' «
A levy on nitrogen input or on nitrogen surplus will slightly reduce the content of nitrogen in compound feed. The effectiveness and the efficiency of the investigated levy systems in the intensive livestock production is poor compared with dairy and agronomy. This is mainly due to the way the pig production in The Netherlands is organized (many pigs per ha, use of compound feed, almost no possibilities for substitution).
In the future, it is doubtful whether a reduction of minerals in compound feed will contribute to saving the environment in The Netherlands. The effect will be negligible when other environmental measures, such as stables with almost no ammonia emission, processing of manure and export of manure, are also implemented.
478
References
Baltussen, W.H.M. & P.L.M, van Home, 1992. Effecten van heffingen op stikstof op de voersamenstelling in de intensieve veehouderij. Den Haag, Landbouw-Economisch Instituut (LEI-DLO), Mededeling 475.
Janssens, S.R.M. & J.G. Groenwold, 1992. Effecten van heffingen op stikstof op de bedrijfsvoering in de akkerbouw. Den Haag, Landbouw-Economisch Instituut (LEI-DLO), Mededeling 478.
Os, J. van, T. de Haan & W.H.M. Baltussen, 1992. Effecten van heffingen op stikstof op de bedrijfsvoering in de melkveehouderij. Den Haag, Landbouw-Economisch Instituut (LEI-DLO), Mededeling 476.
Veen, M.Q. van der, 1993, Reduction of nitrogen in compound feeds in the Netherlands: a model approach. Paper presented at the congress "nitrogen flow in pig production and environmental consequences", Wageningen, The Netherlands, 8-11 June 1993.
479
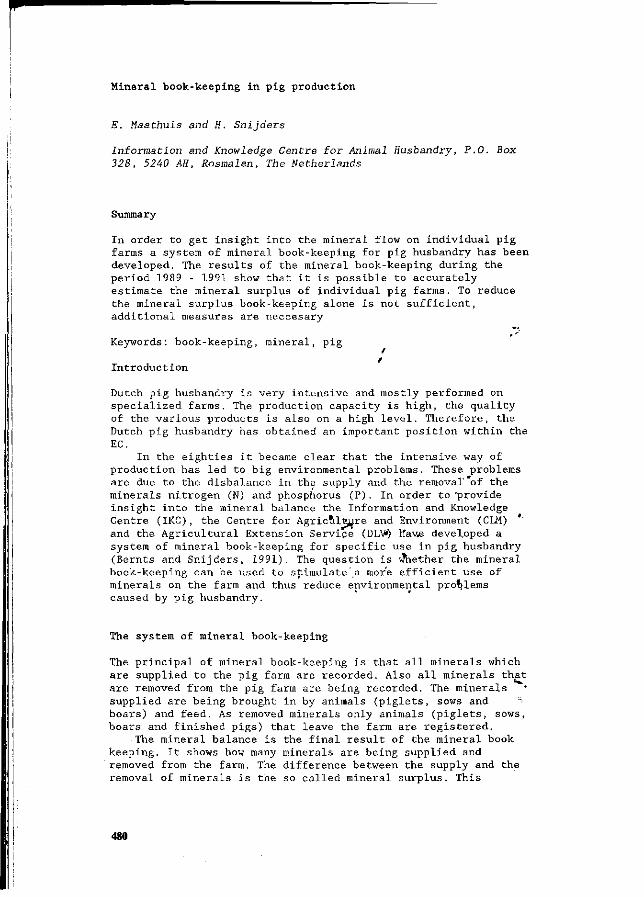
Mineral book-keeping in pig production
E. Maathuis and H. Snijders
Information and Knowledge Centre for Animal Husbandry, P.O. Box 328, 52A0 AH, Rosmalen, The Netherlands
Summary
In order to get insight into the mineral flow on individual pig farms a system of mineral book-keeping for pig husbandry has been developed. The results of the mineral book-keeping during the period 1989 - 1991 show that it is possible to accurately estimate the mineral surplus of individual pig farms. To reduce the mineral surplus book-keeping alone is not sufficient, additional measures are neccesary
Keywords: book-keeping, mineral, pig
Introduction
Dutch pig husbandry is very intensive and mostly performed on specialized farms. The production capacity is high, the quality of the various products is also on a high level. Therefore, the Dutch pig husbandry has obtained an important position within the EC.
In the eighties it became clear that the intensive way of production has led to big environmental problems. These problems are due to the disbalance in the supply and the removal' of the minerals nitrogen (N) and phosphorus (P). In order to 'provide insight into the mineral balance the Information and Knowledge Centre (IKC), the Centre for Agriculture and Environment (CLM) and the Agricultural Extension Service (DL\*) Hav.e developed a system of mineral book-keeping for specific use in pig husbandry (Bernts and Snijders, 1991). The question is wnether the mineral book-keeping can be used to stimulate'a more efficient use of minerals on the farm and thus reduce environmental problems caused by pig husbandry.
The system of mineral book-keeping
The principal of mineral book-keeping is that all minerals which are supplied to the pig farm are recorded. Also all minerals that are removed from the pig farm are being recorded. The minerals supplied are being brought in by animals (piglets, sows and ~-boars) and feed. As removed minerals only animals (piglets, sows, boars and finished pigs) that leave the farm are registered.
The mineral balance is the final result of the mineral book keeping. It shows how many minerals are being supplied and removed from the farm. The difference between the supply and the removal of minerals is the so called mineral surplus. This
480
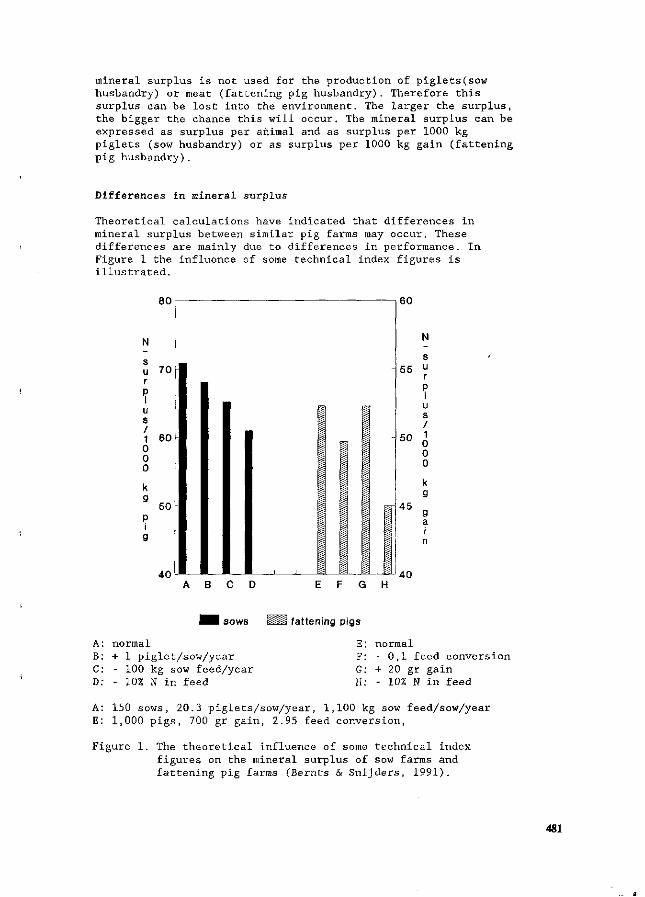
mineral surplus is not used for the production of piglets(sow husbandry) or meat (fattening pig husbandry). Therefore this surplus can be lost into the environment. The larger the surplus, the bigger the chance this will occur. The mineral surplus can be expressed as surplus per animal and as surplus per 1000 kg piglets (sow husbandry) or as surplus per 1000 kg gain (fattening pig husbandry).
Differences in mineral surplus
Theoretical calculations have indicated that differences in mineral surplus between similar pig farms may occur. These differences are mainly due to differences in performance. In Figure 1 the influence of some technical index figures is illustrated.
• • sows
A: normal B: + 1 piglet/sow/year C: - 100 kg sow feed/year D: - 10% N in feed
fattening pigs
E: no rmal F: - 0,1 feed conversion G: + 20 gr gain H: 10% N in feed
A: 150 sows, 20.3 piglets/sow/year, 1,100 kg sow feed/sow/year E: 1,000 pigs, 700 gr gain, 2.95 feed conversion,
Figure 1. The theoretical influence of some technical index figures on the mineral surplus of sow farms and fattening pig farms (Bernts & Snijders, 1991).
4SI
Mean
32.8 8.2
69.1 17.4
13.8 2.4
53.1 9.2
25% lowest
28.3 7.1
58.2 14.4
12.3 2.1
47.3 7.8
25% highest
37.7 9.3
83.1 20.9
15.3 2.8
59.8 10.7
Wijnheimer & Hoste (1992) reported that indeed in practice there are differences among similar farms. The figures in table 1 show that these differences can become quite large.
Table 1. The surplus of N and P (kg) from sow farms and fattening pig farms (Wijnheimer & Hoste, 1992).
N-surplus/sow/year P-surplus/sow/year N-surplus/1000 kg piglets P-surplus/1000 kg piglets
N-surplus/p i g/year P-surplus/pig/year N-surplus/1000 kg gain P-surplus/1000 kg gain
According to Wijnheimer & Hoste (1992) the /differences among the farms are mainly due to differences in the'amount of minerals in feed and to differences in feed intake.
What to do with the figures of mineral book-keeping?
Using the mineral book-keeping it is possible for the individual farmer to calculate the mineral surplus for his own farm. To get insight into the efficiency of mineral use, this figure has to be compared with the mineral surplus of other farmers. .«
In the Netherlands, many pig' farmers are member of. a study group. This is a regular meeting of 10 to 20 pig farmers. In these study groups the technical and economical results of the ». members are being discussed. Because «ït is essential to compare the mineral surplus of the individual' farms among each other, the already existing study groups appear to be an tbv,ious choice to do so. During these meetings the results can be discussed and the farmers will get insight into 'the mineral flow on theiq own farm. They also get insight into the possibilities to'reduce the mineral surplus.
The results of the project mineral book-keeping
<. In 1989, a few study groups were asked to participate in the project mineral book-keeping for pig husbandry, to get insight into possible errors of the system of mineral book-keeping and to gain some experience. The mineral surplus of the farms that have participated in the project are presented in Table 2.
482
Table 2. The mineral surplus (kg) of the participants of the project mineral book-keeping for pig husbandry in the years 1989 - 1991 (Stouthart & van Bergen, 1993)
1989 1990 1991
N-surplus/sow/year P-surplus/sow/year N-surplus/1000 kg piglets P-surplus/1000 kg piglets
N-surplus/pig/year P-surplus/pig/year N-surplus/1000 kg gain P-surplus/1000 kg gain
33.6 8.7
65.1 17.0
14.1 2 .7 --
31.6 8.2
60.2 15.6
13.6 2 . 5
51.5 9 .5
30.2 7 .5
63.9 15.8
14.3 2 . 4
54.5 9 .2
In 1989 the surplus was expressed as surplus/1000 kg meat production.
During the years 1989 - 1991 it has been possible to reduce the N-surplus/sow/year with more 11% and the P-surplus/sow/year with almost 14% on the sow farms. In 1991, the N-surplus/1000 kg piglets and the P-surplus/1000 kg piglets were increased compared with the respective figures of 1990. This is most likely due to the disease PEARS (Stouthart and van Bergen, 1993).
The N-surplus/pig/year on the fattening pig farms decreased from 1989 to 1990, but substantially increased from 1990 to 1991. The differences can be ascribed to the amounts of N used in the feeds (1989: 2,73% ; 1991: 2,81%). However, the P-surplus/pig/year between 1989 to 1991 decreased with more than 11%.
Conclusions
From the project, it can be concluded that the newly developed mineral book-keeping for the pig husbandry has made it possible to accurately compute the mineral flow of the individual pig farm. It also shows that there are substantial differences among farms. But to decrease the mineral surplus only book-keeping is not sufficient. To do so it is necessary that the farmers are forced to take measures, such as the use of feed with a low input of minerals.
References
Bernts, H. & Snijders, H., 1991. Mineralenbenutting Varkenshouderij, Werkboek Begeleider. Mathôt B.V., Haarlem, The Netherlands. 53 p.
Stouthart, F. & Bergen, J. van, 1993. Vermindering van mineralenoverschotten op landbouwbedrijven, deel Varkenshouderij. CLM, Utrecht, The Netherlands (in press).
Wijnheimer, S. & Hoste, R., 1992. Minimale porties mineralen. Boerderij/Varkenshouderij 77 (12): 26VA - 27VA.
483
NUTRITIONAL POSSIBILITIES AND THE DUTCH POLICY ON MANURE SURPLUSES
J.A. Zeevalkink1 and J.B. Schutte2
1. TNO Institute of Environmental and Energy Technology (IMET) , P.O. Box 342, 7300 AH Apeldoorn, the Netherlands
2. TNO Institute of Animal Nutrition and Physiology (ILOB) , P.O. Box 15, 6700 AA Wageningen, the Netherlands
Summary
A short overview is given of the importance of nutritional solutions for the Dutch manure surplus. Especially, the addition of amino acids opens new prospects.
Introduction
This paper gives attention to the possible role of animal feed improvement for solving the' problem of the Dutch manure surplus, which at present is a serious environmental problem. The data are based on a recent assesment study of the Dutch policy by TNO, the Dutch Organization for Applied Scientific Research, with the collaboration of Heidemij Consultants. The study was commissioned by the ministries of Agriculture and of Environment. TNO has broad experience in research actvities conducted to solve the manure problem. It has investigated many unit operations for largescale manure processing, the improvement of mineral uptake from the feed by the animals as well as the production of amino acids manure being the raw material. • »
Overview of the manure problem » .
The content of minerals in the Dutch manure production exceeds the mineral need'of agriculture. This iresults in an environmental problem mainly caused by an excess of the minerals phosphate, nitrogen and potassium when applied to the soil. Formally, the manure surplus results from limitations set to the application of phosphate from manure. Phosphate and nitrogen concentrations in manure are linked by the rule that the phosphate concentration cannot be less than half the nitrogen concentration. In this way, excess ni"terogen dosage is also prevented. The limitations will become more severe in 1995 and 2000. Therefore, in these years there will be an increased surplus if no measures are taken. In 2000 the addition of minerals should equal the uptake of the crops, taking into account unavoidable losses. In 1995 the manure surplus will mainly produced by pigs and
484
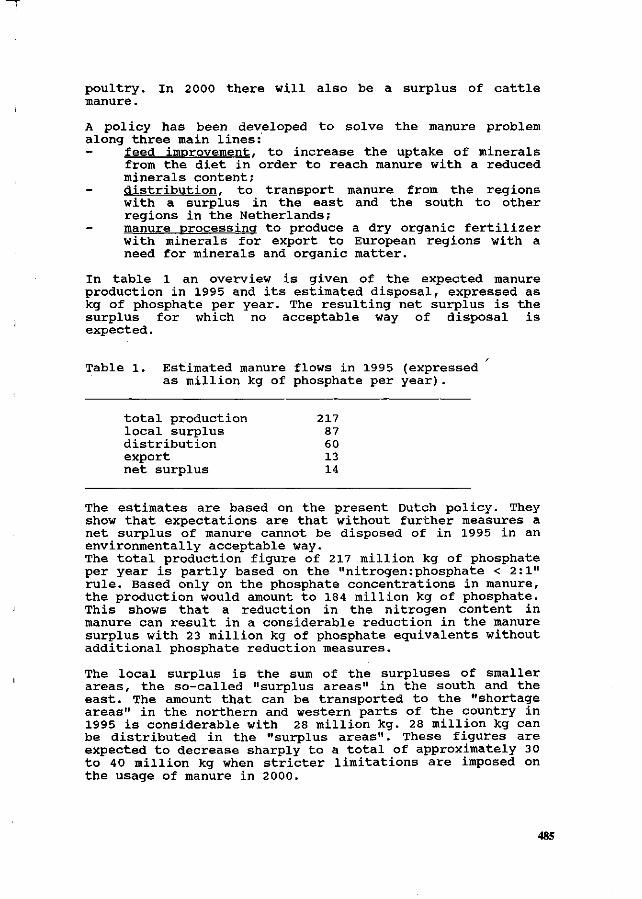
poultry. In 2000 there will also be a surplus of cattle manure.
A policy has been developed to solve the manure problem along three main lines:
feed improvement. to increase the uptake of minerals from the diet in order to reach manure with a reduced minerals content; distribution, to transport manure from the regions with a surplus in the east and the south to other regions in the Netherlands; manure processing to produce a dry organic fertilizer with minerals for export to European regions with a need for minerals and organic matter.
In table 1 an overview is given of the expected manure production in 1995 and its estimated disposal, expressed as kg of phosphate per year. The resulting net surplus is the surplus for which no acceptable way of disposal is expected.
Table 1. Estimated manure flows in 1995 (expressed as million kg of phosphate per year).
total production local surplus distribution export net surplus
217 87 60 13 14
The estimates are based on the present Dutch policy. They show that expectations are that without further measures a net surplus of manure cannot be disposed of in 1995 in an environmentally acceptable way. The total production figure of 217 million kg of phosphate per year is partly based on the "nitrogen:phosphate < 2:1" rule. Based only on the phosphate concentrations in manure, the production would amount to 184 million kg of phosphate. This shows that a reduction in the nitrogen content in manure can result in a considerable reduction in the manure surplus with 23 million kg of phosphate equivalents without additional phosphate reduction measures.
The local surplus is the sum of the surpluses of smaller areas, the so-called "surplus areas" in the south and the east. The amount that can be transported to the "shortage areas" in the northern and western parts of the country in 1995 is considerable with 28 million kg. 28 million kg can be distributed in the "surplus areas". These figures are expected to decrease sharply to a total of approximately 30 to 40 million kg when stricter limitations are imposed on the usage of manure in 2000.
485
The manure export is estimated for 1995; it consists of three different flows:
processed pig manure exported as a dry organic fertilizer with minerals; processed (dried) poultry litter, also exported as an organic fertilizer; relatively dry but not processed poultry litter.
The processing of manure results in a more stable material that is easier to handle and to store and in which pathogens and seeds are practically absent.
Nutritional possibilities
The manure production figure of table 1 is based on estimates with regard to the development of the number of animals (pigs, chicken, cows, etc.) and on estimates of the uptake of minerals from the feed with an improved diet.
On the basis of the present developments, it is expected that the following measures will be taken in 1995 to_ lower the excretion of phosphates and nitrogen:
introduction of phase feeding for pigs; - reduction of safety margins fo:? N and P in the diet; - limited aplication of the enzyme phytase.
The current policy gives only a small direct financial stimulus to feed improvement. (There is an indirect stimulus which consists of expected problems to dispose of the manure.) With a stronger (for example financial) stimulus for nutritional measures, it is expected that the following additional measures will be taken:
extension of the use of the enzyme phytase; extension of phase feeding systems; application of synthetic amino acids to optimise the composition of the dilt^ with respect to mineral excretion. , * ' •
These measures apply to pig and poultry manure. Especially the latter measure is important to decrease the excretion of minerals, also with.respect to the "nitrogen : phosphate < 2:1" rule. It makes a further '• decrease in phosphate concentrations possible.
The application of synthetic amino acids is the most costly measure to be taken. The costs are roughly estimated. Main elements are the cost of phytase and (for 75 %) of the amino acids. The estimated total of the yearly cost amounts to approximately 120 million Dutch guilders which equals 1 Dutch guilder per kg of animal feed: an increase in' the nutritional costs of 2 to 3 %. This leads to the conclusion that the proposed nutritional improvements are not only technically but also economically feasible. However, it must be noted that a policy as indicated with a strong stimulus for feed inprovement has to be developed. Therefore, realisation before 1995 will strongly depend on
486
the free cooperation by Dutch industry and farmers.
For 1995, the nutritional possibilities can be of great significance for the manure problem. As can be seen in table 1, a net surplus of 14 million kg of phosphate is expected for 1995. Calculations have shown that the manure production expressed as phosphate will be reduced with approximately 20 million kg should the indicated possibilities be fully implemented. The yearly costs are of the same order as the cost of processing an equivalent amount of pig manure. However, the problem can be solved (partly) at its source, which, in essence, is the best way. The organisational problems and investment costs related to manure processing are reduced to a minimum.
As stated before, a stimulating policy has to be developed. In essence the manure problem can then be solved for the 1995 situation. In 2000 the limitations set to the application of manure are so strict that nutritional measures are no longer sufficient. A strong increase in the export of minerals will become unavoidable if the same number of animals should be maintained. The export capacity should then rise to 25 million kg phosphate per year. However, without additional nutritional measures the export capacity needed for 2000 is calculated at 41 to 54 million kg.
Conclusions
Improvement in the pig and poultry diets can give a considerable contribute to solving the Dutch manure problem in the near future. However, measures have to be developed to stimulate implementation. In the long term, a strong increase in the export capacity of minerals will be unavoidable.
487
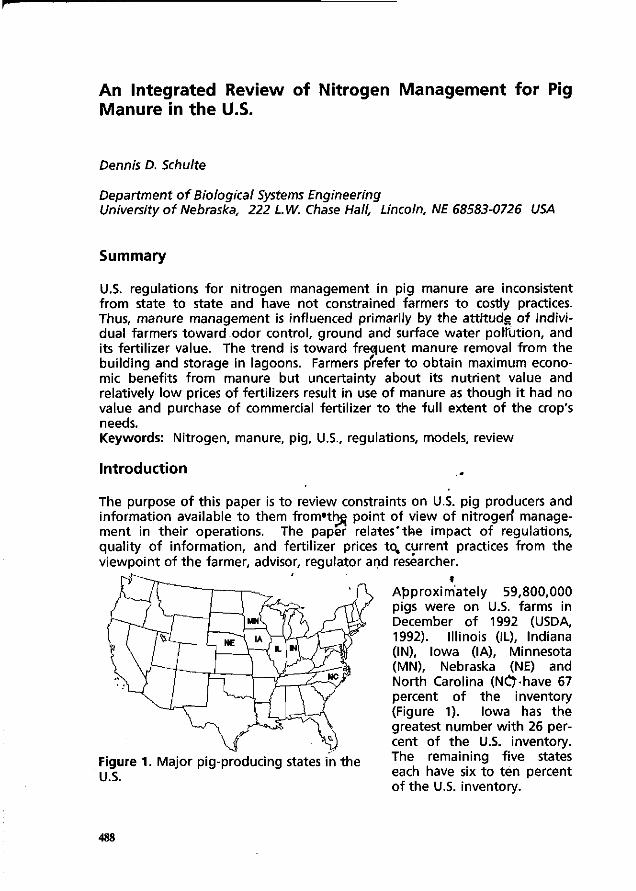
An Integrated Review of Nitrogen Management for Pig Manure in the U.S.
Dennis D. Schulte
Department of Biological Systems Engineering University of Nebraska, 222 LW. Chase Hall, Lincoln, NE 68583-0726 USA
Summary
U.S. regulations for nitrogen management in pig manure are inconsistent from state to state and have not constrained farmers to costly practices. Thus, manure management is influenced primarily by the attitude of individual farmers toward odor control, ground and surface water porllition, and its fertilizer value. The trend is toward frequent manure removal from the building and storage in lagoons. Farmers prefer to obtain maximum economic benefits from manure but uncertainty about its nutrient value and relatively low prices of fertilizers result in use of manure as though it had no value and purchase of commercial fertilizer to the full extent of the crop's needs. Keywords: Nitrogen, manure, pig, U.S., regulations, models, review
Introduction
The purpose of this paper is to review constraints on U.S. pig producers and information available to them from*th^ point of view of nitrogen' management in their operations. The paper relates*the impact of regulations, quality of information, and fertilizer prices to, current practices from the viewpoint of the farmer, advisor, regulator and researcher.
i Approximately 59,800,000 pigs were on U.S. farms in December of 1992 (USDA, 1992). Illinois (IL), Indiana (IN), Iowa (IA), Minnesota (MN), Nebraska (NE) and North Carolina (NÖ-have 67 percent of the inventory (Figure 1). Iowa has the greatest number with 26 percent of the U.S. inventory. The remaining five states each have six to ten percent of the U.S. inventory.
Figure 1. Major pig-producing states in the U.S.
488
Five of the states which dominate the U.S. swine industry are located in the midwest, an area with harsh winters and hot summers. Production in this region is characterized by confinement housing, especially for farrowing and nursery pigs and for finishing units as well. Some open lot pig production exists, but even this usually involves some form of shelter.
Thus, though most U.S. pig producers must manage manure subject to climatic extremes, government imposed constraints on nitrogen management in manure have not been severe and U.S. farmers have not had to reduce emissions to the environment as have their European counterparts. Each of the six dominant states have large amounts of arable land on which to use manure and the industry is widely dispersed within those states. However, concern for the environmental impact of manure management practices in the U.S. is increasing, and loosely defined constraints of the past may become more rigorous.
Regulatory Aspects
The variety of regulations affecting manure management in 1993 is greater in the U.S. than it was a decade ago. This is because the Environmental Protection Agency (EPA) gave administrative authority for the National Pollutant Discharge Elimination System permit process to the states. Thus Minnesota producers, for example, need a permit for all new, expanded or modified units having more than a 25 sow equivalent. But in Michigan permits are not required unless there is a discharge (Muehling, 1992). The majority of U.S. pig producers have not been required to obtain a permit. For those needing permits, nitrogen management has usually not been a major issue.
The EPA has also delegated responsibility for nonpoint source pollution control. States have worked with the Soil Conservation Service (SCS) of the U.S. Department of Agriculture to publish Best Management Practices (BMP's) for land application of manure, but most states do not have regulations on this subject. Indiana is an exception and limits rates to the amount of nitrogen that can be utilized by a crop such as corn. Most states simply offer guidelines usually based on the nitrogen content and uptake rate of various crops. Some even permit application on frozen soil.
The 1980 federal Clean Air Act and its replacement in 1992 have had little impact on the U.S. swine industry. While most states have criteria and procedures for assessing air quality, these have generally not been used to regulate ammonia, carbon dioxide or methane emissions. However, odors have been a particular concern to the industry. Lawsuits seeking to reduce odors and other nuisances are common. Even when experts testify that a producer has practiced state-of-the-art manure management, juries tend to value more highly plaintiffs' rights to a reasonable quality environment. George et al (1985) summarized typical lawsuits in which pig producers were forced out of business and in some cases were fined heavily. These concerns and court actions have prompted the National Pork Producers Council to fund additional research on odor control (Safley, 1993).
489
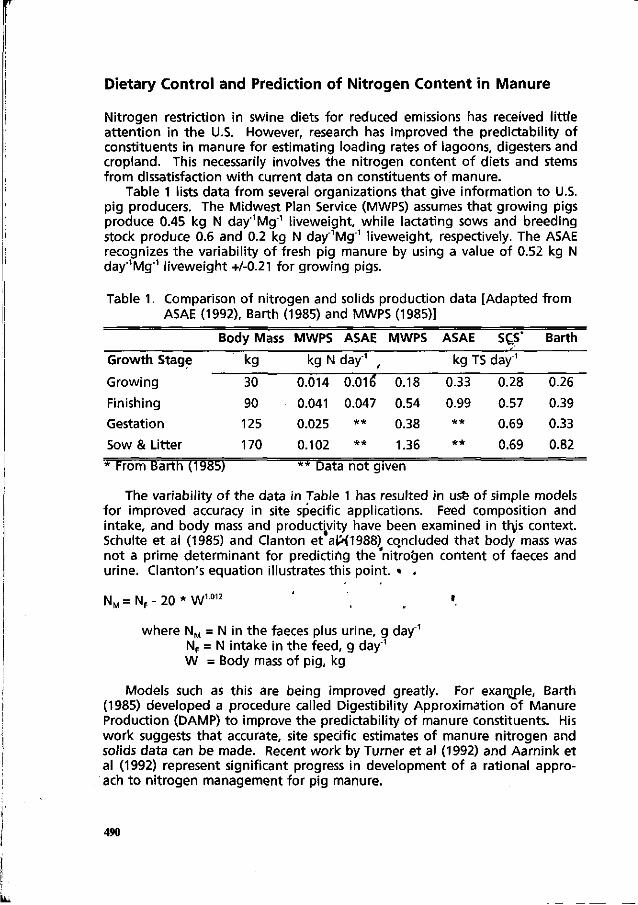
Dietary Control and Prediction of Nitrogen Content in Manure
Nitrogen restriction in swine diets for reduced emissions has received little attention in the U.S. However, research has improved the predictability of constituents in manure for estimating loading rates of lagoons, digesters and cropland. This necessarily involves the nitrogen content of diets and stems from dissatisfaction with current data on constituents of manure.
Table 1 lists data from several organizations that give information to U.S. pig producers. The Midwest Plan Service (MWPS) assumes that growing pigs produce 0.45 kg N day"1Mg1 liveweight, while lactating sows and breeding stock produce 0.6 and 0.2 kg N day"1Mg"1 liveweight, respectively. The ASAE recognizes the variability of fresh pig manure by using a value of 0.52 kg N day"1Mg"1 liveweight +/-0.21 for growing pigs.
Table 1. Comparison of nitrogen and solids production data [Adapted from ASAE (1992), Barth (1985) and MWPS (1985)]
Growth Stage
Growing
Finishing
Gestation
Sow & Litter
Body Mass
* From Barth (1985)
kg
30
90
125
170
MWPS ASAE
kg N day"1
0.014 0.016
0.041 0.047
0.025 **
0.102 **
MWPS
0.18
0.54
0.38
1.36
** Data not given
ASAE ses* kg TS day1
0.33
0.99 **
* *
0.28
0.57
0.69
0.69
Barth
0.26
0.39
0.33
0.82
The variability of the data in Table 1 has resulted in use of simple models for improved accuracy in site specific applications. Feed composition and intake, and body mass and productivity have been examined in thjs context. Schulte et al (1985) and Clanton et aP(1988) concluded that body mass was not a prime determinant for predicting the'nitrogen content of faeces and urine. Clanton's equation illustrates this point. « .
N M = N F - 2 0 * W1012 ' ».
where NM = N in the faeces plus urine, g day1
NF = N intake in the feed, g day1
W = Body mass of pig, kg
Models such as this are being improved greatly. For example, Barth (1985) developed a procedure called Digestibility Approximation of Manure Production (DAMP) to improve the predictability of manure constituents. His work suggests that accurate, site specific estimates of manure nitrogen and solids data can be made. Recent work by Turner et al (1992) and Aarnink et al (1992) represent significant progress in development of a rational approach to nitrogen management for pig manure.
490
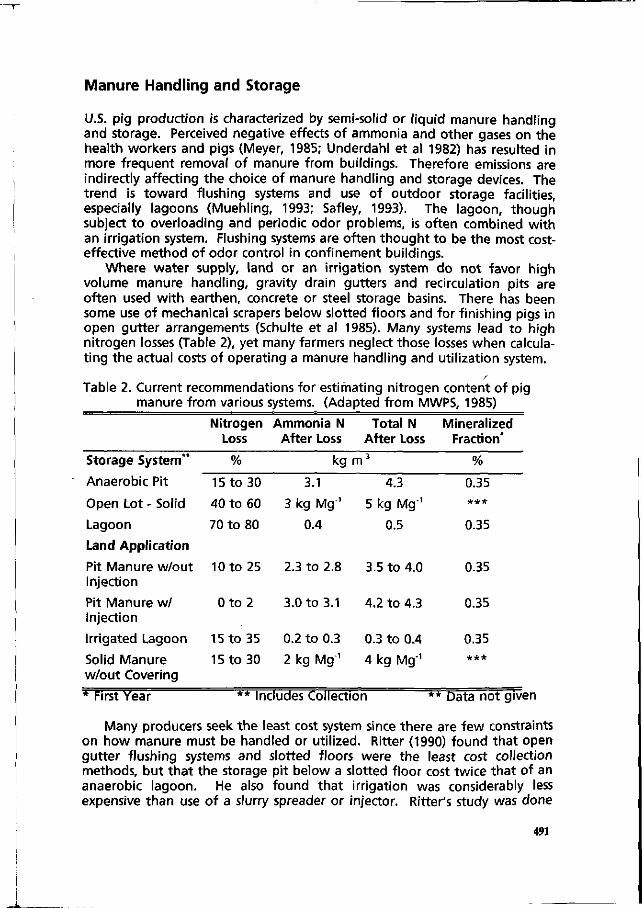
Manure Handling and Storage
U.S. pig production is characterized by semi-solid or liquid manure handling and storage. Perceived negative effects of ammonia and other gases on the health workers and pigs (Meyer, 1985; Underdahl et al 1982) has resulted in more frequent removal of manure from buildings. Therefore emissions are indirectly affecting the choice of manure handling and storage devices. The trend is toward flushing systems and use of outdoor storage facilities, especially lagoons (Muehling, 1993; Safley, 1993). The lagoon, though subject to overloading and periodic odor problems, is often combined with an irrigation system. Flushing systems are often thought to be the most cost-effective method of odor control in confinement buildings.
Where water supply, land or an irrigation system do not favor high volume manure handling, gravity drain gutters and recirculation pits are often used with earthen, concrete or steel storage basins. There has been some use of mechanical scrapers below slotted floors and for finishing pigs in open gutter arrangements (Schulte et al 1985). Many systems lead to high nitrogen losses (Table 2), yet many farmers neglect those losses when calculating the actual costs of operating a manure handling and utilization system.
Table 2. Current recommendations for estimating nitrogen content of pig manure from various systems. (Adapted from MWPS, 1985)
Storage System**
Anaerobic Pit
Open Lot - Solid
Lagoon
Land Application
Pit Manure w/out Injection
Pit Manure w/ Injection
Irrigated Lagoon
Solid Manure w/out Covering
* First Year
Nitrogen Loss
%
15 to 30
40 to 60
70 to 80
10 to 25
0 t o 2
15 to 35
15 to 30
Ammonia N After Loss
kg
3.1
3 kg Mg-'
0.4
2.3 to 2.8
3.0 to 3.1
0.2 to 0.3
2 kg Mg"1
Total N After Loss
m3
4.3
5 kg Mg"'
0.5
3.5 to 4.0
4.2 to 4.3
0.3 to 0.4
4 kg Mg'1
** Includes Collection '
Mineralized Fraction*
%
0.35 * * *
0.35
0.35
0.35
0.35 * **
"* Data not given
Many producers seek the least cost system since there are few constraints on how manure must be handled or utilized. Ritter (1990) found that open gutter flushing systems and slotted floors were the least cost collection methods, but that the storage pit below a slotted floor cost twice that of an anaerobic lagoon. He also found that irrigation was considerably less expensive than use of a slurry spreader or injector. Ritter's study was done
491
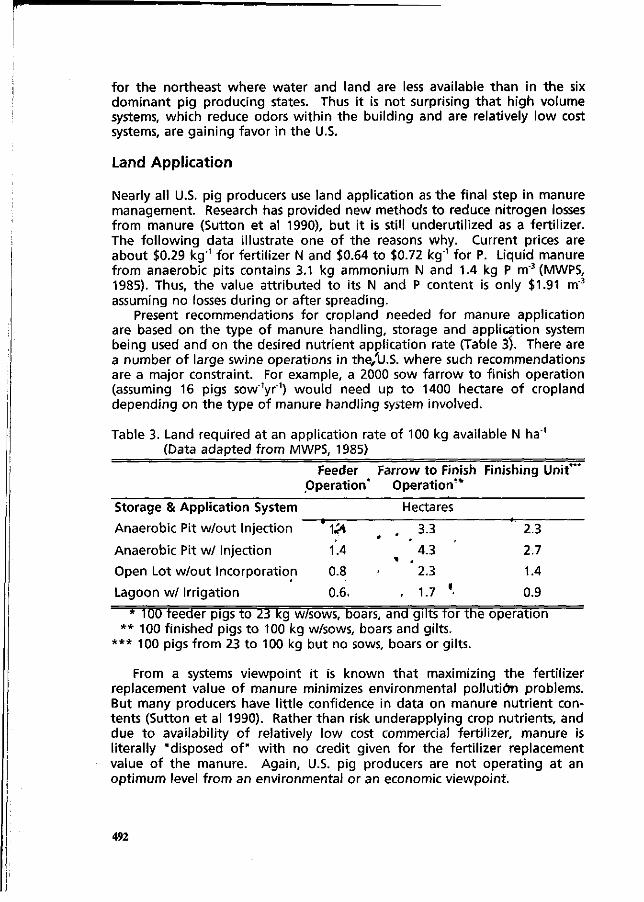
for the northeast where water and land are less available than in the six dominant pig producing states. Thus it is not surprising that high volume systems, which reduce odors within the building and are relatively low cost systems, are gaining favor in the U.S.
Land Application
Nearly all U.S. pig producers use land application as the final step in manure management. Research has provided new methods to reduce nitrogen losses from manure (Sutton et al 1990), but it is stil! underutilized as a fertilizer. The following data illustrate one of the reasons why. Current prices are about $0.29 kg'1 for fertilizer N and $0.64 to $0.72 kg"1 for P. Liquid manure from anaerobic pits contains 3.1 kg ammonium N and 1.4 kg P m3 (MWPS, 1985). Thus, the value attributed to its N and P content is only $1.91 m'3
assuming no losses during or after spreading. Present recommendations for cropland needed for manure application
are based on the type of manure handling, storage and application system being used and on the desired nutrient application rate (Table 3). There are a number of large swine operations in the/U.S. where such recommendations are a major constraint. For example, a 2000 sow farrow to finish operation (assuming 16 pigs sow"1yr"1) would need up to 1400 hectare of cropland depending on the type of manure handling system involved.
Table 3. Land required at an application rate of 100 kg available N ha"1
(Data adapted from MWPS, 1985)
Feeder Farrow to Finish Finishing Unit*" Operation* Operation**
Storage & Application System
Anaerobic Pit w/out Injection
Anaerobic Pit w/ Injection
Open Lot w/out Incorporation
Lagoon w/ Irrigation
* 100 feeder pigs to 23 kg w/sows, boars, and gilts tor the operation * * 100 finished pigs to 100 kg w/sows, boars and gilts.
* * * 100 pigs from 23 to 100 kg but no sows, boars or gilts.
From a systems viewpoint it is known that maximizing the fertilizer replacement value of manure minimizes environmental pollution problems. But many producers have little confidence in data on manure nutrient contents (Sutton et al 1990). Rather than risk underapplying crop nutrients, and due to availability of relatively low cost commercial fertilizer, manure is literally "disposed of" with no credit given for the fertilizer replacement value of the manure. Again, U.S. pig producers are not operating at an optimum level from an environmental or an economic viewpoint.
492
•U4 4
1.4
0.8
0.6.
Hectares
• , 3 " 3
4.3
2.3
. 1.7 '•
2.3
2.7
1.4
0.9
References
Aarnink, A.J.A., E.N.J, van Ouwerkerk and M.W.A. Verstegen. 1992. A mathematical model for estimating the amount and composition of slurry from fattening pigs. Livestock Production Science. 31:133-147.
Barth, CL 1985. Livestock waste characterization - new approach. Proceed ings 5th International Symposium on Agricultural Wastes. ASAE. St Joseph, Ml. pp 286-294.
Clanton, C.J., C.B. Gilbertson, D.D. Schulte and E.R. Peo, Jr. 1988. Model for predicting the effect of nitrogen intake, body mass, and dietary calcium and phosphorus on manure nitrogen content. Transactions of the ASAE. 31:208-214.
George, J.A., CD. Fulhage and S.W. Melvin. 1985. A summary of midwest livestock odor court actions. Proceedings 5th International Symposium on Agriculutural Wastes. ASAE. St Joseph, Ml. pp 431-438.
Meyer, D.J. 1985. Solutions to reduce ammonia levels in swine facilities. Proceedings 5th International Symposium on Agricultural Wastes. ASAE. St Joseph, Ml. pp 461-467.
M.W.P.S. 1985. Livestock waste facilities handbook. Midwest Plan Service. Publication No. 18. Ames, IA.
Muehling, A.J. 1992. Comparing livestock waste regulations between mid western states. Paper No. 92-4501. ASAE. St Joseph, Ml. 8 p.
Muehling, A.J. 1993. Personal communication. February. Ritter, W.F. 1990. Economics of swine waste management systems in the
northeast. Proceedings 6th International Symposium on Agriculutural and Food Processing Waste. ASAE. St Joseph, Ml. pp 525-533.
Schulte, D.D., D.A. Kottwitz and C.B. Gilbertson. 1985. Nitrogen content of scraped swine manure. Proceedings 5th International Symposium on Agricultural Wastes. ASAE. St Joseph, Ml. pp 321-328.
Safley, L.M. Jr. 1993. Personal Communication. February. Sutton, A.L., D.M. Huber and D.D. Jones. 1990. Strategies for maximizing the
nutrient utilization of animal wastes as a fertilizer resource. Proceedings 6th International Symposium on Agriculutural and Food Processing Waste. ASAE. St Joseph, Ml. pp 139-147.
Turner, L.W., T.C. Bridges and J.L. Usry. 1992. Modeling the effects of swine diet formulation on nitrogen waste production. Paper No. 92-7038. ASAE. St Joseph, Ml. 10 p.
Underdahl, N.R. M.B. Rhodes, T.E. Socha and D.D. Schulte. 1982. A study of air quality and respiratory infections in pigs raised in confinement. Livestock Production Science. 9:521-529.
U.S.D.A. 1992. Hogs and pigs December inventory report. Agricultural Statistics Board. U.S. Department of Agriculture. Washington, DC. 2p.
493