Embed Size (px)
Citation preview
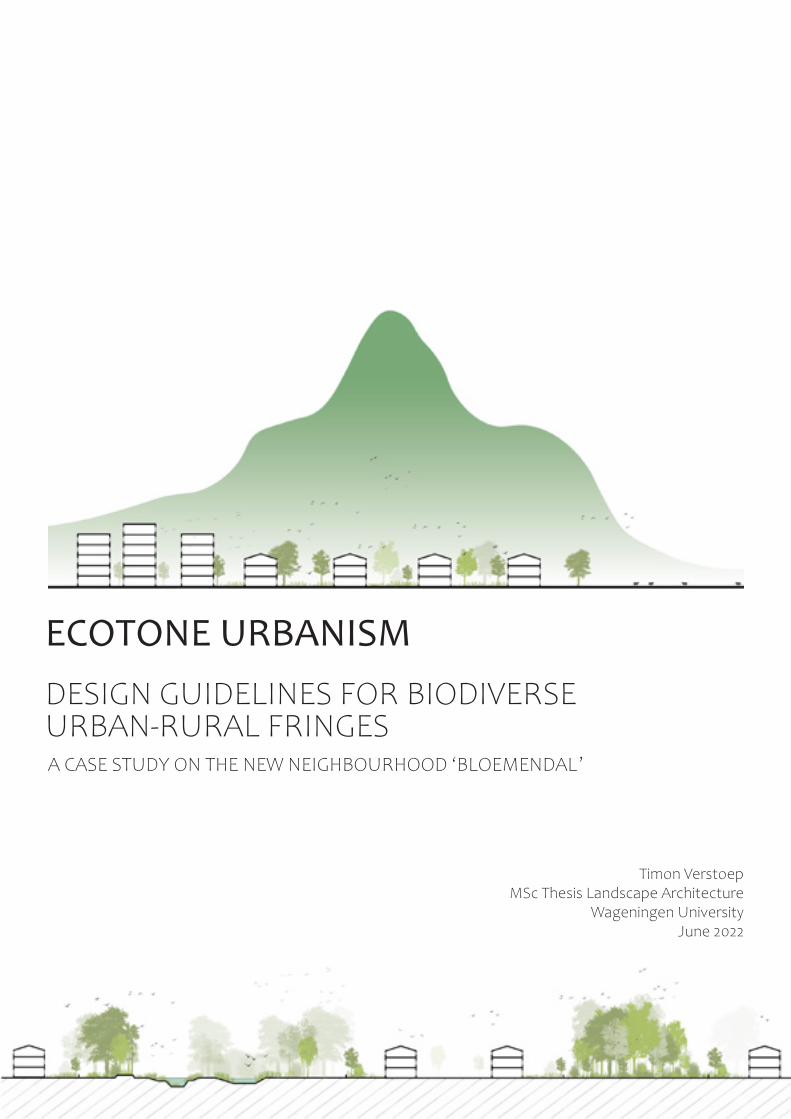
ECOTONE URBANISM
A CASE STUDY ON THE NEW NEIGHBOURHOOD ‘BLOEMENDAL’
Timon Verstoep MSc Thesis Landscape Architecture
Wageningen University June 2022
DESIGN GUIDELINES FOR BIODIVERSE URBAN-RURAL FRINGES
ii
ECOTONE URBANISM Design guidelines for biodiverse urban-rural fringesA case study on the new neighbourhood ‘Bloemendal’.
© Wageningen UniversityJune 2022Landscape Architecture Group
Contact information:Postbus 476700 AA WageningenThe NetherlandsPhone: +31 317 484 056Fax: +31 317 482 166E-mail: [email protected]
Author:© Timon Verstoep E-mail: [email protected] nr.: 961211884100
Supervisor:dr. ir. arch. Christian Nolf
Examiner/reviewer:dr. Homero Marconi Penteado
Examiner: prof. dr. S (Sanda) Lenzholzer
All rights reserved. Nothing from this publication is allowed to be used without permission of the author or the Wageningen UR Landscape Architecture Chairgroup. This publication is written as a final master thesis report for the chairgroup of landscape architecture at Wageningen University.
iii
I would like to say a big thank you to both Christan and Homero for their flexibility and cooperation in completing this thesis before I get married this summer, thank you very much for making this possible.
Above all, I would like to thank my fiancée, who finally makes it possible to get married ; ) but also because she has unconditionally supported me in this thesis process. I also want to thank my parents for their support and prayers, I feel blessed and helped.
Last but not least, I would like to thank everyone who has sympathized over the past six months, my housemates, friends, brothers and sister. I would like to make a special note to the study friends in the thesis room in Gaia, I could not have done it without their practical help and advices and the positive energy that was constantly present in the room over the months, despite covid 19. I will never forget the fun breaks, drinks and card-games.
PREFACE
With the completion of this thesis I am also completing a beautiful period of studying the landscape architecture, bachelor and master at Wageningen University. The thesis period has been a very busy time, that I can look back on with satisfaction.
My thesis topic is a subject that has always fascinated me, I’m glad I was able to learn more about it. My wish was to do something with the actual Dutch housing crisis. This turned out to be not an easy task in the first place, partly because there were no supervisors available who wanted to go along with this current problem. Therefore, I would like to thank my supervisor Christian very much for taking this opportunity with me. Ultimately, the focus has shifted more and more to biodiversity, something we both learned a lot new things about. Regarding the ecology side of this thesis, I would like to thank my unofficial co-supervisor Jana. Several times she has helped to gain direction, focus and grip on the ecology side of the thesis. In addition, I would like to thank her, together with Joop Spijker and Stefan van den Akker, for participating in the expert judgement, an essential part of this thesis.
iv
ABSTRACT
This thesis arises from the notion that there are opportunities for a synthesis between urban expansions and the enhancement of biodiversity in urban-rural fringes towards ‘urban-rural ecotones’. Effective design and configuration of green open space for biodiversity in cities and villages is increasingly important as urban areas and their human populations grow. All to conserve and enhance species populations, increase the nature perspective of urban dwellers, and conserve ecological services on which humans thrive. With the actual housing crisis in the Netherlands, that will continue for the years to come, it might be a great opportunity to implement biodiversity enhancement and create awareness among urban dwellers. Landscape ecology provides spatial concepts and principles for understanding and enhancing (urban) biodiversity both within cities, down to neighbourhood scale, as well as considering cities as a whole, and in their regional context.
Therefore, this thesis looks for good configuration of green open space in new (urban-rural) city expansions to enhance the level of biodiversity which is defined as: quality of a new neighbourhood (as urban-rural ecotone) to act as local habitat for plant and animal species, assessed through three selected target species. Analysis, a literature review, and exemplary reference studies review formed the basis for four different design alternatives, with each the same ingredients but another configuration of the green open space. It offers a set of five general- and, eleven spatial design guidelines on how to configure green open space in new neighbourhoods in the best favourable way to enhance the level of biodiversity. These guidelines are proposed after expert assessments on all design alternatives. To conclude, this thesis stresses that with the current state of the agricultural landscape in the Netherlands, a city expansion with neighbourhood development into an ‘urban-rural ecotone’ can, compared to the former state, truly enhance the level of biodiversity.
v
12223
5678
11121212
1718181920
222324
27
293031333537
41434648
576067
6970707782
87
1. Introduction 1.1 Urbanisation 1.2 Worldwide and Dutch loss of biodiversity 1.3 Why (urban) biodiversity 1.4 The ‘urban-rural fringe’ and the potential for biodiversity
2. Research framework 2.1 Problem statement & knowledge gap 2.2 Case study area 2.3 Thesis statement
3. Methodological framework 3.1 Literature review phase 3.2 Reference study phase 3.3 Design process: four design alternatives and spatial design guidelines 4. Literature review: landscape ecology principles 4.2 The field of landscape ecology 4.3 Urban ecology 4.4 Landscape ecology applied on different scale levels 4.5 Landscape ecology theories, concepts, and principles applied in urban environments 4.6 Landscape ecology spatial principles applied in landscape architecture 4.7 Appilcation of the landscape ecology spaital principles in this thesis 4.8 Four landscape ecology key-concepts
5. Reference study: nature inclusive or ecological neighbourhood developents in practice 5.2 Analytical framework 5.3 Footprints 5.4 Kerckebosch 5.5 ‘t Zand 5.6 EVA-Lanxmeer 5.7 Westwijk
6. Analysis of the case study area: Bloemendal in Barneveld 6.2 The context of Barneveld in the region 6.3 The context of Bloemendal in Barneveld 6.4 Case study area: site analysis
7. Design inventory 7.2 Target species 7.3 Design brief
8. Design alternatives & results 8.1 Design aim 8.2 Design alternatives 8.3 Expert judgement 8.4 Design guidelines
9. Conclusion & Discussion
TABLE OF CONTENTS
1
INTRODUCTION1.
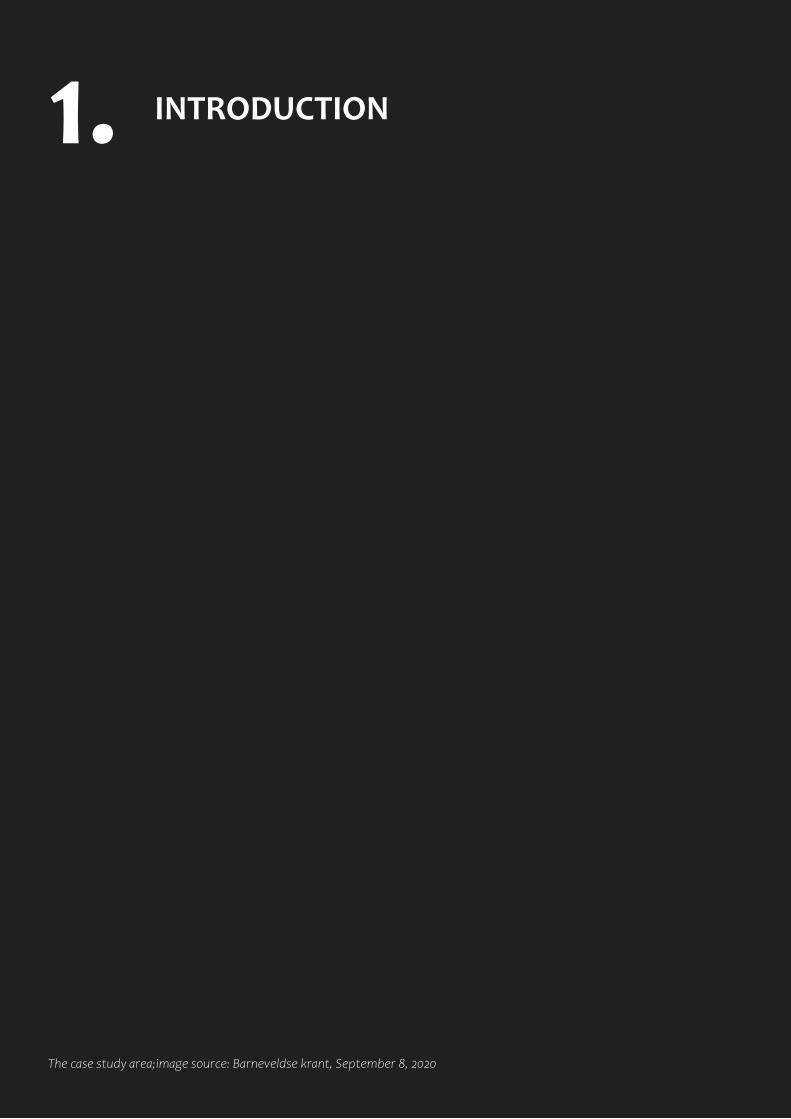
The case study area;image source: Barneveldse krant, September 8, 2020
2
1.1 URBANISATION
At a time when the world has dealt with one of the largest global health crises of a lifetime, covid-19, climate change, biodiversity loss and the rapid growth of the world population living in urbanised areas are huge challenges for the contemporary generations. In 2018, 55% of the world’s population lived in urban areas, a proportion that is expected to increase to 68% by 2050 (United Nations, 2019). The Netherlands follows the same worldwide urbanisation trend since the 1950s. The Dutch numbers are even higher, 74% of the Dutch residents live in urbanised areas (PBL, 2014). Besides, the proportion of people living in cities, spending most of their time in urban environments, is growing. As a result of both of these trends, urban nature and biodiversity becomes a component of the human living environment (Snep et al., 2006).
1.2 WORLDWIDE AND DUTCH LOSS OF BIODIVERSITY
The latest Living Planet Report provides very alarming evidence that nature on our planet suffers from vital natural systems failure. The Living Planet Index of 2020 shows a lasting decline of biodiversity. This is shown in the average decrease of 68% of the population sizes of mammals, birds, amphibians, reptiles and fish between 1970 and 2016 (WWF, 2020).
Therefore we may conclude that biodiversity loss is currently happening at an alarming speed on the global scale. Biodiversity means “the variability among living organisms from all sources, including, ‘inter alia,’ terrestrial, marine, and other aquatic ecosystems, and the ecological complexes of which they are part: This includes diversity within species, between species, and of ecosystems” (United Nations – Convention on Biological Diversity). Besides, this biodiversity loss is also happening in the Netherlands. The unique Dutch nature on land is in worse status than ever. Since 1990, wild animal populations in both open nature areas such as heathland and in agricultural landscapes have halved on average. Various bird, butterfly, and reptile species that used to be common are nowadays rare. Since 1990, populations of wild animals in both open nature
areas such as heathland and in the agricultural landscape have halved on average. The biodiversity loss in such nature and agricultural landscapes is mainly due to intensive agriculture with pesticides and fertiliser which causes deposition of nitrogen (Wereld Natuur Fonds, 2020). Other main reasons for local and global biodiversity loss are land-use changes (e.g. deforestation, intensive monoculture, urbanisation and fragmentation), immediate exploitation such as hunting or fishing, climate change, pollution and invasive alien species (Euro Parliament, 2021).
1.3 WHY (URBAN) BIODIVERSITY
The current biodiversity of nature allows us humans to thrive. This is because of living organisms which are connected with each other in dynamic ecosystems. These working ecosystems provide essential needs that humans take for granted. For example natural cycles such as photosynthesis,
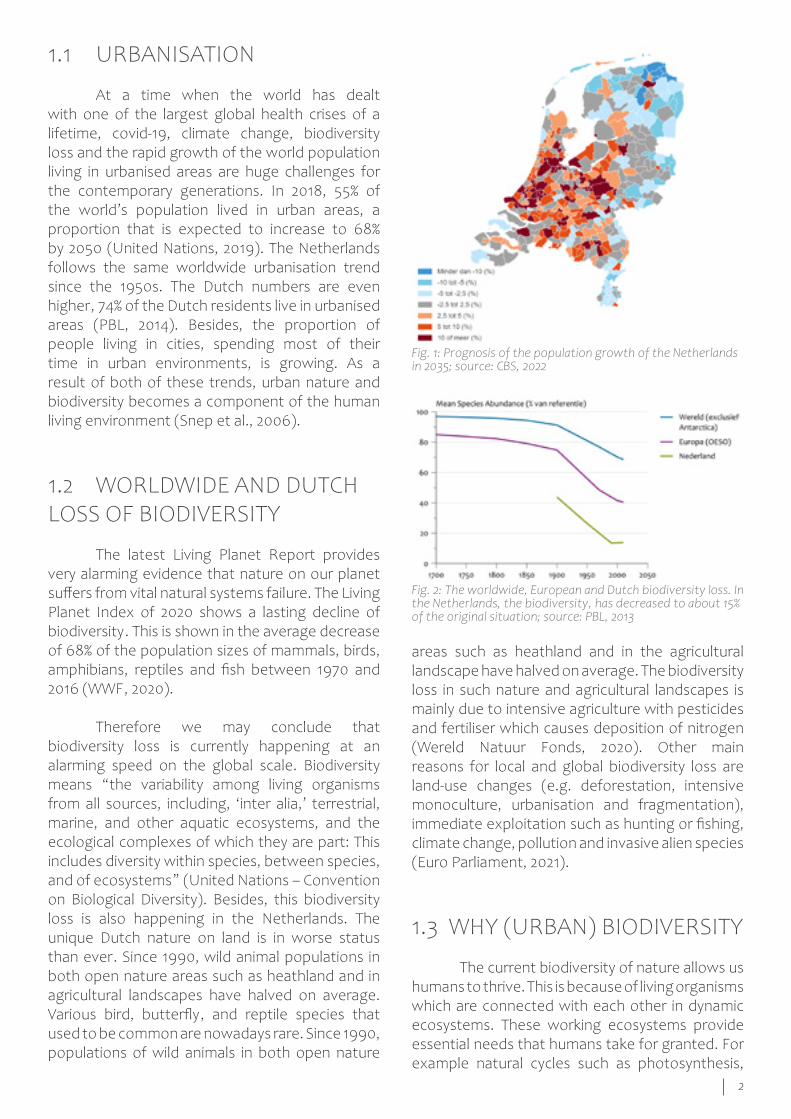
Fig. 1: Prognosis of the population growth of the Netherlands in 2035; source: CBS, 2022
Fig. 2: The worldwide, European and Dutch biodiversity loss. In the Netherlands, the biodiversity, has decreased to about 15% of the original situation; source: PBL, 2013
3
1.4 THE ‘URBAN-RURAL FRINGE’ AND THE POTENTIAL FOR BIODIVERSITY
From an ecological point of view the ‘urban-rural fringe’ or ‘urban-rural ecotone’ is an interesting area. A study from Kühn, Brandl & Klotz (2004) showed that it is especially this urban-rural area, the transition zone from city to rural surroundings, which is species rich. Due to two reasons the flora richness of cities can even be higher than the surrounding rural land: 1) the heterogeneity and potential biotope richness of urban areas, but mainly 2) the low flora richness of the intensively managed agricultural regions surrounding cities (Kühn, Brandl & Klotz, 2004). The focus on optimal yield and efficient agriculture includes the reshaping of the landscape, for example stripping off hedgerows. This results in the modern agricultural ‘deserts’ without any habitat for species. Some of them settle in the little space the urban-rural city edge offers (Snep & Clergeau, 2020).
At the same time, green habitats within cities are under pressure from urban development. Inner-city urban biodiversity can be enhanced by good source areas at city margins. Research shows that nature areas in the urban-rural fringe, if large enough, can have a positive influence on the presence of species in inner-city areas, therefore it can work as a source for inner-city biodiversity. The occurrence of species in cities strongly depend on coherent habitat networks (suggested that metapopulations are a common phenomenon in the urban context). These habitat networks should also be located in the urban-rural fringes on the outside city margins to connect with the inner-city urban biodiversity, for essential long-term survival of many urban species (Snep et al., 2006).
bacteria and other living organisms breaking down organic matter into nutrients, pollinators essential for reproduction and food supply, and the water cycle which is dependent on living organisms (Euro Parliament, 2021). Next to the impact on ecosystem functioning, the loss of biodiversity also impacts human well-being. The so-called ecosystem services, provided by the world’s natural ecosystems, are a broad range of essential services that are indispensable for the quality of human life. Direct or indirect negative consequences for human life are an effect of degradation of these ecosystem services (Chivian, 2002; Snep & Clergeau, 2020).
The main factor in biodiversity loss on the local, regional and global scales are land-use changes of both agriculture and urbanisation. Changing the vegetation and therefore the existence of animal and plant species (Müller & Werner, 2010). Resulting in more urban environments with urban biodiversity, which is “the variety and richness of living organisms (including genetic variation) and habitat diversity found in and on the edge of human settlements”. This biodiversity has a range from the urban-rural fringe to the urban inner-city core. At the level of landscape and habitats urban biodiversity includes 1) remnants of ‘pristine’ natural landscapes, 2) (traditional) agricultural landscapes and 3) urban-industrial landscapes (e.g. city centres, residential areas, industrial parks, railway areas, formal parks and gardens, brownfields (Müller & Werner, 2010).
Within the overall urban matrix nature is mainly limited to ‘urban green spaces’ (parks, public gardens, road verges) due to lack of derelict land and other natural structures. These official ‘urban green spaces’ often have to comply with strict rules of visual attractiveness, low cost maintenance and traditional views of intensive urban green management (Snep et al., 2006). “A low diversity in biotopes and limited naturalness means lower species diversity and lower densities of species. It also means, compared to peri-urban(defined as ‘(rural) area adjacent to the town’) and rural areas, less opportunities for humans to appreciate the (green) environment or to have personal contact with urban plant- and wildlife” (Snep et al., 2006). After all, there are opportunities that urban biodiversity, that means the biodiversity within urbanised areas, will play an important role by the preservation of global biodiversity and combating biodiversity loss (Müller & Werner, 2010).
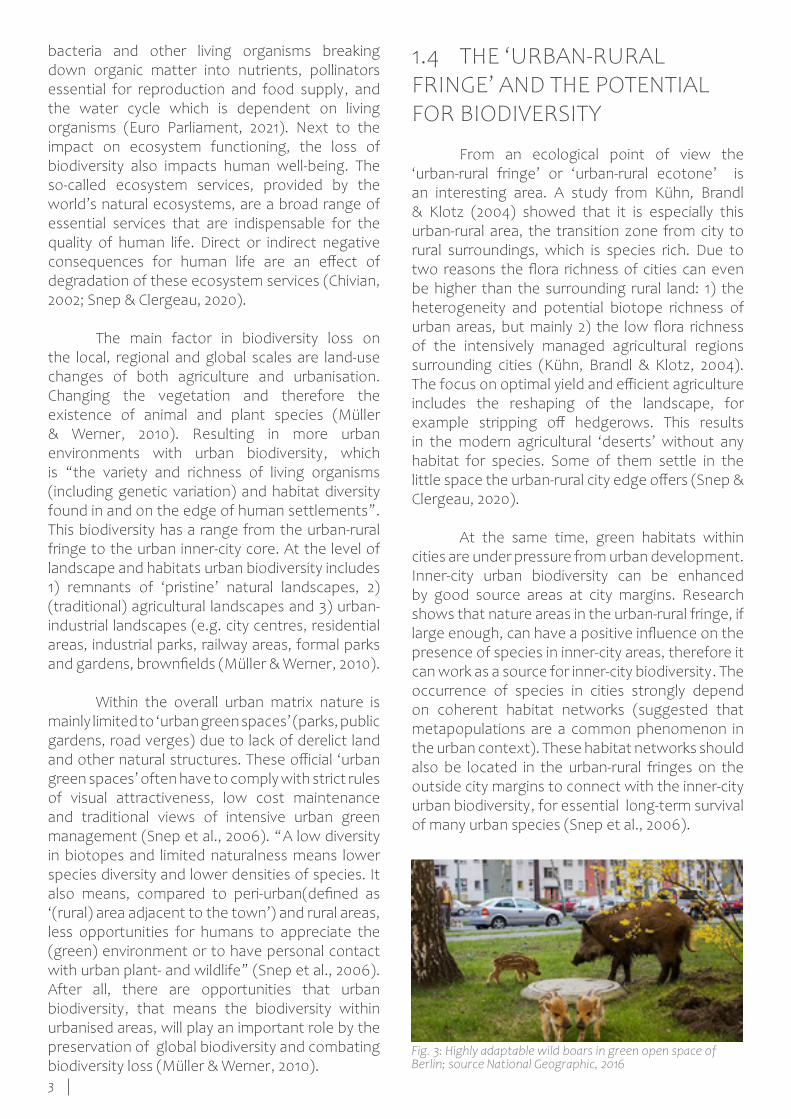
Fig. 3: Highly adaptable wild boars in green open space of Berlin; source National Geographic, 2016

4
5
RESEARCH FRAMEWORK2.
The case study area;image source: Barneveldse krant, September 8, 2020
6
Within the field of landscape architecture, there exists research on ‘ urban ecological design’, however this is merely focussed on broad themes (e.g. reduction of pollution and resource use) that cover a lot more issues than biodiversity (Naess, 2001) ; or ‘green building’ with the intention to minimize the impact of built interventions on local and global environments through the restoration and protection of ecological processes (Calkins, 2005). Within both fields there is hardly any focus or notion of urban biodiversity. Furthermore, this lack of implementation of biodiversity on the level of (urban) design is why for example Makhzoumi (2000) suggest interdisciplinary collaboration with ecologists. Even though landscape architects and urban planners are increasingly implementing biodiversity on the (re)design of urban areas, there is limited research on these design approaches and it is more based on practical experience.
To summarize, the Dutch housing crisis and city expansions in agricultural area at the urban-rural fringe (Nabielek et al., 2013; EIB, 2021), the worldwide and Dutch national and local biodiversity loss (WWF, 2020; Wereld Natuur Fonds, 2020) and a decreased understanding of plant and animal life from an urban dweller perspective which causes less support for nature and wildlife (Snep & Clergeau, 2020) are challenges in the Dutch urban-rural fringe area.
To conclude, the problem is a lack of biodiversity implementation in urban design, combined with the problem of low (urban)nature quality and biodiversity loss, with at the same time scarcity of land and a high demand for new housing development in the Dutch urban-rural fringe. The needed urban expansions in the Netherlands is a great context to explore the potential of urban-rural ecotones.
2.1.1 HYPOTHESIS
New urban developments in urban-rural fringes in the Netherlands can be combined with natural green open space development and enhance the national, regional, and local level of biodiversity.
2.1 PROBLEM STATEMENT & KNOWLEDGE GAP
At the moment the Netherlands is dealing with a battle for space. Use of space has conflicting interests and is confronted with challenges such as climate change (heat and water nuisance), the energy transition, decarbonisation of industry and a better balance between agriculture, nature and major housing shortages. Land in the Netherlands becomes extremely scarce and the question is if there is enough space to accomodate all these functions in the landscape, it demands integrated land-use (PBL, 2021).
The Dutch housing crisis concerns a current shortage of approximately 300,000 houses and an estimated one million new homes will be needed by 2030 to meet the demand for enough homes (Het Parool, 2021). Expected is that a lot of these new houses will be built in agricultural areas surrounding the current cities. A large number of the new houses will be developed within the borders of the urban area. However, an estimated 300,000 houses are needed in agricultural fields at the city edges to meet the high demand (EIB, 2021).
Urban expansions at the urban-rural fringe have formed complex hybrid landscapes consisting of residential areas, commercial zones, agricultural land, recreational and nature areas. Most of the urban developments in the Netherlands take place close to city edges due to urban compaction policies (Nabielek et al., 2013). In this urban-rural fringe area more biodiversity and natural experience is needed (Snep & Clergeau, 2020). Bento (2020) describes problems in seven neighbourhoods in the urban-rural fringe, spread over the Netherlands, and suggests that although the presence of open green space the biodiversity levels of these green spaces in the neighbourhoods is very low.
There are only a few studies that focus on ‘Urban biodiversity and design’ (Connery, 2009; Gerrard et al., 2018; Ignatieva & Stewart & Meurk, 2008; Müller & Werner, 2010). In most of the studies there is a lack of biodiversity implementation for actual design. Connery (2009) says that “biodiversity in urban design is for municipalities often a bit illusive”.
7
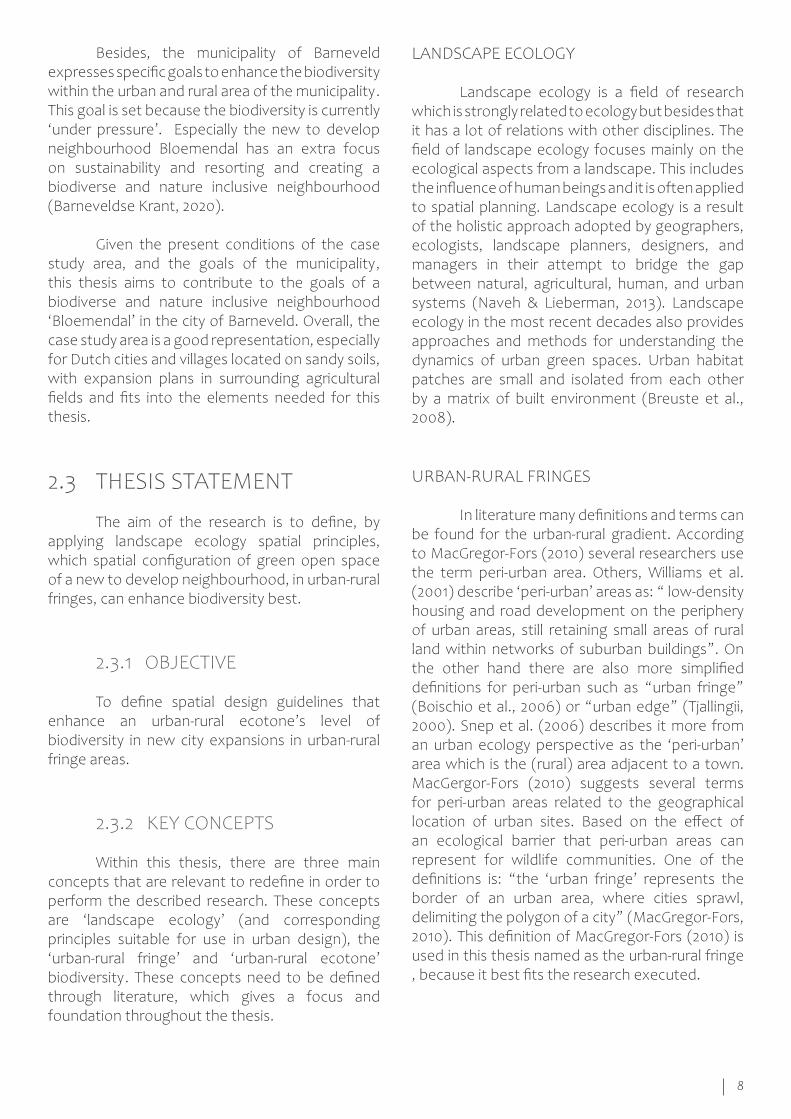
Fig. 5: The case study area positioned in the main Dutch soil types, source: Author, adapted from: Kooijmans et al., 2021.
soils in the context of the Netherlands because the largest nature reserves in the Netherlands are located on sandy soils, this makes the potential connection with nature and urban expansions possible (De Volkskrant, 2020).
2.2 CASE STUDY AREA
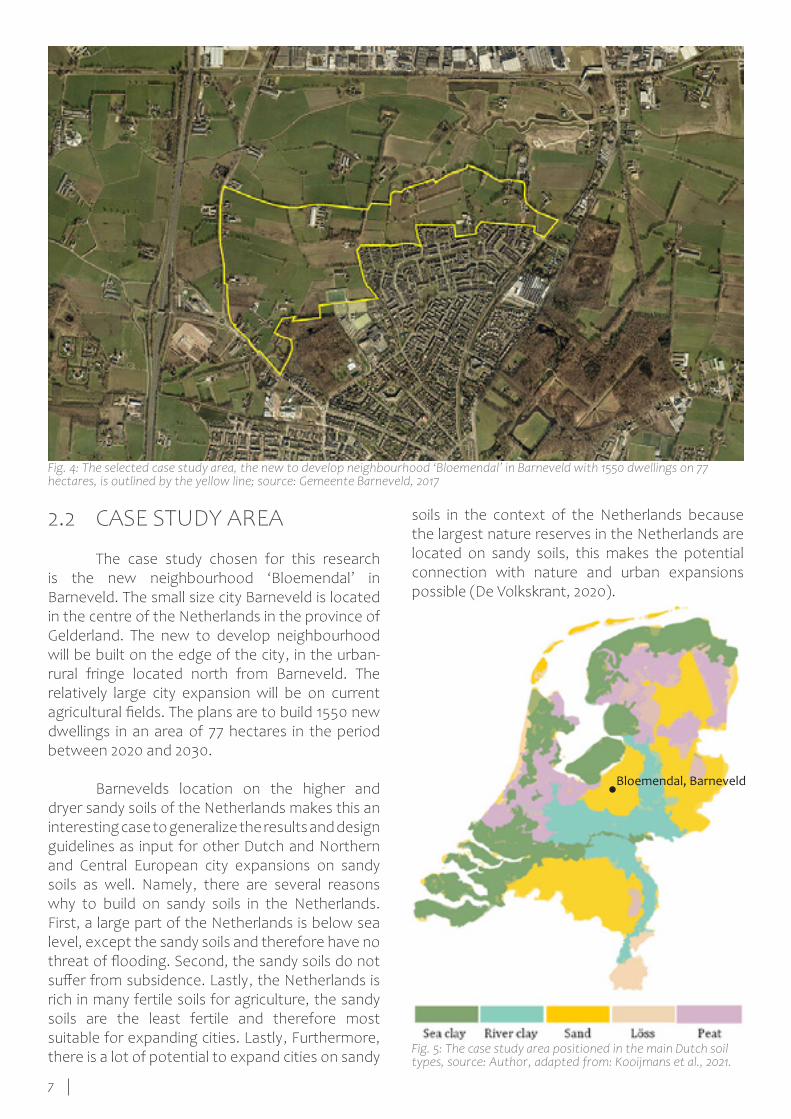
The case study chosen for this research is the new neighbourhood ‘Bloemendal’ in Barneveld. The small size city Barneveld is located in the centre of the Netherlands in the province of Gelderland. The new to develop neighbourhood will be built on the edge of the city, in the urban-rural fringe located north from Barneveld. The relatively large city expansion will be on current agricultural fields. The plans are to build 1550 new dwellings in an area of 77 hectares in the period between 2020 and 2030.
Barnevelds location on the higher and dryer sandy soils of the Netherlands makes this an interesting case to generalize the results and design guidelines as input for other Dutch and Northern and Central European city expansions on sandy soils as well. Namely, there are several reasons why to build on sandy soils in the Netherlands. First, a large part of the Netherlands is below sea level, except the sandy soils and therefore have no threat of flooding. Second, the sandy soils do not suffer from subsidence. Lastly, the Netherlands is rich in many fertile soils for agriculture, the sandy soils are the least fertile and therefore most suitable for expanding cities. Lastly, Furthermore, there is a lot of potential to expand cities on sandy
Fig. 4: The selected case study area, the new to develop neighbourhood ‘Bloemendal’ in Barneveld with 1550 dwellings on 77 hectares, is outlined by the yellow line; source: Gemeente Barneveld, 2017
Bloemendal, Barneveld
8
LANDSCAPE ECOLOGY
Landscape ecology is a field of research which is strongly related to ecology but besides that it has a lot of relations with other disciplines. The field of landscape ecology focuses mainly on the ecological aspects from a landscape. This includes the influence of human beings and it is often applied to spatial planning. Landscape ecology is a result of the holistic approach adopted by geographers, ecologists, landscape planners, designers, and managers in their attempt to bridge the gap between natural, agricultural, human, and urban systems (Naveh & Lieberman, 2013). Landscape ecology in the most recent decades also provides approaches and methods for understanding the dynamics of urban green spaces. Urban habitat patches are small and isolated from each other by a matrix of built environment (Breuste et al., 2008).
URBAN-RURAL FRINGES
In literature many definitions and terms can be found for the urban-rural gradient. According to MacGregor-Fors (2010) several researchers use the term peri-urban area. Others, Williams et al. (2001) describe ‘peri-urban’ areas as: “ low-density housing and road development on the periphery of urban areas, still retaining small areas of rural land within networks of suburban buildings”. On the other hand there are also more simplified definitions for peri-urban such as “urban fringe” (Boischio et al., 2006) or “urban edge” (Tjallingii, 2000). Snep et al. (2006) describes it more from an urban ecology perspective as the ‘peri-urban’ area which is the (rural) area adjacent to a town. MacGergor-Fors (2010) suggests several terms for peri-urban areas related to the geographical location of urban sites. Based on the effect of an ecological barrier that peri-urban areas can represent for wildlife communities. One of the definitions is: “the ‘urban fringe’ represents the border of an urban area, where cities sprawl, delimiting the polygon of a city” (MacGregor-Fors, 2010). This definition of MacGregor-Fors (2010) is used in this thesis named as the urban-rural fringe , because it best fits the research executed.
Besides, the municipality of Barneveld expresses specific goals to enhance the biodiversity within the urban and rural area of the municipality. This goal is set because the biodiversity is currently ‘under pressure’. Especially the new to develop neighbourhood Bloemendal has an extra focus on sustainability and resorting and creating a biodiverse and nature inclusive neighbourhood (Barneveldse Krant, 2020).
Given the present conditions of the case study area, and the goals of the municipality, this thesis aims to contribute to the goals of a biodiverse and nature inclusive neighbourhood ‘Bloemendal’ in the city of Barneveld. Overall, the case study area is a good representation, especially for Dutch cities and villages located on sandy soils, with expansion plans in surrounding agricultural fields and fits into the elements needed for this thesis.
2.3 THESIS STATEMENT
The aim of the research is to define, by applying landscape ecology spatial principles, which spatial configuration of green open space of a new to develop neighbourhood, in urban-rural fringes, can enhance biodiversity best.
2.3.1 OBJECTIVE
To define spatial design guidelines that enhance an urban-rural ecotone’s level of biodiversity in new city expansions in urban-rural fringe areas.
2.3.2 KEY CONCEPTS
Within this thesis, there are three main concepts that are relevant to redefine in order to perform the described research. These concepts are ‘landscape ecology’ (and corresponding principles suitable for use in urban design), the ‘urban-rural fringe’ and ‘urban-rural ecotone’ biodiversity. These concepts need to be defined through literature, which gives a focus and foundation throughout the thesis.
9
2.3.3 RESEARCH QUESTIONS
The main research question (MRQ) for this thesis is:
What spatial design guidelines, based on landscape ecology, could be applied for city expansions to enhance an urban-rural ecotone’s level of biodiversity?
To answer the main research question (MRQ) two sub-research questions (SRQ) and one design question (DQ) have been formulated:
SRQ 1: Which existing landscape ecology principles can be used to enhance biodiversity in urban-rural fringe areas?
SRQ 2: In what way can reference projects of existing urban design projects with a focus on enhancing biodiversity in the context of the urban-rural fringe, inform on the implementation of landscape ecology spatial principles in new neighbourhood design?
DQ: How can the expansion of the new neighbourhood ‘Bloemendal’ in the urban-rural fringe of Barneveld, be spatially configured in a way that enhances the urban-rural ecotone’s level of biodiversity best?
‘URBAN-RURAL ECOTONE’ BIODIVERSITY
“An ecotone is a transition area between two adjacent and different patches of landscape, such as forest and grassland” (Legendre & Legendre, 2012). This transition zone between two different ecosystems contains species and natural characteristics from both ecosystems and also some unique to the ecotone. Another way to consider ‘ecotones’ is the view of zones of overlap, richness and meetings, rather than strict boundaries. The transformation of strict borders into dynamic zones of overlap or gradient is also used in urban areas and in related fields as: urban- planning and architecture and landscape urbanism (Fors et al., 2018). From this approach “the landscape and its geography are the medium for planning across the nature-urban divide” and the transition area between urban and rural is an ecotone as well (Corner & Tiberghien, 2009). Thus, the ‘urban-rural ecotone’, in literature also described as ‘urban-wildland ecotone’ (peri-urban area’) is “the geographical area that separates ‘intra-urban’ areas from agricultural, wildland, rural, and even suburban environments surrounding an urban area” (MacGregor-Fors, 2010). The ‘urban-rural ecotone’ can have a very positive role as source for the inner-city ‘urban biodiversity’ and other surrounding areas, because of its strategic location on the border (Snep et al., 2006). Within this thesis biodiversity is assessed based on: ‘an urban-rural ecotone’s level of biodiversity’, defined as ‘quality of the new neighbourhood (as urban-rural ecotone) to act as local habitat for plant and animal species, assessed through three selected target species, based on Snep, Van Ierland & Opdam (2009).

10
11
METHODOLOGICAL FRAMEWORK3.
The case study area;image source: Gemeente Barneveld, 2020
12
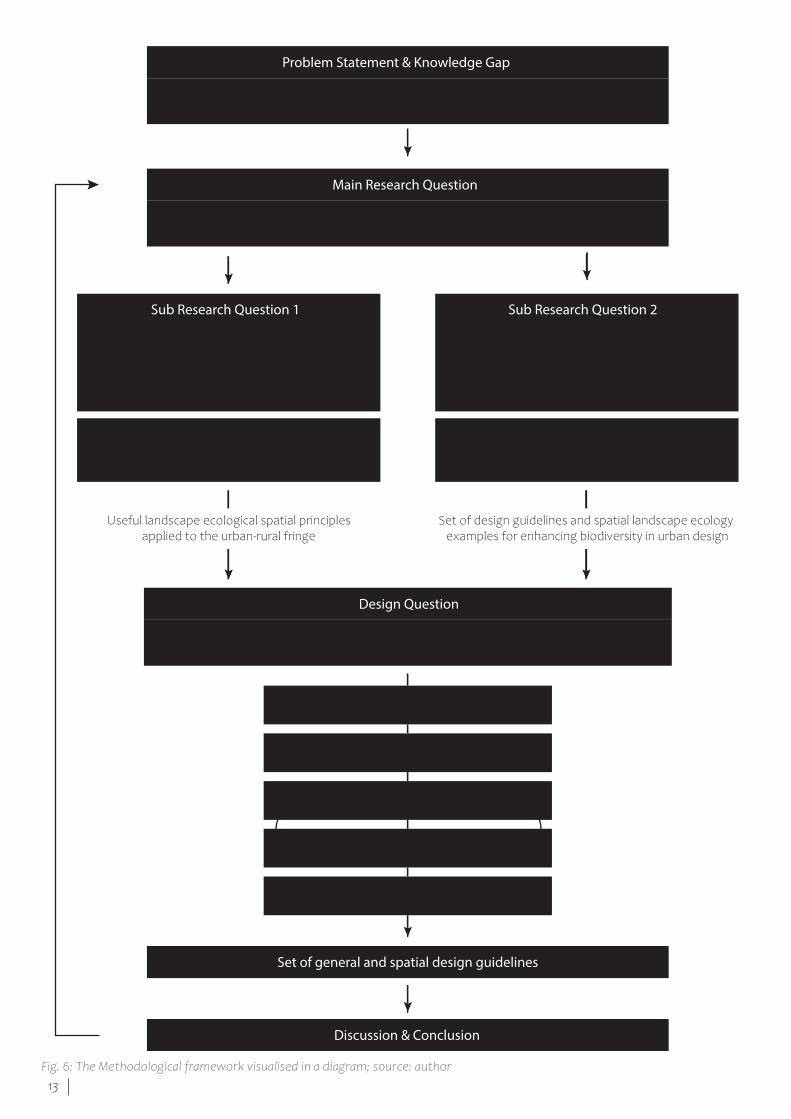
a development with reasonably comparable surfaces and number of dwellings as the case study area of ‘Bloemendal’, and the presence of all four key-concepts found in the literature review in the different cases.
The cases are reviewed to derive examples on configuration, searching for what is needed in an urban design which enhances biodiversity in urban-rural fringes, reflecting what form and lay-out makes that the landscape ecology spatial principles are succesfully implemented. This phase is answered through research on design, which means that the outcomes of the research are based on a review of existing designs (van den Brink et al., 2017).
The first three reference cases meet all the selection criteria, the fourth selected reference project not. That is why the fourth is included as ‘extra’, because it does not fall within the criteria in terms of surface and number of dwellings. In addition, this case has not yet been developed, but it has been selected anyway because it can serve as a good example, especially because it is a contest case with specific focus on the subject of enhancing biodiversity in the urban-rural fringe.
The following four reference studies are selected:
• Kerckebosch, Zeist• ‘t Zand, Son en Breugel • EVA-Lanxmeer, Culemborg
EXTRA:
• Westwijk, Vlaardingen
3.3 DESIGN PROCESS: FOUR DESIGN ALTERNATIVES AND SPATIAL DESIGN GUIDELINES
The DQ is the output of the two sub-research questions which are used as input for this last phase of the thesis, the design phase. This last phase is conducted through ‘research through design’ (RTD) which means that designing is actively used to generate new knowledge (van den Brink et al., 2017). Through the two sub-research questions spatial principles are generated. The landscape ecology principles are implemented in the design phase, given form and configured
The method of this research consists of several phases. A literature review study phase (SRQ 1) and after that a reference study phase (SRQ 2) that results in an overview of ecological principles, and guidelines, handles and examples on the implementation of landscape ecology principles. Through answering each sub-research question the collected knowledge has been implemented in the last phase (designing). The suitable principles and useful guidelines are used for four different design alternatives of the new neighbourhood ‘Bloemendal’ in Barneveld. After that, spatial design guidelines are derived and the main research question answered.
3.1 LITERATURE REVIEW PHASE
SRQ 1 has been answered by the research for design method, which means that the outcomes of the literature research have informed the design process (van den Brink et al., 2017). Based on a literature review an overview of useful spatial principles is set up that have been used as a foundation for the design alternatives. The outcomes of the literature review are landscape ecology principles suitable for urban design that enhance biodiversity in the context of urban-rural fringes. The resulting knowledge is not place specific. The literature review generates the following results. First, as an answer on the first research question some spatial principles which are not place specific. Secondly, the outcome of the literature review, especially the way how the spatial principles are structured by key-concepts, is used as solid basis for the systematic review of the reference study phase and as starting point for the four different design alternatives.
3.2 REFERENCE STUDY PHASE
SRQ 2 is part of the reference study phase. In this phase several reference projects (exemplary case-studies) on urban design with a high focus and implementation of biodiversity are reflected and reviewed in a systematic way. Only award winning (with focus on biodiversity) projects have been selected to be sure that the projects are reviewed by third parties, other than just the designers. Other criteria on which the cases were selected are the location in the urban-rural fringe,
13
Main Research Question
Sub Research Question 1 Sub Research Question 2
What spatial design guidelines, based on landscape ecology, could be applied for city expansions to enhance an urban-rural ecotone’s level of biodiversity?
Design Question
Set of general and spatial design guidelines
Discussion & Conclusion
How can the expansion of the new neighbourhood ‘Bloemendal’ in the urban-rural fringe of Barneveld, be spatially configured in a way that enhances the urban-rural ecotone’s biodiversity?
Problem Statement & Knowledge Gap
Worldwide and local biodiversity loss, combined with the high demand of new houses in the Netherlands, asks for urban expansions which enhance biodiversity
Which existing landscape ecology spatial principles can be used to enhance
biodiversity in urban-rural fringe areas?
In what way can reference projects of existing urban design projects with a focus on enhancing biodiversity in the context of the urban-rural fringe, inform on the
implementation of landscape ecological spatial principles in new neighbourhood design?
Research for Design
Literature review
Useful landscape ecological spatial principlesapplied to the urban-rural fringe
Set of design guidelines and spatial landscape ecology examples for enhancing biodiversity in urban design
Research on Design
Reference study through
Research through Design
Combine imput from SRQ 1 & 2
Regional-, city- and site-scale analysis
Designing four alternatives
Expert judgement
Literature & maps study
Fig. 6: The Methodological framework visualised in a diagram; source: author
14
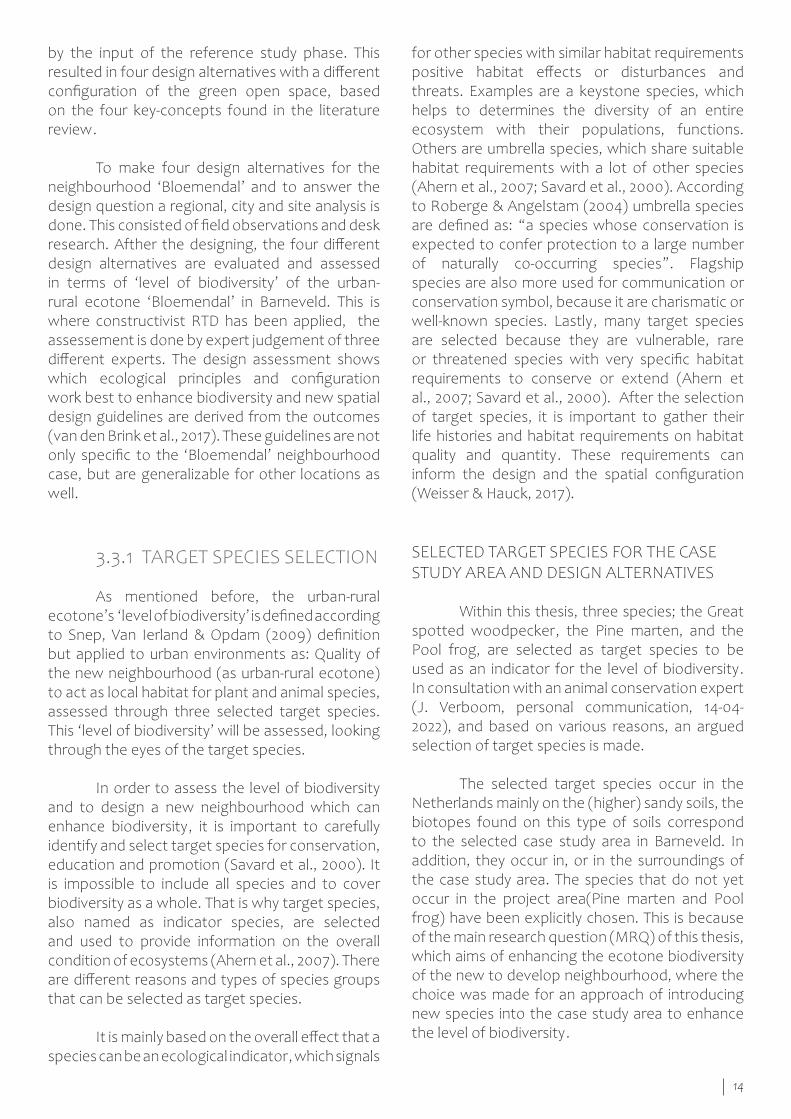
for other species with similar habitat requirements positive habitat effects or disturbances and threats. Examples are a keystone species, which helps to determines the diversity of an entire ecosystem with their populations, functions. Others are umbrella species, which share suitable habitat requirements with a lot of other species (Ahern et al., 2007; Savard et al., 2000). According to Roberge & Angelstam (2004) umbrella species are defined as: “a species whose conservation is expected to confer protection to a large number of naturally co-occurring species”. Flagship species are also more used for communication or conservation symbol, because it are charismatic or well-known species. Lastly, many target species are selected because they are vulnerable, rare or threatened species with very specific habitat requirements to conserve or extend (Ahern et al., 2007; Savard et al., 2000). After the selection of target species, it is important to gather their life histories and habitat requirements on habitat quality and quantity. These requirements can inform the design and the spatial configuration (Weisser & Hauck, 2017).
SELECTED TARGET SPECIES FOR THE CASE STUDY AREA AND DESIGN ALTERNATIVES
Within this thesis, three species; the Great spotted woodpecker, the Pine marten, and the Pool frog, are selected as target species to be used as an indicator for the level of biodiversity. In consultation with an animal conservation expert (J. Verboom, personal communication, 14-04-2022), and based on various reasons, an argued selection of target species is made.
The selected target species occur in the Netherlands mainly on the (higher) sandy soils, the biotopes found on this type of soils correspond to the selected case study area in Barneveld. In addition, they occur in, or in the surroundings of the case study area. The species that do not yet occur in the project area(Pine marten and Pool frog) have been explicitly chosen. This is because of the main research question (MRQ) of this thesis, which aims of enhancing the ecotone biodiversity of the new to develop neighbourhood, where the choice was made for an approach of introducing new species into the case study area to enhance the level of biodiversity.
by the input of the reference study phase. This resulted in four design alternatives with a different configuration of the green open space, based on the four key-concepts found in the literature review.
To make four design alternatives for the neighbourhood ‘Bloemendal’ and to answer the design question a regional, city and site analysis is done. This consisted of field observations and desk research. Afther the designing, the four different design alternatives are evaluated and assessed in terms of ‘level of biodiversity’ of the urban-rural ecotone ‘Bloemendal’ in Barneveld. This is where constructivist RTD has been applied, the assessement is done by expert judgement of three different experts. The design assessment shows which ecological principles and configuration work best to enhance biodiversity and new spatial design guidelines are derived from the outcomes (van den Brink et al., 2017). These guidelines are not only specific to the ‘Bloemendal’ neighbourhood case, but are generalizable for other locations as well.
3.3.1 TARGET SPECIES SELECTION
As mentioned before, the urban-rural ecotone’s ‘level of biodiversity’ is defined according to Snep, Van Ierland & Opdam (2009) definition but applied to urban environments as: Quality of the new neighbourhood (as urban-rural ecotone) to act as local habitat for plant and animal species, assessed through three selected target species. This ‘level of biodiversity’ will be assessed, looking through the eyes of the target species.
In order to assess the level of biodiversity and to design a new neighbourhood which can enhance biodiversity, it is important to carefully identify and select target species for conservation, education and promotion (Savard et al., 2000). It is impossible to include all species and to cover biodiversity as a whole. That is why target species, also named as indicator species, are selected and used to provide information on the overall condition of ecosystems (Ahern et al., 2007). There are different reasons and types of species groups that can be selected as target species.
It is mainly based on the overall effect that a species can be an ecological indicator, which signals
15
green open spaces, he is more of a generalist.
• Stefan van den Akker, a junior ecologist from ARCADIS, an international company with a focus on consultancy for a sustainable built environment. He was involved in the ecological assessment and advice for the municipality of Barneveld about the new neighbourhood ‘Bloemendal’. Together with his senior colleague, he was responsible for the ecological aspects of this project.
For the expert judgement meetings, a presentation was given on the context and background information of the research. This consisted of an explanation of the selected target species, including the relevant life history and requirements of each species. After that, a map of the region (fig. X) was shown to give an indication of the overall ecological context of the case study area. In addition, a map of the city scale (Fig X) and the neighbourhood scale were shown. On this last scale it was indicated which target species occur in the case study area, or the surrounding area (Fig X). Following this, a map was shown with the current ecological barriers bordering the case study area. It was indicated that these barriers would be resolved with appropriate fauna passages, making ecological connections possible. As a penultimate step the existing vegetation structures were shown, this to give an indication of the current potential habitat.
Finally, the four different design alternatives were presented. The experts were able to assess the different design alternatives by giving them scores on the level of biodiversity. This ‘level of biodiversity’ is assessed, looking through the eyes of the target species, by the criteria: patch size, the level of connectivity, and barriers and disturbances according to the LARCH-classic model of Pouwels, & van der Grift (2000). Further explanation on the expert judgement can be found in chapter 8.
With the selection of the target species, it was tried to make a comprehensive and inclusive as possible choice, by selecting species from different animal classification groups. This results in one aerial related species (a bird), one terrestrial related species (a mammal), and one aquatic related species (amphibian) (figure 66).
In addition, the species are selected because they are to a certain extent, so-called umbrella species, as explained in the previous section. By selecting umbrella species, in combination with the fact that the three selected species are of different classification groups, makes that the different design alternatives may also be suitable for potential habitat of other species with similar or related requirements.
Last of all, with the selection is tried to take into account that the municipality of Barneveld has selected several icon-species (flagship species), in this case the Pine marten, that play an important role in communication and education, but also in monitoring biodiversity in the municipality (Municipality of Barneveld, 2021).
3.3.2 EXPERT JUDGEMENT
To assess the level of biodiversity of the four different design alternatives, and to give an answer on the design question of which configuration is most favourable, experts were consulted for their judgement on the four different design alternatives and the current situation.
The following three experts have assessed the different design alternatives during the expert judgement:
• Dr. Jana Verboom, an animal and landscape ecologist from Wageningen Environmental Research, with a special focus on biodiversity, spatial population dynamics and population viability. After 30 years of experience at Alterra she now focusses more on environmental change and the functions nature and urban biodiversity have for humans.
• Ir. Joop Spijker, a vegetation, forest- and landscape ecologist from Wageningen Environmental Research, with a special focus on maintenance of forests, nature and urban

16
17
LITERATURE REVIEW: LANDSCAPE ECOLOGY PRINCIPLES4.
The case study area;image source: Barneveldse krant, September 8, 2020
18
the city’s mosaic of habitats (Leitao & Ahern, 2002; Wu, 2008a). Forman (1995) shows that the concept of land mosaics, at any scale, includes three spatial elements of landscape pattern on land: patches, corridors, and the matrix. Because the key spatial elements are so comprehensive and applicable at any scale, the patch-corridor-matrix model becomes a spatial language, enhancing communication among several fields such as landscape design, planning and art (Forman, 1995).
4.3 URBAN ECOLOGY
Cities are very different from rural and natural landscapes. From an ecological perspective, cities are unique mosaics, which are constructed for residential, commercial, industrial, and infrastructural purposes, alternated by green space (Breuste et al., 2008). City landscapes are so heterogenetic that it is not right to see them as ‘an urban biotope. Cities are these mosaics of biotops within the urban matrix because of the variety of urban land use types, such as residential areas, business areas, shopping malls, (rail)road structures, urban parks, sport field complexes, allotment gardens and cemeteries, which all differ in land cover or soil occupation (Snep & Clergeau, 2020). In general, urban areas that have the ability to provide natural ecological functions and ecosystem services are urban ecological landscapes, such as urban forests, grasslands, green public areas and waterbodies (Sun & Chen, 2017).
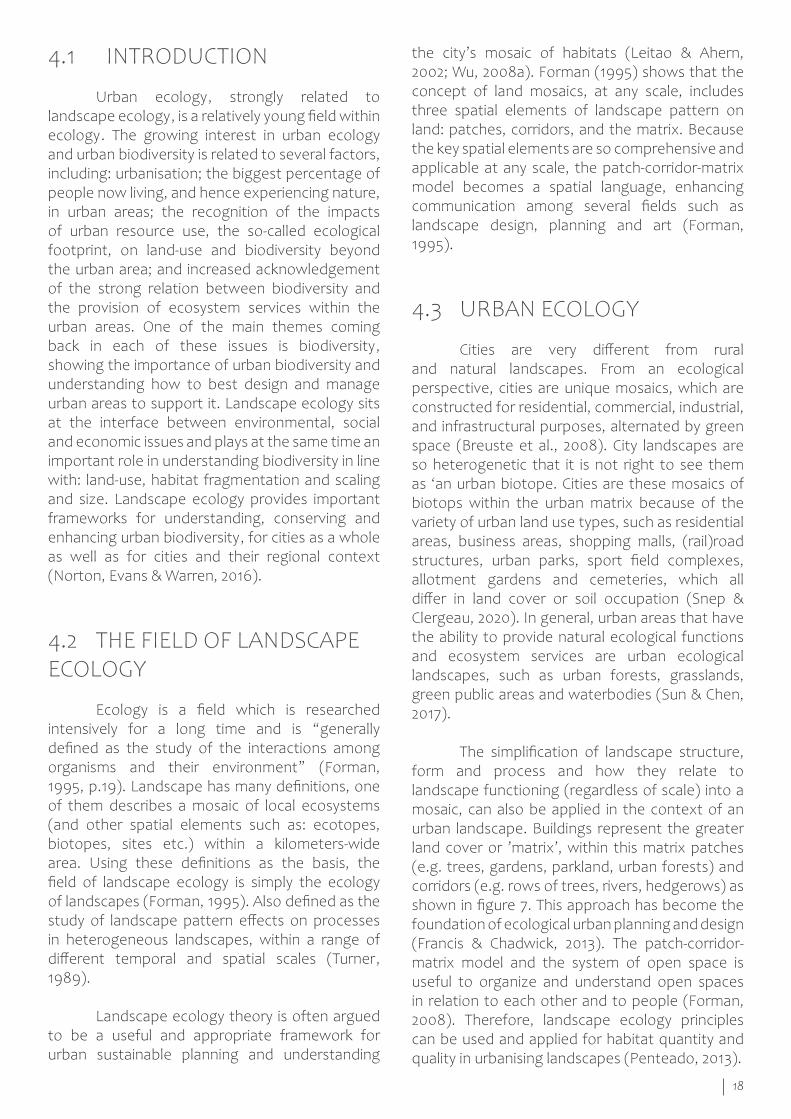
The simplification of landscape structure, form and process and how they relate to landscape functioning (regardless of scale) into a mosaic, can also be applied in the context of an urban landscape. Buildings represent the greater land cover or ’matrix’, within this matrix patches (e.g. trees, gardens, parkland, urban forests) and corridors (e.g. rows of trees, rivers, hedgerows) as shown in figure 7. This approach has become the foundation of ecological urban planning and design (Francis & Chadwick, 2013). The patch-corridor-matrix model and the system of open space is useful to organize and understand open spaces in relation to each other and to people (Forman, 2008). Therefore, landscape ecology principles can be used and applied for habitat quantity and quality in urbanising landscapes (Penteado, 2013).
4.1 INTRODUCTION
Urban ecology, strongly related to landscape ecology, is a relatively young field within ecology. The growing interest in urban ecology and urban biodiversity is related to several factors, including: urbanisation; the biggest percentage of people now living, and hence experiencing nature, in urban areas; the recognition of the impacts of urban resource use, the so-called ecological footprint, on land-use and biodiversity beyond the urban area; and increased acknowledgement of the strong relation between biodiversity and the provision of ecosystem services within the urban areas. One of the main themes coming back in each of these issues is biodiversity, showing the importance of urban biodiversity and understanding how to best design and manage urban areas to support it. Landscape ecology sits at the interface between environmental, social and economic issues and plays at the same time an important role in understanding biodiversity in line with: land-use, habitat fragmentation and scaling and size. Landscape ecology provides important frameworks for understanding, conserving and enhancing urban biodiversity, for cities as a whole as well as for cities and their regional context (Norton, Evans & Warren, 2016).
4.2 THE FIELD OF LANDSCAPE ECOLOGY
Ecology is a field which is researched intensively for a long time and is “generally defined as the study of the interactions among organisms and their environment” (Forman, 1995, p.19). Landscape has many definitions, one of them describes a mosaic of local ecosystems (and other spatial elements such as: ecotopes, biotopes, sites etc.) within a kilometers-wide area. Using these definitions as the basis, the field of landscape ecology is simply the ecology of landscapes (Forman, 1995). Also defined as the study of landscape pattern effects on processes in heterogeneous landscapes, within a range of different temporal and spatial scales (Turner, 1989).
Landscape ecology theory is often argued to be a useful and appropriate framework for urban sustainable planning and understanding
19
Besides the well-known use of landscape ecology patch-corridor-matrix model for biodiversity conservation on regional level, the influence for conservation and enhancing biodiversity on smaller scales is also increasingly recognized (Connery, 2009; Snep et al., 2006). Planning and design on neighbourhood (medium scale) and on-site scale (small scale), including enhancing and conserving biodiversity, illustrates how urban design can contribute to biodiversity across regions. From this point of view there are three layers of urban biodiversity. An ecological network on the regional scale represents the first tier of urban biodiversity. The second tier is neighbourhood open space planning, and the third tier is the on-site biodiversity which causes biological function due to small-scale interventions. All scales relate to each other, the regional biodiversity depends on neighbourhood open space planning, while on her turn the neighbourhood biodiversity depends on the successful implementation of on-site scale design interventions (Connery, 2009).
4.4 LANDSCAPE ECOLOGY APPLIED ON DIFFERENT SCALE LEVELS
As mentioned before the patch-corridor-matrix model relates to landscape functioning regardless of any scale (Forman, 1995). Landscape ecology principles so can be applied within different scales to serve enhancement of biodiversity. “Only by recognizing and addressing landscape changes across different scales (perhaps at least three) can planners and designers maximise protection of biodiversity and natural processes” (Dramstad et al., 1996).
For understanding planning and design for biotic conditions at the scale of entire cities, it is important to consider characteristics of the city on different scale levels: (1) green space and the overall amount of green space (small scale), (2) the whole city, including size (medium scale), and (3) the regional context (large scale) (Norton, Evans & Warren, 2016).
Fig. 7: An application of the patch-corridor-matrix concept to an urban landscape; source: Francis & Chadwick (2013)
20
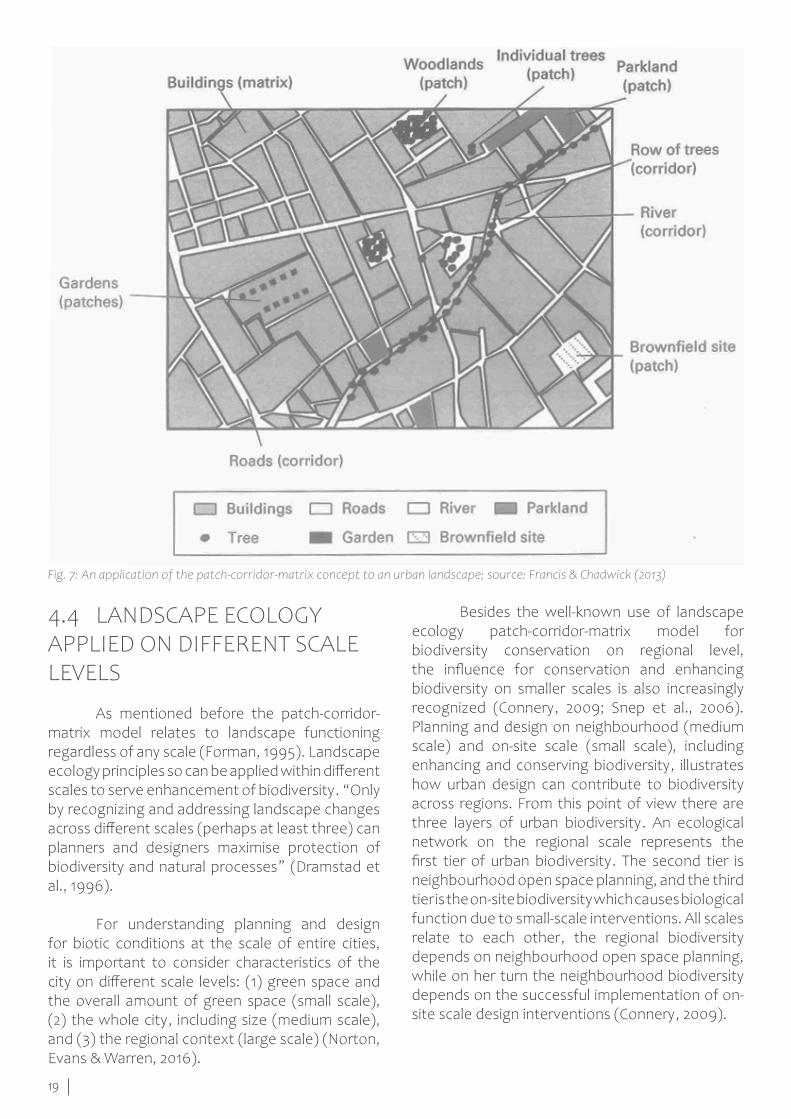
Fig. 8: Regional (XL) scale: 30x30 km Fig. 9: City (L) scale: 6x6 km Fig. 10: Neighbourhood (M) scale 2x2 km
4.4.1 SCALE LEVELS APPLIED IN THE CASE STUDY AREA OF BARNEVELD
Within this thesis the four scales based on Connery (2009): regional (extra-large, XL-scale), city scale (large, L-scale), neighbourhood (middle, M-scale), and on-site (small, S-scale) will be used to structure landscape ecology principles to enhance urban biodiversity. Hereby, it has been chosen that within this thesis the middle scale will be interpreted as neighbourhood, following Connery (2009) instead of Norton, Evans & Warren’s (2016) middle scale of the whole city, the neighbourhood scale fits better the focus and scope of this research thesis. Thereby is chosen to not take the small scale into consideration within this thesis because it does not fit within the scope of the field of landscape ecology. In this thesis the scales are interpreted and translated to the case study area of Barneveld and the neighbourhood Bloemendal. The regional (XL-scale) will be about an area of 30x30 km, the city scale (L-scale) will be 6x6 km and the neighbourhood (M-scale) will be about an area of 2x2 km, as shown in figures 8, 9, 10.
4.5 LANDSCAPE ECOLOGY THEORIES, CONCEPTS, AND PRINCIPLES APPLIED IN URBAN ENVIRONMENTS
Landscape ecology provides approaches and methods for understanding the dynamics of the city’s mosaic of habitats, including urban green spaces (Breuste et al., 2008). Besides, landscape ecological principles are applied in many other fields in the settings of both urban and rural environments, namely urban ecology
(Breuste et al., 2008; Forman, 2008), spatial- and urban planning(Leitao & Ahern, 2002; Wu, 2008a), landscape- and urban design (Dramstad et al., 1996; Ahern, 2005).
Breuste et al. (2008) applies landscape ecological principles in urban environments. These principles are based upon two landscape ecology theories. The characteristics of urban habitat patches, in terms of the relationship between patch size and species richness, can be approached with the island biogeography theory. Another theory Breuste et al., (2008) use as a framework for urban ecological study is the metapopulation theory. The principle of extent and connectivity of green urban space is a huge factor for the species occurrence and dispersal ability (especially the non-flying and ground dwelling species) in urban landscapes. The third ecological theory they applied successfully in urban settings is the” intermediate disturbance hypothesis” which says that in intermediately
ISLAND BIOGEOGRAPHY THEORY
The island biogeography theory is built upon population ecology and genetics, which explains the effect of distance and area of island (patches) populations and the balance between immigration and extinction (MacArthur & Wilson, 1967). The principle is extrapolated from oceanic islands to terrestrial landscapes with their ecosystem patches. Studies showed that large patches consist of a higher biodiversity, but also that specific species need patches of a particular size in order to persist over time. Beside, as the degree of isolation increases, generally the degree of biodiversity decreases (Francis & Chadwick, 2013).
21
METAPOPULATION THEORY
The metapopulation theory (Hanski & Gilpin, 1991) is mainly about dispersal ability of populations. Metapopulations consist of a spatially separated group of populations of the same species, which despite the level of little division, interact with each other (Snep & Clergeau, 2020). The subpopulations are separated by space or barriers, but connected via dispersal movements, which make them together one population. This results in local high variety of the number of species in the population which results in a distribution pattern that shifts over time (Opdam, 1991).
disturbed sites the species richness is higher than in heavily disturbed or undisturbed sites. Three theories of landscape ecology lead towards the guideline of connectivity for urban planning, management and biodiversity (Breuste et al., 2008).
Snep et al. (2006) showed in a study on peri-urban areas, that it is more likely that well-connected habitat patches in a city’s green structure are visited by species than isolated habitat patches. This is based on metapopulation theory and connectivity of patches (Snep et al., 2006). In addition, several studies who have researched the impact of landscape variables on urban biodiversity in a correlative way, demonstrate that species diversity increases with patch size and connectivity, as predicted by the island biogeography and metapopulation theories (Turrini & Knop, 2015). Fragmentation and connectivity are also mentioned by others as important landscape ecology principles (Leitao & Ahern, 2002).
Research shows that habitat connectivity is important to the persistence of plant and animal populations in fragmented landscapes. This is mainly due to connecting isolated patches and creating biotope network systems, which prevents fragmentation (Leitao & Ahern, 2002). In urban context the spatial configuration of patches of green space is important for ensuring connectivity and quality habitat. Francis & Chadwick (2013) mention eight principles of green network planning and design: (1) identification of natural or existing networks, (2) maximizing patch and corridor size, (3) increasing patch and corridor number and density, (4) increasing habitat quality, (5) connecting patches with corridors, (6) maximising circuitry where possible, which means the presence of ‘loops’ of ‘circuits’, (7) allowing natural dynamics, and (8) connecting beyond the region (Francis & Chadwick, 2013, p. 161-166).
Colding (2007) suggests some guidelines for resilience in urban ecosystems mainly by applying ecological land-use complementation, which draws on the island biogeography theory. The guiding principles useful for urban planning and design at the local scale are: (1) Cluster different types of urban green patches, especially within new urban areas, to increase available habitats for species. (2) Plan good conditions for ecological functions which can develop over time.
THREATS FOR BIODIVERSITY: FRAGMENTATION, BARRIERS, AND DISTURBANCES
Fragmentation of habitats is the effect of partition of landscape elements into smaller pieces, mostly happening in relation with land-use change in both structure and function and is a huge threat to biodiversity. It consists of three major elements, loss of original habitat, reduction in habitat patch size, and increasing isolation of habitat patches (Leitao & Ahern, 2002). More specific causes for habitat isolation and fragmentation, are: dissection (splitting an intact habitat into two patches), perforation (creating holes within a habitat patch), shrinkage (decrease in size) and attrition (disappearance of habitat patches) (Dramstad et al., 1996). Barriers also create fragmentation because it separates populations. Disturbance, especially in the form of stress, limits the growth or performance of species, human activities in urban areas provide a lot of disturbance for ecosystems and habitats (Francis & Cadwick, 2013).
(3) Consider ways to manage public and private areas so that they could support each other (Colding, 2007).
Landscape ecological concepts can be applied for their potential role, as a conceptual framework for sustainable landscape planning due
22
to Leitao & Ahern (2002). The patch-corridor-matrix model is used and four patterns for sustainable planning by applying the following concepts from Forman ( 1995, p.452) “(1) maintain large patches of native vegetation, (2) maintain wide riparian corridors, (3) maintain connectivity for movement of key species among the large patches and (4) maintain heterogeneous bits of nature throughout human-developed areas” (Leitao & Ahern, 2002).
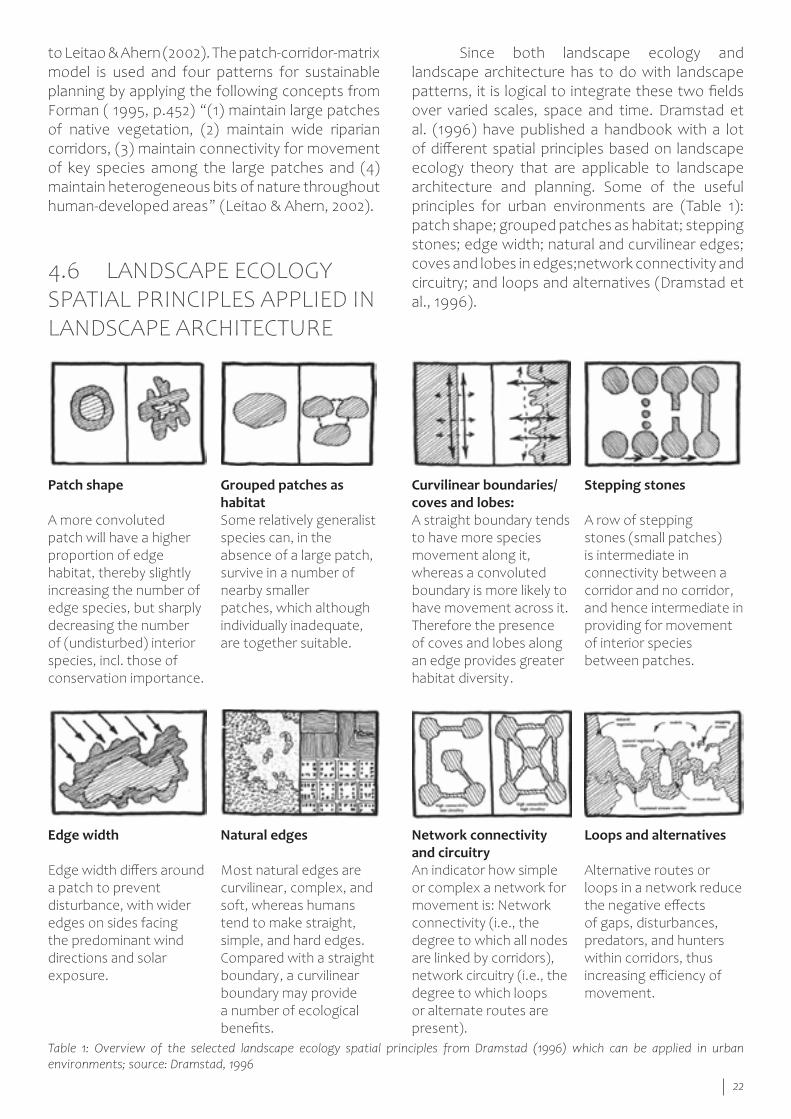
4.6 LANDSCAPE ECOLOGY SPATIAL PRINCIPLES APPLIED IN LANDSCAPE ARCHITECTURE
Since both landscape ecology and landscape architecture has to do with landscape patterns, it is logical to integrate these two fields over varied scales, space and time. Dramstad et al. (1996) have published a handbook with a lot of different spatial principles based on landscape ecology theory that are applicable to landscape architecture and planning. Some of the useful principles for urban environments are (Table 1): patch shape; grouped patches as habitat; stepping stones; edge width; natural and curvilinear edges; coves and lobes in edges;network connectivity and circuitry; and loops and alternatives (Dramstad et al., 1996).
Patch shape
A more convoluted patch will have a higher proportion of edge habitat, thereby slightly increasing the number of edge species, but sharply decreasing the number of (undisturbed) interior species, incl. those of conservation importance.
Curvilinear boundaries/coves and lobes: A straight boundary tends to have more species movement along it, whereas a convoluted boundary is more likely to have movement across it. Therefore the presence of coves and lobes along an edge provides greater habitat diversity.
Edge width
Edge width differs around a patch to prevent disturbance, with wider edges on sides facing the predominant wind directions and solar exposure.
Network connectivity and circuitry An indicator how simple or complex a network for movement is: Network connectivity (i.e., the degree to which all nodes are linked by corridors), network circuitry (i.e., the degree to which loops or alternate routes are present).
Grouped patches as habitatSome relatively generalist species can, in the absence of a large patch, survive in a number of nearby smallerpatches, which although individually inadequate, are together suitable.
Stepping stones
A row of stepping stones (small patches) is intermediate in connectivity between a corridor and no corridor, and hence intermediate in providing for movement of interior species between patches.
Natural edges
Most natural edges are curvilinear, complex, and soft, whereas humans tend to make straight, simple, and hard edges. Compared with a straight boundary, a curvilinear boundary may provide a number of ecological benefits.
Loops and alternatives
Alternative routes or loops in a network reduce the negative effects of gaps, disturbances, predators, and hunters within corridors, thus increasing efficiency of movement.
Table 1: Overview of the selected landscape ecology spatial principles from Dramstad (1996) which can be applied in urban environments; source: Dramstad, 1996
23
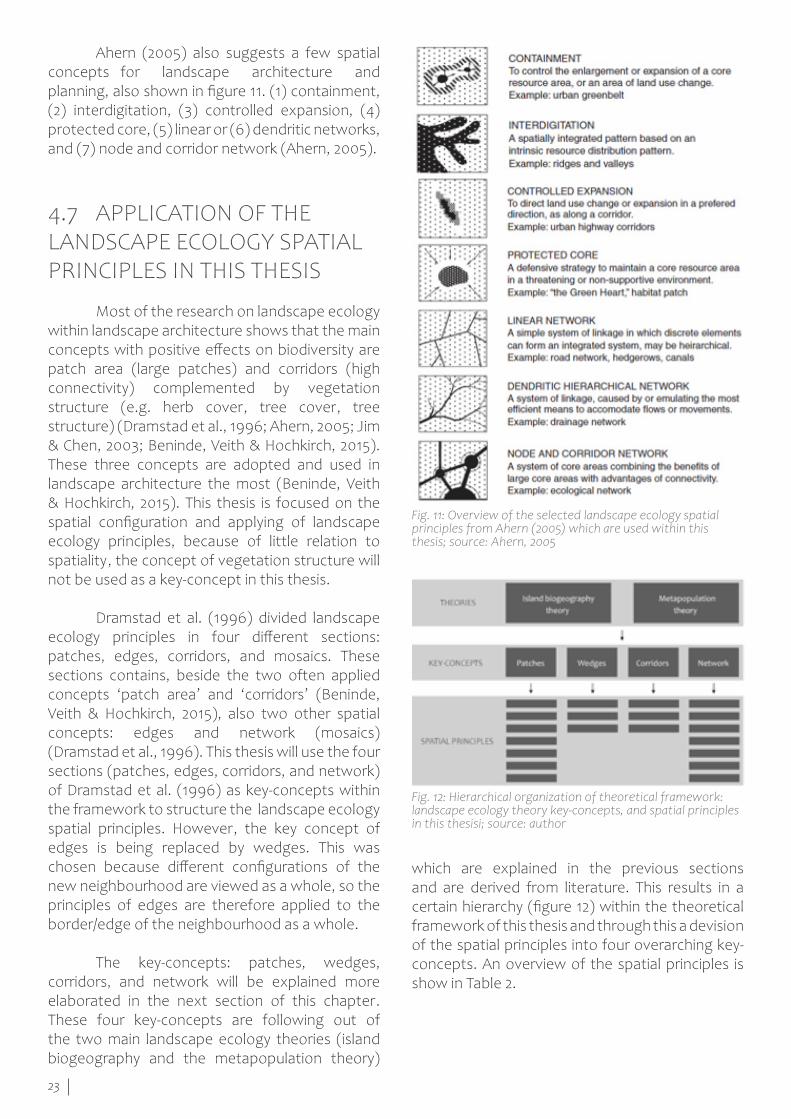
Ahern (2005) also suggests a few spatial concepts for landscape architecture and planning, also shown in figure 11. (1) containment, (2) interdigitation, (3) controlled expansion, (4) protected core, (5) linear or (6) dendritic networks, and (7) node and corridor network (Ahern, 2005).
4.7 APPLICATION OF THE LANDSCAPE ECOLOGY SPATIAL PRINCIPLES IN THIS THESIS
Most of the research on landscape ecology within landscape architecture shows that the main concepts with positive effects on biodiversity are patch area (large patches) and corridors (high connectivity) complemented by vegetation structure (e.g. herb cover, tree cover, tree structure) (Dramstad et al., 1996; Ahern, 2005; Jim & Chen, 2003; Beninde, Veith & Hochkirch, 2015). These three concepts are adopted and used in landscape architecture the most (Beninde, Veith & Hochkirch, 2015). This thesis is focused on the spatial configuration and applying of landscape ecology principles, because of little relation to spatiality, the concept of vegetation structure will not be used as a key-concept in this thesis.
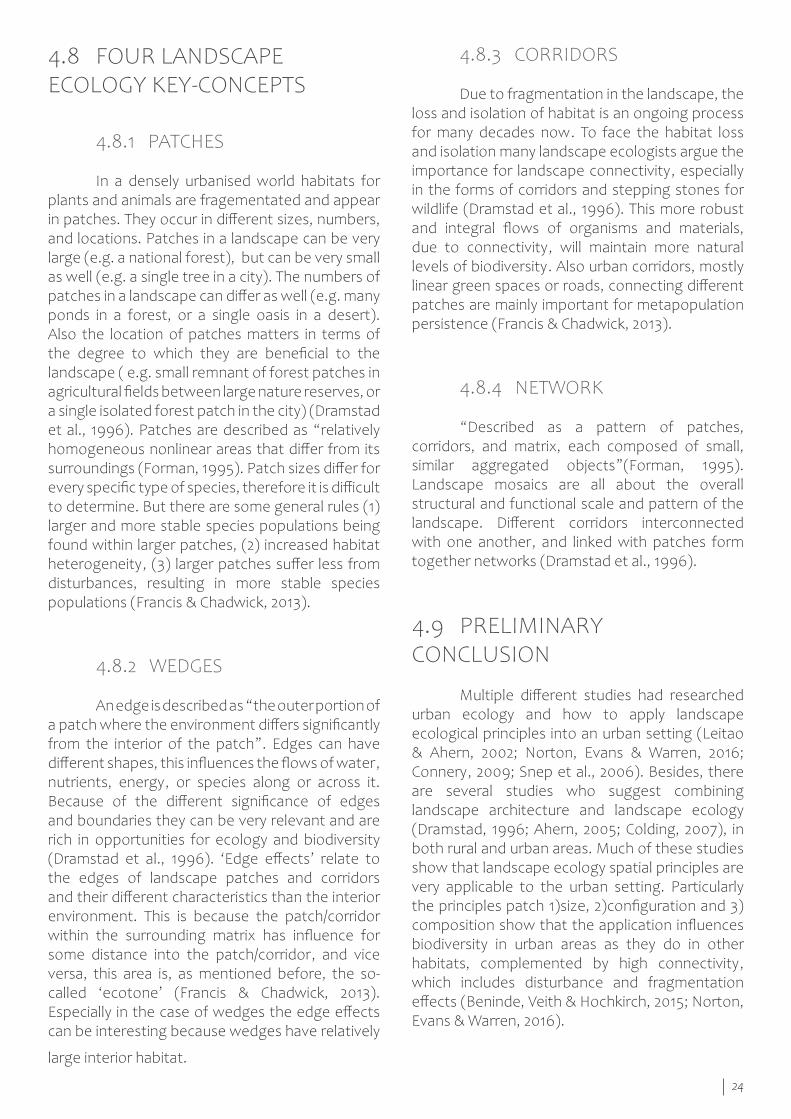
Dramstad et al. (1996) divided landscape ecology principles in four different sections: patches, edges, corridors, and mosaics. These sections contains, beside the two often applied concepts ‘patch area’ and ‘corridors’ (Beninde, Veith & Hochkirch, 2015), also two other spatial concepts: edges and network (mosaics) (Dramstad et al., 1996). This thesis will use the four sections (patches, edges, corridors, and network) of Dramstad et al. (1996) as key-concepts within the framework to structure the landscape ecology spatial principles. However, the key concept of edges is being replaced by wedges. This was chosen because different configurations of the new neighbourhood are viewed as a whole, so the principles of edges are therefore applied to the border/edge of the neighbourhood as a whole.
The key-concepts: patches, wedges, corridors, and network will be explained more elaborated in the next section of this chapter. These four key-concepts are following out of the two main landscape ecology theories (island biogeography and the metapopulation theory)
which are explained in the previous sections and are derived from literature. This results in a certain hierarchy (figure 12) within the theoretical framework of this thesis and through this a devision of the spatial principles into four overarching key-concepts. An overview of the spatial principles is show in Table 2.
Fig. 11: Overview of the selected landscape ecology spatial principles from Ahern (2005) which are used within this thesis; source: Ahern, 2005
Fig. 12: Hierarchical organization of theoretical framework: landscape ecology theory key-concepts, and spatial principles in this thesisi; source: author
24
4.8 FOUR LANDSCAPE ECOLOGY KEY-CONCEPTS
4.8.1 PATCHES
In a densely urbanised world habitats for plants and animals are fragementated and appear in patches. They occur in different sizes, numbers, and locations. Patches in a landscape can be very large (e.g. a national forest), but can be very small as well (e.g. a single tree in a city). The numbers of patches in a landscape can differ as well (e.g. many ponds in a forest, or a single oasis in a desert). Also the location of patches matters in terms of the degree to which they are beneficial to the landscape ( e.g. small remnant of forest patches in agricultural fields between large nature reserves, or a single isolated forest patch in the city) (Dramstad et al., 1996). Patches are described as “relatively homogeneous nonlinear areas that differ from its surroundings (Forman, 1995). Patch sizes differ for every specific type of species, therefore it is difficult to determine. But there are some general rules (1) larger and more stable species populations being found within larger patches, (2) increased habitat heterogeneity, (3) larger patches suffer less from disturbances, resulting in more stable species populations (Francis & Chadwick, 2013).
4.8.2 WEDGES
An edge is described as “the outer portion of a patch where the environment differs significantly from the interior of the patch”. Edges can have different shapes, this influences the flows of water, nutrients, energy, or species along or across it. Because of the different significance of edges and boundaries they can be very relevant and are rich in opportunities for ecology and biodiversity (Dramstad et al., 1996). ‘Edge effects’ relate to the edges of landscape patches and corridors and their different characteristics than the interior environment. This is because the patch/corridor within the surrounding matrix has influence for some distance into the patch/corridor, and vice versa, this area is, as mentioned before, the so-called ‘ecotone’ (Francis & Chadwick, 2013). Especially in the case of wedges the edge effects can be interesting because wedges have relatively
large interior habitat.
4.8.3 CORRIDORS
Due to fragmentation in the landscape, the loss and isolation of habitat is an ongoing process for many decades now. To face the habitat loss and isolation many landscape ecologists argue the importance for landscape connectivity, especially in the forms of corridors and stepping stones for wildlife (Dramstad et al., 1996). This more robust and integral flows of organisms and materials, due to connectivity, will maintain more natural levels of biodiversity. Also urban corridors, mostly linear green spaces or roads, connecting different patches are mainly important for metapopulation persistence (Francis & Chadwick, 2013).
4.8.4 NETWORK
“Described as a pattern of patches, corridors, and matrix, each composed of small, similar aggregated objects”(Forman, 1995). Landscape mosaics are all about the overall structural and functional scale and pattern of the landscape. Different corridors interconnected with one another, and linked with patches form together networks (Dramstad et al., 1996).
4.9 PRELIMINARY CONCLUSION
Multiple different studies had researched urban ecology and how to apply landscape ecological principles into an urban setting (Leitao & Ahern, 2002; Norton, Evans & Warren, 2016; Connery, 2009; Snep et al., 2006). Besides, there are several studies who suggest combining landscape architecture and landscape ecology (Dramstad, 1996; Ahern, 2005; Colding, 2007), in both rural and urban areas. Much of these studies show that landscape ecology spatial principles are very applicable to the urban setting. Particularly the principles patch 1)size, 2)configuration and 3)composition show that the application influences biodiversity in urban areas as they do in other habitats, complemented by high connectivity, which includes disturbance and fragmentation effects (Beninde, Veith & Hochkirch, 2015; Norton, Evans & Warren, 2016).
25
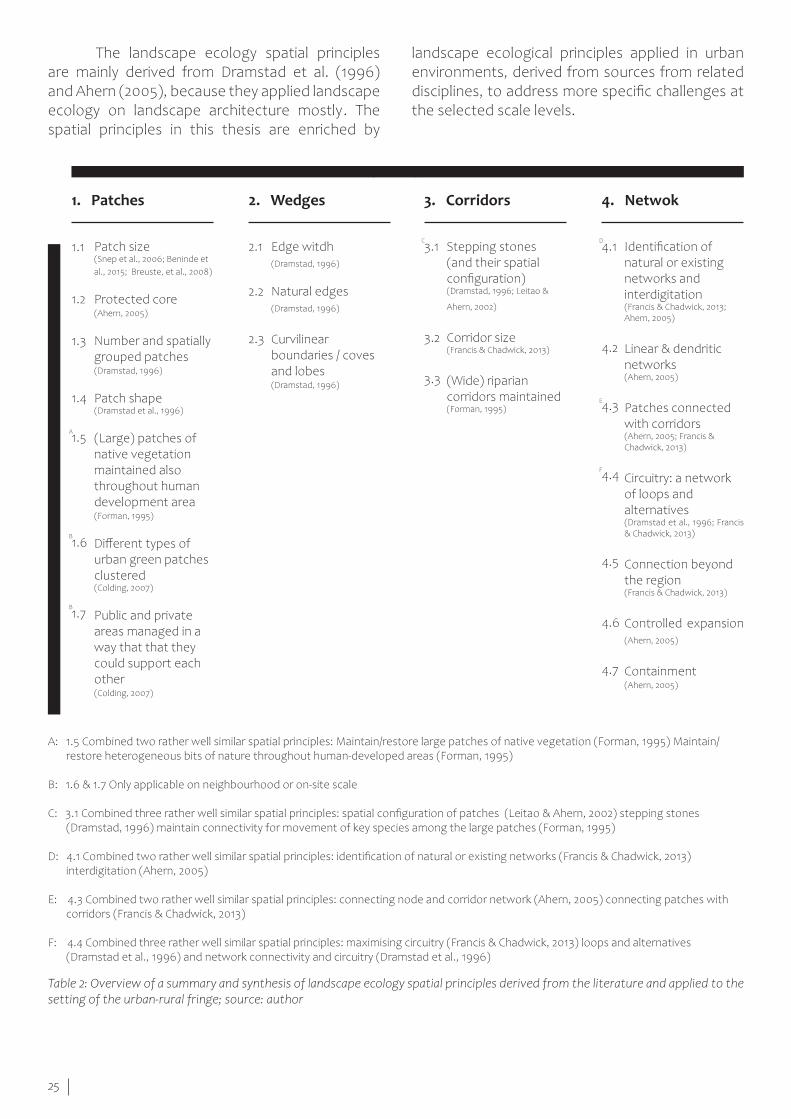
landscape ecological principles applied in urban environments, derived from sources from related disciplines, to address more specific challenges at the selected scale levels.
The landscape ecology spatial principles are mainly derived from Dramstad et al. (1996) and Ahern (2005), because they applied landscape ecology on landscape architecture mostly. The spatial principles in this thesis are enriched by
A: 1.5 Combined two rather well similar spatial principles: Maintain/restore large patches of native vegetation (Forman, 1995) Maintain/ restore heterogeneous bits of nature throughout human-developed areas (Forman, 1995)
B: 1.6 & 1.7 Only applicable on neighbourhood or on-site scale
C: 3.1 Combined three rather well similar spatial principles: spatial configuration of patches (Leitao & Ahern, 2002) stepping stones (Dramstad, 1996) maintain connectivity for movement of key species among the large patches (Forman, 1995)
D: 4.1 Combined two rather well similar spatial principles: identification of natural or existing networks (Francis & Chadwick, 2013) interdigitation (Ahern, 2005)
E: 4.3 Combined two rather well similar spatial principles: connecting node and corridor network (Ahern, 2005) connecting patches with corridors (Francis & Chadwick, 2013)
F: 4.4 Combined three rather well similar spatial principles: maximising circuitry (Francis & Chadwick, 2013) loops and alternatives (Dramstad et al., 1996) and network connectivity and circuitry (Dramstad et al., 1996)
Spat
ial p
rinc
iple
s
1. Patches 2. Wedges 3. Corridors 4. Netwok
Patch size (Snep et al., 2006; Beninde et al., 2015; Breuste, et al., 2008)
Protected core (Ahern, 2005)
Number and spatially grouped patches (Dramstad, 1996)
Patch shape (Dramstad et al., 1996)
(Large) patches of native vegetation maintained also throughout human development area (Forman, 1995)
Different types of urban green patches
clustered(Colding, 2007)
Public and private areas managed in a way that that they could support each other (Colding, 2007)
Edge witdh(Dramstad, 1996)
Natural edges (Dramstad, 1996)
Curvilinear boundaries / coves and lobes (Dramstad, 1996)
Stepping stones (and their spatial configuration) (Dramstad, 1996; Leitao &
Ahern, 2002)
Corridor size (Francis & Chadwick, 2013)
(Wide) riparian corridors maintained (Forman, 1995)
Identification of natural or existing networks and interdigitation (Francis & Chadwick, 2013; Ahern, 2005)
Linear & dendritic networks (Ahern, 2005)
Patches connected with corridors (Ahern, 2005; Francis & Chadwick, 2013)
Circuitry: a network of loops and alternatives (Dramstad et al., 1996; Francis & Chadwick, 2013)
Connection beyond the region (Francis & Chadwick, 2013)
Controlled expansion (Ahern, 2005)
Containment (Ahern, 2005)
1.1
A
B
B
2.1 3.1 4.1
1.2 2.2
3.2 4.2 1.3 2.3
3.3
4.3 1.4
4.4
1.5
4.5
1.6
4.6 1.7
4.7
Key - Concepts
C D
E
F
Table 2: Overview of a summary and synthesis of landscape ecology spatial principles derived from the literature and applied to the setting of the urban-rural fringe; source: author

26
27
REFERENCE STUDY: NATURE INCLUSIVE OR ECOLOGICAL NEIGHBOURHOOD DEVELOPMENTS IN PRACTICE
5.
Image source: Kerckebosch.nl
28
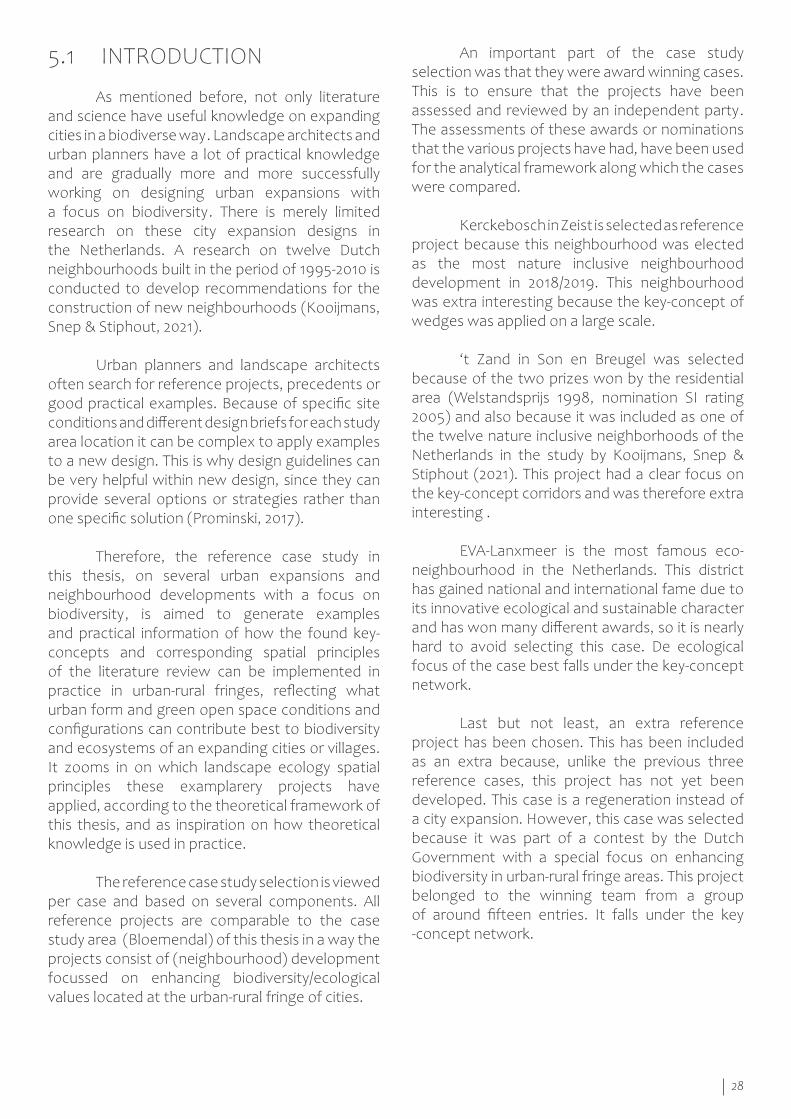
An important part of the case study selection was that they were award winning cases. This is to ensure that the projects have been assessed and reviewed by an independent party. The assessments of these awards or nominations that the various projects have had, have been used for the analytical framework along which the cases were compared.
Kerckebosch in Zeist is selected as reference project because this neighbourhood was elected as the most nature inclusive neighbourhood development in 2018/2019. This neighbourhood was extra interesting because the key-concept of wedges was applied on a large scale.
‘t Zand in Son en Breugel was selected because of the two prizes won by the residential area (Welstandsprijs 1998, nomination SI rating 2005) and also because it was included as one of the twelve nature inclusive neighborhoods of the Netherlands in the study by Kooijmans, Snep & Stiphout (2021). This project had a clear focus on the key-concept corridors and was therefore extra interesting .
EVA-Lanxmeer is the most famous eco-neighbourhood in the Netherlands. This district has gained national and international fame due to its innovative ecological and sustainable character and has won many different awards, so it is nearly hard to avoid selecting this case. De ecological focus of the case best falls under the key-concept network.
Last but not least, an extra reference project has been chosen. This has been included as an extra because, unlike the previous three reference cases, this project has not yet been developed. This case is a regeneration instead of a city expansion. However, this case was selected because it was part of a contest by the Dutch Government with a special focus on enhancing biodiversity in urban-rural fringe areas. This project belonged to the winning team from a group of around fifteen entries. It falls under the key -concept network.
5.1 INTRODUCTION
As mentioned before, not only literature and science have useful knowledge on expanding cities in a biodiverse way. Landscape architects and urban planners have a lot of practical knowledge and are gradually more and more successfully working on designing urban expansions with a focus on biodiversity. There is merely limited research on these city expansion designs in the Netherlands. A research on twelve Dutch neighbourhoods built in the period of 1995-2010 is conducted to develop recommendations for the construction of new neighbourhoods (Kooijmans, Snep & Stiphout, 2021).
Urban planners and landscape architects often search for reference projects, precedents or good practical examples. Because of specific site conditions and different design briefs for each study area location it can be complex to apply examples to a new design. This is why design guidelines can be very helpful within new design, since they can provide several options or strategies rather than one specific solution (Prominski, 2017).
Therefore, the reference case study in this thesis, on several urban expansions and neighbourhood developments with a focus on biodiversity, is aimed to generate examples and practical information of how the found key-concepts and corresponding spatial principles of the literature review can be implemented in practice in urban-rural fringes, reflecting what urban form and green open space conditions and configurations can contribute best to biodiversity and ecosystems of an expanding cities or villages. It zooms in on which landscape ecology spatial principles these examplarery projects have applied, according to the theoretical framework of this thesis, and as inspiration on how theoretical knowledge is used in practice.
The reference case study selection is viewed per case and based on several components. All reference projects are comparable to the case study area (Bloemendal) of this thesis in a way the projects consist of (neighbourhood) development focussed on enhancing biodiversity/ecological values located at the urban-rural fringe of cities.
29
(Urban) biodiversity and use of planting: the way planting is used to create biodiverse and different habitats and ecosystems. Furthermore, other interventions which can enhance biodiversity and potential target species, used as indicators for open green space development.
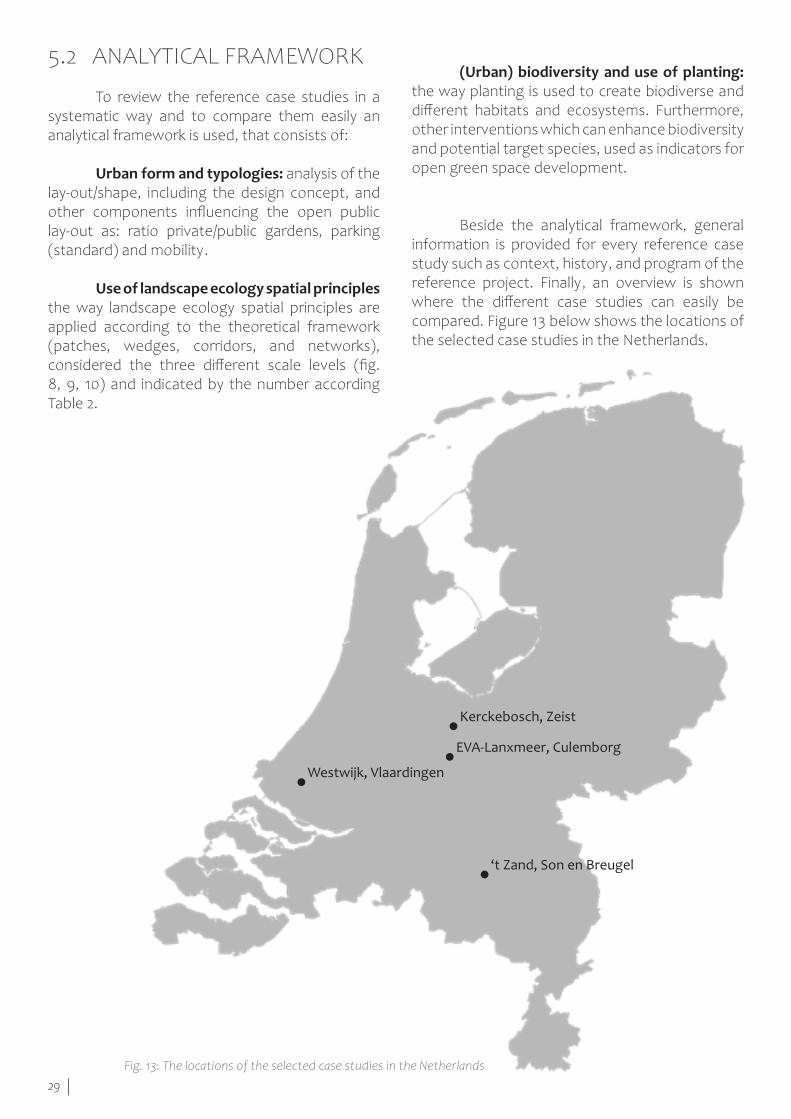
Beside the analytical framework, general information is provided for every reference case study such as context, history, and program of the reference project. Finally, an overview is shown where the different case studies can easily be compared. Figure 13 below shows the locations of the selected case studies in the Netherlands.
5.2 ANALYTICAL FRAMEWORK
To review the reference case studies in a systematic way and to compare them easily an analytical framework is used, that consists of:
Urban form and typologies: analysis of the lay-out/shape, including the design concept, and other components influencing the open public lay-out as: ratio private/public gardens, parking (standard) and mobility.
Use of landscape ecology spatial principles the way landscape ecology spatial principles are applied according to the theoretical framework (patches, wedges, corridors, and networks), considered the three different scale levels (fig. 8, 9, 10) and indicated by the number according Table 2.
Fig. 13: The locations of the selected case studies in the Netherlands
EVA-Lanxmeer, Culemborg
Kerckebosch, Zeist
Westwijk, Vlaardingen
‘t Zand, Son en Breugel
30
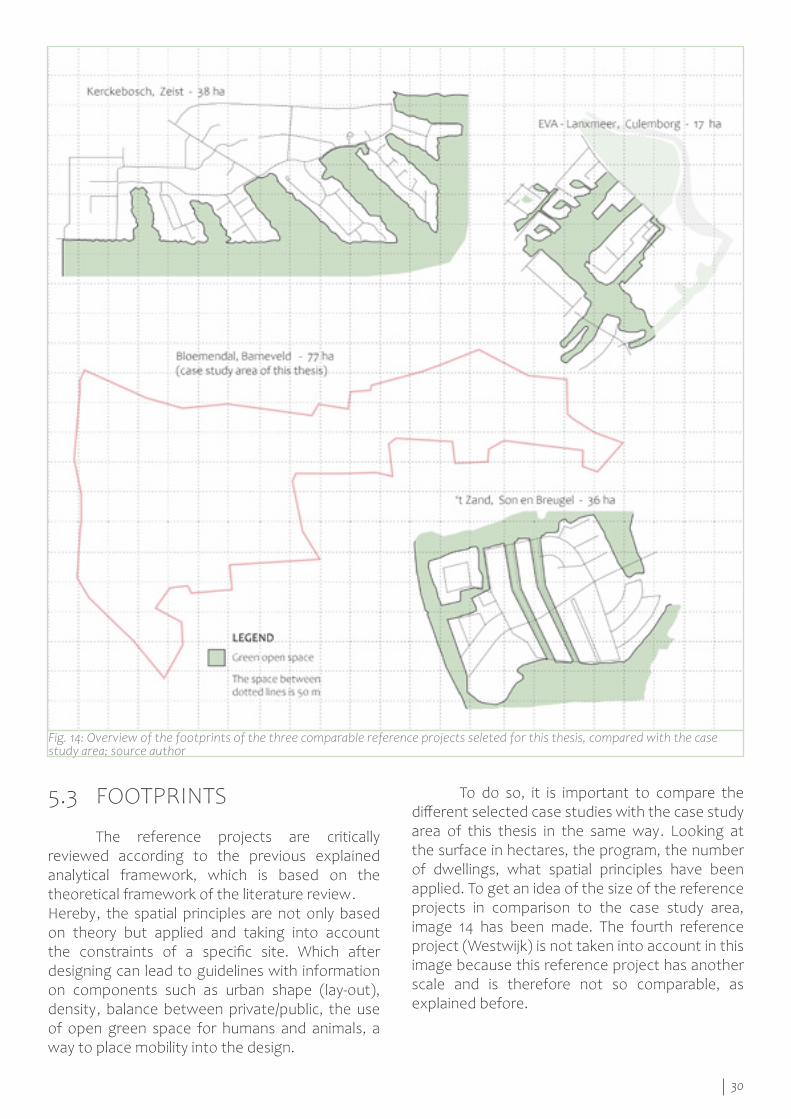
To do so, it is important to compare the different selected case studies with the case study area of this thesis in the same way. Looking at the surface in hectares, the program, the number of dwellings, what spatial principles have been applied. To get an idea of the size of the reference projects in comparison to the case study area, image 14 has been made. The fourth reference project (Westwijk) is not taken into account in this image because this reference project has another scale and is therefore not so comparable, as explained before.
5.3 FOOTPRINTS
The reference projects are critically reviewed according to the previous explained analytical framework, which is based on the theoretical framework of the literature review. Hereby, the spatial principles are not only based on theory but applied and taking into account the constraints of a specific site. Which after designing can lead to guidelines with information on components such as urban shape (lay-out), density, balance between private/public, the use of open green space for humans and animals, a way to place mobility into the design.
Fig. 14: Overview of the footprints of the three comparable reference projects seleted for this thesis, compared with the case study area; source author
31
CONTEXT
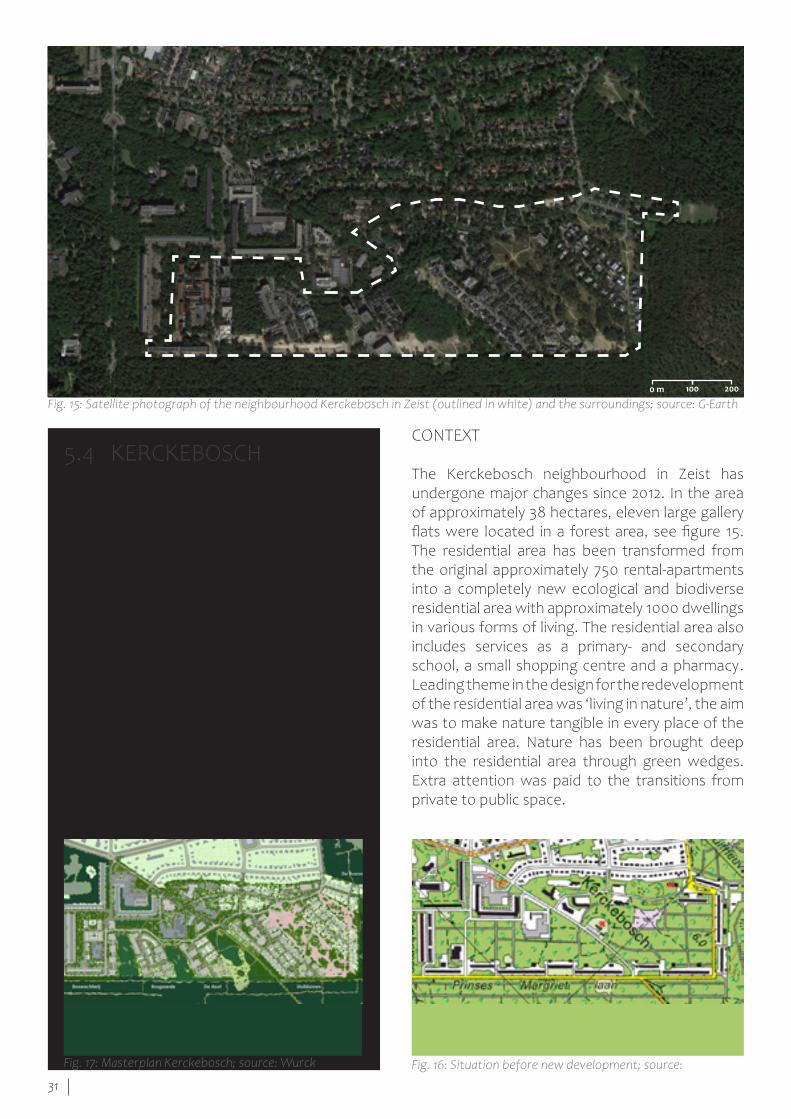
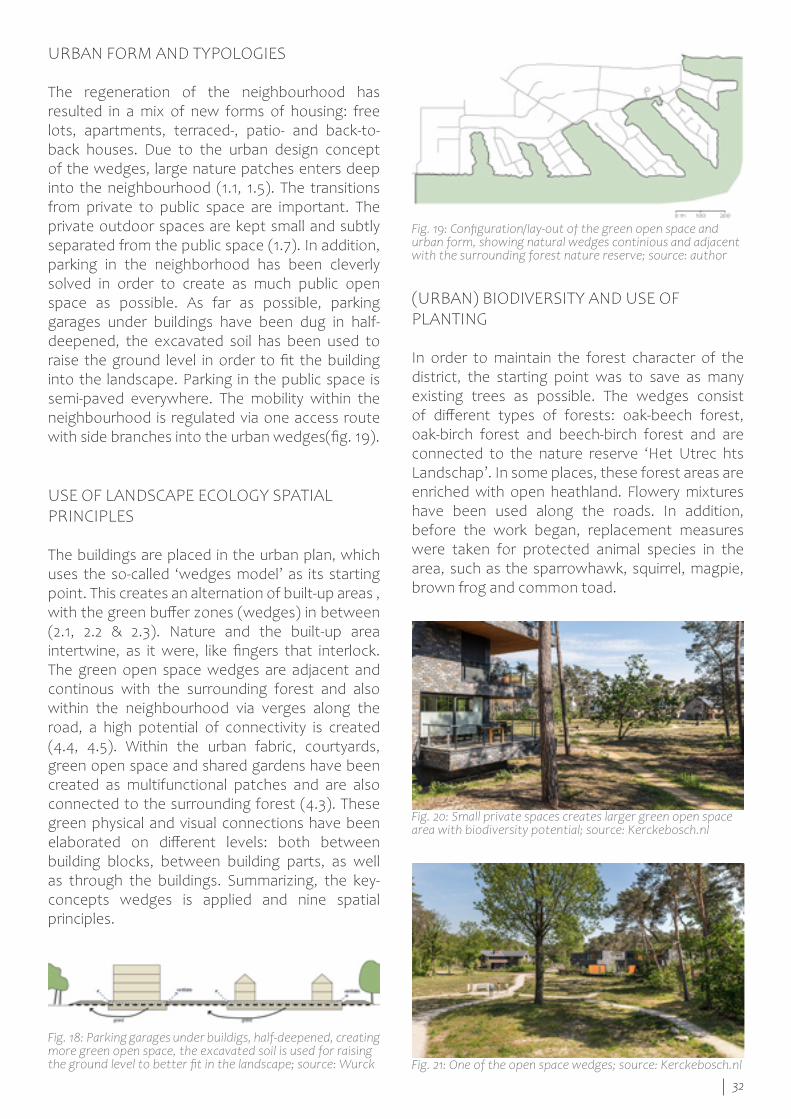
The Kerckebosch neighbourhood in Zeist has undergone major changes since 2012. In the area of approximately 38 hectares, eleven large gallery flats were located in a forest area, see figure 15. The residential area has been transformed from the original approximately 750 rental-apartments into a completely new ecological and biodiverse residential area with approximately 1000 dwellings in various forms of living. The residential area also includes services as a primary- and secondary school, a small shopping centre and a pharmacy. Leading theme in the design for the redevelopment of the residential area was ‘living in nature’, the aim was to make nature tangible in every place of the residential area. Nature has been brought deep into the residential area through green wedges. Extra attention was paid to the transitions from private to public space.
5.4 KERCKEBOSCH
Location Zeist year 2012 - present day Designed by Wurck urbanismAwards Bouwen + Biodiversiteit 2019: most nature inclusive
neighbourhood of NL soil type sandygroundwater level relatively deep Surroundings Very large forest nature reserve size of the area 38 ha dwelling/ha 26,3 (dwellings: 1000)
% green open space 49,2 % % water 0,0 %% built-up area 11,8 % (4,5 ha) % infrastructure 6,6 % % gardens 32,4 % parking standard 1,8
Fig. 15: Satellite photograph of the neighbourhood Kerckebosch in Zeist (outlined in white) and the surroundings; source: G-Earth
Fig. 17: Masterplan Kerckebosch; source: Wurck Fig. 16: Situation before new development; source:
0 m 100 200
32
(URBAN) BIODIVERSITY AND USE OF PLANTING
In order to maintain the forest character of the district, the starting point was to save as many existing trees as possible. The wedges consist of different types of forests: oak-beech forest, oak-birch forest and beech-birch forest and are connected to the nature reserve ‘Het Utrec hts Landschap’. In some places, these forest areas are enriched with open heathland. Flowery mixtures have been used along the roads. In addition, before the work began, replacement measures were taken for protected animal species in the area, such as the sparrowhawk, squirrel, magpie, brown frog and common toad.
URBAN FORM AND TYPOLOGIES
The regeneration of the neighbourhood has resulted in a mix of new forms of housing: free lots, apartments, terraced-, patio- and back-to-back houses. Due to the urban design concept of the wedges, large nature patches enters deep into the neighbourhood (1.1, 1.5). The transitions from private to public space are important. The private outdoor spaces are kept small and subtly separated from the public space (1.7). In addition, parking in the neighborhood has been cleverly solved in order to create as much public open space as possible. As far as possible, parking garages under buildings have been dug in half-deepened, the excavated soil has been used to raise the ground level in order to fit the building into the landscape. Parking in the public space is semi-paved everywhere. The mobility within the neighbourhood is regulated via one access route with side branches into the urban wedges(fig. 19).
USE OF LANDSCAPE ECOLOGY SPATIAL PRINCIPLES
The buildings are placed in the urban plan, which uses the so-called ‘wedges model’ as its starting point. This creates an alternation of built-up areas , with the green buffer zones (wedges) in between (2.1, 2.2 & 2.3). Nature and the built-up area intertwine, as it were, like fingers that interlock. The green open space wedges are adjacent and continous with the surrounding forest and also within the neighbourhood via verges along the road, a high potential of connectivity is created (4.4, 4.5). Within the urban fabric, courtyards, green open space and shared gardens have been created as multifunctional patches and are also connected to the surrounding forest (4.3). These green physical and visual connections have been elaborated on different levels: both between building blocks, between building parts, as well as through the buildings. Summarizing, the key-concepts wedges is applied and nine spatial principles.
Fig. 18: Parking garages under buildigs, half-deepened, creating more green open space, the excavated soil is used for raising the ground level to better fit in the landscape; source: Wurck
Fig. 19: Configuration/lay-out of the green open space and urban form, showing natural wedges continious and adjacent with the surrounding forest nature reserve; source: author
Fig. 20: Small private spaces creates larger green open space area with biodiversity potential; source: Kerckebosch.nl
Fig. 21: One of the open space wedges; source: Kerckebosch.nl
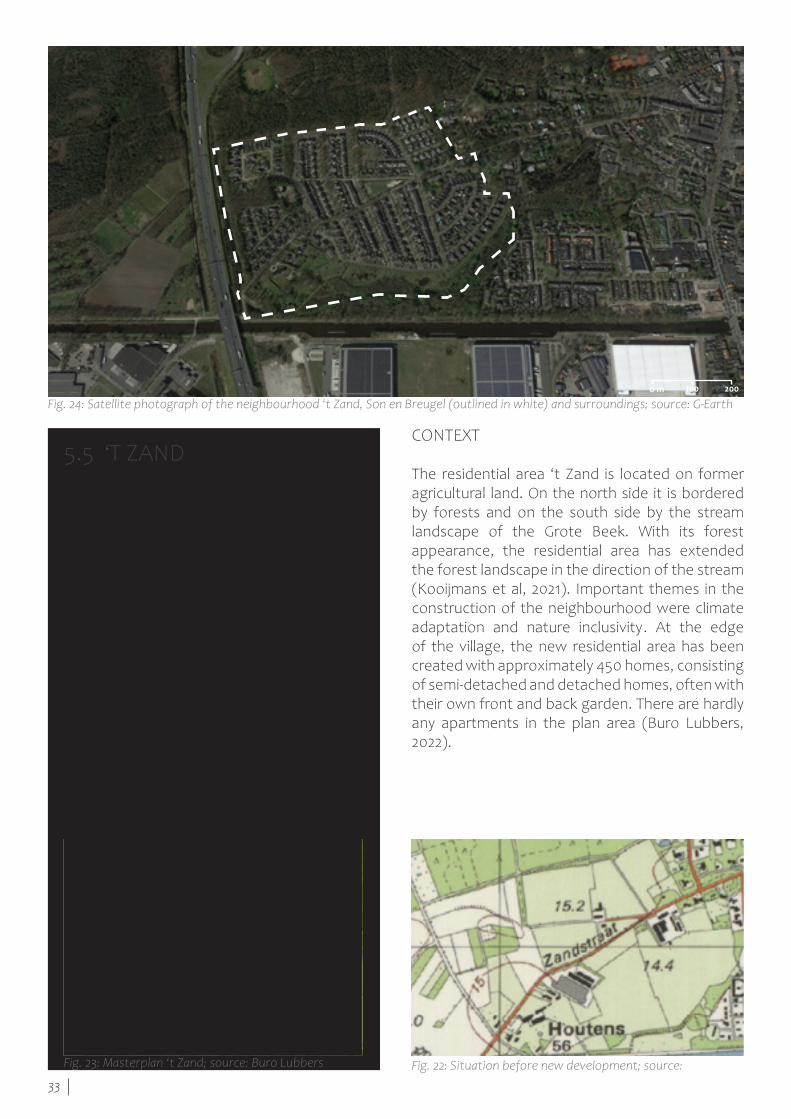
33
CONTEXT
The residential area ‘t Zand is located on former agricultural land. On the north side it is bordered by forests and on the south side by the stream landscape of the Grote Beek. With its forest appearance, the residential area has extended the forest landscape in the direction of the stream (Kooijmans et al, 2021). Important themes in the construction of the neighbourhood were climate adaptation and nature inclusivity. At the edge of the village, the new residential area has been created with approximately 450 homes, consisting of semi-detached and detached homes, often with their own front and back garden. There are hardly any apartments in the plan area (Buro Lubbers, 2022).
5.5 ‘T ZAND
Location Son en Breugel year 2000 - 2005 Designed by INBO urbanism, Buro Lubbers Awards Welstandsprijs 1998, nominatie SI waardering 2005
Soil type sandy Groundwater level from very deep(forest) to relatively high (stream valley)Surroundings Forest (north) stream valley (south)
size of the area 36 ha dwelling/ha 16,6 (dwellings: 450)
% green open space 43,3 % % water 0,3 %% built-up area 12,3 % (4,4 ha) % infrastructure 9,6 % % gardens 35,5 % parking standard 1,6
Fig. 22: Situation before new development; source: Fig. 23: Masterplan ‘t Zand; source: Buro Lubbers
Fig. 24: Satellite photograph of the neighbourhood ‘t Zand, Son en Breugel (outlined in white) and surroundings; source: G-Earth0 m 100 200
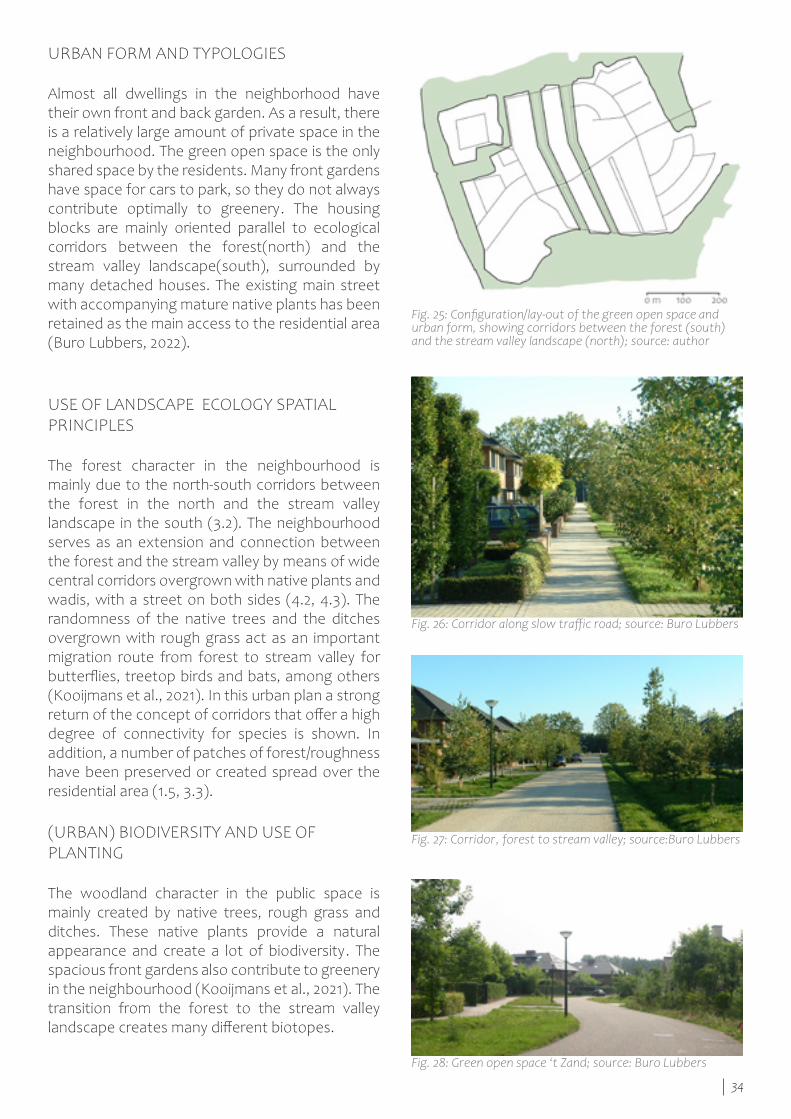
34
URBAN FORM AND TYPOLOGIES
Almost all dwellings in the neighborhood have their own front and back garden. As a result, there is a relatively large amount of private space in the neighbourhood. The green open space is the only shared space by the residents. Many front gardens have space for cars to park, so they do not always contribute optimally to greenery. The housing blocks are mainly oriented parallel to ecological corridors between the forest(north) and the stream valley landscape(south), surrounded by many detached houses. The existing main street with accompanying mature native plants has been retained as the main access to the residential area (Buro Lubbers, 2022).
USE OF LANDSCAPE ECOLOGY SPATIAL PRINCIPLES
The forest character in the neighbourhood is mainly due to the north-south corridors between the forest in the north and the stream valley landscape in the south (3.2). The neighbourhood serves as an extension and connection between the forest and the stream valley by means of wide central corridors overgrown with native plants and wadis, with a street on both sides (4.2, 4.3). The randomness of the native trees and the ditches overgrown with rough grass act as an important migration route from forest to stream valley for butterflies, treetop birds and bats, among others (Kooijmans et al., 2021). In this urban plan a strong return of the concept of corridors that offer a high degree of connectivity for species is shown. In addition, a number of patches of forest/roughness have been preserved or created spread over the residential area (1.5, 3.3).
(URBAN) BIODIVERSITY AND USE OF PLANTING
The woodland character in the public space is mainly created by native trees, rough grass and ditches. These native plants provide a natural appearance and create a lot of biodiversity. The spacious front gardens also contribute to greenery in the neighbourhood (Kooijmans et al., 2021). The transition from the forest to the stream valley landscape creates many different biotopes.
Fig. 25: Configuration/lay-out of the green open space and urban form, showing corridors between the forest (south) and the stream valley landscape (north); source: author
Fig. 26: Corridor along slow traffic road; source: Buro Lubbers
Fig. 27: Corridor, forest to stream valley; source:Buro Lubbers
Fig. 28: Green open space ‘t Zand; source: Buro Lubbers
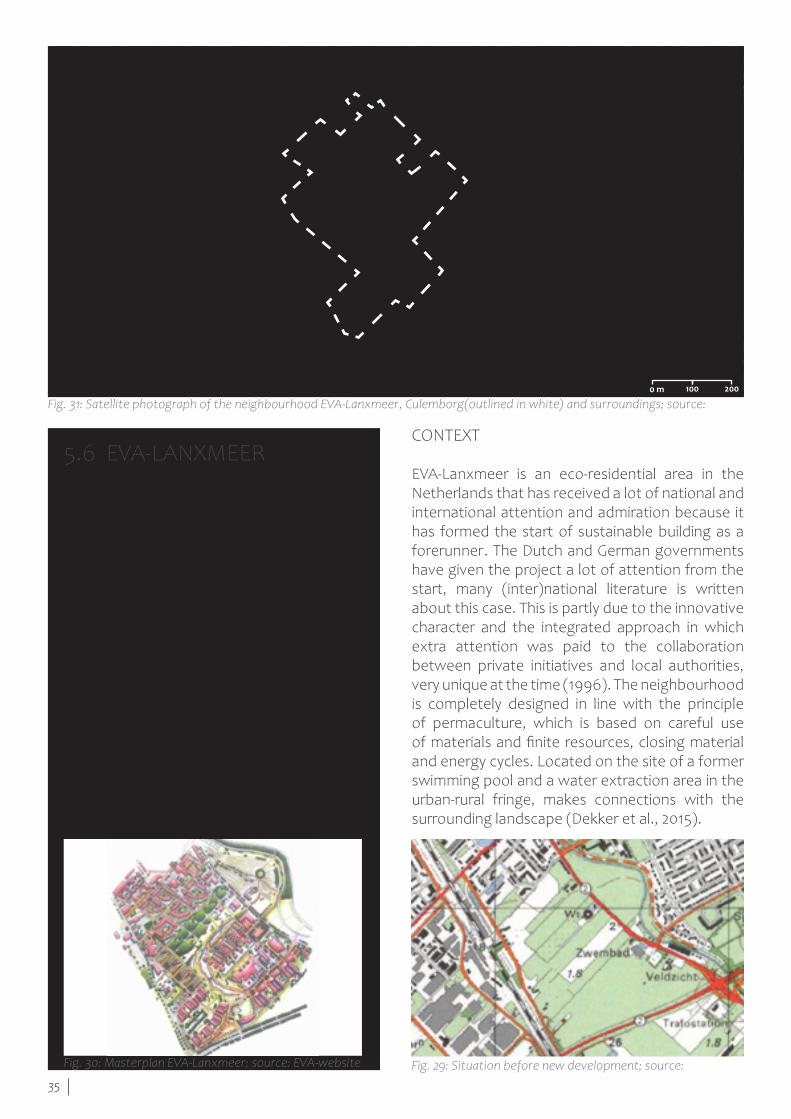
35
CONTEXT
EVA-Lanxmeer is an eco-residential area in the Netherlands that has received a lot of national and international attention and admiration because it has formed the start of sustainable building as a forerunner. The Dutch and German governments have given the project a lot of attention from the start, many (inter)national literature is written about this case. This is partly due to the innovative character and the integrated approach in which extra attention was paid to the collaboration between private initiatives and local authorities, very unique at the time (1996). The neighbourhood is completely designed in line with the principle of permaculture, which is based on careful use of materials and finite resources, closing material and energy cycles. Located on the site of a former swimming pool and a water extraction area in the urban-rural fringe, makes connections with the surrounding landscape (Dekker et al., 2015).
5.6 EVA-LANXMEER
Location Culemborg year 1993 - 2002 Designed by BügelHajema, Joachim Eble, Copijn LandschapsarchitectenAwards Duurzaam Bouwen 2020 Winner ‘Domein Stad’ Golden Award world green design
soil type river clay groundwater level average Surroundings River/stream ‘the Meer’+ fields size of the area 17 ha dwelling/ha 17,7 (dwellings: 300)
% green open space 60,5 %% water 4,7 %% built-up area 11,8 % (2,0 ha) % infrastructure 3,9 % % gardens 19,7 % parking standard 0.7
Fig. 29: Situation before new development; source: Fig. 30: Masterplan EVA-Lanxmeer; source: EVA-website
Fig. 31: Satellite photograph of the neighbourhood EVA-Lanxmeer, Culemborg(outlined in white) and surroundings; source: 0 m 100 200
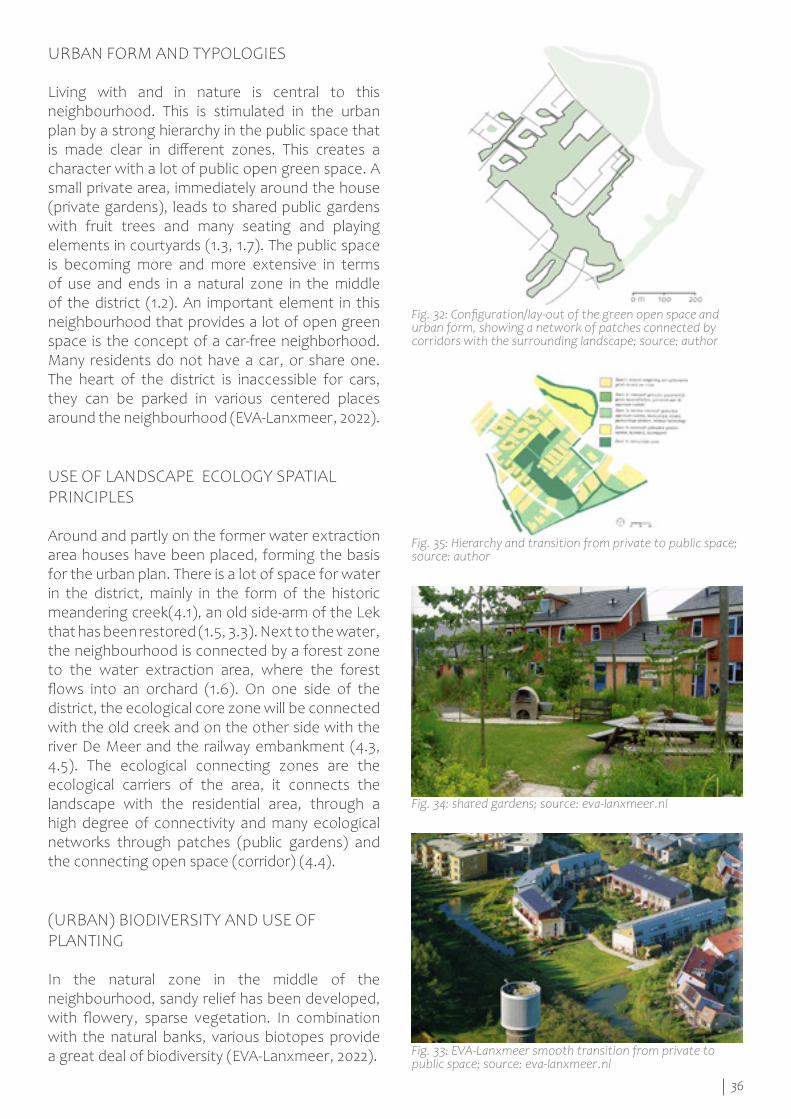
36
URBAN FORM AND TYPOLOGIES
Living with and in nature is central to this neighbourhood. This is stimulated in the urban plan by a strong hierarchy in the public space that is made clear in different zones. This creates a character with a lot of public open green space. A small private area, immediately around the house (private gardens), leads to shared public gardens with fruit trees and many seating and playing elements in courtyards (1.3, 1.7). The public space is becoming more and more extensive in terms of use and ends in a natural zone in the middle of the district (1.2). An important element in this neighbourhood that provides a lot of open green space is the concept of a car-free neighborhood. Many residents do not have a car, or share one. The heart of the district is inaccessible for cars, they can be parked in various centered places around the neighbourhood (EVA-Lanxmeer, 2022).
USE OF LANDSCAPE ECOLOGY SPATIAL PRINCIPLES
Around and partly on the former water extraction area houses have been placed, forming the basis for the urban plan. There is a lot of space for water in the district, mainly in the form of the historic meandering creek(4.1), an old side-arm of the Lek that has been restored (1.5, 3.3). Next to the water, the neighbourhood is connected by a forest zone to the water extraction area, where the forest flows into an orchard (1.6). On one side of the district, the ecological core zone will be connected with the old creek and on the other side with the river De Meer and the railway embankment (4.3, 4.5). The ecological connecting zones are the ecological carriers of the area, it connects the landscape with the residential area, through a high degree of connectivity and many ecological networks through patches (public gardens) and the connecting open space (corridor) (4.4).
(URBAN) BIODIVERSITY AND USE OF PLANTING
In the natural zone in the middle of the neighbourhood, sandy relief has been developed, with flowery, sparse vegetation. In combination with the natural banks, various biotopes provide a great deal of biodiversity (EVA-Lanxmeer, 2022).
Fig. 32: Configuration/lay-out of the green open space and urban form, showing a network of patches connected by corridors with the surrounding landscape; source: author
Fig. 33: EVA-Lanxmeer smooth transition from private to public space; source: eva-lanxmeer.nl
Fig. 34: shared gardens; source: eva-lanxmeer.nl
Fig. 35: Hierarchy and transition from private to public space; source: author
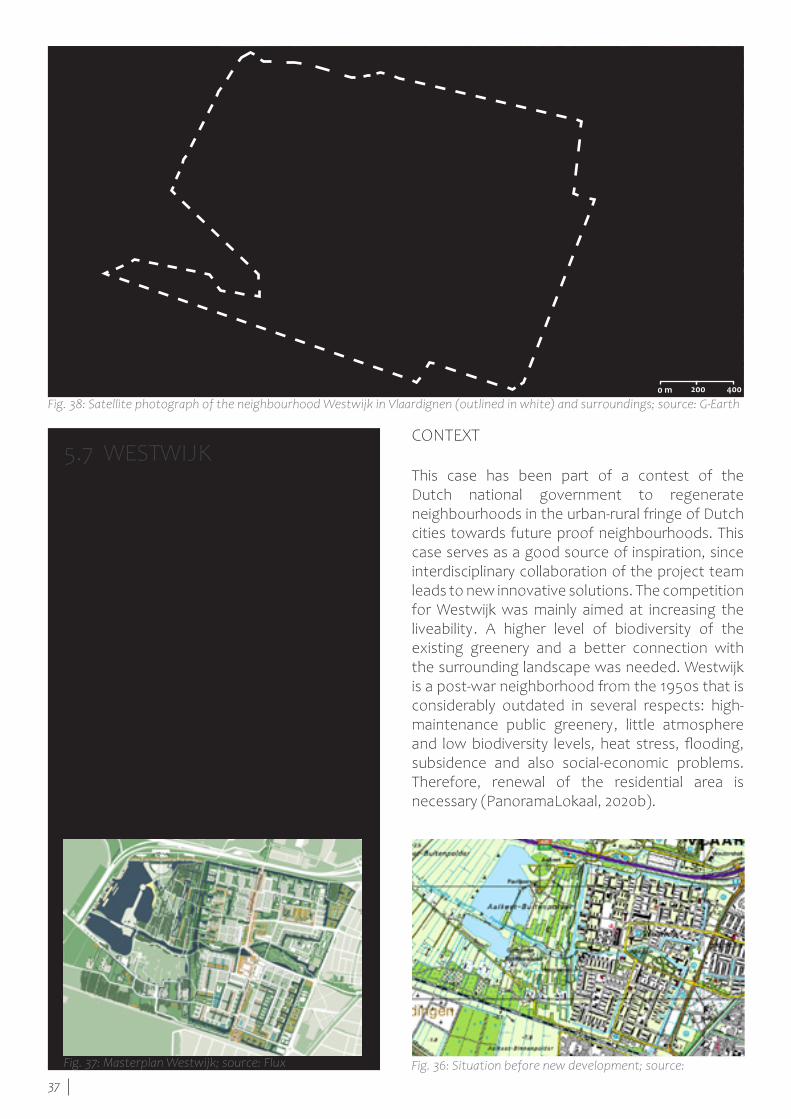
37
CONTEXT
This case has been part of a contest of the Dutch national government to regenerate neighbourhoods in the urban-rural fringe of Dutch cities towards future proof neighbourhoods. This case serves as a good source of inspiration, since interdisciplinary collaboration of the project team leads to new innovative solutions. The competition for Westwijk was mainly aimed at increasing the liveability. A higher level of biodiversity of the existing greenery and a better connection with the surrounding landscape was needed. Westwijk is a post-war neighborhood from the 1950s that is considerably outdated in several respects: high-maintenance public greenery, little atmosphere and low biodiversity levels, heat stress, flooding, subsidence and also social-economic problems. Therefore, renewal of the residential area is necessary (PanoramaLokaal, 2020b).
5.7 WESTWIJK
Location Vlaardingen year contest, not constructed Designed by Flux landscape architecture, shift urbanism, Exept, Bureau Stadsnatuur, Acacia Water. Awards: Winner Panorama Lokaal contest 2020 - regeneration of urban-rural fringes
Soil type peat groundwater level very high Surroundings Peat lake + semi natural forest size of the area 273 ha dwelling/ha 21,6 (dwellings: 5900)
% green open space 43,9 %% water 14,7 %% built-up area 9,8 % (26,7 ha)% infrastructure 8,3 % % gardens 23,3 %
Fig. 36: Situation before new development; source: Fig. 37: Masterplan Westwijk; source: Flux
Fig. 38: Satellite photograph of the neighbourhood Westwijk in Vlaardignen (outlined in white) and surroundings; source: G-Earth0 m 200 400
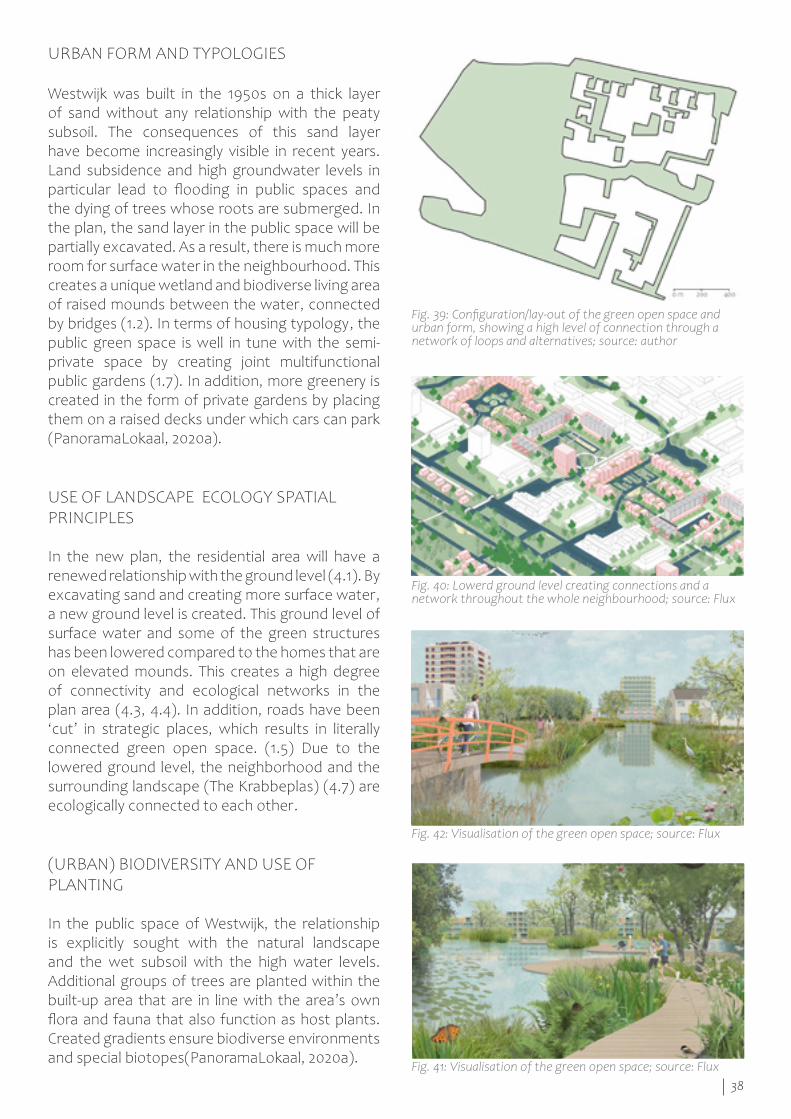
38
URBAN FORM AND TYPOLOGIES
Westwijk was built in the 1950s on a thick layer of sand without any relationship with the peaty subsoil. The consequences of this sand layer have become increasingly visible in recent years. Land subsidence and high groundwater levels in particular lead to flooding in public spaces and the dying of trees whose roots are submerged. In the plan, the sand layer in the public space will be partially excavated. As a result, there is much more room for surface water in the neighbourhood. This creates a unique wetland and biodiverse living area of raised mounds between the water, connected by bridges (1.2). In terms of housing typology, the public green space is well in tune with the semi-private space by creating joint multifunctional public gardens (1.7). In addition, more greenery is created in the form of private gardens by placing them on a raised decks under which cars can park (PanoramaLokaal, 2020a).
USE OF LANDSCAPE ECOLOGY SPATIAL PRINCIPLES
In the new plan, the residential area will have a renewed relationship with the ground level (4.1). By excavating sand and creating more surface water, a new ground level is created. This ground level of surface water and some of the green structures has been lowered compared to the homes that are on elevated mounds. This creates a high degree of connectivity and ecological networks in the plan area (4.3, 4.4). In addition, roads have been ‘cut’ in strategic places, which results in literally connected green open space. (1.5) Due to the lowered ground level, the neighborhood and the surrounding landscape (The Krabbeplas) (4.7) are ecologically connected to each other.
(URBAN) BIODIVERSITY AND USE OF PLANTING
In the public space of Westwijk, the relationship is explicitly sought with the natural landscape and the wet subsoil with the high water levels. Additional groups of trees are planted within the built-up area that are in line with the area’s own flora and fauna that also function as host plants. Created gradients ensure biodiverse environments and special biotopes(PanoramaLokaal, 2020a).
Fig. 39: Configuration/lay-out of the green open space and urban form, showing a high level of connection through a network of loops and alternatives; source: author
Fig. 40: Lowerd ground level creating connections and a network throughout the whole neighbourhood; source: Flux
Fig. 41: Visualisation of the green open space; source: Flux
Fig. 42: Visualisation of the green open space; source: Flux
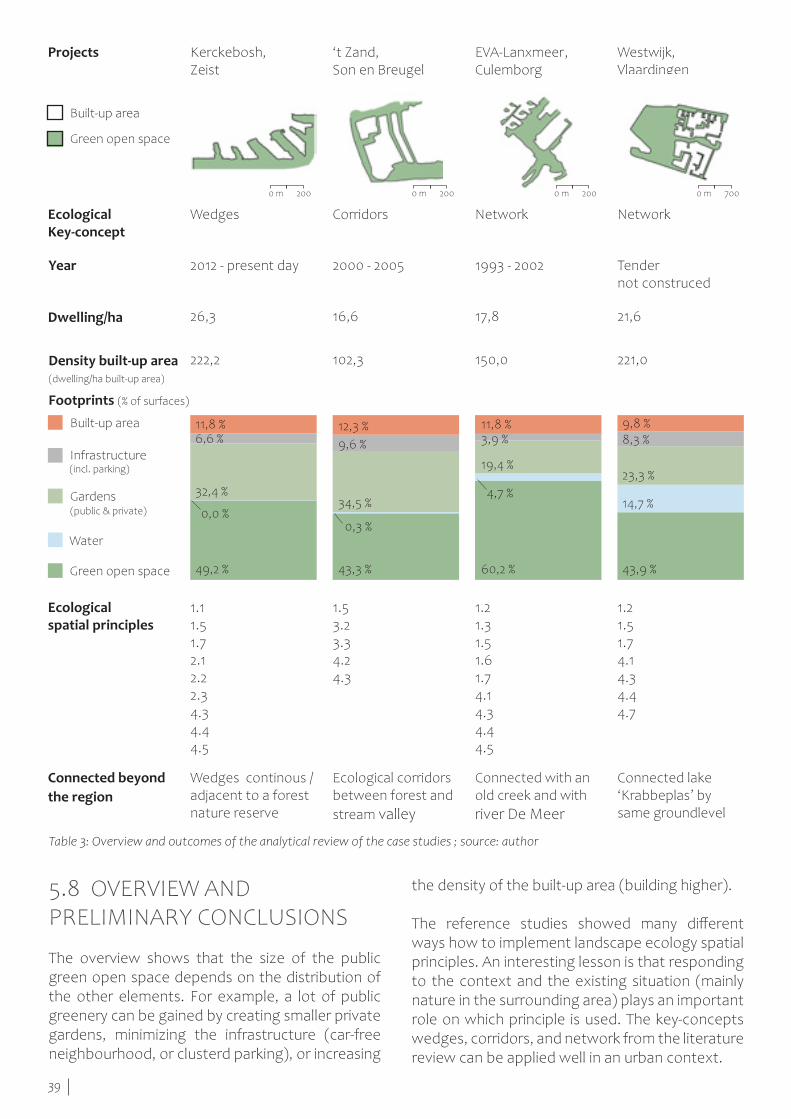
39
Kerckebosh, Zeist
‘t Zand, Son en Breugel
EVA-Lanxmeer,Culemborg
Westwijk, Vlaardingen
Dwelling/ha
Connected beyond the region
Density built-up area (dwelling/ha built-up area)
(incl. parking)
(public & private)
Footprints (% of surfaces)
Ecological Key-concept
Ecological spatial principles
Year
Projects
2012 - present day 2000 - 2005 1993 - 2002 Tender not construced
26,3
Wedges continous /adjacent to a forest nature reserve
16,6
Ecological corridors between forest and stream valley
17,8
Connected with an old creek and with river De Meer
21,6
Connected lake ‘Krabbeplas’ by same groundlevel
222,2 102,3 150,0 221,0
Wedges Corridors Network Network
Green open space
Water
Gardens
Infrastructure
Green open space
Built-up area
Built-up area
1.11.5 1.72.12.22.34.34.44.5
1.5 3.2 3.34.24.3
1.21.3 1.5 1.6 1.74.1 4.34.44.5
1.21.5 1.7 4.1 4.34.44.7
49,2 %
32,4 %
0,0 %
6,6 %11,8 %
43,3 %
0,3 %
34,5 %
9,6 %12,3 %
43,9 %60,2 %
14,7 %4,7 %
23,3 %19,4 %
8,3 %3,9 %9,8 %11,8 %
the density of the built-up area (building higher).
The reference studies showed many different ways how to implement landscape ecology spatial principles. An interesting lesson is that responding to the context and the existing situation (mainly nature in the surrounding area) plays an important role on which principle is used. The key-concepts wedges, corridors, and network from the literature review can be applied well in an urban context.
5.8 OVERVIEW AND PRELIMINARY CONCLUSIONS
The overview shows that the size of the public green open space depends on the distribution of the other elements. For example, a lot of public greenery can be gained by creating smaller private gardens, minimizing the infrastructure (car-free neighbourhood, or clusterd parking), or increasing
Table 3: Overview and outcomes of the analytical review of the case studies ; source: author
0 m 0 m 0 m 0 m200 200 200 700

40
41
ANALYSIS OF THE CASE STUDY AREA:BLOEMENDAL IN BARNEVELD6.
The urban-rural fringe of the case study area; Image source: Gemeente Barneveld, 2020
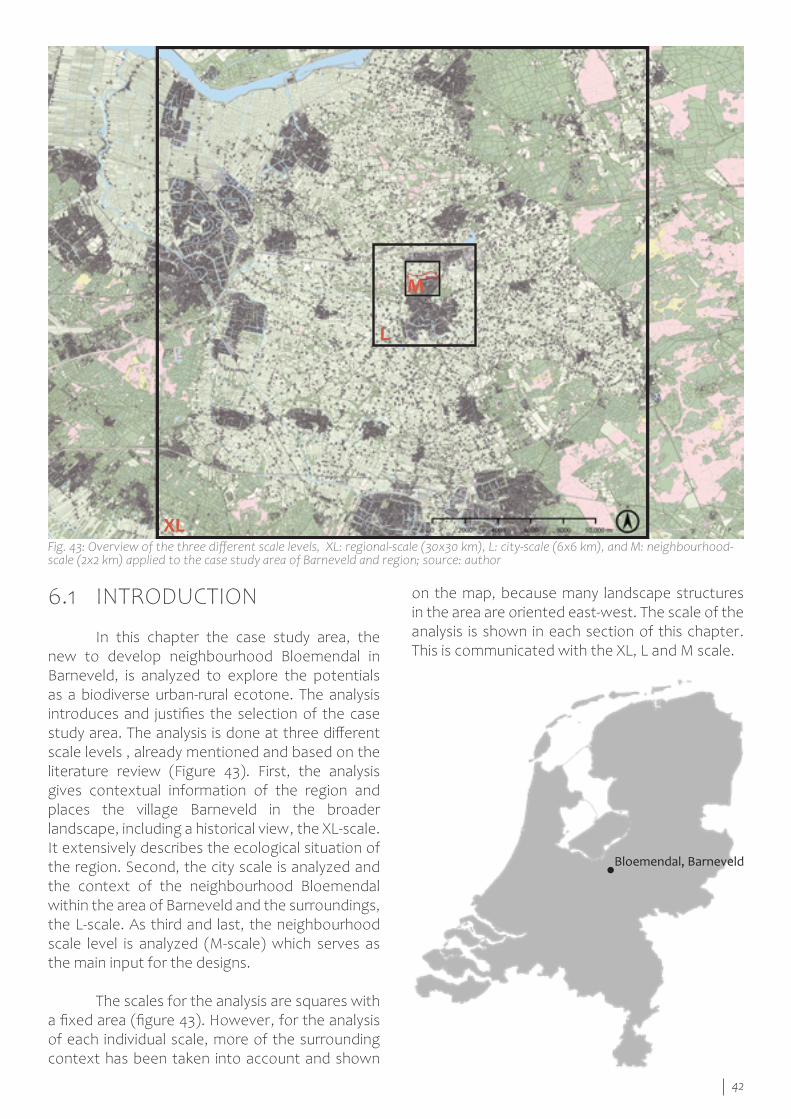
42
on the map, because many landscape structures in the area are oriented east-west. The scale of the analysis is shown in each section of this chapter. This is communicated with the XL, L and M scale.
6.1 INTRODUCTION
In this chapter the case study area, the new to develop neighbourhood Bloemendal in Barneveld, is analyzed to explore the potentials as a biodiverse urban-rural ecotone. The analysis introduces and justifies the selection of the case study area. The analysis is done at three different scale levels , already mentioned and based on the literature review (Figure 43). First, the analysis gives contextual information of the region and places the village Barneveld in the broader landscape, including a historical view, the XL-scale. It extensively describes the ecological situation of the region. Second, the city scale is analyzed and the context of the neighbourhood Bloemendal within the area of Barneveld and the surroundings, the L-scale. As third and last, the neighbourhood scale level is analyzed (M-scale) which serves as the main input for the designs.
The scales for the analysis are squares with a fixed area (figure 43). However, for the analysis of each individual scale, more of the surrounding context has been taken into account and shown
Fig. 43: Overview of the three different scale levels, XL: regional-scale (30x30 km), L: city-scale (6x6 km), and M: neighbourhood-scale (2x2 km) applied to the case study area of Barneveld and region; source: author
XL
L
M
Bloemendal, Barneveld
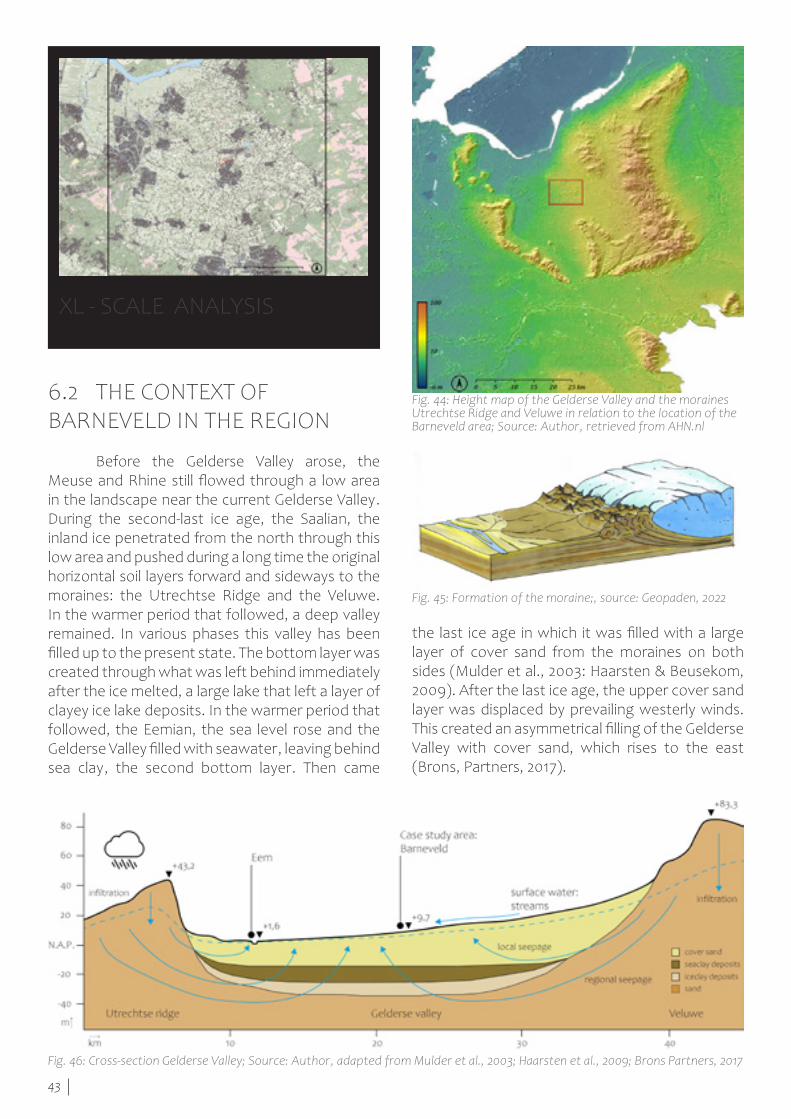
43
6.2 THE CONTEXT OF BARNEVELD IN THE REGION
Before the Gelderse Valley arose, the Meuse and Rhine still flowed through a low area in the landscape near the current Gelderse Valley. During the second-last ice age, the Saalian, the inland ice penetrated from the north through this low area and pushed during a long time the original horizontal soil layers forward and sideways to the moraines: the Utrechtse Ridge and the Veluwe. In the warmer period that followed, a deep valley remained. In various phases this valley has been filled up to the present state. The bottom layer was created through what was left behind immediately after the ice melted, a large lake that left a layer of clayey ice lake deposits. In the warmer period that followed, the Eemian, the sea level rose and the Gelderse Valley filled with seawater, leaving behind sea clay, the second bottom layer. Then came
Fig. 44: Height map of the Gelderse Valley and the moraines Utrechtse Ridge and Veluwe in relation to the location of the Barneveld area; Source: Author, retrieved from AHN.nl
Fig. 45: Formation of the moraine;, source: Geopaden, 2022
Fig. 46: Cross-section Gelderse Valley; Source: Author, adapted from Mulder et al., 2003; Haarsten et al., 2009; Brons Partners, 2017
the last ice age in which it was filled with a large layer of cover sand from the moraines on both sides (Mulder et al., 2003: Haarsten & Beusekom, 2009). After the last ice age, the upper cover sand layer was displaced by prevailing westerly winds. This created an asymmetrical filling of the Gelderse Valley with cover sand, which rises to the east (Brons, Partners, 2017).
XL - SCALE ANALYSISFrame: 30x30 km
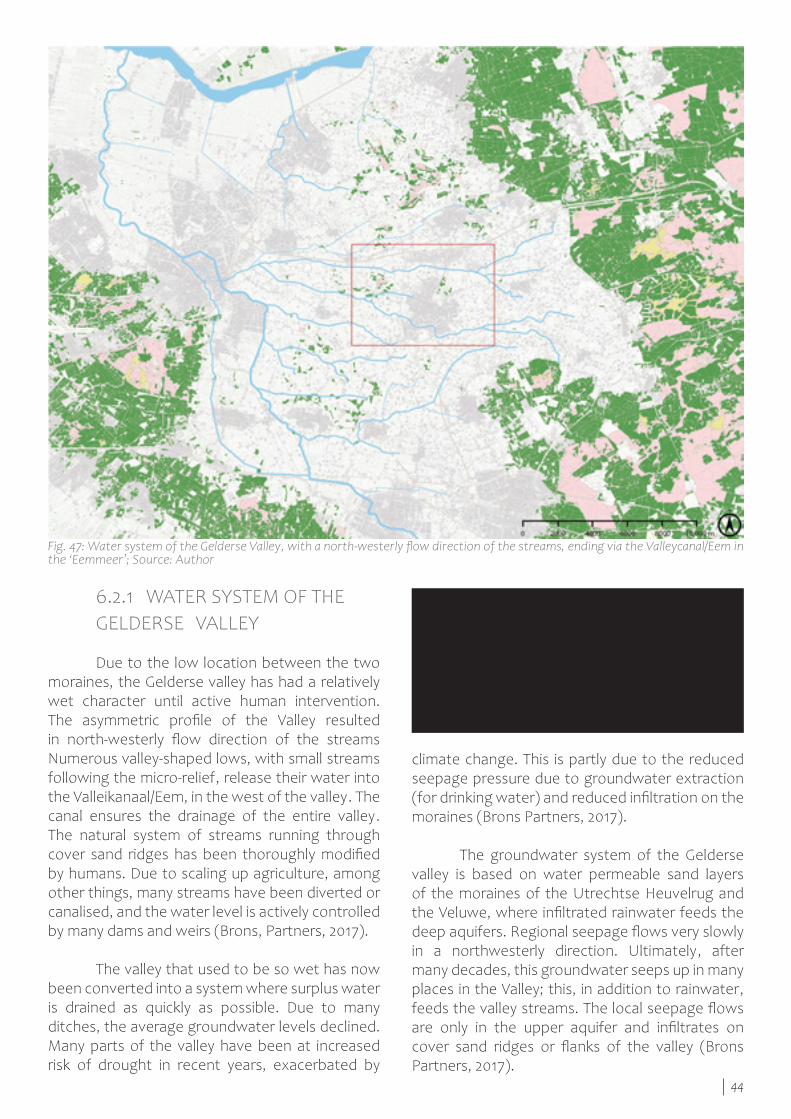
44
The name Barneveld probably also has a wet origin. The oldest form is Barnevelde; if the name had to be converted into contemporary Dutch, we would be talking about ‘well field’. The name means open ground where water seeps up. This seepage originates from the moraines on both sides of the valley (Laak, 2005).
climate change. This is partly due to the reduced seepage pressure due to groundwater extraction (for drinking water) and reduced infiltration on the moraines (Brons Partners, 2017).
The groundwater system of the Gelderse valley is based on water permeable sand layers of the moraines of the Utrechtse Heuvelrug and the Veluwe, where infiltrated rainwater feeds the deep aquifers. Regional seepage flows very slowly in a northwesterly direction. Ultimately, after many decades, this groundwater seeps up in many places in the Valley; this, in addition to rainwater, feeds the valley streams. The local seepage flows are only in the upper aquifer and infiltrates on cover sand ridges or flanks of the valley (Brons Partners, 2017).
6.2.1 WATER SYSTEM OF THE GELDERSE VALLEY
Due to the low location between the two moraines, the Gelderse valley has had a relatively wet character until active human intervention. The asymmetric profile of the Valley resulted in north-westerly flow direction of the streams Numerous valley-shaped lows, with small streams following the micro-relief, release their water into the Valleikanaal/Eem, in the west of the valley. The canal ensures the drainage of the entire valley. The natural system of streams running through cover sand ridges has been thoroughly modified by humans. Due to scaling up agriculture, among other things, many streams have been diverted or canalised, and the water level is actively controlled by many dams and weirs (Brons, Partners, 2017).
The valley that used to be so wet has now been converted into a system where surplus water is drained as quickly as possible. Due to many ditches, the average groundwater levels declined. Many parts of the valley have been at increased risk of drought in recent years, exacerbated by
Fig. 47: Water system of the Gelderse Valley, with a north-westerly flow direction of the streams, ending via the Valleycanal/Eem in the ‘Eemmeer’; Source: Author
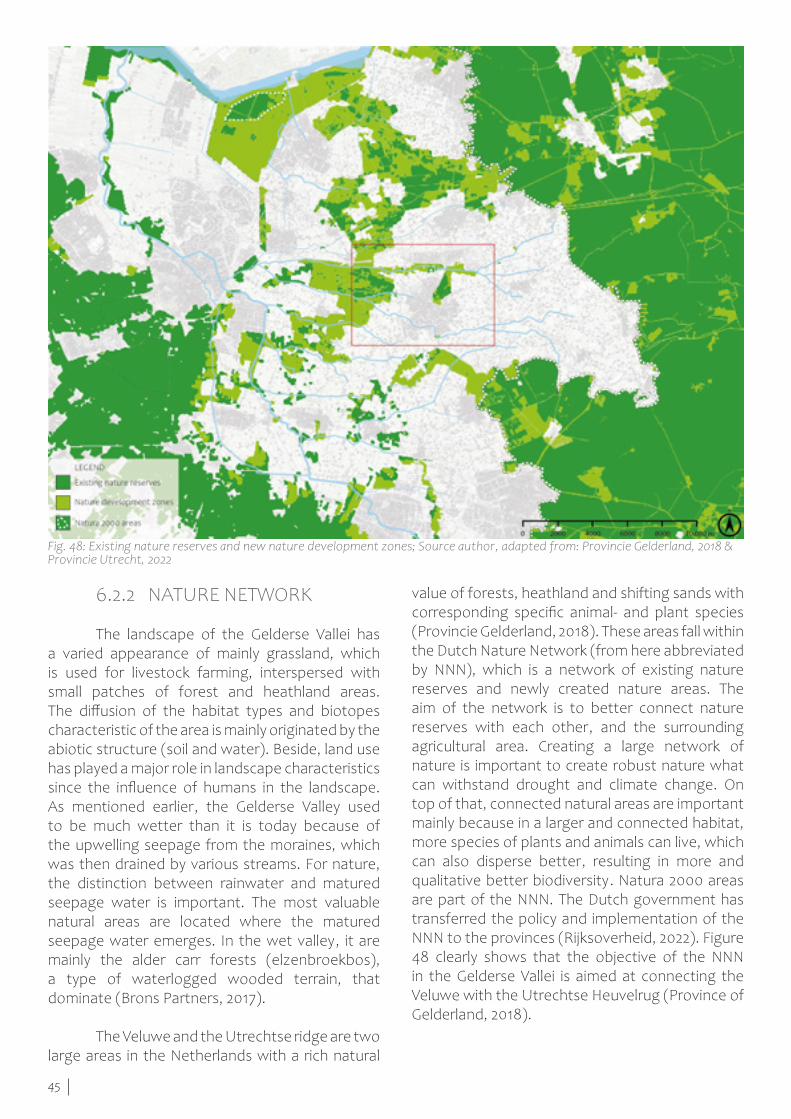
45
value of forests, heathland and shifting sands with corresponding specific animal- and plant species (Provincie Gelderland, 2018). These areas fall within the Dutch Nature Network (from here abbreviated by NNN), which is a network of existing nature reserves and newly created nature areas. The aim of the network is to better connect nature reserves with each other, and the surrounding agricultural area. Creating a large network of nature is important to create robust nature what can withstand drought and climate change. On top of that, connected natural areas are important mainly because in a larger and connected habitat, more species of plants and animals can live, which can also disperse better, resulting in more and qualitative better biodiversity. Natura 2000 areas are part of the NNN. The Dutch government has transferred the policy and implementation of the NNN to the provinces (Rijksoverheid, 2022). Figure 48 clearly shows that the objective of the NNN in the Gelderse Vallei is aimed at connecting the Veluwe with the Utrechtse Heuvelrug (Province of Gelderland, 2018).
6.2.2 NATURE NETWORK
The landscape of the Gelderse Vallei has a varied appearance of mainly grassland, which is used for livestock farming, interspersed with small patches of forest and heathland areas. The diffusion of the habitat types and biotopes characteristic of the area is mainly originated by the abiotic structure (soil and water). Beside, land use has played a major role in landscape characteristics since the influence of humans in the landscape. As mentioned earlier, the Gelderse Valley used to be much wetter than it is today because of the upwelling seepage from the moraines, which was then drained by various streams. For nature, the distinction between rainwater and matured seepage water is important. The most valuable natural areas are located where the matured seepage water emerges. In the wet valley, it are mainly the alder carr forests (elzenbroekbos), a type of waterlogged wooded terrain, that dominate (Brons Partners, 2017).
The Veluwe and the Utrechtse ridge are two large areas in the Netherlands with a rich natural
Fig. 48: Existing nature reserves and new nature development zones; Source author, adapted from: Provincie Gelderland, 2018 & Provincie Utrecht, 2022
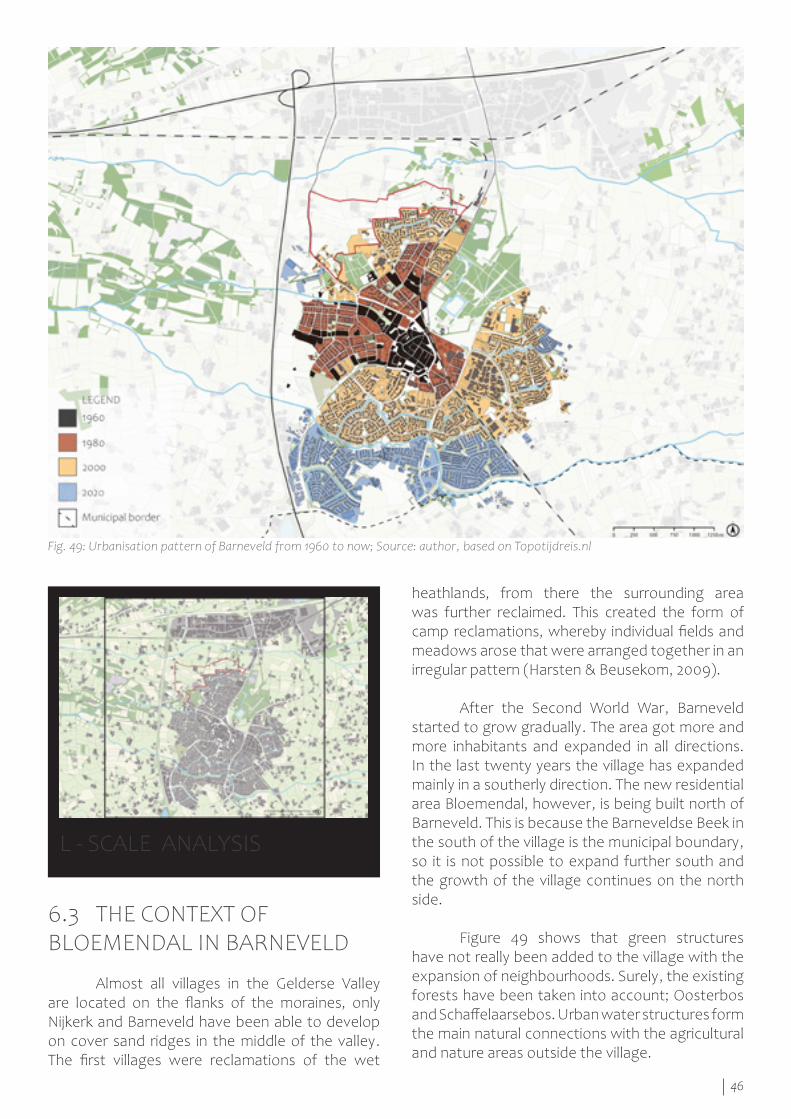
46
heathlands, from there the surrounding area was further reclaimed. This created the form of camp reclamations, whereby individual fields and meadows arose that were arranged together in an irregular pattern (Harsten & Beusekom, 2009).
After the Second World War, Barneveld started to grow gradually. The area got more and more inhabitants and expanded in all directions. In the last twenty years the village has expanded mainly in a southerly direction. The new residential area Bloemendal, however, is being built north of Barneveld. This is because the Barneveldse Beek in the south of the village is the municipal boundary, so it is not possible to expand further south and the growth of the village continues on the north side. Figure 49 shows that green structures have not really been added to the village with the expansion of neighbourhoods. Surely, the existing forests have been taken into account; Oosterbos and Schaffelaarsebos. Urban water structures form the main natural connections with the agricultural and nature areas outside the village.
6.3 THE CONTEXT OF BLOEMENDAL IN BARNEVELD
Almost all villages in the Gelderse Valley are located on the flanks of the moraines, only Nijkerk and Barneveld have been able to develop on cover sand ridges in the middle of the valley. The first villages were reclamations of the wet
Fig. 49: Urbanisation pattern of Barneveld from 1960 to now; Source: author, based on Topotijdreis.nl
L - SCALE ANALYSISFrame: 6x6 km
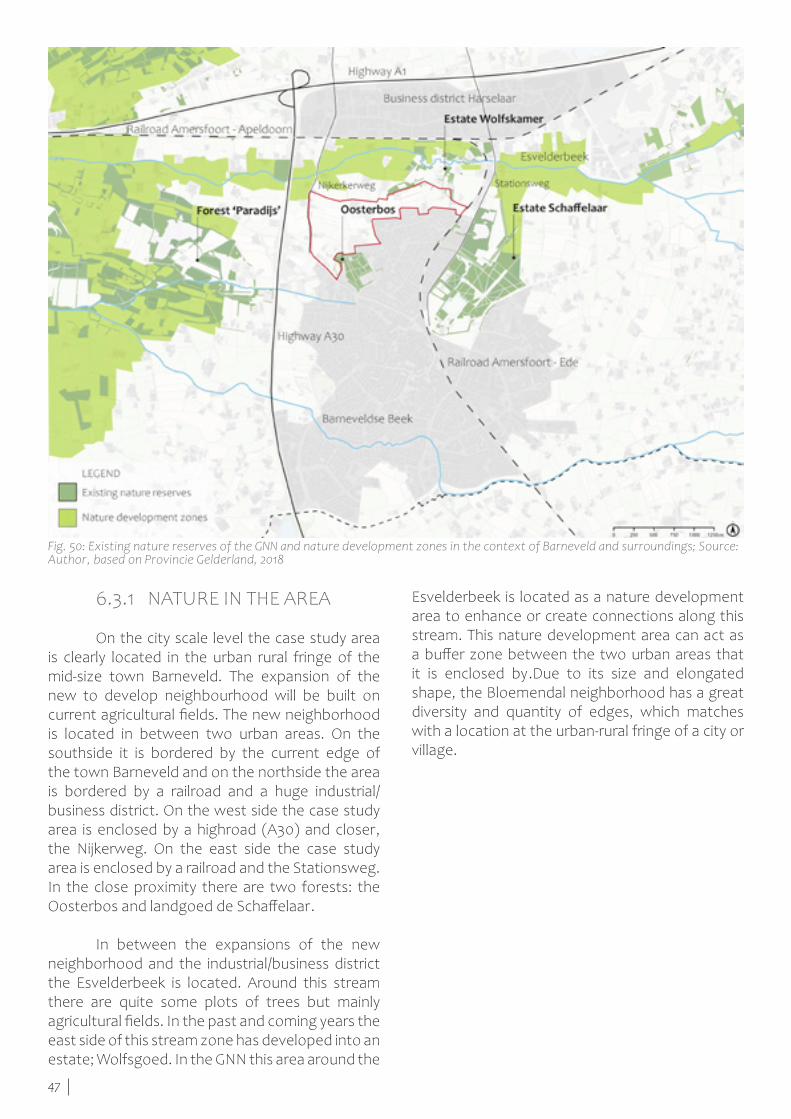
47
Esvelderbeek is located as a nature development area to enhance or create connections along this stream. This nature development area can act as a buffer zone between the two urban areas that it is enclosed by.Due to its size and elongated shape, the Bloemendal neighborhood has a great diversity and quantity of edges, which matches with a location at the urban-rural fringe of a city or village.
6.3.1 NATURE IN THE AREA
On the city scale level the case study area is clearly located in the urban rural fringe of the mid-size town Barneveld. The expansion of the new to develop neighbourhood will be built on current agricultural fields. The new neighborhood is located in between two urban areas. On the southside it is bordered by the current edge of the town Barneveld and on the northside the area is bordered by a railroad and a huge industrial/business district. On the west side the case study area is enclosed by a highroad (A30) and closer, the Nijkerweg. On the east side the case study area is enclosed by a railroad and the Stationsweg. In the close proximity there are two forests: the Oosterbos and landgoed de Schaffelaar.
In between the expansions of the new neighborhood and the industrial/business district the Esvelderbeek is located. Around this stream there are quite some plots of trees but mainly agricultural fields. In the past and coming years the east side of this stream zone has developed into an estate; Wolfsgoed. In the GNN this area around the
Fig. 50: Existing nature reserves of the GNN and nature development zones in the context of Barneveld and surroundings; Source: Author, based on Provincie Gelderland, 2018
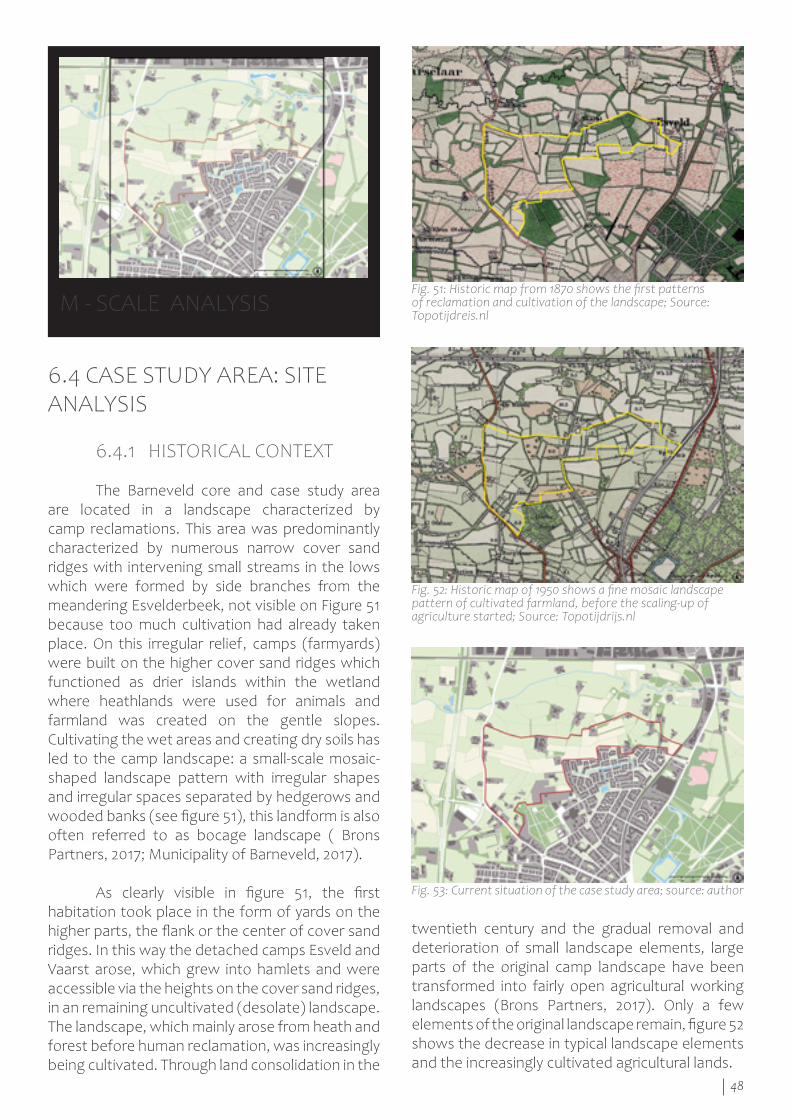
48
twentieth century and the gradual removal and deterioration of small landscape elements, large parts of the original camp landscape have been transformed into fairly open agricultural working landscapes (Brons Partners, 2017). Only a few elements of the original landscape remain, figure 52 shows the decrease in typical landscape elements and the increasingly cultivated agricultural lands.
6.4 CASE STUDY AREA: SITE ANALYSIS
6.4.1 HISTORICAL CONTEXT The Barneveld core and case study area are located in a landscape characterized by camp reclamations. This area was predominantly characterized by numerous narrow cover sand ridges with intervening small streams in the lows which were formed by side branches from the meandering Esvelderbeek, not visible on Figure 51 because too much cultivation had already taken place. On this irregular relief, camps (farmyards) were built on the higher cover sand ridges which functioned as drier islands within the wetland where heathlands were used for animals and farmland was created on the gentle slopes. Cultivating the wet areas and creating dry soils has led to the camp landscape: a small-scale mosaic-shaped landscape pattern with irregular shapes and irregular spaces separated by hedgerows and wooded banks (see figure 51), this landform is also often referred to as bocage landscape ( Brons Partners, 2017; Municipality of Barneveld, 2017).
As clearly visible in figure 51, the first habitation took place in the form of yards on the higher parts, the flank or the center of cover sand ridges. In this way the detached camps Esveld and Vaarst arose, which grew into hamlets and were accessible via the heights on the cover sand ridges, in an remaining uncultivated (desolate) landscape.The landscape, which mainly arose from heath and forest before human reclamation, was increasingly being cultivated. Through land consolidation in the
Fig. 51: Historic map from 1870 shows the first patterns of reclamation and cultivation of the landscape; Source: Topotijdreis.nl
Fig. 52: Historic map of 1950 shows a fine mosaic landscape pattern of cultivated farmland, before the scaling-up of agriculture started; Source: Topotijdrijs.nl
M - SCALE ANALYSIS
Fig. 53: Current situation of the case study area; source: author
Frame: 2x2 km
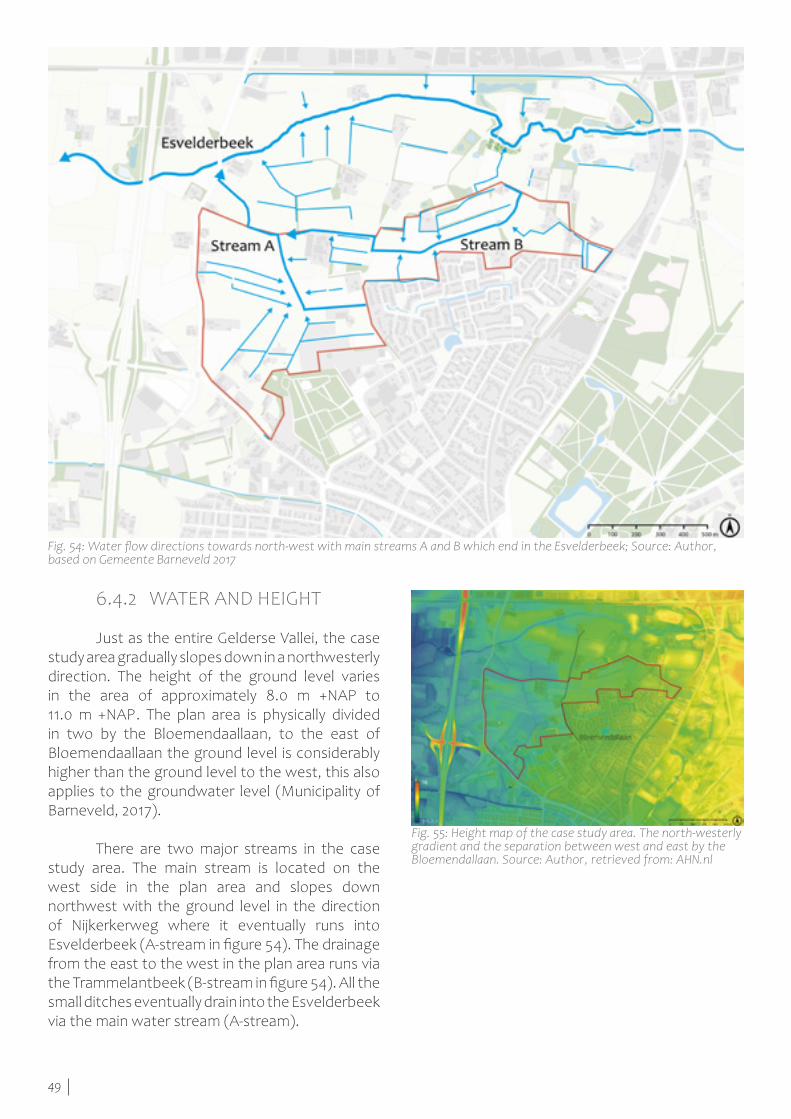
49
6.4.2 WATER AND HEIGHT
Just as the entire Gelderse Vallei, the case study area gradually slopes down in a northwesterly direction. The height of the ground level varies in the area of approximately 8.0 m +NAP to 11.0 m +NAP. The plan area is physically divided in two by the Bloemendaallaan, to the east of Bloemendaallaan the ground level is considerably higher than the ground level to the west, this also applies to the groundwater level (Municipality of Barneveld, 2017).
There are two major streams in the case study area. The main stream is located on the west side in the plan area and slopes down northwest with the ground level in the direction of Nijkerkerweg where it eventually runs into Esvelderbeek (A-stream in figure 54). The drainage from the east to the west in the plan area runs via the Trammelantbeek (B-stream in figure 54). All the small ditches eventually drain into the Esvelderbeek via the main water stream (A-stream).
Fig. 54: Water flow directions towards north-west with main streams A and B which end in the Esvelderbeek; Source: Author, based on Gemeente Barneveld 2017
Fig. 55: Height map of the case study area. The north-westerly gradient and the separation between west and east by the Bloemendallaan. Source: Author, retrieved from: AHN.nl
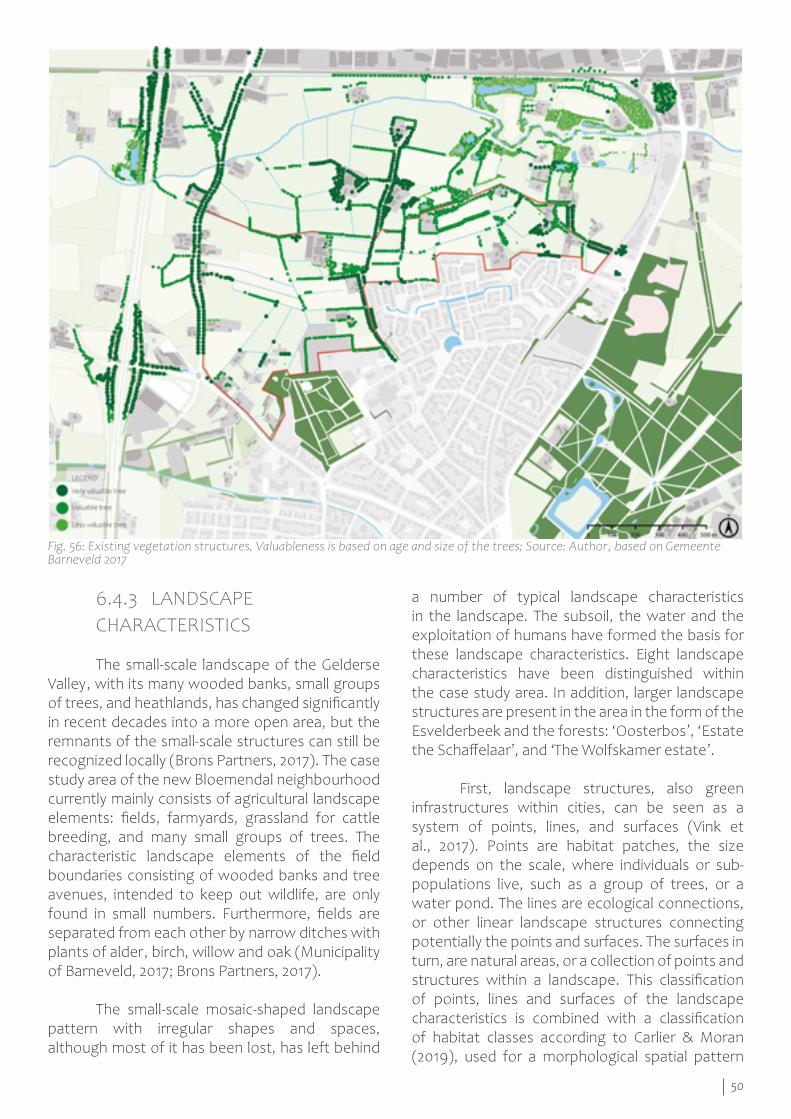
50
a number of typical landscape characteristics in the landscape. The subsoil, the water and the exploitation of humans have formed the basis for these landscape characteristics. Eight landscape characteristics have been distinguished within the case study area. In addition, larger landscape structures are present in the area in the form of the Esvelderbeek and the forests: ‘Oosterbos’, ‘Estate the Schaffelaar’, and ‘The Wolfskamer estate’.
First, landscape structures, also green infrastructures within cities, can be seen as a system of points, lines, and surfaces (Vink et al., 2017). Points are habitat patches, the size depends on the scale, where individuals or sub-populations live, such as a group of trees, or a water pond. The lines are ecological connections, or other linear landscape structures connecting potentially the points and surfaces. The surfaces in turn, are natural areas, or a collection of points and structures within a landscape. This classification of points, lines and surfaces of the landscape characteristics is combined with a classification of habitat classes according to Carlier & Moran (2019), used for a morphological spatial pattern
6.4.3 LANDSCAPE CHARACTERISTICS
The small-scale landscape of the Gelderse Valley, with its many wooded banks, small groups of trees, and heathlands, has changed significantly in recent decades into a more open area, but the remnants of the small-scale structures can still be recognized locally (Brons Partners, 2017). The case study area of the new Bloemendal neighbourhood currently mainly consists of agricultural landscape elements: fields, farmyards, grassland for cattle breeding, and many small groups of trees. The characteristic landscape elements of the field boundaries consisting of wooded banks and tree avenues, intended to keep out wildlife, are only found in small numbers. Furthermore, fields are separated from each other by narrow ditches with plants of alder, birch, willow and oak (Municipality of Barneveld, 2017; Brons Partners, 2017).
The small-scale mosaic-shaped landscape pattern with irregular shapes and spaces, although most of it has been lost, has left behind
Fig. 56: Existing vegetation structures, Valuableness is based on age and size of the trees; Source: Author, based on Gemeente Barneveld 2017
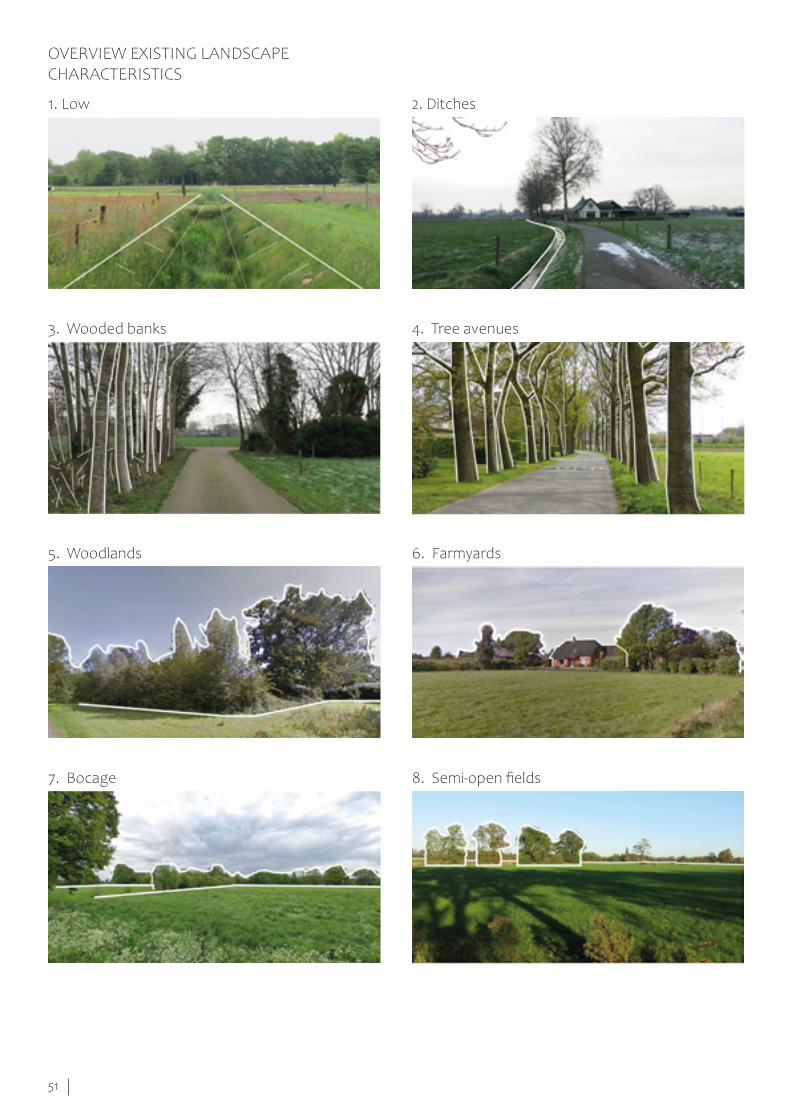
51
OVERVIEW EXISTING LANDSCAPE CHARACTERISTICS
1. Low
3. Wooded banks
5. Woodlands
7. Bocage
2. Ditches
4. Tree avenues
6. Farmyards
8. Semi-open fields
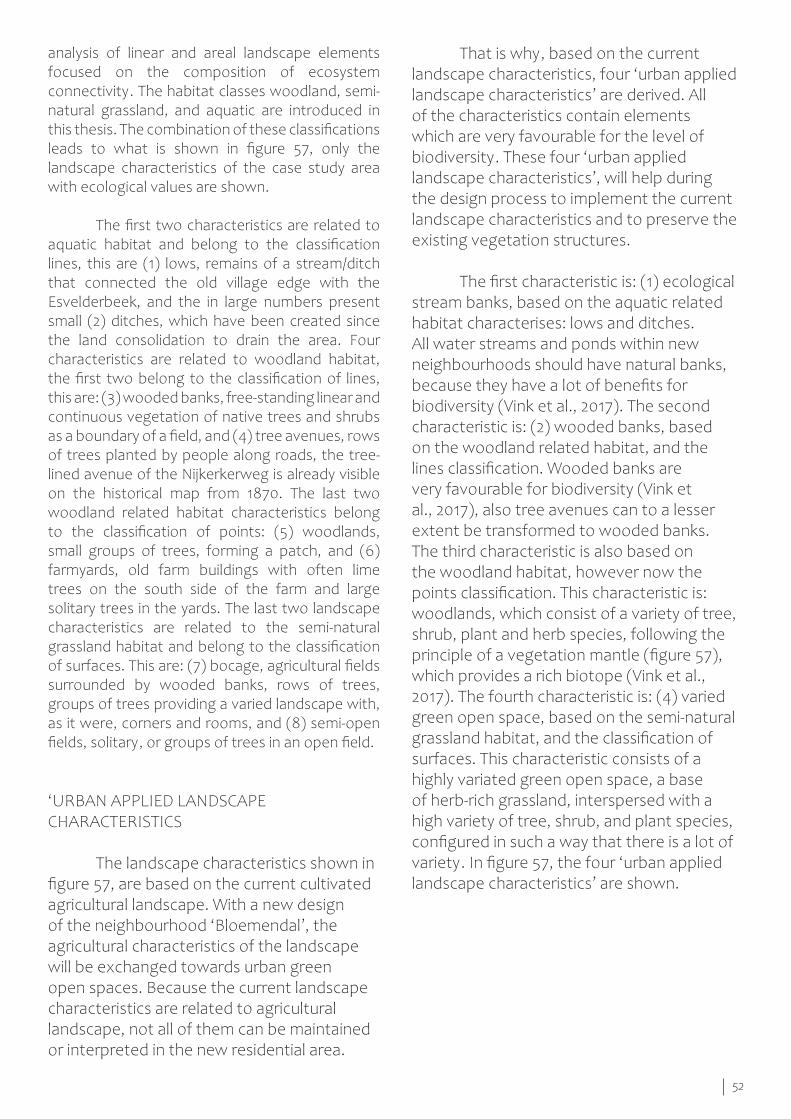
52
That is why, based on the current landscape characteristics, four ‘urban applied landscape characteristics’ are derived. All of the characteristics contain elements which are very favourable for the level of biodiversity. These four ‘urban applied landscape characteristics’, will help during the design process to implement the current landscape characteristics and to preserve the existing vegetation structures.
The first characteristic is: (1) ecological stream banks, based on the aquatic related habitat characterises: lows and ditches. All water streams and ponds within new neighbourhoods should have natural banks, because they have a lot of benefits for biodiversity (Vink et al., 2017). The second characteristic is: (2) wooded banks, based on the woodland related habitat, and the lines classification. Wooded banks are very favourable for biodiversity (Vink et al., 2017), also tree avenues can to a lesser extent be transformed to wooded banks. The third characteristic is also based on the woodland habitat, however now the points classification. This characteristic is: woodlands, which consist of a variety of tree, shrub, plant and herb species, following the principle of a vegetation mantle (figure 57), which provides a rich biotope (Vink et al., 2017). The fourth characteristic is: (4) varied green open space, based on the semi-natural grassland habitat, and the classification of surfaces. This characteristic consists of a highly variated green open space, a base of herb-rich grassland, interspersed with a high variety of tree, shrub, and plant species, configured in such a way that there is a lot of variety. In figure 57, the four ‘urban applied landscape characteristics’ are shown.
analysis of linear and areal landscape elements focused on the composition of ecosystem connectivity. The habitat classes woodland, semi-natural grassland, and aquatic are introduced in this thesis. The combination of these classifications leads to what is shown in figure 57, only the landscape characteristics of the case study area with ecological values are shown.
The first two characteristics are related to aquatic habitat and belong to the classification lines, this are (1) lows, remains of a stream/ditch that connected the old village edge with the Esvelderbeek, and the in large numbers present small (2) ditches, which have been created since the land consolidation to drain the area. Four characteristics are related to woodland habitat, the first two belong to the classification of lines, this are: (3) wooded banks, free-standing linear and continuous vegetation of native trees and shrubs as a boundary of a field, and (4) tree avenues, rows of trees planted by people along roads, the tree-lined avenue of the Nijkerkerweg is already visible on the historical map from 1870. The last two woodland related habitat characteristics belong to the classification of points: (5) woodlands, small groups of trees, forming a patch, and (6) farmyards, old farm buildings with often lime trees on the south side of the farm and large solitary trees in the yards. The last two landscape characteristics are related to the semi-natural grassland habitat and belong to the classification of surfaces. This are: (7) bocage, agricultural fields surrounded by wooded banks, rows of trees, groups of trees providing a varied landscape with, as it were, corners and rooms, and (8) semi-open fields, solitary, or groups of trees in an open field.
‘URBAN APPLIED LANDSCAPE CHARACTERISTICS
The landscape characteristics shown in figure 57, are based on the current cultivated agricultural landscape. With a new design of the neighbourhood ‘Bloemendal’, the agricultural characteristics of the landscape will be exchanged towards urban green open spaces. Because the current landscape characteristics are related to agricultural landscape, not all of them can be maintained or interpreted in the new residential area.
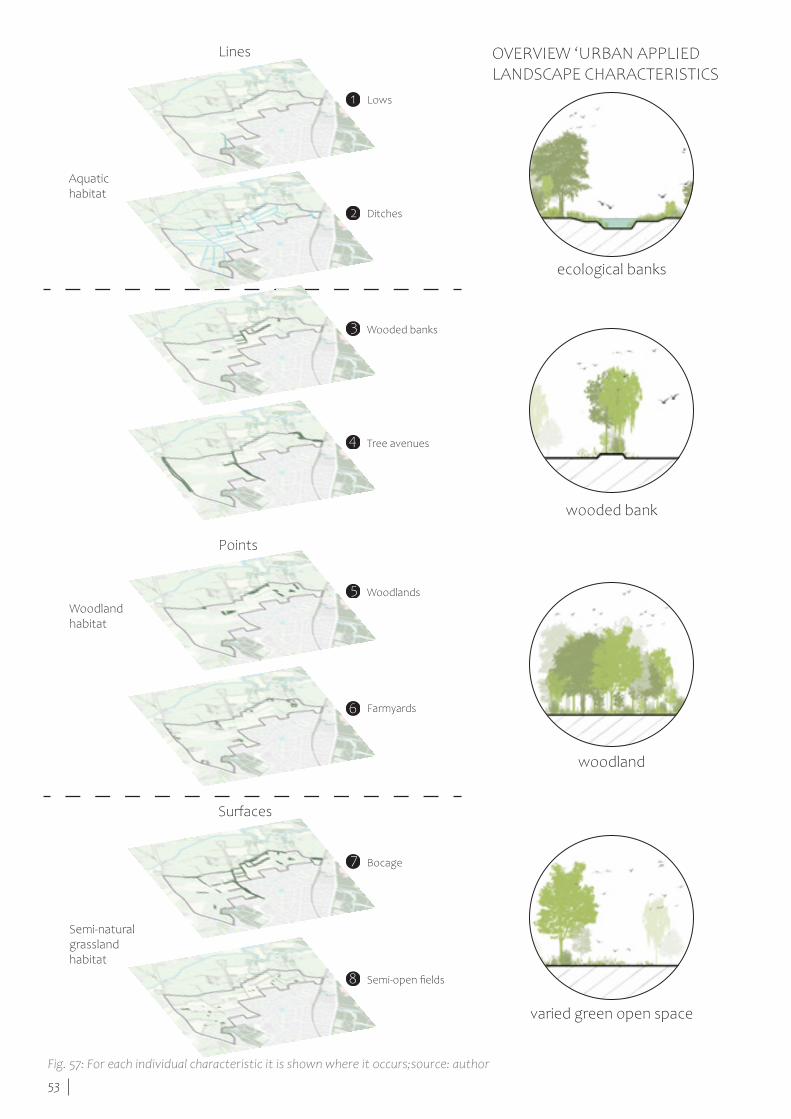
53
ecological banks
wooded bank
woodland
varied green open space
OVERVIEW ‘URBAN APPLIED LANDSCAPE CHARACTERISTICS
Lines
Woodland habitat
Semi-naturalgrasslandhabitat
Aquatic habitat
Lows
Ditches
Wooded banks
Tree avenues
Woodlands
Farmyards
Bocage
Semi-open fields
Points
Surfaces
1
2
3
4
7
8
5
6
Fig. 57: For each individual characteristic it is shown where it occurs;source: author
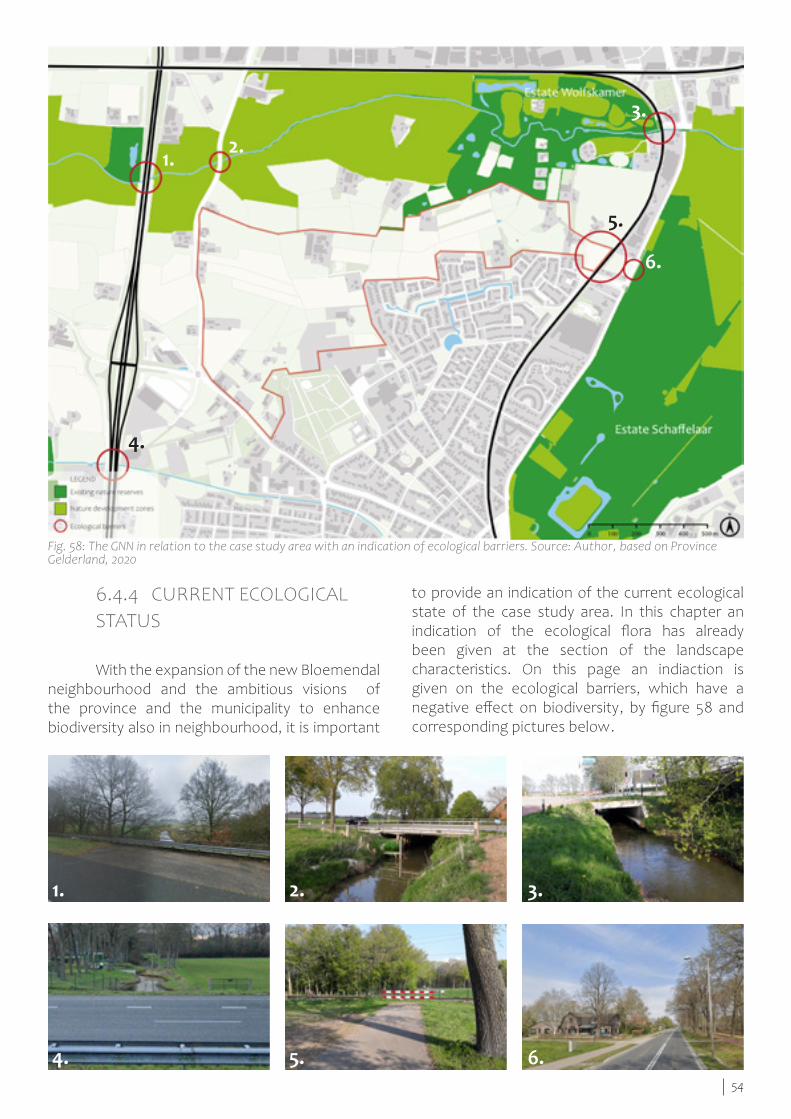
54
Fig. 58: The GNN in relation to the case study area with an indication of ecological barriers. Source: Author, based on Province Gelderland, 2020
1.
1.
2.
2.
3.
4. 5. 6.
6.
to provide an indication of the current ecological state of the case study area. In this chapter an indication of the ecological flora has already been given at the section of the landscape characteristics. On this page an indiaction is given on the ecological barriers, which have a negative effect on biodiversity, by figure 58 and corresponding pictures below.
6.4.4 CURRENT ECOLOGICAL STATUS
With the expansion of the new Bloemendal neighbourhood and the ambitious visions of the province and the municipality to enhance biodiversity also in neighbourhood, it is important
3.
4.
5.
55
The following section will give an indication on the ecological status of the case study area, mainly by showing the existing fauna in the region, and which Dutch policies are involved.
BIODIVERSITY POLICY
As a logical consequence of the global and national loss of biodiversity, the variation in plant and animal species in Gelderland is also decreasing. A lot of intervention is needed to restore biodiversity levels. The province of Gelderland is working on this by connecting nature reserves in a smart way, for example through the aforementioned GNN. As shown in figure 58, the GNN area lies on the border of the project area. This zone of the GNN falls under the Binnenveld and estate zone (including the Wolfskamer estate) and forms a side branch of the connection between the Utrechts Heuvelrug and the Veluwe. In addition, the province also has the objective of bringing livestock farming, agriculture and horticulture more into balance with nature goals. As a third point to increase biodiversity, the province aims to strengthen biodiversity in the built environment by paying more attention to nature in neighbourhoods (Provincie Gelderland, 2018).
The Municipality of Barneveld also has its own biodiversity policy plan. The municipality wants to preserve habitats of plants and animals because of their intrinsic value and to work on a healthy and future-proof living environment. The municipality of Barneveld is rich in different landscape types, the preservation and repair of these different landscape types provides the basis for biodiversity. One of the many components that is being worked on are icon-species to make biodiversity tangible and visible. (ijsvogel, weidebeekjuffer, oranjetipje, steenuil, boommarter, weidehommel, gierzwaluw en ringslang) are typical species that represent the quality of nature in urban areas and our countryside. These icon-species play an important role in communication and education, but also in monitoring of biodiversity (Municipality of Barneveld, 2021).
DUTCH LEGISLATION ON NATURE
In the Netherlands there are two main focuses in terms of nature policy; area protection and species protection. These consist mainly of the Nature Conservation Act 1998, and Flora and Fauna Act. In addition to the national nature conservation policy, these laws also anchor numerous international treaties and guidelines, such as: Birds Directive, Habitats Directive and other conventions. In the Netherlands, one of the most important spearheads in terms of nature policy is the NNN (Arcadis, 2016).
The Flora and Fauna Act regulates the protection of wild plants and animals. The Flora and Fauna Act has a duty of care that applies to all animals. This means that human actions must not have any negative consequences for animal species. In addition to the duty of care, the law contains a number of prohibitions that must ensure that species living in the wild are left alone as much as possible.
The Nature Conservation Act 1998 regulates the protection of nature reserves in the Netherlands. This mainly concerns the protection of Natura 2000 areas, so that these areas are not damaged. The law has so-called conservation objectives for an area (targets for conservation, improvement or expansion). The effects of activities in and around a Natura 2000 site must be assessed against the law. Activities that could have a significant negative effect on the conservation objectives of a Natura 2000 site are not allowed and may not take place without a permit. If, after taking mitigating measures, negative effects for a project area cannot be prevented, then it is only possible to continue the activities if it is for indispensable reasons or if it is of major public interest (Arcadis, 2016).
56
EXISTING FAUNA IN THE REGION
Birds Research in the case study area has shown that the dispersion area of the following protected species occur in the project area: wood falcon, buzzard, barn owl,, rook, little owl (boomvalk, buizerd, kerkuil, roek, steenuil). At the moment, none of these species actually occurs in the project area (including nesting sites). However, this cultural landscape, consisting of farmyards, wooded banks, tree avenues, and small groups of trees is an ideal habitat (nesting site and foraging area) for the aforementioned species, as well as general breeding birds. Common species such as the house sparrow, the long-eared owl and the tree falcon (huismus, de ransuil en de boomvalk) can be assumed to occur in the project area, especially around the Oosterbos (Arcadis, 2016).
Mammals The Bloemendal project area lies within the dispersion area of the following protected mammals: pine marten, badger, squirrel, stone marten and bats (boommarter, das, eekhoorn, steenmarter en vleermuizen). Again, the landscape type with small landscape elements is suitable for these animal species and could eventually function as a dispersal area for the badger and other species. However, none of these species were found within the project area. The pine marten and squirrel do occur in the Oosterbos. The project area can function especially as a dispersal area for the pine marten (Arcadis, 2016).
Amphibians, reptiles, fish and invertebratesOnly common amphibian, reptile, fish and invertebrate species occur in the project area. The protected species from these categories do not occur. As for the amphibians, the moor frog, crested newt and pool frog (heikikker, kamsalamander en poelkikker) do occur in the surroundings. As far as the fish are concerned, the project area is in the dispersion area of the bitterling and the lesser loach (bittervoorn en de kleine modderkruiper), but the chance that these can spread is small because there are not enough water-retaining structures all year round. The same principle applies to invertebrates such as butterflies, dragonflies, and beetles (dagvlinders, libellen, en kevers) due to dispersion data and habitat preferences, these animals are not expected in the case study area (Arcadis, 2016).
57
Current construction work in the case study area; source: Barneveldse krant, September 13, 2021
DESIGN INVENTORY7.
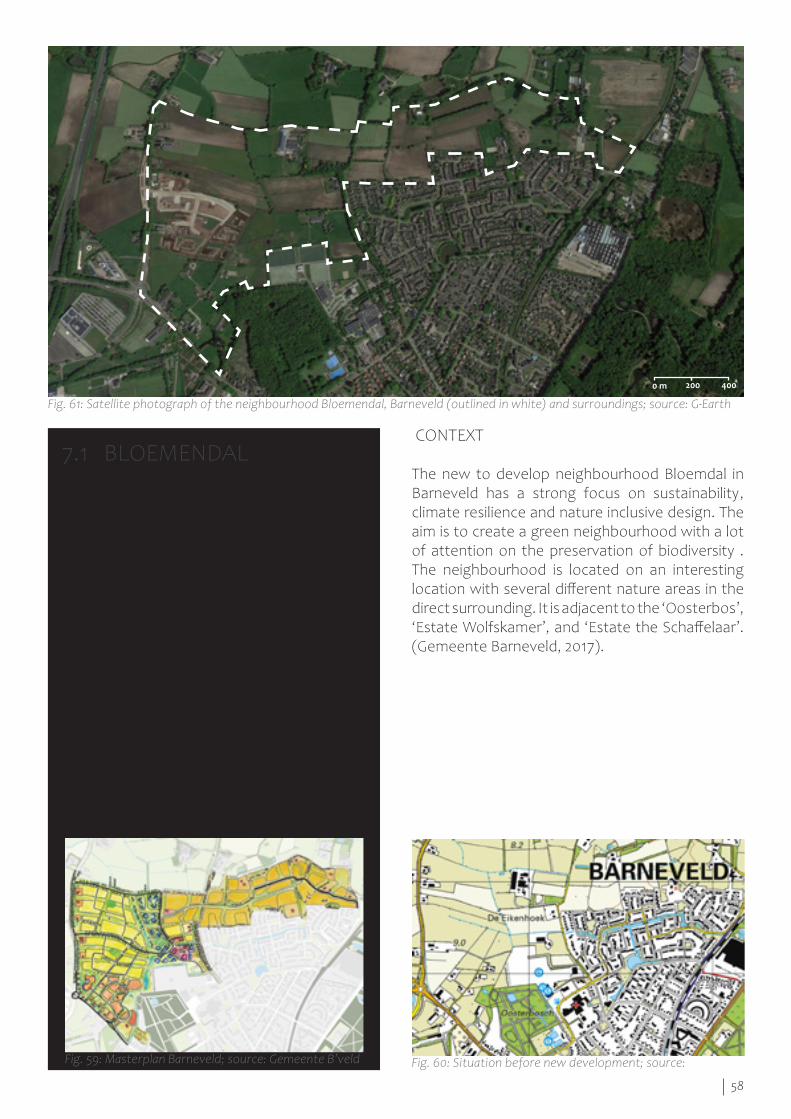
58
CONTEXT
The new to develop neighbourhood Bloemdal in Barneveld has a strong focus on sustainability, climate resilience and nature inclusive design. The aim is to create a green neighbourhood with a lot of attention on the preservation of biodiversity . The neighbourhood is located on an interesting location with several different nature areas in the direct surrounding. It is adjacent to the ‘Oosterbos’, ‘Estate Wolfskamer’, and ‘Estate the Schaffelaar’. (Gemeente Barneveld, 2017).
7.1 BLOEMENDAL
Location Barneveldyear 2020 - 2030 Designed by Municipality of BarneveldAwards: -
Soil type sandygroundwater level relatvively low (due t0 drainage for agriculture) Surroundings Several small forests, estates and the stream Esvelderbeek size of the area 77 ha dwelling/ha 20,1 dwelling/ha (1550)
% green open space 34,4 % (26,5 ha)% water 3,9 % (3 ha)% built-up area 11,1 % (8,5 ha)% infrastructure 15,6 % (12 ha) % gardens 35,0 % (27 ha)
Fig. 59: Masterplan Barneveld; source: Gemeente B’veld Fig. 60: Situation before new development; source:
Fig. 61: Satellite photograph of the neighbourhood Bloemendal, Barneveld (outlined in white) and surroundings; source: G-Earth
0 m 200 400
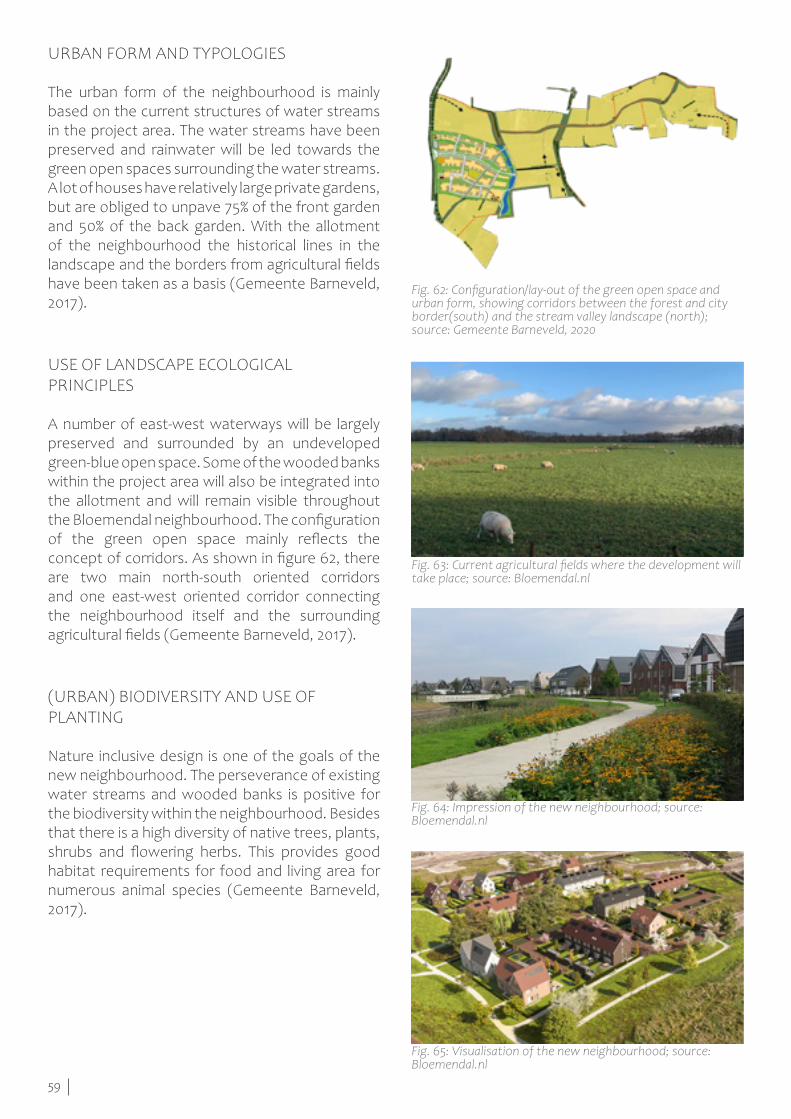
59
URBAN FORM AND TYPOLOGIES
The urban form of the neighbourhood is mainly based on the current structures of water streams in the project area. The water streams have been preserved and rainwater will be led towards the green open spaces surrounding the water streams. A lot of houses have relatively large private gardens, but are obliged to unpave 75% of the front garden and 50% of the back garden. With the allotment of the neighbourhood the historical lines in the landscape and the borders from agricultural fields have been taken as a basis (Gemeente Barneveld, 2017).
USE OF LANDSCAPE ECOLOGICAL PRINCIPLES
A number of east-west waterways will be largely preserved and surrounded by an undeveloped green-blue open space. Some of the wooded banks within the project area will also be integrated into the allotment and will remain visible throughout the Bloemendal neighbourhood. The configuration of the green open space mainly reflects the concept of corridors. As shown in figure 62, there are two main north-south oriented corridors and one east-west oriented corridor connecting the neighbourhood itself and the surrounding agricultural fields (Gemeente Barneveld, 2017).
(URBAN) BIODIVERSITY AND USE OF PLANTING
Nature inclusive design is one of the goals of the new neighbourhood. The perseverance of existing water streams and wooded banks is positive for the biodiversity within the neighbourhood. Besides that there is a high diversity of native trees, plants, shrubs and flowering herbs. This provides good habitat requirements for food and living area for numerous animal species (Gemeente Barneveld, 2017).
Fig. 62: Configuration/lay-out of the green open space and urban form, showing corridors between the forest and city border(south) and the stream valley landscape (north); source: Gemeente Barneveld, 2020
Fig. 63: Current agricultural fields where the development will take place; source: Bloemendal.nl
Fig. 64: Impression of the new neighbourhood; source: Bloemendal.nl
Fig. 65: Visualisation of the new neighbourhood; source: Bloemendal.nl
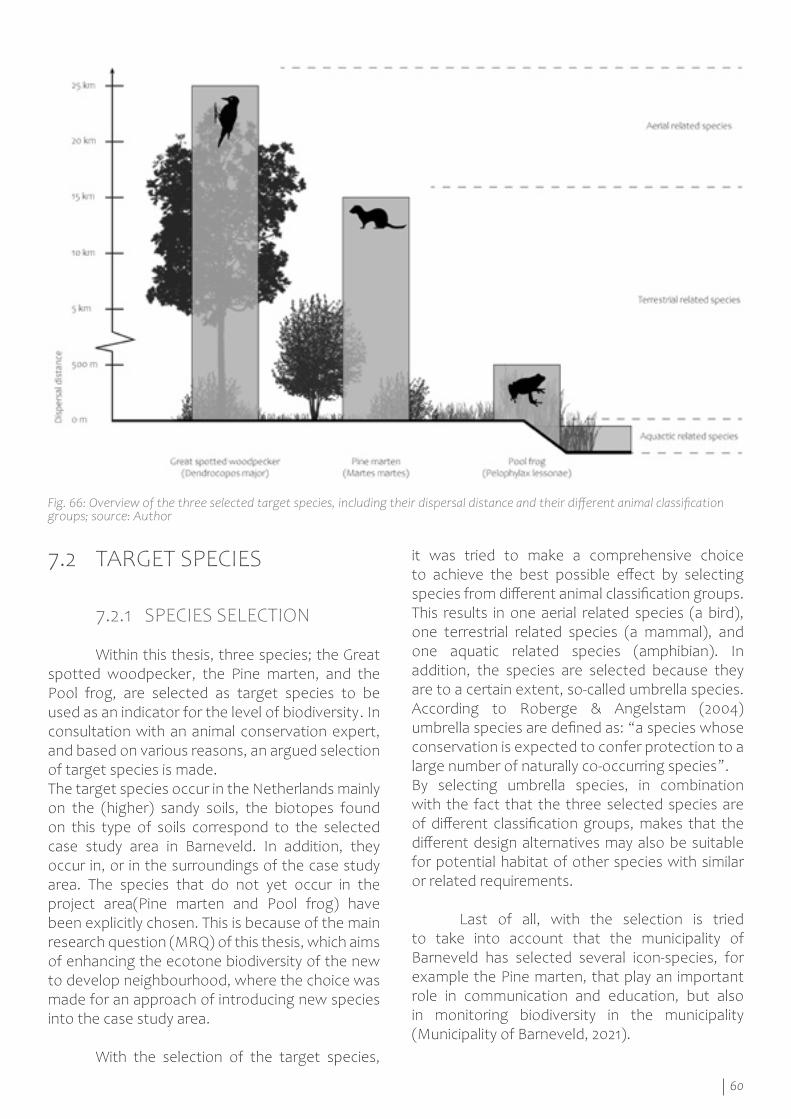
60
it was tried to make a comprehensive choice to achieve the best possible effect by selecting species from different animal classification groups. This results in one aerial related species (a bird), one terrestrial related species (a mammal), and one aquatic related species (amphibian). In addition, the species are selected because they are to a certain extent, so-called umbrella species. According to Roberge & Angelstam (2004) umbrella species are defined as: “a species whose conservation is expected to confer protection to a large number of naturally co-occurring species”. By selecting umbrella species, in combination with the fact that the three selected species are of different classification groups, makes that the different design alternatives may also be suitable for potential habitat of other species with similar or related requirements.
Last of all, with the selection is tried to take into account that the municipality of Barneveld has selected several icon-species, for example the Pine marten, that play an important role in communication and education, but also in monitoring biodiversity in the municipality (Municipality of Barneveld, 2021).
7.2 TARGET SPECIES
7.2.1 SPECIES SELECTION
Within this thesis, three species; the Great spotted woodpecker, the Pine marten, and the Pool frog, are selected as target species to be used as an indicator for the level of biodiversity. In consultation with an animal conservation expert, and based on various reasons, an argued selection of target species is made. The target species occur in the Netherlands mainly on the (higher) sandy soils, the biotopes found on this type of soils correspond to the selected case study area in Barneveld. In addition, they occur in, or in the surroundings of the case study area. The species that do not yet occur in the project area(Pine marten and Pool frog) have been explicitly chosen. This is because of the main research question (MRQ) of this thesis, which aims of enhancing the ecotone biodiversity of the new to develop neighbourhood, where the choice was made for an approach of introducing new species into the case study area.
With the selection of the target species,
Fig. 66: Overview of the three selected target species, including their dispersal distance and their different animal classification groups; source: Author
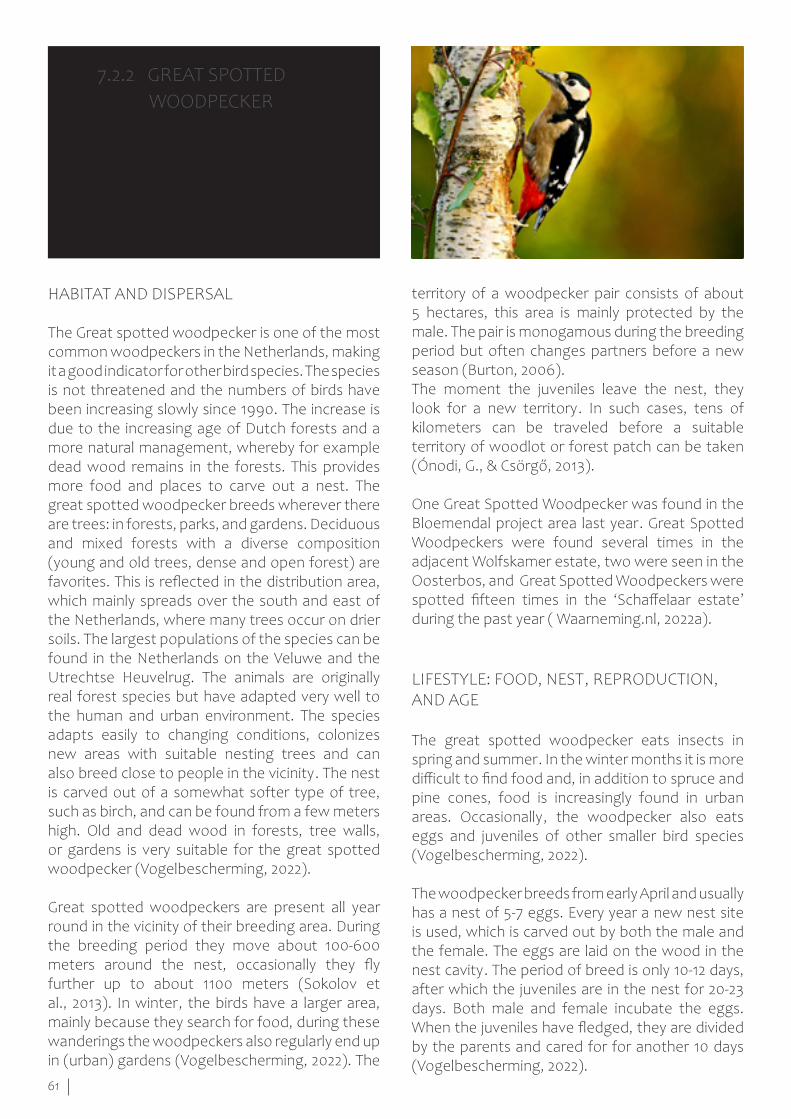
61
territory of a woodpecker pair consists of about 5 hectares, this area is mainly protected by the male. The pair is monogamous during the breeding period but often changes partners before a new season (Burton, 2006).The moment the juveniles leave the nest, they look for a new territory. In such cases, tens of kilometers can be traveled before a suitable territory of woodlot or forest patch can be taken (Ónodi, G., & Csörgő, 2013).
One Great Spotted Woodpecker was found in the Bloemendal project area last year. Great Spotted Woodpeckers were found several times in the adjacent Wolfskamer estate, two were seen in the Oosterbos, and Great Spotted Woodpeckers were spotted fifteen times in the ‘Schaffelaar estate’ during the past year ( Waarneming.nl, 2022a).
LIFESTYLE: FOOD, NEST, REPRODUCTION, AND AGE
The great spotted woodpecker eats insects in spring and summer. In the winter months it is more difficult to find food and, in addition to spruce and pine cones, food is increasingly found in urban areas. Occasionally, the woodpecker also eats eggs and juveniles of other smaller bird species (Vogelbescherming, 2022).
The woodpecker breeds from early April and usually has a nest of 5-7 eggs. Every year a new nest site is used, which is carved out by both the male and the female. The eggs are laid on the wood in the nest cavity. The period of breed is only 10-12 days, after which the juveniles are in the nest for 20-23 days. Both male and female incubate the eggs. When the juveniles have fledged, they are divided by the parents and cared for for another 10 days (Vogelbescherming, 2022).
HABITAT AND DISPERSAL
The Great spotted woodpecker is one of the most common woodpeckers in the Netherlands, making it a good indicator for other bird species. The species is not threatened and the numbers of birds have been increasing slowly since 1990. The increase is due to the increasing age of Dutch forests and a more natural management, whereby for example dead wood remains in the forests. This provides more food and places to carve out a nest. The great spotted woodpecker breeds wherever there are trees: in forests, parks, and gardens. Deciduous and mixed forests with a diverse composition (young and old trees, dense and open forest) are favorites. This is reflected in the distribution area, which mainly spreads over the south and east of the Netherlands, where many trees occur on drier soils. The largest populations of the species can be found in the Netherlands on the Veluwe and the Utrechtse Heuvelrug. The animals are originally real forest species but have adapted very well to the human and urban environment. The species adapts easily to changing conditions, colonizes new areas with suitable nesting trees and can also breed close to people in the vicinity. The nest is carved out of a somewhat softer type of tree, such as birch, and can be found from a few meters high. Old and dead wood in forests, tree walls, or gardens is very suitable for the great spotted woodpecker (Vogelbescherming, 2022).
Great spotted woodpeckers are present all year round in the vicinity of their breeding area. During the breeding period they move about 100-600 meters around the nest, occasionally they fly further up to about 1100 meters (Sokolov et al., 2013). In winter, the birds have a larger area, mainly because they search for food, during these wanderings the woodpeckers also regularly end up in (urban) gardens (Vogelbescherming, 2022). The
Territory size 5 ha (year-round) Daily movement ca 100-600 m (up to 1100 m) Dispersal distance tens of kilometres Pairing and breed April, May
7.2.2 GREAT SPOTTED WOODPECKER (Dendrocopos major)
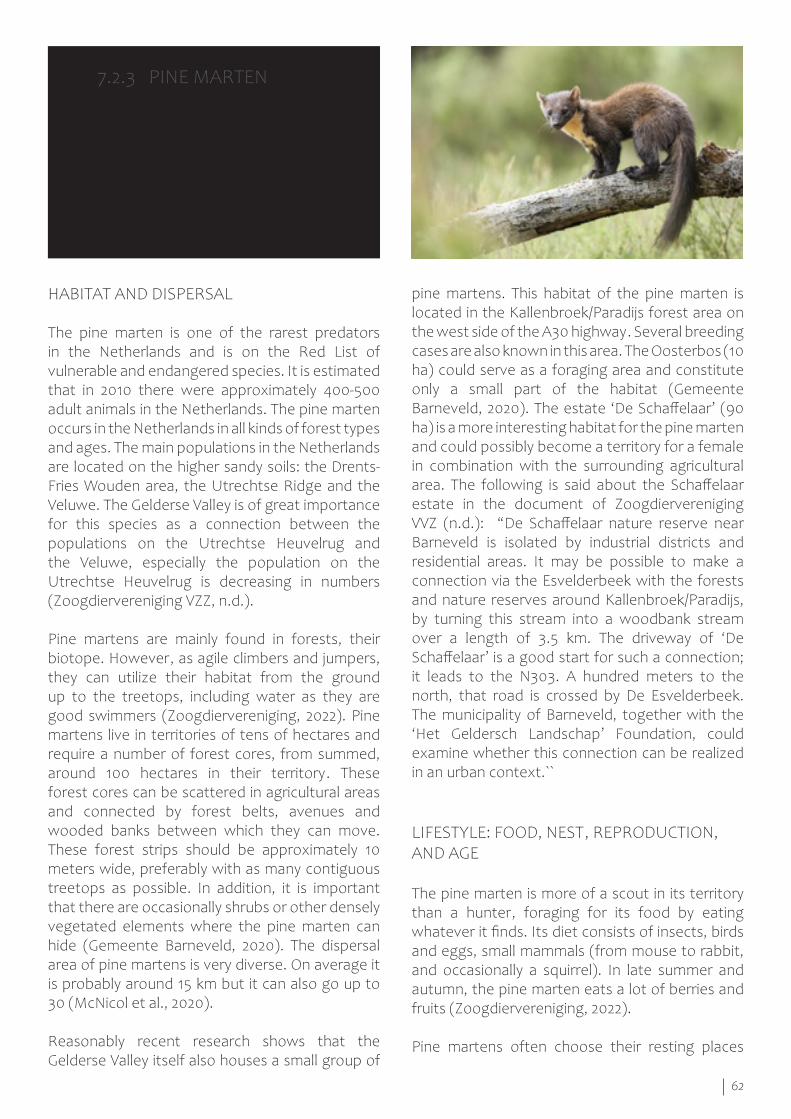
62
pine martens. This habitat of the pine marten is located in the Kallenbroek/Paradijs forest area on the west side of the A30 highway. Several breeding cases are also known in this area. The Oosterbos (10 ha) could serve as a foraging area and constitute only a small part of the habitat (Gemeente Barneveld, 2020). The estate ‘De Schaffelaar’ (90 ha) is a more interesting habitat for the pine marten and could possibly become a territory for a female in combination with the surrounding agricultural area. The following is said about the Schaffelaar estate in the document of Zoogdiervereniging VVZ (n.d.): “De Schaffelaar nature reserve near Barneveld is isolated by industrial districts and residential areas. It may be possible to make a connection via the Esvelderbeek with the forests and nature reserves around Kallenbroek/Paradijs, by turning this stream into a woodbank stream over a length of 3.5 km. The driveway of ‘De Schaffelaar’ is a good start for such a connection; it leads to the N303. A hundred meters to the north, that road is crossed by De Esvelderbeek. The municipality of Barneveld, together with the ‘Het Geldersch Landschap’ Foundation, could examine whether this connection can be realized in an urban context.``
LIFESTYLE: FOOD, NEST, REPRODUCTION, AND AGE
The pine marten is more of a scout in its territory than a hunter, foraging for its food by eating whatever it finds. Its diet consists of insects, birds and eggs, small mammals (from mouse to rabbit, and occasionally a squirrel). In late summer and autumn, the pine marten eats a lot of berries and fruits (Zoogdiervereniging, 2022).
Pine martens often choose their resting places
HABITAT AND DISPERSAL
The pine marten is one of the rarest predators in the Netherlands and is on the Red List of vulnerable and endangered species. It is estimated that in 2010 there were approximately 400-500 adult animals in the Netherlands. The pine marten occurs in the Netherlands in all kinds of forest types and ages. The main populations in the Netherlands are located on the higher sandy soils: the Drents-Fries Wouden area, the Utrechtse Ridge and the Veluwe. The Gelderse Valley is of great importance for this species as a connection between the populations on the Utrechtse Heuvelrug and the Veluwe, especially the population on the Utrechtse Heuvelrug is decreasing in numbers (Zoogdiervereniging VZZ, n.d.).
Pine martens are mainly found in forests, their biotope. However, as agile climbers and jumpers, they can utilize their habitat from the ground up to the treetops, including water as they are good swimmers (Zoogdiervereniging, 2022). Pine martens live in territories of tens of hectares and require a number of forest cores, from summed, around 100 hectares in their territory. These forest cores can be scattered in agricultural areas and connected by forest belts, avenues and wooded banks between which they can move. These forest strips should be approximately 10 meters wide, preferably with as many contiguous treetops as possible. In addition, it is important that there are occasionally shrubs or other densely vegetated elements where the pine marten can hide (Gemeente Barneveld, 2020). The dispersal area of pine martens is very diverse. On average it is probably around 15 km but it can also go up to 30 (McNicol et al., 2020).
Reasonably recent research shows that the Gelderse Valley itself also houses a small group of
Territory size male 150 - 700 ha female 70 - 450 ha Daily movement male 10 - 20 km female 2 - 7 km Dispersal distance average 5 - 15 km possible up to 30 km Pairing and breed July - August, March
7.2.3 PINE MARTEN (Martes martes )
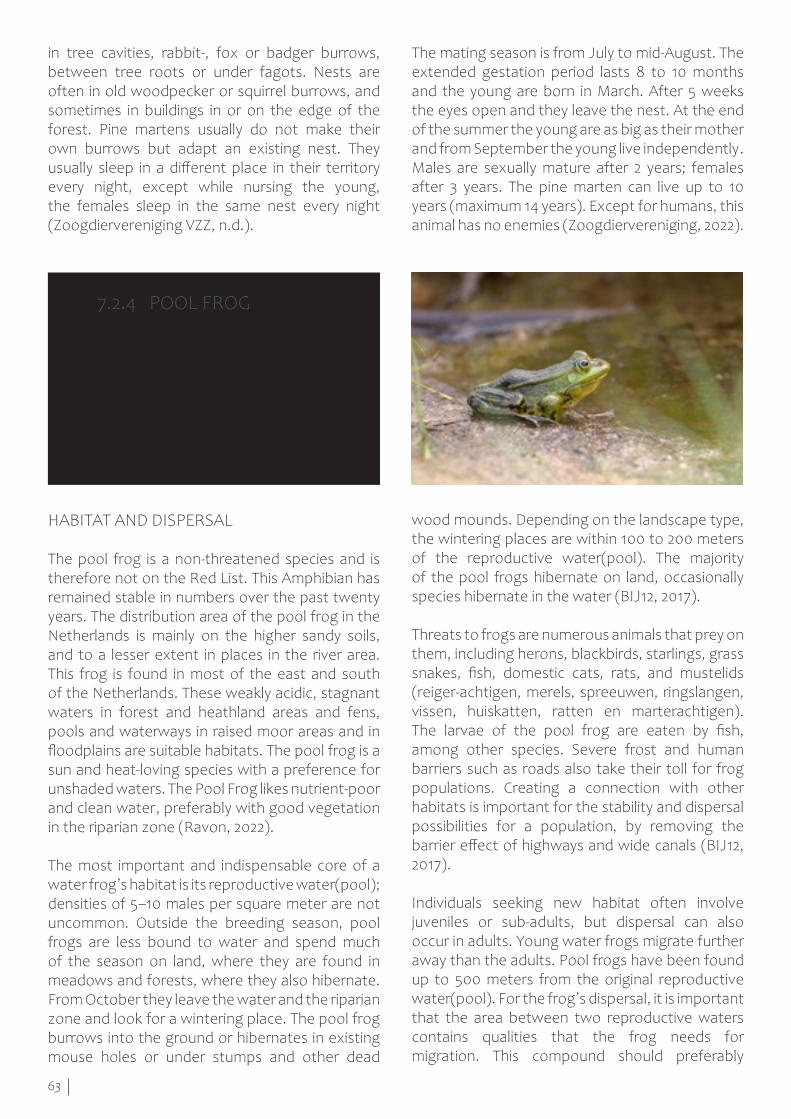
63
The mating season is from July to mid-August. The extended gestation period lasts 8 to 10 months and the young are born in March. After 5 weeks the eyes open and they leave the nest. At the end of the summer the young are as big as their mother and from September the young live independently. Males are sexually mature after 2 years; females after 3 years. The pine marten can live up to 10 years (maximum 14 years). Except for humans, this animal has no enemies (Zoogdiervereniging, 2022).
in tree cavities, rabbit-, fox or badger burrows, between tree roots or under fagots. Nests are often in old woodpecker or squirrel burrows, and sometimes in buildings in or on the edge of the forest. Pine martens usually do not make their own burrows but adapt an existing nest. They usually sleep in a different place in their territory every night, except while nursing the young, the females sleep in the same nest every night (Zoogdiervereniging VZZ, n.d.).
wood mounds. Depending on the landscape type, the wintering places are within 100 to 200 meters of the reproductive water(pool). The majority of the pool frogs hibernate on land, occasionally species hibernate in the water (BIJ12, 2017).
Threats to frogs are numerous animals that prey on them, including herons, blackbirds, starlings, grass snakes, fish, domestic cats, rats, and mustelids (reiger-achtigen, merels, spreeuwen, ringslangen, vissen, huiskatten, ratten en marterachtigen). The larvae of the pool frog are eaten by fish, among other species. Severe frost and human barriers such as roads also take their toll for frog populations. Creating a connection with other habitats is important for the stability and dispersal possibilities for a population, by removing the barrier effect of highways and wide canals (BIJ12, 2017).
Individuals seeking new habitat often involve juveniles or sub-adults, but dispersal can also occur in adults. Young water frogs migrate further away than the adults. Pool frogs have been found up to 500 meters from the original reproductive water(pool). For the frog’s dispersal, it is important that the area between two reproductive waters contains qualities that the frog needs for migration. This compound should preferably
HABITAT AND DISPERSAL
The pool frog is a non-threatened species and is therefore not on the Red List. This Amphibian has remained stable in numbers over the past twenty years. The distribution area of the pool frog in the Netherlands is mainly on the higher sandy soils, and to a lesser extent in places in the river area. This frog is found in most of the east and south of the Netherlands. These weakly acidic, stagnant waters in forest and heathland areas and fens, pools and waterways in raised moor areas and in floodplains are suitable habitats. The pool frog is a sun and heat-loving species with a preference for unshaded waters. The Pool Frog likes nutrient-poor and clean water, preferably with good vegetation in the riparian zone (Ravon, 2022).
The most important and indispensable core of a water frog’s habitat is its reproductive water(pool); densities of 5–10 males per square meter are not uncommon. Outside the breeding season, pool frogs are less bound to water and spend much of the season on land, where they are found in meadows and forests, where they also hibernate. From October they leave the water and the riparian zone and look for a wintering place. The pool frog burrows into the ground or hibernates in existing mouse holes or under stumps and other dead
Territory size 7 ha (100-200 m around waterpool ) Daily movement - Dispersal distance max. 500 m Pairing and breed May - half June
7.2.4 POOL FROG (Pelophylax lessonae)
64
consist of herbaceous and grass-like crops, which are minimally grazed. If new habitats or expansions are to be realised, the construction of a shallow riparian zone, for example in the form of a nature-friendly bank, or more generally a shallow or shallow water-retaining bank is important. The new water must not be too small in connection with the risk of landing too quickly, for example in a pool the diameter must be at least 20 meters (BIJ12, 2017).
LIFESTYLE: FOOD, NEST, REPRODUCTION, AND AGE
Adult pool frogs are not picky about their diet. They usually forage for food on land and eat almost all invertebrates that are neither too small nor too large. In addition, they eat all kinds of insects (especially their larvae), such as flies, beetles, dragonflies, wasps and ants. Small vertebrates such as young mice, birds and smaller amphibians are also eaten. Larvae mainly live on plant material and as they grow older they switch to living animal material (Ravon, 2022).
The breeding period starts late April/early May when the males gather in the reproductive waters. The peak of the mating season is from May to mid-June. The females can lay several clumps of 400-2000 eggs per year. This happens in the well-vegetated riparian zones of stagnant waters. After 5-10 days the larvae hatch and in the following period they complete their metamorphosis. The total period from egg laying to landing of the juveniles is 2-4 months. After the first hibernation, in most cases the pool frogs can already reproduce. Pool frogs usually live no longer than 3-5 years (Ravon, 2022).
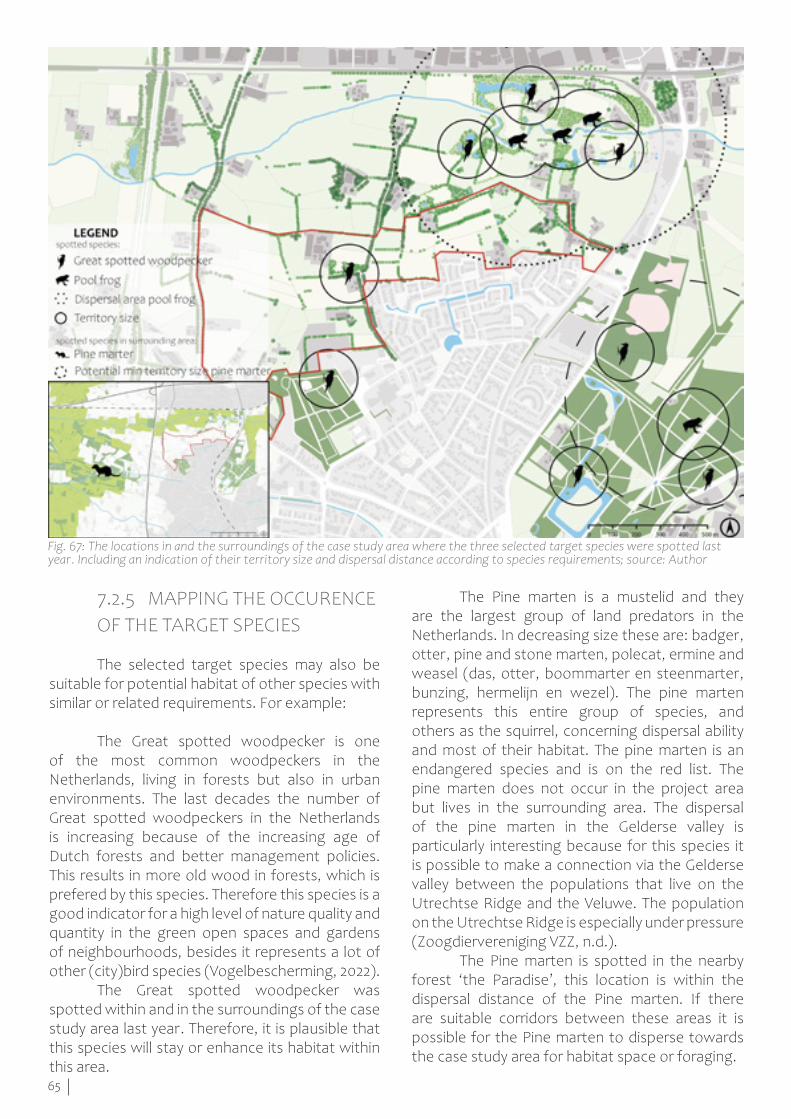
65
The Pine marten is a mustelid and they are the largest group of land predators in the Netherlands. In decreasing size these are: badger, otter, pine and stone marten, polecat, ermine and weasel (das, otter, boommarter en steenmarter, bunzing, hermelijn en wezel). The pine marten represents this entire group of species, and others as the squirrel, concerning dispersal ability and most of their habitat. The pine marten is an endangered species and is on the red list. The pine marten does not occur in the project area but lives in the surrounding area. The dispersal of the pine marten in the Gelderse valley is particularly interesting because for this species it is possible to make a connection via the Gelderse valley between the populations that live on the Utrechtse Ridge and the Veluwe. The population on the Utrechtse Ridge is especially under pressure (Zoogdiervereniging VZZ, n.d.). The Pine marten is spotted in the nearby forest ‘the Paradise’, this location is within the dispersal distance of the Pine marten. If there are suitable corridors between these areas it is possible for the Pine marten to disperse towards the case study area for habitat space or foraging.
7.2.5 MAPPING THE OCCURENCE OF THE TARGET SPECIES
The selected target species may also be suitable for potential habitat of other species with similar or related requirements. For example:
The Great spotted woodpecker is one of the most common woodpeckers in the Netherlands, living in forests but also in urban environments. The last decades the number of Great spotted woodpeckers in the Netherlands is increasing because of the increasing age of Dutch forests and better management policies. This results in more old wood in forests, which is prefered by this species. Therefore this species is a good indicator for a high level of nature quality and quantity in the green open spaces and gardens of neighbourhoods, besides it represents a lot of other (city)bird species (Vogelbescherming, 2022). The Great spotted woodpecker was spotted within and in the surroundings of the case study area last year. Therefore, it is plausible that this species will stay or enhance its habitat within this area.
Fig. 67: The locations in and the surroundings of the case study area where the three selected target species were spotted last year. Including an indication of their territory size and dispersal distance according to species requirements; source: Author
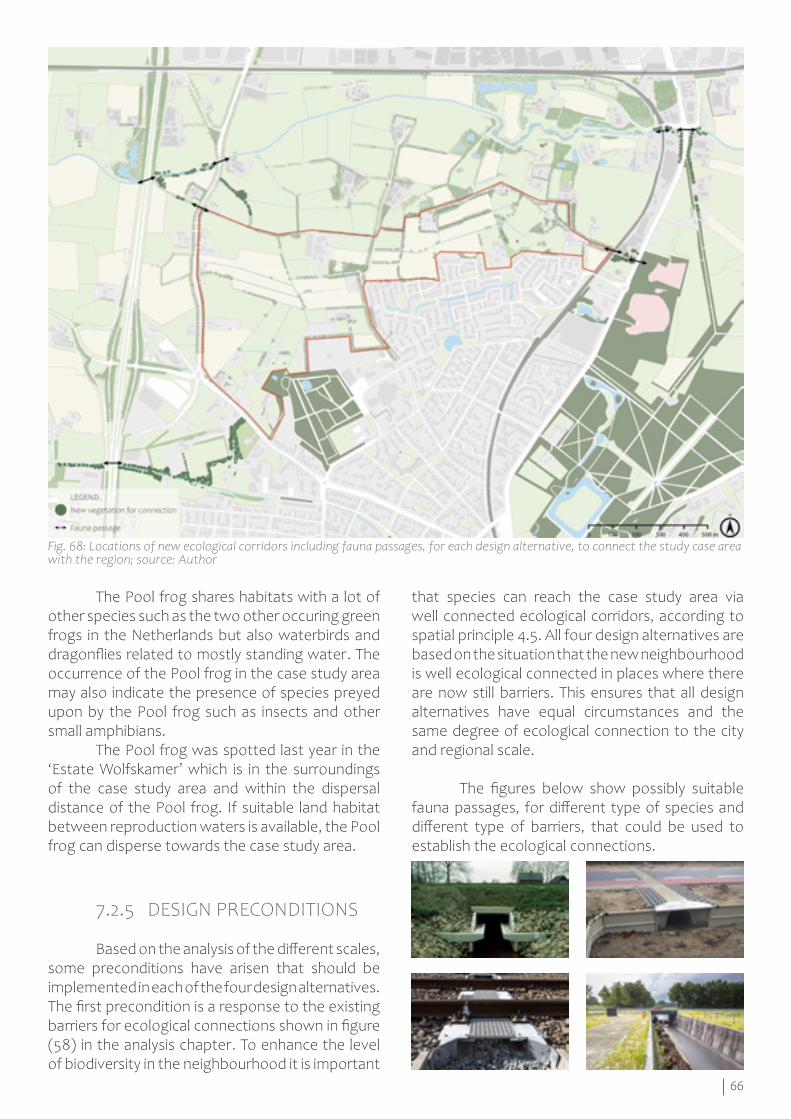
66
that species can reach the case study area via well connected ecological corridors, according to spatial principle 4.5. All four design alternatives are based on the situation that the new neighbourhood is well ecological connected in places where there are now still barriers. This ensures that all design alternatives have equal circumstances and the same degree of ecological connection to the city and regional scale.
The figures below show possibly suitable fauna passages, for different type of species and different type of barriers, that could be used to establish the ecological connections.
The Pool frog shares habitats with a lot of other species such as the two other occuring green frogs in the Netherlands but also waterbirds and dragonflies related to mostly standing water. The occurrence of the Pool frog in the case study area may also indicate the presence of species preyed upon by the Pool frog such as insects and other small amphibians. The Pool frog was spotted last year in the ‘Estate Wolfskamer’ which is in the surroundings of the case study area and within the dispersal distance of the Pool frog. If suitable land habitat between reproduction waters is available, the Pool frog can disperse towards the case study area.
7.2.5 DESIGN PRECONDITIONS
Based on the analysis of the different scales, some preconditions have arisen that should be implemented in each of the four design alternatives. The first precondition is a response to the existing barriers for ecological connections shown in figure (58) in the analysis chapter. To enhance the level of biodiversity in the neighbourhood it is important
Fig. 68: Locations of new ecological corridors including fauna passages, for each design alternative, to connect the study case area with the region; source: Author
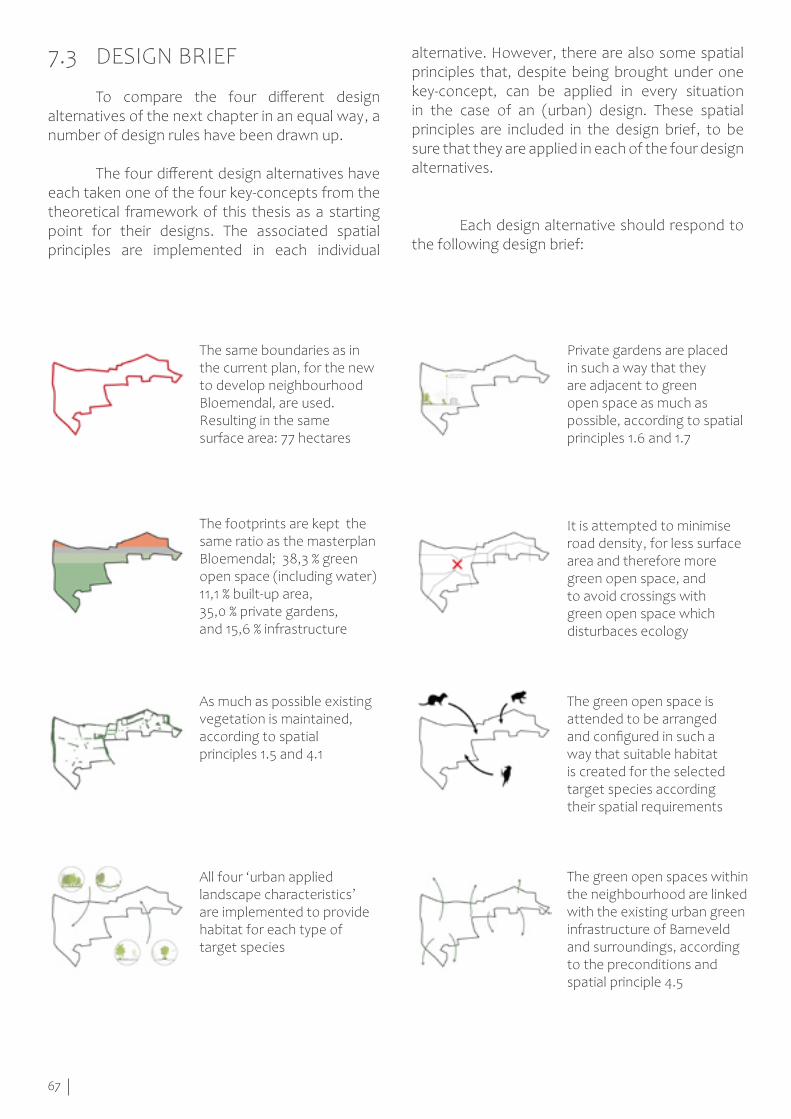
67
The same boundaries as in the current plan, for the new to develop neighbourhood Bloemendal, are used. Resulting in the same surface area: 77 hectares
As much as possible existing vegetation is maintained, according to spatial principles 1.5 and 4.1
All four ‘urban applied landscape characteristics’ are implemented to provide habitat for each type of target species
Private gardens are placed in such a way that they are adjacent to green open space as much as possible, according to spatial principles 1.6 and 1.7
It is attempted to minimise road density, for less surface area and therefore more green open space, and to avoid crossings with green open space which disturbaces ecology
The green open space is attended to be arranged and configured in such a way that suitable habitat is created for the selected target species according their spatial requirements
alternative. However, there are also some spatial principles that, despite being brought under one key-concept, can be applied in every situation in the case of an (urban) design. These spatial principles are included in the design brief, to be sure that they are applied in each of the four design alternatives.
Each design alternative should respond to the following design brief:
7.3 DESIGN BRIEF
To compare the four different design alternatives of the next chapter in an equal way, a number of design rules have been drawn up.
The four different design alternatives have each taken one of the four key-concepts from the theoretical framework of this thesis as a starting point for their designs. The associated spatial principles are implemented in each individual
The footprints are kept the same ratio as the masterplan Bloemendal; 38,3 % green open space (including water) 11,1 % built-up area, 35,0 % private gardens, and 15,6 % infrastructure
The green open spaces within the neighbourhood are linked with the existing urban green infrastructure of Barneveld and surroundings, according to the preconditions and spatial principle 4.5

68
69
DESIGN ALTERNATIVES & RESULTS8.
Current construction work in the case study area; source: Barneveldse krant, September 13, 2021
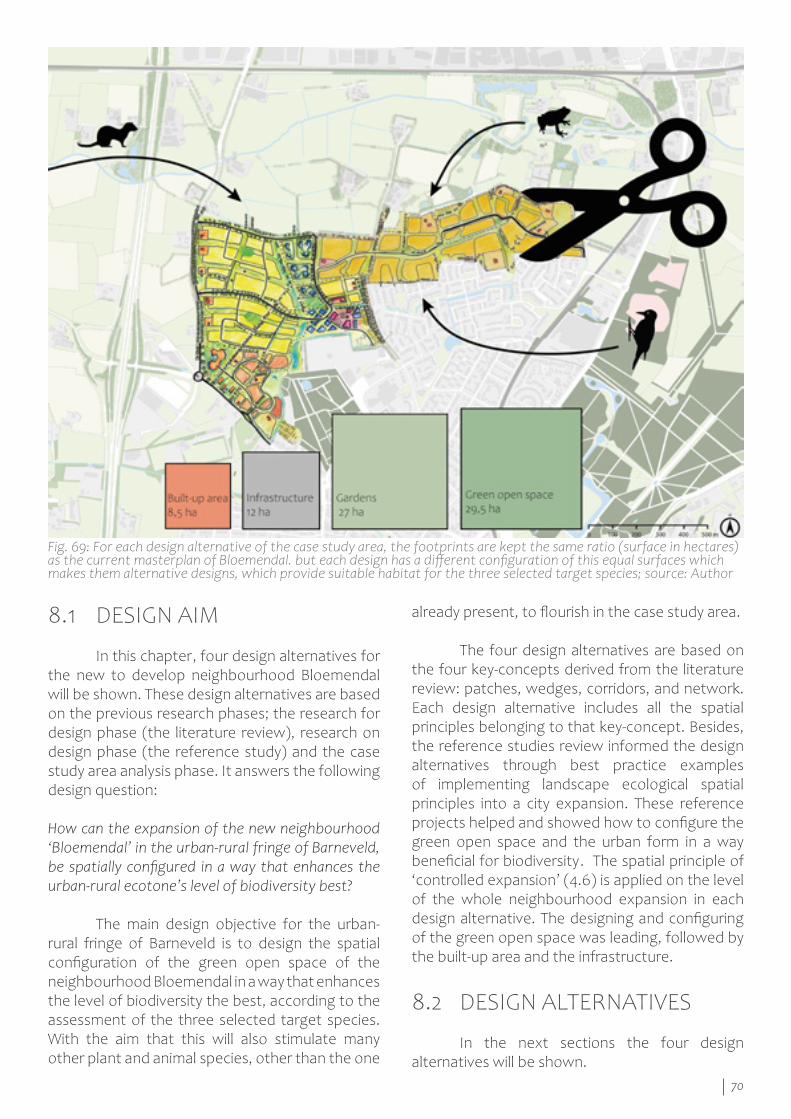
70
already present, to flourish in the case study area. The four design alternatives are based on the four key-concepts derived from the literature review: patches, wedges, corridors, and network. Each design alternative includes all the spatial principles belonging to that key-concept. Besides, the reference studies review informed the design alternatives through best practice examples of implementing landscape ecological spatial principles into a city expansion. These reference projects helped and showed how to configure the green open space and the urban form in a way beneficial for biodiversity. The spatial principle of ‘controlled expansion’ (4.6) is applied on the level of the whole neighbourhood expansion in each design alternative. The designing and configuring of the green open space was leading, followed by the built-up area and the infrastructure.
8.2 DESIGN ALTERNATIVES
In the next sections the four design alternatives will be shown.
8.1 DESIGN AIM
In this chapter, four design alternatives for the new to develop neighbourhood Bloemendal will be shown. These design alternatives are based on the previous research phases; the research for design phase (the literature review), research on design phase (the reference study) and the case study area analysis phase. It answers the following design question:
How can the expansion of the new neighbourhood ‘Bloemendal’ in the urban-rural fringe of Barneveld, be spatially configured in a way that enhances the urban-rural ecotone’s level of biodiversity best?
The main design objective for the urban-rural fringe of Barneveld is to design the spatial configuration of the green open space of the neighbourhood Bloemendal in a way that enhances the level of biodiversity the best, according to the assessment of the three selected target species. With the aim that this will also stimulate many other plant and animal species, other than the one
Fig. 69: For each design alternative of the case study area, the footprints are kept the same ratio (surface in hectares) as the current masterplan of Bloemendal. but each design has a different configuration of this equal surfaces which makes them alternative designs, which provide suitable habitat for the three selected target species; source: Author

71
‘number and spatially grouped patches’ (1.3), and maintaining existing green structures resulted in this configuration of green open space. According to spatial principle ‘Patch shape’ (1.4) there is a variation in patch shapes from very curvilinear to more rectilinear to have both the positive and negative effects of higher proportion of interior- or edge habitat, and more or less interaction with the surroundings of the patch. Some of the cores of the patches will be not accessible for humans, according to ‘protected core’ (1.2). The cross-section (Fig 70) gives an indication of the proportion and size of the patches in relation to the buildings.
8.2.1 GREEN CHESSBOARD (PATCHES)
The first design alternative consists of twenty green open space patches, largely evenly distributed over the case study area. The locations of the patches are mainly based on the existing vegetation. Existing patches are maintained and former farmyards, as shown in the subchapter ‘landscape characteristics’, usually surrounded by trees, are also used as basis for new patches. A trade-off between ‘maximise patch size’ (spatial principle 1.1, from now only number),
Fig. 70: Everywhere in the design there are only two or three building blocks between every patch. The patches have a relatively large surface area.
Fig. 71: Design alternative Green Chessboard: 20 patches largely even distributed.
0 m 10 20
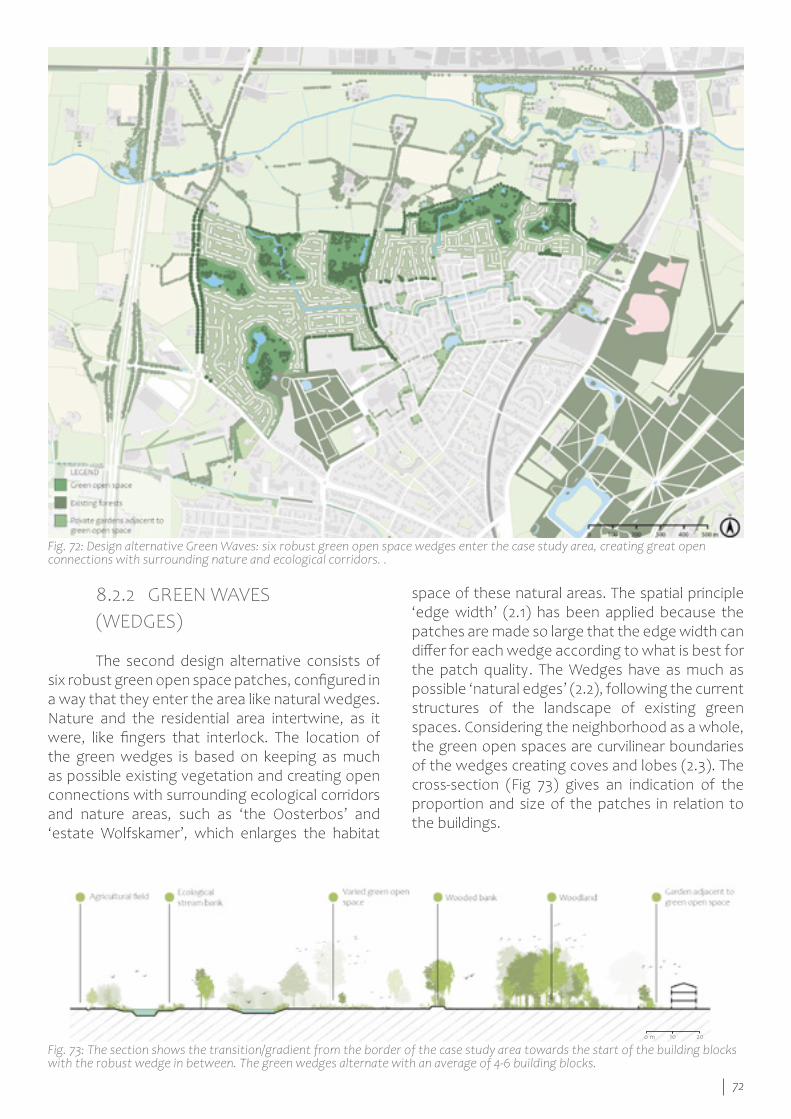
72
space of these natural areas. The spatial principle ‘edge width’ (2.1) has been applied because the patches are made so large that the edge width can differ for each wedge according to what is best for the patch quality. The Wedges have as much as possible ‘natural edges’ (2.2), following the current structures of the landscape of existing green spaces. Considering the neighborhood as a whole, the green open spaces are curvilinear boundaries of the wedges creating coves and lobes (2.3). The cross-section (Fig 73) gives an indication of the proportion and size of the patches in relation to the buildings.
8.2.2 GREEN WAVES (WEDGES)
The second design alternative consists of six robust green open space patches, configured in a way that they enter the area like natural wedges. Nature and the residential area intertwine, as it were, like fingers that interlock. The location of the green wedges is based on keeping as much as possible existing vegetation and creating open connections with surrounding ecological corridors and nature areas, such as ‘the Oosterbos’ and ‘estate Wolfskamer’, which enlarges the habitat
Fig. 72: Design alternative Green Waves: six robust green open space wedges enter the case study area, creating great open connections with surrounding nature and ecological corridors. .
Fig. 73: The section shows the transition/gradient from the border of the case study area towards the start of the building blocks with the robust wedge in between. The green wedges alternate with an average of 4-6 building blocks.
0 m 10 20
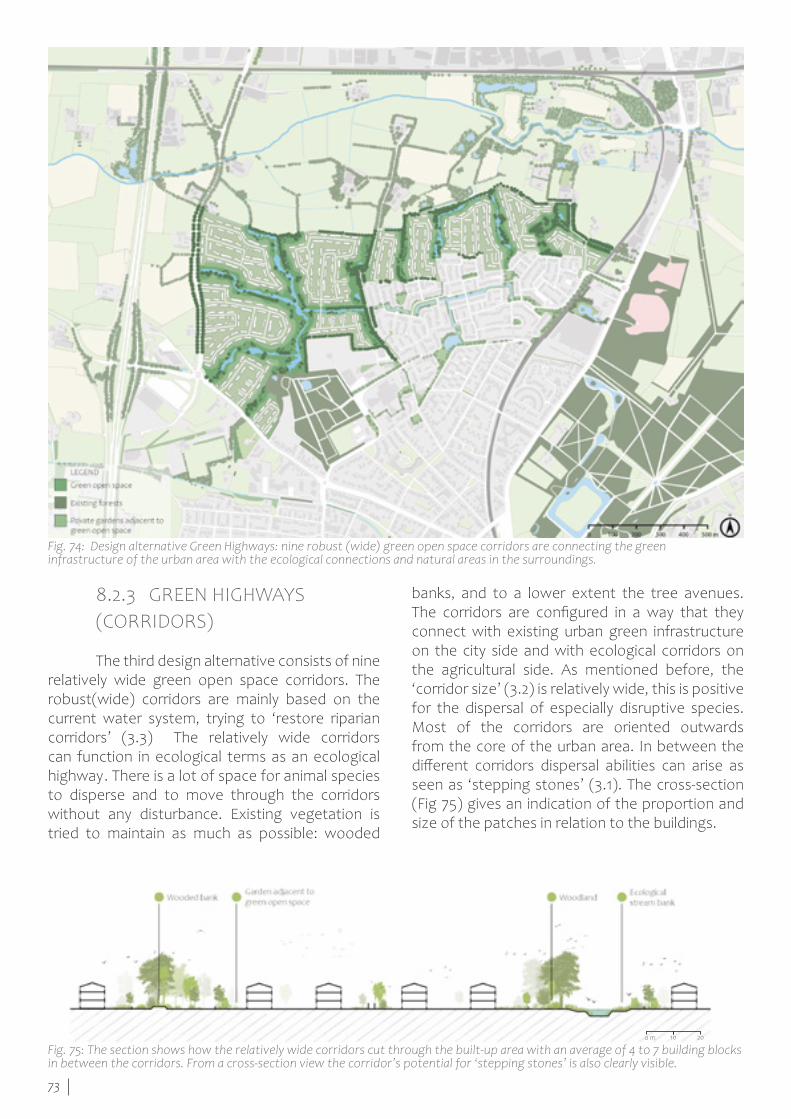
73
banks, and to a lower extent the tree avenues. The corridors are configured in a way that they connect with existing urban green infrastructure on the city side and with ecological corridors on the agricultural side. As mentioned before, the ‘corridor size’ (3.2) is relatively wide, this is positive for the dispersal of especially disruptive species. Most of the corridors are oriented outwards from the core of the urban area. In between the different corridors dispersal abilities can arise as seen as ‘stepping stones’ (3.1). The cross-section (Fig 75) gives an indication of the proportion and size of the patches in relation to the buildings.
8.2.3 GREEN HIGHWAYS (CORRIDORS)
The third design alternative consists of nine relatively wide green open space corridors. The robust(wide) corridors are mainly based on the current water system, trying to ‘restore riparian corridors’ (3.3) The relatively wide corridors can function in ecological terms as an ecological highway. There is a lot of space for animal species to disperse and to move through the corridors without any disturbance. Existing vegetation is tried to maintain as much as possible: wooded
Fig. 74: Design alternative Green Highways: nine robust (wide) green open space corridors are connecting the green infrastructure of the urban area with the ecological connections and natural areas in the surroundings.
Fig. 75: The section shows how the relatively wide corridors cut through the built-up area with an average of 4 to 7 building blocks in between the corridors. From a cross-section view the corridor’s potential for ‘stepping stones’ is also clearly visible.
0 m 10 20
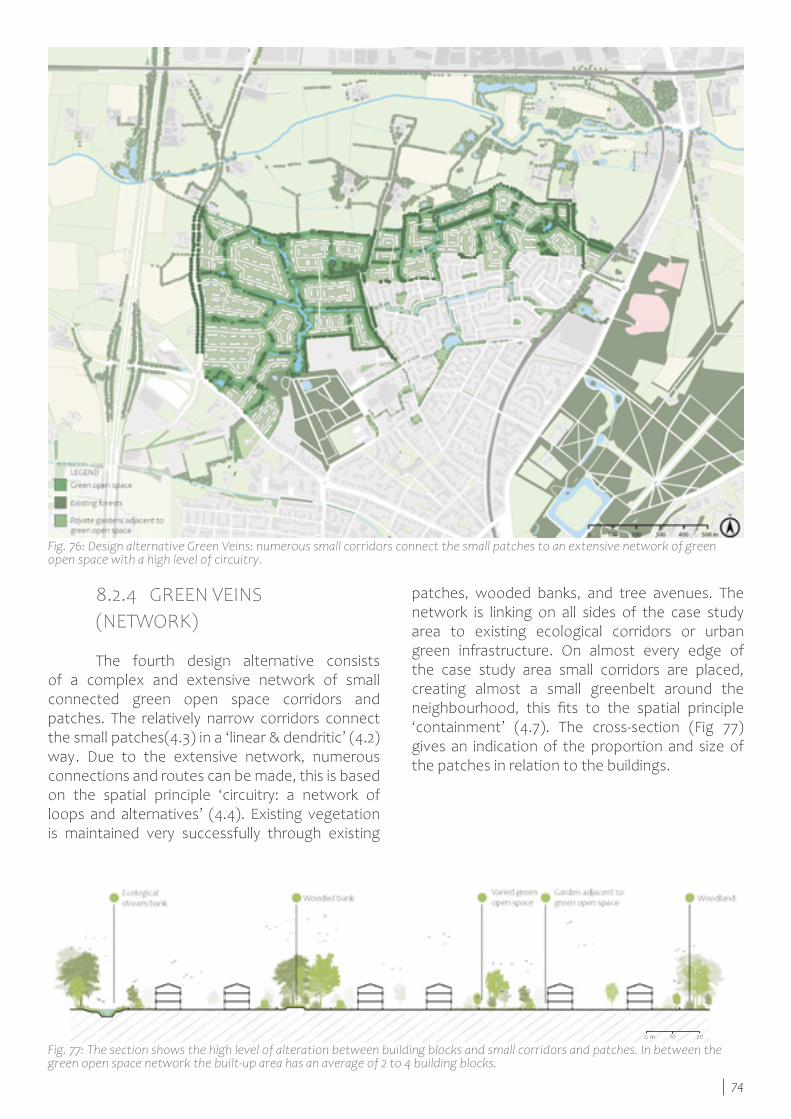
74
patches, wooded banks, and tree avenues. The network is linking on all sides of the case study area to existing ecological corridors or urban green infrastructure. On almost every edge of the case study area small corridors are placed, creating almost a small greenbelt around the neighbourhood, this fits to the spatial principle ‘containment’ (4.7). The cross-section (Fig 77) gives an indication of the proportion and size of the patches in relation to the buildings.
8.2.4 GREEN VEINS (NETWORK)
The fourth design alternative consists of a complex and extensive network of small connected green open space corridors and patches. The relatively narrow corridors connect the small patches(4.3) in a ‘linear & dendritic’ (4.2) way. Due to the extensive network, numerous connections and routes can be made, this is based on the spatial principle ‘circuitry: a network of loops and alternatives’ (4.4). Existing vegetation is maintained very successfully through existing
Fig. 76: Design alternative Green Veins: numerous small corridors connect the small patches to an extensive network of green open space with a high level of circuitry.
Fig. 77: The section shows the high level of alteration between building blocks and small corridors and patches. In between the green open space network the built-up area has an average of 2 to 4 building blocks.
0 m 10 20
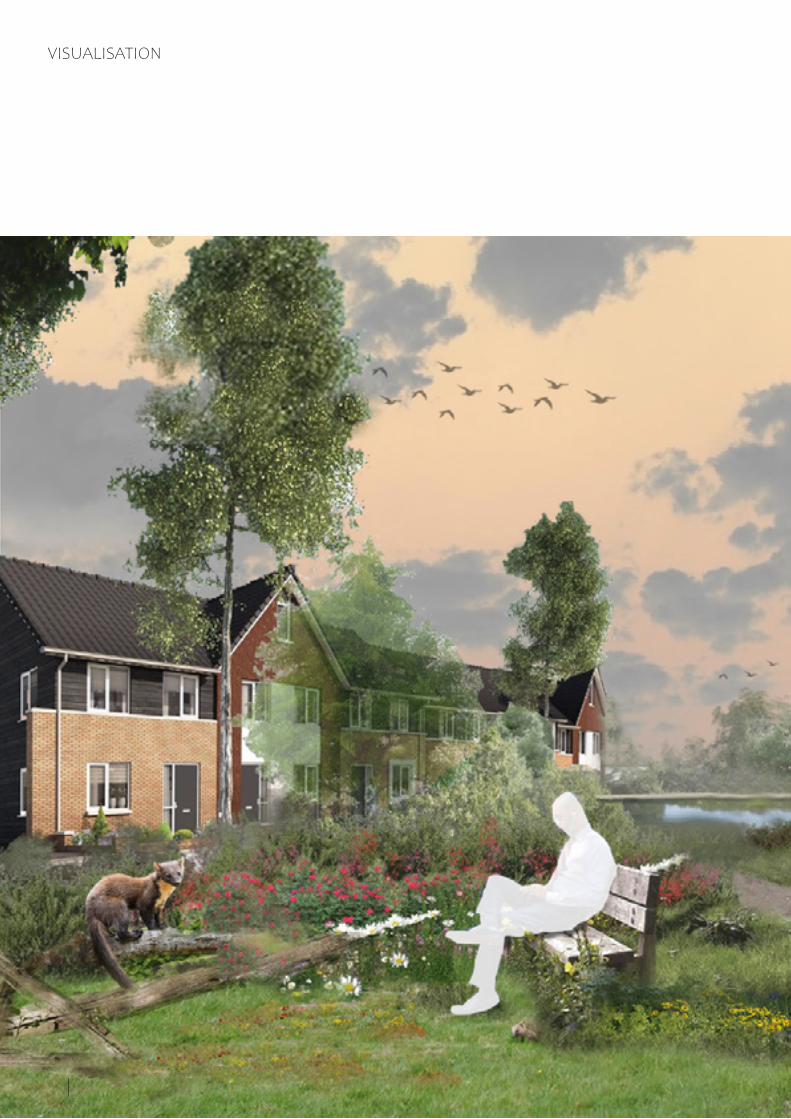
75
VISUALISATION
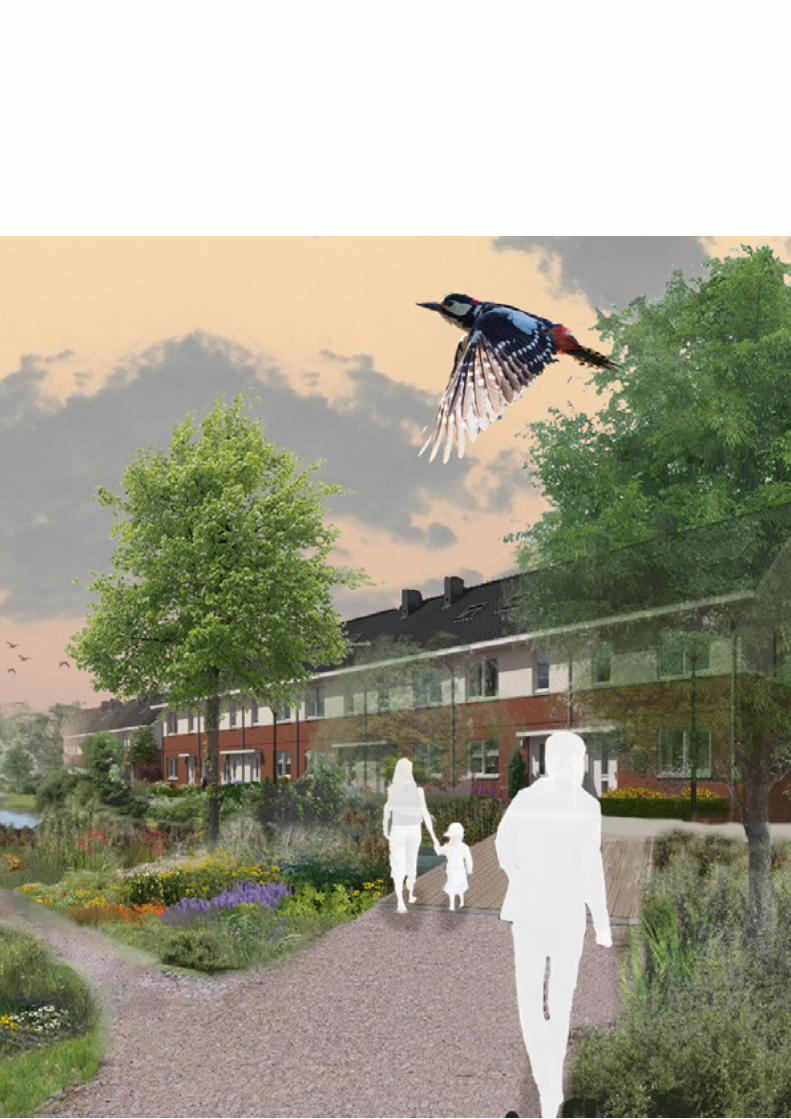
76
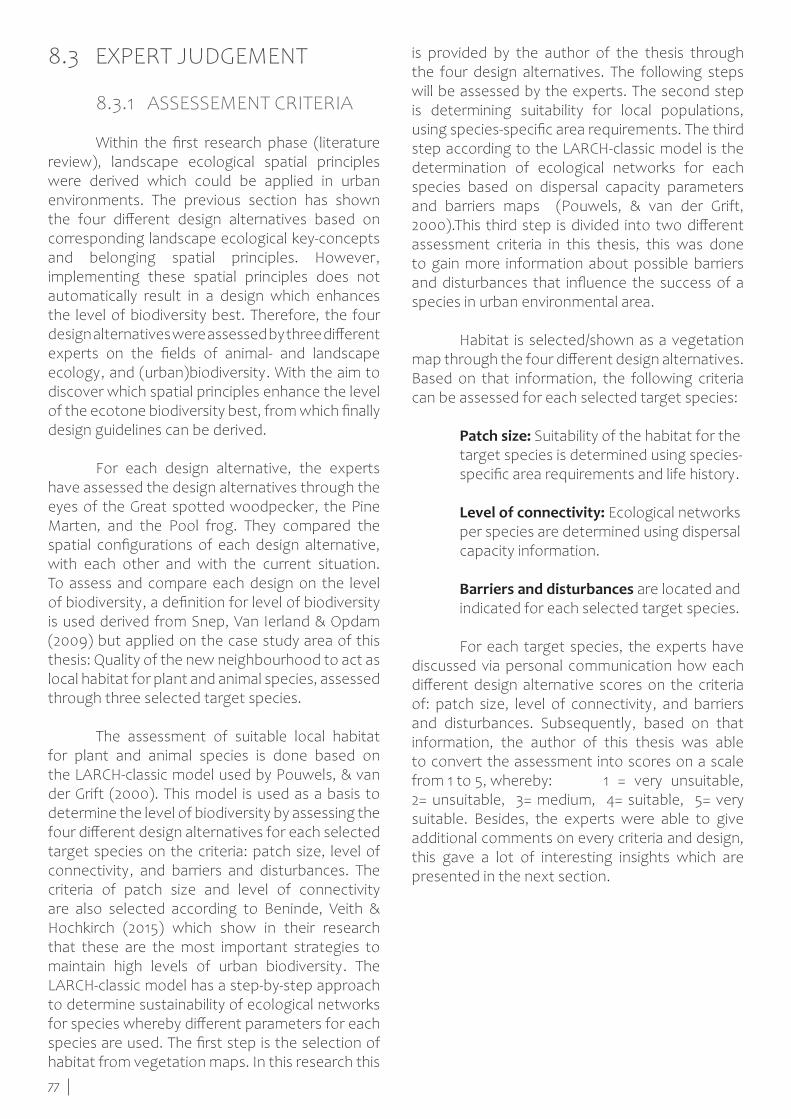
77
is provided by the author of the thesis through the four design alternatives. The following steps will be assessed by the experts. The second step is determining suitability for local populations, using species-specific area requirements. The third step according to the LARCH-classic model is the determination of ecological networks for each species based on dispersal capacity parameters and barriers maps (Pouwels, & van der Grift, 2000).This third step is divided into two different assessment criteria in this thesis, this was done to gain more information about possible barriers and disturbances that influence the success of a species in urban environmental area.
Habitat is selected/shown as a vegetation map through the four different design alternatives. Based on that information, the following criteria can be assessed for each selected target species:
Patch size: Suitability of the habitat for the target species is determined using species- specific area requirements and life history.
Level of connectivity: Ecological networks per species are determined using dispersal capacity information.
Barriers and disturbances are located and indicated for each selected target species.
For each target species, the experts have discussed via personal communication how each different design alternative scores on the criteria of: patch size, level of connectivity, and barriers and disturbances. Subsequently, based on that information, the author of this thesis was able to convert the assessment into scores on a scale from 1 to 5, whereby: 1 = very unsuitable, 2= unsuitable, 3= medium, 4= suitable, 5= very suitable. Besides, the experts were able to give additional comments on every criteria and design, this gave a lot of interesting insights which are presented in the next section.
8.3 EXPERT JUDGEMENT
8.3.1 ASSESSEMENT CRITERIA
Within the first research phase (literature review), landscape ecological spatial principles were derived which could be applied in urban environments. The previous section has shown the four different design alternatives based on corresponding landscape ecological key-concepts and belonging spatial principles. However, implementing these spatial principles does not automatically result in a design which enhances the level of biodiversity best. Therefore, the four design alternatives were assessed by three different experts on the fields of animal- and landscape ecology, and (urban)biodiversity. With the aim to discover which spatial principles enhance the level of the ecotone biodiversity best, from which finally design guidelines can be derived.
For each design alternative, the experts have assessed the design alternatives through the eyes of the Great spotted woodpecker, the Pine Marten, and the Pool frog. They compared the spatial configurations of each design alternative, with each other and with the current situation. To assess and compare each design on the level of biodiversity, a definition for level of biodiversity is used derived from Snep, Van Ierland & Opdam (2009) but applied on the case study area of this thesis: Quality of the new neighbourhood to act as local habitat for plant and animal species, assessed through three selected target species.
The assessment of suitable local habitat for plant and animal species is done based on the LARCH-classic model used by Pouwels, & van der Grift (2000). This model is used as a basis to determine the level of biodiversity by assessing the four different design alternatives for each selected target species on the criteria: patch size, level of connectivity, and barriers and disturbances. The criteria of patch size and level of connectivity are also selected according to Beninde, Veith & Hochkirch (2015) which show in their research that these are the most important strategies to maintain high levels of urban biodiversity. The LARCH-classic model has a step-by-step approach to determine sustainability of ecological networks for species whereby different parameters for each species are used. The first step is the selection of habitat from vegetation maps. In this research this
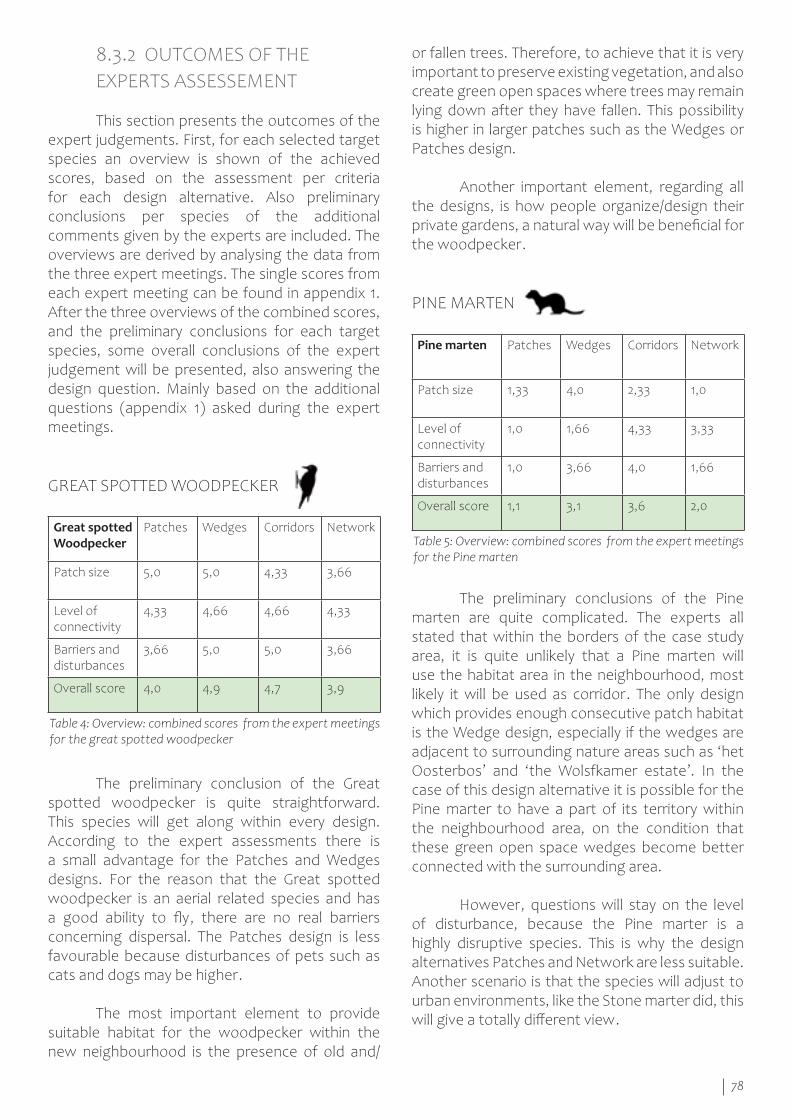
78
or fallen trees. Therefore, to achieve that it is very important to preserve existing vegetation, and also create green open spaces where trees may remain lying down after they have fallen. This possibility is higher in larger patches such as the Wedges or Patches design.
Another important element, regarding all the designs, is how people organize/design their private gardens, a natural way will be beneficial for the woodpecker.
PINE MARTEN
The preliminary conclusion of the Great spotted woodpecker is quite straightforward. This species will get along within every design. According to the expert assessments there is a small advantage for the Patches and Wedges designs. For the reason that the Great spotted woodpecker is an aerial related species and has a good ability to fly, there are no real barriers concerning dispersal. The Patches design is less favourable because disturbances of pets such as cats and dogs may be higher.
The most important element to provide suitable habitat for the woodpecker within the new neighbourhood is the presence of old and/
The preliminary conclusions of the Pine marten are quite complicated. The experts all stated that within the borders of the case study area, it is quite unlikely that a Pine marten will use the habitat area in the neighbourhood, most likely it will be used as corridor. The only design which provides enough consecutive patch habitat is the Wedge design, especially if the wedges are adjacent to surrounding nature areas such as ‘het Oosterbos’ and ‘the Wolsfkamer estate’. In the case of this design alternative it is possible for the Pine marter to have a part of its territory within the neighbourhood area, on the condition that these green open space wedges become better connected with the surrounding area.
However, questions will stay on the level of disturbance, because the Pine marter is a highly disruptive species. This is why the design alternatives Patches and Network are less suitable. Another scenario is that the species will adjust to urban environments, like the Stone marter did, this will give a totally different view.
8.3.2 OUTCOMES OF THE EXPERTS ASSESSEMENT
This section presents the outcomes of the expert judgements. First, for each selected target species an overview is shown of the achieved scores, based on the assessment per criteria for each design alternative. Also preliminary conclusions per species of the additional comments given by the experts are included. The overviews are derived by analysing the data from the three expert meetings. The single scores from each expert meeting can be found in appendix 1. After the three overviews of the combined scores, and the preliminary conclusions for each target species, some overall conclusions of the expert judgement will be presented, also answering the design question. Mainly based on the additional questions (appendix 1) asked during the expert meetings.
GREAT SPOTTED WOODPECKER
Great spotted Woodpecker
Patches Wedges Corridors Network
Patch size 5,0 5,0 4,33 3,66
Level of connectivity
4,33 4,66 4,66 4,33
Barriers and disturbances
3,66 5,0 5,0 3,66
Overall score 4,0 4,9 4,7 3,9
Pine marten Patches Wedges Corridors Network
Patch size 1,33 4,0 2,33 1,0
Level of connectivity
1,0 1,66 4,33 3,33
Barriers and disturbances
1,0 3,66 4,0 1,66
Overall score 1,1 3,1 3,6 2,0
Table 4: Overview: combined scores from the expert meetings for the great spotted woodpecker
Table 5: Overview: combined scores from the expert meetings for the Pine marten
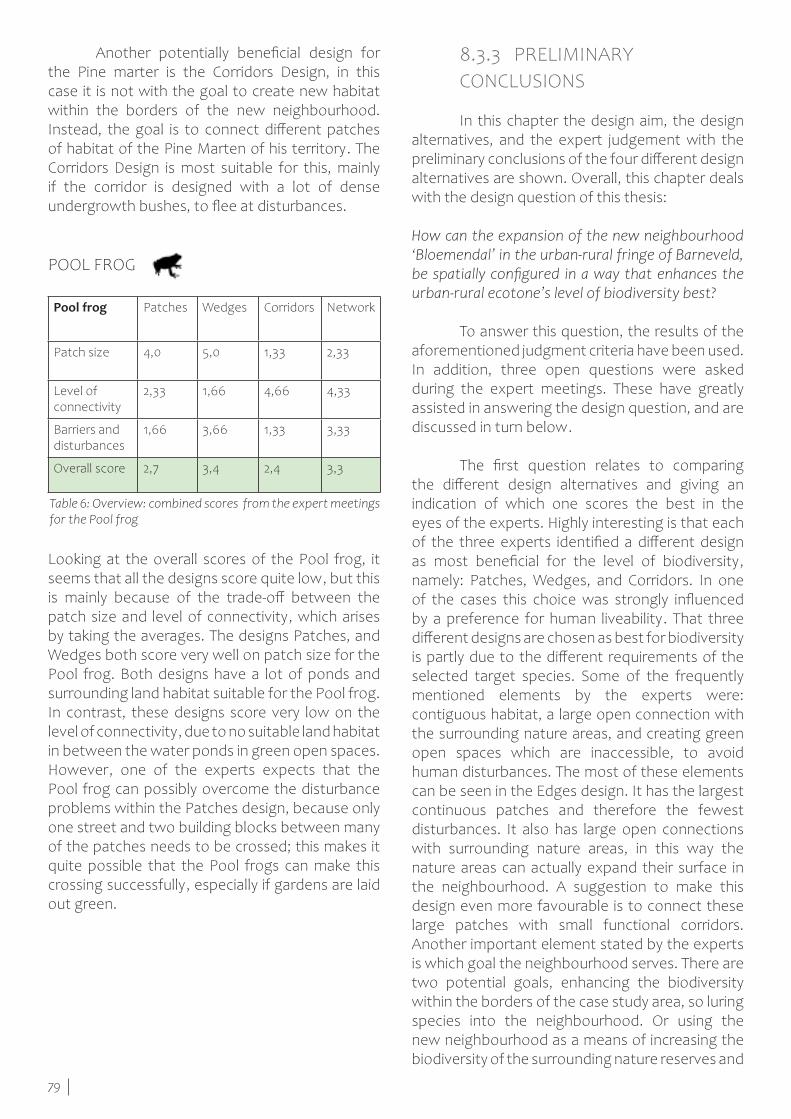
79
8.3.3 PRELIMINARY CONCLUSIONS
In this chapter the design aim, the design alternatives, and the expert judgement with the preliminary conclusions of the four different design alternatives are shown. Overall, this chapter deals with the design question of this thesis: How can the expansion of the new neighbourhood ‘Bloemendal’ in the urban-rural fringe of Barneveld, be spatially configured in a way that enhances the urban-rural ecotone’s level of biodiversity best?
To answer this question, the results of the aforementioned judgment criteria have been used. In addition, three open questions were asked during the expert meetings. These have greatly assisted in answering the design question, and are discussed in turn below.
The first question relates to comparing the different design alternatives and giving an indication of which one scores the best in the eyes of the experts. Highly interesting is that each of the three experts identified a different design as most beneficial for the level of biodiversity, namely: Patches, Wedges, and Corridors. In one of the cases this choice was strongly influenced by a preference for human liveability. That three different designs are chosen as best for biodiversity is partly due to the different requirements of the selected target species. Some of the frequently mentioned elements by the experts were: contiguous habitat, a large open connection with the surrounding nature areas, and creating green open spaces which are inaccessible, to avoid human disturbances. The most of these elements can be seen in the Edges design. It has the largest continuous patches and therefore the fewest disturbances. It also has large open connections with surrounding nature areas, in this way the nature areas can actually expand their surface in the neighbourhood. A suggestion to make this design even more favourable is to connect these large patches with small functional corridors. Another important element stated by the experts is which goal the neighbourhood serves. There are two potential goals, enhancing the biodiversity within the borders of the case study area, so luring species into the neighbourhood. Or using the new neighbourhood as a means of increasing the biodiversity of the surrounding nature reserves and
Looking at the overall scores of the Pool frog, it seems that all the designs score quite low, but this is mainly because of the trade-off between the patch size and level of connectivity, which arises by taking the averages. The designs Patches, and Wedges both score very well on patch size for the Pool frog. Both designs have a lot of ponds and surrounding land habitat suitable for the Pool frog. In contrast, these designs score very low on the level of connectivity, due to no suitable land habitat in between the water ponds in green open spaces. However, one of the experts expects that the Pool frog can possibly overcome the disturbance problems within the Patches design, because only one street and two building blocks between many of the patches needs to be crossed; this makes it quite possible that the Pool frogs can make this crossing successfully, especially if gardens are laid out green.
Another potentially beneficial design for the Pine marter is the Corridors Design, in this case it is not with the goal to create new habitat within the borders of the new neighbourhood. Instead, the goal is to connect different patches of habitat of the Pine Marten of his territory. The Corridors Design is most suitable for this, mainly if the corridor is designed with a lot of dense undergrowth bushes, to flee at disturbances.
POOL FROG
Pool frog Patches Wedges Corridors Network
Patch size 4,0 5,0 1,33 2,33
Level of connectivity
2,33 1,66 4,66 4,33
Barriers and disturbances
1,66 3,66 1,33 3,33
Overall score 2,7 3,4 2,4 3,3
Table 6: Overview: combined scores from the expert meetings for the Pool frog
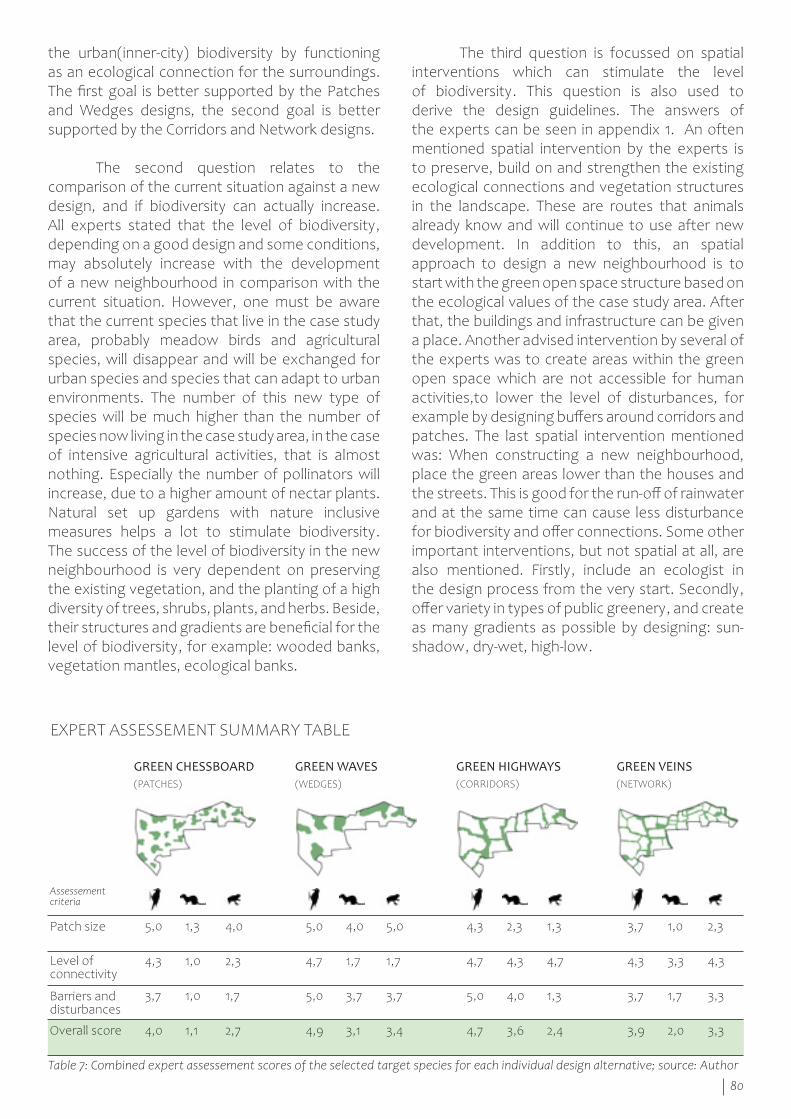
80
The third question is focussed on spatial interventions which can stimulate the level of biodiversity. This question is also used to derive the design guidelines. The answers of the experts can be seen in appendix 1. An often mentioned spatial intervention by the experts is to preserve, build on and strengthen the existing ecological connections and vegetation structures in the landscape. These are routes that animals already know and will continue to use after new development. In addition to this, an spatial approach to design a new neighbourhood is to start with the green open space structure based on the ecological values of the case study area. After that, the buildings and infrastructure can be given a place. Another advised intervention by several of the experts was to create areas within the green open space which are not accessible for human activities,to lower the level of disturbances, for example by designing buffers around corridors and patches. The last spatial intervention mentioned was: When constructing a new neighbourhood, place the green areas lower than the houses and the streets. This is good for the run-off of rainwater and at the same time can cause less disturbance for biodiversity and offer connections. Some other important interventions, but not spatial at all, are also mentioned. Firstly, include an ecologist in the design process from the very start. Secondly, offer variety in types of public greenery, and create as many gradients as possible by designing: sun-shadow, dry-wet, high-low.
the urban(inner-city) biodiversity by functioning as an ecological connection for the surroundings. The first goal is better supported by the Patches and Wedges designs, the second goal is better supported by the Corridors and Network designs.
The second question relates to the comparison of the current situation against a new design, and if biodiversity can actually increase. All experts stated that the level of biodiversity, depending on a good design and some conditions, may absolutely increase with the development of a new neighbourhood in comparison with the current situation. However, one must be aware that the current species that live in the case study area, probably meadow birds and agricultural species, will disappear and will be exchanged for urban species and species that can adapt to urban environments. The number of this new type of species will be much higher than the number of species now living in the case study area, in the case of intensive agricultural activities, that is almost nothing. Especially the number of pollinators will increase, due to a higher amount of nectar plants. Natural set up gardens with nature inclusive measures helps a lot to stimulate biodiversity. The success of the level of biodiversity in the new neighbourhood is very dependent on preserving the existing vegetation, and the planting of a high diversity of trees, shrubs, plants, and herbs. Beside, their structures and gradients are beneficial for the level of biodiversity, for example: wooded banks, vegetation mantles, ecological banks.
5,0 1,3 4,0 5,0 4,0 5,0 4,3 2,3 1,3 3,7 1,0 2,3
4,3 1,0 2,3 4,7 1,7 1,7 4,7 4,3 4,7 4,3 3,3 4,3
3,7 1,0 1,7 5,0 3,7 3,7 5,0 4,0 1,3 3,7 1,7 3,3
4,0 1,1 2,7 4,9 3,1 3,4 4,7 3,6 2,4 3,9 2,0 3,3
Patch size
GREEN CHESSBOARD GREEN WAVES GREEN HIGHWAYS GREEN VEINS
Level of connectivity
Assessement criteria
Barriers and disturbances
Overall score
(PATCHES) (WEDGES) (CORRIDORS) (NETWORK)
EXPERT ASSESSEMENT SUMMARY TABLE
Table 7: Combined expert assessement scores of the selected target species for each individual design alternative; source: Author
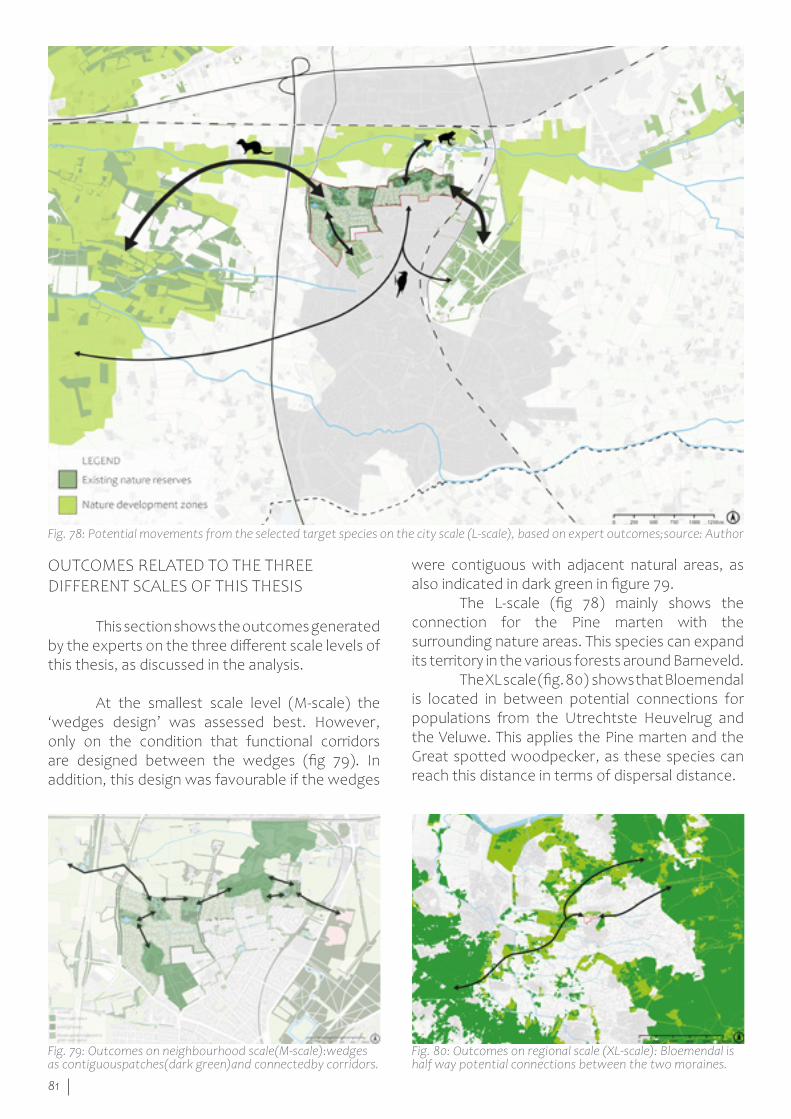
81
OUTCOMES RELATED TO THE THREE DIFFERENT SCALES OF THIS THESIS
This section shows the outcomes generated by the experts on the three different scale levels of this thesis, as discussed in the analysis.
At the smallest scale level (M-scale) the ‘wedges design’ was assessed best. However, only on the condition that functional corridors are designed between the wedges (fig 79). In addition, this design was favourable if the wedges
were contiguous with adjacent natural areas, as also indicated in dark green in figure 79. The L-scale (fig 78) mainly shows the connection for the Pine marten with the surrounding nature areas. This species can expand its territory in the various forests around Barneveld. The XL scale (fig. 80) shows that Bloemendal is located in between potential connections for populations from the Utrechtste Heuvelrug and the Veluwe. This applies the Pine marten and the Great spotted woodpecker, as these species can reach this distance in terms of dispersal distance.
Fig. 78: Potential movements from the selected target species on the city scale (L-scale), based on expert outcomes;source: Author
Fig. 79: Outcomes on neighbourhood scale(M-scale):wedges as contiguouspatches(dark green)and connectedby corridors.
Fig. 80: Outcomes on regional scale (XL-scale): Bloemendal is half way potential connections between the two moraines.
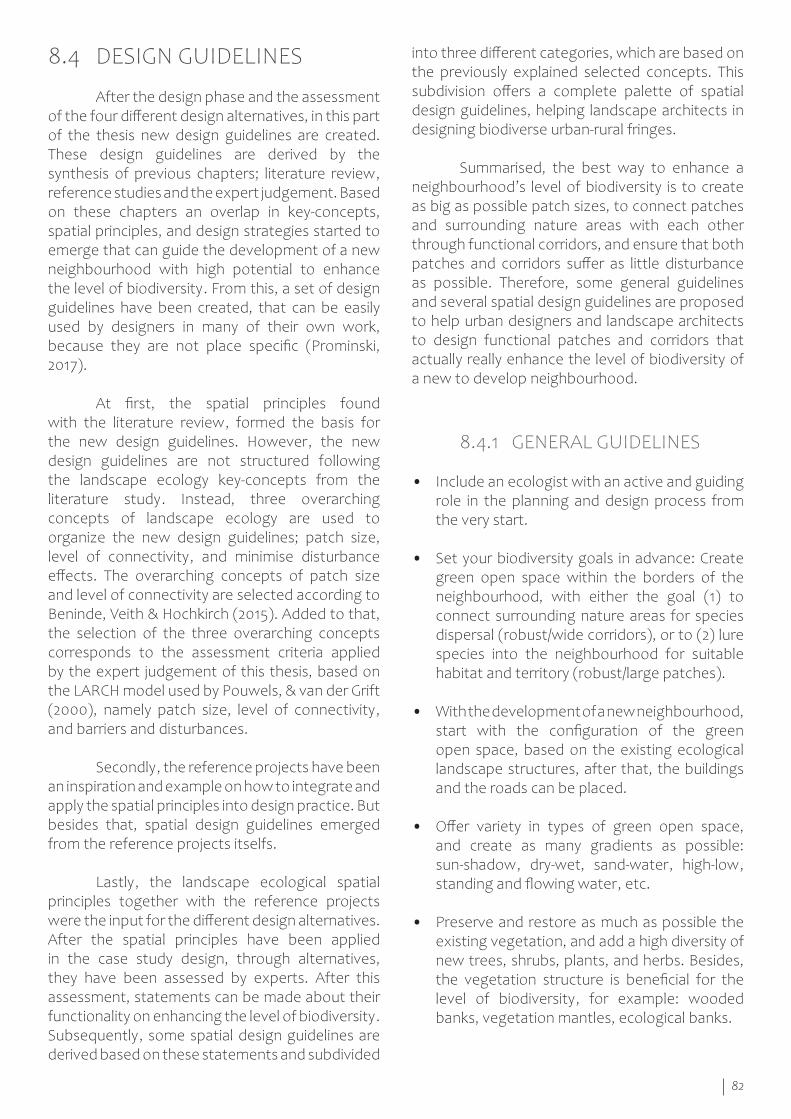
82
into three different categories, which are based on the previously explained selected concepts. This subdivision offers a complete palette of spatial design guidelines, helping landscape architects in designing biodiverse urban-rural fringes.
Summarised, the best way to enhance a neighbourhood’s level of biodiversity is to create as big as possible patch sizes, to connect patches and surrounding nature areas with each other through functional corridors, and ensure that both patches and corridors suffer as little disturbance as possible. Therefore, some general guidelines and several spatial design guidelines are proposed to help urban designers and landscape architects to design functional patches and corridors that actually really enhance the level of biodiversity of a new to develop neighbourhood.
8.4.1 GENERAL GUIDELINES
• Include an ecologist with an active and guiding role in the planning and design process from the very start.
• Set your biodiversity goals in advance: Create green open space within the borders of the neighbourhood, with either the goal (1) to connect surrounding nature areas for species dispersal (robust/wide corridors), or to (2) lure species into the neighbourhood for suitable habitat and territory (robust/large patches).
• With the development of a new neighbourhood, start with the configuration of the green open space, based on the existing ecological landscape structures, after that, the buildings and the roads can be placed.
• Offer variety in types of green open space, and create as many gradients as possible: sun-shadow, dry-wet, sand-water, high-low, standing and flowing water, etc.
• Preserve and restore as much as possible the existing vegetation, and add a high diversity of new trees, shrubs, plants, and herbs. Besides, the vegetation structure is beneficial for the level of biodiversity, for example: wooded banks, vegetation mantles, ecological banks.
8.4 DESIGN GUIDELINES
After the design phase and the assessment of the four different design alternatives, in this part of the thesis new design guidelines are created. These design guidelines are derived by the synthesis of previous chapters; literature review, reference studies and the expert judgement. Based on these chapters an overlap in key-concepts, spatial principles, and design strategies started to emerge that can guide the development of a new neighbourhood with high potential to enhance the level of biodiversity. From this, a set of design guidelines have been created, that can be easily used by designers in many of their own work, because they are not place specific (Prominski, 2017).
At first, the spatial principles found with the literature review, formed the basis for the new design guidelines. However, the new design guidelines are not structured following the landscape ecology key-concepts from the literature study. Instead, three overarching concepts of landscape ecology are used to organize the new design guidelines; patch size, level of connectivity, and minimise disturbance effects. The overarching concepts of patch size and level of connectivity are selected according to Beninde, Veith & Hochkirch (2015). Added to that, the selection of the three overarching concepts corresponds to the assessment criteria applied by the expert judgement of this thesis, based on the LARCH model used by Pouwels, & van der Grift (2000), namely patch size, level of connectivity, and barriers and disturbances.
Secondly, the reference projects have been an inspiration and example on how to integrate and apply the spatial principles into design practice. But besides that, spatial design guidelines emerged from the reference projects itselfs.
Lastly, the landscape ecological spatial principles together with the reference projects were the input for the different design alternatives. After the spatial principles have been applied in the case study design, through alternatives, they have been assessed by experts. After this assessment, statements can be made about their functionality on enhancing the level of biodiversity. Subsequently, some spatial design guidelines are derived based on these statements and subdivided
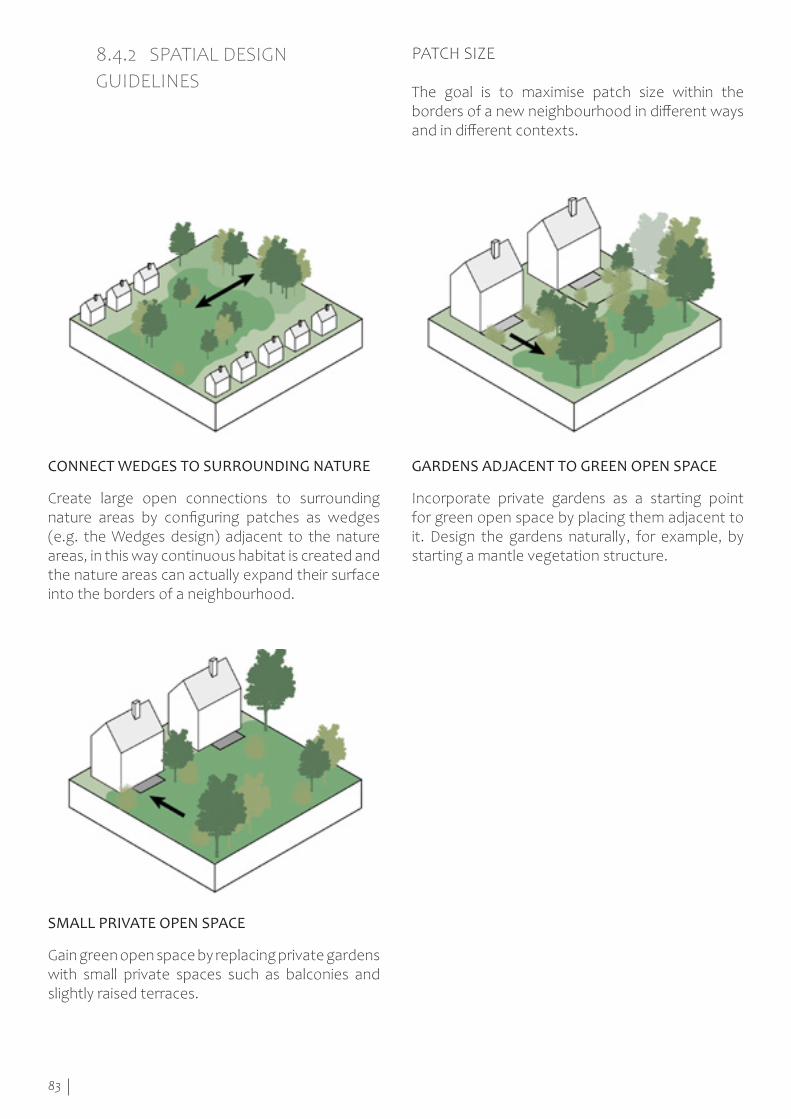
83
Create large open connections to surrounding nature areas by configuring patches as wedges (e.g. the Wedges design) adjacent to the nature areas, in this way continuous habitat is created and the nature areas can actually expand their surface into the borders of a neighbourhood.
Incorporate private gardens as a starting point for green open space by placing them adjacent to it. Design the gardens naturally, for example, by starting a mantle vegetation structure.
Gain green open space by replacing private gardens with small private spaces such as balconies and slightly raised terraces.
8.4.2 SPATIAL DESIGN GUIDELINES
PATCH SIZE
The goal is to maximise patch size within the borders of a new neighbourhood in different ways and in different contexts.
CONNECT WEDGES TO SURROUNDING NATURE
SMALL PRIVATE OPEN SPACE
GARDENS ADJACENT TO GREEN OPEN SPACE
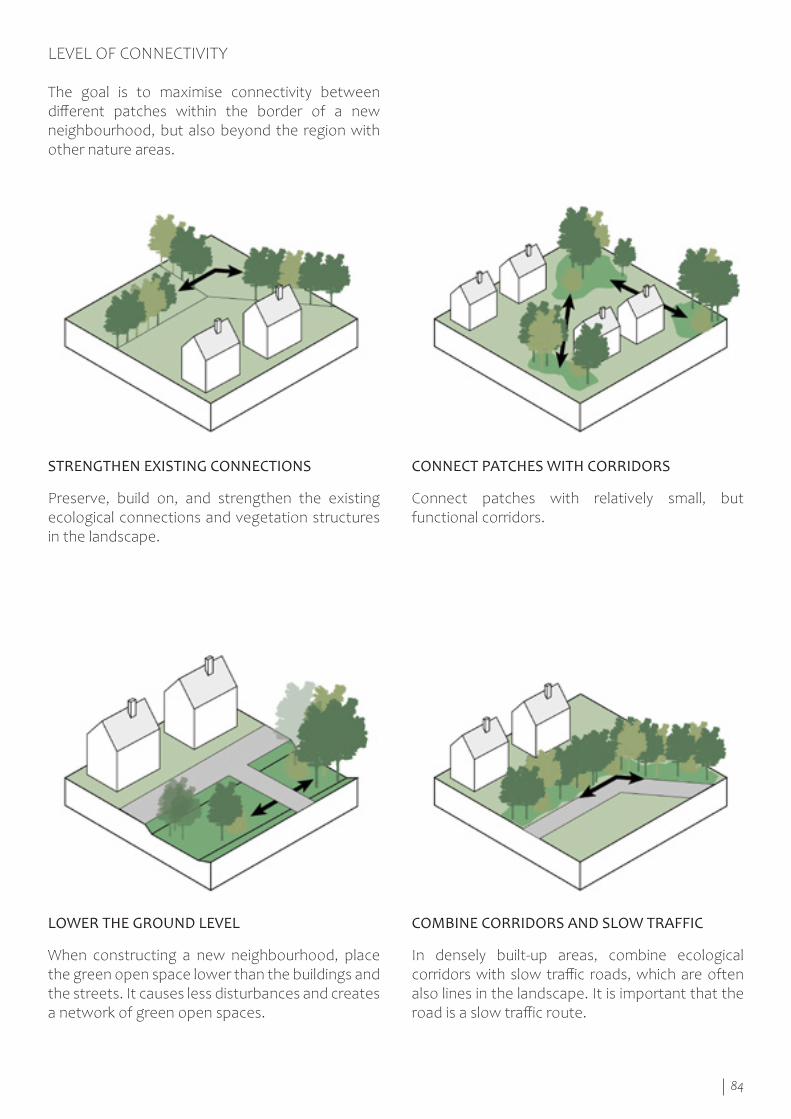
84
Preserve, build on, and strengthen the existing ecological connections and vegetation structures in the landscape.
Connect patches with relatively small, but functional corridors.
When constructing a new neighbourhood, place the green open space lower than the buildings and the streets. It causes less disturbances and creates a network of green open spaces.
In densely built-up areas, combine ecological corridors with slow traffic roads, which are often also lines in the landscape. It is important that the road is a slow traffic route.
LEVEL OF CONNECTIVITY
The goal is to maximise connectivity between different patches within the border of a new neighbourhood, but also beyond the region with other nature areas.
STRENGTHEN EXISTING CONNECTIONS
LOWER THE GROUND LEVEL COMBINE CORRIDORS AND SLOW TRAFFIC
CONNECT PATCHES WITH CORRIDORS
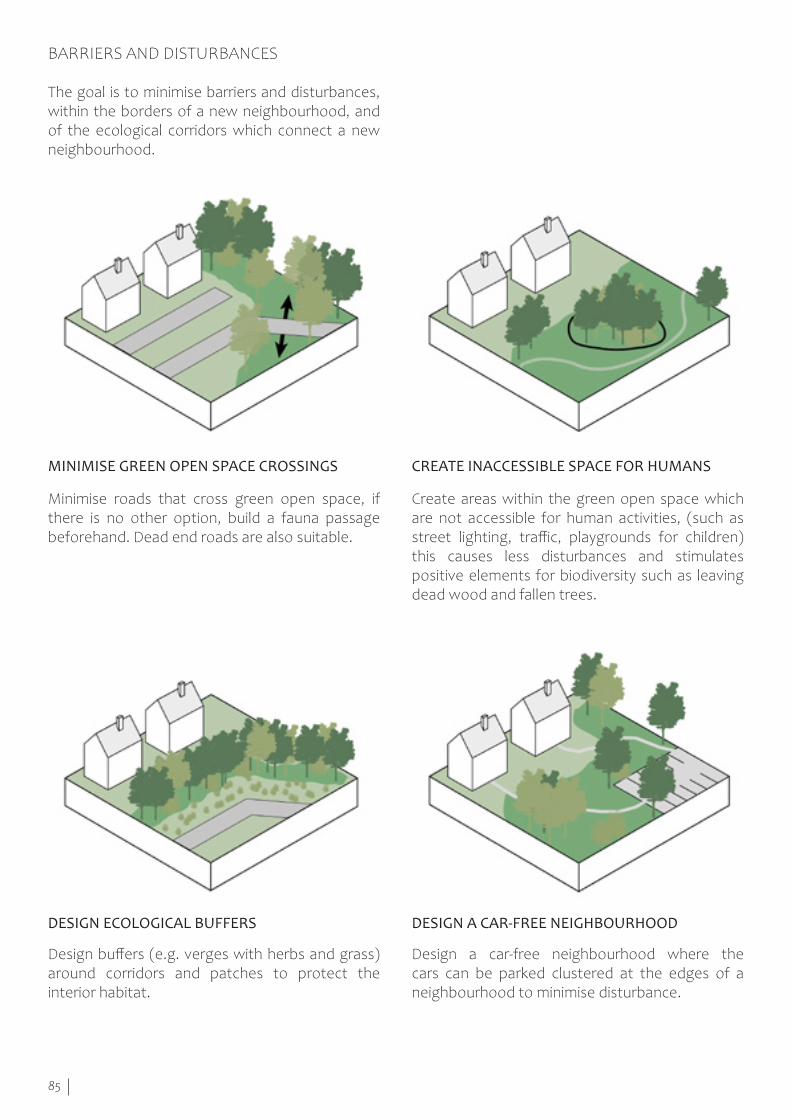
85
BARRIERS AND DISTURBANCES
The goal is to minimise barriers and disturbances, within the borders of a new neighbourhood, and of the ecological corridors which connect a new neighbourhood.
Minimise roads that cross green open space, if there is no other option, build a fauna passage beforehand. Dead end roads are also suitable.
Create areas within the green open space which are not accessible for human activities, (such as street lighting, traffic, playgrounds for children) this causes less disturbances and stimulates positive elements for biodiversity such as leaving dead wood and fallen trees.
Design buffers (e.g. verges with herbs and grass) around corridors and patches to protect the interior habitat.
Design a car-free neighbourhood where the cars can be parked clustered at the edges of a neighbourhood to minimise disturbance.
MINIMISE GREEN OPEN SPACE CROSSINGS
DESIGN ECOLOGICAL BUFFERS DESIGN A CAR-FREE NEIGHBOURHOOD
CREATE INACCESSIBLE SPACE FOR HUMANS

86
87
9. CONCLUSION & DISCUSSION
Image source: Warwickshire, May 2012
88
rural ecotone’s level of biodiversity, the Bloemendal neighbourhood in Barnevel was selected as case study area. It’s location in the urban-rural fringe with nature areas in the surroundings, among other criteria, made it an exemplary case to conduct this research and to generalize the results as input for other Dutch cities with neighbourhood expansions. The expert assessments on the four different design alternatives, each with another configuration of the green open space, resulted in interesting findings and the outcome of this thesis: 11 spatial design guidelines subdivide following the concepts; patch size, level of connectivity and disturbances and barriers.
Thus, the main outcome of this thesis is the combination of the main- and design-question, what together resulted in the 11 spatial design guidelines and some other general outcomes. The choices on the configuration of green open space, to enhance biodiversity with new neighbourhood expansions, depends on the goals you set in forehand. Either create green corridors within the neighbourhood to serve the goal of (1) connecting surrounding nature areas for species exchange and dispersal. Or, set the goal (2) lure species to settle (partly) their territory and habitat within the borders of new neighbourhoods, by providing suitable habitat based on target species requirements. To achieve the first goal, it is important to focus more on the key-concept wedges and create large continuous patches, preferably adjacent to surrounding nature areas. If the second goal is to be achieved, it is advisable to design robust/wide corridors, with as little disturbances as possible, to connect different nature areas and create a high level of connectivity.
In the case of both goals, other choices have to be made on which type of species can live in the new neighbourhood. Choosing one of the two goals will result in other animal species appearing in the neighbourhood. Therefore, selection for one of the two goals should be based and strongly related to the surroundings of the new neighbourhood and the presence of source areas (nature reserves) for target species. For this, the analysis and design-planning on the three different scale levels, with an active role and participation of an ecologist, is important to provide information to make the best choice.
9.1 CONCLUSION
The aim of this thesis has been: define, by applying landscape ecology spatial principles, which spatial configuration of green open space of a new to develop neighbourhood, in urban-rural fringes, can enhance biodiversity best. Through answering both of the research questions and the design question, insights have been obtained about ways to configure green open space based on landscape ecology spatial principles. After all, spatial design guidelines are derived and proposed, to be used for future city expansions to enhance the level of biodiversity.
Sub-research question 1 explored, through a literature review, landscape ecology spatial principles which can be applied in urban environments. A synthesis of the literature review resulted in 20 useful spatial principles, subdivided following four selected key-concepts; patches, wedges, corridors, and network. The findings of the literature review stressed the importance of implementing different scales, at least three, into a biodiversity focussed design. This thesis used the regional-, city-, and neighbourhood-scale, which are implemented and appear in each part of the thesis. Furthermore, the most effective landscape ecology spatial concepts to conserve and enhance biodiversity are patch area/size and high connectivity, which must be mentioned that the degree of disturbance and fragmentation is also included within the concept of high connectivity.
Sub-research question 2 explored how reference projects can inform the configuration and lay-out of a new neighbourhood design. Four award winning reference cases were selected for their innovative or exemplary way on including and enhancing biodiversity in urban design. The findings of the systematic review of the reference cases provided practical information and form/lay-out on successful ways on implementing landscape ecology concepts and spatial principles. Good examples were found for almost all of the 20 spatial principles and the key-concepts wedges, corridors, and network. In addition, the cases have served as a source of inspiration for proposing landscape ecology spatial design guidelines.
To test and discover what spatial design guidelines, based on landscape ecology, could be applied for city expansions to enhance an urban-
89
DESIGNING, RESULTS AND USED METHODS
The focus of this thesis was clearly on enhancing the level of biodiversity. Biodiversity is a very broad concept and there are many ways to define and measure it. Biodiversity measurements are possible with a lot of different ways of modelling, for example: species richness, diversity, or evenness, habitat diversity, number of habitats etcetera (Hermy & Cornelis, 2000). Within this thesis, due to a lack of personal knowledge of the author and time constraints, it was decided not to model the level of biodiversity, but to assess it on the basis of expert judgment, target species have been selected for this. The selection of target species is also an approach that by definition falls short. Because it is a great dilemma and impossible to be truly inclusive for biodiversity by only selecting a few species among the thousands of them (Ahern et al., 2007).
Nevertheless, efforts have been made to be as inclusive and comprehensive as possible in the selection of the target species in this thesis. However, because of the expert judgment and the amount of design alternatives that had to be assessed for each target species, the choice has remained with three species. Because of this no insect/pollinator is chosen. This is unfortunate because this would have added interesting outcomes, but it was decided not to select such a type target species, because the focus was on the configuration of the green open space. Insects/pollinators are less dependent on green open space than the other types of species, in the urban-rural ecotone insects/pollinators also benefit more from private gardens in comparison to the other types of species (Goddard et al., 2010).
Since the focus of this thesis concerned biodiversity in urban areas, the human-aspect is also very important, but not taken into account at all, a conscious choice, due to a lack of time, but a major shortcoming. According Miller (2008) the human factor should definitely taken into account when designing an urban area. Of course the main goal of urban areas is still the human factor and not at first biodiversity. With a biodiverse design, it is therefore always difficult to determine to what extent interventions are possible in reality. To what extent is it allowed and supported by the residents. In addition, it is of course also the question whether we want to give every type of species the opportunity to live in an urban
In conclusion, with a new neighbourhood development at the urban-rural fringe of a city on former agricultural fields, it is possible to enhance the urban-rural ecotone’s level of biodiversity compared to a former situation. In all probability, the absolute numbers, and number of different types of species will be much higher in an urban-rural ecotone, especially pollinators increase, compared to an agricultural setting. However, one must take for granted that the type of species will change, agricultural species will disappear and been replaced by urban (adapted) species.
9.2 DISCUSSION
This discussion interprets and discusses the literature review, the designing and results, the used methods, and the limitations of this thesis, beside some recommendations for further research.
THE THEORETICAL APPROACH OF THIS THESIS
There are many factors influencing the level of biodiversity. Within this thesis the field of landscape ecology is taken as framework to approach biodiversity. This is an interesting point of view, but of course it is possible that many other factors were overlooked. The spatial character of landscape ecology resulted in a spatial focus of this thesis (Forman, 1995). The terrestrial and landscape scale of landscape ecology resulted in an approach on a larger scale of this thesis. As a result of this, many other aspects of biodiversity, especially on smaller scale and maintenance, have not been addressed (Vink et al., 2017).
There are different points of view from which to look at enhancing the level of biodiversity. Landscape factors (patch area, and level of connectivity) are often seen as main influence for species richness. On the other side, some researchers indicate that only a spatial approach has many shortcomings. For example, habitat diversity, vegetation structure, singly focus on vegetation, and maintenance and policy (Werner & Zahner, 2010; Vink et al., 2017; Beninde, Veith & Hochkirch, 2015).
90
an example of a most favourable configuration in the case of the case study area for the level of biodiversity and a generalizable example.
FURTHER RESEARCH
During this thesis, several new and other ideas emerged which could not be included in this study, but are very interesting for further research. First, In this thesis, the green open space of a neighbourhood has been designed based on landscape ecology principles. However, the precondition for the designs was that the border of the case study area would remain the same in all alternatives, so that the alternatives could be compared with each other. What could be an interesting point of view for further research is the expansion of cities (determining/researching the border) based on landscape ecology principles. In contrast to this thesis, the border of the city/neighbourhood should be designed in different ways, following the landscape ecology principles.
Secondly, As mentioned before in this discussion, little attention has been paid in this thesis to planting and vegetation, while it does have a major impact on the level of biodiversity. With the changing climate and the associated challenges to combat urban problems (for example heat stress and flooding), it is interesting what the possible syntheses are for biodiversity enhancement and climate adaptation (Kabisch et al., 2016).
Last, this thesis argues that the level of biodiversity of the urban-rural ecotone can be enhanced through good design and configuration of green open spaces. This statement assumes that developing a neighbourhood thus increases the level of biodiversity compared to a former situation of agricultural fields. The number of animal species is increasing, but this is mainly due to the poor state of the level of biodiversity of the current agricultural landscape. At the moment it would therefore be advantageous to build residential areas in a proper way to enhance the level of biodiversity. However, the question is, will this remain the case if the transition is made to nature inclusive agriculture? This is interesting for further research, especially with the current developments in the Netherlands with attempts to an agricultural transition and the housing crisis.
environment (Given & Meurk, 2000). There are also species that we would rather not have close to our homes.
THE DESIGN PROCESS
In addition, the aspect of urbanism is also minimally taken into consideration. As this was a landscape architecture thesis, the focus has been mainly on the green open space. A number of elements of urbanism have been included, but only at a global level such as minimizing roads and logically designing the built-up area (in terms of density and accessibility). However, there has not been a zoomed-in and precise design on different densities (high-rise), street level designs or the style, function and architecture of the buildings. What is, although to a lesser extent, included in the design is the modularity of the city expansion. In a way that there should be a possibility to extend the same ecological concepts and spatial principles without breaking the ecological value.
In this thesis, four different design alternatives are designed. All four alternatives were based on a key-concept from the literature review. The first three alternatives, patches, wedges and corridors have complied with the explanations in the literature and this thesis. In retrospect, the ‘network’ design was less successful. The definition of the concept of network is explained in the literature, as well as in this thesis, as a combination of patches connected to corridors. This creates a high degree of connectivity and many loops and alternatives. With designing this alternative, informed by the spatial principles and exemplary reference cases, there was too much focus on creating alternatives and circuitry. As a result, the combination of patches connected with corridors has largely been lost to a refined network of corridors with hardly any patches. That is a missed opportunity, as combining large patches with functional corridors based on the expert assessments is the most beneficial alternative for the level of biodiversity in new neighbourhoods.
In this thesis, due to time constraints, the experts were only able to assess the design alternatives once. It would have been interesting to modify the designs after the initial assessment and have them re-evaluated, even if only by one expert. Instead of the four alternatives with a set of spatial design guidelines, this should have provided
91
REFERENCES
Field excursion; Image source: Author
92
and Urban planning, 73(1), 29-48. Chivian, E. (2002) Biodiversity: its importance to human health. Center for Health and the Global Environment, Harvard Medical School, Cambridge, MA, 23.
Colding, J. (2007). ‘Ecological land-use complementation’ for building resilience in urban ecosystems. Landscape and urban planning, 81(1-2), 46-55.
Connery, K. (2009) Biodiversity and urban design: Seeking an integrated solution. Journal of Green Building, 4(2), 23-38. Corner, J., & Tiberghien, G. A. (2008) Intermediate Natures: The Landscapes of Michel Desvigne. Walter de Gruyter.
Dekker, H., Horsten, M., Kok, M., Kruit, E., Lodder, A., & Schik, W. (2015) Duurzame landschapsarchitectuur - essays en praktijkvoorbeelden. Blauwdruk.
Dramstad, W. E., Olson, J. D., & Forman, R. T. (1996) Landscape ecology principles in landscape architecture and land-use planning.
EIB. (2021) Ruimtelijke ordening en bouwlocaties - De potentie van woningbouw in de groene omgeving. Economisch Instituut voor de Bouw.
Euro Parliament. (2021) Verlies aan biodiversiteit: waarom is dit een probleem en wat zijn de oorzaken? EuroParlement. Retrieved January 21, from: https://www .europar l .europa.eu/news/n l /headl ines/society/20200109STO69929/verlies-aan-biodiversiteit-waarom-is-dit-een-probleem-en-wat-zijn-de-oorzaken
EVA-Lanxmeer. (2022) Ontwerp Stedenbouwkundig plan | Eva-Lanxmeer. Retrieved March 31 from: http://www .eva-lanxmeer .nl/over/ontstaan/ontwerp-stedenbouwkundig-plan
Forman R. T. T. (1995) Land mosaics: the ecology of landscapes and regions. Cambridge University Press, Cambridge.
Forman, R. T. T. (2008) Urban regions. Ecology and planning beyond the city. Cambridge University Press, Camebridge.
Forman, R. T. (2014) Urban ecology: science of cities. Cambridge University Press. Fors, H., Nielsen, A. B., van den Bosch, C. C. K., & Jansson, M. (2018) From borders to ecotones–Private-public co-management of urban woodland edges bordering private housing. Urban Forestry & Urban
Ahern, J. (1999) Spatial concepts, planning strategies, and future scenarios: a framework method for integrating landscape ecology and landscape planning. In Landscape ecological analysis (pp. 175-201). Springer, New York, NY.
Ahern J (2005) Integration of landscape ecology and landscape architecture: an evolutionary and reciprocal process. In: Wiens J, Moss MR (eds) Issues and perspectives in landscape ecology. Cambridge University Press, Cambridge, pp 311–319.
Ahern, J., Leduc, E., & York, M. L. (2007) Biodiversity planning and design: sustainable practices. Island Press.
Arcadis. (2016) Natuurtoets Barneveld-Noord - gemeente Barneveld.
Barneveldse Krant. (2020) Barneveld wil biodiversiteit op hoger plan. Barneveldse Krant | Nieuws uit de regio Barneveld. Retrieved January 31 from: https://www.barneveldsekrant.nl/lokaal/natuur-en-milieu/341657/barneveld-wil-biodiversiteit-op-hoger-plan-703088 Beninde, J., Veith, M., & Hochkirch, A. (2015) Biodiversity in cities needs space: a meta‐analysis of factors determining intra‐urban biodiversity variation. Ecology letters, 18(6), 581-592.
Bento, J. (2020) Panorama Lokaal: urban design competition on urban-rural fringes vision (NL). Urban Maestro.
BIJ12. (2017) Kennisdocument Poelkikker, versie 1.0. Utrecht.
Boischio, A., Clegg, A., Mwagore, D. (2006) Health risks and benefits of urban and ‘peri-urban’ agriculture and livestock (UA) in sub-Saharan Africa. Urban Poverty and Environment Series Report 1, IDRC, Canada
Breuste, J., Niemelä, J., & Snep, R. P. (2008) Applying landscape ecological principles in urban environments. Landscape ecology, 23(10), 1139-1142.
Brons Partners. (2017) Landschapsontwikkelingsplan Gelderse Vallei - aangepaste versie 2017. Hoofdrapport Inventarisatie, analyse en visie. Gemeente Leusden.
Buro Lubbers. (2022) ‘t Zand Son en Breugel - ontwerp van een wijk tussen bos en beek. Retrieved March 31 from: https://burolubbers.nl/420_t-zand/
Burton, R. (2006) Garden Bird Behaviour. London: New Holland. p. 77. ISBN 978-1-84537-597-3.
Calkins, M. (2005) Strategy use and challenges of ecological design in landscape architecture. Landscape
93
Low Impact Urban Design and Development (LIUDD): matching urban design and urban ecology. Landscape Review, 12(2), 61-73.
Jim, C. Y., & Chen, S. S. (2003) Comprehensive greenspace planning based on landscape ecology principles in compact Nanjing city, China. Landscape and urban planning, 65(3), 95-116.
Kabisch, N., Frantzeskaki, N., Pauleit, S., Naumann, S., Davis, M., Artmann, M., ... & Bonn, A. (2016) Nature-based solutions to climate change mitigation and adaptation in urban areas: perspectives on indicators, knowledge gaps, barriers, and opportunities for action. Ecology and Society, 21(2).
Kühn, I., Brandl, R., & Klotz, S. (2004) The flora of German cities is naturally species rich. Evolutionary ecology research, 6(5), 749-764.
Kooijmans, J. L., Snep, R., & van Stiphout, M. (2021) Leren van natuurrijke woonbuurten uit het verleden: Aanbevelingen voor het ontwikkelen van een natuurinclusieve woonbuurt op basis van een scan van 12 woningbouwprojecten uit 1995-2010. KAN bouwen.
Laak, J.C. (2005) De taal van het landschap, p. 120-121. ROB, Amersfoort.
Legendre, P., & Legendre, L. (2012) Multiscale analysis: spatial eigenfunctions. In Developments in environmental modelling (Vol. 24, pp. 859-906). Elsevier.
Leitao, A. B., & Ahern, J. (2002) Applying landscape ecological concepts and metrics in sustainable landscape planning. Landscape and urban planning, 59(2), 65-93.
MacArthur R.H., Wilson, E.O. (1967) The theory of island biogeography. Princeton University Press, Princeton, NJ
MacGregor-Fors, I. (2010) How to measure the urban-wildland ecotone: redefining ‘peri-urban’ areas. Ecological Research, 25(4), 883-887. McKinney, M. L., & Lockwood, J. L. (1999) Biotic homogenization: a few winners replacing many losers in the next mass extinction. Trends in ecology & evolution, 14(11), 450-453. McNicol, C. M., Bavin, D., Bearhop, S., Bridges, J., Croose, E., Gill, R., ... & McDonald, R. A. (2020) Postrelease movement and habitat selection of translocated pine martens Martes martes. Ecology and evolution, 10(11), 5106-5118.
Greening, 30, 46-55. Francis, R. A., & Chadwick, M. A. (2013) Urban ecosystems: understanding the human environment. Routledge. Garrard, G. E., Williams, N. S., Mata, L., Thomas, J., & Bekessy, S. A. (2018) Biodiversity sensitive urban design. Conservation Letters, 11(2), e12411.
Gemeente Barneveld. (2017) Barneveld-Noord - masterplan gemeente Barneveld.
Gemeente Barneveld. (2020) Beeldkwaliteitsplan Bloemendal Fase 1 – woonmilieus: Bloemenvelden & Erven Nijkerkerweg.
Gemeente Barneveld. (2021) Biodiversiteitsplan gemeente Barneveld.
Gemeente Zeist. (2008) Globaal beeldkwaliteitsplan Kerckebosch Zeist. Retrieved March 14 from: https://www.kerckeboschzeist.nl/downloads/
Given, D. and Meurk, C., (2000) Biodiversity of the urban environment: the importance of indigenous species and the role urban environments can play in their preservation. In: G.H. Stewart and M.E. Ignatieva, eds. Urban biodiversity and ecology as a basis for holistic planning and design: proceedings of a workshop held at Lincoln University. Christchurch, New Zealand: Wickliffe Press, 22-33.
Goddard, M. A., Dougill, A. J., & Benton, T. G. (2010) Scaling up from gardens: biodiversity conservation in urban environments. Trends in ecology & evolution, 25(2), 90-98.
Haartsen, A., & van Beusekom, E. (2009) Ontgonnen verleden: Regiobeschrijvingen provincie Gelderland. Directie Kennis, Ministerie van Landbouw, Natuur en Voedselkwaliteit.
Hanski, I., & Gilpin, M. (1991) Metapopulation dynamics: brief history and conceptual domain. Biological journal of the Linnean Society, 42(1-2), 3-16.
Hermy, M., & Cornelis, J. (2000) Towards a monitoring method and a number of multifaceted and hierarchical biodiversity indicators for urban and suburban parks. Landscape and urban planning, 49(3-4), 149-162.
Het Parool. (2021) Onenigheid over bouw van bijna 1 miljoen woningen. Het Parool. Retrieved January 24 from: https://www.parool.nl/nederland/onenigheid-over-bouw-van-bijna-1-miljoen-woningen~b813d3b6/
Ignatieva, M., Stewart, G. H., & Meurk, C. D. (2008)
94
projectinformatie. Retrieved March 30 from:https://panoramalokaal.nl/locaties/westwijk/
PBL (2021) Grote opgaven in een beperkte ruimte. Ruimtelijke keuzes voor een toekomstbestendige leefomgeving. Den Haag: Planbureau voor de Leefomgeving. PBL (2014) De Nederlandse bevolking in beeld: verleden, heden, toekomst. 24 infographics op basis van de CBS/PBL-regionale bevolkings-en huishoudensprognose. Den Haag: Planbureau voor de Leefomgeving.
Penteado, H. (2013) Assessing the effects of applying landscape ecological spatial concepts on future habitat quantity and quality in an urbanizing landscape. Landscape Ecol, 28, 1909-1921.
Provincie Gelderland. (2018) Gaaf Gelderland - omgevingsvisie. Arnhem: Provinciale staten Gelderland.
Provincie Utrecht. (2022) Natuur Netwerk Nederland (NNN) in de Provincie Utrecht. Retrieved April 4 from:https://www.provincie-utrecht.nl/onderwerpen/natuur/natuurnetwerk-nederland-nnn#nnn
Ravon. (2022) Poelkikker. Retrieved April 21 from: https://www .ravon.nl/Soorten/Soortinformatie/poelkikker
Rees, W.E. (1996) Revisiting carrying capacity: area-based indicators of sustainability. Popul Environ 17:195–215
Richter, M., Weiland, U. (2012) Applied Urban Ecology: A Global Framework.Wiley-Blackwell
Rijksoverheid. (2022) Natuur en biodiversiteit - natuurnetwerk Nederland. Retrieved April 4 from:https://www .rijksoverheid.nl/onderwerpen/natuur-en-biodiversiteit/natuurnetwerk-nederland
Savard, J. P. L., Clergeau, P., & Mennechez, G. (2000) Biodiversity concepts and urban ecosystems. Landscape and urban planning, 48(3-4), 131-142.
Snep, R. P. H., Opdam, P. F. M., Baveco, J. M., WallisDeVries, M. F., Timmermans, W., Kwak, R. G. M., & Kuypers, V. (2006) How peri-urban areas can strengthen animal populations within cities: A modeling approach. Biological conservation, 127(3), 345-355.
Snep, R. P., & Clergeau, P. (2020) Biodiversity in cities, reconnecting humans with nature. Sustainable built environments, 251-274.
Sokolov, L. V., Shapoval, A. P., & Yakovleva, M. V. (2013). Long-term monitoring of Great Spotted Woodpecker
Miller, J.R., Hobbs, R.J. (2002) Conservation where people live and work. Conserv Biol 16(2):330–337
Miller, J. R. (2008). Conserving Biodiversity in Metropolitan Landscapes A Matter of Scale (But Which Scale). Landscape Journal, 27(1), 114-126.
Muis, R. (2019) Kerckebosch Zeist uitgeroepen tot meest natuurinclusieve wijk. Architectenweb. Retrieved March 14 from: https://architectenweb.nl/nieuws/artikel.aspx?ID=45882
De Mulder, E. F., Geluk, M. C., Ritsema, I., Westerhoff, W. E., & Wong, T. E. (2003) De ondergrond van Nederland.
Müller, N., & Werner, P. (2010) Urban biodiversity and the case for implementing the convention on biological diversity in towns and cities. Urban biodiversity and design, 7, 3-34. Nabielek, K., Kronberger-Nabielek, P., & Hamers, D. (2013) The rural-urban fringe in the Netherlands: recent developments and future challenges. SPOOL, 1(1). doi:10.7480/spool.2013.1.624 Naess, P. (2001) Urban planning and sustainable development. European Planning Studies, 9(4), 503-524.
Nassauer, J. I., & Opdam, P. (2008) Design in science: extending the landscape ecology paradigm. Landscape ecology, 23(6), 633-644.
Naveh, Z., & Lieberman, A. S. (2013) Landscape ecology: theory and application. Springer Science & Business Media.
Norton, B. A., Evans, K. L., & Warren, P. H. (2016) Urban biodiversity and landscape ecology: patterns, processes and planning. Current Landscape Ecology Reports, 1(4), 178-192.
Ónodi, G., & Csörgő, T. (2013) Relationship between vegetation structure and abundance of Great-spotted Woodpeckers (Dendrocopos major) in a mosaic habitat. Ornis hungarica, 21(1), 1-11.
Opdam, P. (1991) Metapopulation theory and habitat fragmentation: a review of holarctic breeding bird studies. Landscape ecology, 5(2), 93-106.
Panorama Lokaal. (2020a) Westwijk Rooted - Inzending Panorama Lokaal, Vlaardingen Westwijk, projectplan. Retrieved March 30 from:https://panoramalokaal.nl/inzendingen/westwijk_team_1/
Panorama Lokaal. (2020b) Westwijk Rooted -
95
21&date_before=2022-04-21&species=109&species_g r o u p = & r a r i t y = & s e a r c h = & o w n _s i g h t i n g s = & u s e r = & s e x = & l i f e _stage=&activity=&method=
Waarneming.nl. (2022b) Waarnemingen gebieden - Barneveld: Kallenbroek, Boommarter. Retrieved May 02 from: https://waarneming.nl/locations/10268/observat ions/ ?date_after=2021 -05-02&date_b e f o r e = 2 0 2 2 - 0 5 - 0 2 & s p e c i e s = 3 7 6 & s p e c i e s _g r o u p = & r a r i t y = & s e a r c h = & o w n _s i g h t i n g s = & u s e r = & s e x = & l i f e _stage=&activity=&method=&view_type=as_map
Weisser, W., & Hauck, T. (2017) Animal-aided design-using a species life-cycle to improve open space planning and conservation in cities and elsewhere.
Wereld Natuur Fonds. (2020) Living Planet Report Nederland. Natuur en landbouw verbonden. WNF, Zeist
Werner, P., & Zahner, R. (2010) Urban Patterns and Biological Diversity: A Review. In Muller, N., Werner, P., & Kelcey, J. G. (Eds.). Urban biodiversity and design (pp. 145-173). John Wiley & Sons.
Williams J., Read C., Norton T., Dovers S., Burgman M., Proctor W., Anderson H. (2001) Biodiversity, Australia state of the environment report 2001 (Theme report). CSIRO (publishing on the behalf of the Department of the Environment and Heritage), Canberra
Wu, J. J. (2008a) Making the case for landscape ecology an effective approach to urban sustainability. Landscape journal, 27(1), 41-50.
Wu, J. (2008b) Toward a landscape ecology of cities: beyond buildings, trees, and urban forests. In Ecology, planning, and management of urban forests (pp. 10-28). Springer, New York, NY.
Wurck. (2021) Kerckebosch, Zeist. Wurck. Retrieved March 14 from: https://www.wurck.nl/projecten/kerckebosch-zeist/
WWF. (2020) Living Planet Report 2020 - Bending the curve of biodiversity loss. Almond, R.E.A., Grooten M. and Petersen, T. (Eds). WWF, Gland, Switzerland.
Zoogdiervereniging VVZ. (n.d.) De boommarter in de gelderse vallei - met uw hulp blijft ie. Aanbevelingen voor concrete maatregelen en tips voor martervriendelijk bosbeheer. Arnhem.
Zoogdiervereniging. (2022) Boommarter. Retrieved April 21 from: https://www.zoogdiervereniging.nl/zoogdiersoorten/boommarter
Dendrocopos major irruptions in the Baltic region and Karelia.
Sun, R., & Chen, L. (2017) How to Design an Urban Ecological Landscape: Sustainability, Efficiency, and Harmony?. In Jinan Forum on Geography and Ecological Sustainability Guangzhou, China (pp. 39-54). Springer, Cham. Tjallingii, S. P. (2000) Ecology on the edge: Landscape and ecology between town and country. Landscape and urban planning, 48(3-4), 103-119.
Turner, M.G. (1989) Landscape ecology: the effect of pattern on process. Annual Review of Ecology and Systematics, 20, 171–97.
Turrini, T., & Knop, E. (2015) A landscape ecology approach identifies important drivers of urban biodiversity. Global change biology, 21(4), 1652-1667.
United Nations. (2006, November 2) United Nations - Convention on Biological Diversity. Retrieved December 30, from: https://www.cbd.int/convention/articles/?a=cbd-02 United Nations. (2019) World Urbanization Prospects: The 2018 Revision. Department of Economic and Social Affairs, Population Division. (ST/ESA/SER.A/420). New York: United Nations. Van den Brink, A., Bruns, D., Tobi, H., & Bell, S. (2017) Research in landscape architecture. Routledge. Taylor and Francis. Oxon.
Vink, J., Vollaard, P., Zwarte, N. de, Tee, J., & Vink,J. (2017) Stads natuur maken = Making urban nature LK -https://wur.on.worldcat.org/oclc/1001370374. In TA - TT-. Nai010 uitgevers/publishers.
Vogelbescherming. (2022) Grote Bonte Specht. Retrieved April 21 from: https://www.vogelbescherming.nl/ontdek-vogels/kennis-over-vogels/vogelgids/vogel/Grote-Bonte-specht?gclid=Cj0KCQjw3v6SBhCsARIsACyrRAlZc8HrdkwE7uJsSVamZwA34pP3LpWTu78AsKf1CdBnuik8bwUmc-oaAiqQEALw_wcB#Verspreiding
De Volkskrant. (2020) Haar huis werd ‘een hellingbaan’. Stedenbouwkundige Riek Bakker weet wat bodemdaling doet. Retrieved May 30, from: Haar huis werd ‘een hellingbaan’. Stedenbouwkundige Riek Bakker weet wat bodemdaling doet (volkskrant.nl)
Waarneming.nl. (2022a) Waarnemingen gebieden - Barneveld: Landgoed de Schaffelaar, Oosterbos, Esvelderbeek/binnenveld zone, de Mheen. Retrieved April 21 from: https://waarneming.nl/locations/8481/observations/?date_after=2021-04-

96
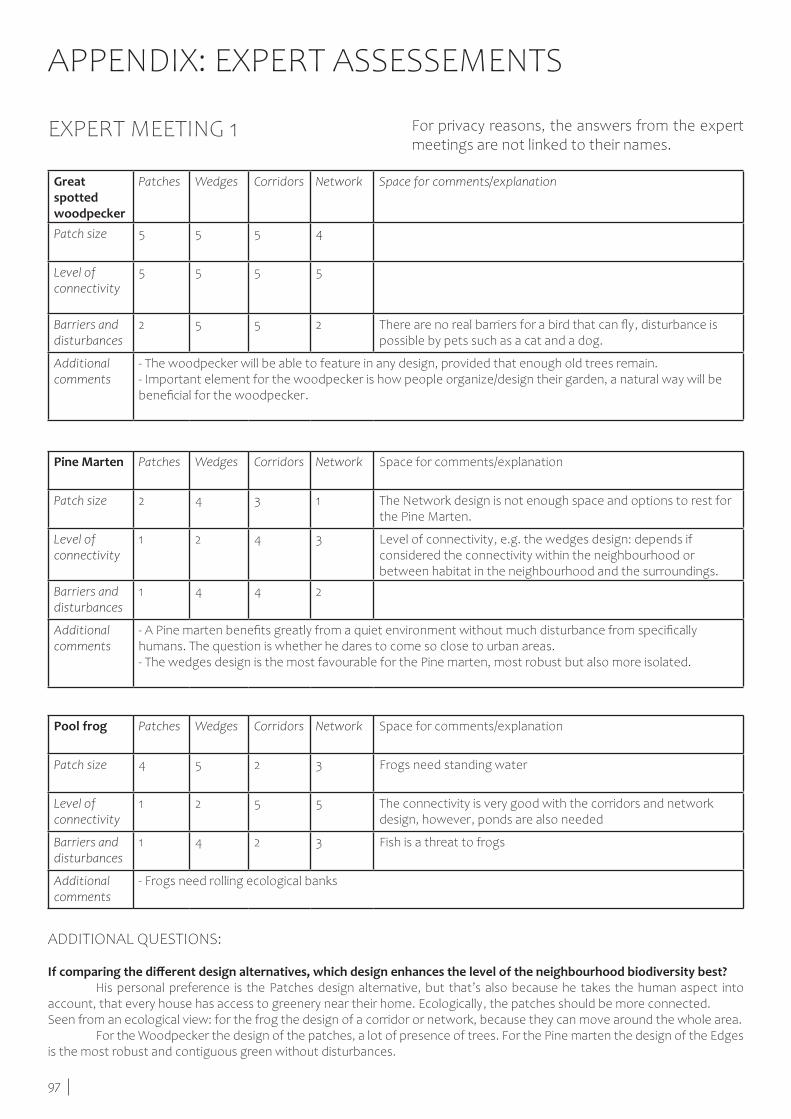
97
ADDITIONAL QUESTIONS:
If comparing the different design alternatives, which design enhances the level of the neighbourhood biodiversity best? His personal preference is the Patches design alternative, but that’s also because he takes the human aspect into account, that every house has access to greenery near their home. Ecologically, the patches should be more connected. Seen from an ecological view: for the frog the design of a corridor or network, because they can move around the whole area. For the Woodpecker the design of the patches, a lot of presence of trees. For the Pine marten the design of the Edges is the most robust and contiguous green without disturbances.
EXPERT MEETING 1 For privacy reasons, the answers from the expert meetings are not linked to their names.
APPENDIX: EXPERT ASSESSEMENTS
Pine Marten Patches Wedges Corridors Network Space for comments/explanation
Patch size 2 4 3 1 The Network design is not enough space and options to rest for the Pine Marten.
Level of connectivity
1 2 4 3 Level of connectivity, e.g. the wedges design: depends if considered the connectivity within the neighbourhood or between habitat in the neighbourhood and the surroundings.
Barriers and disturbances
1 4 4 2
Additional comments
- A Pine marten benefits greatly from a quiet environment without much disturbance from specifically humans. The question is whether he dares to come so close to urban areas. - The wedges design is the most favourable for the Pine marten, most robust but also more isolated.
Pool frog Patches Wedges Corridors Network Space for comments/explanation
Patch size 4 5 2 3 Frogs need standing water
Level of connectivity
1 2 5 5 The connectivity is very good with the corridors and network design, however, ponds are also needed
Barriers and disturbances
1 4 2 3 Fish is a threat to frogs
Additional comments
- Frogs need rolling ecological banks
Great spotted woodpecker
Patches Wedges Corridors Network Space for comments/explanation
Patch size 5 5 5 4
Level of connectivity
5 5 5 5
Barriers and disturbances
2 5 5 2 There are no real barriers for a bird that can fly, disturbance is possible by pets such as a cat and a dog.
Additional comments
- The woodpecker will be able to feature in any design, provided that enough old trees remain.- Important element for the woodpecker is how people organize/design their garden, a natural way will be beneficial for the woodpecker.
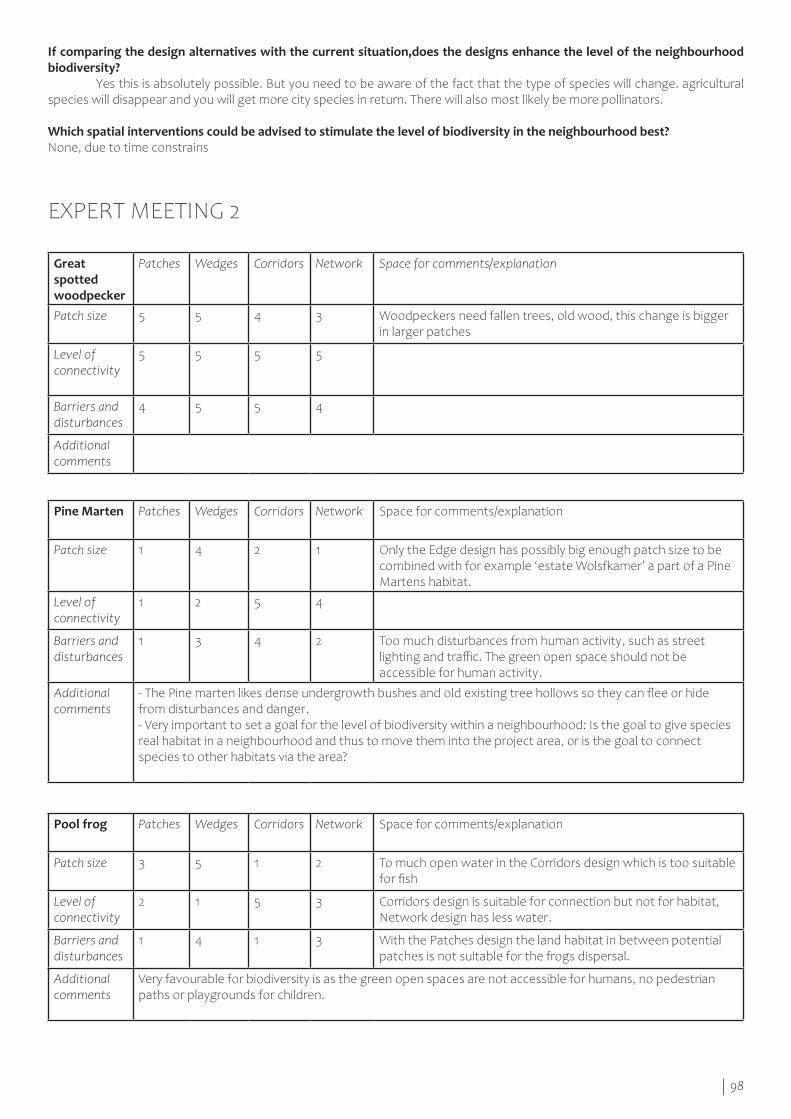
98
If comparing the design alternatives with the current situation,does the designs enhance the level of the neighbourhood biodiversity? Yes this is absolutely possible. But you need to be aware of the fact that the type of species will change. agricultural species will disappear and you will get more city species in return. There will also most likely be more pollinators.
Which spatial interventions could be advised to stimulate the level of biodiversity in the neighbourhood best?None, due to time constrains
EXPERT MEETING 2
Pine Marten Patches Wedges Corridors Network Space for comments/explanation
Patch size 1 4 2 1 Only the Edge design has possibly big enough patch size to be combined with for example ‘estate Wolsfkamer’ a part of a Pine Martens habitat.
Level of connectivity
1 2 5 4
Barriers and disturbances
1 3 4 2 Too much disturbances from human activity, such as street lighting and traffic. The green open space should not be accessible for human activity.
Additional comments
- The Pine marten likes dense undergrowth bushes and old existing tree hollows so they can flee or hide from disturbances and danger. - Very important to set a goal for the level of biodiversity within a neighbourhood: Is the goal to give species real habitat in a neighbourhood and thus to move them into the project area, or is the goal to connect species to other habitats via the area?
Pool frog Patches Wedges Corridors Network Space for comments/explanation
Patch size 3 5 1 2 To much open water in the Corridors design which is too suitable for fish
Level of connectivity
2 1 5 3 Corridors design is suitable for connection but not for habitat, Network design has less water.
Barriers and disturbances
1 4 1 3 With the Patches design the land habitat in between potential patches is not suitable for the frogs dispersal.
Additional comments
Very favourable for biodiversity is as the green open spaces are not accessible for humans, no pedestrian paths or playgrounds for children.
Great spotted woodpecker
Patches Wedges Corridors Network Space for comments/explanation
Patch size 5 5 4 3 Woodpeckers need fallen trees, old wood, this change is bigger in larger patches
Level of connectivity
5 5 5 5
Barriers and disturbances
4 5 5 4
Additional comments
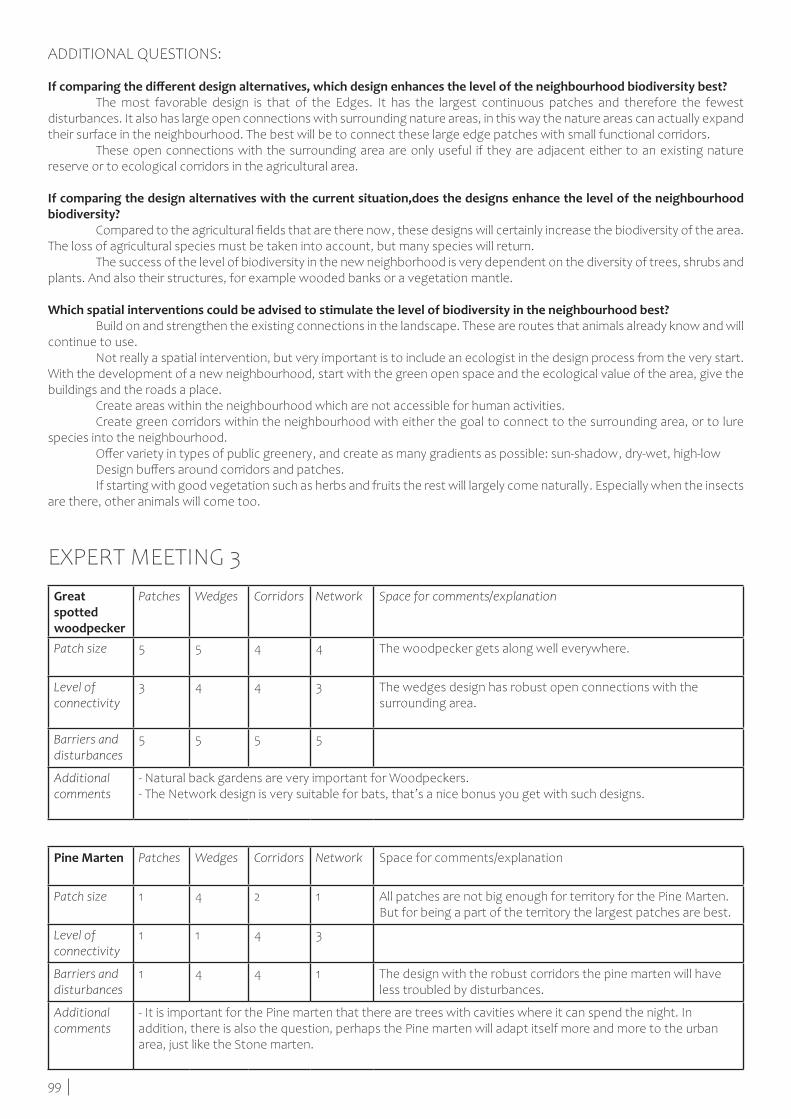
99
ADDITIONAL QUESTIONS:
If comparing the different design alternatives, which design enhances the level of the neighbourhood biodiversity best? The most favorable design is that of the Edges. It has the largest continuous patches and therefore the fewest disturbances. It also has large open connections with surrounding nature areas, in this way the nature areas can actually expand their surface in the neighbourhood. The best will be to connect these large edge patches with small functional corridors. These open connections with the surrounding area are only useful if they are adjacent either to an existing nature reserve or to ecological corridors in the agricultural area.
If comparing the design alternatives with the current situation,does the designs enhance the level of the neighbourhood biodiversity? Compared to the agricultural fields that are there now, these designs will certainly increase the biodiversity of the area. The loss of agricultural species must be taken into account, but many species will return. The success of the level of biodiversity in the new neighborhood is very dependent on the diversity of trees, shrubs and plants. And also their structures, for example wooded banks or a vegetation mantle.
Which spatial interventions could be advised to stimulate the level of biodiversity in the neighbourhood best? Build on and strengthen the existing connections in the landscape. These are routes that animals already know and will continue to use. Not really a spatial intervention, but very important is to include an ecologist in the design process from the very start. With the development of a new neighbourhood, start with the green open space and the ecological value of the area, give the buildings and the roads a place. Create areas within the neighbourhood which are not accessible for human activities. Create green corridors within the neighbourhood with either the goal to connect to the surrounding area, or to lure species into the neighbourhood. Offer variety in types of public greenery, and create as many gradients as possible: sun-shadow, dry-wet, high-low Design buffers around corridors and patches. If starting with good vegetation such as herbs and fruits the rest will largely come naturally. Especially when the insects are there, other animals will come too.
EXPERT MEETING 3
Great spotted woodpecker
Patches Wedges Corridors Network Space for comments/explanation
Patch size 5 5 4 4 The woodpecker gets along well everywhere.
Level of connectivity
3 4 4 3 The wedges design has robust open connections with the surrounding area.
Barriers and disturbances
5 5 5 5
Additional comments
- Natural back gardens are very important for Woodpeckers.- The Network design is very suitable for bats, that’s a nice bonus you get with such designs.
Pine Marten Patches Wedges Corridors Network Space for comments/explanation
Patch size 1 4 2 1 All patches are not big enough for territory for the Pine Marten. But for being a part of the territory the largest patches are best.
Level of connectivity
1 1 4 3
Barriers and disturbances
1 4 4 1 The design with the robust corridors the pine marten will have less troubled by disturbances.
Additional comments
- It is important for the Pine marten that there are trees with cavities where it can spend the night. In addition, there is also the question, perhaps the Pine marten will adapt itself more and more to the urban area, just like the Stone marten.
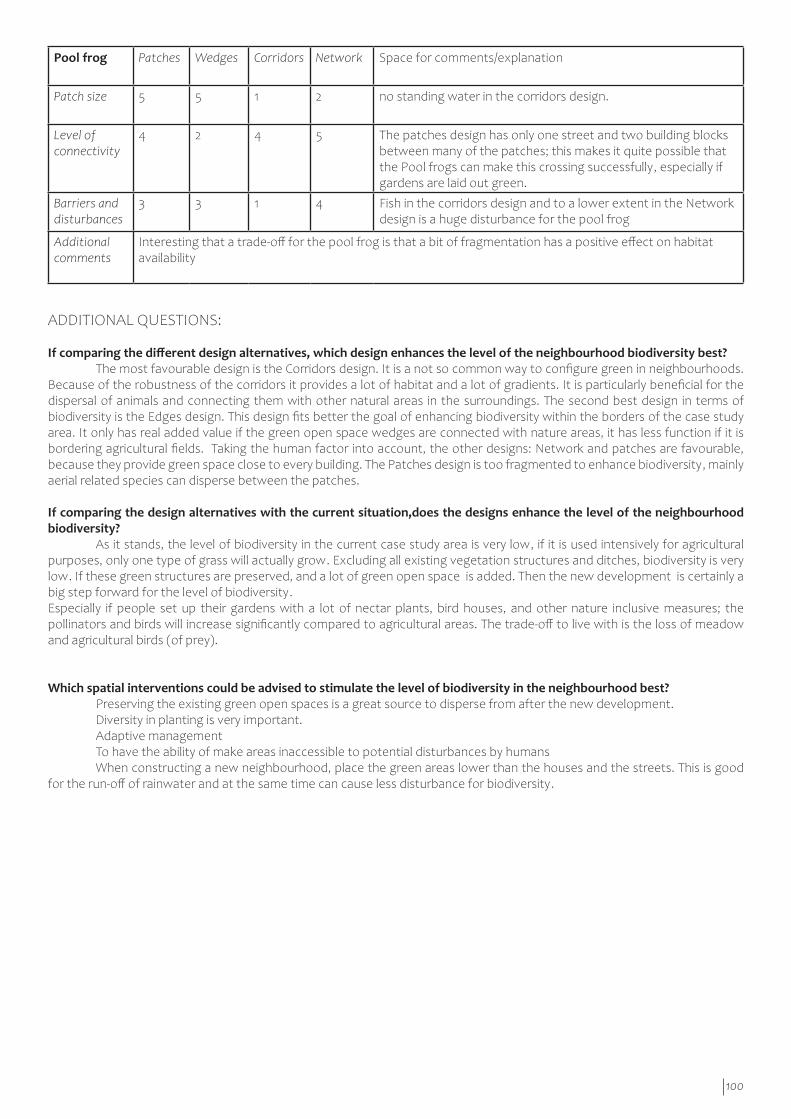
100
ADDITIONAL QUESTIONS:
If comparing the different design alternatives, which design enhances the level of the neighbourhood biodiversity best? The most favourable design is the Corridors design. It is a not so common way to configure green in neighbourhoods. Because of the robustness of the corridors it provides a lot of habitat and a lot of gradients. It is particularly beneficial for the dispersal of animals and connecting them with other natural areas in the surroundings. The second best design in terms of biodiversity is the Edges design. This design fits better the goal of enhancing biodiversity within the borders of the case study area. It only has real added value if the green open space wedges are connected with nature areas, it has less function if it is bordering agricultural fields. Taking the human factor into account, the other designs: Network and patches are favourable, because they provide green space close to every building. The Patches design is too fragmented to enhance biodiversity, mainly aerial related species can disperse between the patches.
If comparing the design alternatives with the current situation,does the designs enhance the level of the neighbourhood biodiversity? As it stands, the level of biodiversity in the current case study area is very low, if it is used intensively for agricultural purposes, only one type of grass will actually grow. Excluding all existing vegetation structures and ditches, biodiversity is very low. If these green structures are preserved, and a lot of green open space is added. Then the new development is certainly a big step forward for the level of biodiversity.Especially if people set up their gardens with a lot of nectar plants, bird houses, and other nature inclusive measures; the pollinators and birds will increase significantly compared to agricultural areas. The trade-off to live with is the loss of meadow and agricultural birds (of prey).
Which spatial interventions could be advised to stimulate the level of biodiversity in the neighbourhood best? Preserving the existing green open spaces is a great source to disperse from after the new development. Diversity in planting is very important. Adaptive management To have the ability of make areas inaccessible to potential disturbances by humans When constructing a new neighbourhood, place the green areas lower than the houses and the streets. This is good for the run-off of rainwater and at the same time can cause less disturbance for biodiversity.
Pool frog Patches Wedges Corridors Network Space for comments/explanation
Patch size 5 5 1 2 no standing water in the corridors design.
Level of connectivity
4 2 4 5 The patches design has only one street and two building blocks between many of the patches; this makes it quite possible that the Pool frogs can make this crossing successfully, especially if gardens are laid out green.
Barriers and disturbances
3 3 1 4 Fish in the corridors design and to a lower extent in the Network design is a huge disturbance for the pool frog
Additional comments
Interesting that a trade-off for the pool frog is that a bit of fragmentation has a positive effect on habitat availability

101