Embed Size (px)
Citation preview

Lehigh UniversityLehigh Preserve
Theses and Dissertations
1998
Flexural strength and ductility of HPS-100W steelI-girdersLarry Alan FahnestockLehigh University
Follow this and additional works at: http://preserve.lehigh.edu/etd
This Thesis is brought to you for free and open access by Lehigh Preserve. It has been accepted for inclusion in Theses and Dissertations by anauthorized administrator of Lehigh Preserve. For more information, please contact [email protected].
Recommended CitationFahnestock, Larry Alan, "Flexural strength and ductility of HPS-100W steel I-girders" (1998). Theses and Dissertations. Paper 528.
Fahnestock, LarryAlan
Flexural Strength .and Ductility ofHPS-1 OOWSteel 1-Girders
May 13,1998

Flexural Strength and Ductility ofHPS-100W Steel I-Girders
by
Larry Alan Fahnestock
A ThesisPresented to the Graduate and Research Committee
of Lehigh Universityin Candidacy for the Degree of
Master of Science
ill
Civil Engineering
Lehigh University
May 6, 1998


Acknowledgments
The author acknowledges the support provided by the American Iron and Steel
Institute (AISI) for the experimental portion of this research. The research was
conducted at the Center for Advanced Technology for Large Structural Systems
(ATLSS) at Lehigh University. Financial support for the author was provided by the
ATLSS Center. The author thanks the technical and support staff of the ATLSS .
Center and the Fritz Engineering Laboratory at Lehigh University.
The author gratefully acknowledges the advice, guidance, and direction given
by his research advisor, Dr. Richard Sause, not only regarding academics and research,
but also concerning personal and professional development.
The opinions, findings, and conclusions expressed in this thesis are those of the
author and do not necessarily reflect the views of those acknowledged here.
Finally, the author thanks Dad, Mom, Lisa, Lauren, and Anne for all of their
love, support and encouragement.
All praise, glory, and honor to Jesus Christ the Lord.
iii

Table of Contents
Page
Title PageAcknowledgmentsList of TablesList of Figures
Abstract
Chapter 1 - Introduction1.1 Objectives1.2 Approach1.3 Thesis Outline
1
iiivi
vii
1
3455
Chapter 2 - Background 72.1 AASHTO LRFD Bridge Design Specifications 7
2.1.1 Slenderness Limits 82.1.2 Alternative Formula for Flexural Resistance 10
2.2 Ductility of I-Girders 122.3 Previous Research 15
2.3.1 McDermott (1969) 152.3.2 Croce (1970) 172.3.3 Holtz and Kulak (1973) 192.3.4 Holtz and Kulak (1975) 202.3.5 Grubb and Carskaddan (1979) 212.3.6 Grubb and Carskaddan (1981) 222.3.7 Schilling (1988) 232.3.8 Schilling (1990) 232.3.9 Barth (1996) 252.3.10 White, Ramirez, and Barth (1997) 262.3.11 Green and Sause (1997) 292.3.12 Summary of Previous Research Relevant to the Present Study30
Chapter 3 - Test Design and Set-Up3.1 Test Specimen Design
3.1.1 Specimen 13.1.2 Specimen 2
iv
40404144


spacing to radius of gyration (4/ry) is limited to 21 for uniform moment regions and
36 for regions of moment gradient.
2.3.2 Croce (1970)
Eight specimens were tested at the University of Texas at Austin in a study
investigating the web slenderness required for use in plastic design. The specimens
were welded I-girders fabricated from ASTM A36 steel, a steel with a nominal yield
stress of 36 ksi (248 MPa). The specimens were three-span continuous I-girders with
varying span lengths and loading configurations.
Flange slenderness values ranged from O.l3tJE/Fyc to 0338~E/Fyc' Web
slenderness values ranged from 2.04~E I Fyc to 4.07~E I FyC . Table 2.2 summarizes
the flange slenderness and web slenderness values for the specimens. The specimens
failed by flange and web local buckling and carried loads greater than those predicted
by simple plastic theory. The study concluded that plastic design can be permitted for
A36 steel members with web slenderness up to 125, provided that the maximum shear
stress is less than the critical web buckling stress assuming pinned boundary
conditions for the web.
Several of the web slenderness values considered by Croce are in the range of
interest of the present study. However, the flange slenderness values were much less
than those considered in the present study. In addition, the loading conditions imposed
on the test specimens were much different than those used in the present study and all
17

other similar studies. The specimens were tested as three-span girders with side spans
of 4.5 ft. (l.48 m) or 7.5 ft. (2.46 m) and center spans of 20 ft. (6.56 m) or 30 ft. (9.84
m). The short side spans were included to provide continuity at the ends of the center
spans, and as a result, the test specimens were indeterminate to the second degree.
Ductility of the specimens was quantified in terms of the midspan deflection. The
ductility limit was reached when the applied load dropped below the theoretical plastic
collapse load for the continuous I-girder. The ductility of the plastic hinges was not
provided by Croce, but can be estimated from the test results. The failure modes for
the majority of the tests involved shear buckling of the web rather than local buckling
of the compression flange and/or the web due to longitudinal bending stresses.
For Croce's Specimen 1, an elastic-plastic analysis was performed to estimate
the inelastic rotation that occurred at each of the three plastic hinges. Specimen 1 was
chosen because it developed local buckling of the compression flange and the web at
the plastic hinge locations and its failure mode did not involve shear buckling of the
web. The values of maximum inelastic rotation through which the plastic moment was
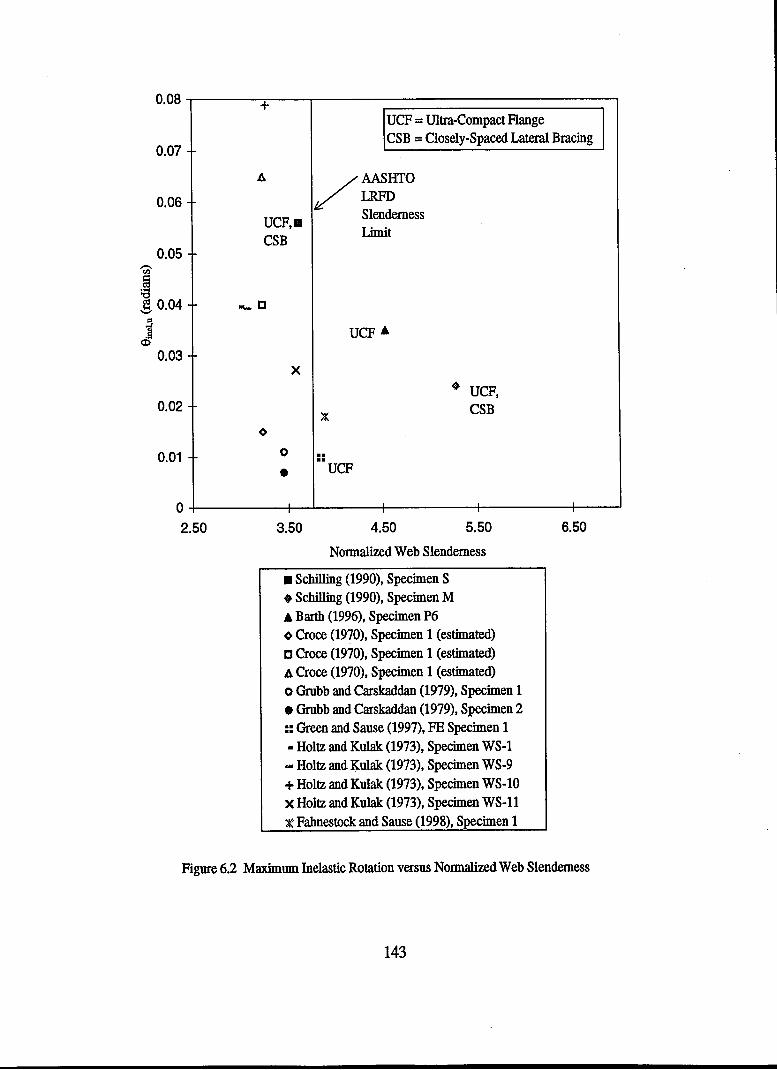
sustained, 8inel,u, are plotted in Figure 2.2. The results show that different levels of
maximum inelastic rotation were estimated for the three hinges of the specimen, ~hich
has only a single value of web slenderness.
18

2.3.3 Holtz and Kulak (1973)
Ten specimens were tested at the University of Alberta to determine the web
slenderness limit for an I-shaped member expected to reach the plastic moment as its
ultimate flexural strength. The specimens were welded I-shaped beams fabricated
from CSA G40.12 steel, a steel with a nominal yield stress of 44 ksi (196 kN). The
beams were simply-supported and loaded symmetrically in four-point loading.
Eight specimens had a flange slenderness of 0388~EI Fyc , and two specimens
had slightly stockier flanges with a slenderness of 0321~E I Fyc • The web
slenderness values for the specimens ranged from 3.00~E I FyC to 554~E I Fyc •
Table 2.3 lists the flange slenderness and web slenderness for each specimen
(Specimens WS-l through WS-l1). The study concluded that I-shaped beams with
flange slenderness not exceeding 0388~E I FyC and web slenderness not exceeding
3.05~E I Fyc are capable of reaching the plastic moment as their ultimate flexural
strength. The study concluded that flexural ductility should not be expected for
specimens meeting the above criteria.
Four of the specimens tested by Holtz and Kulak exceeded the plastic moment.
For these specimens, the rotation capacity, R, is plotted in Figure 2.3. This figure
shows a wide range of rotation capacities for similar levels of normalized web
slenderness, and no clear trend is observed. Figure 2.4 shows a plot of normalized
ultimate flexural strength versus normalized flange slenderness for the ten specimens
19

tested by Holtz and Kulak (1973). This figure shows a clear trend of decreasing
normalized ultimate flexural strength with increasing normalized web slenderness.
2.3.4 Holtz and Kulak (1975)
Two specimens were tested in an experimental program at the University of
Alberta to determine the web slenderness limit for an I-shaped member expected to
reach the yield moment as its ultimate flexural strength. Both specimens were welded
I-shaped beams fabricated from CSA G40.12 steel. The beams were simply-supported
and loaded symmetrically in four-point loading.
Both specimens had a flange slenderness of 0589~E I FyC • The web
slenderness values for the specimens were 4.l8~E I Fyc and 454~E I Fyc • Flange and
web slenderness information is listed in Table 2.3 (Specimens WS-12-N and WS-13
N). The experimental program concluded that specimens with flange slenderness not
exceeding 0388~E I Fyc and web slenderness not exceeding 452~E I Fyc are capable
of reaching the yield moment as their ultimate flexural strength. The two specimens
tested by Holtz and Kulak (1975) are not relevant to the present study because the web
slenderness values are too high.
20

2.3.5 Grubb and Carskaddan (1979)
Three welded I-girders with the same cross-section but different span lengths
were tested by the United States Steel Corporation to examine their flexural ductility.
The I-girders were simply-supported and tested in three-point loading to simulate the
condition of negative flexure at an interior pier of a continuous-span bridge. To
account for the contribution of steel reinforcement in the slab to the behavior in
negative flexure, cover plates were welded to the tension flanges. As a result, the
neutral axis was shifted and more than one-half of the web was in compression. The
girders were fabricated from ASTM A572 Grade 50 steel, a steel with a nominal yield
stress of 50 ksi (345 MPa).
The flange slenderness value for the three specimens was 0351~E I Fyc • The
actual web slenderness value was D/tw = 254~E I Fyc ' To account for the shift of the
neutral axis, twice the depth of the web in compression at the plastic moment, 2Dcp, is
used in place of the actual depth, D, to quantify the web slenderness. Therefore, the
effective web slenderness is Dcp/tw = 3.45~E I Fyc •
The specimens did not provide the flexural strength and ductility that were
expected. One specimen slightly exceeded the plastic moment, one just reached the
plastic moment, and the third specimen did not reach the plastic moment. The study
concluded that a larger depth of web in compression and a more shallow moment
gradient cause a decrease in flexural ductility. Figure 2.2 shows the maximum
inelastic rotation, 8inel,u, versus normalized web slenderness for the two specimens that
21

reached the plastic moment. The normalized ultimate flexural strengths of all three
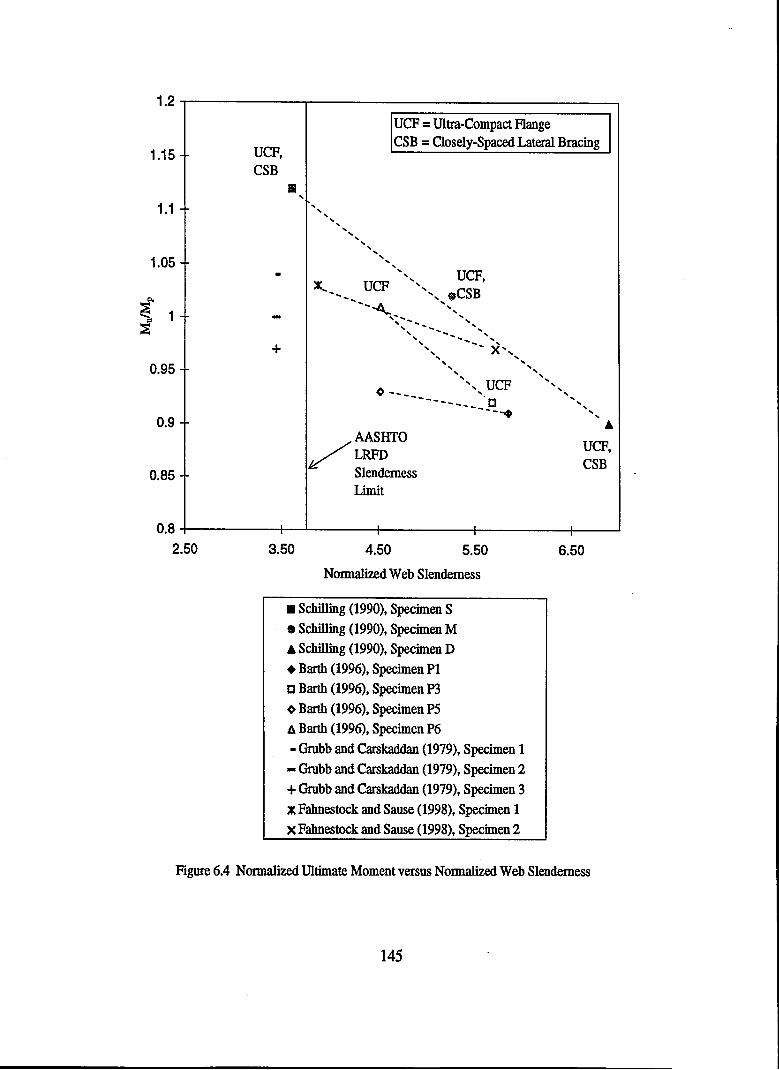
specimens are plotted versus normalized web slenderness in Figure 2.5.
2.3.6 Grubb and Carskaddan (1981)
The three specimens described in the previous section provided flexural
strength and ductility that were less than expected, and, as a result, four additional I
girders were tested by the United States Steel Corporation. These I-girders were
unsymmetrical and were designed to account for the depth of web in compression of
unsymmetrical sections. The specimens were fabricated from ASTM A572 Grade 50
steel. The I-girders were simply-supported and tested in three-point loading to
simulate the condition of negative flexure at an interior pier of a continuous-span
bridge.
The compression flanges of the specimens were ultra-compact, with
slenderness ranging from 0.249~E I Fyc to 0303~E I Fyc ' The effective web
slenderness values at the plastic moment ranged from 1.99~E I FyC to 2.63~E I Fyc •
These specimens performed much better than those of the previous study (Grubb and
Carskaddan, 1979). All four specimens exceeded the plastic moment and exhibited
significant rotation capacity. However, the web and flange slenderness values
considered by Grubb and Carskaddan (1981) are much less than those considered in
the present study.
22

2.3.7 Schilling (1988)
Three steel I-girders were tested by Schilling to obtain full moment-rotation
curves for use in the autostress design of continuous-span bridge I-girders. The
specimens were fabricated from ASTM A572 Grade 50 steel. The I-girders were
simply-supported and tested in three-point loading to simulate the condition of
negative flexure at an interior pier of a continuous-span bridge.
The flange and web slenderness values were nearly identical for all three
specimens tested. Flange slenderness was 0.409~E I Fyc and web slenderness was
7.1O~E I Fyc for two specimens and 7.22~E I Fyc for the third specimen.
Intermediate transverse stiffeners were used between the load bearing and reaction
bearing stiffeners. The study varied several parameters which affect rotation capacity:
section symmetry, span length, initial web out-of-flatness, and shear stress level. The
ultimate flexural strength of each I-girder was very close to the yield moment. From
the test results, Schilling proposed a lower-bound relationship between the moment
and inelastic rotation for I-girders with stiffened webs. The high slenderness values of
the specimens considered by Schilling (1988) ate outside the range of interest of the
present study.
2.3.8 Schilling (1990)
Three I-girders were tested to determine moment-rotation characteristics. The
specimens were fabricated from ASTM A572 Grade 50 steel. The I-girders were
23

simply-supported and tested in three-point loading to simulate the condition of
negative flexure at an interior pier of a continuous-span bridge.
The flanges of the test specimens were ultra-compact, with slenderness
approximately equal to 0300~E I Fyc ' The web slenderness values ranged from
3.6tJE I Fyc to 6.89~E I Fyc ' Table 2.4 lists the flange and web slenderness values
for each specimen. In an effort to restrain local buckling and improve flexural
ductility, intermediate transverse stiffeners were welded on each side of midspan at a
distance of one-half of the section depth away from the load bearing stiffeners at the
midspan. Schilling observed that all specimens failed by an interaction of local flange
buckling, web buckling, and lateral-torsional buckling, and that the additional
stiffeners in the plastic hinge region prevented significant cross-sectional distortion at
their locations while forcing buckling away from midspan. The specimen with the
most slender web failed to reach the plastic moment as its ultimate flexural strength
and the two specimens with less slender webs had ultimate flexural strengths
exceeding the plastic moment. From the test results, Schilling concluded that flexural
ductility increases as the web slenderness decreases.
The tests performed by Schilling (1990) provide useful results to compare with
the flexural strength and ductility of the I-girders tested in the present study. The
maximum inelastic rotation values, 8inel,u, of the two specimens that exceeded the
plastic moment are plotted versus normalized web slenderness in Figure 2.2. The
variation of normalized ultimate flexural strength with normalized web slenderness is
24

shown in Figure 2.5. The two plots show clear trends of decreasing nonnalized
ultimate flexural strength and ductility with increasing normalized web slenderness. In
both figures, the test results are labeled with UCF to indicate that the compression
flange slenderness is much less than the AASHTO LRFD specifications require for a
compact section (Le., ultra-compact flange), and with CSB to indicate that the
compression flange brace spacing is less the AASHTO LRFD specifications require
for an I-girder designed to reach the plastic moment (Le., closely-spaced bracing).
2.3.9 Barth (1996)
Six I-girders were tested at Purdue University to study the effects of flange
slenderness, web slenderness, compression flange brace spacing, and moment gradient
on moment-rotation behavior. The specimens were fabricated from ASTM A572
Grade 50 steel. The I-girders were simply-supported and tested in three-point loading
to simulate the condition of negative flexure at an interior pier of a continuous-span
bridge.
Four test specimens had flange slenderness values near 0390~E I Fyc and two
specimens had ultra-compact flanges with slenderness values near 0.290~E I Fyc • The
web slenderness values ranged from 451~E I Fyc to 5.86~E I Fyc • Table 2.5 lists the
flange and web slenderness values for each specimen. Intermediate transverse
"""""-stiffeners were used between the load bearing and reaction bearing stiffeners. In an
effort to restrain local buckling and improve flexural ductility, intermediate transverse
25

stiffeners were welded on each side of midspan at a distance of one-third of the section
depth away from the load bearing stiffener at the midspan. Only one of the six
specimens reached the plastic moment as its ultimate flexural strength. This specimen,
P6 (Table 2.5), had ultra-compact flanges and a web that was the least slender of all
the specimens tested by Barth (1996). The maximum inelastic rotation, 8inel,u, of
Specimen P6 is plotted in Figure 2.2. Figure 2.5 shows four specimens on a plot of
normalized ultimate flexural strength versus normalized web slenderness. In both
figures, the test results are labeled with UCF to indicate that the compression flange
slenderness is much less than the AASHTO LRFD specifications require for a compact
section (Le., ultra-compact flange).
2.3.10 White, Ramirez, and Barth (1997)
A study was conducted at Purdue University to develop simple comprehensive
moment-rotation relationships for steel I-girders for use in inelastic bridge design.
Previous experimental and analytical. studies were reviewed and compiled into a
uniform data set and a finite element study was conducted to fill major gaps in the
existing data.
The finite element I-girder models had a steel yield stress of 50 ksi (345 MPa).
A wide range of flange and web slenderness values were considered. Flange
slenderness ranged from 0.29 tJE I FyC to 0382~E I Fyc ' Web slenderness ranged
from 357~E I Fyc to 6.77~E I Fyc • The finite element models were simply-supported
26

I-girders loaded in three-point loading to simulate the condition of negative flexure at
an interior pier of a continuous-span bridge.. The experimental program carried out by
Barth (1996), described in Section 2.3.9, was designed to confirm key portions of the
finite element study. As a result of the study, expressions for nominal moment
capacity and inelastic rotation at the nominal moment were developed. The expression
for nominal moment capacity is:
where:
Mn =the nominal moment capacity,
Mp =the plastic moment,
Dcp =the depth of web in compression at the plastic moment,
tw=the thickness of the web,
My =the yield moment.
The parameter arp is defined as:
27
(2-16)
(2-17)

where:
br=the width of the compression flange,
tr =the thickness of the compression flange.
Equation 2-17 is based on steel with compression flange yield stress Fyc =50
ksi (345 MPa). This expression can be rewritten in a form that is valid for steel with
yield stress other than 50 ksi (345 MPa):
M_D =1+Mp
0.73 +_1__ 0.4 Mp ~I.O
2D ~ lOarp My~~
t w E
(2-18)
Fyc =the specified minimum yield stress of the compression flange,
E =the modulus of elasticity of steel.
The expression developed for inelastic rotation, the rotation through which the
nominal moment capacity is sustained, is:
where:
D =the depth of the web.
28

Like Equation 2-16, Equation 2-19 is based on steel with compression flange
yield stress Fyc =50 ksi (345 MPa). This expression can be rewritten in a form that is
valid for steel with yield stress other than 50 ksi (345 MPa):
9RL =0128-0287 b, ~F" -0.0216E.+0.0482.EL~F"E. (2-20)2t f E b f 2t f E b f
2.3.11 Green and Sause (1997)
A finite element study was conducted at Lehigh University to evaluate the
flexural strength and ductility of I-girders fabricated from HPS-70W steel, a newly
developed high performance steel with a nominal yield stress of 70 ksi (483 MPa).
Two I-girders were studied. The finite element models were simply-supported 1-
girders loaded in three-point loading to simulate the condition of negative flexure at an
interior pier of a continuous-span bridge. Both I-girders had ultra-compact flanges
with slenderness equal to0.288~E / Fyc ' The web slenderness values of the two
specimens were 3.84~E / Fyc and 5.76~E / Fyc •
The specimen with the less slender web reached a peak moment equal to the
plastic moment and the specimen with the more slender web reached a peak moment
of 96 percent of the plastic moment. The maximum inelastic rotation, Sinel,u, and the
rotation capacity, R, for the specimen that reached the plastic moment are plotted in
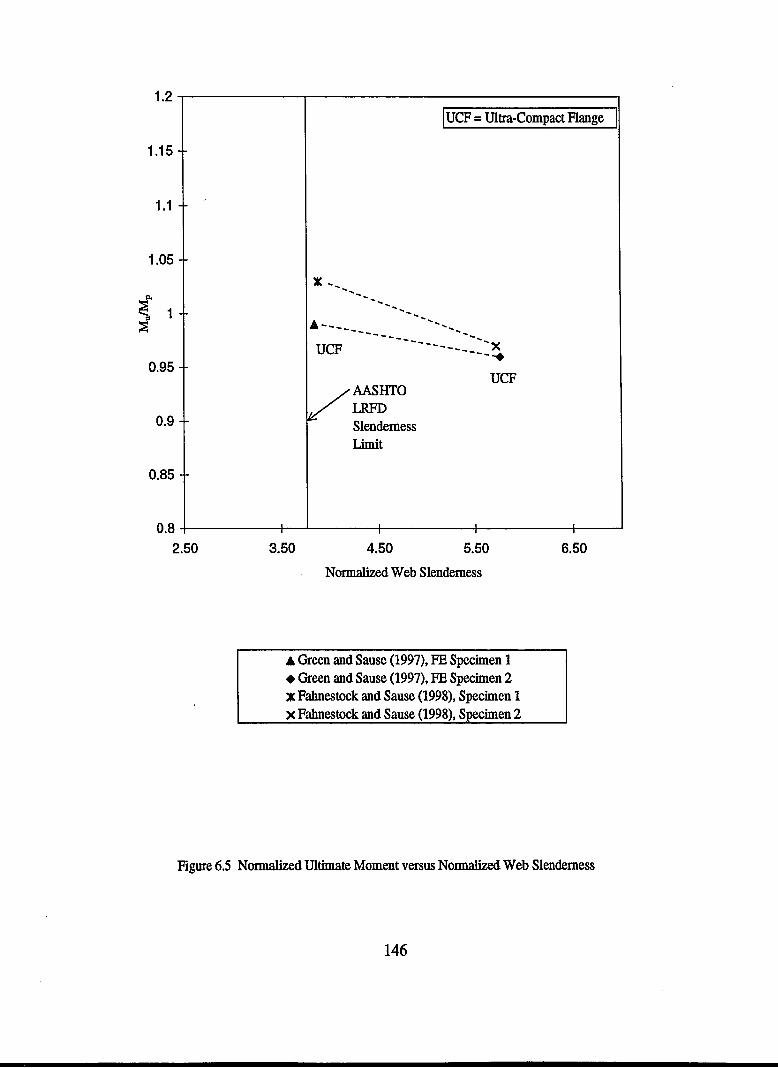
Figures 2.2 and 2.3, respectively. The normalized ultimate flexural strengths of both
specimens are plotted in Figure 2.6. In all three figures, the test results are labeled
29

with UCF to indicate that the compression flange slenderness is much less than the
AASHTO LRFD specifications require for a compact section (Le., ultra-compact
flange). The normalized web slenderness range of the specimens considered by Green
and Sause (1997) is very close to the range considered in the present study.
2.3.12 Summary of Previous Research Relevant to the Present Study
Research results most relevant to the present study are those for I-girders with
compression flange slenderness at or slightly below the slenderness limit for compact
sections in the AASHTO LRFD Bridge Design Specifications (AASHTO, 1997), and
with web slenderness near and above the slenderness limit for compact sections.
Research conducted to investigate the behavior of the negative moment region at the
pier of a continuous-span bridge I-girder is particularly useful because the loading
conditions and the methods of quantifying the results are similar to those of the present
research. The relevant research results are: Grubb and Carskaddan (1979), Schilling
(1990), Barth (1996), and Green and Sause (1997). The tests carried out by Holtz and
Kulak (1973) involved specimens with flange and web slenderness in the ranges of
interest. However, different loading conditions create some difficulty in comparing
test results. The tests conducted by Croce (1970) are of limited interest because the
loading conditions were quite different than those used in the present study and
inelastic rotation data had to be estimated from the test results presented by Croce
(1970).
30

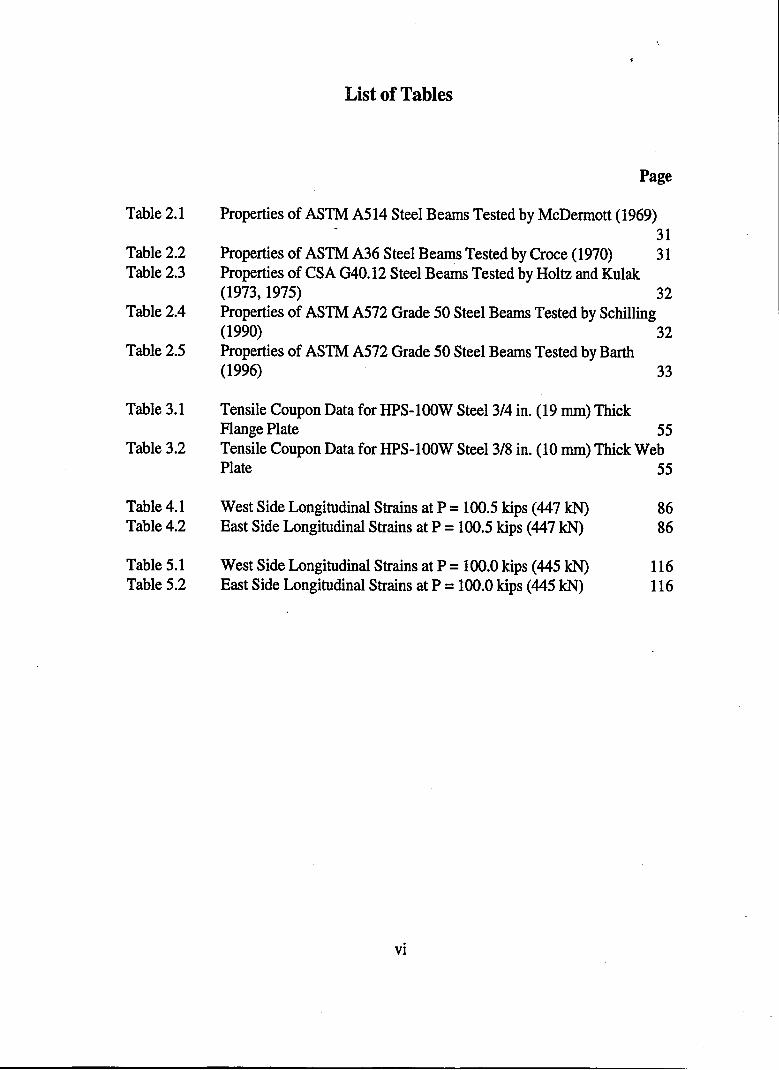
Table 2.1 Properties of ASTM A514 Steel Beams Tested by McDennott (1969)
Jlt~ D"t ~Specimen
2t f E t w E ryR
1 0.777 1.61 11.6 -2 0.533 1.34 9.0 -3 0.381 1.12 7.3 4.84 0.321 1.15 6.0 8.45 0.258 1.14 5.4 6.36 0.205 1.69 24.9 2.47 0.307 1.62 23.9 3.6A 0.208 2.01 37.5 -B 0.309 1.98 35.4 -
Table 2.2 Properties of ASTM A36 Steel Beams Tested by Croce (1970)
Specimen Jlt~ D~!i2t f E t w E
1 0.338 3.232 0.200 2.993 0.200 2.984 0.131 3.035 0.200 2.23
'6 0.205 2.047 0.205 2.908 0.204 4.07
31

Table 2.3 Properties of CSA G40.12 Steel Beams Tested by Holtz and Kulak(1973, 1975)
Specimen ~t' D"t2t f E t w E
WS-1 0.388 3.07WS-2 0.388 3.84WS-3 0.388 4.63WS-4 0.388 5.54WS-6 0.388 3.67
WS-7-P 0.321 3.28WS-8-P 0.321 3.63WS-9 0.388 3.00WS-lO
-0.388 3.27
WS-11 0.388 3.58WS-12-N 0.589 4.18WS-13-N 0.589 4.54
Table 2.4 Properties of ASTM A572 Grade 50 Steel Beams Tested by Schilling(1990)
Specimen ~t" DcpiFyc
2t f E t w E
S .300 3.61M .297 5.27D .295 6.89
32

Table 2.5 Properties of ASTM A572 Grade 50 Steel Beams Tested by Barth (1996)
Specimen Jlt" D~t~2t f E t w E
PI 0.391 5.85P2 0.388 5.86P3 0.296 5.68P4 0.387 5.55P5 0.390 4.51P6 0.291 4.52
33

M
p
4- ~e1 1;~ Lp
. >1
compact
e
Figure 2.1 Typical Moment versus End Rotation Plot for an Adequately Braced Flexural Member
34

6.505.504.503.50
+UCF = Ultra-Compact Flange ICSB = Closely-Spaced Lateral Bracing
A/~HTO
UCF, IISlenderness
CSBLimit
_c
UCF A
X
·UCF,CSB
0
0 :: UCF•
o2.50
0.07
0.06
0.05
0.02
0.08
0.01
Jg 0.04.:3-.a
CD
0.03
Nonnalized Web Slenderness
II Schilling (1990), Specimen S• Schilling (1990), Specimen MA Barth (1996), Specimen P6o Croce (1970), Specimen 1 (estimated)D Croce (1970), Specimen 1 (estimated)4 Croce (1970), Specimen 1 (estimated)o Grubb and Carskaddan (1979), Specimen 1• Grubb and Carskaddan (1979), Specimen 2:: Green and Sause (1997), FE Specimen 1• Holtz and Kulak (1973), Specimen WS-l- Holtz and Kulak (1973), Specimen WS-9+Holtz and Kulak (1973), Specimen WS-I0X Holtz and Kulak (1973), Specimen WS-ll
Figure 2.2 Maximum Inelastic Rotation versus Nonnalized Web Slenderness
35


Rotations were measured by seven rotation meters along the length of the
girder. The rotation meters were placed at midspan, east and west bearings, 12 in.
(305 mm) east and west of midspan, and 54 in. (1370 mm) east and west of midspan,
as shown in Figure 3.10.
Linear strain gages were used to measure longitudinal web and flange strains.
Strain gages were placed near midspan on the web and compression flange in expected
locations of local buckling. Strain gages intended to detect local distortion of the web
and flange plates were placed in pairs, one on each side of the plate at a given location.
In addition, strain gages were placed at the center of the compression and tension
flanges to measure primary bending strains. Strain gage locations are shown in Figure
3.11.
To measure lateral deflection of the compressIon flange, displacement
transducers were placed on the compression and tension flanges within the first and
second unbraced lengths both east and west of midspan. Also, measurements from
strain gages near opposite tips of the compression flange were compared to observe
lateral bending of the compression flange between brace points.
3.6 TestProcedure
The procedure used for both I-girder tests was composed of the same two
steps: (1) two elastic loading cycles to 100 kips (445 kN), and (2) loading until failure.
The initial loading cycles to 100 kips (445 kN) were used to align and seat the test
50

specimen, che~l' the instrumentation, and monitor possible lateral or longitudinal
movement of the load fixture. Load was initially applied at a rate of 10 kips per
minute (44.5 IQJ per nllnute). This load rate corresponds to a displacement rate of
approximately 0·2 in. per minute (5 mm per minute). In the inelastic range, this
displacement fqte was maintained until the test was terminated and the specimen was
unloaded. At ~~vera1 points during the test, the loading was stopped temporarily so
photographs c()\.11d be taken. Loading at the displacement rate of 0.2 in. per minute (5
mm per minut~) \Vas then resumed.
3.7 Steel Str~,"StraiI1 Properties
The ~G"lOOW steel used to fabricate the I-girder specimens has a nominal
yield stress of 100 ksi (690 MPa). The HPS-100W steel was produced at the Gary
Works of United States Steel Corporation. Plates with nominal thickness of 3/4 in.
(19 mm) and 3/~ in. 00 nun) were used for the I-girder flanges and webs, respectively.
After the girders were tested, tensile coupons were cut from regions of the
flange and w~b plates that were subjected to elastic-range stresses during the tests.
The coupons ~~ gage lengths of 8 in. (203 mm), and were fabricated according to
ASTM E8 (AS1'M, 1994). The tensile coupons were tested at the ATLSS Center,
Lehigh Univel's'ty in a Satec 600 kip (2700 kN) hydraulic universal testing machine.
Tests were petfOlll1ed on six flange coupons and four web coupons.
51
_____________ .. ....J


1O!94J69~69~ 94 II" (2388) 'I( (1753) ~1(1041)1(1041)1~ (1753) >r:-(='23~8-8)~)
(10360)
Note: Primary dimensions in inches; secondary dimensions in millimeters.
Figure 3.5 Specimen 1Lateral Brace Locations
~ (l~~5) f 115~ 77~ 77 f 115 f 75
~(2921) (1956) 838 83 «1956) (2921) (1905)
[J DC )( )( li )( )( )(
lfJ~
600~(15240)
Note: Primary dimensions in inches; secondary dimensions in millimeters.
Figure 3.6 Specimen 2 Lateral Brace Locations
60

S\0 00\0 \0.....
'-"
~l~ _<t Girder & Brace
Tefon (Typical)
All connections between anglesand baseplates are made using3/16 in. (5 mm) fillet welds.
All bracing membersare 5 x 5 x 3/4 angles.
Note: Primary dimensions in inches; secondary dimensions in millimeters.
Figure 3.7 Typical Lateral Brace Arrangement
61

MachineHead
Yb ~
(a) Test Specimen in Fixture With No Load Applied
p
!Machine
Head
fI; ~
(b) Test Specimen in Fixture During Loading
Figure 3.8 Test Fixture
62

Figure 3.9 Specimen 1in Test Fixture Prior to Testing (Looking Northeast)
63

[Q==.=.~.=.=PJ~ L ~
Figure 3.10 Location ofRotation Meters
S3 82 81 81 81 81 82 83
I I I I I I I I~
36 +8+6~6+8+ 36~
~(914) (203) (152) 102 102«152) (203) (914)
~[I
~L
~
81 82 83
Note: Primary dimensions in inches; secondary dimensions in millimeters.
Figure 3.11 Location of Strain Gages
64

140
120
100
,-.....80g
til
§ 60CI)
40
20
0
0 20000 40000 60000 80000 100000 120000 140000 160000
Strain (microstrain)
Figure 3.12 Stress versus Strain for HPS-1ooW Steel 3/4 in. (19 mm) Thick Flange Plate
140
120
100
,-..g 80tiltil
~ 60CI)
40
20
0
0 20000 40000 60000 80000 100000 120000 140000 160000
Strain (microstrain)
Figure 3.13 Stress versus Strain for HPS-100W Steel 3/8 in. (10 mm) Thick Web Plate
6S

640
fF;c
Specimen 2•
f(Specimen 1
3.76 ; 1----------------. •yc
.382J; .yc
65
[F;:
Figure 3.14 Web Slenderness versus Flange Slenderness
66
-

Chapter 4
Test Results for Specimen 1
Specimen 1 is a compact section according to the AASHTO LRFD Bridge
Design Specifications (AASHTO, 1997), therefore the ultimate flexural strength of
Specimen 1 was expected to reach or exceed the plastic moment. In addition, the
failure of Specimen -1 was expected to be ductile. In particular, the rotation capacity
was expected to be greater than or equal to three.
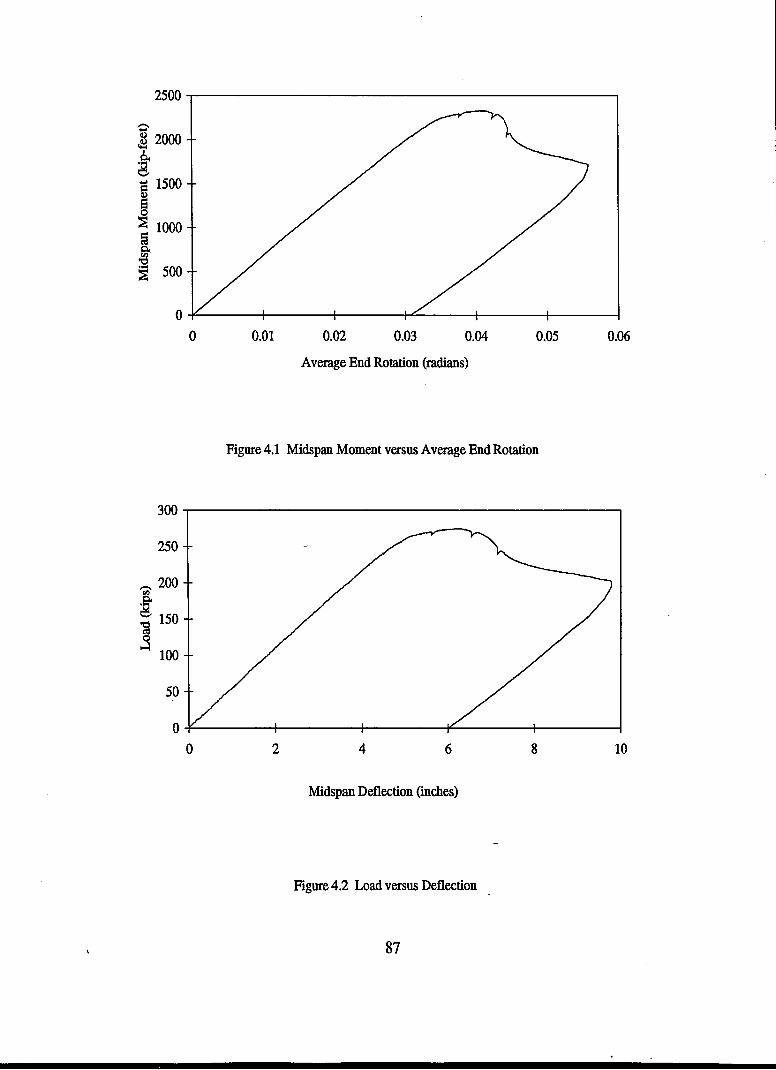
Based on the measured section dimensions and steel yield stress, the theoretical
plastic moment, Mp, is equal to 2257 kip-ft (3060 kN-m), occurring at a theoretical
plastic load, Pp, equal to 265.5 kips (1181 kN). Figure 4.1 presents a plot of midspan
moment versus average end rotation. Specimen 1 reaches a peak midspan moment,
Mu, equal to 2329 kip-ft (3158 kN-m). Figure 4.2 presents a plot of applied load
versus vertical midspan deflection. As shown, the peak load, Pu, is equal to 274.1 kips
(l219kN).
,Test results for Specimen 1 are discussed in the following five sections.
Section 4.1 discusses test results in the elastic range. Section 4.2 discusses the
behavior of Specimen 1 at yielding of the extreme fibers of the flange. Section 4.3
discusses distortion and buckling of the compression flange and web. Section 4.4
discusses the behavior of Specimen 1 after the peak load is reached. Section 4.5
summarizes the test results.
67


-12000 -10000 -8000 -6000 -4000 -2000 oLongitudinal Strain in Compression Flange (microstrain)
--Top-South (TS)
- - -Top-North (TN)
........... Bottom-South (BS)
- - -'- Bottom-North (BN)
Figure 4.5 Load versus Longitudinal Strain 10 in. (254 mm) West of Midspan inCompression Flange
-12000 -10000 -8000 -6000 -4000 -2000 o
Longitudinal Strain in Web Compression Zone (microstrain)
1--North South IFigure 4.6 Load versus Longitudinal Strain 10 in. (254 mm) West ofMidspan in
Web Compression Zone
89
TN,BNTS, TN 250
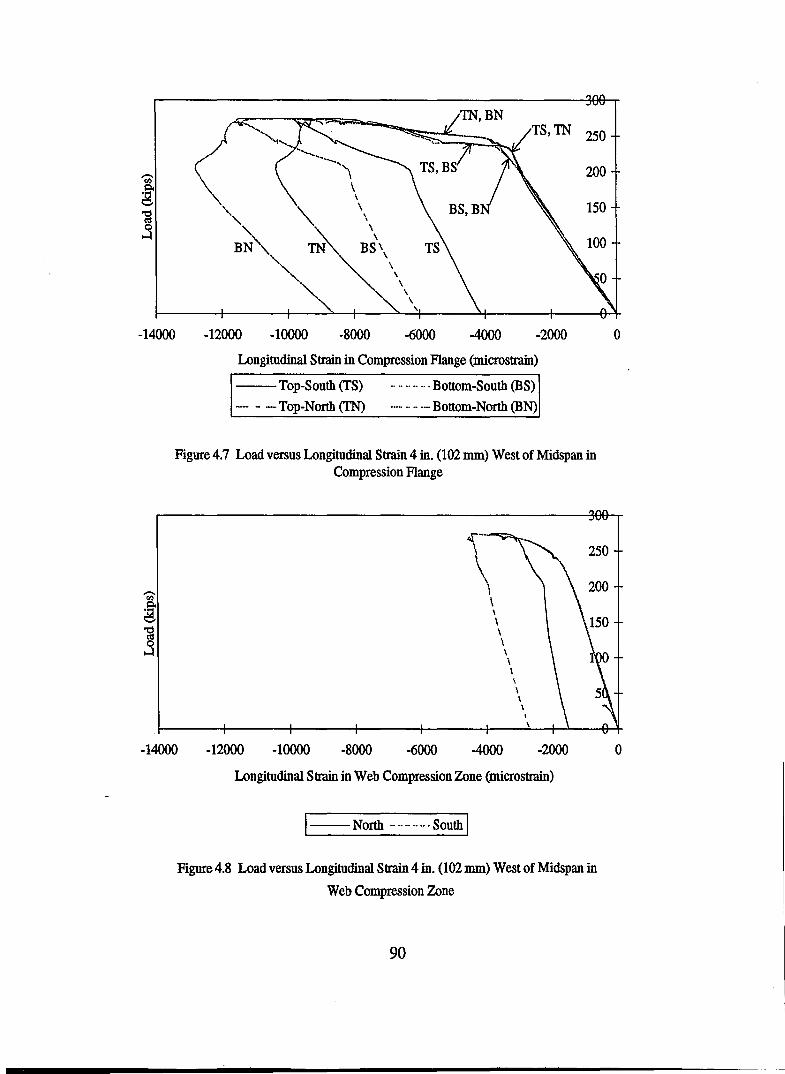
-14000 -12000 -10000 -8000 -6000 -4000 -2000 oLongitudinal Strain in Compression Flange (microstrain)
--Top-South (TS)- - -Top-North (TN)
........... Bottom-South (BS)
- - - .- Bottom-North (BN)
Figure 4.7 Load versus Longitudinal Strain 4 in. (102 mm) West of Midspan inCompression Flange
-14000 -12000 -10000 -8000
i"'"250
\I
\\
\\,i\i\\\\\
-6000 -4000 -2000 0
Longitudinal Strain in Web Compression Zone (microstrain)
1--North South I
Figure 4.8 Load versus Longitudinal Strain 4 in. (102 mm) West of Midspan in
Web Compression Zone
90


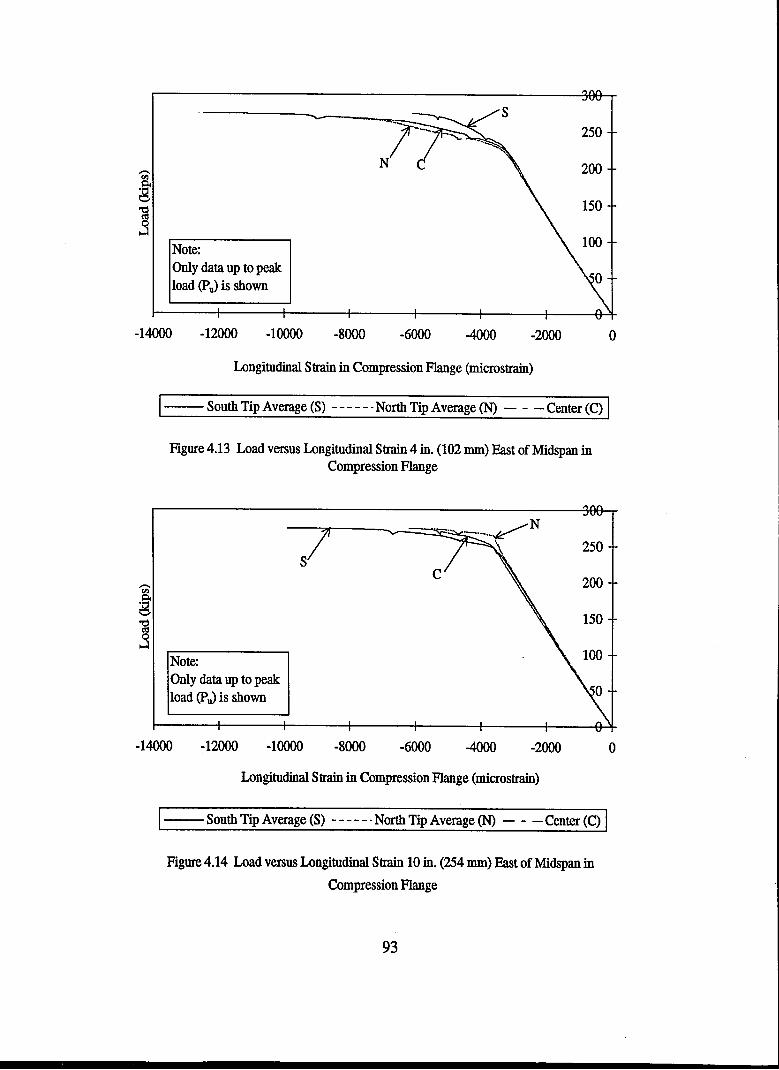


indicates local buckling. At the peak load Pu =287.4 kips (1278 leN), the strain
separation at 4 in. (102 mm) east of midspan is 535 Il£ in the north flange tip and 931
J.1£ in the south flange tip.
At lOin. (254 mm) east of midspan, the local curvature in the north and south
flange tips remains small up to an applied load of 100 kips (448 kN), then increases
steadily as the load increases (Figure 5.16). Both north and south flange tips are
concave upward until a load of 150 kips (667 kN), when the south flange tip reverses
curvature. Near a load of 250 kips (890 kN), the curvatures in the north and south
flange tips begin increasing more rapidly. Figure 5.13 shows strain separation in both
north and south flange tips at the peak load. At the peak load Pu =287.4 kips (1278
kN), the strain separation at 10 in. (102 mm) east of midspan is 1695 J.1£ in the north
flange tip and 1111 Il£ in the south flange tip.
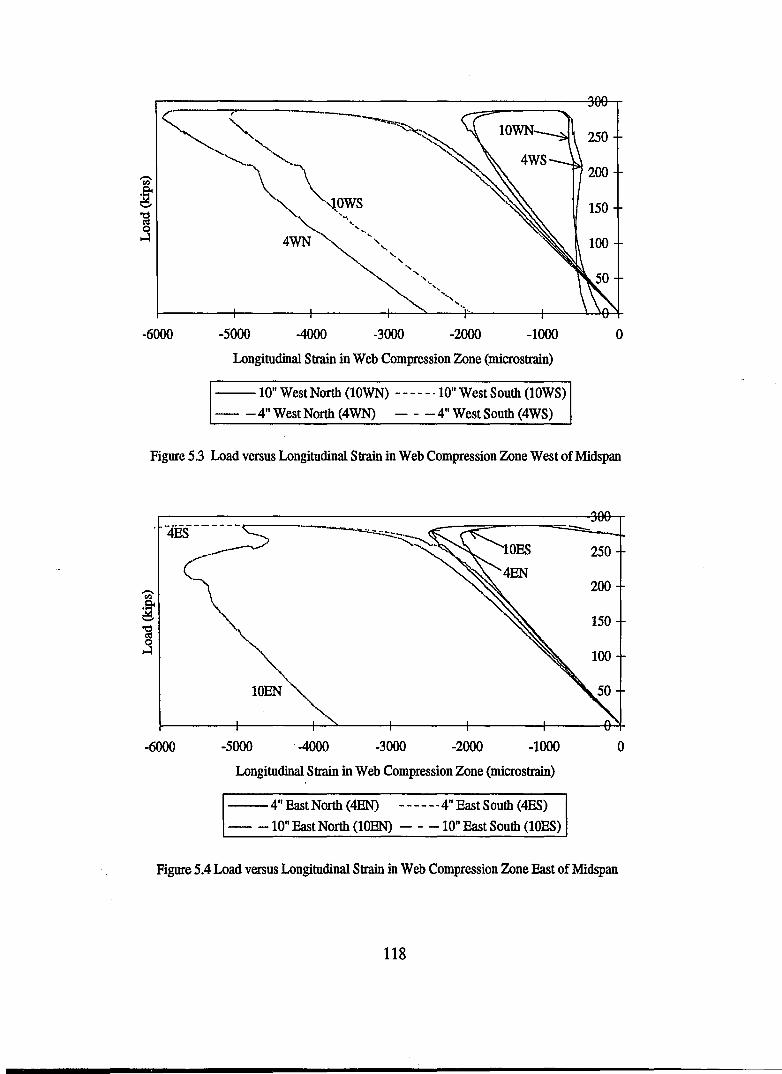
Figures 5.7 and 5.9 show load versus longitudinal strain in the compression
flange at 10 in. (254 mm) and 4 in. (102 mm) west of midspan, respectively. The
compression flange on the west side of the girder did not buckle, but it did distort
locally. At the peak load, the strain separation in the compression flange on the west
side of the girder is: 519 Il£ in the north flange tip 10 in. (254 mm) from midspan, 690
J.1£ in the south flange tip 10 in. (254 mm) from midspan, 626 Il£ in the north flange tip
4 in. (102 mm) from midspan, and 1574 J.1£ in the south flange tip 4 in. (102 mm) from
midspan.
111

5.3.4 Interaction of Web and Flange Distortion and Buckling
Specimen 2 was designed with a web slenderness that is more critical than the
flange slenderness. Therefore, web distortion begins first and eventually drives the
flange distortion. At locations where web distortion begins· early and grows as the
load increases, early flange distortion occurs. At locations where early distortion of
the web does not occur, the compression flange distortion does not occur until the web
distortion begins. For example, significant local curvature is not observed in the web
at 4 in. (102 mm) east of midspan early in the test, and local curvature of the flange at
this location is small until the peak load is reached (Figure 5.15). However at 10 in.
(254 mm) east of midspan, local curvature of the web begins early in the test and local
curvature of the compression flange is significant before the peak load is reached
(Figure 5.16).
Two types of interaction occur between the web and compression flange. First,
as the web distortion increases, the web carries less longitudinal bending stress than
expected from beam theory. As the web sheds bending stresses, the neutral axis drops,
and the bending strains in the compression flange increase. Shedding of bending
stresses from the web and the presence of residual stresses in the compression flange
cause the compression flange to yield at an applied load less than the theoretical yield
load Py =269.7 kips (1200 kN). The yield strain of 3954 J.1E is first observed in the
compression flange at an applied load of 265.1 kips (1179 kN). Figures 5.5 and 5.6
show strains in the compression flange beginning to increase significantly at an
112

applied load of 250 kips (1112 kN). Second, the compression flange partially restrains
the distortion of the web. Yielding of the compression flange reduces the restraint
provided to the web, and the web distortion increases more rapidly. As the web
distortion increases, the web sheds more stress into the compression flange. As a
result of these interactions, local flange distortion tends to be greatest at locations
where web distortion is greatest.
5.4 Post-Peak Behavior
When the peak load Pu = 287.4 kips (1278 kN) was reached, the testing
machine was held at a constant displacement to inspect the specimen and take pictures.
Although the displacement was held constant, the load began to decrease. This event
appears as the straight vertical portion of the load-deflection curve immediately after
the peak load (Figure 5.2). The displacement was held constant until the load on the
girder stabilized. Then the displacement was increased until the end of the test.
When the peak load was reached, and the load decreased while the
displacement was held constant, the flange and web local buckles were growing.
Figures 5.17 and 5.18 are photographs of the north side of the web east of midspan,
taken while the displacement was being held constant and the load was decreasing.
These figures show the rapid growth of flange and web local buckles immediately after
the peak load was reached. Figure 5.19 is a plot of moment versus inelastic girder
113
rotation. After the peak moment, inelastic rotation increases rapidly, largely due to the
growth of the flange and web local buckles.
Figure 5.20 shows moment versus curvature for the regions immediately east
and west of midspan. As seen in this plot, the inelastic deformation is concentrated in
the east side of the girder in the region of local buckling. While inelastic rotation is
increasing at the girder midspan, the remainder of the girder is unloading elastically.
Loading of the girder continued until a midspan deflection of 9.53 in. (242 mm) was
reached, then the load on the girder was removed.
5.5 Summary
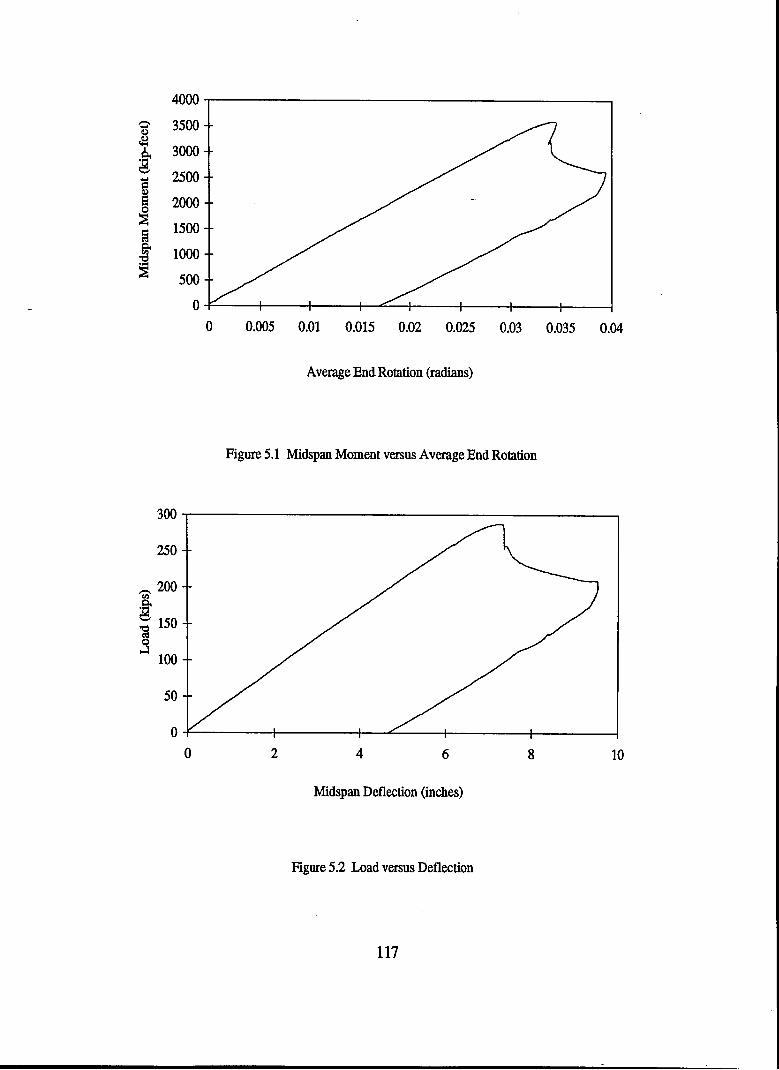
Specimen 2 reached a peak applied load Pu = 287.4 kips (1278 kN)
corresponding to a peak midspan moment Mu = 3592 kip-ft (4870 kN-m). The peak
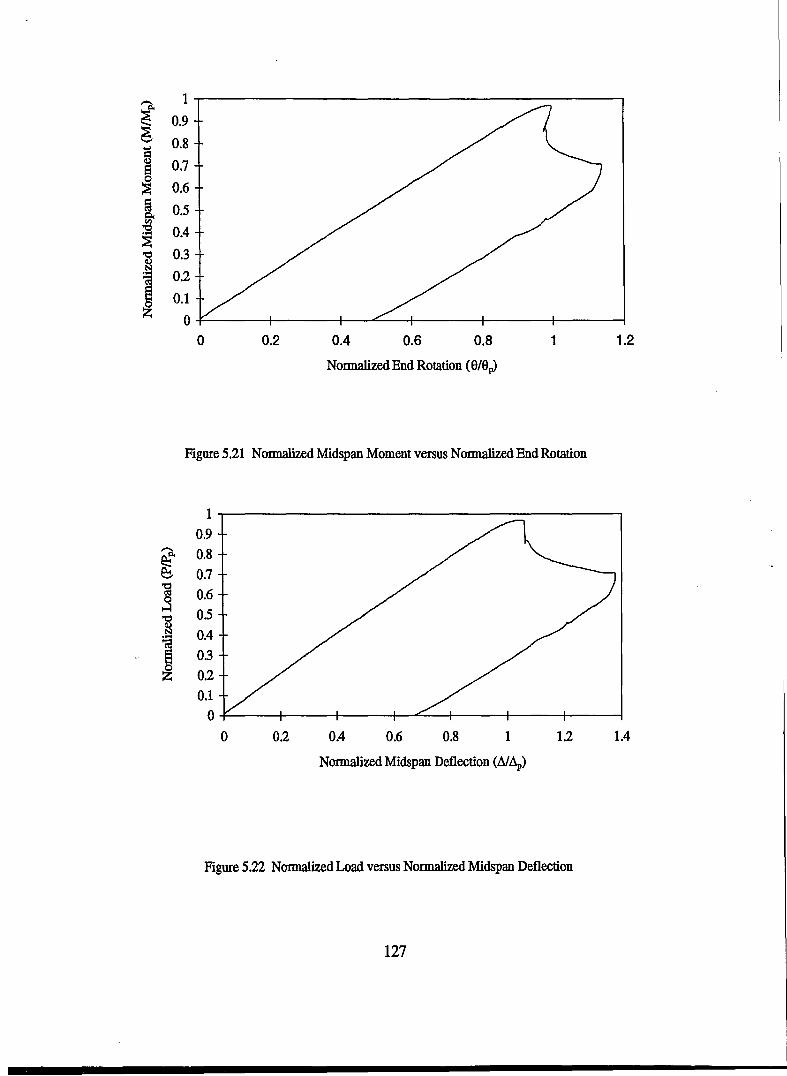
moment is three percent below the theoretical plastic moment. Figure 5.21 shows a
plot of normalized midspan moment (MlMp) versus normalized end rotation (S/Sp).
Figure 5.22 shows a plot of normalized load (PlPp) versus normalized midspan
deflection (Mlip). The sequence of events that lead to a decrease in resistance (Le.,
unloading from the peak load) of Specimen 2 was: local distortion of the web, local
distortion of the compression flange, local buckling of the web, and local buckling of
the compression flange.
Specimen 2 does not have a rotation capacity, R, defined by Equation 2-12, a
maximum inelastic rotation, Sinel,u, defined by Equation 2-14, or a displacement
114

ductility, 1.1, defined by Equation 2-15, because it does not reach the theoretical plastic
moment,Mp•
115
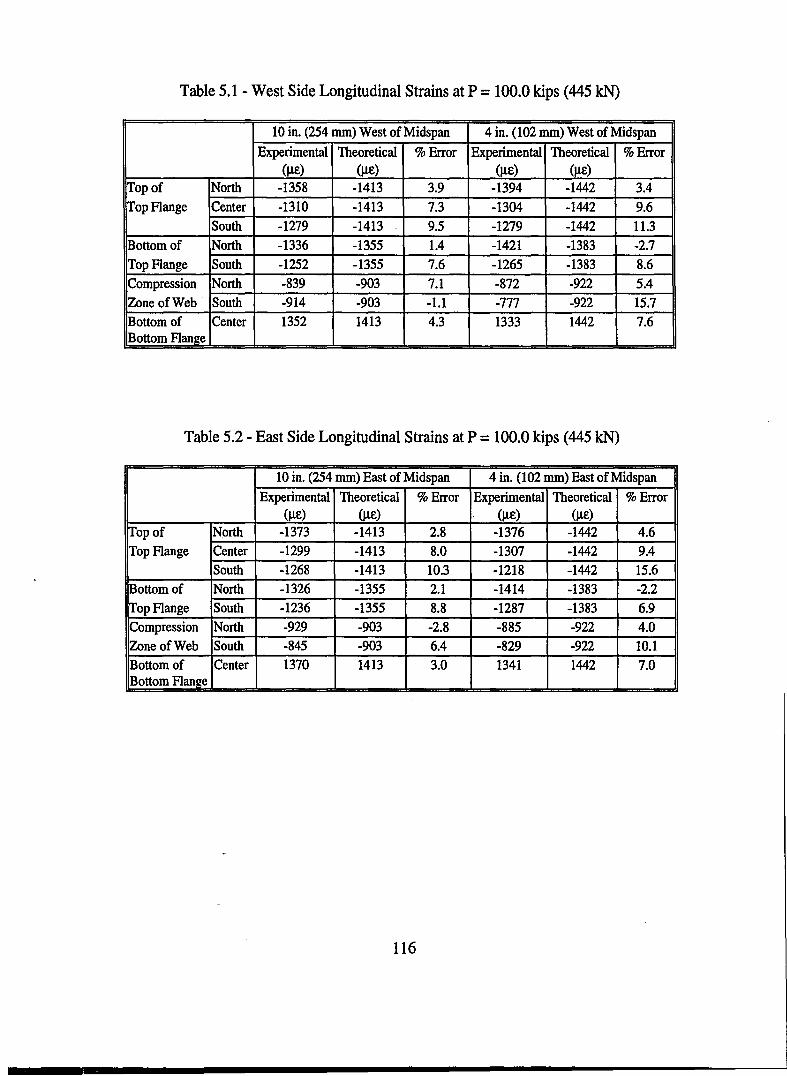
Table 5.1 - West Side Longitudinal Strains at P = 100.0 kips (445 leN)
10 in. (254 mm) West of Midspan 4 in. (102 mm) West of Midspan
Experimental Theoretical % Error Experimental Theoretical % Error(J.I.£) (J.I.£) (~£) (J.I.E)
Top of North -1358 -1413 3.9 -1394 -1442 3.4Top Flange Center -1310 -1413 7.3 -1304 -1442 9.6
South -1279 -1413 9.5 -1279 -1442 11.3Bottom of North -1336 -1355 1.4 -1421 -1383 -2.7Top Flange South -1252 -1355 7.6 -1265 -1383 8.6Compression North -839 -903 7.1 -872 -922 5.4Zone ofWeb South -914 -903 -1.1 -777 -922 15.7Bottom of Center 1352 1413 4.3 1333 1442 7.6Bottom Flan~e
Table 5.2 - East Side Longitudinal Strains at P =100.0 kips (445 kN)
10 in. (254 mm) East ofMidspan 4 in. (102 mm) East ofMidspanExperimental Theoretical % Error Experimental Theoretical % Error
(J.I.£) (J.I.£) (J.I.£) (J.I.£)Top of North -1373 -1413 2.8 -1376 -1442 4.6Top Flange Center -1299 -1413 8.0 -1307 -1442 9.4
South -1268 -1413 10.3 -1218 -1442 15.6Bottom of North -1326 -1355 2.1 -1414 -1383 -2.2Top Flange South -1236 -1355 8.8 -1287 -1383 6.9Compression North -929 -903 -2.8 -885 -922 4.0Zone of Web South -845 -903 6.4 -829 -922 10.1Bottom of Center 1370 1413 3.0 1341 1442 7.0Bottom Flange
116
4000
'0 3500Jj
I 3000g2500...
~§ 2000~ 1500~
~ 1000~ 500
0
0 0.005 0.01 0.015 0.02 0.025 0.03 0.035 0.04
Average End Rotation (radians)
Figure 5.1 Midspan Moment versus Average End Rotation
300 ...,--------------------------,
250
,.... 200enQ.
;g 150
~100
50
108642
O-f------r-----1----..t!.:::.....---f-----+------lo
Midspan Deflection (inches)
Figure 5.2 Load versus Deflection
117
-6000 -5000 -4000 -3000 -2000 -1000 oLongitudinal Strain in Web Compression Zone (microstrain)
--10" West North (tOWN) -----·lO"WestSouth (lOWS)
- -4"WestNorth(4WN) - - -4" West South (4WS)
Figure 5.3 Load versus Longitudinal Strain in Web Compression Zone West ofMidspan
-6000 -5000 -4000 -3000 -2000 -1000 oLongitudinal Strain in Web Compression Zone (microstrain)
--4" East North (4EN) - - - - -·4" East South (4ES)
- - 10" East North (tOEN) - - - 10" East South (lOES)
Figure 5.4 Load versus Longitudinal Strain in Web Compression Zone East of Midspan
118

IiI !I //1
I !
/ .II ;I :, I
250
-15000 OOסס1- -5000 o 5000 ooסס1 15000
Longitudinal Strain in Flange (microstrain)
1--Compression Flange Tension Flange I
Figure 5.5 Load versus Longitudinal Strain 4 in. (102 mm) West of Midspan atCenter ofFlange
t"""'"\
/ I/ \/ )I "/ ;'
, I
I !/ I
I /
250
-15000 OOסס1- -5000 o 5000 10000 15000
Longitudinal Strain in Flange (microstrain)
1--Compression Flange - - - - _. Tension Flange IFigure 5.6 Load versus Longitudinal Strain 4 in. (102 mm) East ofMidspan at
Center ofFlange
119

-12000 -1()()()() -8000 -6000 -4000 -2000 o 2000
Longitudinal Strain in Compression Flange (microstrain)
--Top - South (TS) - - - - - . Bottom - South (BS)
- - - Top - North (TN) - - - - Bottom - North (BN)
Figure 5.7 Load versus Longitudinal Strain 10 in. (254 rom) West of Midspan inCompression Flange
{--_._-~
\\ ,,
\\
-12000 -1()()()() -8000 -6000 -4000 -2000 o 2000
Longitudinal Strain in Web Compression Zone (microstrain)
1--North South I
Figure 5.8 Load versus Longitudinal Strain 10 in. (254 rom) West of Midspan in
Web Compression Zone
120

r"--=-..-:::I"'r---.-
\/
B~\",,\
,'.",
",,,,,,".'---""
250
200
150
\
-12000 -10000 -8000 -6000 -4000 -2000 o 2000
Longitudinal Strain in Compression Flange (microstrain)
--Top - South (TS) - - - - -. Bottom - South (BS)
- - - Top - North (TN) - - - - Bottom - North (BN)
Figure 5.9 Load versus Longitudinal Strain 4 in. (102 mm) West of Midspan inCompression Flange
(-----·\1
\ 2~0
~4\ I
\ 1'0
Qo~
-12000 -10000 -8000 -6000 -4000 ·2000 o 2000
Longitudinal Strain in Web Compression Zone (microstrain)
1--·North - -- - _. South IFigure 5.10 Load versus Longitudinal Strain 4 in. (102 mm) West of Midspan in
Web Compression Zone
121

TS
TN
-30000 -25000 -20000 -15000· -10000 -5000 o 5000 10000
Longitudinal Strain in Compression Flange (microstrain)
--Top - South (TS)
- - - Top - North (TN)
- - - - _. Bottom - South (BS)
- - - - Bottom - North (BN)
Figure 5.11 Load versus Longitudinal Strain 4 in. (102 mm) East of Midspan inCompression Flange
.....................,/_ ...r-----' --
\II
\\\
-30000 -25000 -20000 -15000 -10000 -5000 o 5000 10000
Longitudinal Strain in Web Compression Zone (microstrain)
1--North .....: ..... SouthI
Figure 5.12 Load versus Longitudinal Strain 4 in. (102 mm) East of Midspan in
Web Compression Zone
122

OOסס3- -25000 OOסס2- -15000 OOסס1- -5000 oo5000סס1
TS
o
~ I
~;./-- .._.-// -_._.--_._ .. --
\ \BN\ \BS
\ \I \
Longitudinal Strain in Compression Flange (microstrain)
--Top - South (TS)
- - - Top - North (TN)
- - - - _. Bottom - South (BS)
- - - - Bottom - North (BN)
Figure 5.13 Load versus Longitudinal Strain 10 in. (254 mm) East of Midspan inCompression Flange
III
i
IOOסס3- -25000 OOסס2- -15000 OOסס1- -5000 o 5000 ooסס1
Normal Strain in Web Compression Zone (microstrain)
\--NOrth -----·SouthI
Figure 5.14 Load versus Longitudinal Strain 10 in. (254 mm) East of Midspan in
Web Compression Zone
123

W- - - - - - - - - - ------::::.S_····:...~2c:!--N
25~1
200
Note:Only data up to peak
load (PJ is shown
150
100
50
-0,01 -0.008 -0.006 -0.004 -0.002v
o 0.002 0.004
1--North Tip Average (N) - - - - - . South Tip Average (S) - - - Web (W)1Figure 5.15 Load versus Local Curvature 4 in. (102 mm) East of Midspan in
Compression Flange and Web
N--
50
_--------- - --W
Note:Only data up to peak
load (PJ is shown
-0.004 -0.002 o 0.002 0.004 0.006 0.008 0.01
1--North Flange Tip (N) South Flange Tip (S) - - - Web (W)1Figure 5.16 Load versus Local Curvature 10 in. (254 mm) East ofMidspan in
Compression Flange and Web
124

Figure 5.17 Northeast Side of Specimen 2 at P = 281 kips (1250 kN) Post-Peak
Figure 5.18 Northeast Side of Specimen 2 at P = 271 kips (1205 kN) Post-Peak
125

4000 -r-------------------------,
-=- 3500
~ 3000Q.
;g 2500
=S 2000
~ 1500
! 1000
~ 500
0+------i1---t----/---+----i---1---<-t----i
o 0.005 0.01 0.015 0.02 0.025 0.03 0.035 0.04
Total Inelastic Rotation (radians)
Figure 5.19 Midspan Moment versus Total Inelastic Rotation
--.,"'-.,.-...... ............. ._- ....---_·__·__··_-_·--····7
//
I,I,
3500
3000
-=- 2500eu~,
2000g... 15005
~ 1000
500
0
0 0.0005 0.001 0.0015
"//
0.002 0.0025
1--12" West .. ·· .. ·· .. · 12" East IFigure 5.20 Average Moment versus Curvature in Section 12 in. (305 rom) on Either
Side of Midspan
126
i1
0.9
0.8...§
0.7
~ 0.6§ 0.5~ 0.4~
~OJ
1 0.2
0.1Z 0
0 0.2 0.4 0.6 0.8 1 1.2
NonnalizedEnd Rotation (9/9p)
Figure 5.21 Normalized Midspan Moment versus Nonnalized End Rotation
1.41.20.4 0.6 0.8 1
Nonnalized Midspan Deflection (MIIp)
0.2
1-.-------------------------,0.90.80.70.60.50.40.30.20.10-f----1---+---+-"""""--+----+----+----l
o
Figure 5.22 Normalized Load versus Normalized Midspan Deflection
127

Chapter 6
Summary, Discussion of Test Results, and Conclusions
This chapter briefly summarizes (Section 6.1) the test results presented in
Chapters 4 and 5. The test results are then discussed (Section 6.2) in the context of the
current AASHTO LRFD Bridge Design Specifications and previous research on the
flexural strength and ductility of steel I-girders. Conclusions are then given (Section
6.3). Finally, recommendations for future research are given (Section 6.4).
6.1 Summary
This thesis investigated the flexural strength and ductility of bridge I-girders
fabricated from HPS-lOOW steel, and compared them with the flexural strength and
ductility expected from the AASHTO LRFD Bridge Design Specifications (AASHTO,
1997). The HPS-lOOW steel is a newly developed high performance steel with a
nominal yield stress of 100 ksi (690 MPa). This steel has stress-strain characteristics
that are significantly different than those of conventional ~teel (e.g., ASTM A709
Grade 50), on which the current provisions of the AASHTO LRFD specifications are
based. Two one-half scale I-girder specimens were fabricated from HPS-100W steel
and tested to failure under three-point loading which simulated the condition of
negative flexure at an interior pier of a continuous span bridge. The test results for the
two specimens are summarized in the following two sections.
128

6.1.1 Specimen 1
Specimen 1 was a compact section according to the AASHTO LRFD Bridge
Design Specifications (AASHTO, 1997). The flange slenderness and web slenderness
were at the AASHTO LRFD limits for compact I-girders and the compression flange
brace spacing was designed according to the AASHTO LRFD compact section
criteria; therefore, the ultimate flexural strength of Specimen 1 was expected to reach
or exceed the plastic moment. Specimen 1 was expected to have a ductile failure with
a rotation capacity, R, greater than or equal to three, according to the AASHTO LRFD
specifications. ,
Specimen 1 had a test span of 34 ft. (l0.4 m) and was simply-supported and
loaded at midspan. The girder reached a peak moment, Mu, equal to 2329 kip-ft (3158
kN-m), three percent above the theoretical plastic moment, Mp• The rotation capacity,
R, was equal to 0.28 and the maximum inelastic rotation through which Mp was
sustained was Sinel,u =0.019 radians. The sequence of events that lead to a decrease in
resistance (Le., unloading from the peak load) of Specimen 1 was: lateral distortion of
the compression flange, local distortion of the compression flange, local distortion of
the web, local buckling of the web, and local buckling of the compression flange.
6.1.2 Specimen 2
Specimen 2 was a non-compact section according to the AASHTO LRFD
Bridge Design Specifications (AASHTO, 1997). The flange was compact and the web
129

was non-compact. The compression flange brace spacing satisfied the AASHTO
LRFD specifications for compact sections. According to the alternative formula for
flexural resistance in the AASHTO LRFD specifications, the ultimate flexural strength
of Specimen 2 was expected to reach the plastic moment, but no significant flexural
ductility was expected.
Specimen 2 had a test span of 50 ft. (15.2 m) and was simply-supported and
loaded at midspan. It reached a peak moment, Mu, equal to 3592 kip-ft (5604 kN-m),
three percent below the theoretical plastic moment, Mp• The sequence of events that
lead to a decrease in resistance (Le., unloading from the peak load) of Specimen 2 was:
local distortion of the web, local distortion of the compression flange, local buckling
of the web, and local buckling of the compression flange.
6.2 Discussion of Test Results
6.2.1 Specimen 1
For Specimen 1, the AASHTO LRFD Bridge Design Specifications
(AASHTO, 1997) correctly predicted that the ultimate flexural strength would reach or
exceed the theoretical plastic moment, Mp• Specimen 1 exceeded the theoretical
plastic moment, Mp, by three percent. This result suggests that I-girders fabricated
from HPS-1DOW steel which meet the web and flange slenderness limits for compact
sections in the current AASHTO LRFD specifications can be expected to have a
flexural strength equal to the theoretical plastic moment.
130

While the ultimate strength of Specimen 1 was correctly predicted by the
AASHTO LRFD specifications (AASHTO, 1997), the rotation capacity, R, of 0.28
was well below the expected value of three. The maximum inelastic rotation through
which the plastic moment was sustained was 8inel,u = 0.019 radians. The AASHTO
LRFD specifications do not quantify the expected inelastic rotation and little
information on the expected inelastic rotation of I-girders similar to Specimen 1 exists
in the published literature.
I-girders which satisfy the web and compression flange slenderness criteria of
prior versions of the AISC plastic design specifications (AISC, 1978) are assumed to
provide a maximum inelastic rotation, 8inel,u, of approximately 0.06 radians (Grubb
and Carskaddan, 1981). However, this maximum inelastic rotation is not a reasonable
basis for comparison with Specimen 1 because the slenderness limits of the plastic
design specifications in AISC (1978) are more strict than the slenderness limits in
current specifications. According to AISC (1978), the web slenderness limit for 1-
shaped members designed by the plastic design method is:
(6-1)
131


0- _
~AASHTOLRFD
+ SlendernessLimit
6.50
•
5.50
......-..."'X
4.50
:1(- _
-----..... - ........
IJ
3.50
.............
...0, .... "
" ... III, ..., ...A ' ............
... ... ... ... ............ ... ... ...
............ ... ...
1.2
1.15
1.1
1.05
~ 1
0.95
0.9
0.85
0.82.50
NormalizedWeb Slenderness
• Holtz and Kulak (1973), Specimen WS-l
II Holtz and Kulak (1973), Specimen WS-2
• Holtz and Kulak (1973), Specimen WS-3
• Holtz and Kulak (1973), Specimen WS-4
c Holtz and Kulak (1973), Specimen WS-6
o Holtz and Kulak (1973), Specimen WS-7-P
AHoltz and Kulak (1973), Specimen WS-8-P
o Holtz and Kulak (1973), Specimen WS-9
+ Holtz and Kulak (1973), Specimen WS-IO
- Holtz and Kulak (1973), Specimen WS-ll
XFahnestock and Sause (1998), Specimen 1
XFahnestock and Sause (1998), Specimen 2
Figure 6.3 Nonnalized Ultimate Moment versus Nonnalized Web Slenderness
144
1.2..------,.------------------,
1.15
1.1
1.05
0.95
0.9
UCF,CSB
+
•"
UCF =Ultra-Compact FlangeCSB =Closely-Spaced Lateral Bracing
0.85
/~HTOSlendernessLimit
UCF,CSB
6.505.504.503.500.8 +-----+-....l...----!------f------t-------J
2.50
Nmmalized Web Slenderness
• Schilling (1990), Specimen S• Schilling (1990), Specimen M• Schilling (1990), Specimen D• Barth (1996), Specimen PIc Barth (1996), Specimen P3o Barth (1996), Specimen P511 Barth (1996), Specimen P6• Grubb and Carskaddan (1979), Specimen 1- Grubb and Carskaddan (1979), Specimen 2+Grubb and Carskaddan (1979), Specimen 3:II: Fahnestock and Sause (1998), Specimen 1X Fahnestock and Sause (1998), Specimen 2
Figure 6.4 Nonnalized Ultimate Moment versus Nonnalized Web Slenderness
145
6.505.504.503.50
IUCF =Ultra-Compact Flange I
--
:tC ~~....... _-
~~
~~
A-- ________.....................
~~~~~---
-------===~UCF
UCF
V~HTOSlendernessLimit
0.8
2.50
0.9
1.1
1.2
0.85
0.95
1.05
1.15
Normalized Web Slenderness
A Green and Sause (1997), FE Specimen 1• Green and Sause (1997), FE Specimen 2X Fahnestock and Sause (1998), Specimen 1X Fahnestock and Sause (1998), Specimen 2
Figure 6.5 Nonnalized Ultimate Moment versus Nonnalized Web Slenderness
146

References
AASHTO (1997). AASHTO LRFD Bridge Design Specifications -1997 Interim,American Association of State Highway and Transportation Officials, Inc.,Washington D.C.
AISC (1978). Specifications for the Design, Fabrication, and Erection of StructuralSteel Buildings, American Institute of Steel Construction, Chicago, IL.
ASTM (1994). E8 - Standard Test Methods/or Tension Testing o/Metallic Materials,1994 Annual Book of Standards, American Society of Testing Materials, Philadelphia,PA.
AWS (1988). Bridge Welding Code, American Welding Society, Miami, FL.
Barth, K. E. (1996). Moment-Rotation Characteristics for Inelastic Design of SteelBridge Beams and Girders, Ph.D. Dissertation, Purdue University, West Lafayette, IN.
Croce, A. D. (1970). The Strength of Continuous Welded Girders with UnstiffenedWebs, Structures Research Laboratory Report No. 70-2, Department of CivilEngineering, University of Texas at Austin.
Green, P. S. and R. Sause (1997). Personal communication, Lehigh University.
Grubb, M. A. and P. S. Carskaddan (1979). Autostress Design of Highway Bridges,Phase 3: Initial Moment-Rotation Tests, Research Laboratory Technical Report,United States Steel Corporation, Monroeville, PA, April 18.
Grubb, M. A. and P. S. Carskaddan (1981). Autostress Design of Highway Bridges,Phase 3: Moment-Rotation Requirements, Research Laboratory Technical Report,United States Steel Corporation, Monroeville, PA, July 6.
Holtz N. M. and G. L. Kulak (1973). Web Slenderness Limits for Compact Beams,Structural Engineering Report No. 43, Department of Civil Engineering, University ofAlberta.
Holtz N. M. and G. L. Kulak (1975). Web Slenderness Limits for Non-CompactBeams, Structural Engineering Report No. 51, Department of Civil Engineering,University of Alberta.
147

McDermott, J.F. (1969). Plastic Bending ofA514 Beams, Journal of the StructuralDivision, American Society of Civil Engineers, Vol. 95, No. ST9, September, pp.1851-1871.
Nickerson, Robert L. (1997). Girder Fabrication Report #3: HPS-l00W for LehighUniversity by High Steel Structure~ report to the American Iron and Steel Institute.
Sooi, T. K., P. S. Green, R. Sause, 1. M. Ricles (1995). Stress-Strain CharacteristicsofHigh-Performance Steel and the Implications for Civil-Structure Design,Proceedings of the International Symposium on High Performance Steels forStructural Applications, Cleveland, Ohio, November, pp. 35-43.
Schilling, C. G. (1988). Moment-Rotation Tests ofSteel Bridge Girders, Journal ofStructural Engineering, American Society of Civil Engineers, Vol. 114, No.1, pp.134-149.
Schilling, C.G. (1990). Moment-Rotation Tests ofSteel Girders with Ultra-CompactFlanges, SSRC Annual Technical Session Proceedings, Structural Stability ResearchCouncil, St. Louis, MO, April, pp. 63-71.
SSRC (1988). Technical Memorandum No.7, Guide to Stability Design Criteria forMetal Structures, Structural Stability Research Council, Fourth Edition.
White, D. W., 1. A. Ramirez, K. E. Barth (1997). Moment Rotation Relationships forUnified Autostress Designs of Continuous-Span Bridge Beams and Girder~ FinalReport, Joint Transportation Research Program, West Lafayette, IN, November 17.
148

Vita
Larry Alan Fahnestock was born to James Richard and Nancy Geib Fahnestock
on June 21,1973, in Washington, DC. In June 1996, he graduated summa cum laude
from Drexel University, Philadelphia, PA, with the degrees of Bachelor of Science in
Architectural Engineering and Bachelor of Science in Civil Engineering. In July 1996,
he began graduate study at Lehigh University, Bethlehem, PA. He expects to receive
the degree of Master of Science in Civil Engineering in May 1998. Following
graduation, he will be employed as a structural engineer at Kling Lindquist,
Philadelphia, PA.
149
ENDOF
TITLE


