Embed Size (px)
Citation preview
DUCTILITY DESIGN OF FOUNDATIONS OF HIGHWAY BRIDGEABUTMENTS
Masahiro SHIRATO∗, Jiro FUKUI†, and Junichi KOSEKI‡
Abstract
Ductility design of foundations of abutments against severe earthquakes has beennewly introduced in the Specifications for Highway Bridges in Japan. This paper describesthe summary of the ductility design method as well as its background. One of the featuresof this method is the adoption of a new procedure to evaluate seismic active earth pressurethat is applicable up to high seismic loads based on the modified Mononobe-Okabe method.We also conduct back-analyses of the case histories of abutments including foundationsdamaged in the past earthquakes following the ductility design method proposed here. Theresults from the back-analyses confirm the applicability of the ductility design method.
Introduction
Right after the 1995 Hyogo-ken Nanbu earthquake (Kobe earthquake) in Japan, theSpecifications for Highway Bridges and commentaries were revised in 1996[1, 2]. Thespecification has introduced ductility design of foundations of piers as standard seismicdesign against severe and rare scale earthquakes. It should be noted that the aseismic designof piers based on the ductility design itself was not new, but had been already introducedbefore the 1995 Hyogo-ken Nanbu earthquake against large earthquakes which correspondto type I motions of level 2 earthquake motions defined in detail later.
Nevertheless, abutments and their foundations have been exception in applying theductility design even in the 1996 version of the specification, and the specification stillrequired to check that they behave elastically against level 1 earthquake motions which aresmall to middle (or frequent scale) earthquakes as it had demanded in the past. The reasonsfor this judgment are the following. First, because of the lack of knowledge on a properevaluation method of their performances, including the seismic active earth pressure at highseismic loads, it is difficult to establish any verification methods of seismic performance ofabutments and their foundations against severe earthquakes. Second, there has been no casehistory in Japan where the damage to abutments or their foundations causes unseating ofgirders. Third, a bridge abutment is a structure resisting against the earth pressure exertedfrom the backfill at any moment, and thus it would be just pushed forward by the seismic
∗Research Engineer, Foundation Engineering Research Team, Public Works Research Institute†Team Leader, ditto.‡Associate Professor, Institute of Industrial Science, the University of Tokyo
earth pressure even if it suffers residual displacements during earthquakes, which wouldnot directly result in the unseating of supporting girders.
However it is needed to develop an aseismic design method of abutments and theirfoundations against large earthquakes, which controls their damage within an acceptableextent to recover the service of road network as early as possible after the earthquakes.After publishing our 1996 version of the specifications, we have constructed a database ofpast earthquake damage to abutments or abutment foundations in Japan, and have studiedon the assessment methods which can distinguish the different damage extents for the casehistories in our database. Separately, Koseki et al.[4] have recently proposed an evalua-tion method of active earth pressure at high seismic loads, and it enabled us to establisha computational method to assess seismic performance of abutment foundations. Conse-quently, we could newly introduce the ductility design of abutment foundations into thelatest version of the Specifications for Highway Bridges revised in March 2002. The de-sign method is based on the preceding frame work of the ductility design method of bridgepier foundations, while some modifications are implemented to it in order to reflect theabove-mentioned peculiar mechanical characteristics of foundations of abutments. Thispaper describes the verification procedure and the process of the development of the newductility design method of foundations of abutments.
Fundamentals of seismic design of abutments and their foundations
A two stage aseismic design procedure is applied on the basis of the combinationsof the level 1 and level 2 earthquake motions and corresponding requirements of struc-tural performance. The level 1 earthquake motions are likely to strike a structure once ortwice during the expected service period of the structure. Their peak amplitudes are smallto medium, and are around 0.2 G at the ground surface. On the other hand, the level 2earthquake motions are extremely strong, but very unlikely to strike a structure during itsservice period. The level 2 earthquake motions include two types of motions. One is called‘type I’ motions which are generated at plate boundaries in the ocean. Their peak ampli-tudes at the ground level are smaller than the other one although the type I motions havelonger durations. Their peak amplitudes are about 0.3 G to 0.4 G at the ground surface.The other motions are inland strike type motions called ‘type II’ which are produced by afault located near the site; for example the 1995 Hyogo-ken Nanbu earthquake is catego-rized in this type. The type II motions have high intensities but short duration. Their peakamplitudes are set at 0.6 G to 0.8 G at the ground surface, based on the acceleration recordson the ground surface observed in the 1995 Hyogo-ken Nanbu earthquake.
In the new aseismic design procedure, all abutments and their foundations are veri-fied against the level 1 earthquake motions so that they would cause no structural damage.The abutment and its foundation shall remain in the elastic response region.
Next their seismic performance against the level 2 earthquake motions is checked.However this process is not necessarily applied to all highway abutments and their founda-tions. For only the foundations to be constructed on/in liquefiable ground, the verificationagainst the level 2 earthquake motions shall be conducted. In this case, the foundationshall have the necessary strength and ductility to fulfill the structural requirements as fol-lows: the damage to the foundation shall be limited within a level where it can be repairedwith reasonable cost and shall not cause a state where rescue operation of the bridge is notavailable. These requirements refer to those for pier foundations which undergo effects ofliquefaction. Consequently, the ductility design against the level 2 earthquake motions isapplied only to deep foundations in liquefiable ground.
For abutment bodies above their foundations, verification may be omitted againstthe level 2 earthquake motions even in the new specification as well as in the former speci-fications. This is because an abutment which satisfies the performance requirement for thelevel 1 earthquake motions is considered to posses enough strength and ductility againstthe level 2 ones. This can be also supposed by the past damage case histories. It should benoted that some structural details need to be specified in order to supplement skipping theassessment of the seismic performance against the level 2 earthquake motions. The newspecification requires to arrange lateral confining reinforcements in the abutment body soas to improve its ductility. It also demands to include the same amount of longitudinalreinforcements on the front side of the cross section of the abutment body as those on itsback side in order to prevent excessive bending failure and diagonal tensile failure causedby contacting of the abutment with the deck.
Survey of case histories of damage to abutments
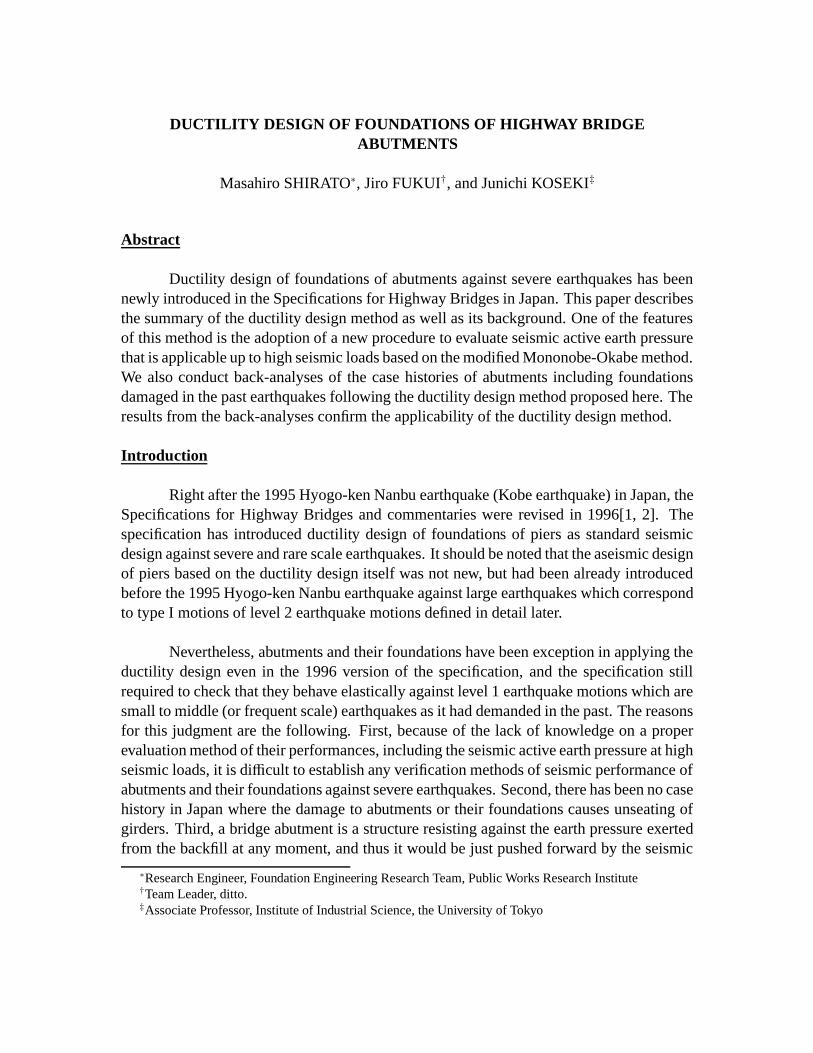
We made a list of damaged abutments including foundations from the past damagereports of recent large earthquakes in Japan. We selected typical cases from the list as issummarized in Table 1. Table 1 exhibits contents of damage, height of abutment from thebottom of pile cap, bearing condition, and equivalent thickness of liquefiable soil strata,which is explained below, for each case. Note that we here picked up only case histo-ries damaged by the type II earthquake motions to simplify the comparison among thesecases, because the behavior of abutments, foundations, and sub-soil layers would highlydepend on characteristics of seismic motions, e.g. the number of cycles, duration time, andthe intensity of earthquakes. All abutments that were finally picked up are supported bygroup-pile foundation. Note also that pile foundations are employed for about a half ofthe highway bridge foundations in Japan, in particular those are constructed in deep soft ordeep loose soil layers.
We judged the rank of damage based on the contents of damage for each case. In
Table 1 List of past damage case histories of abutments and computed nonlinear response of theirpile foundations
Case Earth- Rank Damage Height bearing Equivalent Responsequake* of of condition thickness of ductility
damage** abutment liquefiable factor(m) soil strata
HE (m)A 1 4 - spalling of concrete around anchor bolts of
bearings9.8 move 6.8 3.2
- movement of abutment (10 cm)B 1 4 - tilting of abutment, shear collapse of wing-
wall5 move 19.7 4.2
- slumping of backfill (1.0 m)C 2 3 - tilting of abutment 3.3 move 18 not
- cracks in parapet wall yield- outward movement of foundation (11 cm atthe top of the foundation)
D 1 3 - outward movement of abutment 5.5 fix 13.4 1.8- slumping of backfill
E 1 2 - slumping of backfill (20 cm) 8.5 move 3 not- collapse of bearings yield
F 1 2 - damage of abutment 8.8 move 3.2 1.4- cracks in the surface of approach road
G 1 2 - cracks in parapet wall 10.3 move 6.9 1.1- bump at the connection part between abut-ment and backfill
H 1 2 - cracks of abutment 7 move 8 2- collapse of side-blocks of bearings- exchange of bearings in repair works- slight slumping of backfill
I 1 2 - slumping of backfill 6.5 fix 1 1.2J 1 2 - shrinkage of spacing of expansion joint 12.3 fix 0 2.9
- excessive movement of bearing- bump in backfill
K 1 1 - a little spalling of concrete of abutment 6.6 fix 11.9 1.9L 1 1 - shrinkage of spacing of expansion joint 7.5 move 4.7 1
- cracks in parapet wall- bump in backfill
M 1 1 - shrinkage of spacing of expansion joint 6 fix 0.5 1.3
* ‘1’: the 1995 Hyogo-ken Nanbu earthquake, ‘2’: the 2000 Western Tottori earthquake.** Refer to Table 2
doing so, we set a four-tier criterion for the damage rank emphasizing whether the serviceof the bridge was available or not right after the earthquake. The larger the number of therank, the more disastrous the damage. The relation among the ranks, serviceability andrepairability, and details of damage is displayed in Table 2. The serviceability indicatesthe effect of the damage to the abutment or its foundation on the service or function ofthe bridge right after the earthquake, and the repairability represents whether the completerecover of the abutment and its foundation was possible by repair work with reasonablecost or not.
Equivalent thickness of liquefiable soil strata HE is defined by
HE = H∗1 + H∗2
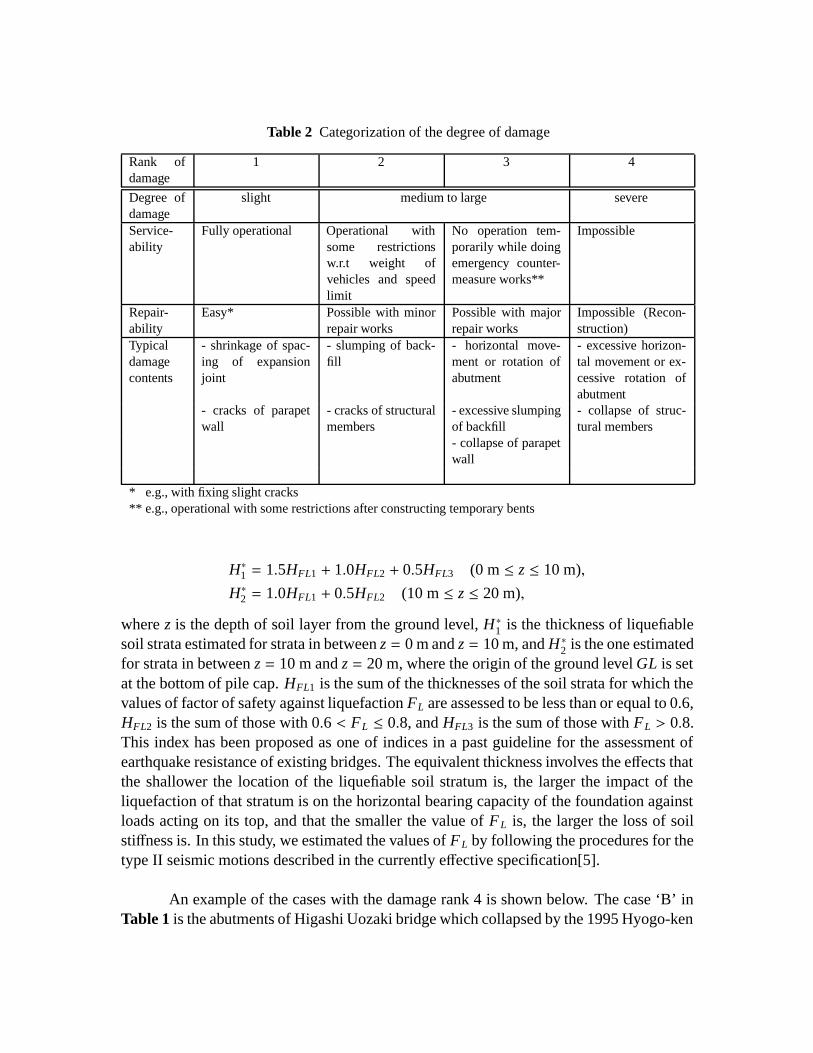
Table 2 Categorization of the degree of damage
Rank ofdamage
1 2 3 4
Degree ofdamage
slight medium to large severe
Service-ability
Fully operational Operational withsome restrictionsw.r.t weight ofvehicles and speedlimit
No operation tem-porarily while doingemergency counter-measure works**
Impossible
Repair-ability
Easy* Possible with minorrepair works
Possible with majorrepair works
Impossible (Recon-struction)
Typicaldamagecontents
- shrinkage of spac-ing of expansionjoint
- slumping of back-fill
- horizontal move-ment or rotation ofabutment
- excessive horizon-tal movement or ex-cessive rotation ofabutment
- cracks of parapetwall
- cracks of structuralmembers
- excessive slumpingof backfill
- collapse of struc-tural members
- collapse of parapetwall
* e.g., with fixing slight cracks** e.g., operational with some restrictions after constructing temporary bents
H∗1 = 1.5HFL1 + 1.0HFL2 + 0.5HFL3 (0 m ≤ z ≤ 10 m),
H∗2 = 1.0HFL1 + 0.5HFL2 (10 m ≤ z ≤ 20 m),
where z is the depth of soil layer from the ground level, H∗1 is the thickness of liquefiablesoil strata estimated for strata in between z = 0 m and z = 10 m, and H ∗2 is the one estimatedfor strata in between z = 10 m and z = 20 m, where the origin of the ground level GL is setat the bottom of pile cap. HFL1 is the sum of the thicknesses of the soil strata for which thevalues of factor of safety against liquefaction FL are assessed to be less than or equal to 0.6,HFL2 is the sum of those with 0.6 < FL ≤ 0.8, and HFL3 is the sum of those with FL > 0.8.This index has been proposed as one of indices in a past guideline for the assessment ofearthquake resistance of existing bridges. The equivalent thickness involves the effects thatthe shallower the location of the liquefiable soil stratum is, the larger the impact of theliquefaction of that stratum is on the horizontal bearing capacity of the foundation againstloads acting on its top, and that the smaller the value of FL is, the larger the loss of soilstiffness is. In this study, we estimated the values of FL by following the procedures for thetype II seismic motions described in the currently effective specification[5].
An example of the cases with the damage rank 4 is shown below. The case ‘B’ inTable 1 is the abutments of Higashi Uozaki bridge which collapsed by the 1995 Hyogo-ken
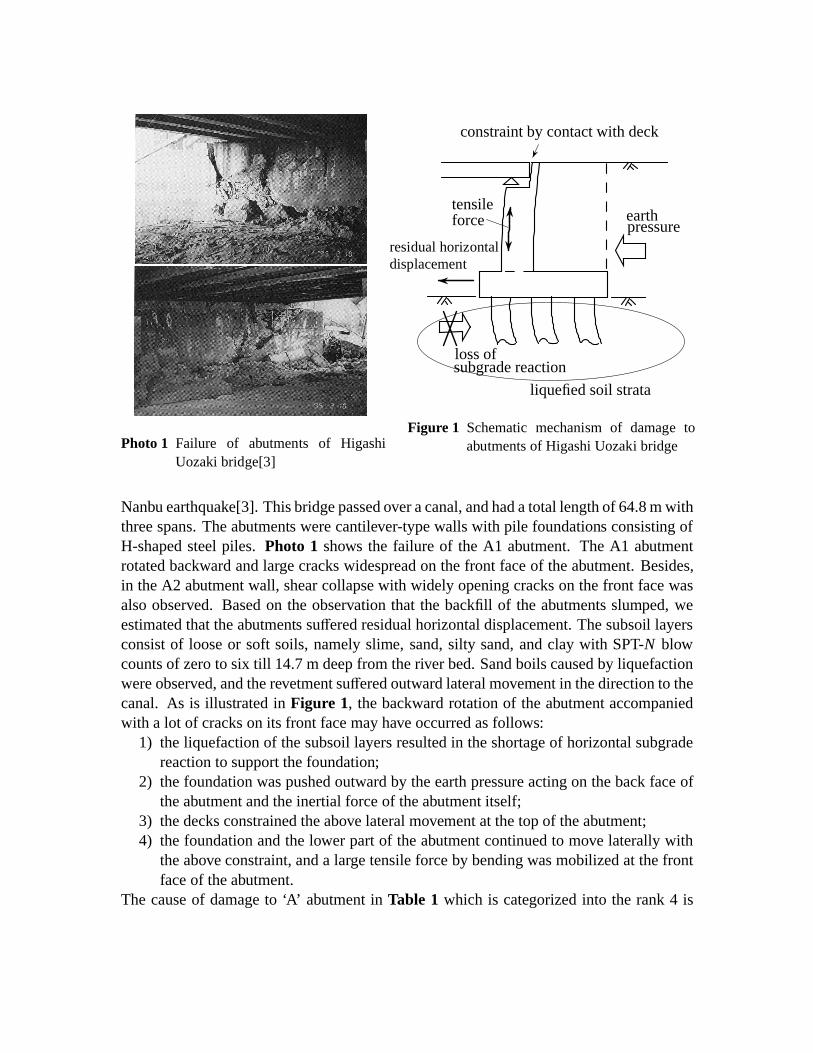
Photo 1 Failure of abutments of HigashiUozaki bridge[3]
liquefied soil strata
residual horizontaldisplacement
earthpressure
constraint by contact with deck
loss ofsubgrade reaction
tensileforce
Figure 1 Schematic mechanism of damage toabutments of Higashi Uozaki bridge
Nanbu earthquake[3]. This bridge passed over a canal, and had a total length of 64.8 m withthree spans. The abutments were cantilever-type walls with pile foundations consisting ofH-shaped steel piles. Photo 1 shows the failure of the A1 abutment. The A1 abutmentrotated backward and large cracks widespread on the front face of the abutment. Besides,in the A2 abutment wall, shear collapse with widely opening cracks on the front face wasalso observed. Based on the observation that the backfill of the abutments slumped, weestimated that the abutments suffered residual horizontal displacement. The subsoil layersconsist of loose or soft soils, namely slime, sand, silty sand, and clay with SPT-N blowcounts of zero to six till 14.7 m deep from the river bed. Sand boils caused by liquefactionwere observed, and the revetment suffered outward lateral movement in the direction to thecanal. As is illustrated in Figure 1, the backward rotation of the abutment accompaniedwith a lot of cracks on its front face may have occurred as follows:
1) the liquefaction of the subsoil layers resulted in the shortage of horizontal subgradereaction to support the foundation;
2) the foundation was pushed outward by the earth pressure acting on the back face ofthe abutment and the inertial force of the abutment itself;
3) the decks constrained the above lateral movement at the top of the abutment;4) the foundation and the lower part of the abutment continued to move laterally with
the above constraint, and a large tensile force by bending was mobilized at the frontface of the abutment.
The cause of damage to ‘A’ abutment in Table 1 which is categorized into the rank 4 is
also the lateral movement of foundation. It was possibly triggered by loss of horizontalsubgrade reaction induced by liquefaction of subsoil layers.
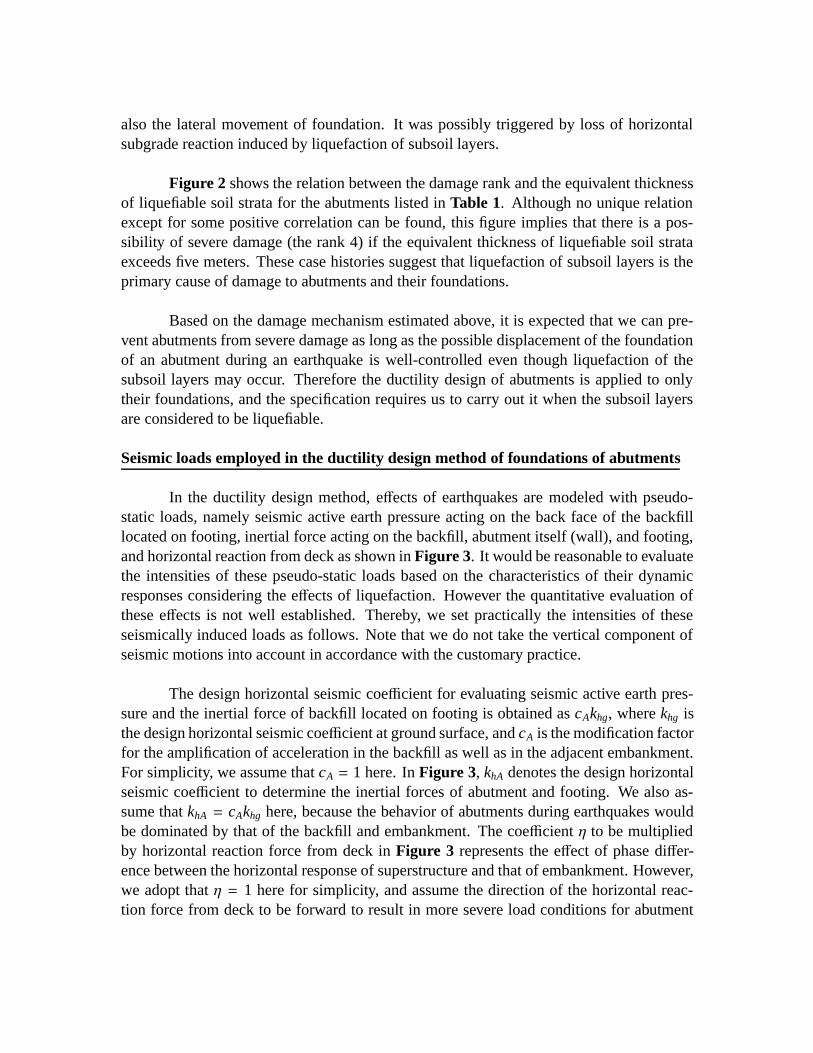
Figure 2 shows the relation between the damage rank and the equivalent thicknessof liquefiable soil strata for the abutments listed in Table 1. Although no unique relationexcept for some positive correlation can be found, this figure implies that there is a pos-sibility of severe damage (the rank 4) if the equivalent thickness of liquefiable soil strataexceeds five meters. These case histories suggest that liquefaction of subsoil layers is theprimary cause of damage to abutments and their foundations.
Based on the damage mechanism estimated above, it is expected that we can pre-vent abutments from severe damage as long as the possible displacement of the foundationof an abutment during an earthquake is well-controlled even though liquefaction of thesubsoil layers may occur. Therefore the ductility design of abutments is applied to onlytheir foundations, and the specification requires us to carry out it when the subsoil layersare considered to be liquefiable.
Seismic loads employed in the ductility design method of foundations of abutments
In the ductility design method, effects of earthquakes are modeled with pseudo-static loads, namely seismic active earth pressure acting on the back face of the backfilllocated on footing, inertial force acting on the backfill, abutment itself (wall), and footing,and horizontal reaction from deck as shown in Figure 3. It would be reasonable to evaluatethe intensities of these pseudo-static loads based on the characteristics of their dynamicresponses considering the effects of liquefaction. However the quantitative evaluation ofthese effects is not well established. Thereby, we set practically the intensities of theseseismically induced loads as follows. Note that we do not take the vertical component ofseismic motions into account in accordance with the customary practice.
The design horizontal seismic coefficient for evaluating seismic active earth pres-sure and the inertial force of backfill located on footing is obtained as cAkhg, where khg isthe design horizontal seismic coefficient at ground surface, and cA is the modification factorfor the amplification of acceleration in the backfill as well as in the adjacent embankment.For simplicity, we assume that cA = 1 here. In Figure 3, khA denotes the design horizontalseismic coefficient to determine the inertial forces of abutment and footing. We also as-sume that khA = cAkhg here, because the behavior of abutments during earthquakes wouldbe dominated by that of the backfill and embankment. The coefficient η to be multipliedby horizontal reaction force from deck in Figure 3 represents the effect of phase differ-ence between the horizontal response of superstructure and that of embankment. However,we adopt that η = 1 here for simplicity, and assume the direction of the horizontal reac-tion force from deck to be forward to result in more severe load conditions for abutment
0 10 20
1
2
3
4
Equivalent thickness of liquefiable
Ran
kof
dam
age
HE = 5 m
soil strata HE (m)
Figure 2 Comparison between equivalent thick-ness of liquefiable soil strata and therank of damage
earth pressure
failureplane
cAkhg
cAkhg
khA
khA
η× reactionforce fromdeck
Figure 3 Schematic figure of numerical model
foundations in practical design.
Seismic active earth pressure
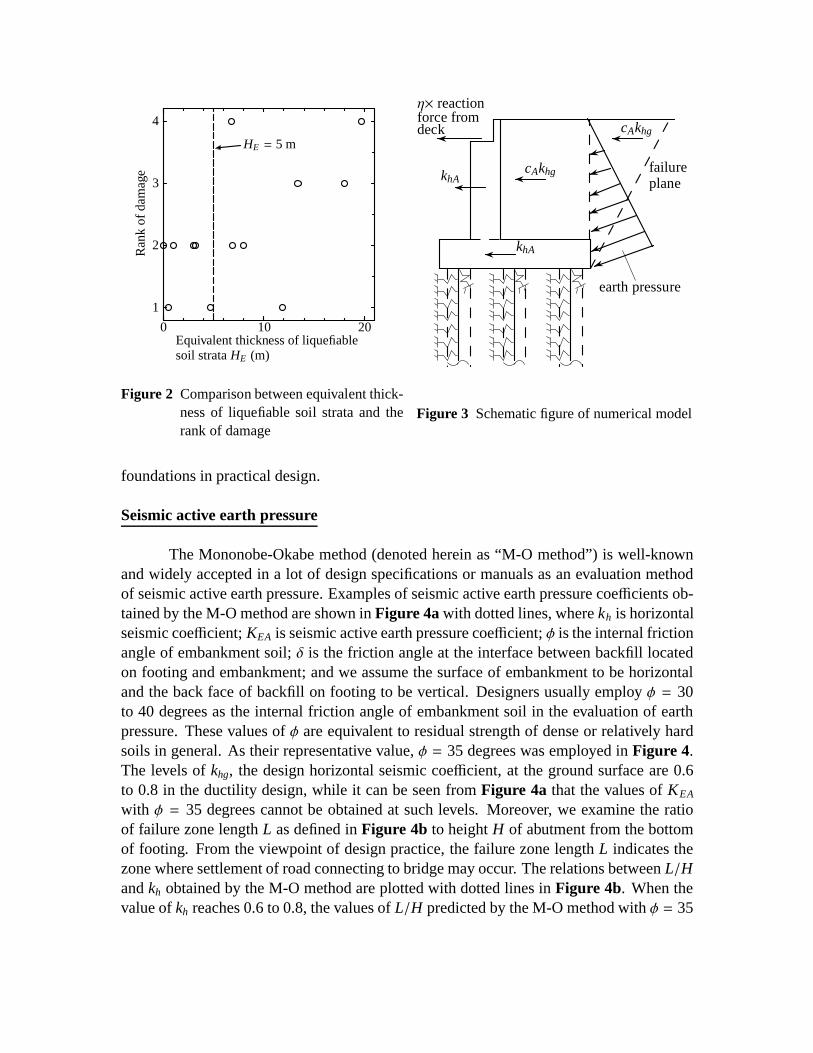
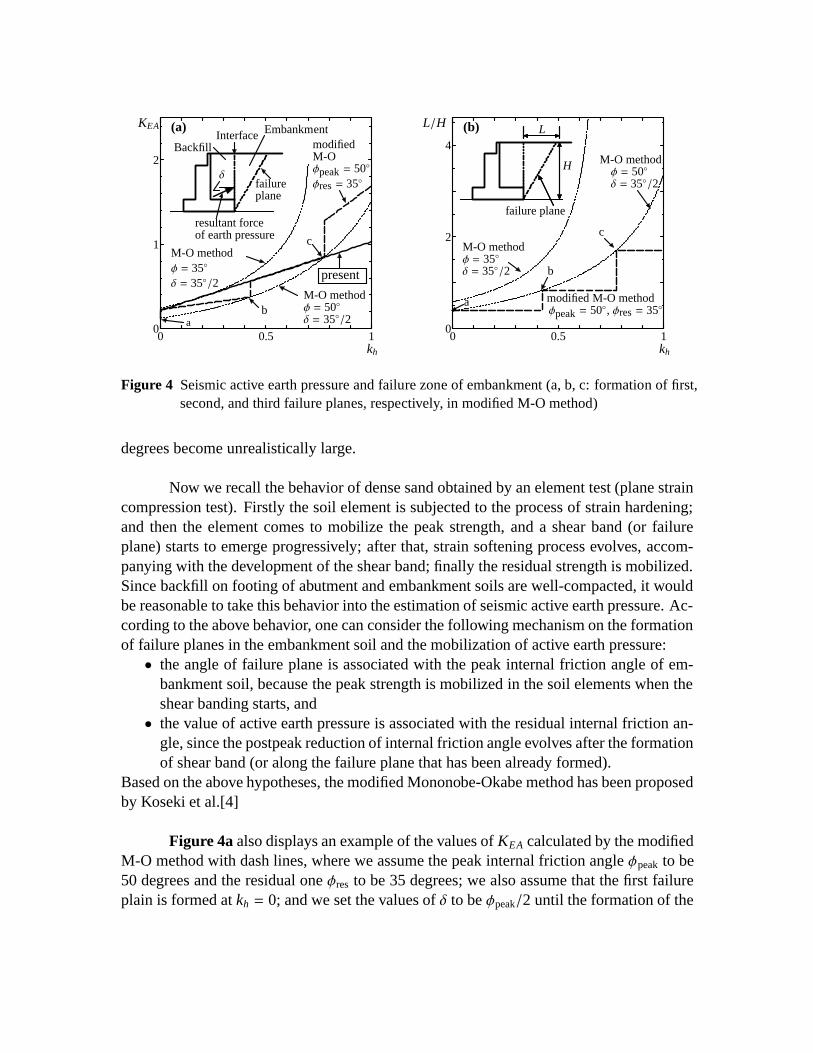
The Mononobe-Okabe method (denoted herein as “M-O method”) is well-knownand widely accepted in a lot of design specifications or manuals as an evaluation methodof seismic active earth pressure. Examples of seismic active earth pressure coefficients ob-tained by the M-O method are shown in Figure 4a with dotted lines, where kh is horizontalseismic coefficient; KEA is seismic active earth pressure coefficient; φ is the internal frictionangle of embankment soil; δ is the friction angle at the interface between backfill locatedon footing and embankment; and we assume the surface of embankment to be horizontaland the back face of backfill on footing to be vertical. Designers usually employ φ = 30to 40 degrees as the internal friction angle of embankment soil in the evaluation of earthpressure. These values of φ are equivalent to residual strength of dense or relatively hardsoils in general. As their representative value, φ = 35 degrees was employed in Figure 4.The levels of khg, the design horizontal seismic coefficient, at the ground surface are 0.6to 0.8 in the ductility design, while it can be seen from Figure 4a that the values of KEA
with φ = 35 degrees cannot be obtained at such levels. Moreover, we examine the ratioof failure zone length L as defined in Figure 4b to height H of abutment from the bottomof footing. From the viewpoint of design practice, the failure zone length L indicates thezone where settlement of road connecting to bridge may occur. The relations between L/Hand kh obtained by the M-O method are plotted with dotted lines in Figure 4b. When thevalue of kh reaches 0.6 to 0.8, the values of L/H predicted by the M-O method with φ = 35
0 0.5 10
1
2modified
φpeak = 50◦
M-O methodφ = 35◦
δ = 35◦/2M-O methodφ = 50◦δ = 35◦/2
failure
kh
KEA
plane
δ
resultant forceof earth pressure
present
φres = 35◦
(a) EmbankmentInterfaceBackfill
b
c
a
M-O
0 0.5 10
2
4
modified M-O methodφpeak = 50◦, φres = 35◦
M-O methodφ = 35◦δ = 35◦/2
H
L
M-O methodφ = 50◦δ = 35◦/2
failure plane
kh
L/H
a
b
c
(b)
Figure 4 Seismic active earth pressure and failure zone of embankment (a, b, c: formation of first,second, and third failure planes, respectively, in modified M-O method)
degrees become unrealistically large.
Now we recall the behavior of dense sand obtained by an element test (plane straincompression test). Firstly the soil element is subjected to the process of strain hardening;and then the element comes to mobilize the peak strength, and a shear band (or failureplane) starts to emerge progressively; after that, strain softening process evolves, accom-panying with the development of the shear band; finally the residual strength is mobilized.Since backfill on footing of abutment and embankment soils are well-compacted, it wouldbe reasonable to take this behavior into the estimation of seismic active earth pressure. Ac-cording to the above behavior, one can consider the following mechanism on the formationof failure planes in the embankment soil and the mobilization of active earth pressure:• the angle of failure plane is associated with the peak internal friction angle of em-
bankment soil, because the peak strength is mobilized in the soil elements when theshear banding starts, and• the value of active earth pressure is associated with the residual internal friction an-
gle, since the postpeak reduction of internal friction angle evolves after the formationof shear band (or along the failure plane that has been already formed).
Based on the above hypotheses, the modified Mononobe-Okabe method has been proposedby Koseki et al.[4]
Figure 4a also displays an example of the values of KEA calculated by the modifiedM-O method with dash lines, where we assume the peak internal friction angle φpeak to be50 degrees and the residual one φres to be 35 degrees; we also assume that the first failureplain is formed at kh = 0; and we set the values of δ to be φpeak/2 until the formation of the
first failure plane (at kh = 0) and to be φres/2 after that, as the value of δ at the interfacebetween soils has been empirically set to be φ/2 in applying the original M-O method. Inthe modified M-O method, after the formation of the first failure plane, the same failureplane continues to be activated unlike the result from the original M-O method, because thepeak strength will be mobilized along any other failure plane in the embankment excludingthe first failure plane along which the residual strength is mobilized. However, when theseismic coefficient kh is increased to a certain level, another failure plane will be activated,because it gives the extremum of seismic active earth pressure, and at this level the secondfailure plane is formed. The third, fourth, and other consecutive failure planes will beformed in a similar manner.
The modified M-O method has a couple of advantages in comparison with the orig-inal M-O method as can be seen in Figure 4. One is that the modified M-O method canprovide active earth pressure coefficient at large earthquake loads, even though the valuesof kh get to 0.6 to 0.8 which are considered in the seismic design against the level 2 earth-quakes. Another advantage is that the modified M-O method provides considerably smallerand much realistic size of active failure zone in embankment than the conventional methodyields. In not only model test results on retaining structures but also case histories of actualrailway retaining walls damaged in the 1995 Hyogo-ken Nanbu earthquake, the observedangle of failure planes formed in backfill cannot be explained without introducing the peakstrength of soils, as has been reported by Koseki et al.[7, 8] Consequently, the modifiedM-O method has been introduced into the new specification.
We, however, have given some engineering judgments to the original paper byKoseki et al.[4] in order to make the modified M-O method more suitable for practicaluse. In the modified M-O method, we have to estimate the level of kh at the formation ofthe first failure plane. Since, at this moment, no reasonable method to evaluate it has beenestablished, we give zero value to the level of kh at which the first failure plane emerges.This is because a failure plane can be formed due to a slight displacement of foundationunder the working load conditions. Next, we assume that no more failure planes appearafter the second failure plane is activated. This is because when the third failure planeappears, the embankment should have already deformed largely, and it is considered thatthe application of limit equilibrium approaches would be difficult at such a level. Thirdly,although we can derive both the first and second failure planes, we take only the secondfailure plane into account in estimating the seismic active earth pressure coefficient KEA
values for all the values of kh, because the second failure plane would be usually activeat the ground acceleration level of 0.6 to 0.8 G corresponding to the level 2 earthquakemotions. From the viewpoint of practical design, this assumption is reasonable, since thisgives us the values of KEA close to those which have been used in the past design practiceat the ground acceleration levels of around 0.2 G corresponding to the level 1 earthquakemotions. Hence the dimensions of abutments and their foundations can become similar to
those based on the past design practice.
The solid straight line in Figure 4 shows the results obtained by applying theseengineering judgments to the results from the modified M-O method. The KEA values canbe formulated as a linear function with respect to the horizontal seismic coefficient kh.Around the acceleration level of 0.2 G, the present method yields the values of KEA closeto those estimated by the original M-O method with φres = 35 degrees. Eventually, inthe newly revised specification, we have adopted the following equations to evaluate theseismic active earth pressure coefficients,
KEA = 0.22 + 0.81kh for dense sand and gravel (1)
KEA = 0.26 + 0.97kh for dense sandy soil (2)
where the surface of embankment is supposed to be horizontal. In obtaining the aboveequations, it is assumed that the internal friction angles of dense sand and gravel are φpeak =
50 degrees and φres = 35 degrees, and those of dense sandy soil are φpeak = 45 degrees andφres = 30 degrees. In addition, as mentioned before, it is also assumed that δ = φpeak/2until initiating the first failure plane and δ = φres/2 after that.
Estimation of inelastic response of foundation system
It can be easily understood that displacement of the foundation of an abutmentwould accumulate to one-way direction during an earthquake especially once the founda-tion reaches yielding, because of the earth pressure acting on backfill on footing at anymoment. Many experimental studies have revealed this type of behavior. However, it isdifficult to predict the progressive movement of the foundation of an abutment since non-linear hysteresis characteristic of foundation as well as that of seismic active/passive earthpressure is not well-known. In the ductility design method of foundations of abutments, weemploy pushover analysis in order to grasp collapse behavior as a global foundation sys-tem, and, in addition, we apply so-called ‘energy conservation method’ to the result from apushover analysis so as to estimate the possible response ductility factor of the foundationsystem.
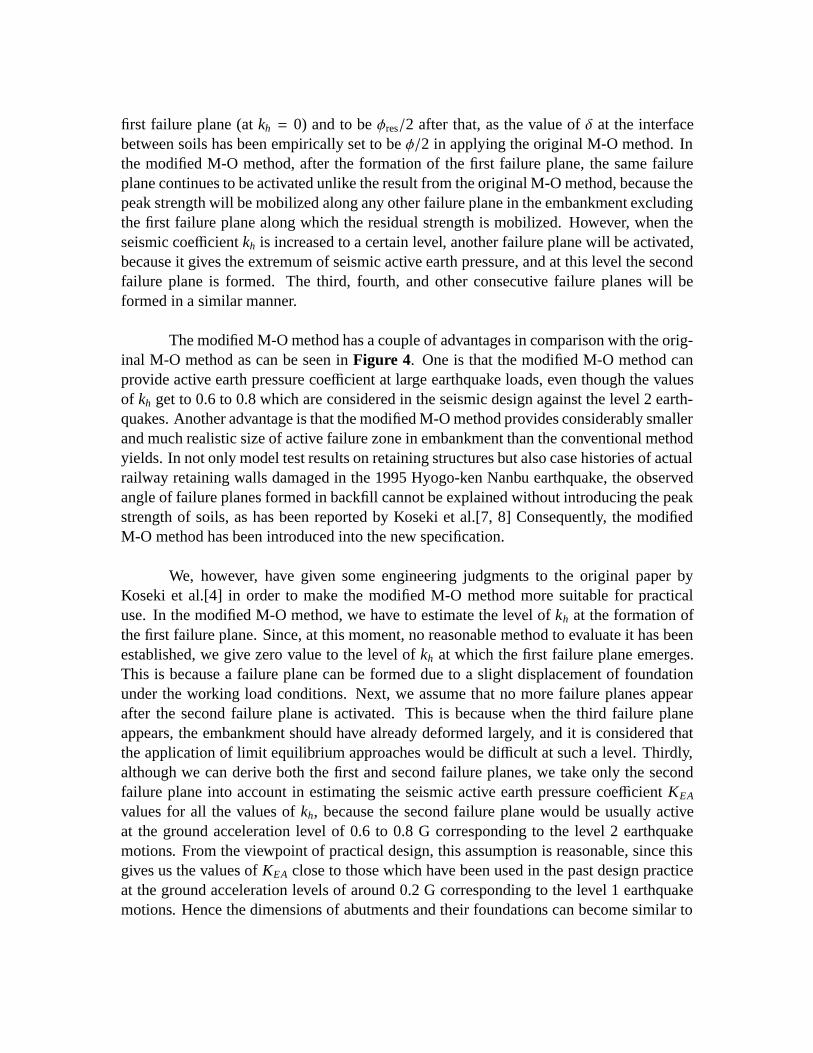
As shown in Figure 5, the relation between horizontal seismic coefficient khA anddisplacement of the top of an abutment ∆ is employed for an evaluation of a nonlinearresponse of the foundation by the energy conservation method. Before carrying out thepushover analysis, we apply vertical dead loads and the active earth pressure that is evalu-ated at kh = 0 in Eqs. (1) and (2) to the abutment in order to derive the initial displacementof the foundation ∆i.
The reasons why we employ the pushover analysis and the energy conservationmethod are as follows. Firstly it may not be necessary to utilize sophisticated methods,
kh (=acc./g)
∆∆i ∆y ∆r
yieldpoint
initial displacement
µr =∆r
∆y
khA
acc.: horizontal accelerationg: the acceleration of gravityµr: response ductility factor∆y: yield displacement∆r: response displacement
Figure 5 Estimation of response ductility factor
since the reliability and accuracy of them in predicting the dynamic behavior of abutmentsystems including foundations and embankments are not well-known. Secondly we canpoint out the characteristics of the intensity and duration of the design earthquake motions.When we consider the type II seismic motions which have a few number of cycles withhigh intensity and short duration, like those of the 1995 Hyogo-ken Nanbu earthquake, thedisplacement assessed by means of the energy conservation method employing their peakhorizontal acceleration would be predominant, and the accumulation of the progressivemovement may be omitted. For example, the energy conservation method is valid theoret-ically for an elasto-plastic response of a single DOF system undergoing an impulse inputmotion, which is relatively similar to the type II seismic motion. On the other hand, thetype I seismic motions have a large number of cycles. However the acceleration intensityof each cycle is less than those of the type II seismic motions as has been explained in thesection of “Fundamentals of seismic design of abutments and their foundations”. Thereby,it is not difficult to achieve enough strength of the foundation of an abutment against thetype I earthquake motions. In other words, there are few possibilities of the occurrence ofexcessive residual displacement against the type I seismic motions with a lot of cycles aslong as we assure the response ductility factor of the foundation to be small enough by pro-viding an adequate strength against the type II motions. Based on the above consideration,in the newly revised specification, the verification against the level 2 earthquake motionsis required only against the type II earthquake motions.
Back-analysis of case histories and determination of allowable ductility factor
The allowable degree of damage for foundations of abutments would be essentiallythe same as that for foundations of piers. With respect to group-pile foundations of piers,the specification recommends that a response ductility factor should not exceed four. Thisrecommendation is based on results from experimental studies on large scale models ofgroup-pile foundations subjected to cyclic loads, such as those conducted by PWRI[9,10]. However, as has been discussed in the previous section, the behavior of foundations
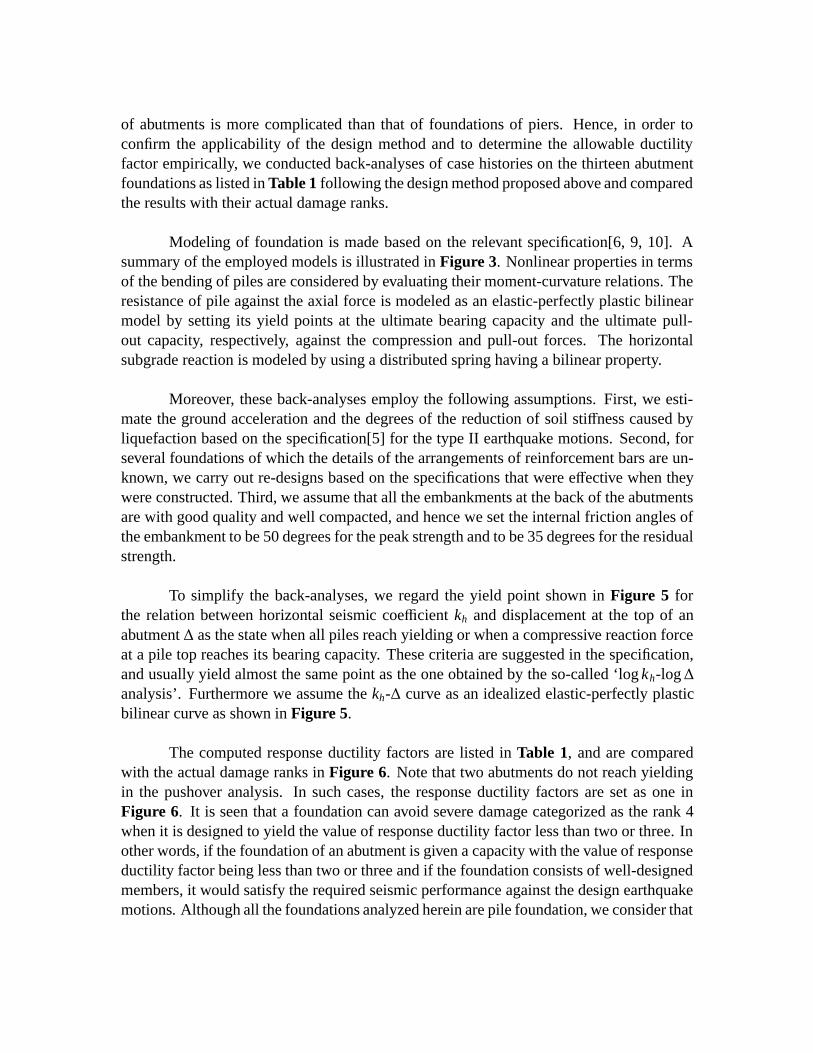
of abutments is more complicated than that of foundations of piers. Hence, in order toconfirm the applicability of the design method and to determine the allowable ductilityfactor empirically, we conducted back-analyses of case histories on the thirteen abutmentfoundations as listed in Table 1 following the design method proposed above and comparedthe results with their actual damage ranks.
Modeling of foundation is made based on the relevant specification[6, 9, 10]. Asummary of the employed models is illustrated in Figure 3. Nonlinear properties in termsof the bending of piles are considered by evaluating their moment-curvature relations. Theresistance of pile against the axial force is modeled as an elastic-perfectly plastic bilinearmodel by setting its yield points at the ultimate bearing capacity and the ultimate pull-out capacity, respectively, against the compression and pull-out forces. The horizontalsubgrade reaction is modeled by using a distributed spring having a bilinear property.
Moreover, these back-analyses employ the following assumptions. First, we esti-mate the ground acceleration and the degrees of the reduction of soil stiffness caused byliquefaction based on the specification[5] for the type II earthquake motions. Second, forseveral foundations of which the details of the arrangements of reinforcement bars are un-known, we carry out re-designs based on the specifications that were effective when theywere constructed. Third, we assume that all the embankments at the back of the abutmentsare with good quality and well compacted, and hence we set the internal friction angles ofthe embankment to be 50 degrees for the peak strength and to be 35 degrees for the residualstrength.
To simplify the back-analyses, we regard the yield point shown in Figure 5 forthe relation between horizontal seismic coefficient kh and displacement at the top of anabutment ∆ as the state when all piles reach yielding or when a compressive reaction forceat a pile top reaches its bearing capacity. These criteria are suggested in the specification,and usually yield almost the same point as the one obtained by the so-called ‘log kh-log∆analysis’. Furthermore we assume the kh-∆ curve as an idealized elastic-perfectly plasticbilinear curve as shown in Figure 5.
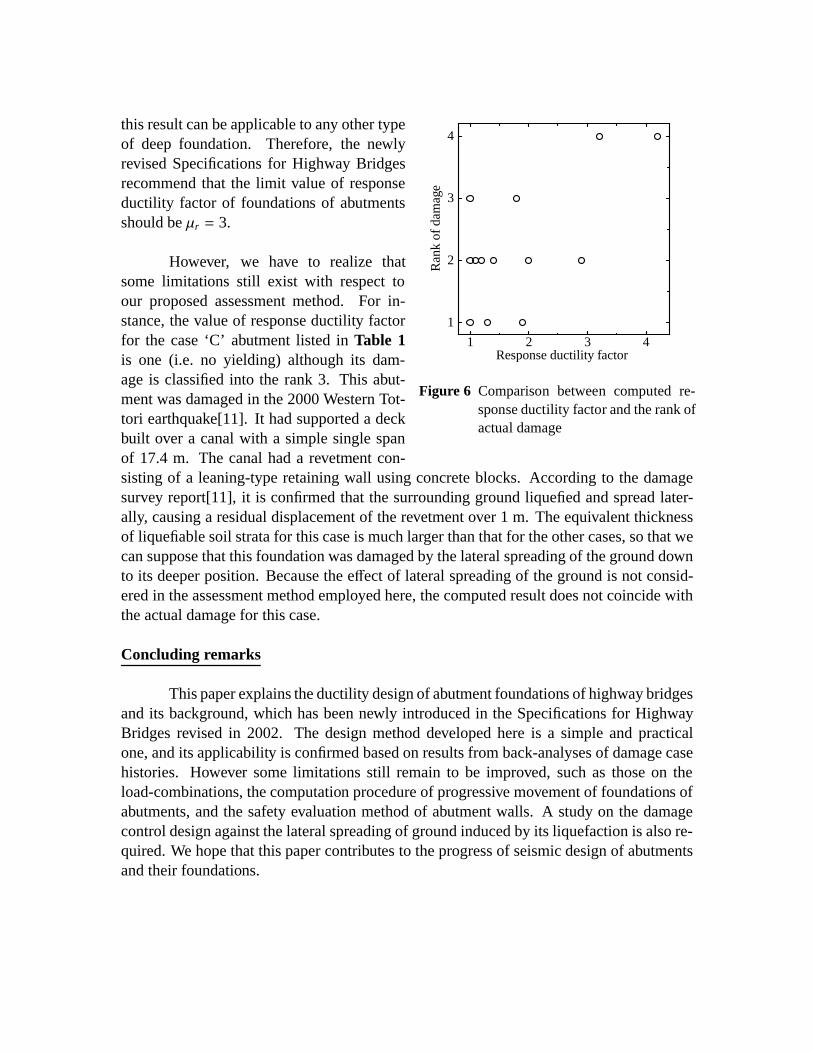
The computed response ductility factors are listed in Table 1, and are comparedwith the actual damage ranks in Figure 6. Note that two abutments do not reach yieldingin the pushover analysis. In such cases, the response ductility factors are set as one inFigure 6. It is seen that a foundation can avoid severe damage categorized as the rank 4when it is designed to yield the value of response ductility factor less than two or three. Inother words, if the foundation of an abutment is given a capacity with the value of responseductility factor being less than two or three and if the foundation consists of well-designedmembers, it would satisfy the required seismic performance against the design earthquakemotions. Although all the foundations analyzed herein are pile foundation, we consider that
1 2 3 4
1
2
3
4
Response ductility factor
Ran
kof
dam
age
Figure 6 Comparison between computed re-sponse ductility factor and the rank ofactual damage
this result can be applicable to any other typeof deep foundation. Therefore, the newlyrevised Specifications for Highway Bridgesrecommend that the limit value of responseductility factor of foundations of abutmentsshould be µr = 3.
However, we have to realize thatsome limitations still exist with respect toour proposed assessment method. For in-stance, the value of response ductility factorfor the case ‘C’ abutment listed in Table 1is one (i.e. no yielding) although its dam-age is classified into the rank 3. This abut-ment was damaged in the 2000 Western Tot-tori earthquake[11]. It had supported a deckbuilt over a canal with a simple single spanof 17.4 m. The canal had a revetment con-sisting of a leaning-type retaining wall using concrete blocks. According to the damagesurvey report[11], it is confirmed that the surrounding ground liquefied and spread later-ally, causing a residual displacement of the revetment over 1 m. The equivalent thicknessof liquefiable soil strata for this case is much larger than that for the other cases, so that wecan suppose that this foundation was damaged by the lateral spreading of the ground downto its deeper position. Because the effect of lateral spreading of the ground is not consid-ered in the assessment method employed here, the computed result does not coincide withthe actual damage for this case.
Concluding remarks
This paper explains the ductility design of abutment foundations of highway bridgesand its background, which has been newly introduced in the Specifications for HighwayBridges revised in 2002. The design method developed here is a simple and practicalone, and its applicability is confirmed based on results from back-analyses of damage casehistories. However some limitations still remain to be improved, such as those on theload-combinations, the computation procedure of progressive movement of foundations ofabutments, and the safety evaluation method of abutment walls. A study on the damagecontrol design against the lateral spreading of ground induced by its liquefaction is also re-quired. We hope that this paper contributes to the progress of seismic design of abutmentsand their foundations.
Acknowledgment This research was performed for the revision of the Specifications forHighway Bridges in Japan. We particularly acknowledge the Working Group for Seis-mic Design of Abutments chaired by Dr. M. Saeki set in the Committee for Substructureschaired by Dr. M. Okahara established in the Japan Road Association for their commentsand supports to our work.
References
[1] Japan Road Association (1996): Specifications for Highway Bridges, Part V, Seismic Design,Maruzen, Tokyo (in Japanese, but translated into English and edited by Unjoh, S. and Te-rayama, T. as the technical memorandum of EED, PWRI., No. 9801, 1998.)
[2] Japan Road Association (1996): Specifications for Highway Bridges, Part IV, Substructures,Maruzen, Tokyo (in Japanese).
[3] Editorial Committee for the Report on the Hanshin-Awaji Earthquake Disaster (1996): Reporton the Hanshin-Awaji Earthquake Disaster, Damage to Civil Engineering Structures, BridgeStructures, JSCE, Tokyo (in Japanese).
[4] Koseki, J., Tatsuoka, F., Munaf, Y., Tateyama, M., and Kojima, K. (1998): A modifiedprocedure to evaluate active earth pressure at high seismic loads, Special Issue of Soils andFoundations, pp. 209-216.
[5] Japan Road Association (2002): Specifications for Highway Bridges, Part V, Seismic Design,Maruzen, Tokyo (in Japanese).
[6] Japan Road Association (2002): Specifications for Highway Bridges, Part IV, Substructures,Maruzen, Tokyo (in Japanese, but the translated into English and edited one will be publishedin 2003 as a technical memorandum of the Foundation Engineering Research Team, PWRI.)
[7] Koseki, J., Munaf, Y., Tateyama, M., Kojima, K., and Horii, K. (1999): Back analysis ofcase histories and model tests on seismic stability of retaining walls, Eleventh Asian RegionalConf. on Soil Mech. and Geotech. Eng. (ed. Hong et al.), pp. 399-402, Balkema, Rotterdam.
[8] Koseki, J., Watanabe, K., Tateyama, M., and Kojima, K. (2001): Seismic earth pressuresacting on reinforced-soil and conventional type retaining walls, Landmarks in Earth Rein-forcement (ed. Ochiai et al.), Swets & Zeitlinger (Balkema), Vol. 1, pp. 393-398.
[9] Nakano, M. and Kimura, Y. (1996): Seismic design of pile foundation, Proc. of the ThirdUS-Japan WS on Seismic Retrofit of Bridges, Vol. 3, pp. 343-355.
[10] Fukui, J., Kimura, Y., Ishida, M., and Nanazawa, T. (1997): Strength and ductility character-istics of highway bridge foundations, Proc. of 29th UJNR, Technical memorandum of PWRI,No. 3524, pp. 567-582.
[11] Sasaki, T., Matsuo, O., Kobayashi, H., Watanabe, T., and Maeda, T. (2001): A back-analysisof the effects of the lateral spreading of the ground on the foundation of an abutment damagedin the 2002 Western Tottori earthquake, Proc. of 56th Annual Conf. of JSCE, III-A, pp. 230-231 (in Japanese).


