Embed Size (px)
Citation preview
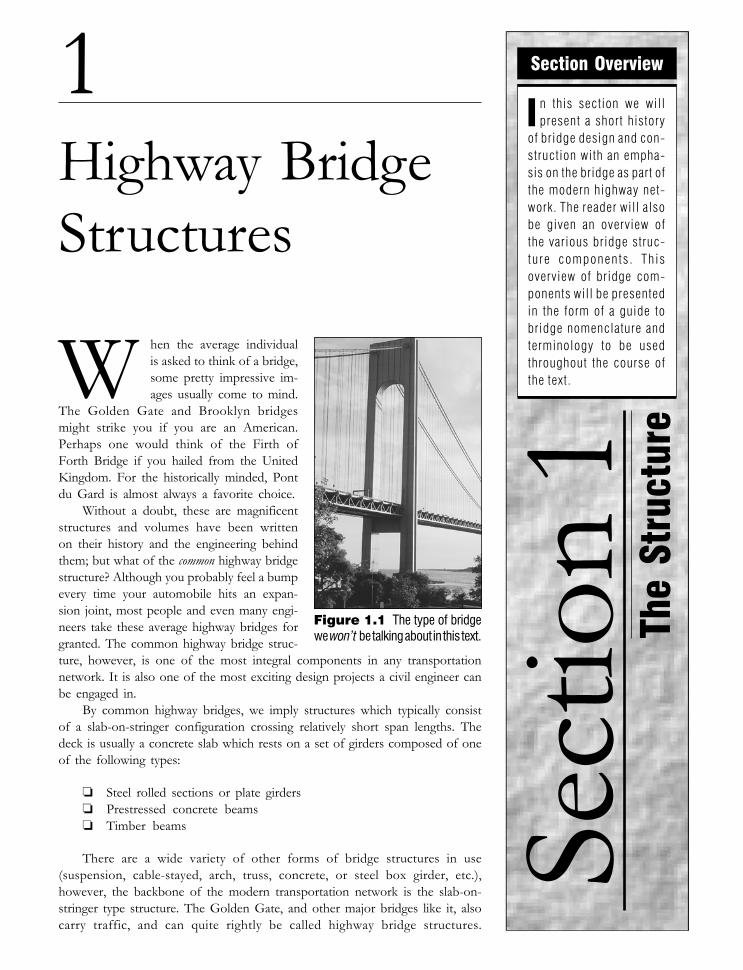
hen the average individualis asked to think of a bridge,some pretty impressive im-ages usually come to mind.
The Golden Gate and Brooklyn bridgesmight strike you if you are an American.Perhaps one would think of the Firth ofForth Bridge if you hailed from the UnitedKingdom. For the historically minded, Pontdu Gard is almost always a favorite choice.
Without a doubt, these are magnificentstructures and volumes have been writtenon their history and the engineering behindthem; but what of the common highway bridgestructure? Although you probably feel a bumpevery time your automobile hits an expan-sion joint, most people and even many engi-neers take these average highway bridges forgranted. The common highway bridge struc-ture, however, is one of the most integral components in any transportationnetwork. It is also one of the most exciting design projects a civil engineer canbe engaged in.
By common highway bridges, we imply structures which typically consistof a slab-on-stringer configuration crossing relatively short span lengths. Thedeck is usually a concrete slab which rests on a set of girders composed of oneof the following types:
❏ Steel rolled sections or plate girders❏ Prestressed concrete beams❏ Timber beams
There are a wide variety of other forms of bridge structures in use(suspension, cable-stayed, arch, truss, concrete, or steel box girder, etc.),however, the backbone of the modern transportation network is the slab-on-stringer type structure. The Golden Gate, and other major bridges like it, alsocarry traffic, and can quite rightly be called highway bridge structures.
Figure 1.1 The type of bridgewe won’t be talking about in this text.
1Highway BridgeStructures
W
Sect
ion
1Th
e St
ruct
ure
Section Overview
I n this section we willpresent a short history
of bridge design and con-struction with an empha-sis on the bridge as part ofthe modern highway net-work. The reader will alsobe given an overview ofthe various bridge struc-ture components . Th isoverview of bridge com-ponents will be presentedin the form of a guide tobridge nomenclature andterminology to be usedthroughout the course ofthe text.
Source: Bridge Engineering
Downloaded from Digital Engineering Library @ McGraw-Hill (www.digitalengineeringlibrary.com)Copyright © 2006 The McGraw-Hill Companies. All rights reserved.
Any use is subject to the Terms of Use as given at the website.
2 SECTION 1 THE STRUCTURE
However, the design and construction of the slab-on-stringer bridge is thefocus of this text, not only because of its continued popularity as a structure innew design projects, but also due to the pressing issues of maintaining andrehabilitating existing slab-on-stringer bridges in an aging infrastructure. Withregard to rehabilitation, today’s civil engineers are presented with a situationthat their forerunners were, for the most part, unfamiliar with. Throughout thetext we will see that rehabilitation design offers its own set of uniquechallenges. As young engineers, when we think of bridge design, we all dreamof a magnificent project like the George Washington or Sydney Harborbridges; but these are few and far between. In the trenches, so to speak, we arefaced with the slab-on-stringer bridge which, while maybe not as glamorous,can prove every bit as challenging as its larger cousins.
[1.0]
rom itsfoundations
rooted in bedrock toits towering pylonsand vaulting span, abridge is a thing ofwonder and ofpoetry.
F
DAVID B. STEINMAN
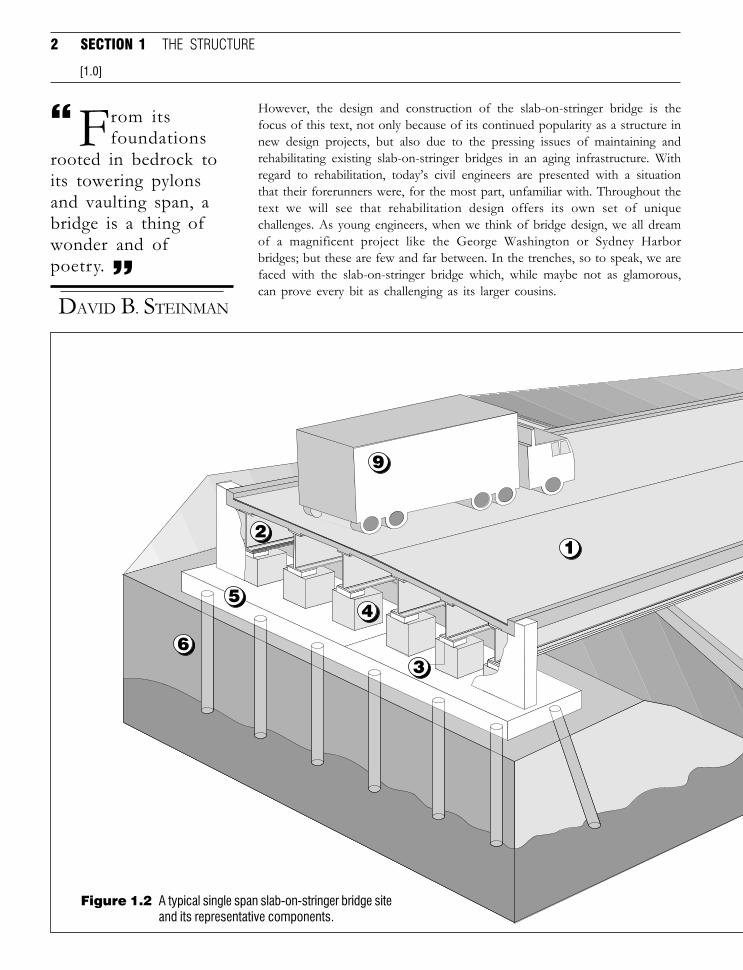
Figure 1.2 A typical single span slab-on-stringer bridge siteand its representative components.
Highway Bridge Structures
Downloaded from Digital Engineering Library @ McGraw-Hill (www.digitalengineeringlibrary.com)Copyright © 2006 The McGraw-Hill Companies. All rights reserved.
Any use is subject to the Terms of Use as given at the website.
3
1.1 USE AND FUNCTIONALITY
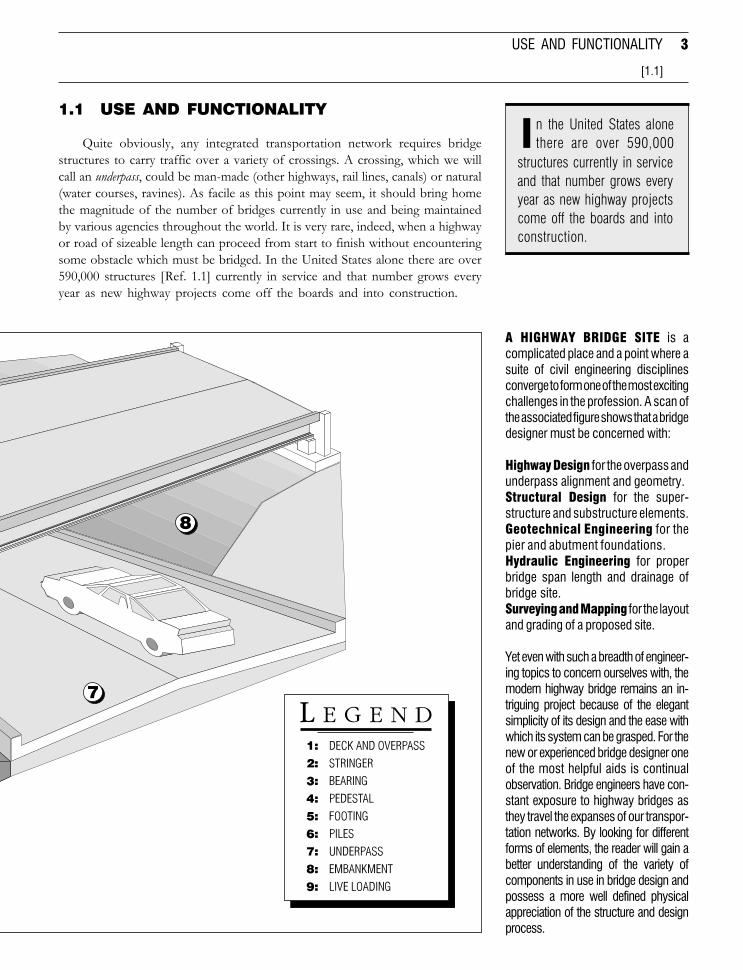
Quite obviously, any integrated transportation network requires bridgestructures to carry traffic over a variety of crossings. A crossing, which we willcall an underpass, could be man-made (other highways, rail lines, canals) or natural(water courses, ravines). As facile as this point may seem, it should bring homethe magnitude of the number of bridges currently in use and being maintainedby various agencies throughout the world. It is very rare, indeed, when a highwayor road of sizeable length can proceed from start to finish without encounteringsome obstacle which must be bridged. In the United States alone there are over590,000 structures [Ref. 1.1] currently in service and that number grows everyyear as new highway projects come off the boards and into construction.
USE AND FUNCTIONALITY
[1.1]
n the United States alonethere are over 590,000I
structures currently in serviceand that number grows everyyear as new highway projectscome off the boards and intoconstruction.
A HIGHWAY BRIDGE SITE is acomplicated place and a point where asuite of civil engineering disciplinesconverge to form one of the most excitingchallenges in the profession. A scan ofthe associated figure shows that a bridgedesigner must be concerned with:
Highway Design for the overpass andunderpass alignment and geometry.Structural Design for the super-structure and substructure elements.Geotechnical Engineering for thepier and abutment foundations.Hydraulic Engineering for properbridge span length and drainage ofbridge site.Surveying and Mapping for the layoutand grading of a proposed site.
Yet even with such a breadth of engineer-ing topics to concern ourselves with, themodern highway bridge remains an in-triguing project because of the elegantsimplicity of its design and the ease withwhich its system can be grasped. For thenew or experienced bridge designer oneof the most helpful aids is continualobservation. Bridge engineers have con-stant exposure to highway bridges asthey travel the expanses of our transpor-tation networks. By looking for differentforms of elements, the reader will gain abetter understanding of the variety ofcomponents in use in bridge design andpossess a more well defined physicalappreciation of the structure and designprocess.
Highway Bridge Structures
Downloaded from Digital Engineering Library @ McGraw-Hill (www.digitalengineeringlibrary.com)Copyright © 2006 The McGraw-Hill Companies. All rights reserved.
Any use is subject to the Terms of Use as given at the website.
4 SECTION 1 THE STRUCTURE
The 1950’s through early 1970’s saw an explosion in the number ofhighway bridges being designed and built in this country. According to U.S.Department of Transportation, by 2003 over 27% of U.S. bridges weredeemed structurally deficient and functionally obsolete [Ref. 1.1]. This situa-tion means that in this century we will see a major push toward the repair andeventual replacement of many of these structures. It is with this in mind thatwe must identify the basic use and functionality of highway bridge structures.
1.1.1 Terminology and Nomenclature
As is the case with any profession, bridge engineering possesses its ownunique language which must first be understood by the designer in order tocreate a uniform basis for discussion. Figure 1.2 shows a typical, slab-on-stringerstructure which carries an overpass roadway over another road. This particularstructure, shown in the figure, consists of a single span. A span is defined as asegment of bridge from support to support. The following offers a briefoverview of some of the major bridge terms we will be using throughout the text.At the end of this section, the reader is provided with a comprehensive BridgeEngineering Lexicon which acts as a dictionary for the bridge designer. The lexiconcontains many of the most common bridge engineering terms and expressionsused on a day-to-day basis by bridge design professionals.
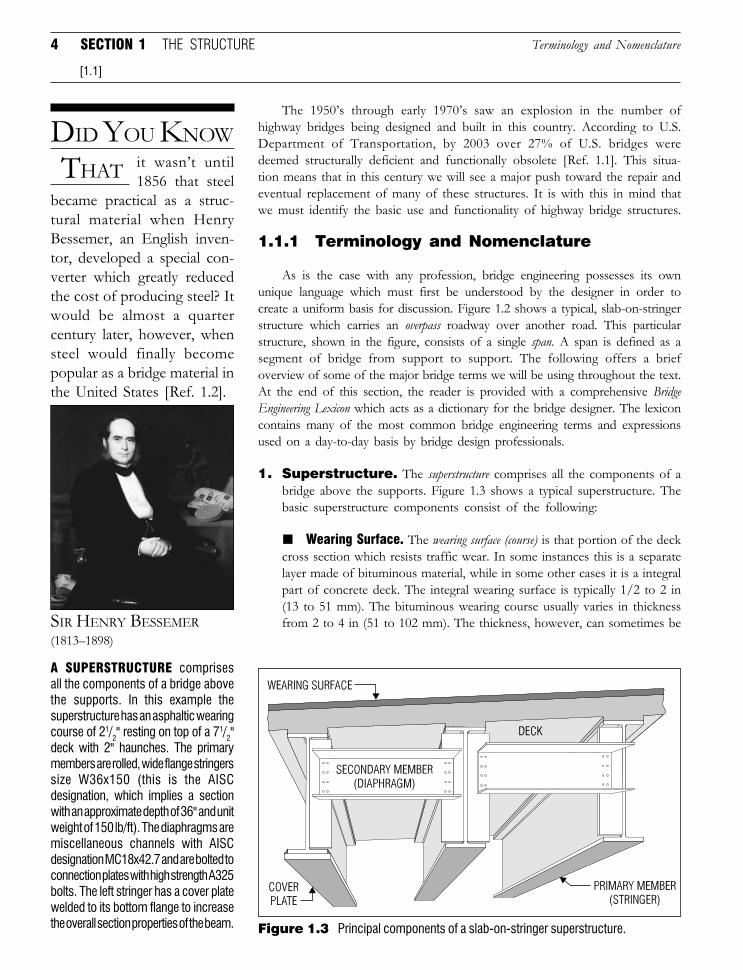
1. Superstructure. The superstructure comprises all the components of abridge above the supports. Figure 1.3 shows a typical superstructure. Thebasic superstructure components consist of the following:
■ Wearing Surface. The wearing surface (course) is that portion of the deckcross section which resists traffic wear. In some instances this is a separatelayer made of bituminous material, while in some other cases it is a integralpart of concrete deck. The integral wearing surface is typically 1/2 to 2 in(13 to 51 mm). The bituminous wearing course usually varies in thicknessfrom 2 to 4 in (51 to 102 mm). The thickness, however, can sometimes be
DID YOU KNOW
THAT it wasn’t until1856 that steel
became practical as a struc-tural material when HenryBessemer, an English inven-tor, developed a special con-verter which greatly reducedthe cost of producing steel? Itwould be almost a quartercentury later, however, whensteel would finally becomepopular as a bridge material inthe United States [Ref. 1.2].
[1.1]
SIR HENRY BESSEMER(1813–1898)
A SUPERSTRUCTURE comprisesall the components of a bridge abovethe supports. In this example thesuperstructure has an asphaltic wearingcourse of 21/2" resting on top of a 71/2"deck with 2" haunches. The primarymembers are rolled, wide flange stringerssize W36x150 (this is the AISCdesignation, which implies a sectionwith an approximate depth of 36" and unitweight of 150 lb/ft). The diaphragms aremiscellaneous channels with AISCdesignation MC18x42.7 and are bolted toconnection plates with high strength A325bolts. The left stringer has a cover platewelded to its bottom flange to increasethe overall section properties of the beam. Figure 1.3 Principal components of a slab-on-stringer superstructure.
Terminology and Nomenclature
Highway Bridge Structures
Downloaded from Digital Engineering Library @ McGraw-Hill (www.digitalengineeringlibrary.com)Copyright © 2006 The McGraw-Hill Companies. All rights reserved.
Any use is subject to the Terms of Use as given at the website.
5USE AND FUNCTIONALITY
larger due to resurfacing of the overpass roadway, which occurs throughoutthe life cycle of a bridge.
■ Deck. The deck is the physical extension of the roadway across theobstruction to be bridged. In this example, the deck is a reinforced concreteslab. In an orthotropic bridge, the deck is a stiffened steel plate. The mainfunction of the deck is to distribute loads transversely along the bridge crosssection. The deck either rests on or is integrated with a frame or otherstructural system designed to distribute loads longitudinally along the lengthof the bridge.
■ Primary Members. Primary members distribute loads longitudinally andare usually designed principally to resist flexure and shear. In Figure 1.3, theprimary members consist of rolled, wide flange beams. In some instances,the outside or fascia primary members possess a larger depth and may havea cover plate welded to the bottom of them to carry heavier loads.
Beam type primary members such as this are also called stringers orgirders. These stringers could be steel wide flange stringers, steel plate girders(i.e., steel plates welded together to form an I section), prestressed concrete,glued laminated timber, or some other type of beam. Rather than have theslab rest directly on the primary member, a small fillet or haunch can beplaced between the deck slab and the top flange of the stringer. The primaryfunction for the haunch is to adjust the geometry between the stringer andthe finished deck. It is also possible for the bridge superstructure to beformed in the shape of a box (either rectangular or trapezoidal). Box girderbridges can be constructed out of steel or prestressed concrete and are usedin situations where large span lengths are required and for horizontallycurved bridges. A more detailed discussion of the different types of primarymembers used in bridge construction is presented in Section 3.1.1.
[1.1.1, Part 1]
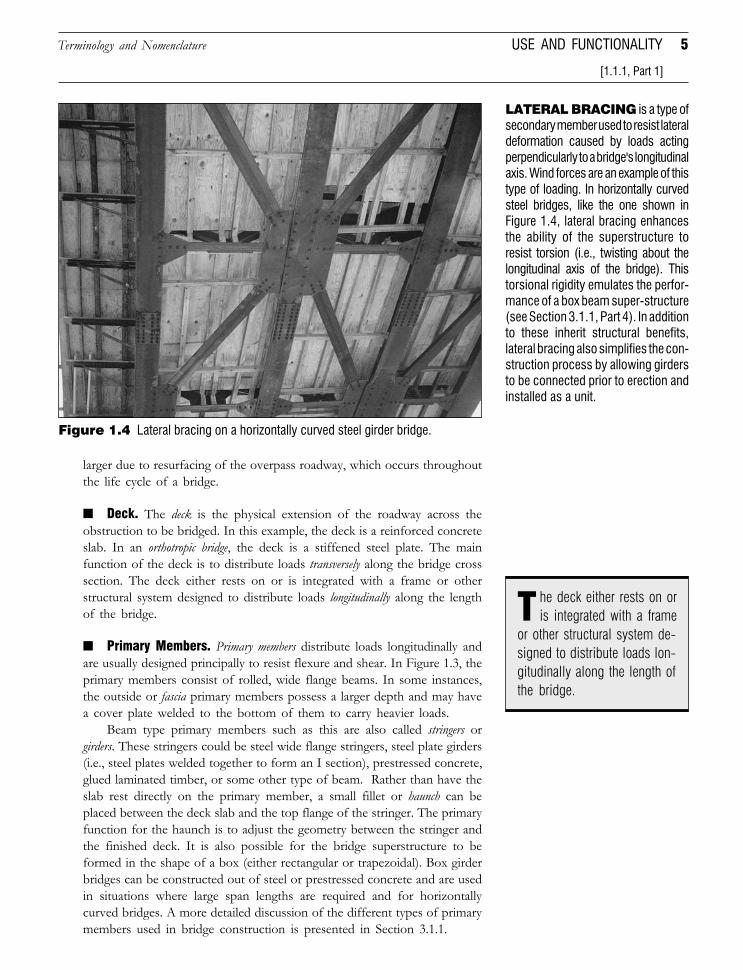
Figure 1.4 Lateral bracing on a horizontally curved steel girder bridge.
Tor other structural system de-signed to distribute loads lon-gitudinally along the length ofthe bridge.
he deck either rests on oris integrated with a frame
LATERAL BRACING is a type ofsecondary member used to resist lateraldeformation caused by loads actingperpendicularly to a bridge's longitudinalaxis. Wind forces are an example of thistype of loading. In horizontally curvedsteel bridges, like the one shown inFigure 1.4, lateral bracing enhancesthe ability of the superstructure toresist torsion (i.e., twisting about thelongitudinal axis of the bridge). Thistorsional rigidity emulates the perfor-mance of a box beam super-structure(see Section 3.1.1, Part 4). In additionto these inherit structural benefits,lateral bracing also simplifies the con-struction process by allowing girdersto be connected prior to erection andinstalled as a unit.
Terminology and Nomenclature
Highway Bridge Structures
Downloaded from Digital Engineering Library @ McGraw-Hill (www.digitalengineeringlibrary.com)Copyright © 2006 The McGraw-Hill Companies. All rights reserved.
Any use is subject to the Terms of Use as given at the website.
6 SECTION 1 THE STRUCTURE
■ Secondary Members. Secondary members are bracing between primarymembers designed to resist cross-sectional deformation of the superstruc-ture frame and help distribute part of the vertical load between stringers.They are also used for the stability of the structure during construction. InFigure 1.3 a detailed view of a bridge superstructure shows channel-typediaphragms used between rolled section stringers. The channels are bolted tosteel connection plates, which are in turn welded to the wide flange stringersshown. Other types of diaphragms are short depth, wide flange beams orcrossed steel angles. Secondary members, composed of crossed frames atthe top or bottom flange of a stringer, are used to resist lateral deformation.This type of secondary member is called lateral bracing (see Figure 1.4 andsidebar). See Section 3.1.4 for more information on the different types ofsecondary members.
2. Substructure. The substructure consists of all elements required tosupport the superstructure and overpass roadway. In Figure 1.2 this wouldbe Items 3 to 6. The basic substructure components consist of thefollowing:
■ Abutments. Abutments are earth-retaining structures which support thesuperstructure and overpass roadway at the beginning and end of a bridge.Like a retaining wall, the abutments resist the longitudinal forces of the earthunderneath the overpass roadway. In Figure 1.2 the abutments are cantilever-type retaining walls. Abutments come in many sizes and shapes, which will,like all elements described in this section, be discussed in detail later.
■ Piers. Piers are structures which support the superstructure at interme-diate points between the end supports (abutments). Since the structure
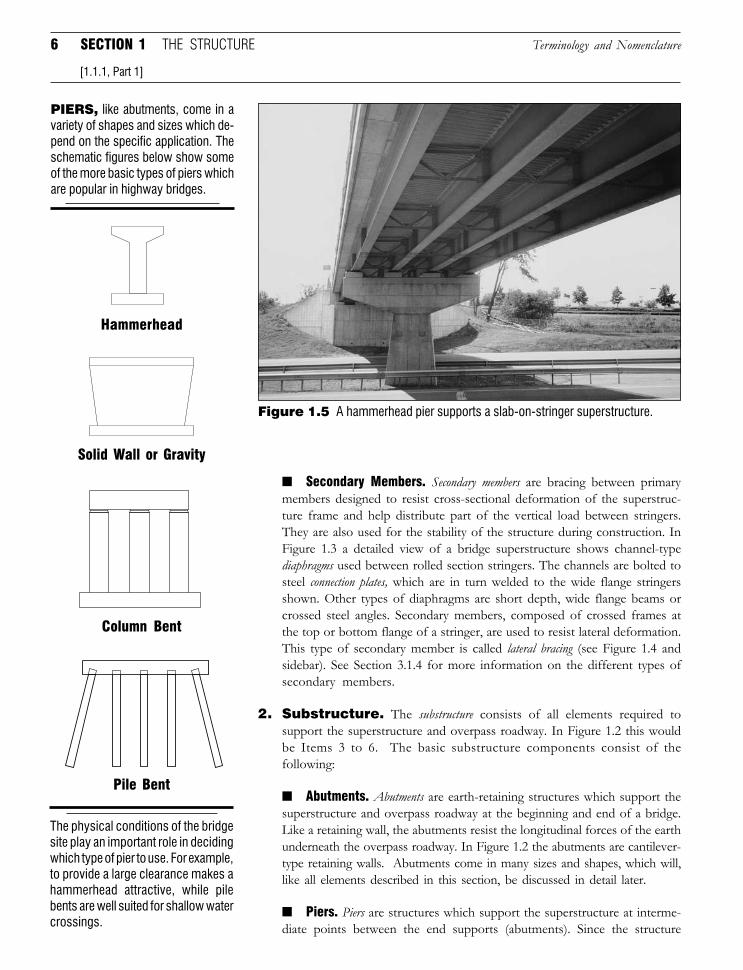
The physical conditions of the bridgesite play an important role in decidingwhich type of pier to use. For example,to provide a large clearance makes ahammerhead attractive, while pilebents are well suited for shallow watercrossings.
Pile Bent
Column Bent
Solid Wall or Gravity
Hammerhead
[1.1.1, Part 1]
Terminology and Nomenclature
Figure 1.5 A hammerhead pier supports a slab-on-stringer superstructure.
PIERS, like abutments, come in avariety of shapes and sizes which de-pend on the specific application. Theschematic figures below show someof the more basic types of piers whichare popular in highway bridges.
Highway Bridge Structures
Downloaded from Digital Engineering Library @ McGraw-Hill (www.digitalengineeringlibrary.com)Copyright © 2006 The McGraw-Hill Companies. All rights reserved.
Any use is subject to the Terms of Use as given at the website.
7
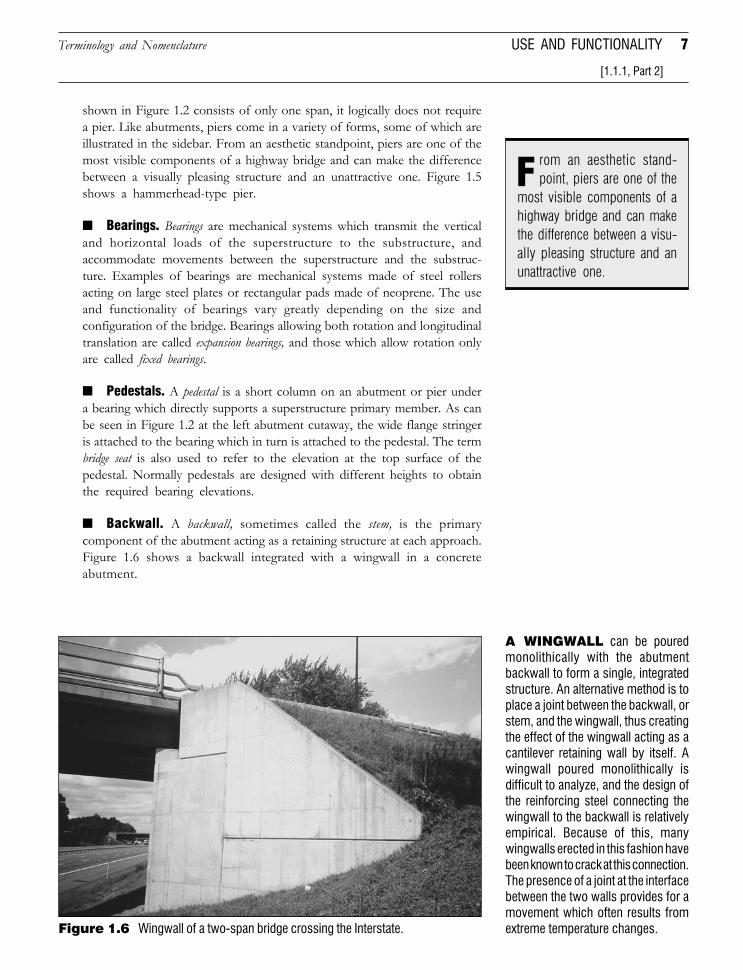
A WINGWALL can be pouredmonolithically with the abutmentbackwall to form a single, integratedstructure. An alternative method is toplace a joint between the backwall, orstem, and the wingwall, thus creatingthe effect of the wingwall acting as acantilever retaining wall by itself. Awingwall poured monolithically isdifficult to analyze, and the design ofthe reinforcing steel connecting thewingwall to the backwall is relativelyempirical. Because of this, manywingwalls erected in this fashion havebeen known to crack at this connection.The presence of a joint at the interfacebetween the two walls provides for amovement which often results fromextreme temperature changes.
shown in Figure 1.2 consists of only one span, it logically does not requirea pier. Like abutments, piers come in a variety of forms, some of which areillustrated in the sidebar. From an aesthetic standpoint, piers are one of themost visible components of a highway bridge and can make the differencebetween a visually pleasing structure and an unattractive one. Figure 1.5shows a hammerhead-type pier.
■ Bearings. Bearings are mechanical systems which transmit the verticaland horizontal loads of the superstructure to the substructure, andaccommodate movements between the superstructure and the substruc-ture. Examples of bearings are mechanical systems made of steel rollersacting on large steel plates or rectangular pads made of neoprene. The useand functionality of bearings vary greatly depending on the size andconfiguration of the bridge. Bearings allowing both rotation and longitudinaltranslation are called expansion bearings, and those which allow rotation onlyare called fixed bearings.
■ Pedestals. A pedestal is a short column on an abutment or pier undera bearing which directly supports a superstructure primary member. As canbe seen in Figure 1.2 at the left abutment cutaway, the wide flange stringeris attached to the bearing which in turn is attached to the pedestal. The termbridge seat is also used to refer to the elevation at the top surface of thepedestal. Normally pedestals are designed with different heights to obtainthe required bearing elevations.
■ Backwall. A backwall, sometimes called the stem, is the primarycomponent of the abutment acting as a retaining structure at each approach.Figure 1.6 shows a backwall integrated with a wingwall in a concreteabutment.
USE AND FUNCTIONALITY
[1.1.1, Part 2]
Terminology and Nomenclature
F rom an aesthetic stand-point, piers are one of the
most visible components of ahighway bridge and can makethe difference between a visu-ally pleasing structure and anunattractive one.
Figure 1.6 Wingwall of a two-span bridge crossing the Interstate.
Highway Bridge Structures
Downloaded from Digital Engineering Library @ McGraw-Hill (www.digitalengineeringlibrary.com)Copyright © 2006 The McGraw-Hill Companies. All rights reserved.
Any use is subject to the Terms of Use as given at the website.
8 SECTION 1 THE STRUCTURE
■ Wingwall. A wingwall is a side wall to the abutment backwall or stemdesigned to assist in confining earth behind the abutment. On many structures,wingwalls are designed quite conservatively, which leads to a rather largewall on many bridges [Figure 1.6].
■ Footing. As bearings transfer the superstructure loads to the substruc-ture, so in turn do the abutment and pier footings transfer loads from thesubstructure to the subsoil or piles. A footing supported by soil without pilesis called a spread footing. A footing supported by piles, like the one in Figure 1.2,is known as a pile cap.
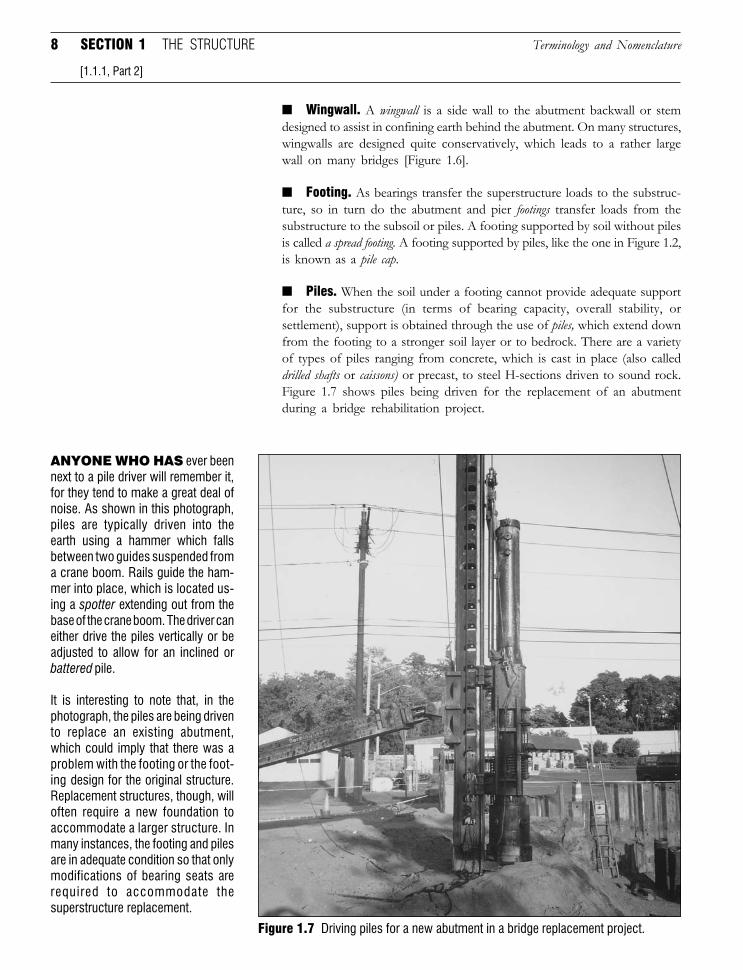
■ Piles. When the soil under a footing cannot provide adequate supportfor the substructure (in terms of bearing capacity, overall stability, orsettlement), support is obtained through the use of piles, which extend downfrom the footing to a stronger soil layer or to bedrock. There are a varietyof types of piles ranging from concrete, which is cast in place (also calleddrilled shafts or caissons) or precast, to steel H-sections driven to sound rock.Figure 1.7 shows piles being driven for the replacement of an abutmentduring a bridge rehabilitation project.
[1.1.1, Part 2]
ANYONE WHO HAS ever beennext to a pile driver will remember it,for they tend to make a great deal ofnoise. As shown in this photograph,piles are typically driven into theearth using a hammer which fallsbetween two guides suspended froma crane boom. Rails guide the ham-mer into place, which is located us-ing a spotter extending out from thebase of the crane boom. The driver caneither drive the piles vertically or beadjusted to allow for an inclined orbattered pile.
It is interesting to note that, in thephotograph, the piles are being drivento replace an existing abutment,which could imply that there was aproblem with the footing or the foot-ing design for the original structure.Replacement structures, though, willoften require a new foundation toaccommodate a larger structure. Inmany instances, the footing and pilesare in adequate condition so that onlymodifications of bearing seats arerequired to accommodate thesuperstructure replacement.
Figure 1.7 Driving piles for a new abutment in a bridge replacement project.
Terminology and Nomenclature
Highway Bridge Structures
Downloaded from Digital Engineering Library @ McGraw-Hill (www.digitalengineeringlibrary.com)Copyright © 2006 The McGraw-Hill Companies. All rights reserved.
Any use is subject to the Terms of Use as given at the website.
9USE AND FUNCTIONALITY
DID YOU KNOW
THAT the SydneyHarbor Bridge in
Australia, intended to be thelongest steel arch bridge of itstime with a span of 1650 ft(502.9 m), was completed in1932 only months after theKill Van Kull Bridge wasopened in the United Stateswith a span of 1652 ft and 1 in(503.5 m), a difference of only25 in (63.5 cm) [Ref. 1.2] ?
[1.1.1, Part 3]
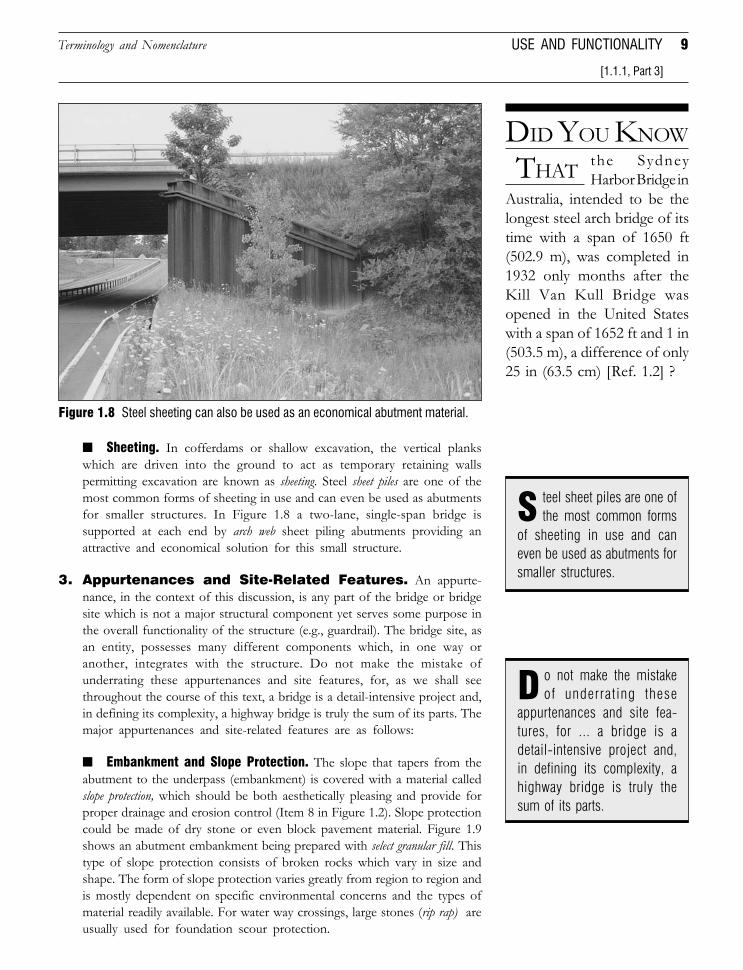
■ Sheeting. In cofferdams or shallow excavation, the vertical plankswhich are driven into the ground to act as temporary retaining wallspermitting excavation are known as sheeting. Steel sheet piles are one of themost common forms of sheeting in use and can even be used as abutmentsfor smaller structures. In Figure 1.8 a two-lane, single-span bridge issupported at each end by arch web sheet piling abutments providing anattractive and economical solution for this small structure.
3. Appurtenances and Site-Related Features. An appurte-nance, in the context of this discussion, is any part of the bridge or bridgesite which is not a major structural component yet serves some purpose inthe overall functionality of the structure (e.g., guardrail). The bridge site, asan entity, possesses many different components which, in one way oranother, integrates with the structure. Do not make the mistake ofunderrating these appurtenances and site features, for, as we shall seethroughout the course of this text, a bridge is a detail-intensive project and,in defining its complexity, a highway bridge is truly the sum of its parts. Themajor appurtenances and site-related features are as follows:
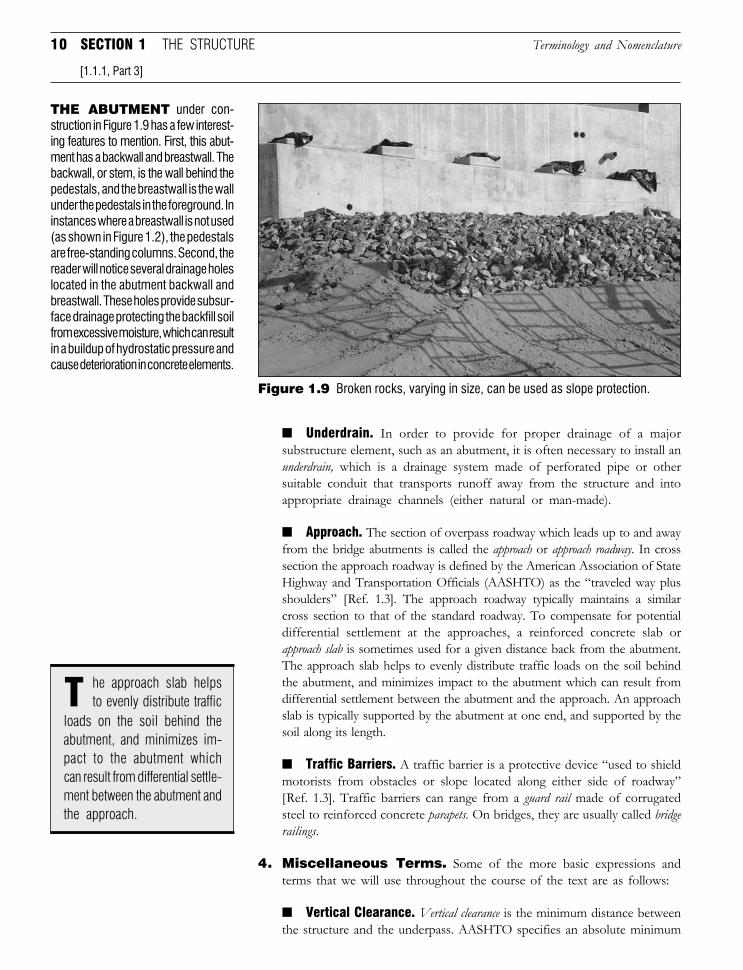
■ Embankment and Slope Protection. The slope that tapers from theabutment to the underpass (embankment) is covered with a material calledslope protection, which should be both aesthetically pleasing and provide forproper drainage and erosion control (Item 8 in Figure 1.2). Slope protectioncould be made of dry stone or even block pavement material. Figure 1.9shows an abutment embankment being prepared with select granular fill. Thistype of slope protection consists of broken rocks which vary in size andshape. The form of slope protection varies greatly from region to region andis mostly dependent on specific environmental concerns and the types ofmaterial readily available. For water way crossings, large stones (rip rap) areusually used for foundation scour protection.
Figure 1.8 Steel sheeting can also be used as an economical abutment material.
of sheeting in use and caneven be used as abutments forsmaller structures.
teel sheet piles are one ofthe most common formsS
o not make the mistakeof underrating these
appurtenances and site fea-tures, for ... a bridge is adetail-intensive project and,in defining its complexity, ahighway bridge is truly thesum of its parts.
D
Terminology and Nomenclature
Highway Bridge Structures
Downloaded from Digital Engineering Library @ McGraw-Hill (www.digitalengineeringlibrary.com)Copyright © 2006 The McGraw-Hill Companies. All rights reserved.
Any use is subject to the Terms of Use as given at the website.
10 SECTION 1 THE STRUCTURE
■ Underdrain. In order to provide for proper drainage of a majorsubstructure element, such as an abutment, it is often necessary to install anunderdrain, which is a drainage system made of perforated pipe or othersuitable conduit that transports runoff away from the structure and intoappropriate drainage channels (either natural or man-made).
■ Approach. The section of overpass roadway which leads up to and awayfrom the bridge abutments is called the approach or approach roadway. In crosssection the approach roadway is defined by the American Association of StateHighway and Transportation Officials (AASHTO) as the “traveled way plusshoulders” [Ref. 1.3]. The approach roadway typically maintains a similarcross section to that of the standard roadway. To compensate for potentialdifferential settlement at the approaches, a reinforced concrete slab orapproach slab is sometimes used for a given distance back from the abutment.The approach slab helps to evenly distribute traffic loads on the soil behindthe abutment, and minimizes impact to the abutment which can result fromdifferential settlement between the abutment and the approach. An approachslab is typically supported by the abutment at one end, and supported by thesoil along its length.
■ Traffic Barriers. A traffic barrier is a protective device “used to shieldmotorists from obstacles or slope located along either side of roadway”[Ref. 1.3]. Traffic barriers can range from a guard rail made of corrugatedsteel to reinforced concrete parapets. On bridges, they are usually called bridgerailings.
4. Miscellaneous Terms. Some of the more basic expressions andterms that we will use throughout the course of the text are as follows:
■ Vertical Clearance. Vertical clearance is the minimum distance betweenthe structure and the underpass. AASHTO specifies an absolute minimum
Figure 1.9 Broken rocks, varying in size, can be used as slope protection.
THE ABUTMENT under con-struction in Figure 1.9 has a few interest-ing features to mention. First, this abut-ment has a backwall and breastwall. Thebackwall, or stem, is the wall behind thepedestals, and the breastwall is the wallunder the pedestals in the foreground. Ininstances where a breastwall is not used(as shown in Figure 1.2), the pedestalsare free-standing columns. Second, thereader will notice several drainage holeslocated in the abutment backwall andbreastwall. These holes provide subsur-face drainage protecting the backfill soilfrom excessive moisture, which can resultin a buildup of hydrostatic pressure andcause deterioration in concrete elements.
[1.1.1, Part 3]
he approach slab helpsto evenly distribute trafficT
loads on the soil behind theabutment, and minimizes im-pact to the abutment whichcan result from differential settle-ment between the abutment andthe approach.
Terminology and Nomenclature
Highway Bridge Structures
Downloaded from Digital Engineering Library @ McGraw-Hill (www.digitalengineeringlibrary.com)Copyright © 2006 The McGraw-Hill Companies. All rights reserved.
Any use is subject to the Terms of Use as given at the website.
11
of 14 ft (4.27 m) and a design clearance of 16 ft (4.88 m). The location ofthe structure (i.e., urbanized area vs. expressway) has a great deal to do withhow this is enforced by the governing agency.
■ Load Rating. An analysis of a structure to compute the maximumallowable loads that can be carried across a bridge is called a load rating. Theguidelines for load ratings are set forth in AASHTO’s Manual for ConditionEvaluation of Bridges. [Ref. 1.4] Two ratings are usually prepared: theinventory rating corresponds to the customary design level of capacity,while operating rating describes the maximum permissible live load to whichthe structure may be subjected. Therefore, operating rating always yields ahigher load rating than inventory rating.
■ Dead Loads. Permanent loads placed on a structure before theconcrete slab hardens are called dead loads. For example, in a slab-on-stringerbridge the stringers, diaphragms, connection plates, and concrete slab itself(including stay-in-place forms) would be considered as dead loads.
■ Superimposed Dead Loads. Superimposed dead loads are permanentloads placed on the structure after the concrete has hardened (e.g., bridgerailing, sidewalks, wearing surface, etc.). Superimposed dead loads aregenerally considered part of total dead loads.
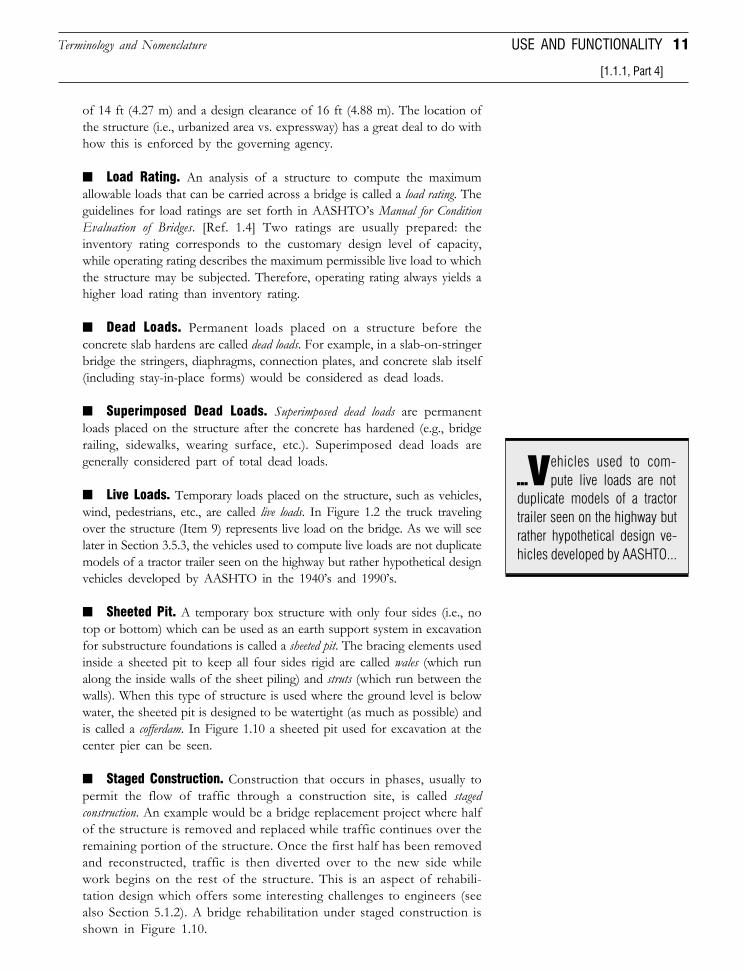
■ Live Loads. Temporary loads placed on the structure, such as vehicles,wind, pedestrians, etc., are called live loads. In Figure 1.2 the truck travelingover the structure (Item 9) represents live load on the bridge. As we will seelater in Section 3.5.3, the vehicles used to compute live loads are not duplicatemodels of a tractor trailer seen on the highway but rather hypothetical designvehicles developed by AASHTO in the 1940’s and 1990’s.
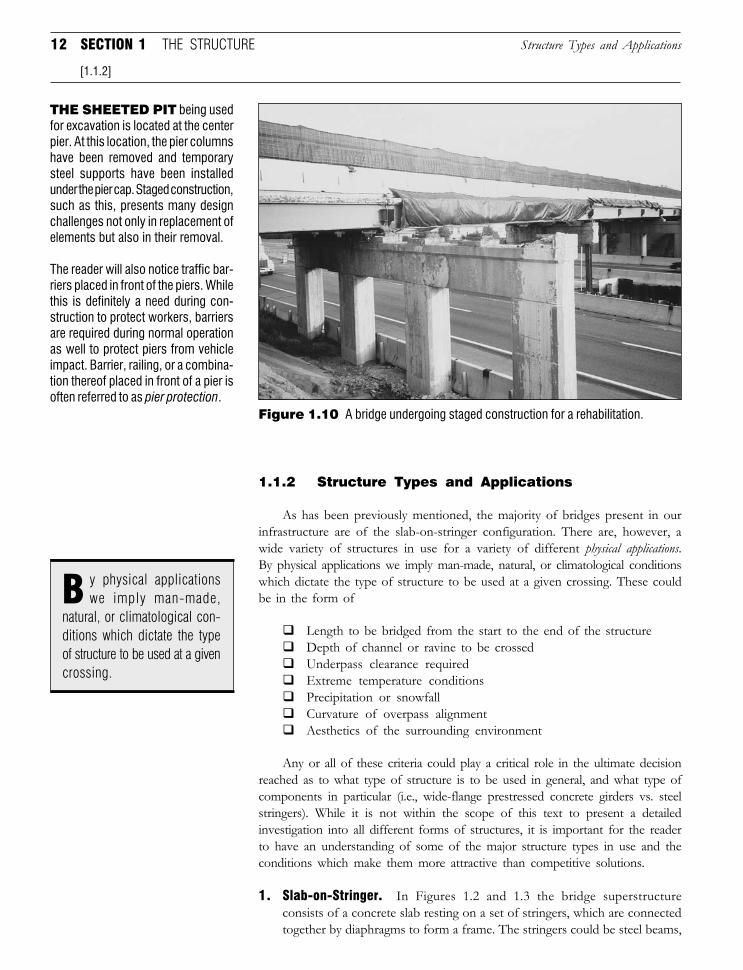
■ Sheeted Pit. A temporary box structure with only four sides (i.e., notop or bottom) which can be used as an earth support system in excavationfor substructure foundations is called a sheeted pit. The bracing elements usedinside a sheeted pit to keep all four sides rigid are called wales (which runalong the inside walls of the sheet piling) and struts (which run between thewalls). When this type of structure is used where the ground level is belowwater, the sheeted pit is designed to be watertight (as much as possible) andis called a cofferdam. In Figure 1.10 a sheeted pit used for excavation at thecenter pier can be seen.
■ Staged Construction. Construction that occurs in phases, usually topermit the flow of traffic through a construction site, is called stagedconstruction. An example would be a bridge replacement project where halfof the structure is removed and replaced while traffic continues over theremaining portion of the structure. Once the first half has been removedand reconstructed, traffic is then diverted over to the new side whilework begins on the rest of the structure. This is an aspect of rehabili-tation design which offers some interesting challenges to engineers (seealso Section 5.1.2). A bridge rehabilitation under staged construction isshown in Figure 1.10.
USE AND FUNCTIONALITY
[1.1.1, Part 4]
ehicles used to com-pute live loads are not
duplicate models of a tractortrailer seen on the highway butrather hypothetical design ve-hicles developed by AASHTO...
...v
Terminology and Nomenclature
Highway Bridge Structures
Downloaded from Digital Engineering Library @ McGraw-Hill (www.digitalengineeringlibrary.com)Copyright © 2006 The McGraw-Hill Companies. All rights reserved.
Any use is subject to the Terms of Use as given at the website.
12 SECTION 1 THE STRUCTURE
1.1.2 Structure Types and Applications
As has been previously mentioned, the majority of bridges present in ourinfrastructure are of the slab-on-stringer configuration. There are, however, awide variety of structures in use for a variety of different physical applications.By physical applications we imply man-made, natural, or climatological conditionswhich dictate the type of structure to be used at a given crossing. These couldbe in the form of
Length to be bridged from the start to the end of the structureDepth of channel or ravine to be crossedUnderpass clearance requiredExtreme temperature conditionsPrecipitation or snowfallCurvature of overpass alignmentAesthetics of the surrounding environment
Any or all of these criteria could play a critical role in the ultimate decisionreached as to what type of structure is to be used in general, and what type ofcomponents in particular (i.e., wide-flange prestressed concrete girders vs. steelstringers). While it is not within the scope of this text to present a detailedinvestigation into all different forms of structures, it is important for the readerto have an understanding of some of the major structure types in use and theconditions which make them more attractive than competitive solutions.
1. Slab-on-Stringer. In Figures 1.2 and 1.3 the bridge superstructureconsists of a concrete slab resting on a set of stringers, which are connectedtogether by diaphragms to form a frame. The stringers could be steel beams,
[1.1.2]
natural, or climatological con-ditions which dictate the typeof structure to be used at a givencrossing.
y physical applicationswe imply man-made,B
THE SHEETED PIT being usedfor excavation is located at the centerpier. At this location, the pier columnshave been removed and temporarysteel supports have been installedunder the pier cap. Staged construction,such as this, presents many designchallenges not only in replacement ofelements but also in their removal.
The reader will also notice traffic bar-riers placed in front of the piers. Whilethis is definitely a need during con-struction to protect workers, barriersare required during normal operationas well to protect piers from vehicleimpact. Barrier, railing, or a combina-tion thereof placed in front of a pier isoften referred to as pier protection.
Figure 1.10 A bridge undergoing staged construction for a rehabilitation.
Structure Types and Applications
Highway Bridge Structures
Downloaded from Digital Engineering Library @ McGraw-Hill (www.digitalengineeringlibrary.com)Copyright © 2006 The McGraw-Hill Companies. All rights reserved.
Any use is subject to the Terms of Use as given at the website.
13
precast-prestressed concrete girders, or of other suitable materials. Trafficpasses over the top of the slab, which can be covered with a wearing surface,although sometimes the slab itself is made thicker to create an integratedwearing surface (i.e., using a portion of the slab rather than a separate layer toresist the wear of traffic). The principal advantages of this system are:
Simplicity of design. It should be understood that simplicity is a relativeterm. From an engineering perspective, slab-on-stringer structures don’tbreak much new ground theoretically, but the complexity they offer froma total project perspective presents a challenge for any designer (seesidebar with Figure 1.2). Indeed, because of all the aspects involved in anyhighway bridge project, the need of providing a straightforward design isessential toward ensuring that costs be kept at a reasonable level for theengineering services portion of a bridge contract.
The slab-on-stringer bridge lends itself well to a uniform design whichcan be standardized easily. This is an advantage because standardiza-tion and uniformity are critical for maintaining bridges in largetransportation networks. Standardization minimizes the need forcreating a plethora of codes and specifications for designers to follow,especially when many owners of bridges rely on private consultants toassist in the design of new bridges and rehabilitation of existingbridges. Uniformity means that consistent, and therefore economical,methods can be employed in repairing deteriorated structures. Imag-ine if a highway network had hundreds of unique designs with custom-ized components for each structure!
Construction is relatively straightforward and makes use of readilyavailable materials. Prefabricated primary members like steel wide-flange stringers or prestressed concrete beams allow for quick erectionand a clean appearance while at the same time provide for an economyof materials that is a benefit to the contractor as well as the owner.
Slab-on-stringer structures, however, are primarily for short spanlengths and average clearance requirements (we will quantify short andaverage a little bit later). When span lengths become excessive and thegeometry and physical constraints of a site become excessive, otherforms of structures must be investigated.
2. One-Way Slab. For a very short span [less than 30 ft (9 m)] a one-wayconcrete slab supported on either end by small abutments is an economicalstructure. Such a short span structure often gains the tag of puddle crosserbecause of the diminutive size of the structure. For short to median spans,[30 to 80 ft (9 to 24 m)] prestressing steel is typically used. Circular voidsin the slab are sometimes used to reduce the dead load.
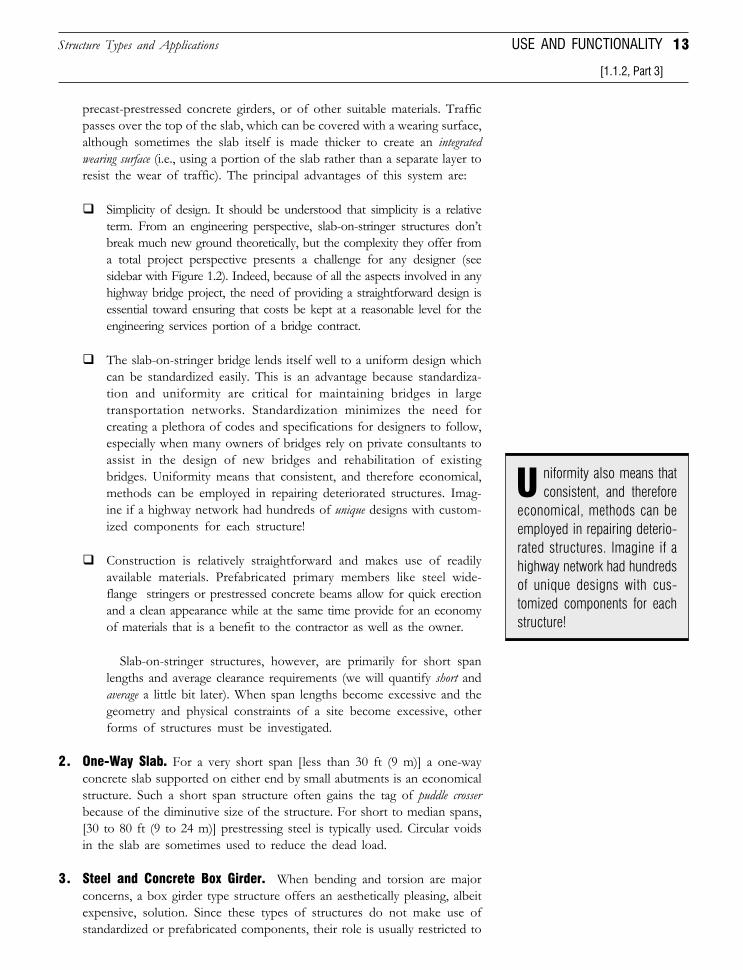
3. Steel and Concrete Box Girder. When bending and torsion are majorconcerns, a box girder type structure offers an aesthetically pleasing, albeitexpensive, solution. Since these types of structures do not make use ofstandardized or prefabricated components, their role is usually restricted to
USE AND FUNCTIONALITY
[1.1.2, Part 3]
niformity also means thatconsistent, and therefore
economical, methods can beemployed in repairing deterio-rated structures. Imagine if ahighway network had hundredsof unique designs with cus-tomized components for eachstructure!
U
Structure Types and Applications
Highway Bridge Structures
Downloaded from Digital Engineering Library @ McGraw-Hill (www.digitalengineeringlibrary.com)Copyright © 2006 The McGraw-Hill Companies. All rights reserved.
Any use is subject to the Terms of Use as given at the website.
14 SECTION 1 THE STRUCTURE
Figure 1.11 KCRC West Rail Viaducts, Hong Kong.
major highway bridges that can take advantage of their ability to meetrelatively long span requirements. Figure 1.11 shows the KCRC West RailViaducts in Hong Kong.
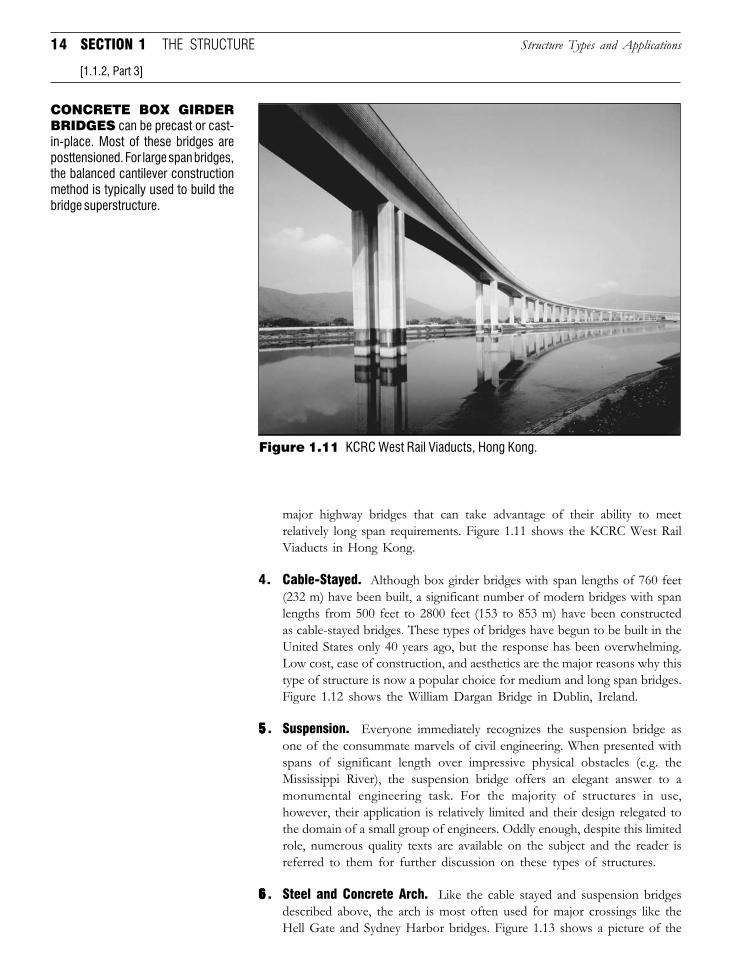
4. Cable-Stayed. Although box girder bridges with span lengths of 760 feet(232 m) have been built, a significant number of modern bridges with spanlengths from 500 feet to 2800 feet (153 to 853 m) have been constructedas cable-stayed bridges. These types of bridges have begun to be built in theUnited States only 40 years ago, but the response has been overwhelming.Low cost, ease of construction, and aesthetics are the major reasons why thistype of structure is now a popular choice for medium and long span bridges.Figure 1.12 shows the William Dargan Bridge in Dublin, Ireland.
55555 . Suspension. Everyone immediately recognizes the suspension bridge asone of the consummate marvels of civil engineering. When presented withspans of significant length over impressive physical obstacles (e.g. theMississippi River), the suspension bridge offers an elegant answer to amonumental engineering task. For the majority of structures in use,however, their application is relatively limited and their design relegated tothe domain of a small group of engineers. Oddly enough, despite this limitedrole, numerous quality texts are available on the subject and the reader isreferred to them for further discussion on these types of structures.
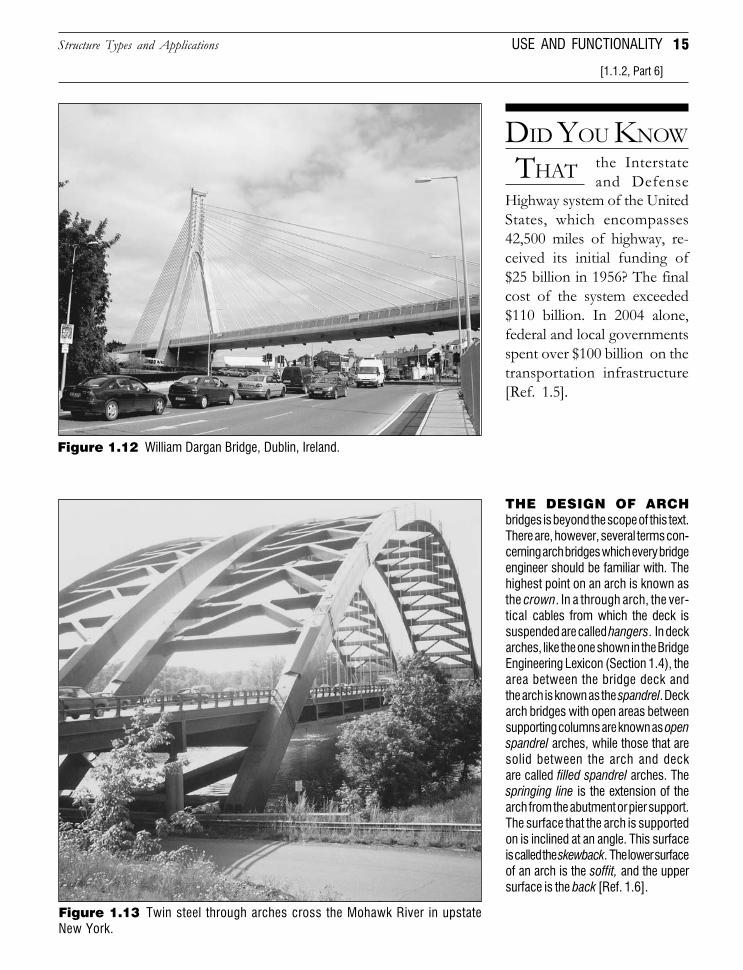
66666 . Steel and Concrete Arch. Like the cable stayed and suspension bridgesdescribed above, the arch is most often used for major crossings like theHell Gate and Sydney Harbor bridges. Figure 1.13 shows a picture of the
[1.1.2, Part 3]
CONCRETE BOX GIRDERBRIDGES can be precast or cast-in-place. Most of these bridges areposttensioned. For large span bridges,the balanced cantilever constructionmethod is typically used to build thebridge superstructure.
Structure Types and Applications
Highway Bridge Structures
Downloaded from Digital Engineering Library @ McGraw-Hill (www.digitalengineeringlibrary.com)Copyright © 2006 The McGraw-Hill Companies. All rights reserved.
Any use is subject to the Terms of Use as given at the website.
15
[1.1.2, Part 6]
Figure 1.12 William Dargan Bridge, Dublin, Ireland.
DID YOU KNOW
THATHighway system of the UnitedStates, which encompasses42,500 miles of highway, re-ceived its initial funding of$25 billion in 1956? The finalcost of the system exceeded$110 billion. In 2004 alone,federal and local governmentsspent over $100 billion on thetransportation infrastructure[Ref. 1.5].
the Interstateand Defense
THE DESIGN OF ARCHbridges is beyond the scope of this text.There are, however, several terms con-cerning arch bridges which every bridgeengineer should be familiar with. Thehighest point on an arch is known asthe crown. In a through arch, the ver-tical cables from which the deck issuspended are called hangers. In deckarches, like the one shown in the BridgeEngineering Lexicon (Section 1.4), thearea between the bridge deck andthe arch is known as the spandrel. Deckarch bridges with open areas betweensupporting columns are known as openspandrel arches, while those that aresolid between the arch and deckare called filled spandrel arches. Thespringing line is the extension of thearch from the abutment or pier support.The surface that the arch is supportedon is inclined at an angle. This surfaceis called the skewback. The lower surfaceof an arch is the soffit, and the uppersurface is the back [Ref. 1.6].
Figure 1.13 Twin steel through arches cross the Mohawk River in upstateNew York.
Structure Types and Applications USE AND FUNCTIONALITY
Highway Bridge Structures
Downloaded from Digital Engineering Library @ McGraw-Hill (www.digitalengineeringlibrary.com)Copyright © 2006 The McGraw-Hill Companies. All rights reserved.
Any use is subject to the Terms of Use as given at the website.
16 SECTION 1 THE STRUCTURE
twin Thaddeus Kosciuzko bridges crossing the Mohawk River in upstateNew York. In this particular site, the steel arches provide for an attractive-looking structure while also eliminating the need for a pier in the river. Whenthe deck, as is the case with the structures in Figure 1.13, is suspended fromthe steel arch, the structure is called a through arch. When the deck issupported on top of the arch, this is called a deck arch. An arch bridgegenerates large reaction forces at its end supports. The horizontal compo-nent of these reaction forces is either resisted by abutment foundations, orin the case of a tied arch, resisted by a tie between arch supports. Otherelements of an arch bridge are described in the sidebar accompanyingFigure 1.13.
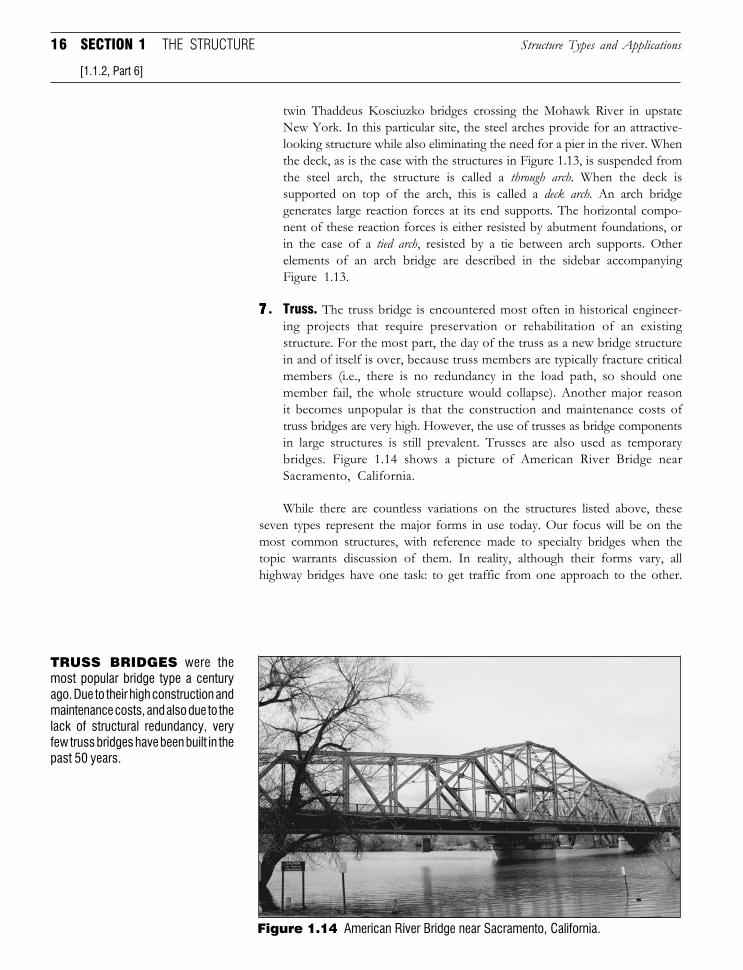
77777 . Truss. The truss bridge is encountered most often in historical engineer-ing projects that require preservation or rehabilitation of an existingstructure. For the most part, the day of the truss as a new bridge structurein and of itself is over, because truss members are typically fracture criticalmembers (i.e., there is no redundancy in the load path, so should onemember fail, the whole structure would collapse). Another major reasonit becomes unpopular is that the construction and maintenance costs oftruss bridges are very high. However, the use of trusses as bridge componentsin large structures is still prevalent. Trusses are also used as temporarybridges. Figure 1.14 shows a picture of American River Bridge nearSacramento, California.
While there are countless variations on the structures listed above, theseseven types represent the major forms in use today. Our focus will be on themost common structures, with reference made to specialty bridges when thetopic warrants discussion of them. In reality, although their forms vary, allhighway bridges have one task: to get traffic from one approach to the other.
[1.1.2, Part 6]
Structure Types and Applications
Figure 1.14 American River Bridge near Sacramento, California.
TRUSS BRIDGES were themost popular bridge type a centuryago. Due to their high construction andmaintenance costs, and also due to thelack of structural redundancy, veryfew truss bridges have been built in thepast 50 years.
Highway Bridge Structures
Downloaded from Digital Engineering Library @ McGraw-Hill (www.digitalengineeringlibrary.com)Copyright © 2006 The McGraw-Hill Companies. All rights reserved.
Any use is subject to the Terms of Use as given at the website.
17
1.2 ORIGINS OF THE MODERN HIGHWAY BRIDGE
Today’s highway bridge is an offspring of the rapid development of themodern transportation network. In the United States, this development tookthe form of what is known as the U.S. Interstate system, a highway systemcomposed of over 46,500 miles (74,800 km) of roadway. The history of theInterstate system is germane to our discussion of bridge design because itsdevelopment parallels the growth of bridge engineering in the second half ofthe twentieth century. The evolution from the design of new structures inalmost assembly-line like fashion, to the detailed design of a bridge rehabilita-tion, did not occur overnight. Indeed, the creation of modern standards andspecifications in place today, central to the design sections of this book, are anoutgrowth of the efforts of an entire generation of civil engineers who grew upprofessionally during the formative years of what was, and still is, the largestpublic works project in the U.S. history.
The Interstate system was funded as a response to the growing U.S.economy after World War II. Although the plan to build some major form ofhighway system that would link the major U.S. metropolitan areas existedbefore World War II, the impetus for the plan did not gain strength until 1956.One of the principal impacts of the Interstate system on highway bridges is inits servicing of long-distance trucking. It is this function that would serve asone of the overriding design constraints in all highway bridge structures. At avariety of levels, the construction of the Interstate highway system affected theway we build bridges today. Whether it is the width of the structure set to allowmultilane travel over a bridge or its clearance, defined to accommodate thepassage of large military vehicles under it, the Interstate was the primaryinfluence on the functionality of the modern highway bridge.
Before the Interstate took hold, most small bridge structures weredesigned to handle low-level vehicular traffic. The advent of the Interstategreatly impacted the need for structures to carry heavier and heavier loads. Itwas also the construction of the Interstate on a national level that led to theadoption of uniform design standards across the states, bringing about themany advantages of standardization enumerated in our discussion of the slab-on-stringer structure [Sec. 1.1.2]. In short, the development of the Interstatesystem has had the following effects on highway bridges:
Through federal funding, the Interstate system financed the construc-tion of a large number of the highway bridges in use today.
The Interstate system spurred the research and development ofhighway bridge design and construction which has led directly tomany of today’s common design and construction practices.
Because of the national concept of the Interstate system, a refinedand common design standard was developed. The detailed designstandard, which was once a reality for a few major states like NewYork, California, and Ohio, now became accessible throughout theUnited States (and even to other countries throughout the world) thatcould not afford to finance the high level of research and effortrequired to produce such specifications.
ORIGINS OF THE MODERN HIGHWAY BRIDGE
[1.2]
Ications in place today ... are anoutgrowth of the efforts of anentire generation of civil engi-neers that grew up profession-ally during the formative yearsof what was, and still is, thelargest public works project inthe U.S. history.
ndeed, the creation of mod-ern standards and specifi-
Highway Bridge Structures
Downloaded from Digital Engineering Library @ McGraw-Hill (www.digitalengineeringlibrary.com)Copyright © 2006 The McGraw-Hill Companies. All rights reserved.
Any use is subject to the Terms of Use as given at the website.
18 SECTION 1 THE STRUCTURE
All of these factors have coalesced to form the science of bridgeengineering as we know it today and make it unique from any other type ofstructural design. If we make an analogy to building design, it can berecognized that the design of highway bridge structures could never befacilitated in the same fashion as one would engineer a building. Althoughbuildings and their associated sites incorporate many, if not all, of the sameconcepts and design principles as bridges, they are often unique with specificsolutions designed on a site-by-site basis with code and specifications varyingdramatically from municipality to municipality. Imagine a highway networkpopulated with bridges in this same fashion with its thousands upon thousandsof structures. The Interstate system, as a result of its magnitude, forced the issue,if you will, by making the various state and local agencies adopt a uniformapproach to the engineering of highway bridges. While some may argue thatthis has depleted bridge design of its flare and creativity, the reality is thatconstruction of such a large number of structures in so short a time framecould never have been undertaken any other way.
Many engineers, both new and experienced, view the heyday of theInterstate in the late 1950’s and 1960’s as the golden age for civil engineering.It is difficult, in today’s litigious environment, for civil engineers to fullyappreciate the velocity with which Interstate development took place and,with this growth, the number of bridges constructed in so few years. In truth,many of today’s rigorous rules were born out of the problems associatedwith moving so quickly in the early days. The alacrity with which new standardswere created, as engineers began to more fully understand the impact whichthe new level of traffic would have on their designs, was so great that planswould literally have to be changed from the time design was completed tothe time the project was let for construction. For the bridge designer, it isalmost amusing to note that it only took 10 or 11 plan sheets to build a newstructure in the 1950’s and today it takes almost 40 just to repair it! The earlyyears of Interstate development, however, also represented a time whenthere was considerable public approval for the building of roads and bridges,which facilitated the speed with which projects came off the boards and intothe field. The environmental movement in the mid 1960’s followed by publicapathy (if not downright disapproval) toward new highway projects effec-tively ended this heyday and ushered in the era of maintaining what ourpredecessors have built.
Yet make no doubt about it, rehabilitation is neither trivial nor mundane.An engineer at the Kansas Department of Transportation was quoted as sayingabout rehabilitation work that “It’s a lot more fun to build something new thanit is to try to refurbish something that is already there.” Where there is certainlynothing exciting about performing surface concrete patching on deterioratedpier columns, the scope and magnitude of a rehabilitation design can oftenexceed that of the design of a new structure. Bill Cosby once noted in amonologue that having only one child does not constitute being a parentbecause “too many things are left out” [Ref. 1.7]. In a similar fashion, we cansay the same thing about the modern bridge designer because, like having onlyone child to blame when a vase is broken, not having to worry about stagedconstruction, maintaining traffic through a project site, dealing with lead paintand other hazardous materials put in the initial design, etc., just leaves toomany things out of the experience of being involved in bridge design today.
[1.2]
t is difficult, in today’slitigious environment, for
civil engineers to fully appre-ciate the velocity with whichInterstate development tookplace and, with this growth,the number of bridges con-structed in so few years.
I
ill Cosby once noted in amonologue that having
only one child does not consti-tute being a parent because “toomany things are left out.” In asimilar fashion, we can say thesame thing about the modernbridge designer ...
B
Highway Bridge Structures
Downloaded from Digital Engineering Library @ McGraw-Hill (www.digitalengineeringlibrary.com)Copyright © 2006 The McGraw-Hill Companies. All rights reserved.
Any use is subject to the Terms of Use as given at the website.
19
In reality, today’s bridge designers should be envious of their predecessorsfor the relative ease with which they could throw a bridge up. Modern designrequires a higher level of details than the engineers of the 1950’s and 1960’swould have ever imagined. Many states require that details, like the design oftemporary earth support systems and reinforcing steel bar schedules, whichwere once left to the contractor at the site, be rigorously detailed by the designengineer. Indeed, the number of managers and agency personnel involved inany one bridge design project today most likely exceeds the number of peopleit took to make high-level decisions on where to locate whole sections of theInterstate.
As with the Germans, who owe a great deal to the building of theAutobahn, we owe much in the United States to the development of theInterstate system, for it was major public works projects like these that createda workable and efficient method of erecting bridges in a manner that was bothconsistent and manageable. It is also important to always keep in mind that thehighway bridge and its many components is but itself one piece in an entiretransportation network. The importance of the role the bridge plays in thisnetwork was never so vividly demonstrated than when the bridge carrying theNew York State Thruway over the Schoharie Creek collapsed in the rushingwaters of a near record flood. The earth beneath the piers washed away(scoured), the footings became undermined, careening out of place, and, in aninstant, this tragic failure effectively cut the state’s transportation trunk in halfand in the process cost 10 people their lives.
1.3 BRIDGE DESIGNERS AND THEIR PROJECTS
In his excellent treatise Bridges and their Builders, D. B. Steinman closes histext with a section called “The Bridge Builder in Contemporary Civilization.”In this final chapter, he defines the role of the modern bridge engineer (circa1957) as a metallurgist, mathematician, foundation expert, steel erector, artist,and leader of mankind [Ref. 1.2]. While leader of mankind may be stretching thepoint a bit, the breadth of scientific and engineering knowledge involved inbridge design is formidable, yet as we shall see, quite definable.
Through the efforts of bridge engineers involved in projects such as thosedescribed in Sec. 1.2, the past 40 years have yielded a set of design standardsthat allows today’s engineer the luxury of not having to reinvent the wheel for eachproject. However, do well-defined standards and sets of details stifle creativity?Perhaps on a more fundamental level, the proper question is: Who are today’sbridge designers anyway? In the United States, highway bridge design istypically undertaken by two principal groups:
Municipal Agencies. These could be local agencies, but for the mostpart they are design groups for a state or county transportation agencyor autonomous agency in charge of a specific branch of highway.
Private Consultants. The majority of private civil engineering consult-ing firms that engage in bridge design are medium (15 to 100 person)to large (100 plus persons) size firms specializing in highway designwork in general and highway bridge design in particular.
[1.3]
BRIDGE DESIGNERS AND THEIR PROJECTS
Towners might betterloosen some of theartificial bonds theyimpose on theirdesigners ... and seek torestore what was oncea design team, or once,even a design andconstruction team.
houghtful
THOMAS R. KUESEL[Ref. 1.8]
Highway Bridge Structures
Downloaded from Digital Engineering Library @ McGraw-Hill (www.digitalengineeringlibrary.com)Copyright © 2006 The McGraw-Hill Companies. All rights reserved.
Any use is subject to the Terms of Use as given at the website.
20 SECTION 1 THE STRUCTURE
In the United States a highway bridge project is usually slated forconstruction by the owner (the agency), after which design is either under-taken by an outside consulting firm or the in-house design department of theowner. Once the appropriate reviews are completed, the project is then listedin an advertisement in response to which several contractors will bid on thejob. The contract is then awarded to the lowest bidder, although this is notalways the case.
An intriguing alternative to this process is under the term design-build(sometimes called value engineering) under which approach, a consultant or theowner prepares a preliminary plan of the bridge to be constructed which
[1.3]
includes only basic information suchas physical location, basic dimensions,design loading and specifications,alignments, clearances, etc. Based onthese preliminary plans and specifica-tions, contractors then propose theirown design and construction costs. Thedesign is either completed by an in-houseengineering department of the con-tractor or a hired consultant. Once thedesign and price proposals are submit-ted to the owner, a group of indepen-dent or check engineers review the plansand the costs, and along with the owner,decide which design and its contractorwill construct the project. The decisionis not based on cost alone but on theoverall solution and its impact on every-thing from aesthetics to environmentalconcerns (so called technical evaluation).Design-build proponents believe thattheir approach creates a competitiveatmosphere that stimulates the variousparties to provide better solutions forthe client, which leads to innovativeand more economical designs for theowner [Ref. 1.8]. Since there is only a singleparty responsible for design and con-struction, the cost and schedule shouldbe improved. Any problem, either fromdesign or construction, can be resolvedeasily. From the owner’s perspective,he or she only needs to deal with oneparty who takes responsibility of engi-neering, cost, schedule, and quality.
There are several problems whichengineers in the United States havewith this approach. First and foremostis the belief that competitive biddingfor engineering services is considered
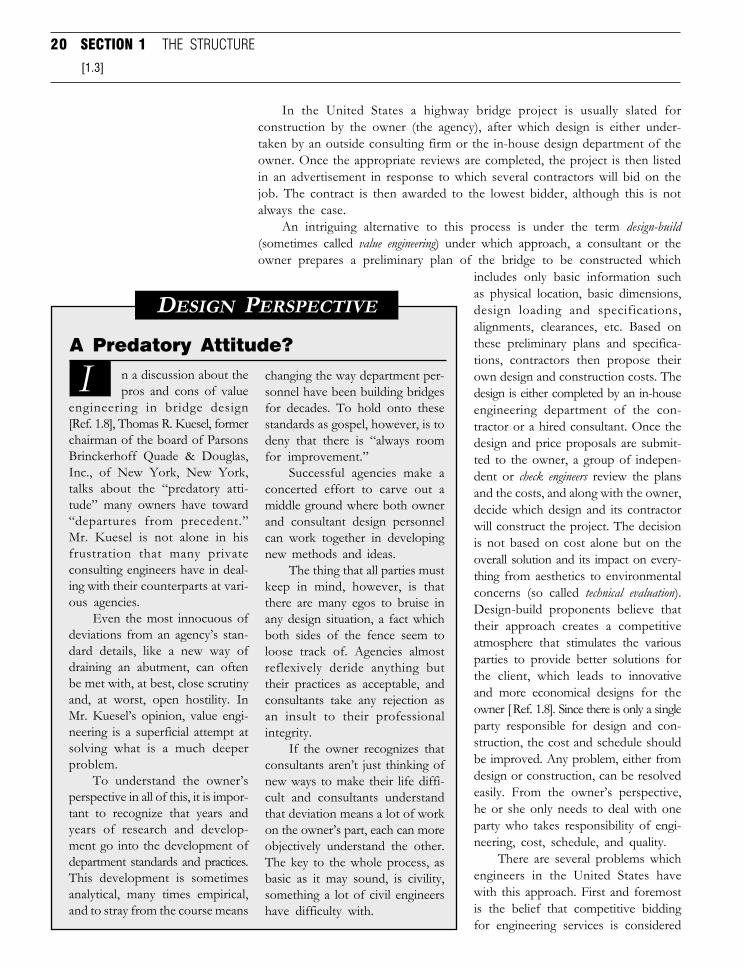
A Predatory Attitude?
DESIGN PERSPECTIVE
Iengineering in bridge design[Ref. 1.8], Thomas R. Kuesel, formerchairman of the board of ParsonsBrinckerhoff Quade & Douglas,Inc., of New York, New York,talks about the “predatory atti-tude” many owners have toward“departures from precedent.”Mr. Kuesel is not alone in hisfrustration that many privateconsulting engineers have in deal-ing with their counterparts at vari-ous agencies.
Even the most innocuous ofdeviations from an agency’s stan-dard details, like a new way ofdraining an abutment, can oftenbe met with, at best, close scrutinyand, at worst, open hostility. InMr. Kuesel’s opinion, value engi-neering is a superficial attempt atsolving what is a much deeperproblem.
To understand the owner’sperspective in all of this, it is impor-tant to recognize that years andyears of research and develop-ment go into the development ofdepartment standards and practices.This development is sometimesanalytical, many times empirical,and to stray from the course means
n a discussion about thepros and cons of value
changing the way department per-sonnel have been building bridgesfor decades. To hold onto thesestandards as gospel, however, is todeny that there is “always roomfor improvement.”
Successful agencies make aconcerted effort to carve out amiddle ground where both ownerand consultant design personnelcan work together in developingnew methods and ideas.
The thing that all parties mustkeep in mind, however, is thatthere are many egos to bruise inany design situation, a fact whichboth sides of the fence seem toloose track of. Agencies almostreflexively deride anything buttheir practices as acceptable, andconsultants take any rejection asan insult to their professionalintegrity.
If the owner recognizes thatconsultants aren’t just thinking ofnew ways to make their life diffi-cult and consultants understandthat deviation means a lot of workon the owner’s part, each can moreobjectively understand the other.The key to the whole process, asbasic as it may sound, is civility,something a lot of civil engineershave difficulty with.
Highway Bridge Structures
Downloaded from Digital Engineering Library @ McGraw-Hill (www.digitalengineeringlibrary.com)Copyright © 2006 The McGraw-Hill Companies. All rights reserved.
Any use is subject to the Terms of Use as given at the website.
21
to be unethical. The thinking behind this belief is that, in trying to save costs toimpress a panel on the design of a project, the engineer will be tempted tosacrifice safety of the structure in order to minimize construction expense.The other major problem U.S. engineers have is with the notion that thecontract will not be based solely on price. Municipal agencies, who mustultimately report to the public, would have to make an extraordinary case forchoosing a more expensive design just because it looks better or fulfills someabstract criterion of the panel. Under the design-build approach, contracts areawarded on a lump sum basis, which means that the owner and contractormust have an extraordinarily good working relationship for this type ofarrangement to be successful. In many cases, an outside consulting firm ishired by the owner to supervise and to approve the contractor’s design, and tooversee the construction for the owner.
The opponents argue that with respect to the contractors, having tosubmit design proposals (in most cases, 30% to 50% complete drawings) is acostly venture, especially when they may not be awarded the project. In someinstances there are monies available to compensate all bidders for their designproposals, but if this is not the case, the costs that contractors incur preparingthese proposals will just be passed along to the consumer on subsequentprojects. In this instance the consumer is the owner and the public they serve.That also indicates that the future maintenance of any constructed project thatis part of an overall infrastructure, be it a bridge or highway, cannot be soeasily dismissed as to say that an independent design under the design-buildapproach will “meet the maintenance needs of the owner.” To do so meansfollowing, to a certain degree, a set of standard details and specifications that inand of itself puts a constriction on creativity.
As with any argument, the answer most likely lies somewhere in themiddle. Design-build does spur the participants on to more creative designs. Itreduces the cost and overall project time. However, competitive engineeringpresents many dangers which cannot be ignored. Also, owners need to domore in the way of working with consultants and contractors within theirpresent system to foster innovation in design, something they have not donewell in the past (see Design Perspective, on facing page). If all parties involvedrecognize that the three fundamental goals of any highway bridge project arelow costs, quality and safety, and longevity of the structure, then much hasalready been accomplished in securing the completion of a successful project,regardless of the way in which it is undertaken.
At present, only a few states in the U.S. have adopted the design-buildapproach as an alternative contract method for large or high profile projects.So far, their results seem to be positive, and as a result, more and more statesare considering joining this group to have the design-build as an alternativecontract method to save project costs, speed up the projects, or choose thebest design for high profile projects.
1.4 THE BRIDGE ENGINEERING LEXICON
So far, we have examined the major components of a highway bridgestructure and, in the process, obtained a general understanding of the nomen-clature employed by bridge engineers. Provided below is a more detailed
[1.4]
THE BRIDGE ENGINEERING LEXICON
nder the design-build ap-proach ... the owner and
contractor must have an extraor-dinarily good working relation-ship for this type of arrangementto be successful.
U
Highway Bridge Structures
Downloaded from Digital Engineering Library @ McGraw-Hill (www.digitalengineeringlibrary.com)Copyright © 2006 The McGraw-Hill Companies. All rights reserved.
Any use is subject to the Terms of Use as given at the website.
22 SECTION 1 THE STRUCTURE
lexicon of the bridge engineer’s daily vernacular. To be sure, it would beimpossible to compile a complete list of all the expressions and terms used inthe profession. The items listed below, however, represent the commonexpressions used throughout this text. An attempt has been made to de-regionalize the terms used in this book. It should be understood by the readerthat each geographic region maintains its own distinct flavor of design, and toa certain extent, the terminologies used for bridge elements. Complicating thissituation is that many designers refer to elements by manufacturers’ brandnames. While there is nothing inherently bad about this except that we shouldnot specify any brand name in our design, it does tend to confuse youngengineers.
It may seem to the reader that a good many of the entries in the lexiconare repeated definitions from the preceding (and following) text. The lexicon ismeant to act as a handy reference for the reader to flip back to while readingthe text. While it is certainly hoped that the book is read from cover to cover,a measure of reality would suggest that many readers will be moving about thebook in a somewhat nonlinear fashion. So, for example, if the term weep tube isused liberally in a section, the reader will not have to hunt down the exact pointof definition in the text but rather can refer back to the entry below. It isrecommended that newcomers to bridge design spend time familiarizingthemselves with the definitions below before moving on to the subsequentsections. The definitions provided herein are within the context of bridgeengineering in general and this text in particular.
AADT Average Annual Daily Traffic.AASHO American Association of State Highway Officials. Founded in 1914
and renamed in 1973 to AASHTO (see below).AASHTO American Association of State Highway and Transportation
Officials. Name changed from AASHO in 1973 to include all modes oftransportation.
Abrasion A weathering action causing a wearing away of a surface due tofrictional or similar forces, as in the abrasive action of wind or watertransporting sediments which grind against a surface.
Absorption The process where a liquid is taken into the permeable pores ofa solid body (as in wetting of concrete). Absorption leads to an increase inthe weight of the porous solid.
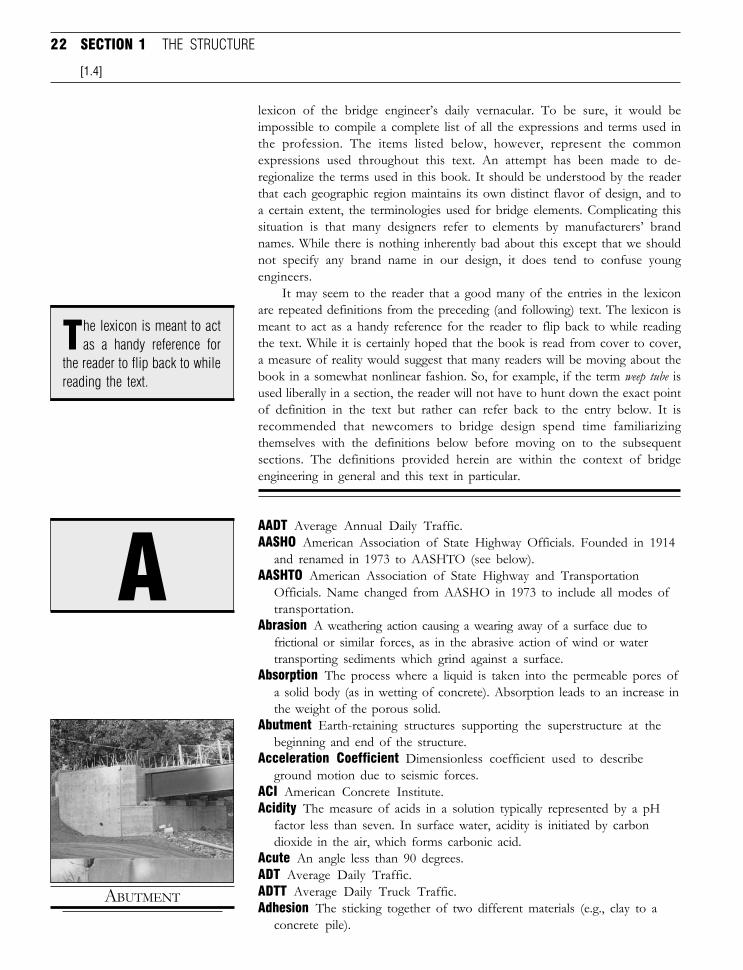
Abutment Earth-retaining structures supporting the superstructure at thebeginning and end of the structure.
Acceleration Coefficient Dimensionless coefficient used to describeground motion due to seismic forces.
ACI American Concrete Institute.Acidity The measure of acids in a solution typically represented by a pH
factor less than seven. In surface water, acidity is initiated by carbondioxide in the air, which forms carbonic acid.
Acute An angle less than 90 degrees.ADT Average Daily Traffic.ADTT Average Daily Truck Traffic.Adhesion The sticking together of two different materials (e.g., clay to a
concrete pile).
[1.4]
A
he lexicon is meant to actas a handy reference for
the reader to flip back to whilereading the text.
T
ABUTMENT
Highway Bridge Structures
Downloaded from Digital Engineering Library @ McGraw-Hill (www.digitalengineeringlibrary.com)Copyright © 2006 The McGraw-Hill Companies. All rights reserved.
Any use is subject to the Terms of Use as given at the website.
23
Admixture A material other than portland cement, aggregates, or waterwhich is added to a concrete batch prior to or during mixing (e.g., sand,clay, fly ash, hydrated lime).
Advanced Detail Design Project level of completion just before submissionof final plans. At this stage all major portions of design should be complete.See also Preliminary Design and PS&E.
Aggradation A condition in a water channel where, over a long period oftime, more sediment is added to a stream bed than removed.
Air Entrainment The process of adding air to concrete in order to increasedurability while causing only a small decrease in strength. Used in bridgedecks to offer resistance to freeze-thaw cycles.
AISC American Institute of Steel Construction.Alkalinity The measure of negative ions in water typically represented by a
pH factor greater than seven.Alligator Cracking Cracks in a wearing surface or approach pavement
which form interlocking, rectangular shapes (similar to an alligator’sskin). Typically initiated by insufficient base support or concreteshrinkage.
Allowable Stress Design AISC designation for Working Stress Design.Anchorage A tie embedded in concrete, rock, or other fixed material
(e.g., an anchor for a post-tensioning tendon).Approach Section of roadway immediately before and after the structure.Approach Pavement Used to describe an approach with a cross
section either consistent with or slightly wider than that of the overpassroad.
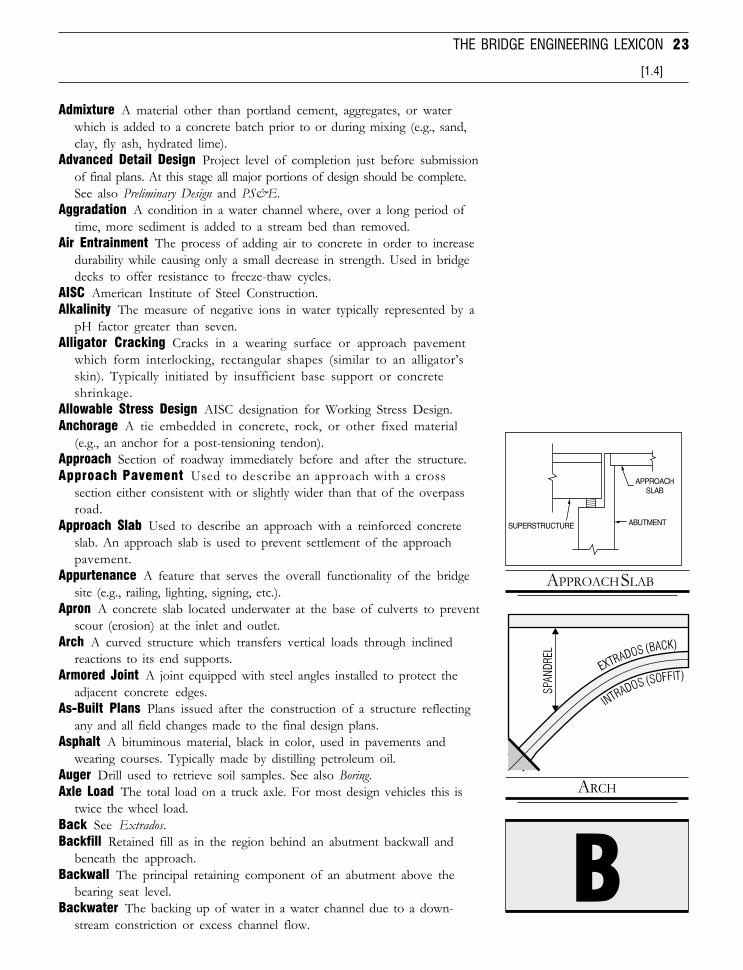
Approach Slab Used to describe an approach with a reinforced concreteslab. An approach slab is used to prevent settlement of the approachpavement.
Appurtenance A feature that serves the overall functionality of the bridgesite (e.g., railing, lighting, signing, etc.).
Apron A concrete slab located underwater at the base of culverts to preventscour (erosion) at the inlet and outlet.
Arch A curved structure which transfers vertical loads through inclinedreactions to its end supports.
Armored Joint A joint equipped with steel angles installed to protect theadjacent concrete edges.
As-Built Plans Plans issued after the construction of a structure reflectingany and all field changes made to the final design plans.
Asphalt A bituminous material, black in color, used in pavements andwearing courses. Typically made by distilling petroleum oil.
Auger Drill used to retrieve soil samples. See also Boring.Axle Load The total load on a truck axle. For most design vehicles this is
twice the wheel load.Back See Extrados.Backfill Retained fill as in the region behind an abutment backwall and
beneath the approach.Backwall The principal retaining component of an abutment above the
bearing seat level.Backwater The backing up of water in a water channel due to a down-
stream constriction or excess channel flow.
[1.4]
THE BRIDGE ENGINEERING LEXICON
BARCH
APPROACH SLAB
SUPERSTRUCTURE ABUTMENT
APPROACHSLAB
Highway Bridge Structures
Downloaded from Digital Engineering Library @ McGraw-Hill (www.digitalengineeringlibrary.com)Copyright © 2006 The McGraw-Hill Companies. All rights reserved.
Any use is subject to the Terms of Use as given at the website.
24 SECTION 1 THE STRUCTURE
Balustrade A railing system comprised of short columns called balusterswhich are connected together by a rail.
Bascule Bridge A moveable bridge in which the deck opens up like a set ofdoors in an upward direction.
Base Course A layer of compacted material directly under the wearingsurface, typically consisting of mineral aggregates and additives which arecompacted to support the pavement. See also Subbase.
Base Metal The existing steel material to which another member is weldedusing an electrode.
Batch Total weight of cement and aggregates which produces a givenamount of concrete.
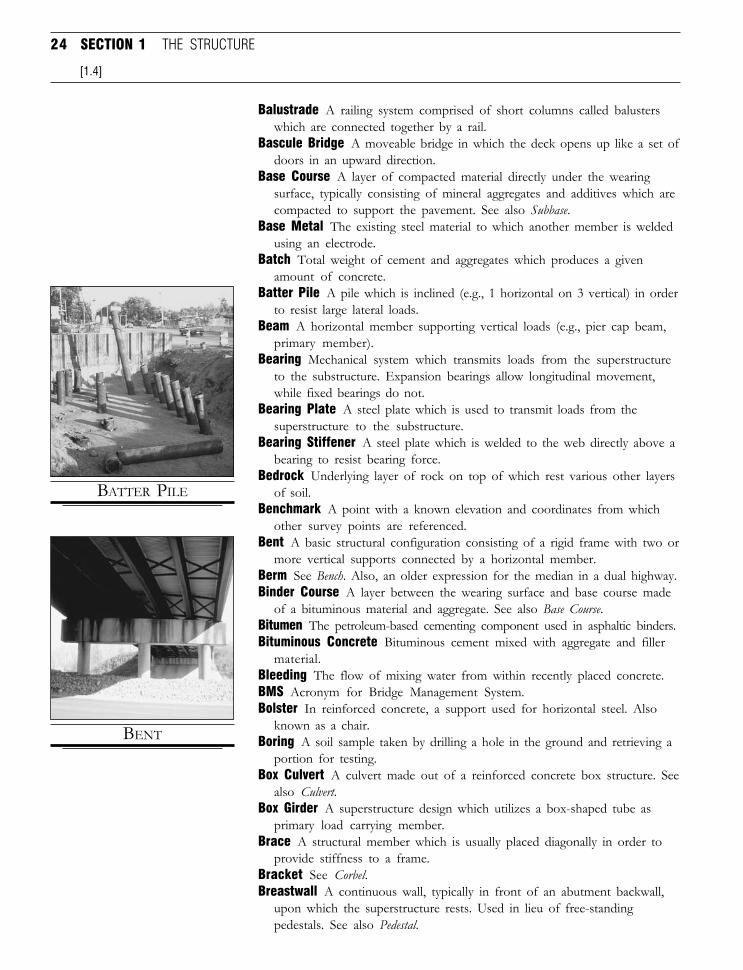
Batter Pile A pile which is inclined (e.g., 1 horizontal on 3 vertical) in orderto resist large lateral loads.
Beam A horizontal member supporting vertical loads (e.g., pier cap beam,primary member).
Bearing Mechanical system which transmits loads from the superstructureto the substructure. Expansion bearings allow longitudinal movement,while fixed bearings do not.
Bearing Plate A steel plate which is used to transmit loads from thesuperstructure to the substructure.
Bearing Stiffener A steel plate which is welded to the web directly above abearing to resist bearing force.
Bedrock Underlying layer of rock on top of which rest various other layersof soil.
Benchmark A point with a known elevation and coordinates from whichother survey points are referenced.
Bent A basic structural configuration consisting of a rigid frame with two ormore vertical supports connected by a horizontal member.
Berm See Bench. Also, an older expression for the median in a dual highway.Binder Course A layer between the wearing surface and base course made
of a bituminous material and aggregate. See also Base Course.Bitumen The petroleum-based cementing component used in asphaltic binders.Bituminous Concrete Bituminous cement mixed with aggregate and filler
material.Bleeding The flow of mixing water from within recently placed concrete.BMS Acronym for Bridge Management System.Bolster In reinforced concrete, a support used for horizontal steel. Also
known as a chair.Boring A soil sample taken by drilling a hole in the ground and retrieving a
portion for testing.Box Culvert A culvert made out of a reinforced concrete box structure. See
also Culvert.Box Girder A superstructure design which utilizes a box-shaped tube as
primary load carrying member.Brace A structural member which is usually placed diagonally in order to
provide stiffness to a frame.Bracket See Corbel.Breastwall A continuous wall, typically in front of an abutment backwall,
upon which the superstructure rests. Used in lieu of free-standingpedestals. See also Pedestal.
[1.4]
BENT
BATTER PILE
Highway Bridge Structures
Downloaded from Digital Engineering Library @ McGraw-Hill (www.digitalengineeringlibrary.com)Copyright © 2006 The McGraw-Hill Companies. All rights reserved.
Any use is subject to the Terms of Use as given at the website.
25
Bridge Seat Refers to the surface on which a bearing rests. Also known asbeam seat. See also Pedestal.
Brittle Fracture A sudden failure of a steel element prior to plastic defor-mation typically occurring at a sharp change of section properties, or dueto fatigue cracks.
Brush Curb A curb used in lieu of a sidewalk to provide wider travel laneson a bridge deck.
BS 5400 The bridge design code used in the United Kingdom and issued byBSI Standards. The code comes in 10 parts.
Buckling Sudden large and irreversible deflection in an axially loadedmember under compression.
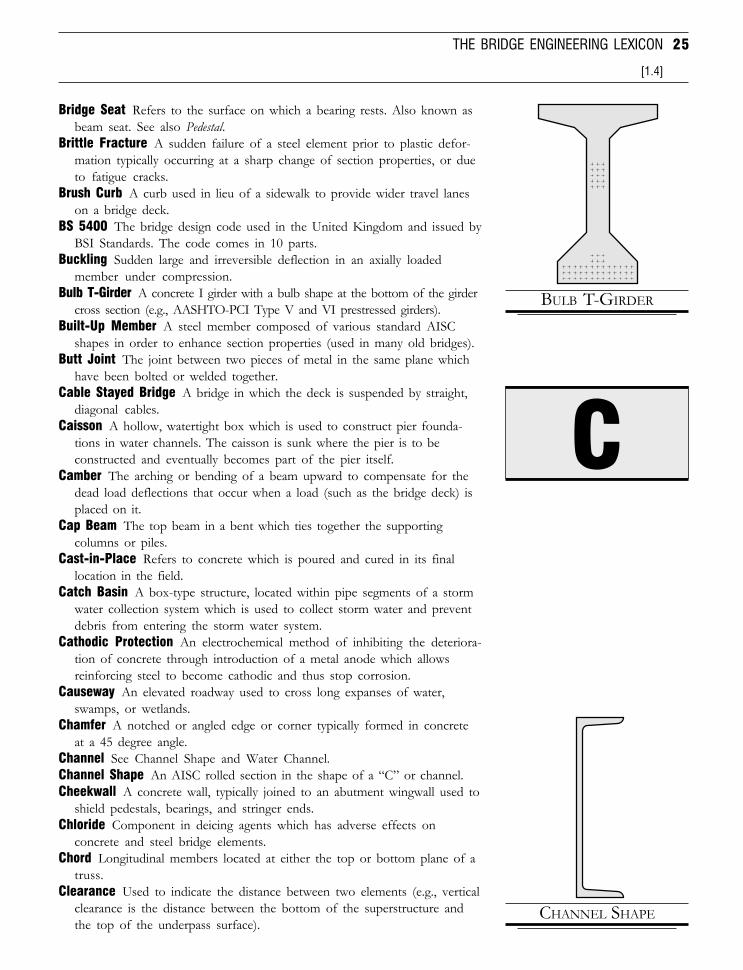
Bulb T-Girder A concrete I girder with a bulb shape at the bottom of the girdercross section (e.g., AASHTO-PCI Type V and VI prestressed girders).
Built-Up Member A steel member composed of various standard AISCshapes in order to enhance section properties (used in many old bridges).
Butt Joint The joint between two pieces of metal in the same plane whichhave been bolted or welded together.
Cable Stayed Bridge A bridge in which the deck is suspended by straight,diagonal cables.
Caisson A hollow, watertight box which is used to construct pier founda-tions in water channels. The caisson is sunk where the pier is to beconstructed and eventually becomes part of the pier itself.
Camber The arching or bending of a beam upward to compensate for thedead load deflections that occur when a load (such as the bridge deck) isplaced on it.
Cap Beam The top beam in a bent which ties together the supportingcolumns or piles.
Cast-in-Place Refers to concrete which is poured and cured in its finallocation in the field.
Catch Basin A box-type structure, located within pipe segments of a stormwater collection system which is used to collect storm water and preventdebris from entering the storm water system.
Cathodic Protection An electrochemical method of inhibiting the deteriora-tion of concrete through introduction of a metal anode which allowsreinforcing steel to become cathodic and thus stop corrosion.
Causeway An elevated roadway used to cross long expanses of water,swamps, or wetlands.
Chamfer A notched or angled edge or corner typically formed in concreteat a 45 degree angle.
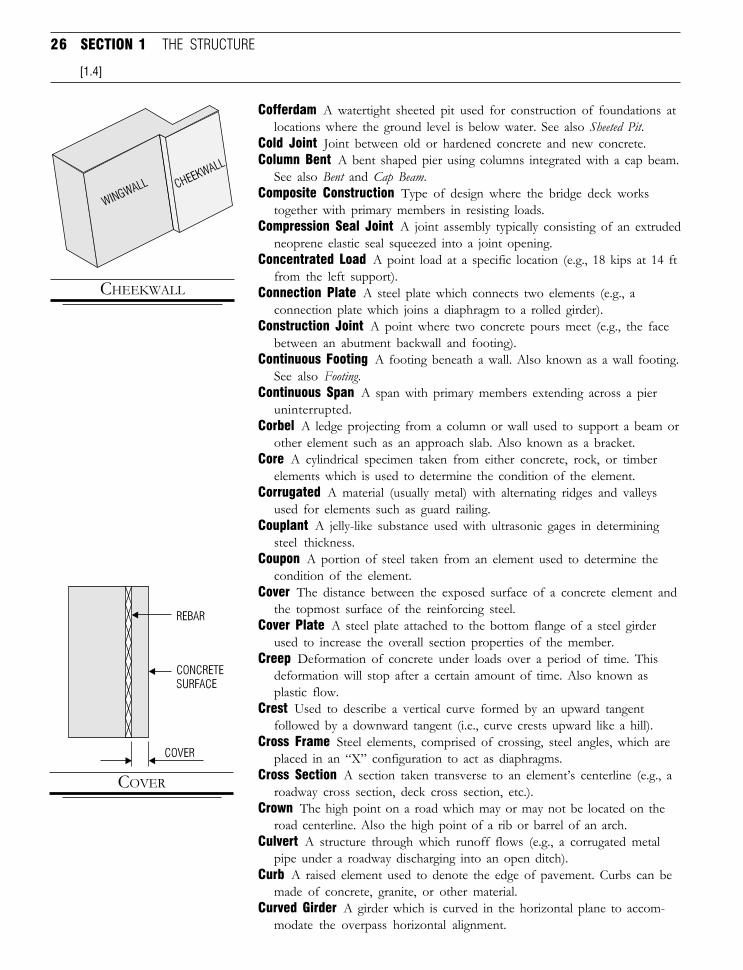
Channel See Channel Shape and Water Channel.Channel Shape An AISC rolled section in the shape of a “C” or channel.Cheekwall A concrete wall, typically joined to an abutment wingwall used to
shield pedestals, bearings, and stringer ends.Chloride Component in deicing agents which has adverse effects on
concrete and steel bridge elements.Chord Longitudinal members located at either the top or bottom plane of a
truss.Clearance Used to indicate the distance between two elements (e.g., vertical
clearance is the distance between the bottom of the superstructure andthe top of the underpass surface).
[1.4]
THE BRIDGE ENGINEERING LEXICON
CHANNEL SHAPE
C
BULB T-GIRDER
Highway Bridge Structures
Downloaded from Digital Engineering Library @ McGraw-Hill (www.digitalengineeringlibrary.com)Copyright © 2006 The McGraw-Hill Companies. All rights reserved.
Any use is subject to the Terms of Use as given at the website.
26 SECTION 1 THE STRUCTURE
Cofferdam A watertight sheeted pit used for construction of foundations atlocations where the ground level is below water. See also Sheeted Pit.
Cold Joint Joint between old or hardened concrete and new concrete.Column Bent A bent shaped pier using columns integrated with a cap beam.
See also Bent and Cap Beam.Composite Construction Type of design where the bridge deck works
together with primary members in resisting loads.Compression Seal Joint A joint assembly typically consisting of an extruded
neoprene elastic seal squeezed into a joint opening.Concentrated Load A point load at a specific location (e.g., 18 kips at 14 ft
from the left support).Connection Plate A steel plate which connects two elements (e.g., a
connection plate which joins a diaphragm to a rolled girder).Construction Joint A point where two concrete pours meet (e.g., the face
between an abutment backwall and footing).Continuous Footing A footing beneath a wall. Also known as a wall footing.
See also Footing.Continuous Span A span with primary members extending across a pier
uninterrupted.Corbel A ledge projecting from a column or wall used to support a beam or
other element such as an approach slab. Also known as a bracket.Core A cylindrical specimen taken from either concrete, rock, or timber
elements which is used to determine the condition of the element.Corrugated A material (usually metal) with alternating ridges and valleys
used for elements such as guard railing.Couplant A jelly-like substance used with ultrasonic gages in determining
steel thickness.Coupon A portion of steel taken from an element used to determine the
condition of the element.Cover The distance between the exposed surface of a concrete element and
the topmost surface of the reinforcing steel.Cover Plate A steel plate attached to the bottom flange of a steel girder
used to increase the overall section properties of the member.Creep Deformation of concrete under loads over a period of time. This
deformation will stop after a certain amount of time. Also known asplastic flow.
Crest Used to describe a vertical curve formed by an upward tangentfollowed by a downward tangent (i.e., curve crests upward like a hill).
Cross Frame Steel elements, comprised of crossing, steel angles, which areplaced in an “X” configuration to act as diaphragms.
Cross Section A section taken transverse to an element’s centerline (e.g., aroadway cross section, deck cross section, etc.).
Crown The high point on a road which may or may not be located on theroad centerline. Also the high point of a rib or barrel of an arch.
Culvert A structure through which runoff flows (e.g., a corrugated metalpipe under a roadway discharging into an open ditch).
Curb A raised element used to denote the edge of pavement. Curbs can bemade of concrete, granite, or other material.
Curved Girder A girder which is curved in the horizontal plane to accom-modate the overpass horizontal alignment.
[1.4]
CHEEKWALL
COVER
Highway Bridge Structures
Downloaded from Digital Engineering Library @ McGraw-Hill (www.digitalengineeringlibrary.com)Copyright © 2006 The McGraw-Hill Companies. All rights reserved.
Any use is subject to the Terms of Use as given at the website.
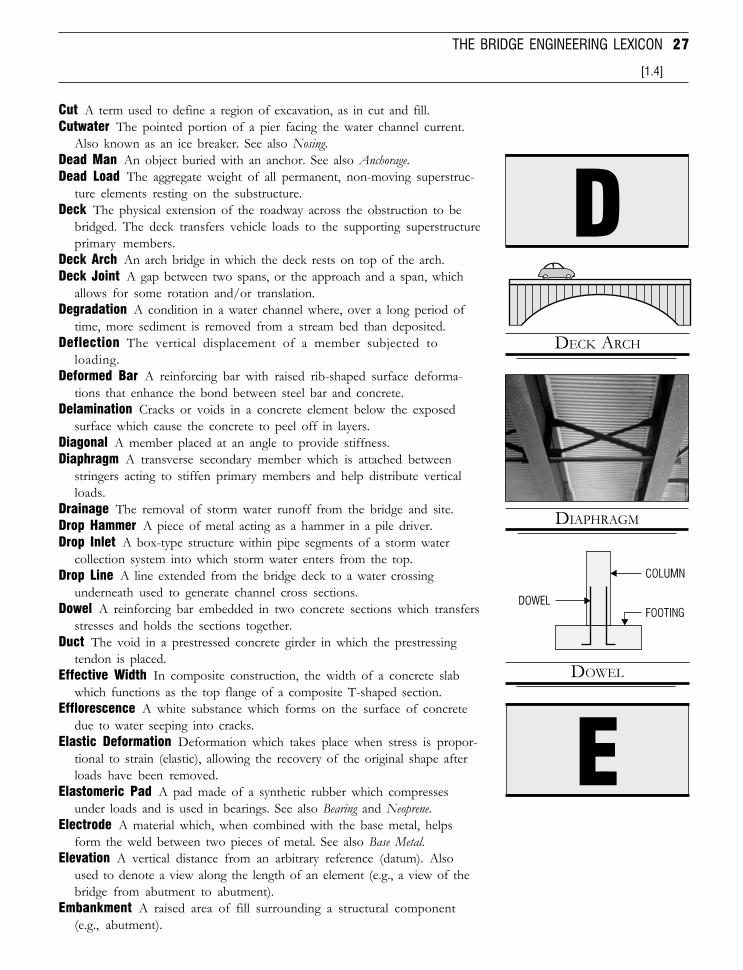
27
Cut A term used to define a region of excavation, as in cut and fill.Cutwater The pointed portion of a pier facing the water channel current.
Also known as an ice breaker. See also Nosing.Dead Man An object buried with an anchor. See also Anchorage.Dead Load The aggregate weight of all permanent, non-moving superstruc-
ture elements resting on the substructure.Deck The physical extension of the roadway across the obstruction to be
bridged. The deck transfers vehicle loads to the supporting superstructureprimary members.
Deck Arch An arch bridge in which the deck rests on top of the arch.Deck Joint A gap between two spans, or the approach and a span, which
allows for some rotation and/or translation.Degradation A condition in a water channel where, over a long period of
time, more sediment is removed from a stream bed than deposited.Deflection The vertical displacement of a member subjected to
loading.Deformed Bar A reinforcing bar with raised rib-shaped surface deforma-
tions that enhance the bond between steel bar and concrete.Delamination Cracks or voids in a concrete element below the exposed
surface which cause the concrete to peel off in layers.Diagonal A member placed at an angle to provide stiffness.Diaphragm A transverse secondary member which is attached between
stringers acting to stiffen primary members and help distribute verticalloads.
Drainage The removal of storm water runoff from the bridge and site.Drop Hammer A piece of metal acting as a hammer in a pile driver.Drop Inlet A box-type structure within pipe segments of a storm water
collection system into which storm water enters from the top.Drop Line A line extended from the bridge deck to a water crossing
underneath used to generate channel cross sections.Dowel A reinforcing bar embedded in two concrete sections which transfers
stresses and holds the sections together.Duct The void in a prestressed concrete girder in which the prestressing
tendon is placed.Effective Width In composite construction, the width of a concrete slab
which functions as the top flange of a composite T-shaped section.Efflorescence A white substance which forms on the surface of concrete
due to water seeping into cracks.Elastic Deformation Deformation which takes place when stress is propor-
tional to strain (elastic), allowing the recovery of the original shape afterloads have been removed.
Elastomeric Pad A pad made of a synthetic rubber which compressesunder loads and is used in bearings. See also Bearing and Neoprene.
Electrode A material which, when combined with the base metal, helpsform the weld between two pieces of metal. See also Base Metal.
Elevation A vertical distance from an arbitrary reference (datum). Alsoused to denote a view along the length of an element (e.g., a view of thebridge from abutment to abutment).
Embankment A raised area of fill surrounding a structural component(e.g., abutment).
[1.4]
THE BRIDGE ENGINEERING LEXICON
DOWEL
DDECK ARCH
DIAPHRAGM
E
Highway Bridge Structures
Downloaded from Digital Engineering Library @ McGraw-Hill (www.digitalengineeringlibrary.com)Copyright © 2006 The McGraw-Hill Companies. All rights reserved.
Any use is subject to the Terms of Use as given at the website.
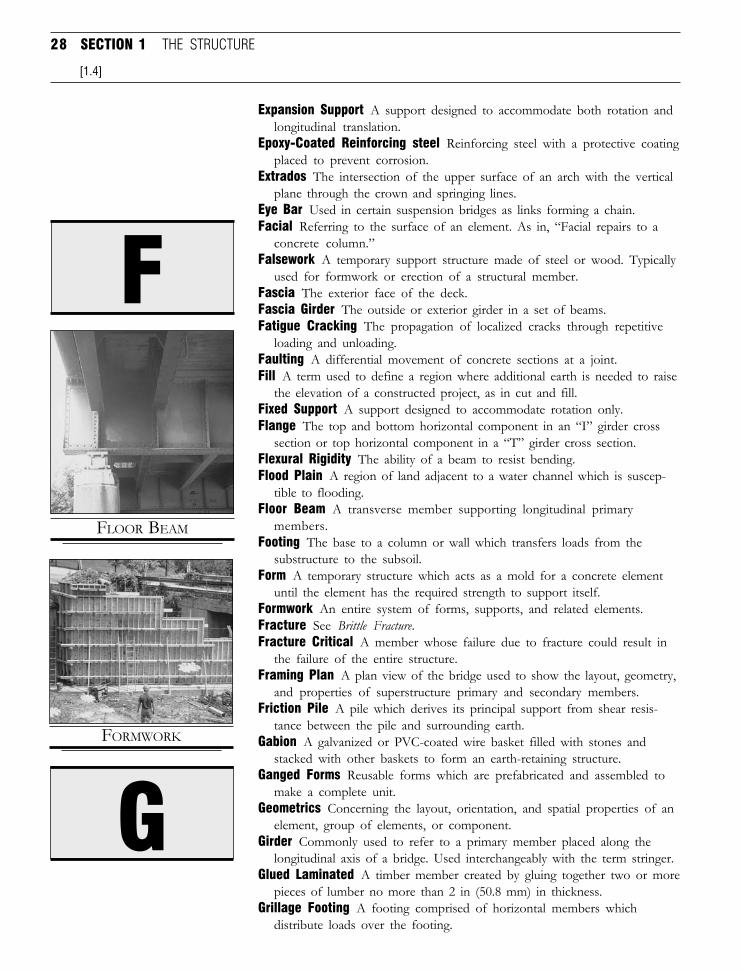
28 SECTION 1 THE STRUCTURE
Expansion Support A support designed to accommodate both rotation andlongitudinal translation.
Epoxy-Coated Reinforcing steel Reinforcing steel with a protective coatingplaced to prevent corrosion.
Extrados The intersection of the upper surface of an arch with the verticalplane through the crown and springing lines.
Eye Bar Used in certain suspension bridges as links forming a chain.Facial Referring to the surface of an element. As in, “Facial repairs to a
concrete column.”Falsework A temporary support structure made of steel or wood. Typically
used for formwork or erection of a structural member.Fascia The exterior face of the deck.Fascia Girder The outside or exterior girder in a set of beams.Fatigue Cracking The propagation of localized cracks through repetitive
loading and unloading.Faulting A differential movement of concrete sections at a joint.Fill A term used to define a region where additional earth is needed to raise
the elevation of a constructed project, as in cut and fill.Fixed Support A support designed to accommodate rotation only.Flange The top and bottom horizontal component in an “I” girder cross
section or top horizontal component in a “T” girder cross section.Flexural Rigidity The ability of a beam to resist bending.Flood Plain A region of land adjacent to a water channel which is suscep-
tible to flooding.Floor Beam A transverse member supporting longitudinal primary
members.Footing The base to a column or wall which transfers loads from the
substructure to the subsoil.Form A temporary structure which acts as a mold for a concrete element
until the element has the required strength to support itself.Formwork An entire system of forms, supports, and related elements.Fracture See Brittle Fracture.Fracture Critical A member whose failure due to fracture could result in
the failure of the entire structure.Framing Plan A plan view of the bridge used to show the layout, geometry,
and properties of superstructure primary and secondary members.Friction Pile A pile which derives its principal support from shear resis-
tance between the pile and surrounding earth.Gabion A galvanized or PVC-coated wire basket filled with stones and
stacked with other baskets to form an earth-retaining structure.Ganged Forms Reusable forms which are prefabricated and assembled to
make a complete unit.Geometrics Concerning the layout, orientation, and spatial properties of an
element, group of elements, or component.Girder Commonly used to refer to a primary member placed along the
longitudinal axis of a bridge. Used interchangeably with the term stringer.Glued Laminated A timber member created by gluing together two or more
pieces of lumber no more than 2 in (50.8 mm) in thickness.Grillage Footing A footing comprised of horizontal members which
distribute loads over the footing.
[1.4]
FLOOR BEAM
F
FORMWORK
G
Highway Bridge Structures
Downloaded from Digital Engineering Library @ McGraw-Hill (www.digitalengineeringlibrary.com)Copyright © 2006 The McGraw-Hill Companies. All rights reserved.
Any use is subject to the Terms of Use as given at the website.
29
Group Loading Combinations of loads and forces (e.g., dead load with liveload, wind, stream flow pressure, etc.) that a structure must be able towithstand.
Grout A cement-based filler material used to fill in voids, cracks, cavities,and other openings in concrete elements. Usually a thin mix of cement,water, and sometimes sand.
Grouting The process of filling cracks and voids with grout.Gunite Portland cement mortar which is blown onto a surface using
compressed air.Gusset Plate A steel plate used to connect steel members to each other
(e.g., as in a cross frame assembly).H Loading A hypothetical design truck developed by AASHTO that comes
in two types, H20-44 and H15-44.Hairline Cracks Extremely fine cracks which are formed on the surface of
new concrete. Typically occurs at high temperatures which causes a rapidloss of moisture.
Hammerhead Used to describe the geometry of a pier with a cap similar inshape to a hammer.
Hanger An assembly utilizing a pin connection designed to allow forexpansion between a cantilevered and suspended span at a point betweensupports.
Haunch A small [roughly 2 to 4 in + (50.8 to 101.6 mm)] layer of concretebetween a superstructure member and a concrete deck.
Haunched Girder A member whose cross-sectional depth varies fromsupport to support.
Heave The upward movement of soil which can be caused by moisture,excavation, pile driving, etc.
Heel The rear face of a footing. See also Toe.Horizontal Alignment The mathematical description of a roadway’s
centerline or baseline alignment in the horizontal plane (i.e., plan view).Horizontal Curve A curve in a horizontal alignment altering the direction of
two tangents.HS Loading A hypothetical design truck developed by AASHTO that comes
in two types, HS20-44 and HS15-44 (although HS-25 is used in manystates recently).
Hybrid Girder A girder with load-bearing plates of varying steel types (e.g.,high-strength steel used for flanges and lower strength for webs).
I-Girder A girder whose cross section resembles the letter “I”.Impact A factor used to describe the dynamic effect of a vehicle moving
across a bridge.Individual Column Footing A footing which supports a single column. See
also Footing.Integral Abutment An abutment which is integrated with an approach slab,
thereby eliminating a joint at that location.Interstate The United States Interstate and Defense Highway system,
which encompasses 46,500 miles (74,800 km) of roadway.Intrados The intersection of the lower surface of an arch with the vertical
plane through the crown and springing lines.Inventory Rating The load capacity of a bridge under normal service
conditions (same as design strength).
[1.4]
THE BRIDGE ENGINEERING LEXICON
H
HEEL
HANGER
I
Highway Bridge Structures
Downloaded from Digital Engineering Library @ McGraw-Hill (www.digitalengineeringlibrary.com)Copyright © 2006 The McGraw-Hill Companies. All rights reserved.
Any use is subject to the Terms of Use as given at the website.
30 SECTION 1 THE STRUCTURE
Invert Elevation The elevation of the lowest point of a catch basic, dropinlet, culvert, or streambed.
Item Number A number assigned by a transportation department toreference a specific material, element, or construction operation.
Jack Arch An arch-type bridge constructed with steel beams encasedin concrete. The concrete is typically formed using stay-in-placeforms.
Jacket A surrounding encasement of an element such as a pier column orpile which can be made of concrete, fabric, or other material.
Jacking The lifting of an element or group of elements usinghydraulic or other types of jacks and, if needed, a temporarysupport system.
Jersey Barrier A concrete barrier named after the New Jersey Departmentof Transportation, which first developed it. Also known as traffic barrier,median barrier, shape barrier, and concrete barrier.
Joint See Cold Joint and Deck Joint.Keeper Plate A plate which is bolted or welded to a sole plate to prohibit a
beam from being disconnected from the bearing.Key A notched or raised protrusion of concrete located on one face of a
construction joint which fits into a recess on the other face.Lateral A member which is placed roughly perpendicular to a primary
member.Laminate Two or more pieces of wood which are joined together, typically
with adhesive or nails. See also Glued Laminated and Nail Laminated.Lane Loading A hypothetical design loading used to simulate a train of
trucks moving across a bridge.Lateral Bracing Bracing located at either the top flange or bottom flange
of a stringer to prevent lateral deformation induced by forces normal tothe bridge centerline (e.g., wind).
Leveling Course A layer of asphalt or binder used to smooth together twosections of pavement.
Lighting Standard The main supporting pole for a lighting fixture. See alsoLuminaire.
Limit States Design A method of design based on the ability of a structureto fulfill its function. This ability is defined by limit states defining safetyand serviceability.
Live Load A temporary, moving load such as vehicular traffic.Load Factor Design A form of limit states design used by AASHTO
standard specifications as an alternative to Working Stress Design.Load Rating A value indicating the load capacity of a bridge. See also
Inventory Rating and Operating Rating.Load and Resistance Factor Design A form of limit states design used by
AASHTO LRFD specifications.Local Buckling Localized buckling of one of a beam’s plate elements which
can potentially lead to failure of the member.Longitudinal Used to describe the axis of a bridge which proceeds from
abutment to abutmentLuminaire A lighting fixture located at the top of a lighting standard.Maintenance Basic remedial operations performed on a bridge which allow
the structure to maintain an adequate level of service.
[1.4]
[1.4]JKL
JERSEY BARRIER
KEY
LONGITUDINAL
MN
Highway Bridge Structures
Downloaded from Digital Engineering Library @ McGraw-Hill (www.digitalengineeringlibrary.com)Copyright © 2006 The McGraw-Hill Companies. All rights reserved.
Any use is subject to the Terms of Use as given at the website.
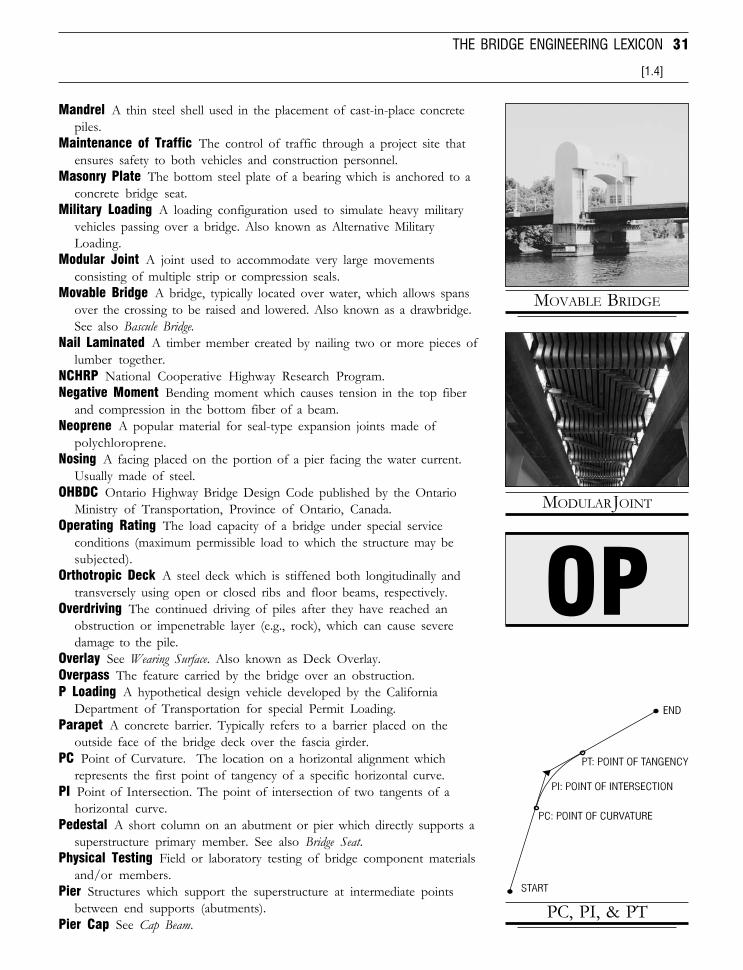
31
Mandrel A thin steel shell used in the placement of cast-in-place concretepiles.
Maintenance of Traffic The control of traffic through a project site thatensures safety to both vehicles and construction personnel.
Masonry Plate The bottom steel plate of a bearing which is anchored to aconcrete bridge seat.
Military Loading A loading configuration used to simulate heavy militaryvehicles passing over a bridge. Also known as Alternative MilitaryLoading.
Modular Joint A joint used to accommodate very large movementsconsisting of multiple strip or compression seals.
Movable Bridge A bridge, typically located over water, which allows spansover the crossing to be raised and lowered. Also known as a drawbridge.See also Bascule Bridge.
Nail Laminated A timber member created by nailing two or more pieces oflumber together.
NCHRP National Cooperative Highway Research Program.Negative Moment Bending moment which causes tension in the top fiber
and compression in the bottom fiber of a beam.Neoprene A popular material for seal-type expansion joints made of
polychloroprene.Nosing A facing placed on the portion of a pier facing the water current.
Usually made of steel.OHBDC Ontario Highway Bridge Design Code published by the Ontario
Ministry of Transportation, Province of Ontario, Canada.Operating Rating The load capacity of a bridge under special service
conditions (maximum permissible load to which the structure may besubjected).
Orthotropic Deck A steel deck which is stiffened both longitudinally andtransversely using open or closed ribs and floor beams, respectively.
Overdriving The continued driving of piles after they have reached anobstruction or impenetrable layer (e.g., rock), which can cause severedamage to the pile.
Overlay See Wearing Surface. Also known as Deck Overlay.Overpass The feature carried by the bridge over an obstruction.P Loading A hypothetical design vehicle developed by the California
Department of Transportation for special Permit Loading.Parapet A concrete barrier. Typically refers to a barrier placed on the
outside face of the bridge deck over the fascia girder.PC Point of Curvature. The location on a horizontal alignment which
represents the first point of tangency of a specific horizontal curve.PI Point of Intersection. The point of intersection of two tangents of a
horizontal curve.Pedestal A short column on an abutment or pier which directly supports a
superstructure primary member. See also Bridge Seat.Physical Testing Field or laboratory testing of bridge component materials
and/or members.Pier Structures which support the superstructure at intermediate points
between end supports (abutments).Pier Cap See Cap Beam.
[1.4]
THE BRIDGE ENGINEERING LEXICON
MODULAR JOINT
MOVABLE BRIDGE
OP
PC, PI, & PT
Highway Bridge Structures
Downloaded from Digital Engineering Library @ McGraw-Hill (www.digitalengineeringlibrary.com)Copyright © 2006 The McGraw-Hill Companies. All rights reserved.
Any use is subject to the Terms of Use as given at the website.
32 SECTION 1 THE STRUCTURE
Pile A member with a small cross-sectional area (in comparison to itslength) used to provide adequate support for a column or wall resting onsoil which is too weak or compressible to support the structure using aspread footer.
Pile Bent A pier comprised of a cap beam and a set of piles. See also Bent,Pier, and Pile.
Pin and Hanger See Hanger.Pitch A grade or slope given to a surface, usually to provide for adequate
drainage. Also the distance between rows of shear studs or completerevolutions in a spiral shear connector.
Plan Used to denote a view of an element, component, or the site from aviewpoint directly above the object looking down.
Plan and Profile A drawing which presents both the roadway plan viewalong with its profile on the same sheet and at equal horizontal scales. Seealso Profile and Vertical Alignment.
Planimetry Topographic information detailing the location and/or elevationof non-terrain related features (e.g., vegetation, fences, catch basins, etc.)
Plastic Deformation A permanent deformation of a member due to loadsthat have been placed on a member for a given period of time.
Plate Girder A girder with an “I” cross section composed of steel plateelements which are connected together by welds, bolts, or rivets.
Plinth A projecting base of a wall.Positive Moment A bending moment which induces compression in the top
fiber of a beam and tension in the bottom fiber.Post-tensioned Girder A prestressed concrete girder where the prestressing
force is applied to the reinforcing tendons after the concrete has cured.Precast A concrete element which has been formed and cured prior to
placement in the field.Preliminary Design An initial design which outlines the major scope of
work to be done in a project.Prestressed Girder A concrete girder which utilizes steel tendons that have
a tensile force placed on them, thereby increasing internal compressionand reducing or eliminating stresses due to tension once the beam isloaded.
Pretensioned Girder A prestressed concrete girder where the prestressingforce is applied to the reinforcing tendons before the concrete has beenpoured.
Primary Member A load-bearing member which distributes loads longitudi-nally and is principally designed to resist flexure.
Profile A graphical depiction of the vertical alignment of a roadway.PS&E Plans, Specifications, and Estimate. A term used to identify the final
submission package of the design team to be given to the owner.PT Point of Tangency. The location on a horizontal alignment which
represents the last point of tangency of a specific horizontal curve.PVC Point of Vertical Curvature. The location on a vertical alignment
which represents the first point of tangency of a specific vertical curve.PVI Point of Vertical Intersection. The point of intersection of two tangents
of a vertical curve.PVT Point of Vertical Tangency. The location on a vertical alignment which
represents the last point of tangency of a specific vertical curve.
[1.4]
PEDESTAL
PITCH
PLATE GIRDER
QR
Highway Bridge Structures
Downloaded from Digital Engineering Library @ McGraw-Hill (www.digitalengineeringlibrary.com)Copyright © 2006 The McGraw-Hill Companies. All rights reserved.
Any use is subject to the Terms of Use as given at the website.
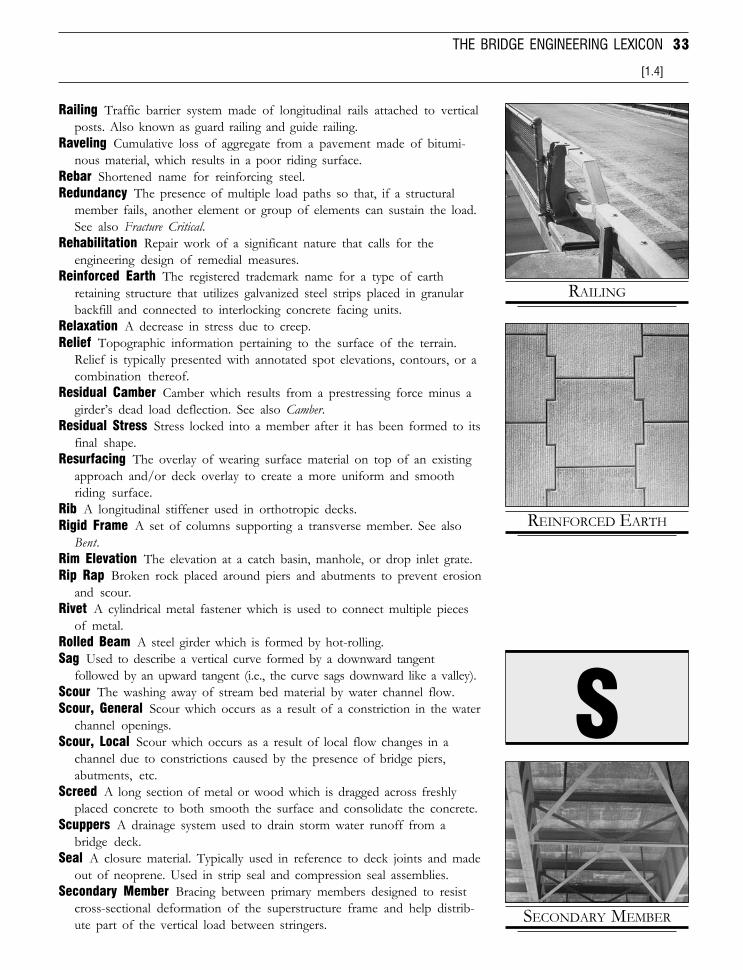
33
Railing Traffic barrier system made of longitudinal rails attached to verticalposts. Also known as guard railing and guide railing.
Raveling Cumulative loss of aggregate from a pavement made of bitumi-nous material, which results in a poor riding surface.
Rebar Shortened name for reinforcing steel.Redundancy The presence of multiple load paths so that, if a structural
member fails, another element or group of elements can sustain the load.See also Fracture Critical.
Rehabilitation Repair work of a significant nature that calls for theengineering design of remedial measures.
Reinforced Earth The registered trademark name for a type of earthretaining structure that utilizes galvanized steel strips placed in granularbackfill and connected to interlocking concrete facing units.
Relaxation A decrease in stress due to creep.Relief Topographic information pertaining to the surface of the terrain.
Relief is typically presented with annotated spot elevations, contours, or acombination thereof.
Residual Camber Camber which results from a prestressing force minus agirder’s dead load deflection. See also Camber.
Residual Stress Stress locked into a member after it has been formed to itsfinal shape.
Resurfacing The overlay of wearing surface material on top of an existingapproach and/or deck overlay to create a more uniform and smoothriding surface.
Rib A longitudinal stiffener used in orthotropic decks.Rigid Frame A set of columns supporting a transverse member. See also
Bent.Rim Elevation The elevation at a catch basin, manhole, or drop inlet grate.Rip Rap Broken rock placed around piers and abutments to prevent erosion
and scour.Rivet A cylindrical metal fastener which is used to connect multiple pieces
of metal.Rolled Beam A steel girder which is formed by hot-rolling.Sag Used to describe a vertical curve formed by a downward tangent
followed by an upward tangent (i.e., the curve sags downward like a valley).Scour The washing away of stream bed material by water channel flow.Scour, General Scour which occurs as a result of a constriction in the water
channel openings.Scour, Local Scour which occurs as a result of local flow changes in a
channel due to constrictions caused by the presence of bridge piers,abutments, etc.
Screed A long section of metal or wood which is dragged across freshlyplaced concrete to both smooth the surface and consolidate the concrete.
Scuppers A drainage system used to drain storm water runoff from abridge deck.
Seal A closure material. Typically used in reference to deck joints and madeout of neoprene. Used in strip seal and compression seal assemblies.
Secondary Member Bracing between primary members designed to resistcross-sectional deformation of the superstructure frame and help distrib-ute part of the vertical load between stringers.
[1.4]
THE BRIDGE ENGINEERING LEXICON
RAILING
REINFORCED EARTH
S
SECONDARY MEMBER
Highway Bridge Structures
Downloaded from Digital Engineering Library @ McGraw-Hill (www.digitalengineeringlibrary.com)Copyright © 2006 The McGraw-Hill Companies. All rights reserved.
Any use is subject to the Terms of Use as given at the website.
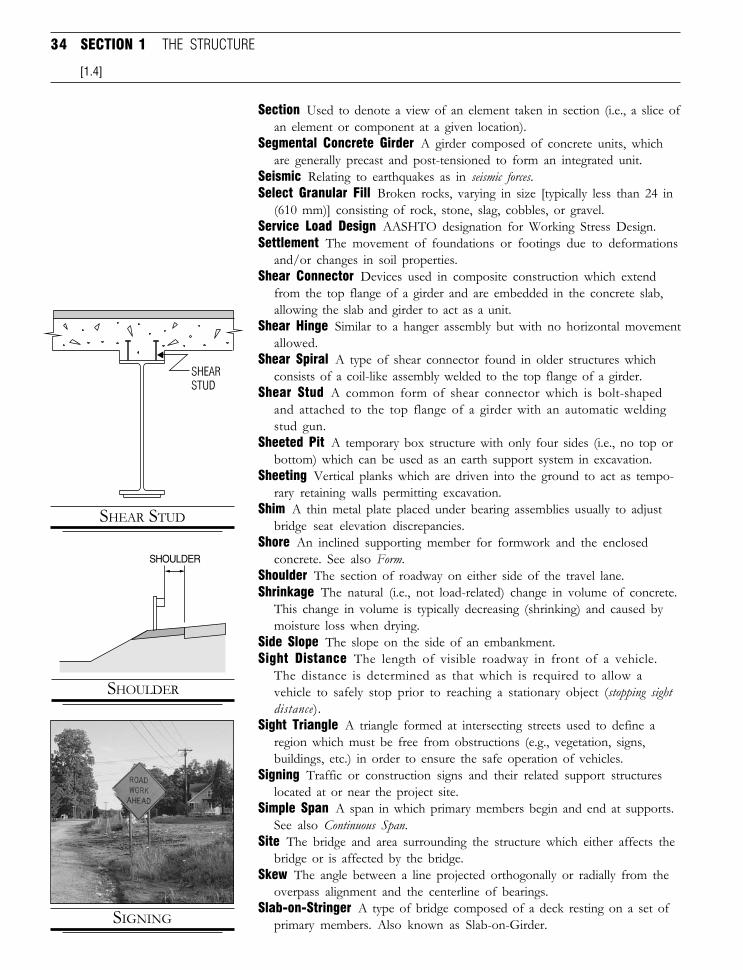
34 SECTION 1 THE STRUCTURE
Section Used to denote a view of an element taken in section (i.e., a slice ofan element or component at a given location).
Segmental Concrete Girder A girder composed of concrete units, whichare generally precast and post-tensioned to form an integrated unit.
Seismic Relating to earthquakes as in seismic forces.Select Granular Fill Broken rocks, varying in size [typically less than 24 in
(610 mm)] consisting of rock, stone, slag, cobbles, or gravel.Service Load Design AASHTO designation for Working Stress Design.Settlement The movement of foundations or footings due to deformations
and/or changes in soil properties.Shear Connector Devices used in composite construction which extend
from the top flange of a girder and are embedded in the concrete slab,allowing the slab and girder to act as a unit.
Shear Hinge Similar to a hanger assembly but with no horizontal movementallowed.
Shear Spiral A type of shear connector found in older structures whichconsists of a coil-like assembly welded to the top flange of a girder.
Shear Stud A common form of shear connector which is bolt-shapedand attached to the top flange of a girder with an automatic weldingstud gun.
Sheeted Pit A temporary box structure with only four sides (i.e., no top orbottom) which can be used as an earth support system in excavation.
Sheeting Vertical planks which are driven into the ground to act as tempo-rary retaining walls permitting excavation.
Shim A thin metal plate placed under bearing assemblies usually to adjustbridge seat elevation discrepancies.
Shore An inclined supporting member for formwork and the enclosedconcrete. See also Form.
Shoulder The section of roadway on either side of the travel lane.Shrinkage The natural (i.e., not load-related) change in volume of concrete.
This change in volume is typically decreasing (shrinking) and caused bymoisture loss when drying.
Side Slope The slope on the side of an embankment.Sight Distance The length of visible roadway in front of a vehicle.
The distance is determined as that which is required to allow avehicle to safely stop prior to reaching a stationary object (stopping sightdistance).
Sight Triangle A triangle formed at intersecting streets used to define aregion which must be free from obstructions (e.g., vegetation, signs,buildings, etc.) in order to ensure the safe operation of vehicles.
Signing Traffic or construction signs and their related support structureslocated at or near the project site.
Simple Span A span in which primary members begin and end at supports.See also Continuous Span.
Site The bridge and area surrounding the structure which either affects thebridge or is affected by the bridge.
Skew The angle between a line projected orthogonally or radially from theoverpass alignment and the centerline of bearings.
Slab-on-Stringer A type of bridge composed of a deck resting on a set ofprimary members. Also known as Slab-on-Girder.
[1.4]
SIGNING
SHEAR STUD
SHOULDER
SHOULDER
Highway Bridge Structures
Downloaded from Digital Engineering Library @ McGraw-Hill (www.digitalengineeringlibrary.com)Copyright © 2006 The McGraw-Hill Companies. All rights reserved.
Any use is subject to the Terms of Use as given at the website.
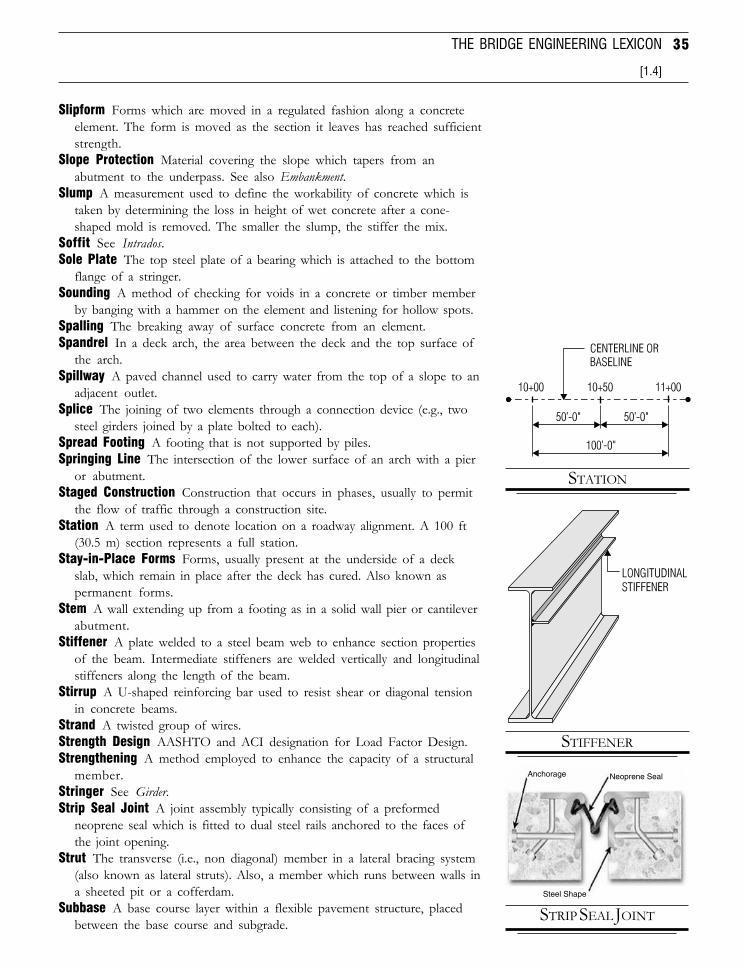
35
[1.4]
THE BRIDGE ENGINEERING LEXICON
Slipform Forms which are moved in a regulated fashion along a concreteelement. The form is moved as the section it leaves has reached sufficientstrength.
Slope Protection Material covering the slope which tapers from anabutment to the underpass. See also Embankment.
Slump A measurement used to define the workability of concrete which istaken by determining the loss in height of wet concrete after a cone-shaped mold is removed. The smaller the slump, the stiffer the mix.
Soffit See Intrados.Sole Plate The top steel plate of a bearing which is attached to the bottom
flange of a stringer.Sounding A method of checking for voids in a concrete or timber member
by banging with a hammer on the element and listening for hollow spots.Spalling The breaking away of surface concrete from an element.Spandrel In a deck arch, the area between the deck and the top surface of
the arch.Spillway A paved channel used to carry water from the top of a slope to an
adjacent outlet.Splice The joining of two elements through a connection device (e.g., two
steel girders joined by a plate bolted to each).Spread Footing A footing that is not supported by piles.Springing Line The intersection of the lower surface of an arch with a pier
or abutment.Staged Construction Construction that occurs in phases, usually to permit
the flow of traffic through a construction site.Station A term used to denote location on a roadway alignment. A 100 ft
(30.5 m) section represents a full station.Stay-in-Place Forms Forms, usually present at the underside of a deck
slab, which remain in place after the deck has cured. Also known aspermanent forms.
Stem A wall extending up from a footing as in a solid wall pier or cantileverabutment.
Stiffener A plate welded to a steel beam web to enhance section propertiesof the beam. Intermediate stiffeners are welded vertically and longitudinalstiffeners along the length of the beam.
Stirrup A U-shaped reinforcing bar used to resist shear or diagonal tensionin concrete beams.
Strand A twisted group of wires.Strength Design AASHTO and ACI designation for Load Factor Design.Strengthening A method employed to enhance the capacity of a structural
member.Stringer See Girder.Strip Seal Joint A joint assembly typically consisting of a preformed
neoprene seal which is fitted to dual steel rails anchored to the faces ofthe joint opening.
Strut The transverse (i.e., non diagonal) member in a lateral bracing system(also known as lateral struts). Also, a member which runs between walls ina sheeted pit or a cofferdam.
Subbase A base course layer within a flexible pavement structure, placedbetween the base course and subgrade.
STRIP SEAL JOINT
STIFFENER
STATION
Anchorage
Steel Shape
Neoprene Seal
Highway Bridge Structures
Downloaded from Digital Engineering Library @ McGraw-Hill (www.digitalengineeringlibrary.com)Copyright © 2006 The McGraw-Hill Companies. All rights reserved.
Any use is subject to the Terms of Use as given at the website.
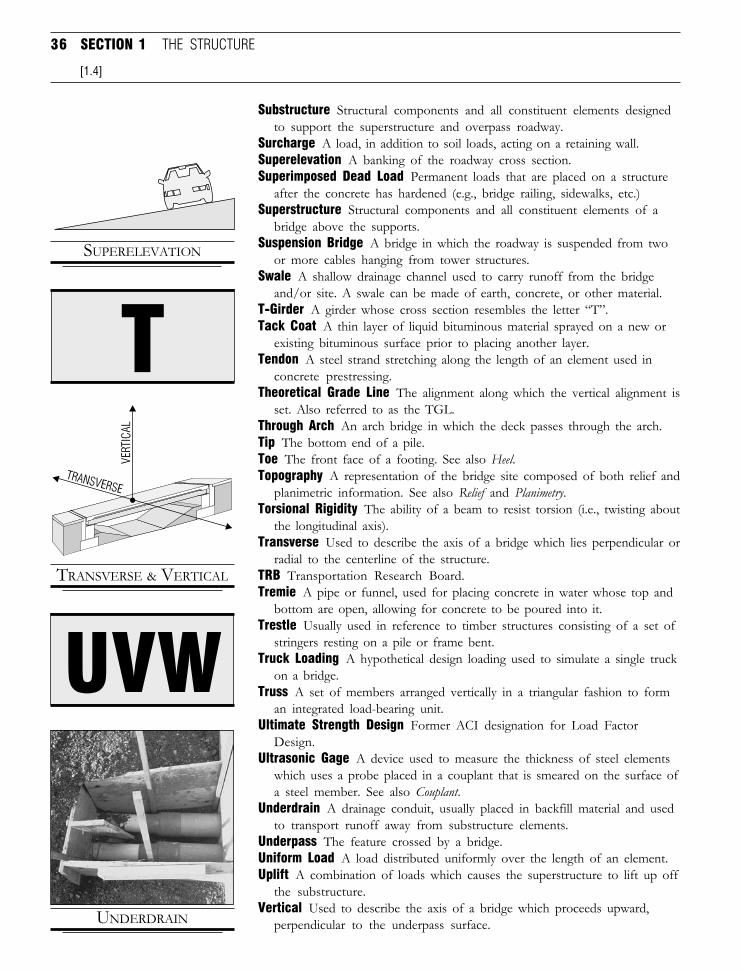
36 SECTION 1 THE STRUCTURE
Substructure Structural components and all constituent elements designedto support the superstructure and overpass roadway.
Surcharge A load, in addition to soil loads, acting on a retaining wall.Superelevation A banking of the roadway cross section.Superimposed Dead Load Permanent loads that are placed on a structure
after the concrete has hardened (e.g., bridge railing, sidewalks, etc.)Superstructure Structural components and all constituent elements of a
bridge above the supports.Suspension Bridge A bridge in which the roadway is suspended from two
or more cables hanging from tower structures.Swale A shallow drainage channel used to carry runoff from the bridge
and/or site. A swale can be made of earth, concrete, or other material.T-Girder A girder whose cross section resembles the letter “T”.Tack Coat A thin layer of liquid bituminous material sprayed on a new or
existing bituminous surface prior to placing another layer.Tendon A steel strand stretching along the length of an element used in
concrete prestressing.Theoretical Grade Line The alignment along which the vertical alignment is
set. Also referred to as the TGL.Through Arch An arch bridge in which the deck passes through the arch.Tip The bottom end of a pile.Toe The front face of a footing. See also Heel.Topography A representation of the bridge site composed of both relief and
planimetric information. See also Relief and Planimetry.Torsional Rigidity The ability of a beam to resist torsion (i.e., twisting about
the longitudinal axis).Transverse Used to describe the axis of a bridge which lies perpendicular or
radial to the centerline of the structure.TRB Transportation Research Board.Tremie A pipe or funnel, used for placing concrete in water whose top and
bottom are open, allowing for concrete to be poured into it.Trestle Usually used in reference to timber structures consisting of a set of
stringers resting on a pile or frame bent.Truck Loading A hypothetical design loading used to simulate a single truck
on a bridge.Truss A set of members arranged vertically in a triangular fashion to form
an integrated load-bearing unit.Ultimate Strength Design Former ACI designation for Load Factor
Design.Ultrasonic Gage A device used to measure the thickness of steel elements
which uses a probe placed in a couplant that is smeared on the surface ofa steel member. See also Couplant.
Underdrain A drainage conduit, usually placed in backfill material and usedto transport runoff away from substructure elements.
Underpass The feature crossed by a bridge.Uniform Load A load distributed uniformly over the length of an element.Uplift A combination of loads which causes the superstructure to lift up off
the substructure.Vertical Used to describe the axis of a bridge which proceeds upward,
perpendicular to the underpass surface.
[1.4]
SUPERELEVATION
TRANSVERSE & VERTICAL
UVW
UNDERDRAIN
T
Highway Bridge Structures
Downloaded from Digital Engineering Library @ McGraw-Hill (www.digitalengineeringlibrary.com)Copyright © 2006 The McGraw-Hill Companies. All rights reserved.
Any use is subject to the Terms of Use as given at the website.
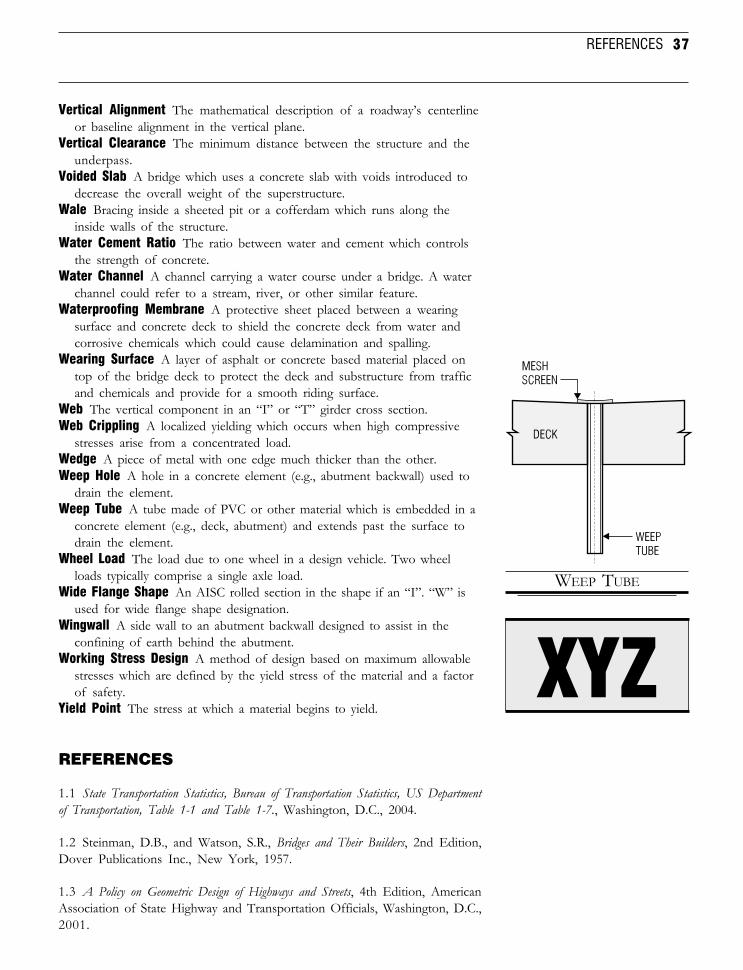
37
Vertical Alignment The mathematical description of a roadway’s centerlineor baseline alignment in the vertical plane.
Vertical Clearance The minimum distance between the structure and theunderpass.
Voided Slab A bridge which uses a concrete slab with voids introduced todecrease the overall weight of the superstructure.
Wale Bracing inside a sheeted pit or a cofferdam which runs along theinside walls of the structure.
Water Cement Ratio The ratio between water and cement which controlsthe strength of concrete.
Water Channel A channel carrying a water course under a bridge. A waterchannel could refer to a stream, river, or other similar feature.
Waterproofing Membrane A protective sheet placed between a wearingsurface and concrete deck to shield the concrete deck from water andcorrosive chemicals which could cause delamination and spalling.
Wearing Surface A layer of asphalt or concrete based material placed ontop of the bridge deck to protect the deck and substructure from trafficand chemicals and provide for a smooth riding surface.
Web The vertical component in an “I” or “T” girder cross section.Web Crippling A localized yielding which occurs when high compressive
stresses arise from a concentrated load.Wedge A piece of metal with one edge much thicker than the other.Weep Hole A hole in a concrete element (e.g., abutment backwall) used to
drain the element.Weep Tube A tube made of PVC or other material which is embedded in a
concrete element (e.g., deck, abutment) and extends past the surface todrain the element.
Wheel Load The load due to one wheel in a design vehicle. Two wheelloads typically comprise a single axle load.
Wide Flange Shape An AISC rolled section in the shape if an “I”. “W” isused for wide flange shape designation.
Wingwall A side wall to an abutment backwall designed to assist in theconfining of earth behind the abutment.
Working Stress Design A method of design based on maximum allowablestresses which are defined by the yield stress of the material and a factorof safety.
Yield Point The stress at which a material begins to yield.
REFERENCES
1.1 State Transportation Statistics, Bureau of Transportation Statistics, US Departmentof Transportation, Table 1-1 and Table 1-7., Washington, D.C., 2004.
1.2 Steinman, D.B., and Watson, S.R., Bridges and Their Builders, 2nd Edition,Dover Publications Inc., New York, 1957.
1.3 A Policy on Geometric Design of Highways and Streets, 4th Edition, AmericanAssociation of State Highway and Transportation Officials, Washington, D.C.,2001.
REFERENCES
WEEP TUBE
XYZ
Highway Bridge Structures
Downloaded from Digital Engineering Library @ McGraw-Hill (www.digitalengineeringlibrary.com)Copyright © 2006 The McGraw-Hill Companies. All rights reserved.
Any use is subject to the Terms of Use as given at the website.

38 SECTION 1 THE STRUCTURE
1.4 Manual for Condition Evaluation of Bridges, 2nd Edition, American Associationof State Highway and Transportation Officials, Washington, D.C., 2003.
1.5 National Transportation Statistics 2004. Table 3-29a, Bureau of Transporta-tion Statistics, US Department of Transportation, Washington, D.C. 2005.
1.6 Kavanagh, Thomas C., and Young, Robert C.Y., “Arches and RigidFrames,” pp. 17-1 to 17-2, Structural Engineering Handbook, Edited by Gaylord,Edwin H. Jr., and Gaylord, Charles N., McGraw-Hill, New York, 1990.
1.7 Bill Cosby: Himself, Jemmin, Inc., released by 20th Century Fox, 1982.
1.8 Heinen, Richard, “Who Should Build Bridges?” Civil Engineering, AmericanSociety of Civil Engineers, vol. 55, no. 7, pp. 63–66, July 1985.
Highway Bridge Structures
Downloaded from Digital Engineering Library @ McGraw-Hill (www.digitalengineeringlibrary.com)Copyright © 2006 The McGraw-Hill Companies. All rights reserved.
Any use is subject to the Terms of Use as given at the website.
2Beginning theProject
here are several important issues which concern the bridgeengineer prior to commencement of design. Before any designcan begin, there is the issue of how bridge projects are selected andfunded. Then there is the issue of which standards and referencesshould be utilized by the engineer during design. Finally, when
design actually begins in earnest, what field data, and, in the case of a rehabilitationproject, record data, are required to commence, and eventually complete the work.
This section of the text is intended to provide the reader with an overviewof the project inception phase of a highway bridge design. While many engineerstend to focus most intently on the nuts and bolts of the actual design, it isimportant to recognize the importance of the issues identified above and howthey affect the underpinnings of any bridge design project. Quite often, designprojects can go astray because of a failure to collect proper field data, amisunderstanding of the owner’s wishes and intents, or even an improper useof reference material.
2.1 PROJECT FUNDING
The design and rehabilitation of highway bridges is an activity which hasconsiderable financial demands. Rehabilitation of a medium size overpassstructure can easily cost over a million dollars. When considering the vastnumber of structures in need of repair, it is easy to see why nationalinfrastructure programs consistently weigh in with multi-billion dollar pricetags. An example of the magnitude of these costs can be found in theTransportation Equity Act for the 21st Century [Ref. 2.1]. The U. S. federalgovernment alone spent $218 billion on the surface transportation from 1998to 2003. When states and local governments are included, the cost exceeded$100 billion per year [Ref. 2.2].
With such huge costs associated for bridges, the obvious question is:where does all this money come from? Funding for highway projects ingeneral, and bridge projects in particular, comes from a variety of sources andvaries from region to region. Fund sources, however, can be broken down intofive principal categories: user fees, nonuser fees, special benefit fees, privatefinancing, and debt financing [Ref. 2.3]. The following offers a brief descrip-tion of these funding sources.
T
Sect
ion
2Pr
ojec
t In
cept
ion
Section Overview
I n this section we willlook at the major issues
which face a bridge engi-neer prior to design. Webegin with a discussion ofhow highway projects arefunded. Following this isa look at some of the impor-tant reference material de-signers must consult. Thesection concludes with adetailed presentation of theimportant issue of bridgeinspection and how it affectsthe design of new bridgesand the rehabilitation ofexisting bridges.
Downloaded from Digital Engineering Library @ McGraw-Hill (www.digitalengineeringlibrary.com)Copyright © 2006 The McGraw-Hill Companies. All rights reserved.
Any use is subject to the Terms of Use as given at the website.
Source: Bridge Engineering
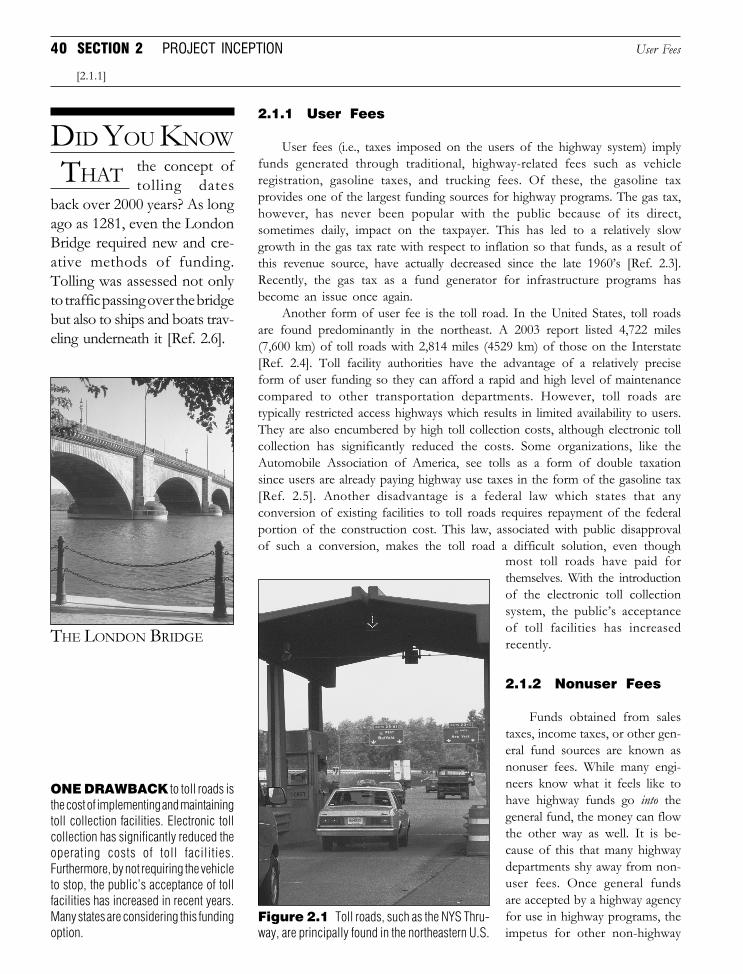
40 SECTION 2 PROJECT INCEPTION
2.1.1 User Fees
User fees (i.e., taxes imposed on the users of the highway system) implyfunds generated through traditional, highway-related fees such as vehicleregistration, gasoline taxes, and trucking fees. Of these, the gasoline taxprovides one of the largest funding sources for highway programs. The gas tax,however, has never been popular with the public because of its direct,sometimes daily, impact on the taxpayer. This has led to a relatively slowgrowth in the gas tax rate with respect to inflation so that funds, as a result ofthis revenue source, have actually decreased since the late 1960’s [Ref. 2.3].Recently, the gas tax as a fund generator for infrastructure programs hasbecome an issue once again.
Another form of user fee is the toll road. In the United States, toll roadsare found predominantly in the northeast. A 2003 report listed 4,722 miles(7,600 km) of toll roads with 2,814 miles (4529 km) of those on the Interstate[Ref. 2.4]. Toll facility authorities have the advantage of a relatively preciseform of user funding so they can afford a rapid and high level of maintenancecompared to other transportation departments. However, toll roads aretypically restricted access highways which results in limited availability to users.They are also encumbered by high toll collection costs, although electronic tollcollection has significantly reduced the costs. Some organizations, like theAutomobile Association of America, see tolls as a form of double taxationsince users are already paying highway use taxes in the form of the gasoline tax[Ref. 2.5]. Another disadvantage is a federal law which states that anyconversion of existing facilities to toll roads requires repayment of the federalportion of the construction cost. This law, associated with public disapprovalof such a conversion, makes the toll road a difficult solution, even though
ONE DRAWBACK to toll roads isthe cost of implementing and maintainingtoll collection facilities. Electronic tollcollection has significantly reduced theoperating costs of toll facilities.Furthermore, by not requiring the vehicleto stop, the public’s acceptance of tollfacilities has increased in recent years.Many states are considering this fundingoption.
DID YOU KNOW
THAT the concept oftolling dates
back over 2000 years? As longago as 1281, even the LondonBridge required new and cre-ative methods of funding.Tolling was assessed not onlyto traffic passing over the bridgebut also to ships and boats trav-eling underneath it [Ref. 2.6].
most toll roads have paid forthemselves. With the introductionof the electronic toll collectionsystem, the public’s acceptanceof toll facilities has increasedrecently.
2.1.2 Nonuser Fees
Funds obtained from salestaxes, income taxes, or other gen-eral fund sources are known asnonuser fees. While many engi-neers know what it feels like tohave highway funds go into thegeneral fund, the money can flowthe other way as well. It is be-cause of this that many highwaydepartments shy away from non-user fees. Once general fundsare accepted by a highway agencyfor use in highway programs, theimpetus for other non-highway
THE LONDON BRIDGE
User Fees
[2.1.1]
Figure 2.1 Toll roads, such as the NYS Thru-way, are principally found in the northeastern U.S.
Downloaded from Digital Engineering Library @ McGraw-Hill (www.digitalengineeringlibrary.com)Copyright © 2006 The McGraw-Hill Companies. All rights reserved.
Any use is subject to the Terms of Use as given at the website.
Beginning the Project
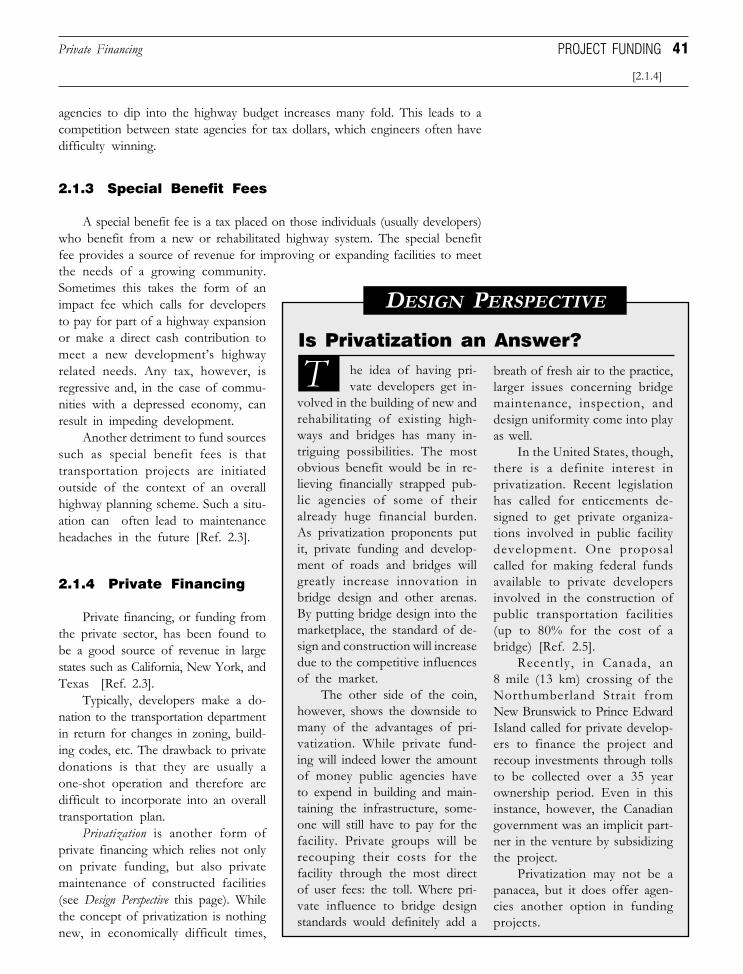
41
Is Privatization an Answer?
Tvolved in the building of new andrehabilitating of existing high-ways and bridges has many in-triguing possibilities. The mostobvious benefit would be in re-lieving financially strapped pub-lic agencies of some of theiralready huge financial burden.As privatization proponents putit, private funding and develop-ment of roads and bridges willgreatly increase innovation inbridge design and other arenas.By putting bridge design into themarketplace, the standard of de-sign and construction will increasedue to the competitive influencesof the market.
The other side of the coin,however, shows the downside tomany of the advantages of pri-vatization. While private fund-ing will indeed lower the amountof money public agencies haveto expend in building and main-taining the infrastructure, some-one will still have to pay for thefacility. Private groups will berecouping their costs for thefacility through the most directof user fees: the toll. Where pri-vate influence to bridge designstandards would definitely add a
he idea of having pri-vate developers get in-
DESIGN PERSPECTIVE
breath of fresh air to the practice,larger issues concerning bridgemaintenance, inspection, anddesign uniformity come into playas well.
In the United States, though,there is a definite interest inprivatization. Recent legislationhas called for enticements de-signed to get private organiza-tions involved in public facilitydevelopment. One proposalcalled for making federal fundsavailable to private developersinvolved in the construction ofpublic transportation facilities(up to 80% for the cost of abridge) [Ref. 2.5].
Recently, in Canada, an8 mile (13 km) crossing of theNorthumberland Strait fromNew Brunswick to Prince EdwardIsland called for private develop-ers to finance the project andrecoup investments through tollsto be collected over a 35 yearownership period. Even in thisinstance, however, the Canadiangovernment was an implicit part-ner in the venture by subsidizingthe project.
Privatization may not be apanacea, but it does offer agen-cies another option in fundingprojects.
the needs of a growing community.Sometimes this takes the form of animpact fee which calls for developersto pay for part of a highway expansionor make a direct cash contribution tomeet a new development’s highwayrelated needs. Any tax, however, isregressive and, in the case of commu-nities with a depressed economy, canresult in impeding development.
Another detriment to fund sourcessuch as special benefit fees is thattransportation projects are initiatedoutside of the context of an overallhighway planning scheme. Such a situ-ation can often lead to maintenanceheadaches in the future [Ref. 2.3].
2.1.4 Private Financing
Private financing, or funding fromthe private sector, has been found tobe a good source of revenue in largestates such as California, New York, andTexas [Ref. 2.3].
Typically, developers make a do-nation to the transportation departmentin return for changes in zoning, build-ing codes, etc. The drawback to privatedonations is that they are usually aone-shot operation and therefore aredifficult to incorporate into an overalltransportation plan.
Privatization is another form ofprivate financing which relies not onlyon private funding, but also privatemaintenance of constructed facilities(see Design Perspective this page). Whilethe concept of privatization is nothingnew, in economically difficult times,
agencies to dip into the highway budget increases many fold. This leads to acompetition between state agencies for tax dollars, which engineers often havedifficulty winning.
2.1.3 Special Benefit Fees
A special benefit fee is a tax placed on those individuals (usually developers)who benefit from a new or rehabilitated highway system. The special benefitfee provides a source of revenue for improving or expanding facilities to meet
PROJECT FUNDING
[2.1.4]
Private Financing
Downloaded from Digital Engineering Library @ McGraw-Hill (www.digitalengineeringlibrary.com)Copyright © 2006 The McGraw-Hill Companies. All rights reserved.
Any use is subject to the Terms of Use as given at the website.
Beginning the Project
42 SECTION 2 PROJECT INCEPTION
the concept gains increased attention. At one end of the spectrum, privatiza-tion allows for a private organization to entirely fund, build, and maintain apublic facility, such as a transportation project. Transportation projects,however, often require the developer to perform activities like right-of-wayacquisition, environmental assessment, etc., that public agencies are bettersuited to handle. Due to these, and other issues, a privatization scheme whichallows a private group to work in concert with a public agency can provide formore flexibility and a higher chance of success [Ref. 2.7]
Countries like Mexico and Pakistan are aggressively pursuing privatizationinitiatives to fund transportation projects. Mexico allows private groups tofinance and build public toll roads. Ownership stays with the private group for20 years after which the facility is turned over to the government. Acting in thepublic’s interest, the Mexican government sets the toll prices [Ref. 2.8].
2.1.5 Debt Financing
Debt financing, usually through revenue bonds, offers a “pay-as-you-go”approach to financing highway projects. This method has the advantage ofproviding highway departments with immediate access to funds which can beused on major projects in a timely fashion. An obvious danger would be in anagency’s overborrowing, leaving transportation departments with a shortfall incovering maintenance needs. Because of this danger, debt financing is avoidedas a source of revenue for ongoing maintenance and construction require-ments. For areas with a solid (and growing) tax base, debt financing is more ofan option than for smaller communities [Ref. 2.3].
2.1.6 Conclusions
To many engineers, the process of funding projects is the domain ofplanners and highway department administrators. However, not only is thebridge engineer’s livelihood directly linked to this funding, the magnitude andextent of design is quite often dictated by the way a transportation departmentreceives and allocates monetary resources. To understand this, one only has tocompare how bridges are designed and rehabilitated on a toll road with thosein a rural county. The spending on surface transportation infrastructure in theUnited States alone encompasses over $100 billion every year [Ref. 2.2]. Bridgeengineers not only need to understand the funding mechanisms that drivebridge design projects, but they must also become part of the process of moreefficiently allocating these massive resources.
2.2 TYPES OF DESIGN STANDARDS
The design of a highway bridge, like most any other civil engineeringproject, is dependent on certain standards and criteria. Naturally, the criticalimportance of highway bridges in a modern transportation system would implya set of rigorous design specifications to ensure the safety and overall qualityof the constructed project. However, as Figure 2.2 may indicate, the volumeof information which a bridge engineer must consult throughout the course ofany given design can be somewhat formidable.
DID YOU KNOW
THAT after year 2007,all bridges in
the U.S. will be designed us-ing AASHTO LRFD Specifi-cations to qualify for federalfunding?
ridge engineers not onlyneed to understand theB
funding mechanisms thatdrive bridge design projects,but they must also becomepart of the process of moreefficiently allocating thesemassive resources.
Debt Financing
[2.1.4]
ountries like Mexico andPakistan are aggressively
pursuing privatization initiativesto fund transportation projects.
C
Downloaded from Digital Engineering Library @ McGraw-Hill (www.digitalengineeringlibrary.com)Copyright © 2006 The McGraw-Hill Companies. All rights reserved.
Any use is subject to the Terms of Use as given at the website.
Beginning the Project
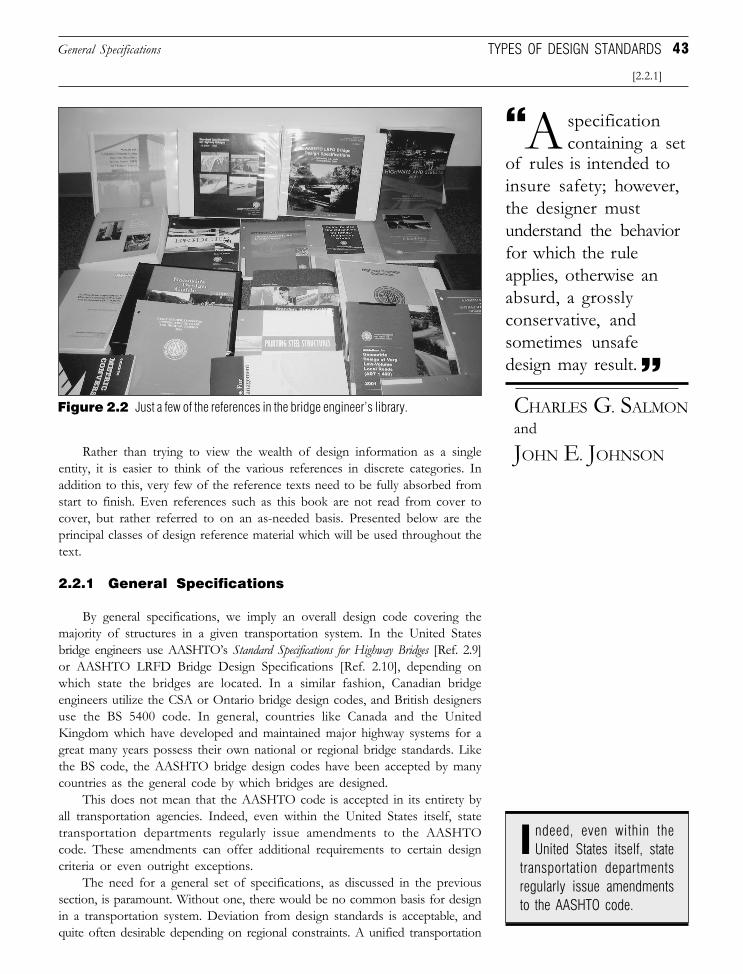
43
specificationcontaining a set
of rules is intended toinsure safety; however,the designer mustunderstand the behaviorfor which the ruleapplies, otherwise anabsurd, a grosslyconservative, andsometimes unsafedesign may result.
A
CHARLES G. SALMONand
JOHN E. JOHNSON
Figure 2.2 Just a few of the references in the bridge engineer’s library.
Rather than trying to view the wealth of design information as a singleentity, it is easier to think of the various references in discrete categories. Inaddition to this, very few of the reference texts need to be fully absorbed fromstart to finish. Even references such as this book are not read from cover tocover, but rather referred to on an as-needed basis. Presented below are theprincipal classes of design reference material which will be used throughout thetext.
2.2.1 General Specifications
By general specifications, we imply an overall design code covering themajority of structures in a given transportation system. In the United Statesbridge engineers use AASHTO’s Standard Specifications for Highway Bridges [Ref. 2.9]or AASHTO LRFD Bridge Design Specifications [Ref. 2.10], depending onwhich state the bridges are located. In a similar fashion, Canadian bridgeengineers utilize the CSA or Ontario bridge design codes, and British designersuse the BS 5400 code. In general, countries like Canada and the UnitedKingdom which have developed and maintained major highway systems for agreat many years possess their own national or regional bridge standards. Likethe BS code, the AASHTO bridge design codes have been accepted by manycountries as the general code by which bridges are designed.
This does not mean that the AASHTO code is accepted in its entirety byall transportation agencies. Indeed, even within the United States itself, statetransportation departments regularly issue amendments to the AASHTOcode. These amendments can offer additional requirements to certain designcriteria or even outright exceptions.
The need for a general set of specifications, as discussed in the previoussection, is paramount. Without one, there would be no common basis for designin a transportation system. Deviation from design standards is acceptable, andquite often desirable depending on regional constraints. A unified transportation
TYPES OF DESIGN STANDARDS
[2.2.1]
General Specifications
ndeed, even within theUnited States itself, stateI
transportation departmentsregularly issue amendmentsto the AASHTO code.
Downloaded from Digital Engineering Library @ McGraw-Hill (www.digitalengineeringlibrary.com)Copyright © 2006 The McGraw-Hill Companies. All rights reserved.
Any use is subject to the Terms of Use as given at the website.
Beginning the Project
44 SECTION 2 PROJECT INCEPTION
network, however, demands a consistent standard, and this is exactly what theAASHTO specifications offer.
Currently, both AASHTO Standard Specifications and AASHTO LRFDspecifications are used by different states, but the trend is that more and morestates are adopting LRFD method. The major advantage of using LRFD is tohave a uniform and predictable reliability. To speed up the effort to unify thedesign standard across the nation, the U. S. Department of Transportation setup year 2007 as the deadline after which all bridges will have to be designedusing AASHTO LRFD to qualify for federal funding.
2.2.2 Material-Related Design Codes
Material design codes are those standards which pertain to bridge compo-nents constructed out of various engineering materials such as steel, concrete,prestressed concrete, timber, etc. General material specifications are put forthby the American Society for Testing and Materials (ASTM). These specifica-tions cover a wide range of materials and are contained within numerousvolumes. For the application of specific materials in bridge design the follow-ing organizations offer material-related design information:
1. Steel. The American Institute of Steel Construction (AISC) offersstructural steel related design and detailing manuals. Where AASHTO iscomprised of professionals from member state transportation depart-ments, AISC standards are developed by steel fabricators, designprofessionals, and manufacturing companies [Ref. 2.11]. The principalAISC reference to be used throughout this text is the Manual of SteelConstruction—LRFD [Ref. 2.12]. AISC also publishes design informationbased on the Allowable Stress Design (ASD) method [Ref. 2.13], but it isbeing phased out because the advantage of LRFD over ASD has beenrecognized by most structural engineers. The organization was founded in1921 and, like other similar organizations listed below, seeks to advance theuse of its material (i.e., steel) in construction projects.
2. Concrete. The American Concrete Institute (ACI) offers bridge engi-neers a set of standards in the analysis and design of reinforced concretestructures. The principal design manual to be used throughout this text isthe Building Code and Commentary [Ref. 2.14]. Like the AASHTO and AISCspecifications, the ACI code covers almost all of the essential informationa bridge engineer will need in the design of concrete elements. The ACIDetailing Manual [Ref. 2.15] is another important publication which providesthe designer with guidelines on how to detail concrete structures andelements. As we will see later in the text, detailing and drafting the finalcontract documents is not a trivial effort to be treated lightly (see Section 5.2).In conjunction with these texts, ACI offers a wide variety of referencescovering various other material standards and specifications which thedesigner can refer to on an as-needed basis.
For prestressed concrete structures, the Prestressed Concrete Institute(PCI) publishes the PCI Design Handbook [Ref. 2.16].
3. Timber. For bridge structures or structural components constructed outof timber, designers can refer to the Timber Construction Manual [Ref. 2.17]
s we will see later in thetext, detailing and draftingA
the final contract documents isnot a trivial effort to be treatedlightly.
Material-Related Design Codes
[2.2.1]
Downloaded from Digital Engineering Library @ McGraw-Hill (www.digitalengineeringlibrary.com)Copyright © 2006 The McGraw-Hill Companies. All rights reserved.
Any use is subject to the Terms of Use as given at the website.
Beginning the Project
45
published by the American Institute of Timber Construction (AITC) andthe National Design Specification for Wood Construction [Ref. 2.18] issued by theAmerican Wood Council (AWC).
It is important to note that, although these manuals offer informationspecific to various design materials, the AASHTO Specification still providesits own interpretation and guidelines for the use of the material in highwaybridge structures. For example, an entire section of the AASHTO StandardSpecifications discusses the use of timber in highway bridges. While this doesnot imply that bridge designers need only reference the AASHTO Specifica-tions, it should alert the reader to make sure that all possible standards havebeen investigated and the most reasonable specifications applied to the designat hand. Normally, AASHTO specifications adopt the same design philoso-phies as those manuals, but AASHTO takes a more conservative approach soit may not necessarily use the identical equations as in these material designmanuals.
One has to keep in mind that these material-related codes mostly deal withbuilding structural design, therefore, they can only be used as references andbackground information. Bridge engineers should always apply AASHTOCode for the design.
2.2.3 Use of Design Standards
It does not take one long to reach the disclaimer in a set of designstandards like those listed above. Sometimes this disclaimer can be found inthe preface, where it says something like, “While these data have beenprepared in accordance with recognized engineering principles and are basedon the most accurate and reliable technical data available, they should not beused or relied upon for any general or specific application without competentprofessional examination and verification ...” [Ref. 2.17].
While, in a way, this may frustrate an engineer looking for the answer in areference, it should also serve as a signal for the responsibility the engineercarries in any design. Salmon and Johnson’s quote at the beginning of thissection illustrates the point quite nicely. Design specifications are essential toolswhich the bridge engineer uses in cobbling together a design, but by no meansdo they offer a uniform template for punching out final contract documents.
In this text we will look at several basic design examples which act as anexcellent guide through the design process. These examples, however, cannotpossibly cover every aspect of design which an engineer will encounter. In onesense, this is what makes bridge engineering so challenging. Even a set ofstructures in the same contract submission will offer distinctly different designproblems for each bridge.
One bridge may have footings on rock, while another requires piles. Astructure on a straight alignment leading into another on a horizontal curve canmake a world of difference between two apparently identical structures only afew hundred feet apart. The design should define the boundary conditions andthe specifications should apply to those constraints, not the other way around.
The bridge engineer should also think to question and improve uponreference design material whenever possible. This does not mean that oneshould begin to question things like the HS20-44 design vehicle, but items like
TYPES OF DESIGN STANDARDS
[2.2.3]
Use of Design Standards
he design should define theboundary conditions and theT
specifications should apply tothose constraints, not the otherway around.
Downloaded from Digital Engineering Library @ McGraw-Hill (www.digitalengineeringlibrary.com)Copyright © 2006 The McGraw-Hill Companies. All rights reserved.
Any use is subject to the Terms of Use as given at the website.
Beginning the Project
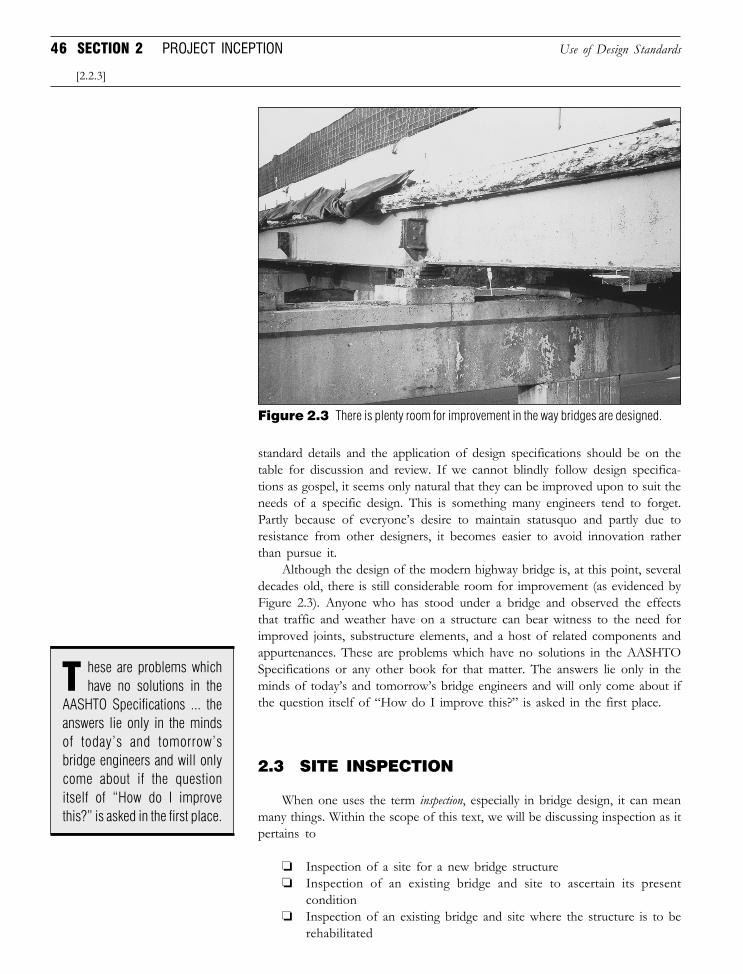
46 SECTION 2 PROJECT INCEPTION
Figure 2.3 There is plenty room for improvement in the way bridges are designed.
standard details and the application of design specifications should be on thetable for discussion and review. If we cannot blindly follow design specifica-tions as gospel, it seems only natural that they can be improved upon to suit theneeds of a specific design. This is something many engineers tend to forget.Partly because of everyone’s desire to maintain statusquo and partly due toresistance from other designers, it becomes easier to avoid innovation ratherthan pursue it.
Although the design of the modern highway bridge is, at this point, severaldecades old, there is still considerable room for improvement (as evidenced byFigure 2.3). Anyone who has stood under a bridge and observed the effectsthat traffic and weather have on a structure can bear witness to the need forimproved joints, substructure elements, and a host of related components andappurtenances. These are problems which have no solutions in the AASHTOSpecifications or any other book for that matter. The answers lie only in theminds of today’s and tomorrow’s bridge engineers and will only come about ifthe question itself of “How do I improve this?” is asked in the first place.
2.3 SITE INSPECTION
When one uses the term inspection, especially in bridge design, it can meanmany things. Within the scope of this text, we will be discussing inspection as itpertains to
❏ Inspection of a site for a new bridge structure❏ Inspection of an existing bridge and site to ascertain its present
condition❏ Inspection of an existing bridge and site where the structure is to be
rehabilitated
Use of Design Standards
[2.2.3]
hese are problems whichhave no solutions in theT
AASHTO Specifications ... theanswers lie only in the mindsof today’s and tomorrow’sbridge engineers and will onlycome about if the questionitself of “How do I improvethis?” is asked in the first place.
Downloaded from Digital Engineering Library @ McGraw-Hill (www.digitalengineeringlibrary.com)Copyright © 2006 The McGraw-Hill Companies. All rights reserved.
Any use is subject to the Terms of Use as given at the website.
Beginning the Project
47
There is a great deal of overlap between the various forms of inspection,with the greatest degree of commonality existing between the latter two typeslisted above. The reader should be aware, however, that the level of detail in aninspection varies depending on what the intent is. With regard to new bridgestructures, a great deal of time and effort will be focused on geologicconditions, highway alignment orientation, and underpass crossing features. Ina rehabilitation design, the inspecting engineer will spend time focusing on theexisting structure elements in an effort to determine which need simplemaintenance and which need extensive rehabilitation or replacement. Mainte-nance inspections, conducted to rate a bridge structure and judge its perfor-mance, are more rapidly conducted than the other two forms. The principalintent of this type of inspection is to document the structure’s condition andaid in deciding whether maintenance or rehabilitation is required.
This section is titled Site Inspection, because it is important to rememberthat a highway bridge exists within a defined environment. This environment iscomposed of many other features in addition to the bridge structure. A bridgeinspection can fail if the inspector does not take into account important sitefeatures such as drainage channels, wetland, embankments, utility lines, etc.,and how they function within the confines of the bridge site.
2.3.1 The Scoping Inspection
In the case of a new or rehabilitation design a thorough site inspectionshould be conducted by principal members of the design team prior tocommencement of design. There are two levels of inspection which should beconducted. First, a cursory visit or scoping inspection should be made todetermine any physical or natural constraints at the site. The design teamproject manager, the lead designer, and (if possible) a representative of theowner should attend this inspection. Prior to the site visit, any record docu-ments concerning the site or an existing structure should be reviewed. Thesedocuments could be in the form of a base map, prior inspection reports, andas-built plans.
There are a variety of site characteristics which need to be investigated forthe engineer to begin formulating the boundary conditions of the project.Some of the major site features which should be investigated are:
❏ Drainage conditions and potential wetland impacts❏ Vertical clearance❏ Soil condition❏ Horizontal and vertical alignment constraints❏ Underpass or channel constraints❏ Potential utility impacts
Following the scoping inspection, a more detailed follow-up inspectionshould be made. In the detailed site inspection, actual physical measurements arerecorded, photographs are taken, and a report prepared.
When dealing with a rehabilitation project or performing a maintenanceinspection, however, the designer is also faced with having to evaluate anexisting structure. The following section describes some of the major issuesconcerning the detailed site inspection for a rehabilitation design project.
SITE INSPECTION
[2.3.1]
The Scoping Inspection
A bridge inspection can failif the inspector does not
take into account importantsite features such as drainagechannels, wetland, embank-ments, utility lines, etc., andhow they function within theconfines of the bridge site.
Downloaded from Digital Engineering Library @ McGraw-Hill (www.digitalengineeringlibrary.com)Copyright © 2006 The McGraw-Hill Companies. All rights reserved.
Any use is subject to the Terms of Use as given at the website.
Beginning the Project
48 SECTION 2 PROJECT INCEPTION
2.3.2 Recording the Inspection
As would be expected, the inspection of an existing structure is brokendown by structural components. In Section 1.1.1, an overview of the majorstructural components for a typical slab-on-stringer bridge was presented. Theinspection process is centered around these components and their associatedelements. Summarizing from Section 1.1.1, an example of a structural compo-nent is an abutment, where a pedestal in that abutment is an element. Eachelement is assigned a rating value after which the entire component proper isgiven a rating. This procedure is repeated for all major structural componentssuch as piers, the deck, superstructure, etc. A final, overall rating is thendetermined for the entire structure.
The Federal Highway Administration utilizes a rigorous inspection systembased on a scale of 0 to 9 (see sidebar on this page) [Ref. 2.19]. Usingpredefined inspection forms, the inspection team rates the structural compo-nents, photographs key elements, and documents their findings for submissionto the owner. Any component with a rating of 4 or less is documented ingreater detail with notes and sketches.
For the owner, the inspection report offers a consistent method fortracking the condition of bridge structures in their transportation network anddeciding which bridges require maintenance or rehabilitation. For the designerin a rehabilitation project, the inspection report acts as a reference documentthroughout the course of design. As a rule of thumb, it is only feasible for theengineer to visit a project site on certain occasions. Therefore, it is necessary,not only for record purposes but also for design purposes, to have a well-documented inspection of the structure.
When an inspection is being conducted for design purposes, the inspectionteam is not only concerned with rating the performance and functionality ofvarious elements but must also take specific field measurements which detailthe extent of deterioration in an element. These measurements will eventuallybe used to
❏ Prepare the preliminary design and scope of work for the project❏ Analyze the adequacy of structural components to remain, be repaired,
or replaced❏ Develop rehabilitation alternatives❏ Provide a basis for making an accurate cost estimate
Detailed field measurements are essential if a designer is to define arealistic scope of work for a project. It is one thing to say a pier columnrates a 3 or a 4, but knowing that 20% to 30% of the column surface isdeteriorated to a depth below the reinforcing steel provides the engineerwith the ability to make a decision on whether to patch the column orreplace it. Noting that a steel primary member shows evidence of rustingand paint loss is helpful in flagging a bridge for maintenance work, but alsoknowing that the stringer has lost 20% of its section properties allows foran accurate load rating analysis to be performed. Final costs are alwaysmore realistic when they can be backed up with documented field mea-surements. This is especially true when patching or superficial maintenanceis being conducted on an element.
THE FHWA RATING system isbased on a scale from 0 to 9. An inspectionmanual is provided to bridge inspectorsdescribing how various componentsshould be rated and which ratings shouldbe assigned for various levels of deterio-ration.
Rating 0-1: Potentially hazard-ous.
Rating 2-4: Poor condition.Rating 5-6: Fair condition.Rating 7-9: Good to excellent
condition.
Rating N: Not inspected or unknown.
Recording the Inspection
[2.3.2]
Downloaded from Digital Engineering Library @ McGraw-Hill (www.digitalengineeringlibrary.com)Copyright © 2006 The McGraw-Hill Companies. All rights reserved.
Any use is subject to the Terms of Use as given at the website.
Beginning the Project
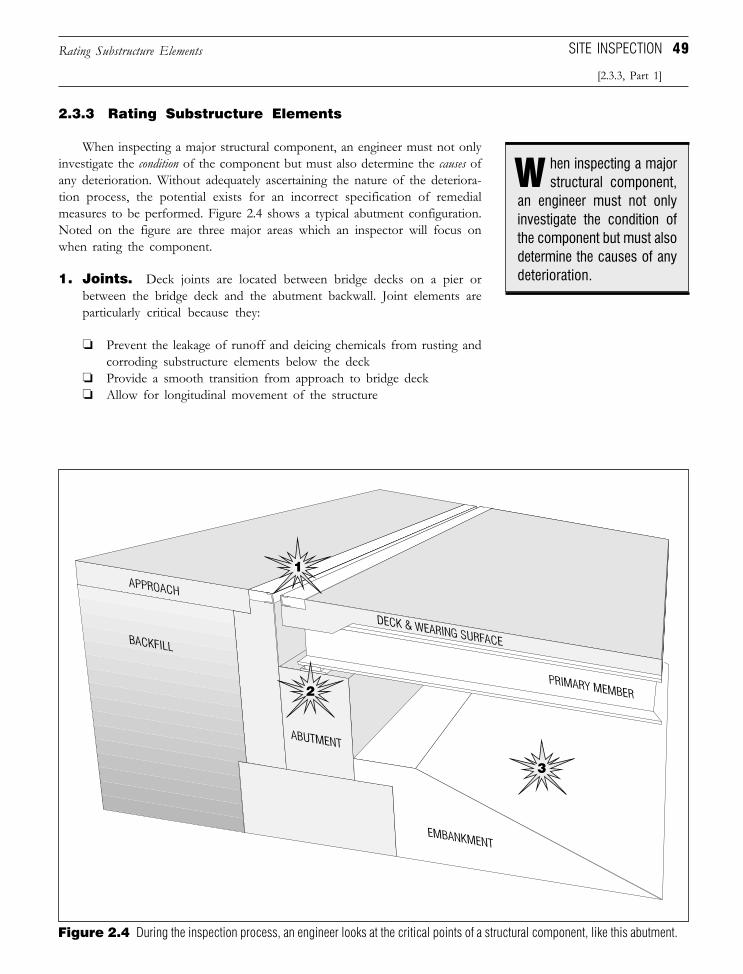
49
2.3.3 Rating Substructure Elements
When inspecting a major structural component, an engineer must not onlyinvestigate the condition of the component but must also determine the causes ofany deterioration. Without adequately ascertaining the nature of the deteriora-tion process, the potential exists for an incorrect specification of remedialmeasures to be performed. Figure 2.4 shows a typical abutment configuration.Noted on the figure are three major areas which an inspector will focus onwhen rating the component.
1. Joints. Deck joints are located between bridge decks on a pier orbetween the bridge deck and the abutment backwall. Joint elements areparticularly critical because they:
❏ Prevent the leakage of runoff and deicing chemicals from rusting andcorroding substructure elements below the deck
❏ Provide a smooth transition from approach to bridge deck❏ Allow for longitudinal movement of the structure
SITE INSPECTION
[2.3.3, Part 1]
Rating Substructure Elements
Figure 2.4 During the inspection process, an engineer looks at the critical points of a structural component, like this abutment.
hen inspecting a majorstructural component,W
an engineer must not onlyinvestigate the condition ofthe component but must alsodetermine the causes of anydeterioration.
Downloaded from Digital Engineering Library @ McGraw-Hill (www.digitalengineeringlibrary.com)Copyright © 2006 The McGraw-Hill Companies. All rights reserved.
Any use is subject to the Terms of Use as given at the website.
Beginning the Project
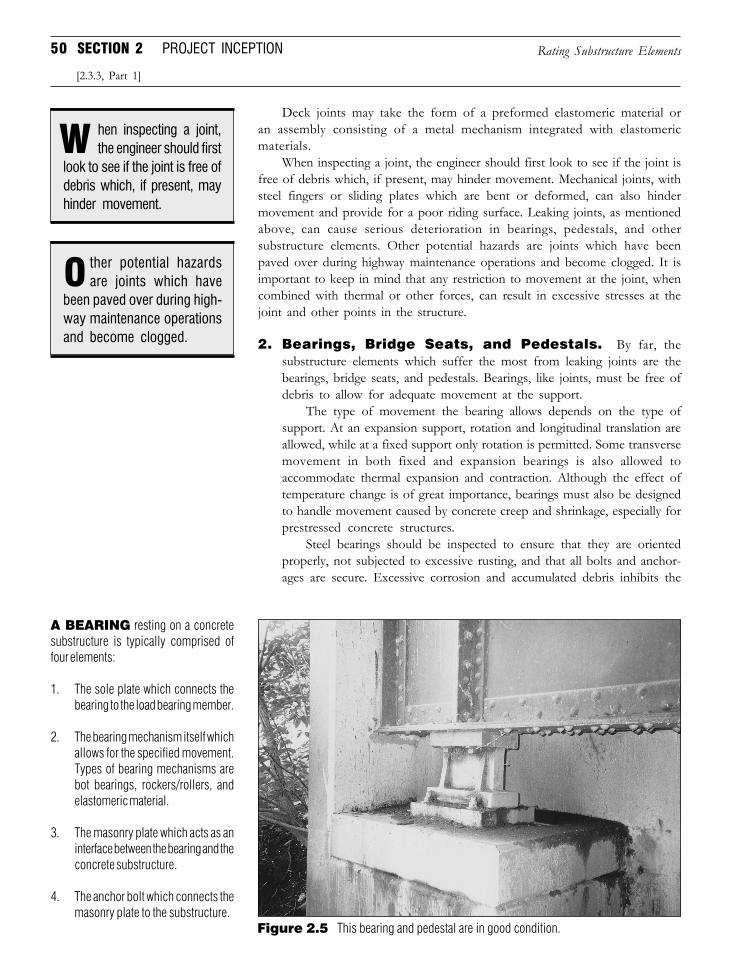
50 SECTION 2 PROJECT INCEPTION
Deck joints may take the form of a preformed elastomeric material oran assembly consisting of a metal mechanism integrated with elastomericmaterials.
When inspecting a joint, the engineer should first look to see if the joint isfree of debris which, if present, may hinder movement. Mechanical joints, withsteel fingers or sliding plates which are bent or deformed, can also hindermovement and provide for a poor riding surface. Leaking joints, as mentionedabove, can cause serious deterioration in bearings, pedestals, and othersubstructure elements. Other potential hazards are joints which have beenpaved over during highway maintenance operations and become clogged. It isimportant to keep in mind that any restriction to movement at the joint, whencombined with thermal or other forces, can result in excessive stresses at thejoint and other points in the structure.
2. Bearings, Bridge Seats, and Pedestals. By far, thesubstructure elements which suffer the most from leaking joints are thebearings, bridge seats, and pedestals. Bearings, like joints, must be free ofdebris to allow for adequate movement at the support.
The type of movement the bearing allows depends on the type ofsupport. At an expansion support, rotation and longitudinal translation areallowed, while at a fixed support only rotation is permitted. Some transversemovement in both fixed and expansion bearings is also allowed toaccommodate thermal expansion and contraction. Although the effect oftemperature change is of great importance, bearings must also be designedto handle movement caused by concrete creep and shrinkage, especially forprestressed concrete structures.
Steel bearings should be inspected to ensure that they are orientedproperly, not subjected to excessive rusting, and that all bolts and anchor-ages are secure. Excessive corrosion and accumulated debris inhibits the
Rating Substructure Elements
[2.3.3, Part 1]
Wlook to see if the joint is free ofdebris which, if present, mayhinder movement.
hen inspecting a joint,the engineer should first
been paved over during high-way maintenance operationsand become clogged.
ther potential hazardsare joints which haveO
A BEARING resting on a concretesubstructure is typically comprised offour elements:
1. The sole plate which connects thebearing to the load bearing member.
2. The bearing mechanism itself whichallows for the specified movement.Types of bearing mechanisms arebot bearings, rockers/rollers, andelastomeric material.
3. The masonry plate which acts as aninterface between the bearing and theconcrete substructure.
4. The anchor bolt which connects themasonry plate to the substructure.
Figure 2.5 This bearing and pedestal are in good condition.
Downloaded from Digital Engineering Library @ McGraw-Hill (www.digitalengineeringlibrary.com)Copyright © 2006 The McGraw-Hill Companies. All rights reserved.
Any use is subject to the Terms of Use as given at the website.
Beginning the Project
51
bearing from functioning as it was designed. Elastomeric-type bearingsshould be checked for excessive deformation to the pad. Any distortion toan elastomeric bearing which exceeds 25% the height of the bearing isconsidered excessive. Another concern is hardening of the elastomericmaterial over time. Hardening of the material, evidenced by cracking anddiscoloration, inhibits the ability of the bearing to accommodate structuremovement.
For bridge seats, a critical issue is whether or not the integrity of thebearing surface area has been corrupted. Such loss of bearing area willbe illustrated in the bridge seat and pedestal by map cracking, spalling,and, in extreme cases, loss ofconcrete at the perimeter of thepedestal. This is a situation whichcan result from inadequate rein-forcing steel in the pedestal. Anytime an engineer sees a situationwhere there is space between themasonry plate of a bearing andthe concrete bearing surface, im-mediate repair should be recom-mended. The affected girder mayneed to be temporarily supportedif extensive repair is to be per-formed under the bearing.
Probably the most commonculprit leading to the physicaldeterioration of a bearing and/orpedestal is leakage from a deckjoint. Once the integrity of thejoint has been compromised, theflow of deicing agents, water, andother potentially corrosive sub-stances will begin to affect theperformance of a bearing. Again,the situation which the inspectorshould look for is if the deteriora-tion that has occurred is impedingthe movement for which the bear-ing was designed.
Another danger at the bearinglocation is the effect of longitudi-nal movement at the approach/abutment interface. The cumula-tive effect of vehicle impact andthermal expansion and contractioncan lead to excessive bearing de-formation or even collapse of thespan. Since movement at the bridgedeck joints is so critical, the com-bination of corrosion inhibiting
Who should inspect what and when?
Tof bridge inspection and how itshould be conducted. In the UnitedStates, the minimum requirementset forth by the Federal HighwayAdministration is a biennial inspec-tion conducted by a certified bridgeinspector who may or may not bea licensed professional engineer.There is, however, a good deal ofdebate over the type of person whoshould be inspecting a structureand the extent and level of detail ofthe inspection.
One thinking calls for bridgeengineers to play a more activerole in the inspection process. Theidea is that bridge designers arebetter suited to identifying designfailings such as fatigue, cracking,and other adverse structural con-ditions. By involving the designengineer in review of the struc-tural design, the argument goes,many potentially hazardous situa-tions can be avoided by pointingthe inspection team in the rightdirection [Ref. 2.21].
Others argue that bridgeinspection is essentially a visuallyoriented project that stands apartfrom the design of the structureitself. It is the inspector’s role to
here are many schoolsof thought on the nature
DESIGN PERSPECTIVE
identify how the structure is per-forming in its present environ-ment and that any design consid-erations are, at this point, moot.Rather than spending funds ondesign review, they would be bet-ter spent on diagnostic tools andincreased inspector education[Ref. 2.22].
As to who should be con-ducting the inspection, some statesrequire that a licensed profes-sional engineer be in charge of theinspection team. In states withthousands of structures requiringinspection every 2 years, however,the demand on personnel resourcesis severe.
A compromise solution is tosupplement the current biennialroutine inspection with a detailedin-depth inspection every 4 to 5years, lead by a professional engi-neer. The biennial inspection wouldcontinue to serve in flaggingbridges in extreme disrepair andrating component and elementcondition. The detailed in-depthinspection would allow for an in-tensive look at potential strength-ening measures and review ofcomponent performance. Any ex-pansion, however, will put a drainon already limited resources.
SITE INSPECTION
[2.3.3, Part 2]
Rating Substructure Elements
Oflow of ... potentially corrosivesubstances will begin to affectthe performance of a bearing.
nce the integrity of the jointhas been compromised, the
Downloaded from Digital Engineering Library @ McGraw-Hill (www.digitalengineeringlibrary.com)Copyright © 2006 The McGraw-Hill Companies. All rights reserved.
Any use is subject to the Terms of Use as given at the website.
Beginning the Project
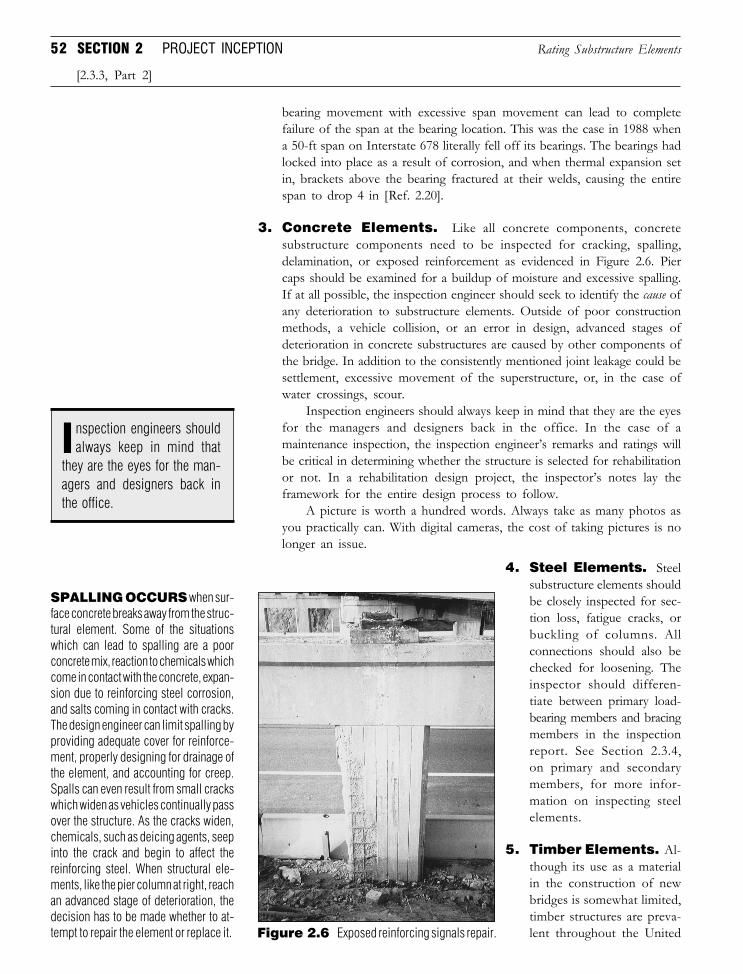
52 SECTION 2 PROJECT INCEPTION
bearing movement with excessive span movement can lead to completefailure of the span at the bearing location. This was the case in 1988 whena 50-ft span on Interstate 678 literally fell off its bearings. The bearings hadlocked into place as a result of corrosion, and when thermal expansion setin, brackets above the bearing fractured at their welds, causing the entirespan to drop 4 in [Ref. 2.20].
3. Concrete Elements. Like all concrete components, concretesubstructure components need to be inspected for cracking, spalling,delamination, or exposed reinforcement as evidenced in Figure 2.6. Piercaps should be examined for a buildup of moisture and excessive spalling.If at all possible, the inspection engineer should seek to identify the cause ofany deterioration to substructure elements. Outside of poor constructionmethods, a vehicle collision, or an error in design, advanced stages ofdeterioration in concrete substructures are caused by other components ofthe bridge. In addition to the consistently mentioned joint leakage could besettlement, excessive movement of the superstructure, or, in the case ofwater crossings, scour.
Inspection engineers should always keep in mind that they are the eyesfor the managers and designers back in the office. In the case of amaintenance inspection, the inspection engineer’s remarks and ratings willbe critical in determining whether the structure is selected for rehabilitationor not. In a rehabilitation design project, the inspector’s notes lay theframework for the entire design process to follow.
A picture is worth a hundred words. Always take as many photos asyou practically can. With digital cameras, the cost of taking pictures is nolonger an issue.
4. Steel Elements. Steelsubstructure elements shouldbe closely inspected for sec-tion loss, fatigue cracks, orbuckling of columns. Allconnections should also bechecked for loosening. Theinspector should differen-tiate between primary load-bearing members and bracingmembers in the inspectionreport. See Section 2.3.4,on primary and secondarymembers, for more infor-mation on inspecting steelelements.
5. Timber Elements. Al-though its use as a materialin the construction of newbridges is somewhat limited,timber structures are preva-lent throughout the United
Rating Substructure Elements
[2.3.3, Part 2]
they are the eyes for the man-agers and designers back inthe office.
nspection engineers shouldalways keep in mind thatI
SPALLING OCCURS when sur-face concrete breaks away from the struc-tural element. Some of the situationswhich can lead to spalling are a poorconcrete mix, reaction to chemicals whichcome in contact with the concrete, expan-sion due to reinforcing steel corrosion,and salts coming in contact with cracks.The design engineer can limit spalling byproviding adequate cover for reinforce-ment, properly designing for drainage ofthe element, and accounting for creep.Spalls can even result from small crackswhich widen as vehicles continually passover the structure. As the cracks widen,chemicals, such as deicing agents, seepinto the crack and begin to affect thereinforcing steel. When structural ele-ments, like the pier column at right, reachan advanced stage of deterioration, thedecision has to be made whether to at-tempt to repair the element or replace it. Figure 2.6 Exposed reinforcing signals repair.
Downloaded from Digital Engineering Library @ McGraw-Hill (www.digitalengineeringlibrary.com)Copyright © 2006 The McGraw-Hill Companies. All rights reserved.
Any use is subject to the Terms of Use as given at the website.
Beginning the Project
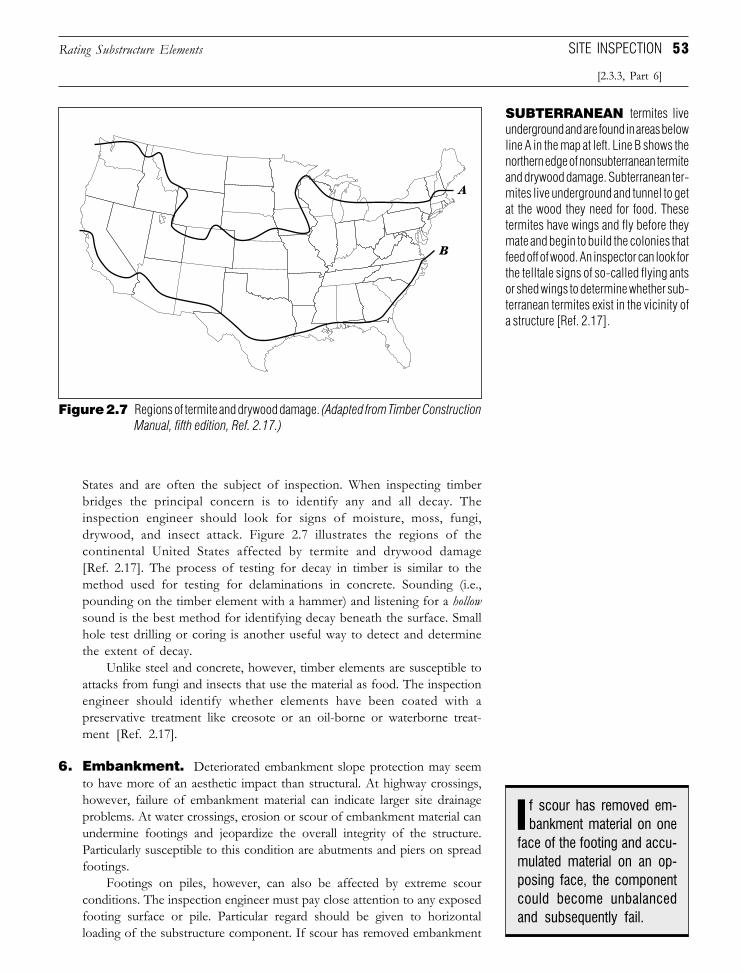
53
SUBTERRANEAN termites liveunderground and are found in areas belowline A in the map at left. Line B shows thenorthern edge of nonsubterranean termiteand drywood damage. Subterranean ter-mites live underground and tunnel to getat the wood they need for food. Thesetermites have wings and fly before theymate and begin to build the colonies thatfeed off of wood. An inspector can look forthe telltale signs of so-called flying antsor shed wings to determine whether sub-terranean termites exist in the vicinity ofa structure [Ref. 2.17].
States and are often the subject of inspection. When inspecting timberbridges the principal concern is to identify any and all decay. Theinspection engineer should look for signs of moisture, moss, fungi,drywood, and insect attack. Figure 2.7 illustrates the regions of thecontinental United States affected by termite and drywood damage[Ref. 2.17]. The process of testing for decay in timber is similar to themethod used for testing for delaminations in concrete. Sounding (i.e.,pounding on the timber element with a hammer) and listening for a hollowsound is the best method for identifying decay beneath the surface. Smallhole test drilling or coring is another useful way to detect and determinethe extent of decay.
Unlike steel and concrete, however, timber elements are susceptible toattacks from fungi and insects that use the material as food. The inspectionengineer should identify whether elements have been coated with apreservative treatment like creosote or an oil-borne or waterborne treat-ment [Ref. 2.17].
6. Embankment. Deteriorated embankment slope protection may seemto have more of an aesthetic impact than structural. At highway crossings,however, failure of embankment material can indicate larger site drainageproblems. At water crossings, erosion or scour of embankment material canundermine footings and jeopardize the overall integrity of the structure.Particularly susceptible to this condition are abutments and piers on spreadfootings.
Footings on piles, however, can also be affected by extreme scourconditions. The inspection engineer must pay close attention to any exposedfooting surface or pile. Particular regard should be given to horizontalloading of the substructure component. If scour has removed embankment
face of the footing and accu-mulated material on an op-posing face, the componentcould become unbalancedand subsequently fail.
f scour has removed em-bankment material on oneI
SITE INSPECTION
[2.3.3, Part 6]
Rating Substructure Elements
Figure 2.7 Regions of termite and drywood damage. (Adapted from Timber ConstructionManual, fifth edition, Ref. 2.17.)
Downloaded from Digital Engineering Library @ McGraw-Hill (www.digitalengineeringlibrary.com)Copyright © 2006 The McGraw-Hill Companies. All rights reserved.
Any use is subject to the Terms of Use as given at the website.
Beginning the Project
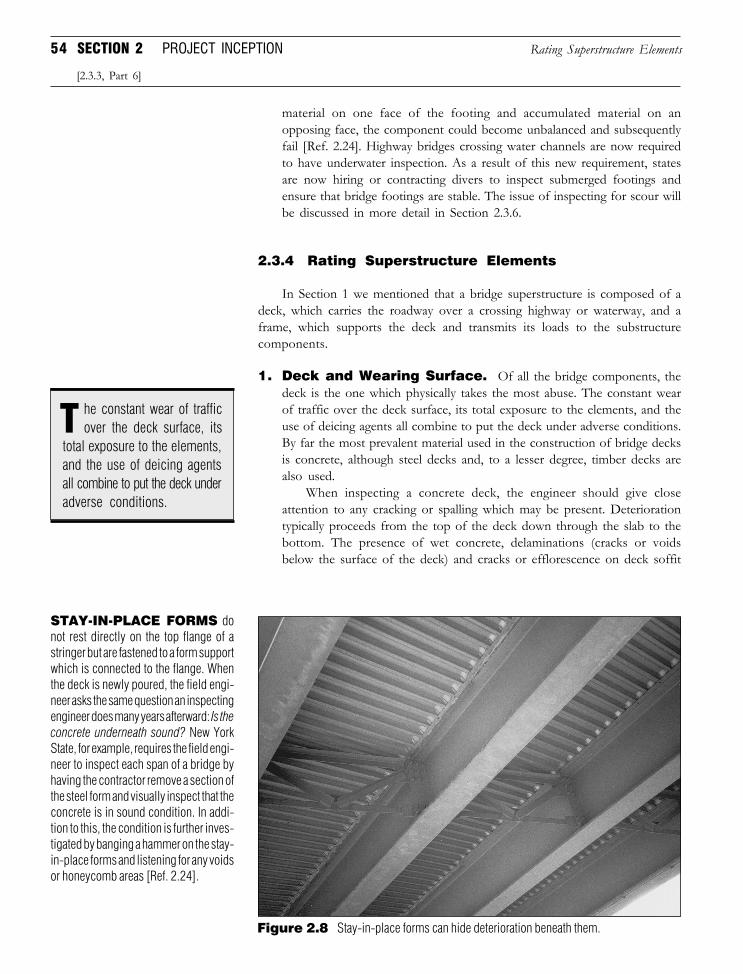
54 SECTION 2 PROJECT INCEPTION
material on one face of the footing and accumulated material on anopposing face, the component could become unbalanced and subsequentlyfail [Ref. 2.24]. Highway bridges crossing water channels are now requiredto have underwater inspection. As a result of this new requirement, statesare now hiring or contracting divers to inspect submerged footings andensure that bridge footings are stable. The issue of inspecting for scour willbe discussed in more detail in Section 2.3.6.
2.3.4 Rating Superstructure Elements
In Section 1 we mentioned that a bridge superstructure is composed of adeck, which carries the roadway over a crossing highway or waterway, and aframe, which supports the deck and transmits its loads to the substructurecomponents.
1. Deck and Wearing Surface. Of all the bridge components, thedeck is the one which physically takes the most abuse. The constant wearof traffic over the deck surface, its total exposure to the elements, and theuse of deicing agents all combine to put the deck under adverse conditions.By far the most prevalent material used in the construction of bridge decksis concrete, although steel decks and, to a lesser degree, timber decks arealso used.
When inspecting a concrete deck, the engineer should give closeattention to any cracking or spalling which may be present. Deteriorationtypically proceeds from the top of the deck down through the slab to thebottom. The presence of wet concrete, delaminations (cracks or voidsbelow the surface of the deck) and cracks or efflorescence on deck soffit
STAY-IN-PLACE FORMS donot rest directly on the top flange of astringer but are fastened to a form supportwhich is connected to the flange. Whenthe deck is newly poured, the field engi-neer asks the same question an inspectingengineer does many years afterward: Is theconcrete underneath sound? New YorkState, for example, requires the field engi-neer to inspect each span of a bridge byhaving the contractor remove a section ofthe steel form and visually inspect that theconcrete is in sound condition. In addi-tion to this, the condition is further inves-tigated by banging a hammer on the stay-in-place forms and listening for any voidsor honeycomb areas [Ref. 2.24].
Figure 2.8 Stay-in-place forms can hide deterioration beneath them.
Rating Superstructure Elements
[2.3.3, Part 6]
he constant wear of trafficover the deck surface, itsT
total exposure to the elements,and the use of deicing agentsall combine to put the deck underadverse conditions.
Downloaded from Digital Engineering Library @ McGraw-Hill (www.digitalengineeringlibrary.com)Copyright © 2006 The McGraw-Hill Companies. All rights reserved.
Any use is subject to the Terms of Use as given at the website.
Beginning the Project
55
(bottom surface of a deck) can indicate more serious damage throughoutthe slab.
Engineers attempting to determine the condition of a concrete deck,however, can be hindered by the presence of a wearing surface and/or stay-in-place forms, both of which can hide damage existing beneath them (seeFigure 2.8). Although methods such as infrared thermography allow for thetesting of concrete decks for delaminations, such facilities may be out ofreach for the average inspector.
Apart from visible signs of deterioration, the inspection engineer shouldalways be on the lookout for excessive deflections and listen for abnormalsounds emanating from the structure. While these observations tend to beextremely subjective, the presence of a strange noise or odd motion in thestructure can often lead to discovering problems which may otherwise havegone unnoticed. This general rule of thumb applies not only to the deck butalso to all structural elements.
The most common and effective way of detecting deck delaminationsis the chain drag over the deck. Any hollow sound is an indication of poorconcrete underneath.
Wearing surfaces should be inspected for general forms of pavementdistress, which range from cracking and potholing for asphalt surfacesto cracking and spalling for concrete. With regard to asphalt surfaces,the inspector should note whether resurfacing has been performed on thebridge wearing surface, as this will introduce additional dead loading onthe structure, which could change the structure load rating value.
2. Primary and Secondary Members. The supporting structuralframe represented by the bridge’s primary and secondary members aretypically inspected for deterioration which causes loss of section to amember. More serious deterioration can lead to a member being unable toresist the loading conditions it was designed for. Primary and secondarymembers are also susceptible to impact by vehicles passing under thestructure.
Close attention should be given to areas where there is a distinct changein section properties, such as at the end of a cover plate, or where weldconnections exist. These areas are especially susceptible to fatigue stresswhich can be induced by a concentrated stress at this location. Any debriswhich has accumulated at the end of a cover plate should be brushed awayby the inspector to ascertain the true condition underneath. Fatigue stresscan also be caused by excessive vibration and stress changes in the primarymember. This is why, as we will see later in the text, the traffic loading ofa structure plays a key role in a fatigue analysis for a bridge.
If the structure is being designed for rehabilitation, the engineer shouldpay a close attention to these members, and like other items discussed in thissection, document all findings with measurements. Taking a steel, wide-flange girder as an example, field measurements which describe the currentstate of the member’s cross-sectional properties (e.g. web and flangethickness, cover plate width and thickness, etc.) should be taken (seeSection 2.5.4). These dimensions can then be used to perform an updatedand accurate load rating analysis for the structure based on the presentcondition.
SITE INSPECTION
[2.3.4, Part 2]
Rating Superstructure Elements
lose attention should begiven to areas where there
is a distinct change in sectionproperties, such as at the endof a cover plate, or where weldconnections exist. These areasare especially susceptible tofatigue stress...
C
Downloaded from Digital Engineering Library @ McGraw-Hill (www.digitalengineeringlibrary.com)Copyright © 2006 The McGraw-Hill Companies. All rights reserved.
Any use is subject to the Terms of Use as given at the website.
Beginning the Project
56 SECTION 2 PROJECT INCEPTION
It may also be necessary to determine the type of steel present in thefield if it was not noted on the as-built plans for the bridge, or if plans areunavailable. In this case the designer has two options. One is to rely on theAASHTO Manual for Condition Evaluation of Bridges [Ref. 2.23], whichpresents a table for yield stresses to be used in analyzing steel members. Thistable gives minimum tensile strength and minimum yield point values forsteel of various vintages. These age groups are, specifically as follows:
❏ Prior to 1905❏ 1905 to 1936❏ 1936 to 1963❏ After 1963
Another option is to perform a coupon test on the steel. In this case,a portion of the steel is taken from a member in the field and tested in alaboratory to determine its properties.
For concrete primary and secondary members, an inspection similar tothat performed for the concrete deck should be conducted. Concretebeams should be checked for cracking, the presence of efflorescence, anddelaminations. Like steel members, concrete beams are also subject tovehicular impact and should be checked for any collisions. In prestressedconcrete bridges, particular attention should be given to the prestressingtendons for any corrosion. Corrosion typically begins at the anchorages andtravels along the tendon, or at voids where duct was not properly grouted.The structural adequacy of the concrete is tested by taking a core samplefrom the concrete member. For more information on coring, refer toSection 2.5.
2.3.5 Rating Appurtenance and Site-Related Elements
Due to the diverse forms of structures in use, there are a wide variety ofappurtenance elements to be considered. Discussed below are the major typesof elements at a bridge site and what they should be investigated for.
1. Railing. A great many bridges that are 30 years, 40 years old, or evenolder still utilize the same bridge railing installed at the time of construction.With regard to inspection, AASHTO recommends that the inspector checkto see if the railing is performing as originally designed [Ref. 2.23]. It is quitelikely, however, that this will not meet present standards for many olderstructures. The greatest danger, with regard to bridge railings, is if the unithas been subjected to impact as a result of a traffic accident. Such impactcould damage the rail itself or loosen its anchorages. If this has occurred,notification to the owner should be made at once to prevent a situationwhere the railing fails.
If a railing shows signs of repeated impact, the engineer should note anysite characteristics that could be leading to this condition and design theremedial measures to correct it. Poor sight triangles at an approach, anarrow transition from approach to bridge, an excessively curved overpassalignment, or a due east-west alignment are some of the site conditions
Rating Appurtenance and Site-Related Elements
[2.3.4, Part 2]
n prestressed concretebridges, particular atten-I
tion should be given to theprestressing tendons for anycorrosion. Corrosion typicallybegins at the anchorages andtravels along the tendon, or atvoids where duct was not prop-erly grouted.
Downloaded from Digital Engineering Library @ McGraw-Hill (www.digitalengineeringlibrary.com)Copyright © 2006 The McGraw-Hill Companies. All rights reserved.
Any use is subject to the Terms of Use as given at the website.
Beginning the Project
57
which can lead to accidents on or near a structure. In some cases it may bepossible to eliminate the cause of repeated impact (e.g., trimming backobstructing foliage); in others, a more rigorous railing/barrier system maybe required. The designer should be aware, however, that existing fasciastringers may not be able to sustain the placement of a new barrier.
2. Drainage Systems. The drainage system of a highway bridge canbe composed of a variety of elements. Deck swales, weep tubes, andscuppers can be used to carry water off the deck, while gutters and earthswales drain runoff from the site and structure proper. Even the compo-sition of backfill material plays an important role in the effective drainageof the structure and its site.
The most common problem with any drainage system is the accumu-lation of debris in a pipe or channel. Another problem can arise fromchanges in the overpass or underpass roadway surface. Constant resurfac-ing can lead to a flattening of the roadway crown which, in turn, leads toponding of water. If there has been a recent rainfall, the inspecting engineershould look for telltale ponding as well as the flow of runoff. However, ifsuch a situation does not present itself, a close examination of any cloggingto drainage elements should be made.
For prestressed concrete bridges, drainage facilities are not onlyrequired to drain storm water runoff but are needed to carry off corrosivedeicing chemicals as well. The inspecting engineer should ensure that thesedrains function properly.
3. Utilities. Highway bridge structures quite often carry various utilitiesacross an underpass feature. These utilities could be in the form of publicservices such as electric, gas, water, cable, or telephone lines among others.In addition to physically carrying a utility line across a road or channel, thepresence of overhead and buried utilities may also affect various character-istics of the bridge and site.
With respect to lines carried by the bridge, the inspection engineershould determine the condition of both the conduit and its support system(should one exist). Obvious failures such as leaks, cracks, and failed supportconnections should be investigated. Utility lines should be checked to ensurethat they do not adversely affect vertical clearance. Any foliage interferingwith lines on or near the site should be cleared away to prevent possible firehazards. Foliage close to utility lines may also cause downed lines duringstorms with high winds or ice.
For the most part, utilities that an inspection engineer finds at a bridgesite have been granted a special permit by the owner. There are, however,instances when unauthorized utility lines encroach onto the bridge or site.Therefore, it is important to note the presence of all utilities so that a checkcan be made by the owner to determine any possible encroachments.
4. Lighting and Signing. Like railing, lighting and signing are safety-related appurtenances designed to offer protection to traffic over and undera bridge. They also offer a degree of protection to the structure itself.Lighting standards and sign structures are typically made of steel oraluminum. When placed in the vicinity of traffic, they are susceptible to
DID YOU KNOW
THAT the red, white,and blue shield
on Interstate route signs is aregistered trademark ofAASHTO? In an effort to pre-vent signs similar to the Inter-state sign from being erectedclose to highways, AASHTOfiled for, and was granted, aregistered trademark in 1967[Ref. 2.26].
SITE INSPECTION
[2.3.5, Part 4]
Rating Appurtenance and Site-Related Elements
Downloaded from Digital Engineering Library @ McGraw-Hill (www.digitalengineeringlibrary.com)Copyright © 2006 The McGraw-Hill Companies. All rights reserved.
Any use is subject to the Terms of Use as given at the website.
Beginning the Project
58 SECTION 2 PROJECT INCEPTION
collisions and damage to their anchorages and other structural members.If lighting and sign standards are continually subjected to damage fromcollisions with vehicles, the installation of some form of fender/barriersystem should be investigated by the owner.
At the top of the lighting standard is a lighting fixture. The lightingfixture is comprised of the lamp, its housing, and a lens. At a basic level, thelamp or luminaire at the top of the light standard should be inspected toensure that it still functions properly (i.e., illuminates). Dirt and other debriscan limit the amount of roadway covered by the lamp. On a more seriouslevel, damaged light housings and exposed electrical connections can createpotential shock and fire hazards. Bridges may also be equipped with lightingon signing, aircraft warning lights, or navigation lights. They should beinspected in a manner similar to highway light fixtures.
One of the more common damages to signing is vandalism fromgraffiti which impairs visibility of the sign message or, in some cases, rendersit illegible. The inspection engineer should also note any encroaching foliagewhich may also limit visibility of the sign.
2.3.6 Inspecting for Scour
Bridges that cross water channels require detailed inspection of channelcharacteristics and the condition of substructure elements in the channel. Theneed for a detailed and thorough scour inspection program is a result of thecatastrophic effects which can be caused by excessive scour.
In order to properly inspect for scour, it is necessary to have a basicunderstanding of what causes it in the first place. Scour is the washingaway of streambed material by water channel flow. Typically, scour occurswhen the water channel becomes narrowed or constricted. From basicfluid dynamics, we know that a smaller opening leads to a greater velocity(Q = Av). If constrictions in the channel are significant, the velocity of thestream can increase such that the substructure footings and/or pilesbecome undermined. Sharp bends or curves in the water channel alsoincrease velocity which can create cross-currents and turbulence. Scourcan either occur locally at specific substructure components (local scour)or over the entire structure crossing the channel (general scour). Dis-cussed below are key issues concerning the inspection of water channelsand bridge elements located in them.
1. The Channel. A principal difficulty in anticipating the effects of scourlies in the amorphous nature of water channels. Put another way, thegeometry of a channel changes periodically both horizontally and vertically.At any given point in time, a waterway’s width can increase or decrease, itsdepth rise and fall. To adequately plan for the types of scour protection thatshould be incorporated at a bridge site, a channel cross section and profilerecord should be maintained.
The channel cross section is created by measuring the distance fromthe bridge deck to the top of the water surface at points along the deckfasciae. A drop line is used and measurements logged in the inspectionreport. The New York State Department of Transportation recommends
Inspecting for Scour
[2.3.5, Part 4]
damage from collisions withvehicles, the installation ofsome form of fender/barriersystem should be investigatedby the owner.
f lighting and sign standardsare continually subjected toI
cour is the washing awayof streambed material by
water channel flow. Typically,scour occurs when the waterchannel becomes narrowed orconstricted.
S
Downloaded from Digital Engineering Library @ McGraw-Hill (www.digitalengineeringlibrary.com)Copyright © 2006 The McGraw-Hill Companies. All rights reserved.
Any use is subject to the Terms of Use as given at the website.
Beginning the Project
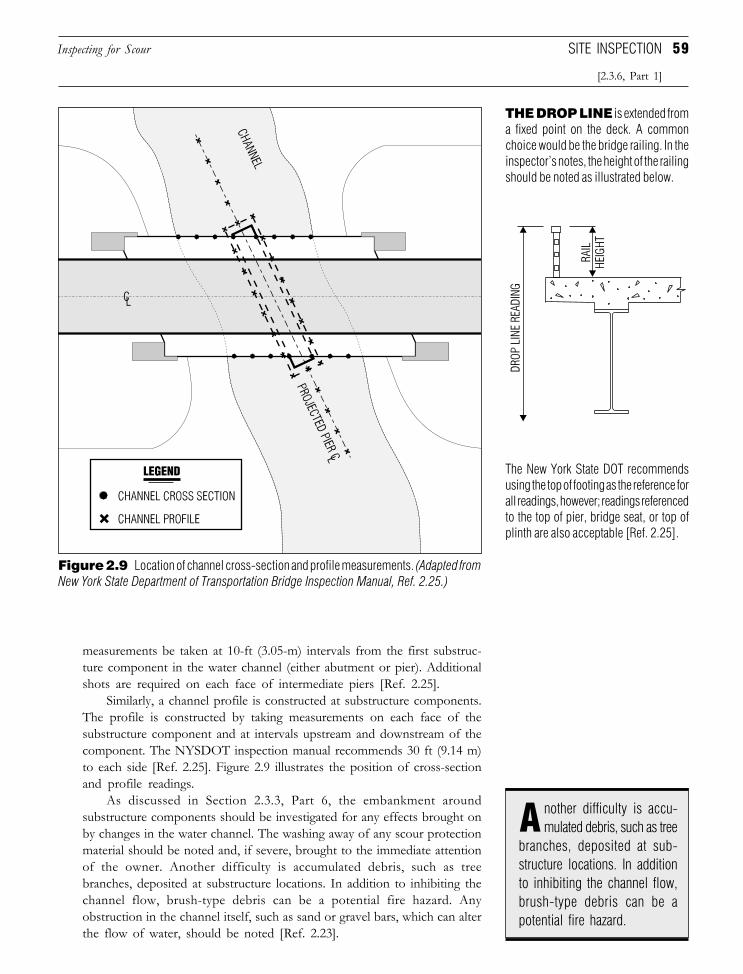
59
THE DROP LINE is extended froma fixed point on the deck. A commonchoice would be the bridge railing. In theinspector’s notes, the height of the railingshould be noted as illustrated below.
The New York State DOT recommendsusing the top of footing as the reference forall readings, however; readings referencedto the top of pier, bridge seat, or top ofplinth are also acceptable [Ref. 2.25].
measurements be taken at 10-ft (3.05-m) intervals from the first substruc-ture component in the water channel (either abutment or pier). Additionalshots are required on each face of intermediate piers [Ref. 2.25].
Similarly, a channel profile is constructed at substructure components.The profile is constructed by taking measurements on each face of thesubstructure component and at intervals upstream and downstream of thecomponent. The NYSDOT inspection manual recommends 30 ft (9.14 m)to each side [Ref. 2.25]. Figure 2.9 illustrates the position of cross-sectionand profile readings.
As discussed in Section 2.3.3, Part 6, the embankment aroundsubstructure components should be investigated for any effects brought onby changes in the water channel. The washing away of any scour protectionmaterial should be noted and, if severe, brought to the immediate attentionof the owner. Another difficulty is accumulated debris, such as treebranches, deposited at substructure locations. In addition to inhibiting thechannel flow, brush-type debris can be a potential fire hazard. Anyobstruction in the channel itself, such as sand or gravel bars, which can alterthe flow of water, should be noted [Ref. 2.23].
SITE INSPECTION
[2.3.6, Part 1]
Inspecting for Scour
Figure 2.9 Location of channel cross-section and profile measurements. (Adapted fromNew York State Department of Transportation Bridge Inspection Manual, Ref. 2.25.)
nother difficulty is accu-mulated debris, such as tree
branches, deposited at sub-structure locations. In additionto inhibiting the channel flow,brush-type debris can be apotential fire hazard.
A
Downloaded from Digital Engineering Library @ McGraw-Hill (www.digitalengineeringlibrary.com)Copyright © 2006 The McGraw-Hill Companies. All rights reserved.
Any use is subject to the Terms of Use as given at the website.
Beginning the Project
60 SECTION 2 PROJECT INCEPTION
2. The Substructure. Investigation of abutments and piers submergedin the water channel is an involved process, but an ultimately necessary one.It is required by the Federal Highway Administration when in-depthinspections are carried out. To make life easier for all involved, inspectionof these components should take place at the time of year when thechannel’s water elevation is at its lowest point. Underwater inspection shouldbe performed by certified divers with a training in bridge inspection. Themajor focus of the diver’s investigation is the presence of scour at thefooting location.
A red flag is always raised in the inspection team’s mind when theabutment or pier rests on a spread footing which is not supported by solidbed rock. Footings resting on piles, while more secure than spread footings,are also susceptible to undermining. Particular attention should be placedon any exposed pile. This concern increases in saltwater environments,where corrosion of the piles can become severe. The condition is seriousenough that AASHTO recommends a 4-year underwater inspectionprogram for steel substructure elements in freshwater, and it requiresbiennial underwater inspections in salt water [Ref. 2.23].
In addition to checking for voids around the foundation for anindication of scour, the underwater inspector should also note any visibledeterioration to the substructure element as would be the case if the elementwere not submerged. Any spalling of concrete, corrosion of steel members,decay in timber piles, etc., should be noted in the inspection report forpossible maintenance or rehabilitation. Pictures should always be taken todocument any deficiencies.
2.3.7 Conclusions
As the preceding text would illustrate, the inspection of a highway bridgestructure is an involved undertaking. Its necessity, however, was born out ofthe failures of bridges and the public’s demand to ensure that bridges in ahighway network offer the maximum level of safety possible.
Bill Kallman of the New York State Department of Transportation wrotethat, “I would not explain to an inspector that any particular bridge is betterbuilt or inherently safer or less risky than another, since the inspector, with hisfew tools, must be very sensitive to things that are going on at that bridge atwhich he is looking” [Ref. 2.22]. There is a great deal of truth in that statement,and the inspection engineer should understand that each bridge site representsan individual project.
Unlike the mechanical engineer, who can often construct numerousprototypes before the final design rolls off the assembly line, the civil engineerhas only one opportunity to get it right. When an inspector goes into the field, heor she is witnessing the culmination, not only of a designer’s work, but also ofthe effort of dozens of detailers, draftsmen, managers, agency review person-nel, and the like. In all of that work the chance of a poor concrete mix,inadequate reinforcement, or blown elevation is great. No amount of analysisin the office will ever be able to give the level of accuracy and specificity thatthe inspector’s report provides.
In a more macroscopic sense, the maintenance inspection’s role inassisting an owner in project selection is critical to say the least. Agencies measure
[2.3.6, Part 2]
Conclusions
Uconstruct numerous proto-types before the final designrolls off the assembly line, thecivil engineer has only oneopportunity to get it right.
nlike the mechanical en-gineer, who can often
Downloaded from Digital Engineering Library @ McGraw-Hill (www.digitalengineeringlibrary.com)Copyright © 2006 The McGraw-Hill Companies. All rights reserved.
Any use is subject to the Terms of Use as given at the website.
Beginning the Project
61
their performance based on the inspection ratings of their structures. If thismeasure is to be an accurate indicator of the overall quality of the bridges in ahighway network, then the inspection report must offer as complete andaccurate a portrayal of each structure as possible.
As a result of this importance, the quality of the inspector’s end product isparamount. The reader should understand that many inspectors work at anextremely accelerated pace. The demands placed on an inspector by a biennialinspection are great. Where the inspector in a rehabilitation design project hasthe luxury of taking time in recording details and measurements, the mainte-nance inspection must be completed in a quick and dirty fashion. The industryas a whole needs to recognize the role each inspection type plays in the bridgedesign process and award it with appropriate levels of respect and resources.
2.4 SITE SURVEY
Before the actual design process can commence in full, a detailed sitesurvey needs to be performed. The survey, led by an experienced land surveyor,is used to create a model of
❏ Topographic features which detail the surface of the overpass andunderpass roadways as well as the surrounding site
❏ Delineate wetland if it exists at the vicinity of the bridge site❏ Planimetric features which detail various natural and man-made items
such as railing, edge of pavement lines, vegetation, drop inlets, etc.❏ Water channel cross-sections if it is a waterway crossing bridge❏ In the case of a rehabilitation design, structural features which detail
location and elevation of bridge structure key points such as bridgeseats, top of walls, pylons, etc.
Discussed below are these groupings and the essential data which needs tobe obtained in the survey. As is the case with the bridge inspection, it isimportant to maximize the information taken while in the field to avoidrepeated trips to the project site.
2.4.1 Topography
In the case of a new bridge design, a thorough survey of the site shouldinclude adequate coverage of proposed substructure component locations (i.e.,abutments and piers). Since the final position of the abutment and pierfootings (and piles if needed) are quite often subject to change due to geologicor hydrological conditions, the survey team should take care to providemaximum coverage of the general substructure locations.
When conducting a rehabilitation design, the establishment of accurateprofiles for the overpass and underpass roadways is essential. Cross sectionsshould be taken at an interval fine enough to accommodate the length of thestructure and adequately establish a centerline profile (particularly if the bridgelies on a vertical curve).
Recent advancements in computer-aided design software allow engineersto construct a three-dimensional graphic model of overpass and underpass
SITE SURVEY
[2.4.1]
Topography
each inspection type plays inthe bridge design process andaward it with appropriate levelsof respect and resources.
he industry as a wholeneeds to recognize the roleT
Downloaded from Digital Engineering Library @ McGraw-Hill (www.digitalengineeringlibrary.com)Copyright © 2006 The McGraw-Hill Companies. All rights reserved.
Any use is subject to the Terms of Use as given at the website.
Beginning the Project
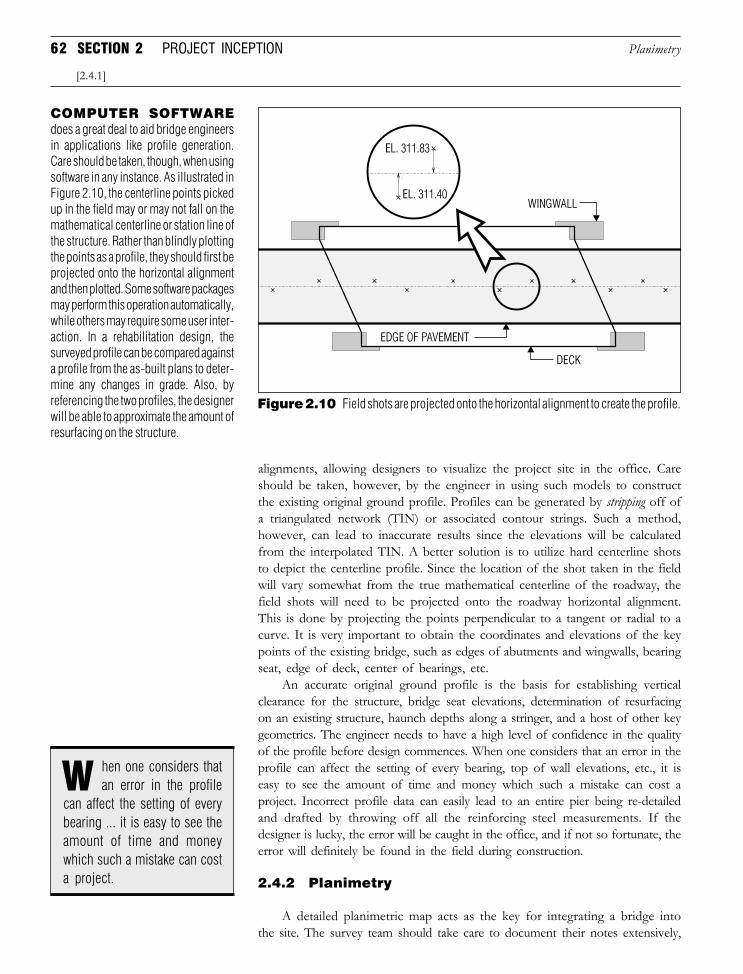
62 SECTION 2 PROJECT INCEPTION
COMPUTER SOFTWAREdoes a great deal to aid bridge engineersin applications like profile generation.Care should be taken, though, when usingsoftware in any instance. As illustrated inFigure 2.10, the centerline points pickedup in the field may or may not fall on themathematical centerline or station line ofthe structure. Rather than blindly plottingthe points as a profile, they should first beprojected onto the horizontal alignmentand then plotted. Some software packagesmay perform this operation automatically,while others may require some user inter-action. In a rehabilitation design, thesurveyed profile can be compared againsta profile from the as-built plans to deter-mine any changes in grade. Also, byreferencing the two profiles, the designerwill be able to approximate the amount ofresurfacing on the structure.
Figure 2.10 Field shots are projected onto the horizontal alignment to create the profile.
alignments, allowing designers to visualize the project site in the office. Careshould be taken, however, by the engineer in using such models to constructthe existing original ground profile. Profiles can be generated by stripping off ofa triangulated network (TIN) or associated contour strings. Such a method,however, can lead to inaccurate results since the elevations will be calculatedfrom the interpolated TIN. A better solution is to utilize hard centerline shotsto depict the centerline profile. Since the location of the shot taken in the fieldwill vary somewhat from the true mathematical centerline of the roadway, thefield shots will need to be projected onto the roadway horizontal alignment.This is done by projecting the points perpendicular to a tangent or radial to acurve. It is very important to obtain the coordinates and elevations of the keypoints of the existing bridge, such as edges of abutments and wingwalls, bearingseat, edge of deck, center of bearings, etc.
An accurate original ground profile is the basis for establishing verticalclearance for the structure, bridge seat elevations, determination of resurfacingon an existing structure, haunch depths along a stringer, and a host of other keygeometrics. The engineer needs to have a high level of confidence in the qualityof the profile before design commences. When one considers that an error in theprofile can affect the setting of every bearing, top of wall elevations, etc., it iseasy to see the amount of time and money which such a mistake can cost aproject. Incorrect profile data can easily lead to an entire pier being re-detailedand drafted by throwing off all the reinforcing steel measurements. If thedesigner is lucky, the error will be caught in the office, and if not so fortunate, theerror will definitely be found in the field during construction.
2.4.2 Planimetry
A detailed planimetric map acts as the key for integrating a bridge intothe site. The survey team should take care to document their notes extensively,
[2.4.1]
Planimetry
W hen one considers thatan error in the profile
can affect the setting of everybearing ... it is easy to see theamount of time and moneywhich such a mistake can costa project.
Downloaded from Digital Engineering Library @ McGraw-Hill (www.digitalengineeringlibrary.com)Copyright © 2006 The McGraw-Hill Companies. All rights reserved.
Any use is subject to the Terms of Use as given at the website.
Beginning the Project
63
both in terms of written notes and sketches. An example of how planimetric dataplay a role in the design process would be in the tying in of a new abutmentunderdrain to an existing storm water collection facility at the site. The surveyteam should not only physically locate various catch basins but also denote theirsize and type as well as rim and invert elevations (see Section 2.7.1). Prior toconducting the site inspection and site survey, team leaders from both groupsshould meet to identify which planimetric features (e.g., railings, inlets, etc.) willbe the inspection team’s responsibility and which items the survey team’s.
Once again, computer-aided methods can be used to create a layer ofplanimetric information, complete with annotation and symbology to beincorporated in the final contract documents. The preparation of final draw-ings will be discussed in more detail later in Section 5.2.
2.4.3 Structure Features
Rehabilitation design projects, in particular, require detailed field documen-tation on the existing bridge components. It may be tempting for the design teamto rely primarily on the record or as-built plans of an existing bridge. While suchplans are indeed essential in creating the new design of the structure, they are noreplacement for accurate field measurements (see Section 2.7).
To build a model of the bridge as it relates to the surrounding site,elevations at structure key points need to be determined. Prior to commencingwork, the survey team, in conjunction with the design team, should identify thepoints on the bridge to be surveyed. Some of the basic features which shouldbe picked up are
❏ Bridge seats❏ Wingwall start and end locations❏ Top of pier caps and abutment bearing seats❏ Berm (bench) at the abutment embankment❏ Deck elevations at bearing lines
It is also necessary to field measure the current vertical clearance.Contrary to what one may initially think, vertical clearance is a dynamic ratherthan static measurement. Resurfacing to the underpass roadway can signifi-cantly alter a bridge’s vertical clearance. With many trucks pushing theclearance criteria to the limit, having hard clearance measurements on anexisting structure can make the difference between a primary member beinghit by a truck and not. If possible, vertical clearance measurements should betaken at the underpass crown or other high point at every stringer location.The effort may take a little longer in the field, but any anomalous resurfacingor changes in the underpass profile will be documented.
Like planimetric data, the survey team should thoroughly document allstructure data with notes, sketches, and photographs. All sketches should clearlyindicate the direction of north. If there are multiple bridges in the survey, thestructure bridge identification number should also accompany any measure-ments being taken to remove any chance of confusion back in the office whenthe notes are being reduced. If as-built plans are available, it is extremely usefulthat all structure measurements are annotated in the survey notes using theidentification nomenclature found in the as-built plans. Meaning that, if the
SITE SURVEY
[2.4.3]
Structure Features
R ehabilitation designprojects, in particular, re-
quire detailed field documen-tation on the existing bridgecomponents.
Downloaded from Digital Engineering Library @ McGraw-Hill (www.digitalengineeringlibrary.com)Copyright © 2006 The McGraw-Hill Companies. All rights reserved.
Any use is subject to the Terms of Use as given at the website.
Beginning the Project
64 SECTION 2 PROJECT INCEPTION
as-built plans call a certain stringer S7, the survey notes should reference anyvertical clearance measurements at that stringer with the S7 identifier. One caneasily imagine the confusion that can occur back in the office, if the surveyteam numbers the stringers from north to south and the as-built plans fromsouth to north.
2.5 PHYSICAL TESTING
While visual inspection provides the bulk of information in most biennialmaintenance inspections, the rehabilitation inspection must also make use ofvarious forms of physical testing to supply needed information concerning theadequacy of materials used in the construction of the bridge. The followingoffers a brief discussion of some of the methods used to accomplish this.
2.5.1 Coring
Physical testing, in the form of pavement and structure cores, should beperformed for a rehabilitation design in which components of the bridge are toremain in place and become part of the new design. In the case of pavement,the cores serve the function of indicating
❏ The material composition of both the approach pavements andstructural deck
❏ The amount of resurfacing on the structure
Structural cores should be taken at key points in certain concrete elementssuch as piers and abutments. Typical locations are in abutment stems as well asdeck, pier caps, and columns. Compression tests are then performed at thetesting laboratory to indicate the strength of the samples taken. The tests willalso indicate the amount of voids and specific gravity of the sample. If existingcomponents are to remain in place, it is essential that core testing be per-formed to ensure the adequacy of the concrete to remain. Conversely, if thecomponent is to be completely removed and replaced, no cores should betaken at that location.
When the testing is complete, the testing laboratory should issue a report,complete with test results and color photographs of all cores taken. This reportwill become part of the engineer’s final design report. In some instances, it maybe necessary to depict the core results in table form on the final contractdocuments.
For timber structures, cores are taken to determine the moisture contentand the extent of decay within the timber element.
2.5.2 Delamination Testing
As mentioned previously, delaminations are cracks that occur below theconcrete surface, typically at the location of the upper reinforcing steel. Themost basic method of testing is using a hammer and sounding for hollow spots.Obviously such a method is quite time consuming and, for large surfaces such
[2.4.3]
Coring
Oback in the office, if the surveyteam numbers the stringers fromnorth to south and the as-builtplans from south to north.
ne can easily imagine theconfusion that can occur
essential that core testingbe performed to ensure theadequacy of the concrete toremain.
f existing components areto remain in place, it isI
Downloaded from Digital Engineering Library @ McGraw-Hill (www.digitalengineeringlibrary.com)Copyright © 2006 The McGraw-Hill Companies. All rights reserved.
Any use is subject to the Terms of Use as given at the website.
Beginning the Project
65
as decks, can prove impractical. As an alternative, a chain can be dragged alongthe deck surface to cover more area, but surrounding noises may make itdifficult to detect hollow sounds.
To facilitate delamination detection, machines based on this acousticmethod are available. Typically they are walked by the inspector, like a lawnmower, along the bridge deck recording delaminations as it travels. Infraredthermography looks for voids beneath the surface by measuring the tempera-ture differential that exists due to the presence of moisture at a void.
2.5.3 Testing for Cover
The chances for spalling greatly increase when there is insufficient coverbetween the concrete surface and the reinforcing steel. Devices, such as apachometer, can be used to determine the amount of cover present in anelement. While the pachometer determines the location of a reinforcing bar viaa magnetic field, other methods are available which utilize ultrasound methodsto locate the steel.
2.5.4 Measuring Steel Thickness
When calculating the load rating of a rehabilitated structure where thesteel primary members are to remain in place, it is important to base theanalysis on primary member cross-section properties which accurately reflectthe current condition of the steel. While a micrometer and/or calipers can beused to determine flange and web thickness values at the ends of members, theproblem of picking up web readings along a stringer requires another method.One approach is to use an ultrasonic gage. The ultrasonic gage, a hand-helddevice which is about the size of a calculator, has a probe connected to itwhich, when placed on the steel, determines the thickness by sending ultrasonicwaves through the steel.
These devices require a relatively smooth surface in order to take anaccurate reading. The inspector should bring a wire brush into the field toclean off any rust, dirt, or debris accumulated on the surface of the steel.Another option would be to use a battery-operated drill with a wire brushattachment. Once the surface has been cleaned, a jelly or couplant is smearedonto the steel to ensure proper contact with the probe. The ultrasonic gagethen shows the measured value on a display.
When using an ultrasonic gage, the inspector should expect some fluctua-tions in the readings. Prior to going out to the bridge site, a schematic framingplan locating the primary members should be made which not only indicatesthe type of steel members present, but all pertinent cross-section dimensions.If possible, a two-person team should take the measurements. While oneinspector uses the gauge, the other can record the measurements and check tosee that the values are in line. It is very disheartening to spend a day in the fieldtaking steel measurements, only to return to the office and find out the flangewhich shows deterioration has increased in thickness!
Some ultrasound devices allow for the measurements to be stored in thedevice and then uploaded to a personal computer where they can be tabulatedby a spreadsheet program. Even if this functionality is present, the presence ofa second inspector will still speed the recording process by allowing the
PHYSICAL TESTING
[2.5.4]
Measuring Steel Thickness
taking steel measurements,only to return to the officeand find out the flange whichshows deterioration has in-creased in thickness!
t is very disheartening tospend a day in the fieldI
Downloaded from Digital Engineering Library @ McGraw-Hill (www.digitalengineeringlibrary.com)Copyright © 2006 The McGraw-Hill Companies. All rights reserved.
Any use is subject to the Terms of Use as given at the website.
Beginning the Project
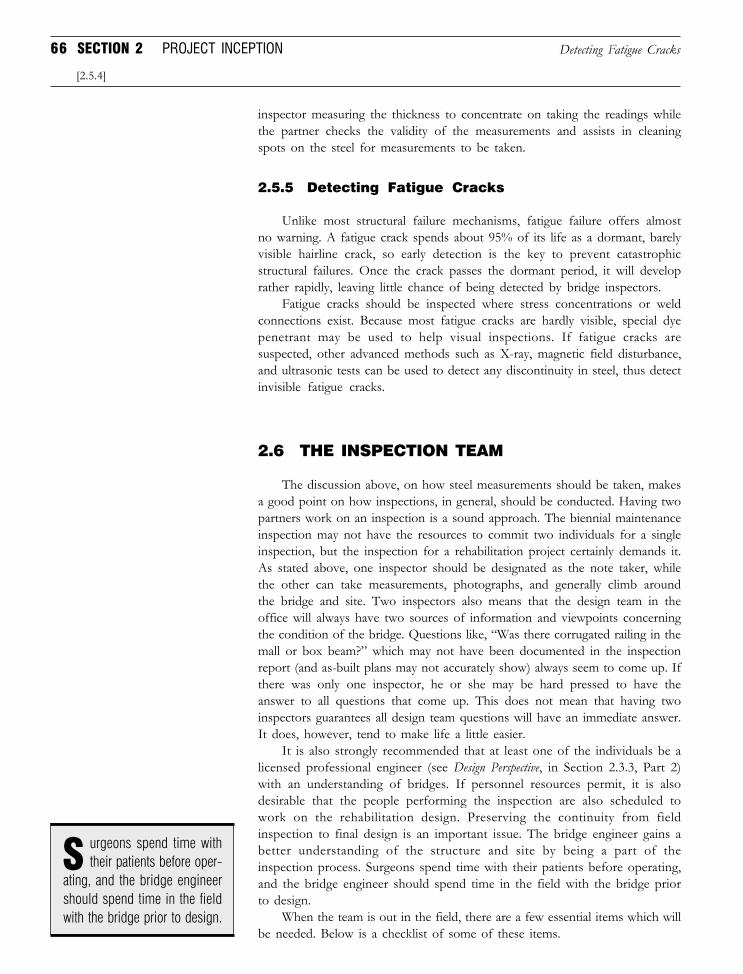
66 SECTION 2 PROJECT INCEPTION
inspector measuring the thickness to concentrate on taking the readings whilethe partner checks the validity of the measurements and assists in cleaningspots on the steel for measurements to be taken.
2.5.5 Detecting Fatigue Cracks
Unlike most structural failure mechanisms, fatigue failure offers almostno warning. A fatigue crack spends about 95% of its life as a dormant, barelyvisible hairline crack, so early detection is the key to prevent catastrophicstructural failures. Once the crack passes the dormant period, it will developrather rapidly, leaving little chance of being detected by bridge inspectors.
Fatigue cracks should be inspected where stress concentrations or weldconnections exist. Because most fatigue cracks are hardly visible, special dyepenetrant may be used to help visual inspections. If fatigue cracks aresuspected, other advanced methods such as X-ray, magnetic field disturbance,and ultrasonic tests can be used to detect any discontinuity in steel, thus detectinvisible fatigue cracks.
2.6 THE INSPECTION TEAM
The discussion above, on how steel measurements should be taken, makesa good point on how inspections, in general, should be conducted. Having twopartners work on an inspection is a sound approach. The biennial maintenanceinspection may not have the resources to commit two individuals for a singleinspection, but the inspection for a rehabilitation project certainly demands it.As stated above, one inspector should be designated as the note taker, whilethe other can take measurements, photographs, and generally climb aroundthe bridge and site. Two inspectors also means that the design team in theoffice will always have two sources of information and viewpoints concerningthe condition of the bridge. Questions like, “Was there corrugated railing in themall or box beam?” which may not have been documented in the inspectionreport (and as-built plans may not accurately show) always seem to come up. Ifthere was only one inspector, he or she may be hard pressed to have theanswer to all questions that come up. This does not mean that having twoinspectors guarantees all design team questions will have an immediate answer.It does, however, tend to make life a little easier.
It is also strongly recommended that at least one of the individuals be alicensed professional engineer (see Design Perspective, in Section 2.3.3, Part 2)with an understanding of bridges. If personnel resources permit, it is alsodesirable that the people performing the inspection are also scheduled towork on the rehabilitation design. Preserving the continuity from fieldinspection to final design is an important issue. The bridge engineer gains abetter understanding of the structure and site by being a part of theinspection process. Surgeons spend time with their patients before operating,and the bridge engineer should spend time in the field with the bridge priorto design.
When the team is out in the field, there are a few essential items which willbe needed. Below is a checklist of some of these items.
Sating, and the bridge engineershould spend time in the fieldwith the bridge prior to design.
urgeons spend time withtheir patients before oper-
Detecting Fatigue Cracks
[2.5.4]
Downloaded from Digital Engineering Library @ McGraw-Hill (www.digitalengineeringlibrary.com)Copyright © 2006 The McGraw-Hill Companies. All rights reserved.
Any use is subject to the Terms of Use as given at the website.
Beginning the Project
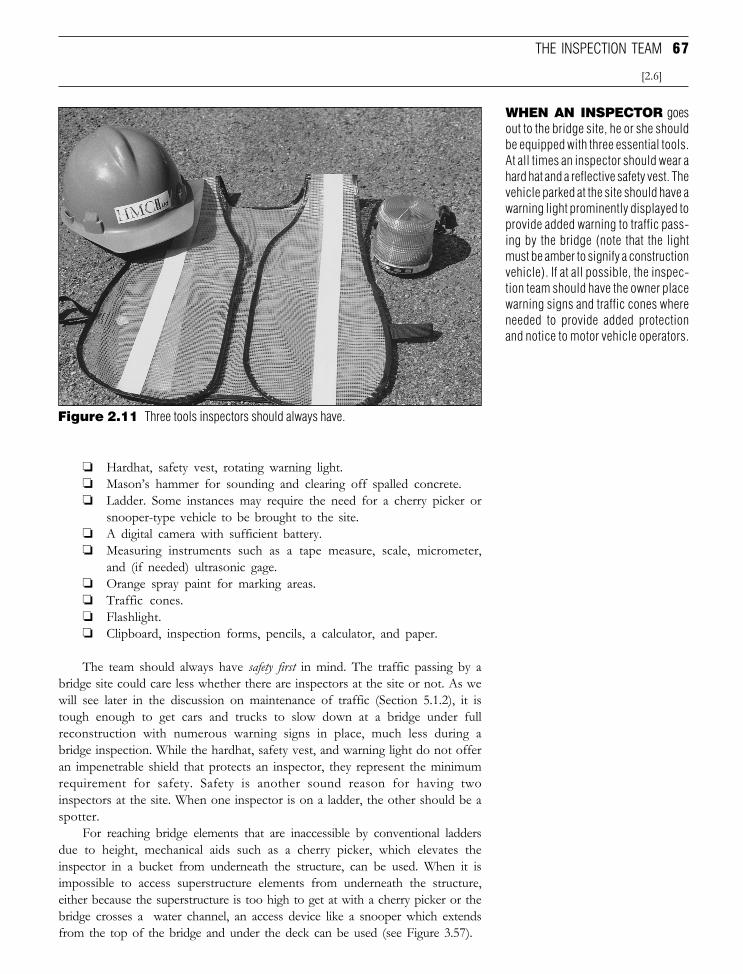
67
WHEN AN INSPECTOR goesout to the bridge site, he or she shouldbe equipped with three essential tools.At all times an inspector should wear ahard hat and a reflective safety vest. Thevehicle parked at the site should have awarning light prominently displayed toprovide added warning to traffic pass-ing by the bridge (note that the lightmust be amber to signify a constructionvehicle). If at all possible, the inspec-tion team should have the owner placewarning signs and traffic cones whereneeded to provide added protectionand notice to motor vehicle operators.
❏ Hardhat, safety vest, rotating warning light.❏ Mason’s hammer for sounding and clearing off spalled concrete.❏ Ladder. Some instances may require the need for a cherry picker or
snooper-type vehicle to be brought to the site.❏ A digital camera with sufficient battery.❏ Measuring instruments such as a tape measure, scale, micrometer,
and (if needed) ultrasonic gage.❏ Orange spray paint for marking areas.❏ Traffic cones.❏ Flashlight.❏ Clipboard, inspection forms, pencils, a calculator, and paper.
The team should always have safety first in mind. The traffic passing by abridge site could care less whether there are inspectors at the site or not. As wewill see later in the discussion on maintenance of traffic (Section 5.1.2), it istough enough to get cars and trucks to slow down at a bridge under fullreconstruction with numerous warning signs in place, much less during abridge inspection. While the hardhat, safety vest, and warning light do not offeran impenetrable shield that protects an inspector, they represent the minimumrequirement for safety. Safety is another sound reason for having twoinspectors at the site. When one inspector is on a ladder, the other should be aspotter.
For reaching bridge elements that are inaccessible by conventional laddersdue to height, mechanical aids such as a cherry picker, which elevates theinspector in a bucket from underneath the structure, can be used. When it isimpossible to access superstructure elements from underneath the structure,either because the superstructure is too high to get at with a cherry picker or thebridge crosses a water channel, an access device like a snooper which extendsfrom the top of the bridge and under the deck can be used (see Figure 3.57).
Figure 2.11 Three tools inspectors should always have.
THE INSPECTION TEAM
[2.6]
Downloaded from Digital Engineering Library @ McGraw-Hill (www.digitalengineeringlibrary.com)Copyright © 2006 The McGraw-Hill Companies. All rights reserved.
Any use is subject to the Terms of Use as given at the website.
Beginning the Project
68 SECTION 2 PROJECT INCEPTION
When taking notes, the inspector designated as the note taker mayprefer to have a clipboard with a cover. The inspectors will be climbingaround bridge abutments, onto pier caps, and other dust-filled areas. A coveron the clipboard may seem innocuous, but it helps a great deal in preservingthe quality of the notes recorded in the field. This is important since theinspection notes are a legally binding document which reflect the inspector’sobservations.
2.7 AS-BUILT PLANS AND OTHER RECORD DATA
As-built plans are the design plans of a project which have been issued asa final revision reflecting any and all changes made in the field duringconstruction. In a rehabilitation bridge design, the as-built plans reflect both theoriginal intent of the designer and the condition of the structure at thecompletion of construction. Prior to beginning a rehabilitation design project,the design team should be provided with a complete set of as-built plans by theowner. The role these plans play throughout the course of design is animportant one since it represents, along with the inspection report, one of thebest sources of information concerning the existing structure. The followingdiscusses some of the issues concerning use of as-built plans as well as othersources of record data.
2.7.1 Supplementing As-Built Plans
A common problem is to rely on as-built plans as a basis for all design. As-built plans, however, are not a gospel-like representation of what the bridge ispresently like. By the time a structure requires rehabilitation, a good deal ofmaintenance work has already been performed on the bridge.
Items such as guard railing and drainage facilities can often change entirelyfrom what is depicted on as-built plans. Dimensions can also vary. If a pier, forexample, has a column which was jacketed because of excessive spalling, thediameter of the pier will have changed. Because of situations like this, theinspection and survey teams should attempt to take measurements as much aspossible to either confirm or refute as-built plan information. This is not meantto imply that every last detail needs to be recorded. Key elements, however,should be identified prior to the field inspection, and recorded once there. If atall possible, a half-size reduction of the as-built plans should be brought to thefield during inspection to aid the team during the inspection. The following aresome of the elements that should be field verified.
1. Guard Railing. It is important for either the inspection or surveyteam to record the type of railing present at various locations around thebridge. In addition to this, items such as the size and type of backup postsand lengths of railing segments should be recorded. The reason for thisis that railing in the field may not conform to new specifications and willtherefore require replacement. If an older type of railing on the bridgedeck is to be replaced, it will have to tie into existing railing on theapproaches, the length of which needs to be noted on the rehabilitation
[2.6]
take measurements as muchas possible to either confirm orrefute as-built plan information.
he inspection and surveyteams should attempt to...t
Ait helps a great deal in pre-serving the quality of the notesrecorded in the field.
cover on the clipboardmay seem innocuous, but
Supplementing As-Built Plans
Downloaded from Digital Engineering Library @ McGraw-Hill (www.digitalengineeringlibrary.com)Copyright © 2006 The McGraw-Hill Companies. All rights reserved.
Any use is subject to the Terms of Use as given at the website.
Beginning the Project
69
plans. It may be the case that the railing measurements are never used, butthe cost associated with a return trip to the field could outweigh the extratime spent recording them.
2. Drainage Facilities. Drainage-related appurtenances such as dropinlets and swales should be measured. Dimensions and type of drainageelement should be noted. Again it is important to emphasize that theinspection team not rely on the as-built plans to have the information. Theinlet may be entirely new or have been repaired since the bridge wasconstructed. The survey team should take care to record both rim andinvert elevations as well. This will aid the design team in performing thedrainage analysis of the site and, if necessary, tie into an existing drainagesystem.
3. Traffic Barriers. Jersey-type barriers should be measured in crosssection and length of each segment. Measurements should also be taken todetermine the taper used on end segments. If there is railing attached tothe barrier and it requires replacement, the barrier measurements will beneeded to attach the new railing.
4. Miscellaneous Elements. The need to record the cross-sectionalproperties of steel primary members has already been discussed. In additionto these measurements, gross geometry measurements should be taken in aquick and dirty fashion. By gross geometry it means items such as columncircumference, pedestal depth, width and height, distance between the edgeof pedestal and edge of bearing masonry plate, curb width, etc. The generalrule of thumb is to think of elements which may have been repaired orreplaced and to record them.
It does not take much time at all to write down 6" brush curb in theinspection notebook. If this is not done, however, and the record plans showa 3"-6" sidewalk, serious problems could arise. The urge to rely solely onthe as-built plans is great. The plans are always at the designer’s side andeasily accessible. It is the job of the inspection team to ensure that thedesigners are provided with as complete a representation of what ispresently at the bridge site as possible.
2.7.2 Other Sources
In addition to as-built plans, the design team should request any othersources of information concerning the bridge. Most agencies maintain adetailed maintenance history log of work performed on the structure. If earlierdesign reports are available, they should also be provided. The most recentinspection prior to the bridge being designated for rehabilitation should beobtained to investigate any potential issues that were overlooked. Utilitypermits, indicating the location of any utilities at the site, are required by thedesign team to determine the effects the utilities may have on issues rangingfrom maintenance of traffic to staging operations. This is of particular concernwhen underground utilities are present at the bridge site.
Where most agencies make a good effort to provide the designers with allinformation possible, it does not hurt to ask for any of the items listed above
AS-BUILT PLANS AND OTHER RECORD DATA
[2.7.2]
Other Sources
I t is the job of the inspec-tion team to ensure that the
designers are provided withas complete a representationof what is presently at the bridgesite as possible.
Downloaded from Digital Engineering Library @ McGraw-Hill (www.digitalengineeringlibrary.com)Copyright © 2006 The McGraw-Hill Companies. All rights reserved.
Any use is subject to the Terms of Use as given at the website.
Beginning the Project
70 SECTION 2 PROJECT INCEPTION
if they have not been initially provided by the owner. The designers shouldunderstand that theirs is just one of many projects the owner has to manageand things sometimes fall through the cracks. A gentle reminder, however,could go a long way in securing needed information.
Conversely, owners need to realize that the design team is trying to designa rehabilitation based on various sources of information that are cobbledtogether by the designers. Any information that the agency can provide to thedesign team will not only speed the design process but also make for a betterend product. An agency often takes for granted that they have the ability towalk across the hall to a filing cabinet or ask someone in another departmentabout an issue. Where it is impossible to expect that every last shred ofinformation be compiled and put into a box which is delivered to the designteam, an earnest effort should be made by both parties, prior to design, toidentify and secure the major sources of information.
2.8 CONCLUSIONS
As evidenced by the preceding dialog, there are many factors which thebridge engineer must be cognizant of before he or she ever lifts a pencil inanger at a design pad. If bridge engineering teaches us anything as civilengineers, it should serve to illustrate the dangers of excessive specialization.While there are solid arguments for professionals to seek a vertical arena ofexpertise, there are many compelling reasons for engineers in general, andbridge engineers in particular, to be well versed in all aspects of the engineeringdesign and management processes.
Quite often, engineers find themselves in the position of drawing compari-sons between themselves and their professional counterparts in the medicalfield. Specialization proponents suggest that engineers should be skilled inindividual disciplines. As physicians have specialists in the care and treatmentof everything from heart to foot ailments, so too should civil engineers bespecialized in structural, geotechnical, hydraulic, and every other discipline.
Specialists, however, see with different eyes and varied vision that can leadto difficulties in engineering projects as involved as a highway bridge design. Ahydraulic specialist may go to a bridge rehabilitation site and notice poorremoval of surface water. A geotechnical engineer could go to the same siteand notice foundation movement. The professional well versed in both fields,however, realizes that inadequate drainage facilities led to the foundationmovement. While conceding that this example is somewhat cartoonish, it is,however, indicative of the broad range of engineering disciplines and theinterrelationship we have discussed just in this section alone.
From project funding to inspecting for scour, the bridge engineer needs tobe, if not an expert, at least knowledgeable of the varied aspects of the field inorder to successfully complete his or her work. It should be reemphasized thatwhile a bridge is composed of many components, it still behaves as a unit,interacts and affects its environment as a unit, and causes the most seriousdamage when it fails as a unit. It is all too easy for engineers to pass off certainaspects of the design and say that this or that issue is the responsibility ofanother specialist. Bridge engineering, like many civil engineering projects, isexciting because it demands integration rather than dissemination.
Bprojects, is exciting because itdemands integration ratherthan dissemination.
ridge engineering, likemany civil engineering
[2.7.2]
Other Sources
Adesign team will not only speedthe design process but alsomake for a better end product.
ny information that theagency can provide to the
Downloaded from Digital Engineering Library @ McGraw-Hill (www.digitalengineeringlibrary.com)Copyright © 2006 The McGraw-Hill Companies. All rights reserved.
Any use is subject to the Terms of Use as given at the website.
Beginning the Project
71
This section should also serve as a warning for the engineer new to bridgedesign to take their time prior to beginning design. The project inception phaseis, for lack of a better term, an information-gathering period. At the end of thisphase, the design team should have most, if not all, of the informationnecessary to perform a sound and professional design of the new or rehabili-tated structure. In addition to this, they should also have an understanding ofthe owner’s wishes and desires and how they impact the eventual design. As wewill see later, errors at the project inception phase can lead to some of the mostsevere problems later in the design process.
REFERENCES
2.1 TEA-21, Transportation Equity Act for the 21st Century, U.S. Departmentof Transportation, Washington, D.C., July, 1998.
2.2 National Transportation Statistics 2004, Bureau of Transportation Statistics,U. S. Department of Transportation, Washington, D.C., Table 3-29a, January2005.
2.3 Understanding the Highway Finance Evolution/Revolution, American Associationof State Highway and Transportation Officials, pp. 7–23, Washington, D.C.,1987.
2.4 Toll Facilities in the United States, Bridges - Roads - Tunnels - Ferries,Office of Highway Policy, U. S. Department of Transportation, Washington,D.C., Table T-1 Part 3, and Table T-1 Part 4, January 2003.
2.5 Novack, Janet, “Toll Call,” Forbes, p. 67, 17 February 1992.
2.6 Wuestefeld, Norman H., “Toll Roads,” Understanding the Highway FinanceEvolution/Revolution, American Association of State Highway and TransportationOfficials, p. 63, Washington, D.C., 1987.
2.7 Tarricone, Paul, “What do you mean by that?” Civil Engineering, AmericanSociety of Civil Engineers, vol. 63, p. 62, April 1993.
2.8 Forbes, Jr., Malcom, “Alien Idea,” Forbes, p. 26, 2 March 1992.
2.9 Standard Specifications for Highway Bridges, seventeenth edition, AmericanAssociation of State Highway and Transportation Officials, Washington, D.C.,2002.
2.10 AASHTO LRFD Bridge Design Specifications. American Association of StateHighway and Transportation Officials, Washington, D.C., 2004.
2.11 Salmon, Charles G., and Johnson, John E., Steel Structures: Design andBehavior, 2nd ed., p. 22, Harper & Row, New York, 1980.
2.12 Manual of Steel Construction, LRFD, 3rd Edition, American Institute of SteelConstruction, Chicago, 2003.
REFERENCES
Downloaded from Digital Engineering Library @ McGraw-Hill (www.digitalengineeringlibrary.com)Copyright © 2006 The McGraw-Hill Companies. All rights reserved.
Any use is subject to the Terms of Use as given at the website.
Beginning the Project
72 SECTION 2 PROJECT INCEPTION
2.13 Manual of Steel Construction, Allowable Stress Design, 9th Edition, AmericanInstitute of Steel Construction, Chicago, 1989.
2.14 Building Code Requirements for Reinforced Concrete (ACI 318-05) and Commen-tary-ACI 318R-05, American Concrete Institute, Detroit, 2005.
2.15 ACI Detailing Manual, SP-66(04), American Concrete Institute, Detroit,2004.
2.16 PCI Design Handbook-Precast and Prestressed Concrete, 6th Edition, Precast/Prestressed Concrete Institute, Chicago, 2004.
2.17 Timber Construction Manual, 5th Edition, American Institute of TimberConstruction, Wiley Publishers, New York, October, 2004.
2.18 National Design Specification for Wood Construction, American Forest & PaperAssociation, American Wood Council, Washington, D.C., 1997.
2.19 Bridge Inspector’s Training Manual/90, U. S. Department of Transportation,Washington, D.C., March 1995.
2.20 Harris-Stewart, Charmaine, “Deck Fails a Month after Inspection,”Engineering News Record, vol. 220, p. 15, March 1988.
2.21 Fox, Gerald, “Bridge Inspections: The Role of the design Engineer andBenefits of Research,” Civil Engineering, American Society of Civil Engineers,vol. 54, p. 6, December 1983.
2.22 Kallman, Bill, “Bridge Inspection Proposals,” Civil Engineering, AmericanSociety of Civil Engineers, vol. 55, pp. 22–24, April, 1984.
2.23 Manual for Condition Evaluation of Bridges, 2nd Edition, American Associationof State Highway and Transportation Officials, Washington, D.C., 2003.
2.24 Standard Specifications for Highway Bridges, New York State Department ofTransportation, Albany, N.Y., 2002.
2.25 Bridge Inspection Manual, New York State Department of Transportation,Albany, 1997.
2.26 The States and the Interstates, American Association of State Highway andTransportation Officials, p. 104, Washington, D.C., 1991.
Downloaded from Digital Engineering Library @ McGraw-Hill (www.digitalengineeringlibrary.com)Copyright © 2006 The McGraw-Hill Companies. All rights reserved.
Any use is subject to the Terms of Use as given at the website.
Beginning the Project
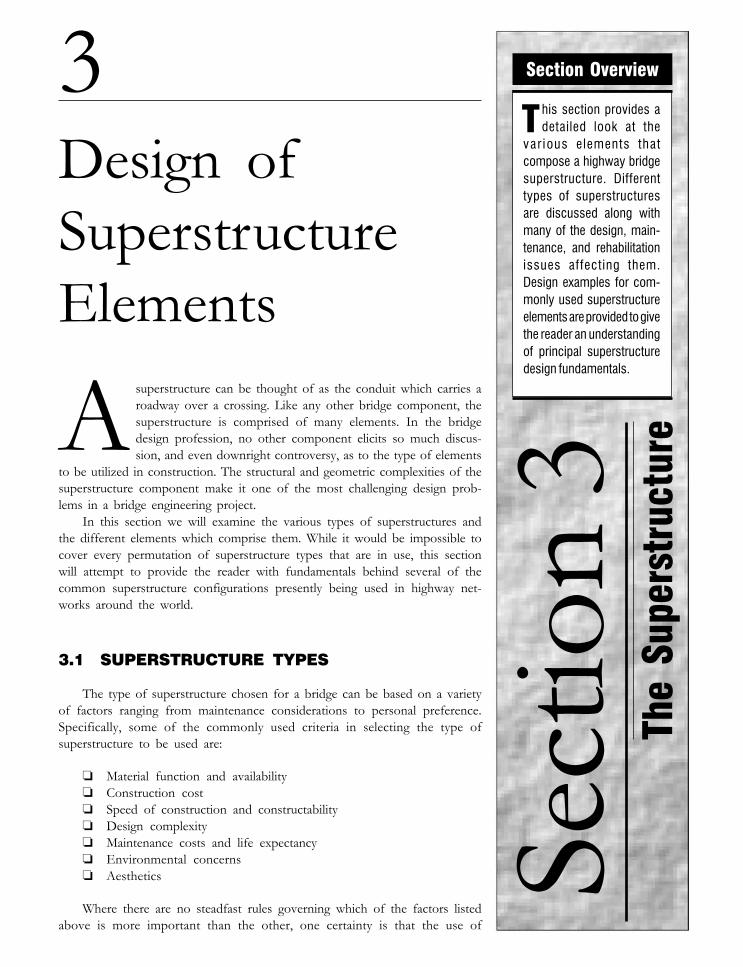
Section Overview
T his section provides adetailed look at the
var ious elements thatcompose a highway bridgesuperstructure. Differenttypes of superstructuresare discussed along withmany of the design, main-tenance, and rehabilitationissues affecting them.Design examples for com-monly used superstructureelements are provided to givethe reader an understandingof principal superstructuredesign fundamentals.
3Design ofSuperstructureElements
The
Supe
rstr
uctu
re
Sect
ion
3Asuperstructure can be thought of as the conduit which carries aroadway over a crossing. Like any other bridge component, thesuperstructure is comprised of many elements. In the bridgedesign profession, no other component elicits so much discus-sion, and even downright controversy, as to the type of elements
to be utilized in construction. The structural and geometric complexities of thesuperstructure component make it one of the most challenging design prob-lems in a bridge engineering project.
In this section we will examine the various types of superstructures andthe different elements which comprise them. While it would be impossible tocover every permutation of superstructure types that are in use, this sectionwill attempt to provide the reader with fundamentals behind several of thecommon superstructure configurations presently being used in highway net-works around the world.
3.1 SUPERSTRUCTURE TYPES
The type of superstructure chosen for a bridge can be based on a varietyof factors ranging from maintenance considerations to personal preference.Specifically, some of the commonly used criteria in selecting the type ofsuperstructure to be used are:
❏ Material function and availability❏ Construction cost❏ Speed of construction and constructability❏ Design complexity❏ Maintenance costs and life expectancy❏ Environmental concerns❏ Aesthetics
Where there are no steadfast rules governing which of the factors listedabove is more important than the other, one certainty is that the use of
Downloaded from Digital Engineering Library @ McGraw-Hill (www.digitalengineeringlibrary.com)Copyright © 2006 The McGraw-Hill Companies. All rights reserved.
Any use is subject to the Terms of Use as given at the website.
Source: Bridge Engineering
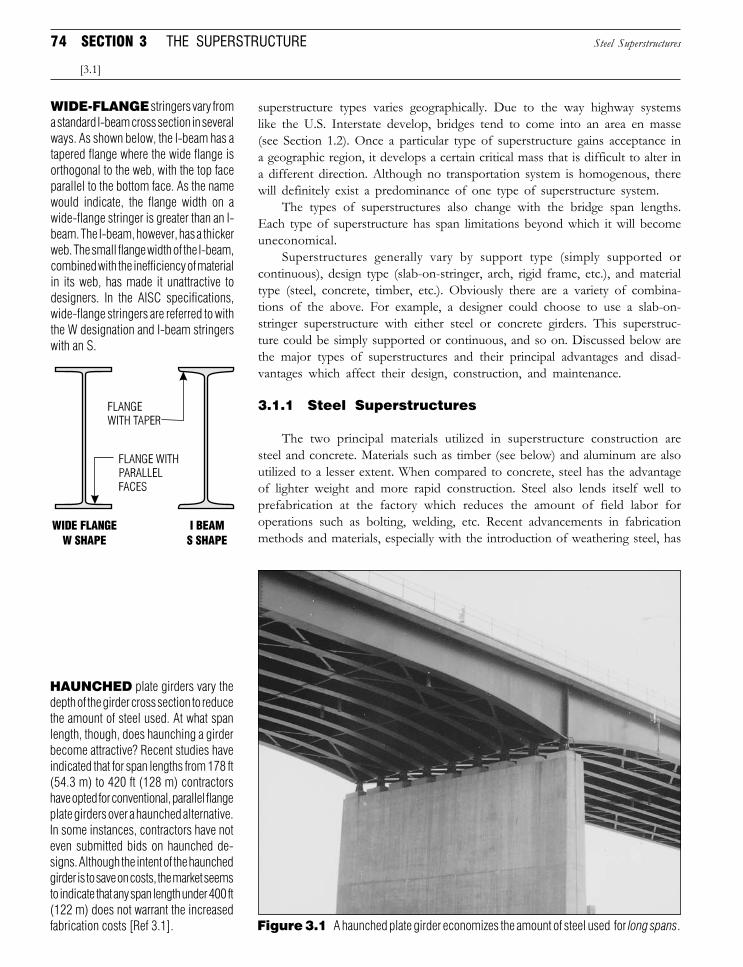
74 SECTION 3 THE SUPERSTRUCTURE
HAUNCHED plate girders vary thedepth of the girder cross section to reducethe amount of steel used. At what spanlength, though, does haunching a girderbecome attractive? Recent studies haveindicated that for span lengths from 178 ft(54.3 m) to 420 ft (128 m) contractorshave opted for conventional, parallel flangeplate girders over a haunched alternative.In some instances, contractors have noteven submitted bids on haunched de-signs. Although the intent of the haunchedgirder is to save on costs, the market seemsto indicate that any span length under 400 ft(122 m) does not warrant the increasedfabrication costs [Ref 3.1].
superstructure types varies geographically. Due to the way highway systemslike the U.S. Interstate develop, bridges tend to come into an area en masse(see Section 1.2). Once a particular type of superstructure gains acceptance ina geographic region, it develops a certain critical mass that is difficult to alter ina different direction. Although no transportation system is homogenous, therewill definitely exist a predominance of one type of superstructure system.
The types of superstructures also change with the bridge span lengths.Each type of superstructure has span limitations beyond which it will becomeuneconomical.
Superstructures generally vary by support type (simply supported orcontinuous), design type (slab-on-stringer, arch, rigid frame, etc.), and materialtype (steel, concrete, timber, etc.). Obviously there are a variety of combina-tions of the above. For example, a designer could choose to use a slab-on-stringer superstructure with either steel or concrete girders. This superstruc-ture could be simply supported or continuous, and so on. Discussed below arethe major types of superstructures and their principal advantages and disad-vantages which affect their design, construction, and maintenance.
3.1.1 Steel Superstructures
The two principal materials utilized in superstructure construction aresteel and concrete. Materials such as timber (see below) and aluminum are alsoutilized to a lesser extent. When compared to concrete, steel has the advantageof lighter weight and more rapid construction. Steel also lends itself well toprefabrication at the factory which reduces the amount of field labor foroperations such as bolting, welding, etc. Recent advancements in fabricationmethods and materials, especially with the introduction of weathering steel, has
WIDE-FLANGE stringers vary froma standard I-beam cross section in severalways. As shown below, the I-beam has atapered flange where the wide flange isorthogonal to the web, with the top faceparallel to the bottom face. As the namewould indicate, the flange width on awide-flange stringer is greater than an I-beam. The I-beam, however, has a thickerweb. The small flange width of the I-beam,combined with the inefficiency of materialin its web, has made it unattractive todesigners. In the AISC specifications,wide-flange stringers are referred to withthe W designation and I-beam stringerswith an S.
Steel Superstructures
[3.1]
Figure 3.1 A haunched plate girder economizes the amount of steel used for long spans.
Downloaded from Digital Engineering Library @ McGraw-Hill (www.digitalengineeringlibrary.com)Copyright © 2006 The McGraw-Hill Companies. All rights reserved.
Any use is subject to the Terms of Use as given at the website.
Design of Superstructure Elements
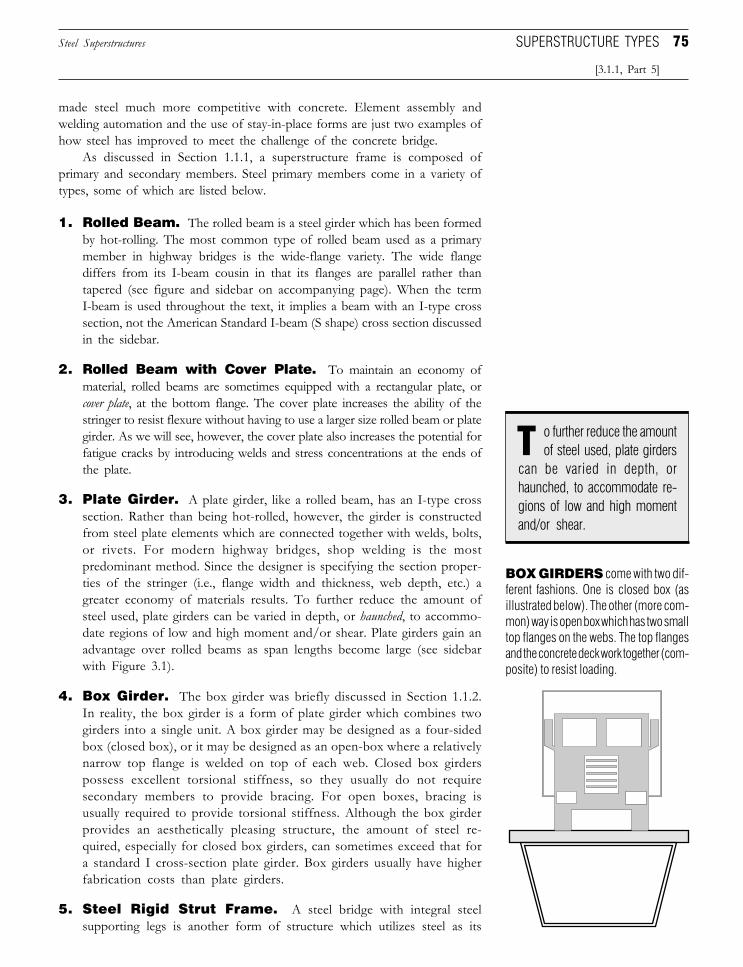
75
made steel much more competitive with concrete. Element assembly andwelding automation and the use of stay-in-place forms are just two examples ofhow steel has improved to meet the challenge of the concrete bridge.
As discussed in Section 1.1.1, a superstructure frame is composed ofprimary and secondary members. Steel primary members come in a variety oftypes, some of which are listed below.
1. Rolled Beam. The rolled beam is a steel girder which has been formedby hot-rolling. The most common type of rolled beam used as a primarymember in highway bridges is the wide-flange variety. The wide flangediffers from its I-beam cousin in that its flanges are parallel rather thantapered (see figure and sidebar on accompanying page). When the termI-beam is used throughout the text, it implies a beam with an I-type crosssection, not the American Standard I-beam (S shape) cross section discussedin the sidebar.
2. Rolled Beam with Cover Plate. To maintain an economy ofmaterial, rolled beams are sometimes equipped with a rectangular plate, orcover plate, at the bottom flange. The cover plate increases the ability of thestringer to resist flexure without having to use a larger size rolled beam or plategirder. As we will see, however, the cover plate also increases the potential forfatigue cracks by introducing welds and stress concentrations at the ends ofthe plate.
3. Plate Girder. A plate girder, like a rolled beam, has an I-type crosssection. Rather than being hot-rolled, however, the girder is constructedfrom steel plate elements which are connected together with welds, bolts,or rivets. For modern highway bridges, shop welding is the mostpredominant method. Since the designer is specifying the section proper-ties of the stringer (i.e., flange width and thickness, web depth, etc.) agreater economy of materials results. To further reduce the amount ofsteel used, plate girders can be varied in depth, or haunched, to accommo-date regions of low and high moment and/or shear. Plate girders gain anadvantage over rolled beams as span lengths become large (see sidebarwith Figure 3.1).
4. Box Girder. The box girder was briefly discussed in Section 1.1.2.In reality, the box girder is a form of plate girder which combines twogirders into a single unit. A box girder may be designed as a four-sidedbox (closed box), or it may be designed as an open-box where a relativelynarrow top flange is welded on top of each web. Closed box girderspossess excellent torsional stiffness, so they usually do not requiresecondary members to provide bracing. For open boxes, bracing isusually required to provide torsional stiffness. Although the box girderprovides an aesthetically pleasing structure, the amount of steel re-quired, especially for closed box girders, can sometimes exceed that fora standard I cross-section plate girder. Box girders usually have higherfabrication costs than plate girders.
5. Steel Rigid Strut Frame. A steel bridge with integral steelsupporting legs is another form of structure which utilizes steel as its
Steel Superstructures
[3.1.1, Part 5]
SUPERSTRUCTURE TYPES
BOX GIRDERS come with two dif-ferent fashions. One is closed box (asillustrated below). The other (more com-mon) way is open box which has two smalltop flanges on the webs. The top flangesand the concrete deck work together (com-posite) to resist loading.
Tcan be varied in depth, orhaunched, to accommodate re-gions of low and high momentand/or shear.
o further reduce the amountof steel used, plate girders
Downloaded from Digital Engineering Library @ McGraw-Hill (www.digitalengineeringlibrary.com)Copyright © 2006 The McGraw-Hill Companies. All rights reserved.
Any use is subject to the Terms of Use as given at the website.
Design of Superstructure Elements
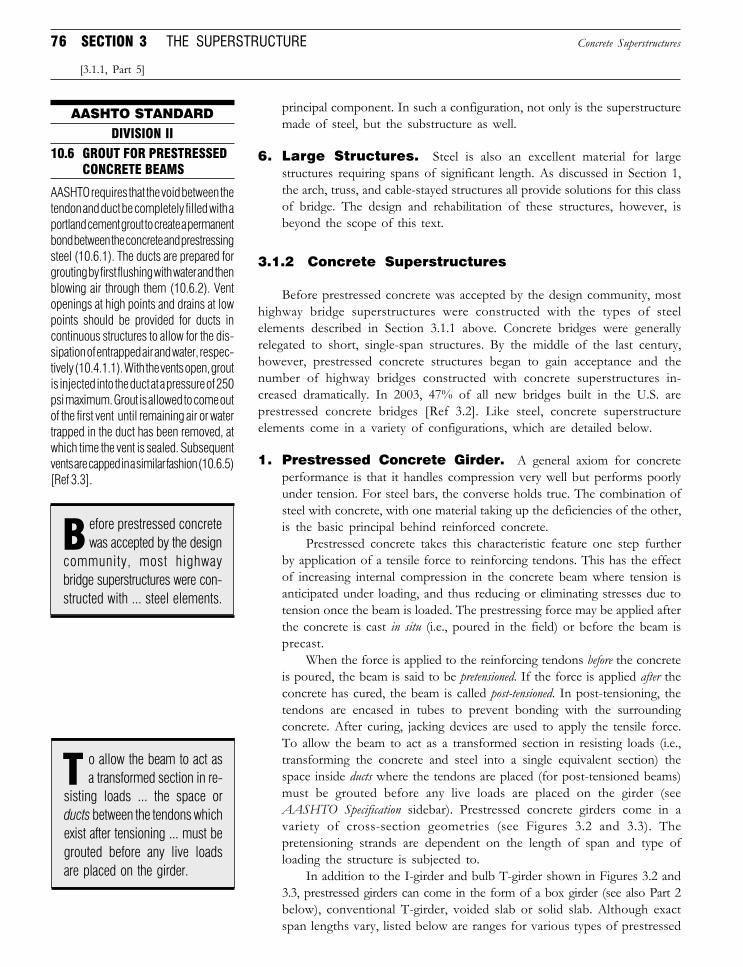
76 SECTION 3 THE SUPERSTRUCTURE
principal component. In such a configuration, not only is the superstructuremade of steel, but the substructure as well.
6. Large Structures. Steel is also an excellent material for largestructures requiring spans of significant length. As discussed in Section 1,the arch, truss, and cable-stayed structures all provide solutions for this classof bridge. The design and rehabilitation of these structures, however, isbeyond the scope of this text.
3.1.2 Concrete Superstructures
Before prestressed concrete was accepted by the design community, mosthighway bridge superstructures were constructed with the types of steelelements described in Section 3.1.1 above. Concrete bridges were generallyrelegated to short, single-span structures. By the middle of the last century,however, prestressed concrete structures began to gain acceptance and thenumber of highway bridges constructed with concrete superstructures in-creased dramatically. In 2003, 47% of all new bridges built in the U.S. areprestressed concrete bridges [Ref 3.2]. Like steel, concrete superstructureelements come in a variety of configurations, which are detailed below.
1. Prestressed Concrete Girder. A general axiom for concreteperformance is that it handles compression very well but performs poorlyunder tension. For steel bars, the converse holds true. The combination ofsteel with concrete, with one material taking up the deficiencies of the other,is the basic principal behind reinforced concrete.
Prestressed concrete takes this characteristic feature one step furtherby application of a tensile force to reinforcing tendons. This has the effectof increasing internal compression in the concrete beam where tension isanticipated under loading, and thus reducing or eliminating stresses due totension once the beam is loaded. The prestressing force may be applied afterthe concrete is cast in situ (i.e., poured in the field) or before the beam isprecast.
When the force is applied to the reinforcing tendons before the concreteis poured, the beam is said to be pretensioned. If the force is applied after theconcrete has cured, the beam is called post-tensioned. In post-tensioning, thetendons are encased in tubes to prevent bonding with the surroundingconcrete. After curing, jacking devices are used to apply the tensile force.To allow the beam to act as a transformed section in resisting loads (i.e.,transforming the concrete and steel into a single equivalent section) thespace inside ducts where the tendons are placed (for post-tensioned beams)must be grouted before any live loads are placed on the girder (seeAASHTO Specification sidebar). Prestressed concrete girders come in avariety of cross-section geometries (see Figures 3.2 and 3.3). Thepretensioning strands are dependent on the length of span and type ofloading the structure is subjected to.
In addition to the I-girder and bulb T-girder shown in Figures 3.2 and3.3, prestressed girders can come in the form of a box girder (see also Part 2below), conventional T-girder, voided slab or solid slab. Although exactspan lengths vary, listed below are ranges for various types of prestressed
AASHTO STANDARD
Concrete Superstructures
[3.1.1, Part 5]
AASHTO requires that the void between thetendon and duct be completely filled with aportland cement grout to create a permanentbond between the concrete and prestressingsteel (10.6.1). The ducts are prepared forgrouting by first flushing with water and thenblowing air through them (10.6.2). Ventopenings at high points and drains at lowpoints should be provided for ducts incontinuous structures to allow for the dis-sipation of entrapped air and water, respec-tively (10.4.1.1). With the vents open, groutis injected into the duct at a pressure of 250psi maximum. Grout is allowed to come outof the first vent until remaining air or watertrapped in the duct has been removed, atwhich time the vent is sealed. Subsequentvents are capped in a similar fashion (10.6.5)[Ref 3.3].
DIVISION II
10.6 GROUT FOR PRESTRESSEDCONCRETE BEAMS
T o allow the beam to act asa transformed section in re-
sisting loads ... the space orducts between the tendons whichexist after tensioning ... must begrouted before any live loadsare placed on the girder.
B efore prestressed concretewas accepted by the design
community, most highwaybridge superstructures were con-structed with ... steel elements.
Downloaded from Digital Engineering Library @ McGraw-Hill (www.digitalengineeringlibrary.com)Copyright © 2006 The McGraw-Hill Companies. All rights reserved.
Any use is subject to the Terms of Use as given at the website.
Design of Superstructure Elements
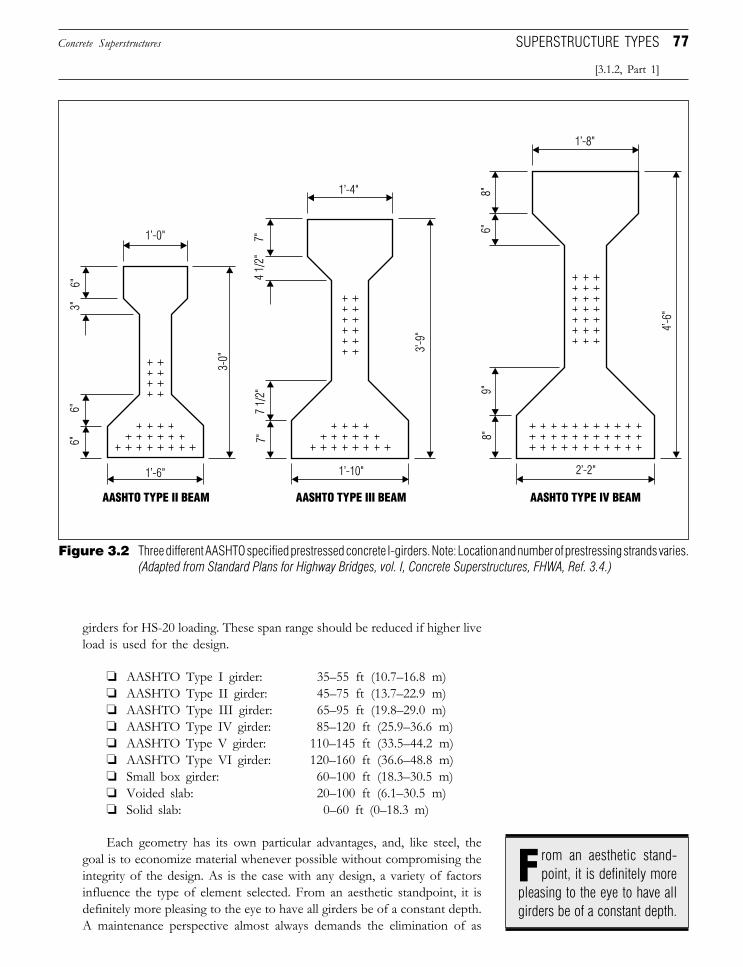
77
girders for HS-20 loading. These span range should be reduced if higher liveload is used for the design.
❏ AASHTO Type I girder: 35–55 ft (10.7–16.8 m)❏ AASHTO Type II girder: 45–75 ft (13.7–22.9 m)❏ AASHTO Type III girder: 65–95 ft (19.8–29.0 m)❏ AASHTO Type IV girder: 85–120 ft (25.9–36.6 m)❏ AASHTO Type V girder: 110–145 ft (33.5–44.2 m)❏ AASHTO Type VI girder: 120–160 ft (36.6–48.8 m)❏ Small box girder: 60–100 ft (18.3–30.5 m)❏ Voided slab: 20–100 ft (6.1–30.5 m)❏ Solid slab: 0–60 ft (0–18.3 m)
Each geometry has its own particular advantages, and, like steel, thegoal is to economize material whenever possible without compromising theintegrity of the design. As is the case with any design, a variety of factorsinfluence the type of element selected. From an aesthetic standpoint, it isdefinitely more pleasing to the eye to have all girders be of a constant depth.A maintenance perspective almost always demands the elimination of as
Concrete Superstructures
[3.1.2, Part 1]
SUPERSTRUCTURE TYPES
rom an aesthetic stand-point, it is definitely more
pleasing to the eye to have allgirders be of a constant depth.
F
Figure 3.2 Three different AASHTO specified prestressed concrete I-girders. Note: Location and number of prestressing strands varies.(Adapted from Standard Plans for Highway Bridges, vol. I, Concrete Superstructures, FHWA, Ref. 3.4.)
Downloaded from Digital Engineering Library @ McGraw-Hill (www.digitalengineeringlibrary.com)Copyright © 2006 The McGraw-Hill Companies. All rights reserved.
Any use is subject to the Terms of Use as given at the website.
Design of Superstructure Elements
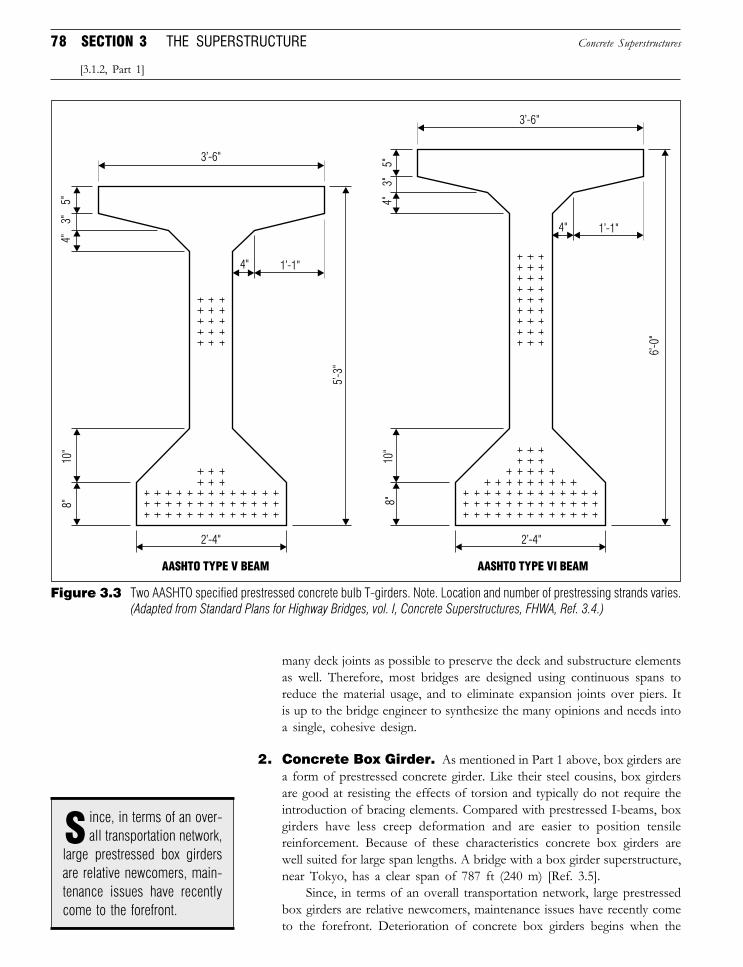
78 SECTION 3 THE SUPERSTRUCTURE
many deck joints as possible to preserve the deck and substructure elementsas well. Therefore, most bridges are designed using continuous spans toreduce the material usage, and to eliminate expansion joints over piers. Itis up to the bridge engineer to synthesize the many opinions and needs intoa single, cohesive design.
2. Concrete Box Girder. As mentioned in Part 1 above, box girders area form of prestressed concrete girder. Like their steel cousins, box girdersare good at resisting the effects of torsion and typically do not require theintroduction of bracing elements. Compared with prestressed I-beams, boxgirders have less creep deformation and are easier to position tensilereinforcement. Because of these characteristics concrete box girders arewell suited for large span lengths. A bridge with a box girder superstructure,near Tokyo, has a clear span of 787 ft (240 m) [Ref. 3.5].
Since, in terms of an overall transportation network, large prestressedbox girders are relative newcomers, maintenance issues have recently cometo the forefront. Deterioration of concrete box girders begins when the
Concrete Superstructures
[3.1.2, Part 1]
ince, in terms of an over-all transportation network,S
large prestressed box girdersare relative newcomers, main-tenance issues have recentlycome to the forefront.
Figure 3.3 Two AASHTO specified prestressed concrete bulb T-girders. Note. Location and number of prestressing strands varies.(Adapted from Standard Plans for Highway Bridges, vol. I, Concrete Superstructures, FHWA, Ref. 3.4.)
Downloaded from Digital Engineering Library @ McGraw-Hill (www.digitalengineeringlibrary.com)Copyright © 2006 The McGraw-Hill Companies. All rights reserved.
Any use is subject to the Terms of Use as given at the website.
Design of Superstructure Elements
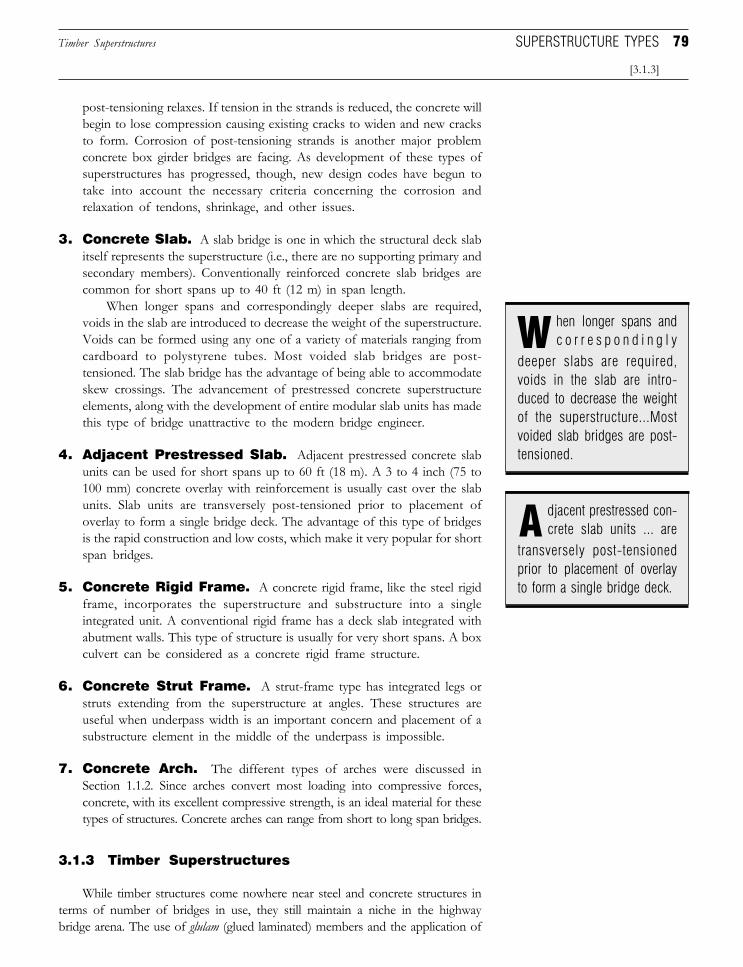
79
post-tensioning relaxes. If tension in the strands is reduced, the concrete willbegin to lose compression causing existing cracks to widen and new cracksto form. Corrosion of post-tensioning strands is another major problemconcrete box girder bridges are facing. As development of these types ofsuperstructures has progressed, though, new design codes have begun totake into account the necessary criteria concerning the corrosion andrelaxation of tendons, shrinkage, and other issues.
3. Concrete Slab. A slab bridge is one in which the structural deck slabitself represents the superstructure (i.e., there are no supporting primary andsecondary members). Conventionally reinforced concrete slab bridges arecommon for short spans up to 40 ft (12 m) in span length.
When longer spans and correspondingly deeper slabs are required,voids in the slab are introduced to decrease the weight of the superstructure.Voids can be formed using any one of a variety of materials ranging fromcardboard to polystyrene tubes. Most voided slab bridges are post-tensioned. The slab bridge has the advantage of being able to accommodateskew crossings. The advancement of prestressed concrete superstructureelements, along with the development of entire modular slab units has madethis type of bridge unattractive to the modern bridge engineer.
4. Adjacent Prestressed Slab. Adjacent prestressed concrete slabunits can be used for short spans up to 60 ft (18 m). A 3 to 4 inch (75 to100 mm) concrete overlay with reinforcement is usually cast over the slabunits. Slab units are transversely post-tensioned prior to placement ofoverlay to form a single bridge deck. The advantage of this type of bridgesis the rapid construction and low costs, which make it very popular for shortspan bridges.
5. Concrete Rigid Frame. A concrete rigid frame, like the steel rigidframe, incorporates the superstructure and substructure into a singleintegrated unit. A conventional rigid frame has a deck slab integrated withabutment walls. This type of structure is usually for very short spans. A boxculvert can be considered as a concrete rigid frame structure.
6. Concrete Strut Frame. A strut-frame type has integrated legs orstruts extending from the superstructure at angles. These structures areuseful when underpass width is an important concern and placement of asubstructure element in the middle of the underpass is impossible.
7. Concrete Arch. The different types of arches were discussed inSection 1.1.2. Since arches convert most loading into compressive forces,concrete, with its excellent compressive strength, is an ideal material for thesetypes of structures. Concrete arches can range from short to long span bridges.
3.1.3 Timber Superstructures
While timber structures come nowhere near steel and concrete structures interms of number of bridges in use, they still maintain a niche in the highwaybridge arena. The use of glulam (glued laminated) members and the application of
Timber Superstructures
[3.1.3]
SUPERSTRUCTURE TYPES
hen longer spans andc o r r e s p o n d i n g l yW
deeper slabs are required,voids in the slab are intro-duced to decrease the weightof the superstructure...Mostvoided slab bridges are post-tensioned.
djacent prestressed con-crete slab units ... areA
transversely post-tensionedprior to placement of overlayto form a single bridge deck.
Downloaded from Digital Engineering Library @ McGraw-Hill (www.digitalengineeringlibrary.com)Copyright © 2006 The McGraw-Hill Companies. All rights reserved.
Any use is subject to the Terms of Use as given at the website.
Design of Superstructure Elements
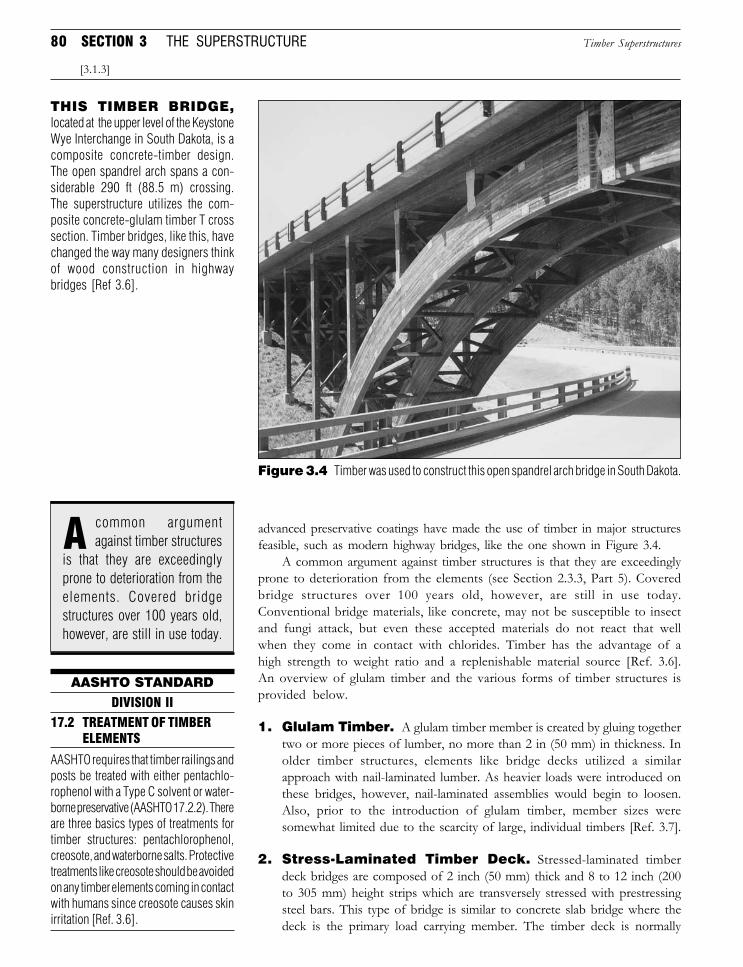
80 SECTION 3 THE SUPERSTRUCTURE
advanced preservative coatings have made the use of timber in major structuresfeasible, such as modern highway bridges, like the one shown in Figure 3.4.
A common argument against timber structures is that they are exceedinglyprone to deterioration from the elements (see Section 2.3.3, Part 5). Coveredbridge structures over 100 years old, however, are still in use today.Conventional bridge materials, like concrete, may not be susceptible to insectand fungi attack, but even these accepted materials do not react that wellwhen they come in contact with chlorides. Timber has the advantage of ahigh strength to weight ratio and a replenishable material source [Ref. 3.6].An overview of glulam timber and the various forms of timber structures isprovided below.
1. Glulam Timber. A glulam timber member is created by gluing togethertwo or more pieces of lumber, no more than 2 in (50 mm) in thickness. Inolder timber structures, elements like bridge decks utilized a similarapproach with nail-laminated lumber. As heavier loads were introduced onthese bridges, however, nail-laminated assemblies would begin to loosen.Also, prior to the introduction of glulam timber, member sizes weresomewhat limited due to the scarcity of large, individual timbers [Ref. 3.7].
2. Stress-Laminated Timber Deck. Stressed-laminated timberdeck bridges are composed of 2 inch (50 mm) thick and 8 to 12 inch (200to 305 mm) height strips which are transversely stressed with prestressingsteel bars. This type of bridge is similar to concrete slab bridge where thedeck is the primary load carrying member. The timber deck is normally
Timber Superstructures
[3.1.3]
Figure 3.4 Timber was used to construct this open spandrel arch bridge in South Dakota.
THIS TIMBER BRIDGE,located at the upper level of the KeystoneWye Interchange in South Dakota, is acomposite concrete-timber design.The open spandrel arch spans a con-siderable 290 ft (88.5 m) crossing.The superstructure utilizes the com-posite concrete-glulam timber T crosssection. Timber bridges, like this, havechanged the way many designers thinkof wood construction in highwaybridges [Ref 3.6].
AASHTO STANDARD
DIVISION II
17.2 TREATMENT OF TIMBERELEMENTS
AASHTO requires that timber railings andposts be treated with either pentachlo-rophenol with a Type C solvent or water-borne preservative (AASHTO 17.2.2). Thereare three basics types of treatments fortimber structures: pentachlorophenol,creosote, and waterborne salts. Protectivetreatments like creosote should be avoidedon any timber elements coming in contactwith humans since creosote causes skinirritation [Ref. 3.6].
common argumentagainst timber structures
is that they are exceedinglyprone to deterioration from theelements. Covered bridgestructures over 100 years old,however, are still in use today.
A
Downloaded from Digital Engineering Library @ McGraw-Hill (www.digitalengineeringlibrary.com)Copyright © 2006 The McGraw-Hill Companies. All rights reserved.
Any use is subject to the Terms of Use as given at the website.
Design of Superstructure Elements
81
covered by a waterproofing membrance, and paved with asphalt pavementas a wearing surface.
3. Trestle. A trestle is a set of timber stringers integrated with a pile or framebent. Stringers can have a rectangular cross section, although glulam I-beamstringers are also used. Previously, timber decking utilized the nail-laminatedapproach discussed earlier. Recently, prefabricated, glulam deck panelswhich are placed transverse to the primary members have been utilized[Ref. 3.6].
4. Truss. A timber truss bridge can be constructed with a timber truss andtimber decking. It is also possible to utilize steel truss components inconjunction with a timber deck. One form of truss bridge, common totimber structures, is the pony truss. A pony truss bridge is a through truss(i.e., the deck passes through, not on top of, the truss) with no bracing ontop. A problem with through trusses, like this, is that they are prone to impactdamage from traffic [Ref. 3.8].
3.1.4 Secondary Members
Secondary members act as bracing for primary members. In general,secondary members are not load bearing elements but are designed to preventcross-sectional deformation of the superstructure frame. In addition to this,secondary members provide for vertical load distribution between stringers bypermitting the superstructure to work together as a unit.
Longitudinal spacing of secondary members varies depending on the typeof primary member and the length of the span. Specific spacing values forvarious types of diaphragm type secondary members are listed below. Thetype of secondary members used varies depending on the type of structureand preference of the designer.
Secondary members come in three general classes: diaphragms, lateralbracing, and portal/sway bracing. Listed below are these three major classes ofsecondary members and their types and function.
1. Diaphragms. A diaphragm is a secondary member attached betweenstringers, in the vertical plane, which acts to stiffen the primary member andhelp distribute vertical loads. For steel superstructures comprised of rolledbeam or plate girder primary members, a rolled beam diaphragm can beused. This rolled beam is usually of the channel or wide flange type cross-section. Channel type rolled sections are designated in the AISC SteelConstruction Manual by either the C (American Standard Channels) or MC(Miscellaneous Channels) designations. For rolled beam primary members,the diaphragm should be at least one-third to one-half the depth of theprimary member. Diaphragms for plate girders should be one-half to three-quarters the girder depth.
When the primary member in a steel superstructure is exceedingly deep[approximately 48 in (1.2 m) or larger] or when curved girders are used, across frame style diaphragm is desirable. Cross frames are typicallycomposed of steel angles in a cross (X) or vee (V) configuration. In steel box
Secondary Members
[3.1.4, Part 1]
SUPERSTRUCTURE TYPES
DID YOU KNOW
THAT in the 1960’sresearch was con-
ducted concerning the pre-stressing of glulam timberelements? The findings showedthat by reinforcing a glulambeam with posttensioningsteel, bending strength could beincreased by roughly 30 percentand the modulus of rupture by25 percent [Ref. 3.6].
W hen the primary mem-ber in a steel super-
structure is exceedingly deep[approximately 48 in (1.2 m)or larger] or when curved gird-ers are used, a cross framestyle diaphragm is desirable.
Downloaded from Digital Engineering Library @ McGraw-Hill (www.digitalengineeringlibrary.com)Copyright © 2006 The McGraw-Hill Companies. All rights reserved.
Any use is subject to the Terms of Use as given at the website.
Design of Superstructure Elements
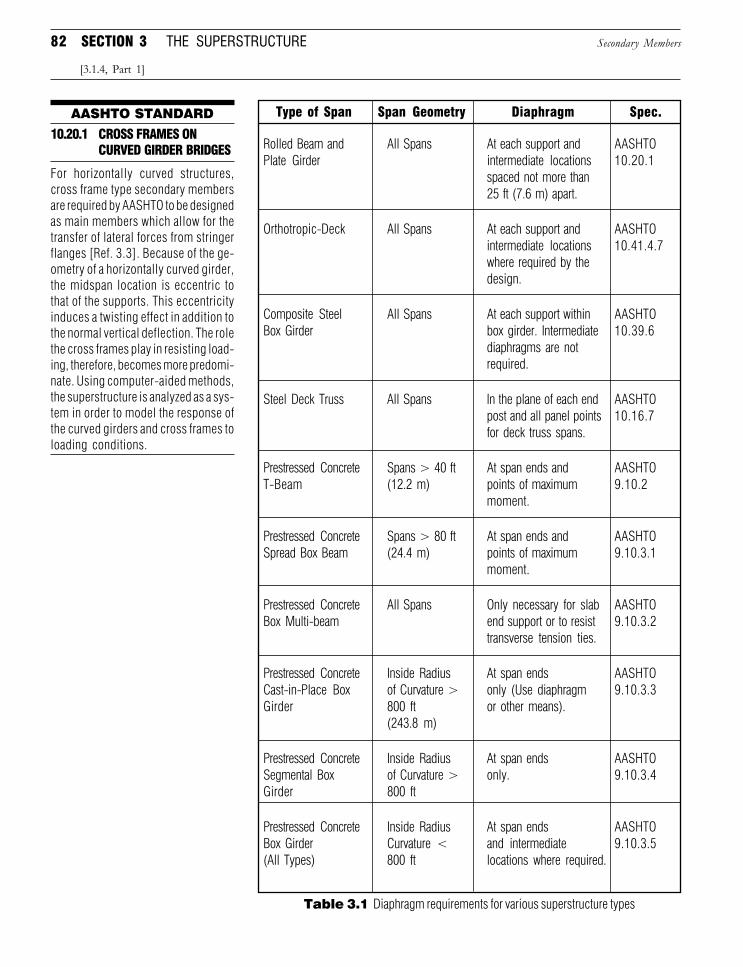
82 SECTION 3 THE SUPERSTRUCTURE
[3.1.4, Part 1]
Secondary Members
AASHTO STANDARD
10.20.1 CROSS FRAMES ONCURVED GIRDER BRIDGES
For horizontally curved structures,cross frame type secondary membersare required by AASHTO to be designedas main members which allow for thetransfer of lateral forces from stringerflanges [Ref. 3.3]. Because of the ge-ometry of a horizontally curved girder,the midspan location is eccentric tothat of the supports. This eccentricityinduces a twisting effect in addition tothe normal vertical deflection. The rolethe cross frames play in resisting load-ing, therefore, becomes more predomi-nate. Using computer-aided methods,the superstructure is analyzed as a sys-tem in order to model the response ofthe curved girders and cross frames toloading conditions.
Table 3.1 Diaphragm requirements for various superstructure types
Type of Span Span Geometry Diaphragm Spec.
Rolled Beam and All Spans At each support and AASHTOPlate Girder intermediate locations 10.20.1
spaced not more than25 ft (7.6 m) apart.
Orthotropic-Deck All Spans At each support and AASHTOintermediate locations 10.41.4.7where required by thedesign.
Composite Steel All Spans At each support within AASHTOBox Girder box girder. Intermediate 10.39.6
diaphragms are notrequired.
Steel Deck Truss All Spans In the plane of each end AASHTOpost and all panel points 10.16.7for deck truss spans.
Prestressed Concrete Spans > 40 ft At span ends and AASHTOT-Beam (12.2 m) points of maximum 9.10.2
moment.
Prestressed Concrete Spans > 80 ft At span ends and AASHTOSpread Box Beam (24.4 m) points of maximum 9.10.3.1
moment.
Prestressed Concrete All Spans Only necessary for slab AASHTOBox Multi-beam end support or to resist 9.10.3.2
transverse tension ties.
Prestressed Concrete Inside Radius At span ends AASHTOCast-in-Place Box of Curvature > only (Use diaphragm 9.10.3.3Girder 800 ft or other means).
(243.8 m)
Prestressed Concrete Inside Radius At span ends AASHTOSegmental Box of Curvature > only. 9.10.3.4Girder 800 ft
Prestressed Concrete Inside Radius At span ends AASHTOBox Girder Curvature < and intermediate 9.10.3.5(All Types) 800 ft locations where required.
Downloaded from Digital Engineering Library @ McGraw-Hill (www.digitalengineeringlibrary.com)Copyright © 2006 The McGraw-Hill Companies. All rights reserved.
Any use is subject to the Terms of Use as given at the website.
Design of Superstructure Elements
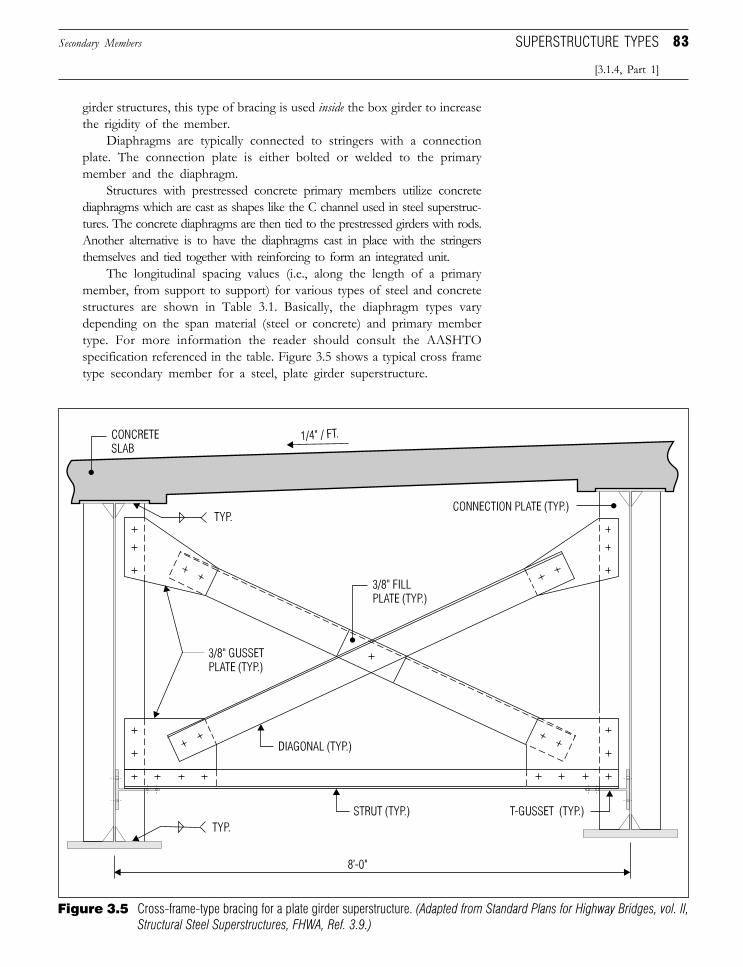
83
girder structures, this type of bracing is used inside the box girder to increasethe rigidity of the member.
Diaphragms are typically connected to stringers with a connectionplate. The connection plate is either bolted or welded to the primarymember and the diaphragm.
Structures with prestressed concrete primary members utilize concretediaphragms which are cast as shapes like the C channel used in steel superstruc-tures. The concrete diaphragms are then tied to the prestressed girders with rods.Another alternative is to have the diaphragms cast in place with the stringersthemselves and tied together with reinforcing to form an integrated unit.
The longitudinal spacing values (i.e., along the length of a primarymember, from support to support) for various types of steel and concretestructures are shown in Table 3.1. Basically, the diaphragm types varydepending on the span material (steel or concrete) and primary membertype. For more information the reader should consult the AASHTOspecification referenced in the table. Figure 3.5 shows a typical cross frametype secondary member for a steel, plate girder superstructure.
[3.1.4, Part 1]
SUPERSTRUCTURE TYPESSecondary Members
Figure 3.5 Cross-frame-type bracing for a plate girder superstructure. (Adapted from Standard Plans for Highway Bridges, vol. II,Structural Steel Superstructures, FHWA, Ref. 3.9.)
Downloaded from Digital Engineering Library @ McGraw-Hill (www.digitalengineeringlibrary.com)Copyright © 2006 The McGraw-Hill Companies. All rights reserved.
Any use is subject to the Terms of Use as given at the website.
Design of Superstructure Elements
84 SECTION 3 THE SUPERSTRUCTURE
2. Lateral Bracing. Bracing located at either the top flange or bottomflange of a stringer to prevent lateral deformation is called lateral bracing.The bracing is similar in form to a cross-frame (i.e., laid out in an X-typeconfiguration) but is laid out along the length of the stringer (in thehorizontal plane), rather than its depth. Lateral bracing is not required atstringer flanges attached to a rigid element, such as a concrete deck orbetween box girders. In general, spans less than 125 ft (38.1 m) are notrequired to have lateral bracing, provided they have a system of diaphragmsor cross-frames installed. Lateral bracing, however, can also add stability tothe superstructure during construction and, for large spans, may bedesirable from this standpoint.
3. Portal and Sway Bracing. Portal and sway bracing are transversebracing elements used in truss bridges. Both portal and sway bracing arelocated at the top series of truss members called the top chord. Portalbracing differs from sway bracing in that it is located at the portal (i.e.,entrance) of a through-truss. Portal bracing is designed to accommodate thetotal end reaction of the lateral system located at the top chord of the truss,and transfer it to the substructure components. Sway bracing is located atintermediate panel points of the top chord in either a cross or knee braceconfiguration to provide lateral support for the truss top chords. Decktrusses require sway bracing at the truss end and intermediate posts toensure truss stability during construction.
3.2 DECK TYPES
In Section 1, it was stated that the deck is the physical extension of theroadway over a crossing. In Section 3.1 we saw that, in certain instances, thedeck can also serve as the bridge superstructure. Like their supporting systems,bridge decks can vary based on material and configuration. The followingdiscussion concerns bridge decks which are supported by or work with asuperstructure system.
3.2.1 Noncomposite and Composite Decks
When a deck is physically connected to and working with a superstructureload bearing member in resisting loads, it is said to be composite. If the deckis just resting on top of the superstructure and has no means of transferringlongitudinal shear from primary members to the deck, then it cannot assist inthe resistance of bending moments induced by vehicle loading and is said to benoncomposite.
From the above it is obvious why composite construction became thenorm for concrete-steel bridge construction from the 1950’s and onward.Composite construction offers:
❏ A more efficient use of materials since steel member size can besignificantly reduced due to the incorporation of the deck into theresisting cross-section properties
Noncomposite and Composite Decks
[3.1.4, Part 2]
n general, spans less than125 ft (38.1 m) are not
required to have lateral brac-ing, provided they have a sys-tem of diaphragms or crossframes installed.
I
Downloaded from Digital Engineering Library @ McGraw-Hill (www.digitalengineeringlibrary.com)Copyright © 2006 The McGraw-Hill Companies. All rights reserved.
Any use is subject to the Terms of Use as given at the website.
Design of Superstructure Elements
85
❏ Greater vertical clearance by a reduction in stringer depth
❏ An ability to sustain greater vehicle loading and to reduce live loaddefection
Because of these significant advantages, composite construction is utilizedwhenever possible in an effort to maximize the performance and use of, notonly different materials, but also different structural elements.
3.2.2 Cast-in-Place Concrete Slab
By far, the predominate form of deck in use is the cast-in-place,reinforced concrete deck slab. The conventional slab can work with eithersteel or concrete superstructures. If properly designed and maintained, aconcrete slab will offer many years of service, even though it takes the mostabuse out of any bridge component. As mentioned above, when working incomposite action, the slab essentially becomes an element in the superstruc-ture component. To protect the concrete slab, a deck overlay can be used ora portion of the deck reserved to resist the wear and tear of traffic (seeSection 3.3 below).
3.2.3 Precast, Prestressed Concrete Panels
Decks can also be made of precast, prestressed concrete panels which arelongitudinally post-tensioned after installation. The panels, which are 4 to 6 ftin width (1.2 to 1.8 m), are placed next to one another transverse to thestringers. A female-female keyway, filled with epoxy mortar, is used to join thepanels together. Should the panels be used in conjunction with a steelsuperstructure, voids in the panels allow for stud shear connectors to be placedon primary members once the panels are in place. After installation of thestuds, the voids, like the keyways, are filled with epoxy mortar [Ref. 3.9].Precast panels are useful alternatives in rehabilitation projects because theyallow for quick placement and are not susceptible to traffic vibrations, whichmay be a problem in projects undergoing staged construction. They cannot,however, be easily used on curved structures and have a higher cost than thetraditional cast-in-place deck.
3.2.4 Steel Orthotropic Plate
An orthotropic deck is a steel plate with stiffeners attached underneath it.The plate is stiffened in two directions: longitudinally and transversely. Longi-tudinal to the bridge, open or closed rib systems are used (see sidebar) tostiffen the deck plate. Floor beams are used to provide stiffness in thetransverse direction. Since the stiffness of the ribs vary from the floor beam,the system is said to be anisotropic. The term orthotropic is derived from theorthogonal (ortho) placement of the stiffeners and the anisotropic (tropic)behavior.
An orthotropic deck acts as the top flange of the primary members and,compared to a concrete deck, adds little dead load to the superstructure.
DECK TYPES
[3.2.4]
Steel Orthotropic Plate
...C omposite constructionis utilized whenever
possible in an effort to maxi-mize the performance and useof, not only different materials,but also different structuralelements.
he term orthotropic is de-rived from the orthogonal
(ortho) placement of the stiff-eners and the anisotropic(tropic) behavior.
T
Downloaded from Digital Engineering Library @ McGraw-Hill (www.digitalengineeringlibrary.com)Copyright © 2006 The McGraw-Hill Companies. All rights reserved.
Any use is subject to the Terms of Use as given at the website.
Design of Superstructure Elements
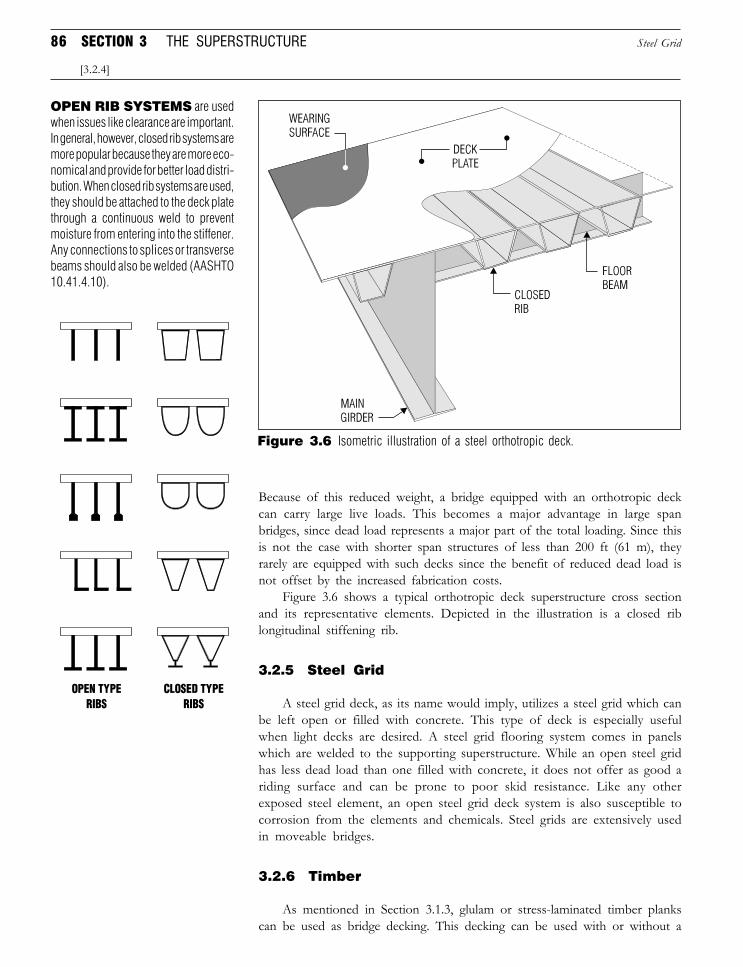
86 SECTION 3 THE SUPERSTRUCTURE
Because of this reduced weight, a bridge equipped with an orthotropic deckcan carry large live loads. This becomes a major advantage in large spanbridges, since dead load represents a major part of the total loading. Since thisis not the case with shorter span structures of less than 200 ft (61 m), theyrarely are equipped with such decks since the benefit of reduced dead load isnot offset by the increased fabrication costs.
Figure 3.6 shows a typical orthotropic deck superstructure cross sectionand its representative elements. Depicted in the illustration is a closed riblongitudinal stiffening rib.
3.2.5 Steel Grid
A steel grid deck, as its name would imply, utilizes a steel grid which canbe left open or filled with concrete. This type of deck is especially usefulwhen light decks are desired. A steel grid flooring system comes in panelswhich are welded to the supporting superstructure. While an open steel gridhas less dead load than one filled with concrete, it does not offer as good ariding surface and can be prone to poor skid resistance. Like any otherexposed steel element, an open steel grid deck system is also susceptible tocorrosion from the elements and chemicals. Steel grids are extensively usedin moveable bridges.
3.2.6 Timber
As mentioned in Section 3.1.3, glulam or stress-laminated timber plankscan be used as bridge decking. This decking can be used with or without a
Steel Grid
[3.2.4]
OPEN RIB SYSTEMS are usedwhen issues like clearance are important.In general, however, closed rib systems aremore popular because they are more eco-nomical and provide for better load distri-bution. When closed rib systems are used,they should be attached to the deck platethrough a continuous weld to preventmoisture from entering into the stiffener.Any connections to splices or transversebeams should also be welded (AASHTO10.41.4.10).
Figure 3.6 Isometric illustration of a steel orthotropic deck.
Downloaded from Digital Engineering Library @ McGraw-Hill (www.digitalengineeringlibrary.com)Copyright © 2006 The McGraw-Hill Companies. All rights reserved.
Any use is subject to the Terms of Use as given at the website.
Design of Superstructure Elements
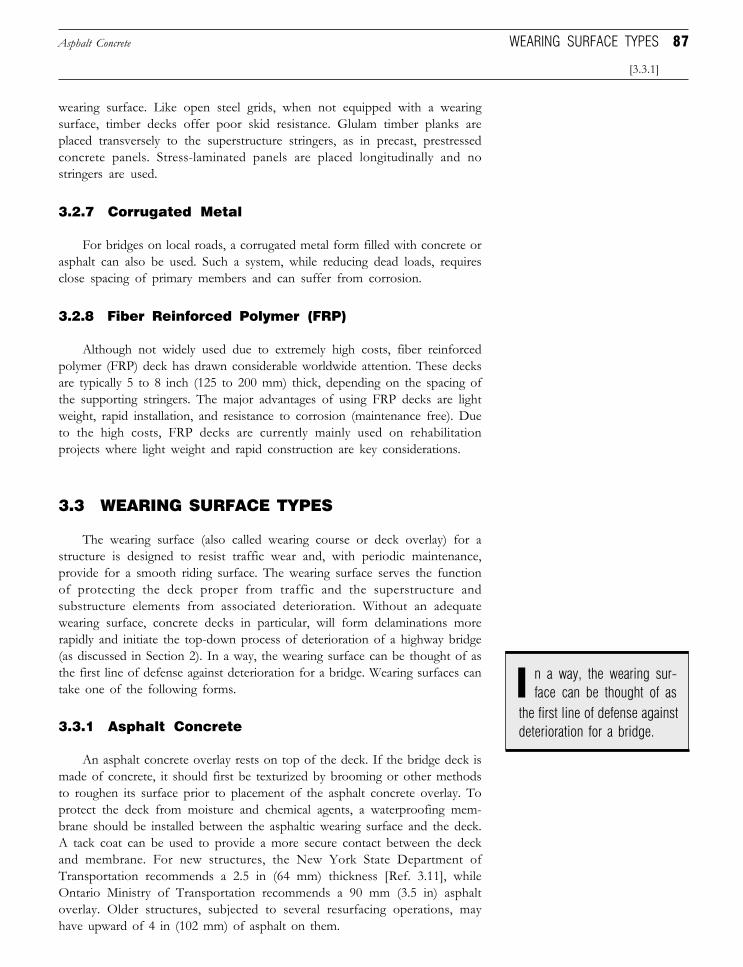
87
wearing surface. Like open steel grids, when not equipped with a wearingsurface, timber decks offer poor skid resistance. Glulam timber planks areplaced transversely to the superstructure stringers, as in precast, prestressedconcrete panels. Stress-laminated panels are placed longitudinally and nostringers are used.
3.2.7 Corrugated Metal
For bridges on local roads, a corrugated metal form filled with concrete orasphalt can also be used. Such a system, while reducing dead loads, requiresclose spacing of primary members and can suffer from corrosion.
3.2.8 Fiber Reinforced Polymer (FRP)
Although not widely used due to extremely high costs, fiber reinforcedpolymer (FRP) deck has drawn considerable worldwide attention. These decksare typically 5 to 8 inch (125 to 200 mm) thick, depending on the spacing ofthe supporting stringers. The major advantages of using FRP decks are lightweight, rapid installation, and resistance to corrosion (maintenance free). Dueto the high costs, FRP decks are currently mainly used on rehabilitationprojects where light weight and rapid construction are key considerations.
3.3 WEARING SURFACE TYPES
The wearing surface (also called wearing course or deck overlay) for astructure is designed to resist traffic wear and, with periodic maintenance,provide for a smooth riding surface. The wearing surface serves the functionof protecting the deck proper from traffic and the superstructure andsubstructure elements from associated deterioration. Without an adequatewearing surface, concrete decks in particular, will form delaminations morerapidly and initiate the top-down process of deterioration of a highway bridge(as discussed in Section 2). In a way, the wearing surface can be thought of asthe first line of defense against deterioration for a bridge. Wearing surfaces cantake one of the following forms.
3.3.1 Asphalt Concrete
An asphalt concrete overlay rests on top of the deck. If the bridge deck ismade of concrete, it should first be texturized by brooming or other methodsto roughen its surface prior to placement of the asphalt concrete overlay. Toprotect the deck from moisture and chemical agents, a waterproofing mem-brane should be installed between the asphaltic wearing surface and the deck.A tack coat can be used to provide a more secure contact between the deckand membrane. For new structures, the New York State Department ofTransportation recommends a 2.5 in (64 mm) thickness [Ref. 3.11], whileOntario Ministry of Transportation recommends a 90 mm (3.5 in) asphaltoverlay. Older structures, subjected to several resurfacing operations, mayhave upward of 4 in (102 mm) of asphalt on them.
Asphalt Concrete
[3.3.1]
WEARING SURFACE TYPES
n a way, the wearing sur-face can be thought of as
the first line of defense againstdeterioration for a bridge.
I
Downloaded from Digital Engineering Library @ McGraw-Hill (www.digitalengineeringlibrary.com)Copyright © 2006 The McGraw-Hill Companies. All rights reserved.
Any use is subject to the Terms of Use as given at the website.
Design of Superstructure Elements
88 SECTION 3 THE SUPERSTRUCTURE
3.3.2 Latex Modified Concrete
Similar to the way an asphalt concrete overlay is placed, a wearing surfacecomposed of latex modified concrete can be used. Latex modified concrete(also known as polymer modified concrete) is composed of cement, aggregate,and a latex emulsion admixture (such as styrene butadiene). With regard towearing surfaces, latex modified concrete provides for a surface which is lessporous, thereby limiting the intrusion of water and chlorides. Latex modifiedconcrete wearing surfaces also enhance the ability of an overlay to adhere toan existing concrete slab and resist thermal forces caused by temperaturefluctuations (see Section 3.5.4, Part 5). Because of its durability, a latexmodified concrete overlay is usually specified at a depth less than for anasphalt concrete surface [1.5 in (38 mm)] [Ref. 3.10]. Prior to placement ofthe latex modified concrete, the concrete deck surface should be blast cleanedand wetted.
Latex modified concrete overlay is routinely used to replace the wearingsurface of existing bridge decks.
3.3.3 High Density-Low Slump Concrete
Another wearing surface material, developed by the Iowa Department ofTransportation, is high density-low slump concrete. Typically the slump shouldbe no more than 1 in (25.4 mm) and water/cement ratio approximately 0.32.New York State specifies a minimum thickness of 2 in (50 mm) with anabsolute minimum of around 1.75 in (45 mm) [Ref. 3.10]. Like latex modifiedconcrete, the deck surface should be cleaned and wetted prior to placement.
3.3.4 Integrated Wearing Surface
An integrated wearing surface is part of the deck system itself. In the caseof a monolithic concrete deck, the top portion of the concrete deck slab istaken as the wearing surface. From a design standpoint, this means that aportion of the top of the slab is neglected for section properties resisting loads.This amount of concrete, however, is still included as dead load on thestructure. In the State of Maryland, 0.5 in (13 mm) of concrete on the top ofslab is ignored when calculating the deck properties. When an integratedwearing surface is used, the surface should be grooved to ensure thathydroplaning does not occur during rain storms.
3.4 DECK JOINT TYPES
As we saw in Section 2, deck joints can play a critical role in the overallperformance of a structure. The type of joint selected for a structure isgenerally dependent on the type and magnitude of motion the joint is requiredto accommodate. Deck joints can provide for longitudinal and transversemovement as well as rotation caused by thermal expansion/contraction andloading conditions. In addition to this, deck joints act as a sealant that protectssubstructure elements from deicing agents and excessive moisture.
[3.3.2]
DID YOU KNOW
THAT the first contactthe western
world had with latex occurredin the 1500’s when SouthAmerican Indians came incontact with Spanish explorers?The Spaniards noticed thesefar-sighted Indians were usingrubber latex, taken from theHavea brasilienis tree, forfootwear [Ref. 3.42].
Latex Modified Concrete
Because of its durability, alatex modified concrete
overlay is usually specified ata depth less than for an as-phalt concrete surface.
TYPES OF LATEX
There are a variety of latex types used ascement modifiers for Latex Modified Con-crete (Section 3.3.2). Some of the morecommon forms and their abbreviationsare listed below [Ref. 3.42].
ELASTOMERICNatural Rubber NRStyrene-Butadiene SBStyrene-Butadiene Rubber SBRPolychloroprene (Neoprene) CRAcrylonitrile-Butadiene Rubber NBR
THERMOPLASTIC
Polyacrylic Ester PAEStyrene-Acrylic SAEthylene Vinyl Acetate EVAVinyl Acetate-Ethylene VAEPolyvinyl Acetate PVACPolyvinylidene Chloride PVDCVinyl Acetate-Acrylic Copolymer VACPolyvinyl PropionatePolypropylenePure Acrylics
Downloaded from Digital Engineering Library @ McGraw-Hill (www.digitalengineeringlibrary.com)Copyright © 2006 The McGraw-Hill Companies. All rights reserved.
Any use is subject to the Terms of Use as given at the website.
Design of Superstructure Elements
89
3.4.1 Open Joints
Deck joints fall into two classes: open and closed. An open joint is nothingmore than an opening between the concrete deck and an adjacent structureelement (e.g., deck/deck, deck/abutment backwall). Sometimes, open jointsare equipped with steel angles at the opening to create an armored open joint.An armored joint prevents some debris from entering the joint and will offergreater protection to the faces of concrete elements.
The obvious deficiency of any open joint, however, is its inability toprevent leakage and its susceptibility to deterioration. In addition to this, anopen joint can only handle small longitudinal movements. Because of theseinadequacies, open joints are rarely used in new structures and are predomi-nately found in older, short span bridges.
Joints consisting of fitting plates, like finger plate joints, can also beconsidered to be open joints. These types of joints are more elaborate than thetype of open joint discussed above and provide for greater longitudinalmovement of the superstructure elements. Specific types of plate joints arediscussed in greater detail later in the Section.
A closed joint covers the gap between the deck and associated structureelement. A closed joint is typically comprised of a sealant and (if needed)mechanical system to provide for movement at the joint. Closed joints areavailable in a wide range of configurations from various manufacturers. Someof the more common forms of closed joints, as well as plate type joints, aredetailed below.
3.4.2 Filled Joints
For short span bridges requiring small joint movement, a filled joint can beused as an alternative to the open joint discussed above. Filled joints are fieldformed and hot poured into the joint. A backer rod is usually inserted into jointgap prior to pouring the joint sealer material (typically silicon).
These types of joints are most often used in rehabilitation work, whereupgrading an open joint or repair of a damaged joint is required. Theadvantages of this type joint are quick and easy installation, inexpensiveness,and ability to be preformed by owners’ in-house maintenance teams. This typeof joint normally last 5 to 10 years.
3.4.3 Compression Seal Joints
A compression seal consists of an elastic material which is squeezed into ajoint opening coated with an adhesive lubricant. The most popular material forcompression seals is extruded neoprene (polychloroprene) with an open cellcross section. The type of cross section used, combined with the material’selasticity, allows the seal to maintain compression and account for movementof the deck. For added durability, compression seals can also be combinedwith steel angles at the deck slab edge to form an armored joint (see Figure 3.7).Compression seal joints are typically used for decks experiencing movement inthe range of 0.5 to 2.5 in (12 mm to 63 mm).
DECK JOINT TYPES
[3.4.3]
Compression Seal Joints
Tis its inability to prevent leak-age and its susceptibility todeterioration.
he obvious deficiency ofany open joint, however,
t is probably safeto say that a
completely satisfactorydeck expansion joint hasnot yet been designed.
I
ARTHUR L. ELLIOT[Ref. 3.12]
Downloaded from Digital Engineering Library @ McGraw-Hill (www.digitalengineeringlibrary.com)Copyright © 2006 The McGraw-Hill Companies. All rights reserved.
Any use is subject to the Terms of Use as given at the website.
Design of Superstructure Elements
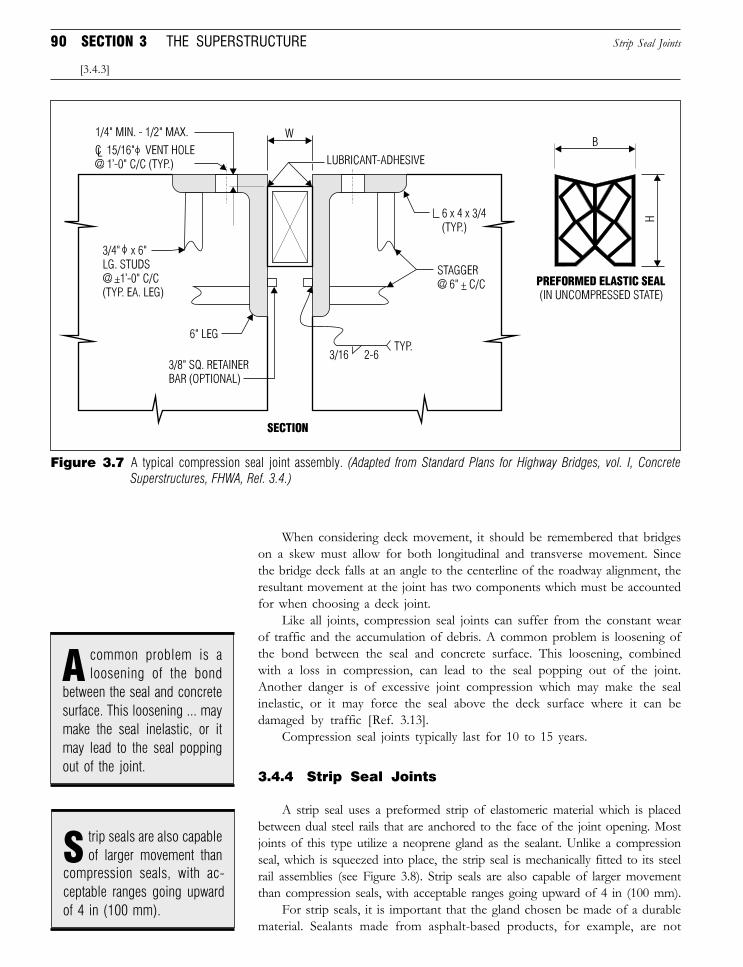
90 SECTION 3 THE SUPERSTRUCTURE
When considering deck movement, it should be remembered that bridgeson a skew must allow for both longitudinal and transverse movement. Sincethe bridge deck falls at an angle to the centerline of the roadway alignment, theresultant movement at the joint has two components which must be accountedfor when choosing a deck joint.
Like all joints, compression seal joints can suffer from the constant wearof traffic and the accumulation of debris. A common problem is loosening ofthe bond between the seal and concrete surface. This loosening, combinedwith a loss in compression, can lead to the seal popping out of the joint.Another danger is of excessive joint compression which may make the sealinelastic, or it may force the seal above the deck surface where it can bedamaged by traffic [Ref. 3.13].
Compression seal joints typically last for 10 to 15 years.
3.4.4 Strip Seal Joints
A strip seal uses a preformed strip of elastomeric material which is placedbetween dual steel rails that are anchored to the face of the joint opening. Mostjoints of this type utilize a neoprene gland as the sealant. Unlike a compressionseal, which is squeezed into place, the strip seal is mechanically fitted to its steelrail assemblies (see Figure 3.8). Strip seals are also capable of larger movementthan compression seals, with acceptable ranges going upward of 4 in (100 mm).
For strip seals, it is important that the gland chosen be made of a durablematerial. Sealants made from asphalt-based products, for example, are not
[3.4.3]
Strip Seal Joints
Figure 3.7 A typical compression seal joint assembly. (Adapted from Standard Plans for Highway Bridges, vol. I, ConcreteSuperstructures, FHWA, Ref. 3.4.)
DECK JOINT TYPES
[3.4.4]
A common problem is aloosening of the bond
between the seal and concretesurface. This loosening ... maymake the seal inelastic, or itmay lead to the seal poppingout of the joint.
S trip seals are also capableof larger movement than
compression seals, with ac-ceptable ranges going upwardof 4 in (100 mm).
Downloaded from Digital Engineering Library @ McGraw-Hill (www.digitalengineeringlibrary.com)Copyright © 2006 The McGraw-Hill Companies. All rights reserved.
Any use is subject to the Terms of Use as given at the website.
Design of Superstructure Elements
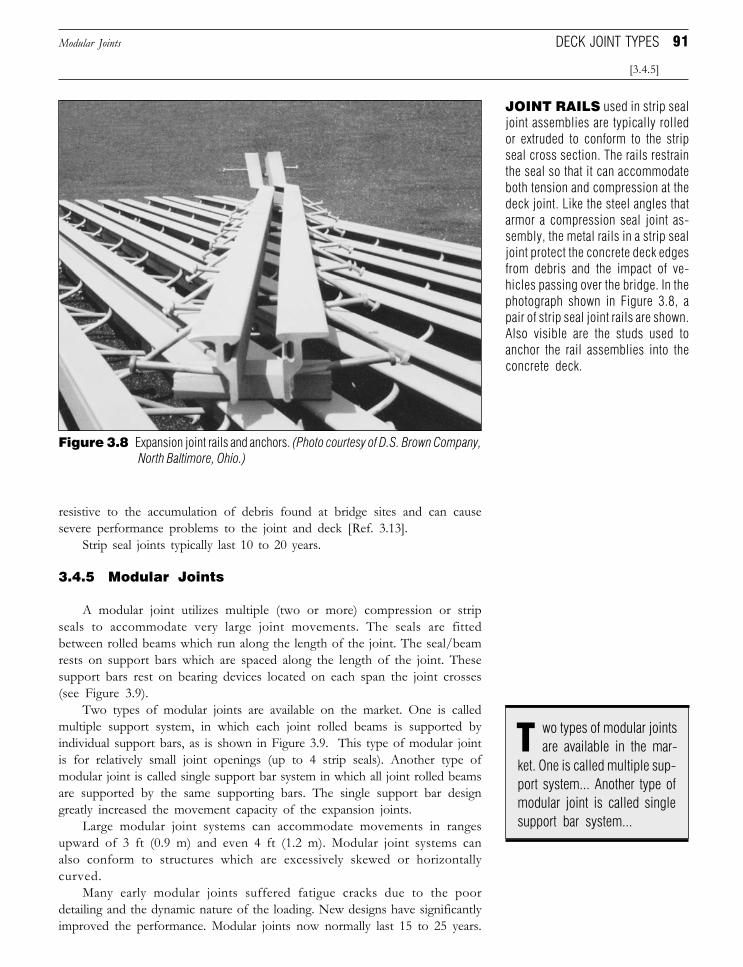
91
resistive to the accumulation of debris found at bridge sites and can causesevere performance problems to the joint and deck [Ref. 3.13].
Strip seal joints typically last 10 to 20 years.
3.4.5 Modular Joints
A modular joint utilizes multiple (two or more) compression or stripseals to accommodate very large joint movements. The seals are fittedbetween rolled beams which run along the length of the joint. The seal/beamrests on support bars which are spaced along the length of the joint. Thesesupport bars rest on bearing devices located on each span the joint crosses(see Figure 3.9).
Two types of modular joints are available on the market. One is calledmultiple support system, in which each joint rolled beams is supported byindividual support bars, as is shown in Figure 3.9. This type of modular jointis for relatively small joint openings (up to 4 strip seals). Another type ofmodular joint is called single support bar system in which all joint rolled beamsare supported by the same supporting bars. The single support bar designgreatly increased the movement capacity of the expansion joints.
Large modular joint systems can accommodate movements in rangesupward of 3 ft (0.9 m) and even 4 ft (1.2 m). Modular joint systems canalso conform to structures which are excessively skewed or horizontallycurved.
Many early modular joints suffered fatigue cracks due to the poordetailing and the dynamic nature of the loading. New designs have significantlyimproved the performance. Modular joints now normally last 15 to 25 years.
[3.4.5]
DECK JOINT TYPESModular Joints
JOINT RAILS used in strip sealjoint assemblies are typically rolledor extruded to conform to the stripseal cross section. The rails restrainthe seal so that it can accommodateboth tension and compression at thedeck joint. Like the steel angles thatarmor a compression seal joint as-sembly, the metal rails in a strip sealjoint protect the concrete deck edgesfrom debris and the impact of ve-hicles passing over the bridge. In thephotograph shown in Figure 3.8, apair of strip seal joint rails are shown.Also visible are the studs used toanchor the rail assemblies into theconcrete deck.
Figure 3.8 Expansion joint rails and anchors. (Photo courtesy of D.S. Brown Company,North Baltimore, Ohio.)
T wo types of modular jointsare available in the mar-
ket. One is called multiple sup-port system... Another type ofmodular joint is called singlesupport bar system...
Downloaded from Digital Engineering Library @ McGraw-Hill (www.digitalengineeringlibrary.com)Copyright © 2006 The McGraw-Hill Companies. All rights reserved.
Any use is subject to the Terms of Use as given at the website.
Design of Superstructure Elements
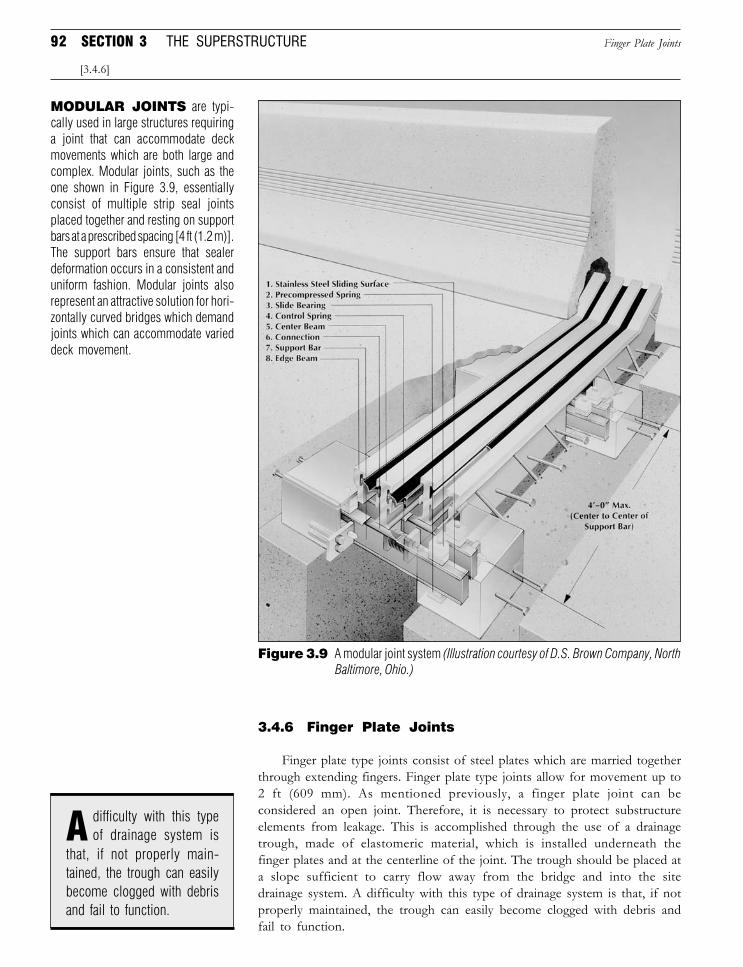
92 SECTION 3 THE SUPERSTRUCTURE
3.4.6 Finger Plate Joints
Finger plate type joints consist of steel plates which are married togetherthrough extending fingers. Finger plate type joints allow for movement up to2 ft (609 mm). As mentioned previously, a finger plate joint can beconsidered an open joint. Therefore, it is necessary to protect substructureelements from leakage. This is accomplished through the use of a drainagetrough, made of elastomeric material, which is installed underneath thefinger plates and at the centerline of the joint. The trough should be placed ata slope sufficient to carry flow away from the bridge and into the sitedrainage system. A difficulty with this type of drainage system is that, if notproperly maintained, the trough can easily become clogged with debris andfail to function.
Finger Plate Joints
[3.4.6]
Figure 3.9 A modular joint system (Illustration courtesy of D.S. Brown Company, NorthBaltimore, Ohio.)
MODULAR JOINTS are typi-cally used in large structures requiringa joint that can accommodate deckmovements which are both large andcomplex. Modular joints, such as theone shown in Figure 3.9, essentiallyconsist of multiple strip seal jointsplaced together and resting on supportbars at a prescribed spacing [4 ft (1.2 m)].The support bars ensure that sealerdeformation occurs in a consistent anduniform fashion. Modular joints alsorepresent an attractive solution for hori-zontally curved bridges which demandjoints which can accommodate varieddeck movement.
A difficulty with this typeof drainage system is
that, if not properly main-tained, the trough can easilybecome clogged with debrisand fail to function.
Downloaded from Digital Engineering Library @ McGraw-Hill (www.digitalengineeringlibrary.com)Copyright © 2006 The McGraw-Hill Companies. All rights reserved.
Any use is subject to the Terms of Use as given at the website.
Design of Superstructure Elements
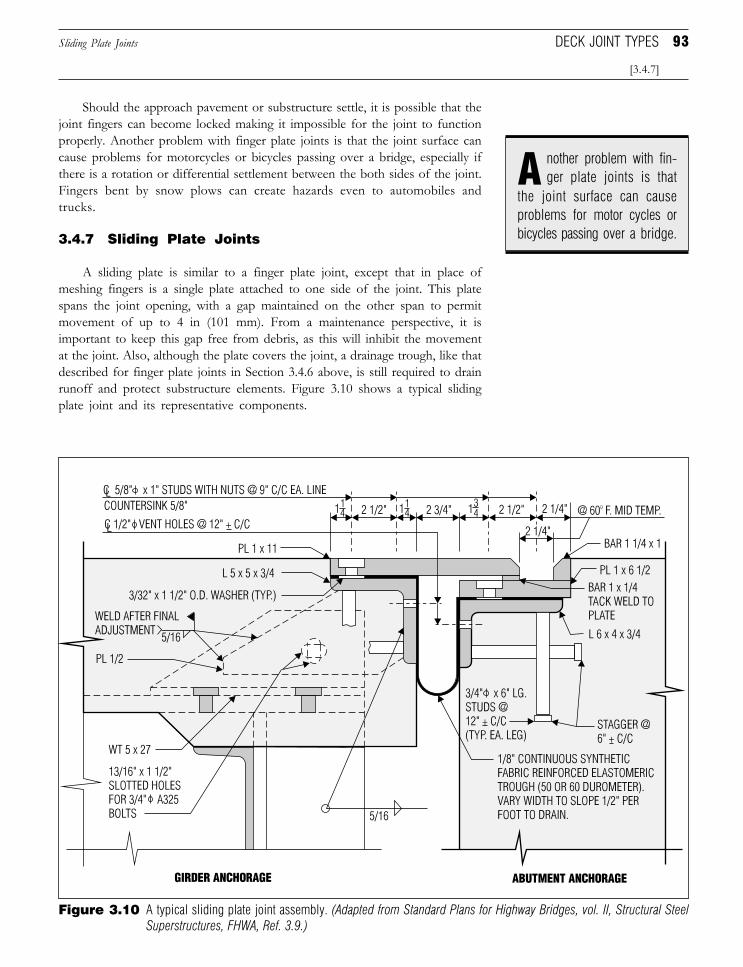
93
Should the approach pavement or substructure settle, it is possible that thejoint fingers can become locked making it impossible for the joint to functionproperly. Another problem with finger plate joints is that the joint surface cancause problems for motorcycles or bicycles passing over a bridge, especially ifthere is a rotation or differential settlement between the both sides of the joint.Fingers bent by snow plows can create hazards even to automobiles andtrucks.
3.4.7 Sliding Plate Joints
A sliding plate is similar to a finger plate joint, except that in place ofmeshing fingers is a single plate attached to one side of the joint. This platespans the joint opening, with a gap maintained on the other span to permitmovement of up to 4 in (101 mm). From a maintenance perspective, it isimportant to keep this gap free from debris, as this will inhibit the movementat the joint. Also, although the plate covers the joint, a drainage trough, like thatdescribed for finger plate joints in Section 3.4.6 above, is still required to drainrunoff and protect substructure elements. Figure 3.10 shows a typical slidingplate joint and its representative components.
[3.4.7]
DECK JOINT TYPESSliding Plate Joints
Figure 3.10 A typical sliding plate joint assembly. (Adapted from Standard Plans for Highway Bridges, vol. II, Structural SteelSuperstructures, FHWA, Ref. 3.9.)
A nother problem with fin-ger plate joints is that
the joint surface can causeproblems for motor cycles orbicycles passing over a bridge.
Downloaded from Digital Engineering Library @ McGraw-Hill (www.digitalengineeringlibrary.com)Copyright © 2006 The McGraw-Hill Companies. All rights reserved.
Any use is subject to the Terms of Use as given at the website.
Design of Superstructure Elements
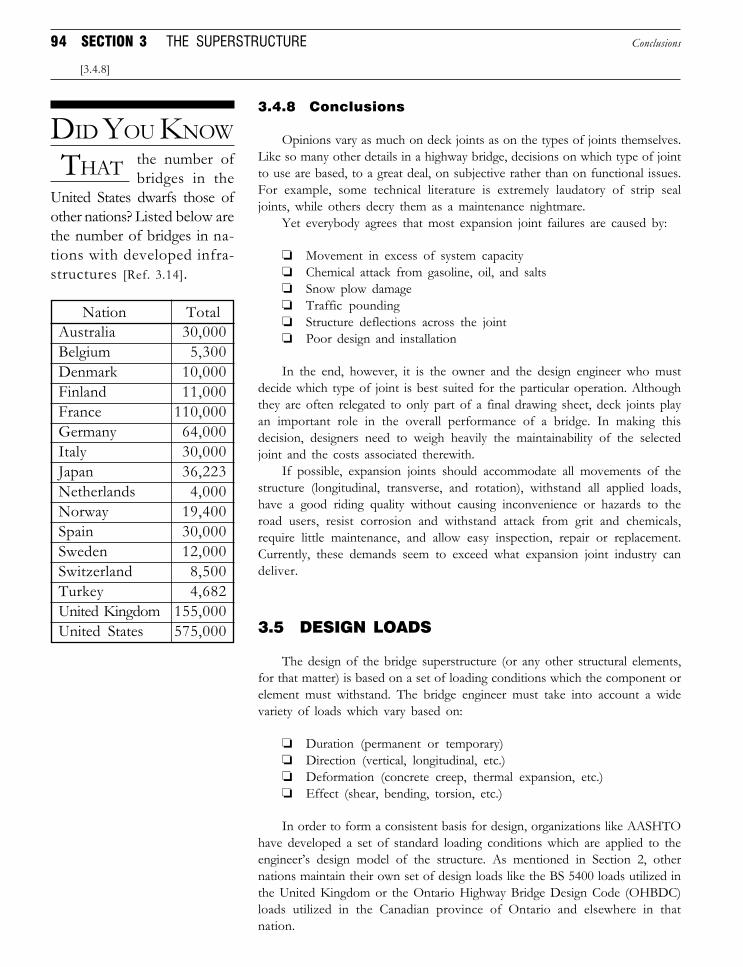
94 SECTION 3 THE SUPERSTRUCTURE
3.4.8 Conclusions
Opinions vary as much on deck joints as on the types of joints themselves.Like so many other details in a highway bridge, decisions on which type of jointto use are based, to a great deal, on subjective rather than on functional issues.For example, some technical literature is extremely laudatory of strip sealjoints, while others decry them as a maintenance nightmare.
Yet everybody agrees that most expansion joint failures are caused by:
❏ Movement in excess of system capacity❏ Chemical attack from gasoline, oil, and salts❏ Snow plow damage❏ Traffic pounding❏ Structure deflections across the joint❏ Poor design and installation
In the end, however, it is the owner and the design engineer who mustdecide which type of joint is best suited for the particular operation. Althoughthey are often relegated to only part of a final drawing sheet, deck joints playan important role in the overall performance of a bridge. In making thisdecision, designers need to weigh heavily the maintainability of the selectedjoint and the costs associated therewith.
If possible, expansion joints should accommodate all movements of thestructure (longitudinal, transverse, and rotation), withstand all applied loads,have a good riding quality without causing inconvenience or hazards to theroad users, resist corrosion and withstand attack from grit and chemicals,require little maintenance, and allow easy inspection, repair or replacement.Currently, these demands seem to exceed what expansion joint industry candeliver.
3.5 DESIGN LOADS
The design of the bridge superstructure (or any other structural elements,for that matter) is based on a set of loading conditions which the component orelement must withstand. The bridge engineer must take into account a widevariety of loads which vary based on:
❏ Duration (permanent or temporary)❏ Direction (vertical, longitudinal, etc.)❏ Deformation (concrete creep, thermal expansion, etc.)❏ Effect (shear, bending, torsion, etc.)
In order to form a consistent basis for design, organizations like AASHTOhave developed a set of standard loading conditions which are applied to theengineer’s design model of the structure. As mentioned in Section 2, othernations maintain their own set of design loads like the BS 5400 loads utilized inthe United Kingdom or the Ontario Highway Bridge Design Code (OHBDC)loads utilized in the Canadian province of Ontario and elsewhere in thatnation.
Conclusions
[3.4.8]
DID YOU KNOW
THAT the number ofbridges in the
United States dwarfs those ofother nations? Listed below arethe number of bridges in na-tions with developed infra-structures [Ref. 3.14].
Nation TotalAustralia 30,000Belgium 5,300Denmark 10,000Finland 11,000France 110,000Germany 64,000Italy 30,000Japan 36,223Netherlands 4,000Norway 19,400Spain 30,000Sweden 12,000Switzerland 8,500Turkey 4,682United Kingdom 155,000United States 575,000
Downloaded from Digital Engineering Library @ McGraw-Hill (www.digitalengineeringlibrary.com)Copyright © 2006 The McGraw-Hill Companies. All rights reserved.
Any use is subject to the Terms of Use as given at the website.
Design of Superstructure Elements
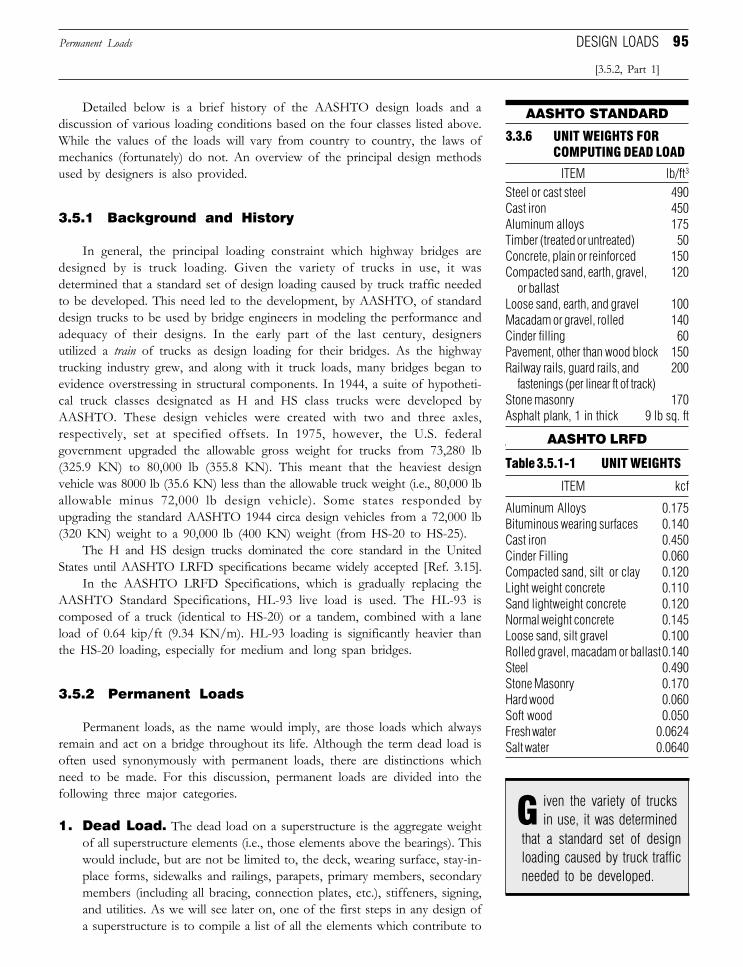
95
Detailed below is a brief history of the AASHTO design loads and adiscussion of various loading conditions based on the four classes listed above.While the values of the loads will vary from country to country, the laws ofmechanics (fortunately) do not. An overview of the principal design methodsused by designers is also provided.
3.5.1 Background and History
In general, the principal loading constraint which highway bridges aredesigned by is truck loading. Given the variety of trucks in use, it wasdetermined that a standard set of design loading caused by truck traffic neededto be developed. This need led to the development, by AASHTO, of standarddesign trucks to be used by bridge engineers in modeling the performance andadequacy of their designs. In the early part of the last century, designersutilized a train of trucks as design loading for their bridges. As the highwaytrucking industry grew, and along with it truck loads, many bridges began toevidence overstressing in structural components. In 1944, a suite of hypotheti-cal truck classes designated as H and HS class trucks were developed byAASHTO. These design vehicles were created with two and three axles,respectively, set at specified offsets. In 1975, however, the U.S. federalgovernment upgraded the allowable gross weight for trucks from 73,280 lb(325.9 KN) to 80,000 lb (355.8 KN). This meant that the heaviest designvehicle was 8000 lb (35.6 KN) less than the allowable truck weight (i.e., 80,000 lballowable minus 72,000 lb design vehicle). Some states responded byupgrading the standard AASHTO 1944 circa design vehicles from a 72,000 lb(320 KN) weight to a 90,000 lb (400 KN) weight (from HS-20 to HS-25).
The H and HS design trucks dominated the core standard in the UnitedStates until AASHTO LRFD specifications became widely accepted [Ref. 3.15].
In the AASHTO LRFD Specifications, which is gradually replacing theAASHTO Standard Specifications, HL-93 live load is used. The HL-93 iscomposed of a truck (identical to HS-20) or a tandem, combined with a laneload of 0.64 kip/ft (9.34 KN/m). HL-93 loading is significantly heavier thanthe HS-20 loading, especially for medium and long span bridges.
3.5.2 Permanent Loads
Permanent loads, as the name would imply, are those loads which alwaysremain and act on a bridge throughout its life. Although the term dead load isoften used synonymously with permanent loads, there are distinctions whichneed to be made. For this discussion, permanent loads are divided into thefollowing three major categories.
1. Dead Load. The dead load on a superstructure is the aggregate weightof all superstructure elements (i.e., those elements above the bearings). Thiswould include, but are not be limited to, the deck, wearing surface, stay-in-place forms, sidewalks and railings, parapets, primary members, secondarymembers (including all bracing, connection plates, etc.), stiffeners, signing,and utilities. As we will see later on, one of the first steps in any design ofa superstructure is to compile a list of all the elements which contribute to
AASHTO STANDARD
3.3.6 UNIT WEIGHTS FORCOMPUTING DEAD LOAD
ITEM lb/ft3
Steel or cast steel 490Cast iron 450Aluminum alloys 175Timber (treated or untreated) 50Concrete, plain or reinforced 150Compacted sand, earth, gravel, 120
or ballastLoose sand, earth, and gravel 100Macadam or gravel, rolled 140Cinder filling 60Pavement, other than wood block 150Railway rails, guard rails, and 200
fastenings (per linear ft of track)Stone masonry 170Asphalt plank, 1 in thick 9 lb sq. ft
Permanent Loads
[3.5.2, Part 1]
DESIGN LOADS
AASHTO LRFD
Table 3.5.1-1 UNIT WEIGHTS
ITEM kcf
Aluminum Alloys 0.175Bituminous wearing surfaces 0.140Cast iron 0.450Cinder Filling 0.060Compacted sand, silt or clay 0.120Light weight concrete 0.110Sand lightweight concrete 0.120Normal weight concrete 0.145Loose sand, silt gravel 0.100Rolled gravel, macadam or ballast0.140Steel 0.490Stone Masonry 0.170Hard wood 0.060Soft wood 0.050Fresh water 0.0624Salt water 0.0640
G iven the variety of trucksin use, it was determined
that a standard set of designloading caused by truck trafficneeded to be developed.
Downloaded from Digital Engineering Library @ McGraw-Hill (www.digitalengineeringlibrary.com)Copyright © 2006 The McGraw-Hill Companies. All rights reserved.
Any use is subject to the Terms of Use as given at the website.
Design of Superstructure Elements
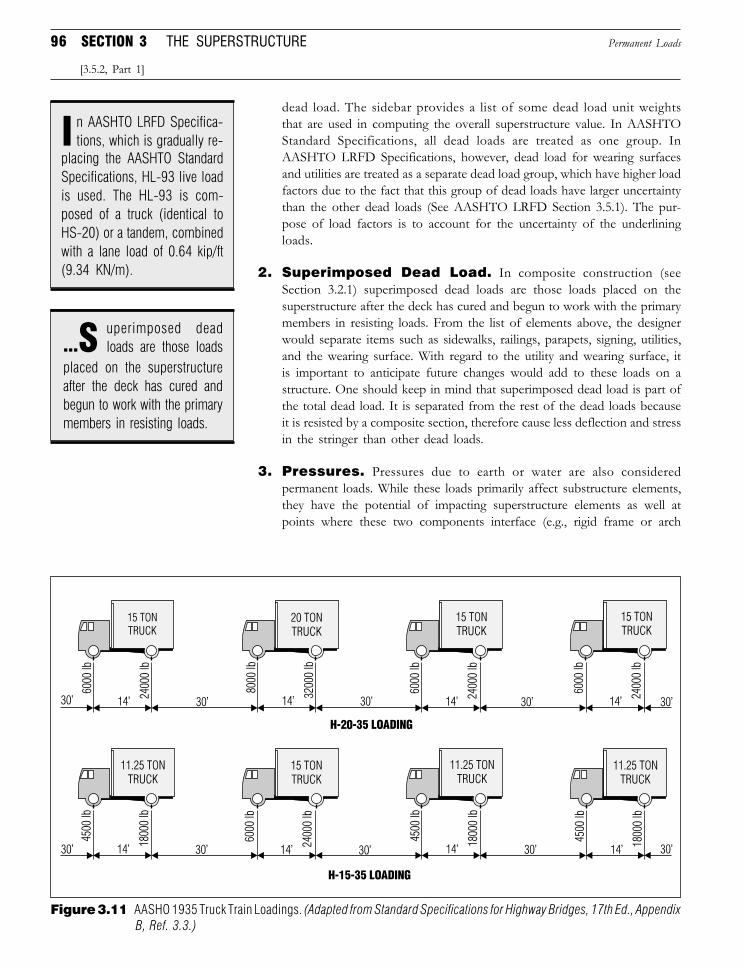
96 SECTION 3 THE SUPERSTRUCTURE
dead load. The sidebar provides a list of some dead load unit weightsthat are used in computing the overall superstructure value. In AASHTOStandard Specifications, all dead loads are treated as one group. InAASHTO LRFD Specifications, however, dead load for wearing surfacesand utilities are treated as a separate dead load group, which have higher loadfactors due to the fact that this group of dead loads have larger uncertaintythan the other dead loads (See AASHTO LRFD Section 3.5.1). The pur-pose of load factors is to account for the uncertainty of the underliningloads.
2. Superimposed Dead Load. In composite construction (seeSection 3.2.1) superimposed dead loads are those loads placed on thesuperstructure after the deck has cured and begun to work with the primarymembers in resisting loads. From the list of elements above, the designerwould separate items such as sidewalks, railings, parapets, signing, utilities,and the wearing surface. With regard to the utility and wearing surface, itis important to anticipate future changes would add to these loads on astructure. One should keep in mind that superimposed dead load is part ofthe total dead load. It is separated from the rest of the dead loads becauseit is resisted by a composite section, therefore cause less deflection and stressin the stringer than other dead loads.
3. Pressures. Pressures due to earth or water are also consideredpermanent loads. While these loads primarily affect substructure elements,they have the potential of impacting superstructure elements as well atpoints where these two components interface (e.g., rigid frame or arch
Permanent Loads
[3.5.2, Part 1]
Figure 3.11 AASHO 1935 Truck Train Loadings. (Adapted from Standard Specifications for Highway Bridges, 17th Ed., AppendixB, Ref. 3.3.)
n AASHTO LRFD Specifica-tions, which is gradually re-I
placing the AASHTO StandardSpecifications, HL-93 live loadis used. The HL-93 is com-posed of a truck (identical toHS-20) or a tandem, combinedwith a lane load of 0.64 kip/ft(9.34 KN/m).
uperimposed deadloads are those loads
placed on the superstructureafter the deck has cured andbegun to work with the primarymembers in resisting loads.
...S
Downloaded from Digital Engineering Library @ McGraw-Hill (www.digitalengineeringlibrary.com)Copyright © 2006 The McGraw-Hill Companies. All rights reserved.
Any use is subject to the Terms of Use as given at the website.
Design of Superstructure Elements
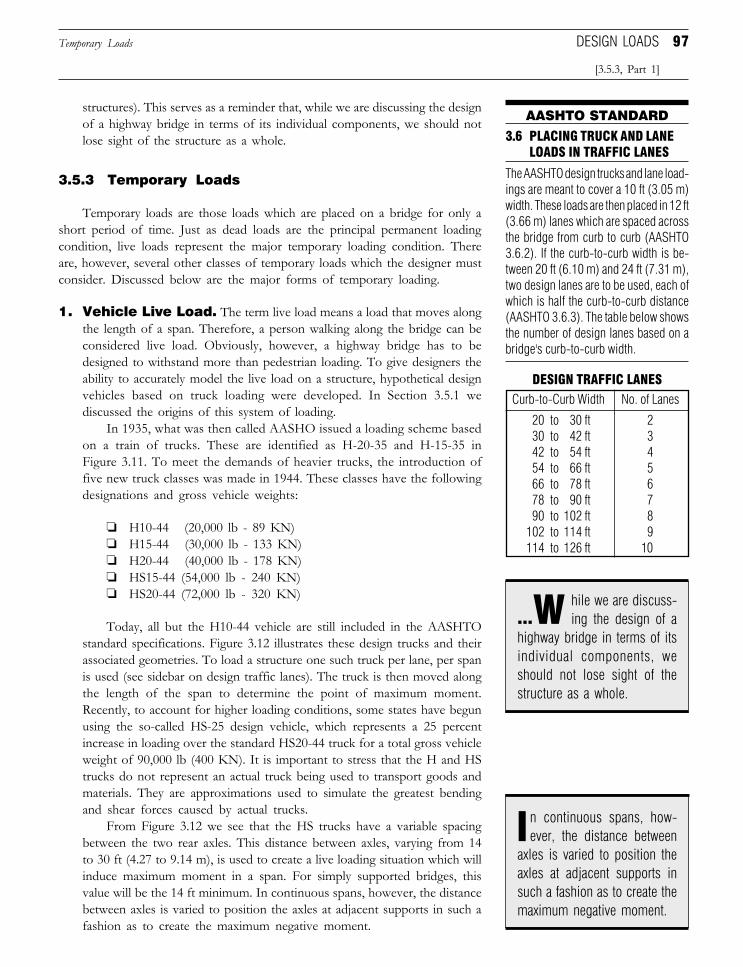
97
structures). This serves as a reminder that, while we are discussing the designof a highway bridge in terms of its individual components, we should notlose sight of the structure as a whole.
3.5.3 Temporary Loads
Temporary loads are those loads which are placed on a bridge for only ashort period of time. Just as dead loads are the principal permanent loadingcondition, live loads represent the major temporary loading condition. Thereare, however, several other classes of temporary loads which the designer mustconsider. Discussed below are the major forms of temporary loading.
1. Vehicle Live Load. The term live load means a load that moves alongthe length of a span. Therefore, a person walking along the bridge can beconsidered live load. Obviously, however, a highway bridge has to bedesigned to withstand more than pedestrian loading. To give designers theability to accurately model the live load on a structure, hypothetical designvehicles based on truck loading were developed. In Section 3.5.1 wediscussed the origins of this system of loading.
In 1935, what was then called AASHO issued a loading scheme basedon a train of trucks. These are identified as H-20-35 and H-15-35 inFigure 3.11. To meet the demands of heavier trucks, the introduction offive new truck classes was made in 1944. These classes have the followingdesignations and gross vehicle weights:
❏ H10-44 (20,000 lb - 89 KN)❏ H15-44 (30,000 lb - 133 KN)❏ H20-44 (40,000 lb - 178 KN)❏ HS15-44 (54,000 lb - 240 KN)❏ HS20-44 (72,000 lb - 320 KN)
Today, all but the H10-44 vehicle are still included in the AASHTOstandard specifications. Figure 3.12 illustrates these design trucks and theirassociated geometries. To load a structure one such truck per lane, per spanis used (see sidebar on design traffic lanes). The truck is then moved alongthe length of the span to determine the point of maximum moment.Recently, to account for higher loading conditions, some states have begunusing the so-called HS-25 design vehicle, which represents a 25 percentincrease in loading over the standard HS20-44 truck for a total gross vehicleweight of 90,000 lb (400 KN). It is important to stress that the H and HStrucks do not represent an actual truck being used to transport goods andmaterials. They are approximations used to simulate the greatest bendingand shear forces caused by actual trucks.
From Figure 3.12 we see that the HS trucks have a variable spacingbetween the two rear axles. This distance between axles, varying from 14to 30 ft (4.27 to 9.14 m), is used to create a live loading situation which willinduce maximum moment in a span. For simply supported bridges, thisvalue will be the 14 ft minimum. In continuous spans, however, the distancebetween axles is varied to position the axles at adjacent supports in such afashion as to create the maximum negative moment.
Temporary Loads
[3.5.3, Part 1]
DESIGN LOADS
20 to 30 ft 230 to 42 ft 342 to 54 ft 454 to 66 ft 566 to 78 ft 678 to 90 ft 790 to 102 ft 8
102 to 114 ft 9114 to 126 ft 10
Curb-to-Curb Width No. of LanesDESIGN TRAFFIC LANES
3.6 PLACING TRUCK AND LANELOADS IN TRAFFIC LANES
The AASHTO design trucks and lane load-ings are meant to cover a 10 ft (3.05 m)width. These loads are then placed in 12 ft(3.66 m) lanes which are spaced acrossthe bridge from curb to curb (AASHTO3.6.2). If the curb-to-curb width is be-tween 20 ft (6.10 m) and 24 ft (7.31 m),two design lanes are to be used, each ofwhich is half the curb-to-curb distance(AASHTO 3.6.3). The table below showsthe number of design lanes based on abridge's curb-to-curb width.
AASHTO STANDARD
In continuous spans, how-ever, the distance between
axles is varied to position theaxles at adjacent supports insuch a fashion as to create themaximum negative moment.
highway bridge in terms of itsindividual components, weshould not lose sight of thestructure as a whole.
hile we are discuss-ing the design of a...W
Downloaded from Digital Engineering Library @ McGraw-Hill (www.digitalengineeringlibrary.com)Copyright © 2006 The McGraw-Hill Companies. All rights reserved.
Any use is subject to the Terms of Use as given at the website.
Design of Superstructure Elements
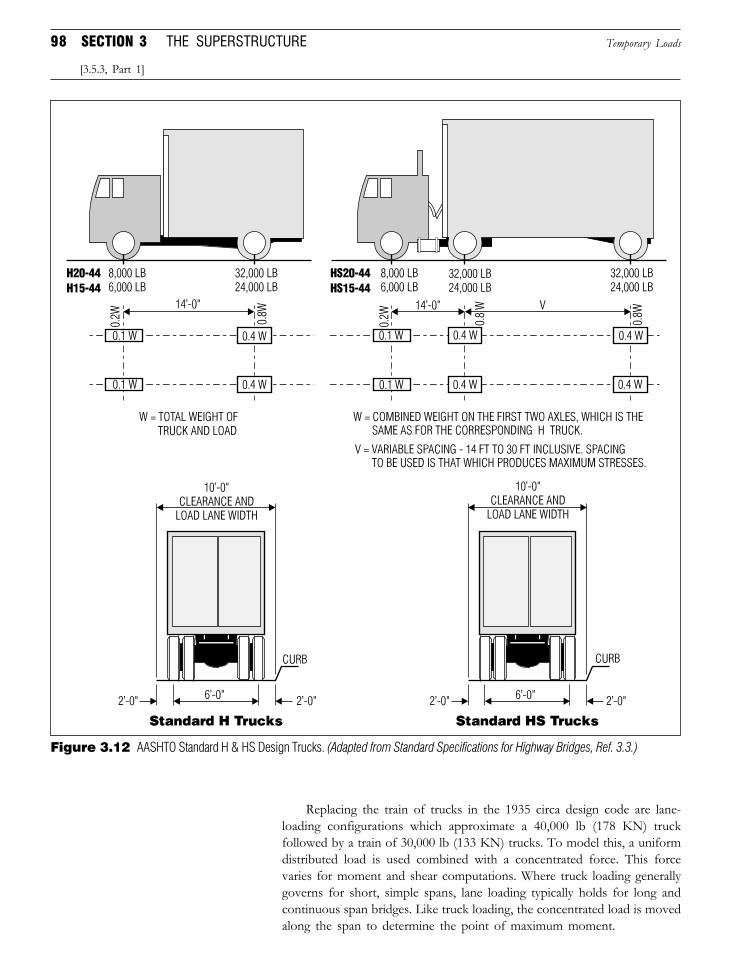
98 SECTION 3 THE SUPERSTRUCTURE
Replacing the train of trucks in the 1935 circa design code are lane-loading configurations which approximate a 40,000 lb (178 KN) truckfollowed by a train of 30,000 lb (133 KN) trucks. To model this, a uniformdistributed load is used combined with a concentrated force. This forcevaries for moment and shear computations. Where truck loading generallygoverns for short, simple spans, lane loading typically holds for long andcontinuous span bridges. Like truck loading, the concentrated load is movedalong the span to determine the point of maximum moment.
Temporary Loads
[3.5.3, Part 1]
Figure 3.12 AASHTO Standard H & HS Design Trucks. (Adapted from Standard Specifications for Highway Bridges, Ref. 3.3.)
Downloaded from Digital Engineering Library @ McGraw-Hill (www.digitalengineeringlibrary.com)Copyright © 2006 The McGraw-Hill Companies. All rights reserved.
Any use is subject to the Terms of Use as given at the website.
Design of Superstructure Elements
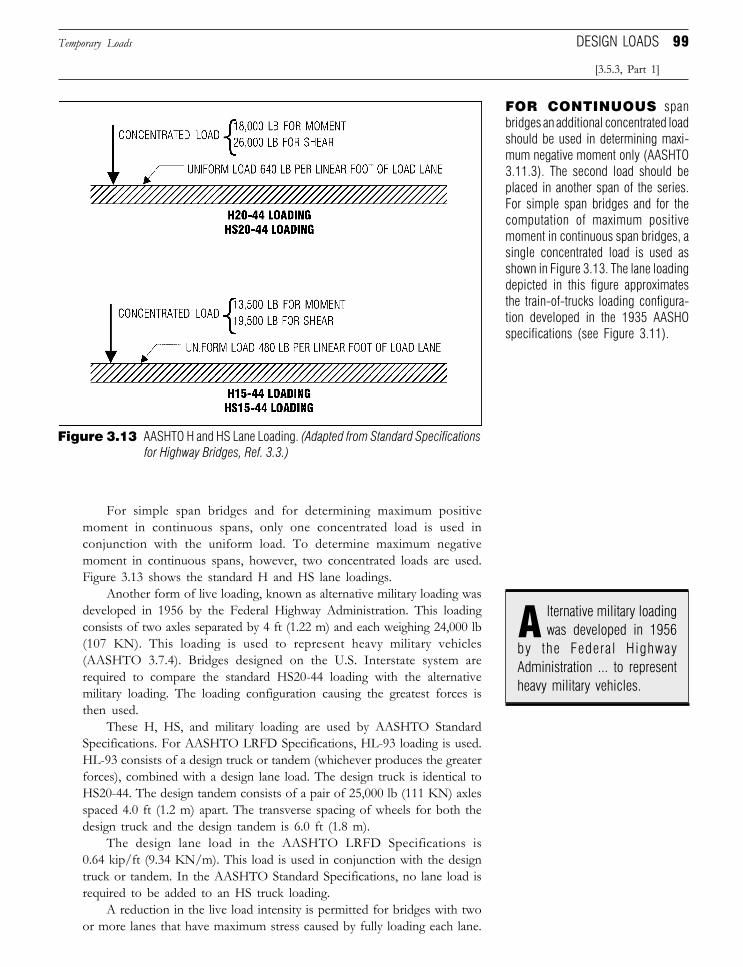
99
For simple span bridges and for determining maximum positivemoment in continuous spans, only one concentrated load is used inconjunction with the uniform load. To determine maximum negativemoment in continuous spans, however, two concentrated loads are used.Figure 3.13 shows the standard H and HS lane loadings.
Another form of live loading, known as alternative military loading wasdeveloped in 1956 by the Federal Highway Administration. This loadingconsists of two axles separated by 4 ft (1.22 m) and each weighing 24,000 lb(107 KN). This loading is used to represent heavy military vehicles(AASHTO 3.7.4). Bridges designed on the U.S. Interstate system arerequired to compare the standard HS20-44 loading with the alternativemilitary loading. The loading configuration causing the greatest forces isthen used.
These H, HS, and military loading are used by AASHTO StandardSpecifications. For AASHTO LRFD Specifications, HL-93 loading is used.HL-93 consists of a design truck or tandem (whichever produces the greaterforces), combined with a design lane load. The design truck is identical toHS20-44. The design tandem consists of a pair of 25,000 lb (111 KN) axlesspaced 4.0 ft (1.2 m) apart. The transverse spacing of wheels for both thedesign truck and the design tandem is 6.0 ft (1.8 m).
The design lane load in the AASHTO LRFD Specifications is0.64 kip/ft (9.34 KN/m). This load is used in conjunction with the designtruck or tandem. In the AASHTO Standard Specifications, no lane load isrequired to be added to an HS truck loading.
A reduction in the live load intensity is permitted for bridges with twoor more lanes that have maximum stress caused by fully loading each lane.
Temporary Loads
[3.5.3, Part 1]
DESIGN LOADS
FOR CONTINUOUS spanbridges an additional concentrated loadshould be used in determining maxi-mum negative moment only (AASHTO3.11.3). The second load should beplaced in another span of the series.For simple span bridges and for thecomputation of maximum positivemoment in continuous span bridges, asingle concentrated load is used asshown in Figure 3.13. The lane loadingdepicted in this figure approximatesthe train-of-trucks loading configura-tion developed in the 1935 AASHOspecifications (see Figure 3.11).
A lternative military loadingwas developed in 1956
by the Federal HighwayAdministration ... to representheavy military vehicles.
Figure 3.13 AASHTO H and HS Lane Loading. (Adapted from Standard Specificationsfor Highway Bridges, Ref. 3.3.)
Downloaded from Digital Engineering Library @ McGraw-Hill (www.digitalengineeringlibrary.com)Copyright © 2006 The McGraw-Hill Companies. All rights reserved.
Any use is subject to the Terms of Use as given at the website.
Design of Superstructure Elements
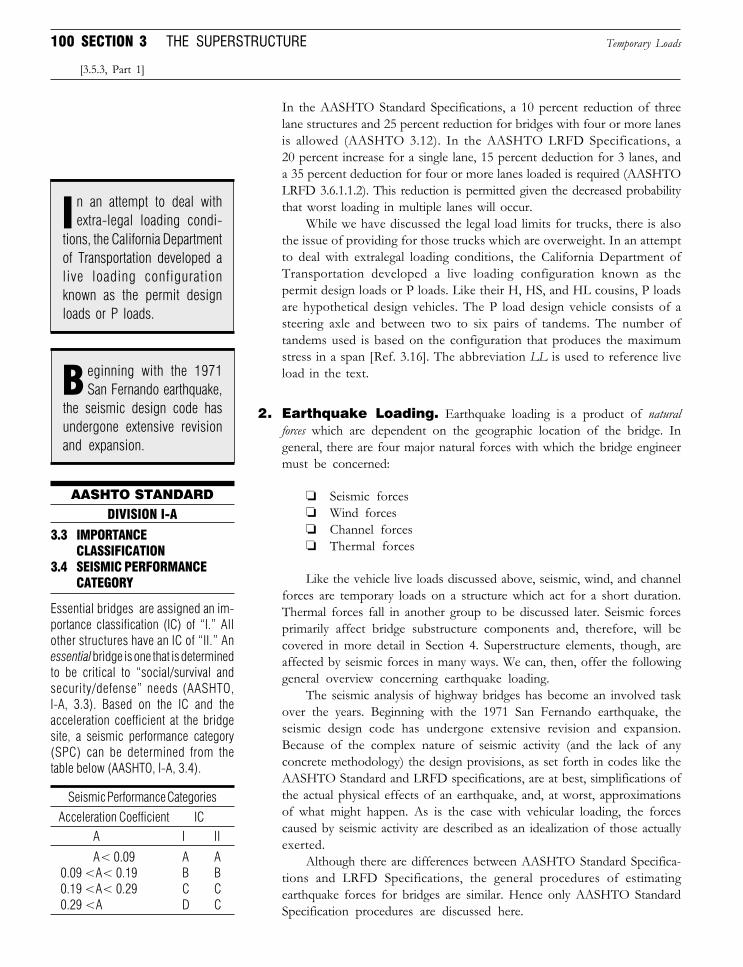
100 SECTION 3 THE SUPERSTRUCTURE
In the AASHTO Standard Specifications, a 10 percent reduction of threelane structures and 25 percent reduction for bridges with four or more lanesis allowed (AASHTO 3.12). In the AASHTO LRFD Specifications, a20 percent increase for a single lane, 15 percent deduction for 3 lanes, anda 35 percent deduction for four or more lanes loaded is required (AASHTOLRFD 3.6.1.1.2). This reduction is permitted given the decreased probabilitythat worst loading in multiple lanes will occur.
While we have discussed the legal load limits for trucks, there is alsothe issue of providing for those trucks which are overweight. In an attemptto deal with extralegal loading conditions, the California Department ofTransportation developed a live loading configuration known as thepermit design loads or P loads. Like their H, HS, and HL cousins, P loadsare hypothetical design vehicles. The P load design vehicle consists of asteering axle and between two to six pairs of tandems. The number oftandems used is based on the configuration that produces the maximumstress in a span [Ref. 3.16]. The abbreviation LL is used to reference liveload in the text.
2. Earthquake Loading. Earthquake loading is a product of naturalforces which are dependent on the geographic location of the bridge. Ingeneral, there are four major natural forces with which the bridge engineermust be concerned:
❏ Seismic forces❏ Wind forces❏ Channel forces❏ Thermal forces
Like the vehicle live loads discussed above, seismic, wind, and channelforces are temporary loads on a structure which act for a short duration.Thermal forces fall in another group to be discussed later. Seismic forcesprimarily affect bridge substructure components and, therefore, will becovered in more detail in Section 4. Superstructure elements, though, areaffected by seismic forces in many ways. We can, then, offer the followinggeneral overview concerning earthquake loading.
The seismic analysis of highway bridges has become an involved taskover the years. Beginning with the 1971 San Fernando earthquake, theseismic design code has undergone extensive revision and expansion.Because of the complex nature of seismic activity (and the lack of anyconcrete methodology) the design provisions, as set forth in codes like theAASHTO Standard and LRFD specifications, are at best, simplifications ofthe actual physical effects of an earthquake, and, at worst, approximationsof what might happen. As is the case with vehicular loading, the forcescaused by seismic activity are described as an idealization of those actuallyexerted.
Although there are differences between AASHTO Standard Specifica-tions and LRFD Specifications, the general procedures of estimatingearthquake forces for bridges are similar. Hence only AASHTO StandardSpecification procedures are discussed here.
Temporary Loads
[3.5.3, Part 1]
DIVISION I-A
Essential bridges are assigned an im-portance classification (IC) of “I.” Allother structures have an IC of “II.” Anessential bridge is one that is determinedto be critical to “social/survival andsecurity/defense” needs (AASHTO,I-A, 3.3). Based on the IC and theacceleration coefficient at the bridgesite, a seismic performance category(SPC) can be determined from thetable below (AASHTO, I-A, 3.4).
3.3 IMPORTANCECLASSIFICATION SEISMIC PERFORMANCECATEGORY
Seismic Performance Categories
A I IIAcceleration Coefficient IC
A< 0.09 A A0.09 <A< 0.19 B B0.19 <A< 0.29 C C0.29 <A D C
AASHTO STANDARD
Itions, the California Departmentof Transportation developed alive loading configurationknown as the permit designloads or P loads.
n an attempt to deal withextra-legal loading condi-
B eginning with the 1971San Fernando earthquake,
the seismic design code hasundergone extensive revisionand expansion.
3.4
Downloaded from Digital Engineering Library @ McGraw-Hill (www.digitalengineeringlibrary.com)Copyright © 2006 The McGraw-Hill Companies. All rights reserved.
Any use is subject to the Terms of Use as given at the website.
Design of Superstructure Elements
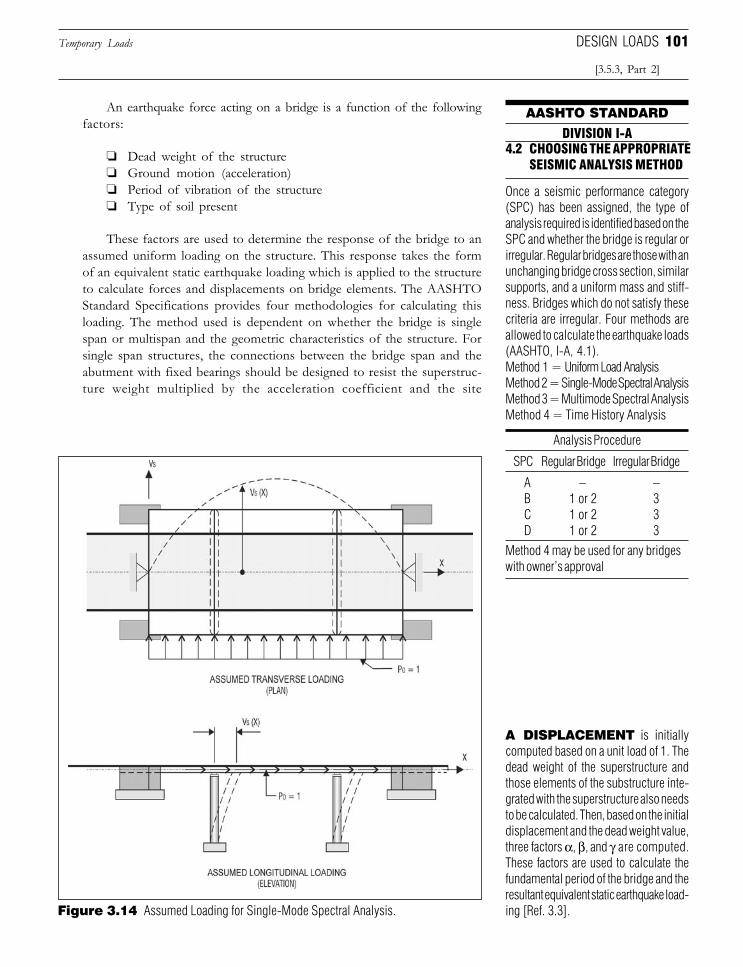
101
An earthquake force acting on a bridge is a function of the followingfactors:
❏ Dead weight of the structure❏ Ground motion (acceleration)❏ Period of vibration of the structure❏ Type of soil present
These factors are used to determine the response of the bridge to anassumed uniform loading on the structure. This response takes the formof an equivalent static earthquake loading which is applied to the structureto calculate forces and displacements on bridge elements. The AASHTOStandard Specifications provides four methodologies for calculating thisloading. The method used is dependent on whether the bridge is singlespan or multispan and the geometric characteristics of the structure. Forsingle span structures, the connections between the bridge span and theabutment with fixed bearings should be designed to resist the superstruc-ture weight multiplied by the acceleration coefficient and the site
Temporary Loads
[3.5.3, Part 2]
DESIGN LOADS
A DISPLACEMENT is initiallycomputed based on a unit load of 1. Thedead weight of the superstructure andthose elements of the substructure inte-grated with the superstructure also needsto be calculated. Then, based on the initialdisplacement and the dead weight value,three factors α, β, and γ are computed.These factors are used to calculate thefundamental period of the bridge and theresultant equivalent static earthquake load-ing [Ref. 3.3].
DIVISION I-A4.2 CHOOSING THE APPROPRIATE
SEISMIC ANALYSIS METHOD
Once a seismic performance category(SPC) has been assigned, the type ofanalysis required is identified based on theSPC and whether the bridge is regular orirregular. Regular bridges are those with anunchanging bridge cross section, similarsupports, and a uniform mass and stiff-ness. Bridges which do not satisfy thesecriteria are irregular. Four methods areallowed to calculate the earthquake loads(AASHTO, I-A, 4.1).Method 1 = Uniform Load AnalysisMethod 2 = Single-Mode Spectral AnalysisMethod 3 = Multimode Spectral AnalysisMethod 4 = Time History Analysis
Analysis Procedure
SPC Regular Bridge Irregular Bridge
A – –B 1 or 2 3C 1 or 2 3D 1 or 2 3
Method 4 may be used for any bridgeswith owner’s approval
AASHTO STANDARD
Figure 3.14 Assumed Loading for Single-Mode Spectral Analysis.
Downloaded from Digital Engineering Library @ McGraw-Hill (www.digitalengineeringlibrary.com)Copyright © 2006 The McGraw-Hill Companies. All rights reserved.
Any use is subject to the Terms of Use as given at the website.
Design of Superstructure Elements
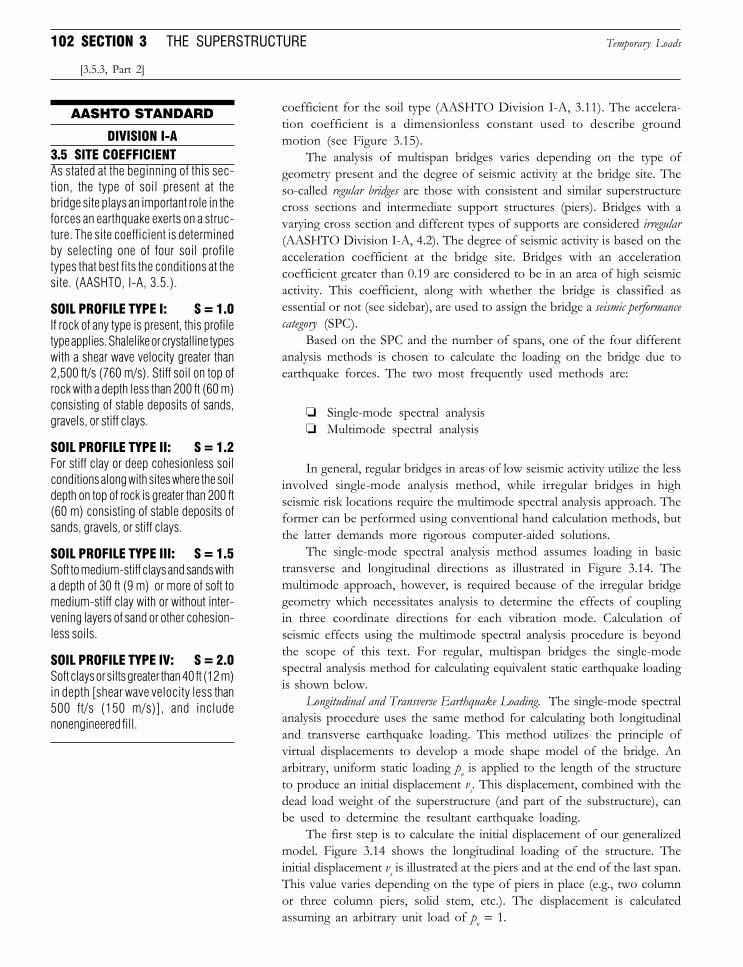
102 SECTION 3 THE SUPERSTRUCTURE
coefficient for the soil type (AASHTO Division I-A, 3.11). The accelera-tion coefficient is a dimensionless constant used to describe groundmotion (see Figure 3.15).
The analysis of multispan bridges varies depending on the type ofgeometry present and the degree of seismic activity at the bridge site. Theso-called regular bridges are those with consistent and similar superstructurecross sections and intermediate support structures (piers). Bridges with avarying cross section and different types of supports are considered irregular(AASHTO Division I-A, 4.2). The degree of seismic activity is based on theacceleration coefficient at the bridge site. Bridges with an accelerationcoefficient greater than 0.19 are considered to be in an area of high seismicactivity. This coefficient, along with whether the bridge is classified asessential or not (see sidebar), are used to assign the bridge a seismic performancecategory (SPC).
Based on the SPC and the number of spans, one of the four differentanalysis methods is chosen to calculate the loading on the bridge due toearthquake forces. The two most frequently used methods are:
❏ Single-mode spectral analysis❏ Multimode spectral analysis
In general, regular bridges in areas of low seismic activity utilize the lessinvolved single-mode analysis method, while irregular bridges in highseismic risk locations require the multimode spectral analysis approach. Theformer can be performed using conventional hand calculation methods, butthe latter demands more rigorous computer-aided solutions.
The single-mode spectral analysis method assumes loading in basictransverse and longitudinal directions as illustrated in Figure 3.14. Themultimode approach, however, is required because of the irregular bridgegeometry which necessitates analysis to determine the effects of couplingin three coordinate directions for each vibration mode. Calculation ofseismic effects using the multimode spectral analysis procedure is beyondthe scope of this text. For regular, multispan bridges the single-modespectral analysis method for calculating equivalent static earthquake loadingis shown below.
Longitudinal and Transverse Earthquake Loading. The single-mode spectralanalysis procedure uses the same method for calculating both longitudinaland transverse earthquake loading. This method utilizes the principle ofvirtual displacements to develop a mode shape model of the bridge. Anarbitrary, uniform static loading po is applied to the length of the structureto produce an initial displacement vs. This displacement, combined with thedead load weight of the superstructure (and part of the substructure), canbe used to determine the resultant earthquake loading.
The first step is to calculate the initial displacement of our generalizedmodel. Figure 3.14 shows the longitudinal loading of the structure. Theinitial displacement vs is illustrated at the piers and at the end of the last span.This value varies depending on the type of piers in place (e.g., two columnor three column piers, solid stem, etc.). The displacement is calculatedassuming an arbitrary unit load of po = 1.
Temporary Loads
[3.5.3, Part 2]
DIVISION I-A
As stated at the beginning of this sec-tion, the type of soil present at thebridge site plays an important role in theforces an earthquake exerts on a struc-ture. The site coefficient is determinedby selecting one of four soil profiletypes that best fits the conditions at thesite. (AASHTO, I-A, 3.5.).
SOIL PROFILE TYPE I: S = 1.0If rock of any type is present, this profiletype applies. Shalelike or crystalline typeswith a shear wave velocity greater than2,500 ft/s (760 m/s). Stiff soil on top ofrock with a depth less than 200 ft (60 m)consisting of stable deposits of sands,gravels, or stiff clays.
SOIL PROFILE TYPE II: S = 1.2For stiff clay or deep cohesionless soilconditions along with sites where the soildepth on top of rock is greater than 200 ft(60 m) consisting of stable deposits ofsands, gravels, or stiff clays.
SOIL PROFILE TYPE III: S = 1.5Soft to medium-stiff clays and sands witha depth of 30 ft (9 m) or more of soft tomedium-stiff clay with or without inter-vening layers of sand or other cohesion-less soils.
SOIL PROFILE TYPE IV: S = 2.0Soft clays or silts greater than 40 ft (12 m)in depth [shear wave velocity less than500 ft/s (150 m/s)], and includenonengineered fill.
3.5 SITE COEFFICIENT
AASHTO STANDARD
Downloaded from Digital Engineering Library @ McGraw-Hill (www.digitalengineeringlibrary.com)Copyright © 2006 The McGraw-Hill Companies. All rights reserved.
Any use is subject to the Terms of Use as given at the website.
Design of Superstructure Elements
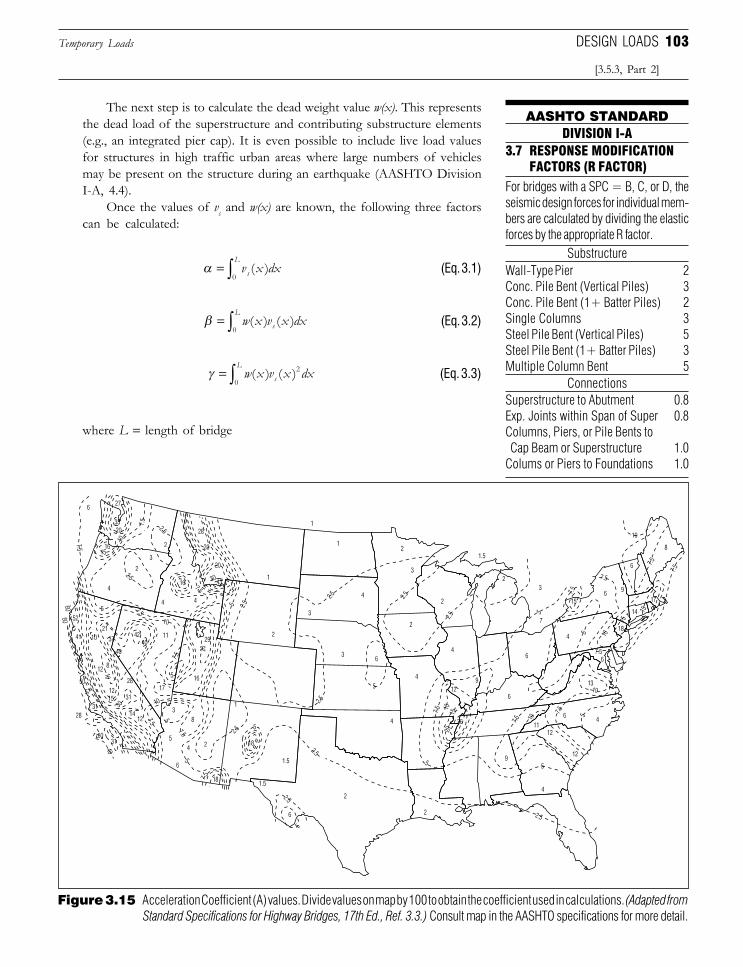
103
The next step is to calculate the dead weight value w(x). This representsthe dead load of the superstructure and contributing substructure elements(e.g., an integrated pier cap). It is even possible to include live load valuesfor structures in high traffic urban areas where large numbers of vehiclesmay be present on the structure during an earthquake (AASHTO DivisionI-A, 4.4).
Once the values of vs and w(x) are known, the following three factorscan be calculated:
α = ∫ v x dxs
L( )
0(Eq. 3.1)
β = ∫ w x v x dxs
L( ) ( )
0(Eq. 3.2)
γ = ∫ w x v x dxs
L( ) ( )2
0(Eq. 3.3)
where L = length of bridge
Temporary Loads
DIVISION I-A3.7 RESPONSE MODIFICATION
FACTORS (R FACTOR)For bridges with a SPC = B, C, or D, theseismic design forces for individual mem-bers are calculated by dividing the elasticforces by the appropriate R factor.
Wall-Type Pier 2Conc. Pile Bent (Vertical Piles) 3Conc. Pile Bent (1+ Batter Piles) 2Single Columns 3Steel Pile Bent (Vertical Piles) 5Steel Pile Bent (1+ Batter Piles) 3Multiple Column Bent 5
Substructure
ConnectionsSuperstructure to Abutment 0.8Exp. Joints within Span of Super 0.8Columns, Piers, or Pile Bents to Cap Beam or Superstructure 1.0Colums or Piers to Foundations 1.0
[3.5.3, Part 2]
DESIGN LOADS
AASHTO STANDARD
Figure 3.15 Acceleration Coefficient (A) values. Divide values on map by 100 to obtain the coefficient used in calculations. (Adapted fromStandard Specifications for Highway Bridges, 17th Ed., Ref. 3.3.) Consult map in the AASHTO specifications for more detail.
Downloaded from Digital Engineering Library @ McGraw-Hill (www.digitalengineeringlibrary.com)Copyright © 2006 The McGraw-Hill Companies. All rights reserved.
Any use is subject to the Terms of Use as given at the website.
Design of Superstructure Elements

104 SECTION 3 THE SUPERSTRUCTURE
With these factors known, the fundamental period of the bridge can becomputed with the following:
Tp go
= 2π γα (Eq. 3.4)
where po = 1g = acceleration of gravity (length/time2)
We are almost ready to compute the resultant horizontal earthquakeloading on the structure. This loading can be described as a function of
❏ The mass of structure❏ The acceleration coefficient❏ The soil type❏ The fundamental period
AASHTO provides an elastic seismic response coefficient whichquantifies these parameters into a dimensionless value. This single coeffi-cient greatly simplifies the analysis since it does not require the designer tocalculate an overall site period. The coefficient is described by
C ASTs = 1 2
2 3
./ (Eq. 3.5)
where A = acceleration coefficient (see Figure 3.15)S = site coefficient (see sidebar)
With the values from Equations 3.1 through 3.5 in place, the intensityof the earthquake loading can be computed. This loading is an approxima-tion of the inertial effects resulting from the dynamic deflection of thestructure and is defined as
p xCw x v x
e
ss( ) ( ) ( )=
βγ (Eq. 3.6)
This load can now be applied to the structure in a fashion similar tothe one in which the initial unit loading of po = 1 was at the beginning ofthe process. Now, though, the value of pe(x) is substituted to determinedisplacement, shears, and moments due to earthquake loading.
3. Wind Loading. Like earthquake loading, wind loading offers acomplicated set of loading conditions which must be idealized in order toprovide a workable design. Although the problem of modeling wind forcesis a dynamic one, with winds acting over a given time interval, these forcescan be approximated as a static load being uniformly distributed over theexposed regions of a bridge.
The exposed region of the bridge is taken as the aggregate surface areasof all elements (both superstructure and substructure) as seen in elevation(i.e., perpendicular to the longitudinal axis). The loading on a bridge due to
Temporary Loads
[3.5.3, Part 2]
DID YOU KNOW
THAT the Loma Prietae a r t h q u a k e
which struck on October 18,1989, had a magnitude of 6.9,killed 62 people, and left over12,000 homeless, all of this withonly 10 seconds of strong motion[Ref. 3.17]? A drawback to theresponse spectrum approachtaken in the AASHTO seismicspecifications is that duration ofshaking is not directly consid-ered but rather accounted for bythe spectrum. The duration ac-counted for in the current codeis approximated to be between20 to 30 seconds [Ref. 3.3].
I t is even possible to includelive load values for struc-
tures in high traffic urbanareas where large numbersof vehicles may be presenton the structure during anearthquake.
Downloaded from Digital Engineering Library @ McGraw-Hill (www.digitalengineeringlibrary.com)Copyright © 2006 The McGraw-Hill Companies. All rights reserved.
Any use is subject to the Terms of Use as given at the website.
Design of Superstructure Elements
105
wind forces is specified by AASHTO based on an assumed wind velocityof 100 miles per hour (160 km/h).
For conventional girder/beam type bridges this translates into anintensity of 50 lb/ft2 (2.40 kN/m2) with the minimum total force being300 lb/ft (4.38 KN/m). Trusses and arches require wind loads applied withan intensity of 75 lb/ft2 (3.60 kN/m2) with the minimum total force ofeither 300 or 150 lb/ft (4.38 or 2.19 kN/m), depending on whether theaffected member is a windward or leeward chord, respectively (AASHTO3.15.1). The windward chord is that chord exposed to the prevailing wind and,conversely, the leeward chord is located away from the wind.
The design wind pressure on vehicles is based on a wind velocity of55 mph (88.5 km/h), acting on a long row of randomly sequencedvehicles, which results a wind pressure of 100 lb/ft, acting normal to, and6.0 ft (1.8 m) above the bridge deck. This load should be transmitted to thesubstructure.
With regard to the superstructure, wind forces are applied in atransverse and longitudinal direction at the center of gravity of the exposedregion of the superstructure. AASHTO offers a set of wind loading valuesfor truss and girder bridges based on the angle of attack (skew angle) of windforces (AASHTO 3.15.2.1 or AASHTO LRFD 3.8.1). For conventionalslab-on-stringer bridges, however, with span lengths less than or equal to125 ft (38.1 m), AASHTO Standard Specifications allow the simplifiedwind loading (AASHTO 3.15.2.1.3):
❏ Wind Load on Structure:Transverse Loading = 50 lb/ft2 (2.40 kN/m2)Longitudinal Loading = 12 lb/ft2 (0.58 kN/m2)
❏ Wind Load on Live Load:Transverse Loading = 100 lb/ft (1.46 kN/m)Longitudinal Loading = 40 lb/ft (0.58 kN/m)
The transverse and longitudinal loads are to be placed simultaneouslyfor both the structure and live load (AASHTO 3.15.2.1.3). Another loadingconsideration is the effect of overturning. To account for this, AASHTOspecifies a 20 lb/ft2 (0.96 kN/m2) upward force to be applied at windwardquarter points of the transverse superstructure width. For AASHTOLRFD, this vertical wind pressure should be applied only for limit states thatdo not involve wind on live load, and only when wind direction isperpendicular to the longitudinal axis of the bridge.
4. Channel Forces. Channel forces are those loads imposed on astructure due to water course–related features. These forces include, butare not limited to stream flow, floating ice, and buoyancy. Channel forces,similar to seismic forces, primarily affect substructure elements. Thefollowing discussion is offered within the context of design loads in generaland their relationship to the substructure.
Stream Flow. Structures with supports in water courses are at risk forhaving those supports slide or overturn due to stream flow forces. Asdiscussed in Section 2.3.6 an excessive stream flow velocity can lead to
Temporary Loads DESIGN LOADS
[3.5.3, Part 4]
AASHTO STANDARD
The equation for the pressure due tostream flows uses a constant to de-scribe the geometry of the pier in a waterchannel. The three possible values arelisted below:
3.18.1 PIER SHAPE CONSTANT
PIERS SUBJECTED TODRIFT BUILD-UP ANDSQUARE ENDED PIERS: K = 1.4CIRCULAR PIERS: K = 0.7ANGLED ENDS: K = 0.5Where the pier ends are angled at30 degrees or less.
AASHTO LRFD
3.7.3.1 DRAG COEFFICIENT
Semicircular-nosed pier: CD = 0.7Square-ended pier: CD = 1.4Debris lodged pier: CD = 1.4Angled end at 90 degrees or less:
CD = 0.8
Downloaded from Digital Engineering Library @ McGraw-Hill (www.digitalengineeringlibrary.com)Copyright © 2006 The McGraw-Hill Companies. All rights reserved.
Any use is subject to the Terms of Use as given at the website.
Design of Superstructure Elements
106 SECTION 3 THE SUPERSTRUCTURE Temporary Loads
adverse scour conditions which can undermine footings and threaten theintegrity of the structure. In general, the pressure due to stream forces is aresult of the change in momentum of water as it impacts a pier and thentravels away from it [Ref. 3.18].
AASHTO Standard Specifications defines the average pressure actingon a bridge pier due to flowing water as (AASHTO 3.18.1):
P K Vavg avg= ⋅( )2(Eq. 3.7)
where Pavg = average stream pressure (lb/ft2)K = constant based on shape of pier (see sidebar)Vavg = average velocity of water (ft/s)
The average velocity is computed by dividing the flow rate by the flowarea. Flow values should be obtained from a thorough hydrologic/hydraulic study for conditions producing maximum velocities. Such astudy may be carried out concurrently with the bridge design project oras a part of an independent study. The maximum stream flow pressure Pmaxis equal to twice the average stream pressure Pavg. A triangular distributionin used with Pmax located at the top of water elevation and a pressure ofzero at the flow line.
In the AASHTO LRFD Specifications, the pressure of flowing streamwater acting in the longitudinal direction of substructure is (AASHTOLRFD 3.7.3.1):
pC VD=
2
1000(Eq. 3.8)
where p = pressure of flowing water (ksf )V = velocity of water (ft/s)
CD = drag coefficient for piers (see sidebar)
When the stream flow and the pier have a skew angle θ, the lateral waterpressure is (AASHTO LRFD 3.7.3.2):
pC VL=
2
1000(Eq. 3.9)
where p = lateral water pressure of flowing (ksf )V = velocity of water (ft/s)CL = lateral drag coefficient for piers (see sidebar)
Ice Load. In cold weather climates highway bridges can suffer severedamage from ice floes and ice sheets impacting substructure and from staticpressure due to thermal movements of ice sheets. In the case of lowclearance bridges, superstructure elements may also be subjected to the
[3.5.3, Part 4]
AASHTO LRFD
The coefficient CL varies depending onthe angle between the direction of flowand the longitudinal axis of the pier.
0 degrees: CL = 0.005 degrees: CL = 0.5010 degrees: CL = 0.7020 degrees: CL = 0.9030 degrees or more: CL = 1.00
3.7.3.2 LATERAL DRAG COEFFICIENT
AASHTO STANDARD
The coefficient Cn varies depending onthe inclination of the nose to vertical (i.e.,the pier nose angle in the vertical plane).Pier noses are often equipped with a steelangle or similar device raked at an angleto act as an ice breaker.
0 to 15 degrees: Cn = 1.0015 to 30 degrees: Cn = 0.7530 to 45 degrees: Cn = 0.50
3.18.2.2.1 INCLINATION OF NOSE
Downloaded from Digital Engineering Library @ McGraw-Hill (www.digitalengineeringlibrary.com)Copyright © 2006 The McGraw-Hill Companies. All rights reserved.
Any use is subject to the Terms of Use as given at the website.
Design of Superstructure Elements
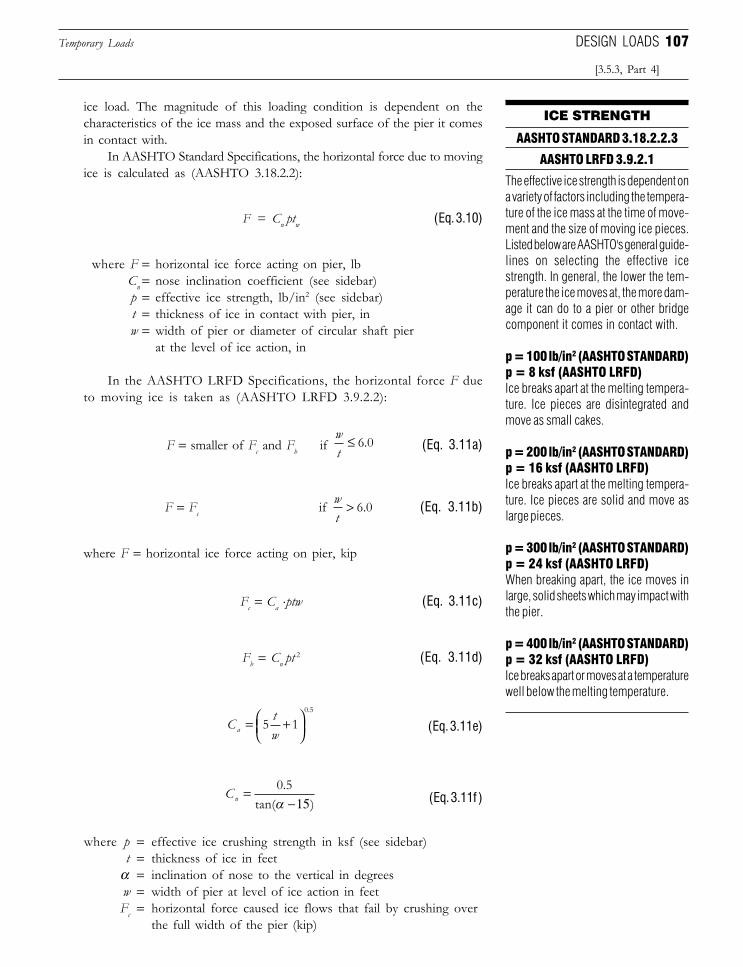
107
ice load. The magnitude of this loading condition is dependent on thecharacteristics of the ice mass and the exposed surface of the pier it comesin contact with.
In AASHTO Standard Specifications, the horizontal force due to movingice is calculated as (AASHTO 3.18.2.2):
F = Cn ptw (Eq. 3.10)
where F = horizontal ice force acting on pier, lbCn = nose inclination coefficient (see sidebar)p = effective ice strength, lb/in2 (see sidebar)t = thickness of ice in contact with pier, inw = width of pier or diameter of circular shaft pier
at the level of ice action, in
In the AASHTO LRFD Specifications, the horizontal force F dueto moving ice is taken as (AASHTO LRFD 3.9.2.2):
F = smaller of Fc and Fb if wt
≤ 6 0. (Eq. 3.11a)
F = Fc if wt
> 6 0. (Eq. 3.11b)
where F = horizontal ice force acting on pier, kip
Fc = Ca .ptw (Eq. 3.11c)
Fb = Cn pt 2 (Eq. 3.11d)
C twa = +
5 10 5.
(Eq. 3.11e)
Cn =−15
0 5.tan( )α (Eq. 3.11f )
where p = effective ice crushing strength in ksf (see sidebar)t = thickness of ice in feet
α = inclination of nose to the vertical in degreesw = width of pier at level of ice action in feetFc = horizontal force caused ice flows that fail by crushing over
the full width of the pier (kip)
Temporary Loads
[3.5.3, Part 4]
DESIGN LOADS
The effective ice strength is dependent ona variety of factors including the tempera-ture of the ice mass at the time of move-ment and the size of moving ice pieces.Listed below are AASHTO's general guide-lines on selecting the effective icestrength. In general, the lower the tem-perature the ice moves at, the more dam-age it can do to a pier or other bridgecomponent it comes in contact with.
p = 100 lb/in2 (AASHTO STANDARD)p = 8 ksf (AASHTO LRFD)Ice breaks apart at the melting tempera-ture. Ice pieces are disintegrated andmove as small cakes.
p = 200 lb/in2 (AASHTO STANDARD)p = 16 ksf (AASHTO LRFD)Ice breaks apart at the melting tempera-ture. Ice pieces are solid and move aslarge pieces.
p = 300 lb/in2 (AASHTO STANDARD)p = 24 ksf (AASHTO LRFD)When breaking apart, the ice moves inlarge, solid sheets which may impact withthe pier.
p = 400 lb/in2 (AASHTO STANDARD)p = 32 ksf (AASHTO LRFD)Ice breaks apart or moves at a temperaturewell below the melting temperature.
ICE STRENGTH
AASHTO STANDARD 3.18.2.2.3
AASHTO LRFD 3.9.2.1
Downloaded from Digital Engineering Library @ McGraw-Hill (www.digitalengineeringlibrary.com)Copyright © 2006 The McGraw-Hill Companies. All rights reserved.
Any use is subject to the Terms of Use as given at the website.
Design of Superstructure Elements
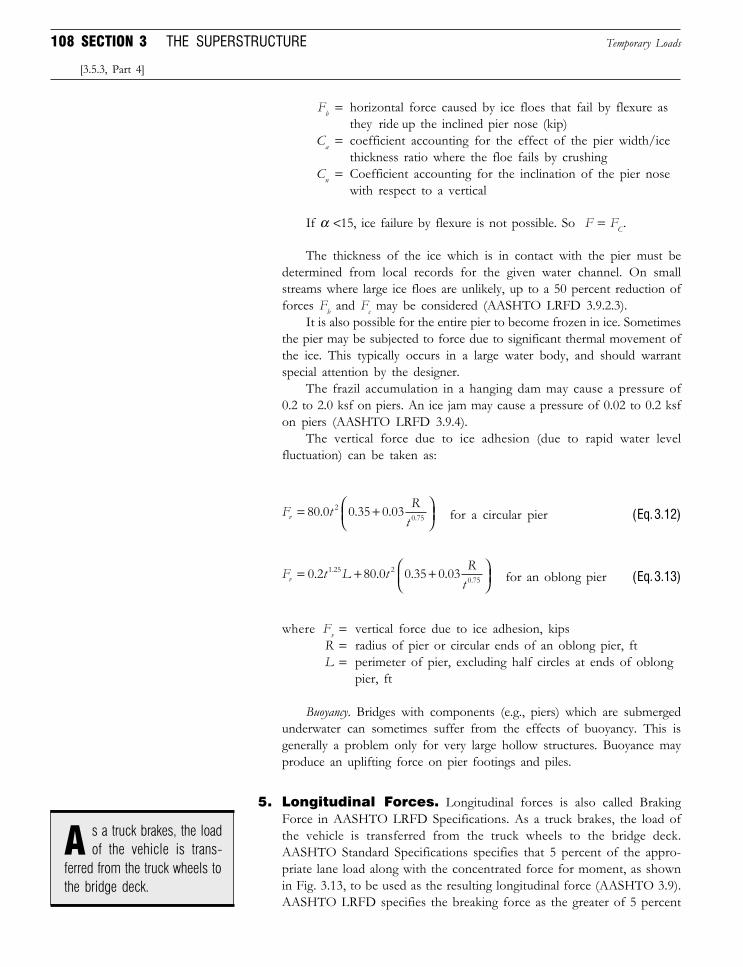
108 SECTION 3 THE SUPERSTRUCTURE
Fb = horizontal force caused by ice floes that fail by flexure asthey ride up the inclined pier nose (kip)
Ca = coefficient accounting for the effect of the pier width/icethickness ratio where the floe fails by crushing
Cn = Coefficient accounting for the inclination of the pier nosewith respect to a vertical
If α <15, ice failure by flexure is not possible. So F = FC.
The thickness of the ice which is in contact with the pier must bedetermined from local records for the given water channel. On smallstreams where large ice floes are unlikely, up to a 50 percent reduction offorces Fb and Fc may be considered (AASHTO LRFD 3.9.2.3).
It is also possible for the entire pier to become frozen in ice. Sometimesthe pier may be subjected to force due to significant thermal movement ofthe ice. This typically occurs in a large water body, and should warrantspecial attention by the designer.
The frazil accumulation in a hanging dam may cause a pressure of0.2 to 2.0 ksf on piers. An ice jam may cause a pressure of 0.02 to 0.2 ksfon piers (AASHTO LRFD 3.9.4).
The vertical force due to ice adhesion (due to rapid water levelfluctuation) can be taken as:
F t Rtv = +
80 0 0 35 0 0320 75. . . . for a circular pier (Eq. 3.12)
F t L t Rtv = + +
0 2 80 0 0 35 0 031 25 20 75. . . ... for an oblong pier (Eq. 3.13)
where Fv = vertical force due to ice adhesion, kipsR = radius of pier or circular ends of an oblong pier, ftL = perimeter of pier, excluding half circles at ends of oblong
pier, ft
Buoyancy. Bridges with components (e.g., piers) which are submergedunderwater can sometimes suffer from the effects of buoyancy. This isgenerally a problem only for very large hollow structures. Buoyance mayproduce an uplifting force on pier footings and piles.
5. Longitudinal Forces. Longitudinal forces is also called BrakingForce in AASHTO LRFD Specifications. As a truck brakes, the load ofthe vehicle is transferred from the truck wheels to the bridge deck.AASHTO Standard Specifications specifies that 5 percent of the appro-priate lane load along with the concentrated force for moment, as shownin Fig. 3.13, to be used as the resulting longitudinal force (AASHTO 3.9).AASHTO LRFD specifies the breaking force as the greater of 5 percent
Temporary Loads
[3.5.3, Part 4]
s a truck brakes, the loadof the vehicle is trans-A
ferred from the truck wheels tothe bridge deck.
Downloaded from Digital Engineering Library @ McGraw-Hill (www.digitalengineeringlibrary.com)Copyright © 2006 The McGraw-Hill Companies. All rights reserved.
Any use is subject to the Terms of Use as given at the website.
Design of Superstructure Elements
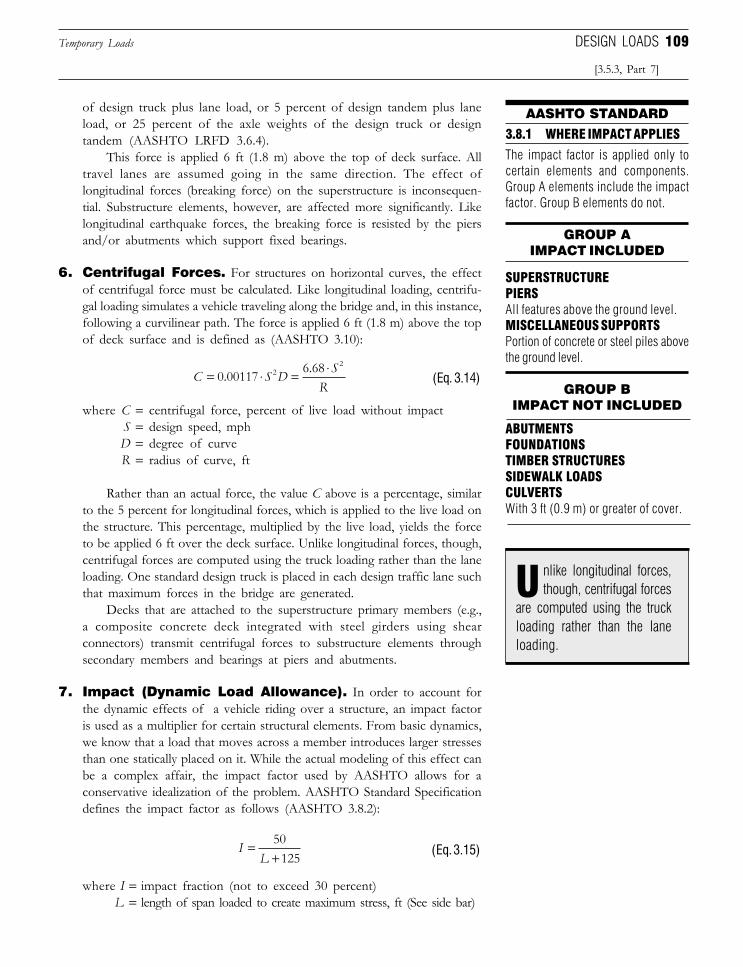
109
of design truck plus lane load, or 5 percent of design tandem plus laneload, or 25 percent of the axle weights of the design truck or designtandem (AASHTO LRFD 3.6.4).
This force is applied 6 ft (1.8 m) above the top of deck surface. Alltravel lanes are assumed going in the same direction. The effect oflongitudinal forces (breaking force) on the superstructure is inconsequen-tial. Substructure elements, however, are affected more significantly. Likelongitudinal earthquake forces, the breaking force is resisted by the piersand/or abutments which support fixed bearings.
6. Centrifugal Forces. For structures on horizontal curves, the effectof centrifugal force must be calculated. Like longitudinal loading, centrifu-gal loading simulates a vehicle traveling along the bridge and, in this instance,following a curvilinear path. The force is applied 6 ft (1.8 m) above the topof deck surface and is defined as (AASHTO 3.10):
C S D SR
= ⋅ = ⋅0 00117 6 6822
. .(Eq. 3.14)
where C = centrifugal force, percent of live load without impactS = design speed, mphD = degree of curveR = radius of curve, ft
Rather than an actual force, the value C above is a percentage, similarto the 5 percent for longitudinal forces, which is applied to the live load onthe structure. This percentage, multiplied by the live load, yields the forceto be applied 6 ft over the deck surface. Unlike longitudinal forces, though,centrifugal forces are computed using the truck loading rather than the laneloading. One standard design truck is placed in each design traffic lane suchthat maximum forces in the bridge are generated.
Decks that are attached to the superstructure primary members (e.g.,a composite concrete deck integrated with steel girders using shearconnectors) transmit centrifugal forces to substructure elements throughsecondary members and bearings at piers and abutments.
7. Impact (Dynamic Load Allowance). In order to account forthe dynamic effects of a vehicle riding over a structure, an impact factoris used as a multiplier for certain structural elements. From basic dynamics,we know that a load that moves across a member introduces larger stressesthan one statically placed on it. While the actual modeling of this effect canbe a complex affair, the impact factor used by AASHTO allows for aconservative idealization of the problem. AASHTO Standard Specificationdefines the impact factor as follows (AASHTO 3.8.2):
IL
=+50
125 (Eq. 3.15)
where I = impact fraction (not to exceed 30 percent)L = length of span loaded to create maximum stress, ft (See side bar)
Temporary Loads DESIGN LOADS
[3.5.3, Part 7]
The impact factor is applied only tocertain elements and components.Group A elements include the impactfactor. Group B elements do not.
GROUP AIMPACT INCLUDED
3.8.1 WHERE IMPACT APPLIES
SUPERSTRUCTUREPIERSAll features above the ground level.MISCELLANEOUS SUPPORTSPortion of concrete or steel piles abovethe ground level.
GROUP BIMPACT NOT INCLUDED
ABUTMENTSFOUNDATIONSTIMBER STRUCTURESSIDEWALK LOADSCULVERTSWith 3 ft (0.9 m) or greater of cover.
AASHTO STANDARD
nlike longitudinal forces,though, centrifugal forces
are computed using the truckloading rather than the laneloading.
U
Downloaded from Digital Engineering Library @ McGraw-Hill (www.digitalengineeringlibrary.com)Copyright © 2006 The McGraw-Hill Companies. All rights reserved.
Any use is subject to the Terms of Use as given at the website.
Design of Superstructure Elements
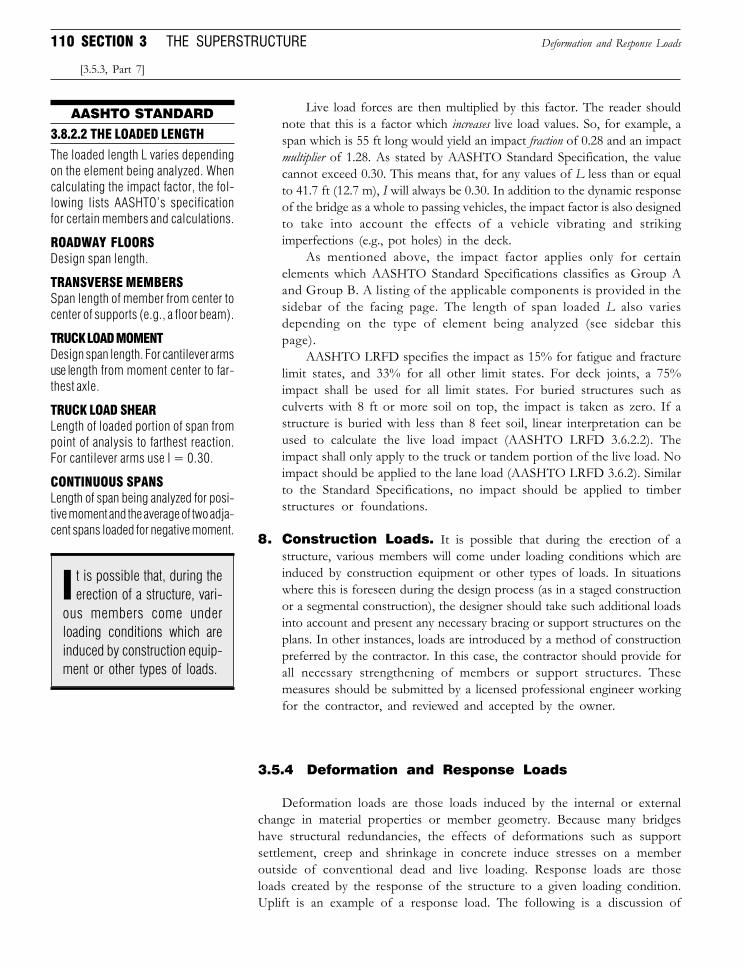
110 SECTION 3 THE SUPERSTRUCTURE
Live load forces are then multiplied by this factor. The reader shouldnote that this is a factor which increases live load values. So, for example, aspan which is 55 ft long would yield an impact fraction of 0.28 and an impactmultiplier of 1.28. As stated by AASHTO Standard Specification, the valuecannot exceed 0.30. This means that, for any values of L less than or equalto 41.7 ft (12.7 m), I will always be 0.30. In addition to the dynamic responseof the bridge as a whole to passing vehicles, the impact factor is also designedto take into account the effects of a vehicle vibrating and strikingimperfections (e.g., pot holes) in the deck.
As mentioned above, the impact factor applies only for certainelements which AASHTO Standard Specifications classifies as Group Aand Group B. A listing of the applicable components is provided in thesidebar of the facing page. The length of span loaded L also variesdepending on the type of element being analyzed (see sidebar thispage).
AASHTO LRFD specifies the impact as 15% for fatigue and fracturelimit states, and 33% for all other limit states. For deck joints, a 75%impact shall be used for all limit states. For buried structures such asculverts with 8 ft or more soil on top, the impact is taken as zero. If astructure is buried with less than 8 feet soil, linear interpretation can beused to calculate the live load impact (AASHTO LRFD 3.6.2.2). Theimpact shall only apply to the truck or tandem portion of the live load. Noimpact should be applied to the lane load (AASHTO LRFD 3.6.2). Similarto the Standard Specifications, no impact should be applied to timberstructures or foundations.
8. Construction Loads. It is possible that during the erection of astructure, various members will come under loading conditions which areinduced by construction equipment or other types of loads. In situationswhere this is foreseen during the design process (as in a staged constructionor a segmental construction), the designer should take such additional loadsinto account and present any necessary bracing or support structures on theplans. In other instances, loads are introduced by a method of constructionpreferred by the contractor. In this case, the contractor should provide forall necessary strengthening of members or support structures. Thesemeasures should be submitted by a licensed professional engineer workingfor the contractor, and reviewed and accepted by the owner.
3.5.4 Deformation and Response Loads
Deformation loads are those loads induced by the internal or externalchange in material properties or member geometry. Because many bridgeshave structural redundancies, the effects of deformations such as supportsettlement, creep and shrinkage in concrete induce stresses on a memberoutside of conventional dead and live loading. Response loads are thoseloads created by the response of the structure to a given loading condition.Uplift is an example of a response load. The following is a discussion of
Deformation and Response Loads
[3.5.3, Part 7]
The loaded length L varies dependingon the element being analyzed. Whencalculating the impact factor, the fol-lowing lists AASHTO’s specificationfor certain members and calculations.
ROADWAY FLOORSDesign span length.
TRANSVERSE MEMBERSSpan length of member from center tocenter of supports (e.g., a floor beam).
TRUCK LOAD MOMENTDesign span length. For cantilever armsuse length from moment center to far-thest axle.
TRUCK LOAD SHEARLength of loaded portion of span frompoint of analysis to farthest reaction.For cantilever arms use I = 0.30.
CONTINUOUS SPANSLength of span being analyzed for posi-tive moment and the average of two adja-cent spans loaded for negative moment.
AASHTO STANDARD
3.8.2.2 THE LOADED LENGTH
I t is possible that, during theerection of a structure, vari-
ous members come underloading conditions which areinduced by construction equip-ment or other types of loads.
Downloaded from Digital Engineering Library @ McGraw-Hill (www.digitalengineeringlibrary.com)Copyright © 2006 The McGraw-Hill Companies. All rights reserved.
Any use is subject to the Terms of Use as given at the website.
Design of Superstructure Elements
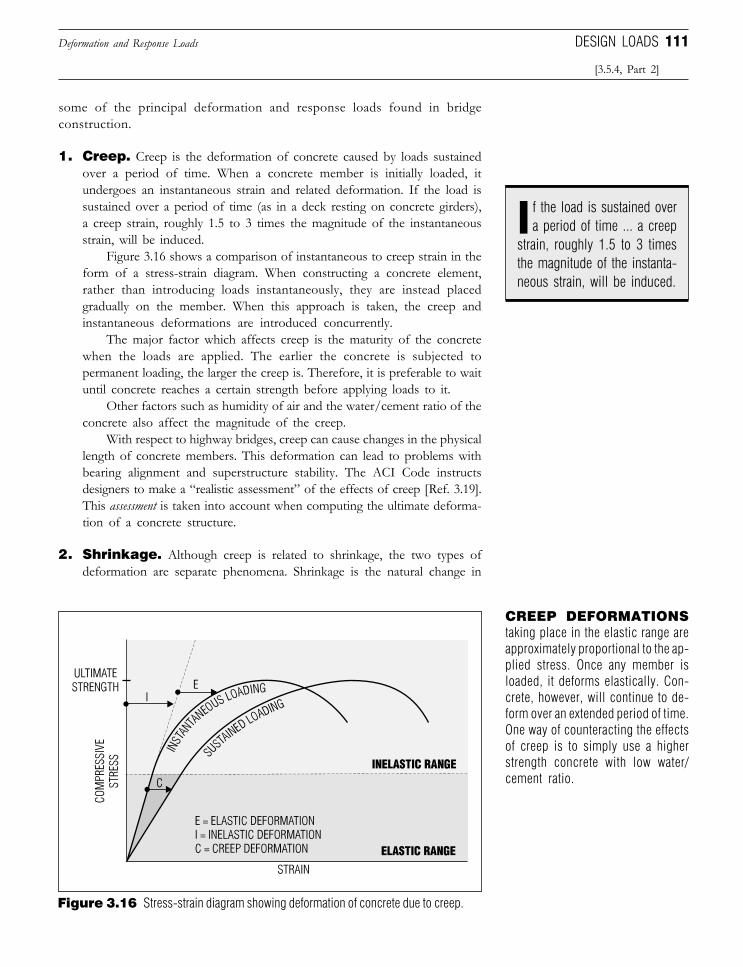
111
some of the principal deformation and response loads found in bridgeconstruction.
1. Creep. Creep is the deformation of concrete caused by loads sustainedover a period of time. When a concrete member is initially loaded, itundergoes an instantaneous strain and related deformation. If the load issustained over a period of time (as in a deck resting on concrete girders),a creep strain, roughly 1.5 to 3 times the magnitude of the instantaneousstrain, will be induced.
Figure 3.16 shows a comparison of instantaneous to creep strain in theform of a stress-strain diagram. When constructing a concrete element,rather than introducing loads instantaneously, they are instead placedgradually on the member. When this approach is taken, the creep andinstantaneous deformations are introduced concurrently.
The major factor which affects creep is the maturity of the concretewhen the loads are applied. The earlier the concrete is subjected topermanent loading, the larger the creep is. Therefore, it is preferable to waituntil concrete reaches a certain strength before applying loads to it.
Other factors such as humidity of air and the water/cement ratio of theconcrete also affect the magnitude of the creep.
With respect to highway bridges, creep can cause changes in the physicallength of concrete members. This deformation can lead to problems withbearing alignment and superstructure stability. The ACI Code instructsdesigners to make a “realistic assessment” of the effects of creep [Ref. 3.19].This assessment is taken into account when computing the ultimate deforma-tion of a concrete structure.
2. Shrinkage. Although creep is related to shrinkage, the two types ofdeformation are separate phenomena. Shrinkage is the natural change in
Deformation and Response Loads DESIGN LOADS
[3.5.4, Part 2]
CREEP DEFORMATIONStaking place in the elastic range areapproximately proportional to the ap-plied stress. Once any member isloaded, it deforms elastically. Con-crete, however, will continue to de-form over an extended period of time.One way of counteracting the effectsof creep is to simply use a higherstrength concrete with low water/cement ratio.
Figure 3.16 Stress-strain diagram showing deformation of concrete due to creep.
f the load is sustained overa period of time ... a creep
strain, roughly 1.5 to 3 timesthe magnitude of the instanta-neous strain, will be induced.
I
Downloaded from Digital Engineering Library @ McGraw-Hill (www.digitalengineeringlibrary.com)Copyright © 2006 The McGraw-Hill Companies. All rights reserved.
Any use is subject to the Terms of Use as given at the website.
Design of Superstructure Elements
112 SECTION 3 THE SUPERSTRUCTURE
volume of concrete. Natural implies a change which is not related to loadingof a member. When shrinkage takes place, the concrete volume generallydecreases (shrinks). This is usually caused by a moisture loss while drying.Therefore, like creep, shrinkage is sensitive to the water/cement ratio of theconcrete, and the humidity condition of the air.
Shrinkage and creep take place at the same time and independently.They have similar effect to the structure. Reinforcement is added per-pendicular to the main reinforcement to account for tensile stressesinduced by shrinkage (see also Part 5, Thermal Forces). Another way oflimiting the effects of shrinkage is for the contractor in the field to makesure that the concrete is properly cured. To ensure shrinkage is minimizedduring the curing process, the contractor must first use concrete thatpossesses a minimum amount of water necessary for workability andstrength. The concrete should then be kept moist during curing, allowingfor a slow cure that will minimize contraction of the concrete. There is noway of completely eliminating shrinkage, but proper attention will limit itseffects.
If not properly controlled, shrinkage can lead to cracking in conven-tional concrete elements. In prestressed concrete, shrinkage can normallylead to a loss of prestress force in a member.
3. Settlement. The downward movement of a footing, approach pave-ment, or structure due to deformations of the supporting soil or piles isknown as settlement. Settlement can be initiated by a number of factorswhich include, but are not limited to:
❏ Overloading the supporting soil or piles❏ Lowering the water table for spread footings or friction piles❏ Vibrations from live loads or seismic loads❏ Loading embankments❏ Changes in soil properties
With regard to the latter item above, the shrinkage and swelling ofsoil due to seasonal variations in moisture can lead to settlementproblems. Therefore, it is important that footings be located at a depththat is unaffected by these fluctuations.
Of particular concern to the bridge engineer are differential settle-ments where a foundation will move downward in an uneven fashion.Such settlements can result in cracking of substructure elements andinstability at superstructure joints and support points. In extreme casesof differential settlement, entire components such as abutments can betilted over. When settlement occurs in a consistent or uniform fashionthe effects are often less severe.
4. Uplift. For a continuous span structure, different loads can combine in sucha fashion that results in the superstructure being lifted upward from thesubstructure supports. Such a phenomenon is known as uplift. When uplift ispossible, AASHTO requires that superstructures be designed with appropriatesuperstructure restraining measures (tension ties) (AASHTO 3.17). Uplift
Deformation and Response Loads
[3.5.4, Part 2]
DID YOU KNOW
THAT because of thelong time it
takes for structures to settle,the settlement of structureswas once considered to be aphenomenon of an unknown,if not, strange nature? The firstsuccessful attempt to definesettlement was made in 1919by the recognized father ofmodern soil mechanics, KarlTerzaghi (1883–1963) [Ref. 3.20].
f particular concern to thebridge engineer are dif-
ferential settlements where afoundation will move down-ward in an uneven fashion.Such settlements can result incracking of substructure ele-ments and instability at ... sup-port points.
O
Downloaded from Digital Engineering Library @ McGraw-Hill (www.digitalengineeringlibrary.com)Copyright © 2006 The McGraw-Hill Companies. All rights reserved.
Any use is subject to the Terms of Use as given at the website.
Design of Superstructure Elements
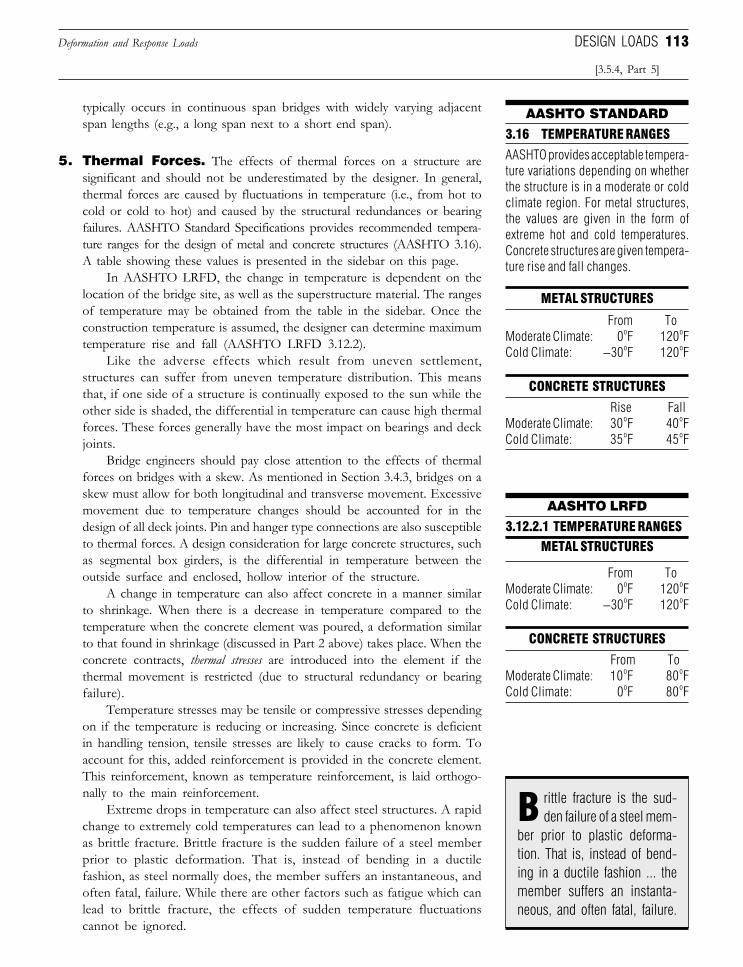
113
typically occurs in continuous span bridges with widely varying adjacentspan lengths (e.g., a long span next to a short end span).
5. Thermal Forces. The effects of thermal forces on a structure aresignificant and should not be underestimated by the designer. In general,thermal forces are caused by fluctuations in temperature (i.e., from hot tocold or cold to hot) and caused by the structural redundances or bearingfailures. AASHTO Standard Specifications provides recommended tempera-ture ranges for the design of metal and concrete structures (AASHTO 3.16).A table showing these values is presented in the sidebar on this page.
In AASHTO LRFD, the change in temperature is dependent on thelocation of the bridge site, as well as the superstructure material. The rangesof temperature may be obtained from the table in the sidebar. Once theconstruction temperature is assumed, the designer can determine maximumtemperature rise and fall (AASHTO LRFD 3.12.2).
Like the adverse effects which result from uneven settlement,structures can suffer from uneven temperature distribution. This meansthat, if one side of a structure is continually exposed to the sun while theother side is shaded, the differential in temperature can cause high thermalforces. These forces generally have the most impact on bearings and deckjoints.
Bridge engineers should pay close attention to the effects of thermalforces on bridges with a skew. As mentioned in Section 3.4.3, bridges on askew must allow for both longitudinal and transverse movement. Excessivemovement due to temperature changes should be accounted for in thedesign of all deck joints. Pin and hanger type connections are also susceptibleto thermal forces. A design consideration for large concrete structures, suchas segmental box girders, is the differential in temperature between theoutside surface and enclosed, hollow interior of the structure.
A change in temperature can also affect concrete in a manner similarto shrinkage. When there is a decrease in temperature compared to thetemperature when the concrete element was poured, a deformation similarto that found in shrinkage (discussed in Part 2 above) takes place. When theconcrete contracts, thermal stresses are introduced into the element if thethermal movement is restricted (due to structural redundancy or bearingfailure).
Temperature stresses may be tensile or compressive stresses dependingon if the temperature is reducing or increasing. Since concrete is deficientin handling tension, tensile stresses are likely to cause cracks to form. Toaccount for this, added reinforcement is provided in the concrete element.This reinforcement, known as temperature reinforcement, is laid orthogo-nally to the main reinforcement.
Extreme drops in temperature can also affect steel structures. A rapidchange to extremely cold temperatures can lead to a phenomenon knownas brittle fracture. Brittle fracture is the sudden failure of a steel memberprior to plastic deformation. That is, instead of bending in a ductilefashion, as steel normally does, the member suffers an instantaneous, andoften fatal, failure. While there are other factors such as fatigue which canlead to brittle fracture, the effects of sudden temperature fluctuationscannot be ignored.
Deformation and Response Loads
[3.5.4, Part 5]
DESIGN LOADS
AASHTO provides acceptable tempera-ture variations depending on whetherthe structure is in a moderate or coldclimate region. For metal structures,the values are given in the form ofextreme hot and cold temperatures.Concrete structures are given tempera-ture rise and fall changes.
METAL STRUCTURES
AASHTO STANDARD
3.16 TEMPERATURE RANGES
From ToModerate Climate: 0oF 120oFCold Climate: −30oF 120oF
CONCRETE STRUCTURES
Rise FallModerate Climate: 30oF 40oFCold Climate: 35oF 45oF
AASHTO LRFD
3.12.2.1 TEMPERATURE RANGES
From ToModerate Climate: 0oF 120oFCold Climate: −30oF 120oF
CONCRETE STRUCTURES
From ToModerate Climate: 10oF 80oFCold Climate: 0oF 80oF
METAL STRUCTURES
rittle fracture is the sud-den failure of a steel mem-
ber prior to plastic deforma-tion. That is, instead of bend-ing in a ductile fashion ... themember suffers an instanta-neous, and often fatal, failure.
B
Downloaded from Digital Engineering Library @ McGraw-Hill (www.digitalengineeringlibrary.com)Copyright © 2006 The McGraw-Hill Companies. All rights reserved.
Any use is subject to the Terms of Use as given at the website.
Design of Superstructure Elements
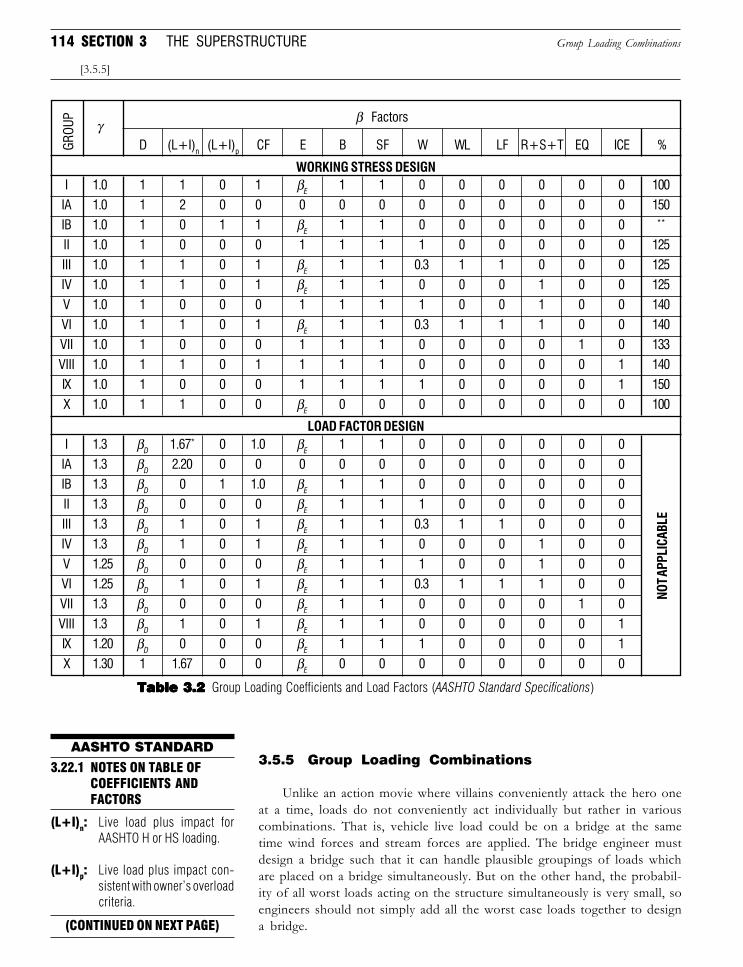
114 SECTION 3 THE SUPERSTRUCTURE
3.5.5 Group Loading Combinations
Unlike an action movie where villains conveniently attack the hero oneat a time, loads do not conveniently act individually but rather in variouscombinations. That is, vehicle live load could be on a bridge at the sametime wind forces and stream forces are applied. The bridge engineer mustdesign a bridge such that it can handle plausible groupings of loads whichare placed on a bridge simultaneously. But on the other hand, the probabil-ity of all worst loads acting on the structure simultaneously is very small, soengineers should not simply add all the worst case loads together to designa bridge.
Group Loading Combinations
[3.5.5]
AASHTO STANDARD
3.22.1 NOTES ON TABLE OFCOEFFICIENTS ANDFACTORS
(CONTINUED ON NEXT PAGE)
(L+I)n: Live load plus impact forAASHTO H or HS loading.
(L+I)p: Live load plus impact con-sistent with owner’s overloadcriteria.
I 1.3 βD 1.67* 0 1.0 βE 1 1 0 0 0 0 0 0
IA 1.3 βD 2.20 0 0 0 0 0 0 0 0 0 0 0
IB 1.3 βD 0 1 1.0 βE 1 1 0 0 0 0 0 0
II 1.3 βD 0 0 0 βE 1 1 1 0 0 0 0 0
III 1.3 βD 1 0 1 βE 1 1 0.3 1 1 0 0 0
IV 1.3 βD 1 0 1 βE 1 1 0 0 0 1 0 0
V 1.25 βD 0 0 0 βE 1 1 1 0 0 1 0 0
VI 1.25 βD 1 0 1 βE 1 1 0.3 1 1 1 0 0
VII 1.3 βD 0 0 0 βE 1 1 0 0 0 0 1 0
VIII 1.3 βD 1 0 1 βE 1 1 0 0 0 0 0 1
IX 1.20 βD 0 0 0 βE 1 1 1 0 0 0 0 1
X 1.30 1 1.67 0 0 βE 0 0 0 0 0 0 0 0
γ
LOAD FACTOR DESIGN
NOT A
PPLI
CABL
E
I 1.0 1 1 0 1 βE 1 1 0 0 0 0 0 0 100
IA 1.0 1 2 0 0 0 0 0 0 0 0 0 0 0 150
IB 1.0 1 0 1 1 βE 1 1 0 0 0 0 0 0 **
II 1.0 1 0 0 0 1 1 1 1 0 0 0 0 0 125
III 1.0 1 1 0 1 βE 1 1 0.3 1 1 0 0 0 125
IV 1.0 1 1 0 1 βE 1 1 0 0 0 1 0 0 125
V 1.0 1 0 0 0 1 1 1 1 0 0 1 0 0 140
VI 1.0 1 1 0 1 βE 1 1 0.3 1 1 1 0 0 140
VII 1.0 1 0 0 0 1 1 1 0 0 0 0 1 0 133
VIII 1.0 1 1 0 1 1 1 1 0 0 0 0 0 1 140
IX 1.0 1 0 0 0 1 1 1 1 0 0 0 0 1 150
X 1.0 1 1 0 0 βE 0 0 0 0 0 0 0 0 100
WORKING STRESS DESIGN
D (L+I)n (L+I)p CF E B SF W WL LF R+S+T EQ ICE %
β Factors
GROU
P
Table 3.2Table 3.2Table 3.2Table 3.2Table 3.2 Group Loading Coefficients and Load Factors (AASHTO Standard Specifications)
Downloaded from Digital Engineering Library @ McGraw-Hill (www.digitalengineeringlibrary.com)Copyright © 2006 The McGraw-Hill Companies. All rights reserved.
Any use is subject to the Terms of Use as given at the website.
Design of Superstructure Elements
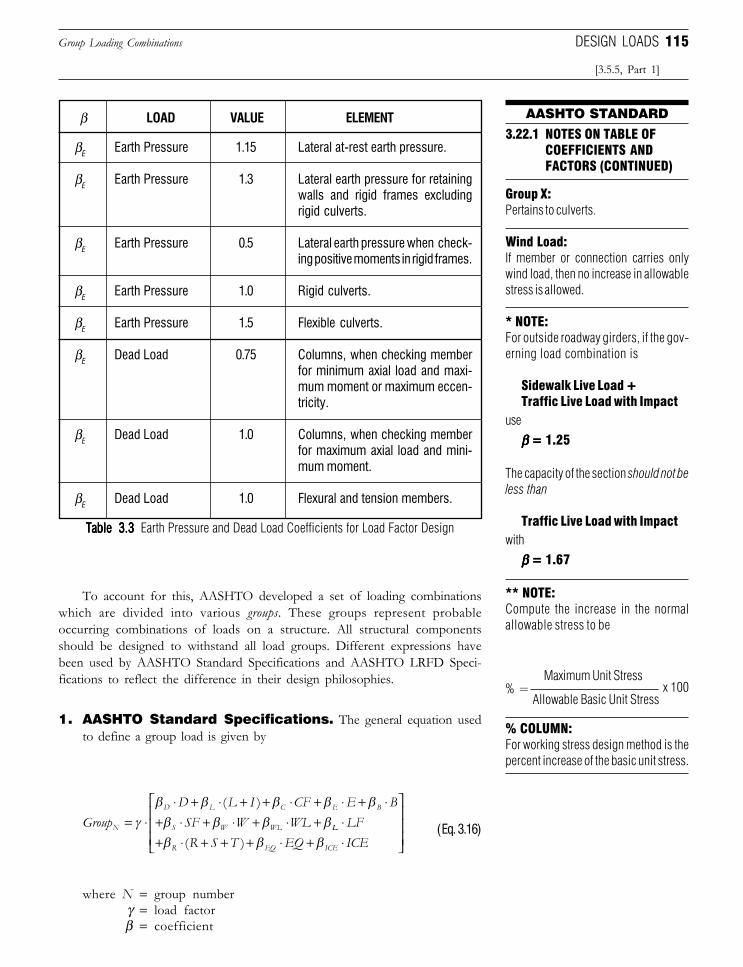
115
To account for this, AASHTO developed a set of loading combinationswhich are divided into various groups. These groups represent probableoccurring combinations of loads on a structure. All structural componentsshould be designed to withstand all load groups. Different expressions havebeen used by AASHTO Standard Specifications and AASHTO LRFD Speci-fications to reflect the difference in their design philosophies.
1. AASHTO Standard Specifications. The general equation usedto define a group load is given by
GroupD L I CF E BSF W WLN
D L C E B
S W WL= ⋅⋅ + ⋅ + + ⋅ + ⋅ + ⋅
+ ⋅ + ⋅ + ⋅ +γβ β β β ββ β β β
( )
LL
R EQ ICE
LFR S T EQ ICE
⋅+ ⋅ + + + ⋅ + ⋅
β β β( )
(Eq. 3.16)
where N = group numberγ = load factorβ = coefficient
Group Loading Combinations
[3.5.5, Part 1]
DESIGN LOADS
Group X:Pertains to culverts.
Wind Load:If member or connection carries onlywind load, then no increase in allowablestress is allowed.
* NOTE:For outside roadway girders, if the gov-erning load combination is
Sidewalk Live Load +Traffic Live Load with Impact
use
βββββ = 1.25
The capacity of the section should not beless than
Traffic Live Load with Impactwith
βββββ = 1.67
** NOTE:Compute the increase in the normalallowable stress to be
% =
% COLUMN:For working stress design method is thepercent increase of the basic unit stress.
AASHTO STANDARD
3.22.1 NOTES ON TABLE OFCOEFFICIENTS ANDFACTORS (CONTINUED)
Maximum Unit Stress
Allowable Basic Unit Stressx 100
βE Earth Pressure 1.15 Lateral at-rest earth pressure.
βE Earth Pressure 1.3 Lateral earth pressure for retainingwalls and rigid frames excludingrigid culverts.
βE Earth Pressure 0.5 Lateral earth pressure when check-ing positive moments in rigid frames.
βE Earth Pressure 1.0 Rigid culverts.
βE Earth Pressure 1.5 Flexible culverts.
βE Dead Load 0.75 Columns, when checking memberfor minimum axial load and maxi-mum moment or maximum eccen-tricity.
βE Dead Load 1.0 Columns, when checking memberfor maximum axial load and mini-mum moment.
βE Dead Load 1.0 Flexural and tension members.
β LOAD VALUE ELEMENT
TableTableTableTableTable 3.33.33.33.33.3 Earth Pressure and Dead Load Coefficients for Load Factor Design
Downloaded from Digital Engineering Library @ McGraw-Hill (www.digitalengineeringlibrary.com)Copyright © 2006 The McGraw-Hill Companies. All rights reserved.
Any use is subject to the Terms of Use as given at the website.
Design of Superstructure Elements
116 SECTION 3 THE SUPERSTRUCTURE
The subscript values in Equation 3.16 represent different types ofloads. A listing of the various load variables is presented in the sidebar.AASHTO Standard Specifications presents values for γ and β based on theworking stress (service load) and load factor (limit state) design methods (seeSection 3.6). These values are illustrated in Table 3.2.
The coefficient β varies based on the type of load. The load factorγ is unity for all working stress groupings and varies, naturally, only for loadfactor design groupings. The last column of the Table 3.2 gives a specifiedincrease of allowable stresses for the working stress design method. Forexample, the Group II allowable stress would be 125 percent, or 1.25 timesthe normal allowable stress. This increase is intended to take into accountthe improbability of peak values of each type of loading taking place atexactly the same time. Allowable stress values will vary depending onindividual components and elements. The reader should consult the specificsections for these values.
From Table 3.2 it is clear that the β coefficients for earth pressure anddead load vary somewhat depending on the load group and design method.This variation results from different values being applicable for differenttypes of elements or components (e.g., columns, rigid frames). Table 3.3provides a description of the various coefficient values to be used for thedesign of different bridge elements.
The reader should note that the AASHTO specifications referencevarious load groups throughout the code. An example of this would be foroverload provisions. The AASHTO code accounts for the infrequentoverloading of a structure, for example, by a truck carrying excessivelyheavy equipment (AASHTO 3.5). In doing so certain load groups areidentified for use to ensure appropriate loading conditions.
The sidebars on each of these facing pages contain notes and specialconsiderations with regard to the group combinations. By inspection, itshould be evident to the reader that it is not necessary to physically calculateevery single load group. While the AASHTO specifications call for thestructure to be able to withstand all loading combinations, in most structuresonly a few load groups will govern and therefore require calculation andincorporation into the final design report.
Another important item to note is that different load groups govern fordifferent structural elements. Some members, in this respect, will require acloser investigation than others to determine the controlling load combina-tion group.
The load factors given for the load factor design method representvalues for the majority of highway bridges in use. Large or specializedstructures may warrant the designer increasing the values to accom-modate certain bridge specific design criteria which the conventionalload factors were not structured to handle. In this instance, AASHTOleaves definition of the load factors to the “engineer’s judgment”(AASHTO 3.22.4).
2. AASHTO LRFD Specifications. AASHTO LRFD is a probability-based design method. The philosophy is to have a relative constantprobability of structural failure for all structures and elements during theirdesign lives regardless of their types, geometry, materials, or construction
Group Loading Combinations
[3.5.5, Part 1]
The AASHTO group loading combina-tions are broken down by types of loads.These load types have been detailedthroughout Section 3.5. The followinglists the coefficient subscript conventionused in Equation 3.16 and Table 3.2.
D = Dead LoadL = Live LoadI = Live Load ImpactE = Earth PressureB = BuoyancyW = Wind Load on StructureWL = Wind Load on Live Load
100 lb/ft (1.46 kN/m)LF = Longitudinal Force from
Live LoadCF = Centrifugal ForceR = Rib Shortening for
Arches or FramesS = ShrinkageT = TemperatureEQ = EarthquakeSF = Stream Flow PressureICE = Ice Pressure
AASHTO STANDARD
3.22 GROUP LOAD VARIABLES
ASHTO LRFD is a prob-ability-based design
method. The philosophy is tohave a relative constant prob-ability of structural failure forall structures and elements...
A
Downloaded from Digital Engineering Library @ McGraw-Hill (www.digitalengineeringlibrary.com)Copyright © 2006 The McGraw-Hill Companies. All rights reserved.
Any use is subject to the Terms of Use as given at the website.
Design of Superstructure Elements
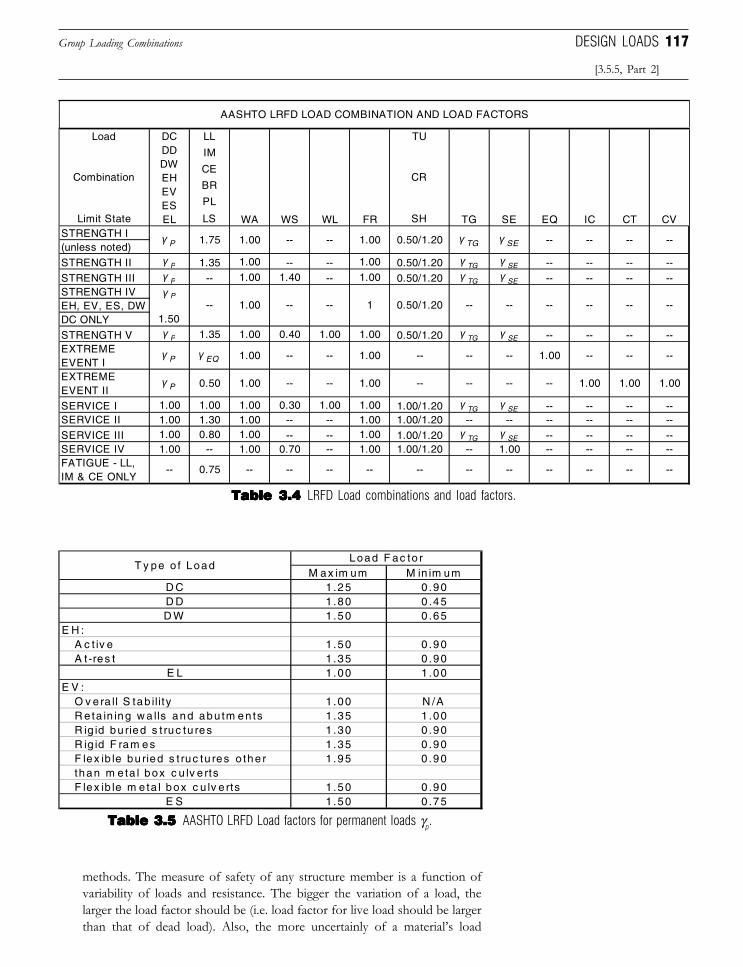
117
methods. The measure of safety of any structure member is a function ofvariability of loads and resistance. The bigger the variation of a load, thelarger the load factor should be (i.e. load factor for live load should be largerthan that of dead load). Also, the more uncertainly of a material’s load
Group Loading Combinations
[3.5.5, Part 2]
DESIGN LOADS
STRENGTH I(unless noted)
STRENGTH II γ P 1.35 1.00 -- -- 1.00 0.50/1.20 γ TG γ SE -- -- -- --
STRENGTH III γ P -- 1.00 1.40 -- 1.00 0.50/1.20 γ TG γ SE -- -- -- --STRENGTH IVEH, EV, ES, DWDC ONLY
STRENGTH V γ P 1.35 1.00 0.40 1.00 1.00 0.50/1.20 γ TG γ SE -- -- -- --
SERVICE I 1.00 1.00 1.00 0.30 1.00 1.00 1.00/1.20 γ TG γ SE -- -- -- --SERVICE II 1.00 1.30 1.00 -- -- 1.00 1.00/1.20 -- -- -- -- -- --
SERVICE III 1.00 0.80 1.00 -- -- 1.00 1.00/1.20 γ TG γ SE -- -- -- --SERVICE IV 1.00 -- 1.00 0.70 -- 1.00 1.00/1.20 -- 1.00 -- -- -- --
AASHTO LRFD LOAD COMBINATION AND LOAD FACTORS
γ P 1.75 1.00 -- -- 1.00 0.50/1.20 γ TG γ SE -- -- -- --
γ P
1.50-- 1.00 -- -- 1 0.50/1.20 -- -- -- -- -- --
EXTREME EVENT I
γ P γ EQ 1.00 -- -- 1.00 -- -- -- 1.00 -- -- --
EXTREME EVENT II
γ P 0.50 1.00 -- -- 1.00 -- -- -- -- 1.00 1.00 1.00
FATIGUE - LL, IM & CE ONLY
-- 0.75 -- -- -- -- -- -- -- -- -- -- --
WA WS WL FR TG SE EQ IC CT CV
TU
CR
SH
Load
Combination
Limit State
DC DD DW EH EV ES EL
LL
IM
CE
BR
PL
LS
Table 3.4Table 3.4Table 3.4Table 3.4Table 3.4 LRFD Load combinations and load factors.
M ax im um M in im umD C 1.25 0 .90D D 1.80 0 .45D W 1.50 0 .65
E H :A c t iv e 1 .50 0 .90A t-res t 1 .35 0 .90
E L 1 .00 1 .00E V :
O v era ll S tab ility 1 .00 N /AR eta in ing w a lls and abu tm en ts 1 .35 1 .00R ig id bu ried s t ruc tu res 1 .30 0 .90R ig id F ram es 1 .35 0 .90F lex ib le bu ried s t ruc tu res o the r 1 .95 0 .90than m e ta l box c u lv e rtsF lex ib le m e ta l box c u lv e rts 1 .50 0 .90
E S 1 .50 0 .75
T y pe o f LoadLoad F ac to r
Table 3.5Table 3.5Table 3.5Table 3.5Table 3.5 AASHTO LRFD Load factors for permanent loads γp.
Downloaded from Digital Engineering Library @ McGraw-Hill (www.digitalengineeringlibrary.com)Copyright © 2006 The McGraw-Hill Companies. All rights reserved.
Any use is subject to the Terms of Use as given at the website.
Design of Superstructure Elements
118 SECTION 3 THE SUPERSTRUCTURE
resistance, the smaller resistance factor it should have, so that all materialswill have similar factor of safety.
To achieve that design objective, strength limit states, service limitstates, and fatigue limit states are checked for every structure member.Strength limit states are intended to ensure that structures have sufficientstrength and stability under various load conditions. Service limit states areused to control deflection, crack width, stress level, and in some cases,stability under normal service conditions to ensure the structure’s service-ability during its design life. Fatigue limit states are restrictions on stressrange under service loading to prevent fatigue failure during the design lifeof the bridge.
Under each load combination, the total factored force effect should betaken as:
Q Qi i i= ⋅Ση γ (Eq. 3.17)
where ηi = load modifier, a factor relating to the structure’s ductility,redundancy, and operational importance. For most bridges,ηi = 1.0 (AASHTO LRFD 1.3).
γ i = load factor, a statistically based multiplier for specificforce effects under specific load combinations.
Qi = force effect from specific loads.
Each member and connection of a structure should satisfy the followinglimit states:
Strength I. This is a basic load combination relating to the normalvehicular use of the structure without wind or any extreme event loads suchas earthquake. Most superstructure members are controlled by this loadcombination.Strength II. This load combination is used for owner-specified specialdesign vehicles or permit vehicles. Like Strength I load combination, nowind or any extreme event load need to be considered. Most bridges aredesigned for HL-93 live load, so this load combination is not commonlyused. Note that if the owner-specified load is very heavy and the bridge isnot subjected to such load regularly, the bridge may be controlled by escortsso that only one such vehicle is loaded on the bridge, while other lanes areassumed unoccupied so the bridge will be able to carry the load, but withoutbeing too much overdesigned.Strength III. This load combination relates to the bridge being exposedto maximum wind velocity. Under such event, no live load is assumed to bepresent on the bridge.Strength IV. This load combination is used for structures with veryhigh dead to live load force effect ratios. It may become controlling loadcombination for certain structural elements if the structure has a shortspan length and/or a large dead load. The purpose of this load combina-tion is to make sure that various types of bridges have a similar probabilityof failure.
Group Loading Combinations
[3.5.5, Part 2]
The following load designations are usedin Table 3.4 for AASHTO LRFD loadcombinations.
Permanent Loads:DD = DowndragDC = Dead loadDW = Dead load of wearing surface
and utilitiesEH = Horizontal earth pressureEL = Force effects resulting from
construction process,including secondary forcesfrom post-tensioning
ES = Earth surcharge loadEV = Vertical earth fill load
Transient Loads:BR = Vehicular braking forceCE = Vehicular centrifugal forceCR = CreepCT = Vehicular collision forceCV = Vessel collision forceEQ = EarthquakeFR = FrictionIC = Ice loadIM = Vehicular dynamic load
allowanceLL = Vehicular live loadLS = Live load surchargePL = Pedestrian live loadSE = SettlementSH = ShrinkageTG = Temperature gradientTU = Uniform temperature changeWA = Water load and stream
pressureWL = Wind on live loadWS = Wind load on structure
3.3.2 LOAD DESIGNATION
AASHTO LRFD
trength I - This is a basicload combination relatingS
to normal vehicular use of su-perstructure... Most superstruc-ture members are controlled bythis load combination.
Downloaded from Digital Engineering Library @ McGraw-Hill (www.digitalengineeringlibrary.com)Copyright © 2006 The McGraw-Hill Companies. All rights reserved.
Any use is subject to the Terms of Use as given at the website.
Design of Superstructure Elements
119
Strength V. This load combination relates to normal vehicular use ofthe bridge with wind velocity of 55 mph (90 km/h). When live load and windloads are combined, both values are reduced because the probability is verylow for a structure to experience a very heavy live load and extremely highwind load.Extreme Event I. This is a load combination related to earthquake.Note that live load shall be considered based on daily traffic volume of thebridge. For normal bridges, a live load factor of 0.5 may be used, whichindicates a low probability of the presence of maximum live load at the timewhen a large earthquake may occur.Extreme Event II. This load combination is used for extreme eventssuch as ice load, collision by vessels and vehicles. Only one of such eventsshould be considered at a time. Like in an earthquake event, only reducedlive load need to be considered at these extreme events.Service I. This load combination is used for normal operational use ofthe bridge with a 55 mph (90 km/h) wind. All loads are taken at theirnominal values and extreme loads are excluded. This load combination isused to control deflection, crack width in reinforced concrete structures,compressive stress in prestressed concrete members, and soil slope stability.Service II. This load combination is for preventing yielding of steelstructures due to vehicular live load. The live load used in this loadcombination is approximately halfway between that used for service I andStrength I limit states.Service III. This load combination relates only to tension in prestressedconcrete superstructure. Researchers have found that if nominal design liveload is used, the superstructure will be overdesigned for concrete tensilestress. Therefore, a load factor of 0.80 is applied to the live load in this loadcombination.Service IV. This load combination relates only to tension in prestressedconcrete substructure to control cracks. The 0.70 factor on wind representsa wind velocity of 84 mph (135 km/h), which reflects the probability thatthe prestressed concrete substructure will be subjected to a tensile stressonce in every 10 years.Fatigue. Fatigue and fracture load combination relates to repetitivegravitational vehicular live load and dynamic responses. The live load factorof 0.75 reflects a load level that represents the majority of truck population.Note that only a single truck with a constant spacing of 30 feet (9.1 m)between the 32 kip (142 kN) axles should be applied for this loadcombination (AASHTO LRFD 3.6.1.4.1).
3.6 DESIGN METHODS
In bridge engineering, there are two principal methods of design in usetoday. The names used to define these design methods vary depending on thestructural material being used, the design code being referenced, or even theera of a publication. For the purposes of this text, we will classify the twodesign methods as
❏ Working stress design❏ Limit states design
Group Loading Combinations DESIGN METHODS
[3.6]
n bridge engineering, thereare two principal methodsI
of design in use today.
Downloaded from Digital Engineering Library @ McGraw-Hill (www.digitalengineeringlibrary.com)Copyright © 2006 The McGraw-Hill Companies. All rights reserved.
Any use is subject to the Terms of Use as given at the website.
Design of Superstructure Elements
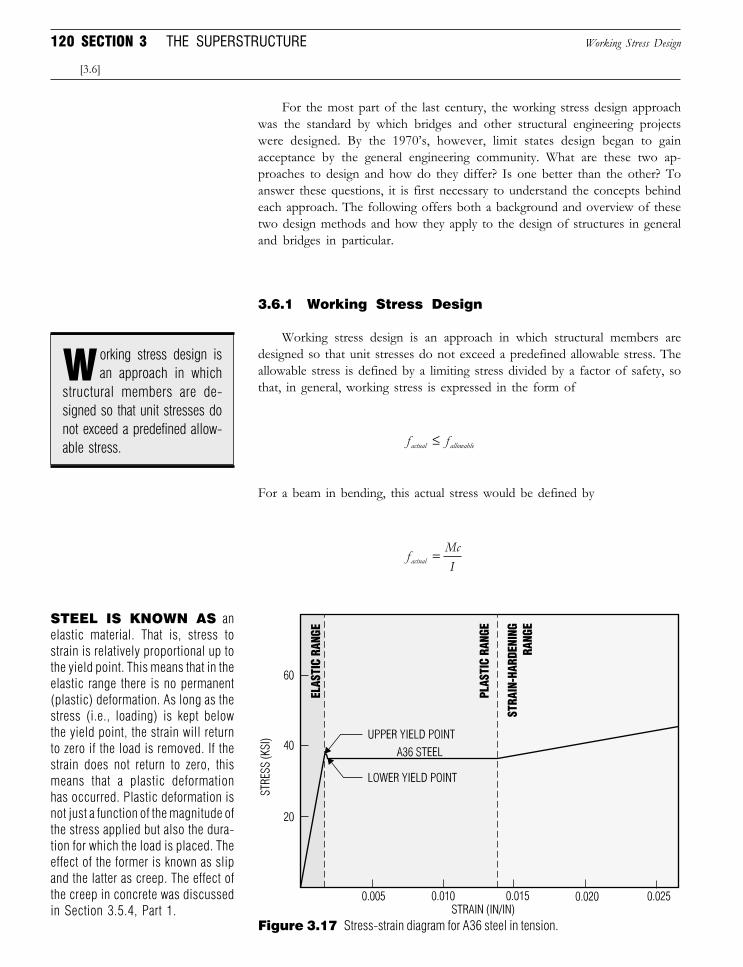
120 SECTION 3 THE SUPERSTRUCTURE
For the most part of the last century, the working stress design approachwas the standard by which bridges and other structural engineering projectswere designed. By the 1970’s, however, limit states design began to gainacceptance by the general engineering community. What are these two ap-proaches to design and how do they differ? Is one better than the other? Toanswer these questions, it is first necessary to understand the concepts behindeach approach. The following offers both a background and overview of thesetwo design methods and how they apply to the design of structures in generaland bridges in particular.
3.6.1 Working Stress Design
Working stress design is an approach in which structural members aredesigned so that unit stresses do not exceed a predefined allowable stress. Theallowable stress is defined by a limiting stress divided by a factor of safety, sothat, in general, working stress is expressed in the form of
f factual allowable≤
For a beam in bending, this actual stress would be defined by
f McIactual =
Working Stress Design
[3.6]
STEEL IS KNOWN AS anelastic material. That is, stress tostrain is relatively proportional up tothe yield point. This means that in theelastic range there is no permanent(plastic) deformation. As long as thestress (i.e., loading) is kept belowthe yield point, the strain will returnto zero if the load is removed. If thestrain does not return to zero, thismeans that a plastic deformationhas occurred. Plastic deformation isnot just a function of the magnitude ofthe stress applied but also the dura-tion for which the load is placed. Theeffect of the former is known as slipand the latter as creep. The effect ofthe creep in concrete was discussedin Section 3.5.4, Part 1.
Figure 3.17 Stress-strain diagram for A36 steel in tension.
orking stress design isan approach in which
structural members are de-signed so that unit stresses donot exceed a predefined allow-able stress.
W
Downloaded from Digital Engineering Library @ McGraw-Hill (www.digitalengineeringlibrary.com)Copyright © 2006 The McGraw-Hill Companies. All rights reserved.
Any use is subject to the Terms of Use as given at the website.
Design of Superstructure Elements
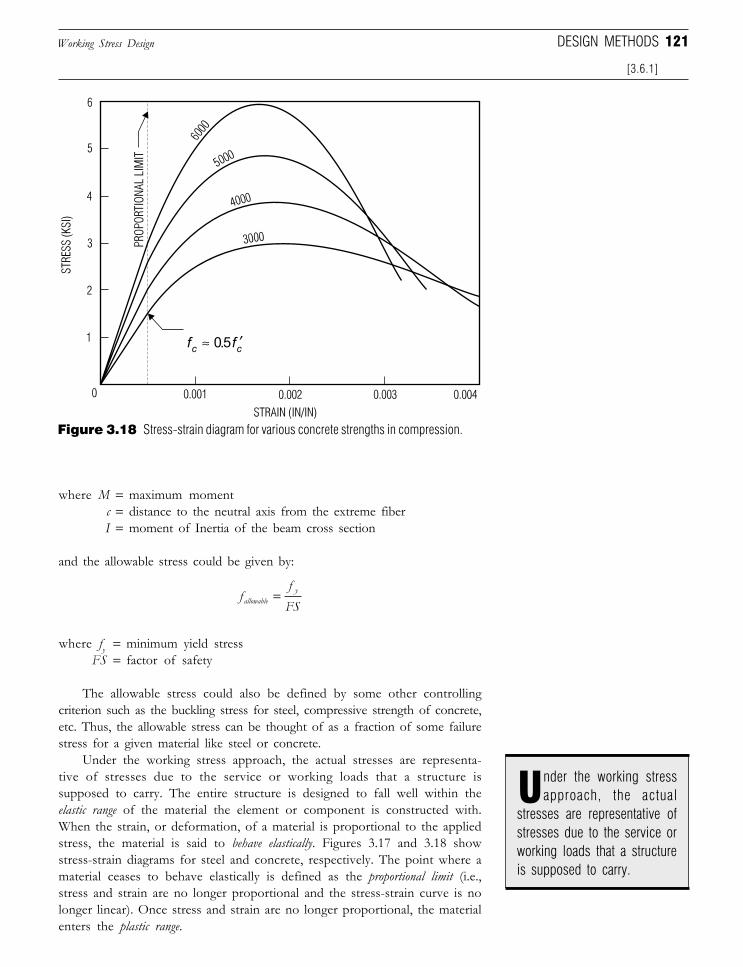
121
where M = maximum momentc = distance to the neutral axis from the extreme fiberI = moment of Inertia of the beam cross section
and the allowable stress could be given by:
ffFSallowabley=
where fy = minimum yield stressFS = factor of safety
The allowable stress could also be defined by some other controllingcriterion such as the buckling stress for steel, compressive strength of concrete,etc. Thus, the allowable stress can be thought of as a fraction of some failurestress for a given material like steel or concrete.
Under the working stress approach, the actual stresses are representa-tive of stresses due to the service or working loads that a structure issupposed to carry. The entire structure is designed to fall well within theelastic range of the material the element or component is constructed with.When the strain, or deformation, of a material is proportional to the appliedstress, the material is said to behave elastically. Figures 3.17 and 3.18 showstress-strain diagrams for steel and concrete, respectively. The point where amaterial ceases to behave elastically is defined as the proportional limit (i.e.,stress and strain are no longer proportional and the stress-strain curve is nolonger linear). Once stress and strain are no longer proportional, the materialenters the plastic range.
Working Stress Design DESIGN METHODS
[3.6.1]
f fc c≈ ′05.
nder the working stressapproach, the actualU
stresses are representative ofstresses due to the service orworking loads that a structureis supposed to carry.
Figure 3.18 Stress-strain diagram for various concrete strengths in compression.
Downloaded from Digital Engineering Library @ McGraw-Hill (www.digitalengineeringlibrary.com)Copyright © 2006 The McGraw-Hill Companies. All rights reserved.
Any use is subject to the Terms of Use as given at the website.
Design of Superstructure Elements
122 SECTION 3 THE SUPERSTRUCTURE
For elastic materials (i.e., materials that behave elastically up to their yieldstress) such as steel, the working stress approach seemed to make a great dealof sense. Since, if a material is loaded passed the yield point, a permanent orplastic deformation will occur, the elastic range offers a known, safe region withinwhich an engineer could confidently design structures. In addition to this, theload a member can carry prior to failure is easily measured. What of materialslike concrete though? Figure 3.18 shows that, under compression, concreteonly behaves elastically to a stress that is approximately one-half its compres-sive strength. That is, for concrete with a compressive strength of 3000 psi, theelastic range only goes up to about 1500 psi. This means that concrete
Limit States Design
[3.6.1]
elements, under the working stressapproach, are designed at a level thatis well below failure.
Another question mark for theworking stress approach is the incor-poration of factors of safety. Whilethe allowable stress has, for all intentsand purposes, a built in factor of safety,it is, however, fixed. This means thatno matter how variable loads are, eitherin terms of frequency or magnitude,the factor of safety is always the same.These deficiencies led to the develop-ment of an alternative to the workingstress design method based on thelimit states of a material.
3.6.2 Limit States Design
The limit states design methodwas, in part, developed to address thedrawbacks to the working stressapproach mentioned above. Thisapproach makes use of the plasticrange for the design of structural mem-bers and incorporates load factors totake into account the inherit variabilityof loading configurations.
The quote from the AISC Manualof Steel Construction at the top ofnext page defines a limit state as acondition representing “structural use-fulness.” As mentioned previously,working stress design method sufferedfrom the inability of the factor ofsafety to adequately address the vari-able nature of loading conditions. Oneof the advantages of the limit statesapproach is that it takes into accountthis variance by defining limit states
Limit States Design—Concrete: Yes. Steel: Is Following.
United States to move toward alimit states approach for the designof steel structures?
After all, since ACI released its1971 edition of the concrete designcode, the limit states approach hasbeen the de facto norm for all con-crete structures. Indeed, develop-ment and promulgation of the con-crete limit states approach began inearnest as early as 1956. Steel, how-ever, has been a relative new comerto the limit states arena.
The lack of a widely acceptedlimit states approach in steel can beattributed to a number of factors.First of all, it wasn’t until 1986when AISC first introduced theLoad and Resistance Factor Designversion of their Manual for SteelConstruction. Even with this release,the code was tailored toward thedesign of building structures.
Another obstacle to overcome,for many engineers, was one thatwas not an issue when concretedesign made the switch over tolimit states in the 1970’s. Com-puter software for steel design hadalready been tailored toward theworking stress approach and, al-though LRFD versions were readily
DESIGN PERSPECTIVE
hat has taken so long toget engineers in the
available, many designers seemedreluctant to upgrade, the school ofthought being, “If it ain’t broke,don’t fix it” [Ref 3.23].
As time has progressed, how-ever, the 1990’s have seen a growthin the accepted use of limit states insteel bridges. The growing famil-iarity of designers with the nuancesof limit states design, combinedwith the advent of such limit statesapproaches as the load factor de-sign method and LRFD, have ledto a growing use of this method inthe design of steel highway bridges.
Perhaps the biggest factorwhich will spur the acceptance anduse of a limit states approach, how-ever, has been the instruction of itin civil engineering curriculumsthroughout the United States.
With the U.S. Federal HighwayAdministration’s mandate to useLRFD to qualify federal funding, itwill not take long before LRFDbecomes the only bridge design codein the United States no matter whatconstruction materials are used. Thatwill also mean the end of the serviceload method anywhere in the world.It should be noted that both AISCand AASHTO have stopped provid-ing revisions for the service loadmethod design.
W
his means that concreteelements, under the work-T
ing stress approach, are de-signed at a level that is wellbelow failure.
Downloaded from Digital Engineering Library @ McGraw-Hill (www.digitalengineeringlibrary.com)Copyright © 2006 The McGraw-Hill Companies. All rights reserved.
Any use is subject to the Terms of Use as given at the website.
Design of Superstructure Elements
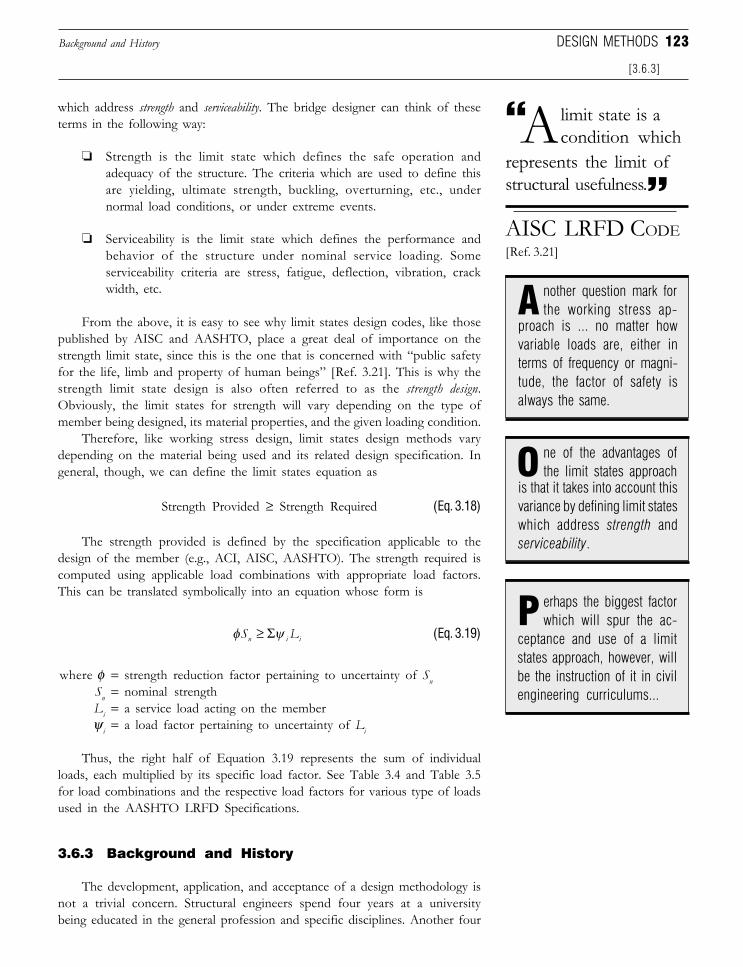
123
which address strength and serviceability. The bridge designer can think of theseterms in the following way:
❏ Strength is the limit state which defines the safe operation andadequacy of the structure. The criteria which are used to define thisare yielding, ultimate strength, buckling, overturning, etc., undernormal load conditions, or under extreme events.
❏ Serviceability is the limit state which defines the performance andbehavior of the structure under nominal service loading. Someserviceability criteria are stress, fatigue, deflection, vibration, crackwidth, etc.
From the above, it is easy to see why limit states design codes, like thosepublished by AISC and AASHTO, place a great deal of importance on thestrength limit state, since this is the one that is concerned with “public safetyfor the life, limb and property of human beings” [Ref. 3.21]. This is why thestrength limit state design is also often referred to as the strength design.Obviously, the limit states for strength will vary depending on the type ofmember being designed, its material properties, and the given loading condition.
Therefore, like working stress design, limit states design methods varydepending on the material being used and its related design specification. Ingeneral, though, we can define the limit states equation as
Strength Provided ≥ Strength Required (Eq. 3.18)
The strength provided is defined by the specification applicable to thedesign of the member (e.g., ACI, AISC, AASHTO). The strength required iscomputed using applicable load combinations with appropriate load factors.This can be translated symbolically into an equation whose form is
φ ψS Ln i i≥ Σ (Eq. 3.19)
where φ = strength reduction factor pertaining to uncertainty of SnSn = nominal strengthLi = a service load acting on the memberψ i = a load factor pertaining to uncertainty of Li
Thus, the right half of Equation 3.19 represents the sum of individualloads, each multiplied by its specific load factor. See Table 3.4 and Table 3.5for load combinations and the respective load factors for various type of loadsused in the AASHTO LRFD Specifications.
3.6.3 Background and History
The development, application, and acceptance of a design methodology isnot a trivial concern. Structural engineers spend four years at a universitybeing educated in the general profession and specific disciplines. Another four
Background and History
[3.6.3]
DESIGN METHODS
limit state is acondition which
represents the limit ofstructural usefulness.
A
AISC LRFD CODE[Ref. 3.21]
erhaps the biggest factorwhich will spur the ac-
ceptance and use of a limitstates approach, however, willbe the instruction of it in civilengineering curriculums...
P
nother question mark forthe working stress ap-
proach is ... no matter howvariable loads are, either interms of frequency or magni-tude, the factor of safety isalways the same.
A
ne of the advantages ofthe limit states approach
is that it takes into account thisvariance by defining limit stateswhich address strength andserviceability.
O
Downloaded from Digital Engineering Library @ McGraw-Hill (www.digitalengineeringlibrary.com)Copyright © 2006 The McGraw-Hill Companies. All rights reserved.
Any use is subject to the Terms of Use as given at the website.
Design of Superstructure Elements
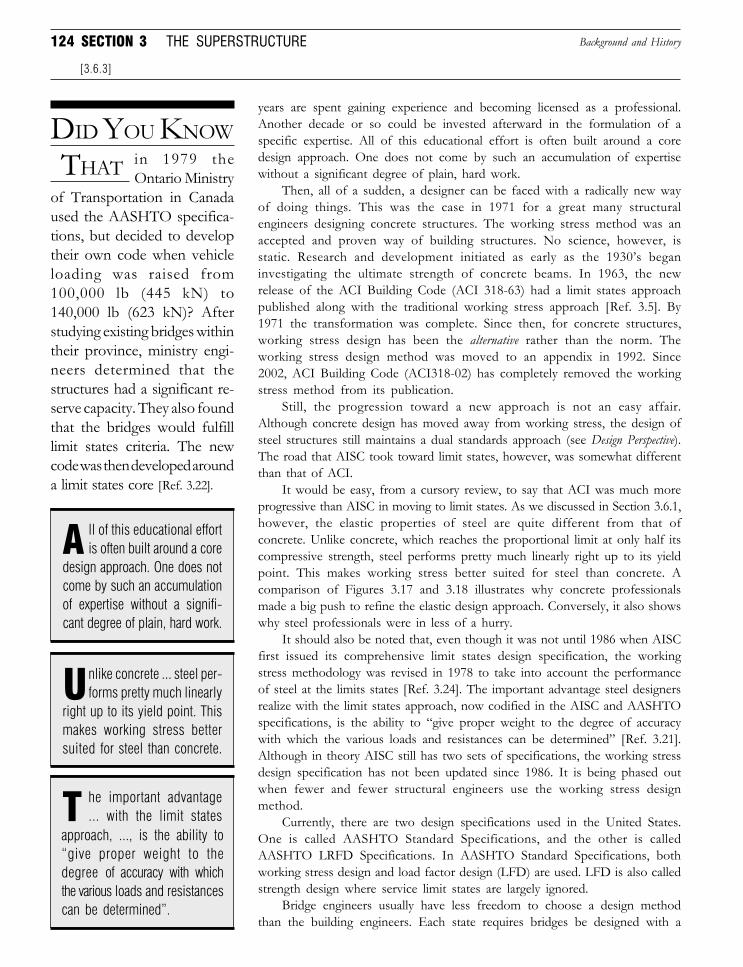
124 SECTION 3 THE SUPERSTRUCTURE
years are spent gaining experience and becoming licensed as a professional.Another decade or so could be invested afterward in the formulation of aspecific expertise. All of this educational effort is often built around a coredesign approach. One does not come by such an accumulation of expertisewithout a significant degree of plain, hard work.
Then, all of a sudden, a designer can be faced with a radically new wayof doing things. This was the case in 1971 for a great many structuralengineers designing concrete structures. The working stress method was anaccepted and proven way of building structures. No science, however, isstatic. Research and development initiated as early as the 1930’s beganinvestigating the ultimate strength of concrete beams. In 1963, the newrelease of the ACI Building Code (ACI 318-63) had a limit states approachpublished along with the traditional working stress approach [Ref. 3.5]. By1971 the transformation was complete. Since then, for concrete structures,working stress design has been the alternative rather than the norm. Theworking stress design method was moved to an appendix in 1992. Since2002, ACI Building Code (ACI318-02) has completely removed the workingstress method from its publication.
Still, the progression toward a new approach is not an easy affair.Although concrete design has moved away from working stress, the design ofsteel structures still maintains a dual standards approach (see Design Perspective).The road that AISC took toward limit states, however, was somewhat differentthan that of ACI.
It would be easy, from a cursory review, to say that ACI was much moreprogressive than AISC in moving to limit states. As we discussed in Section 3.6.1,however, the elastic properties of steel are quite different from that ofconcrete. Unlike concrete, which reaches the proportional limit at only half itscompressive strength, steel performs pretty much linearly right up to its yieldpoint. This makes working stress better suited for steel than concrete. Acomparison of Figures 3.17 and 3.18 illustrates why concrete professionalsmade a big push to refine the elastic design approach. Conversely, it also showswhy steel professionals were in less of a hurry.
It should also be noted that, even though it was not until 1986 when AISCfirst issued its comprehensive limit states design specification, the workingstress methodology was revised in 1978 to take into account the performanceof steel at the limits states [Ref. 3.24]. The important advantage steel designersrealize with the limit states approach, now codified in the AISC and AASHTOspecifications, is the ability to “give proper weight to the degree of accuracywith which the various loads and resistances can be determined” [Ref. 3.21].Although in theory AISC still has two sets of specifications, the working stressdesign specification has not been updated since 1986. It is being phased outwhen fewer and fewer structural engineers use the working stress designmethod.
Currently, there are two design specifications used in the United States.One is called AASHTO Standard Specifications, and the other is calledAASHTO LRFD Specifications. In AASHTO Standard Specifications, bothworking stress design and load factor design (LFD) are used. LFD is also calledstrength design where service limit states are largely ignored.
Bridge engineers usually have less freedom to choose a design methodthan the building engineers. Each state requires bridges be designed with a
Background and History
[3.6.3]
DID YOU KNOW
THAT in 1979 theOntario Ministry
of Transportation in Canadaused the AASHTO specifica-tions, but decided to developtheir own code when vehicleloading was raised from100,000 lb (445 kN) to140,000 lb (623 kN)? Afterstudying existing bridges withintheir province, ministry engi-neers determined that thestructures had a significant re-serve capacity. They also foundthat the bridges would fulfilllimit states criteria. The newcode was then developed arounda limit states core [Ref. 3.22].
ll of this educational effortis often built around a core
design approach. One does notcome by such an accumulationof expertise without a signifi-cant degree of plain, hard work.
A
nlike concrete ... steel per-forms pretty much linearly
right up to its yield point. Thismakes working stress bettersuited for steel than concrete.
U
he important advantage... with the limit statesT
approach, ..., is the ability to“give proper weight to thedegree of accuracy with whichthe various loads and resistancescan be determined”.
Downloaded from Digital Engineering Library @ McGraw-Hill (www.digitalengineeringlibrary.com)Copyright © 2006 The McGraw-Hill Companies. All rights reserved.
Any use is subject to the Terms of Use as given at the website.
Design of Superstructure Elements
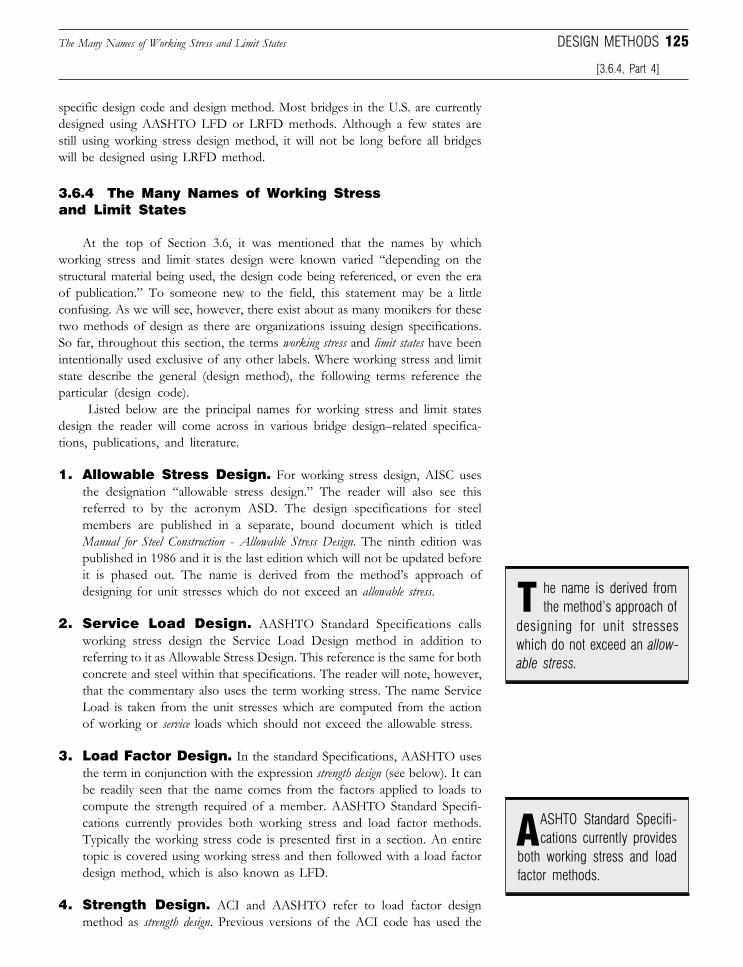
125The Many Names of Working Stress and Limit States
[3.6.4, Part 4]
DESIGN METHODS
specific design code and design method. Most bridges in the U.S. are currentlydesigned using AASHTO LFD or LRFD methods. Although a few states arestill using working stress design method, it will not be long before all bridgeswill be designed using LRFD method.
3.6.4 The Many Names of Working Stressand Limit States
At the top of Section 3.6, it was mentioned that the names by whichworking stress and limit states design were known varied “depending on thestructural material being used, the design code being referenced, or even the eraof publication.” To someone new to the field, this statement may be a littleconfusing. As we will see, however, there exist about as many monikers for thesetwo methods of design as there are organizations issuing design specifications.So far, throughout this section, the terms working stress and limit states have beenintentionally used exclusive of any other labels. Where working stress and limitstate describe the general (design method), the following terms reference theparticular (design code).
Listed below are the principal names for working stress and limit statesdesign the reader will come across in various bridge design–related specifica-tions, publications, and literature.
1. Allowable Stress Design. For working stress design, AISC usesthe designation “allowable stress design.” The reader will also see thisreferred to by the acronym ASD. The design specifications for steelmembers are published in a separate, bound document which is titledManual for Steel Construction - Allowable Stress Design. The ninth edition waspublished in 1986 and it is the last edition which will not be updated beforeit is phased out. The name is derived from the method’s approach ofdesigning for unit stresses which do not exceed an allowable stress.
2. Service Load Design. AASHTO Standard Specifications callsworking stress design the Service Load Design method in addition toreferring to it as Allowable Stress Design. This reference is the same for bothconcrete and steel within that specifications. The reader will note, however,that the commentary also uses the term working stress. The name ServiceLoad is taken from the unit stresses which are computed from the actionof working or service loads which should not exceed the allowable stress.
3. Load Factor Design. In the standard Specifications, AASHTO usesthe term in conjunction with the expression strength design (see below). It canbe readily seen that the name comes from the factors applied to loads tocompute the strength required of a member. AASHTO Standard Specifi-cations currently provides both working stress and load factor methods.Typically the working stress code is presented first in a section. An entiretopic is covered using working stress and then followed with a load factordesign method, which is also known as LFD.
4. Strength Design. ACI and AASHTO refer to load factor designmethod as strength design. Previous versions of the ACI code has used the
he name is derived fromthe method’s approach ofT
designing for unit stresseswhich do not exceed an allow-able stress.
ASHTO Standard Specifi-cations currently provides
both working stress and loadfactor methods.
A
Downloaded from Digital Engineering Library @ McGraw-Hill (www.digitalengineeringlibrary.com)Copyright © 2006 The McGraw-Hill Companies. All rights reserved.
Any use is subject to the Terms of Use as given at the website.
Design of Superstructure Elements
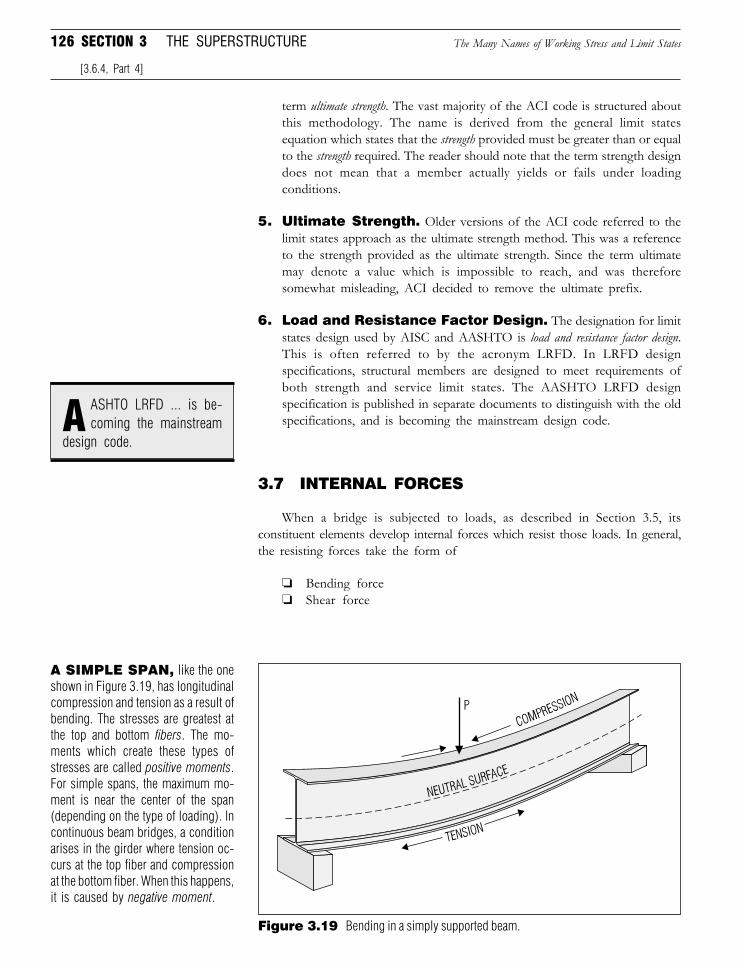
126 SECTION 3 THE SUPERSTRUCTURE
term ultimate strength. The vast majority of the ACI code is structured aboutthis methodology. The name is derived from the general limit statesequation which states that the strength provided must be greater than or equalto the strength required. The reader should note that the term strength designdoes not mean that a member actually yields or fails under loadingconditions.
5. Ultimate Strength. Older versions of the ACI code referred to thelimit states approach as the ultimate strength method. This was a referenceto the strength provided as the ultimate strength. Since the term ultimatemay denote a value which is impossible to reach, and was thereforesomewhat misleading, ACI decided to remove the ultimate prefix.
6. Load and Resistance Factor Design. The designation for limitstates design used by AISC and AASHTO is load and resistance factor design.This is often referred to by the acronym LRFD. In LRFD designspecifications, structural members are designed to meet requirements ofboth strength and service limit states. The AASHTO LRFD designspecification is published in separate documents to distinguish with the oldspecifications, and is becoming the mainstream design code.
3.7 INTERNAL FORCES
When a bridge is subjected to loads, as described in Section 3.5, itsconstituent elements develop internal forces which resist those loads. In general,the resisting forces take the form of
❏ Bending force❏ Shear force
[3.6.4, Part 4]
ASHTO LRFD ... is be-coming the mainstream
design code.A
A SIMPLE SPAN, like the oneshown in Figure 3.19, has longitudinalcompression and tension as a result ofbending. The stresses are greatest atthe top and bottom fibers. The mo-ments which create these types ofstresses are called positive moments.For simple spans, the maximum mo-ment is near the center of the span(depending on the type of loading). Incontinuous beam bridges, a conditionarises in the girder where tension oc-curs at the top fiber and compressionat the bottom fiber. When this happens,it is caused by negative moment.
Figure 3.19 Bending in a simply supported beam.
The Many Names of Working Stress and Limit States
Downloaded from Digital Engineering Library @ McGraw-Hill (www.digitalengineeringlibrary.com)Copyright © 2006 The McGraw-Hill Companies. All rights reserved.
Any use is subject to the Terms of Use as given at the website.
Design of Superstructure Elements
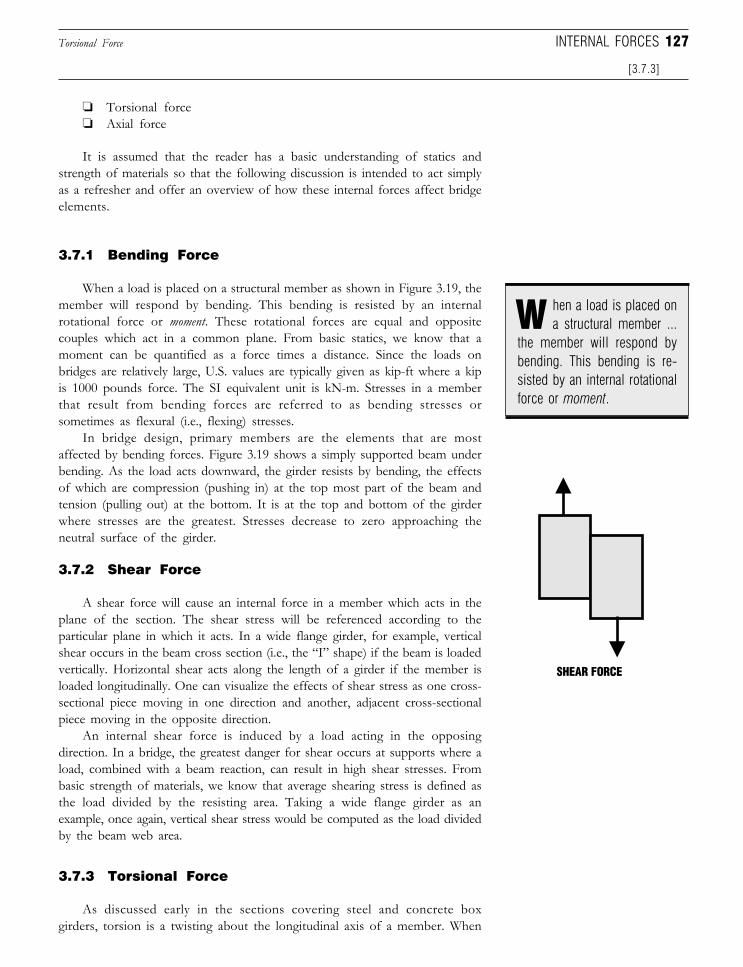
127Torsional Force
[3.7.3]
INTERNAL FORCES
❏ Torsional force❏ Axial force
It is assumed that the reader has a basic understanding of statics andstrength of materials so that the following discussion is intended to act simplyas a refresher and offer an overview of how these internal forces affect bridgeelements.
3.7.1 Bending Force
When a load is placed on a structural member as shown in Figure 3.19, themember will respond by bending. This bending is resisted by an internalrotational force or moment. These rotational forces are equal and oppositecouples which act in a common plane. From basic statics, we know that amoment can be quantified as a force times a distance. Since the loads onbridges are relatively large, U.S. values are typically given as kip-ft where a kipis 1000 pounds force. The SI equivalent unit is kN-m. Stresses in a memberthat result from bending forces are referred to as bending stresses orsometimes as flexural (i.e., flexing) stresses.
In bridge design, primary members are the elements that are mostaffected by bending forces. Figure 3.19 shows a simply supported beam underbending. As the load acts downward, the girder resists by bending, the effectsof which are compression (pushing in) at the top most part of the beam andtension (pulling out) at the bottom. It is at the top and bottom of the girderwhere stresses are the greatest. Stresses decrease to zero approaching theneutral surface of the girder.
3.7.2 Shear Force
A shear force will cause an internal force in a member which acts in theplane of the section. The shear stress will be referenced according to theparticular plane in which it acts. In a wide flange girder, for example, verticalshear occurs in the beam cross section (i.e., the “I” shape) if the beam is loadedvertically. Horizontal shear acts along the length of a girder if the member isloaded longitudinally. One can visualize the effects of shear stress as one cross-sectional piece moving in one direction and another, adjacent cross-sectionalpiece moving in the opposite direction.
An internal shear force is induced by a load acting in the opposingdirection. In a bridge, the greatest danger for shear occurs at supports where aload, combined with a beam reaction, can result in high shear stresses. Frombasic strength of materials, we know that average shearing stress is defined asthe load divided by the resisting area. Taking a wide flange girder as anexample, once again, vertical shear stress would be computed as the load dividedby the beam web area.
3.7.3 Torsional Force
As discussed early in the sections covering steel and concrete boxgirders, torsion is a twisting about the longitudinal axis of a member. When
hen a load is placed ona structural member ...
the member will respond bybending. This bending is re-sisted by an internal rotationalforce or moment.
W
Downloaded from Digital Engineering Library @ McGraw-Hill (www.digitalengineeringlibrary.com)Copyright © 2006 The McGraw-Hill Companies. All rights reserved.
Any use is subject to the Terms of Use as given at the website.
Design of Superstructure Elements
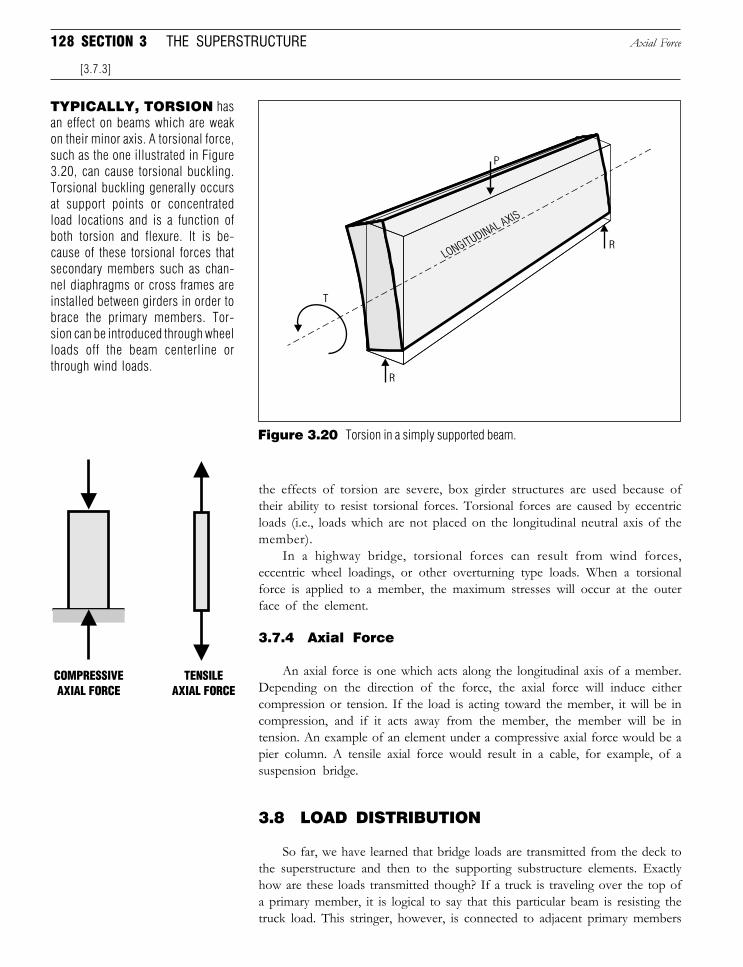
128 SECTION 3 THE SUPERSTRUCTURE
the effects of torsion are severe, box girder structures are used because oftheir ability to resist torsional forces. Torsional forces are caused by eccentricloads (i.e., loads which are not placed on the longitudinal neutral axis of themember).
In a highway bridge, torsional forces can result from wind forces,eccentric wheel loadings, or other overturning type loads. When a torsionalforce is applied to a member, the maximum stresses will occur at the outerface of the element.
3.7.4 Axial Force
An axial force is one which acts along the longitudinal axis of a member.Depending on the direction of the force, the axial force will induce eithercompression or tension. If the load is acting toward the member, it will be incompression, and if it acts away from the member, the member will be intension. An example of an element under a compressive axial force would be apier column. A tensile axial force would result in a cable, for example, of asuspension bridge.
3.8 LOAD DISTRIBUTION
So far, we have learned that bridge loads are transmitted from the deck tothe superstructure and then to the supporting substructure elements. Exactlyhow are these loads transmitted though? If a truck is traveling over the top ofa primary member, it is logical to say that this particular beam is resisting thetruck load. This stringer, however, is connected to adjacent primary members
Axial Force
[3.7.3]
Figure 3.20 Torsion in a simply supported beam.
TYPICALLY, TORSION hasan effect on beams which are weakon their minor axis. A torsional force,such as the one illustrated in Figure3.20, can cause torsional buckling.Torsional buckling generally occursat support points or concentratedload locations and is a function ofboth torsion and flexure. It is be-cause of these torsional forces thatsecondary members such as chan-nel diaphragms or cross frames areinstalled between girders in order tobrace the primary members. Tor-sion can be introduced through wheelloads off the beam centerline orthrough wind loads.
Downloaded from Digital Engineering Library @ McGraw-Hill (www.digitalengineeringlibrary.com)Copyright © 2006 The McGraw-Hill Companies. All rights reserved.
Any use is subject to the Terms of Use as given at the website.
Design of Superstructure Elements
129
through some form of secondary member (e.g., channel diaphragm, cross-frame). In addition to this, the bridge deck itself acts as a connection betweenlongitudinal girders. This connectivity allows different members to worktogether in resisting loads.
Returning to the example of the truck traveling over the top of a specificprimary member, it would be logical to assume that this specific girder iscarrying most of the load. As a result of being connected with the girder inquestion, adjacent members assist in carrying part of the load. Exactly howmuch load they carry is a function of how the load is transmitted or distributedto them. Determining the fraction of load carried by a loaded member and theremainder distributed to other members is the focus of this discussion.
3.8.1 How Loads Are Distributed
The highway bridge, as mentioned previously, is not a collection ofindividual elements, each performing a specific function, but rather an inte-grated unit. The modeling of how a load is actually dispersed from the deckdown through the substructure is not a trivial undertaking. A wide variety ofparameters which range from the structure’s geometry to element materialproperties influence exactly how loads are distributed.
Where defining a precise mathematical model of what happens tobridge loads in a structure is complicated, it is possible to examine the variableswhich influence the distribution. In essence, the influencing parameters are afunction of the bridge superstructure cross-sectional properties. The followingparameters determine how loads are distributed in a bridge superstructure. Itshould be kept in mind, however, that this is a general list and that othervariables could potentially affect the distribution on loads. With this in mind,the influencing parameters are
❏ Type and depth of deck❏ Span length❏ Spacing between stringers❏ Spacing of secondary members❏ Stiffness of primary members❏ Stiffness of secondary members❏ Type of bracing employed (if any)❏ Size and position of loads
As we have seen before with issues like the idealization of the dynamiceffects of vehicle impact, in order to simplify the computation of loaddistribution, AASHTO Standard Specifications choose to utilize a distributionfactor based on only two of the above referenced criteria: type of floor andstringer spacing. AASHTO LRFD Specifications, however, also considers thedeck thickness, span length, and stringer stiffness. To account for the effectsof load distribution, a load distribution factor (DF) is computed and applied tolive load bending moments and shear forces.
Table 3.6 shows the AASHTO Standard Specifications wheel loaddistribution factors for various floor type and spacing configurations. Distri-bution will also vary depending on whether longitudinal or transverse
How Loads Are Distributed
[3.8.1]
LOAD DISTRIBUTION
he modeling of how a loadis actually dispersed from
the deck down through thesubstructure is not a trivial un-dertaking. A wide variety ofparameters ... influence exactlyhow loads are distributed.
T
n order to simplify thecomputation of load dis-
tribution, AASHTO StandardSpecifications chose to utilizea distribution factor based ononly two ... criteria: type offloor and stringer spacing...AASHTO LRFD Specifications,however, also considers thedeck thickness, span length,and stringer stiffness.
...I
Downloaded from Digital Engineering Library @ McGraw-Hill (www.digitalengineeringlibrary.com)Copyright © 2006 The McGraw-Hill Companies. All rights reserved.
Any use is subject to the Terms of Use as given at the website.
Design of Superstructure Elements
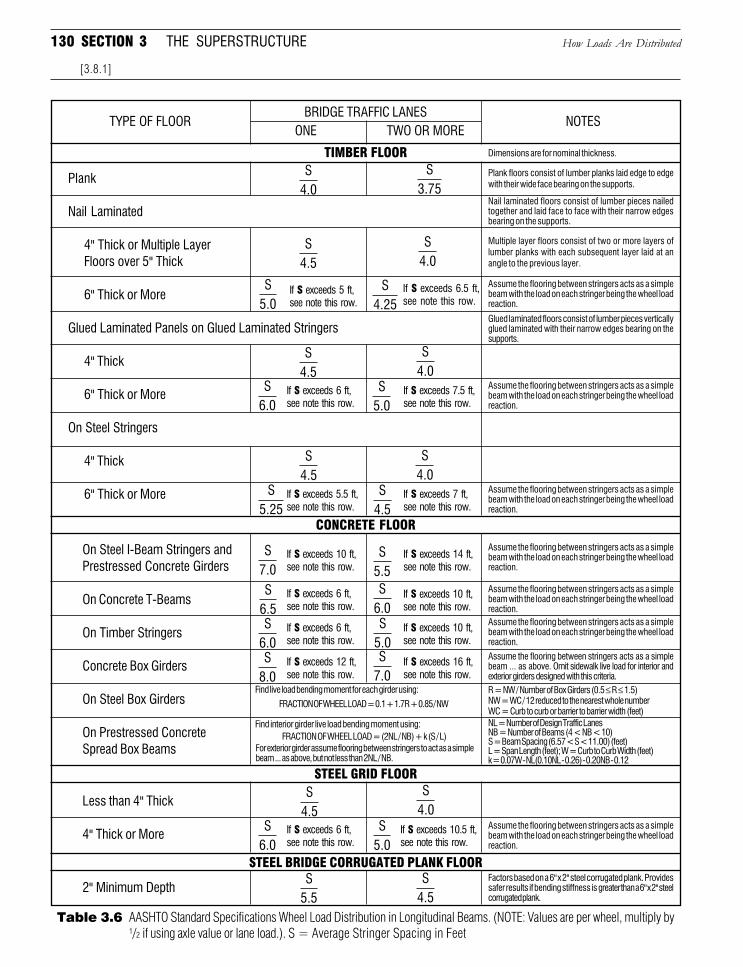
130 SECTION 3 THE SUPERSTRUCTURE How Loads Are Distributed
[3.8.1]
Plank
Nail Laminated
4" Thick or Multiple LayerFloors over 5" Thick
6" Thick or More
Glued Laminated Panels on Glued Laminated Stringers
4" Thick
6" Thick or More
On Steel Stringers
4" Thick
6" Thick or More
2" Minimum Depth
Table 3.6 AASHTO Standard Specifications Wheel Load Distribution in Longitudinal Beams. (NOTE: Values are per wheel, multiply by1/2 if using axle value or lane load.). S = Average Stringer Spacing in Feet
BRIDGE TRAFFIC LANESONE TWO OR MORE
TYPE OF FLOOR
TIMBER FLOOR
Less than 4" Thick
4" Thick or More
CONCRETE FLOOR
On Steel I-Beam Stringers andPrestressed Concrete Girders
On Concrete T-Beams
On Timber Stringers
Concrete Box Girders
On Steel Box Girders
On Prestressed ConcreteSpread Box Beams
STEEL GRID FLOOR
STEEL BRIDGE CORRUGATED PLANK FLOOR
NOTES
Dimensions are for nominal thickness.
Factors based on a 6" x 2" steel corrugated plank. Providessafer results if bending stiffness is greater than a 6" x 2" steelcorrugated plank.
Find live load bending moment for each girder using: R = NW / Number of Box Girders (0.5 ≤ R ≤ 1.5)NW = WC / 12 reduced to the nearest whole numberWC = Curb to curb or barrier to barrier width (feet)
Plank floors consist of lumber planks laid edge to edgewith their wide face bearing on the supports.
Nail laminated floors consist of lumber pieces nailedtogether and laid face to face with their narrow edgesbearing on the supports.
Multiple layer floors consist of two or more layers oflumber planks with each subsequent layer laid at anangle to the previous layer.
Assume the flooring between stringers acts as a simplebeam with the load on each stringer being the wheel loadreaction.
Glued laminated floors consist of lumber pieces verticallyglued laminated with their narrow edges bearing on thesupports.
Assume the flooring between stringers acts as a simplebeam with the load on each stringer being the wheel loadreaction.
Assume the flooring between stringers acts as a simplebeam with the load on each stringer being the wheel loadreaction.
Assume the flooring between stringers acts as a simplebeam with the load on each stringer being the wheel loadreaction.
Assume the flooring between stringers acts as a simplebeam with the load on each stringer being the wheel loadreaction.Assume the flooring between stringers acts as a simplebeam with the load on each stringer being the wheel loadreaction.
Assume the flooring between stringers acts as a simplebeam ... as above. Omit sidewalk live load for interior andexterior girders designed with this criteria.
NL = Number of Design Traffic LanesNB = Number of Beams (4 < NB < 10)S = Beam Spacing (6.57 < S < 11.00) (feet)L = Span Length (feet); W = Curb to Curb Width (feet)k = 0.07W - NL(0.10NL - 0.26) - 0.20NB - 0.12
FRACTION OF WHEEL LOAD = 0.1 + 1.7R + 0.85 / NW
Assume the flooring between stringers acts as a simplebeam with the load on each stringer being the wheel loadreaction.
If S exceeds 5 ft,see note this row.
If S exceeds 6.5 ft,see note this row.
If S exceeds 6 ft,see note this row.
If S exceeds 7.5 ft,see note this row.
If S exceeds 5.5 ft,see note this row.
If S exceeds 7 ft,see note this row.
If S exceeds 10 ft,see note this row.
If S exceeds 14 ft,see note this row.
If S exceeds 6 ft,see note this row.
If S exceeds 10 ft,see note this row.
If S exceeds 10 ft,see note this row.
If S exceeds 6 ft,see note this row.
If S exceeds 16 ft,see note this row.
If S exceeds 12 ft,see note this row.
For exterior girder assume flooring between stringers to act as a simplebeam ... as above, but not less than 2NL / NB.
Find interior girder live load bending moment using:FRACTION OF WHEEL LOAD = (2NL / NB) + k (S / L)
If S exceeds 10.5 ft,see note this row.
If S exceeds 6 ft,see note this row.
S4.0
S4.5
S3.75
S4.0
S4.25
S4.5
S4.0
S6.0
S5.0
S4.5
S4.0
S5.25
S4.5
S7.0
S5.5
S6.5
S6.0
S6.0
S5.0
S8.0
S7.0
S4.0
S6.0
S5.0
S5.5
S4.5
S5.0
S4.5
Downloaded from Digital Engineering Library @ McGraw-Hill (www.digitalengineeringlibrary.com)Copyright © 2006 The McGraw-Hill Companies. All rights reserved.
Any use is subject to the Terms of Use as given at the website.
Design of Superstructure Elements
131
members are being analyzed. It is important to note that these factors areapplied to wheel loads. Figure 3.21 illustrates a typical scenario where an H20-44truck is loading an interior stringer of a slab-on-stringer superstructure. Whencomputing the bending moment due to live load, for example, a fraction ofboth the front and rear wheel loads is taken to act on a given interior stringer.Consulting Table 3.6, for a concrete deck (floor) with two or more lanes and astringer spacing of less than 14 ft, the resultant distribution factor for aninterior stringer will be
DF S= = =5 5
7 05 5
1 27.
..
. ft
This value would be multiplied by half the weight of the design truck. Thetotal weight of an H20-44 truck is 8,000 lb (front axle) + 32,000 lb (rear axle)or 40,000 lb. Therefore, one set of front and rear wheels would be half this
How Loads Are Distributed
[3.8.1]
LOAD DISTRIBUTION
AASHTO Load Distribution: Is it too Conservative?
DESIGN PERSPECTIVE
I f someone wants to chal- and bridge floor configuration,Kuzmanovic and Sanchez investi-gated alternative methods that wouldtake into account torsional proper-ties of the structure in addition to thestiffness and spacing of secondarymembers. They also wanted a methodthat would facilitate the initial designprocess by not requiring definition ofthe entire bridge geometry (as is thecase with a finite element model).
Four alternate methods wereinvestigated, each of which tookinto account the enhanced torsionalproperties of the girder–cross-framesuperstructure. The resulting laneload fractions ranged from 1.42 to1.60 with an average of 1.493 (com-pared with the 1.70 AASHTO Stan-dard Specifications value). The ac-tual value used in the design was1.53, resulting from one of thedesigner’s alternates.
A subsequent finite elementanalysis performed by an AISC com-mittee on the Sunshine Skyway Bridgecomputed a lane load fraction of1.49 [Ref. 3.27].
Studies such as this have longsince demonstrated that the AASHTOStandard Specifications approach rep-resents a conservative simplificationof the load distribution problem. Itshould not be forgotten, however,that what one designer calls conserva-tive another may call safe. If nothingelse, the AASHTO Standard Specifi-cations have yielded designs whichhave been both safe and durable overthe past several decades.
There is, though, always a callfor improvement and refinement.As Kuzmanovic and Sanchez cor-rectly point out in their analysis, thelateral distribution of loads on high-way bridges is influenced by a host offactors which the AASHTO Stan-dard Specifications simply does notaccount for at the present time.
AASHTO LRFD code takesthe consideration of stringer spacingand stiffness, deck type and depth,bridge span length and stiffness ofsecondary members, thus improvedthe accuracy of predicting the loaddistribution factor.
lenge the AASHTO Stan-dard Specifications for being tooconservative, one has to look nofarther than the method employedfor lateral load distribution. Withinthe past few years some designershave sought to address the conser-vatism of AASHTO’s approachand offer alternative methodsthemselves.
Bogdan Kuzmanovic andManuel Sanchez of Beiswenger, Hochand Associates were faced with theneed to economize the design of theSunshine Skyway Bridge in Tampa,Florida. The AASHTO StandardSpecifications method yielded a laneload fraction of 1.70 for a two-girderapproach structure whose stringerswere spaced at 23 ft (7 m). Thedesigners felt this value to be high fora structure equipped with verticalcross bracing as well as lateral bracinglocated at the bottom flanges.
Realizing that the AASHTO Stan-dard Specifications approach onlytakes into account stringer spacing
´
´
Downloaded from Digital Engineering Library @ McGraw-Hill (www.digitalengineeringlibrary.com)Copyright © 2006 The McGraw-Hill Companies. All rights reserved.
Any use is subject to the Terms of Use as given at the website.
Design of Superstructure Elements
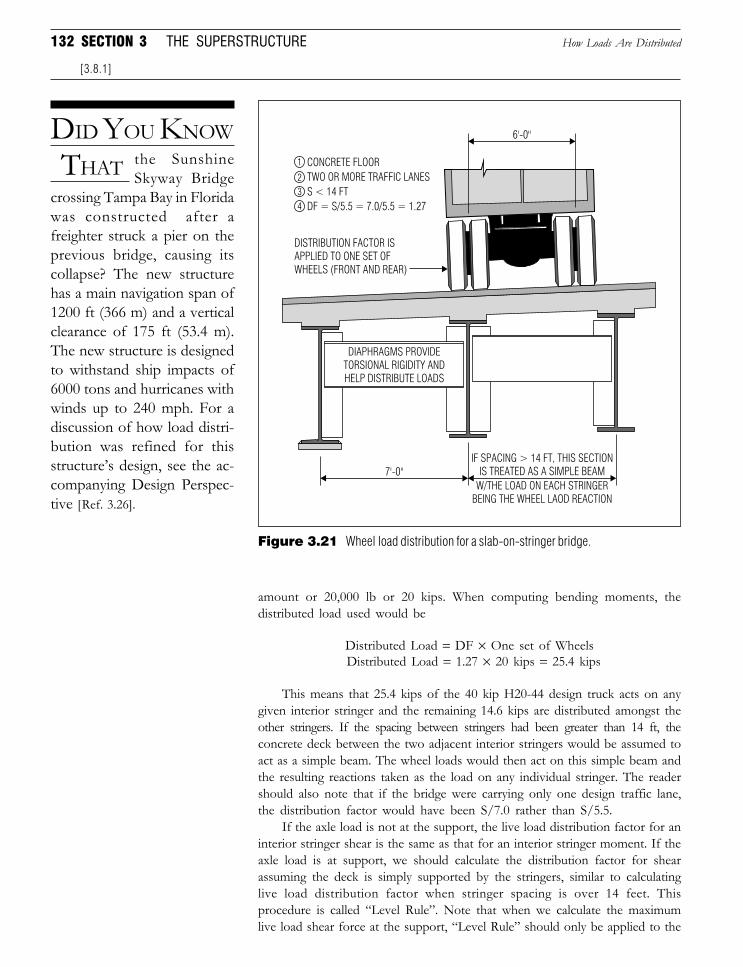
132 SECTION 3 THE SUPERSTRUCTURE
amount or 20,000 lb or 20 kips. When computing bending moments, thedistributed load used would be
Distributed Load = DF × One set of Wheels Distributed Load = 1.27 × 20 kips = 25.4 kips
This means that 25.4 kips of the 40 kip H20-44 design truck acts on anygiven interior stringer and the remaining 14.6 kips are distributed amongst theother stringers. If the spacing between stringers had been greater than 14 ft, theconcrete deck between the two adjacent interior stringers would be assumed toact as a simple beam. The wheel loads would then act on this simple beam andthe resulting reactions taken as the load on any individual stringer. The readershould also note that if the bridge were carrying only one design traffic lane,the distribution factor would have been S/7.0 rather than S/5.5.
If the axle load is not at the support, the live load distribution factor for aninterior stringer shear is the same as that for an interior stringer moment. If theaxle load is at support, we should calculate the distribution factor for shearassuming the deck is simply supported by the stringers, similar to calculatinglive load distribution factor when stringer spacing is over 14 feet. Thisprocedure is called “Level Rule”. Note that when we calculate the maximumlive load shear force at the support, “Level Rule” should only be applied to the
How Loads Are Distributed
[3.8.1]
Figure 3.21 Wheel load distribution for a slab-on-stringer bridge.
DID YOU KNOW
THAT the SunshineSkyway Bridge
crossing Tampa Bay in Floridawas constructed after afreighter struck a pier on theprevious bridge, causing itscollapse? The new structurehas a main navigation span of1200 ft (366 m) and a verticalclearance of 175 ft (53.4 m).The new structure is designedto withstand ship impacts of6000 tons and hurricanes withwinds up to 240 mph. For adiscussion of how load distri-bution was refined for thisstructure’s design, see the ac-companying Design Perspec-tive [Ref. 3.26].
6'-0"
7'-0"IF SPACING > 14 FT, THIS SECTION
IS TREATED AS A SIMPLE BEAMW/THE LOAD ON EACH STRINGER
BEING THE WHEEL LAOD REACTION
DISTRIBUTION FACTOR ISAPPLIED TO ONE SET OFWHEELS (FRONT AND REAR)
DIAPHRAGMS PROVIDETORSIONAL RIGIDITY ANDHELP DISTRIBUTE LOADS
CONCRETE FLOORTWO OR MORE TRAFFIC LANESS < 14 FTDF = S/5.5 = 7.0/5.5 = 1.27
1
234
Downloaded from Digital Engineering Library @ McGraw-Hill (www.digitalengineeringlibrary.com)Copyright © 2006 The McGraw-Hill Companies. All rights reserved.
Any use is subject to the Terms of Use as given at the website.
Design of Superstructure Elements
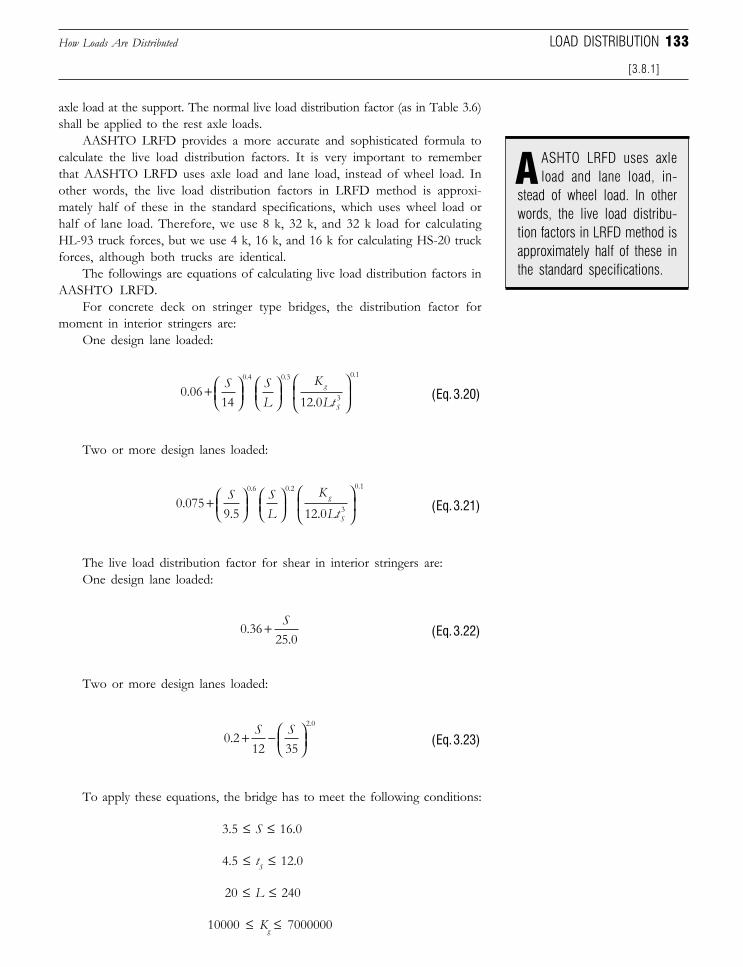
133
axle load at the support. The normal live load distribution factor (as in Table 3.6)shall be applied to the rest axle loads.
AASHTO LRFD provides a more accurate and sophisticated formula tocalculate the live load distribution factors. It is very important to rememberthat AASHTO LRFD uses axle load and lane load, instead of wheel load. Inother words, the live load distribution factors in LRFD method is approxi-mately half of these in the standard specifications, which uses wheel load orhalf of lane load. Therefore, we use 8 k, 32 k, and 32 k load for calculatingHL-93 truck forces, but we use 4 k, 16 k, and 16 k for calculating HS-20 truckforces, although both trucks are identical.
The followings are equations of calculating live load distribution factors inAASHTO LRFD.
For concrete deck on stringer type bridges, the distribution factor formoment in interior stringers are:
One design lane loaded:
0 0614 12 0
0 4 0 3
3
0 1
..
. . .
+
S SL
KLtg
S(Eq. 3.20)
Two or more design lanes loaded:
0 0759 5 12 0
0 6 0 2
3
0 1
.. .
. . .
+
S SL
KLtg
S(Eq. 3.21)
The live load distribution factor for shear in interior stringers are:One design lane loaded:
0 3625 0
..
+ S(Eq. 3.22)
Two or more design lanes loaded:
0 212 35
2 0
..
+ −
S S(Eq. 3.23)
To apply these equations, the bridge has to meet the following conditions:
3.5 ≤ S ≤ 16.0
4.5 ≤ tS ≤ 12.0
20 ≤ L ≤ 240
10000 ≤ Kg ≤ 7000000
How Loads Are Distributed
[3.8.1]
LOAD DISTRIBUTION
ASHTO LRFD uses axleload and lane load, in-
stead of wheel load. In otherwords, the live load distribu-tion factors in LRFD method isapproximately half of these inthe standard specifications.
A
Downloaded from Digital Engineering Library @ McGraw-Hill (www.digitalengineeringlibrary.com)Copyright © 2006 The McGraw-Hill Companies. All rights reserved.
Any use is subject to the Terms of Use as given at the website.
Design of Superstructure Elements
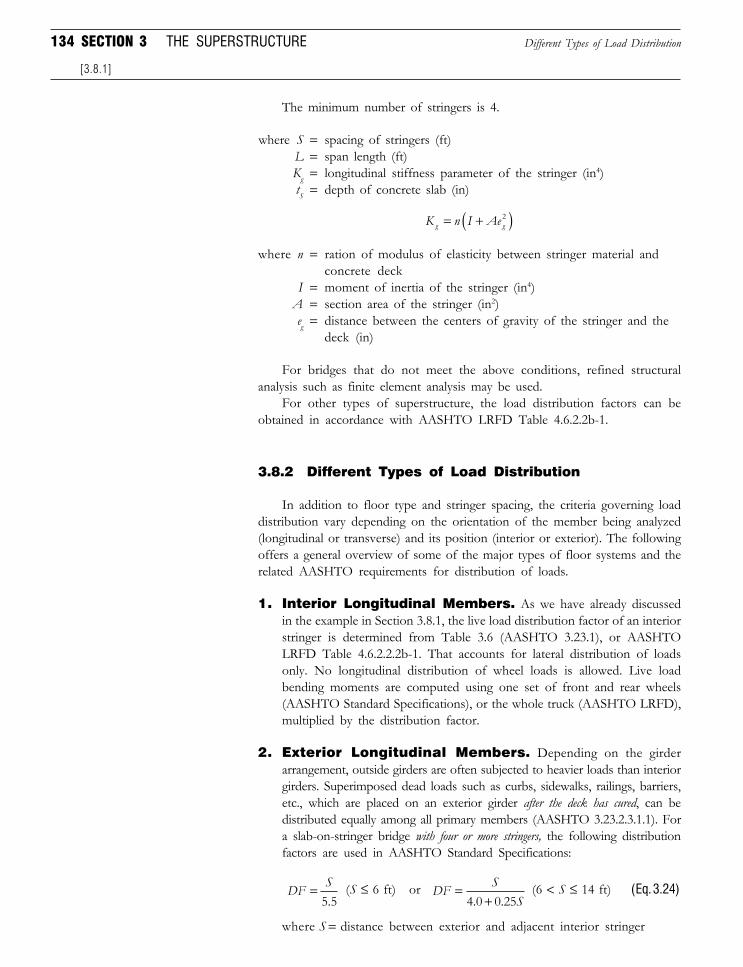
134 SECTION 3 THE SUPERSTRUCTURE
The minimum number of stringers is 4.
where S = spacing of stringers (ft) L = span length (ft) Kg = longitudinal stiffness parameter of the stringer (in4) tS = depth of concrete slab (in)
K n I Aeg g= +( )2
where n = ration of modulus of elasticity between stringer material andconcrete deck
I = moment of inertia of the stringer (in4)A = section area of the stringer (in2)eg = distance between the centers of gravity of the stringer and the
deck (in)
For bridges that do not meet the above conditions, refined structuralanalysis such as finite element analysis may be used.
For other types of superstructure, the load distribution factors can beobtained in accordance with AASHTO LRFD Table 4.6.2.2b-1.
3.8.2 Different Types of Load Distribution
In addition to floor type and stringer spacing, the criteria governing loaddistribution vary depending on the orientation of the member being analyzed(longitudinal or transverse) and its position (interior or exterior). The followingoffers a general overview of some of the major types of floor systems and therelated AASHTO requirements for distribution of loads.
1. Interior Longitudinal Members. As we have already discussedin the example in Section 3.8.1, the live load distribution factor of an interiorstringer is determined from Table 3.6 (AASHTO 3.23.1), or AASHTOLRFD Table 4.6.2.2.2b-1. That accounts for lateral distribution of loadsonly. No longitudinal distribution of wheel loads is allowed. Live loadbending moments are computed using one set of front and rear wheels(AASHTO Standard Specifications), or the whole truck (AASHTO LRFD),multiplied by the distribution factor.
2. Exterior Longitudinal Members. Depending on the girderarrangement, outside girders are often subjected to heavier loads than interiorgirders. Superimposed dead loads such as curbs, sidewalks, railings, barriers,etc., which are placed on an exterior girder after the deck has cured, can bedistributed equally among all primary members (AASHTO 3.23.2.3.1.1). Fora slab-on-stringer bridge with four or more stringers, the following distributionfactors are used in AASHTO Standard Specifications:
DF S=5 5. (S ≤ 6 ft) or DF S
S=
+4 0 0 25. . (6 < S ≤ 14 ft) (Eq. 3.24)
where S = distance between exterior and adjacent interior stringer
Different Types of Load Distribution
[3.8.1]
Downloaded from Digital Engineering Library @ McGraw-Hill (www.digitalengineeringlibrary.com)Copyright © 2006 The McGraw-Hill Companies. All rights reserved.
Any use is subject to the Terms of Use as given at the website.
Design of Superstructure Elements
135
From Equation 3.24 we see that the distribution factor will varydepending on the spacing of stringers. As is the case with many interiorstringers, when the spacing between an exterior and adjacent interiorstringer exceeds 14 ft, the flooring between the two stringers is taken to actas a simple beam with the load on each stringer being the resulting wheel loadreaction.
In AASHTO LRFD Specifications, if only one lane is loaded, the loaddistribution factors for moment and shear can be obtained by positioningthe truck wheel loads 2 feet from the parapet, and calculating the reactionfrom the exterior girder, assuming the deck is simply supported by thegirders in the transverse direction. When two or more lanes are loaded, thelive load distribution factor for moment can be obtained from Eq. 3.21, andmodified by a factor:
0 779 1
..
+ de (Eq. 3.25)
When two or more lanes are loaded, the live load distributionfactor for shear can be obtained from Eq. 3.23, and modified by afactor:
0 610
. + de (Eq. 3.26)
where de = distance between the exterior web of exterior girder to theface of traffic barrier (ft.) ( . )− ≤ ≤1 5 5de
If an exterior girder is under a sidewalk, the girder should be designedfor truck load on the sidewalk.
It should be noted that in no case should an exterior girder be designedsmaller than the interior girders, so that the bridge can be easily widened inthe future.
3. Transverse Members. The AASHTO specifications do not allowfor any lateral distribution of loads for transverse members (e.g., floorbeams). When there are no longitudinal members present and the deck issupported entirely by floor beams, the distribution factors, as outlined inAASHTO Table 3.23.3.1 or AASHTO LRFD Table 4.6.2.2.2f-1, may beused.
For concrete deck bridges, the distribution factors for bothmoment and shear is S/6. Where S is the spacing of the transversebeams. If S exceeds 6 feet (1.8 m), the distribution factor can becalculated by positioning the live load to obtain the maximum reactionat the floor beam, assuming the deck is simply supported by the floorbeams. The distribution factors for both AASHTO Standard Specifi-cations and AASHTO LRFD Specifications are similar.
Different Types of Load Distribution
[3.8.2, Part 3]
LOAD DISTRIBUTION
hen the spacing be-tween an exterior and
adjacent interior stringer ex-ceeds 14 ft, the flooring be-tween the two stringers is takento act as a simple beam ... Inno case should an exteriorbeam be designed smaller thaninterior girders.
...w
f an exterior stringer is un-der a sidewalk, the stringer
should be designed for truckload on the sidewalk.
I
Downloaded from Digital Engineering Library @ McGraw-Hill (www.digitalengineeringlibrary.com)Copyright © 2006 The McGraw-Hill Companies. All rights reserved.
Any use is subject to the Terms of Use as given at the website.
Design of Superstructure Elements
136 SECTION 3 THE SUPERSTRUCTURE
4. Multibeam Concrete Decks (Concrete Panels). A multi-beam concrete deck can be either conventionally reinforced or prestressed.Precast prestressed concrete panel decks were discussed in Section 3.2.3briefly. These types of decks consist of concrete panels which runlongitudinally and are placed next to one another. The panels are connectedtogether with a shear key and lateral post-tensioning rods. A concreteoverlay is usually applied to the top of concrete panels.
As with other longitudinal members, no longitudinal distribution ofwheel loads is allowed. The AASHTO Standard Specifications takes intoaccount the stiffness of the deck panels through use of a stiffness parameterC which is given as
C WL
IJ
WLK= +( ) = ⋅1 µ for W < L (Eq. 3.27a)
C K W L= ≥ for (Eq. 3.27b)
where W = width of entire bridge perpendicular to beams, ftL = span length taken parallel to longitudinal girders, ftI = moment of inertiaJ = torsion constant (see sidebar)µ = poisson’s ratio for concrete, poisson’s ratio can be
assumed to be 0.2K = stiffness constant (see sidebar)
The boundary within which the stiffness parameter C falls and itsvalue are used to define a parameter D, which is given by
D N N CL L= −( ) + −( )5 75 0 5 0 7 1 0 2 2. . . . (Eq. 3.27c)
where NL = number of traffic lanes
Therefore, like other members, the resultant distribution factor canbe calculated as a function of the spacing between beams using theequation:
Load Fraction = SD (Eq. 3.27d)
where S = width of a precast beam
If the value of IJ is greater than 5.0, or bridge skew angle exceeds
45 degrees, AASHTO Standard Specifications recommends that a“more precise method”, such as grillage analysis, be used (AASHTO3.23.4.3).
Different Types of Load Distribution
[3.8.2, Part 4]
The stiffness constant in Equation 3.27ais
Listed below are values for various typesof beams, which can be used by de-signers when performing a preliminarydesign (AASHTO 3.23.4.3).
3.23.4 STIFFNESS CONSTANT
Non-voided Rectangular 0.7Rectangular w/Circular Voids 0.8Box Section Beams 1.0Channel Beams 2.2
In lieu of more exact methods, thetorsion constant J may be estimatedusing one of the following equations:
3.23.4 TORSION CONSTANT
Nonvoided Rectangular Beams,Channels, and Tee Beams
b = length of each rectangularcomponent within section
t = thickness of each rectangularcomponent within section
where
Beam Type K
Box-Section Beams
b = overall width of boxd = overall depth of boxt = thickness of either webtf = thickness of either flange
where
AASHTO STANDARD
K =IJ
1+µ( ).
J=13
bt 1 0.630tb
3 −∑
J=2 t t b t d t
b t+d t t tf
2f
2
f2
f2
⋅ ⋅ − ⋅ −⋅ ⋅ − −
( ) ( )
Downloaded from Digital Engineering Library @ McGraw-Hill (www.digitalengineeringlibrary.com)Copyright © 2006 The McGraw-Hill Companies. All rights reserved.
Any use is subject to the Terms of Use as given at the website.
Design of Superstructure Elements
137
AASHTO LRFD uses slightly different equations to calculate loaddistribution factors for multibeam deck bridges. To calculate moment ininterior and exterior beams, Tables 4.6.2.2.2b-1 and 4.6.2.2.2d-1 can beused. For shear in interior and exterior beams, Tables 4.6.2.2.3a-1 and4.6.2.2.3b-1 can be used.
It can be seen that the value of the distribution factor is greatlydependent on the cross-sectional geometry of the precast panel. Both themoment of inertia and torsional constant are functions of the type of panel/beam used (e.g., voided section, solid beam, etc.). AASHTO provides a listof general constant values for use in the preliminary design of a multibeambridge. The sidebar lists these preliminary values.
3.8.3 Conclusions
As can be seen from the Design Perspective, in this section, the approachwhich AASHTO Standard Specifications takes for the distribution of loads hasfostered some debate as to whether or not the method is too conservative.Regardless of the merits of such arguments, AASHTO LRFD has addressedthe issue by certain extend. Both design methods will be further discussed inthe design examples.
The AASHTO code places the distribution of loads for concrete slabswithin the same section as that which describes the general design criteriafor this element. With this in mind, the presentation of load distributioncriteria for concrete slabs is offered in the following section. For loaddistribution criteria pertaining to other less common flooring, such astimber flooring, the reader is referred to the AASHTO specificationsdirectly for information.
3.9 CONCRETE DECK SLABS
With this section, we begin the portion of the text which concerns theactive design of structural elements in a highway bridge. Design examples willrun parallel with text covering specifications and other related issues. Theseexamples will always be positioned on the right-hand facing page. If there isinsufficient room for the example to be completed on a single page, it will becontinued on the subsequent right-hand facing page (the top of the designcalculation page indicates the total number of pages in the example). For themost part, the associated text on the left-hand facing page and bottom of theright-hand page will be germane to the design example, although there is noguaranteed one-to-one correspondence.
Since both AASHTO standards and LRFD Specifications are currentlyused by bridge engineers in the United States, both will be presented in thedesign examples. In that way, this book can be used as a reference book nomatter which method is required in your state. For students studying bridgeengineering, it is to their benefit to learn both methods to broaden theirknowledge, and to have a feeling of the advantages and disadvantages of eachmethod.
[3.9]
CONCRETE DECK SLABS
t can be seen that the valueof the distribution factor is
greatly dependent on thecross-sectional geometry andthe span length of the precastpanel.
I
Downloaded from Digital Engineering Library @ McGraw-Hill (www.digitalengineeringlibrary.com)Copyright © 2006 The McGraw-Hill Companies. All rights reserved.
Any use is subject to the Terms of Use as given at the website.
Design of Superstructure Elements
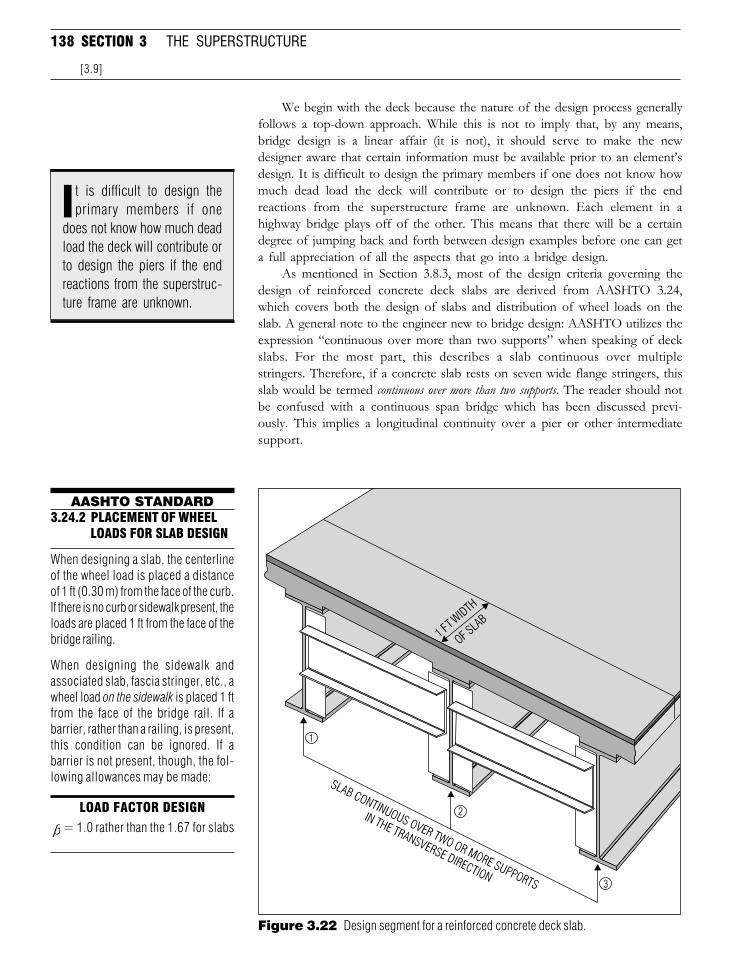
138 SECTION 3 THE SUPERSTRUCTURE
[3.9]
We begin with the deck because the nature of the design process generallyfollows a top-down approach. While this is not to imply that, by any means,bridge design is a linear affair (it is not), it should serve to make the newdesigner aware that certain information must be available prior to an element’sdesign. It is difficult to design the primary members if one does not know howmuch dead load the deck will contribute or to design the piers if the endreactions from the superstructure frame are unknown. Each element in ahighway bridge plays off of the other. This means that there will be a certaindegree of jumping back and forth between design examples before one can geta full appreciation of all the aspects that go into a bridge design.
As mentioned in Section 3.8.3, most of the design criteria governing thedesign of reinforced concrete deck slabs are derived from AASHTO 3.24,which covers both the design of slabs and distribution of wheel loads on theslab. A general note to the engineer new to bridge design: AASHTO utilizes theexpression “continuous over more than two supports” when speaking of deckslabs. For the most part, this describes a slab continuous over multiplestringers. Therefore, if a concrete slab rests on seven wide flange stringers, thisslab would be termed continuous over more than two supports. The reader should notbe confused with a continuous span bridge which has been discussed previ-ously. This implies a longitudinal continuity over a pier or other intermediatesupport.
When designing a slab, the centerlineof the wheel load is placed a distanceof 1 ft (0.30 m) from the face of the curb.If there is no curb or sidewalk present, theloads are placed 1 ft from the face of thebridge railing.
LOAD FACTOR DESIGN
β = 1.0 rather than the 1.67 for slabs
When designing the sidewalk andassociated slab, fascia stringer, etc., awheel load on the sidewalk is placed 1 ftfrom the face of the bridge rail. If abarrier, rather than a railing, is present,this condition can be ignored. If abarrier is not present, though, the fol-lowing allowances may be made:
AASHTO STANDARD3.24.2 PLACEMENT OF WHEEL
LOADS FOR SLAB DESIGN
Figure 3.22 Design segment for a reinforced concrete deck slab.
t is difficult to design theprimary members if one
does not know how much deadload the deck will contribute orto design the piers if the endreactions from the superstruc-ture frame are unknown.
I
1
2
3
Downloaded from Digital Engineering Library @ McGraw-Hill (www.digitalengineeringlibrary.com)Copyright © 2006 The McGraw-Hill Companies. All rights reserved.
Any use is subject to the Terms of Use as given at the website.
Design of Superstructure Elements
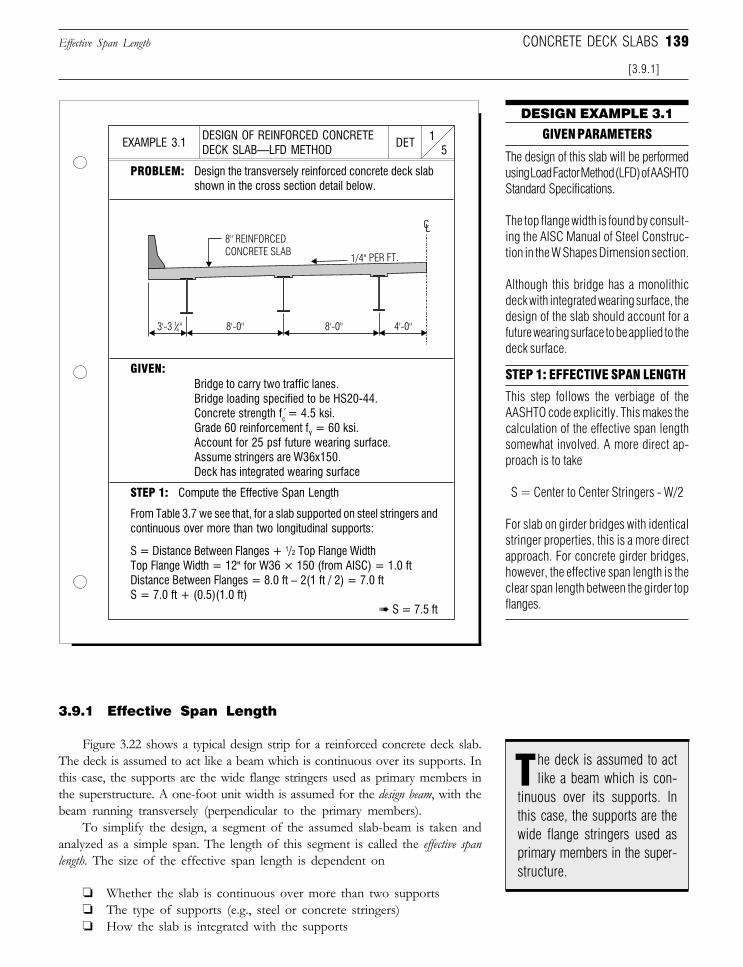
139
3.9.1 Effective Span Length
Figure 3.22 shows a typical design strip for a reinforced concrete deck slab.The deck is assumed to act like a beam which is continuous over its supports. Inthis case, the supports are the wide flange stringers used as primary members inthe superstructure. A one-foot unit width is assumed for the design beam, with thebeam running transversely (perpendicular to the primary members).
To simplify the design, a segment of the assumed slab-beam is taken andanalyzed as a simple span. The length of this segment is called the effective spanlength. The size of the effective span length is dependent on
❏ Whether the slab is continuous over more than two supports❏ The type of supports (e.g., steel or concrete stringers)❏ How the slab is integrated with the supports
Effective Span Length
[3.9.1]
CONCRETE DECK SLABS
DESIGN EXAMPLE 3.1
GIVEN PARAMETERS
The design of this slab will be performedusing Load Factor Method (LFD) of AASHTOStandard Specifications.
The top flange width is found by consult-ing the AISC Manual of Steel Construc-tion in the W Shapes Dimension section.
Although this bridge has a monolithicdeck with integrated wearing surface, thedesign of the slab should account for afuture wearing surface to be applied to thedeck surface.
STEP 1: EFFECTIVE SPAN LENGTH
This step follows the verbiage of theAASHTO code explicitly. This makes thecalculation of the effective span lengthsomewhat involved. A more direct ap-proach is to take
S = Center to Center Stringers - W/2
For slab on girder bridges with identicalstringer properties, this is a more directapproach. For concrete girder bridges,however, the effective span length is theclear span length between the girder topflanges.
DESIGN OF REINFORCED CONCRETEDECK SLAB—LFD METHOD 5
1DETEXAMPLE 3.1
PROBLEM: Design the transversely reinforced concrete deck slabshown in the cross section detail below.
GIVEN:Bridge to carry two traffic lanes.Bridge loading specified to be HS20-44.Concrete strength fc = 4.5 ksi.Grade 60 reinforcement fY = 60 ksi.Account for 25 psf future wearing surface.Assume stringers are W36x150.Deck has integrated wearing surface
STEP 1: Compute the Effective Span Length
S = Distance Between Flanges + 1/2 Top Flange WidthTop Flange Width = 12" for W36 × 150 (from AISC) = 1.0 ftDistance Between Flanges = 8.0 ft − 2(1 ft / 2) = 7.0 ftS = 7.0 ft + (0.5)(1.0 ft)
➠ S = 7.5 ft
From Table 3.7 we see that, for a slab supported on steel stringers andcontinuous over more than two longitudinal supports:
8" REINFORCED
CONCRETE SLAB1/4" PER FT.
3'-3 " 8'-0" 8'-0" 4'-0"
he deck is assumed to actlike a beam which is con-
tinuous over its supports. Inthis case, the supports are thewide flange stringers used asprimary members in the super-structure.
T
Downloaded from Digital Engineering Library @ McGraw-Hill (www.digitalengineeringlibrary.com)Copyright © 2006 The McGraw-Hill Companies. All rights reserved.
Any use is subject to the Terms of Use as given at the website.
Design of Superstructure Elements
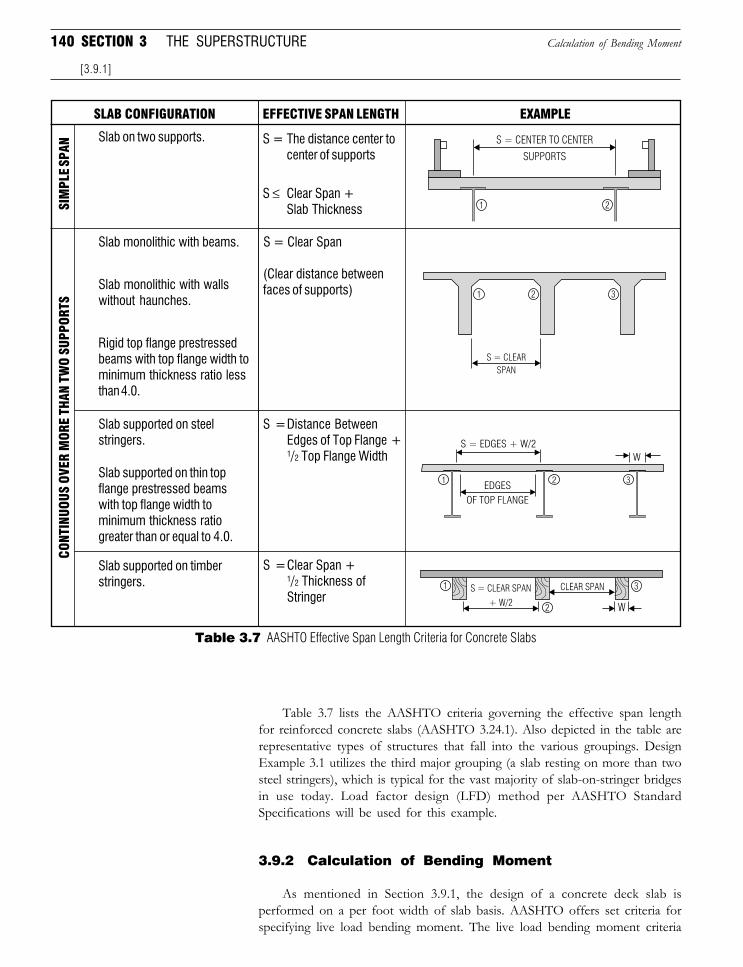
140 SECTION 3 THE SUPERSTRUCTURE
Table 3.7 lists the AASHTO criteria governing the effective span lengthfor reinforced concrete slabs (AASHTO 3.24.1). Also depicted in the table arerepresentative types of structures that fall into the various groupings. DesignExample 3.1 utilizes the third major grouping (a slab resting on more than twosteel stringers), which is typical for the vast majority of slab-on-stringer bridgesin use today. Load factor design (LFD) method per AASHTO StandardSpecifications will be used for this example.
3.9.2 Calculation of Bending Moment
As mentioned in Section 3.9.1, the design of a concrete deck slab isperformed on a per foot width of slab basis. AASHTO offers set criteria forspecifying live load bending moment. The live load bending moment criteria
Calculation of Bending Moment
[3.9.1]SI
MPL
E SP
AN
Slab on two supports.
SLAB CONFIGURATION EFFECTIVE SPAN LENGTH EXAMPLE
Slab monolithic with beams. S = Clear Span
(Clear distance betweenfaces of supports)
Slab supported on steelstringers.
S =Distance BetweenEdges of Top Flange +1/2 Top Flange Width
Slab supported on timberstringers.
S =Clear Span +1/2 Thickness ofStringer
Table 3.7 AASHTO Effective Span Length Criteria for Concrete Slabs
CONT
INUO
US O
VER
MOR
E TH
AN T
WO
SUPP
ORTS
S = The distance center tocenter of supports
Rigid top flange prestressedbeams with top flange width tominimum thickness ratio lessthan 4.0.
Slab monolithic with wallswithout haunches.
Slab supported on thin topflange prestressed beamswith top flange width tominimum thickness ratiogreater than or equal to 4.0.
S ≤ Clear Span +Slab Thickness
S = CENTER TO CENTER
SUPPORTS
1 2
S = CLEAR
SPAN
1 2 3
1 2 3
S = EDGES + W/2
EDGES
OF TOP FLANGE
W
1
2
3S = CLEAR SPAN
+ W/2
CLEAR SPAN
W
Downloaded from Digital Engineering Library @ McGraw-Hill (www.digitalengineeringlibrary.com)Copyright © 2006 The McGraw-Hill Companies. All rights reserved.
Any use is subject to the Terms of Use as given at the website.
Design of Superstructure Elements
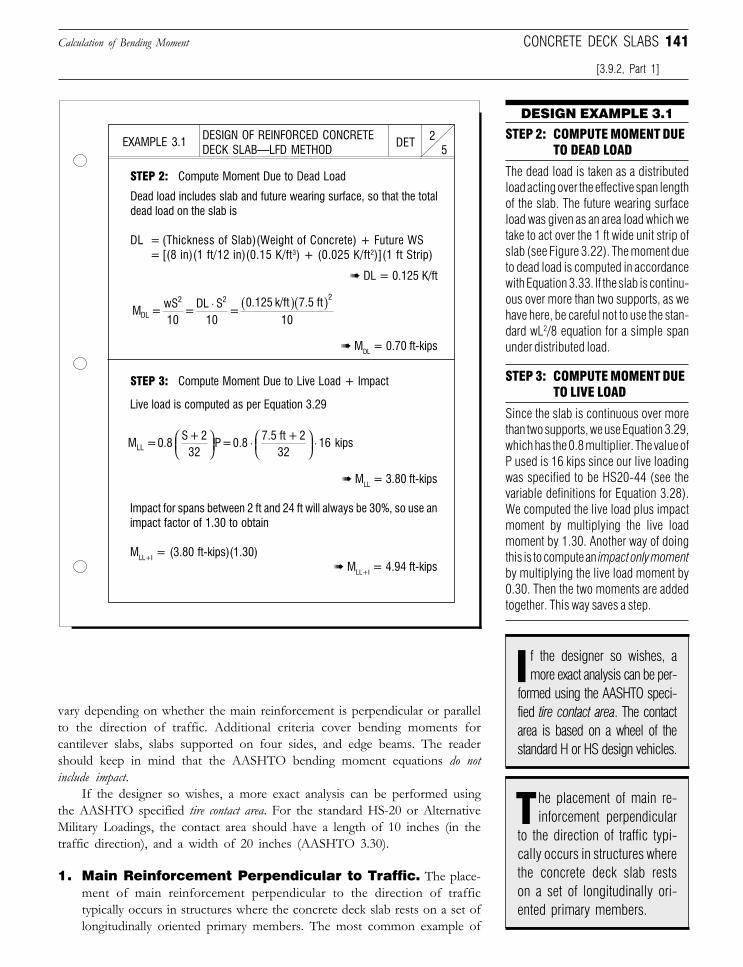
141Calculation of Bending Moment CONCRETE DECK SLABS
[3.9.2, Part 1]
vary depending on whether the main reinforcement is perpendicular or parallelto the direction of traffic. Additional criteria cover bending moments forcantilever slabs, slabs supported on four sides, and edge beams. The readershould keep in mind that the AASHTO bending moment equations do notinclude impact.
If the designer so wishes, a more exact analysis can be performed usingthe AASHTO specified tire contact area. For the standard HS-20 or AlternativeMilitary Loadings, the contact area should have a length of 10 inches (in thetraffic direction), and a width of 20 inches (AASHTO 3.30).
1. Main Reinforcement Perpendicular to Traffic. The place-ment of main reinforcement perpendicular to the direction of traffictypically occurs in structures where the concrete deck slab rests on a set oflongitudinally oriented primary members. The most common example of
DESIGN OF REINFORCED CONCRETEDECK SLAB—LFD METHOD 5
2DETEXAMPLE 3.1
DESIGN EXAMPLE 3.1
STEP 2: COMPUTE MOMENT DUETO DEAD LOAD
STEP 2: Compute Moment Due to Dead Load
Dead load includes slab and future wearing surface, so that the totaldead load on the slab is
DL = (Thickness of Slab)(Weight of Concrete) + Future WS= [(8 in)(1 ft/12 in)(0.15 K/ft3) + (0.025 K/ft2)](1 ft Strip)
The dead load is taken as a distributedload acting over the effective span lengthof the slab. The future wearing surfaceload was given as an area load which wetake to act over the 1 ft wide unit strip ofslab (see Figure 3.22). The moment dueto dead load is computed in accordancewith Equation 3.33. If the slab is continu-ous over more than two supports, as wehave here, be careful not to use the stan-dard wL2/8 equation for a simple spanunder distributed load.
STEP 3: Compute Moment Due to Live Load + Impact
Live load is computed as per Equation 3.29
➠ MLL = 3.80 ft-kips
Impact for spans between 2 ft and 24 ft will always be 30%, so use animpact factor of 1.30 to obtain
MLL+I = (3.80 ft-kips)(1.30)➠ MLL+I = 4.94 ft-kips
STEP 3: COMPUTE MOMENT DUETO LIVE LOAD
Since the slab is continuous over morethan two supports, we use Equation 3.29,which has the 0.8 multiplier. The value ofP used is 16 kips since our live loadingwas specified to be HS20-44 (see thevariable definitions for Equation 3.28).We computed the live load plus impactmoment by multiplying the live loadmoment by 1.30. Another way of doingthis is to compute an impact only momentby multiplying the live load moment by0.30. Then the two moments are addedtogether. This way saves a step.
➠ DL = 0.125 K/ft
➠ MDL = 0.70 ft-kips
he placement of main re-inforcement perpendicular
to the direction of traffic typi-cally occurs in structures wherethe concrete deck slab restson a set of longitudinally ori-ented primary members.
T
f the designer so wishes, amore exact analysis can be per-
formed using the AASHTO speci-fied tire contact area. The contactarea is based on a wheel of thestandard H or HS design vehicles.
I
M = 0.8S+ 2
32P = 0.8
7.5 ft + 232
16 kipsLL
⋅
⋅
M = wS10
= DL S
10 =
0.125 k/ft 7.5 ft10DL
2 2 2⋅ ( )( )
Downloaded from Digital Engineering Library @ McGraw-Hill (www.digitalengineeringlibrary.com)Copyright © 2006 The McGraw-Hill Companies. All rights reserved.
Any use is subject to the Terms of Use as given at the website.
Design of Superstructure Elements
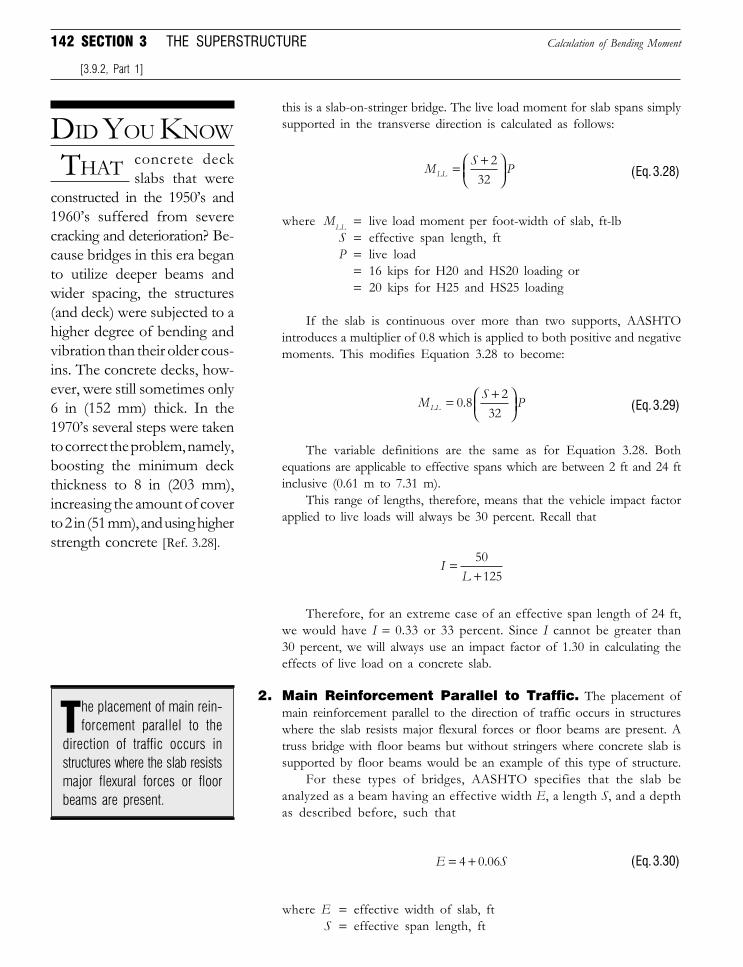
142 SECTION 3 THE SUPERSTRUCTURE
this is a slab-on-stringer bridge. The live load moment for slab spans simplysupported in the transverse direction is calculated as follows:
M S PLL = +
232 (Eq. 3.28)
where MLL = live load moment per foot-width of slab, ft-lbS = effective span length, ftP = live load
= 16 kips for H20 and HS20 loading or= 20 kips for H25 and HS25 loading
If the slab is continuous over more than two supports, AASHTOintroduces a multiplier of 0.8 which is applied to both positive and negativemoments. This modifies Equation 3.28 to become:
M S PLL = +
0 8 232
. (Eq. 3.29)
The variable definitions are the same as for Equation 3.28. Bothequations are applicable to effective spans which are between 2 ft and 24 ftinclusive (0.61 m to 7.31 m).
This range of lengths, therefore, means that the vehicle impact factorapplied to live loads will always be 30 percent. Recall that
IL
=+50
125
Therefore, for an extreme case of an effective span length of 24 ft,we would have I = 0.33 or 33 percent. Since I cannot be greater than30 percent, we will always use an impact factor of 1.30 in calculating theeffects of live load on a concrete slab.
2. Main Reinforcement Parallel to Traffic. The placement ofmain reinforcement parallel to the direction of traffic occurs in structureswhere the slab resists major flexural forces or floor beams are present. Atruss bridge with floor beams but without stringers where concrete slab issupported by floor beams would be an example of this type of structure.
For these types of bridges, AASHTO specifies that the slab beanalyzed as a beam having an effective width E, a length S, and a depthas described before, such that
E S= +4 0 06. (Eq. 3.30)
where E = effective width of slab, ftS = effective span length, ft
Calculation of Bending Moment
[3.9.2, Part 1]
DID YOU KNOW
THAT concrete deckslabs that were
constructed in the 1950’s and1960’s suffered from severecracking and deterioration? Be-cause bridges in this era beganto utilize deeper beams andwider spacing, the structures(and deck) were subjected to ahigher degree of bending andvibration than their older cous-ins. The concrete decks, how-ever, were still sometimes only6 in (152 mm) thick. In the1970’s several steps were takento correct the problem, namely,boosting the minimum deckthickness to 8 in (203 mm),increasing the amount of coverto 2 in (51 mm), and using higherstrength concrete [Ref. 3.28].
he placement of main rein-forcement parallel to the
direction of traffic occurs instructures where the slab resistsmajor flexural forces or floorbeams are present.
T
Downloaded from Digital Engineering Library @ McGraw-Hill (www.digitalengineeringlibrary.com)Copyright © 2006 The McGraw-Hill Companies. All rights reserved.
Any use is subject to the Terms of Use as given at the website.
Design of Superstructure Elements
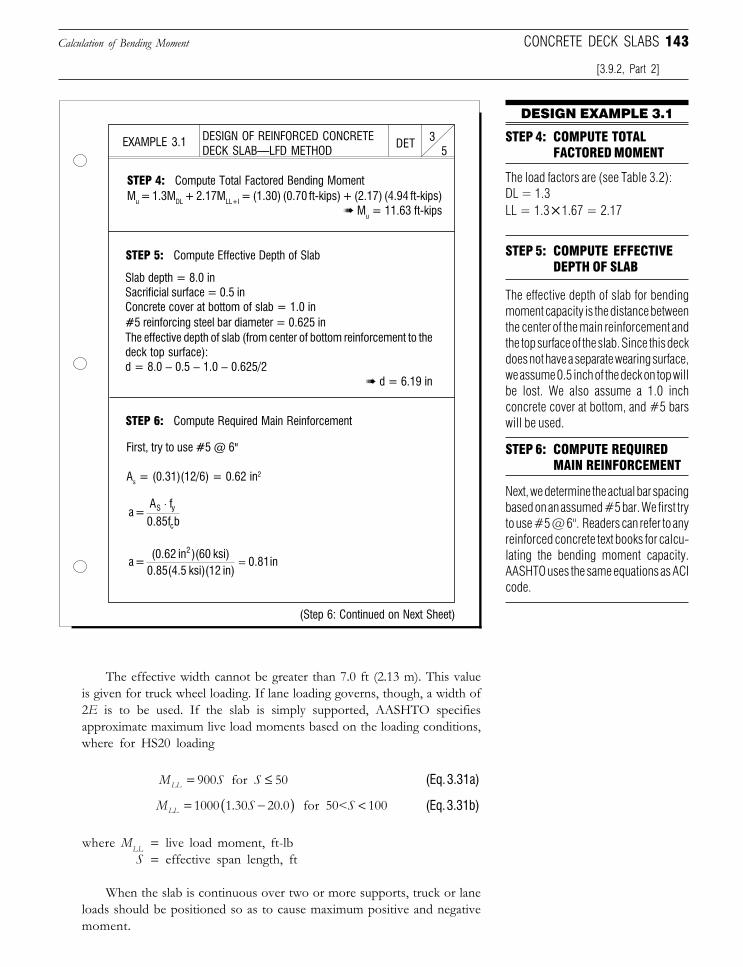
143
The effective width cannot be greater than 7.0 ft (2.13 m). This valueis given for truck wheel loading. If lane loading governs, though, a width of2E is to be used. If the slab is simply supported, AASHTO specifiesapproximate maximum live load moments based on the loading conditions,where for HS20 loading
M S SLL = ≤900 50 for (Eq. 3.31a)
M S SLL = −( ) <1000 1 30 20 0 100. . for 50< (Eq. 3.31b)
where MLL = live load moment, ft-lbS = effective span length, ft
When the slab is continuous over two or more supports, truck or laneloads should be positioned so as to cause maximum positive and negativemoment.
Calculation of Bending Moment
[3.9.2, Part 2]
CONCRETE DECK SLABS
DESIGN EXAMPLE 3.1
STEP 5: COMPUTE EFFECTIVEDEPTH OF SLAB
The effective depth of slab for bendingmoment capacity is the distance betweenthe center of the main reinforcement andthe top surface of the slab. Since this deckdoes not have a separate wearing surface,we assume 0.5 inch of the deck on top willbe lost. We also assume a 1.0 inchconcrete cover at bottom, and #5 barswill be used.
STEP 4: COMPUTE TOTALFACTORED MOMENT
The load factors are (see Table 3.2):DL = 1.3LL = 1.3×1.67 = 2.17
STEP 6: COMPUTE REQUIREDMAIN REINFORCEMENT
Next, we determine the actual bar spacingbased on an assumed #5 bar. We first tryto use #5 @ 6". Readers can refer to anyreinforced concrete text books for calcu-lating the bending moment capacity.AASHTO uses the same equations as ACIcode.
DESIGN OF REINFORCED CONCRETEDECK SLAB—LFD METHOD 5
3DETEXAMPLE 3.1
STEP 5: Compute Effective Depth of Slab
Slab depth = 8.0 inSacrificial surface = 0.5 inConcrete cover at bottom of slab = 1.0 in#5 reinforcing steel bar diameter = 0.625 inThe effective depth of slab (from center of bottom reinforcement to thedeck top surface):d = 8.0 − 0.5 − 1.0 − 0.625/2
➠ d = 6.19 in
STEP 4: Compute Total Factored Bending MomentMu = 1.3MDL + 2.17MLL+I = (1.30) (0.70 ft-kips) + (2.17) (4.94 ft-kips)
➠ Mu = 11.63 ft-kips
STEP 6: Compute Required Main Reinforcement
First, try to use #5 @ 6"
As = (0.31)(12/6) = 0.62 in2
a = A f0.85f b
S y
c
⋅
a = (0.62 in )(60 ksi)
0.85(4.5 ksi)(12 in)0.81in
2
=
(Step 6: Continued on Next Sheet)
Downloaded from Digital Engineering Library @ McGraw-Hill (www.digitalengineeringlibrary.com)Copyright © 2006 The McGraw-Hill Companies. All rights reserved.
Any use is subject to the Terms of Use as given at the website.
Design of Superstructure Elements
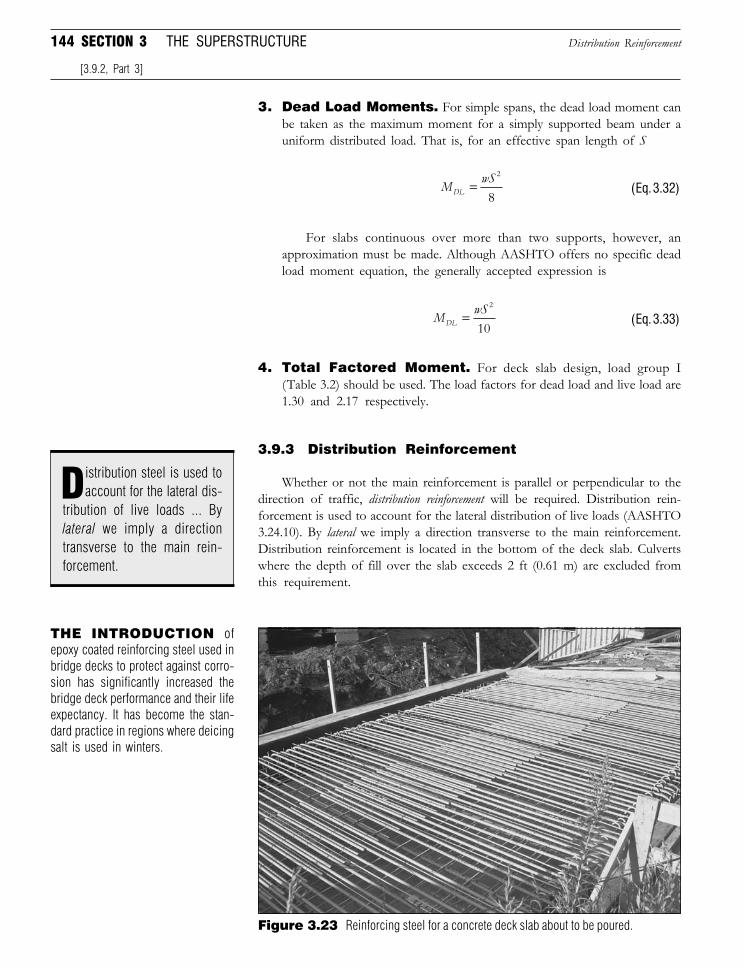
144 SECTION 3 THE SUPERSTRUCTURE
3. Dead Load Moments. For simple spans, the dead load moment canbe taken as the maximum moment for a simply supported beam under auniform distributed load. That is, for an effective span length of S
M wSDL =
2
8(Eq. 3.32)
For slabs continuous over more than two supports, however, anapproximation must be made. Although AASHTO offers no specific deadload moment equation, the generally accepted expression is
M wSDL =
2
10(Eq. 3.33)
4. Total Factored Moment. For deck slab design, load group I(Table 3.2) should be used. The load factors for dead load and live load are1.30 and 2.17 respectively.
3.9.3 Distribution Reinforcement
Whether or not the main reinforcement is parallel or perpendicular to thedirection of traffic, distribution reinforcement will be required. Distribution rein-forcement is used to account for the lateral distribution of live loads (AASHTO3.24.10). By lateral we imply a direction transverse to the main reinforcement.Distribution reinforcement is located in the bottom of the deck slab. Culvertswhere the depth of fill over the slab exceeds 2 ft (0.61 m) are excluded fromthis requirement.
Distribution Reinforcement
[3.9.2, Part 3]
THE INTRODUCTION ofepoxy coated reinforcing steel used inbridge decks to protect against corro-sion has significantly increased thebridge deck performance and their lifeexpectancy. It has become the stan-dard practice in regions where deicingsalt is used in winters.
Figure 3.23 Reinforcing steel for a concrete deck slab about to be poured.
istribution steel is used toaccount for the lateral dis-
tribution of live loads ... Bylateral we imply a directiontransverse to the main rein-forcement.
D
Downloaded from Digital Engineering Library @ McGraw-Hill (www.digitalengineeringlibrary.com)Copyright © 2006 The McGraw-Hill Companies. All rights reserved.
Any use is subject to the Terms of Use as given at the website.
Design of Superstructure Elements
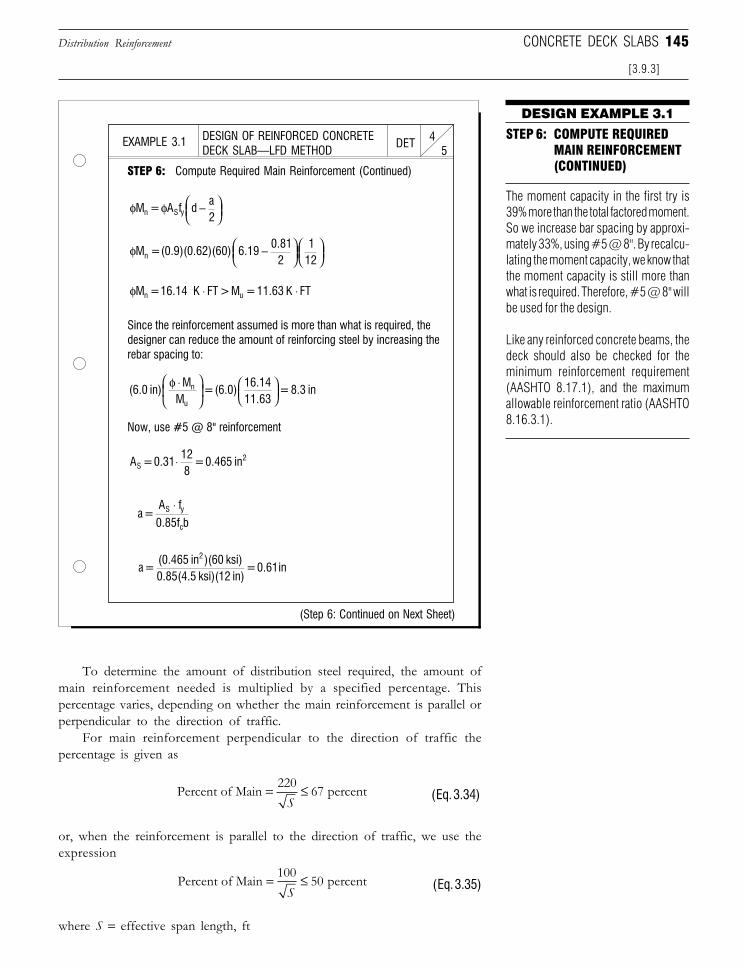
145
To determine the amount of distribution steel required, the amount ofmain reinforcement needed is multiplied by a specified percentage. Thispercentage varies, depending on whether the main reinforcement is parallel orperpendicular to the direction of traffic.
For main reinforcement perpendicular to the direction of traffic thepercentage is given as
Percent of Main percent= ≤220 67S (Eq. 3.34)
or, when the reinforcement is parallel to the direction of traffic, we use theexpression
Percent of Main percent= ≤100 50S (Eq. 3.35)
where S = effective span length, ft
Distribution Reinforcement
[3.9.3]
CONCRETE DECK SLABS
DESIGN EXAMPLE 3.1
STEP 6: COMPUTE REQUIREDMAIN REINFORCEMENT(CONTINUED)
The moment capacity in the first try is39% more than the total factored moment.So we increase bar spacing by approxi-mately 33%, using #5 @ 8". By recalcu-lating the moment capacity, we know thatthe moment capacity is still more thanwhat is required. Therefore, #5 @ 8" willbe used for the design.
Like any reinforced concrete beams, thedeck should also be checked for theminimum reinforcement requirement(AASHTO 8.17.1), and the maximumallowable reinforcement ratio (AASHTO8.16.3.1).
DESIGN OF REINFORCED CONCRETEDECK SLAB—LFD METHOD 5
4DETEXAMPLE 3.1
STEP 6: Compute Required Main Reinforcement (Continued)
φ φM = A f d a2n S y −
φM = (0.9)(0.62)(60) 6.19 0.81
21
12n −
φM = 16.14 K FT >M =11.63 K FTn u⋅ ⋅
Since the reinforcement assumed is more than what is required, thedesigner can reduce the amount of reinforcing steel by increasing therebar spacing to:
(6.0 in)M
M=(6.0)
16.1411.63
=8.3 inn
u
φ ⋅
Now, use #5 @ 8" reinforcement
A = 0.31128
= 0.465 inS2⋅
a = A f0.85f b
S y
c
⋅
a = (0.465 in )(60 ksi)0.85(4.5 ksi)(12 in)
= 0.61in2
(Step 6: Continued on Next Sheet)
Downloaded from Digital Engineering Library @ McGraw-Hill (www.digitalengineeringlibrary.com)Copyright © 2006 The McGraw-Hill Companies. All rights reserved.
Any use is subject to the Terms of Use as given at the website.
Design of Superstructure Elements
146 SECTION 3 THE SUPERSTRUCTURE
The limiting values of 67 percent and 50 percent specified in Equations 3.34and 3.35, respectively, are maximum, not to exceed limits. The reason forlocating the distribution steel at the bottom of the deck slab is that momentstransverse to the main reinforcement cause tension which will be evidencedin the lower portion of the slab. If the main reinforcement is laid perpendicu-lar to traffic, the distribution steel is to be placed on the middle half of thespan, between stringers. Also, no less than 50 percent of the amount used in themiddle is to be placed in the outer quarters of the span (AASHTO3.24.10.3).
3.9.4 Minimum Slab Thickness
As mentioned in the last Did You Know? sidebar, the thickness of aconcrete deck slab has a major impact on the overall longevity of the slab. Thecontrol of superstructure deflections is also affected by slab thickness. Towardthis end, AASHTO has specified criteria which define the minimum thicknessof reinforced concrete deck slabs for both simple spans and slabs continuousover more than two supports.
The minimum thickness in AASHTO Standard Specifications are definedfor concrete flexural members so that they are provided with adequatestiffness to resist excessive deflections. For reinforced concrete slabs, thismeans a deck slab whose main reinforcement is parallel to the direction of traffic. Forslabs which are simply supported, the minimum depth of slab (ft) is given as
tS
min
.=
+( )1 2 1030
(Eq. 3.36)
or, when the slab is continuous over more than two supports, the minimum slabthickness is defined as
tS
min =+( )
≥10
30 0.542 (Eq. 3.37)
where S = effective span length (feet).
AASHTO allows an adjustment to be made for variable depth members(e.g., a haunched slab) to account for changes in stiffness at positive andnegative moment regions (AASHTO 8.9).
In AASHTO LRFD Specifications, the minimum depth of a concrete deckis 7.0 inch (178 mm), in addition to surface grooving and sacrificial surface.
3.9.5 Railing Loads
The portion of slab which resists loads induced by railing posts variesdepending on whether a parapet is present or not (AASHTO 3.24.5.2). When
Minimum Slab Thickness
[3.9.3]
Downloaded from Digital Engineering Library @ McGraw-Hill (www.digitalengineeringlibrary.com)Copyright © 2006 The McGraw-Hill Companies. All rights reserved.
Any use is subject to the Terms of Use as given at the website.
Design of Superstructure Elements

147
a parapet is not present, the effective length of slab resisting the post loads isgiven as
E X= +0 8 3 75. . (Eq. 3.38)
or, when a parapet is provided, the effective length of slab is defined by thefollowing:
E X= +0 8 5 0. . (Eq. 3.39)
where E = effective length of slab resisting railing load, ft X = distance from center of a post to point of analysis, ft
Railing Loads
[3.9.5]
CONCRETE DECK SLABS
STEP 7: DISTRIBUTION STEEL INBOTTOM OF SLAB
Distribution steel is computed in ac-cordance with Equation 3.34. Sincethe value cannot be greater than 67percent, we use this percentage to ob-tain the 0.31 in2/ft required distributionsteel. #5 bars at a 12 in spacing gives0.31 in2/ft.
In a real design, the maximum rein-forcement and minimum reinforcementshould also be check. See AASHTO8.16.3.1 and 8.17.1 for details.
DESIGN EXAMPLE 3.1
STEP 6: Compute Required Main Reinforcement (Continued)
φ φM = A f d a2n S y −
φM = (0.9)(0.465)(60) 6.19 0.61
21
12n −
φMn=12.31 K . FT > Mu=11.63 K.FT
Note that the same reinforcement should be used for both top andbottom of the slab.
DESIGN OF REINFORCED CONCRETEDECK SLAB—LFD METHOD 5
5DETEXAMPLE 3.1
#5 Bars @ 12 in Spacing
STEP 7: Compute Distribution Steel in Bottom of Slab
Distribution Steel = (As)(67%) = (0.465 in2/ft)(0.67) = 0.31 in2/ft
✔
✔
D = 220
S =
2207.5 ft
= 80% > 67% so use 67%
Downloaded from Digital Engineering Library @ McGraw-Hill (www.digitalengineeringlibrary.com)Copyright © 2006 The McGraw-Hill Companies. All rights reserved.
Any use is subject to the Terms of Use as given at the website.
Design of Superstructure Elements
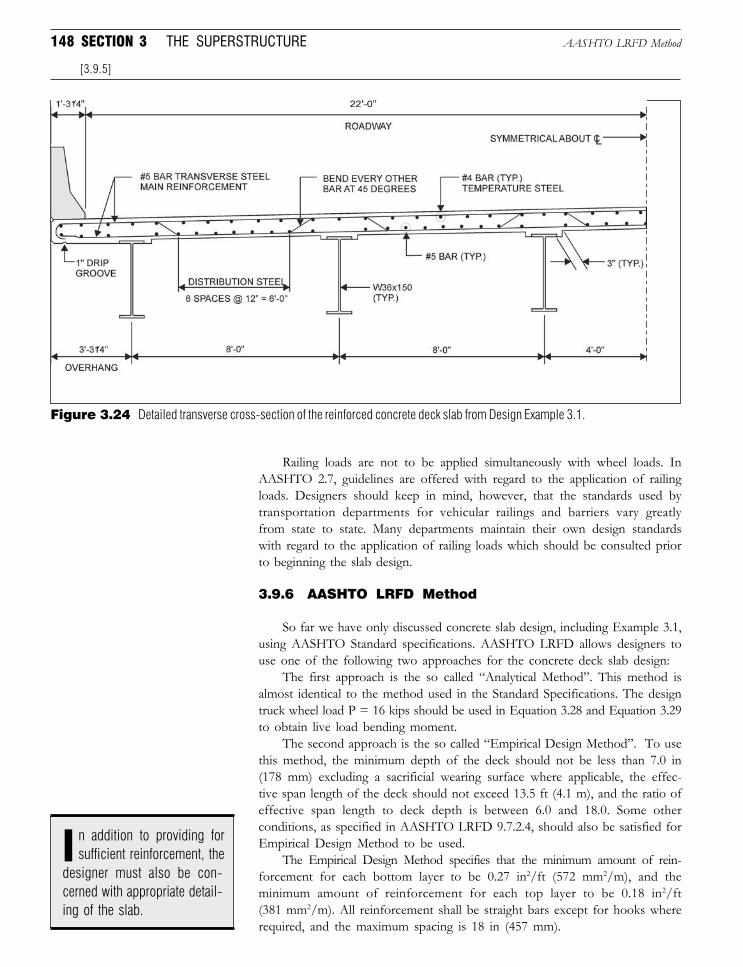
148 SECTION 3 THE SUPERSTRUCTURE
Railing loads are not to be applied simultaneously with wheel loads. InAASHTO 2.7, guidelines are offered with regard to the application of railingloads. Designers should keep in mind, however, that the standards used bytransportation departments for vehicular railings and barriers vary greatlyfrom state to state. Many departments maintain their own design standardswith regard to the application of railing loads which should be consulted priorto beginning the slab design.
3.9.6 AASHTO LRFD Method
So far we have only discussed concrete slab design, including Example 3.1,using AASHTO Standard specifications. AASHTO LRFD allows designers touse one of the following two approaches for the concrete deck slab design:
The first approach is the so called “Analytical Method”. This method isalmost identical to the method used in the Standard Specifications. The designtruck wheel load P = 16 kips should be used in Equation 3.28 and Equation 3.29to obtain live load bending moment.
The second approach is the so called “Empirical Design Method”. To usethis method, the minimum depth of the deck should not be less than 7.0 in(178 mm) excluding a sacrificial wearing surface where applicable, the effec-tive span length of the deck should not exceed 13.5 ft (4.1 m), and the ratio ofeffective span length to deck depth is between 6.0 and 18.0. Some otherconditions, as specified in AASHTO LRFD 9.7.2.4, should also be satisfied forEmpirical Design Method to be used.
The Empirical Design Method specifies that the minimum amount of rein-forcement for each bottom layer to be 0.27 in2/ft (572 mm2/m), and theminimum amount of reinforcement for each top layer to be 0.18 in2/ft(381 mm2/m). All reinforcement shall be straight bars except for hooks whererequired, and the maximum spacing is 18 in (457 mm).
AASHTO LRFD Method
[3.9.5]
Figure 3.24 Detailed transverse cross-section of the reinforced concrete deck slab from Design Example 3.1.
n addition to providing forsufficient reinforcement, the
designer must also be con-cerned with appropriate detail-ing of the slab.
I
Downloaded from Digital Engineering Library @ McGraw-Hill (www.digitalengineeringlibrary.com)Copyright © 2006 The McGraw-Hill Companies. All rights reserved.
Any use is subject to the Terms of Use as given at the website.
Design of Superstructure Elements
149
In Example 3.1, if we use the LRFD Empirical Design Method, we mayuse #5 @ 12" in both directions at the bottom slab (0.31 in2/ft, or 656 mm2/m),and use #5 @ 18" in both directions at the top slab (0.21 in2/ft, or 445 mm2/m).Note that the deck meets all conditions for the Empirical Design method. Thereinforcement in the upper layer and the bottom layer shall be placedperpendicular to the slab supports such as stringers.
3.9.7 Slab Reinforcement Details
In addition to providing for sufficient reinforcement, the designer mustalso be concerned with appropriate detailing of the slab. Some of the majordetailing concerns include, but are not limited to, the following:
❏ Minimum cover❏ Length of bars❏ Spacing between parallel bars❏ Splicing of bars
Rules governing the above often vary depending on the owner’s prefer-ences and standards. Listed in the accompanying sidebar are some of thestandards utilized by the New York State Department of Transportation in thedesign of concrete deck slabs.
3.9.8 Construction, Rehabilitation, and Maintenance
Too often, the subjects of rehabilitation and maintenance are divorcedfrom the design process, and are treated either ancillary or unrelated to eachother. Many a noble word has been spoken about the cause of an integrateddesign-maintain-rehab approach. The theory, however, rarely meets the prac-tice. As we have discussed previously, concrete deck slabs continually sustainsome of the harshest abuse of any bridge element. The increase in truckingloads, use of lighter, more flexible designs, and various environmental impactsall combine to make concrete decks highly susceptible to deterioration.
Related to rehabilitation and maintenance are issues concerning theconstruction details of a bridge. The design of a highway bridge should focusnot only on the ability of the structure to resist design loads but also on itsability to function over a long period of time with minimal maintenance andrepair operations.
There are a variety of construction, rehabilitation, and maintenancemethods employed to increase the useful service lives of concrete bridgedecks. Some methods can be employed at the initial construction of the deckwhile others represent remedial measures taken after deterioration has set in.The following details some of the more common methods of extending theservice life of concrete bridge decks.
1. Increased Slab Thickness and Cover. A simple step inprotecting bridge decks has already been touched on in one of this section’ssidebars: increased slab thickness and cover for reinforcement. Especiallywhen no wearing surface is present, sufficient cover is essential to protectingthe deck from excessive wear. New York State requires 2.5 in (64 mm) of
Construction, Rehabilitation, and Maintenance
[3.9.8, Part 1]
CONCRETE DECK SLABS
SLAB DETAILING
The following are slab reinforcing steeldetailing requirements used by the NewYork State DOT [Ref. 3.11].
MINIMUM COVER
BAR LENGTHS
The maximum length for reinforcing steelis 60 ft (18.29 m) since this is the longestlength which most reinforcing steel plantsin the United States produce bars.
The cover requirement for slabs with anintegrated wearing surface is based onepoxy-coated bars being used in thetop mat.Top of Slabw/Separate Wearing Surface 11/2 inw/Integrated Wearing Surface 21/2 inBottom of Slab 1 in
SPLICING OF REBARS
SPACING OF REBARS
The clear distance D between parallel barsis defined by the following criteria:
D < 24 in (0.61 m)D > 1.5 × Nominal Diameter of BarsD > 1.5 × Max Size of Coarse AggregateD > 1.5 in (38 mm)
Transverse bars under 60 ft long should becomposed of a straight bar with a hook oneach end (or as required) which is splicedhalfway between the exterior and first inte-rior stringer. If the length of a reinforcing barexceeds 60 ft, then the requirement aboveis supplemented with an additional, stag-gered splice required in the straight barhalfway between interior stringers.
any a noble word has beenspoken about the cause of
an integrated design-maintain-rehab approach. The theory, how-ever, rarely meets the practice.
M
Downloaded from Digital Engineering Library @ McGraw-Hill (www.digitalengineeringlibrary.com)Copyright © 2006 The McGraw-Hill Companies. All rights reserved.
Any use is subject to the Terms of Use as given at the website.
Design of Superstructure Elements
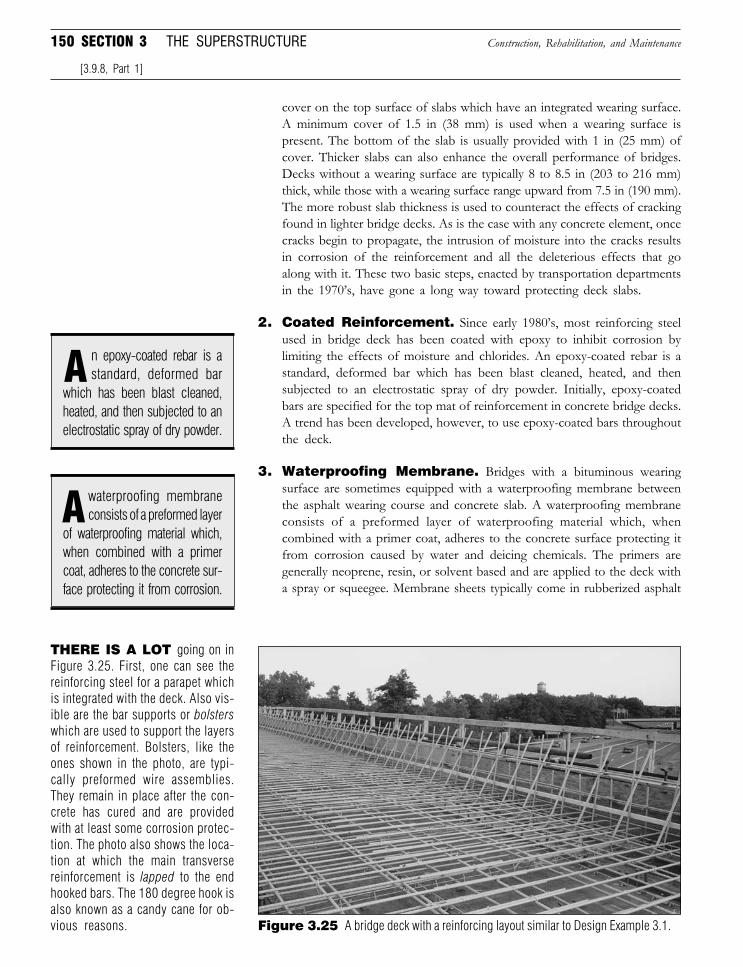
150 SECTION 3 THE SUPERSTRUCTURE
cover on the top surface of slabs which have an integrated wearing surface.A minimum cover of 1.5 in (38 mm) is used when a wearing surface ispresent. The bottom of the slab is usually provided with 1 in (25 mm) ofcover. Thicker slabs can also enhance the overall performance of bridges.Decks without a wearing surface are typically 8 to 8.5 in (203 to 216 mm)thick, while those with a wearing surface range upward from 7.5 in (190 mm).The more robust slab thickness is used to counteract the effects of crackingfound in lighter bridge decks. As is the case with any concrete element, oncecracks begin to propagate, the intrusion of moisture into the cracks resultsin corrosion of the reinforcement and all the deleterious effects that goalong with it. These two basic steps, enacted by transportation departmentsin the 1970’s, have gone a long way toward protecting deck slabs.
2. Coated Reinforcement. Since early 1980’s, most reinforcing steelused in bridge deck has been coated with epoxy to inhibit corrosion bylimiting the effects of moisture and chlorides. An epoxy-coated rebar is astandard, deformed bar which has been blast cleaned, heated, and thensubjected to an electrostatic spray of dry powder. Initially, epoxy-coatedbars are specified for the top mat of reinforcement in concrete bridge decks.A trend has been developed, however, to use epoxy-coated bars throughoutthe deck.
3. Waterproofing Membrane. Bridges with a bituminous wearingsurface are sometimes equipped with a waterproofing membrane betweenthe asphalt wearing course and concrete slab. A waterproofing membraneconsists of a preformed layer of waterproofing material which, whencombined with a primer coat, adheres to the concrete surface protecting itfrom corrosion caused by water and deicing chemicals. The primers aregenerally neoprene, resin, or solvent based and are applied to the deck witha spray or squeegee. Membrane sheets typically come in rubberized asphalt
Construction, Rehabilitation, and Maintenance
[3.9.8, Part 1]
THERE IS A LOT going on inFigure 3.25. First, one can see thereinforcing steel for a parapet whichis integrated with the deck. Also vis-ible are the bar supports or bolsterswhich are used to support the layersof reinforcement. Bolsters, like theones shown in the photo, are typi-cally preformed wire assemblies.They remain in place after the con-crete has cured and are providedwith at least some corrosion protec-tion. The photo also shows the loca-tion at which the main transversereinforcement is lapped to the endhooked bars. The 180 degree hook isalso known as a candy cane for ob-vious reasons. Figure 3.25 A bridge deck with a reinforcing layout similar to Design Example 3.1.
waterproofing membraneconsists of a preformed layer
of waterproofing material which,when combined with a primercoat, adheres to the concrete sur-face protecting it from corrosion.
A
n epoxy-coated rebar is astandard, deformed bar
which has been blast cleaned,heated, and then subjected to anelectrostatic spray of dry powder.
A
Downloaded from Digital Engineering Library @ McGraw-Hill (www.digitalengineeringlibrary.com)Copyright © 2006 The McGraw-Hill Companies. All rights reserved.
Any use is subject to the Terms of Use as given at the website.
Design of Superstructure Elements
151
or modified bitumen sheets, which are placed like shingles (i.e., lapped) inthe direction in which the water drains [Ref. 3.3]. After the waterproofinghas been affixed to the top of the slab, the wearing course is placed on topof it. Earlier waterproofing membranes were composed of a bituminousmaterial and a fiberglass cloth which acts as reinforcement. Other typesincluded an epoxy resin system used in conjunction with a deck wearingcourse.
There are, however, some limitations and disadvantages to water-proofing membranes, which cause some agencies to shy away from them.Since slippage at the wearing surface–membrane-slab interface is apotential problem, waterproofing membranes cannot be installed onbridges with a vertical grade greater than 4 percent [Ref. 3.29]. From aninspection standpoint, waterproofing membranes, like stay-in-place formsunderneath a slab, can hide deterioration to the slab taking placeunderneath the membrane layer (see Section 2.3.4, Part 1). Most agenciesuse waterproofing membrane in conjunction with epoxy coated reinforce-ment to provide better corrosion protection. This should illustrate to thereader, the extreme importance owners place on the integrity and qualityof the structure’s deck.
4. Drainage. Inadequate drainage facilities can severely limit the life spanof a concrete deck. We touched on some of the major features of a deckdrainage system in Section 2.3.5, Part 2. Some of the principal methods fordraining runoff from the bridge deck are as follows:
❏ Deck swales❏ Weep tubes❏ Scuppers❏ Catch basins❏ Drop inlets
A deck swale is a V-shaped channel formed by opposing cross-slopesin the deck cross section; essentially acting as a large gutter. A weep tube isa piece of tubing, made out of PVC or some other material, which extendsfrom the bottom of the wearing surface through the deck. Runoff ischanneled toward the weep tube inlet and drained into the underpass.Scuppers are drain inlets, generally made of cast iron, which carry runofffrom the bridge deck through the deck fascia. Figure 3.26 shows an openscupper drain. Catch basins and drop inlets are nodes in a stormwatercollection facility which collect debris and lower the elevation of upstreamand downstream pipes, respectively.
The adverse effects of inadequate deck drainage can range from trafficsafety hazards to deterioration of the deck surface. First of all, excessivewater collecting on the deck advances the risk of deterioration of the deckthrough the introduction of moisture into already cracked or spalled deckareas. Ponding on a bridge deck, while collecting water into a single,freestanding pool, can also accumulate deicing agents into the sameconcentrated location. From a traffic standpoint, excessive water on thebridge deck can lead to hydroplaning of vehicles in warm seasons and icypatches in cold ones.
Construction, Rehabilitation, and Maintenance
[3.9.8, Part 4]
CONCRETE DECK SLABS
he adverse effects of inad-equate deck drainage can
range from traffic safety haz-ards to deterioration of the decksurface.
T
Downloaded from Digital Engineering Library @ McGraw-Hill (www.digitalengineeringlibrary.com)Copyright © 2006 The McGraw-Hill Companies. All rights reserved.
Any use is subject to the Terms of Use as given at the website.
Design of Superstructure Elements
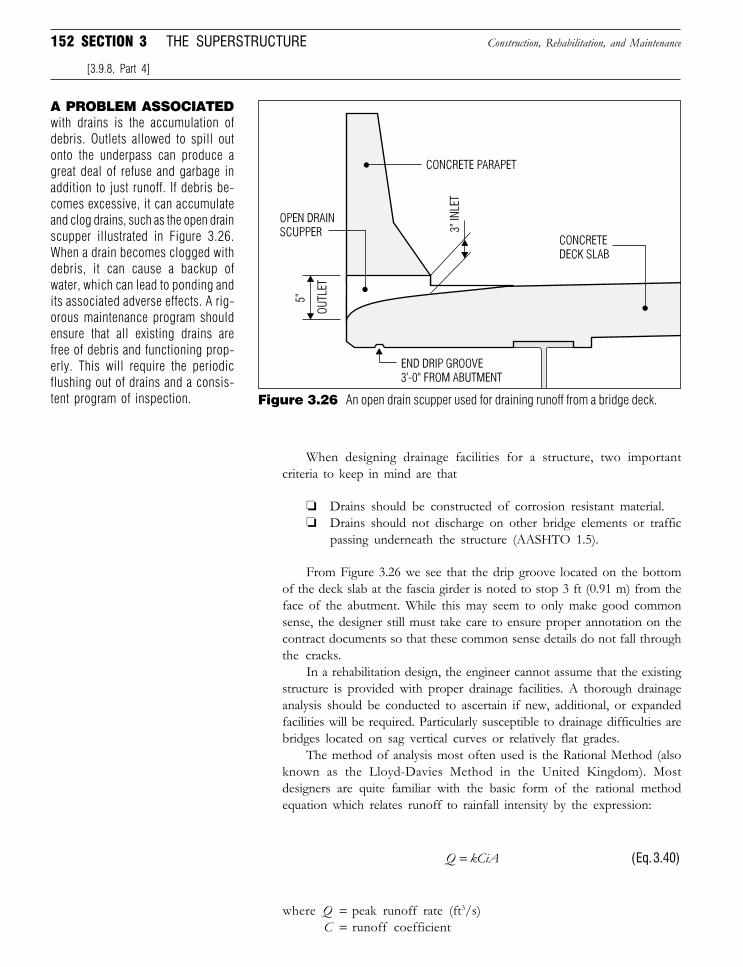
152 SECTION 3 THE SUPERSTRUCTURE
When designing drainage facilities for a structure, two importantcriteria to keep in mind are that
❏ Drains should be constructed of corrosion resistant material.❏ Drains should not discharge on other bridge elements or traffic
passing underneath the structure (AASHTO 1.5).
From Figure 3.26 we see that the drip groove located on the bottomof the deck slab at the fascia girder is noted to stop 3 ft (0.91 m) from theface of the abutment. While this may seem to only make good commonsense, the designer still must take care to ensure proper annotation on thecontract documents so that these common sense details do not fall throughthe cracks.
In a rehabilitation design, the engineer cannot assume that the existingstructure is provided with proper drainage facilities. A thorough drainageanalysis should be conducted to ascertain if new, additional, or expandedfacilities will be required. Particularly susceptible to drainage difficulties arebridges located on sag vertical curves or relatively flat grades.
The method of analysis most often used is the Rational Method (alsoknown as the Lloyd-Davies Method in the United Kingdom). Mostdesigners are quite familiar with the basic form of the rational methodequation which relates runoff to rainfall intensity by the expression:
Q kCiA= (Eq. 3.40)
where Q = peak runoff rate (ft3/s)C = runoff coefficient
Construction, Rehabilitation, and Maintenance
[3.9.8, Part 4]
Figure 3.26 An open drain scupper used for draining runoff from a bridge deck.
A PROBLEM ASSOCIATEDwith drains is the accumulation ofdebris. Outlets allowed to spill outonto the underpass can produce agreat deal of refuse and garbage inaddition to just runoff. If debris be-comes excessive, it can accumulateand clog drains, such as the open drainscupper illustrated in Figure 3.26.When a drain becomes clogged withdebris, it can cause a backup ofwater, which can lead to ponding andits associated adverse effects. A rig-orous maintenance program shouldensure that all existing drains arefree of debris and functioning prop-erly. This will require the periodicflushing out of drains and a consis-tent program of inspection.
Downloaded from Digital Engineering Library @ McGraw-Hill (www.digitalengineeringlibrary.com)Copyright © 2006 The McGraw-Hill Companies. All rights reserved.
Any use is subject to the Terms of Use as given at the website.
Design of Superstructure Elements
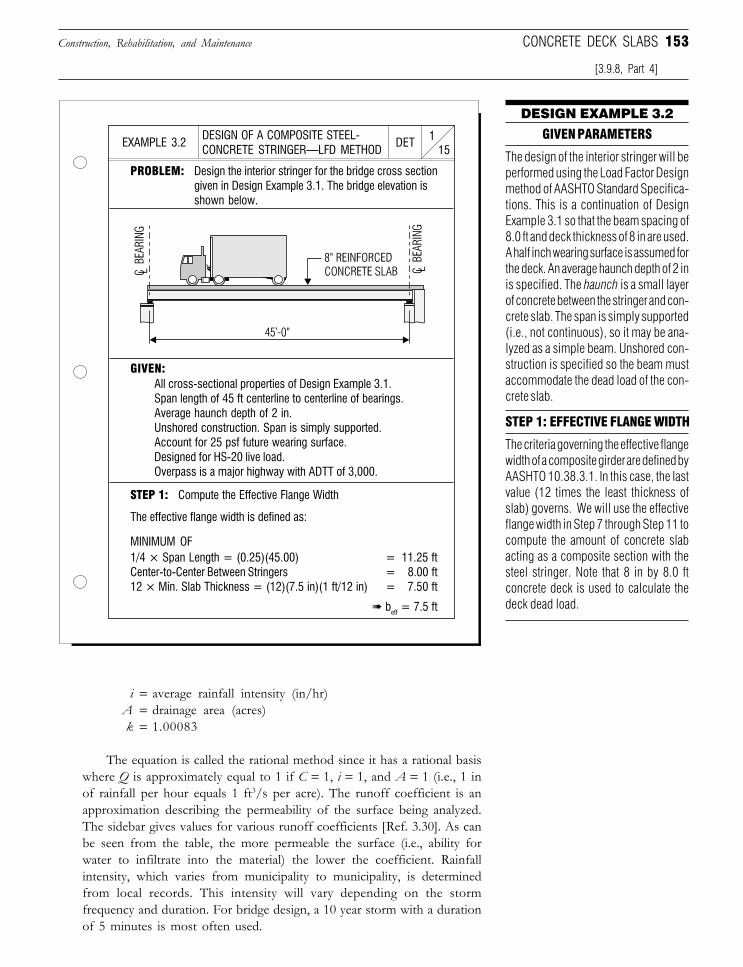
153Construction, Rehabilitation, and Maintenance
DESIGN OF A COMPOSITE STEEL-CONCRETE STRINGER—LFD METHOD 15
1DETEXAMPLE 3.2
PROBLEM: Design the interior stringer for the bridge cross sectiongiven in Design Example 3.1. The bridge elevation isshown below.
GIVEN:All cross-sectional properties of Design Example 3.1.Span length of 45 ft centerline to centerline of bearings.Average haunch depth of 2 in.Unshored construction. Span is simply supported.Account for 25 psf future wearing surface.Designed for HS-20 live load.Overpass is a major highway with ADTT of 3,000.
DESIGN EXAMPLE 3.2
GIVEN PARAMETERS
The design of the interior stringer will beperformed using the Load Factor Designmethod of AASHTO Standard Specifica-tions. This is a continuation of DesignExample 3.1 so that the beam spacing of8.0 ft and deck thickness of 8 in are used.A half inch wearing surface is assumed forthe deck. An average haunch depth of 2 inis specified. The haunch is a small layerof concrete between the stringer and con-crete slab. The span is simply supported(i.e., not continuous), so it may be ana-lyzed as a simple beam. Unshored con-struction is specified so the beam mustaccommodate the dead load of the con-crete slab.
➠ beff = 7.5 ft
1/4 × Span Length = (0.25)(45.00) = 11.25 ftCenter-to-Center Between Stringers = 8.00 ft12 × Min. Slab Thickness = (12)(7.5 in)(1 ft/12 in) = 7.50 ft
STEP 1: Compute the Effective Flange Width
The effective flange width is defined as:
MINIMUM OF
i = average rainfall intensity (in/hr)A = drainage area (acres)k = 1.00083
The equation is called the rational method since it has a rational basiswhere Q is approximately equal to 1 if C = 1, i = 1, and A = 1 (i.e., 1 inof rainfall per hour equals 1 ft3/s per acre). The runoff coefficient is anapproximation describing the permeability of the surface being analyzed.The sidebar gives values for various runoff coefficients [Ref. 3.30]. As canbe seen from the table, the more permeable the surface (i.e., ability forwater to infiltrate into the material) the lower the coefficient. Rainfallintensity, which varies from municipality to municipality, is determinedfrom local records. This intensity will vary depending on the stormfrequency and duration. For bridge design, a 10 year storm with a durationof 5 minutes is most often used.
[3.9.8, Part 4]
CONCRETE DECK SLABS
STEP 1: EFFECTIVE FLANGE WIDTH
The criteria governing the effective flangewidth of a composite girder are defined byAASHTO 10.38.3.1. In this case, the lastvalue (12 times the least thickness ofslab) governs. We will use the effectiveflange width in Step 7 through Step 11 tocompute the amount of concrete slabacting as a composite section with thesteel stringer. Note that 8 in by 8.0 ftconcrete deck is used to calculate thedeck dead load.
Downloaded from Digital Engineering Library @ McGraw-Hill (www.digitalengineeringlibrary.com)Copyright © 2006 The McGraw-Hill Companies. All rights reserved.
Any use is subject to the Terms of Use as given at the website.
Design of Superstructure Elements
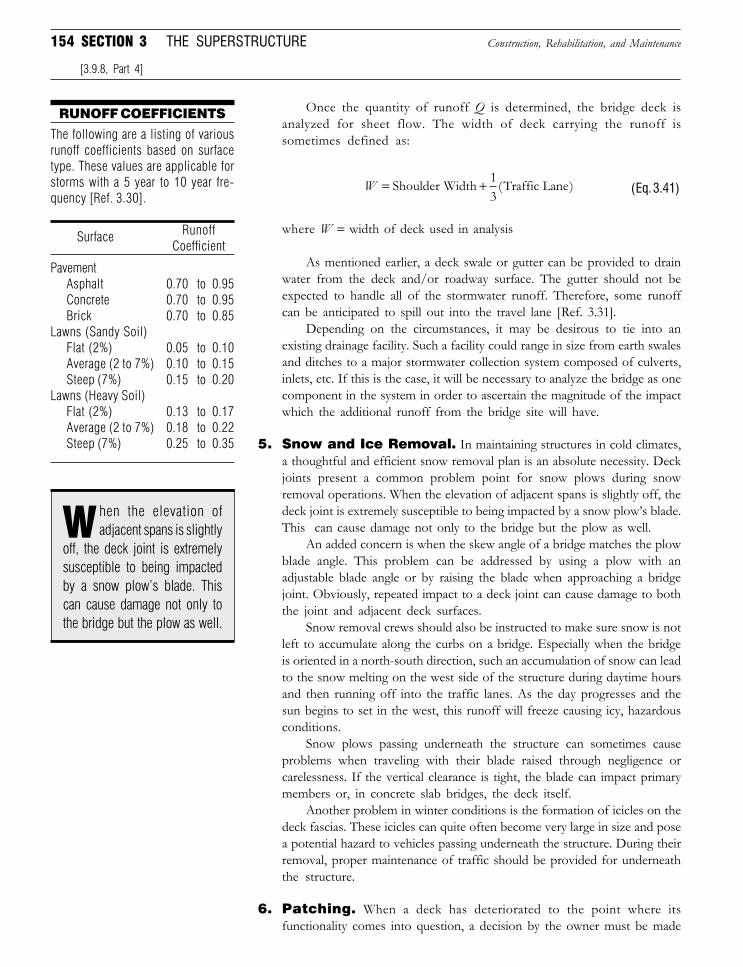
154 SECTION 3 THE SUPERSTRUCTURE
Once the quantity of runoff Q is determined, the bridge deck isanalyzed for sheet flow. The width of deck carrying the runoff issometimes defined as:
W = +Shoulder Width Traffic Lane13
( ) (Eq. 3.41)
where W = width of deck used in analysis
As mentioned earlier, a deck swale or gutter can be provided to drainwater from the deck and/or roadway surface. The gutter should not beexpected to handle all of the stormwater runoff. Therefore, some runoffcan be anticipated to spill out into the travel lane [Ref. 3.31].
Depending on the circumstances, it may be desirous to tie into anexisting drainage facility. Such a facility could range in size from earth swalesand ditches to a major stormwater collection system composed of culverts,inlets, etc. If this is the case, it will be necessary to analyze the bridge as onecomponent in the system in order to ascertain the magnitude of the impactwhich the additional runoff from the bridge site will have.
5. Snow and Ice Removal. In maintaining structures in cold climates,a thoughtful and efficient snow removal plan is an absolute necessity. Deckjoints present a common problem point for snow plows during snowremoval operations. When the elevation of adjacent spans is slightly off, thedeck joint is extremely susceptible to being impacted by a snow plow’s blade.This can cause damage not only to the bridge but the plow as well.
An added concern is when the skew angle of a bridge matches the plowblade angle. This problem can be addressed by using a plow with anadjustable blade angle or by raising the blade when approaching a bridgejoint. Obviously, repeated impact to a deck joint can cause damage to boththe joint and adjacent deck surfaces.
Snow removal crews should also be instructed to make sure snow is notleft to accumulate along the curbs on a bridge. Especially when the bridgeis oriented in a north-south direction, such an accumulation of snow can leadto the snow melting on the west side of the structure during daytime hoursand then running off into the traffic lanes. As the day progresses and thesun begins to set in the west, this runoff will freeze causing icy, hazardousconditions.
Snow plows passing underneath the structure can sometimes causeproblems when traveling with their blade raised through negligence orcarelessness. If the vertical clearance is tight, the blade can impact primarymembers or, in concrete slab bridges, the deck itself.
Another problem in winter conditions is the formation of icicles on thedeck fascias. These icicles can quite often become very large in size and posea potential hazard to vehicles passing underneath the structure. During theirremoval, proper maintenance of traffic should be provided for underneaththe structure.
6. Patching. When a deck has deteriorated to the point where itsfunctionality comes into question, a decision by the owner must be made
Construction, Rehabilitation, and Maintenance
[3.9.8, Part 4]
RUNOFF COEFFICIENTS
The following are a listing of variousrunoff coefficients based on surfacetype. These values are applicable forstorms with a 5 year to 10 year fre-quency [Ref. 3.30].
RunoffCoefficient
Surface
PavementAsphalt 0.70 to 0.95Concrete 0.70 to 0.95Brick 0.70 to 0.85
Lawns (Sandy Soil)Flat (2%) 0.05 to 0.10Average (2 to 7%) 0.10 to 0.15Steep (7%) 0.15 to 0.20
Lawns (Heavy Soil)Flat (2%) 0.13 to 0.17Average (2 to 7%) 0.18 to 0.22Steep (7%) 0.25 to 0.35
hen the elevation ofadjacent spans is slightly
off, the deck joint is extremelysusceptible to being impactedby a snow plow’s blade. Thiscan cause damage not only tothe bridge but the plow as well.
W
Downloaded from Digital Engineering Library @ McGraw-Hill (www.digitalengineeringlibrary.com)Copyright © 2006 The McGraw-Hill Companies. All rights reserved.
Any use is subject to the Terms of Use as given at the website.
Design of Superstructure Elements
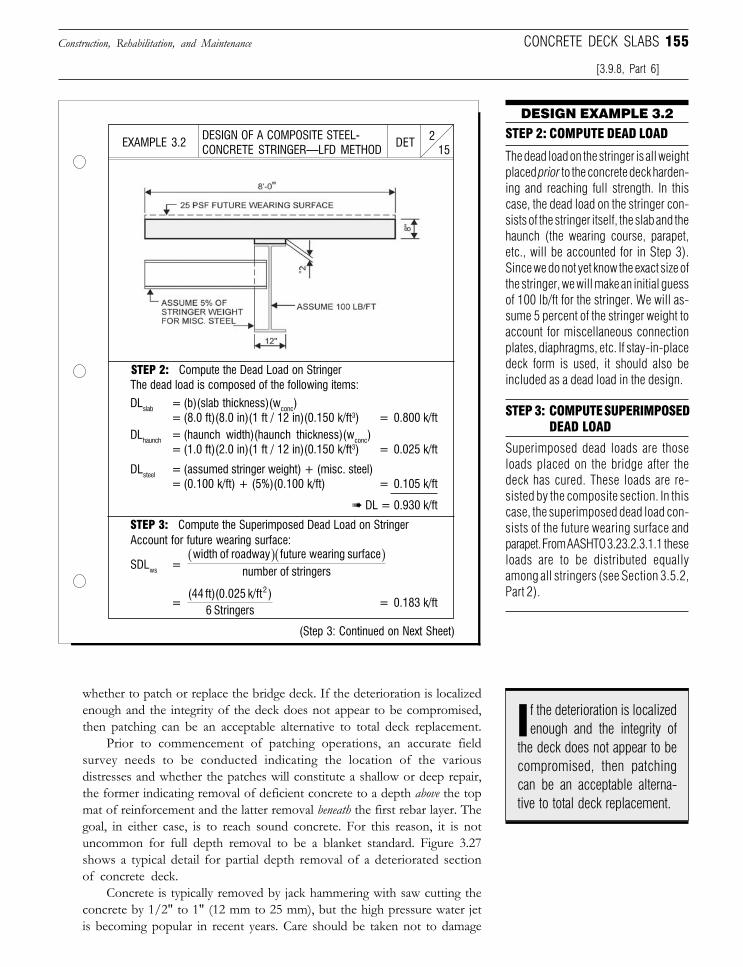
155
DESIGN EXAMPLE 3.2STEP 2: COMPUTE DEAD LOAD
The dead load on the stringer is all weightplaced prior to the concrete deck harden-ing and reaching full strength. In thiscase, the dead load on the stringer con-sists of the stringer itself, the slab and thehaunch (the wearing course, parapet,etc., will be accounted for in Step 3).Since we do not yet know the exact size ofthe stringer, we will make an initial guessof 100 lb/ft for the stringer. We will as-sume 5 percent of the stringer weight toaccount for miscellaneous connectionplates, diaphragms, etc. If stay-in-placedeck form is used, it should also beincluded as a dead load in the design.
DESIGN OF A COMPOSITE STEEL-CONCRETE STRINGER—LFD METHOD 15
2DETEXAMPLE 3.2
STEP 2: Compute the Dead Load on StringerThe dead load is composed of the following items:
DLslab = (b)(slab thickness)(wconc)= (8.0 ft)(8.0 in)(1 ft / 12 in)(0.150 k/ft3) = 0.800 k/ft
DLhaunch = (haunch width)(haunch thickness)(wconc)= (1.0 ft)(2.0 in)(1 ft / 12 in)(0.150 k/ft3) = 0.025 k/ft
DLsteel = (assumed stringer weight) + (misc. steel)= (0.100 k/ft) + (5%)(0.100 k/ft) = 0.105 k/ft
➠ DL = 0.930 k/ft
STEP 3: Compute the Superimposed Dead Load on StringerAccount for future wearing surface:
SDLws =
= = 0.183 k/ft
(Step 3: Continued on Next Sheet)
STEP 3: COMPUTE SUPERIMPOSEDDEAD LOAD
Superimposed dead loads are thoseloads placed on the bridge after thedeck has cured. These loads are re-sisted by the composite section. In thiscase, the superimposed dead load con-sists of the future wearing surface andparapet. From AASHTO 3.23.2.3.1.1 theseloads are to be distributed equallyamong all stringers (see Section 3.5.2,Part 2).
whether to patch or replace the bridge deck. If the deterioration is localizedenough and the integrity of the deck does not appear to be compromised,then patching can be an acceptable alternative to total deck replacement.
Prior to commencement of patching operations, an accurate fieldsurvey needs to be conducted indicating the location of the variousdistresses and whether the patches will constitute a shallow or deep repair,the former indicating removal of deficient concrete to a depth above the topmat of reinforcement and the latter removal beneath the first rebar layer. Thegoal, in either case, is to reach sound concrete. For this reason, it is notuncommon for full depth removal to be a blanket standard. Figure 3.27shows a typical detail for partial depth removal of a deteriorated sectionof concrete deck.
Concrete is typically removed by jack hammering with saw cutting theconcrete by 1/2" to 1" (12 mm to 25 mm), but the high pressure water jetis becoming popular in recent years. Care should be taken not to damage
Construction, Rehabilitation, and Maintenance
[3.9.8, Part 6]
CONCRETE DECK SLABS
f the deterioration is localizedenough and the integrity of
the deck does not appear to becompromised, then patchingcan be an acceptable alterna-tive to total deck replacement.
I
width of roadway future wearing surfacenumber of stringers
( )( )
(44 ft)(0.025 k/ft )6 Stringers
2
Downloaded from Digital Engineering Library @ McGraw-Hill (www.digitalengineeringlibrary.com)Copyright © 2006 The McGraw-Hill Companies. All rights reserved.
Any use is subject to the Terms of Use as given at the website.
Design of Superstructure Elements
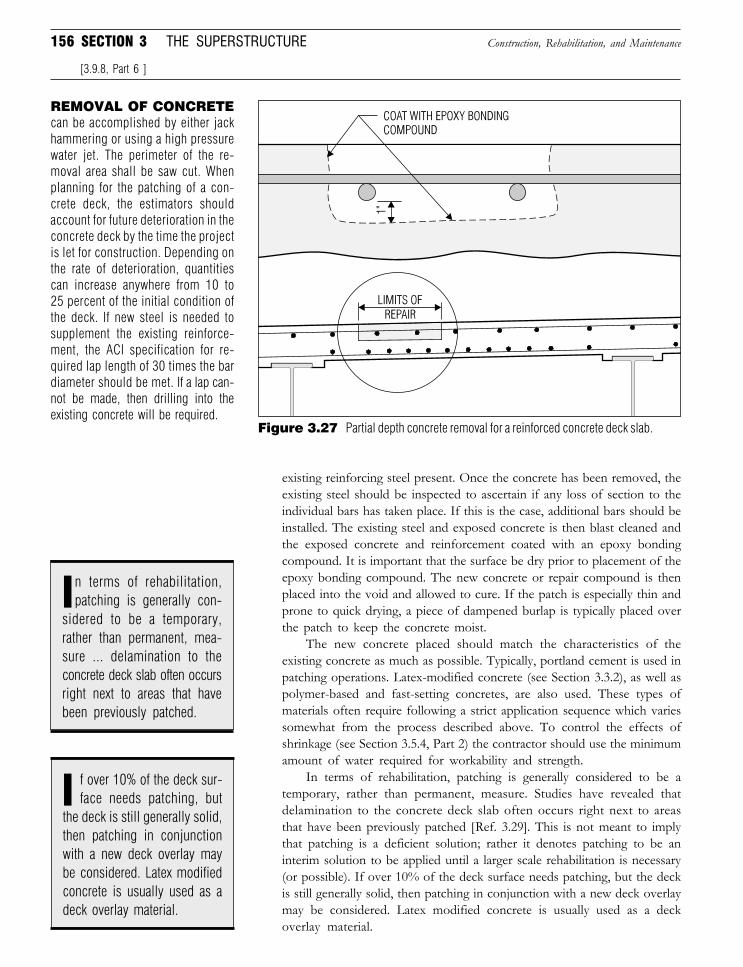
156 SECTION 3 THE SUPERSTRUCTURE
existing reinforcing steel present. Once the concrete has been removed, theexisting steel should be inspected to ascertain if any loss of section to theindividual bars has taken place. If this is the case, additional bars should beinstalled. The existing steel and exposed concrete is then blast cleaned andthe exposed concrete and reinforcement coated with an epoxy bondingcompound. It is important that the surface be dry prior to placement of theepoxy bonding compound. The new concrete or repair compound is thenplaced into the void and allowed to cure. If the patch is especially thin andprone to quick drying, a piece of dampened burlap is typically placed overthe patch to keep the concrete moist.
The new concrete placed should match the characteristics of theexisting concrete as much as possible. Typically, portland cement is used inpatching operations. Latex-modified concrete (see Section 3.3.2), as well aspolymer-based and fast-setting concretes, are also used. These types ofmaterials often require following a strict application sequence which variessomewhat from the process described above. To control the effects ofshrinkage (see Section 3.5.4, Part 2) the contractor should use the minimumamount of water required for workability and strength.
In terms of rehabilitation, patching is generally considered to be atemporary, rather than permanent, measure. Studies have revealed thatdelamination to the concrete deck slab often occurs right next to areasthat have been previously patched [Ref. 3.29]. This is not meant to implythat patching is a deficient solution; rather it denotes patching to be aninterim solution to be applied until a larger scale rehabilitation is necessary(or possible). If over 10% of the deck surface needs patching, but the deckis still generally solid, then patching in conjunction with a new deck overlaymay be considered. Latex modified concrete is usually used as a deckoverlay material.
Construction, Rehabilitation, and Maintenance
[3.9.8, Part 6 ]
REMOVAL OF CONCRETEcan be accomplished by either jackhammering or using a high pressurewater jet. The perimeter of the re-moval area shall be saw cut. Whenplanning for the patching of a con-crete deck, the estimators shouldaccount for future deterioration in theconcrete deck by the time the projectis let for construction. Depending onthe rate of deterioration, quantitiescan increase anywhere from 10 to25 percent of the initial condition ofthe deck. If new steel is needed tosupplement the existing reinforce-ment, the ACI specification for re-quired lap length of 30 times the bardiameter should be met. If a lap can-not be made, then drilling into theexisting concrete will be required.
Figure 3.27 Partial depth concrete removal for a reinforced concrete deck slab.
f over 10% of the deck sur-face needs patching, but
the deck is still generally solid,then patching in conjunctionwith a new deck overlay maybe considered. Latex modifiedconcrete is usually used as adeck overlay material.
I
n terms of rehabilitation,patching is generally con-
sidered to be a temporary,rather than permanent, mea-sure ... delamination to theconcrete deck slab often occursright next to areas that havebeen previously patched.
I
Downloaded from Digital Engineering Library @ McGraw-Hill (www.digitalengineeringlibrary.com)Copyright © 2006 The McGraw-Hill Companies. All rights reserved.
Any use is subject to the Terms of Use as given at the website.
Design of Superstructure Elements
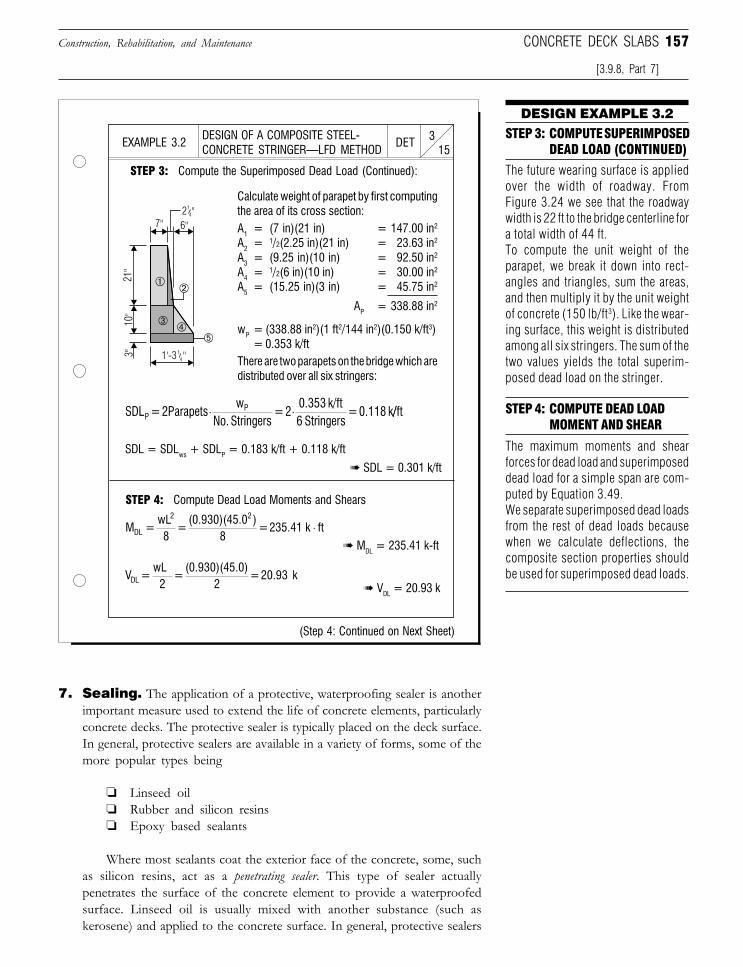
157
7. Sealing. The application of a protective, waterproofing sealer is anotherimportant measure used to extend the life of concrete elements, particularlyconcrete decks. The protective sealer is typically placed on the deck surface.In general, protective sealers are available in a variety of forms, some of themore popular types being
❏ Linseed oil❏ Rubber and silicon resins❏ Epoxy based sealants
Where most sealants coat the exterior face of the concrete, some, suchas silicon resins, act as a penetrating sealer. This type of sealer actuallypenetrates the surface of the concrete element to provide a waterproofedsurface. Linseed oil is usually mixed with another substance (such askerosene) and applied to the concrete surface. In general, protective sealers
Construction, Rehabilitation, and Maintenance
DESIGN EXAMPLE 3.2
DESIGN OF A COMPOSITE STEEL-CONCRETE STRINGER—LFD METHOD 15
3DETEXAMPLE 3.2STEP 3: COMPUTE SUPERIMPOSED
DEAD LOAD (CONTINUED)
The future wearing surface is appliedover the width of roadway. FromFigure 3.24 we see that the roadwaywidth is 22 ft to the bridge centerline fora total width of 44 ft.To compute the unit weight of theparapet, we break it down into rect-angles and triangles, sum the areas,and then multiply it by the unit weightof concrete (150 lb/ft3). Like the wear-ing surface, this weight is distributedamong all six stringers. The sum of thetwo values yields the total superim-posed dead load on the stringer.
STEP 3: Compute the Superimposed Dead Load (Continued):
Calculate weight of parapet by first computingthe area of its cross section:A1 = (7 in)(21 in) = 147.00 in2
A2 = 1/2(2.25 in)(21 in) = 23.63 in2
A3 = (9.25 in)(10 in) = 92.50 in2
A4 = 1/2(6 in)(10 in) = 30.00 in2
A5 = (15.25 in)(3 in) = 45.75 in2
AP = 338.88 in2
wP = (338.88 in2)(1 ft2/144 in2)(0.150 k/ft3)= 0.353 k/ft
There are two parapets on the bridge which aredistributed over all six stringers:
➠ SDL = 0.301 k/ft
STEP 4: Compute Dead Load Moments and Shears
➠ MDL = 235.41 k-ft
STEP 4: COMPUTE DEAD LOAD MOMENT AND SHEAR
[3.9.8, Part 7]
CONCRETE DECK SLABS
➠ VDL = 20.93 k
(Step 4: Continued on Next Sheet)
The maximum moments and shearforces for dead load and superimposeddead load for a simple span are com-puted by Equation 3.49.We separate superimposed dead loadsfrom the rest of dead loads becausewhen we calculate deflections, thecomposite section properties shouldbe used for superimposed dead loads.
SDL = SDLws + SDLP = 0.183 k/ft + 0.118 k/ft
1'-3 "3"10
"21
"
7"
2 "
6"
SDL =2Parapetsw
No. Stringers=2
0.353 k/ft6 Stringers
=0.118 kPP⋅ ⋅ //ft
M = wL8
= (0.930)(45.0 )
8 = 235.41 k ftDL
2 2
⋅
V = wL
2 =
(0.930)(45.0)2
= 20.93 kDL
Downloaded from Digital Engineering Library @ McGraw-Hill (www.digitalengineeringlibrary.com)Copyright © 2006 The McGraw-Hill Companies. All rights reserved.
Any use is subject to the Terms of Use as given at the website.
Design of Superstructure Elements
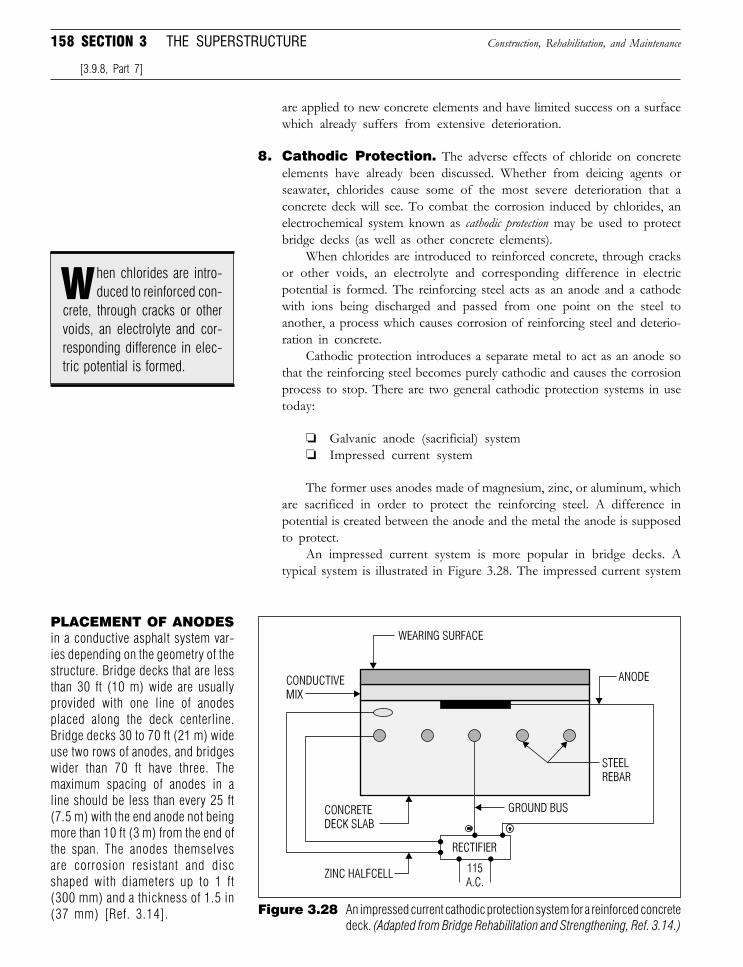
158 SECTION 3 THE SUPERSTRUCTURE
are applied to new concrete elements and have limited success on a surfacewhich already suffers from extensive deterioration.
8. Cathodic Protection. The adverse effects of chloride on concreteelements have already been discussed. Whether from deicing agents orseawater, chlorides cause some of the most severe deterioration that aconcrete deck will see. To combat the corrosion induced by chlorides, anelectrochemical system known as cathodic protection may be used to protectbridge decks (as well as other concrete elements).
When chlorides are introduced to reinforced concrete, through cracksor other voids, an electrolyte and corresponding difference in electricpotential is formed. The reinforcing steel acts as an anode and a cathodewith ions being discharged and passed from one point on the steel toanother, a process which causes corrosion of reinforcing steel and deterio-ration in concrete.
Cathodic protection introduces a separate metal to act as an anode sothat the reinforcing steel becomes purely cathodic and causes the corrosionprocess to stop. There are two general cathodic protection systems in usetoday:
❏ Galvanic anode (sacrificial) system❏ Impressed current system
The former uses anodes made of magnesium, zinc, or aluminum, whichare sacrificed in order to protect the reinforcing steel. A difference inpotential is created between the anode and the metal the anode is supposedto protect.
An impressed current system is more popular in bridge decks. Atypical system is illustrated in Figure 3.28. The impressed current system
Construction, Rehabilitation, and Maintenance
[3.9.8, Part 7]
PLACEMENT OF ANODESin a conductive asphalt system var-ies depending on the geometry of thestructure. Bridge decks that are lessthan 30 ft (10 m) wide are usuallyprovided with one line of anodesplaced along the deck centerline.Bridge decks 30 to 70 ft (21 m) wideuse two rows of anodes, and bridgeswider than 70 ft have three. Themaximum spacing of anodes in aline should be less than every 25 ft(7.5 m) with the end anode not beingmore than 10 ft (3 m) from the end ofthe span. The anodes themselvesare corrosion resistant and discshaped with diameters up to 1 ft(300 mm) and a thickness of 1.5 in(37 mm) [Ref. 3.14]. Figure 3.28 An impressed current cathodic protection system for a reinforced concrete
deck. (Adapted from Bridge Rehabilitation and Strengthening, Ref. 3.14.)
hen chlorides are intro-duced to reinforced con-
crete, through cracks or othervoids, an electrolyte and cor-responding difference in elec-tric potential is formed.
W
Downloaded from Digital Engineering Library @ McGraw-Hill (www.digitalengineeringlibrary.com)Copyright © 2006 The McGraw-Hill Companies. All rights reserved.
Any use is subject to the Terms of Use as given at the website.
Design of Superstructure Elements
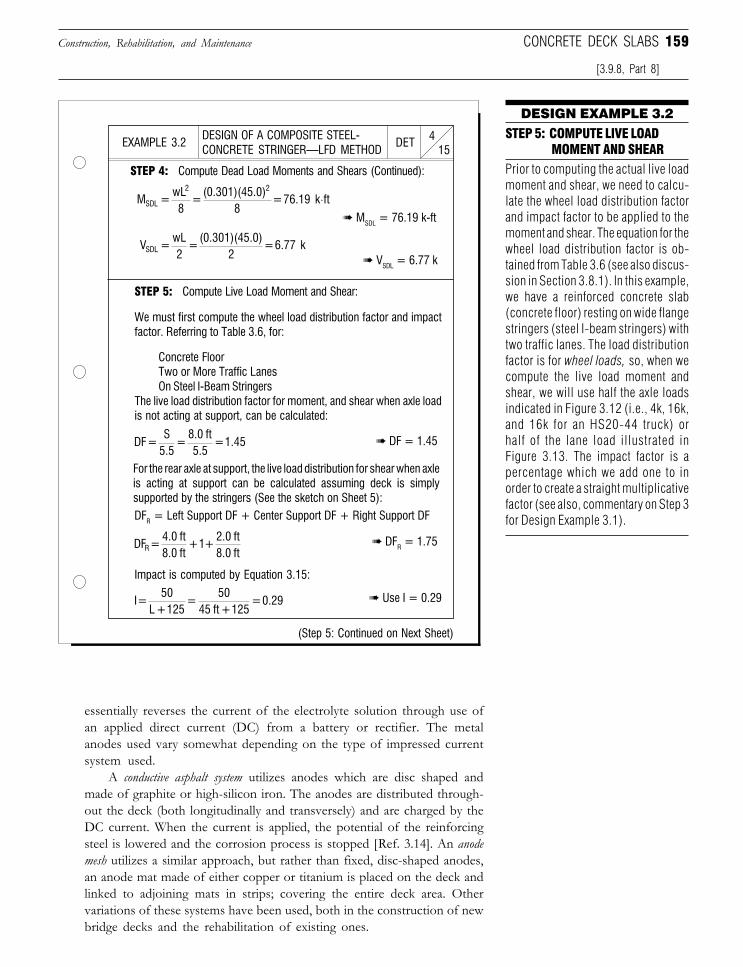
159
DESIGN EXAMPLE 3.2
DESIGN OF A COMPOSITE STEEL-CONCRETE STRINGER—LFD METHOD 15
4DETEXAMPLE 3.2
STEP 4: Compute Dead Load Moments and Shears (Continued):
essentially reverses the current of the electrolyte solution through use ofan applied direct current (DC) from a battery or rectifier. The metalanodes used vary somewhat depending on the type of impressed currentsystem used.
A conductive asphalt system utilizes anodes which are disc shaped andmade of graphite or high-silicon iron. The anodes are distributed through-out the deck (both longitudinally and transversely) and are charged by theDC current. When the current is applied, the potential of the reinforcingsteel is lowered and the corrosion process is stopped [Ref. 3.14]. An anodemesh utilizes a similar approach, but rather than fixed, disc-shaped anodes,an anode mat made of either copper or titanium is placed on the deck andlinked to adjoining mats in strips; covering the entire deck area. Othervariations of these systems have been used, both in the construction of newbridge decks and the rehabilitation of existing ones.
Construction, Rehabilitation, and Maintenance
STEP 5: COMPUTE LIVE LOAD MOMENT AND SHEAR
Prior to computing the actual live loadmoment and shear, we need to calcu-late the wheel load distribution factorand impact factor to be applied to themoment and shear. The equation for thewheel load distribution factor is ob-tained from Table 3.6 (see also discus-sion in Section 3.8.1). In this example,we have a reinforced concrete slab(concrete floor) resting on wide flangestringers (steel I-beam stringers) withtwo traffic lanes. The load distributionfactor is for wheel loads, so, when wecompute the live load moment andshear, we will use half the axle loadsindicated in Figure 3.12 (i.e., 4k, 16k,and 16k for an HS20-44 truck) orhalf of the lane load illustrated inFigure 3.13. The impact factor is apercentage which we add one to inorder to create a straight multiplicativefactor (see also, commentary on Step 3for Design Example 3.1).
➠ Use I = 0.29
Concrete FloorTwo or More Traffic LanesOn Steel I-Beam Stringers
The live load distribution factor for moment, and shear when axle loadis not acting at support, can be calculated:
We must first compute the wheel load distribution factor and impactfactor. Referring to Table 3.6, for:
STEP 5: Compute Live Load Moment and Shear:
(Step 5: Continued on Next Sheet)
CONCRETE DECK SLABS
[3.9.8, Part 8]
Impact is computed by Equation 3.15:
➠ MSDL = 76.19 k-ft
➠ VSDL = 6.77 k
For the rear axle at support, the live load distribution for shear when axleis acting at support can be calculated assuming deck is simplysupported by the stringers (See the sketch on Sheet 5):DFR = Left Support DF + Center Support DF + Right Support DF
➠ DFR = 1.75
➠ DF = 1.45
M = wL8
= (0.301)(45.0)
8 = 76.19 k ftSDL
2 2
⋅
V = wL2
= (0.301)(45.0)
2 = 6.77 kSDL
DF = S
5.5 =
8.0 ft5.5
= 1.45
DF = 4.0 ft8.0 ft
+ 1 + 2.0 ft8.0 ftR
I = 50
L + 125 =
5045 ft + 125
= 0.29
Downloaded from Digital Engineering Library @ McGraw-Hill (www.digitalengineeringlibrary.com)Copyright © 2006 The McGraw-Hill Companies. All rights reserved.
Any use is subject to the Terms of Use as given at the website.
Design of Superstructure Elements
160 SECTION 3 THE SUPERSTRUCTURE
From Figure 3.28 we can see that between the wearing surface andconcrete deck is a layer of conductive mix, generally 2 to 3 in (51 to 76 mm)thick. Since concrete does not conduct electricity very well, the conductive mixprovides for a uniform distribution of the electric current across the bridge deck.The conductive mix is generally a bituminous concrete-based mixture consistingof coke breeze, stone, sand, and asphalt cement. The coke breeze componentacts as a course aggregate and provides for electric conductivity.
The DC rectifier uses AC line voltage which is regulated by a separatecontrol panel located under the structure. The system must be monitoredfrom time to time to ensure that the polarized charge is kept within aspecified range. If the voltage falls too low, the system may not provideadequate protection to the deck, and if it rises too high, debonding of theoverlay may occur.
Some of the drawbacks to cathodic protection are obvious. The need fora constant source of power and continued monitoring of the current adds tothe maintenance operations required for a structure (although not as severeas having to patch or replace the deck). The problem of added dead load onthe structure due to the need of a conductive layer is compounded by anincrease in the depth of the structure, which may have an adverse effect onbridge-highway geometry constraints. Last, but never least, are the added costsassociated with installing and maintaining the system.
Cathodic protection, however, is not a gimmick or experimentaltechnology. In states such as California, the system has been implementedand has proved itself to be successful. It is entirely conceivable that, as thetechnology grows and develops, associated costs will be driven down andinstallation and maintenance simplified to the point where installing acathodic protection system will be as standard as installing deck joints.
3.9.9 Conclusions
The design of the concrete deck slab, while perhaps not the mosttechnically challenging activity, is critical to the overall performance of thestructure. From a rehabilitation standpoint, owners will often decide whetherto perform superficial maintenance or major rehabilitation based on thecondition of the deck slab. In one way, the deck slab can be thought of as thebarometer indicating bridge performance.
It is for these reasons that the detailing of the slab is so critical and wehave spent so much time discussing the implementation of features whicharrest the onset of deterioration. Whether it is incorporation of a drip grooveat the deck fascia or use of epoxy-coated reinforcement, protection of thedeck slab is an important issue which bridge engineers have been working onfor the last half century. The items we have studied in Section 3.9.8 are theresult of decades of research, implementation, and analyses. The waterproof-ing membrane has developed and grown over the years as the performance ofearly models was studied and the system refined. The same is now true forcathodic protection systems. Some engineers find it a bit disheartening whenthe profession seems to be less mathematical and more empirical. Half of thefun in civil engineering, however, is seeing how new ideas play out. An ideadoes not have to be born out of an equation so much as it does out of a
Conclusions
[3.9.8, Part 8]
athodic protection, how-ever, is not a gimmick or
experimental technology. Instates such as California, thesystem has been implementedand has proved itself to besuccessful.
C
ome engineers find it a bitdisheartening when the
profession seems to be lessmathematical and more em-pirical. Half of the fun in civilengineering, however, is see-ing how new ideas play out.
S
Downloaded from Digital Engineering Library @ McGraw-Hill (www.digitalengineeringlibrary.com)Copyright © 2006 The McGraw-Hill Companies. All rights reserved.
Any use is subject to the Terms of Use as given at the website.
Design of Superstructure Elements
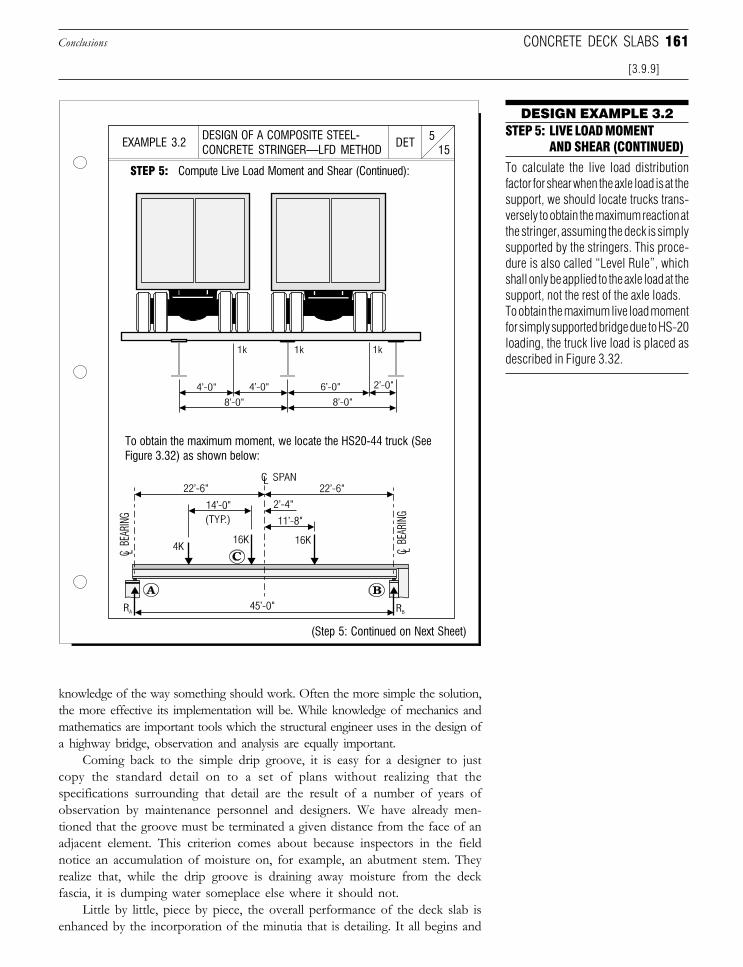
161
knowledge of the way something should work. Often the more simple the solution,the more effective its implementation will be. While knowledge of mechanics andmathematics are important tools which the structural engineer uses in the design ofa highway bridge, observation and analysis are equally important.
Coming back to the simple drip groove, it is easy for a designer to justcopy the standard detail on to a set of plans without realizing that thespecifications surrounding that detail are the result of a number of years ofobservation by maintenance personnel and designers. We have already men-tioned that the groove must be terminated a given distance from the face of anadjacent element. This criterion comes about because inspectors in the fieldnotice an accumulation of moisture on, for example, an abutment stem. Theyrealize that, while the drip groove is draining away moisture from the deckfascia, it is dumping water someplace else where it should not.
Little by little, piece by piece, the overall performance of the deck slab isenhanced by the incorporation of the minutia that is detailing. It all begins and
DESIGN EXAMPLE 3.2
DESIGN OF A COMPOSITE STEEL-CONCRETE STRINGER—LFD METHOD 15
5DETEXAMPLE 3.2
STEP 5: Compute Live Load Moment and Shear (Continued):
To obtain the maximum moment, we locate the HS20-44 truck (SeeFigure 3.32) as shown below:
STEP 5: LIVE LOAD MOMENT AND SHEAR (CONTINUED)
To calculate the live load distributionfactor for shear when the axle load is at thesupport, we should locate trucks trans-versely to obtain the maximum reaction atthe stringer, assuming the deck is simplysupported by the stringers. This proce-dure is also called “Level Rule”, whichshall only be applied to the axle load at thesupport, not the rest of the axle loads.To obtain the maximum live load momentfor simply supported bridge due to HS-20loading, the truck live load is placed asdescribed in Figure 3.32.
Conclusions
[3.9.9]
CONCRETE DECK SLABS
(Step 5: Continued on Next Sheet)
Downloaded from Digital Engineering Library @ McGraw-Hill (www.digitalengineeringlibrary.com)Copyright © 2006 The McGraw-Hill Companies. All rights reserved.
Any use is subject to the Terms of Use as given at the website.
Design of Superstructure Elements
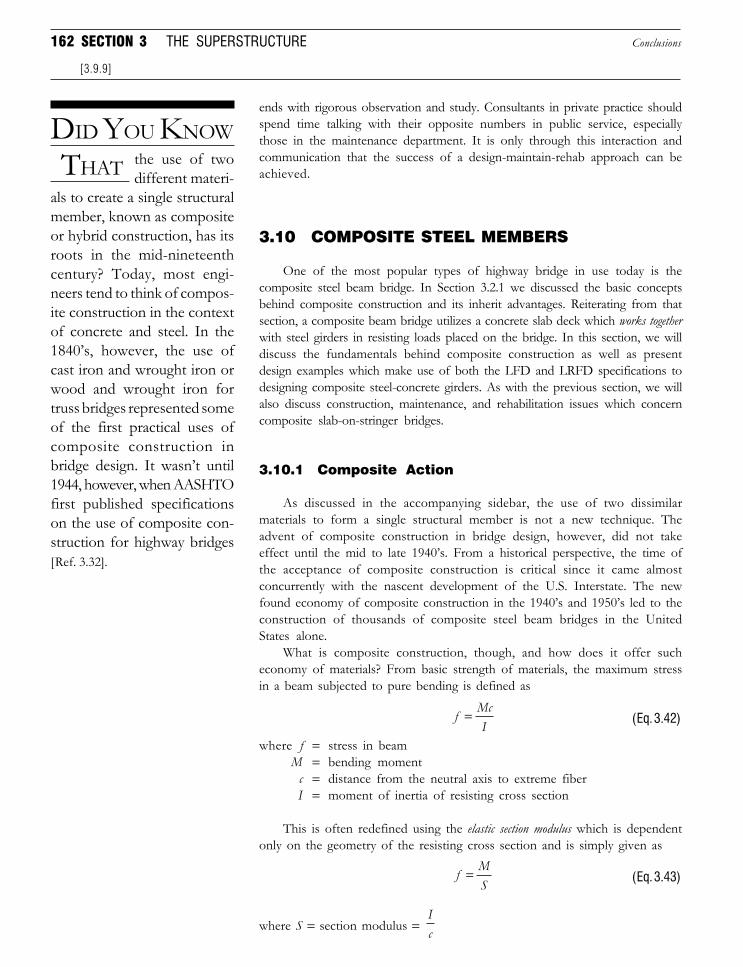
162 SECTION 3 THE SUPERSTRUCTURE
ends with rigorous observation and study. Consultants in private practice shouldspend time talking with their opposite numbers in public service, especiallythose in the maintenance department. It is only through this interaction andcommunication that the success of a design-maintain-rehab approach can beachieved.
3.10 COMPOSITE STEEL MEMBERS
One of the most popular types of highway bridge in use today is thecomposite steel beam bridge. In Section 3.2.1 we discussed the basic conceptsbehind composite construction and its inherit advantages. Reiterating from thatsection, a composite beam bridge utilizes a concrete slab deck which works togetherwith steel girders in resisting loads placed on the bridge. In this section, we willdiscuss the fundamentals behind composite construction as well as presentdesign examples which make use of both the LFD and LRFD specifications todesigning composite steel-concrete girders. As with the previous section, we willalso discuss construction, maintenance, and rehabilitation issues which concerncomposite slab-on-stringer bridges.
3.10.1 Composite Action
As discussed in the accompanying sidebar, the use of two dissimilarmaterials to form a single structural member is not a new technique. Theadvent of composite construction in bridge design, however, did not takeeffect until the mid to late 1940’s. From a historical perspective, the time ofthe acceptance of composite construction is critical since it came almostconcurrently with the nascent development of the U.S. Interstate. The newfound economy of composite construction in the 1940’s and 1950’s led to theconstruction of thousands of composite steel beam bridges in the UnitedStates alone.
What is composite construction, though, and how does it offer sucheconomy of materials? From basic strength of materials, the maximum stressin a beam subjected to pure bending is defined as
f McI
= (Eq. 3.42)
where f = stress in beamM = bending moment
c = distance from the neutral axis to extreme fiberI = moment of inertia of resisting cross section
This is often redefined using the elastic section modulus which is dependentonly on the geometry of the resisting cross section and is simply given as
f MS
= (Eq. 3.43)
where S = section modulus = Ic
Conclusions
[3.9.9]
DID YOU KNOW
THAT the use of twodifferent materi-
als to create a single structuralmember, known as compositeor hybrid construction, has itsroots in the mid-nineteenthcentury? Today, most engi-neers tend to think of compos-ite construction in the contextof concrete and steel. In the1840’s, however, the use ofcast iron and wrought iron orwood and wrought iron fortruss bridges represented someof the first practical uses ofcomposite construction inbridge design. It wasn’t until1944, however, when AASHTOfirst published specificationson the use of composite con-struction for highway bridges[Ref. 3.32].
Downloaded from Digital Engineering Library @ McGraw-Hill (www.digitalengineeringlibrary.com)Copyright © 2006 The McGraw-Hill Companies. All rights reserved.
Any use is subject to the Terms of Use as given at the website.
Design of Superstructure Elements
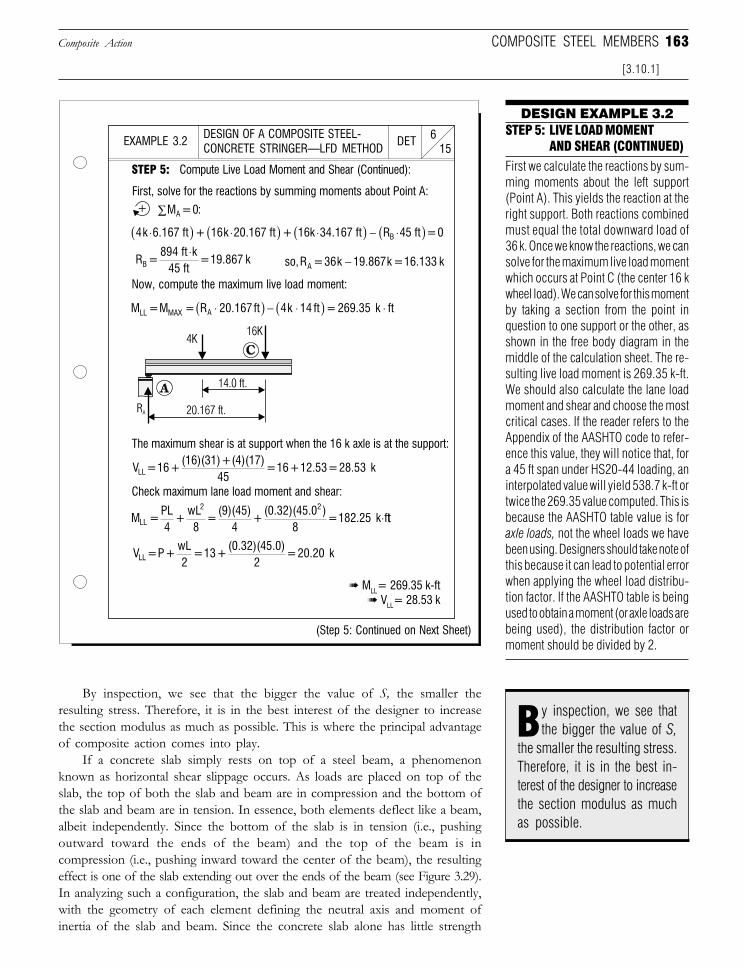
163
DESIGN EXAMPLE 3.2
By inspection, we see that the bigger the value of S, the smaller theresulting stress. Therefore, it is in the best interest of the designer to increasethe section modulus as much as possible. This is where the principal advantageof composite action comes into play.
If a concrete slab simply rests on top of a steel beam, a phenomenonknown as horizontal shear slippage occurs. As loads are placed on top of theslab, the top of both the slab and beam are in compression and the bottom ofthe slab and beam are in tension. In essence, both elements deflect like a beam,albeit independently. Since the bottom of the slab is in tension (i.e., pushingoutward toward the ends of the beam) and the top of the beam is incompression (i.e., pushing inward toward the center of the beam), the resultingeffect is one of the slab extending out over the ends of the beam (see Figure 3.29).In analyzing such a configuration, the slab and beam are treated independently,with the geometry of each element defining the neutral axis and moment ofinertia of the slab and beam. Since the concrete slab alone has little strength
Composite Action
[3.10.1]
COMPOSITE STEEL MEMBERS
First we calculate the reactions by sum-ming moments about the left support(Point A). This yields the reaction at theright support. Both reactions combinedmust equal the total downward load of36 k. Once we know the reactions, we cansolve for the maximum live load momentwhich occurs at Point C (the center 16 kwheel load). We can solve for this momentby taking a section from the point inquestion to one support or the other, asshown in the free body diagram in themiddle of the calculation sheet. The re-sulting live load moment is 269.35 k-ft.We should also calculate the lane loadmoment and shear and choose the mostcritical cases. If the reader refers to theAppendix of the AASHTO code to refer-ence this value, they will notice that, fora 45 ft span under HS20-44 loading, aninterpolated value will yield 538.7 k-ft ortwice the 269.35 value computed. This isbecause the AASHTO table value is foraxle loads, not the wheel loads we havebeen using. Designers should take note ofthis because it can lead to potential errorwhen applying the wheel load distribu-tion factor. If the AASHTO table is beingused to obtain a moment (or axle loads arebeing used), the distribution factor ormoment should be divided by 2.
STEP 5: LIVE LOAD MOMENT AND SHEAR (CONTINUED)
y inspection, we see thatthe bigger the value of S,
the smaller the resulting stress.Therefore, it is in the best in-terest of the designer to increasethe section modulus as muchas possible.
B
DESIGN OF A COMPOSITE STEEL-CONCRETE STRINGER—LFD METHOD 15
6DETEXAMPLE 3.2
STEP 5: Compute Live Load Moment and Shear (Continued):
(Step 5: Continued on Next Sheet)
First, solve for the reactions by summing moments about Point A:
The maximum shear is at support when the 16 k axle is at the support:
Now, compute the maximum live load moment:
+
Check maximum lane load moment and shear:
➠ MLL= 269.35 k-ft➠ VLL= 28.53 k
4k 6.167 ft + 16k 20.167 ft + 16k 34.167 ft R 45 ft = 0B⋅( ) ⋅( ) ⋅( ) − ⋅( )
so, R = 36k 19.867k = 16.133 kA −R = 894 ft k
45 ft = 19.867 kB
⋅
M = M = R 20.167 ft 4k 14 ft = 269.35 k ftLL MAX A ⋅( ) − ⋅( ) ⋅
V = 16 + (16)(31) + (4)(17)
45 = 16 + 12.53 = 28.53 kLL
M = PL4
+ wL8
= (9)(45)
4 +
(0.32)(45.0 )8
= 182.25 k fLL
2 2
⋅ tt
V = P + wL2
= 13 + (0.32)(45.0)
2 = 20.20 kLL
M = 0:A ∑
Downloaded from Digital Engineering Library @ McGraw-Hill (www.digitalengineeringlibrary.com)Copyright © 2006 The McGraw-Hill Companies. All rights reserved.
Any use is subject to the Terms of Use as given at the website.
Design of Superstructure Elements
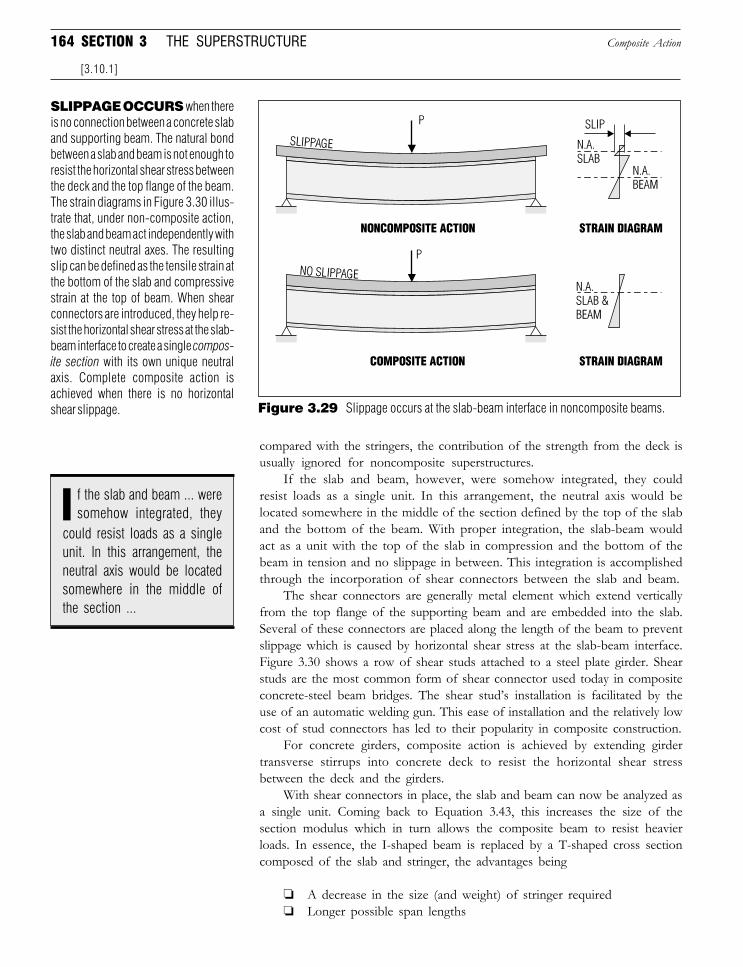
164 SECTION 3 THE SUPERSTRUCTURE
compared with the stringers, the contribution of the strength from the deck isusually ignored for noncomposite superstructures.
If the slab and beam, however, were somehow integrated, they couldresist loads as a single unit. In this arrangement, the neutral axis would belocated somewhere in the middle of the section defined by the top of the slaband the bottom of the beam. With proper integration, the slab-beam wouldact as a unit with the top of the slab in compression and the bottom of thebeam in tension and no slippage in between. This integration is accomplishedthrough the incorporation of shear connectors between the slab and beam.
The shear connectors are generally metal element which extend verticallyfrom the top flange of the supporting beam and are embedded into the slab.Several of these connectors are placed along the length of the beam to preventslippage which is caused by horizontal shear stress at the slab-beam interface.Figure 3.30 shows a row of shear studs attached to a steel plate girder. Shearstuds are the most common form of shear connector used today in compositeconcrete-steel beam bridges. The shear stud’s installation is facilitated by theuse of an automatic welding gun. This ease of installation and the relatively lowcost of stud connectors has led to their popularity in composite construction.
For concrete girders, composite action is achieved by extending girdertransverse stirrups into concrete deck to resist the horizontal shear stressbetween the deck and the girders.
With shear connectors in place, the slab and beam can now be analyzed asa single unit. Coming back to Equation 3.43, this increases the size of thesection modulus which in turn allows the composite beam to resist heavierloads. In essence, the I-shaped beam is replaced by a T-shaped cross sectioncomposed of the slab and stringer, the advantages being
❏ A decrease in the size (and weight) of stringer required❏ Longer possible span lengths
Composite Action
[3.10.1]
f the slab and beam ... weresomehow integrated, they
could resist loads as a singleunit. In this arrangement, theneutral axis would be locatedsomewhere in the middle ofthe section ...
I
Figure 3.29 Slippage occurs at the slab-beam interface in noncomposite beams.
SLIPPAGE OCCURS when thereis no connection between a concrete slaband supporting beam. The natural bondbetween a slab and beam is not enough toresist the horizontal shear stress betweenthe deck and the top flange of the beam.The strain diagrams in Figure 3.30 illus-trate that, under non-composite action,the slab and beam act independently withtwo distinct neutral axes. The resultingslip can be defined as the tensile strain atthe bottom of the slab and compressivestrain at the top of beam. When shearconnectors are introduced, they help re-sist the horizontal shear stress at the slab-beam interface to create a single compos-ite section with its own unique neutralaxis. Complete composite action isachieved when there is no horizontalshear slippage.
Downloaded from Digital Engineering Library @ McGraw-Hill (www.digitalengineeringlibrary.com)Copyright © 2006 The McGraw-Hill Companies. All rights reserved.
Any use is subject to the Terms of Use as given at the website.
Design of Superstructure Elements
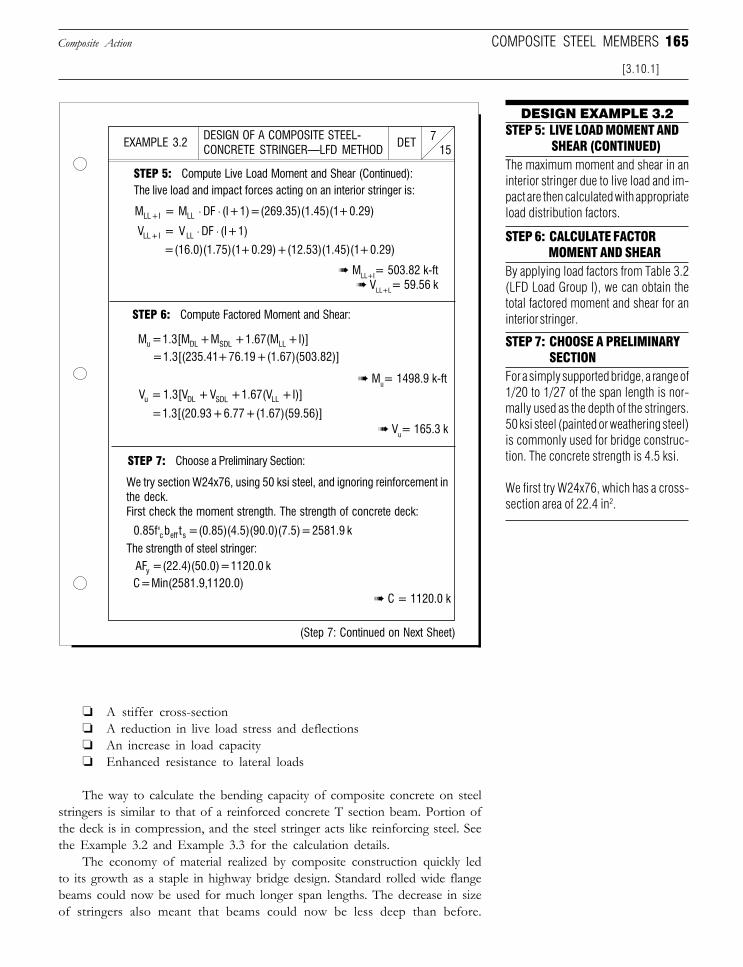
165
DESIGN EXAMPLE 3.2
DESIGN OF A COMPOSITE STEEL-CONCRETE STRINGER—LFD METHOD 15
7DETEXAMPLE 3.2
❏ A stiffer cross-section❏ A reduction in live load stress and deflections❏ An increase in load capacity❏ Enhanced resistance to lateral loads
The way to calculate the bending capacity of composite concrete on steelstringers is similar to that of a reinforced concrete T section beam. Portion ofthe deck is in compression, and the steel stringer acts like reinforcing steel. Seethe Example 3.2 and Example 3.3 for the calculation details.
The economy of material realized by composite construction quickly ledto its growth as a staple in highway bridge design. Standard rolled wide flangebeams could now be used for much longer span lengths. The decrease in sizeof stringers also meant that beams could now be less deep than before.
(Step 7: Continued on Next Sheet)
COMPOSITE STEEL MEMBERSComposite Action
[3.10.1]
STEP 5: Compute Live Load Moment and Shear (Continued):The live load and impact forces acting on an interior stringer is:
➠ MLL+I= 503.82 k-ft➠ VLL+L= 59.56 k
STEP 6: Compute Factored Moment and Shear:
➠ Mu= 1498.9 k-ft
➠ Vu= 165.3 k
STEP 7: Choose a Preliminary Section:
We try section W24x76, using 50 ksi steel, and ignoring reinforcement inthe deck.First check the moment strength. The strength of concrete deck:
The strength of steel stringer:
➠ C = 1120.0 k
The maximum moment and shear in aninterior stringer due to live load and im-pact are then calculated with appropriateload distribution factors.
STEP 5: LIVE LOAD MOMENT AND SHEAR (CONTINUED)
By applying load factors from Table 3.2(LFD Load Group I), we can obtain thetotal factored moment and shear for aninterior stringer.
STEP 6: CALCULATE FACTOR MOMENT AND SHEAR
STEP 7: CHOOSE A PRELIMINARYSECTION
For a simply supported bridge, a range of1/20 to 1/27 of the span length is nor-mally used as the depth of the stringers.50 ksi steel (painted or weathering steel)is commonly used for bridge construc-tion. The concrete strength is 4.5 ksi.
We first try W24x76, which has a cross-section area of 22.4 in2.
M = M DF (I + 1) = (269.35)(1.45)(1 + 0.29)LL + I LL ⋅ ⋅
V = V DF (I + 1)LL + I LL ⋅ ⋅= (16.0)(1.75)(1 + 0.29) + (12.53)(1.45)(1 + 0.29)
M = 1.3[M + M + 1.67(M +I)]u DL SDL LL
= 1.3[(235.41 + 76.19 + (1.67)(503.82)]
V = 1.3[V + V + 1.67(V +I)]u DL SDL LL
= 1.3[(20.93 + 6.77 + (1.67)(59.56)]
0.85f b t = (0.85)(4.5)(90.0)(7.5) = 2581.9 k c eff s'
AF = (22.4)(50.0) = 1120.0 ky
C = Min(2581.9,1120.0)
Downloaded from Digital Engineering Library @ McGraw-Hill (www.digitalengineeringlibrary.com)Copyright © 2006 The McGraw-Hill Companies. All rights reserved.
Any use is subject to the Terms of Use as given at the website.
Design of Superstructure Elements
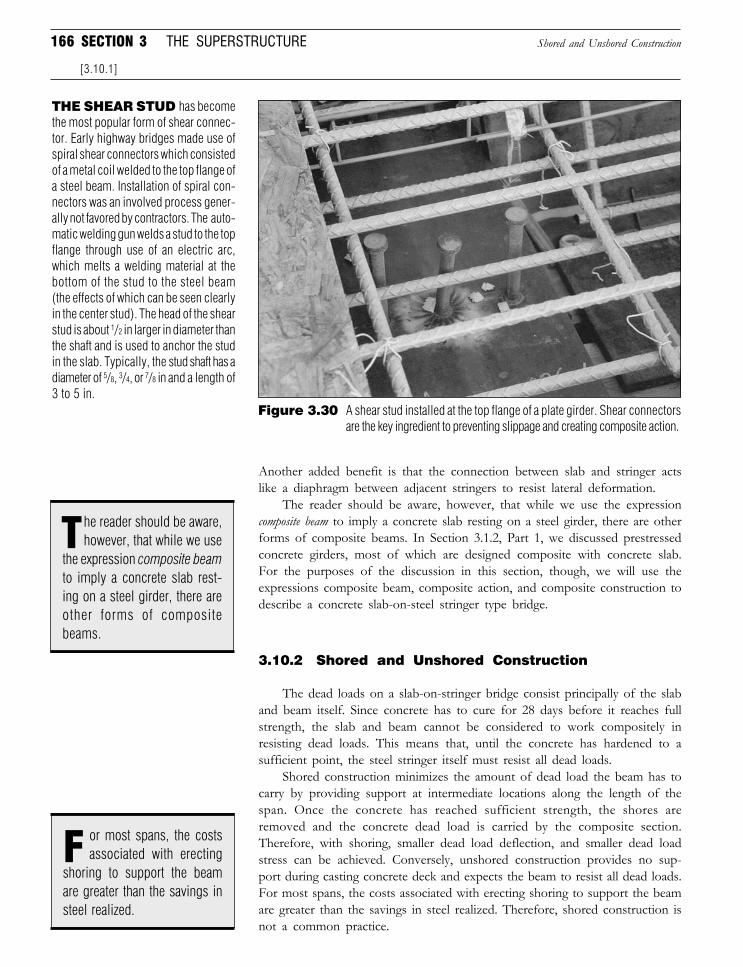
166 SECTION 3 THE SUPERSTRUCTURE
Another added benefit is that the connection between slab and stringer actslike a diaphragm between adjacent stringers to resist lateral deformation.
The reader should be aware, however, that while we use the expressioncomposite beam to imply a concrete slab resting on a steel girder, there are otherforms of composite beams. In Section 3.1.2, Part 1, we discussed prestressedconcrete girders, most of which are designed composite with concrete slab.For the purposes of the discussion in this section, though, we will use theexpressions composite beam, composite action, and composite construction todescribe a concrete slab-on-steel stringer type bridge.
3.10.2 Shored and Unshored Construction
The dead loads on a slab-on-stringer bridge consist principally of the slaband beam itself. Since concrete has to cure for 28 days before it reaches fullstrength, the slab and beam cannot be considered to work compositely inresisting dead loads. This means that, until the concrete has hardened to asufficient point, the steel stringer itself must resist all dead loads.
Shored construction minimizes the amount of dead load the beam has tocarry by providing support at intermediate locations along the length of thespan. Once the concrete has reached sufficient strength, the shores areremoved and the concrete dead load is carried by the composite section.Therefore, with shoring, smaller dead load deflection, and smaller dead loadstress can be achieved. Conversely, unshored construction provides no sup-port during casting concrete deck and expects the beam to resist all dead loads.For most spans, the costs associated with erecting shoring to support the beamare greater than the savings in steel realized. Therefore, shored construction isnot a common practice.
Shored and Unshored Construction
[3.10.1]
Figure 3.30 A shear stud installed at the top flange of a plate girder. Shear connectorsare the key ingredient to preventing slippage and creating composite action.
he reader should be aware,however, that while we use
the expression composite beamto imply a concrete slab rest-ing on a steel girder, there areother forms of compositebeams.
T
or most spans, the costsassociated with erecting
shoring to support the beamare greater than the savings insteel realized.
F
THE SHEAR STUD has becomethe most popular form of shear connec-tor. Early highway bridges made use ofspiral shear connectors which consistedof a metal coil welded to the top flange ofa steel beam. Installation of spiral con-nectors was an involved process gener-ally not favored by contractors. The auto-matic welding gun welds a stud to the topflange through use of an electric arc,which melts a welding material at thebottom of the stud to the steel beam(the effects of which can be seen clearlyin the center stud). The head of the shearstud is about 1/2 in larger in diameter thanthe shaft and is used to anchor the studin the slab. Typically, the stud shaft has adiameter of 5/8, 3/4, or 7/8 in and a length of3 to 5 in.
Downloaded from Digital Engineering Library @ McGraw-Hill (www.digitalengineeringlibrary.com)Copyright © 2006 The McGraw-Hill Companies. All rights reserved.
Any use is subject to the Terms of Use as given at the website.
Design of Superstructure Elements
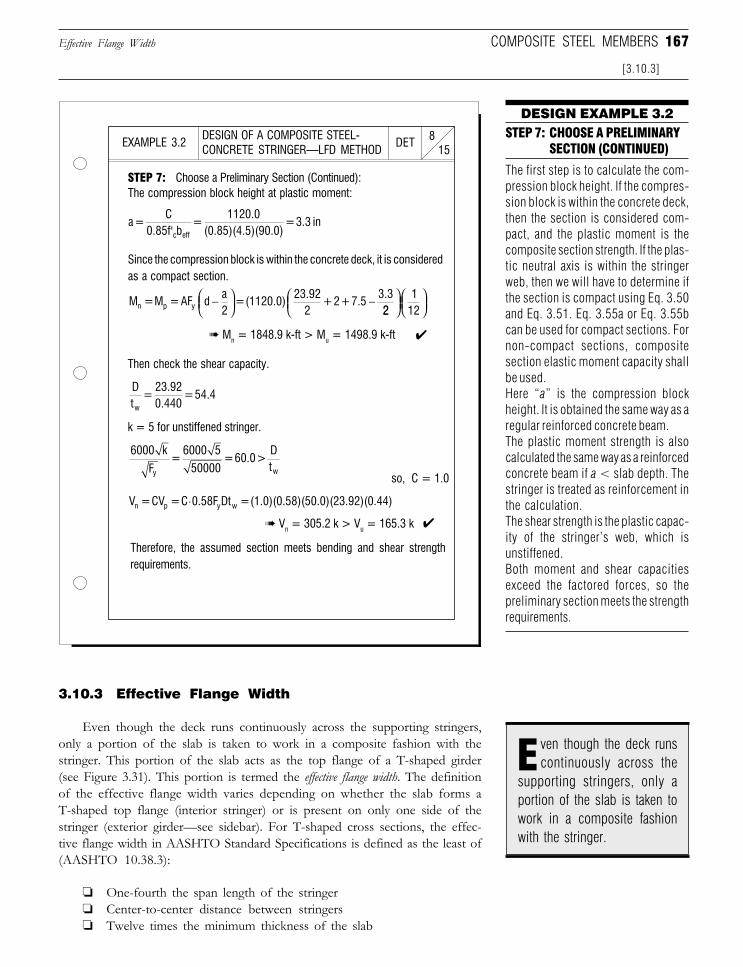
167
DESIGN EXAMPLE 3.2
DESIGN OF A COMPOSITE STEEL-CONCRETE STRINGER—LFD METHOD 15
8DETEXAMPLE 3.2
The first step is to calculate the com-pression block height. If the compres-sion block is within the concrete deck,then the section is considered com-pact, and the plastic moment is thecomposite section strength. If the plas-tic neutral axis is within the stringerweb, then we will have to determine ifthe section is compact using Eq. 3.50and Eq. 3.51. Eq. 3.55a or Eq. 3.55bcan be used for compact sections. Fornon-compact sections, compositesection elastic moment capacity shallbe used.Here “a” is the compression blockheight. It is obtained the same way as aregular reinforced concrete beam.The plastic moment strength is alsocalculated the same way as a reinforcedconcrete beam if a < slab depth. Thestringer is treated as reinforcement inthe calculation.The shear strength is the plastic capac-ity of the stringer’s web, which isunstiffened.Both moment and shear capacitiesexceed the factored forces, so thepreliminary section meets the strengthrequirements.
3.10.3 Effective Flange Width
Even though the deck runs continuously across the supporting stringers,only a portion of the slab is taken to work in a composite fashion with thestringer. This portion of the slab acts as the top flange of a T-shaped girder(see Figure 3.31). This portion is termed the effective flange width. The definitionof the effective flange width varies depending on whether the slab forms aT-shaped top flange (interior stringer) or is present on only one side of thestringer (exterior girder—see sidebar). For T-shaped cross sections, the effec-tive flange width in AASHTO Standard Specifications is defined as the least of(AASHTO 10.38.3):
❏ One-fourth the span length of the stringer❏ Center-to-center distance between stringers❏ Twelve times the minimum thickness of the slab
Effective Flange Width
[3.10.3]
COMPOSITE STEEL MEMBERS
STEP 7: Choose a Preliminary Section (Continued):The compression block height at plastic moment:
Since the compression block is within the concrete deck, it is consideredas a compact section.
➠ Mn = 1848.9 k-ft > Mu = 1498.9 k-ft
Then check the shear capacity.
so, C = 1.0
k = 5 for unstiffened stringer.
➠ Vn = 305.2 k > Vu = 165.3 k
Therefore, the assumed section meets bending and shear strengthrequirements.
STEP 7: CHOOSE A PRELIMINARYSECTION (CONTINUED)
✔
✔
ven though the deck runscontinuously across the
supporting stringers, only aportion of the slab is taken towork in a composite fashionwith the stringer.
E
a = C
0.85f b =
1120.0(0.85)(4.5)(90.0)
= 3.3 inc eff'
M = M = AF d a2
= (1120.0)23.92
2 + 2 + 7.5
3.3n p y −
−22
112
Dt
= 23.920.440
= 54.4w
6000 k
F =
6000 550000
= 60.0 > Dty w
V = CV = C 0.58F Dt = (1.0)(0.58)(50.0)(23.92)(0.44)n p y w⋅
Downloaded from Digital Engineering Library @ McGraw-Hill (www.digitalengineeringlibrary.com)Copyright © 2006 The McGraw-Hill Companies. All rights reserved.
Any use is subject to the Terms of Use as given at the website.
Design of Superstructure Elements
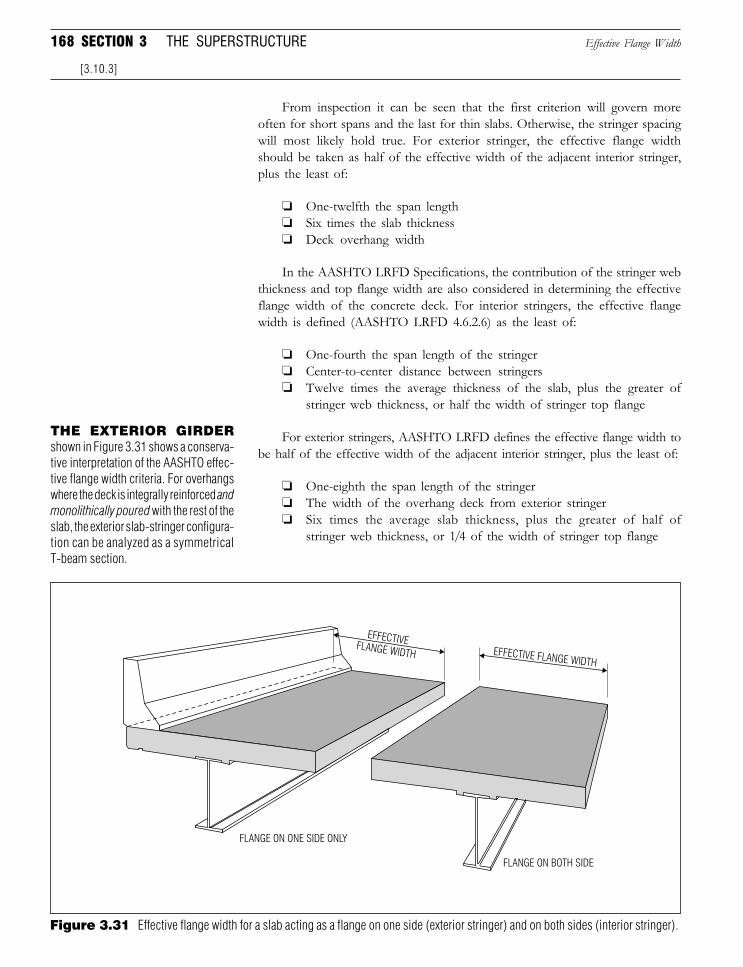
168 SECTION 3 THE SUPERSTRUCTURE
From inspection it can be seen that the first criterion will govern moreoften for short spans and the last for thin slabs. Otherwise, the stringer spacingwill most likely hold true. For exterior stringer, the effective flange widthshould be taken as half of the effective width of the adjacent interior stringer,plus the least of:
❏ One-twelfth the span length❏ Six times the slab thickness❏ Deck overhang width
In the AASHTO LRFD Specifications, the contribution of the stringer webthickness and top flange width are also considered in determining the effectiveflange width of the concrete deck. For interior stringers, the effective flangewidth is defined (AASHTO LRFD 4.6.2.6) as the least of:
❏ One-fourth the span length of the stringer❏ Center-to-center distance between stringers❏ Twelve times the average thickness of the slab, plus the greater of
stringer web thickness, or half the width of stringer top flange
For exterior stringers, AASHTO LRFD defines the effective flange width tobe half of the effective width of the adjacent interior stringer, plus the least of:
❏ One-eighth the span length of the stringer❏ The width of the overhang deck from exterior stringer❏ Six times the average slab thickness, plus the greater of half of
stringer web thickness, or 1/4 of the width of stringer top flange
Effective Flange Width
[3.10.3]
THE EXTERIOR GIRDERshown in Figure 3.31 shows a conserva-tive interpretation of the AASHTO effec-tive flange width criteria. For overhangswhere the deck is integrally reinforced andmonolithically poured with the rest of theslab, the exterior slab-stringer configura-tion can be analyzed as a symmetricalT-beam section.
Figure 3.31 Effective flange width for a slab acting as a flange on one side (exterior stringer) and on both sides (interior stringer).
FLANGE ON ONE SIDE ONLY
FLANGE ON BOTH SIDE
EFFECTIVEFLANGE WIDTH EFFECTIVE FLANGE WIDTH
Downloaded from Digital Engineering Library @ McGraw-Hill (www.digitalengineeringlibrary.com)Copyright © 2006 The McGraw-Hill Companies. All rights reserved.
Any use is subject to the Terms of Use as given at the website.
Design of Superstructure Elements
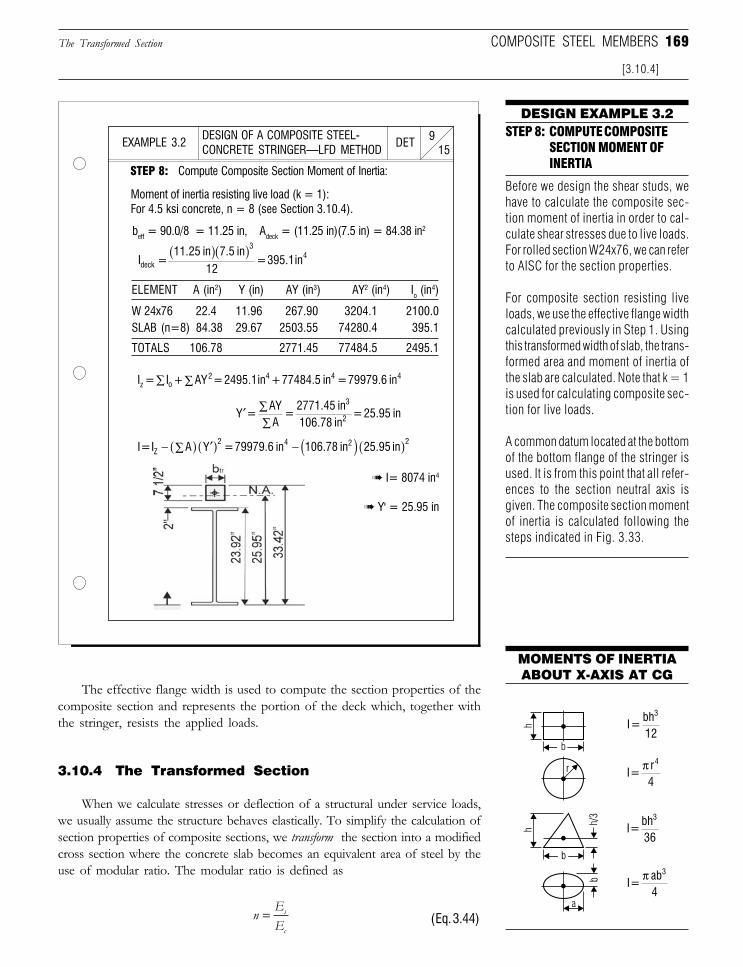
169
The effective flange width is used to compute the section properties of thecomposite section and represents the portion of the deck which, together withthe stringer, resists the applied loads.
3.10.4 The Transformed Section
When we calculate stresses or deflection of a structural under service loads,we usually assume the structure behaves elastically. To simplify the calculation ofsection properties of composite sections, we transform the section into a modifiedcross section where the concrete slab becomes an equivalent area of steel by theuse of modular ratio. The modular ratio is defined as
nEEs
c
= (Eq. 3.44)
DESIGN EXAMPLE 3.2
DESIGN OF A COMPOSITE STEEL-CONCRETE STRINGER—LFD METHOD 15
9DETEXAMPLE 3.2
STEP 8: Compute Composite Section Moment of Inertia:
STEP 8: COMPUTE COMPOSITESECTION MOMENT OFINERTIA
Before we design the shear studs, wehave to calculate the composite sec-tion moment of inertia in order to cal-culate shear stresses due to live loads.For rolled section W24x76, we can referto AISC for the section properties.
For composite section resisting liveloads, we use the effective flange widthcalculated previously in Step 1. Usingthis transformed width of slab, the trans-formed area and moment of inertia ofthe slab are calculated. Note that k = 1is used for calculating composite sec-tion for live loads.
A common datum located at the bottomof the bottom flange of the stringer isused. It is from this point that all refer-ences to the section neutral axis isgiven. The composite section momentof inertia is calculated following thesteps indicated in Fig. 3.33.
The Transformed Section
[3.10.4]
COMPOSITE STEEL MEMBERS
Moment of inertia resisting live load (k = 1):For 4.5 ksi concrete, n = 8 (see Section 3.10.4).
beff = 90.0/8 = 11.25 in, Adeck = (11.25 in)(7.5 in) = 84.38 in2
ELEMENT A (in2) Y (in) AY (in3) AY2 (in4) Io (in4)
W 24x76 22.4 11.96 267.90 3204.1 2100.0SLAB (n=8) 84.38 29.67 2503.55 74280.4 395.1
TOTALS 106.78 2771.45 77484.5 2495.1
➠ I= 8074 in4
➠ Y' = 25.95 in
MOMENTS OF INERTIAABOUT X-AXIS AT CG
I = I + AY = 2495.1in + 77484.5 in = 79979.6 inz o 2
4
4 4∑∑
′ ∑∑
Y = AYA
= 2771.45 in106.78 in
= 25.95 in3
2
I = I A Y = 79979.6 in 106.78 in 25.95 inZ2 4 2 2− ∑( ) ′( ) − ( ) ( )
I=bh12
3
I = r4
4π
I = bh36
3
I = ab4
3π
b
I = 11.25 in 7.5 in
12 = 395.1indeck
34( )( )
Downloaded from Digital Engineering Library @ McGraw-Hill (www.digitalengineeringlibrary.com)Copyright © 2006 The McGraw-Hill Companies. All rights reserved.
Any use is subject to the Terms of Use as given at the website.
Design of Superstructure Elements
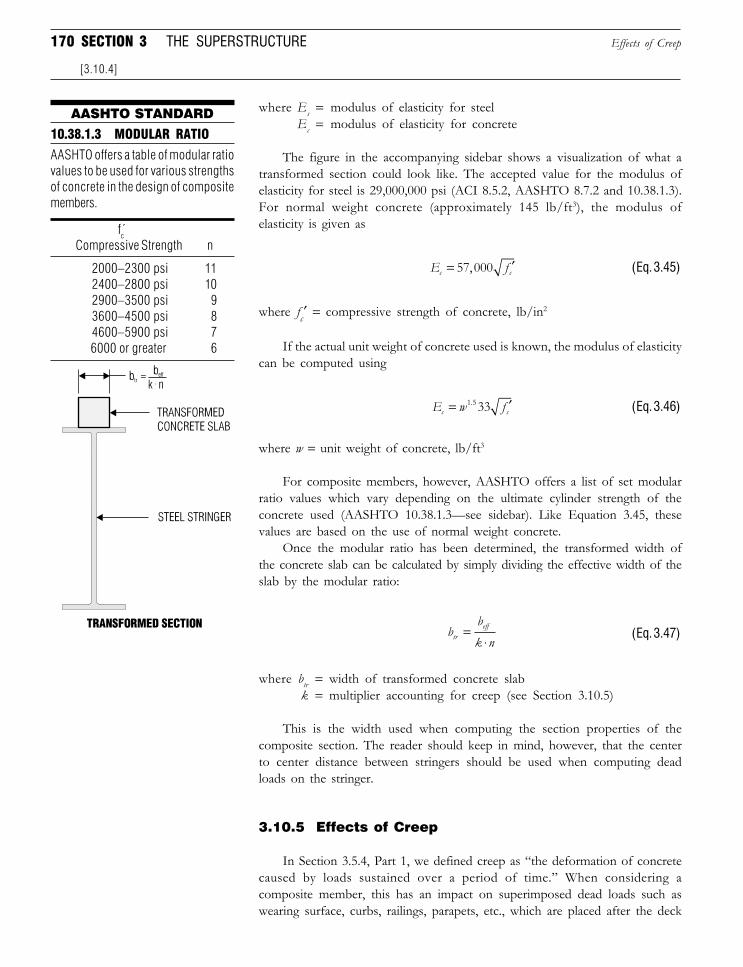
170 SECTION 3 THE SUPERSTRUCTURE
where Es = modulus of elasticity for steelEc = modulus of elasticity for concrete
The figure in the accompanying sidebar shows a visualization of what atransformed section could look like. The accepted value for the modulus ofelasticity for steel is 29,000,000 psi (ACI 8.5.2, AASHTO 8.7.2 and 10.38.1.3).For normal weight concrete (approximately 145 lb/ft3), the modulus ofelasticity is given as
E fc c= ′57 000, (Eq. 3.45)
where fc′ = compressive strength of concrete, lb/in2
If the actual unit weight of concrete used is known, the modulus of elasticitycan be computed using
E w fc c= ′1 5 33. (Eq. 3.46)
where w = unit weight of concrete, lb/ft3
For composite members, however, AASHTO offers a list of set modularratio values which vary depending on the ultimate cylinder strength of theconcrete used (AASHTO 10.38.1.3—see sidebar). Like Equation 3.45, thesevalues are based on the use of normal weight concrete.
Once the modular ratio has been determined, the transformed width ofthe concrete slab can be calculated by simply dividing the effective width of theslab by the modular ratio:
bbk ntreff=⋅
(Eq. 3.47)
where btr = width of transformed concrete slabk = multiplier accounting for creep (see Section 3.10.5)
This is the width used when computing the section properties of thecomposite section. The reader should keep in mind, however, that the centerto center distance between stringers should be used when computing deadloads on the stringer.
3.10.5 Effects of Creep
In Section 3.5.4, Part 1, we defined creep as “the deformation of concretecaused by loads sustained over a period of time.” When considering acomposite member, this has an impact on superimposed dead loads such aswearing surface, curbs, railings, parapets, etc., which are placed after the deck
Effects of Creep
[3.10.4]
AASHTO STANDARD
AASHTO offers a table of modular ratiovalues to be used for various strengthsof concrete in the design of compositemembers.
10.38.1.3 MODULAR RATIO
2000–2300 psi 11 2400–2800 psi 10 2900–3500 psi 9 3600–4500 psi 8 4600–5900 psi 7 6000 or greater 6
fcCompressive Strength n
Downloaded from Digital Engineering Library @ McGraw-Hill (www.digitalengineeringlibrary.com)Copyright © 2006 The McGraw-Hill Companies. All rights reserved.
Any use is subject to the Terms of Use as given at the website.
Design of Superstructure Elements
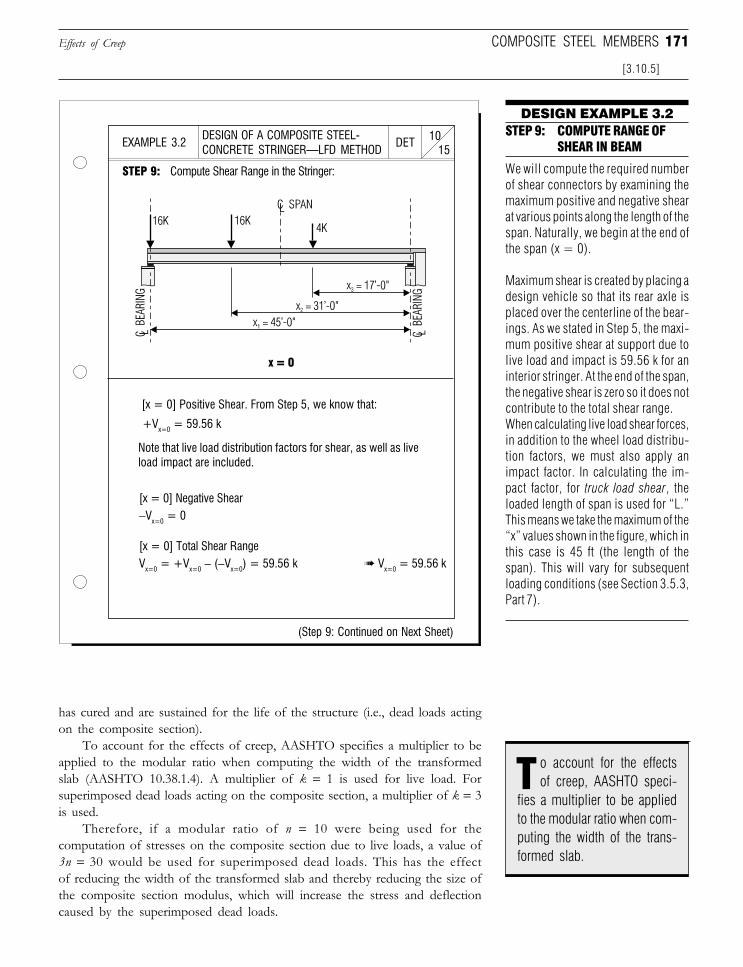
171
DESIGN EXAMPLE 3.2
DESIGN OF A COMPOSITE STEEL-CONCRETE STRINGER—LFD METHOD 15
10DETEXAMPLE 3.2STEP 9: COMPUTE RANGE OF
SHEAR IN BEAM
(Step 9: Continued on Next Sheet)
has cured and are sustained for the life of the structure (i.e., dead loads actingon the composite section).
To account for the effects of creep, AASHTO specifies a multiplier to beapplied to the modular ratio when computing the width of the transformedslab (AASHTO 10.38.1.4). A multiplier of k = 1 is used for live load. Forsuperimposed dead loads acting on the composite section, a multiplier of k = 3is used.
Therefore, if a modular ratio of n = 10 were being used for thecomputation of stresses on the composite section due to live loads, a value of3n = 30 would be used for superimposed dead loads. This has the effectof reducing the width of the transformed slab and thereby reducing the size ofthe composite section modulus, which will increase the stress and deflectioncaused by the superimposed dead loads.
Effects of Creep
[3.10.5]
COMPOSITE STEEL MEMBERS
[x = 0] Positive Shear. From Step 5, we know that:
+Vx=0 = 59.56 k
[x = 0] Total Shear RangeVx=0 = +Vx=0 − (−Vx=0) = 59.56 k ➠ Vx=0 = 59.56 k
[x = 0] Negative Shear−Vx=0 = 0
We will compute the required numberof shear connectors by examining themaximum positive and negative shearat various points along the length of thespan. Naturally, we begin at the end ofthe span (x = 0).
Maximum shear is created by placing adesign vehicle so that its rear axle isplaced over the centerline of the bear-ings. As we stated in Step 5, the maxi-mum positive shear at support due tolive load and impact is 59.56 k for aninterior stringer. At the end of the span,the negative shear is zero so it does notcontribute to the total shear range.When calculating live load shear forces,in addition to the wheel load distribu-tion factors, we must also apply animpact factor. In calculating the im-pact factor, for truck load shear, theloaded length of span is used for “L.”This means we take the maximum of the“x” values shown in the figure, which inthis case is 45 ft (the length of thespan). This will vary for subsequentloading conditions (see Section 3.5.3,Part 7).
STEP 9: Compute Shear Range in the Stringer:
x = 0
Note that live load distribution factors for shear, as well as liveload impact are included.
o account for the effectsof creep, AASHTO speci-
fies a multiplier to be appliedto the modular ratio when com-puting the width of the trans-formed slab.
T
Downloaded from Digital Engineering Library @ McGraw-Hill (www.digitalengineeringlibrary.com)Copyright © 2006 The McGraw-Hill Companies. All rights reserved.
Any use is subject to the Terms of Use as given at the website.
Design of Superstructure Elements
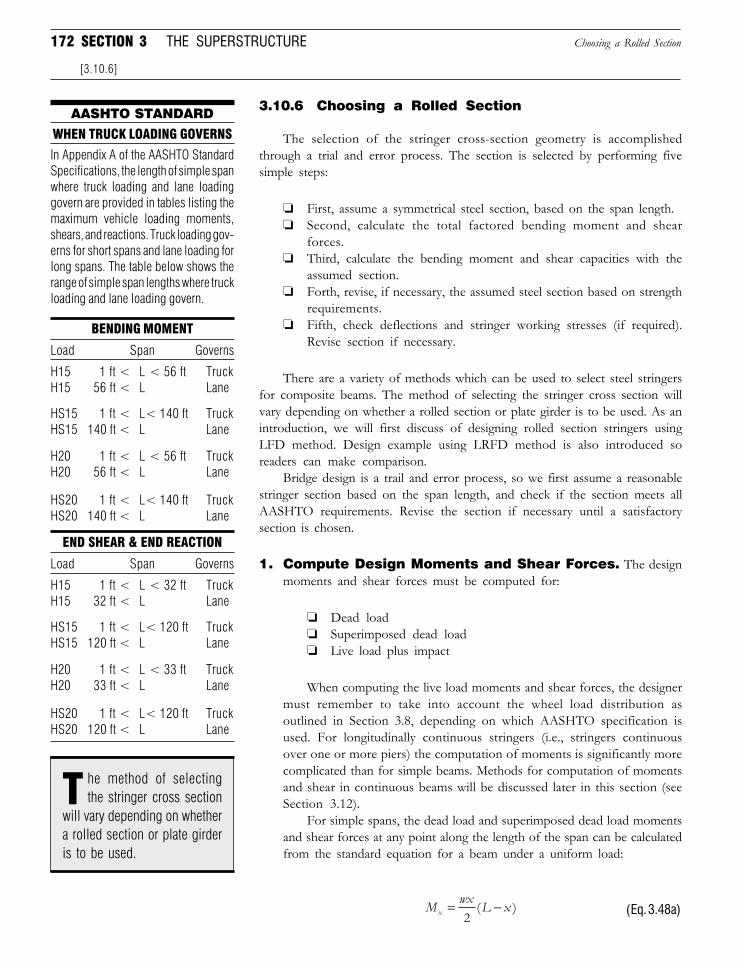
172 SECTION 3 THE SUPERSTRUCTURE
3.10.6 Choosing a Rolled Section
The selection of the stringer cross-section geometry is accomplishedthrough a trial and error process. The section is selected by performing fivesimple steps:
❏ First, assume a symmetrical steel section, based on the span length.❏ Second, calculate the total factored bending moment and shear
forces.❏ Third, calculate the bending moment and shear capacities with the
assumed section.❏ Forth, revise, if necessary, the assumed steel section based on strength
requirements.❏ Fifth, check deflections and stringer working stresses (if required).
Revise section if necessary.
There are a variety of methods which can be used to select steel stringersfor composite beams. The method of selecting the stringer cross section willvary depending on whether a rolled section or plate girder is to be used. As anintroduction, we will first discuss of designing rolled section stringers usingLFD method. Design example using LRFD method is also introduced soreaders can make comparison.
Bridge design is a trail and error process, so we first assume a reasonablestringer section based on the span length, and check if the section meets allAASHTO requirements. Revise the section if necessary until a satisfactorysection is chosen.
1. Compute Design Moments and Shear Forces. The designmoments and shear forces must be computed for:
❏ Dead load❏ Superimposed dead load❏ Live load plus impact
When computing the live load moments and shear forces, the designermust remember to take into account the wheel load distribution asoutlined in Section 3.8, depending on which AASHTO specification isused. For longitudinally continuous stringers (i.e., stringers continuousover one or more piers) the computation of moments is significantly morecomplicated than for simple beams. Methods for computation of momentsand shear in continuous beams will be discussed later in this section (seeSection 3.12).
For simple spans, the dead load and superimposed dead load momentsand shear forces at any point along the length of the span can be calculatedfrom the standard equation for a beam under a uniform load:
M wx L xx = −2
( ) (Eq. 3.48a)
Choosing a Rolled Section
[3.10.6]
AASHTO STANDARD
In Appendix A of the AASHTO StandardSpecifications, the length of simple spanwhere truck loading and lane loadinggovern are provided in tables listing themaximum vehicle loading moments,shears, and reactions. Truck loading gov-erns for short spans and lane loading forlong spans. The table below shows therange of simple span lengths where truckloading and lane loading govern.
WHEN TRUCK LOADING GOVERNS
BENDING MOMENT
Load Span Governs
H15 1 ft < L < 56 ft TruckH15 56 ft < L Lane
HS15 1 ft < L< 140 ft TruckHS15 140 ft < L Lane
H20 1 ft < L < 56 ft TruckH20 56 ft < L Lane
HS20 1 ft < L< 140 ft TruckHS20 140 ft < L Lane
END SHEAR & END REACTION
Load Span Governs
H15 1 ft < L < 32 ft TruckH15 32 ft < L Lane
HS15 1 ft < L< 120 ft TruckHS15 120 ft < L Lane
H20 1 ft < L < 33 ft TruckH20 33 ft < L Lane
HS20 1 ft < L< 120 ft TruckHS20 120 ft < L Lane
he method of selectingthe stringer cross section
will vary depending on whethera rolled section or plate girderis to be used.
T
Downloaded from Digital Engineering Library @ McGraw-Hill (www.digitalengineeringlibrary.com)Copyright © 2006 The McGraw-Hill Companies. All rights reserved.
Any use is subject to the Terms of Use as given at the website.
Design of Superstructure Elements
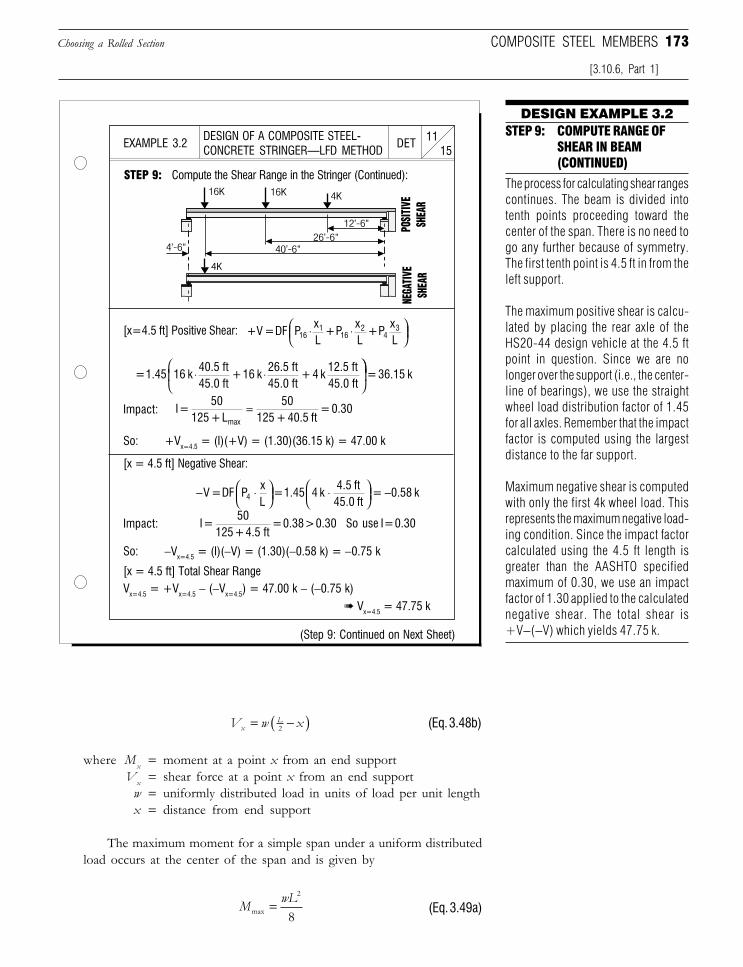
173
[x=4.5 ft] Positive Shear:
Impact:
So: +Vx=4.5 = (I)(+V) = (1.30)(36.15 k) = 47.00 k
[x = 4.5 ft] Negative Shear:
Impact:
So: −Vx=4.5 = (I)(−V) = (1.30)(−0.58 k) = −0.75 k
[x = 4.5 ft] Total Shear RangeVx=4.5 = +Vx=4.5 − (−Vx=4.5) = 47.00 k − (−0.75 k)
➠ Vx=4.5 = 47.75 k
DESIGN OF A COMPOSITE STEEL-CONCRETE STRINGER—LFD METHOD 15
DETEXAMPLE 3.2 11
STEP 9: Compute the Shear Range in the Stringer (Continued):
DESIGN EXAMPLE 3.2STEP 9: COMPUTE RANGE OF
SHEAR IN BEAM(CONTINUED)
The process for calculating shear rangescontinues. The beam is divided intotenth points proceeding toward thecenter of the span. There is no need togo any further because of symmetry.The first tenth point is 4.5 ft in from theleft support.
The maximum positive shear is calcu-lated by placing the rear axle of theHS20-44 design vehicle at the 4.5 ftpoint in question. Since we are nolonger over the support (i.e., the center-line of bearings), we use the straightwheel load distribution factor of 1.45for all axles. Remember that the impactfactor is computed using the largestdistance to the far support.
Maximum negative shear is computedwith only the first 4k wheel load. Thisrepresents the maximum negative load-ing condition. Since the impact factorcalculated using the 4.5 ft length isgreater than the AASHTO specifiedmaximum of 0.30, we use an impactfactor of 1.30 applied to the calculatednegative shear. The total shear is+V−(−V) which yields 47.75 k.
V w xxL= −( )2 (Eq. 3.48b)
where Mx = moment at a point x from an end supportVx = shear force at a point x from an end support
w = uniformly distributed load in units of load per unit lengthx = distance from end support
The maximum moment for a simple span under a uniform distributedload occurs at the center of the span and is given by
M wLmax =
2
8(Eq. 3.49a)
COMPOSITE STEEL MEMBERSChoosing a Rolled Section
[3.10.6, Part 1]
+V = DF PxL
+ PxL
+ PxL16
116
24
3⋅ ⋅
= 1.45 16 k40.5 ft45.0 ft
+16 k26.5 ft45.0 ft
+ 4 k12.5 ft45.0 ft
⋅ ⋅
=36.15 k
I=50
125 +L50
125 + 40.5 ft=0.30
max
=
− ⋅
⋅
V = DF PxL
= 1.45 4 k4.5 ft
45.0 ft= 0.58 k4 −
I=50
125 + 4.5 ft = 0.38 > 0.30 So use I = 0.30
(Step 9: Continued on Next Sheet)
Downloaded from Digital Engineering Library @ McGraw-Hill (www.digitalengineeringlibrary.com)Copyright © 2006 The McGraw-Hill Companies. All rights reserved.
Any use is subject to the Terms of Use as given at the website.
Design of Superstructure Elements
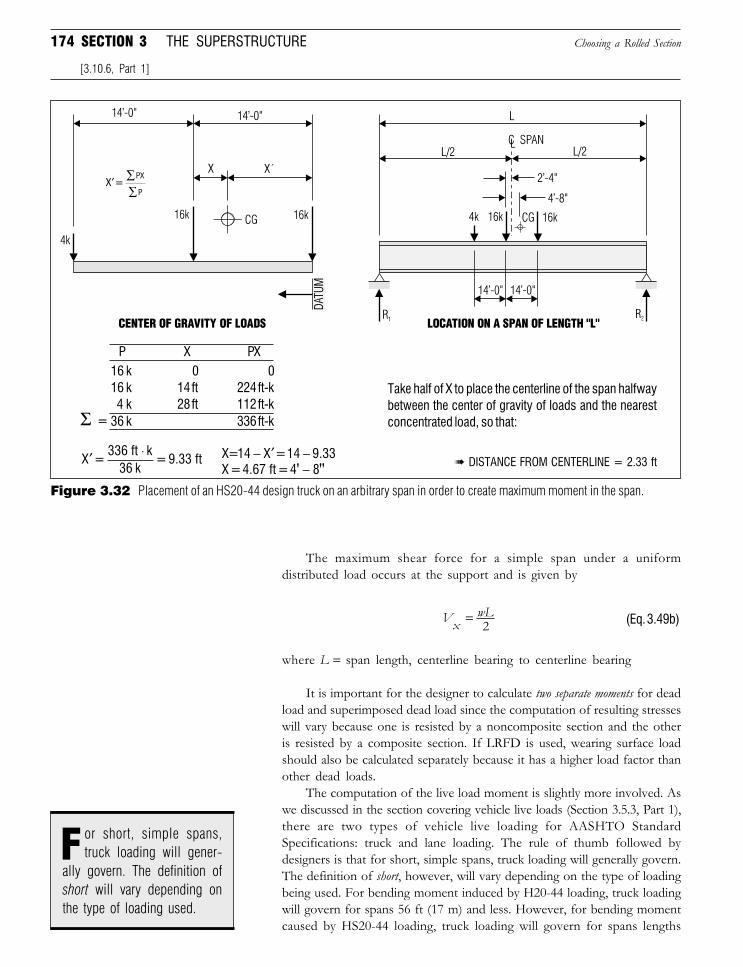
174 SECTION 3 THE SUPERSTRUCTURE
The maximum shear force for a simple span under a uniformdistributed load occurs at the support and is given by
VxwL= 2 (Eq. 3.49b)
where L = span length, centerline bearing to centerline bearing
It is important for the designer to calculate two separate moments for deadload and superimposed dead load since the computation of resulting stresseswill vary because one is resisted by a noncomposite section and the otheris resisted by a composite section. If LRFD is used, wearing surface loadshould also be calculated separately because it has a higher load factor thanother dead loads.
The computation of the live load moment is slightly more involved. Aswe discussed in the section covering vehicle live loads (Section 3.5.3, Part 1),there are two types of vehicle live loading for AASHTO StandardSpecifications: truck and lane loading. The rule of thumb followed bydesigners is that for short, simple spans, truck loading will generally govern.The definition of short, however, will vary depending on the type of loadingbeing used. For bending moment induced by H20-44 loading, truck loadingwill govern for spans 56 ft (17 m) and less. However, for bending momentcaused by HS20-44 loading, truck loading will govern for spans lengths
Choosing a Rolled Section
[3.10.6, Part 1]
Take half of X to place the centerline of the span halfwaybetween the center of gravity of loads and the nearestconcentrated load, so that:
➠ DISTANCE FROM CENTERLINE = 2.33 ft
Figure 3.32 Placement of an HS20-44 design truck on an arbitrary span in order to create maximum moment in the span.
P X PX16 k 0 016 k 14 ft 224 ft-k4 k 28 ft 112 ft-k
36 k 336 ft-kΣ =
or short, simple spans,truck loading will gener-
ally govern. The definition ofshort will vary depending onthe type of loading used.
F
′ ⋅X =
336 ft k36 k
=9.33 ft X=14 X = 14 9.33− ′ −X = 4.67 ft = 4 8' ''−
′ ∑∑
X = PX
P
Downloaded from Digital Engineering Library @ McGraw-Hill (www.digitalengineeringlibrary.com)Copyright © 2006 The McGraw-Hill Companies. All rights reserved.
Any use is subject to the Terms of Use as given at the website.
Design of Superstructure Elements
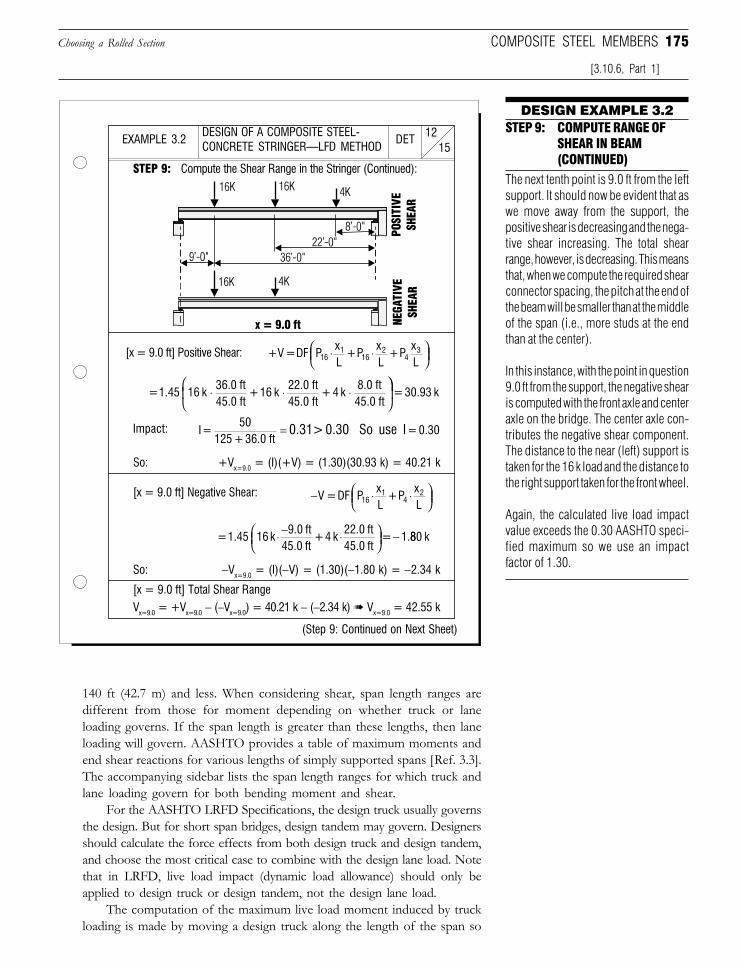
175
140 ft (42.7 m) and less. When considering shear, span length ranges aredifferent from those for moment depending on whether truck or laneloading governs. If the span length is greater than these lengths, then laneloading will govern. AASHTO provides a table of maximum moments andend shear reactions for various lengths of simply supported spans [Ref. 3.3].The accompanying sidebar lists the span length ranges for which truck andlane loading govern for both bending moment and shear.
For the AASHTO LRFD Specifications, the design truck usually governsthe design. But for short span bridges, design tandem may govern. Designersshould calculate the force effects from both design truck and design tandem,and choose the most critical case to combine with the design lane load. Notethat in LRFD, live load impact (dynamic load allowance) should only beapplied to design truck or design tandem, not the design lane load.
The computation of the maximum live load moment induced by truckloading is made by moving a design truck along the length of the span so
DESIGN EXAMPLE 3.2STEP 9: COMPUTE RANGE OF
SHEAR IN BEAM(CONTINUED)
Choosing a Rolled Section
[3.10.6, Part 1]
COMPOSITE STEEL MEMBERS
The next tenth point is 9.0 ft from the leftsupport. It should now be evident that aswe move away from the support, thepositive shear is decreasing and the nega-tive shear increasing. The total shearrange, however, is decreasing. This meansthat, when we compute the required shearconnector spacing, the pitch at the end ofthe beam will be smaller than at the middleof the span (i.e., more studs at the endthan at the center).
In this instance, with the point in question9.0 ft from the support, the negative shearis computed with the front axle and centeraxle on the bridge. The center axle con-tributes the negative shear component.The distance to the near (left) support istaken for the 16 k load and the distance tothe right support taken for the front wheel.
Again, the calculated live load impactvalue exceeds the 0.30 AASHTO speci-fied maximum so we use an impactfactor of 1.30.
DESIGN OF A COMPOSITE STEEL-CONCRETE STRINGER—LFD METHOD
DETEXAMPLE 3.2
(Step 9: Continued on Next Sheet)
1215
STEP 9: Compute the Shear Range in the Stringer (Continued):
[x = 9.0 ft] Positive Shear:
Impact:
Vx=9.0 = +Vx=9.0 − (−Vx=9.0) = 40.21 k − (−2.34 k) ➠ Vx=9.0 = 42.55 k[x = 9.0 ft] Total Shear Range
So: −Vx=9.0 = (I)(−V) = (1.30)(−1.80 k) = −2.34 k
So: +Vx=9.0 = (I)(+V) = (1.30)(30.93 k) = 40.21 k
x = 9.0 ft
[x = 9.0 ft] Negative Shear:
+V = DF PxL
+ PxL
+ PxL16
116
24
3⋅ ⋅
= 1.45 16 k36.0 ft45.0 ft
+16 k22.0 ft45.0 ft
+ 4 k8.0 ft45.0 ft
⋅ ⋅ ⋅
=30.93 k
I=50
125 +36.0 ft=0.300.31>0.30 So use I=
− ⋅ ⋅
V =DF PxL
+ PxL16
14
2
= 1.45 16 k9.0 ft
45.0 ft + 4 k
22.0 ft45.0 ft
= 1.⋅ − ⋅
− 880 k
Downloaded from Digital Engineering Library @ McGraw-Hill (www.digitalengineeringlibrary.com)Copyright © 2006 The McGraw-Hill Companies. All rights reserved.
Any use is subject to the Terms of Use as given at the website.
Design of Superstructure Elements
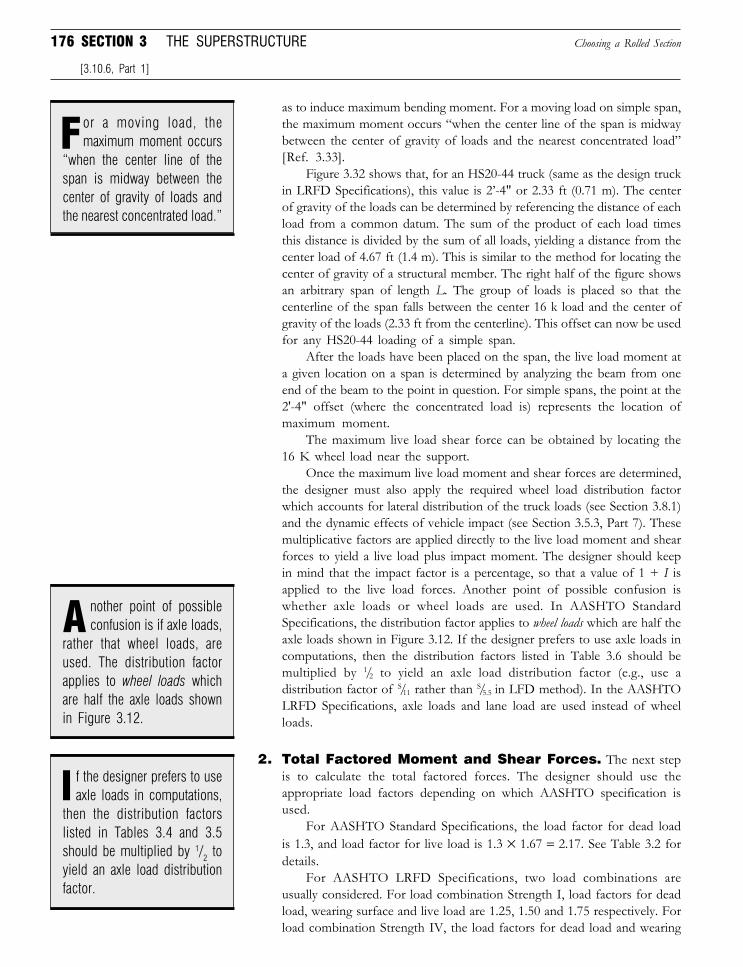
176 SECTION 3 THE SUPERSTRUCTURE
as to induce maximum bending moment. For a moving load on simple span,the maximum moment occurs “when the center line of the span is midwaybetween the center of gravity of loads and the nearest concentrated load”[Ref. 3.33].
Figure 3.32 shows that, for an HS20-44 truck (same as the design truckin LRFD Specifications), this value is 2’-4" or 2.33 ft (0.71 m). The centerof gravity of the loads can be determined by referencing the distance of eachload from a common datum. The sum of the product of each load timesthis distance is divided by the sum of all loads, yielding a distance from thecenter load of 4.67 ft (1.4 m). This is similar to the method for locating thecenter of gravity of a structural member. The right half of the figure showsan arbitrary span of length L. The group of loads is placed so that thecenterline of the span falls between the center 16 k load and the center ofgravity of the loads (2.33 ft from the centerline). This offset can now be usedfor any HS20-44 loading of a simple span.
After the loads have been placed on the span, the live load moment ata given location on a span is determined by analyzing the beam from oneend of the beam to the point in question. For simple spans, the point at the2'-4" offset (where the concentrated load is) represents the location ofmaximum moment.
The maximum live load shear force can be obtained by locating the16 K wheel load near the support.
Once the maximum live load moment and shear forces are determined,the designer must also apply the required wheel load distribution factorwhich accounts for lateral distribution of the truck loads (see Section 3.8.1)and the dynamic effects of vehicle impact (see Section 3.5.3, Part 7). Thesemultiplicative factors are applied directly to the live load moment and shearforces to yield a live load plus impact moment. The designer should keepin mind that the impact factor is a percentage, so that a value of 1 + I isapplied to the live load forces. Another point of possible confusion iswhether axle loads or wheel loads are used. In AASHTO StandardSpecifications, the distribution factor applies to wheel loads which are half theaxle loads shown in Figure 3.12. If the designer prefers to use axle loads incomputations, then the distribution factors listed in Table 3.6 should bemultiplied by 1/2 to yield an axle load distribution factor (e.g., use adistribution factor of S/11 rather than S/5.5 in LFD method). In the AASHTOLRFD Specifications, axle loads and lane load are used instead of wheelloads.
2. Total Factored Moment and Shear Forces. The next stepis to calculate the total factored forces. The designer should use theappropriate load factors depending on which AASHTO specification isused.
For AASHTO Standard Specifications, the load factor for dead loadis 1.3, and load factor for live load is 1.3 × 1.67 = 2.17. See Table 3.2 fordetails.
For AASHTO LRFD Specifications, two load combinations areusually considered. For load combination Strength I, load factors for deadload, wearing surface and live load are 1.25, 1.50 and 1.75 respectively. Forload combination Strength IV, the load factors for dead load and wearing
Choosing a Rolled Section
[3.10.6, Part 1]
nother point of possibleconfusion is if axle loads,
rather that wheel loads, areused. The distribution factorapplies to wheel loads whichare half the axle loads shownin Figure 3.12.
A
or a moving load, themaximum moment occurs
“when the center line of thespan is midway between thecenter of gravity of loads andthe nearest concentrated load.”
F
f the designer prefers to useaxle loads in computations,
then the distribution factorslisted in Tables 3.4 and 3.5should be multiplied by 1/2 toyield an axle load distributionfactor.
I
Downloaded from Digital Engineering Library @ McGraw-Hill (www.digitalengineeringlibrary.com)Copyright © 2006 The McGraw-Hill Companies. All rights reserved.
Any use is subject to the Terms of Use as given at the website.
Design of Superstructure Elements
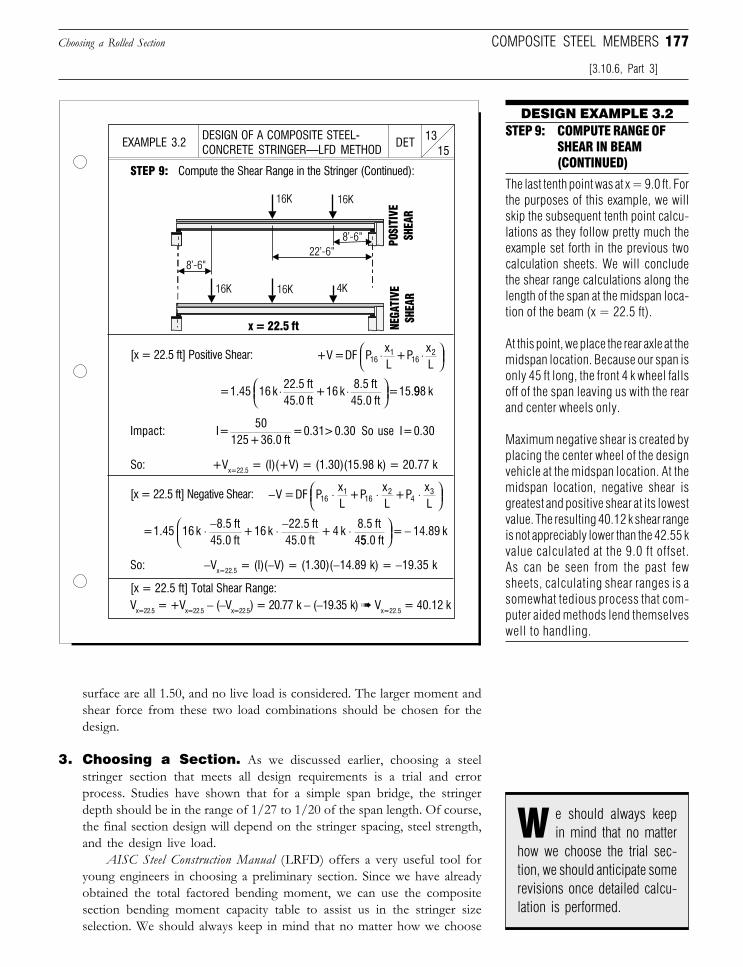
177
DESIGN EXAMPLE 3.2STEP 9: COMPUTE RANGE OF
SHEAR IN BEAM(CONTINUED)
surface are all 1.50, and no live load is considered. The larger moment andshear force from these two load combinations should be chosen for thedesign.
3. Choosing a Section. As we discussed earlier, choosing a steelstringer section that meets all design requirements is a trial and errorprocess. Studies have shown that for a simple span bridge, the stringerdepth should be in the range of 1/27 to 1/20 of the span length. Of course,the final section design will depend on the stringer spacing, steel strength,and the design live load.
AISC Steel Construction Manual (LRFD) offers a very useful tool foryoung engineers in choosing a preliminary section. Since we have alreadyobtained the total factored bending moment, we can use the compositesection bending moment capacity table to assist us in the stringer sizeselection. We should always keep in mind that no matter how we choose
COMPOSITE STEEL MEMBERSChoosing a Rolled Section
[3.10.6, Part 3]
The last tenth point was at x = 9.0 ft. Forthe purposes of this example, we willskip the subsequent tenth point calcu-lations as they follow pretty much theexample set forth in the previous twocalculation sheets. We will concludethe shear range calculations along thelength of the span at the midspan loca-tion of the beam (x = 22.5 ft).
At this point, we place the rear axle at themidspan location. Because our span isonly 45 ft long, the front 4 k wheel fallsoff of the span leaving us with the rearand center wheels only.
Maximum negative shear is created byplacing the center wheel of the designvehicle at the midspan location. At themidspan location, negative shear isgreatest and positive shear at its lowestvalue. The resulting 40.12 k shear rangeis not appreciably lower than the 42.55 kvalue calculated at the 9.0 ft offset.As can be seen from the past fewsheets, calculating shear ranges is asomewhat tedious process that com-puter aided methods lend themselveswell to handling.
e should always keepin mind that no matter
how we choose the trial sec-tion, we should anticipate somerevisions once detailed calcu-lation is performed.
W
DESIGN OF A COMPOSITE STEEL-CONCRETE STRINGER—LFD METHOD
DETEXAMPLE 3.2
STEP 9: Compute the Shear Range in the Stringer (Continued):
1315
[x = 22.5 ft] Positive Shear:
Impact:
So: +Vx=22.5 = (I)(+V) = (1.30)(15.98 k) = 20.77 k
x = 22.5 ft
[x = 22.5 ft] Negative Shear:
So: −Vx=22.5 = (I)(−V) = (1.30)(−14.89 k) = −19.35 k
[x = 22.5 ft] Total Shear Range:Vx=22.5 = +Vx=22.5 − (−Vx=22.5) = 20.77 k − (−19.35 k) ➠ Vx=22.5 = 40.12 k
= 1.45 16 k22.5 ft45.0 ft
+ 16 k8.5 ft45.0 ft
= 15.⋅ ⋅
998 k
I = 50
125 + 36.0 ft = 0.31 > 0.30 So use I = 0.30
− ⋅ ⋅ ⋅
V =DF PxL
+ PxL
+ PxL16
116
24
3
= 1.45 16 k8.5 ft
45.0 ft+16 k
22.5 ft45.0 ft
+ 4 k8.5 ft4
⋅ − ⋅ − ⋅55.0 ft
= 14.89 k
−
+V = DF PxL
+ PxL16
116
2⋅ ⋅
Downloaded from Digital Engineering Library @ McGraw-Hill (www.digitalengineeringlibrary.com)Copyright © 2006 The McGraw-Hill Companies. All rights reserved.
Any use is subject to the Terms of Use as given at the website.
Design of Superstructure Elements
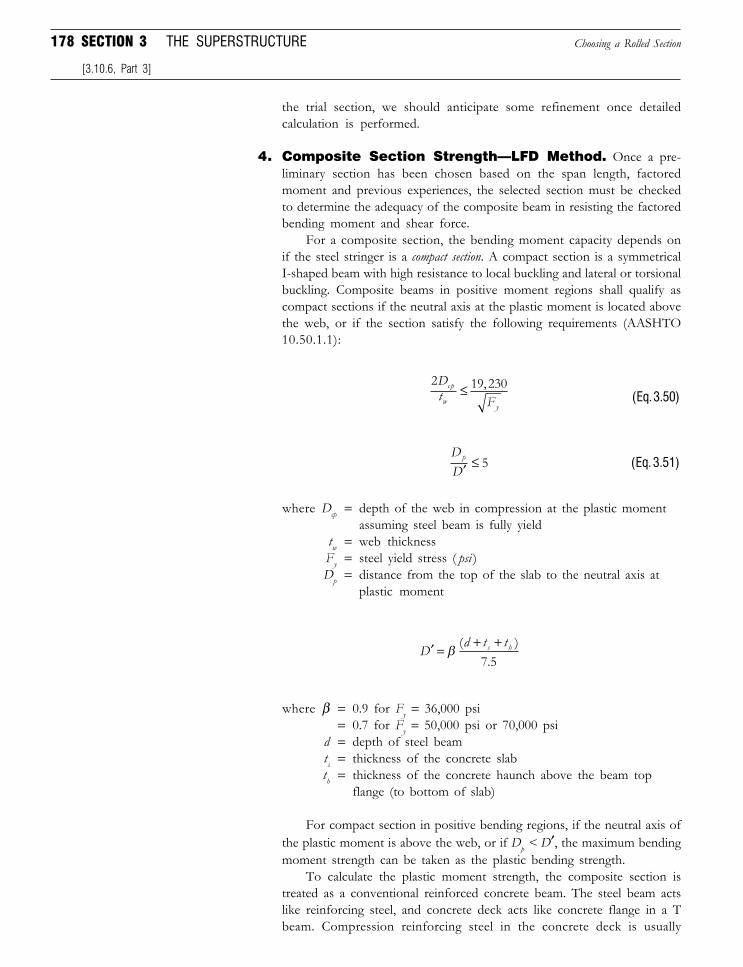
178 SECTION 3 THE SUPERSTRUCTURE
the trial section, we should anticipate some refinement once detailedcalculation is performed.
4. Composite Section Strength—LFD Method. Once a pre-liminary section has been chosen based on the span length, factoredmoment and previous experiences, the selected section must be checkedto determine the adequacy of the composite beam in resisting the factoredbending moment and shear force.
For a composite section, the bending moment capacity depends onif the steel stringer is a compact section. A compact section is a symmetricalI-shaped beam with high resistance to local buckling and lateral or torsionalbuckling. Composite beams in positive moment regions shall qualify ascompact sections if the neutral axis at the plastic moment is located abovethe web, or if the section satisfy the following requirements (AASHTO10.50.1.1):
2 19 230Dt Fcp
wy
≤ ,(Eq. 3.50)
DDp
′ ≤ 5 (Eq. 3.51)
where Dcp = depth of the web in compression at the plastic momentassuming steel beam is fully yield
tw = web thicknessFy = steel yield stress ( psi )Dp = distance from the top of the slab to the neutral axis at
plastic moment
′ = + +D
d t ts hβ( )
.7 5
where β = 0.9 for Fy = 36,000 psi= 0.7 for Fy = 50,000 psi or 70,000 psi
d = depth of steel beamts = thickness of the concrete slabth = thickness of the concrete haunch above the beam top
flange (to bottom of slab)
For compact section in positive bending regions, if the neutral axis ofthe plastic moment is above the web, or if Dp < D′, the maximum bendingmoment strength can be taken as the plastic bending strength.
To calculate the plastic moment strength, the composite section istreated as a conventional reinforced concrete beam. The steel beam actslike reinforcing steel, and concrete deck acts like concrete flange in a Tbeam. Compression reinforcing steel in the concrete deck is usually
Choosing a Rolled Section
[3.10.6, Part 3]
Downloaded from Digital Engineering Library @ McGraw-Hill (www.digitalengineeringlibrary.com)Copyright © 2006 The McGraw-Hill Companies. All rights reserved.
Any use is subject to the Terms of Use as given at the website.
Design of Superstructure Elements
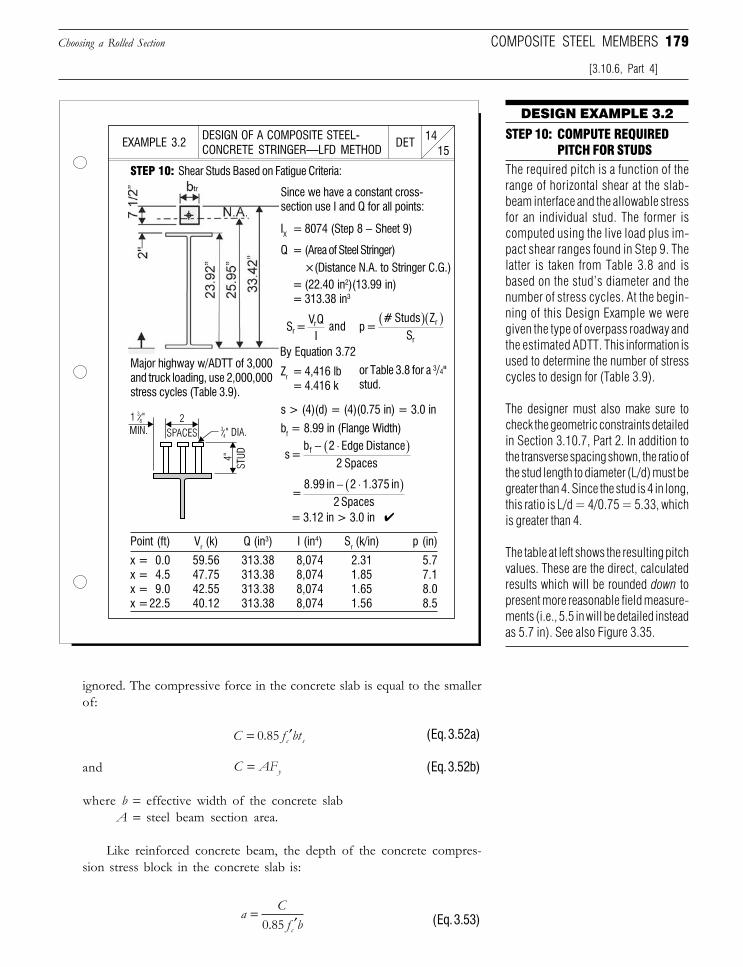
179
ignored. The compressive force in the concrete slab is equal to the smallerof:
C f btc s= ′0 85. (Eq. 3.52a)
and C AFy= (Eq. 3.52b)
where b = effective width of the concrete slabA = steel beam section area.
Like reinforced concrete beam, the depth of the concrete compres-sion stress block in the concrete slab is:
a Cf bc
=′0 85. (Eq. 3.53)
Choosing a Rolled Section
DESIGN EXAMPLE 3.2
[3.10.6, Part 4]
COMPOSITE STEEL MEMBERS
STEP 10: COMPUTE REQUIREDPITCH FOR STUDS
The required pitch is a function of therange of horizontal shear at the slab-beam interface and the allowable stressfor an individual stud. The former iscomputed using the live load plus im-pact shear ranges found in Step 9. Thelatter is taken from Table 3.8 and isbased on the stud’s diameter and thenumber of stress cycles. At the begin-ning of this Design Example we weregiven the type of overpass roadway andthe estimated ADTT. This information isused to determine the number of stresscycles to design for (Table 3.9).
The designer must also make sure tocheck the geometric constraints detailedin Section 3.10.7, Part 2. In addition tothe transverse spacing shown, the ratio ofthe stud length to diameter (L/d) must begreater than 4. Since the stud is 4 in long,this ratio is L/d = 4/0.75 = 5.33, whichis greater than 4.
The table at left shows the resulting pitchvalues. These are the direct, calculatedresults which will be rounded down topresent more reasonable field measure-ments (i.e., 5.5 in will be detailed insteadas 5.7 in). See also Figure 3.35.
DESIGN OF A COMPOSITE STEEL-CONCRETE STRINGER—LFD METHOD
DETEXAMPLE 3.2
STEP 10: Shear Studs Based on Fatigue Criteria:
1415
Since we have a constant cross-section use I and Q for all points:
IX = 8074 (Step 8 − Sheet 9)
= (22.40 in2)(13.99 in)= 313.38 in3
Q = (Area of Steel Stringer)×(Distance N.A. to Stringer C.G.)
Major highway w/ADTT of 3,000and truck loading, use 2,000,000stress cycles (Table 3.9).
Zr = 4,416 lb= 4.416 k
By Equation 3.72
and
s > (4)(d) = (4)(0.75 in) = 3.0 in
bf = 8.99 in (Flange Width)
= 3.12 in > 3.0 in ✔
x = 0.0 59.56 313.38 8,074 2.31 5.7x = 4.5 47.75 313.38 8,074 1.85 7.1x = 9.0 42.55 313.38 8,074 1.65 8.0x =22.5 40.12 313.38 8,074 1.56 8.5
Point (ft) Vr (k) Q (in3) I (in4) Sr (k/in) p (in)
S = V Q
Ir r p =# Studs Z
Sr
r
( )( )
s=b 2 Edge Distance
2 Spacesf − ⋅( )
= 8.99 in 2 1.375 in
2 Spaces− ⋅( )
or Table 3.8 for a 3/4"stud.
Downloaded from Digital Engineering Library @ McGraw-Hill (www.digitalengineeringlibrary.com)Copyright © 2006 The McGraw-Hill Companies. All rights reserved.
Any use is subject to the Terms of Use as given at the website.
Design of Superstructure Elements
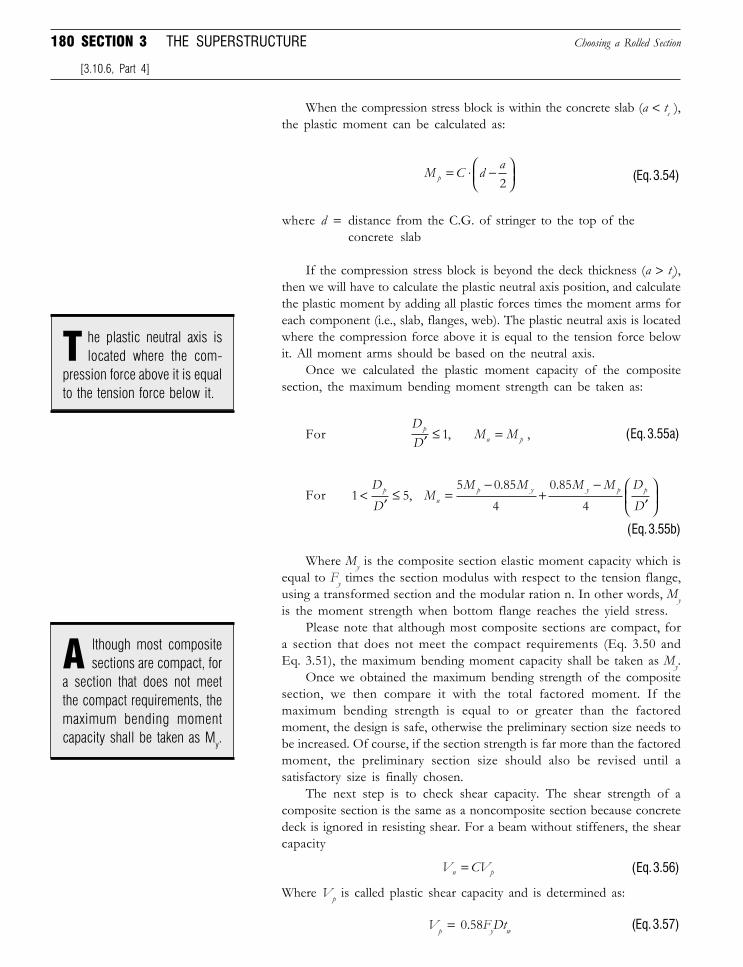
180 SECTION 3 THE SUPERSTRUCTURE
When the compression stress block is within the concrete slab (a < ts ),the plastic moment can be calculated as:
M C d ap = ⋅ −
2 (Eq. 3.54)
where d = distance from the C.G. of stringer to the top of theconcrete slab
If the compression stress block is beyond the deck thickness (a > ts),then we will have to calculate the plastic neutral axis position, and calculatethe plastic moment by adding all plastic forces times the moment arms foreach component (i.e., slab, flanges, web). The plastic neutral axis is locatedwhere the compression force above it is equal to the tension force belowit. All moment arms should be based on the neutral axis.
Once we calculated the plastic moment capacity of the compositesection, the maximum bending moment strength can be taken as:
ForDD M Mp
u p′ ≤ =1, , (Eq. 3.55a)
For 1 55 0 85
40 85
4<
′≤ =
−+
−′
DD
MM M M M D
Dp
up y y p p,
. .
(Eq. 3.55b)
Where My is the composite section elastic moment capacity which isequal to Fy times the section modulus with respect to the tension flange,using a transformed section and the modular ration n. In other words, Myis the moment strength when bottom flange reaches the yield stress.
Please note that although most composite sections are compact, fora section that does not meet the compact requirements (Eq. 3.50 andEq. 3.51), the maximum bending moment capacity shall be taken as My.
Once we obtained the maximum bending strength of the compositesection, we then compare it with the total factored moment. If themaximum bending strength is equal to or greater than the factoredmoment, the design is safe, otherwise the preliminary section size needs tobe increased. Of course, if the section strength is far more than the factoredmoment, the preliminary section size should also be revised until asatisfactory size is finally chosen.
The next step is to check shear capacity. The shear strength of acomposite section is the same as a noncomposite section because concretedeck is ignored in resisting shear. For a beam without stiffeners, the shearcapacity
V CVn p= (Eq. 3.56)
Where Vp is called plastic shear capacity and is determined as:
Vp = 0.58FyDtw (Eq. 3.57)
Choosing a Rolled Section
[3.10.6, Part 4]
he plastic neutral axis islocated where the com-
pression force above it is equalto the tension force below it.
T
lthough most compositesections are compact, for
a section that does not meetthe compact requirements, themaximum bending momentcapacity shall be taken as My.
A
Downloaded from Digital Engineering Library @ McGraw-Hill (www.digitalengineeringlibrary.com)Copyright © 2006 The McGraw-Hill Companies. All rights reserved.
Any use is subject to the Terms of Use as given at the website.
Design of Superstructure Elements
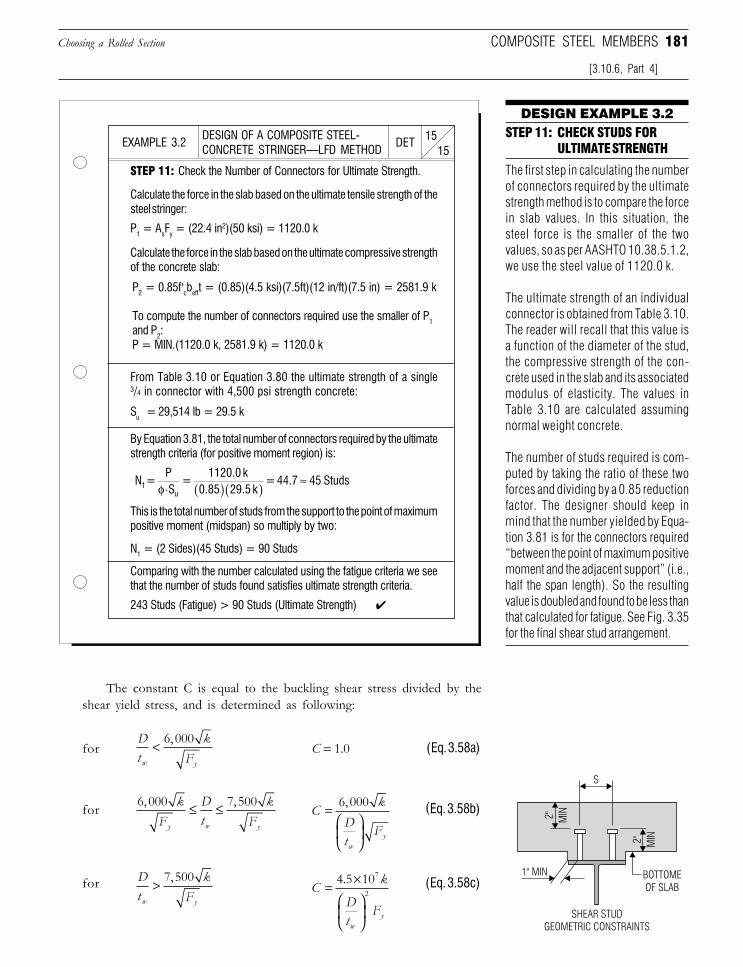
181
DESIGN EXAMPLE 3.2
The constant C is equal to the buckling shear stress divided by theshear yield stress, and is determined as following:
forDt
kFw y
< 6 000, C = 1.0 (Eq. 3.58a)
for 6 000 7 500, ,kF
Dt
kFy w y
≤ ≤ C kDt
Fw
y
=
6 000, (Eq. 3.58b)
for Dt
kFw y
> 7 500,C k
Dt
Fw
y
= ×
4 5 107
2
. (Eq. 3.58c)
Choosing a Rolled Section
[3.10.6, Part 4]
COMPOSITE STEEL MEMBERS
STEP 11: CHECK STUDS FORULTIMATE STRENGTH
The first step in calculating the numberof connectors required by the ultimatestrength method is to compare the forcein slab values. In this situation, thesteel force is the smaller of the twovalues, so as per AASHTO 10.38.5.1.2,we use the steel value of 1120.0 k.
The ultimate strength of an individualconnector is obtained from Table 3.10.The reader will recall that this value isa function of the diameter of the stud,the compressive strength of the con-crete used in the slab and its associatedmodulus of elasticity. The values inTable 3.10 are calculated assumingnormal weight concrete.
The number of studs required is com-puted by taking the ratio of these twoforces and dividing by a 0.85 reductionfactor. The designer should keep inmind that the number yielded by Equa-tion 3.81 is for the connectors required“between the point of maximum positivemoment and the adjacent support” (i.e.,half the span length). So the resultingvalue is doubled and found to be less thanthat calculated for fatigue. See Fig. 3.35for the final shear stud arrangement.
BOTTOME
OF SLAB
SHEAR STUD
GEOMETRIC CONSTRAINTS
S
1" MIN
2" MIN
2" MIN
DESIGN OF A COMPOSITE STEEL-CONCRETE STRINGER—LFD METHOD
DETEXAMPLE 3.2
STEP 11: Check the Number of Connectors for Ultimate Strength.
1515
Calculate the force in the slab based on the ultimate tensile strength of thesteel stringer:
P1 = AsFy = (22.4 in2)(50 ksi) = 1120.0 k
Calculate the force in the slab based on the ultimate compressive strengthof the concrete slab:
From Table 3.10 or Equation 3.80 the ultimate strength of a single3/4 in connector with 4,500 psi strength concrete:
Su = 29,514 lb = 29.5 k
By Equation 3.81, the total number of connectors required by the ultimatestrength criteria (for positive moment region) is:
This is the total number of studs from the support to the point of maximumpositive moment (midspan) so multiply by two:
N1 = (2 Sides)(45 Studs) = 90 Studs
Comparing with the number calculated using the fatigue criteria we seethat the number of studs found satisfies ultimate strength criteria.
243 Studs (Fatigue) > 90 Studs (Ultimate Strength) ✔
P2 = 0.85f'cbefft = (0.85)(4.5 ksi)(7.5ft)(12 in/ft)(7.5 in) = 2581.9 k
To compute the number of connectors required use the smaller of P1
and P2:P = MIN.(1120.0 k, 2581.9 k) = 1120.0 k
N = PS
=1120.0 k
0.85 29.5 k= 44.7 45 Studs1
uφ⋅ ( )( ) ≈
Downloaded from Digital Engineering Library @ McGraw-Hill (www.digitalengineeringlibrary.com)Copyright © 2006 The McGraw-Hill Companies. All rights reserved.
Any use is subject to the Terms of Use as given at the website.
Design of Superstructure Elements
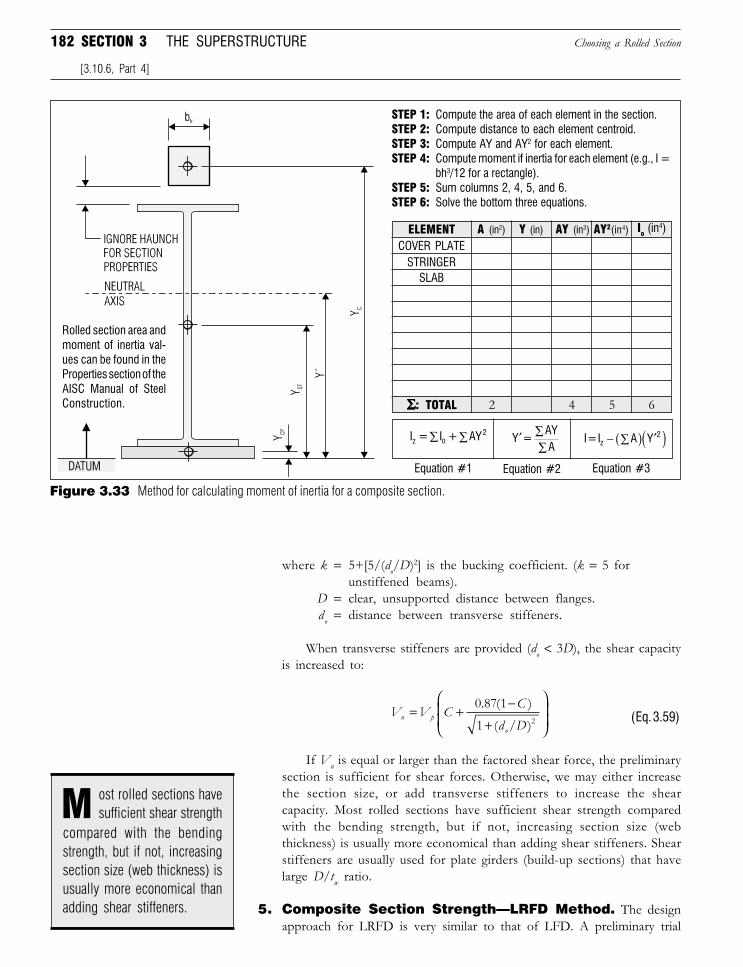
182 SECTION 3 THE SUPERSTRUCTURE
where k = 5+[5/(do/D)2] is the bucking coefficient. (k = 5 forunstiffened beams).
D = clear, unsupported distance between flanges.do = distance between transverse stiffeners.
When transverse stiffeners are provided (do < 3D), the shear capacityis increased to:
V V CC
d Dn p
o
= + −
+
0 87 1
1 2
. ( )
( / ) (Eq. 3.59)
If Vn is equal or larger than the factored shear force, the preliminarysection is sufficient for shear forces. Otherwise, we may either increasethe section size, or add transverse stiffeners to increase the shearcapacity. Most rolled sections have sufficient shear strength comparedwith the bending strength, but if not, increasing section size (webthickness) is usually more economical than adding shear stiffeners. Shearstiffeners are usually used for plate girders (build-up sections) that havelarge D/tw ratio.
5. Composite Section Strength—LRFD Method. The designapproach for LRFD is very similar to that of LFD. A preliminary trial
Choosing a Rolled Section
[3.10.6, Part 4]
Y (in) AY (in3) AY2(in4) Io (in4)ELEMENT A (in2)
ΣΣΣΣΣ: TOTAL
COVER PLATESTRINGER
SLAB
STEP 1: Compute the area of each element in the section.STEP 2: Compute distance to each element centroid.STEP 3: Compute AY and AY2 for each element.STEP 4: Compute moment if inertia for each element (e.g., I =
bh3/12 for a rectangle).STEP 5: Sum columns 2, 4, 5, and 6.STEP 6: Solve the bottom three equations.
6542
Equation #2 Equation #3Equation #1
Figure 3.33 Method for calculating moment of inertia for a composite section.
Rolled section area andmoment of inertia val-ues can be found in theProperties section of theAISC Manual of SteelConstruction.
ost rolled sections havesufficient shear strength
compared with the bendingstrength, but if not, increasingsection size (web thickness) isusually more economical thanadding shear stiffeners.
M
I = I + AYz o2∑∑ ′ ∑
∑Y =
AYA
I = I A Yz2− ∑( ) ′( )
Downloaded from Digital Engineering Library @ McGraw-Hill (www.digitalengineeringlibrary.com)Copyright © 2006 The McGraw-Hill Companies. All rights reserved.
Any use is subject to the Terms of Use as given at the website.
Design of Superstructure Elements
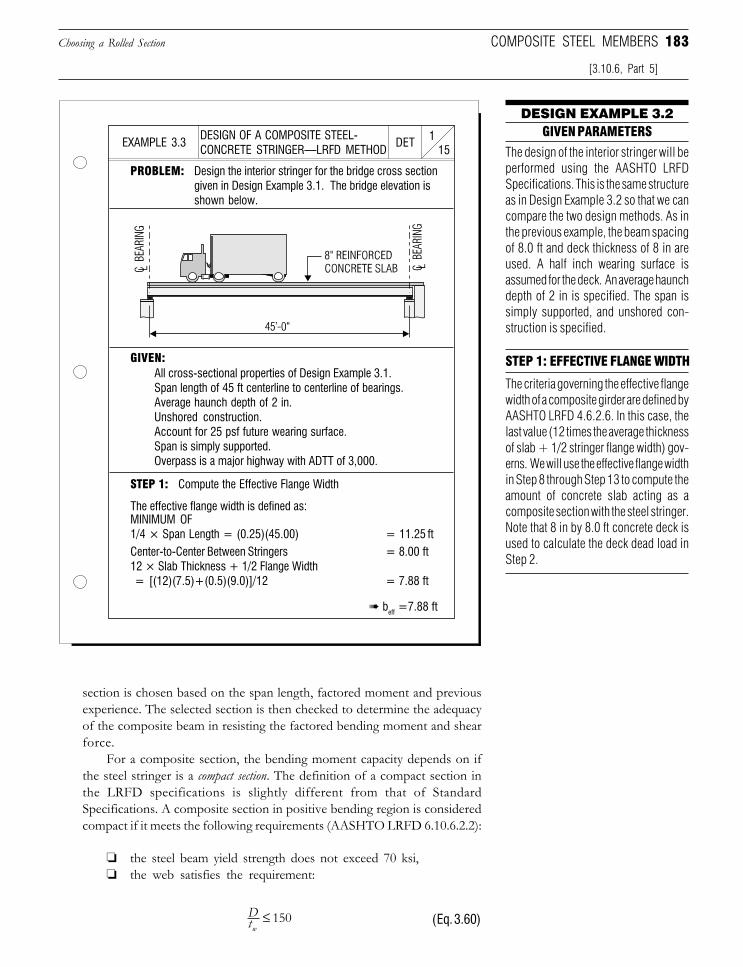
183
DESIGN EXAMPLE 3.2
section is chosen based on the span length, factored moment and previousexperience. The selected section is then checked to determine the adequacyof the composite beam in resisting the factored bending moment and shearforce.
For a composite section, the bending moment capacity depends on ifthe steel stringer is a compact section. The definition of a compact section inthe LRFD specifications is slightly different from that of StandardSpecifications. A composite section in positive bending region is consideredcompact if it meets the following requirements (AASHTO LRFD 6.10.6.2.2):
❏ the steel beam yield strength does not exceed 70 ksi,❏ the web satisfies the requirement:
Dtw
≤ 150 (Eq. 3.60)
Choosing a Rolled Section
[3.10.6, Part 5]
COMPOSITE STEEL MEMBERS
GIVEN PARAMETERS
The design of the interior stringer will beperformed using the AASHTO LRFDSpecifications. This is the same structureas in Design Example 3.2 so that we cancompare the two design methods. As inthe previous example, the beam spacingof 8.0 ft and deck thickness of 8 in areused. A half inch wearing surface isassumed for the deck. An average haunchdepth of 2 in is specified. The span issimply supported, and unshored con-struction is specified.
STEP 1: EFFECTIVE FLANGE WIDTH
The criteria governing the effective flangewidth of a composite girder are defined byAASHTO LRFD 4.6.2.6. In this case, thelast value (12 times the average thicknessof slab + 1/2 stringer flange width) gov-erns. We will use the effective flange widthin Step 8 through Step 13 to compute theamount of concrete slab acting as acomposite section with the steel stringer.Note that 8 in by 8.0 ft concrete deck isused to calculate the deck dead load inStep 2.
DESIGN OF A COMPOSITE STEEL-CONCRETE STRINGER—LRFD METHOD 15
1DETEXAMPLE 3.3
PROBLEM: Design the interior stringer for the bridge cross sectiongiven in Design Example 3.1. The bridge elevation isshown below.
GIVEN:All cross-sectional properties of Design Example 3.1.Span length of 45 ft centerline to centerline of bearings.Average haunch depth of 2 in.Unshored construction.Account for 25 psf future wearing surface.Span is simply supported.Overpass is a major highway with ADTT of 3,000.
➠ beff =7.88 ft
Center-to-Center Between Stringers = 8.00 ft12 × Slab Thickness + 1/2 Flange Width = [(12)(7.5)+(0.5)(9.0)]/12 = 7.88 ft
STEP 1: Compute the Effective Flange Width
The effective flange width is defined as:MINIMUM OF1/4 × Span Length = (0.25)(45.00) = 11.25 ft
Downloaded from Digital Engineering Library @ McGraw-Hill (www.digitalengineeringlibrary.com)Copyright © 2006 The McGraw-Hill Companies. All rights reserved.
Any use is subject to the Terms of Use as given at the website.
Design of Superstructure Elements
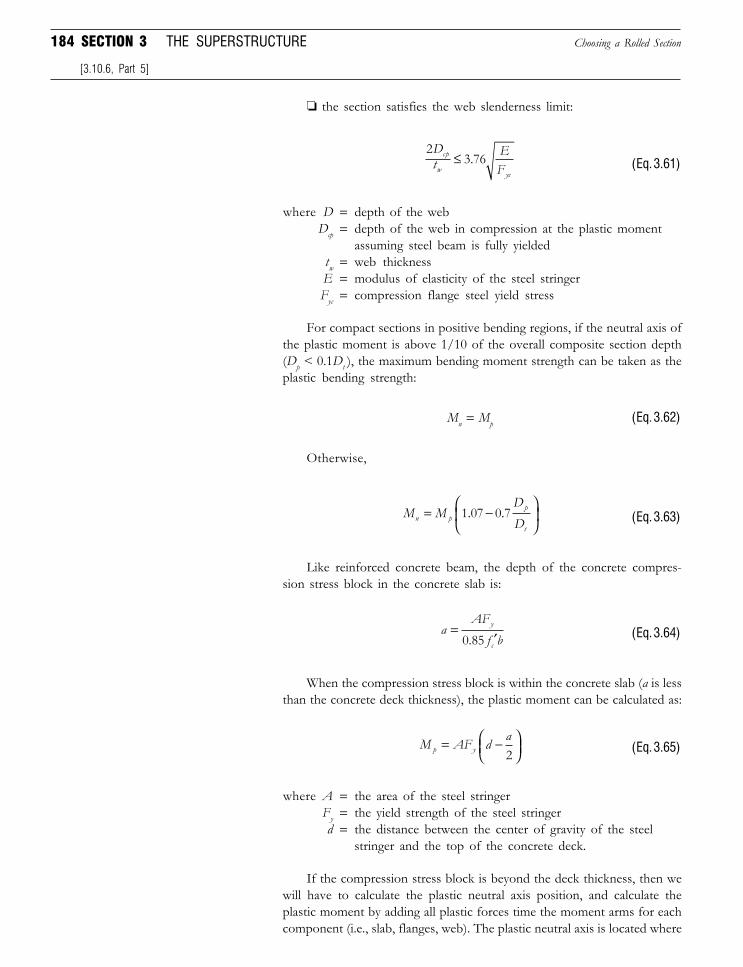
184 SECTION 3 THE SUPERSTRUCTURE Choosing a Rolled Section
[3.10.6, Part 5]
❏ the section satisfies the web slenderness limit:
23 76
Dt
EF
cp
wyc
≤ . (Eq. 3.61)
where D = depth of the webDcp = depth of the web in compression at the plastic moment
assuming steel beam is fully yieldedtw = web thicknessE = modulus of elasticity of the steel stringerFyc = compression flange steel yield stress
For compact sections in positive bending regions, if the neutral axis ofthe plastic moment is above 1/10 of the overall composite section depth(Dp < 0.1Dt ), the maximum bending moment strength can be taken as theplastic bending strength:
Mn = Mp (Eq. 3.62)
Otherwise,
M MDDn pp
t
= −
1 07 0 7. . (Eq. 3.63)
Like reinforced concrete beam, the depth of the concrete compres-sion stress block in the concrete slab is:
aAFf by
c
=′0 85. (Eq. 3.64)
When the compression stress block is within the concrete slab (a is lessthan the concrete deck thickness), the plastic moment can be calculated as:
M AF d ap y= −
2 (Eq. 3.65)
where A = the area of the steel stringerFy = the yield strength of the steel stringerd = the distance between the center of gravity of the steel
stringer and the top of the concrete deck.
If the compression stress block is beyond the deck thickness, then wewill have to calculate the plastic neutral axis position, and calculate theplastic moment by adding all plastic forces time the moment arms for eachcomponent (i.e., slab, flanges, web). The plastic neutral axis is located where
Downloaded from Digital Engineering Library @ McGraw-Hill (www.digitalengineeringlibrary.com)Copyright © 2006 The McGraw-Hill Companies. All rights reserved.
Any use is subject to the Terms of Use as given at the website.
Design of Superstructure Elements
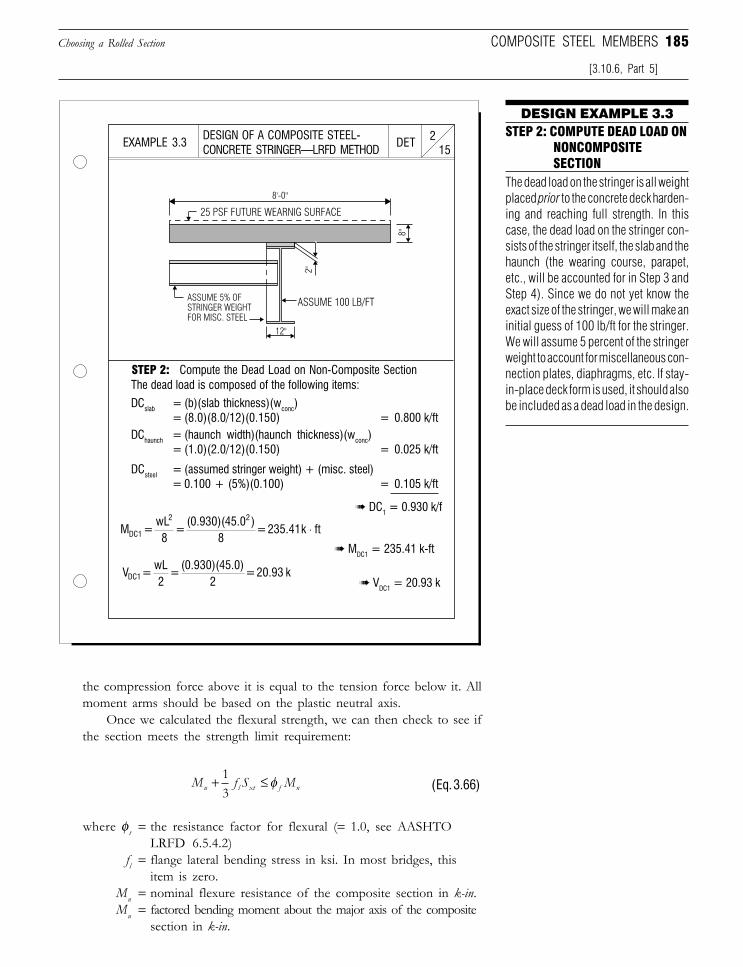
185
DESIGN EXAMPLE 3.3
Choosing a Rolled Section
[3.10.6, Part 5]
COMPOSITE STEEL MEMBERS
the compression force above it is equal to the tension force below it. Allmoment arms should be based on the plastic neutral axis.
Once we calculated the flexural strength, we can then check to see ifthe section meets the strength limit requirement:
M f S Mu l xt f n+ ≤13
φ (Eq. 3.66)
where φ t = the resistance factor for flexural (= 1.0, see AASHTOLRFD 6.5.4.2)
fl = flange lateral bending stress in ksi. In most bridges, thisitem is zero.
Mn = nominal flexure resistance of the composite section in k-in.Mu = factored bending moment about the major axis of the composite
section in k-in.
STEP 2: COMPUTE DEAD LOAD ONNONCOMPOSITESECTION
The dead load on the stringer is all weightplaced prior to the concrete deck harden-ing and reaching full strength. In thiscase, the dead load on the stringer con-sists of the stringer itself, the slab and thehaunch (the wearing course, parapet,etc., will be accounted for in Step 3 andStep 4). Since we do not yet know theexact size of the stringer, we will make aninitial guess of 100 lb/ft for the stringer.We will assume 5 percent of the stringerweight to account for miscellaneous con-nection plates, diaphragms, etc. If stay-in-place deck form is used, it should alsobe included as a dead load in the design.
DESIGN OF A COMPOSITE STEEL-CONCRETE STRINGER—LRFD METHOD 15
2DETEXAMPLE 3.3
STEP 2: Compute the Dead Load on Non-Composite SectionThe dead load is composed of the following items:
DCslab = (b)(slab thickness)(wconc)= (8.0)(8.0/12)(0.150) = 0.800 k/ft
DChaunch = (haunch width)(haunch thickness)(wconc)= (1.0)(2.0/12)(0.150) = 0.025 k/ft
DCsteel = (assumed stringer weight) + (misc. steel)= 0.100 + (5%)(0.100) = 0.105 k/ft
➠ DC1 = 0.930 k/f
➠ MDC1 = 235.41 k-ft
➠ VDC1 = 20.93 k
M = wL8
= (0.930)(45.0 )
8 = 235.41k ftDC1
2 2
⋅
V = wL2
= (0.930)(45.0)
2 = 20.93 kDC1
ASSUME 100 LB/FT
12"
25 PSF FUTURE WEARNIG SURFACE
8'-0"
8"
2"ASSUME 5% OFSTRINGER WEIGHTFOR MISC. STEEL
Downloaded from Digital Engineering Library @ McGraw-Hill (www.digitalengineeringlibrary.com)Copyright © 2006 The McGraw-Hill Companies. All rights reserved.
Any use is subject to the Terms of Use as given at the website.
Design of Superstructure Elements

186 SECTION 3 THE SUPERSTRUCTURE Choosing a Rolled Section
[3.10.6, Part 5]
Sxt = elastic section modulus about the major axis of the sectionto the tension flange as Myt/Fyt.
Myt = yield moment with respect to the tension flange in k-in.
Please note that although most composite sections are compact, for asection that does not meet the compact requirements (Eq. 3.60 and Eq. 3.61),the maximum bending moment capacity shall be taken as My.
The shear strength calculations in LRFD are almost identical to thatof LFD specifications. For a beam without stiffeners, the nominal (withoutresistance factor) shear capacity is:
V CVn p= (Eq. 3.67)
Where Vp is called plastic shear capacity and is determined as:
V F Dtp y w= 0 58. (Eq. 3.68)
The constant C is the ratio of the buckling shear resistance to the shearyield strength, and is determined as following:
ifDt
EkFw y
≤ 1 12. then: C = 1.0 (Eq. 3.69a)
if 1 12 1 40. .EkF
Dt
EkFy w y
< ≤ then: C
Dt
EkF
w
y
=
1 12.(Eq. 3.69b)
ifDt
EkFw y
> 1 40. then: C
Dt
EkF
w
y
=
1 572
.(Eq. 3.69c)
where k = 5+[5/(do/D)2] is the shear bucking coefficient. (k = 5 forunstiffened beams).
D = clear distance between flanges.do = distance between transverse stiffeners.
When transverse stiffeners are provided, the nominal shear capacityis taken as:
V V CC
d D d Dn p
o o
= + −
+ +
0 87 1
1 2
. ( )
( / ) / (Eq. 3.70)
The transverse stiffener spacing (if used) at end panel should notexceed 1.5D.
The resistance factor φv for shear is 1.0 (AASHTO LRFD 6.5.4.2). IfφvVn is equal or larger than the factored shear force, the preliminary sectionis sufficient for shear forces. Otherwise, we may either increase the webthickness, or add transverse stiffeners to increase the shear capacity.
Downloaded from Digital Engineering Library @ McGraw-Hill (www.digitalengineeringlibrary.com)Copyright © 2006 The McGraw-Hill Companies. All rights reserved.
Any use is subject to the Terms of Use as given at the website.
Design of Superstructure Elements
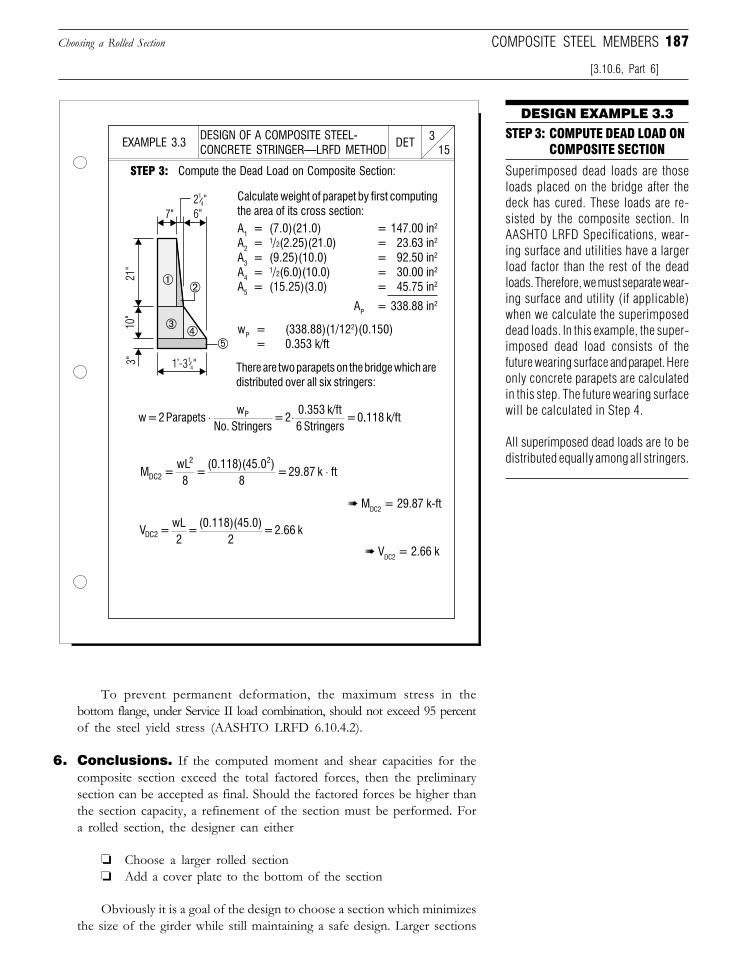
187
DESIGN EXAMPLE 3.3
Choosing a Rolled Section
[3.10.6, Part 6]
COMPOSITE STEEL MEMBERS
To prevent permanent deformation, the maximum stress in thebottom flange, under Service II load combination, should not exceed 95 percentof the steel yield stress (AASHTO LRFD 6.10.4.2).
6. Conclusions. If the computed moment and shear capacities for thecomposite section exceed the total factored forces, then the preliminarysection can be accepted as final. Should the factored forces be higher thanthe section capacity, a refinement of the section must be performed. Fora rolled section, the designer can either
❏ Choose a larger rolled section❏ Add a cover plate to the bottom of the section
Obviously it is a goal of the design to choose a section which minimizesthe size of the girder while still maintaining a safe design. Larger sections
STEP 3: COMPUTE DEAD LOAD ONCOMPOSITE SECTION
Superimposed dead loads are thoseloads placed on the bridge after thedeck has cured. These loads are re-sisted by the composite section. InAASHTO LRFD Specifications, wear-ing surface and utilities have a largerload factor than the rest of the deadloads. Therefore, we must separate wear-ing surface and utility (if applicable)when we calculate the superimposeddead loads. In this example, the super-imposed dead load consists of thefuture wearing surface and parapet. Hereonly concrete parapets are calculatedin this step. The future wearing surfacewill be calculated in Step 4.
All superimposed dead loads are to bedistributed equally among all stringers.
DESIGN OF A COMPOSITE STEEL-CONCRETE STRINGER—LRFD METHOD 15
3DETEXAMPLE 3.3
STEP 3: Compute the Dead Load on Composite Section:
Calculate weight of parapet by first computingthe area of its cross section:A1 = (7.0)(21.0) = 147.00 in2
A2 = 1/2(2.25)(21.0) = 23.63 in2
A3 = (9.25)(10.0) = 92.50 in2
A4 = 1/2(6.0)(10.0) = 30.00 in2
A5 = (15.25)(3.0) = 45.75 in2
AP = 338.88 in2
wP = (338.88)(1/122)(0.150)= 0.353 k/ft
There are two parapets on the bridge which aredistributed over all six stringers:
➠ MDC2 = 29.87 k-ft
➠ VDC2 = 2.66 k
w = 2 Parapetsw
No. Stringers = 2
0.353 k/ft6 Stringers
= 0⋅ ⋅P ..118 k/ft
M = wL8
= (0.118)(45.0 )
8 = 29.87 k ftDC2
2 2
⋅
V = wL2
= (0.118)(45.0)
2 = 2.66 kDC2
Downloaded from Digital Engineering Library @ McGraw-Hill (www.digitalengineeringlibrary.com)Copyright © 2006 The McGraw-Hill Companies. All rights reserved.
Any use is subject to the Terms of Use as given at the website.
Design of Superstructure Elements
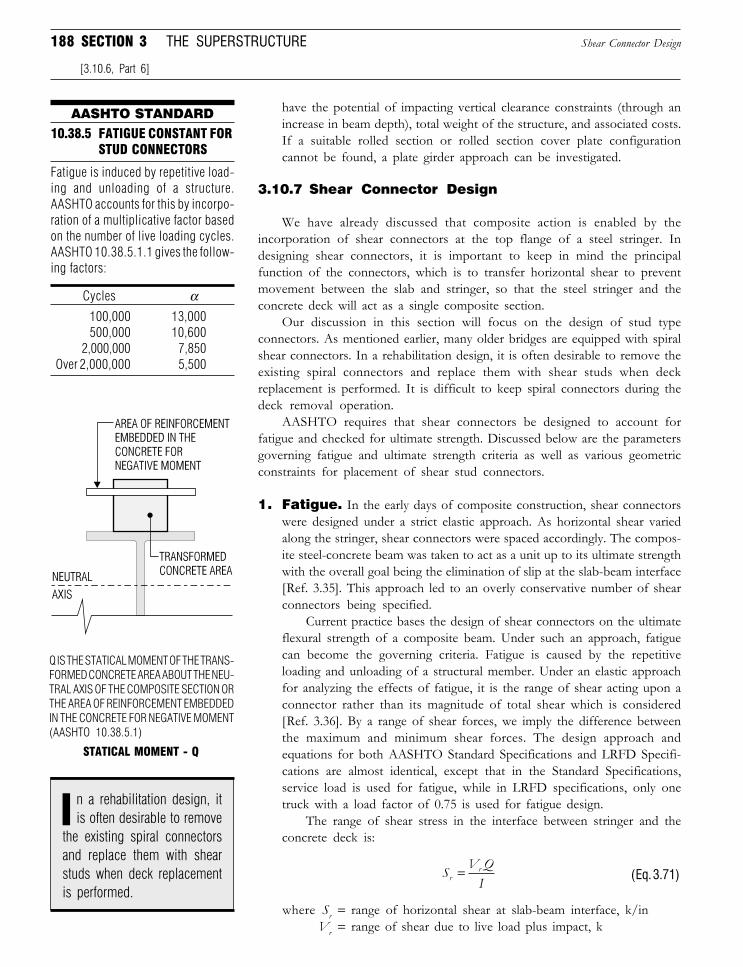
188 SECTION 3 THE SUPERSTRUCTURE Shear Connector Design
[3.10.6, Part 6]
have the potential of impacting vertical clearance constraints (through anincrease in beam depth), total weight of the structure, and associated costs.If a suitable rolled section or rolled section cover plate configurationcannot be found, a plate girder approach can be investigated.
3.10.7 Shear Connector Design
We have already discussed that composite action is enabled by theincorporation of shear connectors at the top flange of a steel stringer. Indesigning shear connectors, it is important to keep in mind the principalfunction of the connectors, which is to transfer horizontal shear to preventmovement between the slab and stringer, so that the steel stringer and theconcrete deck will act as a single composite section.
Our discussion in this section will focus on the design of stud typeconnectors. As mentioned earlier, many older bridges are equipped with spiralshear connectors. In a rehabilitation design, it is often desirable to remove theexisting spiral connectors and replace them with shear studs when deckreplacement is performed. It is difficult to keep spiral connectors during thedeck removal operation.
AASHTO requires that shear connectors be designed to account forfatigue and checked for ultimate strength. Discussed below are the parametersgoverning fatigue and ultimate strength criteria as well as various geometricconstraints for placement of shear stud connectors.
1. Fatigue. In the early days of composite construction, shear connectorswere designed under a strict elastic approach. As horizontal shear variedalong the stringer, shear connectors were spaced accordingly. The compos-ite steel-concrete beam was taken to act as a unit up to its ultimate strengthwith the overall goal being the elimination of slip at the slab-beam interface[Ref. 3.35]. This approach led to an overly conservative number of shearconnectors being specified.
Current practice bases the design of shear connectors on the ultimateflexural strength of a composite beam. Under such an approach, fatiguecan become the governing criteria. Fatigue is caused by the repetitiveloading and unloading of a structural member. Under an elastic approachfor analyzing the effects of fatigue, it is the range of shear acting upon aconnector rather than its magnitude of total shear which is considered[Ref. 3.36]. By a range of shear forces, we imply the difference betweenthe maximum and minimum shear forces. The design approach andequations for both AASHTO Standard Specifications and LRFD Specifi-cations are almost identical, except that in the Standard Specifications,service load is used for fatigue, while in LRFD specifications, only onetruck with a load factor of 0.75 is used for fatigue design.
The range of shear stress in the interface between stringer and theconcrete deck is:
SV QIrr= (Eq. 3.71)
where Sr = range of horizontal shear at slab-beam interface, k/inVr = range of shear due to live load plus impact, k
STATICAL MOMENT - Q
Q IS THE STATICAL MOMENT OF THE TRANS-FORMED CONCRETE AREA ABOUT THE NEU-TRAL AXIS OF THE COMPOSITE SECTION ORTHE AREA OF REINFORCEMENT EMBEDDEDIN THE CONCRETE FOR NEGATIVE MOMENT(AASHTO 10.38.5.1)
n a rehabilitation design, itis often desirable to remove
the existing spiral connectorsand replace them with shearstuds when deck replacementis performed.
I
AASHTO STANDARD10.38.5 FATIGUE CONSTANT FOR
STUD CONNECTORS
Fatigue is induced by repetitive load-ing and unloading of a structure.AASHTO accounts for this by incorpo-ration of a multiplicative factor basedon the number of live loading cycles.AASHTO 10.38.5.1.1 gives the follow-ing factors:
Cycles α100,000 13,000500,000 10,600
2,000,000 7,850Over 2,000,000 5,500
Downloaded from Digital Engineering Library @ McGraw-Hill (www.digitalengineeringlibrary.com)Copyright © 2006 The McGraw-Hill Companies. All rights reserved.
Any use is subject to the Terms of Use as given at the website.
Design of Superstructure Elements
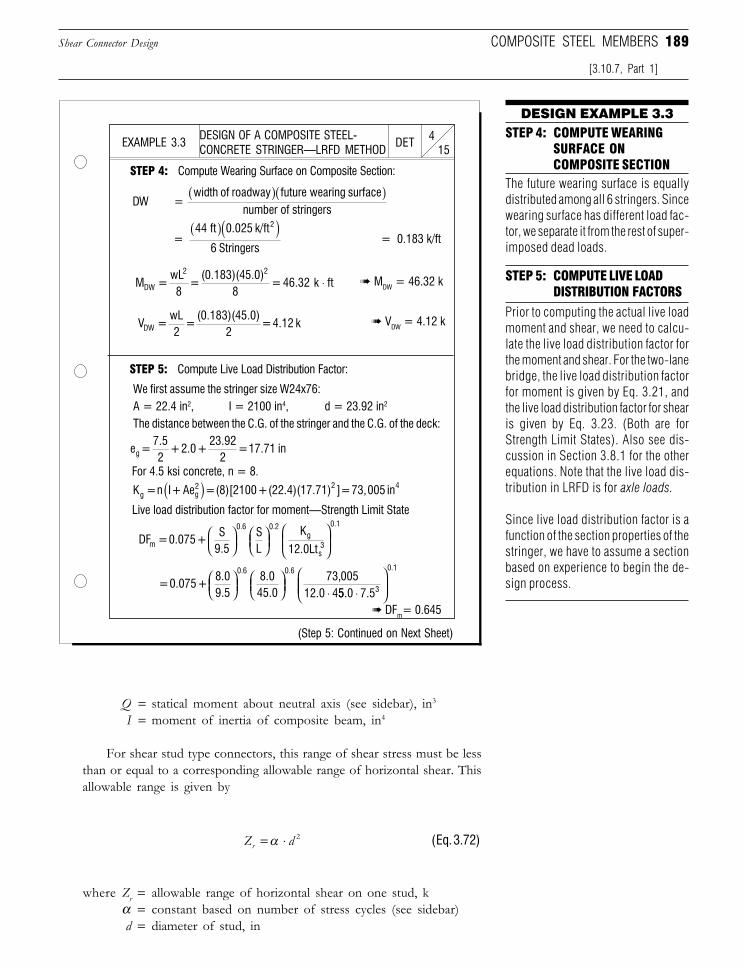
189
DESIGN EXAMPLE 3.3STEP 4: COMPUTE WEARING
SURFACE ONCOMPOSITE SECTION
The future wearing surface is equallydistributed among all 6 stringers. Sincewearing surface has different load fac-tor, we separate it from the rest of super-imposed dead loads.
Shear Connector Design
[3.10.7, Part 1]
COMPOSITE STEEL MEMBERS
Q = statical moment about neutral axis (see sidebar), in3
I = moment of inertia of composite beam, in4
For shear stud type connectors, this range of shear stress must be lessthan or equal to a corresponding allowable range of horizontal shear. Thisallowable range is given by
Z dr = ⋅α 2 (Eq. 3.72)
where Zr = allowable range of horizontal shear on one stud, kα = constant based on number of stress cycles (see sidebar)d = diameter of stud, in
Prior to computing the actual live loadmoment and shear, we need to calcu-late the live load distribution factor forthe moment and shear. For the two-lanebridge, the live load distribution factorfor moment is given by Eq. 3.21, andthe live load distribution factor for shearis given by Eq. 3.23. (Both are forStrength Limit States). Also see dis-cussion in Section 3.8.1 for the otherequations. Note that the live load dis-tribution in LRFD is for axle loads.
Since live load distribution factor is afunction of the section properties of thestringer, we have to assume a sectionbased on experience to begin the de-sign process.
STEP 5: COMPUTE LIVE LOADDISTRIBUTION FACTORS
DESIGN OF A COMPOSITE STEEL-CONCRETE STRINGER—LRFD METHOD 15
4DETEXAMPLE 3.3
STEP 4: Compute Wearing Surface on Composite Section:
➠ DFm= 0.645
We first assume the stringer size W24x76:A = 22.4 in2, I = 2100 in4, d = 23.92 in2
The distance between the C.G. of the stringer and the C.G. of the deck:
STEP 5: Compute Live Load Distribution Factor:
(Step 5: Continued on Next Sheet)
For 4.5 ksi concrete, n = 8.
➠ VDW = 4.12 k
DW =
= = 0.183 k/ft
➠ MDW = 46.32 k
Live load distribution factor for moment—Strength Limit State
width of roadway future wearing surfacenumber of stringers
( )( )
44 ft 0.025 k/ft
6 Stringers
2( )( )
M = wL8
= (0.183)(45.0)
8= 46.32 k ftDW
2 2
⋅
V = wL2
= (0.183)(45.0)
2 = 4.12 kDW
e = 7.52
+ 2.0 + 23.92
2 = 17.71 ing
K = n I + Ae = (8)[2100 + (22.4)(17.71) ] = 73,005 ing g2 2 4( )
DF = 0.075 + S
9.5SL
K
12.0Ltm
0.6 0.2g
s3
0.1
= 0.075 + 8.09.5
8.045.0
73,00512.0 4
0.6 0.6
⋅ 55.0 7.53
0.1
⋅
Downloaded from Digital Engineering Library @ McGraw-Hill (www.digitalengineeringlibrary.com)Copyright © 2006 The McGraw-Hill Companies. All rights reserved.
Any use is subject to the Terms of Use as given at the website.
Design of Superstructure Elements
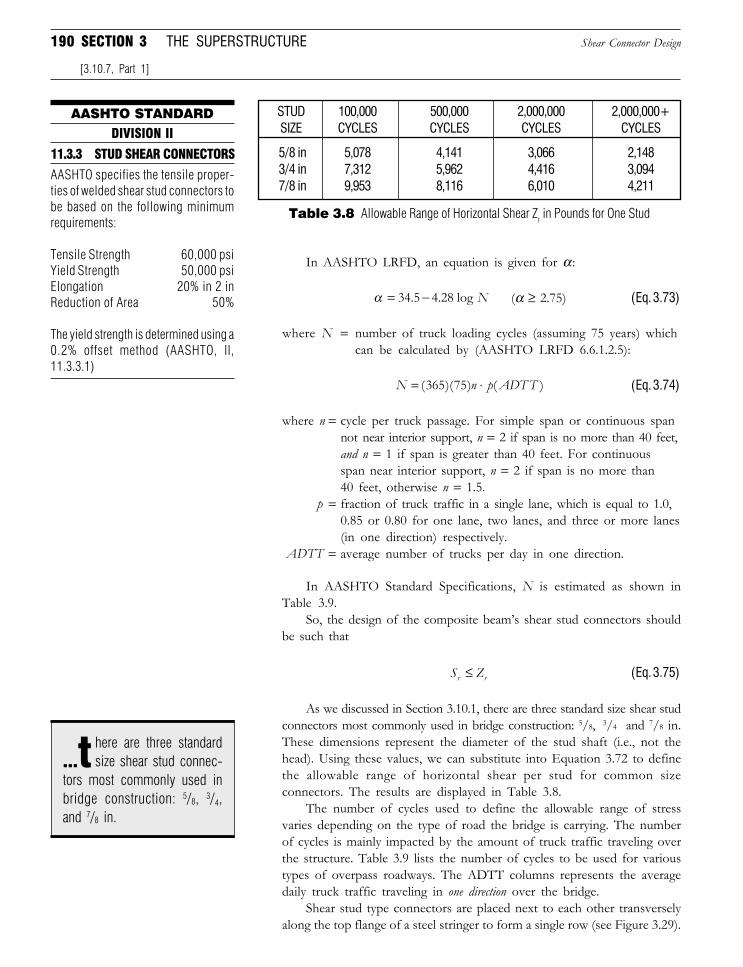
190 SECTION 3 THE SUPERSTRUCTURE Shear Connector Design
[3.10.7, Part 1]
In AASHTO LRFD, an equation is given for α :
α = −34 5 4 28. . log N (α ≥ 2.75) (Eq. 3.73)
where N = number of truck loading cycles (assuming 75 years) whichcan be calculated by (AASHTO LRFD 6.6.1.2.5):
N n p ADTT= ⋅( )( ) ( )365 75 (Eq. 3.74)
where n = cycle per truck passage. For simple span or continuous spannot near interior support, n = 2 if span is no more than 40 feet,and n = 1 if span is greater than 40 feet. For continuousspan near interior support, n = 2 if span is no more than40 feet, otherwise n = 1.5.
p = fraction of truck traffic in a single lane, which is equal to 1.0,0.85 or 0.80 for one lane, two lanes, and three or more lanes(in one direction) respectively.
ADTT = average number of trucks per day in one direction.
In AASHTO Standard Specifications, N is estimated as shown inTable 3.9.
So, the design of the composite beam’s shear stud connectors shouldbe such that
S Zr r≤ (Eq. 3.75)
As we discussed in Section 3.10.1, there are three standard size shear studconnectors most commonly used in bridge construction: 5/8, 3/4 and 7/8 in.These dimensions represent the diameter of the stud shaft (i.e., not thehead). Using these values, we can substitute into Equation 3.72 to definethe allowable range of horizontal shear per stud for common sizeconnectors. The results are displayed in Table 3.8.
The number of cycles used to define the allowable range of stressvaries depending on the type of road the bridge is carrying. The numberof cycles is mainly impacted by the amount of truck traffic traveling overthe structure. Table 3.9 lists the number of cycles to be used for varioustypes of overpass roadways. The ADTT columns represents the averagedaily truck traffic traveling in one direction over the bridge.
Shear stud type connectors are placed next to each other transverselyalong the top flange of a steel stringer to form a single row (see Figure 3.29).
STUD 100,000 500,000 2,000,000 2,000,000+SIZE CYCLES CYCLES CYCLES CYCLES
5/8 in 5,078 4,141 3,066 2,1483/4 in 7,312 5,962 4,416 3,0947/8 in 9,953 8,116 6,010 4,211
Table 3.8 Allowable Range of Horizontal Shear Zr in Pounds for One Stud
AASHTO STANDARDDIVISION II
AASHTO specifies the tensile proper-ties of welded shear stud connectors tobe based on the following minimumrequirements:
Tensile Strength 60,000 psiYield Strength 50,000 psiElongation 20% in 2 inReduction of Area 50%
The yield strength is determined using a0.2% offset method (AASHTO, II,11.3.3.1)
11.3.3 STUD SHEAR CONNECTORS
here are three standardsize shear stud connec-
tors most commonly used inbridge construction: 5/8, 3/4,and 7/8 in.
...t
Downloaded from Digital Engineering Library @ McGraw-Hill (www.digitalengineeringlibrary.com)Copyright © 2006 The McGraw-Hill Companies. All rights reserved.
Any use is subject to the Terms of Use as given at the website.
Design of Superstructure Elements
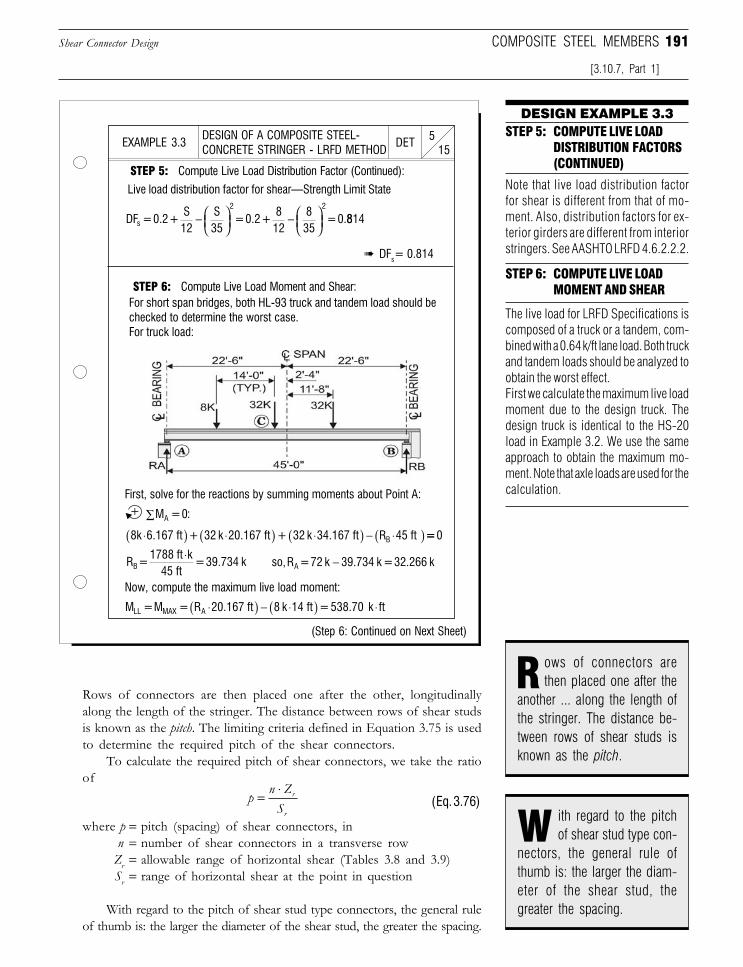
191
DESIGN EXAMPLE 3.3
Note that live load distribution factorfor shear is different from that of mo-ment. Also, distribution factors for ex-terior girders are different from interiorstringers. See AASHTO LRFD 4.6.2.2.2.
STEP 6: COMPUTE LIVE LOADMOMENT AND SHEAR
Shear Connector Design
[3.10.7, Part 1]
COMPOSITE STEEL MEMBERS
Rows of connectors are then placed one after the other, longitudinallyalong the length of the stringer. The distance between rows of shear studsis known as the pitch. The limiting criteria defined in Equation 3.75 is usedto determine the required pitch of the shear connectors.
To calculate the required pitch of shear connectors, we take the ratioof
pn ZS
r
r
=⋅
(Eq. 3.76)
where p = pitch (spacing) of shear connectors, inn = number of shear connectors in a transverse row
Zr = allowable range of horizontal shear (Tables 3.8 and 3.9)Sr = range of horizontal shear at the point in question
With regard to the pitch of shear stud type connectors, the general ruleof thumb is: the larger the diameter of the shear stud, the greater the spacing.
STEP 5: COMPUTE LIVE LOADDISTRIBUTION FACTORS(CONTINUED)
The live load for LRFD Specifications iscomposed of a truck or a tandem, com-bined with a 0.64 k/ft lane load. Both truckand tandem loads should be analyzed toobtain the worst effect.First we calculate the maximum live loadmoment due to the design truck. Thedesign truck is identical to the HS-20load in Example 3.2. We use the sameapproach to obtain the maximum mo-ment. Note that axle loads are used for thecalculation.
ows of connectors arethen placed one after the
another ... along the length ofthe stringer. The distance be-tween rows of shear studs isknown as the pitch.
R
ith regard to the pitchof shear stud type con-
nectors, the general rule ofthumb is: the larger the diam-eter of the shear stud, thegreater the spacing.
W
DESIGN OF A COMPOSITE STEEL-CONCRETE STRINGER - LRFD METHOD 15
5DETEXAMPLE 3.3
STEP 5: Compute Live Load Distribution Factor (Continued):
(Step 6: Continued on Next Sheet)
➠ DFs= 0.814
Live load distribution factor for shear—Strength Limit State
STEP 6: Compute Live Load Moment and Shear:For short span bridges, both HL-93 truck and tandem load should bechecked to determine the worst case.For truck load:
First, solve for the reactions by summing moments about Point A:
Now, compute the maximum live load moment:
+
DF = 0.2 + S
12
S35
= 0.2 + 8
12
835
= 0.s
2
2
−
−
8814
M = 0:A∑
8k 6.167 ft + 32 k 20.167 ft + 32 k 34.167 ft R 45 ft B⋅( ) ⋅( ) ⋅( ) − ⋅( )== 0
R = 1788 ft k
45 ft = 39.734 kB
⋅so, R = 72 k 39.734 k = 32.266 kA −
M = M = R 20.167 ft 8 k 14 ft =538.70 k ftLL MAX A ⋅( ) − ⋅( ) ⋅
Downloaded from Digital Engineering Library @ McGraw-Hill (www.digitalengineeringlibrary.com)Copyright © 2006 The McGraw-Hill Companies. All rights reserved.
Any use is subject to the Terms of Use as given at the website.
Design of Superstructure Elements
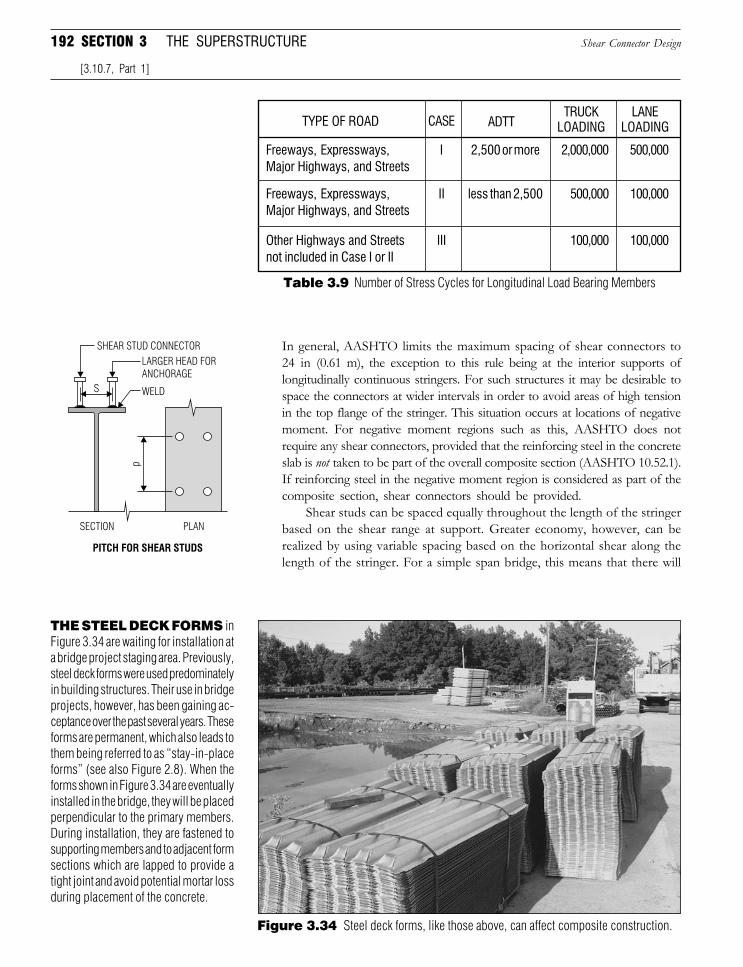
192 SECTION 3 THE SUPERSTRUCTURE Shear Connector Design
[3.10.7, Part 1]
In general, AASHTO limits the maximum spacing of shear connectors to24 in (0.61 m), the exception to this rule being at the interior supports oflongitudinally continuous stringers. For such structures it may be desirable tospace the connectors at wider intervals in order to avoid areas of high tensionin the top flange of the stringer. This situation occurs at locations of negativemoment. For negative moment regions such as this, AASHTO does notrequire any shear connectors, provided that the reinforcing steel in the concreteslab is not taken to be part of the overall composite section (AASHTO 10.52.1).If reinforcing steel in the negative moment region is considered as part of thecomposite section, shear connectors should be provided.
Shear studs can be spaced equally throughout the length of the stringerbased on the shear range at support. Greater economy, however, can berealized by using variable spacing based on the horizontal shear along thelength of the stringer. For a simple span bridge, this means that there will
Table 3.9 Number of Stress Cycles for Longitudinal Load Bearing Members
Freeways, Expressways, I 2,500 or more 2,000,000 500,000Major Highways, and Streets
TYPE OF ROADTRUCK LANE
LOADING LOADING
Freeways, Expressways, II less than 2,500 500,000 100,000Major Highways, and Streets
Other Highways and Streets III 100,000 100,000not included in Case I or II
ADTTCASE
THE STEEL DECK FORMS inFigure 3.34 are waiting for installation ata bridge project staging area. Previously,steel deck forms were used predominatelyin building structures. Their use in bridgeprojects, however, has been gaining ac-ceptance over the past several years. Theseforms are permanent, which also leads tothem being referred to as “stay-in-placeforms” (see also Figure 2.8). When theforms shown in Figure 3.34 are eventuallyinstalled in the bridge, they will be placedperpendicular to the primary members.During installation, they are fastened tosupporting members and to adjacent formsections which are lapped to provide atight joint and avoid potential mortar lossduring placement of the concrete.
Figure 3.34 Steel deck forms, like those above, can affect composite construction.
PITCH FOR SHEAR STUDS
SECTION PLAN
SHEAR STUD CONNECTOR
LARGER HEAD FOR
ANCHORAGE
WELDS
p
Downloaded from Digital Engineering Library @ McGraw-Hill (www.digitalengineeringlibrary.com)Copyright © 2006 The McGraw-Hill Companies. All rights reserved.
Any use is subject to the Terms of Use as given at the website.
Design of Superstructure Elements
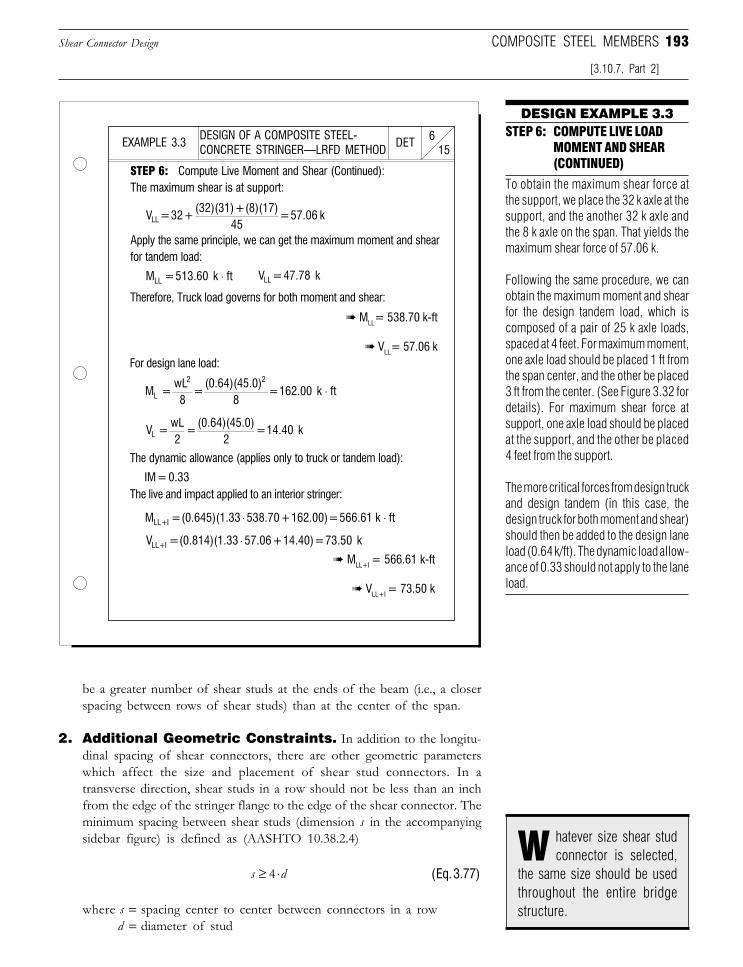
193
DESIGN EXAMPLE 3.3
Shear Connector Design
[3.10.7, Part 2]
COMPOSITE STEEL MEMBERS
be a greater number of shear studs at the ends of the beam (i.e., a closerspacing between rows of shear studs) than at the center of the span.
2. Additional Geometric Constraints. In addition to the longitu-dinal spacing of shear connectors, there are other geometric parameterswhich affect the size and placement of shear stud connectors. In atransverse direction, shear studs in a row should not be less than an inchfrom the edge of the stringer flange to the edge of the shear connector. Theminimum spacing between shear studs (dimension s in the accompanyingsidebar figure) is defined as (AASHTO 10.38.2.4)
s d≥ ⋅4 (Eq. 3.77)
where s = spacing center to center between connectors in a rowd = diameter of stud
To obtain the maximum shear force atthe support, we place the 32 k axle at thesupport, and the another 32 k axle andthe 8 k axle on the span. That yields themaximum shear force of 57.06 k.
Following the same procedure, we canobtain the maximum moment and shearfor the design tandem load, which iscomposed of a pair of 25 k axle loads,spaced at 4 feet. For maximum moment,one axle load should be placed 1 ft fromthe span center, and the other be placed3 ft from the center. (See Figure 3.32 fordetails). For maximum shear force atsupport, one axle load should be placedat the support, and the other be placed4 feet from the support.
The more critical forces from design truckand design tandem (in this case, thedesign truck for both moment and shear)should then be added to the design laneload (0.64 k/ft). The dynamic load allow-ance of 0.33 should not apply to the laneload.
STEP 6: COMPUTE LIVE LOADMOMENT AND SHEAR(CONTINUED)
hatever size shear studconnector is selected,
the same size should be usedthroughout the entire bridgestructure.
W
DESIGN OF A COMPOSITE STEEL-CONCRETE STRINGER—LRFD METHOD 15
6DETEXAMPLE 3.3
STEP 6: Compute Live Moment and Shear (Continued):The maximum shear is at support:
➠ MLL+I = 566.61 k-ft
➠ VLL+I = 73.50 k
Apply the same principle, we can get the maximum moment and shearfor tandem load:
Therefore, Truck load governs for both moment and shear:
For design lane load:
The dynamic allowance (applies only to truck or tandem load):
The live and impact applied to an interior stringer:
➠ MLL= 538.70 k-ft
➠ VLL= 57.06 k
V = 32 + (32)(31) + (8)(17)
45 = 57.06 kLL
M = 513.60 k ftLL ⋅
M = wL8
= (0.64)(45.0)
8 = 162.00 k ftL
2 2
⋅
V = wL2
= (0.64)(45.0)
2 = 14.40 kL
IM=0.33
M = (0.645)(1.33 538.70 + 162.00) = 566.61 k ftLL+I ⋅ ⋅
V = (0.814)(1.33 57.06 + 14.40) = 73.50 kLL+I ⋅
V = 47.78 kLL
Downloaded from Digital Engineering Library @ McGraw-Hill (www.digitalengineeringlibrary.com)Copyright © 2006 The McGraw-Hill Companies. All rights reserved.
Any use is subject to the Terms of Use as given at the website.
Design of Superstructure Elements
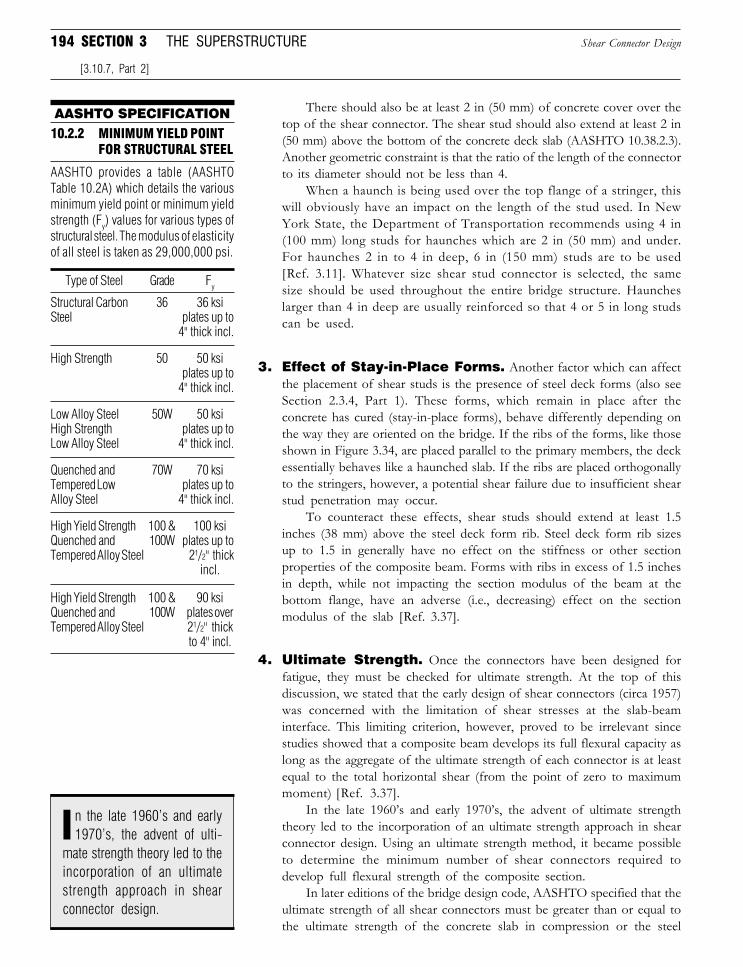
194 SECTION 3 THE SUPERSTRUCTURE Shear Connector Design
[3.10.7, Part 2]
There should also be at least 2 in (50 mm) of concrete cover over thetop of the shear connector. The shear stud should also extend at least 2 in(50 mm) above the bottom of the concrete deck slab (AASHTO 10.38.2.3).Another geometric constraint is that the ratio of the length of the connectorto its diameter should not be less than 4.
When a haunch is being used over the top flange of a stringer, thiswill obviously have an impact on the length of the stud used. In NewYork State, the Department of Transportation recommends using 4 in(100 mm) long studs for haunches which are 2 in (50 mm) and under.For haunches 2 in to 4 in deep, 6 in (150 mm) studs are to be used[Ref. 3.11]. Whatever size shear stud connector is selected, the samesize should be used throughout the entire bridge structure. Hauncheslarger than 4 in deep are usually reinforced so that 4 or 5 in long studscan be used.
3. Effect of Stay-in-Place Forms. Another factor which can affectthe placement of shear studs is the presence of steel deck forms (also seeSection 2.3.4, Part 1). These forms, which remain in place after theconcrete has cured (stay-in-place forms), behave differently depending onthe way they are oriented on the bridge. If the ribs of the forms, like thoseshown in Figure 3.34, are placed parallel to the primary members, the deckessentially behaves like a haunched slab. If the ribs are placed orthogonallyto the stringers, however, a potential shear failure due to insufficient shearstud penetration may occur.
To counteract these effects, shear studs should extend at least 1.5inches (38 mm) above the steel deck form rib. Steel deck form rib sizesup to 1.5 in generally have no effect on the stiffness or other sectionproperties of the composite beam. Forms with ribs in excess of 1.5 inchesin depth, while not impacting the section modulus of the beam at thebottom flange, have an adverse (i.e., decreasing) effect on the sectionmodulus of the slab [Ref. 3.37].
4. Ultimate Strength. Once the connectors have been designed forfatigue, they must be checked for ultimate strength. At the top of thisdiscussion, we stated that the early design of shear connectors (circa 1957)was concerned with the limitation of shear stresses at the slab-beaminterface. This limiting criterion, however, proved to be irrelevant sincestudies showed that a composite beam develops its full flexural capacity aslong as the aggregate of the ultimate strength of each connector is at leastequal to the total horizontal shear (from the point of zero to maximummoment) [Ref. 3.37].
In the late 1960’s and early 1970’s, the advent of ultimate strengththeory led to the incorporation of an ultimate strength approach in shearconnector design. Using an ultimate strength method, it became possibleto determine the minimum number of shear connectors required todevelop full flexural strength of the composite section.
In later editions of the bridge design code, AASHTO specified that theultimate strength of all shear connectors must be greater than or equal tothe ultimate strength of the concrete slab in compression or the steel
AASHTO SPECIFICATION10.2.2 MINIMUM YIELD POINT
FOR STRUCTURAL STEEL
AASHTO provides a table (AASHTOTable 10.2A) which details the variousminimum yield point or minimum yieldstrength (Fy) values for various types ofstructural steel. The modulus of elasticityof all steel is taken as 29,000,000 psi.
Structural Carbon 36 36 ksiSteel plates up to
4" thick incl.
High Strength 50 50 ksiplates up to
4" thick incl.
Low Alloy Steel 50W 50 ksiHigh Strength plates up toLow Alloy Steel 4" thick incl.
Quenched and 70W 70 ksiTempered Low plates up toAlloy Steel 4" thick incl.
High Yield Strength 100 & 100 ksiQuenched and 100W plates up toTempered Alloy Steel 21/2" thick
incl.
High Yield Strength 100 & 90 ksiQuenched and 100W plates overTempered Alloy Steel 21/2" thick
to 4" incl.
Type of Steel Grade Fy
n the late 1960’s and early1970’s, the advent of ulti-
mate strength theory led to theincorporation of an ultimatestrength approach in shearconnector design.
I
Downloaded from Digital Engineering Library @ McGraw-Hill (www.digitalengineeringlibrary.com)Copyright © 2006 The McGraw-Hill Companies. All rights reserved.
Any use is subject to the Terms of Use as given at the website.
Design of Superstructure Elements
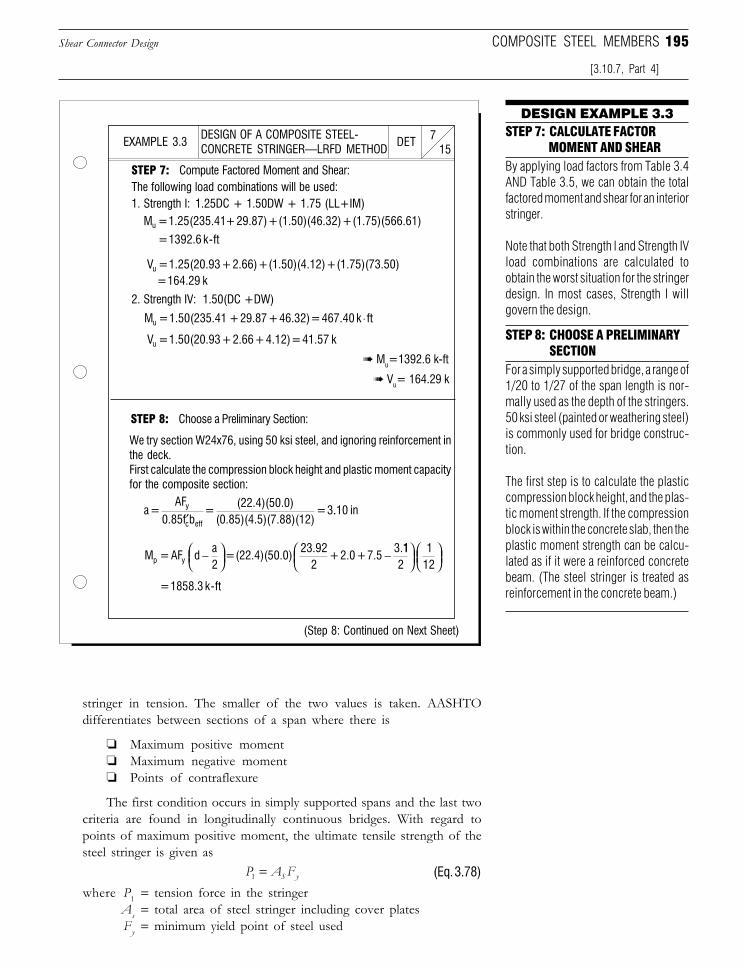
195
DESIGN EXAMPLE 3.3
Shear Connector Design
[3.10.7, Part 4]
COMPOSITE STEEL MEMBERS
stringer in tension. The smaller of the two values is taken. AASHTOdifferentiates between sections of a span where there is
❏ Maximum positive moment❏ Maximum negative moment❏ Points of contraflexure
The first condition occurs in simply supported spans and the last twocriteria are found in longitudinally continuous bridges. With regard topoints of maximum positive moment, the ultimate tensile strength of thesteel stringer is given as
P A FS y1 = (Eq. 3.78)
where P1 = tension force in the stringerAs = total area of steel stringer including cover platesFy = minimum yield point of steel used
By applying load factors from Table 3.4AND Table 3.5, we can obtain the totalfactored moment and shear for an interiorstringer.
Note that both Strength I and Strength IVload combinations are calculated toobtain the worst situation for the stringerdesign. In most cases, Strength I willgovern the design.
STEP 7: CALCULATE FACTOR MOMENT AND SHEAR
STEP 8: CHOOSE A PRELIMINARYSECTION
For a simply supported bridge, a range of1/20 to 1/27 of the span length is nor-mally used as the depth of the stringers.50 ksi steel (painted or weathering steel)is commonly used for bridge construc-tion.
The first step is to calculate the plasticcompression block height, and the plas-tic moment strength. If the compressionblock is within the concrete slab, then theplastic moment strength can be calcu-lated as if it were a reinforced concretebeam. (The steel stringer is treated asreinforcement in the concrete beam.)
➠ Mu=1392.6 k-ft
➠ Vu= 164.29 k
DESIGN OF A COMPOSITE STEEL-CONCRETE STRINGER—LRFD METHOD 15
7DETEXAMPLE 3.3
STEP 7: Compute Factored Moment and Shear:The following load combinations will be used:1. Strength I: 1.25DC + 1.50DW + 1.75 (LL+IM)
2. Strength IV: 1.50(DC +DW)
(Step 8: Continued on Next Sheet)
STEP 8: Choose a Preliminary Section:
We try section W24x76, using 50 ksi steel, and ignoring reinforcement inthe deck.First calculate the compression block height and plastic moment capacityfor the composite section:
M = 1.25(235.41 + 29.87) + (1.50)(46.32) + (1.75)(566.61)u
= 1392.6 k-ft
M = 1.50(235.41 + 29.87 + 46.32) = 467.40 k ftu ⋅
V = 1.50(20.93 + 2.66 + 4.12) = 41.57 ku
a = AF
0.85f b =
(22.4)(50.0)(0.85)(4.5)(7.88)(12)
= 3y
c eff′..10 in
= 1858.3 k-ft
V = 1.25(20.93 + 2.66) + (1.50)(4.12) + (1.75)(73.50)u
= 164.29 k
M = AF d a2
= (22.4)(50.0)23.92
2 + 2.0 + 7.5
3.p y −
− 112
112
Downloaded from Digital Engineering Library @ McGraw-Hill (www.digitalengineeringlibrary.com)Copyright © 2006 The McGraw-Hill Companies. All rights reserved.
Any use is subject to the Terms of Use as given at the website.
Design of Superstructure Elements
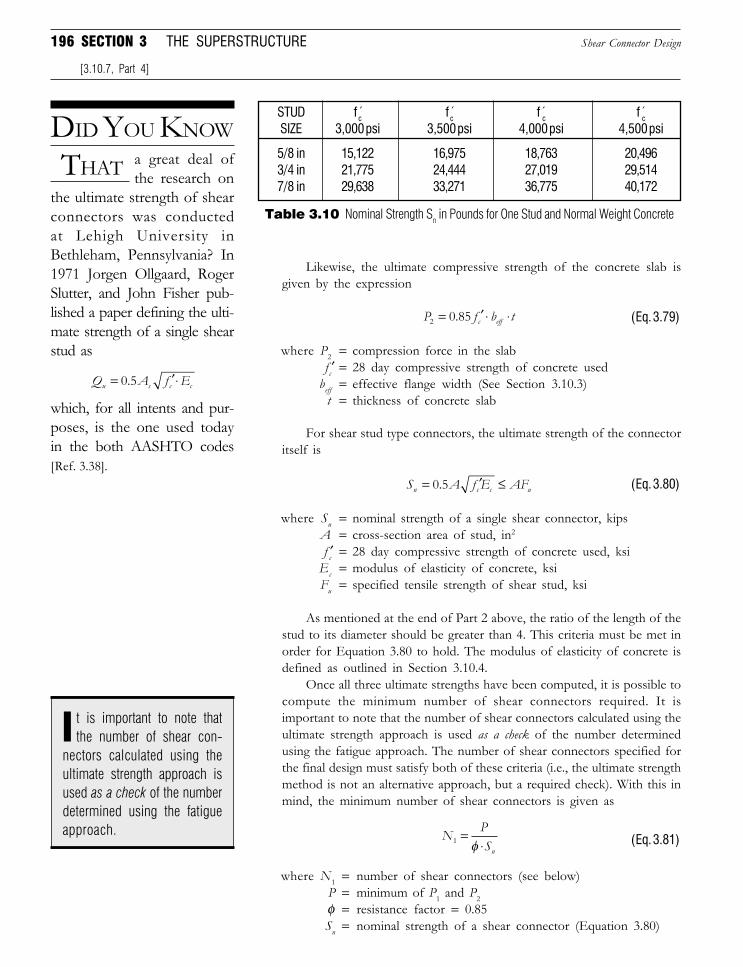
196 SECTION 3 THE SUPERSTRUCTURE Shear Connector Design
[3.10.7, Part 4]
Likewise, the ultimate compressive strength of the concrete slab isgiven by the expression
P f b tc eff2 0 85= ′ ⋅ ⋅. (Eq. 3.79)
where P2 = compression force in the slabf ′c = 28 day compressive strength of concrete used
beff = effective flange width (See Section 3.10.3)t = thickness of concrete slab
For shear stud type connectors, the ultimate strength of the connectoritself is
S A f E AFn c c u= ′ ≤0 5. (Eq. 3.80)
where Sn = nominal strength of a single shear connector, kipsA = cross-section area of stud, in2
f ′c = 28 day compressive strength of concrete used, ksiEc = modulus of elasticity of concrete, ksiFu = specified tensile strength of shear stud, ksi
As mentioned at the end of Part 2 above, the ratio of the length of thestud to its diameter should be greater than 4. This criteria must be met inorder for Equation 3.80 to hold. The modulus of elasticity of concrete isdefined as outlined in Section 3.10.4.
Once all three ultimate strengths have been computed, it is possible tocompute the minimum number of shear connectors required. It isimportant to note that the number of shear connectors calculated using theultimate strength approach is used as a check of the number determinedusing the fatigue approach. The number of shear connectors specified forthe final design must satisfy both of these criteria (i.e., the ultimate strengthmethod is not an alternative approach, but a required check). With this inmind, the minimum number of shear connectors is given as
N PSn
1 =⋅φ (Eq. 3.81)
where N1 = number of shear connectors (see below)P = minimum of P1 and P2φ = resistance factor = 0.85Sn = nominal strength of a shear connector (Equation 3.80)
STUD fc f c f c f c
SIZE 3,000 psi 3,500 psi 4,000 psi 4,500 psi
5/8 in 15,122 16,975 18,763 20,4963/4 in 21,775 24,444 27,019 29,5147/8 in 29,638 33,271 36,775 40,172
Table 3.10 Nominal Strength Sn in Pounds for One Stud and Normal Weight Concrete
THAT a great deal ofthe research on
the ultimate strength of shearconnectors was conductedat Lehigh University inBethleham, Pennsylvania? In1971 Jorgen Ollgaard, RogerSlutter, and John Fisher pub-lished a paper defining the ulti-mate strength of a single shearstud as
which, for all intents and pur-poses, is the one used todayin the both AASHTO codes[Ref. 3.38].
DID YOU KNOW
t is important to note thatthe number of shear con-
nectors calculated using theultimate strength approach isused as a check of the numberdetermined using the fatigueapproach.
I
Q A f Eu s c c= ′⋅0 5.
Downloaded from Digital Engineering Library @ McGraw-Hill (www.digitalengineeringlibrary.com)Copyright © 2006 The McGraw-Hill Companies. All rights reserved.
Any use is subject to the Terms of Use as given at the website.
Design of Superstructure Elements
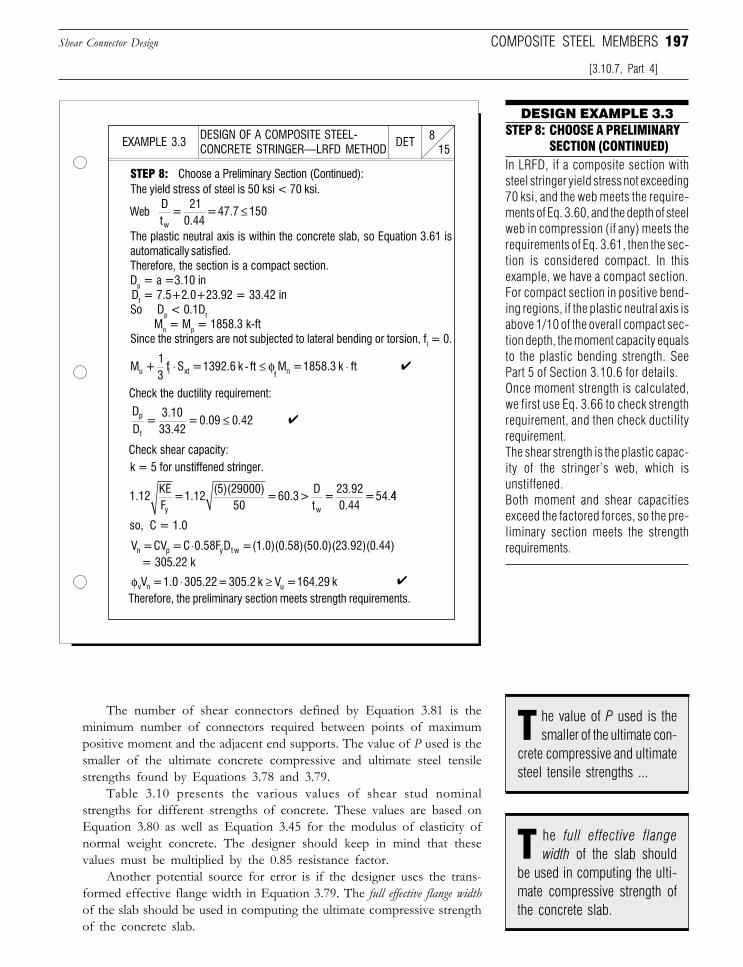
197
DESIGN EXAMPLE 3.3
Shear Connector Design
[3.10.7, Part 4]
COMPOSITE STEEL MEMBERS
The number of shear connectors defined by Equation 3.81 is theminimum number of connectors required between points of maximumpositive moment and the adjacent end supports. The value of P used is thesmaller of the ultimate concrete compressive and ultimate steel tensilestrengths found by Equations 3.78 and 3.79.
Table 3.10 presents the various values of shear stud nominalstrengths for different strengths of concrete. These values are based onEquation 3.80 as well as Equation 3.45 for the modulus of elasticity ofnormal weight concrete. The designer should keep in mind that thesevalues must be multiplied by the 0.85 resistance factor.
Another potential source for error is if the designer uses the trans-formed effective flange width in Equation 3.79. The full effective flange widthof the slab should be used in computing the ultimate compressive strengthof the concrete slab.
STEP 8: CHOOSE A PRELIMINARYSECTION (CONTINUED)
In LRFD, if a composite section withsteel stringer yield stress not exceeding70 ksi, and the web meets the require-ments of Eq. 3.60, and the depth of steelweb in compression (if any) meets therequirements of Eq. 3.61, then the sec-tion is considered compact. In thisexample, we have a compact section.For compact section in positive bend-ing regions, if the plastic neutral axis isabove 1/10 of the overall compact sec-tion depth, the moment capacity equalsto the plastic bending strength. SeePart 5 of Section 3.10.6 for details.Once moment strength is calculated,we first use Eq. 3.66 to check strengthrequirement, and then check ductilityrequirement.The shear strength is the plastic capac-ity of the stringer’s web, which isunstiffened.Both moment and shear capacitiesexceed the factored forces, so the pre-liminary section meets the strengthrequirements.
he value of P used is thesmaller of the ultimate con-
crete compressive and ultimatesteel tensile strengths ...
T
DESIGN OF A COMPOSITE STEEL-CONCRETE STRINGER—LRFD METHOD 15
8DETEXAMPLE 3.3
The plastic neutral axis is within the concrete slab, so Equation 3.61 isautomatically satisfied.Therefore, the section is a compact section.Dp = a =3.10 in Dt = 7.5+2.0+23.92 = 33.42 inSo Dp < 0.1Dt
Mn = Mp = 1858.3 k-ftSince the stringers are not subjected to lateral bending or torsion, fl = 0.
STEP 8: Choose a Preliminary Section (Continued):The yield stress of steel is 50 ksi < 70 ksi.
✔
Check the ductility requirement:
Check shear capacity:
so, C = 1.0
k = 5 for unstiffened stringer.
✔
Therefore, the preliminary section meets strength requirements.
✔
= 305.22 k
Dt
= 21
0.44 = 47.7 150
w
≤
DD
=3.1033.42
=0.09 0.42 p
t
≤
1.12KEF
= 1.12(5)(29000)
50 = 60.3 >
Dt
= 23.920.44
= 54.y w
44
V = CV = C 0.58F D = (1.0)(0.58)(50.0)(23.92)(0.44)n p y t w⋅
Web
he full effective flangewidth of the slab should
be used in computing the ulti-mate compressive strength ofthe concrete slab.
T
φvV = 1.0 305.22 = 305.2 k V = 164.29 kn u⋅ ≥
M + 13
f S = 1392.6 k ft M = 1858.3 k ftu l xt f n⋅ ≤ ⋅- φ
Downloaded from Digital Engineering Library @ McGraw-Hill (www.digitalengineeringlibrary.com)Copyright © 2006 The McGraw-Hill Companies. All rights reserved.
Any use is subject to the Terms of Use as given at the website.
Design of Superstructure Elements
198 SECTION 3 THE SUPERSTRUCTURE Shear Connector Design
[3.10.7, Part 4]
So far, we have discussed the parameters involved in determining thenumber of shear connectors required for points located within regions ofpositive moment only. In areas between maximum positive moment andadjacent maximum negative moment the minimum number of shearconnectors required is given as
N P PSn
23= +
⋅φ (Eq. 3.82)
where N2 = number of shear connectorsP = minimum of P1 and P2P3 = force in slab at points of maximum negative momentφ = resistance factor = 0.85 Sn= nominal strength of a shear connector (Equation 3.80)
The force in the slab at points of maximum negative moment is takenas zero when reinforcement located at the top surface of the concrete slabis not used in calculating the properties of the composite section resistingnegative moments. Otherwise, this force is computed by the following:
For Load Factor Design (AASHTO Standard Specifications):
P A Fsr
yr
3 = ⋅ (Eq. 3.83)
For the LRFD method, P3 is taken as the lesser of:
P A Fs y3 = (Eq. 3.84a)
P f b tc eff3 0 45= ′ ⋅ ⋅. (Eq. 3.84b)
where P3 = force in slab at points of maximum negative momentAs
r = total area of reinforcement within the effective flangewidth at the interior support
Fyr = minimum yield stress of reinforcing steel
beff = effective flange width (see section 3.10.3)t = thickness of concrete slab
As = total cross-section area of the stringerFy = yield stress of the stringer
Note that AASHTO LRFD Specifications takes a more conserva-tive approach in dealing with concrete slab in tension than AASHTOStandard Specifications. The 45% of the deck compressive strengthrepresents the combined contribution of deck reinforcement and thetensile strength of the concrete. In the AASHTO Standard Specifica-tions, only reinforcement in the deck is considered in resisting tension,therefore requiring less shear studs to resist the horizontal shear atnegative moment region.
Downloaded from Digital Engineering Library @ McGraw-Hill (www.digitalengineeringlibrary.com)Copyright © 2006 The McGraw-Hill Companies. All rights reserved.
Any use is subject to the Terms of Use as given at the website.
Design of Superstructure Elements
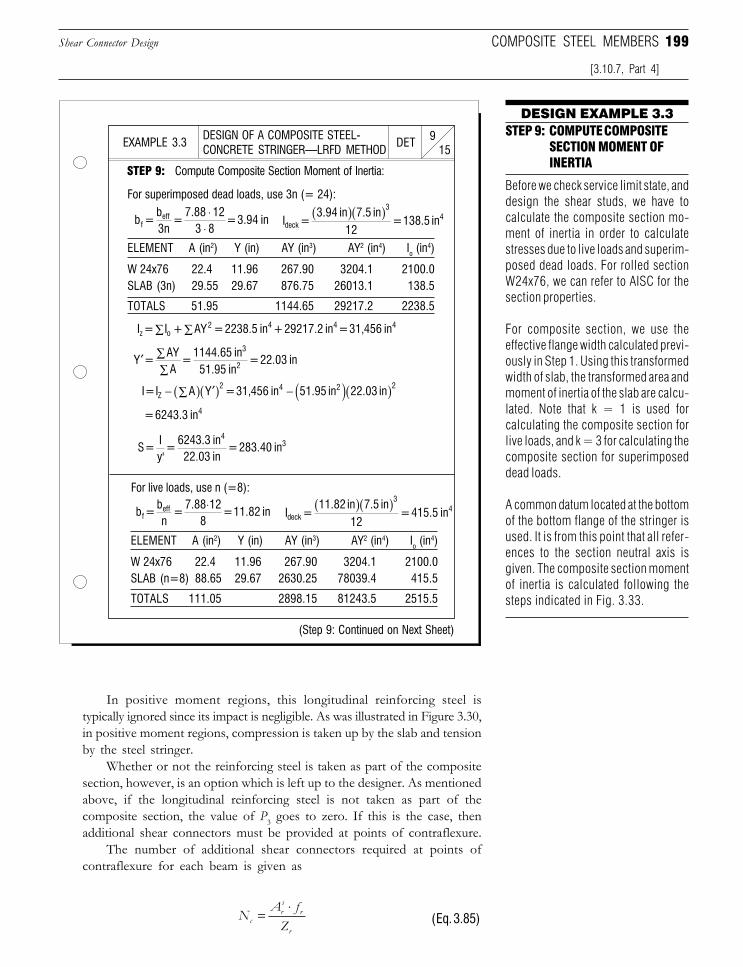
199
DESIGN EXAMPLE 3.3
COMPOSITE STEEL MEMBERSShear Connector Design
[3.10.7, Part 4]
In positive moment regions, this longitudinal reinforcing steel istypically ignored since its impact is negligible. As was illustrated in Figure 3.30,in positive moment regions, compression is taken up by the slab and tensionby the steel stringer.
Whether or not the reinforcing steel is taken as part of the compositesection, however, is an option which is left up to the designer. As mentionedabove, if the longitudinal reinforcing steel is not taken as part of thecomposite section, the value of P3 goes to zero. If this is the case, thenadditional shear connectors must be provided at points of contraflexure.
The number of additional shear connectors required at points ofcontraflexure for each beam is given as
NA fZcrs
r
r
= ⋅(Eq. 3.85)
STEP 9: COMPUTE COMPOSITESECTION MOMENT OFINERTIA
Before we check service limit state, anddesign the shear studs, we have tocalculate the composite section mo-ment of inertia in order to calculatestresses due to live loads and superim-posed dead loads. For rolled sectionW24x76, we can refer to AISC for thesection properties.
For composite section, we use theeffective flange width calculated previ-ously in Step 1. Using this transformedwidth of slab, the transformed area andmoment of inertia of the slab are calcu-lated. Note that k = 1 is used forcalculating the composite section forlive loads, and k = 3 for calculating thecomposite section for superimposeddead loads.
A common datum located at the bottomof the bottom flange of the stringer isused. It is from this point that all refer-ences to the section neutral axis isgiven. The composite section momentof inertia is calculated following thesteps indicated in Fig. 3.33.
STEP 9: Compute Composite Section Moment of Inertia:
For superimposed dead loads, use 3n (= 24):
ELEMENT A (in2) Y (in) AY (in3) AY2 (in4) Io (in4)
W 24x76 22.4 11.96 267.90 3204.1 2100.0SLAB (3n) 29.55 29.67 876.75 26013.1 138.5
TOTALS 51.95 1144.65 29217.2 2238.5
(Step 9: Continued on Next Sheet)
For live loads, use n (=8):
ELEMENT A (in2) Y (in) AY (in3) AY2 (in4) Io (in4)
W 24x76 22.4 11.96 267.90 3204.1 2100.0SLAB (n=8) 88.65 29.67 2630.25 78039.4 415.5
TOTALS 111.05 2898.15 81243.5 2515.5
DESIGN OF A COMPOSITE STEEL-CONCRETE STRINGER—LRFD METHOD 15
9DETEXAMPLE 3.3
b = b3n
= 7.88 12
3 8 = 3.94 inf
eff ⋅⋅
I = 3.94 in 7.5 in
12 = 138.5 indeck
34( )( )
I = I + AY = 2238.5 in + 29217.2 in = 31,456 inz o2 4
4
4∑∑
′ ∑∑
Y = AYA
= 1144.65 in
51.95 in = 22.03 in
3
2
I = I A Y = 31,456 in 51.95 in 22.03 inZ2 4 2 2− ∑( ) ′( ) − ( )( )
= 6243.3 in4
S = Iy'
= 6243.3 in22.03 in
= 283.40 in4
3
b = bn
= 7.88 12
8 = 11.82 inf
eff ⋅I =
11.82 in 7.5 in12
= 415.5 indeck
34( )( )
Downloaded from Digital Engineering Library @ McGraw-Hill (www.digitalengineeringlibrary.com)Copyright © 2006 The McGraw-Hill Companies. All rights reserved.
Any use is subject to the Terms of Use as given at the website.
Design of Superstructure Elements
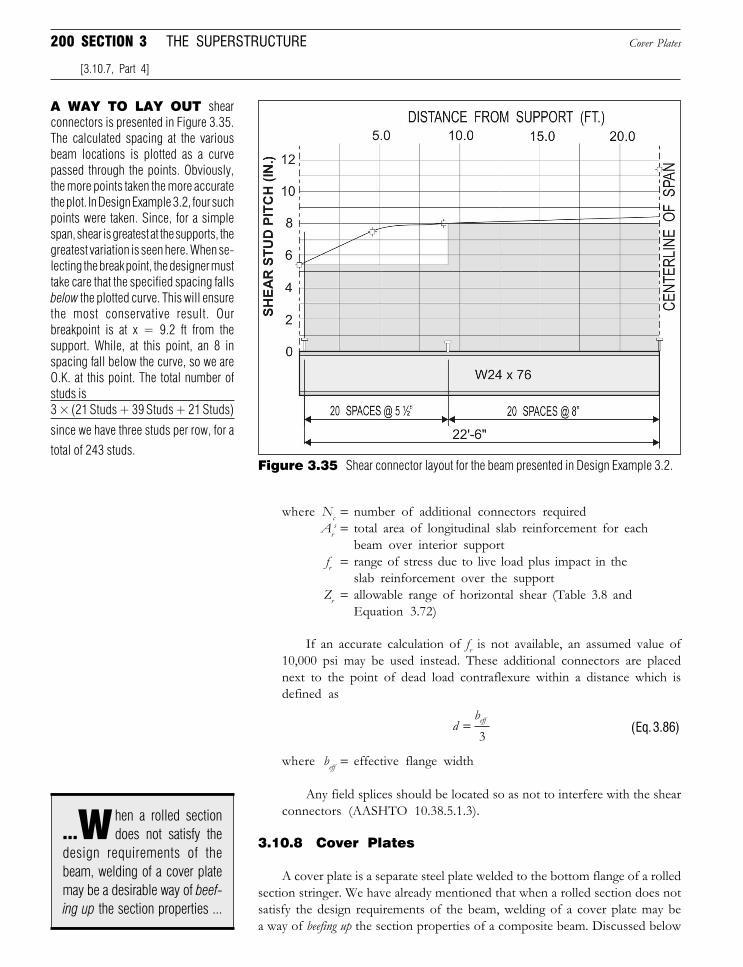
200 SECTION 3 THE SUPERSTRUCTURE
where Nc = number of additional connectors requiredAr
s = total area of longitudinal slab reinforcement for eachbeam over interior support
fr = range of stress due to live load plus impact in theslab reinforcement over the support
Zr = allowable range of horizontal shear (Table 3.8 andEquation 3.72)
If an accurate calculation of fr is not available, an assumed value of10,000 psi may be used instead. These additional connectors are placednext to the point of dead load contraflexure within a distance which isdefined as
dbeff=3
(Eq. 3.86)
where beff = effective flange width
Any field splices should be located so as not to interfere with the shearconnectors (AASHTO 10.38.5.1.3).
3.10.8 Cover Plates
A cover plate is a separate steel plate welded to the bottom flange of a rolledsection stringer. We have already mentioned that when a rolled section does notsatisfy the design requirements of the beam, welding of a cover plate may bea way of beefing up the section properties of a composite beam. Discussed below
A WAY TO LAY OUT shearconnectors is presented in Figure 3.35.The calculated spacing at the variousbeam locations is plotted as a curvepassed through the points. Obviously,the more points taken the more accuratethe plot. In Design Example 3.2, four suchpoints were taken. Since, for a simplespan, shear is greatest at the supports, thegreatest variation is seen here. When se-lecting the break point, the designer musttake care that the specified spacing fallsbelow the plotted curve. This will ensurethe most conservative result. Ourbreakpoint is at x = 9.2 ft from thesupport. While, at this point, an 8 inspacing fall below the curve, so we areO.K. at this point. The total number ofstuds is3 × (21 Studs + 39 Studs + 21 Studs)
total of 243 studs.
since we have three studs per row, for a
Cover Plates
[3.10.7, Part 4]
hen a rolled sectiondoes not satisfy the
design requirements of thebeam, welding of a cover platemay be a desirable way of beef-ing up the section properties ...
...w
Figure 3.35 Shear connector layout for the beam presented in Design Example 3.2.
Downloaded from Digital Engineering Library @ McGraw-Hill (www.digitalengineeringlibrary.com)Copyright © 2006 The McGraw-Hill Companies. All rights reserved.
Any use is subject to the Terms of Use as given at the website.
Design of Superstructure Elements
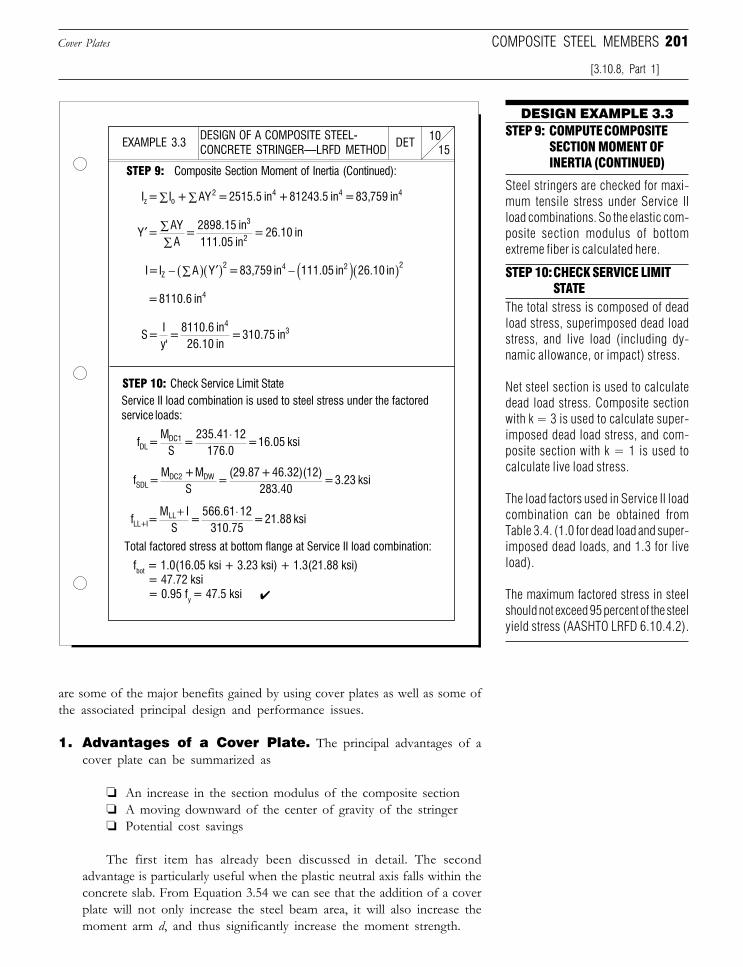
201
STEP 9: Composite Section Moment of Inertia (Continued):
DESIGN OF A COMPOSITE STEEL-CONCRETE STRINGER—LRFD METHOD 15
10DETEXAMPLE 3.3
STEP 10: Check Service Limit StateService II load combination is used to steel stress under the factoredservice loads:
fbot = 1.0(16.05 ksi + 3.23 ksi) + 1.3(21.88 ksi) = 47.72 ksi = 0.95 fy = 47.5 ksi ✔
Total factored stress at bottom flange at Service II load combination:
are some of the major benefits gained by using cover plates as well as some ofthe associated principal design and performance issues.
1. Advantages of a Cover Plate. The principal advantages of acover plate can be summarized as
❏ An increase in the section modulus of the composite section❏ A moving downward of the center of gravity of the stringer❏ Potential cost savings
The first item has already been discussed in detail. The secondadvantage is particularly useful when the plastic neutral axis falls within theconcrete slab. From Equation 3.54 we can see that the addition of a coverplate will not only increase the steel beam area, it will also increase themoment arm d, and thus significantly increase the moment strength.
DESIGN EXAMPLE 3.3STEP 9: COMPUTE COMPOSITE
SECTION MOMENT OFINERTIA (CONTINUED)
Steel stringers are checked for maxi-mum tensile stress under Service IIload combinations. So the elastic com-posite section modulus of bottomextreme fiber is calculated here.
STEP 10:CHECK SERVICE LIMITSTATE
The total stress is composed of deadload stress, superimposed dead loadstress, and live load (including dy-namic allowance, or impact) stress.
Net steel section is used to calculatedead load stress. Composite sectionwith k = 3 is used to calculate super-imposed dead load stress, and com-posite section with k = 1 is used tocalculate live load stress.
The load factors used in Service II loadcombination can be obtained fromTable 3.4. (1.0 for dead load and super-imposed dead loads, and 1.3 for liveload).
The maximum factored stress in steelshould not exceed 95 percent of the steelyield stress (AASHTO LRFD 6.10.4.2).
Cover Plates COMPOSITE STEEL MEMBERS
[3.10.8, Part 1]
I = I + AY = 2515.5 in + 81243.5 in = 83,759 inz o2 4 4 4∑∑
′ ∑∑
Y = AYA
= 2898.15 in111.05 in
= 26.10 in3
2
I = I A Y = 83,759 in 111.05 in 26.10 inZ2 4
2 2− ∑( ) ′( ) − ( )( )
= 8110.6 in4
S = Iy'
= 8110.6 in26.10 in
= 310.75 in4
3
f = M
S =
235.41 12176.0
= 16.05 ksiDL DC1 ⋅
f = M + M
S =
(29.87 + 46.32)(12)283.40
= 3.23 ksiSDL DC2 DW
f = M I
S =
566.61 12310.75
= 21.88 ksiLL+I LL+ ⋅
Downloaded from Digital Engineering Library @ McGraw-Hill (www.digitalengineeringlibrary.com)Copyright © 2006 The McGraw-Hill Companies. All rights reserved.
Any use is subject to the Terms of Use as given at the website.
Design of Superstructure Elements
202 SECTION 3 THE SUPERSTRUCTURE
With regard to the last advantage for adding a cover plate, there issome reasoning which must accompany such a rationale. AISC does notinclude cover plates in their composite beam selection tables because theyfind that the fabrication costs are too great to warrant their incorporation(although they do not prohibit the use of cover plates in general). If this isso, when does use of a cover plate become a cost effective alternative tosimply selecting a larger rolled section?
A general rule of thumb is that, when the economy realized byincorporation of a cover plate is less than 7 lb/ft, their use should beavoided. However, should the cover plate offer a savings of more than12 lb/ft, their use can be justified based on economic considerations[Ref. 3.32].
2. Cover Plate Area. From a design standpoint there are two majorconsiderations which the designer must address when adding a cover plateto a rolled beam:
❏ The area of the plate in section❏ The length of the plate in elevation
With regard to the area of the plate in section, this is a function of themaximum factored moment of the stringer. AASHTO specifies that thethickness of a cover plate welded to a rolled beam should not be greaterthan two times the thickness of the flange (AASHTO 10.13.3). The widthof the cover plate, however, can be larger or smaller than that of the bottomflange. The plate width, however, should confirm to AASHTO weldingcriteria (see Part 6 below).
The designer must first assume a preliminary rolled beam section tobe used. If the composite section moment strength is less than the totalfactored moment, a cover plate may be added to the bottom flange. Thesection area of the cover plate may be chosen as the area of thepreliminary stringer times the percentage of the moment strengthdeficiency.
Once the cover plate is chosen, the composite section strength needsto be recalculated to confirm that the moment strength is sufficient to resistthe factored moment.
3. Cover Plate Length. The length of the cover plate is generallydetermined by the bending moment along the length of the stringer. Coverplates can be classified as either full length, meaning that they run the entirelength of the stringer, or partial length, meaning they are located about thecenter of the beam at offsets from each support.
The location where a partial cover plate ends is known as the cutoff point.This cutoff point can be defined as the point where the moment diagramfor the beam without a cover plate intersects the moment diagram for thebeam with a cover plate [Ref. 3.32]. Figure 3.36 shows a partial lengthcover plate along with the graphical depiction of the location of the cutoffpoints.
It is also possible to determine the approximate length of cover platerequired through use of a mathematical expression based on the parabolic
DID YOU KNOW
THAT convent iona lrolled beam
girders can be used for spansup to 70 ft in length? Theaddition of a cover plate, how-ever, allows rolled beams tobe used for spans up to 90 ft.Composite beams with spansgreater than 90 ft. use a plategirder as the steel stringer. Aplate girder is formed by dif-ferent steel plate elementswhich are welded, bolted, orriveted together, forming anI-beam cross section [Ref. 3.39].
general rule of thumb isthat when the economy
realized by incorporation of acover plate is less than 7 lb/ft,their use should be avoided.
A
his cutoff point can be de-fined as the point where
the moment diagram for thebeam without a cover plate in-tersects the moment diagramfor the beam with a cover plate.
T
Cover Plates
[3.10.8, Part 1]
Downloaded from Digital Engineering Library @ McGraw-Hill (www.digitalengineeringlibrary.com)Copyright © 2006 The McGraw-Hill Companies. All rights reserved.
Any use is subject to the Terms of Use as given at the website.
Design of Superstructure Elements
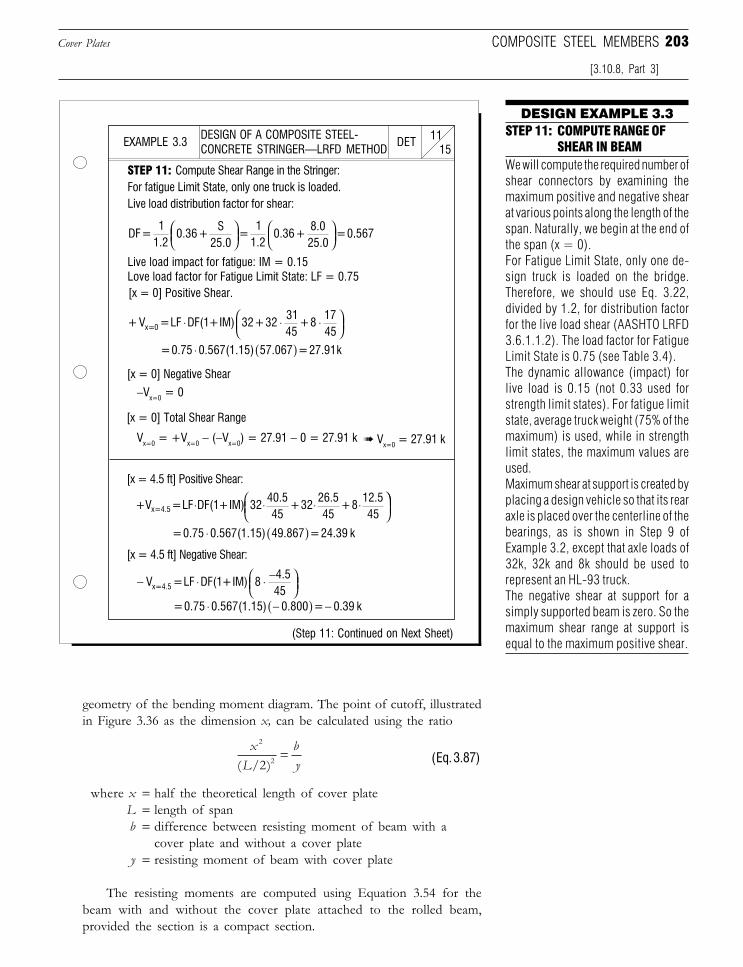
203
geometry of the bending moment diagram. The point of cutoff, illustratedin Figure 3.36 as the dimension x, can be calculated using the ratio
xL
by
2
22( / )= (Eq. 3.87)
where x = half the theoretical length of cover plateL = length of spanb = difference between resisting moment of beam with a
cover plate and without a cover platey = resisting moment of beam with cover plate
The resisting moments are computed using Equation 3.54 for thebeam with and without the cover plate attached to the rolled beam,provided the section is a compact section.
DESIGN EXAMPLE 3.3STEP 11: COMPUTE RANGE OF
SHEAR IN BEAMWe will compute the required number ofshear connectors by examining themaximum positive and negative shearat various points along the length of thespan. Naturally, we begin at the end ofthe span (x = 0).For Fatigue Limit State, only one de-sign truck is loaded on the bridge.Therefore, we should use Eq. 3.22,divided by 1.2, for distribution factorfor the live load shear (AASHTO LRFD3.6.1.1.2). The load factor for FatigueLimit State is 0.75 (see Table 3.4).The dynamic allowance (impact) forlive load is 0.15 (not 0.33 used forstrength limit states). For fatigue limitstate, average truck weight (75% of themaximum) is used, while in strengthlimit states, the maximum values areused.Maximum shear at support is created byplacing a design vehicle so that its rearaxle is placed over the centerline of thebearings, as is shown in Step 9 ofExample 3.2, except that axle loads of32k, 32k and 8k should be used torepresent an HL-93 truck.The negative shear at support for asimply supported beam is zero. So themaximum shear range at support isequal to the maximum positive shear.
STEP 11: Compute Shear Range in the Stringer:For fatigue Limit State, only one truck is loaded.Live load distribution factor for shear:
DESIGN OF A COMPOSITE STEEL-CONCRETE STRINGER—LRFD METHOD 15
11DETEXAMPLE 3.3
(Step 11: Continued on Next Sheet)
[x = 0] Positive Shear.
[x = 0] Total Shear Range
Vx=0 = +Vx=0 − (−Vx=0) = 27.91 − 0 = 27.91 k ➠ Vx=0 = 27.91 k
[x = 0] Negative Shear
−Vx=0 = 0
[x = 4.5 ft] Positive Shear:
Live load impact for fatigue: IM = 0.15Love load factor for Fatigue Limit State: LF = 0.75
[x = 4.5 ft] Negative Shear:
DF = 1
1.20.36 +
S25.0
= 1
1.20.36 +
8.025.0
= 0
..567
+ V = LF DF(1 + IM) 32 + 323145
+ 81745x=0 ⋅ ⋅ ⋅
= 0.75 0.567(1.15) 57.067 = 27.91k⋅ ( )
+V = LF DF(1 + IM) 3240.545
+ 3226.545
+ 812.545x=4.5 ⋅ ⋅ ⋅ ⋅
= 0.75 0.567(1.15) 49.867 = 24.39 k⋅ ( )
− V = LF DF(1 + IM) 84.545x=4.5 ⋅ ⋅ −
= 0.75 0.567(1.15) 0.800 = 0.39 k⋅ −( ) −
[3.10.8, Part 3]
COMPOSITE STEEL MEMBERSCover Plates
Downloaded from Digital Engineering Library @ McGraw-Hill (www.digitalengineeringlibrary.com)Copyright © 2006 The McGraw-Hill Companies. All rights reserved.
Any use is subject to the Terms of Use as given at the website.
Design of Superstructure Elements
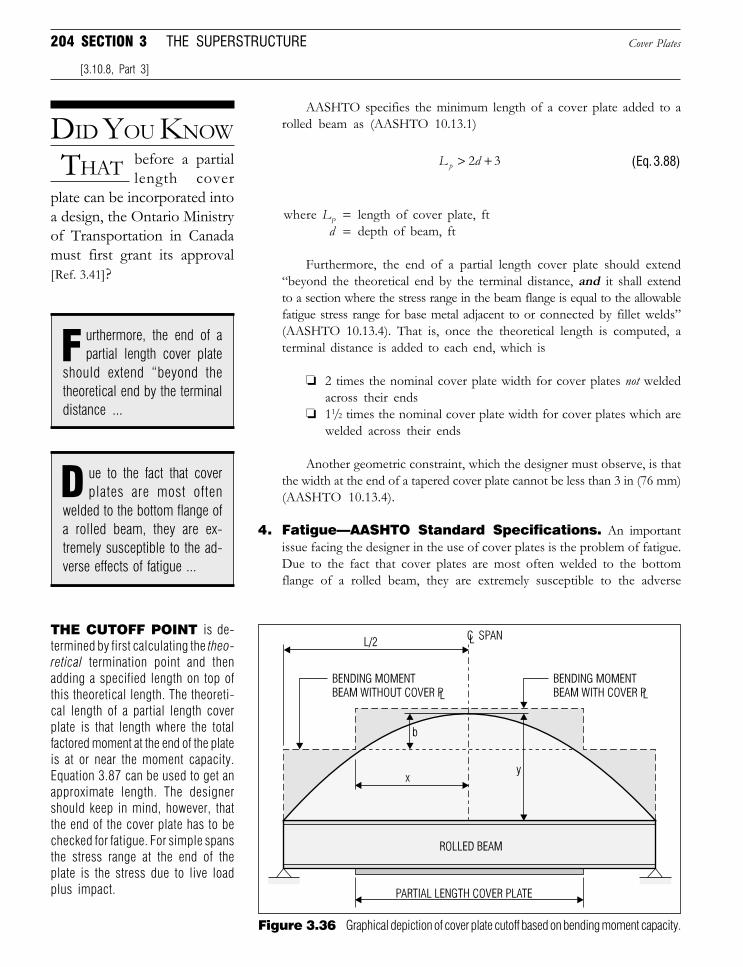
204 SECTION 3 THE SUPERSTRUCTURE
AASHTO specifies the minimum length of a cover plate added to arolled beam as (AASHTO 10.13.1)
L dp > +2 3 (Eq. 3.88)
where LP = length of cover plate, ftd = depth of beam, ft
Furthermore, the end of a partial length cover plate should extend“beyond the theoretical end by the terminal distance, and it shall extendto a section where the stress range in the beam flange is equal to the allowablefatigue stress range for base metal adjacent to or connected by fillet welds”(AASHTO 10.13.4). That is, once the theoretical length is computed, aterminal distance is added to each end, which is
❏ 2 times the nominal cover plate width for cover plates not weldedacross their ends
❏ 11/2 times the nominal cover plate width for cover plates which arewelded across their ends
Another geometric constraint, which the designer must observe, is thatthe width at the end of a tapered cover plate cannot be less than 3 in (76 mm)(AASHTO 10.13.4).
4. Fatigue—AASHTO Standard Specifications. An importantissue facing the designer in the use of cover plates is the problem of fatigue.Due to the fact that cover plates are most often welded to the bottomflange of a rolled beam, they are extremely susceptible to the adverse
DID YOU KNOW
THAT before a partiallength cover
plate can be incorporated intoa design, the Ontario Ministryof Transportation in Canadamust first grant its approval[Ref. 3.41]?
Figure 3.36 Graphical depiction of cover plate cutoff based on bending moment capacity.
THE CUTOFF POINT is de-termined by first calculating the theo-retical termination point and thenadding a specified length on top ofthis theoretical length. The theoreti-cal length of a partial length coverplate is that length where the totalfactored moment at the end of the plateis at or near the moment capacity.Equation 3.87 can be used to get anapproximate length. The designershould keep in mind, however, thatthe end of the cover plate has to bechecked for fatigue. For simple spansthe stress range at the end of theplate is the stress due to live loadplus impact.
ue to the fact that coverplates are most often
welded to the bottom flange ofa rolled beam, they are ex-tremely susceptible to the ad-verse effects of fatigue ...
D
urthermore, the end of apartial length cover plate
should extend “beyond thetheoretical end by the terminaldistance ...
F
[3.10.8, Part 3]
Cover Plates
Downloaded from Digital Engineering Library @ McGraw-Hill (www.digitalengineeringlibrary.com)Copyright © 2006 The McGraw-Hill Companies. All rights reserved.
Any use is subject to the Terms of Use as given at the website.
Design of Superstructure Elements
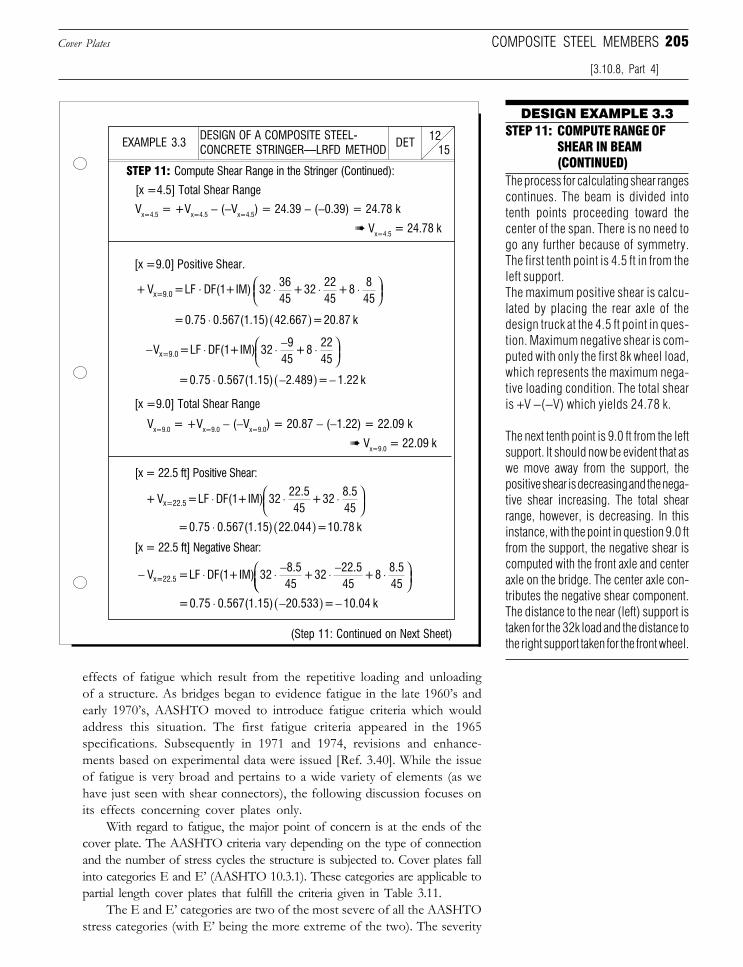
205
DESIGN EXAMPLE 3.3STEP 11: COMPUTE RANGE OF
SHEAR IN BEAM(CONTINUED)
The process for calculating shear rangescontinues. The beam is divided intotenth points proceeding toward thecenter of the span. There is no need togo any further because of symmetry.The first tenth point is 4.5 ft in from theleft support.The maximum positive shear is calcu-lated by placing the rear axle of thedesign truck at the 4.5 ft point in ques-tion. Maximum negative shear is com-puted with only the first 8k wheel load,which represents the maximum nega-tive loading condition. The total shearis +V −(−V) which yields 24.78 k.
The next tenth point is 9.0 ft from the leftsupport. It should now be evident that aswe move away from the support, thepositive shear is decreasing and the nega-tive shear increasing. The total shearrange, however, is decreasing. In thisinstance, with the point in question 9.0 ftfrom the support, the negative shear iscomputed with the front axle and centeraxle on the bridge. The center axle con-tributes the negative shear component.The distance to the near (left) support istaken for the 32k load and the distance tothe right support taken for the front wheel.
effects of fatigue which result from the repetitive loading and unloadingof a structure. As bridges began to evidence fatigue in the late 1960’s andearly 1970’s, AASHTO moved to introduce fatigue criteria which wouldaddress this situation. The first fatigue criteria appeared in the 1965specifications. Subsequently in 1971 and 1974, revisions and enhance-ments based on experimental data were issued [Ref. 3.40]. While the issueof fatigue is very broad and pertains to a wide variety of elements (as wehave just seen with shear connectors), the following discussion focuses onits effects concerning cover plates only.
With regard to fatigue, the major point of concern is at the ends of thecover plate. The AASHTO criteria vary depending on the type of connectionand the number of stress cycles the structure is subjected to. Cover plates fallinto categories E and E’ (AASHTO 10.3.1). These categories are applicable topartial length cover plates that fulfill the criteria given in Table 3.11.
The E and E’ categories are two of the most severe of all the AASHTOstress categories (with E’ being the more extreme of the two). The severity
STEP 11: Compute Shear Range in the Stringer (Continued):
DESIGN OF A COMPOSITE STEEL-CONCRETE STRINGER—LRFD METHOD 15
12DETEXAMPLE 3.3
(Step 11: Continued on Next Sheet)
[x =9.0] Positive Shear.
[x = 22.5 ft] Positive Shear:
[x = 22.5 ft] Negative Shear:
[x =4.5] Total Shear Range
Vx=4.5 = +Vx=4.5 − (−Vx=4.5) = 24.39 − (−0.39) = 24.78 k
➠ Vx=4.5 = 24.78 k
[x =9.0] Total Shear Range
Vx=9.0 = +Vx=9.0 − (−Vx=9.0) = 20.87 − (−1.22) = 22.09 k
➠ Vx=9.0 = 22.09 k
+ V = LF DF(1 + IM) 323645
+ 322245
+ 8845x=9.0 ⋅ ⋅ ⋅ ⋅
= 0.75 0.567(1.15) 42.667 = 20.87 k⋅ ( )
− ⋅ ⋅ − ⋅
V = LF DF(1 + IM) 329
45 + 8
2245x=9.0
+ V = LF DF(1 + IM) 3222.545
+ 328.545x=22.5 ⋅ ⋅ ⋅
Cover Plates COMPOSITE STEEL MEMBERS
[3.10.8, Part 4]
= 0.75 0.567(1.15) 2.489 = 1.22 k⋅ −( ) −
− ⋅ ⋅ − ⋅ − ⋅ V = LF DF(1 + IM) 328.545
+ 3222.545
+ 88.545x=22.5
= 0.75 0.567(1.15) 20.533 = 10.04 k⋅ −( ) −
= 0.75 0.567(1.15) 22.044 = 10.78 k⋅ ( )
Downloaded from Digital Engineering Library @ McGraw-Hill (www.digitalengineeringlibrary.com)Copyright © 2006 The McGraw-Hill Companies. All rights reserved.
Any use is subject to the Terms of Use as given at the website.
Design of Superstructure Elements
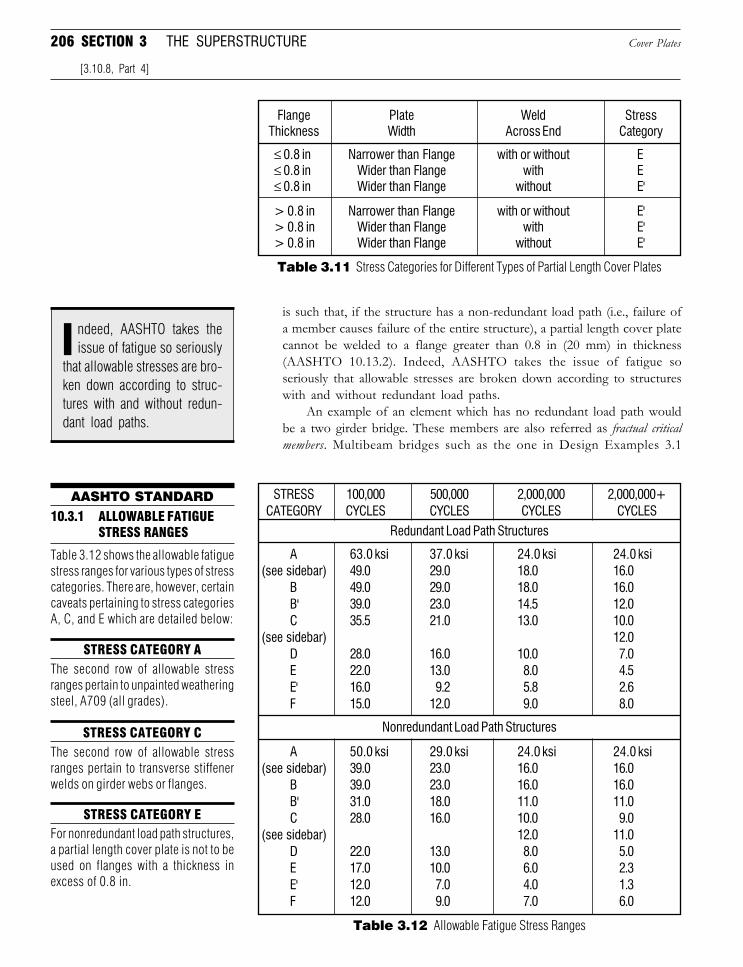
206 SECTION 3 THE SUPERSTRUCTURE
is such that, if the structure has a non-redundant load path (i.e., failure ofa member causes failure of the entire structure), a partial length cover platecannot be welded to a flange greater than 0.8 in (20 mm) in thickness(AASHTO 10.13.2). Indeed, AASHTO takes the issue of fatigue soseriously that allowable stresses are broken down according to structureswith and without redundant load paths.
An example of an element which has no redundant load path wouldbe a two girder bridge. These members are also referred as fractual criticalmembers. Multibeam bridges such as the one in Design Examples 3.1
Table 3.11 Stress Categories for Different Types of Partial Length Cover Plates
> 0.8 in Narrower than Flange with or without E'> 0.8 in Wider than Flange with E'> 0.8 in Wider than Flange without E'
Flange Plate Weld StressThickness Width Across End Category
≤ 0.8 in Narrower than Flange with or without E≤ 0.8 in Wider than Flange with E≤ 0.8 in Wider than Flange without E'
ndeed, AASHTO takes theissue of fatigue so seriously
that allowable stresses are bro-ken down according to struc-tures with and without redun-dant load paths.
I
A 63.0 ksi 37.0 ksi 24.0 ksi 24.0 ksi (see sidebar) 49.0 29.0 18.0 16.0
B 49.0 29.0 18.0 16.0B' 39.0 23.0 14.5 12.0C 35.5 21.0 13.0 10.0
(see sidebar) 12.0D 28.0 16.0 10.0 7.0E 22.0 13.0 8.0 4.5E' 16.0 9.2 5.8 2.6F 15.0 12.0 9.0 8.0
STRESS 100,000 500,000 2,000,000 2,000,000+CATEGORY CYCLES CYCLES CYCLES CYCLES
Redundant Load Path Structures
Nonredundant Load Path Structures
A 50.0 ksi 29.0 ksi 24.0 ksi 24.0 ksi (see sidebar) 39.0 23.0 16.0 16.0
B 39.0 23.0 16.0 16.0B' 31.0 18.0 11.0 11.0C 28.0 16.0 10.0 9.0
(see sidebar) 12.0 11.0D 22.0 13.0 8.0 5.0E 17.0 10.0 6.0 2.3E' 12.0 7.0 4.0 1.3F 12.0 9.0 7.0 6.0
Table 3.12 Allowable Fatigue Stress Ranges
AASHTO STANDARD10.3.1 ALLOWABLE FATIGUE
STRESS RANGES
Table 3.12 shows the allowable fatiguestress ranges for various types of stresscategories. There are, however, certaincaveats pertaining to stress categoriesA, C, and E which are detailed below:
STRESS CATEGORY C
STRESS CATEGORY AThe second row of allowable stressranges pertain to unpainted weatheringsteel, A709 (all grades).
The second row of allowable stressranges pertain to transverse stiffenerwelds on girder webs or flanges.
STRESS CATEGORY EFor nonredundant load path structures,a partial length cover plate is not to beused on flanges with a thickness inexcess of 0.8 in.
[3.10.8, Part 4]
Cover Plates
Downloaded from Digital Engineering Library @ McGraw-Hill (www.digitalengineeringlibrary.com)Copyright © 2006 The McGraw-Hill Companies. All rights reserved.
Any use is subject to the Terms of Use as given at the website.
Design of Superstructure Elements
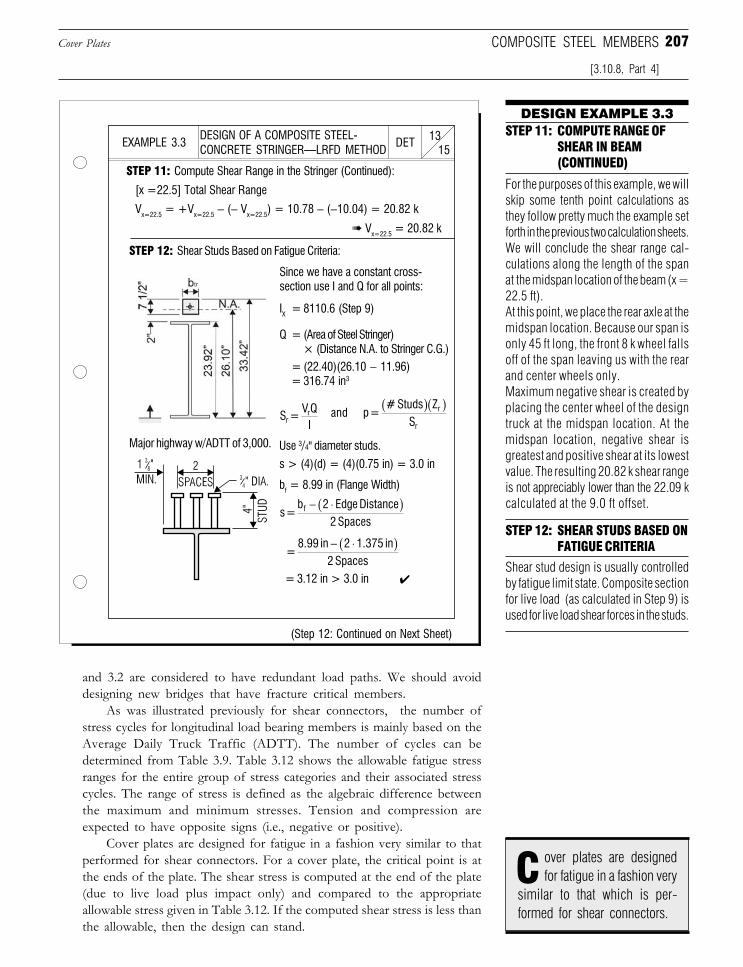
207
and 3.2 are considered to have redundant load paths. We should avoiddesigning new bridges that have fracture critical members.
As was illustrated previously for shear connectors, the number ofstress cycles for longitudinal load bearing members is mainly based on theAverage Daily Truck Traffic (ADTT). The number of cycles can bedetermined from Table 3.9. Table 3.12 shows the allowable fatigue stressranges for the entire group of stress categories and their associated stresscycles. The range of stress is defined as the algebraic difference betweenthe maximum and minimum stresses. Tension and compression areexpected to have opposite signs (i.e., negative or positive).
Cover plates are designed for fatigue in a fashion very similar to thatperformed for shear connectors. For a cover plate, the critical point is atthe ends of the plate. The shear stress is computed at the end of the plate(due to live load plus impact only) and compared to the appropriateallowable stress given in Table 3.12. If the computed shear stress is less thanthe allowable, then the design can stand.
STEP 11: Compute Shear Range in the Stringer (Continued):
DESIGN OF A COMPOSITE STEEL-CONCRETE STRINGER—LRFD METHOD 15
13DETEXAMPLE 3.3
(Step 12: Continued on Next Sheet)
[x =22.5] Total Shear Range
Vx=22.5 = +Vx=22.5 − (− Vx=22.5) = 10.78 − (−10.04) = 20.82 k
➠ Vx=22.5 = 20.82 k
STEP 12: Shear Studs Based on Fatigue Criteria:
Since we have a constant cross-section use I and Q for all points:
IX = 8110.6 (Step 9)
= (22.40)(26.10 − 11.96)= 316.74 in3
Q = (Area of Steel Stringer)× (Distance N.A. to Stringer C.G.)
Major highway w/ADTT of 3,000. Use 3/4" diameter studs.
and
s > (4)(d) = (4)(0.75 in) = 3.0 in
bf = 8.99 in (Flange Width)
= 3.12 in > 3.0 in ✔
DESIGN EXAMPLE 3.3STEP 11: COMPUTE RANGE OF
SHEAR IN BEAM(CONTINUED)
STEP 12: SHEAR STUDS BASED ONFATIGUE CRITERIA
For the purposes of this example, we willskip some tenth point calculations asthey follow pretty much the example setforth in the previous two calculation sheets.We will conclude the shear range cal-culations along the length of the spanat the midspan location of the beam (x =22.5 ft).At this point, we place the rear axle at themidspan location. Because our span isonly 45 ft long, the front 8 k wheel fallsoff of the span leaving us with the rearand center wheels only.Maximum negative shear is created byplacing the center wheel of the designtruck at the midspan location. At themidspan location, negative shear isgreatest and positive shear at its lowestvalue. The resulting 20.82 k shear rangeis not appreciably lower than the 22.09 kcalculated at the 9.0 ft offset.
Shear stud design is usually controlledby fatigue limit state. Composite sectionfor live load (as calculated in Step 9) isused for live load shear forces in the studs.
over plates are designedfor fatigue in a fashion very
similar to that which is per-formed for shear connectors.
C
S = V Q
Ir r p = # Studs Z
Sr
r
( )( )
s = b 2 Edge Distance
2 Spacesf − ⋅( )
= 8.99 in 2 1.375 in
2 Spaces− ⋅( )
COMPOSITE STEEL MEMBERS
[3.10.8, Part 4]
Cover Plates
Downloaded from Digital Engineering Library @ McGraw-Hill (www.digitalengineeringlibrary.com)Copyright © 2006 The McGraw-Hill Companies. All rights reserved.
Any use is subject to the Terms of Use as given at the website.
Design of Superstructure Elements
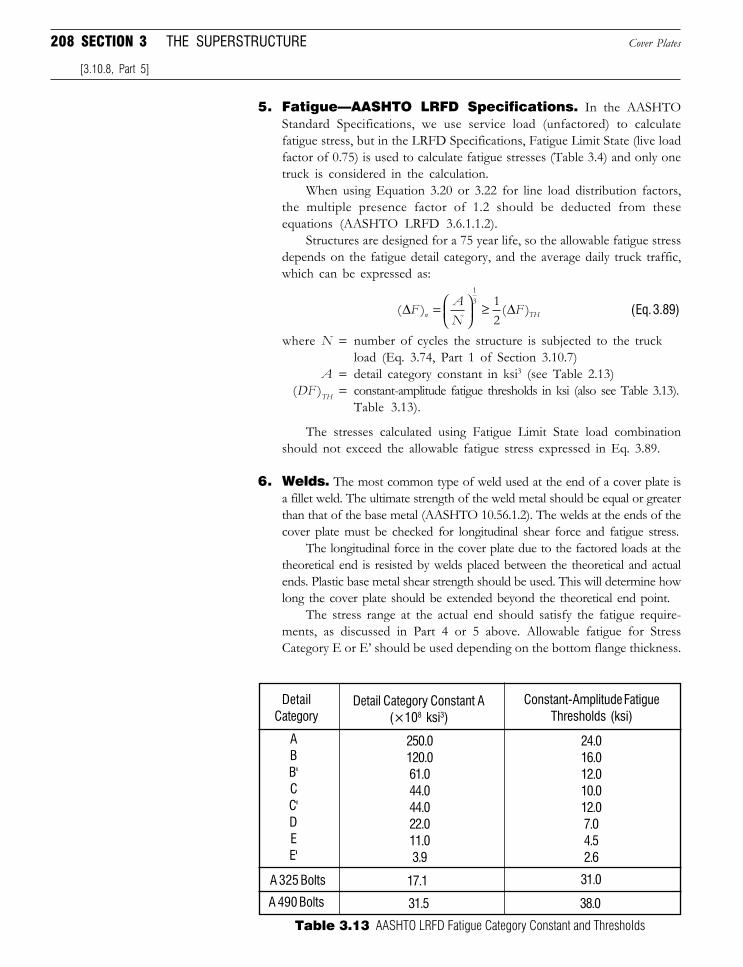
208 SECTION 3 THE SUPERSTRUCTURE
5. Fatigue—AASHTO LRFD Specifications. In the AASHTOStandard Specifications, we use service load (unfactored) to calculatefatigue stress, but in the LRFD Specifications, Fatigue Limit State (live loadfactor of 0.75) is used to calculate fatigue stresses (Table 3.4) and only onetruck is considered in the calculation.
When using Equation 3.20 or 3.22 for line load distribution factors,the multiple presence factor of 1.2 should be deducted from theseequations (AASHTO LRFD 3.6.1.1.2).
Structures are designed for a 75 year life, so the allowable fatigue stressdepends on the fatigue detail category, and the average daily truck traffic,which can be expressed as:
( ) ( )∆ ∆F AN
Fn TH=
≥13 1
2(Eq. 3.89)
where N = number of cycles the structure is subjected to the truckload (Eq. 3.74, Part 1 of Section 3.10.7)
A = detail category constant in ksi3 (see Table 2.13)(DF )TH = constant-amplitude fatigue thresholds in ksi (also see Table 3.13).
Table 3.13).
The stresses calculated using Fatigue Limit State load combinationshould not exceed the allowable fatigue stress expressed in Eq. 3.89.
6. Welds. The most common type of weld used at the end of a cover plate isa fillet weld. The ultimate strength of the weld metal should be equal or greaterthan that of the base metal (AASHTO 10.56.1.2). The welds at the ends of thecover plate must be checked for longitudinal shear force and fatigue stress.
The longitudinal force in the cover plate due to the factored loads at thetheoretical end is resisted by welds placed between the theoretical and actualends. Plastic base metal shear strength should be used. This will determine howlong the cover plate should be extended beyond the theoretical end point.
The stress range at the actual end should satisfy the fatigue require-ments, as discussed in Part 4 or 5 above. Allowable fatigue for StressCategory E or E’ should be used depending on the bottom flange thickness.
Table 3.13 AASHTO LRFD Fatigue Category Constant and Thresholds
[3.10.8, Part 5]
Cover Plates
ABB'CC'DEE'
DetailCategory
Detail Category Constant A(×108 ksi3)
Constant-Amplitude FatigueThresholds (ksi)
250.0120.061.044.044.022.011.03.9
24.016.012.010.012.07.04.52.6
A 325 Bolts
A 490 Bolts
17.1 31.0
31.5 38.0
Downloaded from Digital Engineering Library @ McGraw-Hill (www.digitalengineeringlibrary.com)Copyright © 2006 The McGraw-Hill Companies. All rights reserved.
Any use is subject to the Terms of Use as given at the website.
Design of Superstructure Elements
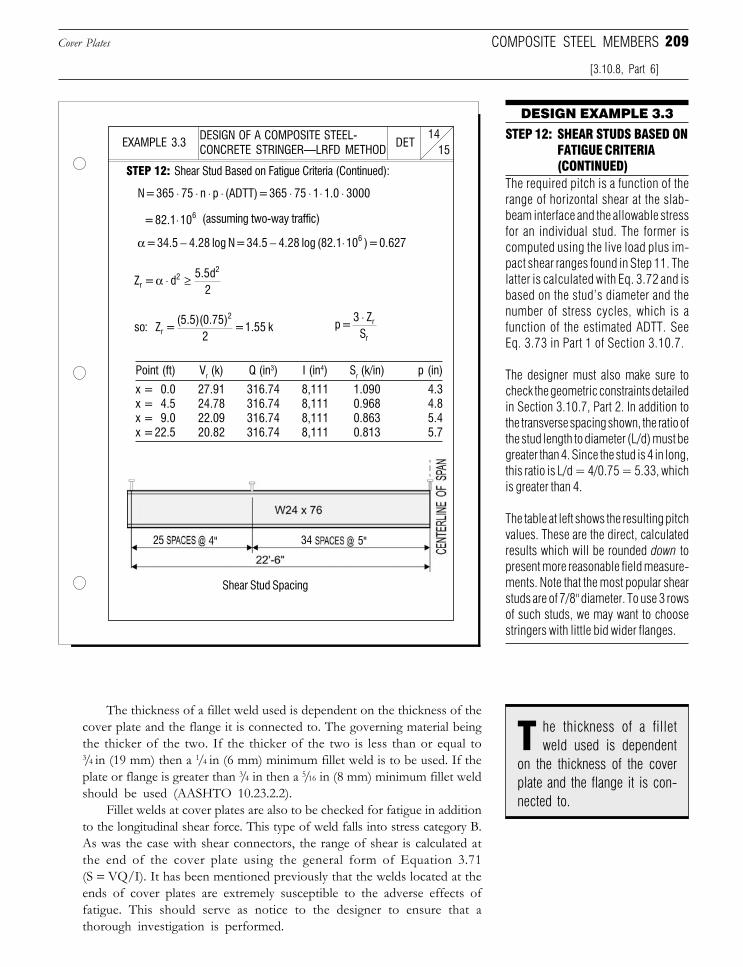
209
The thickness of a fillet weld used is dependent on the thickness of thecover plate and the flange it is connected to. The governing material beingthe thicker of the two. If the thicker of the two is less than or equal to3/4 in (19 mm) then a 1/4 in (6 mm) minimum fillet weld is to be used. If theplate or flange is greater than 3/4 in then a 5/16 in (8 mm) minimum fillet weldshould be used (AASHTO 10.23.2.2).
Fillet welds at cover plates are also to be checked for fatigue in additionto the longitudinal shear force. This type of weld falls into stress category B.As was the case with shear connectors, the range of shear is calculated atthe end of the cover plate using the general form of Equation 3.71(S = VQ/I). It has been mentioned previously that the welds located at theends of cover plates are extremely susceptible to the adverse effects offatigue. This should serve as notice to the designer to ensure that athorough investigation is performed.
x = 0.0 27.91 316.74 8,111 1.090 4.3x = 4.5 24.78 316.74 8,111 0.968 4.8x = 9.0 22.09 316.74 8,111 0.863 5.4x =22.5 20.82 316.74 8,111 0.813 5.7
Point (ft) Vr (k) Q (in3) I (in4) Sr (k/in) p (in)
STEP 12: Shear Stud Based on Fatigue Criteria (Continued):
DESIGN OF A COMPOSITE STEEL-CONCRETE STRINGER—LRFD METHOD 15
14DETEXAMPLE 3.3
DESIGN EXAMPLE 3.3
STEP 12: SHEAR STUDS BASED ONFATIGUE CRITERIA(CONTINUED)
The required pitch is a function of therange of horizontal shear at the slab-beam interface and the allowable stressfor an individual stud. The former iscomputed using the live load plus im-pact shear ranges found in Step 11. Thelatter is calculated with Eq. 3.72 and isbased on the stud’s diameter and thenumber of stress cycles, which is afunction of the estimated ADTT. SeeEq. 3.73 in Part 1 of Section 3.10.7.
The designer must also make sure tocheck the geometric constraints detailedin Section 3.10.7, Part 2. In addition tothe transverse spacing shown, the ratio ofthe stud length to diameter (L/d) must begreater than 4. Since the stud is 4 in long,this ratio is L/d = 4/0.75 = 5.33, whichis greater than 4.
The table at left shows the resulting pitchvalues. These are the direct, calculatedresults which will be rounded down topresent more reasonable field measure-ments. Note that the most popular shearstuds are of 7/8" diameter. To use 3 rowsof such studs, we may want to choosestringers with little bid wider flanges.
he thickness of a filletweld used is dependent
on the thickness of the coverplate and the flange it is con-nected to.
T
= 82.1 106⋅
α = 34.5 4.28 log N = 34.5 4.28 log (82.1 10 ) = 0.6276− − ⋅
Z = d5.5d
2r2
2
α ⋅ ≥
so: Z = (5.5)(0.75)
2 = 1.55 kr
2p =
3 ZS
r
r
⋅
COMPOSITE STEEL MEMBERS
[3.10.8, Part 6]
Cover Plates
N = 365 75 n p (ADTT) = 365 75 1 1.0 3000⋅ ⋅ ⋅ ⋅ ⋅ ⋅ ⋅ ⋅
(assuming two-way traffic)
Shear Stud Spacing
25 34 5"4"
Downloaded from Digital Engineering Library @ McGraw-Hill (www.digitalengineeringlibrary.com)Copyright © 2006 The McGraw-Hill Companies. All rights reserved.
Any use is subject to the Terms of Use as given at the website.
Design of Superstructure Elements
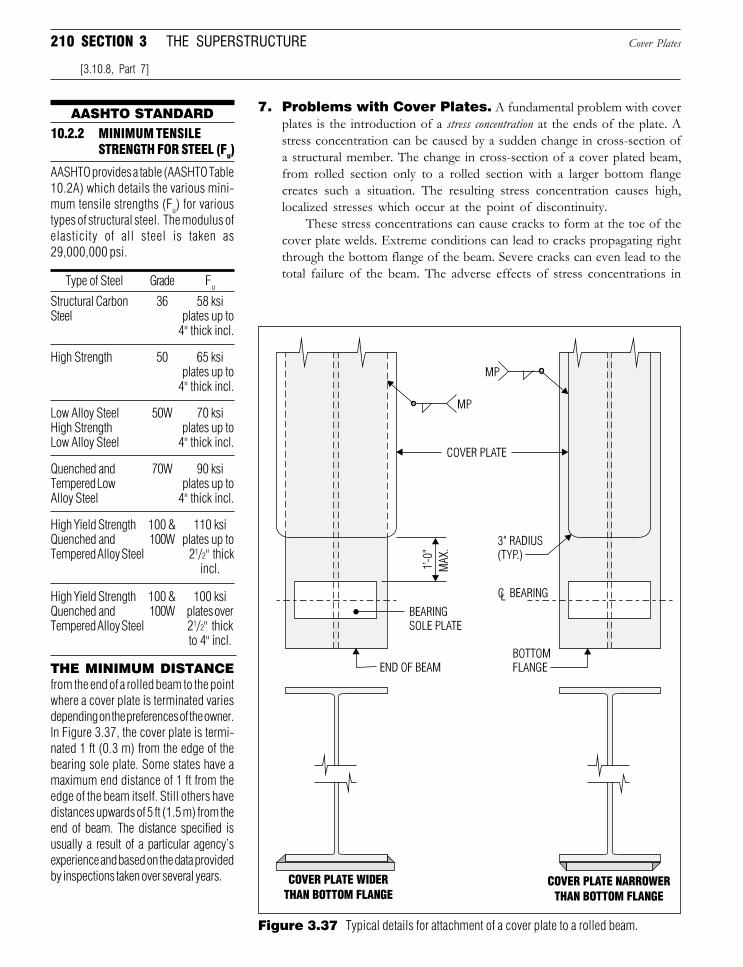
210 SECTION 3 THE SUPERSTRUCTURE
7. Problems with Cover Plates. A fundamental problem with coverplates is the introduction of a stress concentration at the ends of the plate. Astress concentration can be caused by a sudden change in cross-section ofa structural member. The change in cross-section of a cover plated beam,from rolled section only to a rolled section with a larger bottom flangecreates such a situation. The resulting stress concentration causes high,localized stresses which occur at the point of discontinuity.
These stress concentrations can cause cracks to form at the toe of thecover plate welds. Extreme conditions can lead to cracks propagating rightthrough the bottom flange of the beam. Severe cracks can even lead to thetotal failure of the beam. The adverse effects of stress concentrations in
AASHTO STANDARD10.2.2 MINIMUM TENSILE
STRENGTH FOR STEEL (Fu)
AASHTO provides a table (AASHTO Table10.2A) which details the various mini-mum tensile strengths (Fu) for varioustypes of structural steel. The modulus ofelasticity of all steel is taken as29,000,000 psi.
Structural Carbon 36 58 ksiSteel plates up to
4" thick incl.
High Strength 50 65 ksiplates up to
4" thick incl.
Low Alloy Steel 50W 70 ksiHigh Strength plates up toLow Alloy Steel 4" thick incl.
Quenched and 70W 90 ksiTempered Low plates up toAlloy Steel 4" thick incl.
High Yield Strength 100 & 110 ksiQuenched and 100W plates up toTempered Alloy Steel 21/2" thick
incl.
High Yield Strength 100 & 100 ksiQuenched and 100W plates overTempered Alloy Steel 21/2" thick
to 4" incl.
Type of Steel Grade Fu
THE MINIMUM DISTANCEfrom the end of a rolled beam to the pointwhere a cover plate is terminated variesdepending on the preferences of the owner.In Figure 3.37, the cover plate is termi-nated 1 ft (0.3 m) from the edge of thebearing sole plate. Some states have amaximum end distance of 1 ft from theedge of the beam itself. Still others havedistances upwards of 5 ft (1.5 m) from theend of beam. The distance specified isusually a result of a particular agency’sexperience and based on the data providedby inspections taken over several years.
Figure 3.37 Typical details for attachment of a cover plate to a rolled beam.
[3.10.8, Part 7]
Cover Plates
Downloaded from Digital Engineering Library @ McGraw-Hill (www.digitalengineeringlibrary.com)Copyright © 2006 The McGraw-Hill Companies. All rights reserved.
Any use is subject to the Terms of Use as given at the website.
Design of Superstructure Elements
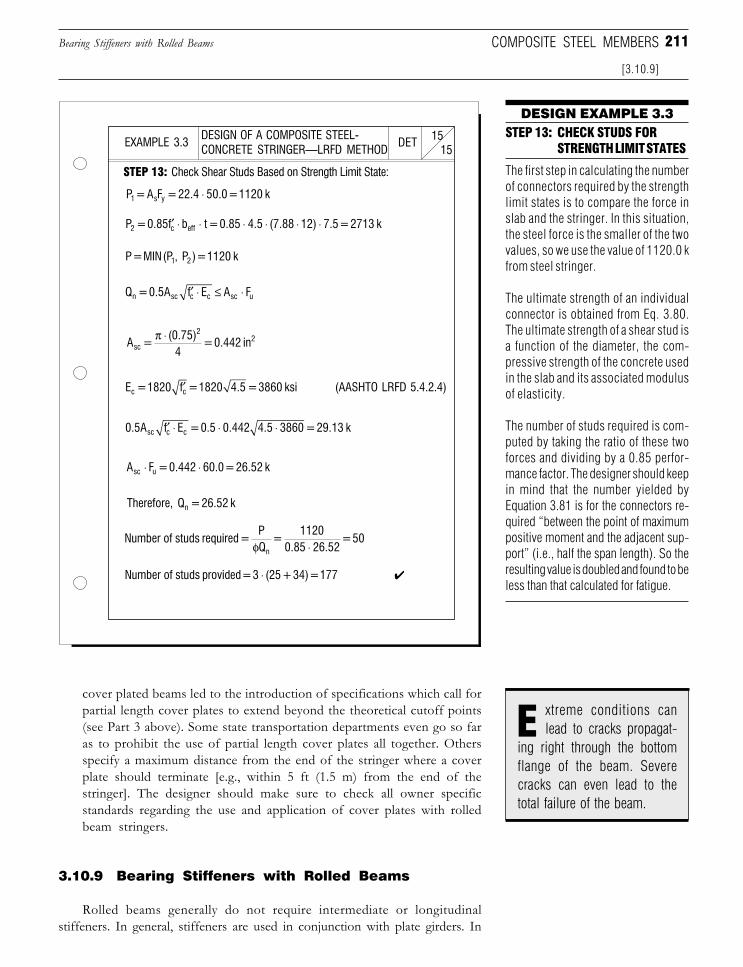
211
cover plated beams led to the introduction of specifications which call forpartial length cover plates to extend beyond the theoretical cutoff points(see Part 3 above). Some state transportation departments even go so faras to prohibit the use of partial length cover plates all together. Othersspecify a maximum distance from the end of the stringer where a coverplate should terminate [e.g., within 5 ft (1.5 m) from the end of thestringer]. The designer should make sure to check all owner specificstandards regarding the use and application of cover plates with rolledbeam stringers.
3.10.9 Bearing Stiffeners with Rolled Beams
Rolled beams generally do not require intermediate or longitudinalstiffeners. In general, stiffeners are used in conjunction with plate girders. In
DESIGN EXAMPLE 3.3STEP 13: CHECK STUDS FOR
STRENGTH LIMIT STATES
The first step in calculating the numberof connectors required by the strengthlimit states is to compare the force inslab and the stringer. In this situation,the steel force is the smaller of the twovalues, so we use the value of 1120.0 kfrom steel stringer.
The ultimate strength of an individualconnector is obtained from Eq. 3.80.The ultimate strength of a shear stud isa function of the diameter, the com-pressive strength of the concrete usedin the slab and its associated modulusof elasticity.
The number of studs required is com-puted by taking the ratio of these twoforces and dividing by a 0.85 perfor-mance factor. The designer should keepin mind that the number yielded byEquation 3.81 is for the connectors re-quired “between the point of maximumpositive moment and the adjacent sup-port” (i.e., half the span length). So theresulting value is doubled and found to beless than that calculated for fatigue.
xtreme conditions canlead to cracks propagat-
ing right through the bottomflange of the beam. Severecracks can even lead to thetotal failure of the beam.
E
DESIGN OF A COMPOSITE STEEL-CONCRETE STRINGER—LRFD METHOD 15
15DETEXAMPLE 3.3
STEP 13: Check Shear Studs Based on Strength Limit State:
✔
(AASHTO LRFD 5.4.2.4)
P = A F = 22.4 50.0 = 1120 k1 s y ⋅
P = 0.85f b t = 0.85 4.5 (7.88 12) 7.5 = 2713 k2 c eff′ ⋅ ⋅ ⋅ ⋅ ⋅ ⋅
P = MIN (P , P ) = 1120 k1 2
Q = 0.5A f E A Fn sc c c sc u′ ⋅ ≤ ⋅
A = (0.75)
4 = 0.442 insc
22π ⋅
E = 1820 f = 1820 4.5 = 3860 ksic c′
0.5A f E = 0.5 0.442 4.5 3860 = 29.13 ksc c c′ ⋅ ⋅ ⋅
A F = 0.442 60.0 = 26.52 ksc u⋅ ⋅
Therefore, Q = 26.52 kn
Number of studs required=PQ
= 1120
0.85 26.52 = 50
nφ ⋅
Number of studs provided = 3 (25 + 34) = 177 ⋅
COMPOSITE STEEL MEMBERS
[3.10.9]
Bearing Stiffeners with Rolled Beams
Downloaded from Digital Engineering Library @ McGraw-Hill (www.digitalengineeringlibrary.com)Copyright © 2006 The McGraw-Hill Companies. All rights reserved.
Any use is subject to the Terms of Use as given at the website.
Design of Superstructure Elements
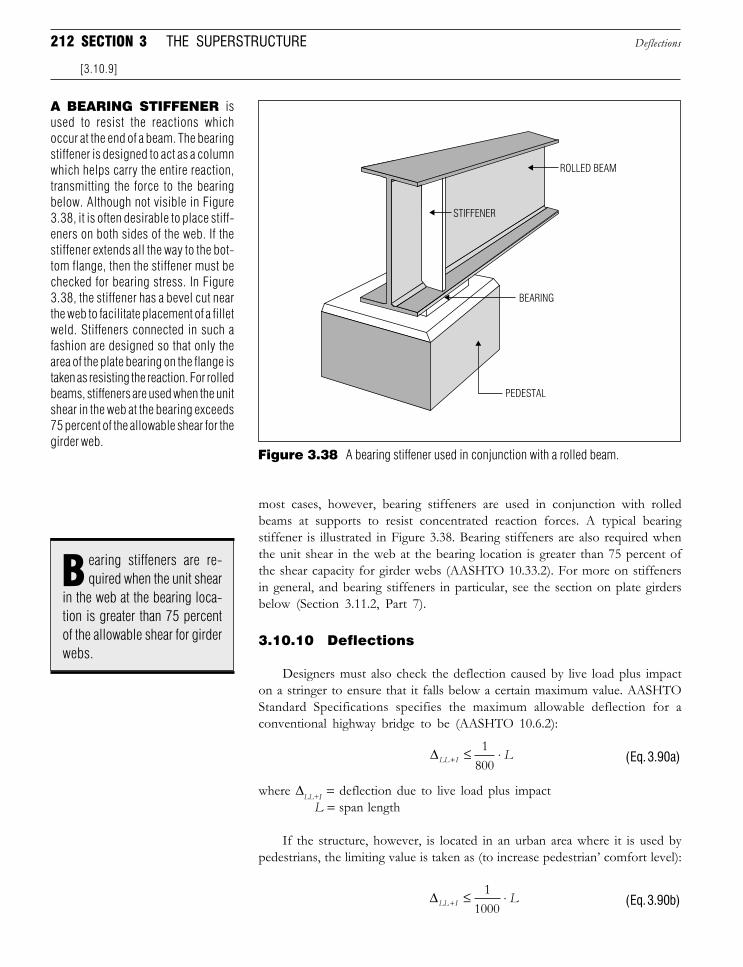
212 SECTION 3 THE SUPERSTRUCTURE
most cases, however, bearing stiffeners are used in conjunction with rolledbeams at supports to resist concentrated reaction forces. A typical bearingstiffener is illustrated in Figure 3.38. Bearing stiffeners are also required whenthe unit shear in the web at the bearing location is greater than 75 percent ofthe shear capacity for girder webs (AASHTO 10.33.2). For more on stiffenersin general, and bearing stiffeners in particular, see the section on plate girdersbelow (Section 3.11.2, Part 7).
3.10.10 Deflections
Designers must also check the deflection caused by live load plus impacton a stringer to ensure that it falls below a certain maximum value. AASHTOStandard Specifications specifies the maximum allowable deflection for aconventional highway bridge to be (AASHTO 10.6.2):
∆LL I L+ ≤ ⋅1800 (Eq. 3.90a)
where ∆LL+I = deflection due to live load plus impact L = span length
If the structure, however, is located in an urban area where it is used bypedestrians, the limiting value is taken as (to increase pedestrian’ comfort level):
∆LL I L+ ≤ ⋅11000 (Eq. 3.90b)
Figure 3.38 A bearing stiffener used in conjunction with a rolled beam.
A BEARING STIFFENER isused to resist the reactions whichoccur at the end of a beam. The bearingstiffener is designed to act as a columnwhich helps carry the entire reaction,transmitting the force to the bearingbelow. Although not visible in Figure3.38, it is often desirable to place stiff-eners on both sides of the web. If thestiffener extends all the way to the bot-tom flange, then the stiffener must bechecked for bearing stress. In Figure3.38, the stiffener has a bevel cut nearthe web to facilitate placement of a filletweld. Stiffeners connected in such afashion are designed so that only thearea of the plate bearing on the flange istaken as resisting the reaction. For rolledbeams, stiffeners are used when the unitshear in the web at the bearing exceeds75 percent of the allowable shear for thegirder web.
earing stiffeners are re-quired when the unit shear
in the web at the bearing loca-tion is greater than 75 percentof the allowable shear for girderwebs.
B
[3.10.9]
Deflections
PEDESTAL
BEARING
ROLLED BEAM
STIFFENER
Downloaded from Digital Engineering Library @ McGraw-Hill (www.digitalengineeringlibrary.com)Copyright © 2006 The McGraw-Hill Companies. All rights reserved.
Any use is subject to the Terms of Use as given at the website.
Design of Superstructure Elements
213
In the AASHTO LRFD Specifications, a live load deflection check isoptional.
Exact computation of live load deflections can be somewhat complicatedif the beam is non-prismatic (i.e., the beam does not possess a constant crosssection throughout its length). The most general example of a non-prismaticbeam is a rolled beam with a cover plate. As a simplification, deflections arecomputed based on the moment of inertia of the beam at the point of maximumpositive moment, so that, in essence, the variations in sectional geometry areignored. Although a certain degree of error is introduced as a result of thisassumption, for most conditions the deviation is negligible (on the order of lessthan 3 percent).
To compute the live load deflection, conventional methods of structuralmechanics can be employed (e.g., conjugate beam method). Actual deflec-tions, however, are typically 15 to 20 percent higher than calculated values[Ref. 3.32]. This increase is due to a variety of factors, the foremost of whichis the increased stiffness of the composite section. This enhanced stiffnesscan potentially lead to an increase in the percentage of deflections due toshear.
The designer should investigate the deflection for all three loadingconditions: dead load, superimposed dead load, and live load plus impact. Themaximum dead load deflections are computed using
∆DL SDLwLEI/ = 5
384
4
(Eq. 3.91)
where ∆DL/SDL = deflection due to dead or superimposed dead loadw = distributed load in units of load per unit lengthL = length of spanE = modulus of elasticity of steel used for beamI = moment of inertia of resisting section
The same conventions apply as before with regard to the moment ofinertia. That is, the steel section is taken only for dead load and a compositesection with k = 3 for superimposed dead load.
In addition to knowing the maximum dead load deflection, it is alsonecessary to compute the dead load deflections along the length of the span.At any point along the beam, the deflection due to a uniformly distributed deador superimposed dead load is given by
∆xwxEI
L Lx x= − +( )24
23 2 3(Eq. 3.92)
where ∆x = deflection at a point x on the beamx = distance from support
s a simplification, deflec-tions are computed based
on the moment of inertia ofthe beam at the point of maxi-mum positive moment.
A
n addition to knowing themaximum dead load deflec-
tion, it is also necessary tocompute the dead load deflec-tions along the length of thespan.
I
COMPOSITE STEEL MEMBERS
[3.10.10]
Deflections
Downloaded from Digital Engineering Library @ McGraw-Hill (www.digitalengineeringlibrary.com)Copyright © 2006 The McGraw-Hill Companies. All rights reserved.
Any use is subject to the Terms of Use as given at the website.
Design of Superstructure Elements
214 SECTION 3 THE SUPERSTRUCTURE
Deflections along the length of the span due to dead loads need to becalculated for a variety of reasons. Some of the principal uses of thesedeflections being
❏ Calculation of final overpass roadway elevations❏ Calculation of the varying depth of deck slab haunches❏ Calculation of beam camber
For the most accurate calculation of live load deflections, a truck should beplaced to create maximum moment (as illustrated in Figure 3.32). An approxima-tion, however, can be made where a single, concentrated load is placed at midspanand the maximum deflection calculated by the following expression:
∆LL IPLEI+ =
3
48(Eq. 3.93)
where ∆LL+I = deflection due to live load plus impactP = concentrated load
The concentrated load P can be taken as:
P DF I= ⋅ ⋅ +Wheel Load ( )1 (Eq. 3.94)
where DF = wheel load distribution factor (see sidebar)I = impact factor (Equation 3.15)
Alternately, the designer can choose to employ more rigorous methods incalculating deflections due to live load, either in the form of traditional handcalculation methods or, if available, computer-aided means. Obviously, longspan, continuous beam bridges will require a closer investigation than shortspan, simply supported structures we have discussed thus far.
It is important to reiterate that any dead loads placed on a composite beambefore the slab has reached at least 75 percent of its full strength will be carriedby the steel section only (unless temporary shoring is provided). Therefore, anycorresponding dead load deflections will impact this resisting section without thebenefits of composite action.
The reasons behind the limitations on deflections are to minimize excessivevibrations to the structure and reduce the risk of potential impact to primarymembers by underpass traffic. It is recommended that the designer new tobridges take a walk over a structure with heavy traffic so they can experiencethe former first hand.
3.10.11 Camber
We have just discussed how dead loads on a structure can cause the primarymembers to deflect downward under their weight. This downward deflection, ifsevere, can cause excessive sagging in the beam. In addition to this, beams whichdrop below their horizontal plane too much can cause extreme fluctuations in thehaunch depth (i.e., the layer of concrete between the slab and steel beam).
To minimize or eliminate this problem, steel beams are often cambered tooffset the effects of dead load deflections, vertical curve requirements, and/or
LIVE LOAD DEFLECTION
When computing live load deflection,the distribution factor is not always thesame as that applied to moments. Forlive load deflection, it is assumed thatall stringers act together and have anequal deflection.
lternately, the designercan choose to employ
more rigorous methods in cal-culating deflections ... eitherin the form of traditional handcalculation methods or, if avail-able, computer-aided means.
A
he reasons behind thelimitations on deflections
are to minimize excessivevibrations to the structure andreduce the risk of potentialimpact to primary members byunderpass traffic.
T
[3.10.10]
Camber
Downloaded from Digital Engineering Library @ McGraw-Hill (www.digitalengineeringlibrary.com)Copyright © 2006 The McGraw-Hill Companies. All rights reserved.
Any use is subject to the Terms of Use as given at the website.
Design of Superstructure Elements
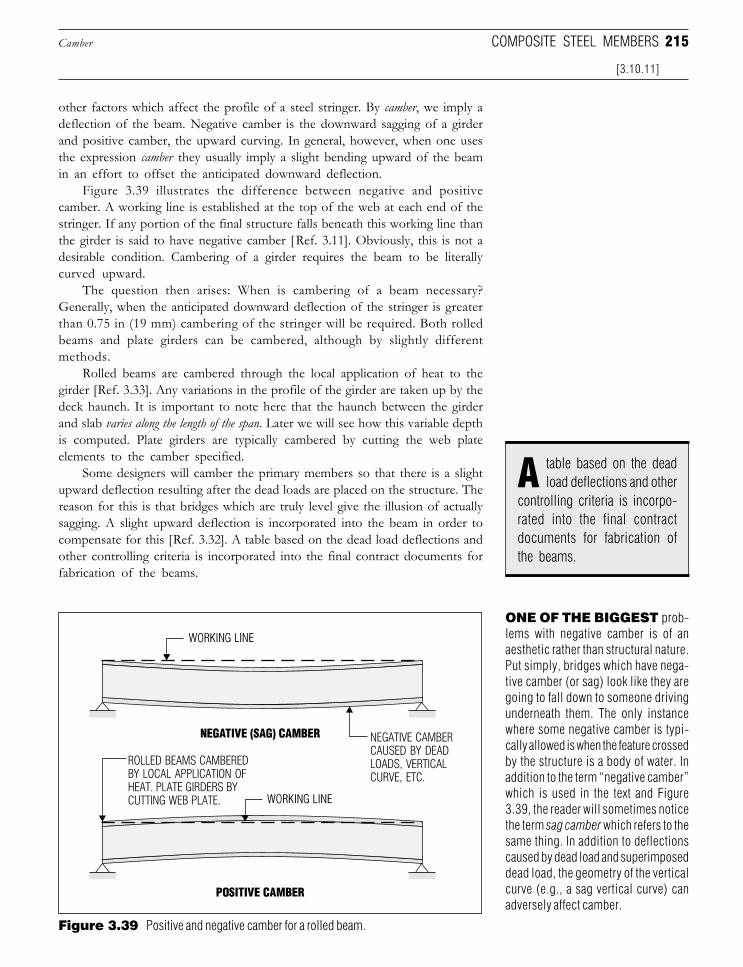
215
other factors which affect the profile of a steel stringer. By camber, we imply adeflection of the beam. Negative camber is the downward sagging of a girderand positive camber, the upward curving. In general, however, when one usesthe expression camber they usually imply a slight bending upward of the beamin an effort to offset the anticipated downward deflection.
Figure 3.39 illustrates the difference between negative and positivecamber. A working line is established at the top of the web at each end of thestringer. If any portion of the final structure falls beneath this working line thanthe girder is said to have negative camber [Ref. 3.11]. Obviously, this is not adesirable condition. Cambering of a girder requires the beam to be literallycurved upward.
The question then arises: When is cambering of a beam necessary?Generally, when the anticipated downward deflection of the stringer is greaterthan 0.75 in (19 mm) cambering of the stringer will be required. Both rolledbeams and plate girders can be cambered, although by slightly differentmethods.
Rolled beams are cambered through the local application of heat to thegirder [Ref. 3.33]. Any variations in the profile of the girder are taken up by thedeck haunch. It is important to note here that the haunch between the girderand slab varies along the length of the span. Later we will see how this variable depthis computed. Plate girders are typically cambered by cutting the web plateelements to the camber specified.
Some designers will camber the primary members so that there is a slightupward deflection resulting after the dead loads are placed on the structure. Thereason for this is that bridges which are truly level give the illusion of actuallysagging. A slight upward deflection is incorporated into the beam in order tocompensate for this [Ref. 3.32]. A table based on the dead load deflections andother controlling criteria is incorporated into the final contract documents forfabrication of the beams.
table based on the deadload deflections and other
controlling criteria is incorpo-rated into the final contractdocuments for fabrication ofthe beams.
A
ONE OF THE BIGGEST prob-lems with negative camber is of anaesthetic rather than structural nature.Put simply, bridges which have nega-tive camber (or sag) look like they aregoing to fall down to someone drivingunderneath them. The only instancewhere some negative camber is typi-cally allowed is when the feature crossedby the structure is a body of water. Inaddition to the term “negative camber”which is used in the text and Figure3.39, the reader will sometimes noticethe term sag camber which refers to thesame thing. In addition to deflectionscaused by dead load and superimposeddead load, the geometry of the verticalcurve (e.g., a sag vertical curve) canadversely affect camber.
Figure 3.39 Positive and negative camber for a rolled beam.
ROLLED BEAMS CAMBEREDBY LOCAL APPLICATION OFHEAT. PLATE GIRDERS BYCUTTING WEB PLATE.
NEGATIVE CAMBERCAUSED BY DEADLOADS, VERTICALCURVE, ETC.
COMPOSITE STEEL MEMBERS
[3.10.11]
Camber
Downloaded from Digital Engineering Library @ McGraw-Hill (www.digitalengineeringlibrary.com)Copyright © 2006 The McGraw-Hill Companies. All rights reserved.
Any use is subject to the Terms of Use as given at the website.
Design of Superstructure Elements
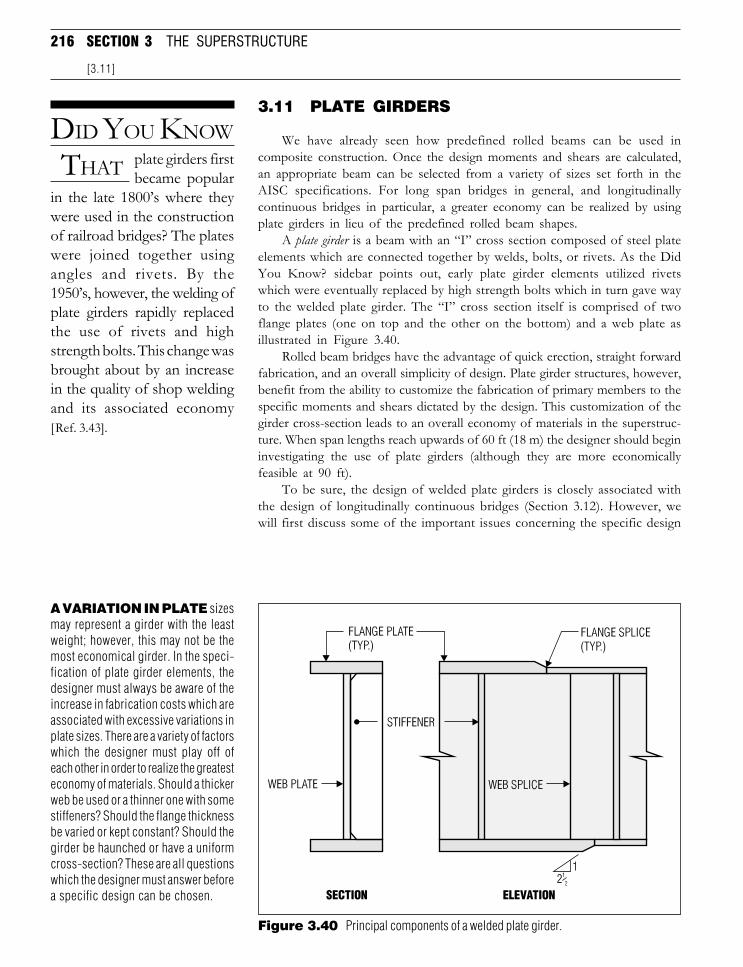
216 SECTION 3 THE SUPERSTRUCTURE
3.11 PLATE GIRDERS
We have already seen how predefined rolled beams can be used incomposite construction. Once the design moments and shears are calculated,an appropriate beam can be selected from a variety of sizes set forth in theAISC specifications. For long span bridges in general, and longitudinallycontinuous bridges in particular, a greater economy can be realized by usingplate girders in lieu of the predefined rolled beam shapes.
A plate girder is a beam with an “I” cross section composed of steel plateelements which are connected together by welds, bolts, or rivets. As the DidYou Know? sidebar points out, early plate girder elements utilized rivetswhich were eventually replaced by high strength bolts which in turn gave wayto the welded plate girder. The “I” cross section itself is comprised of twoflange plates (one on top and the other on the bottom) and a web plate asillustrated in Figure 3.40.
Rolled beam bridges have the advantage of quick erection, straight forwardfabrication, and an overall simplicity of design. Plate girder structures, however,benefit from the ability to customize the fabrication of primary members to thespecific moments and shears dictated by the design. This customization of thegirder cross-section leads to an overall economy of materials in the superstruc-ture. When span lengths reach upwards of 60 ft (18 m) the designer should begininvestigating the use of plate girders (although they are more economicallyfeasible at 90 ft).
To be sure, the design of welded plate girders is closely associated withthe design of longitudinally continuous bridges (Section 3.12). However, wewill first discuss some of the important issues concerning the specific design
[3.11]
DID YOU KNOW
THAT plate girders firstbecame popular
in the late 1800’s where theywere used in the constructionof railroad bridges? The plateswere joined together usingangles and rivets. By the1950’s, however, the welding ofplate girders rapidly replacedthe use of rivets and highstrength bolts. This change wasbrought about by an increasein the quality of shop weldingand its associated economy[Ref. 3.43].
Figure 3.40 Principal components of a welded plate girder.
A VARIATION IN PLATE sizesmay represent a girder with the leastweight; however, this may not be themost economical girder. In the speci-fication of plate girder elements, thedesigner must always be aware of theincrease in fabrication costs which areassociated with excessive variations inplate sizes. There are a variety of factorswhich the designer must play off ofeach other in order to realize the greatesteconomy of materials. Should a thickerweb be used or a thinner one with somestiffeners? Should the flange thicknessbe varied or kept constant? Should thegirder be haunched or have a uniformcross-section? These are all questionswhich the designer must answer beforea specific design can be chosen.
Downloaded from Digital Engineering Library @ McGraw-Hill (www.digitalengineeringlibrary.com)Copyright © 2006 The McGraw-Hill Companies. All rights reserved.
Any use is subject to the Terms of Use as given at the website.
Design of Superstructure Elements
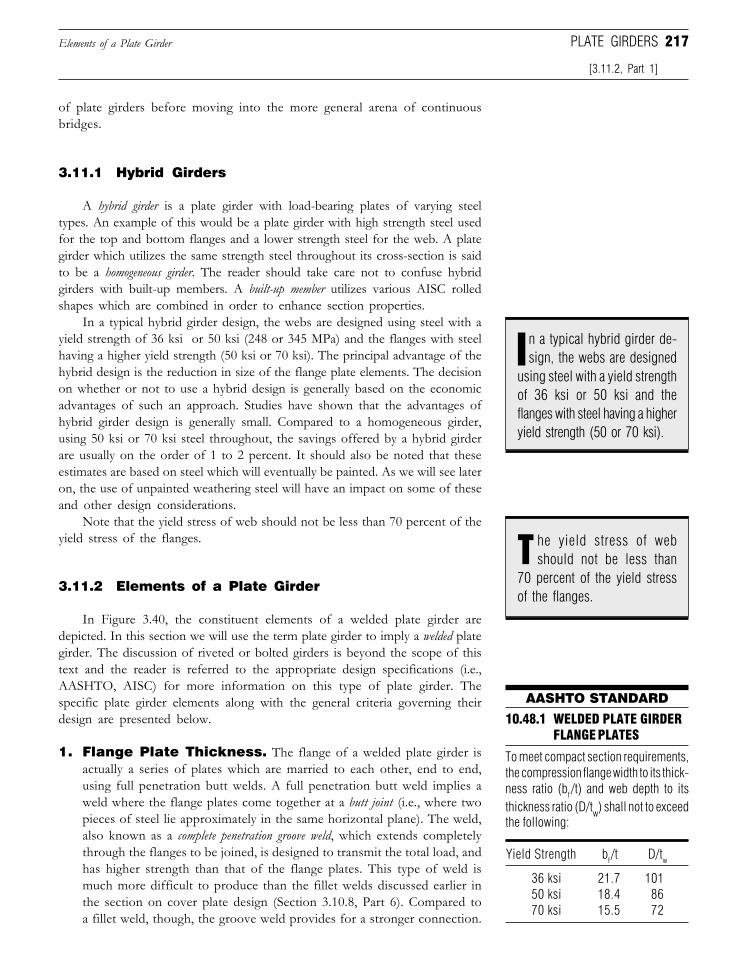
217
of plate girders before moving into the more general arena of continuousbridges.
3.11.1 Hybrid Girders
A hybrid girder is a plate girder with load-bearing plates of varying steeltypes. An example of this would be a plate girder with high strength steel usedfor the top and bottom flanges and a lower strength steel for the web. A plategirder which utilizes the same strength steel throughout its cross-section is saidto be a homogeneous girder. The reader should take care not to confuse hybridgirders with built-up members. A built-up member utilizes various AISC rolledshapes which are combined in order to enhance section properties.
In a typical hybrid girder design, the webs are designed using steel with ayield strength of 36 ksi or 50 ksi (248 or 345 MPa) and the flanges with steelhaving a higher yield strength (50 ksi or 70 ksi). The principal advantage of thehybrid design is the reduction in size of the flange plate elements. The decisionon whether or not to use a hybrid design is generally based on the economicadvantages of such an approach. Studies have shown that the advantages ofhybrid girder design is generally small. Compared to a homogeneous girder,using 50 ksi or 70 ksi steel throughout, the savings offered by a hybrid girderare usually on the order of 1 to 2 percent. It should also be noted that theseestimates are based on steel which will eventually be painted. As we will see lateron, the use of unpainted weathering steel will have an impact on some of theseand other design considerations.
Note that the yield stress of web should not be less than 70 percent of theyield stress of the flanges.
3.11.2 Elements of a Plate Girder
In Figure 3.40, the constituent elements of a welded plate girder aredepicted. In this section we will use the term plate girder to imply a welded plategirder. The discussion of riveted or bolted girders is beyond the scope of thistext and the reader is referred to the appropriate design specifications (i.e.,AASHTO, AISC) for more information on this type of plate girder. Thespecific plate girder elements along with the general criteria governing theirdesign are presented below.
1. Flange Plate Thickness. The flange of a welded plate girder isactually a series of plates which are married to each other, end to end,using full penetration butt welds. A full penetration butt weld implies aweld where the flange plates come together at a butt joint (i.e., where twopieces of steel lie approximately in the same horizontal plane). The weld,also known as a complete penetration groove weld, which extends completelythrough the flanges to be joined, is designed to transmit the total load, andhas higher strength than that of the flange plates. This type of weld ismuch more difficult to produce than the fillet welds discussed earlier inthe section on cover plate design (Section 3.10.8, Part 6). Compared toa fillet weld, though, the groove weld provides for a stronger connection.
Elements of a Plate Girder
[3.11.2, Part 1]
PLATE GIRDERS
n a typical hybrid girder de-sign, the webs are designed
using steel with a yield strengthof 36 ksi or 50 ksi and theflanges with steel having a higheryield strength (50 or 70 ksi).
I
he yield stress of webshould not be less than
70 percent of the yield stressof the flanges.
T
AASHTO STANDARD
10.48.1 WELDED PLATE GIRDERFLANGE PLATES
To meet compact section requirements,the compression flange width to its thick-ness ratio (bf /t) and web depth to itsthickness ratio (D/tw) shall not to exceedthe following:
Yield Strength bf /t D/tw
36 ksi 21.7 101 50 ksi 18.4 86 70 ksi 15.5 72
Downloaded from Digital Engineering Library @ McGraw-Hill (www.digitalengineeringlibrary.com)Copyright © 2006 The McGraw-Hill Companies. All rights reserved.
Any use is subject to the Terms of Use as given at the website.
Design of Superstructure Elements
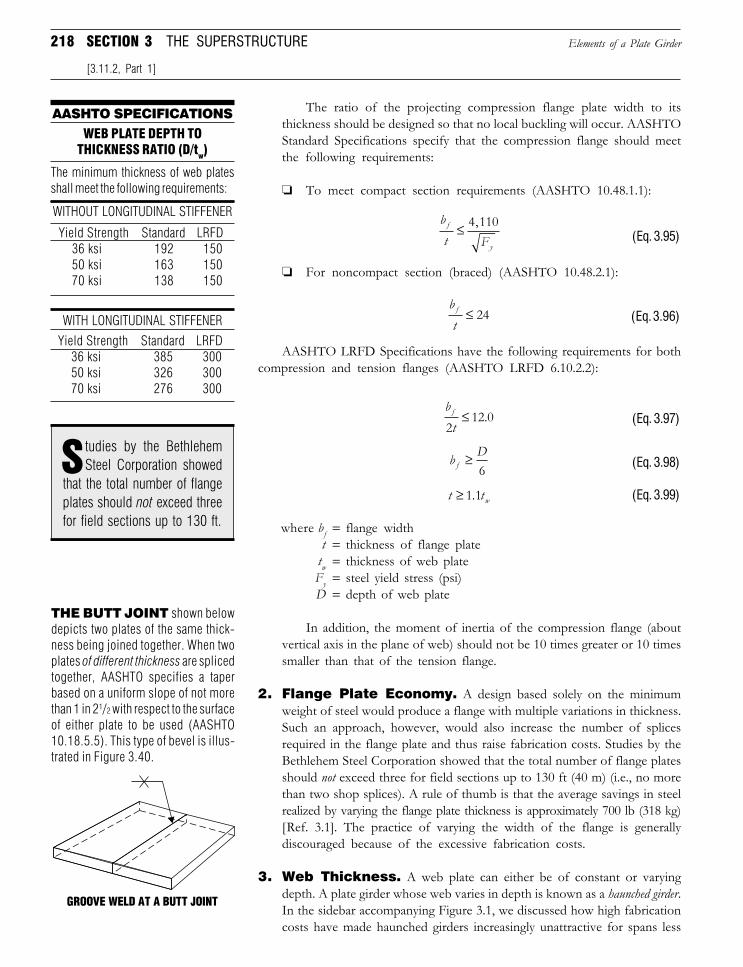
218 SECTION 3 THE SUPERSTRUCTURE
The ratio of the projecting compression flange plate width to itsthickness should be designed so that no local buckling will occur. AASHTOStandard Specifications specify that the compression flange should meetthe following requirements:
❏ To meet compact section requirements (AASHTO 10.48.1.1):
bt Ff
y
≤ 4 110,(Eq. 3.95)
❏ For noncompact section (braced) (AASHTO 10.48.2.1):
btf ≤ 24 (Eq. 3.96)
AASHTO LRFD Specifications have the following requirements for bothcompression and tension flanges (AASHTO LRFD 6.10.2.2):
btf
212 0≤ . (Eq. 3.97)
b Df ≥
6 (Eq. 3.98)
t . t w≥ 1 1 (Eq. 3.99)
where bf = flange widtht = thickness of flange plate
tw = thickness of web plateFy = steel yield stress (psi)D = depth of web plate
In addition, the moment of inertia of the compression flange (aboutvertical axis in the plane of web) should not be 10 times greater or 10 timessmaller than that of the tension flange.
2. Flange Plate Economy. A design based solely on the minimumweight of steel would produce a flange with multiple variations in thickness.Such an approach, however, would also increase the number of splicesrequired in the flange plate and thus raise fabrication costs. Studies by theBethlehem Steel Corporation showed that the total number of flange platesshould not exceed three for field sections up to 130 ft (40 m) (i.e., no morethan two shop splices). A rule of thumb is that the average savings in steelrealized by varying the flange plate thickness is approximately 700 lb (318 kg)[Ref. 3.1]. The practice of varying the width of the flange is generallydiscouraged because of the excessive fabrication costs.
3. Web Thickness. A web plate can either be of constant or varyingdepth. A plate girder whose web varies in depth is known as a haunched girder.In the sidebar accompanying Figure 3.1, we discussed how high fabricationcosts have made haunched girders increasingly unattractive for spans less
Elements of a Plate Girder
[3.11.2, Part 1]
AASHTO SPECIFICATIONSWEB PLATE DEPTH TO
THICKNESS RATIO (D/tw)
The minimum thickness of web platesshall meet the following requirements:
WITHOUT LONGITUDINAL STIFFENER
WITH LONGITUDINAL STIFFENER
Yield Strength Standard LRFD 36 ksi 192 150 50 ksi 163 150 70 ksi 138 150
Yield Strength Standard LRFD 36 ksi 385 300 50 ksi 326 300 70 ksi 276 300
THE BUTT JOINT shown belowdepicts two plates of the same thick-ness being joined together. When twoplates of different thickness are splicedtogether, AASHTO specifies a taperbased on a uniform slope of not morethan 1 in 21/2 with respect to the surfaceof either plate to be used (AASHTO10.18.5.5). This type of bevel is illus-trated in Figure 3.40.
tudies by the BethlehemSteel Corporation showed
that the total number of flangeplates should not exceed threefor field sections up to 130 ft.
S
Downloaded from Digital Engineering Library @ McGraw-Hill (www.digitalengineeringlibrary.com)Copyright © 2006 The McGraw-Hill Companies. All rights reserved.
Any use is subject to the Terms of Use as given at the website.
Design of Superstructure Elements
219
than 400 ft (122 m) in length [Ref. 3.1]. The focus of our discussion in thissection will be on girders with webs of constant depth.
In designing the web of a plate girder, one must specify the depth of theplate (which is dependent on the maximum moment) and its thickness (whichis dependent on the maximum shear). The minimum web thickness is toprevent it from local buckling under the design loads. The thickness limitsin AASHTO Standard Specifications and LRFD Specifications are slightlydifferent. The following are the summary of these limitations (AASHTO10.48 and AASHTO LRFD 6.10.2.1):
❏ To meet compact section requirements:
Dt Fw y
≤ 19 230, (AASHTO Standard) (Eq. 3.100a)
Dtw
≤ 150 (AASHTO LRFD) (Eq. 3.100b)
❏ For transversely stiffened girders:
Dt Fw y
≤ 36 500, (AASHTO Standard) (Eq. 3.101a)
Dtw
≤ 150 (AASHTO LRFD) (Eq. 3.101b)
❏ For longitudinally stiffened girders:
Dt Fw y
≤ 73 000, (AASHTO Standard) (Eq. 3.102a)
Dtw
≤ 300 (AASHTO LRFD) (Eq. 3.102b)
where tw = thickness of webD = depth of webFy = yield stress of web steel (psi)
The minimum web thickness for typical steel is listed in the sidebar. Sinceweb stiffeners can prevent web plates from local buckling, the web thicknesscan be reduced by introducing transverse and/or longitudinal stiffeners.These stiffeners will be discussed in details in Part 5 and Part 8 of this section.
4. Web Plate Economy. When defining the thickness of the web plate,the general rule of thumb is that as the depth of the web increases, so doesits thickness. The area of the flange, however, will decrease as the depth ofthe web increases. This implies that a certain degree of comparison will berequired in order to accurately determine the most cost effective solution.
Elements of a Plate Girder
[3.11.2, Part 4]
PLATE GIRDERS
ince web stiffeners canprevent web plates fromS
local buckling, the web thick-ness can be reduced by intro-ducing transverse and/orlongitudinal stiffeners.
Downloaded from Digital Engineering Library @ McGraw-Hill (www.digitalengineeringlibrary.com)Copyright © 2006 The McGraw-Hill Companies. All rights reserved.
Any use is subject to the Terms of Use as given at the website.
Design of Superstructure Elements
220 SECTION 3 THE SUPERSTRUCTURE
In Part 3 above, it was demonstrated that when a beam islongitudinally stiffened, the thickness of the web may be decreased.As we saw with the varying of flange plate thickness, however, thisreduction in web thickness does not always translate into a moreeconomical solution. The Bethlehem Steel studies found that for spanlengths of 200 ft (61 m) and less, longitudinally stiffened girders werenot cost effective. While the reduction in web thickness results in weightsavings of anywhere from 1 to 12 percent, the associated fabricationcosts resulted in designs will be 1 to 3 percent higher than if the beamwere not longitudinally stiffened. For hybrid girders, the costs were4 to 7 percent higher. Based on these results, longitudinal stiffenersare not recommended unless the span length exceeds 300 ft (91.5 m)[Ref. 3.1].
5. Transverse Intermediate Stiffeners. In order for the webthickness criteria defined in Part 3 above to hold true, the web must be ableto resist the applied shear forces, and it is adequately provided withstiffeners. There are two general types of transverse stiffeners:
❏ Bearing stiffeners, located at the supports of a span and❏ Intermediate stiffeners, located over the length of the span.
A bearing stiffener attached to a rolled beam stringer was depicted inFigure 3.38. Intermediate stiffeners are located at points in between thesupports. Another type of stiffener, known as a longitudinal stiffener, willbe discussed in more detail later. The following discussion details thevarious aspects concerning the design and use of transverse intermediatestiffeners with plate girders.
■ When Stiffeners Are Required. There are several boundary condi-tions which determine whether or not intermediate stiffeners will berequired. It is helpful, however, to explain why intermediate stiffeners areused in the first place. Intermediate stiffeners are provided in order toprevent the web of a girder from buckling. Thin, deep webs are especiallyprone to web buckling. To determine whether intermediate stiffeners arerequired at a specific point along the span, the designer must determine thetotal factored shear force of the web at the point in question. Anintermediate stiffener is not required if the web shear capacity without webstiffeners exceeds the factored shear force. The shear capacity is calculatedwith Equation 3.56 or Equation 3.67, depending on if LFD or LRFDmethod is used in the design.
If the web shear capacity is less than the factored shear force, one caneither increase the web thickness, increase the web depth (provided theminimum web thickness requirements are still met), or add transverseshear stiffeners.
■ Spacing of Stiffeners. If it is determined that intermediate stiffenersare indeed required, then the spacing of the stiffeners must be calculated.The spacing specified is required to satisfy conditions which affect the firstand subsequent intermediate stiffeners. The first step in determining the
Elements of a Plate Girder
[3.11.2, Part 4]
he Bethlehem Steel stud-ies found that for span
lengths of 200 ft (61 m) andless, longitudinally stiffenedgirders were not cost effective.
T
ntermediate stiffeners areprovided in order to prevent
the web of a girder from buck-ling. Thin, deep webs are espe-cially prone to web buckling.
I
Downloaded from Digital Engineering Library @ McGraw-Hill (www.digitalengineeringlibrary.com)Copyright © 2006 The McGraw-Hill Companies. All rights reserved.
Any use is subject to the Terms of Use as given at the website.
Design of Superstructure Elements
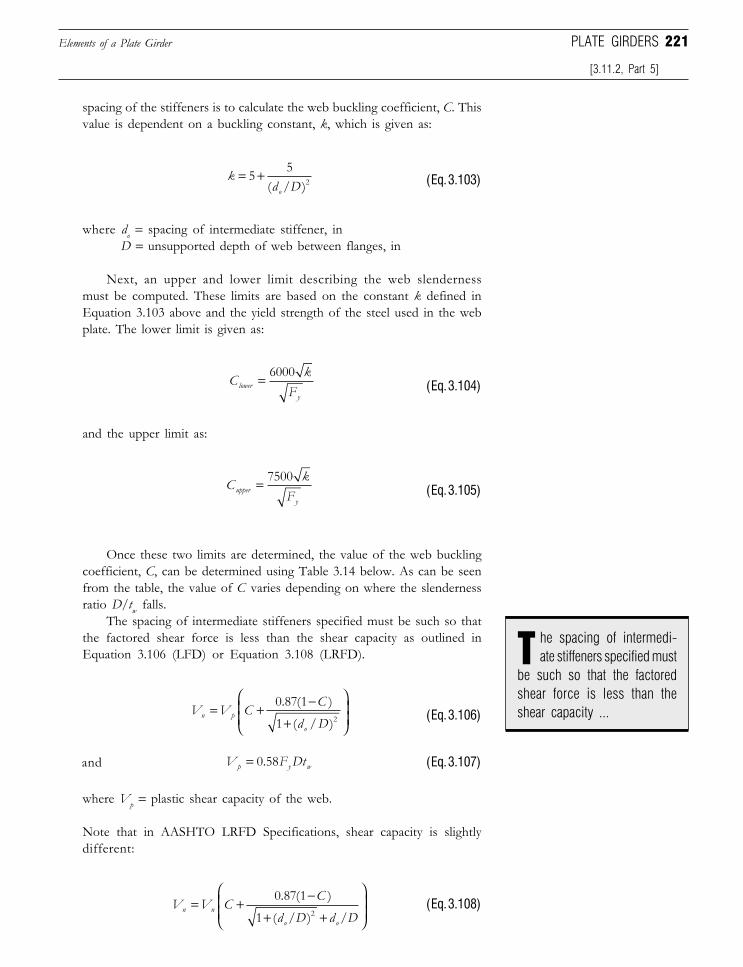
221
spacing of the stiffeners is to calculate the web buckling coefficient, C. Thisvalue is dependent on a buckling constant, k, which is given as:
kd Do
= +5 52( / ) (Eq. 3.103)
where do = spacing of intermediate stiffener, in D = unsupported depth of web between flanges, in
Next, an upper and lower limit describing the web slendernessmust be computed. These limits are based on the constant k defined inEquation 3.103 above and the yield strength of the steel used in the webplate. The lower limit is given as:
C kFlowery
= 6000(Eq. 3.104)
and the upper limit as:
C kFuppery
= 7500(Eq. 3.105)
Once these two limits are determined, the value of the web bucklingcoefficient, C, can be determined using Table 3.14 below. As can be seenfrom the table, the value of C varies depending on where the slendernessratio D/tw falls.
The spacing of intermediate stiffeners specified must be such so thatthe factored shear force is less than the shear capacity as outlined inEquation 3.106 (LFD) or Equation 3.108 (LRFD).
V V CC
d Dn p
o
= + −
+
0 87 1
1 2
. ( )
( / ) (Eq. 3.106)
and V F Dtp y w= 0 58. (Eq. 3.107)
where Vp = plastic shear capacity of the web.
Note that in AASHTO LRFD Specifications, shear capacity is slightlydifferent:
V V CC
d D d Dn n
o o
= + −
+ +
0 87 1
1 2
. ( )
( / ) /(Eq. 3.108)
Elements of a Plate Girder
[3.11.2, Part 5]
PLATE GIRDERS
he spacing of intermedi-ate stiffeners specified must
be such so that the factoredshear force is less than theshear capacity ...
T
Downloaded from Digital Engineering Library @ McGraw-Hill (www.digitalengineeringlibrary.com)Copyright © 2006 The McGraw-Hill Companies. All rights reserved.
Any use is subject to the Terms of Use as given at the website.
Design of Superstructure Elements
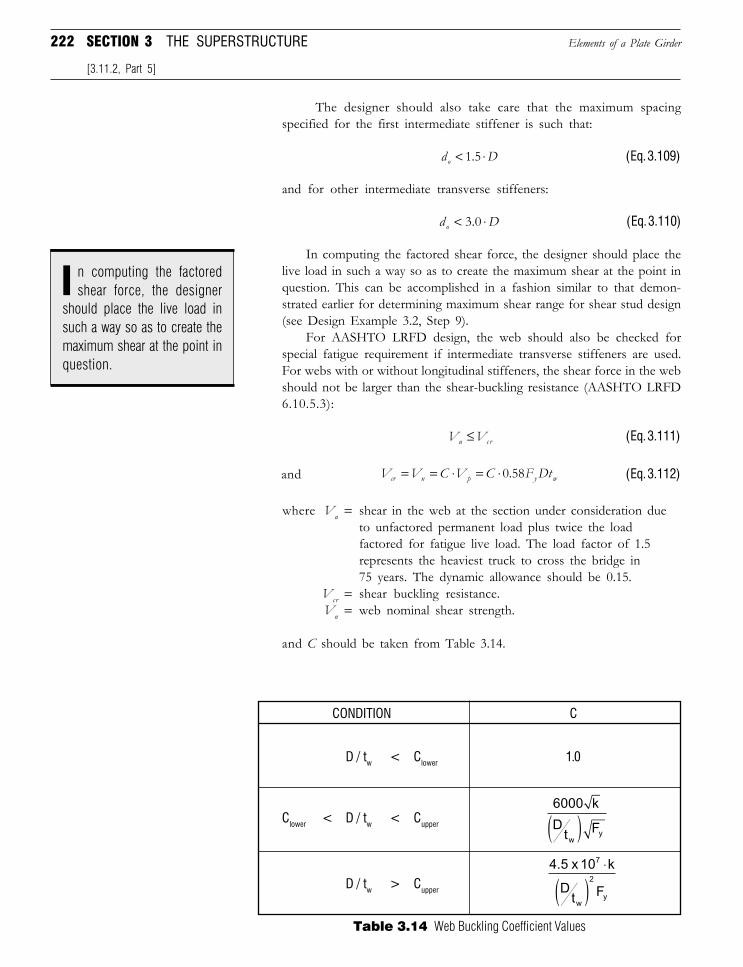
222 SECTION 3 THE SUPERSTRUCTURE
The designer should also take care that the maximum spacingspecified for the first intermediate stiffener is such that:
d Do < ⋅1 5. (Eq. 3.109)
and for other intermediate transverse stiffeners:
d Do < ⋅3 0. (Eq. 3.110)
In computing the factored shear force, the designer should place thelive load in such a way so as to create the maximum shear at the point inquestion. This can be accomplished in a fashion similar to that demon-strated earlier for determining maximum shear range for shear stud design(see Design Example 3.2, Step 9).
For AASHTO LRFD design, the web should also be checked forspecial fatigue requirement if intermediate transverse stiffeners are used.For webs with or without longitudinal stiffeners, the shear force in the webshould not be larger than the shear-buckling resistance (AASHTO LRFD6.10.5.3):
V Vu cr≤ (Eq. 3.111)
and V V C V C F Dtcr n p y w= = ⋅ = ⋅0 58. (Eq. 3.112)
where Vu = shear in the web at the section under consideration dueto unfactored permanent load plus twice the loadfactored for fatigue live load. The load factor of 1.5represents the heaviest truck to cross the bridge in75 years. The dynamic allowance should be 0.15.
Vcr = shear buckling resistance.Vn = web nominal shear strength.
and C should be taken from Table 3.14.
Elements of a Plate Girder
[3.11.2, Part 5]
n computing the factoredshear force, the designer
should place the live load insuch a way so as to create themaximum shear at the point inquestion.
I
D / tw < Clower 1.0
Clower < D / tw < Cupper
D / tw > Cupper
CONDITION C
Table 3.14 Web Buckling Coefficient Values
6000 k
Dt F
wy( )
4.5 x 10 k
Dt F
7
w
2
y
⋅
( )
Downloaded from Digital Engineering Library @ McGraw-Hill (www.digitalengineeringlibrary.com)Copyright © 2006 The McGraw-Hill Companies. All rights reserved.
Any use is subject to the Terms of Use as given at the website.
Design of Superstructure Elements
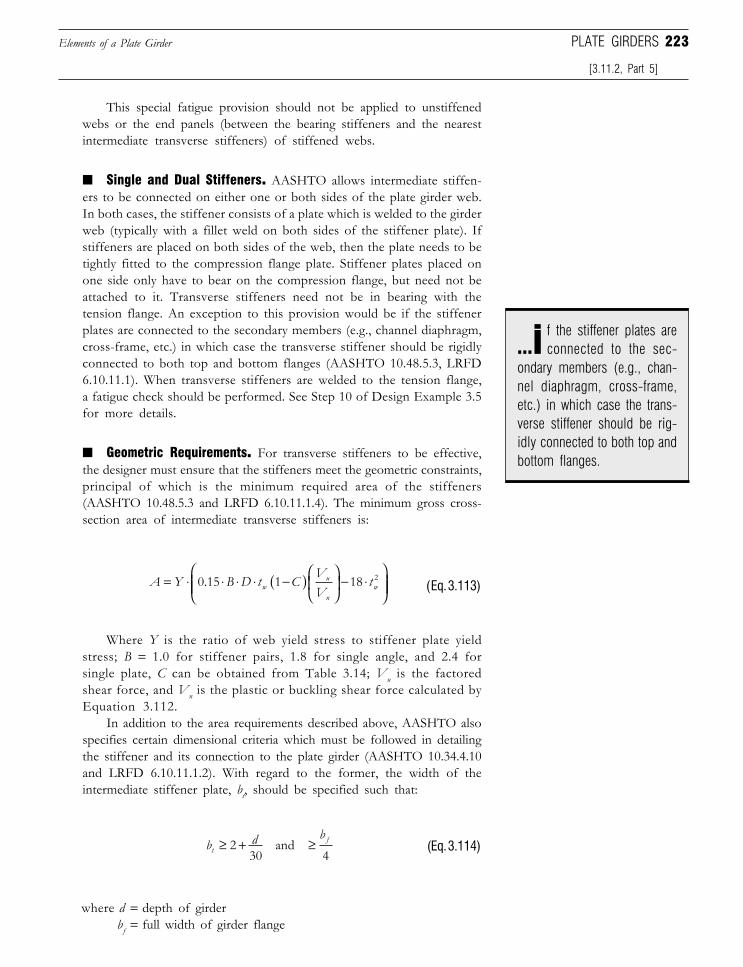
223
This special fatigue provision should not be applied to unstiffenedwebs or the end panels (between the bearing stiffeners and the nearestintermediate transverse stiffeners) of stiffened webs.
■ Single and Dual Stiffeners. AASHTO allows intermediate stiffen-ers to be connected on either one or both sides of the plate girder web.In both cases, the stiffener consists of a plate which is welded to the girderweb (typically with a fillet weld on both sides of the stiffener plate). Ifstiffeners are placed on both sides of the web, then the plate needs to betightly fitted to the compression flange plate. Stiffener plates placed onone side only have to bear on the compression flange, but need not beattached to it. Transverse stiffeners need not be in bearing with thetension flange. An exception to this provision would be if the stiffenerplates are connected to the secondary members (e.g., channel diaphragm,cross-frame, etc.) in which case the transverse stiffener should be rigidlyconnected to both top and bottom flanges (AASHTO 10.48.5.3, LRFD6.10.11.1). When transverse stiffeners are welded to the tension flange,a fatigue check should be performed. See Step 10 of Design Example 3.5for more details.
■ Geometric Requirements. For transverse stiffeners to be effective,the designer must ensure that the stiffeners meet the geometric constraints,principal of which is the minimum required area of the stiffeners(AASHTO 10.48.5.3 and LRFD 6.10.11.1.4). The minimum gross cross-section area of intermediate transverse stiffeners is:
A Y B D t CVV
twu
nw= ⋅ ⋅ ⋅ ⋅ −( )
− ⋅
0 15 1 18 2. (Eq. 3.113)
Where Y is the ratio of web yield stress to stiffener plate yieldstress; B = 1.0 for stiffener pairs, 1.8 for single angle, and 2.4 forsingle plate, C can be obtained from Table 3.14; Vu is the factoredshear force, and Vn is the plastic or buckling shear force calculated byEquation 3.112.
In addition to the area requirements described above, AASHTO alsospecifies certain dimensional criteria which must be followed in detailingthe stiffener and its connection to the plate girder (AASHTO 10.34.4.10and LRFD 6.10.11.1.2). With regard to the former, the width of theintermediate stiffener plate, bt, should be specified such that:
b d bt
f≥ + ≥230 4
and (Eq. 3.114)
where d = depth of girderbf = full width of girder flange
PLATE GIRDERSElements of a Plate Girder
[3.11.2, Part 5]
f the stiffener plates areconnected to the sec-
ondary members (e.g., chan-nel diaphragm, cross-frame,etc.) in which case the trans-verse stiffener should be rig-idly connected to both top andbottom flanges.
...i
Downloaded from Digital Engineering Library @ McGraw-Hill (www.digitalengineeringlibrary.com)Copyright © 2006 The McGraw-Hill Companies. All rights reserved.
Any use is subject to the Terms of Use as given at the website.
Design of Superstructure Elements
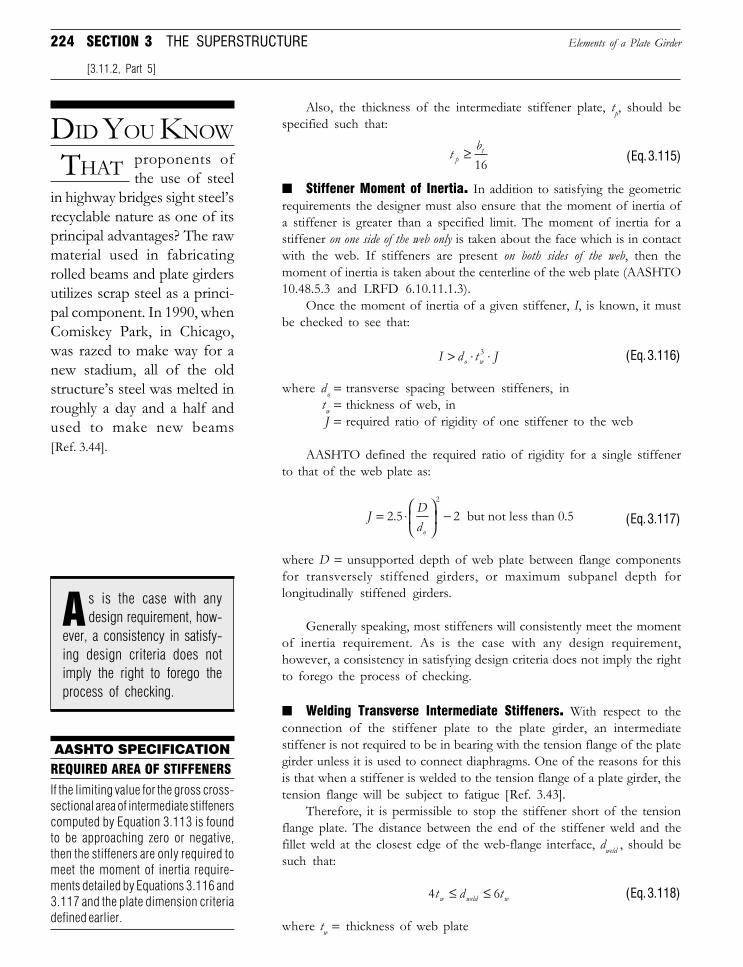
224 SECTION 3 THE SUPERSTRUCTURE
Also, the thickness of the intermediate stiffener plate, tp, should bespecified such that:
tb
pt≥
16 (Eq. 3.115)
■ Stiffener Moment of Inertia. In addition to satisfying the geometricrequirements the designer must also ensure that the moment of inertia ofa stiffener is greater than a specified limit. The moment of inertia for astiffener on one side of the web only is taken about the face which is in contactwith the web. If stiffeners are present on both sides of the web, then themoment of inertia is taken about the centerline of the web plate (AASHTO10.48.5.3 and LRFD 6.10.11.1.3).
Once the moment of inertia of a given stiffener, I, is known, it mustbe checked to see that:
I d t Jo w> ⋅ ⋅3 (Eq. 3.116)
where do = transverse spacing between stiffeners, intw = thickness of web, inJ = required ratio of rigidity of one stiffener to the web
AASHTO defined the required ratio of rigidity for a single stiffenerto that of the web plate as:
J Ddo
= ⋅
−2 5 2
2
. but not less than 0.5 (Eq. 3.117)
where D = unsupported depth of web plate between flange componentsfor transversely stiffened girders, or maximum subpanel depth forlongitudinally stiffened girders.
Generally speaking, most stiffeners will consistently meet the momentof inertia requirement. As is the case with any design requirement,however, a consistency in satisfying design criteria does not imply the rightto forego the process of checking.
■ Welding Transverse Intermediate Stiffeners. With respect to theconnection of the stiffener plate to the plate girder, an intermediatestiffener is not required to be in bearing with the tension flange of the plategirder unless it is used to connect diaphragms. One of the reasons for thisis that when a stiffener is welded to the tension flange of a plate girder, thetension flange will be subject to fatigue [Ref. 3.43].
Therefore, it is permissible to stop the stiffener short of the tensionflange plate. The distance between the end of the stiffener weld and thefillet weld at the closest edge of the web-flange interface, dweld , should besuch that:
4 6t d tw weld w≤ ≤ (Eq. 3.118)
where tw = thickness of web plate
Elements of a Plate Girder
[3.11.2, Part 5]
DID YOU KNOW
THAT proponents ofthe use of steel
in highway bridges sight steel’srecyclable nature as one of itsprincipal advantages? The rawmaterial used in fabricatingrolled beams and plate girdersutilizes scrap steel as a princi-pal component. In 1990, whenComiskey Park, in Chicago,was razed to make way for anew stadium, all of the oldstructure’s steel was melted inroughly a day and a half andused to make new beams[Ref. 3.44].
AASHTO SPECIFICATIONREQUIRED AREA OF STIFFENERS
If the limiting value for the gross cross-sectional area of intermediate stiffenerscomputed by Equation 3.113 is foundto be approaching zero or negative,then the stiffeners are only required tomeet the moment of inertia require-ments detailed by Equations 3.116 and3.117 and the plate dimension criteriadefined earlier.
s is the case with anydesign requirement, how-
ever, a consistency in satisfy-ing design criteria does notimply the right to forego theprocess of checking.
A
Downloaded from Digital Engineering Library @ McGraw-Hill (www.digitalengineeringlibrary.com)Copyright © 2006 The McGraw-Hill Companies. All rights reserved.
Any use is subject to the Terms of Use as given at the website.
Design of Superstructure Elements
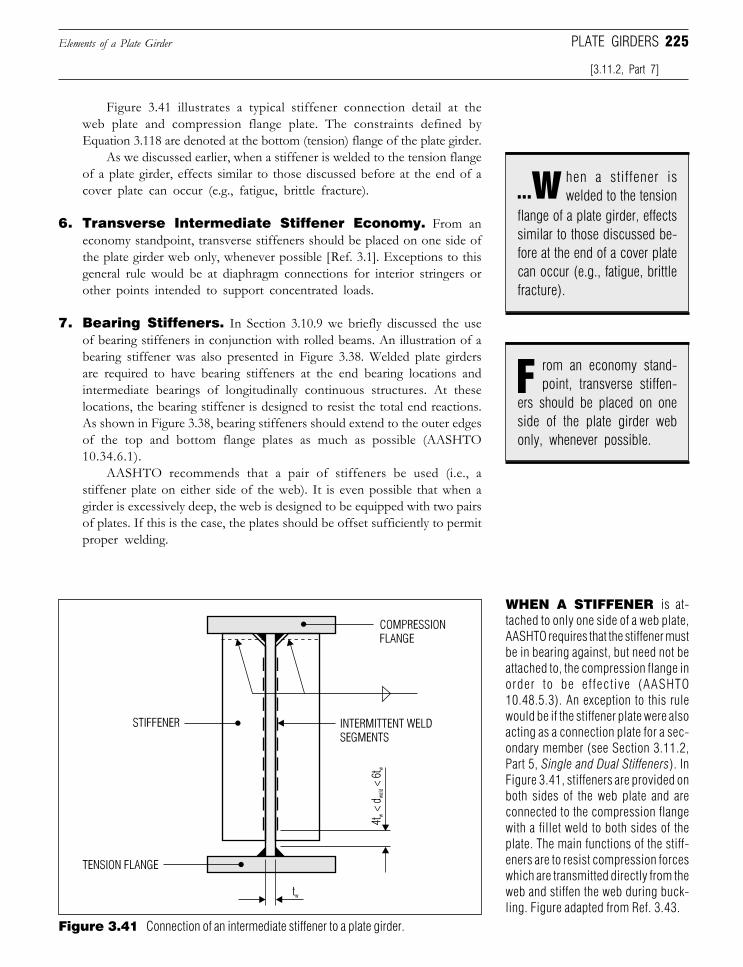
225
Figure 3.41 illustrates a typical stiffener connection detail at theweb plate and compression flange plate. The constraints defined byEquation 3.118 are denoted at the bottom (tension) flange of the plate girder.
As we discussed earlier, when a stiffener is welded to the tension flangeof a plate girder, effects similar to those discussed before at the end of acover plate can occur (e.g., fatigue, brittle fracture).
6. Transverse Intermediate Stiffener Economy. From aneconomy standpoint, transverse stiffeners should be placed on one side ofthe plate girder web only, whenever possible [Ref. 3.1]. Exceptions to thisgeneral rule would be at diaphragm connections for interior stringers orother points intended to support concentrated loads.
7. Bearing Stiffeners. In Section 3.10.9 we briefly discussed the useof bearing stiffeners in conjunction with rolled beams. An illustration of abearing stiffener was also presented in Figure 3.38. Welded plate girdersare required to have bearing stiffeners at the end bearing locations andintermediate bearings of longitudinally continuous structures. At theselocations, the bearing stiffener is designed to resist the total end reactions.As shown in Figure 3.38, bearing stiffeners should extend to the outer edgesof the top and bottom flange plates as much as possible (AASHTO10.34.6.1).
AASHTO recommends that a pair of stiffeners be used (i.e., astiffener plate on either side of the web). It is even possible that when agirder is excessively deep, the web is designed to be equipped with two pairsof plates. If this is the case, the plates should be offset sufficiently to permitproper welding.
Elements of a Plate Girder
[3.11.2, Part 7]
PLATE GIRDERS
Figure 3.41 Connection of an intermediate stiffener to a plate girder.
WHEN A STIFFENER is at-tached to only one side of a web plate,AASHTO requires that the stiffener mustbe in bearing against, but need not beattached to, the compression flange inorder to be effective (AASHTO10.48.5.3). An exception to this rulewould be if the stiffener plate were alsoacting as a connection plate for a sec-ondary member (see Section 3.11.2,Part 5, Single and Dual Stiffeners). InFigure 3.41, stiffeners are provided onboth sides of the web plate and areconnected to the compression flangewith a fillet weld to both sides of theplate. The main functions of the stiff-eners are to resist compression forceswhich are transmitted directly from theweb and stiffen the web during buck-ling. Figure adapted from Ref. 3.43.
hen a stiffener iswelded to the tension
flange of a plate girder, effectssimilar to those discussed be-fore at the end of a cover platecan occur (e.g., fatigue, brittlefracture).
...w
rom an economy stand-point, transverse stiffen-
ers should be placed on oneside of the plate girder webonly, whenever possible.
F
Downloaded from Digital Engineering Library @ McGraw-Hill (www.digitalengineeringlibrary.com)Copyright © 2006 The McGraw-Hill Companies. All rights reserved.
Any use is subject to the Terms of Use as given at the website.
Design of Superstructure Elements
226 SECTION 3 THE SUPERSTRUCTURE
As mentioned in the sidebar accompanying Figure 3.38, bearingstiffeners are designed as columns, resisting the end reactions of the span.The width of each projecting bearing stiffener should satisfy (AASHTOLRFD 6.10.11.2.2):
b t EFf py
≤ 0 48. (Eq. 3.119)
where bf = width of stiffener, inFy = yield strength of steel used for stiffener, ksitp = thickness of projecting stiffener element, in
If two plates on either side of the web plate are used, the width ofthe section acting as the resisting column is taken as the width of the twoplates themselves plus the web thickness located in between them. Theweb plate width is limited to 9 times its thickness on each side ofthe stiffeners. If more than one pair of bearing stiffeners are used, theresisting column section is composed of all stiffeners plus the girderweb extending no more than 9 times the web thickness on each side ofthe outer stiffeners.
Bearing stiffeners should also be designed to resist the factoredbearing forces. The factored bearing resistance can be calculated (AASHTOLRFD 6.10.11.2.2):
( ) ( )R Rsb r b sb n= φ (Eq. 3.120)
where (Rsb)r = factored bearing resistanceφb = resistance factor of bearing (= 1.0, AASHTO LRFD 6.5.4.2)
(Rsb)n = 1.4 ApnFy = nominal bearing resistance Apn = area of bearing stiffeners directly bearing against webs.
The area clipped to clear the web-to-flange fillet weld, and the areabeyond the edge of flange, if any, should not be included in calculating thebearing resistance.
In detailing the interface of the stiffener and flanges, the designer hastwo options; either the stiffener can be:
❏ Milled to bear against the flange through which they receive thetotal end reaction
❏ Connected to the flange using full penetration groove welds
8. Longitudinal Stiffeners. A longitudinal stiffener, like transverseintermediate stiffeners, is welded to the web plate of a plate girder. Thelongitudinal stiffener, as its name would imply, runs along the length of thestringer. We have already demonstrated in Part 3 above that incorporationof a longitudinal stiffener reduces the required thickness of the web plateby one half.
Elements of a Plate Girder
[3.11.2, Part 7]
t is even possible that, whena girder is excessively deep,
the web is designed to beequipped with two pairs ofplates ... the plates should beoffset sufficiently to permitproper welding.
I
Downloaded from Digital Engineering Library @ McGraw-Hill (www.digitalengineeringlibrary.com)Copyright © 2006 The McGraw-Hill Companies. All rights reserved.
Any use is subject to the Terms of Use as given at the website.
Design of Superstructure Elements
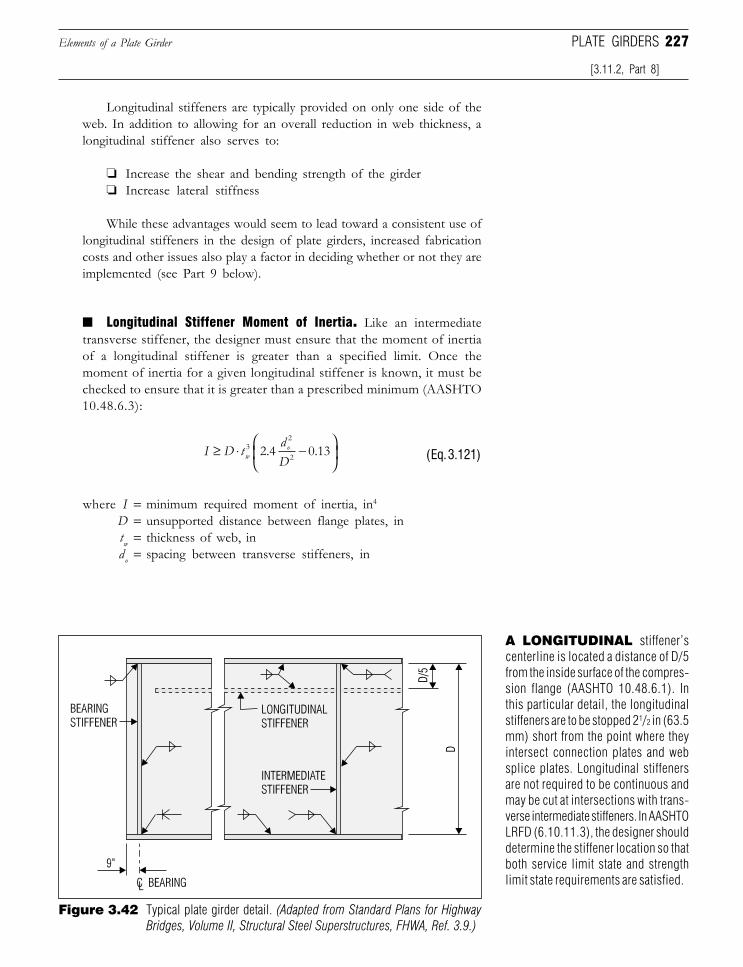
227Elements of a Plate Girder PLATE GIRDERS
Longitudinal stiffeners are typically provided on only one side of theweb. In addition to allowing for an overall reduction in web thickness, alongitudinal stiffener also serves to:
❏ Increase the shear and bending strength of the girder❏ Increase lateral stiffness
While these advantages would seem to lead toward a consistent use oflongitudinal stiffeners in the design of plate girders, increased fabricationcosts and other issues also play a factor in deciding whether or not they areimplemented (see Part 9 below).
■ Longitudinal Stiffener Moment of Inertia. Like an intermediatetransverse stiffener, the designer must ensure that the moment of inertiaof a longitudinal stiffener is greater than a specified limit. Once themoment of inertia for a given longitudinal stiffener is known, it must bechecked to ensure that it is greater than a prescribed minimum (AASHTO10.48.6.3):
I D tdDwo≥ ⋅ −
32
22 4 0 13. . (Eq. 3.121)
where I = minimum required moment of inertia, in4
D = unsupported distance between flange plates, intw = thickness of web, indo = spacing between transverse stiffeners, in
[3.11.2, Part 8]
A LONGITUDINAL stiffener’scenterline is located a distance of D/5from the inside surface of the compres-sion flange (AASHTO 10.48.6.1). Inthis particular detail, the longitudinalstiffeners are to be stopped 21/2 in (63.5mm) short from the point where theyintersect connection plates and websplice plates. Longitudinal stiffenersare not required to be continuous andmay be cut at intersections with trans-verse intermediate stiffeners. In AASHTOLRFD (6.10.11.3), the designer shoulddetermine the stiffener location so thatboth service limit state and strengthlimit state requirements are satisfied.
Figure 3.42 Typical plate girder detail. (Adapted from Standard Plans for HighwayBridges, Volume II, Structural Steel Superstructures, FHWA, Ref. 3.9.)
Downloaded from Digital Engineering Library @ McGraw-Hill (www.digitalengineeringlibrary.com)Copyright © 2006 The McGraw-Hill Companies. All rights reserved.
Any use is subject to the Terms of Use as given at the website.
Design of Superstructure Elements
228 SECTION 3 THE SUPERSTRUCTURE
This moment of inertia is taken about the edge in contact between thelongitudinal stiffener and the web plate.
The radius of gyration of the stiffener should also satisfy:
rd Fo y≥23 000,
(AASHTO Standard) (Eq. 3.122a)
r d FEoy≥ 0 253. (AASHTO LRFD) (Eq. 3.122b)
In calculating the radius of gyration, a centrally located web strip equalto 18tw in width should be considered as a part of the longitudinal stiffener.For hybird girders, some modification to Equation 3.122b is required byAASHTO LRFD (6.10.11.3.3).
■ Geometric Requirements. While AASHTO does not specify aminimum required area for longitudinal stiffeners, a minimum thicknessis defined. The width of longitudinal stiffener should not be wider than(AASHTO LRFD 6.10.11.3.2):
b t EFl sy
≤ 0 48. (Eq. 3.123)
where bl = width of stiffenerts = thickness of the stiffener
This requirement is intended to prevent local buckling of the longitudinalstiffener.
9. Longitudinal Stiffener Economy. We mentioned earlier thatlongitudinal stiffeners are typically placed on one side of the web plate only.A way of improving the overall economy of the fabricated plate girder isto place the longitudinal stiffener on the side opposite from the onecontaining the transverse stiffeners. Such an approach will minimize thenumber of times a longitudinal stiffener intersects with a transversestiffener and thereby decrease fabrication costs.
The economy studies conducted by Bethlehem Steel, discussedpreviously in Parts 2, 4, and 7 above, indicated that longitudinallystiffened plate girders are not economically feasible for spans less than200 ft (61 m) [Ref. 3.1]. Indeed, the studies demonstrated that plategirders equipped with both longitudinal and transverse stiffeners werenot competitive with those equipped with only transverse stiffeners untilthe span lengths exceeded 300 ft (91.5 m). For more on this issue, seePart 4 above.
10.Miscellaneous Economy Issues. The Bethlehem Steel studiesbore out some other results, with regard to plate girder economy, which are
Elements of a Plate Girder
[3.11.2, Part 8]
his moment of inertia istaken about the edge in
contact between the longitudi-nal stiffener and the web plate.
T
tudies demonstrated thatplate girders equipped
with both longitudinal andtransverse stiffeners were notcompetitive with these quippedwith only transverse stiffenersuntil the span lengths exceeded300 ft.
S
Downloaded from Digital Engineering Library @ McGraw-Hill (www.digitalengineeringlibrary.com)Copyright © 2006 The McGraw-Hill Companies. All rights reserved.
Any use is subject to the Terms of Use as given at the website.
Design of Superstructure Elements
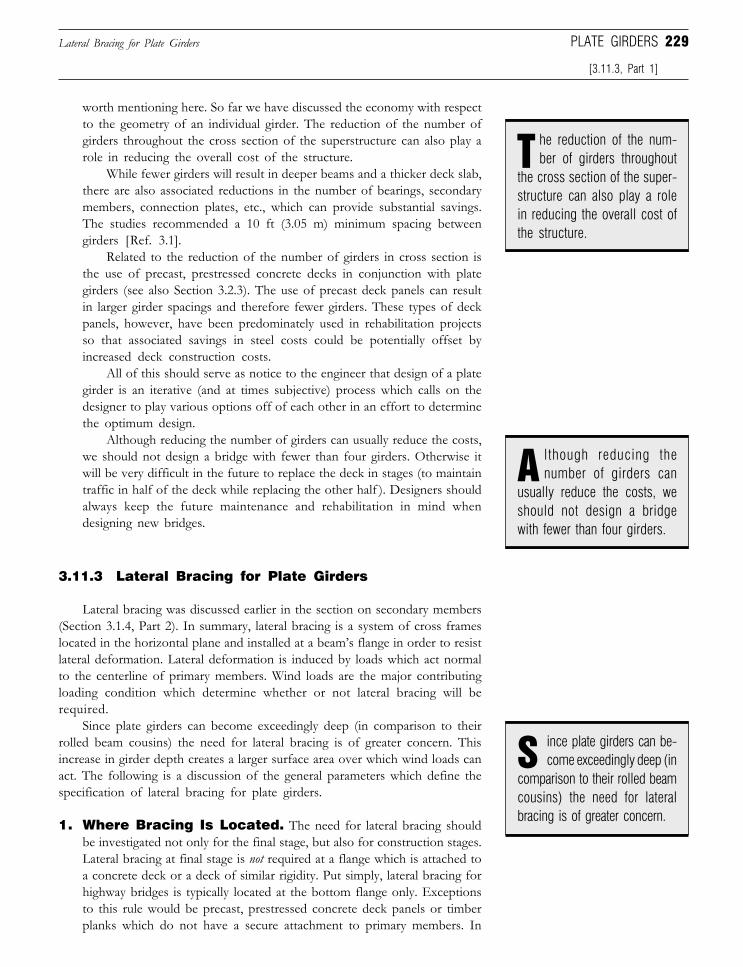
229
worth mentioning here. So far we have discussed the economy with respectto the geometry of an individual girder. The reduction of the number ofgirders throughout the cross section of the superstructure can also play arole in reducing the overall cost of the structure.
While fewer girders will result in deeper beams and a thicker deck slab,there are also associated reductions in the number of bearings, secondarymembers, connection plates, etc., which can provide substantial savings.The studies recommended a 10 ft (3.05 m) minimum spacing betweengirders [Ref. 3.1].
Related to the reduction of the number of girders in cross section isthe use of precast, prestressed concrete decks in conjunction with plategirders (see also Section 3.2.3). The use of precast deck panels can resultin larger girder spacings and therefore fewer girders. These types of deckpanels, however, have been predominately used in rehabilitation projectsso that associated savings in steel costs could be potentially offset byincreased deck construction costs.
All of this should serve as notice to the engineer that design of a plategirder is an iterative (and at times subjective) process which calls on thedesigner to play various options off of each other in an effort to determinethe optimum design.
Although reducing the number of girders can usually reduce the costs,we should not design a bridge with fewer than four girders. Otherwise itwill be very difficult in the future to replace the deck in stages (to maintaintraffic in half of the deck while replacing the other half ). Designers shouldalways keep the future maintenance and rehabilitation in mind whendesigning new bridges.
3.11.3 Lateral Bracing for Plate Girders
Lateral bracing was discussed earlier in the section on secondary members(Section 3.1.4, Part 2). In summary, lateral bracing is a system of cross frameslocated in the horizontal plane and installed at a beam’s flange in order to resistlateral deformation. Lateral deformation is induced by loads which act normalto the centerline of primary members. Wind loads are the major contributingloading condition which determine whether or not lateral bracing will berequired.
Since plate girders can become exceedingly deep (in comparison to theirrolled beam cousins) the need for lateral bracing is of greater concern. Thisincrease in girder depth creates a larger surface area over which wind loads canact. The following is a discussion of the general parameters which define thespecification of lateral bracing for plate girders.
1. Where Bracing Is Located. The need for lateral bracing shouldbe investigated not only for the final stage, but also for construction stages.Lateral bracing at final stage is not required at a flange which is attached toa concrete deck or a deck of similar rigidity. Put simply, lateral bracing forhighway bridges is typically located at the bottom flange only. Exceptionsto this rule would be precast, prestressed concrete deck panels or timberplanks which do not have a secure attachment to primary members. In
Lateral Bracing for Plate Girders
[3.11.3, Part 1]
PLATE GIRDERS
he reduction of the num-ber of girders throughout
the cross section of the super-structure can also play a rolein reducing the overall cost ofthe structure.
T
lthough reducing thenumber of girders can
usually reduce the costs, weshould not design a bridgewith fewer than four girders.
A
ince plate girders can be-come exceedingly deep (in
comparison to their rolled beamcousins) the need for lateralbracing is of greater concern.
S
Downloaded from Digital Engineering Library @ McGraw-Hill (www.digitalengineeringlibrary.com)Copyright © 2006 The McGraw-Hill Companies. All rights reserved.
Any use is subject to the Terms of Use as given at the website.
Design of Superstructure Elements
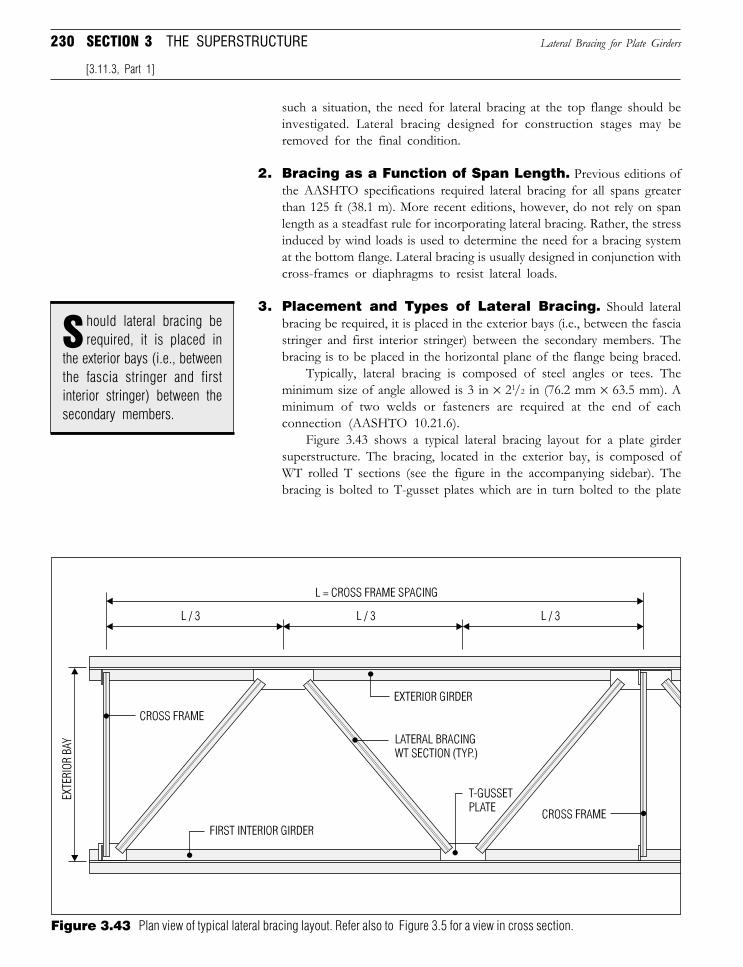
230 SECTION 3 THE SUPERSTRUCTURE
such a situation, the need for lateral bracing at the top flange should beinvestigated. Lateral bracing designed for construction stages may beremoved for the final condition.
2. Bracing as a Function of Span Length. Previous editions ofthe AASHTO specifications required lateral bracing for all spans greaterthan 125 ft (38.1 m). More recent editions, however, do not rely on spanlength as a steadfast rule for incorporating lateral bracing. Rather, the stressinduced by wind loads is used to determine the need for a bracing systemat the bottom flange. Lateral bracing is usually designed in conjunction withcross-frames or diaphragms to resist lateral loads.
3. Placement and Types of Lateral Bracing. Should lateralbracing be required, it is placed in the exterior bays (i.e., between the fasciastringer and first interior stringer) between the secondary members. Thebracing is to be placed in the horizontal plane of the flange being braced.
Typically, lateral bracing is composed of steel angles or tees. Theminimum size of angle allowed is 3 in × 21/2 in (76.2 mm × 63.5 mm). Aminimum of two welds or fasteners are required at the end of eachconnection (AASHTO 10.21.6).
Figure 3.43 shows a typical lateral bracing layout for a plate girdersuperstructure. The bracing, located in the exterior bay, is composed ofWT rolled T sections (see the figure in the accompanying sidebar). Thebracing is bolted to T-gusset plates which are in turn bolted to the plate
Lateral Bracing for Plate Girders
[3.11.3, Part 1]
hould lateral bracing berequired, it is placed in
the exterior bays (i.e., betweenthe fascia stringer and firstinterior stringer) between thesecondary members.
S
Figure 3.43 Plan view of typical lateral bracing layout. Refer also to Figure 3.5 for a view in cross section.
Downloaded from Digital Engineering Library @ McGraw-Hill (www.digitalengineeringlibrary.com)Copyright © 2006 The McGraw-Hill Companies. All rights reserved.
Any use is subject to the Terms of Use as given at the website.
Design of Superstructure Elements
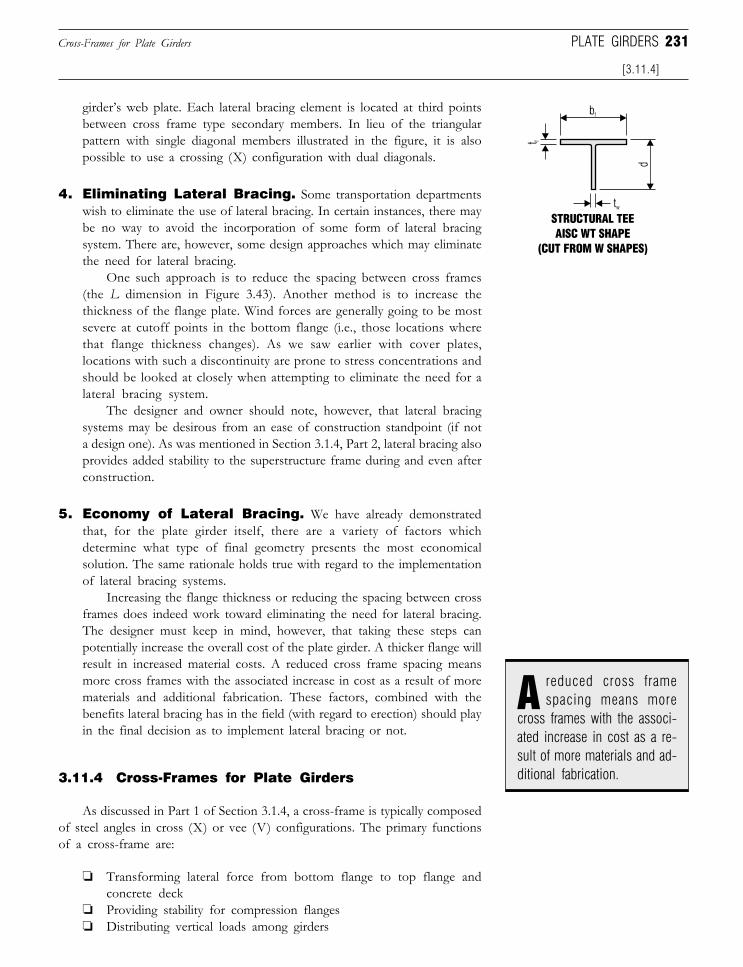
231
girder’s web plate. Each lateral bracing element is located at third pointsbetween cross frame type secondary members. In lieu of the triangularpattern with single diagonal members illustrated in the figure, it is alsopossible to use a crossing (X) configuration with dual diagonals.
4. Eliminating Lateral Bracing. Some transportation departmentswish to eliminate the use of lateral bracing. In certain instances, there maybe no way to avoid the incorporation of some form of lateral bracingsystem. There are, however, some design approaches which may eliminatethe need for lateral bracing.
One such approach is to reduce the spacing between cross frames(the L dimension in Figure 3.43). Another method is to increase thethickness of the flange plate. Wind forces are generally going to be mostsevere at cutoff points in the bottom flange (i.e., those locations wherethat flange thickness changes). As we saw earlier with cover plates,locations with such a discontinuity are prone to stress concentrations andshould be looked at closely when attempting to eliminate the need for alateral bracing system.
The designer and owner should note, however, that lateral bracingsystems may be desirous from an ease of construction standpoint (if nota design one). As was mentioned in Section 3.1.4, Part 2, lateral bracing alsoprovides added stability to the superstructure frame during and even afterconstruction.
5. Economy of Lateral Bracing. We have already demonstratedthat, for the plate girder itself, there are a variety of factors whichdetermine what type of final geometry presents the most economicalsolution. The same rationale holds true with regard to the implementationof lateral bracing systems.
Increasing the flange thickness or reducing the spacing between crossframes does indeed work toward eliminating the need for lateral bracing.The designer must keep in mind, however, that taking these steps canpotentially increase the overall cost of the plate girder. A thicker flange willresult in increased material costs. A reduced cross frame spacing meansmore cross frames with the associated increase in cost as a result of morematerials and additional fabrication. These factors, combined with thebenefits lateral bracing has in the field (with regard to erection) should playin the final decision as to implement lateral bracing or not.
3.11.4 Cross-Frames for Plate Girders
As discussed in Part 1 of Section 3.1.4, a cross-frame is typically composedof steel angles in cross (X) or vee (V) configurations. The primary functionsof a cross-frame are:
❏ Transforming lateral force from bottom flange to top flange andconcrete deck
❏ Providing stability for compression flanges❏ Distributing vertical loads among girders
Cross-Frames for Plate Girders
[3.11.4]
PLATE GIRDERS
reduced cross framespacing means more
cross frames with the associ-ated increase in cost as a re-sult of more materials and ad-ditional fabrication.
A
Downloaded from Digital Engineering Library @ McGraw-Hill (www.digitalengineeringlibrary.com)Copyright © 2006 The McGraw-Hill Companies. All rights reserved.
Any use is subject to the Terms of Use as given at the website.
Design of Superstructure Elements
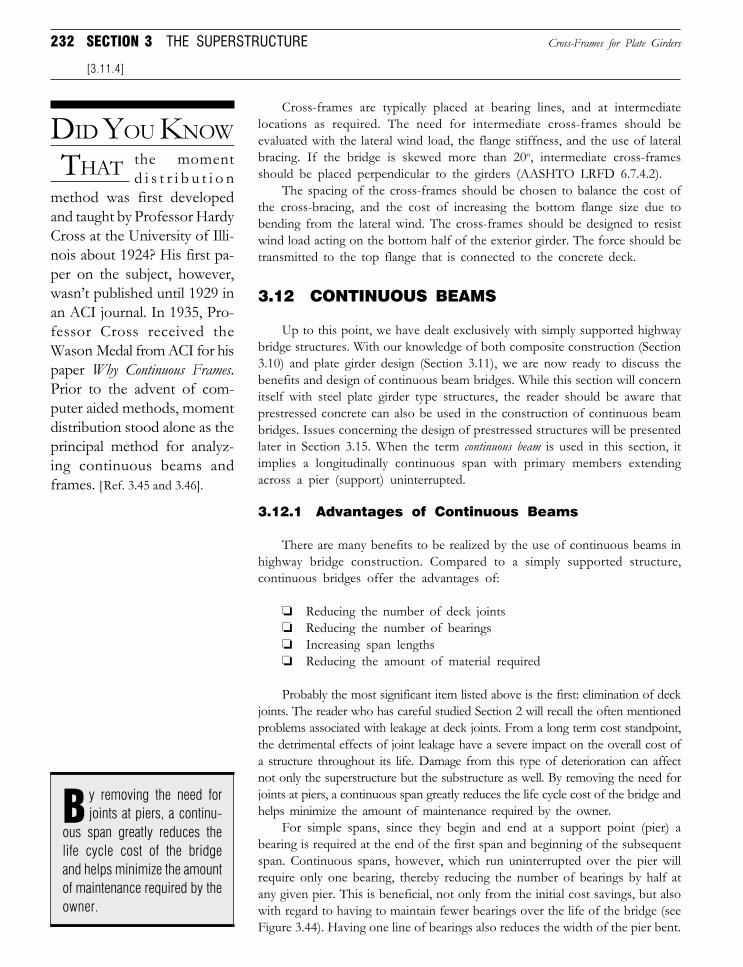
232 SECTION 3 THE SUPERSTRUCTURE
Cross-frames are typically placed at bearing lines, and at intermediatelocations as required. The need for intermediate cross-frames should beevaluated with the lateral wind load, the flange stiffness, and the use of lateralbracing. If the bridge is skewed more than 20o, intermediate cross-framesshould be placed perpendicular to the girders (AASHTO LRFD 6.7.4.2).
The spacing of the cross-frames should be chosen to balance the cost ofthe cross-bracing, and the cost of increasing the bottom flange size due tobending from the lateral wind. The cross-frames should be designed to resistwind load acting on the bottom half of the exterior girder. The force should betransmitted to the top flange that is connected to the concrete deck.
3.12 CONTINUOUS BEAMS
Up to this point, we have dealt exclusively with simply supported highwaybridge structures. With our knowledge of both composite construction (Section3.10) and plate girder design (Section 3.11), we are now ready to discuss thebenefits and design of continuous beam bridges. While this section will concernitself with steel plate girder type structures, the reader should be aware thatprestressed concrete can also be used in the construction of continuous beambridges. Issues concerning the design of prestressed structures will be presentedlater in Section 3.15. When the term continuous beam is used in this section, itimplies a longitudinally continuous span with primary members extendingacross a pier (support) uninterrupted.
3.12.1 Advantages of Continuous Beams
There are many benefits to be realized by the use of continuous beams inhighway bridge construction. Compared to a simply supported structure,continuous bridges offer the advantages of:
❏ Reducing the number of deck joints❏ Reducing the number of bearings❏ Increasing span lengths❏ Reducing the amount of material required
Probably the most significant item listed above is the first: elimination of deckjoints. The reader who has careful studied Section 2 will recall the often mentionedproblems associated with leakage at deck joints. From a long term cost standpoint,the detrimental effects of joint leakage have a severe impact on the overall cost ofa structure throughout its life. Damage from this type of deterioration can affectnot only the superstructure but the substructure as well. By removing the need forjoints at piers, a continuous span greatly reduces the life cycle cost of the bridge andhelps minimize the amount of maintenance required by the owner.
For simple spans, since they begin and end at a support point (pier) abearing is required at the end of the first span and beginning of the subsequentspan. Continuous spans, however, which run uninterrupted over the pier willrequire only one bearing, thereby reducing the number of bearings by half atany given pier. This is beneficial, not only from the initial cost savings, but alsowith regard to having to maintain fewer bearings over the life of the bridge (seeFigure 3.44). Having one line of bearings also reduces the width of the pier bent.
Cross-Frames for Plate Girders
[3.11.4]
DID YOU KNOW
THAT the momentd i s t r i b u t i o n
method was first developedand taught by Professor HardyCross at the University of Illi-nois about 1924? His first pa-per on the subject, however,wasn’t published until 1929 inan ACI journal. In 1935, Pro-fessor Cross received theWason Medal from ACI for hispaper Why Continuous Frames.Prior to the advent of com-puter aided methods, momentdistribution stood alone as theprincipal method for analyz-ing continuous beams andframes. [Ref. 3.45 and 3.46].
y removing the need forjoints at piers, a continu-
ous span greatly reduces thelife cycle cost of the bridgeand helps minimize the amountof maintenance required by theowner.
B
Downloaded from Digital Engineering Library @ McGraw-Hill (www.digitalengineeringlibrary.com)Copyright © 2006 The McGraw-Hill Companies. All rights reserved.
Any use is subject to the Terms of Use as given at the website.
Design of Superstructure Elements
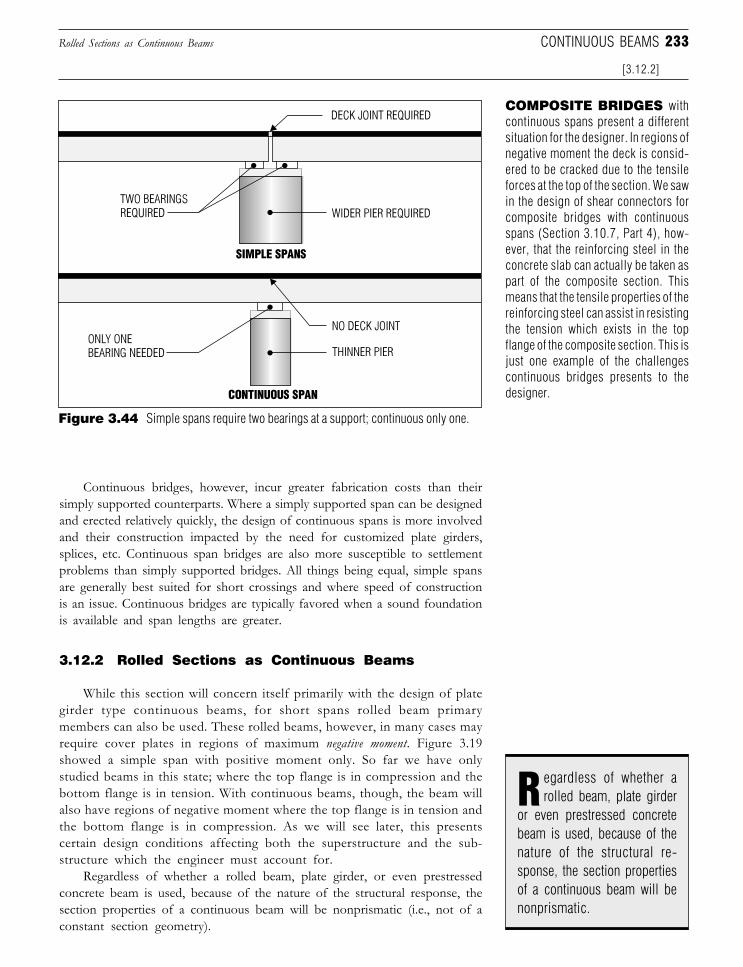
233
Continuous bridges, however, incur greater fabrication costs than theirsimply supported counterparts. Where a simply supported span can be designedand erected relatively quickly, the design of continuous spans is more involvedand their construction impacted by the need for customized plate girders,splices, etc. Continuous span bridges are also more susceptible to settlementproblems than simply supported bridges. All things being equal, simple spansare generally best suited for short crossings and where speed of constructionis an issue. Continuous bridges are typically favored when a sound foundationis available and span lengths are greater.
3.12.2 Rolled Sections as Continuous Beams
While this section will concern itself primarily with the design of plategirder type continuous beams, for short spans rolled beam primarymembers can also be used. These rolled beams, however, in many cases mayrequire cover plates in regions of maximum negative moment. Figure 3.19showed a simple span with positive moment only. So far we have onlystudied beams in this state; where the top flange is in compression and thebottom flange is in tension. With continuous beams, though, the beam willalso have regions of negative moment where the top flange is in tension andthe bottom flange is in compression. As we will see later, this presentscertain design conditions affecting both the superstructure and the sub-structure which the engineer must account for.
Regardless of whether a rolled beam, plate girder, or even prestressedconcrete beam is used, because of the nature of the structural response, thesection properties of a continuous beam will be nonprismatic (i.e., not of aconstant section geometry).
Rolled Sections as Continuous Beams
[3.12.2]
CONTINUOUS BEAMS
Figure 3.44 Simple spans require two bearings at a support; continuous only one.
COMPOSITE BRIDGES withcontinuous spans present a differentsituation for the designer. In regions ofnegative moment the deck is consid-ered to be cracked due to the tensileforces at the top of the section. We sawin the design of shear connectors forcomposite bridges with continuousspans (Section 3.10.7, Part 4), how-ever, that the reinforcing steel in theconcrete slab can actually be taken aspart of the composite section. Thismeans that the tensile properties of thereinforcing steel can assist in resistingthe tension which exists in the topflange of the composite section. This isjust one example of the challengescontinuous bridges presents to thedesigner.
egardless of whether arolled beam, plate girderR
or even prestressed concretebeam is used, because of thenature of the structural re-sponse, the section propertiesof a continuous beam will benonprismatic.
Downloaded from Digital Engineering Library @ McGraw-Hill (www.digitalengineeringlibrary.com)Copyright © 2006 The McGraw-Hill Companies. All rights reserved.
Any use is subject to the Terms of Use as given at the website.
Design of Superstructure Elements
234 SECTION 3 THE SUPERSTRUCTURE
Like simply supported spans, continuous beams benefit from the useof composite construction (see Section 3.10.1). A decrease in the depth ofgirder and stiffer cross section are only two of the major advantages whichmake composite construction as popular for continuous bridges as it is forsimple spans. As the sidebar to Figure 3.44 indicates, however, continuousspans present some technical challenges not found in simply supportedstructures. The presence of tension at the top flange requires the designerto either:
❏ Ignore composite action at regions of negative moment❏ Take into account the effects of reinforcing steel in the slab
In regions of positive moment, however, the behavior of the slab and beamis the same as that discussed previously for simple spans. The controlling designcriteria for continuous spans will be the regions of negative moment whichoccur at the supports. Forces in these areas are generally greater than the pointsof maximum positive moment found near the center of a span.
3.12.3 Moment Distribution
The analysis of continuous beam bridges is somewhat complicated becauseof the physical continuity over a support and the variable nature of the beam’scross section. Because of this complexity, the 1960’s and 1970’s saw a veritableburgeoning of continuous beam analysis software. Today, many engineers relyon such software to perform the design of continuous beam bridges. While useof continuous beam programs is more the norm than the exception today, it isalso important for the bridge engineer to be able to perform the necessaryanalysis by hand. Where hand calculation methods are concerned, the momentdistribution method, developed by Professor Hardy Cross, remains thestandard for analysis of continuous beam bridges (see Did You Know? sidebar).Provided below is an overview of the basic principles behind momentdistribution for continuous beams.
1. Overview. Moment distribution is essentially an iterative approach forsolving beam problems of a variety of complexities. Moment distributionis generally favored as a hand calculation method because it:
❏ Converges to a solution quickly❏ Provides for the direct calculation of moments, shears, and
reactions❏ Is easy to learn
Another advantage of this approach is that it is not bounded by theloading conditions. General relationships are first developed and thenapplied to determine resulting moments, shears, etc. A general limitationon the use of moment distribution is that joints are not allowed to translatelaterally (i.e., sway). Also, moment distribution does not take into accountthe effects of settlement at support points. This may be accounted for ina separate calculation.
Moment Distribution
[3.12.2]
he 1960’s and 1970’ssaw a veritable burgeon-
ing of continuous beam analy-sis software ... many engineersrely on such software to per-form the design of continuousbeam bridges.
...t
Downloaded from Digital Engineering Library @ McGraw-Hill (www.digitalengineeringlibrary.com)Copyright © 2006 The McGraw-Hill Companies. All rights reserved.
Any use is subject to the Terms of Use as given at the website.
Design of Superstructure Elements
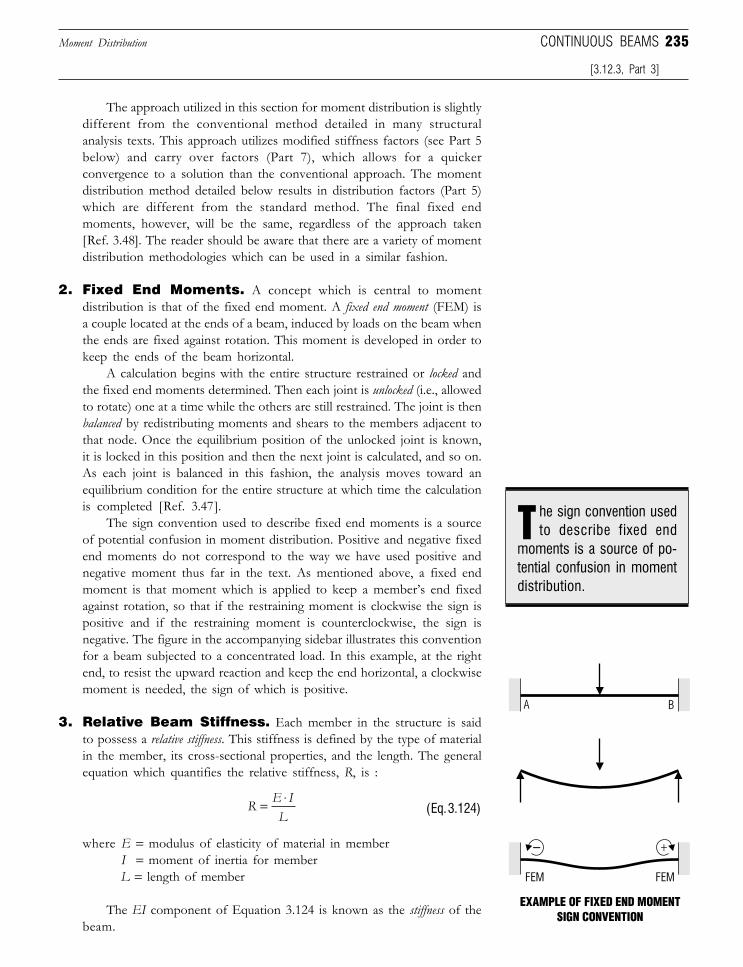
235
The approach utilized in this section for moment distribution is slightlydifferent from the conventional method detailed in many structuralanalysis texts. This approach utilizes modified stiffness factors (see Part 5below) and carry over factors (Part 7), which allows for a quickerconvergence to a solution than the conventional approach. The momentdistribution method detailed below results in distribution factors (Part 5)which are different from the standard method. The final fixed endmoments, however, will be the same, regardless of the approach taken[Ref. 3.48]. The reader should be aware that there are a variety of momentdistribution methodologies which can be used in a similar fashion.
2. Fixed End Moments. A concept which is central to momentdistribution is that of the fixed end moment. A fixed end moment (FEM) isa couple located at the ends of a beam, induced by loads on the beam whenthe ends are fixed against rotation. This moment is developed in order tokeep the ends of the beam horizontal.
A calculation begins with the entire structure restrained or locked andthe fixed end moments determined. Then each joint is unlocked (i.e., allowedto rotate) one at a time while the others are still restrained. The joint is thenbalanced by redistributing moments and shears to the members adjacent tothat node. Once the equilibrium position of the unlocked joint is known,it is locked in this position and then the next joint is calculated, and so on.As each joint is balanced in this fashion, the analysis moves toward anequilibrium condition for the entire structure at which time the calculationis completed [Ref. 3.47].
The sign convention used to describe fixed end moments is a sourceof potential confusion in moment distribution. Positive and negative fixedend moments do not correspond to the way we have used positive andnegative moment thus far in the text. As mentioned above, a fixed endmoment is that moment which is applied to keep a member’s end fixedagainst rotation, so that if the restraining moment is clockwise the sign ispositive and if the restraining moment is counterclockwise, the sign isnegative. The figure in the accompanying sidebar illustrates this conventionfor a beam subjected to a concentrated load. In this example, at the rightend, to resist the upward reaction and keep the end horizontal, a clockwisemoment is needed, the sign of which is positive.
3. Relative Beam Stiffness. Each member in the structure is saidto possess a relative stiffness. This stiffness is defined by the type of materialin the member, its cross-sectional properties, and the length. The generalequation which quantifies the relative stiffness, R, is :
R E IL
= ⋅(Eq. 3.124)
where E = modulus of elasticity of material in member I = moment of inertia for member L = length of member
The EI component of Equation 3.124 is known as the stiffness of thebeam.
Moment Distribution
[3.12.3, Part 3]
CONTINUOUS BEAMS
he sign convention usedto describe fixed end
moments is a source of po-tential confusion in momentdistribution.
T
Downloaded from Digital Engineering Library @ McGraw-Hill (www.digitalengineeringlibrary.com)Copyright © 2006 The McGraw-Hill Companies. All rights reserved.
Any use is subject to the Terms of Use as given at the website.
Design of Superstructure Elements
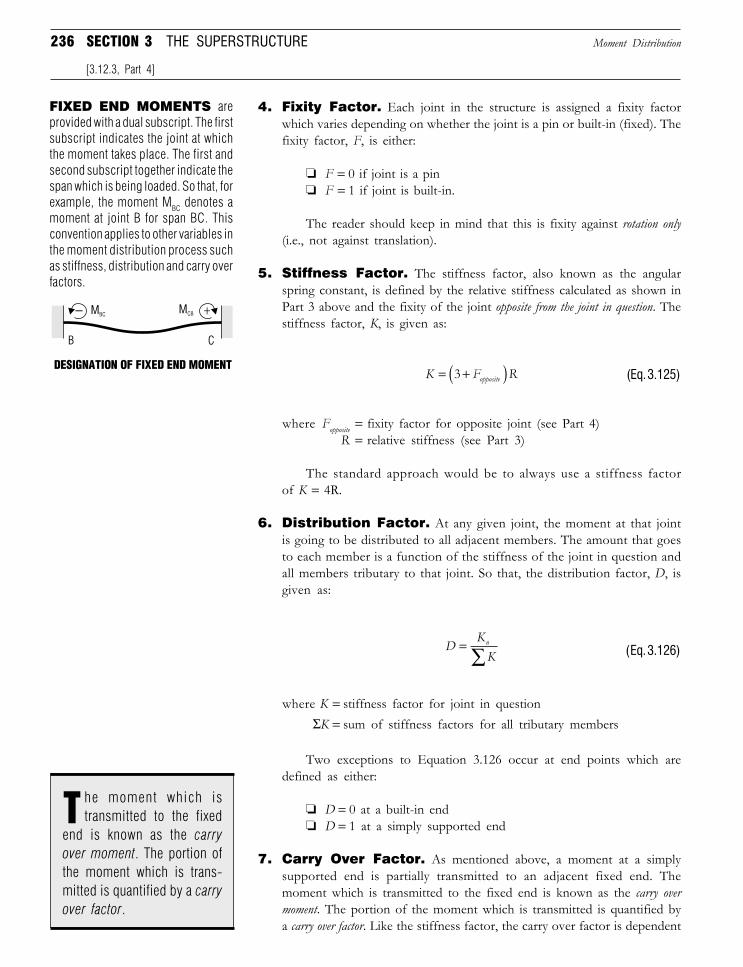
236 SECTION 3 THE SUPERSTRUCTURE
4. Fixity Factor. Each joint in the structure is assigned a fixity factorwhich varies depending on whether the joint is a pin or built-in (fixed). Thefixity factor, F, is either:
❏ F = 0 if joint is a pin❏ F = 1 if joint is built-in.
The reader should keep in mind that this is fixity against rotation only(i.e., not against translation).
5. Stiffness Factor. The stiffness factor, also known as the angularspring constant, is defined by the relative stiffness calculated as shown inPart 3 above and the fixity of the joint opposite from the joint in question. Thestiffness factor, K, is given as:
K F Ropposite= +( )3 (Eq. 3.125)
where Fopposite = fixity factor for opposite joint (see Part 4)R = relative stiffness (see Part 3)
The standard approach would be to always use a stiffness factorof K = 4R.
6. Distribution Factor. At any given joint, the moment at that jointis going to be distributed to all adjacent members. The amount that goesto each member is a function of the stiffness of the joint in question andall members tributary to that joint. So that, the distribution factor, D, isgiven as:
DKKn=
∑ (Eq. 3.126)
where K = stiffness factor for joint in questionΣK = sum of stiffness factors for all tributary members
Two exceptions to Equation 3.126 occur at end points which aredefined as either:
❏ D = 0 at a built-in end❏ D = 1 at a simply supported end
7. Carry Over Factor. As mentioned above, a moment at a simplysupported end is partially transmitted to an adjacent fixed end. Themoment which is transmitted to the fixed end is known as the carry overmoment. The portion of the moment which is transmitted is quantified bya carry over factor. Like the stiffness factor, the carry over factor is dependent
Moment Distribution
FIXED END MOMENTS areprovided with a dual subscript. The firstsubscript indicates the joint at whichthe moment takes place. The first andsecond subscript together indicate thespan which is being loaded. So that, forexample, the moment MBC denotes amoment at joint B for span BC. Thisconvention applies to other variables inthe moment distribution process suchas stiffness, distribution and carry overfactors.
[3.12.3, Part 4]
he moment which istransmitted to the fixedT
end is known as the carryover moment. The portion ofthe moment which is trans-mitted is quantified by a carryover factor.
Downloaded from Digital Engineering Library @ McGraw-Hill (www.digitalengineeringlibrary.com)Copyright © 2006 The McGraw-Hill Companies. All rights reserved.
Any use is subject to the Terms of Use as given at the website.
Design of Superstructure Elements
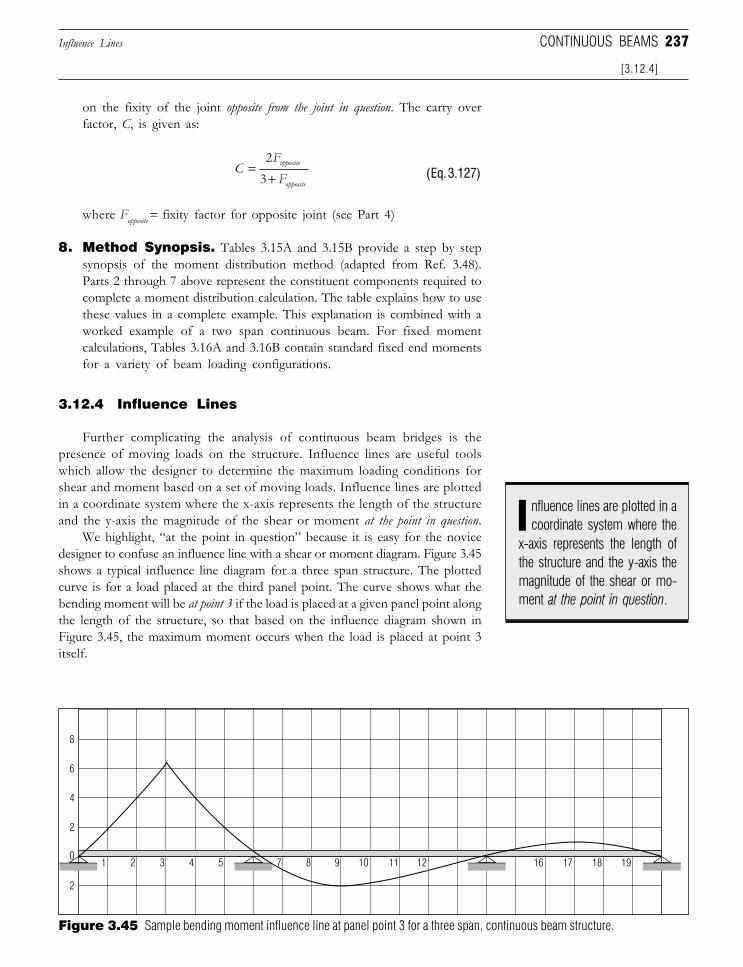
237
on the fixity of the joint opposite from the joint in question. The carry overfactor, C, is given as:
CFFopposite
opposite
=+2
3 (Eq. 3.127)
where Fopposite = fixity factor for opposite joint (see Part 4)
8. Method Synopsis. Tables 3.15A and 3.15B provide a step by stepsynopsis of the moment distribution method (adapted from Ref. 3.48).Parts 2 through 7 above represent the constituent components required tocomplete a moment distribution calculation. The table explains how to usethese values in a complete example. This explanation is combined with aworked example of a two span continuous beam. For fixed momentcalculations, Tables 3.16A and 3.16B contain standard fixed end momentsfor a variety of beam loading configurations.
3.12.4 Influence Lines
Further complicating the analysis of continuous beam bridges is thepresence of moving loads on the structure. Influence lines are useful toolswhich allow the designer to determine the maximum loading conditions forshear and moment based on a set of moving loads. Influence lines are plottedin a coordinate system where the x-axis represents the length of the structureand the y-axis the magnitude of the shear or moment at the point in question.
We highlight, “at the point in question” because it is easy for the novicedesigner to confuse an influence line with a shear or moment diagram. Figure 3.45shows a typical influence line diagram for a three span structure. The plottedcurve is for a load placed at the third panel point. The curve shows what thebending moment will be at point 3 if the load is placed at a given panel point alongthe length of the structure, so that based on the influence diagram shown inFigure 3.45, the maximum moment occurs when the load is placed at point 3itself.
Influence Lines
[3.12.4]
CONTINUOUS BEAMS
Figure 3.45 Sample bending moment influence line at panel point 3 for a three span, continuous beam structure.
01 2 3 4 5 7 8 9 10 11 12 16 17 18 19
2
2
4
6
8
nfluence lines are plotted in acoordinate system where theI
x-axis represents the length ofthe structure and the y-axis themagnitude of the shear or mo-ment at the point in question.
Downloaded from Digital Engineering Library @ McGraw-Hill (www.digitalengineeringlibrary.com)Copyright © 2006 The McGraw-Hill Companies. All rights reserved.
Any use is subject to the Terms of Use as given at the website.
Design of Superstructure Elements
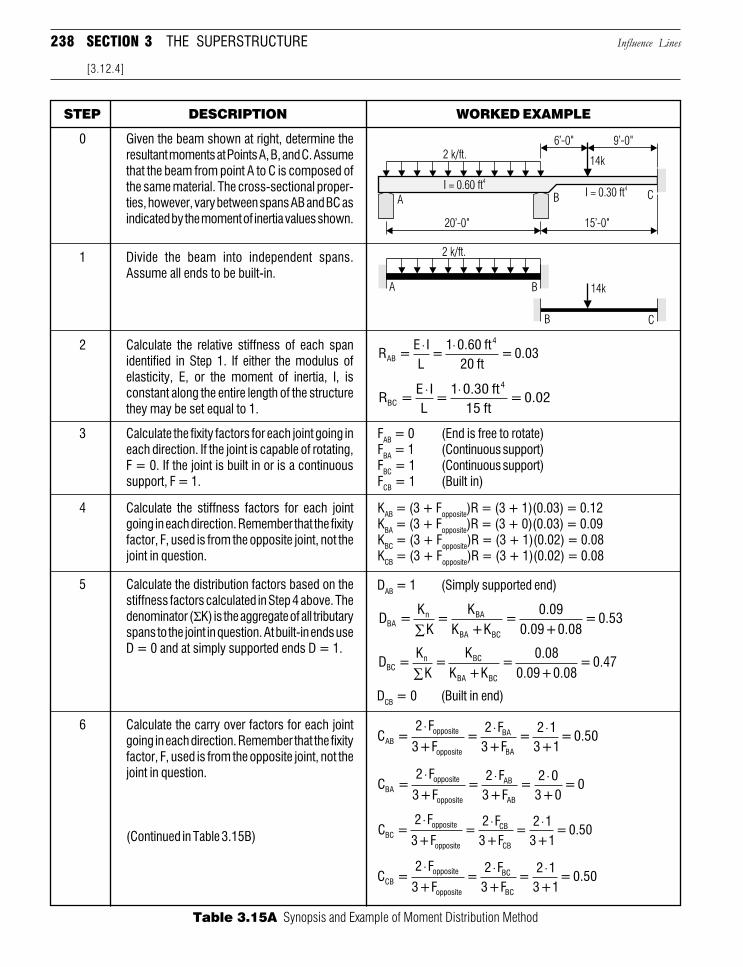
238 SECTION 3 THE SUPERSTRUCTURE Influence Lines
[3.12.4]
Table 3.15A Synopsis and Example of Moment Distribution Method
WORKED EXAMPLESTEP DESCRIPTION
1 Divide the beam into independent spans.Assume all ends to be built-in.
0 Given the beam shown at right, determine theresultant moments at Points A, B, and C. Assumethat the beam from point A to C is composed ofthe same material. The cross-sectional proper-ties, however, vary between spans AB and BC asindicated by the moment of inertia values shown.
2 Calculate the relative stiffness of each spanidentified in Step 1. If either the modulus ofelasticity, E, or the moment of inertia, I, isconstant along the entire length of the structurethey may be set equal to 1.
3 Calculate the fixity factors for each joint going ineach direction. If the joint is capable of rotating,F = 0. If the joint is built in or is a continuoussupport, F = 1.
FAB = 0 (End is free to rotate)FBA = 1 (Continuous support)FBC = 1 (Continuous support)FCB = 1 (Built in)
4 Calculate the stiffness factors for each jointgoing in each direction. Remember that the fixityfactor, F, used is from the opposite joint, not thejoint in question.
KAB = (3 + Fopposite)R = (3 + 1)(0.03) = 0.12KBA = (3 + Fopposite)R = (3 + 0)(0.03) = 0.09KBC = (3 + Fopposite)R = (3 + 1)(0.02) = 0.08KCB = (3 + Fopposite)R = (3 + 1)(0.02) = 0.08
5 Calculate the distribution factors based on thestiffness factors calculated in Step 4 above. Thedenominator (ΣK) is the aggregate of all tributaryspans to the joint in question. At built-in ends useD = 0 and at simply supported ends D = 1.
6 Calculate the carry over factors for each jointgoing in each direction. Remember that the fixityfactor, F, used is from the opposite joint, not thejoint in question.
(Continued in Table 3.15B)
DAB = 1 (Simply supported end)
DCB = 0 (Built in end)
R =E IL
=1 0.60 ft
20 ft=0.03AB
4⋅ ⋅
R =E IL
=1 0.30 ft
15 ft=0.02BC
4⋅ ⋅
D =K
K=
KK +K
=0.09
0.09+0.08=0.53BA
n BA
BA BC∑
D =K
K=
KK +K
=0.08
0.09+0.08=0.47BC
n BC
BA BC∑
C =2 F
3+F=
2 F3+F
=2 1
3+1=0.50AB
opposite
opposite
BA
BA
⋅ ⋅ ⋅
C =2 F
3+F=
2 F3+F
=2 0
3+0=0BA
opposite
opposite
AB
AB
⋅ ⋅ ⋅
C =2 F
3+F=
2 F3+F
=2 1
3+1=0.50BC
opposite
opposite
CB
CB
⋅ ⋅ ⋅
C =2 F
3+F=
2 F3+F
=2 1
3+1=0.50CB
opposite
opposite
BC
BC
⋅ ⋅ ⋅
Downloaded from Digital Engineering Library @ McGraw-Hill (www.digitalengineeringlibrary.com)Copyright © 2006 The McGraw-Hill Companies. All rights reserved.
Any use is subject to the Terms of Use as given at the website.
Design of Superstructure Elements
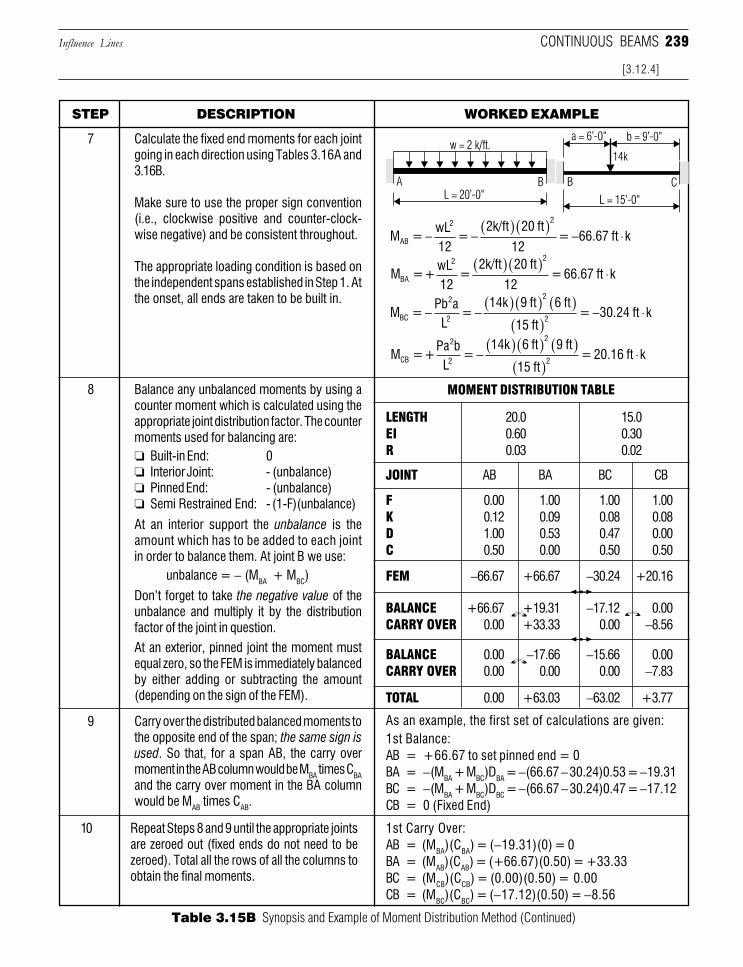
239Influence Lines
[3.12.4]
CONTINUOUS BEAMS
Table 3.15B Synopsis and Example of Moment Distribution Method (Continued)
WORKED EXAMPLESTEP DESCRIPTION
7 Calculate the fixed end moments for each jointgoing in each direction using Tables 3.16A and3.16B.
Make sure to use the proper sign convention(i.e., clockwise positive and counter-clock-wise negative) and be consistent throughout.
The appropriate loading condition is based onthe independent spans established in Step 1. Atthe onset, all ends are taken to be built in.
8 Balance any unbalanced moments by using acounter moment which is calculated using theappropriate joint distribution factor. The countermoments used for balancing are:❏ Built-in End: 0❏ Interior Joint: - (unbalance)❏ Pinned End: - (unbalance)❏ Semi Restrained End: - (1-F)(unbalance)
At an interior support the unbalance is theamount which has to be added to each jointin order to balance them. At joint B we use:
Don’t forget to take the negative value of theunbalance and multiply it by the distributionfactor of the joint in question.
unbalance = − (MBA + MBC)
At an exterior, pinned joint the moment mustequal zero, so the FEM is immediately balancedby either adding or subtracting the amount(depending on the sign of the FEM).
10 Repeat Steps 8 and 9 until the appropriate jointsare zeroed out (fixed ends do not need to bezeroed). Total all the rows of all the columns toobtain the final moments.
9 Carry over the distributed balanced moments tothe opposite end of the span; the same sign isused. So that, for a span AB, the carry overmoment in the AB column would be MBA times CBAand the carry over moment in the BA columnwould be MAB times CAB.
MOMENT DISTRIBUTION TABLE
TOTAL 0.00 +63.03 −63.02 +3.77
BALANCE 0.00 −17.66 −15.66 0.00CARRY OVER 0.00 0.00 0.00 −7.83
BALANCE +66.67 +19.31 −17.12 0.00CARRY OVER 0.00 +33.33 0.00 −8.56
FEM −66.67 +66.67 −30.24 +20.16
F 0.00 1.00 1.00 1.00K 0.12 0.09 0.08 0.08D 1.00 0.53 0.47 0.00C 0.50 0.00 0.50 0.50
JOINT AB BA BC CB
LENGTH 20.0 15.0EI 0.60 0.30R 0.03 0.02
As an example, the first set of calculations are given:
1st Carry Over:AB = (MBA)(CBA) = (−19.31)(0) = 0BA = (MAB)(CAB) = (+66.67)(0.50) = +33.33BC = (MCB)(CCB) = (0.00)(0.50) = 0.00CB = (MBC)(CBC) = (−17.12)(0.50) = −8.56
1st Balance:AB = +66.67 to set pinned end = 0BA = −(MBA + MBC)DBA = −(66.67 − 30.24)0.53 = −19.31BC = −(MBA + MBC)DBC = −(66.67 − 30.24)0.47 = −17.12CB = 0 (Fixed End)
M =wL12
=2k/ft 20 ft
12= 66.67 ft kAB
2 2
− − −( )( )
⋅
M =+wL12
=2k/ft 20 ft
12=66.67 ft kBA
2 2( )( )⋅
M =Pb a
L=
14k 9 ft 6 ft
15 ft= 30.24 ft kBC
2
2
2
2− − − ⋅( )( ) ( )
( )
M =+Pa b
L=
14k 6 ft 9 ft
15 ft= 20.16 ft kCB
2
2
2
2− ⋅( )( ) ( )
( )
Downloaded from Digital Engineering Library @ McGraw-Hill (www.digitalengineeringlibrary.com)Copyright © 2006 The McGraw-Hill Companies. All rights reserved.
Any use is subject to the Terms of Use as given at the website.
Design of Superstructure Elements
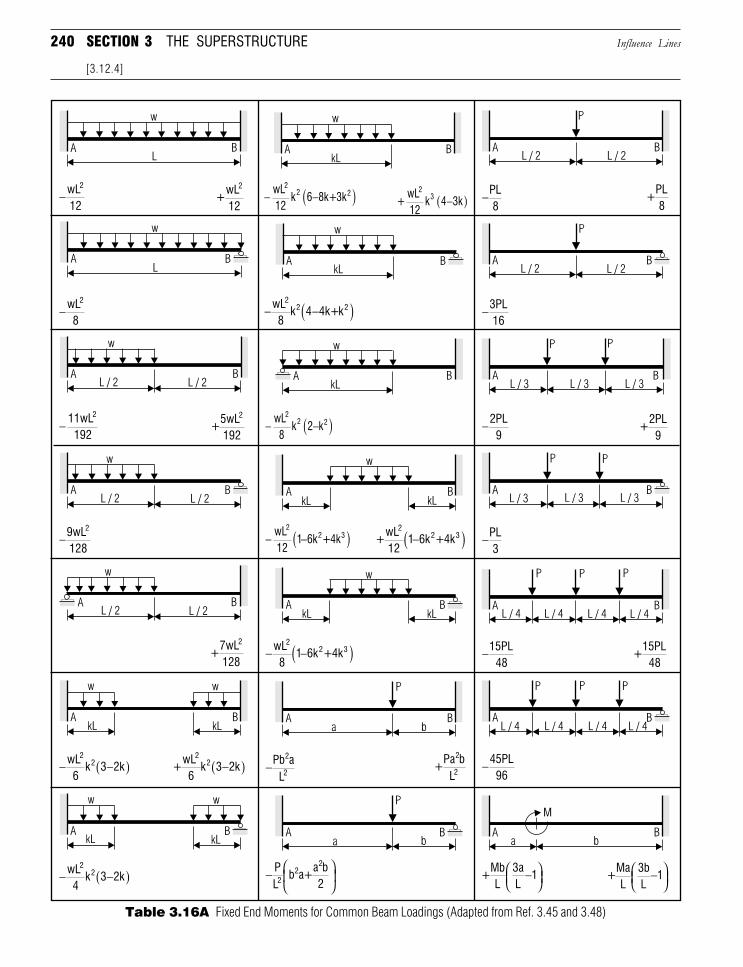
240 SECTION 3 THE SUPERSTRUCTURE Influence Lines
[3.12.4]
Table 3.16A Fixed End Moments for Common Beam Loadings (Adapted from Ref. 3.45 and 3.48)
−wL12
2
+wL12
2
− −( )wL12
k 6 8k+3k2
2 2+
wL12
k 4 3k2
3 −( ) −PL8
+PL8
−wL8
2
− −( )wL8
k 4 4k+k2
2 2 −3PL16
− 11wL192
2
+5wL192
2
− −( )wL8
k 2 k2
2 2 −2PL9
+2PL
9
−9wL128
2
− −( )wL12
1 6k +4k2
2 3 +wL12
1 6k +4k2
2 3−( ) −PL3
+7wL128
2
− −( )wL8
1 6k +4k2
2 3 −15PL48
+15PL
48
− −( )wL6
k 3 2k2
2 +wL6
k 3 2k2
2 −( ) −Pb aL
2
2+
Pa bL
2
2 −45PL96
− −( )wL4
k 3 2k2
2 −
PL
b a+a b22
22
+MbL
3aL
1−
+MaL
3bL
1−
Downloaded from Digital Engineering Library @ McGraw-Hill (www.digitalengineeringlibrary.com)Copyright © 2006 The McGraw-Hill Companies. All rights reserved.
Any use is subject to the Terms of Use as given at the website.
Design of Superstructure Elements
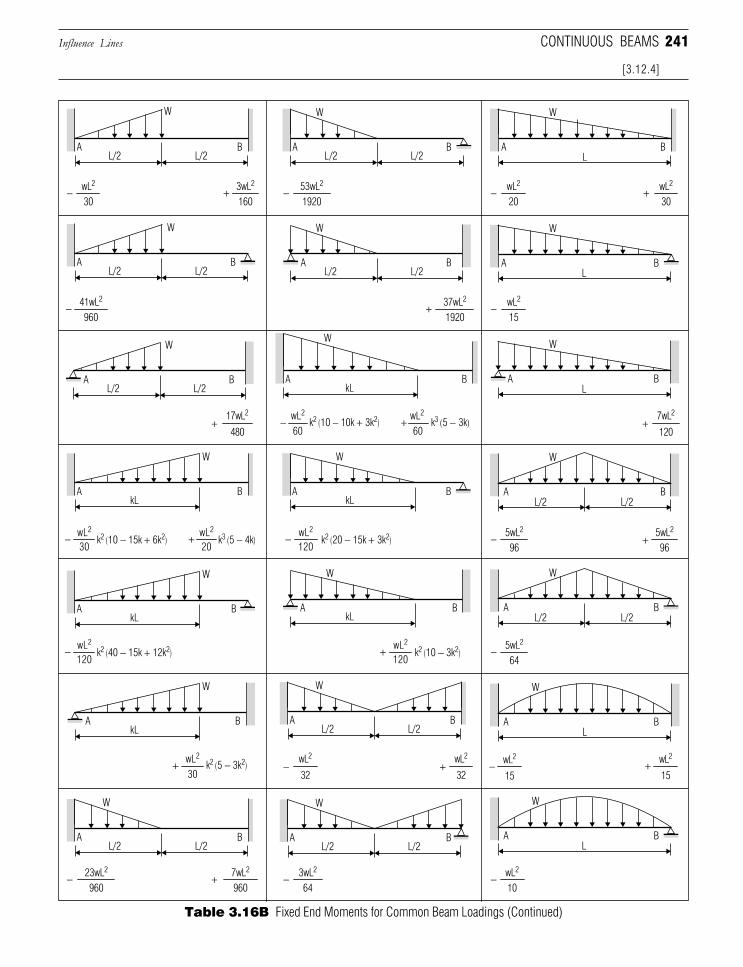
241Influence Lines
[3.12.4]
CONTINUOUS BEAMS
30
wL2
−20
wL2
+
k2 (10 − 10k + 3k2)60
wL2
− k3 (5 − 3k)60
wL2
+
+
+ wL2
30
+7wL2
120
+
+
− wL2
20
− wL2
15
− 5wL2
96
5wL2
96
− 5wL2
64
−
− wL2
10
− 53wL2
1920+ 3wL2
160
+ 37wL2
1920
+17wL2
480
120
wL2
−
120
wL2
+
−wL2
32
wL2
15
wL2
15
wL2
3230
wL2
+
− 3wL2
64+ 7wL2
960
− wL2
30
− 41wL2
960
− 23wL2
960
k2 (10 − 15k + 6k2) k2 (20 − 15k + 3k2)k3 (5 − 4k)
120
wL2
− k2 (40 − 15k + 12k2)
k2 (5 − 3k2)
k2 (10 − 3k2)
A
W
BL/2 L/2
A
W
BL/2 L/2
A
W
BL/2 L/2
A
W
BL/2 L/2
A
W
BkL
A
W
BkL
A
W
BkL
A
W
BkL
A
W
BL/2 L/2
A
W
BL/2 L/2
A
W
BL
A
W
BL
A
W
BL/2 L/2
A
W
BL/2 L/2
A
W
BkL
A
W
BkL
A
W
BL
A
W
BL/2 L/2
A
W
BL/2 L/2
A BL
A
W
W
BL
Table 3.16B Fixed End Moments for Common Beam Loadings (Continued)
Downloaded from Digital Engineering Library @ McGraw-Hill (www.digitalengineeringlibrary.com)Copyright © 2006 The McGraw-Hill Companies. All rights reserved.
Any use is subject to the Terms of Use as given at the website.
Design of Superstructure Elements
242 SECTION 3 THE SUPERSTRUCTURE
1. General Moment Support Equation. The first step is todevelop a general equation which describes the internal moments atsupport points based on a load at any point on the structure. Thisequation is developed using the moment distribution approach describedin Section 3.12.3.
An assumed fixed end moment is placed at the left side of the firstinterior support (i.e., MBA = 100 ft-k). All other joints are set free to rotate(i.e., Mmn = 0 where mn denotes a support location). The momentdistribution method of balancing and carrying over is conducted until thesystem reaches equilibrium. At this time all supports are totaled to yield thefirst set of moments which will be used as coefficients in the resultantmoment support equation.
This process is repeated with a unit moment placed on the other sideof the first interior support (i.e., MBC = 100 ft-k) and all other supports setto zero. Upon completing this step, all information necessary for the firstsupport is available. Moments at subsequent supports are calculated in asimilar fashion.
If there is symmetry present (i.e., two equal end spans, four equalspans, etc.), only the supports before the line of symmetry need to becalculated. In Design Example 3.4, for a three span structure comprisingthree equal spans, only the two sides of the first interior support arerequired to be solved because of symmetry (i.e., the equations at the secondsupport are the mirror image of the first support).
Determining the actual moment or shear from an influence diagram variesdepending on the type of load present. If the load is a concentrated load, theordinate value can be used directly. If the load is a uniform distributed load, thearea under the curve is used.
Influence diagrams can be developed using a variety of methods. Theinfluence lines can be developed using graphical methods, using the method ofvirtual displacement, or even moment distribution. The most tedious aspect ofthis process is that influence lines have to be developed at individual pointsalong each span.
Probably the most common way of obtaining an influence line is throughthe use of predefined tables. These tables offer influence line coordinate datafor a variety of multispan continuous beam structures. The tables are brokendown by varying ratios of span lengths. An example of this would be a three spanstructure where the end spans are taken as length L and the center span witha length of 2L. These tables eliminate a great deal of tedious hand calculations,provided the span ratios match up with those provided in the tables. Generallythe ordinates are provided at tenth point increments along the length ofeach span.
For the purposes of this discussion, we will describe the procedure fordeveloping influence lines for bending moment using the moment distributionmethod. This method is essentially a three step process. The following, alongwith Design Example 3.4, illustrate this approach which can be applied to anycontinuous beam.
Influence Lines
[3.12.4]
he most tedious aspect ofthis process is that influ-T
ence lines have to be devel-oped at individual points alongeach span.
f there is symmetry present(i.e., two equal end spans,
four equal spans, etc.) onlythe supports before the line ofsymmetry need to be calculated.
I
Downloaded from Digital Engineering Library @ McGraw-Hill (www.digitalengineeringlibrary.com)Copyright © 2006 The McGraw-Hill Companies. All rights reserved.
Any use is subject to the Terms of Use as given at the website.
Design of Superstructure Elements
243Influence Lines
The general form of the moment support equation for a unit loadplaced in the first span (AB) is presented below as:
M M M M MBA ABunit
ABFEM
BAunit
BAFEM= ⋅( ) + ⋅( ) (Eq. 3.128)
where MBA = internal support moment at left side of first supportMBA
FEM = moment due to unit moment found using momentdistribution
MBAFEM = fixed end moment calculated by placing a unit load
P = 1 at a point on a span
A similar equation is prepared for the right side of the first interiorsupport, and both sides of all subsequent supports. The unit moments usedin Equation 3.128 are those found by placing the 100 ft-k unit on the leftside of the first interior support. In the equation for the internal momentat the right side of the first support (MBC) the unit moments used would bethose resulting from the 100 ft-k moment placed on the right side of thesupport (and all other supports set equal to zero). This convention isrepeated for all subsequent supports.
2. Unit Loads. Once the support moment equations have been estab-lished, the next step is to develop the influence ordinates at all of thesupport points. This is done by placing a unit load at tenth points alongeach span. The resulting fixed end moments are then computed, asbefore, using Table 3.16A (for a concentrated load). Each fixed endmoment is multiplied by the appropriate unit moment as described inEquation 3.128.
In building a table of influence ordinates, this will result in a columnof ordinates for each support. Table 3.17A illustrates what the influenceordinates table will look like at this stage. For a load placed at any tenthpoint, we now have influence data at all support points. As can be seen fromthe table, however, the ordinates at points within each span for a given unitload still need to be calculated.
3. Influence Data at Intermediate Points. In order to completethe influence data at intermediate points, the designer must:
❏ Take each span as a simple beam and determine the bendingmoment at tenth points and then
❏ Proportion the negative moment (determined in Part 2 above)throughout the span and combine with the simple beam bendingmoment.
We will take the three span continuous beam described in DesignExample 3.4 and Table 3.17A as an example. A unit load of 1 is placed
[3.12.4, Part 3]
CONTINUOUS BEAMS
nce the support momentequations have been es-
tablished, the next step is todevelop the influence ordinatesat all the support points.
O
Downloaded from Digital Engineering Library @ McGraw-Hill (www.digitalengineeringlibrary.com)Copyright © 2006 The McGraw-Hill Companies. All rights reserved.
Any use is subject to the Terms of Use as given at the website.
Design of Superstructure Elements
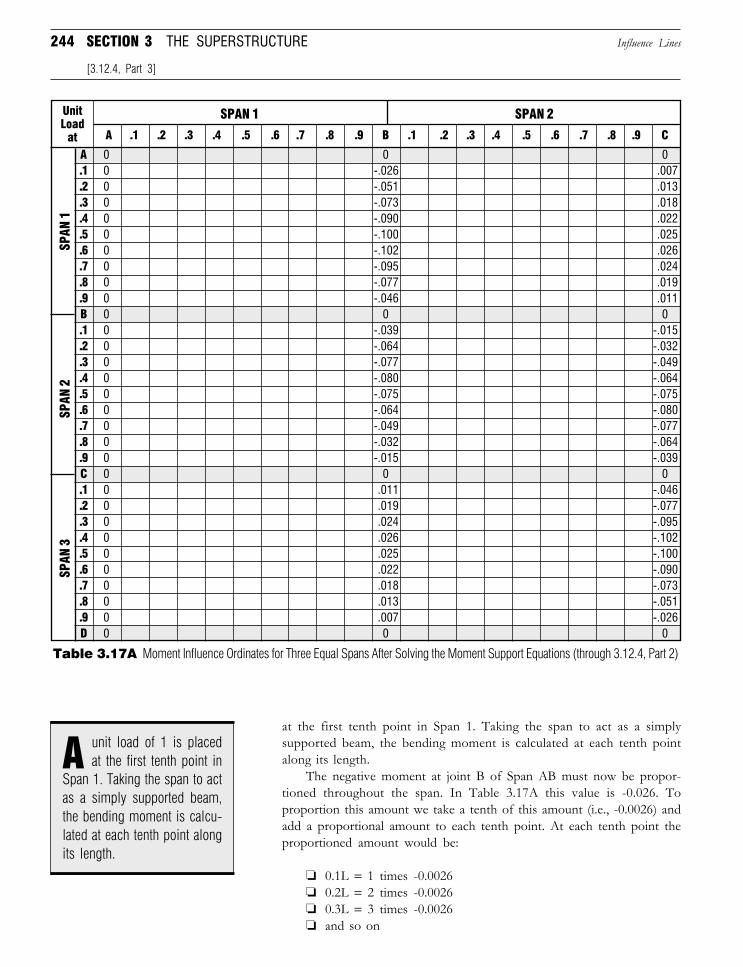
244 SECTION 3 THE SUPERSTRUCTURE
at the first tenth point in Span 1. Taking the span to act as a simplysupported beam, the bending moment is calculated at each tenth pointalong its length.
The negative moment at joint B of Span AB must now be propor-tioned throughout the span. In Table 3.17A this value is -0.026. Toproportion this amount we take a tenth of this amount (i.e., -0.0026) andadd a proportional amount to each tenth point. At each tenth point theproportioned amount would be:
❏ 0.1L = 1 times -0.0026❏ 0.2L = 2 times -0.0026❏ 0.3L = 3 times -0.0026❏ and so on
Influence Lines
[3.12.4, Part 3]
0 0 00 -.026 .0070 -.051 .0130 -.073 .0180 -.090 .0220 -.100 .0250 -.102 .0260 -.095 .0240 -.077 .0190 -.046 .0110 0 00 -.039 -.0150 -.064 -.0320 -.077 -.0490 -.080 -.0640 -.075 -.0750 -.064 -.0800 -.049 -.0770 -.032 -.0640 -.015 -.0390 0 00 .011 -.0460 .019 -.0770 .024 -.0950 .026 -.1020 .025 -.1000 .022 -.0900 .018 -.0730 .013 -.0510 .007 -.0260 0 0
A.1.2.3.4.5.6.7.8.9B.1.2.3.4.5.6.7.8.9C.1.2.3.4.5.6.7.8.9D
A .1 .2 .3 .4 .5 .6 .7 .8 .9 B .1 .2 .3 .4 .5 .6 .7 .8 .9 C
UnitLoad
at
SPAN 2SPAN 1
SPAN
1SP
AN 2
SPAN
3
Table 3.17A Moment Influence Ordinates for Three Equal Spans After Solving the Moment Support Equations (through 3.12.4, Part 2)
unit load of 1 is placedat the first tenth point in
Span 1. Taking the span to actas a simply supported beam,the bending moment is calcu-lated at each tenth point alongits length.
A
Downloaded from Digital Engineering Library @ McGraw-Hill (www.digitalengineeringlibrary.com)Copyright © 2006 The McGraw-Hill Companies. All rights reserved.
Any use is subject to the Terms of Use as given at the website.
Design of Superstructure Elements
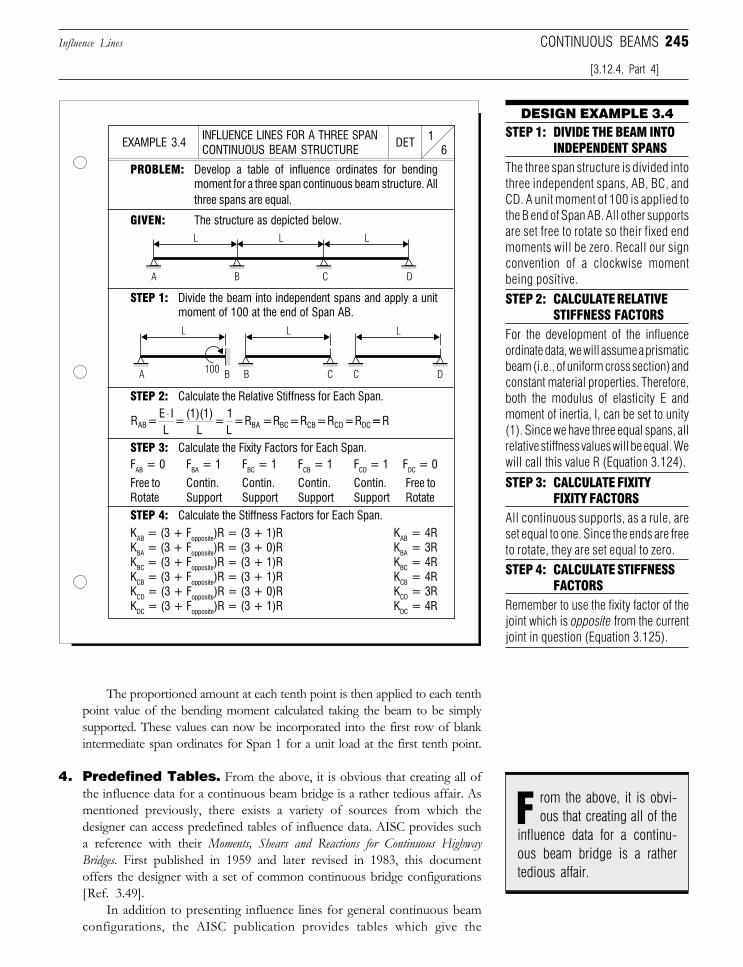
245
DESIGN EXAMPLE 3.4STEP 1: DIVIDE THE BEAM INTO
INDEPENDENT SPANSThe three span structure is divided intothree independent spans, AB, BC, andCD. A unit moment of 100 is applied tothe B end of Span AB. All other supportsare set free to rotate so their fixed endmoments will be zero. Recall our signconvention of a clockwise momentbeing positive.
The proportioned amount at each tenth point is then applied to each tenthpoint value of the bending moment calculated taking the beam to be simplysupported. These values can now be incorporated into the first row of blankintermediate span ordinates for Span 1 for a unit load at the first tenth point.
4. Predefined Tables. From the above, it is obvious that creating all ofthe influence data for a continuous beam bridge is a rather tedious affair. Asmentioned previously, there exists a variety of sources from which thedesigner can access predefined tables of influence data. AISC provides sucha reference with their Moments, Shears and Reactions for Continuous HighwayBridges. First published in 1959 and later revised in 1983, this documentoffers the designer with a set of common continuous bridge configurations[Ref. 3.49].
In addition to presenting influence lines for general continuous beamconfigurations, the AISC publication provides tables which give the
For the development of the influenceordinate data, we will assume a prismaticbeam (i.e., of uniform cross section) andconstant material properties. Therefore,both the modulus of elasticity E andmoment of inertia, I, can be set to unity(1). Since we have three equal spans, allrelative stiffness values will be equal. Wewill call this value R (Equation 3.124).
STEP 2: CALCULATE RELATIVESTIFFNESS FACTORS
All continuous supports, as a rule, areset equal to one. Since the ends are freeto rotate, they are set equal to zero.
STEP 3: CALCULATE FIXITYFIXITY FACTORS
Remember to use the fixity factor of thejoint which is opposite from the currentjoint in question (Equation 3.125).
STEP 4: CALCULATE STIFFNESSFACTORS
Influence Lines
[3.12.4, Part 4]
CONTINUOUS BEAMS
INFLUENCE LINES FOR A THREE SPANCONTINUOUS BEAM STRUCTURE 6
1DETEXAMPLE 3.4
PROBLEM: Develop a table of influence ordinates for bendingmoment for a three span continuous beam structure. Allthree spans are equal.
GIVEN: The structure as depicted below.
STEP 1: Divide the beam into independent spans and apply a unitmoment of 100 at the end of Span AB.
STEP 2: Calculate the Relative Stiffness for Each Span.
STEP 3: Calculate the Fixity Factors for Each Span.FAB = 0 FBA = 1 FBC = 1 FCB = 1 FCD = 1 FDC = 0
Free to Contin. Contin. Contin. Contin. Free toRotate Support Support Support Support RotateSTEP 4: Calculate the Stiffness Factors for Each Span.KAB = (3 + Fopposite)R = (3 + 1)R KAB = 4RKBA = (3 + Fopposite)R = (3 + 0)R KBA = 3RKBC = (3 + Fopposite)R = (3 + 1)R KBC = 4RKCB = (3 + Fopposite)R = (3 + 1)R KCB = 4RKCD = (3 + Fopposite)R = (3 + 0)R KCD = 3RKDC = (3 + Fopposite)R = (3 + 1)R KDC = 4R
A
L L L
B C D
L L
A BB100
C C D
L
R = E IL
= (1)(1)
L =
1L
= R = R = R = R = RAB BA BC CB CD DC ⋅
== R
rom the above, it is obvi-ous that creating all of the
influence data for a continu-ous beam bridge is a rathertedious affair.
F
Downloaded from Digital Engineering Library @ McGraw-Hill (www.digitalengineeringlibrary.com)Copyright © 2006 The McGraw-Hill Companies. All rights reserved.
Any use is subject to the Terms of Use as given at the website.
Design of Superstructure Elements
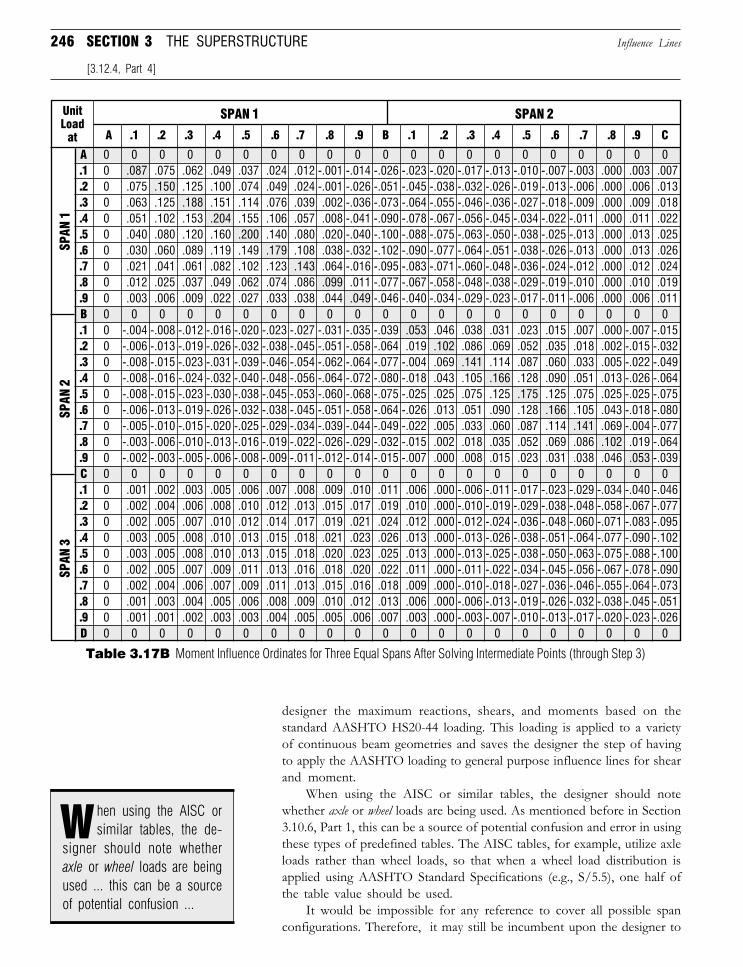
246 SECTION 3 THE SUPERSTRUCTURE
designer the maximum reactions, shears, and moments based on thestandard AASHTO HS20-44 loading. This loading is applied to a varietyof continuous beam geometries and saves the designer the step of havingto apply the AASHTO loading to general purpose influence lines for shearand moment.
When using the AISC or similar tables, the designer should notewhether axle or wheel loads are being used. As mentioned before in Section3.10.6, Part 1, this can be a source of potential confusion and error in usingthese types of predefined tables. The AISC tables, for example, utilize axleloads rather than wheel loads, so that when a wheel load distribution isapplied using AASHTO Standard Specifications (e.g., S/5.5), one half ofthe table value should be used.
It would be impossible for any reference to cover all possible spanconfigurations. Therefore, it may still be incumbent upon the designer to
Influence Lines
[3.12.4, Part 4]
0 0 0 0 0 0 0 0 0 0 0 0 0 0 0 0 0 0 0 0 00 .087 .075 .062 .049 .037 .024 .012 -.001 -.014 -.026 -.023 -.020 -.017 -.013 -.010 -.007 -.003 .000 .003 .0070 .075 .150 .125 .100 .074 .049 .024 -.001 -.026 -.051 -.045 -.038 -.032 -.026 -.019 -.013 -.006 .000 .006 .0130 .063 .125 .188 .151 .114 .076 .039 .002 -.036 -.073 -.064 -.055 -.046 -.036 -.027 -.018 -.009 .000 .009 .0180 .051 .102 .153 .204 .155 .106 .057 .008 -.041 -.090 -.078 -.067 -.056 -.045 -.034 -.022 -.011 .000 .011 .0220 .040 .080 .120 .160 .200 .140 .080 .020 -.040 -.100 -.088 -.075 -.063 -.050 -.038 -.025 -.013 .000 .013 .0250 .030 .060 .089 .119 .149 .179 .108 .038 -.032 -.102 -.090 -.077 -.064 -.051 -.038 -.026 -.013 .000 .013 .0260 .021 .041 .061 .082 .102 .123 .143 .064 -.016 -.095 -.083 -.071 -.060 -.048 -.036 -.024 -.012 .000 .012 .0240 .012 .025 .037 .049 .062 .074 .086 .099 .011 -.077 -.067 -.058 -.048 -.038 -.029 -.019 -.010 .000 .010 .0190 .003 .006 .009 .022 .027 .033 .038 .044 .049 -.046 -.040 -.034 -.029 -.023 -.017 -.011 -.006 .000 .006 .0110 0 0 0 0 0 0 0 0 0 0 0 0 0 0 0 0 0 0 0 00 -.004 -.008 -.012 -.016 -.020 -.023 -.027 -.031 -.035 -.039 .053 .046 .038 .031 .023 .015 .007 .000 -.007 -.0150 -.006 -.013 -.019 -.026 -.032 -.038 -.045 -.051 -.058 -.064 .019 .102 .086 .069 .052 .035 .018 .002 -.015 -.0320 -.008 -.015 -.023 -.031 -.039 -.046 -.054 -.062 -.064 -.077 -.004 .069 .141 .114 .087 .060 .033 .005 -.022 -.0490 -.008 -.016 -.024 -.032 -.040 -.048 -.056 -.064 -.072 -.080 -.018 .043 .105 .166 .128 .090 .051 .013 -.026 -.0640 -.008 -.015 -.023 -.030 -.038 -.045 -.053 -.060 -.068 -.075 -.025 .025 .075 .125 .175 .125 .075 .025 -.025 -.0750 -.006 -.013 -.019 -.026 -.032 -.038 -.045 -.051 -.058 -.064 -.026 .013 .051 .090 .128 .166 .105 .043 -.018 -.0800 -.005 -.010 -.015 -.020 -.025 -.029 -.034 -.039 -.044 -.049 -.022 .005 .033 .060 .087 .114 .141 .069 -.004 -.0770 -.003 -.006 -.010 -.013 -.016 -.019 -.022 -.026 -.029 -.032 -.015 .002 .018 .035 .052 .069 .086 .102 .019 -.0640 -.002 -.003 -.005 -.006 -.008 -.009 -.011 -.012 -.014 -.015 -.007 .000 .008 .015 .023 .031 .038 .046 .053 -.0390 0 0 0 0 0 0 0 0 0 0 0 0 0 0 0 0 0 0 0 00 .001 .002 .003 .005 .006 .007 .008 .009 .010 .011 .006 .000 -.006 -.011 -.017 -.023 -.029 -.034 -.040 -.0460 .002 .004 .006 .008 .010 .012 .013 .015 .017 .019 .010 .000 -.010 -.019 -.029 -.038 -.048 -.058 -.067 -.0770 .002 .005 .007 .010 .012 .014 .017 .019 .021 .024 .012 .000 -.012 -.024 -.036 -.048 -.060 -.071 -.083 -.0950 .003 .005 .008 .010 .013 .015 .018 .021 .023 .026 .013 .000 -.013 -.026 -.038 -.051 -.064 -.077 -.090 -.1020 .003 .005 .008 .010 .013 .015 .018 .020 .023 .025 .013 .000 -.013 -.025 -.038 -.050 -.063 -.075 -.088 -.1000 .002 .005 .007 .009 .011 .013 .016 .018 .020 .022 .011 .000 -.011 -.022 -.034 -.045 -.056 -.067 -.078 -.0900 .002 .004 .006 .007 .009 .011 .013 .015 .016 .018 .009 .000 -.010 -.018 -.027 -.036 -.046 -.055 -.064 -.0730 .001 .003 .004 .005 .006 .008 .009 .010 .012 .013 .006 .000 -.006 -.013 -.019 -.026 -.032 -.038 -.045 -.0510 .001 .001 .002 .003 .003 .004 .005 .005 .006 .007 .003 .000 -.003 -.007 -.010 -.013 -.017 -.020 -.023 -.0260 0 0 0 0 0 0 0 0 0 0 0 0 0 0 0 0 0 0 0 0
A.1.2.3.4.5.6.7.8.9B.1.2.3.4.5.6.7.8.9C.1.2.3.4.5.6.7.8.9D
A .1 .2 .3 .4 .5 .6 .7 .8 .9 B .1 .2 .3 .4 .5 .6 .7 .8 .9 C
UnitLoad
at
SPAN 2SPAN 1
SPAN
1SP
AN 2
SPAN
3
Table 3.17B Moment Influence Ordinates for Three Equal Spans After Solving Intermediate Points (through Step 3)
hen using the AISC orsimilar tables, the de-
signer should note whetheraxle or wheel loads are beingused ... this can be a sourceof potential confusion ...
W
Downloaded from Digital Engineering Library @ McGraw-Hill (www.digitalengineeringlibrary.com)Copyright © 2006 The McGraw-Hill Companies. All rights reserved.
Any use is subject to the Terms of Use as given at the website.
Design of Superstructure Elements
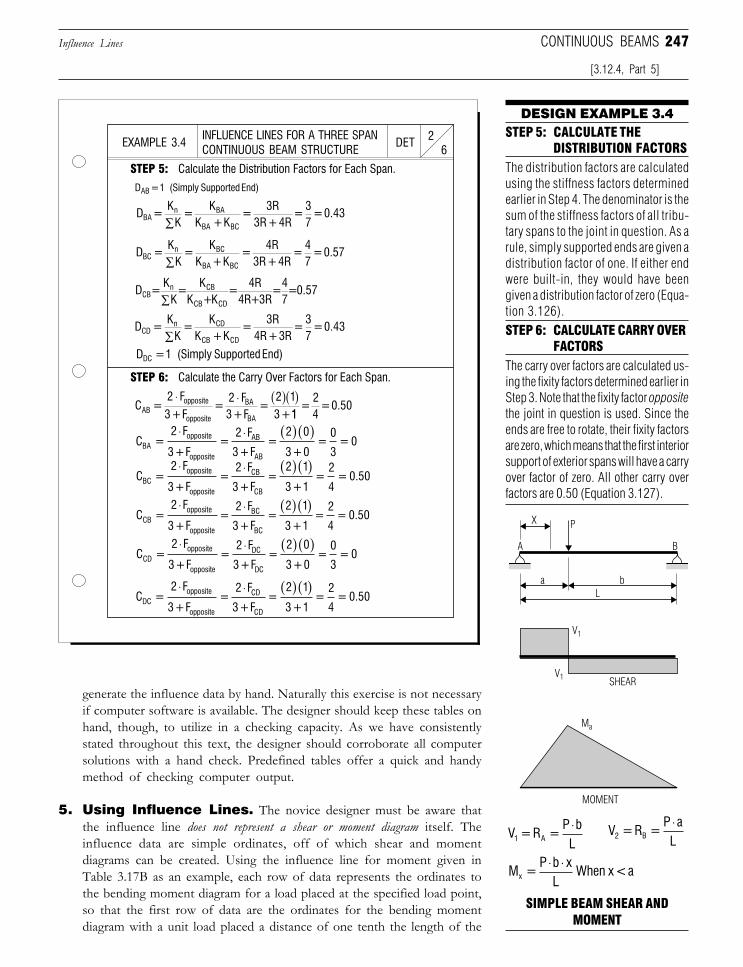
247
DESIGN EXAMPLE 3.4STEP 5: CALCULATE THE
DISTRIBUTION FACTORSThe distribution factors are calculatedusing the stiffness factors determinedearlier in Step 4. The denominator is thesum of the stiffness factors of all tribu-tary spans to the joint in question. As arule, simply supported ends are given adistribution factor of one. If either endwere built-in, they would have beengiven a distribution factor of zero (Equa-tion 3.126).
generate the influence data by hand. Naturally this exercise is not necessaryif computer software is available. The designer should keep these tables onhand, though, to utilize in a checking capacity. As we have consistentlystated throughout this text, the designer should corroborate all computersolutions with a hand check. Predefined tables offer a quick and handymethod of checking computer output.
5. Using Influence Lines. The novice designer must be aware thatthe influence line does not represent a shear or moment diagram itself. Theinfluence data are simple ordinates, off of which shear and momentdiagrams can be created. Using the influence line for moment given inTable 3.17B as an example, each row of data represents the ordinates tothe bending moment diagram for a load placed at the specified load point,so that the first row of data are the ordinates for the bending momentdiagram with a unit load placed a distance of one tenth the length of the
The carry over factors are calculated us-ing the fixity factors determined earlier inStep 3. Note that the fixity factor oppositethe joint in question is used. Since theends are free to rotate, their fixity factorsare zero, which means that the first interiorsupport of exterior spans will have a carryover factor of zero. All other carry overfactors are 0.50 (Equation 3.127).
STEP 6: CALCULATE CARRY OVERFACTORS
Influence Lines
[3.12.4, Part 5]
CONTINUOUS BEAMS
SIMPLE BEAM SHEAR ANDMOMENT
V =R =P bL1 A
⋅ V =R =P aL2 B
⋅
M =P b x
L When x < ax
⋅ ⋅
a b
L
V1
V1SHEAR
MOMENT
Ma
BA
PX
INFLUENCE LINES FOR A THREE SPANCONTINUOUS BEAM STRUCTURE 6
2DETEXAMPLE 3.4
STEP 5: Calculate the Distribution Factors for Each Span.
STEP 6: Calculate the Carry Over Factors for Each Span.
C =2 F
3+F=
2 F
3+F=
2 0
3+0=
0
3= 0BA
opposite
opposite
AB
AB
⋅ ⋅ ( )( )
C =2 F
3+F=
2 F
3+F=
2 1
3+1=
2
4= 0.50BC
opposite
opposite
CB
CB
⋅ ⋅ ( )( )
C =2 F
3+F=
2 F
3+F=
2 1
3+1=
2
4= 0.50CB
opposite
opposite
BC
BC
⋅ ⋅ ( )( )
C =2 F
3+F=
2 F
3+F=
2 0
3+0=
0
3= 0CD
opposite
opposite
DC
DC
⋅ ⋅ ( )( )
D = K
K =
KK + K
= 3R
3R + 4R =
37
= 0.43BA n BA
BA BC∑
D = 1 (Simply Supported End)AB
D = K
K =
KK + K
= 4R
3R + 4R =
47
= 0.57BCn BC
BA BC∑
D =K
K=
KK +K
=4R
4R+3R=
47
=0.57CBn CB
CB CD∑
C = 2 F3 + F
= 2 F3 + F
= 2 13 + AB
opposite
opposite
BA
BA
⋅ ⋅ ( )( )11
= 24
= 0.50
D = K
K =
KK + K
= 3R
4R + 3R =
37
= 0.43CDn CD
CB CD∑D = 1 (Simply Supported End)DC
C =2 F
3+F=
2 F
3+F=
2 1
3+1=
2
4= 0.50DC
opposite
opposite
CD
CD
⋅ ⋅ ( )( )
Downloaded from Digital Engineering Library @ McGraw-Hill (www.digitalengineeringlibrary.com)Copyright © 2006 The McGraw-Hill Companies. All rights reserved.
Any use is subject to the Terms of Use as given at the website.
Design of Superstructure Elements
248 SECTION 3 THE SUPERSTRUCTURE
first span from support A. Because of symmetry, the vertical columns forthe third span of the structure are not provided in the table.
The shaded diagonal represents the maximum ordinates possible forany given unit load. If, for example, a unit load were placed at 0.3 of thefirst span, the maximum ordinate would be 0.188. These shaded values areordinates to the maximum positive moment envelope induced by a single,moving concentrated load.
The way a shear or moment diagram is developed from an influenceline varies depending on whether the beam is loaded with a concentratedload or a uniform distributed load. To determine the actual shear andmoment values from an influence line, the following rules must beobserved [Ref. 3.49]:
■ Reactions and Shears Due to Concentrated Load. To find the actualreaction or shear value due to a concentrated load, the ordinate ismultiplied by the value of the concentrated load.
■ Reactions and Shears Due to Uniform Load. To find the actualreaction or shear value due to a uniformly distributed load, the area underthe influence line is multiplied by the product of the distributed load (inunits of weight per unit length) and the length of the shorter span.
■ Moments Due to Concentrated Load. To find the actual bendingmoment value due to a concentrated load, the ordinate is multiplied by theproduct of the weight of the concentrated load and the length of the shorterspan.
■ Moments Due to Uniform Load. To find the actual bending momentvalue due to a uniformly distributed load, the area under the influence lineis multiplied by the product of the distributed load (in units of weight perunit length) and the square of the length of the shorter span.
The area taken, for a specific panel point, is defined by a column ofinfluence ordinates. In Table 3.17B, for example, the area would becomputed for the curve defined by the first column of ordinates (i.e.,0, .087, .075, .063 ... .002, .001, .001, 0). Many predefined tablesinclude the area under this curve for computing moments due to auniform load.
There are a variety of methods for calculating the area under acurve defined by set of points. The most basic approach would be toplot the curve and break it down into triangles and rectangles and thensum the areas of each part. Obviously, such an approach would provetedious for all but the most basic two span continuous structures.Another approach would be to use a spreadsheet program or math-ematics software package after entering the influence ordinates in tableform. Some handheld calculators even provide predefined programsfor computing the area under a curve defined by a set of points. If suchcomputer methods are unavailable, however, the following sectionoffers a hand calculation method which is relatively straightforwardand provides results quickly.
Influence Lines
[3.12.4, Part 5]
he way a shear or momentdiagram is developed from
an influence line varies depend-ing on whether the beam isloaded with a concentrated loador a uniform ... load.
T
ome handheld calculatorseven provide predefined
programs for computing thearea under a curve defined bya set of points.
S
Downloaded from Digital Engineering Library @ McGraw-Hill (www.digitalengineeringlibrary.com)Copyright © 2006 The McGraw-Hill Companies. All rights reserved.
Any use is subject to the Terms of Use as given at the website.
Design of Superstructure Elements
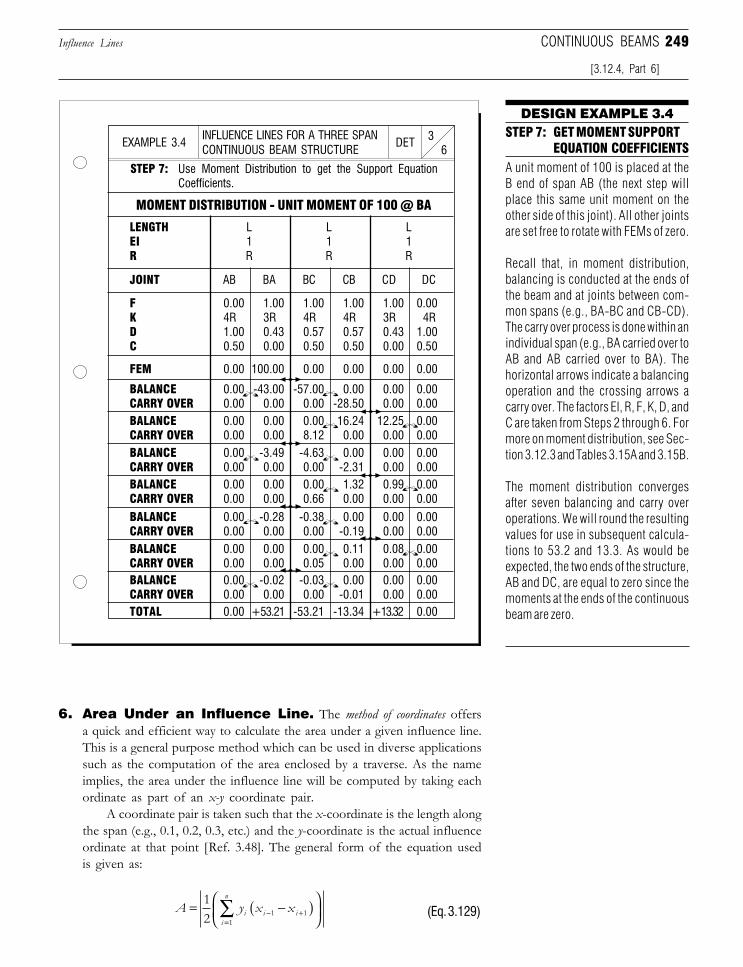
249
INFLUENCE LINES FOR A THREE SPANCONTINUOUS BEAM STRUCTURE 6
3DETEXAMPLE 3.4
DESIGN EXAMPLE 3.4STEP 7: GET MOMENT SUPPORT
EQUATION COEFFICIENTSA unit moment of 100 is placed at theB end of span AB (the next step willplace this same unit moment on theother side of this joint). All other jointsare set free to rotate with FEMs of zero.
Recall that, in moment distribution,balancing is conducted at the ends ofthe beam and at joints between com-mon spans (e.g., BA-BC and CB-CD).The carry over process is done within anindividual span (e.g., BA carried over toAB and AB carried over to BA). Thehorizontal arrows indicate a balancingoperation and the crossing arrows acarry over. The factors EI, R, F, K, D, andC are taken from Steps 2 through 6. Formore on moment distribution, see Sec-tion 3.12.3 and Tables 3.15A and 3.15B.
The moment distribution convergesafter seven balancing and carry overoperations. We will round the resultingvalues for use in subsequent calcula-tions to 53.2 and 13.3. As would beexpected, the two ends of the structure,AB and DC, are equal to zero since themoments at the ends of the continuousbeam are zero.
STEP 7: Use Moment Distribution to get the Support EquationCoefficients.
6. Area Under an Influence Line. The method of coordinates offersa quick and efficient way to calculate the area under a given influence line.This is a general purpose method which can be used in diverse applicationssuch as the computation of the area enclosed by a traverse. As the nameimplies, the area under the influence line will be computed by taking eachordinate as part of an x-y coordinate pair.
A coordinate pair is taken such that the x-coordinate is the length alongthe span (e.g., 0.1, 0.2, 0.3, etc.) and the y-coordinate is the actual influenceordinate at that point [Ref. 3.48]. The general form of the equation usedis given as:
A y x xi i ii
n
= −( )
− +
=∑1
2 1 11
(Eq. 3.129)
TOTAL 0.00 +53.21 -53.21 -13.34 +13.32 0.00
BALANCE 0.00 -0.02 -0.03 0.00 0.00 0.00CARRY OVER 0.00 0.00 0.00 -0.01 0.00 0.00
BALANCE 0.00 0.00 0.00 0.11 0.08 0.00CARRY OVER 0.00 0.00 0.05 0.00 0.00 0.00
BALANCE 0.00 -0.28 -0.38 0.00 0.00 0.00CARRY OVER 0.00 0.00 0.00 -0.19 0.00 0.00
BALANCE 0.00 0.00 0.00 1.32 0.99 0.00CARRY OVER 0.00 0.00 0.66 0.00 0.00 0.00
BALANCE 0.00 -3.49 -4.63 0.00 0.00 0.00CARRY OVER 0.00 0.00 0.00 -2.31 0.00 0.00
BALANCE 0.00 0.00 0.00 16.24 12.25 0.00CARRY OVER 0.00 0.00 8.12 0.00 0.00 0.00
BALANCE 0.00 -43.00 -57.00 0.00 0.00 0.00CARRY OVER 0.00 0.00 0.00 -28.50 0.00 0.00
FEM 0.00 100.00 0.00 0.00 0.00 0.00
F 0.00 1.00 1.00 1.00 1.00 0.00K 4R 3R 4R 4R 3R 4RD 1.00 0.43 0.57 0.57 0.43 1.00C 0.50 0.00 0.50 0.50 0.00 0.50
JOINT AB BA BC CB CD DC
LENGTH L L LEI 1 1 1R R R R
MOMENT DISTRIBUTION - UNIT MOMENT OF 100 @ BA
Influence Lines
[3.12.4, Part 6]
CONTINUOUS BEAMS
Downloaded from Digital Engineering Library @ McGraw-Hill (www.digitalengineeringlibrary.com)Copyright © 2006 The McGraw-Hill Companies. All rights reserved.
Any use is subject to the Terms of Use as given at the website.
Design of Superstructure Elements
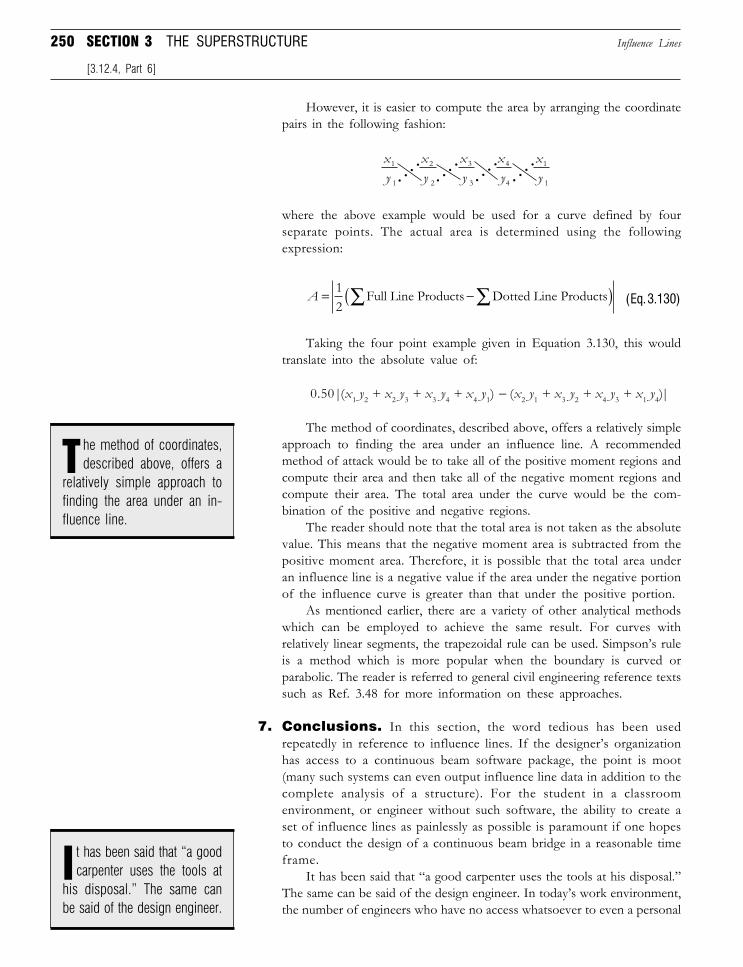
250 SECTION 3 THE SUPERSTRUCTURE Influence Lines
[3.12.4, Part 6]
However, it is easier to compute the area by arranging the coordinatepairs in the following fashion:
where the above example would be used for a curve defined by fourseparate points. The actual area is determined using the followingexpression:
A = −( )∑∑12
Full Line Products Dotted Line Products (Eq. 3.130)
Taking the four point example given in Equation 3.130, this wouldtranslate into the absolute value of:
0.50|(x1 y2 + x2 y3 + x3 y4 + x4 y1) − (x2 y1 + x3 y2 + x4 y3 + x1 y4)|
The method of coordinates, described above, offers a relatively simpleapproach to finding the area under an influence line. A recommendedmethod of attack would be to take all of the positive moment regions andcompute their area and then take all of the negative moment regions andcompute their area. The total area under the curve would be the com-bination of the positive and negative regions.
The reader should note that the total area is not taken as the absolutevalue. This means that the negative moment area is subtracted from thepositive moment area. Therefore, it is possible that the total area underan influence line is a negative value if the area under the negative portionof the influence curve is greater than that under the positive portion.
As mentioned earlier, there are a variety of other analytical methodswhich can be employed to achieve the same result. For curves withrelatively linear segments, the trapezoidal rule can be used. Simpson’s ruleis a method which is more popular when the boundary is curved orparabolic. The reader is referred to general civil engineering reference textssuch as Ref. 3.48 for more information on these approaches.
7. Conclusions. In this section, the word tedious has been usedrepeatedly in reference to influence lines. If the designer’s organizationhas access to a continuous beam software package, the point is moot(many such systems can even output influence line data in addition to thecomplete analysis of a structure). For the student in a classroomenvironment, or engineer without such software, the ability to create aset of influence lines as painlessly as possible is paramount if one hopesto conduct the design of a continuous beam bridge in a reasonable timeframe.
It has been said that “a good carpenter uses the tools at his disposal.”The same can be said of the design engineer. In today’s work environment,the number of engineers who have no access whatsoever to even a personal
he method of coordinates,described above, offers a
relatively simple approach tofinding the area under an in-fluence line.
T
t has been said that “a goodcarpenter uses the tools at
his disposal.” The same canbe said of the design engineer.
I
xy
xy
xy
xy
xy
1
1
2
2
3
3
4
4
1
1
Downloaded from Digital Engineering Library @ McGraw-Hill (www.digitalengineeringlibrary.com)Copyright © 2006 The McGraw-Hill Companies. All rights reserved.
Any use is subject to the Terms of Use as given at the website.
Design of Superstructure Elements
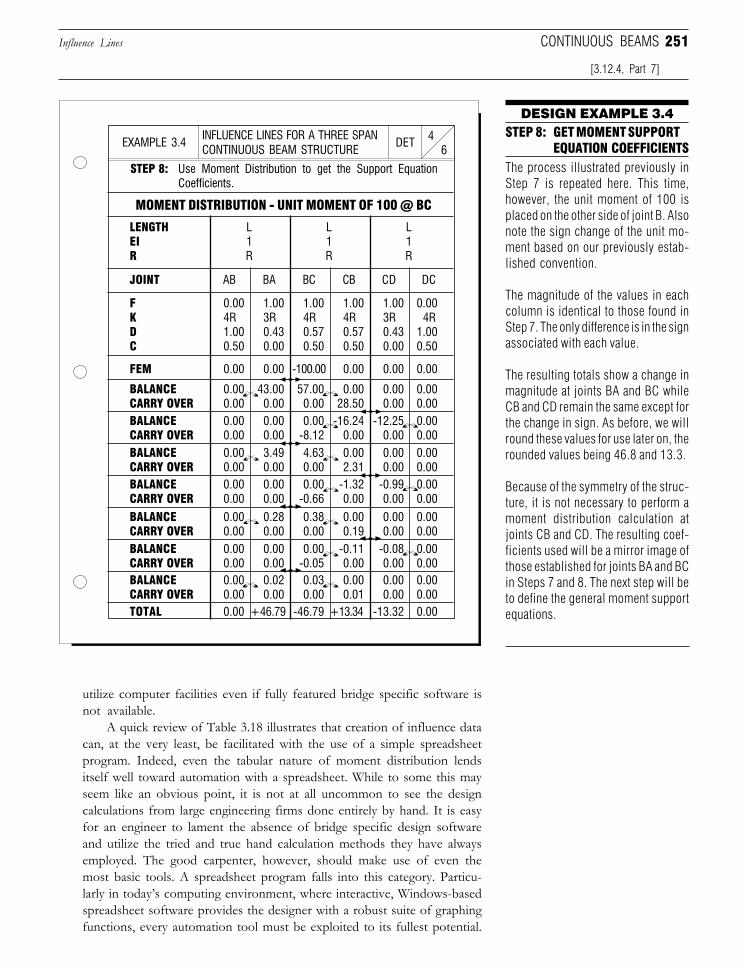
251
INFLUENCE LINES FOR A THREE SPANCONTINUOUS BEAM STRUCTURE 6
4DETEXAMPLE 3.4
DESIGN EXAMPLE 3.4STEP 8: GET MOMENT SUPPORT
EQUATION COEFFICIENTSThe process illustrated previously inStep 7 is repeated here. This time,however, the unit moment of 100 isplaced on the other side of joint B. Alsonote the sign change of the unit mo-ment based on our previously estab-lished convention.
The magnitude of the values in eachcolumn is identical to those found inStep 7. The only difference is in the signassociated with each value.
The resulting totals show a change inmagnitude at joints BA and BC whileCB and CD remain the same except forthe change in sign. As before, we willround these values for use later on, therounded values being 46.8 and 13.3.
Because of the symmetry of the struc-ture, it is not necessary to perform amoment distribution calculation atjoints CB and CD. The resulting coef-ficients used will be a mirror image ofthose established for joints BA and BCin Steps 7 and 8. The next step will beto define the general moment supportequations.
STEP 8: Use Moment Distribution to get the Support EquationCoefficients.
TOTAL 0.00 +46.79 -46.79 +13.34 -13.32 0.00
BALANCE 0.00 0.02 0.03 0.00 0.00 0.00CARRY OVER 0.00 0.00 0.00 0.01 0.00 0.00
BALANCE 0.00 0.00 0.00 -0.11 -0.08 0.00CARRY OVER 0.00 0.00 -0.05 0.00 0.00 0.00
BALANCE 0.00 0.28 0.38 0.00 0.00 0.00CARRY OVER 0.00 0.00 0.00 0.19 0.00 0.00
BALANCE 0.00 0.00 0.00 -1.32 -0.99 0.00CARRY OVER 0.00 0.00 -0.66 0.00 0.00 0.00
BALANCE 0.00 3.49 4.63 0.00 0.00 0.00CARRY OVER 0.00 0.00 0.00 2.31 0.00 0.00
BALANCE 0.00 0.00 0.00 -16.24 -12.25 0.00CARRY OVER 0.00 0.00 -8.12 0.00 0.00 0.00
BALANCE 0.00 43.00 57.00 0.00 0.00 0.00CARRY OVER 0.00 0.00 0.00 28.50 0.00 0.00
FEM 0.00 0.00 -100.00 0.00 0.00 0.00
F 0.00 1.00 1.00 1.00 1.00 0.00K 4R 3R 4R 4R 3R 4RD 1.00 0.43 0.57 0.57 0.43 1.00C 0.50 0.00 0.50 0.50 0.00 0.50
JOINT AB BA BC CB CD DC
LENGTH L L LEI 1 1 1R R R R
MOMENT DISTRIBUTION - UNIT MOMENT OF 100 @ BC
utilize computer facilities even if fully featured bridge specific software isnot available.
A quick review of Table 3.18 illustrates that creation of influence datacan, at the very least, be facilitated with the use of a simple spreadsheetprogram. Indeed, even the tabular nature of moment distribution lendsitself well toward automation with a spreadsheet. While to some this mayseem like an obvious point, it is not at all uncommon to see the designcalculations from large engineering firms done entirely by hand. It is easyfor an engineer to lament the absence of bridge specific design softwareand utilize the tried and true hand calculation methods they have alwaysemployed. The good carpenter, however, should make use of even themost basic tools. A spreadsheet program falls into this category. Particu-larly in today’s computing environment, where interactive, Windows-basedspreadsheet software provides the designer with a robust suite of graphingfunctions, every automation tool must be exploited to its fullest potential.
Influence Lines
[3.12.4, Part 7]
CONTINUOUS BEAMS
Downloaded from Digital Engineering Library @ McGraw-Hill (www.digitalengineeringlibrary.com)Copyright © 2006 The McGraw-Hill Companies. All rights reserved.
Any use is subject to the Terms of Use as given at the website.
Design of Superstructure Elements
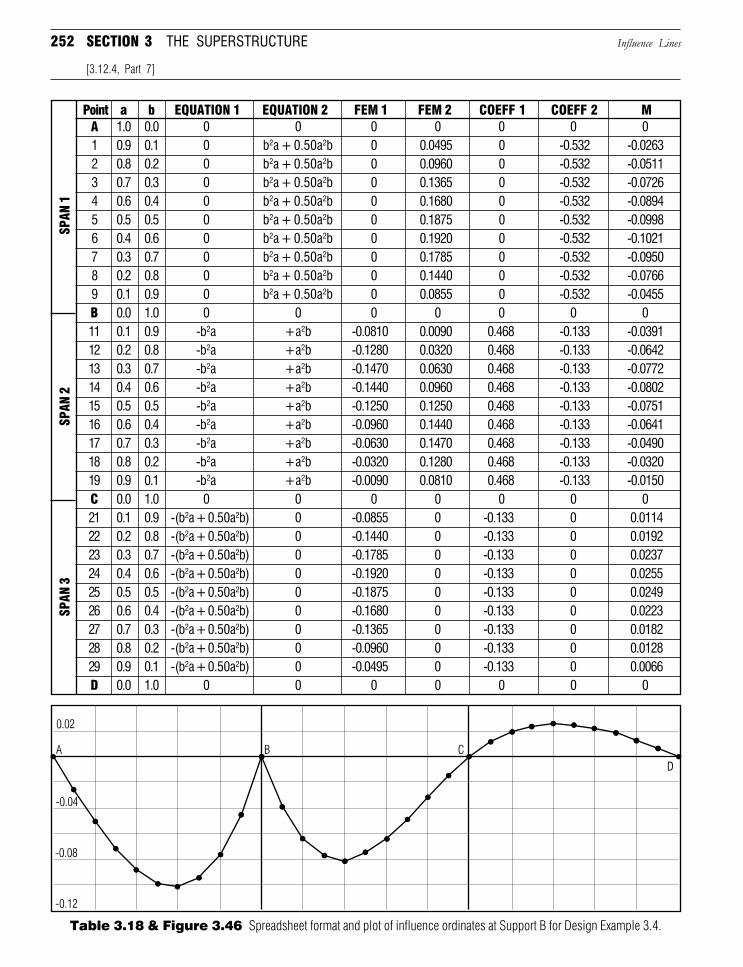
252 SECTION 3 THE SUPERSTRUCTURE Influence Lines
[3.12.4, Part 7]
A 1.0 0.0 0 0 0 0 0 0 01 0.9 0.1 0 b2a + 0.50a2b 0 0.0495 0 -0.532 -0.02632 0.8 0.2 0 b2a + 0.50a2b 0 0.0960 0 -0.532 -0.05113 0.7 0.3 0 b2a + 0.50a2b 0 0.1365 0 -0.532 -0.07264 0.6 0.4 0 b2a + 0.50a2b 0 0.1680 0 -0.532 -0.08945 0.5 0.5 0 b2a + 0.50a2b 0 0.1875 0 -0.532 -0.09986 0.4 0.6 0 b2a + 0.50a2b 0 0.1920 0 -0.532 -0.10217 0.3 0.7 0 b2a + 0.50a2b 0 0.1785 0 -0.532 -0.09508 0.2 0.8 0 b2a + 0.50a2b 0 0.1440 0 -0.532 -0.07669 0.1 0.9 0 b2a + 0.50a2b 0 0.0855 0 -0.532 -0.0455B 0.0 1.0 0 0 0 0 0 0 011 0.1 0.9 -b2a +a2b -0.0810 0.0090 0.468 -0.133 -0.039112 0.2 0.8 -b2a +a2b -0.1280 0.0320 0.468 -0.133 -0.064213 0.3 0.7 -b2a +a2b -0.1470 0.0630 0.468 -0.133 -0.077214 0.4 0.6 -b2a +a2b -0.1440 0.0960 0.468 -0.133 -0.080215 0.5 0.5 -b2a +a2b -0.1250 0.1250 0.468 -0.133 -0.075116 0.6 0.4 -b2a +a2b -0.0960 0.1440 0.468 -0.133 -0.064117 0.7 0.3 -b2a +a2b -0.0630 0.1470 0.468 -0.133 -0.049018 0.8 0.2 -b2a +a2b -0.0320 0.1280 0.468 -0.133 -0.032019 0.9 0.1 -b2a +a2b -0.0090 0.0810 0.468 -0.133 -0.0150C 0.0 1.0 0 0 0 0 0 0 021 0.1 0.9 -(b2a + 0.50a2b) 0 -0.0855 0 -0.133 0 0.011422 0.2 0.8 -(b2a + 0.50a2b) 0 -0.1440 0 -0.133 0 0.019223 0.3 0.7 -(b2a + 0.50a2b) 0 -0.1785 0 -0.133 0 0.023724 0.4 0.6 -(b2a + 0.50a2b) 0 -0.1920 0 -0.133 0 0.025525 0.5 0.5 -(b2a + 0.50a2b) 0 -0.1875 0 -0.133 0 0.024926 0.6 0.4 -(b2a + 0.50a2b) 0 -0.1680 0 -0.133 0 0.022327 0.7 0.3 -(b2a + 0.50a2b) 0 -0.1365 0 -0.133 0 0.018228 0.8 0.2 -(b2a + 0.50a2b) 0 -0.0960 0 -0.133 0 0.012829 0.9 0.1 -(b2a + 0.50a2b) 0 -0.0495 0 -0.133 0 0.0066D 0.0 1.0 0 0 0 0 0 0 0
Point a b EQUATION 1 EQUATION 2 FEM 1 FEM 2 COEFF 1 COEFF 2 M
SPAN
1SP
AN 2
SPAN
3
Table 3.18 & Figure 3.46 Spreadsheet format and plot of influence ordinates at Support B for Design Example 3.4.
Downloaded from Digital Engineering Library @ McGraw-Hill (www.digitalengineeringlibrary.com)Copyright © 2006 The McGraw-Hill Companies. All rights reserved.
Any use is subject to the Terms of Use as given at the website.
Design of Superstructure Elements
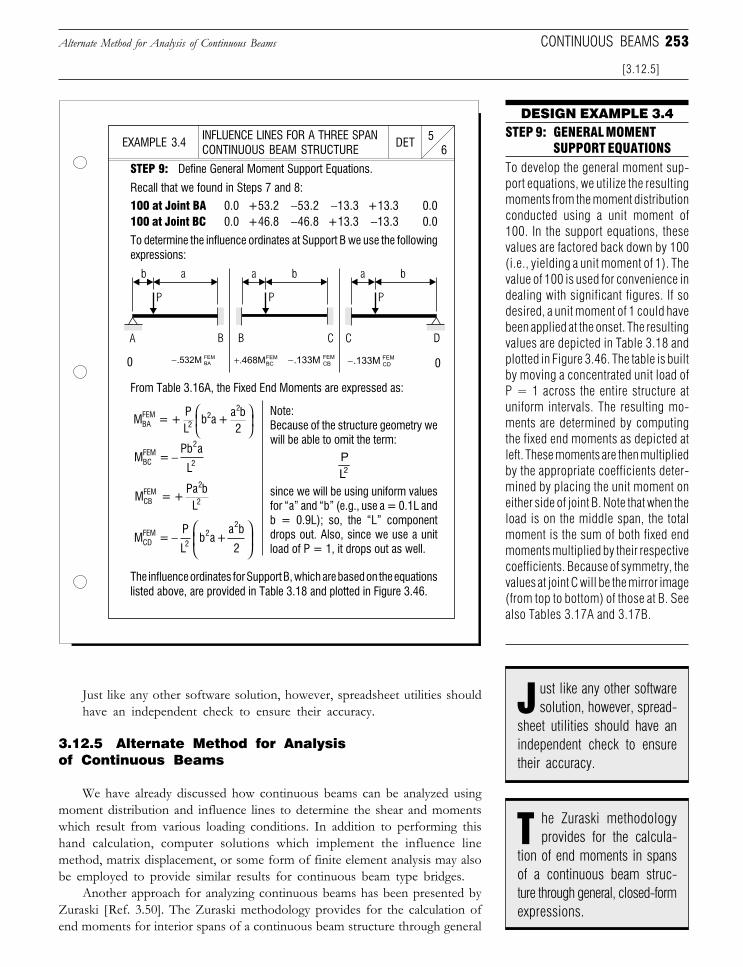
253
INFLUENCE LINES FOR A THREE SPANCONTINUOUS BEAM STRUCTURE 6
5DETEXAMPLE 3.4
DESIGN EXAMPLE 3.4STEP 9: GENERAL MOMENT
SUPPORT EQUATIONSTo develop the general moment sup-port equations, we utilize the resultingmoments from the moment distributionconducted using a unit moment of100. In the support equations, thesevalues are factored back down by 100(i.e., yielding a unit moment of 1). Thevalue of 100 is used for convenience indealing with significant figures. If sodesired, a unit moment of 1 could havebeen applied at the onset. The resultingvalues are depicted in Table 3.18 andplotted in Figure 3.46. The table is builtby moving a concentrated unit load ofP = 1 across the entire structure atuniform intervals. The resulting mo-ments are determined by computingthe fixed end moments as depicted atleft. These moments are then multipliedby the appropriate coefficients deter-mined by placing the unit moment oneither side of joint B. Note that when theload is on the middle span, the totalmoment is the sum of both fixed endmoments multiplied by their respectivecoefficients. Because of symmetry, thevalues at joint C will be the mirror image(from top to bottom) of those at B. Seealso Tables 3.17A and 3.17B.
STEP 9: Define General Moment Support Equations.
Recall that we found in Steps 7 and 8:
100 at Joint BA 0.0 +53.2 −53.2 −13.3 +13.3 0.0100 at Joint BC 0.0 +46.8 −46.8 +13.3 −13.3 0.0
To determine the influence ordinates at Support B we use the followingexpressions:
From Table 3.16A, the Fixed End Moments are expressed as:
Note:Because of the structure geometry wewill be able to omit the term:
since we will be using uniform valuesfor “a” and “b” (e.g., use a = 0.1L andb = 0.9L); so, the “L” componentdrops out. Also, since we use a unitload of P = 1, it drops out as well.
PL2
The influence ordinates for Support B, which are based on the equationslisted above, are provided in Table 3.18 and plotted in Figure 3.46.
Just like any other software solution, however, spreadsheet utilities shouldhave an independent check to ensure their accuracy.
3.12.5 Alternate Method for Analysisof Continuous Beams
We have already discussed how continuous beams can be analyzed usingmoment distribution and influence lines to determine the shear and momentswhich result from various loading conditions. In addition to performing thishand calculation, computer solutions which implement the influence linemethod, matrix displacement, or some form of finite element analysis may alsobe employed to provide similar results for continuous beam type bridges.
Another approach for analyzing continuous beams has been presented byZuraski [Ref. 3.50]. The Zuraski methodology provides for the calculation ofend moments for interior spans of a continuous beam structure through general
Alternate Method for Analysis of Continuous Beams
[3.12.5]
CONTINUOUS BEAMS
M =Pb a
LBCFEM
2
2−
M =P
Lb a+
a b
2CDFEM
22
2
−
M = +PL
b a +a b2BA
FEM2
22
M = +Pa b
LCBFEM
2
2
he Zuraski methodologyprovides for the calcula-
tion of end moments in spansof a continuous beam struc-ture through general, closed-formexpressions.
T
ust like any other softwaresolution, however, spread-
sheet utilities should have anindependent check to ensuretheir accuracy.
J
0 0FEMCD.133M−FEM
BC.468M+ FEMCB.133M−FEM
BA.532M−
Downloaded from Digital Engineering Library @ McGraw-Hill (www.digitalengineeringlibrary.com)Copyright © 2006 The McGraw-Hill Companies. All rights reserved.
Any use is subject to the Terms of Use as given at the website.
Design of Superstructure Elements
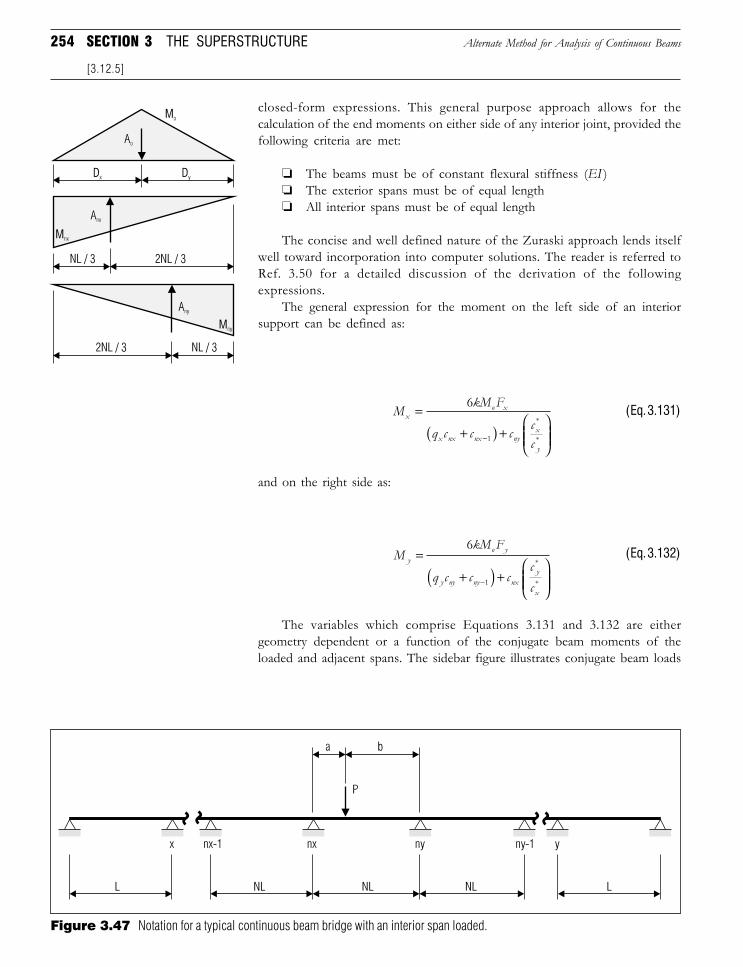
254 SECTION 3 THE SUPERSTRUCTURE Alternate Method for Analysis of Continuous Beams
[3.12.5]
closed-form expressions. This general purpose approach allows for thecalculation of the end moments on either side of any interior joint, provided thefollowing criteria are met:
❏ The beams must be of constant flexural stiffness (EI )❏ The exterior spans must be of equal length❏ All interior spans must be of equal length
The concise and well defined nature of the Zuraski approach lends itselfwell toward incorporation into computer solutions. The reader is referred toRef. 3.50 for a detailed discussion of the derivation of the followingexpressions.
The general expression for the moment on the left side of an interiorsupport can be defined as:
MkM F
q c c c cc
xo x
x nx nx nyx
y
=
+( ) +
−
6
1
*
*
(Eq. 3.131)
and on the right side as:
MkM F
q c c ccc
yo y
y ny ny nxy
x
=+( ) +
−
6
1
*
*
(Eq. 3.132)
The variables which comprise Equations 3.131 and 3.132 are eithergeometry dependent or a function of the conjugate beam moments of theloaded and adjacent spans. The sidebar figure illustrates conjugate beam loads
Figure 3.47 Notation for a typical continuous beam bridge with an interior span loaded.
Downloaded from Digital Engineering Library @ McGraw-Hill (www.digitalengineeringlibrary.com)Copyright © 2006 The McGraw-Hill Companies. All rights reserved.
Any use is subject to the Terms of Use as given at the website.
Design of Superstructure Elements
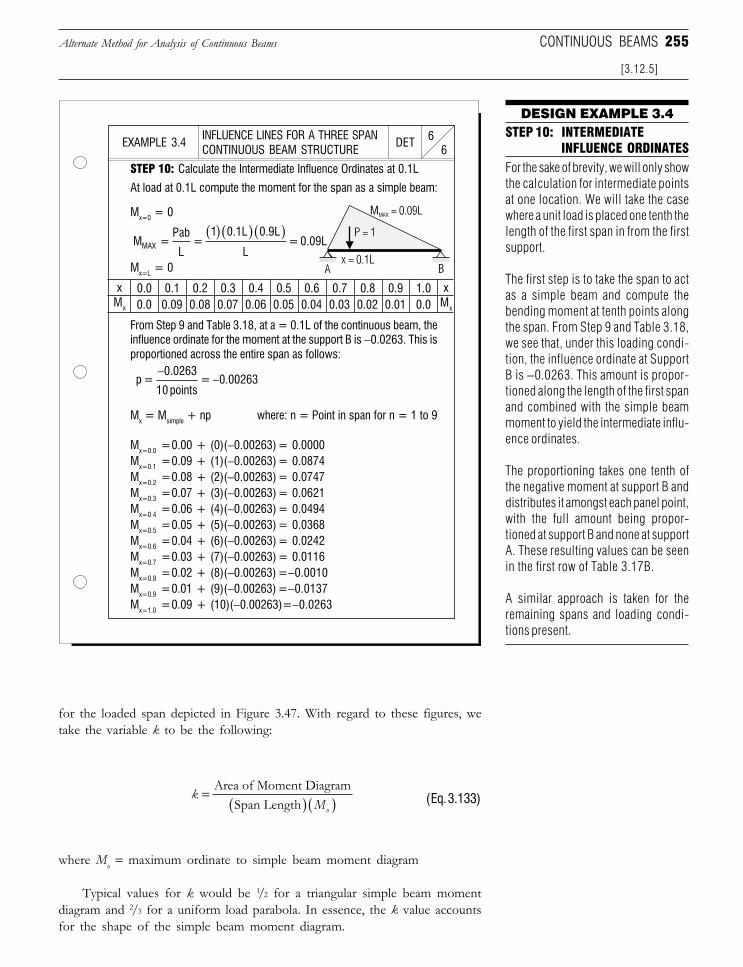
255
INFLUENCE LINES FOR A THREE SPANCONTINUOUS BEAM STRUCTURE 6
6DETEXAMPLE 3.4
DESIGN EXAMPLE 3.4STEP 10: INTERMEDIATE
INFLUENCE ORDINATESFor the sake of brevity, we will only showthe calculation for intermediate pointsat one location. We will take the casewhere a unit load is placed one tenth thelength of the first span in from the firstsupport.
The first step is to take the span to actas a simple beam and compute thebending moment at tenth points alongthe span. From Step 9 and Table 3.18,we see that, under this loading condi-tion, the influence ordinate at SupportB is −0.0263. This amount is propor-tioned along the length of the first spanand combined with the simple beammoment to yield the intermediate influ-ence ordinates.
The proportioning takes one tenth ofthe negative moment at support B anddistributes it amongst each panel point,with the full amount being propor-tioned at support B and none at supportA. These resulting values can be seenin the first row of Table 3.17B.
A similar approach is taken for theremaining spans and loading condi-tions present.
STEP 10: Calculate the Intermediate Influence Ordinates at 0.1L
At load at 0.1L compute the moment for the span as a simple beam:
xMx
Mx=0 = 0
Mx=L = 0
xMx
0.0 0.1 0.2 0.3 0.4 0.5 0.6 0.7 0.8 0.9 1.00.0 0.09 0.08 0.07 0.06 0.05 0.04 0.03 0.02 0.01 0.0
From Step 9 and Table 3.18, at a = 0.1L of the continuous beam, theinfluence ordinate for the moment at the support B is −0.0263. This isproportioned across the entire span as follows:
Mx = Msimple + np where: n = Point in span for n = 1 to 9
Mx=0.0 =0.00 + (0)(−0.00263) = 0.0000Mx=0.1 =0.09 + (1)(−0.00263) = 0.0874Mx=0.2 =0.08 + (2)(−0.00263) = 0.0747Mx=0.3 =0.07 + (3)(−0.00263) = 0.0621Mx=0.4 =0.06 + (4)(−0.00263) = 0.0494Mx=0.5 =0.05 + (5)(−0.00263) = 0.0368Mx=0.6 =0.04 + (6)(−0.00263) = 0.0242Mx=0.7 =0.03 + (7)(−0.00263) = 0.0116Mx=0.8 =0.02 + (8)(−0.00263) =−0.0010Mx=0.9 =0.01 + (9)(−0.00263) =−0.0137Mx=1.0 =0.09 + (10)(−0.00263)=−0.0263
for the loaded span depicted in Figure 3.47. With regard to these figures, wetake the variable k to be the following:
kMo
=( )( )
Area of Moment DiagramSpan Length (Eq. 3.133)
where Mo = maximum ordinate to simple beam moment diagram
Typical values for k would be 1/2 for a triangular simple beam momentdiagram and 2/3 for a uniform load parabola. In essence, the k value accountsfor the shape of the simple beam moment diagram.
Alternate Method for Analysis of Continuous Beams
[3.12.5]
CONTINUOUS BEAMS
M =Pab
L=
1 0.1L 0.9L
L= 0.09LMAX
( )( )( )
p =0.0263
10 points= 0.00263
−−
Downloaded from Digital Engineering Library @ McGraw-Hill (www.digitalengineeringlibrary.com)Copyright © 2006 The McGraw-Hill Companies. All rights reserved.
Any use is subject to the Terms of Use as given at the website.
Design of Superstructure Elements
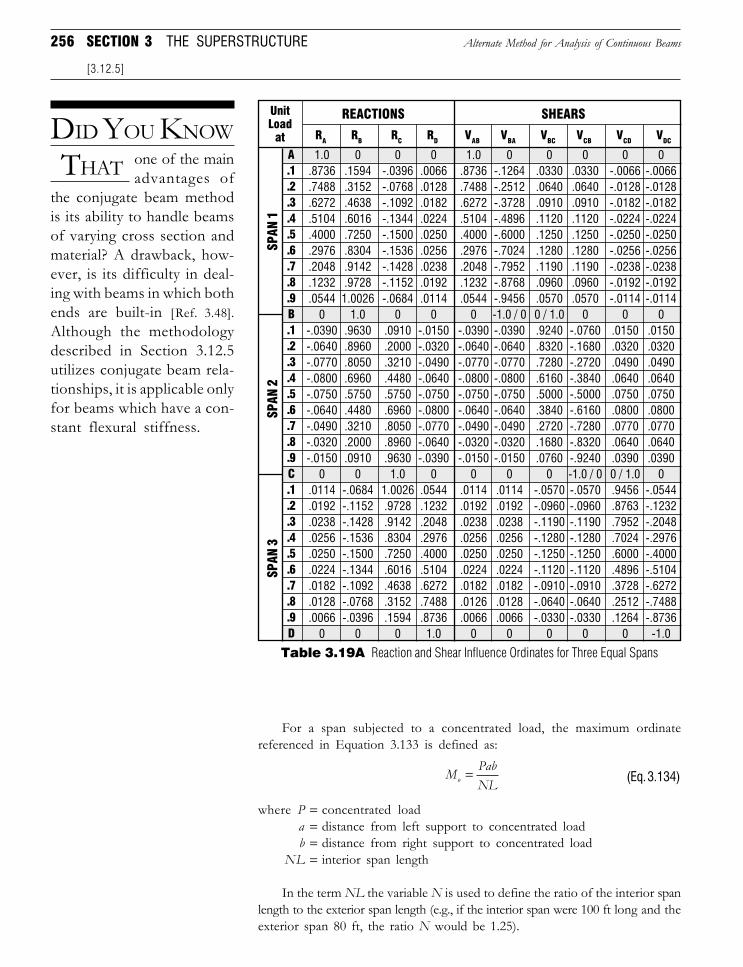
256 SECTION 3 THE SUPERSTRUCTURE
For a span subjected to a concentrated load, the maximum ordinatereferenced in Equation 3.133 is defined as:
M PabNLo = (Eq. 3.134)
where P = concentrated loada = distance from left support to concentrated load
b = distance from right support to concentrated loadNL = interior span length
In the term NL the variable N is used to define the ratio of the interior spanlength to the exterior span length (e.g., if the interior span were 100 ft long and theexterior span 80 ft, the ratio N would be 1.25).
Alternate Method for Analysis of Continuous Beams
[3.12.5]
DID YOU KNOW
THAT one of the mainadvantages of
the conjugate beam methodis its ability to handle beamsof varying cross section andmaterial? A drawback, how-ever, is its difficulty in deal-ing with beams in which bothends are built-in [Ref. 3.48].Although the methodologydescribed in Section 3.12.5utilizes conjugate beam rela-tionships, it is applicable onlyfor beams which have a con-stant flexural stiffness.
SPAN
3
RA RB RC RD VAB VBA VBC VCB VCD VDC
A.1.2.3.4.5.6.7.8.9B.1.2.3.4.5.6.7.8.9C.1.2.3.4.5.6.7.8.9D
UnitLoad
at
REACTIONS
SPAN
1SP
AN 2
SHEARS
Table 3.19A Reaction and Shear Influence Ordinates for Three Equal Spans
1.0 0 0 0 1.0 0 0 0 0 0.8736 .1594 -.0396 .0066 .8736 -.1264 .0330 .0330 -.0066 -.0066.7488 .3152 -.0768 .0128 .7488 -.2512 .0640 .0640 -.0128 -.0128.6272 .4638 -.1092 .0182 .6272 -.3728 .0910 .0910 -.0182 -.0182.5104 .6016 -.1344 .0224 .5104 -.4896 .1120 .1120 -.0224 -.0224.4000 .7250 -.1500 .0250 .4000 -.6000 .1250 .1250 -.0250 -.0250.2976 .8304 -.1536 .0256 .2976 -.7024 .1280 .1280 -.0256 -.0256.2048 .9142 -.1428 .0238 .2048 -.7952 .1190 .1190 -.0238 -.0238.1232 .9728 -.1152 .0192 .1232 -.8768 .0960 .0960 -.0192 -.0192.0544 1.0026 -.0684 .0114 .0544 -.9456 .0570 .0570 -.0114 -.0114
0 1.0 0 0 0 -1.0 / 0 0 / 1.0 0 0 0-.0390 .9630 .0910 -.0150 -.0390 -.0390 .9240 -.0760 .0150 .0150-.0640 .8960 .2000 -.0320 -.0640 -.0640 .8320 -.1680 .0320 .0320-.0770 .8050 .3210 -.0490 -.0770 -.0770 .7280 -.2720 .0490 .0490-.0800 .6960 .4480 -.0640 -.0800 -.0800 .6160 -.3840 .0640 .0640-.0750 .5750 .5750 -.0750 -.0750 -.0750 .5000 -.5000 .0750 .0750-.0640 .4480 .6960 -.0800 -.0640 -.0640 .3840 -.6160 .0800 .0800-.0490 .3210 .8050 -.0770 -.0490 -.0490 .2720 -.7280 .0770 .0770-.0320 .2000 .8960 -.0640 -.0320 -.0320 .1680 -.8320 .0640 .0640-.0150 .0910 .9630 -.0390 -.0150 -.0150 .0760 -.9240 .0390 .0390
0 0 1.0 0 0 0 0 -1.0 / 0 0 / 1.0 0.0114 -.0684 1.0026 .0544 .0114 .0114 -.0570 -.0570 .9456 -.0544.0192 -.1152 .9728 .1232 .0192 .0192 -.0960 -.0960 .8763 -.1232.0238 -.1428 .9142 .2048 .0238 .0238 -.1190 -.1190 .7952 -.2048.0256 -.1536 .8304 .2976 .0256 .0256 -.1280 -.1280 .7024 -.2976.0250 -.1500 .7250 .4000 .0250 .0250 -.1250 -.1250 .6000 -.4000.0224 -.1344 .6016 .5104 .0224 .0224 -.1120 -.1120 .4896 -.5104.0182 -.1092 .4638 .6272 .0182 .0182 -.0910 -.0910 .3728 -.6272.0128 -.0768 .3152 .7488 .0126 .0128 -.0640 -.0640 .2512 -.7488.0066 -.0396 .1594 .8736 .0066 .0066 -.0330 -.0330 .1264 -.8736
0 0 0 1.0 0 0 0 0 0 -1.0
Downloaded from Digital Engineering Library @ McGraw-Hill (www.digitalengineeringlibrary.com)Copyright © 2006 The McGraw-Hill Companies. All rights reserved.
Any use is subject to the Terms of Use as given at the website.
Design of Superstructure Elements
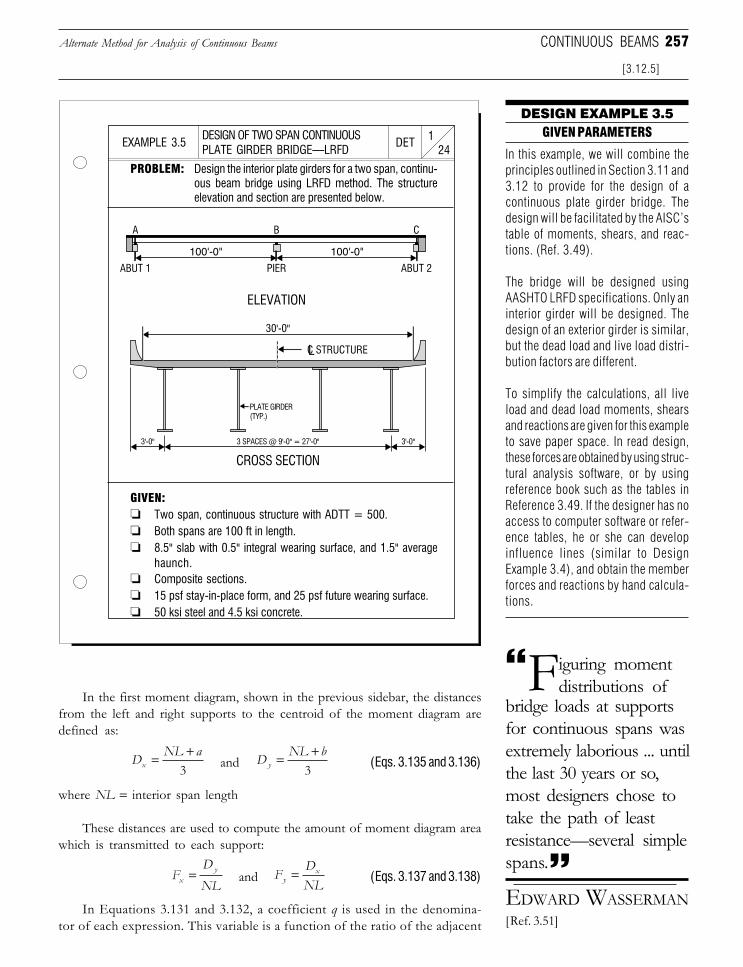
257
DESIGN OF TWO SPAN CONTINUOUSPLATE GIRDER BRIDGE—LRFD 24
1DETEXAMPLE 3.5
PROBLEM: Design the interior plate girders for a two span, continu-ous beam bridge using LRFD method. The structureelevation and section are presented below.
GIVEN:❏ Two span, continuous structure with ADTT = 500.❏ Both spans are 100 ft in length.❏ 8.5" slab with 0.5" integral wearing surface, and 1.5" average
haunch.❏ Composite sections.❏ 15 psf stay-in-place form, and 25 psf future wearing surface.❏ 50 ksi steel and 4.5 ksi concrete.
In the first moment diagram, shown in the previous sidebar, the distancesfrom the left and right supports to the centroid of the moment diagram aredefined as:
D NL ax = +
3 and DNL b
y = +3 (Eqs. 3.135 and 3.136)
where NL = interior span length
These distances are used to compute the amount of moment diagram areawhich is transmitted to each support:
FDNLx
y= and FDNLyx= (Eqs. 3.137 and 3.138)
In Equations 3.131 and 3.132, a coefficient q is used in the denomina-tor of each expression. This variable is a function of the ratio of the adjacent
Alternate Method for Analysis of Continuous Beams
[3.12.5]
CONTINUOUS BEAMS
DESIGN EXAMPLE 3.5GIVEN PARAMETERS
In this example, we will combine theprinciples outlined in Section 3.11 and3.12 to provide for the design of acontinuous plate girder bridge. Thedesign will be facilitated by the AISC’stable of moments, shears, and reac-tions. (Ref. 3.49).
The bridge will be designed usingAASHTO LRFD specifications. Only aninterior girder will be designed. Thedesign of an exterior girder is similar,but the dead load and live load distri-bution factors are different.
To simplify the calculations, all liveload and dead load moments, shearsand reactions are given for this exampleto save paper space. In read design,these forces are obtained by using struc-tural analysis software, or by usingreference book such as the tables inReference 3.49. If the designer has noaccess to computer software or refer-ence tables, he or she can developinfluence lines (similar to DesignExample 3.4), and obtain the memberforces and reactions by hand calcula-tions.
iguring momentdistributions of
bridge loads at supportsfor continuous spans wasextremely laborious ... untilthe last 30 years or so,most designers chose totake the path of leastresistance—several simplespans.
F
EDWARD WASSERMAN[Ref. 3.51]
100'-0" 100'-0"
A
ABUT 1 PIER
ELEVATION
ABUT 2
B C
L
30'-0"
C STRUCTURE
PLATE GIRDER(TYP.)
3 SPACES @ 9'-0" = 27'-0"
CROSS SECTION
3'-0" 3'-0"
Downloaded from Digital Engineering Library @ McGraw-Hill (www.digitalengineeringlibrary.com)Copyright © 2006 The McGraw-Hill Companies. All rights reserved.
Any use is subject to the Terms of Use as given at the website.
Design of Superstructure Elements
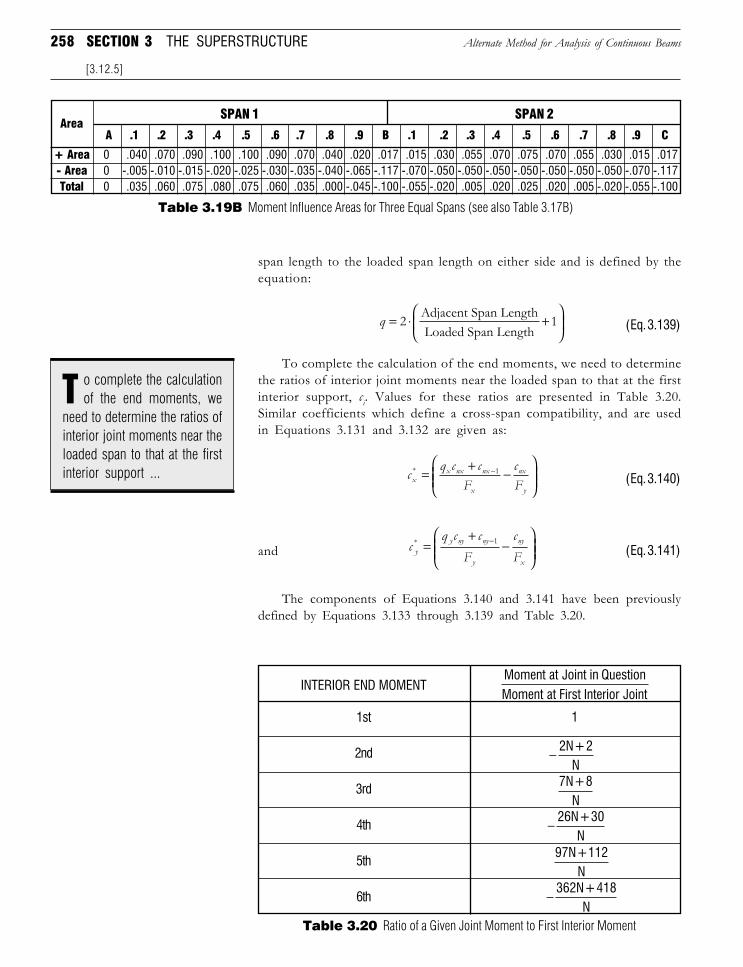
258 SECTION 3 THE SUPERSTRUCTURE
span length to the loaded span length on either side and is defined by theequation:
q = ⋅ +
2 1
Adjacent Span LengthLoaded Span Length (Eq. 3.139)
To complete the calculation of the end moments, we need to determinethe ratios of interior joint moments near the loaded span to that at the firstinterior support, ci. Values for these ratios are presented in Table 3.20.Similar coefficients which define a cross-span compatibility, and are usedin Equations 3.131 and 3.132 are given as:
cq c c
FcFx
x nx nx
x
nx
y
* = + −
−1(Eq. 3.140)
and cq c c
FcFy
y ny ny
y
ny
x
* =+
−
−1(Eq. 3.141)
The components of Equations 3.140 and 3.141 have been previouslydefined by Equations 3.133 through 3.139 and Table 3.20.
Alternate Method for Analysis of Continuous Beams
[3.12.5]
o complete the calculationof the end moments, we
need to determine the ratios ofinterior joint moments near theloaded span to that at the firstinterior support ...
T
0 .040 .070 .090 .100 .100 .090 .070 .040 .020 .017 .015 .030 .055 .070 .075 .070 .055 .030 .015 .0170 -.005 -.010 -.015 -.020 -.025 -.030 -.035 -.040 -.065 -.117 -.070 -.050 -.050 -.050 -.050 -.050 -.050 -.050 -.070 -.1170 .035 .060 .075 .080 .075 .060 .035 .000 -.045 -.100 -.055 -.020 .005 .020 .025 .020 .005 -.020 -.055 -.100
+ Area- AreaTotal
A .1 .2 .3 .4 .5 .6 .7 .8 .9 B .1 .2 .3 .4 .5 .6 .7 .8 .9 C
SPAN 2SPAN 1Area
Table 3.19B Moment Influence Areas for Three Equal Spans (see also Table 3.17B)
Table 3.20 Ratio of a Given Joint Moment to First Interior Moment
1st
2nd
3rd
4th
5th
6th
1
INTERIOR END MOMENTMoment at Joint in Q estionMoment at First Interior Joint
u
− 2N+2N
7N+8N
− 26N+30N
97N+112N
− 362N+418N
Downloaded from Digital Engineering Library @ McGraw-Hill (www.digitalengineeringlibrary.com)Copyright © 2006 The McGraw-Hill Companies. All rights reserved.
Any use is subject to the Terms of Use as given at the website.
Design of Superstructure Elements
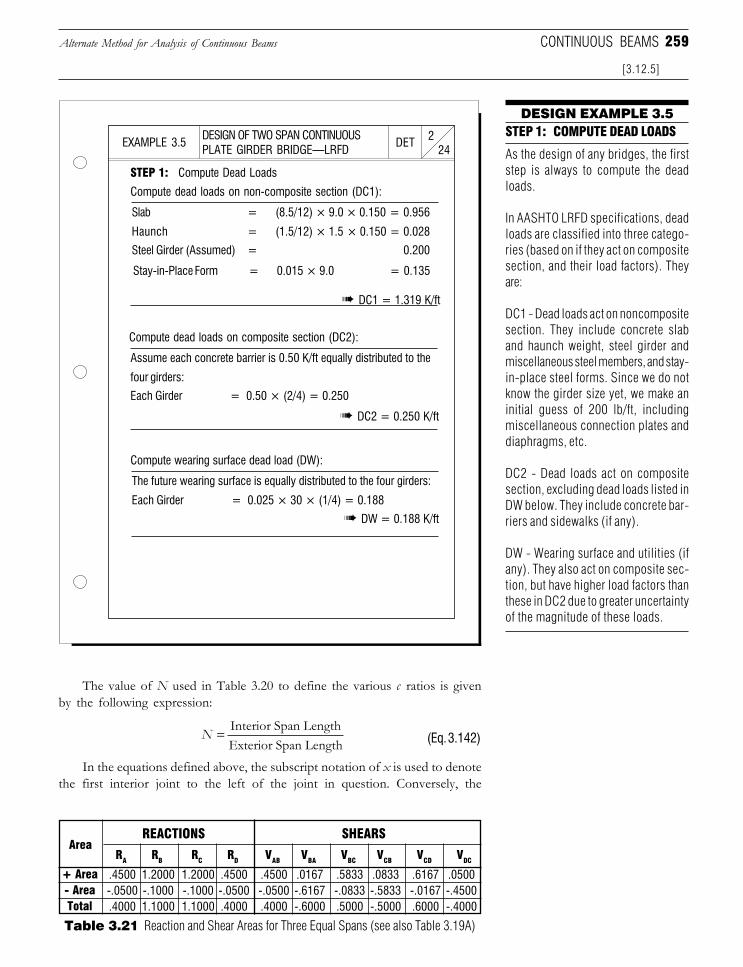
259
DESIGN EXAMPLE 3.5STEP 1: COMPUTE DEAD LOADS
As the design of any bridges, the firststep is always to compute the deadloads.
In AASHTO LRFD specifications, deadloads are classified into three catego-ries (based on if they act on compositesection, and their load factors). Theyare:
DC1 - Dead loads act on noncompositesection. They include concrete slaband haunch weight, steel girder andmiscellaneous steel members, and stay-in-place steel forms. Since we do notknow the girder size yet, we make aninitial guess of 200 lb/ft, includingmiscellaneous connection plates anddiaphragms, etc.
DC2 - Dead loads act on compositesection, excluding dead loads listed inDW below. They include concrete bar-riers and sidewalks (if any).
DW - Wearing surface and utilities (ifany). They also act on composite sec-tion, but have higher load factors thanthese in DC2 due to greater uncertaintyof the magnitude of these loads.
The value of N used in Table 3.20 to define the various c ratios is givenby the following expression:
N = Interior Span LengthExterior Span Length (Eq. 3.142)
In the equations defined above, the subscript notation of x is used to denotethe first interior joint to the left of the joint in question. Conversely, the
Alternate Method for Analysis of Continuous Beams CONTINUOUS BEAMS
[3.12.5]
.4500 1.2000 1.2000 .4500 .4500 .0167 .5833 .0833 .6167 .0500-.0500 -.1000 -.1000 -.0500 -.0500 -.6167 -.0833 -.5833 -.0167 -.4500.4000 1.1000 1.1000 .4000 .4000 -.6000 .5000 -.5000 .6000 -.4000
RA RB RC RD VAB VBA VBC VCB VCD VDC
+ Area- AreaTotal
REACTIONS SHEARSArea
Table 3.21 Reaction and Shear Areas for Three Equal Spans (see also Table 3.19A)
DESIGN OF TWO SPAN CONTINUOUSPLATE GIRDER BRIDGE—LRFD 24
2DETEXAMPLE 3.5
STEP 1: Compute Dead Loads
Compute dead loads on non-composite section (DC1):
Slab = (8.5/12) × 9.0 × 0.150 = 0.956
Steel Girder (Assumed) = 0.200
Haunch = (1.5/12) × 1.5 × 0.150 = 0.028
Stay-in-Place Form = 0.015 × 9.0 = 0.135
➠ DC1 = 1.319 K/ft
Compute dead loads on composite section (DC2):
Assume each concrete barrier is 0.50 K/ft equally distributed to the
Each Girder = 0.50 × (2/4) = 0.250
four girders:
➠ DC2 = 0.250 K/ft
Compute wearing surface dead load (DW):
The future wearing surface is equally distributed to the four girders:
➠ DW = 0.188 K/ft
Each Girder = 0.025 × 30 × (1/4) = 0.188
Downloaded from Digital Engineering Library @ McGraw-Hill (www.digitalengineeringlibrary.com)Copyright © 2006 The McGraw-Hill Companies. All rights reserved.
Any use is subject to the Terms of Use as given at the website.
Design of Superstructure Elements
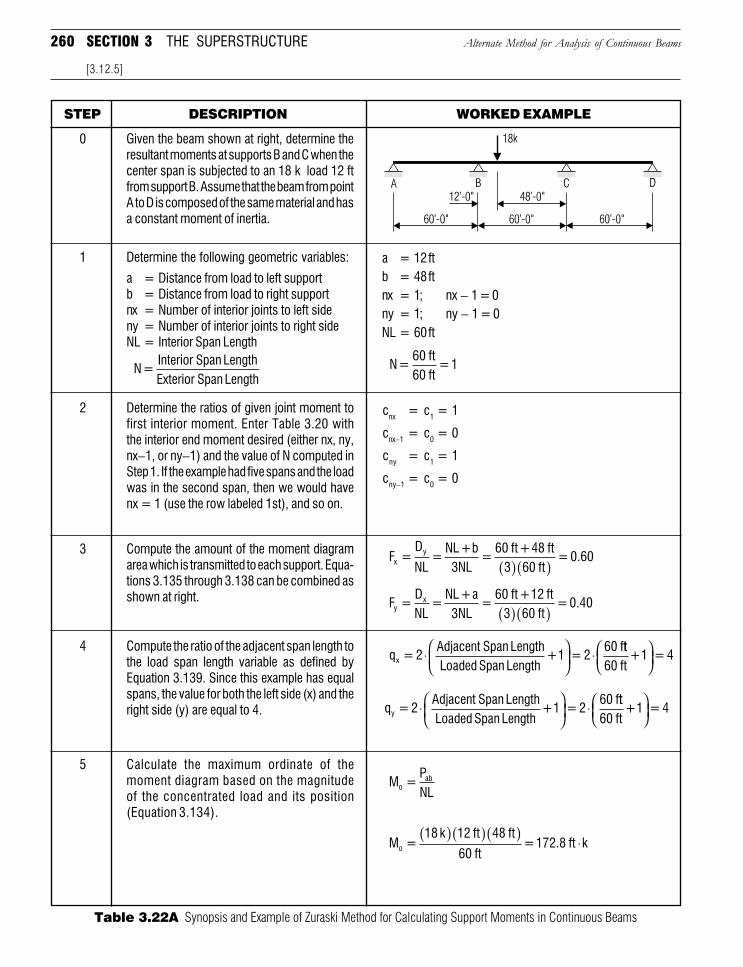
260 SECTION 3 THE SUPERSTRUCTURE Alternate Method for Analysis of Continuous Beams
[3.12.5]
Table 3.22A Synopsis and Example of Zuraski Method for Calculating Support Moments in Continuous Beams
WORKED EXAMPLESTEP DESCRIPTION
0 Given the beam shown at right, determine theresultant moments at supports B and C when thecenter span is subjected to an 18 k load 12 ftfrom support B. Assume that the beam from pointA to D is composed of the same material and hasa constant moment of inertia.
1 Determine the following geometric variables:
a = Distance from load to left supportb = Distance from load to right supportnx = Number of interior joints to left sideny = Number of interior joints to right sideNL = Interior Span Length
a = 12 ftb = 48 ftnx = 1; nx − 1 = 0ny = 1; ny − 1 = 0NL = 60 ft
2 Determine the ratios of given joint moment tofirst interior moment. Enter Table 3.20 withthe interior end moment desired (either nx, ny,nx−1, or ny−1) and the value of N computed inStep 1. If the example had five spans and the loadwas in the second span, then we would havenx = 1 (use the row labeled 1st), and so on.
cnx = c1 = 1
cnx−1 = c0 = 0
cny = c1 = 1
cny−1 = c0 = 0
3 Compute the amount of the moment diagramarea which is transmitted to each support. Equa-tions 3.135 through 3.138 can be combined asshown at right.
4 Compute the ratio of the adjacent span length tothe load span length variable as defined byEquation 3.139. Since this example has equalspans, the value for both the left side (x) and theright side (y) are equal to 4.
5 Calculate the maximum ordinate of themoment diagram based on the magnitudeof the concentrated load and its position(Equation 3.134).
F =D
NL=
NL+b3NL
=60 ft+48 ft
3 60 ft=0.60x
y
( )( )
F =DNL
=NL+a3NL
=60 ft+12 ft
3 60 ft=0.40y
x
( )( )
q = 2Adjacent Span LengthLoaded Span Length
+1 = 260 f
x ⋅ ⋅
tt60 ft
+1 = 4
M =PNLo
ab
q = 2Adjacent Span LengthLoaded Span Length
+1 = 260 f
y ⋅ ⋅
tt60 ft
+1 = 4
M =18 k 12 ft 48 ft
60 ft=172.8 ft ko
( )( )( )⋅
N=Interior Span LengthExterior Span Length
N=60 ft60 ft
=1
Downloaded from Digital Engineering Library @ McGraw-Hill (www.digitalengineeringlibrary.com)Copyright © 2006 The McGraw-Hill Companies. All rights reserved.
Any use is subject to the Terms of Use as given at the website.
Design of Superstructure Elements
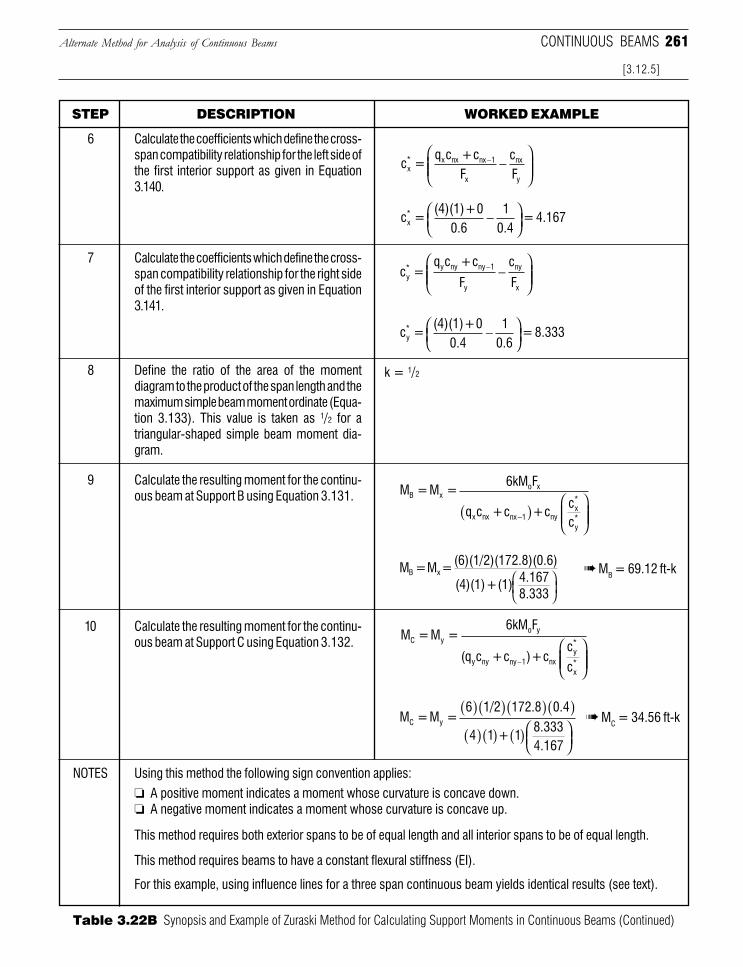
261Alternate Method for Analysis of Continuous Beams
[3.12.5]
CONTINUOUS BEAMS
Table 3.22B Synopsis and Example of Zuraski Method for Calculating Support Moments in Continuous Beams (Continued)
WORKED EXAMPLESTEP DESCRIPTION
6 Calculate the coefficients which define the cross-span compatibility relationship for the left side ofthe first interior support as given in Equation3.140.
8 Define the ratio of the area of the momentdiagram to the product of the span length and themaximum simple beam moment ordinate (Equa-tion 3.133). This value is taken as 1/2 for atriangular-shaped simple beam moment dia-gram.
7 Calculate the coefficients which define the cross-span compatibility relationship for the right sideof the first interior support as given in Equation3.141.
k = 1/2
9 Calculate the resulting moment for the continu-ous beam at Support B using Equation 3.131.
➠ MB = 69.12 ft-k
10 Calculate the resulting moment for the continu-ous beam at Support C using Equation 3.132.
➠ MC = 34.56 ft-k
NOTES Using this method the following sign convention applies:
❏ A positive moment indicates a moment whose curvature is concave down.❏ A negative moment indicates a moment whose curvature is concave up.
This method requires both exterior spans to be of equal length and all interior spans to be of equal length.
This method requires beams to have a constant flexural stiffness (EI).
For this example, using influence lines for a three span continuous beam yields identical results (see text).
c =+0
0.61
0.4= 4.167x
* (4)(1) −
c =q c +c
F
c
Fy* y ny ny 1
y
ny
x
− −
c =+0
0.41
0.6=8.333y
* (4)(1) −
M =M =6kM F
q c +c +ccc
B xo x
x nx nx 1 nyx*
y*−( )
M = M = (6)(1/2)(172.8)(0.6)
(4)(1) + (1) 4.1678.333
B x
M =M =6kM F
(q c +c )+cc
c
C yo y
y ny ny 1 nxy*
x*−
M =M =6 172.8 0.4
4 1 + 18.3334.167
C y
1/2( )( )( )( )( )( ) ( )
c =q c +c
FcFx
* x nx nx 1
x
nx
y
− −
Downloaded from Digital Engineering Library @ McGraw-Hill (www.digitalengineeringlibrary.com)Copyright © 2006 The McGraw-Hill Companies. All rights reserved.
Any use is subject to the Terms of Use as given at the website.
Design of Superstructure Elements
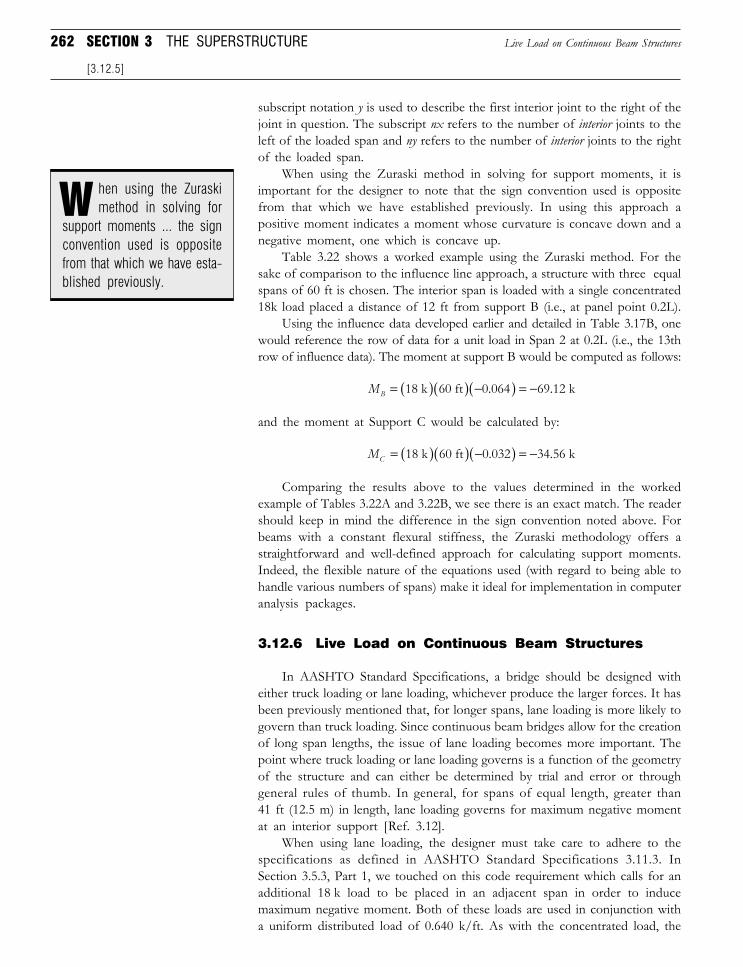
262 SECTION 3 THE SUPERSTRUCTURE
subscript notation y is used to describe the first interior joint to the right of thejoint in question. The subscript nx refers to the number of interior joints to theleft of the loaded span and ny refers to the number of interior joints to the rightof the loaded span.
When using the Zuraski method in solving for support moments, it isimportant for the designer to note that the sign convention used is oppositefrom that which we have established previously. In using this approach apositive moment indicates a moment whose curvature is concave down and anegative moment, one which is concave up.
Table 3.22 shows a worked example using the Zuraski method. For thesake of comparison to the influence line approach, a structure with three equalspans of 60 ft is chosen. The interior span is loaded with a single concentrated18k load placed a distance of 12 ft from support B (i.e., at panel point 0.2L).
Using the influence data developed earlier and detailed in Table 3.17B, onewould reference the row of data for a unit load in Span 2 at 0.2L (i.e., the 13throw of influence data). The moment at support B would be computed as follows:
MB = ( )( ) −( ) = −18 k 60 ft 0.064 69.12 k
and the moment at Support C would be calculated by:
MC = ( )( ) −( ) = −18 k 60 ft 0.032 34.56 k
Comparing the results above to the values determined in the workedexample of Tables 3.22A and 3.22B, we see there is an exact match. The readershould keep in mind the difference in the sign convention noted above. Forbeams with a constant flexural stiffness, the Zuraski methodology offers astraightforward and well-defined approach for calculating support moments.Indeed, the flexible nature of the equations used (with regard to being able tohandle various numbers of spans) make it ideal for implementation in computeranalysis packages.
3.12.6 Live Load on Continuous Beam Structures
In AASHTO Standard Specifications, a bridge should be designed witheither truck loading or lane loading, whichever produce the larger forces. It hasbeen previously mentioned that, for longer spans, lane loading is more likely togovern than truck loading. Since continuous beam bridges allow for the creationof long span lengths, the issue of lane loading becomes more important. Thepoint where truck loading or lane loading governs is a function of the geometryof the structure and can either be determined by trial and error or throughgeneral rules of thumb. In general, for spans of equal length, greater than41 ft (12.5 m) in length, lane loading governs for maximum negative momentat an interior support [Ref. 3.12].
When using lane loading, the designer must take care to adhere to thespecifications as defined in AASHTO Standard Specifications 3.11.3. InSection 3.5.3, Part 1, we touched on this code requirement which calls for anadditional 18 k load to be placed in an adjacent span in order to inducemaximum negative moment. Both of these loads are used in conjunction witha uniform distributed load of 0.640 k/ft. As with the concentrated load, the
Live Load on Continuous Beam Structures
[3.12.5]
hen using the Zuraskimethod in solving for
support moments ... the signconvention used is oppositefrom that which we have esta-blished previously.
W
Downloaded from Digital Engineering Library @ McGraw-Hill (www.digitalengineeringlibrary.com)Copyright © 2006 The McGraw-Hill Companies. All rights reserved.
Any use is subject to the Terms of Use as given at the website.
Design of Superstructure Elements
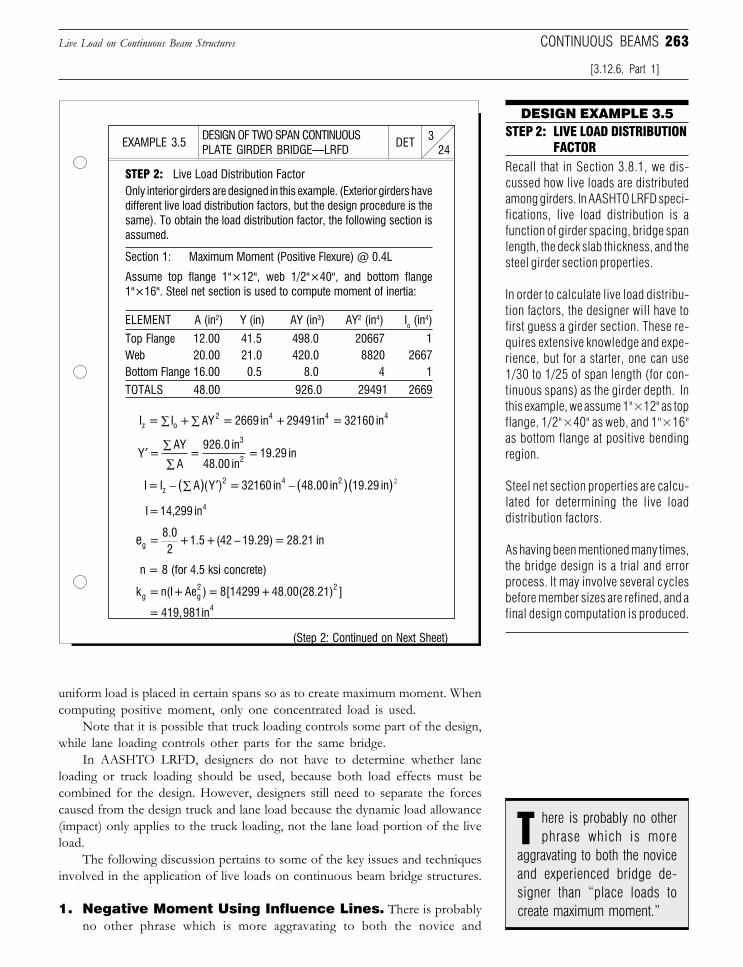
263
DESIGN OF TWO SPAN CONTINUOUSPLATE GIRDER BRIDGE—LRFD 24
3DETEXAMPLE 3.5
STEP 2: Live Load Distribution FactorOnly interior girders are designed in this example. (Exterior girders havedifferent live load distribution factors, but the design procedure is thesame). To obtain the load distribution factor, the following section isassumed.
Section 1: Maximum Moment (Positive Flexure) @ 0.4L
Assume top flange 1"×12", web 1/2"×40", and bottom flange1"×16". Steel net section is used to compute moment of inertia:
ELEMENT A (in2) Y (in) AY (in3) AY2 (in4) Io (in4)
Top Flange 12.00 41.5 498.0 20667 1Web 20.00 21.0 420.0 8820 2667Bottom Flange 16.00 0.5 8.0 4 1
TOTALS 48.00 926.0 29491 2669
(Step 2: Continued on Next Sheet)
n = 8 (for 4.5 ksi concrete)
I = I + AY = 2669 in +29491 in = 32160 inz o2 4 4 4∑∑
′ ∑∑
Y =AY
A=
926.0 in
48.00 in= 19.29 in
3
2
= 419,981in4
I=14,299 in4
I = I A Y = 32160 in 48.00 in 19.29 inz2 4 2− −( ) ( )( )( )∑ ′ 2
uniform load is placed in certain spans so as to create maximum moment. Whencomputing positive moment, only one concentrated load is used.
Note that it is possible that truck loading controls some part of the design,while lane loading controls other parts for the same bridge.
In AASHTO LRFD, designers do not have to determine whether laneloading or truck loading should be used, because both load effects must becombined for the design. However, designers still need to separate the forcescaused from the design truck and lane load because the dynamic load allowance(impact) only applies to the truck loading, not the lane load portion of the liveload.
The following discussion pertains to some of the key issues and techniquesinvolved in the application of live loads on continuous beam bridge structures.
1. Negative Moment Using Influence Lines. There is probablyno other phrase which is more aggravating to both the novice and
Live Load on Continuous Beam Structures
[3.12.6, Part 1]
CONTINUOUS BEAMS
here is probably no otherphrase which is more
aggravating to both the noviceand experienced bridge de-signer than “place loads tocreate maximum moment.”
T
DESIGN EXAMPLE 3.5STEP 2: LIVE LOAD DISTRIBUTION
FACTORRecall that in Section 3.8.1, we dis-cussed how live loads are distributedamong girders. In AASHTO LRFD speci-fications, live load distribution is afunction of girder spacing, bridge spanlength, the deck slab thickness, and thesteel girder section properties.
In order to calculate live load distribu-tion factors, the designer will have tofirst guess a girder section. These re-quires extensive knowledge and expe-rience, but for a starter, one can use1/30 to 1/25 of span length (for con-tinuous spans) as the girder depth. Inthis example, we assume 1"×12" as topflange, 1/2"×40" as web, and 1"×16"as bottom flange at positive bendingregion.
Steel net section properties are calcu-lated for determining the live loaddistribution factors.
As having been mentioned many times,the bridge design is a trial and errorprocess. It may involve several cyclesbefore member sizes are refined, and afinal design computation is produced.
k = n(I + Ae ) = 8[14299+48.00(28.21) ]g g2 2
eg =8.02
+ 1.5+(42 19.29) = 28.21 in−
Downloaded from Digital Engineering Library @ McGraw-Hill (www.digitalengineeringlibrary.com)Copyright © 2006 The McGraw-Hill Companies. All rights reserved.
Any use is subject to the Terms of Use as given at the website.
Design of Superstructure Elements
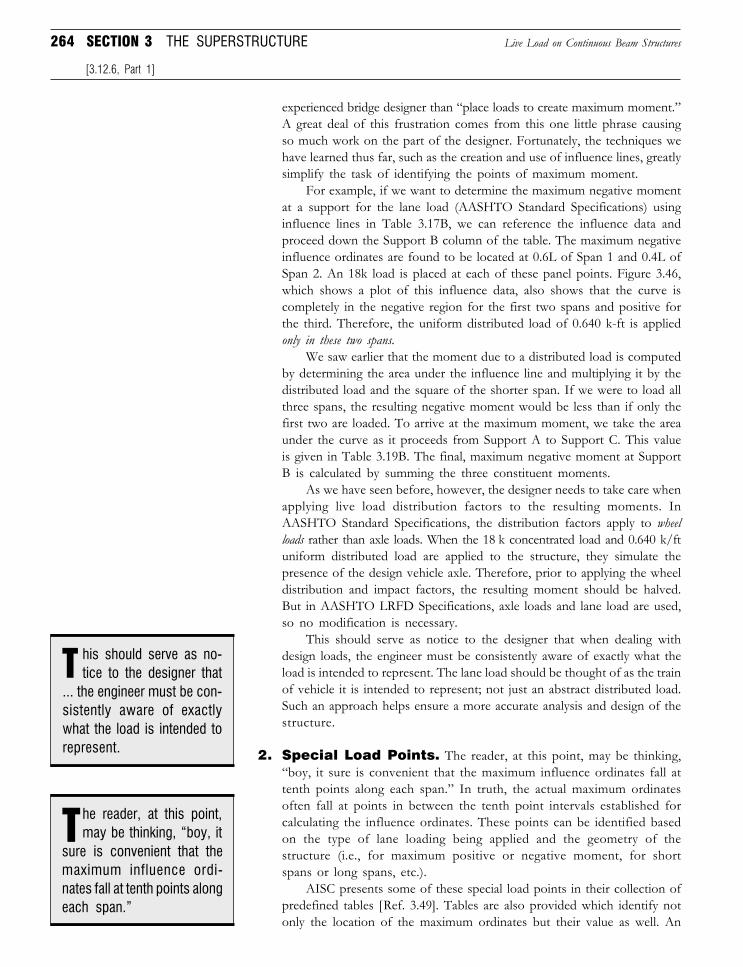
264 SECTION 3 THE SUPERSTRUCTURE
experienced bridge designer than “place loads to create maximum moment.”A great deal of this frustration comes from this one little phrase causingso much work on the part of the designer. Fortunately, the techniques wehave learned thus far, such as the creation and use of influence lines, greatlysimplify the task of identifying the points of maximum moment.
For example, if we want to determine the maximum negative momentat a support for the lane load (AASHTO Standard Specifications) usinginfluence lines in Table 3.17B, we can reference the influence data andproceed down the Support B column of the table. The maximum negativeinfluence ordinates are found to be located at 0.6L of Span 1 and 0.4L ofSpan 2. An 18k load is placed at each of these panel points. Figure 3.46,which shows a plot of this influence data, also shows that the curve iscompletely in the negative region for the first two spans and positive forthe third. Therefore, the uniform distributed load of 0.640 k-ft is appliedonly in these two spans.
We saw earlier that the moment due to a distributed load is computedby determining the area under the influence line and multiplying it by thedistributed load and the square of the shorter span. If we were to load allthree spans, the resulting negative moment would be less than if only thefirst two are loaded. To arrive at the maximum moment, we take the areaunder the curve as it proceeds from Support A to Support C. This valueis given in Table 3.19B. The final, maximum negative moment at SupportB is calculated by summing the three constituent moments.
As we have seen before, however, the designer needs to take care whenapplying live load distribution factors to the resulting moments. InAASHTO Standard Specifications, the distribution factors apply to wheelloads rather than axle loads. When the 18 k concentrated load and 0.640 k/ftuniform distributed load are applied to the structure, they simulate thepresence of the design vehicle axle. Therefore, prior to applying the wheeldistribution and impact factors, the resulting moment should be halved.But in AASHTO LRFD Specifications, axle loads and lane load are used,so no modification is necessary.
This should serve as notice to the designer that when dealing withdesign loads, the engineer must be consistently aware of exactly what theload is intended to represent. The lane load should be thought of as the trainof vehicle it is intended to represent; not just an abstract distributed load.Such an approach helps ensure a more accurate analysis and design of thestructure.
2. Special Load Points. The reader, at this point, may be thinking,“boy, it sure is convenient that the maximum influence ordinates fall attenth points along each span.” In truth, the actual maximum ordinatesoften fall at points in between the tenth point intervals established forcalculating the influence ordinates. These points can be identified basedon the type of lane loading being applied and the geometry of thestructure (i.e., for maximum positive or negative moment, for shortspans or long spans, etc.).
AISC presents some of these special load points in their collection ofpredefined tables [Ref. 3.49]. Tables are also provided which identify notonly the location of the maximum ordinates but their value as well. An
Live Load on Continuous Beam Structures
[3.12.6, Part 1]
his should serve as no-tice to the designer that
... the engineer must be con-sistently aware of exactlywhat the load is intended torepresent.
T
he reader, at this point,may be thinking, “boy, itT
sure is convenient that themaximum influence ordi-nates fall at tenth points alongeach span.”
Downloaded from Digital Engineering Library @ McGraw-Hill (www.digitalengineeringlibrary.com)Copyright © 2006 The McGraw-Hill Companies. All rights reserved.
Any use is subject to the Terms of Use as given at the website.
Design of Superstructure Elements
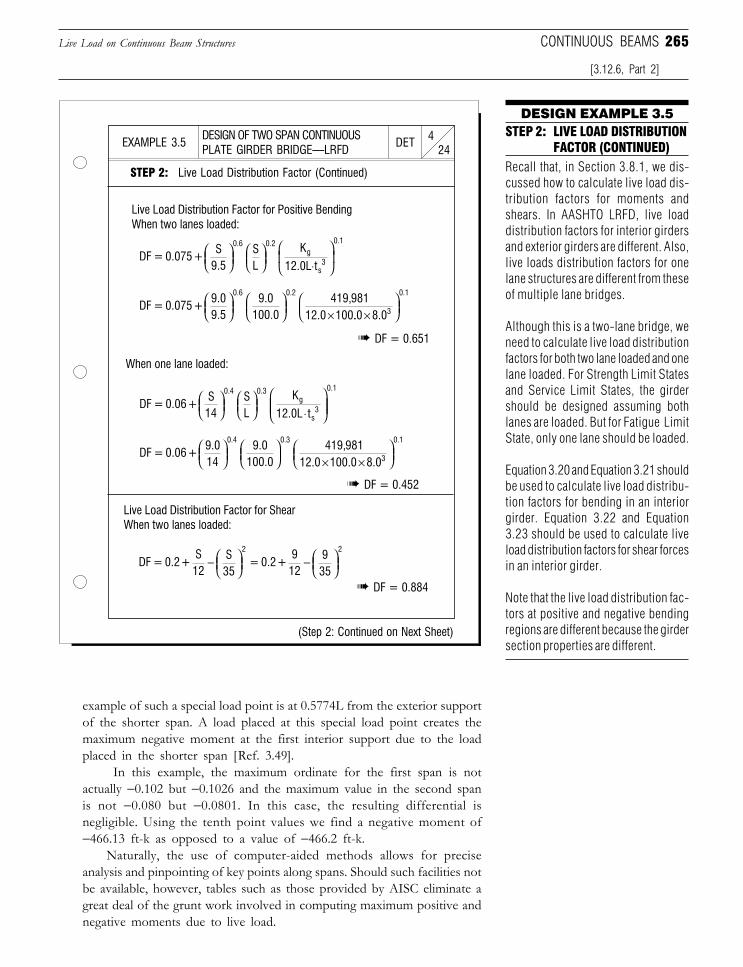
265Live Load on Continuous Beam Structures
example of such a special load point is at 0.5774L from the exterior supportof the shorter span. A load placed at this special load point creates themaximum negative moment at the first interior support due to the loadplaced in the shorter span [Ref. 3.49].
In this example, the maximum ordinate for the first span is notactually −0.102 but −0.1026 and the maximum value in the second spanis not −0.080 but −0.0801. In this case, the resulting differential isnegligible. Using the tenth point values we find a negative moment of−466.13 ft-k as opposed to a value of −466.2 ft-k.
Naturally, the use of computer-aided methods allows for preciseanalysis and pinpointing of key points along spans. Should such facilities notbe available, however, tables such as those provided by AISC eliminate agreat deal of the grunt work involved in computing maximum positive andnegative moments due to live load.
[3.12.6, Part 2]
CONTINUOUS BEAMS
DESIGN OF TWO SPAN CONTINUOUSPLATE GIRDER BRIDGE—LRFD 24
4DETEXAMPLE 3.5
DESIGN EXAMPLE 3.5
STEP 2: Live Load Distribution Factor (Continued)
Live Load Distribution Factor for Positive BendingWhen two lanes loaded:
STEP 2: LIVE LOAD DISTRIBUTIONFACTOR (CONTINUED)
Recall that, in Section 3.8.1, we dis-cussed how to calculate live load dis-tribution factors for moments andshears. In AASHTO LRFD, live loaddistribution factors for interior girdersand exterior girders are different. Also,live loads distribution factors for onelane structures are different from theseof multiple lane bridges.
Although this is a two-lane bridge, weneed to calculate live load distributionfactors for both two lane loaded and onelane loaded. For Strength Limit Statesand Service Limit States, the girdershould be designed assuming bothlanes are loaded. But for Fatigue LimitState, only one lane should be loaded.
Equation 3.20 and Equation 3.21 shouldbe used to calculate live load distribu-tion factors for bending in an interiorgirder. Equation 3.22 and Equation3.23 should be used to calculate liveload distribution factors for shear forcesin an interior girder.
Note that the live load distribution fac-tors at positive and negative bendingregions are different because the girdersection properties are different.
(Step 2: Continued on Next Sheet)
➠ DF = 0.651
When one lane loaded:
➠ DF = 0.452
Live Load Distribution Factor for ShearWhen two lanes loaded:
➠ DF = 0.884
DF = 0.075+S
9.5SL
K
12.0L t
0.6 0.2g
s3
0.1
⋅
DF = 0.06+S
14SL
K
12.0L t
0.4 0.3g
s3
0.1
⋅
DF = 0.2+S
12S35
= 0.2+9
129
35
2 2
−
−
DF = 0.075+9.09.5
9.0100.0
419,98112.0 100
0.6 0.2
× ..0 8.03
0.1
×
DF = 0.06+9.014
9.0100.0
419,98112.0 100.0
0.4 0.3
× 8.03
0.1
×
Downloaded from Digital Engineering Library @ McGraw-Hill (www.digitalengineeringlibrary.com)Copyright © 2006 The McGraw-Hill Companies. All rights reserved.
Any use is subject to the Terms of Use as given at the website.
Design of Superstructure Elements
266 SECTION 3 THE SUPERSTRUCTURE
3. Maximum Shear. In continuous beams, shear is computed alongthe spans using influence lines in a fashion similar to that discussedpreviously for moment. A difference, however, is that in AASHTOStandard specifications, truck loading generally governs for shearexcept for very long spans. That is, where lane loading may govern formoment, it is quite possible that truck loading governs for shear. Shouldlane loading govern, however, the designer should note that theconcentrated load used is 26 k rather than the 18 k load used formoment (AASHTO 3.7.1.2).
There exist, approximate span length limits where truck loading willgovern for shear. If a span length falls below the limit listed below, truckloading will generally govern [Ref. 3.12]. Larger values usually indicate ageometry where lane loading controls. These limits are defined as:
❏ Shear and Reaction at the End Support: Up To 140 ft❏ Shear at Left of First Interior Support: Up To 110 ft❏ Shear at Right of First Interior Support: Up To 110 ft❏ Reaction at First Interior Point: Up To 58 ft
These numbers are just guidelines. Designers should calculate bothlane loading and truck loading, and design each component based onthe most critical loading. Of course, if AASHTO LRFD is used, wehave to add lane loading to truck or tandem loading to get the designforces.
For exterior spans, it is usually sufficient to calculate shear at certainkey points such as the end supports, the point 0.4L from the closest endsupport, and in the negative shear region just to the left of the first interiorsupport. These points can then be connected by straight line segments todevelop the final shear diagram.
4. Impact for Continuous Beams. In AASHTO Standard Speci-fications, Equation 3.15 in Section 3.5.3, Part 7, defined the application oflive load impact. However, when computing the live load impact factor fora continuous beam the question arises as to what the value of L (the lengthof the loaded span) is for a continuous beam.
The value used for L will vary depending on whether the beam is beinganalyzed for positive or negative moment, as outlined below (AASHTO3.8.2.2):
❏ Positive Moment: Length of Span in Question❏ Negative Moment: Average of Two Adjacent Loaded Spans
When spans of varying length are used, the designer should take careto note the variable nature of the impact factor for continuous beams.
In AASHTO LRFD Specifications, live load impact is not affected by theconfiguration of the structure. The impact of 33% should be used exceptfor fatigue, and for fracture limit states, 15% should be used. For deckjoints, a 75% impact for all limit states must be used. Note that no impactshould be applied to the lane loading in any case.
Live Load on Continuous Beam Structures
[3.12.6, Part 3]
hen spans of varyinglength are used, the de-
signer should take care to notethe variable nature of the im-pact factor for continuousbeams.
W
Downloaded from Digital Engineering Library @ McGraw-Hill (www.digitalengineeringlibrary.com)Copyright © 2006 The McGraw-Hill Companies. All rights reserved.
Any use is subject to the Terms of Use as given at the website.
Design of Superstructure Elements
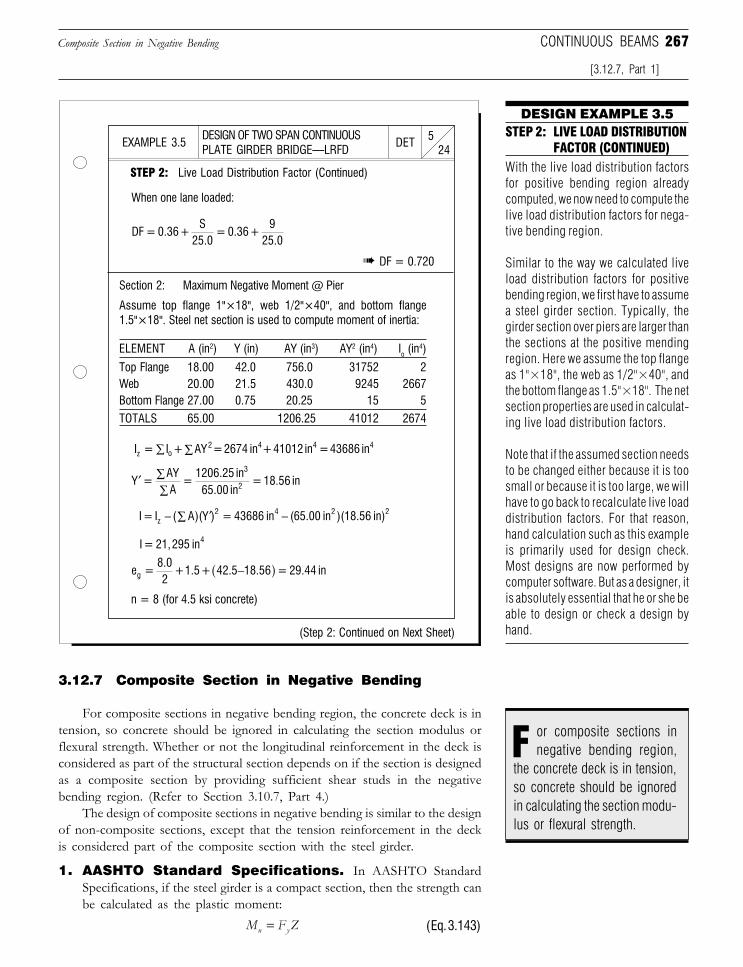
267
DESIGN OF TWO SPAN CONTINUOUSPLATE GIRDER BRIDGE—LRFD 24
5DETEXAMPLE 3.5
STEP 2: Live Load Distribution Factor (Continued)
When one lane loaded:
➠ DF = 0.720
Section 2: Maximum Negative Moment @ Pier
Assume top flange 1"×18", web 1/2"×40", and bottom flange1.5"×18". Steel net section is used to compute moment of inertia:
ELEMENT A (in2) Y (in) AY (in3) AY2 (in4) Io (in4)
Top Flange 18.00 42.0 756.0 31752 2Web 20.00 21.5 430.0 9245 2667Bottom Flange 27.00 0.75 20.25 15 5
TOTALS 65.00 1206.25 41012 2674
n = 8 (for 4.5 ksi concrete)
(Step 2: Continued on Next Sheet)
DF = 0.36+S
25.0= 0.36+
925.0
I = I + AY = 2674 in + 41012 in = 43686 inz o 2
4 4 4∑∑
′ ∑∑
Y =AYA
=1206.25 in
65.00 in= 18.56 in
3
2
I = 21,295 in4
e =8.02
+ 1.5+ 42.5 18.56 = 29.44 ing −( )
3.12.7 Composite Section in Negative Bending
For composite sections in negative bending region, the concrete deck is intension, so concrete should be ignored in calculating the section modulus orflexural strength. Whether or not the longitudinal reinforcement in the deck isconsidered as part of the structural section depends on if the section is designedas a composite section by providing sufficient shear studs in the negativebending region. (Refer to Section 3.10.7, Part 4.)
The design of composite sections in negative bending is similar to the designof non-composite sections, except that the tension reinforcement in the deckis considered part of the composite section with the steel girder.
1. AASHTO Standard Specifications. In AASHTO StandardSpecifications, if the steel girder is a compact section, then the strength canbe calculated as the plastic moment:
M F Zn y= (Eq. 3.143)
Composite Section in Negative Bending
[3.12.7, Part 1]
CONTINUOUS BEAMS
DESIGN EXAMPLE 3.5STEP 2: LIVE LOAD DISTRIBUTION
FACTOR (CONTINUED)With the live load distribution factorsfor positive bending region alreadycomputed, we now need to compute thelive load distribution factors for nega-tive bending region.
Similar to the way we calculated liveload distribution factors for positivebending region, we first have to assumea steel girder section. Typically, thegirder section over piers are larger thanthe sections at the positive mendingregion. Here we assume the top flangeas 1"×18", the web as 1/2"×40", andthe bottom flange as 1.5"×18". The netsection properties are used in calculat-ing live load distribution factors.
Note that if the assumed section needsto be changed either because it is toosmall or because it is too large, we willhave to go back to recalculate live loaddistribution factors. For that reason,hand calculation such as this exampleis primarily used for design check.Most designs are now performed bycomputer software. But as a designer, itis absolutely essential that he or she beable to design or check a design byhand.
or composite sections innegative bending region,F
the concrete deck is in tension,so concrete should be ignoredin calculating the section modu-lus or flexural strength.
I = I ( A)(Y ) = 43686 in (65.00 in )(18.56 in)z2 4 2 2− ∑ ′ −
Downloaded from Digital Engineering Library @ McGraw-Hill (www.digitalengineeringlibrary.com)Copyright © 2006 The McGraw-Hill Companies. All rights reserved.
Any use is subject to the Terms of Use as given at the website.
Design of Superstructure Elements
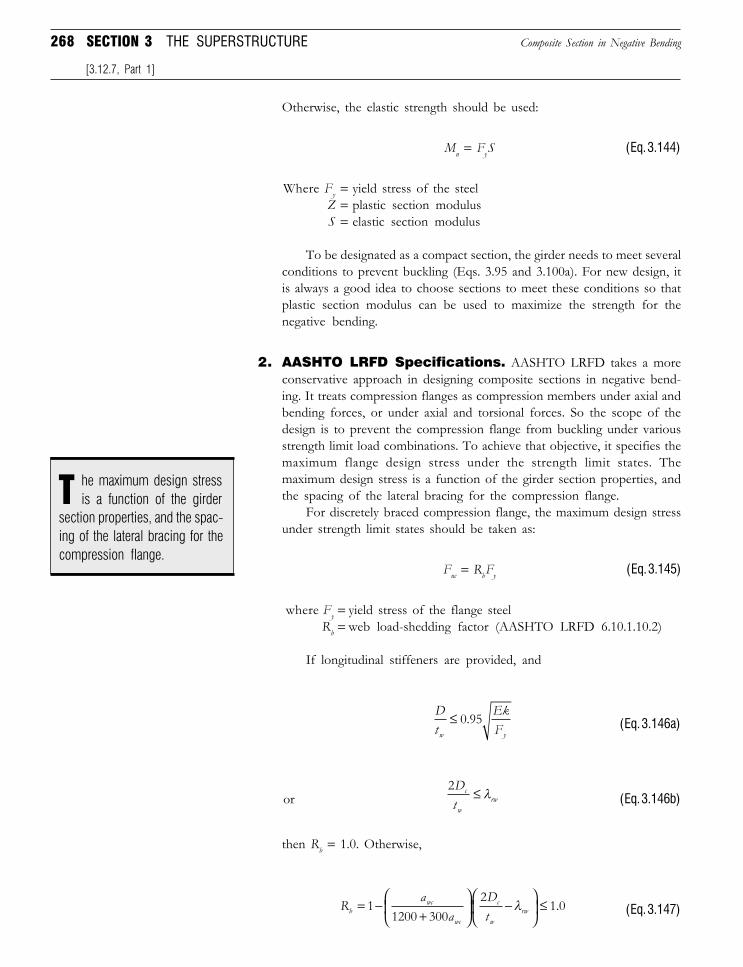
268 SECTION 3 THE SUPERSTRUCTURE
Otherwise, the elastic strength should be used:
Mn = FyS (Eq. 3.144)
Where Fy = yield stress of the steelZ = plastic section modulusS = elastic section modulus
To be designated as a compact section, the girder needs to meet severalconditions to prevent buckling (Eqs. 3.95 and 3.100a). For new design, itis always a good idea to choose sections to meet these conditions so thatplastic section modulus can be used to maximize the strength for thenegative bending.
2. AASHTO LRFD Specifications. AASHTO LRFD takes a moreconservative approach in designing composite sections in negative bend-ing. It treats compression flanges as compression members under axial andbending forces, or under axial and torsional forces. So the scope of thedesign is to prevent the compression flange from buckling under variousstrength limit load combinations. To achieve that objective, it specifies themaximum flange design stress under the strength limit states. Themaximum design stress is a function of the girder section properties, andthe spacing of the lateral bracing for the compression flange.
For discretely braced compression flange, the maximum design stressunder strength limit states should be taken as:
Fnc = RbFy (Eq. 3.145)
where Fy = yield stress of the flange steelRb = web load-shedding factor (AASHTO LRFD 6.10.1.10.2)
If longitudinal stiffeners are provided, and
Dt
EkFw y
≤ 0 95. (Eq. 3.146a)
or2Dtc
wrw≤ λ (Eq. 3.146b)
then Rb = 1.0. Otherwise,
Ra
aDtb
wc
wc
c
wrw= −
+
−
≤1
1200 3002
1 0λ . (Eq. 3.147)
Composite Section in Negative Bending
[3.12.7, Part 1]
he maximum design stressis a function of the girderT
section properties, and the spac-ing of the lateral bracing for thecompression flange.
Downloaded from Digital Engineering Library @ McGraw-Hill (www.digitalengineeringlibrary.com)Copyright © 2006 The McGraw-Hill Companies. All rights reserved.
Any use is subject to the Terms of Use as given at the website.
Design of Superstructure Elements
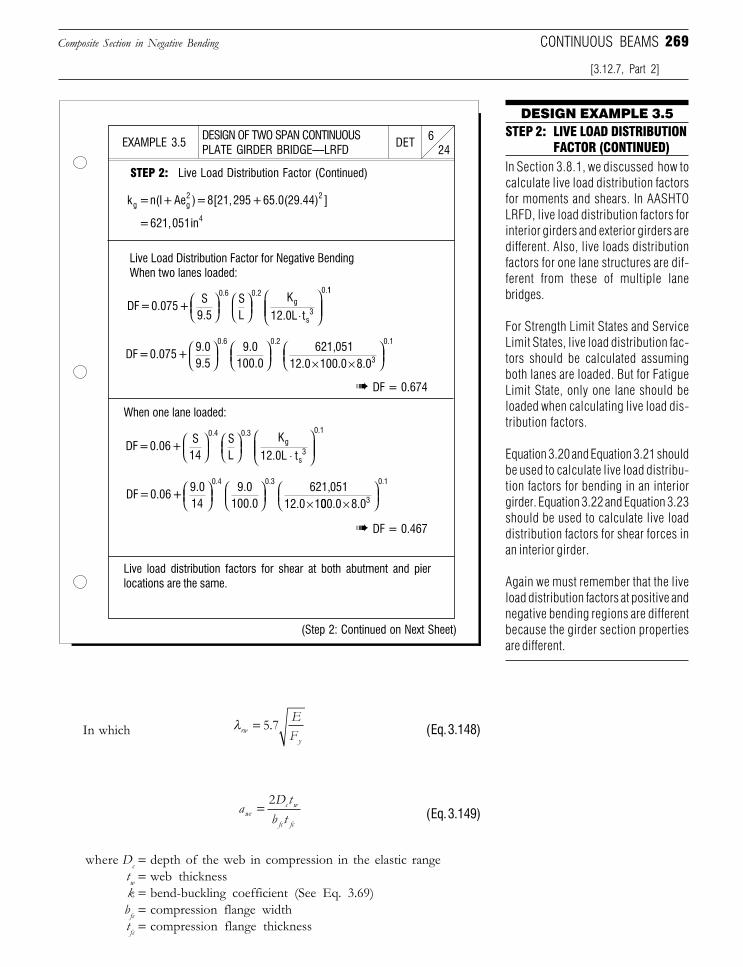
269
In which λrwy
EF
= 5 7. (Eq. 3.148)
aD tb twc
c w
fc fc
= 2(Eq. 3.149)
where Dc = depth of the web in compression in the elastic rangetw = web thicknessk = bend-buckling coefficient (See Eq. 3.69)bfc = compression flange widthtfc = compression flange thickness
Composite Section in Negative Bending
[3.12.7, Part 2]
CONTINUOUS BEAMS
DESIGN OF TWO SPAN CONTINUOUSPLATE GIRDER BRIDGE—LRFD 24
6DETEXAMPLE 3.5
DESIGN EXAMPLE 3.5STEP 2: LIVE LOAD DISTRIBUTION
FACTOR (CONTINUED)In Section 3.8.1, we discussed how tocalculate live load distribution factorsfor moments and shears. In AASHTOLRFD, live load distribution factors forinterior girders and exterior girders aredifferent. Also, live loads distributionfactors for one lane structures are dif-ferent from these of multiple lanebridges.
For Strength Limit States and ServiceLimit States, live load distribution fac-tors should be calculated assumingboth lanes are loaded. But for FatigueLimit State, only one lane should beloaded when calculating live load dis-tribution factors.
Equation 3.20 and Equation 3.21 shouldbe used to calculate live load distribu-tion factors for bending in an interiorgirder. Equation 3.22 and Equation 3.23should be used to calculate live loaddistribution factors for shear forces inan interior girder.
Again we must remember that the liveload distribution factors at positive andnegative bending regions are differentbecause the girder section propertiesare different.
STEP 2: Live Load Distribution Factor (Continued)
Live Load Distribution Factor for Negative BendingWhen two lanes loaded:
➠ DF = 0.674
When one lane loaded:
➠ DF = 0.467
Live load distribution factors for shear at both abutment and pierlocations are the same.
(Step 2: Continued on Next Sheet)
= 621,051in4
DF = 0.075 + S
9.5SL
K
12.0L t
0.6 0.2g
s3
0.
⋅
11
DF = 0.075 + 9.09.5
9.0100.0
621,05112.0
0.6 0.2
× 100.0 8.03
0.1
×
DF = 0.06 + 9.014
9.0100.0
621,05112.0 1
0.4 0.3
× 000.0 8.03
0.1
×
k = n(I + Ae ) = 8[21,295 + 65.0(29.44) ]g g2 2
DF = 0.06 + S
14SL
K
12.0L t
0.4 0.3g
s3
0.1
⋅
Downloaded from Digital Engineering Library @ McGraw-Hill (www.digitalengineeringlibrary.com)Copyright © 2006 The McGraw-Hill Companies. All rights reserved.
Any use is subject to the Terms of Use as given at the website.
Design of Superstructure Elements
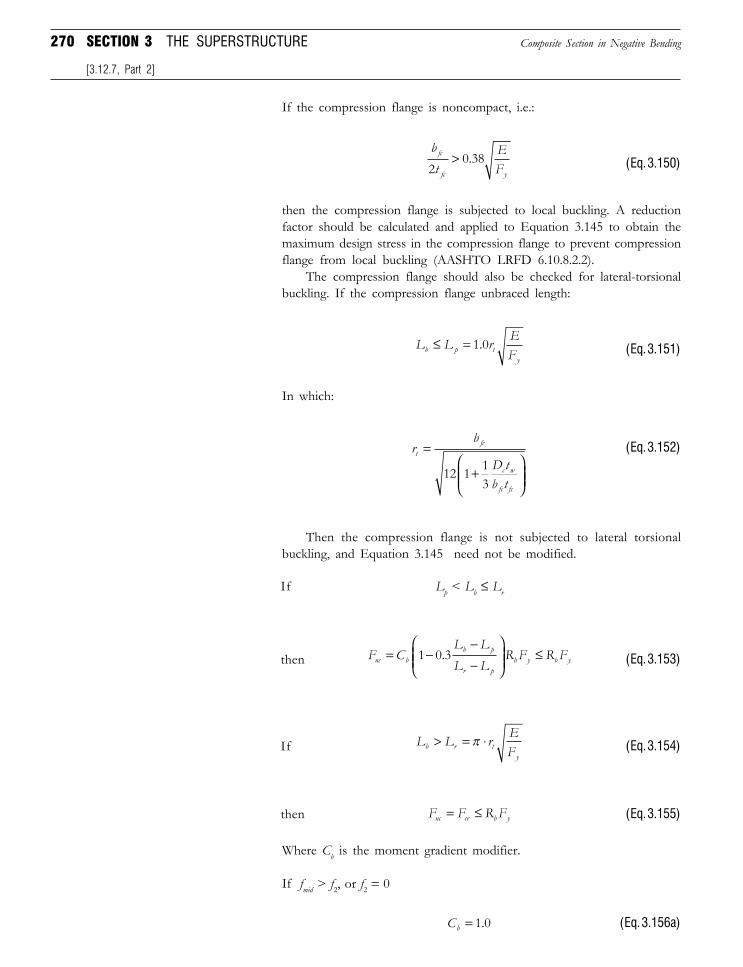
270 SECTION 3 THE SUPERSTRUCTURE
If the compression flange is noncompact, i.e.:
bt
EF
fc
fc y20 38> . (Eq. 3.150)
then the compression flange is subjected to local buckling. A reductionfactor should be calculated and applied to Equation 3.145 to obtain themaximum design stress in the compression flange to prevent compressionflange from local buckling (AASHTO LRFD 6.10.8.2.2).
The compression flange should also be checked for lateral-torsionalbuckling. If the compression flange unbraced length:
L L r EFb p ty
≤ = 1 0. (Eq. 3.151)
In which:
rb
D tb t
tfc
c w
fc fc
=
+
12 1 1
3
(Eq. 3.152)
Then the compression flange is not subjected to lateral torsionalbuckling, and Equation 3.145 need not be modified.
If Lp < Lb ≤ Lr
then F CL LL L
R F R Fnc bb p
r pb y b y= −
−−
≤1 0 3. (Eq. 3.153)
If L L r EFb r ty
> = ⋅π (Eq. 3.154)
then F F R Fnc cr b y= ≤ (Eq. 3.155)
Where Cb is the moment gradient modifier.
If fmid > f2, or f2 = 0
Cb = 1 0. (Eq. 3.156a)
Composite Section in Negative Bending
[3.12.7, Part 2]
Downloaded from Digital Engineering Library @ McGraw-Hill (www.digitalengineeringlibrary.com)Copyright © 2006 The McGraw-Hill Companies. All rights reserved.
Any use is subject to the Terms of Use as given at the website.
Design of Superstructure Elements
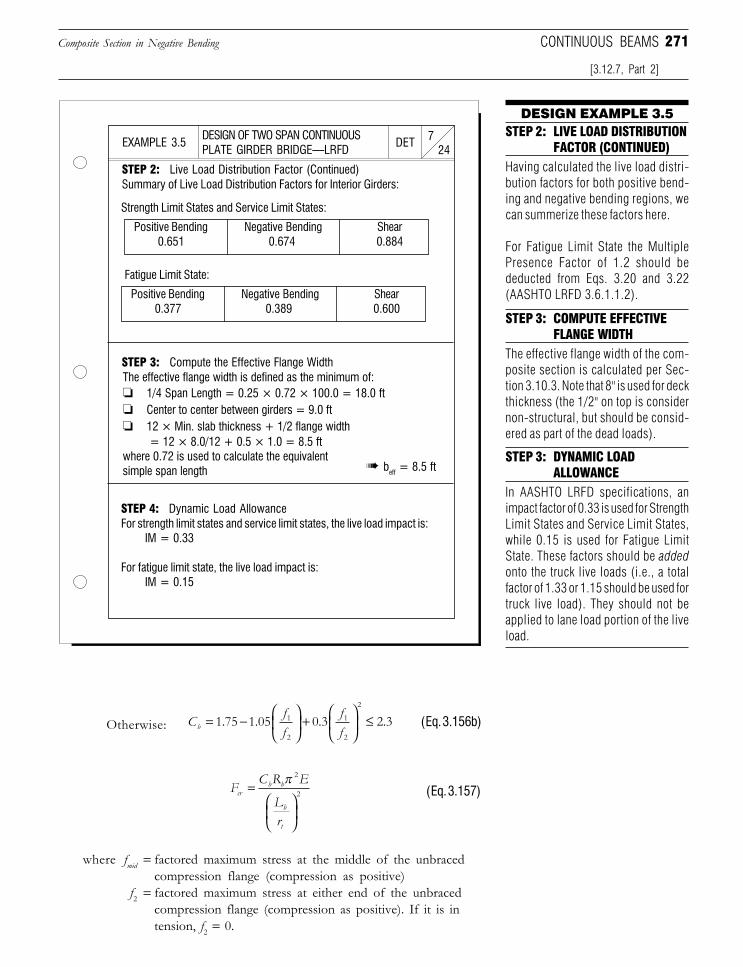
271
The effective flange width is defined as the minimum of:❏ 1/4 Span Length = 0.25 × 0.72 × 100.0 = 18.0 ft❏ Center to center between girders = 9.0 ft❏ 12 × Min. slab thickness + 1/2 flange width
= 12 × 8.0/12 + 0.5 × 1.0 = 8.5 ftwhere 0.72 is used to calculate the equivalentsimple span length
Otherwise: Cff
ffb = −
+
≤1 75 1 05 0 3 2 31
2
1
2
2
. . . . (Eq. 3.156b)
FC R E
Lr
crb b
b
t
=
π 2
2 (Eq. 3.157)
where fmid = factored maximum stress at the middle of the unbracedcompression flange (compression as positive)
f2 = factored maximum stress at either end of the unbracedcompression flange (compression as positive). If it is intension, f2 = 0.
Composite Section in Negative Bending
[3.12.7, Part 2]
CONTINUOUS BEAMS
DESIGN OF TWO SPAN CONTINUOUSPLATE GIRDER BRIDGE—LRFD 24
7DETEXAMPLE 3.5
DESIGN EXAMPLE 3.5STEP 2: LIVE LOAD DISTRIBUTION
FACTOR (CONTINUED)Having calculated the live load distri-bution factors for both positive bend-ing and negative bending regions, wecan summerize these factors here.
For Fatigue Limit State the MultiplePresence Factor of 1.2 should bededucted from Eqs. 3.20 and 3.22(AASHTO LRFD 3.6.1.1.2).
STEP 2: Live Load Distribution Factor (Continued)
➠ beff = 8.5 ft
Positive Bending Negative Bending Shear 0.651 0.674 0.884
Summary of Live Load Distribution Factors for Interior Girders:
Strength Limit States and Service Limit States:
Positive Bending Negative Bending Shear 0.377 0.389 0.600
Fatigue Limit State:
STEP 3: Compute the Effective Flange Width
STEP 4: Dynamic Load AllowanceFor strength limit states and service limit states, the live load impact is:
IM = 0.33
For fatigue limit state, the live load impact is:IM = 0.15
STEP 3: COMPUTE EFFECTIVEFLANGE WIDTH
The effective flange width of the com-posite section is calculated per Sec-tion 3.10.3. Note that 8" is used for deckthickness (the 1/2" on top is considernon-structural, but should be consid-ered as part of the dead loads).
STEP 3: DYNAMIC LOADALLOWANCE
In AASHTO LRFD specifications, animpact factor of 0.33 is used for StrengthLimit States and Service Limit States,while 0.15 is used for Fatigue LimitState. These factors should be addedonto the truck live loads (i.e., a totalfactor of 1.33 or 1.15 should be used fortruck live load). They should not beapplied to lane load portion of the liveload.
Downloaded from Digital Engineering Library @ McGraw-Hill (www.digitalengineeringlibrary.com)Copyright © 2006 The McGraw-Hill Companies. All rights reserved.
Any use is subject to the Terms of Use as given at the website.
Design of Superstructure Elements
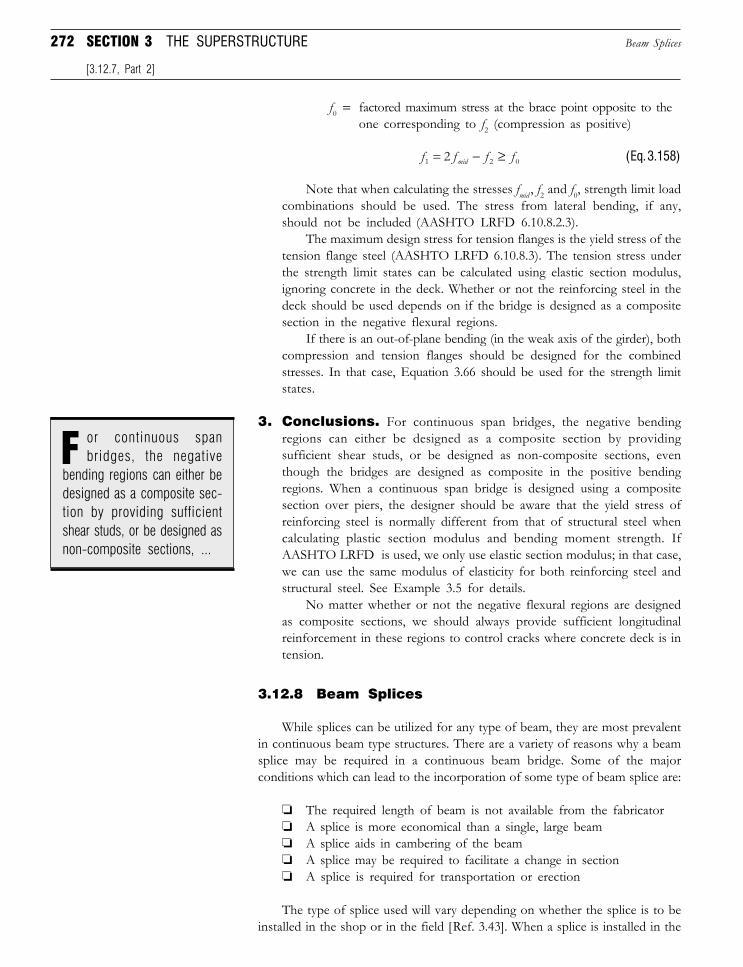
272 SECTION 3 THE SUPERSTRUCTURE
f0 = factored maximum stress at the brace point opposite to theone corresponding to f2 (compression as positive)
f f f fmid1 2 02= − ≥ (Eq. 3.158)
Note that when calculating the stresses fmid , f2 and f0, strength limit loadcombinations should be used. The stress from lateral bending, if any,should not be included (AASHTO LRFD 6.10.8.2.3).
The maximum design stress for tension flanges is the yield stress of thetension flange steel (AASHTO LRFD 6.10.8.3). The tension stress underthe strength limit states can be calculated using elastic section modulus,ignoring concrete in the deck. Whether or not the reinforcing steel in thedeck should be used depends on if the bridge is designed as a compositesection in the negative flexural regions.
If there is an out-of-plane bending (in the weak axis of the girder), bothcompression and tension flanges should be designed for the combinedstresses. In that case, Equation 3.66 should be used for the strength limitstates.
3. Conclusions. For continuous span bridges, the negative bendingregions can either be designed as a composite section by providingsufficient shear studs, or be designed as non-composite sections, eventhough the bridges are designed as composite in the positive bendingregions. When a continuous span bridge is designed using a compositesection over piers, the designer should be aware that the yield stress ofreinforcing steel is normally different from that of structural steel whencalculating plastic section modulus and bending moment strength. IfAASHTO LRFD is used, we only use elastic section modulus; in that case,we can use the same modulus of elasticity for both reinforcing steel andstructural steel. See Example 3.5 for details.
No matter whether or not the negative flexural regions are designedas composite sections, we should always provide sufficient longitudinalreinforcement in these regions to control cracks where concrete deck is intension.
3.12.8 Beam Splices
While splices can be utilized for any type of beam, they are most prevalentin continuous beam type structures. There are a variety of reasons why a beamsplice may be required in a continuous beam bridge. Some of the majorconditions which can lead to the incorporation of some type of beam splice are:
❏ The required length of beam is not available from the fabricator❏ A splice is more economical than a single, large beam❏ A splice aids in cambering of the beam❏ A splice may be required to facilitate a change in section❏ A splice is required for transportation or erection
The type of splice used will vary depending on whether the splice is to beinstalled in the shop or in the field [Ref. 3.43]. When a splice is installed in the
Beam Splices
[3.12.7, Part 2]
or continuous spanbridges, the negative
bending regions can either bedesigned as a composite sec-tion by providing sufficientshear studs, or be designed asnon-composite sections, ...
F
Downloaded from Digital Engineering Library @ McGraw-Hill (www.digitalengineeringlibrary.com)Copyright © 2006 The McGraw-Hill Companies. All rights reserved.
Any use is subject to the Terms of Use as given at the website.
Design of Superstructure Elements
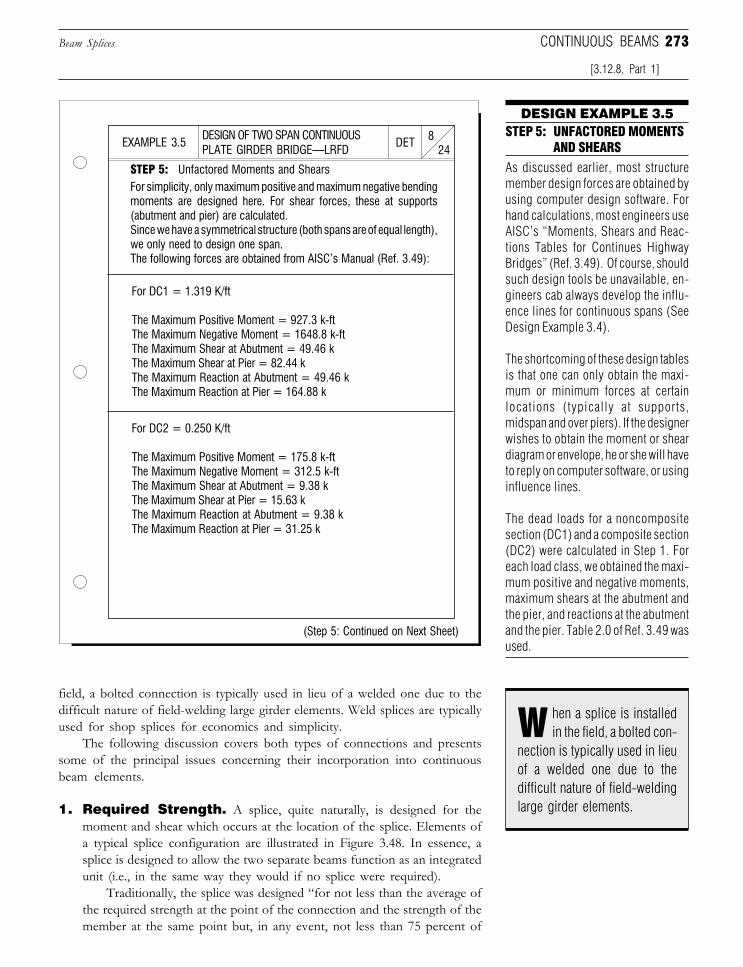
273
field, a bolted connection is typically used in lieu of a welded one due to thedifficult nature of field-welding large girder elements. Weld splices are typicallyused for shop splices for economics and simplicity.
The following discussion covers both types of connections and presentssome of the principal issues concerning their incorporation into continuousbeam elements.
1. Required Strength. A splice, quite naturally, is designed for themoment and shear which occurs at the location of the splice. Elements ofa typical splice configuration are illustrated in Figure 3.48. In essence, asplice is designed to allow the two separate beams function as an integratedunit (i.e., in the same way they would if no splice were required).
Traditionally, the splice was designed “for not less than the average ofthe required strength at the point of the connection and the strength of themember at the same point but, in any event, not less than 75 percent of
Beam Splices
[3.12.8, Part 1]
CONTINUOUS BEAMS
DESIGN OF TWO SPAN CONTINUOUSPLATE GIRDER BRIDGE—LRFD 24
8DETEXAMPLE 3.5
DESIGN EXAMPLE 3.5STEP 5: UNFACTORED MOMENTS
AND SHEARS
As discussed earlier, most structuremember design forces are obtained byusing computer design software. Forhand calculations, most engineers useAISC’s “Moments, Shears and Reac-tions Tables for Continues HighwayBridges” (Ref. 3.49). Of course, shouldsuch design tools be unavailable, en-gineers cab always develop the influ-ence lines for continuous spans (SeeDesign Example 3.4).
The shortcoming of these design tablesis that one can only obtain the maxi-mum or minimum forces at certainlocations (typically at supports,midspan and over piers). If the designerwishes to obtain the moment or sheardiagram or envelope, he or she will haveto reply on computer software, or usinginfluence lines.
The dead loads for a noncompositesection (DC1) and a composite section(DC2) were calculated in Step 1. Foreach load class, we obtained the maxi-mum positive and negative moments,maximum shears at the abutment andthe pier, and reactions at the abutmentand the pier. Table 2.0 of Ref. 3.49 wasused.
STEP 5: Unfactored Moments and ShearsFor simplicity, only maximum positive and maximum negative bendingmoments are designed here. For shear forces, these at supports(abutment and pier) are calculated.Since we have a symmetrical structure (both spans are of equal length),we only need to design one span.The following forces are obtained from AISC’s Manual (Ref. 3.49):
For DC1 = 1.319 K/ft
The Maximum Positive Moment = 927.3 k-ftThe Maximum Negative Moment = 1648.8 k-ftThe Maximum Shear at Abutment = 49.46 kThe Maximum Shear at Pier = 82.44 kThe Maximum Reaction at Abutment = 49.46 kThe Maximum Reaction at Pier = 164.88 k
For DC2 = 0.250 K/ft
The Maximum Positive Moment = 175.8 k-ftThe Maximum Negative Moment = 312.5 k-ftThe Maximum Shear at Abutment = 9.38 kThe Maximum Shear at Pier = 15.63 kThe Maximum Reaction at Abutment = 9.38 kThe Maximum Reaction at Pier = 31.25 k
(Step 5: Continued on Next Sheet)
hen a splice is installedin the field, a bolted con-
nection is typically used in lieuof a welded one due to thedifficult nature of field-weldinglarge girder elements.
W
Downloaded from Digital Engineering Library @ McGraw-Hill (www.digitalengineeringlibrary.com)Copyright © 2006 The McGraw-Hill Companies. All rights reserved.
Any use is subject to the Terms of Use as given at the website.
Design of Superstructure Elements
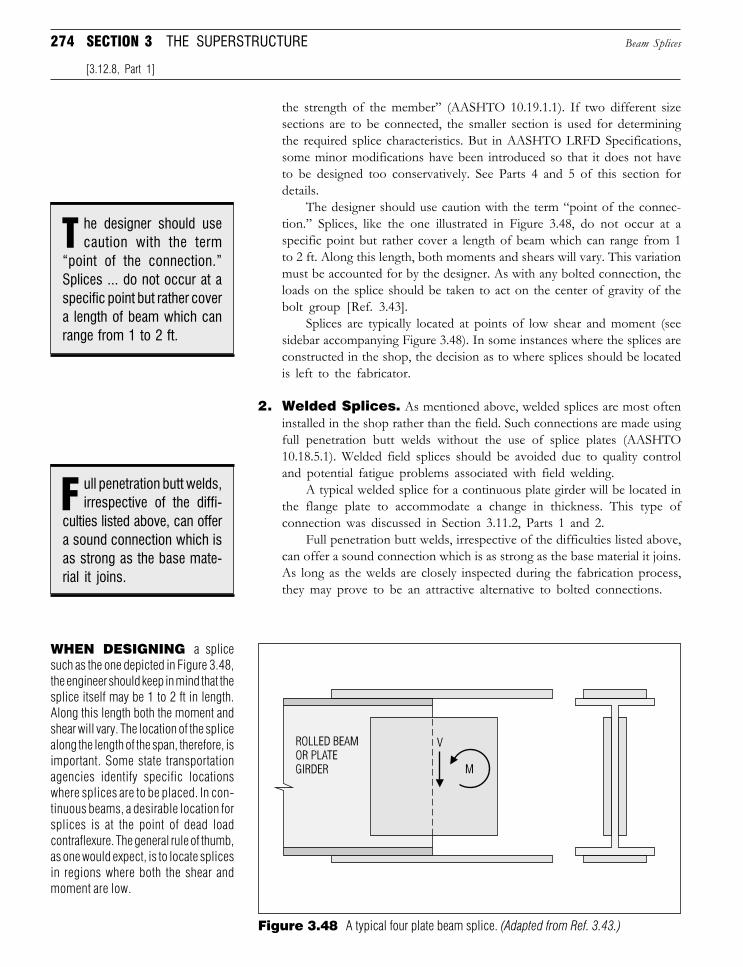
274 SECTION 3 THE SUPERSTRUCTURE
the strength of the member” (AASHTO 10.19.1.1). If two different sizesections are to be connected, the smaller section is used for determiningthe required splice characteristics. But in AASHTO LRFD Specifications,some minor modifications have been introduced so that it does not haveto be designed too conservatively. See Parts 4 and 5 of this section fordetails.
The designer should use caution with the term “point of the connec-tion.” Splices, like the one illustrated in Figure 3.48, do not occur at aspecific point but rather cover a length of beam which can range from 1to 2 ft. Along this length, both moments and shears will vary. This variationmust be accounted for by the designer. As with any bolted connection, theloads on the splice should be taken to act on the center of gravity of thebolt group [Ref. 3.43].
Splices are typically located at points of low shear and moment (seesidebar accompanying Figure 3.48). In some instances where the splices areconstructed in the shop, the decision as to where splices should be locatedis left to the fabricator.
2. Welded Splices. As mentioned above, welded splices are most ofteninstalled in the shop rather than the field. Such connections are made usingfull penetration butt welds without the use of splice plates (AASHTO10.18.5.1). Welded field splices should be avoided due to quality controland potential fatigue problems associated with field welding.
A typical welded splice for a continuous plate girder will be located inthe flange plate to accommodate a change in thickness. This type ofconnection was discussed in Section 3.11.2, Parts 1 and 2.
Full penetration butt welds, irrespective of the difficulties listed above,can offer a sound connection which is as strong as the base material it joins.As long as the welds are closely inspected during the fabrication process,they may prove to be an attractive alternative to bolted connections.
Beam Splices
[3.12.8, Part 1]
Figure 3.48 A typical four plate beam splice. (Adapted from Ref. 3.43.)
WHEN DESIGNING a splicesuch as the one depicted in Figure 3.48,the engineer should keep in mind that thesplice itself may be 1 to 2 ft in length.Along this length both the moment andshear will vary. The location of the splicealong the length of the span, therefore, isimportant. Some state transportationagencies identify specific locationswhere splices are to be placed. In con-tinuous beams, a desirable location forsplices is at the point of dead loadcontraflexure. The general rule of thumb,as one would expect, is to locate splicesin regions where both the shear andmoment are low.
he designer should usecaution with the term
“point of the connection.”Splices ... do not occur at aspecific point but rather covera length of beam which canrange from 1 to 2 ft.
T
ull penetration butt welds,irrespective of the diffi-
culties listed above, can offera sound connection which isas strong as the base mate-rial it joins.
F
Downloaded from Digital Engineering Library @ McGraw-Hill (www.digitalengineeringlibrary.com)Copyright © 2006 The McGraw-Hill Companies. All rights reserved.
Any use is subject to the Terms of Use as given at the website.
Design of Superstructure Elements
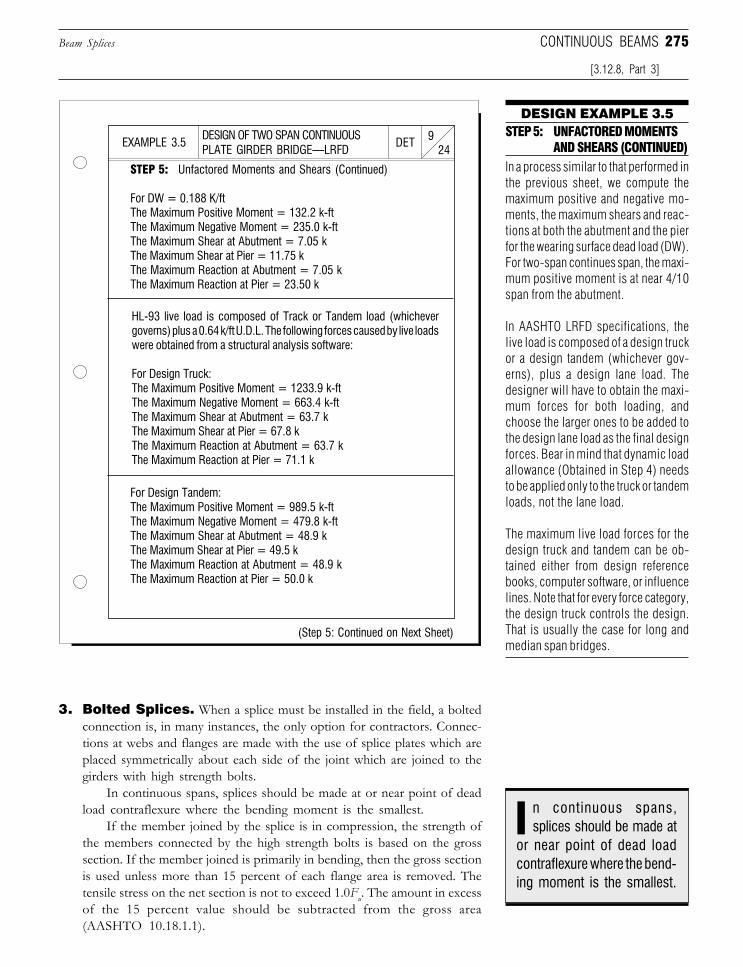
275Beam Splices CONTINUOUS BEAMS
3. Bolted Splices. When a splice must be installed in the field, a boltedconnection is, in many instances, the only option for contractors. Connec-tions at webs and flanges are made with the use of splice plates which areplaced symmetrically about each side of the joint which are joined to thegirders with high strength bolts.
In continuous spans, splices should be made at or near point of deadload contraflexure where the bending moment is the smallest.
If the member joined by the splice is in compression, the strength ofthe members connected by the high strength bolts is based on the grosssection. If the member joined is primarily in bending, then the gross sectionis used unless more than 15 percent of each flange area is removed. Thetensile stress on the net section is not to exceed 1.0Fu. The amount in excessof the 15 percent value should be subtracted from the gross area(AASHTO 10.18.1.1).
[3.12.8, Part 3]
DESIGN OF TWO SPAN CONTINUOUSPLATE GIRDER BRIDGE—LRFD 24
9DETEXAMPLE 3.5
DESIGN EXAMPLE 3.5STEP 5: UNFACTORED MOMENTS
AND SHEARS (CONTINUED)In a process similar to that performed inthe previous sheet, we compute themaximum positive and negative mo-ments, the maximum shears and reac-tions at both the abutment and the pierfor the wearing surface dead load (DW).For two-span continues span, the maxi-mum positive moment is at near 4/10span from the abutment.
In AASHTO LRFD specifications, thelive load is composed of a design truckor a design tandem (whichever gov-erns), plus a design lane load. Thedesigner will have to obtain the maxi-mum forces for both loading, andchoose the larger ones to be added tothe design lane load as the final designforces. Bear in mind that dynamic loadallowance (Obtained in Step 4) needsto be applied only to the truck or tandemloads, not the lane load.
The maximum live load forces for thedesign truck and tandem can be ob-tained either from design referencebooks, computer software, or influencelines. Note that for every force category,the design truck controls the design.That is usually the case for long andmedian span bridges.
STEP 5: Unfactored Moments and Shears (Continued)
(Step 5: Continued on Next Sheet)
For DW = 0.188 K/ftThe Maximum Positive Moment = 132.2 k-ftThe Maximum Negative Moment = 235.0 k-ftThe Maximum Shear at Abutment = 7.05 kThe Maximum Shear at Pier = 11.75 kThe Maximum Reaction at Abutment = 7.05 kThe Maximum Reaction at Pier = 23.50 k
HL-93 live load is composed of Track or Tandem load (whichevergoverns) plus a 0.64 k/ft U.D.L. The following forces caused by live loadswere obtained from a structural analysis software:
For Design Truck:The Maximum Positive Moment = 1233.9 k-ftThe Maximum Negative Moment = 663.4 k-ftThe Maximum Shear at Abutment = 63.7 kThe Maximum Shear at Pier = 67.8 kThe Maximum Reaction at Abutment = 63.7 kThe Maximum Reaction at Pier = 71.1 k
For Design Tandem:The Maximum Positive Moment = 989.5 k-ftThe Maximum Negative Moment = 479.8 k-ftThe Maximum Shear at Abutment = 48.9 kThe Maximum Shear at Pier = 49.5 kThe Maximum Reaction at Abutment = 48.9 kThe Maximum Reaction at Pier = 50.0 k
n continuous spans,splices should be made atI
or near point of dead loadcontraflexure where the bend-ing moment is the smallest.
Downloaded from Digital Engineering Library @ McGraw-Hill (www.digitalengineeringlibrary.com)Copyright © 2006 The McGraw-Hill Companies. All rights reserved.
Any use is subject to the Terms of Use as given at the website.
Design of Superstructure Elements
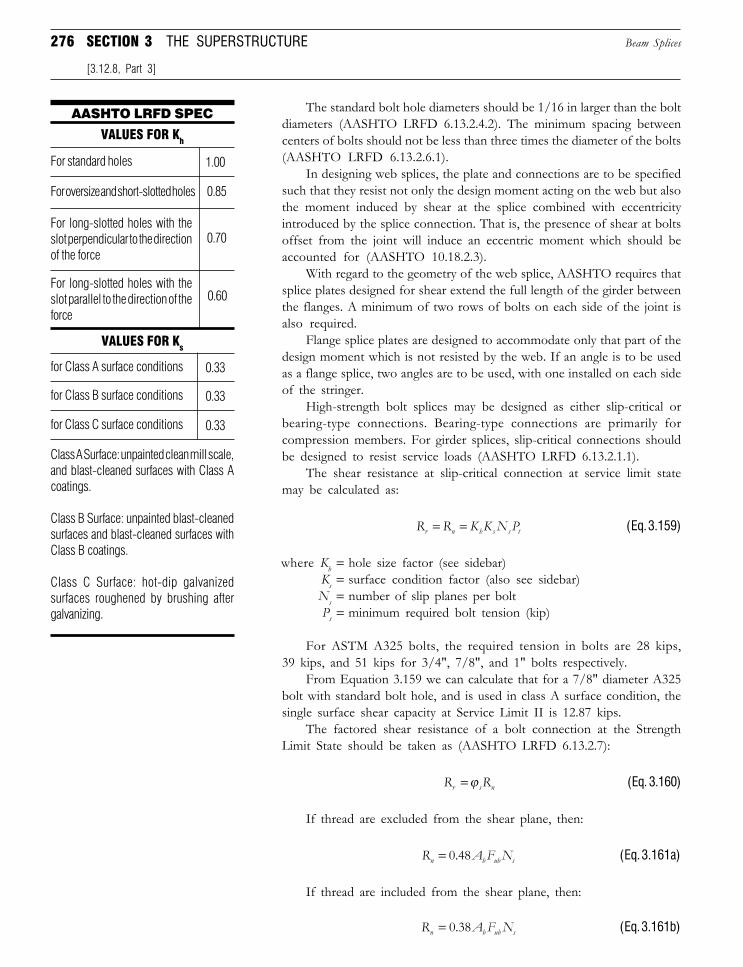
276 SECTION 3 THE SUPERSTRUCTURE
The standard bolt hole diameters should be 1/16 in larger than the boltdiameters (AASHTO LRFD 6.13.2.4.2). The minimum spacing betweencenters of bolts should not be less than three times the diameter of the bolts(AASHTO LRFD 6.13.2.6.1).
In designing web splices, the plate and connections are to be specifiedsuch that they resist not only the design moment acting on the web but alsothe moment induced by shear at the splice combined with eccentricityintroduced by the splice connection. That is, the presence of shear at boltsoffset from the joint will induce an eccentric moment which should beaccounted for (AASHTO 10.18.2.3).
With regard to the geometry of the web splice, AASHTO requires thatsplice plates designed for shear extend the full length of the girder betweenthe flanges. A minimum of two rows of bolts on each side of the joint isalso required.
Flange splice plates are designed to accommodate only that part of thedesign moment which is not resisted by the web. If an angle is to be usedas a flange splice, two angles are to be used, with one installed on each sideof the stringer.
High-strength bolt splices may be designed as either slip-critical orbearing-type connections. Bearing-type connections are primarily forcompression members. For girder splices, slip-critical connections shouldbe designed to resist service loads (AASHTO LRFD 6.13.2.1.1).
The shear resistance at slip-critical connection at service limit statemay be calculated as:
R R K K N Pr n h s s t= = (Eq. 3.159)
where Kh = hole size factor (see sidebar)Ks = surface condition factor (also see sidebar)Ns = number of slip planes per boltPt = minimum required bolt tension (kip)
For ASTM A325 bolts, the required tension in bolts are 28 kips,39 kips, and 51 kips for 3/4", 7/8", and 1" bolts respectively.
From Equation 3.159 we can calculate that for a 7/8" diameter A325bolt with standard bolt hole, and is used in class A surface condition, thesingle surface shear capacity at Service Limit II is 12.87 kips.
The factored shear resistance of a bolt connection at the StrengthLimit State should be taken as (AASHTO LRFD 6.13.2.7):
R Rr s n=ϕ (Eq. 3.160)
If thread are excluded from the shear plane, then:
R A F Nn b ub s= 0 48. (Eq. 3.161a)
If thread are included from the shear plane, then:
R A F Nn b ub s= 0 38. (Eq. 3.161b)
Beam Splices
[3.12.8, Part 3]
AASHTO LRFD SPEC
VALUES FOR Kh
For standard holes
For oversize and short-slotted holes
For long-slotted holes with theslot perpendicular to the directionof the force
For long-slotted holes with theslot parallel to the direction of theforce
1.00
0.85
0.70
0.60
VALUES FOR Ks
for Class A surface conditions 0.33
for Class B surface conditions 0.33
for Class C surface conditions 0.33
Class A Surface: unpainted clean mill scale,and blast-cleaned surfaces with Class Acoatings.
Class B Surface: unpainted blast-cleanedsurfaces and blast-cleaned surfaces withClass B coatings.
Class C Surface: hot-dip galvanizedsurfaces roughened by brushing aftergalvanizing.
Downloaded from Digital Engineering Library @ McGraw-Hill (www.digitalengineeringlibrary.com)Copyright © 2006 The McGraw-Hill Companies. All rights reserved.
Any use is subject to the Terms of Use as given at the website.
Design of Superstructure Elements
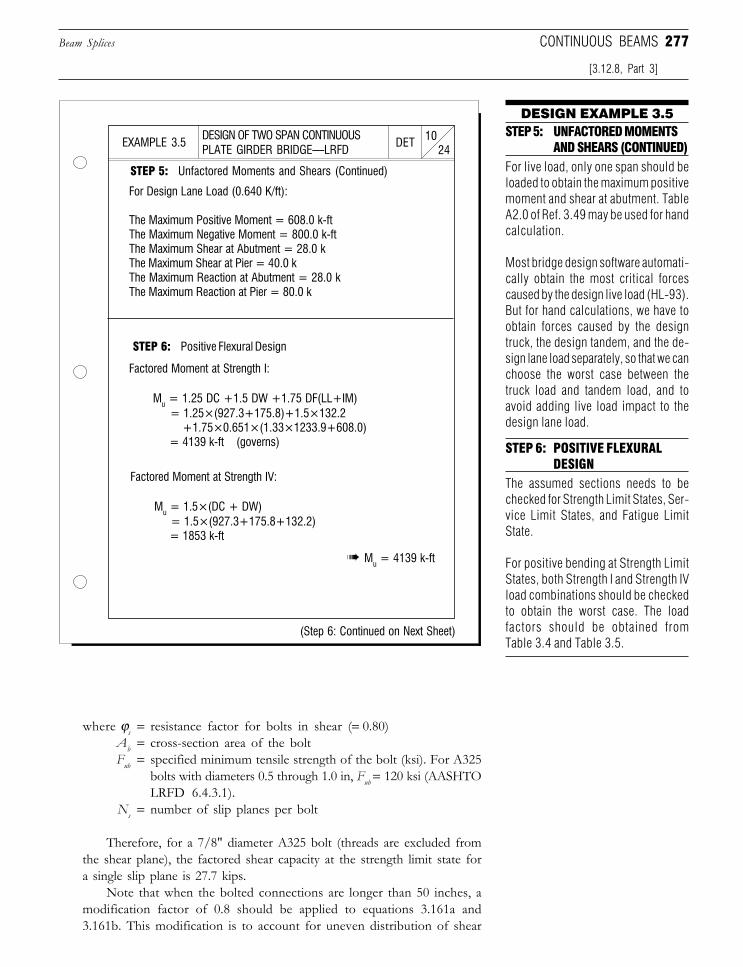
277
where ϕs = resistance factor for bolts in shear (= 0.80)Ab = cross-section area of the boltFub = specified minimum tensile strength of the bolt (ksi). For A325
bolts with diameters 0.5 through 1.0 in, Fub = 120 ksi (AASHTOLRFD 6.4.3.1).
Ns = number of slip planes per bolt
Therefore, for a 7/8" diameter A325 bolt (threads are excluded fromthe shear plane), the factored shear capacity at the strength limit state fora single slip plane is 27.7 kips.
Note that when the bolted connections are longer than 50 inches, amodification factor of 0.8 should be applied to equations 3.161a and3.161b. This modification is to account for uneven distribution of shear
Beam Splices
[3.12.8, Part 3]
CONTINUOUS BEAMS
DESIGN OF TWO SPAN CONTINUOUSPLATE GIRDER BRIDGE—LRFD 24
10DETEXAMPLE 3.5
DESIGN EXAMPLE 3.5STEP 5: UNFACTORED MOMENTS
AND SHEARS (CONTINUED)For live load, only one span should beloaded to obtain the maximum positivemoment and shear at abutment. TableA2.0 of Ref. 3.49 may be used for handcalculation.
Most bridge design software automati-cally obtain the most critical forcescaused by the design live load (HL-93).But for hand calculations, we have toobtain forces caused by the designtruck, the design tandem, and the de-sign lane load separately, so that we canchoose the worst case between thetruck load and tandem load, and toavoid adding live load impact to thedesign lane load.
STEP 5: Unfactored Moments and Shears (Continued)
For Design Lane Load (0.640 K/ft):
The Maximum Positive Moment = 608.0 k-ftThe Maximum Negative Moment = 800.0 k-ftThe Maximum Shear at Abutment = 28.0 kThe Maximum Shear at Pier = 40.0 kThe Maximum Reaction at Abutment = 28.0 kThe Maximum Reaction at Pier = 80.0 k
STEP 6: Positive Flexural Design
Factored Moment at Strength I:
Mu = 1.25 DC +1.5 DW +1.75 DF(LL+IM) = 1.25×(927.3+175.8)+1.5×132.2 +1.75×0.651×(1.33×1233.9+608.0) = 4139 k-ft (governs)
Factored Moment at Strength IV:
Mu = 1.5×(DC + DW) = 1.5×(927.3+175.8+132.2) = 1853 k-ft
➠ Mu = 4139 k-ft
(Step 6: Continued on Next Sheet)
STEP 6: POSITIVE FLEXURALDESIGN
The assumed sections needs to bechecked for Strength Limit States, Ser-vice Limit States, and Fatigue LimitState.
For positive bending at Strength LimitStates, both Strength I and Strength IVload combinations should be checkedto obtain the worst case. The loadfactors should be obtained fromTable 3.4 and Table 3.5.
Downloaded from Digital Engineering Library @ McGraw-Hill (www.digitalengineeringlibrary.com)Copyright © 2006 The McGraw-Hill Companies. All rights reserved.
Any use is subject to the Terms of Use as given at the website.
Design of Superstructure Elements
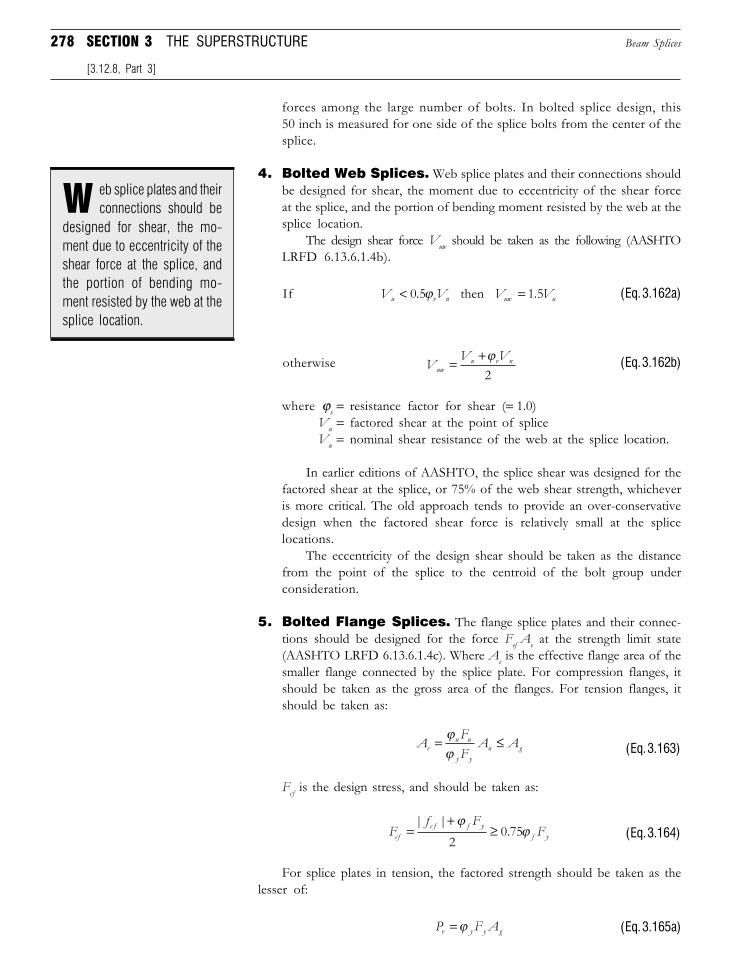
278 SECTION 3 THE SUPERSTRUCTURE
forces among the large number of bolts. In bolted splice design, this50 inch is measured for one side of the splice bolts from the center of thesplice.
4. Bolted Web Splices. Web splice plates and their connections shouldbe designed for shear, the moment due to eccentricity of the shear forceat the splice, and the portion of bending moment resisted by the web at thesplice location.
The design shear force Vuw should be taken as the following (AASHTOLRFD 6.13.6.1.4b).
If V . V V . Vu v n uw u< =0 5 1 5ϕ then (Eq. 3.162a)
otherwise VV V
uwu v n= +ϕ
2(Eq. 3.162b)
where ϕv = resistance factor for shear (= 1.0)Vu = factored shear at the point of spliceVn = nominal shear resistance of the web at the splice location.
In earlier editions of AASHTO, the splice shear was designed for thefactored shear at the splice, or 75% of the web shear strength, whicheveris more critical. The old approach tends to provide an over-conservativedesign when the factored shear force is relatively small at the splicelocations.
The eccentricity of the design shear should be taken as the distancefrom the point of the splice to the centroid of the bolt group underconsideration.
5. Bolted Flange Splices. The flange splice plates and their connec-tions should be designed for the force Fef Ae at the strength limit state(AASHTO LRFD 6.13.6.1.4c). Where Ae is the effective flange area of thesmaller flange connected by the splice plate. For compression flanges, itshould be taken as the gross area of the flanges. For tension flanges, itshould be taken as:
AFFA Ae
u u
y yn g= ≤ϕ
ϕ (Eq. 3.163)
Fcf is the design stress, and should be taken as:
F| f | F
Fcfc f f y
f y=+
≥ϕ
ϕ2
0 75. (Eq. 3.164)
For splice plates in tension, the factored strength should be taken as thelesser of:
P F Ar y y g=ϕ (Eq. 3.165a)
Beam Splices
[3.12.8, Part 3]
eb splice plates and theirconnections should be
designed for shear, the mo-ment due to eccentricity of theshear force at the splice, andthe portion of bending mo-ment resisted by the web at thesplice location.
W
Downloaded from Digital Engineering Library @ McGraw-Hill (www.digitalengineeringlibrary.com)Copyright © 2006 The McGraw-Hill Companies. All rights reserved.
Any use is subject to the Terms of Use as given at the website.
Design of Superstructure Elements
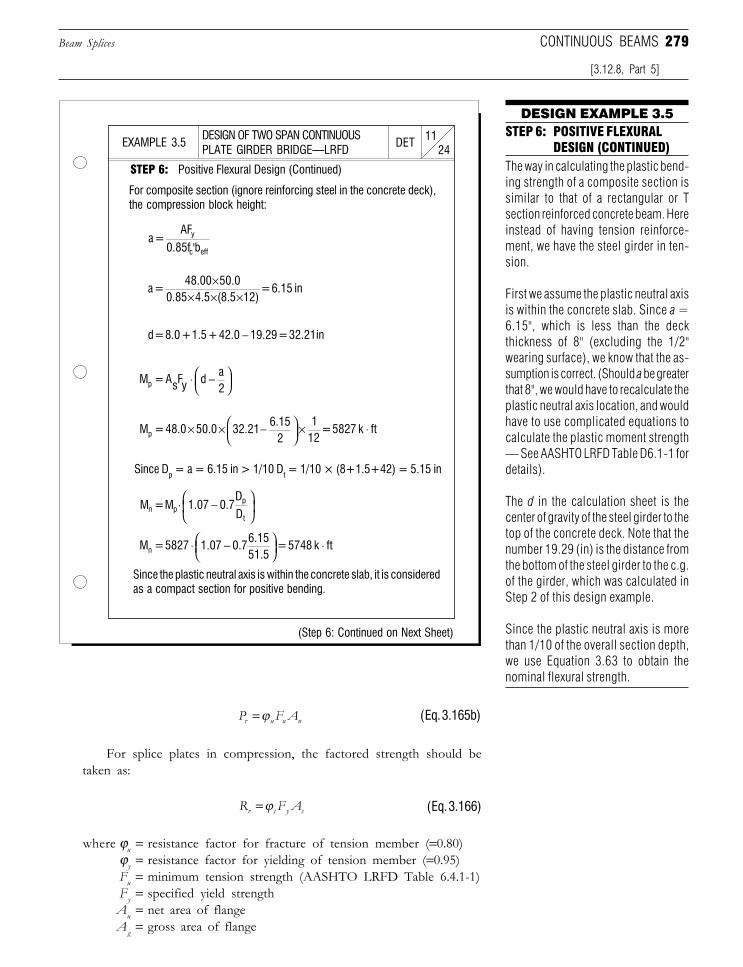
279
P F Ar u u n=ϕ (Eq. 3.165b)
For splice plates in compression, the factored strength should betaken as:
R F Ar c y s=ϕ (Eq. 3.166)
where ϕu = resistance factor for fracture of tension member (=0.80)ϕy = resistance factor for yielding of tension member (=0.95)Fu = minimum tension strength (AASHTO LRFD Table 6.4.1-1)Fy = specified yield strengthAn = net area of flangeAg = gross area of flange
Beam Splices
[3.12.8, Part 5]
CONTINUOUS BEAMS
DESIGN OF TWO SPAN CONTINUOUSPLATE GIRDER BRIDGE—LRFD 24
11DETEXAMPLE 3.5
DESIGN EXAMPLE 3.5STEP 6: POSITIVE FLEXURAL
DESIGN (CONTINUED)The way in calculating the plastic bend-ing strength of a composite section issimilar to that of a rectangular or Tsection reinforced concrete beam. Hereinstead of having tension reinforce-ment, we have the steel girder in ten-sion.
First we assume the plastic neutral axisis within the concrete slab. Since a =6.15", which is less than the deckthickness of 8" (excluding the 1/2"wearing surface), we know that the as-sumption is correct. (Should a be greaterthat 8", we would have to recalculate theplastic neutral axis location, and wouldhave to use complicated equations tocalculate the plastic moment strength— See AASHTO LRFD Table D6.1-1 fordetails).
The d in the calculation sheet is thecenter of gravity of the steel girder to thetop of the concrete deck. Note that thenumber 19.29 (in) is the distance fromthe bottom of the steel girder to the c.g.of the girder, which was calculated inStep 2 of this design example.
Since the plastic neutral axis is morethan 1/10 of the overall section depth,we use Equation 3.63 to obtain thenominal flexural strength.
STEP 6: Positive Flexural Design (Continued)
(Step 6: Continued on Next Sheet)
For composite section (ignore reinforcing steel in the concrete deck),the compression block height:
Since Dp = a = 6.15 in > 1/10 Dt = 1/10 × (8+1.5+42) = 5.15 in
Since the plastic neutral axis is within the concrete slab, it is consideredas a compact section for positive bending.
a = AF
0.85f 'by
c eff
M = AsFy da2p ⋅
−
M = M 1.07 0.7DDn p
p
t
⋅
−
M = 5827 1.07 0.76.1551.5
=5748 k ftn ⋅
⋅−
a = 48.00 50.0
0.85 4.5 (8.5 12) = 6.15 in
×× × ×
d = 8.0 + 1.5 + 42.0 19.29 = 32.21in−
M = 48.0 50.0 32.21 6.15
21
12 = 5827 k ftp × ×
× ⋅−
Downloaded from Digital Engineering Library @ McGraw-Hill (www.digitalengineeringlibrary.com)Copyright © 2006 The McGraw-Hill Companies. All rights reserved.
Any use is subject to the Terms of Use as given at the website.
Design of Superstructure Elements
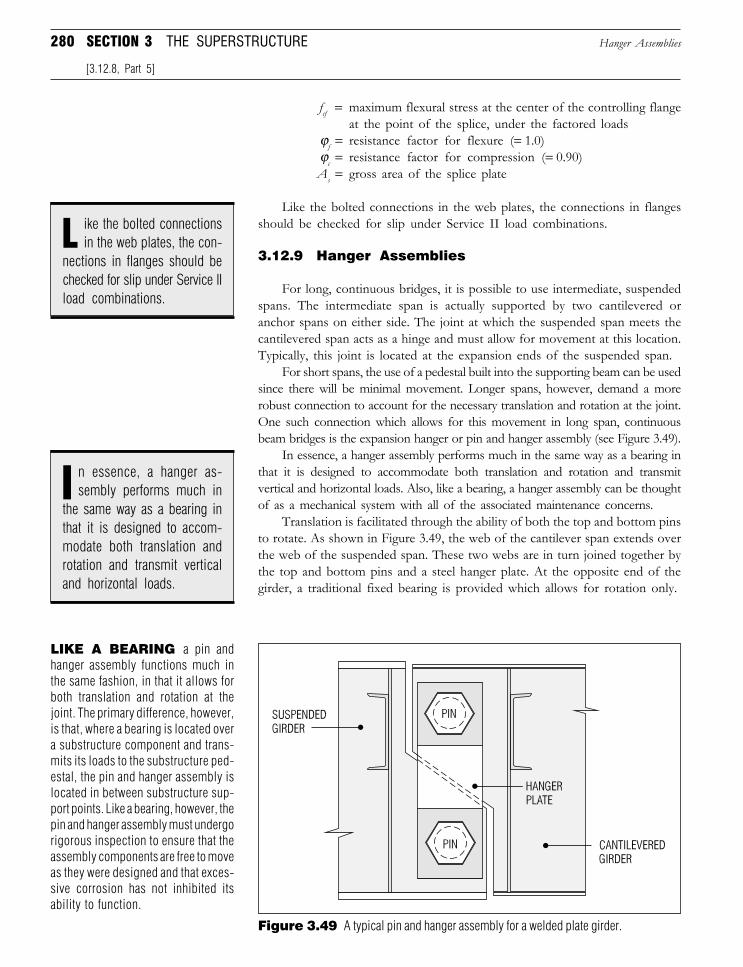
280 SECTION 3 THE SUPERSTRUCTURE
fcf = maximum flexural stress at the center of the controlling flangeat the point of the splice, under the factored loads
ϕf = resistance factor for flexure (= 1.0)ϕc = resistance factor for compression (= 0.90)As = gross area of the splice plate
Like the bolted connections in the web plates, the connections in flangesshould be checked for slip under Service II load combinations.
3.12.9 Hanger Assemblies
For long, continuous bridges, it is possible to use intermediate, suspendedspans. The intermediate span is actually supported by two cantilevered oranchor spans on either side. The joint at which the suspended span meets thecantilevered span acts as a hinge and must allow for movement at this location.Typically, this joint is located at the expansion ends of the suspended span.
For short spans, the use of a pedestal built into the supporting beam can be usedsince there will be minimal movement. Longer spans, however, demand a morerobust connection to account for the necessary translation and rotation at the joint.One such connection which allows for this movement in long span, continuousbeam bridges is the expansion hanger or pin and hanger assembly (see Figure 3.49).
In essence, a hanger assembly performs much in the same way as a bearing inthat it is designed to accommodate both translation and rotation and transmitvertical and horizontal loads. Also, like a bearing, a hanger assembly can be thoughtof as a mechanical system with all of the associated maintenance concerns.
Translation is facilitated through the ability of both the top and bottom pinsto rotate. As shown in Figure 3.49, the web of the cantilever span extends overthe web of the suspended span. These two webs are in turn joined together bythe top and bottom pins and a steel hanger plate. At the opposite end of thegirder, a traditional fixed bearing is provided which allows for rotation only.
Hanger Assemblies
[3.12.8, Part 5]
Figure 3.49 A typical pin and hanger assembly for a welded plate girder.
LIKE A BEARING a pin andhanger assembly functions much inthe same fashion, in that it allows forboth translation and rotation at thejoint. The primary difference, however,is that, where a bearing is located overa substructure component and trans-mits its loads to the substructure ped-estal, the pin and hanger assembly islocated in between substructure sup-port points. Like a bearing, however, thepin and hanger assembly must undergorigorous inspection to ensure that theassembly components are free to moveas they were designed and that exces-sive corrosion has not inhibited itsability to function.
ike the bolted connectionsin the web plates, the con-
nections in flanges should bechecked for slip under Service IIload combinations.
L
n essence, a hanger as-sembly performs much in
the same way as a bearing inthat it is designed to accom-modate both translation androtation and transmit verticaland horizontal loads.
I
Downloaded from Digital Engineering Library @ McGraw-Hill (www.digitalengineeringlibrary.com)Copyright © 2006 The McGraw-Hill Companies. All rights reserved.
Any use is subject to the Terms of Use as given at the website.
Design of Superstructure Elements
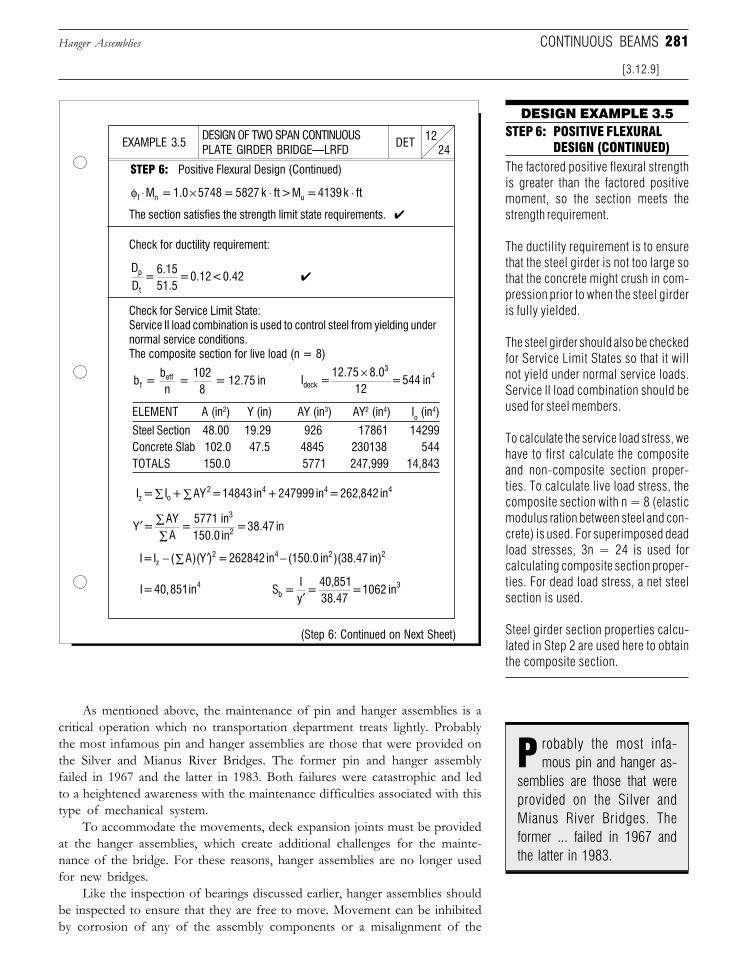
281
As mentioned above, the maintenance of pin and hanger assemblies is acritical operation which no transportation department treats lightly. Probablythe most infamous pin and hanger assemblies are those that were provided onthe Silver and Mianus River Bridges. The former pin and hanger assemblyfailed in 1967 and the latter in 1983. Both failures were catastrophic and ledto a heightened awareness with the maintenance difficulties associated with thistype of mechanical system.
To accommodate the movements, deck expansion joints must be providedat the hanger assemblies, which create additional challenges for the mainte-nance of the bridge. For these reasons, hanger assemblies are no longer usedfor new bridges.
Like the inspection of bearings discussed earlier, hanger assemblies shouldbe inspected to ensure that they are free to move. Movement can be inhibitedby corrosion of any of the assembly components or a misalignment of the
Hanger Assemblies
[3.12.9]
CONTINUOUS BEAMS
DESIGN OF TWO SPAN CONTINUOUSPLATE GIRDER BRIDGE—LRFD 24
12DETEXAMPLE 3.5
DESIGN EXAMPLE 3.5STEP 6: POSITIVE FLEXURAL
DESIGN (CONTINUED)The factored positive flexural strengthis greater than the factored positivemoment, so the section meets thestrength requirement.
The ductility requirement is to ensurethat the steel girder is not too large sothat the concrete might crush in com-pression prior to when the steel girderis fully yielded.
The steel girder should also be checkedfor Service Limit States so that it willnot yield under normal service loads.Service II load combination should beused for steel members.
To calculate the service load stress, wehave to first calculate the compositeand non-composite section proper-ties. To calculate live load stress, thecomposite section with n = 8 (elasticmodulus ration between steel and con-crete) is used. For superimposed deadload stresses, 3n = 24 is used forcalculating composite section proper-ties. For dead load stress, a net steelsection is used.
Steel girder section properties calcu-lated in Step 2 are used here to obtainthe composite section.
STEP 6: Positive Flexural Design (Continued)
The section satisfies the strength limit state requirements. ✔
Check for ductility requirement:
✔
Check for Service Limit State:Service II load combination is used to control steel from yielding undernormal service conditions.The composite section for live load (n = 8)
ELEMENT A (in2) Y (in) AY (in3) AY2 (in4) Io (in4)
Steel Section 48.00 19.29 926 17861 14299Concrete Slab 102.0 47.5 4845 230138 544TOTALS 150.0 5771 247,999 14,843
(Step 6: Continued on Next Sheet)
φf n uM = 1.0 5748 = 5827 k ft > M = 4139 k ft⋅ × ⋅ ⋅
DD
= 6.1551.5
= 0.12 < 0.42p
t
I = 12.75 8.0
12 = 544 indeck
34×
′ ∑∑
Y = AYA
= 5771 in150.0 in
= 38.47 in3
2
S = Iy
= 40,85138.47
= 1062 inb3
′
robably the most infa-mous pin and hanger as-
semblies are those that wereprovided on the Silver andMianus River Bridges. Theformer ... failed in 1967 andthe latter in 1983.
P
b =bn
=102
8= 12.75 inf
eff
I = I + AY = 14843 in + 247999 in = 262,842 inz o 2
4 4 4∑∑
I = I ( A)(Y ) = 262842 in (150.0 in )(38.47 in)z2 4 2 2− ∑ ′ −
I = 40,851in4
Downloaded from Digital Engineering Library @ McGraw-Hill (www.digitalengineeringlibrary.com)Copyright © 2006 The McGraw-Hill Companies. All rights reserved.
Any use is subject to the Terms of Use as given at the website.
Design of Superstructure Elements
282 SECTION 3 THE SUPERSTRUCTURE
girders. Impact from underpass traffic is another concern for the inspector.Like cover plates, hanger assemblies can also suffer from the adverse effectsof fatigue, which are the major causes for the two bridge failures.
3.13 PROTECTING STEEL SUPERSTRUCTURES
So far we have discussed the design of steel highway bridges with a focuson the analytical aspects of the design process. Of equal importance, however,is the specification of systems designed to protect the steel superstructure afterits construction. Whether it is the use of paint systems or weathering steel, intoday’s design environment engineers are becoming increasingly aware of theimportance of ensuring the longevity of the structure they design.
To many designers, the application of a protective coating to a steelsuperstructure may almost be an afterthought. There is an obvious need toprotect an exposed steel superstructure against the corrosive effects of naturaland man-made elements. In the minds of many engineers (both old and young)the specification of a paint system would seem to be a simple, boiler plateoperation. As we will see, however, the advanced state of deterioration of manysteel structures combined with a heightened awareness of the environmentalimpact of many protective systems has led to the protection of steel superstruc-tures becoming a prime issue for many transportation agencies.
The following discussion will focus on the two major ways of protectingsteel superstructures:
❏ Protective coating systems❏ Weathering steel
We will also look at the important issue of paint removal and the impactit has on the rehabilitation of existing structures.
3.13.1 Protective Coating Systems
One of the main arguments proponents of concrete bridges use in lobbyingagainst steel structures is the susceptibility of steel to corrosion from theelements. The incorporation of a high quality protective coating system,however, can go a long way toward extending the life span of a steel structureand reducing maintenance costs in the future. Obviously, the paint coatingsused by transportation agencies did not evolve overnight, but rather havebecome refined and modified as a result of their use and performance. Priorto discussing the main coating systems in use today, an investigation into theorigins of these systems is beneficial.
1. Background and History. The origin of the modern protectivecoating system can be traced back to the middle 19th century [Ref. 3.53].A prime example of how protective coating systems have developed canbe found in the Firth of Forth Bridge in Scotland. The Forth Bridge wasfirst opened to traffic in 1889 [Ref. 3.54]. For a bridge constructed morethan one hundred years ago, the paint system applied to the structure bearsa striking similarity to those present in many bridge still in use today.
Hanger Assemblies
[3.12.9]
DID YOU KNOW
hether it is the use ofpaint systems or weath-W
ering steel ... engineers arebecoming increasingly awareof the importance of ensuringthe longevity of the structurethey design.
THAT the high perfor-mance paint
coatings used in many steelhighway bridges are based onresearch conducted by NASAresearchers in the 1970’s?Using an Australian high-ratiozinc silicate mixture, first de-veloped in 1942, the NASAresearchers increased the zincratio, leading to a coating sys-tem that not only cures as itdries but has enhanced rust-inhibiting properties [Ref. 3.52].
Downloaded from Digital Engineering Library @ McGraw-Hill (www.digitalengineeringlibrary.com)Copyright © 2006 The McGraw-Hill Companies. All rights reserved.
Any use is subject to the Terms of Use as given at the website.
Design of Superstructure Elements
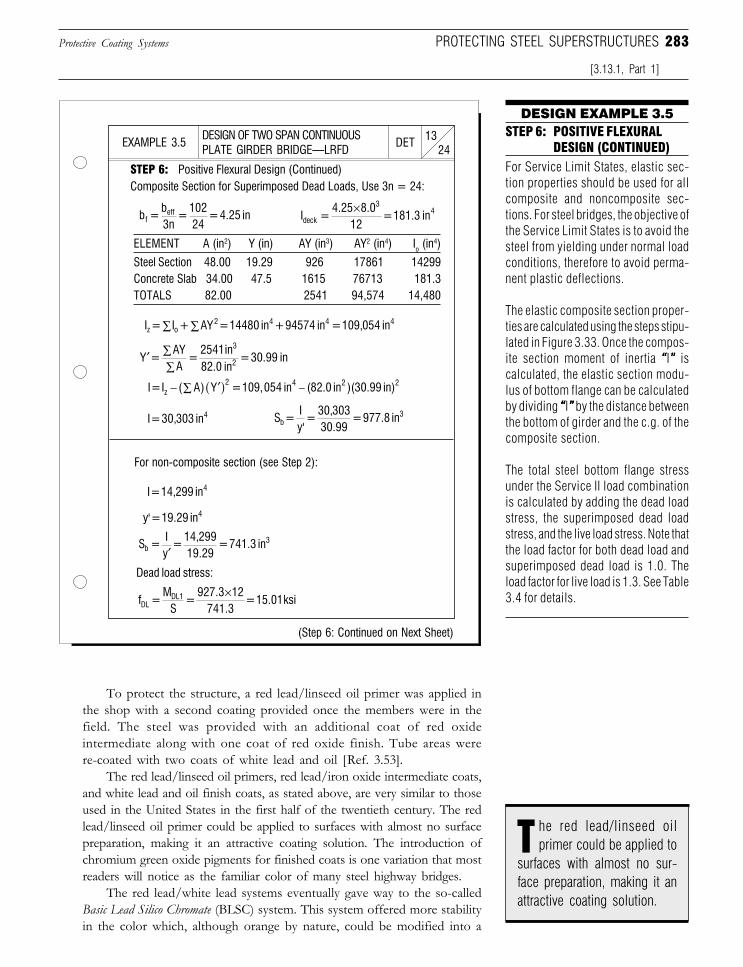
283
To protect the structure, a red lead/linseed oil primer was applied inthe shop with a second coating provided once the members were in thefield. The steel was provided with an additional coat of red oxideintermediate along with one coat of red oxide finish. Tube areas werere-coated with two coats of white lead and oil [Ref. 3.53].
The red lead/linseed oil primers, red lead/iron oxide intermediate coats,and white lead and oil finish coats, as stated above, are very similar to thoseused in the United States in the first half of the twentieth century. The redlead/linseed oil primer could be applied to surfaces with almost no surfacepreparation, making it an attractive coating solution. The introduction ofchromium green oxide pigments for finished coats is one variation that mostreaders will notice as the familiar color of many steel highway bridges.
The red lead/white lead systems eventually gave way to the so-calledBasic Lead Silico Chromate (BLSC) system. This system offered more stabilityin the color which, although orange by nature, could be modified into a
Protective Coating Systems PROTECTING STEEL SUPERSTRUCTURES
[3.13.1, Part 1]
DESIGN OF TWO SPAN CONTINUOUSPLATE GIRDER BRIDGE—LRFD 24
13DETEXAMPLE 3.5
DESIGN EXAMPLE 3.5STEP 6: POSITIVE FLEXURAL
DESIGN (CONTINUED)For Service Limit States, elastic sec-tion properties should be used for allcomposite and noncomposite sec-tions. For steel bridges, the objective ofthe Service Limit States is to avoid thesteel from yielding under normal loadconditions, therefore to avoid perma-nent plastic deflections.
The elastic composite section proper-ties are calculated using the steps stipu-lated in Figure 3.33. Once the compos-ite section moment of inertia “““““I””””” iscalculated, the elastic section modu-lus of bottom flange can be calculatedby dividing “““““I””””” by the distance betweenthe bottom of girder and the c.g. of thecomposite section.
The total steel bottom flange stressunder the Service II load combinationis calculated by adding the dead loadstress, the superimposed dead loadstress, and the live load stress. Note thatthe load factor for both dead load andsuperimposed dead load is 1.0. Theload factor for live load is 1.3. See Table3.4 for details.
STEP 6: Positive Flexural Design (Continued)Composite Section for Superimposed Dead Loads, Use 3n = 24:
(Step 6: Continued on Next Sheet)
ELEMENT A (in2) Y (in) AY (in3) AY2 (in4) Io (in4)
Steel Section 48.00 19.29 926 17861 14299Concrete Slab 34.00 47.5 1615 76713 181.3TOTALS 82.00 2541 94,574 14,480
For non-composite section (see Step 2):
Dead load stress:
b = b3n
= 10224
= 4.25 infeff I =
4.25 8.012
= 181.3 indeck
34×
I = I + AY = 14480 in + 94574 in = 109,054 inz o 2
4
4 4∑∑
′ ∑∑
Y = AYA
= 2541in82.0 in
= 30.99 in3
2
I = I ( A) Y = 109,054 in (82.0 in )(30.99 in)z2 4 2 2
− −∑ ′( )
I = 30,303 in4 S = Iy'
= 30,30330.99
= 977.8 inb 3
I = 14,299 in4
y' = 19.29 in4
S = Iy
= 14,29919.29
= 741.3 inb3
′
f = M
S =
927.3 12741.3
= 15.01ksiDLDL1 ×
he red lead/linseed oilprimer could be applied to
surfaces with almost no sur-face preparation, making it anattractive coating solution.
T
Downloaded from Digital Engineering Library @ McGraw-Hill (www.digitalengineeringlibrary.com)Copyright © 2006 The McGraw-Hill Companies. All rights reserved.
Any use is subject to the Terms of Use as given at the website.
Design of Superstructure Elements
284 SECTION 3 THE SUPERSTRUCTURE
variety of other colors. The BLSC system, over the course of several yearsand associated modifications, eventually evolved into the AASHTO M229 standard in 1950’s.
In terms of service life, the BLSC systems applied to bridges in the1950’s and 1960’s showed life spans in the range of five to ten years andsometimes even twelve years. Enhancements and modifications (particu-larly in the area of polymer chemistry) raised the bar, so to speak, forprotective coating systems into the realm of fifteen to thirty years of usefulperformance.
By the 1980’s high ratio zinc silicates were being offered by a varietyof vendors as high performance primers (see Did You Know? sidebar).Complicating the issue further is the use of micaceous iron oxide (MIO)coatings. MIO coatings, long used in Europe, are attempting to gain afoothold in the lucrative United States bridge maintenance marketplace.Although more expensive than traditional coating systems, the MIOcoating system has been given high marks for longevity and overallperformance (see below). With so many choices and, as we will see, strictenvironmental regulations, the application of protective coating systems tosteel superstructures is indeed becoming an involved issue.
2. The Nature of Steel Corrosion. Like the corrosion of reinforcedconcrete (discussed earlier in the section on cathodic protection, Section3.9.8, Part 8), corrosion of steel is an electrochemical process. When twodifferent metals are placed in an electrolyte, and electrical current iscreated between the two metals. An example of an electrolyte would be saltwater. In essence, one metal acts as the anode and the other as the cathodewith deterioration being the end result. This process of deterioration isknown as galvanic corrosion.
Whether or not a particular steel structure is more susceptible tocorrosion than another is dependent on many factors. The presenceof an electrolyte like salt water, be it through deicing agents or amarine environment, can greatly accelerate the deterioration of steelstructures. Other factors which can accelerate corrosion are thepresence of carbon dioxide and hydrogen sulfide as well as extremelyhigh temperatures.
In general, there are some basic measures which can be taken to limitcorrosion of steel. One approach would be to reduce the contact betweendissimilar metals. Another would be to galvanize the surface of the metal.Lastly, the surfaces can be separated by a different material such as rubberor paint.
From the latter item, we see what is naturally intuitive: a layer of paintshields and protects the underlying steel from the elements. Of course, theactual system which protects the steel is significantly more complicatedthan a simple coat of paint; but the concept is essentially the same. Wheresteel bridges begin to suffer, however, is when the protective coating beginsto break down and exposes the underlying material to the adverse effectsof the surrounding environment. Because of the complete exposure ofa steel superstructure to the elements, this deterioration can causesignificant loss of section to structural members and impact the integrityof the bridge as a whole.
Protective Coating Systems
[3.13.1, Part 1]
bridges and other steelstructures from corrod-ing have found there’s arevolution brewing intheir paint buckets.
Engineers whomust prevent
RITA ROBISON[Ref. 3.52]
here steel bridgesbegin to suffer, how-
ever, is when the protectivecoating begins to break downand expose the underlyingmaterial ...
W
Downloaded from Digital Engineering Library @ McGraw-Hill (www.digitalengineeringlibrary.com)Copyright © 2006 The McGraw-Hill Companies. All rights reserved.
Any use is subject to the Terms of Use as given at the website.
Design of Superstructure Elements
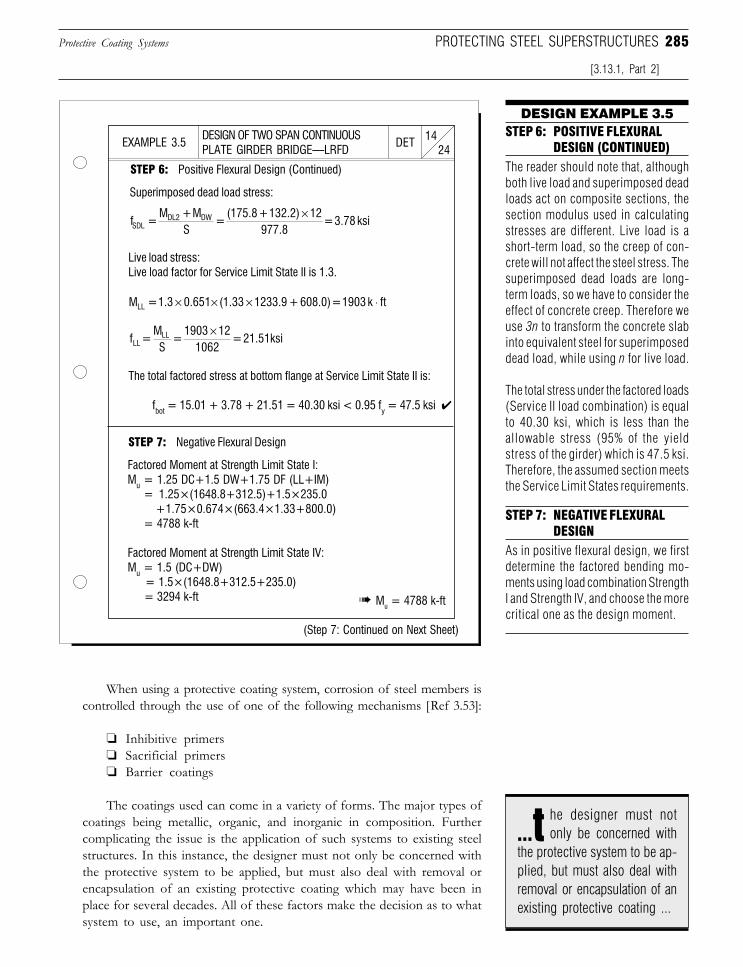
285
When using a protective coating system, corrosion of steel members iscontrolled through the use of one of the following mechanisms [Ref 3.53]:
❏ Inhibitive primers❏ Sacrificial primers❏ Barrier coatings
The coatings used can come in a variety of forms. The major types ofcoatings being metallic, organic, and inorganic in composition. Furthercomplicating the issue is the application of such systems to existing steelstructures. In this instance, the designer must not only be concerned withthe protective system to be applied, but must also deal with removal orencapsulation of an existing protective coating which may have been inplace for several decades. All of these factors make the decision as to whatsystem to use, an important one.
Protective Coating Systems
[3.13.1, Part 2]
PROTECTING STEEL SUPERSTRUCTURES
DESIGN OF TWO SPAN CONTINUOUSPLATE GIRDER BRIDGE—LRFD 24
14DETEXAMPLE 3.5
DESIGN EXAMPLE 3.5STEP 6: POSITIVE FLEXURAL
DESIGN (CONTINUED)The reader should note that, althoughboth live load and superimposed deadloads act on composite sections, thesection modulus used in calculatingstresses are different. Live load is ashort-term load, so the creep of con-crete will not affect the steel stress. Thesuperimposed dead loads are long-term loads, so we have to consider theeffect of concrete creep. Therefore weuse 3n to transform the concrete slabinto equivalent steel for superimposeddead load, while using n for live load.
The total stress under the factored loads(Service II load combination) is equalto 40.30 ksi, which is less than theallowable stress (95% of the yieldstress of the girder) which is 47.5 ksi.Therefore, the assumed section meetsthe Service Limit States requirements.
STEP 6: Positive Flexural Design (Continued)
Superimposed dead load stress:
Live load stress:Live load factor for Service Limit State II is 1.3.
The total factored stress at bottom flange at Service Limit State II is:
fbot = 15.01 + 3.78 + 21.51 = 40.30 ksi < 0.95 fy = 47.5 ksi ✔
STEP 7: Negative Flexural Design
Factored Moment at Strength Limit State I:Mu = 1.25 DC+1.5 DW+1.75 DF (LL+IM)
= 1.25×(1648.8+312.5)+1.5×235.0+1.75×0.674×(663.4×1.33+800.0)
= 4788 k-ft
Factored Moment at Strength Limit State IV:Mu = 1.5 (DC+DW) = 1.5×(1648.8+312.5+235.0) = 3294 k-ft ➠ Mu = 4788 k-ft
(Step 7: Continued on Next Sheet)
STEP 7: NEGATIVE FLEXURALDESIGN
As in positive flexural design, we firstdetermine the factored bending mo-ments using load combination StrengthI and Strength IV, and choose the morecritical one as the design moment.
f = M + M
S =
(175.8 + 132.2) 12977.8
= 3.78 ksiSDLDL2 DW ×
f = MS
= 1903 12
1062 = 21.51 ksiLL
LL ×
he designer must notonly be concerned with
the protective system to be ap-plied, but must also deal withremoval or encapsulation of anexisting protective coating ...
...t
M = 1.3 0.651 (1.33 1233.9 +608.0) = 1903 k ftLL × × × ⋅
Downloaded from Digital Engineering Library @ McGraw-Hill (www.digitalengineeringlibrary.com)Copyright © 2006 The McGraw-Hill Companies. All rights reserved.
Any use is subject to the Terms of Use as given at the website.
Design of Superstructure Elements
286 SECTION 3 THE SUPERSTRUCTURE
3. Inhibitive Primers. A primer is the initial coat of paint which isapplied to the virgin surface of a steel member. The quality of a primer isindicated by its ability to adhere to the surface of the steel. An inhibitiveprimer functions through use of an organic coating which stops corrosionthrough a process of chemical or mechanical inhibition. This inhibition isdesigned to prevent deterioration caused by moisture and oxygen.
The pigments of inhibitive primers give the coating their inhibitivecharacteristics. A pigment, by definition, is a fine, insoluble powder whichis dispersed into the liquid portion of the paint. The pigment gives the paintits color, hardness, and corrosion resisting properties and can be eitherorganic or inorganic. The two basic types of pigments used in inhibitiveprimers are:
❏ Partially soluble hexavalent chromium salt❏ Basic lead compounds
The two most predominate forms of inhibitive primers are red leadand BLSC. While the former has 100 percent toxic agent in its weight, thelatter has only 25 percent. Also, where red lead paint can only be used asa primer, the BLSC system can also function as a second coat and even atop coat.
There is, however, a general concern over the toxic nature of bothof these types of primers. The intensity of this concern has grown rapidlysince the 1980’s. New regulations in the United States enacted by theOccupational Safety and Health Administration (OSHA) and the Envi-ronmental Protection Agency (EPA) have significantly impacted the costof using lead based primers. Some estimates show that the cost ofrepainting a structure has risen from $2 per square foot to the range of$5-$10 per square foot or even $30 per square foot [Ref. 3.52]. Thefocus of these regulations is to minimize the amount of lead which isreleased into the surrounding atmosphere. Lead can be released into theair at any time the structural steel is either painted or blast cleaned in thefield. For these reasons, lead based paint has been totally eliminated inthe United States by late 1980’s.
Research and development has been conducted which has produceda variety of less toxic pigments but the general consensus has been that theinhibitive characteristics of these new products still do not perform as wellas these of chromate and lead based pigments. While this does not meanthat nontoxic inhibitive primers are unacceptable, their widespread use inthe mainstream transportation arena, however, has yet to develop to its fullpotential [Ref. 3.53].
4. Sacrificial Primers. Like an anode in a cathodic protection system(see Section 3.9.8, Part 8), a sacrificial or galvanic primer protects theunderlying steel surface by creating a surface which is electrochemicallynegative in relation to the steel. This results in the steel becomingcompletely cathodic and eliminating potential deterioration. Zinc is themost common material used to make the primer act as an anode. The zincis dispersed through the paint film as a pigment and applied directly to thesteel surface [Ref. 3.53].
Protective Coating Systems
[3.13.1, Part 3]
ust never sleeps.
NEIL YOUNG
R
here is ... a general con-cern over the toxic nature
of both of these types of prim-ers. The intensity of this con-cern has grown rapidly sincethe 1980’s.
T
Downloaded from Digital Engineering Library @ McGraw-Hill (www.digitalengineeringlibrary.com)Copyright © 2006 The McGraw-Hill Companies. All rights reserved.
Any use is subject to the Terms of Use as given at the website.
Design of Superstructure Elements
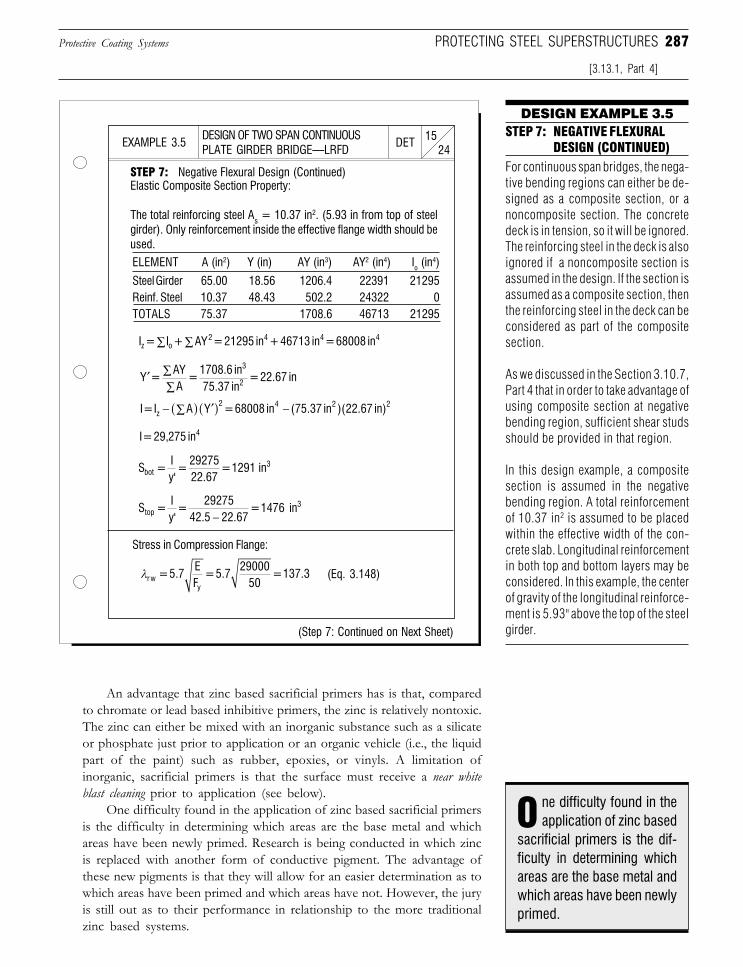
287Protective Coating Systems
An advantage that zinc based sacrificial primers has is that, comparedto chromate or lead based inhibitive primers, the zinc is relatively nontoxic.The zinc can either be mixed with an inorganic substance such as a silicateor phosphate just prior to application or an organic vehicle (i.e., the liquidpart of the paint) such as rubber, epoxies, or vinyls. A limitation ofinorganic, sacrificial primers is that the surface must receive a near whiteblast cleaning prior to application (see below).
One difficulty found in the application of zinc based sacrificial primersis the difficulty in determining which areas are the base metal and whichareas have been newly primed. Research is being conducted in which zincis replaced with another form of conductive pigment. The advantage ofthese new pigments is that they will allow for an easier determination as towhich areas have been primed and which areas have not. However, the juryis still out as to their performance in relationship to the more traditionalzinc based systems.
[3.13.1, Part 4]
PROTECTING STEEL SUPERSTRUCTURES
DESIGN OF TWO SPAN CONTINUOUSPLATE GIRDER BRIDGE—LRFD 24
15DETEXAMPLE 3.5
DESIGN EXAMPLE 3.5STEP 7: NEGATIVE FLEXURAL
DESIGN (CONTINUED)For continuous span bridges, the nega-tive bending regions can either be de-signed as a composite section, or anoncomposite section. The concretedeck is in tension, so it will be ignored.The reinforcing steel in the deck is alsoignored if a noncomposite section isassumed in the design. If the section isassumed as a composite section, thenthe reinforcing steel in the deck can beconsidered as part of the compositesection.
As we discussed in the Section 3.10.7,Part 4 that in order to take advantage ofusing composite section at negativebending region, sufficient shear studsshould be provided in that region.
In this design example, a compositesection is assumed in the negativebending region. A total reinforcementof 10.37 in2 is assumed to be placedwithin the effective width of the con-crete slab. Longitudinal reinforcementin both top and bottom layers may beconsidered. In this example, the centerof gravity of the longitudinal reinforce-ment is 5.93" above the top of the steelgirder.
STEP 7: Negative Flexural Design (Continued)Elastic Composite Section Property:
The total reinforcing steel As = 10.37 in2. (5.93 in from top of steelgirder). Only reinforcement inside the effective flange width should beused.
(Step 7: Continued on Next Sheet)
ELEMENT A (in2) Y (in) AY (in3) AY2 (in4) Io (in4)
Steel Girder 65.00 18.56 1206.4 22391 21295Reinf. Steel 10.37 48.43 502.2 24322 0TOTALS 75.37 1708.6 46713 21295
Stress in Compression Flange:
(Eq. 3.148)
I = I + AY = 21295 in + 46713 in = 68008 inz o 2
4
4
4∑∑
′ ∑∑
Y = AYA
= 1708.6 in75.37 in
= 22.67 in3
2
I = I A Y = 68008 in 75.37 in 22.67 inz2
4 2 2
− −∑( ) ′( ) ( )( )
I = 29,275 in4
S = Iy'
= 2927522.67
= 1291 inbot3
S = Iy'
= 29275
42.5 22.67 = 1476 intop
3
−
λr wy
= 5.7EF
= 5.729000
50 = 137.3
ne difficulty found in theapplication of zinc based
sacrificial primers is the dif-ficulty in determining whichareas are the base metal andwhich areas have been newlyprimed.
O
Downloaded from Digital Engineering Library @ McGraw-Hill (www.digitalengineeringlibrary.com)Copyright © 2006 The McGraw-Hill Companies. All rights reserved.
Any use is subject to the Terms of Use as given at the website.
Design of Superstructure Elements
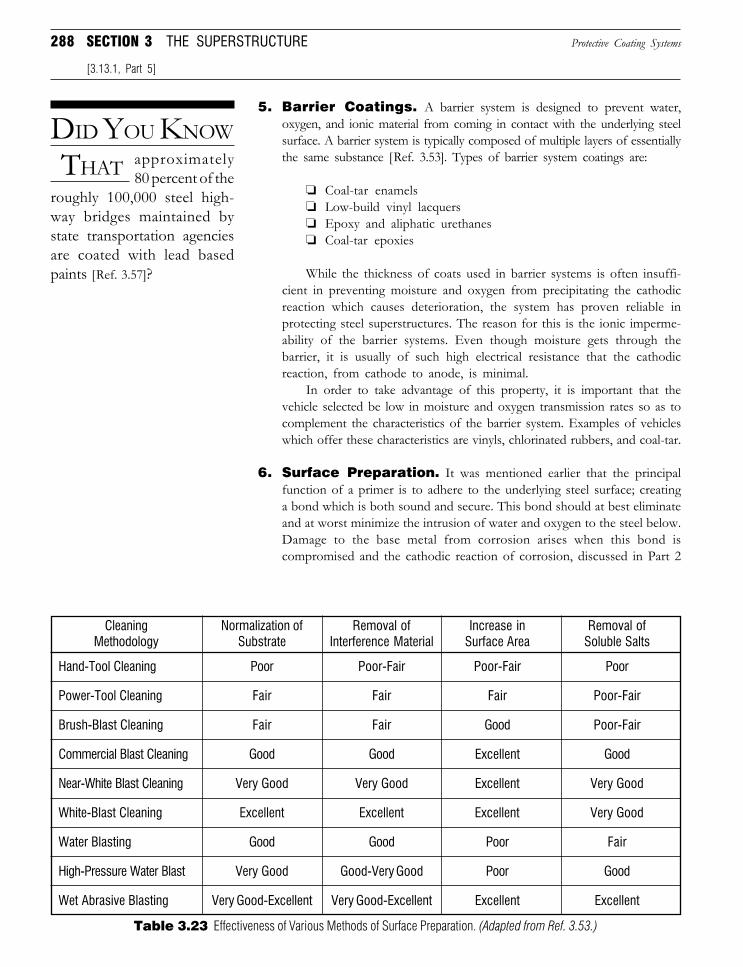
288 SECTION 3 THE SUPERSTRUCTURE
5. Barrier Coatings. A barrier system is designed to prevent water,oxygen, and ionic material from coming in contact with the underlying steelsurface. A barrier system is typically composed of multiple layers of essentiallythe same substance [Ref. 3.53]. Types of barrier system coatings are:
❏ Coal-tar enamels❏ Low-build vinyl lacquers❏ Epoxy and aliphatic urethanes❏ Coal-tar epoxies
While the thickness of coats used in barrier systems is often insuffi-cient in preventing moisture and oxygen from precipitating the cathodicreaction which causes deterioration, the system has proven reliable inprotecting steel superstructures. The reason for this is the ionic imperme-ability of the barrier systems. Even though moisture gets through thebarrier, it is usually of such high electrical resistance that the cathodicreaction, from cathode to anode, is minimal.
In order to take advantage of this property, it is important that thevehicle selected be low in moisture and oxygen transmission rates so as tocomplement the characteristics of the barrier system. Examples of vehicleswhich offer these characteristics are vinyls, chlorinated rubbers, and coal-tar.
6. Surface Preparation. It was mentioned earlier that the principalfunction of a primer is to adhere to the underlying steel surface; creatinga bond which is both sound and secure. This bond should at best eliminateand at worst minimize the intrusion of water and oxygen to the steel below.Damage to the base metal from corrosion arises when this bond iscompromised and the cathodic reaction of corrosion, discussed in Part 2
Protective Coating Systems
[3.13.1, Part 5]
DID YOU KNOW
THAT approximately80 percent of the
roughly 100,000 steel high-way bridges maintained bystate transportation agenciesare coated with lead basedpaints [Ref. 3.57]?
Table 3.23 Effectiveness of Various Methods of Surface Preparation. (Adapted from Ref. 3.53.)
Hand-Tool Cleaning Poor Poor-Fair Poor-Fair Poor
Power-Tool Cleaning Fair Fair Fair Poor-Fair
Brush-Blast Cleaning Fair Fair Good Poor-Fair
Commercial Blast Cleaning Good Good Excellent Good
Near-White Blast Cleaning Very Good Very Good Excellent Very Good
White-Blast Cleaning Excellent Excellent Excellent Very Good
Water Blasting Good Good Poor Fair
High-Pressure Water Blast Very Good Good-Very Good Poor Good
Wet Abrasive Blasting Very Good-Excellent Very Good-Excellent Excellent Excellent
Cleaning Normalization of Removal of Increase in Removal ofMethodology Substrate Interference Material Surface Area Soluble Salts
Downloaded from Digital Engineering Library @ McGraw-Hill (www.digitalengineeringlibrary.com)Copyright © 2006 The McGraw-Hill Companies. All rights reserved.
Any use is subject to the Terms of Use as given at the website.
Design of Superstructure Elements
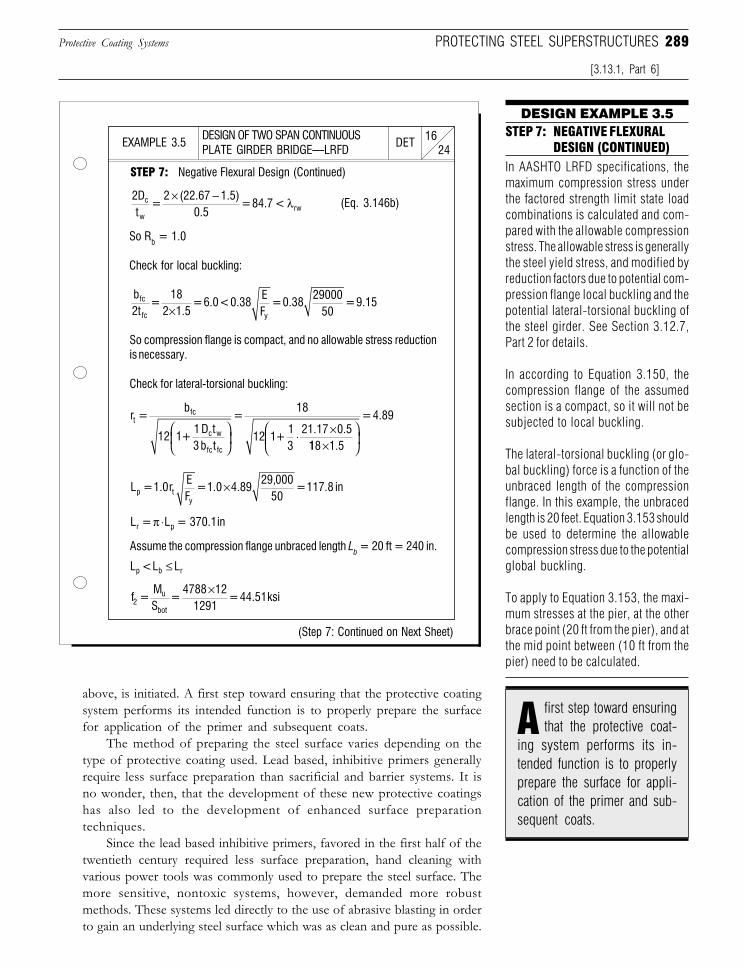
289
above, is initiated. A first step toward ensuring that the protective coatingsystem performs its intended function is to properly prepare the surfacefor application of the primer and subsequent coats.
The method of preparing the steel surface varies depending on thetype of protective coating used. Lead based, inhibitive primers generallyrequire less surface preparation than sacrificial and barrier systems. It isno wonder, then, that the development of these new protective coatingshas also led to the development of enhanced surface preparationtechniques.
Since the lead based inhibitive primers, favored in the first half of thetwentieth century required less surface preparation, hand cleaning withvarious power tools was commonly used to prepare the steel surface. Themore sensitive, nontoxic systems, however, demanded more robustmethods. These systems led directly to the use of abrasive blasting in orderto gain an underlying steel surface which was as clean and pure as possible.
Protective Coating Systems
[3.13.1, Part 6]
PROTECTING STEEL SUPERSTRUCTURES
DESIGN EXAMPLE 3.5STEP 7: NEGATIVE FLEXURAL
DESIGN (CONTINUED)In AASHTO LRFD specifications, themaximum compression stress underthe factored strength limit state loadcombinations is calculated and com-pared with the allowable compressionstress. The allowable stress is generallythe steel yield stress, and modified byreduction factors due to potential com-pression flange local buckling and thepotential lateral-torsional buckling ofthe steel girder. See Section 3.12.7,Part 2 for details.
In according to Equation 3.150, thecompression flange of the assumedsection is a compact, so it will not besubjected to local buckling.
The lateral-torsional buckling (or glo-bal buckling) force is a function of theunbraced length of the compressionflange. In this example, the unbracedlength is 20 feet. Equation 3.153 shouldbe used to determine the allowablecompression stress due to the potentialglobal buckling.
To apply to Equation 3.153, the maxi-mum stresses at the pier, at the otherbrace point (20 ft from the pier), and atthe mid point between (10 ft from thepier) need to be calculated.
DESIGN OF TWO SPAN CONTINUOUSPLATE GIRDER BRIDGE—LRFD 24
16DETEXAMPLE 3.5
STEP 7: Negative Flexural Design (Continued)
(Step 7: Continued on Next Sheet)
So Rb = 1.0
Check for local buckling:
So compression flange is compact, and no allowable stress reductionis necessary.
Check for lateral-torsional buckling:
Assume the compression flange unbraced length Lb = 20 ft = 240 in.
(Eq. 3.146b)2Dt
= 2 (22.67 1.5)
0.5 = 84.7 <c
wrw
× − λ
b2t
= 18
2 1.5 = 6.0 < 0.38
EF
= 0.3829000
50 = 9.15fc
fc y×
r = b
12 1 + 13
D tb t
= 18
12 1 + 13
21.17 0.5
tfc
c w
fc fc
⋅ ×
118 1.5
= 4.89
×
L = 1.0rEF
= 1.0 4.8929,000
50 = 117.8 inp t
y
×
L = L = 370.1inr pπ ⋅
L < L Lp b r≤
f = MS
= 4788 12
1291 = 44.51ksi2
u
bot
×
first step toward ensuringthat the protective coat-
ing system performs its in-tended function is to properlyprepare the surface for appli-cation of the primer and sub-sequent coats.
A
Downloaded from Digital Engineering Library @ McGraw-Hill (www.digitalengineeringlibrary.com)Copyright © 2006 The McGraw-Hill Companies. All rights reserved.
Any use is subject to the Terms of Use as given at the website.
Design of Superstructure Elements
290 SECTION 3 THE SUPERSTRUCTURE
It should be kept in mind that, although the paint itself is an expense, thesurface preparation and eventual application of the protective coating isoften several times the cost of that for the basic materials.
The importance of a sound surface preparation program, however,cannot be understated. Not only does proper surface preparation increasethe bonding action between primer and base metal, it also creates a uniformsurface upon which to place the coating system and thereby minimize theamount of foreign particles which could potentially accelerate the cathodicreaction. These particles could take the form of chloride or sulfate ions onthe steel surface. The principal methods presently utilized for surfacepreparation of steel are:
❏ Hand cleaning❏ Solvent cleaning❏ Blast cleaning❏ Power cleaning
Each of the methods listed above offers various levels of quality andis appropriate for use with certain types of protective coating systems.Surface preparation also varies depending on whether new steel is beingused or an existing structure is being repainted. When considering thequality and thoroughness of the surface preparation of steel, there are twofundamental properties which must be taken into account:
❏ The physical appearance of the steel❏ The chemical cleanliness of the substrate
By “chemically clean” we mean a surface which is free from iogenicmaterial which can initiate the cathodic reaction (e.g., chlorides andsulfates). Table 3.23 lists several methods of surface preparation and ratestheir ability to satisfy the following requirements:
❏ Normalization of the surface❏ Exposing of reactive steel❏ Increasing the real surface area of the steel❏ Removing all iogenic materials
In Europe, the removal of chemical impurities has been given a higherlevel of importance than it has in the United States [Ref. 3.53]. As Table 3.23demonstrates, however, there is no method of surface preparation whichcan be deemed excellent across the board.
Regardless of the method used, whether it be as primitive as the useof hand tools or as sophisticated as wet abrasive blasting, the control oftoxic materials when cleaning steel in the field has become one of theprincipal concerns when preparing steel for painting in the field. Since fieldpreparation of steel is mainly carried out on older structures, this concernis exacerbated by the predominate use of lead based primers in bridgestructures of this vintage.
The following discussion pertains to some of the more basic methodsof surface preparation and their associated benefits and deficiencies.
Protective Coating Systems
[3.13.1, Part 6]
ot only does proper sur-face preparation increase
the bonding action betweenprimer and base metal, it alsocreates a uniform surface uponwhich to place the coatingsystem ...
N
y “chemically clean” wemean a surface which is
free from iogenic materialwhich can initiate the cathodicreaction (e.g., chlorides andsulfates).
B
Downloaded from Digital Engineering Library @ McGraw-Hill (www.digitalengineeringlibrary.com)Copyright © 2006 The McGraw-Hill Companies. All rights reserved.
Any use is subject to the Terms of Use as given at the website.
Design of Superstructure Elements
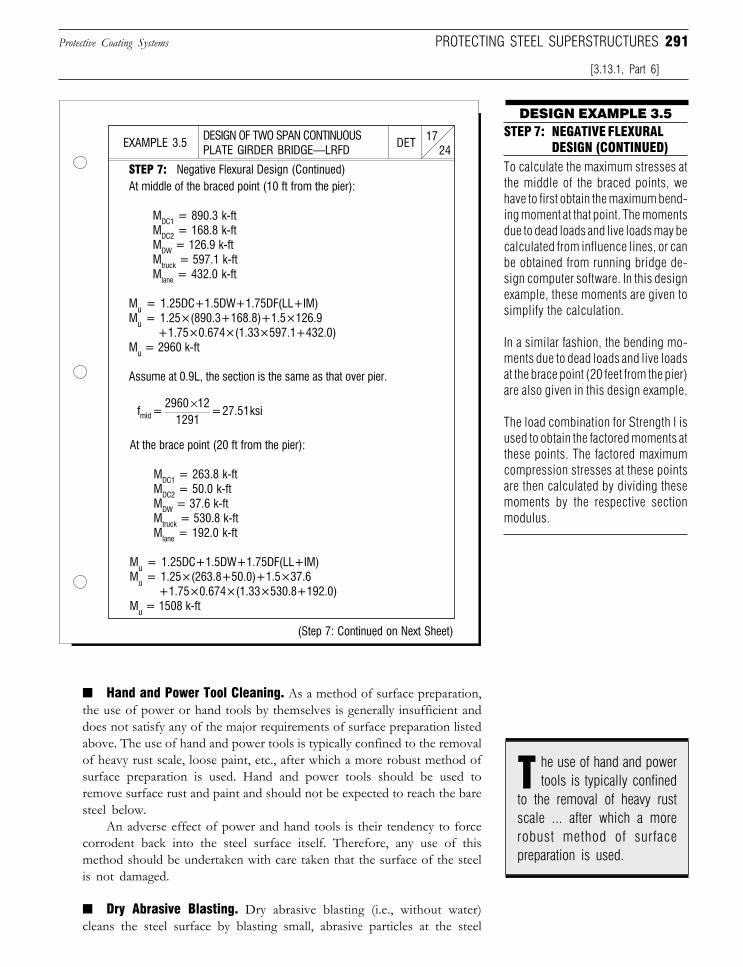
291
STEP 7: NEGATIVE FLEXURALDESIGN (CONTINUED)
■ Hand and Power Tool Cleaning. As a method of surface preparation,the use of power or hand tools by themselves is generally insufficient anddoes not satisfy any of the major requirements of surface preparation listedabove. The use of hand and power tools is typically confined to the removalof heavy rust scale, loose paint, etc., after which a more robust method ofsurface preparation is used. Hand and power tools should be used toremove surface rust and paint and should not be expected to reach the baresteel below.
An adverse effect of power and hand tools is their tendency to forcecorrodent back into the steel surface itself. Therefore, any use of thismethod should be undertaken with care taken that the surface of the steelis not damaged.
■ Dry Abrasive Blasting. Dry abrasive blasting (i.e., without water)cleans the steel surface by blasting small, abrasive particles at the steel
Protective Coating Systems
[3.13.1, Part 6]
PROTECTING STEEL SUPERSTRUCTURES
DESIGN EXAMPLE 3.5
To calculate the maximum stresses atthe middle of the braced points, wehave to first obtain the maximum bend-ing moment at that point. The momentsdue to dead loads and live loads may becalculated from influence lines, or canbe obtained from running bridge de-sign computer software. In this designexample, these moments are given tosimplify the calculation.
In a similar fashion, the bending mo-ments due to dead loads and live loadsat the brace point (20 feet from the pier)are also given in this design example.
The load combination for Strength I isused to obtain the factored moments atthese points. The factored maximumcompression stresses at these pointsare then calculated by dividing thesemoments by the respective sectionmodulus.
STEP 7: Negative Flexural Design (Continued)At middle of the braced point (10 ft from the pier):
MDC1 = 890.3 k-ftMDC2 = 168.8 k-ftMDW = 126.9 k-ftMtruck = 597.1 k-ftMlane = 432.0 k-ft
Mu = 1.25DC+1.5DW+1.75DF(LL+IM)Mu = 1.25×(890.3+168.8)+1.5×126.9 +1.75×0.674×(1.33×597.1+432.0)Mu = 2960 k-ft
Assume at 0.9L, the section is the same as that over pier.
At the brace point (20 ft from the pier):
MDC1 = 263.8 k-ftMDC2 = 50.0 k-ftMDW = 37.6 k-ftMtruck = 530.8 k-ftMlane = 192.0 k-ft
Mu = 1.25DC+1.5DW+1.75DF(LL+IM)Mu = 1.25×(263.8+50.0)+1.5×37.6 +1.75×0.674×(1.33×530.8+192.0)Mu = 1508 k-ft
(Step 7: Continued on Next Sheet)
DESIGN OF TWO SPAN CONTINUOUSPLATE GIRDER BRIDGE—LRFD 24
17DETEXAMPLE 3.5
f = 2960 12
1291 = 27.51ksimid
×
he use of hand and powertools is typically confined
to the removal of heavy rustscale ... after which a morerobust method of surfacepreparation is used.
T
Downloaded from Digital Engineering Library @ McGraw-Hill (www.digitalengineeringlibrary.com)Copyright © 2006 The McGraw-Hill Companies. All rights reserved.
Any use is subject to the Terms of Use as given at the website.
Design of Superstructure Elements
292 SECTION 3 THE SUPERSTRUCTURE
surface which strips off the layers of paint, rust, etc. above the bare steel.Dry abrasive blasting can be performed using one of two differentapproaches:
❏ Centrifugal blasting❏ Air blasting
The former utilizes multiple, rotating blades which launch the abra-sives at the steel surface at extremely high speed. An advantage of thecentrifugal blasting approach is that the abrasives are generally reusableand thus offers a cost savings over multiple cleanings. If and whenabrasives are reused, however, they should be cleaned to ensure that theyare free of oils and other contaminants which could adversely affect futurecleanings. Air blasting works under a similar premise, except in lieu of therotating blades, a stream of compressed air is used to propel abrasives suchas silica, sand, or crushed flint at the surface of the steel.
It is even possible to use grits that are zinc based which, as we sawearlier, has the advantage of arresting the cathodic reaction. Conversely,abrasives which contain copper should be avoided because they are proneto accelerating cathodic reaction. Also, as shown in Table 3.23, a drawbackto dry blasting in general is its weak performance in eliminating chemicalcontaminants on the steel surface. This deficiency is more pronouncedwhen the dry blasting is being conducted in the field rather than the shop.
■ Water Blasting. Water or hydroblasting, as the name would imply,uses a stream of water at very high pressures to remove any paint and rustfrom the surface of a steel member. These high pressures (as high as20,000 psi but usually 5,000 psi for highway bridges) can lead to potentialhazards for the operator. One of the main advantages of the water blastingapproach is that it is good at removing chloride contaminants from the steelsurface. Another benefit is that the water does not scarify (i.e., scratch) thesurface of the steel as mechanical methods are prone to do.
■ Water Abrasive Blasting. Wet abrasive blasting is essentially asynthesis of the two previous methods described above. Water andabrasives are air-blasted toward the steel surface, removing rust, paint, andionic materials from the steel surface. While the results, as shown in theratings in Table 3.23, may appear to indicate that wet abrasive blasting isthe optimum solution for steel surface preparation, there are, however,certain drawbacks.
One such drawback is the sludge by-products created as a result of theprocess (a problem which has particularly adverse results when traffic ispassing underneath the structure). Another problem associated with thismethod is the potential of the steel to begin to corrode in between cleaningand application of the primer.
Similar to the use of zinc abrasives described above, wet abrasiveblasting has been augmented to utilize inhibitive solutions which areintroduced through the water used in blasting. Inhibitors, such as chromatesand phosphates, can be applied in an effort to minimize the potential forrusting in between cleaning and application of the primer coat.
Protective Coating Systems
[3.13.1, Part 6]
n advantage of the cen-trifugal blasting approach
is that the abrasives are gener-ally reusable and thus offers acost savings over multiplecleanings.
A
Downloaded from Digital Engineering Library @ McGraw-Hill (www.digitalengineeringlibrary.com)Copyright © 2006 The McGraw-Hill Companies. All rights reserved.
Any use is subject to the Terms of Use as given at the website.
Design of Superstructure Elements
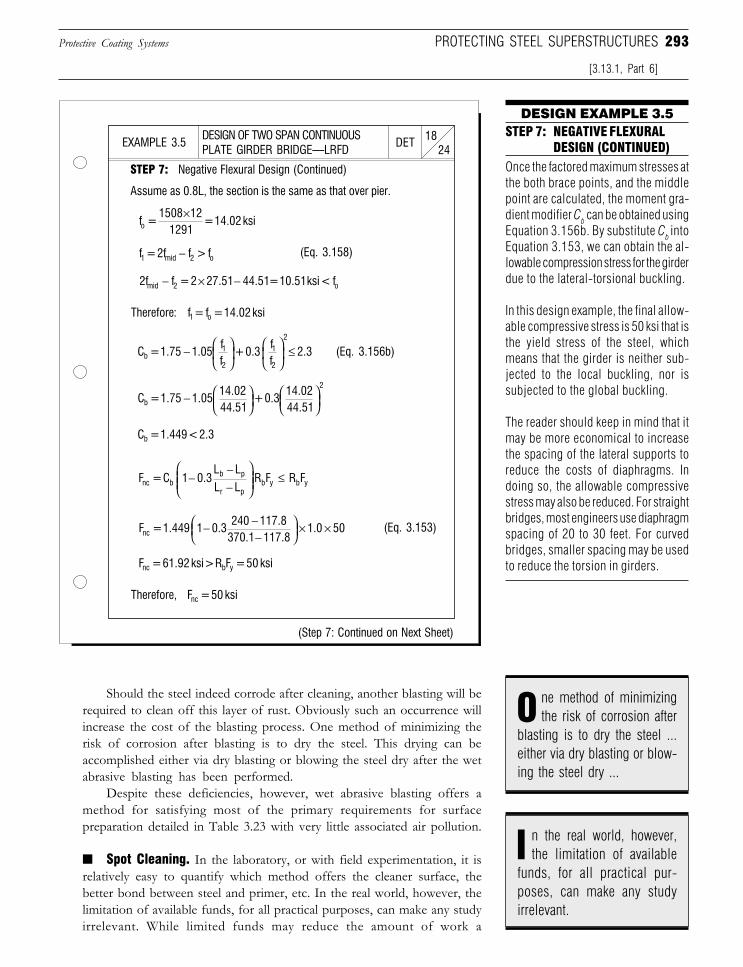
293
Should the steel indeed corrode after cleaning, another blasting will berequired to clean off this layer of rust. Obviously such an occurrence willincrease the cost of the blasting process. One method of minimizing therisk of corrosion after blasting is to dry the steel. This drying can beaccomplished either via dry blasting or blowing the steel dry after the wetabrasive blasting has been performed.
Despite these deficiencies, however, wet abrasive blasting offers amethod for satisfying most of the primary requirements for surfacepreparation detailed in Table 3.23 with very little associated air pollution.
■ Spot Cleaning. In the laboratory, or with field experimentation, it isrelatively easy to quantify which method offers the cleaner surface, thebetter bond between steel and primer, etc. In the real world, however, thelimitation of available funds, for all practical purposes, can make any studyirrelevant. While limited funds may reduce the amount of work a
Protective Coating Systems
[3.13.1, Part 6]
PROTECTING STEEL SUPERSTRUCTURES
DESIGN OF TWO SPAN CONTINUOUSPLATE GIRDER BRIDGE—LRFD 24
18DETEXAMPLE 3.5
DESIGN EXAMPLE 3.5STEP 7: NEGATIVE FLEXURAL
DESIGN (CONTINUED)Once the factored maximum stresses atthe both brace points, and the middlepoint are calculated, the moment gra-dient modifier Cb can be obtained usingEquation 3.156b. By substitute Cb intoEquation 3.153, we can obtain the al-lowable compression stress for the girderdue to the lateral-torsional buckling.
In this design example, the final allow-able compressive stress is 50 ksi that isthe yield stress of the steel, whichmeans that the girder is neither sub-jected to the local buckling, nor issubjected to the global buckling.
The reader should keep in mind that itmay be more economical to increasethe spacing of the lateral supports toreduce the costs of diaphragms. Indoing so, the allowable compressivestress may also be reduced. For straightbridges, most engineers use diaphragmspacing of 20 to 30 feet. For curvedbridges, smaller spacing may be usedto reduce the torsion in girders.
STEP 7: Negative Flexural Design (Continued)
(Step 7: Continued on Next Sheet)
Assume as 0.8L, the section is the same as that over pier.
(Eq. 3.158)
(Eq. 3.156b)
(Eq. 3.153)
f = 2f f > f1 mid 2 o−
2f f = 2 27.51 44.51 = 10.51ksi< fmid 2 o − − ×
f = 1508 12
1291 = 14.02 ksio
×
Therefore: f = f = 14.02 ksi 1 o
C = 1.75 1 .05ff
+ 0.3 ff
2.3b1
2
1
2
2
−
≤
C = 1.75 1.0514.0244.51
+ 0.314.0244.51b
2
−
C = 1.449 < 2.3b
F = C 1 0.3L LL L
R F R Fnc bb p
r pb y b y−
−−
≤
F = 1.449 1 0.3240 117.8
370.1 117.81.0 50nc − −
−
× ×
F = 61.92 ksi > R F = 50 ksinc b y
Therefore, F = 50 ksinc
ne method of minimizingthe risk of corrosion after
blasting is to dry the steel ...either via dry blasting or blow-ing the steel dry ...
O
n the real world, however,the limitation of available
funds, for all practical pur-poses, can make any studyirrelevant.
I
Downloaded from Digital Engineering Library @ McGraw-Hill (www.digitalengineeringlibrary.com)Copyright © 2006 The McGraw-Hill Companies. All rights reserved.
Any use is subject to the Terms of Use as given at the website.
Design of Superstructure Elements
294 SECTION 3 THE SUPERSTRUCTURE
transportation agency can perform in maintaining the surface of a steelsuperstructure, it does not eliminate the need for protecting the steel asmuch as possible given the funds available.
Because of the conflict between limited funds and the need for steelmaintenance, spot cleaning has become a common practice in cleaningpaint surfaces on existing steel bridges. Spot cleaning generally entailscleaning and priming only the deteriorated regions of a steel member andthen applying full coats of conventional intermediate and/or finish coats.These full coats are placed over the isolated areas which have beencleaned as well as the areas of the steel where the paint is still in goodcondition.
The new coats are typically oil/alkyd based. When painting overexisting film the same rules, with regard to chemical cleanliness, apply tothis surface as would the bare steel. Since this film is now essentially thesubstrate to which the new coating system while adhere to, it must be freeof chlorides, dirt, and other debris that would adversely impact the bondbetween the new coat and the old.
7. Overcoating. A method of applying a protective coating to existingsteel bridges, which is based on the spot cleaning approach, is known asovercoating [Ref. 3.55]. Under the overcoating approach, corroded areas arecleaned using hand and/or power tools to remove broken down paint,loose rust, and old coatings. The entire steel, regardless of condition,receives a thorough cleaning through the use of a power water wash whichremoves dirt and a certain percentage of chlorides which are embedded inthe surface of the steel.
Once the steel surface is prepared as described above, a three steppainting process is conducted where:
❏ Any exposed steel areas are spot primed with a surface tolerantone-component moisture cure polyurethane aluminum primer
❏ A polyurethane intermediate coat is applied to the entire bridgesurface
❏ A light-stable polyurethane top coat is applied to the structure
In addition to the obvious cost savings, when compared tocomplete surface cleaning, overcoating also offers the benefit ofgreatly limiting the amount of hazardous waste associated with moreextensive surface preparation methods. The main danger for theemission of toxic material when overcoating occurs is the use of handand power tools. Any debris generated by this spot cleaning must becontained and disposed of.
However, when the entire surface of a steel superstructure, coatedwith a lead based protective coating system, is cleaned, there is an extremelyhigh cost associated with containing and collecting the existing paint. Inaddition to this expense, all of the contaminated abrasive and othermaterials must also be disposed of. With the fiscal constraints imposed onmany transportation departments, such an approach is becoming increas-ingly unacceptable as costs associated with this type of operation continueto rise.
Protective Coating Systems
[3.13.1, Part 6]
nder the overcoating ap-proach, corroded areas
are cleaned using hand and/or power tools to remove bro-ken down paint, loose rust,and old coatings.
U
Downloaded from Digital Engineering Library @ McGraw-Hill (www.digitalengineeringlibrary.com)Copyright © 2006 The McGraw-Hill Companies. All rights reserved.
Any use is subject to the Terms of Use as given at the website.
Design of Superstructure Elements
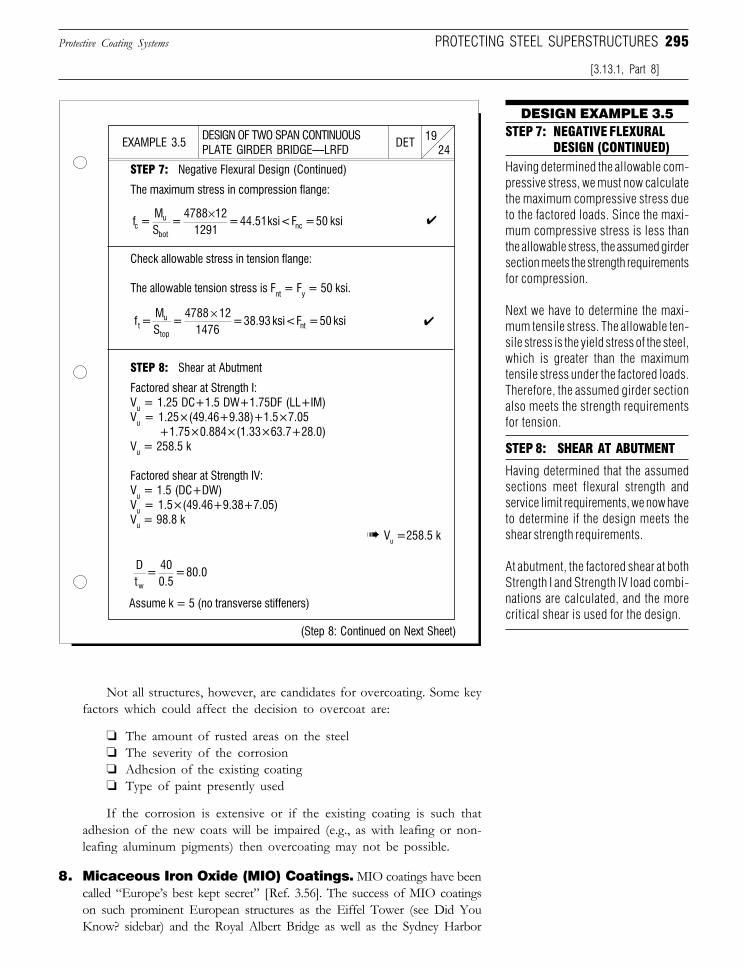
295
Not all structures, however, are candidates for overcoating. Some keyfactors which could affect the decision to overcoat are:
❏ The amount of rusted areas on the steel❏ The severity of the corrosion❏ Adhesion of the existing coating❏ Type of paint presently used
If the corrosion is extensive or if the existing coating is such thatadhesion of the new coats will be impaired (e.g., as with leafing or non-leafing aluminum pigments) then overcoating may not be possible.
8. Micaceous Iron Oxide (MIO) Coatings. MIO coatings have beencalled “Europe’s best kept secret” [Ref. 3.56]. The success of MIO coatingson such prominent European structures as the Eiffel Tower (see Did YouKnow? sidebar) and the Royal Albert Bridge as well as the Sydney Harbor
Protective Coating Systems
[3.13.1, Part 8]
PROTECTING STEEL SUPERSTRUCTURES
DESIGN OF TWO SPAN CONTINUOUSPLATE GIRDER BRIDGE—LRFD 24
19DETEXAMPLE 3.5
DESIGN EXAMPLE 3.5STEP 7: NEGATIVE FLEXURAL
DESIGN (CONTINUED)Having determined the allowable com-pressive stress, we must now calculatethe maximum compressive stress dueto the factored loads. Since the maxi-mum compressive stress is less thanthe allowable stress, the assumed girdersection meets the strength requirementsfor compression.
Next we have to determine the maxi-mum tensile stress. The allowable ten-sile stress is the yield stress of the steel,which is greater than the maximumtensile stress under the factored loads.Therefore, the assumed girder sectionalso meets the strength requirementsfor tension.
STEP 7: Negative Flexural Design (Continued)
The maximum stress in compression flange:
✔
Check allowable stress in tension flange:
The allowable tension stress is Fnt = Fy = 50 ksi.
✔
STEP 8: Shear at Abutment
Factored shear at Strength I:Vu = 1.25 DC+1.5 DW+1.75DF (LL+IM)Vu = 1.25×(49.46+9.38)+1.5×7.05 +1.75×0.884×(1.33×63.7+28.0)Vu = 258.5 k
Factored shear at Strength IV:Vu = 1.5 (DC+DW)Vu = 1.5×(49.46+9.38+7.05)Vu = 98.8 k
➠ Vu =258.5 k
Assume k = 5 (no transverse stiffeners)
(Step 8: Continued on Next Sheet)
STEP 8: SHEAR AT ABUTMENT
Having determined that the assumedsections meet flexural strength andservice limit requirements, we now haveto determine if the design meets theshear strength requirements.
At abutment, the factored shear at bothStrength I and Strength IV load combi-nations are calculated, and the morecritical shear is used for the design.
f = MS
= 4788 12
1291 = 44.51ksi < F = 50 ksic
u
botnc
×
f = MS
= 4788 12
1476 = 38.93 ksi < F = 50 ksit
u
topnt
×
Dt
= 400.5
= 80.0w
Downloaded from Digital Engineering Library @ McGraw-Hill (www.digitalengineeringlibrary.com)Copyright © 2006 The McGraw-Hill Companies. All rights reserved.
Any use is subject to the Terms of Use as given at the website.
Design of Superstructure Elements
296 SECTION 3 THE SUPERSTRUCTURE
Bridge in Australia have led to MIO becoming a de facto standard for bridgesoverseas. In the United States, however, only the Virginia Department ofTransportation has used MIO coatings extensively [Ref. 3.56].
What is it then that makes MIO such a good coating system and whyhas it yet to catch on in the United States? With regard to the first part of thequestion, it is the structure of the MIO coating which makes it so successful.MIO coatings form a protective layer over steel members using opaqueflakes which align themselves in a fashion similar to shingles on a roof. Thisarrangement provides a barrier to moisture attempting to penetrate thecoating while at the same time allowing moisture trapped beneath the surfaceto escape, thus preventing potential blistering and delamination failures[Ref. 3.52]. The structure of MIO coatings can be thought of as a “release-
valve” which allows trapped mois-ture to escape but still reducesmoisture permeability [Ref. 3.56].
MIO coatings have provedthemselves to be corrosion resistant,even in saltwater environments.MIO primers can also be appliedover a wet, or sometimes even oily,surface. Another advantage is thatMIO coatings have excellent ad-hesion properties, meaning thatsubsequent coats can be readilyplaced over existing ones. With allof these advantages, the questionraised at the top of the sectionpersists: why have MIO protec-tive coating systems failed to catchon in the United States?
Proponents of MIO coatingswould argue that one of the disad-vantages that the system has inbecoming marketable in the U.S. isthat Australia is the primary sourceof the proven pigment [Ref. 3.56].Since this requires importing thepigment, potential marketers andusers of MIO coatings are discour-aged by the price. The natural colorof MIO coatings is a dark grey,which many transportation depart-ments in the United States are hesi-tant to use. The color, however, canbe modified with other pigments.
MIO coatings also call onmaintenance personnel to changetheir concept of protective coatingsystems. Most people tend to thinkof paint as a barrier that keeps
Protective Coating Systems
[3.13.1, Part 8]
Is Lead Bridge Paint Hazardous?
is almost reflexive to assumethat it presents an environmen-tal and health risk. But is leadbridge paint dangerous to theenvironment? A report issuedby the National CooperativeHighway Research Program
hen someone firstthinks of lead paint it
DESIGN PERSPECTIVE
pounds such as lead oxide and leadchromate are formed. These com-pounds are virtually insoluble inrainwater, groundwater, or even infreshwater lakes and streams.
Based on the latter scenariodetailed above, the NCHRP reportsuggested that lead buried in sucha fashion posed little threat of leach-ing into the groundwater.
The other side of the safetycoin involves worker safety in re-moving lead based paints. In thisrespect, lead is extremely danger-ous. Lead can contaminate a workerthrough a variety of methods whichrange from simply breathing-in thelead or eating or drinking frommaterial contaminated with leadparticles.
To minimize the adverse ef-fects of lead to workers, a varietyof safety and protective equip-ment from helmets to respiratorsare required for even the mostbasic operations. Research is be-ing conducted by OSHA andother organizations to developbetter equipment and removaltechniques in an effort to reducethe health risk faced by crews inthe field [Ref. 3.57].
W
(NCHRP) says maybe not.The Environmental Pro-
tection Agency defines “hazard-ous” based on the paint’s ex-posure in a municipal landfillenvironment. In such a settingthe lead paint would be exposedto acetic acid, a by-product ofmunicipal waste. When lead iscombined with acetic acid toform the extremely solublecompound lead acetate, the like-lihood of lead residues exceed-ing the EPA limit of 5 ppm isrelatively high.
However, it is not commonconstruction practice to dumplead paint residues in a municipallandfill. Typically all abrasivepaint residue is placed with otherconstruction waste. In this envi-ronment, rather than forminglead acetate, less soluble com-
IO coatings form a pro-tective layer over steel
members using opaque flakeswhich align themselves in afashion similar to shingles ona roof.
M
Downloaded from Digital Engineering Library @ McGraw-Hill (www.digitalengineeringlibrary.com)Copyright © 2006 The McGraw-Hill Companies. All rights reserved.
Any use is subject to the Terms of Use as given at the website.
Design of Superstructure Elements
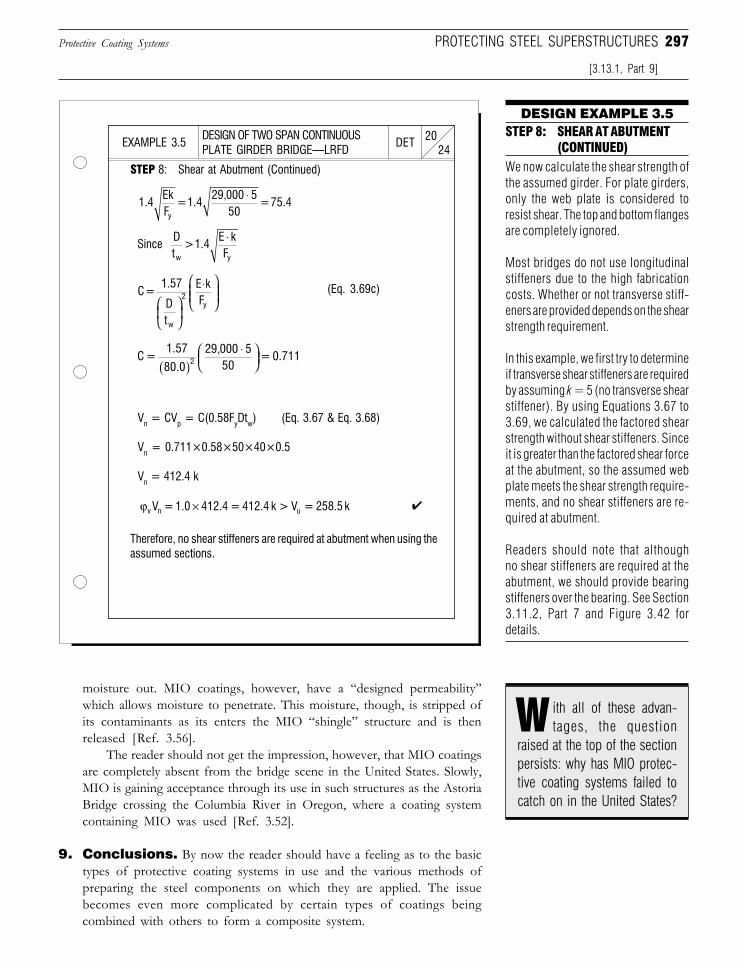
297
moisture out. MIO coatings, however, have a “designed permeability”which allows moisture to penetrate. This moisture, though, is stripped ofits contaminants as its enters the MIO “shingle” structure and is thenreleased [Ref. 3.56].
The reader should not get the impression, however, that MIO coatingsare completely absent from the bridge scene in the United States. Slowly,MIO is gaining acceptance through its use in such structures as the AstoriaBridge crossing the Columbia River in Oregon, where a coating systemcontaining MIO was used [Ref. 3.52].
9. Conclusions. By now the reader should have a feeling as to the basictypes of protective coating systems in use and the various methods ofpreparing the steel components on which they are applied. The issuebecomes even more complicated by certain types of coatings beingcombined with others to form a composite system.
Protective Coating Systems
[3.13.1, Part 9]
PROTECTING STEEL SUPERSTRUCTURES
DESIGN OF TWO SPAN CONTINUOUSPLATE GIRDER BRIDGE—LRFD 24
20DETEXAMPLE 3.5
DESIGN EXAMPLE 3.5STEP 8: SHEAR AT ABUTMENT
(CONTINUED)We now calculate the shear strength ofthe assumed girder. For plate girders,only the web plate is considered toresist shear. The top and bottom flangesare completely ignored.
Most bridges do not use longitudinalstiffeners due to the high fabricationcosts. Whether or not transverse stiff-eners are provided depends on the shearstrength requirement.
In this example, we first try to determineif transverse shear stiffeners are requiredby assuming k = 5 (no transverse shearstiffener). By using Equations 3.67 to3.69, we calculated the factored shearstrength without shear stiffeners. Sinceit is greater than the factored shear forceat the abutment, so the assumed webplate meets the shear strength require-ments, and no shear stiffeners are re-quired at abutment.
Readers should note that althoughno shear stiffeners are required at theabutment, we should provide bearingstiffeners over the bearing. See Section3.11.2, Part 7 and Figure 3.42 fordetails.
STEP 8: Shear at Abutment (Continued)
Vn = CVp = C(0.58FyDtw) (Eq. 3.67 & Eq. 3.68)
Vn = 0.711×0.58×50×40×0.5
Vn = 412.4 k
✔
Therefore, no shear stiffeners are required at abutment when using theassumed sections.
(Eq. 3.69c)
1.4EkF
= 1.429,000 5
50 = 75.4
y
⋅
Since Dt
> 1.4E kFw y
⋅
C = 1.57
Dt
E kF
w
2y
⋅
C =1.57
80.0
29,000 550
= 0.7112( )⋅
ϕv n uV = 1.0 412.4 = 412.4 k > V = 258.5 k×
ith all of these advan-tages, the question
raised at the top of the sectionpersists: why has MIO protec-tive coating systems failed tocatch on in the United States?
W
Downloaded from Digital Engineering Library @ McGraw-Hill (www.digitalengineeringlibrary.com)Copyright © 2006 The McGraw-Hill Companies. All rights reserved.
Any use is subject to the Terms of Use as given at the website.
Design of Superstructure Elements
298 SECTION 3 THE SUPERSTRUCTURE
It is relatively easy for one to rush to conclusions as to which methodis better than another based on the findings of one study versus another.The factors which go into formulating a final decision, however, are quiteoften not cut and dry. Everything from the weather conditions at the bridgesite to available funds to experience and familiarity with one system goesinto the process of selecting one system over another. If anything provesthis point, it is the fact that, based on performance alone, lead basedsystems are proven winners when it comes to protecting steel superstruc-tures. The liability of lead based systems with regard to environmentalconcerns, however, has doomed them to obsolescence.
It is also easy, as we see from above, to attempt to draw comparisonsfrom Europe to the United States; but the vast geography of the UnitedStates combined with its disproportionately larger number of highwaybridge structures begs for a closer analysis. What may work for atransportation department whose bridge structures cross the dry sands ofArizona may not necessarily be applicable to the pile bent supported simplespan bridges crossing the brackish waters of Florida.
There is also something to be said for experience with a given systemand the level of comfort associated with this experience. It has often beensaid that familiarity breeds contempt, but in the world of bridge projectsit could be said that familiarity breeds another contract. Writing aspecification for a certain type of protective coating system is no small featand, to be sure, those involved in writing one are probably not that terriblyeager to begin changing the structure of the specification all around.
If the evidence is there, however, that a new system will provide thesavings its developers promise, then transportation department personnelwill gravitate toward the better solution. The difficulty many protectivecoating systems have, with this respect, is proving something will last15 years on an owner’s bridges when a single coat of their product has yetto be applied to a single stringer. With the advent of the strong environmentalregulations, though, the eyes and ears of many bridge maintenance groupshave turned to this important area and they are more willing now to see andlisten than any time before.
3.13.2 Containment and Disposal of Paint Waste
At the top of this discussion, we mentioned the severe impact newregulations concerning the removal, containment, and disposal of the toxic by-products has on the application of protective coating systems. So far we havetouched on (to a limited degree) the process of removing paint and debris fromthe surface of steel members. Two questions arise, however, after the issue ofremoving the paint has been resolved:
❏ How do you collect the waste? (containment)❏ Where does the waste go after its collected? (disposal)
These are very large issues which have caused the price tag associated withprotecting steel superstructures to skyrocket. To put things in perspective,today transportation agencies actually examine the alternative of putting newsteel in rather than just painting it.
Containment and Disposal of Paint Waste
[3.13.1, Part 9]
t has often been said thatfamiliarity breeds contempt,
but in the world of bridgeprojects it could be said thatfamiliarity breeds another con-tract.
I
o put things in perspec-tive, today transportation
agencies actually examine thealternative of putting new steelin rather than just painting it.
T
DID YOU KNOW
THAT one of the morefamous struc-
tures to be protected usingan MIO coating system is theEiffel Tower? First appliedin 1919, the coating systemutilized red lead linseed oilwhich was topcoated withMIO linseed oil [Ref. 3.56].
Downloaded from Digital Engineering Library @ McGraw-Hill (www.digitalengineeringlibrary.com)Copyright © 2006 The McGraw-Hill Companies. All rights reserved.
Any use is subject to the Terms of Use as given at the website.
Design of Superstructure Elements
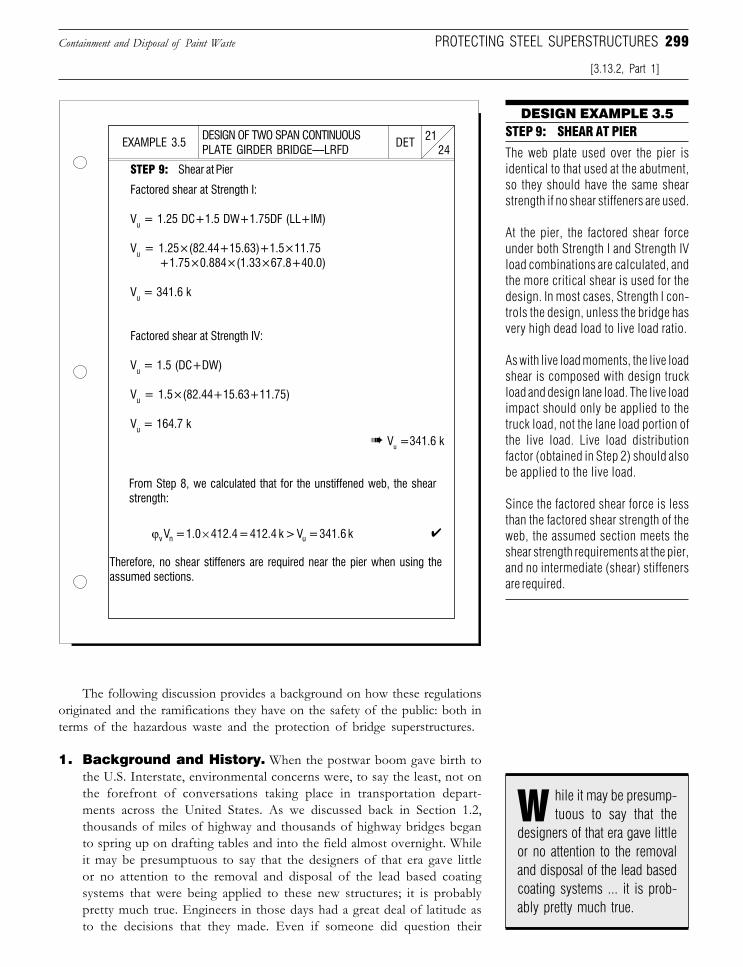
299
The following discussion provides a background on how these regulationsoriginated and the ramifications they have on the safety of the public: both interms of the hazardous waste and the protection of bridge superstructures.
1. Background and History. When the postwar boom gave birth tothe U.S. Interstate, environmental concerns were, to say the least, not onthe forefront of conversations taking place in transportation depart-ments across the United States. As we discussed back in Section 1.2,thousands of miles of highway and thousands of highway bridges beganto spring up on drafting tables and into the field almost overnight. Whileit may be presumptuous to say that the designers of that era gave littleor no attention to the removal and disposal of the lead based coatingsystems that were being applied to these new structures; it is probablypretty much true. Engineers in those days had a great deal of latitude asto the decisions that they made. Even if someone did question their
Containment and Disposal of Paint Waste
[3.13.2, Part 1]
PROTECTING STEEL SUPERSTRUCTURES
DESIGN OF TWO SPAN CONTINUOUSPLATE GIRDER BRIDGE—LRFD 24
21DETEXAMPLE 3.5
DESIGN EXAMPLE 3.5STEP 9: SHEAR AT PIER
The web plate used over the pier isidentical to that used at the abutment,so they should have the same shearstrength if no shear stiffeners are used.
At the pier, the factored shear forceunder both Strength I and Strength IVload combinations are calculated, andthe more critical shear is used for thedesign. In most cases, Strength I con-trols the design, unless the bridge hasvery high dead load to live load ratio.
As with live load moments, the live loadshear is composed with design truckload and design lane load. The live loadimpact should only be applied to thetruck load, not the lane load portion ofthe live load. Live load distributionfactor (obtained in Step 2) should alsobe applied to the live load.
Since the factored shear force is lessthan the factored shear strength of theweb, the assumed section meets theshear strength requirements at the pier,and no intermediate (shear) stiffenersare required.
STEP 9: Shear at Pier
Factored shear at Strength I:
Vu = 1.25 DC+1.5 DW+1.75DF (LL+IM)
Vu = 1.25×(82.44+15.63)+1.5×11.75 +1.75×0.884×(1.33×67.8+40.0)
Vu = 341.6 k
Factored shear at Strength IV:
Vu = 1.5 (DC+DW)
Vu = 1.5×(82.44+15.63+11.75)
Vu = 164.7 k➠ Vu =341.6 k
From Step 8, we calculated that for the unstiffened web, the shearstrength:
✔
Therefore, no shear stiffeners are required near the pier when using theassumed sections.
ϕv n uV = 1.0 412.4 = 412.4 k > V = 341.6 k×
hile it may be presump-tuous to say that the
designers of that era gave littleor no attention to the removaland disposal of the lead basedcoating systems ... it is prob-ably pretty much true.
W
Downloaded from Digital Engineering Library @ McGraw-Hill (www.digitalengineeringlibrary.com)Copyright © 2006 The McGraw-Hill Companies. All rights reserved.
Any use is subject to the Terms of Use as given at the website.
Design of Superstructure Elements
300 SECTION 3 THE SUPERSTRUCTURE
authority (and that was rarely done) the professional integrity of theengineer was usually enough to sway opinion.
All of that changed substantially by the mid 1960’s and the early1970’s. During these years the environmental movement gained momen-tum and suddenly engineers found themselves adapting to a very newworld. This is not to say that transportation departments themselves did nottake the initiative in formulating programs to deal with environmentalconcerns. As early as the 1960’s, states like Louisiana and California hadbegun to formulate programs which addressed the problems associatedwith lead and chromate based paints. As the hazards of lead paint becamemore fully understood, state agencies sought to tackle the most glaringproblem areas. Specifically, the states sought to address the entry of leadparticles into:
❏ Streams❏ Adjacent lands❏ Groundwater supplies
This concern led to some of the initial methods of containment (i.e.,preventing toxic by-products from leaving the project site). Many of theseearly efforts met with limited success. It was soon found, however, thatcontainment was only one part of the puzzle. For even if all of thecontaminated debris was collected (and it wasn’t) the question of what todo with it posed almost as much difficulty.
Even with new regulations being put into place, by the early 1980’s,only a few transportation agencies were aggressively pursuing the issue ofcontainment and disposal [Ref. 3.57]. By the mid-1980’s, however, withenforcement of these regulations becoming more severe, transportationdepartments began to actively study the problem in an effort to developtechniques and guidelines that would help them conform with the new lawswhile at the same time perform their function of ensuring that the highwaybridges they managed were adequately protected.
With regard to the last statement, it is easy for one to empathize withthe position many transportation department engineers found themselvesin. The new regulations, while designed to protect the public, were enactedwithout any real concern with how the maintenance departments wouldprotect their structures. Engineers in state transportation departmentsthroughout the United States were forced to develop the methods ofremoval, containment, and disposal on-the-fly so to speak.
Some states, such as Pennsylvania, went so far as to hire anindependent research contractor to investigate the problem in an effortsimply to develop guidelines with which to perform the work within theframework of the environmental regulations [Ref. 3.57]. By the late 1980’smanufacturers were also investing research and development dollars intothe development of new systems to aid in the containment, recycling,disposal, and processing of the waste.
2. Containment Devices. A containment device is required duringpaint removal operations to confine and collect waste and debris causedby surface preparations. The containment device itself is either an
Containment and Disposal of Paint Waste
[3.13.2, Part 1]
he new regulations, whiledesigned to protect the
public, were enacted withoutany real concern with how themaintenance departmentswould protect their structures.
T
Downloaded from Digital Engineering Library @ McGraw-Hill (www.digitalengineeringlibrary.com)Copyright © 2006 The McGraw-Hill Companies. All rights reserved.
Any use is subject to the Terms of Use as given at the website.
Design of Superstructure Elements
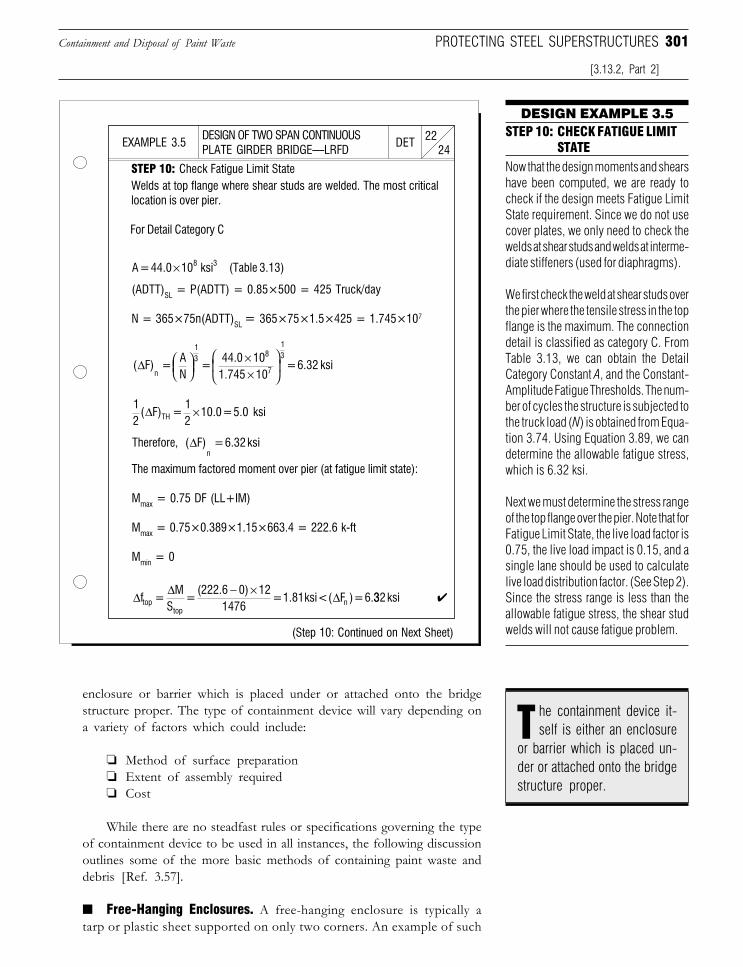
301
enclosure or barrier which is placed under or attached onto the bridgestructure proper. The type of containment device will vary depending ona variety of factors which could include:
❏ Method of surface preparation❏ Extent of assembly required❏ Cost
While there are no steadfast rules or specifications governing the typeof containment device to be used in all instances, the following discussionoutlines some of the more basic methods of containing paint waste anddebris [Ref. 3.57].
■ Free-Hanging Enclosures. A free-hanging enclosure is typically atarp or plastic sheet supported on only two corners. An example of such
Containment and Disposal of Paint Waste
[3.13.2, Part 2]
PROTECTING STEEL SUPERSTRUCTURES
DESIGN OF TWO SPAN CONTINUOUSPLATE GIRDER BRIDGE—LRFD 24
22DETEXAMPLE 3.5
DESIGN EXAMPLE 3.5STEP 10: CHECK FATIGUE LIMIT
STATENow that the design moments and shearshave been computed, we are ready tocheck if the design meets Fatigue LimitState requirement. Since we do not usecover plates, we only need to check thewelds at shear studs and welds at interme-diate stiffeners (used for diaphragms).
We first check the weld at shear studs overthe pier where the tensile stress in the topflange is the maximum. The connectiondetail is classified as category C. FromTable 3.13, we can obtain the DetailCategory Constant A, and the Constant-Amplitude Fatigue Thresholds. The num-ber of cycles the structure is subjected tothe truck load (N) is obtained from Equa-tion 3.74. Using Equation 3.89, we candetermine the allowable fatigue stress,which is 6.32 ksi.
Next we must determine the stress rangeof the top flange over the pier. Note that forFatigue Limit State, the live load factor is0.75, the live load impact is 0.15, and asingle lane should be used to calculatelive load distribution factor. (See Step 2).Since the stress range is less than theallowable fatigue stress, the shear studwelds will not cause fatigue problem.
STEP 10: Check Fatigue Limit StateWelds at top flange where shear studs are welded. The most criticallocation is over pier.
For Detail Category C
(ADTT)SL = P(ADTT) = 0.85×500 = 425 Truck/day
N = 365×75n(ADTT)SL = 365×75×1.5×425 = 1.745×10⁷
The maximum factored moment over pier (at fatigue limit state):
Mmax = 0.75 DF (LL+IM)
Mmax = 0.75×0.389×1.15×663.4 = 222.6 k-ft
Mmin = 0
(Step 10: Continued on Next Sheet)
✔
A = 44.0 10 ksi (Table 3.13)8 3×
12
( F) = 12
10.0 = 5.0 ksiTH∆ ×
Therefore, ( F) = 6.32 ksin
∆
∆ ∆ ∆f = M
S =
(222.6 0) 121476
= 1.81ksi < ( F ) = 6.toptop
n− ×
332 ksi
he containment device it-self is either an enclosure
or barrier which is placed un-der or attached onto the bridgestructure proper.
T
( F) = AN
= 44.0 10
1.745 10= 6.32 ksi
n
13 8
7
13
∆
××
Downloaded from Digital Engineering Library @ McGraw-Hill (www.digitalengineeringlibrary.com)Copyright © 2006 The McGraw-Hill Companies. All rights reserved.
Any use is subject to the Terms of Use as given at the website.
Design of Superstructure Elements
302 SECTION 3 THE SUPERSTRUCTURE
a containment device would be a tarp pinned at the top to the concretefascia of a bridge deck and left to hang down to the underpass roadwaysurface.
An obvious difficulty with such an approach is the “sailing” of the tarp,which can be caused by high winds. If the blowing is severe enough, it ispossible that the enclosure will be pulled from its supports and fall tothe underpass below. This sail effect can present a danger, not only tothe crews working on the bridge, but also to underpass trafficunderneath or adjacent to the structure. Because of this danger, free-hanging enclosures on particularly high bridges is not recommended.
One solution to the wind problems associated with hanging tarps is touse a sheet which allows a certain amount of air to pass through the sheet.This screen, however, must still be of sufficient strength to perform itsfunction.
Naturally, tarps and plastic sheets are attractive choices to contractorsbecause they are relatively inexpensive. A deficiency with this type ofcontainment device is that they merely deflect abrasive debris rather thancollect and support the load itself. Typically the debris which is deflectedoff of the tarps falls to collection points at the base of the structure.
■ Complete Structure Enclosures. A more extreme alternative to thefree-hanging enclosure is to completely enclose the structure. Such anenclosure can be fashioned with a steel or wood framework, cablestructures, or prefabricated panels. While such a method definitelyproduces a secure environment within which debris can be contained andeventually disposed; it is not without potential difficulties.
One difficulty is visibility within the enclosures. The bridge is sur-rounded by a solid structure while at the same time blasting or cleaningoperations will be generating large quantities of dust and debris. Properlighting and protective equipment for the crews is an absolute necessity whena complete structure enclosure is used. Circulation of air within the enclosuremust also be maintained. Otherwise dust could leak from the enclosure.
From a safety standpoint, the enclosure itself is a structure which mustbe properly designed to withstand a variety of loads ranging from theworkers within the enclosure to wind loads on the outside of it.
Inside the structure there must be appropriate facilities to allowworkers to get at the bridge itself. In many instances these platforms willneed to be elevated to reach superstructure elements so that appropriatesafety concerns must also be addressed here.
One advantage of using a complete structure enclosure is the potentialfor reusing the enclosure components on subsequent bridge maintenanceprojects. This is especially beneficial on large structures where theenclosure unit can be broken down after completion of work at one pointon the bridge and reassembled at the next point of work.
An obvious drawback to complete structure enclosures are theassociated costs incurred in acquiring the materials as well as designing andthen assembling the enclosure.
■ Negative Pressure Containment. As mentioned above, a danger withenclosing a structure is the potential risk of dust particles escaping the
Containment and Disposal of Paint Waste
[3.13.2, Part 2]
hile such a method defi-nitely produces a se-
cure environment ... it is notwithout potential difficulties.
W
his sail effect can presenta danger, not only to the
crews working on the bridge,but also to underpass trafficunderneath or adjacent to thestructure.
T
Downloaded from Digital Engineering Library @ McGraw-Hill (www.digitalengineeringlibrary.com)Copyright © 2006 The McGraw-Hill Companies. All rights reserved.
Any use is subject to the Terms of Use as given at the website.
Design of Superstructure Elements
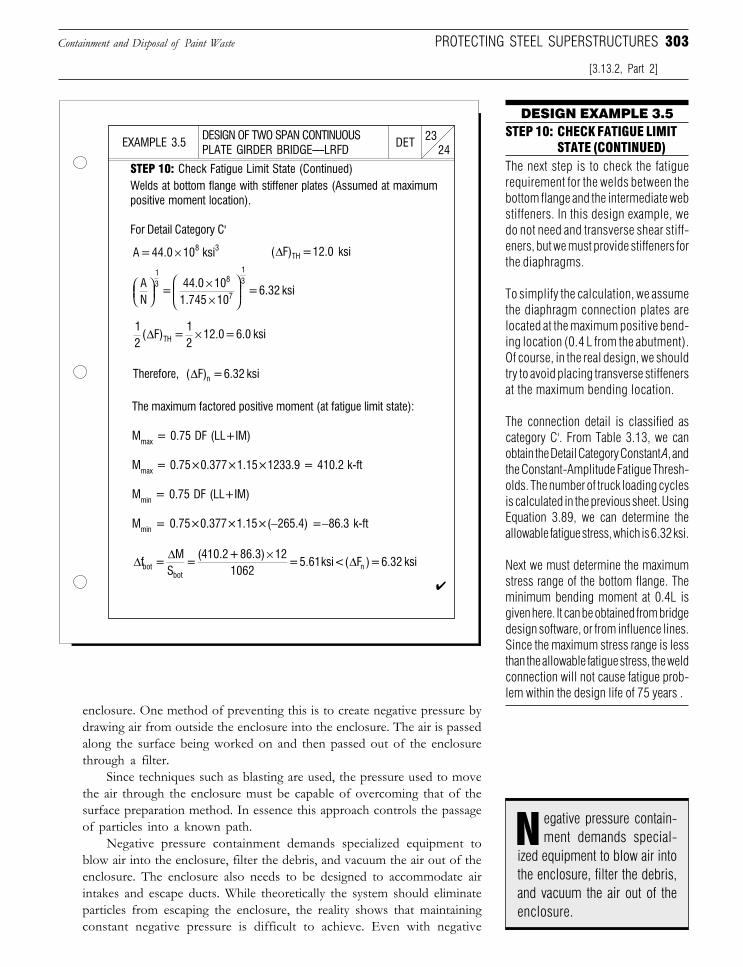
303
enclosure. One method of preventing this is to create negative pressure bydrawing air from outside the enclosure into the enclosure. The air is passedalong the surface being worked on and then passed out of the enclosurethrough a filter.
Since techniques such as blasting are used, the pressure used to movethe air through the enclosure must be capable of overcoming that of thesurface preparation method. In essence this approach controls the passageof particles into a known path.
Negative pressure containment demands specialized equipment toblow air into the enclosure, filter the debris, and vacuum the air out of theenclosure. The enclosure also needs to be designed to accommodate airintakes and escape ducts. While theoretically the system should eliminateparticles from escaping the enclosure, the reality shows that maintainingconstant negative pressure is difficult to achieve. Even with negative
Containment and Disposal of Paint Waste
[3.13.2, Part 2]
PROTECTING STEEL SUPERSTRUCTURES
DESIGN OF TWO SPAN CONTINUOUSPLATE GIRDER BRIDGE—LRFD 24
23DETEXAMPLE 3.5
DESIGN EXAMPLE 3.5STEP 10: CHECK FATIGUE LIMIT
STATE (CONTINUED)The next step is to check the fatiguerequirement for the welds between thebottom flange and the intermediate webstiffeners. In this design example, wedo not need and transverse shear stiff-eners, but we must provide stiffeners forthe diaphragms.
To simplify the calculation, we assumethe diaphragm connection plates arelocated at the maximum positive bend-ing location (0.4 L from the abutment).Of course, in the real design, we shouldtry to avoid placing transverse stiffenersat the maximum bending location.
The connection detail is classified ascategory C'. From Table 3.13, we canobtain the Detail Category Constant A, andthe Constant-Amplitude Fatigue Thresh-olds. The number of truck loading cyclesis calculated in the previous sheet. UsingEquation 3.89, we can determine theallowable fatigue stress, which is 6.32 ksi.
Next we must determine the maximumstress range of the bottom flange. Theminimum bending moment at 0.4L isgiven here. It can be obtained from bridgedesign software, or from influence lines.Since the maximum stress range is lessthan the allowable fatigue stress, the weldconnection will not cause fatigue prob-lem within the design life of 75 years .
STEP 10: Check Fatigue Limit State (Continued)Welds at bottom flange with stiffener plates (Assumed at maximumpositive moment location).
For Detail Category C'
The maximum factored positive moment (at fatigue limit state):
Mmax = 0.75 DF (LL+IM)
Mmax = 0.75×0.377×1.15×1233.9 = 410.2 k-ft
Mmin = 0.75 DF (LL+IM)
Mmin = 0.75×0.377×1.15×(−265.4) =−86.3 k-ft
✔
A = 44.0 10 ksi 8 3×
AN
= 44.0 10
1.745 10 = 6.32 ksi
13 8
7
13
××
12
( F) = 12
12.0 = 6.0 ksiTH∆ ×
Therefore, ( F) = 6.32 ksin∆
∆ ∆ ∆f = M
S =
(410.2 + 86.3) 121062
= 5.61ksi < ( F ) =botbot
n×
6.32 ksi
( F) = 12.0 ksiTH∆
egative pressure contain-ment demands special-
ized equipment to blow air intothe enclosure, filter the debris,and vacuum the air out of theenclosure.
N
Downloaded from Digital Engineering Library @ McGraw-Hill (www.digitalengineeringlibrary.com)Copyright © 2006 The McGraw-Hill Companies. All rights reserved.
Any use is subject to the Terms of Use as given at the website.
Design of Superstructure Elements
304 SECTION 3 THE SUPERSTRUCTURE
pressure systems in place, workers both inside and outside of enclosuresare exposed to extreme health risks from inhaling contaminated air.Negative pressure systems hold a great deal of promise in containing leaddebris and is becoming the standard practice in lead paint removaloperation. However, work still needs to be done in perfecting theiroperation.
■ Power Tool Debris Containment. While the debris generated bypower tools is more easily contained (when compared to blasting methods,
Containment and Disposal of Paint Waste
[3.13.2, Part 2]
for example), the waste still has the same volume of lead paint as thatgenerated by other methods. Indeed, the lead is more concentrated whenpower tools are used and should thus be carefully controlled to avoid entryinto environmentally sensitive areas. Vacuums provide an efficient way ofcontaining debris generated by power tool cleaning methods.
As mentioned in Section 3.13.1, Part 6, power tools should not beexpected to remove material down to the bare steel surface. They are,however, capable of removing the layer of paint which contains the leadcontaminants. Therefore, one method that has been employed is the useof power tools in conjunction with blasting. This so called two-step cleaningprocess takes advantage of the localized containment possible with handtools while at the same time providing a thorough surface preparation.Power tools are used in conjunction with attached vacuums to contain allof the hazardous lead waste. Then, an open abrasive method employspartial containment, essentially to control the escape of dust.
■ Collecting Fallen Abrasives and Debris. Even with attached vacuumdevices, like those described above, debris will invariably fall to the ground.When blasting methods are utilized, abrasives will be distributed in the worksite and need to be channeled and eventually collected. Methods rangingfrom the primitive (sweeping and shoveling) to the more sophisticated(vacuuming and mechanical conveyors) can be used to contain and collectthis waste.
Particularly when dealing with abrasives, a regular collection plan(preferably once per day) should be employed to remove abrasives andwastes. When using suspended tarps or screens to collect abrasives, it isimportant that the abrasives not be allowed to accumulate in excessiveamounts, which could lead to the containment system failing. Oncecollected, the waste is stored in drums or dumpsters. A hazardous wasteshould be appropriately identified on the container.
Another method of containing debris is to channel it through a tubelike conduit and directly into disposal containers located below. TheCalifornia Department of Transportation encloses the scaffolding, whereworkers blast a steel superstructure, with burlap funnels which channeldebris to a cylindrical snorkel-like containment which is suspended fromthe enclosure to the ground [Ref. 3.57].
Containing fallen abrasives and debris for structures which crossbodies of water is even more complicated. One solution often employedis to collect debris on barges located under the structure which can thenbe used to haul the debris away.
his so-called two-stepcleaning process takes ad-
vantage of the localized con-tainment possible with handtools while at the same timeproviding a thorough surfacepreparation.
T
Downloaded from Digital Engineering Library @ McGraw-Hill (www.digitalengineeringlibrary.com)Copyright © 2006 The McGraw-Hill Companies. All rights reserved.
Any use is subject to the Terms of Use as given at the website.
Design of Superstructure Elements
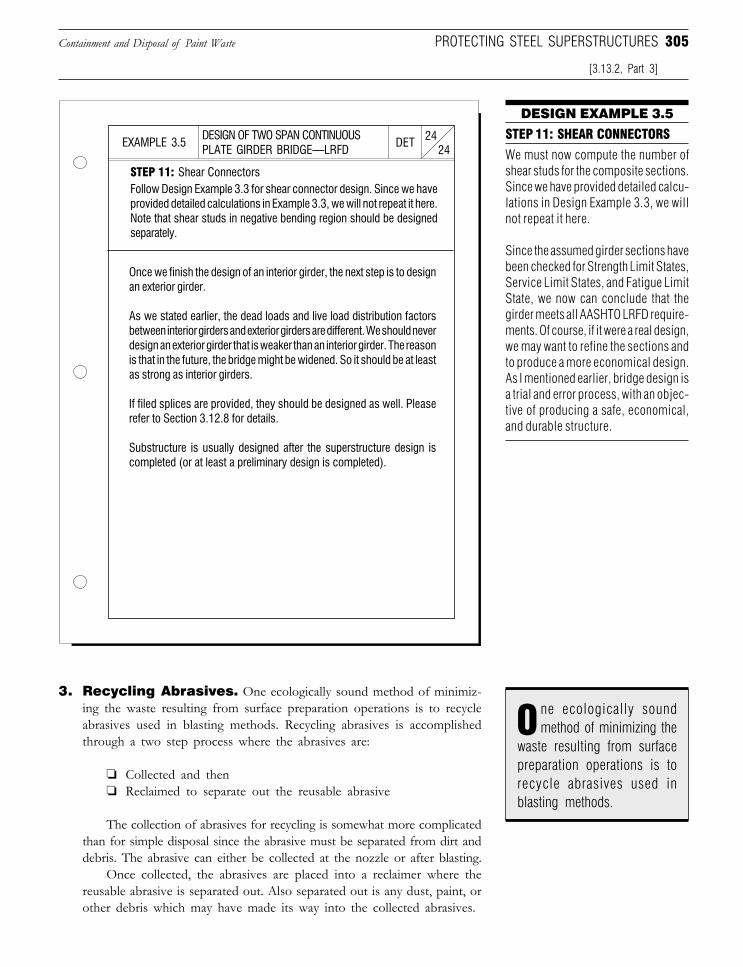
305
3. Recycling Abrasives. One ecologically sound method of minimiz-ing the waste resulting from surface preparation operations is to recycleabrasives used in blasting methods. Recycling abrasives is accomplishedthrough a two step process where the abrasives are:
❏ Collected and then❏ Reclaimed to separate out the reusable abrasive
The collection of abrasives for recycling is somewhat more complicatedthan for simple disposal since the abrasive must be separated from dirt anddebris. The abrasive can either be collected at the nozzle or after blasting.
Once collected, the abrasives are placed into a reclaimer where thereusable abrasive is separated out. Also separated out is any dust, paint, orother debris which may have made its way into the collected abrasives.
Containment and Disposal of Paint Waste
[3.13.2, Part 3]
PROTECTING STEEL SUPERSTRUCTURES
DESIGN OF TWO SPAN CONTINUOUSPLATE GIRDER BRIDGE—LRFD 24
24DETEXAMPLE 3.5
DESIGN EXAMPLE 3.5
STEP 11: SHEAR CONNECTORS
We must now compute the number ofshear studs for the composite sections.Since we have provided detailed calcu-lations in Design Example 3.3, we willnot repeat it here.
Since the assumed girder sections havebeen checked for Strength Limit States,Service Limit States, and Fatigue LimitState, we now can conclude that thegirder meets all AASHTO LRFD require-ments. Of course, if it were a real design,we may want to refine the sections andto produce a more economical design.As I mentioned earlier, bridge design isa trial and error process, with an objec-tive of producing a safe, economical,and durable structure.
STEP 11: Shear ConnectorsFollow Design Example 3.3 for shear connector design. Since we haveprovided detailed calculations in Example 3.3, we will not repeat it here.Note that shear studs in negative bending region should be designedseparately.
Once we finish the design of an interior girder, the next step is to designan exterior girder.
As we stated earlier, the dead loads and live load distribution factorsbetween interior girders and exterior girders are different. We should neverdesign an exterior girder that is weaker than an interior girder. The reasonis that in the future, the bridge might be widened. So it should be at leastas strong as interior girders.
If filed splices are provided, they should be designed as well. Pleaserefer to Section 3.12.8 for details.
Substructure is usually designed after the superstructure design iscompleted (or at least a preliminary design is completed).
ne ecologically soundmethod of minimizing the
waste resulting from surfacepreparation operations is torecycle abrasives used inblasting methods.
O
Downloaded from Digital Engineering Library @ McGraw-Hill (www.digitalengineeringlibrary.com)Copyright © 2006 The McGraw-Hill Companies. All rights reserved.
Any use is subject to the Terms of Use as given at the website.
Design of Superstructure Elements
306 SECTION 3 THE SUPERSTRUCTURE
There are three principal methods used for separating out the reusableabrasives from the associated paint, dust, and debris. The main systemscurrently being used are:
❏ Air-wash separators❏ Cyclone separators❏ Rotary vibratory separators
These systems, while providing adequate results, by no meansproduce a completely pure abrasive upon separation. The recycledabrasive can often suffer from being too “dusty” with the same dustbeing recycled through the system on several occasions [Ref. 3.57]. Thisdust can lead to various visibility and health problems for the cleaningwork crews.
4. Disposal Methods. Disposal of paint and abrasive debris from aproject site used to be a relatively easy affair. Spent abrasive was eitherhauled away to landfills or deposited in rivers [Ref. 3.57]. Obviously, giventhe current tight environmental regulation and our present knowledgeconcerning the adverse effects of lead based coating systems, such anapproach is no longer feasible.
Disposal of paint wastes can be thought of as the third leg of a costtriangle associated with maintaining steel superstructures. One leg of thetriangle is the cost of surface preparation, the other containment andcollection of wastes at the project. The third and final link is disposal of thewaste. When the waste to be disposed of is designated as hazardous, the costwill dramatically increase.
In 1990, the United States EPA enacted regulations which forbade theland disposal of hazardous waste. This means that all hazardous wastesmust be first treated or detoxified. Once treated properly, the waste is nolonger considered hazardous and may then be disposed of. This regulationis also known as the Land Ban.
The process of treating the hazardous waste can be conducted on oneof two levels. The hazardous waste can either be:
❏ Separated out from the nonhazardous waste or❏ Converted to a nonhazardous form
The process of disposing of hazardous waste is further complicated(and made more expensive) by regulations which concern the handling,packaging, storing, transporting, and testing of the waste. Treatment ofthe waste can be conducted on or off site by physical or chemicalmethods; with each having its particular impacts on the overall cost ofthe process.
The following discussion concerns the various methods for bothphysically and chemically treating wastes. In performing this treatment, thegeneral goal is to get the leachable lead content below the EPA maximumallowable of 5 ppm. For more on the EPA requirements and the hazardsassociated with lead bridge paint, the reader is referred to the accompany-ing Design Perspective.
Containment and Disposal of Paint Waste
[3.13.2, Part 3]
n 1990, the United StatesEPA enacted regulations
which forbade the land dis-posal of hazardous waste. Thismeans that all hazardouswastes must be first treated ordetoxified.
I
Downloaded from Digital Engineering Library @ McGraw-Hill (www.digitalengineeringlibrary.com)Copyright © 2006 The McGraw-Hill Companies. All rights reserved.
Any use is subject to the Terms of Use as given at the website.
Design of Superstructure Elements
307
■ Physical Methods. As the name implies, physical methods entailphysically separating out the hazardous component of the generated waste.The principal methods for separating out the hazardous components are:
❏ Screening❏ Crushing or grinding❏ Air wash❏ Flotation❏ Magnetism
The specific physical method used for separating out hazardouscomponents is generally dependent on the nature of the abrasive usedduring surface preparation. Metallic abrasives lend themselves well to air-wash filtration while nonmetallic abrasives may not react well to thisprocess [Ref. 3.57].
■ Chemical Methods. Chemical processing of the debris is designed toeliminate the hazardous risk of paint wastes through one of two principalmethods which are to either:
❏ Vaporize the lead in the debris❏ Make the lead particles insoluble
The former could involve the use of high-temperature incinerationwhile the latter the addition of portland cement to the debris. In someinstances, the waste is even treated on site (although such an alternative issubject to strict requirements by EPA).
5. Conclusions. In the last two sections, we have seen the magnitude ofthe problems facing the application and subsequent maintenance ofprotective coating systems in highway bridges. The apparent simplicity ofsimply “slapping a couple coats of paint” on a steel superstructure certainlybelies the impact removing, containing, and disposing lead based systemshas had on today’s transportation agencies.
Both the alacrity and severity with which new regulations have hitmaintenance departments has created a situation where environmentalconcerns have come face to face with other safety issues. To the layperson,an environmental regulation usually implies that the public is, by default,being protected. It is difficult, however, to draw a straight analogy betweenprotecting wetlands and painting bridges.
Maintenance engineers are faced with sets of regulations which areoften contradictory in the goals they seek to achieve. EPA wants all leadby-products to be contained so that they do not contaminate the environ-ment by, for example, seeping into groundwater. However, in so containinglead dust and other such hazardous waste, workers are more at risk becausethey are exposed to the lead-laden dust within the confines of an enclosurestructure; a situation which OSHA is acutely aware of.
If this were not enough to contend with, there are the associatedcosts which come with attempting to meet all of these regulations.Transportation departments are already limited in the amount of funds
Containment and Disposal of Paint Waste
[3.13.2, Part 5]
PROTECTING STEEL SUPERSTRUCTURES
he specific physical methodused for separating out haz-
ardous components is gener-ally dependent on the natureof the abrasive used duringsurface preparation.
T
aintenance engineers arefaced with sets of regu-
lations which are often contra-dictory in the goals they seekto achieve.
M
Downloaded from Digital Engineering Library @ McGraw-Hill (www.digitalengineeringlibrary.com)Copyright © 2006 The McGraw-Hill Companies. All rights reserved.
Any use is subject to the Terms of Use as given at the website.
Design of Superstructure Elements
308 SECTION 3 THE SUPERSTRUCTURE
they can spend. If the monetary resources are not available then, bydefault, certain bridges will go unpainted. If the steel is allowed todeteriorate to the point where significant loss of section occurs, thenthe traveling public is put at risk.
In summary, engineers in maintenance departments are put in themiddle of three conflicting needs in that they are required by law to satisfy:
❏ Environmental safety❏ Worker safety❏ The safety of traffic over a structure
Trying to meet these goals is aproblem as difficult as any con-tinuous beam analysis or founda-tion design, and the resources be-ing applied prove it.
In the preceding text we havetouched on some of the majormethods used to remove, contain,and dispose of lead waste. Theseare by no means the only solu-tions and methods available. Dueto the severity of the problem, agreat deal of research and devel-opment has been, and is being,conducted to help on issues asdiverse as ventilating enclosurestructures to chemically treatingwaste.
While both public and pri-vate institutions are at work onthese problems, the principal re-sponsibility (at least in the UnitedStates) rests with the owner ofthe structures involved. The so-called cradle-to-grave policy man-dates that it is the transportationdepartment which is ultimatelyresponsible for proper disposalof all waste associated with thepainting of a structure [Ref. 3.57].While the burden may be on theagency, the problem is too bigfor any one organization to solve.Like any answer to a complexproblem, however, a successfulsolution will be achieved througha combination of experience andperseverance.
Containment and Disposal of Paint Waste
[3.13.2, Part 5]
Weathering Steel Environments:This One's Just Right.
tion department, she might findherself having to decide if weather-ing steel should be used at a par-ticular site.
“This one’s too dry,” she maysay. If their are insufficient wet-drycycles, weathering steel may not ad-equately create the protective oxidecoating. Another danger is if thesteel will be continually exposed tospray from contaminants such asindustrial fumes or deicing agents[Ref. 3.58].
Moving on to the next siteGoldilocks may be overheard mut-tering, “... and this one’s too wet.”Excessive moisture on the surfaceof weathering steel can cause ex-treme corrosion. When moistureclings to the weathering steel sur-face for extended periods of time,the steel will also not properly de-velop the protective oxide coating(see Section 3.13.3, Part 2).
Finally, Goldilocks comesupon the ideal site for weatheringsteel, “This one’s just right!” sheexclaims. Climates which have regu-lar wet/dry cycles and are not prone
f Goldilocks were em-ployed by a transporta-
DESIGN PERSPECTIVE
to the harsh effects of marine envi-ronments can prove adequate inallowing the weathering steel todevelop its protective coating.
Topography at the bridge siteis another factor which can impacthow weathering steel performs. Ifone side of the bridge is shaded andthe other exposed to sunlight, thenthe protective coating may not de-velop uniformly. Even the pres-ence of weeds can impede air circu-lation and hinder the performanceof the steel [Ref. 3.58].
Another obvious impact onthe performance of weathering steelis the presence of deck joints andtheir associated leaking if not prop-erly sealed. Opponents of weather-ing steel would note this and otherconcerns as reasons not to use thematerial, while proponents wouldcounter that problems like deicingagents and joint leakage have anadverse impact on any material.
Like any material, however,weathering steel is a viable alterna-tive provided it is implementedwith care and not thought of as apanacea to the protective coatingissue.
I
ike any answer to a com-plex problem, however, a
successful solution will beachieved through a combina-tion of experience and perse-verance.
L
Downloaded from Digital Engineering Library @ McGraw-Hill (www.digitalengineeringlibrary.com)Copyright © 2006 The McGraw-Hill Companies. All rights reserved.
Any use is subject to the Terms of Use as given at the website.
Design of Superstructure Elements
309
3.13.3 Weathering Steel
Having just discussed the plethora of problems associated with protectivecoating systems, we now turn our attention to a steel designated as ASTM A588and A709: weathering steel. On the surface, weathering steel would appear tobe the answer to the many problems and the costs associated with conventionalprotective coating systems. The reality, which we will see, is not as good as itmay first seem but not as bad as some would paint it. The following is adiscussion of the basic properties of weathering steel, its benefits, and associateddifficulties.
1. Background and History. Weathering steel possesses the uniquematerial property of providing a protective coating to the steel by rusting.As weathering steel oxidizes, it forms a protective coating which actuallyinhibits continuous rusting. The benefits of such a material in bridgedesign are obvious. Weathering steel would not have to be painted andthereby would require little or no maintenance to its steel components.The nascent use of weathering steel in bridge design was extremelypositive. As experience with the material grew, however, problems weresoon discovered.
Weathering steel was originally developed for use in the fabrication ofunpainted coal cars [Ref. 3.58]. Its introduction into the world of highwaybridges did not occur until the 1960’s. The promise which weathering steelheld and the initial positive feedback led to its quick incorporation into thestandards of many highway transportation departments.
One such example is the Michigan Department of Transportation.The state’s first weathering steel bridge was built in Detroit in 1963. Theinitial positive feedback on the steel’s performance led to weathering steelbeing adopted throughout the state in 1969. By the 1970’s over 600highway bridges were constructed using weathering steel in the state ofMichigan [Ref. 3.59]. A 1987 survey indicated that there were approxi-mately 2,300 weathering steel structures in use on state highway systemsalone. Such positive reaction seemed to indicate that weathering steel wasthe wave of the future. Investigations into the performance of thesestructures, however, began to raise a cloud over the use of this promisingmaterial.
2. Material Properties of Weathering Steel. Weathering steel isa carbon steel base alloyed with roughly 2 percent of copper, nickel, chromium,and silicon coming in yield strength of 50 to 100 ksi. Highway bridge structuretypically makes use of ASTM A588 and A709. A new quenched and temperedweathering steel known as ASTM A852 is also available and has a yield strengthof 70 ksi [Ref. 3.60]. For the purposes of this discussion we will refer toweathering steel as ASTM A588.
Weathering steel requires moisture and airborne contaminants todevelop the hard coating which protects the steel. Rainwater washes overthe structure in several wet/dry cycles allowing the protective coating todevelop over the steel [Ref. 3.58]. While moisture is essential to formthe protective coating, continuous moisture can adversely affect the
Weathering Steel
[3.13.3, Part 2]
PROTECTING STEEL SUPERSTRUCTURES
eathering steel wasoriginally developed for
use in the fabrication of un-painted coal cars.
W
ike any answer to a com-plex problem, however, a
successful solution will beachieved through a combina-tion of experience and perse-verance.
L
Downloaded from Digital Engineering Library @ McGraw-Hill (www.digitalengineeringlibrary.com)Copyright © 2006 The McGraw-Hill Companies. All rights reserved.
Any use is subject to the Terms of Use as given at the website.
Design of Superstructure Elements
310 SECTION 3 THE SUPERSTRUCTURE
performance of weathering steel. Some sources of continuous moistureinclude:
❏ Nightly condensation❏ Cooling from the deck causing moisture to run down web❏ Capillary moisture❏ Absorption by corrosion products❏ Leaking joints❏ Spray from traffic
A high relative humidity, nightly fog, and moisture which evaporatesfrom nearby bodies of water will also spur the development of moistureover the surface [Ref. 3.60]. As we will see, these environmental conditionsplay an important role concerning how weathering steel will perform.
3. Environmental Considerations. From the above, it becomesreadily visible that the environment in which weathering steel is placed playsan important role in how the material will perform (see also the accompa-nying Design Perspective). Environments which are too dry do not have thenecessary wet/dry cycles required to create the protective oxide coating orpatina. Likewise, environments which are too wet or susceptible tocontinuous moisture (e.g., through excessive humidity) will also serve tohinder the development of a sound patina.
What does all of this mean? First and foremost, it means thatweathering steel must be used in an environment which is conducive to itsinherit material properties and their benefits. An example where this hasbeen done successfully is in the state of Maine. Engineers at the statetransportation department have undertaken an aggressive implementationof weathering steel structures. This use of weathering steel, however, is notmade without a certain measure of prudence. Outlying coastal areas, whichare susceptible to saltwater spray, are intentionally avoided, while inlandlakes, streams, and waterways are targeted sites [Ref. 3.61].
On the other side of the coin, the state of Michigan has seen some ofthe worst deterioration associated with weathering steel. A combination ofconstant contamination from deicing salts and extended exposure tomoisture has led to numerous structures undergoing excessive corrosion[Ref. 3.58]. The problems were so severe that in 1979 a partial moratoriumwas issued which was then followed by a complete ban on the use ofweathering steel in 1980 [Ref. 3.59].
4. Maintenance of Weathering Steel. With two extremes, suchas those detailed above, the question arises “Is weathering steel a viablealternative to protective coatings or not?” The qualified answer is yes,provided that the environmental situation is conducive and the steel isproperly maintained.
The latter item may come as a surprise to the novice bridge designer.After all, the main advantage of weathering steel would appear to be itsability to be “left alone” without having to be repeatedly painted. Noengineering structure, be it a highway bridge or sewer system, is mainte-nance free. Many of the problems associated with weathering steel stem
Weathering Steel
[3.13.3, Part 2]
s we will see, these envi-ronmental conditions play
an important role concerninghow weathering steel will per-form.
A
Downloaded from Digital Engineering Library @ McGraw-Hill (www.digitalengineeringlibrary.com)Copyright © 2006 The McGraw-Hill Companies. All rights reserved.
Any use is subject to the Terms of Use as given at the website.
Design of Superstructure Elements
311
from its implementation in areas where it simply cannot perform well.When weathering steel is placed in the right environmental setting, it willperform well but will still require limited maintenance.
In reference to the state of Maine example detailed above, the statehas a maintenance program where each weathering steel structure receivesan annual washing to remove salt-laden sand from the decks. This washingalso serves to flush out curbs, gutters, and drains. The underside of thestructure also receives a high pressure wash using a water sprayer whichcleans the bearings and interior girders. In the process of washing a bridge,maintenance personnel “kill two birds with one stone” by performing acursory inspection of the structure to detect any possible cracking whichcould allow salts to penetrate into the weathering steel [Ref. 3.61].
Anyone who has seen a weathering steel structure will no doubt noticethe rather unattractive streaks of rust which often stain the light grey surfaceof the concrete substructure. These rust blemishes often spoil the look ofwhat are otherwise striking bridge structures. Staining of the substructure,however, can be prevented by temporarily wrapping piers and abutmentsthroughout construction with heavy gauge polyethylene sheeting [Refs. 3.60and 3.58]. In addition to this protective measure, liquid silicone or epoxybased coatings can be applied to the substructure in order to protect them.
If joints are present, however, they will eventually leak and this willcreate the telltale streaking blemishes at the support locations. Anotherpotential source of these rust streaks is dripping from girders which issomehow channeled to the piers and abutments. In such situations, the onlyrecourse a maintenance department will have will be to either leave thestreaks or attempt to clean the substructure elements with blast cleaningor chemical stain removers [Ref. 3.60].
5. Inspection of Weathering Steel. When a steel bridge which hasbeen painted undergoes inspection, the assigned personnel look for rustingto detect whether or not the protective coating system has failed. How doessomeone inspect a structure, however, which, by design, is covered withrust to protect itself? The answer is: very closely.
Close inspection is required in order to detect whether the protectiveoxide coating has fully developed over the steel surface. During regularbiennial inspections, the weathering steel is inspected to check the color andtexture of the oxide film. This inspection is undertaken using a hammer andwire brush to ascertain whether the rust on the surface of the steel adheresto the underlying steel or has become debonded. Debonding is evidenced byflaking of the rust or peeling off in laminar sheets when either banged witha hammer or wire brushed [Ref. 3.60].
If the protective oxide coating has ceased to function properly, then thesize and depths of any pitting must be logged in an effort to determine theseverity of the deterioration as well as possible causes for the steel corrosion.
With regard to the latter item, it is also important for the inspectors tonote any and all drainage problems and other site conditions which couldbe potential causes for corrosion of the steel. Malfunctioning of joints,vegetation growth around end supports, and the presence of excessive dustor other materials on the surface of the steel are just a few of the conditionswhich can propagate deterioration in weathering steel.
Weathering Steel
[3.13.3, Part 5]
PROTECTING STEEL SUPERSTRUCTURES
nyone who has seen aweathering steel structure
will no doubt notice the ratherunattractive streaks of rustwhich often stain the light greysurface of the concrete sub-structure.
A
ow does someone inspecta structure ... which, by
design, is covered with rust toprotect itself? The answer is:very closely.
H
any of the problems as-sociated with weathering
steel stem from its implemen-tation in areas where it simplycannot perform well.
M
Downloaded from Digital Engineering Library @ McGraw-Hill (www.digitalengineeringlibrary.com)Copyright © 2006 The McGraw-Hill Companies. All rights reserved.
Any use is subject to the Terms of Use as given at the website.
Design of Superstructure Elements
312 SECTION 3 THE SUPERSTRUCTURE Weathering Steel
[3.13.3, Part 5]
Another difficulty associated with the inspection of weathering steelstructures is in the detection of fatigue cracks. When a structure is painted,the rust emitted from a crack is readily visible by contrast to the paintedbackground. In a bridge constructed with weathering steel, however, thecrack not only blends in with the rust colored background, but is also filledwith newly formed rust. Due to this difficulty in visually detecting cracks,fatigue cracks in weathering steel structures are not usually detected untilthe member has fractured [Ref. 3.60]. Therefore, fatigue crack detectiontools are usually used for inspections. Dye penetrant is normally used forvisual inspections. Magnetic field, ultrasonic test, or X-ray may be used todetect cracks.
6. Rehabilitation of Weathering Steel. When a weathering steelstructure begins to shows signs of wear, like those detailed in Part 5 above,then some form of rehabilitation must be undertaken to preserve theintegrity of the steel superstructure. The most basic method which can beemployed is to paint the steel. This involves many of the headachesdiscussed in Section 3.13.2 as well as some additional concerns. Thesurface of weathering steel is, by nature, extremely rough. Therefore, theprotective coating system to be used must be able to withstand excessivedry film thickness variations. Another adverse effect of weathering steel’srough surface is the collection of debris and contaminants within the pittedsurface itself.
This can lead to difficulties when paint crews attempt to meettransportation department specifications calling for near white blastcleaned surface quality [Ref. 3.60]. Because it is difficult, if notimpossible, to achieve such a condition, it may be desirable to have anypertinent specifications revised when the underlying steel is A588 orcomparable.
A form of preventive maintenance is to paint the ends of girders 5 to10 ft (1.5 to 3.0 m) from each side of a joint [Ref. 3.58]. An inorganic zinccoating can be used with a pigment that matches the color of the weatheringsteel. If a persistent drainage problem causes water to be deposited on thesteel, the incorporation of details to carry water away from the steel shouldbe investigated.
7. Conclusions. Whenever a material (or any other product for thatmatter) holds out the promise of being a cure all solution, it is liable toundergo harsh criticism if it does not perform as expected. Weathering steelcan definitely fall into this category. The examples detailed above concern-ing the states of Maine and Michigan serve to bear this out. Theexperiences of these two transportation departments with weathering steelalso serve to illustrate the long-term nature of the problems associated withbridge engineering in general.
The initial feedback which the Michigan DOT had on the perfor-mance of weathering steel was generally positive; leading to its widespreaduse in that state. It was not until several years later that the problemsmentioned earlier began to surface. Because bridge engineers are designingstructures intended to last decades in a harsh environment, no amount of
ue to this difficulty in vi-sually detecting cracks, fa-
tigue cracks in weathering steelstructures are not usually de-tected until the member hasfractured.
D
Downloaded from Digital Engineering Library @ McGraw-Hill (www.digitalengineeringlibrary.com)Copyright © 2006 The McGraw-Hill Companies. All rights reserved.
Any use is subject to the Terms of Use as given at the website.
Design of Superstructure Elements
313Galvanizing
[3.13.4, Part 1]
PROTECTING STEEL SUPERSTRUCTURES
laboratory investigation or analysis can adequately predict how a certainmaterial, or even design, will stand up to any given bridge site.
There is an expression which says “the scout catches all thearrows,” and in this instance, by being on the cutting edge of a newtechnology, Michigan was catching its share of arrows. Once the ideaof a panacea is stripped away from weathering steel, however, it can beviewed as just another material which, when properly implemented, canbe quite useful in the building of bridges. The experience of Mainewould seem to bear this out and it is not the only example. The NewYork State Thruway Authority opted for using weathering steel for thestructure replacing the collapsed Schoharie Creek Bridge. The NewJersey Turnpike is also undergoing an aggressive implementation ofweathering steel structures [Ref. 3.58]. The percentage of weatheringsteel used in the United States increased significantly since early 1990’s.By early 2000’s, more than half of the steel bridges built in the UnitedStates have used weathering steel.
Given the success of many weathering steel structures, it would bewrong to dismiss the material as unusable. On the other hand it must stillbe recognized that weathering steel structures will still require their ownunique type of maintenance to ensure their longevity (see Part 4 above).Like so many other details on a bridge structure, weathering steel willbenefit from the experience gained by those in the field and their effortsto improve upon what is already in use. Research and development intospecialized coating systems for weathering steel is just one area where, overtime, the benefits of weathering steel can be further enhanced and thusmake it more accepted in the industry.
3.13.4 Galvanizing
Another method of protecting steel superstructures is by galvanizing thesteel components. While galvanizing is a popular method for protecting metalin many diverse applications, its use in highway bridges and other civilengineering projects has been somewhat limited. Probably the most well knownapplication of galvanizing in bridge design is the suspension cables of theBrooklyn Bridge (see accompanying Did You Know? sidebar [Ref. 3.62]). Tobe sure, the Brooklyn Bridge is a notable example, but in today’s designenvironment, galvanizing can be more readily discovered in bridge railings thanin primary members.
Like any protective method galvanizing is not without its shortcomings.Recently, the impact of new environmental regulations has caused someengineers to revisit this method of protecting steel elements. The followingdiscussion presents an overview of the basic principles behind galvanizing, itsbenefits, and inherit limitations.
1. Overview. Galvanizing steel is a process whereby a protective coatingis applied by immersing the steel member in a bath of molten zinc[Ref. 3.62]. This process is also known as hot dipping. The coating providesa barrier against oxygen, inhibiting its contact with the base metal, while atthe same time offering cathodic protection against corrosion. For the most
DID YOU KNOW
THAT the BrooklynBridge, com-
pleted in the spring of 1883has a central span of 1,595.5 ft(486.3 m), side spans whichare each 930 ft (283.5 m) long,and a total length, includingapproaches, of 5,989 ft(1,825.4 m)? The width of thebridge is 85 ft (25.9 m). Thefour cables each contain 5,434parallel, galvanized steel, oil-coated wires which arewrapped into a cylinder 15.75 in(40 cm) in diameter [Ref. 3.54].
here is an expressionwhich says “the scout
catches all the arrows,” and inthis instance, by being on thecutting edge of a new technol-ogy, Michigan was catchingits share of arrows.
T
hile galvanizing is apopular method for
protecting metal in many di-verse applications, its use inhighway bridges and other civilengineering projects has beensomewhat limited.
W
Downloaded from Digital Engineering Library @ McGraw-Hill (www.digitalengineeringlibrary.com)Copyright © 2006 The McGraw-Hill Companies. All rights reserved.
Any use is subject to the Terms of Use as given at the website.
Design of Superstructure Elements
314 SECTION 3 THE SUPERSTRUCTURE Conclusions
[3.13.4, Part 1]
part, galvanizing is an option for new steel components only. Most steelscan be readily galvanized. Weathering steel, however, with a silicon contentof 0.15 percent to 0.75 percent cannot be galvanized.
2. Benefits and Drawbacks. Similar to weathering steel, theprincipal benefit of galvanized steel is its ability to withstand corrosion. Theperformance of galvanized steel is such that little or no maintenance orpainting is required. There are, however, two major drawbacks togalvanizing steel.
First, galvanizing is an expensive process with the cost of hot dippingsteel generally more expensive than conventional painting. Second, andprobably more serious, is the limited size of the baths within which the steelmembers are immersed. While galvanizing bath sizes vary, most can onlyhandle beams up to 75 ft (22.9 m) in length. This imposes a severelimitation on many continuous bridges with large span lengths.
Due to the limited use of galvanizing in highway bridges, there arerelatively few galvanizers in business with facilities that can accommodatethe large sizes found in highway bridges; this has the effect of driving upthe cost of galvanizing. Proponents would argue that the initial cost is offsetby the savings in maintenance down the road. While such an argumentmakes sense, it is often a tough sell.
With regard to the problem of galvanizing large elements, one potentialsolution is to hot dip the ends of a beam and then metallize the centerportion of the beam [Ref. 3.62]. Where galvanizing immerses the metalinto a bath, metallizing applies the protective coating with a flame spray.Metallizing, however, requires a near white blast cleaning which brings withit some of the same difficulties found in protective coatings discussedearlier.
There are numerous examples of galvanized bridges in the UnitedStates which have performed well over a number of years. While mostof these structures are small to medium in size, this does not diminish theperformance of their coating system. It may be true that only smallersteel members can be hot dipped, it is also true that there are a lot ofsmall to medium size bridges being built. Even though a long 500 ft(152.4 m) structure cannot be galvanized easily, this should notpreclude investigating the advantages of galvanizing small bridges oreven culverts.
In the United States, most of the impact of galvanizing steel can be foundin the Midwest due to a larger presence of galvanizing facilities in the so-calledRust Belt [Ref. 3.62]. As mentioned above and throughout this section,tough, new environmental regulations are forcing engineers to investigateoptions for protecting steel that, otherwise, may have been overlooked.
3.13.5 Conclusions
To the reader it may seem that the preceding discussion has been ratherexhaustive. At the onset of the section, it was mentioned that many engineersmay tend to trivialize the issue of protecting steel superstructures. If nothingelse, this section should serve as an indicator of how serious and real the
ven though a long 500 ftstructure cannot be gal-
vanized easily, this should notpreclude investigating the ad-vantages of galvanizing smallbridges or even culverts.
...e
Downloaded from Digital Engineering Library @ McGraw-Hill (www.digitalengineeringlibrary.com)Copyright © 2006 The McGraw-Hill Companies. All rights reserved.
Any use is subject to the Terms of Use as given at the website.
Design of Superstructure Elements
315Inventory and Operating Ratings
[3.14.1]
LOAD RATING
problems are confronting a vast majority of the bridges in the United States andthroughout the world.
There is, however, no single solution to the problem. Not MIO. Notweathering steel. Not galvanizing. None of these coatings or materials can, byitself, solve the dilemma of how to protect steel superstructures. Whenmaintaining a highway bridge structure, solutions are not discovered, theyevolve. In a quote from Arthur Elliot, mentioned earlier, it was said that “it isprobably safe to say that a completely satisfactory deck joint has not yet beendesigned” [Ref. 3.12]. One could substitute “protective coating” for “deckjoint” and the quote would be just as valid.
3.14 LOAD RATING
We have already discussed how important sound inspection data is to atransportation maintenance department. One of the main functions of this datais to provide an agency with feedback as to exactly how their bridges areperforming in the field. In addition to sound inspection data, however, amaintenance department requires more quantitative information regardinghow an individual bridge can withstand loads. This quantitative benchmark ofbridge performance is known as the load rating.
While the load rating is based upon the precepts set forth in the generalAASHTO Specifications, the guidelines for developing a highway bridge loadrating value are set forth in the AASHTO publication Manual for ConditionEvaluation of Bridges [Ref. 3.63]. It is important for the reader to recognize thatthe calculated load rating value of a bridge is not a magical number. The loadrating, like inspection data, is only a gauge of bridge performance and onecomponent in the overall profile of a structure.
The use of load rating values varies depending on the specific bridge inquestion. At one end of the spectrum a load rating may be used to determinethe type and scope of rehabilitation a structure receives in order to bring thebridge up to current standards. Another use of load rating values would be inthe posting of a bridge, limiting the type and/or weight of vehicles passing overthe structure.
The following discussion is meant only to offer the novice designer anoverview of the general concepts behind the load rating of a highway bridge.For more information on the technical aspects of load rating, the reader isreferred to Ref. 3.63.
3.14.1 Inventory and Operating Ratings
AASHTO differentiates between lower and upper ranges of bridgeperformance. The lower range of performance implies safe use of a highwaybridge on a day to day basis. Naturally, since this day to day use of a bridge willimply the largest amount of traffic passing over a structure, the factor of safetybuilt into the rating will be relatively large. This lower rating is called the inventoryrating. This rating represents “a load level which can safely utilize an existingstructure for an indefinite period of time” [Ref. 3.63].
There are instances, however, when vehicles (generally trucks) have tocarry abnormally large loads over a structure. While a structure can withstand
ighway bridgeshave histori-H
cally had very highreliability levels evenwhen compared toother massproduced structuralsystems...
MICHEL GHOSN AND
FRED MOSES[Ref. 3.64]
t is important for the reader torecognize that the calculated
load rating value of a bridge isnot a magical number.
I
hen maintaining a high-way bridge structure,
solutions are not discovered,they evolve.
W
Downloaded from Digital Engineering Library @ McGraw-Hill (www.digitalengineeringlibrary.com)Copyright © 2006 The McGraw-Hill Companies. All rights reserved.
Any use is subject to the Terms of Use as given at the website.
Design of Superstructure Elements
316 SECTION 3 THE SUPERSTRUCTURE Field Measurements and Inspection
[3.14.1]
these loads on special occasions, it is not desirable to have them repeatedly passover a structure. This upper range of bridge load capacity uses a smaller factorof safety to maximize the capabilities of the bridge to withstand loads and isknown as the operating rating. This rating represents “the maximum permissiblelive load to which the structure may be subjected” [Ref. 3.63].
Unlike the bridge inspector’s rating assigned to a bridge (see Section 2.3.2)the inventory and operating ratings are calculated using analytical rather thansubjective methods. The live loadings used are the standard AASHTO H andHS trucks depicted earlier in Figure 3.12. The final load rating values can bedeveloped using either the working stress or load factor methods with theformer approach generally yielding more conservative results.
When an existing structure is being load rated, the presence of as-built plans(see Section 2.7) greatly aids in calculation of a load rating value. Should as-builtplans be unavailable, then a thorough site inspection must be conducted toobtain detailed field measurements to fill in the missing gaps.
3.14.2 Field Measurements and Inspection
In Section 2 and above we have touched upon the importance of fieldmeasurements. Regardless of whether detailed as-built plans are available ornot, field measurements which describe the present day condition of a structureare absolutely essential. With regard to steel superstructures, measurements ofprimary members (e.g., flange and web thickness) aid in creating an accuratepicture of what loads a bridge can withstand.
If a bridge has lost 20 percent of its cross-sectional properties, this canresult in a greatly reduced load rating (depending on the location of thedeterioration). This same principle applies to concrete and timber superstruc-tures as well. In addition to loss of section any other defects such asmisalignment, bends, eccentricities, or kinks in compression members shouldalso be noted [Ref. 3.63]. In general, the inspecting engineer should be on thelookout for any physical conditions which he or she feels can impact the loadcarrying capacity of the structure.
3.14.3 Loading the Structure
The load rating of a bridge is based on the structure’s ability to withstandboth dead loads and live loads. Dead loads are computed using the unit weightsof materials and is a relatively straightforward affair [Ref. 3.63]. Live loads areusually calculated using the standard AASHTO H and HS trucks. Special truckloading configurations, however, are used by different agencies. The Manual forCondition Evaluation of Bridges itself has its own set of design vehicles (see page 74,Ref. 3.63). Designers should check with the owner prior to beginning a loadrating calculation to ascertain the loading configuration desired by the agency.
Placement of loads on a bridge are made in accordance with the AASHTOspecifications (see Sections 3.5 and 3.8). The AASHTO Manual for ConditionEvaluation of Bridges, however, adds the following requirements [Ref. 3.63]:
❏ Roadways whose widths are 18 to 20 ft (5.5 to 6.1 m) are given twodesign lanes equal to half the roadway width each. Live loads arecentered in the design lanes.
egardless of whether de-tailed as-built plans are
available or not, field measure-ments which describe thepresent day condition of a struc-ture are absolutely essential.
R
n general, the inspectingengineer should be on the
look out for any physical con-ditions which he or she feelscan impact the load carryingcapacity of the structure.
I
Downloaded from Digital Engineering Library @ McGraw-Hill (www.digitalengineeringlibrary.com)Copyright © 2006 The McGraw-Hill Companies. All rights reserved.
Any use is subject to the Terms of Use as given at the website.
Design of Superstructure Elements
317Working Stress Method
[3.14.4]
LOAD RATING
❏ Roadways whose widths are less than 18 ft are given only one trafficlane.
AASHTO permits a reduction in traffic lanes if the designer believes thatthe present volume of traffic and movement over the structure so warrantssuch a reduction.
As would be expected, impact is also applied to all live loads. Again,AASHTO allows a reduction in impact should alignment conditions, enforcedspeed limit postings, etc., warrant such a reduction. Such conditions, if utilizedin reducing the impact factor, should be deemed to significantly reduce thespeed of vehicles passing over the structure.
Distribution of loads across the superstructure is also performed inaccordance with the general AASHTO specifications. If special loadingconditions are being utilized, then the applicable distribution factors should beapplied.
As mentioned above, either the working stress method, load factor methodor LRFD method can be used in calculating the load rating of a structure. Thefollowing discussion, however, will focus on the working stress and load factorapproaches for calculating a highway bridge’s load rating.
3.14.4 Working Stress Method
As we have already seen, the working stress method is built aroundthe concept of the stress in members falling under a specified allowablestress. This also leads to the method being known as the allowable stressmethod. The AASHTO Manual for Condition Evaluation of Bridges providesguidelines for applying the working stress (and load factor) method incomputing the load rating for structures constructed out of a variety ofmaterials such as:
❏ Steel and wrought iron❏ Conventionally reinforced and prestressed concrete❏ Timber
The general equation for load rating is:
RF C DL I
= −+( )1 (Eq. 3.167)
where RF = rating factorC = the allowable stressD = the stress due to dead loads
L(I +1) = the stress due to live load and impact.
The allowable stress C depends on whether the bridge is rated for inventorylevel or operating level. For inventory level rating, the allowable stress for anymaterial is the same as that used in new bridge design using allowable stress
s we have already seen,the working stress method
is built around the concept ofthe stress in members fallingunder a specified allowablestress.
A
Downloaded from Digital Engineering Library @ McGraw-Hill (www.digitalengineeringlibrary.com)Copyright © 2006 The McGraw-Hill Companies. All rights reserved.
Any use is subject to the Terms of Use as given at the website.
Design of Superstructure Elements
318 SECTION 3 THE SUPERSTRUCTURE Working Stress Method
[3.14.4]
method. For operating level rating, a higher allowable stress is allowed. SeePart 1 of this section for more details.
From Equation 3.167 we can see that load rating is to calculate how muchlive load a particular structural member can resist. If the rating factor is greaterthan one, it means that member can carry more than the rated live load. Eachsuperstructure member should be rated for various forces (i.e., moment, shear,etc.). The smallest rating factor from every member will be the rating factor forthe whole structure.
For example, if a bridge under HS-20 loading has a rating factor of0.90 for inventory level, and 1.15 for operating level, it means that it can carry90% of HS-20 loading (or HS-18 ) at inventory level, and it can resist 115%of HS-20 loading (or HS-23) at operating level.
If there is no visible overstress, the substructure is usually not required tobe rated.
The following provides an overview of the basic criteria governing thesevarious materials.
1. Steel and Wrought Iron. In rating an existing steel structure, theseallowable stresses will vary depending on the following:
❏ Whether an inventory or operating rating is calculated❏ The type of steel present
With regard to the latter item, it is quite possible that, for olderstructures, the type of steel used is unknown. Such a situation can arisefrom the absence of as-built plans. However, even if as-built or other plansare available, it is quite possible that the type of steel used was not labeledon the plans in the first place.
For this reason, AASHTO provides minimum tensile strength andyield strength values for steel constructed during various years (see alsoSection 2.3.4, Part 2). These values are based on the probable type of steelused in construction during certain eras (e.g., A7 steel was quite popularduring the 1950’s).
In addition to this, AASHTO also provides various allowable stressesbased on the loading condition the member is subjected to. Some examplesof these loading conditions are:
❏ Axial tension❏ Compression in extreme fiber of beams❏ Compression in concentrically loaded columns❏ Shear in girder webs
For steel structures, the principal difference between inventory andoperating ratings is the reduction factor applied to the minimum yieldstrength. For inventory ratings the following allowable stresses are used:
0.55Fy for tension or compression0.33Fy for web shear
type of steel used is unknown.Such a situation can arise fromthe absence of as-built plans.
...i t is quite possible that,for older structures, the
Downloaded from Digital Engineering Library @ McGraw-Hill (www.digitalengineeringlibrary.com)Copyright © 2006 The McGraw-Hill Companies. All rights reserved.
Any use is subject to the Terms of Use as given at the website.
Design of Superstructure Elements
319Load Factor Method
[3.14.5]
LOAD RATING
and for operating ratings the allowable stresses are:
0.75Fy for tension or compression0.45Fy for web shear
There are, however, exceptions to these criteria depending on theloading and physical conditions (e.g., bearing on milled stiffeners). Whena girder with transverse intermediate stiffeners is being investigated, thespacing of the stiffeners does not require checking unless the web hasseverely deteriorated and/or the spacing of the stiffeners exceeds thedepth of the web.
For wrought iron structures, the maximum unit stress for tension andbending is defined as:
Inventory = 14,600 psiOperating = 20,000 psi
2. Conventionally Reinforced and Prestressed Concrete.For conventionally reinforced concrete, AASHTO Standard Specifica-tions can be used for various modular ratios for different strengths ofconcrete. Allowable stresses for various grades of reinforcing steel intension are also presented. Inventory and operating allowable stresses aregiven for structures constructed prior to 1954 (18 ksi and 25 ksi), Grade40 billet (20 ksi and 28 ksi), Grade 50 rail (20 ksi and 32.5 ksi), and Grade 60(24 ksi and 36 ksi). These values are used without reduction.
Allowable stresses for concrete in compression are:
Inventory = 0.4fc′Operating = 0.6fc′
Prestressed concrete structures should be rated for both allowablestress and the strength. At inventory level, the allowable concrete strengthis 6 ′f c in tension, and 0.6fc′ in compression (where stresses are in psi). Atoperating level, only strengths (moment, shear, etc.) are rated. See Section 3.14.5for load factor method for strength evaluation details.
3. Timber. In load rating timber structures, AASHTO relies heavily on thejudgment of the investigating engineer [Ref. 3.63]. The general criteriongoverning the load rating of timber structures, however, is that themaximum allowable operating unit stress should not exceed 1.33 times theallowable stresses for stress-grade lumber as set forth in the standardAASHTO specifications. Criteria governing the rating of timber columnsare also provided.
3.14.5 Load Factor Method
So far we have covered some of the basic guidelines for rating a bridge asset forth in the AASHTO Manual for Condition Evaluation of Bridges usingallowable stress method. Some states are still using allowable stress method to
steel in tension are also pre-sented.
A llowable stresses for vari-ous grades of reinforcing
Downloaded from Digital Engineering Library @ McGraw-Hill (www.digitalengineeringlibrary.com)Copyright © 2006 The McGraw-Hill Companies. All rights reserved.
Any use is subject to the Terms of Use as given at the website.
Design of Superstructure Elements
320 SECTION 3 THE SUPERSTRUCTURE Load Factor Method
[3.14.5]
rate old bridges that were designed using the same method. But most bridgeare being rated using load factor method. This method is based on astrength evaluation and is also detailed in Ref. 3.63.
Compared with allowable stress method, load factor method for ratingbridges has improved the load rating results (increased the consistency ofstructural safety) and has addressed the following concerns:
❏ Reduce the amount variation in ratings between structures as men-tioned above
❏ Provide more realistic ratings through use of a load factor methodol-ogy (similar to AASHTO load factor design)
A belief that is fairly widespread in the transportation community is thatthe working stress approach in general, and the working stress method loadrating methodology in particular, is overly conservative in the analysis ofbridges. A major focus of the strength evaluation criteria is to offer a morerealistic image of a structure’s actual capacity. The load factor (or strength)evaluation methodology is based upon the design practice of using AASHTOload factor design, which was the main stream design practice in the UnitedStates in the past 20 years.
When rating any structure, the basic requirement an engineer seeks tocheck is whether the capacity of the structure is greater than the loads it issubjected to. The rating equation is expressed as:
RFC A DA L I
= −+1
2 1( ) (Eq. 3.168)
where RF = rating factorC = capacity of the member (moment, shear, torsion, etc.)D = dead load affects
L(I + 1) = live load and impact effectsA1 = load factor for dead loadsA2 = load factor for live load
The dead load factor (A1) is equal to 1.3. The live load factor (A2)depends on whether the structure is rated for inventory level or operatinglevel. For inventory rating, a live load factor of 2.16 (similar to theAASHTO LFD design) is used. For operating level, a reduced live loadfactor of 1.3 is used. As we discussed earlier, inventory level represents thestrength requirements for the new design, while operating level representsthe minimum level of safety the bridge is expected to carry the specifiedlive load.
The capacity (C ) can be obtained using AASHTO Standard Specification’sload factor method. Like any other load rating calculations, each structuremember should be rated for various load conditions (i.e., moment, shear, etc.),and the lowest rating factor from all members should be taken as the overallrating for the structure.
hen rating any structure,the basic requirement an
engineer seeks to check iswhether the capacity of thestructure is greater than theloads it is subjected to.
W
ome states are still us-ing allowable stress
method to rate old bridges thatwere designed using the samemethod. But most bridge arebeing rated using load factormethod.
S
Downloaded from Digital Engineering Library @ McGraw-Hill (www.digitalengineeringlibrary.com)Copyright © 2006 The McGraw-Hill Companies. All rights reserved.
Any use is subject to the Terms of Use as given at the website.
Design of Superstructure Elements
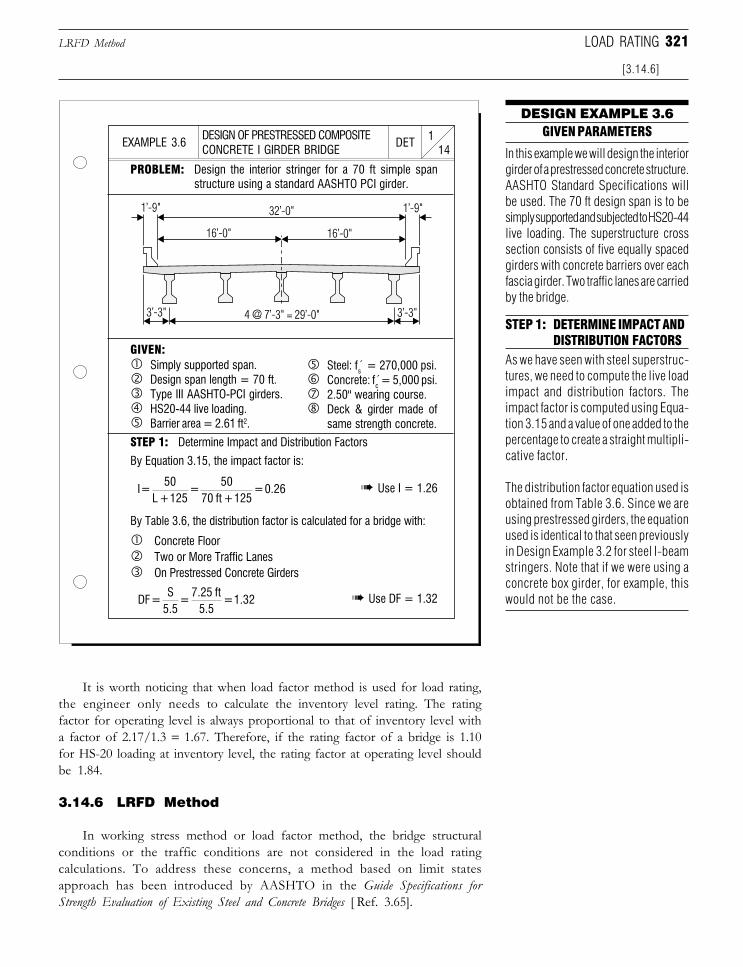
321LRFD Method
[3.14.6]
LOAD RATING
It is worth noticing that when load factor method is used for load rating,the engineer only needs to calculate the inventory level rating. The ratingfactor for operating level is always proportional to that of inventory level witha factor of 2.17/1.3 = 1.67. Therefore, if the rating factor of a bridge is 1.10for HS-20 loading at inventory level, the rating factor at operating level shouldbe 1.84.
3.14.6 LRFD Method
In working stress method or load factor method, the bridge structuralconditions or the traffic conditions are not considered in the load ratingcalculations. To address these concerns, a method based on limit statesapproach has been introduced by AASHTO in the Guide Specifications forStrength Evaluation of Existing Steel and Concrete Bridges [ Ref. 3.65].
DESIGN OF PRESTRESSED COMPOSITECONCRETE I GIRDER BRIDGE 14
1DETEXAMPLE 3.6
DESIGN EXAMPLE 3.6GIVEN PARAMETERS
PROBLEM: Design the interior stringer for a 70 ft simple spanstructure using a standard AASHTO PCI girder.
In this example we will design the interiorgirder of a prestressed concrete structure.AASHTO Standard Specifications willbe used. The 70 ft design span is to besimply supported and subjected to HS20-44live loading. The superstructure crosssection consists of five equally spacedgirders with concrete barriers over eachfascia girder. Two traffic lanes are carriedby the bridge.
➠ Use I = 1.26
STEP 1: Determine Impact and Distribution Factors
By Equation 3.15, the impact factor is:
By Table 3.6, the distribution factor is calculated for a bridge with:
Concrete FloorTwo or More Traffic LanesOn Prestressed Concrete Girders
➠ Use DF = 1.32
GIVEN:Simply supported span.Design span length = 70 ft.Type III AASHTO-PCI girders.HS20-44 live loading.Barrier area = 2.61 ft2.
Steel: fs = 270,000 psi.Concrete: fc = 5,000 psi.2.50" wearing course.Deck & girder made ofsame strength concrete.
STEP 1: DETERMINE IMPACT ANDDISTRIBUTION FACTORS
As we have seen with steel superstruc-tures, we need to compute the live loadimpact and distribution factors. Theimpact factor is computed using Equa-tion 3.15 and a value of one added to thepercentage to create a straight multipli-cative factor.
The distribution factor equation used isobtained from Table 3.6. Since we areusing prestressed girders, the equationused is identical to that seen previouslyin Design Example 3.2 for steel I-beamstringers. Note that if we were using aconcrete box girder, for example, thiswould not be the case.
I = 50
L + 125 =
5070 ft + 125
= 0.26
DF = S
5.5 =
7.25 ft5.5
= 1.32
Downloaded from Digital Engineering Library @ McGraw-Hill (www.digitalengineeringlibrary.com)Copyright © 2006 The McGraw-Hill Companies. All rights reserved.
Any use is subject to the Terms of Use as given at the website.
Design of Superstructure Elements
322 SECTION 3 THE SUPERSTRUCTURE LRFD Method
[3.14.6]
Although load rating using LRFD method is not widely used in theUnited States yet mainly because the vast majority of the existing bridgeswere designed either using allowable stress method, or using load factormethod (LFD), as we discussed earlier, AASHTO load factor design will becompletely replaced by AASHTO LRFD after 2007. Therefore, readersshould be prepared to take the challenges of using LRFD as a primarymethod in the near future.
It is beyond the scope of this book to offer a thorough examination ofthe load and resistance factor method for rating bridge structures. However,the following is an overview of the basic concepts behind the method andsome of the major points of concern designers will have in utilizing thisapproach.
1. Overview. Where the allowable stress method compensates for uncer-tainty with a factor of safety, the limit states method (LRFD, and to someextend, load factor method as well) takes a “probabilistic approach” tosafety through the use of load and resistance factors [Ref. 3.65]. Theresulting load rating is developed by comparing factored loads with the factoredresistance of key sections.
The AASHTO Guide Specification believes that the LRFD rating ismore realistic and more advantageous than the allowable stress or loadfactor methods because it provides for:
❏ A more uniform and consistent evaluation of bridges❏ Flexibility in making evaluations❏ Uniform levels of reliability based on performance histories❏ An incorporation of traffic and response data❏ The use of site specific data in the evaluation
2. The Concept of Safe Evaluation. The load and resistance factormethod is based on the concept of safe evaluation. By safe evaluation, weimply an approach which takes into account the function and site specificsof a structure in order to render a rating. This is made in contrast to themethodology previously discussed, which is, for all intents and purposes,a straight analytical approach (although it may be argued that a similar safeevaluation has been built into the allowable stresses through their refine-ment over the years).
At first blush, the reader may get the impression that the limit statesevaluation approach will consistently produce ratings which are higher thanthe traditional, working stress or load and resistance factor approaches.This, however, is not always the case. A bridge which possesses a redundantload path, is well maintained, and has well enforced traffic regulations willmost likely produce an operating rating larger than was previouslycomputed. A structure, however, which has significant deterioration, non-redundant components, and heavy truck traffic may produce an inventoryrating which is below its previous rating.
Like any limit states method, the strength evaluation approach forrating bridges lives and dies by the quality of the load and resistance factorsused. If one were to draw the analogy between load factors and pasta sauceit would be prudent for an engineer to be able to say “It’s in there.” What
ike any limit states method,the strength evaluation ap-
proach for rating bridges livesand dies by the quality of theload and resistance factorsused.
L
Downloaded from Digital Engineering Library @ McGraw-Hill (www.digitalengineeringlibrary.com)Copyright © 2006 The McGraw-Hill Companies. All rights reserved.
Any use is subject to the Terms of Use as given at the website.
Design of Superstructure Elements
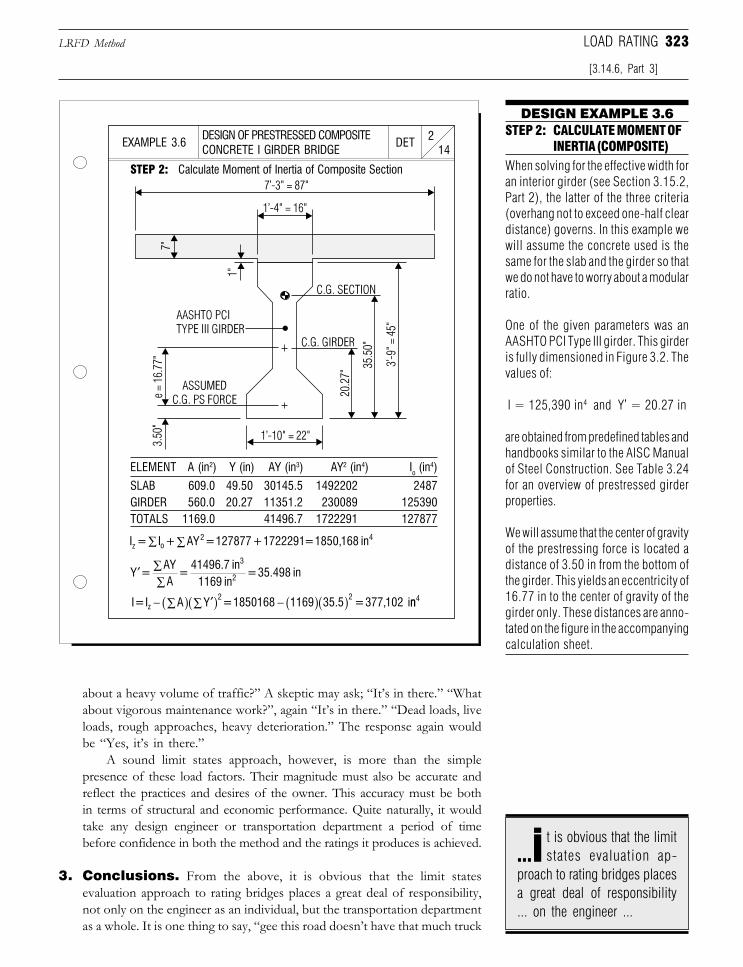
323LRFD Method
[3.14.6, Part 3]
LOAD RATING
about a heavy volume of traffic?” A skeptic may ask; “It’s in there.” “Whatabout vigorous maintenance work?”, again “It’s in there.” “Dead loads, liveloads, rough approaches, heavy deterioration.” The response again wouldbe “Yes, it’s in there.”
A sound limit states approach, however, is more than the simplepresence of these load factors. Their magnitude must also be accurate andreflect the practices and desires of the owner. This accuracy must be bothin terms of structural and economic performance. Quite naturally, it wouldtake any design engineer or transportation department a period of timebefore confidence in both the method and the ratings it produces is achieved.
3. Conclusions. From the above, it is obvious that the limit statesevaluation approach to rating bridges places a great deal of responsibility,not only on the engineer as an individual, but the transportation departmentas a whole. It is one thing to say, “gee this road doesn’t have that much truck
DESIGN OF PRESTRESSED COMPOSITECONCRETE I GIRDER BRIDGE 14
2DETEXAMPLE 3.6
DESIGN EXAMPLE 3.6
STEP 2: Calculate Moment of Inertia of Composite Section
ELEMENT A (in2) Y (in) AY (in3) AY2 (in4) Io (in4)
SLAB 609.0 49.50 30145.5 1492202 2487GIRDER 560.0 20.27 11351.2 230089 125390TOTALS 1169.0 41496.7 1722291 127877
STEP 2: CALCULATE MOMENT OFINERTIA (COMPOSITE)
When solving for the effective width foran interior girder (see Section 3.15.2,Part 2), the latter of the three criteria(overhang not to exceed one-half cleardistance) governs. In this example wewill assume the concrete used is thesame for the slab and the girder so thatwe do not have to worry about a modularratio.
One of the given parameters was anAASHTO PCI Type III girder. This girderis fully dimensioned in Figure 3.2. Thevalues of:
I = 125,390 in4 and Y' = 20.27 in
are obtained from predefined tables andhandbooks similar to the AISC Manualof Steel Construction. See Table 3.24for an overview of prestressed girderproperties.
We will assume that the center of gravityof the prestressing force is located adistance of 3.50 in from the bottom ofthe girder. This yields an eccentricity of16.77 in to the center of gravity of thegirder only. These distances are anno-tated on the figure in the accompanyingcalculation sheet.
I = I + AY = 127877 + 1722291 = 1850,168 inz o 2
4∑∑
′ ∑∑
Y = AYA
= 41496.7 in
1169 in = 35.498 in
3
2
I = I A Y = 1850168 1169 35.5 = 377,102 iz2
2
− −∑( ) ′∑( ) ( )( ) nn4
t is obvious that the limitstates evaluation ap-
proach to rating bridges placesa great deal of responsibility... on the engineer ...
...i
Downloaded from Digital Engineering Library @ McGraw-Hill (www.digitalengineeringlibrary.com)Copyright © 2006 The McGraw-Hill Companies. All rights reserved.
Any use is subject to the Terms of Use as given at the website.
Design of Superstructure Elements
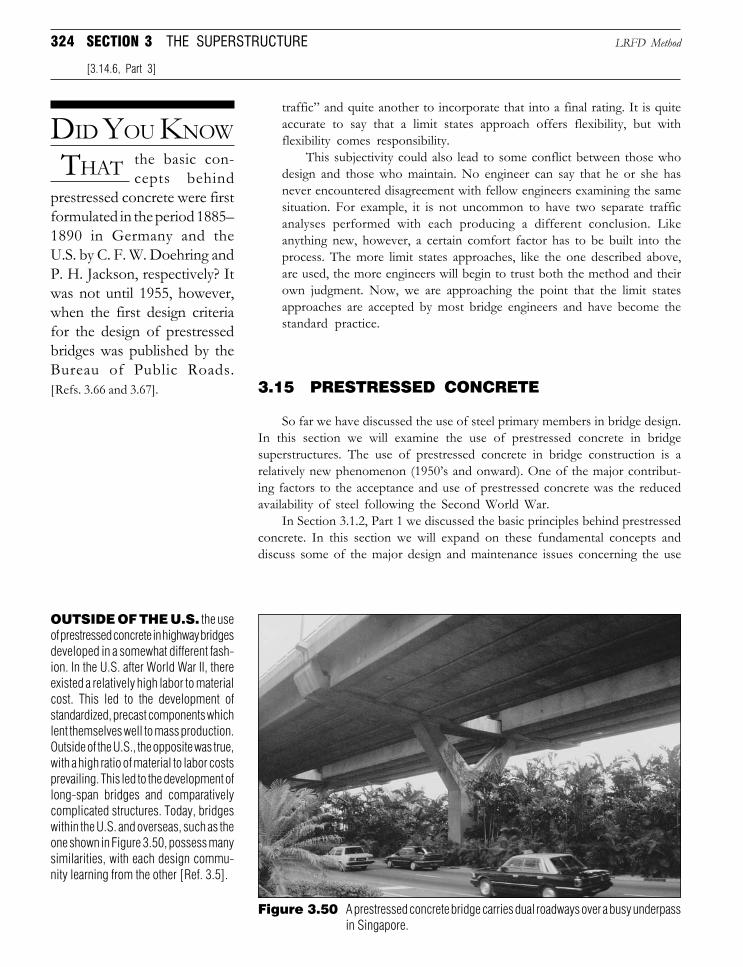
324 SECTION 3 THE SUPERSTRUCTURE
traffic” and quite another to incorporate that into a final rating. It is quiteaccurate to say that a limit states approach offers flexibility, but withflexibility comes responsibility.
This subjectivity could also lead to some conflict between those whodesign and those who maintain. No engineer can say that he or she hasnever encountered disagreement with fellow engineers examining the samesituation. For example, it is not uncommon to have two separate trafficanalyses performed with each producing a different conclusion. Likeanything new, however, a certain comfort factor has to be built into theprocess. The more limit states approaches, like the one described above,are used, the more engineers will begin to trust both the method and theirown judgment. Now, we are approaching the point that the limit statesapproaches are accepted by most bridge engineers and have become thestandard practice.
3.15 PRESTRESSED CONCRETE
So far we have discussed the use of steel primary members in bridge design.In this section we will examine the use of prestressed concrete in bridgesuperstructures. The use of prestressed concrete in bridge construction is arelatively new phenomenon (1950’s and onward). One of the major contribut-ing factors to the acceptance and use of prestressed concrete was the reducedavailability of steel following the Second World War.
In Section 3.1.2, Part 1 we discussed the basic principles behind prestressedconcrete. In this section we will expand on these fundamental concepts anddiscuss some of the major design and maintenance issues concerning the use
LRFD Method
[3.14.6, Part 3]
OUTSIDE OF THE U.S. the useof prestressed concrete in highway bridgesdeveloped in a somewhat different fash-ion. In the U.S. after World War II, thereexisted a relatively high labor to materialcost. This led to the development ofstandardized, precast components whichlent themselves well to mass production.Outside of the U.S., the opposite was true,with a high ratio of material to labor costsprevailing. This led to the development oflong-span bridges and comparativelycomplicated structures. Today, bridgeswithin the U.S. and overseas, such as theone shown in Figure 3.50, possess manysimilarities, with each design commu-nity learning from the other [Ref. 3.5].
Figure 3.50 A prestressed concrete bridge carries dual roadways over a busy underpassin Singapore.
DID YOU KNOW
THAT the basic con-cepts behind
prestressed concrete were firstformulated in the period 1885–1890 in Germany and theU.S. by C. F. W. Doehring andP. H. Jackson, respectively? Itwas not until 1955, however,when the first design criteriafor the design of prestressedbridges was published by theBureau of Public Roads.[Refs. 3.66 and 3.67].
Downloaded from Digital Engineering Library @ McGraw-Hill (www.digitalengineeringlibrary.com)Copyright © 2006 The McGraw-Hill Companies. All rights reserved.
Any use is subject to the Terms of Use as given at the website.
Design of Superstructure Elements
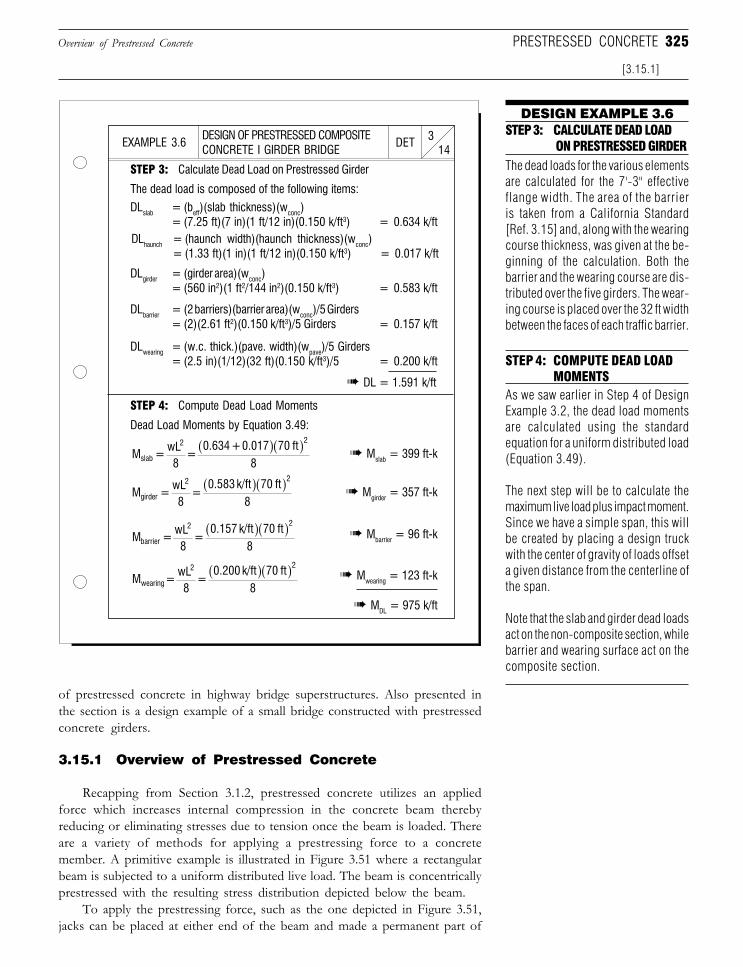
325
of prestressed concrete in highway bridge superstructures. Also presented inthe section is a design example of a small bridge constructed with prestressedconcrete girders.
3.15.1 Overview of Prestressed Concrete
Recapping from Section 3.1.2, prestressed concrete utilizes an appliedforce which increases internal compression in the concrete beam therebyreducing or eliminating stresses due to tension once the beam is loaded. Thereare a variety of methods for applying a prestressing force to a concretemember. A primitive example is illustrated in Figure 3.51 where a rectangularbeam is subjected to a uniform distributed live load. The beam is concentricallyprestressed with the resulting stress distribution depicted below the beam.
To apply the prestressing force, such as the one depicted in Figure 3.51,jacks can be placed at either end of the beam and made a permanent part of
DESIGN OF PRESTRESSED COMPOSITECONCRETE I GIRDER BRIDGE 14
3DETEXAMPLE 3.6
DESIGN EXAMPLE 3.6
STEP 3: Calculate Dead Load on Prestressed Girder
STEP 3: CALCULATE DEAD LOAD ON PRESTRESSED GIRDERThe dead loads for the various elementsare calculated for the 7'-3" effectiveflange width. The area of the barrieris taken from a California Standard[Ref. 3.15] and, along with the wearingcourse thickness, was given at the be-ginning of the calculation. Both thebarrier and the wearing course are dis-tributed over the five girders. The wear-ing course is placed over the 32 ft widthbetween the faces of each traffic barrier.
The dead load is composed of the following items:
DLslab = (beff)(slab thickness)(wconc)= (7.25 ft)(7 in)(1 ft/12 in)(0.150 k/ft3) = 0.634 k/ft
DLhaunch = (haunch width)(haunch thickness)(wconc)= (1.33 ft)(1 in)(1 ft/12 in)(0.150 k/ft3) = 0.017 k/ft
DLgirder = (girder area)(wconc)= (560 in2)(1 ft2/144 in2)(0.150 k/ft3) = 0.583 k/ft
DLbarrier = (2 barriers)(barrier area)(wconc)/5 Girders= (2)(2.61 ft2)(0.150 k/ft3)/5 Girders = 0.157 k/ft
DLwearing = (w.c. thick.)(pave. width)(wpave)/5 Girders= (2.5 in)(1/12)(32 ft)(0.150 k/ft3)/5 = 0.200 k/ft
➠ DL = 1.591 k/ft
STEP 4: Compute Dead Load Moments
Dead Load Moments by Equation 3.49:
➠ Mslab = 399 ft-k
➠ Mgirder = 357 ft-k
➠ Mbarrier = 96 ft-k
➠ Mwearing = 123 ft-k
STEP 4: COMPUTE DEAD LOADMOMENTS
As we saw earlier in Step 4 of DesignExample 3.2, the dead load momentsare calculated using the standardequation for a uniform distributed load(Equation 3.49).
The next step will be to calculate themaximum live load plus impact moment.Since we have a simple span, this willbe created by placing a design truckwith the center of gravity of loads offseta given distance from the centerline ofthe span.
Note that the slab and girder dead loadsact on the non-composite section, whilebarrier and wearing surface act on thecomposite section.
➠ MDL = 975 k/ft
Overview of Prestressed Concrete
[3.15.1]
PRESTRESSED CONCRETE
M = wL8
= 0.634 + 0.017 70 ft
8slab
2 2( )( )
M = wL8
= 0.583 k/ft 70 ft
8girder
2 2( )( )
M = wL8
= 0.157 k/ft 70 ft
8barrier
2 2( )( )
M = wL8
= 0.200 k/ft 70 ft
8wearing
2 2( )( )
Downloaded from Digital Engineering Library @ McGraw-Hill (www.digitalengineeringlibrary.com)Copyright © 2006 The McGraw-Hill Companies. All rights reserved.
Any use is subject to the Terms of Use as given at the website.
Design of Superstructure Elements
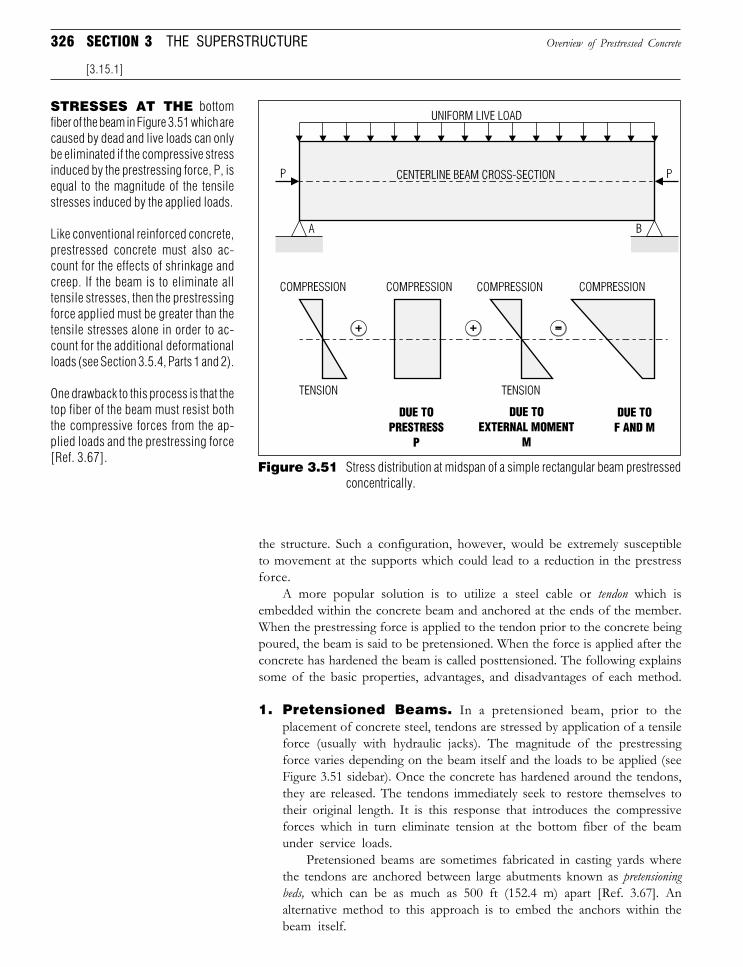
326 SECTION 3 THE SUPERSTRUCTURE
the structure. Such a configuration, however, would be extremely susceptibleto movement at the supports which could lead to a reduction in the prestressforce.
A more popular solution is to utilize a steel cable or tendon which isembedded within the concrete beam and anchored at the ends of the member.When the prestressing force is applied to the tendon prior to the concrete beingpoured, the beam is said to be pretensioned. When the force is applied after theconcrete has hardened the beam is called posttensioned. The following explainssome of the basic properties, advantages, and disadvantages of each method.
1. Pretensioned Beams. In a pretensioned beam, prior to theplacement of concrete steel, tendons are stressed by application of a tensileforce (usually with hydraulic jacks). The magnitude of the prestressingforce varies depending on the beam itself and the loads to be applied (seeFigure 3.51 sidebar). Once the concrete has hardened around the tendons,they are released. The tendons immediately seek to restore themselves totheir original length. It is this response that introduces the compressiveforces which in turn eliminate tension at the bottom fiber of the beamunder service loads.
Pretensioned beams are sometimes fabricated in casting yards wherethe tendons are anchored between large abutments known as pretensioningbeds, which can be as much as 500 ft (152.4 m) apart [Ref. 3.67]. Analternative method to this approach is to embed the anchors within thebeam itself.
Overview of Prestressed Concrete
[3.15.1]
Figure 3.51 Stress distribution at midspan of a simple rectangular beam prestressedconcentrically.
STRESSES AT THE bottomfiber of the beam in Figure 3.51 which arecaused by dead and live loads can onlybe eliminated if the compressive stressinduced by the prestressing force, P, isequal to the magnitude of the tensilestresses induced by the applied loads.
Like conventional reinforced concrete,prestressed concrete must also ac-count for the effects of shrinkage andcreep. If the beam is to eliminate alltensile stresses, then the prestressingforce applied must be greater than thetensile stresses alone in order to ac-count for the additional deformationalloads (see Section 3.5.4, Parts 1 and 2).
One drawback to this process is that thetop fiber of the beam must resist boththe compressive forces from the ap-plied loads and the prestressing force[Ref. 3.67].
Downloaded from Digital Engineering Library @ McGraw-Hill (www.digitalengineeringlibrary.com)Copyright © 2006 The McGraw-Hill Companies. All rights reserved.
Any use is subject to the Terms of Use as given at the website.
Design of Superstructure Elements
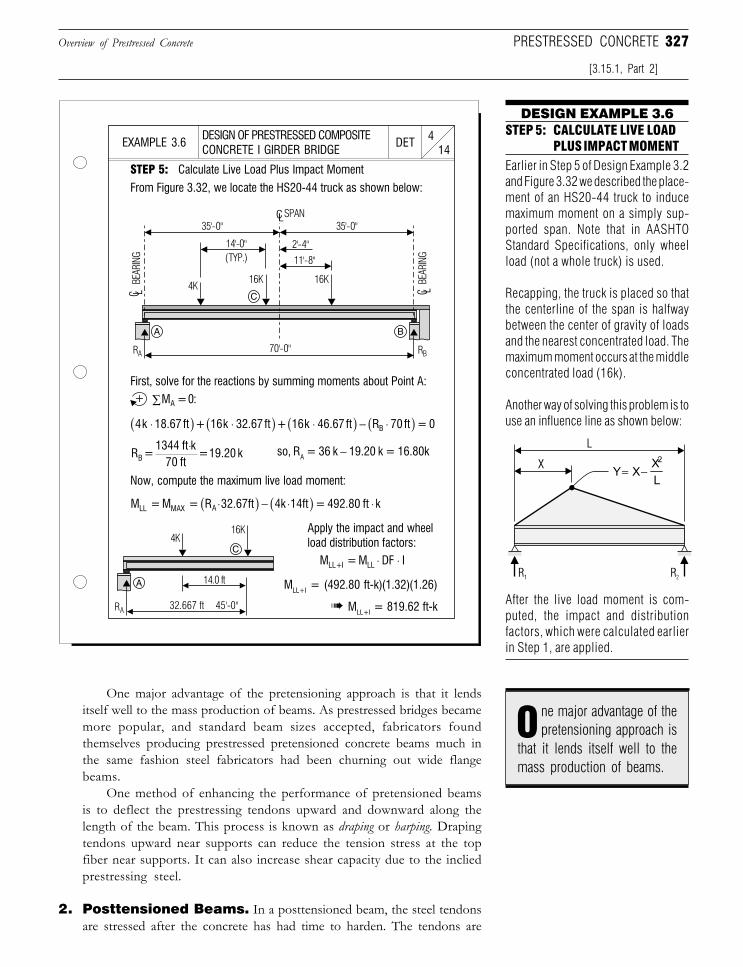
327
One major advantage of the pretensioning approach is that it lendsitself well to the mass production of beams. As prestressed bridges becamemore popular, and standard beam sizes accepted, fabricators foundthemselves producing prestressed pretensioned concrete beams much inthe same fashion steel fabricators had been churning out wide flangebeams.
One method of enhancing the performance of pretensioned beamsis to deflect the prestressing tendons upward and downward along thelength of the beam. This process is known as draping or harping. Drapingtendons upward near supports can reduce the tension stress at the topfiber near supports. It can also increase shear capacity due to the incliedprestressing steel.
2. Posttensioned Beams. In a posttensioned beam, the steel tendonsare stressed after the concrete has had time to harden. The tendons are
DESIGN OF PRESTRESSED COMPOSITECONCRETE I GIRDER BRIDGE 14
4DETEXAMPLE 3.6
DESIGN EXAMPLE 3.6
STEP 5: Calculate Live Load Plus Impact Moment
STEP 5: CALCULATE LIVE LOADPLUS IMPACT MOMENT
Earlier in Step 5 of Design Example 3.2and Figure 3.32 we described the place-ment of an HS20-44 truck to inducemaximum moment on a simply sup-ported span. Note that in AASHTOStandard Specifications, only wheelload (not a whole truck) is used.
Recapping, the truck is placed so thatthe centerline of the span is halfwaybetween the center of gravity of loadsand the nearest concentrated load. Themaximum moment occurs at the middleconcentrated load (16k).
Another way of solving this problem is touse an influence line as shown below:
From Figure 3.32, we locate the HS20-44 truck as shown below:
First, solve for the reactions by summing moments about Point A:+
so, RA = 36 k − 19.20 k = 16.80k
Now, compute the maximum live load moment:
Apply the impact and wheelload distribution factors:
➠ MLL+I = 819.62 ft-k
MLL+I = (492.80 ft-k)(1.32)(1.26)After the live load moment is com-puted, the impact and distributionfactors, which were calculated earlierin Step 1, are applied.
Overview of Prestressed Concrete PRESTRESSED CONCRETE
[3.15.1, Part 2]
4k 18.67 ft + 16k 32.67 ft + 16k 46.67 ft R 70 ft = 0B⋅( ) ⋅( ) ⋅( ) − ⋅( )
R = 1344 ft k
70 ft = 19.20 kB
⋅
M = M = R 32.67ft 4k 14ft = 492.80 ft kLL MAX A ⋅( ) − ⋅( ) ⋅
M = M DF ILL+I LL ⋅ ⋅
M = 0:A∑
ne major advantage of thepretensioning approach is
that it lends itself well to themass production of beams.
O
RA RB
4K16K 16K
70'-0"
14'-0"
(TYP.) 11'-8"
2'-4"
35'-0"35'-0"
SPAN
BEA
RIN
G
BEA
RIN
G
A B
C
14.0 ftA
C
32.667 ft 45'-0"RA
4K16K
Y XXL
2
= −
Downloaded from Digital Engineering Library @ McGraw-Hill (www.digitalengineeringlibrary.com)Copyright © 2006 The McGraw-Hill Companies. All rights reserved.
Any use is subject to the Terms of Use as given at the website.
Design of Superstructure Elements
328 SECTION 3 THE SUPERSTRUCTURE
incorporated into the concrete beam in either one of the following twofashions:
❏ Bonded❏ Unbonded
Bonded tendons are placed within preformed voids in the concretemember. These voids could be formed by metal ducts or plastic tubes.Plastic tubes may crack and cause potential corrosion of prestressing steel,so most bridges use metal ducts. After the concrete has hardened and theposttensioning stress is applied, the space between the hole and the tendonis filled with grout so that the tendon/tube assembly becomes bonded to thesurrounding concrete beam.
Unbonded tendons are simply greased and wrapped in paper. After theposttensioning force is applied, they are left as is or unbonded to thesurrounding concrete beam. To protect the tendons a waterproofing paperis sometimes used to guard against potential corrosion. The grease usedmay also be provided with an anticorrosion component [Ref. 3.67]. Withrespect to bridge design, bonded tendons are more the norm withunbonded tendons primarily used in building construction. Both of thesemethods require the incorporation of an anchorage at the ends of theposttensioned member.
Where pretensioning has the advantage of being well suited to massproduction, posttensioning is advantageous when very large elements arebeing fabricated which cannot be transported to the project site. The abilityto posttension precast or cast-in-place members is another advantage whichprovides the designer with added flexibility. Where pretensioned beams aretypically produced in standard sizes and geometries, posttensioned girderscan be customized to fit site-specific conditions. Also, pretensionning steelcan either be straight or draped. Posttensioning steel can, however, be of anyshape, so it is usually designed to follow the moment diagram of the girder.
3. Application of Pre- and Posttensioned Concrete. Thegeneral rule of thumb is that pretensioned beams are utilized for shortspans and posttensioned beams for longer, more complicated spans. Forshort spans with simple alignment and clearance constraints, the preten-sioned beam offers a straightforward, economical solution.
Larger spans, however, which can be cast-in-place at or near theproject site, are better suited to posttensioning. Another advantage ofposttensioned construction is that the tendons can be placed on nonlinearpaths (something that is very difficult to do when the beam is pretensioned).Thus, when complicated overpass alignment geometries are present,posttensioning is the preferred approach.
4. Prestressing Steels. A major problem encountered by the earlyfabricators of prestressed concrete beams was a low prestress, which ledto an eventual loss of prestress due to creep and shrinkage [Ref. 3.5]. Thiswas a direct result of the use of conventional structural steel. Tocompensate for the effects of creep and shrinkage, high strength steel isneeded which can allow for the application of a high initial stress.
Overview of Prestressed Concrete
[3.15.1, Part 2]
There are a wide variety of patented sys-tems for both pretensioning and postten-sioning. The United States, Germany,France, and Russia are some countrieswhere these technologies have beendeveloped. Listed below are some of themore popular methods for stressing andanchoring tendons [Ref. 3.68].
LINEAR PRESTRESSINGSYSTEMS
PRETENSIONING
STRESSING METHODS
■ Against buttresses or stressing beds■ Against central steel tube■ Continuous stressing against molds■ Electric current to heat steel
ANCHORING METHODS
■ During prestressing:Wires and Strands
■ For transfer of prestress:Bond (for strands and small wires)Corrugated clips (for big wires)
POSTTENSIONING
STRESSING METHODS
■ Steel against concrete■ Concrete against concrete■ Expanding cement■ Electric prestressing■ Bending steel beams
ANCHORING METHODS
■ Wires, by frictional grips■ Wires, by bearing■ Wires, by loops and other methods■ Bars, by bearing and by grips■ Strands, by bearing■ Strands, by friction grips
major problem encounteredby the early fabricators of
prestressed concrete beams wasa low prestress which led to aneventual loss of prestress due tocreep and shrinkage.
A
Downloaded from Digital Engineering Library @ McGraw-Hill (www.digitalengineeringlibrary.com)Copyright © 2006 The McGraw-Hill Companies. All rights reserved.
Any use is subject to the Terms of Use as given at the website.
Design of Superstructure Elements
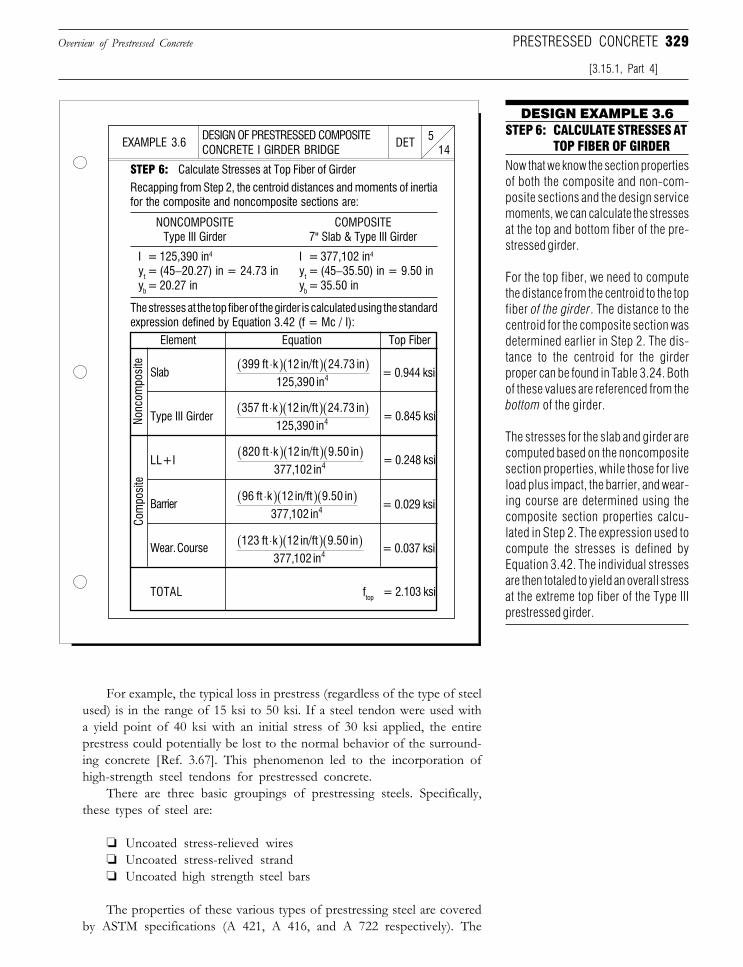
329
For example, the typical loss in prestress (regardless of the type of steelused) is in the range of 15 ksi to 50 ksi. If a steel tendon were used witha yield point of 40 ksi with an initial stress of 30 ksi applied, the entireprestress could potentially be lost to the normal behavior of the surround-ing concrete [Ref. 3.67]. This phenomenon led to the incorporation ofhigh-strength steel tendons for prestressed concrete.
There are three basic groupings of prestressing steels. Specifically,these types of steel are:
❏ Uncoated stress-relieved wires❏ Uncoated stress-relived strand❏ Uncoated high strength steel bars
The properties of these various types of prestressing steel are coveredby ASTM specifications (A 421, A 416, and A 722 respectively). The
DESIGN OF PRESTRESSED COMPOSITECONCRETE I GIRDER BRIDGE 14
5DETEXAMPLE 3.6
DESIGN EXAMPLE 3.6
STEP 6: Calculate Stresses at Top Fiber of Girder
STEP 6: CALCULATE STRESSES ATTOP FIBER OF GIRDER
Now that we know the section propertiesof both the composite and non-com-posite sections and the design servicemoments, we can calculate the stressesat the top and bottom fiber of the pre-stressed girder.
For the top fiber, we need to computethe distance from the centroid to the topfiber of the girder. The distance to thecentroid for the composite section wasdetermined earlier in Step 2. The dis-tance to the centroid for the girderproper can be found in Table 3.24. Bothof these values are referenced from thebottom of the girder.
The stresses for the slab and girder arecomputed based on the noncompositesection properties, while those for liveload plus impact, the barrier, and wear-ing course are determined using thecomposite section properties calcu-lated in Step 2. The expression used tocompute the stresses is defined byEquation 3.42. The individual stressesare then totaled to yield an overall stressat the extreme top fiber of the Type IIIprestressed girder.
Recapping from Step 2, the centroid distances and moments of inertiafor the composite and noncomposite sections are:
I = 125,390 in4 I = 377,102 in4
yt = (45−20.27) in = 24.73 in yt = (45−35.50) in = 9.50 inyb = 20.27 in yb = 35.50 in
NONCOMPOSITE COMPOSITEType III Girder 7" Slab & Type III Girder
The stresses at the top fiber of the girder is calculated using the standardexpression defined by Equation 3.42 (f = Mc / I):
Slab
Type III Girder
LL+I
Barrier
Wear. Course
TOTAL ftop
Element Equation Top Fiber
Com
posi
teNo
ncom
posi
te
= 0.944 ksi
= 0.845 ksi
= 0.248 ksi
= 0.029 ksi
= 0.037 ksi
= 2.103 ksi
Overview of Prestressed Concrete
[3.15.1, Part 4]
PRESTRESSED CONCRETE
357 ft k 12 in/ft 24.73 in125,390 in4
⋅( )( )( )
399 ft k 12 in/ft 24.73 in125,390 in4
⋅( )( )( )
820 ft k 12 in/ft 9.50 in377,102 in4
⋅( )( )( )
96 ft k 12 in/ft 9.50 in377,102 in4
⋅( )( )( )
123 ft k 12 in/ft 9.50 in377,102 in4
⋅( )( )( )
Downloaded from Digital Engineering Library @ McGraw-Hill (www.digitalengineeringlibrary.com)Copyright © 2006 The McGraw-Hill Companies. All rights reserved.
Any use is subject to the Terms of Use as given at the website.
Design of Superstructure Elements
330 SECTION 3 THE SUPERSTRUCTURE
reader is referred to these specifications and Ref. 3.67 for more informa-tion on these steels and their properties.
5. Concrete for Prestressing. We saw earlier that for convention-ally reinforced concrete, concrete with compressive strengths in therange of 3000 to 4000 psi are typically used. For elements like concretedeck slabs, use of any higher strength concrete would present minimaladvantages.
For prestressed concrete, however, high strength concrete withcompressive strengths in the range of 5000 to 6000 psi is the norm. Theprincipal reasons for this are that:
❏ A reduction in weight and therefore cost can be achieved❏ High strength concrete undergoes smaller volume changes
With regard to the latter item, it is important that the concreteutilized has a composition which limits the effects of creep andshrinkage (see Section 3.5.4, Parts 1 and 2). As we have alreadydiscussed, significant volume changes in the concrete can lead to apotential loss of prestress.
The effects of shrinkage on prestressed concrete, however, are quitedifferent from these on conventionally reinforced concrete. In regularreinforced concrete, the compressive forces due to shrinkage are taken upby the reinforcing steel. In prestressed concrete, however, the steel iscompletely in tension so that the compressive forces act on the concreteonly. This has the effect of increasing the deformation due to shrinkage.In addition to the volumetric changes caused by shrinkage and creep, thedesigner must also account for the effects of deformations caused bytemperature variations.
3.15.2 Composite Beams
For medium size highway bridges, composite prestressed concrete struc-tures which utilize precast beams and a cast-in-place deck are a viable andpopular solution. There are many similarities to be drawn between this type ofstructure and the steel-concrete composite structures presented earlier inSection 3.10. Discussed below are some of the major issues concerning thedesign of composite prestressed beams:
1. Advantages. One of the main advantages of using a compositebeam when dealing with prestressed concrete is that it allows forfabrication of the girders at a location off-site where conditions aregenerally more favorable. Like steel wide flange beams which aretypically designed as unshored, precast prestressed girders are sized anddesigned to accommodate both the dead loads and future live loads sothat falsework is typically not needed. This feature, combined with theready availability of primary members, allows for relatively quickerection and construction.
Composite Beams
[3.15.1, Part 4]
ne of the main advantagesof using a composite
beam when dealing with pre-stressed concrete is that it al-lows for fabrication of the gird-ers at a location off-site ...
O
Downloaded from Digital Engineering Library @ McGraw-Hill (www.digitalengineeringlibrary.com)Copyright © 2006 The McGraw-Hill Companies. All rights reserved.
Any use is subject to the Terms of Use as given at the website.
Design of Superstructure Elements
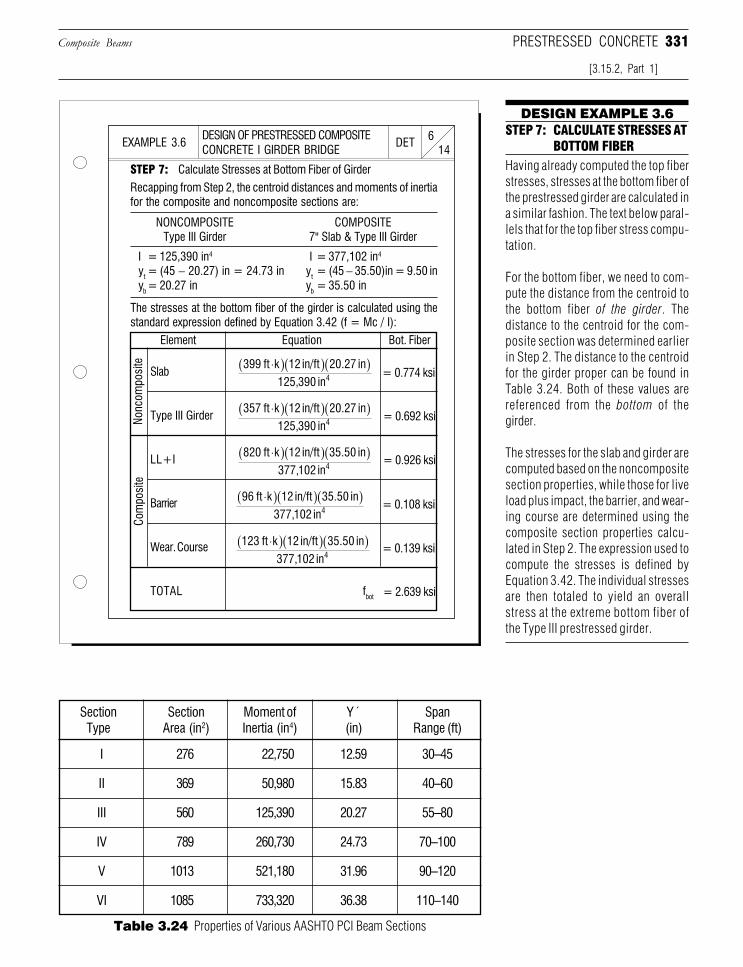
331
Slab
Type III Girder
LL+I
Barrier
Wear. Course
TOTAL fbot
DESIGN OF PRESTRESSED COMPOSITECONCRETE I GIRDER BRIDGE 14
6DETEXAMPLE 3.6
DESIGN EXAMPLE 3.6
STEP 7: Calculate Stresses at Bottom Fiber of Girder
STEP 7: CALCULATE STRESSES ATBOTTOM FIBER
Having already computed the top fiberstresses, stresses at the bottom fiber ofthe prestressed girder are calculated ina similar fashion. The text below paral-lels that for the top fiber stress compu-tation.
For the bottom fiber, we need to com-pute the distance from the centroid tothe bottom fiber of the girder. Thedistance to the centroid for the com-posite section was determined earlierin Step 2. The distance to the centroidfor the girder proper can be found inTable 3.24. Both of these values arereferenced from the bottom of thegirder.
The stresses for the slab and girder arecomputed based on the noncompositesection properties, while those for liveload plus impact, the barrier, and wear-ing course are determined using thecomposite section properties calcu-lated in Step 2. The expression used tocompute the stresses is defined byEquation 3.42. The individual stressesare then totaled to yield an overallstress at the extreme bottom fiber ofthe Type III prestressed girder.
Recapping from Step 2, the centroid distances and moments of inertiafor the composite and noncomposite sections are:
I = 125,390 in4 I = 377,102 in4
yt = (45 − 20.27) in = 24.73 in yt = (45 − 35.50)in = 9.50 inyb = 20.27 in yb = 35.50 in
NONCOMPOSITE COMPOSITEType III Girder 7" Slab & Type III Girder
The stresses at the bottom fiber of the girder is calculated using thestandard expression defined by Equation 3.42 (f = Mc / I):
Element Equation Bot. Fiber
Com
posi
teNo
ncom
posi
te
= 0.774 ksi
= 0.692 ksi
= 0.926 ksi
= 0.108 ksi
= 0.139 ksi
= 2.639 ksi
Composite Beams
[3.15.2, Part 1]
PRESTRESSED CONCRETE
399 ft k 12 in/ft 20.27 in125,390 in4
⋅( )( )( )
357 ft k 12 in/ft 20.27 in125,390 in4
⋅( )( )( )
820 ft k 12 in/ft 35.50 in377,102 in4
⋅( )( )( )
96 ft k 12 in/ft 35.50 in377,102 in4
⋅( )( )( )
123 ft k 12 in/ft 35.50 in377,102 in4
⋅( )( )( )
Table 3.24 Properties of Various AASHTO PCI Beam Sections
I 276 22,750 12.59 30–45
II 369 50,980 15.83 40–60
III 560 125,390 20.27 55–80
IV 789 260,730 24.73 70–100
V 1013 521,180 31.96 90–120
VI 1085 733,320 36.38 110–140
Section Section Moment of Y´ SpanType Area (in2) Inertia (in4) (in) Range (ft)
Downloaded from Digital Engineering Library @ McGraw-Hill (www.digitalengineeringlibrary.com)Copyright © 2006 The McGraw-Hill Companies. All rights reserved.
Any use is subject to the Terms of Use as given at the website.
Design of Superstructure Elements
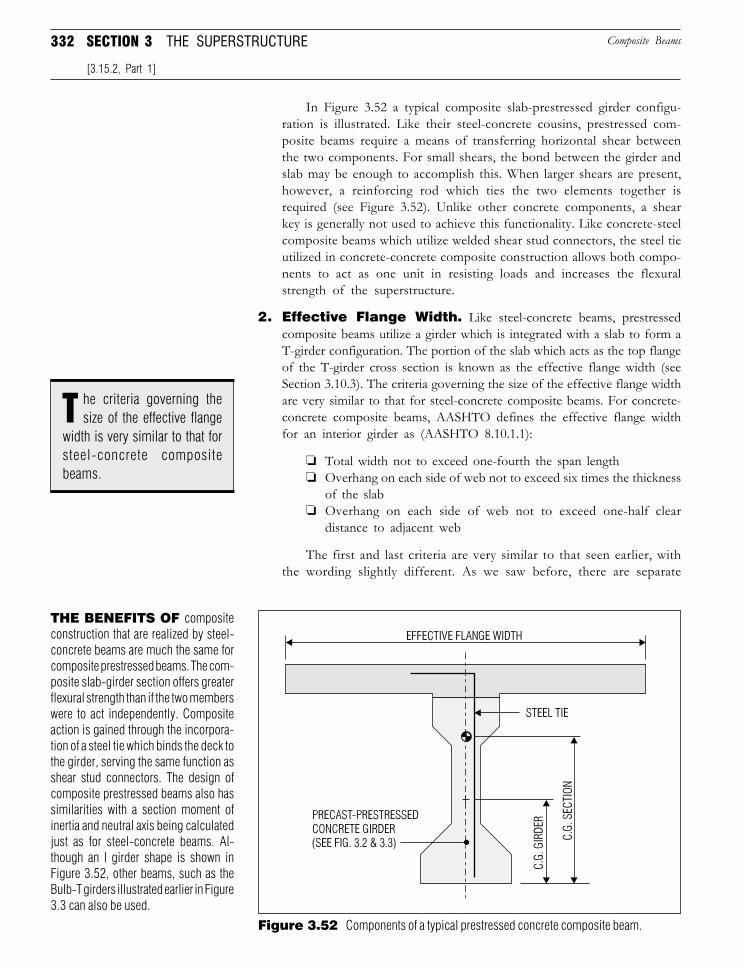
332 SECTION 3 THE SUPERSTRUCTURE
In Figure 3.52 a typical composite slab-prestressed girder configu-ration is illustrated. Like their steel-concrete cousins, prestressed com-posite beams require a means of transferring horizontal shear betweenthe two components. For small shears, the bond between the girder andslab may be enough to accomplish this. When larger shears are present,however, a reinforcing rod which ties the two elements together isrequired (see Figure 3.52). Unlike other concrete components, a shearkey is generally not used to achieve this functionality. Like concrete-steelcomposite beams which utilize welded shear stud connectors, the steel tieutilized in concrete-concrete composite construction allows both compo-nents to act as one unit in resisting loads and increases the flexuralstrength of the superstructure.
2. Effective Flange Width. Like steel-concrete beams, prestressedcomposite beams utilize a girder which is integrated with a slab to form aT-girder configuration. The portion of the slab which acts as the top flangeof the T-girder cross section is known as the effective flange width (seeSection 3.10.3). The criteria governing the size of the effective flange widthare very similar to that for steel-concrete composite beams. For concrete-concrete composite beams, AASHTO defines the effective flange widthfor an interior girder as (AASHTO 8.10.1.1):
❏ Total width not to exceed one-fourth the span length❏ Overhang on each side of web not to exceed six times the thickness
of the slab❏ Overhang on each side of web not to exceed one-half clear
distance to adjacent web
The first and last criteria are very similar to that seen earlier, withthe wording slightly different. As we saw before, there are separate
Composite Beams
[3.15.2, Part 1]
Figure 3.52 Components of a typical prestressed concrete composite beam.
THE BENEFITS OF compositeconstruction that are realized by steel-concrete beams are much the same forcomposite prestressed beams. The com-posite slab-girder section offers greaterflexural strength than if the two memberswere to act independently. Compositeaction is gained through the incorpora-tion of a steel tie which binds the deck tothe girder, serving the same function asshear stud connectors. The design ofcomposite prestressed beams also hassimilarities with a section moment ofinertia and neutral axis being calculatedjust as for steel-concrete beams. Al-though an I girder shape is shown inFigure 3.52, other beams, such as theBulb-T girders illustrated earlier in Figure3.3 can also be used.
he criteria governing thesize of the effective flange
width is very similar to that forsteel-concrete compositebeams.
T
Downloaded from Digital Engineering Library @ McGraw-Hill (www.digitalengineeringlibrary.com)Copyright © 2006 The McGraw-Hill Companies. All rights reserved.
Any use is subject to the Terms of Use as given at the website.
Design of Superstructure Elements
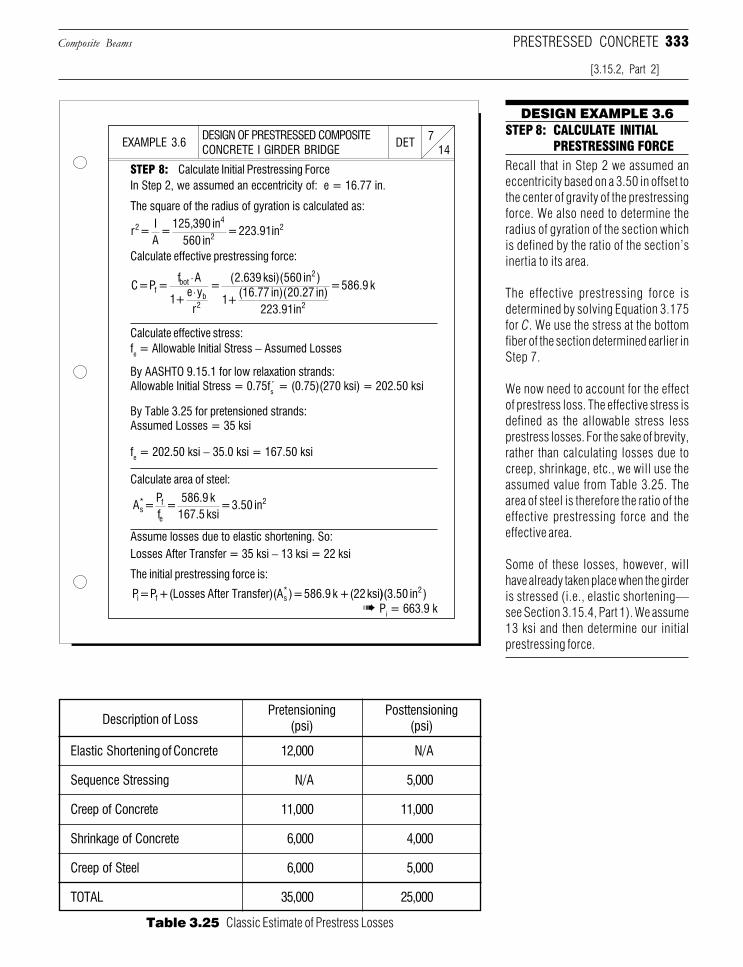
333
DESIGN OF PRESTRESSED COMPOSITECONCRETE I GIRDER BRIDGE 14
7DETEXAMPLE 3.6
DESIGN EXAMPLE 3.6
STEP 8: Calculate Initial Prestressing Force
STEP 8: CALCULATE INITIALPRESTRESSING FORCE
Recall that in Step 2 we assumed aneccentricity based on a 3.50 in offset tothe center of gravity of the prestressingforce. We also need to determine theradius of gyration of the section whichis defined by the ratio of the section’sinertia to its area.
The effective prestressing force isdetermined by solving Equation 3.175for C. We use the stress at the bottomfiber of the section determined earlier inStep 7.
We now need to account for the effectof prestress loss. The effective stress isdefined as the allowable stress lessprestress losses. For the sake of brevity,rather than calculating losses due tocreep, shrinkage, etc., we will use theassumed value from Table 3.25. Thearea of steel is therefore the ratio of theeffective prestressing force and theeffective area.
Some of these losses, however, willhave already taken place when the girderis stressed (i.e., elastic shortening—see Section 3.15.4, Part 1). We assume13 ksi and then determine our initialprestressing force.
In Step 2, we assumed an eccentricity of: e = 16.77 in.
The square of the radius of gyration is calculated as:
Calculate effective prestressing force:
Calculate effective stress:fe = Allowable Initial Stress − Assumed Losses
By AASHTO 9.15.1 for low relaxation strands:Allowable Initial Stress = 0.75fs = (0.75)(270 ksi) = 202.50 ksi
By Table 3.25 for pretensioned strands:Assumed Losses = 35 ksi
fe = 202.50 ksi − 35.0 ksi = 167.50 ksi
Assume losses due to elastic shortening. So:Losses After Transfer = 35 ksi − 13 ksi = 22 ksi
The initial prestressing force is:
Calculate area of steel:
➠ Pi = 663.9 k
Composite Beams
[3.15.2, Part 2]
PRESTRESSED CONCRETE
r = IA
= 125,390 in
560 in = 223.91 in2
4
22
C = P = f A
1 + e yr
= 2.639 ksi 560 in
1 + 16.77f
bot
b2
2⋅⋅
( )( )( in 20.27 in
223.91 in
= 586.9 k
2)( )
A = Pf
= 586.9 k
167.5 ksi = 3.50 ins
* f
e
2
P= P + (Losses After Transfer)(A ) = 586.9 k + (22 ksii f s* ))(3.50 in )2
Table 3.25 Classic Estimate of Prestress Losses
Elastic Shortening of Concrete 12,000 N/A
Sequence Stressing N/A 5,000
Creep of Concrete 11,000 11,000
Shrinkage of Concrete 6,000 4,000
Creep of Steel 6,000 5,000
TOTAL 35,000 25,000
Pretensioning Posttensioning(psi) (psi)Description of Loss
Downloaded from Digital Engineering Library @ McGraw-Hill (www.digitalengineeringlibrary.com)Copyright © 2006 The McGraw-Hill Companies. All rights reserved.
Any use is subject to the Terms of Use as given at the website.
Design of Superstructure Elements
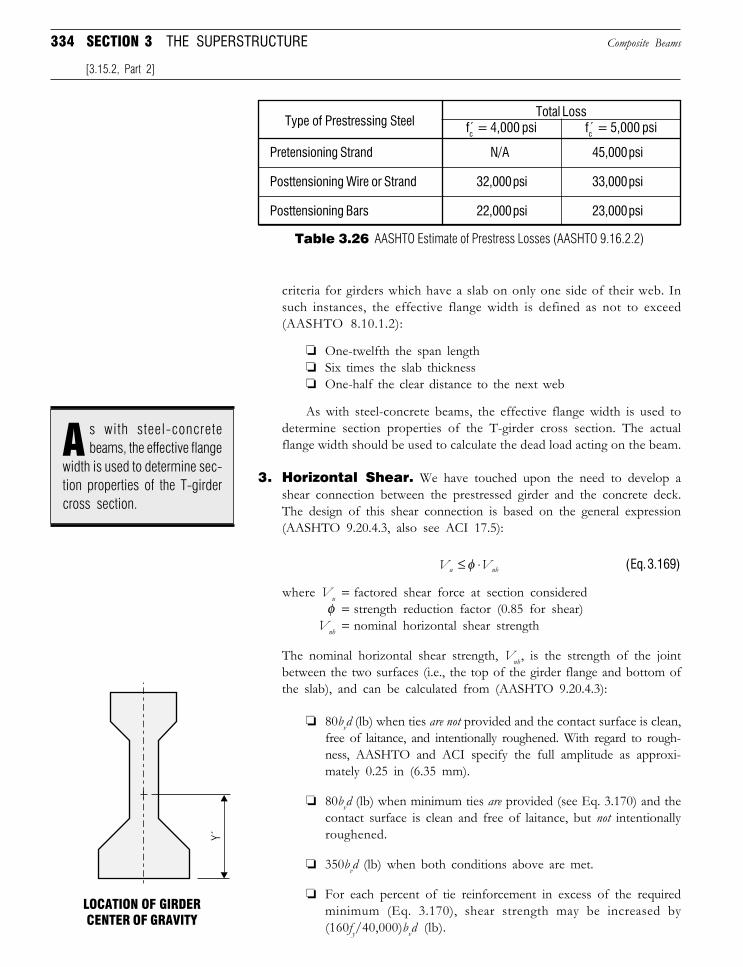
334 SECTION 3 THE SUPERSTRUCTURE
criteria for girders which have a slab on only one side of their web. Insuch instances, the effective flange width is defined as not to exceed(AASHTO 8.10.1.2):
❏ One-twelfth the span length❏ Six times the slab thickness❏ One-half the clear distance to the next web
As with steel-concrete beams, the effective flange width is used todetermine section properties of the T-girder cross section. The actualflange width should be used to calculate the dead load acting on the beam.
3. Horizontal Shear. We have touched upon the need to develop ashear connection between the prestressed girder and the concrete deck.The design of this shear connection is based on the general expression(AASHTO 9.20.4.3, also see ACI 17.5):
V Vu nh≤ ⋅φ (Eq. 3.169)
where Vu = factored shear force at section consideredφ = strength reduction factor (0.85 for shear)
Vnh = nominal horizontal shear strength
The nominal horizontal shear strength, Vnh, is the strength of the jointbetween the two surfaces (i.e., the top of the girder flange and bottom ofthe slab), and can be calculated from (AASHTO 9.20.4.3):
❏ 80bvd (lb) when ties are not provided and the contact surface is clean,free of laitance, and intentionally roughened. With regard to rough-ness, AASHTO and ACI specify the full amplitude as approxi-mately 0.25 in (6.35 mm).
❏ 80bvd (lb) when minimum ties are provided (see Eq. 3.170) and thecontact surface is clean and free of laitance, but not intentionallyroughened.
❏ 350bvd (lb) when both conditions above are met.
❏ For each percent of tie reinforcement in excess of the requiredminimum (Eq. 3.170), shear strength may be increased by(160fy/40,000)bvd (lb).
Composite Beams
[3.15.2, Part 2]
LOCATION OF GIRDERCENTER OF GRAVITY
Table 3.26 AASHTO Estimate of Prestress Losses (AASHTO 9.16.2.2)
Pretensioning Strand N/A 45,000 psi
Posttensioning Wire or Strand 32,000 psi 33,000 psi
Posttensioning Bars 22,000 psi 23,000 psi
Total Lossfc = 4,000 psi fc = 5,000 psiType of Prestressing Steel
s with steel-concretebeams, the effective flange
width is used to determine sec-tion properties of the T-girdercross section.
A
Downloaded from Digital Engineering Library @ McGraw-Hill (www.digitalengineeringlibrary.com)Copyright © 2006 The McGraw-Hill Companies. All rights reserved.
Any use is subject to the Terms of Use as given at the website.
Design of Superstructure Elements
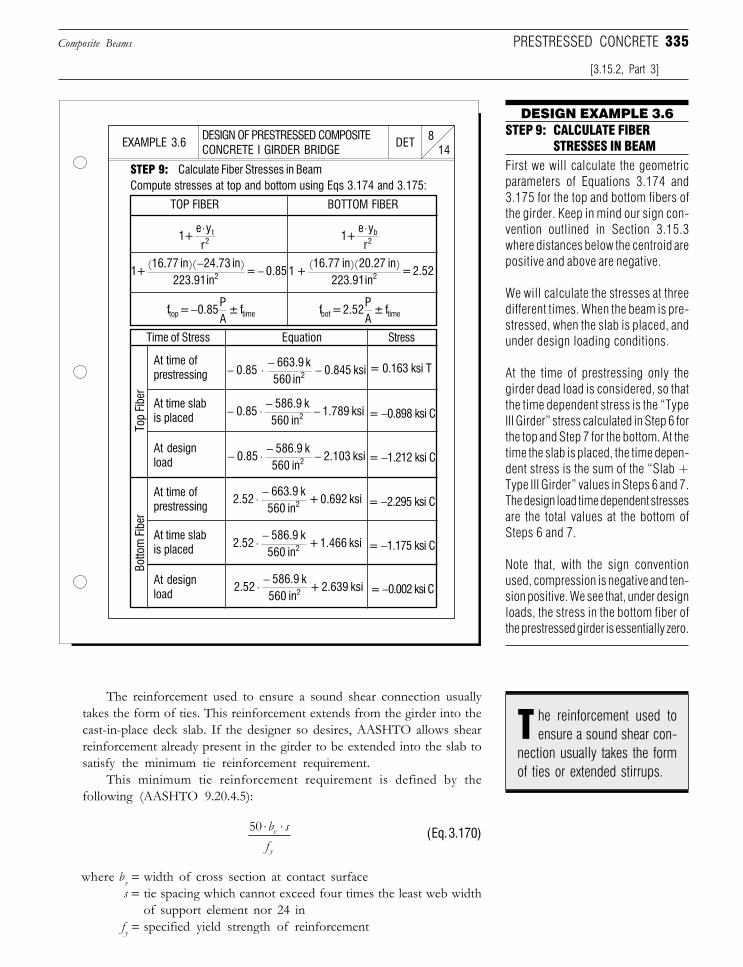
335
The reinforcement used to ensure a sound shear connection usuallytakes the form of ties. This reinforcement extends from the girder into thecast-in-place deck slab. If the designer so desires, AASHTO allows shearreinforcement already present in the girder to be extended into the slab tosatisfy the minimum tie reinforcement requirement.
This minimum tie reinforcement requirement is defined by thefollowing (AASHTO 9.20.4.5):
50 ⋅ ⋅b sfv
y
(Eq. 3.170)
where bv = width of cross section at contact surfaces = tie spacing which cannot exceed four times the least web width
of support element nor 24 infy = specified yield strength of reinforcement
DESIGN OF PRESTRESSED COMPOSITECONCRETE I GIRDER BRIDGE 14
8DETEXAMPLE 3.6
DESIGN EXAMPLE 3.6
STEP 9: Calculate Fiber Stresses in Beam
STEP 9: CALCULATE FIBERSTRESSES IN BEAM
First we will calculate the geometricparameters of Equations 3.174 and3.175 for the top and bottom fibers ofthe girder. Keep in mind our sign con-vention outlined in Section 3.15.3where distances below the centroid arepositive and above are negative.
We will calculate the stresses at threedifferent times. When the beam is pre-stressed, when the slab is placed, andunder design loading conditions.
At the time of prestressing only thegirder dead load is considered, so thatthe time dependent stress is the “TypeIII Girder” stress calculated in Step 6 forthe top and Step 7 for the bottom. At thetime the slab is placed, the time depen-dent stress is the sum of the “Slab +Type III Girder” values in Steps 6 and 7.The design load time dependent stressesare the total values at the bottom ofSteps 6 and 7.
Note that, with the sign conventionused, compression is negative and ten-sion positive. We see that, under designloads, the stress in the bottom fiber ofthe prestressed girder is essentially zero.
Compute stresses at top and bottom using Eqs 3.174 and 3.175:
TOP FIBER BOTTOM FIBER
Time of Stress Equation Stress
Top
Fibe
r
= −0.898 ksi C
= −1.212 ksi C
= −1.175 ksi C
= −0.002 ksi C
Botto
m F
iber
At time ofprestressing
At time slabis placed
At designload
At time ofprestressing
At time slabis placed
At designload
= 0.163 ksi T
= −2.295 ksi C
Composite Beams
[3.15.2, Part 3]
PRESTRESSED CONCRETE
1 + e yr
t2
⋅1 +
e yr
b2
⋅
1 + 16.77 in 24.73 in
223.91in = 0.852
( )( )− − 1 +16.77 in 20.27 in
223.91in = 2.522
( )( )
f = 0.85PA
± ftop time− f = 2.52PA
± fbot time
− ⋅ − −0.85 663.9 k
560 in0.845 ksi2
− ⋅ − −0.85586.9 k
560 in1.789 ksi2
− ⋅ − −0.85586.9 k
560 in2.103 ksi2
2.52586.9 k
560 in+1.466 ksi2⋅ −
2.52586.9 k
560 in+ 2.639 ksi2⋅ −
2.52663.9 k
560 in+0.692 ksi2⋅ −
he reinforcement used toensure a sound shear con-
nection usually takes the formof ties or extended stirrups.
T
Downloaded from Digital Engineering Library @ McGraw-Hill (www.digitalengineeringlibrary.com)Copyright © 2006 The McGraw-Hill Companies. All rights reserved.
Any use is subject to the Terms of Use as given at the website.
Design of Superstructure Elements
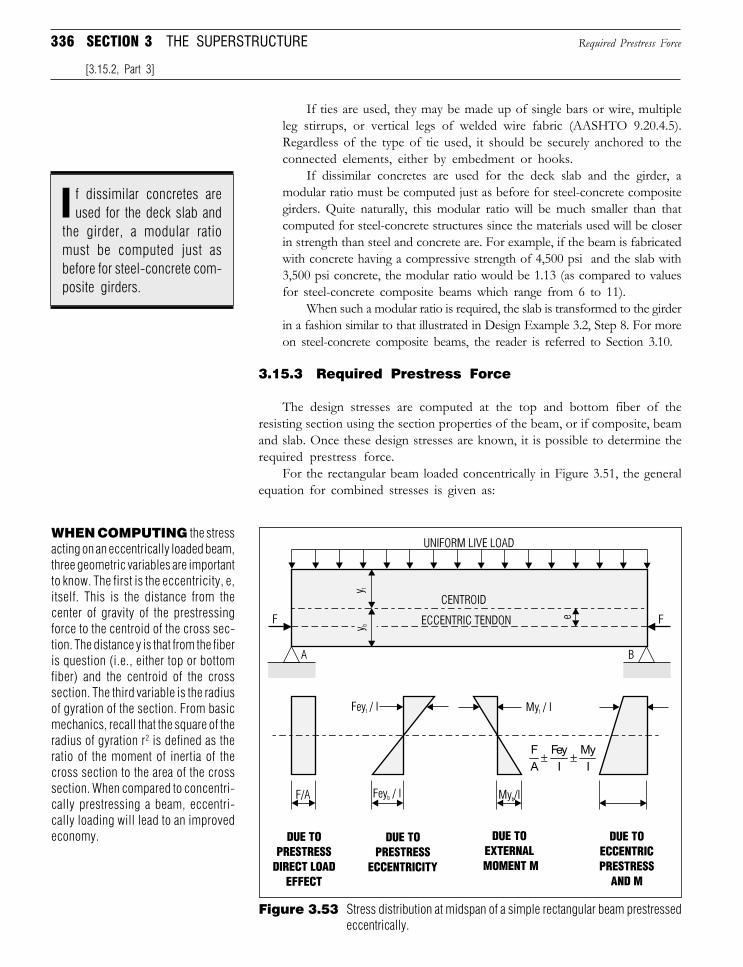
336 SECTION 3 THE SUPERSTRUCTURE
If ties are used, they may be made up of single bars or wire, multipleleg stirrups, or vertical legs of welded wire fabric (AASHTO 9.20.4.5).Regardless of the type of tie used, it should be securely anchored to theconnected elements, either by embedment or hooks.
If dissimilar concretes are used for the deck slab and the girder, amodular ratio must be computed just as before for steel-concrete compositegirders. Quite naturally, this modular ratio will be much smaller than thatcomputed for steel-concrete structures since the materials used will be closerin strength than steel and concrete are. For example, if the beam is fabricatedwith concrete having a compressive strength of 4,500 psi and the slab with3,500 psi concrete, the modular ratio would be 1.13 (as compared to valuesfor steel-concrete composite beams which range from 6 to 11).
When such a modular ratio is required, the slab is transformed to the girderin a fashion similar to that illustrated in Design Example 3.2, Step 8. For moreon steel-concrete composite beams, the reader is referred to Section 3.10.
3.15.3 Required Prestress Force
The design stresses are computed at the top and bottom fiber of theresisting section using the section properties of the beam, or if composite, beamand slab. Once these design stresses are known, it is possible to determine therequired prestress force.
For the rectangular beam loaded concentrically in Figure 3.51, the generalequation for combined stresses is given as:
Required Prestress Force
[3.15.2, Part 3]
Figure 3.53 Stress distribution at midspan of a simple rectangular beam prestressedeccentrically.
WHEN COMPUTING the stressacting on an eccentrically loaded beam,three geometric variables are importantto know. The first is the eccentricity, e,itself. This is the distance from thecenter of gravity of the prestressingforce to the centroid of the cross sec-tion. The distance y is that from the fiberis question (i.e., either top or bottomfiber) and the centroid of the crosssection. The third variable is the radiusof gyration of the section. From basicmechanics, recall that the square of theradius of gyration r2 is defined as theratio of the moment of inertia of thecross section to the area of the crosssection. When compared to concentri-cally prestressing a beam, eccentri-cally loading will lead to an improvedeconomy.
FA
FeyI
MyI
± ±
f dissimilar concretes areused for the deck slab and
the girder, a modular ratiomust be computed just asbefore for steel-concrete com-posite girders.
I
Downloaded from Digital Engineering Library @ McGraw-Hill (www.digitalengineeringlibrary.com)Copyright © 2006 The McGraw-Hill Companies. All rights reserved.
Any use is subject to the Terms of Use as given at the website.
Design of Superstructure Elements
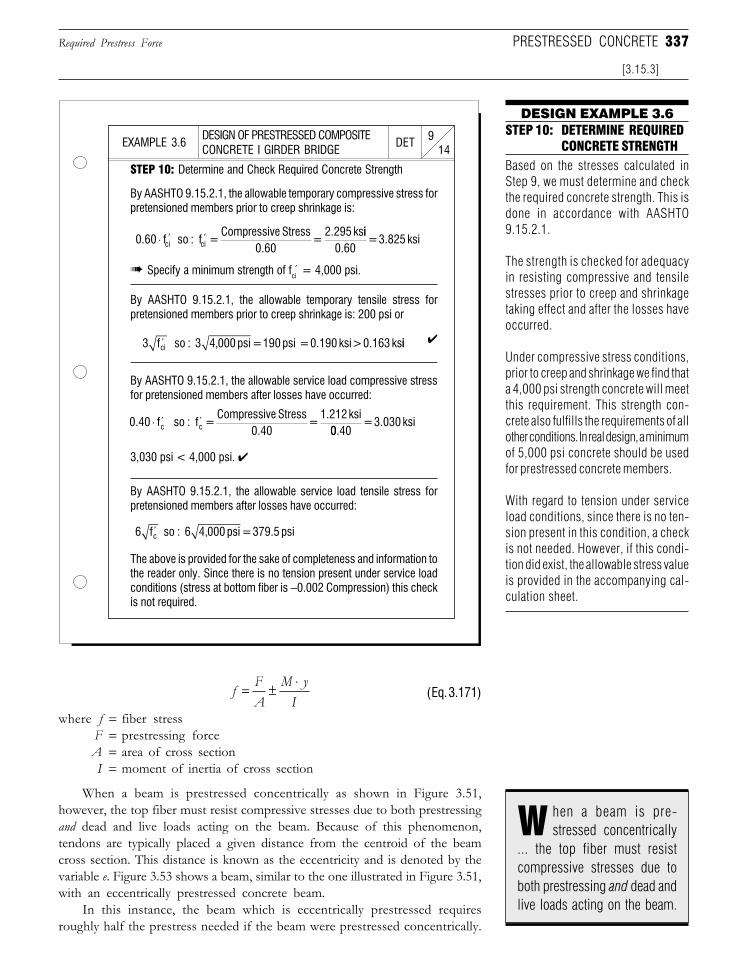
337
f FA
M yI
= ± ⋅(Eq. 3.171)
where f = fiber stressF = prestressing forceA = area of cross sectionI = moment of inertia of cross section
When a beam is prestressed concentrically as shown in Figure 3.51,however, the top fiber must resist compressive stresses due to both prestressingand dead and live loads acting on the beam. Because of this phenomenon,tendons are typically placed a given distance from the centroid of the beamcross section. This distance is known as the eccentricity and is denoted by thevariable e. Figure 3.53 shows a beam, similar to the one illustrated in Figure 3.51,with an eccentrically prestressed concrete beam.
In this instance, the beam which is eccentrically prestressed requiresroughly half the prestress needed if the beam were prestressed concentrically.
DESIGN OF PRESTRESSED COMPOSITECONCRETE I GIRDER BRIDGE 14
9DETEXAMPLE 3.6
DESIGN EXAMPLE 3.6
STEP 10: Determine and Check Required Concrete Strength
STEP 10: DETERMINE REQUIREDCONCRETE STRENGTH
Based on the stresses calculated inStep 9, we must determine and checkthe required concrete strength. This isdone in accordance with AASHTO9.15.2.1.
The strength is checked for adequacyin resisting compressive and tensilestresses prior to creep and shrinkagetaking effect and after the losses haveoccurred.
Under compressive stress conditions,prior to creep and shrinkage we find thata 4,000 psi strength concrete will meetthis requirement. This strength con-crete also fulfills the requirements of allother conditions. In real design, a minimumof 5,000 psi concrete should be usedfor prestressed concrete members.
With regard to tension under serviceload conditions, since there is no ten-sion present in this condition, a checkis not needed. However, if this condi-tion did exist, the allowable stress valueis provided in the accompanying cal-culation sheet.
The above is provided for the sake of completeness and information tothe reader only. Since there is no tension present under service loadconditions (stress at bottom fiber is −0.002 Compression) this checkis not required.
By AASHTO 9.15.2.1, the allowable service load tensile stress forpretensioned members after losses have occurred:
By AASHTO 9.15.2.1, the allowable service load compressive stressfor pretensioned members after losses have occurred:
3,030 psi < 4,000 psi. ✔
✔
By AASHTO 9.15.2.1, the allowable temporary tensile stress forpretensioned members prior to creep shrinkage is: 200 psi or
➠ Specify a minimum strength of fci = 4,000 psi.
By AASHTO 9.15.2.1, the allowable temporary compressive stress forpretensioned members prior to creep shrinkage is:
Required Prestress Force
[3.15.3]
PRESTRESSED CONCRETE
3 f so : 3 4,000 psi = 190 psi = 0.190 ksi > 0.163 ks ci ′ ii
0.40 f so : f = Compressive Stress
0.40 =
1.212 ksi c
c⋅ ′ ′
00.40 = 3.030 ksi
6 f so : 6 4,000 psi = 379.5 psi c′
hen a beam is pre-stressed concentrically
... the top fiber must resistcompressive stresses due toboth prestressing and dead andlive loads acting on the beam.
W
0.60 so : f = Compressive Stress
0.60 =
2.295 ksci
ci ⋅ ′ ′f
ii0.60
= 3.825 ksi
Downloaded from Digital Engineering Library @ McGraw-Hill (www.digitalengineeringlibrary.com)Copyright © 2006 The McGraw-Hill Companies. All rights reserved.
Any use is subject to the Terms of Use as given at the website.
Design of Superstructure Elements
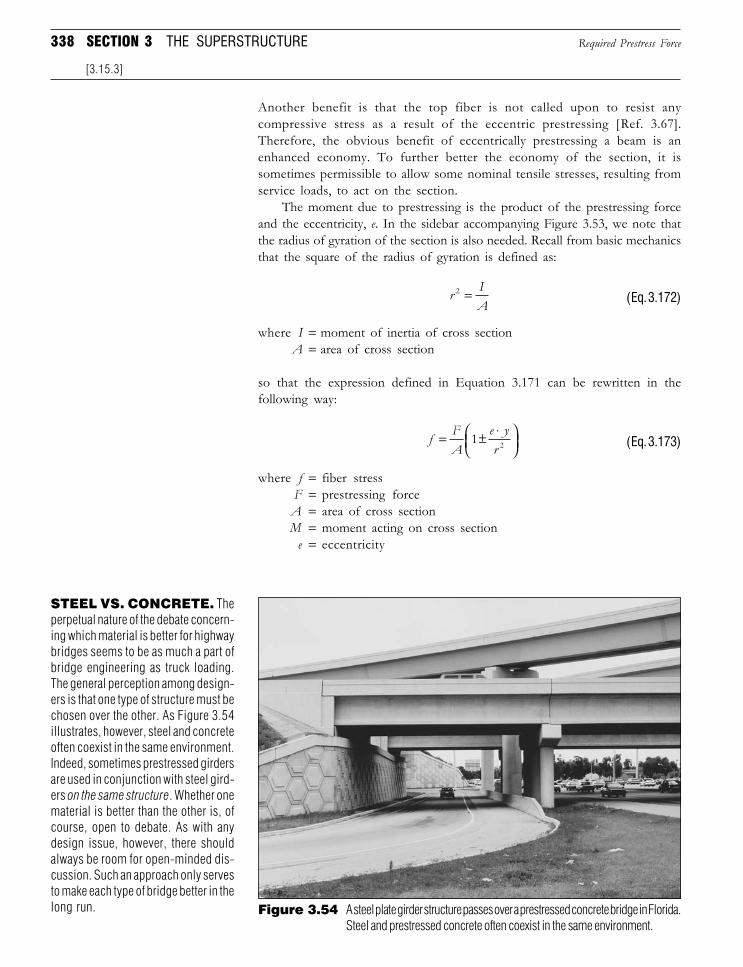
338 SECTION 3 THE SUPERSTRUCTURE
Another benefit is that the top fiber is not called upon to resist anycompressive stress as a result of the eccentric prestressing [Ref. 3.67].Therefore, the obvious benefit of eccentrically prestressing a beam is anenhanced economy. To further better the economy of the section, it issometimes permissible to allow some nominal tensile stresses, resulting fromservice loads, to act on the section.
The moment due to prestressing is the product of the prestressing forceand the eccentricity, e. In the sidebar accompanying Figure 3.53, we note thatthe radius of gyration of the section is also needed. Recall from basic mechanicsthat the square of the radius of gyration is defined as:
r IA
2 = (Eq. 3.172)
where I = moment of inertia of cross sectionA = area of cross section
so that the expression defined in Equation 3.171 can be rewritten in thefollowing way:
f FA
e yr
= ± ⋅
1 2 (Eq. 3.173)
where f = fiber stressF = prestressing forceA = area of cross sectionM = moment acting on cross section
e = eccentricity
Required Prestress Force
[3.15.3]
Figure 3.54 A steel plate girder structure passes over a prestressed concrete bridge in Florida.Steel and prestressed concrete often coexist in the same environment.
STEEL VS. CONCRETE. Theperpetual nature of the debate concern-ing which material is better for highwaybridges seems to be as much a part ofbridge engineering as truck loading.The general perception among design-ers is that one type of structure must bechosen over the other. As Figure 3.54illustrates, however, steel and concreteoften coexist in the same environment.Indeed, sometimes prestressed girdersare used in conjunction with steel gird-ers on the same structure. Whether onematerial is better than the other is, ofcourse, open to debate. As with anydesign issue, however, there shouldalways be room for open-minded dis-cussion. Such an approach only servesto make each type of bridge better in thelong run.
Downloaded from Digital Engineering Library @ McGraw-Hill (www.digitalengineeringlibrary.com)Copyright © 2006 The McGraw-Hill Companies. All rights reserved.
Any use is subject to the Terms of Use as given at the website.
Design of Superstructure Elements
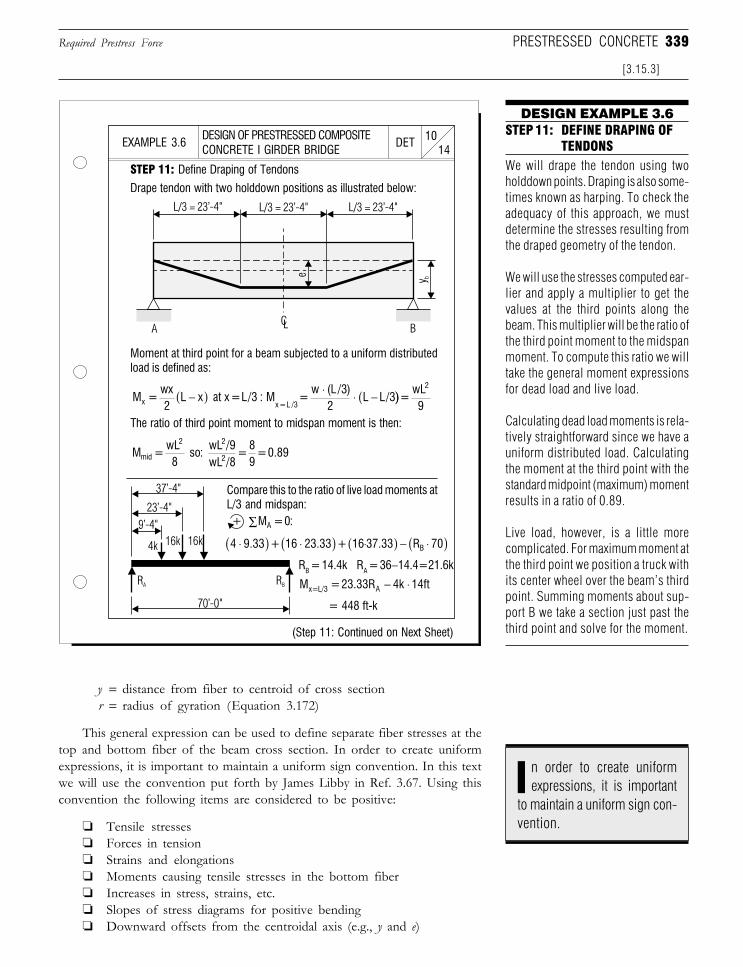
339
y = distance from fiber to centroid of cross sectionr = radius of gyration (Equation 3.172)
This general expression can be used to define separate fiber stresses at thetop and bottom fiber of the beam cross section. In order to create uniformexpressions, it is important to maintain a uniform sign convention. In this textwe will use the convention put forth by James Libby in Ref. 3.67. Using thisconvention the following items are considered to be positive:
❏ Tensile stresses❏ Forces in tension❏ Strains and elongations❏ Moments causing tensile stresses in the bottom fiber❏ Increases in stress, strains, etc.❏ Slopes of stress diagrams for positive bending❏ Downward offsets from the centroidal axis (e.g., y and e)
DESIGN OF PRESTRESSED COMPOSITECONCRETE I GIRDER BRIDGE 14
10DETEXAMPLE 3.6
DESIGN EXAMPLE 3.6
STEP 11: Define Draping of Tendons
STEP 11: DEFINE DRAPING OFTENDONS
We will drape the tendon using twoholddown points. Draping is also some-times known as harping. To check theadequacy of this approach, we mustdetermine the stresses resulting fromthe draped geometry of the tendon.
We will use the stresses computed ear-lier and apply a multiplier to get thevalues at the third points along thebeam. This multiplier will be the ratio ofthe third point moment to the midspanmoment. To compute this ratio we willtake the general moment expressionsfor dead load and live load.
Calculating dead load moments is rela-tively straightforward since we have auniform distributed load. Calculatingthe moment at the third point with thestandard midpoint (maximum) momentresults in a ratio of 0.89.
Live load, however, is a little morecomplicated. For maximum moment atthe third point we position a truck withits center wheel over the beam’s thirdpoint. Summing moments about sup-port B we take a section just past thethird point and solve for the moment.
Drape tendon with two holddown positions as illustrated below:
Moment at third point for a beam subjected to a uniform distributedload is defined as:
The ratio of third point moment to midspan moment is then:
Compare this to the ratio of live load moments atL/3 and midspan:+
RB = 14.4k RA = 36−14.4=21.6k
= 448 ft-k
(Step 11: Continued on Next Sheet)
Required Prestress Force
[3.15.3]
PRESTRESSED CONCRETE
M = wx2
L x at x = L/3 : M = w
2L L/3x x = L /3
−( ) ⋅ ⋅ −((L /3) )) = wL9
2
M = wL8
so: wL /9wL /8
= 89
= 0.89mid
2 2
2
M = 0:A∑
4 9.33 + 16 23.33 + 16 37.33 R 70B⋅( ) ⋅( ) ⋅( ) − ⋅( )
M = 23.33R 4k 14ftx=L/3 A − ⋅
n order to create uniformexpressions, it is important
to maintain a uniform sign con-vention.
I
Downloaded from Digital Engineering Library @ McGraw-Hill (www.digitalengineeringlibrary.com)Copyright © 2006 The McGraw-Hill Companies. All rights reserved.
Any use is subject to the Terms of Use as given at the website.
Design of Superstructure Elements
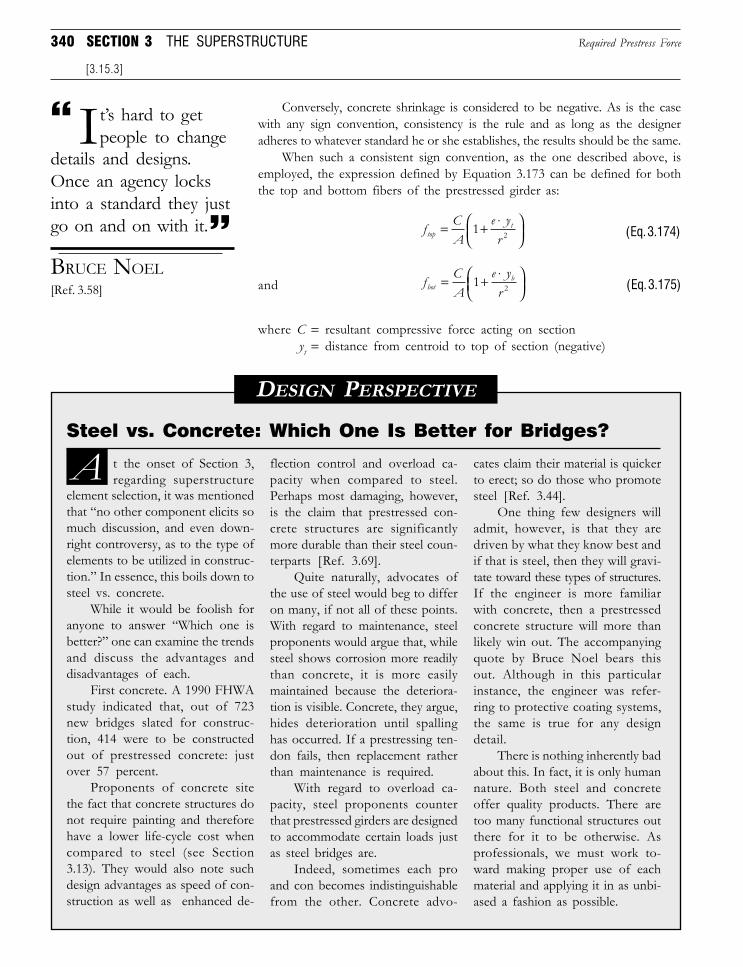
340 SECTION 3 THE SUPERSTRUCTURE
Conversely, concrete shrinkage is considered to be negative. As is the casewith any sign convention, consistency is the rule and as long as the designeradheres to whatever standard he or she establishes, the results should be the same.
When such a consistent sign convention, as the one described above, isemployed, the expression defined by Equation 3.173 can be defined for boththe top and bottom fibers of the prestressed girder as:
f CA
e yrtop
t= + ⋅
1 2 (Eq. 3.174)
and f CA
e yrbot
b= + ⋅
1 2 (Eq. 3.175)
where C = resultant compressive force acting on sectionyt = distance from centroid to top of section (negative)
Steel vs. Concrete: Which One Is Better for Bridges?
DESIGN PERSPECTIVE
A t the onset of Section 3,regarding superstructure
flection control and overload ca-pacity when compared to steel.Perhaps most damaging, however,is the claim that prestressed con-crete structures are significantlymore durable than their steel coun-terparts [Ref. 3.69].
Quite naturally, advocates ofthe use of steel would beg to differon many, if not all of these points.With regard to maintenance, steelproponents would argue that, whilesteel shows corrosion more readilythan concrete, it is more easilymaintained because the deteriora-tion is visible. Concrete, they argue,hides deterioration until spallinghas occurred. If a prestressing ten-don fails, then replacement ratherthan maintenance is required.
With regard to overload ca-pacity, steel proponents counterthat prestressed girders are designedto accommodate certain loads justas steel bridges are.
Indeed, sometimes each proand con becomes indistinguishablefrom the other. Concrete advo-
cates claim their material is quickerto erect; so do those who promotesteel [Ref. 3.44].
One thing few designers willadmit, however, is that they aredriven by what they know best andif that is steel, then they will gravi-tate toward these types of structures.If the engineer is more familiarwith concrete, then a prestressedconcrete structure will more thanlikely win out. The accompanyingquote by Bruce Noel bears thisout. Although in this particularinstance, the engineer was refer-ring to protective coating systems,the same is true for any designdetail.
There is nothing inherently badabout this. In fact, it is only humannature. Both steel and concreteoffer quality products. There aretoo many functional structures outthere for it to be otherwise. Asprofessionals, we must work to-ward making proper use of eachmaterial and applying it in as unbi-ased a fashion as possible.
element selection, it was mentionedthat “no other component elicits somuch discussion, and even down-right controversy, as to the type ofelements to be utilized in construc-tion.” In essence, this boils down tosteel vs. concrete.
While it would be foolish foranyone to answer “Which one isbetter?” one can examine the trendsand discuss the advantages anddisadvantages of each.
First concrete. A 1990 FHWAstudy indicated that, out of 723new bridges slated for construc-tion, 414 were to be constructedout of prestressed concrete: justover 57 percent.
Proponents of concrete sitethe fact that concrete structures donot require painting and thereforehave a lower life-cycle cost whencompared to steel (see Section3.13). They would also note suchdesign advantages as speed of con-struction as well as enhanced de-
t’s hard to getpeople to change
details and designs.Once an agency locksinto a standard they justgo on and on with it.
BRUCE NOEL[Ref. 3.58]
I
Required Prestress Force
[3.15.3]
Downloaded from Digital Engineering Library @ McGraw-Hill (www.digitalengineeringlibrary.com)Copyright © 2006 The McGraw-Hill Companies. All rights reserved.
Any use is subject to the Terms of Use as given at the website.
Design of Superstructure Elements
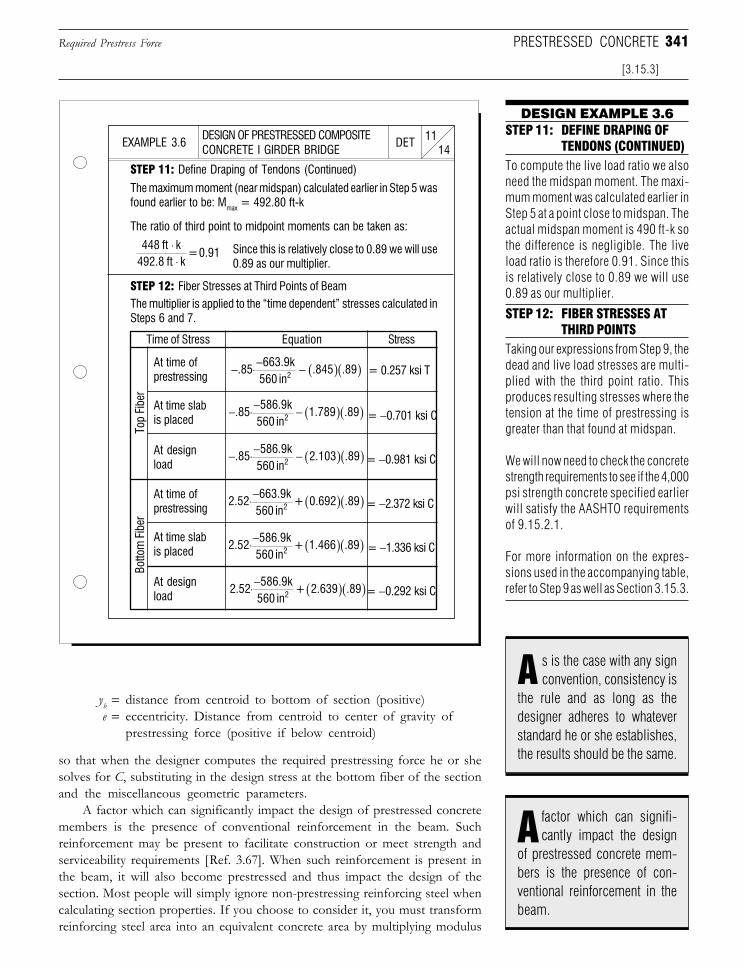
341
yb = distance from centroid to bottom of section (positive)e = eccentricity. Distance from centroid to center of gravity of
prestressing force (positive if below centroid)
so that when the designer computes the required prestressing force he or shesolves for C, substituting in the design stress at the bottom fiber of the sectionand the miscellaneous geometric parameters.
A factor which can significantly impact the design of prestressed concretemembers is the presence of conventional reinforcement in the beam. Suchreinforcement may be present to facilitate construction or meet strength andserviceability requirements [Ref. 3.67]. When such reinforcement is present inthe beam, it will also become prestressed and thus impact the design of thesection. Most people will simply ignore non-prestressing reinforcing steel whencalculating section properties. If you choose to consider it, you must transformreinforcing steel area into an equivalent concrete area by multiplying modulus
DESIGN OF PRESTRESSED COMPOSITECONCRETE I GIRDER BRIDGE 14
11DETEXAMPLE 3.6
DESIGN EXAMPLE 3.6
STEP 11: Define Draping of Tendons (Continued)
STEP 11: DEFINE DRAPING OFTENDONS (CONTINUED)
To compute the live load ratio we alsoneed the midspan moment. The maxi-mum moment was calculated earlier inStep 5 at a point close to midspan. Theactual midspan moment is 490 ft-k sothe difference is negligible. The liveload ratio is therefore 0.91. Since thisis relatively close to 0.89 we will use0.89 as our multiplier.
The maximum moment (near midspan) calculated earlier in Step 5 wasfound earlier to be: Mmax = 492.80 ft-k
The ratio of third point to midpoint moments can be taken as:
Since this is relatively close to 0.89 we will use0.89 as our multiplier.
Time of Stress Equation Stress
Top
Fibe
r
= −0.701 ksi C
= −0.981 ksi C
= −1.336 ksi C
= −0.292 ksi C
Botto
m F
iber
At time ofprestressing
At time slabis placed
At designload
At time ofprestressing
At time slabis placed
At designload
= 0.257 ksi T
= −2.372 ksi C
The multiplier is applied to the “time dependent” stresses calculated inSteps 6 and 7.
STEP 12: Fiber Stresses at Third Points of Beam
STEP 12: FIBER STRESSES ATTHIRD POINTS
Taking our expressions from Step 9, thedead and live load stresses are multi-plied with the third point ratio. Thisproduces resulting stresses where thetension at the time of prestressing isgreater than that found at midspan.
We will now need to check the concretestrength requirements to see if the 4,000psi strength concrete specified earlierwill satisfy the AASHTO requirementsof 9.15.2.1.
For more information on the expres-sions used in the accompanying table,refer to Step 9 as well as Section 3.15.3.
[3.15.3]
PRESTRESSED CONCRETERequired Prestress Force
− ⋅− − ( )( ).85663.9k
560 in.845 .892
− ⋅− − ( )( ).85586.9k
560 in 1.789 .892
− ⋅− − ( )( ).85586.9k
560 in 2.103 .892
2.52663.9k
560 in + 0.692 .892⋅− ( )( )
2.52586.9k
560 in + 1.466 .892⋅− ( )( )
2.52586.9k
560 in + 2.639 .892⋅− ( )( )
448 ft k492.8 ft k
= 0.91⋅⋅
s is the case with any signconvention, consistency is
the rule and as long as thedesigner adheres to whateverstandard he or she establishes,the results should be the same.
A
factor which can signifi-cantly impact the design
of prestressed concrete mem-bers is the presence of con-ventional reinforcement in thebeam.
A
Downloaded from Digital Engineering Library @ McGraw-Hill (www.digitalengineeringlibrary.com)Copyright © 2006 The McGraw-Hill Companies. All rights reserved.
Any use is subject to the Terms of Use as given at the website.
Design of Superstructure Elements
342 SECTION 3 THE SUPERSTRUCTURE
ration n. A detailed discussion of these effects is beyond the scope of this text,and the reader is referred to Ref. 3.67 for more information on the subject.
3.15.4 Loss of Prestress
Eventually, there will be a loss of prestress in the tendons which must beaccounted for by the designer. This loss of prestress can be initiated by severalcontributing factors. Some of the principal phenomena which can cause a lossof prestress are [Ref. 3.68]:
❏ Immediate elastic shortening of concrete under compression❏ Shrinkage of concrete during drying❏ Creep under sustained compression❏ Frictional force between tendons and concrete during tensioning❏ Relaxation in steel under tension❏ Slippage and slackening of tendons during anchoring
Discussed below is an overview of some of the above referencedcontributing factors which lead to a loss of prestress.
1. Elastic Shortening of Concrete. When the prestressing force isapplied to the beam the surrounding concrete will undergo a deformation. Thisdeformation typically results in the concrete around the tendons compressingcausing the beam to shorten slightly. This small shortening, which takes placeover a short period of time, is called elastic shortening. One potential side effectof this phenomenon is a loss of prestress.
The loss of prestress due to pretensioning a member can be definedby the following expression (AASHTO 9.16.2.1.2):
ES f n fs cir= = ⋅∆ (Eq. 3.176)
where ∆fs = loss of prestress in steeln = modular ratio (see Equations 3.177 and 3.178 below)fcir = concrete stress at the center of gravity of the prestressing
steel due to prestressing force F and dead load of beamimmediately after transfer
In the above expression, the modular ratio is defined by the followingexpression:
n EEs
ci
= (Eq. 3.177)
where E w fci ci= ′33 32 (Eq. 3.178)
and Es = modulus of elasticity of prestressing steel, psi(typically assumed as 28 × 106 psi)
Eci = modulus of elasticity of concrete at stress transfer, psi(defined by Equation 3.178)
w = concrete unit weight, lb/ft3
fc i′ = concrete compressive strength at time of initialprestress, psi
Loss of Prestress
[3.15.3]
ventually, there will be aloss of prestress in the
tendons which ... can be initi-ated by several contributingfactors.
E
Downloaded from Digital Engineering Library @ McGraw-Hill (www.digitalengineeringlibrary.com)Copyright © 2006 The McGraw-Hill Companies. All rights reserved.
Any use is subject to the Terms of Use as given at the website.
Design of Superstructure Elements
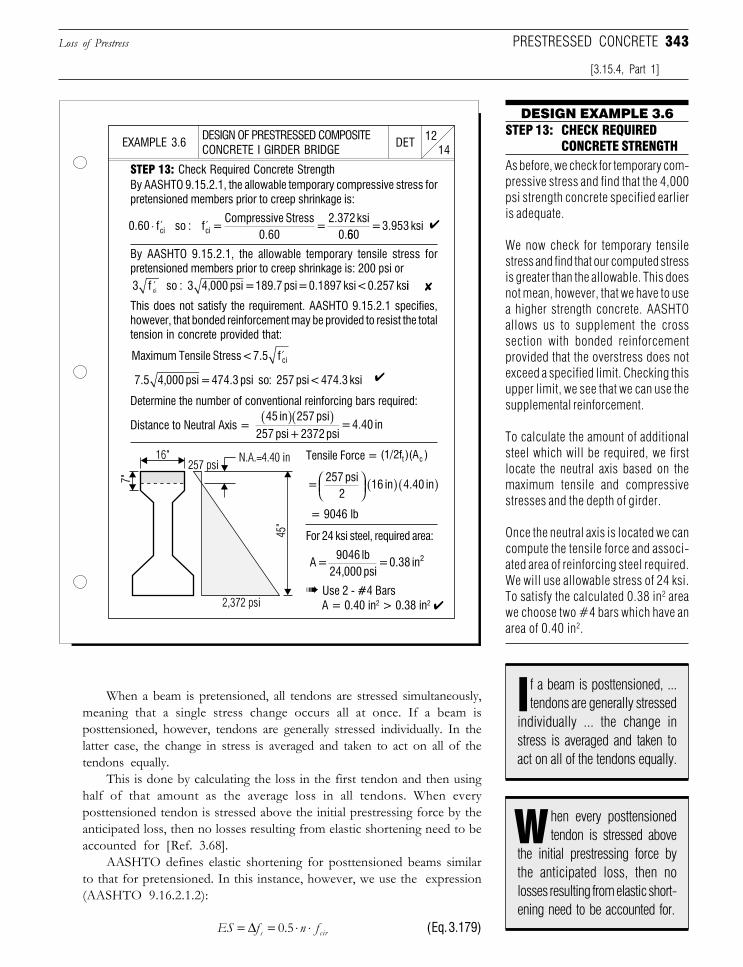
343
DESIGN OF PRESTRESSED COMPOSITECONCRETE I GIRDER BRIDGE 14
12DETEXAMPLE 3.6
DESIGN EXAMPLE 3.6STEP 13: CHECK REQUIRED
CONCRETE STRENGTHAs before, we check for temporary com-pressive stress and find that the 4,000psi strength concrete specified earlieris adequate.
We now check for temporary tensilestress and find that our computed stressis greater than the allowable. This doesnot mean, however, that we have to usea higher strength concrete. AASHTOallows us to supplement the crosssection with bonded reinforcementprovided that the overstress does notexceed a specified limit. Checking thisupper limit, we see that we can use thesupplemental reinforcement.
To calculate the amount of additionalsteel which will be required, we firstlocate the neutral axis based on themaximum tensile and compressivestresses and the depth of girder.
Once the neutral axis is located we cancompute the tensile force and associ-ated area of reinforcing steel required.We will use allowable stress of 24 ksi.To satisfy the calculated 0.38 in2 areawe choose two #4 bars which have anarea of 0.40 in2.
STEP 13: Check Required Concrete StrengthBy AASHTO 9.15.2.1, the allowable temporary compressive stress forpretensioned members prior to creep shrinkage is:
✔
By AASHTO 9.15.2.1, the allowable temporary tensile stress forpretensioned members prior to creep shrinkage is: 200 psi or
✘
This does not satisfy the requirement. AASHTO 9.15.2.1 specifies,however, that bonded reinforcement may be provided to resist the totaltension in concrete provided that:
✔
Determine the number of conventional reinforcing bars required:
Distance to Neutral Axis =
Tensile Force =
= 9046 lb
➠ Use 2 - #4 BarsA = 0.40 in2 > 0.38 in2 ✔
For 24 ksi steel, required area:
When a beam is pretensioned, all tendons are stressed simultaneously,meaning that a single stress change occurs all at once. If a beam isposttensioned, however, tendons are generally stressed individually. In thelatter case, the change in stress is averaged and taken to act on all of thetendons equally.
This is done by calculating the loss in the first tendon and then usinghalf of that amount as the average loss in all tendons. When everyposttensioned tendon is stressed above the initial prestressing force by theanticipated loss, then no losses resulting from elastic shortening need to beaccounted for [Ref. 3.68].
AASHTO defines elastic shortening for posttensioned beams similarto that for pretensioned. In this instance, however, we use the expression(AASHTO 9.16.2.1.2):
ES f n fs c ir= = ⋅ ⋅∆ 0 5. (Eq. 3.179)
Loss of Prestress
[3.15.4, Part 1]
PRESTRESSED CONCRETE
3 f so : 3 4,000 psi = 189.7 psi = 0.1897 ksi < 0.257 ks ci′ ii
Maximum Tensile Stress < 7.5 f ci′
7.5 4,000 psi = 474.3 psi so: 257 psi < 474.3 ksi
45 in 257 psi257 psi + 2372 psi
= 4.40 in( )( )
(1/2f )(A )t c
= 257 psi
216 in 4.40 in
( )( )
A = 9046 lb
24,000 psi = 0.38 in2
0.60 f so : f = Compressive Stress
0.60 =
2.372 ksi0.
ci
ci⋅ ′ ′
660 = 3.953 ksi
hen every posttensionedtendon is stressed above
the initial prestressing force bythe anticipated loss, then nolosses resulting from elastic short-ening need to be accounted for.
W
f a beam is posttensioned, ...tendons are generally stressed
individually ... the change instress is averaged and taken toact on all of the tendons equally.
I
Downloaded from Digital Engineering Library @ McGraw-Hill (www.digitalengineeringlibrary.com)Copyright © 2006 The McGraw-Hill Companies. All rights reserved.
Any use is subject to the Terms of Use as given at the website.
Design of Superstructure Elements
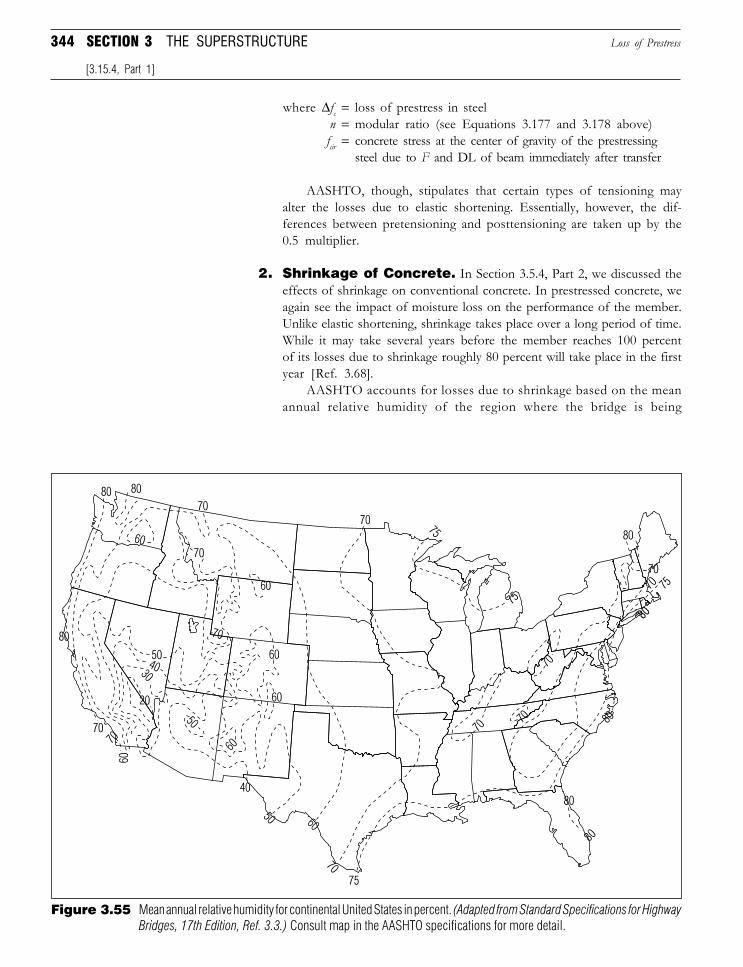
344 SECTION 3 THE SUPERSTRUCTURE
where ∆fs = loss of prestress in steeln = modular ratio (see Equations 3.177 and 3.178 above)fcir = concrete stress at the center of gravity of the prestressing
steel due to F and DL of beam immediately after transfer
AASHTO, though, stipulates that certain types of tensioning mayalter the losses due to elastic shortening. Essentially, however, the dif-ferences between pretensioning and posttensioning are taken up by the0.5 multiplier.
2. Shrinkage of Concrete. In Section 3.5.4, Part 2, we discussed theeffects of shrinkage on conventional concrete. In prestressed concrete, weagain see the impact of moisture loss on the performance of the member.Unlike elastic shortening, shrinkage takes place over a long period of time.While it may take several years before the member reaches 100 percentof its losses due to shrinkage roughly 80 percent will take place in the firstyear [Ref. 3.68].
AASHTO accounts for losses due to shrinkage based on the meanannual relative humidity of the region where the bridge is being
[3.15.4, Part 1]
Loss of Prestress
Figure 3.55 Mean annual relative humidity for continental United States in percent. (Adapted from Standard Specifications for HighwayBridges, 17th Edition, Ref. 3.3.) Consult map in the AASHTO specifications for more detail.
Downloaded from Digital Engineering Library @ McGraw-Hill (www.digitalengineeringlibrary.com)Copyright © 2006 The McGraw-Hill Companies. All rights reserved.
Any use is subject to the Terms of Use as given at the website.
Design of Superstructure Elements
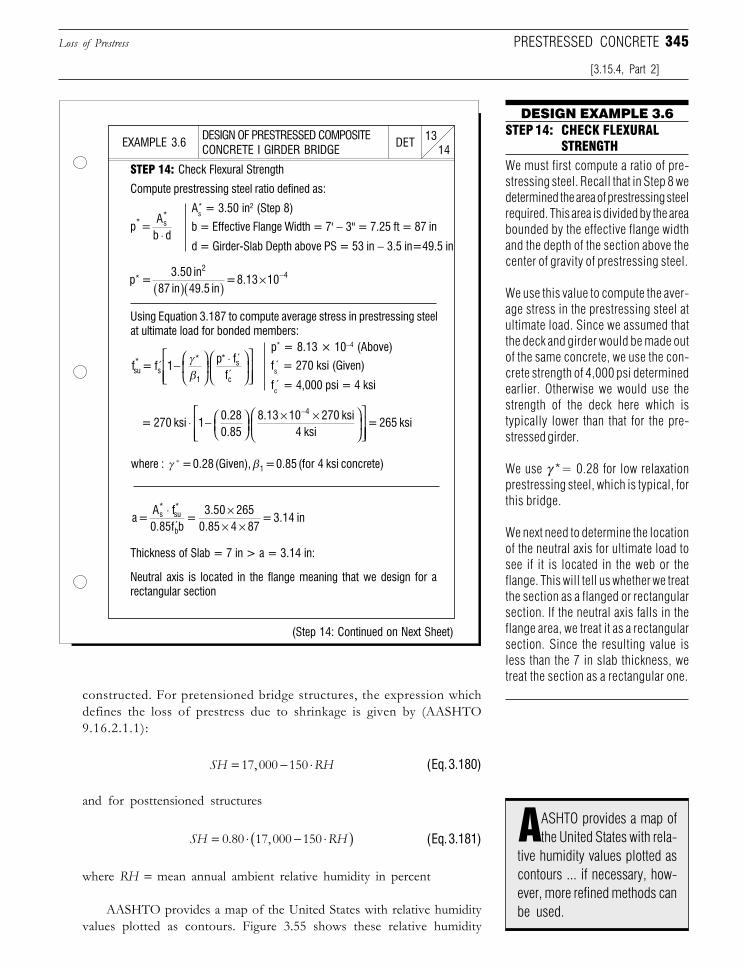
345
constructed. For pretensioned bridge structures, the expression whichdefines the loss of prestress due to shrinkage is given by (AASHTO9.16.2.1.1):
SH RH= − ⋅17 000 150, (Eq. 3.180)
and for posttensioned structures
SH RH= ⋅ − ⋅( )0 80 17 000 150. , (Eq. 3.181)
where RH = mean annual ambient relative humidity in percent
AASHTO provides a map of the United States with relative humidityvalues plotted as contours. Figure 3.55 shows these relative humidity
DESIGN OF PRESTRESSED COMPOSITECONCRETE I GIRDER BRIDGE 14
13DETEXAMPLE 3.6
DESIGN EXAMPLE 3.6STEP 14: CHECK FLEXURAL
STRENGTHWe must first compute a ratio of pre-stressing steel. Recall that in Step 8 wedetermined the area of prestressing steelrequired. This area is divided by the areabounded by the effective flange widthand the depth of the section above thecenter of gravity of prestressing steel.
We use this value to compute the aver-age stress in the prestressing steel atultimate load. Since we assumed thatthe deck and girder would be made outof the same concrete, we use the con-crete strength of 4,000 psi determinedearlier. Otherwise we would use thestrength of the deck here which istypically lower than that for the pre-stressed girder.
We use γ *= 0.28 for low relaxationprestressing steel, which is typical, forthis bridge.
We next need to determine the locationof the neutral axis for ultimate load tosee if it is located in the web or theflange. This will tell us whether we treatthe section as a flanged or rectangularsection. If the neutral axis falls in theflange area, we treat it as a rectangularsection. Since the resulting value isless than the 7 in slab thickness, wetreat the section as a rectangular one.
STEP 14: Check Flexural Strength
Compute prestressing steel ratio defined as:
b = Effective Flange Width = 7' − 3" = 7.25 ft = 87 in
As* = 3.50 in2 (Step 8)
d = Girder-Slab Depth above PS = 53 in − 3.5 in=49.5 in
Using Equation 3.187 to compute average stress in prestressing steelat ultimate load for bonded members:
fs = 270 ksi (Given)
p* = 8.13 × 10⁻⁴ (Above)
fc = 4,000 psi = 4 ksi
Thickness of Slab = 7 in > a = 3.14 in:
Neutral axis is located in the flange meaning that we design for arectangular section
(Step 14: Continued on Next Sheet)
Loss of Prestress PRESTRESSED CONCRETE
[3.15.4, Part 2]
p = 3.50 in
87 in 49.5 in = 8.13 10*
24
( )( ) × −
p = A
b d*
s*
⋅
ASHTO provides a map ofthe United States with rela-
tive humidity values plotted ascontours ... if necessary, how-ever, more refined methods canbe used.
A
f = f 1 p f
fsu*
s
*
1
* s
c
′′
′−
⋅
⋅
γβ
where : = 0.28 (Given), = 0.85 (for 4 ksi concrete)γ β*1
a = A f0.85f b
=3.50 265
0.85 4 87=3.14 ins
*su*
b
⋅ ×× ×′
= 270 ksi 1 0.280.85
8.13 10 270 ksi4 ksi
4
⋅ −
× ×
−
= 265 ksi
Downloaded from Digital Engineering Library @ McGraw-Hill (www.digitalengineeringlibrary.com)Copyright © 2006 The McGraw-Hill Companies. All rights reserved.
Any use is subject to the Terms of Use as given at the website.
Design of Superstructure Elements
346 SECTION 3 THE SUPERSTRUCTURE
contours for the continental United States only. If necessary, however,more refined methods can be used.
3. Creep of Concrete. In Section 3.5.4, Part 1, we discussed the effectsof creep on conventional concrete. Like shrinkage, creep is time dependentand acts on the member over a given period of time when the beam issubjected to sustained loads. The onset of creep is assumed to occur afterthe prestressing force has been applied and the superimposed dead loadsare placed on the member.
To compute losses due to creep, the concrete stress at the center ofgravity of the prestressing steel is reduced by the tensile strain which occursas a result of the placement of superimposed dead loads. Specifically,AASHTO defines the loss due to creep of concrete with the followingexpression (AASHTO 9.16.2.1.3):
CR f fc cir cds= ⋅ − ⋅12 7 (Eq. 3.182)
where fcir = concrete stress at the center of gravity of the prestressingsteel due to F and DL of beam immediately after transfer
fcds = concrete stress at the center of gravity of the prestressingsteel due to all DL except DL present at time F is applied
This expression is used to define losses due to creep of concrete forboth pretensioned and posttensioned members.
4. Friction. In general, the stress in a tendon at a point away from thetensioning end is lower due to the friction which occurs between thetendon and surrounding concrete or sheathing [Ref. 3.68]. One factorwhich influences the loss due to friction is known as the length effect.This length or wobbling effect is the amount of friction which wouldoccur if the tendon were perfectly straight. Since this is not the case, acertain amount of friction results between the prestressing steel andsurrounding material.
Obviously, many factors impact the amount of friction which resultsfrom this phenomenon, some of which are:
❏ Length of the tendon❏ Stress in the tendons❏ Friction coefficient❏ Type of duct used
Another component of friction loss is known as the curvature effect.This loss results from the curve the prestressing tendon is intended tofollow. The two basic contributing factors impacting the curvature effectare:
❏ Pressure on surrounding concrete caused by the tendon❏ Friction coefficient
Loss of Prestress
[3.15.4, Part 2]
he onset of creep is as-sumed to occur after the
prestressing force has beenapplied and the superimposeddead loads are placed on themember.
T
Downloaded from Digital Engineering Library @ McGraw-Hill (www.digitalengineeringlibrary.com)Copyright © 2006 The McGraw-Hill Companies. All rights reserved.
Any use is subject to the Terms of Use as given at the website.
Design of Superstructure Elements
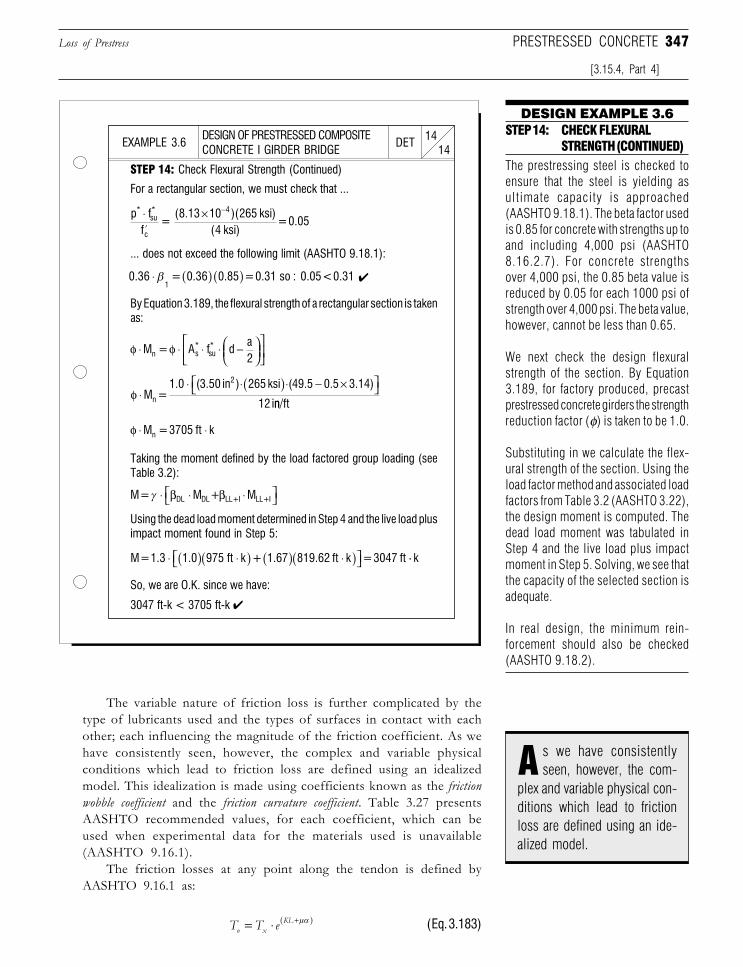
347
The variable nature of friction loss is further complicated by thetype of lubricants used and the types of surfaces in contact with eachother; each influencing the magnitude of the friction coefficient. As wehave consistently seen, however, the complex and variable physicalconditions which lead to friction loss are defined using an idealizedmodel. This idealization is made using coefficients known as the frictionwobble coefficient and the friction curvature coefficient. Table 3.27 presentsAASHTO recommended values, for each coefficient, which can beused when experimental data for the materials used is unavailable(AASHTO 9.16.1).
The friction losses at any point along the tendon is defined byAASHTO 9.16.1 as:
T T eo xKL= ⋅ +( )µα (Eq. 3.183)
DESIGN OF PRESTRESSED COMPOSITECONCRETE I GIRDER BRIDGE 14
14DETEXAMPLE 3.6
DESIGN EXAMPLE 3.6STEP 14: CHECK FLEXURAL
STRENGTH (CONTINUED)The prestressing steel is checked toensure that the steel is yielding asultimate capacity is approached(AASHTO 9.18.1). The beta factor usedis 0.85 for concrete with strengths up toand including 4,000 psi (AASHTO8.16.2.7). For concrete strengthsover 4,000 psi, the 0.85 beta value isreduced by 0.05 for each 1000 psi ofstrength over 4,000 psi. The beta value,however, cannot be less than 0.65.
We next check the design flexuralstrength of the section. By Equation3.189, for factory produced, precastprestressed concrete girders the strengthreduction factor (φ) is taken to be 1.0.
Substituting in we calculate the flex-ural strength of the section. Using theload factor method and associated loadfactors from Table 3.2 (AASHTO 3.22),the design moment is computed. Thedead load moment was tabulated inStep 4 and the live load plus impactmoment in Step 5. Solving, we see thatthe capacity of the selected section isadequate.
In real design, the minimum rein-forcement should also be checked(AASHTO 9.18.2).
STEP 14: Check Flexural Strength (Continued)
For a rectangular section, we must check that ...
... does not exceed the following limit (AASHTO 9.18.1):
✔
By Equation 3.189, the flexural strength of a rectangular section is takenas:
Taking the moment defined by the load factored group loading (seeTable 3.2):
Using the dead load moment determined in Step 4 and the live load plusimpact moment found in Step 5:
3047 ft-k < 3705 ft-k ✔
So, we are O.K. since we have:
Loss of Prestress
[3.15.4, Part 4]
PRESTRESSED CONCRETE
0.36 = 0.36 0.85 = 0.31 so : 0.05 < 0.311
⋅ ( ) ( )β
φ φ⋅ ⋅ ⋅ ⋅ −
M = A f d a2n s
*su*
φ ⋅⋅ ⋅( )⋅ − × M =
1.0 (3.50 in ) 265 ksi (49.5 0.5 3.14)
12 in
2
nn/ft
φ ⋅ ⋅M = 3705 ft kn
M = M + MDL DL LL+I LL+Iγ ⋅ ⋅ ⋅ β β
M = 1.3 1.0 975 ft k + 1.67 819.62 ft k = 3047 ft⋅ ( ) ⋅( ) ( ) ⋅( ) ⋅⋅ k
p ff
=8.13 10 265 ksi
4 ksi = 0.05
*su*
c
4⋅ ×′
−( )( )( )
s we have consistentlyseen, however, the com-
plex and variable physical con-ditions which lead to frictionloss are defined using an ide-alized model.
A
Downloaded from Digital Engineering Library @ McGraw-Hill (www.digitalengineeringlibrary.com)Copyright © 2006 The McGraw-Hill Companies. All rights reserved.
Any use is subject to the Terms of Use as given at the website.
Design of Superstructure Elements
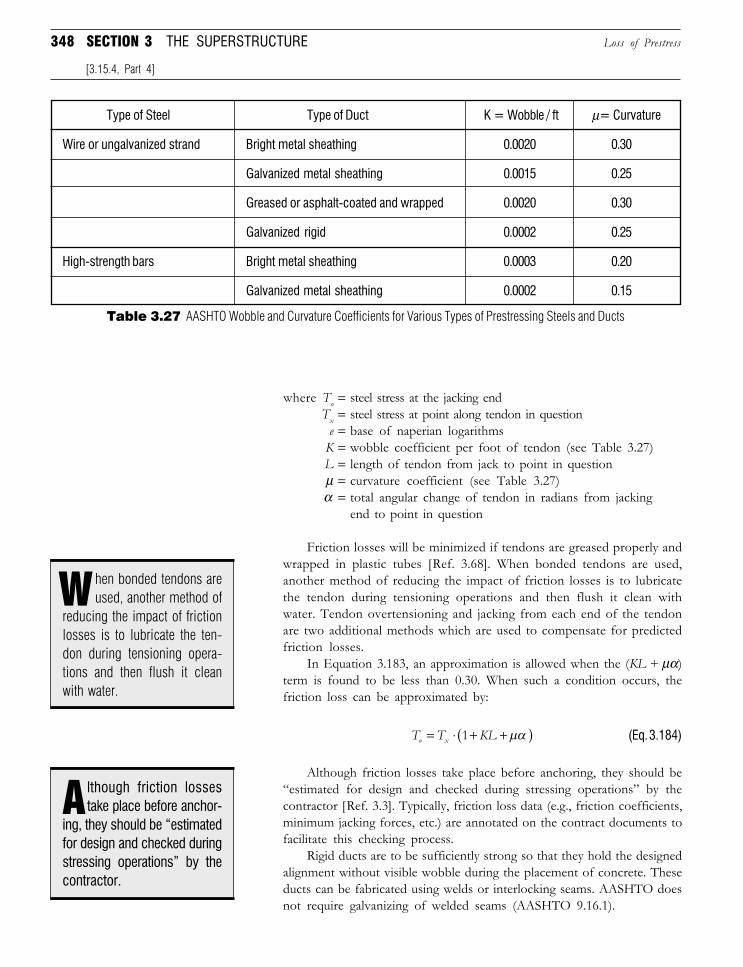
348 SECTION 3 THE SUPERSTRUCTURE
where To = steel stress at the jacking endTx = steel stress at point along tendon in question
e = base of naperian logarithmsK = wobble coefficient per foot of tendon (see Table 3.27)L = length of tendon from jack to point in questionµ = curvature coefficient (see Table 3.27)α = total angular change of tendon in radians from jacking
end to point in question
Friction losses will be minimized if tendons are greased properly andwrapped in plastic tubes [Ref. 3.68]. When bonded tendons are used,another method of reducing the impact of friction losses is to lubricatethe tendon during tensioning operations and then flush it clean withwater. Tendon overtensioning and jacking from each end of the tendonare two additional methods which are used to compensate for predictedfriction losses.
In Equation 3.183, an approximation is allowed when the (KL + µα)term is found to be less than 0.30. When such a condition occurs, thefriction loss can be approximated by:
T T KLo x= ⋅ + +( )1 µα (Eq. 3.184)
Although friction losses take place before anchoring, they should be“estimated for design and checked during stressing operations” by thecontractor [Ref. 3.3]. Typically, friction loss data (e.g., friction coefficients,minimum jacking forces, etc.) are annotated on the contract documents tofacilitate this checking process.
Rigid ducts are to be sufficiently strong so that they hold the designedalignment without visible wobble during the placement of concrete. Theseducts can be fabricated using welds or interlocking seams. AASHTO doesnot require galvanizing of welded seams (AASHTO 9.16.1).
Loss of Prestress
[3.15.4, Part 4]
hen bonded tendons areused, another method of
reducing the impact of frictionlosses is to lubricate the ten-don during tensioning opera-tions and then flush it cleanwith water.
W
lthough friction lossestake place before anchor-
ing, they should be “estimatedfor design and checked duringstressing operations” by thecontractor.
A
Table 3.27 AASHTO Wobble and Curvature Coefficients for Various Types of Prestressing Steels and Ducts
Type of Steel Type of Duct K = Wobble / ft µ= Curvature
Wire or ungalvanized strand Bright metal sheathing 0.0020 0.30
Galvanized metal sheathing 0.0015 0.25
Greased or asphalt-coated and wrapped 0.0020 0.30
Galvanized rigid 0.0002 0.25
High-strength bars Bright metal sheathing 0.0003 0.20
Galvanized metal sheathing 0.0002 0.15
Downloaded from Digital Engineering Library @ McGraw-Hill (www.digitalengineeringlibrary.com)Copyright © 2006 The McGraw-Hill Companies. All rights reserved.
Any use is subject to the Terms of Use as given at the website.
Design of Superstructure Elements
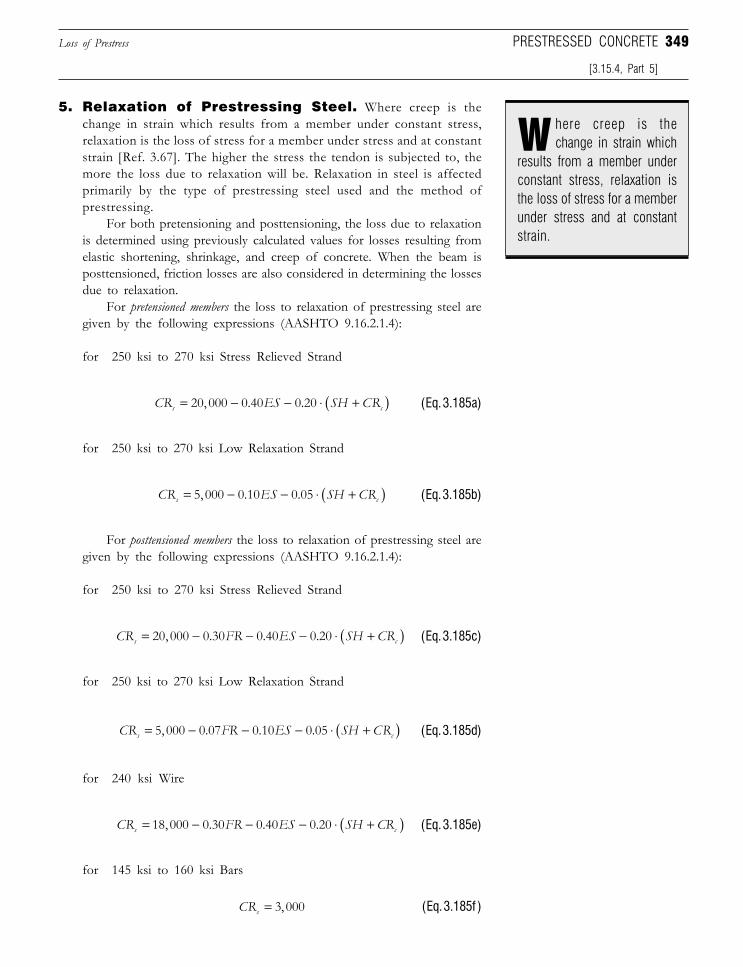
349
5. Relaxation of Prestressing Steel. Where creep is thechange in strain which results from a member under constant stress,relaxation is the loss of stress for a member under stress and at constantstrain [Ref. 3.67]. The higher the stress the tendon is subjected to, themore the loss due to relaxation will be. Relaxation in steel is affectedprimarily by the type of prestressing steel used and the method ofprestressing.
For both pretensioning and posttensioning, the loss due to relaxationis determined using previously calculated values for losses resulting fromelastic shortening, shrinkage, and creep of concrete. When the beam isposttensioned, friction losses are also considered in determining the lossesdue to relaxation.
For pretensioned members the loss to relaxation of prestressing steel aregiven by the following expressions (AASHTO 9.16.2.1.4):
for 250 ksi to 270 ksi Stress Relieved Strand
CR ES SH CRs c= − − ⋅ +( )20 000 0 40 0 20, . . (Eq. 3.185a)
for 250 ksi to 270 ksi Low Relaxation Strand
CR ES SH CRs c= − − ⋅ +( )5 000 0 10 0 05, . . (Eq. 3.185b)
For posttensioned members the loss to relaxation of prestressing steel aregiven by the following expressions (AASHTO 9.16.2.1.4):
for 250 ksi to 270 ksi Stress Relieved Strand
CR FR ES SH CRs c= − − − ⋅ +( )20 000 0 30 0 40 0 20, . . . (Eq. 3.185c)
for 250 ksi to 270 ksi Low Relaxation Strand
CR FR ES SH CRs c= − − − ⋅ +( )5 000 0 07 0 10 0 05, . . . (Eq. 3.185d)
for 240 ksi Wire
CR FR ES SH CRs c= − − − ⋅ +( )18 000 0 30 0 40 0 20, . . . (Eq. 3.185e)
for 145 ksi to 160 ksi Bars
CRs = 3 000, (Eq. 3.185f )
Loss of Prestress
[3.15.4, Part 5]
PRESTRESSED CONCRETE
here creep is thechange in strain which
results from a member underconstant stress, relaxation isthe loss of stress for a memberunder stress and at constantstrain.
W
Downloaded from Digital Engineering Library @ McGraw-Hill (www.digitalengineeringlibrary.com)Copyright © 2006 The McGraw-Hill Companies. All rights reserved.
Any use is subject to the Terms of Use as given at the website.
Design of Superstructure Elements
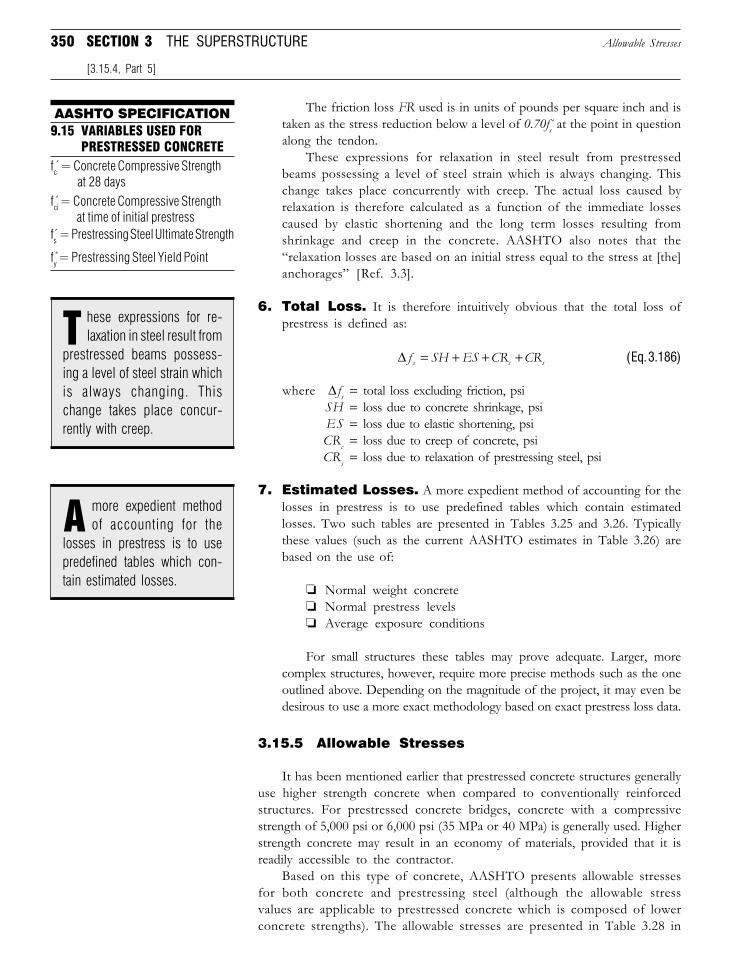
350 SECTION 3 THE SUPERSTRUCTURE
The friction loss FR used is in units of pounds per square inch and istaken as the stress reduction below a level of 0.70fs at the point in questionalong the tendon.
These expressions for relaxation in steel result from prestressedbeams possessing a level of steel strain which is always changing. Thischange takes place concurrently with creep. The actual loss caused byrelaxation is therefore calculated as a function of the immediate lossescaused by elastic shortening and the long term losses resulting fromshrinkage and creep in the concrete. AASHTO also notes that the“relaxation losses are based on an initial stress equal to the stress at [the]anchorages” [Ref. 3.3].
6. Total Loss. It is therefore intuitively obvious that the total loss ofprestress is defined as:
∆ f SH ES CR CRs c s= + + + (Eq. 3.186)
where ∆ fs = total loss excluding friction, psiSH = loss due to concrete shrinkage, psiES = loss due to elastic shortening, psiCRc = loss due to creep of concrete, psiCRs = loss due to relaxation of prestressing steel, psi
7. Estimated Losses. A more expedient method of accounting for thelosses in prestress is to use predefined tables which contain estimatedlosses. Two such tables are presented in Tables 3.25 and 3.26. Typicallythese values (such as the current AASHTO estimates in Table 3.26) arebased on the use of:
❏ Normal weight concrete❏ Normal prestress levels❏ Average exposure conditions
For small structures these tables may prove adequate. Larger, morecomplex structures, however, require more precise methods such as the oneoutlined above. Depending on the magnitude of the project, it may even bedesirous to use a more exact methodology based on exact prestress loss data.
3.15.5 Allowable Stresses
It has been mentioned earlier that prestressed concrete structures generallyuse higher strength concrete when compared to conventionally reinforcedstructures. For prestressed concrete bridges, concrete with a compressivestrength of 5,000 psi or 6,000 psi (35 MPa or 40 MPa) is generally used. Higherstrength concrete may result in an economy of materials, provided that it isreadily accessible to the contractor.
Based on this type of concrete, AASHTO presents allowable stressesfor both concrete and prestressing steel (although the allowable stressvalues are applicable to prestressed concrete which is composed of lowerconcrete strengths). The allowable stresses are presented in Table 3.28 in
Allowable Stresses
[3.15.4, Part 5]
AASHTO SPECIFICATION9.15 VARIABLES USED FOR
PRESTRESSED CONCRETEfc = Concrete Compressive Strength
at 28 daysfci = Concrete Compressive Strength
at time of initial prestressfs = Prestressing Steel Ultimate Strength
fy*= Prestressing Steel Yield Point
hese expressions for re-laxation in steel result from
prestressed beams possess-ing a level of steel strain whichis always changing. Thischange takes place concur-rently with creep.
T
more expedient methodof accounting for the
losses in prestress is to usepredefined tables which con-tain estimated losses.
A
Downloaded from Digital Engineering Library @ McGraw-Hill (www.digitalengineeringlibrary.com)Copyright © 2006 The McGraw-Hill Companies. All rights reserved.
Any use is subject to the Terms of Use as given at the website.
Design of Superstructure Elements
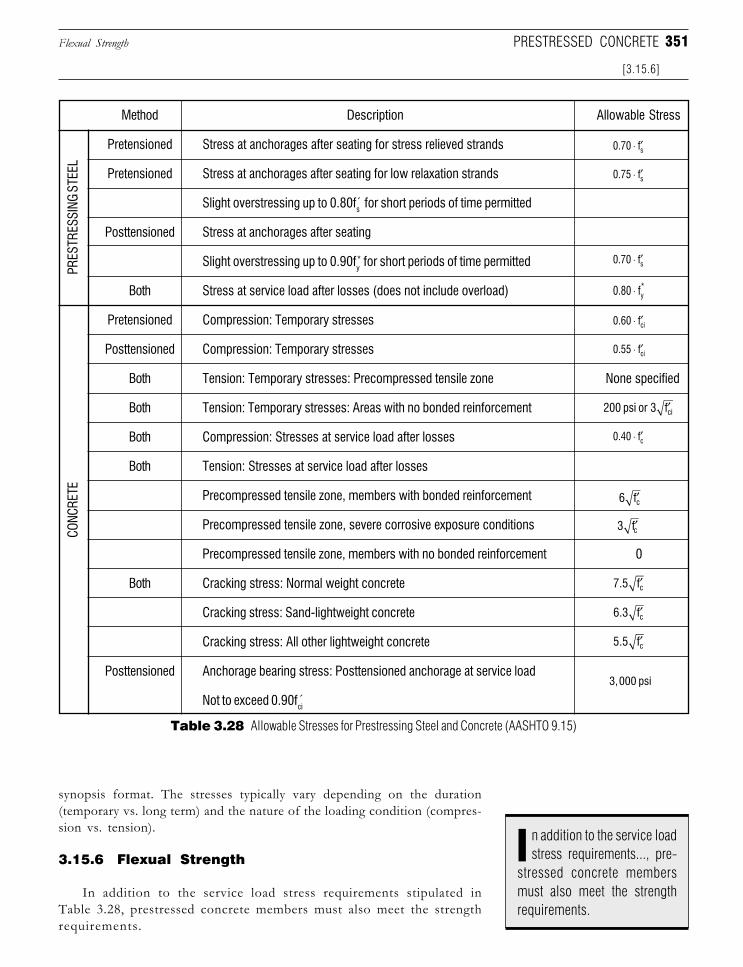
351
synopsis format. The stresses typically vary depending on the duration(temporary vs. long term) and the nature of the loading condition (compres-sion vs. tension).
3.15.6 Flexual Strength
In addition to the service load stress requirements stipulated inTable 3.28, prestressed concrete members must also meet the strengthrequirements.
Flexual Strength PRESTRESSED CONCRETE
[3.15.6]
Method Description Allowable Stress
Pretensioned Stress at anchorages after seating for stress relieved strands
Pretensioned Stress at anchorages after seating for low relaxation strands
Slight overstressing up to 0.80fs for short periods of time permitted
Posttensioned Stress at anchorages after seating
Slight overstressing up to 0.90fy* for short periods of time permitted
Both Stress at service load after losses (does not include overload)
Pretensioned Compression: Temporary stresses
Posttensioned Compression: Temporary stresses
Both Tension: Temporary stresses: Precompressed tensile zone None specified
Both Tension: Temporary stresses: Areas with no bonded reinforcement
Both Compression: Stresses at service load after losses
Both Tension: Stresses at service load after losses
Precompressed tensile zone, members with bonded reinforcement
Precompressed tensile zone, severe corrosive exposure conditions
Precompressed tensile zone, members with no bonded reinforcement 0
Both Cracking stress: Normal weight concrete
Cracking stress: Sand-lightweight concrete
Cracking stress: All other lightweight concrete
Posttensioned Anchorage bearing stress: Posttensioned anchorage at service load
Not to exceed 0.90fci
PRES
TRES
SING
STE
ELCO
NCRE
TE
Table 3.28 Allowable Stresses for Prestressing Steel and Concrete (AASHTO 9.15)
0.70 fs⋅ ′
0.75 fs⋅ ′
0.70 fs⋅ ′
0.80 fy*⋅
0.60 fci⋅ ′
0.55 fci⋅ ′
200 psi or 3 fci′
0.40 fc⋅ ′
6 fc′
7.5 fc′
6.3 fc′
5.5 fc′
3,000 psi
3 fc′
n addition to the service loadstress requirements..., pre-
stressed concrete membersmust also meet the strengthrequirements.
I
Downloaded from Digital Engineering Library @ McGraw-Hill (www.digitalengineeringlibrary.com)Copyright © 2006 The McGraw-Hill Companies. All rights reserved.
Any use is subject to the Terms of Use as given at the website.
Design of Superstructure Elements
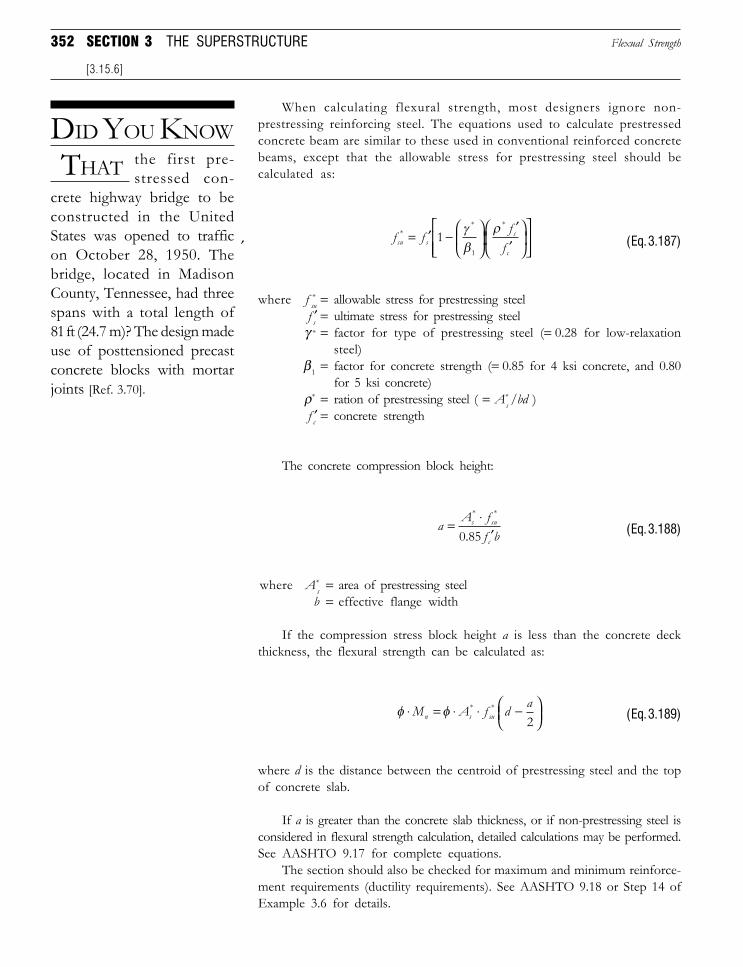
352 SECTION 3 THE SUPERSTRUCTURE
When calculating flexural strength, most designers ignore non-prestressing reinforcing steel. The equations used to calculate prestressedconcrete beam are similar to these used in conventional reinforced concretebeams, except that the allowable stress for prestressing steel should becalculated as:
f fffsu ss
c
** *
= ′ −
′′
11
γβ
ρ(Eq. 3.187)
where f *su = allowable stress for prestressing steelf ′s = ultimate stress for prestressing steel
γ * = factor for type of prestressing steel (= 0.28 for low-relaxationsteel)
β1 = factor for concrete strength (= 0.85 for 4 ksi concrete, and 0.80for 5 ksi concrete)
ρ* = ration of prestressing steel ( = A*s /bd )
f ′c = concrete strength
The concrete compression block height:
aA f
f bs su
c
= ⋅′
* *
.0 85 (Eq. 3.188)
where A*s = area of prestressing steel
b = effective flange width
If the compression stress block height a is less than the concrete deckthickness, the flexural strength can be calculated as:
φ φ⋅ = ⋅ ⋅ −
M A f d an s su
* *
2 (Eq. 3.189)
where d is the distance between the centroid of prestressing steel and the topof concrete slab.
If a is greater than the concrete slab thickness, or if non-prestressing steel isconsidered in flexural strength calculation, detailed calculations may be performed.See AASHTO 9.17 for complete equations.
The section should also be checked for maximum and minimum reinforce-ment requirements (ductility requirements). See AASHTO 9.18 or Step 14 ofExample 3.6 for details.
Flexual Strength
[3.15.6]
DID YOU KNOW
THAT the first pre-stressed con-
crete highway bridge to beconstructed in the UnitedStates was opened to trafficon October 28, 1950. Thebridge, located in MadisonCounty, Tennessee, had threespans with a total length of81 ft (24.7 m)? The design madeuse of posttensioned precastconcrete blocks with mortarjoints [Ref. 3.70].
′
Downloaded from Digital Engineering Library @ McGraw-Hill (www.digitalengineeringlibrary.com)Copyright © 2006 The McGraw-Hill Companies. All rights reserved.
Any use is subject to the Terms of Use as given at the website.
Design of Superstructure Elements
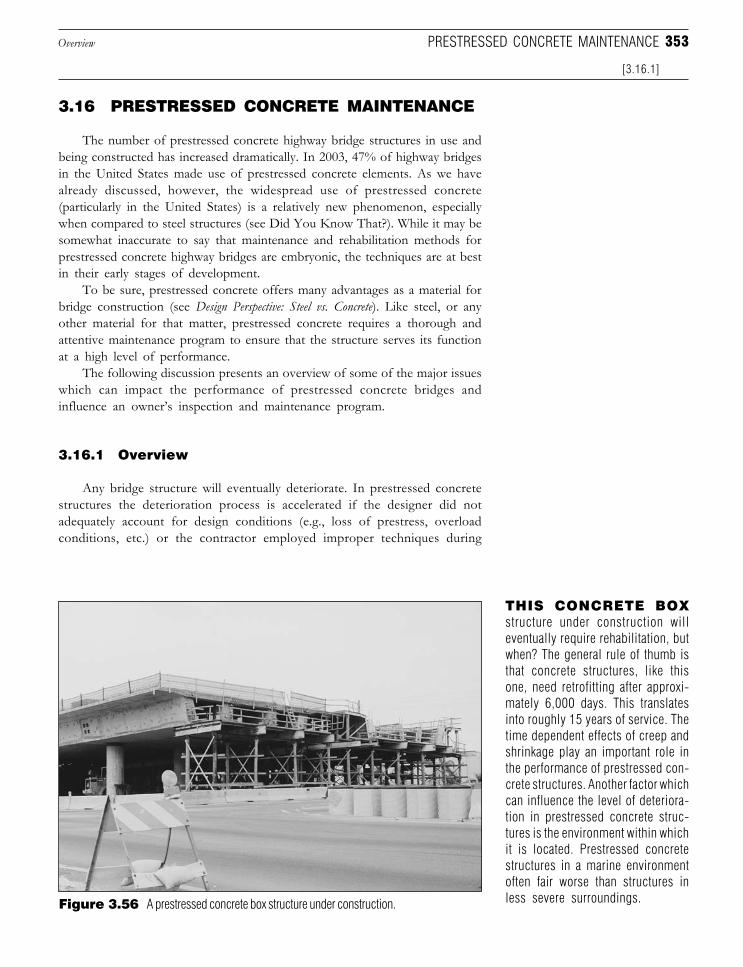
353
Figure 3.56 A prestressed concrete box structure under construction.
3.16 PRESTRESSED CONCRETE MAINTENANCE
The number of prestressed concrete highway bridge structures in use andbeing constructed has increased dramatically. In 2003, 47% of highway bridgesin the United States made use of prestressed concrete elements. As we havealready discussed, however, the widespread use of prestressed concrete(particularly in the United States) is a relatively new phenomenon, especiallywhen compared to steel structures (see Did You Know That?). While it may besomewhat inaccurate to say that maintenance and rehabilitation methods forprestressed concrete highway bridges are embryonic, the techniques are at bestin their early stages of development.
To be sure, prestressed concrete offers many advantages as a material forbridge construction (see Design Perspective: Steel vs. Concrete). Like steel, or anyother material for that matter, prestressed concrete requires a thorough andattentive maintenance program to ensure that the structure serves its functionat a high level of performance.
The following discussion presents an overview of some of the major issueswhich can impact the performance of prestressed concrete bridges andinfluence an owner’s inspection and maintenance program.
3.16.1 Overview
Any bridge structure will eventually deteriorate. In prestressed concretestructures the deterioration process is accelerated if the designer did notadequately account for design conditions (e.g., loss of prestress, overloadconditions, etc.) or the contractor employed improper techniques during
Overview
[3.16.1]
PRESTRESSED CONCRETE MAINTENANCE
THIS CONCRETE BOXstructure under construction willeventually require rehabilitation, butwhen? The general rule of thumb isthat concrete structures, like thisone, need retrofitting after approxi-mately 6,000 days. This translatesinto roughly 15 years of service. Thetime dependent effects of creep andshrinkage play an important role inthe performance of prestressed con-crete structures. Another factor whichcan influence the level of deteriora-tion in prestressed concrete struc-tures is the environment within whichit is located. Prestressed concretestructures in a marine environmentoften fair worse than structures inless severe surroundings.
Downloaded from Digital Engineering Library @ McGraw-Hill (www.digitalengineeringlibrary.com)Copyright © 2006 The McGraw-Hill Companies. All rights reserved.
Any use is subject to the Terms of Use as given at the website.
Design of Superstructure Elements
354 SECTION 3 THE SUPERSTRUCTURE
construction. With regard to the maintenance and rehabilitation of pre-stressed concrete bridges, it is important for the reader to appreciate thatprestressed concrete is not so much a material but rather a method ofconstruction [Ref. 3.70]. Maintenance and rehabilitation of prestressedconcrete differs from that of conventionally reinforced structures in twobasic ways. These differences being that prestressed concrete makes use ofhigher strength concrete and prestressing tendons are used to develop itsstrength.
Since higher strength concrete is generally the rule of thumb, the concretecomponent of a prestressed element will, on the whole, perform better than thatof a conventionally reinforced element. Because of this, much attention isfocused on the performance of the prestressing steel.
The impact which prestressing steel has on the performance of a structureis great, particularly in light of the resulting adverse effects which can occurshould the tendons fail. What makes maintenance of prestressed structuresdifferent from steel bridges is the difficulty in inspecting the hidden elements(i.e., prestressing steel) of a prestressed component.
This difficulty also leads to associated problems with rehabilitation. Sincea prestressed girder is essentially a self-contained, enclosed assembly, it isdifficult to rehabilitate portions of a span as can be done with a steel girder. Inmany instances replacement rather than rehabilitation is the only solutionavailable to an owner.
Prestressed concrete bridges are not without their share of failures either.Failures of prestressed concrete structures have occurred both within theUnited States and overseas. In spite of these difficulties, however, prestressedconcrete structures have gained popularity because of their durability. As thefirst generation of prestressed concrete bridges has grown older, new methodsfor their maintenance have also developed.
3.16.2 Deterioration of Prestressed Concrete
Prestressed concrete suffers from some of the same types of deteriorationas conventionally reinforced elements (e.g., cracking and scaling). The presenceof prestressing steel, however, leads to some subtle and not so subtledifferences.
In general, corrosion of prestressed concrete takes place as a result ofseveral mechanisms [Ref. 3.70]. Some of the major contributing factors whichinitiate and propagate corrosion are:
❏ Pitting corrosion❏ Stress corrosion❏ Hydrogen embrittlement
The most severe consequence which can result from corrosion to aprestressed concrete member is a total loss of prestress in the steel tendonswhich can ultimately lead to failure of the structure. The seriousness of thisnecessitates the development of a sound and thorough maintenance programwhich can detect deterioration in its early stages and thus identify potentialproblem areas in advance. While there are a variety of advanced tools
Deterioration of Prestressed Concrete
[3.16.1]
t is important for thereader to appreciate that
prestressed concrete is not somuch a material but rather amethod of construction.
...i
he impact which pre-stressing steel has on the
performance of a structure isgreat, particularly in light ofthe resulting adverse effectswhich can occur should thetendons fail.
T
Downloaded from Digital Engineering Library @ McGraw-Hill (www.digitalengineeringlibrary.com)Copyright © 2006 The McGraw-Hill Companies. All rights reserved.
Any use is subject to the Terms of Use as given at the website.
Design of Superstructure Elements
355
available to facilitate the inspection process (e.g., radiography, exposure ofprestressing steel, etc.), the basis of any maintenance operations will be thevisual inspection. For this reason, we need to discuss the principal forms ofdeterioration which an inspector will be faced with in inspecting prestressedconcrete elements.
Provided below is an outline of some of the major forms of deteriorationprestressed concrete members are subjected to.
1. Cracking. Like conventionally reinforced concrete, prestressedconcrete is susceptible to cracking. Map cracking and other types ofcracks can result from many of the same conditions as discussedpreviously for conventional concrete. Chief among the causes of suchcracking are the intrusion of chlorides and other harmful agents whichare typical of marine and cold weather environments. Such crackingcan initiate abnormal expansion and lead to a loss of strength of themember [Ref. 3.70].
Other forms of cracking include plastic shrinkage cracks and dryingshrinkage cracks, which can result from improper drying of the concrete.Settlement cracks may also occur as a result of either poor workmanshipduring construction or settlement of the structure’s foundation.
Principal causes for structural cracks can be detailed by the following[Ref. 3.70]:
❏ Inadequate moment and shear capacity❏ Incorrect allowance for thermal forces❏ Incorrect allowance for stresses from tendon curvature❏ Poor construction techniques❏ Poor tolerances requirements for locating strands❏ Use of under strength materials
The impact which such cracking will have on a structure will vary.Some cracks will naturally be more severe than others. Because of thenaturally occurring phenomena of shrinkage and creep, it is impossible tocompletely eliminate all cracking. Cracking, however, can be limited byavoiding some of the design and fabrication pitfalls detailed above. Flexuralcracks, for example, indicate an improper or inadequate accounting forstresses due to tension at the extreme fiber of the resisting beam crosssection. Indeed, although creep and shrinkage are unavoidable, as we sawin Section 3.15, they can and should be accounted for during the designprocess.
The same is true for cracks caused by thermal forces which, in somestructures, can cause stresses even greater than live loading conditions.Thermal cracks are evidenced by vertical cracks located close tointermediate supports. Another key point is at tendon anchorage loca-tions where cracks may develop as a result of improper design and/orconstruction.
Similar to plate girders, shear cracks will predominately affect girderwebs where they are inclined at approximate 45 degree angles. Shear cracksare generally located in the area between the span support and inflectionpoint [Ref. 3.70].
Deterioration of Prestressed Concrete
[3.16.2, Part 1]
PRESTRESSED CONCRETE MAINTENANCE
ecause of the naturallyoccurring phenomena of
shrinkage and creep, it is im-possible to completely elimi-nate all cracking.
B
hile there are a varietyof advanced tools
available to facilitate the in-spection process ... the basisof any maintenance operationswill be the visual inspection.
W
hief among the causesof such cracking are the
intrusion of chlorides andother harmful agents whichare typical of marine andcold weather environments.
C
Downloaded from Digital Engineering Library @ McGraw-Hill (www.digitalengineeringlibrary.com)Copyright © 2006 The McGraw-Hill Companies. All rights reserved.
Any use is subject to the Terms of Use as given at the website.
Design of Superstructure Elements
356 SECTION 3 THE SUPERSTRUCTURE
2. Other Forms of Concrete Corrosion. In addition to cracking,other forms of concrete corrosion which can affect the performance ofa structure are:
❏ Scaling❏ Honeycombing❏ Air pockets❏ Popouts resulting from internal pressure❏ Surface deposits (e.g., efflorescence)❏ Wear from traffic❏ Erosion❏ Chemical attacks
Scaling, honeycombing, and air pockets typically result from poorconstruction methods. Chemical attacks, as mentioned earlier, result fromenvironmental factors. Prestressed concrete will also suffer from thecathodic action discussed earlier in Section 3.9.8, Part 8. This can lead todamage to both the prestressing steel (see Part 3 below) and surroundingconcrete.
3. Deterioration of Prestressing Steel. As mentioned above,prestressing steel is subjected to the same cathodic action that conventionalreinforcing steel is. The principal physical difference between deteriorationof conventional reinforcing bars and prestressing steel is that the latter issubjected to higher stresses and is therefore more susceptible to corrosionthan the comparatively lightly stressed reinforcing steel. For the most part,however, this differential is negligible. The more extreme differencebetween the reinforcing bars and prestressing steel is that the consequencesof an excessively deteriorated prestressing tendon is much greater than fora conventional reinforcing bar.
Corrosion to steel components of a prestressed girder can beaccelerated through the existence of cracks as described above. Thepresence of such cracks provides an excellent vehicle for water, chlorides,and other harmful agents to penetrate the surface of the concrete andreach the underlying steel.
Another source of deterioration is the often mentioned deck jointleakage. This is of particular concern in prestressed concrete girders as theend anchorages can potentially be affected. When water penetrates tothe end anchorage location it will generally travel down the entire length ofthe tendon damaging both the prestressing steel and the surroundingconcrete. This will in turn lead to unbonding, which will greatly acceleratethe deterioration process.
3.16.3 Inspection of Prestressed Concrete
In Section 2 we discussed the general procedures associated with a detailedsite inspection. With regard to prestressed concrete structures, there are certainkey issues which need to be addressed. In this section we have already touchedon the importance of a thorough visual inspection in order to formulate anaccurate and coherent maintenance plan. Likewise, it can be said that the
Inspection of Prestressed Concrete
[3.16.2, Part 2]
he consequences of anexcessively deteriorated
prestressing tendon is muchgreater than for a conventionalreinforcing bar.
...t
Downloaded from Digital Engineering Library @ McGraw-Hill (www.digitalengineeringlibrary.com)Copyright © 2006 The McGraw-Hill Companies. All rights reserved.
Any use is subject to the Terms of Use as given at the website.
Design of Superstructure Elements
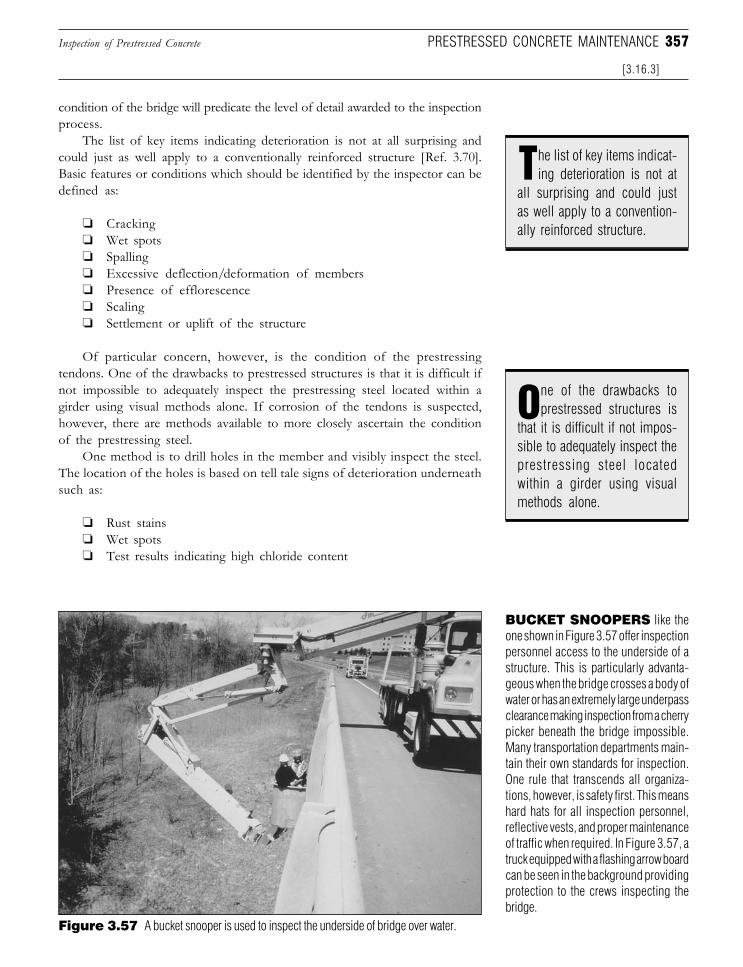
357
condition of the bridge will predicate the level of detail awarded to the inspectionprocess.
The list of key items indicating deterioration is not at all surprising andcould just as well apply to a conventionally reinforced structure [Ref. 3.70].Basic features or conditions which should be identified by the inspector can bedefined as:
❏ Cracking❏ Wet spots❏ Spalling❏ Excessive deflection/deformation of members❏ Presence of efflorescence❏ Scaling❏ Settlement or uplift of the structure
Of particular concern, however, is the condition of the prestressingtendons. One of the drawbacks to prestressed structures is that it is difficult ifnot impossible to adequately inspect the prestressing steel located within agirder using visual methods alone. If corrosion of the tendons is suspected,however, there are methods available to more closely ascertain the conditionof the prestressing steel.
One method is to drill holes in the member and visibly inspect the steel.The location of the holes is based on tell tale signs of deterioration underneathsuch as:
❏ Rust stains❏ Wet spots❏ Test results indicating high chloride content
Figure 3.57 A bucket snooper is used to inspect the underside of bridge over water.
BUCKET SNOOPERS like theone shown in Figure 3.57 offer inspectionpersonnel access to the underside of astructure. This is particularly advanta-geous when the bridge crosses a body ofwater or has an extremely large underpassclearance making inspection from a cherrypicker beneath the bridge impossible.Many transportation departments main-tain their own standards for inspection.One rule that transcends all organiza-tions, however, is safety first. This meanshard hats for all inspection personnel,reflective vests, and proper maintenanceof traffic when required. In Figure 3.57, atruck equipped with a flashing arrow boardcan be seen in the background providingprotection to the crews inspecting thebridge.
Inspection of Prestressed Concrete PRESTRESSED CONCRETE MAINTENANCE
[3.16.3]
he list of key items indicat-ing deterioration is not at
all surprising and could justas well apply to a convention-ally reinforced structure.
T
ne of the drawbacks toprestressed structures is
that it is difficult if not impos-sible to adequately inspect theprestressing steel locatedwithin a girder using visualmethods alone.
O
Downloaded from Digital Engineering Library @ McGraw-Hill (www.digitalengineeringlibrary.com)Copyright © 2006 The McGraw-Hill Companies. All rights reserved.
Any use is subject to the Terms of Use as given at the website.
Design of Superstructure Elements
358 SECTION 3 THE SUPERSTRUCTURE
The obvious danger associated with such an approach is that the inspectionitself could damage the girder and accelerate deterioration. Because of this risk,it is important that the utmost care be taken in the drilling process. To removethe concrete and expose the underlying strands, an electric chipping hammercan be used [Ref. 3.70].
In posttensioned structures coring to a given depth is acceptable, providedthat it stops short of the tendon duct. The remaining concrete is removed witha chipping hammer and the tendon inspected. A method developed in Germanyutilizes a drill equipped with a magnetic sensor which stops the drill just shortof the underlying steel.
In addition to these basic methods, advanced methods which are based onultrasonic, electrical, and radiographic techniques can be used to indicatepossible delaminations in the concrete or corrosion to the prestressing steel.Some of these approaches were covered previously in Section 2.
In general, the inspection of a prestressed concrete structure shouldfocus on the most sensitive areas of the bridge. An obvious candidate forconsistent inspection is at anchorage zones and beam ends. As mentionedearlier, these areas are particularly susceptible to joint leakage and theintrusion of water at the anchorage will carry moisture along the tendonthrough capillary action, accelerating deterioration. In addition to thepresence of moisture, anchorage zones are also susceptible to cracking dueto high stresses at this location.
Like steel girders, prestressed girders are also prone to vehicle impact whenlocated over underpasses with a tight vertical clearance. Such impact can leadto a chipping away of concrete, exposure of prestressing strands, or evendamage to the strands themselves.
3.16.4 Rehabilitation of Prestressed Concrete
If an inspection indicates that remedial measures need to be taken, thereare several basic steps an owner can take to both protect and repair aprestressed concrete structure. One basic step is to ensure proper drainage ofthe bridge deck and to repair or replace any deficient joints. Indeed, suchmeasures should be undertaken consistently by a maintenance department asa form of preventive maintenance.
It is inevitable, however, that individual structures will, at one time oranother, require rehabilitation. This rehabilitation could be necessitated byfactors which can be grouped as:
❏ Deterioration related❏ Accidental damage related
Methods for rehabilitating prestressed concrete structures will varydepending on which of the two groups the problem lies in. Accidental damage,such as impact from overheight trucks, is typically localized and can berepaired in a discrete fashion. Deterioration related repairs, however, must dealwith the possibility that the problem will not be contained by the remedialmeasure. For example, the intrusion of chlorides can spread throughout a girderover a period of time. The risk is always present that the measure employed willslow but not arrest deterioration.
[3.16.3]
Rehabilitation of Prestressed Concrete
ccidental damage, suchas impact from overheight
trucks, is typically localized andcan be repaired in a discretefashion.
A
Downloaded from Digital Engineering Library @ McGraw-Hill (www.digitalengineeringlibrary.com)Copyright © 2006 The McGraw-Hill Companies. All rights reserved.
Any use is subject to the Terms of Use as given at the website.
Design of Superstructure Elements
359
Discussed below are some of the basic methods employed to repairdamage to prestressed concrete elements. As mentioned above, however, theapplicability of the methods will vary depending on the origin of the deficiency.
1. Patching. For small, localized areas of deterioration, patching offersa quick low cost remedial measure which maintenance departments oftenrely on. In comparing the patching of a prestressed concrete element to aconventionally reinforced element, it is important to note that the size ofthe patch for prestressed elements is of great importance in that extensivepatching could adversely influence the strength of the member. Therefore,any patching of a significant nature should also be accompanied by astructural analysis to determine the impact the repair work will have on theperformance of the element.
This becomes of particular concern when the patch is located in anarea that is normally in compression. If such a situation occurs, the membershould be preloaded to simulate the effects of live load on the structure[Ref. 3.70]. These loads should be maintained until the patch has attainedits specified strength. If this is not done, cracks will develop, generally atthe bond line or in the existing concrete next to the patch because the patchmaterial is generally of a higher strength than the existing base concrete.
A deficiency with patching is that when the deteriorated area hassuffered from corrosion damage due to chloride intrusion, the patchingmay actually accelerate deterioration. In Section 3.9.8, Part 8 we describedthe process of cathodic action which causes deterioration. By patching achloride-contaminated area with patch material of a different chloride-oxygen content, the effect will be to cause the formation of strongercorrosion cells. One solution to this problem is to use a dielectric materialfor patching (e.g., a polymer mortar), although even this is not foolproofsince corrosion cells can still develop if the repair work is not impervious[Ref. 3.70].
In Section 3.9.8, Part 6 we discussed the process of patching concretedeck elements. The process, as it is applied to the patching of prestressedconcrete elements, is remarkably similar. The principal difference, how-ever, is that in the patching of concrete bridge decks, it is feasible (and oftenan economic necessity) to leave in place adjacent sections of concretewhich, while contaminated, are still relatively sound. This same philosophycannot be uniformly applied to prestressed concrete elements.
The main reason for this is that it is difficult to ascertain the futureperformance of a prestressed concrete element once the patching has beenperformed. In the most extreme and dire scenario, extensive corrosion canseriously impact the structural adequacy of the structure. Conversely,however, there are very few alternative methods presently available torepair the type of surface damage usually addressed with patching. It istherefore recommended that patches, when they are made, be consistentlymonitored to gauge the level of performance of the repair. Such inspectioncan be performed either visually or through the use of sounding.
2. Permanent Formwork. When prestressed concrete girders havebeen subjected to accidental damage which causes the exposure ofprestressing steel, a form of permanent formwork or enclosure of the
PRESTRESSED CONCRETE MAINTENANCE
[3.16.4, Part 2]
Rehabilitation of Prestressed Concrete
deficiency with patchingis that when the deterio-
rated area has suffered fromcorrosion damage due to chlo-ride intrusion, the patching mayactually accelerate deterioration.
A
Downloaded from Digital Engineering Library @ McGraw-Hill (www.digitalengineeringlibrary.com)Copyright © 2006 The McGraw-Hill Companies. All rights reserved.
Any use is subject to the Terms of Use as given at the website.
Design of Superstructure Elements
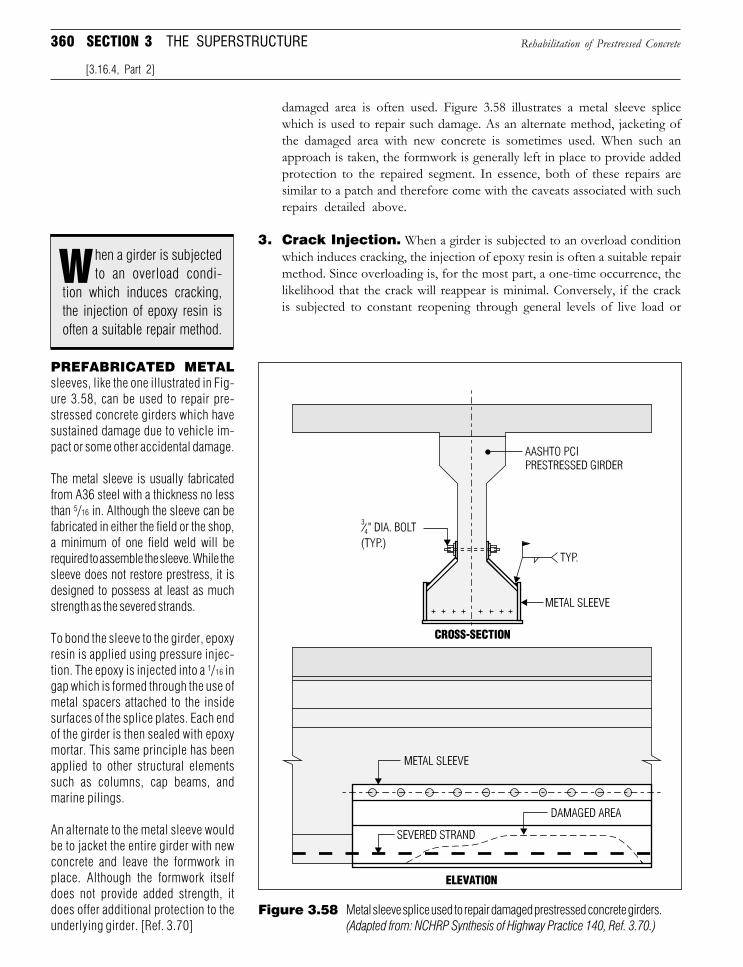
360 SECTION 3 THE SUPERSTRUCTURE
damaged area is often used. Figure 3.58 illustrates a metal sleeve splicewhich is used to repair such damage. As an alternate method, jacketing ofthe damaged area with new concrete is sometimes used. When such anapproach is taken, the formwork is generally left in place to provide addedprotection to the repaired segment. In essence, both of these repairs aresimilar to a patch and therefore come with the caveats associated with suchrepairs detailed above.
3. Crack Injection. When a girder is subjected to an overload conditionwhich induces cracking, the injection of epoxy resin is often a suitable repairmethod. Since overloading is, for the most part, a one-time occurrence, thelikelihood that the crack will reappear is minimal. Conversely, if the crackis subjected to constant reopening through general levels of live load or
PREFABRICATED METALsleeves, like the one illustrated in Fig-ure 3.58, can be used to repair pre-stressed concrete girders which havesustained damage due to vehicle im-pact or some other accidental damage.
The metal sleeve is usually fabricatedfrom A36 steel with a thickness no lessthan 5/16 in. Although the sleeve can befabricated in either the field or the shop,a minimum of one field weld will berequired to assemble the sleeve. While thesleeve does not restore prestress, it isdesigned to possess at least as muchstrength as the severed strands.
To bond the sleeve to the girder, epoxyresin is applied using pressure injec-tion. The epoxy is injected into a 1/16 ingap which is formed through the use ofmetal spacers attached to the insidesurfaces of the splice plates. Each endof the girder is then sealed with epoxymortar. This same principle has beenapplied to other structural elementssuch as columns, cap beams, andmarine pilings.
An alternate to the metal sleeve wouldbe to jacket the entire girder with newconcrete and leave the formwork inplace. Although the formwork itselfdoes not provide added strength, itdoes offer additional protection to theunderlying girder. [Ref. 3.70]
Figure 3.58 Metal sleeve splice used to repair damaged prestressed concrete girders.(Adapted from: NCHRP Synthesis of Highway Practice 140, Ref. 3.70.)
Rehabilitation of Prestressed Concrete
[3.16.4, Part 2]
hen a girder is subjectedto an overload condi-
tion which induces cracking,the injection of epoxy resin isoften a suitable repair method.
W
Downloaded from Digital Engineering Library @ McGraw-Hill (www.digitalengineeringlibrary.com)Copyright © 2006 The McGraw-Hill Companies. All rights reserved.
Any use is subject to the Terms of Use as given at the website.
Design of Superstructure Elements
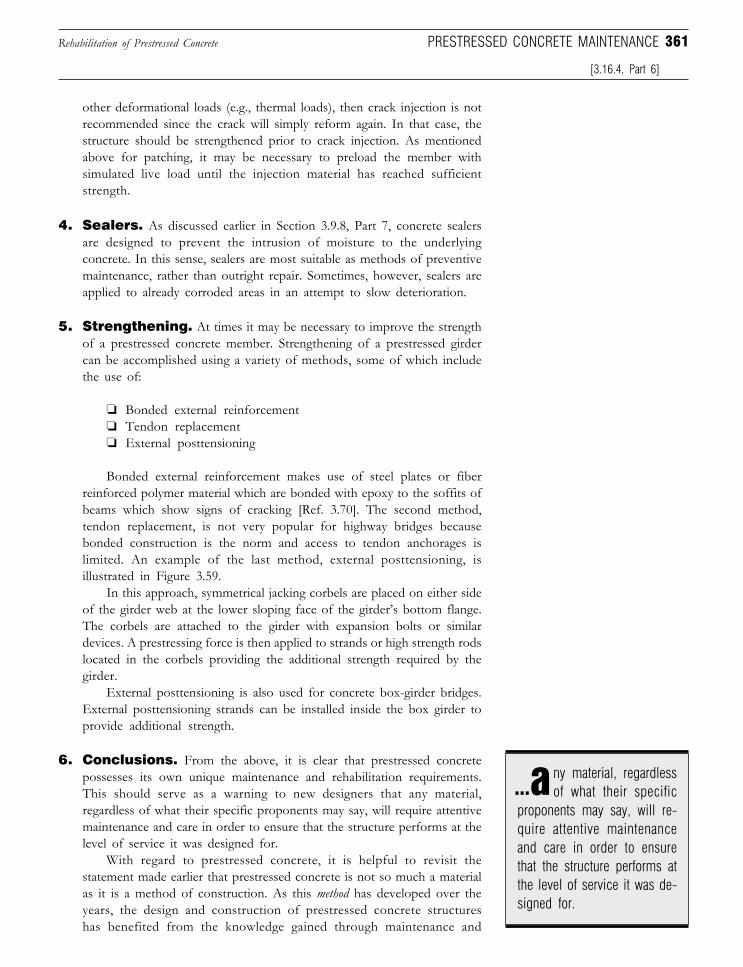
361
other deformational loads (e.g., thermal loads), then crack injection is notrecommended since the crack will simply reform again. In that case, thestructure should be strengthened prior to crack injection. As mentionedabove for patching, it may be necessary to preload the member withsimulated live load until the injection material has reached sufficientstrength.
4. Sealers. As discussed earlier in Section 3.9.8, Part 7, concrete sealersare designed to prevent the intrusion of moisture to the underlyingconcrete. In this sense, sealers are most suitable as methods of preventivemaintenance, rather than outright repair. Sometimes, however, sealers areapplied to already corroded areas in an attempt to slow deterioration.
5. Strengthening. At times it may be necessary to improve the strengthof a prestressed concrete member. Strengthening of a prestressed girdercan be accomplished using a variety of methods, some of which includethe use of:
❏ Bonded external reinforcement❏ Tendon replacement❏ External posttensioning
Bonded external reinforcement makes use of steel plates or fiberreinforced polymer material which are bonded with epoxy to the soffits ofbeams which show signs of cracking [Ref. 3.70]. The second method,tendon replacement, is not very popular for highway bridges becausebonded construction is the norm and access to tendon anchorages islimited. An example of the last method, external posttensioning, isillustrated in Figure 3.59.
In this approach, symmetrical jacking corbels are placed on either sideof the girder web at the lower sloping face of the girder’s bottom flange.The corbels are attached to the girder with expansion bolts or similardevices. A prestressing force is then applied to strands or high strength rodslocated in the corbels providing the additional strength required by thegirder.
External posttensioning is also used for concrete box-girder bridges.External posttensioning strands can be installed inside the box girder toprovide additional strength.
6. Conclusions. From the above, it is clear that prestressed concretepossesses its own unique maintenance and rehabilitation requirements.This should serve as a warning to new designers that any material,regardless of what their specific proponents may say, will require attentivemaintenance and care in order to ensure that the structure performs at thelevel of service it was designed for.
With regard to prestressed concrete, it is helpful to revisit thestatement made earlier that prestressed concrete is not so much a materialas it is a method of construction. As this method has developed over theyears, the design and construction of prestressed concrete structureshas benefited from the knowledge gained through maintenance and
PRESTRESSED CONCRETE MAINTENANCERehabilitation of Prestressed Concrete
[3.16.4, Part 6]
ny material, regardlessof what their specific
proponents may say, will re-quire attentive maintenanceand care in order to ensurethat the structure performs atthe level of service it was de-signed for.
...a
Downloaded from Digital Engineering Library @ McGraw-Hill (www.digitalengineeringlibrary.com)Copyright © 2006 The McGraw-Hill Companies. All rights reserved.
Any use is subject to the Terms of Use as given at the website.
Design of Superstructure Elements
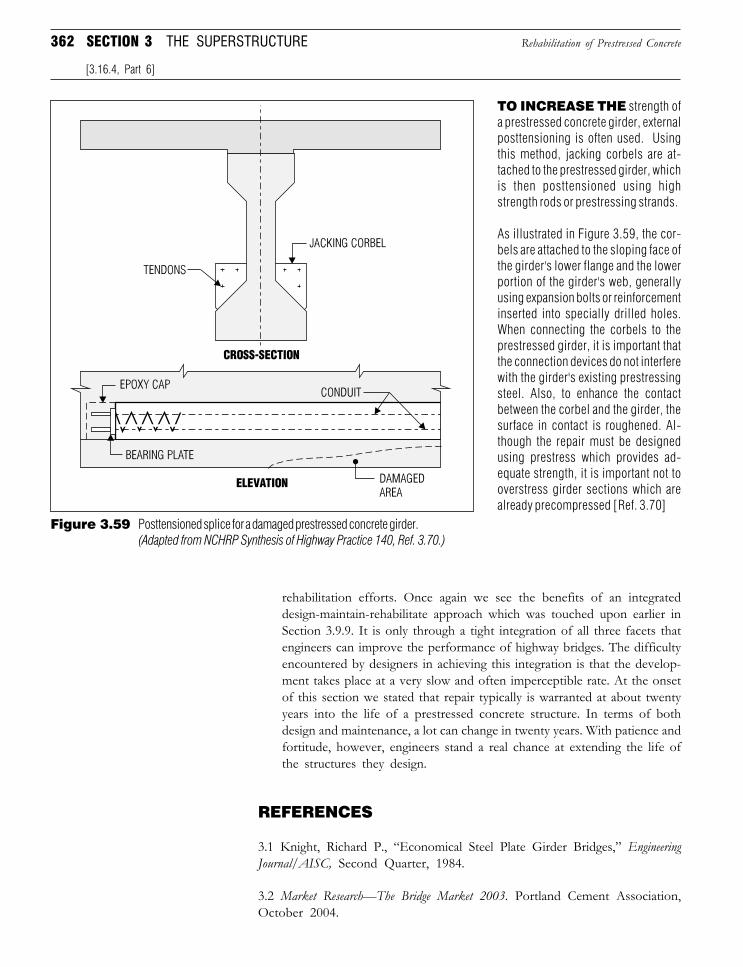
362 SECTION 3 THE SUPERSTRUCTURE
rehabilitation efforts. Once again we see the benefits of an integrateddesign-maintain-rehabilitate approach which was touched upon earlier inSection 3.9.9. It is only through a tight integration of all three facets thatengineers can improve the performance of highway bridges. The difficultyencountered by designers in achieving this integration is that the develop-ment takes place at a very slow and often imperceptible rate. At the onsetof this section we stated that repair typically is warranted at about twentyyears into the life of a prestressed concrete structure. In terms of bothdesign and maintenance, a lot can change in twenty years. With patience andfortitude, however, engineers stand a real chance at extending the life ofthe structures they design.
REFERENCES
3.1 Knight, Richard P., “Economical Steel Plate Girder Bridges,” EngineeringJournal/AISC, Second Quarter, 1984.
3.2 Market Research—The Bridge Market 2003. Portland Cement Association,October 2004.
TO INCREASE THE strength ofa prestressed concrete girder, externalposttensioning is often used. Usingthis method, jacking corbels are at-tached to the prestressed girder, whichis then posttensioned using highstrength rods or prestressing strands.
As illustrated in Figure 3.59, the cor-bels are attached to the sloping face ofthe girder's lower flange and the lowerportion of the girder's web, generallyusing expansion bolts or reinforcementinserted into specially drilled holes.When connecting the corbels to theprestressed girder, it is important thatthe connection devices do not interferewith the girder's existing prestressingsteel. Also, to enhance the contactbetween the corbel and the girder, thesurface in contact is roughened. Al-though the repair must be designedusing prestress which provides ad-equate strength, it is important not tooverstress girder sections which arealready precompressed [Ref. 3.70]
Figure 3.59 Posttensioned splice for a damaged prestressed concrete girder.(Adapted from NCHRP Synthesis of Highway Practice 140, Ref. 3.70.)
[3.16.4, Part 6]
Rehabilitation of Prestressed Concrete
Downloaded from Digital Engineering Library @ McGraw-Hill (www.digitalengineeringlibrary.com)Copyright © 2006 The McGraw-Hill Companies. All rights reserved.
Any use is subject to the Terms of Use as given at the website.
Design of Superstructure Elements

363
3.3 Standard Specifications for Highway Bridges, 17th ed., American Association ofState Highway and Transportation Officials, Washington, D.C., 2002.
3.4 Standard Plans for Highway Bridges, vol. I, Concrete Superstructures, U.S.Department of Transportation, Federal Highway Administration, Washington,D.C., 1990.
3.5 Winter, George and Nilson, Arthur H., Design of Concrete Structures, 9th ed.,McGraw-Hill, New York, 1979.
3.6 Gutkowski, Richard M. and Williamson, Thomas G., “Timber Bridges:State-of-the-Art,” Journal of Structural Engineering, American Society of CivilEngineers, pp. 2175–2191, vol. 109, No. 9, September, 1983.
3.7 Scofield, W. Fleming and O’Brien, W.H., Modern Timber Engineering, 4th ed.,p. 144, Southern Pine Association, New Orleans, 1954.
3.8 Timber Construction Manual, 3rd ed., American Institute of Timber Con-struction, pp. 5-360 to 5-363, John Wiley & Sons, New York, 1985.
3.9 Standard Plans for Highway Bridges, vol. II, Structural Steel Superstructures, U.S.Department of Transportation, Federal Highway Administration, Washington,D.C., 1982.
3.10 “Rehabilitation and Replacement of Bridges on Secondary Highways andLocal Roads,” NCHRP Report 243, Transportation Research Board, pp. 10–12,Washington, D.C., December, 1981.
3.11 Standard Details for Highway Bridges, New York State Department ofTransportation, Albany, 1989.
3.12 Elliot, Arthur L., “Steel and Concrete Bridges,” Structural EngineeringHandbook, Edited by Gaylord, Edwin H., Jr., and Gaylord, Charles N., McGraw-Hill, New York, 1990.
3.13 AASHTO Manual for Bridge Maintenance, American Association of StateHighway and Transportation Officials, pp. 77–104, Washington, D.C., 1987.
3.14 Bridge Rehabilitation and Strengthening, Organisation for EconomicCo-Operation and Development, Paris, 1983.
3.15 AASHTO LRFD Bridge Design Specifications, American Association of StateHighway and Transportation Officials, Washington, D.C., 2004.
3.16 Bridge Design Practice Manual, California Department of Transportation,p. 1-11, Sacramento, 1993.
3.17 Page, Robert A. et al., Goals, Opportunities, and Priorities for the USGSEarthquake Hazards Reduction Program, U.S. Geological Survey, p. 3, Washington,D.C., 1992.
REFERENCES
Downloaded from Digital Engineering Library @ McGraw-Hill (www.digitalengineeringlibrary.com)Copyright © 2006 The McGraw-Hill Companies. All rights reserved.
Any use is subject to the Terms of Use as given at the website.
Design of Superstructure Elements

364 SECTION 3 THE SUPERSTRUCTURE
3.18 Walley, W.J., and Purkiss, J.A., “Bridge Abutments and Piers,” pp. 836–837,The Design and Construction of Engineering Foundations, Edited by Henry, F.D.C.,Chapman and Hall, New York, 1986.
3.19 Building Code Requirements for Reinforced Concrete and Commentary, AmericanConcrete Institute, Detroit, 2002.
3.20 Peck, Ralph B., Hanson, Walter E., Thornburn, and Thomas H., FoundationEngineering, p. 59, John Wiley & Sons, New York, 1974.
3.21 Load and Resistance Factor Design Manual of Steel Construction, 2nd ed.,American Institute of Steel Construction, Chicago, 1998.
3.22 Green, Peter, “Bridge Code Updated,” Engineering News Record, vol. 227,pp. 33–34, 15 July 1991.
3.23 Brazil, Aine, et al., “LRFD: Still Waiting,” Civil Engineering, AmericanSociety of Civil Engineers, vol. 61, pp. 47–48, June 1991.
3.24 Salmon, Charles G. and Johnson, John E., Steel Structures: Design andBehavior, 2nd ed., Harper & Row, New York, 1980.
3.25 Building Code Requirements for Reinforced Concrete (ACI 318–89) (Revised1992) and Commentary-ACI 318R-89 (Revised 1992), American ConcreteInstitute, Detroit, 1992.
3.26 Troitsky, M. S., Cable-Stayed Bridges, pp. 135–137, Van Nostrand Reinhold,New York, 1988.
3.27 Kuzmanovic, Bogdan O., and Sanchez, Manuel R., “Lateral Distribu-tion of Live Loads on Highway Bridge,” Journal of Structural Engineering,American Society of Civil Engineers, vol. 112, no. 8, pp. 1847–1862, August1986.
3.28 Banks, Ralph K., “Bridge Decks: Their Problems and Solutions,” PublicWorks, vol. 117, pp. 26–28, December, 1986.
3.29 “Rehabilitation and Replacement of Bridges on Secondary Highways andLocal Roads,” NCHRP Report 243, Transportation Research Board, pp. 2–7,Washington, D.C., December, 1981.
3.30 Design and Construction of Sanitary and Storm Sewers, American Society ofCivil Engineers and the Water Pollution Control Federation, pp. 42–57, 1969.
3.31 A Policy on Geometric Design of Highways and Streets, 4th ed., AmericanAssociation of State Highway and Transportation Officials, Washington, D.C.,2001.
3.32 Cook, John P., Composite Construction Methods, Robert E. Krieger PublishingCo., Malabar, Florida, 1985.
Downloaded from Digital Engineering Library @ McGraw-Hill (www.digitalengineeringlibrary.com)Copyright © 2006 The McGraw-Hill Companies. All rights reserved.
Any use is subject to the Terms of Use as given at the website.
Design of Superstructure Elements

365
3.33 Allowable Stress Design Manual of Steel Construction, 9th ed., AmericanInstitute of Steel Construction, Chicago, 1989.
3.34 Manual of Steel Construction, LRFD, 3rd ed., American Institute of SteelConstruction, Chicago, 2003.
3.35 Slutter, Roger G. and Driscoll, George C., “Flexural Strength of Steel-Concrete Composite Beams,” Journal of Structural Engineering, American Societyof Civil Engineers, vol. 91, no. ST2, pp. 71–99, April, 1965.
3.36 Slutter, Roger G. and Fisher, John W., “Fatigue Strength of ShearConnectors,” Highway Research Record, no 147, Highway Research Board,Washington, D.C., 1966.
3.37 Viest, Ivan M., Chairman, Task Committee on Composite Construction,“Composite Steel Construction,” Journal of Structural Engineering, AmericanSociety of Civil Engineers, vol. 100, no. ST5, pp. 1085–1139, May, 1974.
3.38 Ollgaard, Jorgen G., Slutter, Roger G., and Fisher, John W., “ShearStrength of Stud Connectors in Lightweight and Normal-Weight Concrete,”Engineering Journal/AISC, pp. 55–64, April, 1971.
3.39 Hooper, Ira, Grubb, Michael A., and Viest, Ivan M. “Design of CompositeMembers,” pg. 14–22, Structural Engineering Handbook, Edited by Gaylord,Edwin H., Jr., and Gaylord, Charles N., McGraw-Hill, New York, 1990.
3.40 “Rehabilitation and Replacement of Bridges on Secondary Highways andLocal Roads,” NCHRP Report 243, Transportation Research Board, pp. 17–22,Washington, December, 1981.
3.41 Bridge Code, 3rd ed., Ontario Ministry of Transportation, p. 294, Toronto,1992.
3.42 Latex-Modified Concretes and Mortars, NCHRP Synthesis of HighwayPractice 179, Transportation Research Board, Washington, D.C., August, 1992.
3.43 Salmon, Charles G. and Johnson, John E., Steel Structures: Design andBehavior, 3rd ed., Harper Collins, New York, 1990.
3.44 Johnson, Andy, “Steel Weighs In,” Civil Engineering, American Society ofCivil Engineers, vol. 62, pp. 69–71, July, 1992.
3.45 Bridge Design Practice Manual, 3rd ed., California Department of Transpor-tation, Sacramento, 1971.
3.46 Large, George E., Basic Reinforced Concrete Design: Elastic and Creep, 2nd ed.,p. 126, The Ronald Press Company, New York, 1957.
3.47 Pecknold, David A., “Structural Analysis,” pp. 1-39 to 1-41, StructuralEngineering Handbook, Edited by Gaylord, Edwin H., Jr., and Gaylord, CharlesN., McGraw-Hill, New York, 1990.
REFERENCES
Downloaded from Digital Engineering Library @ McGraw-Hill (www.digitalengineeringlibrary.com)Copyright © 2006 The McGraw-Hill Companies. All rights reserved.
Any use is subject to the Terms of Use as given at the website.
Design of Superstructure Elements

366 SECTION 3 THE SUPERSTRUCTURE
3.48 Lindeburg, Michael R., Civil Engineering Reference Manual, 5th ed., Profes-sional Publications, Belmont, California, 1989.
3.49 Moments, Shears and Reactions for Continuous Highway Bridges, AmericanInstitute of Steel Construction, Chicago, 1986.
3.50 Zuraski, Patrick D., “Continuous-Beam Analysis for Highway Bridges,”Journal of Structural Engineering, American Society of Civil Engineers, vol. 117,no. 1, pp. 80–99, January, 1991.
3.51 Wasserman, Edward P., “Jointless Bridge Decks,” Engineering Journal/AISC, pp. 93-100, Third Quarter, 1987.
3.52 Robison, Rita, “Safeguarding Steel,” Civil Engineering, American Society ofCivil Engineers, vol. 62, pp. 50-53, April, 1992.
3.53 Hare, Clive H., “Protective Coatings for Bridge Steel,” NCHRP Synthesisof Highway Practice 136, Transportation Research Board, pp. 1-107, Washing-ton, D.C., December, 1987.
3.54 Steinman, D. B., and Watson, S. R., Bridges and Their Builders, 2nd ed., DoverPublications Inc., New York, 1957.
3.55 Angeloff, Carl, “Overcoating Bridges Containing Lead-Based Paints: AnEconomical Alternative,” Public Works, vol. 124, pp. 56-57, January, 1993.
3.56 “Europe’s Best Kept Secret: MIO Bridge Coatings,” Public Works, vol. 123,pp. 39–40, January, 1992.
3.57 Appleman, Bernard R., “Bridge Paint: Removal, Containment, andDisposal,” NCHRP Synthesis of Highway Practice 176, TransportationResearch Board, pp. 1–37, Washington, D.C., February, 1992.
3.58 Robison, Rita, “Weathering Steel: Industry’s Stepchild,” Civil Engineering,American Society of Civil Engineers, vol. 58, pp. 42–45, October, 1988.
3.59 Culp, James D., Reincke, Jon W., and Tinklenberg, Gary L., “Total ShopPainting of Steel Bridges,” Public Works, vol. 119, pp. 48–50, November, 1988.
3.60 “Weathering Steel: Can Rust Be a Friend?” Public Works, vol. 121, pp. 168–182,September, 1990.
3.61 “Maine Benefits from Weathering Steel Bridges,” Public Works, vol. 122,pg. 74, January, 1991.
3.62 Robison, Rita, “A New Look at Galvanized Bridges,” Civil Engineering,American Society of Civil Engineers, vol. 61, pp. 52–55, July, 1991.
3.63 Manual for Condition Evaluation of Bridges, American Association of StateHighway and Transportation Officials, Washington, D.C., 2003.
Downloaded from Digital Engineering Library @ McGraw-Hill (www.digitalengineeringlibrary.com)Copyright © 2006 The McGraw-Hill Companies. All rights reserved.
Any use is subject to the Terms of Use as given at the website.
Design of Superstructure Elements
367
3.64 Ghosn, Michel and Moses, Fred, “Reliability Calibration of Bridge DesignCode,” Journal of Structural Engineering, American Society of Civil Engineers,vol. 112, no. 4, pg. 745, April, 1986.
3.65 Guide Specifications for Strength Evaluation of Existing Steel and Concrete Bridges,American Association of State Highway and Transportation Officials, Washington,D.C., 1989.
3.66 Wang, Chu-Kia and Salmon, Charles G., Reinforced Concrete Design, 4th ed.,Harper & Row Publishers, New York, 1985.
3.67 Libby, James R., Modern Prestressed Concrete, 4th ed., Van NostrandReinhold, New York, 1990.
3.68 Lin, T.Y. and Zia, Paul, “Design of Prestressed-Concrete StructuralMembers,” p. 13-7, Structural Engineering Handbook, Edited by Gaylord, EdwinH., Jr., and Gaylord, Charles N., McGraw-Hill, New York, 1990.
3.69 Freyermuth, Clifford L., “Sizing up Segmentals,” Civil Engineering, AmericanSociety of Civil Engineers, vol. 62, pp. 66–69, July, 1992.
3.70 Manning, David G., “Durability of Prestressed Concrete HighwayStructures,” NCHRP Synthesis of Highway Practice 140, TransportationResearch Board, pp. 1–65, Washington, D.C., November, 1988.
3.71 Gaylord, Edwin H., and Gaylord, Charles N., Design of Steel Structures,McGraw-Hill, New York, 1972.
REFERENCES
Downloaded from Digital Engineering Library @ McGraw-Hill (www.digitalengineeringlibrary.com)Copyright © 2006 The McGraw-Hill Companies. All rights reserved.
Any use is subject to the Terms of Use as given at the website.
Design of Superstructure Elements

Downloaded from Digital Engineering Library @ McGraw-Hill (www.digitalengineeringlibrary.com)Copyright © 2006 The McGraw-Hill Companies. All rights reserved.
Any use is subject to the Terms of Use as given at the website.
Design of Superstructure Elements
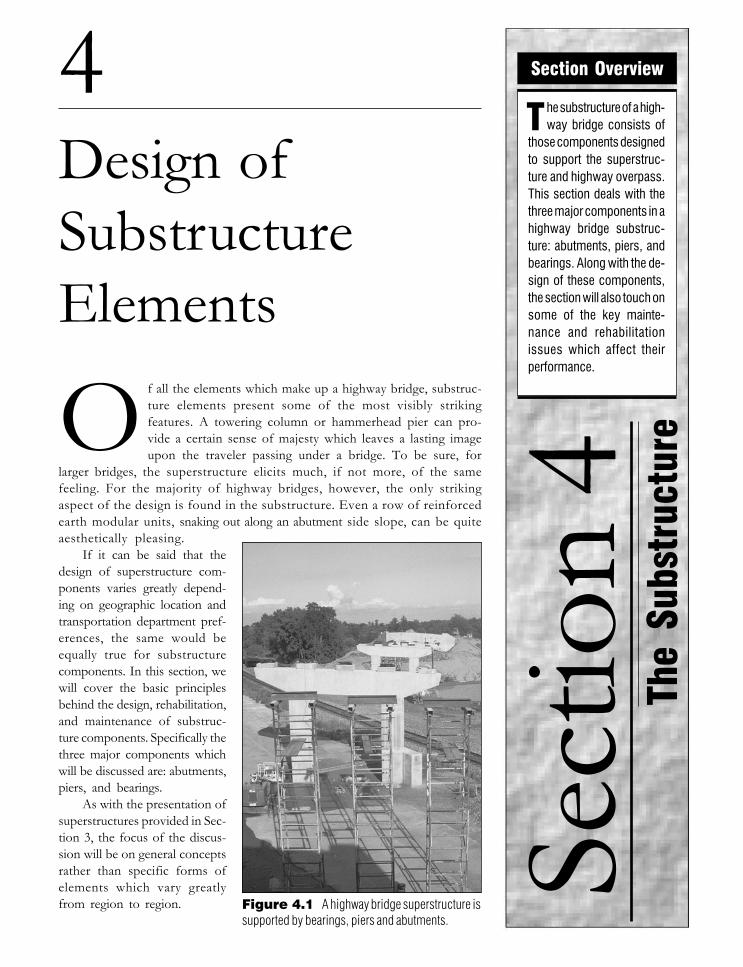
Sect
ion
4
Section Overview
T he substructure of a high-way bridge consists of
those components designedto support the superstruc-ture and highway overpass.This section deals with thethree major components in ahighway bridge substruc-ture: abutments, piers, andbearings. Along with the de-sign of these components,the section will also touch onsome of the key mainte-nance and rehabilitationissues which affect theirperformance.
4Design ofSubstructureElements
The
Subs
truc
tureOf all the elements which make up a highway bridge, substruc-
ture elements present some of the most visibly strikingfeatures. A towering column or hammerhead pier can pro-vide a certain sense of majesty which leaves a lasting imageupon the traveler passing under a bridge. To be sure, for
larger bridges, the superstructure elicits much, if not more, of the samefeeling. For the majority of highway bridges, however, the only strikingaspect of the design is found in the substructure. Even a row of reinforcedearth modular units, snaking out along an abutment side slope, can be quiteaesthetically pleasing.
If it can be said that thedesign of superstructure com-ponents varies greatly depend-ing on geographic location andtransportation department pref-erences, the same would beequally true for substructurecomponents. In this section, wewill cover the basic principlesbehind the design, rehabilitation,and maintenance of substruc-ture components. Specifically thethree major components whichwill be discussed are: abutments,piers, and bearings.
As with the presentation ofsuperstructures provided in Sec-tion 3, the focus of the discus-sion will be on general conceptsrather than specific forms ofelements which vary greatlyfrom region to region. Figure 4.1 A highway bridge superstructure is
supported by bearings, piers and abutments.
Downloaded from Digital Engineering Library @ McGraw-Hill (www.digitalengineeringlibrary.com)Copyright © 2006 The McGraw-Hill Companies. All rights reserved.
Any use is subject to the Terms of Use as given at the website.
Source: Bridge Engineering
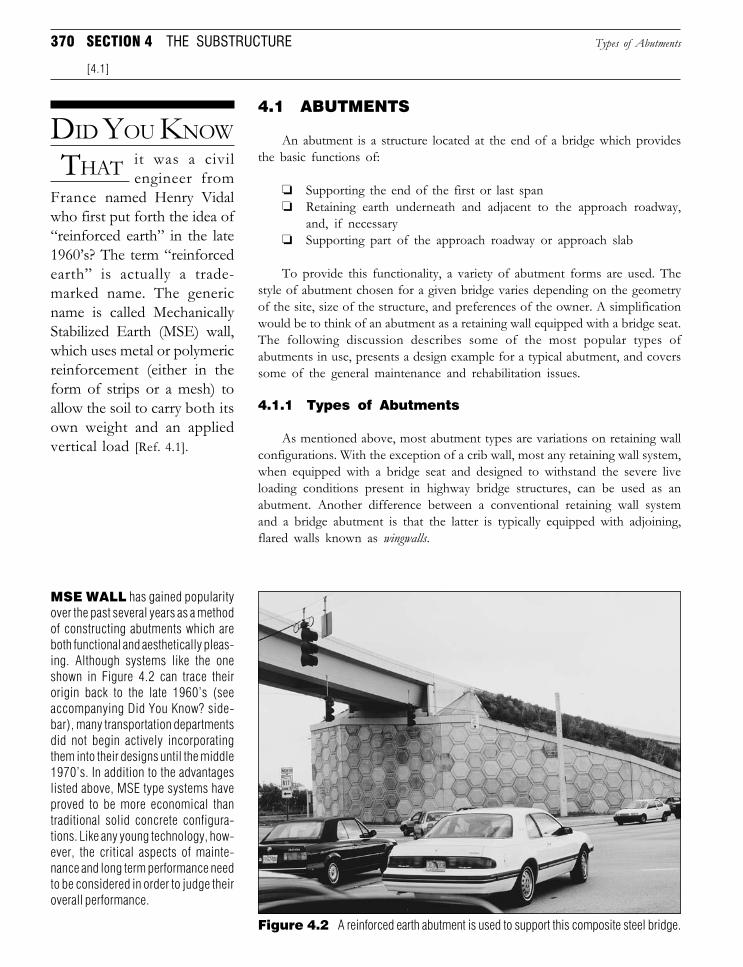
370 SECTION 4 THE SUBSTRUCTURE
4.1 ABUTMENTS
An abutment is a structure located at the end of a bridge which providesthe basic functions of:
❏ Supporting the end of the first or last span❏ Retaining earth underneath and adjacent to the approach roadway,
and, if necessary❏ Supporting part of the approach roadway or approach slab
To provide this functionality, a variety of abutment forms are used. Thestyle of abutment chosen for a given bridge varies depending on the geometryof the site, size of the structure, and preferences of the owner. A simplificationwould be to think of an abutment as a retaining wall equipped with a bridge seat.The following discussion describes some of the most popular types ofabutments in use, presents a design example for a typical abutment, and coverssome of the general maintenance and rehabilitation issues.
4.1.1 Types of Abutments
As mentioned above, most abutment types are variations on retaining wallconfigurations. With the exception of a crib wall, most any retaining wall system,when equipped with a bridge seat and designed to withstand the severe liveloading conditions present in highway bridge structures, can be used as anabutment. Another difference between a conventional retaining wall systemand a bridge abutment is that the latter is typically equipped with adjoining,flared walls known as wingwalls.
Types of Abutments
DID YOU KNOW
THAT it was a civilengineer from
France named Henry Vidalwho first put forth the idea of“reinforced earth” in the late1960’s? The term “reinforcedearth” is actually a trade-marked name. The genericname is called MechanicallyStabilized Earth (MSE) wall,which uses metal or polymericreinforcement (either in theform of strips or a mesh) toallow the soil to carry both itsown weight and an appliedvertical load [Ref. 4.1].
[4.1]
Figure 4.2 A reinforced earth abutment is used to support this composite steel bridge.
MSE WALL has gained popularityover the past several years as a methodof constructing abutments which areboth functional and aesthetically pleas-ing. Although systems like the oneshown in Figure 4.2 can trace theirorigin back to the late 1960’s (seeaccompanying Did You Know? side-bar), many transportation departmentsdid not begin actively incorporatingthem into their designs until the middle1970’s. In addition to the advantageslisted above, MSE type systems haveproved to be more economical thantraditional solid concrete configura-tions. Like any young technology, how-ever, the critical aspects of mainte-nance and long term performance needto be considered in order to judge theiroverall performance.
Downloaded from Digital Engineering Library @ McGraw-Hill (www.digitalengineeringlibrary.com)Copyright © 2006 The McGraw-Hill Companies. All rights reserved.
Any use is subject to the Terms of Use as given at the website.
Design of Substructure Elements
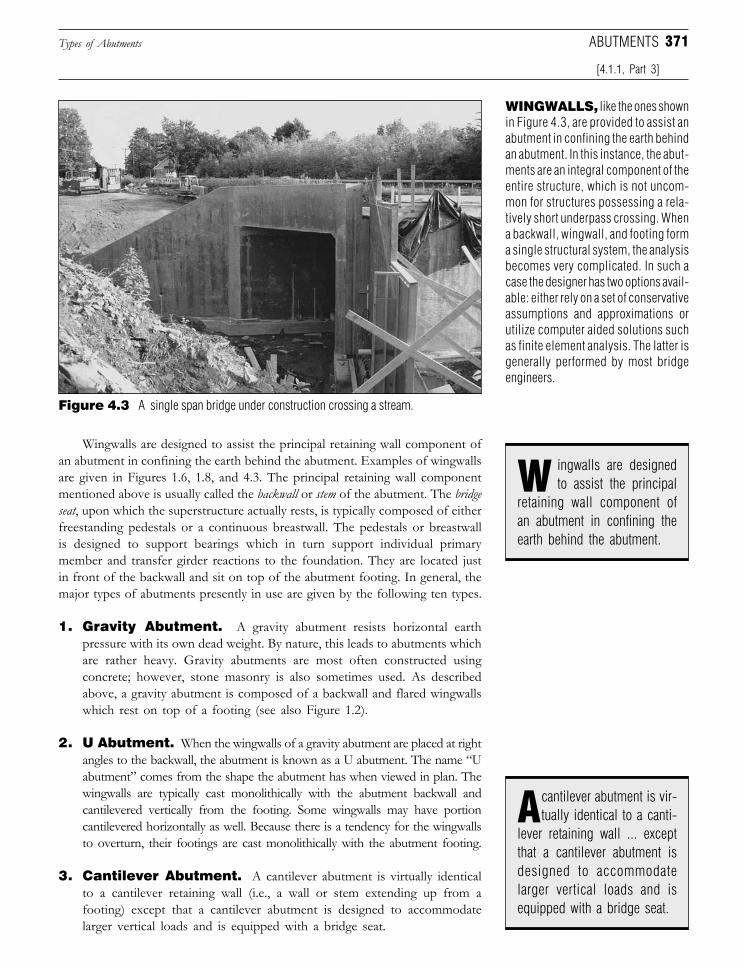
371
Wingwalls are designed to assist the principal retaining wall component ofan abutment in confining the earth behind the abutment. Examples of wingwallsare given in Figures 1.6, 1.8, and 4.3. The principal retaining wall componentmentioned above is usually called the backwall or stem of the abutment. The bridgeseat, upon which the superstructure actually rests, is typically composed of eitherfreestanding pedestals or a continuous breastwall. The pedestals or breastwallis designed to support bearings which in turn support individual primarymember and transfer girder reactions to the foundation. They are located justin front of the backwall and sit on top of the abutment footing. In general, themajor types of abutments presently in use are given by the following ten types.
1. Gravity Abutment. A gravity abutment resists horizontal earthpressure with its own dead weight. By nature, this leads to abutments whichare rather heavy. Gravity abutments are most often constructed usingconcrete; however, stone masonry is also sometimes used. As describedabove, a gravity abutment is composed of a backwall and flared wingwallswhich rest on top of a footing (see also Figure 1.2).
2. U Abutment. When the wingwalls of a gravity abutment are placed at rightangles to the backwall, the abutment is known as a U abutment. The name “Uabutment” comes from the shape the abutment has when viewed in plan. Thewingwalls are typically cast monolithically with the abutment backwall andcantilevered vertically from the footing. Some wingwalls may have portioncantilevered horizontally as well. Because there is a tendency for the wingwallsto overturn, their footings are cast monolithically with the abutment footing.
3. Cantilever Abutment. A cantilever abutment is virtually identicalto a cantilever retaining wall (i.e., a wall or stem extending up from afooting) except that a cantilever abutment is designed to accommodatelarger vertical loads and is equipped with a bridge seat.
Types of Abutments
Figure 4.3 A single span bridge under construction crossing a stream.
WINGWALLS, like the ones shownin Figure 4.3, are provided to assist anabutment in confining the earth behindan abutment. In this instance, the abut-ments are an integral component of theentire structure, which is not uncom-mon for structures possessing a rela-tively short underpass crossing. Whena backwall, wingwall, and footing forma single structural system, the analysisbecomes very complicated. In such acase the designer has two options avail-able: either rely on a set of conservativeassumptions and approximations orutilize computer aided solutions suchas finite element analysis. The latter isgenerally performed by most bridgeengineers.
retaining wall component ofan abutment in confining theearth behind the abutment.
ingwalls are designedto assist the principalW
[4.1.1, Part 3]
ABUTMENTS
lever retaining wall ... exceptthat a cantilever abutment isdesigned to accommodatelarger vertical loads and isequipped with a bridge seat.
cantilever abutment is vir-tually identical to a canti-A
Downloaded from Digital Engineering Library @ McGraw-Hill (www.digitalengineeringlibrary.com)Copyright © 2006 The McGraw-Hill Companies. All rights reserved.
Any use is subject to the Terms of Use as given at the website.
Design of Substructure Elements
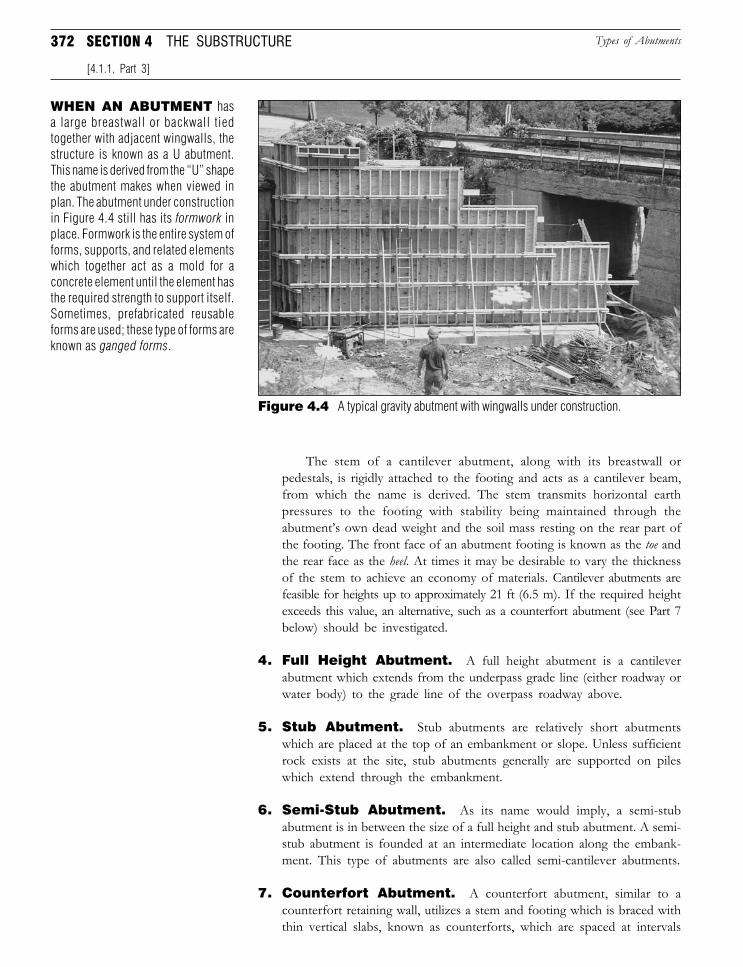
372 SECTION 4 THE SUBSTRUCTURE
WHEN AN ABUTMENT hasa large breastwall or backwall tiedtogether with adjacent wingwalls, thestructure is known as a U abutment.This name is derived from the “U” shapethe abutment makes when viewed inplan. The abutment under constructionin Figure 4.4 still has its formwork inplace. Formwork is the entire system offorms, supports, and related elementswhich together act as a mold for aconcrete element until the element hasthe required strength to support itself.Sometimes, prefabricated reusableforms are used; these type of forms areknown as ganged forms.
Figure 4.4 A typical gravity abutment with wingwalls under construction.
The stem of a cantilever abutment, along with its breastwall orpedestals, is rigidly attached to the footing and acts as a cantilever beam,from which the name is derived. The stem transmits horizontal earthpressures to the footing with stability being maintained through theabutment’s own dead weight and the soil mass resting on the rear part ofthe footing. The front face of an abutment footing is known as the toe andthe rear face as the heel. At times it may be desirable to vary the thicknessof the stem to achieve an economy of materials. Cantilever abutments arefeasible for heights up to approximately 21 ft (6.5 m). If the required heightexceeds this value, an alternative, such as a counterfort abutment (see Part 7below) should be investigated.
4. Full Height Abutment. A full height abutment is a cantileverabutment which extends from the underpass grade line (either roadway orwater body) to the grade line of the overpass roadway above.
5. Stub Abutment. Stub abutments are relatively short abutmentswhich are placed at the top of an embankment or slope. Unless sufficientrock exists at the site, stub abutments generally are supported on pileswhich extend through the embankment.
6. Semi-Stub Abutment. As its name would imply, a semi-stubabutment is in between the size of a full height and stub abutment. A semi-stub abutment is founded at an intermediate location along the embank-ment. This type of abutments are also called semi-cantilever abutments.
7. Counterfort Abutment. A counterfort abutment, similar to acounterfort retaining wall, utilizes a stem and footing which is braced withthin vertical slabs, known as counterforts, which are spaced at intervals
Types of Abutments
[4.1.1, Part 3]
Downloaded from Digital Engineering Library @ McGraw-Hill (www.digitalengineeringlibrary.com)Copyright © 2006 The McGraw-Hill Companies. All rights reserved.
Any use is subject to the Terms of Use as given at the website.
Design of Substructure Elements
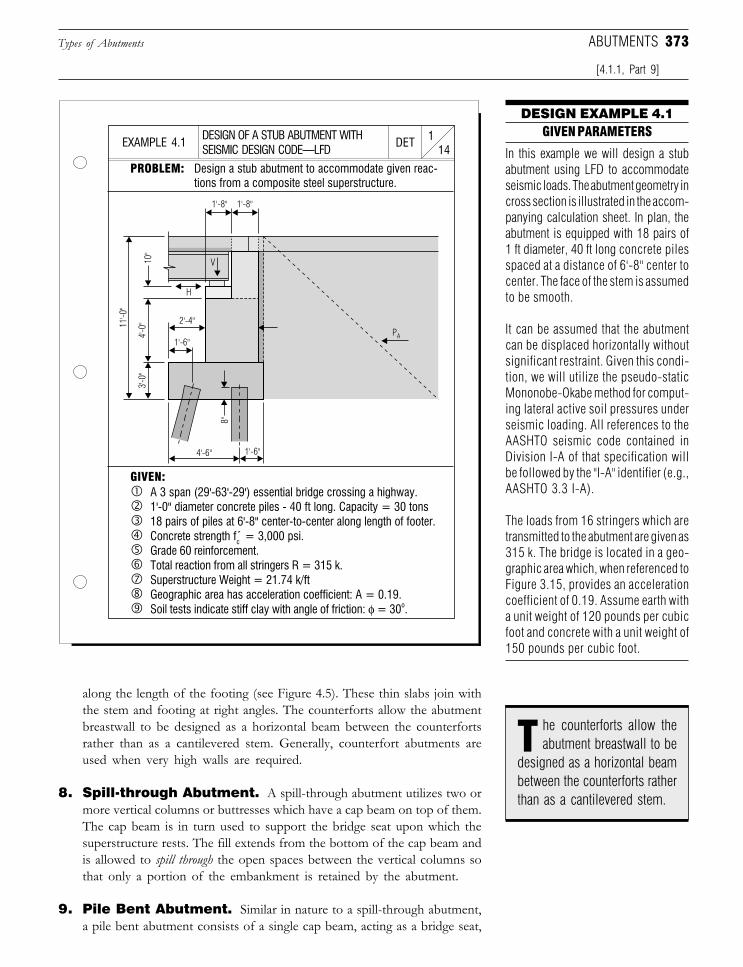
373
DESIGN OF A STUB ABUTMENT WITHSEISMIC DESIGN CODE—LFD 14
1DETEXAMPLE 4.1
DESIGN EXAMPLE 4.1GIVEN PARAMETERS
PROBLEM: Design a stub abutment to accommodate given reac-tions from a composite steel superstructure.
In this example we will design a stubabutment using LFD to accommodateseismic loads. The abutment geometry incross section is illustrated in the accom-panying calculation sheet. In plan, theabutment is equipped with 18 pairs of1 ft diameter, 40 ft long concrete pilesspaced at a distance of 6'-8" center tocenter. The face of the stem is assumedto be smooth.
It can be assumed that the abutmentcan be displaced horizontally withoutsignificant restraint. Given this condi-tion, we will utilize the pseudo-staticMononobe-Okabe method for comput-ing lateral active soil pressures underseismic loading. All references to theAASHTO seismic code contained inDivision I-A of that specification willbe followed by the "I-A" identifier (e.g.,AASHTO 3.3 I-A).
The loads from 16 stringers which aretransmitted to the abutment are given as315 k. The bridge is located in a geo-graphic area which, when referenced toFigure 3.15, provides an accelerationcoefficient of 0.19. Assume earth witha unit weight of 120 pounds per cubicfoot and concrete with a unit weight of150 pounds per cubic foot.
GIVEN:A 3 span (29'-63'-29') essential bridge crossing a highway.1'-0" diameter concrete piles - 40 ft long. Capacity = 30 tons18 pairs of piles at 6'-8" center-to-center along length of footer.Concrete strength fc = 3,000 psi.Grade 60 reinforcement.Total reaction from all stringers R = 315 k.Superstructure Weight = 21.74 k/ftGeographic area has acceleration coefficient: A = 0.19.Soil tests indicate stiff clay with angle of friction: φ = 30o.
along the length of the footing (see Figure 4.5). These thin slabs join withthe stem and footing at right angles. The counterforts allow the abutmentbreastwall to be designed as a horizontal beam between the counterfortsrather than as a cantilevered stem. Generally, counterfort abutments areused when very high walls are required.
8. Spill-through Abutment. A spill-through abutment utilizes two ormore vertical columns or buttresses which have a cap beam on top of them.The cap beam is in turn used to support the bridge seat upon which thesuperstructure rests. The fill extends from the bottom of the cap beam andis allowed to spill through the open spaces between the vertical columns sothat only a portion of the embankment is retained by the abutment.
9. Pile Bent Abutment. Similar in nature to a spill-through abutment,a pile bent abutment consists of a single cap beam, acting as a bridge seat,
Types of Abutments
[4.1.1, Part 9]
ABUTMENTS
designed as a horizontal beambetween the counterforts ratherthan as a cantilevered stem.
he counterforts allow theabutment breastwall to beT
1'-8"
4'-6" 1'-6"
1'-6"
2'-4"
H
V10"
11'-
0"
4'-0
"
8"
3'-0
"
1'-8"
PA
Downloaded from Digital Engineering Library @ McGraw-Hill (www.digitalengineeringlibrary.com)Copyright © 2006 The McGraw-Hill Companies. All rights reserved.
Any use is subject to the Terms of Use as given at the website.
Design of Substructure Elements
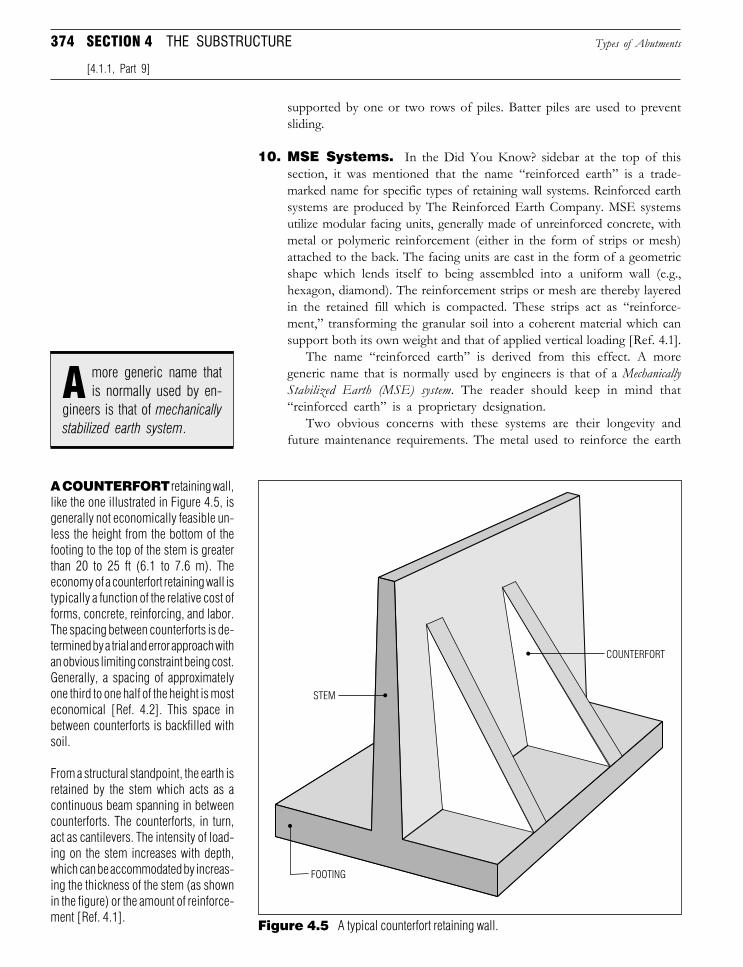
374 SECTION 4 THE SUBSTRUCTURE
supported by one or two rows of piles. Batter piles are used to preventsliding.
10. MSE Systems. In the Did You Know? sidebar at the top of thissection, it was mentioned that the name “reinforced earth” is a trade-marked name for specific types of retaining wall systems. Reinforced earthsystems are produced by The Reinforced Earth Company. MSE systemsutilize modular facing units, generally made of unreinforced concrete, withmetal or polymeric reinforcement (either in the form of strips or mesh)attached to the back. The facing units are cast in the form of a geometricshape which lends itself to being assembled into a uniform wall (e.g.,hexagon, diamond). The reinforcement strips or mesh are thereby layeredin the retained fill which is compacted. These strips act as “reinforce-ment,” transforming the granular soil into a coherent material which cansupport both its own weight and that of applied vertical loading [Ref. 4.1].
The name “reinforced earth” is derived from this effect. A moregeneric name that is normally used by engineers is that of a MechanicallyStabilized Earth (MSE) system. The reader should keep in mind that“reinforced earth” is a proprietary designation.
Two obvious concerns with these systems are their longevity andfuture maintenance requirements. The metal used to reinforce the earth
Figure 4.5 A typical counterfort retaining wall.
A COUNTERFORT retaining wall,like the one illustrated in Figure 4.5, isgenerally not economically feasible un-less the height from the bottom of thefooting to the top of the stem is greaterthan 20 to 25 ft (6.1 to 7.6 m). Theeconomy of a counterfort retaining wall istypically a function of the relative cost offorms, concrete, reinforcing, and labor.The spacing between counterforts is de-termined by a trial and error approach withan obvious limiting constraint being cost.Generally, a spacing of approximatelyone third to one half of the height is mosteconomical [Ref. 4.2]. This space inbetween counterforts is backfilled withsoil.
From a structural standpoint, the earth isretained by the stem which acts as acontinuous beam spanning in betweencounterforts. The counterforts, in turn,act as cantilevers. The intensity of load-ing on the stem increases with depth,which can be accommodated by increas-ing the thickness of the stem (as shownin the figure) or the amount of reinforce-ment [Ref. 4.1].
Types of Abutments
[4.1.1, Part 9]
gineers is that of mechanicallystabilized earth system.
more generic name thatis normally used by en-A
STEM
FOOTING
COUNTERFORT
Downloaded from Digital Engineering Library @ McGraw-Hill (www.digitalengineeringlibrary.com)Copyright © 2006 The McGraw-Hill Companies. All rights reserved.
Any use is subject to the Terms of Use as given at the website.
Design of Substructure Elements
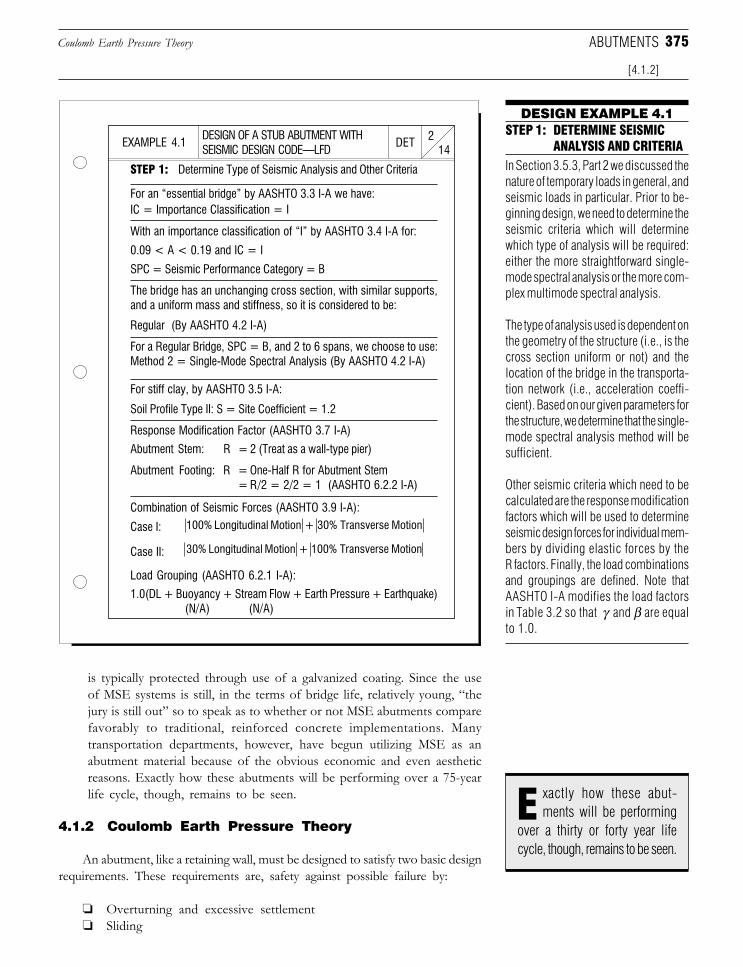
375
DESIGN OF A STUB ABUTMENT WITHSEISMIC DESIGN CODE—LFD 14
2DETEXAMPLE 4.1
DESIGN EXAMPLE 4.1
STEP 1: Determine Type of Seismic Analysis and Other Criteria
STEP 1: DETERMINE SEISMICANALYSIS AND CRITERIA
In Section 3.5.3, Part 2 we discussed thenature of temporary loads in general, andseismic loads in particular. Prior to be-ginning design, we need to determine theseismic criteria which will determinewhich type of analysis will be required:either the more straightforward single-mode spectral analysis or the more com-plex multimode spectral analysis.
The type of analysis used is dependent onthe geometry of the structure (i.e., is thecross section uniform or not) and thelocation of the bridge in the transporta-tion network (i.e., acceleration coeffi-cient). Based on our given parameters forthe structure, we determine that the single-mode spectral analysis method will besufficient.
Other seismic criteria which need to becalculated are the response modificationfactors which will be used to determineseismic design forces for individual mem-bers by dividing elastic forces by theR factors. Finally, the load combinationsand groupings are defined. Note thatAASHTO I-A modifies the load factorsin Table 3.2 so that γ and β are equalto 1.0.
For an “essential bridge” by AASHTO 3.3 I-A we have:IC = Importance Classification = I
With an importance classification of “I” by AASHTO 3.4 I-A for:
0.09 < A < 0.19 and IC = I
SPC = Seismic Performance Category = B
The bridge has an unchanging cross section, with similar supports,and a uniform mass and stiffness, so it is considered to be:
Regular (By AASHTO 4.2 I-A)
For a Regular Bridge, SPC = B, and 2 to 6 spans, we choose to use:Method 2 = Single-Mode Spectral Analysis (By AASHTO 4.2 I-A)
For stiff clay, by AASHTO 3.5 I-A:
Soil Profile Type II: S = Site Coefficient = 1.2
Response Modification Factor (AASHTO 3.7 I-A)
Abutment Stem: R = 2 (Treat as a wall-type pier)
Abutment Footing: R = One-Half R for Abutment Stem= R/2 = 2/2 = 1 (AASHTO 6.2.2 I-A)
Combination of Seismic Forces (AASHTO 3.9 I-A):
Case I:
Case II:
Load Grouping (AASHTO 6.2.1 I-A):
1.0(DL + Buoyancy + Stream Flow + Earth Pressure + Earthquake)(N/A) (N/A)
is typically protected through use of a galvanized coating. Since the useof MSE systems is still, in the terms of bridge life, relatively young, “thejury is still out” so to speak as to whether or not MSE abutments comparefavorably to traditional, reinforced concrete implementations. Manytransportation departments, however, have begun utilizing MSE as anabutment material because of the obvious economic and even aestheticreasons. Exactly how these abutments will be performing over a 75-yearlife cycle, though, remains to be seen.
4.1.2 Coulomb Earth Pressure Theory
An abutment, like a retaining wall, must be designed to satisfy two basic designrequirements. These requirements are, safety against possible failure by:
❏ Overturning and excessive settlement❏ Sliding
Coulomb Earth Pressure Theory
[4.1.2]
ABUTMENTS
100% Longitudinal Motion + 30% Transverse Motion
30% Longitudinal Motion + 100% Transverse Motion
over a thirty or forty year lifecycle, though, remains to be seen.
xactly how these abut-ments will be performingE
Downloaded from Digital Engineering Library @ McGraw-Hill (www.digitalengineeringlibrary.com)Copyright © 2006 The McGraw-Hill Companies. All rights reserved.
Any use is subject to the Terms of Use as given at the website.
Design of Substructure Elements
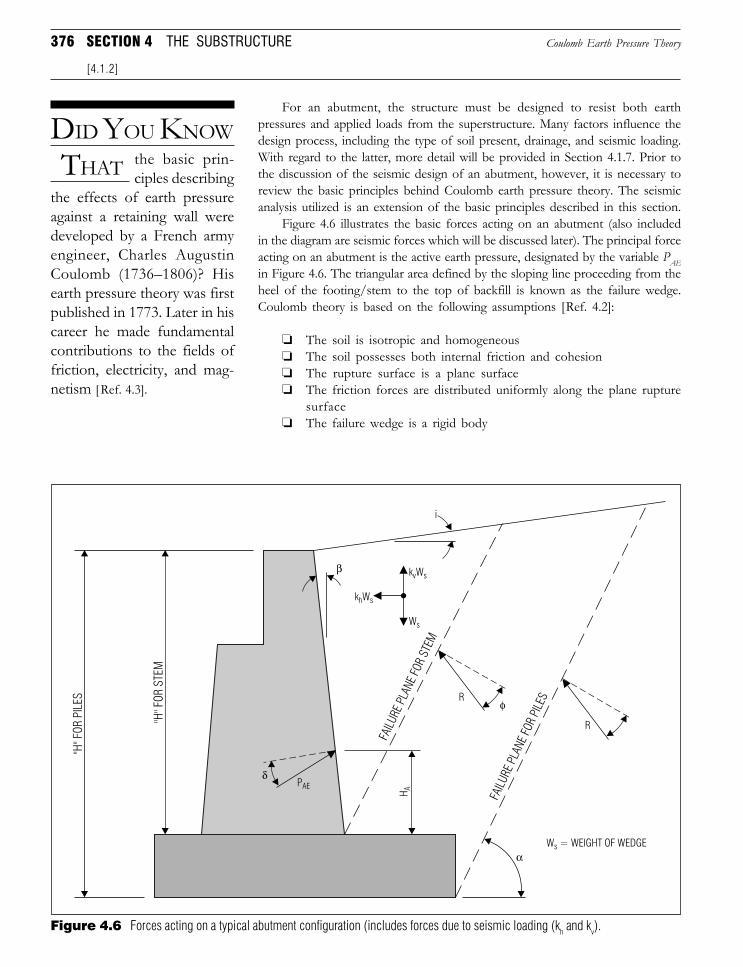
376 SECTION 4 THE SUBSTRUCTURE
Figure 4.6 Forces acting on a typical abutment configuration (includes forces due to seismic loading (kh and kv).
DID YOU KNOW
THAT the basic prin-ciples describing
the effects of earth pressureagainst a retaining wall weredeveloped by a French armyengineer, Charles AugustinCoulomb (1736–1806)? Hisearth pressure theory was firstpublished in 1773. Later in hiscareer he made fundamentalcontributions to the fields offriction, electricity, and mag-netism [Ref. 4.3].
For an abutment, the structure must be designed to resist both earthpressures and applied loads from the superstructure. Many factors influence thedesign process, including the type of soil present, drainage, and seismic loading.With regard to the latter, more detail will be provided in Section 4.1.7. Prior tothe discussion of the seismic design of an abutment, however, it is necessary toreview the basic principles behind Coulomb earth pressure theory. The seismicanalysis utilized is an extension of the basic principles described in this section.
Figure 4.6 illustrates the basic forces acting on an abutment (also includedin the diagram are seismic forces which will be discussed later). The principal forceacting on an abutment is the active earth pressure, designated by the variable PAEin Figure 4.6. The triangular area defined by the sloping line proceeding from theheel of the footing/stem to the top of backfill is known as the failure wedge.Coulomb theory is based on the following assumptions [Ref. 4.2]:
❏ The soil is isotropic and homogeneous❏ The soil possesses both internal friction and cohesion❏ The rupture surface is a plane surface❏ The friction forces are distributed uniformly along the plane rupture
surface❏ The failure wedge is a rigid body
Coulomb Earth Pressure Theory
[4.1.2]
i
khWs
kvWs
Ws
R
R
Ws = WEIGHT OF WEDGE
FAIL
URE
PLA
NE
FOR
PILE
S
FAIL
URE
PLA
NE
FOR
STEM
HA
PAE
"H"
FOR
STE
M
"H"
FOR
PIL
ES
β
φ
α
δ
Downloaded from Digital Engineering Library @ McGraw-Hill (www.digitalengineeringlibrary.com)Copyright © 2006 The McGraw-Hill Companies. All rights reserved.
Any use is subject to the Terms of Use as given at the website.
Design of Substructure Elements
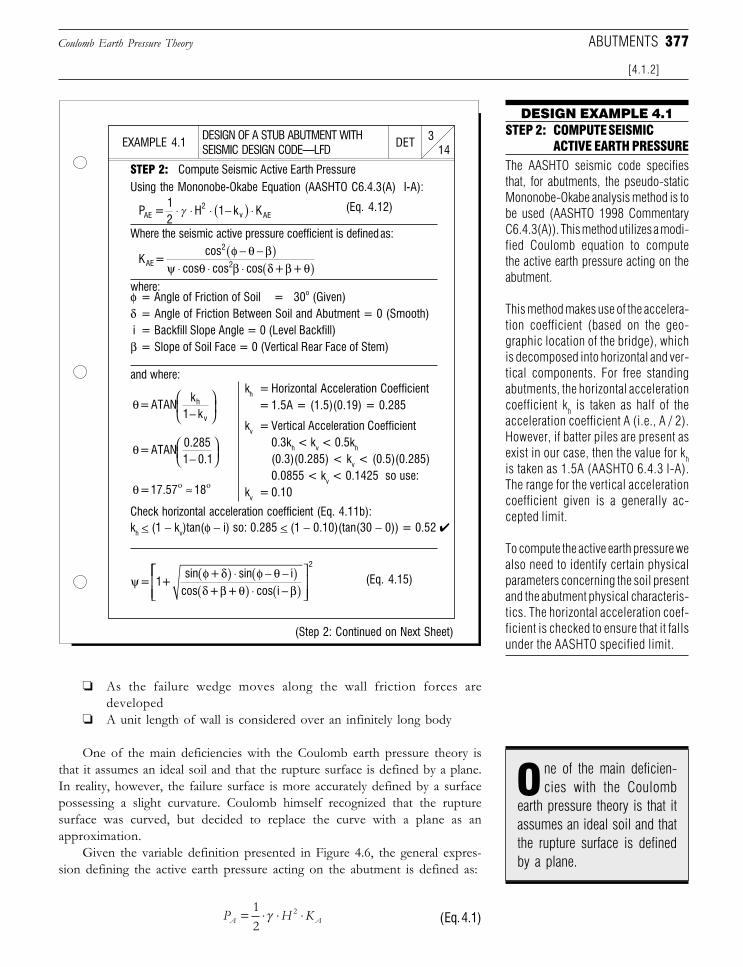
377
DESIGN OF A STUB ABUTMENT WITHSEISMIC DESIGN CODE—LFD 14
3DETEXAMPLE 4.1
DESIGN EXAMPLE 4.1
STEP 2: Compute Seismic Active Earth Pressure
STEP 2: COMPUTE SEISMICACTIVE EARTH PRESSURE
The AASHTO seismic code specifiesthat, for abutments, the pseudo-staticMononobe-Okabe analysis method is tobe used (AASHTO 1998 CommentaryC6.4.3(A)). This method utilizes a modi-fied Coulomb equation to computethe active earth pressure acting on theabutment.
This method makes use of the accelera-tion coefficient (based on the geo-graphic location of the bridge), whichis decomposed into horizontal and ver-tical components. For free standingabutments, the horizontal accelerationcoefficient kh is taken as half of theacceleration coefficient A (i.e., A / 2).However, if batter piles are present asexist in our case, then the value for khis taken as 1.5A (AASHTO 6.4.3 I-A).The range for the vertical accelerationcoefficient given is a generally ac-cepted limit.
To compute the active earth pressure wealso need to identify certain physicalparameters concerning the soil presentand the abutment physical characteris-tics. The horizontal acceleration coef-ficient is checked to ensure that it fallsunder the AASHTO specified limit.
Using the Mononobe-Okabe Equation (AASHTO C6.4.3(A) I-A):
kv = Vertical Acceleration Coefficient0.3kh < kv < 0.5kh
(0.3)(0.285) < kv < (0.5)(0.285)0.0855 < kv < 0.1425 so use:
kv = 0.10
kh = Horizontal Acceleration Coefficient= 1.5A = (1.5)(0.19) = 0.285
❏ As the failure wedge moves along the wall friction forces aredeveloped
❏ A unit length of wall is considered over an infinitely long body
One of the main deficiencies with the Coulomb earth pressure theory isthat it assumes an ideal soil and that the rupture surface is defined by a plane.In reality, however, the failure surface is more accurately defined by a surfacepossessing a slight curvature. Coulomb himself recognized that the rupturesurface was curved, but decided to replace the curve with a plane as anapproximation.
Given the variable definition presented in Figure 4.6, the general expres-sion defining the active earth pressure acting on the abutment is defined as:
P H KA A= ⋅ ⋅ ⋅12
2γ (Eq. 4.1)
Coulomb Earth Pressure Theory
(Step 2: Continued on Next Sheet)
Where the seismic active pressure coefficient is defined as:
where:φ = Angle of Friction of Soil = 30o (Given)δ = Angle of Friction Between Soil and Abutment = 0 (Smooth) i = Backfill Slope Angle = 0 (Level Backfill)β = Slope of Soil Face = 0 (Vertical Rear Face of Stem)
and where:
Check horizontal acceleration coefficient (Eq. 4.11b):kh < (1 − kv)tan(φ − i) so: 0.285 < (1 − 0.10)(tan(30 − 0)) = 0.52 ✔
[4.1.2]
ABUTMENTS
(Eq. 4.12)
(Eq. 4.15)
P = 12
H 1 k KAE2
v AE⋅ ⋅ ⋅ −( ) ⋅γ
K = cos
cos cos cos + + AE
2
2
φ θ βψ θ β δ β θ
− −( )⋅ ⋅ ⋅ ( )
θ = ATANk
1 kh
v−
θ = ATAN0.2851 0.1−
θ ο ο=17.57 18≈
ψ φ δ φ θ δ β θ β
= 1 + sin + sin i
cos + + cos i ( ) ⋅ − −( )( ) ⋅ −( )
2
earth pressure theory is that itassumes an ideal soil and thatthe rupture surface is definedby a plane.
ne of the main deficien-cies with the CoulombO
Downloaded from Digital Engineering Library @ McGraw-Hill (www.digitalengineeringlibrary.com)Copyright © 2006 The McGraw-Hill Companies. All rights reserved.
Any use is subject to the Terms of Use as given at the website.
Design of Substructure Elements
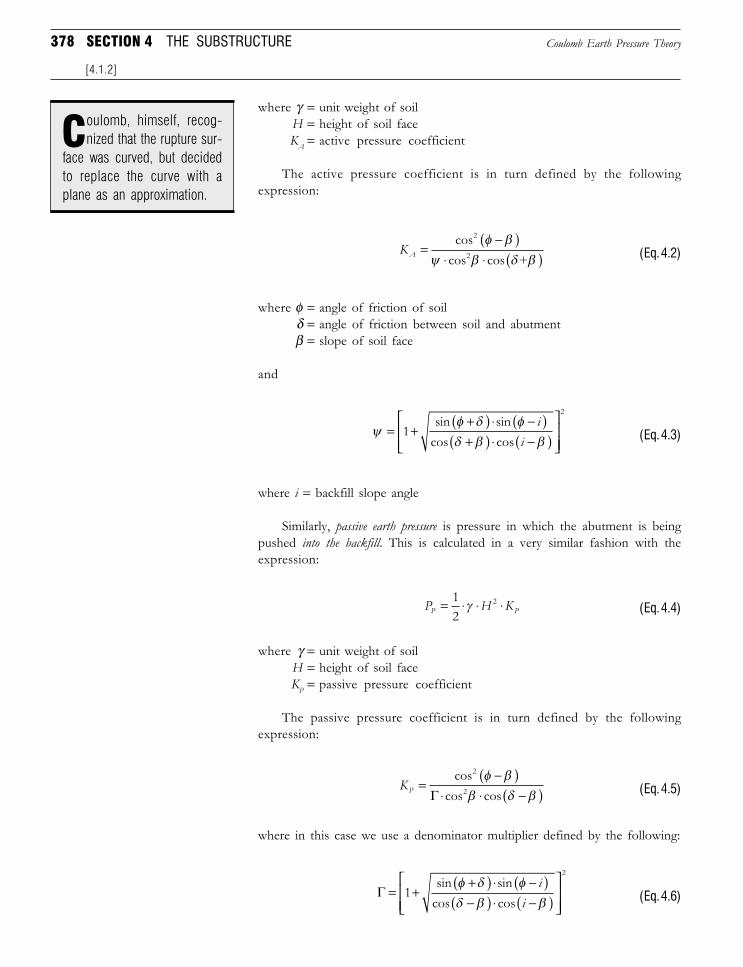
378 SECTION 4 THE SUBSTRUCTURE
where γ = unit weight of soilH = height of soil faceKA = active pressure coefficient
The active pressure coefficient is in turn defined by the followingexpression:
KA =−( )
⋅ ⋅ ( )cos2 φ β
ψ β δ βcos cos +2 (Eq. 4.2)
where φ = angle of friction of soilδ = angle of friction between soil and abutmentβ = slope of soil face
and
ψφ δ φδ β β
= ++( ) ⋅ −( )+( ) ⋅ −( )
12
sin sincos cos
ii (Eq. 4.3)
where i = backfill slope angle
Similarly, passive earth pressure is pressure in which the abutment is beingpushed into the backfill. This is calculated in a very similar fashion with theexpression:
P H KP P= ⋅ ⋅ ⋅12
2γ (Eq. 4.4)
where γ = unit weight of soilH = height of soil faceKP = passive pressure coefficient
The passive pressure coefficient is in turn defined by the followingexpression:
KP =−( )
⋅ ⋅ −( )cos2 φ ββ δ βΓ cos cos2 (Eq. 4.5)
where in this case we use a denominator multiplier defined by the following:
Γ = ++( ) ⋅ −( )−( ) ⋅ −( )
12
sin sincos cos
φ δ φδ β β
ii (Eq. 4.6)
face was curved, but decidedto replace the curve with aplane as an approximation.
oulomb, himself, recog-nized that the rupture sur-C
Coulomb Earth Pressure Theory
[4.1.2]
Downloaded from Digital Engineering Library @ McGraw-Hill (www.digitalengineeringlibrary.com)Copyright © 2006 The McGraw-Hill Companies. All rights reserved.
Any use is subject to the Terms of Use as given at the website.
Design of Substructure Elements
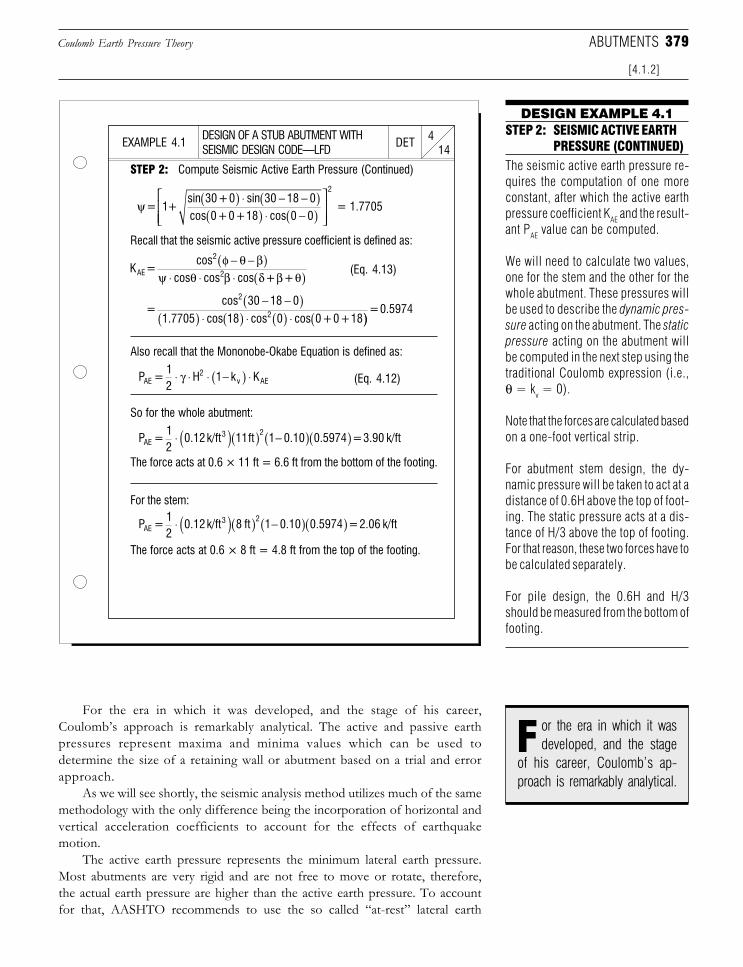
379
DESIGN OF A STUB ABUTMENT WITHSEISMIC DESIGN CODE—LFD 14
4DETEXAMPLE 4.1
DESIGN EXAMPLE 4.1
STEP 2: Compute Seismic Active Earth Pressure (Continued)
STEP 2: SEISMIC ACTIVE EARTHPRESSURE (CONTINUED)
The seismic active earth pressure re-quires the computation of one moreconstant, after which the active earthpressure coefficient KAE and the result-ant PAE value can be computed.
We will need to calculate two values,one for the stem and the other for thewhole abutment. These pressures willbe used to describe the dynamic pres-sure acting on the abutment. The staticpressure acting on the abutment willbe computed in the next step using thetraditional Coulomb expression (i.e.,θ = kv = 0).
Note that the forces are calculated basedon a one-foot vertical strip.
For abutment stem design, the dy-namic pressure will be taken to act at adistance of 0.6H above the top of foot-ing. The static pressure acts at a dis-tance of H/3 above the top of footing.For that reason, these two forces have tobe calculated separately.
For pile design, the 0.6H and H/3should be measured from the bottom offooting.
Recall that the seismic active pressure coefficient is defined as:
Also recall that the Mononobe-Okabe Equation is defined as:
So for the whole abutment:
For the era in which it was developed, and the stage of his career,Coulomb’s approach is remarkably analytical. The active and passive earthpressures represent maxima and minima values which can be used todetermine the size of a retaining wall or abutment based on a trial and errorapproach.
As we will see shortly, the seismic analysis method utilizes much of the samemethodology with the only difference being the incorporation of horizontal andvertical acceleration coefficients to account for the effects of earthquakemotion.
The active earth pressure represents the minimum lateral earth pressure.Most abutments are very rigid and are not free to move or rotate, therefore,the actual earth pressure are higher than the active earth pressure. To accountfor that, AASHTO recommends to use the so called “at-rest” lateral earth
Coulomb Earth Pressure Theory
[4.1.2]
ABUTMENTS
(Eq. 4.13)
(Eq. 4.12)
The force acts at 0.6 × 11 ft = 6.6 ft from the bottom of the footing.
For the stem:
The force acts at 0.6 × 8 ft = 4.8 ft from the top of the footing.
ψ = 1 + sin 30 + 0 sin 30 18 0cos 0 + 0 + 18 cos 0
( ) ⋅ − −( )( ) ⋅ − 0
= 1.7705
2
( )
K = cos
cos cos cos + + AE
2
2
φ θ βψ θ β δ β θ
− −( )⋅ ⋅ ⋅ ( )
= cos 30 18 0
1.7705 cos 18 cos 0 cos 0 + 0 + 18
2
2
− −( )( ) ⋅ ( ) ⋅ ( ) ⋅ ( ))
= 0.5974
P = 12
H 1 k KAE2
v AE⋅ ⋅ ⋅ −( ) ⋅γ
P = 12
0.12 k/ft 11 ft 1 0.10 0.5974 = 3.90 k/ftAE3 2⋅ ( )( ) −( )( )
P = 12
0.12 k/ft 8 ft 1 0.10 0.5974 = 2.06 k/ftAE3 2⋅ ( )( ) −( )( )
of his career, Coulomb’s ap-proach is remarkably analytical.
or the era in which it wasdeveloped, and the stageF
Downloaded from Digital Engineering Library @ McGraw-Hill (www.digitalengineeringlibrary.com)Copyright © 2006 The McGraw-Hill Companies. All rights reserved.
Any use is subject to the Terms of Use as given at the website.
Design of Substructure Elements
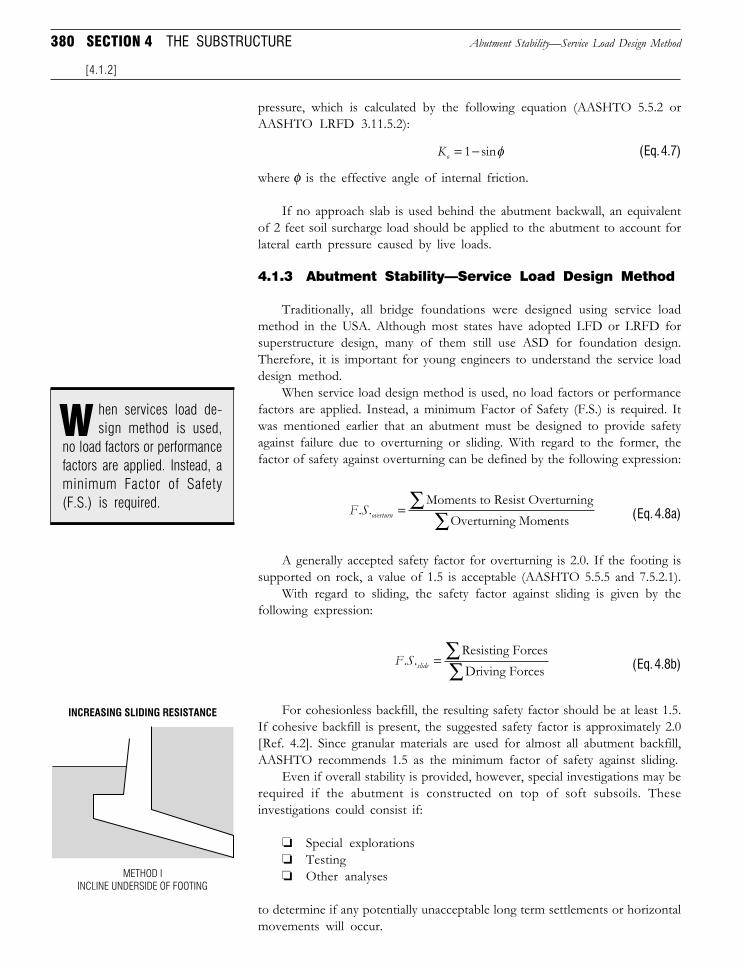
380 SECTION 4 THE SUBSTRUCTURE
pressure, which is calculated by the following equation (AASHTO 5.5.2 orAASHTO LRFD 3.11.5.2):
Ko = −1 sinφ (Eq. 4.7)
where φ is the effective angle of internal friction.
If no approach slab is used behind the abutment backwall, an equivalentof 2 feet soil surcharge load should be applied to the abutment to account forlateral earth pressure caused by live loads.
4.1.3 Abutment Stability—Service Load Design Method
Traditionally, all bridge foundations were designed using service loadmethod in the USA. Although most states have adopted LFD or LRFD forsuperstructure design, many of them still use ASD for foundation design.Therefore, it is important for young engineers to understand the service loaddesign method.
When service load design method is used, no load factors or performancefactors are applied. Instead, a minimum Factor of Safety (F.S.) is required. Itwas mentioned earlier that an abutment must be designed to provide safetyagainst failure due to overturning or sliding. With regard to the former, thefactor of safety against overturning can be defined by the following expression:
F S overturn. . = ∑Moments to Resist OverturningOverturning Momeents∑ (Eq. 4.8a)
A generally accepted safety factor for overturning is 2.0. If the footing issupported on rock, a value of 1.5 is acceptable (AASHTO 5.5.5 and 7.5.2.1).
With regard to sliding, the safety factor against sliding is given by thefollowing expression:
F S slide. . = ∑∑
Resisting ForcesDriving Forces (Eq. 4.8b)
For cohesionless backfill, the resulting safety factor should be at least 1.5.If cohesive backfill is present, the suggested safety factor is approximately 2.0[Ref. 4.2]. Since granular materials are used for almost all abutment backfill,AASHTO recommends 1.5 as the minimum factor of safety against sliding.
Even if overall stability is provided, however, special investigations may berequired if the abutment is constructed on top of soft subsoils. Theseinvestigations could consist if:
❏ Special explorations❏ Testing❏ Other analyses
to determine if any potentially unacceptable long term settlements or horizontalmovements will occur.
Abutment Stability—Service Load Design Method
[4.1.2]
no load factors or performancefactors are applied. Instead, aminimum Factor of Safety(F.S.) is required.
hen services load de-sign method is used,W
INCREASING SLIDING RESISTANCE
METHOD I
INCLINE UNDERSIDE OF FOOTING
Downloaded from Digital Engineering Library @ McGraw-Hill (www.digitalengineeringlibrary.com)Copyright © 2006 The McGraw-Hill Companies. All rights reserved.
Any use is subject to the Terms of Use as given at the website.
Design of Substructure Elements
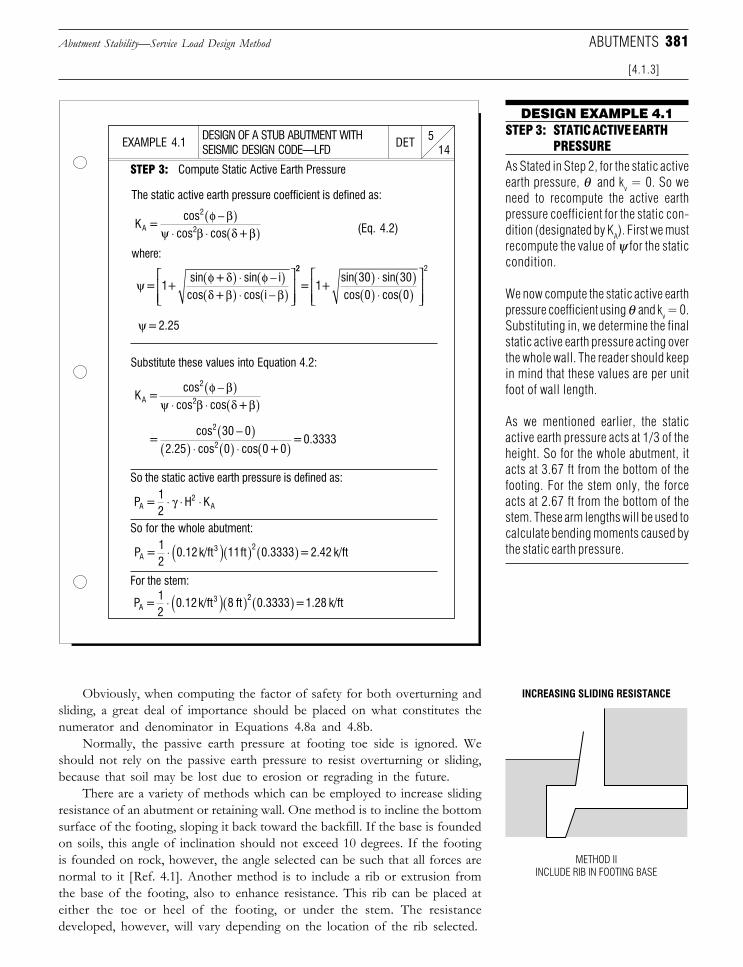
381
DESIGN OF A STUB ABUTMENT WITHSEISMIC DESIGN CODE—LFD 14
5DETEXAMPLE 4.1
DESIGN EXAMPLE 4.1STEP 3: STATIC ACTIVE EARTH
PRESSURE
As Stated in Step 2, for the static activeearth pressure, θ and kv = 0. So weneed to recompute the active earthpressure coefficient for the static con-dition (designated by KA). First we mustrecompute the value of ψ for the staticcondition.
We now compute the static active earthpressure coefficient using θ and kv = 0.Substituting in, we determine the finalstatic active earth pressure acting overthe whole wall. The reader should keepin mind that these values are per unitfoot of wall length.
As we mentioned earlier, the staticactive earth pressure acts at 1/3 of theheight. So for the whole abutment, itacts at 3.67 ft from the bottom of thefooting. For the stem only, the forceacts at 2.67 ft from the bottom of thestem. These arm lengths will be used tocalculate bending moments caused bythe static earth pressure.
STEP 3: Compute Static Active Earth Pressure
Substitute these values into Equation 4.2:
So the static active earth pressure is defined as:
So for the whole abutment:
Obviously, when computing the factor of safety for both overturning andsliding, a great deal of importance should be placed on what constitutes thenumerator and denominator in Equations 4.8a and 4.8b.
Normally, the passive earth pressure at footing toe side is ignored. Weshould not rely on the passive earth pressure to resist overturning or sliding,because that soil may be lost due to erosion or regrading in the future.
There are a variety of methods which can be employed to increase slidingresistance of an abutment or retaining wall. One method is to incline the bottomsurface of the footing, sloping it back toward the backfill. If the base is foundedon soils, this angle of inclination should not exceed 10 degrees. If the footingis founded on rock, however, the angle selected can be such that all forces arenormal to it [Ref. 4.1]. Another method is to include a rib or extrusion fromthe base of the footing, also to enhance resistance. This rib can be placed ateither the toe or heel of the footing, or under the stem. The resistancedeveloped, however, will vary depending on the location of the rib selected.
Abutment Stability—Service Load Design Method
[4.1.3]
ABUTMENTS
The static active earth pressure coefficient is defined as:
where:
(Eq. 4.2)
For the stem:
K = cos
cos cos + A
2
2
φ βψ β δ β
−( )⋅ ⋅ ( )
ψ φ δ φ δ β β
= 1 + sin + sin i
cos + cos i ( ) ⋅ −( )( ) ⋅ −( )
22 2
= 1 + sin 30 sin 30cos 0 cos 0
( ) ⋅ ( )( ) ⋅ ( )
K = cos
cos cos + A
2
2
φ βψ β δ β
−( )⋅ ⋅ ( )
= cos 30 0
2.25 cos 0 cos 0 + 0 = 0.3333
2
2
−( )( ) ⋅ ( ) ⋅ ( )
P = 12
H KA2
A⋅ ⋅ ⋅γ
P = 12
0.12 k/ft 11 ft 0.3333 = 2.42 k/ftA3 2⋅ ( )( ) ( )
P = 12
0.12 k/ft 8 ft 0.3333 = 1.28 k/ftA3 2⋅ ( )( ) ( )
ψ = 2.25
INCREASING SLIDING RESISTANCE
METHOD II
INCLUDE RIB IN FOOTING BASE
Downloaded from Digital Engineering Library @ McGraw-Hill (www.digitalengineeringlibrary.com)Copyright © 2006 The McGraw-Hill Companies. All rights reserved.
Any use is subject to the Terms of Use as given at the website.
Design of Substructure Elements
382 SECTION 4 THE SUBSTRUCTURE
4.1.4 Load Factor Design Method
In AASHTO Standard Specifications, load factor design for foundationsis treated as an alternative design method. As we mentioned in Section 4.1.3,most engineers in the USA are used to the service load design method for bridgefoundations.
The LFD approach for substructure is the same as for superstructurediscussed in Section 3. Load factors for load combinations I or VII (whereearthquake is considered) are usually used. The resistance factors for strengthlimit states are summarized in Tables 4.10.6-1 to 4.10.6-3 of the AASHTOStandard Specifications [Ref. 4.4].
Note that when LFD is used, we still need to check the serviceability of thefoundation such as excessive movements of the foundation, or excessivevibrations caused by dynamic loadings (AASHTO 5.13.1). Service load(unfactored) should be used for these serviceability check.
4.1.5 Load and Resistance Factor Design Method
In AASHTO LRFD [Ref. 4.5], foundations are designed for strengthlimit states and service limit states. Extreme event limit states such as seismicloading, scour, vessel or vehicular collision, should also be considered ifapplicable.
The strength limit states mainly deal with structural safety issues, whichinclude:
❏ Bearing resistance (except presumptive capacity is used in design)❏ Sliding at the base of footing❏ Excessive loss of contact (scour)❏ Loss of lateral support❏ Structural Capacity
Similar to LFD approach, the resistance factors for various types offoundations are specified in Table 1 through Table 3 in AASHTO LRFD 10.5.5.Load factors for strength limit states as specified in Table 3.4 should be used.
Since traditionally foundations are designed using the service load method,and many geotechnical engineers still give soil bearing capacity based on theservice load method, AASHTO LRFD allows engineers to use the Service Iload combination to check bearing capacity if the presumptive resistance valueis used.
For earthquake load, load combination for Extreme Event I should beused. Unlike AASHTO Standard Specifications, a certain percentage of liveload should be considered when combined with earthquake load. AASHTOLRFD does not give a specific value for live load factor, but it indicates that0.50 can be used for normal average daily truck traffic.
Foundations should also be designed for service limit states. They shouldinclude (AASHTO LRFD 10.5.2):
❏ Settlement and lateral displacement❏ Overall stability (slope stability)❏ Bearing resistance if presumptive bearing capacity is used
Load Factor Design Method
[4.1.4]
load combination to checkbearing capacity if presump-tive resistance value is used.
ASHTO LRFD allows en-gineers to use Service IA
Downloaded from Digital Engineering Library @ McGraw-Hill (www.digitalengineeringlibrary.com)Copyright © 2006 The McGraw-Hill Companies. All rights reserved.
Any use is subject to the Terms of Use as given at the website.
Design of Substructure Elements
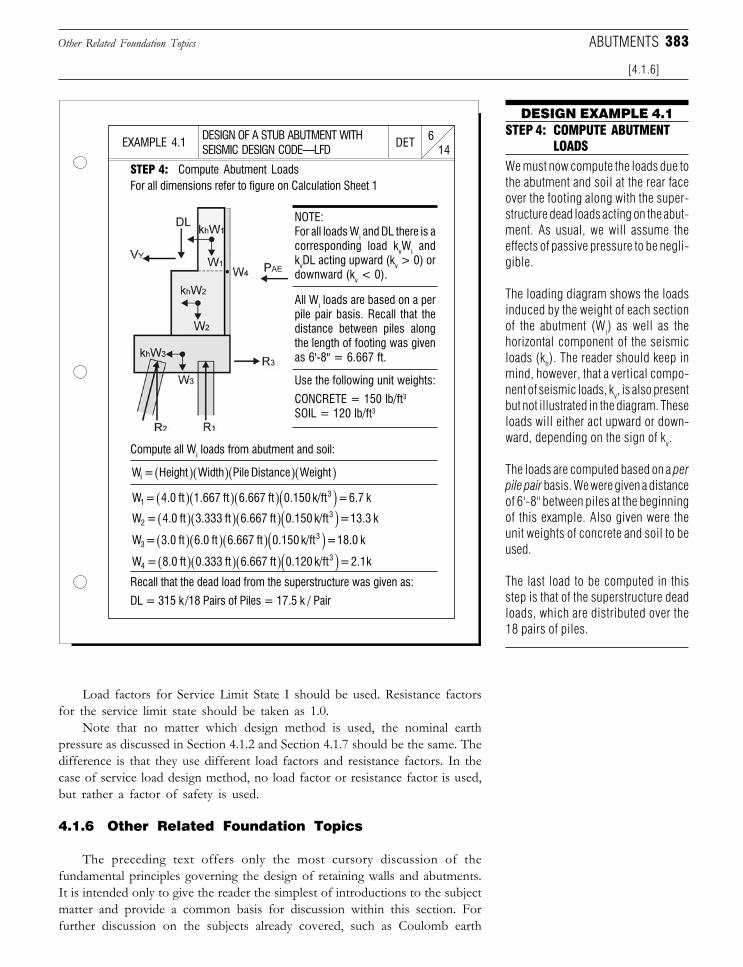
383
DESIGN OF A STUB ABUTMENT WITHSEISMIC DESIGN CODE—LFD 14
6DETEXAMPLE 4.1
DESIGN EXAMPLE 4.1STEP 4: COMPUTE ABUTMENT
LOADS
We must now compute the loads due tothe abutment and soil at the rear faceover the footing along with the super-structure dead loads acting on the abut-ment. As usual, we will assume theeffects of passive pressure to be negli-gible.
The loading diagram shows the loadsinduced by the weight of each sectionof the abutment (Wi) as well as thehorizontal component of the seismicloads (kh). The reader should keep inmind, however, that a vertical compo-nent of seismic loads, kv, is also presentbut not illustrated in the diagram. Theseloads will either act upward or down-ward, depending on the sign of kv.
The loads are computed based on a perpile pair basis. We were given a distanceof 6'-8" between piles at the beginningof this example. Also given were theunit weights of concrete and soil to beused.
The last load to be computed in thisstep is that of the superstructure deadloads, which are distributed over the18 pairs of piles.
STEP 4: Compute Abutment LoadsFor all dimensions refer to figure on Calculation Sheet 1
NOTE:For all loads Wi and DL there is acorresponding load kvWi andkvDL acting upward (kv > 0) ordownward (kv < 0).
All Wi loads are based on a perpile pair basis. Recall that thedistance between piles alongthe length of footing was givenas 6'-8" = 6.667 ft.
Use the following unit weights:
CONCRETE = 150 lb/ft3
SOIL = 120 lb/ft3
Compute all Wi loads from abutment and soil:
Recall that the dead load from the superstructure was given as:
DL = 315 k /18 Pairs of Piles = 17.5 k / Pair
Load factors for Service Limit State I should be used. Resistance factorsfor the service limit state should be taken as 1.0.
Note that no matter which design method is used, the nominal earthpressure as discussed in Section 4.1.2 and Section 4.1.7 should be the same. Thedifference is that they use different load factors and resistance factors. In thecase of service load design method, no load factor or resistance factor is used,but rather a factor of safety is used.
4.1.6 Other Related Foundation Topics
The preceding text offers only the most cursory discussion of thefundamental principles governing the design of retaining walls and abutments.It is intended only to give the reader the simplest of introductions to the subjectmatter and provide a common basis for discussion within this section. Forfurther discussion on the subjects already covered, such as Coulomb earth
Other Related Foundation Topics
[4.1.6]
ABUTMENTS
W = Height Width Pile Distance Weighti ( )( )( )( )W = 4.0 ft 1.667 ft 6.667 ft 0.150 k/ft = 6.7 k1
3( )( )( )( )W = 4.0 ft 3.333 ft 6.667 ft 0.150 k/ft = 13.3 k2
3( )( )( )( )W = 3.0 ft 6.0 ft 6.667 ft 0.150 k/ft = 18.0 k3
3( )( )( )( )W = 8.0 ft 0.333 ft 6.667 ft 0.120 k/ft = 2.1k4
3( )( )( )( )
Downloaded from Digital Engineering Library @ McGraw-Hill (www.digitalengineeringlibrary.com)Copyright © 2006 The McGraw-Hill Companies. All rights reserved.
Any use is subject to the Terms of Use as given at the website.
Design of Substructure Elements
384 SECTION 4 THE SUBSTRUCTURE
pressure theory and abutment stability, as well as topics such as Rankine earthpressures, the design of piles, and other related topics which were not covered,the reader is referred to References 4.1 through 4.3, all of which offer thoroughand complete discussions on these and related topics.
4.1.7 Mononobe-Okabe Analysis
A topic which is becoming of particular concern in the bridge designprofession is that of seismic design. Particularly in light of recent earthquakes,such as the Loma Prieta earthquake of 1989 and the earthquake which struckSouthern California in 1994, the conventional design of substructure compo-nents is no longer acceptable. Indeed, one of the most frequently askedquestions of a bridge engineer is, “Are highway bridges safe enough to handlean earthquake?”
Transportation departments in states such as New York, where seismicactivity does not garner the same headlines as that on the west coast, haveundertaken rigid new guidelines concerning the seismic design of highwaybridges. It is because of this heightened awareness in seismic design that thedesign example in this section has been structured to take into account theeffects of seismic loading.
There are two fundamental issues which face bridge engineers with regardto seismic loading:
❏ Seismic retrofitting of existing structures❏ Design of new structures to accommodate seismic loads
Where the seismic design of bridges definitely requires new details for thedesign of various components, it also requires a different type of analysis. InSection 3.5.3, Part 2 we discussed the unique loading conditions imposed by theapplication of seismic forces on a bridge structure. With regard to bridgeabutments, one such analysis method used to account for seismic loading is theso-called Mononobe-Okabe analysis method.
For a freestanding abutment or retaining wall which can displacehorizontally without “significant restraint,” AASHTO recommends that thepseudo-static Mononobe-Okabe method of analysis be used to determine theeffects of lateral active soil pressures during seismic loading (AASHTODivision I-A, 6.4.3(A)). An example of “significant restraint” would be tie-backs or battered piles which prevent abutment stem from horizontal orrotational movement.
The following discussion provides a background and overview of the basicconcepts behind the Mononobe-Okabe analysis method. The nomenclatureand variable designation used in this section is consistent with that presentedin Figure 4.6 and Section 4.1.2.
1. Background. The Mononobe-Okabe method was developed in the1920’s and is frequently used for the calculation of the effects of seismicsoil forces acting on a bridge abutment [Ref. 4.4]. This method is essentiallyan extension of the Coulomb sliding wedge theory (see Section 4.1.2),which takes into account horizontal and vertical inertia forces acting on thesoil. These are illustrated, in part, in Figure 4.6, by the forces designated
Mononobe-Okabe Analysis
[4.1.6]
bridge engineer hears is, “Arehighway bridges safe enoughto handle an earthquake?”
ndeed, one of the most fre-quently asked questions aI
the 1920’s and is frequentlyused for the calculation of theeffects of seismic soil forcesacting on a bridge abutment.
he Mononobe-Okabemethod was developed inT
Downloaded from Digital Engineering Library @ McGraw-Hill (www.digitalengineeringlibrary.com)Copyright © 2006 The McGraw-Hill Companies. All rights reserved.
Any use is subject to the Terms of Use as given at the website.
Design of Substructure Elements
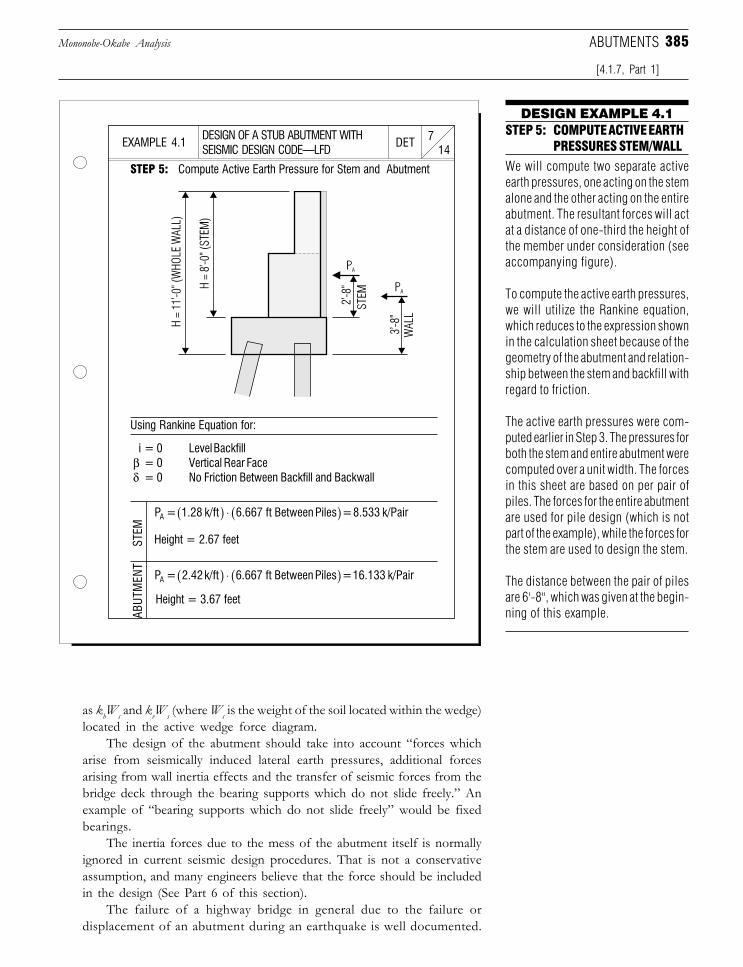
385
DESIGN OF A STUB ABUTMENT WITHSEISMIC DESIGN CODE—LFD 14
7DETEXAMPLE 4.1
DESIGN EXAMPLE 4.1STEP 5: COMPUTE ACTIVE EARTH
PRESSURES STEM/WALL
We will compute two separate activeearth pressures, one acting on the stemalone and the other acting on the entireabutment. The resultant forces will actat a distance of one-third the height ofthe member under consideration (seeaccompanying figure).
To compute the active earth pressures,we will utilize the Rankine equation,which reduces to the expression shownin the calculation sheet because of thegeometry of the abutment and relation-ship between the stem and backfill withregard to friction.
The active earth pressures were com-puted earlier in Step 3. The pressures forboth the stem and entire abutment werecomputed over a unit width. The forcesin this sheet are based on per pair ofpiles. The forces for the entire abutmentare used for pile design (which is notpart of the example), while the forces forthe stem are used to design the stem.
The distance between the pair of pilesare 6'-8", which was given at the begin-ning of this example.
Using Rankine Equation for:
i = 0 Level Backfillβ = 0 Vertical Rear Faceδ = 0 No Friction Between Backfill and Backwall
STEP 5: Compute Active Earth Pressure for Stem and Abutment
STEM
ABUT
MEN
T
as khWs and kvWs (where Ws is the weight of the soil located within the wedge)located in the active wedge force diagram.
The design of the abutment should take into account “forces whicharise from seismically induced lateral earth pressures, additional forcesarising from wall inertia effects and the transfer of seismic forces from thebridge deck through the bearing supports which do not slide freely.” Anexample of “bearing supports which do not slide freely” would be fixedbearings.
The inertia forces due to the mess of the abutment itself is normallyignored in current seismic design procedures. That is not a conservativeassumption, and many engineers believe that the force should be includedin the design (See Part 6 of this section).
The failure of a highway bridge in general due to the failure ordisplacement of an abutment during an earthquake is well documented.
Mononobe-Okabe Analysis
[4.1.7, Part 1]
ABUTMENTS
Height = 2.67 feet
Height = 3.67 feet
P = 1.28 k/ft 6.667 ft Between Piles = 8.533 k/PairA ( ) ⋅ ( )
P = 2.42 k/ft 6.667 ft Between Piles = 16.133 k/PairA ( ) ⋅ ( )
Downloaded from Digital Engineering Library @ McGraw-Hill (www.digitalengineeringlibrary.com)Copyright © 2006 The McGraw-Hill Companies. All rights reserved.
Any use is subject to the Terms of Use as given at the website.
Design of Substructure Elements
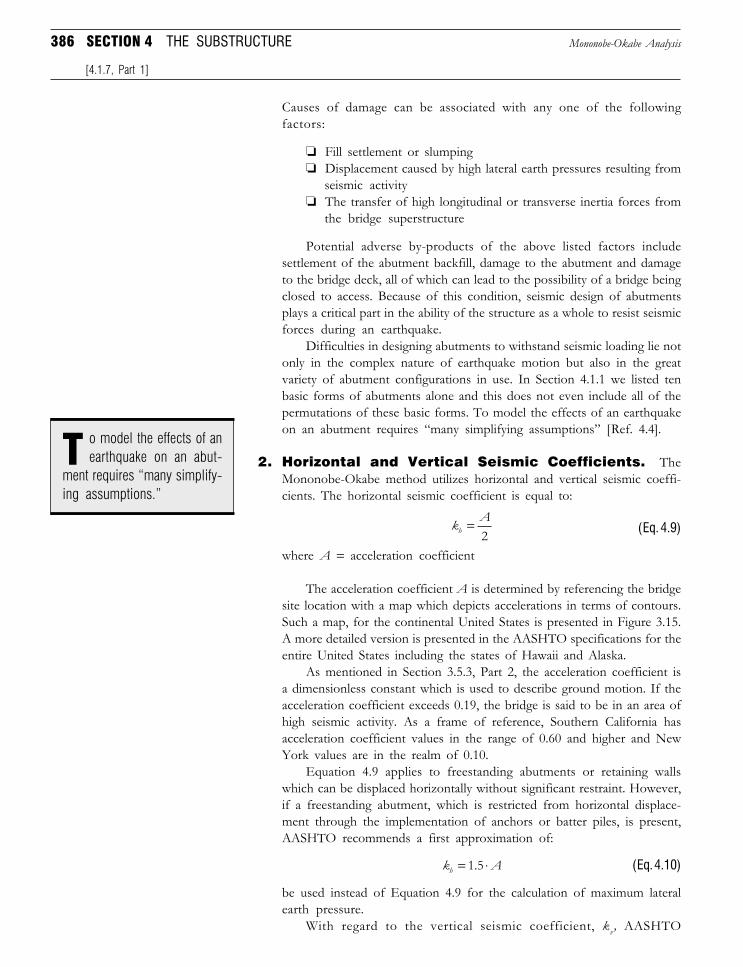
386 SECTION 4 THE SUBSTRUCTURE
Causes of damage can be associated with any one of the followingfactors:
❏ Fill settlement or slumping❏ Displacement caused by high lateral earth pressures resulting from
seismic activity❏ The transfer of high longitudinal or transverse inertia forces from
the bridge superstructure
Potential adverse by-products of the above listed factors includesettlement of the abutment backfill, damage to the abutment and damageto the bridge deck, all of which can lead to the possibility of a bridge beingclosed to access. Because of this condition, seismic design of abutmentsplays a critical part in the ability of the structure as a whole to resist seismicforces during an earthquake.
Difficulties in designing abutments to withstand seismic loading lie notonly in the complex nature of earthquake motion but also in the greatvariety of abutment configurations in use. In Section 4.1.1 we listed tenbasic forms of abutments alone and this does not even include all of thepermutations of these basic forms. To model the effects of an earthquakeon an abutment requires “many simplifying assumptions” [Ref. 4.4].
2. Horizontal and Vertical Seismic Coefficients. TheMononobe-Okabe method utilizes horizontal and vertical seismic coeffi-cients. The horizontal seismic coefficient is equal to:
k Ah =
2 (Eq. 4.9)
where A = acceleration coefficient
The acceleration coefficient A is determined by referencing the bridgesite location with a map which depicts accelerations in terms of contours.Such a map, for the continental United States is presented in Figure 3.15.A more detailed version is presented in the AASHTO specifications for theentire United States including the states of Hawaii and Alaska.
As mentioned in Section 3.5.3, Part 2, the acceleration coefficient isa dimensionless constant which is used to describe ground motion. If theacceleration coefficient exceeds 0.19, the bridge is said to be in an area ofhigh seismic activity. As a frame of reference, Southern California hasacceleration coefficient values in the range of 0.60 and higher and NewYork values are in the realm of 0.10.
Equation 4.9 applies to freestanding abutments or retaining wallswhich can be displaced horizontally without significant restraint. However,if a freestanding abutment, which is restricted from horizontal displace-ment through the implementation of anchors or batter piles, is present,AASHTO recommends a first approximation of:
k Ah = ⋅1 5. (Eq. 4.10)
be used instead of Equation 4.9 for the calculation of maximum lateralearth pressure.
With regard to the vertical seismic coefficient, kv, AASHTO
Mononobe-Okabe Analysis
[4.1.7, Part 1]
ment requires “many simplify-ing assumptions.”
o model the effects of anearthquake on an abut-T
Downloaded from Digital Engineering Library @ McGraw-Hill (www.digitalengineeringlibrary.com)Copyright © 2006 The McGraw-Hill Companies. All rights reserved.
Any use is subject to the Terms of Use as given at the website.
Design of Substructure Elements
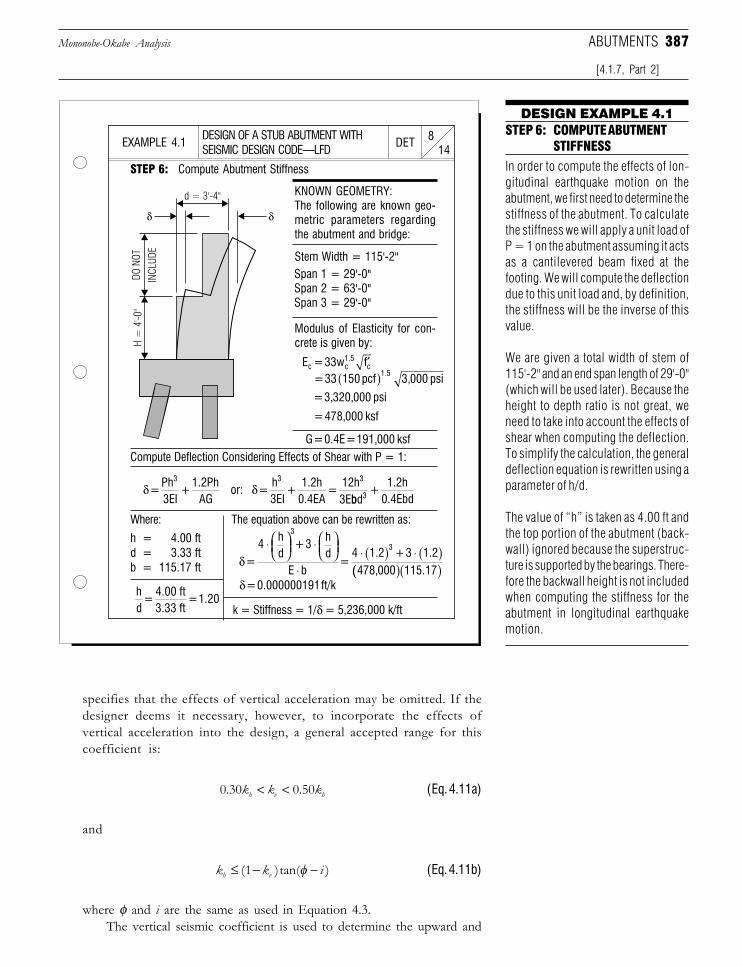
387
specifies that the effects of vertical acceleration may be omitted. If thedesigner deems it necessary, however, to incorporate the effects ofvertical acceleration into the design, a general accepted range for thiscoefficient is:
0 30 0 50. .k k kh v h< < (Eq. 4.11a)
and
k k ih v≤ − −( )tan( )1 φ (Eq. 4.11b)
where φ and i are the same as used in Equation 4.3.The vertical seismic coefficient is used to determine the upward and
DESIGN OF A STUB ABUTMENT WITHSEISMIC DESIGN CODE—LFD 14
8DETEXAMPLE 4.1
DESIGN EXAMPLE 4.1STEP 6: COMPUTE ABUTMENT
STIFFNESS
In order to compute the effects of lon-gitudinal earthquake motion on theabutment, we first need to determine thestiffness of the abutment. To calculatethe stiffness we will apply a unit load ofP = 1 on the abutment assuming it actsas a cantilevered beam fixed at thefooting. We will compute the deflectiondue to this unit load and, by definition,the stiffness will be the inverse of thisvalue.
We are given a total width of stem of115'-2" and an end span length of 29'-0"(which will be used later). Because theheight to depth ratio is not great, weneed to take into account the effects ofshear when computing the deflection.To simplify the calculation, the generaldeflection equation is rewritten using aparameter of h/d.
The value of “h” is taken as 4.00 ft andthe top portion of the abutment (back-wall) ignored because the superstruc-ture is supported by the bearings. There-fore the backwall height is not includedwhen computing the stiffness for theabutment in longitudinal earthquakemotion.
STEP 6: Compute Abutment Stiffness
Compute Deflection Considering Effects of Shear with P = 1:
KNOWN GEOMETRY:The following are known geo-metric parameters regardingthe abutment and bridge:
Stem Width = 115'-2"Span 1 = 29'-0"Span 2 = 63'-0"Span 3 = 29'-0"
Modulus of Elasticity for con-crete is given by:
Where:
h = 4.00 ftd = 3.33 ftb = 115.17 ft
The equation above can be rewritten as:
k = Stiffness = 1/δ = 5,236,000 k/ft
Mononobe-Okabe Analysis
[4.1.7, Part 2]
ABUTMENTS
E = 33w fc c1.5
c′= 33 150 pcf 3,000 psi1.5( )= 3,320,000 psi
= 478,000 ksf
G = 0.4E = 191,000 ksf
δ δ = Ph3EI
+ 1.2Ph
AG or: =
h3EI
+ 1.2h
0.4EA =
12h3E
3 3 3
bbd +
1.2h0.4Ebd3
δ = 4
hd
+ 3hd
E b =
4 1.2 + 3 1.2478,000
3
3⋅
⋅
⋅⋅ ( ) ⋅ ( )
(( )( )115.17δ = 0.000000191ft/kh
d =
4.00 ft3.33 ft
= 1.20
DO
NO
T
INC
LUD
E
H =
4'-
0"
d = 3'-4"
δδ
Downloaded from Digital Engineering Library @ McGraw-Hill (www.digitalengineeringlibrary.com)Copyright © 2006 The McGraw-Hill Companies. All rights reserved.
Any use is subject to the Terms of Use as given at the website.
Design of Substructure Elements
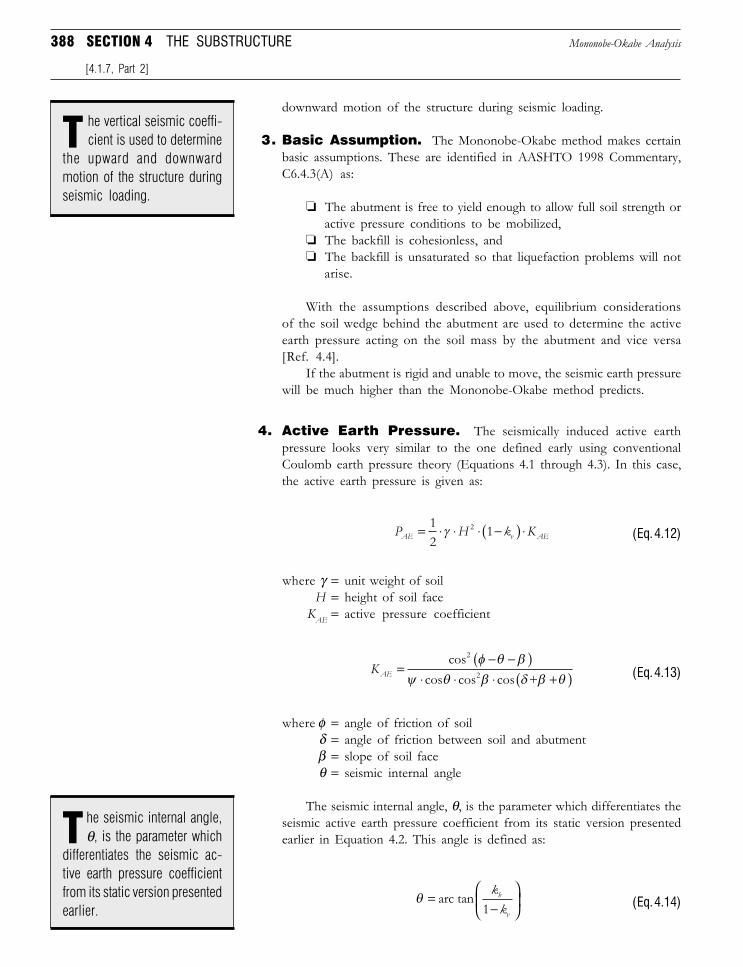
388 SECTION 4 THE SUBSTRUCTURE
downward motion of the structure during seismic loading.
3. Basic Assumption. The Mononobe-Okabe method makes certainbasic assumptions. These are identified in AASHTO 1998 Commentary,C6.4.3(A) as:
❏ The abutment is free to yield enough to allow full soil strength oractive pressure conditions to be mobilized,
❏ The backfill is cohesionless, and❏ The backfill is unsaturated so that liquefaction problems will not
arise.
With the assumptions described above, equilibrium considerationsof the soil wedge behind the abutment are used to determine the activeearth pressure acting on the soil mass by the abutment and vice versa[Ref. 4.4].
If the abutment is rigid and unable to move, the seismic earth pressurewill be much higher than the Mononobe-Okabe method predicts.
4. Active Earth Pressure. The seismically induced active earthpressure looks very similar to the one defined early using conventionalCoulomb earth pressure theory (Equations 4.1 through 4.3). In this case,the active earth pressure is given as:
P H k KAE v AE= ⋅ ⋅ ⋅ −( ) ⋅12
12γ (Eq. 4.12)
where γ = unit weight of soilH = height of soil face
KAE = active pressure coefficient
KAE =− −( )
⋅ ⋅ ⋅ +( )cos
cos
2 φ θ βψ θ β δ β θcos cos +2 (Eq. 4.13)
where φ = angle of friction of soilδ = angle of friction between soil and abutmentβ = slope of soil faceθ = seismic internal angle
The seismic internal angle, θ, is the parameter which differentiates theseismic active earth pressure coefficient from its static version presentedearlier in Equation 4.2. This angle is defined as:
θ =−
arc tan
kkh
v1 (Eq. 4.14)
Mononobe-Okabe Analysis
[4.1.7, Part 2]
the upward and downwardmotion of the structure duringseismic loading.
he vertical seismic coeffi-cient is used to determineT
differentiates the seismic ac-tive earth pressure coefficientfrom its static version presentedearlier.
he seismic internal angle,θ, is the parameter whichT
Downloaded from Digital Engineering Library @ McGraw-Hill (www.digitalengineeringlibrary.com)Copyright © 2006 The McGraw-Hill Companies. All rights reserved.
Any use is subject to the Terms of Use as given at the website.
Design of Substructure Elements
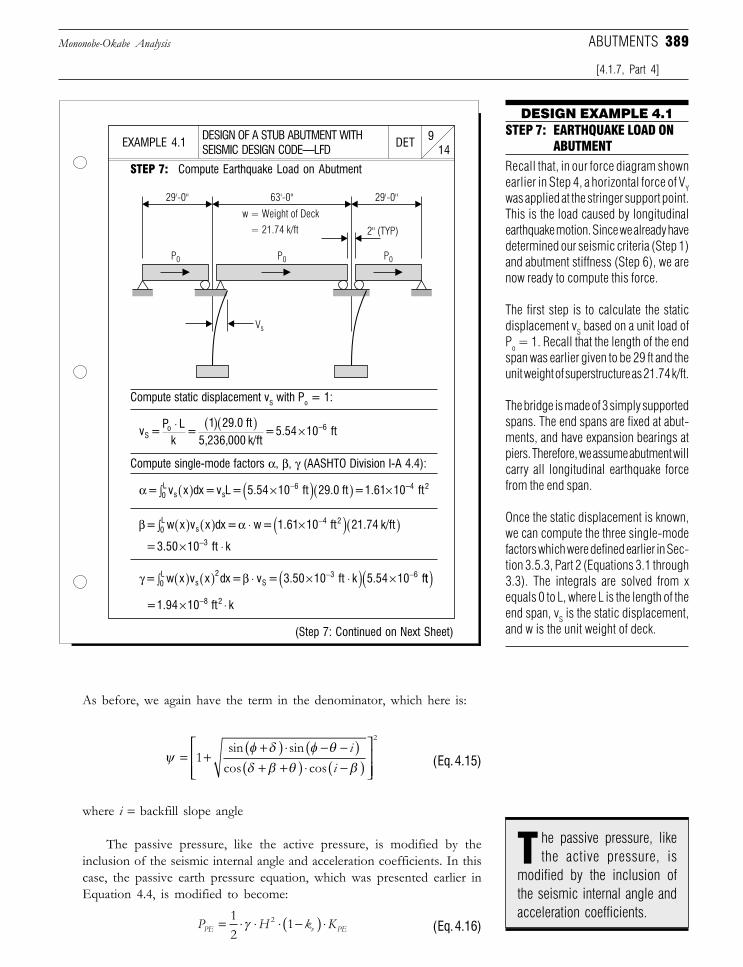
389
DESIGN OF A STUB ABUTMENT WITHSEISMIC DESIGN CODE—LFD 14
9DETEXAMPLE 4.1
DESIGN EXAMPLE 4.1STEP 7: EARTHQUAKE LOAD ON
ABUTMENT
Recall that, in our force diagram shownearlier in Step 4, a horizontal force of VYwas applied at the stringer support point.This is the load caused by longitudinalearthquake motion. Since we already havedetermined our seismic criteria (Step 1)and abutment stiffness (Step 6), we arenow ready to compute this force.
The first step is to calculate the staticdisplacement vS based on a unit load ofPo = 1. Recall that the length of the endspan was earlier given to be 29 ft and theunit weight of superstructure as 21.74 k/ft.
The bridge is made of 3 simply supportedspans. The end spans are fixed at abut-ments, and have expansion bearings atpiers. Therefore, we assume abutment willcarry all longitudinal earthquake forcefrom the end span.
Once the static displacement is known,we can compute the three single-modefactors which were defined earlier in Sec-tion 3.5.3, Part 2 (Equations 3.1 through3.3). The integrals are solved from xequals 0 to L, where L is the length of theend span, vS is the static displacement,and w is the unit weight of deck.
STEP 7: Compute Earthquake Load on Abutment
Compute static displacement vS with Po = 1:
Compute single-mode factors α, β, γ (AASHTO Division I-A 4.4):
(Step 7: Continued on Next Sheet)
As before, we again have the term in the denominator, which here is:
ψφ δ φ θδ β θ β
= ++( ) ⋅ − −( )+ +( ) ⋅ −( )
12
sin sincos cos
ii (Eq. 4.15)
where i = backfill slope angle
The passive pressure, like the active pressure, is modified by theinclusion of the seismic internal angle and acceleration coefficients. In thiscase, the passive earth pressure equation, which was presented earlier inEquation 4.4, is modified to become:
P H k KPE v PE= ⋅ ⋅ ⋅ −( ) ⋅12
12γ (Eq. 4.16)
Mononobe-Okabe Analysis
[4.1.7, Part 4]
ABUTMENTS
v = P L
k =
1 29.0 ft5,236,000 k/ft
= 5.54 10 ftSo 6⋅ ( )( ) × −
α = v x dx = v L = 5.54 10 ft 29.0 ft = 1.61 10s0L
s6∫ ( ) ×( )( ) ×− −−4 2ft
β α= w x v x dx = w = 1.61 10 ft 21.74 k/ft0L
s4 2∫ ( ) ( ) ⋅ ×( )( )−
= 3.50 10 ft k3× ⋅−
γ β= w x v x dx = v = 3.50 10 ft k 5.54 10 f0L
s2
S3 6∫ ( ) ( ) ⋅ × ⋅( ) ×− − tt( )
= 1.94 10 ft k8 2× ⋅−
modified by the inclusion ofthe seismic internal angle andacceleration coefficients.
he passive pressure, likethe active pressure, isT
w = Weight of Deck
= 21.74 k/ft
P0 P0 P0
Vs
29'-0" 63'-0" 29'-0"
2" (TYP)
Downloaded from Digital Engineering Library @ McGraw-Hill (www.digitalengineeringlibrary.com)Copyright © 2006 The McGraw-Hill Companies. All rights reserved.
Any use is subject to the Terms of Use as given at the website.
Design of Substructure Elements
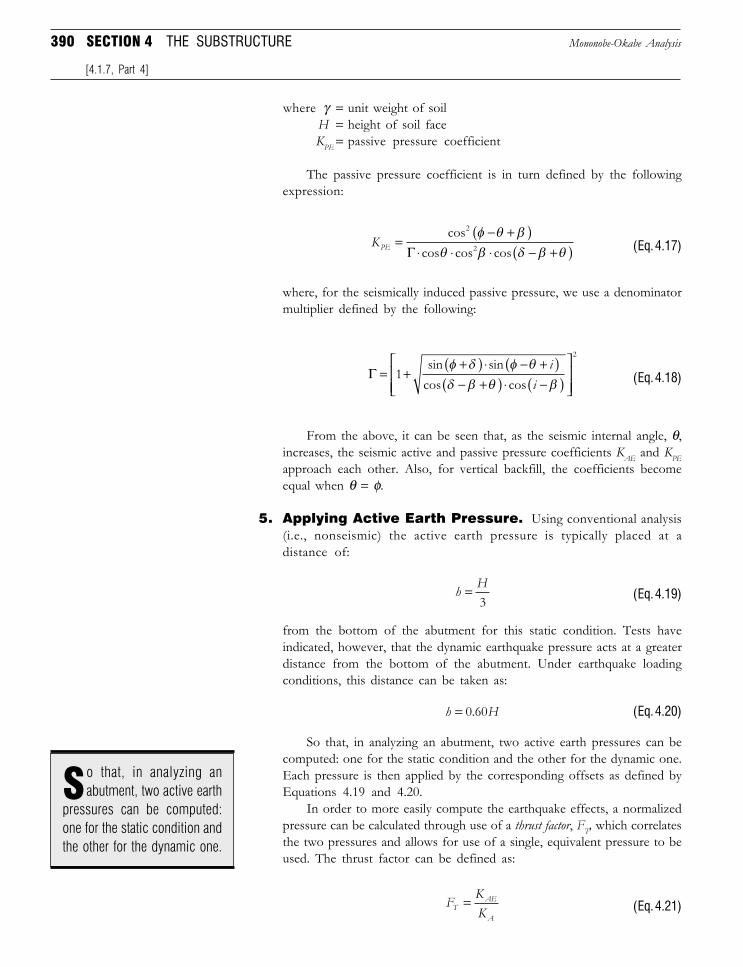
390 SECTION 4 THE SUBSTRUCTURE
where γ = unit weight of soilH = height of soil faceKPE = passive pressure coefficient
The passive pressure coefficient is in turn defined by the followingexpression:
KPE =− +( )
⋅ ⋅ ⋅ − +( )cos
cos
2 φ θ βθ β δ β θΓ cos cos2 (Eq. 4.17)
where, for the seismically induced passive pressure, we use a denominatormultiplier defined by the following:
Γ = ++( ) ⋅ − +( )− +( ) ⋅ −( )
12
sin sincos cos
φ δ φ θδ β θ β
ii (Eq. 4.18)
From the above, it can be seen that, as the seismic internal angle, θ,increases, the seismic active and passive pressure coefficients KAE and KPEapproach each other. Also, for vertical backfill, the coefficients becomeequal when θ = φ.
5. Applying Active Earth Pressure. Using conventional analysis(i.e., nonseismic) the active earth pressure is typically placed at adistance of:
h H=3 (Eq. 4.19)
from the bottom of the abutment for this static condition. Tests haveindicated, however, that the dynamic earthquake pressure acts at a greaterdistance from the bottom of the abutment. Under earthquake loadingconditions, this distance can be taken as:
h H= 0 60. (Eq. 4.20)
So that, in analyzing an abutment, two active earth pressures can becomputed: one for the static condition and the other for the dynamic one.Each pressure is then applied by the corresponding offsets as defined byEquations 4.19 and 4.20.
In order to more easily compute the earthquake effects, a normalizedpressure can be calculated through use of a thrust factor, FT, which correlatesthe two pressures and allows for use of a single, equivalent pressure to beused. The thrust factor can be defined as:
FKKTAE
A
= (Eq. 4.21)
Mononobe-Okabe Analysis
[4.1.7, Part 4]
pressures can be computed:one for the static condition andthe other for the dynamic one.
o that, in analyzing anabutment, two active earthS
Downloaded from Digital Engineering Library @ McGraw-Hill (www.digitalengineeringlibrary.com)Copyright © 2006 The McGraw-Hill Companies. All rights reserved.
Any use is subject to the Terms of Use as given at the website.
Design of Substructure Elements
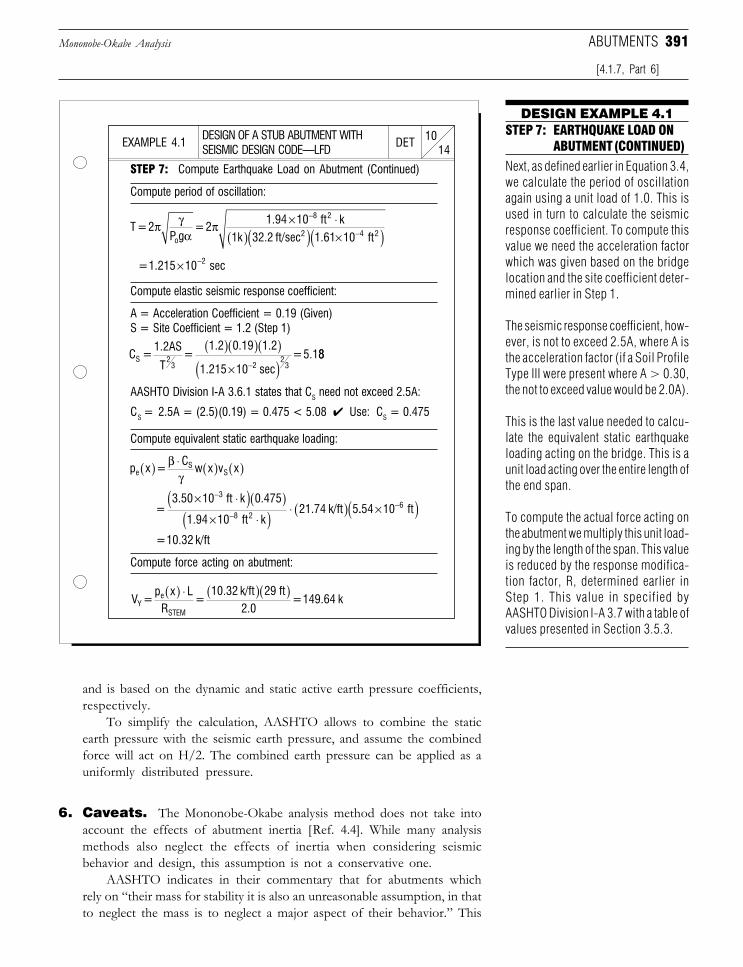
391
DESIGN OF A STUB ABUTMENT WITHSEISMIC DESIGN CODE—LFD 14
10DETEXAMPLE 4.1
DESIGN EXAMPLE 4.1STEP 7: EARTHQUAKE LOAD ON
ABUTMENT (CONTINUED)
Next, as defined earlier in Equation 3.4,we calculate the period of oscillationagain using a unit load of 1.0. This isused in turn to calculate the seismicresponse coefficient. To compute thisvalue we need the acceleration factorwhich was given based on the bridgelocation and the site coefficient deter-mined earlier in Step 1.
The seismic response coefficient, how-ever, is not to exceed 2.5A, where A isthe acceleration factor (if a Soil ProfileType III were present where A > 0.30,the not to exceed value would be 2.0A).
This is the last value needed to calcu-late the equivalent static earthquakeloading acting on the bridge. This is aunit load acting over the entire length ofthe end span.
To compute the actual force acting onthe abutment we multiply this unit load-ing by the length of the span. This valueis reduced by the response modifica-tion factor, R, determined earlier inStep 1. This value in specified byAASHTO Division I-A 3.7 with a table ofvalues presented in Section 3.5.3.
STEP 7: Compute Earthquake Load on Abutment (Continued)
Compute period of oscillation:
Compute elastic seismic response coefficient:
A = Acceleration Coefficient = 0.19 (Given)S = Site Coefficient = 1.2 (Step 1)
AASHTO Division I-A 3.6.1 states that CS need not exceed 2.5A:
CS = 2.5A = (2.5)(0.19) = 0.475 < 5.08 ✔ Use: CS = 0.475
Compute equivalent static earthquake loading:
Compute force acting on abutment:
and is based on the dynamic and static active earth pressure coefficients,respectively.
To simplify the calculation, AASHTO allows to combine the staticearth pressure with the seismic earth pressure, and assume the combinedforce will act on H/2. The combined earth pressure can be applied as auniformly distributed pressure.
6. Caveats. The Mononobe-Okabe analysis method does not take intoaccount the effects of abutment inertia [Ref. 4.4]. While many analysismethods also neglect the effects of inertia when considering seismicbehavior and design, this assumption is not a conservative one.
AASHTO indicates in their commentary that for abutments whichrely on “their mass for stability it is also an unreasonable assumption, in thatto neglect the mass is to neglect a major aspect of their behavior.” This
Mononobe-Okabe Analysis
[4.1.7, Part 6]
ABUTMENTS
T = 2P g
= 21.94 10 ft k
1 k 32.2 ft/sec 1.61 o
8 2
2π γ
απ × ⋅
( )( ) ×
−
10 ft4 2−( )= 1.215 10 sec2× −
C = 1.2AS
T =
1.2 0.19 1.2
1.215 10 sec = 5.1S 2
3 22
3
( )( )( )×( )−
88
p x = C
w x v xeS
S( ) ⋅ ( ) ( )βγ
= 3.50 10 ft k 0.475
1.94 10 ft k21.74 k/ft 5
3
8 2
× ⋅( )( )× ⋅( ) ⋅ ( )
−
−..54 10 ft6×( )−
= 10.32 k/ft
V = p x L
R =
10.32 k/ft 29 ft2.0
= 149.64 kY e
STEM
( ) ⋅ ( )( )
Downloaded from Digital Engineering Library @ McGraw-Hill (www.digitalengineeringlibrary.com)Copyright © 2006 The McGraw-Hill Companies. All rights reserved.
Any use is subject to the Terms of Use as given at the website.
Design of Substructure Elements
392 SECTION 4 THE SUBSTRUCTURE
means that for substructure components, such as a gravity retaining wall,wall inertia forces should not be neglected.
7. Superstructure Loads. In addition to the earth pressureloading, the designer must also account for earthquake loads from thesuperstructure. These loads, resulting from longitudinal and transverseearthquake motion, are transferred to and must be accommodated bythe abutment.
To calculate these loads, the procedure as outlined in Section 3.5.3,Part 2 is utilized in order to determine an equivalent static earthquakeloading, pe(x). Depending on the type of structure present, this is accom-plished through use of either the single mode spectral analysis method orthe multimode spectral analysis method. Factors which influence themagnitude of the applied loads are the soil type present, accelerationcoefficient at the project site, length of the span at the abutment, and unitweight of the bridge deck.
This loading condition, together with the superstructure dead load andearth pressure loads discussed above, represent the three major loadingconditions influencing the design of an abutment.
4.1.8 Rehabilitation and Maintenance
Like any other component of a highway bridge, abutments are susceptibleto the ravages of deterioration. Particularly in structures with a deck jointlocated over the abutment support point, a bridge abutment can undergo someof the most severe damage in a highway bridge caused by exposure to theelements and harmful agents.
Some of the major types of deterioration and maintenance problems whichcan occur in an abutment are [Ref. 4.6]:
❏ Settlement or movement❏ Vertical cracking❏ Surface deterioration❏ Deterioration at the water line❏ Spalling under bearing masonry plates❏ Backwall undermining❏ Rotting of timber elements (if present)
The following discussion covers some of the principal forms of deteriora-tion in bridge abutments, as well as some of the remedial methods which canbe taken to correct them. Attention is also given to some of the situations whichcan lead to abutment deterioration so that potential preventive maintenancemeasures can be taken to correct them.
1. Cracking. Cracks in abutments can develop as a result of a wide varietyof situations. Vertical cracking in an abutment stem can often be initiatedby differential (i.e., uneven) settlement of the abutment. Cracks can alsobe induced by deformational loads such as shrinkage.
If proper drainage is not provided for the abutment backfill, a situationcan arise where the backfill side of an abutment stem is continually moist,
Rehabilitation and Maintenance
[4.1.7, Part 6]
must also account for earth-quake loads from the super-structure.
n addition to the earth pres-sure loading, the designerI
often be initiated by differential(i.e., uneven) settlement of theabutment.
ertical cracking in anabutment backwall canV
Downloaded from Digital Engineering Library @ McGraw-Hill (www.digitalengineeringlibrary.com)Copyright © 2006 The McGraw-Hill Companies. All rights reserved.
Any use is subject to the Terms of Use as given at the website.
Design of Substructure Elements
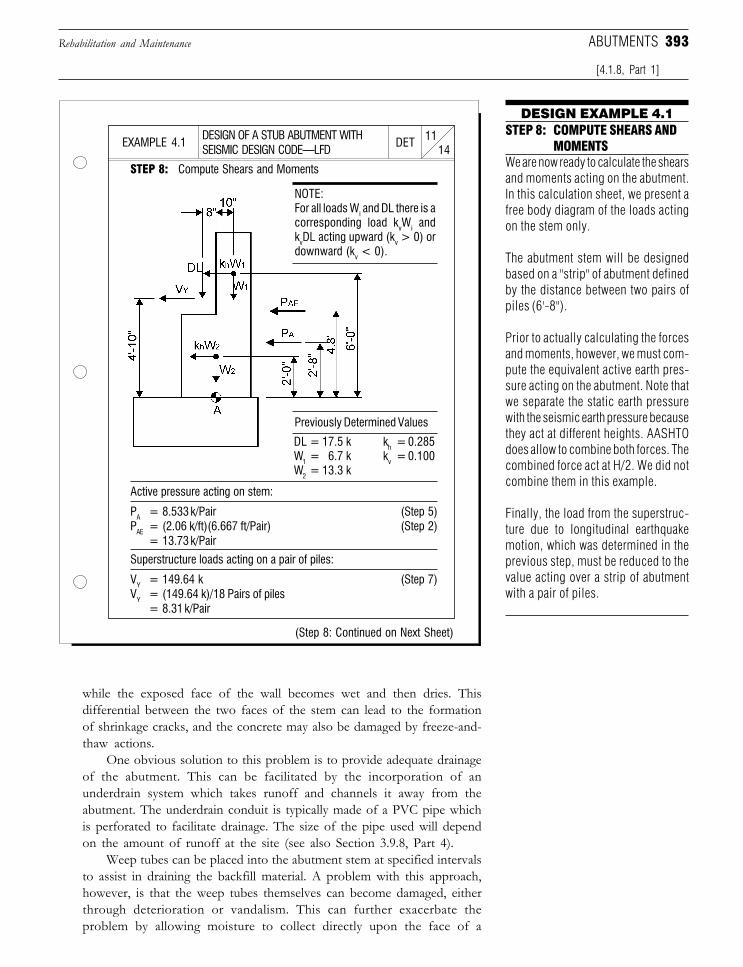
393
DESIGN OF A STUB ABUTMENT WITHSEISMIC DESIGN CODE—LFD 14
11DETEXAMPLE 4.1
DESIGN EXAMPLE 4.1STEP 8: COMPUTE SHEARS AND
MOMENTSWe are now ready to calculate the shearsand moments acting on the abutment.In this calculation sheet, we present afree body diagram of the loads actingon the stem only.
The abutment stem will be designedbased on a "strip" of abutment definedby the distance between two pairs ofpiles (6'-8").
Prior to actually calculating the forcesand moments, however, we must com-pute the equivalent active earth pres-sure acting on the abutment. Note thatwe separate the static earth pressurewith the seismic earth pressure becausethey act at different heights. AASHTOdoes allow to combine both forces. Thecombined force act at H/2. We did notcombine them in this example.
Finally, the load from the superstruc-ture due to longitudinal earthquakemotion, which was determined in theprevious step, must be reduced to thevalue acting over a strip of abutmentwith a pair of piles.
STEP 8: Compute Shears and Moments
NOTE:For all loads Wi and DL there is acorresponding load kvWi andkvDL acting upward (kv > 0) ordownward (kv < 0).
Superstructure loads acting on a pair of piles:
VY = 149.64 k (Step 7)VY = (149.64 k)/18 Pairs of piles
= 8.31 k/Pair
Active pressure acting on stem:
PA = 8.533 k/Pair (Step 5)PAE = (2.06 k/ft)(6.667 ft/Pair) (Step 2)
= 13.73 k/Pair
Previously Determined Values
DL = 17.5 k kh = 0.285W1 = 6.7 k kv = 0.100W2 = 13.3 k
(Step 8: Continued on Next Sheet)
while the exposed face of the wall becomes wet and then dries. Thisdifferential between the two faces of the stem can lead to the formationof shrinkage cracks, and the concrete may also be damaged by freeze-and-thaw actions.
One obvious solution to this problem is to provide adequate drainageof the abutment. This can be facilitated by the incorporation of anunderdrain system which takes runoff and channels it away from theabutment. The underdrain conduit is typically made of a PVC pipe whichis perforated to facilitate drainage. The size of the pipe used will dependon the amount of runoff at the site (see also Section 3.9.8, Part 4).
Weep tubes can be placed into the abutment stem at specified intervalsto assist in draining the backfill material. A problem with this approach,however, is that the weep tubes themselves can become damaged, eitherthrough deterioration or vandalism. This can further exacerbate theproblem by allowing moisture to collect directly upon the face of a
Rehabilitation and Maintenance
[4.1.8, Part 1]
ABUTMENTS
Downloaded from Digital Engineering Library @ McGraw-Hill (www.digitalengineeringlibrary.com)Copyright © 2006 The McGraw-Hill Companies. All rights reserved.
Any use is subject to the Terms of Use as given at the website.
Design of Substructure Elements
394 SECTION 4 THE SUBSTRUCTURE
abutment. The backfill material itself should be of a composition thatfacilitates proper drainage. Gravel and sand are backfill materials which arewell suited for this. The applicability of any method will vary depending onthe specifics of the project site and the owner’s preferences.
Another cause of cracking, particularly in older structures, is the useof a poor concrete mix or inadequate reinforcement. When such a situationoccurs, replacement rather than rehabilitation may be the only solution.Many older abutments, however, are aided by their large size. Evenstructures that were constructed as late as the 1950’s are equipped withwingwalls that, by any standard, would be considered massive.
The type of rehabilitation selected to repair cracks will obviously varydepending on the size and magnitude of the cracks present. Someshrinkage cracks, for example, can be relatively fine and therefore will notrequire extensive rehabilitation.
2. Surface Deterioration. Like any other exposed concrete element,abutments can suffer from surface deterioration problems which areindicated by the presence of:
❏ Spalling❏ Scaling❏ Pop-outs❏ Sloughing off corners
A variety of factors can lead to any of the above situations occurring.Chief among contributing causes is, of course, chemical attacks; eitherthrough deicing agents or other corrosive materials being sprayed ontoexposed concrete. When reinforcing steel corrodes, it increases its volume,which causes concrete to crack. Other potential causes for surfacedeterioration are the use of a poor concrete mix, poor aggregates, orthermal expansion and contraction.
Repair of abutments damaged by surface deterioration is verysimilar to that described earlier for concrete decks. First, the deterioratedconcrete must be removed to a depth where sound concrete is present.Generally this is to a point beneath the reinforcing steel (see Figure 3.27).This surface should be clean and free from debris so that new concretemay be bonded into the void. Bonding is typically made with some formof epoxy bonding compound, although mechanical bonding is also some-times used.
3. Stability Problems. In Part 1 above, it was mentioned that verticalcracking can result from differential settlement of the abutment. Stabilityproblems such as this can arise from situations ranging from changes in soilcharacteristics to poor design. Some of the major stability problems for anabutment which could potentially arise as a result of these adverse conditions,or other reasons are:
❏ Differential settlement or other vertical movement❏ Lateral movement (sliding)❏ Rotational movement (tipping, overturning)
Rehabilitation and Maintenance
[4.1.8, Part 1]
1950’s are equipped withwingwalls that, by any stan-dard, would be consideredmassive.
ven structures that wereconstructed as late as theE
the use of a poor concrete mix,poor aggregates, or thermal ex-pansion and contraction.
ther potential causes forsurface deterioration areO
Downloaded from Digital Engineering Library @ McGraw-Hill (www.digitalengineeringlibrary.com)Copyright © 2006 The McGraw-Hill Companies. All rights reserved.
Any use is subject to the Terms of Use as given at the website.
Design of Substructure Elements
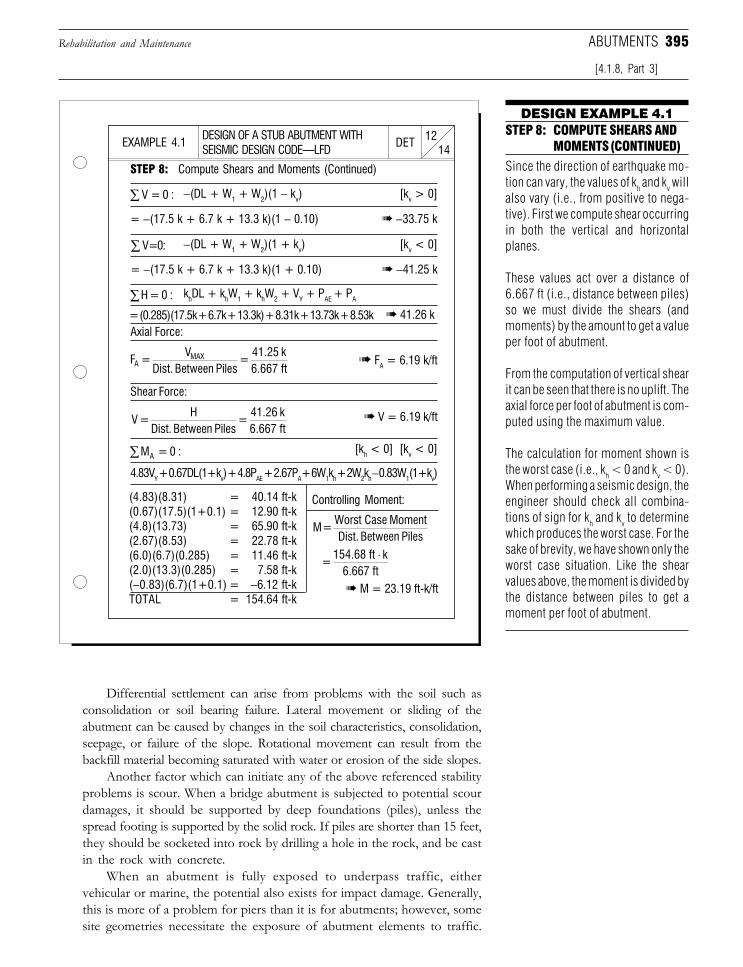
395
DESIGN OF A STUB ABUTMENT WITHSEISMIC DESIGN CODE—LFD 14
12DETEXAMPLE 4.1
DESIGN EXAMPLE 4.1STEP 8: COMPUTE SHEARS AND
MOMENTS (CONTINUED)
Since the direction of earthquake mo-tion can vary, the values of kh and kv willalso vary (i.e., from positive to nega-tive). First we compute shear occurringin both the vertical and horizontalplanes.
These values act over a distance of6.667 ft (i.e., distance between piles)so we must divide the shears (andmoments) by the amount to get a valueper foot of abutment.
From the computation of vertical shearit can be seen that there is no uplift. Theaxial force per foot of abutment is com-puted using the maximum value.
The calculation for moment shown isthe worst case (i.e., kh < 0 and kv < 0).When performing a seismic design, theengineer should check all combina-tions of sign for kh and kv to determinewhich produces the worst case. For thesake of brevity, we have shown only theworst case situation. Like the shearvalues above, the moment is divided bythe distance between piles to get amoment per foot of abutment.
STEP 8: Compute Shears and Moments (Continued)
= −(17.5 k + 6.7 k + 13.3 k)(1 − 0.10) ➠ −33.75 k
[kv > 0]−(DL + W1 + W2)(1 − kv)
[kv < 0]
= −(17.5 k + 6.7 k + 13.3 k)(1 + 0.10) ➠ −41.25 k
−(DL + W1 + W2)(1 + kv)
khDL + khW1 + khW2 + VY + PAE + PA
= (0.285)(17.5k + 6.7k + 13.3k) + 8.31k + 13.73k + 8.53kAxial Force:
➠ FA = 6.19 k/ft
Shear Force:
➠ V = 6.19 k/ft
[kh < 0] [kv < 0]
4.83VY + 0.67DL(1+kv) + 4.8PAE + 2.67PA+ 6W1kh + 2W2kh − 0.83W1(1+kv)
(4.83)(8.31) = 40.14 ft-k(0.67)(17.5)(1+0.1) = 12.90 ft-k(4.8)(13.73) = 65.90 ft-k(2.67)(8.53) = 22.78 ft-k(6.0)(6.7)(0.285) = 11.46 ft-k(2.0)(13.3)(0.285) = 7.58 ft-k(−0.83)(6.7)(1+0.1) = −6.12 ft-kTOTAL = 154.64 ft-k
Controlling Moment:
➠ M = 23.19 ft-k/ft
Differential settlement can arise from problems with the soil such asconsolidation or soil bearing failure. Lateral movement or sliding of theabutment can be caused by changes in the soil characteristics, consolidation,seepage, or failure of the slope. Rotational movement can result from thebackfill material becoming saturated with water or erosion of the side slopes.
Another factor which can initiate any of the above referenced stabilityproblems is scour. When a bridge abutment is subjected to potential scourdamages, it should be supported by deep foundations (piles), unless thespread footing is supported by the solid rock. If piles are shorter than 15 feet,they should be socketed into rock by drilling a hole in the rock, and be castin the rock with concrete.
When an abutment is fully exposed to underpass traffic, eithervehicular or marine, the potential also exists for impact damage. Generally,this is more of a problem for piers than it is for abutments; however, somesite geometries necessitate the exposure of abutment elements to traffic.
Rehabilitation and Maintenance
[4.1.8, Part 3]
ABUTMENTS
➠ 41.26 k
V = 0 :∑
V=0:∑
H = 0 :∑
F = V
Dist. Between Piles =
41.25 k6.667 ftA
MAX
V = H
Dist. Between Piles =
41.26 k6.667 ft
M = 0 :A∑
M = Worst Case MomentDist. Between Piles
= 154.68 ft k
6.667 ft⋅
Downloaded from Digital Engineering Library @ McGraw-Hill (www.digitalengineeringlibrary.com)Copyright © 2006 The McGraw-Hill Companies. All rights reserved.
Any use is subject to the Terms of Use as given at the website.
Design of Substructure Elements
396 SECTION 4 THE SUBSTRUCTURE
If such a situation occurs, the abutment (like piers) should be equipped witha protective barrier system to ensure that the stability of the abutment isnot compromised by accidental impact. This is particularly a problem forabutments which are supported by exposed piles. Such a configuration isoften used in bridges present in marine environments. When piles areexposed in such a fashion, collision with marine traffic can result not onlyin possible damage to the abutment itself, but failure of the end span.
To protect the abutment, a fender or dolphin system should beinstalled. A dolphin is a collection of piles, equipped with protective capswhich are positioned in a circle around a center pile with their upper endsjoined together. Dolphins can be constructed out of timber, steel tubes, orsheet piling.
A fender is a protective system which can be composed of driven piles,rubber, spring elements, or hydraulic-pneumatic components, designed toabsorb the impact from a vehicle and thereby protect the bridge elementbehind it. Fender systems come in a variety of sizes and can be specifiedto withstand loads which range from the very small to the very large.
4. Bridge Seat Deterioration. As discussed earlier in Section 2.3.3,Part 2, extreme deterioration of a bridge seat can severely compromise theintegrity of a structure. Damage to bridge seats, whether they be in the formof individual pedestals or a single bench (e.g., breastwall) is evidenced byspalling, scaling, pop-outs, and/or sloughing off at corners (as we saw forgeneral surface deterioration).
Some of the potential causes of deterioration to an abutment’s bridgeseats are [Ref. 4.6]:
❏ Chemical attack❏ Poor aggregates❏ Poor concrete❏ Thermal expansion and contraction❏ Inadequate reinforcement
Once again, the principal culprit is a leaking joint. Therefore, the first lineof defense that a maintenance department has in protecting an abutment’sbridge seats is to ensure that the joint over the abutment is functioningproperly. If a structure is due for rehabilitation, serious consideration shouldbe given to eliminating joints whenever and wherever possible. This is notalways an option because of obvious economic reasons. If pursued, however,the elimination of joints will greatly enhance the longevity of a bridge. Ifeliminating joints is not possible, an effective way to protect bridge seats isto install neoprene trough under the expansion joint, between the backwalland the superstructure. Another form of preventive maintenance which canbe taken is to apply an epoxy protective coating to pedestals to guard againstdeterioration due to moisture. For new bridge design, epoxy coatedreinforcing steel should be used at the bridge seat area.
Repair of damaged bridge seats may require jacking of the superstruc-ture to correct the problem. The level of repair will naturally varydepending on the extent of deterioration present. At one end of thespectrum, repair could consist of simply removing to sound concrete and
Rehabilitation and Maintenance
[4.1.8, Part 3]
traffic can result not only inpossible damage to the abut-ment itself, but failure of theend span.
hen piles are exposed...collision with marineW
ation should be given to elimi-nating joints whenever andwherever possible.
f a structure is due for reha-bilitation, serious consider-I
Downloaded from Digital Engineering Library @ McGraw-Hill (www.digitalengineeringlibrary.com)Copyright © 2006 The McGraw-Hill Companies. All rights reserved.
Any use is subject to the Terms of Use as given at the website.
Design of Substructure Elements
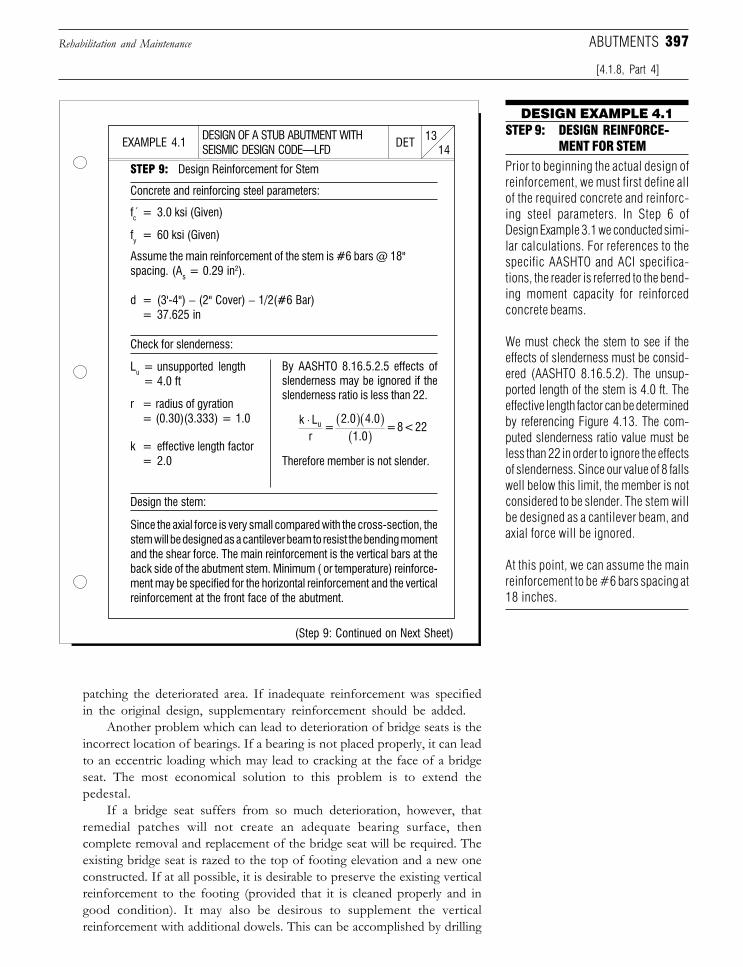
397
DESIGN OF A STUB ABUTMENT WITHSEISMIC DESIGN CODE—LFD 14
13DETEXAMPLE 4.1
DESIGN EXAMPLE 4.1STEP 9: DESIGN REINFORCE-
MENT FOR STEM
Prior to beginning the actual design ofreinforcement, we must first define allof the required concrete and reinforc-ing steel parameters. In Step 6 ofDesign Example 3.1 we conducted simi-lar calculations. For references to thespecific AASHTO and ACI specifica-tions, the reader is referred to the bend-ing moment capacity for reinforcedconcrete beams.
We must check the stem to see if theeffects of slenderness must be consid-ered (AASHTO 8.16.5.2). The unsup-ported length of the stem is 4.0 ft. Theeffective length factor can be determinedby referencing Figure 4.13. The com-puted slenderness ratio value must beless than 22 in order to ignore the effectsof slenderness. Since our value of 8 fallswell below this limit, the member is notconsidered to be slender. The stem willbe designed as a cantilever beam, andaxial force will be ignored.
At this point, we can assume the mainreinforcement to be #6 bars spacing at18 inches.
STEP 9: Design Reinforcement for Stem
Concrete and reinforcing steel parameters:
fc = 3.0 ksi (Given)
Assume the main reinforcement of the stem is #6 bars @ 18"spacing. (As = 0.29 in2).
d = (3'-4") − (2" Cover) − 1/2(#6 Bar)= 37.625 in
fy = 60 ksi (Given)
Check for slenderness:
Lu = unsupported length= 4.0 ft
r = radius of gyration= (0.30)(3.333) = 1.0
k = effective length factor= 2.0
By AASHTO 8.16.5.2.5 effects ofslenderness may be ignored if theslenderness ratio is less than 22.
Therefore member is not slender.
Design the stem:
(Step 9: Continued on Next Sheet)
patching the deteriorated area. If inadequate reinforcement was specifiedin the original design, supplementary reinforcement should be added.
Another problem which can lead to deterioration of bridge seats is theincorrect location of bearings. If a bearing is not placed properly, it can leadto an eccentric loading which may lead to cracking at the face of a bridgeseat. The most economical solution to this problem is to extend thepedestal.
If a bridge seat suffers from so much deterioration, however, thatremedial patches will not create an adequate bearing surface, thencomplete removal and replacement of the bridge seat will be required. Theexisting bridge seat is razed to the top of footing elevation and a new oneconstructed. If at all possible, it is desirable to preserve the existing verticalreinforcement to the footing (provided that it is cleaned properly and ingood condition). It may also be desirous to supplement the verticalreinforcement with additional dowels. This can be accomplished by drilling
Rehabilitation and Maintenance
[4.1.8, Part 4]
ABUTMENTS
Since the axial force is very small compared with the cross-section, thestem will be designed as a cantilever beam to resist the bending momentand the shear force. The main reinforcement is the vertical bars at theback side of the abutment stem. Minimum ( or temperature) reinforce-ment may be specified for the horizontal reinforcement and the verticalreinforcement at the front face of the abutment.
k Lr
= 2.0 4.0
1.0 = 8 < 22u⋅ ( )( )
( )
Downloaded from Digital Engineering Library @ McGraw-Hill (www.digitalengineeringlibrary.com)Copyright © 2006 The McGraw-Hill Companies. All rights reserved.
Any use is subject to the Terms of Use as given at the website.
Design of Substructure Elements
398 SECTION 4 THE SUBSTRUCTURE
and grouting new reinforcement into the existing footing. If, however, theexisting reinforcement is in such bad condition that it can not be salvaged,then new reinforcing steel must be used entirely.
Whenever possible, the rehabilitation of any component in a highwaybridge should be made to conform to the current details and practices usedby a transportation department. Using the example of a deteriorated bridgeseat that is to be completely replaced, if the current detail used by an agencyis to utilize a breastwall rather than a set of freestanding pedestals, then thisalternate should be investigated.
With an eye toward aesthetics, however, any partial replacement workperformed should be detailed to reflect other components of a structure(e.g., both abutments should either use freestanding pedestals or breast-walls, not a mix of the two).
5. Sheet Piling Abutments. An abutment constructed with steelsheet piling was shown earlier in Figure 1.8. Steel sheeting is also sometimesused as an abutment material in marine environments. When placed in suchan environment, steel sheeting is susceptible to deterioration through thepresence of high water or varying wet-dry cycles. When placed close tounderpass traffic, like the steel sheeting abutment in Figure 1.8, accidentalcollision with traffic is another potential problem.
An obvious remedial measure which can be taken is to remove andreplace any damaged or deteriorated sheeting. Another option is to drivenew sheet piling around the existing abutment, filling the void between thetwo with new backing material [Ref. 4.6]. Like other abutments, thematerial behind a steel sheet piling abutment must be kept free from water.To enhance the longevity of this type of abutment a coating or waterproof-ing material (e.g., synthetic resin, linseed oil, etc.) should be used. Areas onsteel sheet piling abutments which are continually exposed to wet-dry cyclesshould receive a protective coating.
6. Stone Masonry Abutments. Stone masonry abutments need tobe maintained so that cracks are not allowed to develop, especially atmortared joints. While stone does not deteriorate as fast as concrete, itstensile strength is generally less than that of concrete [Ref. 4.6]. This canlead to problems, particularly when differential settlement occurs. Sincedeterioration in stone masonry abutments can propagate quickly, it isimportant that any cracks which are present be immediately sealed withmortar to prevent the intrusion of moisture. Defective joints should beraked out and then rejointed. This can be accomplished with pressureinjection with epoxy. Also, any vegetation which has begun to grow intocracks should be removed.
7. MSE Systems. MSE (mechanically stabilized earth) systems werediscussed earlier in Section 4.1.1, Part 10. These systems consist of threebasic components:
❏ The precast concrete facing units or skin❏ The metal or polymetric reinforcement❏ The soil
Rehabilitation and Maintenance
[4.1.8, Part 4]
component in a highwaybridge should be made to con-form to the current details andpractices used by a transpor-tation department.
henever possible, therehabilitation of anyW
-
that cracks are not allowed todevelop, especially at mortaredjoints.
tone masonry abutmentsneed to be maintained soS
Downloaded from Digital Engineering Library @ McGraw-Hill (www.digitalengineeringlibrary.com)Copyright © 2006 The McGraw-Hill Companies. All rights reserved.
Any use is subject to the Terms of Use as given at the website.
Design of Substructure Elements
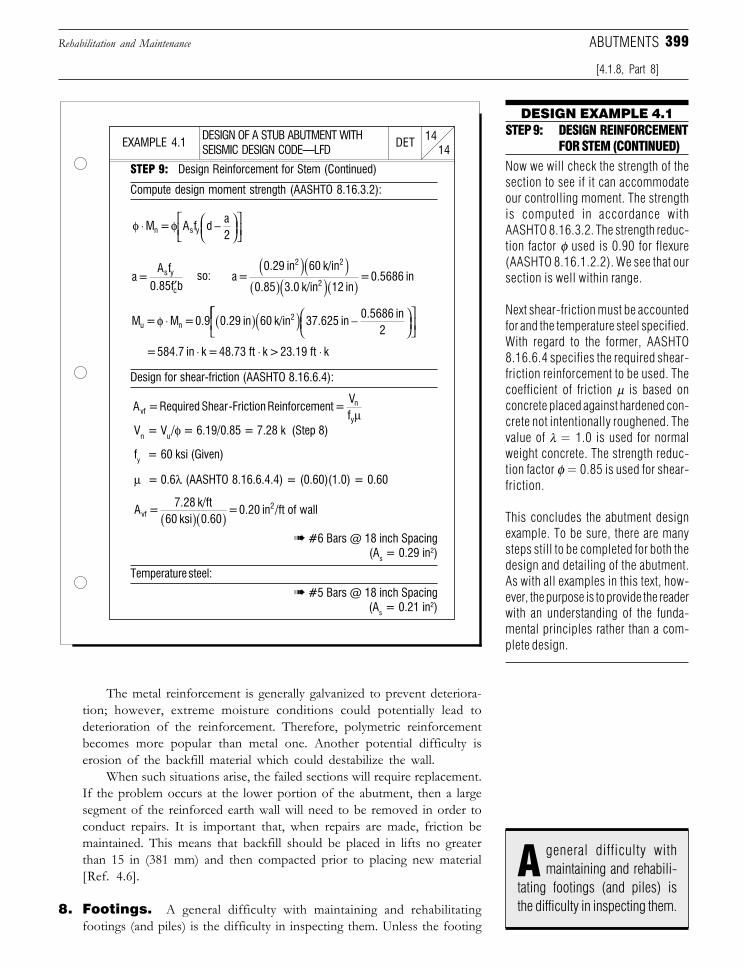
399
DESIGN OF A STUB ABUTMENT WITHSEISMIC DESIGN CODE—LFD 14
14DETEXAMPLE 4.1
DESIGN EXAMPLE 4.1STEP 9: DESIGN REINFORCEMENT
FOR STEM (CONTINUED)
Now we will check the strength of thesection to see if it can accommodateour controlling moment. The strengthis computed in accordance withAASHTO 8.16.3.2. The strength reduc-tion factor φ used is 0.90 for flexure(AASHTO 8.16.1.2.2). We see that oursection is well within range.
Next shear-friction must be accountedfor and the temperature steel specified.With regard to the former, AASHTO8.16.6.4 specifies the required shear-friction reinforcement to be used. Thecoefficient of friction µ is based onconcrete placed against hardened con-crete not intentionally roughened. Thevalue of λ = 1.0 is used for normalweight concrete. The strength reduc-tion factor φ = 0.85 is used for shear-friction.
This concludes the abutment designexample. To be sure, there are manysteps still to be completed for both thedesign and detailing of the abutment.As with all examples in this text, how-ever, the purpose is to provide the readerwith an understanding of the funda-mental principles rather than a com-plete design.
STEP 9: Design Reinforcement for Stem (Continued)
Compute design moment strength (AASHTO 8.16.3.2):
so:
Design for shear-friction (AASHTO 8.16.6.4):
➠ #5 Bars @ 18 inch Spacing(As = 0.21 in2)
Temperature steel:
Vn = Vu/φ = 6.19/0.85 = 7.28 k (Step 8)
fy = 60 ksi (Given)
µ = 0.6λ (AASHTO 8.16.6.4.4) = (0.60)(1.0) = 0.60
➠ #6 Bars @ 18 inch Spacing (As = 0.29 in2)
The metal reinforcement is generally galvanized to prevent deteriora-tion; however, extreme moisture conditions could potentially lead todeterioration of the reinforcement. Therefore, polymetric reinforcementbecomes more popular than metal one. Another potential difficulty iserosion of the backfill material which could destabilize the wall.
When such situations arise, the failed sections will require replacement.If the problem occurs at the lower portion of the abutment, then a largesegment of the reinforced earth wall will need to be removed in order toconduct repairs. It is important that, when repairs are made, friction bemaintained. This means that backfill should be placed in lifts no greaterthan 15 in (381 mm) and then compacted prior to placing new material[Ref. 4.6].
8. Footings. A general difficulty with maintaining and rehabilitatingfootings (and piles) is the difficulty in inspecting them. Unless the footing
Rehabilitation and Maintenance
[4.1.8, Part 8]
ABUTMENTS
φ φ⋅ −
M = A f d a2n s y
a = A f
0.85f bs y
c′a =
0.29 in 60 k/in
0.85 3.0 k/in 12 in = 0.5686 in
2 2
2
( )( )( )( )( )
M = M = 0.9 0.29 in 60 k/in 37.625 in 0.5686 in
2u n2φ ⋅ ( )( ) −
= 584.7 in k = 48.73 ft k > 23.19 ft k ⋅ ⋅ ⋅
A =Required Shear-Friction Reinforcement = Vfvf
n
yµ
A = 7.28 k/ft
60 ksi 0.60 = 0.20 in /ft of wallvf
2
( )( )
tating footings (and piles) isthe difficulty in inspecting them.
general difficulty withmaintaining and rehabili-A
Downloaded from Digital Engineering Library @ McGraw-Hill (www.digitalengineeringlibrary.com)Copyright © 2006 The McGraw-Hill Companies. All rights reserved.
Any use is subject to the Terms of Use as given at the website.
Design of Substructure Elements
400 SECTION 4 THE SUBSTRUCTURE
or piles are exposed (as in a pile bent) these elements are buried underseveral feet of earth. There are, however, indicators of footing problemswhich can be evidenced by associated problems in the portion of theabutment which is above ground.
We have already discussed the problems which are associated withsettlement of an abutment. The presence of excessive vertical crackingcould indicate foundation problems below the surface of the earth.Therefore, inspectors should look for cracks which run straight up theabutment stem.
If the footing is exposed (i.e., located above grade), either by design orthrough erosion and/or scour, spalling and other forms of deterioration ofthe concrete should be investigated. To repair this damage, it may benecessary to construct a cofferdam around the footing either through theuse of steel sheet piling or sandbags.
9. Piles. Piles are used when the soil under a footing cannot provideadequate support for the substructure (see Section 1.1.1 and Figure 1.7).Piles can often be found in areas that are highly susceptible to erosion andscour. This implies that many piles will be used in environments which canbe considered as harsh.
As mentioned for footings above, if a pile is exposed, then it isimportant to ensure that the pile does not lose section properties todeterioration. Concrete piles are susceptible to all of the adverse deterio-ration other concrete elements are subjected to (e.g., spalling, scaling, etc.).Other types of piles include timber piles which can rot and metal piles whichcan corrode.
With regard to the latter, timber piles can suffer from attack by verminwhich burrow and tunnel their way to the buried member [Ref. 4.6]. Inmost instances, the vermin will use timber piles for shelter, food, or both(see also Section 2.3.3, Part 5). This is of particular concern in marineenvironments where they are waterborne and can damage timber piles wellbelow the mud line. One method of protecting timber piles is to have thempressure treated with wood preservatives in accordance with AASHTOM133 standard.
Like columns, severely deteriorated piles can be rehabilitated byjacketing the pile using steel plates. This jacketing does not necessarily haveto extend the full length of the pile. A recommended approach is to jacketa pile approximately 2 ft (0.61 m) above to 2 ft below the area which hasdeteriorated [Ref. 4.6].
When steel piles are used (e.g., steel H piles), it is possible to repairdeterioration by adding a section to the deteriorated portions. This isgenerally recommended for less severe deterioration with losses of sectionup to 50 percent in smaller and fewer area. Alternatively, the deterioratedsteel pile can be encased. When steel piles extend underwater, encasementin usually the preferred method of rehabilitation. If the deterioratedsegment of steel pile is located in a dry area or aboveground, anothermethod of repair is to splice a piece of new section to the existing pile. Likeany steel member, when exposed to moisture, the steel should be providedwith a protective coating to prevent corrosion.
Rehabilitation and Maintenance
[4.1.8, Part 8]
hen steel piles extendunderwater, encase-
ment in usually the preferredmethod of rehabilitation.
W
Downloaded from Digital Engineering Library @ McGraw-Hill (www.digitalengineeringlibrary.com)Copyright © 2006 The McGraw-Hill Companies. All rights reserved.
Any use is subject to the Terms of Use as given at the website.
Design of Substructure Elements
401
For concrete piles, repair of deteriorated sections is undertaken usingtechniques which are very similar to those for other concrete elements. Thedamaged concrete is removed to a distance below the reinforcing steel. Anydamaged reinforcing is replaced and the existing steel remaining is cleaned.The surface of the exposed concrete into which the patch is to be madeshould be cleaned and coated with a bonding compound. The concreteused to patch the section should be nonshrink or quick setting, so that thepropagation of cracks is minimized at the patch location.
Some cracking in concrete piles can occur as a result of the drivingprocess itself. These cracks are tension related and occur when stresses aregreater than the concrete’s modulus of rupture. When this has occurred,the cracks should be sealed to prevent the intrusion of silt, debris, andmoisture. Further deterioration could be initiated by the formation of icein cracks [Ref. 4.6].
Like footings described in Part 8 above, repair of piles may require theconstruction of a cofferdam around the deteriorated pile or piles. Thedriving of sheet piling to create the cofferdam can be somewhat compli-cated in an existing bridge site because of potential interference with thebridge superstructure above. In some cases, the only option is to removea segment of the superstructure temporarily so that the sheeting can bedriven.
To prevent future deterioration to piles (and footings for that matter),it is important to provide for proper site drainage and eliminate anypotential sources of erosion of the earth which surrounds, and protects, thepiles. If the piles are located in an area which is susceptible to scour, it maybe necessary to place additional riprap or other protective material. Whenplacing the fill material back around the foundation, once work iscompleted, the fill should be compacted as much as possible.
4.2 PIERS
The development of bridge piers parallels the growth of the modernhighway system. Previously, the use of bridge piers was confined to structurescrossing rivers or railways. With the development of massive transportationnetworks, like the U.S. Interstate (see Section 1.2), the need for land piers tofacilitate grade-separated highways increased dramatically [Ref. 4.8].
A pier is a substructure which provides the basic function of supportingspans at intermediate points between end supports (abutments). Piers arepredominately constructed using concrete, although steel and, to a lesserdegree, timber are also used. The concrete is generally conventionally rein-forced. Prestressed concrete, however, is sometimes used as a pier material forspecial structures.
The basic design functions of a highway bridge pier can be summarized bythe following list. In general, a pier is designed to:
❏ Carry its own weight❏ Sustain superstructure dead loads, live loads, and lateral loads❏ Transmit all loads to the foundation
DID YOU KNOW
THAT ancient Romanengineers im-
pregnated their structural tim-ber with oils and resins? Inaddition to this, they also se-lected the type of timber basedon the intended use. For un-derwater pile foundations atpiers, the Romans preferredoak and ash because of theirhigh durability [Ref. 4.7].
[4.2]
PIERS
f the piles are located in anarea which is susceptible to
scour, it may be necessary toplace additional riprap or otherprotective material.
I
Downloaded from Digital Engineering Library @ McGraw-Hill (www.digitalengineeringlibrary.com)Copyright © 2006 The McGraw-Hill Companies. All rights reserved.
Any use is subject to the Terms of Use as given at the website.
Design of Substructure Elements
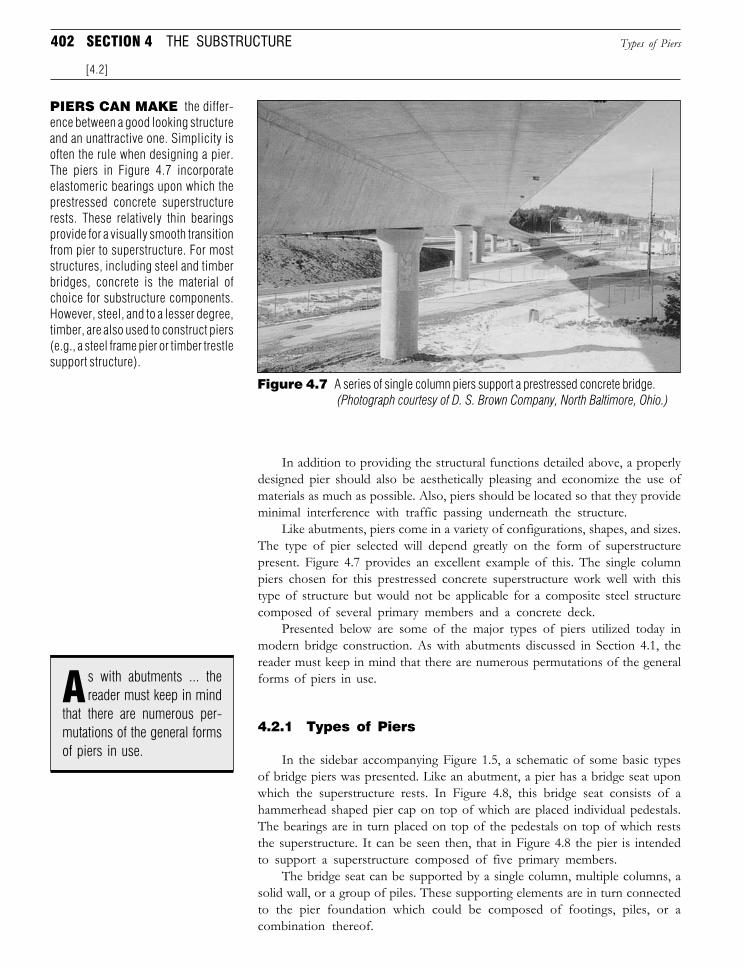
402 SECTION 4 THE SUBSTRUCTURE
In addition to providing the structural functions detailed above, a properlydesigned pier should also be aesthetically pleasing and economize the use ofmaterials as much as possible. Also, piers should be located so that they provideminimal interference with traffic passing underneath the structure.
Like abutments, piers come in a variety of configurations, shapes, and sizes.The type of pier selected will depend greatly on the form of superstructurepresent. Figure 4.7 provides an excellent example of this. The single columnpiers chosen for this prestressed concrete superstructure work well with thistype of structure but would not be applicable for a composite steel structurecomposed of several primary members and a concrete deck.
Presented below are some of the major types of piers utilized today inmodern bridge construction. As with abutments discussed in Section 4.1, thereader must keep in mind that there are numerous permutations of the generalforms of piers in use.
4.2.1 Types of Piers
In the sidebar accompanying Figure 1.5, a schematic of some basic typesof bridge piers was presented. Like an abutment, a pier has a bridge seat uponwhich the superstructure rests. In Figure 4.8, this bridge seat consists of ahammerhead shaped pier cap on top of which are placed individual pedestals.The bearings are in turn placed on top of the pedestals on top of which reststhe superstructure. It can be seen then, that in Figure 4.8 the pier is intendedto support a superstructure composed of five primary members.
The bridge seat can be supported by a single column, multiple columns, asolid wall, or a group of piles. These supporting elements are in turn connectedto the pier foundation which could be composed of footings, piles, or acombination thereof.
Types of Piers
[4.2]
Figure 4.7 A series of single column piers support a prestressed concrete bridge.(Photograph courtesy of D. S. Brown Company, North Baltimore, Ohio.)
PIERS CAN MAKE the differ-ence between a good looking structureand an unattractive one. Simplicity isoften the rule when designing a pier.The piers in Figure 4.7 incorporateelastomeric bearings upon which theprestressed concrete superstructurerests. These relatively thin bearingsprovide for a visually smooth transitionfrom pier to superstructure. For moststructures, including steel and timberbridges, concrete is the material ofchoice for substructure components.However, steel, and to a lesser degree,timber, are also used to construct piers(e.g., a steel frame pier or timber trestlesupport structure).
s with abutments ... thereader must keep in mind
that there are numerous per-mutations of the general formsof piers in use.
A
Downloaded from Digital Engineering Library @ McGraw-Hill (www.digitalengineeringlibrary.com)Copyright © 2006 The McGraw-Hill Companies. All rights reserved.
Any use is subject to the Terms of Use as given at the website.
Design of Substructure Elements
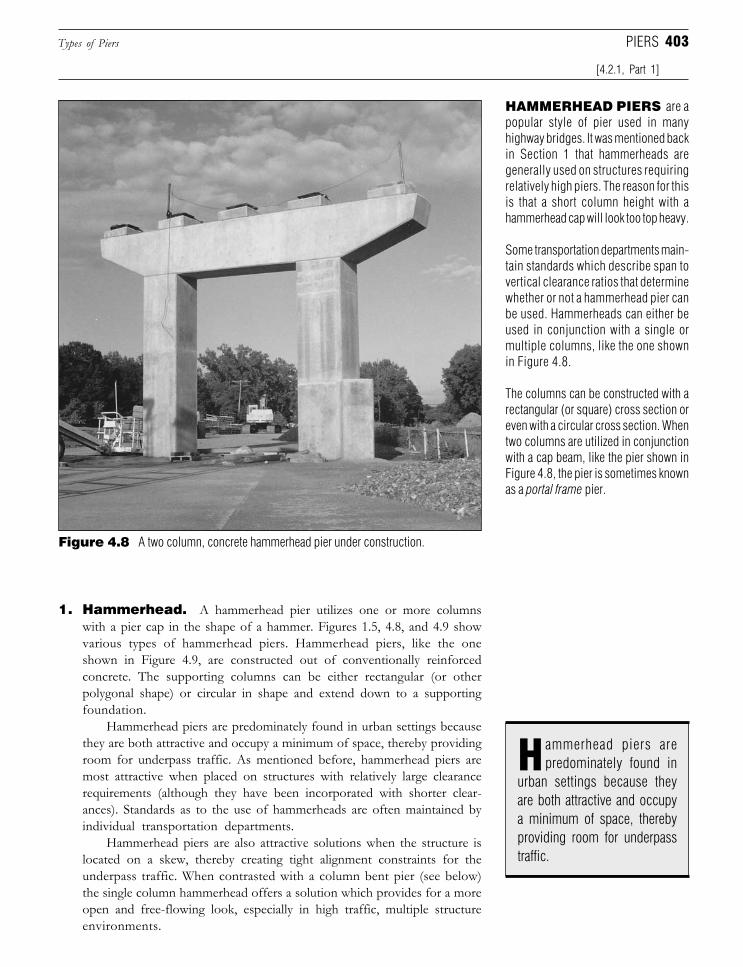
403
1. Hammerhead. A hammerhead pier utilizes one or more columnswith a pier cap in the shape of a hammer. Figures 1.5, 4.8, and 4.9 showvarious types of hammerhead piers. Hammerhead piers, like the oneshown in Figure 4.9, are constructed out of conventionally reinforcedconcrete. The supporting columns can be either rectangular (or otherpolygonal shape) or circular in shape and extend down to a supportingfoundation.
Hammerhead piers are predominately found in urban settings becausethey are both attractive and occupy a minimum of space, thereby providingroom for underpass traffic. As mentioned before, hammerhead piers aremost attractive when placed on structures with relatively large clearancerequirements (although they have been incorporated with shorter clear-ances). Standards as to the use of hammerheads are often maintained byindividual transportation departments.
Hammerhead piers are also attractive solutions when the structure islocated on a skew, thereby creating tight alignment constraints for theunderpass traffic. When contrasted with a column bent pier (see below)the single column hammerhead offers a solution which provides for a moreopen and free-flowing look, especially in high traffic, multiple structureenvironments.
Types of Piers
[4.2.1, Part 1]
PIERS
HAMMERHEAD PIERS are apopular style of pier used in manyhighway bridges. It was mentioned backin Section 1 that hammerheads aregenerally used on structures requiringrelatively high piers. The reason for thisis that a short column height with ahammerhead cap will look too top heavy.
Some transportation departments main-tain standards which describe span tovertical clearance ratios that determinewhether or not a hammerhead pier canbe used. Hammerheads can either beused in conjunction with a single ormultiple columns, like the one shownin Figure 4.8.
The columns can be constructed with arectangular (or square) cross section oreven with a circular cross section. Whentwo columns are utilized in conjunctionwith a cap beam, like the pier shown inFigure 4.8, the pier is sometimes knownas a portal frame pier.
Figure 4.8 A two column, concrete hammerhead pier under construction.
ammerhead piers arepredominately found in
urban settings because theyare both attractive and occupya minimum of space, therebyproviding room for underpasstraffic.
H
Downloaded from Digital Engineering Library @ McGraw-Hill (www.digitalengineeringlibrary.com)Copyright © 2006 The McGraw-Hill Companies. All rights reserved.
Any use is subject to the Terms of Use as given at the website.
Design of Substructure Elements
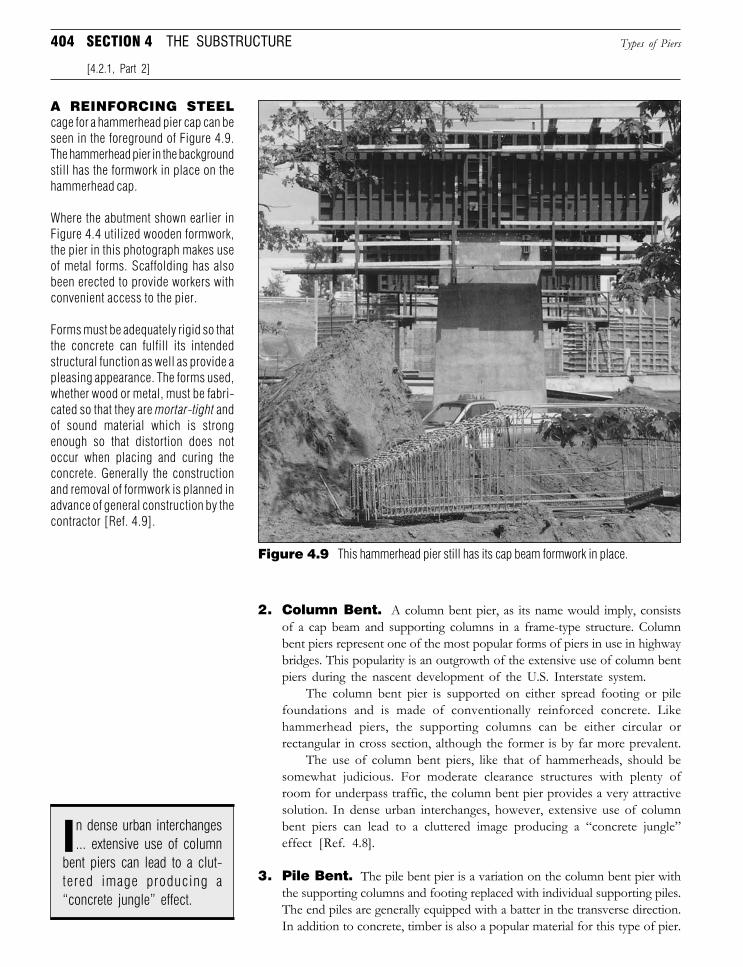
404 SECTION 4 THE SUBSTRUCTURE
2. Column Bent. A column bent pier, as its name would imply, consistsof a cap beam and supporting columns in a frame-type structure. Columnbent piers represent one of the most popular forms of piers in use in highwaybridges. This popularity is an outgrowth of the extensive use of column bentpiers during the nascent development of the U.S. Interstate system.
The column bent pier is supported on either spread footing or pilefoundations and is made of conventionally reinforced concrete. Likehammerhead piers, the supporting columns can be either circular orrectangular in cross section, although the former is by far more prevalent.
The use of column bent piers, like that of hammerheads, should besomewhat judicious. For moderate clearance structures with plenty ofroom for underpass traffic, the column bent pier provides a very attractivesolution. In dense urban interchanges, however, extensive use of columnbent piers can lead to a cluttered image producing a “concrete jungle”effect [Ref. 4.8].
3. Pile Bent. The pile bent pier is a variation on the column bent pier withthe supporting columns and footing replaced with individual supporting piles.The end piles are generally equipped with a batter in the transverse direction.In addition to concrete, timber is also a popular material for this type of pier.
Types of Piers
[4.2.1, Part 2]
A REINFORCING STEELcage for a hammerhead pier cap can beseen in the foreground of Figure 4.9.The hammerhead pier in the backgroundstill has the formwork in place on thehammerhead cap.
Where the abutment shown earlier inFigure 4.4 utilized wooden formwork,the pier in this photograph makes useof metal forms. Scaffolding has alsobeen erected to provide workers withconvenient access to the pier.
Forms must be adequately rigid so thatthe concrete can fulfill its intendedstructural function as well as provide apleasing appearance. The forms used,whether wood or metal, must be fabri-cated so that they are mortar-tight andof sound material which is strongenough so that distortion does notoccur when placing and curing theconcrete. Generally the constructionand removal of formwork is planned inadvance of general construction by thecontractor [Ref. 4.9].
Figure 4.9 This hammerhead pier still has its cap beam formwork in place.
n dense urban interchanges... extensive use of column
bent piers can lead to a clut-tered image producing a“concrete jungle” effect.
I
Downloaded from Digital Engineering Library @ McGraw-Hill (www.digitalengineeringlibrary.com)Copyright © 2006 The McGraw-Hill Companies. All rights reserved.
Any use is subject to the Terms of Use as given at the website.
Design of Substructure Elements
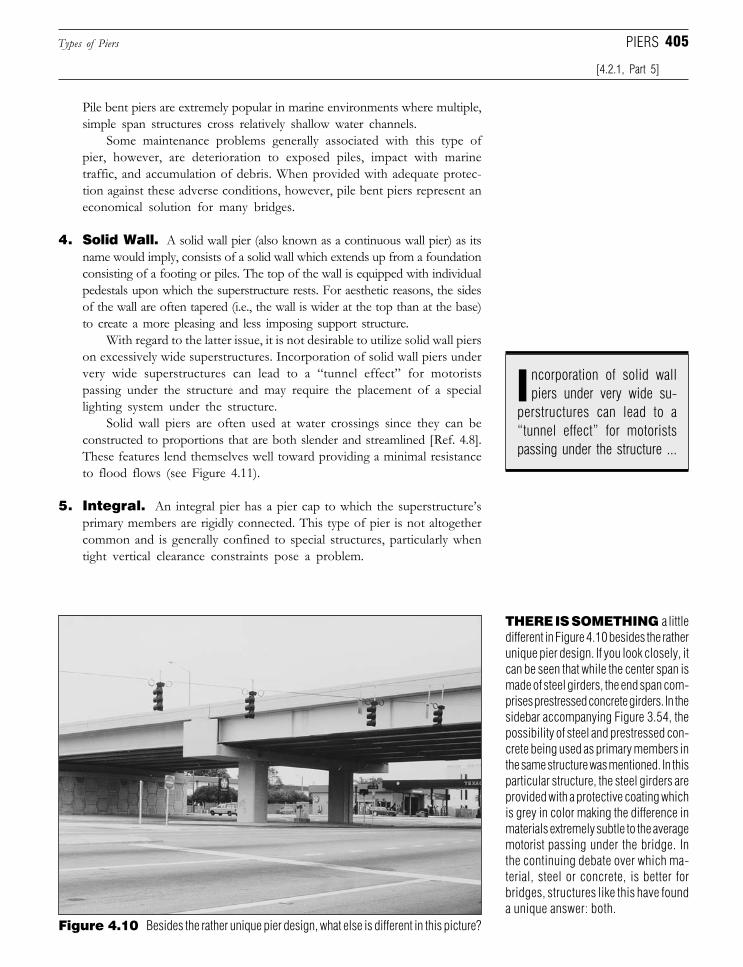
405
Pile bent piers are extremely popular in marine environments where multiple,simple span structures cross relatively shallow water channels.
Some maintenance problems generally associated with this type ofpier, however, are deterioration to exposed piles, impact with marinetraffic, and accumulation of debris. When provided with adequate protec-tion against these adverse conditions, however, pile bent piers represent aneconomical solution for many bridges.
4. Solid Wall. A solid wall pier (also known as a continuous wall pier) as itsname would imply, consists of a solid wall which extends up from a foundationconsisting of a footing or piles. The top of the wall is equipped with individualpedestals upon which the superstructure rests. For aesthetic reasons, the sidesof the wall are often tapered (i.e., the wall is wider at the top than at the base)to create a more pleasing and less imposing support structure.
With regard to the latter issue, it is not desirable to utilize solid wall pierson excessively wide superstructures. Incorporation of solid wall piers undervery wide superstructures can lead to a “tunnel effect” for motoristspassing under the structure and may require the placement of a speciallighting system under the structure.
Solid wall piers are often used at water crossings since they can beconstructed to proportions that are both slender and streamlined [Ref. 4.8].These features lend themselves well toward providing a minimal resistanceto flood flows (see Figure 4.11).
5. Integral. An integral pier has a pier cap to which the superstructure’sprimary members are rigidly connected. This type of pier is not altogethercommon and is generally confined to special structures, particularly whentight vertical clearance constraints pose a problem.
Types of Piers
[4.2.1, Part 5]
PIERS
ncorporation of solid wallpiers under very wide su-
perstructures can lead to a“tunnel effect” for motoristspassing under the structure ...
I
Figure 4.10 Besides the rather unique pier design, what else is different in this picture?
THERE IS SOMETHING a littledifferent in Figure 4.10 besides the ratherunique pier design. If you look closely, itcan be seen that while the center span ismade of steel girders, the end span com-prises prestressed concrete girders. In thesidebar accompanying Figure 3.54, thepossibility of steel and prestressed con-crete being used as primary members inthe same structure was mentioned. In thisparticular structure, the steel girders areprovided with a protective coating whichis grey in color making the difference inmaterials extremely subtle to the averagemotorist passing under the bridge. Inthe continuing debate over which ma-terial, steel or concrete, is better forbridges, structures like this have founda unique answer: both.
Downloaded from Digital Engineering Library @ McGraw-Hill (www.digitalengineeringlibrary.com)Copyright © 2006 The McGraw-Hill Companies. All rights reserved.
Any use is subject to the Terms of Use as given at the website.
Design of Substructure Elements
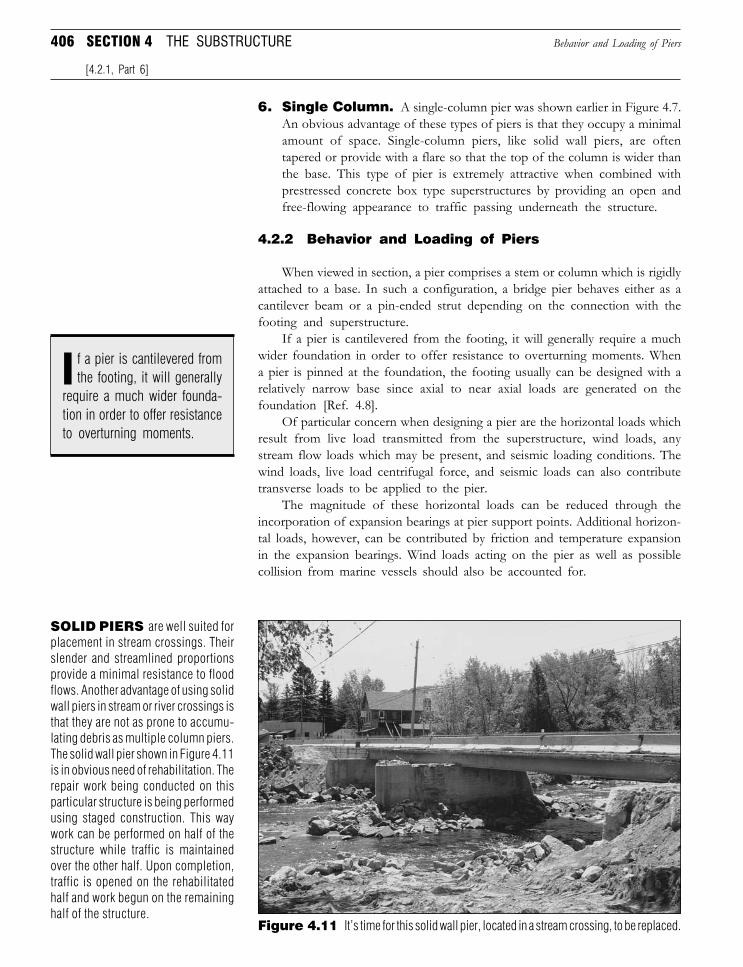
406 SECTION 4 THE SUBSTRUCTURE
6. Single Column. A single-column pier was shown earlier in Figure 4.7.An obvious advantage of these types of piers is that they occupy a minimalamount of space. Single-column piers, like solid wall piers, are oftentapered or provide with a flare so that the top of the column is wider thanthe base. This type of pier is extremely attractive when combined withprestressed concrete box type superstructures by providing an open andfree-flowing appearance to traffic passing underneath the structure.
4.2.2 Behavior and Loading of Piers
When viewed in section, a pier comprises a stem or column which is rigidlyattached to a base. In such a configuration, a bridge pier behaves either as acantilever beam or a pin-ended strut depending on the connection with thefooting and superstructure.
If a pier is cantilevered from the footing, it will generally require a muchwider foundation in order to offer resistance to overturning moments. Whena pier is pinned at the foundation, the footing usually can be designed with arelatively narrow base since axial to near axial loads are generated on thefoundation [Ref. 4.8].
Of particular concern when designing a pier are the horizontal loads whichresult from live load transmitted from the superstructure, wind loads, anystream flow loads which may be present, and seismic loading conditions. Thewind loads, live load centrifugal force, and seismic loads can also contributetransverse loads to be applied to the pier.
The magnitude of these horizontal loads can be reduced through theincorporation of expansion bearings at pier support points. Additional horizon-tal loads, however, can be contributed by friction and temperature expansionin the expansion bearings. Wind loads acting on the pier as well as possiblecollision from marine vessels should also be accounted for.
Behavior and Loading of Piers
[4.2.1, Part 6]
SOLID PIERS are well suited forplacement in stream crossings. Theirslender and streamlined proportionsprovide a minimal resistance to floodflows. Another advantage of using solidwall piers in stream or river crossings isthat they are not as prone to accumu-lating debris as multiple column piers.The solid wall pier shown in Figure 4.11is in obvious need of rehabilitation. Therepair work being conducted on thisparticular structure is being performedusing staged construction. This waywork can be performed on half of thestructure while traffic is maintainedover the other half. Upon completion,traffic is opened on the rehabilitatedhalf and work begun on the remaininghalf of the structure.
Figure 4.11 It’s time for this solid wall pier, located in a stream crossing, to be replaced.
f a pier is cantilevered fromthe footing, it will generally
require a much wider founda-tion in order to offer resistanceto overturning moments.
I
Downloaded from Digital Engineering Library @ McGraw-Hill (www.digitalengineeringlibrary.com)Copyright © 2006 The McGraw-Hill Companies. All rights reserved.
Any use is subject to the Terms of Use as given at the website.
Design of Substructure Elements
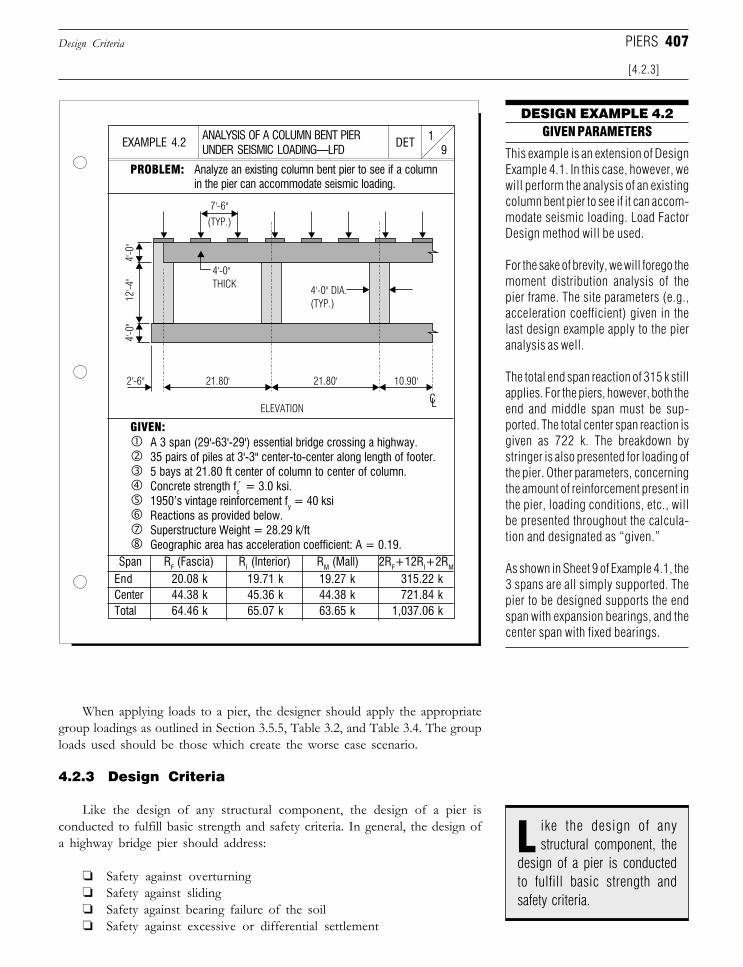
407
When applying loads to a pier, the designer should apply the appropriategroup loadings as outlined in Section 3.5.5, Table 3.2, and Table 3.4. The grouploads used should be those which create the worse case scenario.
4.2.3 Design Criteria
Like the design of any structural component, the design of a pier isconducted to fulfill basic strength and safety criteria. In general, the design ofa highway bridge pier should address:
❏ Safety against overturning❏ Safety against sliding❏ Safety against bearing failure of the soil❏ Safety against excessive or differential settlement
Design Criteria
[4.2.3]
PIERS
ANALYSIS OF A COLUMN BENT PIERUNDER SEISMIC LOADING—LFD 9
1DETEXAMPLE 4.2
DESIGN EXAMPLE 4.2GIVEN PARAMETERS
PROBLEM: Analyze an existing column bent pier to see if a columnin the pier can accommodate seismic loading.
This example is an extension of DesignExample 4.1. In this case, however, wewill perform the analysis of an existingcolumn bent pier to see if it can accom-modate seismic loading. Load FactorDesign method will be used.
For the sake of brevity, we will forego themoment distribution analysis of thepier frame. The site parameters (e.g.,acceleration coefficient) given in thelast design example apply to the pieranalysis as well.
The total end span reaction of 315 k stillapplies. For the piers, however, both theend and middle span must be sup-ported. The total center span reaction isgiven as 722 k. The breakdown bystringer is also presented for loading ofthe pier. Other parameters, concerningthe amount of reinforcement present inthe pier, loading conditions, etc., willbe presented throughout the calcula-tion and designated as “given.”
As shown in Sheet 9 of Example 4.1, the3 spans are all simply supported. Thepier to be designed supports the endspan with expansion bearings, and thecenter span with fixed bearings.
GIVEN:A 3 span (29'-63'-29') essential bridge crossing a highway.35 pairs of piles at 3'-3" center-to-center along length of footer.5 bays at 21.80 ft center of column to center of column.Concrete strength fc = 3.0 ksi.1950’s vintage reinforcement fy = 40 ksiReactions as provided below.Superstructure Weight = 28.29 k/ftGeographic area has acceleration coefficient: A = 0.19.
Span RF (Fascia) RI (Interior) RM (Mall) 2RF+12RI+2RM
End 20.08 k 19.71 k 19.27 k 315.22 kCenter 44.38 k 45.36 k 44.38 k 721.84 kTotal 64.46 k 65.07 k 63.65 k 1,037.06 k
ike the design of anystructural component, the
design of a pier is conductedto fulfill basic strength andsafety criteria.
L
ELEVATION
21.80'
4'-0"
THICK
7'-6"
(TYP.)
4'-0" DIA.
(TYP.)
4'-0
"4'
-0"
12'-
4"
2'-6" 21.80' 10.90'
Downloaded from Digital Engineering Library @ McGraw-Hill (www.digitalengineeringlibrary.com)Copyright © 2006 The McGraw-Hill Companies. All rights reserved.
Any use is subject to the Terms of Use as given at the website.
Design of Substructure Elements
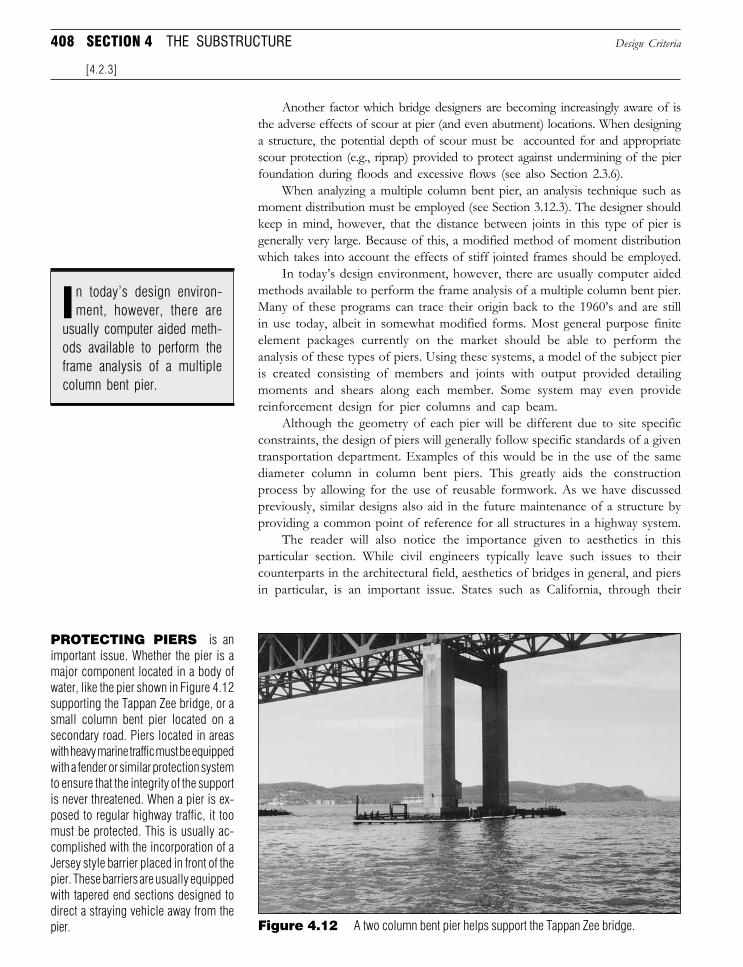
408 SECTION 4 THE SUBSTRUCTURE
Another factor which bridge designers are becoming increasingly aware of isthe adverse effects of scour at pier (and even abutment) locations. When designinga structure, the potential depth of scour must be accounted for and appropriatescour protection (e.g., riprap) provided to protect against undermining of the pierfoundation during floods and excessive flows (see also Section 2.3.6).
When analyzing a multiple column bent pier, an analysis technique such asmoment distribution must be employed (see Section 3.12.3). The designer shouldkeep in mind, however, that the distance between joints in this type of pier isgenerally very large. Because of this, a modified method of moment distributionwhich takes into account the effects of stiff jointed frames should be employed.
In today’s design environment, however, there are usually computer aidedmethods available to perform the frame analysis of a multiple column bent pier.Many of these programs can trace their origin back to the 1960’s and are stillin use today, albeit in somewhat modified forms. Most general purpose finiteelement packages currently on the market should be able to perform theanalysis of these types of piers. Using these systems, a model of the subject pieris created consisting of members and joints with output provided detailingmoments and shears along each member. Some system may even providereinforcement design for pier columns and cap beam.
Although the geometry of each pier will be different due to site specificconstraints, the design of piers will generally follow specific standards of a giventransportation department. Examples of this would be in the use of the samediameter column in column bent piers. This greatly aids the constructionprocess by allowing for the use of reusable formwork. As we have discussedpreviously, similar designs also aid in the future maintenance of a structure byproviding a common point of reference for all structures in a highway system.
The reader will also notice the importance given to aesthetics in thisparticular section. While civil engineers typically leave such issues to theircounterparts in the architectural field, aesthetics of bridges in general, and piersin particular, is an important issue. States such as California, through their
Design Criteria
[4.2.3]
Figure 4.12 A two column bent pier helps support the Tappan Zee bridge.
PROTECTING PIERS is animportant issue. Whether the pier is amajor component located in a body ofwater, like the pier shown in Figure 4.12supporting the Tappan Zee bridge, or asmall column bent pier located on asecondary road. Piers located in areaswith heavy marine traffic must be equippedwith a fender or similar protection systemto ensure that the integrity of the supportis never threatened. When a pier is ex-posed to regular highway traffic, it toomust be protected. This is usually ac-complished with the incorporation of aJersey style barrier placed in front of thepier. These barriers are usually equippedwith tapered end sections designed todirect a straying vehicle away from thepier.
n today’s design environ-ment, however, there are
usually computer aided meth-ods available to perform theframe analysis of a multiplecolumn bent pier.
I
Downloaded from Digital Engineering Library @ McGraw-Hill (www.digitalengineeringlibrary.com)Copyright © 2006 The McGraw-Hill Companies. All rights reserved.
Any use is subject to the Terms of Use as given at the website.
Design of Substructure Elements
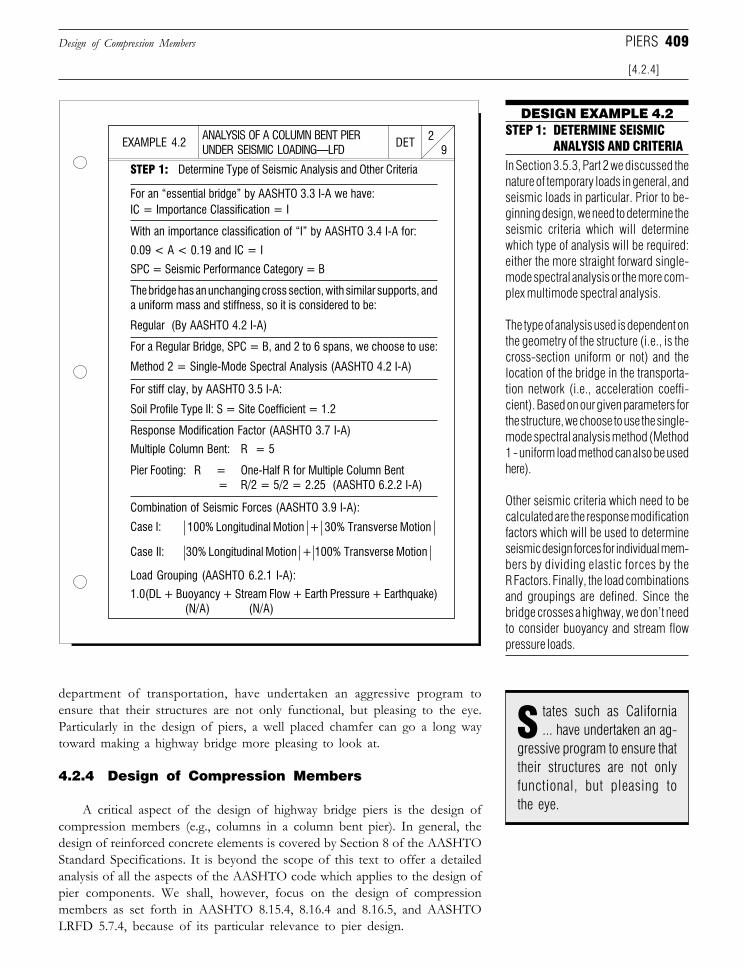
409
department of transportation, have undertaken an aggressive program toensure that their structures are not only functional, but pleasing to the eye.Particularly in the design of piers, a well placed chamfer can go a long waytoward making a highway bridge more pleasing to look at.
4.2.4 Design of Compression Members
A critical aspect of the design of highway bridge piers is the design ofcompression members (e.g., columns in a column bent pier). In general, thedesign of reinforced concrete elements is covered by Section 8 of the AASHTOStandard Specifications. It is beyond the scope of this text to offer a detailedanalysis of all the aspects of the AASHTO code which applies to the design ofpier components. We shall, however, focus on the design of compressionmembers as set forth in AASHTO 8.15.4, 8.16.4 and 8.16.5, and AASHTOLRFD 5.7.4, because of its particular relevance to pier design.
Design of Compression Members
[4.2.4]
PIERS
ANALYSIS OF A COLUMN BENT PIERUNDER SEISMIC LOADING—LFD 9
2DETEXAMPLE 4.2
DESIGN EXAMPLE 4.2
STEP 1: Determine Type of Seismic Analysis and Other Criteria
STEP 1: DETERMINE SEISMICANALYSIS AND CRITERIA
In Section 3.5.3, Part 2 we discussed thenature of temporary loads in general, andseismic loads in particular. Prior to be-ginning design, we need to determine theseismic criteria which will determinewhich type of analysis will be required:either the more straight forward single-mode spectral analysis or the more com-plex multimode spectral analysis.
The type of analysis used is dependent onthe geometry of the structure (i.e., is thecross-section uniform or not) and thelocation of the bridge in the transporta-tion network (i.e., acceleration coeffi-cient). Based on our given parameters forthe structure, we choose to use the single-mode spectral analysis method (Method1 - uniform load method can also be usedhere).
Other seismic criteria which need to becalculated are the response modificationfactors which will be used to determineseismic design forces for individual mem-bers by dividing elastic forces by theR Factors. Finally, the load combinationsand groupings are defined. Since thebridge crosses a highway, we don’t needto consider buoyancy and stream flowpressure loads.
For an “essential bridge” by AASHTO 3.3 I-A we have:IC = Importance Classification = I
With an importance classification of “I” by AASHTO 3.4 I-A for:
0.09 < A < 0.19 and IC = I
SPC = Seismic Performance Category = B
The bridge has an unchanging cross section, with similar supports, anda uniform mass and stiffness, so it is considered to be:
Regular (By AASHTO 4.2 I-A)
For a Regular Bridge, SPC = B, and 2 to 6 spans, we choose to use:
Method 2 = Single-Mode Spectral Analysis (AASHTO 4.2 I-A)
For stiff clay, by AASHTO 3.5 I-A:
Soil Profile Type II: S = Site Coefficient = 1.2
Response Modification Factor (AASHTO 3.7 I-A)
Multiple Column Bent: R = 5
Pier Footing: R = One-Half R for Multiple Column Bent = R/2 = 5/2 = 2.25 (AASHTO 6.2.2 I-A)
Combination of Seismic Forces (AASHTO 3.9 I-A):
Case I:
Case II:
Load Grouping (AASHTO 6.2.1 I-A):
1.0(DL + Buoyancy + Stream Flow + Earth Pressure + Earthquake)(N/A) (N/A)
tates such as California... have undertaken an ag-
gressive program to ensure thattheir structures are not onlyfunctional, but pleasing tothe eye.
S
100% Longitudinal Motion + 30% Transverse Motion
30% Longitudinal Motion + 100% Transverse Motion
Downloaded from Digital Engineering Library @ McGraw-Hill (www.digitalengineeringlibrary.com)Copyright © 2006 The McGraw-Hill Companies. All rights reserved.
Any use is subject to the Terms of Use as given at the website.
Design of Substructure Elements
410 SECTION 4 THE SUBSTRUCTURE
The following discussion offers an overview of some of the major criteriagoverning the design of compression members. For most equations, the readeris referred to the section of the design code given in the associated text.
1. Load Factor Design Considerations. In AASHTO Stan-dard Specifications, a compression member is based on the equations setforth in AASHTO 8.16.4 and 8.16.5 for load factor design. Thesespecifications define the axial load strength of compression members.The axial load strength will vary depending on the type of reinforcementpresent (e.g., spiral or tie) and the type of loading the member is subjectedto (e.g., pure compression or pure flexure). If the effects of slendernessapply to the member (see Part 3 below), then the maximum factoredmoment, Mu, is magnified to account for these effects. The axial loadstrength of a compression member is based, in large part, on the followingparameters:
❏ The strength of concrete used❏ The yield strength of reinforcement present❏ The gross section area of the member❏ The total area of longitudinal reinforcement❏ The confinement provided by lateral reinforcement
The general requirements for the design of compression members aregiven in AASHTO 8.16.4.1.2. The criteria governing the design ofcompression members under pure compression are given in AASHTO8.16.4.2.1. For those members under pure flexure, the reader is referredto AASHTO 8.16.4.2.2.
2. Load and Resistance Factor Design Considerations.In AASHTO LRFD Specifications, the equations for computing thecompression member strength are the same as these in the AASHTO LFDprovisions. Refer to AASHTO LRFD 5.7.4.4 for axial resistance, and5.7.4.5 for biaxial flexure strength.
The transverse reinforcement in the pier columns should meet theminimum requirements of AASHTO LRFD 5.7.4.6 to ensure thatsufficient confinement is provided for the concrete. In Seismic Zone 2 andhigher areas, additional transverse reinforcement is required to enhancethe columns’ ductilities.
3. Slenderness Effects. When a compression member’s cross-section dimensions are small in comparison to its length, the member is saidto be slender. Whether or not a member can be considered slender isdependent of the magnitude of the member’s slenderness ratio. The slender-ness ratio of a compression member is defined by the following expression:
k Lr
u⋅(Eq. 4.22)
where k = effective length factor for compression membersLu = unsupported length of compression member r = radius of gyration
Design of Compression Members
[4.2.4]
f the effects of slendernessapply to the member ... then
the maximum factored moment,Mu, is magnified to accountfor these effects.
I
hen a compressionmember’s cross-section
dimensions are small in com-parison to its length, the mem-ber is said to be slender.
W
Downloaded from Digital Engineering Library @ McGraw-Hill (www.digitalengineeringlibrary.com)Copyright © 2006 The McGraw-Hill Companies. All rights reserved.
Any use is subject to the Terms of Use as given at the website.
Design of Substructure Elements
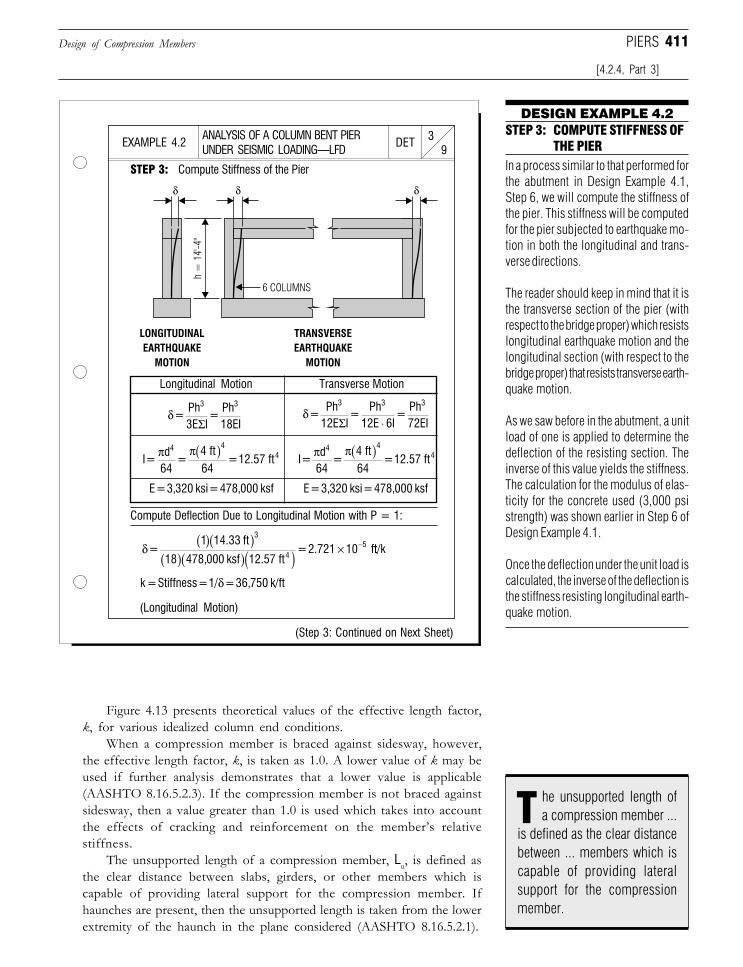
411
Figure 4.13 presents theoretical values of the effective length factor,k, for various idealized column end conditions.
When a compression member is braced against sidesway, however,the effective length factor, k, is taken as 1.0. A lower value of k may beused if further analysis demonstrates that a lower value is applicable(AASHTO 8.16.5.2.3). If the compression member is not braced againstsidesway, then a value greater than 1.0 is used which takes into accountthe effects of cracking and reinforcement on the member’s relativestiffness.
The unsupported length of a compression member, Lu, is defined asthe clear distance between slabs, girders, or other members which iscapable of providing lateral support for the compression member. Ifhaunches are present, then the unsupported length is taken from the lowerextremity of the haunch in the plane considered (AASHTO 8.16.5.2.1).
Design of Compression Members
[4.2.4, Part 3]
PIERS
ANALYSIS OF A COLUMN BENT PIERUNDER SEISMIC LOADING—LFD 9
3DETEXAMPLE 4.2
DESIGN EXAMPLE 4.2
STEP 3: Compute Stiffness of the Pier
STEP 3: COMPUTE STIFFNESS OFTHE PIER
In a process similar to that performed forthe abutment in Design Example 4.1,Step 6, we will compute the stiffness ofthe pier. This stiffness will be computedfor the pier subjected to earthquake mo-tion in both the longitudinal and trans-verse directions.
The reader should keep in mind that it isthe transverse section of the pier (withrespect to the bridge proper) which resistslongitudinal earthquake motion and thelongitudinal section (with respect to thebridge proper) that resists transverse earth-quake motion.
As we saw before in the abutment, a unitload of one is applied to determine thedeflection of the resisting section. Theinverse of this value yields the stiffness.The calculation for the modulus of elas-ticity for the concrete used (3,000 psistrength) was shown earlier in Step 6 ofDesign Example 4.1.
Once the deflection under the unit load iscalculated, the inverse of the deflection isthe stiffness resisting longitudinal earth-quake motion.
Longitudinal Motion Transverse Motion
Compute Deflection Due to Longitudinal Motion with P = 1:
(Longitudinal Motion)
(Step 3: Continued on Next Sheet)
δ = Ph3E I
= Ph18EI
3 3
Σδ =
Ph12E I
= Ph
12E 6I =
Ph72EI
3 3 3
Σ ⋅
I = d
64 =
4 ft64
= 12.57 ft4 4
4π π( )I =
d64
= 4 ft64
= 12.57 ft4 4
4π π( )
E = 3,320 ksi = 478,000 ksf E = 3,320 ksi = 478,000 ksf
δ = 1 14.33 ft
18 478,000 ksf 12.57 ft = 2.721 10 f
3
45( )( )
( )( )( ) × − tt/k
k = Stiffness = 1/ = 36,750 k/ftδ
he unsupported length ofa compression member ...
is defined as the clear distancebetween ... members which iscapable of providing lateralsupport for the compressionmember.
T
6 COLUMNS
h =
14'
-4"
δ δ δ
LONGITUDINAL
EARTHQUAKE
MOTION
TRANSVERSE
EARTHQUAKE
MOTION
Downloaded from Digital Engineering Library @ McGraw-Hill (www.digitalengineeringlibrary.com)Copyright © 2006 The McGraw-Hill Companies. All rights reserved.
Any use is subject to the Terms of Use as given at the website.
Design of Substructure Elements
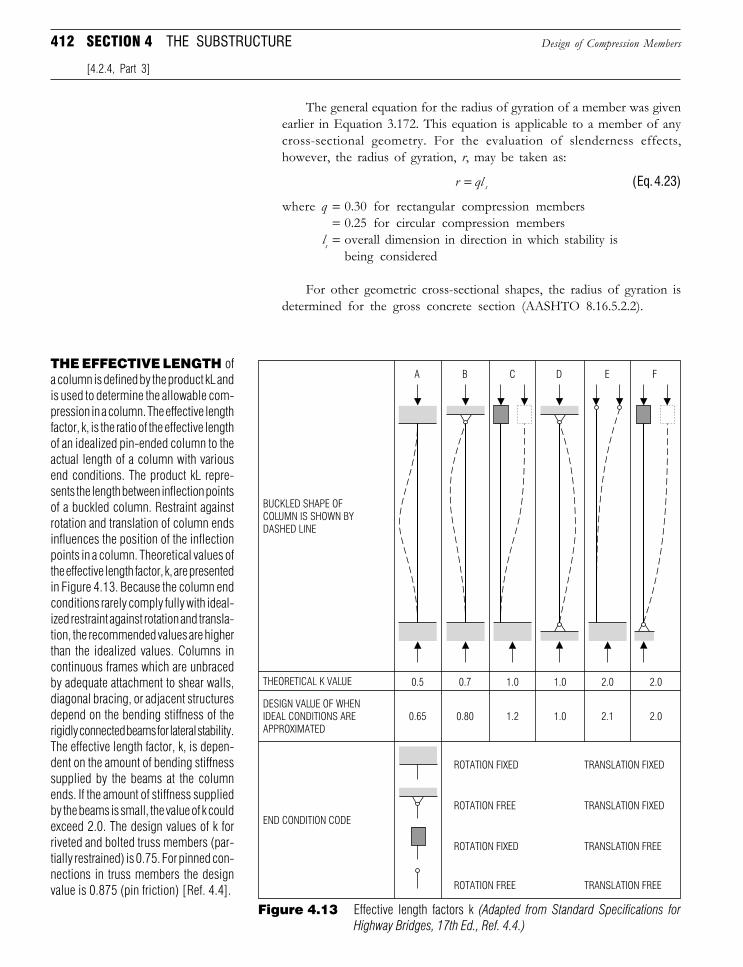
412 SECTION 4 THE SUBSTRUCTURE
The general equation for the radius of gyration of a member was givenearlier in Equation 3.172. This equation is applicable to a member of anycross-sectional geometry. For the evaluation of slenderness effects,however, the radius of gyration, r, may be taken as:
r ql s= (Eq. 4.23)
where q = 0.30 for rectangular compression members= 0.25 for circular compression members
ls = overall dimension in direction in which stability isbeing considered
For other geometric cross-sectional shapes, the radius of gyration isdetermined for the gross concrete section (AASHTO 8.16.5.2.2).
Design of Compression Members
[4.2.4, Part 3]
Figure 4.13 Effective length factors k (Adapted from Standard Specifications forHighway Bridges, 17th Ed., Ref. 4.4.)
THE EFFECTIVE LENGTH ofa column is defined by the product kL andis used to determine the allowable com-pression in a column. The effective lengthfactor, k, is the ratio of the effective lengthof an idealized pin-ended column to theactual length of a column with variousend conditions. The product kL repre-sents the length between inflection pointsof a buckled column. Restraint againstrotation and translation of column endsinfluences the position of the inflectionpoints in a column. Theoretical values ofthe effective length factor, k, are presentedin Figure 4.13. Because the column endconditions rarely comply fully with ideal-ized restraint against rotation and transla-tion, the recommended values are higherthan the idealized values. Columns incontinuous frames which are unbracedby adequate attachment to shear walls,diagonal bracing, or adjacent structuresdepend on the bending stiffness of therigidly connected beams for lateral stability.The effective length factor, k, is depen-dent on the amount of bending stiffnesssupplied by the beams at the columnends. If the amount of stiffness suppliedby the beams is small, the value of k couldexceed 2.0. The design values of k forriveted and bolted truss members (par-tially restrained) is 0.75. For pinned con-nections in truss members the designvalue is 0.875 (pin friction) [Ref. 4.4].
BUCKLED SHAPE OF
COLUMN IS SHOWN BY
DASHED LINE
THEORETICAL K VALUE
DESIGN VALUE OF WHEN
IDEAL CONDITIONS ARE
APPROXIMATED
END CONDITION CODE
A
0.5 0.7 1.0 1.0 2.0 2.0
0.65 0.80
ROTATION FIXED
ROTATION FREE
ROTATION FIXED
ROTATION FREE
1.2 1.0 2.1 2.0
B C D E F
TRANSLATION FIXED
TRANSLATION FIXED
TRANSLATION FREE
TRANSLATION FREE
Downloaded from Digital Engineering Library @ McGraw-Hill (www.digitalengineeringlibrary.com)Copyright © 2006 The McGraw-Hill Companies. All rights reserved.
Any use is subject to the Terms of Use as given at the website.
Design of Substructure Elements
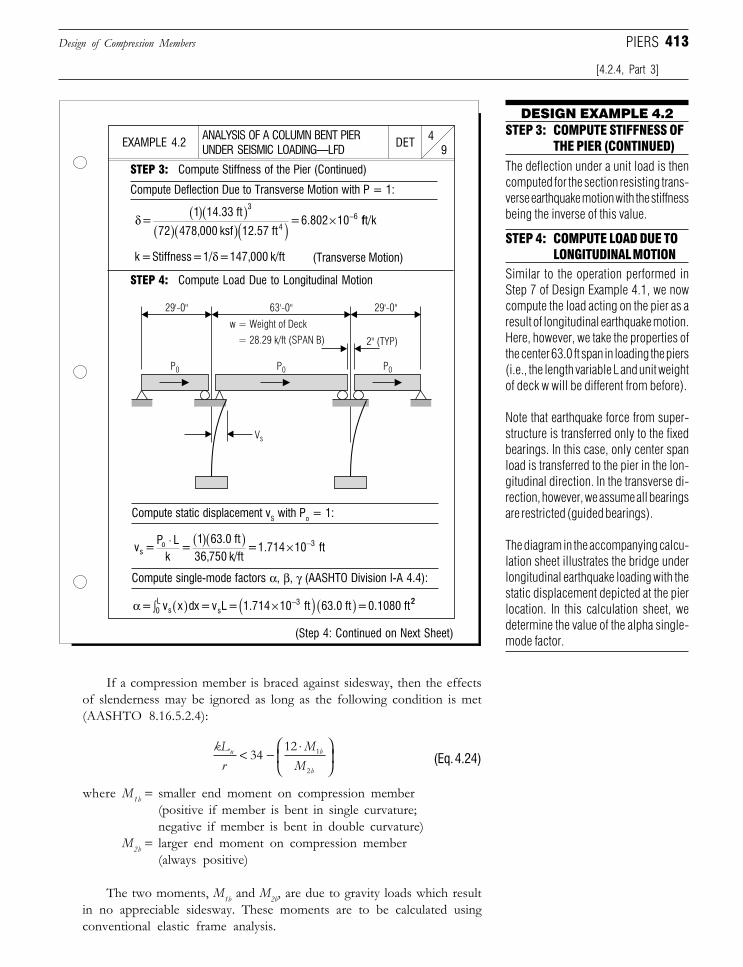
413
If a compression member is braced against sidesway, then the effectsof slenderness may be ignored as long as the following condition is met(AASHTO 8.16.5.2.4):
kLr
MM
u b
b
< − ⋅
34
12 1
2(Eq. 4.24)
where M1b = smaller end moment on compression member(positive if member is bent in single curvature;negative if member is bent in double curvature)
M2b = larger end moment on compression member(always positive)
The two moments, M1b and M2b, are due to gravity loads which resultin no appreciable sidesway. These moments are to be calculated usingconventional elastic frame analysis.
Design of Compression Members
[4.2.4, Part 3]
PIERS
ANALYSIS OF A COLUMN BENT PIERUNDER SEISMIC LOADING—LFD 9
4DETEXAMPLE 4.2
DESIGN EXAMPLE 4.2
STEP 3: Compute Stiffness of the Pier (Continued)
STEP 3: COMPUTE STIFFNESS OFTHE PIER (CONTINUED)
Compute Deflection Due to Transverse Motion with P = 1:
STEP 4: Compute Load Due to Longitudinal Motion
Compute static displacement vS with Po = 1:
Compute single-mode factors α, β, γ (AASHTO Division I-A 4.4):
(Step 4: Continued on Next Sheet)
STEP 4: COMPUTE LOAD DUE TOLONGITUDINAL MOTION
Similar to the operation performed inStep 7 of Design Example 4.1, we nowcompute the load acting on the pier as aresult of longitudinal earthquake motion.Here, however, we take the properties ofthe center 63.0 ft span in loading the piers(i.e., the length variable L and unit weightof deck w will be different from before).
Note that earthquake force from super-structure is transferred only to the fixedbearings. In this case, only center spanload is transferred to the pier in the lon-gitudinal direction. In the transverse di-rection, however, we assume all bearingsare restricted (guided bearings).
The diagram in the accompanying calcu-lation sheet illustrates the bridge underlongitudinal earthquake loading with thestatic displacement depicted at the pierlocation. In this calculation sheet, wedetermine the value of the alpha single-mode factor.
The deflection under a unit load is thencomputed for the section resisting trans-verse earthquake motion with the stiffnessbeing the inverse of this value.
(Transverse Motion)
δ = 1 14.33 ft
72 478,000 ksf 12.57 ft = 6.802 10
3
46( )( )
( )( )( ) × − fft/k
k = Stiffness = 1/ = 147,000 k/ftδ
v = P L
k =
1 63.0 ft36,750 k/ft
= 1.714 10 ftso 3⋅ ( )( ) × −
α = v x dx = v L = 1.714 10 ft 63.0 ft = 0.1080 fts0L
s3( )∫ ×( ) ( )− 22
w = Weight of Deck
= 28.29 k/ft (SPAN B)
P0 P0 P0
Vs
29'-0" 63'-0" 29'-0"
2" (TYP)
Downloaded from Digital Engineering Library @ McGraw-Hill (www.digitalengineeringlibrary.com)Copyright © 2006 The McGraw-Hill Companies. All rights reserved.
Any use is subject to the Terms of Use as given at the website.
Design of Substructure Elements
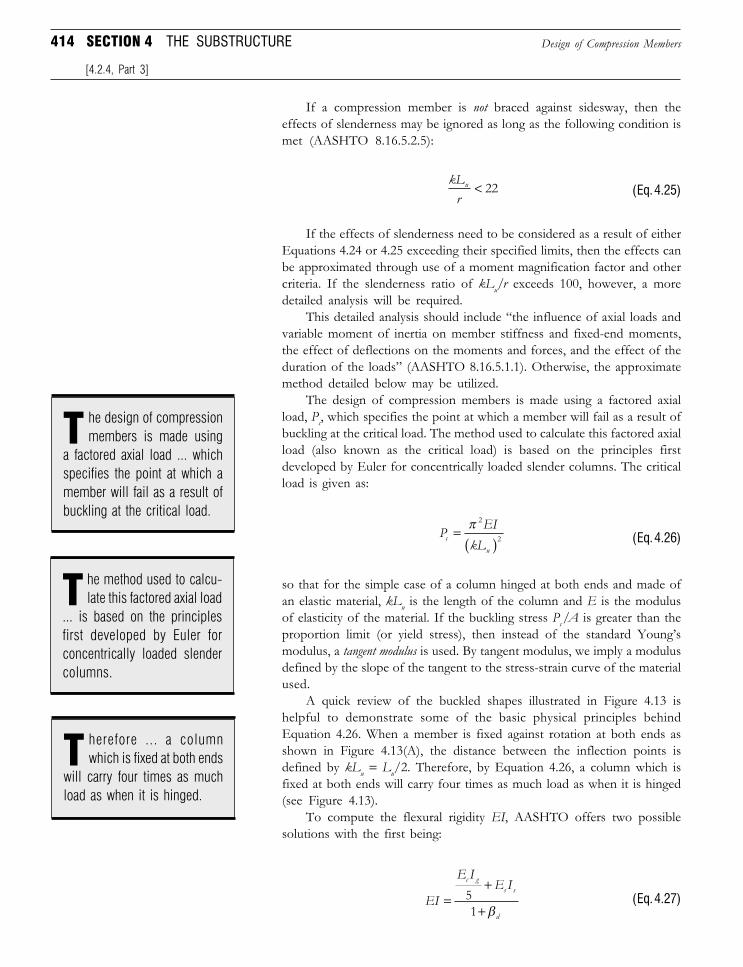
414 SECTION 4 THE SUBSTRUCTURE
If a compression member is not braced against sidesway, then theeffects of slenderness may be ignored as long as the following condition ismet (AASHTO 8.16.5.2.5):
kLru < 22 (Eq. 4.25)
If the effects of slenderness need to be considered as a result of eitherEquations 4.24 or 4.25 exceeding their specified limits, then the effects canbe approximated through use of a moment magnification factor and othercriteria. If the slenderness ratio of kLu/r exceeds 100, however, a moredetailed analysis will be required.
This detailed analysis should include “the influence of axial loads andvariable moment of inertia on member stiffness and fixed-end moments,the effect of deflections on the moments and forces, and the effect of theduration of the loads” (AASHTO 8.16.5.1.1). Otherwise, the approximatemethod detailed below may be utilized.
The design of compression members is made using a factored axialload, Pc, which specifies the point at which a member will fail as a result ofbuckling at the critical load. The method used to calculate this factored axialload (also known as the critical load) is based on the principles firstdeveloped by Euler for concentrically loaded slender columns. The criticalload is given as:
P EIkL
cu
=( )π 2
2 (Eq. 4.26)
so that for the simple case of a column hinged at both ends and made ofan elastic material, kLu is the length of the column and E is the modulusof elasticity of the material. If the buckling stress Pc/A is greater than theproportion limit (or yield stress), then instead of the standard Young’smodulus, a tangent modulus is used. By tangent modulus, we imply a modulusdefined by the slope of the tangent to the stress-strain curve of the materialused.
A quick review of the buckled shapes illustrated in Figure 4.13 ishelpful to demonstrate some of the basic physical principles behindEquation 4.26. When a member is fixed against rotation at both ends asshown in Figure 4.13(A), the distance between the inflection points isdefined by kLu = Lu/2. Therefore, by Equation 4.26, a column which isfixed at both ends will carry four times as much load as when it is hinged(see Figure 4.13).
To compute the flexural rigidity EI, AASHTO offers two possiblesolutions with the first being:
EI
E IE Ic gs s
d
=+
+51 β
(Eq. 4.27)
Design of Compression Members
[4.2.4, Part 3]
he design of compressionmembers is made using
a factored axial load ... whichspecifies the point at which amember will fail as a result ofbuckling at the critical load.
T
he method used to calcu-late this factored axial load
... is based on the principlesfirst developed by Euler forconcentrically loaded slendercolumns.
T
herefore ... a columnwhich is fixed at both ends
will carry four times as muchload as when it is hinged.
T
Downloaded from Digital Engineering Library @ McGraw-Hill (www.digitalengineeringlibrary.com)Copyright © 2006 The McGraw-Hill Companies. All rights reserved.
Any use is subject to the Terms of Use as given at the website.
Design of Substructure Elements
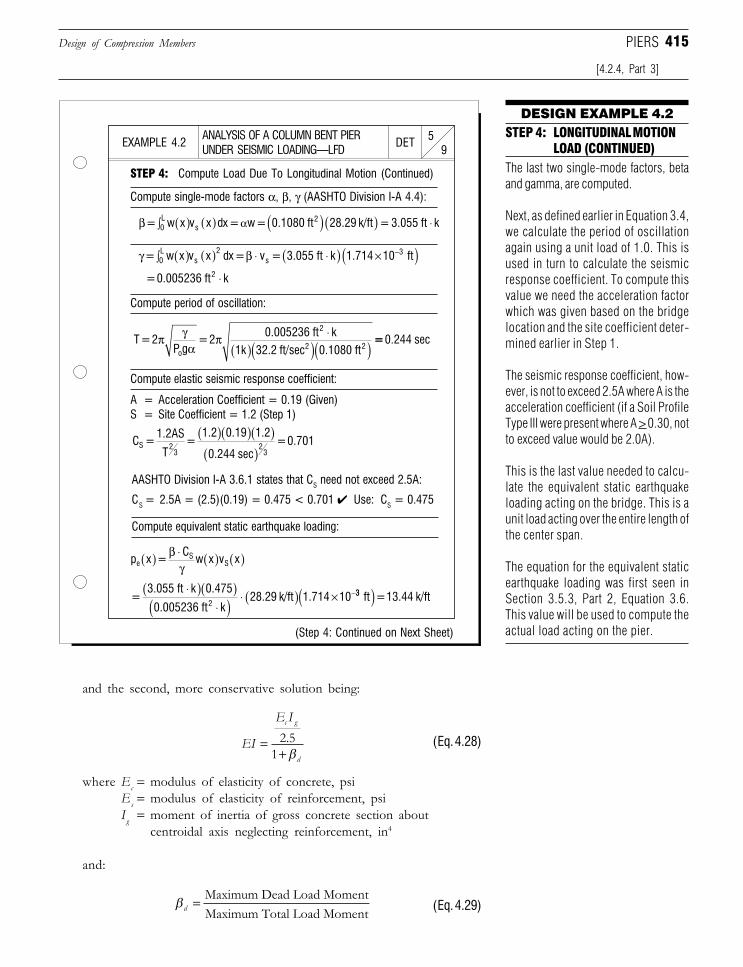
415
and the second, more conservative solution being:
EI
E Ic g
d
=+2 5
1.β
(Eq. 4.28)
where Ec = modulus of elasticity of concrete, psiEs = modulus of elasticity of reinforcement, psiI g = moment of inertia of gross concrete section about
centroidal axis neglecting reinforcement, in4
and:
βd = Maximum Dead Load MomentMaximum Total Load Moment (Eq. 4.29)
Design of Compression Members
[4.2.4, Part 3]
PIERS
ANALYSIS OF A COLUMN BENT PIERUNDER SEISMIC LOADING—LFD 9
5DETEXAMPLE 4.2
DESIGN EXAMPLE 4.2
STEP 4: Compute Load Due To Longitudinal Motion (Continued)
STEP 4: LONGITUDINAL MOTIONLOAD (CONTINUED)
The last two single-mode factors, betaand gamma, are computed.
Next, as defined earlier in Equation 3.4,we calculate the period of oscillationagain using a unit load of 1.0. This isused in turn to calculate the seismicresponse coefficient. To compute thisvalue we need the acceleration factorwhich was given based on the bridgelocation and the site coefficient deter-mined earlier in Step 1.
The seismic response coefficient, how-ever, is not to exceed 2.5A where A is theacceleration coefficient (if a Soil ProfileType III were present where A > 0.30, notto exceed value would be 2.0A).
This is the last value needed to calcu-late the equivalent static earthquakeloading acting on the bridge. This is aunit load acting over the entire length ofthe center span.
The equation for the equivalent staticearthquake loading was first seen inSection 3.5.3, Part 2, Equation 3.6.This value will be used to compute theactual load acting on the pier.
AASHTO Division I-A 3.6.1 states that CS need not exceed 2.5A:
CS = 2.5A = (2.5)(0.19) = 0.475 < 0.701 ✔ Use: CS = 0.475
Compute equivalent static earthquake loading:
Compute period of oscillation:
A = Acceleration Coefficient = 0.19 (Given)S = Site Coefficient = 1.2 (Step 1)
Compute elastic seismic response coefficient:
(Step 4: Continued on Next Sheet)
Compute single-mode factors α, β, γ (AASHTO Division I-A 4.4):
β α= w x v x dx = w = 0.1080 ft 28.29 k/ft = 3.055 ft k0L
s2( )∫ ( ) ( )( ) ⋅
γ β= w x v x dx = v = 3.055 ft k 1.714 10 ft0L
s2
s3( )∫ ( ) ⋅ ⋅( ) ×( )−
= 0.005236 ft k2 ⋅
T = 2P g
= 20.005236 ft k
1k 32.2 ft/sec 0.1080 ft
o
2
2 2π γ
απ ⋅
( )( )( ) == 0.244 sec
C = 1.2AS
T =
1.2 0.19 1.2
0.244 sec = 0.701S 2
32
3
( )( )( )( )
p x = C
w x v xeS
S( ) ⋅ ( ) ( )βγ
= 3.055 ft k 0.475
0.005236 ft k28.29 k/ft 1.714 10
2
⋅( )( )⋅( ) ⋅ ( ) × −33 ft = 13.44 k/ft( )
Downloaded from Digital Engineering Library @ McGraw-Hill (www.digitalengineeringlibrary.com)Copyright © 2006 The McGraw-Hill Companies. All rights reserved.
Any use is subject to the Terms of Use as given at the website.
Design of Substructure Elements
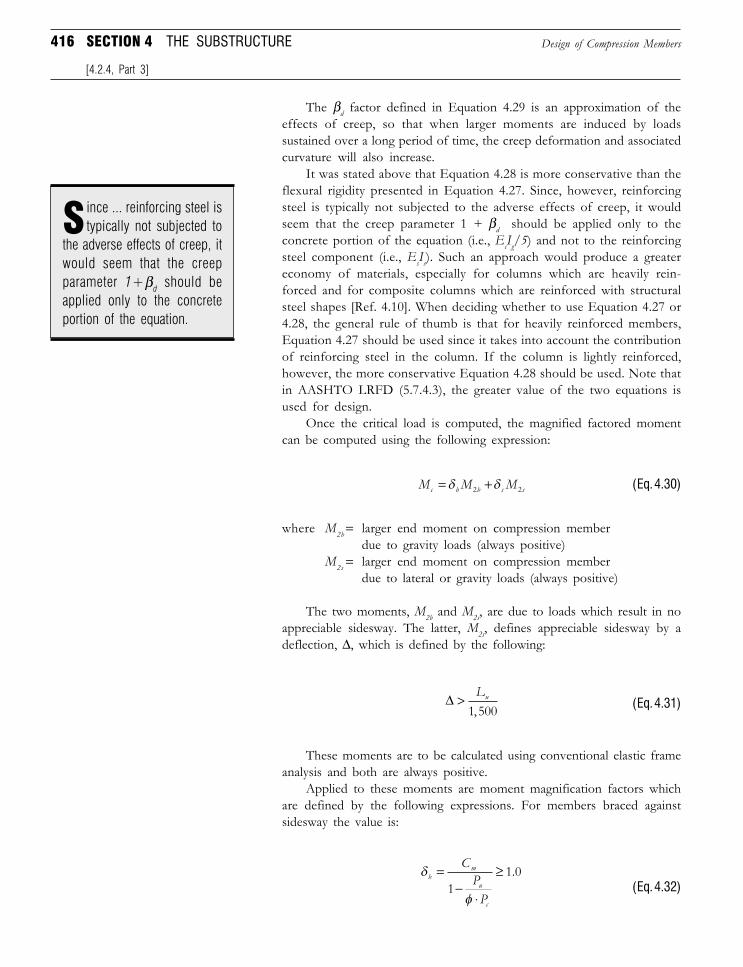
416 SECTION 4 THE SUBSTRUCTURE
The βd factor defined in Equation 4.29 is an approximation of theeffects of creep, so that when larger moments are induced by loadssustained over a long period of time, the creep deformation and associatedcurvature will also increase.
It was stated above that Equation 4.28 is more conservative than theflexural rigidity presented in Equation 4.27. Since, however, reinforcingsteel is typically not subjected to the adverse effects of creep, it wouldseem that the creep parameter 1 + βd should be applied only to theconcrete portion of the equation (i.e., EcIg/5) and not to the reinforcingsteel component (i.e., EsIs). Such an approach would produce a greatereconomy of materials, especially for columns which are heavily rein-forced and for composite columns which are reinforced with structuralsteel shapes [Ref. 4.10]. When deciding whether to use Equation 4.27 or4.28, the general rule of thumb is that for heavily reinforced members,Equation 4.27 should be used since it takes into account the contributionof reinforcing steel in the column. If the column is lightly reinforced,however, the more conservative Equation 4.28 should be used. Note thatin AASHTO LRFD (5.7.4.3), the greater value of the two equations isused for design.
Once the critical load is computed, the magnified factored momentcan be computed using the following expression:
M M Mc b b s s= +δ δ2 2 (Eq. 4.30)
where M2b = larger end moment on compression memberdue to gravity loads (always positive)
M2s = larger end moment on compression memberdue to lateral or gravity loads (always positive)
The two moments, M2b and M2s, are due to loads which result in noappreciable sidesway. The latter, M2s, defines appreciable sidesway by adeflection, ∆, which is defined by the following:
∆ > Lu1 500, (Eq. 4.31)
These moments are to be calculated using conventional elastic frameanalysis and both are always positive.
Applied to these moments are moment magnification factors whichare defined by the following expressions. For members braced againstsidesway the value is:
δ
φ
bm
u
c
CPP
=−
⋅
≥1
1 0.(Eq. 4.32)
Design of Compression Members
[4.2.4, Part 3]
ince ... reinforcing steel istypically not subjected to
the adverse effects of creep, itwould seem that the creepparameter 1+βd should beapplied only to the concreteportion of the equation.
S
Downloaded from Digital Engineering Library @ McGraw-Hill (www.digitalengineeringlibrary.com)Copyright © 2006 The McGraw-Hill Companies. All rights reserved.
Any use is subject to the Terms of Use as given at the website.
Design of Substructure Elements
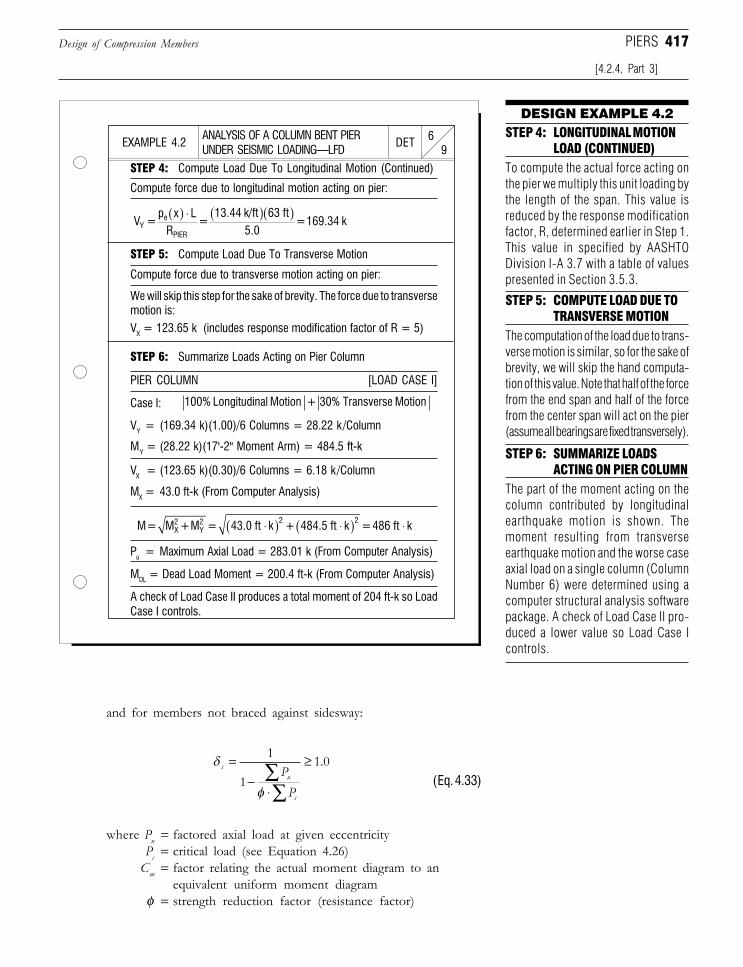
417
and for members not braced against sidesway:
δ
φ
su
c
PP
=−
⋅
≥∑∑
1
11 0.
(Eq. 4.33)
where Pu = factored axial load at given eccentricityPc = critical load (see Equation 4.26)
Cm = factor relating the actual moment diagram to anequivalent uniform moment diagram
φ = strength reduction factor (resistance factor)
Design of Compression Members
[4.2.4, Part 3]
PIERS
ANALYSIS OF A COLUMN BENT PIERUNDER SEISMIC LOADING—LFD 9
6DETEXAMPLE 4.2
DESIGN EXAMPLE 4.2STEP 4: LONGITUDINAL MOTION
LOAD (CONTINUED)To compute the actual force acting onthe pier we multiply this unit loading bythe length of the span. This value isreduced by the response modificationfactor, R, determined earlier in Step 1.This value in specified by AASHTODivision I-A 3.7 with a table of valuespresented in Section 3.5.3.
STEP 5: Compute Load Due To Transverse Motion
Compute force due to transverse motion acting on pier:
Case I:
VY = (169.34 k)(1.00)/6 Columns = 28.22 k /Column
A check of Load Case II produces a total moment of 204 ft-k so LoadCase I controls.
STEP 5: COMPUTE LOAD DUE TOTRANSVERSE MOTION
The computation of the load due to trans-verse motion is similar, so for the sake ofbrevity, we will skip the hand computa-tion of this value. Note that half of the forcefrom the end span and half of the forcefrom the center span will act on the pier(assume all bearings are fixed transversely).
STEP 6: SUMMARIZE LOADSACTING ON PIER COLUMN
The part of the moment acting on thecolumn contributed by longitudinalearthquake motion is shown. Themoment resulting from transverseearthquake motion and the worse caseaxial load on a single column (ColumnNumber 6) were determined using acomputer structural analysis softwarepackage. A check of Load Case II pro-duced a lower value so Load Case Icontrols.
STEP 4: Compute Load Due To Longitudinal Motion (Continued)
Compute force due to longitudinal motion acting on pier:
We will skip this step for the sake of brevity. The force due to transversemotion is:VX = 123.65 k (includes response modification factor of R = 5)
STEP 6: Summarize Loads Acting on Pier Column
PIER COLUMN [LOAD CASE I]
MY = (28.22 k)(17'-2" Moment Arm) = 484.5 ft-k
VX = (123.65 k)(0.30)/6 Columns = 6.18 k /Column
MX = 43.0 ft-k (From Computer Analysis)
Pu = Maximum Axial Load = 283.01 k (From Computer Analysis)
MDL = Dead Load Moment = 200.4 ft-k (From Computer Analysis)
V = p x L
R =
13.44 k/ft 63 ft5.0
= 169.34 kYe
PIER
( ) ⋅ ( )( )
100% Longitudinal Motion + 30% Transverse Motion
M = M + M = 43.0 ft k + 484.5 ft k = 486 ft kX2
Y2 2 2⋅( ) ⋅( ) ⋅
Downloaded from Digital Engineering Library @ McGraw-Hill (www.digitalengineeringlibrary.com)Copyright © 2006 The McGraw-Hill Companies. All rights reserved.
Any use is subject to the Terms of Use as given at the website.
Design of Substructure Elements
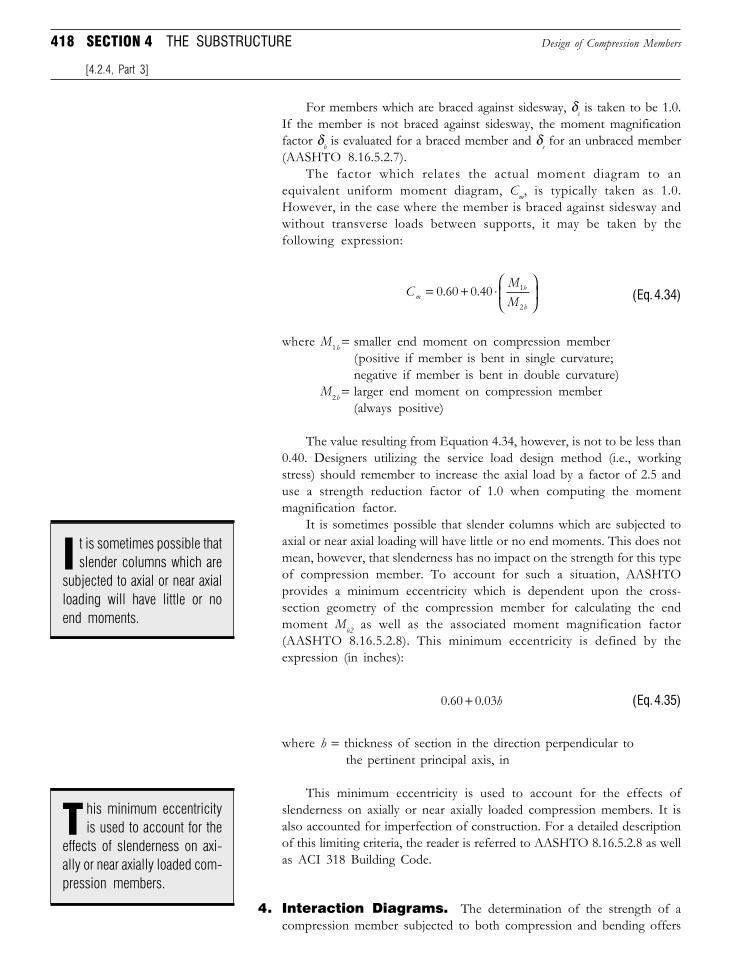
418 SECTION 4 THE SUBSTRUCTURE
For members which are braced against sidesway, δs is taken to be 1.0.If the member is not braced against sidesway, the moment magnificationfactor δb is evaluated for a braced member and δs for an unbraced member(AASHTO 8.16.5.2.7).
The factor which relates the actual moment diagram to anequivalent uniform moment diagram, Cm, is typically taken as 1.0.However, in the case where the member is braced against sidesway andwithout transverse loads between supports, it may be taken by thefollowing expression:
CMMm
b
b
= + ⋅
0 60 0 40 1
2
. . (Eq. 4.34)
where M1b = smaller end moment on compression member(positive if member is bent in single curvature;negative if member is bent in double curvature)
M2b = larger end moment on compression member(always positive)
The value resulting from Equation 4.34, however, is not to be less than0.40. Designers utilizing the service load design method (i.e., workingstress) should remember to increase the axial load by a factor of 2.5 anduse a strength reduction factor of 1.0 when computing the momentmagnification factor.
It is sometimes possible that slender columns which are subjected toaxial or near axial loading will have little or no end moments. This does notmean, however, that slenderness has no impact on the strength for this typeof compression member. To account for such a situation, AASHTOprovides a minimum eccentricity which is dependent upon the cross-section geometry of the compression member for calculating the endmoment Mb2 as well as the associated moment magnification factor(AASHTO 8.16.5.2.8). This minimum eccentricity is defined by theexpression (in inches):
0 60 0 03. .+ h (Eq. 4.35)
where h = thickness of section in the direction perpendicular tothe pertinent principal axis, in
This minimum eccentricity is used to account for the effects ofslenderness on axially or near axially loaded compression members. It isalso accounted for imperfection of construction. For a detailed descriptionof this limiting criteria, the reader is referred to AASHTO 8.16.5.2.8 as wellas ACI 318 Building Code.
4. Interaction Diagrams. The determination of the strength of acompression member subjected to both compression and bending offers
Design of Compression Members
[4.2.4, Part 3]
t is sometimes possible thatslender columns which are
subjected to axial or near axialloading will have little or noend moments.
I
his minimum eccentricityis used to account for the
effects of slenderness on axi-ally or near axially loaded com-pression members.
T
Downloaded from Digital Engineering Library @ McGraw-Hill (www.digitalengineeringlibrary.com)Copyright © 2006 The McGraw-Hill Companies. All rights reserved.
Any use is subject to the Terms of Use as given at the website.
Design of Substructure Elements
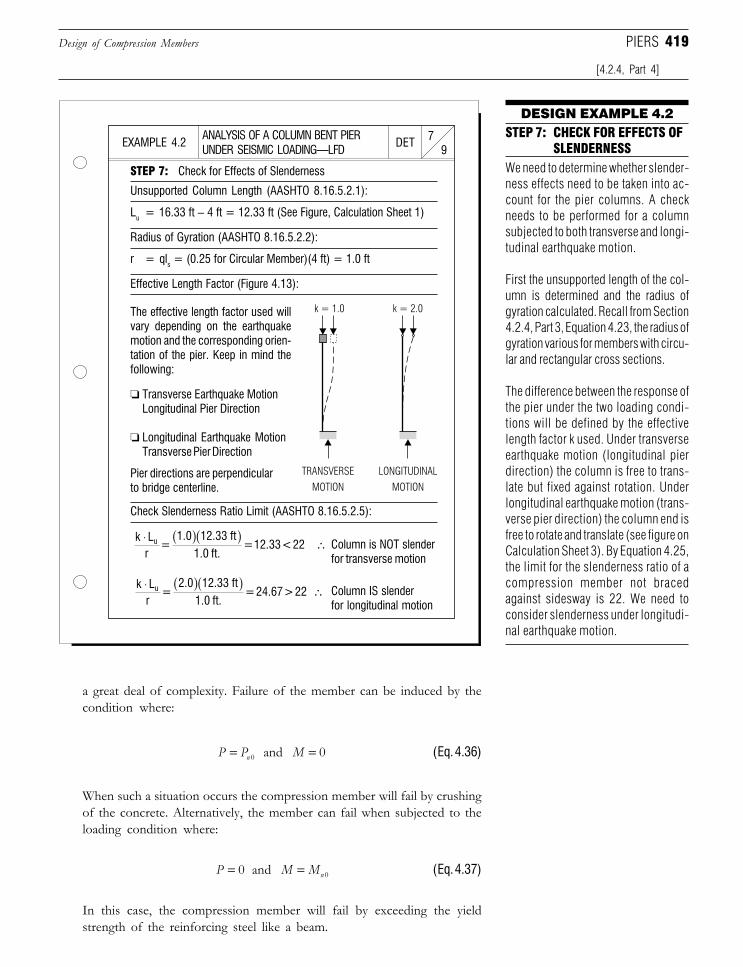
419
a great deal of complexity. Failure of the member can be induced by thecondition where:
P P Mn= =0 0 and (Eq. 4.36)
When such a situation occurs the compression member will fail by crushingof the concrete. Alternatively, the member can fail when subjected to theloading condition where:
P M Mn= =0 0 and (Eq. 4.37)
In this case, the compression member will fail by exceeding the yieldstrength of the reinforcing steel like a beam.
Design of Compression Members
[4.2.4, Part 4]
PIERS
ANALYSIS OF A COLUMN BENT PIERUNDER SEISMIC LOADING—LFD 9
7DETEXAMPLE 4.2
DESIGN EXAMPLE 4.2STEP 7: CHECK FOR EFFECTS OF
SLENDERNESSWe need to determine whether slender-ness effects need to be taken into ac-count for the pier columns. A checkneeds to be performed for a columnsubjected to both transverse and longi-tudinal earthquake motion.
First the unsupported length of the col-umn is determined and the radius ofgyration calculated. Recall from Section4.2.4, Part 3, Equation 4.23, the radius ofgyration various for members with circu-lar and rectangular cross sections.
The difference between the response ofthe pier under the two loading condi-tions will be defined by the effectivelength factor k used. Under transverseearthquake motion (longitudinal pierdirection) the column is free to trans-late but fixed against rotation. Underlongitudinal earthquake motion (trans-verse pier direction) the column end isfree to rotate and translate (see figure onCalculation Sheet 3). By Equation 4.25,the limit for the slenderness ratio of acompression member not bracedagainst sidesway is 22. We need toconsider slenderness under longitudi-nal earthquake motion.
STEP 7: Check for Effects of Slenderness
Unsupported Column Length (AASHTO 8.16.5.2.1):
Lu = 16.33 ft − 4 ft = 12.33 ft (See Figure, Calculation Sheet 1)
r = qls = (0.25 for Circular Member)(4 ft) = 1.0 ft
Radius of Gyration (AASHTO 8.16.5.2.2):
Effective Length Factor (Figure 4.13):
The effective length factor used willvary depending on the earthquakemotion and the corresponding orien-tation of the pier. Keep in mind thefollowing:
Check Slenderness Ratio Limit (AASHTO 8.16.5.2.5):
Column is NOT slenderfor transverse motion
Column IS slenderfor longitudinal motion
Pier directions are perpendicularto bridge centerline.
❏ Transverse Earthquake MotionLongitudinal Pier Direction
❏ Longitudinal Earthquake MotionTransverse Pier Direction
k Lr
= 2.0 12.33 ft
1.0 ft. = 24.67 > 22 u⋅ ( )( )
∴
k Lr
= 1.0 12.33 ft
1.0 ft. = 12.33 < 22u⋅ ( )( )
∴
k = 1.0
TRANSVERSE
MOTION
LONGITUDINAL
MOTION
k = 2.0
Downloaded from Digital Engineering Library @ McGraw-Hill (www.digitalengineeringlibrary.com)Copyright © 2006 The McGraw-Hill Companies. All rights reserved.
Any use is subject to the Terms of Use as given at the website.
Design of Substructure Elements
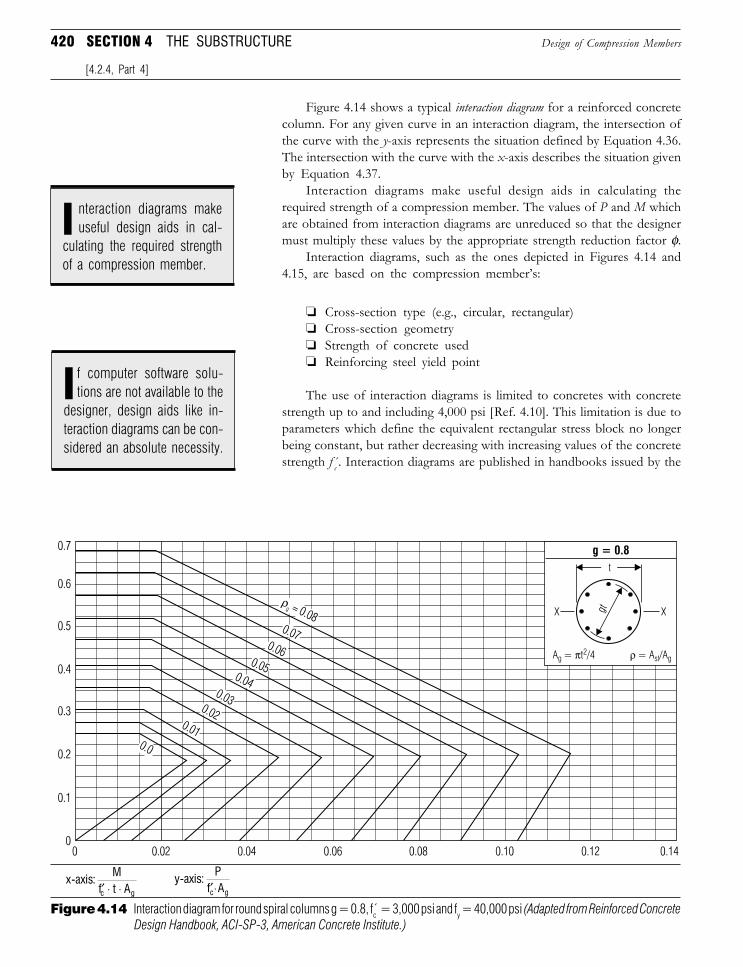
420 SECTION 4 THE SUBSTRUCTURE
Figure 4.14 shows a typical interaction diagram for a reinforced concretecolumn. For any given curve in an interaction diagram, the intersection ofthe curve with the y-axis represents the situation defined by Equation 4.36.The intersection with the curve with the x-axis describes the situation givenby Equation 4.37.
Interaction diagrams make useful design aids in calculating therequired strength of a compression member. The values of P and M whichare obtained from interaction diagrams are unreduced so that the designermust multiply these values by the appropriate strength reduction factor φ.
Interaction diagrams, such as the ones depicted in Figures 4.14 and4.15, are based on the compression member’s:
❏ Cross-section type (e.g., circular, rectangular)❏ Cross-section geometry❏ Strength of concrete used❏ Reinforcing steel yield point
The use of interaction diagrams is limited to concretes with concretestrength up to and including 4,000 psi [Ref. 4.10]. This limitation is due toparameters which define the equivalent rectangular stress block no longerbeing constant, but rather decreasing with increasing values of the concretestrength f c . Interaction diagrams are published in handbooks issued by the
Design of Compression Members
[4.2.4, Part 4]
Figure 4.14 Interaction diagram for round spiral columns g = 0.8, fc = 3,000 psi and fy = 40,000 psi (Adapted from Reinforced ConcreteDesign Handbook, ACI-SP-3, American Concrete Institute.)
nteraction diagrams makeuseful design aids in cal-
culating the required strengthof a compression member.
I
f computer software solu-tions are not available to the
designer, design aids like in-teraction diagrams can be con-sidered an absolute necessity.
I
x-axis: M
f t Ac g′ ⋅ ⋅y-axis:
Pf Ac g′⋅
ρ
g = 0.8
Ag = πt2/4 ρ = Ast/Ag
X X
t
gt
Downloaded from Digital Engineering Library @ McGraw-Hill (www.digitalengineeringlibrary.com)Copyright © 2006 The McGraw-Hill Companies. All rights reserved.
Any use is subject to the Terms of Use as given at the website.
Design of Substructure Elements
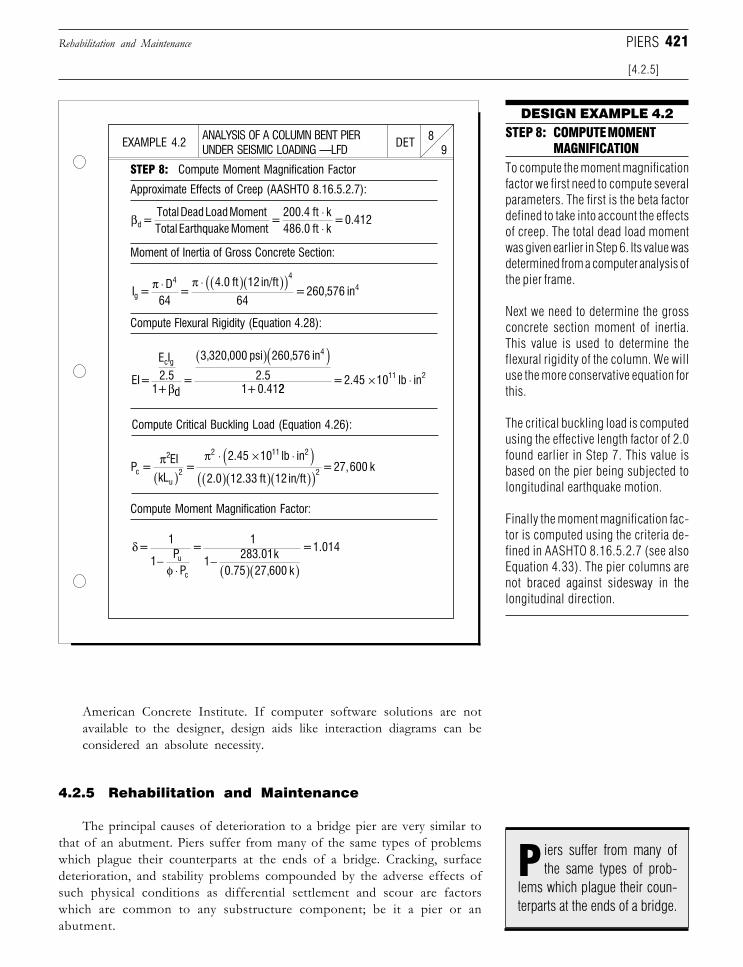
421
American Concrete Institute. If computer software solutions are notavailable to the designer, design aids like interaction diagrams can beconsidered an absolute necessity.
4.2.5 Rehabilitation and Maintenance
The principal causes of deterioration to a bridge pier are very similar tothat of an abutment. Piers suffer from many of the same types of problemswhich plague their counterparts at the ends of a bridge. Cracking, surfacedeterioration, and stability problems compounded by the adverse effects ofsuch physical conditions as differential settlement and scour are factorswhich are common to any substructure component; be it a pier or anabutment.
Rehabilitation and Maintenance
[4.2.5]
PIERS
ANALYSIS OF A COLUMN BENT PIERUNDER SEISMIC LOADING —LFD 9
8DETEXAMPLE 4.2
DESIGN EXAMPLE 4.2STEP 8: COMPUTE MOMENT
MAGNIFICATIONTo compute the moment magnificationfactor we first need to compute severalparameters. The first is the beta factordefined to take into account the effectsof creep. The total dead load momentwas given earlier in Step 6. Its value wasdetermined from a computer analysis ofthe pier frame.
Next we need to determine the grossconcrete section moment of inertia.This value is used to determine theflexural rigidity of the column. We willuse the more conservative equation forthis.
The critical buckling load is computedusing the effective length factor of 2.0found earlier in Step 7. This value isbased on the pier being subjected tolongitudinal earthquake motion.
Finally the moment magnification fac-tor is computed using the criteria de-fined in AASHTO 8.16.5.2.7 (see alsoEquation 4.33). The pier columns arenot braced against sidesway in thelongitudinal direction.
Approximate Effects of Creep (AASHTO 8.16.5.2.7):
STEP 8: Compute Moment Magnification Factor
Moment of Inertia of Gross Concrete Section:
Compute Flexural Rigidity (Equation 4.28):
Compute Critical Buckling Load (Equation 4.26):
Compute Moment Magnification Factor:
βd = Total Dead Load MomentTotal Earthquake Moment
= 200.4 ft k486.0 ft k
= 0.412⋅⋅
I = D
64 =
4.0 ft 12 in/ft
64 = 260,576 ing
4 44π π⋅ ⋅ ( )( )( )
EI =
E I2.5
1 + d =
3,320,000 psi 260,576 in
2.51 + 0.41
c g4
β
( )( )22
= 2.45 10 lb in11 2× ⋅
P = EI
kL =
2.45 10 lb in
2.0 12.33 ft 12c
2
u2
2 11 2π π
( )⋅ × ⋅( )
( )( ) in/ft = 27,600 k2( )( )
δ
φ
= 1
1 P
P
= 1
1 283.01k
0.75 27,600 k
= 1.014u
c
−⋅
− ( )( )
iers suffer from many ofthe same types of prob-
lems which plague their coun-terparts at the ends of a bridge.
P
Downloaded from Digital Engineering Library @ McGraw-Hill (www.digitalengineeringlibrary.com)Copyright © 2006 The McGraw-Hill Companies. All rights reserved.
Any use is subject to the Terms of Use as given at the website.
Design of Substructure Elements
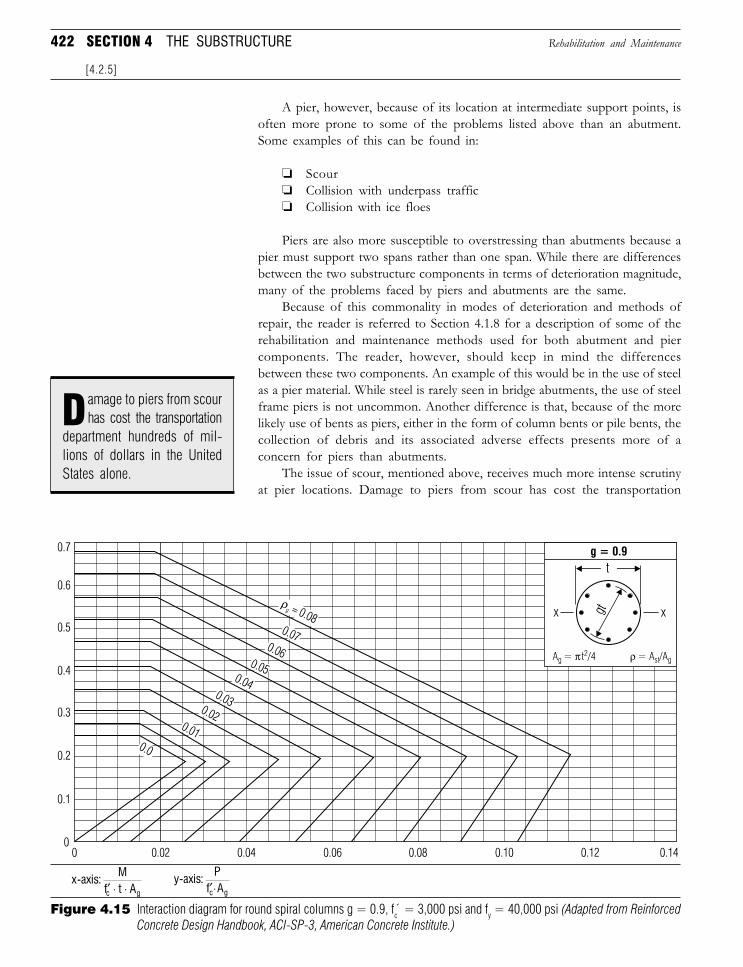
422 SECTION 4 THE SUBSTRUCTURE
A pier, however, because of its location at intermediate support points, isoften more prone to some of the problems listed above than an abutment.Some examples of this can be found in:
❏ Scour❏ Collision with underpass traffic❏ Collision with ice floes
Piers are also more susceptible to overstressing than abutments because apier must support two spans rather than one span. While there are differencesbetween the two substructure components in terms of deterioration magnitude,many of the problems faced by piers and abutments are the same.
Because of this commonality in modes of deterioration and methods ofrepair, the reader is referred to Section 4.1.8 for a description of some of therehabilitation and maintenance methods used for both abutment and piercomponents. The reader, however, should keep in mind the differencesbetween these two components. An example of this would be in the use of steelas a pier material. While steel is rarely seen in bridge abutments, the use of steelframe piers is not uncommon. Another difference is that, because of the morelikely use of bents as piers, either in the form of column bents or pile bents, thecollection of debris and its associated adverse effects presents more of aconcern for piers than abutments.
The issue of scour, mentioned above, receives much more intense scrutinyat pier locations. Damage to piers from scour has cost the transportation
Rehabilitation and Maintenance
[4.2.5]
Figure 4.15 Interaction diagram for round spiral columns g = 0.9, fc = 3,000 psi and fy = 40,000 psi (Adapted from ReinforcedConcrete Design Handbook, ACI-SP-3, American Concrete Institute.)
amage to piers from scourhas cost the transportation
department hundreds of mil-lions of dollars in the UnitedStates alone.
D
x-axis: M
f t Ac g′ ⋅ ⋅y-axis:
Pf Ac g′⋅
ρ
g = 0.9
Ag = π t2/4 ρ = Ast/Ag
Downloaded from Digital Engineering Library @ McGraw-Hill (www.digitalengineeringlibrary.com)Copyright © 2006 The McGraw-Hill Companies. All rights reserved.
Any use is subject to the Terms of Use as given at the website.
Design of Substructure Elements
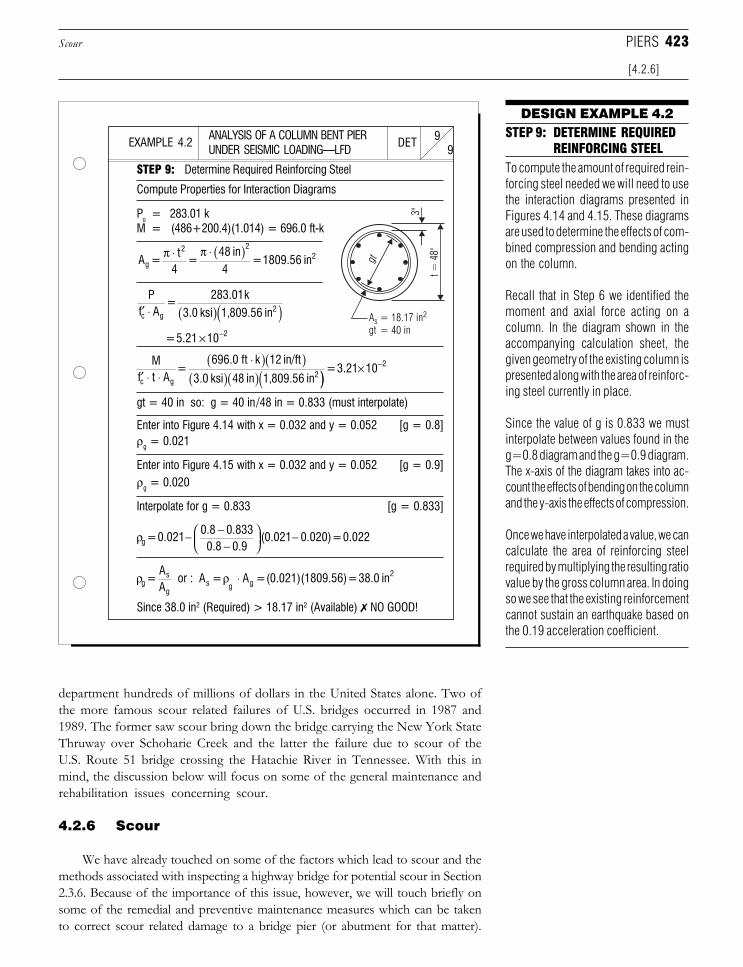
423
ANALYSIS OF A COLUMN BENT PIERUNDER SEISMIC LOADING—LFD 9
9DETEXAMPLE 4.2
Compute Properties for Interaction Diagrams
STEP 9: Determine Required Reinforcing Steel
Pu = 283.01 kM = (486+200.4)(1.014) = 696.0 ft-k
gt = 40 in so: g = 40 in/48 in = 0.833 (must interpolate)
Enter into Figure 4.14 with x = 0.032 and y = 0.052 [g = 0.8]ρg = 0.021
Enter into Figure 4.15 with x = 0.032 and y = 0.052 [g = 0.9]ρg = 0.020
Interpolate for g = 0.833 [g = 0.833]
Since 38.0 in2 (Required) > 18.17 in2 (Available) ✗ NO GOOD!
A = t
4 =
48 in4
= 1809.56 ing
2 22π π⋅ ⋅ ( )
Pf A
= 283.01k
3.0 ksi 1,809.56 inc g2′ ⋅ ( )( )
Mf t A
= 696.0 ft k 12 in/ft
3.0 ksi 48 in 1,809.56 inc g2′ ⋅ ⋅
⋅( )( )( )( )( )) × − = 3.21 10 2
ρg = 0.021 0.8 0.833
0.8 0.9(0.021 0.020) = 0− −
−
− ..022
ρ ρg s
gs g g
2= AA
or : A = A = (0.021)(1809.56) = 38.0 in⋅
= 5.21 10 2× −
department hundreds of millions of dollars in the United States alone. Two ofthe more famous scour related failures of U.S. bridges occurred in 1987 and1989. The former saw scour bring down the bridge carrying the New York StateThruway over Schoharie Creek and the latter the failure due to scour of theU.S. Route 51 bridge crossing the Hatachie River in Tennessee. With this inmind, the discussion below will focus on some of the general maintenance andrehabilitation issues concerning scour.
4.2.6 Scour
We have already touched on some of the factors which lead to scour and themethods associated with inspecting a highway bridge for potential scour in Section2.3.6. Because of the importance of this issue, however, we will touch briefly onsome of the remedial and preventive maintenance measures which can be takento correct scour related damage to a bridge pier (or abutment for that matter).
Scour
[4.2.6]
PIERS
DESIGN EXAMPLE 4.2STEP 9: DETERMINE REQUIRED
REINFORCING STEELTo compute the amount of required rein-forcing steel needed we will need to usethe interaction diagrams presented inFigures 4.14 and 4.15. These diagramsare used to determine the effects of com-bined compression and bending actingon the column.
Recall that in Step 6 we identified themoment and axial force acting on acolumn. In the diagram shown in theaccompanying calculation sheet, thegiven geometry of the existing column ispresented along with the area of reinforc-ing steel currently in place.
Since the value of g is 0.833 we mustinterpolate between values found in theg=0.8 diagram and the g=0.9 diagram.The x-axis of the diagram takes into ac-count the effects of bending on the columnand the y-axis the effects of compression.
Once we have interpolated a value, we cancalculate the area of reinforcing steelrequired by multiplying the resulting ratiovalue by the gross column area. In doingso we see that the existing reinforcementcannot sustain an earthquake based onthe 0.19 acceleration coefficient.
As = 18.17 in2
gt = 40 in
gt
t = 4
8"
3"
Downloaded from Digital Engineering Library @ McGraw-Hill (www.digitalengineeringlibrary.com)Copyright © 2006 The McGraw-Hill Companies. All rights reserved.
Any use is subject to the Terms of Use as given at the website.
Design of Substructure Elements
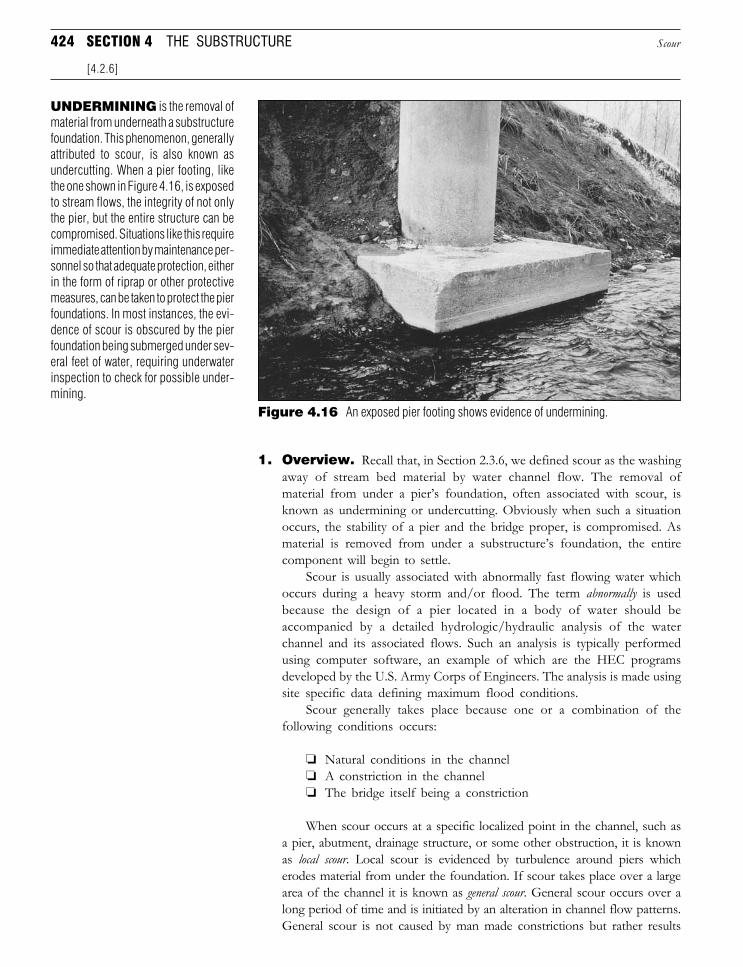
424 SECTION 4 THE SUBSTRUCTURE
1. Overview. Recall that, in Section 2.3.6, we defined scour as the washingaway of stream bed material by water channel flow. The removal ofmaterial from under a pier’s foundation, often associated with scour, isknown as undermining or undercutting. Obviously when such a situationoccurs, the stability of a pier and the bridge proper, is compromised. Asmaterial is removed from under a substructure’s foundation, the entirecomponent will begin to settle.
Scour is usually associated with abnormally fast flowing water whichoccurs during a heavy storm and/or flood. The term abnormally is usedbecause the design of a pier located in a body of water should beaccompanied by a detailed hydrologic/hydraulic analysis of the waterchannel and its associated flows. Such an analysis is typically performedusing computer software, an example of which are the HEC programsdeveloped by the U.S. Army Corps of Engineers. The analysis is made usingsite specific data defining maximum flood conditions.
Scour generally takes place because one or a combination of thefollowing conditions occurs:
❏ Natural conditions in the channel❏ A constriction in the channel❏ The bridge itself being a constriction
When scour occurs at a specific localized point in the channel, such asa pier, abutment, drainage structure, or some other obstruction, it is knownas local scour. Local scour is evidenced by turbulence around piers whicherodes material from under the foundation. If scour takes place over a largearea of the channel it is known as general scour. General scour occurs over along period of time and is initiated by an alteration in channel flow patterns.General scour is not caused by man made constrictions but rather results
Scour
[4.2.6]
UNDERMINING is the removal ofmaterial from underneath a substructurefoundation. This phenomenon, generallyattributed to scour, is also known asundercutting. When a pier footing, likethe one shown in Figure 4.16, is exposedto stream flows, the integrity of not onlythe pier, but the entire structure can becompromised. Situations like this requireimmediate attention by maintenance per-sonnel so that adequate protection, eitherin the form of riprap or other protectivemeasures, can be taken to protect the pierfoundations. In most instances, the evi-dence of scour is obscured by the pierfoundation being submerged under sev-eral feet of water, requiring underwaterinspection to check for possible under-mining.
Figure 4.16 An exposed pier footing shows evidence of undermining.
Downloaded from Digital Engineering Library @ McGraw-Hill (www.digitalengineeringlibrary.com)Copyright © 2006 The McGraw-Hill Companies. All rights reserved.
Any use is subject to the Terms of Use as given at the website.
Design of Substructure Elements
425
from a change in the supply of sediment to a large area. Scour which resultsfrom a reduction in the cross-sectional area of a channel due to the placementof an obstruction such as a highway bridge or drainage structure is knownas constriction scour. Since the cross-sectional area is decreased by theconstriction, a higher water velocity results. This higher velocity will typicallyoccur at the bridge location, increasing the potential for scour damage.
The reader only has to recall the massive flooding which overtook thebanks of the Mississippi River in 1993 to fully appreciate the magnitudeand potential impact flooding can have on a highway bridge structure.During this flood, it was not uncommon to see entire highway bridgescompletely submerged beneath the flood waters.
2. Rehabilitation and Maintenance. If a pier is found to be sufferingfrom adverse scour conditions, the problem can be corrected by either:
❏ Changing the structure❏ Replacing the material which has been washed away
The first solution typically involves altering the foundation. This canbe accomplished by enlarging the footer, strengthening or adding piles, orproviding a sheet piling barrier around the pier foundation. Replacementof material generally involves the placement of erosion resistant materialsuch as riprap or broken concrete around the pier (or abutment) to offera barrier of sorts to scour.
Obviously the solution selected will depend greatly on the scope of theproblem (i.e., how severe is the scour) as well as available funds andmaterial availability. Due to limited resources, it may be feasible to onlyprovide temporary protection to a pier. When this is the case, replacementof the washed away material is the generally accepted solution. Fortemporary repairs, the soundness of the stone used is generally notimportant [Ref. 4.6]. Another factor which could affect the method usedis the size of the water channel and other environmental considerations(i.e., impact on downstream conditions, etc.).
Discussed below are methods for either replacing washed awaymaterial or changing the structure to account for current water channelconditions. To be sure, there are a variety of approaches which transpor-tation departments utilize in addressing the important issue of scour. It isthe intent of the following discussion, however, to present the reader newto bridge design with an overview of some of the general forms ofrehabilitation and maintenance methods in use.
3. Replacement of Material. As mentioned above, the replacementof washed away material can be made with broken stone or concrete. Thesize of stone used to protect against scour is dependent upon thecharacteristics of the bridge site. Some features which are used todetermine the size of stone used to protect piers are:
❏ Type and orientation of pier or abutment❏ Geometry and physical properties of stream❏ Size and location of scour hole
Scour
[4.2.6, Part 3]
PIERS
he reader only has to re-call the massive flooding
which overtook the banks ofthe Mississippi River in 1993to fully appreciate the magni-tude and potential impact flood-ing can have on a highwaybridge structure.
T
eplacement of materialgenerally involves the
placement of erosion resistantmaterial such as riprap or bro-ken concrete around the pier... to offer a barrier of sorts toscour.
R
Downloaded from Digital Engineering Library @ McGraw-Hill (www.digitalengineeringlibrary.com)Copyright © 2006 The McGraw-Hill Companies. All rights reserved.
Any use is subject to the Terms of Use as given at the website.
Design of Substructure Elements
426 SECTION 4 THE SUBSTRUCTURE
❏ Local climate and environment❏ Material and vegetation of stream bed and banks
The bridge crossing a stream, shown earlier in Figure 4.11, should givethe reader a feeling for the type of stone used to protect substructures fromscour. Because of the relatively large size of some of these stones, caremust be taken by the maintenance personnel in placing them around a pier.Careless dumping of riprap can often damage the pier itself. Anotherconcern is an uneven placement of riprap which can lead to stabilityproblems (see also Section 2.3.6). For this reason, riprap should be placedin uniform lifts.
If concrete is being used as a repair material for scour, it will requireeither underwater placement or dewatering at the pier location. The lattermethod requires that water be removed from the pier location so that theconcrete can be placed. This method has the inherent advantage ofproviding a dry environment for placement of the concrete.
Dewatering can be accomplished through the construction of a coffer-dam around a pier using sheet piling. As mentioned earlier in Section 4.1.8,Part 9, the driving of sheet piling under a bridge is difficult because ofpotential interference with the bridge superstructure overhead. Placement ofthe cofferdam may only be possible by removing a span. Another methodfor dewatering a pier is to divert channel flow away from the bridge. Thismethod, however, could potentially create adverse effects at other pointsalong the channel and will require a thorough investigation and analysis toensure that no associated damage takes place as a result of the diversion.
There are a variety of methods available for underwater placement ofconcrete. Some of the more popular methods include:
❏ Tremie❏ Pumping❏ Underwater bucket❏ Bagged concrete
A tremie utilizes gravity flow to place concrete underwater. A tremieis a tube which is equipped with a discharge gate at one end and a hopperat the other. With the discharge gate closed, the tremie is filled withconcrete and then submerged beneath the water to the location requiringrepair. The hopper must be continually filled with concrete and thedischarge end submerged during the pour so that the tremie does notbecome filled with water. Pumping uses the same basic concept except theconcrete is pumped through the tube. This provides for greater control inplacing the concrete.
Underwater buckets, as the name would imply, consist of loweringbuckets of concrete to the location requiring repair. The bucket may becovered or uncovered; however, if it is uncovered, care must be takenduring the placement operation. Bagged concrete consists of concrete,wrapped in a burlap bag, which is then placed around the repair location.A certain degree of bonding between adjacent bags takes place as a resultof concrete seeping through the pores in the burlap bags. Some baggedconcrete consists of dry concrete which is placed and then wetted.
Scour
[4.2.6, Part 3]
areless dumping of riprapcan often damage the pier
itself. Another concern is anuneven placement of riprapwhich can lead to stabilityproblems ...
C
Downloaded from Digital Engineering Library @ McGraw-Hill (www.digitalengineeringlibrary.com)Copyright © 2006 The McGraw-Hill Companies. All rights reserved.
Any use is subject to the Terms of Use as given at the website.
Design of Substructure Elements
427
4. Changing the Structure. The other type of repair methodinvolves physically altering the form and function of the pier. Severelydeteriorated piers, like the one shown earlier in Figure 4.11, are sometimesrepaired by jacketing the pier with a new layer of concrete. The foundationitself can be deepened and then jacketed to provide added protection andrepair deteriorated portions.
Another solution is to drive additional, deeper piles for the pierfoundation or repair existing piles which have been damaged. Both opera-tions are complicated by having to work underwater. If the bridge issusceptible to high flood waters which can result in overtopping of thechannel (i.e., flood waters exceeding the height of the structure) any solidparapet type barriers should be replaced with open railings to allow the waterto pass through. As a protective measure, steel sheeting can be installedaround the pier.
5. Replacing the Structure. If the scour problem is so severe thatnone of the methods described in Part 3 or Part 4 above will rectify thesituation, the only feasible alternative may be to completely replace thestructure. The design of a more scour resistant structure should beperformed with the following considerations in mind:
❏ The vertical clearance should be as large as possible❏ Deep, pile foundations should be used❏ Socket piles into rock if piles are short❏ The piers should be oriented so as to limit scour❏ The largest possible channel width under the bridge should be
provided for
It may also be possible to alter the channel alignment and provide forthe incorporation of relief culverts so as to minimize the effect of excessiveflows passing under a bridge. By providing for the largest possible channelwidth, the cross-sectional area becomes larger and thereby decreases thevelocity of water passing under the structure. Any major bridge rehabilitationwork should also include the removal of any debris located in the channelthat could be acting as a constriction to channel flow. While these generalguidelines are offered with regard to the replacement of an existing structure,the reader should keep in mind their applicability to the design of a new one.
4.3 BEARINGS
Bearings are mechanical systems which transmit loads from the superstruc-ture to the substructure. In a way, bearings can be thought of as the interfacebetween the superstructure and the substructure. In addition to transmittingvertical loads to the substructure component (i.e., pier or abutment) a bearing alsoprovides for movement due to thermal expansion and contraction as well asrotational movement associated with deflection of primary members.
The importance of bearings cannot be understated. Bearings whichbecome frozen due to corrosion, clogged with debris, or fail to function asoriginally designed can induce high stresses and potentially lead to failure of anindividual span or an entire structure. The importance of bearings in a bridgedesign is often paid little (or no) attention because many bridge designers rely
[4.3]
BEARINGS
y providing for the larg-est possible channel
width, the cross-sectional areabecomes larger and therebydecreases the velocity of waterpassing under the structure.
B
Downloaded from Digital Engineering Library @ McGraw-Hill (www.digitalengineeringlibrary.com)Copyright © 2006 The McGraw-Hill Companies. All rights reserved.
Any use is subject to the Terms of Use as given at the website.
Design of Substructure Elements
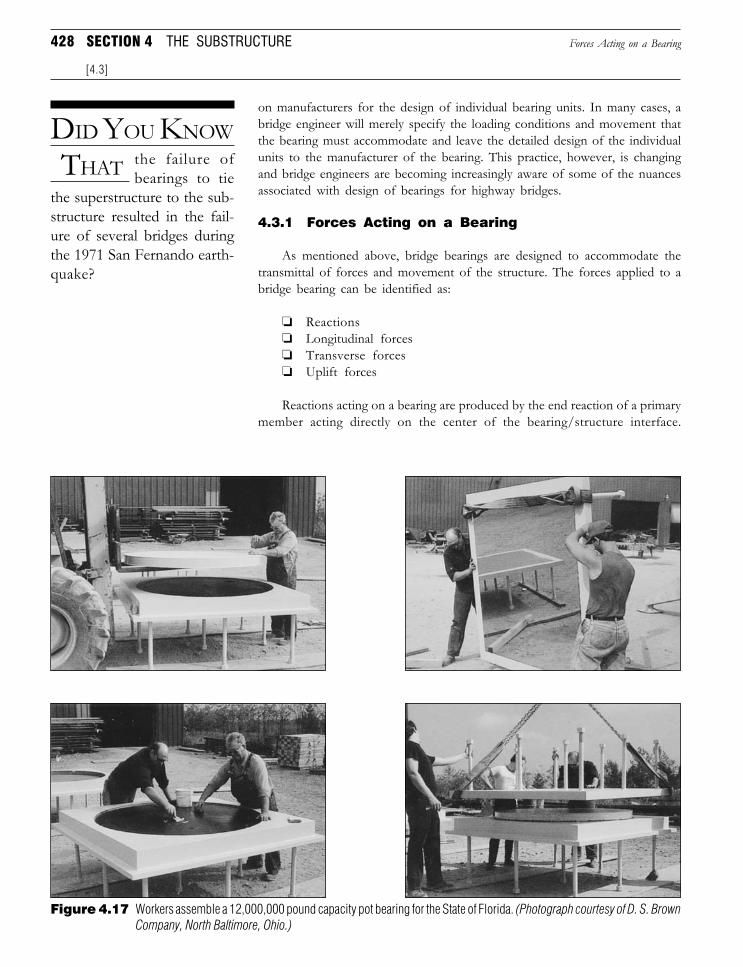
428 SECTION 4 THE SUBSTRUCTURE
Figure 4.17 Workers assemble a 12,000,000 pound capacity pot bearing for the State of Florida. (Photograph courtesy of D. S. BrownCompany, North Baltimore, Ohio.)
on manufacturers for the design of individual bearing units. In many cases, abridge engineer will merely specify the loading conditions and movement thatthe bearing must accommodate and leave the detailed design of the individualunits to the manufacturer of the bearing. This practice, however, is changingand bridge engineers are becoming increasingly aware of some of the nuancesassociated with design of bearings for highway bridges.
4.3.1 Forces Acting on a Bearing
As mentioned above, bridge bearings are designed to accommodate thetransmittal of forces and movement of the structure. The forces applied to abridge bearing can be identified as:
❏ Reactions❏ Longitudinal forces❏ Transverse forces❏ Uplift forces
Reactions acting on a bearing are produced by the end reaction of a primarymember acting directly on the center of the bearing/structure interface.
Forces Acting on a Bearing
[4.3]
DID YOU KNOW
THAT the failure ofbearings to tie
the superstructure to the sub-structure resulted in the fail-ure of several bridges duringthe 1971 San Fernando earth-quake?
Downloaded from Digital Engineering Library @ McGraw-Hill (www.digitalengineeringlibrary.com)Copyright © 2006 The McGraw-Hill Companies. All rights reserved.
Any use is subject to the Terms of Use as given at the website.
Design of Substructure Elements
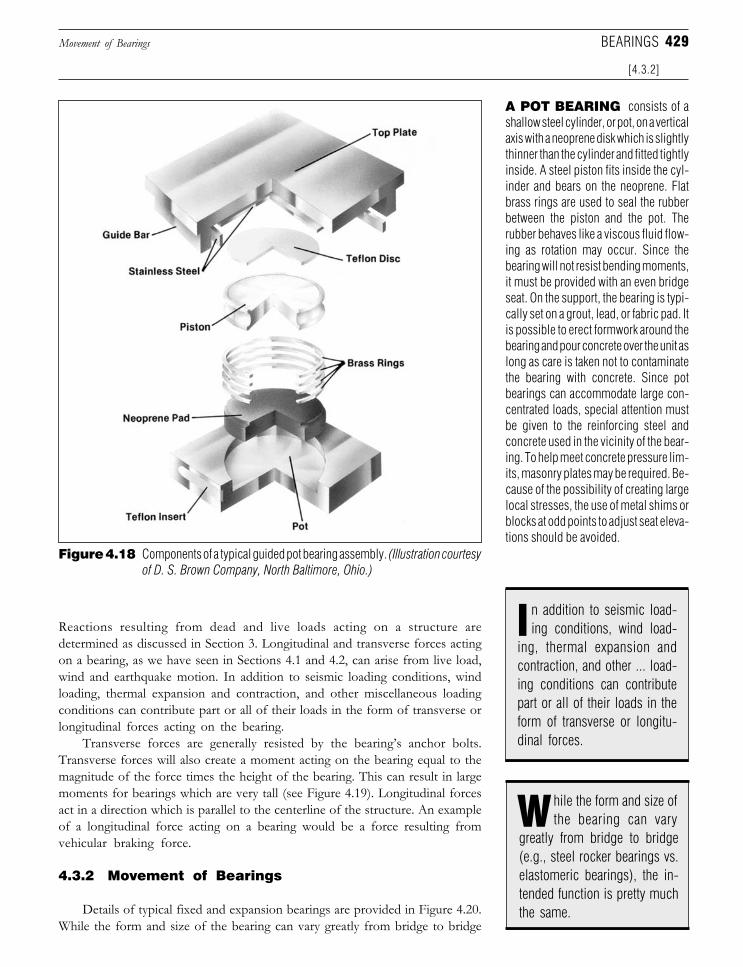
429
Reactions resulting from dead and live loads acting on a structure aredetermined as discussed in Section 3. Longitudinal and transverse forces actingon a bearing, as we have seen in Sections 4.1 and 4.2, can arise from live load,wind and earthquake motion. In addition to seismic loading conditions, windloading, thermal expansion and contraction, and other miscellaneous loadingconditions can contribute part or all of their loads in the form of transverse orlongitudinal forces acting on the bearing.
Transverse forces are generally resisted by the bearing’s anchor bolts.Transverse forces will also create a moment acting on the bearing equal to themagnitude of the force times the height of the bearing. This can result in largemoments for bearings which are very tall (see Figure 4.19). Longitudinal forcesact in a direction which is parallel to the centerline of the structure. An exampleof a longitudinal force acting on a bearing would be a force resulting fromvehicular braking force.
4.3.2 Movement of Bearings
Details of typical fixed and expansion bearings are provided in Figure 4.20.While the form and size of the bearing can vary greatly from bridge to bridge
Movement of Bearings
[4.3.2]
BEARINGS
A POT BEARING consists of ashallow steel cylinder, or pot, on a verticalaxis with a neoprene disk which is slightlythinner than the cylinder and fitted tightlyinside. A steel piston fits inside the cyl-inder and bears on the neoprene. Flatbrass rings are used to seal the rubberbetween the piston and the pot. Therubber behaves like a viscous fluid flow-ing as rotation may occur. Since thebearing will not resist bending moments,it must be provided with an even bridgeseat. On the support, the bearing is typi-cally set on a grout, lead, or fabric pad. Itis possible to erect formwork around thebearing and pour concrete over the unit aslong as care is taken not to contaminatethe bearing with concrete. Since potbearings can accommodate large con-centrated loads, special attention mustbe given to the reinforcing steel andconcrete used in the vicinity of the bear-ing. To help meet concrete pressure lim-its, masonry plates may be required. Be-cause of the possibility of creating largelocal stresses, the use of metal shims orblocks at odd points to adjust seat eleva-tions should be avoided.
Figure 4.18 Components of a typical guided pot bearing assembly. (Illustration courtesyof D. S. Brown Company, North Baltimore, Ohio.)
n addition to seismic load-ing conditions, wind load-
ing, thermal expansion andcontraction, and other ... load-ing conditions can contributepart or all of their loads in theform of transverse or longitu-dinal forces.
I
hile the form and size ofthe bearing can varyW
greatly from bridge to bridge(e.g., steel rocker bearings vs.elastomeric bearings), the in-tended function is pretty muchthe same.
Downloaded from Digital Engineering Library @ McGraw-Hill (www.digitalengineeringlibrary.com)Copyright © 2006 The McGraw-Hill Companies. All rights reserved.
Any use is subject to the Terms of Use as given at the website.
Design of Substructure Elements
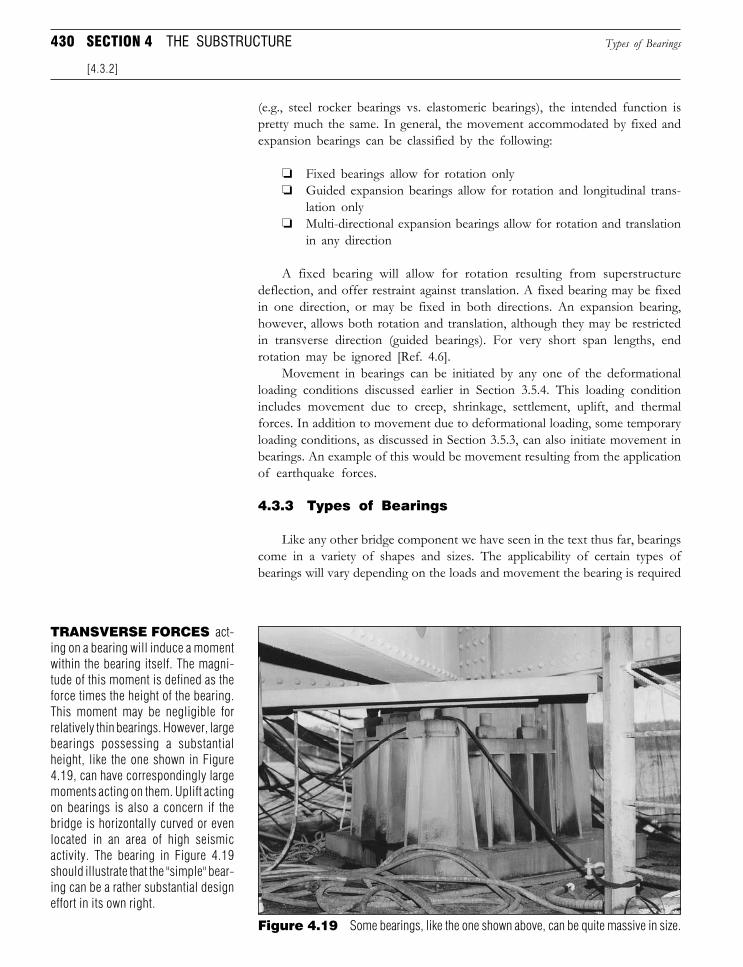
430 SECTION 4 THE SUBSTRUCTURE
(e.g., steel rocker bearings vs. elastomeric bearings), the intended function ispretty much the same. In general, the movement accommodated by fixed andexpansion bearings can be classified by the following:
❏ Fixed bearings allow for rotation only❏ Guided expansion bearings allow for rotation and longitudinal trans-
lation only❏ Multi-directional expansion bearings allow for rotation and translation
in any direction
A fixed bearing will allow for rotation resulting from superstructuredeflection, and offer restraint against translation. A fixed bearing may be fixedin one direction, or may be fixed in both directions. An expansion bearing,however, allows both rotation and translation, although they may be restrictedin transverse direction (guided bearings). For very short span lengths, endrotation may be ignored [Ref. 4.6].
Movement in bearings can be initiated by any one of the deformationalloading conditions discussed earlier in Section 3.5.4. This loading conditionincludes movement due to creep, shrinkage, settlement, uplift, and thermalforces. In addition to movement due to deformational loading, some temporaryloading conditions, as discussed in Section 3.5.3, can also initiate movement inbearings. An example of this would be movement resulting from the applicationof earthquake forces.
4.3.3 Types of Bearings
Like any other bridge component we have seen in the text thus far, bearingscome in a variety of shapes and sizes. The applicability of certain types ofbearings will vary depending on the loads and movement the bearing is required
Types of Bearings
[4.3.2]
Figure 4.19 Some bearings, like the one shown above, can be quite massive in size.
TRANSVERSE FORCES act-ing on a bearing will induce a momentwithin the bearing itself. The magni-tude of this moment is defined as theforce times the height of the bearing.This moment may be negligible forrelatively thin bearings. However, largebearings possessing a substantialheight, like the one shown in Figure4.19, can have correspondingly largemoments acting on them. Uplift actingon bearings is also a concern if thebridge is horizontally curved or evenlocated in an area of high seismicactivity. The bearing in Figure 4.19should illustrate that the "simple" bear-ing can be a rather substantial designeffort in its own right.
Downloaded from Digital Engineering Library @ McGraw-Hill (www.digitalengineeringlibrary.com)Copyright © 2006 The McGraw-Hill Companies. All rights reserved.
Any use is subject to the Terms of Use as given at the website.
Design of Substructure Elements
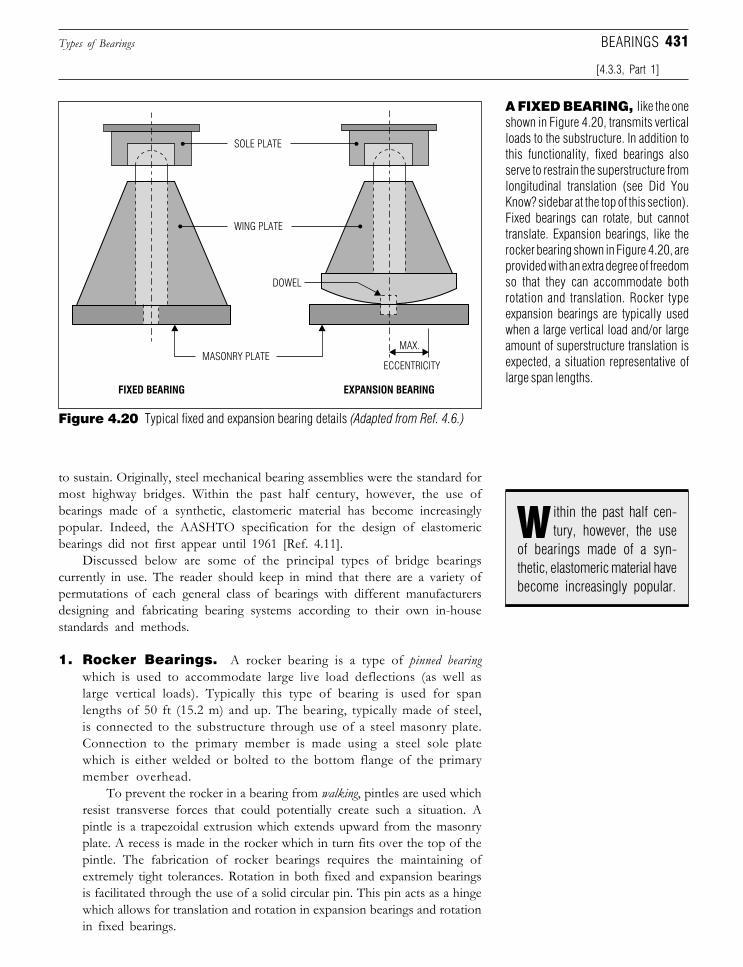
431Types of Bearings
[4.3.3, Part 1]
BEARINGS
to sustain. Originally, steel mechanical bearing assemblies were the standard formost highway bridges. Within the past half century, however, the use ofbearings made of a synthetic, elastomeric material has become increasinglypopular. Indeed, the AASHTO specification for the design of elastomericbearings did not first appear until 1961 [Ref. 4.11].
Discussed below are some of the principal types of bridge bearingscurrently in use. The reader should keep in mind that there are a variety ofpermutations of each general class of bearings with different manufacturersdesigning and fabricating bearing systems according to their own in-housestandards and methods.
1. Rocker Bearings. A rocker bearing is a type of pinned bearingwhich is used to accommodate large live load deflections (as well aslarge vertical loads). Typically this type of bearing is used for spanlengths of 50 ft (15.2 m) and up. The bearing, typically made of steel,is connected to the substructure through use of a steel masonry plate.Connection to the primary member is made using a steel sole platewhich is either welded or bolted to the bottom flange of the primarymember overhead.
To prevent the rocker in a bearing from walking, pintles are used whichresist transverse forces that could potentially create such a situation. Apintle is a trapezoidal extrusion which extends upward from the masonryplate. A recess is made in the rocker which in turn fits over the top of thepintle. The fabrication of rocker bearings requires the maintaining ofextremely tight tolerances. Rotation in both fixed and expansion bearingsis facilitated through the use of a solid circular pin. This pin acts as a hingewhich allows for translation and rotation in expansion bearings and rotationin fixed bearings.
A FIXED BEARING, like the oneshown in Figure 4.20, transmits verticalloads to the substructure. In addition tothis functionality, fixed bearings alsoserve to restrain the superstructure fromlongitudinal translation (see Did YouKnow? sidebar at the top of this section).Fixed bearings can rotate, but cannottranslate. Expansion bearings, like therocker bearing shown in Figure 4.20, areprovided with an extra degree of freedomso that they can accommodate bothrotation and translation. Rocker typeexpansion bearings are typically usedwhen a large vertical load and/or largeamount of superstructure translation isexpected, a situation representative oflarge span lengths.
Figure 4.20 Typical fixed and expansion bearing details (Adapted from Ref. 4.6.)
SOLE PLATE
WING PLATE
DOWEL
MASONRY PLATE
FIXED BEARING EXPANSION BEARING
MAX.
ECCENTRICITY
ithin the past half cen-tury, however, the use
of bearings made of a syn-thetic, elastomeric material havebecome increasingly popular.
W
Downloaded from Digital Engineering Library @ McGraw-Hill (www.digitalengineeringlibrary.com)Copyright © 2006 The McGraw-Hill Companies. All rights reserved.
Any use is subject to the Terms of Use as given at the website.
Design of Substructure Elements
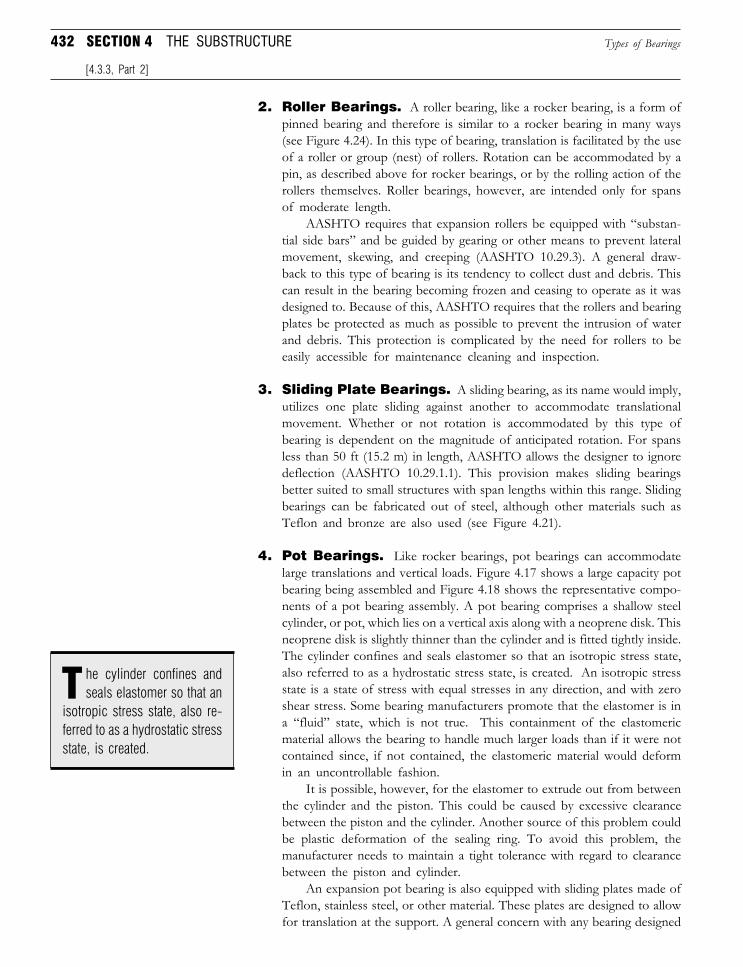
432 SECTION 4 THE SUBSTRUCTURE Types of Bearings
[4.3.3, Part 2]
2. Roller Bearings. A roller bearing, like a rocker bearing, is a form ofpinned bearing and therefore is similar to a rocker bearing in many ways(see Figure 4.24). In this type of bearing, translation is facilitated by the useof a roller or group (nest) of rollers. Rotation can be accommodated by apin, as described above for rocker bearings, or by the rolling action of therollers themselves. Roller bearings, however, are intended only for spansof moderate length.
AASHTO requires that expansion rollers be equipped with “substan-tial side bars” and be guided by gearing or other means to prevent lateralmovement, skewing, and creeping (AASHTO 10.29.3). A general draw-back to this type of bearing is its tendency to collect dust and debris. Thiscan result in the bearing becoming frozen and ceasing to operate as it wasdesigned to. Because of this, AASHTO requires that the rollers and bearingplates be protected as much as possible to prevent the intrusion of waterand debris. This protection is complicated by the need for rollers to beeasily accessible for maintenance cleaning and inspection.
3. Sliding Plate Bearings. A sliding bearing, as its name would imply,utilizes one plate sliding against another to accommodate translationalmovement. Whether or not rotation is accommodated by this type ofbearing is dependent on the magnitude of anticipated rotation. For spansless than 50 ft (15.2 m) in length, AASHTO allows the designer to ignoredeflection (AASHTO 10.29.1.1). This provision makes sliding bearingsbetter suited to small structures with span lengths within this range. Slidingbearings can be fabricated out of steel, although other materials such asTeflon and bronze are also used (see Figure 4.21).
4. Pot Bearings. Like rocker bearings, pot bearings can accommodatelarge translations and vertical loads. Figure 4.17 shows a large capacity potbearing being assembled and Figure 4.18 shows the representative compo-nents of a pot bearing assembly. A pot bearing comprises a shallow steelcylinder, or pot, which lies on a vertical axis along with a neoprene disk. Thisneoprene disk is slightly thinner than the cylinder and is fitted tightly inside.The cylinder confines and seals elastomer so that an isotropic stress state,also referred to as a hydrostatic stress state, is created. An isotropic stressstate is a state of stress with equal stresses in any direction, and with zeroshear stress. Some bearing manufacturers promote that the elastomer is ina “fluid” state, which is not true. This containment of the elastomericmaterial allows the bearing to handle much larger loads than if it were notcontained since, if not contained, the elastomeric material would deformin an uncontrollable fashion.
It is possible, however, for the elastomer to extrude out from betweenthe cylinder and the piston. This could be caused by excessive clearancebetween the piston and the cylinder. Another source of this problem couldbe plastic deformation of the sealing ring. To avoid this problem, themanufacturer needs to maintain a tight tolerance with regard to clearancebetween the piston and cylinder.
An expansion pot bearing is also equipped with sliding plates made ofTeflon, stainless steel, or other material. These plates are designed to allowfor translation at the support. A general concern with any bearing designed
isotropic stress state, also re-ferred to as a hydrostatic stressstate, is created.
he cylinder confines andseals elastomer so that anT
Downloaded from Digital Engineering Library @ McGraw-Hill (www.digitalengineeringlibrary.com)Copyright © 2006 The McGraw-Hill Companies. All rights reserved.
Any use is subject to the Terms of Use as given at the website.
Design of Substructure Elements
433Types of Bearings
[4.3.3, Part 6]
BEARINGS
to accommodate large loads is the quality of the substructure supportelement below it (i.e., pedestal or other bridge seat element). Like thebearing, a concrete pedestal must be designed with concrete and reinforc-ing steel of sufficient strength to handle the large reaction. It is alsoadvisable to avoid the use of metal shims or other devices which are usedto adjust the final bridge seat elevation. Such devices can induce large localstresses and should be avoided.
5. Spherical Bearings. A spherical bearing accommodates rotationthrough use of a curved bottom plate located at the lower portion of thebearing. This curved plate marries to a matching plate above it. Translationis achieved through use of a flat plate located at the upper portion of thebearing. The curved surfaces of the bearing which allow for rotation arefabricated out of stainless steel, lubricated bronze, or other material. Theflat upper surfaces, designed for translation, are equipped with a layer ofstainless steel and Teflon.
6. Elastomeric Bearings. An elastomeric bearing can be made upof an unreinforced elastomeric pad or a reinforced elastomeric bearing. Areinforced elastomeric bearing is fabricated by bonding together alternatelaminates of rubber (either natural or synthetic) and steel. The rubber andsteel are molded together into a solid mass which is free of voids. As thebearing is loaded, the elastomeric material will tend to deform or bulge. Anillustration of unreinforced and reinforced elastomeric bearings is provided
A SLIDING BEARING consistsof two components. The top compo-nent incorporates a steel load plate witha polished stainless steel plate weldedto it. The top plate is welded or boltedto the girder during installation. Thebottom component consists of a Teflonsheet which is 1/16 to 3/32 in thick.
This sheet is bonded to a stainless steelbacking plate, which is bonded to anelastomeric bearing, that is in turnbonded to a steel load plate. All bond-ing is accomplished through vulcani-zation during the molding process.
Sliding bearings may be guided or freeto move and are custom made to indi-vidual project requirements for materialtypes and performance (i.e., expan-sion, rotation).
Figure 4.21 Components of a typical sliding bearing assembly. (Illustration courtesy ofD. S. Brown Company, North Baltimore, Ohio.)
ike the bearing, a concretepedestal must be designed
with concrete and reinforcingsteel of sufficient strength tohandle the large reaction.
L
bonding together alternatelaminates of rubber (eithernatural or synthetic) and steel.
reinforced elastomericbearing is fabricated byA
Downloaded from Digital Engineering Library @ McGraw-Hill (www.digitalengineeringlibrary.com)Copyright © 2006 The McGraw-Hill Companies. All rights reserved.
Any use is subject to the Terms of Use as given at the website.
Design of Substructure Elements
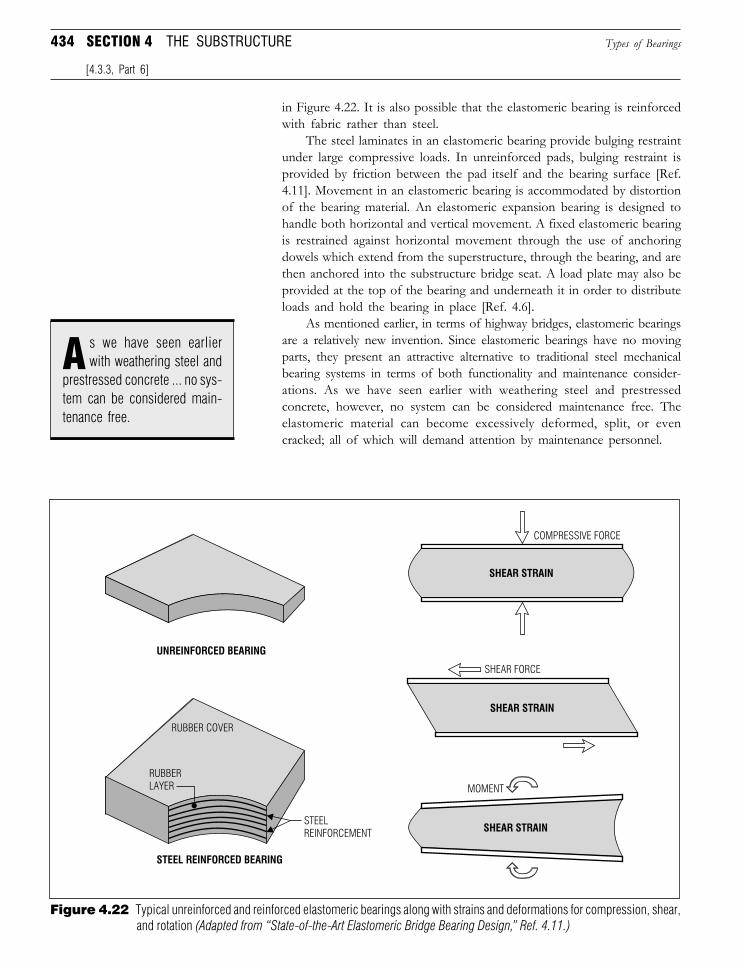
434 SECTION 4 THE SUBSTRUCTURE Types of Bearings
[4.3.3, Part 6]
in Figure 4.22. It is also possible that the elastomeric bearing is reinforcedwith fabric rather than steel.
The steel laminates in an elastomeric bearing provide bulging restraintunder large compressive loads. In unreinforced pads, bulging restraint isprovided by friction between the pad itself and the bearing surface [Ref.4.11]. Movement in an elastomeric bearing is accommodated by distortionof the bearing material. An elastomeric expansion bearing is designed tohandle both horizontal and vertical movement. A fixed elastomeric bearingis restrained against horizontal movement through the use of anchoringdowels which extend from the superstructure, through the bearing, and arethen anchored into the substructure bridge seat. A load plate may also beprovided at the top of the bearing and underneath it in order to distributeloads and hold the bearing in place [Ref. 4.6].
As mentioned earlier, in terms of highway bridges, elastomeric bearingsare a relatively new invention. Since elastomeric bearings have no movingparts, they present an attractive alternative to traditional steel mechanicalbearing systems in terms of both functionality and maintenance consider-ations. As we have seen earlier with weathering steel and prestressedconcrete, however, no system can be considered maintenance free. Theelastomeric material can become excessively deformed, split, or evencracked; all of which will demand attention by maintenance personnel.
prestressed concrete ... no sys-tem can be considered main-tenance free.
s we have seen earlierwith weathering steel andA
Figure 4.22 Typical unreinforced and reinforced elastomeric bearings along with strains and deformations for compression, shear,and rotation (Adapted from “State-of-the-Art Elastomeric Bridge Bearing Design,” Ref. 4.11.)
UNREINFORCED BEARING
STEEL REINFORCED BEARING
SHEAR STRAIN
SHEAR STRAIN
SHEAR STRAIN
RUBBER COVER
RUBBER
LAYER
STEEL
REINFORCEMENT
MOMENT
SHEAR FORCE
COMPRESSIVE FORCE
Downloaded from Digital Engineering Library @ McGraw-Hill (www.digitalengineeringlibrary.com)Copyright © 2006 The McGraw-Hill Companies. All rights reserved.
Any use is subject to the Terms of Use as given at the website.
Design of Substructure Elements
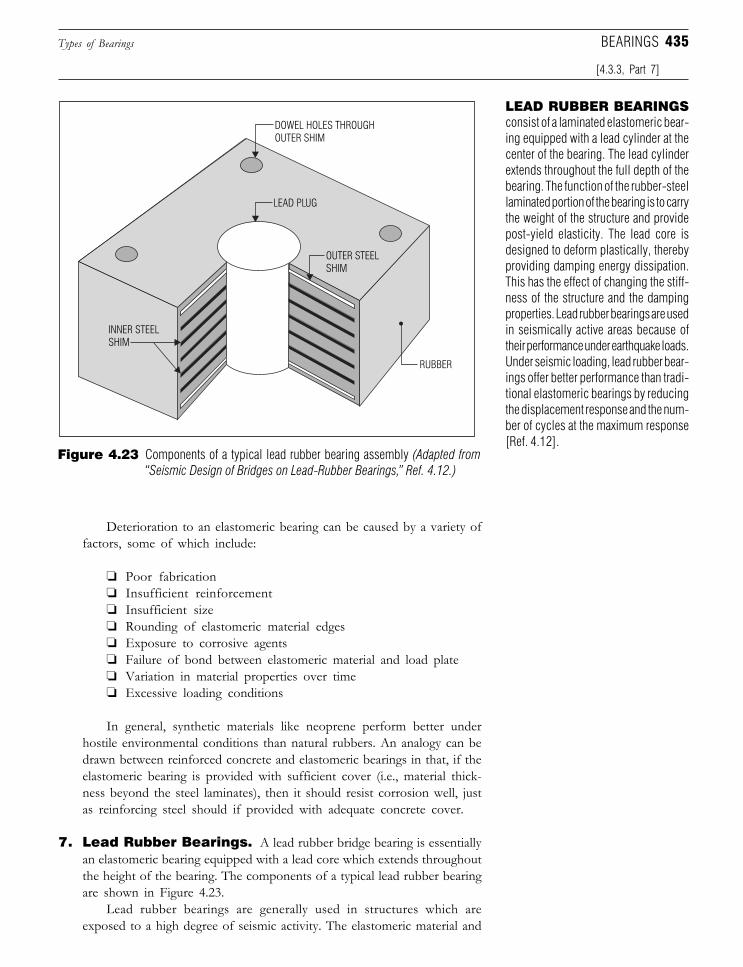
435Types of Bearings
[4.3.3, Part 7]
BEARINGS
Deterioration to an elastomeric bearing can be caused by a variety offactors, some of which include:
❏ Poor fabrication❏ Insufficient reinforcement❏ Insufficient size❏ Rounding of elastomeric material edges❏ Exposure to corrosive agents❏ Failure of bond between elastomeric material and load plate❏ Variation in material properties over time❏ Excessive loading conditions
In general, synthetic materials like neoprene perform better underhostile environmental conditions than natural rubbers. An analogy can bedrawn between reinforced concrete and elastomeric bearings in that, if theelastomeric bearing is provided with sufficient cover (i.e., material thick-ness beyond the steel laminates), then it should resist corrosion well, justas reinforcing steel should if provided with adequate concrete cover.
7. Lead Rubber Bearings. A lead rubber bridge bearing is essentiallyan elastomeric bearing equipped with a lead core which extends throughoutthe height of the bearing. The components of a typical lead rubber bearingare shown in Figure 4.23.
Lead rubber bearings are generally used in structures which areexposed to a high degree of seismic activity. The elastomeric material and
LEAD RUBBER BEARINGSconsist of a laminated elastomeric bear-ing equipped with a lead cylinder at thecenter of the bearing. The lead cylinderextends throughout the full depth of thebearing. The function of the rubber-steellaminated portion of the bearing is to carrythe weight of the structure and providepost-yield elasticity. The lead core isdesigned to deform plastically, therebyproviding damping energy dissipation.This has the effect of changing the stiff-ness of the structure and the dampingproperties. Lead rubber bearings are usedin seismically active areas because oftheir performance under earthquake loads.Under seismic loading, lead rubber bear-ings offer better performance than tradi-tional elastomeric bearings by reducingthe displacement response and the num-ber of cycles at the maximum response[Ref. 4.12].
Figure 4.23 Components of a typical lead rubber bearing assembly (Adapted from“Seismic Design of Bridges on Lead-Rubber Bearings,” Ref. 4.12.)
DOWEL HOLES THROUGH
OUTER SHIM
LEAD PLUG
OUTER STEEL
SHIM
RUBBER
INNER STEEL
SHIM
Downloaded from Digital Engineering Library @ McGraw-Hill (www.digitalengineeringlibrary.com)Copyright © 2006 The McGraw-Hill Companies. All rights reserved.
Any use is subject to the Terms of Use as given at the website.
Design of Substructure Elements
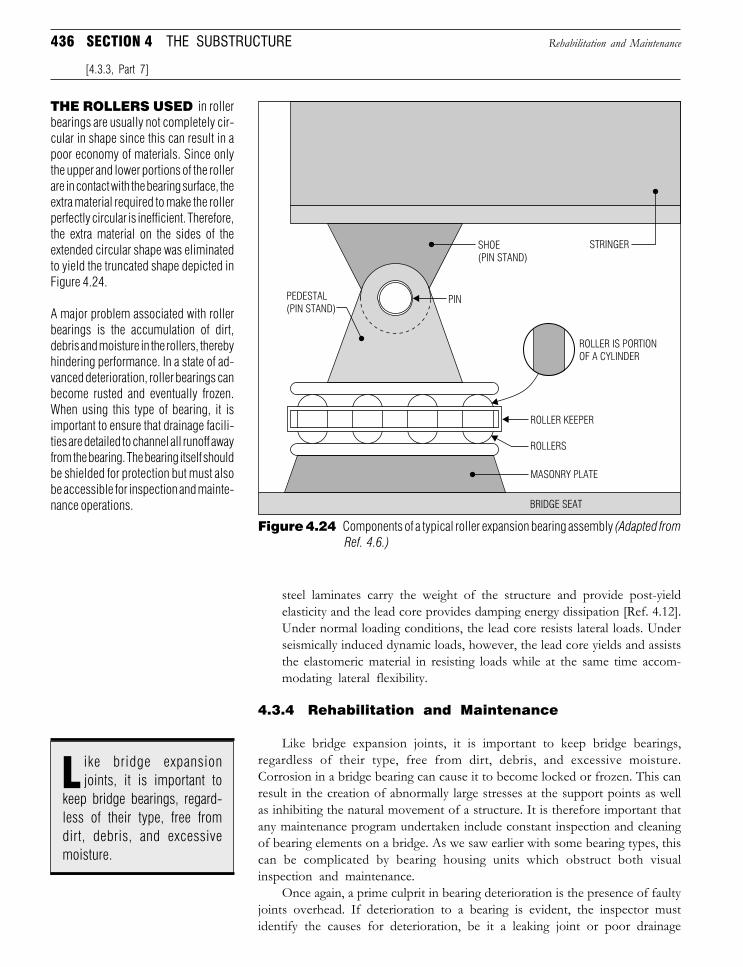
436 SECTION 4 THE SUBSTRUCTURE
steel laminates carry the weight of the structure and provide post-yieldelasticity and the lead core provides damping energy dissipation [Ref. 4.12].Under normal loading conditions, the lead core resists lateral loads. Underseismically induced dynamic loads, however, the lead core yields and assiststhe elastomeric material in resisting loads while at the same time accom-modating lateral flexibility.
4.3.4 Rehabilitation and Maintenance
Like bridge expansion joints, it is important to keep bridge bearings,regardless of their type, free from dirt, debris, and excessive moisture.Corrosion in a bridge bearing can cause it to become locked or frozen. This canresult in the creation of abnormally large stresses at the support points as wellas inhibiting the natural movement of a structure. It is therefore important thatany maintenance program undertaken include constant inspection and cleaningof bearing elements on a bridge. As we saw earlier with some bearing types, thiscan be complicated by bearing housing units which obstruct both visualinspection and maintenance.
Once again, a prime culprit in bearing deterioration is the presence of faultyjoints overhead. If deterioration to a bearing is evident, the inspector mustidentify the causes for deterioration, be it a leaking joint or poor drainage
THE ROLLERS USED in rollerbearings are usually not completely cir-cular in shape since this can result in apoor economy of materials. Since onlythe upper and lower portions of the rollerare in contact with the bearing surface, theextra material required to make the rollerperfectly circular is inefficient. Therefore,the extra material on the sides of theextended circular shape was eliminatedto yield the truncated shape depicted inFigure 4.24.
A major problem associated with rollerbearings is the accumulation of dirt,debris and moisture in the rollers, therebyhindering performance. In a state of ad-vanced deterioration, roller bearings canbecome rusted and eventually frozen.When using this type of bearing, it isimportant to ensure that drainage facili-ties are detailed to channel all runoff awayfrom the bearing. The bearing itself shouldbe shielded for protection but must alsobe accessible for inspection and mainte-nance operations.
keep bridge bearings, regard-less of their type, free fromdirt, debris, and excessivemoisture.
ike bridge expansionjoints, it is important toL
Rehabilitation and Maintenance
[4.3.3, Part 7]
Figure 4.24 Components of a typical roller expansion bearing assembly (Adapted fromRef. 4.6.)
BRIDGE SEAT
MASONRY PLATE
ROLLERS
ROLLER KEEPER
ROLLER IS PORTION
OF A CYLINDER
STRINGERSHOE
(PIN STAND)
PINPEDESTAL
(PIN STAND)
Downloaded from Digital Engineering Library @ McGraw-Hill (www.digitalengineeringlibrary.com)Copyright © 2006 The McGraw-Hill Companies. All rights reserved.
Any use is subject to the Terms of Use as given at the website.
Design of Substructure Elements
437
facilities. In steel bearings, particular attention should be given to the conditionof the bearing anchor bolts to ensure that excessive rusting has not compro-mised their integrity.
Another potential problem spot is deterioration of the bearing surface.Corrosion to the masonry plate and/or concrete substructure can presentstability problems. When design and detailing a bearing assembly, it isimportant to maintain adequate edge distance from the face of the masonryplate to the face of the supporting pedestal. Many states maintain strict designcriteria governing the placement of the bearing footprint on a pedestal orother bridge seat which the designer should take care to adhere to.
Like any other steel element, steel bearing assemblies should be providedwith some form of protective system designed to limit corrosion. This can takethe form of paint or galvanizing. As part of an on-going maintenance program,steel bearings will also require periodic lubrication of their working elements.
As mentioned in Section 4.3.3, Part 6, elastomeric bearings will also requireperiodic inspection and maintenance. Elastomeric bearings should be inspectedfor an accumulation of dirt and debris. The integrity of the elastomeric materialshould also be checked in an effort to detect excessive deformation or ozonecracking. In certain instances, it may be necessary to jack the superstructure inorder to replace elastomeric material which has been damaged.
Rocker and roller steel bearings are especially susceptible to a build-up ofdebris in their moving elements. Roller nests, like the one shown in Figure 4.24,are extremely susceptible to collecting debris. The underside of rocker bearingsis also a potential collection point for movement-inhibiting debris. In addition tolimiting the intended movement of a bearing, dirt and debris will pit and corrodethe surface of the bearing elements, which can also impede functionality.
Other potential sources for bearing problems can be identified by thefollowing:
❏ Corrosion from chemical agents❏ Settlement of the substructure❏ Excessive deformational loads
Bearings, like any other element in a cold environment, will deteriorate asa result of coming in contact with deicing agents. Settlement of the abutmentsor piers can result in a bearing becoming destabilizing and undergoing loadingconditions which the element was not designed for. Another potential sourcefor this problem is the presence of excessive deformational loads such as creepand shrinkage. While the first problem listed is difficult to control, the latter twocan certainly be addressed by a proper and thorough design.
REFERENCES
4.1 Starzewski, K., “Earth Retaining Structures and Culverts,” The Design andConstruction of Engineering Foundations, Edited by Henry, F.D.C., Chapman andHall, New York, 1986.
4.2 Bowles, Joseph E., Foundation Analysis and Design, 2nd ed., McGraw-Hill,New York, 1977.
ronment, will deteriorate as aresult of coming in contact withdeicing agents.
earings, like any otherelement in a cold envi-B
REFERENCES
Downloaded from Digital Engineering Library @ McGraw-Hill (www.digitalengineeringlibrary.com)Copyright © 2006 The McGraw-Hill Companies. All rights reserved.
Any use is subject to the Terms of Use as given at the website.
Design of Substructure Elements
438 SECTION 4 THE SUBSTRUCTURE
4.3 Peck, Ralph B., Hanson, Walter E., and Thornburn, Thomas H., FoundationEngineering, John Wiley & Sons, New York, 1974.
4.4 Standard Specifications for Highway Bridges, 17th ed., American Association ofState Highway and Transportation Officials, Washington, D.C., 2002.
4.5 AASHTO LRFD Bridge Design Specifications, 3rd ed., American Associationof State Highway and Transportation Officials, Washington, D.C., 2004.
4.6 Manual for Bridge Condition Evaluation, 2nd ed., American Association of StateHighway and Transportation Officials, Washington, D.C., 2003.
4.7 Wittfoht, Hans, Building Bridges: History, Technology, Construction, p. 16, Beton-Verlag, Düsseldorf, December, 1984.
4.8 Walley, W. J., and Purkiss, J. A., “Bridge Abutments and Piers,” pp. 821–884,The Design and Construction of Engineering Foundations, Edited by Henry, F.D.C.,Chapman and Hall, New York, 1986.
4.9 Bordner, Randolph H., Chairman, ACI Committee 347, “Guide to Formworkfor Concrete,” ACI Structural Journal, vol. 85, September-October, 1988.
4.10 Winter, George, and Nilson, Arthur H., Design of Concrete Structures, 9th ed.,McGraw-Hill, New York, 1979.
4.11 Roeder, Charles W. and Stanton, John F., “State-of-the-Art ElastomericBridge Bearing Design,” ACI Structural Journal, vol. 88, January-February, 1991.
4.12 Turkington, D. H., Carr, A. J., Cooke, N., and Moss, P. J., “Seismic Designof Bridges on Lead-Rubber Bearings,” Journal of Structural Engineering, AmericanSociety of Civil Engineers, vol. 115, no. 12, pp. 3000-3016, December, 1989.
Downloaded from Digital Engineering Library @ McGraw-Hill (www.digitalengineeringlibrary.com)Copyright © 2006 The McGraw-Hill Companies. All rights reserved.
Any use is subject to the Terms of Use as given at the website.
Design of Substructure Elements

Section Overview
W e conclude the textwith a discussion of
the implementation andmanagement of a bridge ina transportation network.Specifically, this sectiontouches on some of the moregeneral themes and issuesbehind key bridge relatedhighway concerns, thepreparation of final contractdocuments, and the devel-opment and implementationof computer assisted BridgeManagement Systems.
5ImplementationandManagement
Impl
emen
tatio
n &
Man
agem
ent
Sect
ion
5A bridge is not a discrete component which is designed, built, andthen forgotten about. At the onset of the text, it was stated that“the common highway bridge structure ... is one of the mostintegral components in any transportation network.” It isfitting that we end the text with this same thought in mind, for
it is the downfall of many design engineers to view their work in discreteterms. As we have seen in the preceding sections, the ideas of design,rehabilitation, and maintenance are closely interwoven to form a cohesivefabric. Rather than being independent topics, these issues impact one anotherand, in many ways, influencethe performance of a highwaybridge throughout its life. Inthis section, we will touch onsome important issues con-cerning the final implementa-tion and eventual managementof highway bridges.
These implementationand management issues spe-cifically concern the incorpo-ration of a bridge into thehighway itself. Another topicdiscussed is the preparationof final contract documentswhich act as the manuscriptof a bridge engineer’s efforts.Finally we will briefly touchon a subject which is gainingincreased importance in theprofession: the managementof groups of bridges in a high-way network. Figure 5.1 Whether a bridge is large or small, it
is still just one component in a highway network.
Downloaded from Digital Engineering Library @ McGraw-Hill (www.digitalengineeringlibrary.com)Copyright © 2006 The McGraw-Hill Companies. All rights reserved.
Any use is subject to the Terms of Use as given at the website.
Source: Bridge Engineering
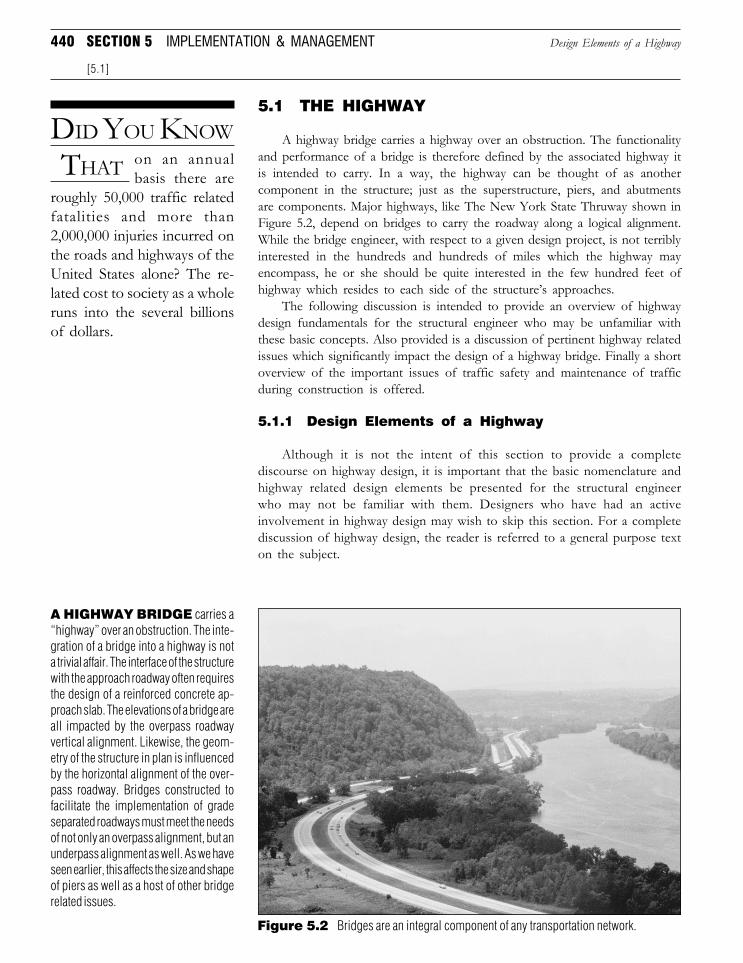
440 SECTION 5 IMPLEMENTATION & MANAGEMENT
5.1 THE HIGHWAY
A highway bridge carries a highway over an obstruction. The functionalityand performance of a bridge is therefore defined by the associated highway itis intended to carry. In a way, the highway can be thought of as anothercomponent in the structure; just as the superstructure, piers, and abutmentsare components. Major highways, like The New York State Thruway shown inFigure 5.2, depend on bridges to carry the roadway along a logical alignment.While the bridge engineer, with respect to a given design project, is not terriblyinterested in the hundreds and hundreds of miles which the highway mayencompass, he or she should be quite interested in the few hundred feet ofhighway which resides to each side of the structure’s approaches.
The following discussion is intended to provide an overview of highwaydesign fundamentals for the structural engineer who may be unfamiliar withthese basic concepts. Also provided is a discussion of pertinent highway relatedissues which significantly impact the design of a highway bridge. Finally a shortoverview of the important issues of traffic safety and maintenance of trafficduring construction is offered.
5.1.1 Design Elements of a Highway
Although it is not the intent of this section to provide a completediscourse on highway design, it is important that the basic nomenclature andhighway related design elements be presented for the structural engineerwho may not be familiar with them. Designers who have had an activeinvolvement in highway design may wish to skip this section. For a completediscussion of highway design, the reader is referred to a general purpose texton the subject.
Figure 5.2 Bridges are an integral component of any transportation network.
DID YOU KNOW
THAT on an annualbasis there are
roughly 50,000 traffic relatedfatalities and more than2,000,000 injuries incurred onthe roads and highways of theUnited States alone? The re-lated cost to society as a wholeruns into the several billionsof dollars.
A HIGHWAY BRIDGE carries a“highway” over an obstruction. The inte-gration of a bridge into a highway is nota trivial affair. The interface of the structurewith the approach roadway often requiresthe design of a reinforced concrete ap-proach slab. The elevations of a bridge areall impacted by the overpass roadwayvertical alignment. Likewise, the geom-etry of the structure in plan is influencedby the horizontal alignment of the over-pass roadway. Bridges constructed tofacilitate the implementation of gradeseparated roadways must meet the needsof not only an overpass alignment, but anunderpass alignment as well. As we haveseen earlier, this affects the size and shapeof piers as well as a host of other bridgerelated issues.
[5.1]
Design Elements of a Highway
Downloaded from Digital Engineering Library @ McGraw-Hill (www.digitalengineeringlibrary.com)Copyright © 2006 The McGraw-Hill Companies. All rights reserved.
Any use is subject to the Terms of Use as given at the website.
Implementation and Management
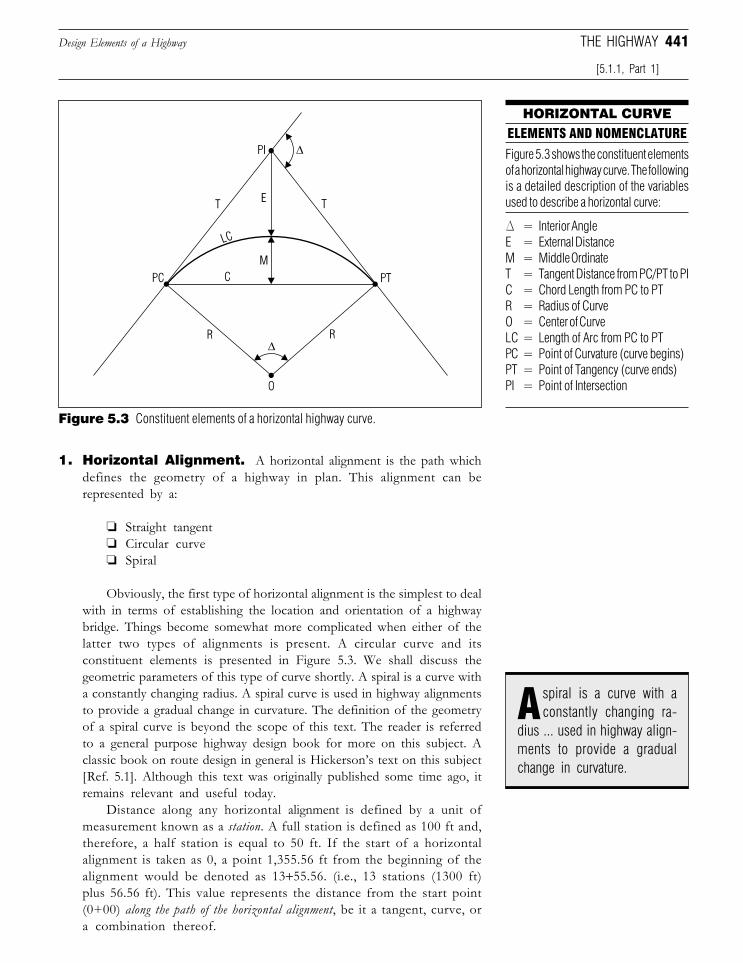
441Design Elements of a Highway
∆
∆
Figure 5.3 Constituent elements of a horizontal highway curve.
HORIZONTAL CURVEELEMENTS AND NOMENCLATURE
Figure 5.3 shows the constituent elementsof a horizontal highway curve. The followingis a detailed description of the variablesused to describe a horizontal curve:
D = Interior AngleE = External DistanceM = Middle OrdinateT = Tangent Distance from PC/PT to PIC = Chord Length from PC to PTR = Radius of CurveO = Center of CurveLC = Length of Arc from PC to PTPC = Point of Curvature (curve begins)PT = Point of Tangency (curve ends)PI = Point of Intersection
1. Horizontal Alignment. A horizontal alignment is the path whichdefines the geometry of a highway in plan. This alignment can berepresented by a:
❏ Straight tangent❏ Circular curve❏ Spiral
Obviously, the first type of horizontal alignment is the simplest to dealwith in terms of establishing the location and orientation of a highwaybridge. Things become somewhat more complicated when either of thelatter two types of alignments is present. A circular curve and itsconstituent elements is presented in Figure 5.3. We shall discuss thegeometric parameters of this type of curve shortly. A spiral is a curve witha constantly changing radius. A spiral curve is used in highway alignmentsto provide a gradual change in curvature. The definition of the geometryof a spiral curve is beyond the scope of this text. The reader is referredto a general purpose highway design book for more on this subject. Aclassic book on route design in general is Hickerson’s text on this subject[Ref. 5.1]. Although this text was originally published some time ago, itremains relevant and useful today.
Distance along any horizontal alignment is defined by a unit ofmeasurement known as a station. A full station is defined as 100 ft and,therefore, a half station is equal to 50 ft. If the start of a horizontalalignment is taken as 0, a point 1,355.56 ft from the beginning of thealignment would be denoted as 13+55.56. (i.e., 13 stations (1300 ft)plus 56.56 ft). This value represents the distance from the start point(0+00) along the path of the horizontal alignment, be it a tangent, curve, ora combination thereof.
[5.1.1, Part 1]
THE HIGHWAY
dius ... used in highway align-ments to provide a gradualchange in curvature.
spiral is a curve with aconstantly changing ra-A
Downloaded from Digital Engineering Library @ McGraw-Hill (www.digitalengineeringlibrary.com)Copyright © 2006 The McGraw-Hill Companies. All rights reserved.
Any use is subject to the Terms of Use as given at the website.
Implementation and Management
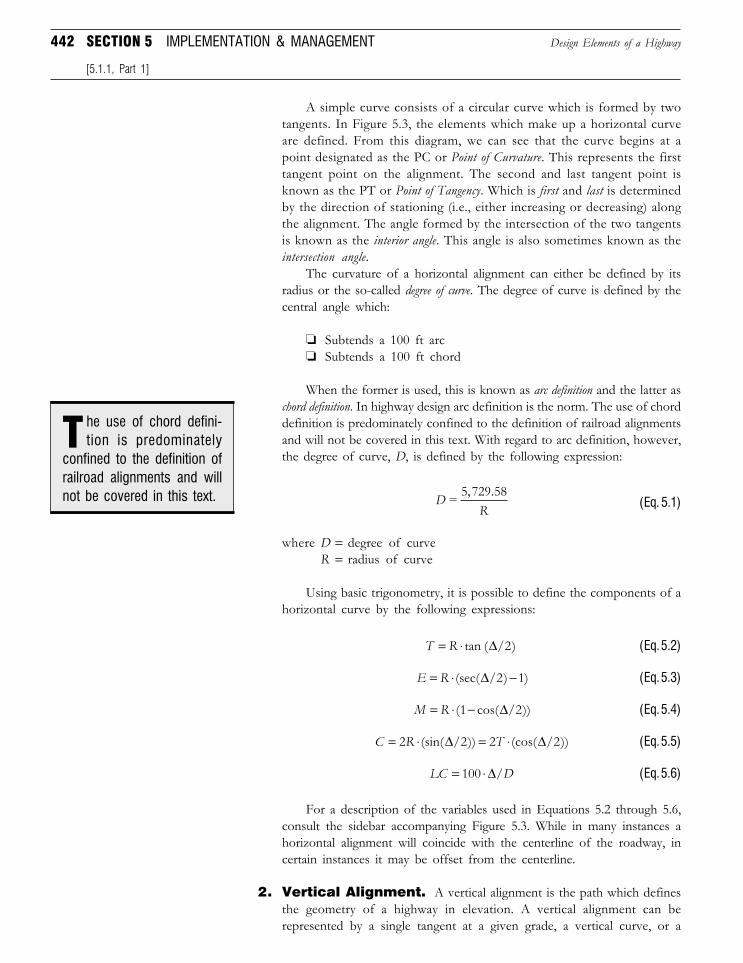
442 SECTION 5 IMPLEMENTATION & MANAGEMENT Design Elements of a Highway
A simple curve consists of a circular curve which is formed by twotangents. In Figure 5.3, the elements which make up a horizontal curveare defined. From this diagram, we can see that the curve begins at apoint designated as the PC or Point of Curvature. This represents the firsttangent point on the alignment. The second and last tangent point isknown as the PT or Point of Tangency. Which is first and last is determinedby the direction of stationing (i.e., either increasing or decreasing) alongthe alignment. The angle formed by the intersection of the two tangentsis known as the interior angle. This angle is also sometimes known as theintersection angle.
The curvature of a horizontal alignment can either be defined by itsradius or the so-called degree of curve. The degree of curve is defined by thecentral angle which:
❏ Subtends a 100 ft arc❏ Subtends a 100 ft chord
When the former is used, this is known as arc definition and the latter aschord definition. In highway design arc definition is the norm. The use of chorddefinition is predominately confined to the definition of railroad alignmentsand will not be covered in this text. With regard to arc definition, however,the degree of curve, D, is defined by the following expression:
DR
=, .5 729 58
(Eq. 5.1)
where D = degree of curveR = radius of curve
Using basic trigonometry, it is possible to define the components of ahorizontal curve by the following expressions:
T R= ⋅ tan ( / )∆ 2 (Eq. 5.2)
E R= ⋅ −(sec( / ) )∆ 2 1 (Eq. 5.3)
M R= ⋅ −( cos( / ))1 2∆ (Eq. 5.4)
C R T= ⋅ = ⋅2 2 2 2(sin( / )) (cos( / ))∆ ∆ (Eq. 5.5)
LC D= ⋅100 ∆/ (Eq. 5.6)
For a description of the variables used in Equations 5.2 through 5.6,consult the sidebar accompanying Figure 5.3. While in many instances ahorizontal alignment will coincide with the centerline of the roadway, incertain instances it may be offset from the centerline.
2. Vertical Alignment. A vertical alignment is the path which definesthe geometry of a highway in elevation. A vertical alignment can berepresented by a single tangent at a given grade, a vertical curve, or a
[5.1.1, Part 1]
confined to the definition ofrailroad alignments and willnot be covered in this text.
he use of chord defini-tion is predominatelyT
Downloaded from Digital Engineering Library @ McGraw-Hill (www.digitalengineeringlibrary.com)Copyright © 2006 The McGraw-Hill Companies. All rights reserved.
Any use is subject to the Terms of Use as given at the website.
Implementation and Management
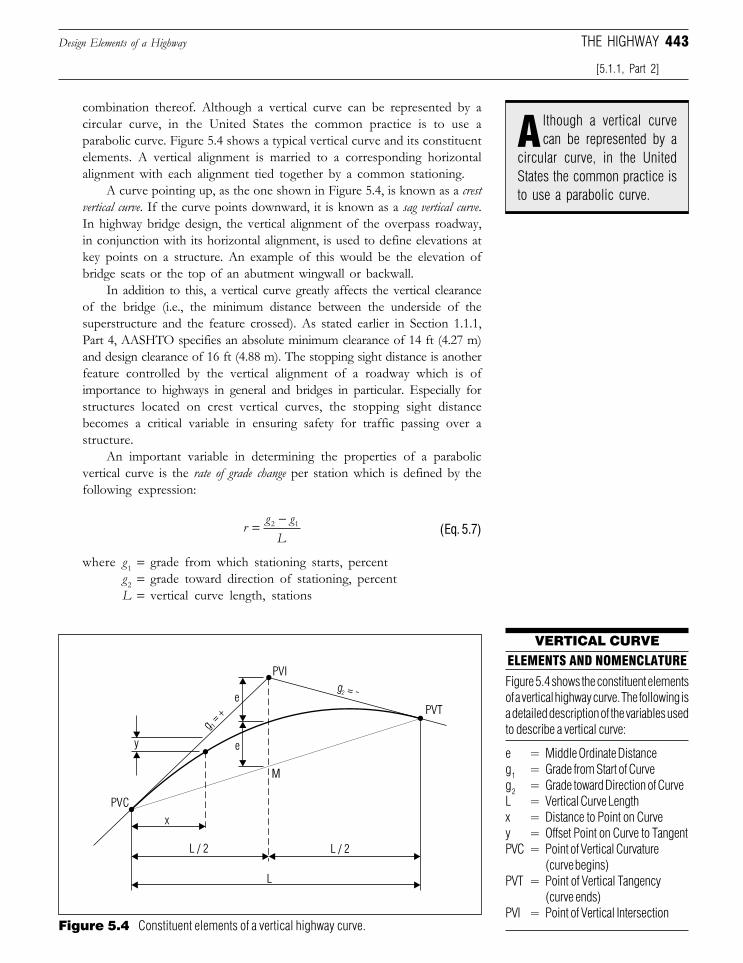
443Design Elements of a Highway
combination thereof. Although a vertical curve can be represented by acircular curve, in the United States the common practice is to use aparabolic curve. Figure 5.4 shows a typical vertical curve and its constituentelements. A vertical alignment is married to a corresponding horizontalalignment with each alignment tied together by a common stationing.
A curve pointing up, as the one shown in Figure 5.4, is known as a crestvertical curve. If the curve points downward, it is known as a sag vertical curve.In highway bridge design, the vertical alignment of the overpass roadway,in conjunction with its horizontal alignment, is used to define elevations atkey points on a structure. An example of this would be the elevation ofbridge seats or the top of an abutment wingwall or backwall.
In addition to this, a vertical curve greatly affects the vertical clearanceof the bridge (i.e., the minimum distance between the underside of thesuperstructure and the feature crossed). As stated earlier in Section 1.1.1,Part 4, AASHTO specifies an absolute minimum clearance of 14 ft (4.27 m)and design clearance of 16 ft (4.88 m). The stopping sight distance is anotherfeature controlled by the vertical alignment of a roadway which is ofimportance to highways in general and bridges in particular. Especially forstructures located on crest vertical curves, the stopping sight distancebecomes a critical variable in ensuring safety for traffic passing over astructure.
An important variable in determining the properties of a parabolicvertical curve is the rate of grade change per station which is defined by thefollowing expression:
rg gL
= −2 1 (Eq. 5.7)
where g1 = grade from which stationing starts, percentg2 = grade toward direction of stationing, percentL = vertical curve length, stations
[5.1.1, Part 2]
THE HIGHWAY
circular curve, in the UnitedStates the common practice isto use a parabolic curve.
lthough a vertical curvecan be represented by aA
Figure 5.4 Constituent elements of a vertical highway curve.
VERTICAL CURVEELEMENTS AND NOMENCLATURE
Figure 5.4 shows the constituent elementsof a vertical highway curve. The following isa detailed description of the variables usedto describe a vertical curve:
e = Middle Ordinate Distanceg1 = Grade from Start of Curveg2 = Grade toward Direction of CurveL = Vertical Curve Lengthx = Distance to Point on Curvey = Offset Point on Curve to TangentPVC = Point of Vertical Curvature
(curve begins)PVT = Point of Vertical Tangency
(curve ends)PVI = Point of Vertical Intersection
Downloaded from Digital Engineering Library @ McGraw-Hill (www.digitalengineeringlibrary.com)Copyright © 2006 The McGraw-Hill Companies. All rights reserved.
Any use is subject to the Terms of Use as given at the website.
Implementation and Management
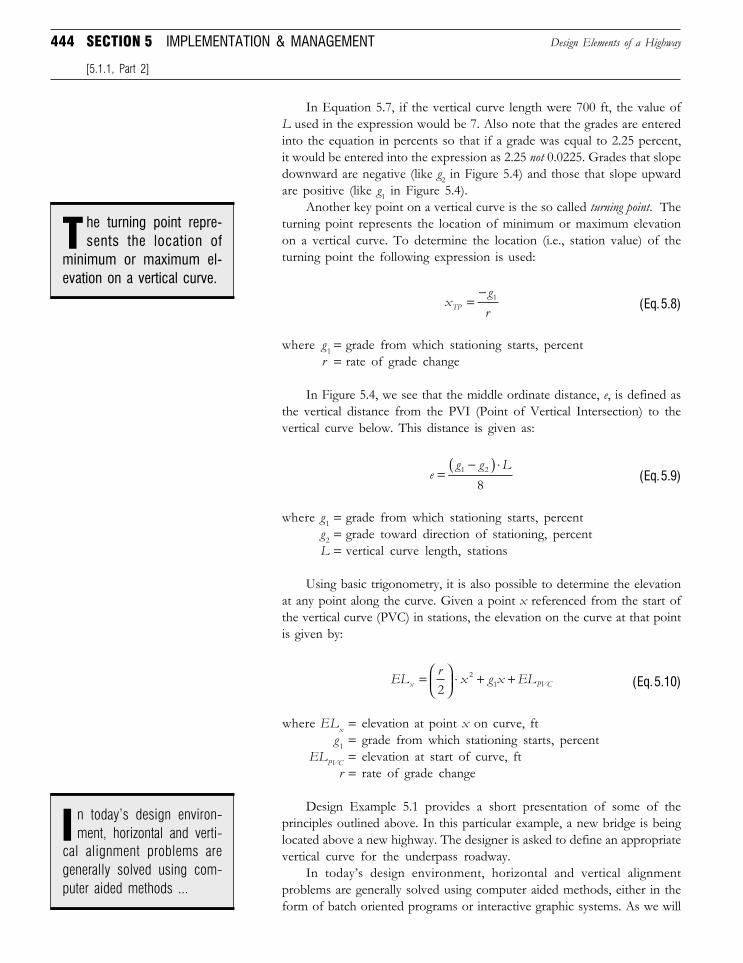
444 SECTION 5 IMPLEMENTATION & MANAGEMENT
In Equation 5.7, if the vertical curve length were 700 ft, the value ofL used in the expression would be 7. Also note that the grades are enteredinto the equation in percents so that if a grade was equal to 2.25 percent,it would be entered into the expression as 2.25 not 0.0225. Grades that slopedownward are negative (like g2 in Figure 5.4) and those that slope upwardare positive (like g1 in Figure 5.4).
Another key point on a vertical curve is the so called turning point. Theturning point represents the location of minimum or maximum elevationon a vertical curve. To determine the location (i.e., station value) of theturning point the following expression is used:
xgrTP =
− 1(Eq. 5.8)
where g1 = grade from which stationing starts, percentr = rate of grade change
In Figure 5.4, we see that the middle ordinate distance, e, is defined asthe vertical distance from the PVI (Point of Vertical Intersection) to thevertical curve below. This distance is given as:
eg g L
=−( ) ⋅1 2
8(Eq. 5.9)
where g1 = grade from which stationing starts, percentg2 = grade toward direction of stationing, percentL = vertical curve length, stations
Using basic trigonometry, it is also possible to determine the elevationat any point along the curve. Given a point x referenced from the start ofthe vertical curve (PVC) in stations, the elevation on the curve at that pointis given by:
EL r x g x ELx PVC=
⋅ + +2
21 (Eq. 5.10)
where ELx = elevation at point x on curve, ftg1 = grade from which stationing starts, percent
ELPVC = elevation at start of curve, ftr = rate of grade change
Design Example 5.1 provides a short presentation of some of theprinciples outlined above. In this particular example, a new bridge is beinglocated above a new highway. The designer is asked to define an appropriatevertical curve for the underpass roadway.
In today’s design environment, horizontal and vertical alignmentproblems are generally solved using computer aided methods, either in theform of batch oriented programs or interactive graphic systems. As we will
Design Elements of a Highway
[5.1.1, Part 2]
Ical alignment problems aregenerally solved using com-puter aided methods ...
n today’s design environ-ment, horizontal and verti-
minimum or maximum el-evation on a vertical curve.
he turning point repre-sents the location ofT
Downloaded from Digital Engineering Library @ McGraw-Hill (www.digitalengineeringlibrary.com)Copyright © 2006 The McGraw-Hill Companies. All rights reserved.
Any use is subject to the Terms of Use as given at the website.
Implementation and Management
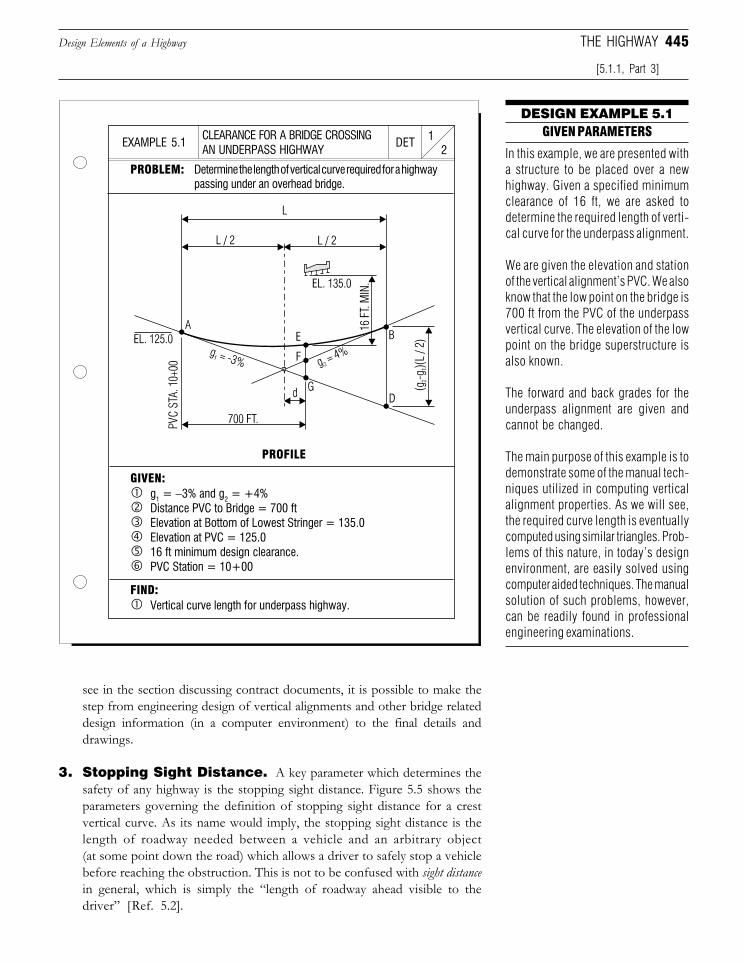
445
CLEARANCE FOR A BRIDGE CROSSINGAN UNDERPASS HIGHWAY 2
1DETEXAMPLE 5.1
DESIGN EXAMPLE 5.1GIVEN PARAMETERS
PROBLEM: Determine the length of vertical curve required for a highwaypassing under an overhead bridge.
In this example, we are presented witha structure to be placed over a newhighway. Given a specified minimumclearance of 16 ft, we are asked todetermine the required length of verti-cal curve for the underpass alignment.
We are given the elevation and stationof the vertical alignment’s PVC. We alsoknow that the low point on the bridge is700 ft from the PVC of the underpassvertical curve. The elevation of the lowpoint on the bridge superstructure isalso known.
The forward and back grades for theunderpass alignment are given andcannot be changed.
The main purpose of this example is todemonstrate some of the manual tech-niques utilized in computing verticalalignment properties. As we will see,the required curve length is eventuallycomputed using similar triangles. Prob-lems of this nature, in today’s designenvironment, are easily solved usingcomputer aided techniques. The manualsolution of such problems, however,can be readily found in professionalengineering examinations.
GIVEN:g1 = −3% and g2 = +4%Distance PVC to Bridge = 700 ftElevation at Bottom of Lowest Stringer = 135.0Elevation at PVC = 125.016 ft minimum design clearance.PVC Station = 10+00
PROFILE
FIND:Vertical curve length for underpass highway.
see in the section discussing contract documents, it is possible to make thestep from engineering design of vertical alignments and other bridge relateddesign information (in a computer environment) to the final details anddrawings.
3. Stopping Sight Distance. A key parameter which determines thesafety of any highway is the stopping sight distance. Figure 5.5 shows theparameters governing the definition of stopping sight distance for a crestvertical curve. As its name would imply, the stopping sight distance is thelength of roadway needed between a vehicle and an arbitrary object(at some point down the road) which allows a driver to safely stop a vehiclebefore reaching the obstruction. This is not to be confused with sight distancein general, which is simply the “length of roadway ahead visible to thedriver” [Ref. 5.2].
Design Elements of a Highway
[5.1.1, Part 3]
THE HIGHWAY
Downloaded from Digital Engineering Library @ McGraw-Hill (www.digitalengineeringlibrary.com)Copyright © 2006 The McGraw-Hill Companies. All rights reserved.
Any use is subject to the Terms of Use as given at the website.
Implementation and Management
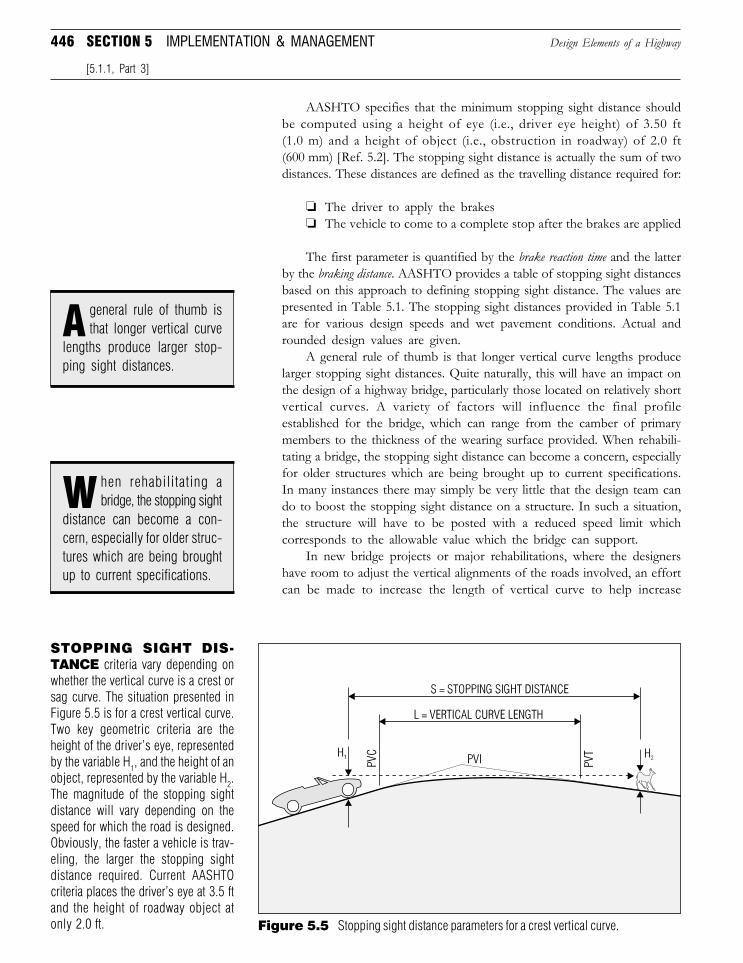
446 SECTION 5 IMPLEMENTATION & MANAGEMENT
AASHTO specifies that the minimum stopping sight distance shouldbe computed using a height of eye (i.e., driver eye height) of 3.50 ft(1.0 m) and a height of object (i.e., obstruction in roadway) of 2.0 ft(600 mm) [Ref. 5.2]. The stopping sight distance is actually the sum of twodistances. These distances are defined as the travelling distance required for:
❏ The driver to apply the brakes❏ The vehicle to come to a complete stop after the brakes are applied
The first parameter is quantified by the brake reaction time and the latterby the braking distance. AASHTO provides a table of stopping sight distancesbased on this approach to defining stopping sight distance. The values arepresented in Table 5.1. The stopping sight distances provided in Table 5.1are for various design speeds and wet pavement conditions. Actual androunded design values are given.
A general rule of thumb is that longer vertical curve lengths producelarger stopping sight distances. Quite naturally, this will have an impact onthe design of a highway bridge, particularly those located on relatively shortvertical curves. A variety of factors will influence the final profileestablished for the bridge, which can range from the camber of primarymembers to the thickness of the wearing surface provided. When rehabili-tating a bridge, the stopping sight distance can become a concern, especiallyfor older structures which are being brought up to current specifications.In many instances there may simply be very little that the design team cando to boost the stopping sight distance on a structure. In such a situation,the structure will have to be posted with a reduced speed limit whichcorresponds to the allowable value which the bridge can support.
In new bridge projects or major rehabilitations, where the designershave room to adjust the vertical alignments of the roads involved, an effortcan be made to increase the length of vertical curve to help increase
Design Elements of a Highway
[5.1.1, Part 3]
distance can become a con-cern, especially for older struc-tures which are being broughtup to current specifications.
hen rehabilitating abridge, the stopping sightW
Figure 5.5 Stopping sight distance parameters for a crest vertical curve.
STOPPING SIGHT DIS-TANCE criteria vary depending onwhether the vertical curve is a crest orsag curve. The situation presented inFigure 5.5 is for a crest vertical curve.Two key geometric criteria are theheight of the driver’s eye, representedby the variable H1, and the height of anobject, represented by the variable H2.The magnitude of the stopping sightdistance will vary depending on thespeed for which the road is designed.Obviously, the faster a vehicle is trav-eling, the larger the stopping sightdistance required. Current AASHTOcriteria places the driver’s eye at 3.5 ftand the height of roadway object atonly 2.0 ft.
lengths produce larger stop-ping sight distances.
general rule of thumb isthat longer vertical curveA
Downloaded from Digital Engineering Library @ McGraw-Hill (www.digitalengineeringlibrary.com)Copyright © 2006 The McGraw-Hill Companies. All rights reserved.
Any use is subject to the Terms of Use as given at the website.
Implementation and Management
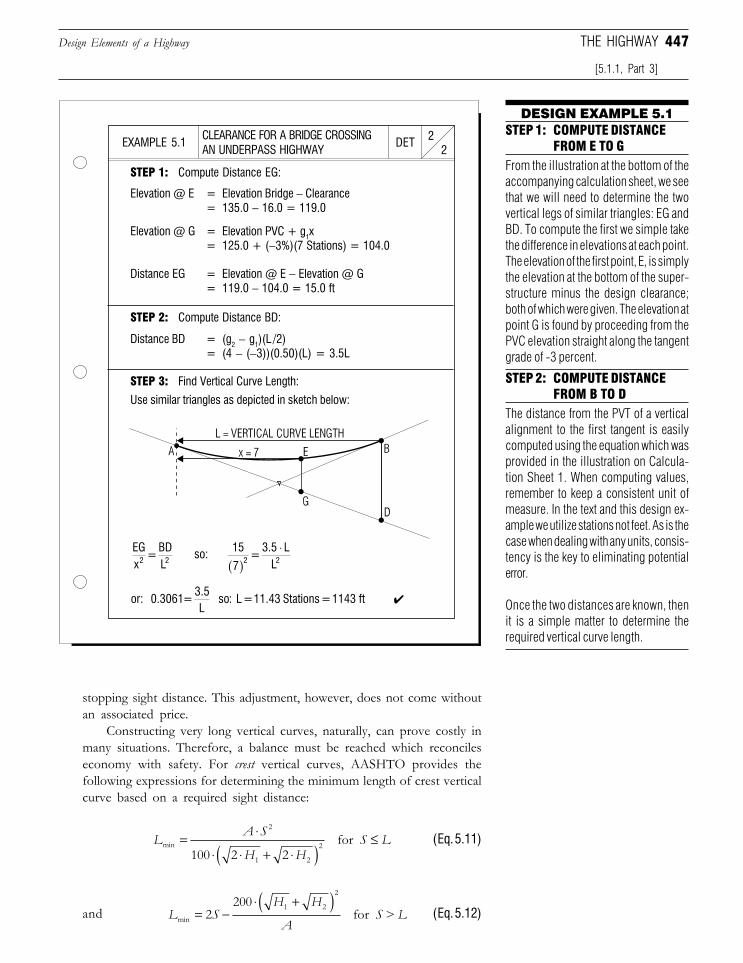
447
CLEARANCE FOR A BRIDGE CROSSINGAN UNDERPASS HIGHWAY 2
2DETEXAMPLE 5.1
DESIGN EXAMPLE 5.1STEP 1: COMPUTE DISTANCE
FROM E TO GFrom the illustration at the bottom of theaccompanying calculation sheet, we seethat we will need to determine the twovertical legs of similar triangles: EG andBD. To compute the first we simple takethe difference in elevations at each point.The elevation of the first point, E, is simplythe elevation at the bottom of the super-structure minus the design clearance;both of which were given. The elevation atpoint G is found by proceeding from thePVC elevation straight along the tangentgrade of -3 percent.
STEP 1: Compute Distance EG:
Elevation @ E = Elevation Bridge − Clearance= 135.0 − 16.0 = 119.0
Elevation @ G = Elevation PVC + g1x= 125.0 + (−3%)(7 Stations) = 104.0
Distance EG = Elevation @ E − Elevation @ G= 119.0 − 104.0 = 15.0 ft
STEP 2: Compute Distance BD:
Distance BD = (g2 − g1)(L /2)= (4 − (−3))(0.50)(L) = 3.5L
STEP 3: Find Vertical Curve Length:
Use similar triangles as depicted in sketch below:
✔
so:
STEP 2: COMPUTE DISTANCEFROM B TO D
The distance from the PVT of a verticalalignment to the first tangent is easilycomputed using the equation which wasprovided in the illustration on Calcula-tion Sheet 1. When computing values,remember to keep a consistent unit ofmeasure. In the text and this design ex-ample we utilize stations not feet. As is thecase when dealing with any units, consis-tency is the key to eliminating potentialerror.
Once the two distances are known, thenit is a simple matter to determine therequired vertical curve length.
Design Elements of a Highway
[5.1.1, Part 3]
THE HIGHWAY
stopping sight distance. This adjustment, however, does not come withoutan associated price.
Constructing very long vertical curves, naturally, can prove costly inmany situations. Therefore, a balance must be reached which reconcileseconomy with safety. For crest vertical curves, AASHTO provides thefollowing expressions for determining the minimum length of crest verticalcurve based on a required sight distance:
L A S
H HS Lmin = ⋅
⋅ ⋅ + ⋅( )≤
2
1 2
2100 2 2
for (Eq. 5.11)
and L SH H
AS Lmin = −
⋅ +( )2
200 1 2
2
for > (Eq. 5.12)
EGx
= BDL2 2
15
7 =
3.5 LL2 2( )
⋅
or: 0.3061 = 3.5L
so: L = 11.43 Stations=1143 ft
Downloaded from Digital Engineering Library @ McGraw-Hill (www.digitalengineeringlibrary.com)Copyright © 2006 The McGraw-Hill Companies. All rights reserved.
Any use is subject to the Terms of Use as given at the website.
Implementation and Management
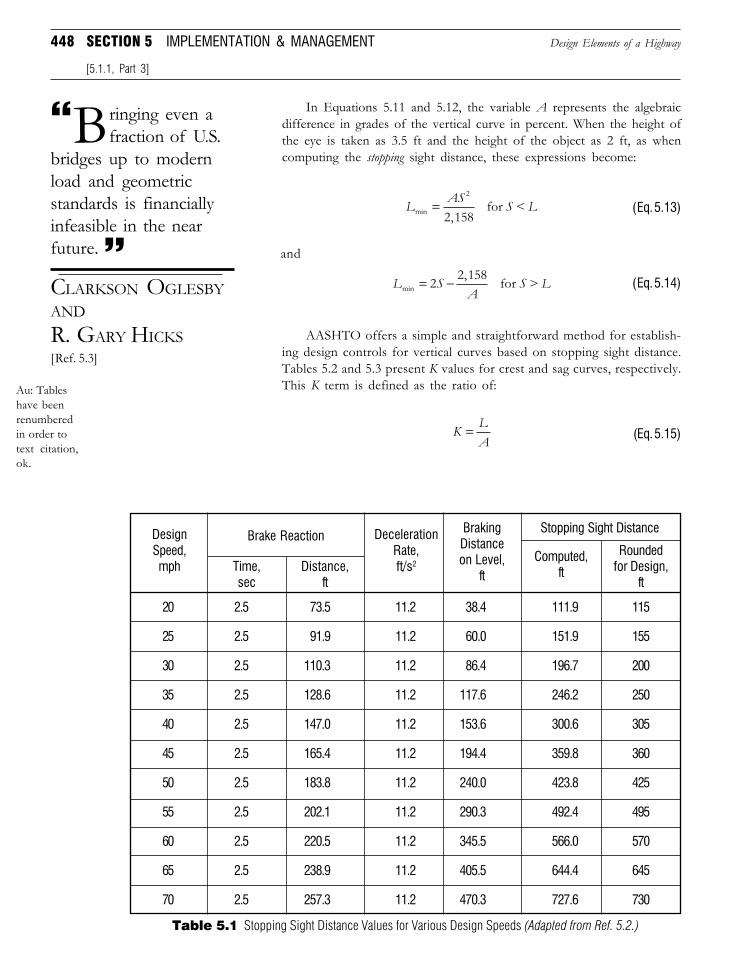
448 SECTION 5 IMPLEMENTATION & MANAGEMENT
In Equations 5.11 and 5.12, the variable A represents the algebraicdifference in grades of the vertical curve in percent. When the height ofthe eye is taken as 3.5 ft and the height of the object as 2 ft, as whencomputing the stopping sight distance, these expressions become:
L AS S Lmin ,=
2
2 158 for < (Eq. 5.13)
and
L SA
S Lmin,= −2 2 158 for > (Eq. 5.14)
AASHTO offers a simple and straightforward method for establish-ing design controls for vertical curves based on stopping sight distance.Tables 5.2 and 5.3 present K values for crest and sag curves, respectively.This K term is defined as the ratio of:
K LA
= (Eq. 5.15)
20 2.5 73.5 11.2 38.4 111.9 115
25 2.5 91.9 11.2 60.0 151.9 155
30 2.5 110.3 11.2 86.4 196.7 200
35 2.5 128.6 11.2 117.6 246.2 250
40 2.5 147.0 11.2 153.6 300.6 305
45 2.5 165.4 11.2 194.4 359.8 360
50 2.5 183.8 11.2 240.0 423.8 425
55 2.5 202.1 11.2 290.3 492.4 495
60 2.5 220.5 11.2 345.5 566.0 570
65 2.5 238.9 11.2 405.5 644.4 645
70 2.5 257.3 11.2 470.3 727.6 730
Table 5.1 Stopping Sight Distance Values for Various Design Speeds (Adapted from Ref. 5.2.)
DesignSpeed,mph Time,
secDistance,
ft
BrakingDistanceon Level,
ftComputed,
ft
Roundedfor Design,
ft
Stopping Sight DistanceBrake Reaction
bridges up to modernload and geometricstandards is financiallyinfeasible in the nearfuture.
CLARKSON OGLESBYANDR. GARY HICKS[Ref. 5.3]
Bringing even afraction of U.S.
Design Elements of a Highway
[5.1.1, Part 3]
DecelerationRate,ft/s2
Au: Tableshave beenrenumberedin order totext citation,ok.
Downloaded from Digital Engineering Library @ McGraw-Hill (www.digitalengineeringlibrary.com)Copyright © 2006 The McGraw-Hill Companies. All rights reserved.
Any use is subject to the Terms of Use as given at the website.
Implementation and Management
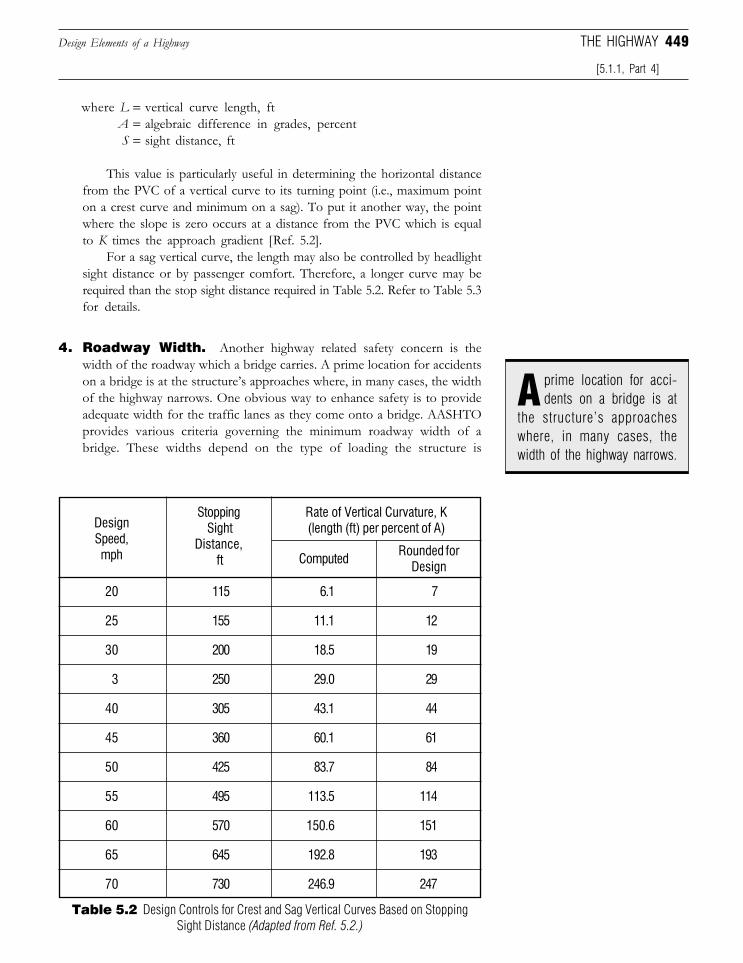
449
where L = vertical curve length, ftA = algebraic difference in grades, percentS = sight distance, ft
This value is particularly useful in determining the horizontal distancefrom the PVC of a vertical curve to its turning point (i.e., maximum pointon a crest curve and minimum on a sag). To put it another way, the pointwhere the slope is zero occurs at a distance from the PVC which is equalto K times the approach gradient [Ref. 5.2].
For a sag vertical curve, the length may also be controlled by headlightsight distance or by passenger comfort. Therefore, a longer curve may berequired than the stop sight distance required in Table 5.2. Refer to Table 5.3for details.
4. Roadway Width. Another highway related safety concern is thewidth of the roadway which a bridge carries. A prime location for accidentson a bridge is at the structure’s approaches where, in many cases, the widthof the highway narrows. One obvious way to enhance safety is to provideadequate width for the traffic lanes as they come onto a bridge. AASHTOprovides various criteria governing the minimum roadway width of abridge. These widths depend on the type of loading the structure is
Design Elements of a Highway
[5.1.1, Part 4]
THE HIGHWAY
Table 5.2 Design Controls for Crest and Sag Vertical Curves Based on StoppingSight Distance (Adapted from Ref. 5.2.)
20 115 6.1 7
25 155 11.1 12
30 200 18.5 19
3 250 29.0 29
40 305 43.1 44
45 360 60.1 61
50 425 83.7 84
55 495 113.5 114
60 570 150.6 151
65 645 192.8 193
70 730 246.9 247
Computed
Rate of Vertical Curvature, K(length (ft) per percent of A)
Stopping Sight
Distance, ft
DesignSpeed,mph Rounded for
Design
the structure’s approacheswhere, in many cases, thewidth of the highway narrows.
prime location for acci-dents on a bridge is atA
Downloaded from Digital Engineering Library @ McGraw-Hill (www.digitalengineeringlibrary.com)Copyright © 2006 The McGraw-Hill Companies. All rights reserved.
Any use is subject to the Terms of Use as given at the website.
Implementation and Management
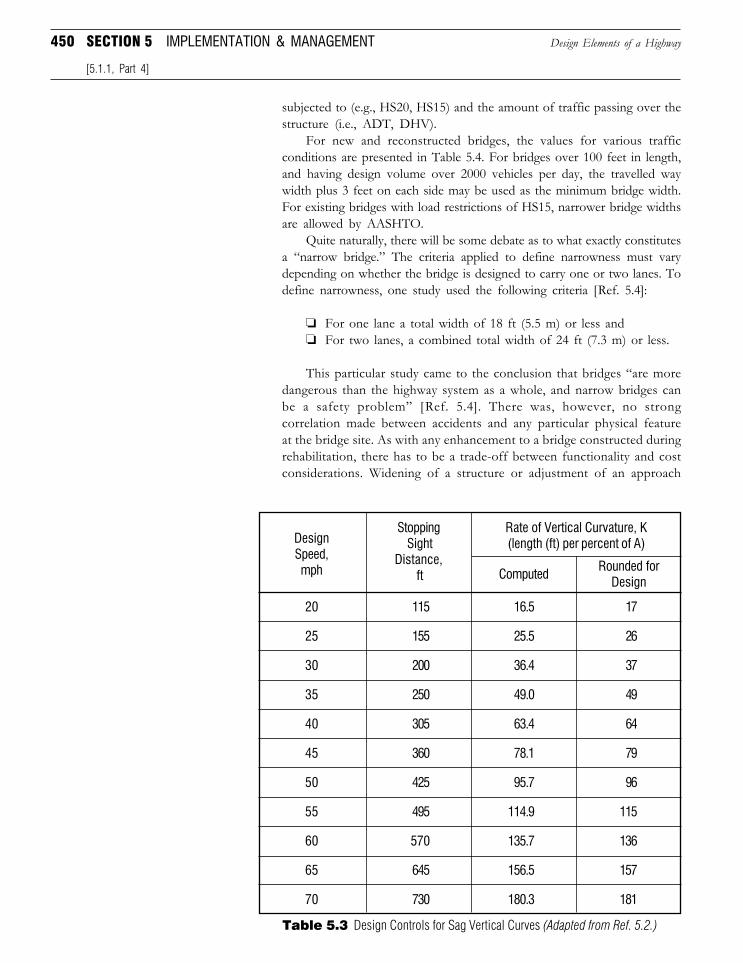
450 SECTION 5 IMPLEMENTATION & MANAGEMENT
subjected to (e.g., HS20, HS15) and the amount of traffic passing over thestructure (i.e., ADT, DHV).
For new and reconstructed bridges, the values for various trafficconditions are presented in Table 5.4. For bridges over 100 feet in length,and having design volume over 2000 vehicles per day, the travelled waywidth plus 3 feet on each side may be used as the minimum bridge width.For existing bridges with load restrictions of HS15, narrower bridge widthsare allowed by AASHTO.
Quite naturally, there will be some debate as to what exactly constitutesa “narrow bridge.” The criteria applied to define narrowness must varydepending on whether the bridge is designed to carry one or two lanes. Todefine narrowness, one study used the following criteria [Ref. 5.4]:
❏ For one lane a total width of 18 ft (5.5 m) or less and❏ For two lanes, a combined total width of 24 ft (7.3 m) or less.
This particular study came to the conclusion that bridges “are moredangerous than the highway system as a whole, and narrow bridges canbe a safety problem” [Ref. 5.4]. There was, however, no strongcorrelation made between accidents and any particular physical featureat the bridge site. As with any enhancement to a bridge constructed duringrehabilitation, there has to be a trade-off between functionality and costconsiderations. Widening of a structure or adjustment of an approach
Design Elements of a Highway
[5.1.1, Part 4]
Table 5.3 Design Controls for Sag Vertical Curves (Adapted from Ref. 5.2.)
20 115 16.5 17
25 155 25.5 26
30 200 36.4 37
35 250 49.0 49
40 305 63.4 64
45 360 78.1 79
50 425 95.7 96
55 495 114.9 115
60 570 135.7 136
65 645 156.5 157
70 730 180.3 181
Computed
Rate of Vertical Curvature, K(length (ft) per percent of A)
Stopping Sight
Distance, ft
DesignSpeed,mph Rounded for
Design
Downloaded from Digital Engineering Library @ McGraw-Hill (www.digitalengineeringlibrary.com)Copyright © 2006 The McGraw-Hill Companies. All rights reserved.
Any use is subject to the Terms of Use as given at the website.
Implementation and Management
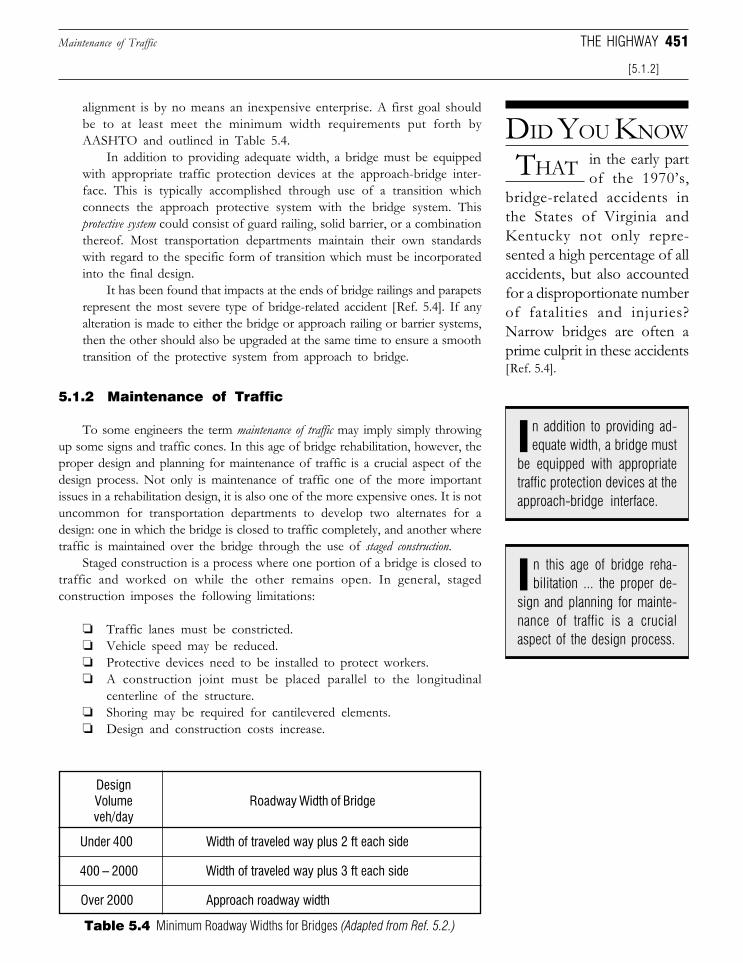
451
alignment is by no means an inexpensive enterprise. A first goal shouldbe to at least meet the minimum width requirements put forth byAASHTO and outlined in Table 5.4.
In addition to providing adequate width, a bridge must be equippedwith appropriate traffic protection devices at the approach-bridge inter-face. This is typically accomplished through use of a transition whichconnects the approach protective system with the bridge system. Thisprotective system could consist of guard railing, solid barrier, or a combinationthereof. Most transportation departments maintain their own standardswith regard to the specific form of transition which must be incorporatedinto the final design.
It has been found that impacts at the ends of bridge railings and parapetsrepresent the most severe type of bridge-related accident [Ref. 5.4]. If anyalteration is made to either the bridge or approach railing or barrier systems,then the other should also be upgraded at the same time to ensure a smoothtransition of the protective system from approach to bridge.
5.1.2 Maintenance of Traffic
To some engineers the term maintenance of traffic may imply simply throwingup some signs and traffic cones. In this age of bridge rehabilitation, however, theproper design and planning for maintenance of traffic is a crucial aspect of thedesign process. Not only is maintenance of traffic one of the more importantissues in a rehabilitation design, it is also one of the more expensive ones. It is notuncommon for transportation departments to develop two alternates for adesign: one in which the bridge is closed to traffic completely, and another wheretraffic is maintained over the bridge through the use of staged construction.
Staged construction is a process where one portion of a bridge is closed totraffic and worked on while the other remains open. In general, stagedconstruction imposes the following limitations:
❏ Traffic lanes must be constricted.❏ Vehicle speed may be reduced.❏ Protective devices need to be installed to protect workers.❏ A construction joint must be placed parallel to the longitudinal
centerline of the structure.❏ Shoring may be required for cantilevered elements.❏ Design and construction costs increase.
DID YOU KNOW
THAT in the early partof the 1970’s,
bridge-related accidents inthe States of Virginia andKentucky not only repre-sented a high percentage of allaccidents, but also accountedfor a disproportionate numberof fatalities and injuries?Narrow bridges are often aprime culprit in these accidents[Ref. 5.4].
Maintenance of Traffic
[5.1.2]
THE HIGHWAY
be equipped with appropriatetraffic protection devices at theapproach-bridge interface.
n addition to providing ad-equate width, a bridge mustI
sign and planning for mainte-nance of traffic is a crucialaspect of the design process.
n this age of bridge reha-bilitation ... the proper de-I
Table 5.4 Minimum Roadway Widths for Bridges (Adapted from Ref. 5.2.)
DesignVolumeveh/day
Under 400 Width of traveled way plus 2 ft each side
400 – 2000 Width of traveled way plus 3 ft each side
Over 2000 Approach roadway width
Roadway Width of Bridge
Downloaded from Digital Engineering Library @ McGraw-Hill (www.digitalengineeringlibrary.com)Copyright © 2006 The McGraw-Hill Companies. All rights reserved.
Any use is subject to the Terms of Use as given at the website.
Implementation and Management
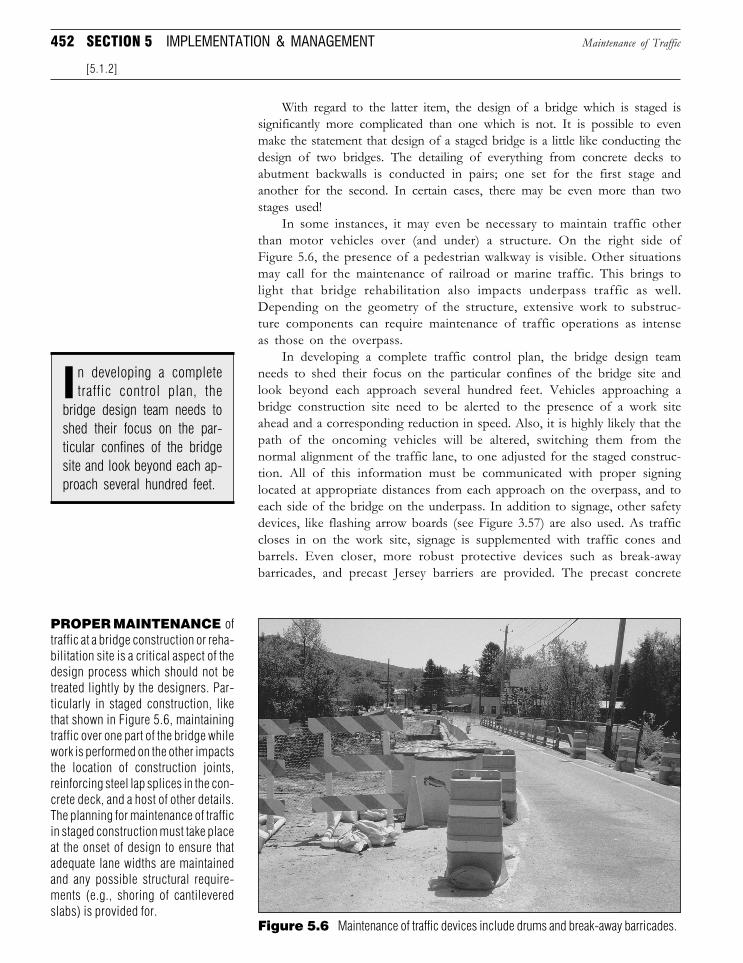
452 SECTION 5 IMPLEMENTATION & MANAGEMENT
With regard to the latter item, the design of a bridge which is staged issignificantly more complicated than one which is not. It is possible to evenmake the statement that design of a staged bridge is a little like conducting thedesign of two bridges. The detailing of everything from concrete decks toabutment backwalls is conducted in pairs; one set for the first stage andanother for the second. In certain cases, there may be even more than twostages used!
In some instances, it may even be necessary to maintain traffic otherthan motor vehicles over (and under) a structure. On the right side ofFigure 5.6, the presence of a pedestrian walkway is visible. Other situationsmay call for the maintenance of railroad or marine traffic. This brings tolight that bridge rehabilitation also impacts underpass traffic as well.Depending on the geometry of the structure, extensive work to substruc-ture components can require maintenance of traffic operations as intenseas those on the overpass.
In developing a complete traffic control plan, the bridge design teamneeds to shed their focus on the particular confines of the bridge site andlook beyond each approach several hundred feet. Vehicles approaching abridge construction site need to be alerted to the presence of a work siteahead and a corresponding reduction in speed. Also, it is highly likely that thepath of the oncoming vehicles will be altered, switching them from thenormal alignment of the traffic lane, to one adjusted for the staged construc-tion. All of this information must be communicated with proper signinglocated at appropriate distances from each approach on the overpass, and toeach side of the bridge on the underpass. In addition to signage, other safetydevices, like flashing arrow boards (see Figure 3.57) are also used. As trafficcloses in on the work site, signage is supplemented with traffic cones andbarrels. Even closer, more robust protective devices such as break-awaybarricades, and precast Jersey barriers are provided. The precast concrete
Maintenance of Traffic
[5.1.2]
Figure 5.6 Maintenance of traffic devices include drums and break-away barricades.
PROPER MAINTENANCE oftraffic at a bridge construction or reha-bilitation site is a critical aspect of thedesign process which should not betreated lightly by the designers. Par-ticularly in staged construction, likethat shown in Figure 5.6, maintainingtraffic over one part of the bridge whilework is performed on the other impactsthe location of construction joints,reinforcing steel lap splices in the con-crete deck, and a host of other details.The planning for maintenance of trafficin staged construction must take placeat the onset of design to ensure thatadequate lane widths are maintainedand any possible structural require-ments (e.g., shoring of cantileveredslabs) is provided for.
bridge design team needs toshed their focus on the par-ticular confines of the bridgesite and look beyond each ap-proach several hundred feet.
n developing a completetraffic control plan, theI
Downloaded from Digital Engineering Library @ McGraw-Hill (www.digitalengineeringlibrary.com)Copyright © 2006 The McGraw-Hill Companies. All rights reserved.
Any use is subject to the Terms of Use as given at the website.
Implementation and Management
453
barriers should be bolted to the concrete deck to ensure the safety of thetravelling motorists.
Obviously the most limiting factor in all of this is space. At times, it mayeven be necessary to bring traffic to a standstill, and allow one lane of trafficonly to pass over the structure; simply because there is no room for anythingelse. On small, local roads this can usually be done without much difficulty. Onmajor highways, however, where motorists are used to traveling at 55 mph(and often much faster) the necessity of providing adequate signing andprotection for workers is paramount.
Most transportation departments provide their own in-house standardsfor traffic control plans. These plans generally specify:
❏ Appropriate signing❏ Setback distances from the work site❏ Appropriate lane widths depending on the design speed
In many instances, the design team will be required to develop a new,albeit temporary, horizontal alignment which is used to carry traffic over theportion of the structure which remains open. In doing so, the appropriateAASHTO criteria must be utilized for the reduced speed at the project site. Ifsignificant changes are being made to the vertical alignment of the structure,the change in elevation must be accounted for so that a smooth transition ismade from the approach. Like the transitional horizontal alignment mentionedabove, this adjustment is usually temporary in nature. To provide for extralane width, it may be necessary to utilize a portion of the shoulder (if one ispresent). In such an event, the designers should ensure that the shoulder issufficiently stabilized to support the traffic. When properly designed, a trafficcontrol plan will provide for safety to both workers and motorists. If not givenadequate attention, however, maintenance of traffic can become a headachethat few can afford.
5.2 CONTRACT DOCUMENTS
The contract documents of any engineering project act as the manuscriptdetailing the design team’s findings. No matter how good the design, final planswhich do not accurately and effectively convey the final engineering design canpotentially lead to a poorly constructed project. For a highway bridge, be it anew structure or an existing one undergoing rehabilitation, the preparation ofthe final contract documents is a time consuming affair. A common acronymused for contract documents is that of PS&E, which translates into a threevolume submission of:
❏ Plans❏ Specifications❏ Estimate
Rather than being a discrete operation which takes place after anengineering team has finished its design, the preparation of contract docu-ments runs parallel with the design effort. If this preparation is not properly
[5.2]
CONTRACT DOCUMENTS
takes place after an engineer-ing team has finished its de-sign, the preparation of con-tract documents runs parallelwith the design effort.
ather than being a dis-crete operation whichR
Downloaded from Digital Engineering Library @ McGraw-Hill (www.digitalengineeringlibrary.com)Copyright © 2006 The McGraw-Hill Companies. All rights reserved.
Any use is subject to the Terms of Use as given at the website.
Implementation and Management
454 SECTION 5 IMPLEMENTATION & MANAGEMENT
managed, a bridge design project can quickly become a chaotic and expensiveenterprise.
Although the final goal in a bridge design project is to submit contractdocuments, which will eventually lead to the construction and implementation ofthe engineer’s design, it is incorrect to view the final PS&E submission as an endin and of itself. Contract documents, like a design, grow in stages throughout thecourse of design as a result of intermediate submissions. The discussion belowoutlines the various phases of submission of contract documents and providesan overview of some of the latest trends and techniques available for producingcontract documents, most of which are computer related.
5.2.1 Design Submissions
Obviously for a project of substantial size, a design team is not going tosimply turn over a set of plans after completing work. Sometimes, especially intext books, it is easy to forget that designs are performed for someone else, notmerely as an exercise to solve some abstract problem. In the bridge designworld this “someone else” is generally a transportation department (owner).When a project begins, there is (hopefully) a general consensus on projectscope and the nature of work to be done. This consensus, however, is not thefinal word on what will eventually result from an engineering design.
Engineering design is an iterative process and therefore requires constantrefinement from the onset of design to its eventual conclusion. Therefore, thedesign process itself demands several check points where an owner anddesigner can discuss the progress of work and make decisions which furtherrefine and define the design. Perhaps an owner originally intended to utilize acertain type of pier but the designer later determines that the desired form ofpier is not feasible. Somehow this change in scope has to be communicatedand the vehicle used to communicate the engineer’s thoughts are interimsubmissions.
Naturally, these submissions have to be scheduled at logical points in thedesign process. While many transportation departments maintain their ownstandards as to when and how design submissions should take place, a generallyaccepted format is to make four separate submissions which are designated bythe following:
❏ Alternative Study❏ Preliminary❏ Advanced detail❏ Final design
Discussed below is the level of detail which goes into each submission andwhat products should be produced by the design team at a given stage in thedesign process.
1. Alternative Study. Before any design is started, the design teamusually first performs an engineering study that focus on selecting thebest option for the proposed structure. Typically three alternatives arestudied.
Design Submissions
[5.2]
usually first performs anengineering study that focuson selecting the best optionfor the proposed structure.Typically three alternatives arestudied.
efore any design isstarted, the design teamB
Downloaded from Digital Engineering Library @ McGraw-Hill (www.digitalengineeringlibrary.com)Copyright © 2006 The McGraw-Hill Companies. All rights reserved.
Any use is subject to the Terms of Use as given at the website.
Implementation and Management
455
Depending on the individual situation, different materials (i.e., steel,concrete), different type of structures (i.e., slab-on-girder, box-girder,adjacent slab), different span arrangements (i.e., single span bridge, three-span bridge), or combination of these mentioned, may be chosen asalternatives. Based on the engineer’s judgment and the owner’s preference,the three best options are selected for the detailed study.
Preliminary structural analyses are then performed for eachalternative. If the bridge is over a stream, a hydrological and hydraulicstudy also needs to be performed to make sure that the proposed bridgeswill have sufficient opening so that they will not cause flooding on theupstream. The structural analyses should provide enough informationsuch as the sizes of the preliminary members. Normally, a typical cross-section for each bridge alternative is provided in the report, and apreliminary cost estimate is also provided for each alternative. The costestimates are based on the previous project costs of the same material andof the similar structural type and size.
The most important part of the study is to offer recommendations onwhich alternative should be chosen for the final design. That is usually doneusing a decision matrix, taking consideration of the major factors that havesignificant impact on the project. These factors include:
❏ Initial construction cost❏ Maintenance❏ Constructability❏ Environmental impact❏ Aesthetics
How these factors are weighted depends on the location and theimportance of the bridge. For the vast majority of highway bridges, the initialconstruction cost should be weighted over 50%, followed by maintenance.The most cost-effective option usually wins. For a major bridge, especiallyin a urban setting, engineers may give more weight to aesthetics andconstructability.
The final deliverable (the product) of the study is an engineeringreport. Once the owner approves the recommendations, the recom-mended option will be advanced to the second phase of the designprocess.
2. Preliminary Submission. A preliminary design should functionlike the working lines in an artist’s painting. A preliminary submission isused to flesh out the design process, provide a schematic to the owner onhow the engineer sees the problems associated with the design, and describeintended measures to be taken in order to complete the design. All of thismay sound well and good, but the preliminary submission of any engineer-ing project can often be one of the most difficult.
To the new engineer, this may seem somewhat strange. After all, if thepreliminary submission is only a schematic, how severe could the problemsbe at this early stage? The answer to this question is that problems arisefrom preliminary submissions because they are extremely difficult toreview.
Design Submissions
[5.2.1, Part 2]
CONTRACT DOCUMENTS
lines in an artist’s painting.
preliminary design shouldfunction like the workingA
Downloaded from Digital Engineering Library @ McGraw-Hill (www.digitalengineeringlibrary.com)Copyright © 2006 The McGraw-Hill Companies. All rights reserved.
Any use is subject to the Terms of Use as given at the website.
Implementation and Management
456 SECTION 5 IMPLEMENTATION & MANAGEMENT
A typical preliminary submission of a bridge design project consists ofthe following products:
❏ A short set of plans (typically no more than four or five sheets)❏ A preliminary engineer’s estimate of project costs
It is relatively straightforward to look at a set of final plans and followthe proposed work to be done. Preliminary plans, however, are a cartoonof what the final plans will look like. This means that there are a lot ofthings left out. The absence of material, in and of itself, often leads toquestions.
For engineers placed in the position of reviewing preliminary plans, itis important to recognize that much of the real design work has yet to bedone. The preliminary submission should focus on the scope of work forwhich design measures are to be taken and nothing else. At the preliminarystage of a project it is not important to see reinforcing in a pier if it has yetto be decided what type of pier is to be used in the first place. This may seemrather obvious, but engineers, by nature, like to see things in their completedform to understand all aspects of what it is that they are reviewing. The costassociated with providing this, however, places an extreme burden on thedesigner.
The request to see an overabundance of information in preliminarysubmissions is not a feature of bridge or transportation projects alone. Thepreliminary submission checklist for site development projects in manymunicipalities looks more like a final design submission than a preliminaryone. Both owner and designer, however, have to view the preliminarysubmission as a chance to set the design process down a common road.Serious problems can arise if this is not achieved at the end of thepreliminary submission stage.
Because almost all preliminary plans are prepared through the use ofComputer Aided Design and Drafting (CADD) techniques, there is no needto view the preliminary plans as “disposable.” By using a careful andthoughtful CADD approach, the preliminary plans can lay the foundationfor the final plans to follow. The preliminary plans should include:
❏ Bridge plan, elevation and typical section❏ General notes❏ Vertical and horizontal roadway profile❏ Type of foundation❏ Type of abutment and pier
The preliminary estimate, like the plans, is a rough sketch of the finalcosts associated with the bridge. While specific construction item prices areused to develop the final estimate, preliminary estimates are best developedusing costs from previous projects on a more gross scale. It is a good ideato include a certain amount for contingencies to cover items missed orignored when developing the estimate.
A geotechnical report, and a hydrological and hydraulic report shouldalso be included as a part of this submission.
Design Submissions
[5.2.1, Part 2]
final plans will look like. Thismeans that there are a lot ofthings left out. The absence ofmaterial, in and of itself, oftenleads to questions.
reliminary plans, however,are a cartoon of what theP
Downloaded from Digital Engineering Library @ McGraw-Hill (www.digitalengineeringlibrary.com)Copyright © 2006 The McGraw-Hill Companies. All rights reserved.
Any use is subject to the Terms of Use as given at the website.
Implementation and Management
457
3. Advanced Detail Submission. Once the preliminary submis-sion has been accepted by the owner, work can begin on preparation of theadvanced detail submission. At the advanced detail stage, the plans arealmost at the level of being ready to be used in the field. The design anddetailing of the major components of the structure have been, by the endof this stage, completed and transferred to the drawings. Ancillary(although essential) information such as reinforcing bar schedules andtraffic control plans may or may not be included with this submission.
We have spoken extensively on the owner’s need to review preliminaryplans as preliminary, not final plans. Likewise, it is important for the designengineers to respect the process as well. At times, designers may submitplans that look more like advanced detail plans rather than preliminary andare then faced with major reworking of the drawings when a change has tobe made.
The function of the advanced detail submission is to provide the ownerwith a hard look at what the final product is going to look like. It is at thisstage that detail oriented problems are usually addressed. An example of thiswould be correcting of a drainage appurtenance or selection of a differentexpansion joint seal. It is also not at all uncommon for more significantchanges to take place at this stage and designers should make allowances forsuch alterations in their schedules. In general, however, the advanced detailset of plans should look pretty much like the final plans in both shape andform. Although a detailed estimate is usually submitted at this stage alongwith the advanced detail plans, contract specifications may or may not beincluded.
4. Final Submission. As its name would imply, the final submission isgenerally that: final. The submission of the plans is usually made on a formof permanent medium (e.g., Mylar) and is accompanied by a final estimatewith associated workup sheets, and detailed contract specifications. Designcalculation sheets may or may not be required to be submitted, but engineersshould always keep a copy as a permanent record, and as a reference for thefuture design. With regard to design calculations, if computer software wasused to perform the design, a copy of the input used and the associatedoutput should also be included. Since the use of CADD in preparing plansis becoming so prevalent, many agencies are also requesting that the finalplans be accompanied by the computer version on a CD or DVD.
5.2.2 Computer Aided Design and Drafting
In reviewing older texts, it is often humorous to read the sections describingthe “latest advances” in computer technology to aid the profession. In the rapidlychanging world of computer technology, texts can become obsolete just monthsafter hitting the shelves. Two things that do not vary that much, however, arecommon sense and organization skills; and these are two of the most importantingredients to implementing a successful CADD operation.
For many years, designers shied away from using CADD in bridge designbecause of the extremely variable nature of highway bridges in general [Ref. 5.5].Even in the relatively homogeneous world of a local state transportationnetwork, no two bridges are alike. Since one of the principal advantages of
Computer Aided Design and Drafting
[5.2.2]
CONTRACT DOCUMENTS
sion is to provide the ownerwith a hard look at what thefinal product is going to looklike. It is at this stage thatdetail oriented problems areusually addressed.
he function of the ad-vanced detail submis-T
Downloaded from Digital Engineering Library @ McGraw-Hill (www.digitalengineeringlibrary.com)Copyright © 2006 The McGraw-Hill Companies. All rights reserved.
Any use is subject to the Terms of Use as given at the website.
Implementation and Management
458 SECTION 5 IMPLEMENTATION & MANAGEMENT
CADD is speed through repetition, and no two bridges are alike, why thenshould an engineering office use computer rather than manual methods?
Since the late 1980’s, this argument has essentially become moot. Thespeed of today’s computer hardware makes the skilled CADD technicianseveral times faster than a manual draftsperson. Only 25 years ago, however,this statement could not be so easily made. While it now costs a relatively smallamount of money to set up a single CADD workstation, the cost in 1985, forexample, represented a significant amount of money, which could literallymake or break an engineering firm.
Fast hardware and slick software, though, do not by themselves imply asuccessful implementation of CADD. Bridge design projects offer particularchallenges which can only be addressed through use of common sense andorganization.
Discussed below are some basic techniques which can be utilized to moreeffectively manage a bridge project through use of computer assisted methods.The goal of using any computer system is to maximize the inherent benefits ofspeed through repetition whenever and wherever possible.
1. File Organization. One of the most basic problems to befall anycomputerized operation is a disorganized method of storing data files ona computer’s mass storage device (i.e., hard drive). Many engineers wouldlaugh at the idea of dumping all of their drawings into a single flat file andlabeling them as “Drawings.” When it comes to storing computerized data,however, many take the same approach.
It is now a common practice to have all computers in an engineeringoffice networked. All CADD files should be stored on the server, ratherthan individual personal computers, so that everybody working on theproject have access to the files. That way also ensures that the files peoplehave access to are the latest version. The worst thing could happen tothe CADD file management is that different people make modifications tothe same files saved on different computers, so that there are differentversions of the “latest files” with the same file names.
In order to successfully use CADD in producing final drawings,however, a consistent and orderly naming convention must be imple-mented. The simplest approach is to adopt a sequential numbering systemfor all details (e.g., det-001, det-002, and so on). A separate index must bemaintained identifying what each drawing file corresponds to. For miscel-laneous details like expansion joints, appurtenances, and the like, this maybe the only approach.
Major structural elements, such as abutments, decks, and piers can bestored a little differently. In a set of bridge plans, elements like these will appearin a multitude of locations. A sectional view of an abutment, for example, maybe used in the detailing of reinforcing in the backwall of the abutment,excavation details, in the longitudinal section of the entire structure, and otherplaces throughout the plans. In addition to this, if the detail is drawn to scaleand the facilities are present within the CADD software used, it is also possibleto retrieve quantities from the CADD generated geometry of the detail(e.g., area of backwall, area of pedestals). Some packages even have thecapability of going from the graphic image of the element (e.g., pier elevation)to an analysis module (frame analysis program) to generate the design.
Computer Aided Design and Drafting
[5.2.2]
computerized operation is adisorganized method of storingdata files on a computer’s massstorage device.
ne of the most basicproblems to befall anyO
by themselves imply a success-ful implementation of CADD.
ast hardware and slicksoftware, though, do notF
Downloaded from Digital Engineering Library @ McGraw-Hill (www.digitalengineeringlibrary.com)Copyright © 2006 The McGraw-Hill Companies. All rights reserved.
Any use is subject to the Terms of Use as given at the website.
Implementation and Management
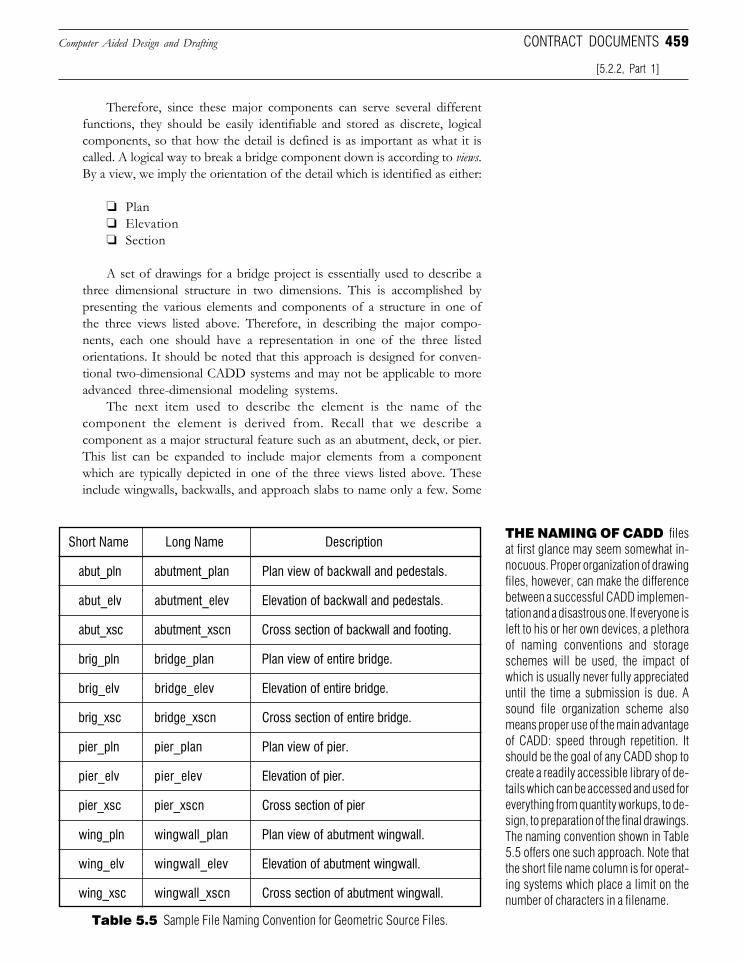
459
Therefore, since these major components can serve several differentfunctions, they should be easily identifiable and stored as discrete, logicalcomponents, so that how the detail is defined is as important as what it iscalled. A logical way to break a bridge component down is according to views.By a view, we imply the orientation of the detail which is identified as either:
❏ Plan❏ Elevation❏ Section
A set of drawings for a bridge project is essentially used to describe athree dimensional structure in two dimensions. This is accomplished bypresenting the various elements and components of a structure in one ofthe three views listed above. Therefore, in describing the major compo-nents, each one should have a representation in one of the three listedorientations. It should be noted that this approach is designed for conven-tional two-dimensional CADD systems and may not be applicable to moreadvanced three-dimensional modeling systems.
The next item used to describe the element is the name of thecomponent the element is derived from. Recall that we describe acomponent as a major structural feature such as an abutment, deck, or pier.This list can be expanded to include major elements from a componentwhich are typically depicted in one of the three views listed above. Theseinclude wingwalls, backwalls, and approach slabs to name only a few. Some
Short Name Long Name Description
abut_pln abutment_plan Plan view of backwall and pedestals.
abut_elv abutment_elev Elevation of backwall and pedestals.
abut_xsc abutment_xscn Cross section of backwall and footing.
brig_pln bridge_plan Plan view of entire bridge.
brig_elv bridge_elev Elevation of entire bridge.
brig_xsc bridge_xscn Cross section of entire bridge.
pier_pln pier_plan Plan view of pier.
pier_elv pier_elev Elevation of pier.
pier_xsc pier_xscn Cross section of pier
wing_pln wingwall_plan Plan view of abutment wingwall.
wing_elv wingwall_elev Elevation of abutment wingwall.
wing_xsc wingwall_xscn Cross section of abutment wingwall.
Table 5.5 Sample File Naming Convention for Geometric Source Files.
THE NAMING OF CADD filesat first glance may seem somewhat in-nocuous. Proper organization of drawingfiles, however, can make the differencebetween a successful CADD implemen-tation and a disastrous one. If everyone isleft to his or her own devices, a plethoraof naming conventions and storageschemes will be used, the impact ofwhich is usually never fully appreciateduntil the time a submission is due. Asound file organization scheme alsomeans proper use of the main advantageof CADD: speed through repetition. Itshould be the goal of any CADD shop tocreate a readily accessible library of de-tails which can be accessed and used foreverything from quantity workups, to de-sign, to preparation of the final drawings.The naming convention shown in Table5.5 offers one such approach. Note thatthe short file name column is for operat-ing systems which place a limit on thenumber of characters in a filename.
Computer Aided Design and Drafting
[5.2.2, Part 1]
CONTRACT DOCUMENTS
Downloaded from Digital Engineering Library @ McGraw-Hill (www.digitalengineeringlibrary.com)Copyright © 2006 The McGraw-Hill Companies. All rights reserved.
Any use is subject to the Terms of Use as given at the website.
Implementation and Management
460 SECTION 5 IMPLEMENTATION & MANAGEMENT
sample names for drawings and their associated meanings are depicted inTable 5.5.
2. Geometric Source Files. So we see that to describe a majorelement in the bridge, we use a two-part name which indicates the view andthe particular element being described. However, what exactly is in thesedrawing files? As mentioned above, each major component should bedrawn to scale, meaning that the details should be generated at a scale of1:1. This allows for distances, areas, and other geometric properties to betaken right off the screen without having to worry about applying scalefactors (e.g., 1/4 in = 1 ft). To ensure accuracy in generating the geometryof elements, CADD software which is capable of double precisionaccuracy is highly recommended.
These actual scale source files should also be free from annotation (i.e.,notes, dimensioning, etc.). Since the major elements are referenced in somany different locations, the source files (as we will call them) act as atemplate upon which we can base the final, annotated details. Since we areusing a 1:1 scale, the details in the source file can be transformed to anydesired scale. Taking the abutment section example again, the scale used fora longitudinal scale will be much different than that used to detail backwallreinforcement. By maintaining one actual scale source file we can utilize thesame template in two separate locations without having to “reinvent thewheel.”
A tool which many CADD packages possess that greatly facilitates thisprocess is called parametric modeling. Using this approach, a general model ofthe element is created whose dimensions are variable. This means a genericparametric model of a stub abutment can be created once, and for eachproject, the technician simply enters the height and depth of backwall, depthof footing, etc. and the generic shape will be drawn to the appropriatedimensions. Such a feature, quite naturally, greatly speeds the process ofcreating the base geometry of an element.
3. The Forgotten D in CADD. One of the worst things an engineeringorganization can do is to utilize CADD as an overglorified technical pen,by which we imply a process where the CADD system is employed togenerate drawings through a pure brute force method. Each sheet iscreated one at a time in a process similar to manual methods. Such anapproach fails to take advantage of the inherit benefits of CADD.
In the discussion above we have touched upon only a few of thenatural extensions of the geometric information which goes into the finaldrawings. Anyone who has had to sit down and compute the area of acomplicated abutment geometry to determine the amount of sealerneeded can testify to the tedious nature of the process. Designers andtechnicians alike need to be aware of the potential uses of the informationthey are dealing with in an effort to derive the maximum benefits fromthe CADD system.
We have only briefly touched on the design aspect of CADD which canappropriately be called “the forgotten D in CADD.” For many people,CADD has become a misnomer for drafting only. True CADD, however,incorporates design as an essential aspect of the entire process. Under a true
Computer Aided Design and Drafting
[5.2.2, Part 1]
elements, CADD softwarewhich is capable of doubleprecision accuracy is highlyrecommended.
o ensure accuracy in gen-erating the geometry ofT
can do is to utilize CADD as anoverglorified technical pen.
ne of the worst things anengineering organizationO
Downloaded from Digital Engineering Library @ McGraw-Hill (www.digitalengineeringlibrary.com)Copyright © 2006 The McGraw-Hill Companies. All rights reserved.
Any use is subject to the Terms of Use as given at the website.
Implementation and Management
461
CADD approach, design software should be capable of producing themajority of the drawing sheets automatically. If a structural analysis systemis used to generate the size of column needed in a pier, its height, andrequired reinforcement it should also be capable of producing a graphicrepresentation of this information. This detail will more than likely requirerefinement and editing, but the design software should be performing themajority of the work. Although drafting software has done much to bringautomation to the forefront in the engineering world, it has also served toadversely diminish the importance of design software in the drawingpreparation process.
4. Graphic Standards and Quality Control. Like the organiza-tion of details and drawings, the standards used in preparing the finaldrawings also need to be established and rigorously enforced. Items whichrequire standardization are:
❏ Line thicknesses❏ Text sizes❏ Dimensioning criteria (arrow sizes, text offset, etc.)❏ Annotation of notes
On most bridge projects of a significant size, several individuals will beinvolved in the preparation of the final drawings. Some may like big arrows,other smaller ones. If each is left to his or her own devices, individual tastesand preferences will permeate each detail, creating final drawing sheetswhich are dissimilar, unattractive, and difficult to follow.
Prior to beginning a project, standards should be documented andissued to all technicians working on the project. Periodic checks of workshould be made to ensure that conformity with the standards exists. Thesechecks should be conducted more frequently at the onset of the project andcan taper off toward the middle. For established CADD departments, newindividuals joining the staff should be monitored more closely.
This is not to say that standards should be cast in stone and neverrevised. On the contrary, there is always room for improvement andenhancement in the preparation of contract documents; however, it shouldnot take place in the middle of a project. A key to ensuring that standardsare adhered to is to document them in written form. Each technician shouldbe provided with a key that describes all pertinent graphic standards so thatthere is little room left for doubt. It will be difficult to envision all possiblepermutations when first developing this key, so it should be updated fromtime to time.
One problem associated with CADD is the ability of errors topropagate throughout a set of drawings. We have already mentioned theadvantages of speed through repetition. A CADD department must alwaysbe on guard, however, for error through repetition. Using the abutmentbackwall section as an example again, if the source geometry file is incorrect,then it will be wrong everywhere it has been referenced in the drawings.Therefore, it is essential that quality control procedures be implemented tocatch potentially far-reaching errors at the beginning rather than end of aproject.
Computer Aided Design and Drafting
[5.2.2, Part 4]
CONTRACT DOCUMENTS
of speed through repetition. ACADD department must alwaysbe on guard, however, for errorthrough repetition.
e have already men-tioned the advantagesW
Downloaded from Digital Engineering Library @ McGraw-Hill (www.digitalengineeringlibrary.com)Copyright © 2006 The McGraw-Hill Companies. All rights reserved.
Any use is subject to the Terms of Use as given at the website.
Implementation and Management
462 SECTION 5 IMPLEMENTATION & MANAGEMENT
Check plots of all major geometric components should be made withdimensions scaled by hand to ensure accuracy. As the project progresses,check plots are also beneficial to catch potential annotation problems as theyhappen. This periodic checking “spreads the pain” so to speak, and providesfor a more fluid drawing preparation process. A helpful tool which can beused to achieve this level of quality control is to supplement submissions tothe owner with in-house submission dates, giving everyone a deadline tomeet. This will ensure that the design team members themselves are pleasedwith quality of work.
5.2.3 Conclusions
From the above, it should be evident that the preparation of contractdocuments is not a trivial affair. Indeed, an entire volume could be writtenon this process alone. The above has been offered, however, as a guide tothe potential pitfalls that may occur during this crucial part of a bridge designproject. As engineers, we tend to focus so intently on the design aspect of ourwork that we can easily lose sight of the management component. Becausewe are trained to design, our natural impulse is to become mired within thedesign, which inevitably leads to losing sight of the overall picture. Engineersneed to produce a set of documents that will lead to the eventual construc-tion of the project. It is always nice to know that a column can sustain acertain amount of loading, but if the column is never built there is not muchpoint to the analysis.
With the advent and proliferation of CADD systems in the designenvironment, the traditional methods of producing contract documents haschanged considerably in some areas, and not so much in others. Maintaininggraphic standards, for example, is not a new idea. Whether a drawing isgenerated by hand or with a computer, consistency must still be maintained.As mentioned at the beginning of this section, most of the informationprovided above is more common sense than anything else. Common sense,however, is a valuable commodity when performing the design of a highwaybridge.
The design of a structure has also undergone extensive changes in the pastthirty years. It was mentioned earlier in the text that many designers avoidedcontinuous span structures because of the complexity involved in the analysis.It is difficult for today’s engineers to understand a time when a mechanicalcalculator was a luxury. In fact, when the word “calculator” was used by theengineers who designed many of the bridges in our infrastructure, it was inreference to a technician who sat at the side of a designer crunching out cal-culations by hand and with log tables.
Today the use of design software in the workplace is not only the fact butalso a necessity. In preparing contract documents, it is essential that a paper trailbe maintained of all computer derived solutions and made part of the finaldocumentation. It is all too easy to accept computer generated analysis as an“answer” that requires no justification. We have already touched upon theimportance of augmenting computer calculations with a hand check. This doesnot mean that the entire design needs to be completed twice. It does mean,however, that certain key parameters of the design should be checked to ensurethat answers are in the right ballpark. These hand checks should also be
Conclusions
[5.2.2, Part 4]
engineers who designed manyof the bridges in our infra-structure, it was in reference toa technician who sat at theside of a designer crunchingout calculations by hand ...
n fact, when the word“calculator” was used by theI
Downloaded from Digital Engineering Library @ McGraw-Hill (www.digitalengineeringlibrary.com)Copyright © 2006 The McGraw-Hill Companies. All rights reserved.
Any use is subject to the Terms of Use as given at the website.
Implementation and Management
463
incorporated into the final analysis documents. This can make for an imposingdocument when completed, but it is all part of the final record of the designprocess.
It should also be noted that many transportation departments maintaintheir own preferences on all of the issues discussed in this section. Whether itis the size of arrowheads on a dimension or the information to be included inthe final design submission, each owner has their own standards which adesigner is obliged to comply with. As we have stated all along, with properorganization and common sense, the preparation of contract documents willlead to the construction of a lasting project.
5.3 BRIDGE MANAGEMENT SYSTEMS
Throughout the course of this text we have discussed the nature ofhighway bridges, the allocation of funds for their construction, the design oftheir major components, and preparation of the final contract documentswhich lead to their construction. In addition to these topics, we have alsocovered the important issues of bridge maintenance and rehabilitation as theypertain to the bridge as a whole and specific elements. The focus, however, hasalways been on the individual bridge. We have, though, consistently mentionedthat the highway bridge is but one component itself in an expansive transporta-tion network. The task of dealing with hundreds and even thousands ofhighway bridges at once is one which, over the past decade, has gainedincreased prominence and importance.
In essence, this problem of coping with deficient bridges is one ofmanagement. How does an owner manage a host of structures in a networkgiven the omnipresent restrictions of a limited availability of finances andresources? It is one thing to say that a certain bridge’s piers are in bad shapeand another one has a poor deck, but if funds are only available to fix one orthe other, which one should be rehabilitated first? If a group of certain bridgesall have bearings in deteriorated condition, why has this deterioration takenplace? Is it because of faulty bearings? Maybe a certain type of expansion jointabove the bearings is especially prone to failure? These are all questions whichmaintenance personnel at transportation departments ask. They are justsamples of the type of questions that are supposed to be answered by a BridgeManagement System (BMS).
In the present environment a BMS is almost always taken to mean acomputerized management system which is used to track the condition of agroup of bridges in a highway network and assist in the determination ofremedial measures to be taken. A BMS, however, does not necessarily have tobe a computer based system. To be sure, when dealing with thousands ofbridges, the practical management of such a massive amount of data demandscomputer assisted methods. This, however, belies the fact that transportationdepartments have had Bridge Management Systems in place for a number ofyears, even if they were not called that. A BMS is nothing more than anorganizational and decision assisting system. Whether that system is based on3" × 5" index cards and monthly meetings or through the use of a relationaldatabase system, it is still a BMS. In recent years, with the bridges that were bornout of the development of the U.S. Interstate system reaching fifty years in age,
bridges, a vital segmentof the U. S. surfacetransportation system,to be unfailingly safeand durable.
The travelingpublic expects
CHARLES F. GALAMBOS[Ref. 5.6]
[5.3]
BRIDGE MANAGEMENT SYSTEMS
departments have had BridgeManagement Systems in placefor a number of years, even ifthey were not called that.
T his, however, belies thefact that transportation
Downloaded from Digital Engineering Library @ McGraw-Hill (www.digitalengineeringlibrary.com)Copyright © 2006 The McGraw-Hill Companies. All rights reserved.
Any use is subject to the Terms of Use as given at the website.
Implementation and Management
464 SECTION 5 IMPLEMENTATION & MANAGEMENT
the need for quickly and efficiently managing the maintenance and rehabilita-tion of highway bridges has increased dramatically.
Although much work has been performed in developing working, comput-erized BMSs, there is still a great deal that remains to be done towardmaximizing the potential usefulness of these systems. In this section we willoffer a short background on the basic parameters which define what a BMSneeds to address, some of the major difficulties associated with developing aworking and accurate system, and lastly the potential link of such systems to thedesign phase of a bridge project. Since the focus of a BMS is typically onmaintenance, this last important application of BMS is often forgotten.
5.3.1 Background and History
The difficulties associated with bridge management in the United Statescan be traced back to the development of the U.S. Interstate. The constructionof major portions of the Interstate at such a rapid pace resulted in a majorityof highway bridges being built in roughly the same era. While this had theeffect of spurring an economic boom through readily accessible transportationfrom one coast to the other, it has also resulted in many bridges growing oldand deficient at the same time. Another period of extensive bridge construction,albeit to a lesser degree, occurred during the Depression years of the 1930’s.The result of this expansion has had an effect similar to that of the Interstatedevelopment which took place from the 1950’s to 1970’s. The effects of“growing old at the same time” has increased both the magnitude of theproblem and the burden placed on maintenance departments in addressingthese deficiencies.
In the preceding sections, the reader has been provided with a sampling ofsome of the more persistent problems associated with highway bridges. Theseproblems can range from a leaking deck joint, to fatigue damage to steelprimary members, to scour at substructure footings. It is the goal of a BMS toprovide a maintenance department with the ability to determine:
❏ The overall condition of any bridge in the network❏ The condition of specific components of a particular bridge
In addition to this basic condition assessment of a structure or group ofstructures, a BMS should be equipped with analytical and/or statisticalmethods which aid the user in determining:
❏ Potential maintenance and rehabilitation plans❏ Associated costs of such plans
To meet these four goals is no small task. Two factors which complicatethe development of a BMS are the expansiveness of the database required todescribe the condition of a structure (see below) and the variable nature ofhighway bridges themselves. In this book alone we have talked about dozensof different types of bridges, numerous forms of components which can makeup each type of structure, and the many permutations of element types withineach component and element class. This variable nature is much more thanjust defining whether the bridge is steel or concrete. If it is a steel bridge, what
Background and History
[5.3]
BMS are the expansiveness ofthe database required to de-scribe the condition of a struc-ture ... and the variable natureof highway bridges themselves.
wo factors which compli-cate the development of aT
Downloaded from Digital Engineering Library @ McGraw-Hill (www.digitalengineeringlibrary.com)Copyright © 2006 The McGraw-Hill Companies. All rights reserved.
Any use is subject to the Terms of Use as given at the website.
Implementation and Management
465
kind of deck is used, concrete or orthotropic plate? Is there a separate asphaltwearing surface or is it integrated? Are the piers column bent, hammerhead, oreven a steel frame? All of this information must be known and accurate inorder for any of the four goals listed above to be met.
To address these questions, in previous years, transportation departmentsrelied on manual methods in their efforts to maintain the bridges in theirnetwork. To a great degree, based on the excellent record of durability ofhighway bridges, these methods have worked with remarkable success. Theaging of the infrastructure, particularly with many bridges coming of age forrehabilitation at the same time, has made manual methods incapable of meetingthe challenges faced by maintenance departments. To address the managementof highway bridge maintenance and rehabilitation, computerized methodspresent the only reasonable method for dealing with such a large amount ofinformation.
5.3.2 Inventory Database
The foundation of any BMS is the inventory database. An inventorydatabase contains record information on the type of elements in a highwaybridge and their associated condition. In Section 2.3 we discussed the processof inspecting highway bridges and the associated task of recording theinspection. The core of an inventory database is built around this inspectiondata. In a manual system, maintenance personnel can pull the inspection reportfor a given bridge from the file and peruse through the various pages todetermine the condition of various elements. In a computerized system, theinspection information is stored in a database. The concept of the inventorydatabase has its roots in the creation of the National Bridge Inventory (NBI) inthe 1970’s [Ref. 5.7]. Many state transportation departments, however, maintaintheir own scheme of rating individual elements (see Section 2.3.3). There isalso a corresponding variation in the level of detail of each state’s inventorydatabase.
The “level of detail” of an inventory database basically concerns theamount of information stored for each bridge. For any given structure therecan be hundreds and hundreds of different attributes stored which describeeverything from deck condition to drainage facilities. The process of sortingthrough and disseminating all of this data is one of the core challenges increating a working BMS. If logging and sorting through all of this data is sucha challenge, applying it to the decision making process of selecting andscheduling bridges for maintenance and rehabilitation is even more of one.Without the inventory database, however, the building of a BMS would beimpossible. The inventory database, in essence, represents a picture of ahighway bridge. How fine or blurry that picture is can be directly linked to thequality and integrity of the inventory database.
While field inspection data, like that described earlier in Section 2.3, formsthe nucleus of the inventory database, it is by no means the only source ofinformation which can be incorporated. Using present computer automationmethods, everything from photographs of a bridge to its referenced locationon a topographic map can be built into the database and accessed by the user.Another potential source of information which is beginning to make its wayinto BMS inventory databases is record plan information. As we will discuss in
Inventory Database
[5.3.2]
BRIDGE MANAGEMENT SYSTEMS
picture of a highway bridge.How fine or blurry that pictureis can be directly linked to thequality and integrity of theinventory database.
T he inventory database, inessence, represents a
Downloaded from Digital Engineering Library @ McGraw-Hill (www.digitalengineeringlibrary.com)Copyright © 2006 The McGraw-Hill Companies. All rights reserved.
Any use is subject to the Terms of Use as given at the website.
Implementation and Management
466 SECTION 5 IMPLEMENTATION & MANAGEMENT
more detail later, once the geometric properties of an element are known(e.g., primary member section properties, column diameter), it is possible tomake the step from management decisions to design decisions; all from thesingle repository of information that is in the inventory database.
It should be noted, however, that more is not necessarily better. If a wealthof information is stored in a database, yet never utilized, it simply adds overheadto the system performance. Building a large database requires significantresources, both in terms of manpower and money, and the creation of massiveamounts of data that will never be used drains these resources from themeaningful work of applying the data.
5.3.3 Maintenance Database
Where the inventory database maintains a record of the elements compris-ing a bridge and its relative condition, a maintenance database contains adescription of the work that has been done to date on a structure as well as thework that is presently scheduled to be done. This information is referencedagainst the inventory data to determine remedial measures to be taken incorrecting deficiencies, meaning that if a bridge is slated to have new deck jointsinstalled, then possibly major rehabilitation work can be deferred for anotheryear or two while work is performed on structures with more pressing needs.
5.3.4 Project and Network Level Analysis
A BMS can either function using a project and/or network level analysisapproach. Project level analysis concerns itself with individual structures and theremedial measures that are to be taken to correct any deficiencies. Associatedcosting and predicted ramifications of various measures can be performed inan effort to determine which method of repair offers the best solution, bothin terms of economy and safety.
Network level analysis concerns itself with a group of bridges and makes itsdecisions based not only on the needs of an individual bridge, but that of thenetwork as a whole. An example of this would be in one bridge requiring deckrepair and another suffering extensive scour damage. With finite fundsavailable, the BMS could assist in the decision making process which identifiescorrecting the scour problem, with the ultimate impact of structure failure, tobe more pressing than fixing the deck, which should not be ignored but at leastcan be deferred until later. This is but one example of a network level decisionmaking scenario.
A well rounded BMS provides the functionality of examining bridges usingboth of the methods described above. Although the theoretical image of a BMSis one that produces a list of bridges with appropriate measures to be taken, thereality is much different. A BMS is not so much a decision making tool as it isa decision assisting tool. Engineers must absorb this information and with theaid of the BMS arrive at a logical plan of attack for maintaining a network’sstructures. There are simply too many factors outside of the BMS analysisprocess that influence project selection for the system to function as a “blackbox.” It is difficult to imagine the coding of a routine in a BMS which accountsfor the political pressure employed by a legislator with a deteriorating bridge inhis or her community.
Maintenance Database
[5.3.2]
it is a decision assisting tool.Engineers must absorb this in-formation and with the aid ofthe BMS arrive at a logicalplan of attack for maintaining anetwork’s structures.
BMS is not so much adecision making tool asA
Downloaded from Digital Engineering Library @ McGraw-Hill (www.digitalengineeringlibrary.com)Copyright © 2006 The McGraw-Hill Companies. All rights reserved.
Any use is subject to the Terms of Use as given at the website.
Implementation and Management
467
A way to view the network level–project level relationship is that of themacroscopic database to the microscopic one. The macroscopic databaseprovides a view of the entire set of bridges, in essence acting as a bird’s-eye viewfrom far away. From such a view, maintenance personnel can gain an apprecia-tion of the magnitude and scope of the problems they are facing. This can becalled the pie chart view. For example, a typical network analysis product is toshow the percentage of bridges which can be classified as poor, good, orexcellent. A well established BMS can perform network level optimizationanalysis—determining the optimal time to take improvement actions on variousbridges in the network, under the constraints of the limited budget.
The microscopic project level analysis provides a detailed snapshot of anindividual structure. This snapshot includes information on specific elements,the present condition, and possible ramifications if left untouched. The projectlevel view of a bridge can be used to refine the selection process and weed outfinal candidates for various levels of repair. Where the network analysismethods can be used to determine which bridges make the final round ofconsideration, a project level approach can be used to select the winningcandidates, and be used to define the rehabilitation scope. This two-stepapproach provides a coherent basis for project selection which takes advantageof both methodologies.
5.3.5 Predicting the Condition of Bridges
Predicting the future condition of a highway bridge is an important factorin determining the type and scope of repair a bridge should receive. Thisprediction is usually made based on one of the following possible scenarioswhere:
❏ No work is performed❏ Partial, interim measures are taken❏ Full repair to correct all deficiencies is made
A basic tool in making these predictions is the so-called deterioration model. Adeterioration model takes the present condition of an element and extrapolatesthe condition of an element based on certain remedial measures. The followingis an example of how a deterioration model can work. A structure’s bearingsand pedestals show evidence of corrosion and deterioration causing them torate a 3 out of a possible 7. If no work is performed, a deterioration modelmay indicate that the bearings could fall to a 1 in 2 years. If partial work isdone to correct failing deck joints and provide surface repair to the pedestals,the rating may hold at a 3 for 3 more years. If the structure is jacked and thedeteriorated bearings replaced, the resulting rating would be a 7. The resultingrating is then used to determine an overall rating for the entire structure, sothat the picture becomes a little bit more complicated when weighting all of thevarious alternatives. Maybe the bearings will be repaired and an existing pierproblem left alone, or vice versa. These are the type of questions which adeterioration model is supposed to address.
The answers produced by a deterioration model are based in large part onthe wealth of knowledge already present in a transportation department andthen incorporated into the model. These projections should take into account
Predicting the Condition of Bridges
[5.3.5]
BRIDGE MANAGEMENT SYSTEMS
used to determine whichbridges make the final round ofconsideration, a project levelapproach can be used to selectthe winning candidates.
W here the network analy-sis methods can be
Downloaded from Digital Engineering Library @ McGraw-Hill (www.digitalengineeringlibrary.com)Copyright © 2006 The McGraw-Hill Companies. All rights reserved.
Any use is subject to the Terms of Use as given at the website.
Implementation and Management
468 SECTION 5 IMPLEMENTATION & MANAGEMENT
historical data on bridges in the same geographic region and of a similar type.Variations in geography, climate, and structure type will obviously have a greatimpact on the answers generated by a deterioration model. For example, if astructure is in a marine environment or constantly exposed to deicing agents,the corresponding effects on concrete components should be accounted for inthe model. In a way, building a deterioration model can be considered more ofan art than a science. Because there are so many factors that may affect abridge’s future condition, most BMSs use probabilistic models to give futuredeterioration predictions.
5.3.6 Miscellaneous Decision Assisting Criteria
In conjunction with the results generated by the deterioration modeling ofa structure, there are a variety of decision assisting criteria which are used toarrive at a general recommendation for work to be done. One such criterionis the level of service criterion. The level of service criterion is similar in concept tothe Importance Classification (IC) used in determining the effects of earth-quake loading on a structure (see Section 3.5.3, Part 2). In essence, the level ofservice criterion defines whether or not a structure can be considered essential.Examples of essential bridges would be structures that carry emergencyvehicles and school buses. This model should relate structure functionality tovarious characteristics of the structure such as deck width, vertical clearance,and load carrying capacity [Ref. 5.7].
Other decision assisting criteria are used to account for the impact of factorsranging from future traffic conditions to deterioration of a structure. Thesemodels are used to optimize the expenditure of a transportation department’sresources to address conditions that may exist several years into the future.
5.3.7 Costing Models
Quite naturally, the costing of various treatments and alternatives plays animportant role in a BMS. As we discussed earlier in the preparation of anengineer’s estimate (see Section 5.2.1), the basis of any estimate is historicalcosting from previous work performed. Incorporated into any BMS should bethe ability to track cost expenditures which correspond to various levels ofwork and detail. Meaning that, a BMS should maintain in its database the costof projects on a gross scale (e.g., the cost for a complete rehabilitation of aconventional overhead bridge in the system) and on a more refined scale(e.g., the cost of retrofitting deck joints).
In addition to these basic work cost schedules, a BMS must also take intoaccount various budgetary and funding considerations and limitations (e.g., federalmatching funds, allocation of funds to various geographic regions). Costing modelsmust also account for inflation and other economic parameters which influencethe cost of a project which is deferred for work at a later time.
A BMS should also take consideration of the user cost savings fortravelling time, fuel, safety, and serviceability improvements. That is thereason why a BMS always give preference to the heavily travelled bridgeswhen deciding which bridges should be rehabilitated first.
These are just some of the basic criteria which go into making a costingmodel for a BMS. Given the complex nature of project funding in the
DID YOU KNOW
THAT the U.S. spendsapproximately
$1 trillion on transporta-tion services (1993 dollars)?This translates into roughly17 percent of the nation’s to-tal output. The transportationsystems included in this ex-penditure include roads andbridges, rail and waterways,airports, transit lines, and othertransportation systems [Ref. 5.8].
Miscellaneous Decision Assisting Criteria
[5.3.5]
BMS must also take into ac-count various budgetary andfunding considerations andlimitations.
n addition to these basicwork cost schedules, aI
Downloaded from Digital Engineering Library @ McGraw-Hill (www.digitalengineeringlibrary.com)Copyright © 2006 The McGraw-Hill Companies. All rights reserved.
Any use is subject to the Terms of Use as given at the website.
Implementation and Management
469
transportation industry (see Section 2.1), a wide variety of factors caninfluence the cost of specific remedial measures to be taken. This complexitycan lead to making the development of a costing model one of the mostdifficult tasks in creating a BMS. The accuracy of results produced by thesemodels must also be taken in light of the wide variety of factors whichinfluence them. There is always a tendency, however, to view rough costingnumbers derived from a BMS in the same way as one would review anengineer’s final estimate.
Like any other feature in a BMS, the answers produced are more generalindications rather than actual conditions. It is the responsibility of the owner tosift through the information generated and distill it into a thoughtful, andhopefully accurate, maintenance plan.
5.3.8 Optimization Models
Optimization analyses may be performed on both network level andproject level. A mathematical approach called “Liner Programming” is usedfor the analyses. The objective function of the optimization is to “minimizethe life-cycle cost”. The life-cycle cost is the total cost from present to theindefinite future, including maintenance, rehabilitation, and user costs. All futurecosts are converted into present values.
BMS optimization determines the least-cost strategies for maintenanceand rehabilitation for the entire network, based on the results of deteriorationand cost analyses. Life-cycle cost analysis is used for the optimization model.It also considers the desired level of service that any bridge should accommo-date. For example, if a small bridge is unsafe to the public, it will be rehabilitatedeven though widening a major Interstate highway bridge may make moreeconomical sense. The optimization is performed under the constraints of theavailable budget.
The optimization is usually a top-down approach. It first determines whichbridges need to be repaired/rehabilitated under the budget constraint, and thendetermines what actions should be taken for these selected bridges by performingoptimization on the project level.
For small bridge populations, the bottom-up approach may be used.Although it takes more computing time, the bottom-up approach provides amore accurate result than the top-down approach.
5.3.9 Building the Database
Building a BMS database is a formidable, and often awe-inspiring task.There is simply an overwhelming abundance of information required todevelop accurate models, predictions, and recommendations. This can lead tothe development of a BMS becoming mired in the creation of a database alone.This is not a characteristic of BMS alone but in the construction of any similarsystem, such as a Geographic Information System (GIS). What is needed inbuilding a database of this size is patience and a logical implementation plan.
One method in creating such a massive repository of information is for anagency to bootstrap its way up the database. The “bootstrap” approach calls forthe creation of a core database, which in the case of a BMS is the inventorydatabase. Because of the push started with the creation of the NBI, many
Building the Database
[5.3.9]
BRIDGE MANAGEMENT SYSTEMS
information generated anddistill it into a thoughtful, andhopefully accurate, mainte-nance plan.
t is the responsibility of theowner to sift through theI
Downloaded from Digital Engineering Library @ McGraw-Hill (www.digitalengineeringlibrary.com)Copyright © 2006 The McGraw-Hill Companies. All rights reserved.
Any use is subject to the Terms of Use as given at the website.
Implementation and Management
470 SECTION 5 IMPLEMENTATION & MANAGEMENT
transportation departments are well developed in this respect. In general,development of a BMS is predicated on the existence of a sound inspectionprogram, without which there can be no description of a structure. It isimportant to emphasize that the goal of a BMS, like that of a design system, isto create a model of a structure in the field. Where a frame analysis packageneeds to know the dimensions and material properties of columns and capbeams in order to perform its analysis, a BMS needs to know their general typeand condition so it too can perform an analysis.
No agency, however sophisticated in its automation methods, will be ableto design and implement a BMS with the required database completely inplace. There is simply too much information for this to occur. Developmentof a BMS needs to begin with a core database which is built upon over thecourse of time. With such an approach the basic functionality of variousmodules within the system can be developed, tested, and implemented as thedatabase grows and matures over time. Using this approach, a transportationdepartment can begin to realize immediate benefits from the system and stillpursue the development of a BMS in its “final” form.
We put “final” in quotations because a BMS is truly never final but rathercontinually evolving. Indeed, the methods of funding, designing, and con-structing bridges themselves are not static, so therefore a system developed tomanage them can in no way be static itself. Throughout the development of aBMS, however, there are a variety of immediate benefits which can be realizedwhich fall significantly short of an ultimate system implementation.
For example, simply being able to quickly access and view structureinventory and inspection data is a benefit in and of itself, particularly whenmany transportation departments rely on retrieving hardcopy versions ofinspection data from a file cabinet. In the development of a BMS, the first goalshould be the accessing and retrieval of data that already exists. If inspectiondata is present in digital form, it should immediately be made available tomaintenance and even design personnel at the earliest opportunity. Like anyother computer system, once the actual end users get their hands on the data,an explosion of potential uses of that data will occur that no developer of asystem could ever imagine on his or her own. Therefore, it can be said thatimmediate access to data by the end users of that data is not only important forthe users themselves, but is also a critical step in the development of a BMS.
5.3.10 Managing Small and Large Structures
An important issue in the development of a BMS is how small and largestructures are handled within a single database. Quite naturally, the mainte-nance operations for a three span structure are significantly different inmagnitude and scope when compared with a hundred span structure. Difficul-ties arise, however, when a hundred span structure is treated in the same wayas a three span bridge, and vice versa.
One method of addressing this discrepancy is to treat a large structure asa group of bridges by itself. This is done by performing all of the BMS analysismethods on a span by span basis, so that in essence, a hundred span bridge isturned into a mini-network of a hundred structures which traverse fromsupport to support. This so-called span-based approach is even sometimesapplied to a network of bridges as a whole (i.e., both large and small bridges).
Managing Small and Large Structures
[5.3.9]
existence of a sound inspec-tion program, without whichthere can be no description ofa structure.
n general, development of aBMS is predicated on theI
Downloaded from Digital Engineering Library @ McGraw-Hill (www.digitalengineeringlibrary.com)Copyright © 2006 The McGraw-Hill Companies. All rights reserved.
Any use is subject to the Terms of Use as given at the website.
Implementation and Management
471BMS Link to Design of Bridges
for the majority of bridges inany network rarely occurs on aspan by span basis but rather ona structure by structure basis.
t should be remembered,however, that rehabilitationI
[5.3.12]
BRIDGE MANAGEMENT SYSTEMS
It should be remembered, however, that rehabilitation for the majority ofbridges in any network rarely occurs on a span by span basis but rather on astructure by structure basis. For example, if the second span of a three spanstructure has a deck which requires replacement, it is highly unlikely that onlythe second span deck alone would be replaced. This is because many bridgesconstructed in the first half of last century utilized different material properties(e.g., strength of concrete and reinforcing steel) and different geometries(e.g., thickness of deck, curb, and sidewalk width) than are customary today,making a span based rehabilitation infeasible. A transportation agency, forexample, would not reconstruct a single span to 1950’s era standards.
As a method of determining overall network costs, however, the span-basedapproach offers some benefits. When actual predictions and recommendationsare generated by the BMS, though, they should take into account the probablestructure-wide application of remedial measures (i.e., replacement of the secondspan deck will necessitate replacement of the first and third span deck as well).
5.3.11 Current Bridge Management Systems
As we have discussed, a BMS is a very complicated system, which requiresa significant amount of resources to develop. Most transportation depart-ments in the U.S. do not even have sufficient funds for the routine mainte-nance, so it is not practical for each DOT to develop its own BMS. MostDOTs adopt one of the two popular bridge management systems—“Points”and “BRIDGIT.”
Points is a BMS developed by FHWA in conjunction with six states,and some private consultants. In its database, a bridge is divided intoindividual elements. These elements with the same materials and can beexpected to deteriorate in the same manner are grouped into sections. Thecondition of each element is reported on a scale of 1 to 5, based on theinspection report.
Points uses probabilistic approach for predicting future deterioration. Itscost models have the ability to estimate user costs such as accidents, traveltime and fuel costs, etc. For optimization, it uses top-down approach byoptimizing the overall network before selecting individual projects.
BRIDGIT is a BMS developed jointly by NCHRP and National Engi-neering Technology Corporation. BRIDGIT is very similar to Points in termsof modeling and capacities. Their database, the deterioration prediction mod-els, and the cost models are all similar. The primary difference betweenBRIDGIT and Points lies in the optimization approach. BRIDGIT adoptedthe bottom-up approach for the optimization. It can also perform “what if”delaying action analysis on a particular bridge. It can tell if delaying a particularproject will save or cost more money for the entire bridge life.
BRIDGIT is slower than Points, so it is better suited for small networks.
5.3.12 BMS Link to Design of Bridges
In most discussions of BMS development there is usually an ancillarymention of the potential link to CADD facilities present at a transportationdepartment. This important component to a working BMS, however, is oftenignored. The need for a strong link between maintenance and design operations
management systems—“Points”and “BRIDGIT.”
ost DOTs adopt one ofthe two popular bridgeM
Downloaded from Digital Engineering Library @ McGraw-Hill (www.digitalengineeringlibrary.com)Copyright © 2006 The McGraw-Hill Companies. All rights reserved.
Any use is subject to the Terms of Use as given at the website.
Implementation and Management
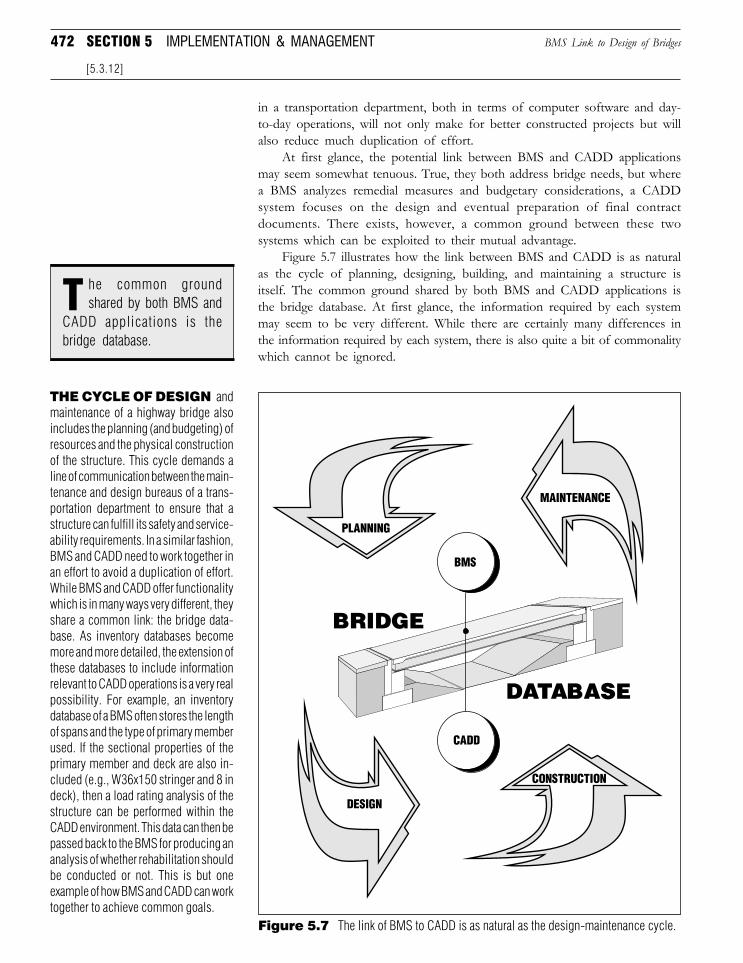
472 SECTION 5 IMPLEMENTATION & MANAGEMENT BMS Link to Design of Bridges
[5.3.12]
in a transportation department, both in terms of computer software and day-to-day operations, will not only make for better constructed projects but willalso reduce much duplication of effort.
At first glance, the potential link between BMS and CADD applicationsmay seem somewhat tenuous. True, they both address bridge needs, but wherea BMS analyzes remedial measures and budgetary considerations, a CADDsystem focuses on the design and eventual preparation of final contractdocuments. There exists, however, a common ground between these twosystems which can be exploited to their mutual advantage.
Figure 5.7 illustrates how the link between BMS and CADD is as naturalas the cycle of planning, designing, building, and maintaining a structure isitself. The common ground shared by both BMS and CADD applications isthe bridge database. At first glance, the information required by each systemmay seem to be very different. While there are certainly many differences inthe information required by each system, there is also quite a bit of commonalitywhich cannot be ignored.
THE CYCLE OF DESIGN andmaintenance of a highway bridge alsoincludes the planning (and budgeting) ofresources and the physical constructionof the structure. This cycle demands aline of communication between the main-tenance and design bureaus of a trans-portation department to ensure that astructure can fulfill its safety and service-ability requirements. In a similar fashion,BMS and CADD need to work together inan effort to avoid a duplication of effort.While BMS and CADD offer functionalitywhich is in many ways very different, theyshare a common link: the bridge data-base. As inventory databases becomemore and more detailed, the extension ofthese databases to include informationrelevant to CADD operations is a very realpossibility. For example, an inventorydatabase of a BMS often stores the lengthof spans and the type of primary memberused. If the sectional properties of theprimary member and deck are also in-cluded (e.g., W36x150 stringer and 8 indeck), then a load rating analysis of thestructure can be performed within theCADD environment. This data can then bepassed back to the BMS for producing ananalysis of whether rehabilitation shouldbe conducted or not. This is but oneexample of how BMS and CADD can worktogether to achieve common goals.
Figure 5.7 The link of BMS to CADD is as natural as the design-maintenance cycle.
CADD applications is thebridge database.
he common groundshared by both BMS andT
Downloaded from Digital Engineering Library @ McGraw-Hill (www.digitalengineeringlibrary.com)Copyright © 2006 The McGraw-Hill Companies. All rights reserved.
Any use is subject to the Terms of Use as given at the website.
Implementation and Management
473BMS Link to Design of Bridges
[5.3.12]
BRIDGE MANAGEMENT SYSTEMS
A basic example of how BMS and CADD can work together is in the loadrating of a structure. A BMS needs to know the load carrying capacity of astructure in order to determine what the course of maintenance should be ona structure. A functionality present in most CADD systems (tailored for bridgedesign) is the ability to prepare a load rating analysis. In a disparate environ-ment where BMS and CADD work separately, this information would have tobe determined by the design department using whatever means are at theirdisposal (CADD or manual) and then provided for hardwiring or computerspread sheets into the BMS database.
An integrated approach, however, utilizes an expanded inventory database.Most BMS inventory databases already store the length of spans in astructure as well as the type of primary members used (e.g., rolled section,prestressed concrete). The database would need to also include the sectionproperties of the primary member (e.g., W36x150, AASHTO-PCI Type IIIprestressed concrete girder), deck thickness, and other relevant geometricdata. Working off of the same database, the CADD system could access therequired information, perform a load rating analysis, and pass the informa-tion back to the BMS for future analysis in determining potential remedialmeasures to be taken.
The same type of link can be applied to a wide variety of structuralcomponents. The application of this link does not merely apply to structuralanalysis of bridge components. In the section on the use of CADD in contractdocument preparation (Section 5.2.2) we discussed the functionality of para-metric modeling. If detailed geometric information is also maintained, then theautomated production of drawing sheets can also be facilitated. This data canbe further applied to the computation of rough quantities (e.g., area requiredfor application of concrete epoxy protective coating, volume of concrete to beremoved for component replacement, etc.) which can again be passed back tothe BMS for a more refined estimate of proposed work to be performed on astructure selected for repair. To be sure, such detailed interaction would not beperformed on a network level analysis, but on the more detailed project levelanalysis where significant questions can arise. The potential for obtaining amore refined answer in short order is a very real possibility.
Obviously, there is a great deal of work required to build such anintegrated system. Like the development of a BMS, however, such anintegration is not going to be achieved overnight. The process is also facilitatedby the fact that many of the pieces, both on the BMS and CADD end, arealready developed. What remains to be done is the integration between them.While the task is certainly formidable, it is by no means impossible. The loadrating example given above is an excellent first step to be made towardintegrating BMS and CADD applications. From there, cross-links between thesystems can be cobbled together.
Another obvious concern for such integration is the massive size of thedatabase involved and the time required to build it. With respect todatabase size, there is no need to maintain all information in a single database.Separate databases can be established as long as links and the ability to cross-update the databases is accounted for in their design. As far as building thedatabase is concerned, the same bootstrap approach which is recommendedfor the creation of a BMS database applies to the development of a design orCADD database.
together is in the load rating ofa structure.
basic example of howBMS and CADD can workA
Downloaded from Digital Engineering Library @ McGraw-Hill (www.digitalengineeringlibrary.com)Copyright © 2006 The McGraw-Hill Companies. All rights reserved.
Any use is subject to the Terms of Use as given at the website.
Implementation and Management
474 SECTION 5 IMPLEMENTATION & MANAGEMENT
The data needed for most CADD application level analysis can beobtained from record plans and/or field measurements. As an activity whichcan be performed in conjunction with the inspection of a structure, fieldverification of key CADD related data can be achieved. Again, the informa-tion required would be small at first and gradually built upon as the needpresented itself. Slowly, one structure at a time, the database will grow andalong with this growth will be a corresponding growth in functionality andusefulness.
5.3.13 BMS Link to Pavement Management Systems
A Pavement Management System (PMS) performs much of the samefunctionality as a BMS, with the emphasis on sections of highway rather thanbridge structures. As the bridge is but one component in an overall highwaynetwork, the link between pavement and bridge management systems is animportant one. The principal benefit of such an integration would be a moreunified and logical expenditure of funds. Rather than treating the maintenanceof highways and bridges as discrete and independent operations, a link of PMSand BMS applications provides the foundation upon which a transportationdepartment can more judiciously and efficiently allocate funds.
It is not at all uncommon to have a section of highway receive mainte-nance work (e.g., resurfacing) and then have structures in the same vicinityundergo rehabilitation. If a combined highway-bridge work schedule is antici-pated through the use of an integrated pavement and bridge managementsystem, then consolidation of resources could be made, thereby reducing theoverall cost to each project. Such an integration has to be undertaken in afashion similar to that described for the link between BMS and CADDapplications. Like the BMS-CADD integration, the integration of a PMS witha BMS can be made utilizing a common database.
The common link between PMS and BMS is the geography which bothhighways and bridges share. Where maintenance work in a PMS is analyzedover large lengths of highway (e.g., several miles) the work for a bridge occursat a specific point, so that an integrated PMS-BMS system could identifylocations where bridge and pavement work coincide.
5.3.14 GIS and Imaging Technologies
Another technology which can enhance the functionality of both BMSand PMS is that of a GIS. The ability to view both bridge and pavement datawithin the context of the geography which they share provides an excellent toolfor both visualizing and presenting the work a transportation department isundertaking. Another technology which can be exploited in the developmentof a BMS is that of imaging. Imaging technology allows for the scanning andautomated access of plans, inspection reports, and other pertinent informationin a digital environment, so that if a BMS arrives at a certain recommendation,and it is desirable to view the inspector’s original remarks in the inspectionreport, a user can simply access the actual inspection report from within theBMS without having to look at the actual hardcopy report.
Both GIS and imaging technologies serve to illustrate the rapid changesthat have taken place in the development of bridge management systems. The
the foundation upon which atransportation department canmore judiciously and efficientlyallocate funds.
link of PMS and BMSapplications provides...a
[5.3.12]
BMS Link to Pavement Management Systems
analysis can be obtainedfrom record plans and/or fieldmeasurements.
he data needed for mostCADD application levelT
Downloaded from Digital Engineering Library @ McGraw-Hill (www.digitalengineeringlibrary.com)Copyright © 2006 The McGraw-Hill Companies. All rights reserved.
Any use is subject to the Terms of Use as given at the website.
Implementation and Management
475
creation of a sound database, however, like the creation of a solid foundation,provides the basis which makes the extension to these and other emergingtechnologies possible. Over the next several decades, these systems will matureand grow to the point where it will be difficult to imagine maintainingstructures without them; just as it is difficult to imagine the design of highwaybridges without the aid of a personal computer.
REFERENCES
5.1 Hickerson, Thomas F., Route Surveys and Design, 4th ed., McGraw-Hill,New York, 1959.
5.2 A Policy on Geometric Design of Highways and Streets, 4th ed. AmericanAssociation of State Highway and Transportation Officials, Washington, D.C.,2001.
5.3 Oglesby, Clarkson H., and Hicks, R. Gary, Highway Engineering, 4th ed.,p. 445, John Wiley & Sons, New York, 1982.
5.4 Brinkman, Charles P. and Mak, King K., “Accident Analysis of HighwayNarrow Bridge Sites,” Public Roads, vol. 49, no. 4, pp. 127–133, March, 1986.
5.5 Tonias, Demetrios E., et al., “CADD as a Production Tool in BridgeDesign,” Public Works, pp. 34–37, April, 1988.
5.6 Galambos, Charles F., “Bridge Design, Maintenance, and Management,”Public Roads, pp. 109–115, vol. 50, March, 1987.
5.7 Guidelines for Bridge Management Systems, American Association of StateHighway and Transportation Officials, Washington, D.C., 1993.
5.8 The National Highway System: The Backbone of America’s Intermodal TransportationNetwork, U.S. Department of Transportation, Federal Highway Administration,Washington, D.C., December, 1993.
REFERENCES
Downloaded from Digital Engineering Library @ McGraw-Hill (www.digitalengineeringlibrary.com)Copyright © 2006 The McGraw-Hill Companies. All rights reserved.
Any use is subject to the Terms of Use as given at the website.
Implementation and Management

Downloaded from Digital Engineering Library @ McGraw-Hill (www.digitalengineeringlibrary.com)Copyright © 2006 The McGraw-Hill Companies. All rights reserved.
Any use is subject to the Terms of Use as given at the website.
Implementation and Management


