Embed Size (px)
Citation preview

Jalayer, Zhou, Gong, Hu, and Grinter 1
A Comprehensive Assessment of Highway Inventory Data Collection Methods for Implementing Highway Safety Manual
Mohammad Jalayer*
Ph.D. Graduate Student, Dept. of Civil Engineering Auburn University, Auburn, AL 36849-5337
Phone: +1-312-351-4730 [email protected]
Huaguo Zhou
Associate Professor, Dept. of Civil Engineering Auburn University, Auburn, AL 36849-5337
Phone: +1-334-844-1239 [email protected]
Jie Gong
Assistant Professor, Dept. of Civil & Environmental Engineering Rutgers, the State University of New Jersey, Rutgers, NJ 08854-8018
Phone: +1-848-445-2881 [email protected]
ShunFu Hu
Professor, Dept. of Geography Southern Illinois University Edwardsville, Edwardsville, IL 62026-1800
Phone: +1-618-650-2281 [email protected]
Mark Grinter
Assistant Professor, Dept. of Construction Southern Illinois University Edwardsville, Edwardsville, IL 62026-1800
Phone: +1-618-650-5019 [email protected]
*Corresponding Author
Word Count = 6,000 (Text) + 250×6 (Tables and Figures) = 7,500
A Paper Submitted for Presentation at the 94th Transportation Research Board Annual Meeting

Jalayer, Zhou, Gong, Hu, and Grinter 1
ABSTRACT 1 The implementation of the Highway Safety Manual (HSM) at the state level has the potential to 2
allow transportation agencies to proactively address safety concerns. However, the widespread 3
utilization of HSM faces significant barriers as many state Department of Transportations (DOTs) 4
do not have sufficient HSM-required highway inventory data. Many techniques have been utilized 5
by state DOTs and local agencies to collect highway inventory data for other purposes. 6
Nevertheless, it is unknown which of these methods or any combination of them is capable of 7
efficiently collecting the required dataset while minimizing cost and safety concerns. The focus of 8
this study is to characterize the capability of existing methods for collecting highway inventory 9
data vital to the implementation of the recently published HSM. More specifically, this study 10
evaluates existing highway inventory methods through a nationwide survey and a field trial of the 11
identified-promising highway inventory data collection (HIDC) methods for various types of 12
highway segments. A comparative analysis was conducted to present an example on how to 13
incorporate weights provided by state DOT stakeholders to select the most suitable HIDC method 14
for the specific purpose. 15
16
Keywords: Data Collection, Highway Inventory Data, Mobile LiDAR, Highway Safety Manual, 17
Photo/Video Log, Field Inventory, Roadside Features. 18
19

Jalayer, Zhou, Gong, Hu, and Grinter 2
INTRODUCTION 1 The Highway Safety Manual (HSM) provides decision makers and engineers with the information 2
and tools to improve roadway safety performance. In the first edition of the HSM, predictive 3
methods, which can be employed to quantitatively estimate the safety of a transportation facility 4
in terms of number of crashes, were provided for three types of facilities: [1] rural two-lane, two-5
way roads, [2] rural multilane highways, and [3] urban and suburban arterials (1). The National 6
Cooperative Highway Research Program (NCHRP) 17-45 Project recently developed safety 7
prediction models for freeways and interchanges as well (2). Since the release of the HSM in 2010, 8
many states have sought to tailor the various safety measures and functions within the report to 9
better reflect road safety in their specific locations. This manual provides valuable insight that can 10
help practitioners to prioritize projects, compare different alternatives, and select the most 11
appropriate countermeasures in the planning, design, construction, and maintenance process. 12
To implement methods presented in the HSM, a major challenge for state and local 13
agencies is the collection of necessary roadway information along thousands of miles of highways. 14
Collecting roadway asset inventory data often incurs significant but unknown costs. To date, state 15
Department of Transportations (DOTs) and local agencies have employed a variety of methods to 16
collect the roadway inventory data, including field inventory, photo/video log, integrated GPS/GIS 17
mapping systems, aerial photography, satellite imagery, airborne Light Detection and Ranging 18
(LiDAR), static terrestrial laser scanning, and mobile LiDAR. These methods vary based on 19
equipment needed, time required for both collecting data and reducing data, and costs. Each 20
method has its specific advantages and limitations. Particularly, vehicle-mounted LiDAR, a 21
relatively new type of mobile mapping system, is capable of collecting a large amount of detailed 22
3D highway inventory data, but it requires expensive equipment and significant data reduction 23
efforts to extract the desired highway inventory data. On the other hand, a traditional field survey 24
requires less equipment investment, training, and data reduction efforts. This method is not only 25
time-consuming and labor-intensive, but it also exposes data collection crews to dangerous 26
roadway environments. 27
The efforts and costs associated with collecting various data with different techniques vary 28
greatly. As a result of this, there is a need to understand the application of existing highway 29
inventory data collection (HIDC) methods for gathering HSM-related roadway inventory data. 30
This study sought to present an in-depth review of various roadway asset inventory data collection 31
methods and to compare the quality and desirability of these methods. A national survey was 32
conducted to all the state DOTs to collect the related information toward these various data 33
collection techniques. Additionally, field trials were conducted to identify the most promising 34
methods for collecting and recording highway inventory data to support HSM implementation. By 35
virtue of the fact that many state DOTs are currently redesigning their asset management plans to 36
meet “MAP-21” requirements, the outcomes of this research effort may provide a resource for 37
saving money and time. 38
39
RESEARCH BACKGROUND 40
Highway Inventory Data for Highway Safety Manual 41 The HSM can be utilized to predict the safety performance of a roadway segment or an 42
intersection. The safety performance is evaluated by using a system of equations, known as Safety 43
Performance Functions (SPFs), to estimate the average crash frequency based upon roadway 44
characteristics and traffic conditions. The input data for different types of roadway segments and 45
intersections are quite different. Tables 1a and 1b summarize the required input data for the safety 46

Jalayer, Zhou, Gong, Hu, and Grinter 3
predictive models in the HSM. The checkmark indicates the required variables for roadway 1
segments and intersections. 2 3
TABLE 1 HSM-required Inventory Data (1) 4
Variables (Road Segments) Rural Two-lane, Two-way Roads
Rural Multilane Highways
Urban and Suburban Arterials
Number of through lanes √ √ √ Lane width √ √ Shoulder width √ √ Shoulder type √ √ Presence of median √ √ Median width √ Presence of passing lane √
Presence of rumble strips √
Presence of two-way left-turn lane √ √ Driveway density √ Number of major/minor commercial driveways
√
Number of major/minor residential driveways
√
Number of major/minor industrial/institutional driveways
√
Number of other driveways √ Horizontal curve length √ Horizontal curve radius √ Horizontal curve superelevation √ Presence of spiral transition √ Grade √ Roadside hazard rating √ Roadside slope √ Roadside fixed object density/offset √ Percent of length with on-street parking √ Type of on-street parking √ Presence of lighting √ √ √ Presence of auto speed enforcement √ √ √
5
6

Jalayer, Zhou, Gong, Hu, and Grinter 4
TABLE 1 HSM-required Inventory Data, Cont. (1) 1
Variables (Intersections) Rural Two-lane Two-way Roads
Rural Multilane Highways
Urban and Suburban Arterials
Number of intersection legs √ √ √ Number of approaches with left-turn lane(s)
√ √ √
Number of approaches with right-turn lane(s)
√ √ √
Intersection skew angle √ √ Presence of lighting √ √ Pedestrian volume/lane √ Number of bus stop within 1000 ft. √ Number of alcohol sales within 1000 ft. √ Presence of schools within 1000 ft. √
2
Currently, few states have existing highway inventory databases that contain all the 3
required variables for the input of the HSM models. A significant amount of roadside information, 4
such as roadside slope, grade, roadside fixed objects and their density, and offset to the edge of 5
travel way are missing in the current Illinois Department of Transportation (IDOT) databases. 6
Therefore, the main objective of this study is to evaluate which data collection method is able to 7
collect those roadside features in the most economical and effective way. The findings of this study 8
will be helpful to provide guidance for other states due to the absence of these features in many 9
state DOTs databases. 10
11
Review of Highway Inventory Data Collection Methods 12 HIDC methods can be broadly divided into two different categories: land-based and air- or space-13
based methods (3 and 4). These methods vary in equipment used, data collection time, data 14
reduction time, accuracy, and cost. A brief description of the available data collection methods and 15
related studies is provided in Table 2. 16
Jalayer, Zhou, Gong, Hu, and Grinter 5
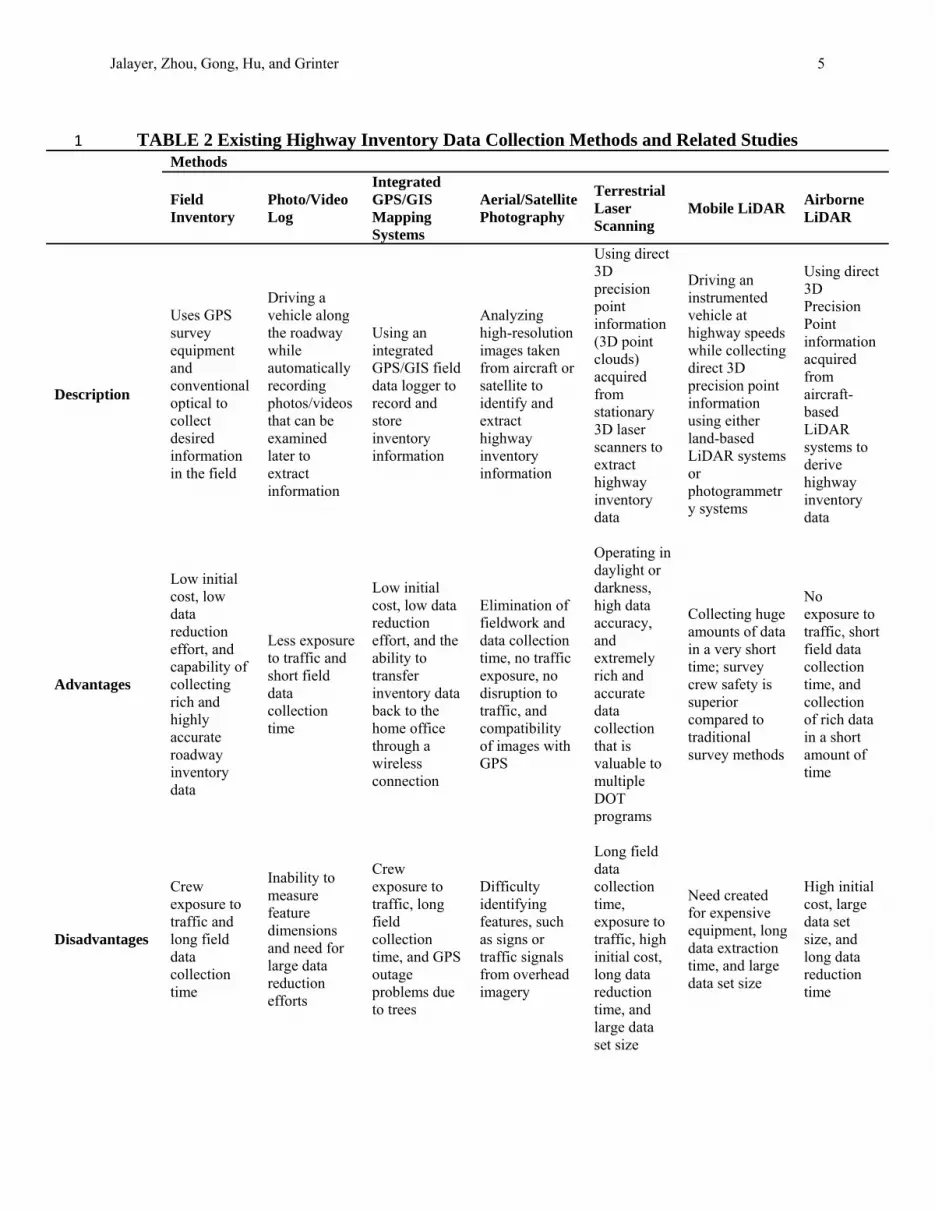
TABLE 2 Existing Highway Inventory Data Collection Methods and Related Studies 1
Methods
Field Inventory
Photo/Video Log
Integrated GPS/GIS Mapping Systems
Aerial/Satellite Photography
Terrestrial Laser Scanning
Mobile LiDAR Airborne LiDAR
Description
Uses GPS survey equipment and conventional optical to collect desired information in the field
Driving a vehicle along the roadway while automatically recording photos/videos that can be examined later to extract information
Using an integrated GPS/GIS field data logger to record and store inventory information
Analyzing high-resolution images taken from aircraft or satellite to identify and extract highway inventory information
Using direct 3D precision point information (3D point clouds) acquired from stationary 3D laser scanners to extract highway inventory data
Driving an instrumented vehicle at highway speeds while collecting direct 3D precision point information using either land-based LiDAR systems or photogrammetry systems
Using direct 3D Precision Point information acquired from aircraft-based LiDAR systems to derive highway inventory data
Advantages
Low initial cost, low data reduction effort, and capability of collecting rich and highly accurate roadway inventory data
Less exposure to traffic and short field data collection time
Low initial cost, low data reduction effort, and the ability to transfer inventory data back to the home office through a wireless connection
Elimination of fieldwork and data collection time, no traffic exposure, no disruption to traffic, and compatibility of images with GPS
Operating in daylight or darkness, high data accuracy, and extremely rich and accurate data collection that is valuable to multiple DOT programs
Collecting huge amounts of data in a very short time; survey crew safety is superior compared to traditional survey methods
No exposure to traffic, short field data collection time, and collection of rich data in a short amount of time
Disadvantages
Crew exposure to traffic and long field data collection time
Inability to measure feature dimensions and need for large data reduction efforts
Crew exposure to traffic, long field collection time, and GPS outage problems due to trees
Difficulty identifying features, such as signs or traffic signals from overhead imagery
Long field data collection time, exposure to traffic, high initial cost, long data reduction time, and large data set size
Need created for expensive equipment, long data extraction time, and large data set size
High initial cost, large data set size, and long data reduction time
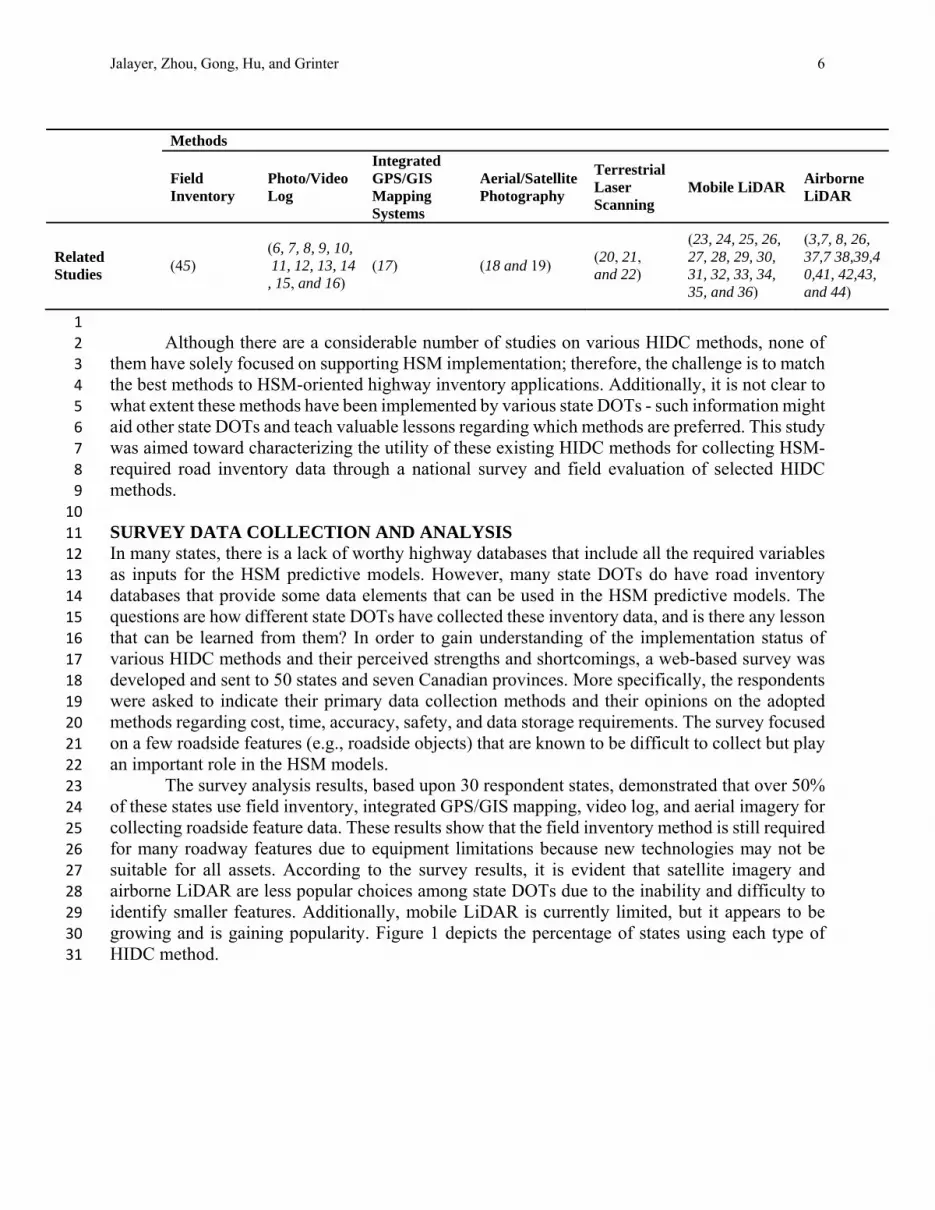
Jalayer, Zhou, Gong, Hu, and Grinter 6
Methods
Field Inventory
Photo/Video Log
Integrated GPS/GIS Mapping Systems
Aerial/Satellite Photography
Terrestrial Laser Scanning
Mobile LiDAR Airborne LiDAR
Related Studies
(45) (6, 7, 8, 9, 10, 11, 12, 13, 14, 15, and 16)
(17) (18 and 19) (20, 21, and 22)
(23, 24, 25, 26,27, 28, 29, 30, 31, 32, 33, 34, 35, and 36)
(3,7, 8, 26, 37,7 38,39,40,41, 42,43, and 44)
1
Although there are a considerable number of studies on various HIDC methods, none of 2
them have solely focused on supporting HSM implementation; therefore, the challenge is to match 3
the best methods to HSM-oriented highway inventory applications. Additionally, it is not clear to 4
what extent these methods have been implemented by various state DOTs - such information might 5
aid other state DOTs and teach valuable lessons regarding which methods are preferred. This study 6
was aimed toward characterizing the utility of these existing HIDC methods for collecting HSM-7
required road inventory data through a national survey and field evaluation of selected HIDC 8
methods. 9
10
SURVEY DATA COLLECTION AND ANALYSIS 11 In many states, there is a lack of worthy highway databases that include all the required variables 12
as inputs for the HSM predictive models. However, many state DOTs do have road inventory 13
databases that provide some data elements that can be used in the HSM predictive models. The 14
questions are how different state DOTs have collected these inventory data, and is there any lesson 15
that can be learned from them? In order to gain understanding of the implementation status of 16
various HIDC methods and their perceived strengths and shortcomings, a web-based survey was 17
developed and sent to 50 states and seven Canadian provinces. More specifically, the respondents 18
were asked to indicate their primary data collection methods and their opinions on the adopted 19
methods regarding cost, time, accuracy, safety, and data storage requirements. The survey focused 20
on a few roadside features (e.g., roadside objects) that are known to be difficult to collect but play 21
an important role in the HSM models. 22
The survey analysis results, based upon 30 respondent states, demonstrated that over 50% 23
of these states use field inventory, integrated GPS/GIS mapping, video log, and aerial imagery for 24
collecting roadside feature data. These results show that the field inventory method is still required 25
for many roadway features due to equipment limitations because new technologies may not be 26
suitable for all assets. According to the survey results, it is evident that satellite imagery and 27
airborne LiDAR are less popular choices among state DOTs due to the inability and difficulty to 28
identify smaller features. Additionally, mobile LiDAR is currently limited, but it appears to be 29
growing and is gaining popularity. Figure 1 depicts the percentage of states using each type of 30
HIDC method. 31

Jalayer, Zhou, Gong, Hu, and Grinter 7
1 FIGURE 1 Technology Adoption Percentage in Respondent States 2
3
Most of the respondent states indicated that they use a combination of several data 4
collection methods to meet their roadside inventory data needs. The results revealed that 5
guardrails, shoulders, and mileposts are the predominant objects collected, but they use a multitude 6
of methods. Moreover, only nine percent of states collected roadside slope and curvature 7
alignments. 8
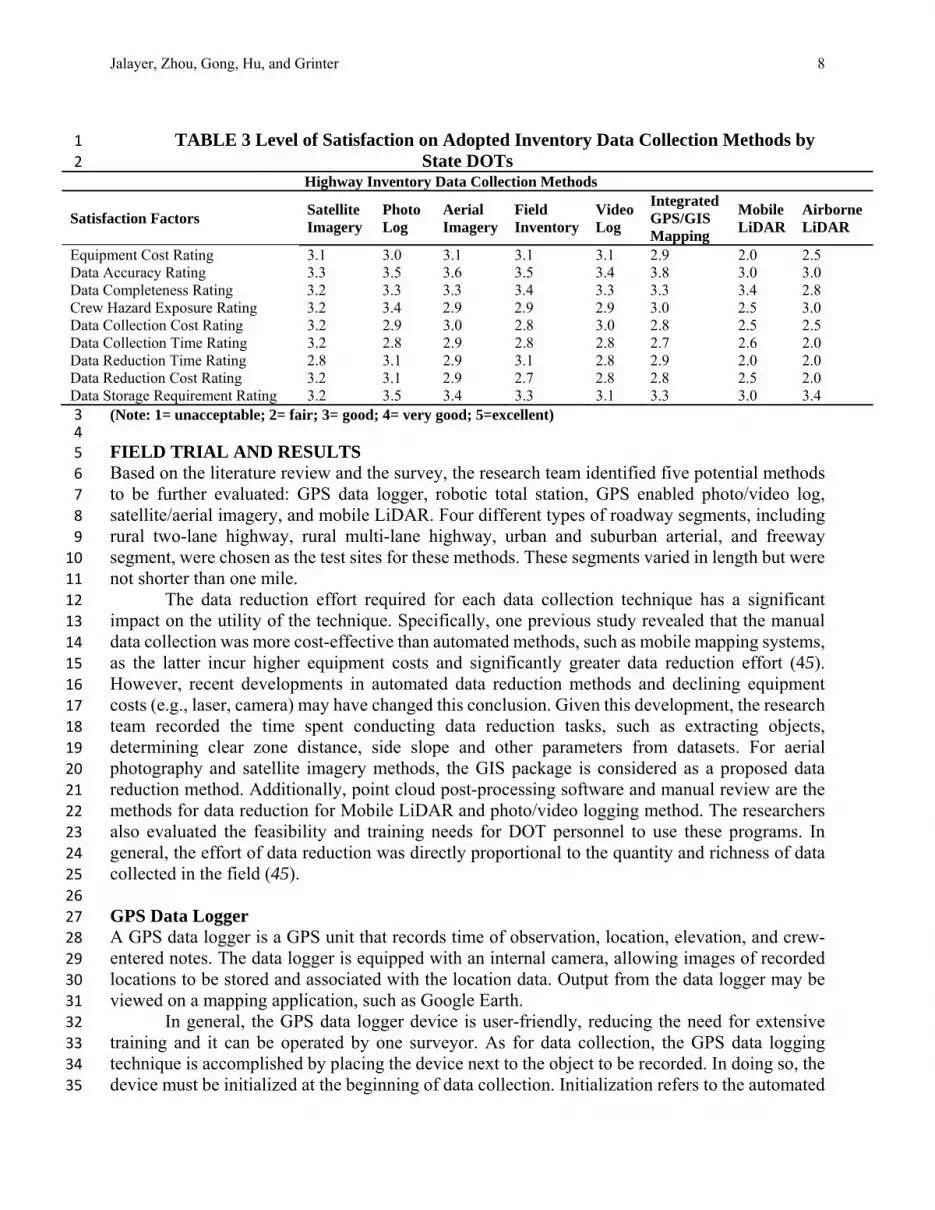
Additionally, the survey respondents were requested to indicate their level of satisfaction 9
with their primary collection method using a scale of 1 to 5 (representing unacceptable, fair, good, 10
very good, and excellent, respectively), where one (1) is the worst and five (5) is the best. Table 3 11
illustrates the results for the nine satisfaction indicators considered in the survey, including 12
equipment cost, data accuracy, data completeness, crew hazard exposure, data collection cost, data 13
collection time, data reduction cost, data reduction time, and data storage requirement. It showed 14
that satellite imagery, photo logs, and aerial imagery received the highest scores on all evaluation 15
elements. An examination of the scores for different evaluation elements revealed that most 16
methods had lower rankings for data reduction time, data collection time, and data collection cost. 17
This clarifies that the focus of concern of state DOTs is on the time required for data collection 18
and reduction and the associated cost. Moreover, state DOTs who used either airborne LiDAR or 19
mobile LiDAR expressed less satisfaction toward these two methods in equipment cost, data 20
reduction cost, and data reduction time performance categories. Their concerns are related to the 21
data reduction time associated with these two methods, because both methods collect a tremendous 22
volume of data that is difficult to process. Other notable findings include the New York State DOT 23
rating its GPS/GIS system as unacceptable to fair in several categories and the California State 24
DOT appearing generally dissatisfied with its photo log system. Overall, no single technology 25
stands out as the obvious choice of methods for roadside feature data collection and most agencies 26
perceive that their inventory methods could be substantially improved. 27
28
Jalayer, Zhou, Gong, Hu, and Grinter 8
TABLE 3 Level of Satisfaction on Adopted Inventory Data Collection Methods by 1
State DOTs 2 Highway Inventory Data Collection Methods
Satisfaction Factors Satellite Imagery
Photo Log
Aerial Imagery
Field Inventory
Video Log
Integrated GPS/GIS Mapping
Mobile LiDAR
Airborne LiDAR
Equipment Cost Rating 3.1 3.0 3.1 3.1 3.1 2.9 2.0 2.5 Data Accuracy Rating 3.3 3.5 3.6 3.5 3.4 3.8 3.0 3.0 Data Completeness Rating 3.2 3.3 3.3 3.4 3.3 3.3 3.4 2.8 Crew Hazard Exposure Rating 3.2 3.4 2.9 2.9 2.9 3.0 2.5 3.0 Data Collection Cost Rating 3.2 2.9 3.0 2.8 3.0 2.8 2.5 2.5 Data Collection Time Rating 3.2 2.8 2.9 2.8 2.8 2.7 2.6 2.0 Data Reduction Time Rating 2.8 3.1 2.9 3.1 2.8 2.9 2.0 2.0 Data Reduction Cost Rating 3.2 3.1 2.9 2.7 2.8 2.8 2.5 2.0 Data Storage Requirement Rating 3.2 3.5 3.4 3.3 3.1 3.3 3.0 3.4
(Note: 1= unacceptable; 2= fair; 3= good; 4= very good; 5=excellent) 3 4
FIELD TRIAL AND RESULTS 5 Based on the literature review and the survey, the research team identified five potential methods 6
to be further evaluated: GPS data logger, robotic total station, GPS enabled photo/video log, 7
satellite/aerial imagery, and mobile LiDAR. Four different types of roadway segments, including 8
rural two-lane highway, rural multi-lane highway, urban and suburban arterial, and freeway 9
segment, were chosen as the test sites for these methods. These segments varied in length but were 10
not shorter than one mile. 11
The data reduction effort required for each data collection technique has a significant 12
impact on the utility of the technique. Specifically, one previous study revealed that the manual 13
data collection was more cost-effective than automated methods, such as mobile mapping systems, 14
as the latter incur higher equipment costs and significantly greater data reduction effort (45). 15
However, recent developments in automated data reduction methods and declining equipment 16
costs (e.g., laser, camera) may have changed this conclusion. Given this development, the research 17
team recorded the time spent conducting data reduction tasks, such as extracting objects, 18
determining clear zone distance, side slope and other parameters from datasets. For aerial 19
photography and satellite imagery methods, the GIS package is considered as a proposed data 20
reduction method. Additionally, point cloud post-processing software and manual review are the 21
methods for data reduction for Mobile LiDAR and photo/video logging method. The researchers 22
also evaluated the feasibility and training needs for DOT personnel to use these programs. In 23
general, the effort of data reduction was directly proportional to the quantity and richness of data 24
collected in the field (45). 25
26
GPS Data Logger 27 A GPS data logger is a GPS unit that records time of observation, location, elevation, and crew-28
entered notes. The data logger is equipped with an internal camera, allowing images of recorded 29
locations to be stored and associated with the location data. Output from the data logger may be 30
viewed on a mapping application, such as Google Earth. 31
In general, the GPS data logger device is user-friendly, reducing the need for extensive 32
training and it can be operated by one surveyor. As for data collection, the GPS data logging 33
technique is accomplished by placing the device next to the object to be recorded. In doing so, the 34
device must be initialized at the beginning of data collection. Initialization refers to the automated 35

Jalayer, Zhou, Gong, Hu, and Grinter 9
startup routine that GPS receivers employ to scan the visible sky, identify observable satellites, 1
and make a location determination. Depending on the number of satellites in view and their 2
geometrical distribution above the target, this process may require from a few minutes to as many 3
as 15 minutes. Once initialization is complete, location data is provided in real time, even if the 4
receiver is in motion. In this method, data collection time is very sensitive to the type of objects, 5
the objects’ density, the distance between objects, and the terrain. With this study, the average 6
times for setting up the device and collecting data per object were five minutes and one minute, 7
respectively. 8
As to the data reduction effort, one of the primary tasks is the organization of all data 9
collected for the purpose. The data reduction steps required in this research by the method, 10
included importing the collected data files into a Computer Aided Design (CAD) software program 11
(e.g. AutoCAD Civil 3D), establishing a drawing-file template, which includes many of the 12
standard file settings and objects for use in a new file, and importing the resulting data files into 13
the drawing format. The latter consisted of a series of discrete points with associated elevation and 14
description attributes. By virtue of the drawing file, a highway alignment drawing was assembled. 15
Moreover, additional processing using the discrete point elevations to define a surface representing 16
the topography, “slope banding,” was simultaneously employed to identify roadside slope based 17
upon percentage of slope. 18
In this study, the analysis of results demonstrated that the GPS data logger not only can 19
gather all the objective highway inventory data to be implemented in the HSM but it also can meet 20
the accuracy required by the HSM safety predictive models; i.e., four inches accuracy of feature 21
locations can be achieved. One shortcoming is the likelihood of GPS outage in areas with tall 22
buildings and significant tree coverage. Crew exposure to traffic is another issue that requires 23
mitigation strategies, such as setting up warning signs and traffic cones that consumed a significant 24
percentage of the time required to survey each segment. 25
26
Robotic Total Station 27 During the late 1980s, electronic distance measuring equipment was successfully integrated with 28
electronic theodolites, which are used for measuring angles in horizontal and vertical planes, to 29
create "total station" surveying instruments. This new generation of surveying instrument directly 30
displays horizontal and vertical angles, slope distance, and derived horizontal distance, vertical 31
distance, and x,y,z coordinates. With the addition of electronic data collection in the early 1990s, 32
survey fieldwork productivity has dramatically improved. 33
A typical survey crew uses a total station instrument consisting of three people: an 34
instrument person to point the instrument and initiate measurement; a party chief to direct the work 35
and sketch additional data; and a rodman to walk to the recorded object, plumbing the reflector 36
prism equipped survey rod over the object. Surveying total stations and robotic total stations 37
employs electronic distance measuring systems that record the time required for light to travel 38
from the instrument to the target and back. A retro-prism mounted on a pole is placed at the target, 39
the instrument's light beam is directed toward it, and then it is sent directly back by the reflective 40
prism. By adding the prism’s auto tracking via radio links and robotic servos, total station systems 41
have been developed that automatically continuously tracks the prism target and transmits data to 42
a data collector and operating controller located on the prism pole. This type of system is referred 43
to as a robotic total station. 44
A robotic total station may be operated by a single person who controls the robotic total 45
station remotely while walking with the prism pole and data collector. During this study, a single 46
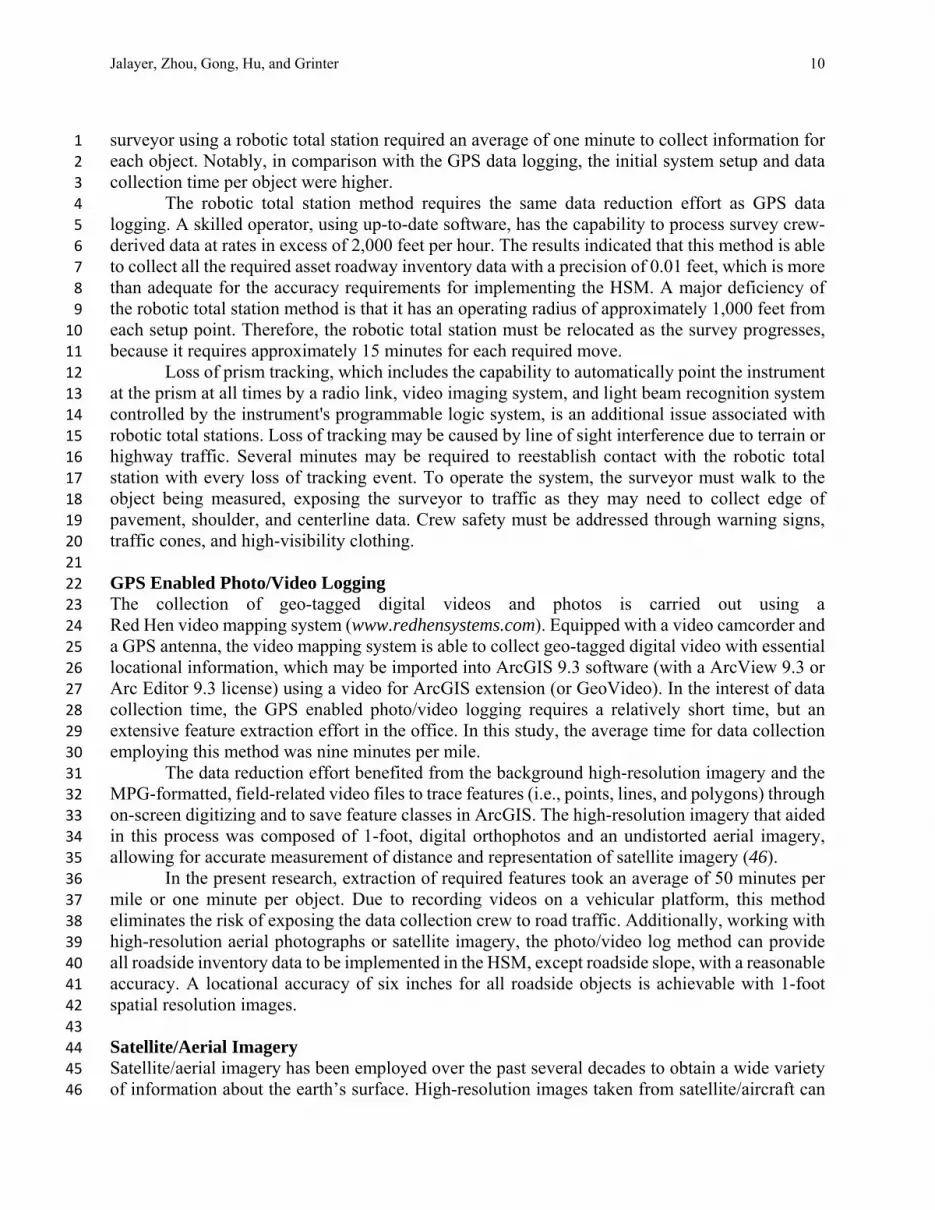
Jalayer, Zhou, Gong, Hu, and Grinter 10
surveyor using a robotic total station required an average of one minute to collect information for 1
each object. Notably, in comparison with the GPS data logging, the initial system setup and data 2
collection time per object were higher. 3
The robotic total station method requires the same data reduction effort as GPS data 4
logging. A skilled operator, using up-to-date software, has the capability to process survey crew-5
derived data at rates in excess of 2,000 feet per hour. The results indicated that this method is able 6
to collect all the required asset roadway inventory data with a precision of 0.01 feet, which is more 7
than adequate for the accuracy requirements for implementing the HSM. A major deficiency of 8
the robotic total station method is that it has an operating radius of approximately 1,000 feet from 9
each setup point. Therefore, the robotic total station must be relocated as the survey progresses, 10
because it requires approximately 15 minutes for each required move. 11
Loss of prism tracking, which includes the capability to automatically point the instrument 12
at the prism at all times by a radio link, video imaging system, and light beam recognition system 13
controlled by the instrument's programmable logic system, is an additional issue associated with 14
robotic total stations. Loss of tracking may be caused by line of sight interference due to terrain or 15
highway traffic. Several minutes may be required to reestablish contact with the robotic total 16
station with every loss of tracking event. To operate the system, the surveyor must walk to the 17
object being measured, exposing the surveyor to traffic as they may need to collect edge of 18
pavement, shoulder, and centerline data. Crew safety must be addressed through warning signs, 19
traffic cones, and high-visibility clothing. 20
21
GPS Enabled Photo/Video Logging 22 The collection of geo-tagged digital videos and photos is carried out using a 23
Red Hen video mapping system (www.redhensystems.com). Equipped with a video camcorder and 24
a GPS antenna, the video mapping system is able to collect geo-tagged digital video with essential 25
locational information, which may be imported into ArcGIS 9.3 software (with a ArcView 9.3 or 26
Arc Editor 9.3 license) using a video for ArcGIS extension (or GeoVideo). In the interest of data 27
collection time, the GPS enabled photo/video logging requires a relatively short time, but an 28
extensive feature extraction effort in the office. In this study, the average time for data collection 29
employing this method was nine minutes per mile. 30
The data reduction effort benefited from the background high-resolution imagery and the 31
MPG-formatted, field-related video files to trace features (i.e., points, lines, and polygons) through 32
on-screen digitizing and to save feature classes in ArcGIS. The high-resolution imagery that aided 33
in this process was composed of 1-foot, digital orthophotos and an undistorted aerial imagery, 34
allowing for accurate measurement of distance and representation of satellite imagery (46). 35
In the present research, extraction of required features took an average of 50 minutes per 36
mile or one minute per object. Due to recording videos on a vehicular platform, this method 37
eliminates the risk of exposing the data collection crew to road traffic. Additionally, working with 38
high-resolution aerial photographs or satellite imagery, the photo/video log method can provide 39
all roadside inventory data to be implemented in the HSM, except roadside slope, with a reasonable 40
accuracy. A locational accuracy of six inches for all roadside objects is achievable with 1-foot 41
spatial resolution images. 42
43
Satellite/Aerial Imagery 44 Satellite/aerial imagery has been employed over the past several decades to obtain a wide variety 45
of information about the earth’s surface. High-resolution images taken from satellite/aircraft can 46
Jalayer, Zhou, Gong, Hu, and Grinter 11
be utilized to identify and extract highway inventory data input, (3, and 4547) making Google 1
maps and Bing maps as two beneficial tools for this purpose. The increasing availability of high-2
resolution images offers the possibility of leveraging these images to extract some HSM-related 3
roadside features. 4
One of the considerable benefits of the satellite/aerial imagery method is the elimination 5
of data collection efforts, since all imagery is already freely accessible. Compared to other 6
methods, this method is the most economical one due to the absence of the field data collection 7
cost; however, similar to the photo/video log method, the satellite/aerial imagery is not capable of 8
collecting some HSM-related highway inventory data. For instance, extraction of roadside slope 9
information is difficult for images and small vertical objects are not quite visible. Based on the 10
analysis of results from this method, the average extraction time was 1.5 minutes per object. 11
12
Mobile LiDAR 13 Mobile LiDAR is an emerging technology that employs laser scanner technology in combination 14
with Global Navigation Satellite Systems (GNSS) and other sensors to capture accurate and precise 15
geospatial data from a moving vehicle. This system can collect data on approximately 30 miles of 16
highway per day with a high data measurement rate of 50,000 to 500,000 points per second per 17
scanner (3 and 34). 18
Regarding data collection, this method is capable of collecting a huge amount of data in a 19
very short time, using an equipped vehicle, in comparison with conventional survey methods (3, 20
and 45). Taking advantage of this technology for this study, an average of 30 minutes was required 21
to collect information for each mile of segment. However, the data reduction is a major undertaking 22
with mobile LiDAR and the time associated with the data reduction part in this method is 23
significantly high. Additionally, the processing and feature extraction from mobile LiDAR data 24
involves a fairly intensive computational effort, requiring software and technical expertise (48, 49, 25
and 50). 26
In terms of commercial packages for LiDAR data processing, Terrasolid Suite, Virtual 27
Geomatics, TopoDOT, and QTModeler are found to be applicable for a variety of data extraction 28
purposes. In particular, the Terrasolid Suite is the most commonly used software for airborne and 29
mobile LiDAR data processing. Because of this, it was chosen as the program to benchmark the 30
data reduction time. The data processed during the data reduction steps included point clouds, 31
which is a set of data points in some coordinate systems, geo-referenced imagery, data collection 32
path, and an AutoCAD file. 33
One of the concerns with the mobile LiDAR method is the need for large data storage 34
space, in this study, 9.3 Gigabyte (GB) space per mile of roadway. Given this fact, the mobile 35
LiDAR data are typically divided into manageable blocks to reduce any difficulty during the 36
process. For the purpose of this research, a typical block did not exceed 2 GB. As each type of 37
highway segment was broken into equal-sized blocks, data extraction was performed on 38
representative blocks and then the results were utilized to infer the data reduction time for the 39
whole highway segment. In this study, determining roadside slope, roadside fixed objects density, 40
super-elevation rate, and grade took 5, 15, 15 and 15 minutes per block. 41
The mobile LiDAR has the capability of collecting all categories of HSM highway 42
inventory data. Although the data collection time in this method is short, the cost of field data 43
collection is higher than other methods (45). However, these shortcomings cannot overshadow the 44
potential of this method - it collects survey-grade data, which only can be matched by the robotic 45
total station method, but with no traffic exposure or need for road closures. The main strength of 46

Jalayer, Zhou, Gong, Hu, and Grinter 12
this method lies in its ability to collect data that are valuable for multiple DOT programs. The rapid 1
development of computing hardware and LiDAR data processing methods indicate that the mobile 2
LiDAR method will soon be comparable with other methods in terms of data reduction time. 3
Overall, GPS data logger and robotic total station can gather all required feature data, but 4
they impose longer field data collection times and expose data collection crews to dangerous road 5
traffic. Photo/video logging and aerial imagery, when used together, can collect nearly all required 6
feature data, except roadside slope. The mobile LiDAR has the capability to collect all required 7
feature data in a short amount of field time, but the data require extensive reduction efforts. 8
The results of field trials are summarized in Table 4.The table displays the capability of 9
each HIDC method evaluated using the metrics, including capability of collecting HSM-related 10
roadside features, total data collection time, total data reduction time, unit data collection and 11
reduction time, and total cost. For cost analysis, two unit labor costs were assumed: $75 per hour 12
for a person trained at an introductory level and $130 per hour for an expert-level person. Based 13
on the quotes from five LiDAR companies, the average data collection cost per mile for mobile 14
LiDAR was considered to be $200. In the present research, the photo/video log method required 15
the least total time (man-hr./mi) and the robotic total station method required the most. 16
Specifically, the mobile LiDAR technology ranked in the middle with 5.5 man-hr./mile. 17
18
TABLE 4 Comparison between Different Highway Inventory Data Collection Methods 19
Methods Type of Segment Selected
Capability of Collecting HSM-related Roadside Features
Total Length (mi)
Total Data Collection Time (man-hr)
Total Data Reduction Time (man-hr)
Total Time (man-hr/mi)
Total Cost ($/mi)
Photo/Video Log 1, 2, 3, 4 Some 28.0 4.0 23.0 0.96 $72
Satellite/Aerial Imagery
1, 2, 3, 4 Some 7.0 --- 10.0 1.43 $107
Mobile LiDAR 1, 2, 3, 4 All 14.2 8.0 70.0 5.50 $915
GPS Data Logger 2, 3, 4 All 1.3 6.0 3.5 7.31 $700
Robotic Total Station
1, 3, 4 All 1.3 13.0 3.5 12.70 $1,075
(Note: 1= rural multi-lane highways; 2= freeway segment; 3= rural two-lane highway; 4= urban/suburban 20 arterials) 21 22
Furthermore, based on Table 4, the total cost per mile to prepare the required highway 23
inventory dataset for photo/video log, satellite/aerial imagery, GPS data logger, mobile LiDAR, 24
and robotic total station methods were $72, $107, $700, $915, and $1,075, respectively. In 25
particular, the photo/video log had the lowest cost and the robotic total station had the highest cost. 26
27
COMPARATIVE ANALYSIS OF SELECTED DATA COLLECTION METHODS 28 In addition to unit cost, some other factors are important in selecting data collection method, such 29
as data quality and completeness, safety and disruption of traffic. To consider those factors, based 30
on the field trial results, an evaluation matrix was developed to compare different data collection 31
methods, as shown in Table 5. Eleven criteria were utilized to assess the performance of the 32
different technologies. Each criterion was assigned a score of 1 to 5 for ranking (5 being the best 33
and 1 the worst) to indicate the relative performance of one method compared to the others. 34
Specifically, the equipment cost for the satellite/aerial imagery method had a score of "5" because 35

Jalayer, Zhou, Gong, Hu, and Grinter 13
it did not incur any field data collection cost. The total weighted score is the summation of score 1
of each criterion multipled by its corresponding weighing factor. For GPS data logger method, as 2
an example, the total weighted score is 24 which is sum of (3×0.25) + (2×0.25) + (2×0.25) + 3
(2×1.00) + (3×2.00) + (3×2.00) + (2×1.00) + (5×0.25) + (5×0.25) + (5×0.50) + (5×0.25). 4
5
TABLE 5 Evaluation Matrix for Highway Inventory Data Collection Methods 6
Criteria
Highway Inventory Data Collection Methods GPS Data Logger
Robotic Total Station
GPS Enable Photo/Video Log
Satellite/Aerial Imagery
Mobile LiDAR
Weighting Factor
Field Data Collection
Equipment Cost 3 2 4 5 1 0.25 Labor Cost 2 1 4 5 3 0.25 Data Collection Time 2 1 4 5 3 0.25 Safety 2 1 4 5 3 1.00 Data Completeness 3 4 2 1 5 2.00 Data Quality 3 4 2 1 5 2.00 Disruption to Traffic 2 1 4 5 3 1.00
Field Data Reduction
Software Cost 5 4 3 2 1 0.25 Labor Cost 5 3 4 2 1 0.25 Data Reduction Time 5 3 4 2 1 0.50
Data Storage Size 5 4 2 3 1 0.25 Total Weighted Score
24 23 23 21 29
7
For each evaluation criteria, a weighing factor (WF) was designated. These WFs, that 8
imply the relative importance of each data collection method, were identified through discussions 9
with stakeholders at IDOT. A weight of 2.0 was assigned for data completeness and data quality 10
because the highest data quality and completeness were required to have collected data to serve 11
different offices (e.g., planning, design, pavement management, and safety) in the agency. 12
Transportation agencies can assign their own WF for each evaluation criteria for their specific 13
purposes. This method, as used in multi-criteria analysis (MCA) approaches, is widely utilized to 14
assess and recognize the importance of one criterion over another in an intuitive manner when 15
quantitative ratings are not available (51). All of these criteria were employed to rank various 16
HIDC methods based on the summation of weighted components. The results demonstrated that 17
the mobile LiDAR has the highest overall score when data completeness and data quality are the 18
top priority for the agency. 19
20
CONCLUSIONS AND RECOMMENDATIONS 21 The purpose of this study was to identify cost-effective methods for collecting highway inventory 22
data for implementing in the HSM. Several promising methods, including the GPS data logger, 23
the robotic total station, the GPS enabled the photo/video log, the satellite/aerial imagery, and the 24
mobile LiDAR, were identified through a comprehensive literature review to compare and 25
determine their capabilities and limitations. Moreover, field trials for collecting HSM-related 26
highway inventory data on four types of roadway segments (including rural two-lane two-way 27
roadways, rural multi-lane highways, urban and suburban arterials, and freeways) were performed 28
to evaluate and compare the utility of these methods. The findings of this research indicate that the 29

Jalayer, Zhou, Gong, Hu, and Grinter 14
GPS data logger, the robotic total station, the mobile LiDAR, and the combination of video/photo 1
log method with aerial imagery are all capable of collecting HSM-related information. Based on 2
the perceived advantages and disadvantages of each data collection method, the following 3
recommendations are made for consideration by state and local transportation agencies: 4
The GPS data logger method can be employed for short distances, low speeds, and low to 5
medium traffic volume roadways that are not obstructed by buildings or trees. 6
The robotic total station technology can be employed for points of specific interest, such 7
as intersections. 8
The photo/video log method, together with high-resolution aerial imagery, can be used to 9
collect roadside inventory data for large-scale statewide data collection. 10
The mobile LiDAR technology can be utilized to gather highway inventory data with the 11
highest data quality and completeness for serving multiple offices in state DOTs and local 12
agencies. In order to share the costs of the mobile LiDAR data collection and processing, 13
identifying multiple clients within the DOT is important. 14
15
ACKNOWLEDGMENT 16 This study was made possible through the funding from the Illinois Department of Transportation 17
(IDOT) and Illinois Center for Transportation (ICT). The authors thank the Technical Review 18
Panel (TRP) members for their inputs on this project. 19
20
REFERENCES 21 1. Highway Safety Manual. American Association of State Highway and Transportation Officials 22
(AASHTO), Washington, D.C., 2010. 23
2. Bonneson, J. A., S. Geedipally, M. P. Pratt, and D. Lord. Safety Prediction Methodology and 24
Analysis Tool for Freeways and Interchanges. Publication Final Report 17-45, NCHRP, 25
Transportation Research Board, Washington, D.C., 2012. 26
3. Gong, J., H. Zhou, C. Gordon, and M. Jalayer. Mobile Terrestrial Laser Scanning for Highway 27
Inventory Data Collection. Presented at International Conference on Computing in Civil 28
Engineering, Clearwater Beach, FL., 2012, pp. 545–552. 29
4. Jalayer, M., H. Zhou, J. Gong, S. Hu, and M. Grinter. A Comprehensive Assessment of 30
Highway Inventory Data Collection Methods. Journal of Transportation Research Forum. 31
Vol. 53, No. 2, 2014, pp. 73-92. 32
5. Khattak, A. J., J. E. Hummer, and H. A. Karimi. New and Existing Roadway Inventory Data 33
Acquisition Methods. Journal of Transportation and Statistics, Vol. 3, No. 3, 2000, pp. 33-46. 34
6. Maerz, N. H. and S. McKenna. Mobile Highway Inventory and Measurement System. In 35
Transportation research Record: Journal of Transportation Research Board, No. 1690, 36
Transportation Research Board of the National Academies, Washington, D.C., 1999, pp. 135-37
142. 38
7. Hu, X., C. V. Tao, and Y. Hu. Automatic Road Extraction from Dense Urban Area by 39
Integrated Processing of High Resolution Imagery and LiDAR Data. International Society for 40
Photogrammetry and Remote Sensing ISPRS, 2002, pp. 388-400. 41
8. Degray, J. and K. L. Hancock. Ground-based Image and Data Acquisition Systems for 42
Roadway Inventories in New England: A Synthesis of Highway Practice. New England 43
Transportation Consortium, 2002. 44
Jalayer, Zhou, Gong, Hu, and Grinter 15
9. Jeyapalan, K., and E. Jaselskis. Technology Transfer of As-Built and Preliminary Surveys 1
Using GPS, Soft Photogrammetry, and Video Logging. Publication TR-446, Iowa Department 2
of Transportation, Ames, IA., 2002. 3
10. Jeyapalan, K. Mobile Digital Cameras for As-Built Surveys of Roadside Features. Journal of 4
Photogrammetric Engineering and Remote Sensing, Vol. 70, No. 3, 2004, pp. 301-312. 5
11. Robyak, R. and G. Orvets. Video Based Asset Data Collection at NJDOT. New Jersey 6
Department of Transportation, 2004. 7
12. Wu, J. and Y. Tsai. Enhanced Roadway Geometry Data Collection Using an Effective Video 8
Log Image-Processing Algorithm. In Transportation Research Record: Journal of 9
Transportation Research Board, No. 1972, Transportation Research Board of the National 10
Academies, Washington, D.C., 1972, pp. 133-140. 11
13. Tsai, Y. Using Image Pattern Recognition Algorithms for Processing Video Log Images to 12
Enhance Infrastructure Data Collection. Publication Final Report 17-45, NCHRP, 13
Transportation Research Board, Washington, D.C., 2009. 14
14. Wang, K. C. P., Z. Hou, and W. Gong. Automated Road Sign Inventory System Based on 15
Stereo Vision and Tracking. Journal of Computer-Aided Civil and Infrastructure Engineering, 16
Vol. 25, No. 6, 2010, pp. 468-477. 17
15. Balali, V., M. Golparvar-Fard, and J. M. de la Garza. Video-Based Highway Asset Recognition 18
and 3D Localization. Presented at International Conference on Computing in Civil 19
Engineering, Los Angeles, CA, 2013, pp. 379-386. 20
16. Balali, V., and M. Golparvar-Fard. Segmentation and Recognition of Roadway Assets from 21
Car-Mounted Video Streams using Scalable Non-Parametric Image Parsing. Journal of 22
Automation in Construction. Vol. 49, 2015, pp. 27-39. 23
17. Caddell, R., P. Hammond, and S. Reinmuth. Roadside Features Inventory Program. 24
Washington State Department of Transportation (WSDOT), 2009. 25
18. Hallmark, S. L., K. Mantravadi, D. Veneziano, and R. R. Souleyrette. Evaluating Remotely 26
Sensed Images for Use in Inventorying Roadway Infrastructure Features. Center for 27
Transportation Research and Education, Iowa State University, 2001. 28
19. Veneziano, D. Roadway Intersection Inventory and Remote Sensing. I. S. U. Center for 29
Transportation Research and Education, 2001. 30
20. Pagounis, V., M. Tsakiri, S. Palaskas, B. Biza, and E. Zaloumi. 3D Laser Scanning for Road 31
Safety and Accident Reconstruction. XXIII FIG Congress, Munich, Germany, 2009. 32
21. Slattery, D. K. and K. T. Slattery. Evaluation of 3-D Laser Scanning for Construction 33
Application. Publication FHWA-ICT-10-068. FHWA, U.S. Department of Transportation, 34
2010. 35
22. Terrestrial Laser Scanning Specifications. California State Department of Transportation 36
Caltrans Surveys Manual, 2011. 37
23. Tao, C. V. “Mobile Mapping Technology for Road Network Data Acquisition. Journal of 38
Geospatial Engineering, Vol.2, No. 2, 2000, pp. 1-14. 39
24. Vosselman, G., B. G. H. Gorte, G. Sithole, and T. Rabbani. Recognizing Structure in Laser 40
Scanner Point Clouds. International Archives of Photogrammetry, Remote Sensing and Spatial 41
Information Sciences, Vol. 46, No. 8, 2004, pp. 33-38. 42
25. Laflamme, C., T. Kingston, and R. McCuaig. Automated Mobile Mapping for Asset Managers. 43
International FIG Congress, Citeseer, Munich, Germany, 2006. 44
26. Pfeifer, N. and C. Briese. Geometrical Aspects of Airborne Laser Scanning and Terrestrial 45
Laser Scanning. International Archives of Photogrammetry and Remote Sensing XXXVI , 46
Jalayer, Zhou, Gong, Hu, and Grinter 16
2007, pp. 311-319. 1
27. Kampchen, N. Feature Level Fusion of Laser Scanner and Video Data for Advanced Driver 2
Assistance Systems. University of Ulm, Ulm, Germany, 2007. 3
28. Barber, D., J. Mills, and S. Smith-Voysey. Geometric Validation of a Ground-based Mobile 4
Laser Scanning System. ISPRS Journal of Photogrammetry and Remote Sensing, Vol. 63, No. 5
1, 2008, pp. 128-141. 6
29. Huber, R., T. Kingston, C. Laflamme, and C. Larouche. Automation and Mobile Mapping for 7
Safe and Accurate Pavement Analysis. Presenetd at 2008 International Conference on 8
Managing Pavement Assets, 2009. 9
30. Lato, M., J. Hutchinson, M. Diederichs, D. Ball, and R. Harrap. Engineering Monitoring of 10
Rockfall Hazards Along Transportation Corridors: Using Mobile Terrestrial LiDAR. Journal 11
of Natural Hazards and Earth System Sciences, Vol. 9, 2009, pp. 935-946. 12
31. Garza, J., C. F. Figueroa, C. G. Howerton, J. Plummer, I. Roca, O. Shogli, D. Sideris, and B. 13
Uslu. Implementation of IP-S2 Mobile Mapping Technology for Highway Asset Visualization 14
in Data Collection to Benefit VT-VDOT TAMS Project. Center for Highway Asset 15
Management Programs, Virginia Department of Transportation, 2009. 16
32. Lehtomaki, M., A. Jaakkola, J. Hyyppa, A. Kukko, and H. Kaartinen. Detection of Vertical 17
Pole-like Objects in a Road Environment Using Vehicle-based Laser Scanning Data. Journal 18
of Remote Sensing, Vol. 2, No. 3, 2010, pp. 641-664. 19
33. Graham, L. Mobile Mapping Systems Overview. Presenetd at Photogrammetric Engineering 20
and Remote Sensing, 2010, pp. 222-228. 21
34. Tang, J. and A. Zakhor. 3D Object Detection from Roadside Data Using Laser Scanners. 22
University of California at Berkeley, 2011. 23
35. Yen, K. S., K. Akin, A. Lofton, B. Ravani, and T. A. Lasky. Using Mobile Laser Scanning to 24
Produce Digital Terrain Models of Pavement Surfaces. California Department of 25
Transportation, 2011. 26
36. Yen, K. S., B. Ravani, and T. A. Lasky. LiDAR for Data Efficiency. Washington State 27
Department of Transportation (WSDOT), 2011. 28
37. Jensen, J. R. and D. C. Cowen. Remote Sensing of Urban/Suburban Infrastructure and Socio-29
economic Attributes. Journal of Photogrammetric Engineering and Remote Sensing, Vol. 65, 30
1999, pp. 611-622. 31
38. Hatger, C. and C. Brenner. Extraction of Road Geometry Parameters from Laser Scanning and 32
Existing Databases. Archives of Photogrammetry, Remote Sensing and Spatial Information 33
Sciences, 2003, pp. 225-230. 34
39. Souleyrette, R., S. Hallmark, S. Pattnaik, M. O'Brien, and D. Veneziano. Grade and Cross 35
Slope Estimation from LiDAR-based Surface Models. Iowa Department of Transportation, 36
2003. 37
40. Shamayleh, H. and A. Khattak. Utilization of LiDAR Technology for Highway Inventory. 38
Presented at Mid-Continent Transportation Research Symposium, Ames, Iowa, 2003. 39
41. Zhang, K. and H. C. Frey. Road Grade Estimation for On-road Vehicle Emission Modeling 40
Using LiDAR Data. Journal of the Air & Waste Management Association, Vol. 56, No. 6, 41
2006, pp. 777-788. 42
42. McCarthy, T., S. Fotheringham, M. Charlton, A. Winstanley, and V. O’Malley. Integration of 43
LiDAR and Stereoscopic Imagery for Route Corridor Surveying. Presented at 5th International 44
Symposium on Mobile Mapping Technologies, Padua, Italy, 2007. 45
43. Uddin, W. Airborne Laser Terrain Mapping for Expediting Highway Projects: Evaluation of 46

Jalayer, Zhou, Gong, Hu, and Grinter 17
Accuracy and Cost. ASCE Journal of Construction Engineering and Management, Vol. 134, 1
2008, pp. 411. 2
44. Chow, T. E. and M. E. Hodgson. Effects of LiDAR Post-spacing and DEM Resolution to Mean 3
Slope Estimation. International Journal of Geographical Information Science, Vol. 23, No. 4
10, 2009, pp. 1277-1295. 5
45. Zhou, H., M. Jalayer, J. Gong, S. Hu, and M. Grinter. Investigation of Methods and Approaches 6
for Collecting and Recording Highway Inventory Data. Publication FHWA-ICT-13-022. 7
Illinois Center for Transportation, 2013. 8
46. Jalayer, M., S. Hu, H. Zhou, and R. E. Turochy. Evaluation of Geo-tagged Photo/Video 9
Logging Methods to Collect Geospatial Highway Inventory Data. Journal of Papers in Applied 10
Geography. Vol. 1, No. X, 2015 (in Press). 11
47. Golparvar-Fard, M., V. Balali, and J. De la Garza. Segmentation and Recognition of Highway 12
Assets Using Image-Based 3D Point Clouds and Semantic Texton Forests. Journal of 13
Computing in Civil Engineering, doi:10.1061/(ASCE) CP.1943-5487.0000283, 2012, 14
04014023. 15
48. Jalayer, M., J. Gong, H. Zhou, and M. Grinter. Evaluation of Remote Sensing Technologies 16
for Collecting Roadside Feature Data to Support Highway Safety Manual Implementation. 17
Presented at 92nd Annual Meeting of the Transportation Research Board, Washington D.C., 18
2013. 19
49. Oskouie, P., B. Becerik-Gerber, and L. Soibelman. Automated Cleaning of Point Clouds for 20
Highway Retaining Wall Conditions Assessment. Presented at International Conference on 21
Computing in Civil Engineering, Orlando, FL., 2014, pp. 966–974. 22
50. Nourzad, S., and A. Pradhan. Ensemble Methods for Binary Classifications of Airborne 23
LIDAR Data. Journal of Computing in Civil Engineering. Vol. 28, No. 6, 2014, 24
DOI:10.1061/(ASCE)CP.1943-5487.0000276 25
51. Dodgson, J. S., M. Spackman, A. Pearman, and L. D. Phillips. Multi-criteria Analysis: A 26
Manual. Communities and Local Government Publications, London, England, 2009. 27


