Embed Size (px)
Citation preview
Greenhouse Gas Emissions 1990-2010 May 25, 2012
National Inventory Report TA
2915
2012

National Inventory Report 2012 - Norway
Preface
The United Nations Framework Convention on Climate Change (UNFCCC) was adopted in
1992 and entered into force in 1994. According to Articles 4 and 12 of the Convention,
Parties are required to develop and submit to the UNFCCC national inventories of
anthropogenic emissions by sources and removals by sinks of all greenhouse gases not
controlled by the Montreal Protocol on an annual basis.
To comply with the above requirement, Norway has prepared the present 2012 National
Inventory Report (NIR). The report and the associated Common Reporting Format (CRF)
tables have been prepared in accordance with the UNFCCC Reporting Guidelines on Annual
Inventories as adopted by the COP by its Decision 18/CP. 8. The methodologies used in the
calculation of emissions are based on the Revised 1996 IPCC Guidelines for National
Greenhouse Gas Inventories (IPCC Guidelines) and the IPCC Good Practice Guidance and
Uncertainty Management in National Greenhouse Gas Inventories prepared by the
Intergovernmental Panel on Climate Change (IPCC).
This National Inventory Report 2012 also includes supplementary information required under
Article 7, paragraph 1, of the Kyoto Protocol. This supplementary information comprises
chapter 11 with emissions and removals from Land Use, Land-Use Change and Forestry.
Note that Norway has chosen commitment-period accounting on the activities under Article
3.3 and for the activity “forest management” under Article 3.4.of the Kyoto Protocol. Chapter
12 includes information on Kyoto units, chapter 13 includes information on changes in
national systems, chapter 14 includes information on changes in national registries and
chapter 15 includes information on minimization of adverse impacts.
The Climate and Pollution Agency, a directorate under the Norwegian Ministry of
Environment, is responsible for the reporting. Contributors to the preparation of the inventory
and NIR are Hans H. Kolshus, Eilev Gjerald, Britta Hoem, Simen Helgesen Ramberg, Hege
Haugland, Hilde Valved, George Nicholas Nelson, Torgrim Asphjell, Øyvind Christophersen,
Alice Gaustad, Birgitte Rubæk and Marte Monsen Hvalryg.
Statistics Norway has been the principle contributor to the preparation of the report, and
contributors to the preparation of the inventory and NIR are Ketil Flugsrud, Lisbet Høgset,
Nina Holmengen, Trond Sandmo, Kathrine Bjønness, Marte Kittilsen, Henning Høie, Kristin
Aasestad and Håkon Skullerud. The Norwegian Forest and Landscape Institute has through
Gro Hylen contributed to the chapter regarding Land Use, Land Use Change and Forestry.
Oslo, 25 May 2012
Audun Rosland
Director, Department of Climate
Climate and Pollution Agency
National Inventory Report 2012 - Norway
Executive Summary 1
Table of contents
1 Introduction .................................................................................................................. 7
1.1 Background information on greenhouse gas inventories ......................................... 7 1.2 Institutional arrangement for inventory preparation ................................................ 8 1.3 The process of inventory preparation..................................................................... 10
1.3.1 Introduction ......................................................................................................... 10 1.3.2 Data collection, processing and archiving .......................................................... 10
1.4 Methodologies and data sources used .................................................................... 10
1.4.1 Introduction ......................................................................................................... 10 1.4.2 The main emission model ................................................................................... 11
1.4.3 The LULUCF model ........................................................................................... 12 1.4.4 Data sources ........................................................................................................ 13
1.5 Key Categories ....................................................................................................... 14 1.6 Quality assurance and quality control (QA/QC) .................................................... 17
1.6.1 Quality assurance and quality control (QA/QC) ................................................. 17
1.6.2 Verification studies ............................................................................................. 18 1.6.3 Confidentiality issues .......................................................................................... 18
1.7 Uncertainty evaluation ........................................................................................... 18
1.7.1 Introduction ......................................................................................................... 18 1.7.2 Uncertainty in emission levels ............................................................................ 19
1.7.3 Uncertainty in emission trend ............................................................................. 21
1.8 General assessment of the completeness ............................................................... 22
1.9 Implemented and planned improvements .............................................................. 23
1.9.1 Implemented improvements since NIR 2011 ...................................................... 23 1.9.2 Planned improvements ........................................................................................ 25
2 Trends in Greenhouse Gas Emissions .....................................................................30
2.1 Emission trends for aggregated greenhouse gas emissions ................................... 30 2.2 Emission trends by gas ........................................................................................... 33
2.2.1 Carbon dioxide (CO2) ......................................................................................... 35
2.2.2 Methane (CH4) .................................................................................................... 38 2.2.3 Nitrous oxide (N2O) ............................................................................................ 40 2.2.4 Perfluorcarbons (PFCs) ....................................................................................... 42
2.2.5 Sulphur hexafluoride (SF6) ................................................................................. 44 2.2.6 Hydrofluorcarbons (HFCs) ................................................................................. 45
2.3 Emission trend by source ....................................................................................... 47
2.3.1 Total emissions by source classification ............................................................. 47 2.3.2 Energy ................................................................................................................. 48
2.3.3 Industrial processes ............................................................................................. 55 2.3.4 Solvent and other product use ............................................................................. 57 2.3.5 Agriculture .......................................................................................................... 58
2.3.6 Source: Statistics Norway/Climate and Pollution Agency ................................. 59
National Inventory Report 2012 - Norway
2.3.7 Waste ................................................................................................................... 59
2.4 Land Use Change and Forestry .............................................................................. 61
2.5 Emission trends for indirect greenhouse gases and SO2 ........................................ 63
3 Energy .........................................................................................................................65
3.1 Overview ................................................................................................................ 65 3.2 Energy Combustion ............................................................................................... 69
3.2.1 Overview ............................................................................................................. 69 3.2.2 Energy industries (CRF source category 1A1) ................................................... 84 3.2.3 Manufacturing industries and construction (CRF source category 1A2) ........... 89 3.2.4 Transport – Civil Aviation (CRF source category 1A3a) ................................... 92 3.2.5 Transport – Road Transportation (CRF source category 1A3b) ......................... 96
3.2.6 Transport – Railways (CRF source category 1A3c) ......................................... 106 3.2.7 Transport – Navigation (CRF source category 1A3d) ...................................... 107 3.2.8 Transport – Other transportation – (CRF source category 1A3e) ..................... 110
3.2.9 Other Sectors (CRF source category 1A4) ....................................................... 113 3.2.10 Other (CRF source category 1A5) .................................................................... 116
3.3 Fugitive Emissions from Coal Mining and Handling – 1B1a – CH4 (Key
Category) ............................................................................................................................ 119
3.3.1 Description ........................................................................................................ 119
3.3.2 Methodological issues ....................................................................................... 120 3.3.3 Activity data ...................................................................................................... 120
3.3.4 Emission factor ................................................................................................. 120 3.3.5 Uncertainties ..................................................................................................... 121 3.3.6 Source specific QA/QC and verification .......................................................... 121
3.3.7 Recalculations ................................................................................................... 121 3.3.8 Planned Improvements ...................................................................................... 121
3.4 Fugitive Emissions from Oil and Natural Gas – 2B ............................................ 122
3.4.1 Overview ........................................................................................................... 122 3.4.2 Fugitive Emissions from Oil – CO2, CH4 – 1.B.2.a (Key Category) ................ 127
3.4.3 Fugitive Emissions from Natural Gas – CH4 – 1.B.2.b (Key Category) .......... 131
3.5 CO2 capture and storage at oil and gas production fields (Key Category) .......... 139
3.6 Cross-cutting issues ............................................................................................. 157 3.7 Memo items ......................................................................................................... 162
3.7.1 International bunkers......................................................................................... 162 3.7.2 CO2 emissions from biomass ............................................................................ 165
4 Industrial Processes ..................................................................................................... 166
4.1 Overview .............................................................................................................. 166 4.2 Mineral Products – 2A ......................................................................................... 167
4.2.1 Cement Production – CO2 – 2A1 (Key Category) ............................................ 168 4.2.2 Lime Production – 2A2 (Key category) ............................................................ 169 4.2.3 Limestone and Dolomite Use – 2A3 ................................................................. 170
4.3 Chemical Industry – 2B ....................................................................................... 171
4.3.1 Ammonia Production – CO2 – 2B1 (Key category) ......................................... 172 4.3.2 Production of Nitric Acid –N2O – 2B2 (Key Category) ................................... 174 4.3.3 Silicon Carbide – 2B4 (Key Category) ............................................................. 176
National Inventory Report 2012 - Norway
4.3.4 Production of Calcium Carbide – 2B4 .............................................................. 180
4.3.5 Production of Methanol – 2B5 .......................................................................... 181 4.3.6 Production of Plastic 2B5 ................................................................................. 182 4.3.7 Titanium dioxide production – 2B5 .................................................................. 183
4.3.8 Production of Explosives – 2B5........................................................................ 183
4.4 Metal Production – 2C ......................................................................................... 183
4.4.1 Production of Iron and Steel – CO2 – 2C1(Key Category) ............................... 184 4.4.2 Production of Ferroalloys – CO2 – 2C2 (Key Category) .................................. 186 4.4.3 Production of Primary Aluminium –CO2 and PFC – 2C3 (Key Category) ...... 190 4.4.4 Production of Secondary Aluminium – 2C4 ..................................................... 196
4.4.5 Production of magnesium –SF6 – 2C4 (Key Category) .................................... 196 4.4.6 Production of Nickel – 2C5 .............................................................................. 198 4.4.7 Manufacture of Anodes – 2C5 .......................................................................... 198
4.5 Other Production – 2D ......................................................................................... 199
4.5.1 Pulp and paper – 2D1 ........................................................................................ 199
4.5.2 Food and drink – CO2 – 2D2 (Key category) ................................................... 200
4.6 Consumption of Halocarbons and SF6 ................................................................. 201
4.6.1 HFCs and PFCs from Products and Processes – HFC – 2F (Key Category) .... 201
4.6.2 Emissions of SF6 from Products and Processes – 2F ........................................ 204 4.6.3 Paraffin wax use – 2G ....................................................................................... 206
5 Solvent and other product use ................................................................................ 208
5.1 Overview .............................................................................................................. 208 5.2 Solvent losses (NMVOC) – 3A, 3B, 3C, 3D ....................................................... 208
5.2.1 Description ........................................................................................................ 208
5.2.2 Method .............................................................................................................. 208 5.2.3 Activity data ...................................................................................................... 209
5.2.4 Emission factors ................................................................................................ 210 5.2.5 Uncertainty ........................................................................................................ 210
5.2.6 Completeness .................................................................................................... 211 5.2.7 Source specific QA/QC and verification .......................................................... 211 5.2.8 Recalculations ................................................................................................... 211
5.2.9 Planned improvements ...................................................................................... 212
5.3 Other product use -3D .......................................................................................... 212
5.3.1 Use of N2O in anaesthesia – 3D1 ...................................................................... 212
5.3.2 Use of N2O as propellant – 3D4 ........................................................................ 213
6 Agriculture ................................................................................................................ 214
6.1 Overview .............................................................................................................. 214 6.2 Emissions from enteric fermentation in domestic livestock 4A– CH4
(Key Category) ................................................................................................................... 215
6.2.1 Description ........................................................................................................ 215
6.2.2 Methodological issues ....................................................................................... 215 6.2.3 Activity data ...................................................................................................... 215 6.2.4 Emission factors ................................................................................................ 217 6.2.5 Uncertainties ..................................................................................................... 218 6.2.6 Completeness .................................................................................................... 218
National Inventory Report 2012 - Norway
6.2.7 Source specific QA/QC and verification .......................................................... 218
6.2.8 Recalculations ................................................................................................... 219 6.2.9 Planned improvements ...................................................................................... 219
6.3 Emissions from manure management – 4B – CH4, N2O (Key categories) .......... 219
6.3.1 Description ........................................................................................................ 219
6.3.2 Methodological issues ....................................................................................... 220 6.3.3 Activity data ...................................................................................................... 225 6.3.4 Emission factors ................................................................................................ 226 6.3.5 Uncertainties ..................................................................................................... 230 6.3.6 Completeness .................................................................................................... 231
6.3.7 Source specific QA/QC and verification .......................................................... 231 6.3.8 Recalculations ................................................................................................... 231 6.3.9 Planned improvements ...................................................................................... 231
6.4 Direct and indirect emissions from agricultural soils – 4D – N2O (Key
Category) ............................................................................................................................ 232
6.4.1 Description ........................................................................................................ 232 6.4.2 Methodological issues ....................................................................................... 233 6.4.3 Activity data ...................................................................................................... 236
6.4.4 Emission factors ................................................................................................ 239 6.4.5 Uncertainties ..................................................................................................... 242 6.4.6 Completeness .................................................................................................... 243
6.4.7 Source specific QA/QC and verification .......................................................... 243 6.4.8 Recalculations ................................................................................................... 244
6.4.9 Planned improvements ...................................................................................... 244
6.5 Emissions from agricultural residue burning (agricultural wastes) – 4F –
CH4, N2O ............................................................................................................................ 245
6.5.1 Methodological issues ....................................................................................... 245
6.5.2 Activity data ...................................................................................................... 245 6.5.3 Emission factors ................................................................................................ 245
6.5.4 Uncertainties ..................................................................................................... 245 6.5.5 Completeness .................................................................................................... 245 6.5.6 Source specific QA/QC and verification .......................................................... 245
6.5.7 Recalculations ................................................................................................... 246 6.5.8 Planned improvements ...................................................................................... 246
7 Land-Use, Land-Use Change and Forestry (LULUCF) ........................................... 247
7.1 Overview of sector ............................................................................................... 247
7.1.1 Activity data ...................................................................................................... 247 7.1.2 Emissions and removals .................................................................................... 248
7.1.3 Key categories ................................................................................................... 252
7.2 Source category description ................................................................................. 253
7.2.1 Land use categories, CRF 5A, 5B, 5C, 5D, 5E and 5F ..................................... 253
7.2.2 Consistency in reporting carbon stock change in living tree biomass – 5A, 5B,
5C, 5D, 5E ......................................................................................................... 260 7.2.3 Auxiliary data .................................................................................................... 262
7.3 Forest land 5.A ..................................................................................................... 263
7.3.1 Forest land remaining forest land – 5A1 (Key Category) ................................. 263
National Inventory Report 2012 - Norway
7.3.2 Land converted to forest land and forest land converted to other land-use
categories – 5A2, 5B2, 5C2, 5D2, 5E2, 5F2 ..................................................... 267
7.4 Cropland 5B ......................................................................................................... 271
7.4.1 Cropland remaining cropland – 5B1 (Key Category) ....................................... 271 7.4.2 Land converted to cropland – 5B2 .................................................................... 281
7.5 Grassland 5C ........................................................................................................ 281
7.5.1 Grassland remaining grassland – 5C1 (Key Category) ..................................... 281
7.5.2 Land converted to grassland – 5C2 ................................................................... 283
7.6 Wetlands 5D ......................................................................................................... 284
7.6.1 Wetlands remaining wetlands – 5D1 ................................................................ 284 7.6.2 Land converted to wetlands – 5D2 ................................................................... 285
7.7 Settlements 5E ..................................................................................................... 286
7.7.1 Settlements remaining settlements – 5E1 ......................................................... 286
7.7.2 Land converted to settlements – 5E2 (Key category) ....................................... 286
7.8 Other land 5F ....................................................................................................... 287
7.8.1 Other land remaining other land – 5F1 ............................................................. 287
7.8.2 Land converted to other land – 5F2 .................................................................. 287
7.9 Other 5G ............................................................................................................... 288
7.9.1 Liming of agricultural soils and lakes ............................................................... 288 7.9.2 Harvested wood products .................................................................................. 288
7.10 Emissions of non-CO2 gases ................................................................................ 288
7.10.1 Forests ............................................................................................................... 288
7.10.2 Cropland ............................................................................................................ 295 7.10.3 Grassland ........................................................................................................... 296
7.10.4 Wetlands............................................................................................................ 297
7.11 Uncertainties ........................................................................................................ 297 7.12 Source-specific QA/QC and verification ............................................................. 298
7.13 Recalculations ...................................................................................................... 298 7.14 Planned improvements ......................................................................................... 300
8 Waste ......................................................................................................................... 302
8.1 Overview .............................................................................................................. 302 8.2 Managed Waste Disposal on Land – CH4 – 6A1 (Key Category) ....................... 302
8.2.1 Description ........................................................................................................ 302 8.2.2 Methodological issues ....................................................................................... 303 8.2.3 Activity data ...................................................................................................... 306 8.2.4 Emission factor ................................................................................................. 307
8.2.5 Uncertainties ..................................................................................................... 307 8.2.6 Source specific QA/QC and verification .......................................................... 308 8.2.7 Recalculations ................................................................................................... 308 8.2.8 Planned improvements ...................................................................................... 308
8.3 Unmanaged Waste Disposal Sites – 6A2 ............................................................. 308 8.4 Wastewater handling – N2O – 6B (Key category) ............................................... 309
8.4.1 Description ........................................................................................................ 309
National Inventory Report 2012 - Norway
8.4.2 Methodological issue ........................................................................................ 309
8.4.3 Activity data ...................................................................................................... 311 8.4.4 Emission factor ................................................................................................. 312 8.4.5 Uncertainties ..................................................................................................... 314
8.4.6 Source specific QA/QC and verification .......................................................... 315 8.4.7 Recalculations ................................................................................................... 315 8.4.8 Planned improvements ...................................................................................... 315
8.5 Waste incineration – CO2 – 6C ............................................................................ 316
8.5.1 Description ........................................................................................................ 316 8.5.2 Methodological issues ....................................................................................... 316
8.5.3 Activity data ...................................................................................................... 316 8.5.4 Emission factors ................................................................................................ 317 8.5.5 Uncertainties ..................................................................................................... 317 8.5.6 Source specific QA/QC and verification .......................................................... 317
8.5.7 Recalculations ................................................................................................... 317 8.5.8 Planned improvements ...................................................................................... 317
9 Recalculations .......................................................................................................... 318
9.1 Overall description of recalculations ................................................................... 318 9.2 Specific description of the recalculations ............................................................ 318
9.2.1 Energy ............................................................................................................... 318 9.2.2 Industrial processes ........................................................................................... 322
9.2.3 Solvents and other product use ......................................................................... 323 9.2.4 Agriculture ........................................................................................................ 323
9.2.5 Waste ................................................................................................................. 324 9.2.6 Land-Use, Land-Use Change and Forestry ....................................................... 325
9.3 Implications of the recalculations for the greenhouse gases ................................ 327
9.3.1 Implications for emissions levels ...................................................................... 327 9.3.2 Implications for emission trends ....................................................................... 329
10 Other (CRF sector 7) (if applicable) ......................................................................... 330
11 KP-LULUCF ............................................................................................................... 331
11.1 General information ............................................................................................. 331
11.1.1 Definition of forest and other criteria ............................................................... 331
11.1.2 Elected activities under Article 3.4 ................................................................... 331 11.1.3 Description of how the definitions of each activity under Article 3.3 and 3.4
have been applied consistently over time ......................................................... 332
11.1.4 Descriptions of precedence conditions and/or hierarchy among Article 3.4
activities, and how they have been consistently applied in determining how land
was classified .................................................................................................... 332
11.2 Land-related information ..................................................................................... 332
11.2.1 Spatial assessment units used for determining the area of the units of land under
article 3.3 ........................................................................................................... 332 11.2.2 Methodology used to develop the land transition matrix .................................. 333 11.2.3 Maps and/or database to identify the geographical locations, and the system of
identification codes for the geographical locations ........................................... 333
11.3 Activity specific Information ............................................................................... 334
National Inventory Report 2012 - Norway
11.3.1 Methods for carbon stock change and GHG emission and removal estimates . 334
11.4 Article 3.3 ............................................................................................................ 336
11.4.1 Information that demonstrates that activities under Article 3.3 began on or after l
January 1990 and before 31 December 2012 and are direct human-induced ... 336 11.4.2 Information on how harvesting or forest disturbance that is followed by the re-
establishment of forest is distinguished from deforestation.............................. 336 11.4.3 Information on the size and geographical location of forest areas that have lost
forest cover but which are not yet classified as deforested. .............................. 336
11.5 Article 3.4 ............................................................................................................ 337
11.5.1 Information that demonstrates that activities under Article 3.4 have occurred
since l January 1990 and are human-induced ................................................... 337 11.5.2 Information relating to Cropland Management, Grazing Land Management and
Revegetation, if elected, for the base year ........................................................ 337 11.5.3 Information relating to Forest Management: .................................................... 337
11.6 Other information ................................................................................................. 337
11.6.1 Key category analysis for Article 3.3 activities and any elected activities under
Article 3.4.......................................................................................................... 337
11.7 Information relating to Article 6 .......................................................................... 337
12 Information on accounting of Kyoto units .............................................................. 338
12.1 Background information ...................................................................................... 338 12.2 Summary of information reported in the SEF tables ........................................... 338
12.3 Discrepancies and notifications ........................................................................... 339 12.4 Publicly accessible information ........................................................................... 339 12.5 Calculation of the commitment period reserve (CPR) ......................................... 340
13 Information on changes in the National System .................................................... 341
13.1 Changes in the National Greenhouse Gas Inventory System .............................. 341
14 Information on changes in national registry ........................................................... 342
15 Information on minimization of adverse impacts in accordance with Article 3. Paragraph 14 .................................................................................................................... 345
REFERENCES ................................................................................................................... 348
National Inventory Report 2012 - Norway
ANNEX (I – IX) (in separate electronic document)
Annex I Key Categories
Annex II Uncertainties in the Greenhouse Gas Emission Inventory
Annex III Energy Balance Sheets 1990 - 2010
Annex IV CO2 Capture and Storage at petroleum production fields – storage site
characteristics and monitoring technology
Annex V National Greenhouse Gas Inventory System in Norway
Annex VI CRF Summary 2 Tables 1990 – 2010
Annex VII Harvested Wood Products
Annex VIII SEF and Registry Changes Annex IX Reference Approach versus Sectoral Approach - Quantification of
differences
National Inventory Report 2012 - Norway
1
National Inventory Report 2012
E.S Executive Summary
E.S.1. Background
The 1992 United Nations Framework Convention on Climate Change (UNFCCC) requires
that the Parties to the Convention develop, update and submit to the UNFCCC annual
inventories of greenhouse gas emissions by sources and removals by sinks. This report
documents the Norwegian National Inventory Report (NIR) 2012 for the period 1990-2010.
The report and the associated Common Reporting Format (CRF) tables have been prepared in
accordance with the UNFCCC Reporting Guidelines on Annual Inventories as adopted by the
COP by its Decision 18/CP. 8. The methodologies used in the calculation of emissions are
based on the Revised 1996 IPCC Guidelines for National Greenhouse Gas Inventories (IPCC
Guidelines) and the IPCC Good Practice Guidance and Uncertainty Management in National
Greenhouse Gas Inventories (Good Practice Guidance) prepared by the Intergovernmental
Panel on Climate Change (IPCC). As recommended by the IPCC Guidelines country specific
methods have been used where appropriate.
Emissions of the following greenhouse gases are covered in this report: carbon dioxide (CO2),
methane (CH4), nitrous oxide (N2O), perfluorocarbons (PFCs), hydrofluorocarbons (HFCs)
and sulphur hexafluoride (SF6). In addition, the inventory includes calculations of emissions
of the precursors NOx, NMVOC, and CO, as well as for SO2. Indirect CO2 emissions
originating from the fossil part of CH4 and NMVOC are calculated according to the UNFCCC
reporting guidelines and are accounted for in the inventory.
E.S.2 Summary of national emission and removal related trends
In 2010, the total emissions of greenhouse gases in Norway amounted to 53.9 million tonnes
CO2 equivalents, without emissions and removals from Land-Use, Land-Use Change and
Forestry (LULUCF). From 1990 to 2010 the total emissions increased by more than 8 per
cent.
Norway has experienced economic growth since 1990, with only minor setbacks in the early
nineties, which explains the general increase in emissions. The emissions increased by 2.4 per
cent between 2009 and 2010. The increase was mainly due to economic growth causing higer
emissions in almost all sectors. In 2010, CO2 contributed with 84 per cent of the total emission
figures, while methane and nitrous oxide contributed with respectively 8 and 6 per cent. PFCs,
HFCs and SF6 together accounted for approximately 2 per cent of the total GHG emissions.
In 2010 the land-use category forest land contributed with a total amount of sequestration of
35.9 million tonnes CO2 equivalents. The remaining land-use categories showed net
emissions of 2.9 million tonnes CO2 equivalents. The most important category was grassland
with total emissions of about 1.7 million tonnes of CO2. This gave a net removal from the
LULUCF sector of 32.9 million tonnes CO2 equivalents.
The net greenhouse gas emissions, including all sources and sinks were 21 million tonnes CO2
equivalents in 2010, a decrease of almost 50 per cent from the net figure in 1990.
National Inventory Report 2012 - Norway
2
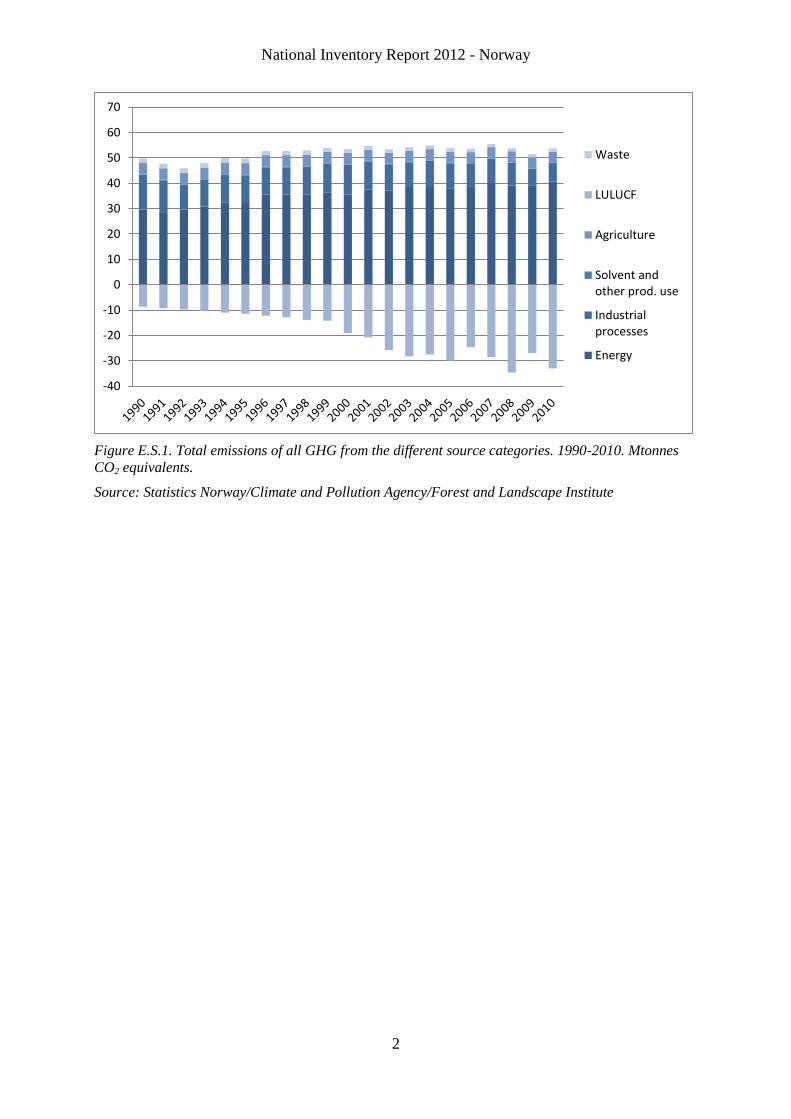
Figure E.S.1. Total emissions of all GHG from the different source categories. 1990-2010. Mtonnes
CO2 equivalents.
Source: Statistics Norway/Climate and Pollution Agency/Forest and Landscape Institute
-40
-30
-20
-10
0
10
20
30
40
50
60
70
Waste
LULUCF
Agriculture
Solvent andother prod. use
Industrialprocesses
Energy
National Inventory Report 2012 - Norway
3
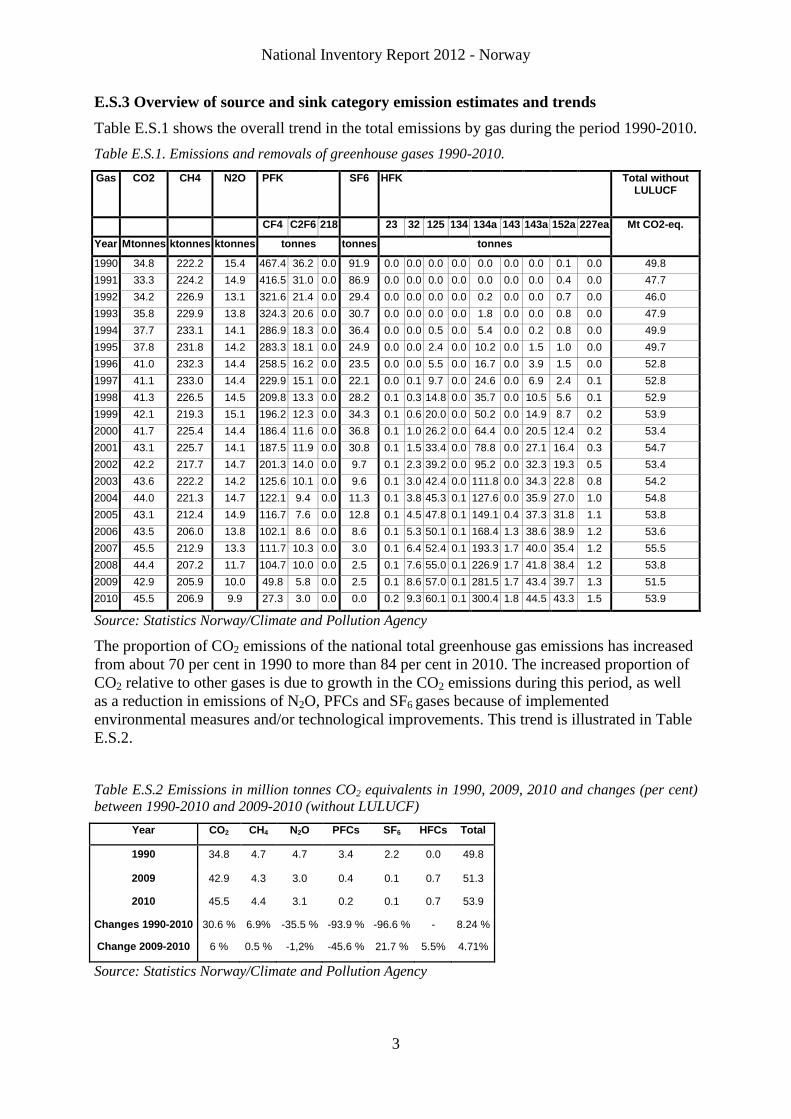
E.S.3 Overview of source and sink category emission estimates and trends
Table E.S.1 shows the overall trend in the total emissions by gas during the period 1990-2010.
Table E.S.1. Emissions and removals of greenhouse gases 1990-2010.
Gas CO2 CH4 N2O PFK SF6 HFK Total without LULUCF
CF4 C2F6 218 23 32 125 134 134a 143 143a 152a 227ea Mt CO2-eq.
Year Mtonnes ktonnes ktonnes tonnes tonnes tonnes
1990 34.8 222.2 15.4 467.4 36.2 0.0 91.9 0.0 0.0 0.0 0.0 0.0 0.0 0.0 0.1 0.0 49.8
1991 33.3 224.2 14.9 416.5 31.0 0.0 86.9 0.0 0.0 0.0 0.0 0.0 0.0 0.0 0.4 0.0 47.7
1992 34.2 226.9 13.1 321.6 21.4 0.0 29.4 0.0 0.0 0.0 0.0 0.2 0.0 0.0 0.7 0.0 46.0
1993 35.8 229.9 13.8 324.3 20.6 0.0 30.7 0.0 0.0 0.0 0.0 1.8 0.0 0.0 0.8 0.0 47.9
1994 37.7 233.1 14.1 286.9 18.3 0.0 36.4 0.0 0.0 0.5 0.0 5.4 0.0 0.2 0.8 0.0 49.9
1995 37.8 231.8 14.2 283.3 18.1 0.0 24.9 0.0 0.0 2.4 0.0 10.2 0.0 1.5 1.0 0.0 49.7
1996 41.0 232.3 14.4 258.5 16.2 0.0 23.5 0.0 0.0 5.5 0.0 16.7 0.0 3.9 1.5 0.0 52.8
1997 41.1 233.0 14.4 229.9 15.1 0.0 22.1 0.0 0.1 9.7 0.0 24.6 0.0 6.9 2.4 0.1 52.8
1998 41.3 226.5 14.5 209.8 13.3 0.0 28.2 0.1 0.3 14.8 0.0 35.7 0.0 10.5 5.6 0.1 52.9
1999 42.1 219.3 15.1 196.2 12.3 0.0 34.3 0.1 0.6 20.0 0.0 50.2 0.0 14.9 8.7 0.2 53.9
2000 41.7 225.4 14.4 186.4 11.6 0.0 36.8 0.1 1.0 26.2 0.0 64.4 0.0 20.5 12.4 0.2 53.4
2001 43.1 225.7 14.1 187.5 11.9 0.0 30.8 0.1 1.5 33.4 0.0 78.8 0.0 27.1 16.4 0.3 54.7
2002 42.2 217.7 14.7 201.3 14.0 0.0 9.7 0.1 2.3 39.2 0.0 95.2 0.0 32.3 19.3 0.5 53.4
2003 43.6 222.2 14.2 125.6 10.1 0.0 9.6 0.1 3.0 42.4 0.0 111.8 0.0 34.3 22.8 0.8 54.2
2004 44.0 221.3 14.7 122.1 9.4 0.0 11.3 0.1 3.8 45.3 0.1 127.6 0.0 35.9 27.0 1.0 54.8
2005 43.1 212.4 14.9 116.7 7.6 0.0 12.8 0.1 4.5 47.8 0.1 149.1 0.4 37.3 31.8 1.1 53.8
2006 43.5 206.0 13.8 102.1 8.6 0.0 8.6 0.1 5.3 50.1 0.1 168.4 1.3 38.6 38.9 1.2 53.6
2007 45.5 212.9 13.3 111.7 10.3 0.0 3.0 0.1 6.4 52.4 0.1 193.3 1.7 40.0 35.4 1.2 55.5
2008 44.4 207.2 11.7 104.7 10.0 0.0 2.5 0.1 7.6 55.0 0.1 226.9 1.7 41.8 38.4 1.2 53.8
2009 42.9 205.9 10.0 49.8 5.8 0.0 2.5 0.1 8.6 57.0 0.1 281.5 1.7 43.4 39.7 1.3 51.5
2010 45.5 206.9 9.9 27.3 3.0 0.0 0.0 0.2 9.3 60.1 0.1 300.4 1.8 44.5 43.3 1.5 53.9
Source: Statistics Norway/Climate and Pollution Agency
The proportion of CO2 emissions of the national total greenhouse gas emissions has increased
from about 70 per cent in 1990 to more than 84 per cent in 2010. The increased proportion of
CO2 relative to other gases is due to growth in the CO2 emissions during this period, as well
as a reduction in emissions of N2O, PFCs and SF6 gases because of implemented
environmental measures and/or technological improvements. This trend is illustrated in Table
E.S.2.
Table E.S.2 Emissions in million tonnes CO2 equivalents in 1990, 2009, 2010 and changes (per cent)
between 1990-2010 and 2009-2010 (without LULUCF)
Year CO2 CH4 N2O PFCs SF6 HFCs Total
1990 34.8 4.7 4.7 3.4 2.2 0.0 49.8
2009 42.9 4.3 3.0 0.4 0.1 0.7 51.3
2010 45.5 4.4 3.1 0.2 0.1 0.7 53.9
Changes 1990-2010 30.6 % 6.9% -35.5 % -93.9 % -96.6 % - 8.24 %
Change 2009-2010 6 % 0.5 % -1,2% -45.6 % 21.7 % 5.5% 4.71%
Source: Statistics Norway/Climate and Pollution Agency
National Inventory Report 2012 - Norway
4
About 51 per cent of the methane emissions in 2010 originated from agriculture, and 25 per
cent originated from landfills. The total methane emissions decreased by about 0.5 per cent
from 2009 to 2010.
In 2010, agriculture and nitric acid production contributed to 67 per cent and 12 per cent of
the total N2O-emission respectively. Due to technical improvements in production of nitric
acid, and despite increased production, the total emissions of N2O have decreased by 36 per
cent since 1990.
The decrease in PFC emissions was almost 45 per cent from 2009 to 2010, resulting in a total
reduction of 94 per cent since 1990. PFC emissions originate primarily from the production
of aluminium, where technical measures have been undertaken to reduce them. CO2 emissions
from aluminium production have increased since 1990 due to increased production.
SF6 emissions have been reduced by 97 per cent from 1990 to 2010, mainly because of
technological improvements and the closure of a magnesium production plant and a
magnesium recycling foundry.
HFC emissions increased by 6 per cent in 2010 compared to 2009. The emissions in 1990
were insignificant. But the emissions increased significantly from mid-1990 until 2002, when
a tax on HFC was introduced in 2003. After that the increase has been somewhat smaller.
The net CO2 sequestration from the LULUCF category was 32.9 million tonnes in 2010.
Since 1990 there has been an increase in carbon stored in living biomass, dead organic matter
and in soils in Norway, more than doubling the net sequestration of CO2 since 1990. The
increase in carbon stored is a result of an active forest management policy over the last 50
years. The annual harvests have been much lower than the annual increments, thus causing an
accumulation of wood and other tree components.
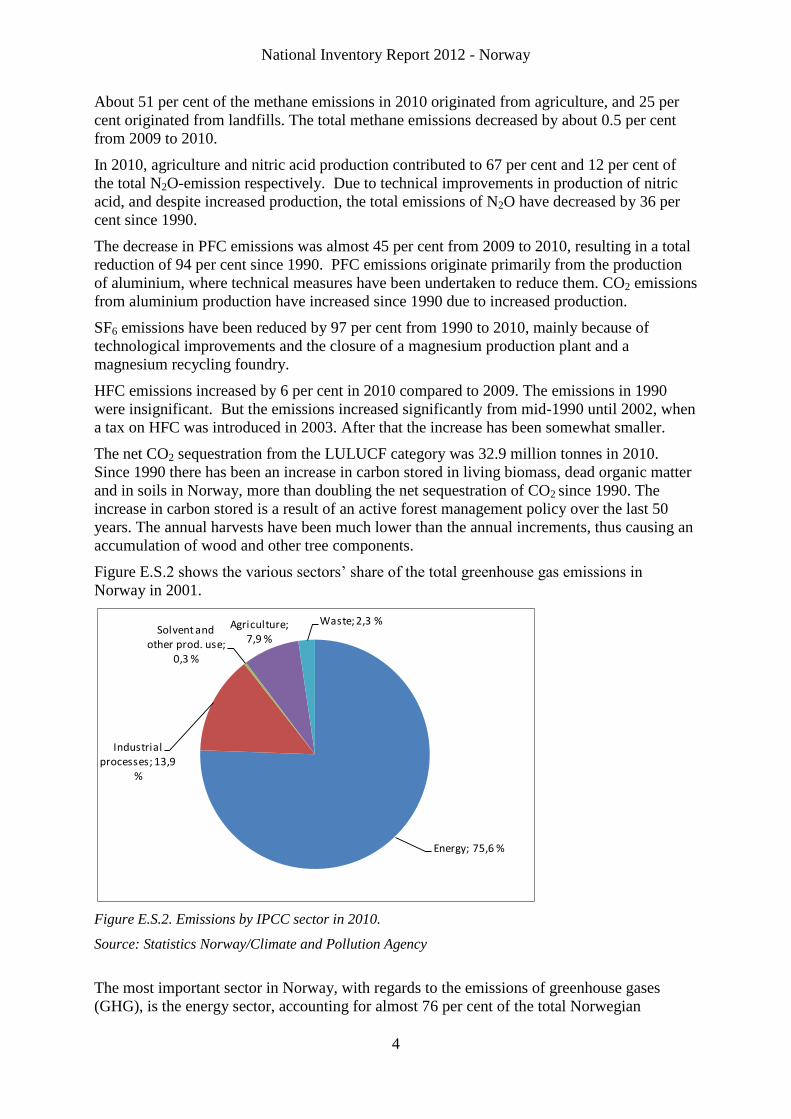
Figure E.S.2 shows the various sectors’ share of the total greenhouse gas emissions in
Norway in 2001.
Figure E.S.2. Emissions by IPCC sector in 2010.
Source: Statistics Norway/Climate and Pollution Agency
The most important sector in Norway, with regards to the emissions of greenhouse gases
(GHG), is the energy sector, accounting for almost 76 per cent of the total Norwegian
Energy; 75,6 %
Industrial processes; 13,9
%
Solvent and other prod. use;
0,3 %
Agriculture; 7,9 %
Waste; 2,3 %
National Inventory Report 2012 - Norway
5
emissions. The energy sector includes the energy industries (including oil and gas extraction),
the transport sector, energy use in manufacturing and constructing, fugitive emissions from
fuels and energy combustion in other sectors. Road traffic and offshore gas turbines
(electricity generation and pumping of natural gas) are the largest single contributors, while
coastal navigation and energy commodities used for the production of raw materials are other
major sources.
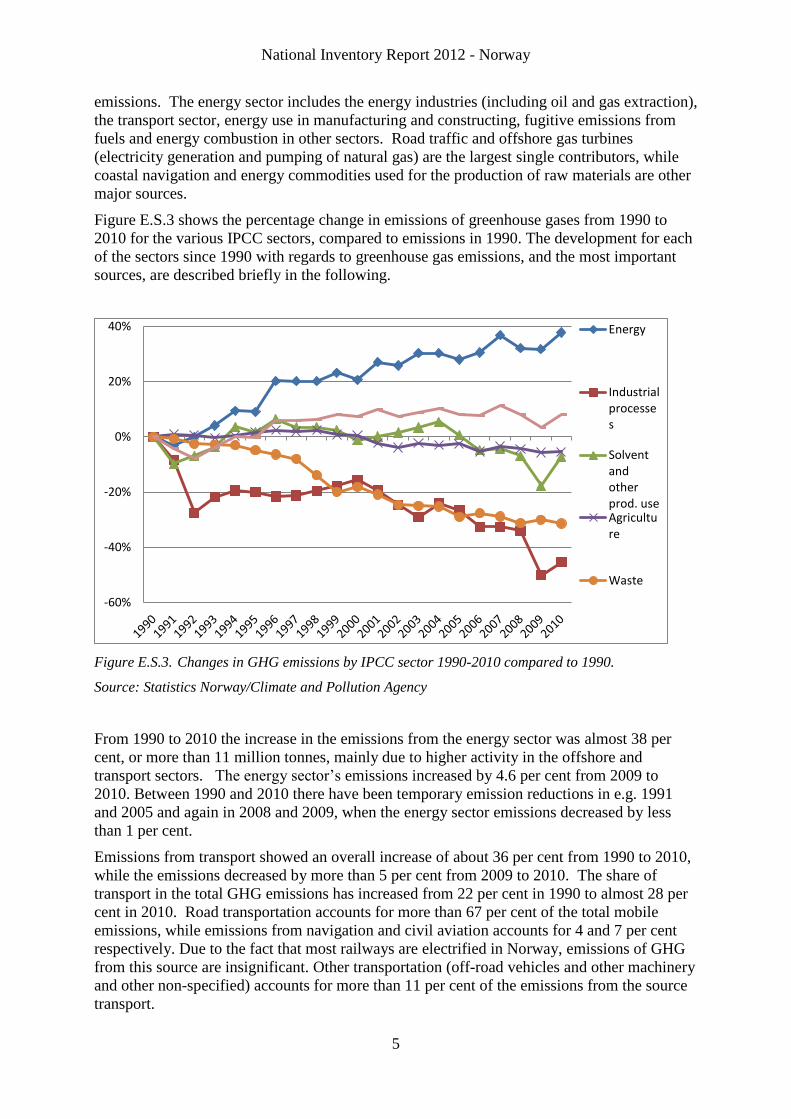
Figure E.S.3 shows the percentage change in emissions of greenhouse gases from 1990 to
2010 for the various IPCC sectors, compared to emissions in 1990. The development for each
of the sectors since 1990 with regards to greenhouse gas emissions, and the most important
sources, are described briefly in the following.
Figure E.S.3. Changes in GHG emissions by IPCC sector 1990-2010 compared to 1990.
Source: Statistics Norway/Climate and Pollution Agency
From 1990 to 2010 the increase in the emissions from the energy sector was almost 38 per
cent, or more than 11 million tonnes, mainly due to higher activity in the offshore and
transport sectors. The energy sector’s emissions increased by 4.6 per cent from 2009 to
2010. Between 1990 and 2010 there have been temporary emission reductions in e.g. 1991
and 2005 and again in 2008 and 2009, when the energy sector emissions decreased by less
than 1 per cent.
Emissions from transport showed an overall increase of about 36 per cent from 1990 to 2010,
while the emissions decreased by more than 5 per cent from 2009 to 2010. The share of
transport in the total GHG emissions has increased from 22 per cent in 1990 to almost 28 per
cent in 2010. Road transportation accounts for more than 67 per cent of the total mobile
emissions, while emissions from navigation and civil aviation accounts for 4 and 7 per cent
respectively. Due to the fact that most railways are electrified in Norway, emissions of GHG
from this source are insignificant. Other transportation (off-road vehicles and other machinery
and other non-specified) accounts for more than 11 per cent of the emissions from the source
transport.
-60%
-40%
-20%
0%
20%
40% Energy
Industrialprocesses
Solventandotherprod. useAgriculture
Waste
National Inventory Report 2012 - Norway
6
Industrial processes contributed to almost 14 per cent of the total national emissions of
greenhouse gases. Production of metals and chemicals is the main source of process-related
industrial emissions of both CO2 and other greenhouse gases such as N2O (fertilizer
production) and PFCs (aluminium production). Between 1990 and 2010 emissions from
industrial processes experienced an overall decrease by over 55 per cent. This is mainly due to
reduced PFC emissions from the production of aluminium and SF6 from the production of
magnesium.
Solvent and other product use accounted for only 0.3 per cent of the total emissions of
greenhouse gases in Norway. This contribution has been stable since 1990.
The agricultural sector contributed in 2010 to about 8 per cent to the total emissions of
greenhouse gases. This corresponds to 4.3 million tonnes CO2 equivalents, which is 0.2 per
cent lower than in 2009. This sector has experienced an emission reduction of about 5 per cent
over the period 1990-2010. The dominant sources of GHGs are agricultural soils (N2O) and
enteric fermentation (CH4) from domestic animals. These sources contributed to about 45 and
44 per cent respectively of the sector’s emissions.
The waste sector contributed with 2 per cent of total Norwegian greenhouse gas emissions in
2010. The emissions of greenhouse gases from the waste sector were relatively stable during
the 1990s. From 1998 the emissions declined, and in 2010 they were about 31 per cent lower
than in 1990. Waste volumes have increased significantly over the period, but this has been
offset by increased recycling and incineration of waste as well as increased burning of
methane from landfills.
E.S.4 Precursors and SO2
Nitrogen oxides (NOx), non-methane volatile organic compounds (NMVOC) and carbon
monoxide (CO) are not greenhouse gases, but they have an indirect effect on the climate
through their influence on greenhouse gases, in particular ozone. Sulphur dioxide (SO2) also
has an indirect impact on climate, as it increases the level of aerosols with a subsequent
cooling effect. Therefore, emissions of these gases are to some extent included in the
inventory.
The overall NOx emissions have decreased by approximately 3 per cent from 1990 to 2010,
primarily because of stricter emission regulations directed towards road traffic, which
counteracted increased emissions from oil and gas production and from navigation. From
2009 to 2010 the total NOx emissions decreased by more than 3 per cent.
The emissions of NMVOC experienced an increase in the period from 1990 to 2001, mainly
because of the rise in oil production and the loading and storage of oil. However, the
emissions have decreased by 64 per cent from 2001 to 2010, and are now 51 per cent lower
than in 1990. From 2009 to 2010 the emissions of NMVOC decreased by 1 per cent.
Over the period 1990-2010 emissions of CO decreased by approximately 55 per cent. This is
explained primarily by the implementation of new emissions standards for motor vehicles.
Emissions of SO2 were reduced by 63 per cent from 1990 to 2010. This can mainly be
explained by a reduction in sulphur content of all oil products and lower process emissions
from ferroalloy and aluminium production, as well as refineries.
National Inventory Report 2012 - Norway
7
Part I: Annual Inventory Submission
1 Introduction
1.1 Background information on greenhouse gas inventories
The 1992 United Nation Framework Convention on Climate Change (UNFCCC) was ratified
by Norway on 9 July 1993 and entered into force on 21 March 1994. One of the commitments
of the Convention is that Parties are required to report their national inventories of
anthropogenic emissions by sources and removals by sinks of the greenhouse gases CO2,
CH4, N2O as well as fluorinated greenhouse gases not controlled by the Montreal Protocol
(HFCs, PFCs and SF6), using methodologies agreed upon by the Conference of the Parties to
the Convention (COP).
In compliance with its reporting requirements, Norway has submitted to the UNFCCC
national emission inventory reports on an annual basis since 1993. With the adoption of the
Kyoto Protocol in 1997, Norway is faced with the requirement to limit its total greenhouse
gas emissions to 1 per cent above the 1990 level during the commitment period 2008-2012.
On 30 May 2002 Norway ratified the Kyoto Protocol, which entered into force on 16
February 2005.
The National Inventory Report 2012 together with the associated Common Reporting Format
(CRF) tables are Norway’s contribution to the 2012 round of reporting under the Convention,
and it covers emissions and removals for the period 1990-2010.
This report also includes supplementary information required under Article 7, paragraph 1, of
the Kyoto Protocol, in accordance with paragraph 3(a) of decision 15/CMP.1.1. This
supplementary information comprises:
• Information on anthropogenic greenhouse gas emissions by sources and removals by
sinks from land use, land-use change and forestry (LULUCF) activities under Article
3, paragraph 3, and elected activities under Article 3, paragraph 4, of the Kyoto
Protocol.
• Information on Kyoto units (emission reduction units, certified emission reductions,
temporary certified emission reductions, long-term certified emission reductions,
assigned amount units and removal units).
• Changes in national systems in accordance with Article 5, paragraph 1.
• Changes in national registries.
• Minimization of adverse impacts in accordance with Article 3, paragraph 14.
In December 2006, Norway submitted the Initial Report according to Decision 13/CMP.1 on
"Modalities for accounting of assigned amounts under Article 7.4 of the Kyoto Protocol".
This National Inventory Report has been prepared according to the system described in the
report “National Greenhouse Gas Inventory System in Norway” (Annex V).
The report is prepared in accordance with the UNFCCC Reporting Guidelines on Annual
Inventories as adopted by the COP by its Decision 18/CP. 8. The methodologies used in the
National Inventory Report 2012 - Norway
8
calculation of emissions and removals are based on the Revised 1996 Intergovernmental
Panel on Climate Change Guidelines for National Greenhouse Gas Inventories (Revised
1996 IPCC GL), the IPCC Good Practice Guidance and Uncertainty Management in
National Greenhouse Gas Inventories (IPCC 2000), IPCC Good Practice Guidance for Land-
Use, Land-Use Change and Forestry sector (IPCC 2003), and to some extent the new 2006
Guidelines from IPCC. As recommended by the IPCC Guidelines country specific methods
have been used where appropriate and where they provide more accurate emission data.
The greenhouse gases or groups of gases included in the national inventory are the following:
Carbon dioxide (CO2);
Methane (CH4);
Nitrous oxide (N2O);
Hydrofluorocarbons (HFCs);
Perfluorocarbons (PFCs);
Sulphur hexafluoride (SF6).
Aggregated emissions and removals of greenhouse gases expressed in CO2-equivalents are
also reported. We have used Global Warming Potentials (GWP) calculated on a 100-year time
horizon, as provided by the IPCC in the Second Assessment Report.
Indirect CO2 emissions originating from the fossil part of CH4 and NMVOC are calculated
according to the reporting guidelines to the UNFCCC, and accounted for in the inventory.
This includes emissions from fuel combustion and non-combustion sources, such as fugitive
emissions from loading of crude oil, oil refineries, distribution of oil products, and from
solvents and other product use.
The report also contains calculations of emissions of the precursors and indirect greenhouse
gases NOx, NMVOC, CO and SO2, which should be included according to the reporting
guidelines. However, we have not in this submission included detailed descriptions of the
calculation methodologies for these gases. This information is available in the report Statistics
Norway (2011a).
Since the introduction of annual technical reviews of the national inventories by independent
experts in 2000, Norway has undergone nine desk/centralized reviews, in 2000, 2001, 2003,
2004, 2005, 2008, 2009, 2010 and 2011. An in-country review was held in Oslo in October
2002. The Initial Report and Norway’s 2006 greenhouse gas inventory submission was
reviewed in an in-country review 23-28 April 2007. The recommendations from these reviews
have been incorporated in this report to the extent possible.
1.2 Institutional arrangement for inventory preparation
The Norwegian greenhouse gas inventory has been produced in more than two decades as an
collaboration between Statistics Norway and the Climate and Pollution Agency. The reporting
to the UNFCCC has been based on this greenhouse gas inventory.
The Norwegian national system for greenhouse gas inventories is based on existing
cooperation. The Climate and Pollution Agency, Statistics Norway and the Norwegian Forest
and Landscape Institute are the core institutions in the national greenhouse gas inventory
system in Norway. Statistics Norway is responsible for the official statistics on emissions to
air. The Norwegian Forest and Landscape Institute is responsible for the calculations of
National Inventory Report 2012 - Norway
9
emission and removals from Land Use and Land Use Change and Forestry.
The Climate and Pollution Agency has been appointed by the Ministry of the Environment as
the national entity through the budget proposition to the Norwegian parliament (Stortinget)
for 2006.
The three core institutions; Climate and Pollution Agency, Statistics Norway and The
Norwegian Forest and Landscape Institute, work together to fulfill the requirements for the
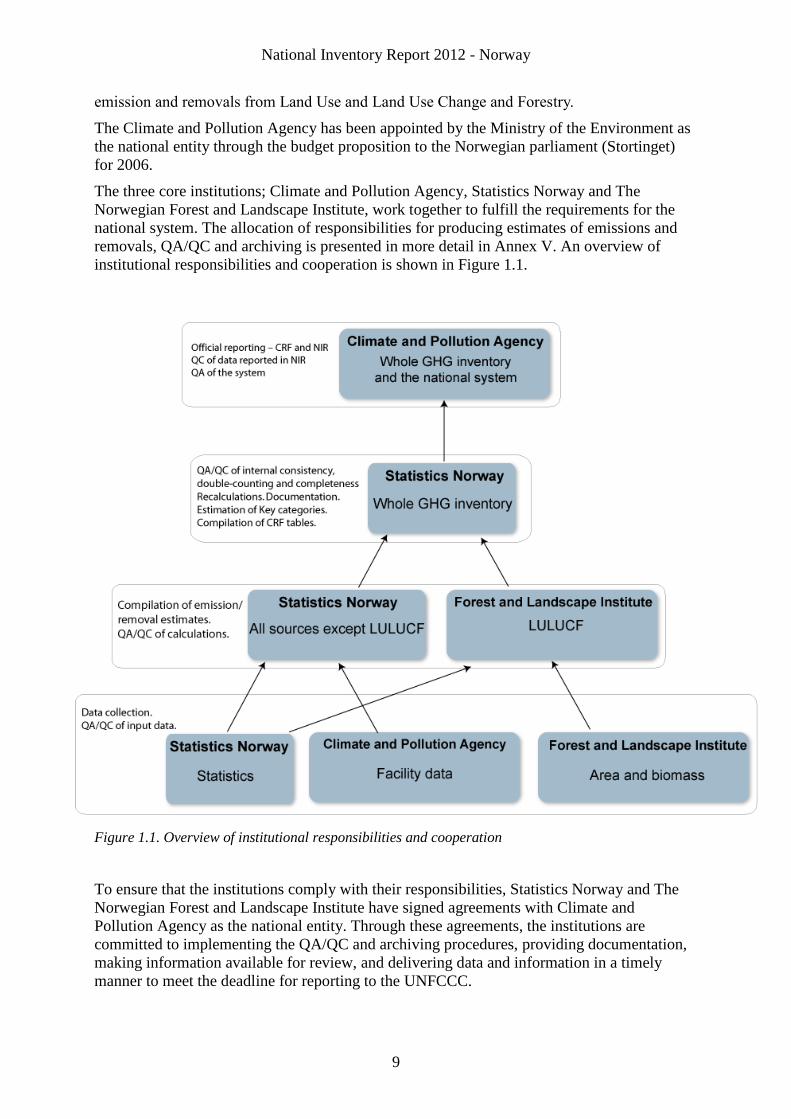
national system. The allocation of responsibilities for producing estimates of emissions and
removals, QA/QC and archiving is presented in more detail in Annex V. An overview of
institutional responsibilities and cooperation is shown in Figure 1.1.
Figure 1.1. Overview of institutional responsibilities and cooperation
To ensure that the institutions comply with their responsibilities, Statistics Norway and The
Norwegian Forest and Landscape Institute have signed agreements with Climate and
Pollution Agency as the national entity. Through these agreements, the institutions are
committed to implementing the QA/QC and archiving procedures, providing documentation,
making information available for review, and delivering data and information in a timely
manner to meet the deadline for reporting to the UNFCCC.
National Inventory Report 2012 - Norway
10
1.3 The process of inventory preparation
1.3.1 Introduction
The core institutions; Climate and Pollution Agency, Statistics Norway and the Norwegian
Forest and Landscape Institute have agreed on a “milestone” production plan. This plan has
been changed in the revised report of the National Greenhouse Gas Inventory System in
Norway, to better reflect existing national publishing obligations etc. This plan is further
described in Annex V. The plan is supplemented by internal production plans in the three core
institutions.
1.3.2 Data collection, processing and archiving
The three core institutions of the national system have defined areas of responsibility for data
collection. This is further described in Annex V.
Statistics Norway is responsible for the collection and development of activity data, and
emission figures are derived from models operated by Statistics Norway. The Climate and
Pollution Agency is responsible for the emission factors, for providing data from specific
industries and sources and for considering the quality, and assuring necessary updating, of
emissions models like e.g. the road traffic model and calculation of methane emissions from
landfills. Emission data are used for a range of national applications and for international
reporting. The Norwegian Forest and Landscape Institute collects almost all data regarding the
LULUCF sector. The collected data are subjected to the Quality Assessment and Quality
Control (QA/QC) routines described in section 1.6 as well as source specific routines as
described under each source chapter. They are all (except data regarding LULUCF) sub-
sequently processed by Statistics Norway into a format appropriate to enter the emission
models. The models are designed in a manner that accommodates both the estimation
methodologies reflecting Norwegian conditions and those recommended internationally.
All three core institutions are responsible for archiving the data they collect and the estimates
they calculate with associated methodology documentation and internal documentation on
QA/QC.
Due to the differences in the character of data collected, Norway has chosen to keep archiving
systems in the three core institutions, which means that not all information is archived at a
single location. These archiving systems are, however, consistent, and operate under the same
rules. Although the data are archived separately, all can be accessed efficiently during a
review. In addition, the Climate and Pollution Agency is establishing a library with the most
important methodology reports.
1.4 Methodologies and data sources used
1.4.1 Introduction
Details of the methods and framework for the production of the emission inventory are given
in the report “The Norwegian Emission Inventory 2011. Documentation of methodologies for
estimating emissions of greenhouse gases and long-range transboundary air pollutants”
(Statistics Norway 2011a). This report is updated annually in conjunction with important
methodological changes and used as a basis for the NIR. A revised, draft version of (Statistics
Norway 2012, not published) which is due to be published in 2012 has also been used in the
preparation for this inventory. Information on the methods and framework for the production
of data for the LULUF sector are mainly given in the Report “Emissions and removals of
greenhouse gases from land use, land-use change and forestry in Norway” (NIJOS 2005).
National Inventory Report 2012 - Norway
11
Norway has an integrated inventory system for producing inventories of the greenhouse gases
included in the Kyoto Protocol and the air pollutants SO2, NOx, non-methane volatile organic
compounds (NMVOC), ammonia, CO, particulate matter, heavy metals and persistent organic
pollutants reported under the LRTAP Convention. The data flow and QA/QC procedures are
to a large extent common to all pollutants.
The emission estimation methodologies are being improved continuously. Statistics Norway
and Climate and Pollution Agency have carried out several studies on specific emission
sources. Often, such projects are connected to an evaluation of emission reduction measures.
An important element in Statistics Norway’s work is to increase the environmental relevance
of the statistical system. As far as possible, data collection relevant to the emission inventories
is integrated into other surveys and statistics.
1.4.2 The main emission model
The model was developed by Statistics Norway (Daasvatn et al. 1992, 1994). It was
redesigned in 2003 in order to improve reporting to the UNFCCC and LRTAP, and to
improve QA/QC procedures.
The model is called “Kuben” (“the Cube”). Several emission sources – e.g. road traffic, air
traffic and solvents – are covered by more detailed satellite models. Aggregated results from
these side models are used as input to the general model.
The general emission model is based on equation (1).
(1) Emissions (E) = Activity level (A) Emission Factor (EF)
For emissions from combustion, the activity data is based on energy use. In the Norwegian
energy accounts, the use of different forms of energy is allocated to industries (economic
sectors). In order to calculate emissions to air, energy use must also be allocated to
technical sources (e.g. equipment). After energy use has been allocated in this way, the
energy accounts may be viewed as a cube in which the three axes are fuels, industries, and
sources.
The energy use data are combined with a corresponding matrix of emission factors. In
principle, there should be one emission factor for each combination of fuel, industry,
source, and pollutant. Thus, the factors may be viewed as a four-dimensional “cube” with
pollutants as the additional dimension. However, in a matrix with a cell for each
combination, most of the cells would be empty (no consumption). In addition, the same
emission factor would apply to many cells.
Emissions of some pollutants from major manufacturing plants (point sources) are
available from measurements or other plant-specific calculations (collected by the Climate
and Pollution Agency). When such measured data are available, the estimated values are
replaced by the measured ones:
(2) Emissions (E) = [ (A - APS) EF] + EPS
where APS and EPS are the activity and the measured emissions at the point sources,
respectively. Emissions from activities for which no point source estimate is available (A-
APS) are still estimated with the regular emission factor.
National Inventory Report 2012 - Norway
12
Non-combustion emissions are generally calculated in the same way, by combining
appropriate activity data with emission factors. Some emissions are measured directly and
reported to the Climate and Pollution Agency, and some may be obtained from current reports
and investigations. The emissions are fitted into the general model using the parameters
industry, source, and pollutant. The fuel parameter is not relevant here. The source sector
categories are based on EMEP/NFR and UNFCCC/CRF categories, with further subdivisions
where more detailed methods are available.
The model uses approximately 130 industries (economic sectors). The classification is
common with the Energy Accounts and is almost identical to that used in the National
Accounts, which is aggregated from the European NACE (rev. 1) classification (Daasvatn et
al. 1994). The large number of sectors is an advantage in dealing with important emissions
from manufacturing industries. The disadvantage is an unnecessary disaggregation of sectors
with very small emissions. To make the standard sectors more appropriate for calculation of
emissions, a few changes have been made, e.g. "Private households" is defined as a sector.
1.4.3 The LULUCF model
The Norwegian Forest and Landscape Institute is in charge of estimating emissions and
removals from Land use, Land-Use Change and Forestry (LULUCF). They have developed a
calculation system in the form of computer programs that uses the SAS system software,
FORTRAN and R for the implementation of the IPCC good practice guidance for the
LULUCF sector. The systems use input data from different sources and create final output
datasets. These final datasets include all data needed for the tables in the common reporting
format (CRF), both for the Climate Convention and the Kyoto-protocol.
In light of the importance of the forest sector, the National Forest Inventory (NFI) is used as
the most important source of information of forestry and to establish total area of forest,
cropland, wetlands, settlements and other land and land-use transitions between these. The
data from the NFI is complemented with other data (e.g. horticulture, tillage practice, amount
of fertilizer used, liming and drainage of forest soil, liming of lakes and forest fires) collected
by Statistics Norway, Norwegian Agricultural Authority, Food Safety Authority, The
Norwegian Directorate for Nature Management and The Directorate for Civil Protection and
Emergency Planning.
The sampling design of the NFI is based on a systematic grid of geo-referenced sample plots
covering the entire country. The NFI utilizes a 5-year cycle based on a re-sampling method of
the permanent plots. Up to 2010 the estimates were based on detailed information from
sample plots below the coniferous limit. To confirm the land use, the extent of the area of
forest and other wooded land at higher altitudes and in Finnmark County, the NFI conducted a
complete forest inventory during 2005–2010 for these areas. All areas are for the first time
included in the estimates for the LULUCF sector in this inventory submission. The estimates
for areas above the coniferous limit and in Finnmark County, may be recalculated in future
greenhouse gas inventories as more information, e.g. from NFI, maps, old and new aerial
photos, may be used to improve the estimates back to 1990.
The calculations of biomass and carbon stock in forest are based on single tree measurements
and stand attributes from the permanent sample plots on forest and other wooded land under
the coniferous forest limit. Biomass is calculated using single tree biomass equations
developed in Sweden for Norway spruce, Scots pine and birch (Marklund 1988 and Petersson
and Ståhl 2006). These equations provide biomass estimates for various tree biomass
components: stem, stem bark, living branches, dead branches and needles, stumps and roots.
National Inventory Report 2012 - Norway
13
These components are used to calculate above- and belowground biomass. The biomass of
trees below and above coniferous limit and with diameter less than 50 mm (small trees) at 1.3
meter height (DBH) , trees from higher altitudes and trees in Finnmark County, are included
in the estimates for the whole time-series. The standing volume of these biomass pools
constitute 7 percent of the stem volume of standing trees with DBH equal to or larger than 50
mm from the area below the coniferous limit. Hence 7 percent of the net change of CO2
removals of living trees below the coniferous limit is included in the estimates. It is assumed
that these proportions have remained constant over the last twenty years.
The dynamic soil model Yasso, as described in detail by Liski et al. (2005), and for
Norwegian conditions by de Wit et al. (2006), is used to calculate changes in carbon stock in
dead organic matter and in soil for forest land remaining forest land. The Yasso07, a newer
version of the model, has been used to obtain estimates of soil organic carbon for lands
converted to forest land and forest land converted to other lands (Liski et al. 2009, Tuomi and
Liski 2009, Tuomi et al. 2009, www.ymparisto.fi/syke/yasso). The Yasso07 model provides
an aggregated estimate of carbon stock change for the total of litter, dead wood and soil
organic matter. The system is still under development. All data used as input to the models is
provided by the Norwegian Forest and Landscape Institute, Statistics Norway, Norwegian
Meteorological Institute and Bioforsk. We assume the models are relevant for Norwegian
conditions. The calculations are hence done in accordance to a Tier 3 method.
1.4.4 Data sources
The data sources used in the Norwegian inventorying activities are outlined in the following:
Activity levels – these normally originate from official statistical sources available internally
in Statistics Norway and other material available from external sources. When such
information is not available, research reports are used or extrapolations are made from expert
judgments.
Emission factors – these originate from reports on Norwegian conditions and are either
estimated from measurements or elaborated in special investigations. However, international
default data are used in cases where emission factors are highly uncertain (e.g. N2O from
agriculture, CH4 and N2O from stationary combustion, CH4 and N2O road transport) or when
the source is insignificant in relation to other sources.
Aggregated results from the side models – The operation of these side models requires various
sets of additional parameters pertinent to the emission source at hand. These data sets are as
far as possible defined in official registers, public statistics and surveys, but some are based
on assumptions.
Emission figures for point sources – For large industrial plants these are figures reported to
the Climate and Pollution Agency by the plants’ responsible (based on measurements or
calculations at the plants).
National Inventory Report 2012 - Norway
14
1.5 Key Categories
According to the IPCC definition, key categories are those that add up to 90 per cent of the
total uncertainty in level and/or trend. In the Norwegian greenhouse gas emission inventory
key categories are primarily identified by means of a Tier 2 method. A description of the
methodology as well as background tables and the results from the analyses is presented in
Annex I. In this chapter a summary of the analysis and the results are described.
According to the IPCC Good Practice Guidance (IPCC 2000) it is good practice to give the
results at the Tier 2 level if available. The advantage of using a Tier 2 methodology is that
uncertainties are taken into account and the ranking shows where uncertainties can be
reduced. However, in the 2006 IPCC guidelines it is suggested that good practice reporting
should include key categories from both Tier 1 and Tier 2.
The Tier 2 and Tier 1 analyses were performed at the level of IPCC source categories and
each greenhouse gas from each source category was considered separately with respect to
total GWP weighted emissions, except land-use, land-use change and forestry.
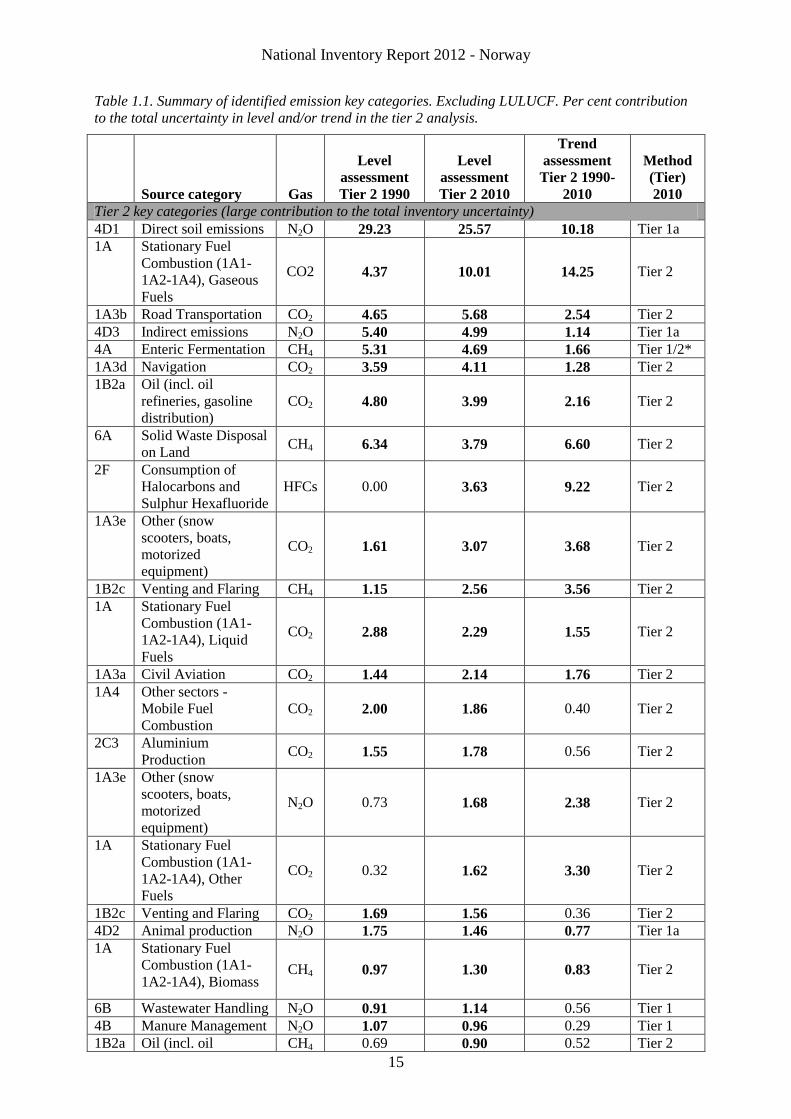
The results from the key category analyses are summarized in Table 1.1. The Tier 2 analysis
identified 30 key categories which are arranged primarily according to contribution to the
uncertainty in level. In addition we have also included in Table 1.1 those source categories
that according to Tier 1 key category analysis or qualitative criteria in the NIR are defined as
key categories. Altogether there are 41 key categories. Key categories in the Land use, land
use change and forestry sector (LULUCF) was identified in separate analyses and are
summarized in Table 1.2.
The complete Tier 1 analysis is included in Annex I together with background data and the
complete analysis including LULUCF. Fugitive emissions from coal mining and handling are
included as a key category due to change in trend in the coal production and the fact that the
national emission factors used is an order of magnitude less than IPCC’s default factors. The
last identified key category is CO2 capture and storage. This removal category is considered
key since there until recently has been no methodology as such defined in the IPCC
guidelines and because these operations are unique internationally.
National Inventory Report 2012 - Norway
15
Table 1.1. Summary of identified emission key categories. Excluding LULUCF. Per cent contribution
to the total uncertainty in level and/or trend in the tier 2 analysis.
Source category Gas
Level
assessment
Tier 2 1990
Level
assessment
Tier 2 2010
Trend
assessment
Tier 2 1990-
2010
Method
(Tier)
2010
Tier 2 key categories (large contribution to the total inventory uncertainty)
4D1 Direct soil emissions N2O 29.23 25.57 10.18 Tier 1a
1A Stationary Fuel
Combustion (1A1-
1A2-1A4), Gaseous
Fuels
CO2 4.37 10.01 14.25 Tier 2
1A3b Road Transportation CO2 4.65 5.68 2.54 Tier 2
4D3 Indirect emissions N2O 5.40 4.99 1.14 Tier 1a
4A Enteric Fermentation CH4 5.31 4.69 1.66 Tier 1/2*
1A3d Navigation CO2 3.59 4.11 1.28 Tier 2
1B2a Oil (incl. oil
refineries, gasoline
distribution)
CO2 4.80 3.99 2.16 Tier 2
6A Solid Waste Disposal
on Land CH4 6.34 3.79 6.60 Tier 2
2F Consumption of
Halocarbons and
Sulphur Hexafluoride
HFCs 0.00 3.63 9.22 Tier 2
1A3e Other (snow
scooters, boats,
motorized
equipment)
CO2 1.61 3.07 3.68 Tier 2
1B2c Venting and Flaring CH4 1.15 2.56 3.56 Tier 2
1A Stationary Fuel
Combustion (1A1-
1A2-1A4), Liquid
Fuels
CO2 2.88 2.29 1.55 Tier 2
1A3a Civil Aviation CO2 1.44 2.14 1.76 Tier 2
1A4 Other sectors -
Mobile Fuel
Combustion
CO2 2.00 1.86 0.40 Tier 2
2C3 Aluminium
Production CO2 1.55 1.78 0.56 Tier 2
1A3e Other (snow
scooters, boats,
motorized
equipment)
N2O 0.73 1.68 2.38 Tier 2
1A Stationary Fuel
Combustion (1A1-
1A2-1A4), Other
Fuels
CO2 0.32 1.62 3.30 Tier 2
1B2c Venting and Flaring CO2 1.69 1.56 0.36 Tier 2
4D2 Animal production N2O 1.75 1.46 0.77 Tier 1a
1A Stationary Fuel
Combustion (1A1-
1A2-1A4), Biomass CH4 0.97 1.30 0.83 Tier 2
6B Wastewater Handling N2O 0.91 1.14 0.56 Tier 1
4B Manure Management N2O 1.07 0.96 0.29 Tier 1
1B2a Oil (incl. oil CH4 0.69 0.90 0.52 Tier 2
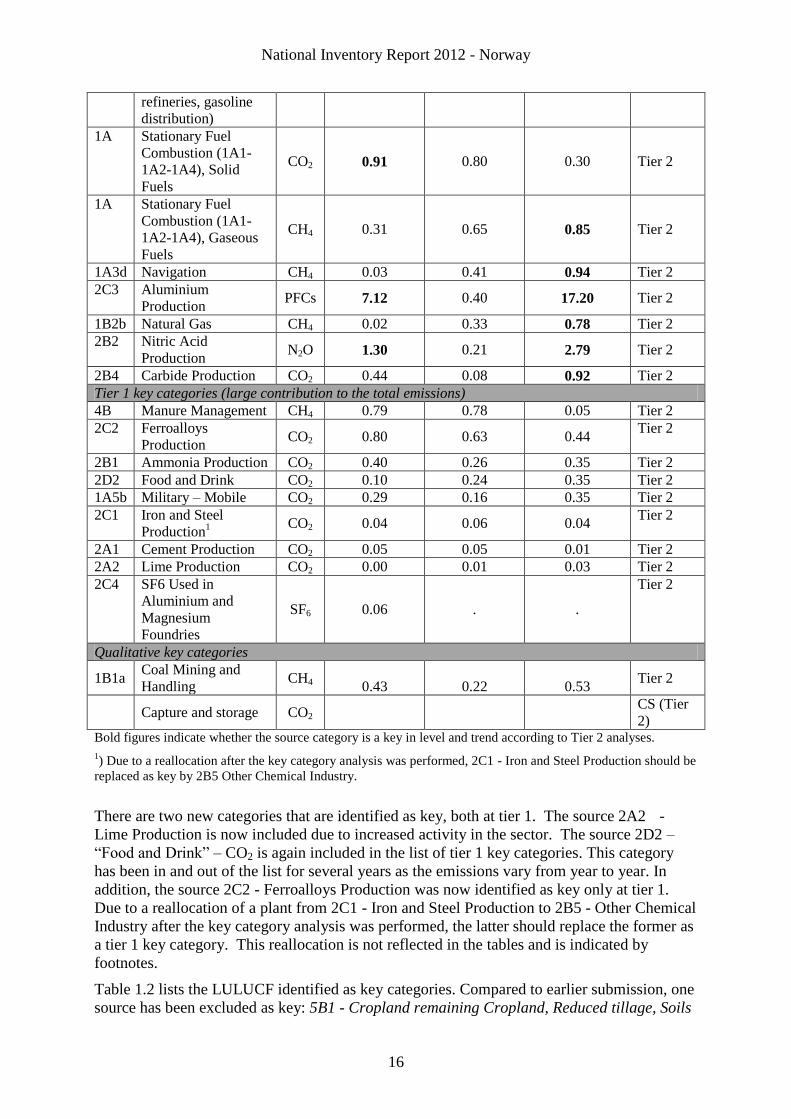
National Inventory Report 2012 - Norway
16
refineries, gasoline
distribution)
1A Stationary Fuel
Combustion (1A1-
1A2-1A4), Solid
Fuels
CO2 0.91 0.80 0.30 Tier 2
1A Stationary Fuel
Combustion (1A1-
1A2-1A4), Gaseous
Fuels
CH4 0.31 0.65 0.85 Tier 2
1A3d Navigation CH4 0.03 0.41 0.94 Tier 2
2C3 Aluminium
Production PFCs 7.12 0.40 17.20 Tier 2
1B2b Natural Gas CH4 0.02 0.33 0.78 Tier 2
2B2 Nitric Acid
Production N2O 1.30 0.21 2.79 Tier 2
2B4 Carbide Production CO2 0.44 0.08 0.92 Tier 2
Tier 1 key categories (large contribution to the total emissions)
4B Manure Management CH4 0.79 0.78 0.05 Tier 2
2C2 Ferroalloys
Production CO2 0.80 0.63 0.44
Tier 2
2B1 Ammonia Production CO2 0.40 0.26 0.35 Tier 2
2D2 Food and Drink CO2 0.10 0.24 0.35 Tier 2
1A5b Military – Mobile CO2 0.29 0.16 0.35 Tier 2
2C1 Iron and Steel
Production1 CO2 0.04 0.06 0.04
Tier 2
2A1 Cement Production CO2 0.05 0.05 0.01 Tier 2
2A2 Lime Production CO2 0.00 0.01 0.03 Tier 2
2C4 SF6 Used in
Aluminium and
Magnesium
Foundries
SF6 0.06 . .
Tier 2
Qualitative key categories
1B1a Coal Mining and
Handling CH4 0.43 0.22 0.53
Tier 2
Capture and storage CO2 CS (Tier
2) Bold figures indicate whether the source category is a key in level and trend according to Tier 2 analyses.
1) Due to a reallocation after the key category analysis was performed, 2C1 - Iron and Steel Production should be
replaced as key by 2B5 Other Chemical Industry.
There are two new categories that are identified as key, both at tier 1. The source 2A2 -
Lime Production is now included due to increased activity in the sector. The source 2D2 –
“Food and Drink” – CO2 is again included in the list of tier 1 key categories. This category
has been in and out of the list for several years as the emissions vary from year to year. In
addition, the source 2C2 - Ferroalloys Production was now identified as key only at tier 1.
Due to a reallocation of a plant from 2C1 - Iron and Steel Production to 2B5 - Other Chemical
Industry after the key category analysis was performed, the latter should replace the former as
a tier 1 key category. This reallocation is not reflected in the tables and is indicated by
footnotes.
Table 1.2 lists the LULUCF identified as key categories. Compared to earlier submission, one
source has been excluded as key: 5B1 - Cropland remaining Cropland, Reduced tillage, Soils
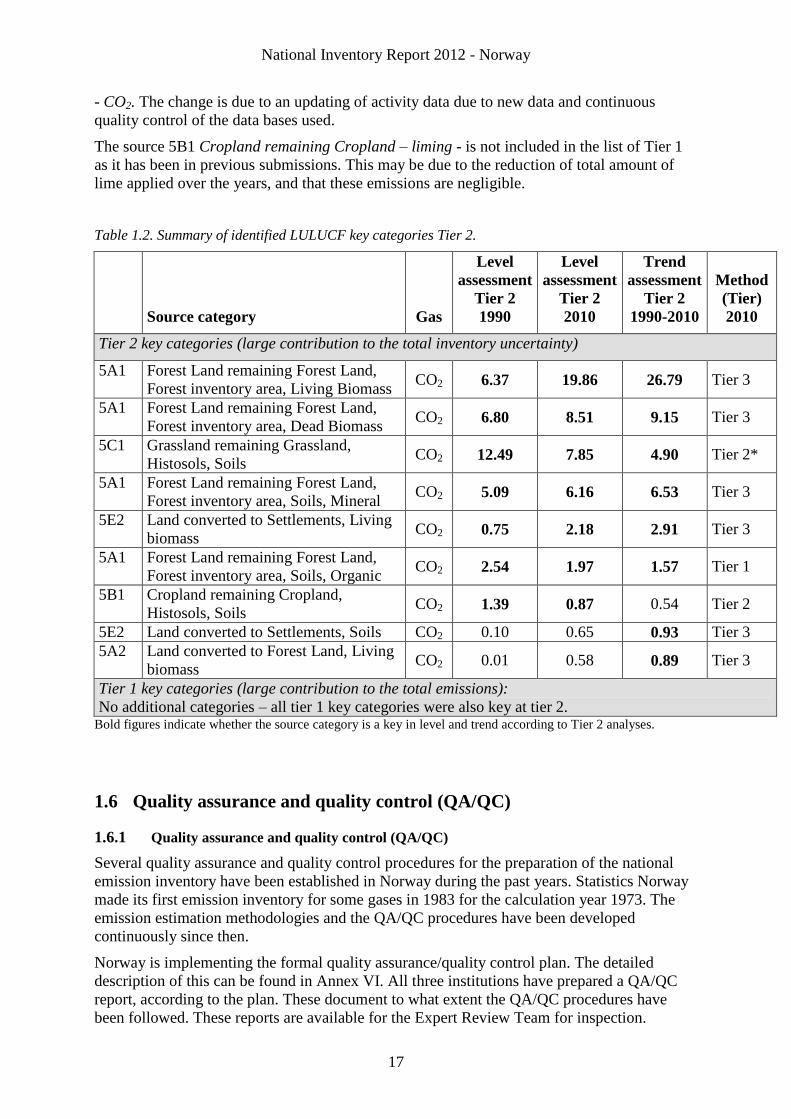
National Inventory Report 2012 - Norway
17
- CO2. The change is due to an updating of activity data due to new data and continuous
quality control of the data bases used.
The source 5B1 Cropland remaining Cropland – liming - is not included in the list of Tier 1
as it has been in previous submissions. This may be due to the reduction of total amount of
lime applied over the years, and that these emissions are negligible.
Table 1.2. Summary of identified LULUCF key categories Tier 2.
Source category Gas
Level
assessment
Tier 2
1990
Level
assessment
Tier 2
2010
Trend
assessment
Tier 2
1990-2010
Method
(Tier)
2010
Tier 2 key categories (large contribution to the total inventory uncertainty)
5A1 Forest Land remaining Forest Land,
Forest inventory area, Living Biomass CO2 6.37 19.86 26.79 Tier 3
5A1 Forest Land remaining Forest Land,
Forest inventory area, Dead Biomass CO2 6.80 8.51 9.15 Tier 3
5C1 Grassland remaining Grassland,
Histosols, Soils CO2 12.49 7.85 4.90 Tier 2*
5A1 Forest Land remaining Forest Land,
Forest inventory area, Soils, Mineral CO2 5.09 6.16 6.53 Tier 3
5E2 Land converted to Settlements, Living
biomass CO2 0.75 2.18 2.91 Tier 3
5A1 Forest Land remaining Forest Land,
Forest inventory area, Soils, Organic CO2 2.54 1.97 1.57 Tier 1
5B1 Cropland remaining Cropland,
Histosols, Soils CO2 1.39 0.87 0.54 Tier 2
5E2 Land converted to Settlements, Soils CO2 0.10 0.65 0.93 Tier 3
5A2 Land converted to Forest Land, Living
biomass CO2 0.01 0.58 0.89 Tier 3
Tier 1 key categories (large contribution to the total emissions):
No additional categories – all tier 1 key categories were also key at tier 2. Bold figures indicate whether the source category is a key in level and trend according to Tier 2 analyses.
1.6 Quality assurance and quality control (QA/QC)
1.6.1 Quality assurance and quality control (QA/QC)
Several quality assurance and quality control procedures for the preparation of the national
emission inventory have been established in Norway during the past years. Statistics Norway
made its first emission inventory for some gases in 1983 for the calculation year 1973. The
emission estimation methodologies and the QA/QC procedures have been developed
continuously since then.
Norway is implementing the formal quality assurance/quality control plan. The detailed
description of this can be found in Annex VI. All three institutions have prepared a QA/QC
report, according to the plan. These document to what extent the QA/QC procedures have
been followed. These reports are available for the Expert Review Team for inspection.
National Inventory Report 2012 - Norway
18
Based on these reports, the three institutions collaborate on which actions to take to further
improve the QA/QC of the inventory.
1.6.2 Verification studies
In general, the final inventory data provided by Statistics Norway are checked and verified by
Climate and Pollution Agency. In the following, some verification studies which have been
previously performed are briefly described.
Emission estimates for a source are often compared with estimates performed with a different
methodology. In particular, Norway has conducted a study on verification of the Norwegian
emission inventory (SFT/Statistics Norway 2000). The main goals of that work were to
investigate the possibility of using statistical data as indicators for comparing emission figures
between countries on a general basis, and to test the method on the Norwegian national
emission estimates. In the report Norwegian emission data are compared with national data
for Canada, Sweden and New Zealand. It was concluded that no large errors in the Norwegian
emission inventory were detected. The process of verification did, however, reveal several
smaller reporting errors; emissions that had been reported in other categories than they should
have been. These errors have been corrected in later reports to the UNFCCC. We do realize
that this method of verification only considers consistency compared with what other
countries report. It is not a verification of the scientific value of the inventory data themselves.
In 2002, a project funded by the Nordic Council of Ministers was carried out, where
emissions of greenhouse gases from the agricultural sector in the national emission
inventories were compared with the emissions derived from the IPCC default methodology
and the IPCC default factors (for details, see Chapter 6 on Agriculture).
1.6.3 Confidentiality issues
In general, the data contained in the Norwegian emission inventory are available to the public,
both activity data and emission factors. Confidentiality could be an issue for some of the data
collected by Statistics Norway when there are few entities reporting for a source-category.
However, confidential data used in the inventory are now almost entirely replaced by non-
confidential data collected by the Climate and Pollution Agency. All emission data and
activity data necessary for the CRF are publicly available.
1.7 Uncertainty evaluation
1.7.1 Introduction
The uncertainty in the Norwegian greenhouse gas emission inventory has been investigated
by a tier 2 analysis in 2011 and the results are described in section 1.7 and in Annex II in the
NIR 2012. A tier 2 analysis for the greenhouse gases was also performed in 2006, and the
results from that analysis is given in (Statistics Norway 2010c). The uncertainty in the
Norwegian emission inventory has also earlier been investigated systematically in three
reports SFT/Statistics Norway 1999, Statistics Norway 2000, Statistics Norway 2001c). The
first two reports focused on the uncertainty in the greenhouse gas emissions, and the last
report investigated the uncertainty in the emission estimates of long-range air pollutants.
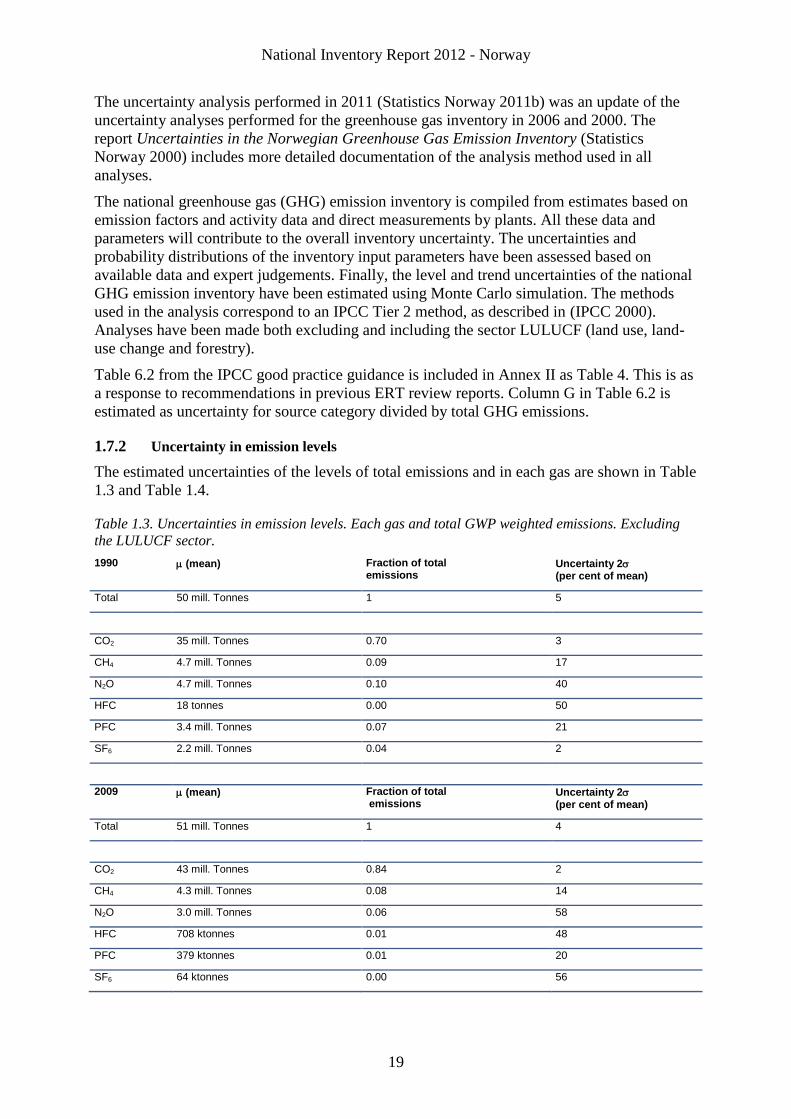
National Inventory Report 2012 - Norway
19
The uncertainty analysis performed in 2011 (Statistics Norway 2011b) was an update of the
uncertainty analyses performed for the greenhouse gas inventory in 2006 and 2000. The
report Uncertainties in the Norwegian Greenhouse Gas Emission Inventory (Statistics
Norway 2000) includes more detailed documentation of the analysis method used in all
analyses.
The national greenhouse gas (GHG) emission inventory is compiled from estimates based on
emission factors and activity data and direct measurements by plants. All these data and
parameters will contribute to the overall inventory uncertainty. The uncertainties and
probability distributions of the inventory input parameters have been assessed based on
available data and expert judgements. Finally, the level and trend uncertainties of the national
GHG emission inventory have been estimated using Monte Carlo simulation. The methods
used in the analysis correspond to an IPCC Tier 2 method, as described in (IPCC 2000).
Analyses have been made both excluding and including the sector LULUCF (land use, land-
use change and forestry).
Table 6.2 from the IPCC good practice guidance is included in Annex II as Table 4. This is as
a response to recommendations in previous ERT review reports. Column G in Table 6.2 is
estimated as uncertainty for source category divided by total GHG emissions.
1.7.2 Uncertainty in emission levels
The estimated uncertainties of the levels of total emissions and in each gas are shown in Table
1.3 and Table 1.4.
Table 1.3. Uncertainties in emission levels. Each gas and total GWP weighted emissions. Excluding
the LULUCF sector.
1990 (mean) Fraction of total emissions
Uncertainty 2 (per cent of mean)
Total 50 mill. Tonnes 1 5
CO2 35 mill. Tonnes 0.70 3
CH4 4.7 mill. Tonnes 0.09 17
N2O 4.7 mill. Tonnes 0.10 40
HFC 18 tonnes 0.00 50
PFC 3.4 mill. Tonnes 0.07 21
SF6 2.2 mill. Tonnes 0.04 2
2009 (mean) Fraction of total emissions
Uncertainty 2 (per cent of mean)
Total 51 mill. Tonnes 1 4
CO2 43 mill. Tonnes 0.84 2
CH4 4.3 mill. Tonnes 0.08 14
N2O 3.0 mill. Tonnes 0.06 58
HFC 708 ktonnes 0.01 48
PFC 379 ktonnes 0.01 20
SF6 64 ktonnes 0.00 56
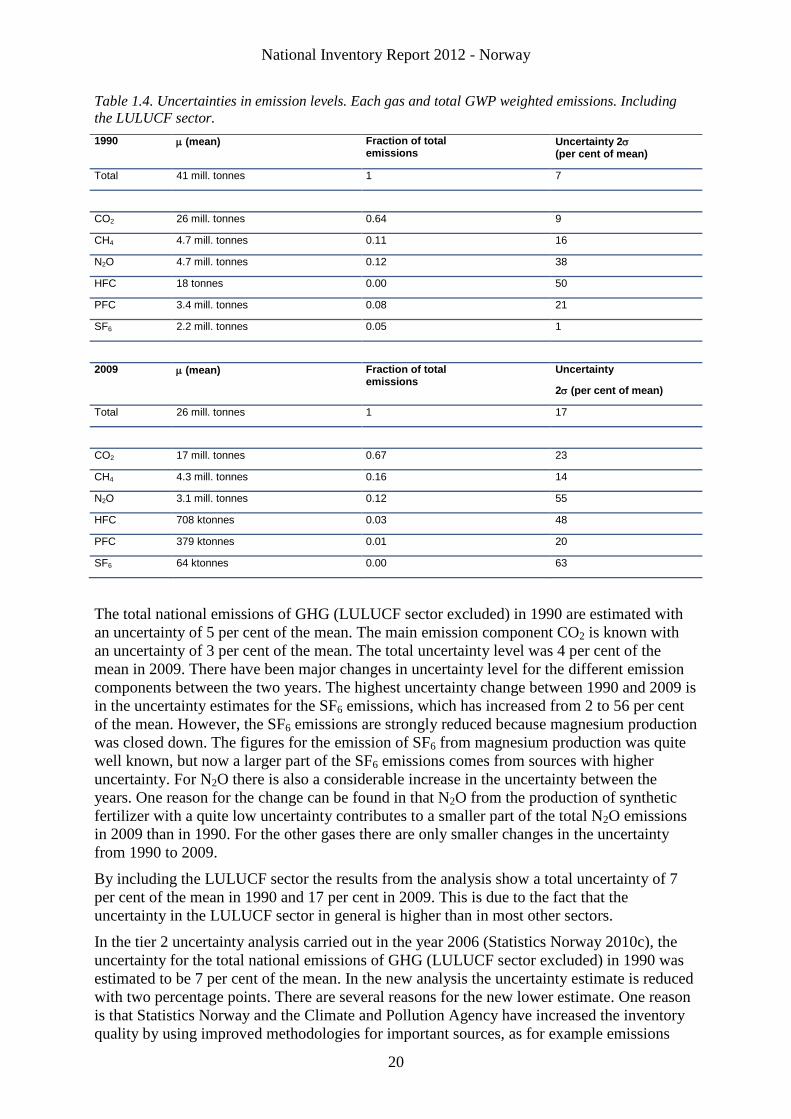
National Inventory Report 2012 - Norway
20
Table 1.4. Uncertainties in emission levels. Each gas and total GWP weighted emissions. Including
the LULUCF sector.
1990 (mean) Fraction of total emissions
Uncertainty 2 (per cent of mean)
Total 41 mill. tonnes 1 7
CO2 26 mill. tonnes 0.64 9
CH4 4.7 mill. tonnes 0.11 16
N2O 4.7 mill. tonnes 0.12 38
HFC 18 tonnes 0.00 50
PFC 3.4 mill. tonnes 0.08 21
SF6 2.2 mill. tonnes 0.05 1
2009 (mean) Fraction of total emissions
Uncertainty
2 (per cent of mean)
Total 26 mill. tonnes 1 17
CO2 17 mill. tonnes 0.67 23
CH4 4.3 mill. tonnes 0.16 14
N2O 3.1 mill. tonnes 0.12 55
HFC 708 ktonnes 0.03 48
PFC 379 ktonnes 0.01 20
SF6 64 ktonnes 0.00 63
The total national emissions of GHG (LULUCF sector excluded) in 1990 are estimated with
an uncertainty of 5 per cent of the mean. The main emission component CO2 is known with
an uncertainty of 3 per cent of the mean. The total uncertainty level was 4 per cent of the
mean in 2009. There have been major changes in uncertainty level for the different emission
components between the two years. The highest uncertainty change between 1990 and 2009 is
in the uncertainty estimates for the SF6 emissions, which has increased from 2 to 56 per cent
of the mean. However, the SF6 emissions are strongly reduced because magnesium production
was closed down. The figures for the emission of SF6 from magnesium production was quite
well known, but now a larger part of the SF6 emissions comes from sources with higher
uncertainty. For N2O there is also a considerable increase in the uncertainty between the
years. One reason for the change can be found in that N2O from the production of synthetic
fertilizer with a quite low uncertainty contributes to a smaller part of the total N2O emissions
in 2009 than in 1990. For the other gases there are only smaller changes in the uncertainty
from 1990 to 2009.
By including the LULUCF sector the results from the analysis show a total uncertainty of 7
per cent of the mean in 1990 and 17 per cent in 2009. This is due to the fact that the
uncertainty in the LULUCF sector in general is higher than in most other sectors.
In the tier 2 uncertainty analysis carried out in the year 2006 (Statistics Norway 2010c), the
uncertainty for the total national emissions of GHG (LULUCF sector excluded) in 1990 was
estimated to be 7 per cent of the mean. In the new analysis the uncertainty estimate is reduced
with two percentage points. There are several reasons for the new lower estimate. One reason
is that Statistics Norway and the Climate and Pollution Agency have increased the inventory
quality by using improved methodologies for important sources, as for example emissions
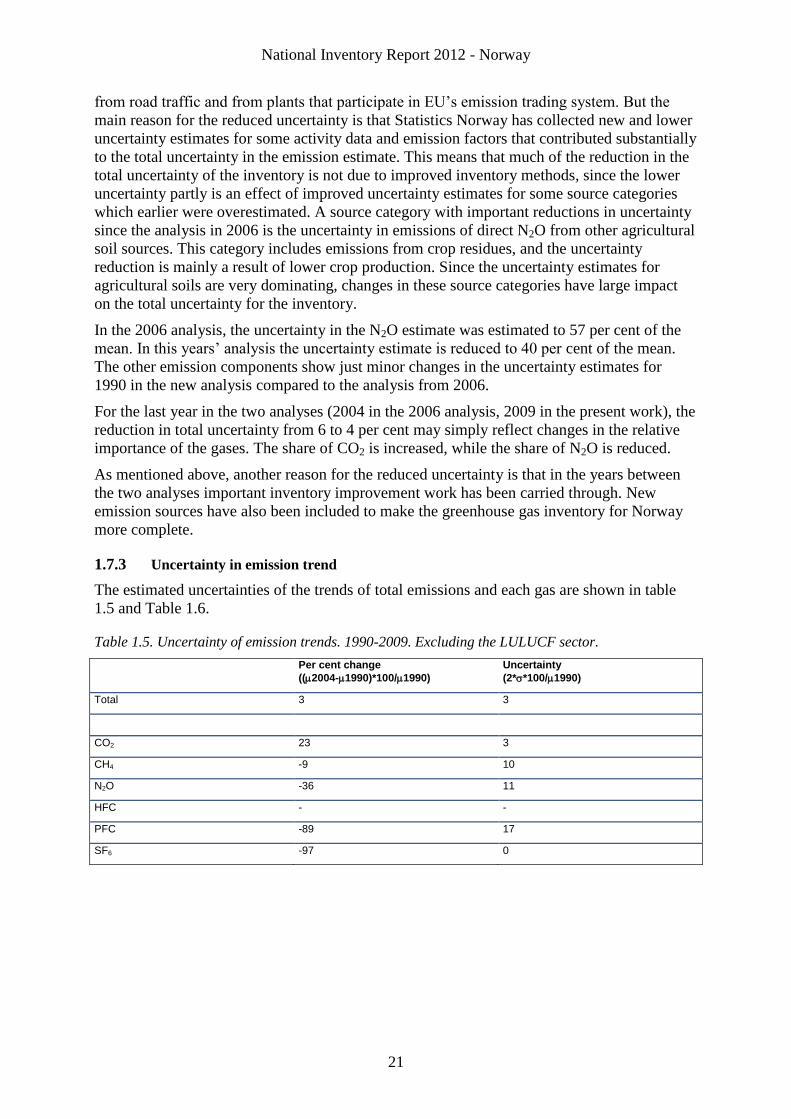
National Inventory Report 2012 - Norway
21
from road traffic and from plants that participate in EU’s emission trading system. But the
main reason for the reduced uncertainty is that Statistics Norway has collected new and lower
uncertainty estimates for some activity data and emission factors that contributed substantially
to the total uncertainty in the emission estimate. This means that much of the reduction in the
total uncertainty of the inventory is not due to improved inventory methods, since the lower
uncertainty partly is an effect of improved uncertainty estimates for some source categories
which earlier were overestimated. A source category with important reductions in uncertainty
since the analysis in 2006 is the uncertainty in emissions of direct N2O from other agricultural
soil sources. This category includes emissions from crop residues, and the uncertainty
reduction is mainly a result of lower crop production. Since the uncertainty estimates for
agricultural soils are very dominating, changes in these source categories have large impact
on the total uncertainty for the inventory.
In the 2006 analysis, the uncertainty in the N2O estimate was estimated to 57 per cent of the
mean. In this years’ analysis the uncertainty estimate is reduced to 40 per cent of the mean.
The other emission components show just minor changes in the uncertainty estimates for
1990 in the new analysis compared to the analysis from 2006.
For the last year in the two analyses (2004 in the 2006 analysis, 2009 in the present work), the
reduction in total uncertainty from 6 to 4 per cent may simply reflect changes in the relative
importance of the gases. The share of CO2 is increased, while the share of N2O is reduced.
As mentioned above, another reason for the reduced uncertainty is that in the years between
the two analyses important inventory improvement work has been carried through. New
emission sources have also been included to make the greenhouse gas inventory for Norway
more complete.
1.7.3 Uncertainty in emission trend
The estimated uncertainties of the trends of total emissions and each gas are shown in table
1.5 and Table 1.6.
Table 1.5. Uncertainty of emission trends. 1990-2009. Excluding the LULUCF sector.
Per cent change
((2004-1990)*100/1990)
Uncertainty
(2**100/1990)
Total 3 3
CO2 23 3
CH4 -9 10
N2O -36 11
HFC - -
PFC -89 17
SF6 -97 0
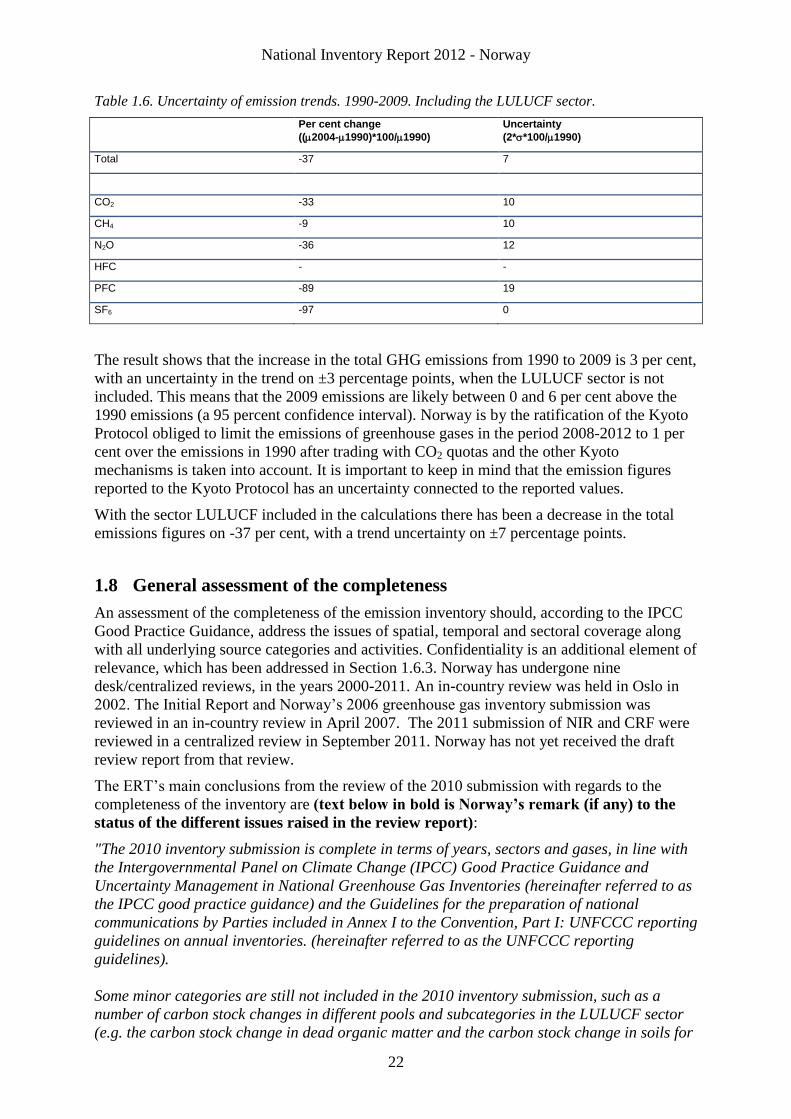
National Inventory Report 2012 - Norway
22
Table 1.6. Uncertainty of emission trends. 1990-2009. Including the LULUCF sector.
Per cent change
((2004-1990)*100/1990)
Uncertainty
(2**100/1990)
Total -37 7
CO2 -33 10
CH4 -9 10
N2O -36 12
HFC - -
PFC -89 19
SF6 -97 0
The result shows that the increase in the total GHG emissions from 1990 to 2009 is 3 per cent,
with an uncertainty in the trend on ±3 percentage points, when the LULUCF sector is not
included. This means that the 2009 emissions are likely between 0 and 6 per cent above the
1990 emissions (a 95 percent confidence interval). Norway is by the ratification of the Kyoto
Protocol obliged to limit the emissions of greenhouse gases in the period 2008-2012 to 1 per
cent over the emissions in 1990 after trading with CO2 quotas and the other Kyoto
mechanisms is taken into account. It is important to keep in mind that the emission figures
reported to the Kyoto Protocol has an uncertainty connected to the reported values.
With the sector LULUCF included in the calculations there has been a decrease in the total
emissions figures on -37 per cent, with a trend uncertainty on ±7 percentage points.
1.8 General assessment of the completeness
An assessment of the completeness of the emission inventory should, according to the IPCC
Good Practice Guidance, address the issues of spatial, temporal and sectoral coverage along
with all underlying source categories and activities. Confidentiality is an additional element of
relevance, which has been addressed in Section 1.6.3. Norway has undergone nine
desk/centralized reviews, in the years 2000-2011. An in-country review was held in Oslo in
2002. The Initial Report and Norway’s 2006 greenhouse gas inventory submission was
reviewed in an in-country review in April 2007. The 2011 submission of NIR and CRF were
reviewed in a centralized review in September 2011. Norway has not yet received the draft
review report from that review.
The ERT’s main conclusions from the review of the 2010 submission with regards to the
completeness of the inventory are (text below in bold is Norway’s remark (if any) to the
status of the different issues raised in the review report):
"The 2010 inventory submission is complete in terms of years, sectors and gases, in line with
the Intergovernmental Panel on Climate Change (IPCC) Good Practice Guidance and
Uncertainty Management in National Greenhouse Gas Inventories (hereinafter referred to as
the IPCC good practice guidance) and the Guidelines for the preparation of national
communications by Parties included in Annex I to the Convention, Part I: UNFCCC reporting
guidelines on annual inventories. (hereinafter referred to as the UNFCCC reporting
guidelines).
Some minor categories are still not included in the 2010 inventory submission, such as a
number of carbon stock changes in different pools and subcategories in the LULUCF sector
(e.g. the carbon stock change in dead organic matter and the carbon stock change in soils for
National Inventory Report 2012 - Norway
23
land converted to forest land). However, fewer subcategories were reported as not estimated
(.NE.) under the LULUCF sector in the 2010 inventory submission than in the 2009 inventory
submission, and in the other sectors all categories are estimated except for N2O from
industrial wastewater. The ERT encourages Norway to continue to make efforts to estimate
emissions for the subcategories that are currently reported as "NE". Norway continuously
strives to estimate emissions that are reported as NE. With regards to some of the
LULUCF subcategories, chapter 7.3.2 explains that the model applied is not designed
for obtaining dead organic matter and soil organic carbon for disaggregated areas of
land-use categories.
The ERT noted the detection of a blank cell in CRF table 1.A(b) as reported in the 2010 status
report for Norway. The ERT recommends that Norway fill in the blank cell in the CRF table
for its next annual submission. We have not found any blank cell in CRF table 1.A(b).
The ERT commends Norway for making progress on the completeness of its inventory and for
submitting, for the first time, data for several categories as recommended in previous review
reports (e.g. CH4 and N2O from oil flaring and potential emissions of SF6)."
In terms of spatial coverage, the emission reporting under the UNFCCC covers all activities
within Norway’s jurisdiction. There is an exception of minor sources/sinks, which are not
covered. They are:
Emissions of CH4 from agricultural waste, after it is applied to soils. In the IPCC
Guidelines it is written that "Agricultural soils may also emit CH4", but no calculation
methodology is proposed. (Comment: As far as we know there is no calculation
method for this in (IPPC 1997b) or GPG (IPCC 2000). From our knowledge there is
no other party reporting CH4 in this sector.)
Carbon stock change of harvested wood products (HWP). The IPCC default method is
used, where harvested wood is counted as emissions the year the harvest takes places. For
this NIR, Norway has decided to report on net removals from HWP following the stock
change approach. The reported net removals is however not included in the LULUCF
category “5G-Other”, but reported separately in Annex VII to this report.
1.9 Implemented and planned improvements
1.9.1 Implemented improvements since NIR 2011
Table 1.17 gives a brief overview of the improvements implemented since the 2011
submission.
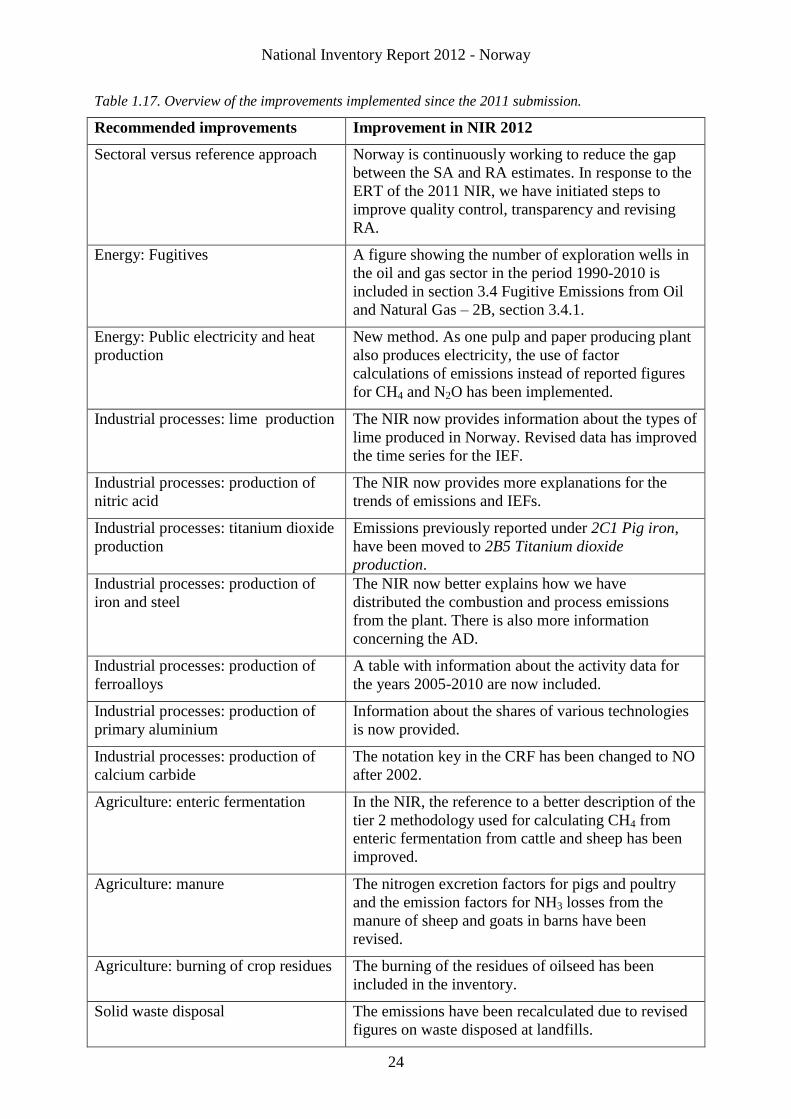
National Inventory Report 2012 - Norway
24
Table 1.17. Overview of the improvements implemented since the 2011 submission.
Recommended improvements Improvement in NIR 2012
Sectoral versus reference approach Norway is continuously working to reduce the gap
between the SA and RA estimates. In response to the
ERT of the 2011 NIR, we have initiated steps to
improve quality control, transparency and revising
RA.
Energy: Fugitives A figure showing the number of exploration wells in
the oil and gas sector in the period 1990-2010 is
included in section 3.4 Fugitive Emissions from Oil
and Natural Gas – 2B, section 3.4.1.
Energy: Public electricity and heat
production
New method. As one pulp and paper producing plant
also produces electricity, the use of factor
calculations of emissions instead of reported figures
for CH4 and N2O has been implemented.
Industrial processes: lime production The NIR now provides information about the types of
lime produced in Norway. Revised data has improved
the time series for the IEF.
Industrial processes: production of
nitric acid
The NIR now provides more explanations for the
trends of emissions and IEFs.
Industrial processes: titanium dioxide
production
Emissions previously reported under 2C1 Pig iron,
have been moved to 2B5 Titanium dioxide
production.
Industrial processes: production of
iron and steel
The NIR now better explains how we have
distributed the combustion and process emissions
from the plant. There is also more information
concerning the AD.
Industrial processes: production of
ferroalloys
A table with information about the activity data for
the years 2005-2010 are now included.
Industrial processes: production of
primary aluminium
Information about the shares of various technologies
is now provided.
Industrial processes: production of
calcium carbide
The notation key in the CRF has been changed to NO
after 2002.
Agriculture: enteric fermentation In the NIR, the reference to a better description of the
tier 2 methodology used for calculating CH4 from
enteric fermentation from cattle and sheep has been
improved.
Agriculture: manure The nitrogen excretion factors for pigs and poultry
and the emission factors for NH3 losses from the
manure of sheep and goats in barns have been
revised.
Agriculture: burning of crop residues The burning of the residues of oilseed has been
included in the inventory.
Solid waste disposal The emissions have been recalculated due to revised
figures on waste disposed at landfills.
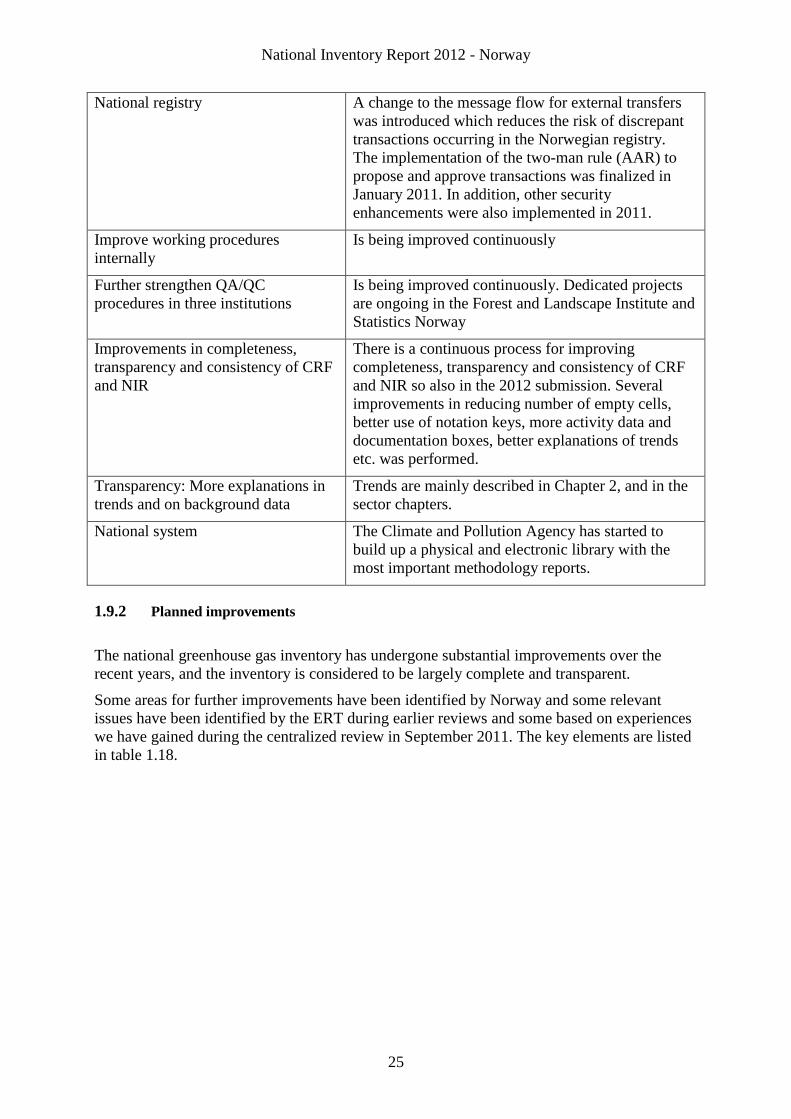
National Inventory Report 2012 - Norway
25
National registry A change to the message flow for external transfers
was introduced which reduces the risk of discrepant
transactions occurring in the Norwegian registry.
The implementation of the two-man rule (AAR) to
propose and approve transactions was finalized in
January 2011. In addition, other security
enhancements were also implemented in 2011.
Improve working procedures
internally
Is being improved continuously
Further strengthen QA/QC
procedures in three institutions
Is being improved continuously. Dedicated projects
are ongoing in the Forest and Landscape Institute and
Statistics Norway
Improvements in completeness,
transparency and consistency of CRF
and NIR
There is a continuous process for improving
completeness, transparency and consistency of CRF
and NIR so also in the 2012 submission. Several
improvements in reducing number of empty cells,
better use of notation keys, more activity data and
documentation boxes, better explanations of trends
etc. was performed.
Transparency: More explanations in
trends and on background data
Trends are mainly described in Chapter 2, and in the
sector chapters.
National system The Climate and Pollution Agency has started to
build up a physical and electronic library with the
most important methodology reports.
1.9.2 Planned improvements
The national greenhouse gas inventory has undergone substantial improvements over the
recent years, and the inventory is considered to be largely complete and transparent.
Some areas for further improvements have been identified by Norway and some relevant
issues have been identified by the ERT during earlier reviews and some based on experiences
we have gained during the centralized review in September 2011. The key elements are listed
in table 1.18.
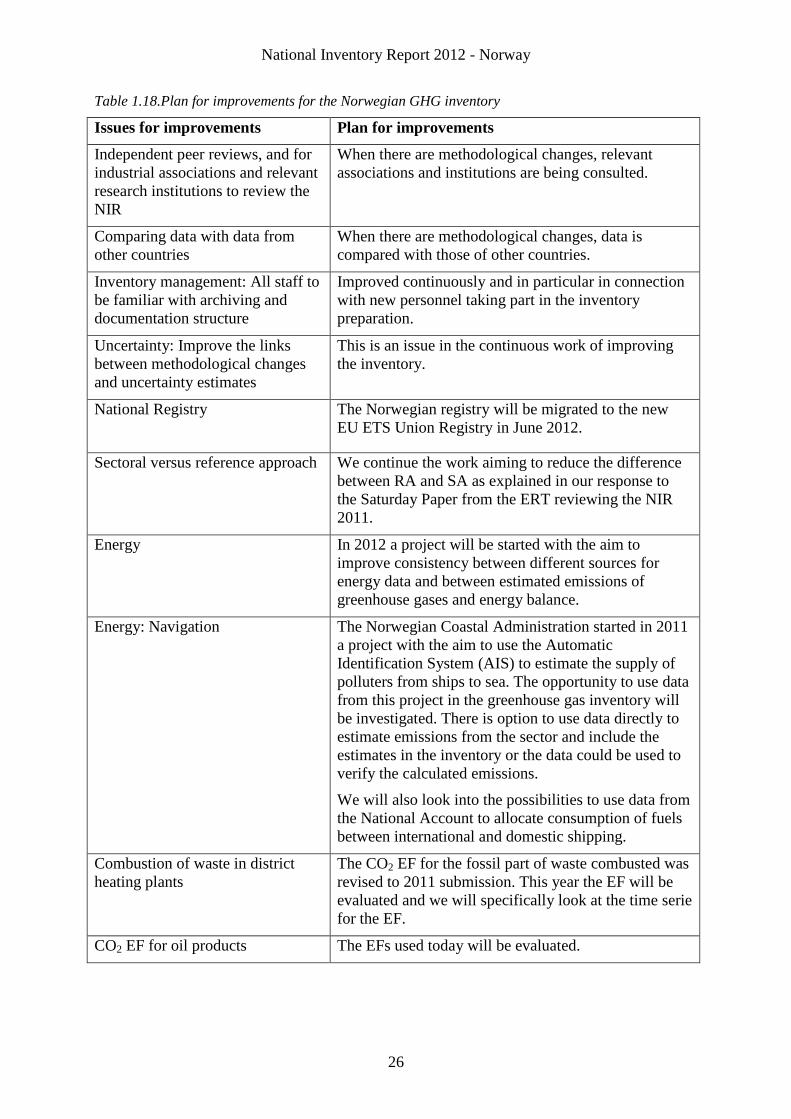
National Inventory Report 2012 - Norway
26
Table 1.18.Plan for improvements for the Norwegian GHG inventory
Issues for improvements Plan for improvements
Independent peer reviews, and for
industrial associations and relevant
research institutions to review the
NIR
When there are methodological changes, relevant
associations and institutions are being consulted.
Comparing data with data from
other countries
When there are methodological changes, data is
compared with those of other countries.
Inventory management: All staff to
be familiar with archiving and
documentation structure
Improved continuously and in particular in connection
with new personnel taking part in the inventory
preparation.
Uncertainty: Improve the links
between methodological changes
and uncertainty estimates
This is an issue in the continuous work of improving
the inventory.
National Registry
The Norwegian registry will be migrated to the new
EU ETS Union Registry in June 2012.
Sectoral versus reference approach We continue the work aiming to reduce the difference
between RA and SA as explained in our response to
the Saturday Paper from the ERT reviewing the NIR
2011.
Energy In 2012 a project will be started with the aim to
improve consistency between different sources for
energy data and between estimated emissions of
greenhouse gases and energy balance.
Energy: Navigation The Norwegian Coastal Administration started in 2011
a project with the aim to use the Automatic
Identification System (AIS) to estimate the supply of
polluters from ships to sea. The opportunity to use data
from this project in the greenhouse gas inventory will
be investigated. There is option to use data directly to
estimate emissions from the sector and include the
estimates in the inventory or the data could be used to
verify the calculated emissions.
We will also look into the possibilities to use data from
the National Account to allocate consumption of fuels
between international and domestic shipping.
Combustion of waste in district
heating plants
The CO2 EF for the fossil part of waste combusted was
revised to 2011 submission. This year the EF will be
evaluated and we will specifically look at the time serie
for the EF.
CO2 EF for oil products The EFs used today will be evaluated.
National Inventory Report 2012 - Norway
27
Energy: Road transportation A new road emission model has been implemented this
year and further improvement of the model will be
considered before next year submission. The report
with a complete documentation of the new model has
not been finalized to the 2012 submission due to
personnel being on leave.
Energy: off-road machinery A project have been started to evaluate and update the
calculation model and the plan is to complete this work
in time for the 2013 submission.
Industrial processes : HFC model A project on updating activity data and the calculation
model was started in 2011 and is continuing through
2012. A first draft for updating activity data for the
years 2005-2009 was generated in 2011 by combining
the two data sources. In 2012 the calculation model
will be moved to a new platform because of the lack of
flexibility in the current Excel-based model.
Industrial processes: soda ash use During the centralized review of the 2011 NIR, the
ERT asked for information confirming that no soda ash
use takes place in Norway. A first examination
indicates that we have some use of soda ash in
Norway. We will look further into this and plan to
report these emissions in the 2013 submission.
Industrial processes: plastic The ERT has noted an unstable and increasing trend
from 2006 for the CO2 emissions from plastic. A
preliminary assessment is that the increase may be due
to inconsistencies with regards to where emissions
from flaring have been allocated. We intend to look
into this in time for the submission of the 2013 NIR.
Industrial processes: consumption
of halocarbons and SF6
During the centralized review of the 2011 NIR, a small
error in the emission factor for HFC-134 and
Perfluorpentane (C3F8) was discovered. This does not
have consequences for the size of emissions, but will
result in a shift in the time series. We intend to
reallocate these emissions in the 2013 submission.
Industrial processes: chemicals The ERT has recommended Norway to investigate the
treatment and allocation of carbon monoxide (CO) gas
used for fuel combustion under the chemicals category
and provide more detailed documentation in the NIR.
We intend to look into this in time for the submission
of the 2013 NIR.
Agriculture: Bo, MCF A project with the aim to revise the Norwegian CH4
conversion factors (MCF) for the manure storage
systems in use is ongoing at the Norwegian University
of Life Sciences (UMB). The maximum CH4
producing capacity (Bo) is also planned to be revised
for cattle manure. The results from the project are
planned to be implemented in the 2013 submission.
National Inventory Report 2012 - Norway
28
Agriculture: manure storage
systems
New information about the use of manure storage
systems from the Sample survey of agriculture 2011
performed by Statistics Norway is planned to be
implemented in the inventory before the 2013
submission.
Agriculture: nitrogen excretion
factors and VS
A project with the aim to update the Norwegian
nitrogen excretion factors and the values for manure
excreted for the different animal species are ongoing at
the Norwegian University of Life Sciences (UMB).
The results from the project are planned to be
implemented in the 2013 submission.
Agriculture: nitrogen leaching and
run-off
The national Frac LEACH factor is under revision and the
results of the study is planned to be implemented in the
2013 submission.
LULUCF: The extent of the area
of forest and other wooded land at
higher altitudes
The data collection to confirm the extent of the area
of forest and other wooded land at higher altitudes
was finalized in 2009. The preliminary results
included in this submission is planned to be further
improved until the reporting in 2014.
LULUCF: Including Finnmark
County
A full forest inventory on plots in a 3x3 km grid in
coniferous forest areas and in a 9x9 km grid in birch
forest areas in Finnmark County started in 2005 and
was conducted in 2011, but not in time for the results
to be included in this submission. The preliminary
results included in this submission is planned to be
further improved until the reporting in 2014.
LULUCF: Improve the
information of land cover and
land-use of plots in the 3×3 km
grid that was assessed in the
earlier inventories
In 2007 national aerial photographs started to be used
to supplement the field survey to update and check
land cover statistics and land cover change statistics.
In addition this information will among others be
used to make a reliable back-casting of biomass and
land-use classes for newly established inventory plots
back to 1990.
LULUCF: Survey of dead wood
at all inventory plots
The NFI started in 2010 a survey of dead wood on the
ground at all inventory plots in the entire country. The
results will be used in the inventory consecutively
when available.
LULUCF: Cropland and grassland
Within 2013 it is planned to evaluate the methods
used for assessing emissions and removals for
cropland and grassland.

National Inventory Report 2012 - Norway
29
LULUCF: Forest soils
It is planned to improve the estimates of net change in
soil organic carbon for mineral soils at forest land
remaining forest land, land converted to forest land
and forest land converted to other land-use categories.
It is planned to use the Yasso07 model for these
calculations. Furthermore, it is planned to update all
the required input values covering the entire country
when they are available from the NFI and research
projects, at latest for the reporting in 2014.
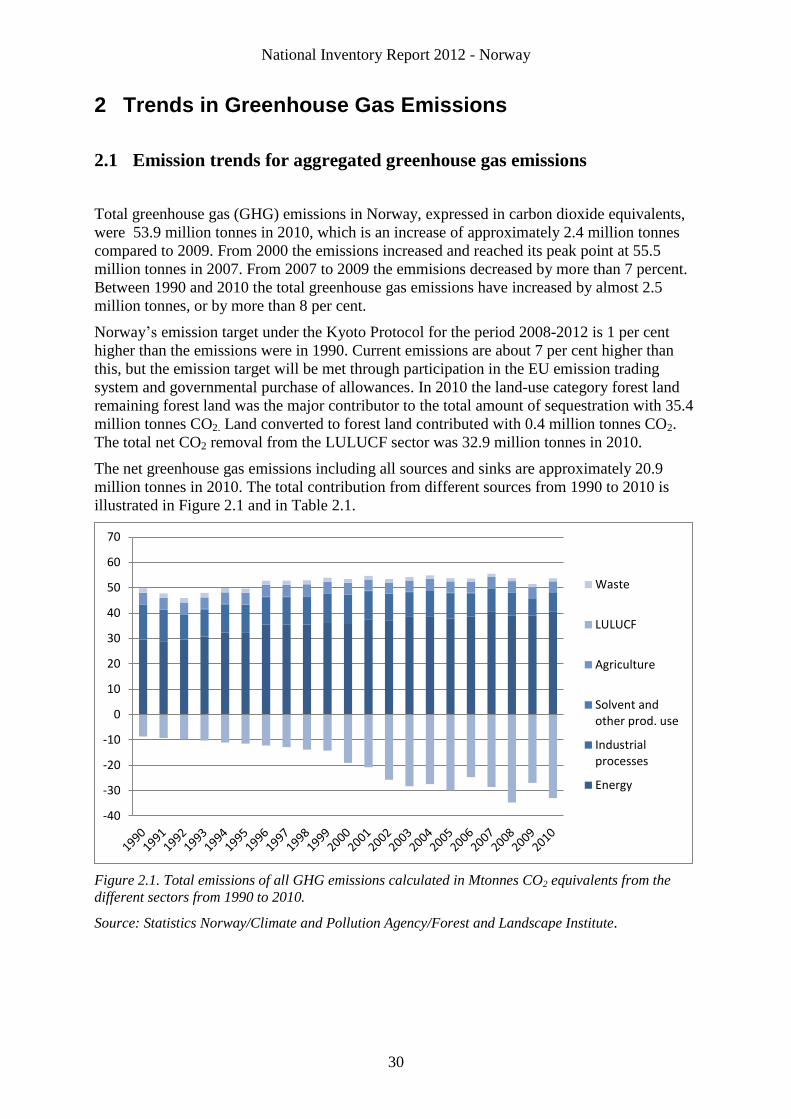
National Inventory Report 2012 - Norway
30
2 Trends in Greenhouse Gas Emissions
2.1 Emission trends for aggregated greenhouse gas emissions
Total greenhouse gas (GHG) emissions in Norway, expressed in carbon dioxide equivalents,
were 53.9 million tonnes in 2010, which is an increase of approximately 2.4 million tonnes
compared to 2009. From 2000 the emissions increased and reached its peak point at 55.5
million tonnes in 2007. From 2007 to 2009 the emmisions decreased by more than 7 percent.
Between 1990 and 2010 the total greenhouse gas emissions have increased by almost 2.5
million tonnes, or by more than 8 per cent.
Norway’s emission target under the Kyoto Protocol for the period 2008-2012 is 1 per cent
higher than the emissions were in 1990. Current emissions are about 7 per cent higher than
this, but the emission target will be met through participation in the EU emission trading
system and governmental purchase of allowances. In 2010 the land-use category forest land
remaining forest land was the major contributor to the total amount of sequestration with 35.4
million tonnes CO2. Land converted to forest land contributed with 0.4 million tonnes CO2.
The total net CO2 removal from the LULUCF sector was 32.9 million tonnes in 2010.
The net greenhouse gas emissions including all sources and sinks are approximately 20.9
million tonnes in 2010. The total contribution from different sources from 1990 to 2010 is
illustrated in Figure 2.1 and in Table 2.1.
Figure 2.1. Total emissions of all GHG emissions calculated in Mtonnes CO2 equivalents from the
different sectors from 1990 to 2010.
Source: Statistics Norway/Climate and Pollution Agency/Forest and Landscape Institute.
-40
-30
-20
-10
0
10
20
30
40
50
60
70
Waste
LULUCF
Agriculture
Solvent andother prod. use
Industrialprocesses
Energy
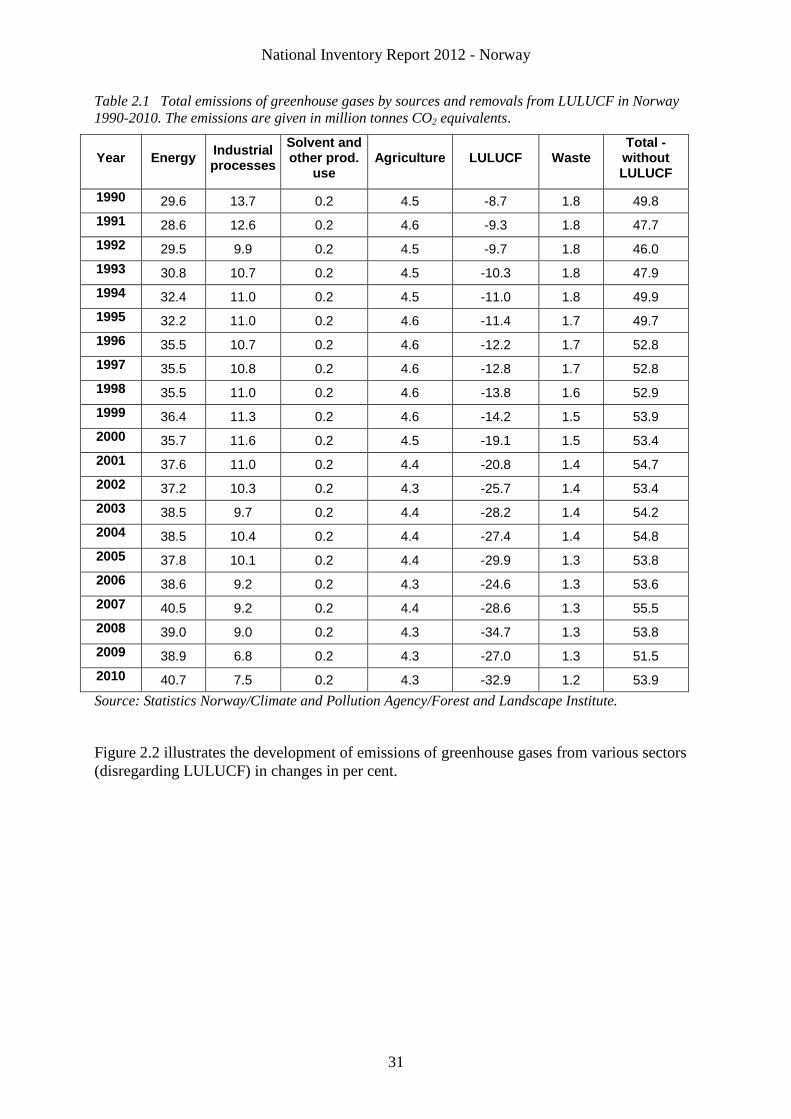
National Inventory Report 2012 - Norway
31
Table 2.1 Total emissions of greenhouse gases by sources and removals from LULUCF in Norway
1990-2010. The emissions are given in million tonnes CO2 equivalents.
Year Energy Industrial processes
Solvent and other prod.
use Agriculture LULUCF Waste
Total - without LULUCF
1990 29.6 13.7 0.2 4.5 -8.7 1.8 49.8
1991 28.6 12.6 0.2 4.6 -9.3 1.8 47.7
1992 29.5 9.9 0.2 4.5 -9.7 1.8 46.0
1993 30.8 10.7 0.2 4.5 -10.3 1.8 47.9
1994 32.4 11.0 0.2 4.5 -11.0 1.8 49.9
1995 32.2 11.0 0.2 4.6 -11.4 1.7 49.7
1996 35.5 10.7 0.2 4.6 -12.2 1.7 52.8
1997 35.5 10.8 0.2 4.6 -12.8 1.7 52.8
1998 35.5 11.0 0.2 4.6 -13.8 1.6 52.9
1999 36.4 11.3 0.2 4.6 -14.2 1.5 53.9
2000 35.7 11.6 0.2 4.5 -19.1 1.5 53.4
2001 37.6 11.0 0.2 4.4 -20.8 1.4 54.7
2002 37.2 10.3 0.2 4.3 -25.7 1.4 53.4
2003 38.5 9.7 0.2 4.4 -28.2 1.4 54.2
2004 38.5 10.4 0.2 4.4 -27.4 1.4 54.8
2005 37.8 10.1 0.2 4.4 -29.9 1.3 53.8
2006 38.6 9.2 0.2 4.3 -24.6 1.3 53.6
2007 40.5 9.2 0.2 4.4 -28.6 1.3 55.5
2008 39.0 9.0 0.2 4.3 -34.7 1.3 53.8
2009 38.9 6.8 0.2 4.3 -27.0 1.3 51.5
2010 40.7 7.5 0.2 4.3 -32.9 1.2 53.9
Source: Statistics Norway/Climate and Pollution Agency/Forest and Landscape Institute.
Figure 2.2 illustrates the development of emissions of greenhouse gases from various sectors
(disregarding LULUCF) in changes in per cent.
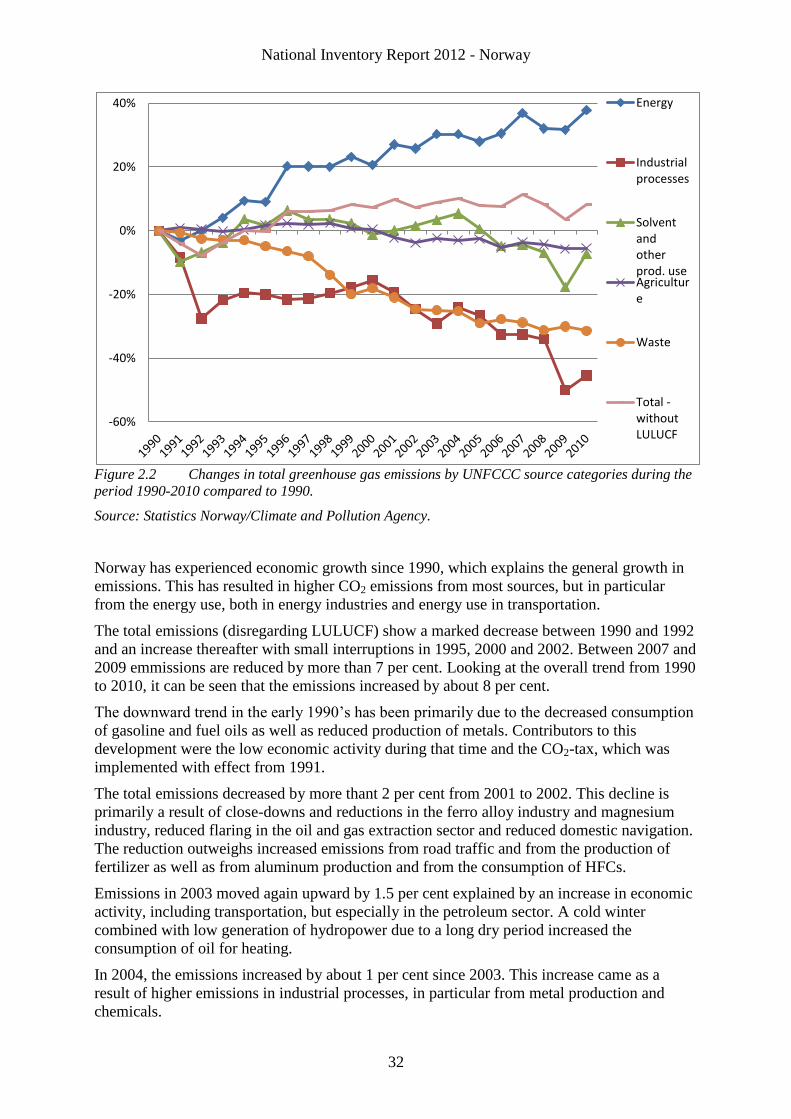
National Inventory Report 2012 - Norway
32
Figure 2.2 Changes in total greenhouse gas emissions by UNFCCC source categories during the
period 1990-2010 compared to 1990.
Source: Statistics Norway/Climate and Pollution Agency.
Norway has experienced economic growth since 1990, which explains the general growth in
emissions. This has resulted in higher CO2 emissions from most sources, but in particular
from the energy use, both in energy industries and energy use in transportation.
The total emissions (disregarding LULUCF) show a marked decrease between 1990 and 1992
and an increase thereafter with small interruptions in 1995, 2000 and 2002. Between 2007 and
2009 emmissions are reduced by more than 7 per cent. Looking at the overall trend from 1990
to 2010, it can be seen that the emissions increased by about 8 per cent.
The downward trend in the early 1990’s has been primarily due to the decreased consumption
of gasoline and fuel oils as well as reduced production of metals. Contributors to this
development were the low economic activity during that time and the CO2-tax, which was
implemented with effect from 1991.
The total emissions decreased by more thant 2 per cent from 2001 to 2002. This decline is
primarily a result of close-downs and reductions in the ferro alloy industry and magnesium
industry, reduced flaring in the oil and gas extraction sector and reduced domestic navigation.
The reduction outweighs increased emissions from road traffic and from the production of
fertilizer as well as from aluminum production and from the consumption of HFCs.
Emissions in 2003 moved again upward by 1.5 per cent explained by an increase in economic
activity, including transportation, but especially in the petroleum sector. A cold winter
combined with low generation of hydropower due to a long dry period increased the
consumption of oil for heating.
In 2004, the emissions increased by about 1 per cent since 2003. This increase came as a
result of higher emissions in industrial processes, in particular from metal production and
chemicals.
-60%
-40%
-20%
0%
20%
40% Energy
Industrialprocesses
Solventandotherprod. useAgriculture
Waste
Total -withoutLULUCF
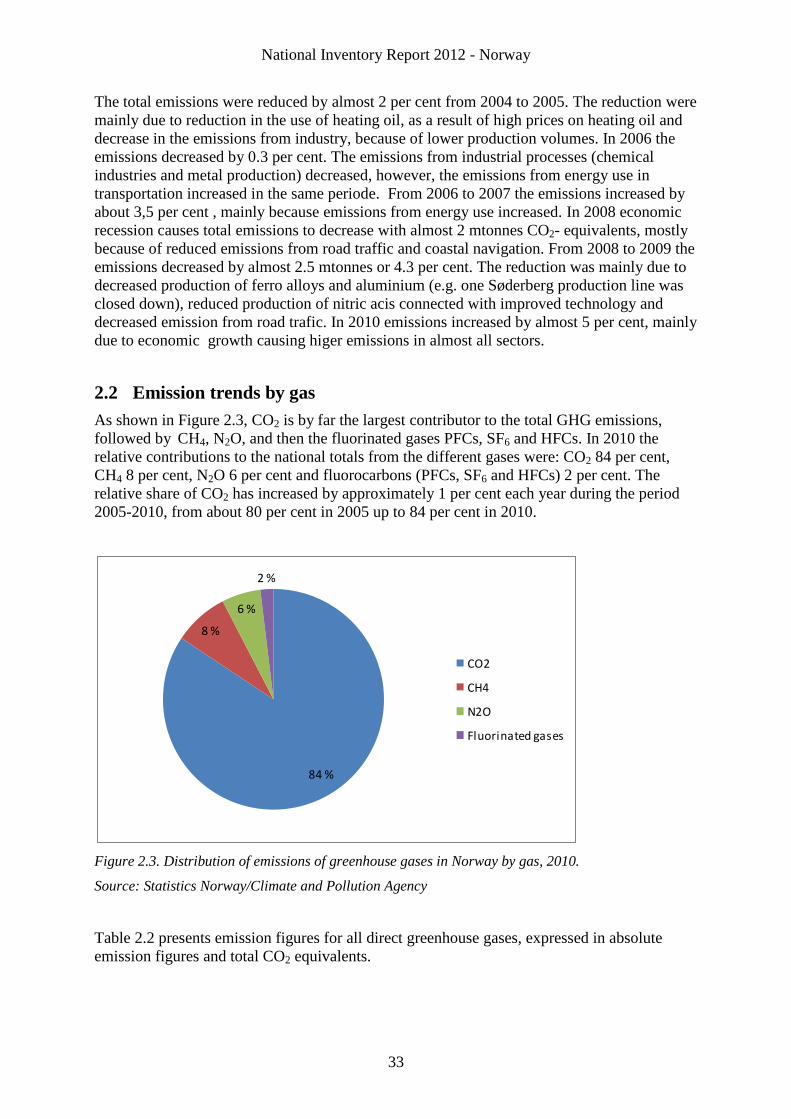
National Inventory Report 2012 - Norway
33
The total emissions were reduced by almost 2 per cent from 2004 to 2005. The reduction were
mainly due to reduction in the use of heating oil, as a result of high prices on heating oil and
decrease in the emissions from industry, because of lower production volumes. In 2006 the
emissions decreased by 0.3 per cent. The emissions from industrial processes (chemical
industries and metal production) decreased, however, the emissions from energy use in
transportation increased in the same periode. From 2006 to 2007 the emissions increased by
about 3,5 per cent , mainly because emissions from energy use increased. In 2008 economic
recession causes total emissions to decrease with almost 2 mtonnes CO2- equivalents, mostly
because of reduced emissions from road traffic and coastal navigation. From 2008 to 2009 the
emissions decreased by almost 2.5 mtonnes or 4.3 per cent. The reduction was mainly due to
decreased production of ferro alloys and aluminium (e.g. one Søderberg production line was
closed down), reduced production of nitric acis connected with improved technology and
decreased emission from road trafic. In 2010 emissions increased by almost 5 per cent, mainly
due to economic growth causing higer emissions in almost all sectors.
2.2 Emission trends by gas
As shown in Figure 2.3, CO2 is by far the largest contributor to the total GHG emissions,
followed by CH4, N2O, and then the fluorinated gases PFCs, SF6 and HFCs. In 2010 the
relative contributions to the national totals from the different gases were: CO2 84 per cent,
CH4 8 per cent, N2O 6 per cent and fluorocarbons (PFCs, SF6 and HFCs) 2 per cent. The
relative share of CO2 has increased by approximately 1 per cent each year during the period
2005-2010, from about 80 per cent in 2005 up to 84 per cent in 2010.
Figure 2.3. Distribution of emissions of greenhouse gases in Norway by gas, 2010.
Source: Statistics Norway/Climate and Pollution Agency
Table 2.2 presents emission figures for all direct greenhouse gases, expressed in absolute
emission figures and total CO2 equivalents.
84 %
8 %
6 %
2 %
CO2
CH4
N2O
Fluorinated gases
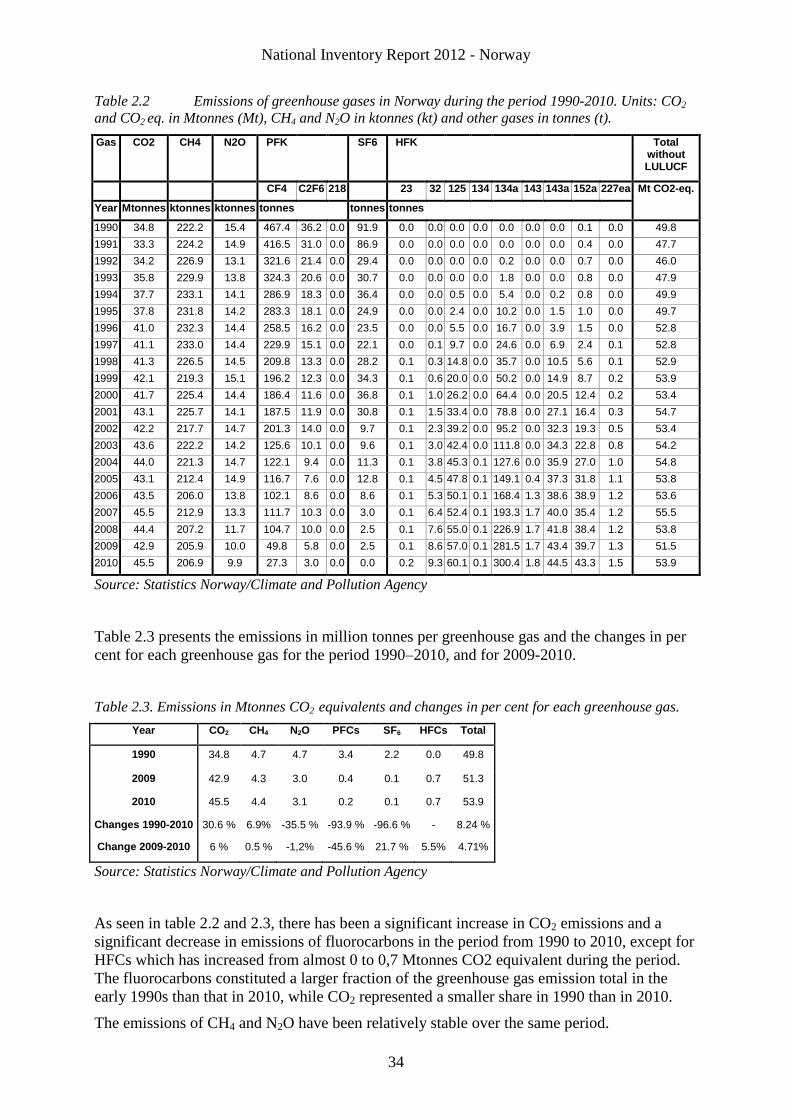
National Inventory Report 2012 - Norway
34
Table 2.2 Emissions of greenhouse gases in Norway during the period 1990-2010. Units: CO2
and CO2 eq. in Mtonnes (Mt), CH4 and N2O in ktonnes (kt) and other gases in tonnes (t).
Gas CO2 CH4 N2O PFK SF6 HFK Total without LULUCF
CF4 C2F6 218 23 32 125 134 134a 143 143a 152a 227ea Mt CO2-eq.
Year Mtonnes ktonnes ktonnes tonnes tonnes tonnes
1990 34.8 222.2 15.4 467.4 36.2 0.0 91.9 0.0 0.0 0.0 0.0 0.0 0.0 0.0 0.1 0.0 49.8
1991 33.3 224.2 14.9 416.5 31.0 0.0 86.9 0.0 0.0 0.0 0.0 0.0 0.0 0.0 0.4 0.0 47.7
1992 34.2 226.9 13.1 321.6 21.4 0.0 29.4 0.0 0.0 0.0 0.0 0.2 0.0 0.0 0.7 0.0 46.0
1993 35.8 229.9 13.8 324.3 20.6 0.0 30.7 0.0 0.0 0.0 0.0 1.8 0.0 0.0 0.8 0.0 47.9
1994 37.7 233.1 14.1 286.9 18.3 0.0 36.4 0.0 0.0 0.5 0.0 5.4 0.0 0.2 0.8 0.0 49.9
1995 37.8 231.8 14.2 283.3 18.1 0.0 24.9 0.0 0.0 2.4 0.0 10.2 0.0 1.5 1.0 0.0 49.7
1996 41.0 232.3 14.4 258.5 16.2 0.0 23.5 0.0 0.0 5.5 0.0 16.7 0.0 3.9 1.5 0.0 52.8
1997 41.1 233.0 14.4 229.9 15.1 0.0 22.1 0.0 0.1 9.7 0.0 24.6 0.0 6.9 2.4 0.1 52.8
1998 41.3 226.5 14.5 209.8 13.3 0.0 28.2 0.1 0.3 14.8 0.0 35.7 0.0 10.5 5.6 0.1 52.9
1999 42.1 219.3 15.1 196.2 12.3 0.0 34.3 0.1 0.6 20.0 0.0 50.2 0.0 14.9 8.7 0.2 53.9
2000 41.7 225.4 14.4 186.4 11.6 0.0 36.8 0.1 1.0 26.2 0.0 64.4 0.0 20.5 12.4 0.2 53.4
2001 43.1 225.7 14.1 187.5 11.9 0.0 30.8 0.1 1.5 33.4 0.0 78.8 0.0 27.1 16.4 0.3 54.7
2002 42.2 217.7 14.7 201.3 14.0 0.0 9.7 0.1 2.3 39.2 0.0 95.2 0.0 32.3 19.3 0.5 53.4
2003 43.6 222.2 14.2 125.6 10.1 0.0 9.6 0.1 3.0 42.4 0.0 111.8 0.0 34.3 22.8 0.8 54.2
2004 44.0 221.3 14.7 122.1 9.4 0.0 11.3 0.1 3.8 45.3 0.1 127.6 0.0 35.9 27.0 1.0 54.8
2005 43.1 212.4 14.9 116.7 7.6 0.0 12.8 0.1 4.5 47.8 0.1 149.1 0.4 37.3 31.8 1.1 53.8
2006 43.5 206.0 13.8 102.1 8.6 0.0 8.6 0.1 5.3 50.1 0.1 168.4 1.3 38.6 38.9 1.2 53.6
2007 45.5 212.9 13.3 111.7 10.3 0.0 3.0 0.1 6.4 52.4 0.1 193.3 1.7 40.0 35.4 1.2 55.5
2008 44.4 207.2 11.7 104.7 10.0 0.0 2.5 0.1 7.6 55.0 0.1 226.9 1.7 41.8 38.4 1.2 53.8
2009 42.9 205.9 10.0 49.8 5.8 0.0 2.5 0.1 8.6 57.0 0.1 281.5 1.7 43.4 39.7 1.3 51.5
2010 45.5 206.9 9.9 27.3 3.0 0.0 0.0 0.2 9.3 60.1 0.1 300.4 1.8 44.5 43.3 1.5 53.9
Source: Statistics Norway/Climate and Pollution Agency
Table 2.3 presents the emissions in million tonnes per greenhouse gas and the changes in per
cent for each greenhouse gas for the period 1990–2010, and for 2009-2010.
Table 2.3. Emissions in Mtonnes CO2 equivalents and changes in per cent for each greenhouse gas.
Year CO2 CH4 N2O PFCs SF6 HFCs Total
1990 34.8 4.7 4.7 3.4 2.2 0.0 49.8
2009 42.9 4.3 3.0 0.4 0.1 0.7 51.3
2010 45.5 4.4 3.1 0.2 0.1 0.7 53.9
Changes 1990-2010 30.6 % 6.9% -35.5 % -93.9 % -96.6 % - 8.24 %
Change 2009-2010 6 % 0.5 % -1,2% -45.6 % 21.7 % 5.5% 4.71%
Source: Statistics Norway/Climate and Pollution Agency
As seen in table 2.2 and 2.3, there has been a significant increase in CO2 emissions and a
significant decrease in emissions of fluorocarbons in the period from 1990 to 2010, except for
HFCs which has increased from almost 0 to 0,7 Mtonnes CO2 equivalent during the period.
The fluorocarbons constituted a larger fraction of the greenhouse gas emission total in the
early 1990s than that in 2010, while CO2 represented a smaller share in 1990 than in 2010.
The emissions of CH4 and N2O have been relatively stable over the same period.
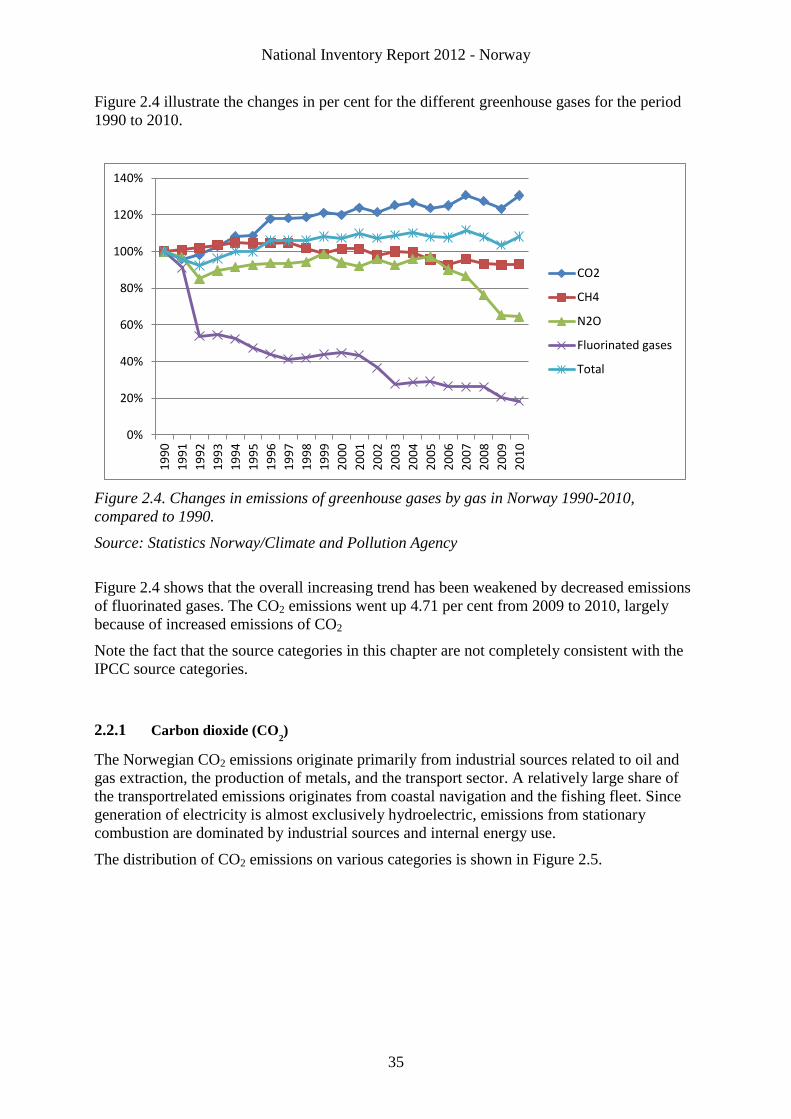
National Inventory Report 2012 - Norway
35
Figure 2.4 illustrate the changes in per cent for the different greenhouse gases for the period
1990 to 2010.
Figure 2.4. Changes in emissions of greenhouse gases by gas in Norway 1990-2010,
compared to 1990.
Source: Statistics Norway/Climate and Pollution Agency
Figure 2.4 shows that the overall increasing trend has been weakened by decreased emissions
of fluorinated gases. The CO2 emissions went up 4.71 per cent from 2009 to 2010, largely
because of increased emissions of CO2
Note the fact that the source categories in this chapter are not completely consistent with the
IPCC source categories.
2.2.1 Carbon dioxide (CO2)
The Norwegian CO2 emissions originate primarily from industrial sources related to oil and
gas extraction, the production of metals, and the transport sector. A relatively large share of
the transportrelated emissions originates from coastal navigation and the fishing fleet. Since
generation of electricity is almost exclusively hydroelectric, emissions from stationary
combustion are dominated by industrial sources and internal energy use.
The distribution of CO2 emissions on various categories is shown in Figure 2.5.
0%
20%
40%
60%
80%
100%
120%
140%1
99
0
19
91
19
92
19
93
19
94
19
95
19
96
19
97
19
98
19
99
20
00
20
01
20
02
20
03
20
04
20
05
20
06
20
07
20
08
20
09
20
10
CO2
CH4
N2O
Fluorinated gases
Total
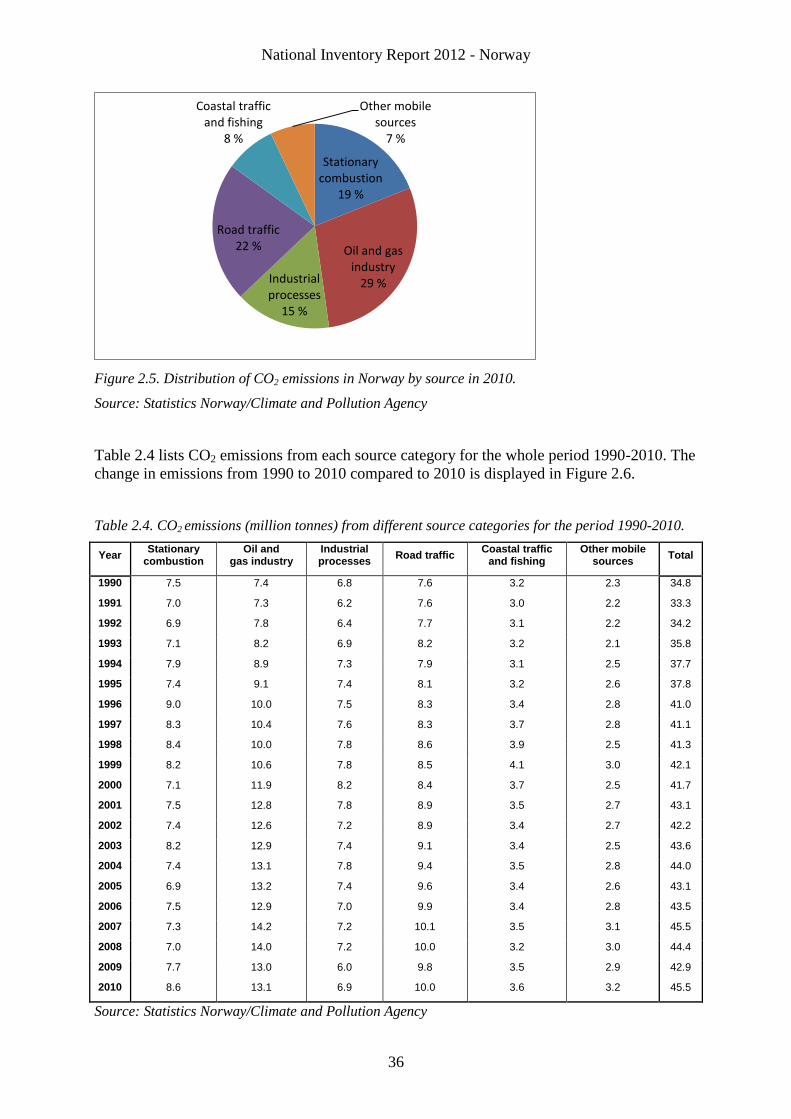
National Inventory Report 2012 - Norway
36
Figure 2.5. Distribution of CO2 emissions in Norway by source in 2010.
Source: Statistics Norway/Climate and Pollution Agency
Table 2.4 lists CO2 emissions from each source category for the whole period 1990-2010. The
change in emissions from 1990 to 2010 compared to 2010 is displayed in Figure 2.6.
Table 2.4. CO2 emissions (million tonnes) from different source categories for the period 1990-2010.
Year Stationary
combustion Oil and
gas industry Industrial processes
Road traffic Coastal traffic
and fishing Other mobile
sources Total
1990 7.5 7.4 6.8 7.6 3.2 2.3 34.8
1991 7.0 7.3 6.2 7.6 3.0 2.2 33.3
1992 6.9 7.8 6.4 7.7 3.1 2.2 34.2
1993 7.1 8.2 6.9 8.2 3.2 2.1 35.8
1994 7.9 8.9 7.3 7.9 3.1 2.5 37.7
1995 7.4 9.1 7.4 8.1 3.2 2.6 37.8
1996 9.0 10.0 7.5 8.3 3.4 2.8 41.0
1997 8.3 10.4 7.6 8.3 3.7 2.8 41.1
1998 8.4 10.0 7.8 8.6 3.9 2.5 41.3
1999 8.2 10.6 7.8 8.5 4.1 3.0 42.1
2000 7.1 11.9 8.2 8.4 3.7 2.5 41.7
2001 7.5 12.8 7.8 8.9 3.5 2.7 43.1
2002 7.4 12.6 7.2 8.9 3.4 2.7 42.2
2003 8.2 12.9 7.4 9.1 3.4 2.5 43.6
2004 7.4 13.1 7.8 9.4 3.5 2.8 44.0
2005 6.9 13.2 7.4 9.6 3.4 2.6 43.1
2006 7.5 12.9 7.0 9.9 3.4 2.8 43.5
2007 7.3 14.2 7.2 10.1 3.5 3.1 45.5
2008 7.0 14.0 7.2 10.0 3.2 3.0 44.4
2009 7.7 13.0 6.0 9.8 3.5 2.9 42.9
2010 8.6 13.1 6.9 10.0 3.6 3.2 45.5
Source: Statistics Norway/Climate and Pollution Agency
Stationary combustion
19 %
Oil and gas industry
29 % Industrial processes
15 %
Road traffic 22 %
Coastal traffic and fishing
8 %
Other mobile sources
7 %
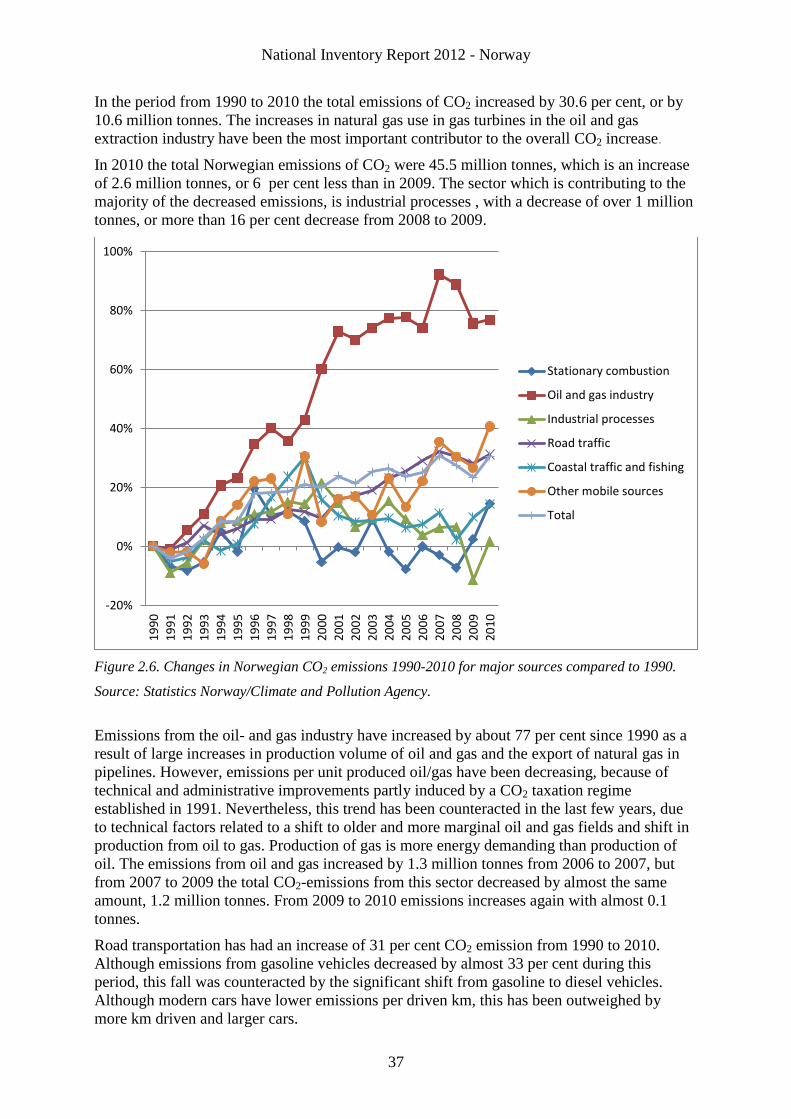
National Inventory Report 2012 - Norway
37
In the period from 1990 to 2010 the total emissions of CO2 increased by 30.6 per cent, or by
10.6 million tonnes. The increases in natural gas use in gas turbines in the oil and gas
extraction industry have been the most important contributor to the overall CO2 increase.
In 2010 the total Norwegian emissions of CO2 were 45.5 million tonnes, which is an increase
of 2.6 million tonnes, or 6 per cent less than in 2009. The sector which is contributing to the
majority of the decreased emissions, is industrial processes , with a decrease of over 1 million
tonnes, or more than 16 per cent decrease from 2008 to 2009.
Figure 2.6. Changes in Norwegian CO2 emissions 1990-2010 for major sources compared to 1990.
Source: Statistics Norway/Climate and Pollution Agency.
Emissions from the oil- and gas industry have increased by about 77 per cent since 1990 as a
result of large increases in production volume of oil and gas and the export of natural gas in
pipelines. However, emissions per unit produced oil/gas have been decreasing, because of
technical and administrative improvements partly induced by a CO2 taxation regime
established in 1991. Nevertheless, this trend has been counteracted in the last few years, due
to technical factors related to a shift to older and more marginal oil and gas fields and shift in
production from oil to gas. Production of gas is more energy demanding than production of
oil. The emissions from oil and gas increased by 1.3 million tonnes from 2006 to 2007, but
from 2007 to 2009 the total CO2-emissions from this sector decreased by almost the same
amount, 1.2 million tonnes. From 2009 to 2010 emissions increases again with almost 0.1
tonnes.
Road transportation has had an increase of 31 per cent CO2 emission from 1990 to 2010.
Although emissions from gasoline vehicles decreased by almost 33 per cent during this
period, this fall was counteracted by the significant shift from gasoline to diesel vehicles.
Although modern cars have lower emissions per driven km, this has been outweighed by
more km driven and larger cars.
-20%
0%
20%
40%
60%
80%
100%
19
90
19
91
19
92
19
93
19
94
19
95
19
96
19
97
19
98
19
99
20
00
20
01
20
02
20
03
20
04
20
05
20
06
20
07
20
08
20
09
20
10
Stationary combustion
Oil and gas industry
Industrial processes
Road traffic
Coastal traffic and fishing
Other mobile sources
Total
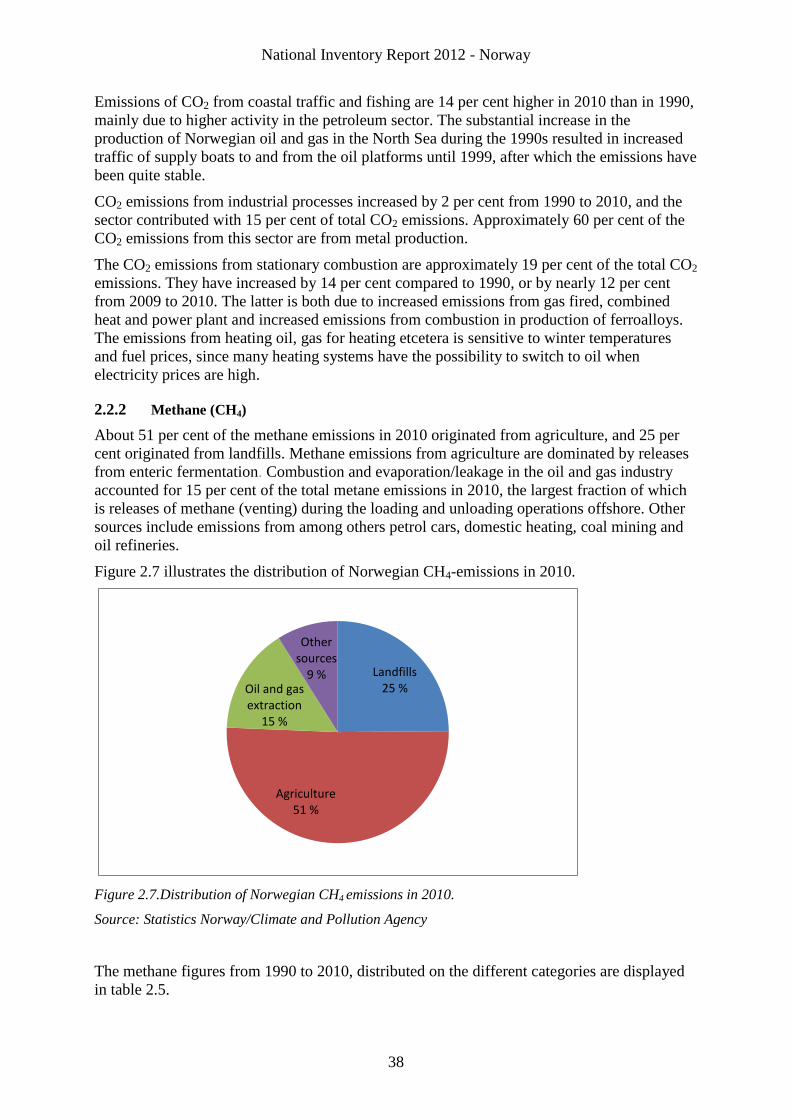
National Inventory Report 2012 - Norway
38
Emissions of CO2 from coastal traffic and fishing are 14 per cent higher in 2010 than in 1990,
mainly due to higher activity in the petroleum sector. The substantial increase in the
production of Norwegian oil and gas in the North Sea during the 1990s resulted in increased
traffic of supply boats to and from the oil platforms until 1999, after which the emissions have
been quite stable.
CO2 emissions from industrial processes increased by 2 per cent from 1990 to 2010, and the
sector contributed with 15 per cent of total CO2 emissions. Approximately 60 per cent of the
CO2 emissions from this sector are from metal production.
The CO2 emissions from stationary combustion are approximately 19 per cent of the total CO2
emissions. They have increased by 14 per cent compared to 1990, or by nearly 12 per cent
from 2009 to 2010. The latter is both due to increased emissions from gas fired, combined
heat and power plant and increased emissions from combustion in production of ferroalloys.
The emissions from heating oil, gas for heating etcetera is sensitive to winter temperatures
and fuel prices, since many heating systems have the possibility to switch to oil when
electricity prices are high.
2.2.2 Methane (CH4)
About 51 per cent of the methane emissions in 2010 originated from agriculture, and 25 per
cent originated from landfills. Methane emissions from agriculture are dominated by releases
from enteric fermentation. Combustion and evaporation/leakage in the oil and gas industry
accounted for 15 per cent of the total metane emissions in 2010, the largest fraction of which
is releases of methane (venting) during the loading and unloading operations offshore. Other
sources include emissions from among others petrol cars, domestic heating, coal mining and
oil refineries.
Figure 2.7 illustrates the distribution of Norwegian CH4-emissions in 2010.
Figure 2.7.Distribution of Norwegian CH4 emissions in 2010.
Source: Statistics Norway/Climate and Pollution Agency
The methane figures from 1990 to 2010, distributed on the different categories are displayed
in table 2.5.
Landfills 25 %
Agriculture 51 %
Oil and gas extraction
15 %
Other sources
9 %
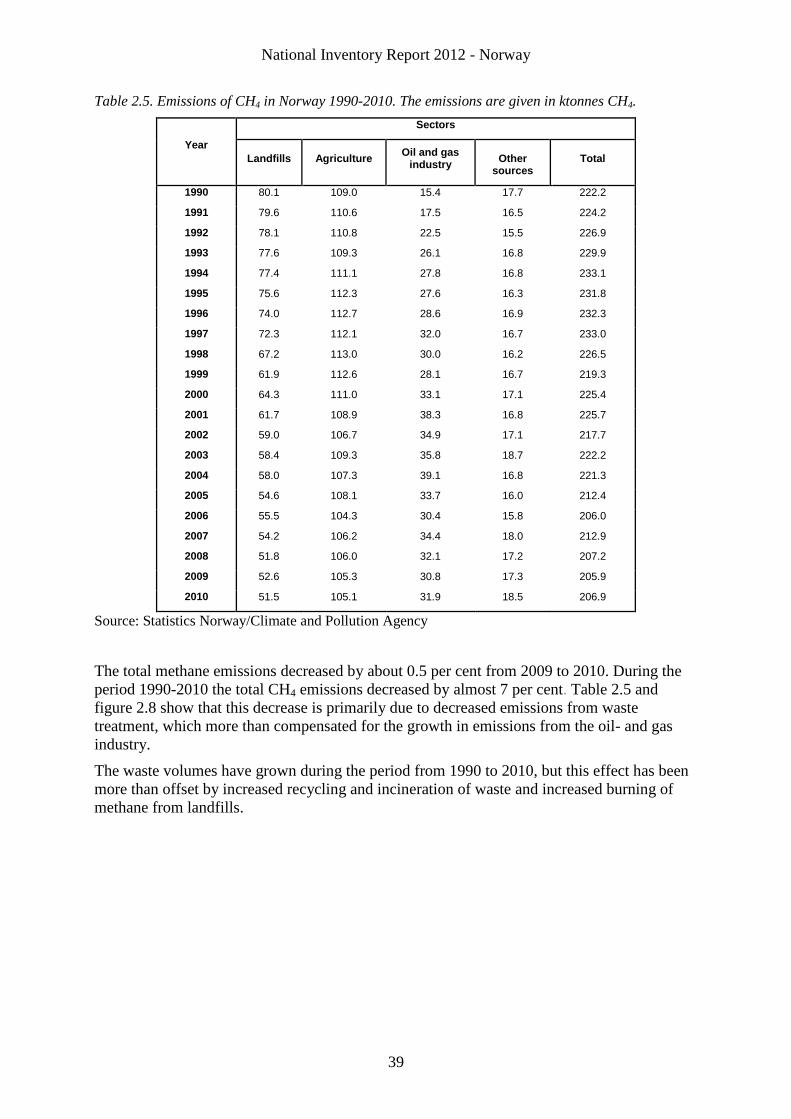
National Inventory Report 2012 - Norway
39
Table 2.5. Emissions of CH4 in Norway 1990-2010. The emissions are given in ktonnes CH4.
Year
Sectors
Landfills Agriculture Oil and gas
industry
Other
sources Total
1990 80.1 109.0 15.4 17.7 222.2
1991 79.6 110.6 17.5 16.5 224.2
1992 78.1 110.8 22.5 15.5 226.9
1993 77.6 109.3 26.1 16.8 229.9
1994 77.4 111.1 27.8 16.8 233.1
1995 75.6 112.3 27.6 16.3 231.8
1996 74.0 112.7 28.6 16.9 232.3
1997 72.3 112.1 32.0 16.7 233.0
1998 67.2 113.0 30.0 16.2 226.5
1999 61.9 112.6 28.1 16.7 219.3
2000 64.3 111.0 33.1 17.1 225.4
2001 61.7 108.9 38.3 16.8 225.7
2002 59.0 106.7 34.9 17.1 217.7
2003 58.4 109.3 35.8 18.7 222.2
2004 58.0 107.3 39.1 16.8 221.3
2005 54.6 108.1 33.7 16.0 212.4
2006 55.5 104.3 30.4 15.8 206.0
2007 54.2 106.2 34.4 18.0 212.9
2008 51.8 106.0 32.1 17.2 207.2
2009 52.6 105.3 30.8 17.3 205.9
2010 51.5 105.1 31.9 18.5 206.9
Source: Statistics Norway/Climate and Pollution Agency
The total methane emissions decreased by about 0.5 per cent from 2009 to 2010. During the
period 1990-2010 the total CH4 emissions decreased by almost 7 per cent. Table 2.5 and
figure 2.8 show that this decrease is primarily due to decreased emissions from waste
treatment, which more than compensated for the growth in emissions from the oil- and gas
industry.
The waste volumes have grown during the period from 1990 to 2010, but this effect has been
more than offset by increased recycling and incineration of waste and increased burning of
methane from landfills.
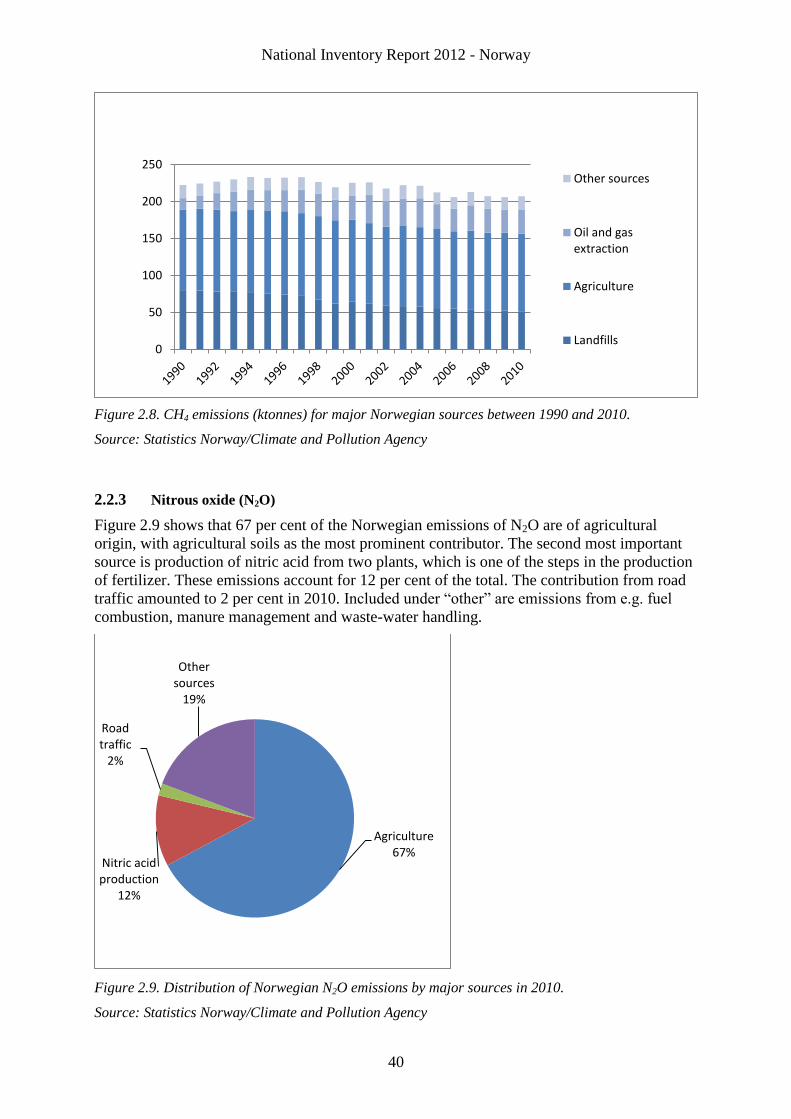
National Inventory Report 2012 - Norway
40
Figure 2.8. CH4 emissions (ktonnes) for major Norwegian sources between 1990 and 2010.
Source: Statistics Norway/Climate and Pollution Agency
2.2.3 Nitrous oxide (N2O)
Figure 2.9 shows that 67 per cent of the Norwegian emissions of N2O are of agricultural
origin, with agricultural soils as the most prominent contributor. The second most important
source is production of nitric acid from two plants, which is one of the steps in the production
of fertilizer. These emissions account for 12 per cent of the total. The contribution from road
traffic amounted to 2 per cent in 2010. Included under “other” are emissions from e.g. fuel
combustion, manure management and waste-water handling.
Figure 2.9. Distribution of Norwegian N2O emissions by major sources in 2010.
Source: Statistics Norway/Climate and Pollution Agency
0
50
100
150
200
250Other sources
Oil and gasextraction
Agriculture
Landfills
Agriculture 67%
Nitric acid production
12%
Road traffic
2%
Other sources
19%
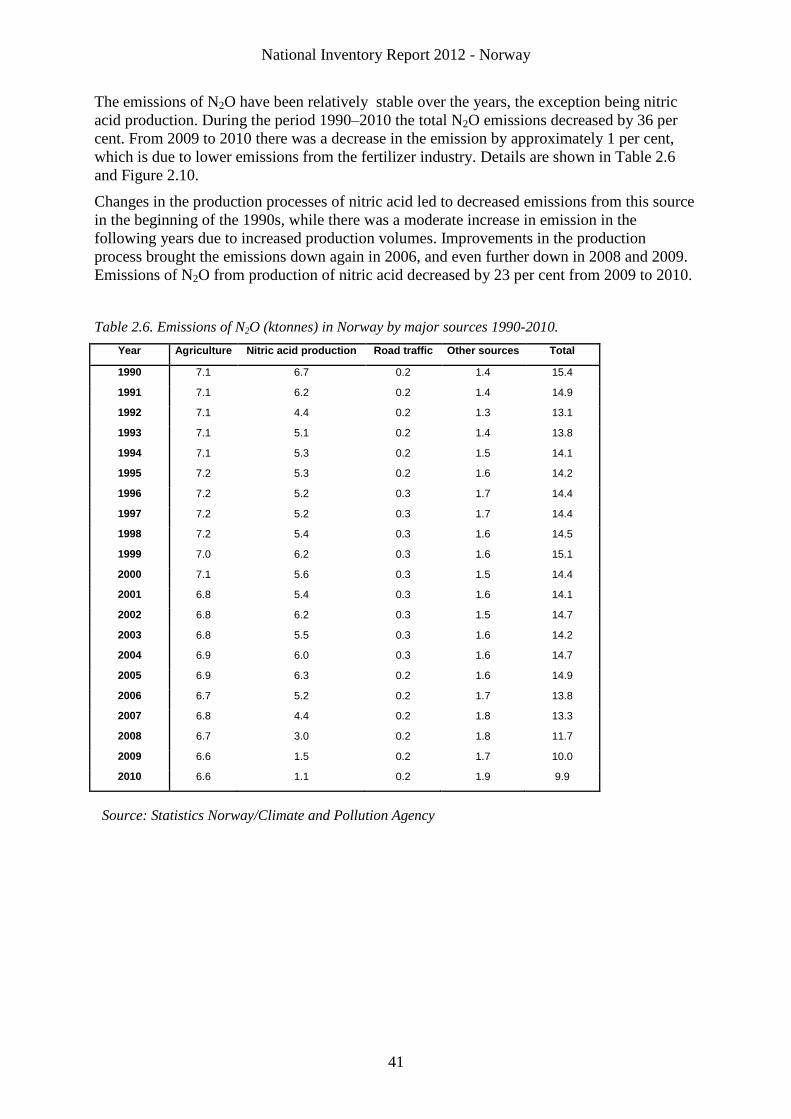
National Inventory Report 2012 - Norway
41
The emissions of N2O have been relatively stable over the years, the exception being nitric
acid production. During the period 1990–2010 the total N2O emissions decreased by 36 per
cent. From 2009 to 2010 there was a decrease in the emission by approximately 1 per cent,
which is due to lower emissions from the fertilizer industry. Details are shown in Table 2.6
and Figure 2.10.
Changes in the production processes of nitric acid led to decreased emissions from this source
in the beginning of the 1990s, while there was a moderate increase in emission in the
following years due to increased production volumes. Improvements in the production
process brought the emissions down again in 2006, and even further down in 2008 and 2009.
Emissions of N2O from production of nitric acid decreased by 23 per cent from 2009 to 2010.
Table 2.6. Emissions of N2O (ktonnes) in Norway by major sources 1990-2010.
Year Agriculture Nitric acid production Road traffic Other sources Total
1990 7.1 6.7 0.2 1.4 15.4
1991 7.1 6.2 0.2 1.4 14.9
1992 7.1 4.4 0.2 1.3 13.1
1993 7.1 5.1 0.2 1.4 13.8
1994 7.1 5.3 0.2 1.5 14.1
1995 7.2 5.3 0.2 1.6 14.2
1996 7.2 5.2 0.3 1.7 14.4
1997 7.2 5.2 0.3 1.7 14.4
1998 7.2 5.4 0.3 1.6 14.5
1999 7.0 6.2 0.3 1.6 15.1
2000 7.1 5.6 0.3 1.5 14.4
2001 6.8 5.4 0.3 1.6 14.1
2002 6.8 6.2 0.3 1.5 14.7
2003 6.8 5.5 0.3 1.6 14.2
2004 6.9 6.0 0.3 1.6 14.7
2005 6.9 6.3 0.2 1.6 14.9
2006 6.7 5.2 0.2 1.7 13.8
2007 6.8 4.4 0.2 1.8 13.3
2008 6.7 3.0 0.2 1.8 11.7
2009 6.6 1.5 0.2 1.7 10.0
2010 6.6 1.1 0.2 1.9 9.9
Source: Statistics Norway/Climate and Pollution Agency
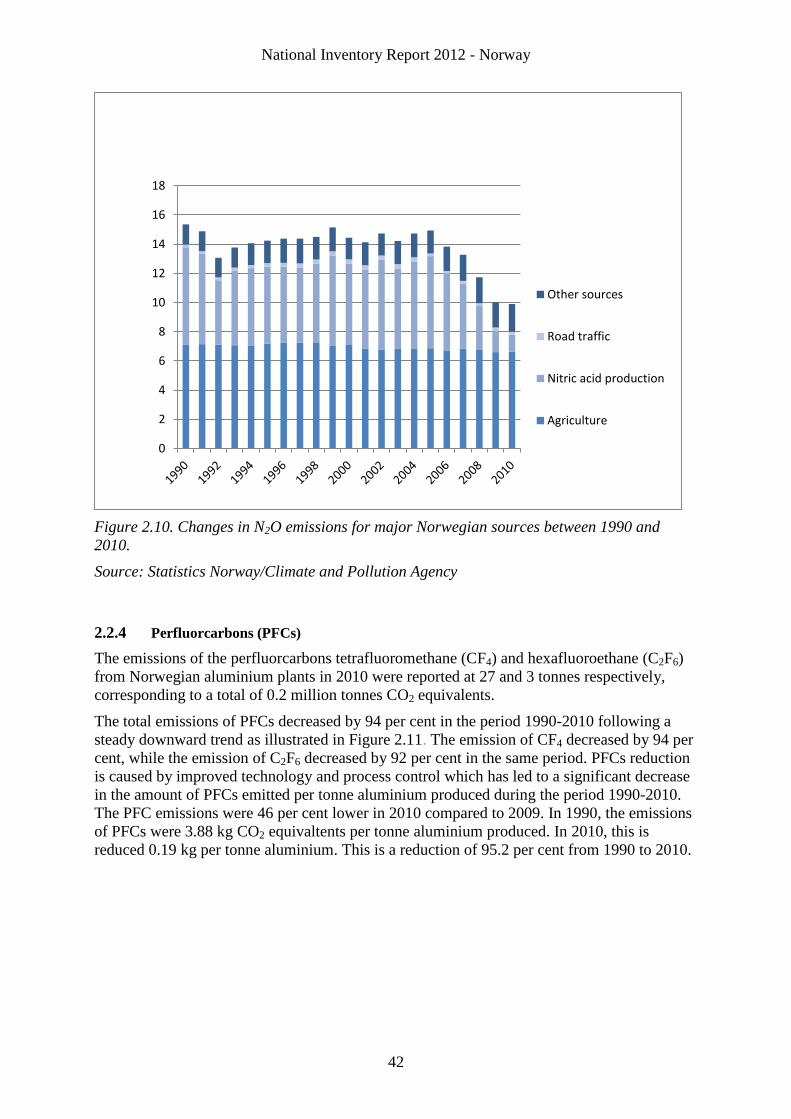
National Inventory Report 2012 - Norway
42
Figure 2.10. Changes in N2O emissions for major Norwegian sources between 1990 and
2010.
Source: Statistics Norway/Climate and Pollution Agency
2.2.4 Perfluorcarbons (PFCs)
The emissions of the perfluorcarbons tetrafluoromethane (CF4) and hexafluoroethane (C2F6)
from Norwegian aluminium plants in 2010 were reported at 27 and 3 tonnes respectively,
corresponding to a total of 0.2 million tonnes CO2 equivalents.
The total emissions of PFCs decreased by 94 per cent in the period 1990-2010 following a
steady downward trend as illustrated in Figure 2.11. The emission of CF4 decreased by 94 per
cent, while the emission of C2F6 decreased by 92 per cent in the same period. PFCs reduction
is caused by improved technology and process control which has led to a significant decrease
in the amount of PFCs emitted per tonne aluminium produced during the period 1990-2010.
The PFC emissions were 46 per cent lower in 2010 compared to 2009. In 1990, the emissions
of PFCs were 3.88 kg CO2 equivaltents per tonne aluminium produced. In 2010, this is
reduced 0.19 kg per tonne aluminium. This is a reduction of 95.2 per cent from 1990 to 2010.
0
2
4
6
8
10
12
14
16
18
Other sources
Road traffic
Nitric acid production
Agriculture
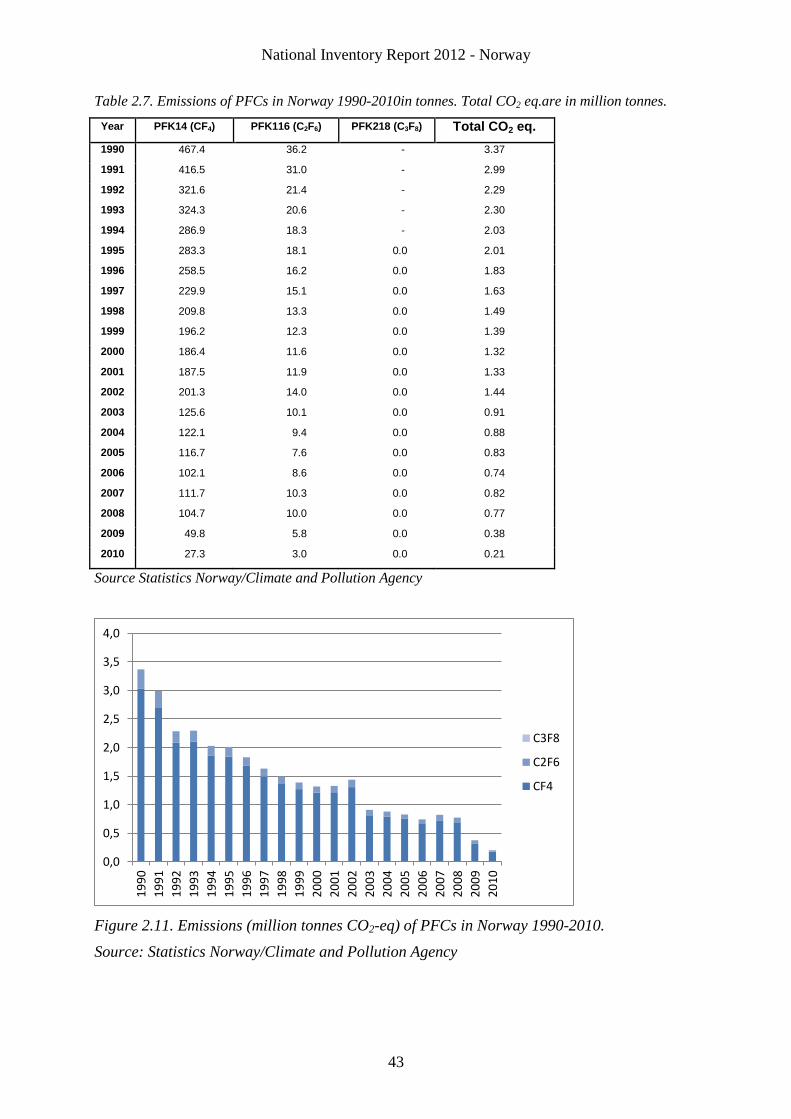
National Inventory Report 2012 - Norway
43
Table 2.7. Emissions of PFCs in Norway 1990-2010in tonnes. Total CO2 eq.are in million tonnes.
Year PFK14 (CF4) PFK116 (C2F6) PFK218 (C3F8) Total CO2 eq.
1990 467.4 36.2 - 3.37
1991 416.5 31.0 - 2.99
1992 321.6 21.4 - 2.29
1993 324.3 20.6 - 2.30
1994 286.9 18.3 - 2.03
1995 283.3 18.1 0.0 2.01
1996 258.5 16.2 0.0 1.83
1997 229.9 15.1 0.0 1.63
1998 209.8 13.3 0.0 1.49
1999 196.2 12.3 0.0 1.39
2000 186.4 11.6 0.0 1.32
2001 187.5 11.9 0.0 1.33
2002 201.3 14.0 0.0 1.44
2003 125.6 10.1 0.0 0.91
2004 122.1 9.4 0.0 0.88
2005 116.7 7.6 0.0 0.83
2006 102.1 8.6 0.0 0.74
2007 111.7 10.3 0.0 0.82
2008 104.7 10.0 0.0 0.77
2009 49.8 5.8 0.0 0.38
2010 27.3 3.0 0.0 0.21
Source Statistics Norway/Climate and Pollution Agency
Figure 2.11. Emissions (million tonnes CO2-eq) of PFCs in Norway 1990-2010.
Source: Statistics Norway/Climate and Pollution Agency
0,0
0,5
1,0
1,5
2,0
2,5
3,0
3,5
4,0
19
90
19
91
19
92
19
93
19
94
19
95
19
96
19
97
19
98
19
99
20
00
20
01
20
02
20
03
20
04
20
05
20
06
20
07
20
08
20
09
20
10
C3F8
C2F6
CF4
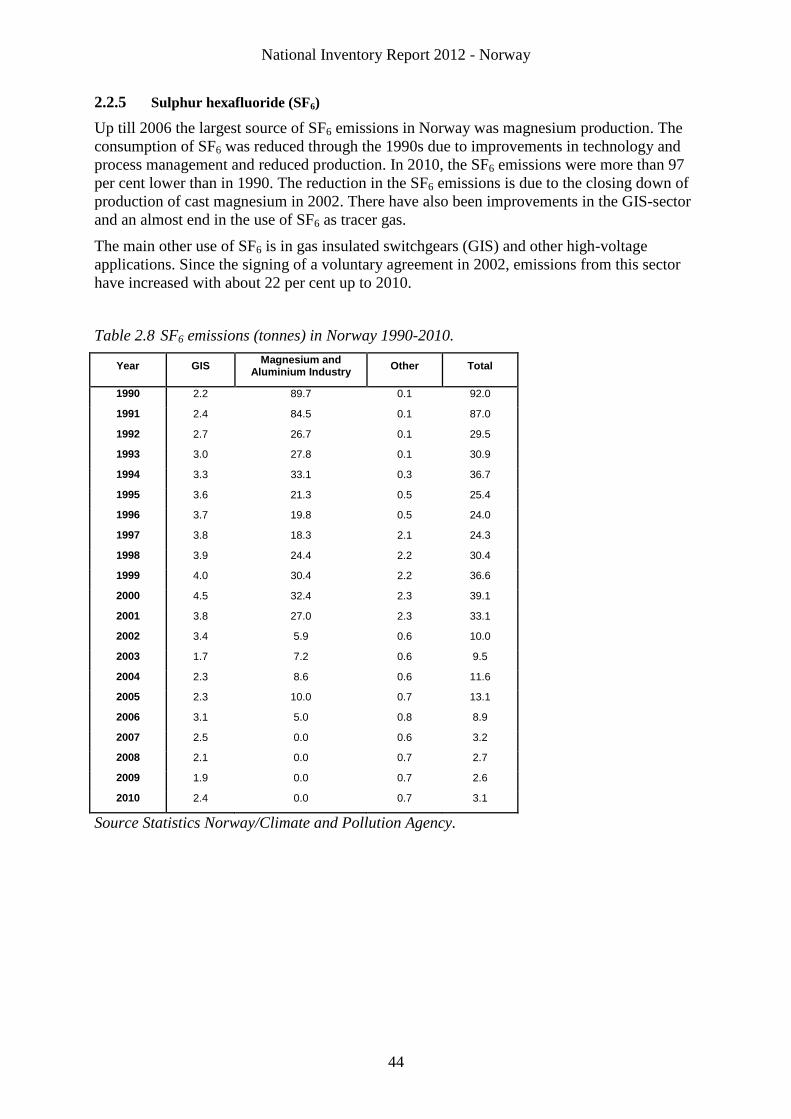
National Inventory Report 2012 - Norway
44
2.2.5 Sulphur hexafluoride (SF6)
Up till 2006 the largest source of SF6 emissions in Norway was magnesium production. The
consumption of SF6 was reduced through the 1990s due to improvements in technology and
process management and reduced production. In 2010, the SF6 emissions were more than 97
per cent lower than in 1990. The reduction in the SF6 emissions is due to the closing down of
production of cast magnesium in 2002. There have also been improvements in the GIS-sector
and an almost end in the use of SF6 as tracer gas.
The main other use of SF6 is in gas insulated switchgears (GIS) and other high-voltage
applications. Since the signing of a voluntary agreement in 2002, emissions from this sector
have increased with about 22 per cent up to 2010.
Table 2.8 SF6 emissions (tonnes) in Norway 1990-2010.
Year GIS Magnesium and
Aluminium Industry Other Total
1990 2.2 89.7 0.1 92.0
1991 2.4 84.5 0.1 87.0
1992 2.7 26.7 0.1 29.5
1993 3.0 27.8 0.1 30.9
1994 3.3 33.1 0.3 36.7
1995 3.6 21.3 0.5 25.4
1996 3.7 19.8 0.5 24.0
1997 3.8 18.3 2.1 24.3
1998 3.9 24.4 2.2 30.4
1999 4.0 30.4 2.2 36.6
2000 4.5 32.4 2.3 39.1
2001 3.8 27.0 2.3 33.1
2002 3.4 5.9 0.6 10.0
2003 1.7 7.2 0.6 9.5
2004 2.3 8.6 0.6 11.6
2005 2.3 10.0 0.7 13.1
2006 3.1 5.0 0.8 8.9
2007 2.5 0.0 0.6 3.2
2008 2.1 0.0 0.7 2.7
2009 1.9 0.0 0.7 2.6
2010 2.4 0.0 0.7 3.1
Source Statistics Norway/Climate and Pollution Agency.
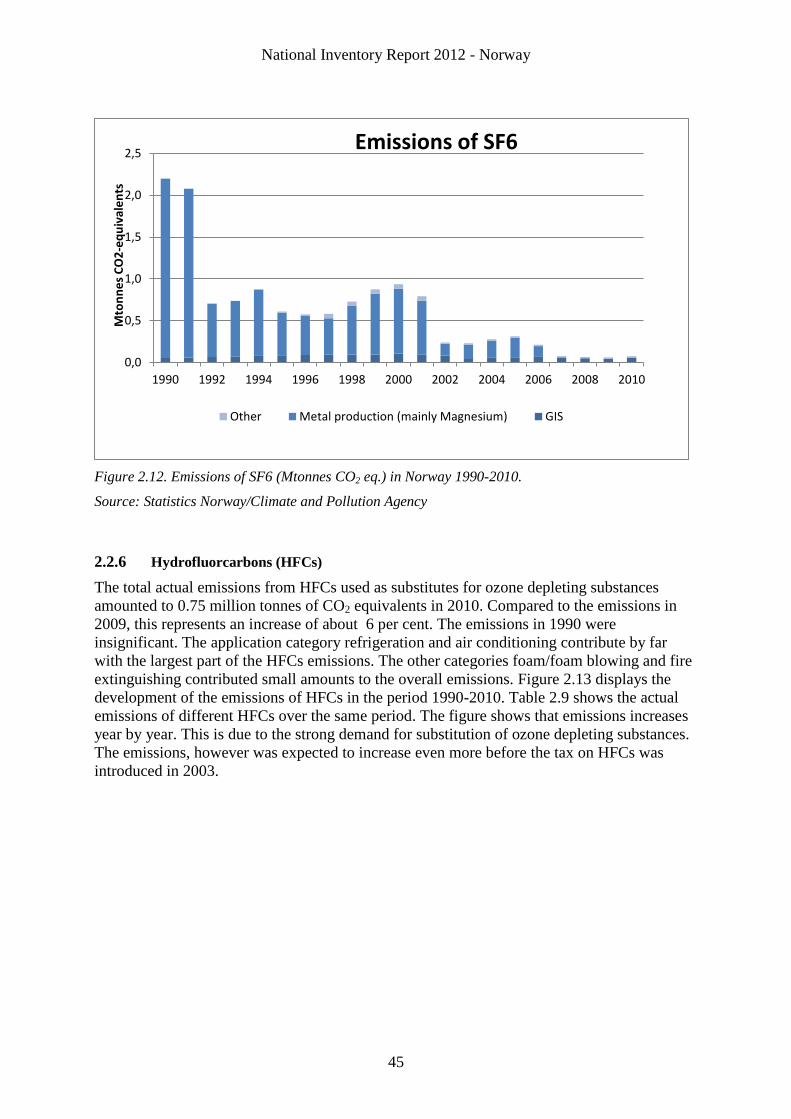
National Inventory Report 2012 - Norway
45
Figure 2.12. Emissions of SF6 (Mtonnes CO2 eq.) in Norway 1990-2010.
Source: Statistics Norway/Climate and Pollution Agency
2.2.6 Hydrofluorcarbons (HFCs)
The total actual emissions from HFCs used as substitutes for ozone depleting substances
amounted to 0.75 million tonnes of CO2 equivalents in 2010. Compared to the emissions in
2009, this represents an increase of about 6 per cent. The emissions in 1990 were
insignificant. The application category refrigeration and air conditioning contribute by far
with the largest part of the HFCs emissions. The other categories foam/foam blowing and fire
extinguishing contributed small amounts to the overall emissions. Figure 2.13 displays the
development of the emissions of HFCs in the period 1990-2010. Table 2.9 shows the actual
emissions of different HFCs over the same period. The figure shows that emissions increases
year by year. This is due to the strong demand for substitution of ozone depleting substances.
The emissions, however was expected to increase even more before the tax on HFCs was
introduced in 2003.
0,0
0,5
1,0
1,5
2,0
2,5
1990 1992 1994 1996 1998 2000 2002 2004 2006 2008 2010
Mto
nn
es
CO
2-e
qu
ival
en
ts
Emissions of SF6
Other Metal production (mainly Magnesium) GIS
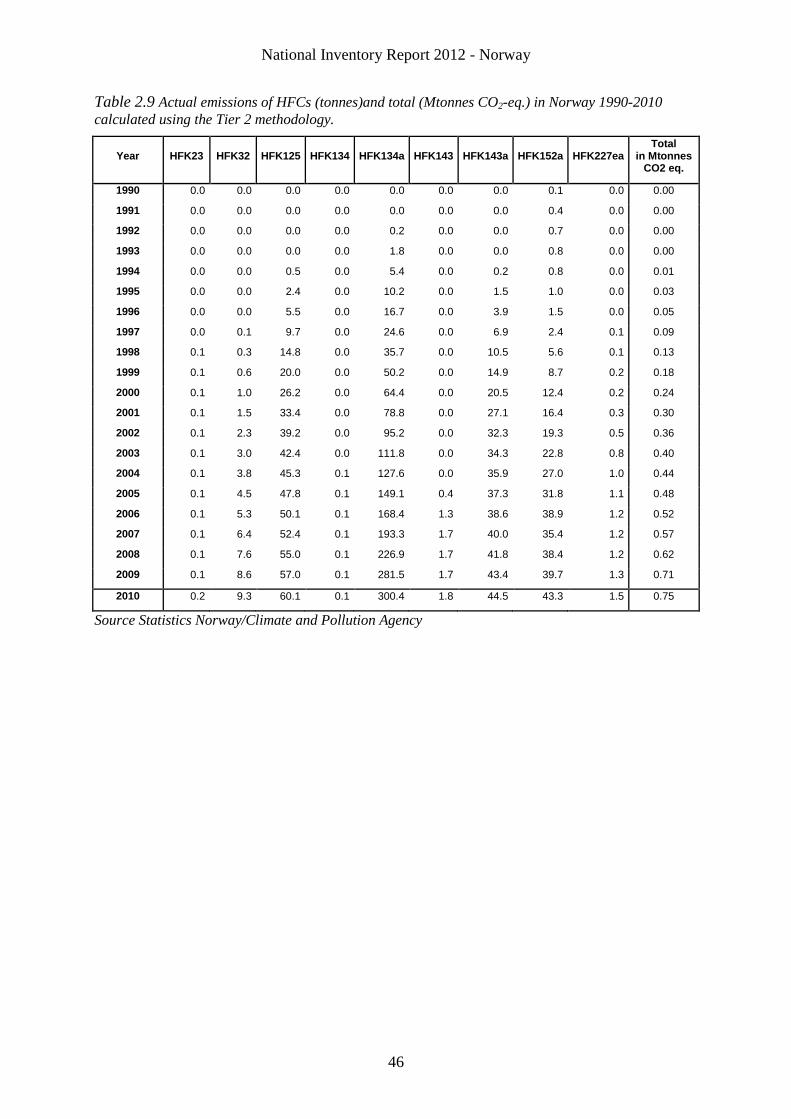
National Inventory Report 2012 - Norway
46
Table 2.9 Actual emissions of HFCs (tonnes)and total (Mtonnes CO2-eq.) in Norway 1990-2010
calculated using the Tier 2 methodology.
Year HFK23 HFK32 HFK125 HFK134 HFK134a HFK143 HFK143a HFK152a HFK227ea Total
in Mtonnes CO2 eq.
1990 0.0 0.0 0.0 0.0 0.0 0.0 0.0 0.1 0.0 0.00
1991 0.0 0.0 0.0 0.0 0.0 0.0 0.0 0.4 0.0 0.00
1992 0.0 0.0 0.0 0.0 0.2 0.0 0.0 0.7 0.0 0.00
1993 0.0 0.0 0.0 0.0 1.8 0.0 0.0 0.8 0.0 0.00
1994 0.0 0.0 0.5 0.0 5.4 0.0 0.2 0.8 0.0 0.01
1995 0.0 0.0 2.4 0.0 10.2 0.0 1.5 1.0 0.0 0.03
1996 0.0 0.0 5.5 0.0 16.7 0.0 3.9 1.5 0.0 0.05
1997 0.0 0.1 9.7 0.0 24.6 0.0 6.9 2.4 0.1 0.09
1998 0.1 0.3 14.8 0.0 35.7 0.0 10.5 5.6 0.1 0.13
1999 0.1 0.6 20.0 0.0 50.2 0.0 14.9 8.7 0.2 0.18
2000 0.1 1.0 26.2 0.0 64.4 0.0 20.5 12.4 0.2 0.24
2001 0.1 1.5 33.4 0.0 78.8 0.0 27.1 16.4 0.3 0.30
2002 0.1 2.3 39.2 0.0 95.2 0.0 32.3 19.3 0.5 0.36
2003 0.1 3.0 42.4 0.0 111.8 0.0 34.3 22.8 0.8 0.40
2004 0.1 3.8 45.3 0.1 127.6 0.0 35.9 27.0 1.0 0.44
2005 0.1 4.5 47.8 0.1 149.1 0.4 37.3 31.8 1.1 0.48
2006 0.1 5.3 50.1 0.1 168.4 1.3 38.6 38.9 1.2 0.52
2007 0.1 6.4 52.4 0.1 193.3 1.7 40.0 35.4 1.2 0.57
2008 0.1 7.6 55.0 0.1 226.9 1.7 41.8 38.4 1.2 0.62
2009 0.1 8.6 57.0 0.1 281.5 1.7 43.4 39.7 1.3 0.71
2010 0.2 9.3 60.1 0.1 300.4 1.8 44.5 43.3 1.5 0.75
Source Statistics Norway/Climate and Pollution Agency
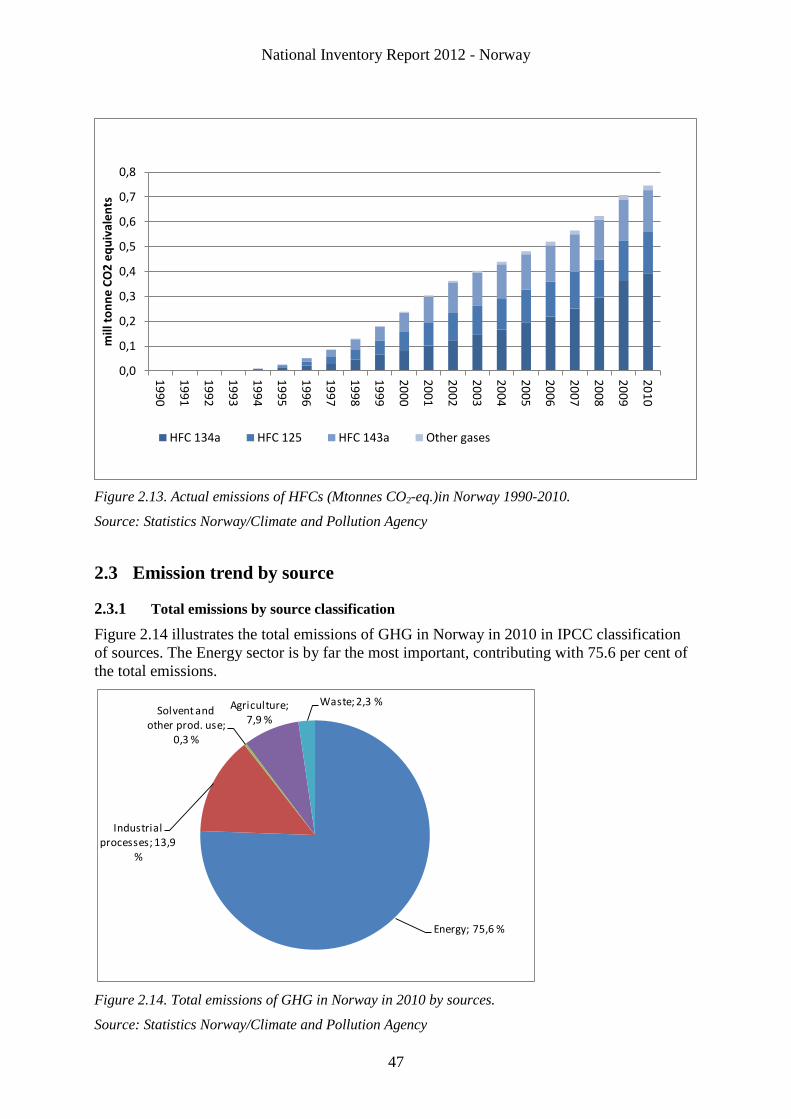
National Inventory Report 2012 - Norway
47
Figure 2.13. Actual emissions of HFCs (Mtonnes CO2-eq.)in Norway 1990-2010.
Source: Statistics Norway/Climate and Pollution Agency
2.3 Emission trend by source
2.3.1 Total emissions by source classification
Figure 2.14 illustrates the total emissions of GHG in Norway in 2010 in IPCC classification
of sources. The Energy sector is by far the most important, contributing with 75.6 per cent of
the total emissions.
Figure 2.14. Total emissions of GHG in Norway in 2010 by sources.
Source: Statistics Norway/Climate and Pollution Agency
0,0
0,1
0,2
0,3
0,4
0,5
0,6
0,7
0,8
19
90
19
91
19
92
19
93
19
94
19
95
19
96
19
97
19
98
19
99
20
00
20
01
20
02
20
03
20
04
20
05
20
06
20
07
20
08
20
09
20
10
mill
to
nn
e C
O2
eq
uiv
ale
nts
HFC 134a HFC 125 HFC 143a Other gases
Energy; 75,6 %
Industrial processes; 13,9
%
Solvent and other prod. use;
0,3 %
Agriculture; 7,9 %
Waste; 2,3 %
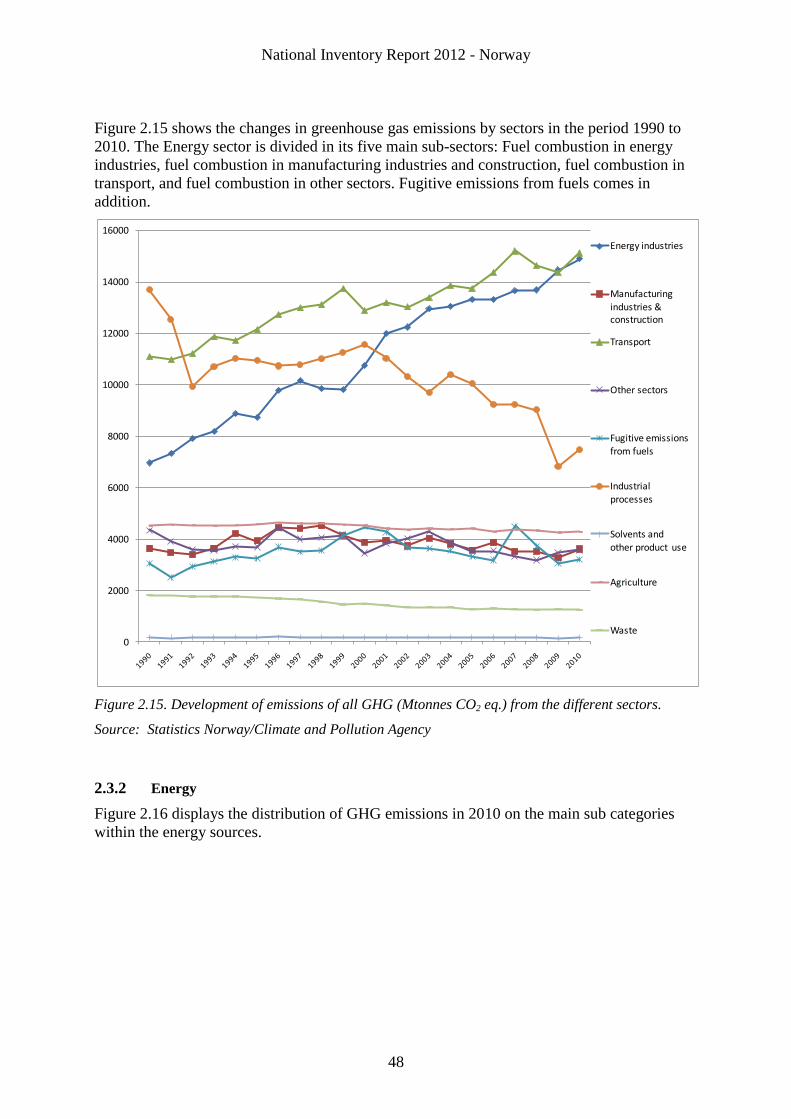
National Inventory Report 2012 - Norway
48
Figure 2.15 shows the changes in greenhouse gas emissions by sectors in the period 1990 to
2010. The Energy sector is divided in its five main sub-sectors: Fuel combustion in energy
industries, fuel combustion in manufacturing industries and construction, fuel combustion in
transport, and fuel combustion in other sectors. Fugitive emissions from fuels comes in
addition.
Figure 2.15. Development of emissions of all GHG (Mtonnes CO2 eq.) from the different sectors.
Source: Statistics Norway/Climate and Pollution Agency
2.3.2 Energy
Figure 2.16 displays the distribution of GHG emissions in 2010 on the main sub categories
within the energy sources.
0
2000
4000
6000
8000
10000
12000
14000
16000
Energy industries
Manufacturing
industries & construction
Transport
Other sectors
Fugitive emissionsfrom fuels
Industrial processes
Solvents and
other product use
Agriculture
Waste
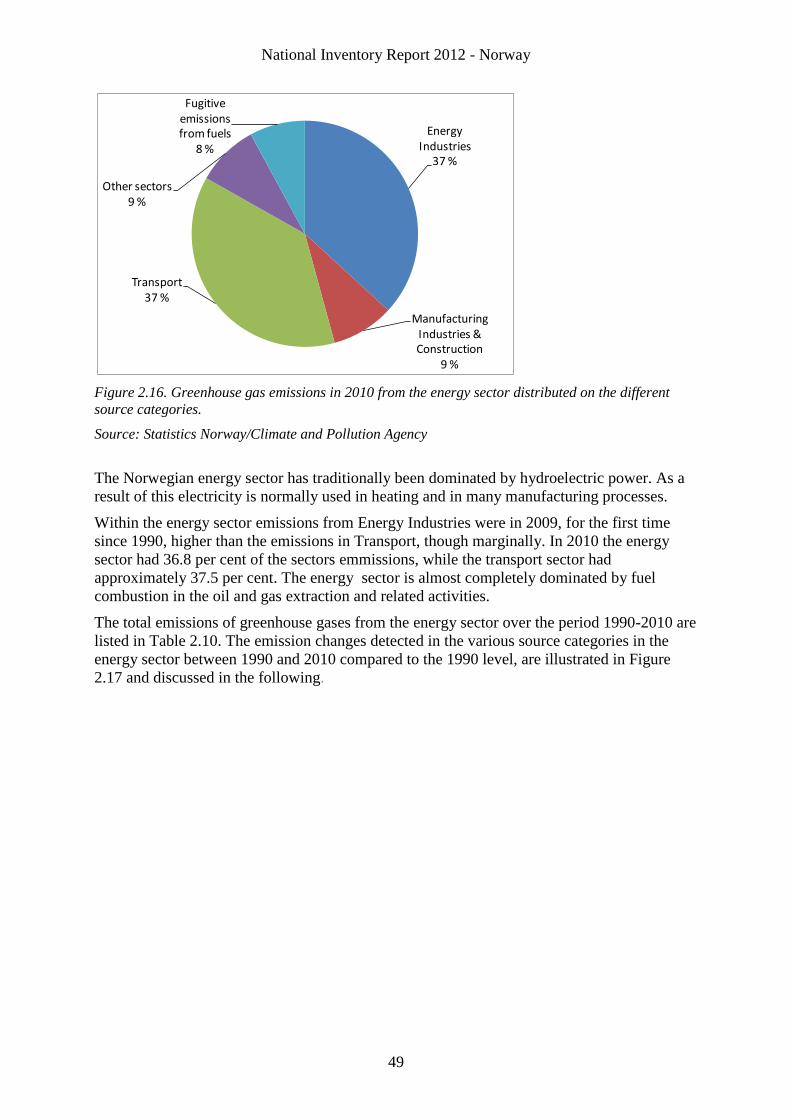
National Inventory Report 2012 - Norway
49
Figure 2.16. Greenhouse gas emissions in 2010 from the energy sector distributed on the different
source categories.
Source: Statistics Norway/Climate and Pollution Agency
The Norwegian energy sector has traditionally been dominated by hydroelectric power. As a
result of this electricity is normally used in heating and in many manufacturing processes.
Within the energy sector emissions from Energy Industries were in 2009, for the first time
since 1990, higher than the emissions in Transport, though marginally. In 2010 the energy
sector had 36.8 per cent of the sectors emmissions, while the transport sector had
approximately 37.5 per cent. The energy sector is almost completely dominated by fuel
combustion in the oil and gas extraction and related activities.
The total emissions of greenhouse gases from the energy sector over the period 1990-2010 are
listed in Table 2.10. The emission changes detected in the various source categories in the
energy sector between 1990 and 2010 compared to the 1990 level, are illustrated in Figure
2.17 and discussed in the following.
Energy Industries
37 %
Manufacturing Industries & Construction
9 %
Transport37 %
Other sectors9 %
Fugitive emissionsfrom fuels
8 %
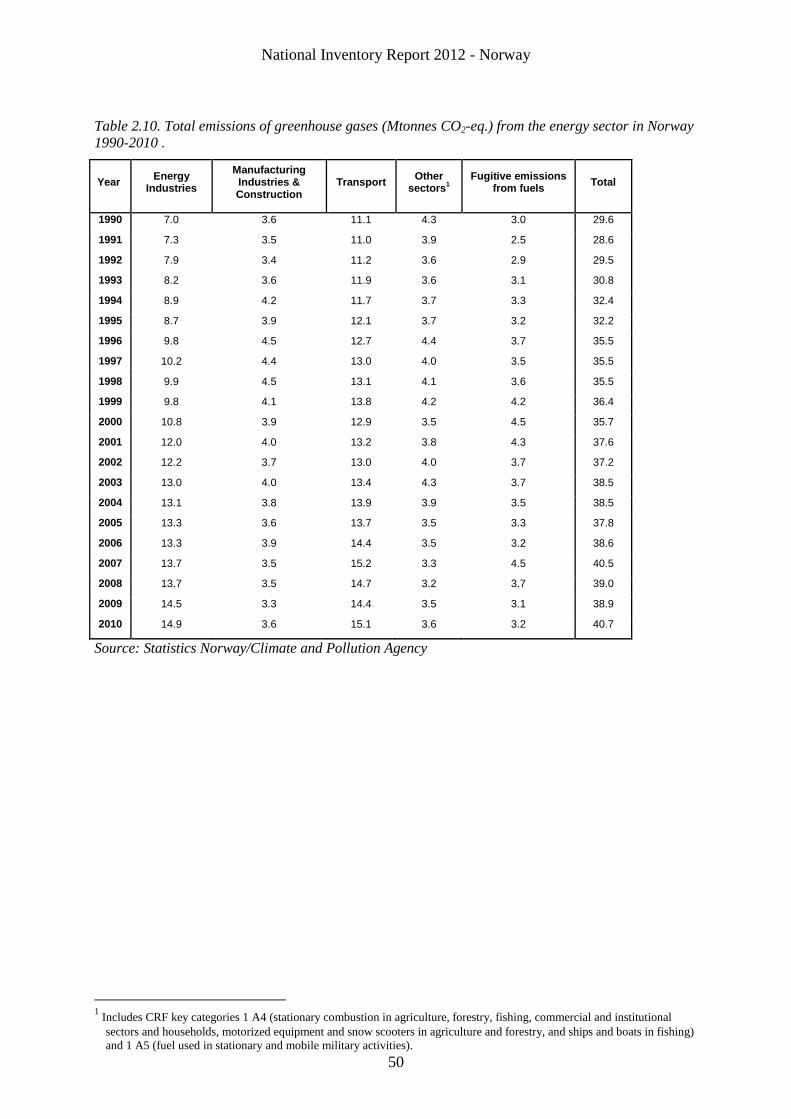
National Inventory Report 2012 - Norway
50
Table 2.10. Total emissions of greenhouse gases (Mtonnes CO2-eq.) from the energy sector in Norway
1990-2010 .
Year Energy
Industries
Manufacturing Industries & Construction
Transport Other
sectors1
Fugitive emissions from fuels
Total
1990 7.0 3.6 11.1 4.3 3.0 29.6
1991 7.3 3.5 11.0 3.9 2.5 28.6
1992 7.9 3.4 11.2 3.6 2.9 29.5
1993 8.2 3.6 11.9 3.6 3.1 30.8
1994 8.9 4.2 11.7 3.7 3.3 32.4
1995 8.7 3.9 12.1 3.7 3.2 32.2
1996 9.8 4.5 12.7 4.4 3.7 35.5
1997 10.2 4.4 13.0 4.0 3.5 35.5
1998 9.9 4.5 13.1 4.1 3.6 35.5
1999 9.8 4.1 13.8 4.2 4.2 36.4
2000 10.8 3.9 12.9 3.5 4.5 35.7
2001 12.0 4.0 13.2 3.8 4.3 37.6
2002 12.2 3.7 13.0 4.0 3.7 37.2
2003 13.0 4.0 13.4 4.3 3.7 38.5
2004 13.1 3.8 13.9 3.9 3.5 38.5
2005 13.3 3.6 13.7 3.5 3.3 37.8
2006 13.3 3.9 14.4 3.5 3.2 38.6
2007 13.7 3.5 15.2 3.3 4.5 40.5
2008 13.7 3.5 14.7 3.2 3.7 39.0
2009 14.5 3.3 14.4 3.5 3.1 38.9
2010 14.9 3.6 15.1 3.6 3.2 40.7
Source: Statistics Norway/Climate and Pollution Agency
1 Includes CRF key categories 1 A4 (stationary combustion in agriculture, forestry, fishing, commercial and institutional
sectors and households, motorized equipment and snow scooters in agriculture and forestry, and ships and boats in fishing)
and 1 A5 (fuel used in stationary and mobile military activities).
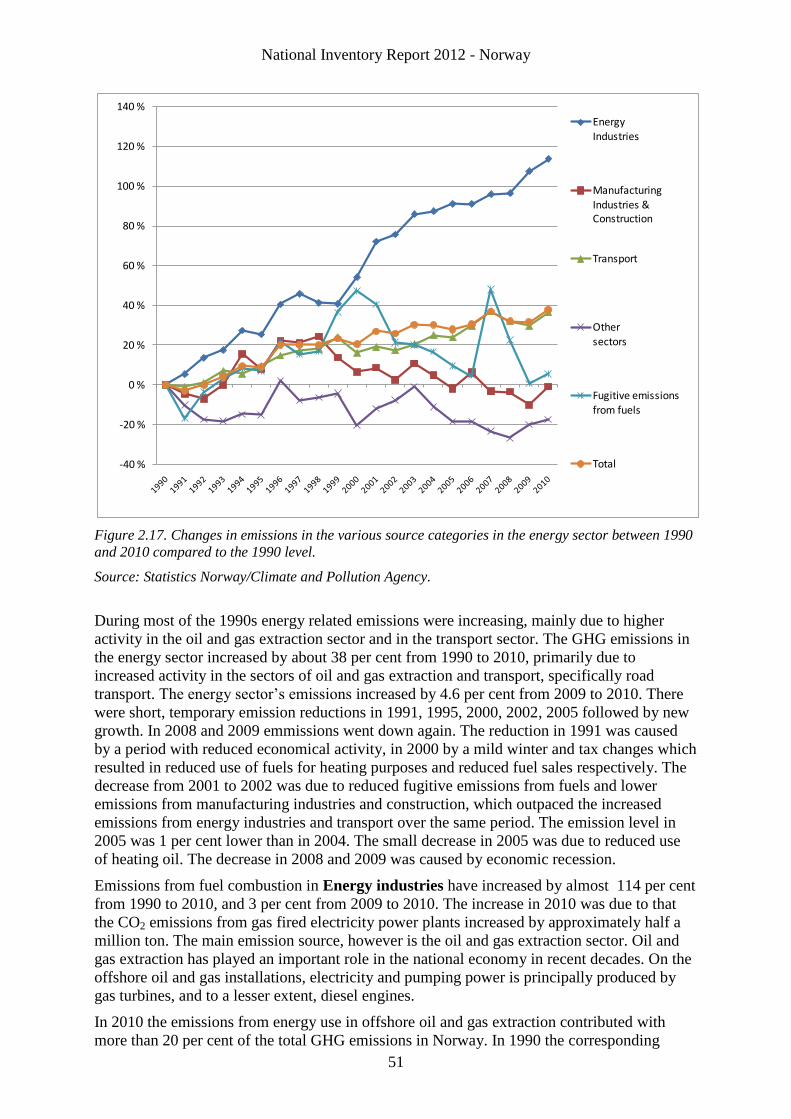
National Inventory Report 2012 - Norway
51
Figure 2.17. Changes in emissions in the various source categories in the energy sector between 1990
and 2010 compared to the 1990 level.
Source: Statistics Norway/Climate and Pollution Agency.
During most of the 1990s energy related emissions were increasing, mainly due to higher
activity in the oil and gas extraction sector and in the transport sector. The GHG emissions in
the energy sector increased by about 38 per cent from 1990 to 2010, primarily due to
increased activity in the sectors of oil and gas extraction and transport, specifically road
transport. The energy sector’s emissions increased by 4.6 per cent from 2009 to 2010. There
were short, temporary emission reductions in 1991, 1995, 2000, 2002, 2005 followed by new
growth. In 2008 and 2009 emmissions went down again. The reduction in 1991 was caused
by a period with reduced economical activity, in 2000 by a mild winter and tax changes which
resulted in reduced use of fuels for heating purposes and reduced fuel sales respectively. The
decrease from 2001 to 2002 was due to reduced fugitive emissions from fuels and lower
emissions from manufacturing industries and construction, which outpaced the increased
emissions from energy industries and transport over the same period. The emission level in
2005 was 1 per cent lower than in 2004. The small decrease in 2005 was due to reduced use
of heating oil. The decrease in 2008 and 2009 was caused by economic recession.
Emissions from fuel combustion in Energy industries have increased by almost 114 per cent
from 1990 to 2010, and 3 per cent from 2009 to 2010. The increase in 2010 was due to that
the CO2 emissions from gas fired electricity power plants increased by approximately half a
million ton. The main emission source, however is the oil and gas extraction sector. Oil and
gas extraction has played an important role in the national economy in recent decades. On the
offshore oil and gas installations, electricity and pumping power is principally produced by
gas turbines, and to a lesser extent, diesel engines.
In 2010 the emissions from energy use in offshore oil and gas extraction contributed with
more than 20 per cent of the total GHG emissions in Norway. In 1990 the corresponding
-40 %
-20 %
0 %
20 %
40 %
60 %
80 %
100 %
120 %
140 %
Energy Industries
Manufacturing Industries & Construction
Transport
Other sectors
Fugitive emissionsfrom fuels
Total
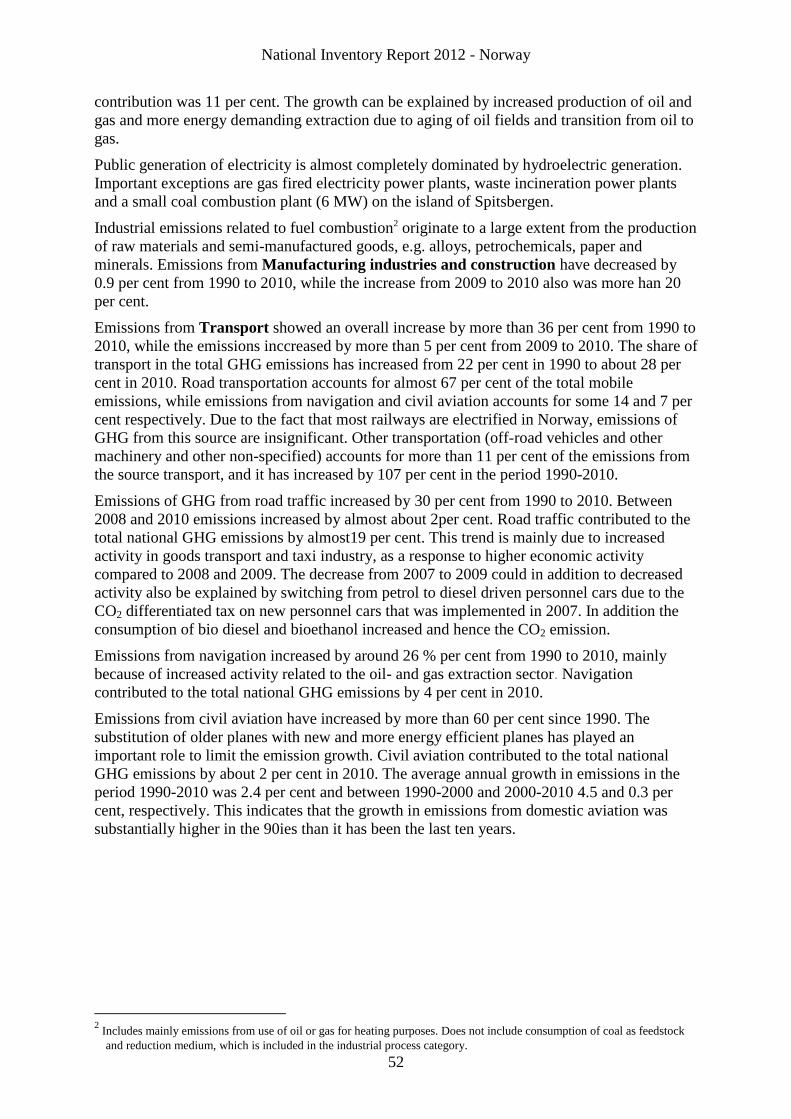
National Inventory Report 2012 - Norway
52
contribution was 11 per cent. The growth can be explained by increased production of oil and
gas and more energy demanding extraction due to aging of oil fields and transition from oil to
gas.
Public generation of electricity is almost completely dominated by hydroelectric generation.
Important exceptions are gas fired electricity power plants, waste incineration power plants
and a small coal combustion plant (6 MW) on the island of Spitsbergen.
Industrial emissions related to fuel combustion2 originate to a large extent from the production
of raw materials and semi-manufactured goods, e.g. alloys, petrochemicals, paper and
minerals. Emissions from Manufacturing industries and construction have decreased by
0.9 per cent from 1990 to 2010, while the increase from 2009 to 2010 also was more han 20
per cent.
Emissions from Transport showed an overall increase by more than 36 per cent from 1990 to
2010, while the emissions inccreased by more than 5 per cent from 2009 to 2010. The share of
transport in the total GHG emissions has increased from 22 per cent in 1990 to about 28 per
cent in 2010. Road transportation accounts for almost 67 per cent of the total mobile
emissions, while emissions from navigation and civil aviation accounts for some 14 and 7 per
cent respectively. Due to the fact that most railways are electrified in Norway, emissions of
GHG from this source are insignificant. Other transportation (off-road vehicles and other
machinery and other non-specified) accounts for more than 11 per cent of the emissions from
the source transport, and it has increased by 107 per cent in the period 1990-2010.
Emissions of GHG from road traffic increased by 30 per cent from 1990 to 2010. Between
2008 and 2010 emissions increased by almost about 2per cent. Road traffic contributed to the
total national GHG emissions by almost19 per cent. This trend is mainly due to increased
activity in goods transport and taxi industry, as a response to higher economic activity
compared to 2008 and 2009. The decrease from 2007 to 2009 could in addition to decreased
activity also be explained by switching from petrol to diesel driven personnel cars due to the
CO2 differentiated tax on new personnel cars that was implemented in 2007. In addition the
consumption of bio diesel and bioethanol increased and hence the CO2 emission.
Emissions from navigation increased by around 26 % per cent from 1990 to 2010, mainly
because of increased activity related to the oil- and gas extraction sector. Navigation
contributed to the total national GHG emissions by 4 per cent in 2010.
Emissions from civil aviation have increased by more than 60 per cent since 1990. The
substitution of older planes with new and more energy efficient planes has played an
important role to limit the emission growth. Civil aviation contributed to the total national
GHG emissions by about 2 per cent in 2010. The average annual growth in emissions in the
period 1990-2010 was 2.4 per cent and between 1990-2000 and 2000-2010 4.5 and 0.3 per
cent, respectively. This indicates that the growth in emissions from domestic aviation was
substantially higher in the 90ies than it has been the last ten years.
2 Includes mainly emissions from use of oil or gas for heating purposes. Does not include consumption of coal as feedstock
and reduction medium, which is included in the industrial process category.
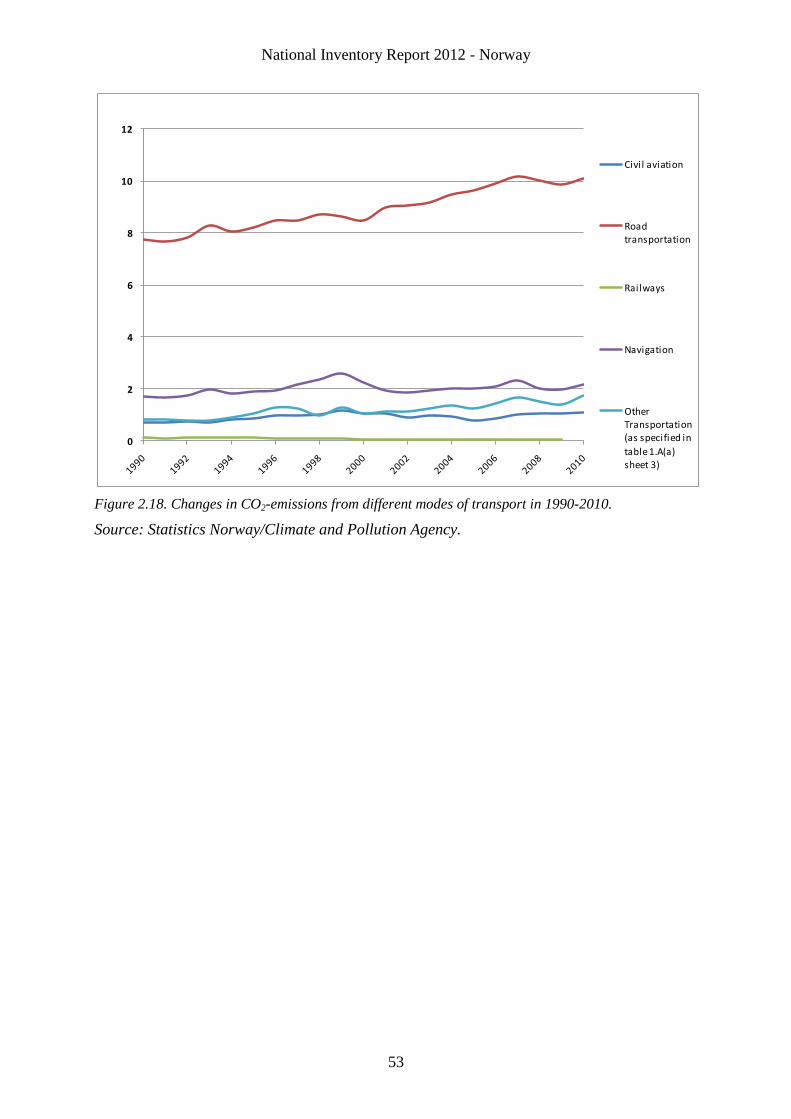
National Inventory Report 2012 - Norway
53
Figure 2.18. Changes in CO2-emissions from different modes of transport in 1990-2010.
Source: Statistics Norway/Climate and Pollution Agency.
0
2
4
6
8
10
12
Civil aviation
Road transportation
Railways
Navigation
Other Transportation (as specified in
table 1.A(a) sheet 3)
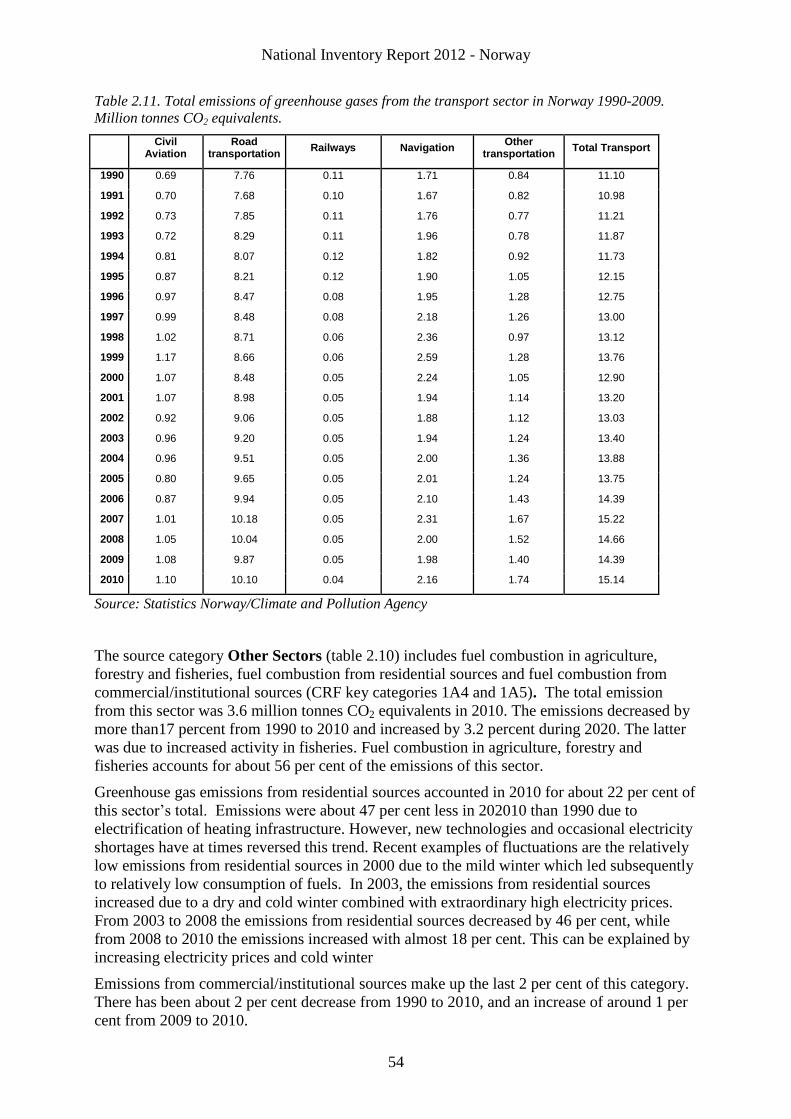
National Inventory Report 2012 - Norway
54
Table 2.11. Total emissions of greenhouse gases from the transport sector in Norway 1990-2009.
Million tonnes CO2 equivalents.
Civil
Aviation Road
transportation Railways Navigation
Other transportation
Total Transport
1990 0.69 7.76 0.11 1.71 0.84 11.10
1991 0.70 7.68 0.10 1.67 0.82 10.98
1992 0.73 7.85 0.11 1.76 0.77 11.21
1993 0.72 8.29 0.11 1.96 0.78 11.87
1994 0.81 8.07 0.12 1.82 0.92 11.73
1995 0.87 8.21 0.12 1.90 1.05 12.15
1996 0.97 8.47 0.08 1.95 1.28 12.75
1997 0.99 8.48 0.08 2.18 1.26 13.00
1998 1.02 8.71 0.06 2.36 0.97 13.12
1999 1.17 8.66 0.06 2.59 1.28 13.76
2000 1.07 8.48 0.05 2.24 1.05 12.90
2001 1.07 8.98 0.05 1.94 1.14 13.20
2002 0.92 9.06 0.05 1.88 1.12 13.03
2003 0.96 9.20 0.05 1.94 1.24 13.40
2004 0.96 9.51 0.05 2.00 1.36 13.88
2005 0.80 9.65 0.05 2.01 1.24 13.75
2006 0.87 9.94 0.05 2.10 1.43 14.39
2007 1.01 10.18 0.05 2.31 1.67 15.22
2008 1.05 10.04 0.05 2.00 1.52 14.66
2009 1.08 9.87 0.05 1.98 1.40 14.39
2010 1.10 10.10 0.04 2.16 1.74 15.14
Source: Statistics Norway/Climate and Pollution Agency
The source category Other Sectors (table 2.10) includes fuel combustion in agriculture,
forestry and fisheries, fuel combustion from residential sources and fuel combustion from
commercial/institutional sources (CRF key categories 1A4 and 1A5). The total emission
from this sector was 3.6 million tonnes CO2 equivalents in 2010. The emissions decreased by
more than17 percent from 1990 to 2010 and increased by 3.2 percent during 2020. The latter
was due to increased activity in fisheries. Fuel combustion in agriculture, forestry and
fisheries accounts for about 56 per cent of the emissions of this sector.
Greenhouse gas emissions from residential sources accounted in 2010 for about 22 per cent of
this sector’s total. Emissions were about 47 per cent less in 202010 than 1990 due to
electrification of heating infrastructure. However, new technologies and occasional electricity
shortages have at times reversed this trend. Recent examples of fluctuations are the relatively
low emissions from residential sources in 2000 due to the mild winter which led subsequently
to relatively low consumption of fuels. In 2003, the emissions from residential sources
increased due to a dry and cold winter combined with extraordinary high electricity prices.
From 2003 to 2008 the emissions from residential sources decreased by 46 per cent, while
from 2008 to 2010 the emissions increased with almost 18 per cent. This can be explained by
increasing electricity prices and cold winter
Emissions from commercial/institutional sources make up the last 2 per cent of this category.
There has been about 2 per cent decrease from 1990 to 2010, and an increase of around 1 per
cent from 2009 to 2010.
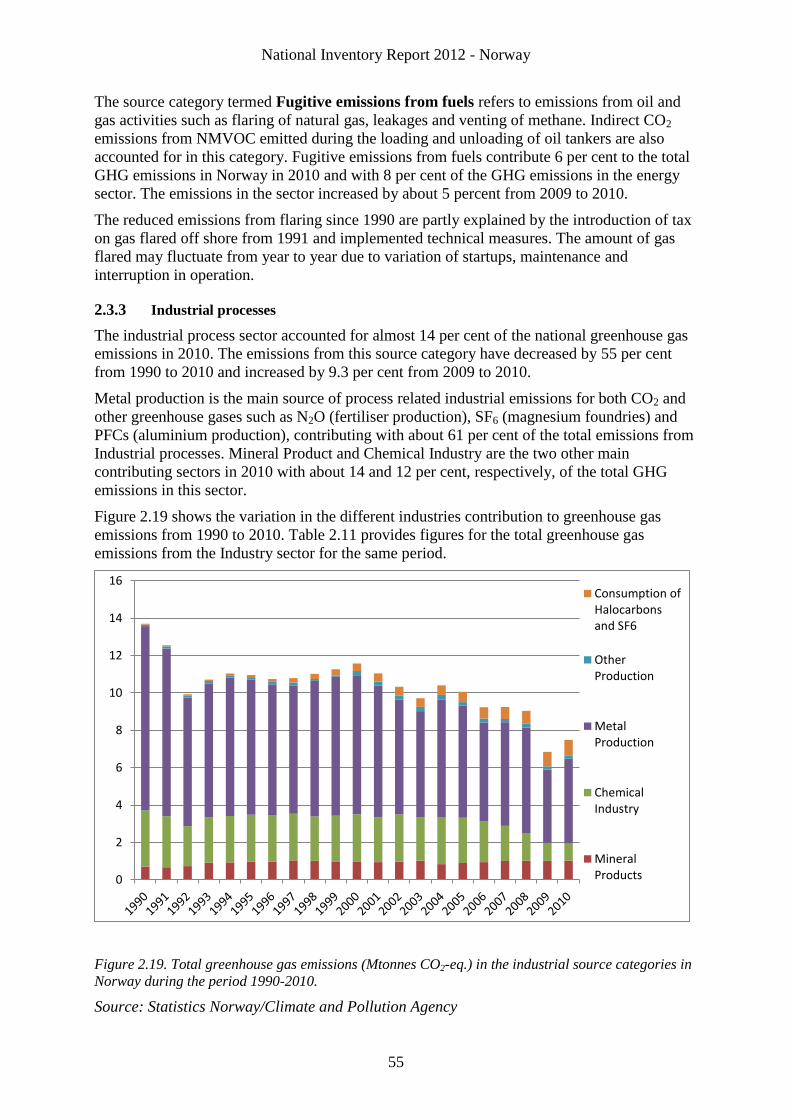
National Inventory Report 2012 - Norway
55
The source category termed Fugitive emissions from fuels refers to emissions from oil and
gas activities such as flaring of natural gas, leakages and venting of methane. Indirect CO2
emissions from NMVOC emitted during the loading and unloading of oil tankers are also
accounted for in this category. Fugitive emissions from fuels contribute 6 per cent to the total
GHG emissions in Norway in 2010 and with 8 per cent of the GHG emissions in the energy
sector. The emissions in the sector increased by about 5 percent from 2009 to 2010.
The reduced emissions from flaring since 1990 are partly explained by the introduction of tax
on gas flared off shore from 1991 and implemented technical measures. The amount of gas
flared may fluctuate from year to year due to variation of startups, maintenance and
interruption in operation.
2.3.3 Industrial processes
The industrial process sector accounted for almost 14 per cent of the national greenhouse gas
emissions in 2010. The emissions from this source category have decreased by 55 per cent
from 1990 to 2010 and increased by 9.3 per cent from 2009 to 2010.
Metal production is the main source of process related industrial emissions for both CO2 and
other greenhouse gases such as N2O (fertiliser production), SF6 (magnesium foundries) and
PFCs (aluminium production), contributing with about 61 per cent of the total emissions from
Industrial processes. Mineral Product and Chemical Industry are the two other main
contributing sectors in 2010 with about 14 and 12 per cent, respectively, of the total GHG
emissions in this sector.
Figure 2.19 shows the variation in the different industries contribution to greenhouse gas
emissions from 1990 to 2010. Table 2.11 provides figures for the total greenhouse gas
emissions from the Industry sector for the same period.
Figure 2.19. Total greenhouse gas emissions (Mtonnes CO2-eq.) in the industrial source categories in
Norway during the period 1990-2010.
Source: Statistics Norway/Climate and Pollution Agency
0
2
4
6
8
10
12
14
16Consumption ofHalocarbonsand SF6
OtherProduction
MetalProduction
ChemicalIndustry
MineralProducts
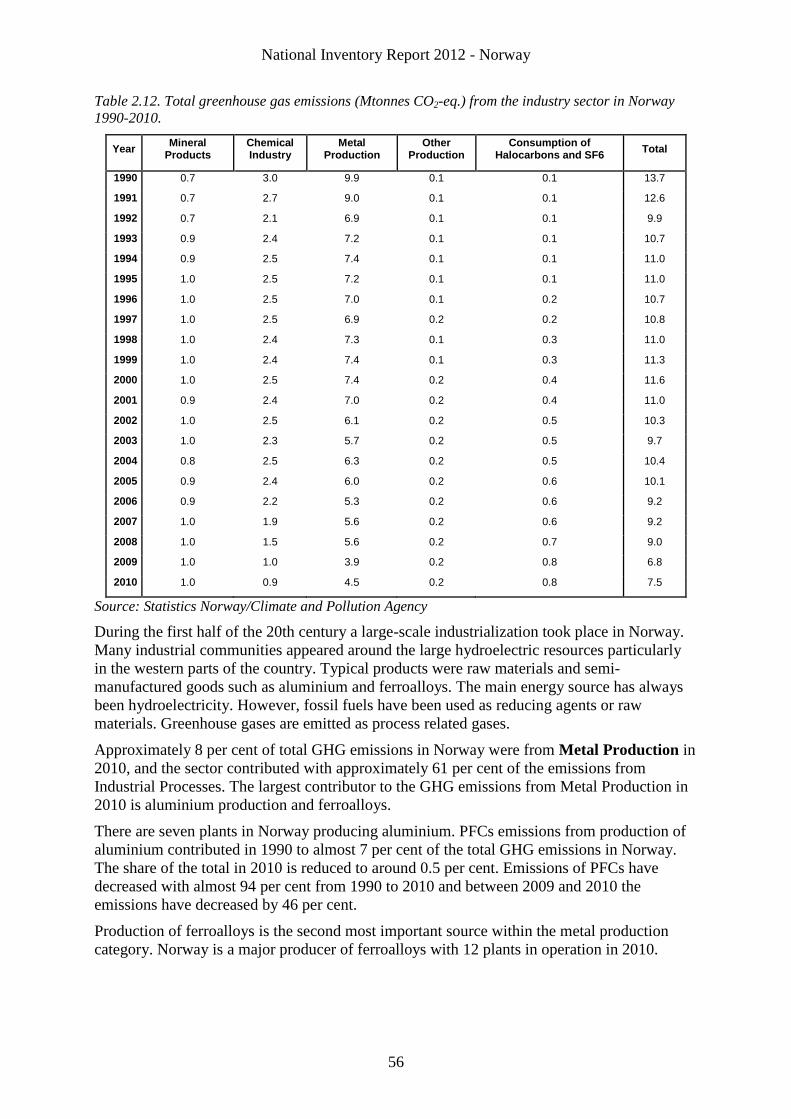
National Inventory Report 2012 - Norway
56
Table 2.12. Total greenhouse gas emissions (Mtonnes CO2-eq.) from the industry sector in Norway
1990-2010.
Year Mineral
Products Chemical Industry
Metal Production
Other Production
Consumption of Halocarbons and SF6
Total
1990 0.7 3.0 9.9 0.1 0.1 13.7
1991 0.7 2.7 9.0 0.1 0.1 12.6
1992 0.7 2.1 6.9 0.1 0.1 9.9
1993 0.9 2.4 7.2 0.1 0.1 10.7
1994 0.9 2.5 7.4 0.1 0.1 11.0
1995 1.0 2.5 7.2 0.1 0.1 11.0
1996 1.0 2.5 7.0 0.1 0.2 10.7
1997 1.0 2.5 6.9 0.2 0.2 10.8
1998 1.0 2.4 7.3 0.1 0.3 11.0
1999 1.0 2.4 7.4 0.1 0.3 11.3
2000 1.0 2.5 7.4 0.2 0.4 11.6
2001 0.9 2.4 7.0 0.2 0.4 11.0
2002 1.0 2.5 6.1 0.2 0.5 10.3
2003 1.0 2.3 5.7 0.2 0.5 9.7
2004 0.8 2.5 6.3 0.2 0.5 10.4
2005 0.9 2.4 6.0 0.2 0.6 10.1
2006 0.9 2.2 5.3 0.2 0.6 9.2
2007 1.0 1.9 5.6 0.2 0.6 9.2
2008 1.0 1.5 5.6 0.2 0.7 9.0
2009 1.0 1.0 3.9 0.2 0.8 6.8
2010 1.0 0.9 4.5 0.2 0.8 7.5
Source: Statistics Norway/Climate and Pollution Agency
During the first half of the 20th century a large-scale industrialization took place in Norway.
Many industrial communities appeared around the large hydroelectric resources particularly
in the western parts of the country. Typical products were raw materials and semi-
manufactured goods such as aluminium and ferroalloys. The main energy source has always
been hydroelectricity. However, fossil fuels have been used as reducing agents or raw
materials. Greenhouse gases are emitted as process related gases.
Approximately 8 per cent of total GHG emissions in Norway were from Metal Production in
2010, and the sector contributed with approximately 61 per cent of the emissions from
Industrial Processes. The largest contributor to the GHG emissions from Metal Production in
2010 is aluminium production and ferroalloys.
There are seven plants in Norway producing aluminium. PFCs emissions from production of
aluminium contributed in 1990 to almost 7 per cent of the total GHG emissions in Norway.
The share of the total in 2010 is reduced to around 0.5 per cent. Emissions of PFCs have
decreased with almost 94 per cent from 1990 to 2010 and between 2009 and 2010 the
emissions have decreased by 46 per cent.
Production of ferroalloys is the second most important source within the metal production
category. Norway is a major producer of ferroalloys with 12 plants in operation in 2010.
National Inventory Report 2012 - Norway
57
The GHG emissions (CO2, CH4 and N2O) from ferroalloy production accounted for more than
5per cent of the national total GHG emissions in 1990 and 4 per cent in 2010, a decrease by
almost 15 per cent since 1990. From 2009 to 2010 GHG emissions from ferroalloys increased
by approximately 50.2 per cent.
SF6 from magnesium foundries accounted in 1990 for around 4 per cent of the national total
GHG emissions, but since then the emissions have decreased. The reduction in the SF6
emissions is due to the closing down of production of cast magnesium in 2002, improvements
in the GIS-sector and an almost end in the use of SF6 as tracer gas.
Production of Mineral products contributed in 1990 by more than 1 percent of the total
GHG emissions in Norway and this share has increased to 2 per cent in 2010. The emissions
from the sector increased with 45 per cent from 1990-2010, mainly due to increased
production of clinker and lime. Emissions increased by1.8 per cent from 2009-2010. Cement
is produced in two plants in Norway, releasing CO2 emissions from coal and waste used in
direct fired furnaces, and from carbon in limestone. In 2010, the CO2 emissions from clinker
production accounted for more than 1 per cent of the total national GHG emissions and
approximately 10 per cent of the GHG emissions in the sector. From 1990-2001 the CO2
emissions from clinker production increased by 18 per cent, and from 209 to 2010 the CO2
emission increased by 10.4 per cent.
The chemical industry accounted for 12 per cent of the emissions in this sector. The
emissions decreased with more than 70 per cent in the period 1990-2010. From 2009 to 2010
the emissions decreased by almost 6.2 per cent. In Norway, this category includes primarily
production of fertilizers and silicon carbide. These processes release N2O (from nitric acid
production) and CO2 (from production of ammonia and carbides). The N2O emissions from
production of nitric acid accounted for 0.7 per cent of the total GHG emissions in 2010, and
approximately 5 per cent of the GHG emissions in sector Industrial processes. The N2O
emissions have decreased by almost 83 per cent from 1990 to 2010 while the production of
nitric acid increased by more than 24 per cent. The emission reduction is due to improved
technology in the nitric acid production. Corresponding changes from 2009 to 2010 was a
decrease in N2O emissions by almost 23 per cent and more than 43 per cent increase in
production.
Refrigeration and air conditioning equipment is the most important application category
related to emissions of hydro fluorocarbons (HFCs) under the category Consumption of
halocarbons and SF6. The emissions constitute almost 11 per cent of the emissions from the
industry sector, and from 2009 to 2010 the emissions increased by some 7 per cent. The tax
on HFCs introduced in 2003 has moderated this growth somewhat (Statistics Norway
(2007b)). Electrical switchgears and the use of SF6 as trace gas are the most important sources
of non-process emissions of SF6. Norway does not manufacture halocarbons or SF6.
2.3.4 Solvent and other product use
Use of solvents and products containing solvents result in emissions of non-methane volatile
organic compounds (NMVOC), which is regarded as an indirect greenhouse gas. The
NMVOC emissions will over a period of time in the atmosphere oxidize to CO2.
In 2010, the total emissions from solvents and other product use were about 0.2 million
tonnes of CO2 equivalents. This represented approximately 0.3 per cent of the total GHG
emissions in 2010. The emissions have decreased by around 7 per cent compared to 1990 and
have increased by almost 13 per cent from 2009.
National Inventory Report 2012 - Norway
58
2.3.5 Agriculture
In 2010, about 8 per cent of the total Norwegian emissions of greenhouse gases (GHG)
originated from agriculture. This corresponds to approximately 4.3 million tonnes CO2
equivalents. The emissions from agriculture are quite stable with minor fluctuations. The
emissions are about 5 per cent lower in 2010 than in 1990, and 0.2 per cent lower than in
2009.
The sectors clearly largest sources of GHGs are “agricultural soils” (N2O) from domestic
animals, contributing with 45 per cent, and “enteric fermentation” (CH4), contributing with 44
per cent of the sectors emissions. Manure management contributes with 10 per cent. These
sources are also key categories.
Enteric fermentation contributed with 1892 Ktonnes CO2 equivalents in 2010, which is
approximately 4 per cent of the national GHG emissions. Enteric fermentation constitutes 86
per cent of the overall CH4 emissions from agriculture.
CH4-emissions due to manure management amounted to 315 Ktonnes CO2 equivalents, and
N2O-emissions due to manure management amounted to 130 Ktonnes CO2 equivalents in
2010. In 2010, manure management emitted 1 per cent of the Norwegian emissions of GHGs.
Emissions of GHGs from manure management increased by more than 3 per cent in the
period 1990-2010 and increased by almost 0.1 % from 2009 to 2010.
The emissions of N2O in Norway from agricultural soils amounted to 1.9 million tonnes,
calculated in CO2 equivalents. They accounted for about 63 per cent of the total Norwegian
N2O emissions in 2010 or about 3.6 per cent of the total Norwegian GHG emissions that year.
Emissions of N2O from agricultural soils are a key category because of uncertainty, both in
level and trend. During the period 1990-2009 emissions decreased by 6.5 per cent. From 2009
to2010 the emissions increased by 0.6 per cent.
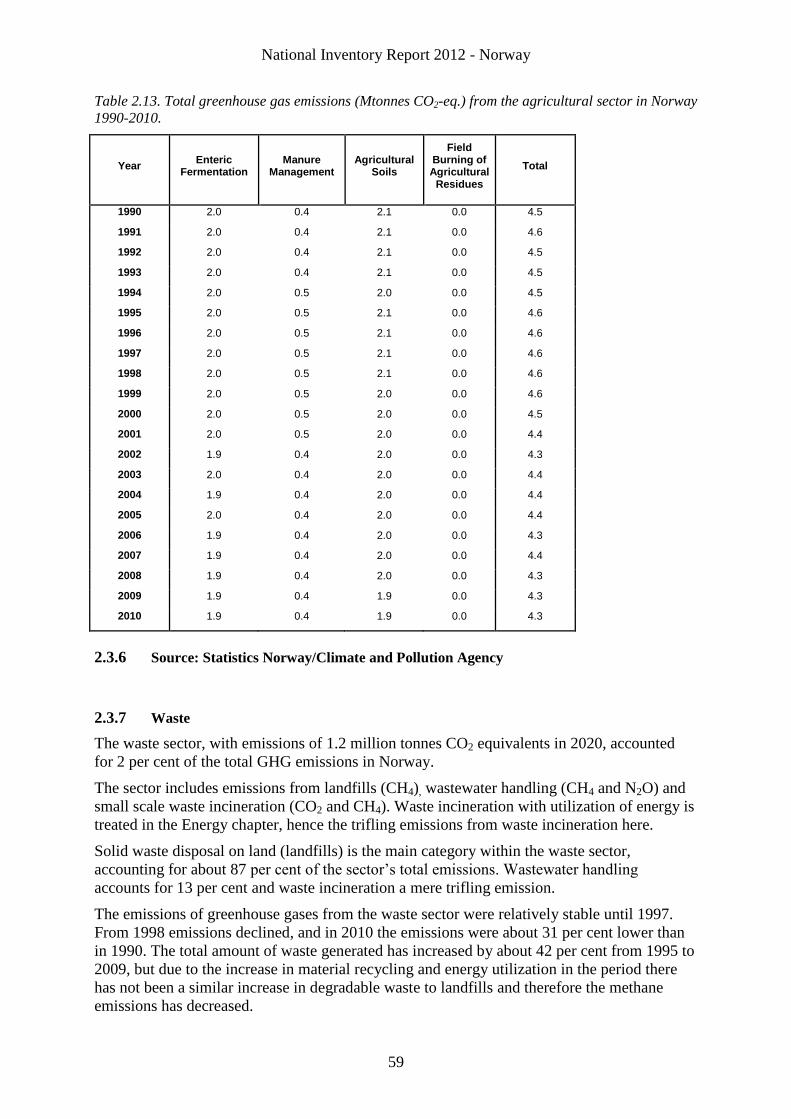
National Inventory Report 2012 - Norway
59
Table 2.13. Total greenhouse gas emissions (Mtonnes CO2-eq.) from the agricultural sector in Norway
1990-2010.
Year Enteric
Fermentation Manure
Management Agricultural
Soils
Field Burning of Agricultural
Residues
Total
1990 2.0 0.4 2.1 0.0 4.5
1991 2.0 0.4 2.1 0.0 4.6
1992 2.0 0.4 2.1 0.0 4.5
1993 2.0 0.4 2.1 0.0 4.5
1994 2.0 0.5 2.0 0.0 4.5
1995 2.0 0.5 2.1 0.0 4.6
1996 2.0 0.5 2.1 0.0 4.6
1997 2.0 0.5 2.1 0.0 4.6
1998 2.0 0.5 2.1 0.0 4.6
1999 2.0 0.5 2.0 0.0 4.6
2000 2.0 0.5 2.0 0.0 4.5
2001 2.0 0.5 2.0 0.0 4.4
2002 1.9 0.4 2.0 0.0 4.3
2003 2.0 0.4 2.0 0.0 4.4
2004 1.9 0.4 2.0 0.0 4.4
2005 2.0 0.4 2.0 0.0 4.4
2006 1.9 0.4 2.0 0.0 4.3
2007 1.9 0.4 2.0 0.0 4.4
2008 1.9 0.4 2.0 0.0 4.3
2009 1.9 0.4 1.9 0.0 4.3
2010 1.9 0.4 1.9 0.0 4.3
2.3.6 Source: Statistics Norway/Climate and Pollution Agency
2.3.7 Waste
The waste sector, with emissions of 1.2 million tonnes CO2 equivalents in 2020, accounted
for 2 per cent of the total GHG emissions in Norway.
The sector includes emissions from landfills (CH4), wastewater handling (CH4 and N2O) and
small scale waste incineration (CO2 and CH4). Waste incineration with utilization of energy is
treated in the Energy chapter, hence the trifling emissions from waste incineration here.
Solid waste disposal on land (landfills) is the main category within the waste sector,
accounting for about 87 per cent of the sector’s total emissions. Wastewater handling
accounts for 13 per cent and waste incineration a mere trifling emission.
The emissions of greenhouse gases from the waste sector were relatively stable until 1997.
From 1998 emissions declined, and in 2010 the emissions were about 31 per cent lower than
in 1990. The total amount of waste generated has increased by about 42 per cent from 1995 to
2009, but due to the increase in material recycling and energy utilization in the period there
has not been a similar increase in degradable waste to landfills and therefore the methane
emissions has decreased.
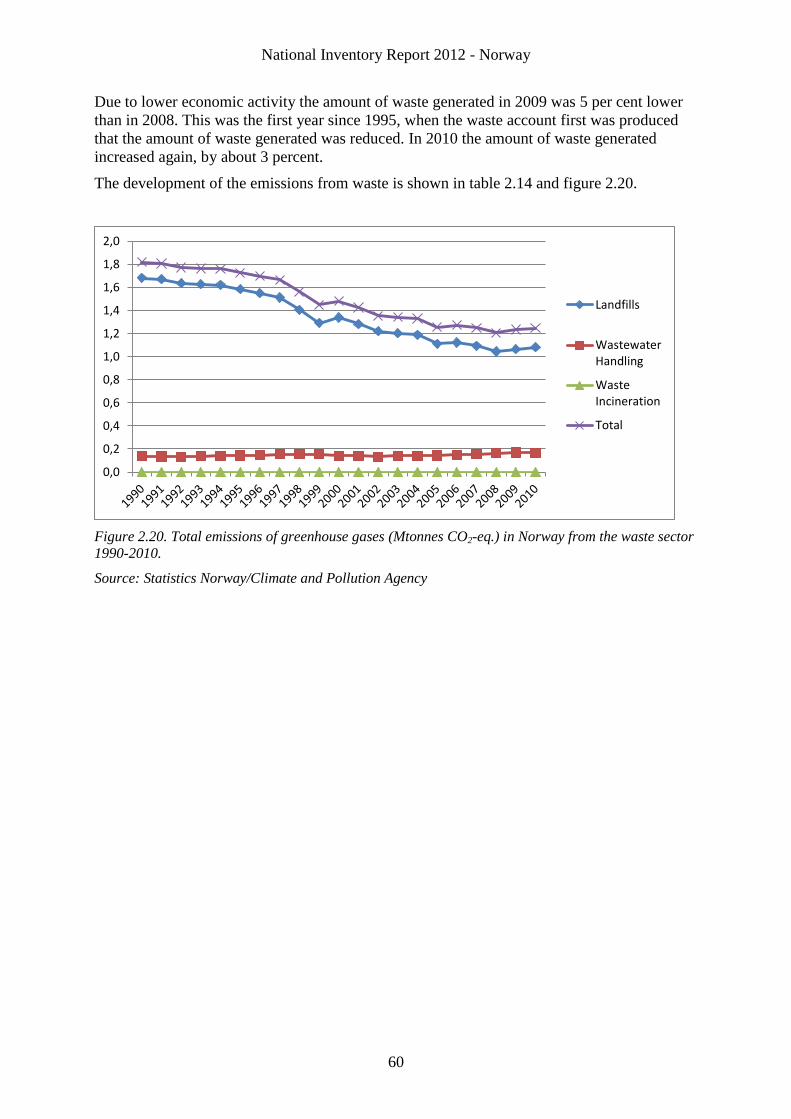
National Inventory Report 2012 - Norway
60
Due to lower economic activity the amount of waste generated in 2009 was 5 per cent lower
than in 2008. This was the first year since 1995, when the waste account first was produced
that the amount of waste generated was reduced. In 2010 the amount of waste generated
increased again, by about 3 percent.
The development of the emissions from waste is shown in table 2.14 and figure 2.20.
Figure 2.20. Total emissions of greenhouse gases (Mtonnes CO2-eq.) in Norway from the waste sector
1990-2010.
Source: Statistics Norway/Climate and Pollution Agency
0,0
0,2
0,4
0,6
0,8
1,0
1,2
1,4
1,6
1,8
2,0
Landfills
WastewaterHandling
WasteIncineration
Total
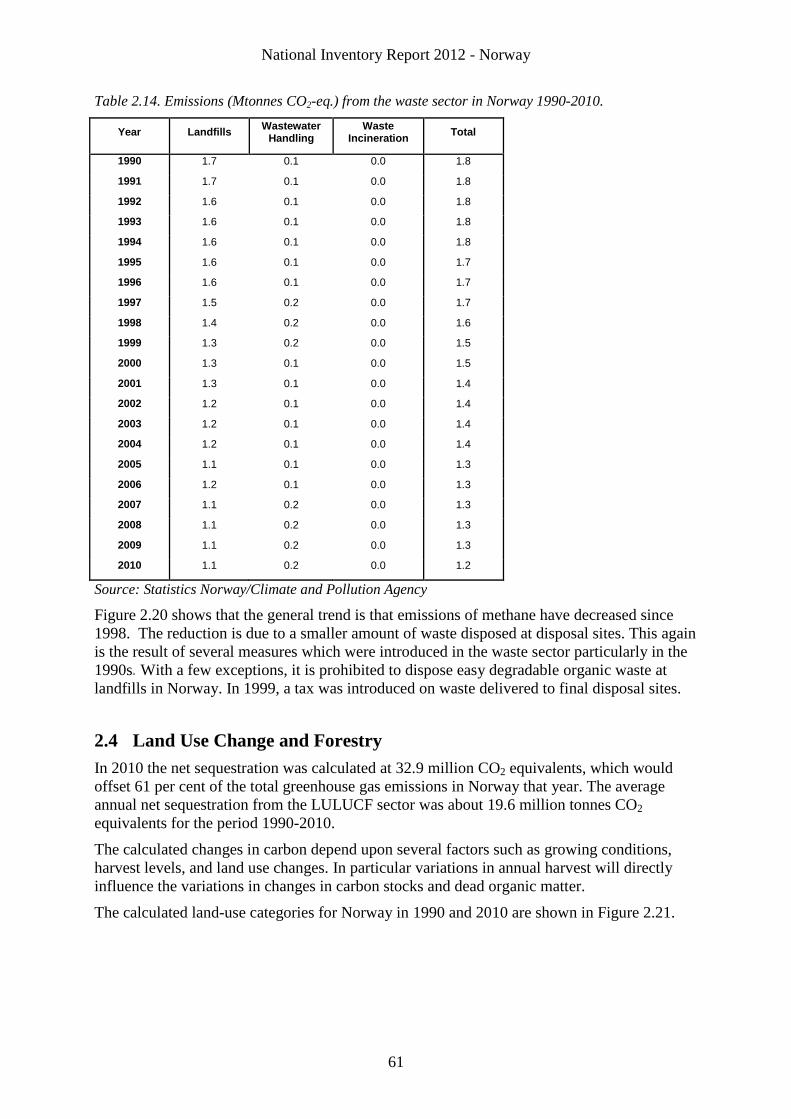
National Inventory Report 2012 - Norway
61
Table 2.14. Emissions (Mtonnes CO2-eq.) from the waste sector in Norway 1990-2010.
Year Landfills Wastewater
Handling Waste
Incineration Total
1990 1.7 0.1 0.0 1.8
1991 1.7 0.1 0.0 1.8
1992 1.6 0.1 0.0 1.8
1993 1.6 0.1 0.0 1.8
1994 1.6 0.1 0.0 1.8
1995 1.6 0.1 0.0 1.7
1996 1.6 0.1 0.0 1.7
1997 1.5 0.2 0.0 1.7
1998 1.4 0.2 0.0 1.6
1999 1.3 0.2 0.0 1.5
2000 1.3 0.1 0.0 1.5
2001 1.3 0.1 0.0 1.4
2002 1.2 0.1 0.0 1.4
2003 1.2 0.1 0.0 1.4
2004 1.2 0.1 0.0 1.4
2005 1.1 0.1 0.0 1.3
2006 1.2 0.1 0.0 1.3
2007 1.1 0.2 0.0 1.3
2008 1.1 0.2 0.0 1.3
2009 1.1 0.2 0.0 1.3
2010 1.1 0.2 0.0 1.2
Source: Statistics Norway/Climate and Pollution Agency
Figure 2.20 shows that the general trend is that emissions of methane have decreased since
1998. The reduction is due to a smaller amount of waste disposed at disposal sites. This again
is the result of several measures which were introduced in the waste sector particularly in the
1990s. With a few exceptions, it is prohibited to dispose easy degradable organic waste at
landfills in Norway. In 1999, a tax was introduced on waste delivered to final disposal sites.
2.4 Land Use Change and Forestry
In 2010 the net sequestration was calculated at 32.9 million CO2 equivalents, which would
offset 61 per cent of the total greenhouse gas emissions in Norway that year. The average
annual net sequestration from the LULUCF sector was about 19.6 million tonnes CO2
equivalents for the period 1990-2010.
The calculated changes in carbon depend upon several factors such as growing conditions,
harvest levels, and land use changes. In particular variations in annual harvest will directly
influence the variations in changes in carbon stocks and dead organic matter.
The calculated land-use categories for Norway in 1990 and 2010 are shown in Figure 2.21.
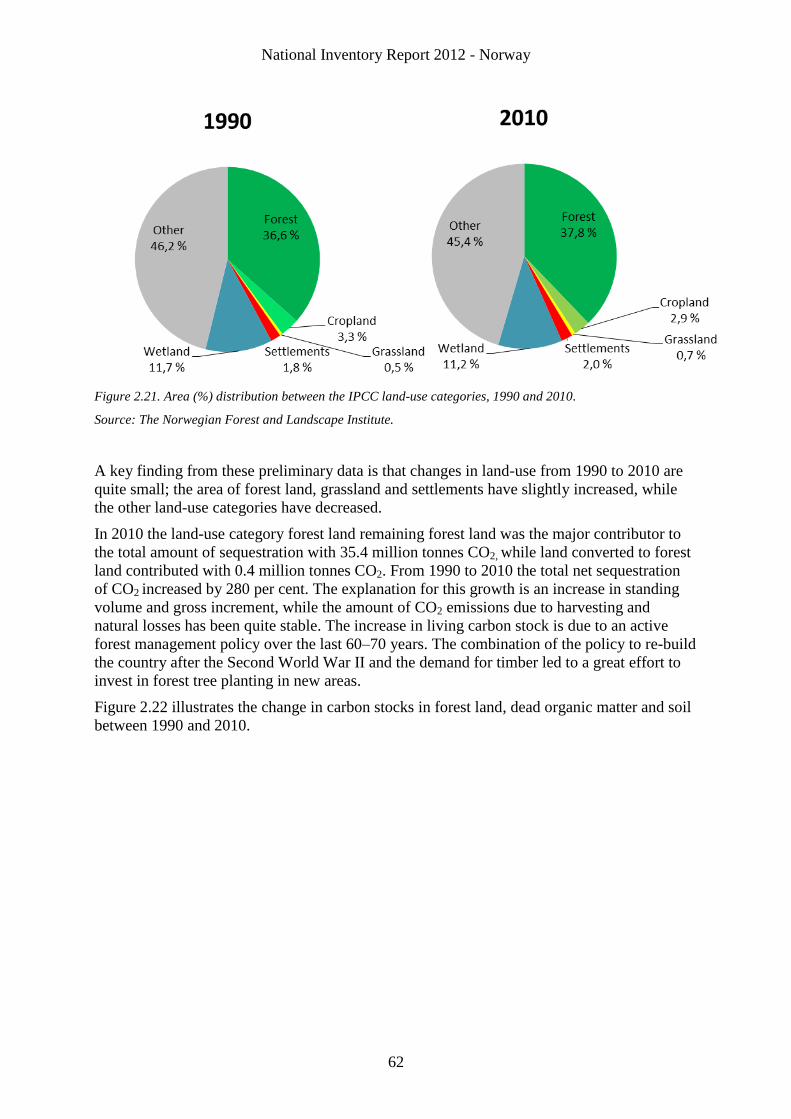
National Inventory Report 2012 - Norway
62
Figure 2.21. Area (%) distribution between the IPCC land-use categories, 1990 and 2010.
Source: The Norwegian Forest and Landscape Institute.
A key finding from these preliminary data is that changes in land-use from 1990 to 2010 are
quite small; the area of forest land, grassland and settlements have slightly increased, while
the other land-use categories have decreased.
In 2010 the land-use category forest land remaining forest land was the major contributor to
the total amount of sequestration with 35.4 million tonnes CO2, while land converted to forest
land contributed with 0.4 million tonnes CO2. From 1990 to 2010 the total net sequestration
of CO2 increased by 280 per cent. The explanation for this growth is an increase in standing
volume and gross increment, while the amount of CO2 emissions due to harvesting and
natural losses has been quite stable. The increase in living carbon stock is due to an active
forest management policy over the last 60–70 years. The combination of the policy to re-build
the country after the Second World War II and the demand for timber led to a great effort to
invest in forest tree planting in new areas.
Figure 2.22 illustrates the change in carbon stocks in forest land, dead organic matter and soil
between 1990 and 2010.
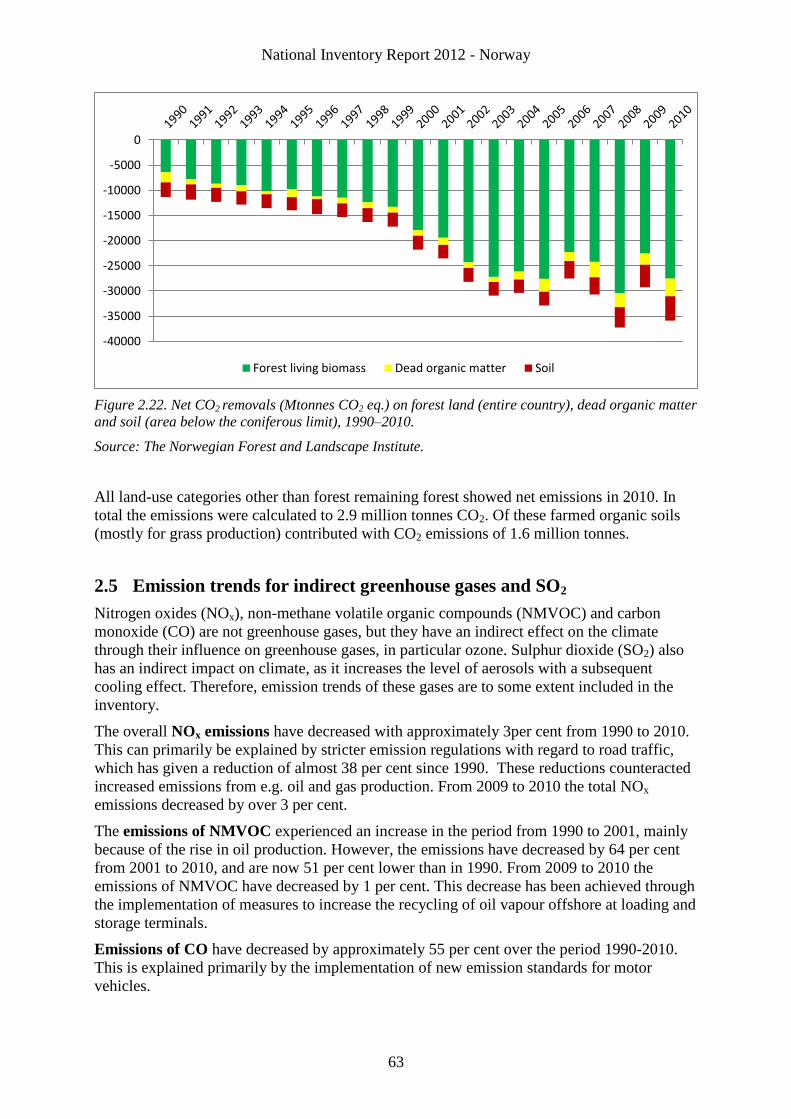
National Inventory Report 2012 - Norway
63
Figure 2.22. Net CO2 removals (Mtonnes CO2 eq.) on forest land (entire country), dead organic matter
and soil (area below the coniferous limit), 1990–2010.
Source: The Norwegian Forest and Landscape Institute.
All land-use categories other than forest remaining forest showed net emissions in 2010. In
total the emissions were calculated to 2.9 million tonnes CO2. Of these farmed organic soils
(mostly for grass production) contributed with CO2 emissions of 1.6 million tonnes.
2.5 Emission trends for indirect greenhouse gases and SO2
Nitrogen oxides (NOx), non-methane volatile organic compounds (NMVOC) and carbon
monoxide (CO) are not greenhouse gases, but they have an indirect effect on the climate
through their influence on greenhouse gases, in particular ozone. Sulphur dioxide (SO2) also
has an indirect impact on climate, as it increases the level of aerosols with a subsequent
cooling effect. Therefore, emission trends of these gases are to some extent included in the
inventory.
The overall NOx emissions have decreased with approximately 3per cent from 1990 to 2010.
This can primarily be explained by stricter emission regulations with regard to road traffic,
which has given a reduction of almost 38 per cent since 1990. These reductions counteracted
increased emissions from e.g. oil and gas production. From 2009 to 2010 the total NOx
emissions decreased by over 3 per cent.
The emissions of NMVOC experienced an increase in the period from 1990 to 2001, mainly
because of the rise in oil production. However, the emissions have decreased by 64 per cent
from 2001 to 2010, and are now 51 per cent lower than in 1990. From 2009 to 2010 the
emissions of NMVOC have decreased by 1 per cent. This decrease has been achieved through
the implementation of measures to increase the recycling of oil vapour offshore at loading and
storage terminals.
Emissions of CO have decreased by approximately 55 per cent over the period 1990-2010.
This is explained primarily by the implementation of new emission standards for motor
vehicles.
-40000
-35000
-30000
-25000
-20000
-15000
-10000
-5000
0
Forest living biomass Dead organic matter Soil
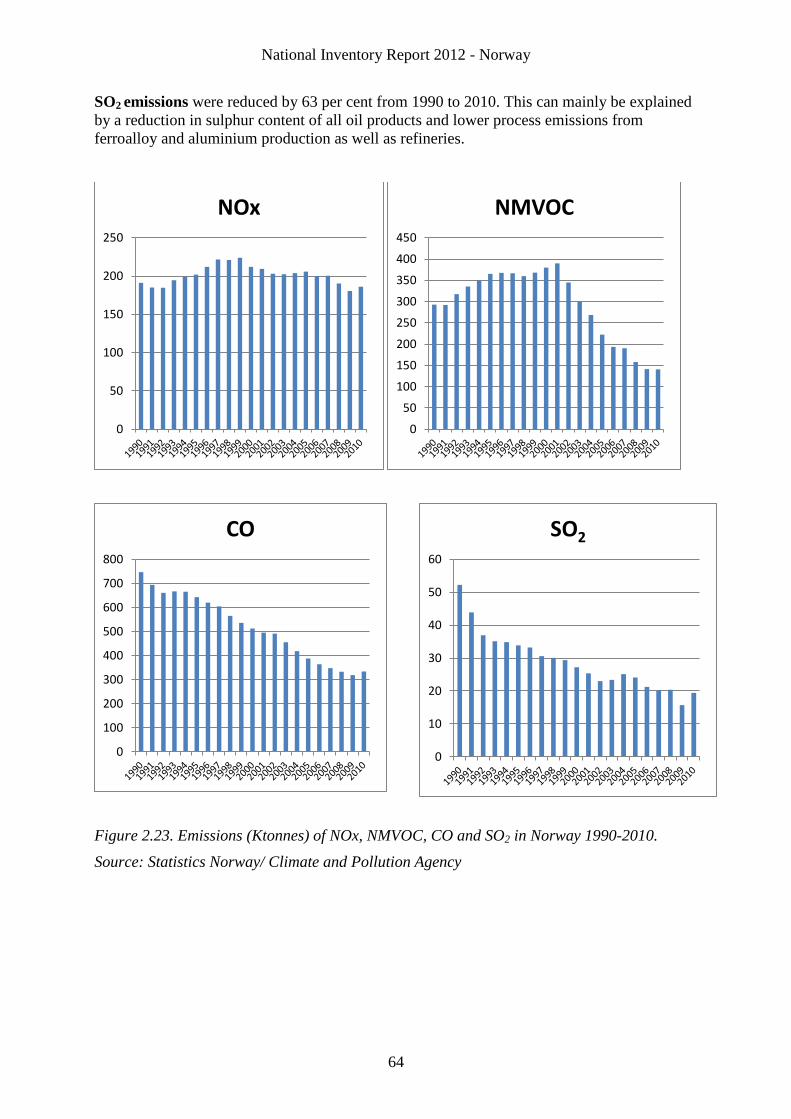
National Inventory Report 2012 - Norway
64
SO2 emissions were reduced by 63 per cent from 1990 to 2010. This can mainly be explained
by a reduction in sulphur content of all oil products and lower process emissions from
ferroalloy and aluminium production as well as refineries.
Figure 2.23. Emissions (Ktonnes) of NOx, NMVOC, CO and SO2 in Norway 1990-2010.
Source: Statistics Norway/ Climate and Pollution Agency
0
50
100
150
200
250
NOx
0
50
100
150
200
250
300
350
400
450
NMVOC
0
100
200
300
400
500
600
700
800
CO
0
10
20
30
40
50
60
SO2
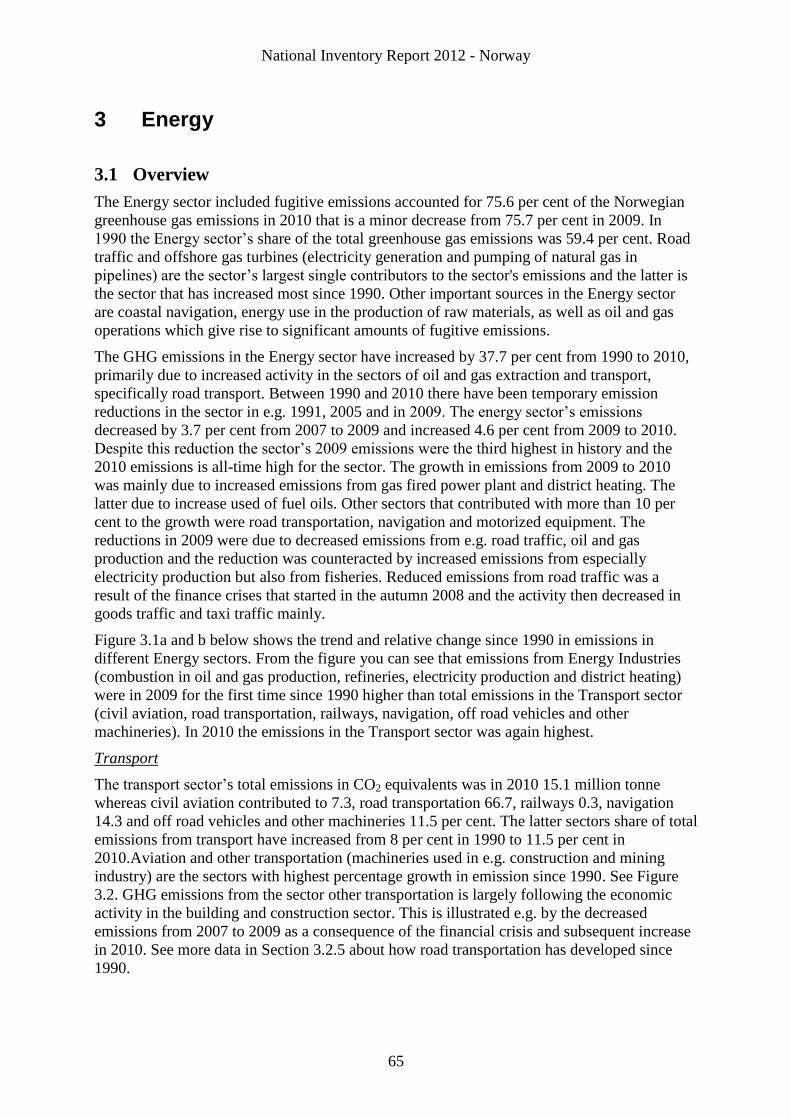
National Inventory Report 2012 - Norway
65
3 Energy
3.1 Overview
The Energy sector included fugitive emissions accounted for 75.6 per cent of the Norwegian
greenhouse gas emissions in 2010 that is a minor decrease from 75.7 per cent in 2009. In
1990 the Energy sector’s share of the total greenhouse gas emissions was 59.4 per cent. Road
traffic and offshore gas turbines (electricity generation and pumping of natural gas in
pipelines) are the sector’s largest single contributors to the sector's emissions and the latter is
the sector that has increased most since 1990. Other important sources in the Energy sector
are coastal navigation, energy use in the production of raw materials, as well as oil and gas
operations which give rise to significant amounts of fugitive emissions.
The GHG emissions in the Energy sector have increased by 37.7 per cent from 1990 to 2010,
primarily due to increased activity in the sectors of oil and gas extraction and transport,
specifically road transport. Between 1990 and 2010 there have been temporary emission
reductions in the sector in e.g. 1991, 2005 and in 2009. The energy sector’s emissions
decreased by 3.7 per cent from 2007 to 2009 and increased 4.6 per cent from 2009 to 2010.
Despite this reduction the sector’s 2009 emissions were the third highest in history and the
2010 emissions is all-time high for the sector. The growth in emissions from 2009 to 2010
was mainly due to increased emissions from gas fired power plant and district heating. The
latter due to increase used of fuel oils. Other sectors that contributed with more than 10 per
cent to the growth were road transportation, navigation and motorized equipment. The
reductions in 2009 were due to decreased emissions from e.g. road traffic, oil and gas
production and the reduction was counteracted by increased emissions from especially
electricity production but also from fisheries. Reduced emissions from road traffic was a
result of the finance crises that started in the autumn 2008 and the activity then decreased in
goods traffic and taxi traffic mainly.
Figure 3.1a and b below shows the trend and relative change since 1990 in emissions in
different Energy sectors. From the figure you can see that emissions from Energy Industries
(combustion in oil and gas production, refineries, electricity production and district heating)
were in 2009 for the first time since 1990 higher than total emissions in the Transport sector
(civil aviation, road transportation, railways, navigation, off road vehicles and other
machineries). In 2010 the emissions in the Transport sector was again highest.
Transport
The transport sector’s total emissions in CO2 equivalents was in 2010 15.1 million tonne
whereas civil aviation contributed to 7.3, road transportation 66.7, railways 0.3, navigation
14.3 and off road vehicles and other machineries 11.5 per cent. The latter sectors share of total
emissions from transport have increased from 8 per cent in 1990 to 11.5 per cent in
2010.Aviation and other transportation (machineries used in e.g. construction and mining
industry) are the sectors with highest percentage growth in emission since 1990. See Figure
3.2. GHG emissions from the sector other transportation is largely following the economic
activity in the building and construction sector. This is illustrated e.g. by the decreased
emissions from 2007 to 2009 as a consequence of the financial crisis and subsequent increase
in 2010. See more data in Section 3.2.5 about how road transportation has developed since
1990.
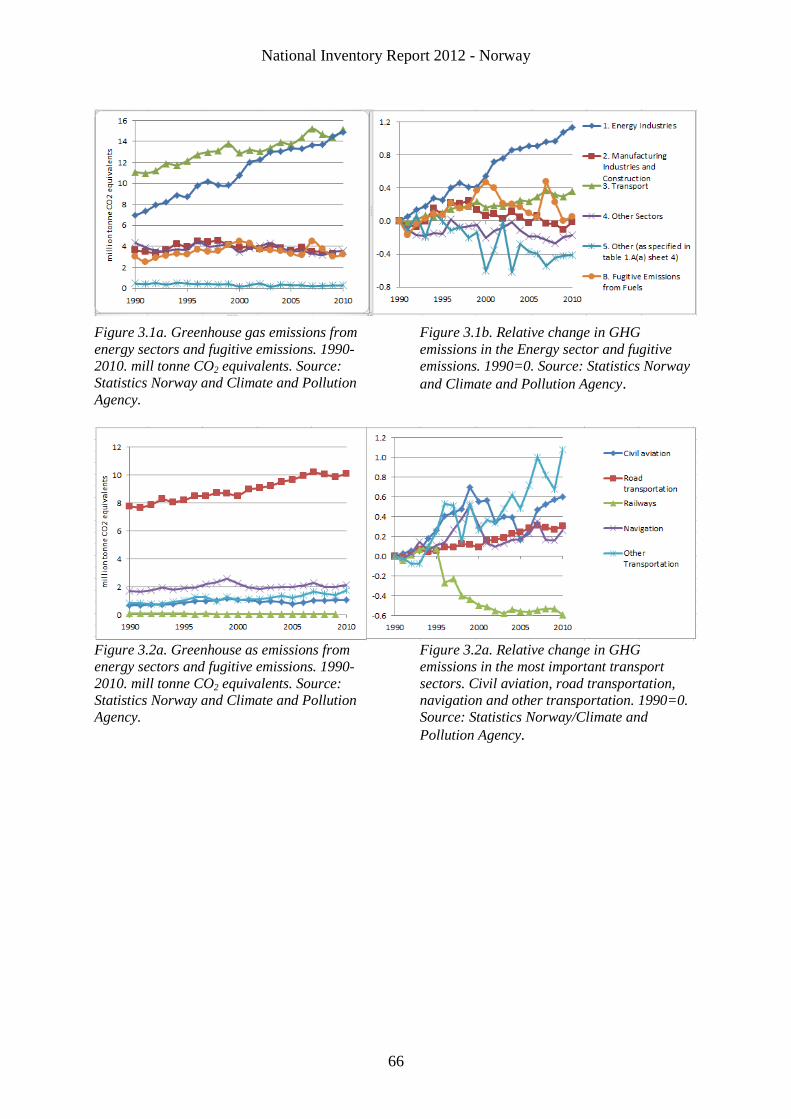
National Inventory Report 2012 - Norway
66
Figure 3.1a. Greenhouse gas emissions from
energy sectors and fugitive emissions. 1990-
2010. mill tonne CO2 equivalents. Source:
Statistics Norway and Climate and Pollution
Agency.
Figure 3.1b. Relative change in GHG
emissions in the Energy sector and fugitive
emissions. 1990=0. Source: Statistics Norway
and Climate and Pollution Agency.
Figure 3.2a. Greenhouse as emissions from
energy sectors and fugitive emissions. 1990-
2010. mill tonne CO2 equivalents. Source:
Statistics Norway and Climate and Pollution
Agency.
Figure 3.2a. Relative change in GHG
emissions in the most important transport
sectors. Civil aviation, road transportation,
navigation and other transportation. 1990=0.
Source: Statistics Norway/Climate and
Pollution Agency.
National Inventory Report 2012 - Norway
67
Key source categories
As indicated in Section 1.5, the Tier 2 key category analysis performed for the years 1990 and
2010 has revealed that in terms of total level and/or trend uncertainty the key categories in the
Energy sector for 1990 and/or 2010 are, in CRF order, the following:
Stationary Fuel Combustion, Solid Fuels – CO2 (1A1-1A2-1A4)
Stationary Fuel Combustion, Liquid Fuels – CO2 (1A1-1A2-1A4)
Stationary Fuel Combustion, Gaseous Fuels – CO2 (1A1-1A2-1A4)
Stationary Fuel Combustion, Gaseous Fuels – CH4 (1A1-1A2-1A4)
Stationary Fuel Combustion, Other Fuels – CO2 (1A1-1A2-1A4)
Stationary Fuel Combustion, Biomass – CH4 (1A1-1A2-1A4)
Other sectors, Mobile Fuel Combustion – CO2 (1A4)
Civil Aviation – CO2 (1A3a)
Road Transportation – CO2 (1A3b)
Navigation – CO2 (1A3d)
Navigation – CH4 (1A3d) ok
Other Transportation – CO2 (1A3e)
Other Transportation – N2O (1A3e)
Fugitive Emissions from Oil – CO2 (1B2a)
Fugitive Emissions from Oil – CH4 (1B2a)
Fugitive Emissions from Natural gas – CH4 (1B2b)
Venting and Flaring – CO2 (1B2c)
Venting and Flaring – CH4 (1B2c).
In addition to source categories defined as key categories according to the Tier 2 key category
analysis one source categories is defined as key according to Tier 1 key category analysis:
Military, mobile – CO2 (1A5b).
Coal mining (1B1a) is not found to be a key category in the key category analysis. However,
it is here regarded as a key category on the basis of “qualitative” criteria such as change in
trend and uncertainty in the emission factors. This source is described in detail in Section 3.3.
An important issue, which is also elaborated in this sector, concerns the capture and storage of
CO2 emissions at the offshore oil and gas field Sleipner Vest and Hammerfest LNG (Snøhvit
gas-condensate field). These unique operations are discussed in detail in Section 3.5.
Emission allocation
Emissions from waste incineration at district heating plants are accounted for under the
energy sector, as the energy is utilized. Methane from landfills used for energy purposes is
also accounted for in this sector. Emissions from flaring in the energy sectors are described in
Sections 3.4 Fugitives Emissions from Oil and Natural Gas. Coal and coke used as reducing
agents and gas used for production of ammonia (non-energy part) are accounted for under
industrial processes. Flaring outside the energy sectors is described in Chapter 8 Waste. The
same applies to emissions from cigarettes, accidental fires etc. Emissions from burning of
crop residues and agricultural waste are accounted for under Chapter 6 Agriculture.
Mode of presentation
The elaboration of the energy sector in the following starts with a description of emissions
from the energy combustion sources (Section 3.2), followed by a description of fugitive

National Inventory Report 2012 - Norway
68
emissions (Section 3.3 and 3.4) and a discussion on the capture and storage of CO2 emissions
at the oil and gas field Sleipner Vest and Hammerfest LNG (Snøhvit gas-condensate field)
(Section 3.5). Cross-cutting issues are elaborated in Section 3.6 and comprise the following
elements:
Comparison between the sectoral and reference approach
Feedstock and non-energy use of fuels
Indirect CO2 emissions from CH4 and NMVOC
Finally, the memo items of international bunker fuels and CO2 emissions from biomass are
addressed in Section 3.7.
In the case of energy combustion, emissions from the individual combustion sources are
discussed after a comprehensive presentation of the energy combustion sector as a whole
(Section 3.2). The purpose for such an arrangement is to avoid repetition of methodological
issues which are common among underlying source categories, and to enable easier cross-
reference.
National Inventory Report 2012 - Norway
69
3.2 Energy Combustion
3.2.1 Overview
This section describes the general methodology for calculation of GHG emissions from the
combustion of fossil fuels and biomass. All known combustion activities within energy
utilization in various industries and private households are included.
The GHG emissions from fuel combustion (1A) accounted for 69.6 per cent of national total
emissions in 2010. The emissions increased by 41.4 per cent between 1990 and 2010,
primarily due to activity growth in oil and gas extraction that is the major part of energy
industries sector and transport, mainly road transportation. The emissions from source
category 1A increased by 1.6 per cent from 2008 to 2009 and additional 4.6 per cent 2009 to
2010. While the emission from nearly all source categories within sector 1A decreased in
2009 except Public Electricity and Heat Production, almost all sectors increased its emissions
in 2010. The change in 2010 was dominated by increased activity in Public Electricity and
Heat Production (gas fired power plants and district heating), Manufacturing Industries and
Construction (specifically non-ferrous metal), transport (specifically other transportation and
also road transportation and navigation). Emissions from oil and gas extraction were nearly
unchanged from 2009 to 2010.
The fuel combustion sector is dominated by the emissions of CO2 which in 2010 contributed
98 per cent to the totals of this sector (1A).
This sector hosts thirteen source categories defined as keys according to Tier 2 key category
analyses and one as key category from the Tier 1 analyses. These, along with the non-key
categories, are presented in detail in the following sections.
3.2.1.1 Methodological issues
Emissions from fuel combustion are estimated at the sectoral level in accordance with the
IPCC sectoral approach Tier1/Tier 2/Tier 3. Often total fuel consumption is better known than
the sectoral consumption.
The general method to estimate emissions from fuel combustion is multiplication of fuel
consumption by source and sector by an appropriate emission factor. Exceptions are road traffic
and aviation where more detailed estimation models are used; involving additional activity data
(see Sections 3.2.5 and 3.2.4. respectively). The total amount of fuel consumption is taken from
the Norwegian energy balance (see Annex III). The mean theoretical energy content of fuels
and their density are listed in Table 3.1.
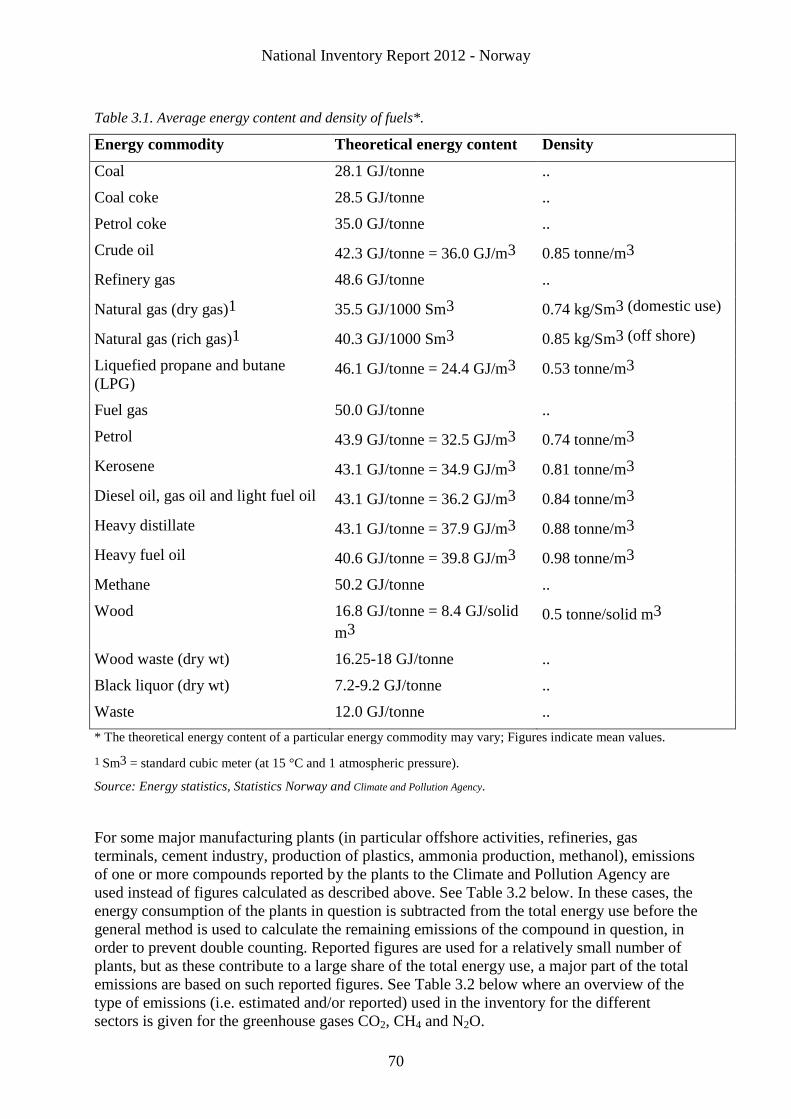
National Inventory Report 2012 - Norway
70
Table 3.1. Average energy content and density of fuels*.
Energy commodity Theoretical energy content Density
Coal 28.1 GJ/tonne ..
Coal coke 28.5 GJ/tonne ..
Petrol coke 35.0 GJ/tonne ..
Crude oil 42.3 GJ/tonne = 36.0 GJ/m3 0.85 tonne/m3
Refinery gas 48.6 GJ/tonne ..
Natural gas (dry gas)1 35.5 GJ/1000 Sm3 0.74 kg/Sm3 (domestic use)
Natural gas (rich gas)1 40.3 GJ/1000 Sm3 0.85 kg/Sm3 (off shore)
Liquefied propane and butane
(LPG) 46.1 GJ/tonne = 24.4 GJ/m3 0.53 tonne/m3
Fuel gas 50.0 GJ/tonne ..
Petrol 43.9 GJ/tonne = 32.5 GJ/m3 0.74 tonne/m3
Kerosene 43.1 GJ/tonne = 34.9 GJ/m3 0.81 tonne/m3
Diesel oil, gas oil and light fuel oil 43.1 GJ/tonne = 36.2 GJ/m3 0.84 tonne/m3
Heavy distillate 43.1 GJ/tonne = 37.9 GJ/m3 0.88 tonne/m3
Heavy fuel oil 40.6 GJ/tonne = 39.8 GJ/m3 0.98 tonne/m3
Methane 50.2 GJ/tonne ..
Wood 16.8 GJ/tonne = 8.4 GJ/solid
m3
0.5 tonne/solid m3
Wood waste (dry wt) 16.25-18 GJ/tonne ..
Black liquor (dry wt) 7.2-9.2 GJ/tonne ..
Waste 12.0 GJ/tonne ..
* The theoretical energy content of a particular energy commodity may vary; Figures indicate mean values.
1 Sm3 = standard cubic meter (at 15 °C and 1 atmospheric pressure).
Source: Energy statistics, Statistics Norway and Climate and Pollution Agency.
For some major manufacturing plants (in particular offshore activities, refineries, gas
terminals, cement industry, production of plastics, ammonia production, methanol), emissions
of one or more compounds reported by the plants to the Climate and Pollution Agency are
used instead of figures calculated as described above. See Table 3.2 below. In these cases, the
energy consumption of the plants in question is subtracted from the total energy use before the
general method is used to calculate the remaining emissions of the compound in question, in
order to prevent double counting. Reported figures are used for a relatively small number of
plants, but as these contribute to a large share of the total energy use, a major part of the total
emissions are based on such reported figures. See Table 3.2 below where an overview of the
type of emissions (i.e. estimated and/or reported) used in the inventory for the different
sectors is given for the greenhouse gases CO2, CH4 and N2O.
National Inventory Report 2012 - Norway
71
The reports are from the mandatory reporting obligation that is a part of the plants permits
given by the authorities and from 2005 the emission data is from the emission trading system.
The ETS was first a voluntary system, 2005-2007, and then as a part of EU ETS since
2008.From 1997 there have been different voluntary agreements between national authority
and the industry. The agreement from 1997 covered the aluminum producers and included
from 2005 industry not included in the ETS. The industry has in the different voluntary
agreements committed themselves to reduce their greenhouse gas emissions as a group. As
part of the agreements the industry has every year reported detailed AD and emissions to the
Climate and Pollution Agency. The voluntary agreement has involved industry i.e. ferro alloy,
aluminum, ammonia. Figures on energy use are based on data reported from the plants to
Statistics Norway. Some of the energy figures used to calculate reported emissions may
deviate from the figures in the energy balance. This may in some cases cause inaccuracies in
IEFs, but, generally, this should not be regarded as an important issue.
Table 3.3 shows the share of the emissions of CO2, CH4 and N2O in the different energy
sectors that is based on either estimated or reported emissions in 2010. For the source
categories like Petroleum Refining, Manufacture of Solid Fuels and Other Energy Industries,
mainly oil and gas extraction, and Iron and Steel more than 90 per cent of the categories
emissions is based on reported CO2 emissions. In 2010 92 per cent of the CO2 emissions from
Energy Industries were based on reported emissions and 49 per cent of the CO2 emissions
from Manufacturing Industries and Construction. The table is a result from an advice from the
ERT reviewing Norway’s 2010 submission.
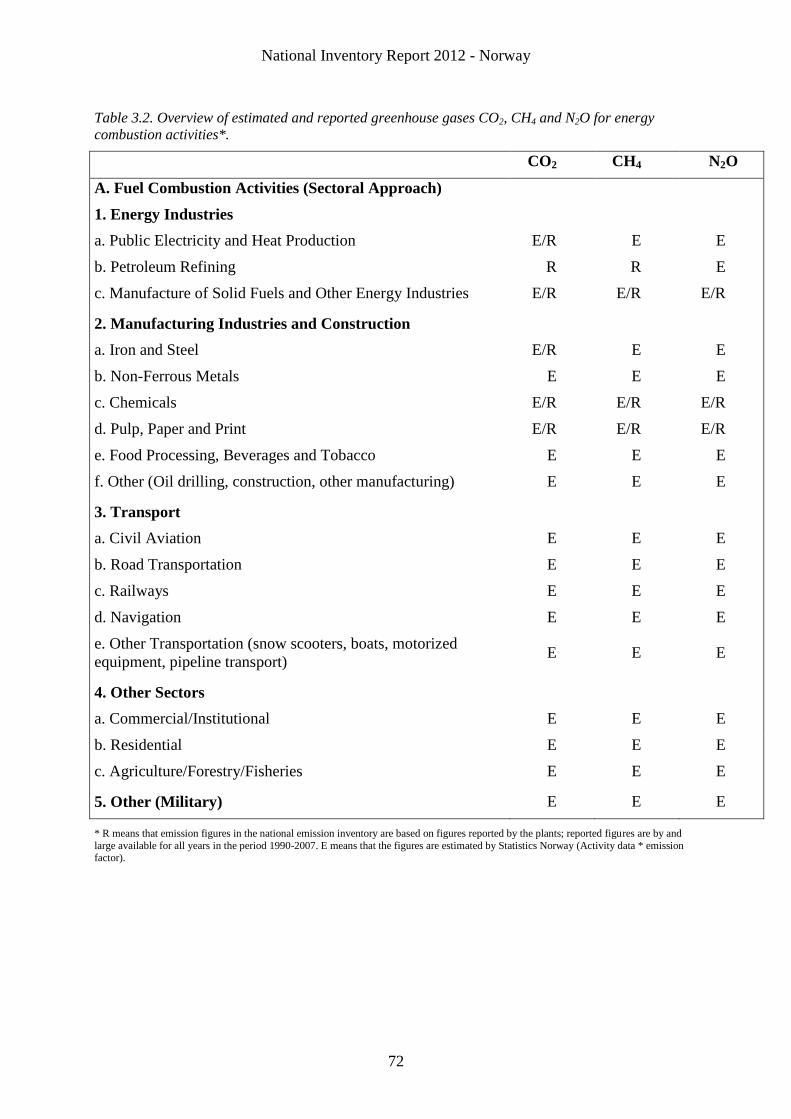
National Inventory Report 2012 - Norway
72
Table 3.2. Overview of estimated and reported greenhouse gases CO2, CH4 and N2O for energy
combustion activities*.
CO2 CH4 N2O
A. Fuel Combustion Activities (Sectoral Approach)
1. Energy Industries
a. Public Electricity and Heat Production E/R E E
b. Petroleum Refining R R E
c. Manufacture of Solid Fuels and Other Energy Industries E/R E/R E/R
2. Manufacturing Industries and Construction
a. Iron and Steel E/R E E
b. Non-Ferrous Metals E E E
c. Chemicals E/R E/R E/R
d. Pulp, Paper and Print E/R E/R E/R
e. Food Processing, Beverages and Tobacco E E E
f. Other (Oil drilling, construction, other manufacturing) E E E
3. Transport
a. Civil Aviation E E E
b. Road Transportation E E E
c. Railways E E E
d. Navigation E E E
e. Other Transportation (snow scooters, boats, motorized
equipment, pipeline transport) E E E
4. Other Sectors
a. Commercial/Institutional E E E
b. Residential E E E
c. Agriculture/Forestry/Fisheries E E E
5. Other (Military) E E E
* R means that emission figures in the national emission inventory are based on figures reported by the plants; reported figures are by and
large available for all years in the period 1990-2007. E means that the figures are estimated by Statistics Norway (Activity data * emission factor).
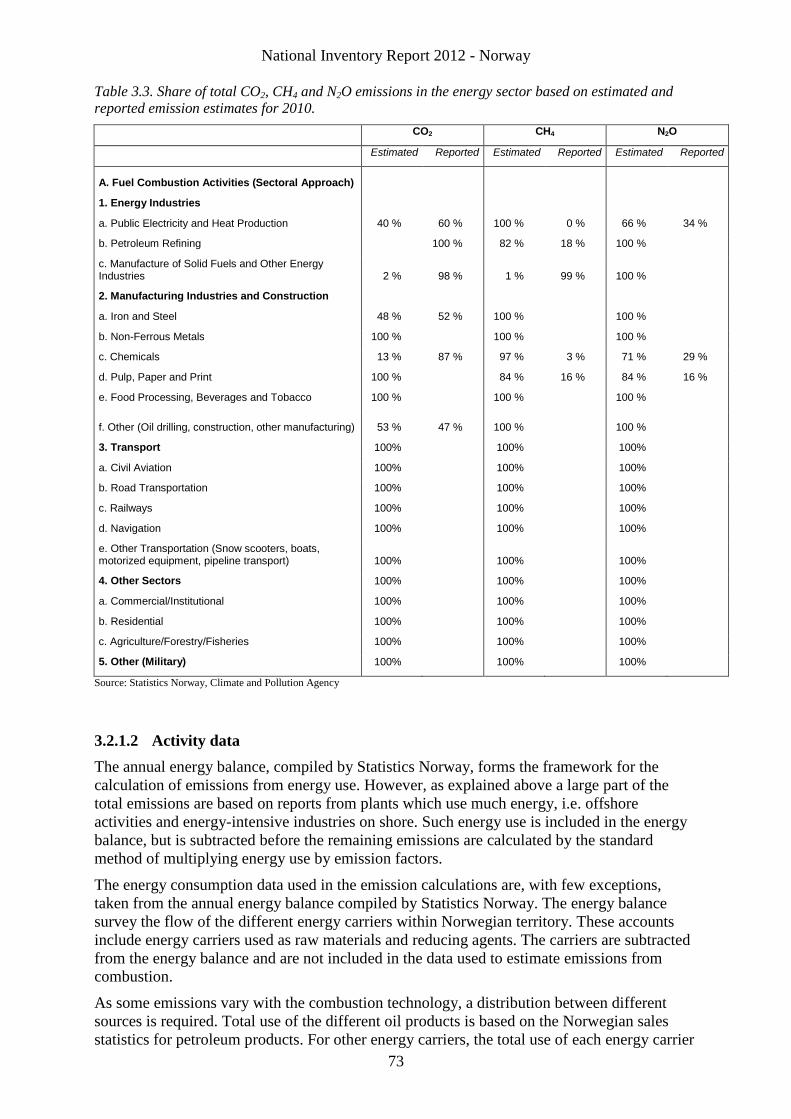
National Inventory Report 2012 - Norway
73
Table 3.3. Share of total CO2, CH4 and N2O emissions in the energy sector based on estimated and
reported emission estimates for 2010.
CO2 CH4 N2O
Estimated Reported Estimated Reported Estimated Reported
A. Fuel Combustion Activities (Sectoral Approach)
1. Energy Industries
a. Public Electricity and Heat Production 40 % 60 % 100 % 0 % 66 % 34 %
b. Petroleum Refining
100 % 82 % 18 % 100 %
c. Manufacture of Solid Fuels and Other Energy Industries 2 % 98 % 1 % 99 % 100 %
2. Manufacturing Industries and Construction
a. Iron and Steel 48 % 52 % 100 %
100 %
b. Non-Ferrous Metals 100 %
100 %
100 %
c. Chemicals 13 % 87 % 97 % 3 % 71 % 29 %
d. Pulp, Paper and Print 100 %
84 % 16 % 84 % 16 %
e. Food Processing, Beverages and Tobacco 100 %
100 %
100 %
f. Other (Oil drilling, construction, other manufacturing) 53 % 47 % 100 %
100 %
3. Transport 100% 100% 100%
a. Civil Aviation 100% 100% 100%
b. Road Transportation 100% 100% 100%
c. Railways 100% 100% 100%
d. Navigation 100% 100% 100%
e. Other Transportation (Snow scooters, boats, motorized equipment, pipeline transport) 100% 100% 100%
4. Other Sectors 100% 100% 100%
a. Commercial/Institutional 100% 100% 100%
b. Residential 100% 100% 100%
c. Agriculture/Forestry/Fisheries 100% 100% 100%
5. Other (Military) 100% 100% 100%
Source: Statistics Norway, Climate and Pollution Agency
3.2.1.2 Activity data
The annual energy balance, compiled by Statistics Norway, forms the framework for the
calculation of emissions from energy use. However, as explained above a large part of the
total emissions are based on reports from plants which use much energy, i.e. offshore
activities and energy-intensive industries on shore. Such energy use is included in the energy
balance, but is subtracted before the remaining emissions are calculated by the standard
method of multiplying energy use by emission factors.
The energy consumption data used in the emission calculations are, with few exceptions,
taken from the annual energy balance compiled by Statistics Norway. The energy balance
survey the flow of the different energy carriers within Norwegian territory. These accounts
include energy carriers used as raw materials and reducing agents. The carriers are subtracted
from the energy balance and are not included in the data used to estimate emissions from
combustion.
As some emissions vary with the combustion technology, a distribution between different
sources is required. Total use of the different oil products is based on the Norwegian sales
statistics for petroleum products. For other energy carriers, the total use of each energy carrier
National Inventory Report 2012 - Norway
74
is determined by summing up reported/estimated consumption in the different sectors. A short
summary of the determination of amounts used of the main groups of energy carriers and the
distribution between emission sources is given below, followed by an explanation of the
difference between energy accounts and the energy balance sheets, including the differences
involved in Norway’s submissions to international organizations. Energy balance sheets for
all years in the period 1990-2010 are presented in Annex III of this report.
The independent collection of different energy carriers conducted by Statistics Norway, as
described below, makes it possible to perform a thorough verification of the emission data
reported by the entities to the Climate and Pollution Agency and Norwegian Petroleum
Directorate and included in the inventory.
Natural gas
Most of the combustion of natural gas is related to extraction of oil and gas on the Norwegian
continental shelf. The amounts of gas combusted, distributed between gas turbines and
flaring, are reported annually to Statistics Norway by the Norwegian Petroleum Directorate
(NPD). These figures include natural gas combusted in gas turbines on the various oil and gas
fields as well as on Norway’s four gas terminals onshore. However, as explained above
emission figures of CO2 from the largest gas consumers e.g. off shore activities, gas terminals,
petro chemical industry are figures reported by the plants. The data are of high quality, due to
the Norwegian system of CO2 taxation on fuel combustion. Statistics Norway's annual survey
on energy use in manufacturing industries and sales figures from distributors give the
remainder. Some manufacturing industries use natural gas in direct-fired furnaces; the rest is
burned in boilers and, in some cases, flared.
LPG and other gases
Consumption of LPG in manufacturing industries is reported by the plants to Statistics
Norway in the annual survey on energy use. Figures on use of LPG in households are based
on sales figures, collected annually from the oil companies. Use in agriculture and
construction is based on non-annual surveys; the figure for agriculture is held constant,
whereas the figure for construction is adjusted annually, based on employment figures.
Use of refinery gas is reported to Statistics Norway from the refineries. The distribution
between the sources direct-fired furnaces, flaring and boilers is based on information collected
from the refineries in the early 1990's. However, the total emissions from the refineries
included in inventory are equal to emissions reported from the plants and is regarded being of
high quality. Emissions from energy combustion for energy purposes are reported in 1A1b,
emissions from flaring in 1B2c Flaring and emissions from cracker is reported in 1B2a.iv.
Chapter 3.4.2.2 (Refining/Storage – 1.B.2.a.iv) describes the estimation methodology for
emissions from cracker. The distribution of emissions from combustion at refineries to
different categories is done by using same proportion for all years in the time series. This is of
course not a very exact method but comparisons we have made, and reported in previous
NIRs and answers submitted during reviews, shows quite good accordance with what is
reported by the plants.
At some industrial plants, excess gas from chemical and metallurgical industrial processes is
burned, partly in direct-fired furnaces and partly in boilers. These amounts of gases are
reported to Statistics Norway. Two ferroalloy plants sell excess gas (CO gas) some other
plants (one producer of ammonia, a district heating plant, iron and steel producers and mineral
industry), where it is combusted for energy purposes. Amounts sold are annually reported to
Statistics Norway.
One sewage treatment plant utilizes biogas extracted at the plant, and reports quantities
combusted (in turbines) and calculated CO2 emissions. Other emissions are estimated by
National Inventory Report 2012 - Norway
75
Statistics Norway, using the same emission factors as for combustion of natural gas in
turbines.
Oil products
Total use of the different oil products is based on Statistics Norway's annual sales statistics for
petroleum products. The data are considered very reliable since all major oil companies
selling oil products have interest in and report to these statistics3. The use of sales statistics
provides a given total for the use of oil products, which the use in the different sectors must
sum up to. This is not the case for the other energy carriers. The method used for oil products
defines use as identical to sales; in practice, there will be annual changes in consumer stocks,
which are not accounted for.
However, since the late 1990s the distribution in the sales statistics between different middle
distillates has not been in accordance with the bottom-up estimated consumption of the
products. In particular, the registered sales of light fuel oil have generally been too low, and it
is known that some auto diesel also is used for heating. In order to balance the accounts for
the different products, it has since 1998 been necessary to transfer some amounts between
products instead of using the sales figures directly. The most important transfer is from auto
diesel to light fuel oil, but in addition some auto diesel has also been transferred to heavy
distillate.
Stationary use takes place in boilers and, in some manufacturing industries, in direct-fired
furnaces. There is also some combustion in small ovens, mainly in private households. Mobile
combustion is distributed among different sources, described in more detail under the
transport sector (Sections 3.2.4-3.2.8). In addition to oil products included in the sales
statistics, figures on use of waste oil are given in Statistics Norway's industry statistics.
Statistics Norway also collects additional information directly from a few companies about
the use of waste oil as a fuel source.
Coal
Use of coal, coke and petrol coke in manufacturing industries is annually reported from the
plants to Statistics Norway. The statistics cover all main consumers and are of high quality.
Combustion takes place partly in direct-fired furnaces, partly in boilers. Figures on some
minor quantities burned in small ovens in private households are based on sales figures. In
addition, an insignificant figure on use of coal in the agricultural sector has formerly been
collected from the farmers. Since 2002, there has been no use of coal in Norwegian
agriculture.
Bio fuels
Use of wood waste and black liquor in manufacturing industries is taken from Statistics
Norway's annual survey on energy use in these sectors. Use of wood in households is based
on figures on the amount of wood burned from the annual survey on consumer expenditure
for the years before 2005. The statistics cover purchase in physical units and estimates for
self-harvest of wood. The survey figures refer to quantities acquired, which do not necessarily
correspond to use. The survey gathers monthly data that cover the preceding twelve months;
the figure used in the emission calculations (taken from the energy balance), is the average of
the survey figures from the year in question and the following year. For the years after 2005
the figures are based on responses to questions relating to wood-burning in Statistics
Norway’s Travel and Holiday Survey. The figures from the new survey refer to quantities of
wood used. The survey gathers quarterly data that cover the preceding twelve months. The
figure used in the emission calculations is the average of 5 quarterly surveys. Figures on some
minor use in agriculture and in construction are derived from earlier surveys for these sectors.
3 The statistics are corrected for direct import by other importers or companies.
National Inventory Report 2012 - Norway
76
Combustion takes place in boilers and in small ovens in private households. Consumption
figures for wood pellets and wood briquettes are estimates, based on annual information from
producers and distributors. Data on use of peat for energy purposes is not available, but
according to the Energy Farm, the center for Bioenergy in Norway, such use is very limited
(Hohle, E.E. ed. 2005).
Waste
District heating plants and incineration plants annually report combusted amounts of waste
(boilers) to Statistics Norway and the Climate and Pollution Agency. There is also some
combustion in manufacturing industries, reported to Statistics Norway.
According to the Norwegian Pollution Act, each incineration plant has to report emission data
for SO2, NOX, CO, NH3, particles, heavy metals and dioxins, and the amount of waste
incinerated to the county governor. The county governor then reports this information to the
Climate and Pollution Agency. If emissions are not reported, the general method to estimate
emissions from waste incineration is to multiply the amount of waste used by an appropriate
emission factor. Normally a plant specific emission factor is made for the component in
question. This factor is based on the ratio between previous emission figures and quantities of
waste burned. This factor is then multiplied with the amount of waste incinerated that specific
year.
Energy balance sheets vs energy accounts
There are two different ways of presenting energy balances: Energy balance sheets (EBS) and
energy accounts. The energy figures used in the emission calculations are mainly based on the
energy balance sheets. The energy balance sheets for the years 1990-2010 are presented in
Annex III.
The energy accounts follow the energy consumption in Norwegian economic activity in the
same way as the National accounts. All the energy used by Norwegian enterprises and
households is to be included. Energy used by Norwegian transport trades and tourists abroad
is also included, while the energy used by foreign transport industries and tourists in Norway
is excluded.
The energy balance sheet follows the flow of energy within Norway. This means that the
figures only include energy sold in Norway, regardless of the users' nationality. This includes
different figures between the energy sources balance sheet and the energy account, especially
for international shipping and aviation.
The energy balance sheet has a separate item for energy sources consumed for transportation
purposes. The energy accounts place the consumption of all energy under the relevant
consumer sector, regardless of whether the consumption refers to transportation, heating or
processing.
In response to previous year’s ERT recommendation, balance sheets in Annex III are now
presented in a way that displays a greater level of disaggregation than that of previous reports.
This more detailed presentation concerns, in particular, the years 1992-2010. For 1990 and
1991, balance sheets are presented in the old format, as technical problems did not allow
preparation of a corresponding disaggregation in time for the NIR submission.
Figures from the energy sources balance sheet are reported to international organizations such
as the OECD and the UN. The energy balance sheet will therefore usually be comparable
with international energy statistics.
National Inventory Report 2012 - Norway
77
Important differences between figures presented in the energy balance sheet (EBS) and
figures used in the emission calculations (EC) are:
Fishing: EC use only fuel sold in Norway, whereas EBS also includes an estimate for
fuel purchased abroad
Air transport: EC use only Norwegian domestic air traffic (excluding military), while
EBS includes all fuel sold in Norway for air transport, including military and fuel used
for international air transport
Coal/coke for non-energy purposes: This consumption is included in net domestic
consumption in EBS, whereas EC include only energy used for combustion in the
calculation of emissions from energy.
3.2.1.3 Emission factors
The standard emission factors used in the absence of more specific ones are addressed as
general.
CO2
Emission factors for CO2 are independent of technology and are based on the average carbon
content of fuels used in Norway. The general emission factors for CO2 used in the emission
inventory are listed in Table 3.4, followed by a more detailed description of the factors used
for offshore operations and gas terminals.
Note that the standard factor for natural gas (dry gas) used outside the energy sector has been
changed from 2.34 kg/Sm3 to 1.99 kg/Sm
3 in the current inventory and hence the emissions
for the time series have been recalculated. The factor 2.34 kg/Sm3 reflects offshore
combustion of rich gas.
Bio fuels for transport are not handled as separate fuels. The consumption is included with
gasoline and auto diesel. The CO2 factors for these fuels are adjusted annually according to
the bio fuel content.
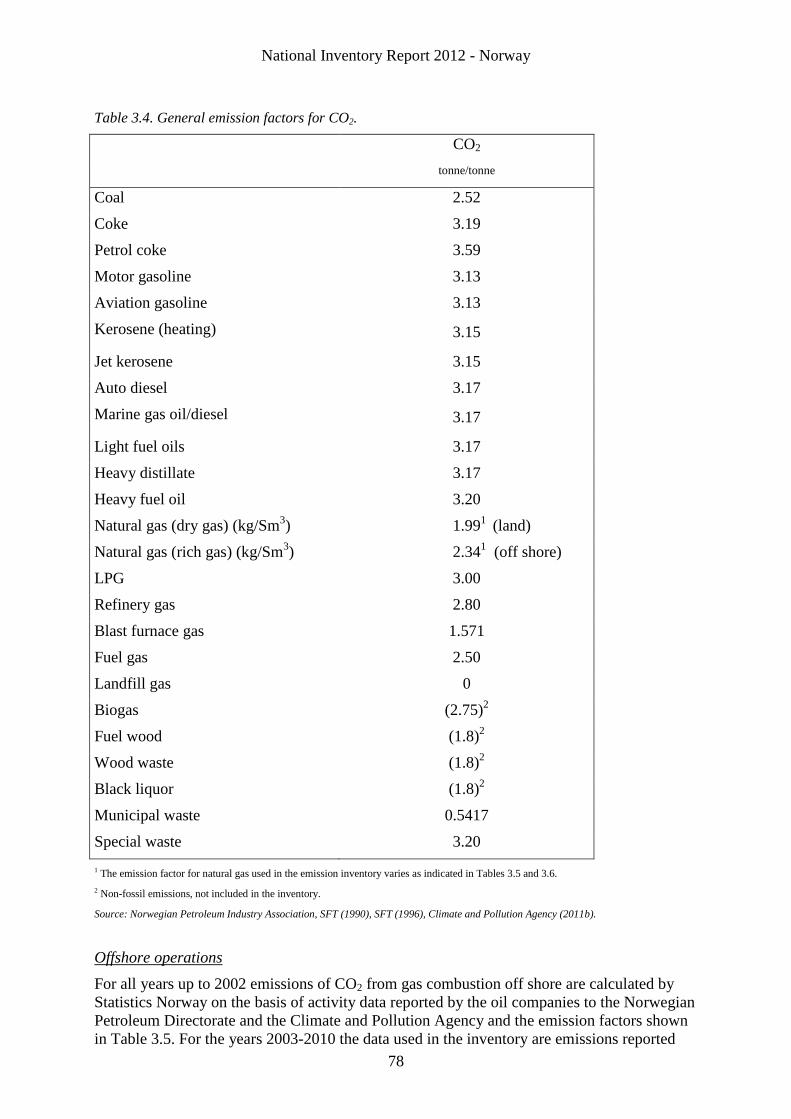
National Inventory Report 2012 - Norway
78
Table 3.4. General emission factors for CO2.
CO2
tonne/tonne
Coal 2.52
Coke 3.19
Petrol coke 3.59
Motor gasoline 3.13
Aviation gasoline 3.13
Kerosene (heating) 3.15
Jet kerosene 3.15
Auto diesel 3.17
Marine gas oil/diesel 3.17
Light fuel oils 3.17
Heavy distillate 3.17
Heavy fuel oil 3.20
Natural gas (dry gas) (kg/Sm3) 1.99
1 (land)
Natural gas (rich gas) (kg/Sm3) 2.34
1 (off shore)
LPG 3.00
Refinery gas 2.80
Blast furnace gas 1.571
Fuel gas 2.50
Landfill gas 0
Biogas (2.75)2
Fuel wood (1.8)2
Wood waste (1.8)2
Black liquor (1.8)2
Municipal waste 0.5417
Special waste 3.20
1 The emission factor for natural gas used in the emission inventory varies as indicated in Tables 3.5 and 3.6.
2 Non-fossil emissions, not included in the inventory.
Source: Norwegian Petroleum Industry Association, SFT (1990), SFT (1996), Climate and Pollution Agency (2011b).
Offshore operations
For all years up to 2002 emissions of CO2 from gas combustion off shore are calculated by
Statistics Norway on the basis of activity data reported by the oil companies to the Norwegian
Petroleum Directorate and the Climate and Pollution Agency and the emission factors shown
in Table 3.5. For the years 2003-2010 the data used in the inventory are emissions reported
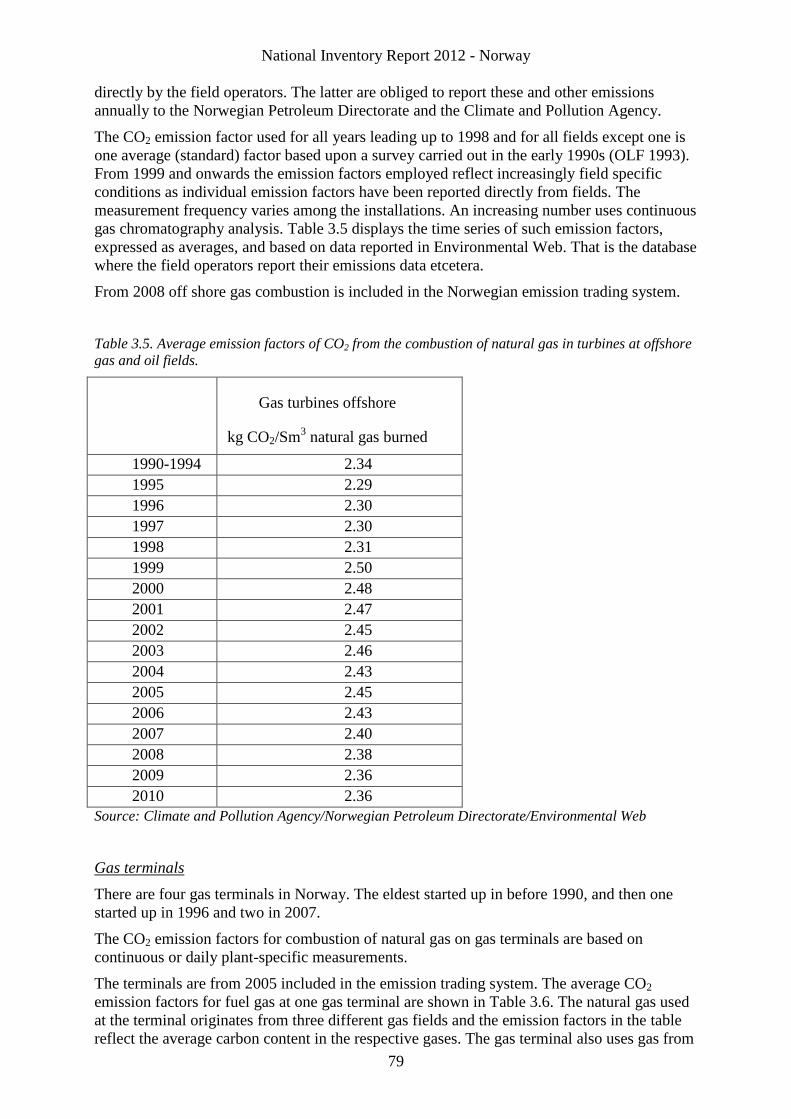
National Inventory Report 2012 - Norway
79
directly by the field operators. The latter are obliged to report these and other emissions
annually to the Norwegian Petroleum Directorate and the Climate and Pollution Agency.
The CO2 emission factor used for all years leading up to 1998 and for all fields except one is
one average (standard) factor based upon a survey carried out in the early 1990s (OLF 1993).
From 1999 and onwards the emission factors employed reflect increasingly field specific
conditions as individual emission factors have been reported directly from fields. The
measurement frequency varies among the installations. An increasing number uses continuous
gas chromatography analysis. Table 3.5 displays the time series of such emission factors,
expressed as averages, and based on data reported in Environmental Web. That is the database
where the field operators report their emissions data etcetera.
From 2008 off shore gas combustion is included in the Norwegian emission trading system.
Table 3.5. Average emission factors of CO2 from the combustion of natural gas in turbines at offshore
gas and oil fields.
Gas turbines offshore
kg CO2/Sm3 natural gas burned
1990-1994 2.34
1995 2.29
1996 2.30
1997 2.30
1998 2.31
1999 2.50
2000 2.48
2001 2.47
2002 2.45
2003 2.46
2004 2.43
2005 2.45
2006 2.43
2007 2.40
2008 2.38
2009 2.36
2010 2.36
Source: Climate and Pollution Agency/Norwegian Petroleum Directorate/Environmental Web
Gas terminals
There are four gas terminals in Norway. The eldest started up in before 1990, and then one
started up in 1996 and two in 2007.
The CO2 emission factors for combustion of natural gas on gas terminals are based on
continuous or daily plant-specific measurements.
The terminals are from 2005 included in the emission trading system. The average CO2
emission factors for fuel gas at one gas terminal are shown in Table 3.6. The natural gas used
at the terminal originates from three different gas fields and the emission factors in the table
reflect the average carbon content in the respective gases. The gas terminal also uses gas from
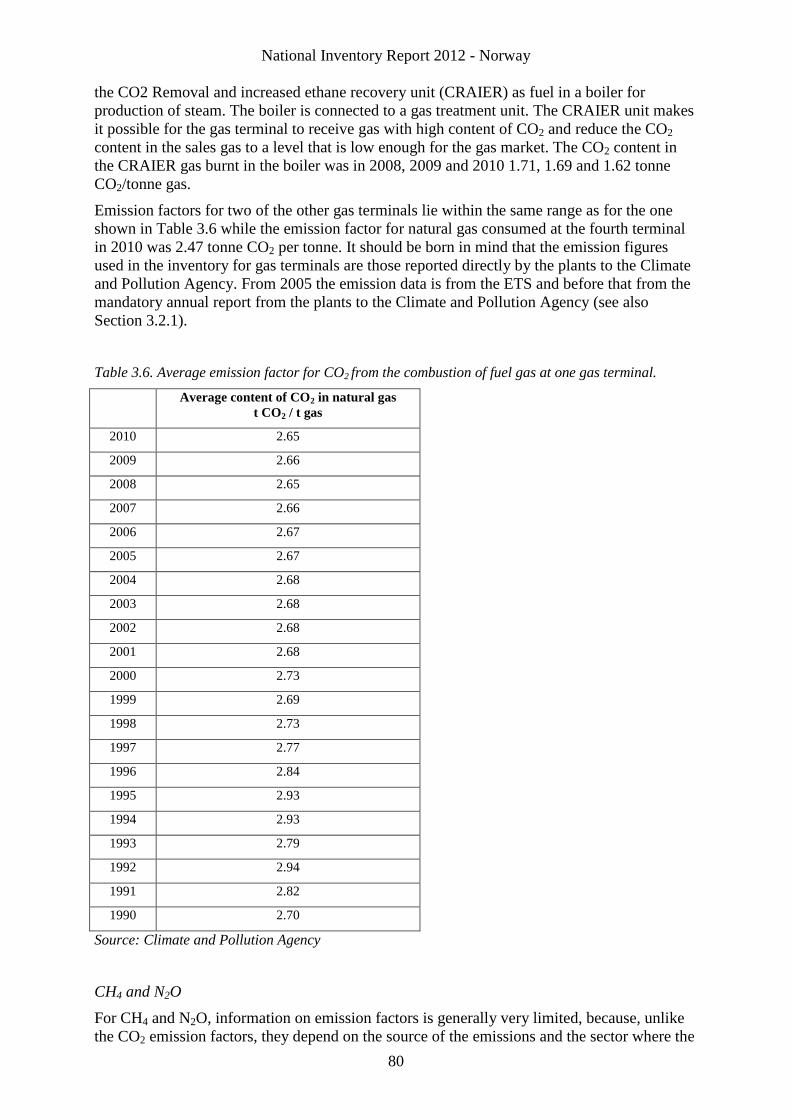
National Inventory Report 2012 - Norway
80
the CO2 Removal and increased ethane recovery unit (CRAIER) as fuel in a boiler for
production of steam. The boiler is connected to a gas treatment unit. The CRAIER unit makes
it possible for the gas terminal to receive gas with high content of CO2 and reduce the CO2
content in the sales gas to a level that is low enough for the gas market. The CO2 content in
the CRAIER gas burnt in the boiler was in 2008, 2009 and 2010 1.71, 1.69 and 1.62 tonne
CO2/tonne gas.
Emission factors for two of the other gas terminals lie within the same range as for the one
shown in Table 3.6 while the emission factor for natural gas consumed at the fourth terminal
in 2010 was 2.47 tonne CO2 per tonne. It should be born in mind that the emission figures
used in the inventory for gas terminals are those reported directly by the plants to the Climate
and Pollution Agency. From 2005 the emission data is from the ETS and before that from the
mandatory annual report from the plants to the Climate and Pollution Agency (see also
Section 3.2.1).
Table 3.6. Average emission factor for CO2 from the combustion of fuel gas at one gas terminal.
Average content of CO2 in natural gas
t CO2 / t gas
2010 2.65
2009 2.66
2008 2.65
2007 2.66
2006 2.67
2005 2.67
2004 2.68
2003 2.68
2002 2.68
2001 2.68
2000 2.73
1999 2.69
1998 2.73
1997 2.77
1996 2.84
1995 2.93
1994 2.93
1993 2.79
1992 2.94
1991 2.82
1990 2.70
Source: Climate and Pollution Agency
CH4 and N2O
For CH4 and N2O, information on emission factors is generally very limited, because, unlike
the CO2 emission factors, they depend on the source of the emissions and the sector where the
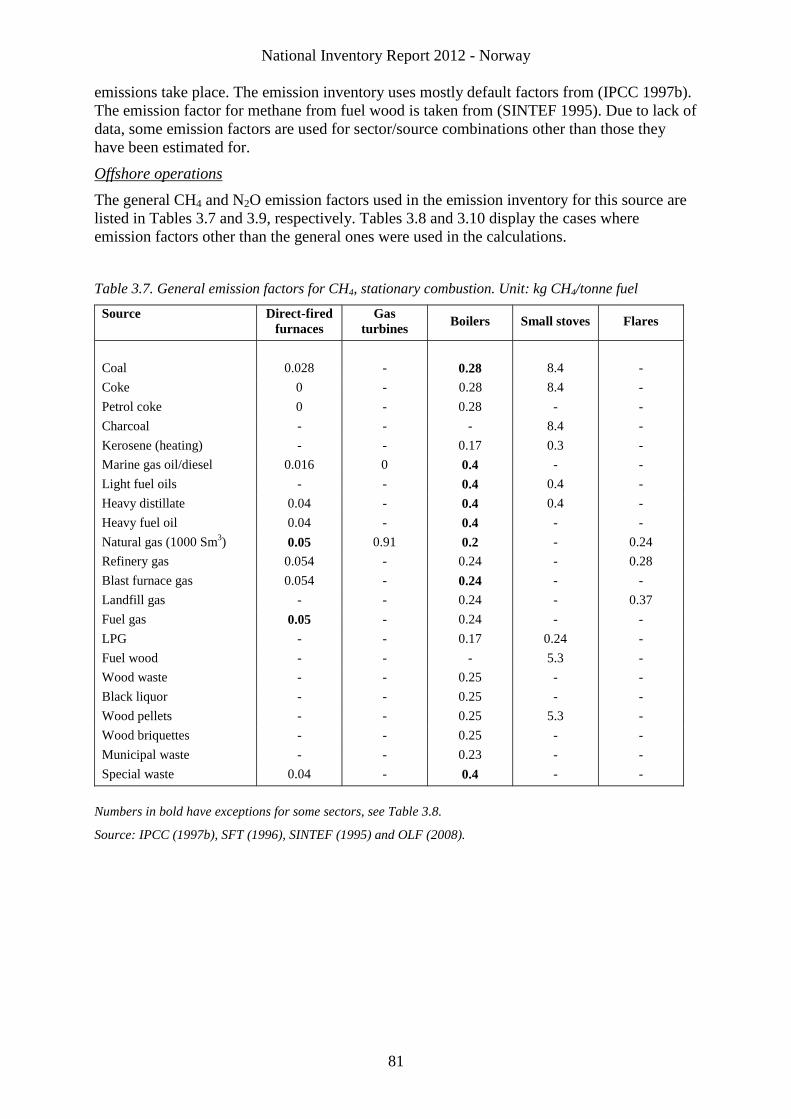
National Inventory Report 2012 - Norway
81
emissions take place. The emission inventory uses mostly default factors from (IPCC 1997b).
The emission factor for methane from fuel wood is taken from (SINTEF 1995). Due to lack of
data, some emission factors are used for sector/source combinations other than those they
have been estimated for.
Offshore operations
The general CH4 and N2O emission factors used in the emission inventory for this source are
listed in Tables 3.7 and 3.9, respectively. Tables 3.8 and 3.10 display the cases where
emission factors other than the general ones were used in the calculations.
Table 3.7. General emission factors for CH4, stationary combustion. Unit: kg CH4/tonne fuel
Source Direct-fired
furnaces
Gas
turbines Boilers Small stoves Flares
Coal 0.028 - 0.28 8.4 -
Coke 0 - 0.28 8.4 -
Petrol coke 0 - 0.28 - -
Charcoal - - - 8.4 -
Kerosene (heating) - - 0.17 0.3 -
Marine gas oil/diesel 0.016 0 0.4 - -
Light fuel oils - - 0.4 0.4 -
Heavy distillate 0.04 - 0.4 0.4 -
Heavy fuel oil 0.04 - 0.4 - -
Natural gas (1000 Sm3) 0.05 0.91 0.2 - 0.24
Refinery gas 0.054 - 0.24 - 0.28
Blast furnace gas 0.054 - 0.24 - -
Landfill gas - - 0.24 - 0.37
Fuel gas 0.05 - 0.24 - -
LPG - - 0.17 0.24 -
Fuel wood - - - 5.3 -
Wood waste - - 0.25 - -
Black liquor - - 0.25 - -
Wood pellets - - 0.25 5.3 -
Wood briquettes - - 0.25 - -
Municipal waste - - 0.23 - -
Special waste 0.04 - 0.4 - -
Numbers in bold have exceptions for some sectors, see Table 3.8.
Source: IPCC (1997b), SFT (1996), SINTEF (1995) and OLF (2008).
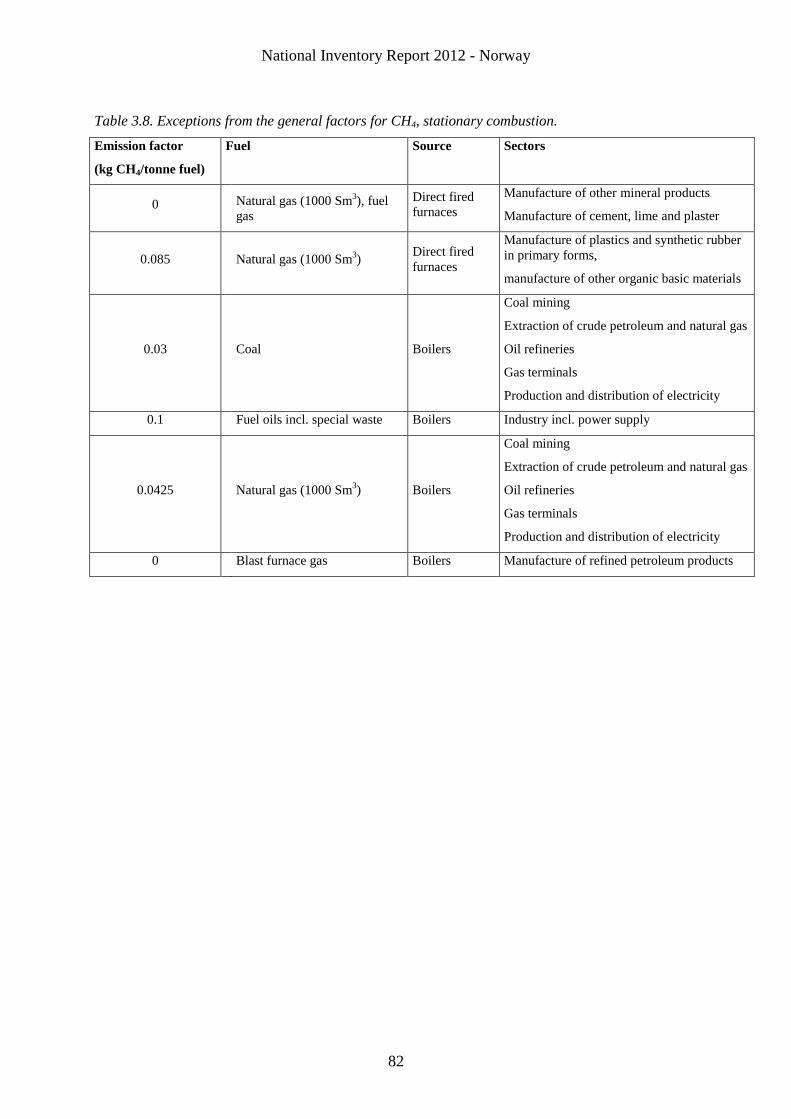
National Inventory Report 2012 - Norway
82
Table 3.8. Exceptions from the general factors for CH4, stationary combustion.
Emission factor
(kg CH4/tonne fuel)
Fuel Source Sectors
0
Natural gas (1000 Sm3), fuel
gas
Direct fired
furnaces
Manufacture of other mineral products
Manufacture of cement, lime and plaster
0.085
Natural gas (1000 Sm3)
Direct fired
furnaces
Manufacture of plastics and synthetic rubber
in primary forms,
manufacture of other organic basic materials
0.03
Coal Boilers
Coal mining
Extraction of crude petroleum and natural gas
Oil refineries
Gas terminals
Production and distribution of electricity
0.1 Fuel oils incl. special waste Boilers Industry incl. power supply
0.0425
Natural gas (1000 Sm3) Boilers
Coal mining
Extraction of crude petroleum and natural gas
Oil refineries
Gas terminals
Production and distribution of electricity
0 Blast furnace gas Boilers Manufacture of refined petroleum products
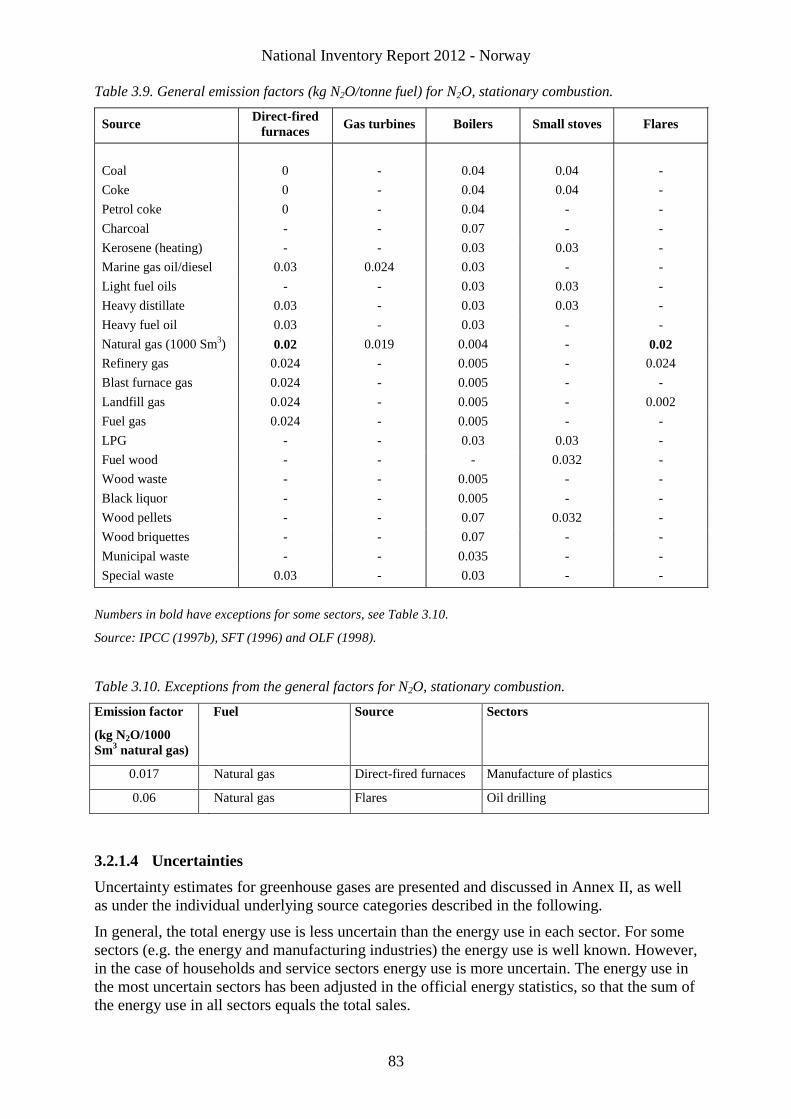
National Inventory Report 2012 - Norway
83
Table 3.9. General emission factors (kg N2O/tonne fuel) for N2O, stationary combustion.
Source Direct-fired
furnaces Gas turbines Boilers Small stoves Flares
Coal 0 - 0.04 0.04 -
Coke 0 - 0.04 0.04 -
Petrol coke 0 - 0.04 - -
Charcoal - - 0.07 - -
Kerosene (heating) - - 0.03 0.03 -
Marine gas oil/diesel 0.03 0.024 0.03 - -
Light fuel oils - - 0.03 0.03 -
Heavy distillate 0.03 - 0.03 0.03 -
Heavy fuel oil 0.03 - 0.03 - -
Natural gas (1000 Sm3) 0.02 0.019 0.004 - 0.02
Refinery gas 0.024 - 0.005 - 0.024
Blast furnace gas 0.024 - 0.005 - -
Landfill gas 0.024 - 0.005 - 0.002
Fuel gas 0.024 - 0.005 - -
LPG - - 0.03 0.03 -
Fuel wood - - - 0.032 -
Wood waste - - 0.005 - -
Black liquor - - 0.005 - -
Wood pellets - - 0.07 0.032 -
Wood briquettes - - 0.07 - -
Municipal waste - - 0.035 - -
Special waste 0.03 - 0.03 - -
Numbers in bold have exceptions for some sectors, see Table 3.10.
Source: IPCC (1997b), SFT (1996) and OLF (1998).
Table 3.10. Exceptions from the general factors for N2O, stationary combustion.
Emission factor
(kg N2O/1000
Sm3 natural gas)
Fuel Source Sectors
0.017 Natural gas Direct-fired furnaces Manufacture of plastics
0.06 Natural gas Flares Oil drilling
3.2.1.4 Uncertainties
Uncertainty estimates for greenhouse gases are presented and discussed in Annex II, as well
as under the individual underlying source categories described in the following.
In general, the total energy use is less uncertain than the energy use in each sector. For some
sectors (e.g. the energy and manufacturing industries) the energy use is well known. However,
in the case of households and service sectors energy use is more uncertain. The energy use in
the most uncertain sectors has been adjusted in the official energy statistics, so that the sum of
the energy use in all sectors equals the total sales.
National Inventory Report 2012 - Norway
84
3.2.1.5 Source specific QA/QC and verification
The emission sources in the energy sector are subjected to the QA/QC procedures described
in Section 1.6. Three documentation reports have been published describing the
methodologies used for road traffic (SFT 1999c) (previous model for road transportation),
aviation (Statistics Norway 2002a) and navigation (Statistics Norway 2001a).
Plant specific emission data included in the greenhouse gas inventory are as explained above
based on three different reports. First, the annual report that each plant that has a permit from
the Climate and Pollution Agency has a legal obligation to submit. This report covers all
activity at the plant. Emissions data from the largest plants are included in the national
greenhouse gas inventory. Then from 2005 we have also received an annual report from
entities included in the ETS. In connection with establishing the ETS the plants estimates
were quality checked for the time series and specific emphasis on the years 1998-2001.
During this process a consistent time series were established for the period from 1990. In
addition to this the Climate and Pollution Agency also receive emission data through a
voluntary agreement first established in 1997 between the authority and the industry. From
2005 the agreement covers sectors that are not yet included in the ETS. Data received by the
Climate and Pollution Agency though the different reporting channels described above are
controlled very thoroughly by the Climate and Pollution Agency and Statistics Norway.
Especially the emission data plants included in the ETS and in the voluntary agreement are
verified extensively.
3.2.1.6 Recalculations
Most of the recalculations have been performed for 2009, because the energy figures for 2009
used in the previous inventory were preliminary. There will always be some changes in the
energy figures, e.g. some figures on energy use in manufacturing industries will be adjusted,
which will lead to adjustments in other sectors, as total use of oil products must sum up to
national sales. Now the final figures for energy use are available and are used in the emission
calculations. Changes in the emission figures due to such changes in the energy statistics will
not be commented on specifically under each IPCC code. In the following, reported emissions
are defined as emissions calculated by the plants and reported to the Climate and Pollution
Agency, whereas calculated emissions are emissions calculated by Statistics Norway, based
on figures on energy use reported to Statistics Norway.
3.2.1.7 Planned improvements
There will in 2012 be started a project with the aim to improve consistency between different
sources for energy data and between estimated emissions of greenhouse gases and energy
balance. Planned activity that will improve the data quality for category 1A before NIR 2013
in addition to the above described improvement will be mentioned in the source category
specific sections.
3.2.2 Energy industries (CRF source category 1A1)
3.2.2.1 Description
Energy industries include emissions from electricity and heat generation and distribution,
extraction of oil and natural gas, coal production, gas terminals and oil refineries. Norway
produces electricity mainly from hydropower, so emissions from electricity production are
small compared to most other countries. Due to the large production of oil and gas, the
emissions from combustion in energy production are high. It is important to specify that it is
emissions from energy combustion for energy purposes that is included in section 3.2 Energy
National Inventory Report 2012 - Norway
85
combustion in general and therefor also in the source category 1A1. Emissions from
combustion not for energy purposed e.g. flaring is included in section 3.3 and 3.4.
Emissions from drilling at moveable offshore installations are included here. The emissions
are reallocated from navigation in this inventory cycle. Emissions from these installations
while not in operation (during transport, etc.) are included with 1A3d Navigation.
GHG emissions from the energy industries accounted for 37.0 per cent of the sectoral totals
and 27.6 per cent of the total emissions in Norway in 2010. The increase that took place
during the period 1990-2010 is as high as 113.8 per cent and is attributed primarily to the
increased activity in the oil and gas extraction sector but the increase in 2010 was due to that
the CO2 emissions from gas fired electricity power plants increased by approximately one
million ton. GHG emissions in the sector in 2009 were 5.6 and in 2010 3 per cent above 2008
and 2009, respectively.
According to the Tier 2 key category analysis for 1990 and 2010, this sector is, in conjunction
with sectors 1A2 and 1A4, a key category with respect to:
Emissions of CO2 from the combustion of liquid and gaseous fuels in both level and trend
uncertainty
Emissions of CO2 from the combustion of Other fuels in level in 2010 and trend
uncertainty and solid fuels are key category in level in 1990
Emissions of CH4 from the combustion of gaseous fuels in trend uncertainty and biomass
in level in 1990 and 2010 and in trend
3.2.2.2 Methodological issues
A description of the general method used for estimation of emissions from fuel combustion is
given in Section 3.2.1.1 and (Statistics Norway 2011a). However, most of the reported
emissions in this source category are from the annual report from the entities to the Climate
and Pollution Agency and the Norwegian Petroleum Directorate. In the case of waste
incineration, further specifications on the methodology are given below.
Oil refineries
The emissions from oil refineries are based on annual report from each refinery to the Climate
and Pollution Authority. The reports up to 2004 are from the mandatory reporting obligation
that is a part of the plants permits given by the authorities and from 2005 the emission data is
from the emission trading system. The distribution of the emissions between flaring and
energy utilisation of refinery gas in the whole period 1990-2009 is based on plant and year
specific figures. The emission from energy utilization is reported in 1A1b and from flaring in
1B2c. One of the refineries has a catalytic cracker. The emissions from the burn off of coke
on the catalyst at the cracker is, since the emissions from that combustion is not emissions
from energy utilization, reported in 1B2a Fugitive Emissions from Oil.
Waste incineration – CO2 and CH4
Net CO2 emissions from wood/ biomass burning are not considered in the Norwegian
inventory, because the amount of CO2 released during burning is the same as that absorbed by
the plant during growth. Carbon emitted in compounds other than CO2, e.g. as CO, CH4 and
NMVOC, is also included in the CO2 emission estimates. This double counting of carbon is in
accordance with the IPCC guidelines (IPCC 1997b).
National Inventory Report 2012 - Norway
86
Waste incineration – N2O
Emissions of N2O are derived from the emissions of NOX which are reported from each plant to
the Climate and Pollution Agency. More specifically, an estimated amount of 2.5 per cent of
this NOX is subtracted and reported to UNFCCC as N2O (SFT 1996). Accordingly, the net NOX
emissions constitute 97.5 per cent of the emissions reported by the plants. For some years,
emissions of NOx have not been reported for a number of plants. In these cases, specific
emission factors for the plants have been made, based upon earlier emissions and amounts of
waste incinerated. These new factors have been used to estimate the missing figures.
3.2.2.3 Activity data
Electricity and heat generation and distribution
The energy producers annually report their use of different energy carriers to Statistics
Norway. There is only some minor use of oil products at plants producing electricity from
hydropower. Combustion of coal at Norway's only dual purpose power plant at
Svalbard/Spitsbergen is of a somewhat larger size. The amount of waste combusted at district
heating plants is reported annually both to Statistics Norway and the Climate and Pollution
Agency. The data are considered to be of high quality.
Extraction of oil and natural gas
Production of oil and natural gas is the dominating sector for emissions from combustion in
the energy industries in Norway. The Norwegian Petroleum Directorate reports annually the
amounts of gas combusted in turbines and diesel burned in turbines and direct-fired furnaces
on the oil and gas fields. The data are of high quality due to the CO2 tax on fuel combustion.
The activity data are used for 1990-2002. From 2003 onwards, reported emission figures from
the field operators reported into the database Environmental Web are used.
Coal production
Norway's coal production takes place on Svalbard. The only coal producing company reports
its coal consumption and some minor use of oil products annually. In addition to emissions
related to Norway's own coal production, emissions from Russian activities are also included
in the Norwegian emission inventory. As Russian activity data are scarce, emissions from an
estimated quantity of coal combusted in Russian power plants are calculated. Since 1999 there
has been only one such plant; in earlier years there were two of those.
Gas terminals
Norway has four gas terminals, where natural gas from the Norwegian continental shelf is
landed, treated and distributed. Annual figures on natural gas combusted in turbines and flared
are reported to the Climate and Pollution Agency and the Norwegian Petroleum Directorate.
Emissions included in inventory for this category are from the gas terminals annual report to
the Climate and Pollution Agency.
National Inventory Report 2012 - Norway
87
Oil refineries
The oil refineries annually report their use of different energy carriers to Statistics Norway.
Refinery gas is most important, but there is also some use of LPG and oil products. Emissions
included in inventory for this category are from the refineries annual report to the Climate and
Pollution Agency. Emissions from the catalytic cracker at one refinery are reported in
1.B.2.a.iv Refining/Storage.
3.2.2.4 Emission factors
The emission factors used for the energy industries are those presented in Section 3.2.1.3. For
some industries and components, more information about the derivation of the emission
factors is given below.
Waste incineration
The emission factors for combustion of waste (fossil part only) for CO2, CH4 and N2O are
displayed in Tables 3.4, 3.7 and 3.9, respectively. Emission factors for CH4 have been
calculated by (SFT 1996).
CO2 emission factor for the fossil part of waste combusted in waste incineration plants in
Norway was revised last year (Climate and Pollution Agency 2011b). The new factor is based
on that there are 2.708 tonne CO2 per tonne plastic combusted, 20 per cent of combusted
waste is fossil (Avfall Norge 2006) and is used from 1996 and until today and about 9 per
cent before 1996. The energy content in combusted waste used in the calculation is in average
12 GJ per tonne waste (Avfall Norge 2006) and (PROFU 2006). The latter energy content is
used from 1996 and before that 10.5 GJ per tonne waste (Statistics Norway 2011a).
The factor 2.708 tonne CO2 per tonne plastic combusted is based upon the same composition
of polymers combusted as in (Denmark NIR 2010). Denmark has in their inventory based
their calculation on that 13 per cent of combusted waste is of fossil origin.
The content of fossil waste of 20 per cent is from (Avfall Norge 2006) and is based on
surveys of the composition of waste combusted in 2004 and before. In the mid 90ies there
were conducted surveys of the composition of waste combusted and the conclusion was then
that the content of fossil waste in combusted waste was about 9 per cent (SFT 1996). Due to
lack of data we have chosen to use the two factors as constants for two periods. While we
assume that it is more reasonable to believe that there is a more gradual increase in the content
of fossil waste. We will consider looking further into this subject in the coming years.
Extraction of oil and natural gas
The CO2 emission factor for gas combustion offshore that has been used for all years leading
up to 1998 and for all fields except one is an average factor based upon a survey carried out in
the early 1990's (OLF 1993, 1994). From 1999 onwards the emission factors employed reflect
increasingly field specific conditions (see also Section 3.2.1.3).
The carbon content of gas burnt varies considerably between the various oil and gas fields.
These changes are reflected in the reported emissions. Up to the early 1990s, most of the gas
was used in the Ekofisk area, which has a below average carbon content. From around 2000,
fields with higher carbon content came into production. In the last few years, there has again
been a shift towards fields with somewhat lower carbon content.
Oil refineries
The CO2 emission factor for combustion of refinery gas is based on daily or weekly plant-
specific measurements. The refinery gas consists of hydrogen and various hydrocarbons. The
composition is variable, leading to changing emissions factors measured as tonne CO2/tonne
fuel or tonne CO2/TJ. High hydrogen content leads to low emission factors as measured in
National Inventory Report 2012 - Norway
88
tonne CO2/TJ. As an example, a gas with 40 % hydrogen and 60 % hydrocarbons with an
average carbon number of 2 give an emission factor of 50 tonne CO2/TJ. In the Norwegian
inventory, the emission factor varies in the range 45-60 tonne CO2/TJ.
3.2.2.5 Uncertainties
The uncertainty analysis performed (Annex II) has shown that for the energy industries the
uncertainty in the activity data is 3 per cent of the mean for oil, 4 per cent for gas and 5
per cent of the mean for coal/coke and waste.
In the case of the emission factors for CO2, the uncertainty is 3 per cent of the mean for oil,
7 per cent for coal/coke and gas and 30 per cent of the mean for waste.
Emission factors for CH4 and N2O are very uncertain. Distributions are strongly skewed with
uncertainties which lie below and above the mean by a factor of 2 and 3, respectively.
3.2.2.6 Source specific QA/QC and verification
The energy industries are subjected to the general QA/QC procedures described in Section
1.6. Some source specific QA/QC activities were conducted in the following industries:
Extraction of oil and natural gas
From 2003 onwards field specific emission figures reported from the companies are used
directly in the emission model. These figures are compared with emissions calculated on the
basis of field specific activity data and emission factors.
Oil refineries
The CO2 emissions reported from the refineries are compared with the emissions estimated by
Statistics Norway on the basis of activity data and emission factors for the different energy
carriers used.
Results from the above studies have so far shown that emission estimates are in agreement
with the reported figures.
3.2.2.7 Recalculations
1A 1a Public electricity and heat production
Revised data. Reported N2O emissions from one district heating plant in 2008 has
been somewhat increased. For two plants, reported figures for 2009 replaces
previously used 2008 figures. There is a minor change in the reported N2O figure for
2009 for another plant. For yet another plant the figure on use of fuel oil in 2009 has
been marginally reduced, causing corresponding emission reductions
Revised data. Figures on use of wood waste at one district heating plant have been
somewhat adjusted for 2006-2009, causing marginal emission changes
Revised data. A minor reduction in use of light fuel oil in 2008 causes marginal
emission reductions. This reduction should have been reflected in an increase in
another sector, in order to include total sales in the energy statistics and emission
calculations. Unfortunately, this transfer has not taken place, which means that total
CO2 emissions in 2008 are approximately 4 500 tonnes too small. The error will be
corrected in the 2013 submission
New method. As one pulp and paper producing plant also produces electricity, the use
of factor calculations of emissions instead of reported figures for CH4 and N2O as
described under 1A2d, also cause emission changes for all years in 1A1a.
National Inventory Report 2012 - Norway
89
1A 1b Petroleum refining
Reallocation. Previously, the same key for distribution between flaring and energy
utilisation of refinery gas was used for all years in the whole period 1990-2009. Now
plant and year specific figures have been used instead. This causes a reallocation of
emissions between 1A1b and 1B2c, but there is no change in total emissions. The
reallocation causes higher emissions for 1A1b in 1991, 1995 and 2003-2009, whereas
the emissions have been reduced in 1990, 1992-1994, and 1996-2002. Emissions of
CO2, CH4 and N2O are affected by the change
Correction of error. The removal of a previous double counting for CO2 and CH4 in
2008 and 2009 has counteracted the emission increase caused by the reallocation
mentioned above, and caused an overall reduction in CO2 emissions for 2008 and a
reduced increase for CH4 in 2008 and for both CO2 and CH4 in 2009. The removal of
a previous double counting for CO2 and CH4 in 2008 and 2009 has, in addition to the
reallocation mentioned above, caused a further reduction in CO2 and CH4 emissions
for these years.
1A 1c Manufacture of solid fuels and other energy industries
Reallocation/revised data. Part of the 2008 CO2 figure for one plant, previously
registered as emission from venting, has been reallocated to combustion. At the same
time, parts of the CH4 figures 2007-2009 for the same plant, previously registered as
combustion emissions, have been reallocated to 1B2aiii. There are also changes in
total CH4 figures for this plant
Correction of error: CO2 and CH4 for 1A1C (Manufacture of solid fuels and other
energy industries) and 1A3D (National navigation) in 2005. In the previous
submission, emissions from drilling at moveable offshore installations were
reallocated from 1A3D to 1A1C. In that operation, a mistake was made for certain
components in 2005. This mistake has now been corrected. Total emissions for the
two sectors were reduced
Reallocation: As part of the correction mentioned above, an amount of fuel oil was
reallocated from 1A3D (National navigation) to 1A1C (Manufacture of solid fuels and
other energy industries) in 2005. All components are affected. Total emissions for
N2O for the two sectors were unchanged, whereas for CO2 and CH4 there was an
additional correction as mentioned above
3.2.2.8 Planned improvements
There is for the moment no planned activity that will improve the data quality for NIR 2013.
3.2.3 Manufacturing industries and construction (CRF source category 1A2)
3.2.3.1 Description
A description of the general method used for estimation of emissions from fuel combustion is
given in Section 3.2.1.1 and in (Statistics Norway 2011a). Emissions from the sector of
manufacturing industries and construction include industrial emissions originating to a large
extent from the production of raw materials and semi-manufactured goods (e.g. iron and steel,
non-ferrous metals, chemicals (e.g. ammonia, methanol, plastics), fertilizers, pulp and paper,
mineral industries, food processing industries, building and construction industry). These
emissions are related to fuel combustion only, that is, emissions from use of oil or gas for
National Inventory Report 2012 - Norway
90
heating purposes. Consumption of coal as feedstock and reduction medium is not included in
this sector, but it is accounted for under the industrial processes sector.
Emissions from this sector contributed 6.7 per cent to the national GHG total in 2010.
Emission from the sector has decreased by 0.9 per cent from 1990 to 2010. Between 2009 and
2010 1A2's sectoral emissions increased by 10.2 per cent, about 334 Gg CO2 equivalents.
Emissions from non-ferrous metals has increased by 62.3 per cent in 2010, 117 Gg CO2
equivalents. All other sub-sectors in 1A2 have increased in the period. How the emissions
from this industry have developed in 2010 gives a good indication of that the industry seems
to have been recovered from the problems that occurred from the end of 2008 and 2009.
According to the Tier 2 key category analysis for 1990 and 2010, this sector is, in conjunction
with sectors 1A1 and 1A4, a key category with respect to:
Emissions of CO2 from the combustion of liquid and gaseous fuels in both level and trend
uncertainty
Emissions of CO2 from the combustion of Other fuels in level in 2010 and trend
uncertainty and solid fuels are key category in level in 1990
Emissions of CH4 from the combustion of gaseous fuels in trend uncertainty and biomass
in level in 1990 and 2010 and in trend
3.2.3.2 Methodological issues
A description of the general method used for estimation of emissions from fuel combustion is
given in Section 1.2.1.1. For a few plants the emission figures are based on reported figures
from the plants to the Climate and Pollution Agency. However, in 2010 these plants account
for approximately half (49 per cent) of the CO2 emissions reported for the sector. The general
calculation method, amount of fuel combusted multiplied with a fuel specific emissions
factor, is valid for both the estimates performed by Statistics Norway and the emissions
reported by the plants to the Climate and Pollution Agency in this sector.
Ammonia production
Emissions from production of ammonia is reported in this section as far as emissions from
combustion from energy utilization is concerned while emissions from production of
hydrogen from wet gas is reported in section 2B1, see Section 4.3.1.1.
The emissions from fuel combustion included in this section are liquid petroleum gas of
different composition and CO rich blast furnace gas from a producer of ferro alloy. The
activity data and emission factors for the different fuels combusted are shown in Section
3.2.3.4.
3.2.3.3 Activity data
Statistics Norway carries out annual surveys on energy use in manufacturing industries, which
supply most of the data material for the calculation of combustion emissions in these sectors.
The energy use survey covers 90 per cent of the energy use in this sector. For the remaining
companies, figures are estimated based on data from the sample together with data on
economic turnover, taking into account use of different energy carriers in the same industries
and size groups. A change in methodology from 1998 has had minor consequences for the
time series, since the energy use is mainly concentrated to a few major plants within the
industry, from which data were collected both in the present and the earlier method. The data
on energy use in manufacturing industries are considered to be of high quality.
Information on use of waste oil and other hazardous waste is also collected through the energy
use statistics.
National Inventory Report 2012 - Norway
91
For the construction industry, the figures on use of the different energy carriers are partly
taken from the annual sales statistics for petroleum products and are partly projected from
earlier surveys; the energy data are considered rather uncertain.
In some sectors auto diesel is mainly used in machinery and off-road vehicles, particularly in
mining and construction. This amount of fuel is based on reported consumption of duty-free
auto diesel in the manufacturing industries and on reported sales of duty-free auto diesel to
construction. The methods for calculating emissions are discussed in Section 3.2.8. Emissions
from off-road machinery in industry are currently reported under the CRF source category
1A3e – Other Transportation. According to the guidelines, they should be included under the
source category 1A2.
3.2.3.4 Emission factors
The emission factors used in this source category are those presented in Section 3.2.1.3.
Ammonia
The LPGs used as fuels in the ammonia production is mainly a mix of propane/butane with
the emission factor 3.01 tonne CO2 /t gas and ethane the emissions factor 2.93 tonne CO2
/tonne. Then a small amount of a light fuel gas (composition of 60 per cent H2 and 40 per cent
CH4) from a producer of plastic is used a few years with an emissions factor of 2.4 t CO2 per
tonne gas.
The blast furnace gas used as fuel has an emission factor of 0.714 t CO2 per tonne gas. This
gas is sold from a metal producer and is mainly used as fuel in ammonia production and is
reported under solid fuels. This lead to emission factors in the range of 190-264 tonne CO2/TJ
for solid fuels in source category 1A2c Chemical industry. The default emission factor for
blast furnace gas in the 2006 guidelines is 70.8 tonne C/TJ, or 260 tonne CO2/TJ.
Uncertainties
Uncertainties in the activity data and the emission factors in the manufacturing industries and
construction are as presented in Section 3.2.2.5. A more detailed description is presented
Annex II.
3.2.3.5 Source specific QA/QC and verification
There is no specific QA/QC procedure for this source category. For a description of the
general QA/QC procedure (see Section 1.6).
3.2.3.6 Recalculations
Chemicals
Revised data. Reported figures on CH4 from one plant have been adjusted downwards
for 2005-2007
Reallocation. CO2 figures for one plant, previously registered as combustion
emissions, have now been split between combustion and process. This causes an
annual reduction in the size of 10-15 ktonne for all years 1990-2008.
1A 2 d Pulp and paper
New method. Previously, reported emissions for CH4 and N2O from two plants and
CH4 from another plant were used in the inventory. They have now been replaced by
factor estimations based on registered use of different energy commodities for all
years 1990-2009
Revised data. A revised reported CH4 figure for one plant in 2008 has caused an
emission reduction.
National Inventory Report 2012 - Norway
92
1A 2 f Other
Revised data. For two rock wool producing plants, there are minor changes in reported
CO2 figures for 2005-2008
3.2.3.7 Planned improvements
There is for the moment no planned activity that will improve the data quality for NIR 2013.
3.2.4 Transport – Civil Aviation (CRF source category 1A3a)
3.2.4.1 Description
In 2010 emissions from this source category were 7.3 per cent of the total emissions from
transport and 2.0 per cent of the GHG national total. From 1990 to 2010 these emissions
increased by 60.2 per cent due to activity growth. Emission fluctuations over time have been
dictated by the activity growth rates. The GHG emissions from aviation in 2010 were 1.6 per
cent higher (180Gg CO2 equivalents) than in 2009. The average annual growth in emissions
in the period 1990-2010 was 2.4 per cent and between 1990-2000 and 2000-2010 4.5 and 0.3
per cent, respectively. This indicates that the growth in emissions from domestic aviation was
substantial higher in the 90ies than it has been the last nine years.
Civil aviation is a key category with respect to CO2 emissions in level in 1990 and 2010 and
in trend.
Emissions of CH4 and N2O from this source category are insignificant.
3.2.4.2 Methodological issues
The calculation methodology applied is described in Statistics Norway (2002a). According to
the IPCC Good Practice Guidance the methodology used is Tier 2 based on the detailed
methodology described in EEA (2001). This methodology allows estimation of emissions and
fuel consumption for different types of aircraft according to the average flying distance and
numbers of landings and take-offs (LTO). All movements below 1000 m are included in the
"Landing Take Off" (LTO) cycle. Movements over 1000 m are included in the cruise phase.
All emissions from international aviation are excluded from national totals, and are reported
separate (see Section 3.7.1.3).
3.2.4.3 Activity data
Statistics Norway annually collects data on use of fuel from the air traffic companies. These
data include specifications on domestic use and amounts bought in Norway and abroad. The
types of fuel used in aircraft are both jet fuel (kerosene) and aviation petrol. The latter is used
in small aircraft only. Emissions from the consumption of jet kerosene in domestic air traffic
are based directly on these reported figures. Domestic consumption of jet kerosene has been
reported to Statistics Norway by the airlines since 1993. The survey is annual, but data from
the surveys for 1993 and 1994 have not been used here, as one of the largest airlines in
Norway was not included. Domestic consumption prior to 1995 is estimated by extrapolation
on the basis of domestic kilometers flown and is more uncertain (Statistics Norway 2002a).
Sales figures are used for the minor use of aviation petrol.
3.2.4.4 Emission factors
The emission factors used in the emission inventory for civil aviation are presented in Tables
3.11-3.12.

National Inventory Report 2012 - Norway
93
The Norwegian Petroleum Industry Association provides emission factors for CO2 for the
combustion of jet fuel and gasoline (Statistics Norway 2002a). The CO2 emission factor used
for aviation gasoline is 3.13 tonne CO2/tonne fuel and has been applied to all small aircraft.
All other aircraft use jet fuel (kerosene) with an emission factor of 3.15 tonne CO2/tonne fuel.
For N2O a default emission factor is used for all aircraft (IPCC) and is valid for both LTO and
the cruise phase. EEA (2001) and IPCC (2000) suggest using an emission factor for CH4, given in Olivier (1991), to be 10 per cent of total VOC. This is, however, only valid for LTO
since studies indicate that only insignificant amounts of methane is emitted during the cruise
phase. No methane is therefore calculated for the cruise phase and all emissions are assumed
to be VOC (HC). The VOC emission factors are aircraft specific as given in EEA (2001).
Only aggregated emission factors (kg/tonne fuel used) are used in the Norwegian inventory.
The emission factors are calculated based on total emission divided by activity data for LTO
and in the cruise phase, respectively.
Recalculations performed in connection with last year’s submission were based on a new
methodology (EEA 2001 and Statistics Norway 2002a) and led to changes in emission factors
for previous years. New emission factors back to 1980 were therefore used in the inventory.
Emission factors were calculated with activity data for 1989, 1995, and 2000. Factors for the
years 1990-1994 and 1996-1999 were interpolated. Factors before 1989 and after 2000 were
kept constant.
Emission factors for small aircraft are the same for the whole period.
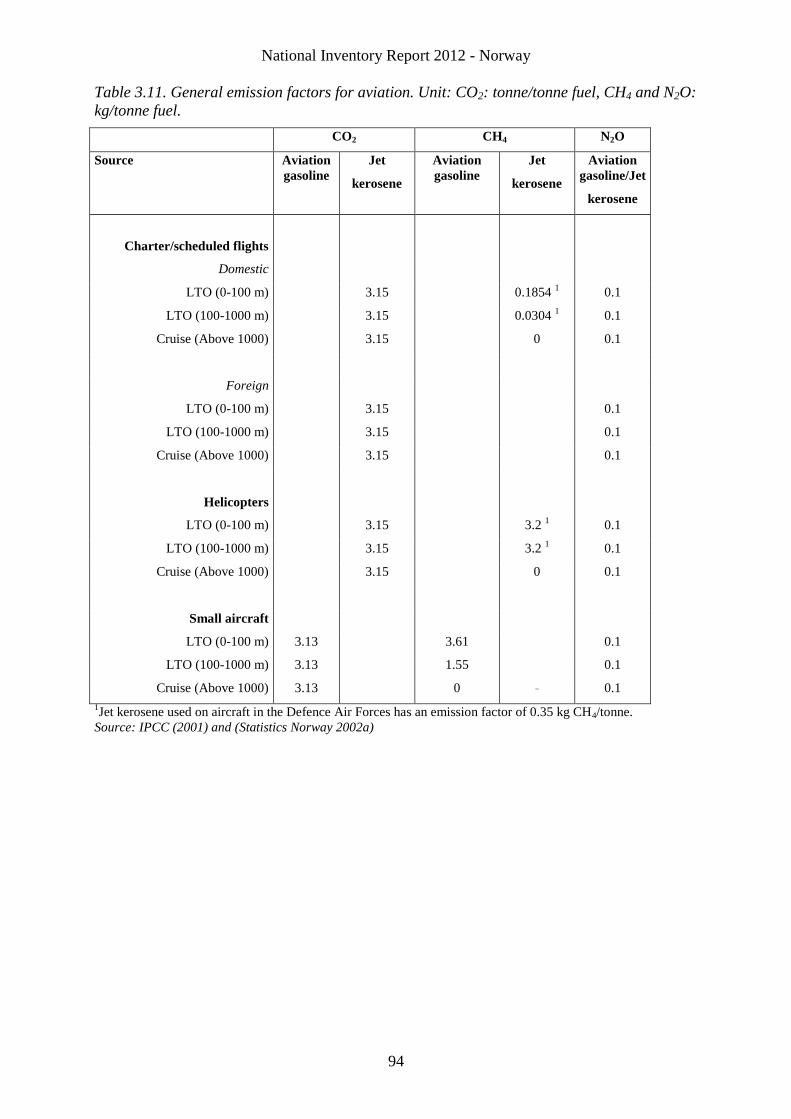
National Inventory Report 2012 - Norway
94
Table 3.11. General emission factors for aviation. Unit: CO2: tonne/tonne fuel, CH4 and N2O:
kg/tonne fuel.
CO2 CH4 N2O
Source Aviation
gasoline
Jet
kerosene
Aviation
gasoline
Jet
kerosene
Aviation
gasoline/Jet
kerosene
Charter/scheduled flights
Domestic
LTO (0-100 m) 3.15 0.1854 1 0.1
LTO (100-1000 m) 3.15 0.0304 1 0.1
Cruise (Above 1000) 3.15 0 0.1
Foreign
LTO (0-100 m) 3.15 0.1
LTO (100-1000 m) 3.15 0.1
Cruise (Above 1000) 3.15 0.1
Helicopters
LTO (0-100 m) 3.15 3.2 1 0.1
LTO (100-1000 m) 3.15 3.2 1 0.1
Cruise (Above 1000) 3.15 0 0.1
Small aircraft
LTO (0-100 m) 3.13 3.61 0.1
LTO (100-1000 m) 3.13 1.55 0.1
Cruise (Above 1000) 3.13 0 - 0.1
1Jet kerosene used on aircraft in the Defence Air Forces has an emission factor of 0.35 kg CH4/tonne.
Source: IPCC (2001) and (Statistics Norway 2002a)
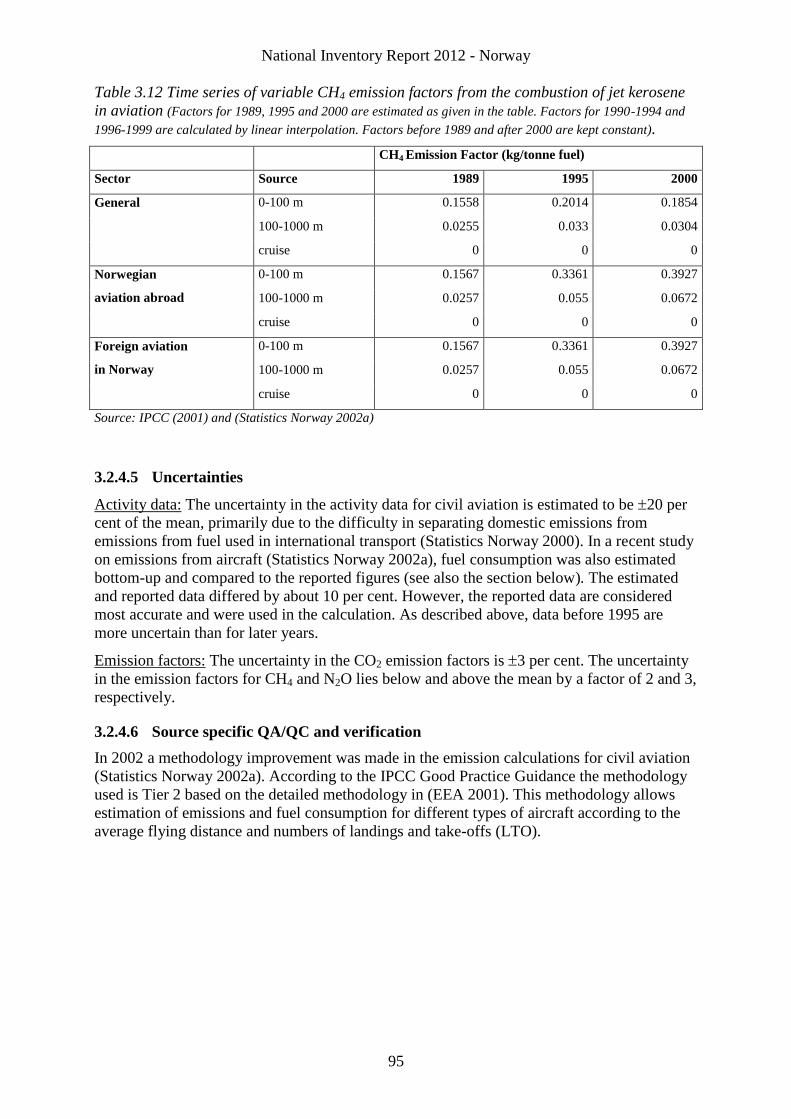
National Inventory Report 2012 - Norway
95
Table 3.12 Time series of variable CH4 emission factors from the combustion of jet kerosene
in aviation (Factors for 1989, 1995 and 2000 are estimated as given in the table. Factors for 1990-1994 and
1996-1999 are calculated by linear interpolation. Factors before 1989 and after 2000 are kept constant).
CH4 Emission Factor (kg/tonne fuel)
Sector Source 1989 1995 2000
General 0-100 m 0.1558 0.2014 0.1854
100-1000 m 0.0255 0.033 0.0304
cruise 0 0 0
Norwegian
aviation abroad
0-100 m 0.1567 0.3361 0.3927
100-1000 m 0.0257 0.055 0.0672
cruise 0 0 0
Foreign aviation
in Norway
0-100 m 0.1567 0.3361 0.3927
100-1000 m 0.0257 0.055 0.0672
cruise 0 0 0
Source: IPCC (2001) and (Statistics Norway 2002a)
3.2.4.5 Uncertainties
Activity data: The uncertainty in the activity data for civil aviation is estimated to be 20 per
cent of the mean, primarily due to the difficulty in separating domestic emissions from
emissions from fuel used in international transport (Statistics Norway 2000). In a recent study
on emissions from aircraft (Statistics Norway 2002a), fuel consumption was also estimated
bottom-up and compared to the reported figures (see also the section below). The estimated
and reported data differed by about 10 per cent. However, the reported data are considered
most accurate and were used in the calculation. As described above, data before 1995 are
more uncertain than for later years.
Emission factors: The uncertainty in the CO2 emission factors is 3 per cent. The uncertainty
in the emission factors for CH4 and N2O lies below and above the mean by a factor of 2 and 3,
respectively.
3.2.4.6 Source specific QA/QC and verification
In 2002 a methodology improvement was made in the emission calculations for civil aviation
(Statistics Norway 2002a). According to the IPCC Good Practice Guidance the methodology
used is Tier 2 based on the detailed methodology in (EEA 2001). This methodology allows
estimation of emissions and fuel consumption for different types of aircraft according to the
average flying distance and numbers of landings and take-offs (LTO).
National Inventory Report 2012 - Norway
96
3.2.4.7 Recalculations
1A 3 a Civil aviation
Correction of error. For 2007-2009, the key for distribution of jet fuel between
airplanes and helicopters were, due to an error, previously not updated. The correction
of this error has led to a minor shift between LTO and cruise, as the distribution
between airplanes and helicopters in these groups differs. For CH4, also the emission
factors vary between the two groups, causing a minor reduction in overall emissions
from civil aviation.
3.2.4.8 Planned improvements
There is for the moment no planned activity that will improve the data quality for NIR 2013.
3.2.5 Transport – Road Transportation (CRF source category 1A3b)
Road traffic accounted for 66.7 per cent of the total GHG emissions from transport and for
18.7 per cent of the national GHG total in 2010.
During the period 1990-2010 an increase in emissions of 30.1 per cent took place in road
transportation. Whereof PCs share of the total increased emissions from road transportation
was 20, LCVs 34 and HDVs 46 per cent.
Emissions from PC petrol were reduced by 34 per cent and PC diesel increased its emissions
10 times in the period 1990-2010.
The annual average growth in CO2 emissions from road transportation in the period 1990-
2010 was 1.3 per cent. Between 1990-2000 and 2000-2010 the annual average growth were
0.9 and 1.8 per cent, respectively.
Passenger cars (PC). Figure 3.3a shows that the total emissions from PCs have been stable
all years from 1990 till 2001. From 2001 to 2006 the CO2 emissions from PCs slightly
increased by 6 per cent. In 2007 the emissions increased by 3 per cent and after that the
emissions has been almost unchanged. So from 1990 emissions from PCs have increased by 9
percent while vehicle kilometers have increased by 35 per cent and the number of PCs has
had slightly a higher growth, see Figure 3.3g. The percentage difference between growth in
emission and driven kilometers is explained by more fuel efficient vehicles in the period, see
Figure 3.3e and f, and switching from petrol to diesel driven personnel cars in all years. But
specifically from 2007 due to the CO2 differentiated tax on new personnel cars that was
implemented that year. In addition the consumption of bio diesel and bioethanol increased
since 2006, see Figure 3.4, and hence the CO2 emission decreased.
Figure 3.3e and f shows the change in absolute emissions per kilometer and relative change.
This is the core emission factors that are included in the HBEFA model. In addition there
emissions related to driving conditions like e.g. gradient, air conditioning. The gross
emissions factor is therefor higher than those in the figure and in Table 3.14.
It is worth to mention that kilometers driven increased by 17 percent in 15 years, 1990-2005,
and additional 18 percent in 2006-2010, mostly in 2007-2008.
Emissions from light commercial vehicles (LCV) and heavy duty vehicles (HDV) have
increased with 108 and 63 per cent, respectively, in the period 1990-2010. See Figure 3.3c.
PC’s contribution to total CO2 emissions from road traffic has decreased from 68 per cent in
1990 to 56 per cent in 2010. While light commercial vehicles (LCV) and heavy duty vehicles
(HDV) have increased their contribution to total emissions for road traffic from 10 and 15
percent and 23 and 26 per cent, respectively, in 1990 and 2010.
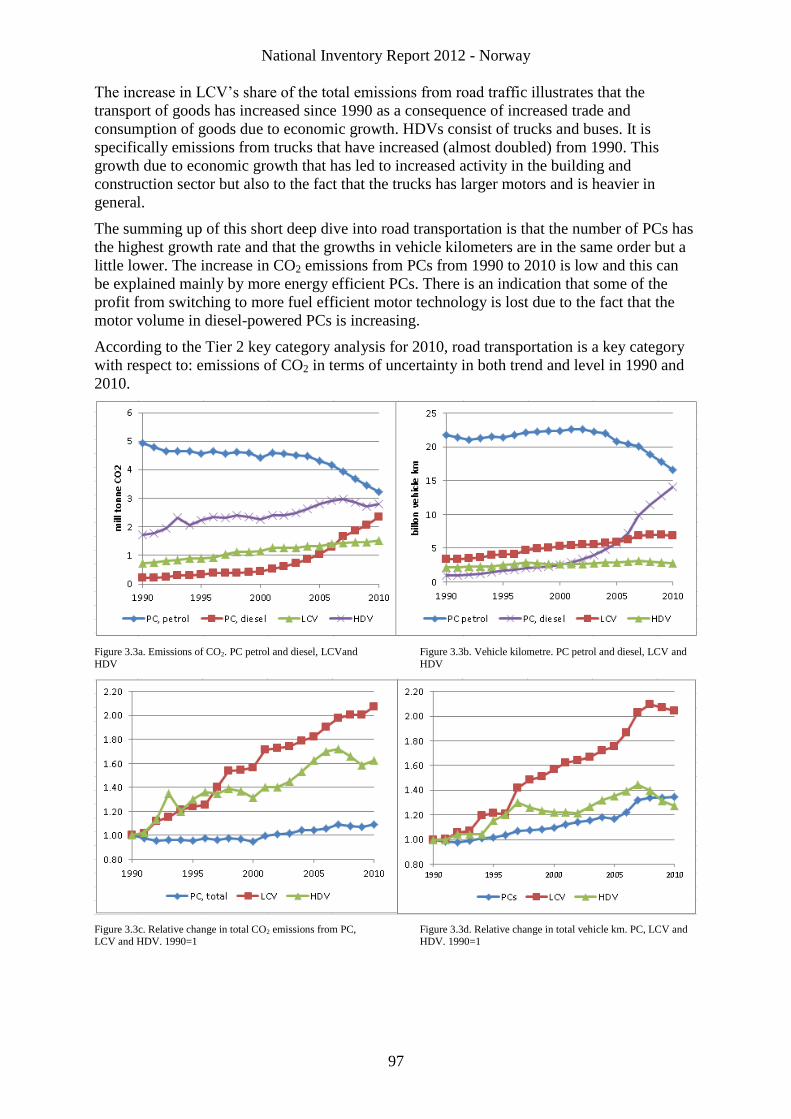
National Inventory Report 2012 - Norway
97
The increase in LCV’s share of the total emissions from road traffic illustrates that the
transport of goods has increased since 1990 as a consequence of increased trade and
consumption of goods due to economic growth. HDVs consist of trucks and buses. It is
specifically emissions from trucks that have increased (almost doubled) from 1990. This
growth due to economic growth that has led to increased activity in the building and
construction sector but also to the fact that the trucks has larger motors and is heavier in
general.
The summing up of this short deep dive into road transportation is that the number of PCs has
the highest growth rate and that the growths in vehicle kilometers are in the same order but a
little lower. The increase in CO2 emissions from PCs from 1990 to 2010 is low and this can
be explained mainly by more energy efficient PCs. There is an indication that some of the
profit from switching to more fuel efficient motor technology is lost due to the fact that the
motor volume in diesel-powered PCs is increasing.
According to the Tier 2 key category analysis for 2010, road transportation is a key category
with respect to: emissions of CO2 in terms of uncertainty in both trend and level in 1990 and
2010.
Figure 3.3a. Emissions of CO2. PC petrol and diesel, LCVand
HDV Figure 3.3b. Vehicle kilometre. PC petrol and diesel, LCV and
HDV
Figure 3.3c. Relative change in total CO2 emissions from PC, LCV and HDV. 1990=1
Figure 3.3d. Relative change in total vehicle km. PC, LCV and HDV. 1990=1
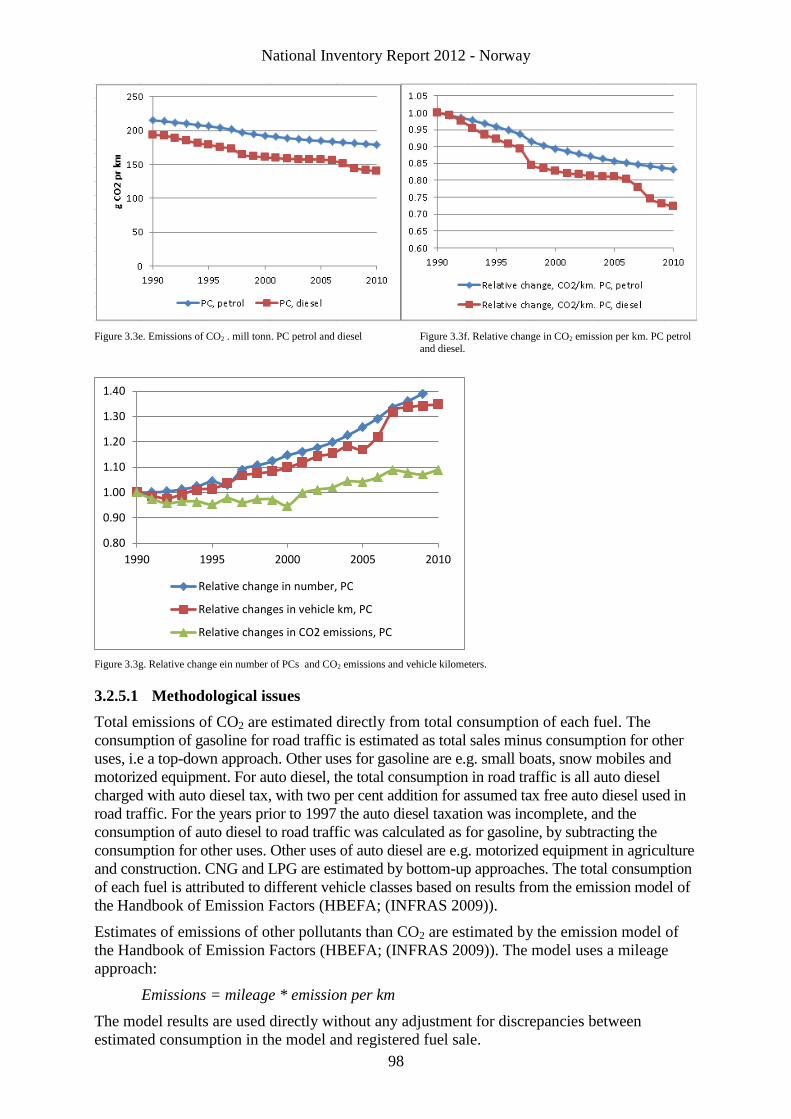
National Inventory Report 2012 - Norway
98
Figure 3.3e. Emissions of CO2 . mill tonn. PC petrol and diesel Figure 3.3f. Relative change in CO2 emission per km. PC petrol
and diesel.
Figure 3.3g. Relative change ein number of PCs and CO2 emissions and vehicle kilometers.
3.2.5.1 Methodological issues
Total emissions of CO2 are estimated directly from total consumption of each fuel. The
consumption of gasoline for road traffic is estimated as total sales minus consumption for other
uses, i.e a top-down approach. Other uses for gasoline are e.g. small boats, snow mobiles and
motorized equipment. For auto diesel, the total consumption in road traffic is all auto diesel
charged with auto diesel tax, with two per cent addition for assumed tax free auto diesel used in
road traffic. For the years prior to 1997 the auto diesel taxation was incomplete, and the
consumption of auto diesel to road traffic was calculated as for gasoline, by subtracting the
consumption for other uses. Other uses of auto diesel are e.g. motorized equipment in agriculture
and construction. CNG and LPG are estimated by bottom-up approaches. The total consumption
of each fuel is attributed to different vehicle classes based on results from the emission model of
the Handbook of Emission Factors (HBEFA; (INFRAS 2009)).
Estimates of emissions of other pollutants than CO2 are estimated by the emission model of
the Handbook of Emission Factors (HBEFA; (INFRAS 2009)). The model uses a mileage
approach:
Emissions = mileage * emission per km
The model results are used directly without any adjustment for discrepancies between
estimated consumption in the model and registered fuel sale.
0.80
0.90
1.00
1.10
1.20
1.30
1.40
1990 1995 2000 2005 2010
Relative change in number, PC
Relative changes in vehicle km, PC
Relative changes in CO2 emissions, PC

National Inventory Report 2012 - Norway
99
The HBEFA model provides emission factors and possibilities for calculating emissions for
segments and sub-segments for the vehicle class passenger cars, light commercial vehicles,
heavy commercial vehicles, urban buses, coaches and motorcycles (including mopeds). The
segments are based on engine volume for passenger cars and motorcycles, total weight for
heavy commercial vehicles, urban buses and coaches, and gross weight for light commercial
vehicles. The segments are further disaggregated into sub segments based on fuel type and
technology type (e.g. Euro-1 – Euro-5). The segments used for Norway in the HBEFA model
are given in Table 3.13.
The model combines the number of vehicles within each segment with driving lengths for the
same segments to produce annual national mileage per sub segment. For heavy goods
vehicles, the vehicle number is corrected for vehicles driving with trailers, and the driving is
split into three load classes (empty, half loaded and fully loaded).
The annual national mileage is split between shares driven in different traffic situations. The
traffic situations are a combination of area (urban/rural), road type (e.g. trunk road and access
road), speed limit and level of service (free flow, heavy, saturated, and stop and go). The
traffic situations are further disaggregated by gradients, where it for each traffic situation is
specified the amount of driving on roads with slopes ranging from -6 per cent to 6 per cent.
Hot emission factors are provided on the disaggregated level of sub segments and traffic
situations with different gradients, and the emissions are estimated after these steps of
disaggregation.
The HBEFA model provides emission factors for cold emissions and evaporative emissions
(soak, running losses and diurnal), in addition to hot emission factors. In order to calculate
cold and evaporative emissions, information on diurnal variation in curves of traffic, trip
length distributions, parking time distributions and driving behaviour distributions must be
provided, in addition to variation in mean air temperature and humidity.
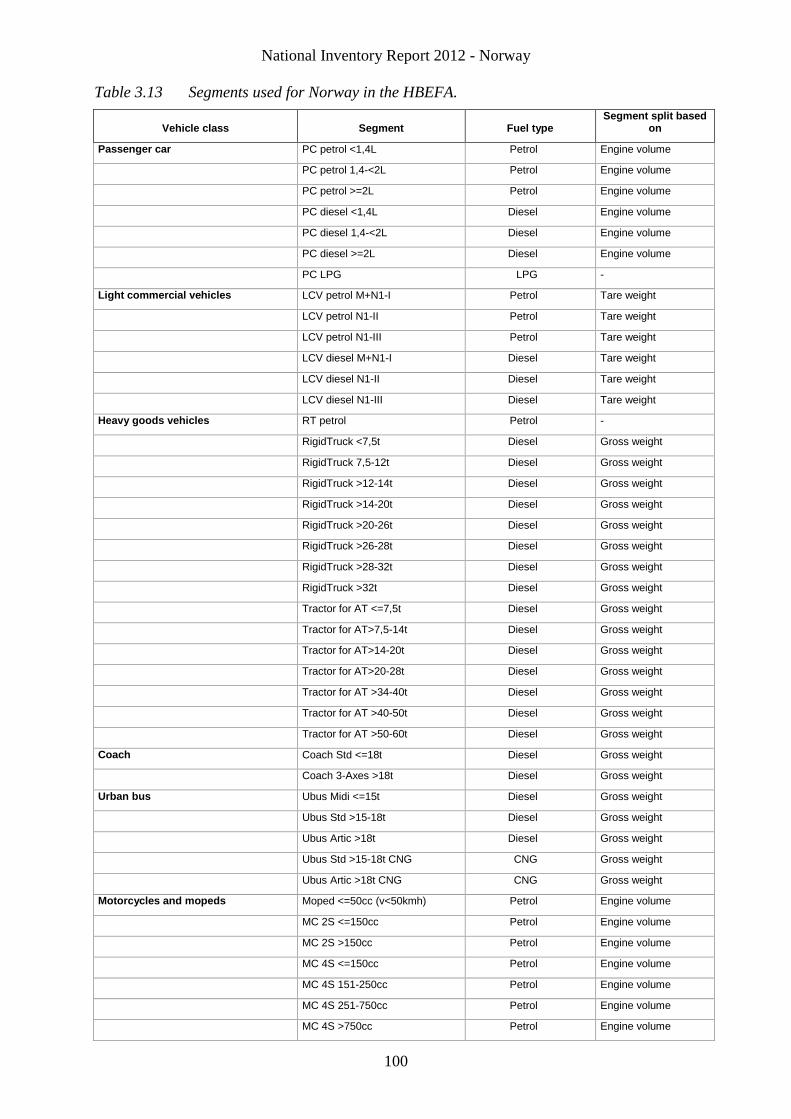
National Inventory Report 2012 - Norway
100
Table 3.13 Segments used for Norway in the HBEFA.
Vehicle class Segment Fuel type Segment split based
on
Passenger car PC petrol <1,4L Petrol Engine volume
PC petrol 1,4-<2L Petrol Engine volume
PC petrol >=2L Petrol Engine volume
PC diesel <1,4L Diesel Engine volume
PC diesel 1,4-<2L Diesel Engine volume
PC diesel >=2L Diesel Engine volume
PC LPG LPG -
Light commercial vehicles LCV petrol M+N1-I Petrol Tare weight
LCV petrol N1-II Petrol Tare weight
LCV petrol N1-III Petrol Tare weight
LCV diesel M+N1-I Diesel Tare weight
LCV diesel N1-II Diesel Tare weight
LCV diesel N1-III Diesel Tare weight
Heavy goods vehicles RT petrol Petrol -
RigidTruck <7,5t Diesel Gross weight
RigidTruck 7,5-12t Diesel Gross weight
RigidTruck >12-14t Diesel Gross weight
RigidTruck >14-20t Diesel Gross weight
RigidTruck >20-26t Diesel Gross weight
RigidTruck >26-28t Diesel Gross weight
RigidTruck >28-32t Diesel Gross weight
RigidTruck >32t Diesel Gross weight
Tractor for AT <=7,5t Diesel Gross weight
Tractor for AT>7,5-14t Diesel Gross weight
Tractor for AT>14-20t Diesel Gross weight
Tractor for AT>20-28t Diesel Gross weight
Tractor for AT >34-40t Diesel Gross weight
Tractor for AT >40-50t Diesel Gross weight
Tractor for AT >50-60t Diesel Gross weight
Coach Coach Std <=18t Diesel Gross weight
Coach 3-Axes >18t Diesel Gross weight
Urban bus Ubus Midi <=15t Diesel Gross weight
Ubus Std >15-18t Diesel Gross weight
Ubus Artic >18t Diesel Gross weight
Ubus Std >15-18t CNG CNG Gross weight
Ubus Artic >18t CNG CNG Gross weight
Motorcycles and mopeds Moped <=50cc (v<50kmh) Petrol Engine volume
MC 2S <=150cc Petrol Engine volume
MC 2S >150cc Petrol Engine volume
MC 4S <=150cc Petrol Engine volume
MC 4S 151-250cc Petrol Engine volume
MC 4S 251-750cc Petrol Engine volume
MC 4S >750cc Petrol Engine volume
National Inventory Report 2012 - Norway
101
3.2.5.2 Activity data
All activity data are, as far as possible, updated for every year of the inventory. Data are taken
primarily from official registers, public statistics and surveys. However, some of the data are
based on assumptions. Many of the data sources are less comprehensive for the earliest years
in the inventory. The sources of activity data are listed below:
Total fuel consumption: the total amounts of fuels consumed are corrected for off-road use
(in boats, snow scooters, motorized equipment, etc.). These corrections are estimated either
from assumptions about the number of units, annual operation time, and specific fuel
consumption, or from assumptions about and investigations of the fraction of consumption
used off-road in each sector. Statistics Norway’s sales statistics for petroleum products
supplies the data for total fuel consumption (Statistics Norway Annually). See Figure 3.4.
Number of vehicles: the number of vehicles in the various categories and age groups is
taken from the official register of the Norwegian Directorate of Public Roads. The model
input is number of vehicles per vehicle class for each inventory year, and the share of
vehicles for any given combination of segment and fuel type. These data are combined with
information on the introduction of technology classes to provide number of vehicles within
each sub segment. The information on introduction of technology classes are for recent
years based on information from the official register of the Norwegian Directorate of Public
Roads and on legislation for the years in which the information in the register is
insufficient.
The HBEFA model distinguishes between two types of buses: urban buses mainly used
for urban driving, and coaches, mainly used for rural and motorway driving. Due to lack
of specific information in the national vehicle register, the distinction between urban
buses and coaches are based on a methodology used in Sweden (Swedish environmental
protection agency 2011), where the split is made based on the ratio p/w. Here, p is equal
to the maximum allowed number of passengers (number of seats plus number of allowed
standing passengers), and w is equal to the gross vehicle weight. These data are available
from the national vehicle register. Buses with a p/w-value above 3.7 are classified as
urban buses, whereas buses with a p/w-value below 3.75 are classified as coaches.
Average annual mileage: Mileages for passenger cars, light commercial vehicles, heavy
goods vehicles, coaches and urban buses are from 2005 onwards based on odometer
readings taken during annual or biannual roadworthiness tests. The readings are collected
by the Directorate of Public Roads and further processed by Statistics Norway (Statistics
Norway 2010a). For earlier years, most figures are determined from surveys by Statistics
Norway or the Institute of Transport Economics. In some instances assumptions are needed.
The average annual mileages vary as a function of age, with older vehicles generally
driving shorter annual distances than newer vehicles. The correction of driving as a
function of vehicle age is based on odometer readings taken during the roadworthiness
test. The functions are calculated as the mean of the years 2005-2008, and the same
correction curve is used for all years.
Motorcycles and mopeds are not subject to roadworthiness tests in Norway. Average
annual mileage are taken from a report on transport volumes in Norway (Vågane og
Rideng 2010). Due to lack of data, corrections of annual mileage as a function of age
for motor cycles and mopeds are taken from a Swedish survey (Bjørketun og Nilsson
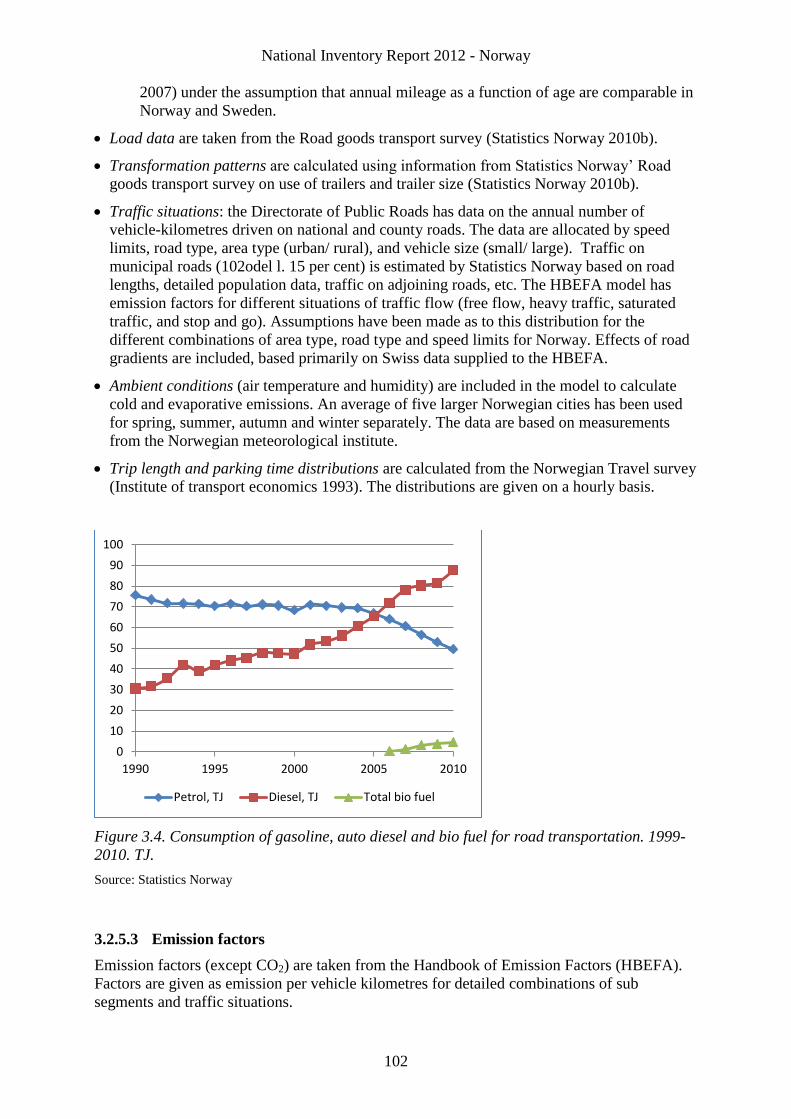
National Inventory Report 2012 - Norway
102
2007) under the assumption that annual mileage as a function of age are comparable in
Norway and Sweden.
Load data are taken from the Road goods transport survey (Statistics Norway 2010b).
Transformation patterns are calculated using information from Statistics Norway’ Road
goods transport survey on use of trailers and trailer size (Statistics Norway 2010b).
Traffic situations: the Directorate of Public Roads has data on the annual number of
vehicle-kilometres driven on national and county roads. The data are allocated by speed
limits, road type, area type (urban/ rural), and vehicle size (small/ large). Traffic on
municipal roads (102odel l. 15 per cent) is estimated by Statistics Norway based on road
lengths, detailed population data, traffic on adjoining roads, etc. The HBEFA model has
emission factors for different situations of traffic flow (free flow, heavy traffic, saturated
traffic, and stop and go). Assumptions have been made as to this distribution for the
different combinations of area type, road type and speed limits for Norway. Effects of road
gradients are included, based primarily on Swiss data supplied to the HBEFA.
Ambient conditions (air temperature and humidity) are included in the model to calculate
cold and evaporative emissions. An average of five larger Norwegian cities has been used
for spring, summer, autumn and winter separately. The data are based on measurements
from the Norwegian meteorological institute.
Trip length and parking time distributions are calculated from the Norwegian Travel survey
(Institute of transport economics 1993). The distributions are given on a hourly basis.
Figure 3.4. Consumption of gasoline, auto diesel and bio fuel for road transportation. 1999-
2010. TJ.
Source: Statistics Norway
3.2.5.3 Emission factors
Emission factors (except CO2) are taken from the Handbook of Emission Factors (HBEFA).
Factors are given as emission per vehicle kilometres for detailed combinations of sub
segments and traffic situations.
0
10
20
30
40
50
60
70
80
90
100
1990 1995 2000 2005 2010
Petrol, TJ Diesel, TJ Total bio fuel
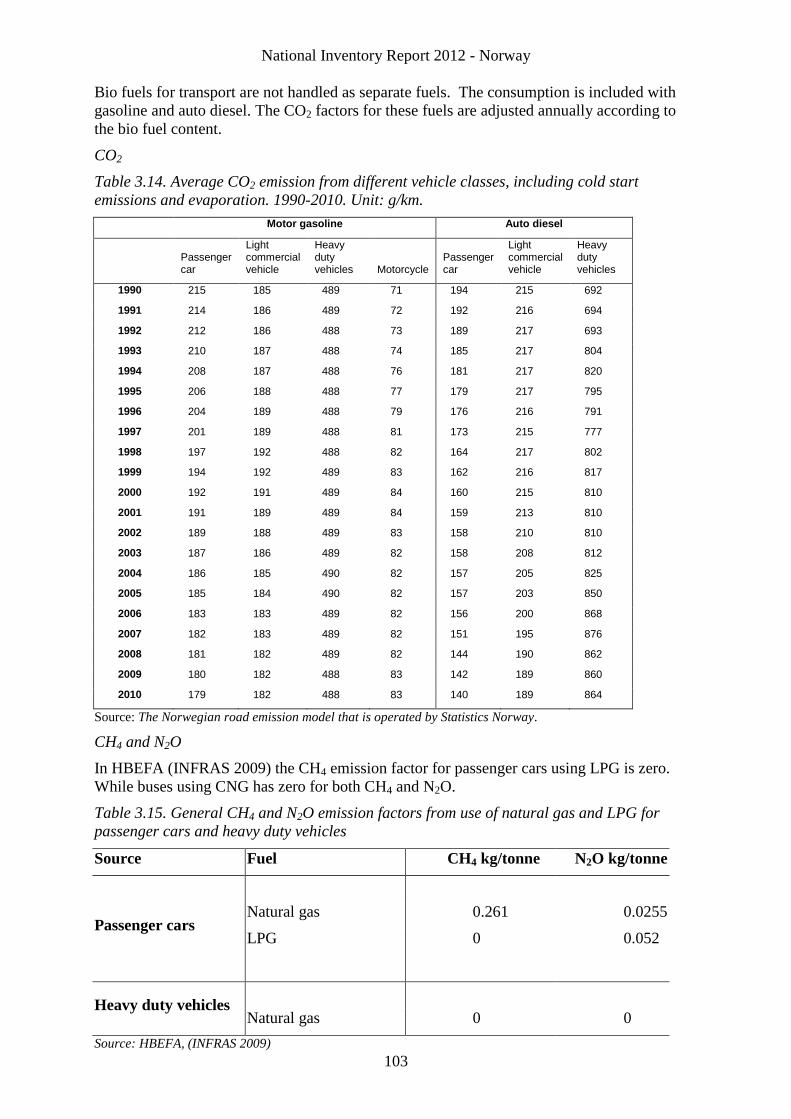
National Inventory Report 2012 - Norway
103
Bio fuels for transport are not handled as separate fuels. The consumption is included with
gasoline and auto diesel. The CO2 factors for these fuels are adjusted annually according to
the bio fuel content.
CO2
Table 3.14. Average CO2 emission from different vehicle classes, including cold start
emissions and evaporation. 1990-2010. Unit: g/km.
Motor gasoline Auto diesel
Passenger car
Light commercial vehicle
Heavy duty vehicles Motorcycle
Passenger car
Light commercial vehicle
Heavy duty vehicles
1990 215 185 489 71 194 215 692
1991 214 186 489 72 192 216 694
1992 212 186 488 73 189 217 693
1993 210 187 488 74 185 217 804
1994 208 187 488 76 181 217 820
1995 206 188 488 77 179 217 795
1996 204 189 488 79 176 216 791
1997 201 189 488 81 173 215 777
1998 197 192 488 82 164 217 802
1999 194 192 489 83 162 216 817
2000 192 191 489 84 160 215 810
2001 191 189 489 84 159 213 810
2002 189 188 489 83 158 210 810
2003 187 186 489 82 158 208 812
2004 186 185 490 82 157 205 825
2005 185 184 490 82 157 203 850
2006 183 183 489 82 156 200 868
2007 182 183 489 82 151 195 876
2008 181 182 489 82 144 190 862
2009 180 182 488 83 142 189 860
2010 179 182 488 83 140 189 864
Source: The Norwegian road emission model that is operated by Statistics Norway.
CH4 and N2O
In HBEFA (INFRAS 2009) the CH4 emission factor for passenger cars using LPG is zero.
While buses using CNG has zero for both CH4 and N2O.
Table 3.15. General CH4 and N2O emission factors from use of natural gas and LPG for
passenger cars and heavy duty vehicles
Source Fuel CH4 kg/tonne N2O kg/tonne
Passenger cars
Natural gas 0.261 0.0255
LPG 0 0.052
Heavy duty vehicles
Natural gas 0 0
Source: HBEFA, (INFRAS 2009)
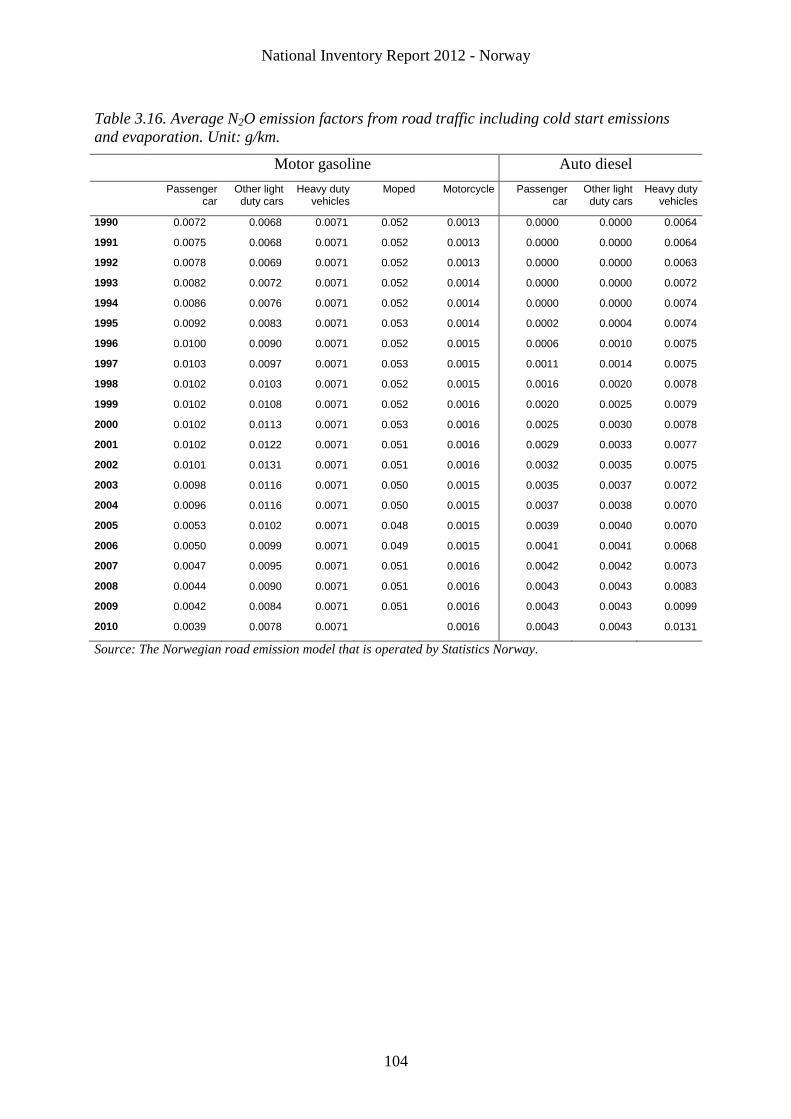
National Inventory Report 2012 - Norway
104
Table 3.16. Average N2O emission factors from road traffic including cold start emissions
and evaporation. Unit: g/km.
Motor gasoline Auto diesel
Passenger
car Other light
duty cars Heavy duty
vehicles Moped Motorcycle Passenger
car Other light
duty cars Heavy duty
vehicles
1990 0.0072 0.0068 0.0071 0.052 0.0013 0.0000 0.0000 0.0064
1991 0.0075 0.0068 0.0071 0.052 0.0013 0.0000 0.0000 0.0064
1992 0.0078 0.0069 0.0071 0.052 0.0013 0.0000 0.0000 0.0063
1993 0.0082 0.0072 0.0071 0.052 0.0014 0.0000 0.0000 0.0072
1994 0.0086 0.0076 0.0071 0.052 0.0014 0.0000 0.0000 0.0074
1995 0.0092 0.0083 0.0071 0.053 0.0014 0.0002 0.0004 0.0074
1996 0.0100 0.0090 0.0071 0.052 0.0015 0.0006 0.0010 0.0075
1997 0.0103 0.0097 0.0071 0.053 0.0015 0.0011 0.0014 0.0075
1998 0.0102 0.0103 0.0071 0.052 0.0015 0.0016 0.0020 0.0078
1999 0.0102 0.0108 0.0071 0.052 0.0016 0.0020 0.0025 0.0079
2000 0.0102 0.0113 0.0071 0.053 0.0016 0.0025 0.0030 0.0078
2001 0.0102 0.0122 0.0071 0.051 0.0016 0.0029 0.0033 0.0077
2002 0.0101 0.0131 0.0071 0.051 0.0016 0.0032 0.0035 0.0075
2003 0.0098 0.0116 0.0071 0.050 0.0015 0.0035 0.0037 0.0072
2004 0.0096 0.0116 0.0071 0.050 0.0015 0.0037 0.0038 0.0070
2005 0.0053 0.0102 0.0071 0.048 0.0015 0.0039 0.0040 0.0070
2006 0.0050 0.0099 0.0071 0.049 0.0015 0.0041 0.0041 0.0068
2007 0.0047 0.0095 0.0071 0.051 0.0016 0.0042 0.0042 0.0073
2008 0.0044 0.0090 0.0071 0.051 0.0016 0.0043 0.0043 0.0083
2009 0.0042 0.0084 0.0071 0.051 0.0016 0.0043 0.0043 0.0099
2010 0.0039 0.0078 0.0071 0.0016 0.0043 0.0043 0.0131
Source: The Norwegian road emission model that is operated by Statistics Norway.
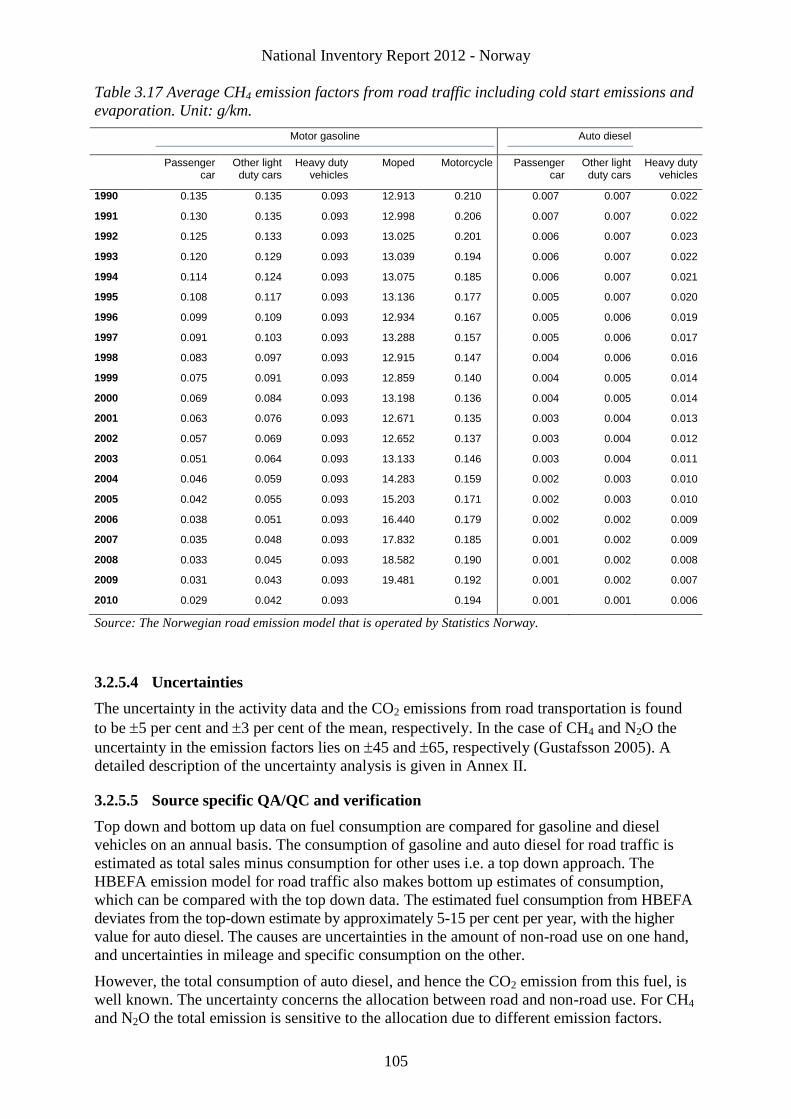
National Inventory Report 2012 - Norway
105
Table 3.17 Average CH4 emission factors from road traffic including cold start emissions and
evaporation. Unit: g/km.
Motor gasoline Auto diesel
Passenger
car Other light
duty cars Heavy duty
vehicles Moped Motorcycle Passenger
car Other light
duty cars Heavy duty
vehicles
1990 0.135 0.135 0.093 12.913 0.210 0.007 0.007 0.022
1991 0.130 0.135 0.093 12.998 0.206 0.007 0.007 0.022
1992 0.125 0.133 0.093 13.025 0.201 0.006 0.007 0.023
1993 0.120 0.129 0.093 13.039 0.194 0.006 0.007 0.022
1994 0.114 0.124 0.093 13.075 0.185 0.006 0.007 0.021
1995 0.108 0.117 0.093 13.136 0.177 0.005 0.007 0.020
1996 0.099 0.109 0.093 12.934 0.167 0.005 0.006 0.019
1997 0.091 0.103 0.093 13.288 0.157 0.005 0.006 0.017
1998 0.083 0.097 0.093 12.915 0.147 0.004 0.006 0.016
1999 0.075 0.091 0.093 12.859 0.140 0.004 0.005 0.014
2000 0.069 0.084 0.093 13.198 0.136 0.004 0.005 0.014
2001 0.063 0.076 0.093 12.671 0.135 0.003 0.004 0.013
2002 0.057 0.069 0.093 12.652 0.137 0.003 0.004 0.012
2003 0.051 0.064 0.093 13.133 0.146 0.003 0.004 0.011
2004 0.046 0.059 0.093 14.283 0.159 0.002 0.003 0.010
2005 0.042 0.055 0.093 15.203 0.171 0.002 0.003 0.010
2006 0.038 0.051 0.093 16.440 0.179 0.002 0.002 0.009
2007 0.035 0.048 0.093 17.832 0.185 0.001 0.002 0.009
2008 0.033 0.045 0.093 18.582 0.190 0.001 0.002 0.008
2009 0.031 0.043 0.093 19.481 0.192 0.001 0.002 0.007
2010 0.029 0.042 0.093 0.194 0.001 0.001 0.006
Source: The Norwegian road emission model that is operated by Statistics Norway.
3.2.5.4 Uncertainties
The uncertainty in the activity data and the CO2 emissions from road transportation is found
to be 5 per cent and 3 per cent of the mean, respectively. In the case of CH4 and N2O the
uncertainty in the emission factors lies on 45 and 65, respectively (Gustafsson 2005). A
detailed description of the uncertainty analysis is given in Annex II.
3.2.5.5 Source specific QA/QC and verification
Top down and bottom up data on fuel consumption are compared for gasoline and diesel
vehicles on an annual basis. The consumption of gasoline and auto diesel for road traffic is
estimated as total sales minus consumption for other uses i.e. a top down approach. The
HBEFA emission model for road traffic also makes bottom up estimates of consumption,
which can be compared with the top down data. The estimated fuel consumption from HBEFA
deviates from the top-down estimate by approximately 5-15 per cent per year, with the higher
value for auto diesel. The causes are uncertainties in the amount of non-road use on one hand,
and uncertainties in mileage and specific consumption on the other.
However, the total consumption of auto diesel, and hence the CO2 emission from this fuel, is
well known. The uncertainty concerns the allocation between road and non-road use. For CH4
and N2O the total emission is sensitive to the allocation due to different emission factors.
National Inventory Report 2012 - Norway
106
3.2.5.6 Recalculations
1A 3 b i-iii Road transport
Revised data. The consumption of auto diesel includes a certain amount of biodiesel.
The emission factor for CO2 is reduced to account for this effect. Due to revised
figures on total sales of auto diesel for the year 2009, the emission factor for CO2 has
been upwards adjusted
Revised data. The consumption of gasoline includes a certain amount of bioethanol,
but until 2010 the amount has been insignificant. However, while gathering
bioethanol data also information on 2008-2009 was obtained. The emission factor for
CO2 is reduced by ca. 0.1% to account for this effect.
3.2.5.7 Planned improvements
The evaluation of the Norwegian road emission model started in 2008 and the new HBEFA
model is now implemented as a part of the Norwegian greenhouse gas emission inventory.
However, there will always be room for elaborating different aspect of the model as a part of
the continuous process for improving and correcting the inventory and the documentation of the methodologies employed. We assume that this is mainly valid for improving the accuracy
of the emissions estimates for other gases than the greenhouse gases. In 2012 we will
specifically look further into activity data for traffic and the time series for consumption of
fuels. A documentation report for the new model is planned to be prepared.
3.2.6 Transport – Railways (CRF source category 1A3c)
3.2.6.1 Description
Railway traffic in Norway uses mainly electricity (auto diesel is used at a small number of
lines, for shunting etcetera). The greenhouse gas emissions from this source category
accounted for 0.3 per cent of the total emissions from transport in 2010. The emissions
decreased by 59.0 per cent from 1990 to 2010.
3.2.6.2 Methodological issues
The general estimation methodology for calculating combustion emissions from consumption
figures and emission factors is used in this source category.
3.2.6.3 Activity data
Consumption figures for auto diesel used in locomotives are collected annually from the
Norwegian State Railways.
3.2.6.4 Emission factors
The emission factors used in this source category are displayed in Table 3.4 for CO2 and
Table 3.19 for CH4 and N2O.
3.2.6.5 Uncertainties
The consumption data are of high quality. Their uncertainty is estimated to be 5 per cent of
the mean. The uncertainty in the emission factors for CO2 is 3 per cent of the mean, whereas
for CH4 and N2O the uncertainty is below and above the mean by a factor of 2 and 3,
respectively.
National Inventory Report 2012 - Norway
107
3.2.6.6 Source specific QA/QC and verification
Consumption data from the Norwegian State Railways are compared with sales to railways
according to the Petroleum statistics. However, the latter includes some consumption by buses
operated by the State Railways. Since 1998, the reported sales of "tax-free" auto diesel to
railways have been around 20 per cent higher than the consumption data from the State
Railways. Until 1997, the reported sales were around 5 per cent higher. The reason for this
discrepancy has not been checked. "Tax-free" auto diesel is only for non-road use, so
consumption by buses should not be the cause.
3.2.6.7 Recalculations
There were performed no specific recalculations for this sector this year.
3.2.6.8 Planned improvements
There is for the moment no planned activity that will improve the data quality for NIR 2013.
3.2.7 Transport – Navigation (CRF source category 1A3d)
3.2.7.1 Description
According to UNFCCC, Norwegian national sea traffic is defined as ships moving between
two Norwegian ports. In this connection installations at the Norwegian part of the continental
shelf are defined as ports. Emissions from fishing are described in Section 3.2.9.
Greenhouse gas emissions from navigation constituted 4.0 per cent of the national GHG total
in 2010 and 14.3 per cent of emissions from transport. The emissions from shipping increased
by 26.3 per cent from 1990 to 2010, mainly because of increased activity in the oil and gas
extraction sector. GHG emissions in 2010 were 9.1 per cent higher than those of 2009. The
average annual growth in GHG emissions from navigation from 1990 to 2010 was 1.2 per
cent. Between 1990-2000 and 2000-2010 the annual average growth were 2.7 and – 0.4 per
cent, respectively. The increased emissions in the 90ies can to large extent be explained by the
growing activity in the oil and gas sector in general but especially by the fast growing
production of crude oil and hence the increasing demand for ships transporting the oil from
the oil fields to land. Due to the decreasing production of crude oil since 2001 the demand for
transport of crude oil has been reduced. But this reduction has been counteracted by growth in
demand in other segments of transport.
Navigation is a key category with respect to CO2 emissions in level in 1990 and 2010 and
trend uncertainty and for CH4 in trend.
3.2.7.2 Methodological issues
Emissions from navigation are estimated according to the Tier 2 IPCC methodology.
Emissions from moveable installations used in oil and gas exploration and extraction are split
between 1A1 – energy industries (Section 3.2.2) and navigation: Emissions from drilling are
reported under 1A1, while emissions from transport and other activities are reported under
navigation. Emissions from international marine bunkers are excluded from the national totals
and are reported separately (see Section 3.7.1), in accordance with the IPCC Good Practice
Guidance.
Annual emissions are estimated from sales of fuel to domestic shipping, using average
emission factors in the calculations.
For 1993 and 1998 (Statistics Norway 2001a), 2004 and 2007 emissions have also been
estimated based on a bottom up. Fuel consumption data were collected for all categories of
National Inventory Report 2012 - Norway
108
ships (based on the full population of Norwegian ships in domestic transport); freight vessels
(bulk and tank by size), oil loading vessels, supply/standby ships, tug boats, passenger
vessels, fishing vessels, military ships and other ships. Emissions were estimated from ship
and size specific emission factors and fuel use. From this information, average emission
factors were estimated for application in the annual update based on fuel sales. This approach
is unfortunately too resource demanding to conduct annually.
3.2.7.3 Activity data
The annual sales statistics for petroleum products gives figures on the use of marine gas oil,
heavy distillates and heavy fuel oil in domestic navigation. Information on fuel used in the
ship categories in the bottom up analysis is mainly given by data from the Business Sector’s
NOx-fund for 2007 and by earlier Statistics Norway analyses for 1993 and 1998 (Statistics
Norway 2001a), and 2004. Data on fuel consumed by public road ferries are available from
the Directorate of Public Roads.
Information on fuel use at mobile drilling rigs is taken from sale statistics, but information on
use i.e. whether it is used for drilling, stationary combustion etcetera, is taken from the oil
companies’ reports to the Climate and Pollution Agency and the Norwegian Petroleum
Directorate. These reports are found in the Environmental Web, a database operated by the
Norwegian Oil Industry Association (OLF), Norwegian Petroleum Directorate and the
Climate and Pollution Agency.
For marine gas oil, the amount used for navigation is equal to total sales figures except
bunkers, after the deduction of estimated stationary use, mainly in oil and gas extraction, but
also some minor use in manufacturing industries and construction.
Use of natural gas in navigation, which was introduced in 2000 and has increased
considerably from 2007, is based on sales figures reported to Statistics Norway from the
distributors.
3.2.7.4 Emission factors
CO2
For CO2 the following standard emission factors based on carbon content are used:
Marine gas oil/diesel and special distillate: 3.17 kg/kg fuel
Heavy fuel oil: 3.20 kg/kg fuel
CH4 and N2O
For liquid fuels the general/standard emission factors for CH4 and N2O used in the emission
inventory are taken from IPCC/OECD: 0.23 kg CH4/tonne fuel and 0.08 kg N2O/tonne fuel.
In the case of oil drilling, the employed factors are as follows:
CH4: 0.8 kg/tonne marine gas oil/diesel; 1.9 kg/tonne heavy fuel oil
N2O: 0.02 kg/tonne marine gas oil/diesel.
Some natural gas is combusted in ferry transportation and offshore supply; the CH4 emission
factors used are based on the emission factors in Table 3.18. From the year 2000, when the
first vessel that used LNG as fuel started operating, a mean factor for all skips weighted after
consumption data for the different ship categories (ferries and supply ships) are calculated.
Ferry consumption data used in the calculations are given by the Directorate of Public Roads
(Norddal 2010).
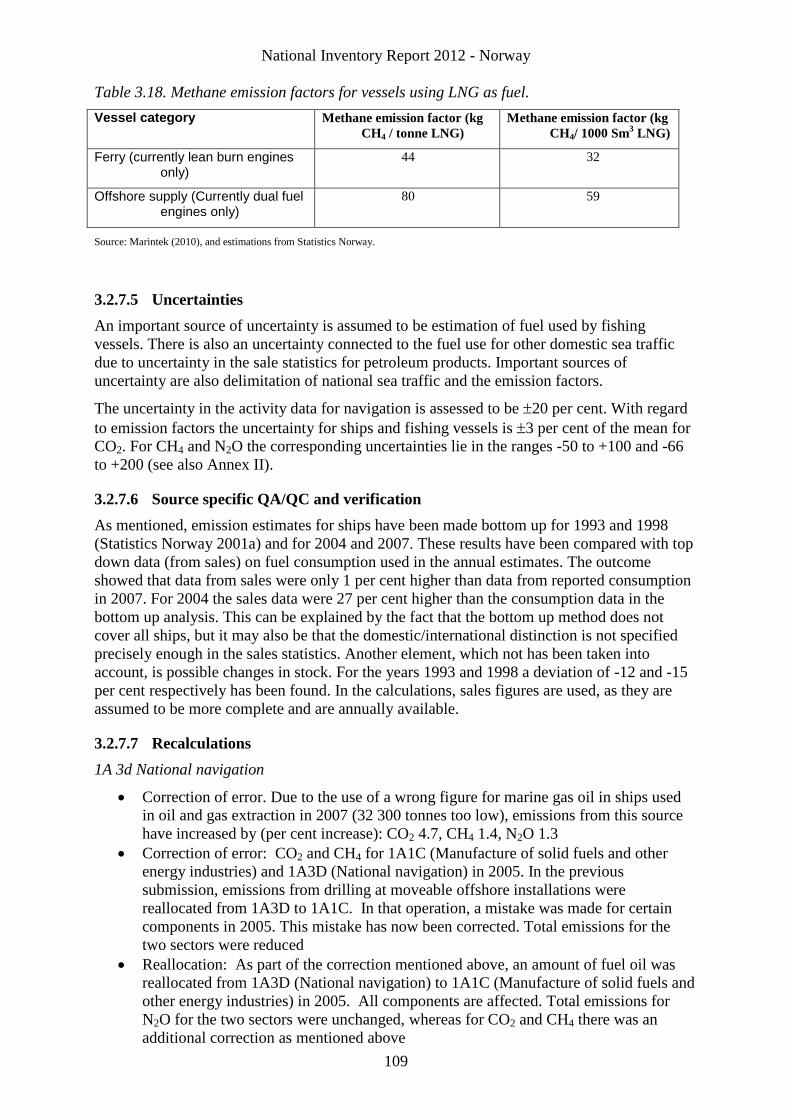
National Inventory Report 2012 - Norway
109
Table 3.18. Methane emission factors for vessels using LNG as fuel.
Vessel category Methane emission factor (kg
CH4 / tonne LNG) Methane emission factor (kg
CH4/ 1000 Sm3 LNG)
Ferry (currently lean burn engines only)
44 32
Offshore supply (Currently dual fuel engines only)
80 59
Source: Marintek (2010), and estimations from Statistics Norway.
3.2.7.5 Uncertainties
An important source of uncertainty is assumed to be estimation of fuel used by fishing
vessels. There is also an uncertainty connected to the fuel use for other domestic sea traffic
due to uncertainty in the sale statistics for petroleum products. Important sources of
uncertainty are also delimitation of national sea traffic and the emission factors.
The uncertainty in the activity data for navigation is assessed to be 20 per cent. With regard
to emission factors the uncertainty for ships and fishing vessels is 3 per cent of the mean for
CO2. For CH4 and N2O the corresponding uncertainties lie in the ranges -50 to +100 and -66
to +200 (see also Annex II).
3.2.7.6 Source specific QA/QC and verification
As mentioned, emission estimates for ships have been made bottom up for 1993 and 1998
(Statistics Norway 2001a) and for 2004 and 2007. These results have been compared with top
down data (from sales) on fuel consumption used in the annual estimates. The outcome
showed that data from sales were only 1 per cent higher than data from reported consumption
in 2007. For 2004 the sales data were 27 per cent higher than the consumption data in the
bottom up analysis. This can be explained by the fact that the bottom up method does not
cover all ships, but it may also be that the domestic/international distinction is not specified
precisely enough in the sales statistics. Another element, which not has been taken into
account, is possible changes in stock. For the years 1993 and 1998 a deviation of -12 and -15
per cent respectively has been found. In the calculations, sales figures are used, as they are
assumed to be more complete and are annually available.
3.2.7.7 Recalculations
1A 3d National navigation
Correction of error. Due to the use of a wrong figure for marine gas oil in ships used
in oil and gas extraction in 2007 (32 300 tonnes too low), emissions from this source
have increased by (per cent increase): CO2 4.7, CH4 1.4, N2O 1.3
Correction of error: CO2 and CH4 for 1A1C (Manufacture of solid fuels and other
energy industries) and 1A3D (National navigation) in 2005. In the previous
submission, emissions from drilling at moveable offshore installations were
reallocated from 1A3D to 1A1C. In that operation, a mistake was made for certain
components in 2005. This mistake has now been corrected. Total emissions for the
two sectors were reduced
Reallocation: As part of the correction mentioned above, an amount of fuel oil was
reallocated from 1A3D (National navigation) to 1A1C (Manufacture of solid fuels and
other energy industries) in 2005. All components are affected. Total emissions for
N2O for the two sectors were unchanged, whereas for CO2 and CH4 there was an
additional correction as mentioned above
National Inventory Report 2012 - Norway
110
3.2.7.8 Planned improvements
The Norwegian Coastal Administration started in 2011 a project with the aim to use the
Automatic Identification System (AIS) to estimate the supply of polluters from ships to sea.
The Climate and Pollution Agency is co-financing the project. The opportunity to use data
from this project in the greenhouse gas inventory will be investigated. There is option to use
data directly to estimate emissions from the sector and include the estimates in the inventory
or the data could be used to verify the calculated emissions.
We will also look into the possibilities to use data from the National Account to allocate
consumption of fuels between international and domestic shipping.
3.2.8 Transport – Other transportation – (CRF source category 1A3e)
3.2.8.1 Description
This source category includes emissions from motorized equipment only.
3.2.8.2 Pipelines
Figures on natural gas used in turbines for pipeline transport at two separate facilities are
reported annually from the Norwegian Petroleum Directorate to Statistics Norway. However,
energy generation for pipeline transport also takes place at the production facilities. Specific
data on consumption for transport are not available. Thus, the consumption at the two
pipeline facilities does not give a correct picture of the activity in this sector. As a
consequence, all emissions from pipelines are reported under NFR/IPCC 1A1.
3.2.8.3 Motorized equipment
3.2.8.3.1 Description
Emissions from this sector were 3.2 per cent of the national GHG total emissions in 2010. In
the period 1990-2010, these emissions increased by 107.9 per cent. In 2010 emission levels
were 7.8 per cent lower than those in 2008 and in 2010 23.9 per cent above 2009 level. .
The category motorized equipment comprises all mobile combustion sources except road, sea,
air, and railway transport. Equipment used in agricultural and construction sector is the most
important categories. Other categories include mines and quarries, forestry, snow scooters,
small boats and miscellaneous household equipment.
Emissions from motorized equipment are reported under several source categories:
Agriculture/Forestry/Fishing: IPCC 1A4c
Households: IPCC 1A3e
Military: IPCC 1A5b
Other Transportation: IPCC 1A3e
Only consumption of gasoline and auto diesel is considered. A small amount of fuel oil used
for equipment in construction is also accounted for.
According to the Tier 2 key category analysis for 1990 and 2010, 1A4 Other sectors – Mobile
fuel combustion is a key category with respect to emissions of CO2 of level in 1990 and 2010.
1A3e Other (snow scooters, boats, motorized equipment) is key category with respect to
National Inventory Report 2012 - Norway
111
emissions of CO2 in level in 1990 and 2010 and trend and with respect to N2O in level in
2010 and trend.
3.2.8.3.2 Methodological issues
Emissions are estimated through the general methodology described earlier, involving
consumption figures and appropriate emission factors.
3.2.8.3.3 Activity data
Gasoline and auto diesel are handled differently. Consumption of gasoline is estimated
bottom-up for each type of machinery based on data on the number of each type of
equipment, usage and specific consumption.
Snow scooters: Number of equipment is obtained annually from the Norwegian Public Roads
Administration. We assume a mileage of 850 km/year and a specific consumption of 0.15
l/km (TI 1991). A portion of 16 per cent of petrol consumption in agriculture is assigned to
snow scooters. The remaining snow scooter fuel consumption is assigned to households.
Chainsaws and other two-stroke equipment: Only consumption in forestry is considered,
based on felling data. Felling statistics are gathered by Statistics Norway. 50 per cent is
supposed to be felled with use of chain saws, with a consumption of 0.33 l/m3. Note:
Consumption has been kept fixed since 1994 based on a calculation by the Institute of
Technology (Bang 1996).
Lawn mowers and other four-stroke equipment: Only consumption in households considered.
Consumption of auto diesel is based on data from the energy accounts. Total use of auto
diesel in motorized equipment is given as the difference between total sales and estimated use
in other sources. From 2001, a certain fraction of the consumption in a number of industries is
allocated to motorized equipment, based on the distribution of taxed and tax-free diesel – the
latter is meant for use outside road transport. The distribution formulas are based on figures
from the statistics on energy use in manufacturing industries or from the sales statistics. The
statistics on energy use in manufacturing industries did not have such a split before 2001, and
therefore distribution formulas for 2001 are used for 2000 and earlier years. It is important to
bear in mind that the total consumption of auto diesel in motorized equipment is considered
being of high quality since there is now road tax on this part of the auto diesel. So it is only
the allocation between different consumers that might be questioned. There is CO2 tax on the
auto diesel used for motorized equipment as well as for road traffic.
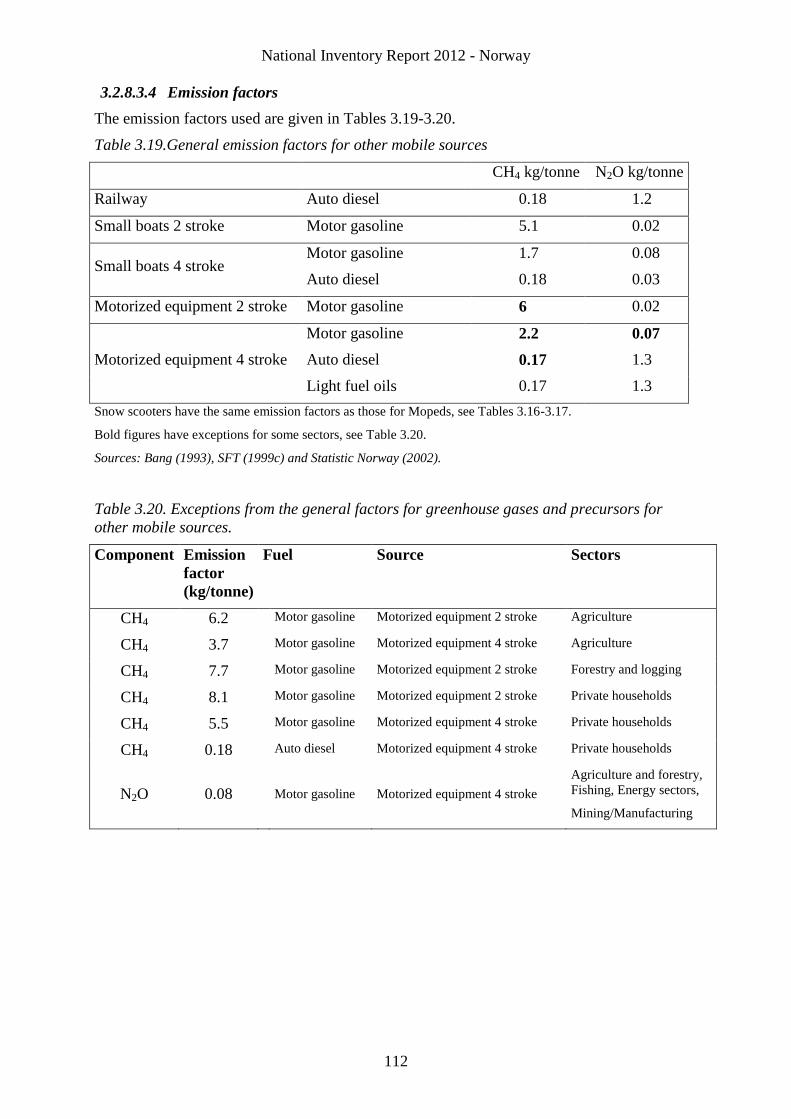
National Inventory Report 2012 - Norway
112
3.2.8.3.4 Emission factors
The emission factors used are given in Tables 3.19-3.20.
Table 3.19.General emission factors for other mobile sources
CH4 kg/tonne N2O kg/tonne
Railway Auto diesel 0.18 1.2
Small boats 2 stroke Motor gasoline 5.1 0.02
Small boats 4 stroke Motor gasoline 1.7 0.08
Auto diesel 0.18 0.03
Motorized equipment 2 stroke Motor gasoline 6 0.02
Motorized equipment 4 stroke
Motor gasoline 2.2 0.07
Auto diesel 0.17 1.3
Light fuel oils 0.17 1.3
Snow scooters have the same emission factors as those for Mopeds, see Tables 3.16-3.17.
Bold figures have exceptions for some sectors, see Table 3.20.
Sources: Bang (1993), SFT (1999c) and Statistic Norway (2002).
Table 3.20. Exceptions from the general factors for greenhouse gases and precursors for
other mobile sources.
Component Emission
factor
(kg/tonne)
Fuel Source Sectors
CH4 6.2 Motor gasoline Motorized equipment 2 stroke Agriculture
CH4 3.7 Motor gasoline Motorized equipment 4 stroke Agriculture
CH4 7.7 Motor gasoline Motorized equipment 2 stroke Forestry and logging
CH4 8.1 Motor gasoline Motorized equipment 2 stroke Private households
CH4 5.5 Motor gasoline Motorized equipment 4 stroke Private households
CH4 0.18 Auto diesel Motorized equipment 4 stroke Private households
N2O 0.08 Motor gasoline Motorized equipment 4 stroke
Agriculture and forestry,
Fishing, Energy sectors,
Mining/Manufacturing
National Inventory Report 2012 - Norway
113
3.2.8.3.5 Uncertainties
The estimates of consumption are considered quite uncertain, particularly for gasoline.
However, the total consumption of gasoline and auto diesel is well known (see also Annex II).
3.2.8.3.6 Source specific QA/QC and verification
There is no source specific QA/QC procedure for this sector. For a description of the general
QA/QC procedure (see Section 1.6).
3.2.8.3.7 Recalculations
1A 3 e Other (snow scooters, boats, motorized equipment)
Revised data. A small rise in 2008 emissions of CO2, CH4 and N2O, due to the
inclusion of a minor auto diesel figure for one plant.
Reallocation. Due to a reallocation of auto diesel 2000-2009 between forestry and
other mobile sources and machinery, there is a small increase of emissions of all
components these years. The reallocation is due to an error in the estimation of diesel
use in forestry, which has given too high figures for the years in question. As total use
is defined as equal to total sales, the amounts subtracted from forestry have been
transferred to 1A3eii.
3.2.8.3.8 Planned improvements
Norway has now started a project with the aim to consider and improve the methodology,
activity data etcetera used to calculate emissions from motorized equipment. The total
consumption of auto diesel in this sector is as explained above considered being of high
quality so it is the allocation between source categories and equipment that will be focus in
the project. The allocation is important when we calculate emissions of e.g. NOX where the
emissions are dependent of technology. The project is planned to be finalized to the 2013
submission.
3.2.9 Other Sectors (CRF source category 1A4)
3.2.9.1 Description
The source category Other Sectors includes stationary combustion in agriculture, forestry,
fishing, commercial and institutional sectors and households, motorized equipment and snow
scooters in agriculture and forestry, and fishing vessels and boats.
Fuel combustion in agriculture, forestry and fisheries accounts for more than half of the
emissions of this source category. This share of the sectors emissions decreased by 29 percent
from 1990 to 2010 and increased in both 2009 and 2010, the latter year by 8 percent. In 2010
the emissions from the whole sector were 3.6 million tonne CO2-equivalents and constitute of
6.7 per cent of national total GHG that year. The sectors emissions decreased by 17.2 percent
from 1990 to 2010 and increased by 3.2 percent during 2010 and the latter was due to
increased activity in fisheries, combustion and motorized equipment. Throughout the period
1990-2010, emissions have fluctuated although with a decreasing trend. The decreasing trend
is mainly due to reduced consumption of fuel oil in the commercial, institutional and
households sectors.
According to the Tier 2 key category analysis for 1990 and 2010, this sector is, in conjunction
with sectors 1A1 and 1A2, a key category with respect to:
Emissions of CO2 from the combustion of liquid and gaseous fuels in both level and trend
uncertainty
National Inventory Report 2012 - Norway
114
Emissions of CO2 from the combustion of Other fuels in level in 2010 and trend
uncertainty and solid fuels are key category in level in 1990
Emissions of CH4 from the combustion of gaseous fuels in trend uncertainty and biomass
in level in 1990 and 2010 and in trend
3.2.9.2 Activity data
Motorized equipment
Activity data are as described in Section 3.2.8.3.
Households
Use of wood in households for the years after 2005 is based on responses to questions relating
to wood-burning in Statistics Norway’s Travel and Holiday Survey. The figures in the survey
refer to quantities of wood used. The survey quarterly gathers data that cover the preceding
twelve months. The figure used in the emission calculations is the average of 5 quarterly
surveys. For the years before 2005 figures are based on the amount of wood burned from the
annual survey on consumer expenditure. The statistics cover purchase in physical units and
estimates for self-harvest. The survey figures refer to quantities acquired, which not
necessarily correspond to use. The survey gathers monthly data that cover the preceding
twelve months; the figure used in the emission calculations (taken from the energy accounts),
is the average of the survey figures from the year in question and the following year.
Combustion takes place in small ovens in private households.
Figures on use of coal and coal coke are derived from information from the main importer.
Formerly, Norway's only coal producing company had figures on coal sold for residential
heating in Norway. From about 2000, this sale was replaced by imports from abroad. Figures
for LPG are collected from the suppliers. Heavy fuel oil is taken from the sales statistics for
petroleum products. As the consumption of each energy carrier shall balance against the total
sales in the sales statistics, use of fuel oil, kerosene and heavy distillates in households is
given as the residual after consumption in all other sectors has been assessed.
Agriculture
Data on energy use in hothouses are collected in surveys performed regularly. Sales figures
are used to project the figures for consumption of oil products in the years between. For bio
fuels and LPG figures are interpolated for years not included in surveys. The Agricultural
Budgeting Board has figures on the use of gasoline, auto diesel and fuel oil in agriculture
excluding hothouses. A figure on the minor use of coal was previously collected annually
from the only consumer. Since 2002, however, there has been no use of coal in the Norwegian
agricultural activities.
Fishing
Figures on the use of marine gas oil, heavy distillate and heavy fuel oil are identical with the
registered sales to fishing vessels in the sales statistics for petroleum products. In addition to
these figures on use in large fishing vessels, a minor figure on estimated use of gasoline in
small fishing boats is also included.
Commercial and institutional sectors
Figures on energy use in wholesale and retail trade and hotels and restaurants, are based on a
survey for 2000, performed by Statistics Norway. For the following years, figures from this
survey have been adjusted proportionally to the development in employment in the industries
in question. For earlier years, the figures are based on a survey from the mid-1980s. LPG
National Inventory Report 2012 - Norway
115
figures for the whole period from 1990 have, however, been estimated separately after
consultation with an oil company.
For most other commercial and institutional sectors, the total use of fuel oil appears as a
residual after the use in all other sectors has been estimated; the distribution of this residual
between sub-sectors is done by using figures on energy use per man-labour year from the
energy survey from the mid-1980s.
Use of heating kerosene in commercial industries is calculated by projecting a figure on use
from the mid-1980s proportionally with the registered sales to buildings in industrial
industries outside the manufacturing industries. The estimated total amount is distributed
between sub-sectors by using figures on energy use per man-labour year from the mid-1980s
survey.
3.2.9.3 Emission factor
The emission factors used in this source category are presented in Section 3.2.1.3.
3.2.9.4 Uncertainties
Uncertainty in fishing is described together with navigation in Section 3.2.7.5.
The method used for finding the use of fuel oil, kerosene and heavy distillates in households
implies a great deal of uncertainty regarding the quality of these figures, particularly for fuel
oil, which is the most important of these three energy carriers. Since the late 1990s it also has
been necessary to adjust figures for other sectors in order to get consumption figures for
households that look reasonable. Hopefully, new surveys will improve the quality of these
figures in the future.
As the total use of the different oil products is defined as equal to the registered sales, use in
some sectors are given as a residual. This applies to use of heating kerosene and heavy
distillates in households, and total use of fuel oil in commercial and institutional sectors.
Accordingly, these quantities must be regarded as uncertain, as they are not based on direct
calculations. This uncertainty, however, applies only to the distribution of use between sectors
– the total use is defined as equal to registered sales, regardless of changes in stock.
The uncertainty in the activity data for this source category is 20 per cent of the mean for
solid and liquid fuels, and 30 per cent of the mean for biomass and waste. For natural gas the
amount is considered to be known with 0 per cent (see Annex II).
3.2.9.5 Source specific QA/QC and verification
There is no source specific QA/QC procedure for this sector. For a description of the general
QA/QC procedure (see Section 1.6).
3.2.9.6 Recalculations
1A 4 a Commercial/institutional
Correction of error. 1.6 ktonne of coal coke has been removed from this category in
2009. However, because of higher use of other energy goods, there is still an overall
emission increase in 1A4a
1A 4 b Residential
Revised activity data. For the years 2005-2009 the amount of wood burned in private
households has been revised due to a new weighting of figures from the survey used to
calculate wood consumption. This has led to increased emissions of all components
National Inventory Report 2012 - Norway
116
included in the national inventory, included CH4, for 2007-2009 and reduced
emissions 2005-2006.
1A 4 c Agriculture/Forestry/Fishing
Reallocation. Due to a reallocation of auto diesel 2000-2009 between forestry and
other mobile sources and machinery, there is a small decrease in emissions of all
components these years. The reallocation is due an error in the estimation of diesel use
in forestry, which has given too high figures for the years in question
3.2.9.7 Planned improvements
See Section 3.2.8.3.8.
3.2.10 Other (CRF source category 1A5)
This source includes solely emissions from fuel use in military stationary and mobile
activities. Emissions of CO2 from the mobile military sub-sector appear to be a key category
according to Tier 1 key source analysis.
Figures on fuel oil are annually collected directly from the military administration, while for
other energy carriers figures from the sales statistics for petroleum products are used. For
stationary activities the emission factors used in this source category are those presented in
Section 3.2.1.3. For mobile activities the employed emission factors are those presented in the
corresponding transport sectors (see Sections 3.2.4-3.2.8). The stationary and mobile
emissions from the Norwegian military activities for the years 1990-2008 are listed in Table
3.21.
There have been large variations in annual sales of military aviation kerosene; as stock
changes are not taken into account. The actual annual use of kerosene and hence emissions is
therefore uncertain.
3.2.10.1 Recalculations
There were performed no specific recalculations for this sector this year.
3.2.10.2 Planned improvements
There is for the moment no planned activity that will improve the data quality for NIR 2013
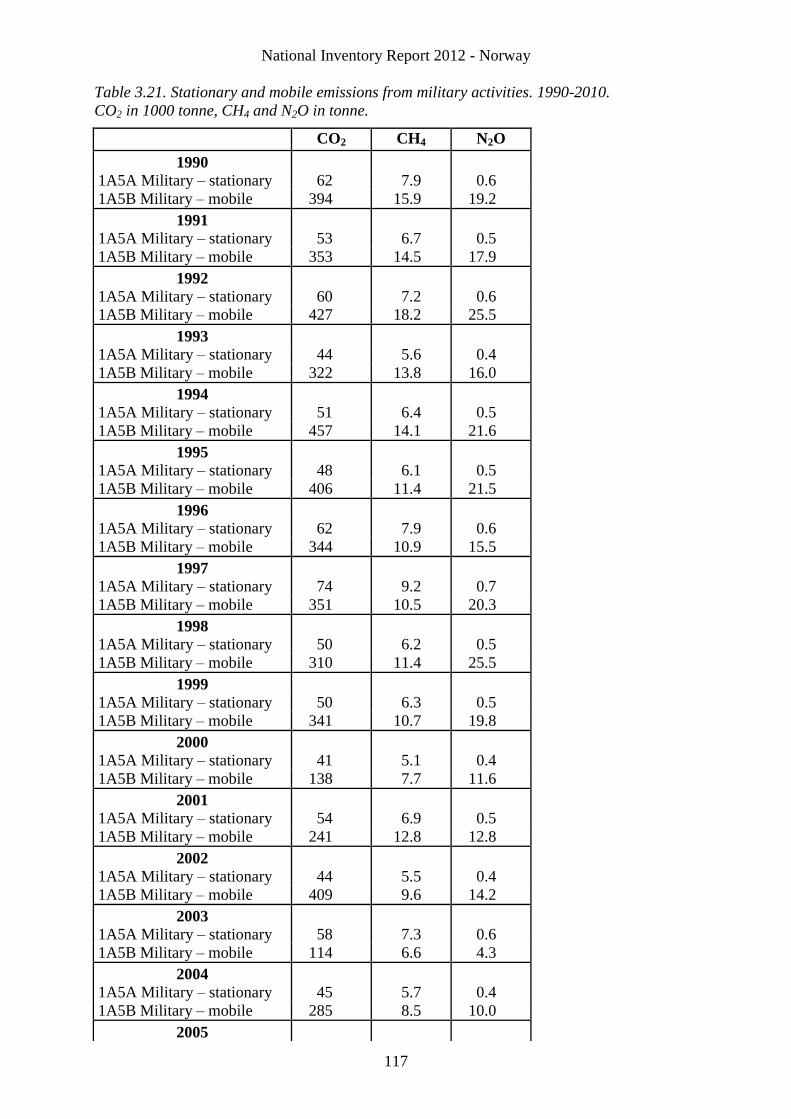
National Inventory Report 2012 - Norway
117
Table 3.21. Stationary and mobile emissions from military activities. 1990-2010.
CO2 in 1000 tonne, CH4 and N2O in tonne.
CO2 CH4 N2O
1990
1A5A Military – stationary 62 7.9 0.6
1A5B Military – mobile 394 15.9 19.2
1991
1A5A Military – stationary 53 6.7 0.5
1A5B Military – mobile 353 14.5 17.9
1992
1A5A Military – stationary 60 7.2 0.6
1A5B Military – mobile 427 18.2 25.5
1993
1A5A Military – stationary 44 5.6 0.4
1A5B Military – mobile 322 13.8 16.0
1994
1A5A Military – stationary 51 6.4 0.5
1A5B Military – mobile 457 14.1 21.6
1995
1A5A Military – stationary 48 6.1 0.5
1A5B Military – mobile 406 11.4 21.5
1996
1A5A Military – stationary 62 7.9 0.6
1A5B Military – mobile 344 10.9 15.5
1997
1A5A Military – stationary 74 9.2 0.7
1A5B Military – mobile 351 10.5 20.3
1998
1A5A Military – stationary 50 6.2 0.5
1A5B Military – mobile 310 11.4 25.5
1999
1A5A Military – stationary 50 6.3 0.5
1A5B Military – mobile 341 10.7 19.8
2000
1A5A Military – stationary 41 5.1 0.4
1A5B Military – mobile 138 7.7 11.6
2001
1A5A Military – stationary 54 6.9 0.5
1A5B Military – mobile 241 12.8 12.8
2002
1A5A Military – stationary 44 5.5 0.4
1A5B Military – mobile 409 9.6 14.2
2003
1A5A Military – stationary 58 7.3 0.6
1A5B Military – mobile 114 6.6 4.3
2004
1A5A Military – stationary 45 5.7 0.4
1A5B Military – mobile 285 8.5 10.0
2005
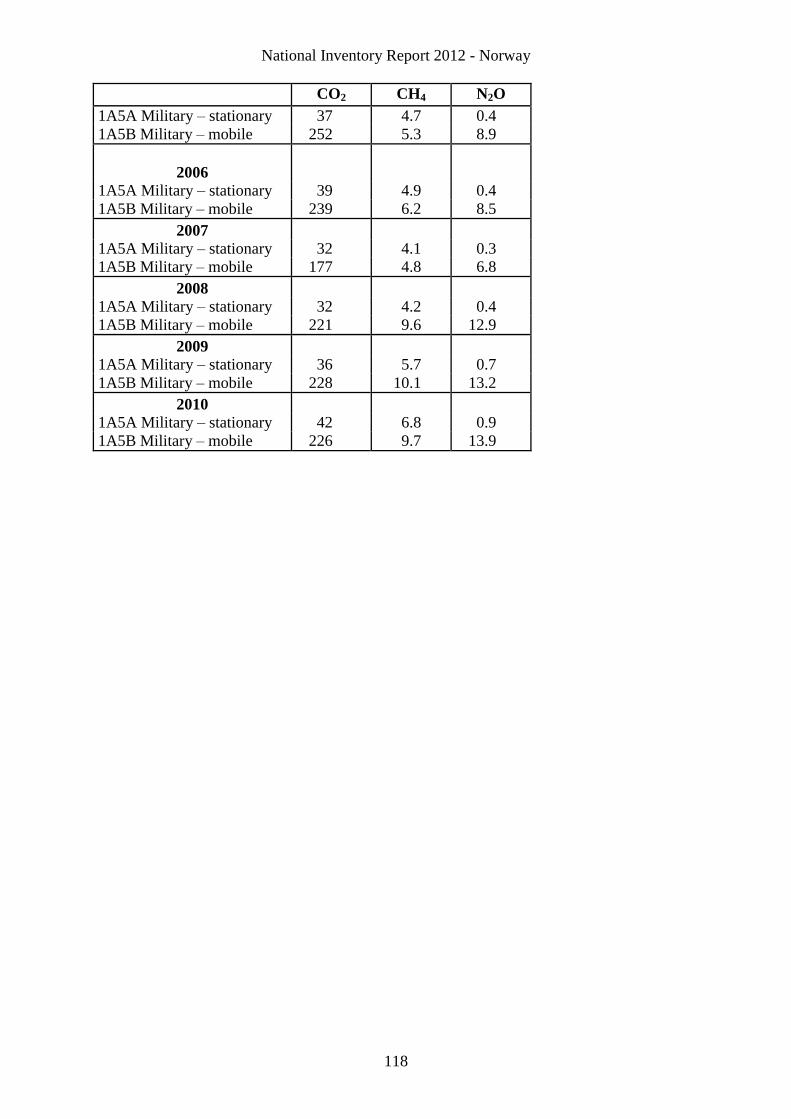
National Inventory Report 2012 - Norway
118
CO2 CH4 N2O
1A5A Military – stationary 37 4.7 0.4
1A5B Military – mobile 252 5.3 8.9
2006
1A5A Military – stationary 39 4.9 0.4
1A5B Military – mobile 239 6.2 8.5
2007
1A5A Military – stationary 32 4.1 0.3
1A5B Military – mobile 177 4.8 6.8
2008
1A5A Military – stationary 32 4.2 0.4
1A5B Military – mobile 221 9.6 12.9
2009
1A5A Military – stationary 36 5.7 0.7
1A5B Military – mobile 228 10.1 13.2
2010
1A5A Military – stationary 42 6.8 0.9
1A5B Military – mobile 226 9.7 13.9
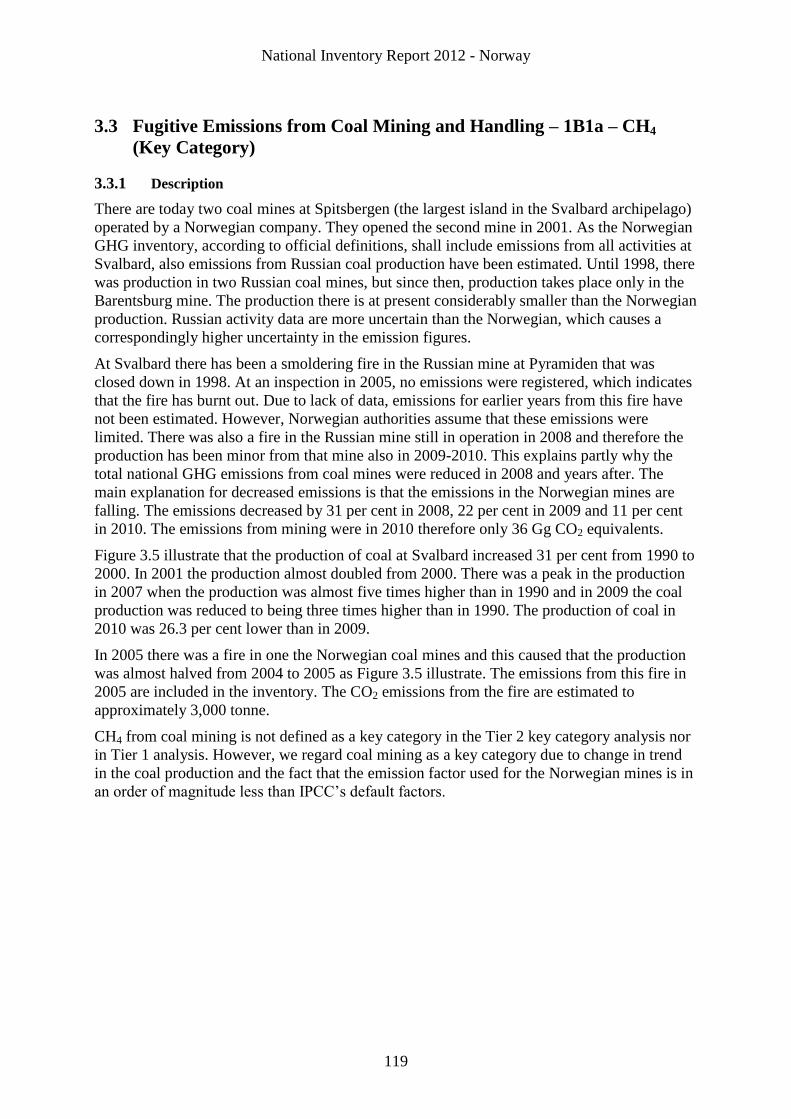
National Inventory Report 2012 - Norway
119
3.3 Fugitive Emissions from Coal Mining and Handling – 1B1a – CH4
(Key Category)
3.3.1 Description
There are today two coal mines at Spitsbergen (the largest island in the Svalbard archipelago)
operated by a Norwegian company. They opened the second mine in 2001. As the Norwegian
GHG inventory, according to official definitions, shall include emissions from all activities at
Svalbard, also emissions from Russian coal production have been estimated. Until 1998, there
was production in two Russian coal mines, but since then, production takes place only in the
Barentsburg mine. The production there is at present considerably smaller than the Norwegian
production. Russian activity data are more uncertain than the Norwegian, which causes a
correspondingly higher uncertainty in the emission figures.
At Svalbard there has been a smoldering fire in the Russian mine at Pyramiden that was
closed down in 1998. At an inspection in 2005, no emissions were registered, which indicates
that the fire has burnt out. Due to lack of data, emissions for earlier years from this fire have
not been estimated. However, Norwegian authorities assume that these emissions were
limited. There was also a fire in the Russian mine still in operation in 2008 and therefore the
production has been minor from that mine also in 2009-2010. This explains partly why the
total national GHG emissions from coal mines were reduced in 2008 and years after. The
main explanation for decreased emissions is that the emissions in the Norwegian mines are
falling. The emissions decreased by 31 per cent in 2008, 22 per cent in 2009 and 11 per cent
in 2010. The emissions from mining were in 2010 therefore only 36 Gg CO2 equivalents.
Figure 3.5 illustrate that the production of coal at Svalbard increased 31 per cent from 1990 to
2000. In 2001 the production almost doubled from 2000. There was a peak in the production
in 2007 when the production was almost five times higher than in 1990 and in 2009 the coal
production was reduced to being three times higher than in 1990. The production of coal in
2010 was 26.3 per cent lower than in 2009.
In 2005 there was a fire in one the Norwegian coal mines and this caused that the production
was almost halved from 2004 to 2005 as Figure 3.5 illustrate. The emissions from this fire in
2005 are included in the inventory. The CO2 emissions from the fire are estimated to
approximately 3,000 tonne.
CH4 from coal mining is not defined as a key category in the Tier 2 key category analysis nor
in Tier 1 analysis. However, we regard coal mining as a key category due to change in trend
in the coal production and the fact that the emission factor used for the Norwegian mines is in
an order of magnitude less than IPCC’s default factors.
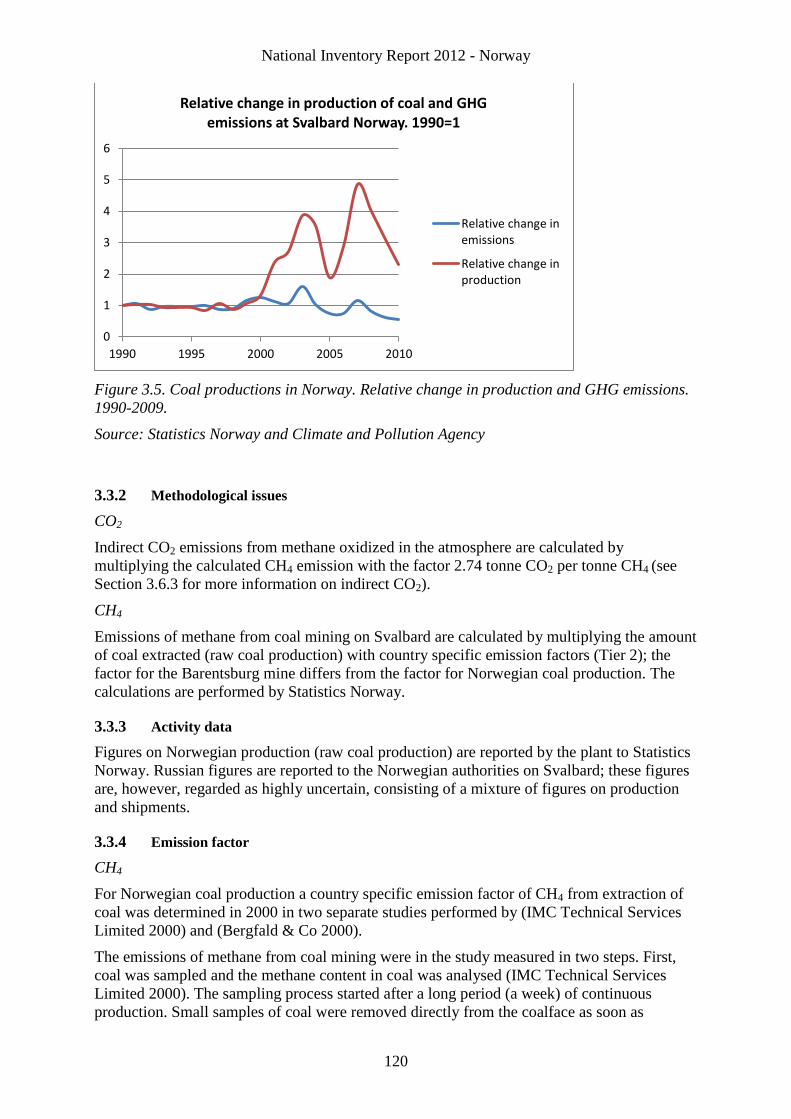
National Inventory Report 2012 - Norway
120
Figure 3.5. Coal productions in Norway. Relative change in production and GHG emissions.
1990-2009.
Source: Statistics Norway and Climate and Pollution Agency
3.3.2 Methodological issues
CO2
Indirect CO2 emissions from methane oxidized in the atmosphere are calculated by
multiplying the calculated CH4 emission with the factor 2.74 tonne CO2 per tonne CH4 (see
Section 3.6.3 for more information on indirect CO2).
CH4
Emissions of methane from coal mining on Svalbard are calculated by multiplying the amount
of coal extracted (raw coal production) with country specific emission factors (Tier 2); the
factor for the Barentsburg mine differs from the factor for Norwegian coal production. The
calculations are performed by Statistics Norway.
3.3.3 Activity data
Figures on Norwegian production (raw coal production) are reported by the plant to Statistics
Norway. Russian figures are reported to the Norwegian authorities on Svalbard; these figures
are, however, regarded as highly uncertain, consisting of a mixture of figures on production
and shipments.
3.3.4 Emission factor
CH4
For Norwegian coal production a country specific emission factor of CH4 from extraction of
coal was determined in 2000 in two separate studies performed by (IMC Technical Services
Limited 2000) and (Bergfald & Co 2000).
The emissions of methane from coal mining were in the study measured in two steps. First,
coal was sampled and the methane content in coal was analysed (IMC Technical Services
Limited 2000). The sampling process started after a long period (a week) of continuous
production. Small samples of coal were removed directly from the coalface as soon as
0
1
2
3
4
5
6
1990 1995 2000 2005 2010
Relative change in production of coal and GHG emissions at Svalbard Norway. 1990=1
Relative change inemissions
Relative change inproduction
National Inventory Report 2012 - Norway
121
possible after a cut was taken. This was to minimize degassing losses in the samples if the
face or heading had been standing for a long time.
The samples yielded an estimate of seam gas content of 0.535-1.325 m3 methane per tonne
coal derived from an average content of 0.79 m3 per tonne. This factor includes the total
possible methane emissions from coal mining, loading and transport on shore and on sea. The
factor also includes the possible emission from handling and crushing of coal at the coal
power plant.
Secondly, the methane content in ventilation air from the underground coal mines at
Spitsbergen was measured (Bergfald & Co 2000). From the Norwegian mines the methane
content in the ventilation air was measured to 0.1-0.4 m3 methane per tonne coal.
Considering the measurements it was therefore decided to use 0.54 kg methane per tonne coal
as emission factor when calculating methane emissions from coal mining in Norway.
According to IPCC`s Good Practice Guidance, the Norwegian mines at Spitsbergen have
characteristics that should define the mines as underground mines, whereas the emission
factor we use is more characteristic for surface mines. The low content of methane is
explained with the mine’s location 300-400 meters above sea level. Furthermore, the rock at
Spitsbergen is porous and therefore methane has been aired through many years.
For the Russian mine in Barentsburg, the emission factor for CH4 has been estimated in the
same manner as the Norwegian factor, based on measurements by (Bergfald & Co as 2000).
This is an underground mine, which causes considerably higher emissions than from the
Norwegian mines; we use the factor 7.16 kg methane per tonne coal for this mine. The
Russian mine that was closed down in 1998, however, was situated more like the Norwegian
mines; accordingly we use the same emission factor for this as for the Norwegian mines.
3.3.5 Uncertainties
The uncertainty in the activity data concerning Norwegian coal production is regarded as
being low. The uncertainty in Russian data is considerably higher.
Today, country specific factors based on measurements are used in the calculations. We
assume that the uncertainty in the EF is much lower than that reported in (Statistics Norway
2000), when an IPCC default emission factor was used. In (Statistics Norway 2000) the
uncertainty in the EF was estimated by expert judgments to as much as -50 to +100 per cent.
The EF we use for the Norwegian mines is an average of the measurement of methane in coal
sampled in the study (IMC Technical Services Limited 2000). This average EF is two to eight
times higher than the methane content measured in ventilation air by (Bergfald & Co 2000).
This should indicate that the chosen emission factor is rather conservative.
3.3.6 Source specific QA/QC and verification
Independent methods to estimate the EFs used in the calculations are described above in this
chapter.
Statistics Norway and the Climate and Pollution Agency carry out internal checks of the
emission time-series and corrections are made when errors are detected, see Section 1.6 for
general QA/QC procedures.
3.3.7 Recalculations
There has not been recalculation of the emission estimates since NIR 2009.
3.3.8 Planned Improvements
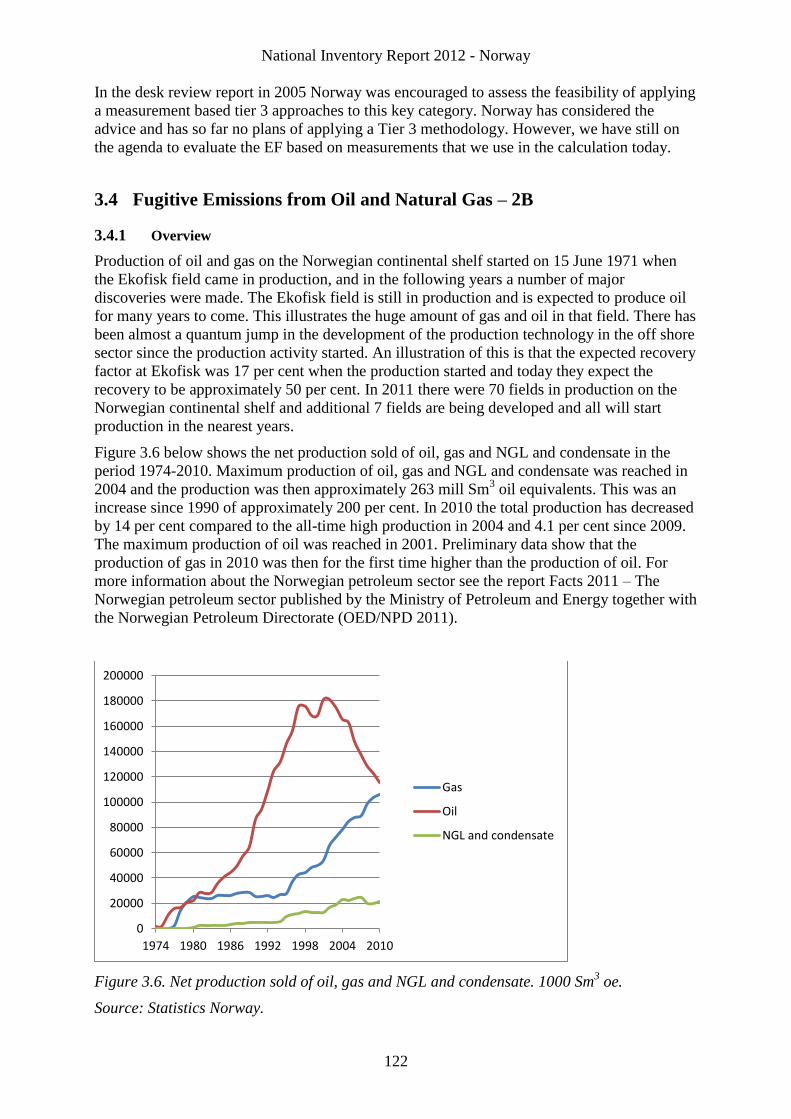
National Inventory Report 2012 - Norway
122
In the desk review report in 2005 Norway was encouraged to assess the feasibility of applying
a measurement based tier 3 approaches to this key category. Norway has considered the
advice and has so far no plans of applying a Tier 3 methodology. However, we have still on
the agenda to evaluate the EF based on measurements that we use in the calculation today.
3.4 Fugitive Emissions from Oil and Natural Gas – 2B
3.4.1 Overview
Production of oil and gas on the Norwegian continental shelf started on 15 June 1971 when
the Ekofisk field came in production, and in the following years a number of major
discoveries were made. The Ekofisk field is still in production and is expected to produce oil
for many years to come. This illustrates the huge amount of gas and oil in that field. There has
been almost a quantum jump in the development of the production technology in the off shore
sector since the production activity started. An illustration of this is that the expected recovery
factor at Ekofisk was 17 per cent when the production started and today they expect the
recovery to be approximately 50 per cent. In 2011 there were 70 fields in production on the
Norwegian continental shelf and additional 7 fields are being developed and all will start
production in the nearest years.
Figure 3.6 below shows the net production sold of oil, gas and NGL and condensate in the
period 1974-2010. Maximum production of oil, gas and NGL and condensate was reached in
2004 and the production was then approximately 263 mill Sm3 oil equivalents. This was an
increase since 1990 of approximately 200 per cent. In 2010 the total production has decreased
by 14 per cent compared to the all-time high production in 2004 and 4.1 per cent since 2009.
The maximum production of oil was reached in 2001. Preliminary data show that the
production of gas in 2010 was then for the first time higher than the production of oil. For
more information about the Norwegian petroleum sector see the report Facts 2011 – The
Norwegian petroleum sector published by the Ministry of Petroleum and Energy together with
the Norwegian Petroleum Directorate (OED/NPD 2011).
Figure 3.6. Net production sold of oil, gas and NGL and condensate. 1000 Sm3 oe.
Source: Statistics Norway.
0
20000
40000
60000
80000
100000
120000
140000
160000
180000
200000
1974 1980 1986 1992 1998 2004 2010
Gas
Oil
NGL and condensate
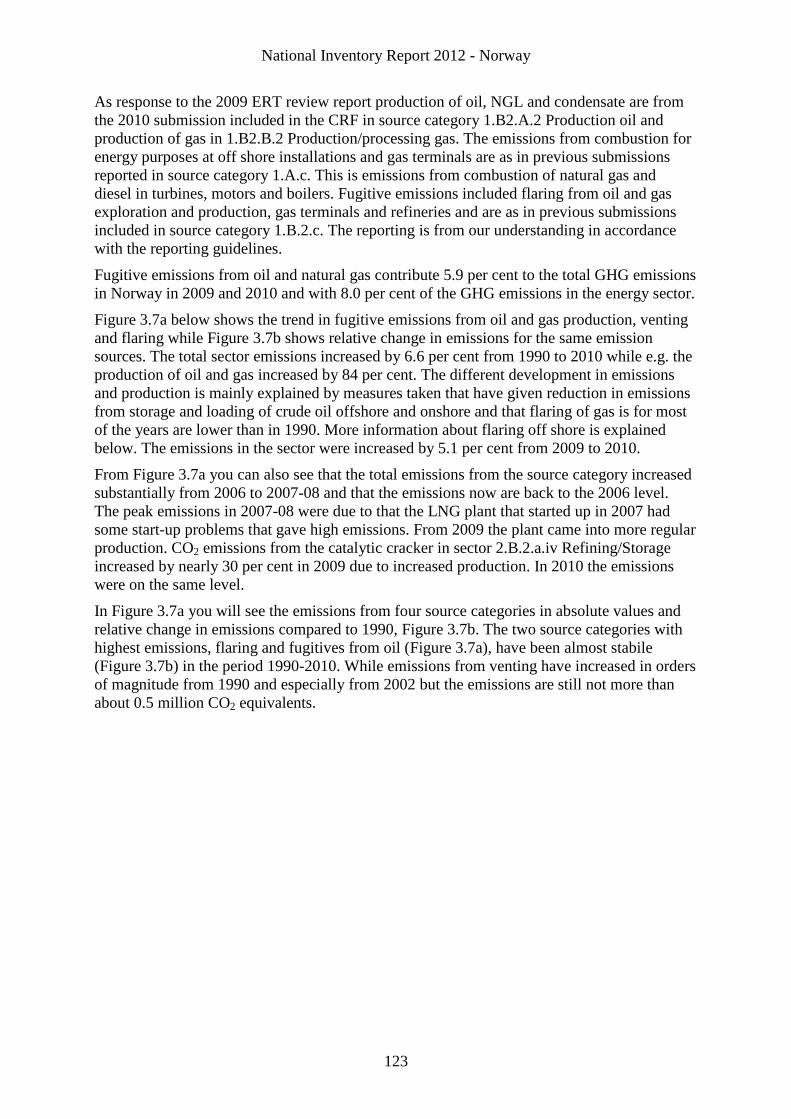
National Inventory Report 2012 - Norway
123
As response to the 2009 ERT review report production of oil, NGL and condensate are from
the 2010 submission included in the CRF in source category 1.B2.A.2 Production oil and
production of gas in 1.B2.B.2 Production/processing gas. The emissions from combustion for
energy purposes at off shore installations and gas terminals are as in previous submissions
reported in source category 1.A.c. This is emissions from combustion of natural gas and
diesel in turbines, motors and boilers. Fugitive emissions included flaring from oil and gas
exploration and production, gas terminals and refineries and are as in previous submissions
included in source category 1.B.2.c. The reporting is from our understanding in accordance
with the reporting guidelines.
Fugitive emissions from oil and natural gas contribute 5.9 per cent to the total GHG emissions
in Norway in 2009 and 2010 and with 8.0 per cent of the GHG emissions in the energy sector.
Figure 3.7a below shows the trend in fugitive emissions from oil and gas production, venting
and flaring while Figure 3.7b shows relative change in emissions for the same emission
sources. The total sector emissions increased by 6.6 per cent from 1990 to 2010 while e.g. the
production of oil and gas increased by 84 per cent. The different development in emissions
and production is mainly explained by measures taken that have given reduction in emissions
from storage and loading of crude oil offshore and onshore and that flaring of gas is for most
of the years are lower than in 1990. More information about flaring off shore is explained
below. The emissions in the sector were increased by 5.1 per cent from 2009 to 2010.
From Figure 3.7a you can also see that the total emissions from the source category increased
substantially from 2006 to 2007-08 and that the emissions now are back to the 2006 level.
The peak emissions in 2007-08 were due to that the LNG plant that started up in 2007 had
some start-up problems that gave high emissions. From 2009 the plant came into more regular
production. CO2 emissions from the catalytic cracker in sector 2.B.2.a.iv Refining/Storage
increased by nearly 30 per cent in 2009 due to increased production. In 2010 the emissions
were on the same level.
In Figure 3.7a you will see the emissions from four source categories in absolute values and
relative change in emissions compared to 1990, Figure 3.7b. The two source categories with
highest emissions, flaring and fugitives from oil (Figure 3.7a), have been almost stabile
(Figure 3.7b) in the period 1990-2010. While emissions from venting have increased in orders
of magnitude from 1990 and especially from 2002 but the emissions are still not more than
about 0.5 million CO2 equivalents.
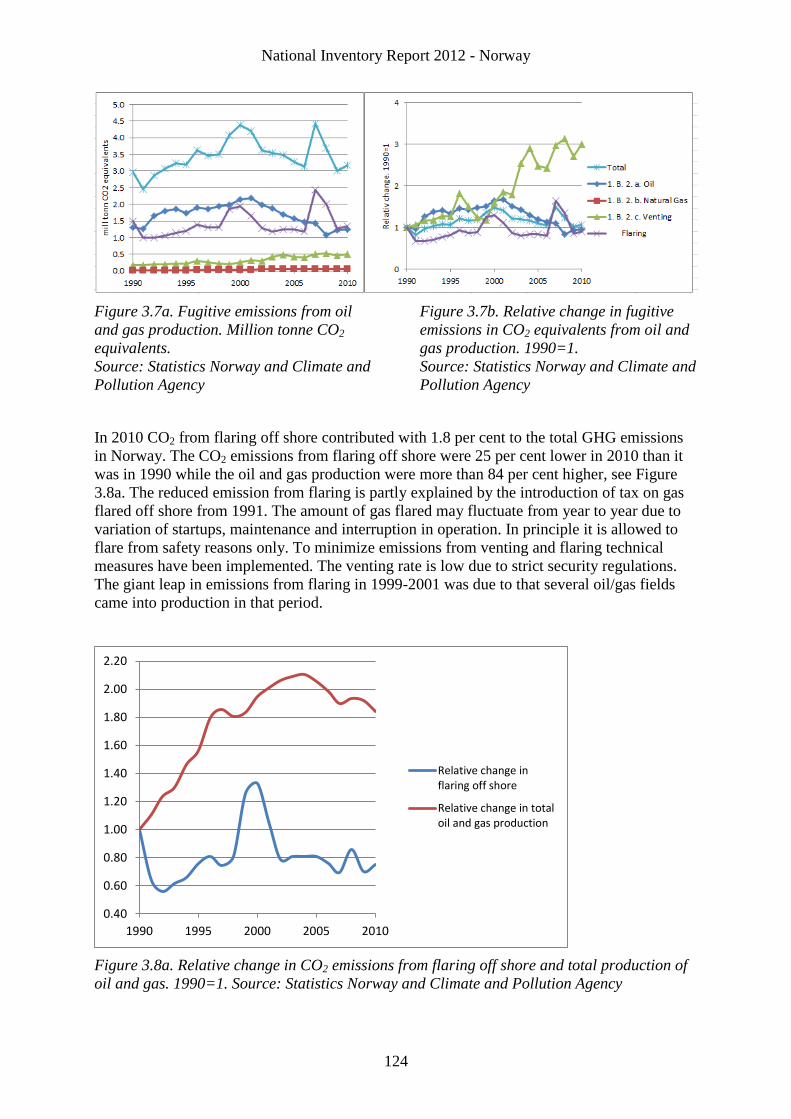
National Inventory Report 2012 - Norway
124
Figure 3.7a. Fugitive emissions from oil
and gas production. Million tonne CO2
equivalents.
Source: Statistics Norway and Climate and
Pollution Agency
Figure 3.7b. Relative change in fugitive
emissions in CO2 equivalents from oil and
gas production. 1990=1.
Source: Statistics Norway and Climate and
Pollution Agency
In 2010 CO2 from flaring off shore contributed with 1.8 per cent to the total GHG emissions
in Norway. The CO2 emissions from flaring off shore were 25 per cent lower in 2010 than it
was in 1990 while the oil and gas production were more than 84 per cent higher, see Figure
3.8a. The reduced emission from flaring is partly explained by the introduction of tax on gas
flared off shore from 1991. The amount of gas flared may fluctuate from year to year due to
variation of startups, maintenance and interruption in operation. In principle it is allowed to
flare from safety reasons only. To minimize emissions from venting and flaring technical
measures have been implemented. The venting rate is low due to strict security regulations.
The giant leap in emissions from flaring in 1999-2001 was due to that several oil/gas fields
came into production in that period.
Figure 3.8a. Relative change in CO2 emissions from flaring off shore and total production of
oil and gas. 1990=1. Source: Statistics Norway and Climate and Pollution Agency
0.40
0.60
0.80
1.00
1.20
1.40
1.60
1.80
2.00
2.20
1990 1995 2000 2005 2010
Relative change inflaring off shore
Relative change in totaloil and gas production
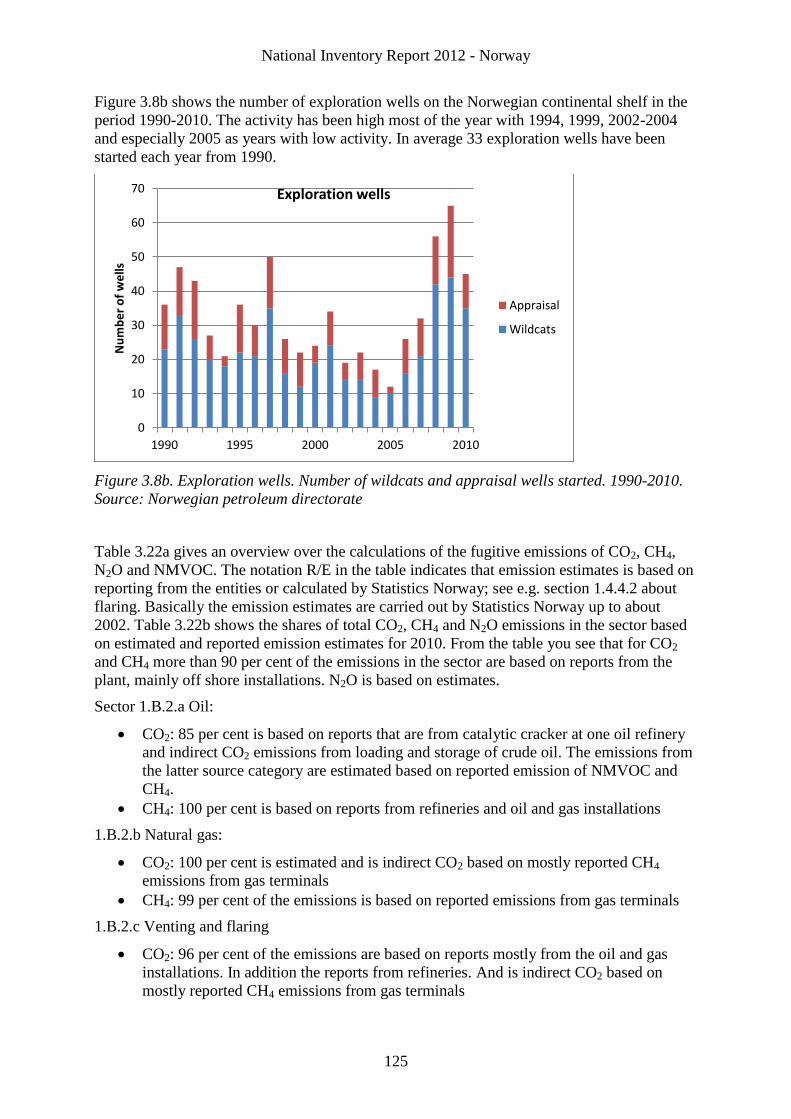
National Inventory Report 2012 - Norway
125
Figure 3.8b shows the number of exploration wells on the Norwegian continental shelf in the
period 1990-2010. The activity has been high most of the year with 1994, 1999, 2002-2004
and especially 2005 as years with low activity. In average 33 exploration wells have been
started each year from 1990.
Figure 3.8b. Exploration wells. Number of wildcats and appraisal wells started. 1990-2010.
Source: Norwegian petroleum directorate
Table 3.22a gives an overview over the calculations of the fugitive emissions of CO2, CH4,
N2O and NMVOC. The notation R/E in the table indicates that emission estimates is based on
reporting from the entities or calculated by Statistics Norway; see e.g. section 1.4.4.2 about
flaring. Basically the emission estimates are carried out by Statistics Norway up to about
2002. Table 3.22b shows the shares of total CO2, CH4 and N2O emissions in the sector based
on estimated and reported emission estimates for 2010. From the table you see that for CO2
and CH4 more than 90 per cent of the emissions in the sector are based on reports from the
plant, mainly off shore installations. N2O is based on estimates.
Sector 1.B.2.a Oil:
CO2: 85 per cent is based on reports that are from catalytic cracker at one oil refinery
and indirect CO2 emissions from loading and storage of crude oil. The emissions from
the latter source category are estimated based on reported emission of NMVOC and
CH4.
CH4: 100 per cent is based on reports from refineries and oil and gas installations
1.B.2.b Natural gas:
CO2: 100 per cent is estimated and is indirect CO2 based on mostly reported CH4
emissions from gas terminals
CH4: 99 per cent of the emissions is based on reported emissions from gas terminals
1.B.2.c Venting and flaring
CO2: 96 per cent of the emissions are based on reports mostly from the oil and gas
installations. In addition the reports from refineries. And is indirect CO2 based on
mostly reported CH4 emissions from gas terminals
0
10
20
30
40
50
60
70
1990 1995 2000 2005 2010
Nu
mb
er
of
we
lls
Exploration wells
Appraisal
Wildcats
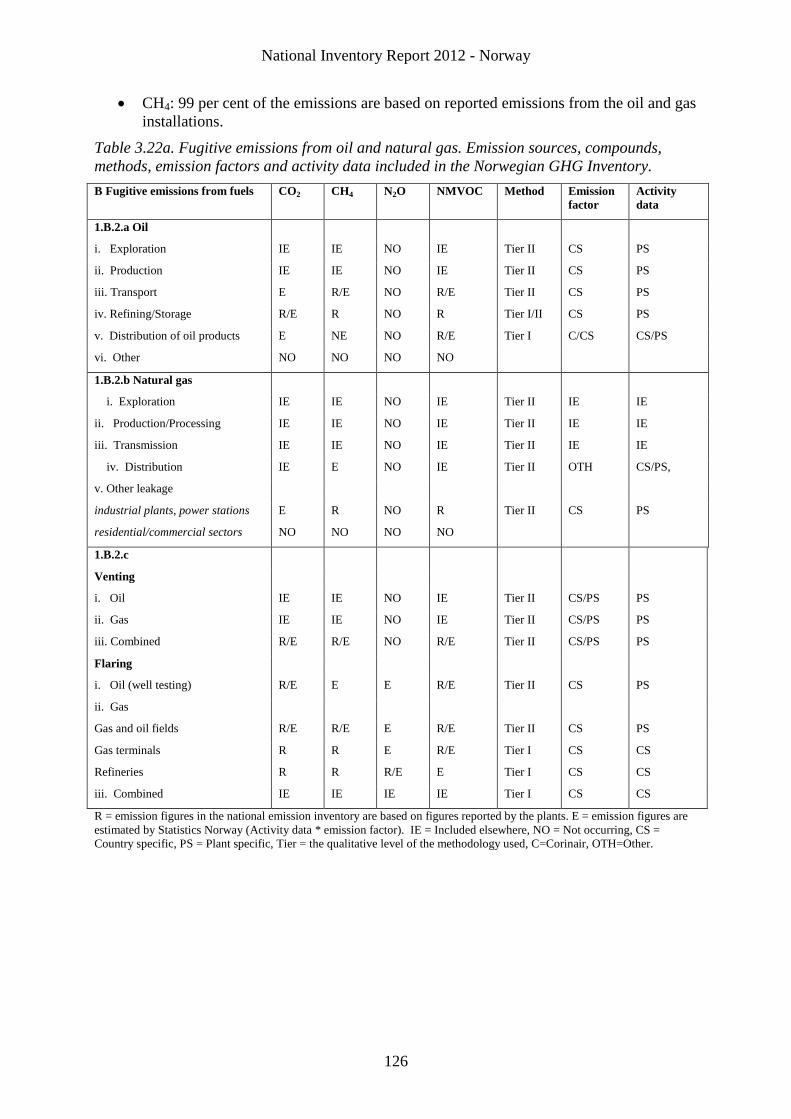
National Inventory Report 2012 - Norway
126
CH4: 99 per cent of the emissions are based on reported emissions from the oil and gas
installations.
Table 3.22a. Fugitive emissions from oil and natural gas. Emission sources, compounds,
methods, emission factors and activity data included in the Norwegian GHG Inventory.
B Fugitive emissions from fuels CO2 CH4 N2O NMVOC Method Emission
factor
Activity
data
1.B.2.a Oil
i. Exploration IE IE NO IE Tier II CS PS
ii. Production IE IE NO IE Tier II CS PS
iii. Transport E R/E NO R/E Tier II CS PS
iv. Refining/Storage R/E R NO R Tier I/II CS PS
v. Distribution of oil products E NE NO R/E Tier I C/CS CS/PS
vi. Other NO NO NO NO
1.B.2.b Natural gas
i. Exploration IE IE NO IE Tier II IE IE
ii. Production/Processing IE IE NO IE Tier II IE IE
iii. Transmission IE IE NO IE Tier II IE IE
iv. Distribution IE E NO IE Tier II OTH CS/PS,
v. Other leakage
industrial plants, power stations E R NO R Tier II CS PS
residential/commercial sectors NO NO NO NO
1.B.2.c
Venting
i. Oil IE IE NO IE Tier II CS/PS PS
ii. Gas IE IE NO IE Tier II CS/PS PS
iii. Combined R/E R/E NO R/E Tier II CS/PS PS
Flaring
i. Oil (well testing) R/E E E R/E Tier II CS PS
ii. Gas
Gas and oil fields R/E R/E E R/E Tier II CS PS
Gas terminals R R E R/E Tier I CS CS
Refineries R R R/E E Tier I CS CS
iii. Combined IE IE IE IE Tier I CS CS
R = emission figures in the national emission inventory are based on figures reported by the plants. E = emission figures are
estimated by Statistics Norway (Activity data * emission factor). IE = Included elsewhere, NO = Not occurring, CS =
Country specific, PS = Plant specific, Tier = the qualitative level of the methodology used, C=Corinair, OTH=Other.
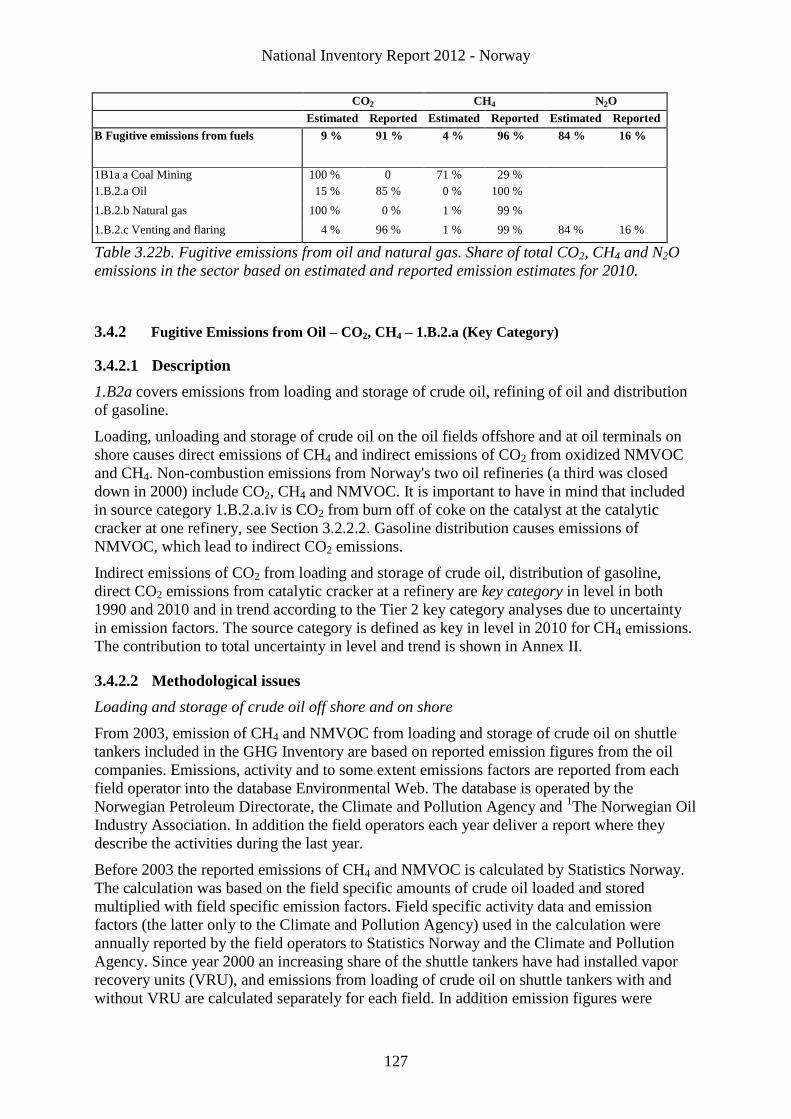
National Inventory Report 2012 - Norway
127
CO2 CH4 N2O
Estimated Reported Estimated Reported Estimated Reported
B Fugitive emissions from fuels 9 % 91 % 4 % 96 % 84 % 16 %
1B1a a Coal Mining 100 % 0 71 % 29 %
1.B.2.a Oil 15 % 85 % 0 % 100 %
1.B.2.b Natural gas 100 % 0 % 1 % 99 %
1.B.2.c Venting and flaring 4 % 96 % 1 % 99 % 84 % 16 %
Table 3.22b. Fugitive emissions from oil and natural gas. Share of total CO2, CH4 and N2O
emissions in the sector based on estimated and reported emission estimates for 2010.
3.4.2 Fugitive Emissions from Oil – CO2, CH4 – 1.B.2.a (Key Category)
3.4.2.1 Description
1.B2a covers emissions from loading and storage of crude oil, refining of oil and distribution
of gasoline.
Loading, unloading and storage of crude oil on the oil fields offshore and at oil terminals on
shore causes direct emissions of CH4 and indirect emissions of CO2 from oxidized NMVOC
and CH4. Non-combustion emissions from Norway's two oil refineries (a third was closed
down in 2000) include CO2, CH4 and NMVOC. It is important to have in mind that included
in source category 1.B.2.a.iv is CO2 from burn off of coke on the catalyst at the catalytic
cracker at one refinery, see Section 3.2.2.2. Gasoline distribution causes emissions of
NMVOC, which lead to indirect CO2 emissions.
Indirect emissions of CO2 from loading and storage of crude oil, distribution of gasoline,
direct CO2 emissions from catalytic cracker at a refinery are key category in level in both
1990 and 2010 and in trend according to the Tier 2 key category analyses due to uncertainty
in emission factors. The source category is defined as key in level in 2010 for CH4 emissions.
The contribution to total uncertainty in level and trend is shown in Annex II.
3.4.2.2 Methodological issues
Loading and storage of crude oil off shore and on shore
From 2003, emission of CH4 and NMVOC from loading and storage of crude oil on shuttle
tankers included in the GHG Inventory are based on reported emission figures from the oil
companies. Emissions, activity and to some extent emissions factors are reported from each
field operator into the database Environmental Web. The database is operated by the
Norwegian Petroleum Directorate, the Climate and Pollution Agency and 1The Norwegian Oil
Industry Association. In addition the field operators each year deliver a report where they
describe the activities during the last year.
Before 2003 the reported emissions of CH4 and NMVOC is calculated by Statistics Norway.
The calculation was based on the field specific amounts of crude oil loaded and stored
multiplied with field specific emission factors. Field specific activity data and emission
factors (the latter only to the Climate and Pollution Agency) used in the calculation were
annually reported by the field operators to Statistics Norway and the Climate and Pollution
Agency. Since year 2000 an increasing share of the shuttle tankers have had installed vapor
recovery units (VRU), and emissions from loading of crude oil on shuttle tankers with and
without VRU are calculated separately for each field. In addition emission figures were
National Inventory Report 2012 - Norway
128
annually reported to the Climate and Pollution Agency and used in the QC of the calculated
Statistics Norway emission figures.
Norway considers that the method for calculating the CH4 and NMVOC emissions from
loading and storage of crude oil is consistent for the period 1990-2005.
Only emissions from loading and storage of the Norwegian part of oil production are included
in the inventory.
For the two Norwegian oil terminals on shore, the emissions from loading of crude oil are
reported annually from the terminals to the Climate and Pollution Agency. At one of the
terminals VRU for recovering NMVOC was installed in 1996. The calculation of the
emissions of CH4 and NMVOC at both terminals is based upon the amount of crude oil
loaded and oil specific emission factor dependent of the origin of the crude oil loaded.
The reported indirect CO2 emissions from the oxidation of CH4 and NMVOC in the
atmosphere see Section 3.6.3 for this source category is calculated by Statistics Norway.
Refining/Storage – 1.B.2.A.iv
The direct emissions of CO2, CH4 and NMVOC included in the inventory are reported by the
refineries to the Climate and Pollution Agency. There is however one exception and that is
CH4 emissions from the largest refinery. The CH4 emissions from that refinery are estimated
by the Climate and Pollution Agency by multiplying the yearly amount of crude oil
throughput by a plant specific emission factor that is based on measurements carried out by
Spectracyne in 2002 and 2005. Also the NMVOC emissions are based on measurement
carried out by Spectracyne in 2002 and 2005.
The CO2 emissions originate from the coke on the catalyst that is burned off and from the
coke calcining kilns. The emissions from the catalytic cracker are included in the Norwegian
ETS and the emissions reported in source category 1.B.2.a. iv is from the ETS and is therefore
regarded being of high quality. The CO2 emissions from catalytic cracker and calcining kilns
are calculated from the formula:
(2006) tonne CO2 per year = ((Nm3 RG per year * volume% CO2 ) / 100 *( molar weight
of CO2 / 22.4)) / 1000
the amount of stack gas (RG) is measured continuously
the density of the stack gas is 1.31 kg/Nm3
volume percentage of CO2 is based on continuously measurements. However, if the
refinery can document that the volume percentage of CO2 is not fluctuating more than
2 per cent from last year report it is not mandatory to have continuous measurements.
The indirect CO2 from oxidized CH4 and NMVOC is calculated by Statistics Norway.
Gasoline distribution – 1.B.2.a.v
NMVOC emissions from gasoline distribution are calculated from the amount of gasoline
sold and emission factors for loading of tankers at gasoline depot, loading of tanks at gasoline
stations and loading of cars.
National Inventory Report 2012 - Norway
129
3.4.2.3 Activity data
Loading and storage of crude oil off shore and on shore
The amount of oil buoy loaded and oil loaded from storage tankers is reported by the field
operators in an annual report to the Climate and Pollution Agency and the Norwegian
Petroleum Directorate. The amount of oil loaded on shuttle tankers with or without VRU is
separated in the report.
Before 2003, Statistics Norway gathered data on amounts of crude oil loaded at shuttle
tankers and stored at storage vessels from the Norwegian Petroleum Directorate. The data
from each field are reported monthly by the field operators to the Norwegian Petroleum
Directorate on both a mass and a volume basis. The allocation of the amount of crude oil
loaded at shuttle tankers and stored at storage vessels with or without VRU is from the
annually report the field operators are committed to deliver to the Climate and Pollution
Agency and the Norwegian Petroleum Directorate.
The amount of oil loaded at on shore oil terminals is also reported to the Climate and
Pollution Agency and the Norwegian Petroleum Directorate.
The amount of crude oil buoy loaded and loaded from storage tankers off shore and crude oil
loaded and unloaded at on shore oil terminals is reported for all years in the 2010 submission
in source category 1.B.2.a.iii, as recommended by ERT in previous review reports.
Refining – 1.B.2.a.iv
The crude oil refined included in the CRF is crude oil converted in refineries from the Energy
balance.
Gasoline distribution – 1.B.2.a.v
Gasoline sold is annually collected in Statistics Norway’s sale statistics for petroleum
products.
3.4.2.4 Emission factors
Loading and storage of crude oil off shore and on shore
For the years before 2003, emission factors used in the calculation of CH4 and NMVOC
emissions offshore are field specific and were reported to the Climate and Pollution Agency
and the Norwegian Petroleum Directorate in an annual report. The Climate and Pollution
Agency forwarded the emission factors to Statistics Norway. From 2003 the emission figures
reported by the field operators are used in the inventory.
The evaporation rate varies from field to field and over time, and the emission factors are
dependent on the composition of the crude oil as indicated by density and Reid vapour
pressure (RVP). The VOC evaporation emission factors are obtained from measurements,
which include emissions from loading and washing of shuttle tankers. For some fields the
emission factors are not measured, only estimated. The CH4 content of the VOC evaporated is
also measured so that total emissions of VOC are split between CH4 and NMVOC.
The emission factors that the field operator use in their calculations is reported to the Climate
and Pollution Agency and the Norwegian Petroleum Directorate. They report emissions factor
with and without VRU and the split between CH4 and NMVOC.
Loading on shore: The emission factors are considerably lower at one of Norway's two oil
terminals than at the other, because the oil is transported by ship and therefore the lightest
fractions have already evaporated. At the other terminal the oil is delivered by pipeline. The
National Inventory Report 2012 - Norway
130
latter terminal has installed VRU, which may reduce NMVOC emissions from loading of
ships at the terminal by about 90 per cent. NMVOC emissions at this terminal are estimated to
be more than 50 per cent lower than they would have been without VRU. However, the VRU
technology is not designed to reduce methane and ethane emissions.
Refining/Storage – 1.B.2.A.iv
The CO2 emissions from the catalytic cracker are calculated as described above under
Methodological issues. The CO2 IEF in CRF is calculated from the emissions from catalytic
cracker at one refinery and the amount of crude oil refined at three refineries up to 2002 and
thereafter two refineries.
The emission factor used in the calculation of methane emissions from the largest refinery is
based upon measurements performed by Spectracyne in 2002 and 2005. The EF is deduced
from the measured methane emissions and the crude oil throughput in 2005.
Gasoline distribution – 1.B.2.a.v
Emission factor for NMVOC from filling gasoline to cars used in the calculations are from
(EEA 2001) and is 1.48 kg NMVOC/tonne gasoline.
3.4.2.5 Uncertainties
The uncertainty in the emission factors of methane from oil loading (Statistics Norway 2000)
and NMVOC (Statistics Norway 2001c) is estimated to be 40 per cent and in the activity
data 3 per cent.
3.4.2.6 Source-specific QA/QC and verification
Statistics Norway gathers data for the amount of crude oil loaded off and on shore from the
Norwegian Petroleum Directorate. This data is reported monthly by the field operators to the
Norwegian Petroleum Directorate. The activity data are quality controlled by comparing them
with the figures reported in the field operator’s annual report to the Climate and Pollution
Agency and the Norwegian Petroleum Directorate.
Statistics Norway’s calculated emissions for 1990-02 are compared with the emission data
that the field operators report to the Climate and Pollution Agency and the Norwegian
Petroleum Directorate. From 2003 Statistics Norway estimate emission based on activity data
that the filed operators monthly report to the Norwegian Petroleum Directorate and reported
emission factors. When discrepancies are found between the two sets of data they are
investigated and corrections are made if appropriate. If errors are found, the Climate and
Pollution Agency contacts the plant to discuss the reported data and changes are made if
necessary.
3.4.2.7 Recalculations
1 B 2 a iii Oil exploration, production, transport
Revised data. CH4 emissions have been increased by 391 tonnes in 2009 due to a
revised reported figure on loading of oil at one plant on shore
Reallocation/revised data. Parts of CH4 figures 2007-2009 for one plant, previously
registered as combustion emissions, have been reallocated to 1B2aiii. There are also
changes in total CH4 emissions for this plant.
National Inventory Report 2012 - Norway
131
1B 2a v Distribution of oil products
Revised data. Due to revised figures in the sales statistics for petroleum products,
indirect emissions of CO2 from petrol distribution in 2006-2009 have been somewhat
altered. The figures for 2006 and 2007 have increased by 1 tonne, emissions in 2008
have been reduced by 20 tonnes and the figures for 2009 are 199 tonnes higher.
3.4.2.8 Planned improvements
There is for the moment no planned activity that will improve the data quality for NIR 2013.
3.4.3 Fugitive Emissions from Natural Gas – CH4 – 1.B.2.b (Key Category)
3.4.3.1 Description
Sector 1.B.2.b covers fugitive emissions of CH4 and NMVOC and indirect emissions of CO2
from the two gas terminals and emissions from distribution of natural gas. For 1.B.2.b.i
Exploration and ii Production/Processing, see section 3.4.1.
CH4 from natural gas is key category with respect to total trend. Their contribution to total
uncertainty in level and trend is shown in Annex II.
3.4.3.2 Methodological issues
Gas terminals
Fugitive emissions of CH4 and NMVOC from gas terminals are annually reported from the
terminals to the Climate and Pollution Agency.
The emissions are calculated based on the number of sealed and leaky equipment units that is
recorded through the measuring and maintenance program for reducing the leakage. The
number of sealed and leaky equipment units is collected two times a year and the average
number of the counting is used in the calculation. It is assumed in the calculation that a
leakage has lasted the whole year if not the opposite is documented.
Gas distribution
CH4
Emissions of CH4 from three different subgroups of distribution of natural gas are estimated:
High pressure transmission pipelines: Large diameter pipelines that transport gas long
distances from field production and processing areas to distribution systems or large
volume customers such as power plants or chemical plants. Emissions are calculated
by multiplying pipeline distance with an emission factor.
Low pressure distribution pipelines: Distribution pipelines which take the high-
pressure gas from the transmission system at “city gate” stations, reduce the pressure
and distribute the gas through primarily underground mains and service lines to
individual end users. Emissions are calculated by multiplying pipeline distance with
an emission factor.
Storage: Emissions from end users’ storage. Emissions are calculated by multiplying
the amount of gas consumed with an emission factor.
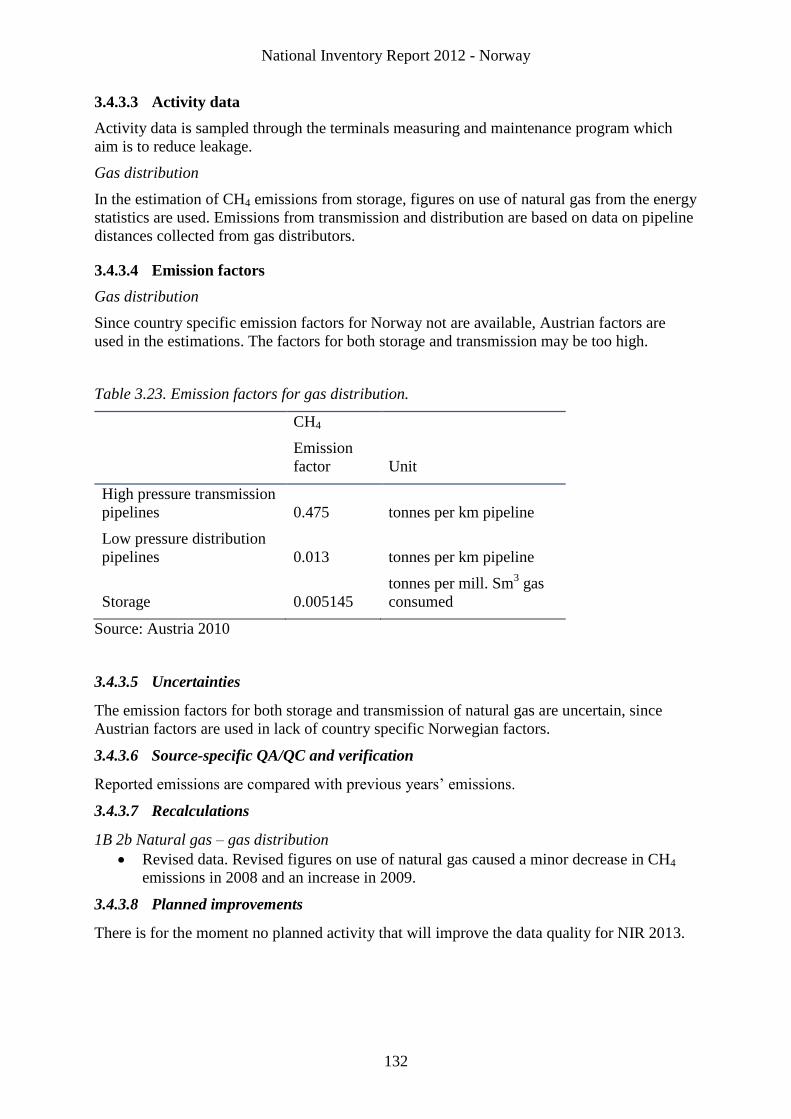
National Inventory Report 2012 - Norway
132
3.4.3.3 Activity data
Activity data is sampled through the terminals measuring and maintenance program which
aim is to reduce leakage.
Gas distribution
In the estimation of CH4 emissions from storage, figures on use of natural gas from the energy
statistics are used. Emissions from transmission and distribution are based on data on pipeline
distances collected from gas distributors.
3.4.3.4 Emission factors
Gas distribution
Since country specific emission factors for Norway not are available, Austrian factors are
used in the estimations. The factors for both storage and transmission may be too high.
Table 3.23. Emission factors for gas distribution.
CH4
Emission
factor Unit
High pressure transmission
pipelines 0.475 tonnes per km pipeline
Low pressure distribution
pipelines 0.013 tonnes per km pipeline
Storage 0.005145
tonnes per mill. Sm3 gas
consumed
Source: Austria 2010
3.4.3.5 Uncertainties
The emission factors for both storage and transmission of natural gas are uncertain, since
Austrian factors are used in lack of country specific Norwegian factors.
3.4.3.6 Source-specific QA/QC and verification
Reported emissions are compared with previous years’ emissions.
3.4.3.7 Recalculations
1B 2b Natural gas – gas distribution
Revised data. Revised figures on use of natural gas caused a minor decrease in CH4
emissions in 2008 and an increase in 2009.
3.4.3.8 Planned improvements
There is for the moment no planned activity that will improve the data quality for NIR 2013.
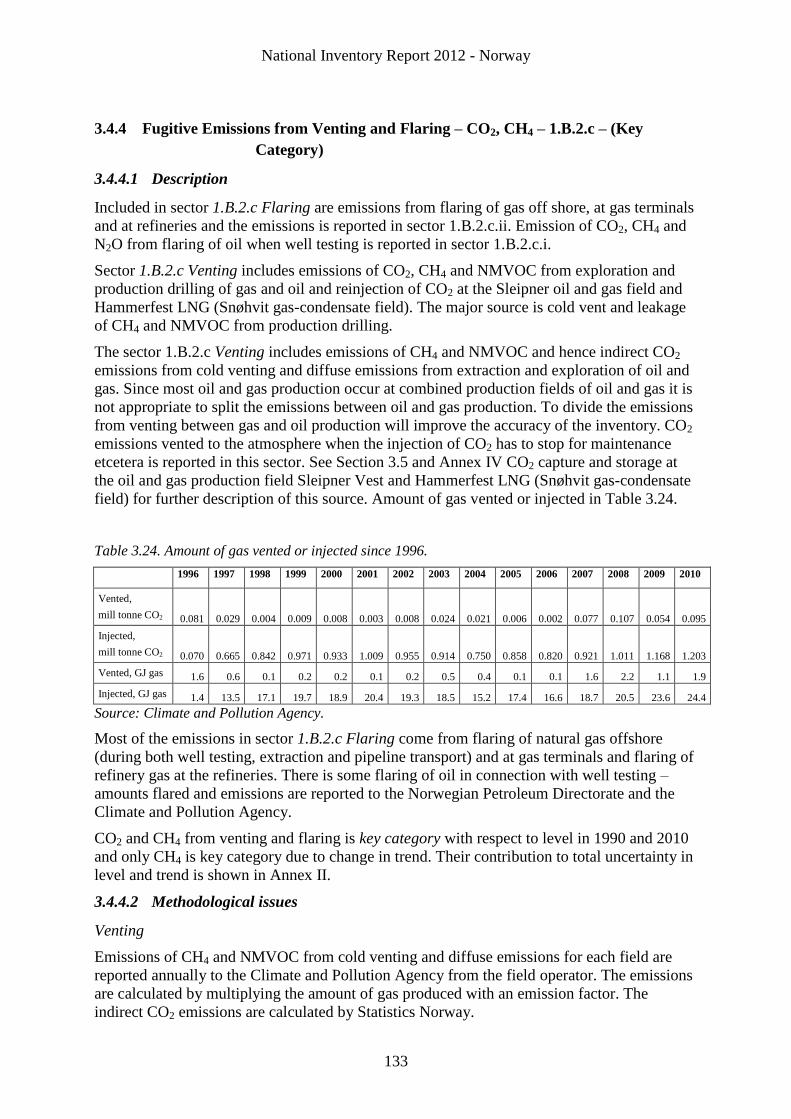
National Inventory Report 2012 - Norway
133
3.4.4 Fugitive Emissions from Venting and Flaring – CO2, CH4 – 1.B.2.c – (Key
Category)
3.4.4.1 Description
Included in sector 1.B.2.c Flaring are emissions from flaring of gas off shore, at gas terminals
and at refineries and the emissions is reported in sector 1.B.2.c.ii. Emission of CO2, CH4 and
N2O from flaring of oil when well testing is reported in sector 1.B.2.c.i.
Sector 1.B.2.c Venting includes emissions of CO2, CH4 and NMVOC from exploration and
production drilling of gas and oil and reinjection of CO2 at the Sleipner oil and gas field and
Hammerfest LNG (Snøhvit gas-condensate field). The major source is cold vent and leakage
of CH4 and NMVOC from production drilling.
The sector 1.B.2.c Venting includes emissions of CH4 and NMVOC and hence indirect CO2
emissions from cold venting and diffuse emissions from extraction and exploration of oil and
gas. Since most oil and gas production occur at combined production fields of oil and gas it is
not appropriate to split the emissions between oil and gas production. To divide the emissions
from venting between gas and oil production will improve the accuracy of the inventory. CO2
emissions vented to the atmosphere when the injection of CO2 has to stop for maintenance
etcetera is reported in this sector. See Section 3.5 and Annex IV CO2 capture and storage at
the oil and gas production field Sleipner Vest and Hammerfest LNG (Snøhvit gas-condensate
field) for further description of this source. Amount of gas vented or injected in Table 3.24.
Table 3.24. Amount of gas vented or injected since 1996.
1996 1997 1998 1999 2000 2001 2002 2003 2004 2005 2006 2007 2008 2009 2010
Vented,
mill tonne CO2 0.081 0.029 0.004 0.009 0.008 0.003 0.008 0.024 0.021 0.006 0.002 0.077 0.107 0.054 0.095
Injected,
mill tonne CO2 0.070 0.665 0.842 0.971 0.933 1.009 0.955 0.914 0.750 0.858 0.820 0.921 1.011 1.168 1.203
Vented, GJ gas 1.6 0.6 0.1 0.2 0.2 0.1 0.2 0.5 0.4 0.1 0.1 1.6 2.2 1.1 1.9
Injected, GJ gas 1.4 13.5 17.1 19.7 18.9 20.4 19.3 18.5 15.2 17.4 16.6 18.7 20.5 23.6 24.4
Source: Climate and Pollution Agency.
Most of the emissions in sector 1.B.2.c Flaring come from flaring of natural gas offshore
(during both well testing, extraction and pipeline transport) and at gas terminals and flaring of
refinery gas at the refineries. There is some flaring of oil in connection with well testing –
amounts flared and emissions are reported to the Norwegian Petroleum Directorate and the
Climate and Pollution Agency.
CO2 and CH4 from venting and flaring is key category with respect to level in 1990 and 2010
and only CH4 is key category due to change in trend. Their contribution to total uncertainty in
level and trend is shown in Annex II.
3.4.4.2 Methodological issues
Venting
Emissions of CH4 and NMVOC from cold venting and diffuse emissions for each field are
reported annually to the Climate and Pollution Agency from the field operator. The emissions
are calculated by multiplying the amount of gas produced with an emission factor. The
indirect CO2 emissions are calculated by Statistics Norway.
National Inventory Report 2012 - Norway
134
The vented CO2 at Sleipner Vest and Hammerfest LNG (Snøhvit gas-condensate field) are
measured.
Flaring
The CO2, CH4 and N2O emissions from flaring of gas off shore is for the period 1990-2002
calculated by Statistics Norway on the basis of field specific gas consumption data and
country specific average emission factor (see Table 3.22). From 2003, emissions of CO2 and
CH4 from flaring offshore reported by the oil companies to the Norwegian Petroleum
Directorate and the Climate and Pollution Agency are used in the inventory. The same method
is used in the calculation of emission from flaring of gas by well testing. We consider that the
method is consistent for all year.
Emissions of CH4 and N2O from flaring of oil is estimated for all years by Statistics Norway
based on the amount of oil well tested reported annually by the field operators and the same
emission factors for the whole period.
Emissions of CO2 from flaring at the four gas terminals that is included in the inventory are
reported from the plant.
The refineries reports annually CO2 emissions from flaring to the Climate and Pollution
Agency. The emissions are calculated by multiplying the amount of gas flared with plant
specific emission factors. See additional information section 3.2.1.2.
3.4.4.3 Activity data
Venting
Amounts of gas produced or handled at the platforms are reported from the Norwegian
Petroleum Directorate and use in the QC of the reported emissions.
Flaring
Amounts of gas flared at offshore oil and gas installations are monthly reported by the
operators to the Norwegian Petroleum Directorate. Amounts flared at the four gas terminals
are reported to the Norwegian Petroleum Directorate and the Climate and Pollution Agency.
Amounts of refinery gas flared are found by distributing the total amounts of refinery gas
between different combustion technologies by using an old distribution key, based on data
collected from the refineries in the early 1990s. This distribution is confirmed in 2003.
3.4.4.4 Emission factors
Venting
The emission factors used in the calculation of vented emissions is the default emission
factors listed in Table 3.21 or field specific factors. Some of the Efs in the table are more
accurate (more decimals) than those given in this table in previous submissions. The reference
for the default factors is Aker Engineering (1992). During the expert review of the NIR 2005
it was a subject whether the Efs we used were default factors or field specific.
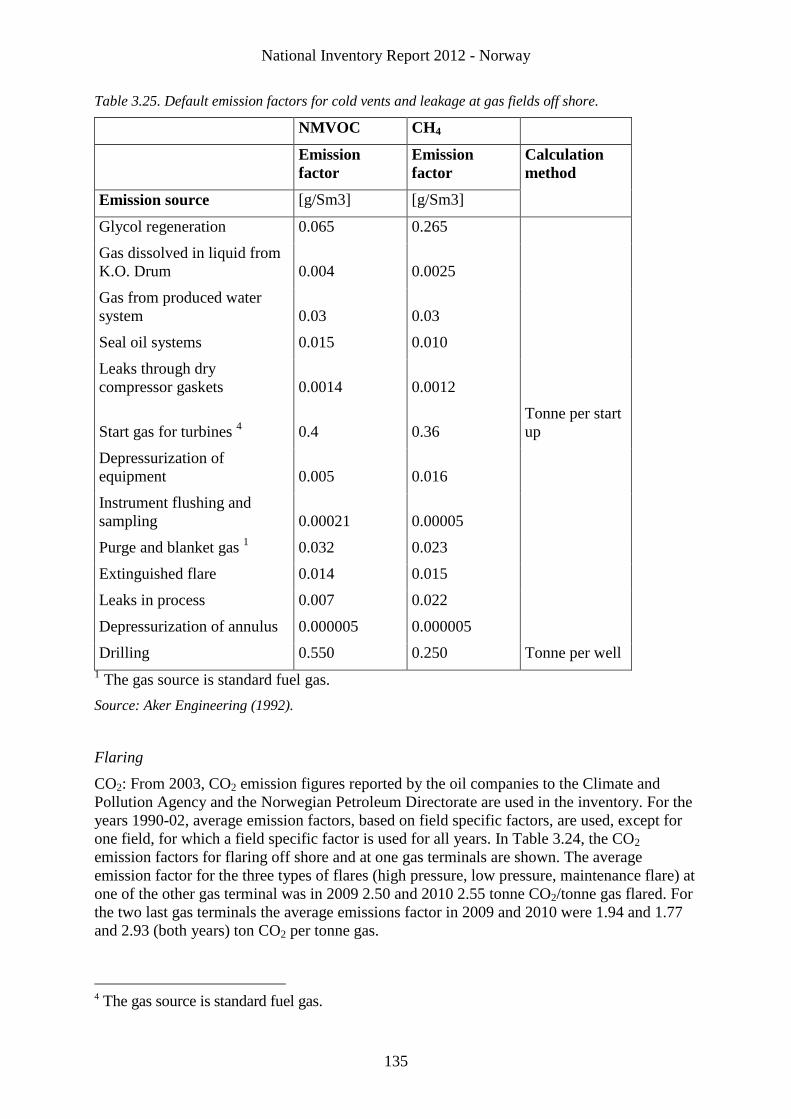
National Inventory Report 2012 - Norway
135
Table 3.25. Default emission factors for cold vents and leakage at gas fields off shore.
NMVOC CH4
Emission
factor
Emission
factor
Calculation
method
Emission source [g/Sm3] [g/Sm3]
Glycol regeneration 0.065 0.265
Gas dissolved in liquid from
K.O. Drum 0.004 0.0025
Gas from produced water
system 0.03 0.03
Seal oil systems 0.015 0.010
Leaks through dry
compressor gaskets 0.0014 0.0012
Start gas for turbines 4 0.4 0.36
Tonne per start
up
Depressurization of
equipment 0.005 0.016
Instrument flushing and
sampling 0.00021 0.00005
Purge and blanket gas 1 0.032 0.023
Extinguished flare 0.014 0.015
Leaks in process 0.007 0.022
Depressurization of annulus 0.000005 0.000005
Drilling 0.550 0.250 Tonne per well
1 The gas source is standard fuel gas.
Source: Aker Engineering (1992).
Flaring
CO2: From 2003, CO2 emission figures reported by the oil companies to the Climate and
Pollution Agency and the Norwegian Petroleum Directorate are used in the inventory. For the
years 1990-02, average emission factors, based on field specific factors, are used, except for
one field, for which a field specific factor is used for all years. In Table 3.24, the CO2
emission factors for flaring off shore and at one gas terminals are shown. The average
emission factor for the three types of flares (high pressure, low pressure, maintenance flare) at
one of the other gas terminal was in 2009 2.50 and 2010 2.55 tonne CO2/tonne gas flared. For
the two last gas terminals the average emissions factor in 2009 and 2010 were 1.94 and 1.77
and 2.93 (both years) ton CO2 per tonne gas.
4 The gas source is standard fuel gas.
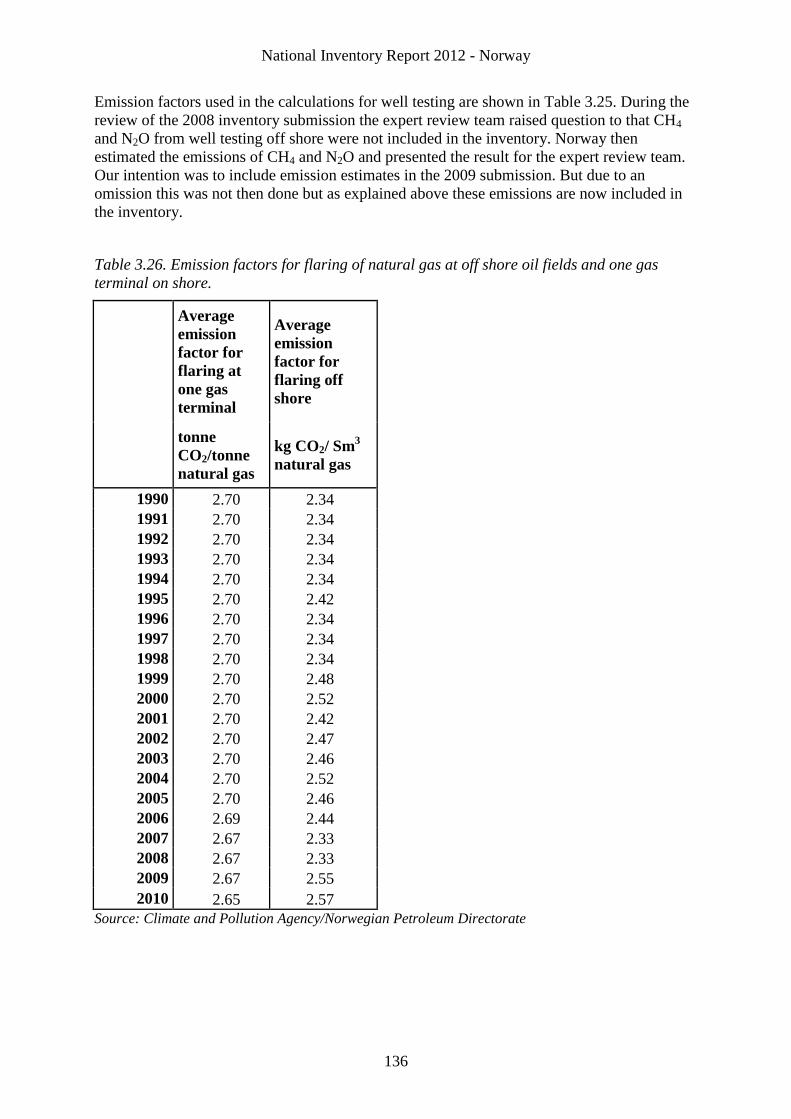
National Inventory Report 2012 - Norway
136
Emission factors used in the calculations for well testing are shown in Table 3.25. During the
review of the 2008 inventory submission the expert review team raised question to that CH4
and N2O from well testing off shore were not included in the inventory. Norway then
estimated the emissions of CH4 and N2O and presented the result for the expert review team.
Our intention was to include emission estimates in the 2009 submission. But due to an
omission this was not then done but as explained above these emissions are now included in
the inventory.
Table 3.26. Emission factors for flaring of natural gas at off shore oil fields and one gas
terminal on shore.
Average
emission
factor for
flaring at
one gas
terminal
Average
emission
factor for
flaring off
shore
tonne
CO2/tonne
natural gas
kg CO2/ Sm3
natural gas
1990 2.70 2.34
1991 2.70 2.34
1992 2.70 2.34
1993 2.70 2.34
1994 2.70 2.34
1995 2.70 2.42
1996 2.70 2.34
1997 2.70 2.34
1998 2.70 2.34
1999 2.70 2.48
2000 2.70 2.52
2001 2.70 2.42
2002 2.70 2.47
2003 2.70 2.46
2004 2.70 2.52
2005 2.70 2.46
2006 2.69 2.44
2007 2.67 2.33
2008 2.67 2.33
2009 2.67 2.55
2010 2.65 2.57
Source: Climate and Pollution Agency/Norwegian Petroleum Directorate
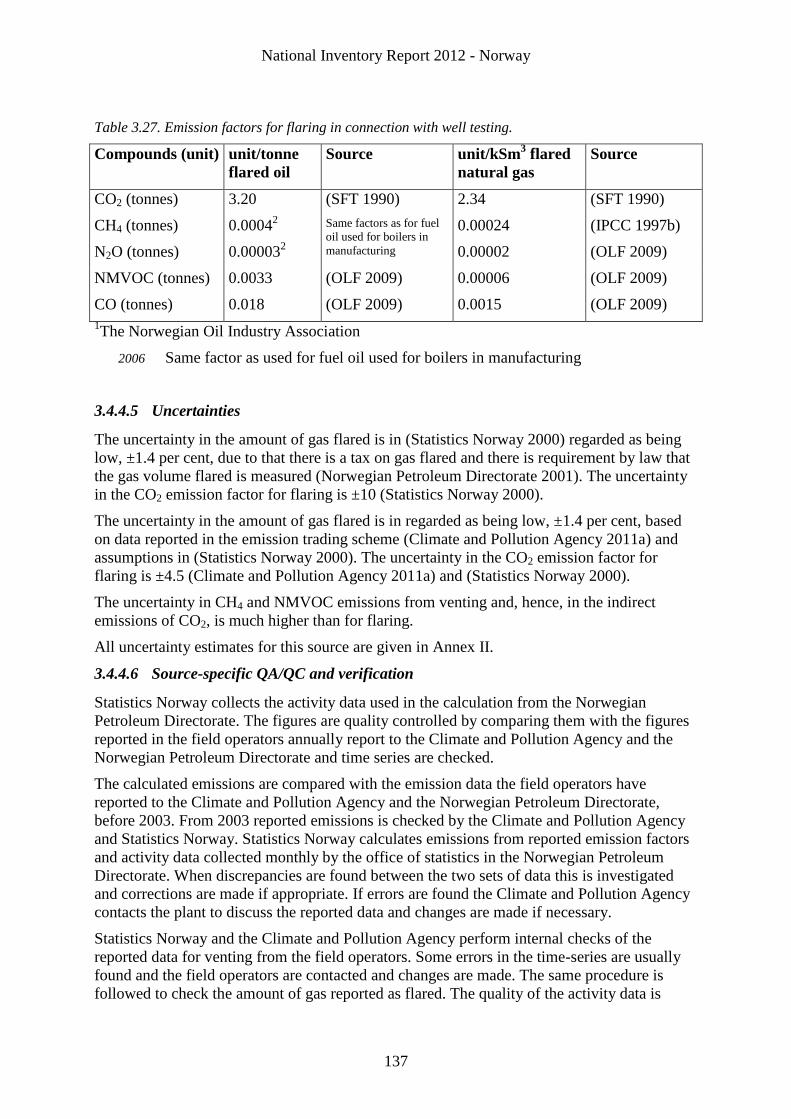
National Inventory Report 2012 - Norway
137
Table 3.27. Emission factors for flaring in connection with well testing.
Compounds (unit) unit/tonne
flared oil
Source unit/kSm3 flared
natural gas
Source
CO2 (tonnes) 3.20 (SFT 1990) 2.34 (SFT 1990)
CH4 (tonnes) 0.00042 Same factors as for fuel
oil used for boilers in
manufacturing
0.00024 (IPCC 1997b)
N2O (tonnes) 0.000032 0.00002 (OLF 2009)
NMVOC (tonnes) 0.0033 (OLF 2009) 0.00006 (OLF 2009)
CO (tonnes) 0.018 (OLF 2009) 0.0015 (OLF 2009)
1The Norwegian Oil Industry Association
2006 Same factor as used for fuel oil used for boilers in manufacturing
3.4.4.5 Uncertainties
The uncertainty in the amount of gas flared is in (Statistics Norway 2000) regarded as being
low, ±1.4 per cent, due to that there is a tax on gas flared and there is requirement by law that
the gas volume flared is measured (Norwegian Petroleum Directorate 2001). The uncertainty
in the CO2 emission factor for flaring is ±10 (Statistics Norway 2000).
The uncertainty in the amount of gas flared is in regarded as being low, ±1.4 per cent, based
on data reported in the emission trading scheme (Climate and Pollution Agency 2011a) and
assumptions in (Statistics Norway 2000). The uncertainty in the CO2 emission factor for
flaring is ±4.5 (Climate and Pollution Agency 2011a) and (Statistics Norway 2000).
The uncertainty in CH4 and NMVOC emissions from venting and, hence, in the indirect
emissions of CO2, is much higher than for flaring.
All uncertainty estimates for this source are given in Annex II.
3.4.4.6 Source-specific QA/QC and verification
Statistics Norway collects the activity data used in the calculation from the Norwegian
Petroleum Directorate. The figures are quality controlled by comparing them with the figures
reported in the field operators annually report to the Climate and Pollution Agency and the
Norwegian Petroleum Directorate and time series are checked.
The calculated emissions are compared with the emission data the field operators have
reported to the Climate and Pollution Agency and the Norwegian Petroleum Directorate,
before 2003. From 2003 reported emissions is checked by the Climate and Pollution Agency
and Statistics Norway. Statistics Norway calculates emissions from reported emission factors
and activity data collected monthly by the office of statistics in the Norwegian Petroleum
Directorate. When discrepancies are found between the two sets of data this is investigated
and corrections are made if appropriate. If errors are found the Climate and Pollution Agency
contacts the plant to discuss the reported data and changes are made if necessary.
Statistics Norway and the Climate and Pollution Agency perform internal checks of the
reported data for venting from the field operators. Some errors in the time-series are usually
found and the field operators are contacted and changes are made. The same procedure is
followed to check the amount of gas reported as flared. The quality of the activity data is
National Inventory Report 2012 - Norway
138
considered to be high due to that there is a tax on gas flared off shore. The Norwegian
Petroleum Directorate has a thorough control of the amount of gas reported as flared.
3.4.4.7 Recalculations
1B 2c1iii Venting combined
Revised data. New reported figures for two oil and gas extraction fields have increased
the CH4 emissions in 2009 by 444 tonnes. Indirect CO2 emissions from CH4 and
NMVOC have increased by 4478 tonnes
New data. CO2 emissions in 2007 have risen by 70 500 tonnes, due to the inclusion of
a previously not registered figure for one plant
Reallocation. A part of the previously registered CO2 figure for one plant has been
reallocated to combustion.
1B 2c2ii Flaring of gas
Reallocation. As mentioned above in 1A 1b the same key for distribution between
flaring and energy utilisation of refinery gas previously has been used for all years in
the whole period 1990-2009. Now plant and year specific figures have been used
instead. This causes a reallocation of emissions between 1A1b and 1B2c, but there is
no change in total emissions. The reallocation causes lower emissions for 1B2c in
1991, 1995 and 2003-2009, whereas the emissions have been increased in 1990, 1992-
1994, and 1996-2002. Emissions of CO2, CH4 and N2O are affected by the change
Correction of error. The removal of a previous double counting for CO2 and CH4 in
2008 and 2009 has, in addition to the reallocation mentioned above, caused a further
reduction in CO2 and CH4 emissions for these years
Reallocation/revised data. Parts of the CH4 figures 2007-2009 for one plant,
previously registered as emissions from flaring, have been reallocated to process.
There are also changes in total CH4 figures for this plant.
3.4.4.8 Planned improvements
There is for the moment no planned activity that will improve the data quality for NIR 2013.
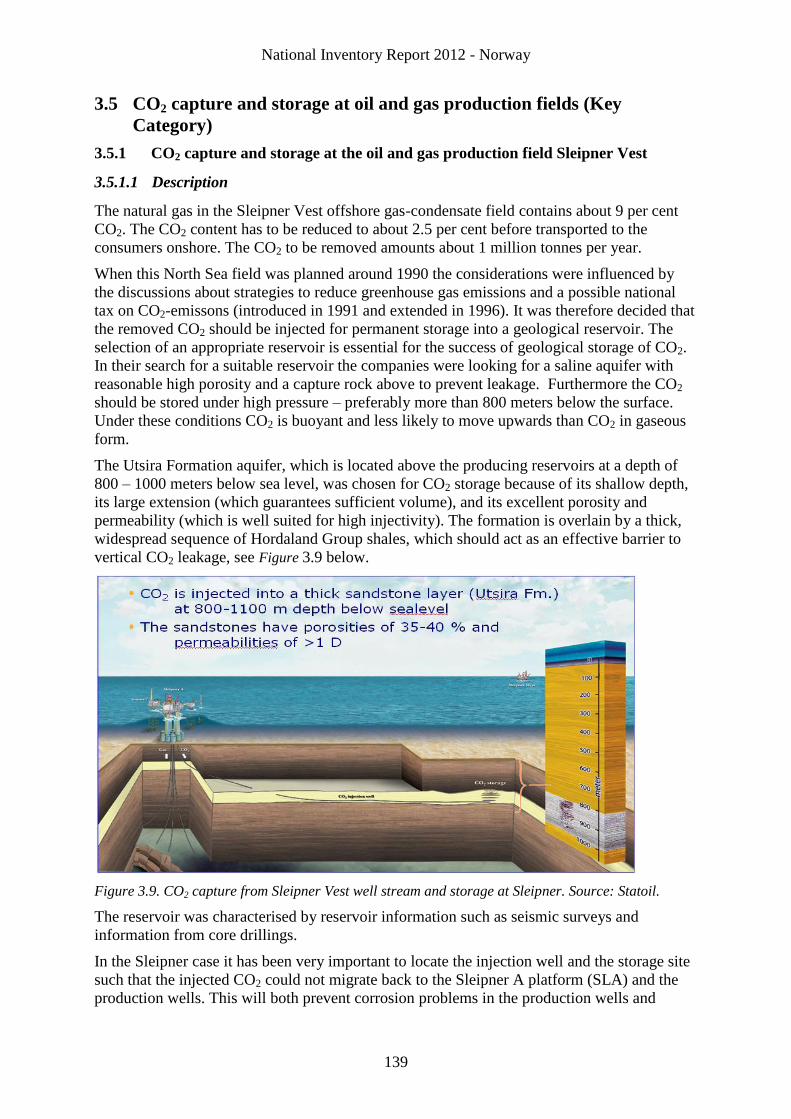
National Inventory Report 2012 - Norway
139
3.5 CO2 capture and storage at oil and gas production fields (Key
Category)
3.5.1 CO2 capture and storage at the oil and gas production field Sleipner Vest
3.5.1.1 Description
The natural gas in the Sleipner Vest offshore gas-condensate field contains about 9 per cent
CO2. The CO2 content has to be reduced to about 2.5 per cent before transported to the
consumers onshore. The CO2 to be removed amounts about 1 million tonnes per year.
When this North Sea field was planned around 1990 the considerations were influenced by
the discussions about strategies to reduce greenhouse gas emissions and a possible national
tax on CO2-emissons (introduced in 1991 and extended in 1996). It was therefore decided that
the removed CO2 should be injected for permanent storage into a geological reservoir. The
selection of an appropriate reservoir is essential for the success of geological storage of CO2.
In their search for a suitable reservoir the companies were looking for a saline aquifer with
reasonable high porosity and a capture rock above to prevent leakage. Furthermore the CO2
should be stored under high pressure – preferably more than 800 meters below the surface.
Under these conditions CO2 is buoyant and less likely to move upwards than CO2 in gaseous
form.
The Utsira Formation aquifer, which is located above the producing reservoirs at a depth of
800 – 1000 meters below sea level, was chosen for CO2 storage because of its shallow depth,
its large extension (which guarantees sufficient volume), and its excellent porosity and
permeability (which is well suited for high injectivity). The formation is overlain by a thick,
widespread sequence of Hordaland Group shales, which should act as an effective barrier to
vertical CO2 leakage, see Figure 3.9 below.
Figure 3.9. CO2 capture from Sleipner Vest well stream and storage at Sleipner. Source: Statoil.
The reservoir was characterised by reservoir information such as seismic surveys and
information from core drillings.
In the Sleipner case it has been very important to locate the injection well and the storage site
such that the injected CO2 could not migrate back to the Sleipner A platform (SLA) and the
production wells. This will both prevent corrosion problems in the production wells and
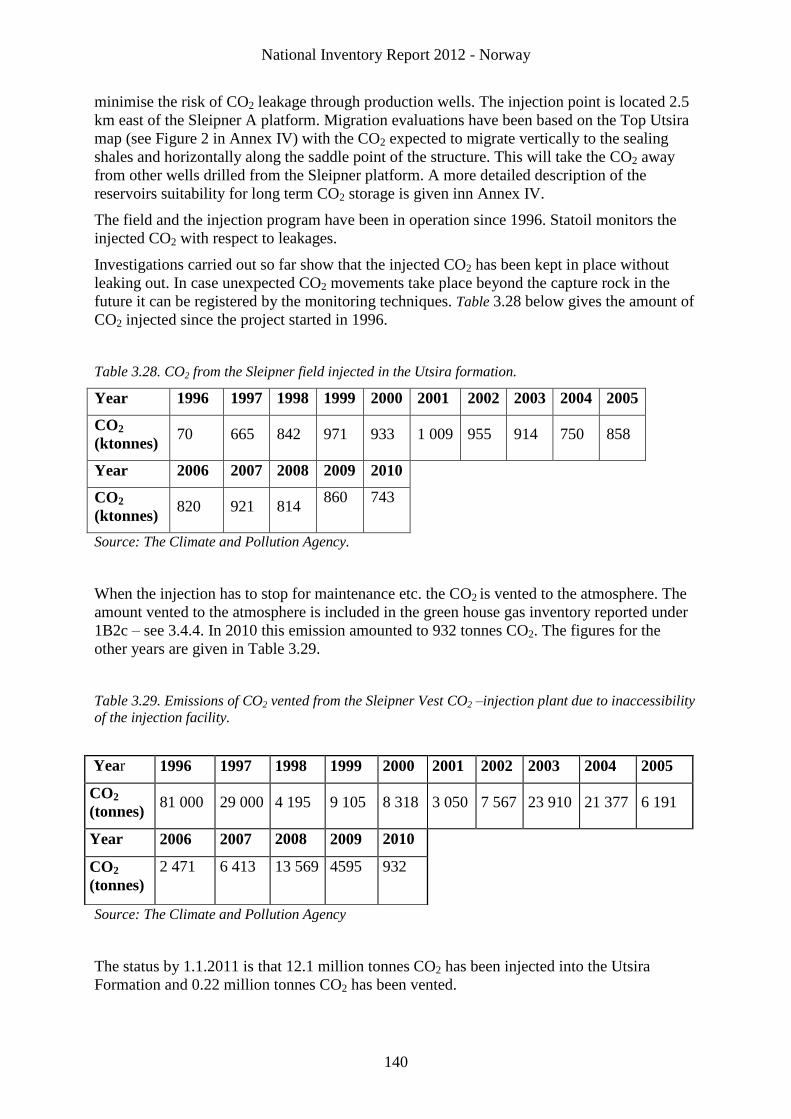
National Inventory Report 2012 - Norway
140
minimise the risk of CO2 leakage through production wells. The injection point is located 2.5
km east of the Sleipner A platform. Migration evaluations have been based on the Top Utsira
map (see Figure 2 in Annex IV) with the CO2 expected to migrate vertically to the sealing
shales and horizontally along the saddle point of the structure. This will take the CO2 away
from other wells drilled from the Sleipner platform. A more detailed description of the
reservoirs suitability for long term CO2 storage is given inn Annex IV.
The field and the injection program have been in operation since 1996. Statoil monitors the
injected CO2 with respect to leakages.
Investigations carried out so far show that the injected CO2 has been kept in place without
leaking out. In case unexpected CO2 movements take place beyond the capture rock in the
future it can be registered by the monitoring techniques. Table 3.28 below gives the amount of
CO2 injected since the project started in 1996.
Table 3.28. CO2 from the Sleipner field injected in the Utsira formation.
Year 1996 1997 1998 1999 2000 2001 2002 2003 2004 2005
CO2
(ktonnes) 70 665 842 971 933 1 009 955 914 750 858
Year 2006 2007 2008 2009 2010
CO2
(ktonnes) 820 921 814
860 743
Source: The Climate and Pollution Agency.
When the injection has to stop for maintenance etc. the CO2 is vented to the atmosphere. The
amount vented to the atmosphere is included in the green house gas inventory reported under
1B2c – see 3.4.4. In 2010 this emission amounted to 932 tonnes CO2. The figures for the
other years are given in Table 3.29.
Table 3.29. Emissions of CO2 vented from the Sleipner Vest CO2 –injection plant due to inaccessibility
of the injection facility.
Source: The Climate and Pollution Agency
The status by 1.1.2011 is that 12.1 million tonnes CO2 has been injected into the Utsira
Formation and 0.22 million tonnes CO2 has been vented.
Year 1996 1997 1998 1999 2000 2001 2002 2003 2004 2005
CO2
(tonnes) 81 000 29 000 4 195 9 105 8 318 3 050 7 567 23 910 21 377 6 191
Year 2006 2007 2008 2009 2010
CO2
(tonnes)
2 471 6 413 13 569 4595 932
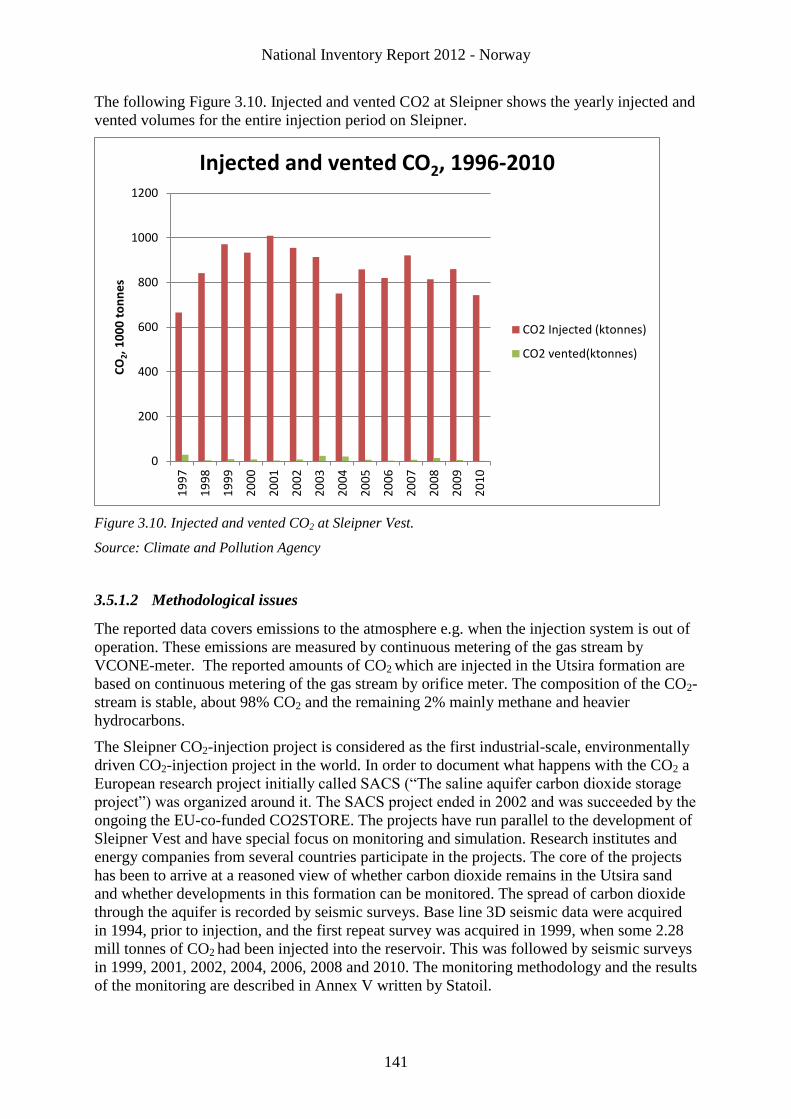
National Inventory Report 2012 - Norway
141
The following Figure 3.10. Injected and vented CO2 at Sleipner shows the yearly injected and
vented volumes for the entire injection period on Sleipner.
Figure 3.10. Injected and vented CO2 at Sleipner Vest.
Source: Climate and Pollution Agency
3.5.1.2 Methodological issues
The reported data covers emissions to the atmosphere e.g. when the injection system is out of
operation. These emissions are measured by continuous metering of the gas stream by
VCONE-meter. The reported amounts of CO2 which are injected in the Utsira formation are
based on continuous metering of the gas stream by orifice meter. The composition of the CO2-
stream is stable, about 98% CO2 and the remaining 2% mainly methane and heavier
hydrocarbons.
The Sleipner CO2-injection project is considered as the first industrial-scale, environmentally
driven CO2-injection project in the world. In order to document what happens with the CO2 a
European research project initially called SACS (“The saline aquifer carbon dioxide storage
project”) was organized around it. The SACS project ended in 2002 and was succeeded by the
ongoing the EU-co-funded CO2STORE. The projects have run parallel to the development of
Sleipner Vest and have special focus on monitoring and simulation. Research institutes and
energy companies from several countries participate in the projects. The core of the projects
has been to arrive at a reasoned view of whether carbon dioxide remains in the Utsira sand
and whether developments in this formation can be monitored. The spread of carbon dioxide
through the aquifer is recorded by seismic surveys. Base line 3D seismic data were acquired
in 1994, prior to injection, and the first repeat survey was acquired in 1999, when some 2.28
mill tonnes of CO2 had been injected into the reservoir. This was followed by seismic surveys
in 1999, 2001, 2002, 2004, 2006, 2008 and 2010. The monitoring methodology and the results
of the monitoring are described in Annex V written by Statoil.
0
200
400
600
800
1000
12001
99
7
19
98
19
99
20
00
20
01
20
02
20
03
20
04
20
05
20
06
20
07
20
08
20
09
20
10
CO
2, 1
00
0 t
on
ne
s
Injected and vented CO2, 1996-2010
CO2 Injected (ktonnes)
CO2 vented(ktonnes)
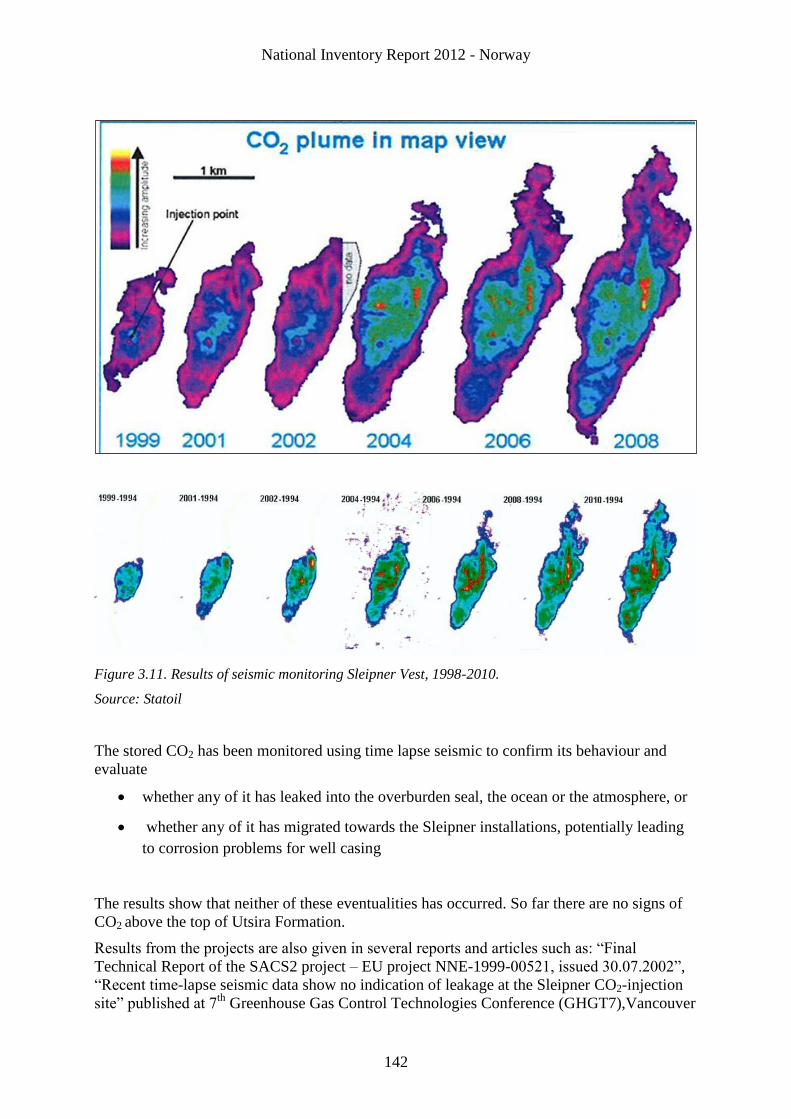
National Inventory Report 2012 - Norway
142
Figure 3.11. Results of seismic monitoring Sleipner Vest, 1998-2010.
Source: Statoil
The stored CO2 has been monitored using time lapse seismic to confirm its behaviour and
evaluate
whether any of it has leaked into the overburden seal, the ocean or the atmosphere, or
whether any of it has migrated towards the Sleipner installations, potentially leading
to corrosion problems for well casing
The results show that neither of these eventualities has occurred. So far there are no signs of
CO2 above the top of Utsira Formation.
Results from the projects are also given in several reports and articles such as: “Final
Technical Report of the SACS2 project – EU project NNE-1999-00521, issued 30.07.2002”,
“Recent time-lapse seismic data show no indication of leakage at the Sleipner CO2-injection
site” published at 7th
Greenhouse Gas Control Technologies Conference (GHGT7),Vancouver
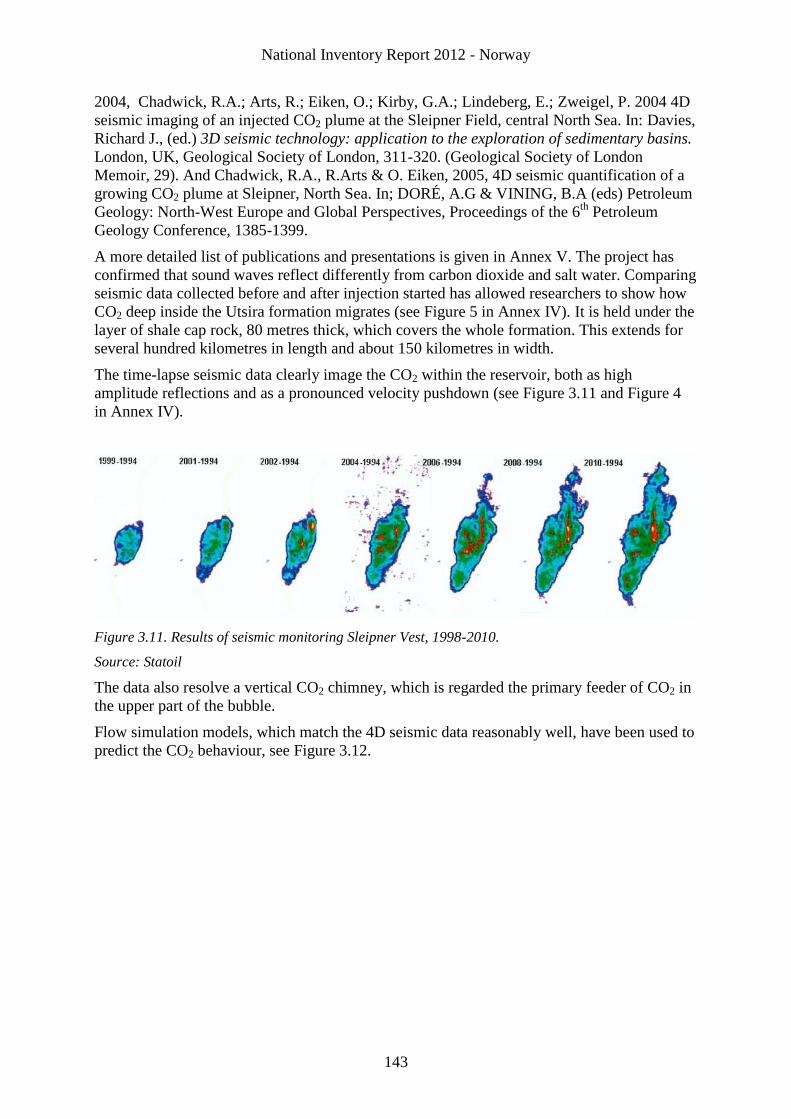
National Inventory Report 2012 - Norway
143
2004, Chadwick, R.A.; Arts, R.; Eiken, O.; Kirby, G.A.; Lindeberg, E.; Zweigel, P. 2004 4D
seismic imaging of an injected CO2 plume at the Sleipner Field, central North Sea. In: Davies,
Richard J., (ed.) 3D seismic technology: application to the exploration of sedimentary basins.
London, UK, Geological Society of London, 311-320. (Geological Society of London
Memoir, 29). And Chadwick, R.A., R.Arts & O. Eiken, 2005, 4D seismic quantification of a
growing CO2 plume at Sleipner, North Sea. In; DORÉ, A.G & VINING, B.A (eds) Petroleum
Geology: North-West Europe and Global Perspectives, Proceedings of the 6th
Petroleum
Geology Conference, 1385-1399.
A more detailed list of publications and presentations is given in Annex V. The project has
confirmed that sound waves reflect differently from carbon dioxide and salt water. Comparing
seismic data collected before and after injection started has allowed researchers to show how
CO2 deep inside the Utsira formation migrates (see Figure 5 in Annex IV). It is held under the
layer of shale cap rock, 80 metres thick, which covers the whole formation. This extends for
several hundred kilometres in length and about 150 kilometres in width.
The time-lapse seismic data clearly image the CO2 within the reservoir, both as high
amplitude reflections and as a pronounced velocity pushdown (see Figure 3.11 and Figure 4
in Annex IV).
Figure 3.11. Results of seismic monitoring Sleipner Vest, 1998-2010.
Source: Statoil
The data also resolve a vertical CO2 chimney, which is regarded the primary feeder of CO2 in
the upper part of the bubble.
Flow simulation models, which match the 4D seismic data reasonably well, have been used to
predict the CO2 behaviour, see Figure 3.12.
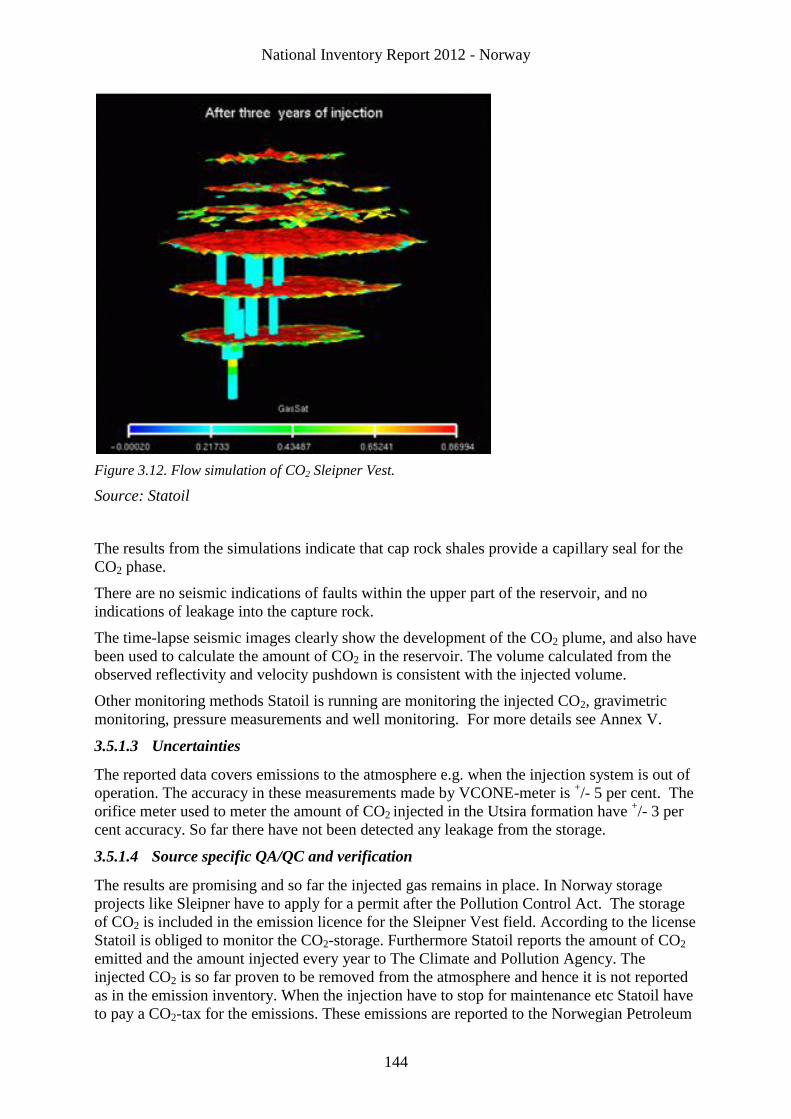
National Inventory Report 2012 - Norway
144
Figure 3.12. Flow simulation of CO2 Sleipner Vest.
Source: Statoil
The results from the simulations indicate that cap rock shales provide a capillary seal for the
CO2 phase.
There are no seismic indications of faults within the upper part of the reservoir, and no
indications of leakage into the capture rock.
The time-lapse seismic images clearly show the development of the CO2 plume, and also have
been used to calculate the amount of CO2 in the reservoir. The volume calculated from the
observed reflectivity and velocity pushdown is consistent with the injected volume.
Other monitoring methods Statoil is running are monitoring the injected CO2, gravimetric
monitoring, pressure measurements and well monitoring. For more details see Annex V.
3.5.1.3 Uncertainties
The reported data covers emissions to the atmosphere e.g. when the injection system is out of
operation. The accuracy in these measurements made by VCONE-meter is +/- 5 per cent. The
orifice meter used to meter the amount of CO2 injected in the Utsira formation have +/- 3 per
cent accuracy. So far there have not been detected any leakage from the storage.
3.5.1.4 Source specific QA/QC and verification
The results are promising and so far the injected gas remains in place. In Norway storage
projects like Sleipner have to apply for a permit after the Pollution Control Act. The storage
of CO2 is included in the emission licence for the Sleipner Vest field. According to the license
Statoil is obliged to monitor the CO2-storage. Furthermore Statoil reports the amount of CO2
emitted and the amount injected every year to The Climate and Pollution Agency. The
injected CO2 is so far proven to be removed from the atmosphere and hence it is not reported
as in the emission inventory. When the injection have to stop for maintenance etc Statoil have
to pay a CO2-tax for the emissions. These emissions are reported to the Norwegian Petroleum

National Inventory Report 2012 - Norway
145
directorate. In this national emissions inventory this amount of CO2 vented is reported under
1B2c.
3.5.1.5 Planned improvements
No specific planned improvements.
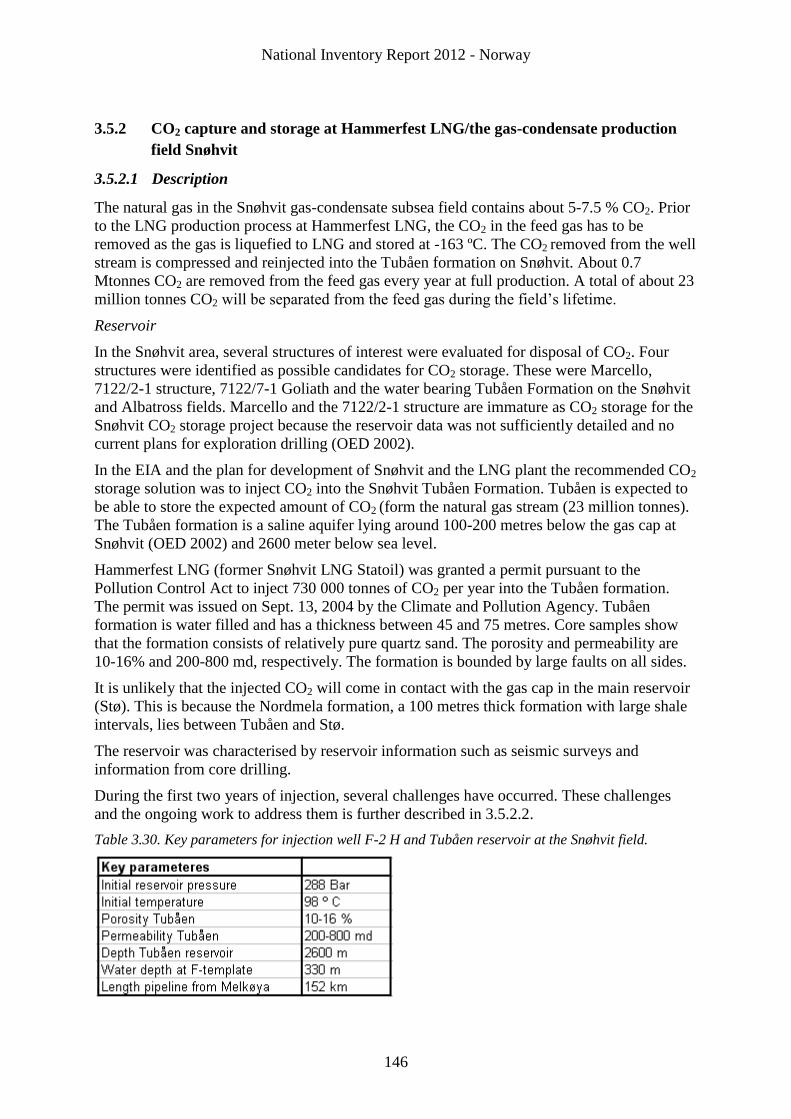
National Inventory Report 2012 - Norway
146
3.5.2 CO2 capture and storage at Hammerfest LNG/the gas-condensate production
field Snøhvit
3.5.2.1 Description
The natural gas in the Snøhvit gas-condensate subsea field contains about 5-7.5 % CO2. Prior
to the LNG production process at Hammerfest LNG, the CO2 in the feed gas has to be
removed as the gas is liquefied to LNG and stored at -163 ºC. The CO2 removed from the well
stream is compressed and reinjected into the Tubåen formation on Snøhvit. About 0.7
Mtonnes CO2 are removed from the feed gas every year at full production. A total of about 23
million tonnes CO2 will be separated from the feed gas during the field’s lifetime.
Reservoir
In the Snøhvit area, several structures of interest were evaluated for disposal of CO2. Four
structures were identified as possible candidates for CO2 storage. These were Marcello,
7122/2-1 structure, 7122/7-1 Goliath and the water bearing Tubåen Formation on the Snøhvit
and Albatross fields. Marcello and the 7122/2-1 structure are immature as CO2 storage for the
Snøhvit CO2 storage project because the reservoir data was not sufficiently detailed and no
current plans for exploration drilling (OED 2002).
In the EIA and the plan for development of Snøhvit and the LNG plant the recommended CO2
storage solution was to inject CO2 into the Snøhvit Tubåen Formation. Tubåen is expected to
be able to store the expected amount of CO2 (form the natural gas stream (23 million tonnes).
The Tubåen formation is a saline aquifer lying around 100-200 metres below the gas cap at
Snøhvit (OED 2002) and 2600 meter below sea level.
Hammerfest LNG (former Snøhvit LNG Statoil) was granted a permit pursuant to the
Pollution Control Act to inject 730 000 tonnes of CO2 per year into the Tubåen formation.
The permit was issued on Sept. 13, 2004 by the Climate and Pollution Agency. Tubåen
formation is water filled and has a thickness between 45 and 75 metres. Core samples show
that the formation consists of relatively pure quartz sand. The porosity and permeability are
10-16% and 200-800 md, respectively. The formation is bounded by large faults on all sides.
It is unlikely that the injected CO2 will come in contact with the gas cap in the main reservoir
(Stø). This is because the Nordmela formation, a 100 metres thick formation with large shale
intervals, lies between Tubåen and Stø.
The reservoir was characterised by reservoir information such as seismic surveys and
information from core drilling.
During the first two years of injection, several challenges have occurred. These challenges
and the ongoing work to address them is further described in 3.5.2.2.
Table 3.30. Key parameters for injection well F-2 H and Tubåen reservoir at the Snøhvit field.
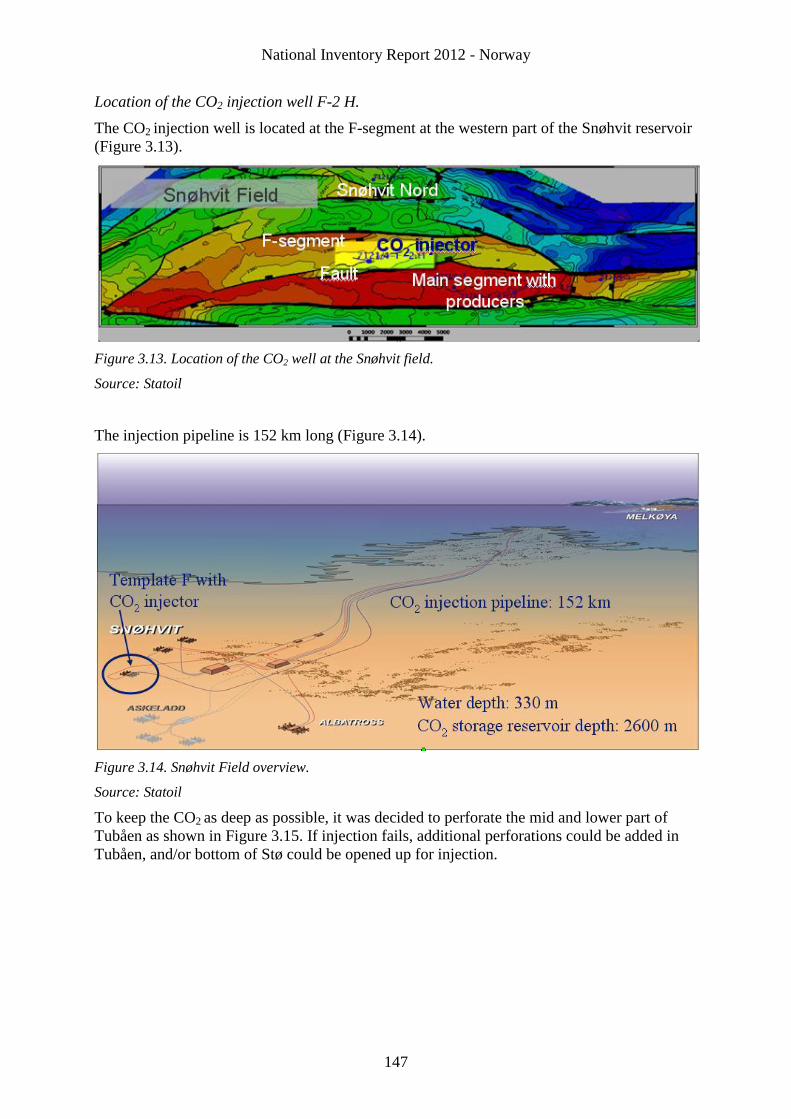
National Inventory Report 2012 - Norway
147
Location of the CO2 injection well F-2 H.
The CO2 injection well is located at the F-segment at the western part of the Snøhvit reservoir
(Figure 3.13).
Figure 3.13. Location of the CO2 well at the Snøhvit field.
Source: Statoil
The injection pipeline is 152 km long (Figure 3.14).
Figure 3.14. Snøhvit Field overview.
Source: Statoil
To keep the CO2 as deep as possible, it was decided to perforate the mid and lower part of
Tubåen as shown in Figure 3.15. If injection fails, additional perforations could be added in
Tubåen, and/or bottom of Stø could be opened up for injection.
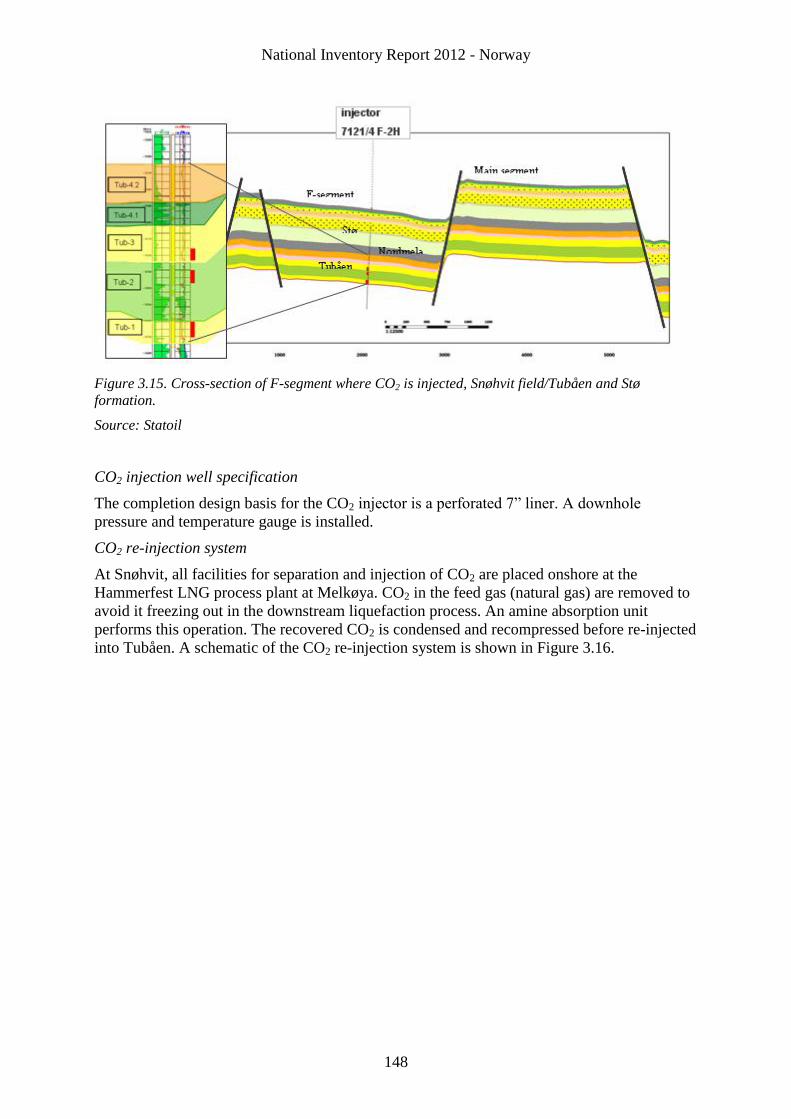
National Inventory Report 2012 - Norway
148
Figure 3.15. Cross-section of F-segment where CO2 is injected, Snøhvit field/Tubåen and Stø
formation.
Source: Statoil
CO2 injection well specification
The completion design basis for the CO2 injector is a perforated 7” liner. A downhole
pressure and temperature gauge is installed.
CO2 re-injection system
At Snøhvit, all facilities for separation and injection of CO2 are placed onshore at the
Hammerfest LNG process plant at Melkøya. CO2 in the feed gas (natural gas) are removed to
avoid it freezing out in the downstream liquefaction process. An amine absorption unit
performs this operation. The recovered CO2 is condensed and recompressed before re-injected
into Tubåen. A schematic of the CO2 re-injection system is shown in Figure 3.16.
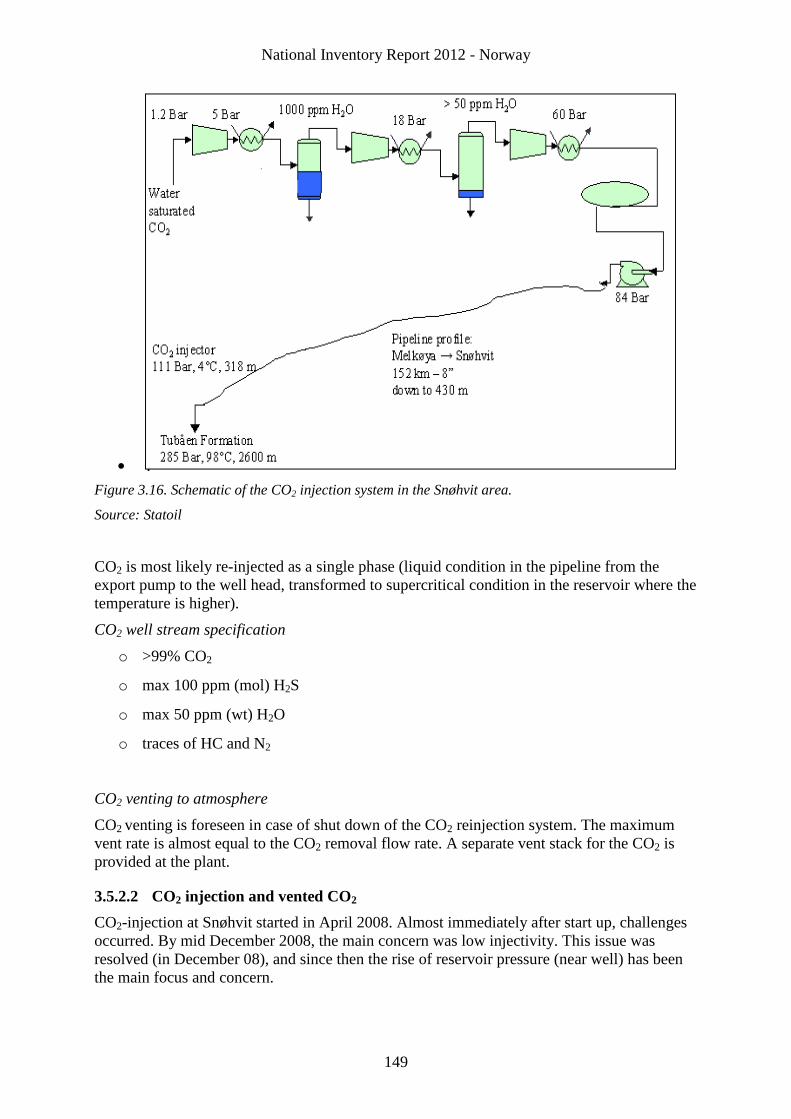
National Inventory Report 2012 - Norway
149
Figure 3.16. Schematic of the CO2 injection system in the Snøhvit area.
Source: Statoil
CO2 is most likely re-injected as a single phase (liquid condition in the pipeline from the
export pump to the well head, transformed to supercritical condition in the reservoir where the
temperature is higher).
CO2 well stream specification
o >99% CO2
o max 100 ppm (mol) H2S
o max 50 ppm (wt) H2O
o traces of HC and N2
CO2 venting to atmosphere
CO2 venting is foreseen in case of shut down of the CO2 reinjection system. The maximum
vent rate is almost equal to the CO2 removal flow rate. A separate vent stack for the CO2 is
provided at the plant.
3.5.2.2 CO2 injection and vented CO2
CO2-injection at Snøhvit started in April 2008. Almost immediately after start up, challenges
occurred. By mid December 2008, the main concern was low injectivity. This issue was
resolved (in December 08), and since then the rise of reservoir pressure (near well) has been
the main focus and concern.
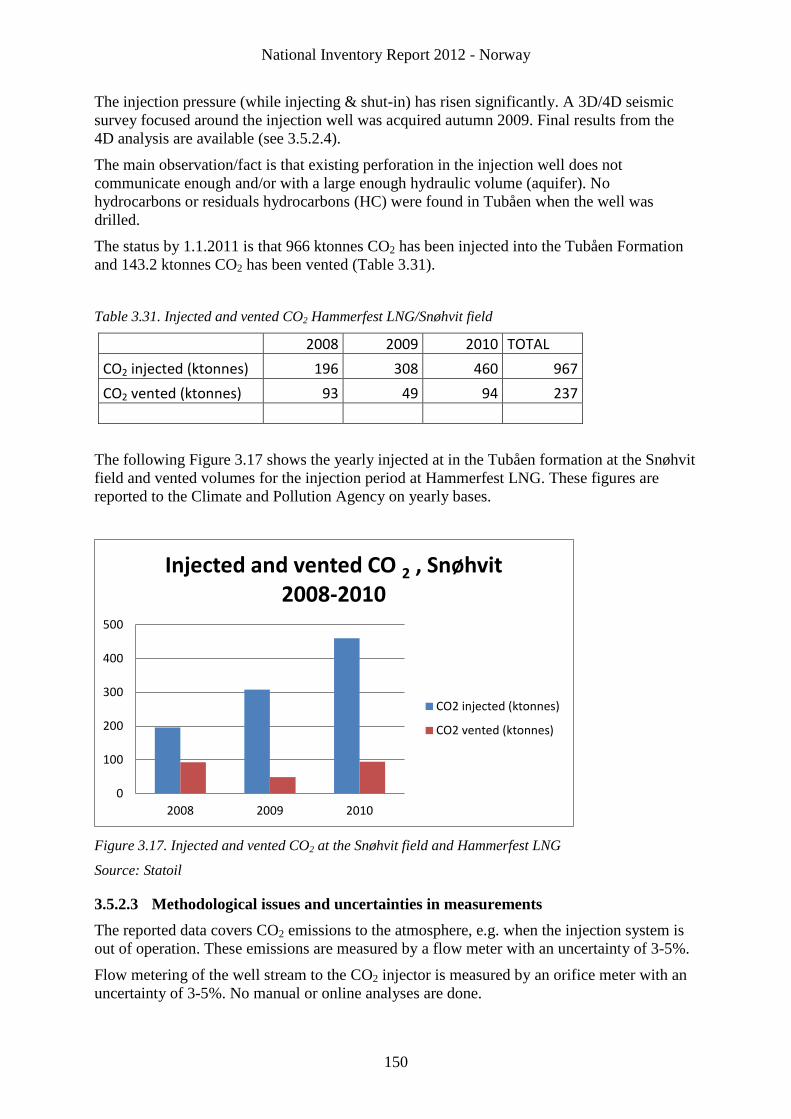
National Inventory Report 2012 - Norway
150
The injection pressure (while injecting & shut-in) has risen significantly. A 3D/4D seismic
survey focused around the injection well was acquired autumn 2009. Final results from the
4D analysis are available (see 3.5.2.4).
The main observation/fact is that existing perforation in the injection well does not
communicate enough and/or with a large enough hydraulic volume (aquifer). No
hydrocarbons or residuals hydrocarbons (HC) were found in Tubåen when the well was
drilled.
The status by 1.1.2011 is that 966 ktonnes CO2 has been injected into the Tubåen Formation
and 143.2 ktonnes CO2 has been vented (Table 3.31).
Table 3.31. Injected and vented CO2 Hammerfest LNG/Snøhvit field
2008 2009 2010 TOTAL
CO2 injected (ktonnes) 196 308 460 967
CO2 vented (ktonnes) 93 49 94 237
The following Figure 3.17 shows the yearly injected at in the Tubåen formation at the Snøhvit
field and vented volumes for the injection period at Hammerfest LNG. These figures are
reported to the Climate and Pollution Agency on yearly bases.
Figure 3.17. Injected and vented CO2 at the Snøhvit field and Hammerfest LNG
Source: Statoil
3.5.2.3 Methodological issues and uncertainties in measurements
The reported data covers CO2 emissions to the atmosphere, e.g. when the injection system is
out of operation. These emissions are measured by a flow meter with an uncertainty of 3-5%.
Flow metering of the well stream to the CO2 injector is measured by an orifice meter with an
uncertainty of 3-5%. No manual or online analyses are done.
0
100
200
300
400
500
2008 2009 2010
Injected and vented CO 2 , Snøhvit 2008-2010
CO2 injected (ktonnes)
CO2 vented (ktonnes)
National Inventory Report 2012 - Norway
151
Gas composition of injected or vented gas from the CO2injector is controlled by analyses.
This is primarily done as a quality assurance of the CO2 removal system (system 22). For
environmental reporting, the following values are used : 99.549 weight % CO2, 0.0066 weight
% H2S, 0.331% CH4 and 0.088 weight % nmVOC and the analysis performed on a regular
basis from April 2010 to September 2010 confirm these values..
3.5.2.4 Reservoir monitoring
Seismic monitoring
Prior to the application for permits to inject CO2 into the Tubåen formation compositional
models have been built and used to simulate and evaluate the behavior of CO2 injection. A 2D
Seismic survey was carried out in 2006 in order to establish a 2D-4D reference for future
seismic monitoring. The frequency of seismic surveys was not laid down as a permit
condition, but it was anticipated that a monitoring program should be designed in accordance
to the recommendations in the Best Practice Document on Monitoring (part of the SACS
program) which was underway.
Due to the challenges related to rapid pressure increase in the CO2 injection the 3Dseismic
was shot autumn 2009. This survey covers an 8kmx8km area centred about the injection well.
The time lapse effect was evaluated by 4D processing this survey together with the 3D survey
from 2003. Additionally a North West – South East 2D line passing through the injection well
was also acquired. This line was a repetition of a 2D line from 2D/4D reference survey
ST0608 acquired in 2006. Further plans for seismic monitoring will be made after
consultations with the Climate and Pollution Agency when the challenges in the CO2 well are
clarified.
The 3D/4D seismic monitoring survey was shot from 24.August – 9.September 2009. A clear
amplitude response is seen on the seismic in the lower part of Tubåen, up to 3 km2 from the
well. The upper two perforations give a response of about 600 m2 (Figure 3.18). A likely
interpretation of this result is that the main amount of CO2 is flowing into the lower part of
Tubåen.
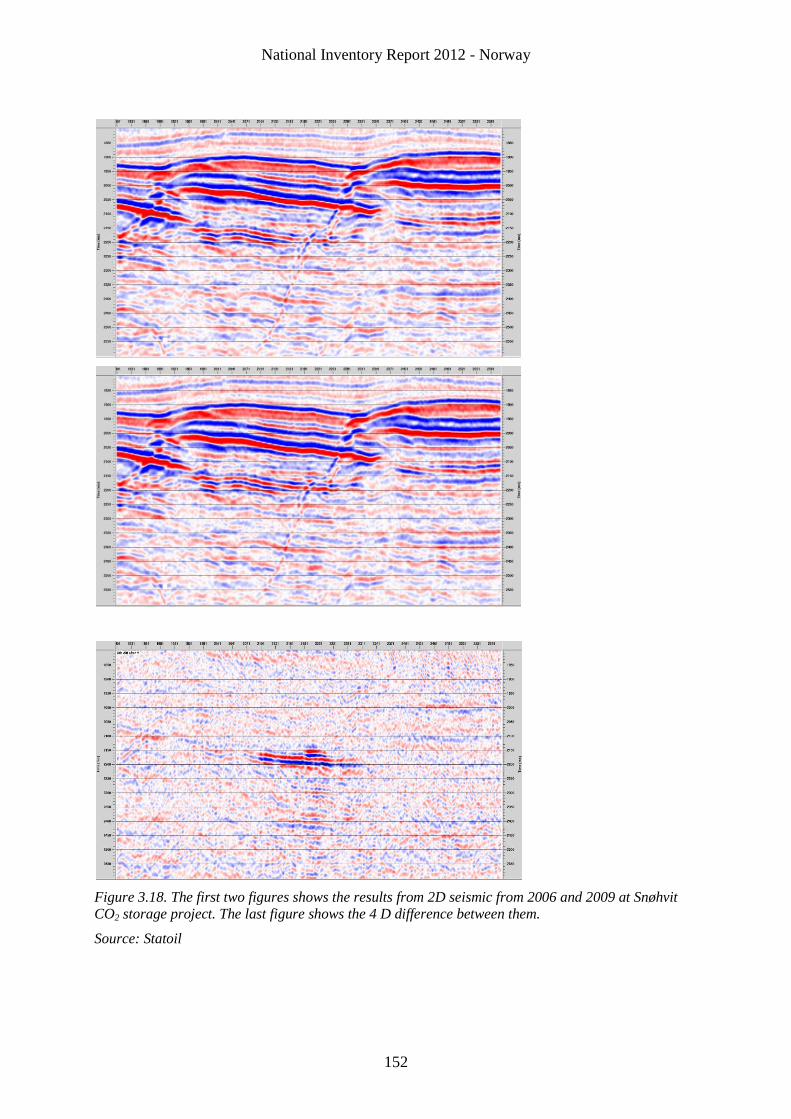
National Inventory Report 2012 - Norway
152
Figure 3.18. The first two figures shows the results from 2D seismic from 2006 and 2009 at Snøhvit
CO2 storage project. The last figure shows the 4 D difference between them.
Source: Statoil
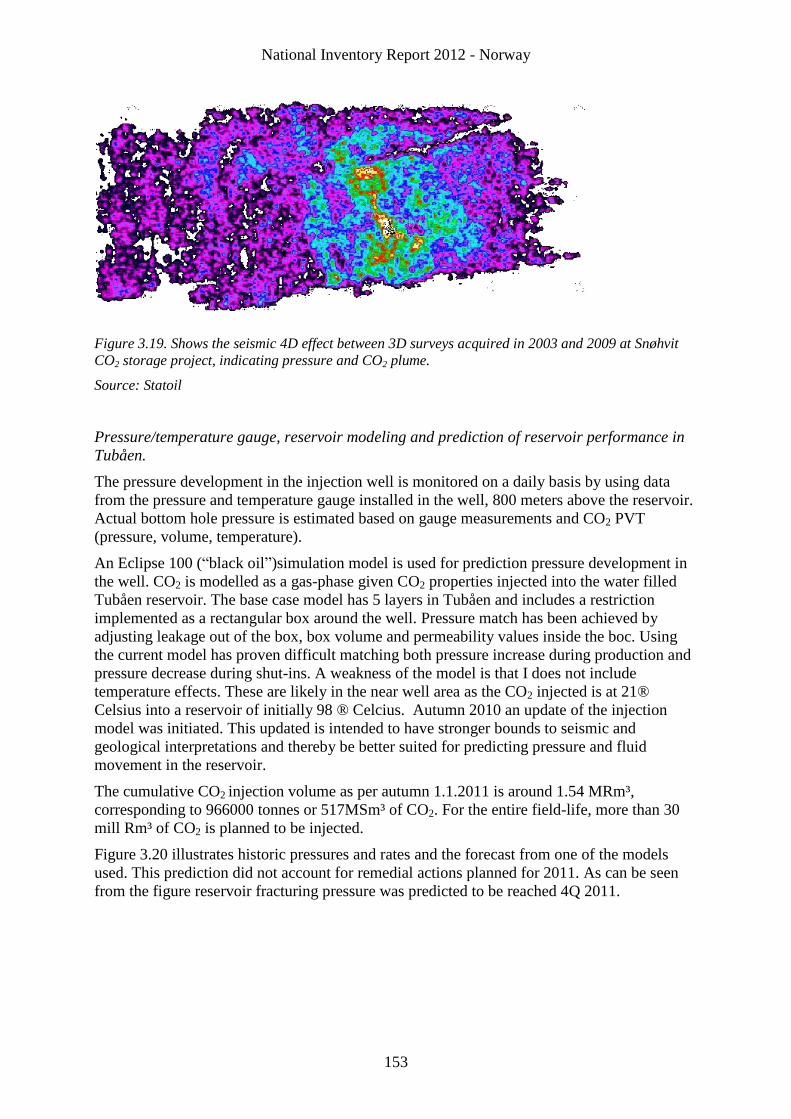
National Inventory Report 2012 - Norway
153
Figure 3.19. Shows the seismic 4D effect between 3D surveys acquired in 2003 and 2009 at Snøhvit
CO2 storage project, indicating pressure and CO2 plume.
Source: Statoil
Pressure/temperature gauge, reservoir modeling and prediction of reservoir performance in
Tubåen.
The pressure development in the injection well is monitored on a daily basis by using data
from the pressure and temperature gauge installed in the well, 800 meters above the reservoir.
Actual bottom hole pressure is estimated based on gauge measurements and CO2 PVT
(pressure, volume, temperature).
An Eclipse 100 (“black oil”)simulation model is used for prediction pressure development in
the well. CO2 is modelled as a gas-phase given CO2 properties injected into the water filled
Tubåen reservoir. The base case model has 5 layers in Tubåen and includes a restriction
implemented as a rectangular box around the well. Pressure match has been achieved by
adjusting leakage out of the box, box volume and permeability values inside the boc. Using
the current model has proven difficult matching both pressure increase during production and
pressure decrease during shut-ins. A weakness of the model is that I does not include
temperature effects. These are likely in the near well area as the CO2 injected is at 21®
Celsius into a reservoir of initially 98 ® Celcius. Autumn 2010 an update of the injection
model was initiated. This updated is intended to have stronger bounds to seismic and
geological interpretations and thereby be better suited for predicting pressure and fluid
movement in the reservoir.
The cumulative CO2 injection volume as per autumn 1.1.2011 is around 1.54 MRm³,
corresponding to 966000 tonnes or 517MSm³ of CO2. For the entire field-life, more than 30
mill Rm³ of CO2 is planned to be injected.
Figure 3.20 illustrates historic pressures and rates and the forecast from one of the models
used. This prediction did not account for remedial actions planned for 2011. As can be seen
from the figure reservoir fracturing pressure was predicted to be reached 4Q 2011.
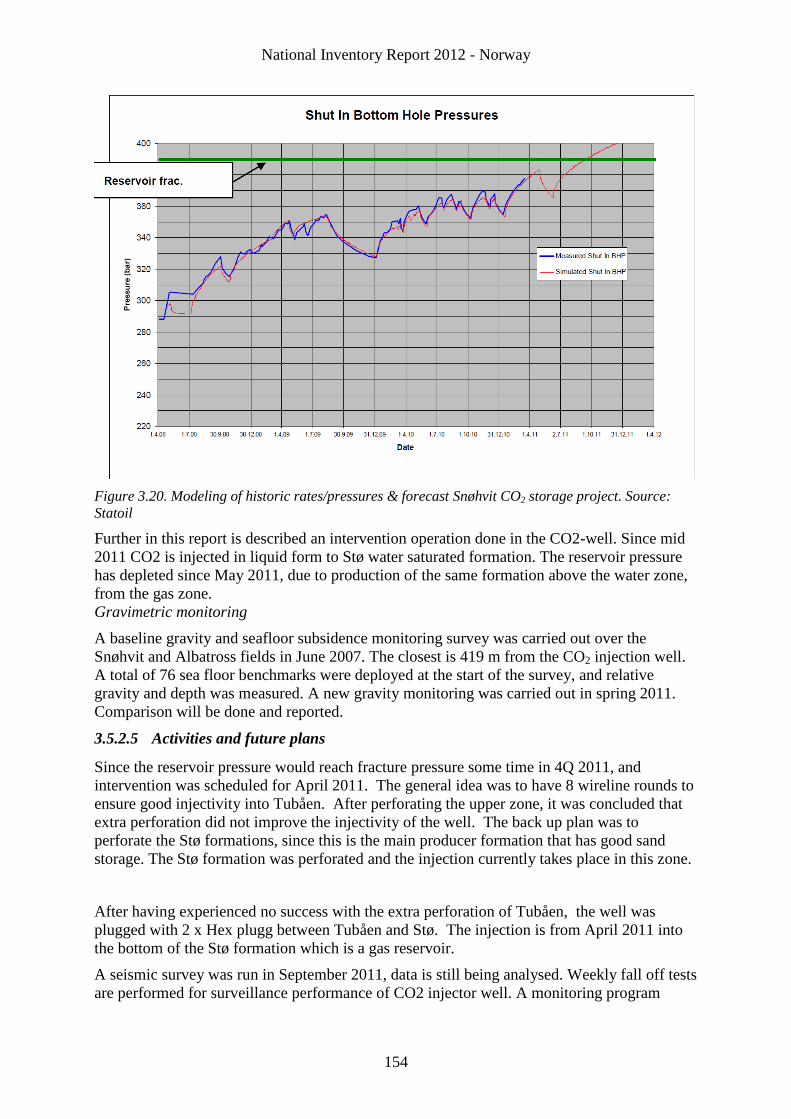
National Inventory Report 2012 - Norway
154
Figure 3.20. Modeling of historic rates/pressures & forecast Snøhvit CO2 storage project. Source:
Statoil
Further in this report is described an intervention operation done in the CO2-well. Since mid
2011 CO2 is injected in liquid form to Stø water saturated formation. The reservoir pressure
has depleted since May 2011, due to production of the same formation above the water zone,
from the gas zone.
Gravimetric monitoring
A baseline gravity and seafloor subsidence monitoring survey was carried out over the
Snøhvit and Albatross fields in June 2007. The closest is 419 m from the CO2 injection well.
A total of 76 sea floor benchmarks were deployed at the start of the survey, and relative
gravity and depth was measured. A new gravity monitoring was carried out in spring 2011.
Comparison will be done and reported.
3.5.2.5 Activities and future plans
Since the reservoir pressure would reach fracture pressure some time in 4Q 2011, and
intervention was scheduled for April 2011. The general idea was to have 8 wireline rounds to
ensure good injectivity into Tubåen. After perforating the upper zone, it was concluded that
extra perforation did not improve the injectivity of the well. The back up plan was to
perforate the Stø formations, since this is the main producer formation that has good sand
storage. The Stø formation was perforated and the injection currently takes place in this zone.
After having experienced no success with the extra perforation of Tubåen, the well was
plugged with 2 x Hex plugg between Tubåen and Stø. The injection is from April 2011 into
the bottom of the Stø formation which is a gas reservoir.
A seismic survey was run in September 2011, data is still being analysed. Weekly fall off tests
are performed for surveillance performance of CO2 injector well. A monitoring program
National Inventory Report 2012 - Norway
155
covering the period 2011-2020 has recently been presented to the environmental authorities
for their assessment and comments.
The challenge with pressure increase in the CO2 well has lead to a great effort to find
solutions that makes the CO2 injection as robust as possible. The authorities have been kept
informed about the situation and the activities and measures planned. The following activities
has been carried out
Continuous monitoring of the pressure development in the well
4D interpretation and analysis
Studies of injection in Tubåen based on results from 4D seismic including predictions
on reservoir performance for Tubåen with or without additional perforations.
o Analyse the limitation and how long we can inject CO2 in Upper Tubåen
Studies on possible Stø injection – consequences
Planning for a well intervention in the injection well summer 2010
The main ongoing activity is planning for a possible new injector well
The situation that occurred at Tubåen, with pressure build-up in the early phase of injecting
into Tubåen was described in the documentation report on Snøhvit CO2-model-compositional
simulations, 2004. If no HC is available, and F-2 connects a reservoir-volume of 330 mill.
Rm³, fracture pressure will be reached after 150 days of injection.
The same document, supported by compositional simulation, indicates what will happen if
CO2 is injected into bottom of Stø in present well location. A figure from this document is
copied below and indicates how CO2 moves if injected into Stø.
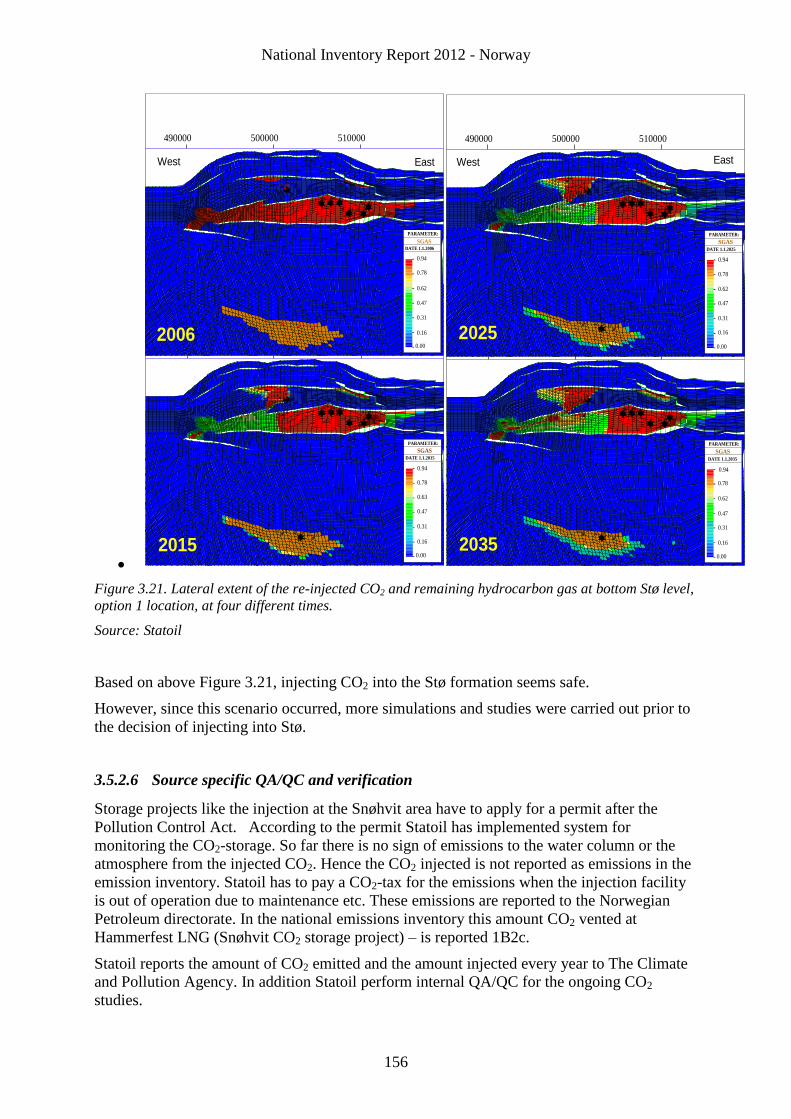
National Inventory Report 2012 - Norway
156
Figure 3.21. Lateral extent of the re-injected CO2 and remaining hydrocarbon gas at bottom Stø level,
option 1 location, at four different times.
Source: Statoil
Based on above Figure 3.21, injecting CO2 into the Stø formation seems safe.
However, since this scenario occurred, more simulations and studies were carried out prior to
the decision of injecting into Stø.
3.5.2.6 Source specific QA/QC and verification
Storage projects like the injection at the Snøhvit area have to apply for a permit after the
Pollution Control Act. According to the permit Statoil has implemented system for
monitoring the CO2-storage. So far there is no sign of emissions to the water column or the
atmosphere from the injected CO2. Hence the CO2 injected is not reported as emissions in the
emission inventory. Statoil has to pay a CO2-tax for the emissions when the injection facility
is out of operation due to maintenance etc. These emissions are reported to the Norwegian
Petroleum directorate. In the national emissions inventory this amount CO2 vented at
Hammerfest LNG (Snøhvit CO2 storage project) – is reported 1B2c.
Statoil reports the amount of CO2 emitted and the amount injected every year to The Climate
and Pollution Agency. In addition Statoil perform internal QA/QC for the ongoing CO2
studies.
490000 500000 510000
PARAMETER:
SGASDATE 1.1.2015
0.00
0.16
0.31
0.47
0.63
0.78
0.94
490000 500000 510000
PARAMETER:
SGAS
DATE 1.1.2035
0.00
0.16
0.31
0.47
0.62
0.78
0.94
490000 500000 510000
PARAMETER:
SGASDATE 1.1.2025
0.00
0.16
0.31
0.47
0.62
0.78
0.94
490000 500000 510000
PARAMETER:
SGASDATE 1.1.2006
0.00
0.16
0.31
0.47
0.62
0.78
0.94
2006 2025
2015 2035
East EastWestWest
National Inventory Report 2012 - Norway
157
3.5.2.7 CO2 projects outside Statoil ASA using Snøhvit data
The EU project CO2ReMoVe plans to perform a complete performance and risk assessment
for the Snøhvit project by complementing the work done under the CASTOR umbrella.
Particular attention will be paid to potential vertical CO2 migration to the upper gas field and
lateral migration, potential flow through deteriorated wells and through undetected faults. The
geochemical interaction between CO2, fluids and rock and coupling with geomechanical
effects will be investigated.
Data from Snøhvit is released to the FME SUCCESS Centre (Centre for Environmental
Friendly Energy Research; Subsurface CO2 Storage- Critical Elements and Superior
Strategy). Based on this information, specific research tasks may be defined.
3.6 Cross-cutting issues
3.6.1 Sectoral versus reference approach
In the review of the Norwegian greenhouse gas inventory submitted in 2011 the ERT raised
potential problems with non-inventory elements of Norway's annual submission under the
Kyoto Protocol. Norway was asked to explain the difference between Reference Approach
(RA) and Sectoral Approach (SA). Norway has examined the differences and the results are
explained in this section and in a new Annex IX in the NIR.
Norway has calculated energy consumption and CO2 emissions from energy combustion
based on Reference Approach (RA) and Sectoral Approach (SA). The supply side in the RA
is from the national energy balance that is included in Annex III in the NIR. In previous
submissions we have used energy balance data reported to IEA in RA even if the energy
balance reported in Annex III also in previous submissions have been the national energy
balance. The supply data in RA are now consistent with the energy balance data used in the
SA.
Sectoral versus reference approach. The result of the estimation with the two methods is
shown in Table 3.32. There are large differences between the output from RA and SA, both
for the energy consumption data and the CO2 emissions. The difference between the fuel
consumption in the RA and SA ranges from about –14 per cent to + 45 per cent. The
deviations for CO2 emissions are generally around 5 percentage points higher. The highest
discrepancy for CO2 is in 1999-2001, 2004-2006, and 2008-2010. For 2010, the difference for
CO2 is 41 per cent. The large discrepancies are primarily due to statistical differences in the
energy balance, as shown below.
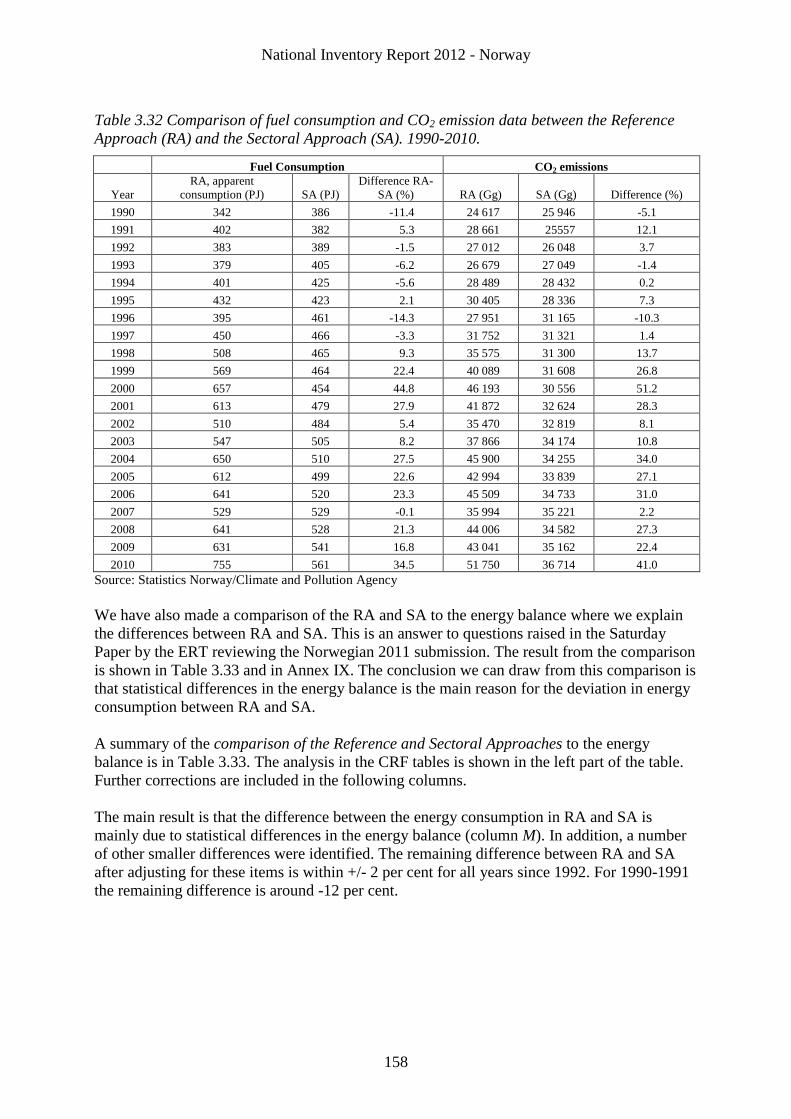
National Inventory Report 2012 - Norway
158
Table 3.32 Comparison of fuel consumption and CO2 emission data between the Reference
Approach (RA) and the Sectoral Approach (SA). 1990-2010.
Fuel Consumption CO2 emissions
Year
RA, apparent
consumption (PJ) SA (PJ)
Difference RA-
SA (%) RA (Gg) SA (Gg) Difference (%)
1990 342 386 -11.4 24 617 25 946 -5.1
1991 402 382 5.3 28 661 25557 12.1
1992 383 389 -1.5 27 012 26 048 3.7
1993 379 405 -6.2 26 679 27 049 -1.4
1994 401 425 -5.6 28 489 28 432 0.2
1995 432 423 2.1 30 405 28 336 7.3
1996 395 461 -14.3 27 951 31 165 -10.3
1997 450 466 -3.3 31 752 31 321 1.4
1998 508 465 9.3 35 575 31 300 13.7
1999 569 464 22.4 40 089 31 608 26.8
2000 657 454 44.8 46 193 30 556 51.2
2001 613 479 27.9 41 872 32 624 28.3
2002 510 484 5.4 35 470 32 819 8.1
2003 547 505 8.2 37 866 34 174 10.8
2004 650 510 27.5 45 900 34 255 34.0
2005 612 499 22.6 42 994 33 839 27.1
2006 641 520 23.3 45 509 34 733 31.0
2007 529 529 -0.1 35 994 35 221 2.2
2008 641 528 21.3 44 006 34 582 27.3
2009 631 541 16.8 43 041 35 162 22.4
2010 755 561 34.5 51 750 36 714 41.0
Source: Statistics Norway/Climate and Pollution Agency
We have also made a comparison of the RA and SA to the energy balance where we explain
the differences between RA and SA. This is an answer to questions raised in the Saturday
Paper by the ERT reviewing the Norwegian 2011 submission. The result from the comparison
is shown in Table 3.33 and in Annex IX. The conclusion we can draw from this comparison is
that statistical differences in the energy balance is the main reason for the deviation in energy
consumption between RA and SA.
A summary of the comparison of the Reference and Sectoral Approaches to the energy
balance is in Table 3.33. The analysis in the CRF tables is shown in the left part of the table.
Further corrections are included in the following columns.
The main result is that the difference between the energy consumption in RA and SA is
mainly due to statistical differences in the energy balance (column M). In addition, a number
of other smaller differences were identified. The remaining difference between RA and SA
after adjusting for these items is within +/- 2 per cent for all years since 1992. For 1990-1991
the remaining difference is around -12 per cent.
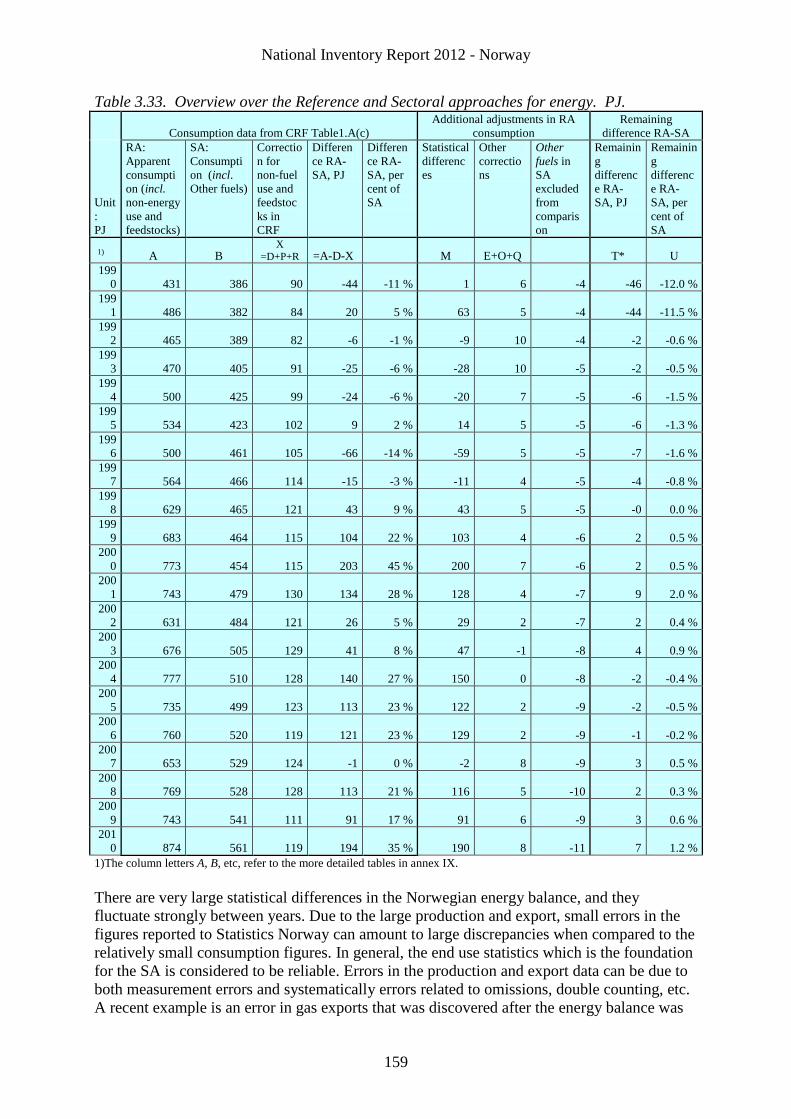
National Inventory Report 2012 - Norway
159
Table 3.33. Overview over the Reference and Sectoral approaches for energy. PJ.
Consumption data from CRF Table1.A(c)
Additional adjustments in RA
consumption
Remaining
difference RA-SA
Unit
:
PJ
RA:
Apparent
consumpti
on (incl.
non-energy
use and
feedstocks)
SA:
Consumpti
on (incl.
Other fuels)
Correctio
n for
non-fuel
use and
feedstoc
ks in
CRF
Differen
ce RA-
SA, PJ
Differen
ce RA-
SA, per
cent of
SA
Statistical
differenc
es
Other
correctio
ns
Other
fuels in
SA
excluded
from
comparis
on
Remainin
g
differenc
e RA-
SA, PJ
Remainin
g
differenc
e RA-
SA, per
cent of
SA
1) A B X
=D+P+R =A-D-X M E+O+Q T* U
199
0 431 386 90 -44 -11 % 1 6 -4 -46 -12.0 %
199
1 486 382 84 20 5 % 63 5 -4 -44 -11.5 %
199
2 465 389 82 -6 -1 % -9 10 -4 -2 -0.6 %
199
3 470 405 91 -25 -6 % -28 10 -5 -2 -0.5 %
199
4 500 425 99 -24 -6 % -20 7 -5 -6 -1.5 %
199
5 534 423 102 9 2 % 14 5 -5 -6 -1.3 %
199
6 500 461 105 -66 -14 % -59 5 -5 -7 -1.6 %
199
7 564 466 114 -15 -3 % -11 4 -5 -4 -0.8 %
199
8 629 465 121 43 9 % 43 5 -5 -0 0.0 %
199
9 683 464 115 104 22 % 103 4 -6 2 0.5 %
200
0 773 454 115 203 45 % 200 7 -6 2 0.5 %
200
1 743 479 130 134 28 % 128 4 -7 9 2.0 %
200
2 631 484 121 26 5 % 29 2 -7 2 0.4 %
200
3 676 505 129 41 8 % 47 -1 -8 4 0.9 %
200
4 777 510 128 140 27 % 150 0 -8 -2 -0.4 %
200
5 735 499 123 113 23 % 122 2 -9 -2 -0.5 %
200
6 760 520 119 121 23 % 129 2 -9 -1 -0.2 %
200
7 653 529 124 -1 0 % -2 8 -9 3 0.5 %
200
8 769 528 128 113 21 % 116 5 -10 2 0.3 %
200
9 743 541 111 91 17 % 91 6 -9 3 0.6 %
201
0 874 561 119 194 35 % 190 8 -11 7 1.2 %
1)The column letters A, B, etc, refer to the more detailed tables in annex IX.
There are very large statistical differences in the Norwegian energy balance, and they
fluctuate strongly between years. Due to the large production and export, small errors in the
figures reported to Statistics Norway can amount to large discrepancies when compared to the
relatively small consumption figures. In general, the end use statistics which is the foundation
for the SA is considered to be reliable. Errors in the production and export data can be due to
both measurement errors and systematically errors related to omissions, double counting, etc.
A recent example is an error in gas exports that was discovered after the energy balance was

National Inventory Report 2012 - Norway
160
finalized: Gas export had been omitted from the foreign trade statistics for a number of new
fields that deliver the gas through installations on the territory of neighbouring states. This
error explains most of the change in the statistical difference for gas since 2008.
3.6.2 Feedstocks and non-energy use of fuels
Emissions from the use of feedstock are according to the Good Practice Guidance and are
generally accounted for in the industrial processes sector in the Norwegian inventory. By-
products from processes like CO gas and fuel gas from ethylene cracking that is sold and
combusted are accounted for and reported under the energy sector.
National Inventory Report 2012 - Norway
161
3.6.3 Indirect CO2 emissions from CH4 and NMVOC
According to the reporting guidelines to the Climate Convention all emissions of carbon from
fossil compounds are to be included in the national GHG inventory. When methane or
NMVOC are 161odel lo in the atmosphere indirect CO2 emissions are formed. The emissions
of CH4 and NMVOC from some sources will partly be of fossil origin and should therefore be
included. Indirect CO2 emissions originating from the fossil part of CH4 and NMVOC during
fuel combustion are automatically included in the emission inventory. The corresponding
emissions from non-combustion sources are accounted for in the inventory under the
following source categories:
Coal Mining and Handling – 1B1a
Gas terminals – 1B2b
Oil terminals – 1B2a
Refineries – 1B2a
Oil gas extraction activity – especially from loading of crude oil – 1B2a and 2B2c
Distribution of oil products – 1B2a
Silicon carbide – 2B4.1
Calcium carbide – 2B4.2
Methanol – 2B5.5
Plastic – 2B.5
Ferroalloys – 2C.2
Solvent and other product use – 3.
The indirect CO2 emissions from oxidized CH4 and NMVOC are calculated from the content
of fossil carbon in the compounds. The average amount of carbon is estimated to be 75 per
cent in methane and 82 per cent in NMVOC. This leads to the emission factors 2.74 kg
CO2/kg CH4 and 3 kg CO2/kg NMVOC, calculated on basis of mass of molecules.
National Inventory Report 2012 - Norway
162
3.7 Memo items
3.7.1 International bunkers
3.7.1.1 Description
Emissions from international marine and aviation bunker fuels are excluded from the
national totals, as required by the IPCC Guidelines. The estimated emission figures
are reported separately and are presented in Table 3.34.
In 2010 CO2 emissions from ships and aircraft in international traffic bunkered in
Norway amounted to a total of 2.7 million tonnes, which corresponds to 5.0 per cent
of the total Norwegian CO2 emissions. The CO2 emissions from bunkers have
increased by 28 per cent from 1990 to 2010.
During the period 1990-2010, emissions of CO2 from marine bunkers decreased by 6
per cent. The emissions have varied greatly in this period and reached a peak in 1997.
Thereafter there has been a descending trend in emissions and the emissions
decreased by more than 50 per cent in the period 1997-2010.
The CO2 emissions from international air traffic bunkered in Norway was in 2010 1.4
million tonne that is all time high emission level. Due to variations in the activity
level, CO2 emissions from international air traffic varied during the period 1990-2010,
as well. These emissions have been on its highest level from 2006-2010 when the
emissions were more doubled compared to 1990. However, as aircraft engines are
improving their fuel-efficiency, it follows that the increase in international air traffic
has in fact been higher than that of the emissions. After a general increase in the
1990s, emissions declined somewhat from 2000 to 2004, followed by a substantial
increase in 2005-2008. In 2009 the emissions from international aviation decreased by
5 per cent as effect of the financial crises but have increased again in 2010 by 19 per
cent.
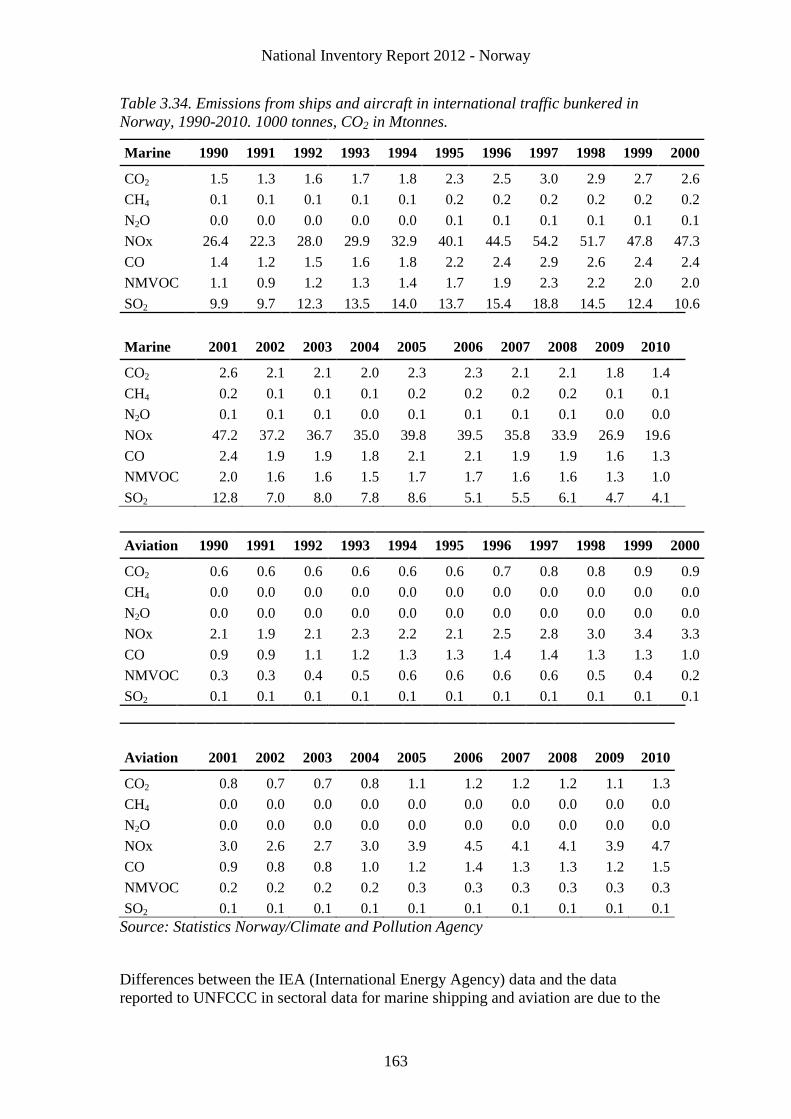
National Inventory Report 2012 - Norway
163
Table 3.34. Emissions from ships and aircraft in international traffic bunkered in
Norway, 1990-2010. 1000 tonnes, CO2 in Mtonnes.
Marine 1990 1991 1992 1993 1994 1995 1996 1997 1998 1999 2000
CO2 1.5 1.3 1.6 1.7 1.8 2.3 2.5 3.0 2.9 2.7 2.6
CH4 0.1 0.1 0.1 0.1 0.1 0.2 0.2 0.2 0.2 0.2 0.2
N2O 0.0 0.0 0.0 0.0 0.0 0.1 0.1 0.1 0.1 0.1 0.1
NOx 26.4 22.3 28.0 29.9 32.9 40.1 44.5 54.2 51.7 47.8 47.3
CO 1.4 1.2 1.5 1.6 1.8 2.2 2.4 2.9 2.6 2.4 2.4
NMVOC 1.1 0.9 1.2 1.3 1.4 1.7 1.9 2.3 2.2 2.0 2.0
SO2 9.9 9.7 12.3 13.5 14.0 13.7 15.4 18.8 14.5 12.4 10.6
Marine 2001
2002
2003
2004
2005
2006 2007 2008 2009 2010
CO2 2.6 2.1 2.1 2.0 2.3 2.3 2.1 2.1 1.8 1.4
CH4 0.2 0.1 0.1 0.1 0.2 0.2 0.2 0.2 0.1 0.1
N2O 0.1 0.1 0.1 0.0 0.1 0.1 0.1 0.1 0.0 0.0
NOx 47.2 37.2 36.7 35.0 39.8 39.5 35.8 33.9 26.9 19.6
CO 2.4 1.9 1.9 1.8 2.1 2.1 1.9 1.9 1.6 1.3
NMVOC 2.0 1.6 1.6 1.5 1.7 1.7 1.6 1.6 1.3 1.0
SO2 12.8 7.0 8.0 7.8 8.6 5.1 5.5 6.1 4.7 4.1
Aviation 1990 1991 1992 1993 1994 1995 1996 1997 1998 1999 2000
CO2 0.6 0.6 0.6 0.6 0.6 0.6 0.7 0.8 0.8 0.9 0.9
CH4 0.0 0.0 0.0 0.0 0.0 0.0 0.0 0.0 0.0 0.0 0.0
N2O 0.0 0.0 0.0 0.0 0.0 0.0 0.0 0.0 0.0 0.0 0.0
NOx 2.1 1.9 2.1 2.3 2.2 2.1 2.5 2.8 3.0 3.4 3.3
CO 0.9 0.9 1.1 1.2 1.3 1.3 1.4 1.4 1.3 1.3 1.0
NMVOC 0.3 0.3 0.4 0.5 0.6 0.6 0.6 0.6 0.5 0.4 0.2
SO2 0.1 0.1 0.1 0.1 0.1 0.1 0.1 0.1 0.1 0.1 0.1
Aviation 2001
2002
2003
2004
2005
2006 2007 2008 2009 2010
CO2 0.8 0.7 0.7 0.8 1.1 1.2 1.2 1.2 1.1 1.3
CH4 0.0 0.0 0.0 0.0 0.0 0.0 0.0 0.0 0.0 0.0
N2O 0.0 0.0 0.0 0.0 0.0 0.0 0.0 0.0 0.0 0.0
NOx 3.0 2.6 2.7 3.0 3.9 4.5 4.1 4.1 3.9 4.7
CO 0.9 0.8 0.8 1.0 1.2 1.4 1.3 1.3 1.2 1.5
NMVOC 0.2 0.2 0.2 0.2 0.3 0.3 0.3 0.3 0.3 0.3
SO2 0.1 0.1 0.1 0.1 0.1 0.1 0.1 0.1 0.1 0.1
Source: Statistics Norway/Climate and Pollution Agency
Differences between the IEA (International Energy Agency) data and the data
reported to UNFCCC in sectoral data for marine shipping and aviation are due to the
National Inventory Report 2012 - Norway
164
fact that different definitions of domestic use are employed. In the Norwegian
inventory, domestic consumption is based on a census in accordance with the IPCC
good practice guidance. On the other hand, the IEA makes its own assessment with
respect to the split between the domestic and the international market.
3.7.1.2 Shipping
Methodological issues
Emissions are calculated by multiplying activity data with emission factors. The sales
statistics for petroleum products, which is based on reports from the oil companies to
Statistics Norway, has figures on sales for bunkers of marine gas oil, heavy distillates
and heavy fuel oil. The same emission factors as in the Norwegian national
calculations are used.
Activity data
Sales figures for international sea transport from Statistics Norway's sales statistics for
petroleum products are used for marine gas oil, heavy distillates and heavy fuel oil.
Emission factors
Emission factors used for shipping are described under Navigation in Section 3.2.7.
3.7.1.3 Aviation
Methodological issues
The consumption of aviation bunker fuelled in Norway is estimated as the difference
between total purchases of jet kerosene in Norway for civil aviation and reported
domestic consumption. Figures on total aviation fuel consumption are derived from
sales data reported to Statistics Norway from the oil companies. These data do not
distinguish between national and international uses. Data on domestic fuel purchase
and consumption are therefore collected by Statistics Norway from all airline
companies operating domestic traffic in Norway. The figures on domestic
consumption from airlines are deducted from the total sales of jet kerosene to arrive at
the total fuel sales for international aviation. The bottom-up approach of Norway is
the detailed Tier2 CORINAIR methodology. The methodology is based on detailed
information on types of aircraft and number of LTOs, as well as cruise distances.
Activity data
Statistics Norway annually collects data on use of fuel from the air traffic companies,
including specifications on domestic use and purchases of fuel in Norway and abroad.
Emission factors
Emission factors used for Aviation are described under Aviation in Section 3.2.4.
3.7.1.4 Precursors
Emissions of NOx from international sea traffic in 2010 were about 19.6 ktonnes,
which equals 11 per cent of the national Norwegian NOx emissions. During the period
from 1990 to 2010, NOx emissions from international shipping bunkered in Norway
decreased by 26 per cent.
National Inventory Report 2012 - Norway
165
NOx emissions from international aviation amounted to 4.7 ktonnes in 2010. This is
the highest emissions ever, 123 per cent higher than in 1990.
Apart from NOx from marine bunkers, emissions of precursors from international
aviation and sea transport are small compared to the total national emissions of these
gases.
3.7.2 CO2 emissions from biomass
Emissions are estimated from figures in the energy accounts on use of wood, wood
waste and black liquor. According to the guidelines, these CO2 emissions are not
included in the national total in the Norwegian emission inventory but are reported as
memo items in the CRF.
National Inventory Report 2012 - Norway
166
4 Industrial Processes
4.1 Overview
The chapter provides descriptions of the methodologies employed to calculate emissions of
greenhouse gases from industrial processes. Only non-combustion emissions are included in
this chapter. Emissions from fuel combustion in Industry are reported in Chapter 3 Energy.
Nearly all of the GHG emissions from industrial processes included in the Norwegian GHG
Inventory are from annual reports sent by each plant to the Climate and Pollution Agency
(Klif).5 The rest of the emissions included in the inventory are calculated by Statistics
Norway. The calculations are based on emission factors and activity data. The emission
factors are collected from different sources, while the activity data used in calculations carried
out by Statistics Norway is from official statistics collected by Statistics Norway.
A specific QA/QC was carried out in 2006 (SFT, 2006) for the whole time series for the
industrial processes sector as recommended by the expert review team. The QA/QC covered
the GHG emissions from the largest industrial plants to be included in the inventory. The
changes in the emissions resulting from the QA/QC were described in the recalculation
section for each source category in NIR 2006.
The GHG emissions from Industrial processes in 2010 were 13.9 per cent of the total GHG
emissions in Norway. The corresponding percentage in 1990 and 2009 were 27.5 and 13.3 per
cent respectively. The emissions from this source category decreased by 45.4 per cent from
1990 to 2009 and increased by 9.3 per cent from 2009 to 2010. The decrease from 1990 to
2010 is mainly due to reduced PFC emissions from production of aluminium and SF6 from
production of magnesium. There was a reduction in the PFC emissions by 93.9 per cent even
if the production of aluminium in the period 1990-2010 has increased by 26.7 per cent. The
reduction in the SF6 emissions is due to the closing down of production of cast magnesium in
2002, improvements in the GIS-sector and an almost end in the use of SF6 as tracer gas. In
June 2006 also the magnesium recycling foundry was closed down. In addition, N2O
emissions from nitric acid production have decreased by 82.9 per cent since 1990.
Metal production contributed to 60.8 per cent of the total GHG emissions from Industrial
Processes in 2010, mainly from production of ferro alloys and aluminium, and in 1990 the
contribution from metal production was 71.9 per cent. Mineral Product and Chemical Industry
are the two other main contributing sectors in 2010 with 13.8 and 12.0 per cent, respectively,
of the total GHG emissions in this sector.
The Tier 2 key category analysis performed for 1990 and 2010 has revealed the key categories
in terms of level and/or trend uncertainty in the sector Industrial Processes as shown in Table
4.1. However, source category 2A1, 2A2, 2B1, 2C1, 2C2, 2C4 and 2D2 are key categories
from Tier 1 key category analysis.
5 Former Norwegian Pollution Control Authority.
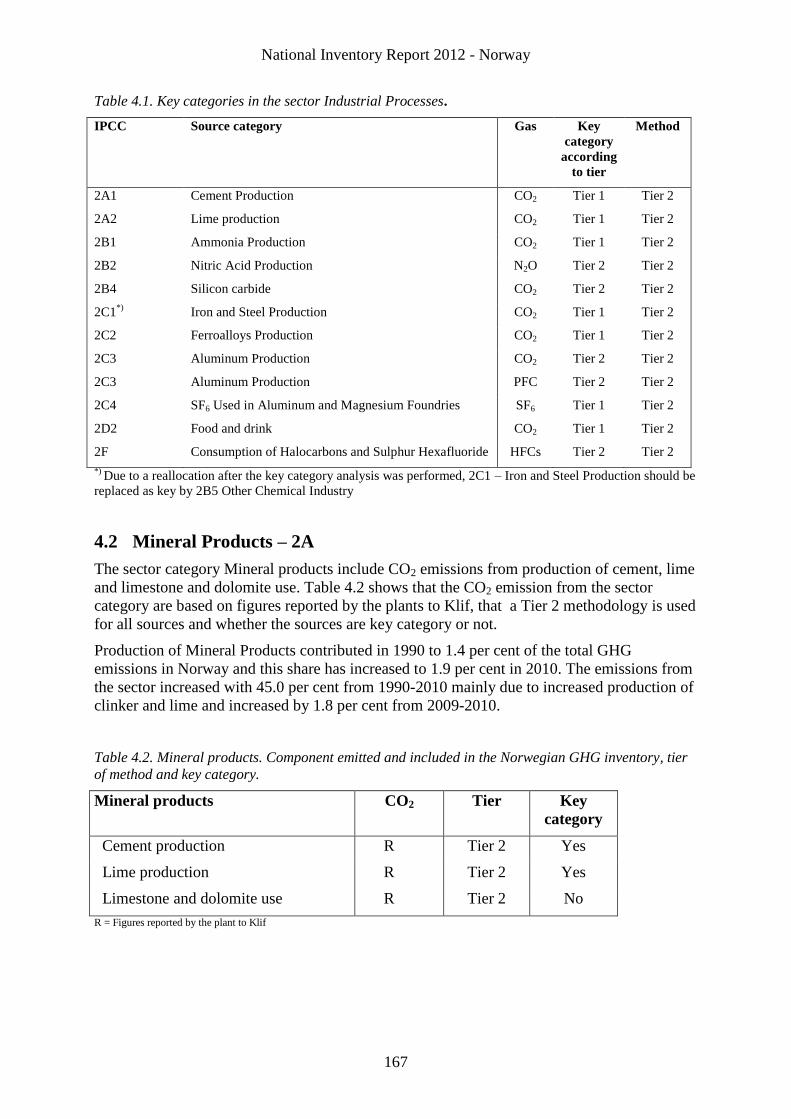
National Inventory Report 2012 - Norway
167
Table 4.1. Key categories in the sector Industrial Processes.
IPCC Source category Gas Key
category
according
to tier
Method
2A1
2A2
Cement Production
Lime production
CO2
CO2
Tier 1
Tier 1
Tier 2
Tier 2
2B1 Ammonia Production CO2 Tier 1 Tier 2
2B2 Nitric Acid Production N2O Tier 2 Tier 2
2B4 Silicon carbide CO2 Tier 2 Tier 2
2C1*)
Iron and Steel Production CO2 Tier 1 Tier 2
2C2 Ferroalloys Production CO2 Tier 1 Tier 2
2C3 Aluminum Production CO2 Tier 2 Tier 2
2C3 Aluminum Production PFC Tier 2 Tier 2
2C4
2D2
SF6 Used in Aluminum and Magnesium Foundries
Food and drink
SF6
CO2
Tier 1
Tier 1
Tier 2
Tier 2
2F Consumption of Halocarbons and Sulphur Hexafluoride HFCs Tier 2 Tier 2
*) Due to a reallocation after the key category analysis was performed, 2C1 – Iron and Steel Production should be
replaced as key by 2B5 Other Chemical Industry
4.2 Mineral Products – 2A
The sector category Mineral products include CO2 emissions from production of cement, lime
and limestone and dolomite use. Table 4.2 shows that the CO2 emission from the sector
category are based on figures reported by the plants to Klif, that a Tier 2 methodology is used
for all sources and whether the sources are key category or not.
Production of Mineral Products contributed in 1990 to 1.4 per cent of the total GHG
emissions in Norway and this share has increased to 1.9 per cent in 2010. The emissions from
the sector increased with 45.0 per cent from 1990-2010 mainly due to increased production of
clinker and lime and increased by 1.8 per cent from 2009-2010.
Table 4.2. Mineral products. Component emitted and included in the Norwegian GHG inventory, tier
of method and key category.
Mineral products CO2 Tier Key
category
Cement production R Tier 2 Yes
Lime production R Tier 2 Yes
Limestone and dolomite use R Tier 2 No
R = Figures reported by the plant to Klif
National Inventory Report 2012 - Norway
168
4.2.1 Cement Production – CO2 – 2A1 (Key Category)
4.2.1.1 Description
Two plants in Norway produce cement. Production of cement gives rise to both non-
combustion and combustion emissions of CO2. The emission from combustion is reported in
Chapter 3 Energy. The non-combustion emissions originate from the raw material calcium
carbonate (CaCO3). The resulting calcium oxide is heated to form clinker and then crushed to
form cement
(4.1) CaCO3 + heat CaO + CO2
In 2010, the CO2 emissions from clinker production accounted for 1.4 per cent of the total
national GHG emissions and 10.1 per cent of the GHG emissions in the sector Industrial
processes.
From 1990-2010 the CO2 emissions from clinker production increased by 18.9 per cent and
from 2009 to 2010 the CO2 emission decreased by 10.4 per cent.
CO2 from clinker production is according to a Tier 1 key category analysis defined as key
category due to contribution in level to total GHG emission.
4.2.1.2 Methodological issues
The emissions of CO2 from clinker production included in the GHG inventory are reported by
the two producers in an annually report to Klif. Emissions are estimated by multiplying the
annually clinker production, included the Cement Kiln Dust (CKD), at the plant with plant
specific emission factors. This is regarded as a Tier 2 methodology.
4.2.1.3 Activity data
The amount of clinker and CKD that the plants use in their calculation is reported each year
from the plants to Klif.
4.2.1.4 Emission factors
CO2
The emission factors used are plant specific. The factors are dependent on the chemical
composition of the clinker i.e. the content of Ca and Mg. The fraction of CaO from non-
carbonate sources like ashes is subtracted. The emission factors are calculated particularly for
the two Norwegian factories. One plant uses the factor 0.530 tonne CO2 per tonne clinker
(Norcem 2006). The other producers use the emission factor 0.541 tonne CO2 per tonne clinker as
recommended by (SINTEF 1998a). The IPCC default emission factor is 0.5071 tonne CO2/tonne
clinker. The same emission factors are used for CKD as for clinker production.
4.2.1.5 Uncertainties
Uncertainty estimates for greenhouse gases are given in Annex II.
4.2.1.6 Source specific QA/QC and verification
The general QA/QC methodology is given in Section 1.6 and the specific QA/QC carried out
for Industrial processes is described in Annex III to the 2010 NIR.
Statistics Norway occasionally calculate alternative emission figures for CO2 and compare
them with the emission figures reported by the plants to the Climate and Pollution Agency to
check if they are reasonable. The calculations are based on the clinker production (reported
National Inventory Report 2012 - Norway
169
annually from the plants to the Statistic Norway). The emission factors used are
recommended by SINTEF (1998a) and based on the actual composition of the raw materials
used. These emission factors are calculated particularly for the two Norwegian plants and are
0.520 and 0.541 tonne CO2 per tonne clinker respectively. The IPCC default emission factor is
0.5071 tonne CO2/tonne clinker. The calculated emission figures agree quite well with
emissions figures reported by the plants.
4.2.1.7 Recalculations
There has been no recalculation since NIR 2010.
4.2.1.8 Planned improvements
There is no planned activity this year that will improve the data quality for NIR 2013.
4.2.2 Lime Production – 2A2 (Key category)
4.2.2.1 Description
Three plants that produce lime in Norway reported CO2 emissions from processes to Klif. The
GHG emissions from lime production represent 3.3 per cent of the total emission from
Industrial processes in 2010 and have increased by 395.9 per cent since 1990. This is due to
increased production at existing plants and the establishment of a new plant in 2007 with large
production.
CO2 from lime production is according to a Tier 1 key category analysis defined as key
category due to contribution in level to total GHG emission.
4.2.2.2 Methodological issues
All three plants calculate the emissions of CO2 based on actual production volumes of lime
and plant specific emission factors for CO2 from limestone and dolomite respectively. The
emissions are reported to the Klif. For one of the plants, Klif has estimated the emissions for
2002-2004 based on activity data and plant specific emission factors. Klif has also
interpolated the emissions for the years 1991-1997 for the same plant.
National Inventory Report 2012 - Norway
170
4.2.2.3 Activity data
The activity data is the input of limestone and dolomite and the the plants report the annual
amounts to Klif. For two of the plants, the input of limestone is determined by adding up the
production volumes of lime (weighed on a scale for trucks). Analysis of the contents of CaO
in lime is then used to calculate the input of limestone. For the third plant, the amounts of
limestone and dolomite going into the production process are weighed in batches. The
weights of these batches are then added to get an annual figure. The ERT of the 2009 NIR
recommended that missing AD should be included in the CRF tables and Norway has since
then included these. The ERT of the 2011 NIR asked if there were data available on the types
of lime produced in Norway. The production in Norway consists of quicklime and dolomitic
lime. In 2010, all lime production was quicklime whereas it accounted for 96% in 2009. The
time series consistency for the IEF has improved due to the revised data as described under
recalculations.
4.2.2.4 Emission factors
The plants use emission factors in the range of 0.4254 to 0.437 tonnes CO2 per tonne
limestone and 0.474 tonnes CO2 per tonne dolomite used.
4.2.2.5 Uncertainties
Uncertainty estimates for greenhouse gases are given in Annex II.
4.2.2.6 Source specific QA/QC and verification
The general QA/QC methodology is given in Section 1.6 and the specific QA/QC carried out
for Industrial processes is described in Annex III to the 2010 NIR.
4.2.2.7 Recalculations
For one plant, the reported CO2 emissions 1990-2007 have been adjusted, partly upwards,
partly downwards due to revised data. This results in only minor changes for all years.
4.2.2.8 Planned improvements
There is no planned activity this year that will improve the data quality for NIR 2013.
4.2.3 Limestone and Dolomite Use – 2A3
4.2.3.1 Description
Four plants report emissions from limestone and dolomite use to Klif. One plant neutralizes
sulphuric acid waste with limestone and fly ash. This produces CO2. The use of fly ash
decrease the CO2 emissions compared with when limestone is used. The second plant is a
brick producer and uses limestone in its production. The third plant produces calcium oxide
and magnesium oxide from limestone and dolomite. The fourth plant produces glass fibers.
The GHG emissions from this source category in 2010 were 0.3 per cent of the total emission
from Industrial processes.
Norway has included CO2 emissions from limestone and dolomite consumption in ferroalloy
production under the category ferroalloys production (2C2). This allocation of emissions is
the one set out in the 2006 IPCC Guidelines for National Greenhouse Gas Inventories, which
encourage all emissions from carbonate consumption to be reported under the category in
National Inventory Report 2012 - Norway
171
which they are consumed. The ERT of the 2009 NIR agreed that such a calculation approach
leads to accurate estimates of emissions from ferroalloys but recommended to report the
emissions under 2A3 in order to facilitate transparency and comparability among reporting
Parties. The ERT of the 2010 NIR noted the recommendation made in the previous review
report, but recommended that Norway continue with its current reporting. Therefore, see
category 2C2 (ferroalloys production) for more information.
4.2.3.2 Methodological issues
The plants report emission figures of CO2 to Klif. The emissions are calculated by multiplying
the amount of sulphuric acid and limestone with emission factors.
4.2.3.3 Activity data
The amount of limestone and dolomite that the plants use in their calculation is reported each
year from the plants to Klif. The ERT of the 2009 NIR recommended that missing AD should
be included in the CRF tables. Norway has included the AD in the CRF tables.
4.2.3.4 Emission factors
An emission factor of 0.45 tonnes CO2 per tonne sulphuric acid is used by the plant,
calculated from the reaction equation. The brick producing plant uses an emission factor of
0.44 tonnes CO2 per tonne CaCO3. The plant producing calcium oxide and magnesium oxide
uses emission factors of 0.44 tonnes CO2 per tonne limestone and 0.46 tonnes CO2 per tonne
dolomite. The plant producing glass fibres uses an emission factor of 0.477 tonnes CO2 per
tonne dolomite.
4.2.3.5 Uncertainties
Uncertainty estimates for greenhouse gases are given in Annex II.
4.2.3.6 Source specific QA/QC and verification
The general QA/QC methodology is given in Section 1.6 and the specific QA/QC carried out
for Industrial processes is described in Annex III to the 2010 NIR.
4.2.3.7 Recalculations
There has been no recalculation since NIR 2010.
4.2.3.8 Planned improvements
There is no planned activity this year that will improve the data quality for NIR 2013.
4.3 Chemical Industry – 2B
In the Norwegian inventory, there are 14 different activities included under chemical industry.
Nearly all emissions figures from this industry included in the inventory are reported figures
from the plants to Klif. Table 4.3 shows the GHGs that are emitted from which industry, tier
of methodology and if the source category is key category or not.
The Chemical Industry contributed in 1990 to 6.0 per cent of the total GHG emissions in
Norway and this share has decreased to 1.7 per cent in 2010. The emissions from the sector
decreased with 70.0 per cent from 1990-2010 mainly due to lower emissions from the
National Inventory Report 2012 - Norway
172
production of nitric acid, ammonia and carbide. The emissions decreased by 6.2 per cent from
2009-2010.
Table 4.3. Chemical industry. Components emitted and included in the Norwegian inventory.
CO2 CH4 N2O NMVOC Tier Key
category
Ammonia R NA NA NA Tier 2 Yes
Nitric acid NA NA R NA Tier 2 Yes
Silicon carbide R+E R/E NA NA Tier 2 Yes
Calcium carbide R NA NA R Tier 1 No
Methanol E R NA R Tier 2 No
Plastic
Titanium dioxide
production*)
R+E
R
R
R
NA
R
R
NA
Tier 2
Tier 2
No
Yes
R means that emission figures in the national emission inventory are based on figures reported by the plants. E means that the figures are estimated by Statistics Norway (Activity data * emission factor). NA = Not Applicable.
*) Due to a reallocation after the key category analysis was performed, 2C1 – Iron and Steel Production should be replaced as key by 2B5 Other Chemical Industry
4.3.1 Ammonia Production – CO2 – 2B1 (Key category)
4.3.1.1 Description
In Norway ammonia is produced by catalytic steam reforming of wet fuel gas (containing
ethane, propane and some buthane). This is one of the steps in the production of fertilizers.
Hydrogen is needed to produce ammonia, and wet fuel gas is the basis for the production of
hydrogen. A substantial amount of CO2 is recovered from the production process.
The net CO2 emissions from production of ammonia represented 4.7 per cent of the GHG
emissions from Industrial processes and 0.7 per cent of the Norwegian emissions in 2010.
The gross CO2 emissions from the production process were 7.4 per cent lower in 2010
compared to 1990 while the net emissions decreased by 34.4 per cent in the same period. The
reduction in the net emissions is due to that the amount of recovered CO2 increased by about
194.6 per cent. From 2009 to 2010 the gross CO2 emissions increased by 3.6 per cent, the net
emissions decreased by 2.1 per cent while the recovered CO2 increased by 14.7 per cent. In
2010 197 kilo tonnes CO2 were captured and sold, see Figure 4.1.
According to the Tier 1 key category analysis ammonia production is defined as key category
due to contribution in level and trend.
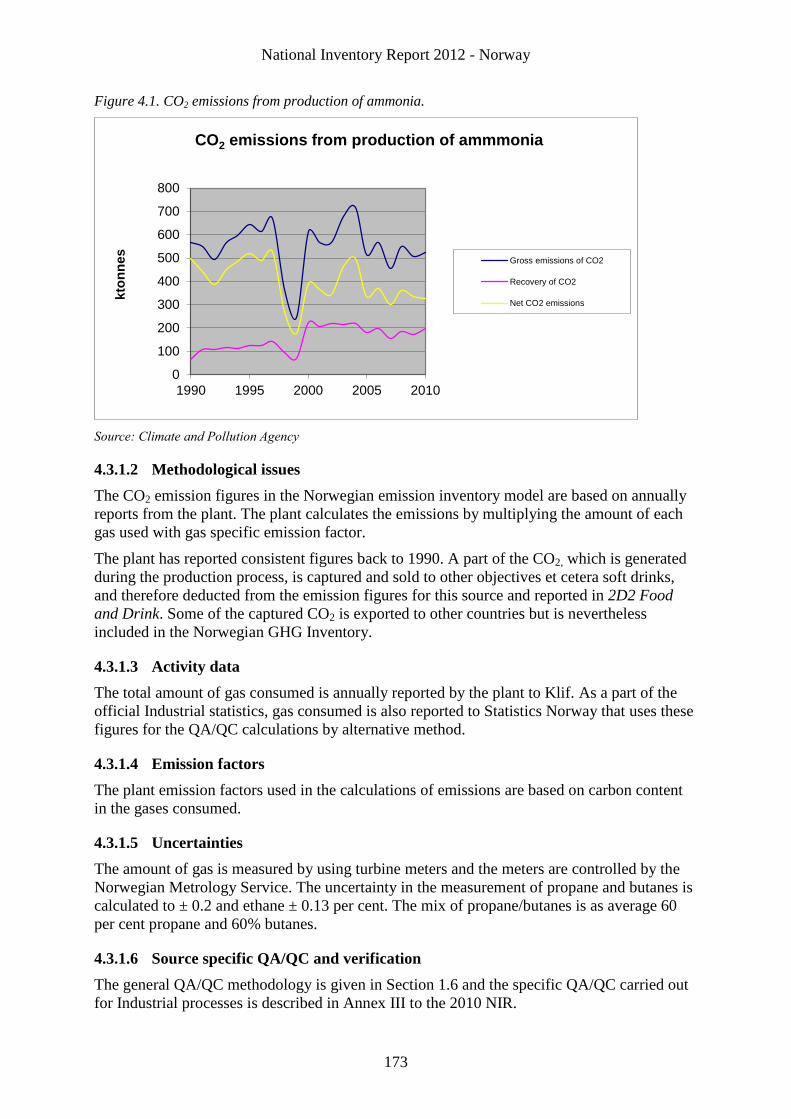
National Inventory Report 2012 - Norway
173
Figure 4.1. CO2 emissions from production of ammonia.
Source: Climate and Pollution Agency
4.3.1.2 Methodological issues
The CO2 emission figures in the Norwegian emission inventory model are based on annually
reports from the plant. The plant calculates the emissions by multiplying the amount of each
gas used with gas specific emission factor.
The plant has reported consistent figures back to 1990. A part of the CO2, which is generated
during the production process, is captured and sold to other objectives et cetera soft drinks,
and therefore deducted from the emission figures for this source and reported in 2D2 Food
and Drink. Some of the captured CO2 is exported to other countries but is nevertheless
included in the Norwegian GHG Inventory.
4.3.1.3 Activity data
The total amount of gas consumed is annually reported by the plant to Klif. As a part of the
official Industrial statistics, gas consumed is also reported to Statistics Norway that uses these
figures for the QA/QC calculations by alternative method.
4.3.1.4 Emission factors
The plant emission factors used in the calculations of emissions are based on carbon content
in the gases consumed.
4.3.1.5 Uncertainties
The amount of gas is measured by using turbine meters and the meters are controlled by the
Norwegian Metrology Service. The uncertainty in the measurement of propane and butanes is
calculated to ± 0.2 and ethane ± 0.13 per cent. The mix of propane/butanes is as average 60
per cent propane and 60% butanes.
4.3.1.6 Source specific QA/QC and verification
The general QA/QC methodology is given in Section 1.6 and the specific QA/QC carried out
for Industrial processes is described in Annex III to the 2010 NIR.
0
100
200
300
400
500
600
700
800
1990 1995 2000 2005 2010
kto
nn
es
CO2 emissions from production of ammmonia
Gross emissions of CO2
Recovery of CO2
Net CO2 emissions
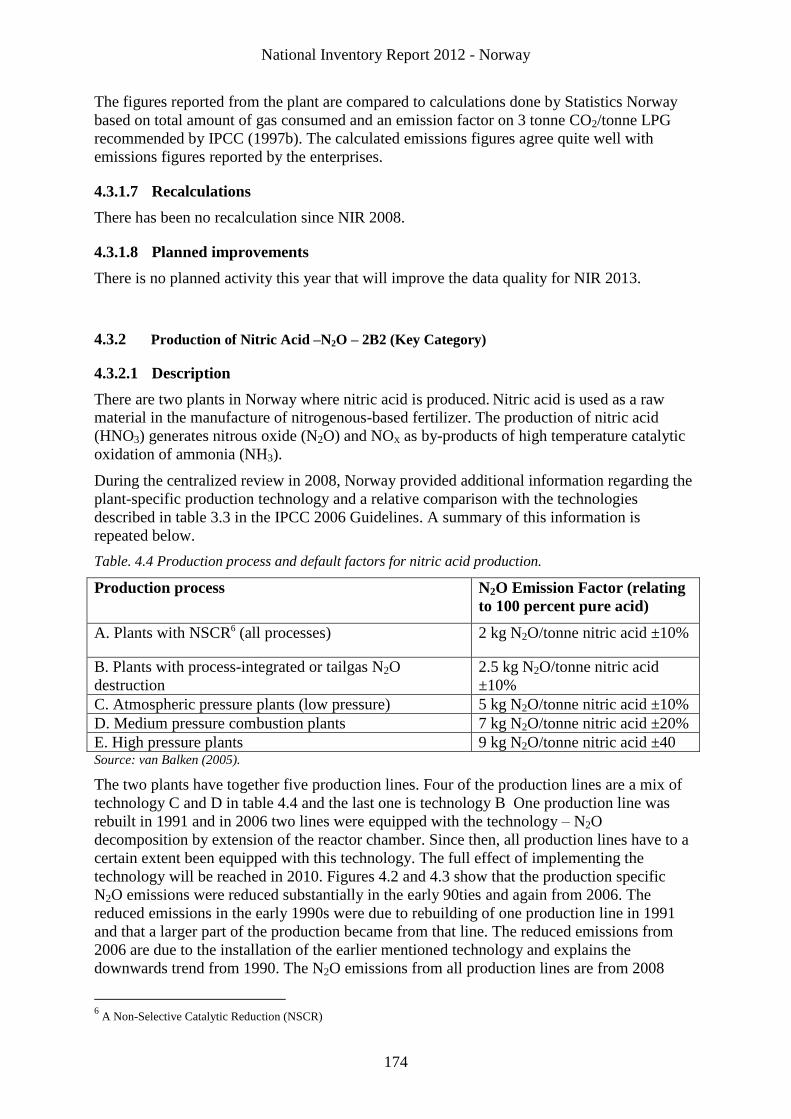
National Inventory Report 2012 - Norway
174
The figures reported from the plant are compared to calculations done by Statistics Norway
based on total amount of gas consumed and an emission factor on 3 tonne CO2/tonne LPG
recommended by IPCC (1997b). The calculated emissions figures agree quite well with
emissions figures reported by the enterprises.
4.3.1.7 Recalculations
There has been no recalculation since NIR 2008.
4.3.1.8 Planned improvements
There is no planned activity this year that will improve the data quality for NIR 2013.
4.3.2 Production of Nitric Acid –N2O – 2B2 (Key Category)
4.3.2.1 Description
There are two plants in Norway where nitric acid is produced. Nitric acid is used as a raw
material in the manufacture of nitrogenous-based fertilizer. The production of nitric acid
(HNO3) generates nitrous oxide (N2O) and NOX as by-products of high temperature catalytic
oxidation of ammonia (NH3).
During the centralized review in 2008, Norway provided additional information regarding the
plant-specific production technology and a relative comparison with the technologies
described in table 3.3 in the IPCC 2006 Guidelines. A summary of this information is
repeated below.
Table. 4.4 Production process and default factors for nitric acid production.
Production process N2O Emission Factor (relating
to 100 percent pure acid)
A. Plants with NSCR6 (all processes) 2 kg N2O/tonne nitric acid ±10%
B. Plants with process-integrated or tailgas N2O
destruction
2.5 kg N2O/tonne nitric acid
±10%
C. Atmospheric pressure plants (low pressure) 5 kg N2O/tonne nitric acid ±10%
D. Medium pressure combustion plants 7 kg N2O/tonne nitric acid ±20%
E. High pressure plants 9 kg N2O/tonne nitric acid ±40 Source: van Balken (2005).
The two plants have together five production lines. Four of the production lines are a mix of
technology C and D in table 4.4 and the last one is technology B One production line was
rebuilt in 1991 and in 2006 two lines were equipped with the technology – N2O
decomposition by extension of the reactor chamber. Since then, all production lines have to a
certain extent been equipped with this technology. The full effect of implementing the
technology will be reached in 2010. Figures 4.2 and 4.3 show that the production specific
N2O emissions were reduced substantially in the early 90ties and again from 2006. The
reduced emissions in the early 1990s were due to rebuilding of one production line in 1991
and that a larger part of the production became from that line. The reduced emissions from
2006 are due to the installation of the earlier mentioned technology and explains the
downwards trend from 1990. The N2O emissions from all production lines are from 2008
6 A Non-Selective Catalytic Reduction (NSCR)
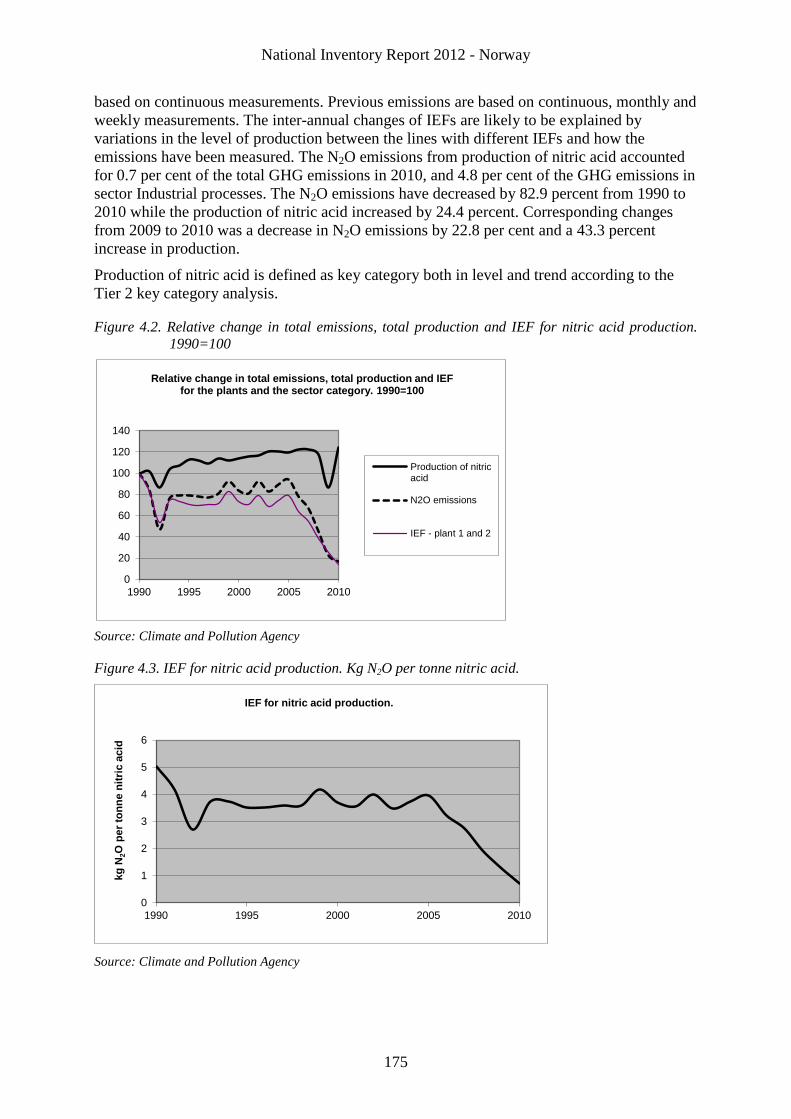
National Inventory Report 2012 - Norway
175
based on continuous measurements. Previous emissions are based on continuous, monthly and
weekly measurements. The inter-annual changes of IEFs are likely to be explained by
variations in the level of production between the lines with different IEFs and how the
emissions have been measured. The N2O emissions from production of nitric acid accounted
for 0.7 per cent of the total GHG emissions in 2010, and 4.8 per cent of the GHG emissions in
sector Industrial processes. The N2O emissions have decreased by 82.9 percent from 1990 to
2010 while the production of nitric acid increased by 24.4 percent. Corresponding changes
from 2009 to 2010 was a decrease in N2O emissions by 22.8 per cent and a 43.3 percent
increase in production.
Production of nitric acid is defined as key category both in level and trend according to the
Tier 2 key category analysis.
Figure 4.2. Relative change in total emissions, total production and IEF for nitric acid production.
1990=100
Source: Climate and Pollution Agency
Figure 4.3. IEF for nitric acid production. Kg N2O per tonne nitric acid.
Source: Climate and Pollution Agency
0
20
40
60
80
100
120
140
1990 1995 2000 2005 2010
Relative change in total emissions, total production and IEF for the plants and the sector category. 1990=100
Production of nitricacid
N2O emissions
IEF - plant 1 and 2
0
1
2
3
4
5
6
1990 1995 2000 2005 2010
kg
N2O
pe
r to
nn
e n
itri
c a
cid
IEF for nitric acid production.
National Inventory Report 2012 - Norway
176
4.3.2.2 Methodological issues
NO2
The two plants report the emissions of N2O to Klif. The N2O emissions have been
continuously measured since 1991 at one production line and from 2000 at another. The
emissions at the three other production lines are based on monthly and weekly measurements.
4.3.2.3 Activity data
The plants report the production of HNO3 to Klif.
4.3.2.4 Uncertainties
Uncertainty estimates for greenhouse gases are given in Annex II. The uncertainty in the
measurements is estimated by the plant to ±7 (SFT 2000). However, in the 2006 report to Klif
one plant reports that the uncertainty in measurement of N2O is calculated to ±1-3 per cent.
4.3.2.5 Source specific QA/QC and verification
The general QA/QC methodology is given in Section 1.6 and the specific QA/QC carried out
for Industrial processes is described in Annex III to the 2010 NIR.
The plants report the production of HNO3 to Klif. They compare trends in the production data
with the trend in N2O emission and use this as a quality check.
4.3.2.6 Recalculations
There has been no recalculation since NIR 2009.
4.3.2.7 Planned improvements
There is no planned activity this year that will improve the data quality for NIR 2013.
4.3.3 Silicon Carbide – 2B4 (Key Category)
4.3.3.1 Description
Silicon carbide has been produced at three plants until 2006 when one plant was closed down.
Silicon carbide (SiC) is produced by reduction of quartz (SiO2) with petrol coke as a reducing
agent.
(4.2) SiO2 + 3C SiC + 2CO
CO CO2
In the production of silicon carbide, CO2 and CO is released as a by-product from the reaction
between quartz and carbon. Methane (CH4) may be emitted from petrol coke during parts of
the process and sulphur origin from the petrol coke.
The GHG emissions from production of silicon carbide accounted for 0.1 per cent of the total
GHG emissions in 2010, and 1.0per cent of the GHG emissions in sector Industrial processes.
The emissions were reduced by 66.4 per cent in the years 1990- 2010 and increased by 47.1
per cent from 2009 to 2010. The large decrease from 1990 to 2010 is due to reduced
production and that one plant was closed down in 2006. The fluctuation in emissions over the
years is due to variation in production of crude silicon carbide.
According to the Tier 2 key category analysis carbide production is defined as key category
due to change in trend.
National Inventory Report 2012 - Norway
177
4.3.3.2 Methodological issues
Norway changed in NIR 2006 the method for calculating CO2 from silicon carbide production
from the mass balance method described in the Revised 1996 IPCC Guidelines (using input of
reducing agents) to an EF-based method (using crude silicon carbide production as activity
data). Both methods are regarded as being Tier 2 methods in IPCC 2006. During the review of
the initial report in 2007 the reviewer raised question to the change of method but concluded
after consideration that the two methods provide very similar results, except for 1990, and that
the use of the present method is justified.
CO2
Emission figures are reported annually by the three plants to the Klif.
CO2 from process is calculated based on the following equation:
(4.3) CO2 = Σ Activity data * Emission factor
The three production sites have used amount of produced crude silicon carbide as activity data
in the calculation of CO2 emissions.
NMVOC
Emission figures are reported to the Climate and Pollution Agency by the plants. The
emissions are calculated by multiplying annual production of silicon carbide by an emission
factor.
Indirect emission of CO2 is calculated by Statistics Norway based on the emission of CH4.
CH4
The emission of CH4 from production of silicon carbide is calculated based on the following
equation:
(4.4) CO2= Activity datai * Emission factori
The three production sites has used amount of produced crude silicon carbide as activity data
and a plant specific emission factor.
CO
The emissions of CO are calculated by Statistics Norway from the consumption of petrol coke
and an emission factor.
4.3.3.3 Activity data
The activity data used by the plants for the calculation of CO2 and CH4 are the amount of
produced crude silicon carbide. The activity data used by Statistics Norway for the calculation
of CO is the consumption of petrol coke as reported to Statistics Norway.
4.3.3.4 Emission factors
CO2
National Inventory Report 2012 - Norway
178
All three sites have changed their emission factor to the default factor of 2.62 ton CO2/ton
crude silicon carbide (IPPC 2006), see Table 4.5.
CH4
For calculation of methane emissions the plant specific emission factor 4.2 kg CH4/tonne
crude SiC is used, see Table 4.4.Documentation of the choice and uncertainties of the
emission factor is given below.
CO
The emission factor is in accordance with the IPCC Guidelines (IPCC 1997b).
Table 4.5. Emission factor for CO2, CH4 and CO used for silicon carbide production.
Component Emission factor Source
CO2 2.62 kg CO2/tonnes crude SiC IPCC 2006
CH4 4.2 kg CH4 /tonnes crude SiC PS
CO 0.4 tonnes CO/tonnes petrol coke Rosland (1987)
NMVOC
From 2007 and onwards the emission factor is based on measurements made once a year. The
emission factors for 2007 for are 10.906 t NMVOC/kt Sic for Washington Mills and 10.84 t
NMVOC/kt Sic for Saint Gobain. For previous years, the emission factor for Saint Gobain is
more or less constant whereas the emission factor for Washington Mills varies.
4.3.3.5 Uncertainties
CO2
Activity data: The three productions sites use the amount of produced crude silicon carbide as
activity data. The uncertainty of the activity data given as this production figure is calculated
to be ± 3 per cent.
Emission factor: When using the standard emission factor of 2.62 tonne CO2/tonnes SiC, the
uncertainty range is estimated to be – 16 % to - +7 %. This can be explained due to variations
in raw materials as well as process variations, and is based on previous development of site
specific emissions factors (SINTEF 1998e).
The carbon content in coke is varying, normally from 85 to 92 % carbon. The coke is also
varying in the content of volatile components, e.g hydrocarbons. There are also variations in
the process itself. The Acheson process is at batch process, and the reactions include many
part reactions that differ from batch to batch, because of variations in the mix of quarts and
coke, the reactivity of the coke etc. The process variations described above is the reason why
the factor presented in tonne CO2/tonn coke used is not constant. For Washington Mills the
factor is in the range 1.07-1.27. For Saint Gobain one has to look at the two plants in
Lillesand and Arendal together, because the input and output from them are somewhat mixed
together. The factor for them is in the range 0.99-1.24. This implies that the output of SiC will
have some variation from batch to batch.
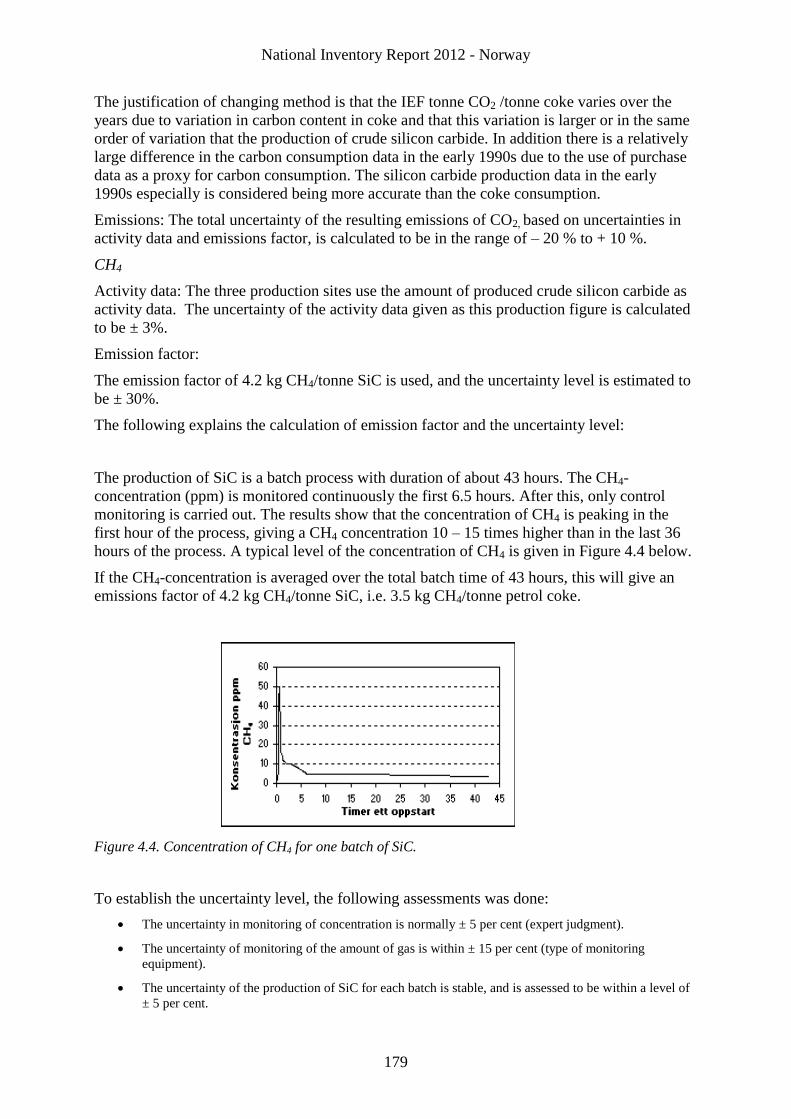
National Inventory Report 2012 - Norway
179
The justification of changing method is that the IEF tonne CO2 /tonne coke varies over the
years due to variation in carbon content in coke and that this variation is larger or in the same
order of variation that the production of crude silicon carbide. In addition there is a relatively
large difference in the carbon consumption data in the early 1990s due to the use of purchase
data as a proxy for carbon consumption. The silicon carbide production data in the early
1990s especially is considered being more accurate than the coke consumption.
Emissions: The total uncertainty of the resulting emissions of CO2, based on uncertainties in
activity data and emissions factor, is calculated to be in the range of – 20 % to + 10 %.
CH4
Activity data: The three production sites use the amount of produced crude silicon carbide as
activity data. The uncertainty of the activity data given as this production figure is calculated
to be ± 3%.
Emission factor:
The emission factor of 4.2 kg CH4/tonne SiC is used, and the uncertainty level is estimated to
be ± 30%.
The following explains the calculation of emission factor and the uncertainty level:
The production of SiC is a batch process with duration of about 43 hours. The CH4-
concentration (ppm) is monitored continuously the first 6.5 hours. After this, only control
monitoring is carried out. The results show that the concentration of CH4 is peaking in the
first hour of the process, giving a CH4 concentration 10 – 15 times higher than in the last 36
hours of the process. A typical level of the concentration of CH4 is given in Figure 4.4 below.
If the CH4-concentration is averaged over the total batch time of 43 hours, this will give an
emissions factor of 4.2 kg CH4/tonne SiC, i.e. 3.5 kg CH4/tonne petrol coke.
Figure 4.4. Concentration of CH4 for one batch of SiC.
To establish the uncertainty level, the following assessments was done:
The uncertainty in monitoring of concentration is normally ± 5 per cent (expert judgment).
The uncertainty of monitoring of the amount of gas is within ± 15 per cent (type of monitoring
equipment).
The uncertainty of the production of SiC for each batch is stable, and is assessed to be within a level of
± 5 per cent.
National Inventory Report 2012 - Norway
180
The uncertainties of raw materials and process variation add ± 5 per cent.
If these uncertainties are added, the estimate result of total uncertainties for the resulting
emissions of CH4 is ± 30 per cent.
4.3.3.6 Source 180odel lo QA/QC and verification
The general QA/QC methodology is given in Section 1.6 and the specific QA/QC carried out
for Industrial processes is described in Annex III to the 2010 NIR.
4.3.3.7 Recalculations
There has been no recalculation since NIR 2010.
4.3.3.8 Planned improvements
There is no planned activity this year that will improve the data quality for NIR 2013.
4.3.4 Production of Calcium Carbide – 2B4
4.3.4.1 Description
One plant in Norway was producing calcium carbide until 2003. The production of calcium
carbide generates CO2 emissions when limestone is heated and when petrol coke is used as a
reducing agent.
The reaction
(4.5) CaCO3 CaO + CO2
which takes place when limestone (calcium carbonate) is heated.
The reactions
(4.6) CaO + C (petrol coke) CaC2 + CO
(4.7) CO 2O CO2
where petrol coke is used as a reducing agent to reduce the CaO to calcium carbide.
4.3.4.2 Methodological issues
The CO2 figures in the National GHG emission inventory are based on emission figures
reported from the plant to Klif. The emission estimates are based on the amount of calcium
carbide produced each year and an emission factor estimated by (SINTEF 1998e). Some of
the carbon from petrol coke will be sequestered in the product, but not permanently. Thus,
this carbon is included in the emission estimate.
4.3.4.3 Activity data
The amount of calcium carbide produced is reported by the plant to Klif.
4.3.4.4 Emission factors
The emission factor used by the plants in the calculation of CO2 has been estimated by
(SINTEF 1998e) to be 1.71 tonne/ tonne included 0.02 t CO2 /t CaC2 from fuel. In the CRF the
emissions from fuels is reported in the Energy chapter. (SINTEF 1998e) conclude that the one
reason for the difference between the factors is that the IPCC assumes that all calcium
carbonate is calcinated. However, in the production process at the plant they first produced
National Inventory Report 2012 - Norway
181
CaC2 that gives CO2 emissions. Some of the CaC2 was then refined to DICY in a process that
consumed CO2. This CO2 gas was collected from one of the first steps of the CaC2
production. The net consumption of CO2 in production of DICY is according to SINTEF
about 1.3 tonne CO2 per tonne DICY produced. This implies that the specific CO2 IEF
fluctuates.
4.3.4.5 Uncertainties
Uncertainty estimates for greenhouse gases are given in Annex II.
4.3.4.6 Source specific QA/QC and verification
The general QA/QC methodology is given in Section 1.6 and the specific QA/QC carried out
for Industrial processes is described in Annex III to the 2010 NIR.
4.3.4.7 Recalculations
There has been no recalculation since NIR 2008.
4.3.4.8 Planned improvements
Since the plant is closed down there is no further planned activity to review historical data.
4.3.5 Production of Methanol – 2B5
4.3.5.1 Description
One plant in Norway produces methanol. Natural gas and oxygen are used in the production
of methanol. The conversion from the raw materials to methanol is done in various steps and
on different locations at the plant. CH4 and NMVOC are emitted during the production
process. Emissions from flaring of natural gas by production of methanol are as recommended
by the review team reported under 2B5. The CO2 emissions from energy combustion are
included under 1.A.2.C
Indirect emissions of CO2 are calculated by Statistics Norway based on the emission of CH4
and NMVOC, see chapter 1.3.3.
4.3.5.2 Methodological issues
The plant reports emission figures of CH4 and NMVOC to Klif. The reported emissions are
based on measurements.
4.3.5.3 Emission factors
Emission factors for flare of natural gas are for CO2: 2340 tonnes/Sm3, for CH4: 0.24
tonnes/Sm3 and for N2O: 0.02 tonnes/Sm
3.
4.3.5.4 Uncertainties
Uncertainty estimates for greenhouse gases are given in Annex II.
4.3.5.5 Source specific QA/QC and verification
The general QA/QC methodology is given in Section 1.6 and the specific QA/QC carried out
for Industrial processes is described in Annex III to the 2010 NIR.
National Inventory Report 2012 - Norway
182
4.3.5.6 Recalculations
There has been no recalculation since NIR 2008.
4.3.5.7 Planned improvements
There is no planned activity this year that will improve the data quality for NIR 2013.
4.3.6 Production of Plastic 2B5
4.3.6.1 Description
Three plants report emissions under this source category. Two of the plants were one plant up
to 2001. One of the plants produces ethylene and propylene where the other has vinyl chloride
production. Various components are emitted during the production of plastic.
CH4 and NMVOC emissions are from leakages in the process. Direct CO2 emission is from
combustion and is reported in Chapter 3 Energy.
During the production process of ethylene and vinyl chloride there is an oxide chloride step
for production of ethylene chloride followed by cracking to vinyl chloride monomer and
hydrochloric acid.
4.3.6.2 Methodological issues
CO2, CH4 and NMVOC
Emission figures are annually reported to Klif. CO2 from combustion is based on gas specific
emissions factors and activity data. CH4 and NMVOC emissions reported are based on
measurements.
Indirect emissions of CO2 calculated by Statistics Norway are based on the emission of CH4
and NMVOC.
4.3.6.3 Uncertainties
It is difficult to measure leakages of CH4 and NMVOC and therefore the uncertainty is
regarded as being large. Uncertainty estimates for greenhouse gases are given in Annex II.
4.3.6.4 Source specific QA/QC and verification
The general QA/QC methodology is given in Section 1.6 and the specific QA/QC carried out
for Industrial processes is described in Annex III to the 2010 NIR.
4.3.6.5 Recalculations
For one plant, some CO2 emissions previously registered as combustion emissions, have now
been reallocated to process emissions. This causes an annual rise in the process emissions of
10-15 ktonnes for all years 1990-2008.
4.3.6.6 Planned improvements
The ERT has noted an unstable and increasing trend from 2006 for the CO2 emissions from
plastic. A preliminary assessment is that the increase may be due to inconsistencies with
regards to where emissions from flaring have been allocated. We intend to look into this in
time for the submission of the 2013 NIR.
National Inventory Report 2012 - Norway
183
4.3.7 Titanium dioxide production – 2B5
4.3.7.1 Description
One plant producing titanium dioxide slag is included in the Norwegian Inventory. The plant
also produced pig iron as a by-product. The titanium dioxide slag and pig iron are produced
from the mineral ilmenite and coal is used as a reducing agent. Various components included
CO2 are emitted during the production process.
Due to a reallocation after the key category analysis was performed, 2C1 – Iron and Steel
Production should be replaced as key by 2B5 Other Chemical Industry. This will be updated
in the next NIR submission.
4.3.7.2 Methodological issues
The method that is used for all years can be defined as a calculation based on carbon balance.
This method accounts for all the carbon in the materials entering the process and subtracts the
CO2 captured in the products.
4.3.7.3 Emission factors
Emission factors for flare of natural gas are for CO2: 2340 tonnes/Sm3, for CH4 0.24
tonnes/Sm3 and for N2O: 0.02 tonnes/Sm3.
4.3.7.4 Uncertainties
Uncertainty estimates for greenhouse gases are given in Annex II.
4.3.7.5 Source specific QA/QC and verification
The general QA/QC methodology is given in Section 1.6 and the specific QA/QC carried out
for Industrial processes is described in Annex III to the 2010 NIR.
4.3.7.6 Recalculations
As recommended by the ERT, emissions previously reported under 2C1 Pig iron, have been
moved to 2B5 Titanium dioxide production for the whole time period.
4.3.7.7 Planned improvements
There is no planned activity this year that will improve the data quality for NIR 2013.
4.3.8 Production of Explosives – 2B5
4.3.8.1 Description
There has been one plant in Norway producing explosives, but the plant was closed down in
2001. Nitric acid was used as a raw material in the manufacture of explosives and in the
production of nitric acid NOX was emitted.
4.4 Metal Production – 2C
Metal production in Norway includes plants producing iron and steel, ferroalloys, aluminum,
nickel zinc and also magnesium until spring 2006. Production of anodes is also included in
National Inventory Report 2012 - Norway
184
this chapter. Nearly all emissions figures from the production of metals included in the
inventory are figures reported annually from the plants to the Klif.
8.4 per cent of total GHG emissions in Norway were from Metal Production in 2010, and the
sector contributed with 60.8 per cent of the emissions from Industrial Processes. The largest
contributor to the GHG emissions from Metal Production in 2010 is Aluminum production
and ferroalloys.
The emissions from Metal Production decreased by 53.9 per cent from 1990-2010 and
increased by 16.0 per cent from 2009-2010. The reduction from 1990-2010 was due to
decreased PFC and SF6 that again was due to improvement in technology aluminum
production, the close down of a magnesium plant in 2006 and generally lower production
volumes. The CO2 emissions from Metal Production decreased by 0.1 per cent from 1990-
2010 and increased by 22.5 percent from 2009-2010.
Table 4.6. Metal production. Components emitted and included in the Norwegian inventory.
CO2 CH4 PFCs SF6 Tier Key
category
2C1 Iron and
steel*)
R NA NA NA Tier 2 Yes
2C2 Ferroalloys R R NA NA Tier 2/3 Yes
2C3 Primary
aluminium
R NA R R Tier 2 Yes
2C4 Secondary
aluminium
NA NA NA R Tier 1 No
2C4 Magnesium E NA NA R Tier 2 Yes
2C5 Nickel R NA NA NA Tier 2 No
2C5 Anodes R NA NA NA Tier 2 No
R means that emission figures in the national emission inventory are based on figures reported by the
plants. E means that the figures are estimated by Statistics Norway (Activity data * emission factor).
NA = Not Applicable.
*) Due to a reallocation after the key category analysis was performed, 2C1 – Iron and Steel Production
should be replaced as key by 2B5 Other Chemical Industry.
4.4.1 Production of Iron and Steel – CO2 – 2C1(Key Category)
4.4.1.1 Description
Norway includes one plant producing steel in the Norwegian Inventory and the activity data
in the CRF is steel produced.
Due to a reallocation after the key category analysis was performed, 2C1 – Iron and Steel
Production should be replaced as key by 2B5 Other Chemical Industry. This will be updated
in the next NIR submission.
National Inventory Report 2012 - Norway
185
4.4.1.2 Methodological issues
In the Norwegian GHG Inventory, emission figures of CO2, annually reported to the Klif, are
used. This reporting includes both the reporting under the EU ETS and reporting as required
under its regular emission permit.All emission figures are based on calculations.
The total emissions from steel production cover emissions from industrial processes and from
combustion. For the years 1998-2001 and 2005-2008 we have detailed emission distributed
between combustion and processes from the plant. The process emissions in 1990, 1992-1997
have been estimated on the basis of CO2 emissions per ton steel produced in 1998 multiplied
with the actual production of steel. For 2002-2004 the same method is used but then we have
used the 2005 process emissions per ton steel produced. The emissions from combustion are
the total CO2 emissions reported by the plant minus the estimated emissions from processes.
The process CO2 emissions stem from an Electric Arc Furnace (EAF) where scrap iron is
melted with other carbon materials. The emissions from the scrap iron are calculated based on
the use of each types of scrap iron and the appurtenant content of carbon in each type of scrap
iron. E.g. in 2010 the plant used 10 types of scrap iron. The types of scrap iron are according
to the UK steel protocol and the carbon content in the types of scrap used varies from 0.15 per
cent up to 4 per cent. The other input materials to the EAF are coal, lime and the metals
ferromanganese, ferrosilicon and silicomanganese and electrodes. The outputs are steel, dust
and slag. The net emissions from the mass balance are the process emissions.
4.4.1.3 Uncertainties
Uncertainty estimates for greenhouse gases are given in Annex IV.
4.4.1.4 Source specific QA/QC and verification
The general QA/QC methodology is given in Section 1.6 and the specific QA/QC carried out
for Industrial processes is described in Annex III to the 2010 NIR. CO2 emission figures
reported to Klif are compared with calculations at Statistics Norway using the amount of
reducing agent and emission factors. This method is recommended by IPCC when data from
measurements are not available.
Annually reported emission figures are first controlled by the Klif and then Statistics Norway.
Adjustments and recalculations have been done for those years reported emission figures
seem to be unreasonable high or low compared to previously years. This is applicable when
the variations in the reported emission figures do not have a natural explanation.
4.4.1.5 Recalculations
The reported CO2 emissions for 2009 have increased by 2 000 tonnes due to revised data. In
addition, as recommended by the ERT, emissions previously reported under 2C1 Pig iron,
have been reallocated to 2B5 Titanium dioxide production for the whole time period.
4.4.1.6 Planned improvements
There is no planned activity this year that will improve the data quality for NIR 2013.
National Inventory Report 2012 - Norway
186
4.4.2 Production of Ferroalloys – CO2 – 2C2 (Key Category)
4.4.2.1 Description
There were 12 plants producing ferroalloys in Norway in 2010. One plant closed down in
2001, two plants were closed down during 2003 and two in 2006. The plant that was out of
production in 2006 started up again in 2007. Ferrosilicon, silicon metal, ferromanganese and
silicon manganese are now produced in Norway. Ferrochromium was produced until the
summer in 2001. Ferro silicon with 65 to 96 percent Si and silicon metal with 98-99 percent
Si is produced. The raw material for silicon is quarts (SiO2). SiO2 is reduced to Si and CO
using reducing agents like coal, coke and charcoal.
(4.8) SiO2 SiO Si + CO
The waste gas CO and some SiO burns to form CO2 and SiO2 (silica dust).
In ferroalloy production, raw ore, carbon materials and slag forming materials are mixed and
heated to high temperatures for reduction and smelting. The carbon materials used are coal,
coke and some bio carbon (charcoal and wood). Electric submerged arc furnaces with
graphite electrodes or consumable Soederberg electrodes are used. The heat is produced by
the electric arcs and by the resistance in the charge materials. The furnaces used in Norway
are open, semi-covered or covered.
Several components are emitted from production of ferroalloys. Emission of CO2 is a result of
the oxidation of the reducing agent used in the production of ferroalloys. In the production of
FeSi and silicon metal NMVOC and CH4 emissions originates from the use of coal and coke
in the production processes. From the production of ferro manganes (FeMn), silicon
manganes (SiMn) and ferrochromium (FeCr) there is only CO2 emissions.
Measurements performed at Norwegian plants producing ferro alloys indicates that in addition
to emissions of CO2 and CH4 also N2O is emitted. The emissions of CH4 and N2O are
influenced by the following parameters:
The silicon level of the alloy (65, 75, 90 or 98 % Si) and the silicon yield
The method used for charging the furnace (batch or continuously)
The amount of air used to burn the gases at the top controlling the temperature in off
gases.
The GHG emissions (CO2, CH4 and N2O) from ferroalloy production accounted for 5.1 per
cent of the national total GHG emissions in 1990 and 4.0 per cent in 2010. The emissions
from production of ferroalloy decreased by 14.9 per cent from 1990 to 2010. From 2009 to
2010 the GHG emissions from ferroalloy production increased by 50.2 per cent.
According to the Tier 1 key category analysis CO2 emissions from production of ferroalloys
are key category due to the large share of total emissions.
4.4.2.2 Methodological issues
CO2
The methods used in the calculation of CO2 emissions form production of ferroalloy is in
accordance with the method recommended by the IPCC (IPCC 1997b), GPG (IPCC 2001)
and the 2006 Guidelines adopted by IPCC.. Emissions are reported by each plant in an annual
report to the Klif.
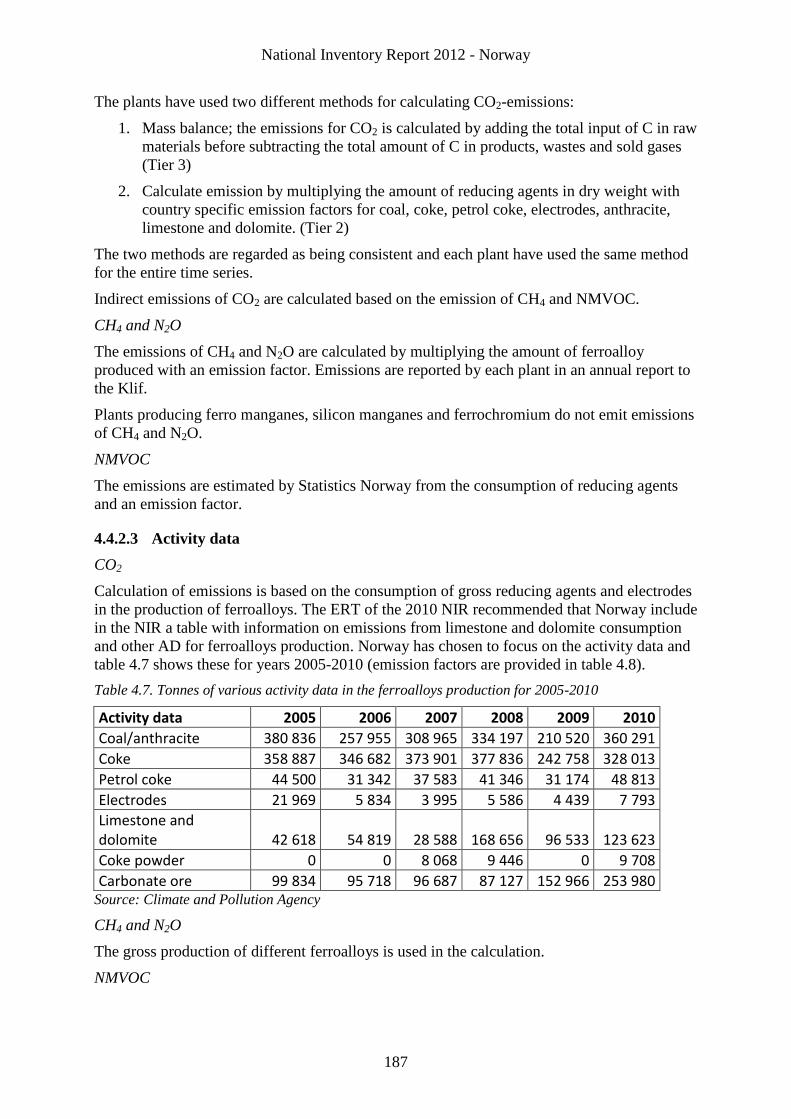
National Inventory Report 2012 - Norway
187
The plants have used two different methods for calculating CO2-emissions:
1. Mass balance; the emissions for CO2 is calculated by adding the total input of C in raw
materials before subtracting the total amount of C in products, wastes and sold gases
(Tier 3)
2. Calculate emission by multiplying the amount of reducing agents in dry weight with
country specific emission factors for coal, coke, petrol coke, electrodes, anthracite,
limestone and dolomite. (Tier 2)
The two methods are regarded as being consistent and each plant have used the same method
for the entire time series.
Indirect emissions of CO2 are calculated based on the emission of CH4 and NMVOC.
CH4 and N2O
The emissions of CH4 and N2O are calculated by multiplying the amount of ferroalloy
produced with an emission factor. Emissions are reported by each plant in an annual report to
the Klif.
Plants producing ferro manganes, silicon manganes and ferrochromium do not emit emissions
of CH4 and N2O.
NMVOC
The emissions are estimated by Statistics Norway from the consumption of reducing agents
and an emission factor.
4.4.2.3 Activity data
CO2
Calculation of emissions is based on the consumption of gross reducing agents and electrodes
in the production of ferroalloys. The ERT of the 2010 NIR recommended that Norway include
in the NIR a table with information on emissions from limestone and dolomite consumption
and other AD for ferroalloys production. Norway has chosen to focus on the activity data and
table 4.7 shows these for years 2005-2010 (emission factors are provided in table 4.8).
Table 4.7. Tonnes of various activity data in the ferroalloys production for 2005-2010
Activity data 2005 2006 2007 2008 2009 2010
Coal/anthracite 380 836 257 955 308 965 334 197 210 520 360 291
Coke 358 887 346 682 373 901 377 836 242 758 328 013
Petrol coke 44 500 31 342 37 583 41 346 31 174 48 813
Electrodes 21 969 5 834 3 995 5 586 4 439 7 793
Limestone and dolomite 42 618 54 819 28 588 168 656 96 533 123 623
Coke powder 0 0 8 068 9 446 0 9 708
Carbonate ore 99 834 95 718 96 687 87 127 152 966 253 980 Source: Climate and Pollution Agency
CH4 and N2O
The gross production of different ferroalloys is used in the calculation.
NMVOC
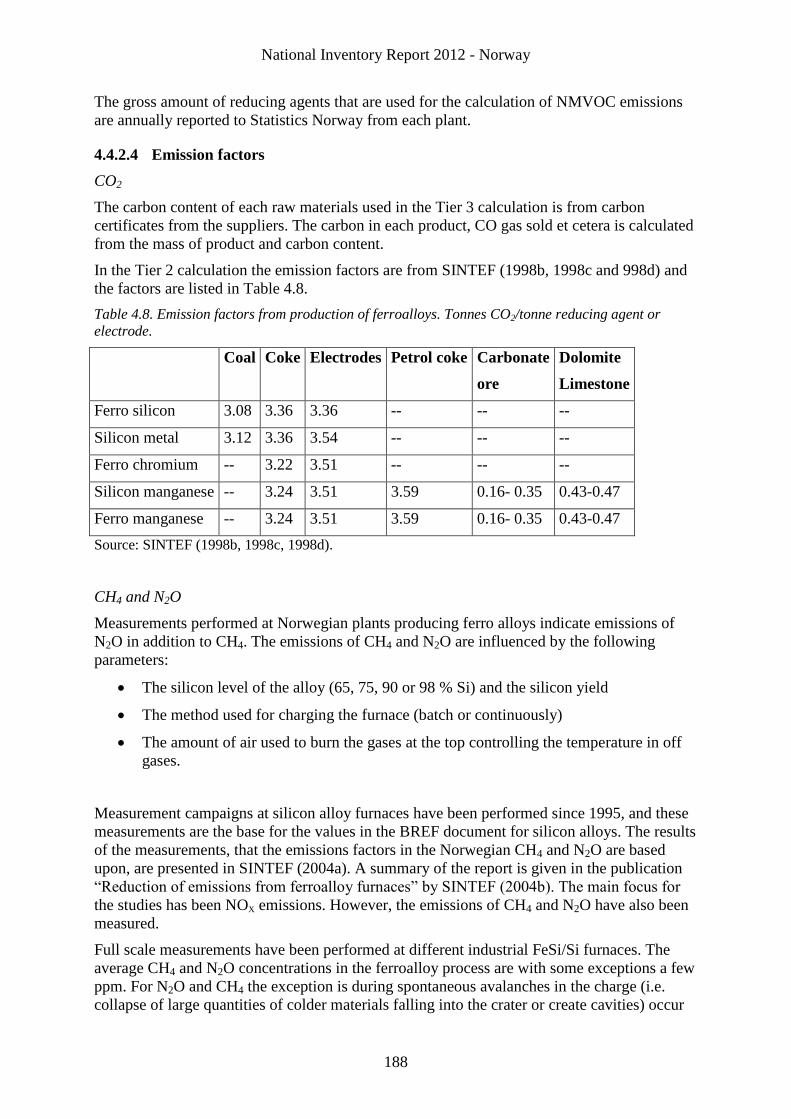
National Inventory Report 2012 - Norway
188
The gross amount of reducing agents that are used for the calculation of NMVOC emissions
are annually reported to Statistics Norway from each plant.
4.4.2.4 Emission factors
CO2
The carbon content of each raw materials used in the Tier 3 calculation is from carbon
certificates from the suppliers. The carbon in each product, CO gas sold et cetera is calculated
from the mass of product and carbon content.
In the Tier 2 calculation the emission factors are from SINTEF (1998b, 1998c and 998d) and
the factors are listed in Table 4.8.
Table 4.8. Emission factors from production of ferroalloys. Tonnes CO2/tonne reducing agent or
electrode.
Coal Coke Electrodes Petrol coke Carbonate
ore
Dolomite
Limestone
Ferro silicon 3.08 3.36 3.36 -- -- --
Silicon metal 3.12 3.36 3.54 -- -- --
Ferro chromium -- 3.22 3.51 -- -- --
Silicon manganese -- 3.24 3.51 3.59 0.16- 0.35 0.43-0.47
Ferro manganese -- 3.24 3.51 3.59 0.16- 0.35 0.43-0.47
Source: SINTEF (1998b, 1998c, 1998d).
CH4 and N2O
Measurements performed at Norwegian plants producing ferro alloys indicate emissions of
N2O in addition to CH4. The emissions of CH4 and N2O are influenced by the following
parameters:
The silicon level of the alloy (65, 75, 90 or 98 % Si) and the silicon yield
The method used for charging the furnace (batch or continuously)
The amount of air used to burn the gases at the top controlling the temperature in off
gases.
Measurement campaigns at silicon alloy furnaces have been performed since 1995, and these
measurements are the base for the values in the BREF document for silicon alloys. The results
of the measurements, that the emissions factors in the Norwegian CH4 and N2O are based
upon, are presented in SINTEF (2004a). A summary of the report is given in the publication
“Reduction of emissions from ferroalloy furnaces” by SINTEF (2004b). The main focus for
the studies has been NOX emissions. However, the emissions of CH4 and N2O have also been
measured.
Full scale measurements have been performed at different industrial FeSi/Si furnaces. The
average CH4 and N2O concentrations in the ferroalloy process are with some exceptions a few
ppm. For N2O and CH4 the exception is during spontaneous avalanches in the charge (i.e.
collapse of large quantities of colder materials falling into the crater or create cavities) occur
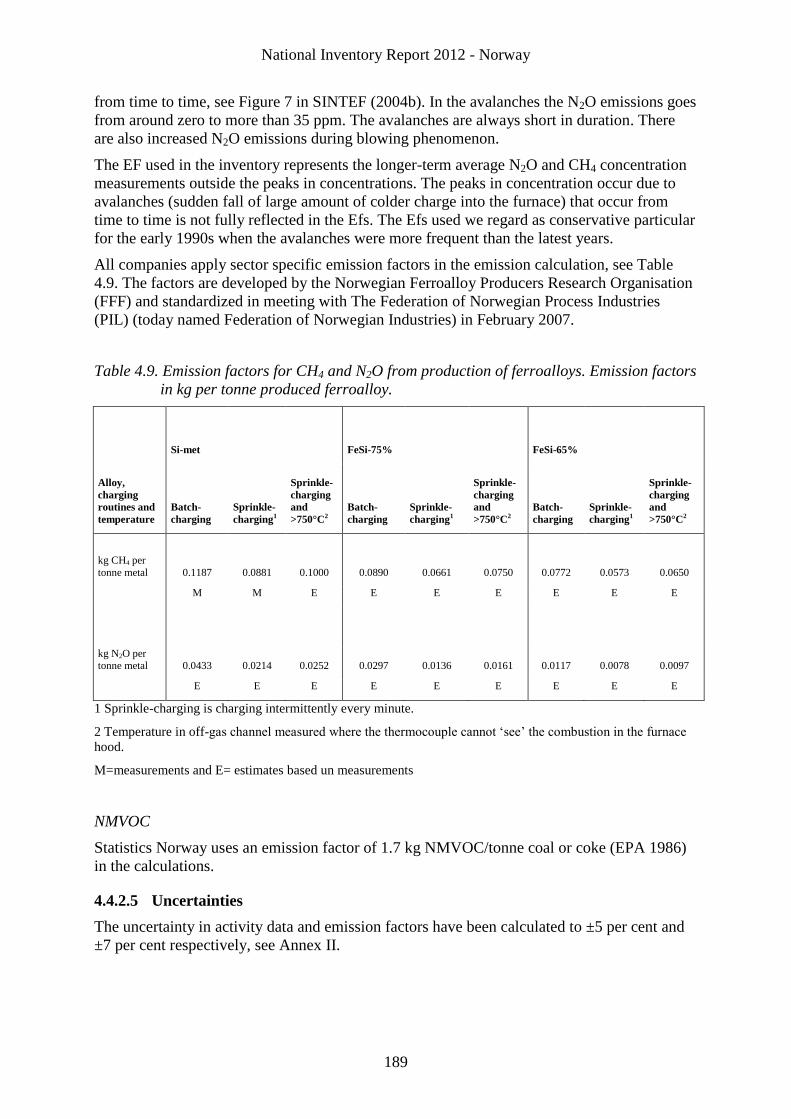
National Inventory Report 2012 - Norway
189
from time to time, see Figure 7 in SINTEF (2004b). In the avalanches the N2O emissions goes
from around zero to more than 35 ppm. The avalanches are always short in duration. There
are also increased N2O emissions during blowing phenomenon.
The EF used in the inventory represents the longer-term average N2O and CH4 concentration
measurements outside the peaks in concentrations. The peaks in concentration occur due to
avalanches (sudden fall of large amount of colder charge into the furnace) that occur from
time to time is not fully reflected in the Efs. The Efs used we regard as conservative particular
for the early 1990s when the avalanches were more frequent than the latest years.
All companies apply sector specific emission factors in the emission calculation, see Table
4.9. The factors are developed by the Norwegian Ferroalloy Producers Research Organisation
(FFF) and standardized in meeting with The Federation of Norwegian Process Industries
(PIL) (today named Federation of Norwegian Industries) in February 2007.
Table 4.9. Emission factors for CH4 and N2O from production of ferroalloys. Emission factors
in kg per tonne produced ferroalloy.
Alloy,
charging
routines and
temperature
Si-met FeSi-75% FeSi-65%
Batch-
charging
Sprinkle-
charging1
Sprinkle-
charging
and
>750°C2
Batch-
charging
Sprinkle-
charging1
Sprinkle-
charging
and
>750°C2
Batch-
charging
Sprinkle-
charging1
Sprinkle-
charging
and
>750°C2
kg CH4 per
tonne metal 0.1187 0.0881 0.1000 0.0890 0.0661 0.0750 0.0772 0.0573 0.0650
M M E E E E E E E
kg N2O per tonne metal 0.0433 0.0214 0.0252 0.0297 0.0136 0.0161 0.0117 0.0078 0.0097
E E E E E E E E E
1 Sprinkle-charging is charging intermittently every minute.
2 Temperature in off-gas channel measured where the thermocouple cannot ‘see’ the combustion in the furnace
hood.
M=measurements and E= estimates based un measurements
NMVOC
Statistics Norway uses an emission factor of 1.7 kg NMVOC/tonne coal or coke (EPA 1986)
in the calculations.
4.4.2.5 Uncertainties
The uncertainty in activity data and emission factors have been calculated to ±5 per cent and
±7 per cent respectively, see Annex II.
National Inventory Report 2012 - Norway
190
4.4.2.6 Source specific QA/QC and verification
The general QA/QC methodology is given in Section 1.6 and the specific QA/QC carried out
for Industrial processes is described in Annex III to the 2010 NIR. The reported emissions
from the plants were compared with emissions data given in the white book and other relevant
data available. In some cases, the emission data were verified by making control calculation
based on emission factors and activity data. In all cases, the construction of charts and figures
of emissions and activity data helped identifying missing data and possible errors.
All the main producers of ferroalloys in Norway were contacted and asked to supply missing
emissions data and activity, and to explain any possible errors identified. The feedback from
the companies made it possible to make corrections and filling of gaps in the series of data.
A complete time series from 1990 to 2004 could be established for all three relevant
greenhouse gas parameters for most companies. Data from the white book and the reported
company data corresponded well.
During the review of the initial report in the 2007 activity data like coal, coke, electrodes,
petrol coke and bio carbon were collected from each plant once again and so were emissions
of CH4 and N2O based on Efs shown in Table 4.8. With very few exceptions the AD reported
in the CRF is data that the plants have reported to Klif. The IEF for the sector and also for
each plant is fluctuating from year to year mainly due to variation in sold CO and in
production of ferro alloy products.
Statistics Norway makes in addition an annual quality control (QC) of the emission data on
the bases of the consumption of reducing agents they collect in an annual survey and average
emission factors.
4.4.2.7 Recalculations
The reported CO2 figures for one plant have been marginally adjusted downwards for 2007,
and were increased by 10 000 tonnes for 2008 due to revised data.
4.4.2.8 Planned improvements
There is no planned activity this year that will improve the data quality for NIR 2013.
4.4.3 Production of Primary Aluminium –CO2 and PFC – 2C3 (Key Category)
4.4.3.1 Description
There are seven plants in Norway producing aluminium. Both prebaked anode and the
Soederberg production methods are used. In the Soederberg technology, the anodes are baked
in the electrolysis oven, while in the prebaked technology the anodes are baked in a separate
plant. In general the emissions are larger from the Soederberg technology than from the
prebaked technology.
Production of aluminium leads to emission of various components as CO2, SO2, NOX,
perfluorocarbons (PFCs), heavy metals and persistent organic pollutants. The emission of CO2
is due to the electrolysis process during the production of aluminium, while the SO2 emissions
are from the sulphur in the reducing agents used. NOX is primary produced by the high
temperature oxidation of nitrogen in the air. All plants also report emissions of particles,
heavy metals and PAH. Emissions of heavy metals are due to the metal content in the raw
materials used and the reducing agents.
National Inventory Report 2012 - Norway
191
There has been a substantial reduction in the total PFC emissions from the seven Norwegian
aluminium plants in the period from 1990 to 2010. This is a result of the sustained work and
the strong focus on reduction of the anode effect frequency in all these pot lines and that there
has been a shift from Soederberg to prebaked technology. The focus on reducing anode effect
frequency started to produce results from 1992 for both technologies. For prebaked
technology the PFC emissions per tonne aluminium were reduced from 2.57 in 1990 to 1.98
in 1991 and 0.96 in 1992 and respective values for Soederberg were 5.61, 5.29 and 5.03. In
2010 the specific PFC emissions for prebaked and Soederberg were 0.18 and 0.27 kg CO2-
equivalent, see Figure 4.5.
In 1990, 57 per cent of the aluminium production in Norway was produced with prebaked
technology and the share of aluminium production from prebaked was increased to 92 per
cent in 2010. Two new plants with prebaked technology were established in 2002 and plants
using Soederberg technology were closed down in the period 2002-2009.
PFCs emissions from production of aluminium contribute in 1990 to 6.8 per cent of the total
GHG emissions in Norway. The share of the totals in 2010 is reduced to 0.4 per cent.
Emissions of PFCs are decreased with 93.9 per cent from 1990 to 2010. Between 2009 and
2010 emissions decreased by 45.6 per cent.
The PFC emissions per tonne aluminium produced in Norway was 3.88 kg CO2-equivalent in
1990 and 0.19 kg CO2-equivalent in 2010. This is a reduction of 95.2 per cent from 1990 to
2010. From 2009 to 2010, the PFC emissions per tonne aluminium produced were reduced by
44.7 per cent.
An increase in production capacity is also included in the modernisation, leading to higher
total emissions of CO2. The implied emission factor for CO2 is relatively stable.
PFCs and CO2 emissions from aluminium production are both key category in level, PFC also
in trend both according to the Tier 2 key category analysis.
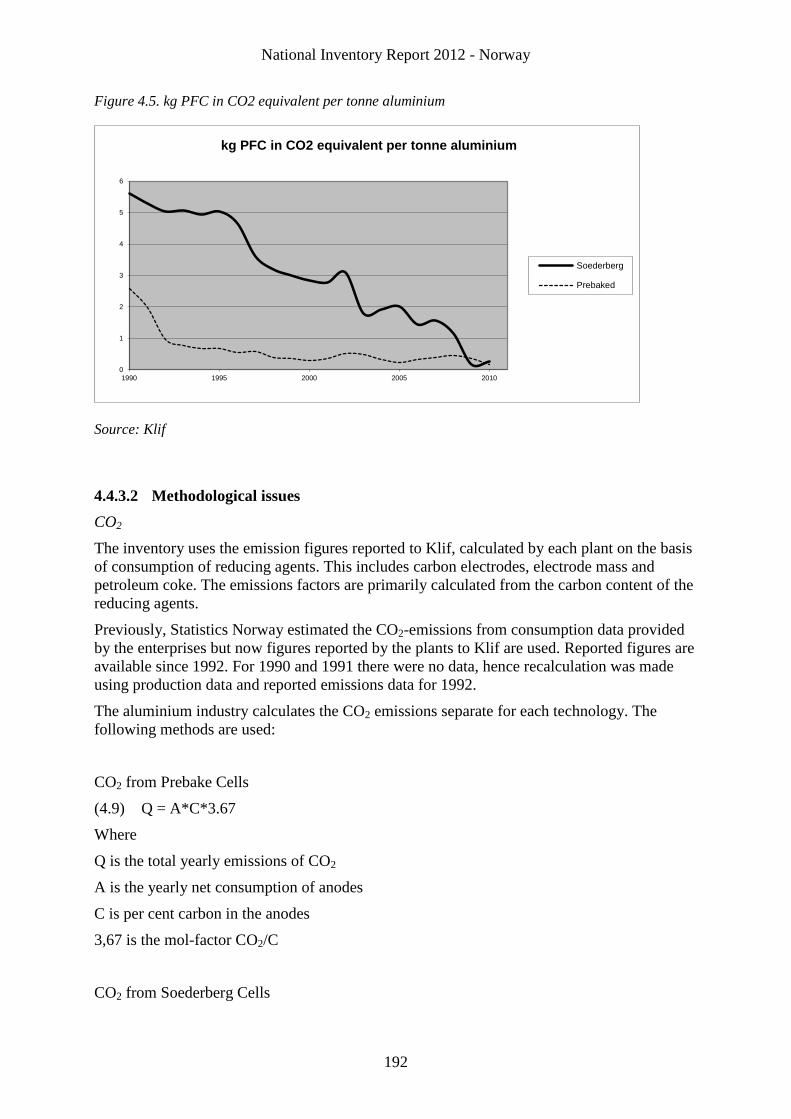
National Inventory Report 2012 - Norway
192
Figure 4.5. kg PFC in CO2 equivalent per tonne aluminium
Source: Klif
4.4.3.2 Methodological issues
CO2
The inventory uses the emission figures reported to Klif, calculated by each plant on the basis
of consumption of reducing agents. This includes carbon electrodes, electrode mass and
petroleum coke. The emissions factors are primarily calculated from the carbon content of the
reducing agents.
Previously, Statistics Norway estimated the CO2-emissions from consumption data provided
by the enterprises but now figures reported by the plants to Klif are used. Reported figures are
available since 1992. For 1990 and 1991 there were no data, hence recalculation was made
using production data and reported emissions data for 1992.
The aluminium industry calculates the CO2 emissions separate for each technology. The
following methods are used:
CO2 from Prebake Cells
(4.9) Q = A*C*3.67
Where
Q is the total yearly emissions of CO2
A is the yearly net consumption of anodes
C is per cent carbon in the anodes
3,67 is the mol-factor CO2/C
CO2 from Soederberg Cells
0
1
2
3
4
5
6
1990 1995 2000 2005 2010
kg PFC in CO2 equivalent per tonne aluminium
Soederberg
Prebaked
National Inventory Report 2012 - Norway
193
(4.10) Q = S*3.67*(K*C1+P*C2)
Where
Q is the total yearly emissions of CO2
S is the yearly consumption of Soederberg paste
K is the share of coke in the Soederberg paste
P is the share of patch in the Soederberg paste
K+P=1
C1 is the fraction of carbon in the coke. Fraction is per cent Carbon/100
C2 is the fraction of carbon in the peach. Fraction is per cent Carbon/100
PFCs
Perfluorinated hydrocarbons (PFCs), e.g. tetrafluoromethane (CF4) and hexafluoroethane
(C2F6), are produced during anode effects (AE) in the Prebake and Soederberg cells, when the
voltage of the cells increases from the normal 4-5V to 25-40V. During normal operating
condition, PFCs are not produced. The fluorine in the PFCs produced during anode effects
originates from cryolite. Molten cryolite is necessary as a solvent for alumina in the
production process.
Emissions of PFCs from a pot line (or from smelters) are dependent on the number of anode
effects and their intensity and duration. Anode effect characteristics will be different from
plant to plant and also depend on the technology used (Prebake or Soederberg).
During electrolysis two per fluorocarbon gases (PFCs), tetrafluormethane (CF4) and
heksafluorethane (C2F6), may be produced in the following reaction:
Reaction 1
463 3CF12NaF4Al3CAlF4Na
Reaction 2
6263 FC212NaF4Al4CAlF4Na
The national data are based on calculated plant specific figures from each of the seven
Norwegian plants. We have used the Tier 2 method in our calculations, which are based on a
technology specific relationship between anode effect performance and PFCs emissions. The
PFCs emissions are then calculated by the so-called slope method, where a constant slope
coefficient, see Table 4.10, given as kg CF4/tonne Al/anode effect minutes per cellday, is
multiplied by the product of anode effect frequency and anode effect duration (in other words,
by the number of anode effect minutes per cell day), and this product is finally multiplied by
the annual aluminum production figure (tonnes of Al/year). The formula for calculating the
PFCs is:
kg CF4 per year = SCF4 • AEM • MP
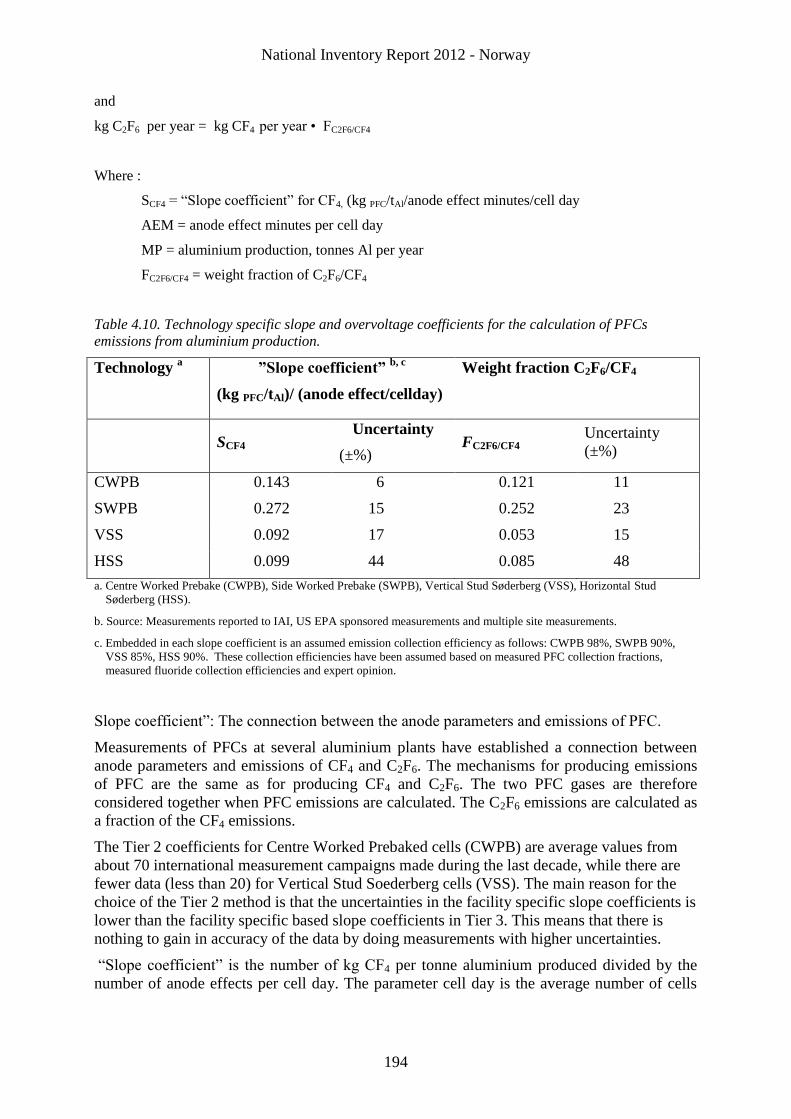
National Inventory Report 2012 - Norway
194
and
kg C2F6 per year = kg CF4 per year • FC2F6/CF4
Where :
SCF4 = “Slope coefficient” for CF4, (kg PFC/tAl/anode effect minutes/cell day
AEM = anode effect minutes per cell day
MP = aluminium production, tonnes Al per year
FC2F6/CF4 = weight fraction of C2F6/CF4
Table 4.10. Technology specific slope and overvoltage coefficients for the calculation of PFCs
emissions from aluminium production.
Technology a ”Slope coefficient”
b, c
(kg PFC/tAl)/ (anode effect/cellday)
Weight fraction C2F6/CF4
SCF4
Uncertainty
(±%) FC2F6/CF4
Uncertainty
(±%)
CWPB 0.143 6 0.121 11
SWPB 0.272 15 0.252 23
VSS 0.092 17 0.053 15
HSS 0.099 44 0.085 48
a. Centre Worked Prebake (CWPB), Side Worked Prebake (SWPB), Vertical Stud Søderberg (VSS), Horizontal Stud
Søderberg (HSS).
b. Source: Measurements reported to IAI, US EPA sponsored measurements and multiple site measurements.
c. Embedded in each slope coefficient is an assumed emission collection efficiency as follows: CWPB 98%, SWPB 90%,
VSS 85%, HSS 90%. These collection efficiencies have been assumed based on measured PFC collection fractions,
measured fluoride collection efficiencies and expert opinion.
Slope coefficient”: The connection between the anode parameters and emissions of PFC.
Measurements of PFCs at several aluminium plants have established a connection between
anode parameters and emissions of CF4 and C2F6. The mechanisms for producing emissions
of PFC are the same as for producing CF4 and C2F6. The two PFC gases are therefore
considered together when PFC emissions are calculated. The C2F6 emissions are calculated as
a fraction of the CF4 emissions.
The Tier 2 coefficients for Centre Worked Prebaked cells (CWPB) are average values from
about 70 international measurement campaigns made during the last decade, while there are
fewer data (less than 20) for Vertical Stud Soederberg cells (VSS). The main reason for the
choice of the Tier 2 method is that the uncertainties in the facility specific slope coefficients is
lower than the facility specific based slope coefficients in Tier 3. This means that there is
nothing to gain in accuracy of the data by doing measurements with higher uncertainties.
“Slope coefficient” is the number of kg CF4 per tonne aluminium produced divided by the
number of anode effects per cell day. The parameter cell day is the average number of cells
National Inventory Report 2012 - Norway
195
producing on a yearly basis multiplied with the number of days in a year that the cells have
been producing.
Sulphur hexafluoride (SF6)
SF6 used as cover gas in the aluminium industry is assumed to be inert, and SF6 emissions are
therefore assumed to be equal to consumption. At one plant SF6 was used as cover gas in the
production of a specific quality of aluminium from 1992 to 1996. The aluminium plant no
longer produces this quality, which means that SF6 emissions have stopped.
4.4.3.3 Emission factors
In the present calculations we have calculated the PFC emissions using the newest Tier 2
recommended values by IAI for CF4 (the slope coefficients of 0.143 kg CF4/tonne Al/anode
effect minutes per cell day for CWPB and 0.092 for VSS). The amount of C2F6 is calculated
from the Tier 2 values for CF4, where the weight fraction of C2F6 to CF4 is set equal to 0.121
for CWPB and 0.053 for VSS. This change alone increases the calculated CO2-equivalent
emissions by 10% for our prebake cells, because of the high global warming potential for
C2F6.
Thus, all the values we have used in our present calculations are technology specific data,
recommended by IAI. Our facility specific measured data that we have used until today are all
in agreement with these data, within the uncertainty range of the measurement method
employed.
4.4.3.4 Activity data
Both production data and consumption of reducing agents and electrodes is reported annually
to Klif.
PFCs
The basis for the calculations of PFCs is the amount of primary aluminium produced in the
pot lines and sent to the cast house. Thus, any remelted metal is not included here.
4.4.3.5 Uncertainties
Uncertainty estimates for greenhouse gases are given in Annex II.
PFCs
The uncertainties in the so-called Tier 2 slope coefficients from IAI is lower (6% and 17% for
CWPB and VSS cells, respectively), compared to the measured facility specific based slope
coefficients, where the uncertainties are around 20%, even when the most modern measuring
equipment is used (the continuous extractive-type Fourier Transform Infrared (FTIR)
spectroscopic system). Control measurements in two Hydro Aluminium plants (Karmøy and
Sunndal) done by Jerry Marks in November 2004, showed that the measured values for
CWPB and VSS cells were well within the uncertainty range of the Tier 2 slope coefficients.
4.4.3.6 Source specific QA/QC and verification
The general QA/QC methodology is given in Section 1.6 and the specific QA/QC carried out
for Industrial processes is described in Annex III to the 2010 NIR.
CO2
National Inventory Report 2012 - Norway
196
It was possible to establish data series of CO2 from 1990 to 2004 for all plants. There are still
some discrepancies between reports of process related CO2 and energy related CO2, especially
in the beginning of the 1990s. This is because it was difficult to provide sufficient energy data
to calculate the energy related combustions.
The emission figures reported by the plants are also controlled by Statistics Norway. Statistics
Norway make their own estimates based on the consumption of reducing agents and
production data collected in an annual survey and average emission factors.
Percflourocarbons (PFCs)
The emission figures from the aluminium plants are reported to Klif annually. As a quality
control, it is checked that the reports are complete. Each figure is compared with similar
reports from previous years and also analysed taking technical changes and utilisation of
production capacity during the year into account. If errors are found the Klif contacts the plant
to discuss the reported data and changes are made if necessary.
Klif has regular meetings with the aluminium industry where all plants are represented. This
forum is used for discussion of uncertainties and improvement possibilities.
Klif’s auditing department are regularly auditing the aluminium plants. As part of the audits,
their system for monitoring, calculation and reporting of emissions are controlled.
4.4.3.7 Recalculations
The PFC emissions in 2009 from four plants have been revised due to decimal errors in the
figures used in the 2011 submission. The CF4 and C2F6 emissions reported by three of the
plants were in thousand tonnes e.g. 29000 tonnes CF4 and corrected to 28989 tonnes CF4. For
the fourth plant the emissions was included in the inventory with two decimals and now is
included with three decimals.
4.4.3.8 Planned improvements
There is no planned activity this year that will improve the data quality for NIR 2013.
4.4.4 Production of Secondary Aluminium – 2C4
4.4.4.1 Description
One open mill in Norway is handling secondary aluminium production. For earlier years there
have been some emissions of SF6.
4.4.5 Production of magnesium –SF6 – 2C4 (Key Category)
4.4.5.1 Description
There was previously one plant in Norway producing magnesium. The plant closed down the
production of primary magnesium in 2002 and the production of cast magnesium was closed
down in 2006. From the mid-1970s, both the magnesium chloride brine process and the
chlorination process were used for magnesium production. Since 1991, only the chlorination
process was in use.
Production of magnesium leads to process related CO2 and CO emissions. During the
calcinations of Dolomite (MgCa(CO3)2) to magnesium oxide, CO2 is emitted. This is reported
National Inventory Report 2012 - Norway
197
under category 2C5. During the next step, magnesium oxide is chlorinated to magnesium
chloride and coke is added to bind the oxygen as CO and CO2. SO2 is emitted due to the
sulphur in the reducing agent used.
In the foundry, producing cast magnesium, SF6 is used as a cover gas to prevent oxidation of
magnesium. The Norwegian producers of cast magnesium has assessed whether SF6 used a
cover gas reacts with other components in the furnace. The results indicate that it is relatively
inert, and it is therefore assumed that all SF6 used as cover gas is emitted to the air.
SF6 from magnesium foundries accounted in 1990 for 4.3 per cent of the national total GHG
emissions. The emissions have decreased and this is due to improvements in technology and
in process management. The primary magnesium production stopped in 2002 and only
secondary production is retained and this production has no CO2 emissions from processes.
During 2006 also the production of remelting Mg stopped and there were no emissions from
this source in 2007 and 2008.
SF6 emissions from magnesium foundries are, according to the Tier 1 key category analysis,
defined as key category in level and trend.
4.4.5.2 Methodological issues
CO2
The IPCC (1997b) recommends using the consumption of reducing agent as the activity data
for estimating emissions. (SINTEF 1998f), on the other hand, recommends using production
volume in the calculations. The Norwegian emission inventory use production data as activity
data. The CO2 emissions are therefore calculated by using annually production volume and the
emission factor recommended by (SINTEF 1998f).
SF6
The consumption figures of the cover gas (SF6) are used as the emission estimates in
accordance with the IPCC Guidelines (IPCC 1997a, 1997b). The SF6 emissions are reported
annually to Klif.
Studies performed by the Norwegian producer have assessed that SF6 used as cover gas is
inert. Therefore the consumption of SF6 is uses as the emission estimate in accordance with
the IPCC Inventory Guidelines and Good Practice Guidance.The plant reports the emissions
each year to Klif.
4.4.5.3 Activity data
In the GHG emission inventory we use production volumes as activity data in the calculation
of CO2. This method is recommended by (SINTEF 1998f). The plant reports the consumption
of SF6 to Klif.
4.4.5.4 Emission factor
An emission factor of 4.07 tonnes CO2/tonnes produced magnesium is used to calculated the
annually emissions of CO2 (SINTEF 1998f).
4.4.5.5 Uncertainties
The uncertainty in the emissions is assumed to be ± 5 per cent, see Annex II.
National Inventory Report 2012 - Norway
198
4.4.5.6 Source specific QA/QC and verification
The general QA/QC methodology is given in Section 1.6 and the specific QA/QC carried out
for Industrial processes is described in Annex III to the 2010 NIR. The latest reported
emission data from the plant were compared with previously reported data and the emissions
were compared with the production.
4.4.5.7 Recalculations
There has been no recalculation since NIR 2008.
4.4.5.8 Planned improvements
Since the plant is closed down there is no further planned activity to review historical data.
4.4.6 Production of Nickel – 2C5
4.4.6.1 Description
One plant in Norway produces nickel. During the production of nickel CO2 is emitted. CO2 is
emitted in the production of nickel due to the soda from the production of nickel carbonate
and use of coke as a reducing agent.
4.4.6.2 Methodological issues
CO2
Emission figures are annually reported from the plant to the Klif and based on calculation of
material balance.
4.4.6.3 Uncertainties
Uncertainty estimates for greenhouse gases are given in Annex II.
4.4.6.4 Source specific QA/QC and verification
The general QA/QC methodology is given in Section 1.6 and the specific QA/QC carried out
for Industrial processes is described in Annex III to the 2010 NIR. There is no source specific
QA/QC procedure for this sector. See section 1.6 for the description of the general QA/QC
procedure.
4.4.6.5 Recalculations
There has been no recalculation since NIR 2008.
4.4.6.6 Planned improvements
There is no planned activity this year that will improve the data quality for NIR 2013.
4.4.7 Manufacture of Anodes – 2C5
4.4.7.1 Description
Four plants in Norway produce anodes. Prebaked anodes and coal electrodes are alternatives
to the use of coal and coke as reducing agents in the production process for aluminium and
National Inventory Report 2012 - Norway
199
ferroalloys. The anodes and coal electrodes are produced from coal and coke. The production
of anodes and coal electrodes leads to emissions of CO2.
4.4.7.2 Methodological issues
The emissions of CO2 are calculated by each plant and the method is based on the Aluminium
Sector Greenhouse Gas Protocol by the International Aluminium Institute (IAI 2005).
4.4.7.3 Uncertainties
Uncertainty estimates for greenhouse gases are given in Annex II.
4.4.7.4 Source specific QA/QC and verification
The general QA/QC methodology is given in Section 1.6 and the specific QA/QC carried out
for Industrial processes is described in Annex III to the 2010 NIR.
4.4.7.5 Recalculations
There has been no recalculation since NIR 2010.
4.4.7.6 Planned improvements
There is no planned activity this year that will improve the data quality for NIR 2013.
4.5 Other Production – 2D
4.5.1 Pulp and paper – 2D1
4.5.1.1 Description
There are CO2 emissions from non-combustion from one plant in this sector. The emissions
originate from the limestone. Emissions from combustion are included in Chapter 3.
4.5.1.2 Methodological issues
The CO2 emissions are calculated by multiplying the amount of limestone by an emission
factor. For the years 1990-97 the emissions are calculated by Klif based upon activity data
reported to Klif by the plant and emission factor. The emissions in the period 1998-2004 are
reported in the plant’s application for CO2-permits within the Norwegian emissions trading
scheme. From 2005 and onwards, the plant reports the emissions through the annual reporting
under the emissions trading scheme.
4.5.1.3 Activity data
Activity data is reported by the plant to Klif. The amount of limestone is calculated from
purchased amount.
4.5.1.4 Emission factors
The emission factor used in the calculation is 0.44 CO2 per tonne limestone.
4.5.1.5 Uncertainties
No source specific uncertainty is known.
National Inventory Report 2012 - Norway
200
4.5.1.6 Source specific QA/QC and verification
The general QA/QC methodology is given in Section 1.6 and the specific QA/QC carried out
for Industrial processes is described in Annex III to the 2010 NIR.
4.5.1.7 Recalculations
There has been no recalculation since NIR 2008.
4.5.1.8 Planned improvements
There is no planned activity this year that will improve the data quality for NIR 2013.
4.5.2 Food and drink – CO2 – 2D2 (Key category)
4.5.2.1 Description
This source category includes NMVOC emissions from production of bread and beer, CO2
from carbonic acid mainly used in breweries, export of captured CO2 and CO2 from
production of bio protein.
As mentioned in Section 4.3.1 Ammonia Production, some CO2 from this production is
captured and in Norway mainly used as carbonic acid in carbonated beverages but most of the
captured CO2 is exported. The whole tonnage, inland use and exported volume, is reported
under this category, 2D2. The largest part of the emissions takes place after the bottles is
opened and not in the breweries. In 2010, about 197 ktonnes CO2 were sold for national use
and export.
CO2 from food and drink is according to a Tier 1 key category analysis defined as key
category due to contribution in level to total GHG emission.
4.5.2.2 Methodological issues
CO2
The figures are based on the sale statistics from the ammonia producing plant.
NMVOC
Production of bread and beer (and other similar yeast products) involves fermentation
processes that lead to emission of NMVOC (ethanol). Emissions are calculated based on
production volumes and emission factors.
Production of Bio Protein CO2
CO2 emissions from production of bio protein from natural gas are included from the year
2001 when this production started. The bio protein is being used as animal fodder. Emission
data reported from the plant to the Klif are included in the national inventory.
4.5.2.3 Activity data
NMVOC
Production volumes of bread and beverage are annually reported to Statistics Norway.
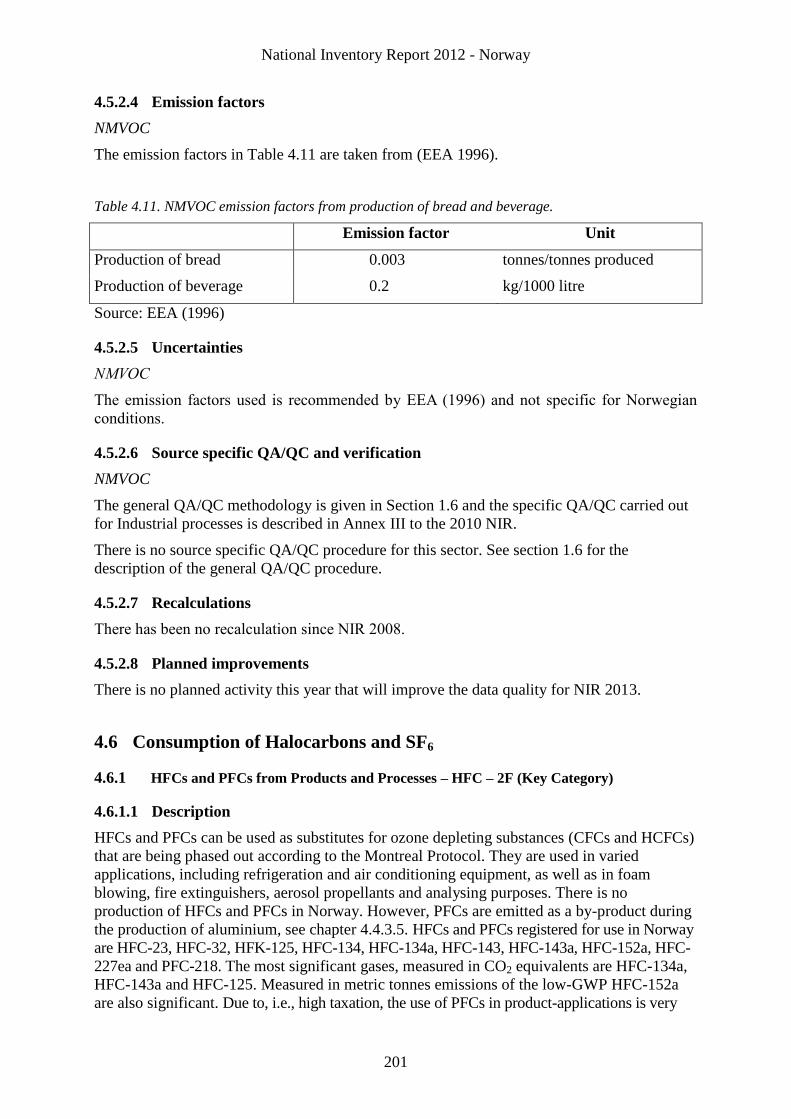
National Inventory Report 2012 - Norway
201
4.5.2.4 Emission factors
NMVOC
The emission factors in Table 4.11 are taken from (EEA 1996).
Table 4.11. NMVOC emission factors from production of bread and beverage.
Emission factor Unit
Production of bread 0.003 tonnes/tonnes produced
Production of beverage 0.2 kg/1000 litre
Source: EEA (1996)
4.5.2.5 Uncertainties
NMVOC
The emission factors used is recommended by EEA (1996) and not specific for Norwegian
conditions.
4.5.2.6 Source specific QA/QC and verification
NMVOC
The general QA/QC methodology is given in Section 1.6 and the specific QA/QC carried out
for Industrial processes is described in Annex III to the 2010 NIR.
There is no source specific QA/QC procedure for this sector. See section 1.6 for the
description of the general QA/QC procedure.
4.5.2.7 Recalculations
There has been no recalculation since NIR 2008.
4.5.2.8 Planned improvements
There is no planned activity this year that will improve the data quality for NIR 2013.
4.6 Consumption of Halocarbons and SF6
4.6.1 HFCs and PFCs from Products and Processes – HFC – 2F (Key Category)
4.6.1.1 Description
HFCs and PFCs can be used as substitutes for ozone depleting substances (CFCs and HCFCs)
that are being phased out according to the Montreal Protocol. They are used in varied
applications, including refrigeration and air conditioning equipment, as well as in foam
blowing, fire extinguishers, aerosol propellants and analysing purposes. There is no
production of HFCs and PFCs in Norway. However, PFCs are emitted as a by-product during
the production of aluminium, see chapter 4.4.3.5. HFCs and PFCs registered for use in Norway
are HFC-23, HFC-32, HFK-125, HFC-134, HFC-134a, HFC-143, HFC-143a, HFC-152a, HFC-
227ea and PFC-218. The most significant gases, measured in CO2 equivalents are HFC-134a,
HFC-143a and HFC-125. Measured in metric tonnes emissions of the low-GWP HFC-152a
are also significant. Due to, i.e., high taxation, the use of PFCs in product-applications is very
National Inventory Report 2012 - Norway
202
low.In January 2003 a tax on import and production of HFC and PFC was introduced. In July
2004 this tax was supplemented with a refund for the destruction of used gas. In 2010 the tax
and refund were both 213 NOK (approximately 29 Euro) per tonnes of CO2-equivalents.
Based on these new realities a project was established to review the emission calculations of
HFC and PFC. This work (Statistics Norway (2007b)) was completed in mars 2007 and is
reflected in this report.
EU regulation (EC) No 842/2006 on certain fluorinated greenhouse gases was included in
Norwegian legislation in May 2010.
HFC emissions increased from 0.77 Mtonnes CO2-equivalents in 2009 to 0.82 Mtonnes CO2
equivalents in 2010, and constitute 1.5% of total emissions in Norway.
This sector (2F) is according to the Tier 2 key category analysis defined as key category due
to uncertainty in trend.
4.6.1.2 Method
Actual emissions of HFCs and PFCs are calculated using the Tier 2 methodology. This
methodology takes into account the time lag in emissions from long lived sources, such as
refrigerators and air-conditioning equipment. The chemicals slowly leak out from seams and
ruptures during the lifetime of the equipment. The leakage rate, or emission factor, varies
considerably depending on type of equipment.
Potential emissions are calculated employing the Tier 1b methodology, which only considers
the import, export and destruction of chemicals in bulk and in products without time lag. The
ratio between potential (Tier 1b) and actual emissions (Tier 2) has decreased from about 4:1
in the year 2000 to less than 2:1 in 2010.
4.6.1.3 Activity data
There is no production of HFC or PFC in Norway. Hence all emissions of these chemicals
originate from imported chemicals. The methodology requires that annual imported amounts
of each chemical are obtained by source category. Various data sources are used: Amounts of
chemicals imported in bulk were up to 2009 obtained from the Norwegian Climate and
Pollution Agency. After 2009 bulk data are collected from the Norwegian Directorate of
Custom and ExciseImported and exported amounts of chemicals in all products for the years
1995-1997 were collected through a survey in 1999 (SFT 1999a), and this information was
used to estimate imports and exports the years prior to and after the survey. For the source
category refrigeration, data on imports from customs statistics were used to update the
estimated amounts for the years after 1997.
4.6.1.4 Emission factors
Leakage rates and product lifetimes used in the calculations are shown in Table 4.12.
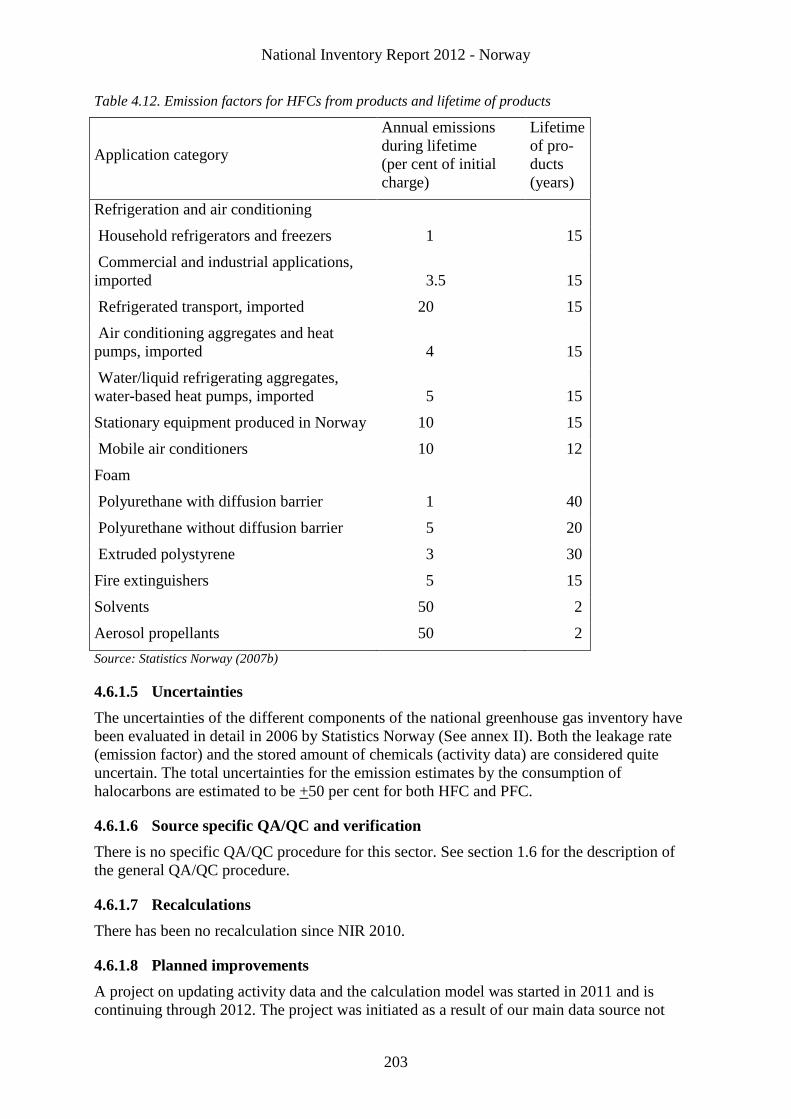
National Inventory Report 2012 - Norway
203
Table 4.12. Emission factors for HFCs from products and lifetime of products
Application category
Annual emissions
during lifetime
(per cent of initial
charge)
Lifetime
of pro-
ducts
(years)
Refrigeration and air conditioning
Household refrigerators and freezers 1 15
Commercial and industrial applications,
imported 3.5 15
Refrigerated transport, imported 20 15
Air conditioning aggregates and heat
pumps, imported 4 15
Water/liquid refrigerating aggregates,
water-based heat pumps, imported 5 15
Stationary equipment produced in Norway 10 15
Mobile air conditioners 10 12
Foam
Polyurethane with diffusion barrier 1 40
Polyurethane without diffusion barrier 5 20
Extruded polystyrene 3 30
Fire extinguishers 5 15
Solvents 50 2
Aerosol propellants 50 2
Source: Statistics Norway (2007b)
4.6.1.5 Uncertainties
The uncertainties of the different components of the national greenhouse gas inventory have
been evaluated in detail in 2006 by Statistics Norway (See annex II). Both the leakage rate
(emission factor) and the stored amount of chemicals (activity data) are considered quite
uncertain. The total uncertainties for the emission estimates by the consumption of
halocarbons are estimated to be +50 per cent for both HFC and PFC.
4.6.1.6 Source specific QA/QC and verification
There is no specific QA/QC procedure for this sector. See section 1.6 for the description of
the general QA/QC procedure.
4.6.1.7 Recalculations
There has been no recalculation since NIR 2010.
4.6.1.8 Planned improvements
A project on updating activity data and the calculation model was started in 2011 and is
continuing through 2012. The project was initiated as a result of our main data source not
National Inventory Report 2012 - Norway
204
being available from 2010 and onward. Data is however available through the Norwegian
Directorate of Custom and Exice, and new routines for collection and revision of data was
established in 2011. A first draft for updating activity data for the years 2005-2009 was
generated in 2011 by combining the two data sources. In 2012 the calculation model will be
moved to a new platform because of the lack of flexibility in the current Excel-based model.
Additionally, a small error in the emission factor for HFC-134 and Perfluorpentane (C3F8)
was discovered under the centralized review of the 2011 NIR. This does not have
consequences for the size of emissions, but will result in a shift in the time series. We intend
to reallocate these emissions in the 2013 submission.
4.6.2 Emissions of SF6 from Products and Processes – 2F
4.6.2.1 Description
In mars 2002 a voluntary agreement was signed between the Ministry of Environment and the
most important users and producers of GIS. According to this agreement emission from this
sector should be reduced by 13 per cent in 2005 and 30 per cent in 2010 with 2000 as base
year. For the following up of this agreement, the users (electricity plants and –distributors)
and producers (one factory) report yearly to the government. This voluntary agreement
terminated successfully in 2010, but a continuation is being discussed.
4.6.2.2 Methodological issues
The general methodology for estimating SF6 emissions was revised in 1999 (SFT 1999d),
while the sector specific methodology for GIS has been revised in the 2010 reporting based on
new information from the agreement. The current method for GIS is largely in accordance
with the Tier 3a methodology in the IPCC Good Practice Guidance (IPCC 2000).
The method for other sources is largely in accordance with the Tier 2 methodology in the
IPPC guidelines for emission inventories (IPCC 1997a,b). The calculations take into account
imports, exports, recycling, accumulation in bank, technical lifetimes of products, and
different rates of leakage from processes, products and production processes. From 2003 and
onwards emission estimates reported directly from users and producers, according to the
voluntary agreement, are important input.
Emissions from production of GIS (one factory) were included for the first time in 2003. The
company has, as part of the voluntary agreement with the Ministry of the Environment, made
detailed emission estimates back to 1985. These emissions constitute a significant part of
national emissions of SF6. In recent years emissions rates have been considerably reduced due
to new investments and better routines. The company now performs detailed emission
calculations based on accounting of the SF6 use throughout the whole production chain.
Emissions from a small number of GIS users that are not part of the agreement are calculated
with emission factors from Table 4.13. They account for 1-2 per cent of total emissions from
GIS use in 2008.
4.6.2.3 Activity data
Data is collected from direct consultations with importers and exporters of bulk chemicals and
products containing SF6, and from companies that use SF6 in various processes.
4.6.2.4 Emission factors
Leakage rates and product lifetimes used in the calculations are shown in Tables 4.13 and
4.14.
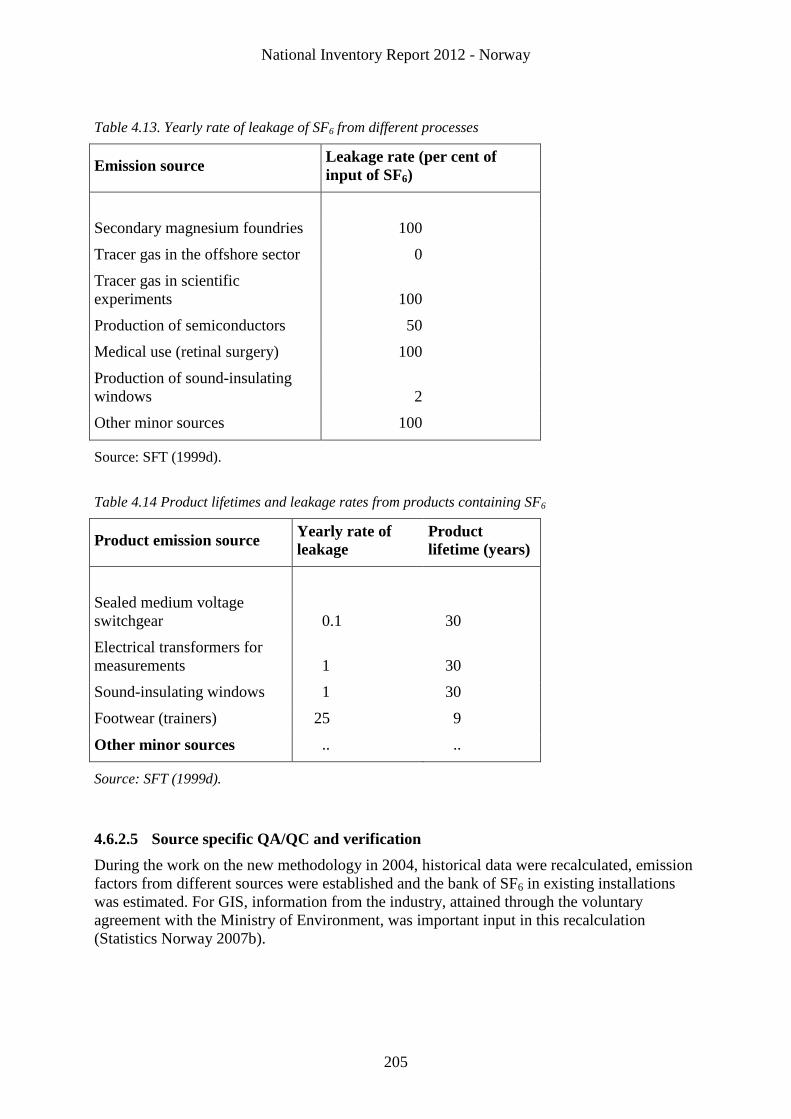
National Inventory Report 2012 - Norway
205
Table 4.13. Yearly rate of leakage of SF6 from different processes
Emission source Leakage rate (per cent of
input of SF6)
Secondary magnesium foundries 100
Tracer gas in the offshore sector 0
Tracer gas in scientific
experiments 100
Production of semiconductors 50
Medical use (retinal surgery) 100
Production of sound-insulating
windows 2
Other minor sources 100
Source: SFT (1999d).
Table 4.14 Product lifetimes and leakage rates from products containing SF6
Product emission source Yearly rate of
leakage
Product
lifetime (years)
Sealed medium voltage
switchgear 0.1 30
Electrical transformers for
measurements
1 30
Sound-insulating windows 1 30
Footwear (trainers) 25 9
Other minor sources .. ..
Source: SFT (1999d).
4.6.2.5 Source specific QA/QC and verification
During the work on the new methodology in 2004, historical data were recalculated, emission
factors from different sources were established and the bank of SF6 in existing installations
was estimated. For GIS, information from the industry, attained through the voluntary
agreement with the Ministry of Environment, was important input in this recalculation
(Statistics Norway 2007b).
National Inventory Report 2012 - Norway
206
4.6.2.6 Recalculations
For one plant, the reported SF6 emissions have been revised downwards for 2003 and 2009
due to revised data.
4.6.2.7 Planned improvements
There is no planned activity this year that will improve the data quality for NIR 2013.
4.6.3 Paraffin wax use – 2G
4.6.3.1 Description
Paraffin waxes are produced from crude oil and used in a number of different applications,
including candles, tapers and the like. Combustion of such products results in emissions of
fossil CO2.
Emissions from the incineration of products containing paraffin wax, such as wax coated
boxes, are covered by emissions estimates from waste incineration.
4.6.3.2 Methodological issues
Emissions of CO2 from the burning of candles, tapers and the like are calculated using a
modified version of equation 5.4 for Waxes – Tier 1 Method of the 2006 IPCC Guidelines:
(4.11) Emissions = PC* PF *·CCWax *·44/12
Where:
Emissions = CO2 emissions from waxes, tonne CO2
PC = total candle consumption, TJ
PF = fraction of candles made of paraffin waxes
CCWax = carbon content of paraffin wax (default), tonne C/TJ (Lower Heating Value
basis)
44/12 = mass ratio of CO2/C
Consumption figures on paraffin waxes are multiplied by the default net calorific values
(NCV). Net consumption in calorific value is then converted to carbon amount, using the
value for carbon content (Lower Heating Value basis) and finally to CO2 emissions, using the
mass ratio of CO2/C.
4.6.3.3 Activity data
Statistics Norway collects data on import, export and sold produce of “Candles, tapers and the
like (including night lights fitted with a float)”. Using these data, net consumption of paraffin
waxes and other candle waxes (including stearin) can be calculated.
4.6.3.4 Emission factors
Parameter values used in the emissions calculations are given in Table 4.15.
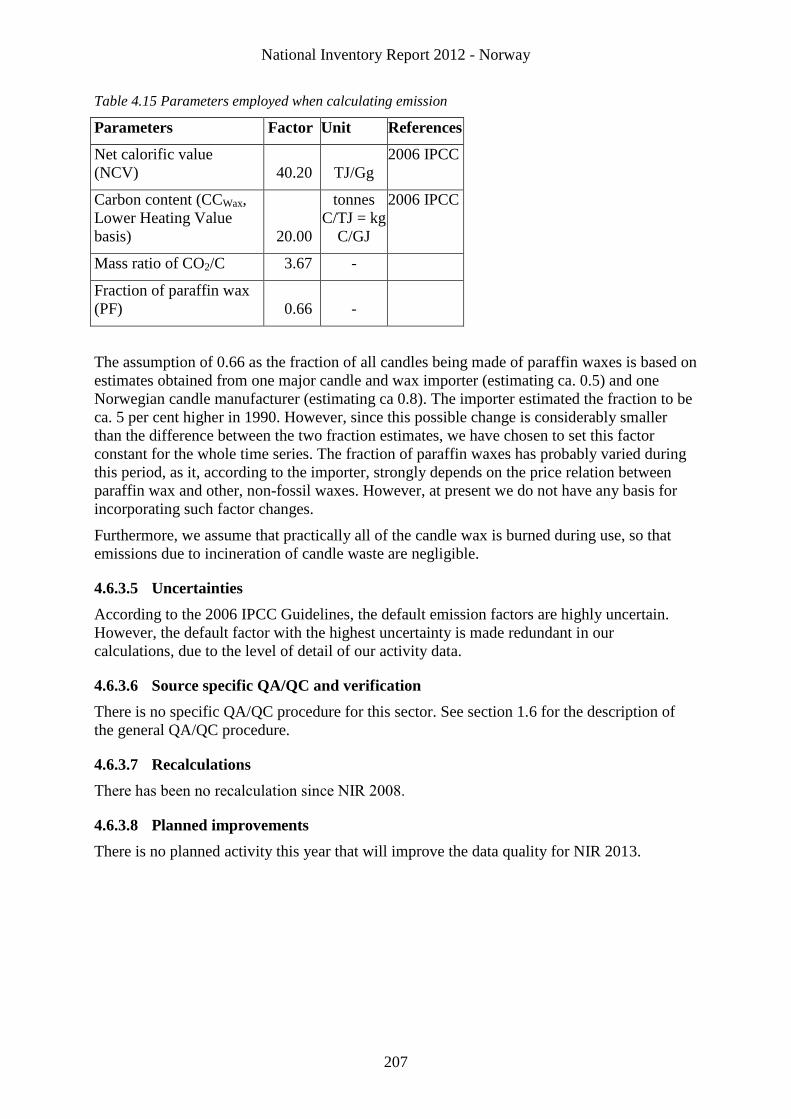
National Inventory Report 2012 - Norway
207
Table 4.15 Parameters employed when calculating emission
Parameters Factor Unit References
Net calorific value
(NCV) 40.20 TJ/Gg
2006 IPCC
Carbon content (CCWax,
Lower Heating Value
basis) 20.00
tonnes
C/TJ = kg
C/GJ
2006 IPCC
Mass ratio of CO2/C 3.67 -
Fraction of paraffin wax
(PF) 0.66 -
The assumption of 0.66 as the fraction of all candles being made of paraffin waxes is based on
estimates obtained from one major candle and wax importer (estimating ca. 0.5) and one
Norwegian candle manufacturer (estimating ca 0.8). The importer estimated the fraction to be
ca. 5 per cent higher in 1990. However, since this possible change is considerably smaller
than the difference between the two fraction estimates, we have chosen to set this factor
constant for the whole time series. The fraction of paraffin waxes has probably varied during
this period, as it, according to the importer, strongly depends on the price relation between
paraffin wax and other, non-fossil waxes. However, at present we do not have any basis for
incorporating such factor changes.
Furthermore, we assume that practically all of the candle wax is burned during use, so that
emissions due to incineration of candle waste are negligible.
4.6.3.5 Uncertainties
According to the 2006 IPCC Guidelines, the default emission factors are highly uncertain.
However, the default factor with the highest uncertainty is made redundant in our
calculations, due to the level of detail of our activity data.
4.6.3.6 Source specific QA/QC and verification
There is no specific QA/QC procedure for this sector. See section 1.6 for the description of
the general QA/QC procedure.
4.6.3.7 Recalculations
There has been no recalculation since NIR 2008.
4.6.3.8 Planned improvements
There is no planned activity this year that will improve the data quality for NIR 2013.
National Inventory Report 2012 - Norway
208
5 Solvent and other product use
5.1 Overview
This chapter describes emissions from solvents and other products. Use of solvents and
products containing solvents result in emissions of non-methane volatile organic compounds
(NMVOC), which is regarded as an indirect greenhouse gas. The NMVOC emissions will
over a period of time in the atmosphere oxidise to CO2.
In addition to solvents emitting NMVOC, there are other products that emit other volatile
components. Emissions of N2O from anaesthesia procedures and spray cans are included in
the Norwegian inventory.
In 2010, the total emissions from solvents and other product use totaled 0,170 million tonnes
of CO2-equivalents. This represented 0.31 per cent of the total GHG emissions in 2010. The
emissions have decreased by 7.3 % compared to 1990 and have increased by 12.7 % from
2009.
5.2 Solvent losses (NMVOC) – 3A, 3B, 3C, 3D
5.2.1 Description
The use of solvents leads to emissions of non-methane volatile organic compounds
(NMVOC) which is regarded as an indirect greenhouse gas. The NMVOC emissions will over
a period of time in the atmosphere oxidise to CO2, which is included in the total greenhouse
gas emissions reported to UNFCCC.
Solvents and other product use are non-key categories.
5.2.2 Method
Our general model is a simplified version of the detailed methodology described in chapter 6
of the EMEP/CORINAIR Guidebook 2007 (EEA 2007). It represents a mass balance per
substance, where emissions are calculated by multiplying relevant activity data with an
emission factor. For better coverage, point sources reported from industries to the Climate and
Pollution Agency and calculated emissions from a side model for cosmetics are added to the
estimates. For a detailed description of method and activity data, see Holmengen and Kittilsen
(2009).
It is assumed that all products are used the same year as they are registered, and substances
are not assumed to accumulate in long-lived products. In other words, it is assumed that all
emissions generated by the use of a given product during its lifetime take place in the same
year as the product is declared to our data source, the Norwegian Product Register. In sum,
this leads to emission estimates that do not fully reflect the actual emissions taking place in a
given year. Emissions that in real life are spread out over several years all appear in the
emission estimate for the year of registration. However, this systematic overestimation for a
given year probably more or less compensates for emissions due to previously accumulated
amounts not being included in the estimate figures.
National Inventory Report 2012 - Norway
209
No official definition of solvents exists, and a list of substances to be included in the
inventory on NMVOC emissions was thus created. The substance list used in the Swedish
NMVOC inventory (Skårman et al. 2006) was used as a basis. This substance list is based on
the definition stated in the UNECE Guidelines7. The list is supplemented by NMVOC
reported in the UK’s National Atmospheric Emissions Inventory (NAEI) (AEA Energy and
Environment 2007). The resulting list was comprised by 678 substances. Of these, 355 were
found in the Norwegian Product Register for one or more years in the period 2005-2007.
Cosmetics
Cosmetics are not subject to the duty of declaration. The side model is based on a study in
2004, when the Climate and Pollution Agency calculated the consumption of pharmaceuticals
and cosmetics (SFT 2005a). The consumption was calculated for product groups such as
shaving products, hair dye, body lotions and antiperspirants. The consumption in tonnes each
year is calculated by using the relationship between consumption in Norwegian kroner and in
tonnes in 2004. Figures on VOC content and emission factors for each product group were
taken for the most part from a study in the Netherlands (IVAM 2005), with some supplements
from the previous Norwegian solvent balance (the previous NMVOC emission model).
NMVOC and CO2
The use of solvents leads to emissions of non-methane volatile organic compounds
(NMVOC) which is regarded as an indirect greenhouse gas. The NMVOC emissions will over
a period of time in the atmosphere oxidise to CO2, which is included in the total greenhouse
gas emissions reported to UNFCCC (see chapter 1.9.).
5.2.3 Activity data
The data source is the Norwegian Product Register. Any person placing dangerous chemicals
on the Norwegian market for professional or private use has a duty of declaration to the
Product Register, and import, export and manufacturing is reported annually. The only
exception is when the amount of a given product placed on the market by a given
importer/producer is less than 100 kg per year.
The information pertained in the data from the Product Register makes it possible to analyse
the activity data on a substance level, distributed over product types (given in UCN codes;
Product Register 2007), industrial sectors (following standard industrial classification
(NACE; Statistics Norway 2003b), including private households (no NACE), or a
combination of both. As a consequence, the identification of specific substances, products or
industrial sectors that have a major influence on the emissions is greatly facilitated.
Cosmetics
The side model for cosmetics is updated each year with data on from the Norwegian
Association of Cosmetics, Toiletries and Fragrance Suppliers (KLF).
Point sources
Data from nine point sources provided by the Climate and Pollution Agency is added to the
emissions estimates. The point sources are reported from the industrial sector “Manufacture of
7 “Volatile compound (VOC) shall mean any organic compound having at 293.15 degrees K a vapor pressure of 0.01 kPa or
more, or having a corresponding volatility under the particular conditions of use."
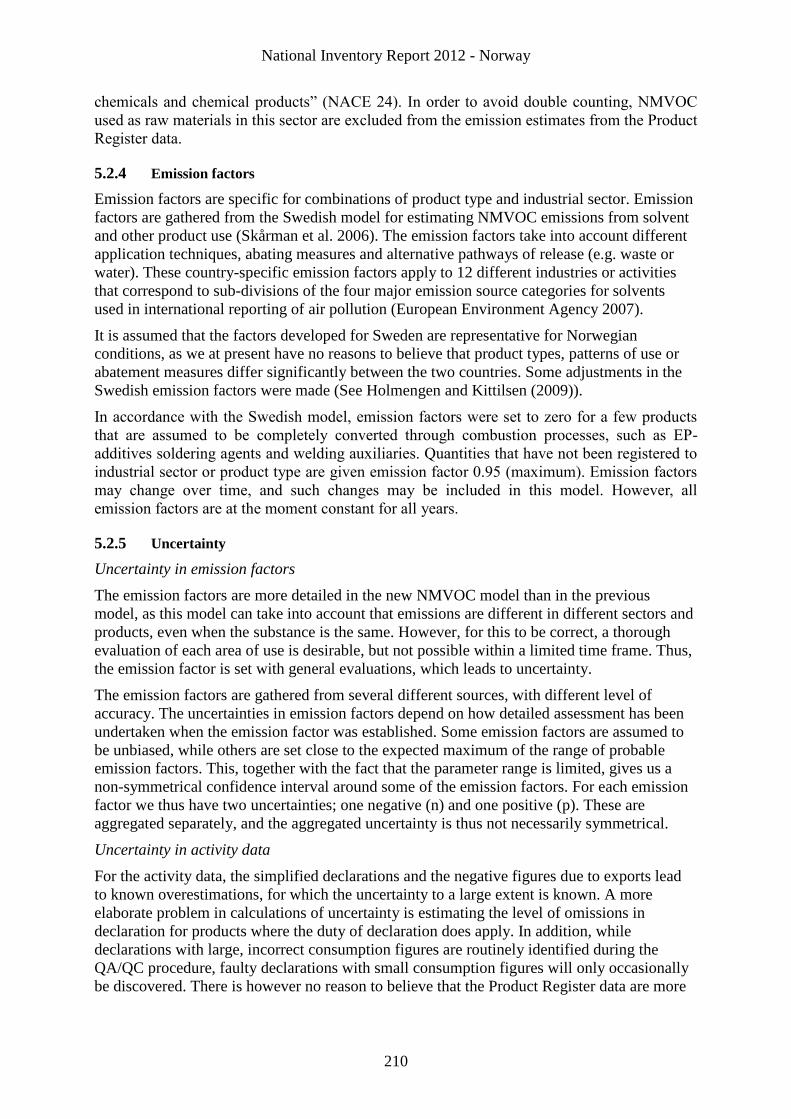
National Inventory Report 2012 - Norway
210
chemicals and chemical products” (NACE 24). In order to avoid double counting, NMVOC
used as raw materials in this sector are excluded from the emission estimates from the Product
Register data.
5.2.4 Emission factors
Emission factors are specific for combinations of product type and industrial sector. Emission
factors are gathered from the Swedish model for estimating NMVOC emissions from solvent
and other product use (Skårman et al. 2006). The emission factors take into account different
application techniques, abating measures and alternative pathways of release (e.g. waste or
water). These country-specific emission factors apply to 12 different industries or activities
that correspond to sub-divisions of the four major emission source categories for solvents
used in international reporting of air pollution (European Environment Agency 2007).
It is assumed that the factors developed for Sweden are representative for Norwegian
conditions, as we at present have no reasons to believe that product types, patterns of use or
abatement measures differ significantly between the two countries. Some adjustments in the
Swedish emission factors were made (See Holmengen and Kittilsen (2009)).
In accordance with the Swedish model, emission factors were set to zero for a few products
that are assumed to be completely converted through combustion processes, such as EP-
additives soldering agents and welding auxiliaries. Quantities that have not been registered to
industrial sector or product type are given emission factor 0.95 (maximum). Emission factors
may change over time, and such changes may be included in this model. However, all
emission factors are at the moment constant for all years.
5.2.5 Uncertainty
Uncertainty in emission factors
The emission factors are more detailed in the new NMVOC model than in the previous
model, as this model can take into account that emissions are different in different sectors and
products, even when the substance is the same. However, for this to be correct, a thorough
evaluation of each area of use is desirable, but not possible within a limited time frame. Thus,
the emission factor is set with general evaluations, which leads to uncertainty.
The emission factors are gathered from several different sources, with different level of
accuracy. The uncertainties in emission factors depend on how detailed assessment has been
undertaken when the emission factor was established. Some emission factors are assumed to
be unbiased, while others are set close to the expected maximum of the range of probable
emission factors. This, together with the fact that the parameter range is limited, gives us a
non-symmetrical confidence interval around some of the emission factors. For each emission
factor we thus have two uncertainties; one negative (n) and one positive (p). These are
aggregated separately, and the aggregated uncertainty is thus not necessarily symmetrical.
Uncertainty in activity data
For the activity data, the simplified declarations and the negative figures due to exports lead
to known overestimations, for which the uncertainty to a large extent is known. A more
elaborate problem in calculations of uncertainty is estimating the level of omissions in
declaration for products where the duty of declaration does apply. In addition, while
declarations with large, incorrect consumption figures are routinely identified during the
QA/QC procedure, faulty declarations with small consumption figures will only occasionally
be discovered. There is however no reason to believe that the Product Register data are more
National Inventory Report 2012 - Norway
211
uncertain than the data source used in the previous model (statistics on production and
external trade), as similar QA/QC routines are used for these statistics.
The errors in activity data are not directly quantifiable. Any under-coverage in the Product
Register is not taken into account. Skårman et al. (2006) found that the activity data from the
Swedish Product register had an uncertainty of about 15 per cent. The Norwegian Product
Register is assumed to be comparable to the Swedish, and thus the uncertainty in the activity
data is assumed to be 15 per cent. For some products, simplified declarations give an
indication of maximum and minimum possible amounts. In these cases, the maximum amount
is used, and the positive uncertainty is set to 15 per cent as for other activity data, while the
negative uncertainty is assumed to be the interval between maximum and minimum amount.
All activity data are set to zero if negative.
For a detailed description of the uncertainty analysis, see Holmengen and Kittilsen (2009).
The variance of total emission was estimated from the variance estimates obtained for
emission factors and activity data, using standard formulas for the variance of a sum and the
variance of a product of independent random variables. The aggregated uncertainties in level
and trend are given in table 5.1 and 5.2.
Table 5.1 Uncertainty estimates for level in NMVOC emissions, 2005-2007. Tonnes and per cent
Uncertainty in
level
Negative (n) Negative (n)
(per cent of
total emissions)
Positive (p) Positive (p)
(per cent of
total emissions)
2005 2 288 4.58 1 437 2.88
2006 1 651 3.70 1 103 2.47
2007 1 299 2.79 1 168 2.51
Table 5.2 Uncertainty estimates for trend in NMVOC emissions, 2005-2007. Tonnes
Uncertainty in trend Negative (n) Positive (p) 95% confidence interval
for change
2005-2006 2 135 1 067 (-7 366 , -4 164)
2006-2007 1 420 947 (407 , 2 774)
2005-2007 1 882 1 076 (-5 286 , -2 328)
5.2.6 Completeness
No major missing emission sources are likely.
5.2.7 Source specific QA/QC and verification
Internal checks of the time-series of calculated emissions data and input activity data have
been conducted by Statistics Norway and corrections are made when errors are found.
5.2.8 Recalculations
National Inventory Report 2012 - Norway
212
The indirect emissions of CO2 have decreased by 8 729 tonnes in 2005, 9 510 tonnes in 2006,
10 234 tonnes in 2007, 10 041 tonnes in 2008 and 8 798 tonnes in 2009. This is due to revised
data on use of formic acid used for ensilage means and cosmetics.
5.2.9 Planned improvements
There is no planned activity this year that will improve the data quality for NIR 2013.
5.3 Other product use -3D
5.3.1 Use of N2O in anaesthesia – 3D1
5.3.1.1 Method
N2O is used in anaesthesia procedures and will lead to emissions of N2O. The figures are
based on N2O data from the two major producers and importers in 2000. These figures are
related to the number of births and number of bednights in hospitals for each year to estimate
consumption.
5.3.1.2 Activity data
For this source actual sale of N2O is used for the year 2000. Number of births and bednigths
in hospitals is gathered from the Statistical yearbook of Norway each year.
5.3.1.3 Emission factors
As mentioned, no emission factors are used since the figures are based on sales of N2O.
5.3.1.4 Uncertainty
The figures are uncertain. There may be small importers not included in Statistics Norway's
telephone survey with 2000 data, but the emissions are small, so it is believed that the
uncertainty is at an acceptable level.
5.3.1.5 Completeness
A minor consumption from small importers may be missing, but these will probably account
for an insignificant fraction of the total N2O emissions.
5.3.1.6 Source specific QA/QC and verification
There is no source specific QA/QC procedure for this sector. See section 1.6. for the
description of the general QA/QC procedure.
5.3.1.7 Recalculations
There has been no recalculation since NIR 2009.
5.3.1.8 Planned improvements
There is no planned activity this year that will improve the data quality for NIR 2013.
National Inventory Report 2012 - Norway
213
5.3.2 Use of N2O as propellant – 3D4
N2O is used as a propellant in spray boxes and this use will lead to emissions of N2O. It is
also used in research work, for instance in the food industry and at universities. Small
amounts are used at engineering workshops among others for drag-racing. There is no
production of N2O for these purposes in Norway.
5.3.2.1 Methodological issues
Information on sale volumes has been reported by the plants to Statistics Norway. Statistics
Norway assumes that all propellant is released to air
5.3.2.2 Activity data
Information has been gathered from the plants indicating that there is no production or sale of
N2O for use as a propellant in Norway. The N2O is already in the spray cans when imported.
There was no import of these spray cans prior to 1993. Activity data for the year 2003 has
been used for all years since.
For activity data on N2O used in research work and in drag-racing, data on imported amounts
in 2002 has been used for all years.
5.3.2.3 Uncertainty
The figures for one year are used for all years. It is believed that all figures from all major
importers are included in the inventory.
5.3.2.4 Completeness
No major missing emission components are likely.
5.3.2.5 Source specific QA/QC
There is no source specific QA/QC procedure for this sector. See section 1.6. for the
description of the general QA/QC procedure.
5.3.2.6 Recalculations
There has been no recalculation since NIR 2009.
5.3.2.7 Planned improvements
There is no planned activity this year that will improve the data quality for NIR 2013.
National Inventory Report 2012 - Norway
214
6 Agriculture
6.1 Overview
About 8 per cent of the total Norwegian emissions of greenhouse gases (GHG) originated
from agriculture, in 20108. This corresponds to 4.3 million tonnes CO2-eq. The emissions
from agriculture are quite stable with emissions in 2010 about 5 percent lower than in 19909,
but about 0.2 percent higher than in 200910
.
The sectors clearly biggest sources of GHG’s were “enteric fermentation” (CH4) from
domestic animals11
, contributing with 44 per cent and “agricultural soils” (N2O) contributing
with 45 percent of the sectors emissions. “Manure management” contributed with about 10
percent12
. Agriculture contributes particularly to CH4, N2O and NH3 emissions. Domestic
animals are the major source of CH4 emissions from agriculture. Both enteric fermentation
and manure management contribute to process emissions of CH4. Manure management also
generates emissions of N2O.
Microbiological processes in soil lead to emissions of N2O. Three sources of N2O are
distinguished in the IPCC methodology and are included in the Norwegian inventory:
1. direct emissions from agricultural soils (from use of synthetic fertilisers, animal excreta
nitrogen used as fertiliser, biological nitrogen fixation, crop residues, industrial and urban
wastes and cultivation of soils with a high organic content)
2. direct soil emissions from animal production (emissions from droppings on pastures)
3. N2O emissions indirectly induced by agricultural activities (N losses by volatilisation,
leaching and runoff).
There are also some emissions of the greenhouse gases N2O and CH4 arising from the burning
of crop residues on the fields.
Animal manure and the use of fertilizer also generate emissions of ammonia (NH3). As
indicated in Table A1-3 in Annex I of this report, the key category analysis performed in 2012
for the years 1990 and 2010 has revealed that in terms of total level and trend uncertainty the
key categories in the Agricultural sector are the following:
Enteric fermentation – CH4 (4A)
Direct soil emissions – N2O (4D1)
Animal production - N2O (4D2)
Indirect emissions - N2O (4D3)
Manure management – CH413
and N2O (4B)
8 4273.40 Ktonnes CO2-eq
9 4521.32 Ktonnes CO2-eq
10 4264.44 Ktonnes CO2-eq
11 1892.13 Ktonnes CO2-eq
12 444.89 Ktonnes CO2-eq
13 Key category only in Tier 1 key category analysis.
National Inventory Report 2012 - Norway
215
6.2 Emissions from enteric fermentation in domestic livestock 4A– CH4
(Key Category)
6.2.1 Description
An important end product from the ruminal fermentation is methane (CH4). The amount of
CH4 produced from enteric fermentation is dependent on several factors, like animal species,
production level, quantity and quality of feed ingested and environmental conditions.
According to IPCC (IPCC, 2000) the method for estimating CH4 emission from enteric
fermentation requires three basic items:
The livestock population must be divided into animal subgroups, which describe
animal type and production level.
Estimate the emission factors for each subgroup in terms of kilograms of CH4 per
animal per year.
Multiply the subgroup emission factors by the subgroup populations to estimate
subgroup emission, and sum across the subgroups to estimate total emission.
Enteric fermentation is a key category because of uncertainty in level and trend.
Its contribution to uncertainty in the national inventory is 4.69 % to uncertainty in level and
1.66 % to uncertainty in trend.
Enteric fermentation contributed with 1892.13 Ktonnes CO2 equivalents in 2010, which is 3.5
per cent of the national GHG emissions.
Enteric fermentation constituted 86 per cent of the overall CH4 emissions from agriculture and
44 percent of this sector GHG emission. Emissions have been rather stable with minor
fluctuations. Emissions decreased by 5.0 percent in the period 1990-2010 and by 0.2 percent
in 2009-2010.
6.2.2 Methodological issues
A Tier 2 methodology is used for calculating CH4 from enteric fermentation for the main
emission sources cattle and sheep. The Tier 2 methodology used is described more in detail in
Appendix H in Statistics Norway (2011a). The methodology for calculating CH4 from enteric
fermentation for the other animal categories is in accordance with IPCC’s Good Practice
Guidance Tier 1 method (IPCC 1997b, a). The numbers of animals of each kind and average
emission factors of tonnes CH4/ animal/ year for each kind of animals are used to calculate the
emissions.
6.2.3 Activity data
The Tier 2 method of calculation requires subdividing the cattle and sheep populations by
animal type, physiological status (dry, lactating or pregnant) live weight and age. Table 6.1
describes the animal categories used for cattle and sheep in the calculations.
For dairy cows, additional information from the Cow Recording System concerning annual
milk production and proportion of concentrate in the diet is used (Tine BA annually). The
Cow Recording System also supplies annual information about slaughter age and slaughter
weight for growing cattle (Moen, pers. Comm., e-mail from Oddvar Moen, Tine Rådgivning,
annually). Information about average daily weight gain (ADG), 215odel lo in the calculations
for growing cattle, was also taken from the Cow Recording System in 2005 when the Tier 2
National Inventory Report 2012 - Norway
216
model was developed.
Table 6.1 Categories of cattle and sheep used in the Norwegian calculations of methane
emission from enteric fermentation.
Categories of cattle and sheep
Dairy cows
Beef cows
Replacement heifers, < one year
Replacement heifers, > one year
Finisher heifers, < one year
Finisher heifers, > one year
Finisher bulls, < one year
Finisher bulls, > one year
Breeding sheep, > one year
Breeding sheep, < one year
Slaughter lamb, < one year. Jan- May
Slaughter lamb, < one year. Jun- Dec
The main source of the livestock statistics is the register of production subsidies. The register
covers 90-100 per cent of the animal populations, except for horses and reindeer. The register
is used in order to get consistent time series of data. Animals are counted twice a year and the
register is updated with these counts. The average number of the two counts is used. In
addition to the animals included in the register of production subsidies, an estimate of the
number of horses that are not used in farming is obtained from the Norwegian Agricultural
Economics Research Institute (NILF). The number of reindeer is obtained from the
Norwegian Reindeer Husbandry Administration. For some categories of animals not living a
whole year, for instance lambs, lifetime is taken into account to get a yearly average for the
number of animals. An expert judgment suggests an average lifetime of 143 days for lambs
(UMB, pers. Comm., Expert Judgement by Department of Animal Science, Norwegian
University of Life Sciences, Ås 2001). The formula for calculating the average figure for
lambs will then be:
(6.1) 365
143*Lambs
There exist some differences between these numbers and the FAO statistics. The explanation
is, that the figures to the FAO are supplied by the Norwegian Agricultural Economics
Research Institute (NILF). NILF elaborates an overall calculation for the agricultural sector,
which is the basis for the annual negotiations for the economic compensation to the sector.
The overall calculation includes a grouping of all agricultural activities, comprising area,
number of animals and production data. This method is a little different from the one used by
Statistics Norway. Differences include
Different emphasis on the dates for counting, 31.07 and 31.12
National Inventory Report 2012 - Norway
217
NILF does not register pigs under 8 weeks, whilst Statistics Norway does.
6.2.4 Emission factors
For cattle and sheep the following basic equation is used to calculate the CH4 emission factor
for the subgroups (Tier 2):
(6.2) EF = (GE ∙ Ym ∙ 365 days/yr) / 55.65 MJ/kg CH4
Where:
EF = emission factor, kg CH4/head/yr
GE = gross energy intake, MJ/head/day
Ym = CH4 conversion rate, which is the fraction of gross energy in feed converted to CH4.
M = animal category
This equation assumes an emission factor for an entire year (365 days). In some
circumstances the animal category may be alive for a shorter period or a period longer than
one year and in this case the emission factor will be estimated for the specific period (e.g.,
lambs living for only 143 days and for beef cattle which are slaughtered after 540 days).
Further description of the determination of the variables GE and Ym for the different animal
categories is given in Statistics Norway (2011a) Appendix H.
The emissions from domestic reindeer, deer, ostrich and fur-bearing animals are also included
in the Norwegian calculations. For reindeer the emission factor 19.9 kg/animal/year is used.
The source of this factor is the Swedish and Finnish emission inventories where it has been
developed by a Tier 2 method (Statistics Finland 2009 and Swedish Environmental Protection
Agency 2009) Emission factors for deer, ostrich and fur-bearing animals are developed by
scaling emission factors for other animals that are assumed most similar with regard to
digestive system and feeding. The scaling is done by comparing average weights for the
actual animal groups. The emission factor for deer of 52.64 kg/animal/yr has been estimated
by scaling the emission factor for dairy cattle and the emission factor 4.97 kg/animal/yr for
ostrich by scaling the emission factor for horses. The emission factor for fur-bearing animals
is set to 0.10 kg/animal/yr, and has been estimated by scaling the emission factor for pigs.
For the other animal categories the Tier 1 default emission factors for each kind of animal
(IPCC 1997b) is used.
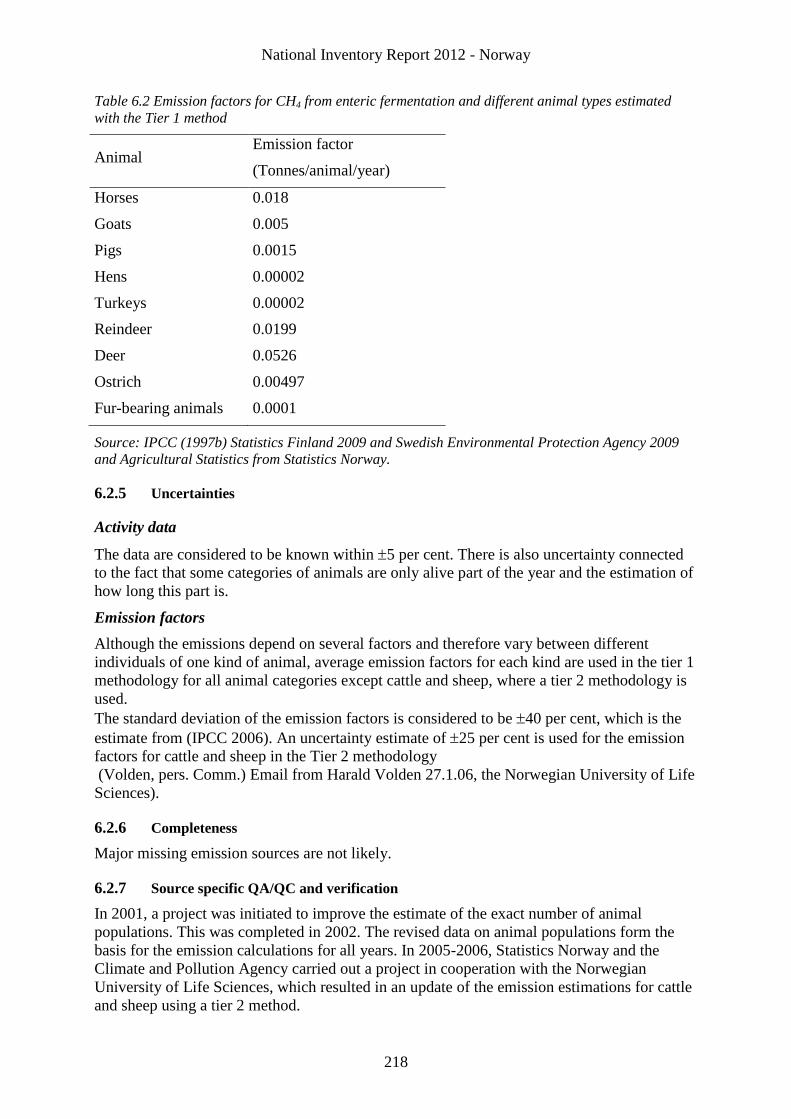
National Inventory Report 2012 - Norway
218
Table 6.2 Emission factors for CH4 from enteric fermentation and different animal types estimated
with the Tier 1 method
Animal Emission factor
(Tonnes/animal/year)
Horses 0.018
Goats 0.005
Pigs 0.0015
Hens 0.00002
Turkeys 0.00002
Reindeer 0.0199
Deer 0.0526
Ostrich 0.00497
Fur-bearing animals 0.0001
Source: IPCC (1997b) Statistics Finland 2009 and Swedish Environmental Protection Agency 2009
and Agricultural Statistics from Statistics Norway.
6.2.5 Uncertainties
Activity data
The data are considered to be known within 5 per cent. There is also uncertainty connected
to the fact that some categories of animals are only alive part of the year and the estimation of
how long this part is.
Emission factors
Although the emissions depend on several factors and therefore vary between different
individuals of one kind of animal, average emission factors for each kind are used in the tier 1
methodology for all animal categories except cattle and sheep, where a tier 2 methodology is
used.
The standard deviation of the emission factors is considered to be 40 per cent, which is the
estimate from (IPCC 2006). An uncertainty estimate of 25 per cent is used for the emission
factors for cattle and sheep in the Tier 2 methodology
(Volden, pers. Comm.) Email from Harald Volden 27.1.06, the Norwegian University of Life
Sciences).
6.2.6 Completeness
Major missing emission sources are not likely.
6.2.7 Source specific QA/QC and verification
In 2001, a project was initiated to improve the estimate of the exact number of animal
populations. This was completed in 2002. The revised data on animal populations form the
basis for the emission calculations for all years. In 2005-2006, Statistics Norway and the
Climate and Pollution Agency carried out a project in cooperation with the Norwegian
University of Life Sciences, which resulted in an update of the emission estimations for cattle
and sheep using a tier 2 method.
National Inventory Report 2012 - Norway
219
In 2009, the emission factor for reindeer has been revised and changed to a Tier 2 factor for
reindeer used by Sweden and Finland.
6.2.8 Recalculations
There were performed no specific recalculations for this sector.
6.2.9 Planned improvements
No new improvements are planned before next NIR.
6.3 Emissions from manure management – 4B – CH4, N2O (Key
categories)
6.3.1 Description
The relevant pollutants emitted from this source category are CH4 (IPCC 4B (a)), N2O (IPCC
4B (b)) and NH3 (NFR 4B). Emissions from cattle are most important in Norway for all three
components.
N2O is key category according to Tier 2 key category analysis because of its contributions to
level uncertainty. CH4 is key category only in the Tier 1 key category analysis.
CH4-emissions due to manure management amounted to 315 Ktonnes CO2 equivalents in
2010 whilst N2O-emissions amounted to 130 Ktonnes CO2 equivalents.
Manure management emitted 445 Ktonnes of CO2 equivalents in 2010, which are
approximately 10 per cent of the GHG emissions from agriculture and 0.8 per cent of the
Norwegian emissions of GHGs.
Emissions of GHGs from manure management increased by 2.8 % in the period 1990-2010
and decreased by 0.1 % from 2009 to 2010.
Organic material in manure is transformed to CH4 in an anaerobic environment by
microbiological processes. Emissions from cattle (manure) are most important in Norway.
The emissions from manure depend on several factors; type of animal, feeding, manure
management system and weather conditions (temperature and humidity).
During storage and handling of manure (i.e. before the manure is added to soils), some
nitrogen is converted to N2O. The amount released depends on the system and duration of
manure management. Solid storage and dry lot of manure is the most important source.
Emissions of NH3 from manure depend on several factors, e.g. type of animal, nitrogen
content in fodder, manure management, climate and time of spreading of manure, cultivation
practices and characteristics of the soil. In the IPCC default method a NH3 volatilisation
fraction of 20 per cent is used for the total N excretion by animals in the country. But in the
Norwegian emission inventory, yearly updated ammonia volatilisation values from Statistics
Norway's ammonia model are used, which are expected to give more correct values for
Norway. The estimated national volatilization fractions have differed between 17-20 per cent
since 1990, and are now close to the IPCC default value of 20 per cent.
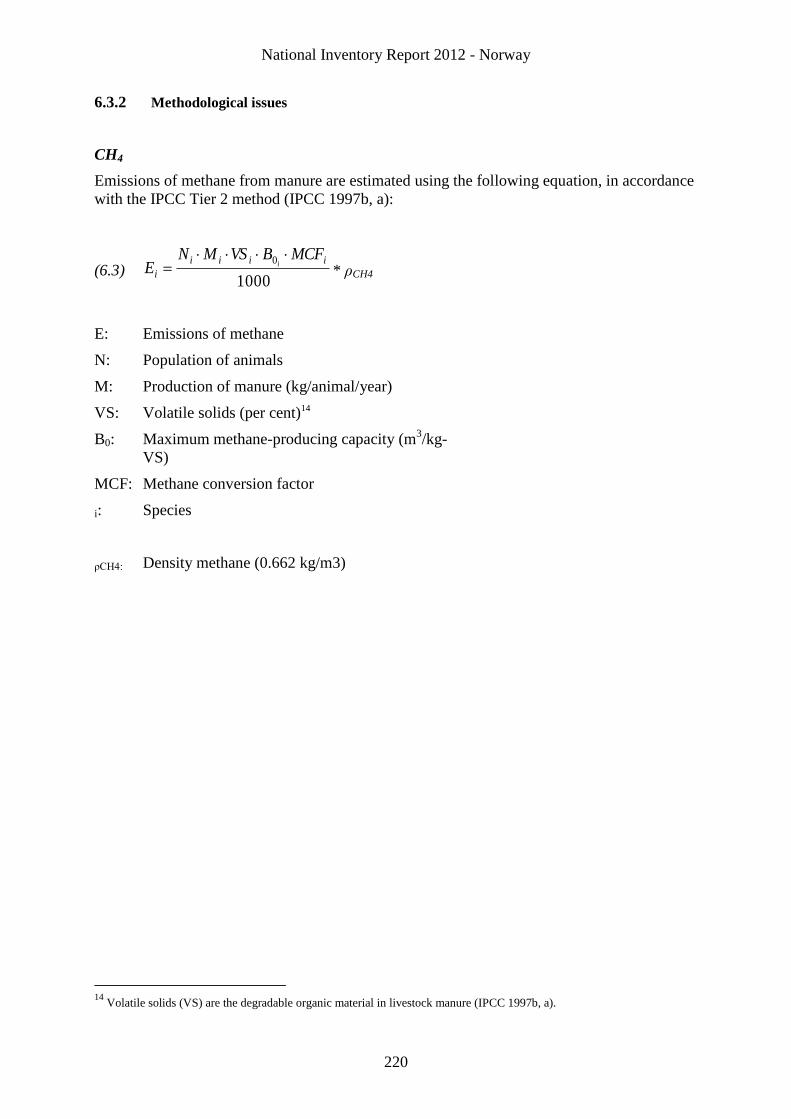
National Inventory Report 2012 - Norway
220
6.3.2 Methodological issues
CH4
Emissions of methane from manure are estimated using the following equation, in accordance
with the IPCC Tier 2 method (IPCC 1997b, a):
(6.3) 1000
0 iiii
i
MCFBVSMNE i
* ρCH4
E: Emissions of methane
N: Population of animals
M: Production of manure (kg/animal/year)
VS: Volatile solids (per cent)14
B0: Maximum methane-producing capacity (m3/kg-
VS)
MCF: Methane conversion factor
i: Species
ρCH4: Density methane (0.662 kg/m3)
14
Volatile solids (VS) are the degradable organic material in livestock manure (IPCC 1997b, a).
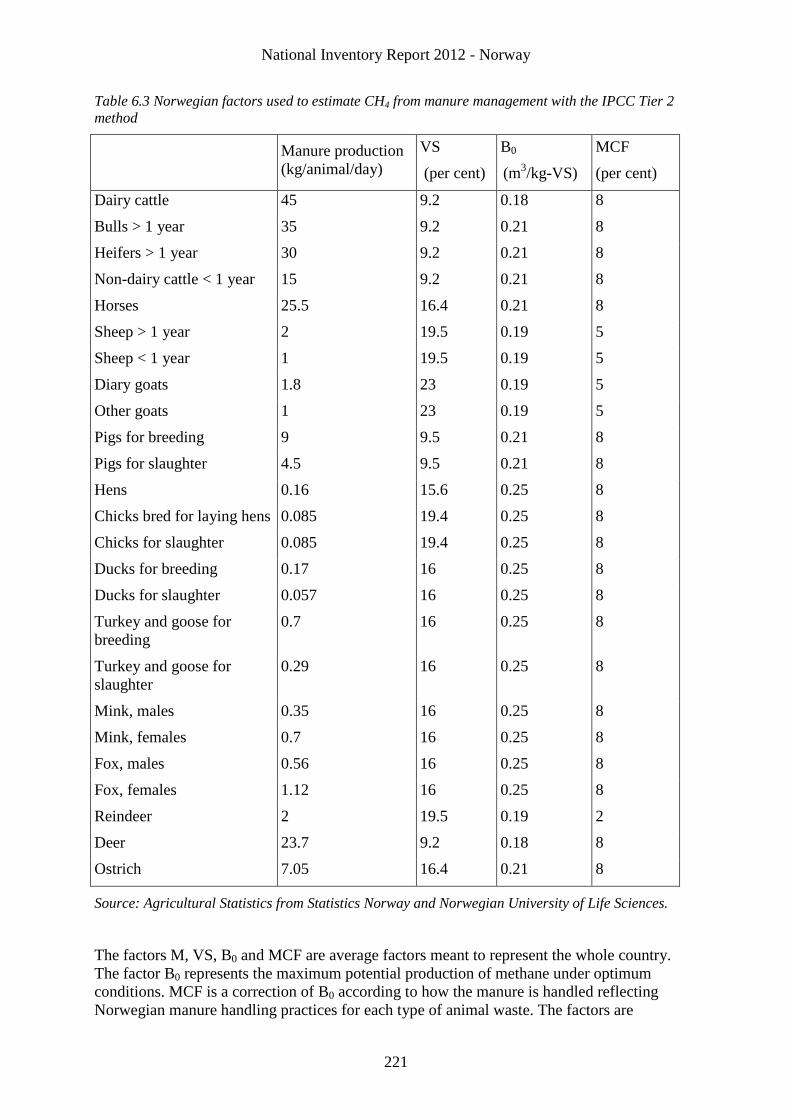
National Inventory Report 2012 - Norway
221
Table 6.3 Norwegian factors used to estimate CH4 from manure management with the IPCC Tier 2
method
Manure production
(kg/animal/day)
VS
(per cent)
B0
(m3/kg-VS)
MCF
(per cent)
Dairy cattle 45 9.2 0.18 8
Bulls > 1 year 35 9.2 0.21 8
Heifers > 1 year 30 9.2 0.21 8
Non-dairy cattle < 1 year 15 9.2 0.21 8
Horses 25.5 16.4 0.21 8
Sheep > 1 year 2 19.5 0.19 5
Sheep < 1 year 1 19.5 0.19 5
Diary goats 1.8 23 0.19 5
Other goats 1 23 0.19 5
Pigs for breeding 9 9.5 0.21 8
Pigs for slaughter 4.5 9.5 0.21 8
Hens 0.16 15.6 0.25 8
Chicks bred for laying hens 0.085 19.4 0.25 8
Chicks for slaughter 0.085 19.4 0.25 8
Ducks for breeding 0.17 16 0.25 8
Ducks for slaughter 0.057 16 0.25 8
Turkey and goose for
breeding
0.7 16 0.25 8
Turkey and goose for
slaughter
0.29 16 0.25 8
Mink, males 0.35 16 0.25 8
Mink, females 0.7 16 0.25 8
Fox, males 0.56 16 0.25 8
Fox, females 1.12 16 0.25 8
Reindeer 2 19.5 0.19 2
Deer 23.7 9.2 0.18 8
Ostrich 7.05 16.4 0.21 8
Source: Agricultural Statistics from Statistics Norway and Norwegian University of Life Sciences.
The factors M, VS, B0 and MCF are average factors meant to represent the whole country.
The factor B0 represents the maximum potential production of methane under optimum
conditions. MCF is a correction of B0 according to how the manure is handled reflecting
Norwegian manure handling practices for each type of animal waste. The factors are
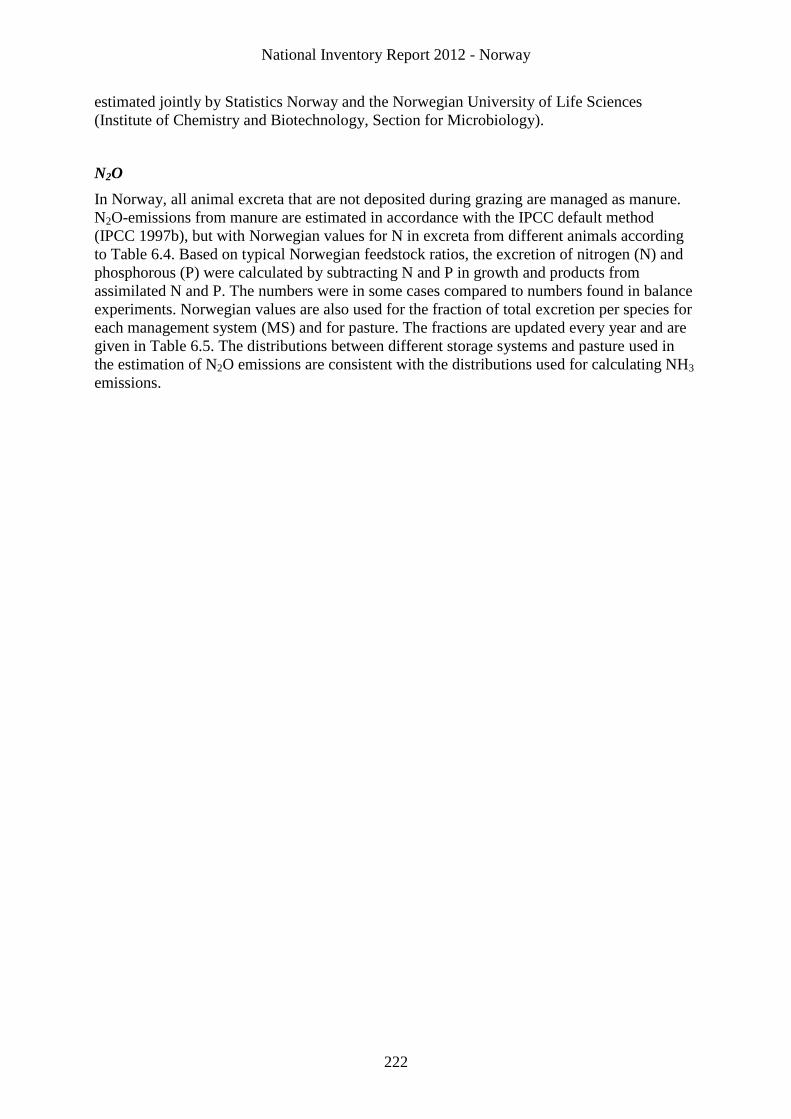
National Inventory Report 2012 - Norway
222
estimated jointly by Statistics Norway and the Norwegian University of Life Sciences
(Institute of Chemistry and Biotechnology, Section for Microbiology).
N2O
In Norway, all animal excreta that are not deposited during grazing are managed as manure.
N2O-emissions from manure are estimated in accordance with the IPCC default method
(IPCC 1997b), but with Norwegian values for N in excreta from different animals according
to Table 6.4. Based on typical Norwegian feedstock ratios, the excretion of nitrogen (N) and
phosphorous (P) were calculated by subtracting N and P in growth and products from
assimilated N and P. The numbers were in some cases compared to numbers found in balance
experiments. Norwegian values are also used for the fraction of total excretion per species for
each management system (MS) and for pasture. The fractions are updated every year and are
given in Table 6.5. The distributions between different storage systems and pasture used in
the estimation of N2O emissions are consistent with the distributions used for calculating NH3
emissions.
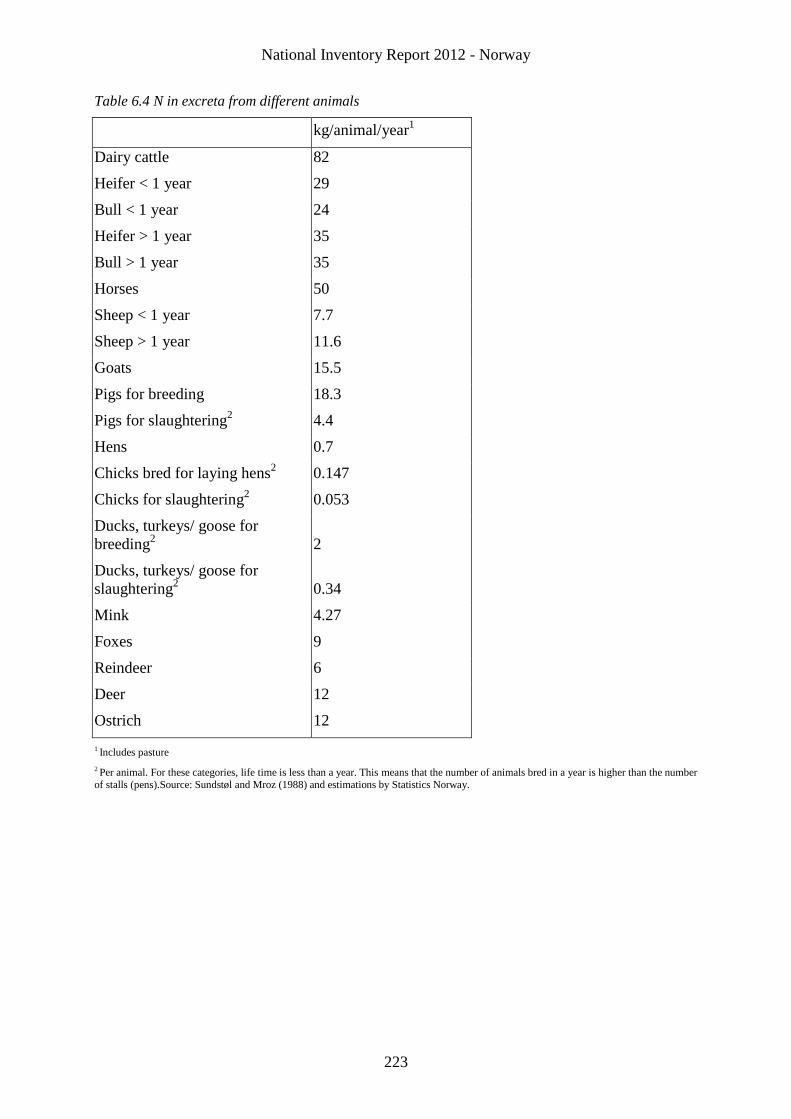
National Inventory Report 2012 - Norway
223
Table 6.4 N in excreta from different animals
kg/animal/year1
Dairy cattle 82
Heifer < 1 year 29
Bull < 1 year 24
Heifer > 1 year 35
Bull > 1 year 35
Horses 50
Sheep < 1 year 7.7
Sheep > 1 year 11.6
Goats 15.5
Pigs for breeding 18.3
Pigs for slaughtering2 4.4
Hens 0.7
Chicks bred for laying hens2 0.147
Chicks for slaughtering2 0.053
Ducks, turkeys/ goose for
breeding2
2
Ducks, turkeys/ goose for
slaughtering2
0.34
Mink 4.27
Foxes 9
Reindeer 6
Deer 12
Ostrich 12
1 Includes pasture
2 Per animal. For these categories, life time is less than a year. This means that the number of animals bred in a year is higher than the number
of stalls (pens).Source: Sundstøl and Mroz (1988) and estimations by Statistics Norway.
National Inventory Report 2012 - Norway
224
Table 6.5 Fraction of total excretion per specie for each management system and for pasture 2010
Anaerobic
Lagoon
Liquid system Solid storage
and drylot
Pasture range
and paddock
Other
manure
management
systems
Dairy cattle 0 0.75 0.06 0.20 0
Non-dairy
cattle
0
0.64 0.05 0.31
0
Poultry 0 0.27 0.73 0 0
Sheep 0 0.25 0.30 0.45 0
Swine 0 0.88 0.12 0 0
Other animals 0 0.26 0.29 0.45 0
Source: Data for storage systems from Statistics Norway (Statistics Norway 2004) and (Statistics
Norway 2001b) (poultry) and data for pasture times from (Tine BA annually){ (Dairy cattle, goat),
Statistics Norway's Sample Survey 2001 (Statistics Norway 2002b) (non-dairy cattle, sheep) and
expert judgements.
The emissions of nitrous oxide from manure management are estimated using the following
equation, in accordance with the IPCC Tier 2 method (IPCC 1997b, a):
(6.4) s si siii EFMSNexNE ,
E: Emissions of N2O-N (kg N2O-N/year, N2O-N is the amount of nitrogen in
the nitrous oxide compound)
N: Population of animals
Nex: Annual average N excretion (kg N/animal/year)
MS: Fraction of total excretion per specie for each management system
EF: N2O emission factor (kg N2O-N/kg N)
S: Manure management system
i: Species
For liquid system and solid storage and dry lot a correction is made for the NH3 volatilisation
from manure storage.
NH3
Statistics Norway's NH3 model is used for calculating the emissions of ammonia from manure
management. The principle of the model is illustrated in figure 6.1.
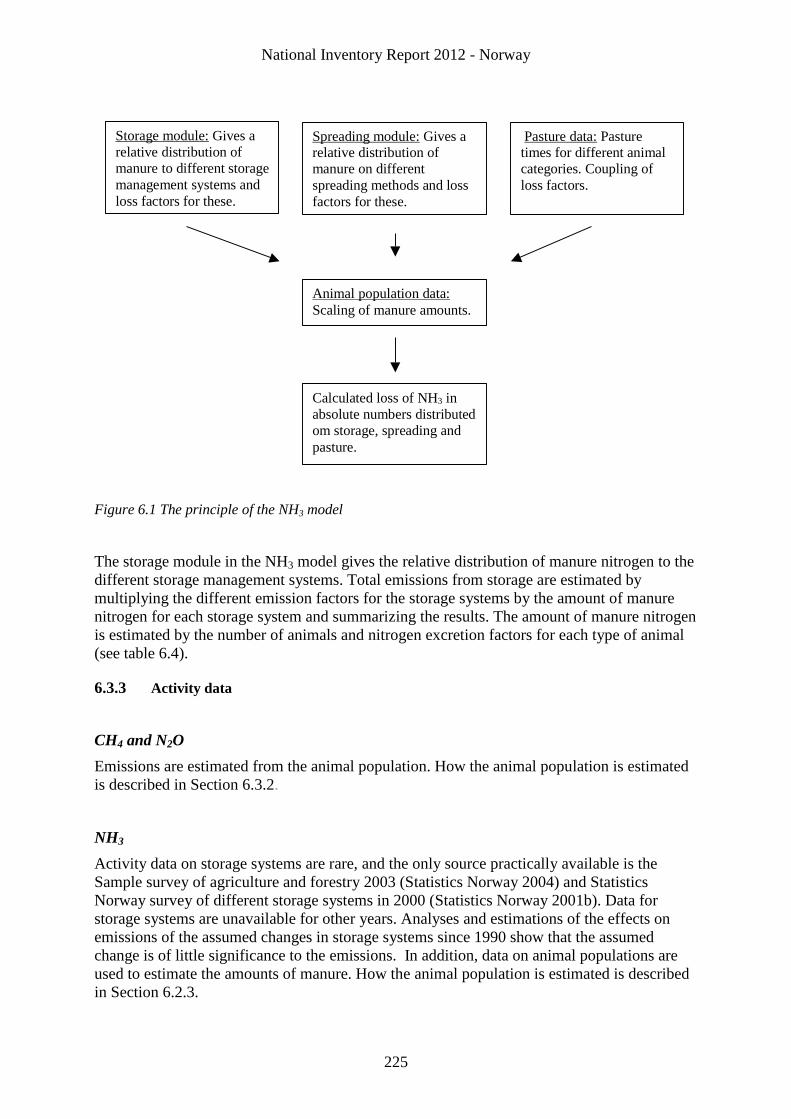
National Inventory Report 2012 - Norway
225
Figure 6.1 The principle of the NH3 model
The storage module in the NH3 model gives the relative distribution of manure nitrogen to the
different storage management systems. Total emissions from storage are estimated by
multiplying the different emission factors for the storage systems by the amount of manure
nitrogen for each storage system and summarizing the results. The amount of manure nitrogen
is estimated by the number of animals and nitrogen excretion factors for each type of animal
(see table 6.4).
6.3.3 Activity data
CH4 and N2O
Emissions are estimated from the animal population. How the animal population is estimated
is described in Section 6.3.2.
NH3
Activity data on storage systems are rare, and the only source practically available is the
Sample survey of agriculture and forestry 2003 (Statistics Norway 2004) and Statistics
Norway survey of different storage systems in 2000 (Statistics Norway 2001b). Data for
storage systems are unavailable for other years. Analyses and estimations of the effects on
emissions of the assumed changes in storage systems since 1990 show that the assumed
change is of little significance to the emissions. In addition, data on animal populations are
used to estimate the amounts of manure. How the animal population is estimated is described
in Section 6.2.3.
Spreading module: Gives a relative distribution of
manure on different
spreading methods and loss
factors for these.
Pasture data: Pasture times for different animal
categories. Coupling of
loss factors.
Storage module: Gives a
relative distribution of
manure to different storage
management systems and
loss factors for these.
Animal population data:
Scaling of manure amounts.
Calculated loss of NH 34 in
absolute numbers distributed
om storage, spreading and
pasture.
National Inventory Report 2012 - Norway
226
The manure is distributed to the following storage systems categories:
Manure cellar for slurry
Manure pit for slurry
Indoor built up/deep litter
Outdoor built up/enclosure
Storage for solid dung and urine
Each of these categories is given for all combinations of the following productions and
regions:
Regions:
South-Eastern Norway
Hedmark and Oppland
Rogaland
Western Norway
Trøndelag
Northern Norway
Production:
Cattle
Pigs
Sheep and goat
Poultry
Horses, farm raised fur-bearing animals
6.3.4 Emission factors
CH4
The calculated average emission factors for different animal types are shown in table 6.6.They
are country specific factors which may deviate from the IPCC default values.
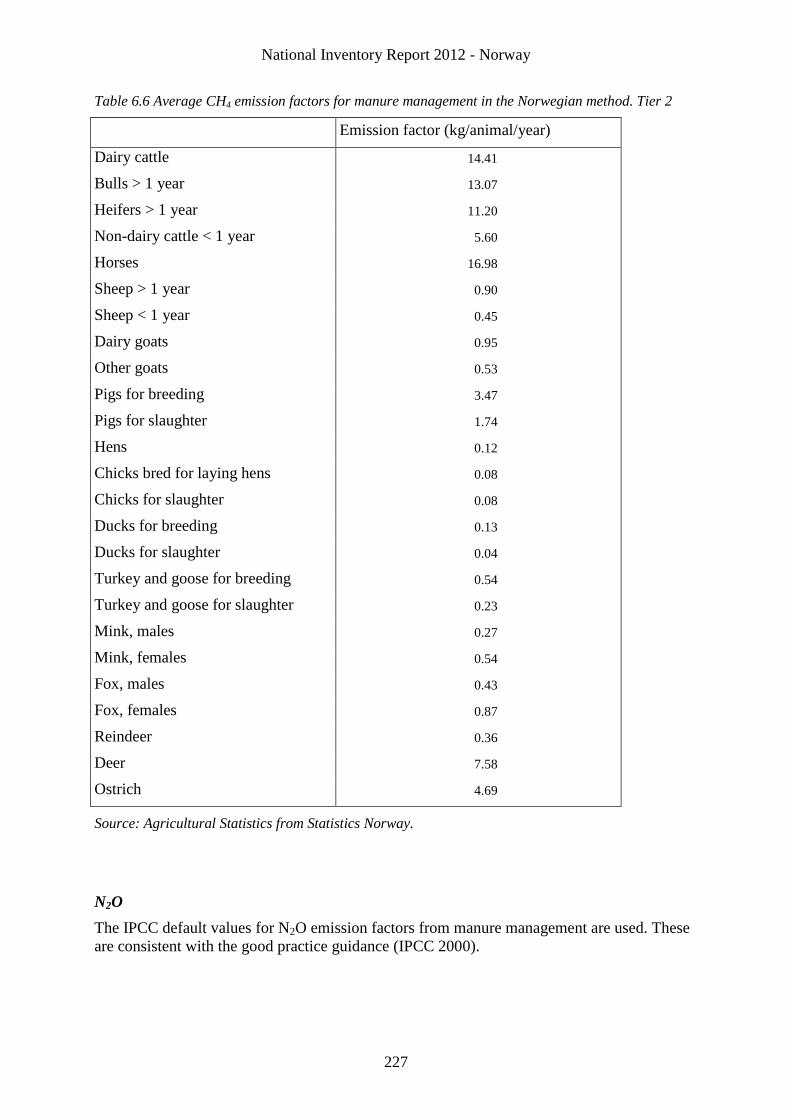
National Inventory Report 2012 - Norway
227
Table 6.6 Average CH4 emission factors for manure management in the Norwegian method. Tier 2
Emission factor (kg/animal/year)
Dairy cattle 14.41
Bulls > 1 year 13.07
Heifers > 1 year 11.20
Non-dairy cattle < 1 year 5.60
Horses 16.98
Sheep > 1 year 0.90
Sheep < 1 year 0.45
Dairy goats 0.95
Other goats 0.53
Pigs for breeding 3.47
Pigs for slaughter 1.74
Hens 0.12
Chicks bred for laying hens 0.08
Chicks for slaughter 0.08
Ducks for breeding 0.13
Ducks for slaughter 0.04
Turkey and goose for breeding 0.54
Turkey and goose for slaughter 0.23
Mink, males 0.27
Mink, females 0.54
Fox, males 0.43
Fox, females 0.87
Reindeer 0.36
Deer 7.58
Ostrich 4.69
Source: Agricultural Statistics from Statistics Norway.
N2O
The IPCC default values for N2O emission factors from manure management are used. These
are consistent with the good practice guidance (IPCC 2000).
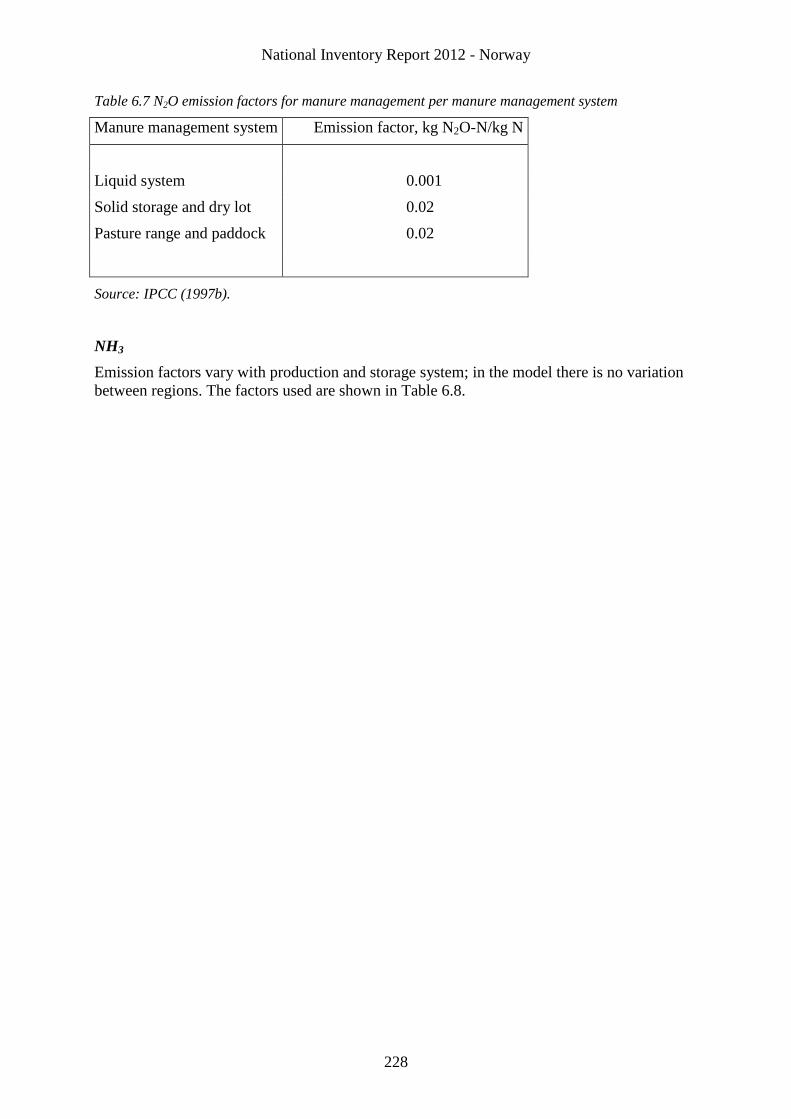
National Inventory Report 2012 - Norway
228
Table 6.7 N2O emission factors for manure management per manure management system
Manure management system Emission factor, kg N2O-N/kg N
Liquid system 0.001
Solid storage and dry lot 0.02
Pasture range and paddock 0.02
Source: IPCC (1997b).
NH3
Emission factors vary with production and storage system; in the model there is no variation
between regions. The factors used are shown in Table 6.8.
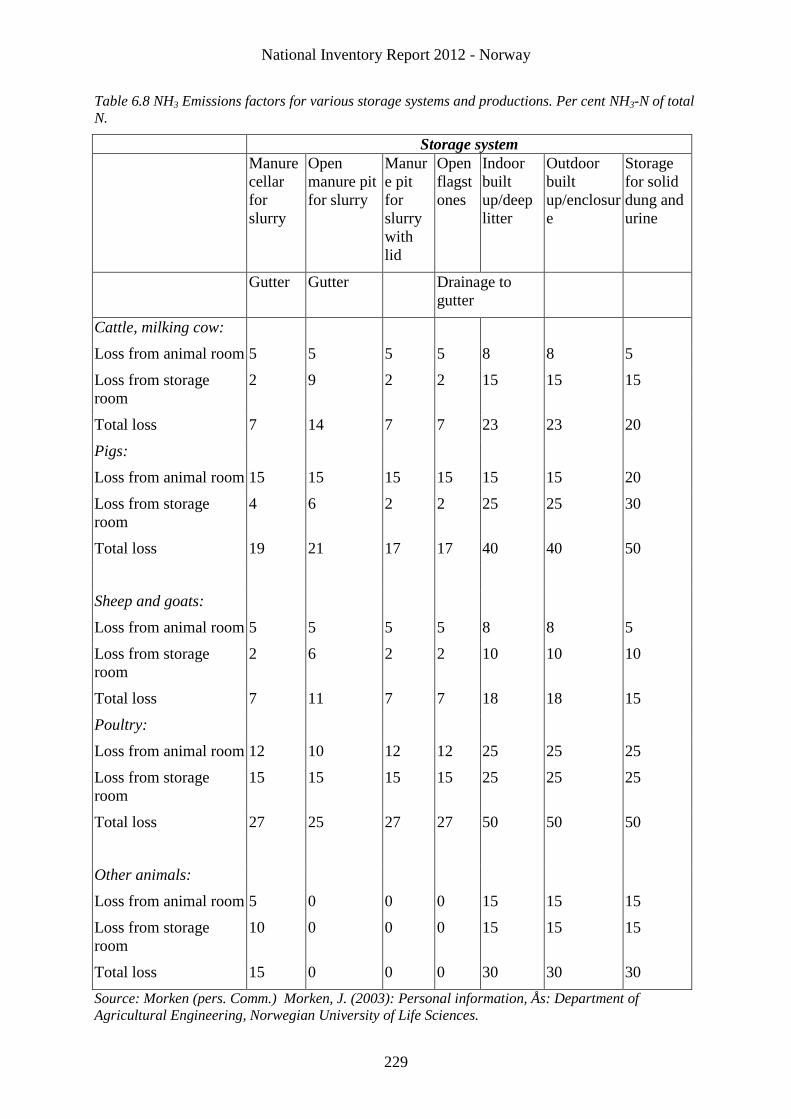
National Inventory Report 2012 - Norway
229
Table 6.8 NH3 Emissions factors for various storage systems and productions. Per cent NH3-N of total
N.
Storage system
Manure
cellar
for
slurry
Open
manure pit
for slurry
Manur
e pit
for
slurry
with
lid
Open
flagst
ones
Indoor
built
up/deep
litter
Outdoor
built
up/enclosur
e
Storage
for solid
dung and
urine
Gutter Gutter Drainage to
gutter
Cattle, milking cow:
Loss from animal room 5 5 5 5 8 8 5
Loss from storage
room
2 9 2 2 15 15 15
Total loss 7 14 7 7 23 23 20
Pigs:
Loss from animal room 15 15 15 15 15 15 20
Loss from storage
room
4 6 2 2 25 25 30
Total loss 19 21 17 17 40 40 50
Sheep and goats:
Loss from animal room 5 5 5 5 8 8 5
Loss from storage
room
2 6 2 2 10 10 10
Total loss 7 11 7 7 18 18 15
Poultry:
Loss from animal room 12 10 12 12 25 25 25
Loss from storage
room
15 15 15 15 25 25 25
Total loss 27 25 27 27 50 50 50
Other animals:
Loss from animal room 5 0 0 0 15 15 15
Loss from storage
room
10 0 0 0 15 15 15
Total loss 15 0 0 0 30 30 30
Source: Morken (pers. Comm.) Morken, J. (2003): Personal information, Ås: Department of
Agricultural Engineering, Norwegian University of Life Sciences.
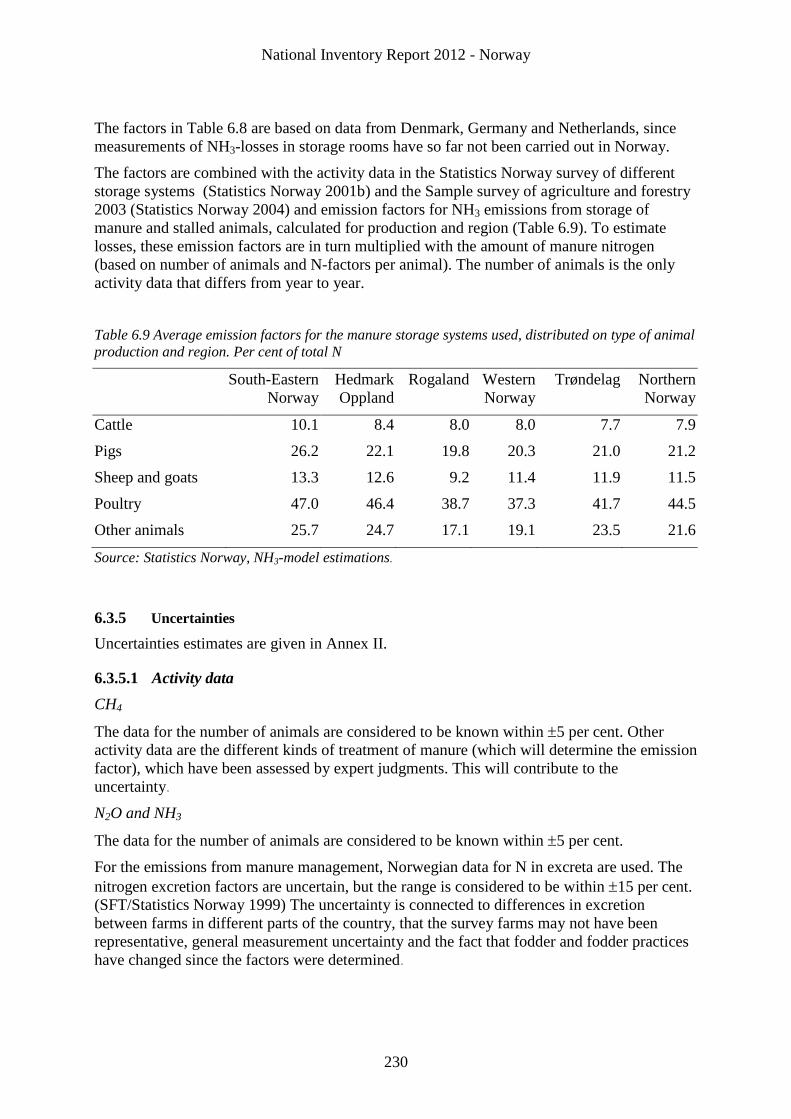
National Inventory Report 2012 - Norway
230
The factors in Table 6.8 are based on data from Denmark, Germany and Netherlands, since
measurements of NH3-losses in storage rooms have so far not been carried out in Norway.
The factors are combined with the activity data in the Statistics Norway survey of different
storage systems (Statistics Norway 2001b) and the Sample survey of agriculture and forestry
2003 (Statistics Norway 2004) and emission factors for NH3 emissions from storage of
manure and stalled animals, calculated for production and region (Table 6.9). To estimate
losses, these emission factors are in turn multiplied with the amount of manure nitrogen
(based on number of animals and N-factors per animal). The number of animals is the only
activity data that differs from year to year.
Table 6.9 Average emission factors for the manure storage systems used, distributed on type of animal
production and region. Per cent of total N
South-Eastern
Norway
Hedmark
Oppland
Rogaland Western
Norway
Trøndelag Northern
Norway
Cattle 10.1 8.4 8.0 8.0 7.7 7.9
Pigs 26.2 22.1 19.8 20.3 21.0 21.2
Sheep and goats 13.3 12.6 9.2 11.4 11.9 11.5
Poultry 47.0 46.4 38.7 37.3 41.7 44.5
Other animals 25.7 24.7 17.1 19.1 23.5 21.6
Source: Statistics Norway, NH3-model estimations.
6.3.5 Uncertainties
Uncertainties estimates are given in Annex II.
6.3.5.1 Activity data
CH4
The data for the number of animals are considered to be known within 5 per cent. Other
activity data are the different kinds of treatment of manure (which will determine the emission
factor), which have been assessed by expert judgments. This will contribute to the
uncertainty.
N2O and NH3
The data for the number of animals are considered to be known within 5 per cent.
For the emissions from manure management, Norwegian data for N in excreta are used. The
nitrogen excretion factors are uncertain, but the range is considered to be within 15 per cent.
(SFT/Statistics Norway 1999) The uncertainty is connected to differences in excretion
between farms in different parts of the country, that the survey farms may not have been
representative, general measurement uncertainty and the fact that fodder and fodder practices
have changed since the factors were determined.
National Inventory Report 2012 - Norway
231
There is also an uncertainty connected to the division between different storage systems for
manure, which is considered to be within 10 per cent, and the division between storage and
pasture, which is considered to be within 15 per cent.
6.3.5.2 Emission factors
CH4
Norway is using the IPCC default factors (Tier 2 methodology) for the emission of CH4, but
with some national data. The emission factors are considered to have the uncertainty range
25 per cent (Statistics Norway 2000).
N2O
For the emission of N2O from different storage systems, IPCC default emission factors are
used. They have an uncertainty range of -50 to +100 per cent (IPCC 2000) except for the
storage category "daily spread" where it is not applicable.
NH3
Ammonia emissions from agriculture are estimated based on national conditions. There are
uncertainties in several parameters (fraction of manure left on pastures, amount of manure,
conditions of storage, conditions of spreading and climate conditions. There is not made any
uncertainty analysis for the revised NH3 model, which has been in use since 2003. The
revision of the model is however supposed to have reduced the uncertainty
6.3.6 Completeness
Major missing emission sources are not likely.
6.3.7 Source specific QA/QC and verification
In a Nordic project in 2002, the results for emissions of both CH4 and N2O from manure
management in the national emission inventories have been compared with the results using
the IPCC default methodology and the IPCC default factors (Petersen and Olesen 2002). This
study contributed to discover differences and gaps in each of the Nordic national
methodologies.
Statistics Norway, in cooperation with the Norwegian University of Life Sciences (UMB),
made improvements in the calculation model for ammonia emissions from the agricultural
sector. Data sources used for the recalculations in the revised NH3 model are coefficients from
the Norwegian University of Life Sciences, and two surveys from Statistics Norway; a
manure survey (Statistics Norway 2001b) and the sample survey of agriculture and forestry
(Statistics Norway 2002b).
Statistics Norway’s detailed manure survey gives more extended activity data which are better
related to emission source categories, for manure management and spreading. New loss
factors for different manure management categories are also used in the revised NH3-model.
These factors are closer connected to specific activities.
6.3.8 Recalculations
The nitrogen excretion factors for pigs and poultry and the emission factors for NH3 losses
from the manure of sheep and goats in barns have been revised. More information about these
recalculations is given in Chapter 9.
6.3.9 Planned improvements
National Inventory Report 2012 - Norway
232
A project with the aim to update the Norwegian nitrogen excretion factors and the values for
manure excreted for the different animal species are ongoing at the Norwegian University of
Life Sciences (UMB). The results from the project are planned to be implemented in the 2013
submission.
A project with the aim to revise the Norwegian CH4 conversion factors (MCF) for the manure
storage systems in use is ongoing at the Norwegian University of Life Sciences (UMB). The
maximum CH4 producing capacity (Bo) is also planned to be revised for cattle manure. The
results from the project are planned to be implemented in the 2013 submission.
New information about the use of manure storage systems from the Sample survey of
agriculture 2011 performed by Statistics Norway is planned to be implemented in the
inventory before the 2013 submission.
6.4 Direct and indirect emissions from agricultural soils – 4D – N2O (Key
Category)
6.4.1 Description
The greenhouse gases N2O and CO2 are emitted from agricultural soils in Norway. Emissions
of CO2 are discussed section 7.
The emissions of N2O in Norway from agricultural soils amounted to 1.93 Mtonnes calculated
in CO2-equivalents. They accounted for about 63 per cent of the total Norwegian N2O
emissions in 2010 or about 3.6 per cent of the total Norwegian GHG emissions that year
The emissions had minor fluctuations in the period 1990-2010. During the period 1990-2010
emissions decreased by 6.5 %. From 2009 to 2010 the emissions increased by 0.6 %.
Three sources of N2O from agricultural soils are distinguished in the IPCC methodology,
namely:
Direct emissions from agricultural soils (from use of synthetic fertilisers, animal
excreta nitrogen used as fertliser, biological nitrogen fixation, crop residues, industrial
and urban wastes and cultivation of soils with a high organic content);
Direct soil emissions from animal production (emissions from droppings on pastures);
N2O emissions indirectly induced by agricultural activities (N losses by volatilization,
leaching and runoff).
The use of synthetic fertilisers, animal excreta nitrogen as fertilizer, and droppings on pastures
also results in emissions of NH3. For the first two sources, the calculated amount of nitrogen
that is emitted directly as N2O has been corrected for the nitrogen emitted as NH3.
Emissions of N2O from agricultural soils are key categories because of uncertainty, both in
level and trend. Their contribution to uncertainty of the national inventory was:
4D1 Direct soil emissions: 25.27 % for level in 2010 and 10.18 % for trend (1990-
2010).
4D2 Animal production: 1.46 % for level in 2010 and 0.77 % for trend (1990-2010).
4D3 Indirect emissions: 4.99 % for level in 2010 and 1.14 % for trend (1990-2010).
National Inventory Report 2012 - Norway
233
6.4.2 Methodological issues
6.4.2.1 Synthetic fertiliser
N2O
The direct emissions of N2O from use of synthetic fertiliser are calculated from data on total
annual amount of fertiliser sold in Norway and its nitrogen content, corrected for the amount
of synthetic fertilizer applied in forest (this in accordance with the comments of the review
team in the 2005 review). The resulting amount that is applied on agricultural fields is
multiplied with the IPCC default emission factor. The emissions are corrected for NH3 that
volatilises during spreading.
NH3
Statistics Norway's NH3 model (described section 6.3.2) is used for calculating the emissions
of ammonia from the use of synthetic fertilizer. The calculations of NH3 emissions from the
use of synthetic fertiliser are based on the amounts of nitrogen supplied and emission factors
for the percentage of nitrogen emitted as NH3 during spreading.
6.4.2.2 Manure applied to soils
N2O
In Norway, all animal excreta that are not deposited during grazing are used as manure and
applied to soils. Further, it is assumed that animals do not emit N2O themselves, but emissions
of N2O and NH3 from manure management before manure application on fields are taken into
account (see section 6.3.2).
The emission of N2O from manure used as fertiliser is calculated by multiplying the total
amount of N in manure used as fertiliser with the IPCC default emission factor. The N2O
emissions are corrected for NH3 that volatilises during spreading.
NH3
Statistics Norway's NH3 model (fig 6.1 in section 6.3.2) is used for calculating emissions of
ammonia from spreading of manure on cultivated fields and meadow. A spreading module in
the NH3 model gives the relative distribution of manure spread as fertiliser, distributed on
different spreading methods. Total emissions from spreading are estimated by emission
factors for the different spreading methods multiplied by the amount of manure. The amount
of manure is estimated by the number of animals and manure production factors for each type
of animal.
6.4.2.3 N2O from biological nitrogen fixation
Another source of N2O emissions is biological nitrogen fixation. The most important N-fixing
crop in Norway is clover. The amount of nitrogen fixed by a crop is very uncertain, and it is
difficult to assign a conversion factor for N2O emissions derived from nitrogen fixation (IPCC
1997b, a). The amount of nitrogen fixed is multiplied with the IPCC default emission factor.
6.4.2.4 N2O from crop residues
Concerning re-utilisation of nitrogen from crop residues, there is only limited information.
N2O emissions associated with crop residue decomposition are calculated by using the Tier 1b
method, as described in the IPCC (IPCC 2000). Due to lack of national or default factors,
factors from the Swedish National Inventory (Swedish Environmental Protection Agency
2005) have been used for the Residue/Crop ratio for grass and green fodder, for FracDM for
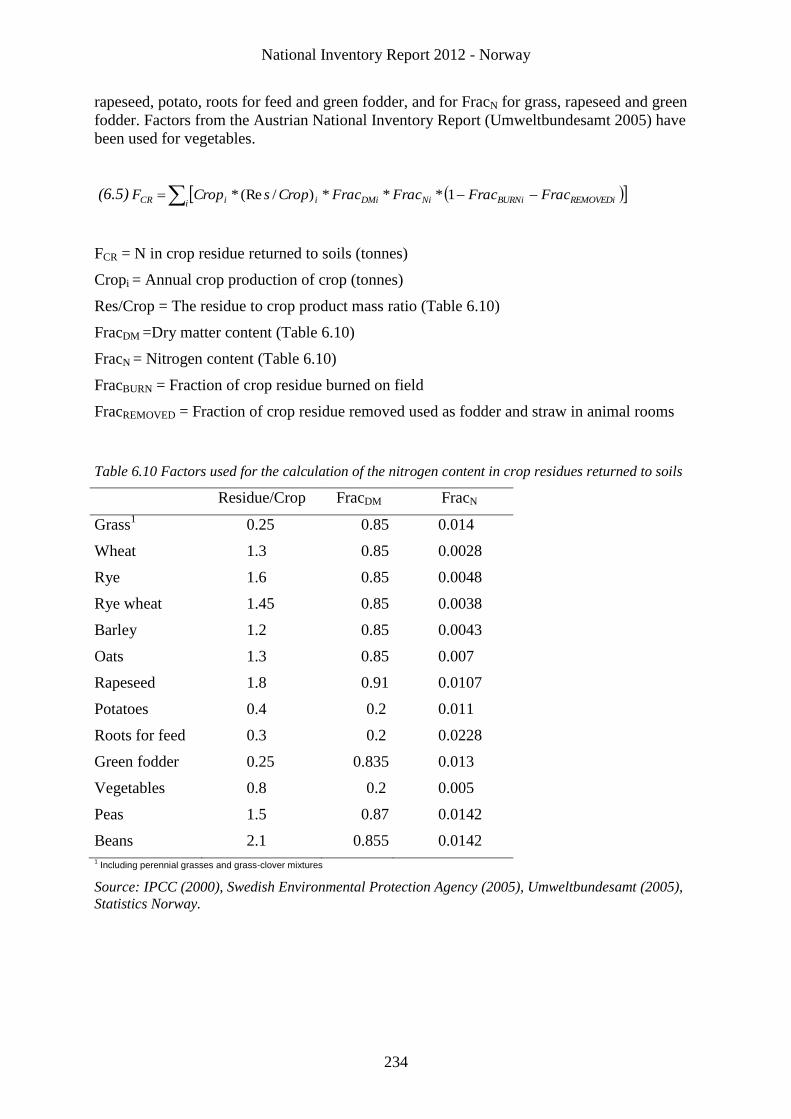
National Inventory Report 2012 - Norway
234
rapeseed, potato, roots for feed and green fodder, and for FracN for grass, rapeseed and green
fodder. Factors from the Austrian National Inventory Report (Umweltbundesamt 2005) have
been used for vegetables.
(6.5) i REMOVEDiBURNiNiDMiiiCR FracFracFracFracCropsCropF 1***)/(Re*
FCR = N in crop residue returned to soils (tonnes)
Cropi = Annual crop production of crop (tonnes)
Res/Crop = The residue to crop product mass ratio (Table 6.10)
FracDM =Dry matter content (Table 6.10)
FracN = Nitrogen content (Table 6.10)
FracBURN = Fraction of crop residue burned on field
FracREMOVED = Fraction of crop residue removed used as fodder and straw in animal rooms
Table 6.10 Factors used for the calculation of the nitrogen content in crop residues returned to soils
Residue/Crop FracDM FracN
Grass1 0.25 0.85 0.014
Wheat 1.3 0.85 0.0028
Rye 1.6 0.85 0.0048
Rye wheat 1.45 0.85 0.0038
Barley 1.2 0.85 0.0043
Oats 1.3 0.85 0.007
Rapeseed 1.8 0.91 0.0107
Potatoes 0.4 0.2 0.011
Roots for feed 0.3 0.2 0.0228
Green fodder 0.25 0.835 0.013
Vegetables 0.8 0.2 0.005
Peas 1.5 0.87 0.0142
Beans 2.1 0.855 0.0142 1 Including perennial grasses and grass-clover mixtures
Source: IPCC (2000), Swedish Environmental Protection Agency (2005), Umweltbundesamt (2005),
Statistics Norway.
National Inventory Report 2012 - Norway
235
6.4.2.5 N2O from industrial and urban wastes
No data are available for the amount of N in industrial waste applied as fertilizer, but this
source is assumed to be very limited in Norway. Data for the N2O emission arising from
sewage sludge applied on fields has been calculated by multiplying the amount of nitrate in
the sewage sludge applied with the IPCC default emission factor. Statistics Norway (waste
water statistics) annually gives values for the amount of sewage sludge, and the fraction of the
sewage sludge that are applied on fields. The N-content in the sludge is given in Statistics
Norway (2001f), and the same value of 2.82 per cent is used for all years.
6.4.2.6 N2O from cultivation of soils with a high organic content
Large N2O emissions occur as a result of cultivation of organic soils (histosols) due to
enhanced mineralisation of old, N-rich organic matter. The emissions are calculated using the
IPCC default emission factor of 8 kg N2O-N/ha per year, and an estimation of the area of
cultivated organic soil in Norway. The area estimate of organic soils is based on
measurements of C in the soil. National figures for the carbon content in agricultural soils are
estimated on the basis of carbon and area data from a soil database by Skog og landskap (The
Norwegian Forest and Landscape Institute), which covers about 50 per cent of the agricultural
area in Norway. The figures are scaled up to a national level by using an area resource
database by Skog og landskap and a soil database by Bioforsk (Norwegian Institute for
Agricultural and Environmental Research). The soil database by Bioforsk contains results
from about 600 000 soil samples. The soil samples represent about 65 per cent of the farms in
Norway (Grønlund et al. 2008b).
The soil mapping was mainly carried out in 1994, which gives a relatively accurate figure for
the area estimate this year, ca. 830 km2. After 1995 the area has decreased due to the
transition to mineral soil after the peat layer has decomposed and cultivated moors taken out
of production. This decrease has to some extent been counteracted by cultivation of new
moors. Figures for the development of cultivated area after 1994 have been estimated by
Bioforsk (Grønlund 2010, pers.Comm.15) based on four different estimates for reduction and
new cultivation. Four scenarios are developed based on the assumptions of an annual area
decline of 1.4 or 1.0 per cent combined with an annual cultivation of new moor of 2 alt. 4
km2.
6.4.2.7 Direct soil emissions from animal production (emissions from droppings on
pastures)
N2O
The fraction of the total amount of animal manure produced that is droppings on pastures is
given by national data for the distribution of manure to different storage systems and data for
pasture times (Table 6.5). The amount of N deposited during grazing is multiplied with the
IPCC default emission factor.
NH3
Statistics Norway's NH3 model is used for calculating the emissions of ammonia from
pastures. Animal population data, data for pasture times, and factors for the nitrogen amount
in excreta for different animal categories give the nitrogen amounts for the animal categories
on pastures. Specific emission factors by animal category are used.
15
Grønlund, A. (2010): Personal information, email from Arne Grønlund 16/8-2010, Ås: Bioforsk.
National Inventory Report 2012 - Norway
236
6.4.2.8 N losses by volatilisation
Atmospheric deposition of nitrogen compounds fertilises soils and surface waters, and
enhances biogenic N2O formation. Climate and fertliser type influence the ammonia
volatilisation. Deposition of ammonia is assumed to correspond to the amount of NH3 that
volatilises during the spreading of synthetic fertilisers, storage and spreading of manure, and
volatlisation from pastures. This amount is obtained from Statistics Norway's ammonia
model. The N2O emissions are calculated by multiplying the amount of N from deposition
with the IPCC default emission factor.
6.4.2.9 N2O from leaching and runoff
A considerable amount of fertiliser nitrogen is lost from agricultural soils through leaching
and runoff. Fertiliser nitrogen in ground water and surface waters enhances biogenic
production of N2O as the nitrogen undergoes nitrification and denitrification. The fraction of
the fertliser and manure nitrogen lost to leaching and surface runoff may range from 10 to 80
per cent. The IPCC (IPCC 1997b, a) proposes a default value of 30 per cent, but in the
Norwegian inventory a national factor of 18 per cent is used that is believed to give better
results under Norwegian conditions. This country specific factor has been calculated based on
an estimate of the amount of nitrate leaching for the country on 33 kg N/hectare (Vagstad et al
1998), which comes from a runoff model by Jordforsk (Norwegian Centre for Soil and
Environmental Research),. The figure is an estimated average based on measurements of N-
leaching in 12 small watershed areas, and expresses the discharge to nearest surface water
recipient. Behind this average figure, there is a huge variation in N-leaching, depending on
weather conditions, soil types, farm practices, geographical location etc. Climate data, soil
data, agricultural practices etc. are monitored closely in these 12 watershed areas. The areas
are chosen so that they together make up a representative selection of Norwegian farming
with regard to farming practices, geographical localization and climate and soil conditions.
The amount of nitrogen lost to leaching is multiplied with the IPCC default emission factor to
calculate the emission of N2O.
6.4.3 Activity data
N2O
The activity data significant for the estimation of direct and indirect emissions of N2O from
agricultural soils and N2O emissions from pastures, and the sources for the activity data are
listed in Table 6.11.
The calculation of emissions from use of nitrogen fertiliser is based on sales figures for each
year. A strong price increase for nitrogen fertiliser caused a stock building in 2008 and
corresponding lower sales in 2009. In addition, new fertilisation standards may have brought
about a reduction of the use of fertilisers. To correct for this a transfer of fertiliser use has
been made from 2008 to 2009.
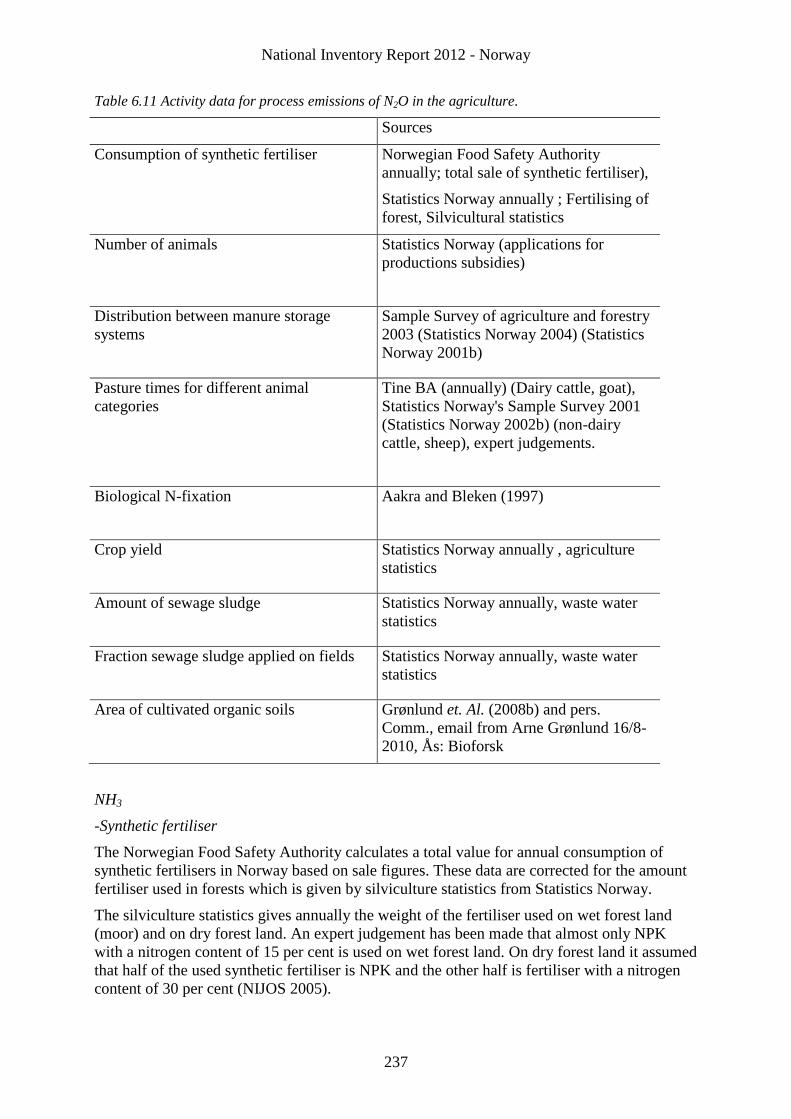
National Inventory Report 2012 - Norway
237
Table 6.11 Activity data for process emissions of N2O in the agriculture.
Sources
Consumption of synthetic fertiliser
Norwegian Food Safety Authority
annually; total sale of synthetic fertiliser),
Statistics Norway annually ; Fertilising of
forest, Silvicultural statistics
Number of animals Statistics Norway (applications for
productions subsidies)
Distribution between manure storage
systems
Sample Survey of agriculture and forestry
2003 (Statistics Norway 2004) (Statistics
Norway 2001b)
Pasture times for different animal
categories
Tine BA (annually) (Dairy cattle, goat),
Statistics Norway's Sample Survey 2001
(Statistics Norway 2002b) (non-dairy
cattle, sheep), expert judgements.
Biological N-fixation
Aakra and Bleken (1997)
Crop yield
Statistics Norway annually , agriculture
statistics
Amount of sewage sludge
Statistics Norway annually, waste water
statistics
Fraction sewage sludge applied on fields
Statistics Norway annually, waste water
statistics
Area of cultivated organic soils
Grønlund et. Al. (2008b) and pers.
Comm., email from Arne Grønlund 16/8-
2010, Ås: Bioforsk
NH3
-Synthetic fertiliser
The Norwegian Food Safety Authority calculates a total value for annual consumption of
synthetic fertilisers in Norway based on sale figures. These data are corrected for the amount
fertiliser used in forests which is given by silviculture statistics from Statistics Norway.
The silviculture statistics gives annually the weight of the fertiliser used on wet forest land
(moor) and on dry forest land. An expert judgement has been made that almost only NPK
with a nitrogen content of 15 per cent is used on wet forest land. On dry forest land it assumed
that half of the used synthetic fertiliser is NPK and the other half is fertiliser with a nitrogen
content of 30 per cent (NIJOS 2005).
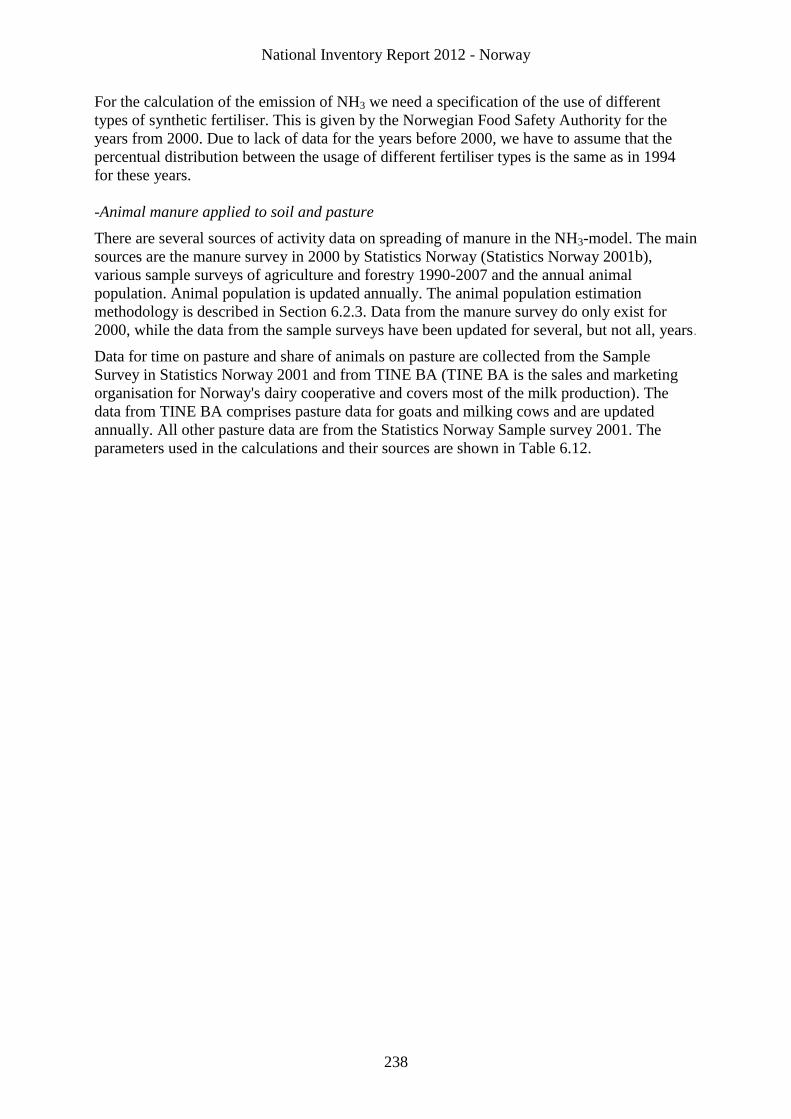
National Inventory Report 2012 - Norway
238
For the calculation of the emission of NH3 we need a specification of the use of different
types of synthetic fertiliser. This is given by the Norwegian Food Safety Authority for the
years from 2000. Due to lack of data for the years before 2000, we have to assume that the
percentual distribution between the usage of different fertiliser types is the same as in 1994
for these years.
-Animal manure applied to soil and pasture
There are several sources of activity data on spreading of manure in the NH3-model. The main
sources are the manure survey in 2000 by Statistics Norway (Statistics Norway 2001b),
various sample surveys of agriculture and forestry 1990-2007 and the annual animal
population. Animal population is updated annually. The animal population estimation
methodology is described in Section 6.2.3. Data from the manure survey do only exist for
2000, while the data from the sample surveys have been updated for several, but not all, years.
Data for time on pasture and share of animals on pasture are collected from the Sample
Survey in Statistics Norway 2001 and from TINE BA (TINE BA is the sales and marketing
organisation for Norway's dairy cooperative and covers most of the milk production). The
data from TINE BA comprises pasture data for goats and milking cows and are updated
annually. All other pasture data are from the Statistics Norway Sample survey 2001. The
parameters used in the calculations and their sources are shown in Table 6.12.
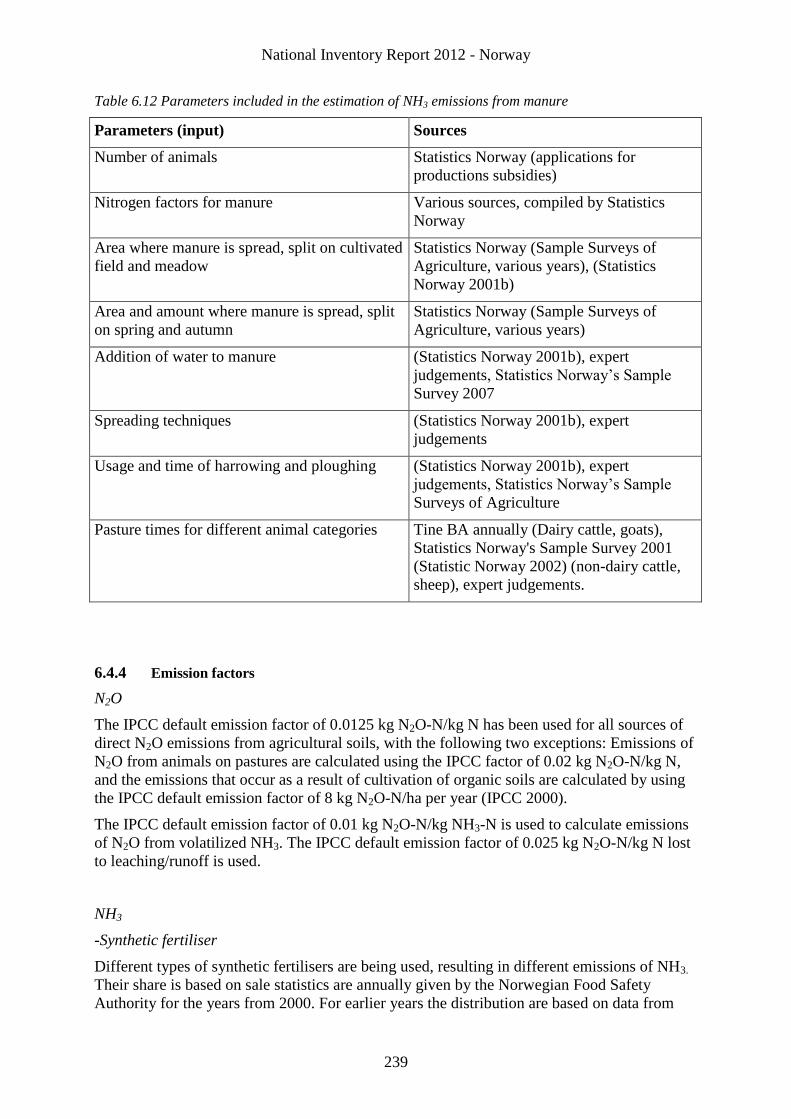
National Inventory Report 2012 - Norway
239
Table 6.12 Parameters included in the estimation of NH3 emissions from manure
Parameters (input) Sources
Number of animals Statistics Norway (applications for
productions subsidies)
Nitrogen factors for manure Various sources, compiled by Statistics
Norway
Area where manure is spread, split on cultivated
field and meadow
Statistics Norway (Sample Surveys of
Agriculture, various years), (Statistics
Norway 2001b)
Area and amount where manure is spread, split
on spring and autumn
Statistics Norway (Sample Surveys of
Agriculture, various years)
Addition of water to manure
(Statistics Norway 2001b), expert
judgements, Statistics Norway’s Sample
Survey 2007
Spreading techniques (Statistics Norway 2001b), expert
judgements
Usage and time of harrowing and ploughing (Statistics Norway 2001b), expert
judgements, Statistics Norway’s Sample
Surveys of Agriculture
Pasture times for different animal categories Tine BA annually (Dairy cattle, goats),
Statistics Norway's Sample Survey 2001
(Statistic Norway 2002) (non-dairy cattle,
sheep), expert judgements.
6.4.4 Emission factors
N2O
The IPCC default emission factor of 0.0125 kg N2O-N/kg N has been used for all sources of
direct N2O emissions from agricultural soils, with the following two exceptions: Emissions of
N2O from animals on pastures are calculated using the IPCC factor of 0.02 kg N2O-N/kg N,
and the emissions that occur as a result of cultivation of organic soils are calculated by using
the IPCC default emission factor of 8 kg N2O-N/ha per year (IPCC 2000).
The IPCC default emission factor of 0.01 kg N2O-N/kg NH3-N is used to calculate emissions
of N2O from volatilized NH3. The IPCC default emission factor of 0.025 kg N2O-N/kg N lost
to leaching/runoff is used.
NH3
-Synthetic fertiliser
Different types of synthetic fertilisers are being used, resulting in different emissions of NH3.
Their share is based on sale statistics are annually given by the Norwegian Food Safety
Authority for the years from 2000. For earlier years the distribution are based on data from
National Inventory Report 2012 - Norway
240
1994. The NH3 emission factors (per cent loss of N) for the different types of fertilisers are
shown in table 6.13.
Table 6.13 Emission factors for NH3-N for different fertilisers
Fertiliser Emission factor ( per
cent of applied N)
Urea 15
Ammonium sulphate and
Ammonium nitrate
5
Calcium nitrate 0
Calcium ammonium nitrate 1
NPK (Nitrogen, phosphorus,
potassium)
1
Other 1
Source: ECETOC (1994) and Norsk Hydro, pers. Comm.16
-Animal manure applied to soil and pasture
Emission factors for spreading of stored manure vary with spreading method, water contents,
type and time of treatment of soil, time of year of spreading, cultivation, and region. The basic
factors used are shown in Table 6.14.
Emission factors for spreading of stored manure vary with spreading method (Statistics
Norway 2001b), water contents (Statistics Norway 2007a), type and time of treatment of soil
(Statistics Norway 2001b), time of year of spreading (Statistics Norway 2001b)(Statistics
Norway 2007a), cultivation and region. The basic factors used are shown in table 6.14.
16
Norsk Hydro (1995): Personal information, Kaarstad, Norsk Hydro.
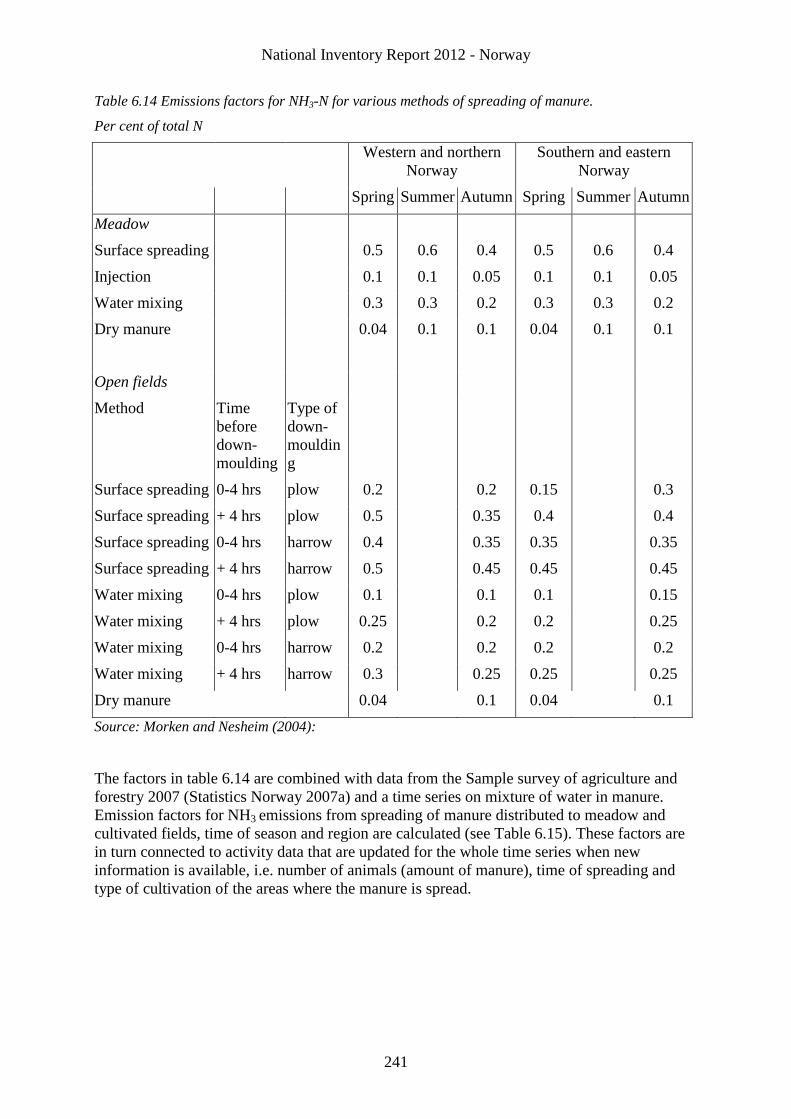
National Inventory Report 2012 - Norway
241
Table 6.14 Emissions factors for NH3-N for various methods of spreading of manure.
Per cent of total N
Western and northern
Norway
Southern and eastern
Norway
Spring Summer Autumn Spring Summer Autumn
Meadow
Surface spreading 0.5 0.6 0.4 0.5 0.6 0.4
Injection 0.1 0.1 0.05 0.1 0.1 0.05
Water mixing 0.3 0.3 0.2 0.3 0.3 0.2
Dry manure 0.04 0.1 0.1 0.04 0.1 0.1
Open fields
Method Time
before
down-
moulding
Type of
down-
mouldin
g
Surface spreading 0-4 hrs plow 0.2 0.2 0.15 0.3
Surface spreading + 4 hrs plow 0.5 0.35 0.4 0.4
Surface spreading 0-4 hrs harrow 0.4 0.35 0.35 0.35
Surface spreading + 4 hrs harrow 0.5 0.45 0.45 0.45
Water mixing 0-4 hrs plow 0.1 0.1 0.1 0.15
Water mixing + 4 hrs plow 0.25 0.2 0.2 0.25
Water mixing 0-4 hrs harrow 0.2 0.2 0.2 0.2
Water mixing + 4 hrs harrow 0.3 0.25 0.25 0.25
Dry manure 0.04 0.1 0.04 0.1
Source: Morken and Nesheim (2004):
The factors in table 6.14 are combined with data from the Sample survey of agriculture and
forestry 2007 (Statistics Norway 2007a) and a time series on mixture of water in manure.
Emission factors for NH3 emissions from spreading of manure distributed to meadow and
cultivated fields, time of season and region are calculated (see Table 6.15). These factors are
in turn connected to activity data that are updated for the whole time series when new
information is available, i.e. number of animals (amount of manure), time of spreading and
type of cultivation of the areas where the manure is spread.
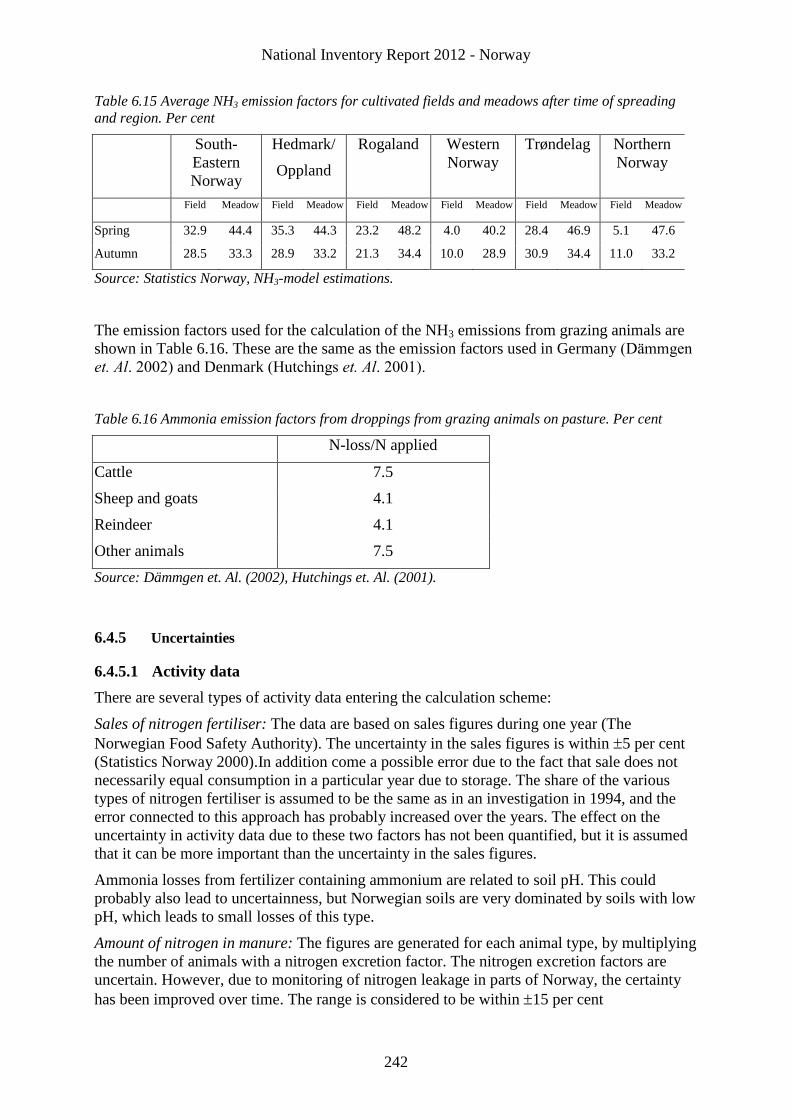
National Inventory Report 2012 - Norway
242
Table 6.15 Average NH3 emission factors for cultivated fields and meadows after time of spreading
and region. Per cent
South-
Eastern
Norway
Hedmark/
Oppland
Rogaland Western
Norway
Trøndelag Northern
Norway
Field Meadow Field Meadow Field Meadow Field Meadow Field Meadow Field Meadow
Spring 32.9 44.4 35.3 44.3 23.2 48.2 4.0 40.2 28.4 46.9 5.1 47.6
Autumn 28.5 33.3 28.9 33.2 21.3 34.4 10.0 28.9 30.9 34.4 11.0 33.2
Source: Statistics Norway, NH3-model estimations.
The emission factors used for the calculation of the NH3 emissions from grazing animals are
shown in Table 6.16. These are the same as the emission factors used in Germany (Dämmgen
et. Al. 2002) and Denmark (Hutchings et. Al. 2001).
Table 6.16 Ammonia emission factors from droppings from grazing animals on pasture. Per cent
N-loss/N applied
Cattle 7.5
Sheep and goats 4.1
Reindeer 4.1
Other animals 7.5
Source: Dämmgen et. Al. (2002), Hutchings et. Al. (2001).
6.4.5 Uncertainties
6.4.5.1 Activity data
There are several types of activity data entering the calculation scheme:
Sales of nitrogen fertiliser: The data are based on sales figures during one year (The
Norwegian Food Safety Authority). The uncertainty in the sales figures is within 5 per cent
(Statistics Norway 2000).In addition come a possible error due to the fact that sale does not
necessarily equal consumption in a particular year due to storage. The share of the various
types of nitrogen fertiliser is assumed to be the same as in an investigation in 1994, and the
error connected to this approach has probably increased over the years. The effect on the
uncertainty in activity data due to these two factors has not been quantified, but it is assumed
that it can be more important than the uncertainty in the sales figures.
Ammonia losses from fertilizer containing ammonium are related to soil pH. This could
probably also lead to uncertainness, but Norwegian soils are very dominated by soils with low
pH, which leads to small losses of this type.
Amount of nitrogen in manure: The figures are generated for each animal type, by multiplying
the number of animals with a nitrogen excretion factor. The nitrogen excretion factors are
uncertain. However, due to monitoring of nitrogen leakage in parts of Norway, the certainty
has been improved over time. The range is considered to be within 15 per cent
National Inventory Report 2012 - Norway
243
(SFT/Statistics Norway 1999). The uncertainty is connected to differences in excreted N
between farms in different parts of the country, that the surveyed farms may have not been
representative, general measurement uncertainty and the fact that fodder and feeding practices
have changed since the factors were determined.
The uncertainty connected to the estimate of the amount of manure is higher than for the
amount of synthetic fertiliser used.
Fate of manure: There is significant uncertainty connected to the allocation of manure
between what is used as fertiliser and droppings on pastures.
Atmospheric deposition of agriculturalNH3 emissions: The data are based on national NH3
emission figures. These are within 30 per cent (SFT/Statistics Norway 1999).
Leakage of nitrogen: The upper limit for the leakage is the applied nitrogen. The uncertainty
is roughly about 70 per cent (SFT/Statistics Norway 1999).
6.4.5.2 Emission factors
N2O
Uncertainty estimates used for the N2O emission factors are given in Annex II.
NH3
The uncertainty in the estimate of emissions of NH3 from use of fertiliser is assessed to be
about 20 per cent (Statistics Norway 2001c). This uncertainty could be lower if better data
on fertiliser composition were obtained. The uncertainty is higher for animal manure, 30 per
cent (Statistics Norway 2001c). This is due to uncertainties in several parameters including
fraction of manure left on pastures, amount of manure, conditions of storage, conditions of
spreading and climate conditions (Statistics Norway 2001c). Other factors that could lead to
uncertainness are variation in storage periods, variation in house types and climate, variation
in manure properties.
6.4.6 Completeness
All sources described in the IPCC reporting guidelines are included in the estimates.
However, the emission factors might not be reflecting national conditions.
6.4.7 Source specific QA/QC and verification
In a Nordic project in 2002, the estimates for emissions of direct and indirect N2O from
agricultural soils in the national emission inventories have been compared with the results
using the IPCC default methodology and the IPCC default factors. The results for the Nordic
countries are presented in a report (Petersen and Olesen 2002).
Statistics Norway, in cooperation with the Norwegian University of Life Sciences (UMB),
made in 2003 improvements in the calculation model for ammonia emissions from the
agricultural sector. Data sources used for the recalculations in the revised NH3 model are
coefficients from the Norwegian University of Life Sciences, and two surveys from Statistics
Norway; a manure survey (Statistics Norway 2001b) and the sample survey of agriculture and
forestry (2001).
In 2006, the methodology used for estimating N2O from crop residues has been changed to
the method Tier 1b (IPCC 2000). The new method is more detailed and is supposed to better
reflect the real emissions than the earlier used national method.
National Inventory Report 2012 - Norway
244
In 2009, the earlier used constant estimate for the area of cultivated organic soils was replaced
with new estimates for the whole time series. The recalculations give a decrease in N2O
emissions for the whole period.'
There was a strong price increase for nitrogen fertiliser, which caused a stock building in
2008 and corresponding lower purchases in 2009. The calculation of N2O emissions from use
of nitrogen fertiliser is based on sales figures for each year. To correct for this there a transfer
of fertiliser from 2008 to 2009 was made in the calculations.
6.4.8 Recalculations
The nitrogen excretion factors for pigs and poultry and the emission factors for NH3 losses
from the manure of sheep and goats in barns have been revised. More information about
these recalculations is given in Chapter 9.
6.4.9 Planned improvements
A project with the aim to update the Norwegian nitrogen excretion factors and the values for
manure excreted for the different animal species are ongoing at the Norwegian University of
Life Sciences (UMB). The results from the project are planned to be implemented in the 2013
submission.
A project with the aim to revise the Norwegian CH4 conversion factors (MCF) for the manure
storage systems in use is ongoing at the Norwegian University of Life Sciences (UMB). The
maximum CH4 producing capacity (Bo) is also planned to be revised for cattle manure. The
results from the project are planned to be implemented in the 2013 submission.
New information about the use of manure storage systems from the Sample survey of
agriculture 2011 performed by Statistics Norway is planned to be implemented in the
inventory before the 2013 submission.
The national Frac LEACH factor is under revision and the results of the study is planned to be
implemented in the 2013 submission.
National Inventory Report 2012 - Norway
245
6.5 Emissions from agricultural residue burning (agricultural wastes) – 4F
– CH4, N2O
Burning of agricultural residues gives emissions of standard non-fossil combustion products.
6.5.1 Methodological issues
The emissions from the burning of crop residues are calculated in accordance with a Tier 1
approach (EEA 2009):
EPollutant = ARresidue_burnt * EFPollutant
EPollutant = emission I of pollutant
ARresidue_burnt = activity rate (AR), mass of residue burnt (dry matter)
EFPollutant = emission factor (EF) for pollutant
6.5.2 Activity data
The calculation of the annual amount of crop residue burned on the fields is based on crop
production data for cereals and rapeseed from Statistics Norway, and estimates of the fraction
burned made by the Norwegian Crop Research Institute and Statistics Norway (chapter
6.4.2.4). For cereals a water content of 15 per cent is used (IPCC 1997b) and the water
content for rapeseed is set to 9 per cent (Swedish environmental protection agency 2005). The
activity data is consistent with the data used in the estimations of N2O from crop residues.
6.5.3 Emission factors
Table 6.17. Emission factors for agricultural residue burning.
Components Emission factors Unit Source
Greenhouse gases
CH4 2.7 kg/ tonnes crop residue (d.m.) burned
(IPCC 2006)
N2O 0.07 kg/ tonnes crop residue (d.m.) burned
(IPCC 2006)
6.5.4 Uncertainties
Uncertainty estimates are given in Annex II.
6.5.5 Completeness
The main emission components from burning of agricultural residues are considered to be
covered in the emission calculations.
6.5.6 Source specific QA/QC and verification
National Inventory Report 2012 - Norway
246
In 2002, the emissions of CH4 and N2O, from agricultural residual burning were included in
the Norwegian inventory. The time series were included but it should be noted that the
figures for the earlier years have a higher uncertainty than the more recent years.
In 2010, the emission factors have been revised and emission factors from the 2006 IPCC
guidelines for national greenhouse gas inventories (IPCC 2006) are now used in the
inventory.
6.5.7 Recalculations
The burning of the residues of oilseed has been included in the inventory.
6.5.8 Planned improvements
No further improvements are planned before next NIR.
National Inventory Report 2012 - Norway
247
7 Land-Use, Land-Use Change and Forestry (LULUCF)
This chapter provides estimates of emissions and removals from Land Use, Land-Use Change
and Forestry (LULUCF) and documentation of the implementation of guidelines given in
“Good Practice Guidance for Land Use, Land-Use Change and Forestry” (IPCC, 2003). The
information is mainly based on the report “Emissions and removals of greenhouse gases from
land use, land-use change and forestry in Norway” (NIJOS, 2005).
The NIJOS 2005 report discussed carbon stock changes and each category of emissions and
removals of CO2 and other greenhouse gases, the methodological choice, underlying
assumptions, availability of data and recommendations for use of data. The NIJOS 2005
report included a chapter entitled “Recommendation for future reporting framework” and a
chapter that discussed how data collected for reporting under the UNFCCC could be used for
the Kyoto Protocol reporting. These chapters are now covered in “Framework for reporting
under Article 3.3 and 3.4 of the Kyoto Protocol” (Anon, 2006b), “Estimates of emissions and
removals resulting from activities under Article 3.3 and 3.4 of the Kyoto Protocol” (Anon,
2006a) and “Electing Cropland Management as an Article 3.4 Activity under the Kyoto
Protocol. Considerations for Norway” (Rypdal et al, 2006) and in the “National Greenhouse
Gas Inventory System in Norway” (see Annex VI).
The whole time-series have been recalculated due to a updating of the activity data provided
by the NFI for the entire country due to new data and continuous quality control of the data
bases used. CRF-tables for both for LULUCF and KP-LULUCF are updated compared to
earlier submitted reports and included in the NIR-submission. The work has been carried out
by the Norwegian Forest and Landscape Institute.
7.1 Overview of sector
7.1.1 Activity data
In light of the importance of the forest sector and the lack of sources of statistical information
that can be used to monitor all land-use transitions on an annual basis, data from the National
Forest Inventory (NFI) has been used as the most important source of information to establish
total area of forest, cropland, wetlands, settlements and other land and land-use transitions
between these. Data from the NFI is also used to calculate net change of carbon stock in
living biomass and as input values for modeling changes of carbon stock in dead organic
matter and soil.
The data from the NFI are complemented with other data (e.g. horticulture, tillage practice,
amount of fertilizer used, liming and drainage of forest soil, liming of lakes and forest fires)
collected by Statistics Norway, Norwegian Agricultural Authority, Food Safety Authority,
The Norwegian Directorate for Nature Management and The Directorate for Civil Protection
and Emergency Planning.
The calculated land-use categories for Norway in 1990 and 2010 are shown in Figure 7.1.
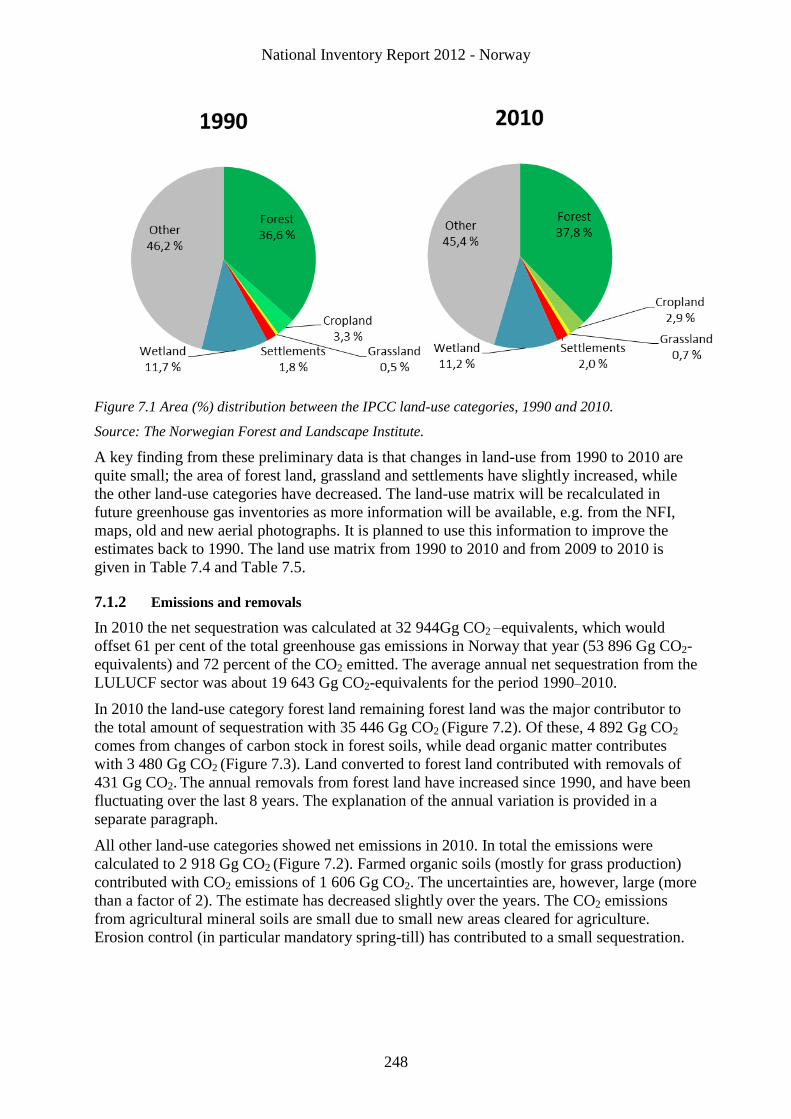
National Inventory Report 2012 - Norway
248
Figure 7.1 Area (%) distribution between the IPCC land-use categories, 1990 and 2010.
Source: The Norwegian Forest and Landscape Institute.
A key finding from these preliminary data is that changes in land-use from 1990 to 2010 are
quite small; the area of forest land, grassland and settlements have slightly increased, while
the other land-use categories have decreased. The land-use matrix will be recalculated in
future greenhouse gas inventories as more information will be available, e.g. from the NFI,
maps, old and new aerial photographs. It is planned to use this information to improve the
estimates back to 1990. The land use matrix from 1990 to 2010 and from 2009 to 2010 is
given in Table 7.4 and Table 7.5.
7.1.2 Emissions and removals
In 2010 the net sequestration was calculated at 32 944Gg CO2 –equivalents, which would
offset 61 per cent of the total greenhouse gas emissions in Norway that year (53 896 Gg CO2-
equivalents) and 72 percent of the CO2 emitted. The average annual net sequestration from the
LULUCF sector was about 19 643 Gg CO2-equivalents for the period 1990–2010.
In 2010 the land-use category forest land remaining forest land was the major contributor to
the total amount of sequestration with 35 446 Gg CO2 (Figure 7.2). Of these, 4 892 Gg CO2
comes from changes of carbon stock in forest soils, while dead organic matter contributes
with 3 480 Gg CO2 (Figure 7.3). Land converted to forest land contributed with removals of
431 Gg CO2. The annual removals from forest land have increased since 1990, and have been
fluctuating over the last 8 years. The explanation of the annual variation is provided in a
separate paragraph.
All other land-use categories showed net emissions in 2010. In total the emissions were
calculated to 2 918 Gg CO2 (Figure 7.2). Farmed organic soils (mostly for grass production)
contributed with CO2 emissions of 1 606 Gg CO2. The uncertainties are, however, large (more
than a factor of 2). The estimate has decreased slightly over the years. The CO2 emissions
from agricultural mineral soils are small due to small new areas cleared for agriculture.
Erosion control (in particular mandatory spring-till) has contributed to a small sequestration.
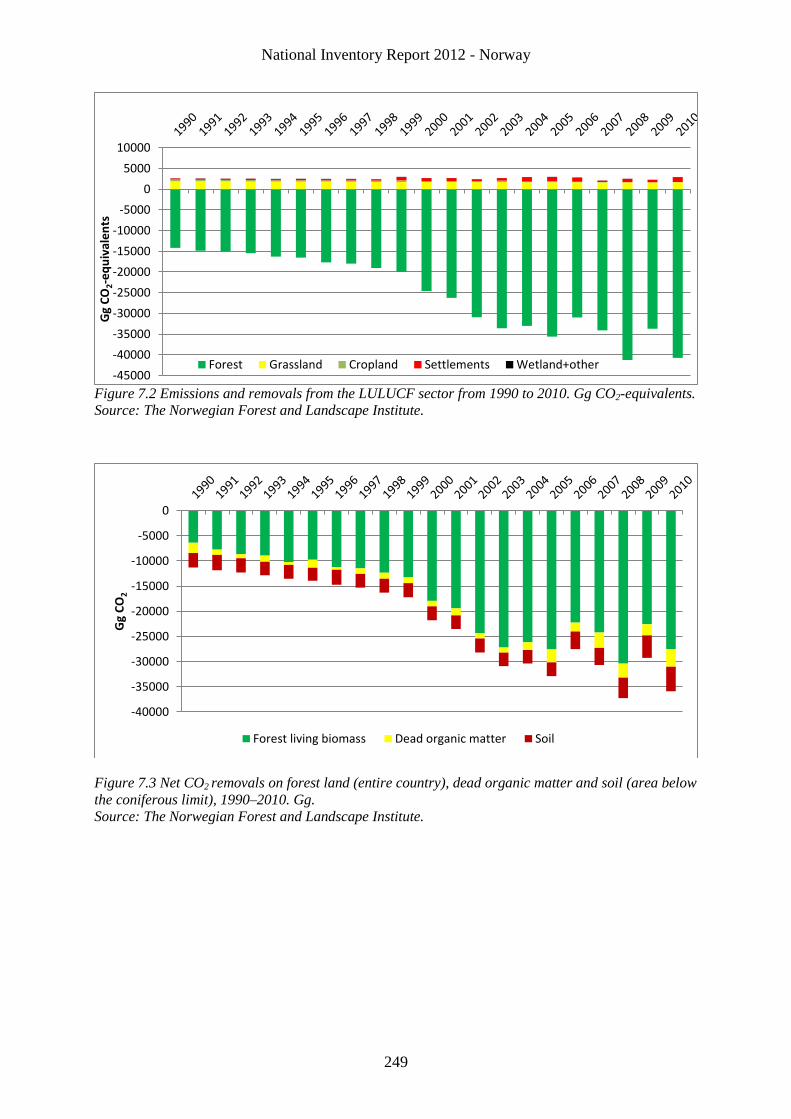
National Inventory Report 2012 - Norway
249
Figure 7.2 Emissions and removals from the LULUCF sector from 1990 to 2010. Gg CO2-equivalents.
Source: The Norwegian Forest and Landscape Institute.
Figure 7.3 Net CO2 removals on forest land (entire country), dead organic matter and soil (area below
the coniferous limit), 1990–2010. Gg.
Source: The Norwegian Forest and Landscape Institute.
-45000
-40000
-35000
-30000
-25000
-20000
-15000
-10000
-5000
0
5000
10000
Gg
CO
2-e
qu
ival
en
ts
Forest Grassland Cropland Settlements Wetland+other
-40000
-35000
-30000
-25000
-20000
-15000
-10000
-5000
0
Gg
CO
2
Forest living biomass Dead organic matter Soil
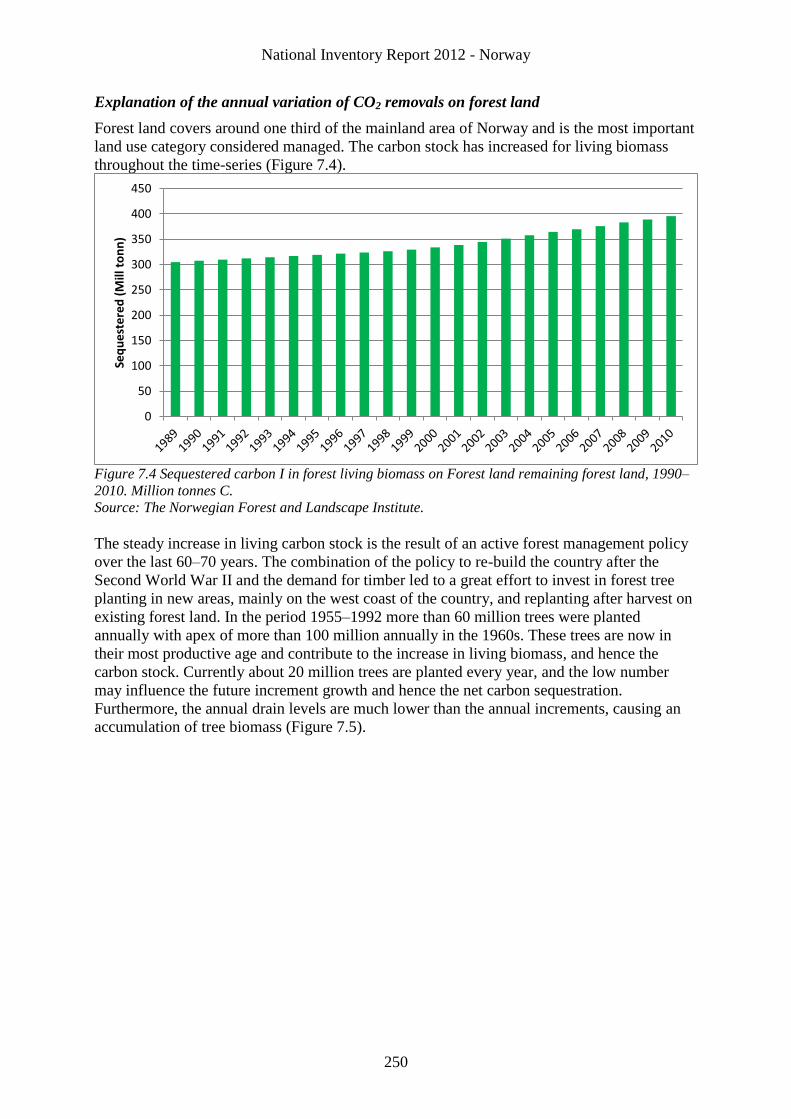
National Inventory Report 2012 - Norway
250
Explanation of the annual variation of CO2 removals on forest land
Forest land covers around one third of the mainland area of Norway and is the most important
land use category considered managed. The carbon stock has increased for living biomass
throughout the time-series (Figure 7.4).
Figure 7.4 Sequestered carbon I in forest living biomass on Forest land remaining forest land, 1990–
2010. Million tonnes C.
Source: The Norwegian Forest and Landscape Institute.
The steady increase in living carbon stock is the result of an active forest management policy
over the last 60–70 years. The combination of the policy to re-build the country after the
Second World War II and the demand for timber led to a great effort to invest in forest tree
planting in new areas, mainly on the west coast of the country, and replanting after harvest on
existing forest land. In the period 1955–1992 more than 60 million trees were planted
annually with apex of more than 100 million annually in the 1960s. These trees are now in
their most productive age and contribute to the increase in living biomass, and hence the
carbon stock. Currently about 20 million trees are planted every year, and the low number
may influence the future increment growth and hence the net carbon sequestration.
Furthermore, the annual drain levels are much lower than the annual increments, causing an
accumulation of tree biomass (Figure 7.5).
0
50
100
150
200
250
300
350
400
450
Seq
ue
ste
red
(M
ill t
on
n)
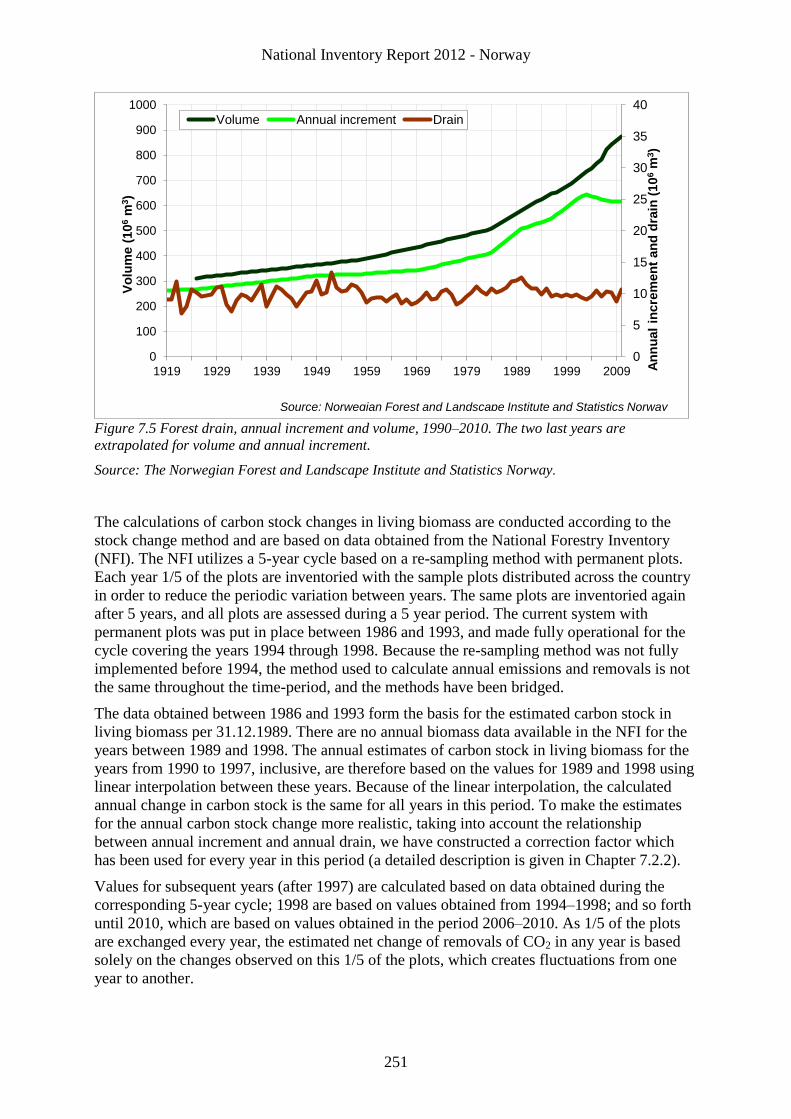
National Inventory Report 2012 - Norway
251
Figure 7.5 Forest drain, annual increment and volume, 1990–2010. The two last years are
extrapolated for volume and annual increment.
Source: The Norwegian Forest and Landscape Institute and Statistics Norway.
The calculations of carbon stock changes in living biomass are conducted according to the
stock change method and are based on data obtained from the National Forestry Inventory
(NFI). The NFI utilizes a 5-year cycle based on a re-sampling method with permanent plots.
Each year 1/5 of the plots are inventoried with the sample plots distributed across the country
in order to reduce the periodic variation between years. The same plots are inventoried again
after 5 years, and all plots are assessed during a 5 year period. The current system with
permanent plots was put in place between 1986 and 1993, and made fully operational for the
cycle covering the years 1994 through 1998. Because the re-sampling method was not fully
implemented before 1994, the method used to calculate annual emissions and removals is not
the same throughout the time-period, and the methods have been bridged.
The data obtained between 1986 and 1993 form the basis for the estimated carbon stock in
living biomass per 31.12.1989. There are no annual biomass data available in the NFI for the
years between 1989 and 1998. The annual estimates of carbon stock in living biomass for the
years from 1990 to 1997, inclusive, are therefore based on the values for 1989 and 1998 using
linear interpolation between these years. Because of the linear interpolation, the calculated
annual change in carbon stock is the same for all years in this period. To make the estimates
for the annual carbon stock change more realistic, taking into account the relationship
between annual increment and annual drain, we have constructed a correction factor which
has been used for every year in this period (a detailed description is given in Chapter 7.2.2).
Values for subsequent years (after 1997) are calculated based on data obtained during the
corresponding 5-year cycle; 1998 are based on values obtained from 1994–1998; and so forth
until 2010, which are based on values obtained in the period 2006–2010. As 1/5 of the plots
are exchanged every year, the estimated net change of removals of CO2 in any year is based
solely on the changes observed on this 1/5 of the plots, which creates fluctuations from one
year to another.
0
5
10
15
20
25
30
35
40
0
100
200
300
400
500
600
700
800
900
1000
1919 1929 1939 1949 1959 1969 1979 1989 1999 2009 An
nu
al
inc
rem
en
t a
nd
dra
in (
10
6 m
3)
Vo
lum
e (
10
6 m
3)
Volume Annual increment Drain
Source: Norwegian Forest and Landscape Institute and Statistics Norway
National Inventory Report 2012 - Norway
252
In spite of the systematic grid for the NFI sample plots, we see differences in the amount of
carbon sequestrated (biomass) in living trees between the selections of plots assessed every
year. One group of plots has high values every 5th
year, while another group of plots has
relatively low values every five years. These changes depend upon several factors such as site
quality, variation of growing conditions such as temperature and precipitation at the location
during the growing season, age and species distribution of the assessed forests, harvest levels
and the amount of land-use changes in the area. All these factors influence indirectly the
reported annual net change of CO2 removals from the atmosphere caused by the
photosynthesis taking place in living biomass. In other words; if there are small changes in the
amount of carbon between two subsequent 5-year periods, the estimated net change in
removals will be low, and vice versa when large differences between two 5-year periods
occur. Then the estimated removals for that year will be larger than the previous year.
The stock change method is also used to calculate the changes in CO2 sequestrated in dead
organic matter and soil. The annual fluctuation seen in CO2 sequestrated for dead organic
matter and soil are influenced by annual variation in the input data to the Yasso model; litter
from standing biomass, natural mortality, harvest residues and, stumps and roots from
harvested trees. All these factors are influenced by the same natural and man-made factors as
stated for living biomass.
7.1.3 Key categories
Statistics Norway has carried out the standard key category analysis, both at Tier 1 and Tier 2
levels, for the whole greenhouse gas inventory including source categories from LULUCF
(IPCC 2001). Table 7.1 lists the identified LULUCF key categories based on the results from
the Tier 2 level analysis. Uncertainties were not determined by a rigid analysis, see Section
7.11.
Compared to earlier submissions, one source has been excluded as key: 5B1 Cropland
remaining Cropland – Reduced tillage- Soils. The change is due to an updating of activity
data due to new data and continuous quality control of the data bases used.
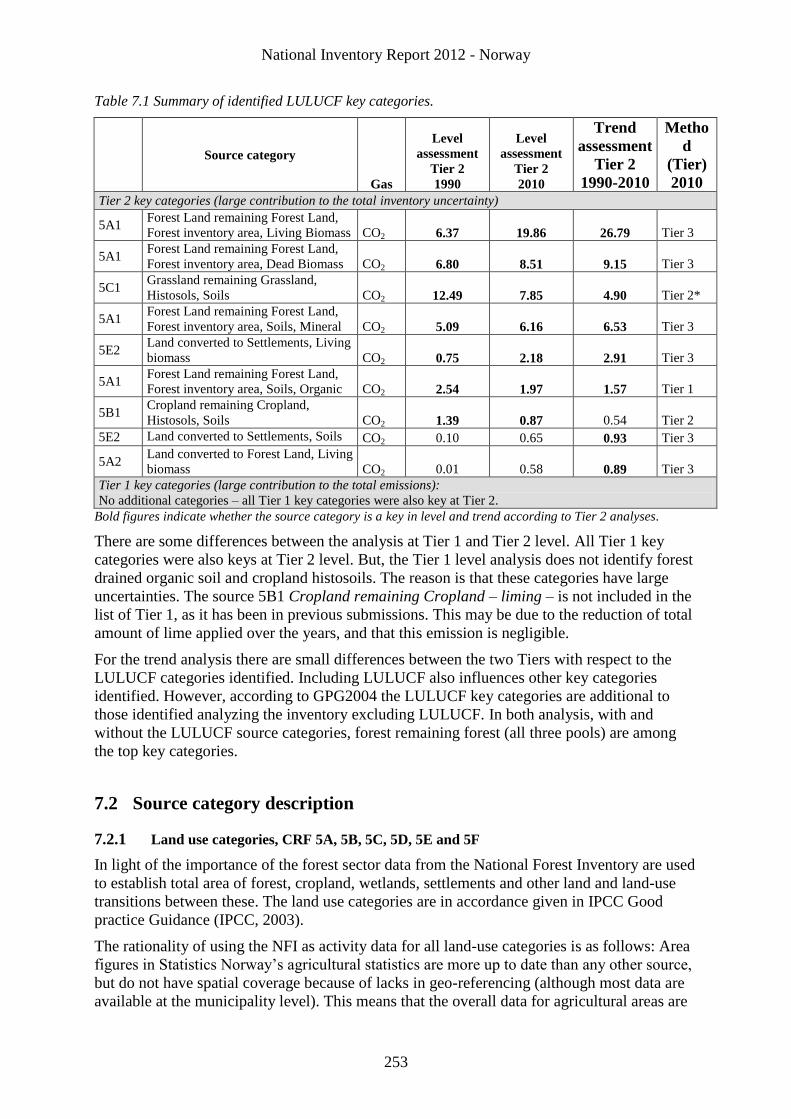
National Inventory Report 2012 - Norway
253
Table 7.1 Summary of identified LULUCF key categories.
Source category
Gas
Level
assessment
Tier 2
1990
Level
assessment
Tier 2
2010
Trend
assessment
Tier 2
1990-2010
Metho
d
(Tier)
2010 Tier 2 key categories (large contribution to the total inventory uncertainty)
5A1 Forest Land remaining Forest Land,
Forest inventory area, Living Biomass CO2 6.37 19.86 26.79 Tier 3
5A1 Forest Land remaining Forest Land,
Forest inventory area, Dead Biomass CO2 6.80 8.51 9.15 Tier 3
5C1 Grassland remaining Grassland,
Histosols, Soils CO2 12.49 7.85 4.90 Tier 2*
5A1 Forest Land remaining Forest Land,
Forest inventory area, Soils, Mineral CO2 5.09 6.16 6.53 Tier 3
5E2 Land converted to Settlements, Living
biomass CO2 0.75 2.18 2.91 Tier 3
5A1 Forest Land remaining Forest Land,
Forest inventory area, Soils, Organic CO2 2.54 1.97 1.57 Tier 1
5B1 Cropland remaining Cropland,
Histosols, Soils CO2 1.39 0.87 0.54 Tier 2
5E2 Land converted to Settlements, Soils CO2 0.10 0.65 0.93 Tier 3
5A2 Land converted to Forest Land, Living
biomass CO2 0.01 0.58 0.89 Tier 3
Tier 1 key categories (large contribution to the total emissions):
No additional categories – all Tier 1 key categories were also key at Tier 2.
Bold figures indicate whether the source category is a key in level and trend according to Tier 2 analyses.
There are some differences between the analysis at Tier 1 and Tier 2 level. All Tier 1 key
categories were also keys at Tier 2 level. But, the Tier 1 level analysis does not identify forest
drained organic soil and cropland histosoils. The reason is that these categories have large
uncertainties. The source 5B1 Cropland remaining Cropland – liming – is not included in the
list of Tier 1, as it has been in previous submissions. This may be due to the reduction of total
amount of lime applied over the years, and that this emission is negligible.
For the trend analysis there are small differences between the two Tiers with respect to the
LULUCF categories identified. Including LULUCF also influences other key categories
identified. However, according to GPG2004 the LULUCF key categories are additional to
those identified analyzing the inventory excluding LULUCF. In both analysis, with and
without the LULUCF source categories, forest remaining forest (all three pools) are among
the top key categories.
7.2 Source category description
7.2.1 Land use categories, CRF 5A, 5B, 5C, 5D, 5E and 5F
In light of the importance of the forest sector data from the National Forest Inventory are used
to establish total area of forest, cropland, wetlands, settlements and other land and land-use
transitions between these. The land use categories are in accordance given in IPCC Good
practice Guidance (IPCC, 2003).
The rationality of using the NFI as activity data for all land-use categories is as follows: Area
figures in Statistics Norway’s agricultural statistics are more up to date than any other source,
but do not have spatial coverage because of lacks in geo-referencing (although most data are
available at the municipality level). This means that the overall data for agricultural areas are
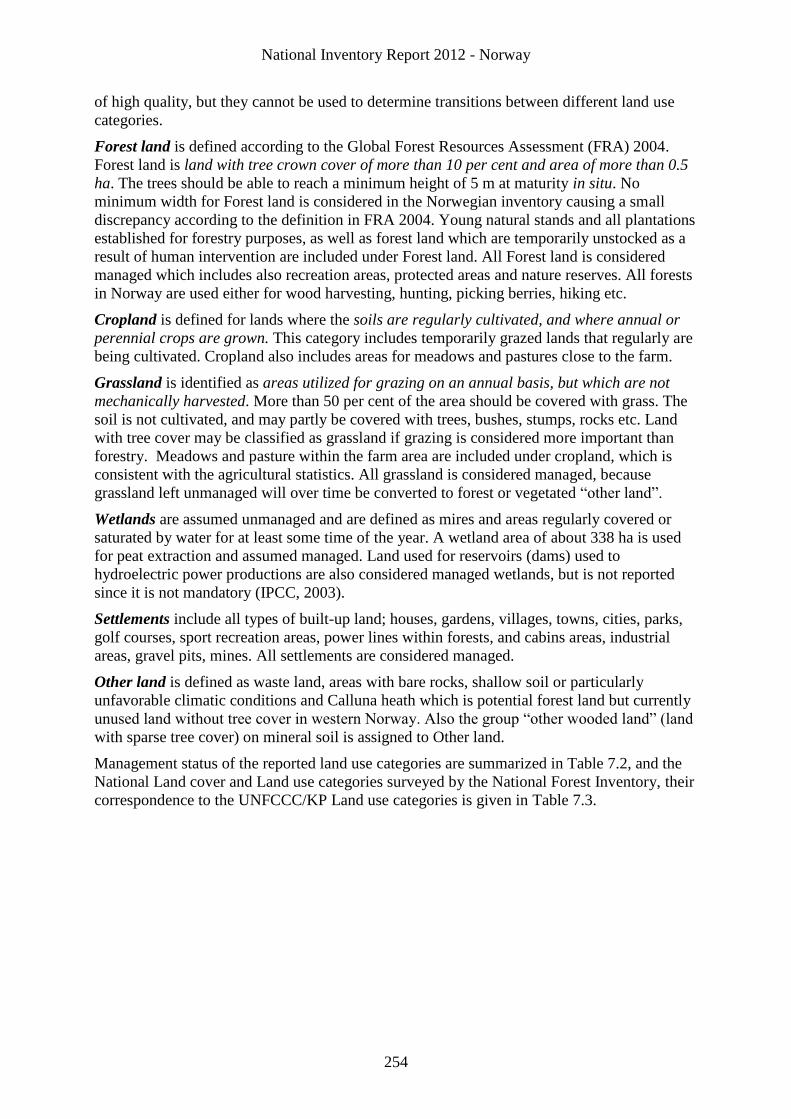
National Inventory Report 2012 - Norway
254
of high quality, but they cannot be used to determine transitions between different land use
categories.
Forest land is defined according to the Global Forest Resources Assessment (FRA) 2004.
Forest land is land with tree crown cover of more than 10 per cent and area of more than 0.5
ha. The trees should be able to reach a minimum height of 5 m at maturity in situ. No
minimum width for Forest land is considered in the Norwegian inventory causing a small
discrepancy according to the definition in FRA 2004. Young natural stands and all plantations
established for forestry purposes, as well as forest land which are temporarily unstocked as a
result of human intervention are included under Forest land. All Forest land is considered
managed which includes also recreation areas, protected areas and nature reserves. All forests
in Norway are used either for wood harvesting, hunting, picking berries, hiking etc.
Cropland is defined for lands where the soils are regularly cultivated, and where annual or
perennial crops are grown. This category includes temporarily grazed lands that regularly are
being cultivated. Cropland also includes areas for meadows and pastures close to the farm.
Grassland is identified as areas utilized for grazing on an annual basis, but which are not
mechanically harvested. More than 50 per cent of the area should be covered with grass. The
soil is not cultivated, and may partly be covered with trees, bushes, stumps, rocks etc. Land
with tree cover may be classified as grassland if grazing is considered more important than
forestry. Meadows and pasture within the farm area are included under cropland, which is
consistent with the agricultural statistics. All grassland is considered managed, because
grassland left unmanaged will over time be converted to forest or vegetated “other land”.
Wetlands are assumed unmanaged and are defined as mires and areas regularly covered or
saturated by water for at least some time of the year. A wetland area of about 338 ha is used
for peat extraction and assumed managed. Land used for reservoirs (dams) used to
hydroelectric power productions are also considered managed wetlands, but is not reported
since it is not mandatory (IPCC, 2003).
Settlements include all types of built-up land; houses, gardens, villages, towns, cities, parks,
golf courses, sport recreation areas, power lines within forests, and cabins areas, industrial
areas, gravel pits, mines. All settlements are considered managed.
Other land is defined as waste land, areas with bare rocks, shallow soil or particularly
unfavorable climatic conditions and Calluna heath which is potential forest land but currently
unused land without tree cover in western Norway. Also the group “other wooded land” (land
with sparse tree cover) on mineral soil is assigned to Other land.
Management status of the reported land use categories are summarized in Table 7.2, and the
National Land cover and Land use categories surveyed by the National Forest Inventory, their
correspondence to the UNFCCC/KP Land use categories is given in Table 7.3.
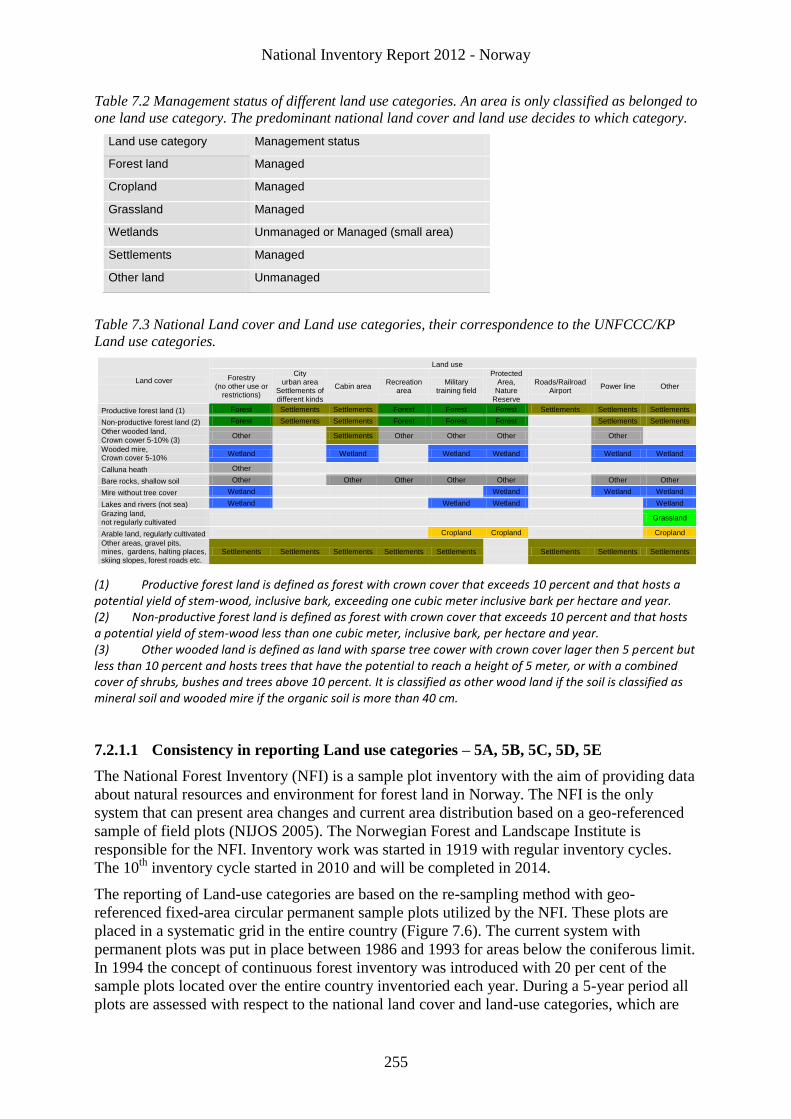
National Inventory Report 2012 - Norway
255
Table 7.2 Management status of different land use categories. An area is only classified as belonged to
one land use category. The predominant national land cover and land use decides to which category.
Land use category Management status
Forest land Managed
Cropland Managed
Grassland Managed
Wetlands Unmanaged or Managed (small area)
Settlements Managed
Other land Unmanaged
Table 7.3 National Land cover and Land use categories, their correspondence to the UNFCCC/KP
Land use categories.
(1) Productive forest land is defined as forest with crown cover that exceeds 10 percent and that hosts a potential yield of stem-wood, inclusive bark, exceeding one cubic meter inclusive bark per hectare and year. (2) Non-productive forest land is defined as forest with crown cover that exceeds 10 percent and that hosts a potential yield of stem-wood less than one cubic meter, inclusive bark, per hectare and year. (3) Other wooded land is defined as land with sparse tree cower with crown cover lager then 5 percent but less than 10 percent and hosts trees that have the potential to reach a height of 5 meter, or with a combined cover of shrubs, bushes and trees above 10 percent. It is classified as other wood land if the soil is classified as mineral soil and wooded mire if the organic soil is more than 40 cm.
7.2.1.1 Consistency in reporting Land use categories – 5A, 5B, 5C, 5D, 5E
The National Forest Inventory (NFI) is a sample plot inventory with the aim of providing data
about natural resources and environment for forest land in Norway. The NFI is the only
system that can present area changes and current area distribution based on a geo-referenced
sample of field plots (NIJOS 2005). The Norwegian Forest and Landscape Institute is
responsible for the NFI. Inventory work was started in 1919 with regular inventory cycles.
The 10th
inventory cycle started in 2010 and will be completed in 2014.
The reporting of Land-use categories are based on the re-sampling method with geo-
referenced fixed-area circular permanent sample plots utilized by the NFI. These plots are
placed in a systematic grid in the entire country (Figure 7.6). The current system with
permanent plots was put in place between 1986 and 1993 for areas below the coniferous limit.
In 1994 the concept of continuous forest inventory was introduced with 20 per cent of the
sample plots located over the entire country inventoried each year. During a 5-year period all
plots are assessed with respect to the national land cover and land-use categories, which are
Land use
Land cover Forestry (no other use or
restrictions)
City urban area
Settlements of different kinds
Cabin area Recreation
area Military
training field
Protected Area,
Nature Reserve
Roads/Railroad Airport
Power line Other
Productive forest land (1) Forest Settlements Settlements Forest Forest Forest Settlements Settlements Settlements
Non-productive forest land (2) Forest Settlements Settlements Forest Forest Forest Settlements Settlements
Other wooded land, Crown cower 5-10% (3)
Other Settlements Other Other Other Other
Wooded mire, Crown cover 5-10%
Wetland Wetland Wetland Wetland Wetland Wetland
Calluna heath Other
Bare rocks, shallow soil Other Other Other Other Other Other Other
Mire without tree cover Wetland Wetland Wetland Wetland
Lakes and rivers (not sea) Wetland Wetland Wetland Wetland
Grazing land, not regularly cultivated
Grassland
Arable land, regularly cultivated Cropland Cropland Cropland
Other areas, gravel pits, mines, gardens, halting places, skiing slopes, forest roads etc.
Settlements Settlements Settlements Settlements Settlements Settlements Settlements Settlements
National Inventory Report 2012 - Norway
256
coded into the UNFCCC land-use categories. Hence, the area of these categories is available.
For each reporting year the land-use matrix is formed based on the changes in land-use
between the consecutive 5-year periods. When a piece of land changes land-use category, it is
included in that new land-use category for 20 years.
Up to the 2010 submission, the area of the different land-use categories were based on
detailed information from sample plots below the coniferous limit. In order to determine the
land use at higher altitudes and in Finnmark County, the NFI conducted a complete forest
inventory for these areas in the period 2005–2010. This allows for assessment of the extent of
forest area, other wooded land and other land uses in these areas. However, this is a snapshot
of the current land use and does not allow for estimation of land-use changes. The plots are
planned to be incorporated in the management plan for the future forest inventories.
All areas for the different land-use categories are reported for the entire country in this
inventory submission. The land-use reported for 2010 is derived from approximately 26 000
sample plots. The land-use matrix will be recalculated in future greenhouse gas inventories as
more information will be available, e.g. from the NFI, maps, old and new aerial photographs.
It is planned to use this information to improve the estimates back to 1990 for all new plots
included in the system throughout the time-period.
Table 7.4 gives the land-use change from 1990 to 2010 and table 7.5 gives the land-use
change from 2009 to 2010. The figures are based on data from the NFI and Norwegian
Mapping Authority which provided the figures for the total land area for Norway. A key
finding from these data is that the change in land-use from 1990 to 2010 is quite small; the
forest-, settlements- and grassland area are increasing and the cropland-, wetland- and other
land area are decreasing.
The Land-use change matrix used for the reporting is given in Table 7.6.
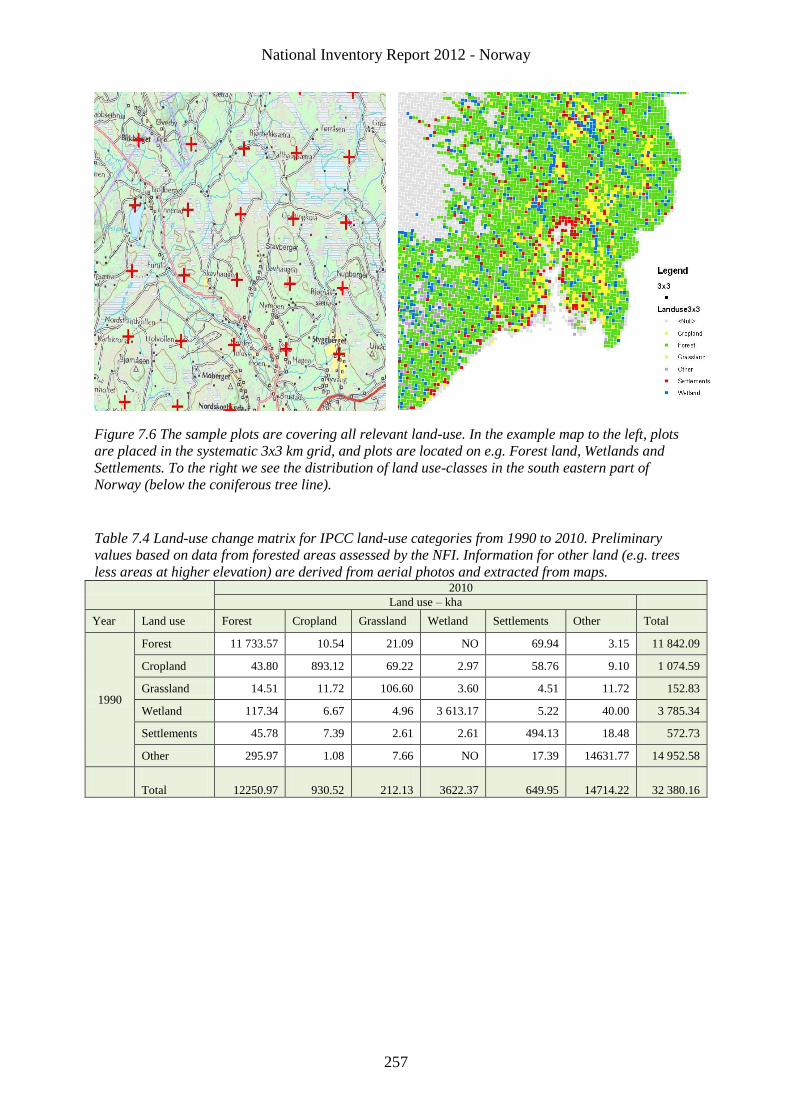
National Inventory Report 2012 - Norway
257
Figure 7.6 The sample plots are covering all relevant land-use. In the example map to the left, plots
are placed in the systematic 3x3 km grid, and plots are located on e.g. Forest land, Wetlands and
Settlements. To the right we see the distribution of land use-classes in the south eastern part of
Norway (below the coniferous tree line).
Table 7.4 Land-use change matrix for IPCC land-use categories from 1990 to 2010. Preliminary
values based on data from forested areas assessed by the NFI. Information for other land (e.g. trees
less areas at higher elevation) are derived from aerial photos and extracted from maps. 2010
Land use – kha
Year Land use Forest Cropland Grassland Wetland Settlements Other Total
1990
Forest 11 733.57 10.54 21.09 NO 69.94 3.15 11 842.09
Cropland 43.80 893.12 69.22 2.97 58.76 9.10 1 074.59
Grassland 14.51 11.72 106.60 3.60 4.51 11.72 152.83
Wetland 117.34 6.67 4.96 3 613.17 5.22 40.00 3 785.34
Settlements 45.78 7.39 2.61 2.61 494.13 18.48 572.73
Other 295.97 1.08 7.66 NO 17.39 14631.77 14 952.58
Total 12250.97 930.52 212.13 3622.37 649.95 14714.22 32 380.16
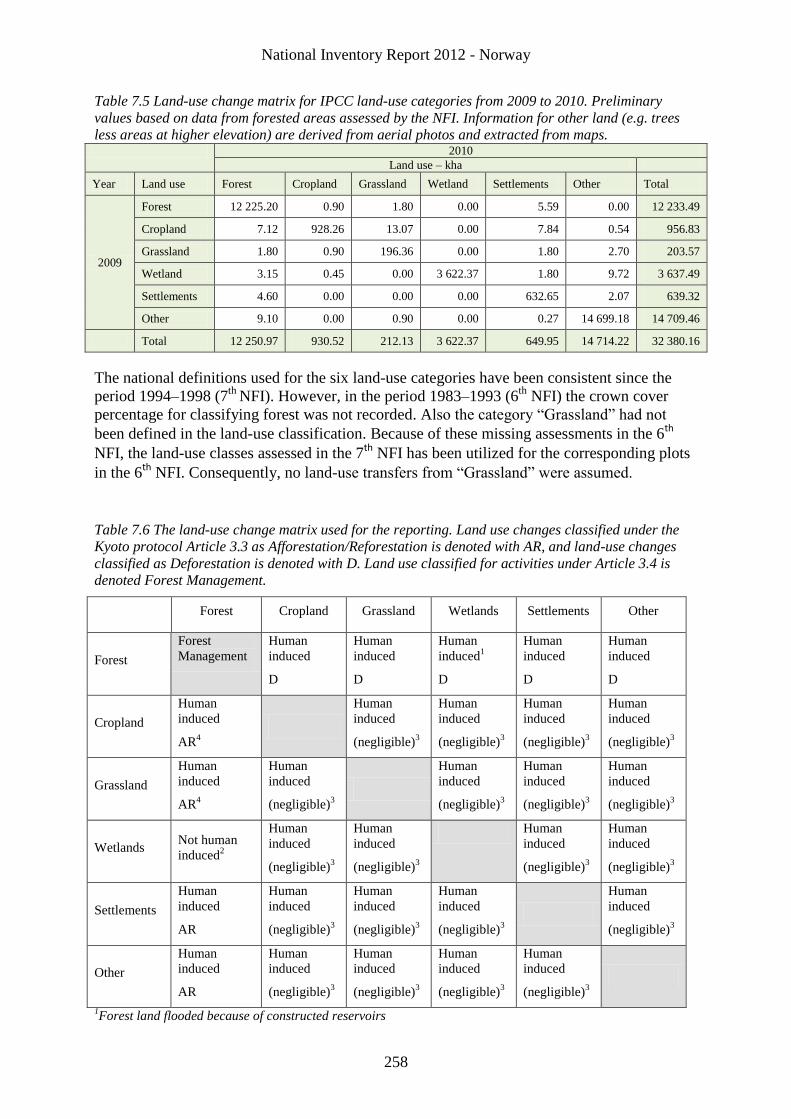
National Inventory Report 2012 - Norway
258
Table 7.5 Land-use change matrix for IPCC land-use categories from 2009 to 2010. Preliminary
values based on data from forested areas assessed by the NFI. Information for other land (e.g. trees
less areas at higher elevation) are derived from aerial photos and extracted from maps. 2010
Land use – kha
Year Land use Forest Cropland Grassland Wetland Settlements Other Total
2009
Forest 12 225.20 0.90 1.80 0.00 5.59 0.00 12 233.49
Cropland 7.12 928.26 13.07 0.00 7.84 0.54 956.83
Grassland 1.80 0.90 196.36 0.00 1.80 2.70 203.57
Wetland 3.15 0.45 0.00 3 622.37 1.80 9.72 3 637.49
Settlements 4.60 0.00 0.00 0.00 632.65 2.07 639.32
Other 9.10 0.00 0.90 0.00 0.27 14 699.18 14 709.46
Total 12 250.97 930.52 212.13 3 622.37 649.95 14 714.22 32 380.16
The national definitions used for the six land-use categories have been consistent since the
period 1994–1998 (7th
NFI). However, in the period 1983–1993 (6th
NFI) the crown cover
percentage for classifying forest was not recorded. Also the category “Grassland” had not
been defined in the land-use classification. Because of these missing assessments in the 6th
NFI, the land-use classes assessed in the 7th
NFI has been utilized for the corresponding plots
in the 6th
NFI. Consequently, no land-use transfers from “Grassland” were assumed.
Table 7.6 The land-use change matrix used for the reporting. Land use changes classified under the
Kyoto protocol Article 3.3 as Afforestation/Reforestation is denoted with AR, and land-use changes
classified as Deforestation is denoted with D. Land use classified for activities under Article 3.4 is
denoted Forest Management.
Forest Cropland Grassland Wetlands Settlements Other
Forest
Forest
Management
Human
induced
D
Human
induced
D
Human
induced1
D
Human
induced
D
Human
induced
D
Cropland
Human
induced
AR4
Human
induced
(negligible)3
Human
induced
(negligible)3
Human
induced
(negligible)3
Human
induced
(negligible)3
Grassland
Human
induced
AR4
Human
induced
(negligible)3
Human
induced
(negligible)3
Human
induced
(negligible)3
Human
induced
(negligible)3
Wetlands Not human
induced2
Human
induced
(negligible)3
Human
induced
(negligible)3
Human
induced
(negligible)3
Human
induced
(negligible)3
Settlements
Human
induced
AR
Human
induced
(negligible)3
Human
induced
(negligible)3
Human
induced
(negligible)3
Human
induced
(negligible)3
Other
Human
induced
AR
Human
induced
(negligible)3
Human
induced
(negligible)3
Human
induced
(negligible)3
Human
induced
(negligible)3
1Forest land flooded because of constructed reservoirs
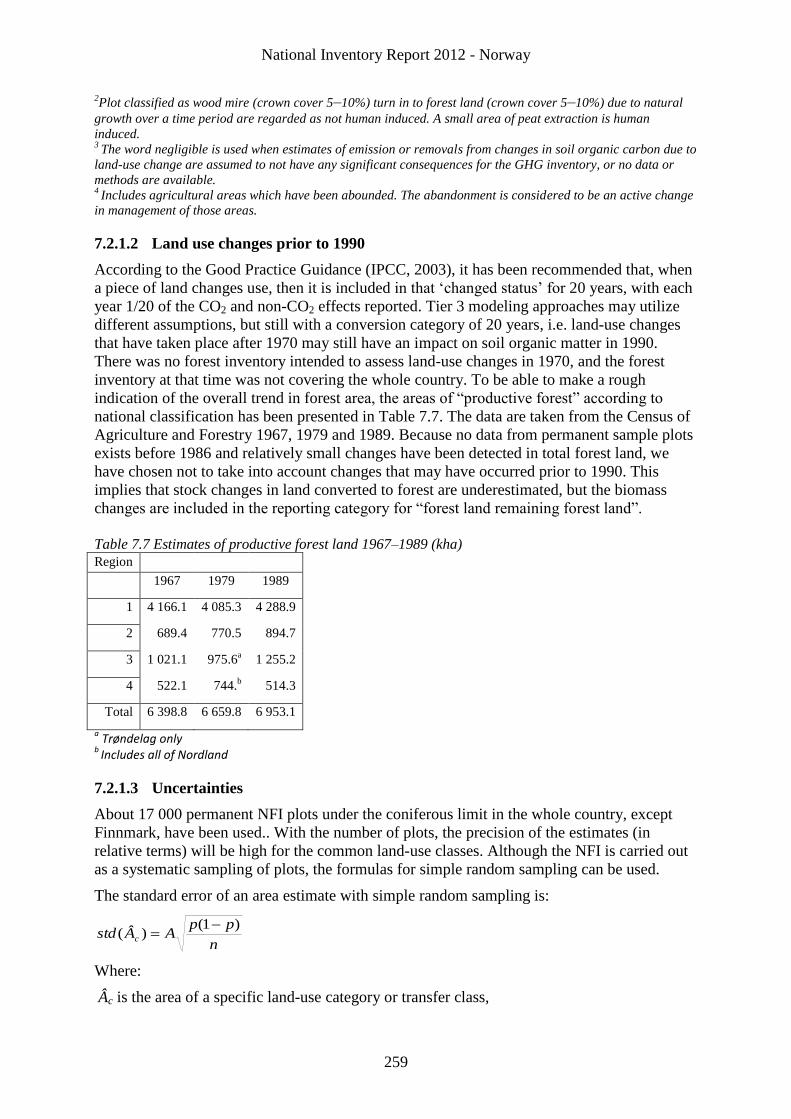
National Inventory Report 2012 - Norway
259
2Plot classified as wood mire (crown cover 5–10%) turn in to forest land (crown cover 5–10%) due to natural
growth over a time period are regarded as not human induced. A small area of peat extraction is human
induced. 3 The word negligible is used when estimates of emission or removals from changes in soil organic carbon due to
land-use change are assumed to not have any significant consequences for the GHG inventory, or no data or
methods are available. 4 Includes agricultural areas which have been abounded. The abandonment is considered to be an active change
in management of those areas.
7.2.1.2 Land use changes prior to 1990
According to the Good Practice Guidance (IPCC, 2003), it has been recommended that, when
a piece of land changes use, then it is included in that ‘changed status’ for 20 years, with each
year 1/20 of the CO2 and non-CO2 effects reported. Tier 3 modeling approaches may utilize
different assumptions, but still with a conversion category of 20 years, i.e. land-use changes
that have taken place after 1970 may still have an impact on soil organic matter in 1990.
There was no forest inventory intended to assess land-use changes in 1970, and the forest
inventory at that time was not covering the whole country. To be able to make a rough
indication of the overall trend in forest area, the areas of “productive forest” according to
national classification has been presented in Table 7.7. The data are taken from the Census of
Agriculture and Forestry 1967, 1979 and 1989. Because no data from permanent sample plots
exists before 1986 and relatively small changes have been detected in total forest land, we
have chosen not to take into account changes that may have occurred prior to 1990. This
implies that stock changes in land converted to forest are underestimated, but the biomass
changes are included in the reporting category for “forest land remaining forest land”.
Table 7.7 Estimates of productive forest land 1967–1989 (kha)
Region
1967 1979 1989
1 4 166.1 4 085.3 4 288.9
2 689.4 770.5 894.7
3 1 021.1 975.6a 1 255.2
4 522.1 744.b 514.3
Total 6 398.8 6 659.8 6 953.1
a Trøndelag only
b Includes all of Nordland
7.2.1.3 Uncertainties
About 17 000 permanent NFI plots under the coniferous limit in the whole country, except
Finnmark, have been used.. With the number of plots, the precision of the estimates (in
relative terms) will be high for the common land-use classes. Although the NFI is carried out
as a systematic sampling of plots, the formulas for simple random sampling can be used.
The standard error of an area estimate with simple random sampling is:
n
ppAÂstd c
)1()(
Where:
Âc is the area of a specific land-use category or transfer class,
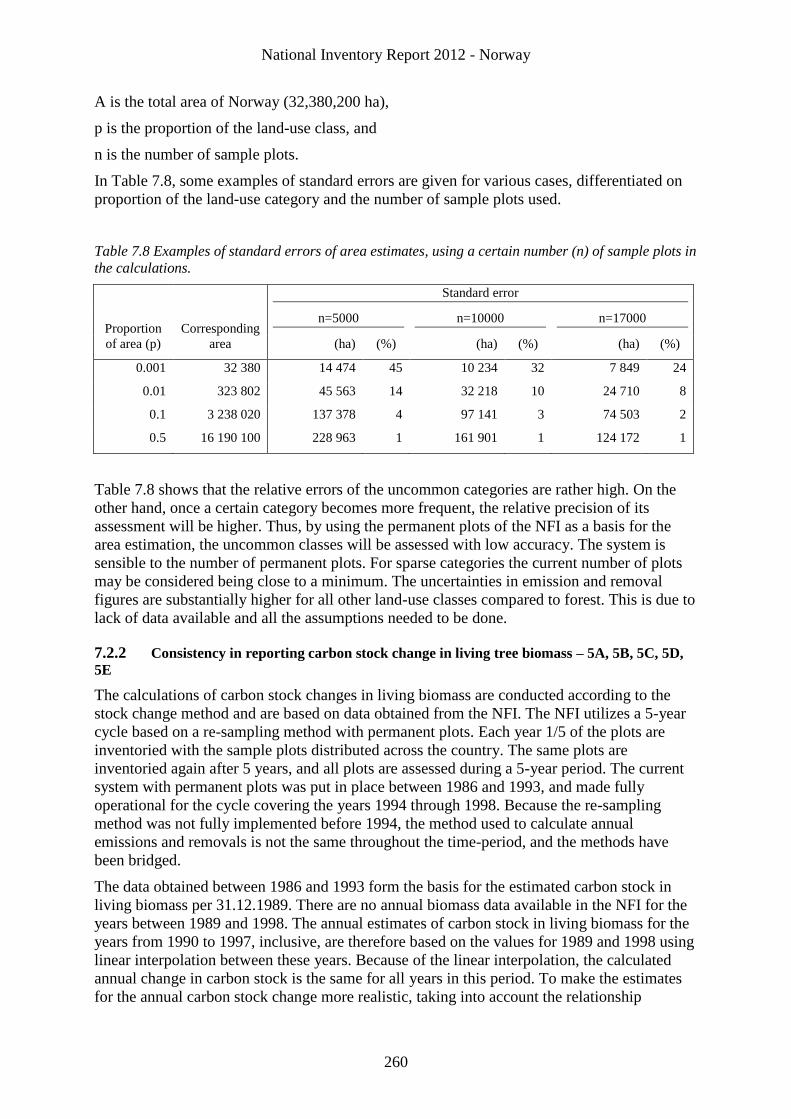
National Inventory Report 2012 - Norway
260
A is the total area of Norway (32,380,200 ha),
p is the proportion of the land-use class, and
n is the number of sample plots.
In Table 7.8, some examples of standard errors are given for various cases, differentiated on
proportion of the land-use category and the number of sample plots used.
Table 7.8 Examples of standard errors of area estimates, using a certain number (n) of sample plots in
the calculations.
Standard error
Proportion
of area (p)
Corresponding
area
n=5000 n=10000 n=17000
(ha) (%) (ha) (%) (ha) (%)
0.001 32 380 14 474 45 10 234 32 7 849 24
0.01 323 802 45 563 14 32 218 10 24 710 8
0.1 3 238 020 137 378 4 97 141 3 74 503 2
0.5 16 190 100 228 963 1 161 901 1 124 172 1
Table 7.8 shows that the relative errors of the uncommon categories are rather high. On the
other hand, once a certain category becomes more frequent, the relative precision of its
assessment will be higher. Thus, by using the permanent plots of the NFI as a basis for the
area estimation, the uncommon classes will be assessed with low accuracy. The system is
sensible to the number of permanent plots. For sparse categories the current number of plots
may be considered being close to a minimum. The uncertainties in emission and removal
figures are substantially higher for all other land-use classes compared to forest. This is due to
lack of data available and all the assumptions needed to be done.
7.2.2 Consistency in reporting carbon stock change in living tree biomass – 5A, 5B, 5C, 5D,
5E
The calculations of carbon stock changes in living biomass are conducted according to the
stock change method and are based on data obtained from the NFI. The NFI utilizes a 5-year
cycle based on a re-sampling method with permanent plots. Each year 1/5 of the plots are
inventoried with the sample plots distributed across the country. The same plots are
inventoried again after 5 years, and all plots are assessed during a 5-year period. The current
system with permanent plots was put in place between 1986 and 1993, and made fully
operational for the cycle covering the years 1994 through 1998. Because the re-sampling
method was not fully implemented before 1994, the method used to calculate annual
emissions and removals is not the same throughout the time-period, and the methods have
been bridged.
The data obtained between 1986 and 1993 form the basis for the estimated carbon stock in
living biomass per 31.12.1989. There are no annual biomass data available in the NFI for the
years between 1989 and 1998. The annual estimates of carbon stock in living biomass for the
years from 1990 to 1997, inclusive, are therefore based on the values for 1989 and 1998 using
linear interpolation between these years. Because of the linear interpolation, the calculated
annual change in carbon stock is the same for all years in this period. To make the estimates
for the annual carbon stock change more realistic, taking into account the relationship
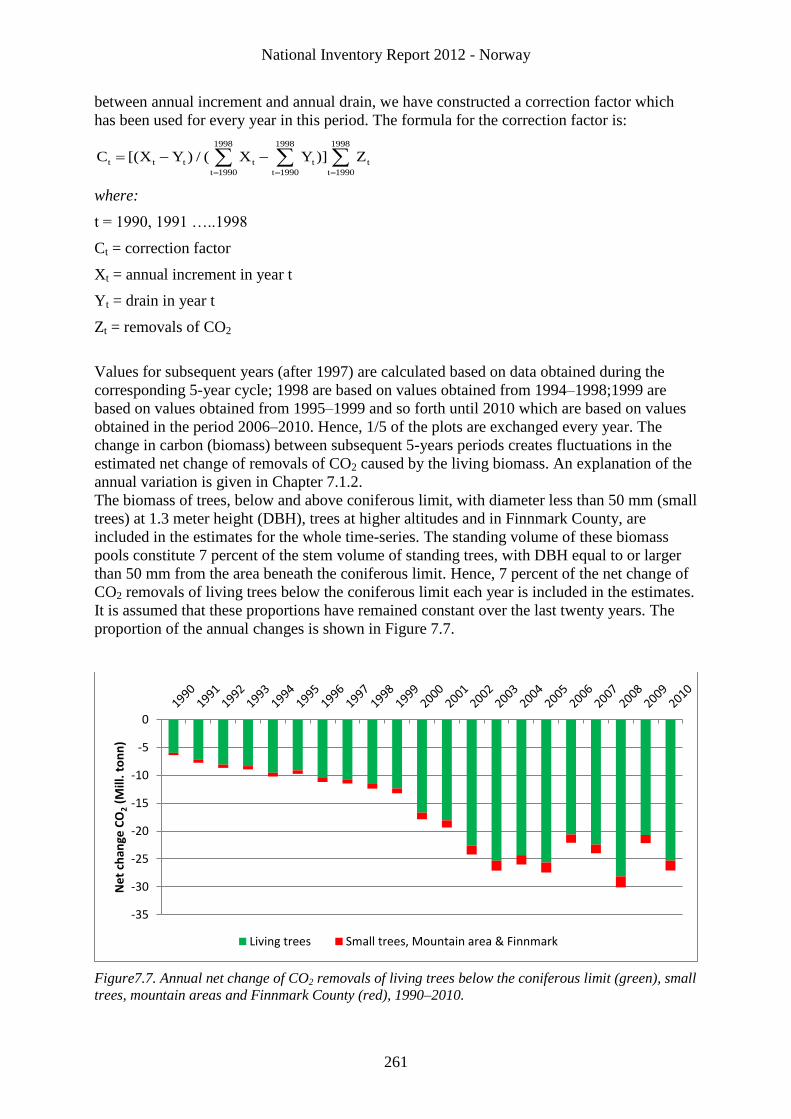
National Inventory Report 2012 - Norway
261
between annual increment and annual drain, we have constructed a correction factor which
has been used for every year in this period. The formula for the correction factor is:
1998 1998 1998
t t t t t t
t 1990 t 1990 t 1990
C [(X Y ) / ( X Y )] Z
where:
t = 1990, 1991 …..1998
Ct = correction factor
Xt = annual increment in year t
Yt = drain in year t
Zt = removals of CO2
Values for subsequent years (after 1997) are calculated based on data obtained during the
corresponding 5-year cycle; 1998 are based on values obtained from 1994–1998;1999 are
based on values obtained from 1995–1999 and so forth until 2010 which are based on values
obtained in the period 2006–2010. Hence, 1/5 of the plots are exchanged every year. The
change in carbon (biomass) between subsequent 5-years periods creates fluctuations in the
estimated net change of removals of CO2 caused by the living biomass. An explanation of the
annual variation is given in Chapter 7.1.2.
The biomass of trees, below and above coniferous limit, with diameter less than 50 mm (small
trees) at 1.3 meter height (DBH), trees at higher altitudes and in Finnmark County, are
included in the estimates for the whole time-series. The standing volume of these biomass
pools constitute 7 percent of the stem volume of standing trees, with DBH equal to or larger
than 50 mm from the area beneath the coniferous limit. Hence, 7 percent of the net change of
CO2 removals of living trees below the coniferous limit each year is included in the estimates.
It is assumed that these proportions have remained constant over the last twenty years. The
proportion of the annual changes is shown in Figure 7.7.
Figure7.7. Annual net change of CO2 removals of living trees below the coniferous limit (green), small
trees, mountain areas and Finnmark County (red), 1990–2010.
-35
-30
-25
-20
-15
-10
-5
0
Ne
t ch
ange
CO
2 (M
ill.
ton
n)
Living trees Small trees, Mountain area & Finnmark
National Inventory Report 2012 - Norway
262
7.2.3 Auxiliary data
The data from the NFI have been complemented with other statistical data. The rational for
choosing databases are given in NIJOS 2005.
The data from the NFI are complemented with other data (e.g. horticulture, tillage practice,
amount of fertilizer used, liming and drainage of forest soil, liming of lakes and forest fires)
collected by Statistics Norway, Norwegian Agricultural Authority, Food Safety Authority,
The Norwegian Directorate for Nature Management and The Directorate for Civil Protection
and Emergency Planning.
Horticulture
Statistics Norway collects data on the area of fruit trees annually (apple, pears, plum, cheery
and sweet cherry) which are used to calculate annual changes in carbon stock in living
biomass for perennial crops for the greenhouse gas inventory. The statistics are based on
information about area and production collected by questionnaires in a sample survey. Active
agricultural holdings meeting the minimum of 0.1 ha cultivated area of fruit trees, are
included in the statistics. The purpose of the statistics is to present annual statistics covering
total area, production yields per area unit and total production for important horticultural
crops. The statistics used in the greenhouse gas inventory goes back to 1989. Up to 2005
Statistics Norway worked out area and production statistics for horticultural crops. From 1996
to 2004 the Norwegian Agricultural Authority had the responsibility. From 2005 the statistics
are again being worked out by Statistics Norway. Methods and procedures were changed
when the Norwegian Agricultural Authority was in charge of the statistics. For 2005 Statistics
Norway has kept the same methodology as developed and used by the Norwegian
Agricultural Authority. More information can be found at
http://www.ssb.no/vis/hagebruk_en/about.html.
Tillage practice
Annually agricultural statistics are collected by Sample surveys of agriculture and forestry,
carried out by Statistics Norway. The samples consist of about 11 500–13 000 units, which
are drawn from the Farm register administered by the Norwegian Agricultural Authority. The
samples are drawn on the basis of agricultural area in use and productive forest area. The
structural variation between different counties is also taken into consideration, and the relative
size of the samples differs both by county and by size of holding. The sample surveys of
agriculture and forestry provide figures for number of holdings and the size of agricultural
area in use. Data concerning soil preparation are collected regularly, likewise information
about labour force and working time on holdings. The annual figures on tillage practice are
taken from this statistics back to 1989. More information can be found at
http://www.ssb.no/vis/emner/10/04/10/lu/om.html.
Fertilizers and drainage of forests
Statistics on consumption of fertilizers and drainage of forest are based on silviculture
statistics provided by Statistics Norway. The statistics only cover activities financed wholly or
partly by the Forest Trust Fund and/or by government subsidies. The silviculture statistics are
based on information from the Norwegian Agricultural Authority and their database on the
Forest Trust Fund. The figures used in the National Greenhouse Gas Inventory are dated back
to 1989. More information can be found at
http://www.ssb.no/english/subjects/10/04/20/skogkultur_en/.
National Inventory Report 2012 - Norway
263
Liming of lakes and agricultural soils
Statistics on consumption of liming of lakes and agricultural soils are based on data from the
Norwegian Directorate for Nature Management and The Norwegian Food Safety Authority.
The statistics are based on reports from commercial suppliers of lime. The figures used in the
National Greenhouse Gas Inventory are dated back to 1989. More information can be found at
http://www.dirnat.no/naturmangfold/vann/kalking/ and
http://www.mattilsynet.no/planter/gjodsler/omsetningsstatistikker .
Forest fires
Statistics on area burned in forest fires (numbers of fires, productive and unproductive
forests) are available from the Directorate for Civil Protection and Emergency. More
information can be found at http://www.dsb.no/en/Hygiene/English/.
Area data for organic soils, peat extraction and others are based on research projects at
Bioforsk.
7.3 Forest land 5.A
7.3.1 Forest land remaining forest land – 5A1 (Key Category)
Forest is the most important land-use category with respect to biomass sequestration in
Norway. According to the Tier 2 key category analysis (Section 7.1.3) this category is found
to be a key category with respect to sequestration in living biomass, dead biomass, soils
(mineral and drained organic) because of uncertainty in level and trend.
7.3.1.1 Methodological issues
Change in carbon stock in living biomass
The IPCCs (2003) stock change method is used. The method implemented corresponds to
Tier 3; a combination of national forest inventory data and models to estimate changes in
biomass.
Trees with diameter larger than 50 mm at breast height and below the coniferous tree limit
The reported carbon refers to the biomass of all living trees with a height of at least 1.3 m.
Thus, shrubs and other vegetation, such as herbs are not included in the figures. The biomass
of trees with a stem diameter larger than 50 mm measured 1.3 m above the ground (DBH), is
individually monitored. It is possible to match the biomass to land use of each tree.
Both above ground and below ground biomass are reported. Above ground biomass is defined
as living biomass above stump height (1 per cent of the tree height). The Swedish single tree
allometric regression functions developed by Marklund (1988) are applied to data from the
NFI for predicting the various tree biomass components; stem, stem bark, living branches,
dead branches, needles (not leaves) of Norway spruce (Picea abies), Scots pine (Pinus
sylvestris) and birch (Betula pendula and Betula pubecens). These functions require
measurements of a trees diameter and height. These three species (including other coniferous
about 1 per cent) constitute about 92 per cent of the standing volume (Larsson and Hylen
2007). Other, broad-leaved species constitute most of the remaining 8 per cent and the birch
functions are applied to all broad-leaved species.
Below ground biomass is defined as living biomass below stump height down to a root
diameter of 2 mm and are estimated by Petersson and Ståhl’s (2006) single tree allometric
National Inventory Report 2012 - Norway
264
regression functions for the same tree species as for above ground living biomass. The living
biomass is estimated consistently based on the same monitoring design, by using the same
functions for the same tree species from the base year 1990 and onward.
Trees with diameter less than 50 mm at breast height
The growing stock of trees with a dbh less than 50 mm at breast height is estimated as a
proportion of the volume of total growing stock below the coniferous tree line. This
proportion is estimated to 3 per cent and covers all forested areas for the period 2005–2009,
except Finnmark County. It is assumed that this proportion has remained constant over the
last twenty years, and is therefore incorporated in the net change of carbon stock since 1990
and onwards.
Traditional volume or biomass models have not been developed to predict the stem volumes
of trees with dbh less than 50 mm, because the volumes of these trees have usually not been
included in the national forest statistics of Norway. The Swedish model by Jonson (1928) has
been used to estimate the volume (V). This model expresses the stem volume as a model of
dbh only:
V = 0.21 • (1+dbh2) + ε
On the basis of the field assessment procedure, the heights of the single small trees are not
measured. To assign a height estimate to each value of dbh, a model based on sub-sample tree
data from the NFI has been applied (Tomter 1998). The assumption is that the point of the
average dbh and height of the smallest measurable trees (≥ 50 mm) and the point H = 1.3 m;
dbh = 0 can be connected by a straight line, thus a linear relationship between H and dbh can
be described for the interval 0 mm < dbh < 50 mm:
Dbh = 1.4 • H – 1.8 + ε
Trees with a height of less than 1.3 m are not included in the growing stock. The number of
small trees is grouped by the main tree species and by the dbh intervals 0–2.4 cm and 2.5–4.9
cm. Thus, the midpoint of each interval has been selected to represent the typical (mean)
volume of a tree within a dbh class. Only two diameters (1.25 cm and 3.75 cm) are then
required to estimate the volume of the small trees from the model.
Trees in the mountain birch area and Finnmark County
During the time-period 2005–2010, the mountain birch areas and Finnmark County were
assessed by following the guidelines of the NFI, but with the plots in a less dense systematic
grid compared to the rest of the Country. The standing volume in the mountain birch area and
in Finnmark County is estimated to 2.7 per cent and 1.3 per cent of the total volume below the
coniferous tree line, respectively. It is assumed that this proportion has remained constant
over the last twenty years, and is therefore incorporated in the net change of carbon stock
since 1990 and onwards.
The volume of the growing stock in these areas is estimated by using traditional national
functions (Braastad 1966, Brantseg 1967, Vestjordet 1967, Tomter 1997).
Change in carbon stock in dead organic matter and in soil
The dynamic soil model Yasso, as described in detailed by Liski et al. 2005, and for
Norwegian conditions by de Wit et al. (2006), are used to calculated changes in carbon stock
in dead organic matter and in soil (Figure 7.8). The calculations are hence done according to a
Tier 3 method. The current implementation of the Yasso model is not designed for obtaining
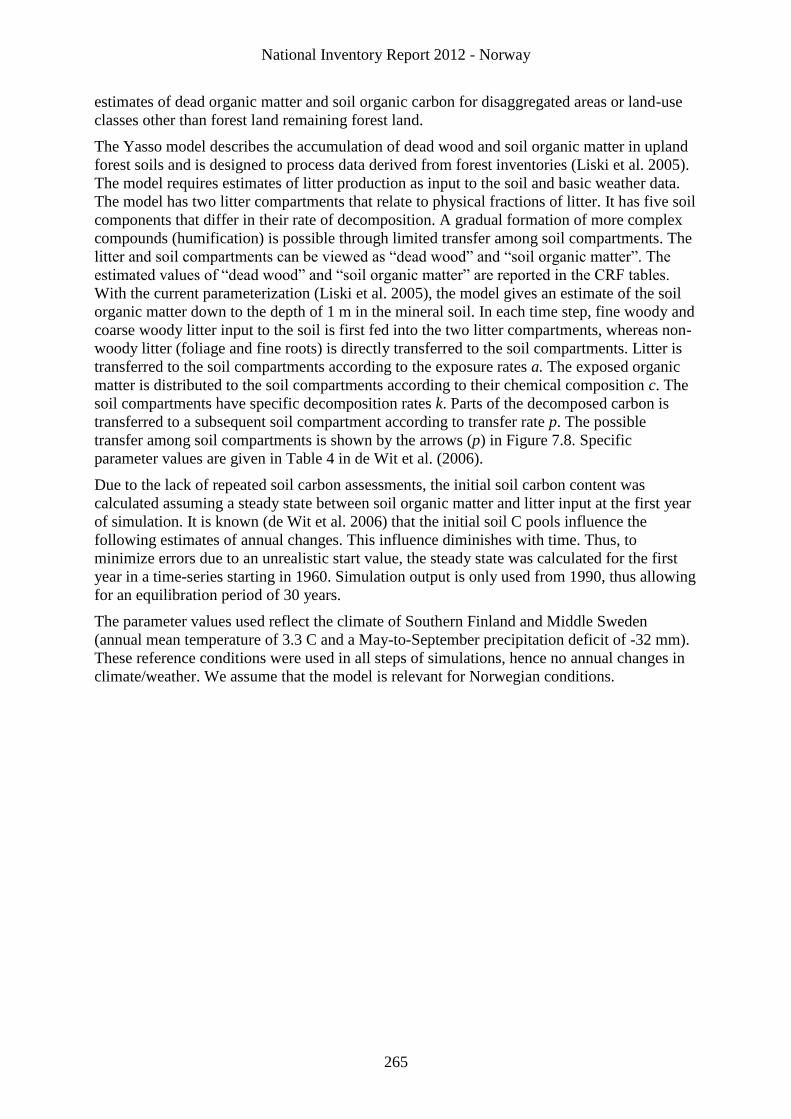
National Inventory Report 2012 - Norway
265
estimates of dead organic matter and soil organic carbon for disaggregated areas or land-use
classes other than forest land remaining forest land.
The Yasso model describes the accumulation of dead wood and soil organic matter in upland
forest soils and is designed to process data derived from forest inventories (Liski et al. 2005).
The model requires estimates of litter production as input to the soil and basic weather data.
The model has two litter compartments that relate to physical fractions of litter. It has five soil
components that differ in their rate of decomposition. A gradual formation of more complex
compounds (humification) is possible through limited transfer among soil compartments. The
litter and soil compartments can be viewed as “dead wood” and “soil organic matter”. The
estimated values of “dead wood” and “soil organic matter” are reported in the CRF tables.
With the current parameterization (Liski et al. 2005), the model gives an estimate of the soil
organic matter down to the depth of 1 m in the mineral soil. In each time step, fine woody and
coarse woody litter input to the soil is first fed into the two litter compartments, whereas non-
woody litter (foliage and fine roots) is directly transferred to the soil compartments. Litter is
transferred to the soil compartments according to the exposure rates a. The exposed organic
matter is distributed to the soil compartments according to their chemical composition c. The
soil compartments have specific decomposition rates k. Parts of the decomposed carbon is
transferred to a subsequent soil compartment according to transfer rate p. The possible
transfer among soil compartments is shown by the arrows (p) in Figure 7.8. Specific
parameter values are given in Table 4 in de Wit et al. (2006).
Due to the lack of repeated soil carbon assessments, the initial soil carbon content was
calculated assuming a steady state between soil organic matter and litter input at the first year
of simulation. It is known (de Wit et al. 2006) that the initial soil C pools influence the
following estimates of annual changes. This influence diminishes with time. Thus, to
minimize errors due to an unrealistic start value, the steady state was calculated for the first
year in a time-series starting in 1960. Simulation output is only used from 1990, thus allowing
for an equilibration period of 30 years.
The parameter values used reflect the climate of Southern Finland and Middle Sweden
(annual mean temperature of 3.3 C and a May-to-September precipitation deficit of -32 mm).
These reference conditions were used in all steps of simulations, hence no annual changes in
climate/weather. We assume that the model is relevant for Norwegian conditions.
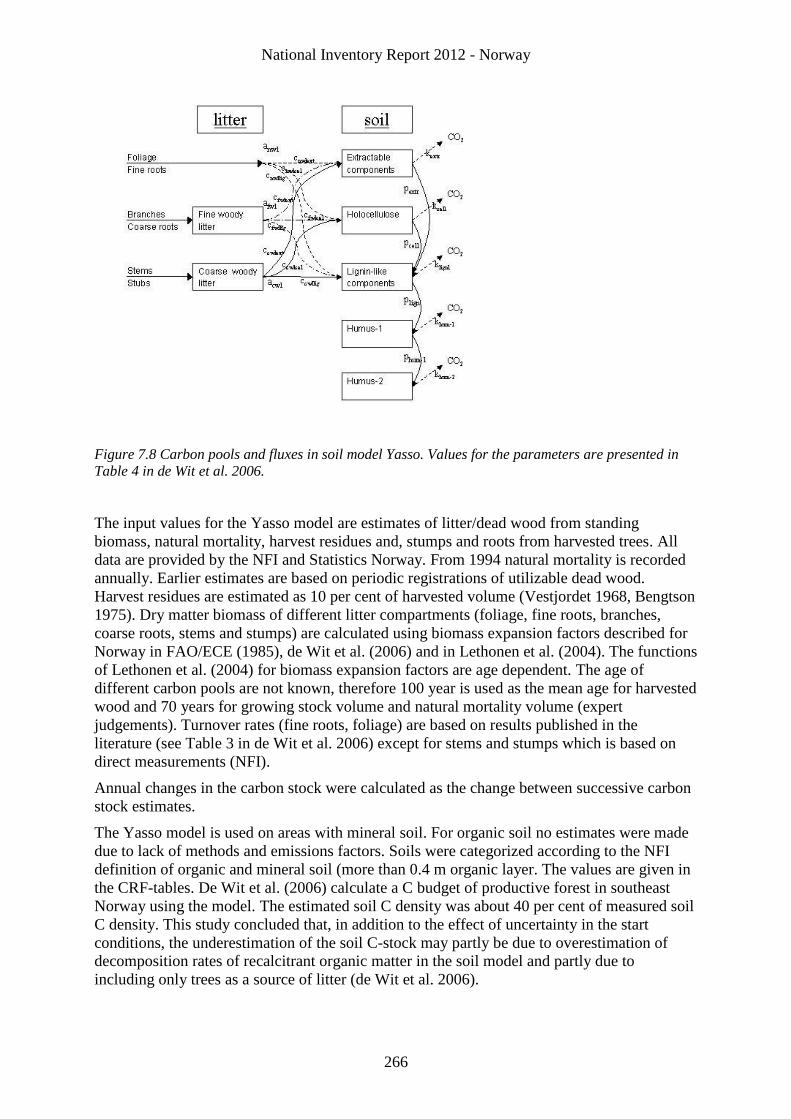
National Inventory Report 2012 - Norway
266
Figure 7.8 Carbon pools and fluxes in soil model Yasso. Values for the parameters are presented in
Table 4 in de Wit et al. 2006.
The input values for the Yasso model are estimates of litter/dead wood from standing
biomass, natural mortality, harvest residues and, stumps and roots from harvested trees. All
data are provided by the NFI and Statistics Norway. From 1994 natural mortality is recorded
annually. Earlier estimates are based on periodic registrations of utilizable dead wood.
Harvest residues are estimated as 10 per cent of harvested volume (Vestjordet 1968, Bengtson
1975). Dry matter biomass of different litter compartments (foliage, fine roots, branches,
coarse roots, stems and stumps) are calculated using biomass expansion factors described for
Norway in FAO/ECE (1985), de Wit et al. (2006) and in Lethonen et al. (2004). The functions
of Lethonen et al. (2004) for biomass expansion factors are age dependent. The age of
different carbon pools are not known, therefore 100 year is used as the mean age for harvested
wood and 70 years for growing stock volume and natural mortality volume (expert
judgements). Turnover rates (fine roots, foliage) are based on results published in the
literature (see Table 3 in de Wit et al. 2006) except for stems and stumps which is based on
direct measurements (NFI).
Annual changes in the carbon stock were calculated as the change between successive carbon
stock estimates.
The Yasso model is used on areas with mineral soil. For organic soil no estimates were made
due to lack of methods and emissions factors. Soils were categorized according to the NFI
definition of organic and mineral soil (more than 0.4 m organic layer. The values are given in
the CRF-tables. De Wit et al. (2006) calculate a C budget of productive forest in southeast
Norway using the model. The estimated soil C density was about 40 per cent of measured soil
C density. This study concluded that, in addition to the effect of uncertainty in the start
conditions, the underestimation of the soil C-stock may partly be due to overestimation of
decomposition rates of recalcitrant organic matter in the soil model and partly due to
including only trees as a source of litter (de Wit et al. 2006).
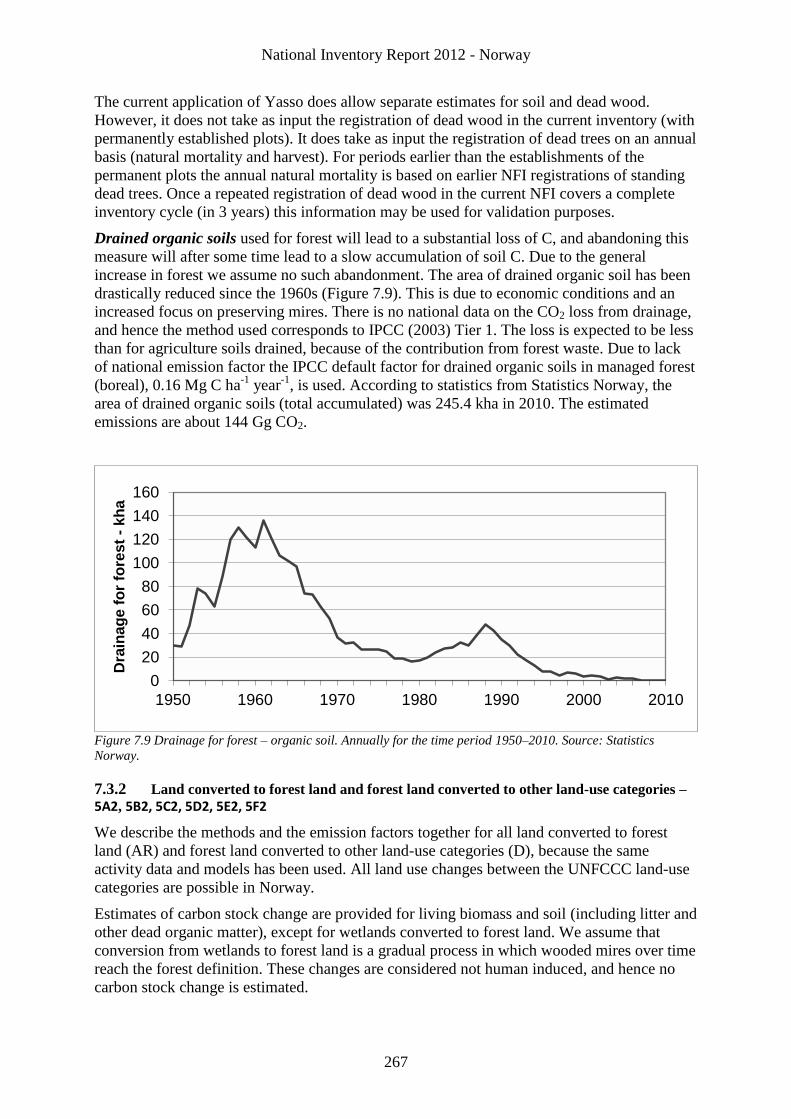
National Inventory Report 2012 - Norway
267
The current application of Yasso does allow separate estimates for soil and dead wood.
However, it does not take as input the registration of dead wood in the current inventory (with
permanently established plots). It does take as input the registration of dead trees on an annual
basis (natural mortality and harvest). For periods earlier than the establishments of the
permanent plots the annual natural mortality is based on earlier NFI registrations of standing
dead trees. Once a repeated registration of dead wood in the current NFI covers a complete
inventory cycle (in 3 years) this information may be used for validation purposes.
Drained organic soils used for forest will lead to a substantial loss of C, and abandoning this
measure will after some time lead to a slow accumulation of soil C. Due to the general
increase in forest we assume no such abandonment. The area of drained organic soil has been
drastically reduced since the 1960s (Figure 7.9). This is due to economic conditions and an
increased focus on preserving mires. There is no national data on the CO2 loss from drainage,
and hence the method used corresponds to IPCC (2003) Tier 1. The loss is expected to be less
than for agriculture soils drained, because of the contribution from forest waste. Due to lack
of national emission factor the IPCC default factor for drained organic soils in managed forest
(boreal), 0.16 Mg C ha-1
year-1
, is used. According to statistics from Statistics Norway, the
area of drained organic soils (total accumulated) was 245.4 kha in 2010. The estimated
emissions are about 144 Gg CO2.
Figure 7.9 Drainage for forest – organic soil. Annually for the time period 1950–2010. Source: Statistics
Norway.
7.3.2 Land converted to forest land and forest land converted to other land-use categories –
5A2, 5B2, 5C2, 5D2, 5E2, 5F2
We describe the methods and the emission factors together for all land converted to forest
land (AR) and forest land converted to other land-use categories (D), because the same
activity data and models has been used. All land use changes between the UNFCCC land-use
categories are possible in Norway.
Estimates of carbon stock change are provided for living biomass and soil (including litter and
other dead organic matter), except for wetlands converted to forest land. We assume that
conversion from wetlands to forest land is a gradual process in which wooded mires over time
reach the forest definition. These changes are considered not human induced, and hence no
carbon stock change is estimated.
0
20
40
60
80
100
120
140
160
1950 1960 1970 1980 1990 2000 2010
Dra
inag
e f
or
fore
st
- kh
a
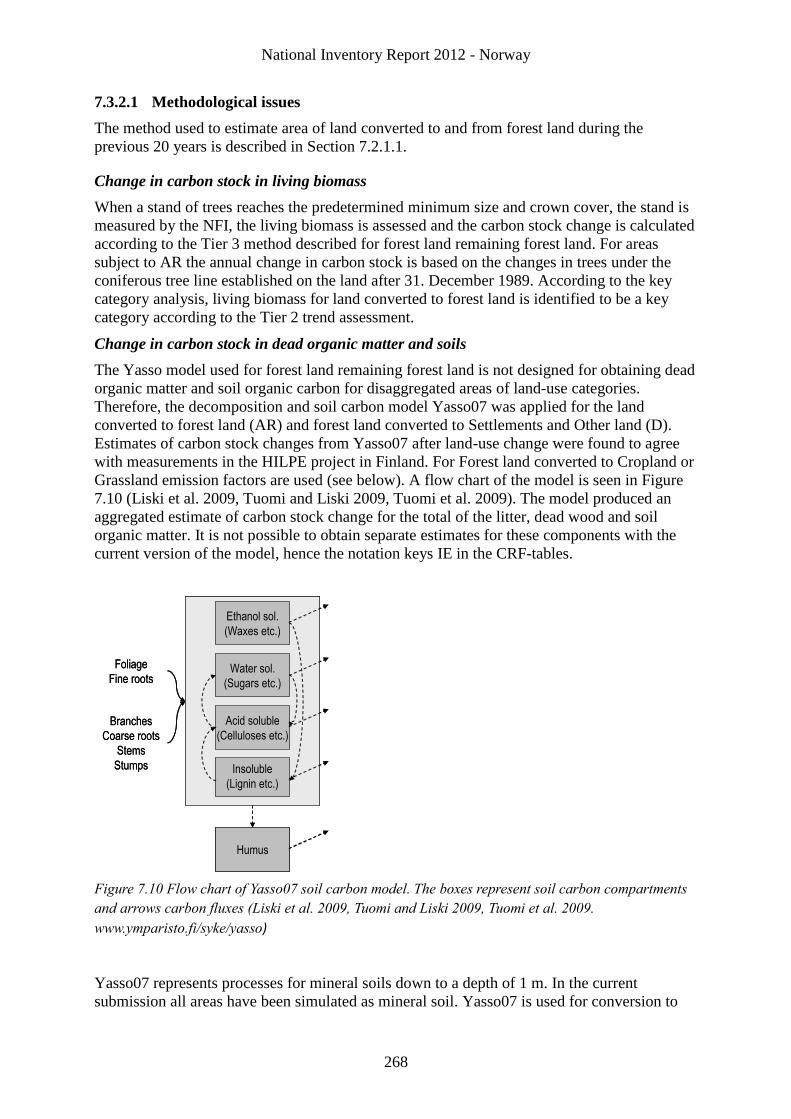
National Inventory Report 2012 - Norway
268
7.3.2.1 Methodological issues
The method used to estimate area of land converted to and from forest land during the
previous 20 years is described in Section 7.2.1.1.
Change in carbon stock in living biomass
When a stand of trees reaches the predetermined minimum size and crown cover, the stand is
measured by the NFI, the living biomass is assessed and the carbon stock change is calculated
according to the Tier 3 method described for forest land remaining forest land. For areas
subject to AR the annual change in carbon stock is based on the changes in trees under the
coniferous tree line established on the land after 31. December 1989. According to the key
category analysis, living biomass for land converted to forest land is identified to be a key
category according to the Tier 2 trend assessment.
Change in carbon stock in dead organic matter and soils
The Yasso model used for forest land remaining forest land is not designed for obtaining dead
organic matter and soil organic carbon for disaggregated areas of land-use categories.
Therefore, the decomposition and soil carbon model Yasso07 was applied for the land
converted to forest land (AR) and forest land converted to Settlements and Other land (D).
Estimates of carbon stock changes from Yasso07 after land-use change were found to agree
with measurements in the HILPE project in Finland. For Forest land converted to Cropland or
Grassland emission factors are used (see below). A flow chart of the model is seen in Figure
7.10 (Liski et al. 2009, Tuomi and Liski 2009, Tuomi et al. 2009). The model produced an
aggregated estimate of carbon stock change for the total of the litter, dead wood and soil
organic matter. It is not possible to obtain separate estimates for these components with the
current version of the model, hence the notation keys IE in the CRF-tables.
Figure 7.10 Flow chart of Yasso07 soil carbon model. The boxes represent soil carbon compartments
and arrows carbon fluxes (Liski et al. 2009, Tuomi and Liski 2009, Tuomi et al. 2009.
www.ymparisto.fi/syke/yasso)
Yasso07 represents processes for mineral soils down to a depth of 1 m. In the current
submission all areas have been simulated as mineral soil. Yasso07 is used for conversion to
Foliage
Fine roots
Branches
Coarse roots
Stems
Stumps
Ethanol sol.
(Waxes etc.)
Water sol.
(Sugars etc.)
Acid soluble
(Celluloses etc.)
Humus
Insoluble
(Lignin etc.)
Foliage
Fine roots
Branches
Coarse roots
Stems
Stumps
Ethanol sol.
(Waxes etc.)
Water sol.
(Sugars etc.)
Acid soluble
(Celluloses etc.)
Humus
Insoluble
(Lignin etc.)
National Inventory Report 2012 - Norway
269
and from forest land on mineral soil. Soils were categorized according to the NFI definition of
organic/mineral soil (more or less than 0.4 m organic layer). Weather data used as input to the
model is a mean for areas subjected to AR and D, respectively. Interpolated weather data from
the Norwegian Meteorological Institute (mean for 1991–200817) were used for AR-areas
(mean annual air temperature 3.88 C°; mean annual precipitation 1286.48 mm; mean
amplitude for air temperature 8.19 C°), and for D-areas (mean annual air temperature 4.55 C°;
mean annual precipitation 1208.60 mm; mean amplitude for air temperature 8.57 C°).
Conversions to forest land on organic soils are assumed to result in no changes of soil carbon.
There is currently no empirical information or estimation methods available. For all Yasso07
simulations the litter input from 1990 to the current year of reporting2010 was based on the
different components (foliage, stem, roots, …, etc.) of the living tree biomass. These were
derived from the total of living tree biomass on areas subject to conversion, by using the
proportion of each biomass components as found for all Norwegian forests. The biomass of
the tree components was found by using biomass functions by Marklund (1988), and
Petersson and Ståhl (2006) (e.g. stem constitute about 43 per cent and coarse roots constitute
about 19 per cent of the total biomass). For the areas subject to conversion it was assumed
that living tree biomass was equally distributed among the tree species; spruce, pine and
birch. Litter production was determined by turnover rates as in de Wit et al. (2006). Natural
mortality rates were assessed to 0.4 per cent of the living biomass per year. This mortality rate
was equal to or lower than the rate observed for land-use change areas where the NFI
registrations were available. In the current application it is assumed that no harvest occurred.
Litter quality is described as in the Yasso07 manual.
(http://www.ymparisto.fi/download.asp?contentid=100355&lan=en).
Table 7.9 gives an overview of the methods applied for the different conversions and the
assumptions associated with the starting value of soil carbon I of the previous land-use classes
before conversion. The values are used to start the Yasso07 simulations. For some of the
conversions the model was started by running litter input in many time steps (>1000) until the
C pools in the model have reached a steady state where input is equal to output (= spin-up).
The litter input used for the spin-up varies for each type of conversion. For the conversions
from cropland and from grassland to forest land, the amount of litter was gradually increased
until the result from the spin-up agreed with the published soil C stock for Norwegian
cropland and grassland (references are given below). For the conversion “other to forest land”
and from “forest land to other/settlements” the litter input used in the spin-up was found from
the living tree biomass on other land and forest land respectively in the period 1993–1997
(inventory 7) on areas that have been subject to conversion after this period.
17
Changes in C stocks for litter, dead organic matter and soil on areas subject to conversion to or from forest land were
estimated for the first time in 2010 (“Response to the Potential Problems and Further Questions from the ERT formulated
in the course of the 2010 review of the greenhouse gas inventories of Norway submitted in 2010”, dated November 8th
2010). The methods in the current submission are identical to those used in 2010 only the areas and living tree biomass
were updated with 2010 data and only on mineral soil.
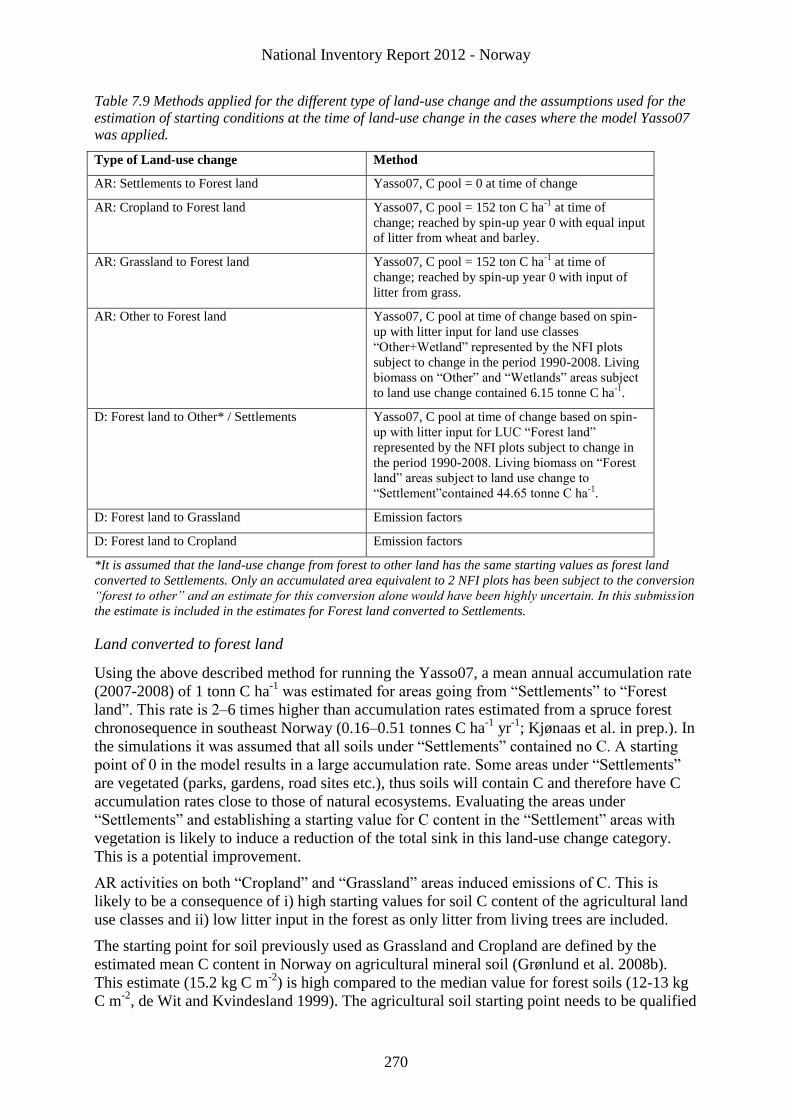
National Inventory Report 2012 - Norway
270
Table 7.9 Methods applied for the different type of land-use change and the assumptions used for the
estimation of starting conditions at the time of land-use change in the cases where the model Yasso07
was applied.
Type of Land-use change Method
AR: Settlements to Forest land Yasso07, C pool = 0 at time of change
AR: Cropland to Forest land Yasso07, C pool = 152 ton C ha-1
at time of
change; reached by spin-up year 0 with equal input
of litter from wheat and barley.
AR: Grassland to Forest land Yasso07, C pool = 152 ton C ha-1
at time of
change; reached by spin-up year 0 with input of
litter from grass.
AR: Other to Forest land Yasso07, C pool at time of change based on spin-
up with litter input for land use classes
“Other+Wetland” represented by the NFI plots
subject to change in the period 1990-2008. Living
biomass on “Other” and “Wetlands” areas subject
to land use change contained 6.15 tonne C ha-1
.
D: Forest land to Other* / Settlements Yasso07, C pool at time of change based on spin-
up with litter input for LUC “Forest land”
represented by the NFI plots subject to change in
the period 1990-2008. Living biomass on “Forest
land” areas subject to land use change to
“Settlement”contained 44.65 tonne C ha-1
.
D: Forest land to Grassland Emission factors
D: Forest land to Cropland Emission factors
*It is assumed that the land-use change from forest to other land has the same starting values as forest land
converted to Settlements. Only an accumulated area equivalent to 2 NFI plots has been subject to the conversion
“forest to other” and an estimate for this conversion alone would have been highly uncertain. In this submission
the estimate is included in the estimates for Forest land converted to Settlements.
Land converted to forest land
Using the above described method for running the Yasso07, a mean annual accumulation rate
(2007-2008) of 1 tonn C ha-1
was estimated for areas going from “Settlements” to “Forest
land”. This rate is 2–6 times higher than accumulation rates estimated from a spruce forest
chronosequence in southeast Norway (0.16–0.51 tonnes C ha-1
yr-1
; Kjønaas et al. in prep.). In
the simulations it was assumed that all soils under “Settlements” contained no C. A starting
point of 0 in the model results in a large accumulation rate. Some areas under “Settlements”
are vegetated (parks, gardens, road sites etc.), thus soils will contain C and therefore have C
accumulation rates close to those of natural ecosystems. Evaluating the areas under
“Settlements” and establishing a starting value for C content in the “Settlement” areas with
vegetation is likely to induce a reduction of the total sink in this land-use change category.
This is a potential improvement.
AR activities on both “Cropland” and “Grassland” areas induced emissions of C. This is
likely to be a consequence of i) high starting values for soil C content of the agricultural land
use classes and ii) low litter input in the forest as only litter from living trees are included.
The starting point for soil previously used as Grassland and Cropland are defined by the
estimated mean C content in Norway on agricultural mineral soil (Grønlund et al. 2008b).
This estimate (15.2 kg C m-2
) is high compared to the median value for forest soils (12-13 kg
C m-2
, de Wit and Kvindesland 1999). The agricultural soil starting point needs to be qualified
National Inventory Report 2012 - Norway
271
to ensure that a starting point is used that represent the relevant areas and land-use classes.
This was not possible for the current estimate, but will be part of the work for future
improvements. Furthermore, in the current method two crops are used to establish a start
condition for the Cropland soil. This assumption must be checked and improved if necessary
to ensure that starting conditions for simulations are valid.
Litter from the ground vegetation in newly afforestated and abandoned land is expected to be
a significant part of total input to the soil (Kjønaas et al. in prep.). However, up until now
there has been no possibility for estimating this input at the national scale. Future
improvements will look at the possibility to include ground vegetation litter in the estimation
method.
Forest land converted to Cropland or Grassland
For conversion from forest land to Cropland a general emission factor is used for the entire
area. It is assumed that 0.6 tonnes C ha-1
is lost annually on mineral soils and 8 tonnes C ha-1
is lost annually on organic soils (Riley and Bakkegård, 2006, Grønlund et al., 2008a). Based
on registrations on mineral and organic soil characteristics in the NFI since 1990 and up to the
present, of areas subjected to these land-use changes, 10 per cent was characterized by
organic soils. Emission on Grassland areas are assumed to be 0 (areas in equilibrium) based
on Uhlen (1991) and Grønlund et al. (2008b). These conversions are represented by little area
(few sample plots): Cropland 10 544 ha (ca. 10 plots), Grassland 21 089 ha (ca. 21 plots)
relative to other conversions.
Planned improvements
In addition to above mentioned improvements, future submissions will use a higher degree of
geographic disaggregation and area specific information on litter quality (tree species) will be
applied. This current method is not considered final and is expected to undergo evaluation
within the 2014 reporting.
7.4 Cropland 5B
7.4.1 Cropland remaining cropland – 5B1 (Key Category)
About 3 per cent of the total area of Norway is used as cropland. This category is found to be
key category with respect to sequestration in soils (histosols) (Tier 2) because of uncertainty
in level,
Most of the area for agriculture is used for annual crops which imply that the carbon is not
stored over a very long time in aboveground biomass. An exception is horticulture. Carbon
stocks in soils can be significant (IPCC, 2003). Land conversion to cropland from forest,
grassland or wetlands usually results in a net loss carbon from biomass and soil to the
atmosphere (IPCC, 2003). The soil carbon is, however, also affected by management
practices (for example ploughing and fertilization) (Singh and Lal, 2004). In addition,
Norwegian soils are limed to stabilize the pH. Liming contributes to improving the biomass
production and the potential for carbon sequestration.
National Inventory Report 2012 - Norway
272
7.4.1.1 Methodological issues
Change in carbon stock in living biomass
The annual changes in carbon stocks of cropland remaining cropland can be estimated as the
sum of changes in living biomass and soil. The method implemented corresponds to Tier 1 of
IPCC (2003).
Changes in living biomass have only been considered for perennial woody crops as in
accordance with IPCC (2003). For annual crops, the increase of biomass in crops will equal
loss from harvest and mortality the same year, thus there is no net accumulation or loss
(IPCC, 2003). The notation key NO has been used in the CRF-tables. Perennial crops are used
in horticulture. Statistics Norway collects data on the area of fruit trees (apple, pears, plum,
cherry and sweet cherry). In general the area has been decreasing since 1990. There are no
national data on their volume and carbon content. IPCC (2003) suggest default parameters for
aboveground biomass carbon stock at harvest, biomass accumulation rate and biomass loss
for temperate regions (it does not distinguish between vegetation types).
Changes in biomass in existing areas of fruit trees:
The IPCC default value for biomass accumulation rate is 2.1 Mg C ha-1
year-1
(IPCC, 2003).
This gives an annual uptake corresponding to only 19 Gg CO2 per year. The average age at
harvest is somewhat lower than the IPCC default assumption (20–25 years). The average
height is around 2 m and one tree occupies about 10 m2 according to the Norwegian
University of Life Sciences. The “harvest” can then be estimated at around 6.3 Gg C ha-1
. The
net CO2 uptake from these areas are reported under cropland remaining cropland –
Horticulture (CRF 5.B.1).
Conversion from perennial crops to other land categories:
Until 2007 the area of fruit trees decreased. In 2007, 2008 and 2009 the area increased for
then decreasing again in 2010. There is no statistics indicating directly to what type of land
the fruit trees area has been converted to. Therefore, the net emissions of CO2 are reported
under cropland converted to grassland when the area decrease (CRF 5.C.2.2.). When the area
of fruit trees increase, the removals of CO2 are reported under grassland converted to cropland
(CRF 5.B.2.2). In accordance with IPCC Tier 1 we assume that all carbon is lost at the year
of harvest of the tree. The IPCC default value for carbon stock at harvest (temperate region) is
63 Mg C/ha. The resulting emissions are very small, see Table 7.10. (There is something
wrong in the cells of notation keys for methof and EF used in CRF-table 5.B.2.2. Grassland
converted to Cropland. It is not possible to correct the, .The notation keys should be NA for
all years, except for 2007, 2008 and 2009. For those years the notation keys should be T1 for
method and CS for EF used.)
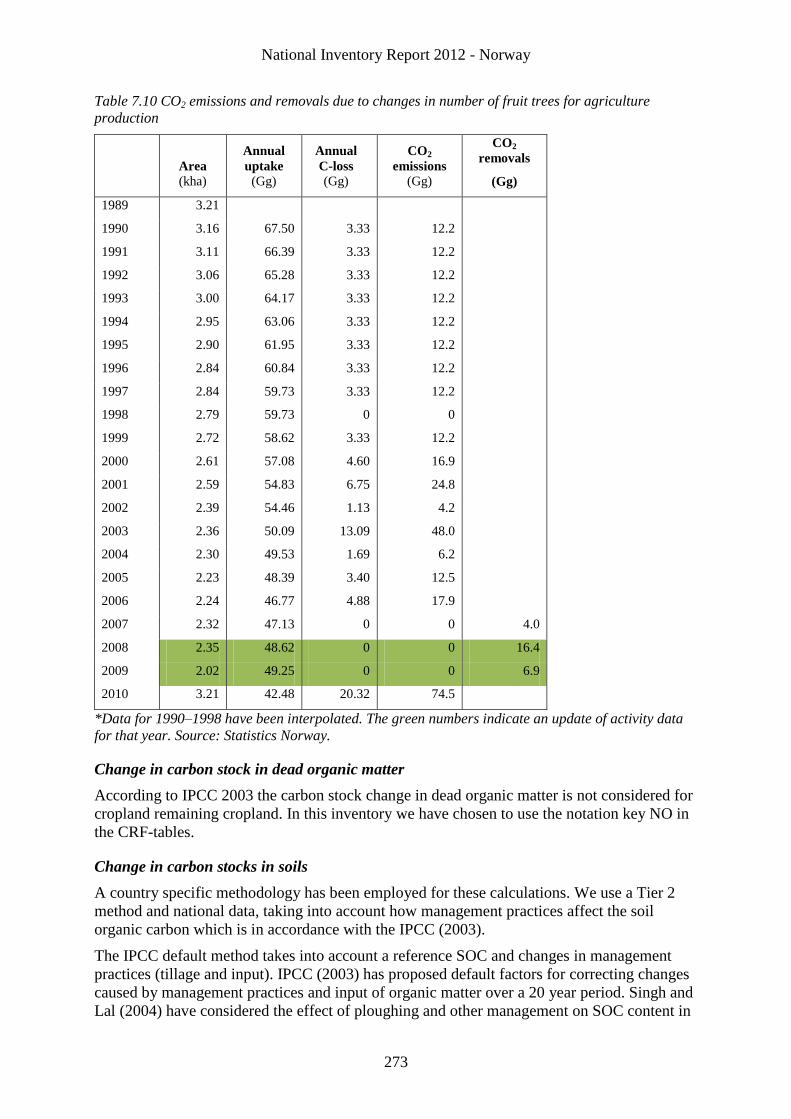
National Inventory Report 2012 - Norway
273
Table 7.10 CO2 emissions and removals due to changes in number of fruit trees for agriculture
production
Area
(kha)
Annual
uptake
(Gg)
Annual
C-loss
(Gg)
CO2
emissions
(Gg)
CO2
removals
(Gg)
1989 3.21
1990 3.16 67.50 3.33 12.2
1991 3.11 66.39 3.33 12.2
1992 3.06 65.28 3.33 12.2
1993 3.00 64.17 3.33 12.2
1994 2.95 63.06 3.33 12.2
1995 2.90 61.95 3.33 12.2
1996 2.84 60.84 3.33 12.2
1997 2.84 59.73 3.33 12.2
1998 2.79 59.73 0 0
1999 2.72 58.62 3.33 12.2
2000 2.61 57.08 4.60 16.9
2001 2.59 54.83 6.75 24.8
2002 2.39 54.46 1.13 4.2
2003 2.36 50.09 13.09 48.0
2004 2.30 49.53 1.69 6.2
2005 2.23 48.39 3.40 12.5
2006 2.24 46.77 4.88 17.9
2007 2.32 47.13 0 0 4.0
2008 2.35 48.62 0 0 16.4
2009 2.02 49.25 0 0 6.9
2010 3.21 42.48 20.32 74.5
*Data for 1990–1998 have been interpolated. The green numbers indicate an update of activity data
for that year. Source: Statistics Norway.
Change in carbon stock in dead organic matter
According to IPCC 2003 the carbon stock change in dead organic matter is not considered for
cropland remaining cropland. In this inventory we have chosen to use the notation key NO in
the CRF-tables.
Change in carbon stocks in soils
A country specific methodology has been employed for these calculations. We use a Tier 2
method and national data, taking into account how management practices affect the soil
organic carbon which is in accordance with the IPCC (2003).
The IPCC default method takes into account a reference SOC and changes in management
practices (tillage and input). IPCC (2003) has proposed default factors for correcting changes
caused by management practices and input of organic matter over a 20 year period. Singh and
Lal (2004) have considered the effect of ploughing and other management on SOC content in
National Inventory Report 2012 - Norway
274
soils. They conclude that the sequestration rate due to reduced tillage or increased N-
application is higher in Norway compared to other countries, possibly due to lower
temperatures and consequently lower rates of decomposition.
Erosion
Carbon in Norwegian cropland soils has been studied by Singh and Lal (2001;2004). Singh
and Lal (2001) have estimated C loss by accelerated erosion of agriculture and pasture land.
Erosion leads to less productivity and consequently less biomass returned to soil, and it
removes C from the site to somewhere else. On the whole, soil erosion leads to C emissions.
In Norway, soil erosion is mainly a problem in south-eastern regions of the country. Based on
assumptions on ploughing practices and erosion rates from these, Singh and Lal (2001) have
estimated a net erosion rate of 2.2 Mg ha-1
years-1
under autumn ploughing. The rate in other
areas is 0.44 Mg/ha/years. They assumed 70 per cent autumn plowing and 30 per cent spring
stubble, arriving at an average of 1.67 Mg ha-1
year-1
for 1999. The grass and pasture erosion
rate is 67 kg ha-1
year-1
.
In line with Singh and Lal (2001) the following equation has been used to estimate the
erosion:
SOC loss = Area * soil loss * sediment delivery ratio * SOC * Enrichment ratio
The sediment delivery ratio is assumed to be 10 per cent, and the enrichment ratio is assumed
to be 1.35. The mean carbon content of soils varies between regions, 27.3–58.7 g kg-1
, a value
of 40 per cent has been used in the calculations (all these assumptions were taken from Singh
and Lal (2001)).
Finally, it is assumed that 20 per cent of the C transported by erosion is released to the atmosphere.
Other factors such as Residue management, Crop rotations, Cover crops, Fertilizer and
organic manure, may contribute to acceleration or retardation in erosion (Singh and Lal,
2001). According to the discussion in NIJOS (2005) these factors are not accounted for in this
report.
Tillage practices
Tillage practices have been changing over the last 10 years aiming at reducing N-leakages and
runoff. Farmers are informed and rewarded for reducing the tillage rates in vulnerable areas,
in particular autumn tillage (Bye, 2002 and 2005), see Figure 7.11. The fraction of area under
autumn tillage was 82 per cent in 1989/2000, which was reduced to 43 per cent in 2001/2002
(based on annual surveys).
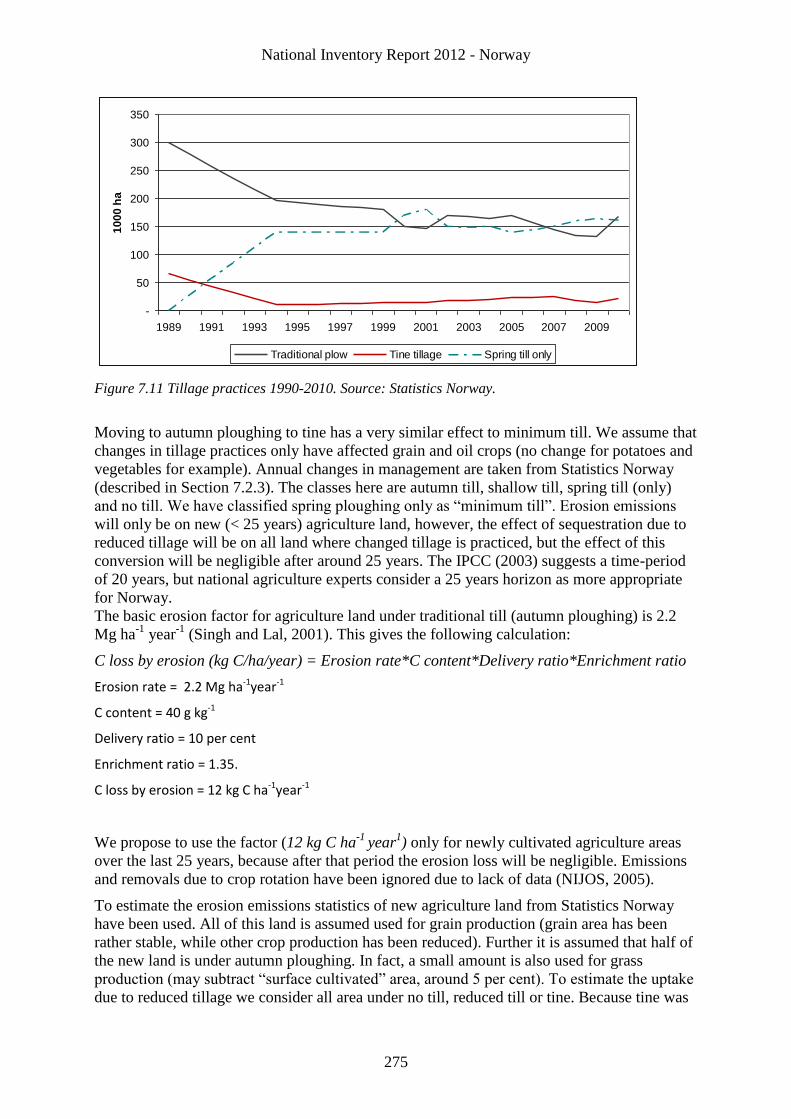
National Inventory Report 2012 - Norway
275
Figure 7.11 Tillage practices 1990-2010. Source: Statistics Norway.
Moving to autumn ploughing to tine has a very similar effect to minimum till. We assume that
changes in tillage practices only have affected grain and oil crops (no change for potatoes and
vegetables for example). Annual changes in management are taken from Statistics Norway
(described in Section 7.2.3). The classes here are autumn till, shallow till, spring till (only)
and no till. We have classified spring ploughing only as “minimum till”. Erosion emissions
will only be on new (< 25 years) agriculture land, however, the effect of sequestration due to
reduced tillage will be on all land where changed tillage is practiced, but the effect of this
conversion will be negligible after around 25 years. The IPCC (2003) suggests a time-period
of 20 years, but national agriculture experts consider a 25 years horizon as more appropriate
for Norway.
The basic erosion factor for agriculture land under traditional till (autumn ploughing) is 2.2
Mg ha-1
year-1
(Singh and Lal, 2001). This gives the following calculation:
C loss by erosion (kg C/ha/year) = Erosion rate*C content*Delivery ratio*Enrichment ratio
Erosion rate = 2.2 Mg ha-1year-1
C content = 40 g kg-1
Delivery ratio = 10 per cent
Enrichment ratio = 1.35.
C loss by erosion = 12 kg C ha-1year-1
We propose to use the factor (12 kg C ha-1
year1) only for newly cultivated agriculture areas
over the last 25 years, because after that period the erosion loss will be negligible. Emissions
and removals due to crop rotation have been ignored due to lack of data (NIJOS, 2005).
To estimate the erosion emissions statistics of new agriculture land from Statistics Norway
have been used. All of this land is assumed used for grain production (grain area has been
rather stable, while other crop production has been reduced). Further it is assumed that half of
the new land is under autumn ploughing. In fact, a small amount is also used for grass
production (may subtract “surface cultivated” area, around 5 per cent). To estimate the uptake
due to reduced tillage we consider all area under no till, reduced till or tine. Because tine was
-
50
100
150
200
250
300
350
1989 1991 1993 1995 1997 1999 2001 2003 2005 2007 2009
10
00
ha
Traditional plow Tine tillage Spring till only
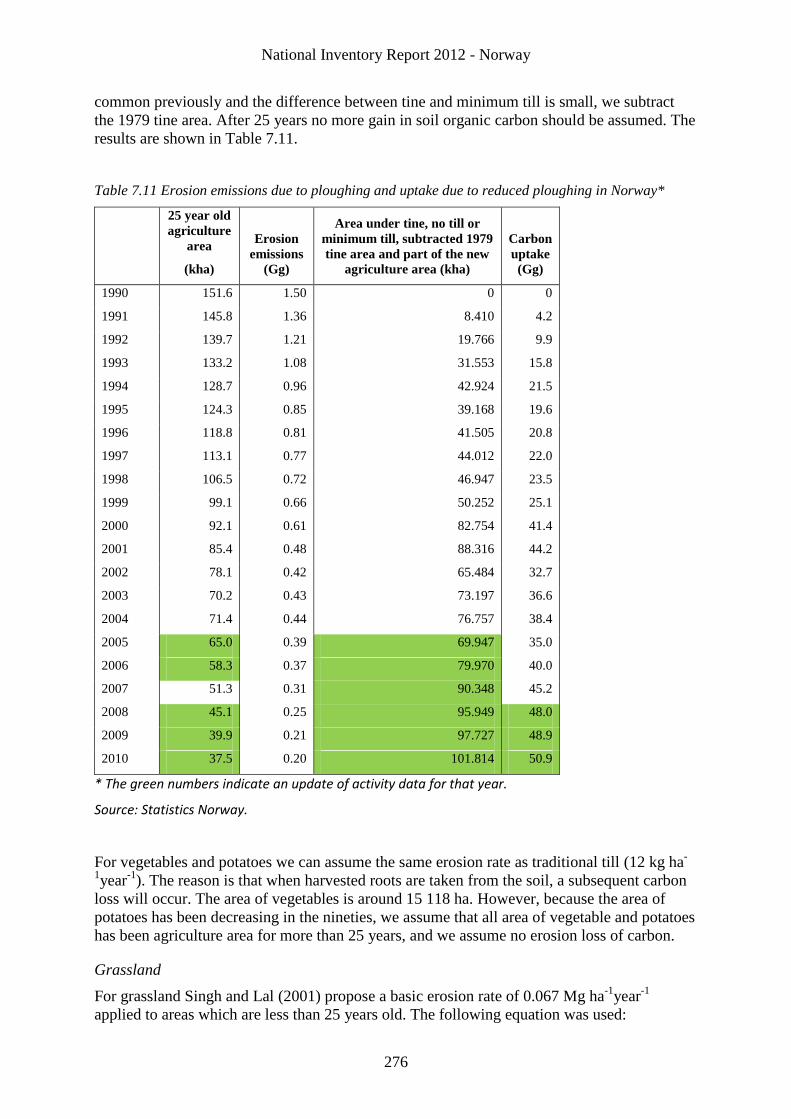
National Inventory Report 2012 - Norway
276
common previously and the difference between tine and minimum till is small, we subtract
the 1979 tine area. After 25 years no more gain in soil organic carbon should be assumed. The
results are shown in Table 7.11.
Table 7.11 Erosion emissions due to ploughing and uptake due to reduced ploughing in Norway*
25 year old
agriculture
area
(kha)
Erosion
emissions
(Gg)
Area under tine, no till or
minimum till, subtracted 1979
tine area and part of the new
agriculture area (kha)
Carbon
uptake
(Gg)
1990 151.6 1.50 0 0
1991 145.8 1.36 8.410 4.2
1992 139.7 1.21 19.766 9.9
1993 133.2 1.08 31.553 15.8
1994 128.7 0.96 42.924 21.5
1995 124.3 0.85 39.168 19.6
1996 118.8 0.81 41.505 20.8
1997 113.1 0.77 44.012 22.0
1998 106.5 0.72 46.947 23.5
1999 99.1 0.66 50.252 25.1
2000 92.1 0.61 82.754 41.4
2001 85.4 0.48 88.316 44.2
2002 78.1 0.42 65.484 32.7
2003 70.2 0.43 73.197 36.6
2004 71.4 0.44 76.757 38.4
2005 65.0 0.39 69.947 35.0
2006 58.3 0.37 79.970 40.0
2007 51.3 0.31 90.348 45.2
2008 45.1 0.25 95.949 48.0
2009 39.9 0.21 97.727 48.9
2010 37.5 0.20 101.814 50.9
* The green numbers indicate an update of activity data for that year.
Source: Statistics Norway.
For vegetables and potatoes we can assume the same erosion rate as traditional till (12 kg ha-
1year
-1). The reason is that when harvested roots are taken from the soil, a subsequent carbon
loss will occur. The area of vegetables is around 15 118 ha. However, because the area of
potatoes has been decreasing in the nineties, we assume that all area of vegetable and potatoes
has been agriculture area for more than 25 years, and we assume no erosion loss of carbon.
Grassland
For grassland Singh and Lal (2001) propose a basic erosion rate of 0.067 Mg ha-1
year-1
applied to areas which are less than 25 years old. The following equation was used:
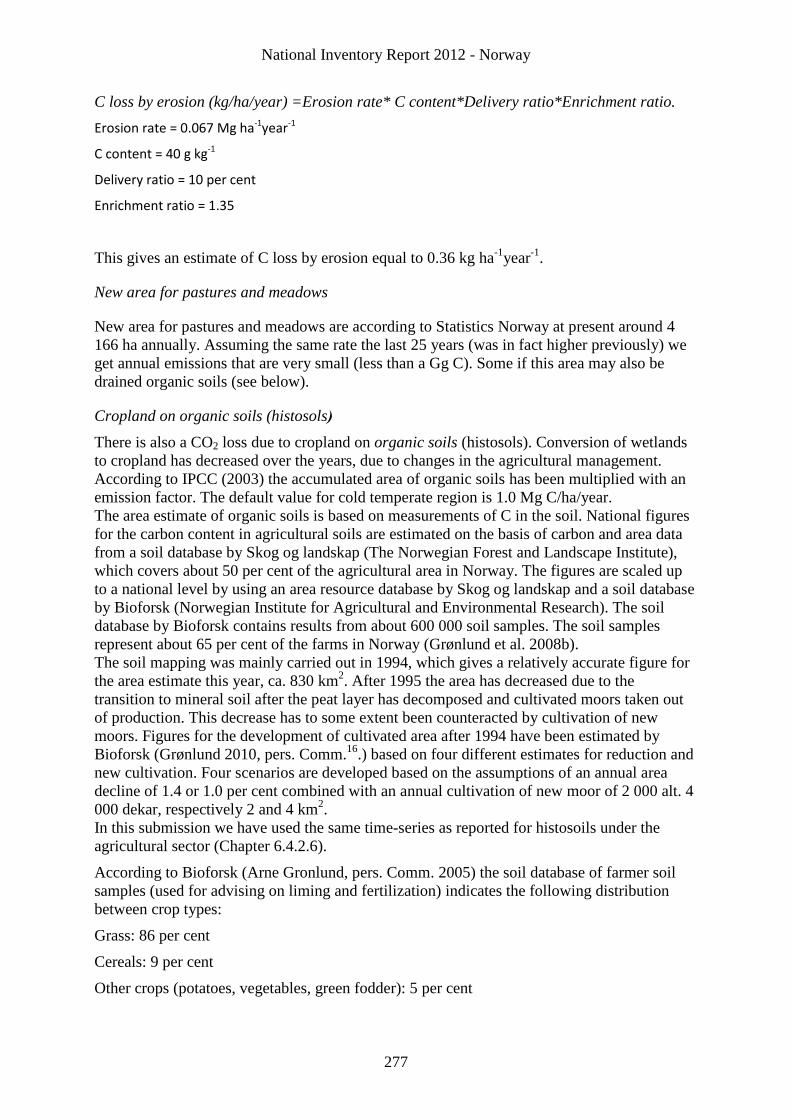
National Inventory Report 2012 - Norway
277
C loss by erosion (kg/ha/year) =Erosion rate* C content*Delivery ratio*Enrichment ratio.
Erosion rate = 0.067 Mg ha-1year-1
C content = 40 g kg-1
Delivery ratio = 10 per cent
Enrichment ratio = 1.35
This gives an estimate of C loss by erosion equal to 0.36 kg ha-1
year-1
.
New area for pastures and meadows
New area for pastures and meadows are according to Statistics Norway at present around 4
166 ha annually. Assuming the same rate the last 25 years (was in fact higher previously) we
get annual emissions that are very small (less than a Gg C). Some if this area may also be
drained organic soils (see below).
Cropland on organic soils (histosols)
There is also a CO2 loss due to cropland on organic soils (histosols). Conversion of wetlands
to cropland has decreased over the years, due to changes in the agricultural management.
According to IPCC (2003) the accumulated area of organic soils has been multiplied with an
emission factor. The default value for cold temperate region is 1.0 Mg C/ha/year.
The area estimate of organic soils is based on measurements of C in the soil. National figures
for the carbon content in agricultural soils are estimated on the basis of carbon and area data
from a soil database by Skog og landskap (The Norwegian Forest and Landscape Institute),
which covers about 50 per cent of the agricultural area in Norway. The figures are scaled up
to a national level by using an area resource database by Skog og landskap and a soil database
by Bioforsk (Norwegian Institute for Agricultural and Environmental Research). The soil
database by Bioforsk contains results from about 600 000 soil samples. The soil samples
represent about 65 per cent of the farms in Norway (Grønlund et al. 2008b).
The soil mapping was mainly carried out in 1994, which gives a relatively accurate figure for
the area estimate this year, ca. 830 km2. After 1995 the area has decreased due to the
transition to mineral soil after the peat layer has decomposed and cultivated moors taken out
of production. This decrease has to some extent been counteracted by cultivation of new
moors. Figures for the development of cultivated area after 1994 have been estimated by
Bioforsk (Grønlund 2010, pers. Comm.16
.) based on four different estimates for reduction and
new cultivation. Four scenarios are developed based on the assumptions of an annual area
decline of 1.4 or 1.0 per cent combined with an annual cultivation of new moor of 2 000 alt. 4
000 dekar, respectively 2 and 4 km2.
In this submission we have used the same time-series as reported for histosoils under the
agricultural sector (Chapter 6.4.2.6).
According to Bioforsk (Arne Gronlund, pers. Comm. 2005) the soil database of farmer soil
samples (used for advising on liming and fertilization) indicates the following distribution
between crop types:
Grass: 86 per cent
Cereals: 9 per cent
Other crops (potatoes, vegetables, green fodder): 5 per cent
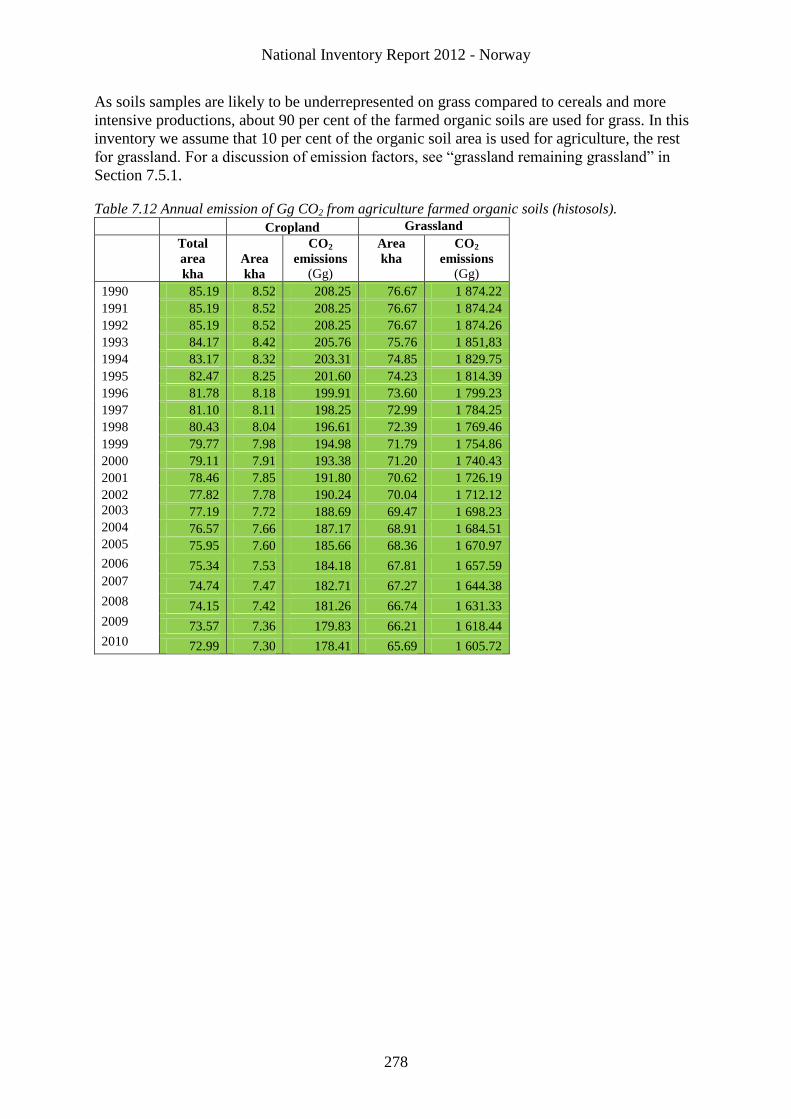
National Inventory Report 2012 - Norway
278
As soils samples are likely to be underrepresented on grass compared to cereals and more
intensive productions, about 90 per cent of the farmed organic soils are used for grass. In this
inventory we assume that 10 per cent of the organic soil area is used for agriculture, the rest
for grassland. For a discussion of emission factors, see “grassland remaining grassland” in
Section 7.5.1.
Table 7.12 Annual emission of Gg CO2 from agriculture farmed organic soils (histosols).
Cropland Grassland
Total
area
kha
Area
kha
CO2
emissions
(Gg)
Area
kha
CO2
emissions
(Gg)
1990 85.19 8.52 208.25 76.67 1 874.22
1991 85.19 8.52 208.25 76.67 1 874.24
1992 85.19 8.52 208.25 76.67 1 874.26
1993 84.17 8.42 205.76 75.76 1 851,83
1994 83.17 8.32 203.31 74.85 1 829.75
1995 82.47 8.25 201.60 74.23 1 814.39
1996 81.78 8.18 199.91 73.60 1 799.23
1997 81.10 8.11 198.25 72.99 1 784.25
1998 80.43 8.04 196.61 72.39 1 769.46
1999 79.77 7.98 194.98 71.79 1 754.86
2000 79.11 7.91 193.38 71.20 1 740.43
2001 78.46 7.85 191.80 70.62 1 726.19
2002 77.82 7.78 190.24 70.04 1 712.12
2003 77.19 7.72 188.69 69.47 1 698.23
2004 76.57 7.66 187.17 68.91 1 684.51
2005 75.95 7.60 185.66 68.36 1 670.97
2006 75.34 7.53 184.18 67.81 1 657.59
2007 74.74 7.47 182.71 67.27 1 644.38
2008 74.15 7.42 181.26 66.74 1 631.33
2009 73.57 7.36 179.83 66.21 1 618.44
2010 72.99 7.30 178.41 65.69 1 605.72
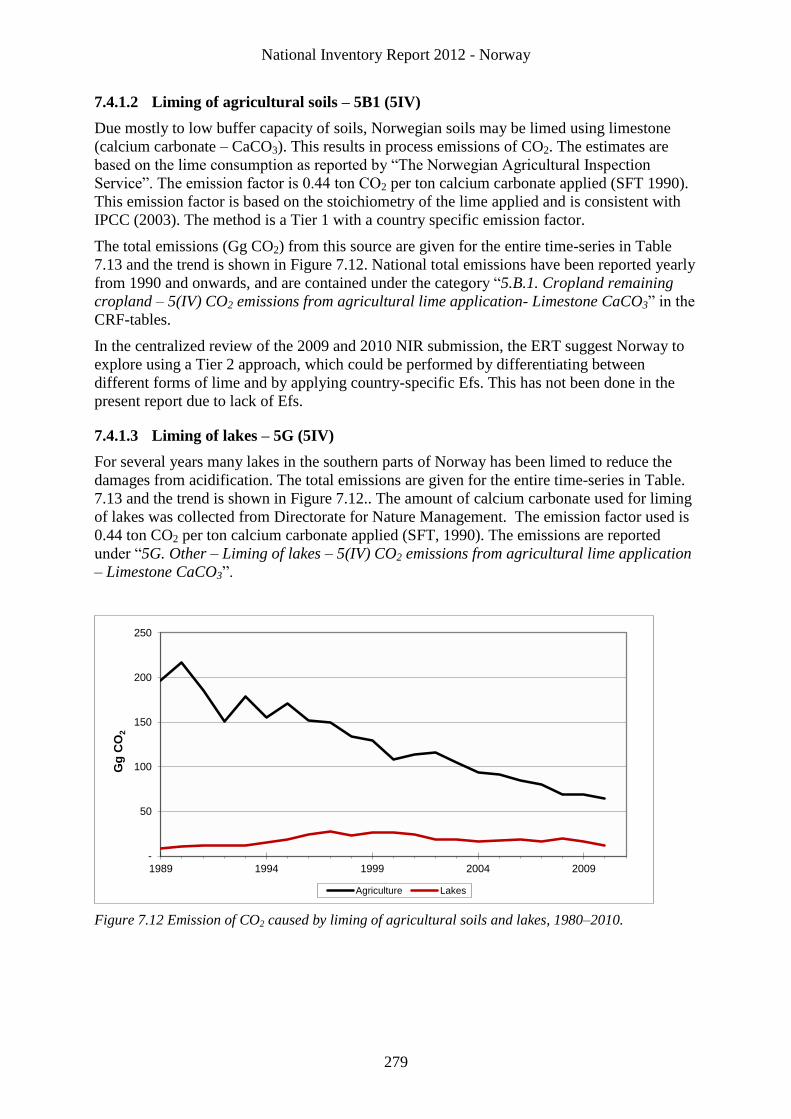
National Inventory Report 2012 - Norway
279
7.4.1.2 Liming of agricultural soils – 5B1 (5IV)
Due mostly to low buffer capacity of soils, Norwegian soils may be limed using limestone
(calcium carbonate – CaCO3). This results in process emissions of CO2. The estimates are
based on the lime consumption as reported by “The Norwegian Agricultural Inspection
Service”. The emission factor is 0.44 ton CO2 per ton calcium carbonate applied (SFT 1990).
This emission factor is based on the stoichiometry of the lime applied and is consistent with
IPCC (2003). The method is a Tier 1 with a country specific emission factor.
The total emissions (Gg CO2) from this source are given for the entire time-series in Table
7.13 and the trend is shown in Figure 7.12. National total emissions have been reported yearly
from 1990 and onwards, and are contained under the category “5.B.1. Cropland remaining
cropland – 5(IV) CO2 emissions from agricultural lime application- Limestone CaCO3” in the
CRF-tables.
In the centralized review of the 2009 and 2010 NIR submission, the ERT suggest Norway to
explore using a Tier 2 approach, which could be performed by differentiating between
different forms of lime and by applying country-specific Efs. This has not been done in the
present report due to lack of Efs.
7.4.1.3 Liming of lakes – 5G (5IV)
For several years many lakes in the southern parts of Norway has been limed to reduce the
damages from acidification. The total emissions are given for the entire time-series in Table.
7.13 and the trend is shown in Figure 7.12.. The amount of calcium carbonate used for liming
of lakes was collected from Directorate for Nature Management. The emission factor used is
0.44 ton CO2 per ton calcium carbonate applied (SFT, 1990). The emissions are reported
under “5G. Other – Liming of lakes – 5(IV) CO2 emissions from agricultural lime application
– Limestone CaCO3”.
Figure 7.12 Emission of CO2 caused by liming of agricultural soils and lakes, 1980–2010.
-
50
100
150
200
250
1989 1994 1999 2004 2009
Gg
CO
2
Agriculture Lakes
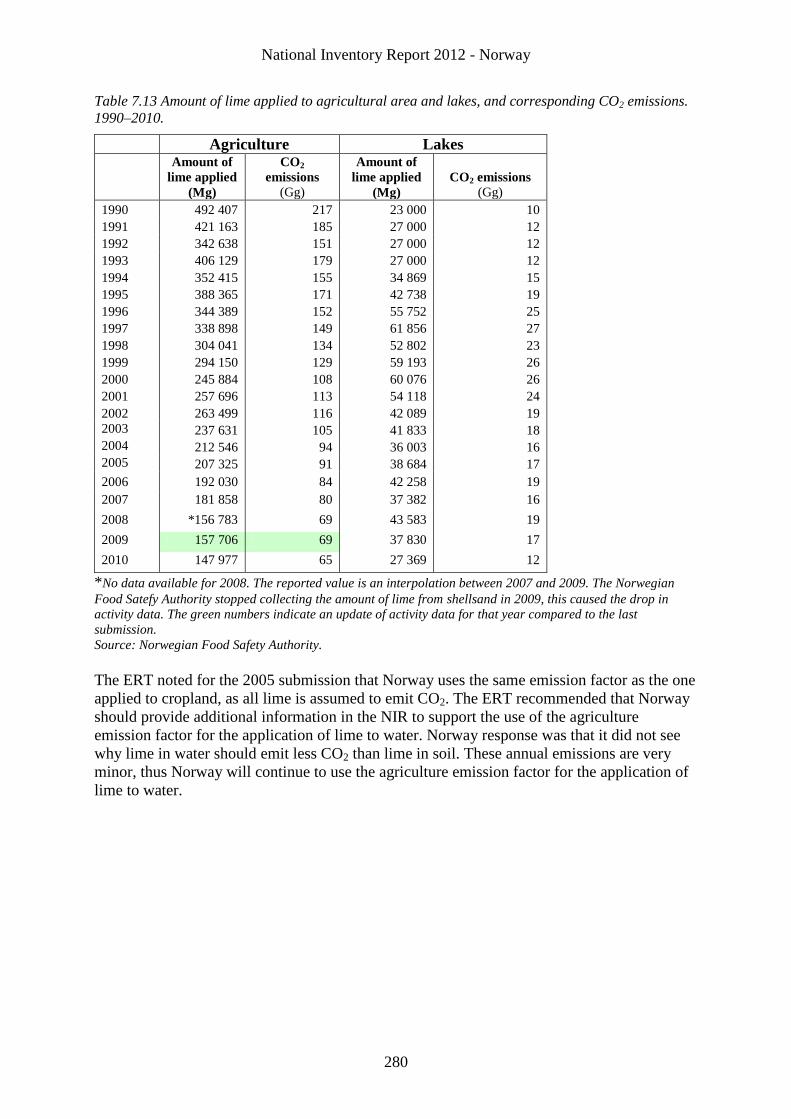
National Inventory Report 2012 - Norway
280
Table 7.13 Amount of lime applied to agricultural area and lakes, and corresponding CO2 emissions.
1990–2010.
Agriculture Lakes
Amount of
lime applied
(Mg)
CO2
emissions
(Gg)
Amount of
lime applied
(Mg)
CO2 emissions
(Gg)
1990 492 407 217 23 000 10
1991 421 163 185 27 000 12
1992 342 638 151 27 000 12
1993 406 129 179 27 000 12
1994 352 415 155 34 869 15
1995 388 365 171 42 738 19
1996 344 389 152 55 752 25
1997 338 898 149 61 856 27
1998 304 041 134 52 802 23
1999 294 150 129 59 193 26
2000 245 884 108 60 076 26
2001 257 696 113 54 118 24
2002 263 499 116 42 089 19
2003 237 631 105 41 833 18
2004 212 546 94 36 003 16
2005 207 325 91 38 684 17
2006 192 030 84 42 258 19
2007 181 858 80 37 382 16
2008 *156 783 69 43 583 19
2009 157 706 69 37 830 17
2010 147 977 65 27 369 12
*No data available for 2008. The reported value is an interpolation between 2007 and 2009. The Norwegian
Food Satefy Authority stopped collecting the amount of lime from shellsand in 2009, this caused the drop in
activity data. The green numbers indicate an update of activity data for that year compared to the last
submission.
Source: Norwegian Food Safety Authority.
The ERT noted for the 2005 submission that Norway uses the same emission factor as the one
applied to cropland, as all lime is assumed to emit CO2. The ERT recommended that Norway
should provide additional information in the NIR to support the use of the agriculture
emission factor for the application of lime to water. Norway response was that it did not see
why lime in water should emit less CO2 than lime in soil. These annual emissions are very
minor, thus Norway will continue to use the agriculture emission factor for the application of
lime to water.
National Inventory Report 2012 - Norway
281
7.4.2 Land converted to cropland – 5B2
7.4.2.1 Methodological issues
Land conversion to cropland from forest, grassland or wetlands usually results in a net loss
carbon from biomass and soils to the atmosphere (IPCC, 2003).
Change in carbon stock in living biomass
When forest land is converted to cropland the losses are calculated. Generally, for all other
land conversions we assume no changes in carbon stocks in living biomass is not estimated
due to lack of data and method. Furthermore, the changes are regarded as negligible. There is
one exception when the area of horticulture increases. Then the removals of CO2 are reported
under grassland converted to cropland.
Change in carbon stock in dead organic matter
The estimate of carbon stock change in dead organic matter is for forest land converted to
cropland included in the estimates of carbon stock change in soil. This is discussed in chapter
7.3.2.1. Due to lack of methods, it is not mandatory to report carbon stock change in dead
organic matter for land conversions to cropland, hence the notation key NE in the CRF-
reporter.
Change in carbon stocks in soils
Forest land converted to cropland
The method used for calculating emission from or forest land converted to cropland is
described in chapter 7.3.2.1.
Conversions from all other land use
Because the basic agriculture erosion factor is based on the one for grassland, we assume no
immediate loss when other land-use categories are converted to cropland. Losses are
accounted for according to the changes in management (see cropland remaining cropland).
Conversions between wetlands to cropland are negligible. The conversion from wetlands to
agriculture land was addressed above, under cropland remaining cropland (cropland on
organic soil).
7.5 Grassland 5C
According to the area definitions, grassland also includes pasture. Grasslands are used for
harvest and pasture. Parts of the pasture land are in the mountains. Pasture practices have been
changing over the last decades, gradually leading to altered vegetation (including expansion
of forests and other wooded land).
7.5.1 Grassland remaining grassland – 5C1 (Key Category)
As for cropland, we consider changes in soil carbon. According to the Tier 2 key category
analysis this category is identified as key category with respect to changes in carbon stock in
soils (histosols) because of uncertainty in level and trend. Changes in management have,
however, influenced the vegetation on pastures. Gradually, some of this area will fall under
the forest definition.
National Inventory Report 2012 - Norway
282
7.5.1.1 Methodological issues
Change in carbon stock in living biomass
No changes in living biomass are assumed for grassland remaining grassland because the
mass of above ground biomass is small and is in a steady state in accordance with IPCC
(2003) Tier 1, hence the notation key NO in the CRF tables.
Change in carbon stock in dead organic matter
No change in dead organic matter is assumed for this category because the mass of
aboveground biomass is small and is in a steady state in accordance with IPCC (2003), hence
the notation key NO in the CRF tables.
Change in carbon stocks in soils
As for cropland, we consider changes in carbon stocks in soil. Large amounts of carbon are
stored in roots and soils. There have not been any major changes in management of grasslands
(apart from pasture) in Norway. Consequently, that would justify ignoring carbon losses or
uptake from mineral soils on existing grassland area. For grassland which is harvested
(meadow) we have used the erosion factor of Singh and Lal (2001) of 0.78 kg C ha-1
year-1
.
This factor should, however, only be applied to grassland which is younger than 25 years, see
discussion under “cropland remaining cropland” in Section 7.4.1.
There will be a loss of carbon from grassland on organic soils. As discussed for cropland, it is
assumed that 90 per cent of organic soil used for agriculture production is used for grass
production (organic soils are not suited for example for producing grain). The IPCC default
emission factor is 0.25 Mg C ha-1
year-1
for cold temperate regions. However, according to
Norwegian measurements emission can be larger because the age of the organic soils is lower
than in Southern Europe. The average subsidence has been estimated by Bioforsk at 2 cm
year-1(18)
which is equivalent to 20 Mg C ha -1(19)
. Some of this reduction is due to compaction
and can be attributed to a sink in the height of the soil layer(20)
. The soil loss also includes
leaching of organic components in the drainage water. Based on measurements the emission
losses of CO2 from farmed organic soils in Sweden and Finland have been reported to be
between 200 and 1 000 g CO2-C m-2
year-1
(Final report from the EU Project Greenhouse Gas
Emissions for Farmed Organic Soils (GEFOS). This corresponds to 2-10 Mg ha-1
year-1
. The
assumptions on C-losses are also justified because a change in C/N ratio over time is
observed. We propose using a loss factor of 10 Mg C ha-1
year-1
for high organic matter soil.
For mixed organic soils the factor will be lower, we propose using 5 Mg C ha-1
year-1
(expert
judgement).
Of the total area of histosoils given in table 7.12, 90 per cent were assumed used for grass
production. Of these we assume one third is highly organic, the rest is mixed. The annual
emissions are given in table 7.12.
Given the importance of this estimate compared to other sources and the large difference from
the IPCC default value, about 21 Gg C year-1
(78 Gg CO2), it is recommended to further
improve the emission factor (measurements, modeling, literature). Other Nordic countries
have similar agriculture practices. We will propose to reconsider the Norwegian emission
18
Meadow. The decrease in layer is larger on field grassland. However, organic soils are rarely used for the purpose. 19
Assuming a soil density of 0.2 kg/l, and 50 per cent C. 20
Assuming a soil density of 0.2 kg/l, and 50 per cent C.
National Inventory Report 2012 - Norway
283
factors in light of results conducted in Sweden and Finland. This is planned to be done within
the reporting in 2014.
There is no practice of liming grassland in Norway, hence the notation key NO is used in the
CRF-tables.
7.5.2 Land converted to grassland – 5C2
7.5.2.1 Methodological issues
Change in carbon stock in living biomass
Carbon stock change in living biomass is calculated for conversion of forest land to grassland
(described in Chapter 7.3.2) and when the area of cropland used for horticulture is decreasing.
Carbon stock changes for all other land use changes are not estimated, thus the notation key
NE is used in the CRF-tables. For cropland converted to grassland this is justified because the
IPCC (2003) defaults for aboveground biomass are quite similar for grassland and cropland.
(5 Mg carbon ha-1
for cropland, 8.5 Mg dry matter ha-1
for grassland (boreal zone) equal to
4.2 Mg C ha-1
given a carbon content of 0.5)For all other land-use changes to grassland the
change in carbon stock for living biomass is regarded as negligible. This is justified because
the land area of wetlands, settlements and other land converted to grassland is in average 0.7
kha per year since 1990. In addition, according to IPCC (2003) the implications of converting
other land to grassland are uncertain. .
Change in carbon stock in dead organic matter
The estimate of carbon stock change in dead organic matter is not estimated for forest land
converted to grassland due to lack of data, hence the notation key NE in the CRF tables. This
is discussed in chapter 7.3.2.1. For all other land conversions to grassland we assume no net
change in carbon of dead organic matter, thus the notation key NO in the CRF-tables. In
addition, according to the IPCC (2003) the carbon stock change in dead organic matter is not
considered when land is converted to grassland.
Change in carbon stocks in soils
The soil organic carbon in grazing land and unmanaged grassland is not known. However,
much of the grassland will be in mountain areas where the soil organic carbon can be low.
Conversion of forest land to grassland
There are some transitions from forest land to grassland, approximately 1 kha per year since
1990. The Norwegian Forest and Landscape Institute has estimated the mean carbon content
in productive forest to 13.6 kg C per m2
(de Wit, H. A., and S. Kvindesland, 1999). The
corresponding mean value for all cultivated mineral soils (both grassland and cropland) has
been calculated at 15 kg C per m2 (Grønlund et al. 2008). These results indicate no large
difference in carbon content between forest and cultivated soils. Land with tree cover may be
classified as grassland if grazing is considered more important than forest. Thus the carbon
stock change in soil is regarded as negligible when forest land is converted to grassland,
hence the notation key NE in the CRF tables.
Conversion of cropland to grassland
When cropland is converted to grassland the soil organic matter may change due to changes in
management, for example ploughing and N-fertilization. The result is expected to be a net
uptake. According to Statistics Norway the managed grassland area have increased in the
National Inventory Report 2012 - Norway
284
nineties. Bioforsk confirms that farms with animals (and grass production) have a slightly
higher soil organic carbon than those without (NIJOS, 2005). There are no data for grassland
outside home fields, but they usually have a lower soil organic carbon. IPCC default Tier 1
method accounts for differences in soil organic carbon in the land use conversion according to
changes in management. Assuming that the grassland is nominally managed and the same
level of fertilization, also the IPCC (2003) default method indicates no change. We assume
the changes in soil organic carbon when cropland is converted to grassland to be negligible,
hence the use of notation key NE in the CRF tables. Furthermore, this is a conservative
approach since the result of this conversions are expected to be a net uptake
Conversion of wetland to grassland
See discussion on drained organic soils under “grassland remaining grassland” in Section
7.5.1. The notation key NE is used in the CRF tables.
Conversion of other land to grassland
Due to lack of data and emission factors, no estimates are given for carbon stock change in
soil when other land-use is converted to grassland, hence the notation key NE in the CRF
tables.
Due to the sparse soil in the land use category "other land" we assume that the results of these
conversions will be a net uptake of CO2. Therefore, the approach not to provide estimates for
this conversion is regarded as conservative. Furthermore, the area of other land converted to
grassland is small and the carbon stock changes are regarded as negligible.
7.6 Wetlands 5D
Most of the wetlands in Norway are unmanaged mires, bogs and fens, as well as lakes and
rivers. Managed wetlands include peat extraction and reservoirs (dams).
7.6.1 Wetlands remaining wetlands – 5D1
Wetlands remaining wetlands is only covered in appendix 3a.3 in the Good Practice Guidance
(IPCC, 2003). That means that reporting is not mandatory. Consequently, changes in carbon
stocks in unmanaged wetlands and reservoirs have not been considered in this report.
7.6.1.1 Methodological issues
Reservoirs
At present there exists no readily available water or land-use change statistics related to dams
or reservoirs. Reservoirs should be considered in the future due to the many hydroelectric
power stations in Norway. Regarding the SINTEF-StatKraft project the preliminary results
are classified information according to the Norwegian Water Resources and Energy
Directorate. If and when the findings of this project will be declassified is not known at this
time.
Peat extraction
Changes in carbon stocks for peat extraction are estimated with a Tier 1 method based on
Swedish emission factors. According to Bioforsk, peat extraction in Norway is between 220
000 and 300 000 m3 year
-1 (we assume no change in extraction). The extraction is around 5–
National Inventory Report 2012 - Norway
285
10 cm year-1
. This corresponds to 13 m2 m
3-1. The total area harvested is consequently around
338 ha.
The IPCC default method considers only change in soil carbon during peat extraction.
Changes in biomass and changes in soil carbon due to other processes associated with
extraction (drainage, stockpiling, etc) are assumed to be zero at Tier 1. Extraction is assumed
to enhance oxidation, leading to a continuing decrease in soil carbon. Although some of the
extraction areas may belong to the temperate zone, we propose using the default emission
factor for nutrient poor bogs in the boreal zone. The IPCC emission factor is 0.2 Mg C ha-
1year
-1.
We propose using emission factors for Sweden (Uppenberg et al. (2001)). Prior to drainage
and extraction the peat land acts as a small carbon sink (62-96 g m-2
year-1
). During extraction
emissions will be around 10 Mg CO2 ha-1
year-1
(2.7 Mg C ha-1
year-1
), somewhat lower after
drainage and before extraction. Because the age of the harvested area is not known, we apply
the same emission factor for every year.
This gives an annual estimate of 0.9 Gg C or 3.4 Gg CO2.
Wooded mire
Wooded mire according to Norway’s national definition will be classified as forest, if the
requirements of the international forest definition are met. The rest of wooded mire would be
considered “other wooded wetland”, and could form a subgroup under “wetlands”. The living
biomass is, however, negligible compared to forest, and the usefulness of forming such a
category would be questionable.
Liming
Lakes are limed in Norway to stabilize the pH. The methodology is explained in Section
7.4.1.3 (see Table 7.13 and Figure 7.12). The corresponding emissions of CO2 vary annually.
Other wetlands
Other wetlands are considered unmanaged, and no emissions and removals are estimated that
is in line with IPCC 2003.
7.6.2 Land converted to wetlands – 5D2
No data are available on land converted to managed wetlands. In practice, this is only relevant
for reservoirs. Land taken into use for peat extraction would normally be unmanaged
wetlands.
Furthermore, conversion of forest land to wetlands is expected to be a slow process, because
this involves re-growth of ditches and a steady increase in water level. Additionally, a
conversion to the land-use category ‘wetlands’ requires a reduction in tree cover, otherwise
the land would still be considered forest. Clearly, drained forest must have been abandoned
for some time in order to return to the land-use category of wetlands.
We assume no loss or uptake of carbon when other land-use is converted to wetlands, because
we assume the features of these areas will approach those of wetlands, hence the notation key
NO in the CRF tables.
National Inventory Report 2012 - Norway
286
7.7 Settlements 5E
7.7.1 Settlements remaining settlements – 5E1
Reporting of emissions and removals from this category is not mandatory. There are,
furthermore, no data available in Norway to estimate the tree biomass. Changes in carbon
stocks for settlements remaining settlements have consequently not been estimated and the
notation key NE has been used in the CRF-tables.
7.7.2 Land converted to settlements – 5E2 (Key category)
IPCC (2003) suggests a method in which only forest biomass is considered. Thus, all other
carbon stock changes when land categories are converted to settlements are not estimated,
hence the notation key NE in the CRF-tables. IPCC further suggests as a Tier 1 method that
all biomass is lost in the year of conversion.
According to the Tier 2 key category analysis forest land converted to settlements is found to
be a key category with respect to losses of living biomass and for soil. It is introduced a new
method to calculate carbon stock change for the category forest land converted to settlements.
Change in carbon stock in living biomass
We assume that all the biomass is lost the year of conversion when forest land is converted to
settlements. The emission is calculated following the stock change methods. Due to lack of
method carbon stock changes for living biomass have not been estimated for any other land
use conversions to settlements (IPCC, 2003), hence the notation key NE in the CRF tables.
Change in carbon stock in dead organic matter
The estimate of carbon stock change in dead organic matter is for forest land converted to
settlements included in the estimates of carbon stock change in soil, hence the notation key IE
in the CRF tables. This is discussed in chapter 7.3.2.1. Due to lack of method, carbon stock
changes for dead organic matter have not been estimated for any other land conversions to
settlements (IPCC, 2003), hence the notation key NE in the CRF tables.
Change in carbon stocks in soils
When forests are converted to settlements it is reasonable to assume that soils will be
disturbed in order to make the surface suitable for building purposes, for instance by leveling
the surface and by removing the top soil. As most carbon is in the top soil, it seems reasonable
to assume that most soil carbon will be lost in a short time. In this inventory, change in soil
carbon has been calculated for forest land converted to settlements according to the method
described in Chapter 7.3.2.1. No change in carbon stock in soil has been estimated for any
other land-use changes to settlements, due to uncertainty about the methods and in accordance
with IPCC (2003), hence the notation key NE in the CRF tables.
National Inventory Report 2012 - Norway
287
7.8 Other land 5F
7.8.1 Other land remaining other land – 5F1
7.8.1.1 Methodological issues
Change in carbon stock in living biomass
It is not mandatory to report carbon stock in living biomass. This is in accordance with IPCC
(2003) because this land is considered unmanaged.
Change in carbon stock in dead organic matter
It is not mandatory to report carbon stock in dead organic matter. This is in accordance with
IPCC (2003), because this land is considered unmanaged.
Change in carbon stocks in soils
It is not mandatory to report carbon stock in soils. This is in accordance with IPCC (2003)
because this land is considered unmanaged.
7.8.2 Land converted to other land – 5F2
7.8.2.1 Methodological issues
Change in carbon stock in living biomass
In the case of conversion from forest land to other land, the carbon stock change in biomass
will be reported because the NFI is following all areas over time. Due to the 20 years
approach for the land-use transition, there can be reported changes in carbon stock for living
tree biomass for land converted to other land. Due to lack of methods and data no estimates
for carbon stock changes of living biomass are provided for all other land categories
conversions to other land, hence the use of notation key NE in the CRF tables. The carbon
stock change is regarded as negligible.
Change in carbon stock in dead organic matter
The estimate of carbon stock change in dead organic matter is for forest land converted to
other land included in the estimates of carbon stock change in soil, hence the use of notation
key IE in the CRF tables. This is discussed in chapter 7.3.2.1. Due to lack of methods and
data, no estimates for carbon stock changes of dead organic matter are provided for all other
land categories conversions to other land, hence the use of notation key NE in the CRF tables.
The carbon stock change is regarded as negligible.
Change in carbon stocks in soils
The estimates for carbon stock change in soils when forest land is converted to other land is
included in the estimates for forest land converted to settlements, hence the notation keys IE
in the CRF tables (explained in Chapter 7.3.2.1). For all other land use conversions to other
land we no estimates for carbon stock changes of soil organic matter are provided. This is due
to lack of methods and data. The notation key NE is used in the CRF tables. The carbon stock
change is regarded as negligible.
National Inventory Report 2012 - Norway
288
7.9 Other 5G
7.9.1 Liming of agricultural soils and lakes
Emissions of CO2 from liming of agricultural soils and lakes are included in this category.
The descriptions of the methodologies are contained in Section 7.4.1.2 and 7.3.1.3,
respectively.
7.9.2 Harvested wood products
According to the IPCC default approach, emissions of CO2 from harvested wood products
(HWP) are accounted for in the year of harvest and the country of harvest. All harvested wood
is thus assumed to be oxidized to CO2 in the year of harvesting, and no wood are assumed to
be stored in long-lived products. Much of the harvested wood will however be stored for a
shorter or longer period of time before it oxidizes. In the 2009 and 2010 submissions, Norway
has estimated the net removals from HWP following the stock change approach (SCA) and
the revised method. Due to Decision 2/CMP.7 in Durban, the SCA approach can no longer be
used after 2015. In this submission Norway has hence started using the production approach (PA) and the IPCC HWP method for the reporting of HWP to the UNFCCC. The results are
included in annex VII to this report. The results are preliminary and will be recalculated in
future submissions. The contribution from HWP is not included in the LULUCF category
“5G-Other”.
7.10 Emissions of non-CO2 gases
Changes in forest and other land-use change will influence emissions of other greenhouse
gases than CO2. Emissions of methane (CH4) are caused by fires. Changes in land-use may
also change natural emissions, but according to the IPCC methodology these changes are not
included in the accounting framework. Emissions of nitrous oxide (N2O) are in addition to
fires caused by soil organic matter mineralization, nitrogen input and cultivation of organic
soils. Indirect emissions are not considered in this sector, but under agriculture. Emissions of
N2O from land converted to cropland are estimated. According to IPCC (2003) liming of
forest and forest management may change N2O emissions, but the effect is uncertain.
Norwegian forest is, however, not subject to liming. The emissions of non-CO2 gases are
small (non-key) and default parameters and methods have been applied in most
circumstances. Norwegian experts, and to some extent Swedish, have been contacted in
search for improved information.
Emissions and removals in the Appendices of IPCC (2003) have only partly been included.
Methodologies have been presented in NIJOS (2005) for further methodology development,
but the corresponding emissions can be reported if national information is available. For the
non-CO2 GHG reservoirs can be a source in Norway, but the corresponding emissions have
not been estimated.
7.10.1 Forests
N2O is produced in soils as a by-product of nitrification and denitrification. Emissions
increase due to input of N through fertilization and drainage of wet forest soil (IPCC, 2003).
Forest management may also alter the natural methane sink in undisturbed forest soils (IPCC,
2003), but data does currently not allow a quantification of this effect. According to IPCC
(2003) fertilizer input is particularly important for this process, but fertilization of forest is of
little importance in Norway.
National Inventory Report 2012 - Norway
289
N2O from fertilization
Because national emission factors for fertilization of forest soil are unavailable the estimate is
based on Tier 1 and default emission factors.
N2O-direct fertliser = (FStatistics Norway + FON)*EF1 * 44/28
Where:
FStatistics Norway = the amount of synthetic fertilizer applied to forest soil adjusted for
volatilization as NH3 and NOx. Gg N.
FON = the amount of organic fertilizer applied to forest soil adjusted for volatilization as NH3
and NOx. Gg N.
EF1 = Emission factor for emissions from N input, kg N2O-N/kg N input.
There are national statistics on the area with fertilizer applied. This area is very small, only 7
km2 in 2004 and 26 km
2 in 1990 (Statistics Norway, Forestry Statistics). The statistics do not
specify whether this is synthetic or organic fertilizer. Furthermore, it does not say anything
about the amount applied. Statistics Norway has supplied unpublished data on application on
synthetic fertilizer for the period 1995-2005. The average ratio between the amount applied
and the area fertilized was used to estimate the amount applied for 1990–1994. It is assumed
that organic fertilizer is not applied to forest in Norway. To the extent that it is applied, the
associated emissions will be reported under agriculture (this assumption is according to IPCC
2003). The amount of fertilizer applied is given as total weight. The nitrogen content is
depending on the type used. According to Statistics Norway, 95 per cent NPK-fertilizer is
used on wetlands. On dry land about half is NPK and the rest N-fertilizer. The N-content of
these were taken from YARA (www.hydroagri.com).
The default emission factor is 1.25 per cent of applied N. There are no national data to
improve this. 1 per cent of the N-applied is volatized as NH3 (the ammonia model of Statistics
Norway).
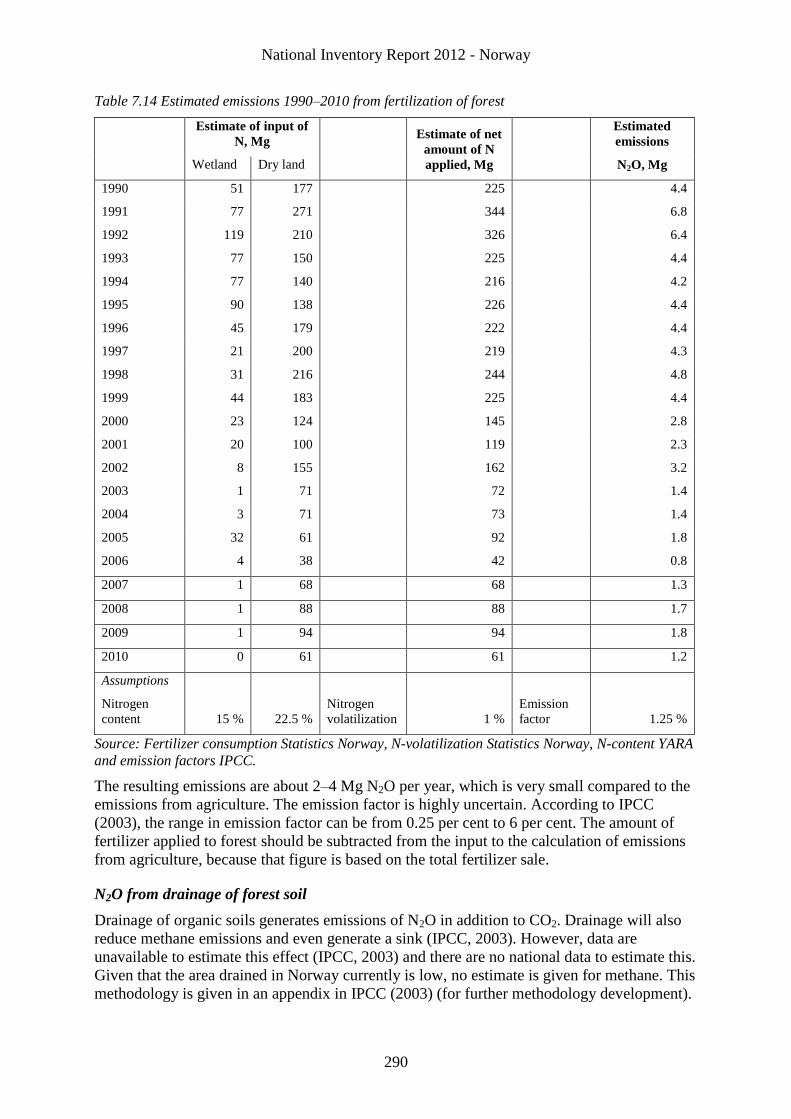
National Inventory Report 2012 - Norway
290
Table 7.14 Estimated emissions 1990–2010 from fertilization of forest
Estimate of input of
N, Mg Estimate of net
amount of N
applied, Mg
Estimated
emissions
N2O, Mg Wetland Dry land
1990 51 177 225 4.4
1991 77 271 344 6.8
1992 119 210 326 6.4
1993 77 150 225 4.4
1994 77 140 216 4.2
1995 90 138 226 4.4
1996 45 179 222 4.4
1997 21 200 219 4.3
1998 31 216 244 4.8
1999 44 183 225 4.4
2000 23 124 145 2.8
2001 20 100 119 2.3
2002 8 155 162 3.2
2003 1 71 72 1.4
2004 3 71 73 1.4
2005 32 61 92 1.8
2006 4 38 42 0.8
2007 1 68 68 1.3
2008 1 88 88 1.7
2009 1 94 94 1.8
2010 0 61 61 1.2
Assumptions
Nitrogen
content 15 % 22.5 %
Nitrogen
volatilization 1 %
Emission
factor 1.25 %
Source: Fertilizer consumption Statistics Norway, N-volatilization Statistics Norway, N-content YARA
and emission factors IPCC.
The resulting emissions are about 2–4 Mg N2O per year, which is very small compared to the
emissions from agriculture. The emission factor is highly uncertain. According to IPCC
(2003), the range in emission factor can be from 0.25 per cent to 6 per cent. The amount of
fertilizer applied to forest should be subtracted from the input to the calculation of emissions
from agriculture, because that figure is based on the total fertilizer sale.
N2O from drainage of forest soil
Drainage of organic soils generates emissions of N2O in addition to CO2. Drainage will also
reduce methane emissions and even generate a sink (IPCC, 2003). However, data are
unavailable to estimate this effect (IPCC, 2003) and there are no national data to estimate this.
Given that the area drained in Norway currently is low, no estimate is given for methane. This
methodology is given in an appendix in IPCC (2003) (for further methodology development).
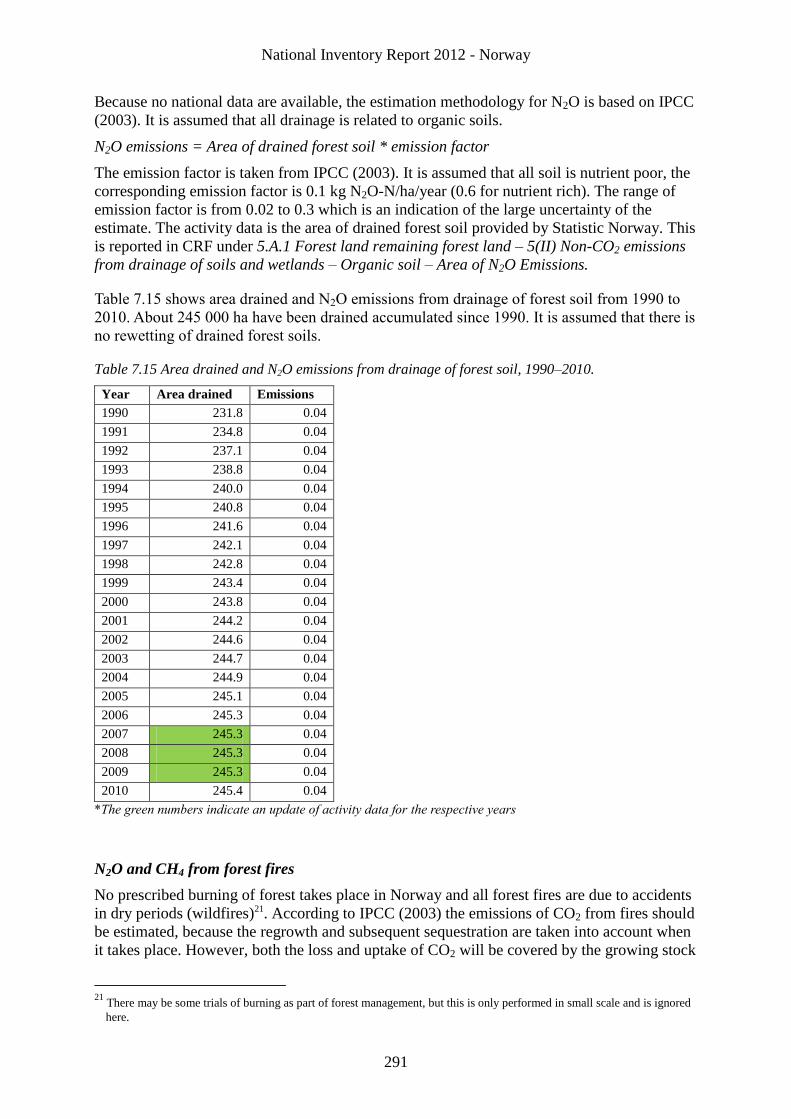
National Inventory Report 2012 - Norway
291
Because no national data are available, the estimation methodology for N2O is based on IPCC
(2003). It is assumed that all drainage is related to organic soils.
N2O emissions = Area of drained forest soil * emission factor
The emission factor is taken from IPCC (2003). It is assumed that all soil is nutrient poor, the
corresponding emission factor is 0.1 kg N2O-N/ha/year (0.6 for nutrient rich). The range of
emission factor is from 0.02 to 0.3 which is an indication of the large uncertainty of the
estimate. The activity data is the area of drained forest soil provided by Statistic Norway. This
is reported in CRF under 5.A.1 Forest land remaining forest land – 5(II) Non-CO2 emissions
from drainage of soils and wetlands – Organic soil – Area of N2O Emissions.
Table 7.15 shows area drained and N2O emissions from drainage of forest soil from 1990 to
2010. About 245 000 ha have been drained accumulated since 1990. It is assumed that there is
no rewetting of drained forest soils.
Table 7.15 Area drained and N2O emissions from drainage of forest soil, 1990–2010.
Year Area drained
(accumulated
1000 ha)
Emissions
N2O
(Gg)
1990 231.8 0.04
1991 234.8 0.04
1992 237.1 0.04
1993 238.8 0.04
1994 240.0 0.04
1995 240.8 0.04
1996 241.6 0.04
1997 242.1 0.04
1998 242.8 0.04
1999 243.4 0.04
2000 243.8 0.04
2001 244.2 0.04
2002 244.6 0.04
2003 244.7 0.04
2004 244.9 0.04
2005 245.1
0.04
2006 245.3 0.04
2007 245.3 0.04
2008 245.3 0.04
2009 245.3 0.04
2010 245.4 0.04
*The green numbers indicate an update of activity data for the respective years
N2O and CH4 from forest fires
No prescribed burning of forest takes place in Norway and all forest fires are due to accidents
in dry periods (wildfires)21. According to IPCC (2003) the emissions of CO2 from fires should
be estimated, because the regrowth and subsequent sequestration are taken into account when
it takes place. However, both the loss and uptake of CO2 will be covered by the growing stock
21
There may be some trials of burning as part of forest management, but this is only performed in small scale and is ignored
here.
National Inventory Report 2012 - Norway
292
change based CO2 calculations. The estimates provided in Table 7.17 are for comparison only
and to be able to estimate other pollutants, and will not be used in the CO2 calculations.
Data on area burned in forest fires are available from the Directorate for Civil Protection and
Emergency Planning for 1993–2010 (Table 7.16). For 1990–1992 only data on the number of
fires were available and these data were used to estimate the area burned based on the ratio for
subsequent years. This method may be very inaccurate because the size of fires is very
variable. Because the number of fires was higher in 1990–1992 than later, it is possible that
the estimate for the base year is too high.
In accordance with the principles of this report emissions in all forest is reported. The area
burned varies considerably from year to year due to natural factors (for example variations in
precipitation). Assuming that the carbon content of biomass is 50 per cent, half of the biomass
burned will end up as CO2. There are no exact data on the amount of biomass burned per area.
Normally, only the needles/leaves, parts of the humus and smaller branches are burned. We
have assumed that there are 20 m3 biomass per ha and that the mass of trees burned constitute
25 per cent of this (this is consistent with IPCC (2003). It is also likely that there is about 1 m3
dead-wood per ha that will be affected by the fire due to its dryness. It is difficult to assess
how much of the humus is burned, and this is much dependent on forest type. There is about 7
500 kg humus per ha, we assume that 10 per cent of this is burned. This factor is, however,
very dependent on the vegetation type. Most of the forest fires in Norway take place in pine
forest with a very shallow humus layer.
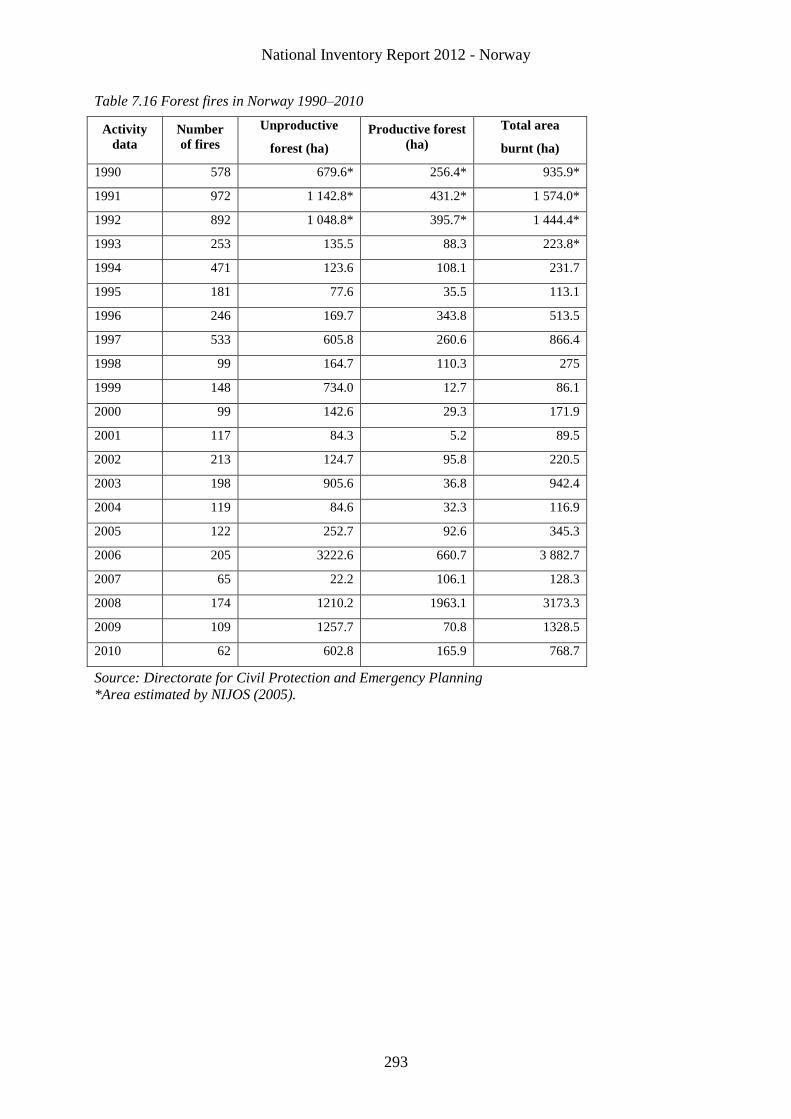
National Inventory Report 2012 - Norway
293
Table 7.16 Forest fires in Norway 1990–2010
Source: Directorate for Civil Protection and Emergency Planning
*Area estimated by NIJOS (2005).
Activity
data
Number
of fires
Unproductive
forest (ha)
Productive forest
(ha)
Total area
burnt (ha)
1990 578 679.6* 256.4* 935.9*
1991 972 1 142.8* 431.2* 1 574.0*
1992 892 1 048.8* 395.7* 1 444.4*
1993 253 135.5 88.3 223.8*
1994 471 123.6 108.1 231.7
1995 181 77.6 35.5 113.1
1996 246 169.7 343.8 513.5
1997 533 605.8 260.6 866.4
1998 99 164.7 110.3 275
1999 148 734.0 12.7 86.1
2000 99 142.6 29.3 171.9
2001 117 84.3 5.2 89.5
2002 213 124.7 95.8 220.5
2003 198 905.6 36.8 942.4
2004 119 84.6 32.3 116.9
2005 122 252.7 92.6 345.3
2006 205 3222.6 660.7 3 882.7
2007 65 22.2 106.1 128.3
2008 174 1210.2 1963.1 3173.3
2009 109 1257.7 70.8 1328.5
2010 62 602.8 165.9 768.7
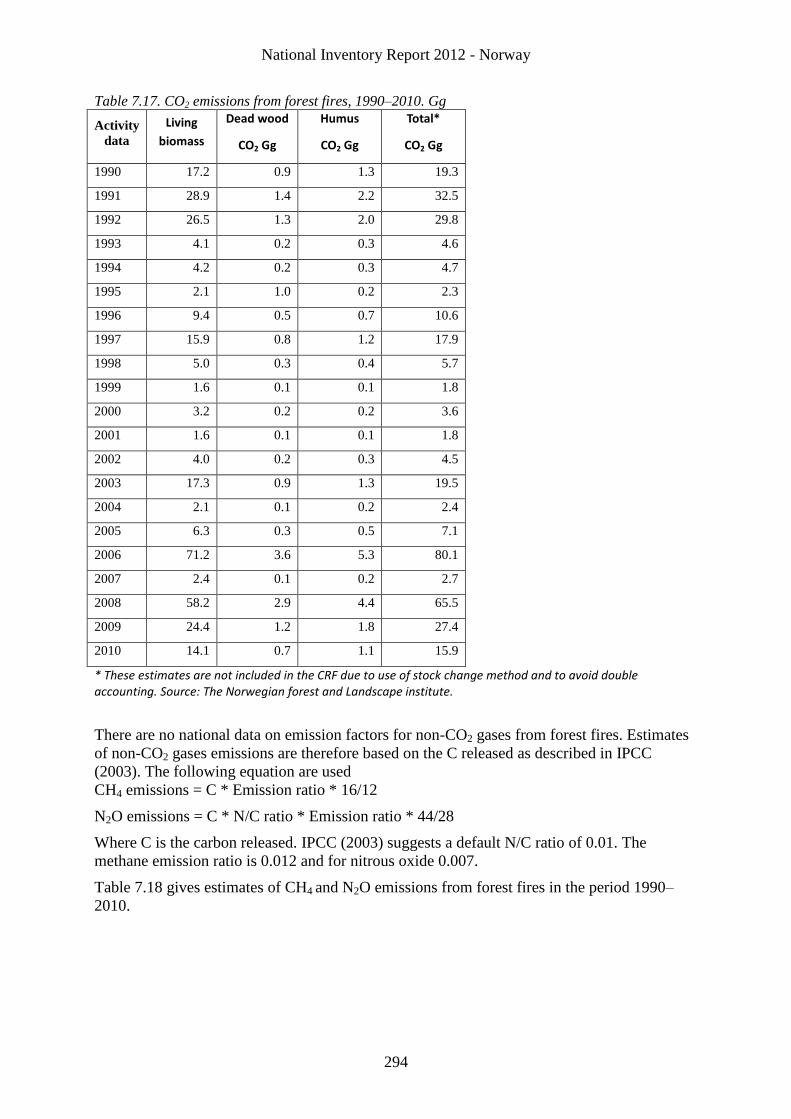
National Inventory Report 2012 - Norway
294
Table 7.17. CO2 emissions from forest fires, 1990–2010. Gg
Activity
data
Living
biomass
Dead wood
CO2 Gg
Humus
CO2 Gg
Total*
CO2 Gg
1990 17.2 0.9 1.3 19.3
1991 28.9 1.4 2.2 32.5
1992 26.5 1.3 2.0 29.8
1993 4.1 0.2 0.3 4.6
1994 4.2 0.2 0.3 4.7
1995 2.1 1.0 0.2 2.3
1996 9.4 0.5 0.7 10.6
1997 15.9 0.8 1.2 17.9
1998 5.0 0.3 0.4 5.7
1999 1.6 0.1 0.1 1.8
2000 3.2 0.2 0.2 3.6
2001 1.6 0.1 0.1 1.8
2002 4.0 0.2 0.3 4.5
2003 17.3 0.9 1.3 19.5
2004 2.1 0.1 0.2 2.4
2005 6.3 0.3 0.5 7.1
2006 71.2 3.6 5.3 80.1
2007 2.4 0.1 0.2 2.7
2008 58.2 2.9 4.4 65.5
2009 24.4 1.2 1.8 27.4
2010 14.1 0.7 1.1 15.9
* These estimates are not included in the CRF due to use of stock change method and to avoid double accounting. Source: The Norwegian forest and Landscape institute.
There are no national data on emission factors for non-CO2 gases from forest fires. Estimates
of non-CO2 gases emissions are therefore based on the C released as described in IPCC
(2003). The following equation are used
CH4 emissions = C * Emission ratio * 16/12
N2O emissions = C * N/C ratio * Emission ratio * 44/28
Where C is the carbon released. IPCC (2003) suggests a default N/C ratio of 0.01. The
methane emission ratio is 0.012 and for nitrous oxide 0.007.
Table 7.18 gives estimates of CH4 and N2O emissions from forest fires in the period 1990–
2010.
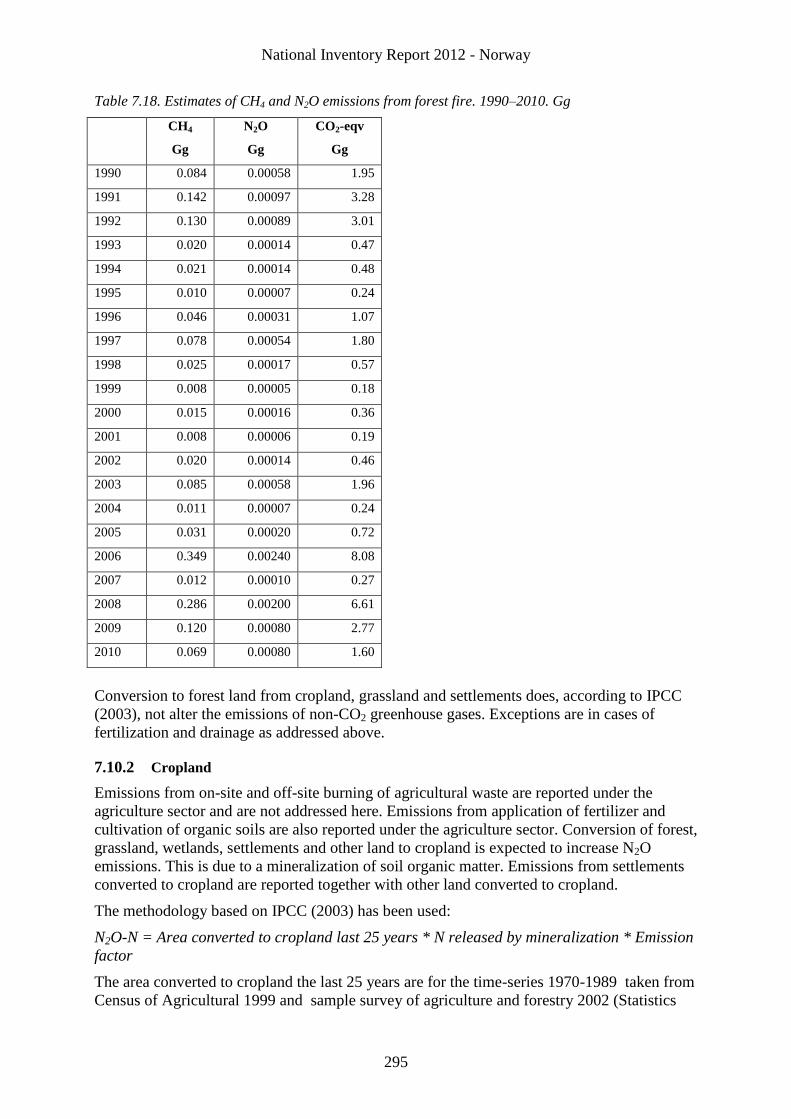
National Inventory Report 2012 - Norway
295
Table 7.18. Estimates of CH4 and N2O emissions from forest fire. 1990–2010. Gg
CH4
Gg
N2O
Gg
CO2-eqv
Gg
1990 0.084 0.00058 1.95
1991 0.142 0.00097 3.28
1992 0.130 0.00089 3.01
1993 0.020 0.00014 0.47
1994 0.021 0.00014 0.48
1995 0.010 0.00007 0.24
1996 0.046 0.00031 1.07
1997 0.078 0.00054 1.80
1998 0.025 0.00017 0.57
1999 0.008 0.00005 0.18
2000 0.015 0.00016 0.36
2001 0.008 0.00006 0.19
2002 0.020 0.00014 0.46
2003 0.085 0.00058 1.96
2004 0.011 0.00007 0.24
2005 0.031 0.00020 0.72
2006 0.349 0.00240 8.08
2007 0.012 0.00010 0.27
2008 0.286 0.00200 6.61
2009 0.120 0.00080 2.77
2010 0.069 0.00080 1.60
Conversion to forest land from cropland, grassland and settlements does, according to IPCC
(2003), not alter the emissions of non-CO2 greenhouse gases. Exceptions are in cases of
fertilization and drainage as addressed above.
7.10.2 Cropland
Emissions from on-site and off-site burning of agricultural waste are reported under the
agriculture sector and are not addressed here. Emissions from application of fertilizer and
cultivation of organic soils are also reported under the agriculture sector. Conversion of forest,
grassland, wetlands, settlements and other land to cropland is expected to increase N2O
emissions. This is due to a mineralization of soil organic matter. Emissions from settlements
converted to cropland are reported together with other land converted to cropland.
The methodology based on IPCC (2003) has been used:
N2O-N = Area converted to cropland last 25 years * N released by mineralization * Emission
factor
The area converted to cropland the last 25 years are for the time-series 1970-1989 taken from
Census of Agricultural 1999 and sample survey of agriculture and forestry 2002 (Statistics
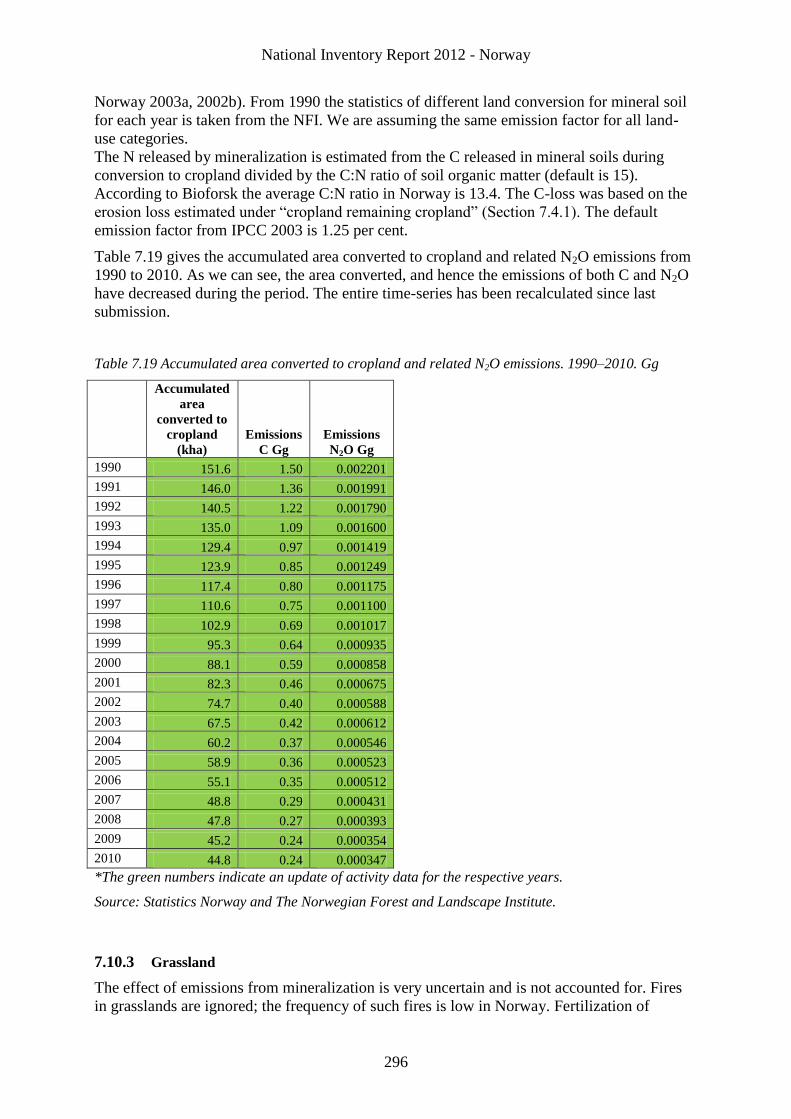
National Inventory Report 2012 - Norway
296
Norway 2003a, 2002b). From 1990 the statistics of different land conversion for mineral soil
for each year is taken from the NFI. We are assuming the same emission factor for all land-
use categories.
The N released by mineralization is estimated from the C released in mineral soils during
conversion to cropland divided by the C:N ratio of soil organic matter (default is 15).
According to Bioforsk the average C:N ratio in Norway is 13.4. The C-loss was based on the
erosion loss estimated under “cropland remaining cropland” (Section 7.4.1). The default
emission factor from IPCC 2003 is 1.25 per cent.
Table 7.19 gives the accumulated area converted to cropland and related N2O emissions from
1990 to 2010. As we can see, the area converted, and hence the emissions of both C and N2O
have decreased during the period. The entire time-series has been recalculated since last
submission.
Table 7.19 Accumulated area converted to cropland and related N2O emissions. 1990–2010. Gg
Accumulated
area
converted to
cropland
(kha)
Emissions
C Gg
Emissions
N2O Gg
1990 151.6 1.50 0.002201
1991 146.0 1.36 0.001991
1992 140.5 1.22 0.001790
1993 135.0 1.09 0.001600
1994 129.4 0.97 0.001419
1995 123.9 0.85 0.001249
1996 117.4 0.80 0.001175
1997 110.6 0.75 0.001100
1998 102.9 0.69 0.001017
1999 95.3 0.64 0.000935
2000 88.1 0.59 0.000858
2001 82.3 0.46 0.000675
2002 74.7 0.40 0.000588
2003 67.5 0.42 0.000612
2004 60.2 0.37 0.000546
2005 58.9 0.36 0.000523
2006 55.1 0.35 0.000512
2007 48.8 0.29 0.000431
2008 47.8 0.27 0.000393
2009 45.2 0.24 0.000354
2010 44.8 0.24 0.000347
*The green numbers indicate an update of activity data for the respective years.
Source: Statistics Norway and The Norwegian Forest and Landscape Institute.
7.10.3 Grassland
The effect of emissions from mineralization is very uncertain and is not accounted for. Fires
in grasslands are ignored; the frequency of such fires is low in Norway. Fertilization of
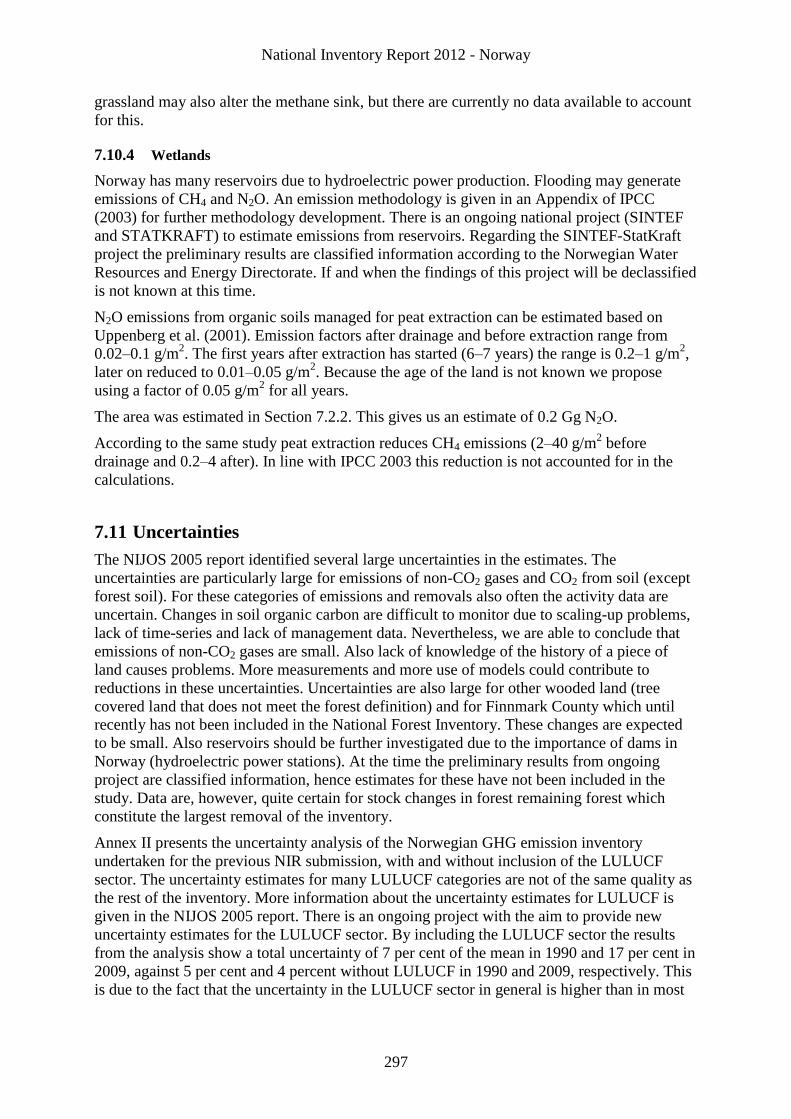
National Inventory Report 2012 - Norway
297
grassland may also alter the methane sink, but there are currently no data available to account
for this.
7.10.4 Wetlands
Norway has many reservoirs due to hydroelectric power production. Flooding may generate
emissions of CH4 and N2O. An emission methodology is given in an Appendix of IPCC
(2003) for further methodology development. There is an ongoing national project (SINTEF
and STATKRAFT) to estimate emissions from reservoirs. Regarding the SINTEF-StatKraft
project the preliminary results are classified information according to the Norwegian Water
Resources and Energy Directorate. If and when the findings of this project will be declassified
is not known at this time.
N2O emissions from organic soils managed for peat extraction can be estimated based on
Uppenberg et al. (2001). Emission factors after drainage and before extraction range from
0.02–0.1 g/m2. The first years after extraction has started (6–7 years) the range is 0.2–1 g/m
2,
later on reduced to 0.01–0.05 g/m2. Because the age of the land is not known we propose
using a factor of 0.05 g/m2 for all years.
The area was estimated in Section 7.2.2. This gives us an estimate of 0.2 Gg N2O.
According to the same study peat extraction reduces CH4 emissions (2–40 g/m2 before
drainage and 0.2–4 after). In line with IPCC 2003 this reduction is not accounted for in the
calculations.
7.11 Uncertainties
The NIJOS 2005 report identified several large uncertainties in the estimates. The
uncertainties are particularly large for emissions of non-CO2 gases and CO2 from soil (except
forest soil). For these categories of emissions and removals also often the activity data are
uncertain. Changes in soil organic carbon are difficult to monitor due to scaling-up problems,
lack of time-series and lack of management data. Nevertheless, we are able to conclude that
emissions of non-CO2 gases are small. Also lack of knowledge of the history of a piece of
land causes problems. More measurements and more use of models could contribute to
reductions in these uncertainties. Uncertainties are also large for other wooded land (tree
covered land that does not meet the forest definition) and for Finnmark County which until
recently has not been included in the National Forest Inventory. These changes are expected
to be small. Also reservoirs should be further investigated due to the importance of dams in
Norway (hydroelectric power stations). At the time the preliminary results from ongoing
project are classified information, hence estimates for these have not been included in the
study. Data are, however, quite certain for stock changes in forest remaining forest which
constitute the largest removal of the inventory.
Annex II presents the uncertainty analysis of the Norwegian GHG emission inventory
undertaken for the previous NIR submission, with and without inclusion of the LULUCF
sector. The uncertainty estimates for many LULUCF categories are not of the same quality as
the rest of the inventory. More information about the uncertainty estimates for LULUCF is
given in the NIJOS 2005 report. There is an ongoing project with the aim to provide new
uncertainty estimates for the LULUCF sector. By including the LULUCF sector the results
from the analysis show a total uncertainty of 7 per cent of the mean in 1990 and 17 per cent in
2009, against 5 per cent and 4 percent without LULUCF in 1990 and 2009, respectively. This
is due to the fact that the uncertainty in the LULUCF sector in general is higher than in most
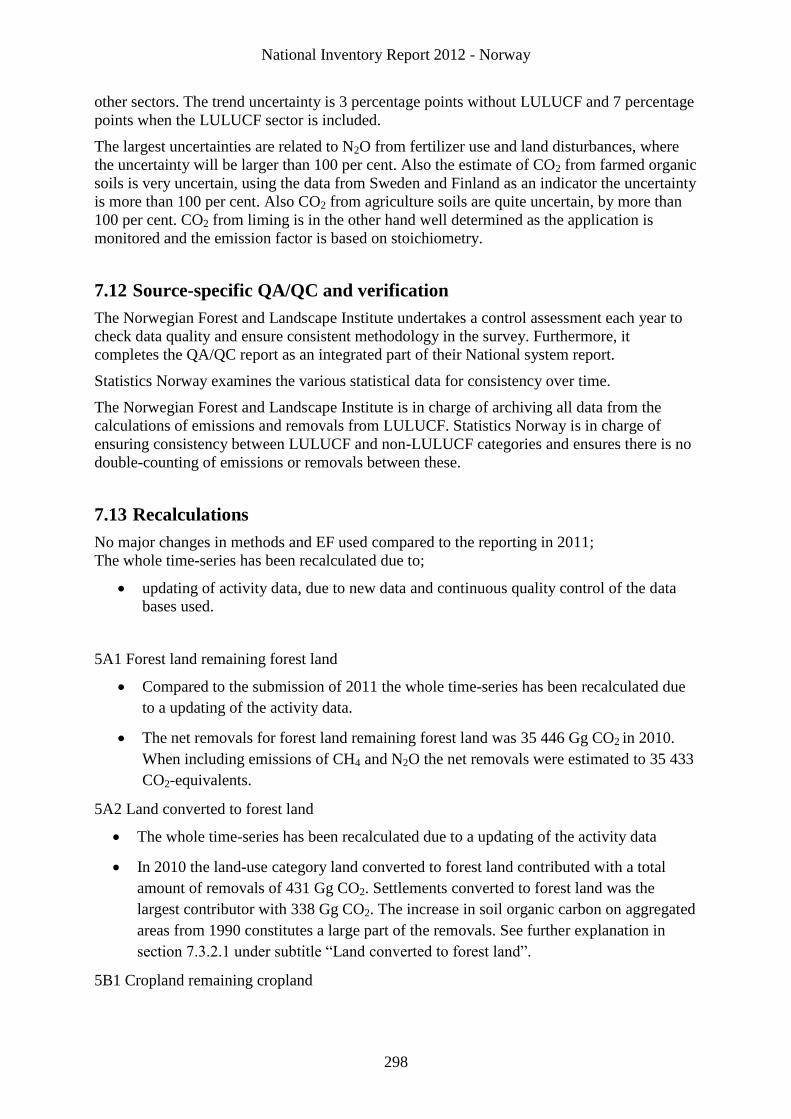
National Inventory Report 2012 - Norway
298
other sectors. The trend uncertainty is 3 percentage points without LULUCF and 7 percentage
points when the LULUCF sector is included.
The largest uncertainties are related to N2O from fertilizer use and land disturbances, where
the uncertainty will be larger than 100 per cent. Also the estimate of CO2 from farmed organic
soils is very uncertain, using the data from Sweden and Finland as an indicator the uncertainty
is more than 100 per cent. Also CO2 from agriculture soils are quite uncertain, by more than
100 per cent. CO2 from liming is in the other hand well determined as the application is
monitored and the emission factor is based on stoichiometry.
7.12 Source-specific QA/QC and verification
The Norwegian Forest and Landscape Institute undertakes a control assessment each year to
check data quality and ensure consistent methodology in the survey. Furthermore, it
completes the QA/QC report as an integrated part of their National system report.
Statistics Norway examines the various statistical data for consistency over time.
The Norwegian Forest and Landscape Institute is in charge of archiving all data from the
calculations of emissions and removals from LULUCF. Statistics Norway is in charge of
ensuring consistency between LULUCF and non-LULUCF categories and ensures there is no
double-counting of emissions or removals between these.
7.13 Recalculations
No major changes in methods and EF used compared to the reporting in 2011;
The whole time-series has been recalculated due to;
updating of activity data, due to new data and continuous quality control of the data
bases used.
5A1 Forest land remaining forest land
Compared to the submission of 2011 the whole time-series has been recalculated due
to a updating of the activity data.
The net removals for forest land remaining forest land was 35 446 Gg CO2 in 2010.
When including emissions of CH4 and N2O the net removals were estimated to 35 433
CO2-equivalents.
5A2 Land converted to forest land
The whole time-series has been recalculated due to a updating of the activity data
In 2010 the land-use category land converted to forest land contributed with a total
amount of removals of 431 Gg CO2. Settlements converted to forest land was the
largest contributor with 338 Gg CO2. The increase in soil organic carbon on aggregated
areas from 1990 constitutes a large part of the removals. See further explanation in
section 7.3.2.1 under subtitle “Land converted to forest land”.
5B1 Cropland remaining cropland
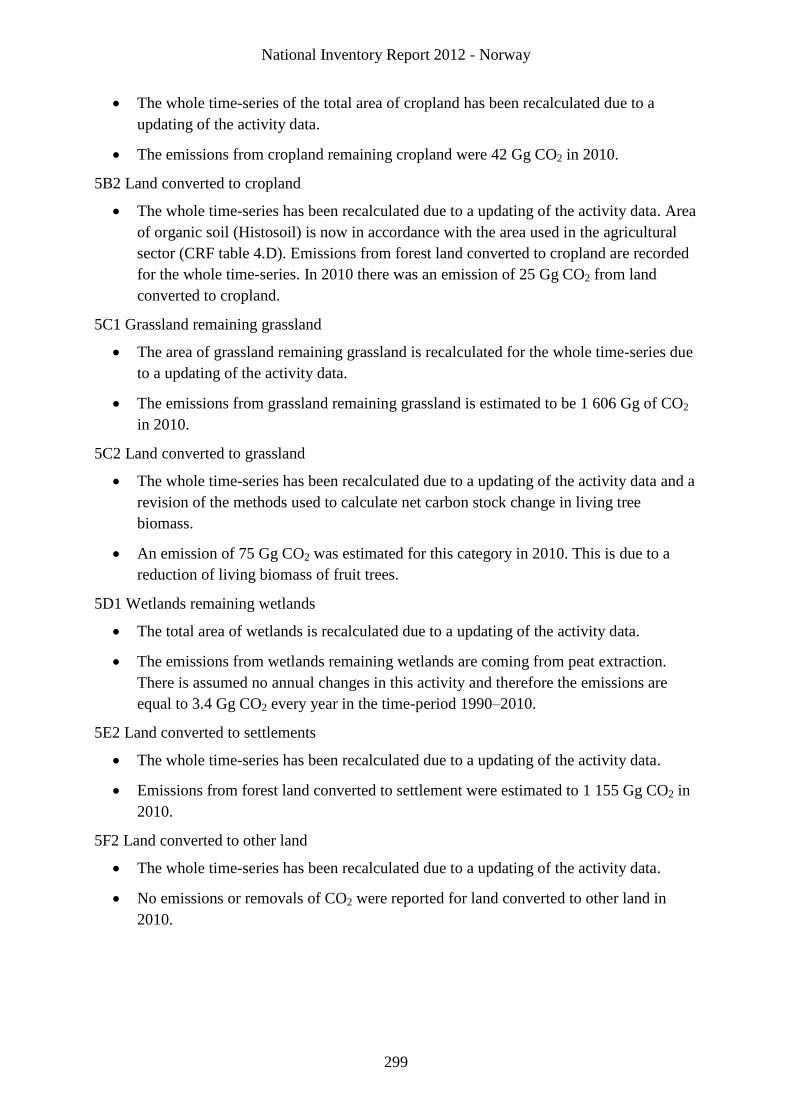
National Inventory Report 2012 - Norway
299
The whole time-series of the total area of cropland has been recalculated due to a
updating of the activity data.
The emissions from cropland remaining cropland were 42 Gg CO2 in 2010.
5B2 Land converted to cropland
The whole time-series has been recalculated due to a updating of the activity data. Area
of organic soil (Histosoil) is now in accordance with the area used in the agricultural
sector (CRF table 4.D). Emissions from forest land converted to cropland are recorded
for the whole time-series. In 2010 there was an emission of 25 Gg CO2 from land
converted to cropland.
5C1 Grassland remaining grassland
The area of grassland remaining grassland is recalculated for the whole time-series due
to a updating of the activity data.
The emissions from grassland remaining grassland is estimated to be 1 606 Gg of CO2
in 2010.
5C2 Land converted to grassland
The whole time-series has been recalculated due to a updating of the activity data and a
revision of the methods used to calculate net carbon stock change in living tree
biomass.
An emission of 75 Gg CO2 was estimated for this category in 2010. This is due to a
reduction of living biomass of fruit trees.
5D1 Wetlands remaining wetlands
The total area of wetlands is recalculated due to a updating of the activity data.
The emissions from wetlands remaining wetlands are coming from peat extraction.
There is assumed no annual changes in this activity and therefore the emissions are
equal to 3.4 Gg CO2 every year in the time-period 1990–2010.
5E2 Land converted to settlements
The whole time-series has been recalculated due to a updating of the activity data.
Emissions from forest land converted to settlement were estimated to 1 155 Gg CO2 in
2010.
5F2 Land converted to other land
The whole time-series has been recalculated due to a updating of the activity data.
No emissions or removals of CO2 were reported for land converted to other land in
2010.
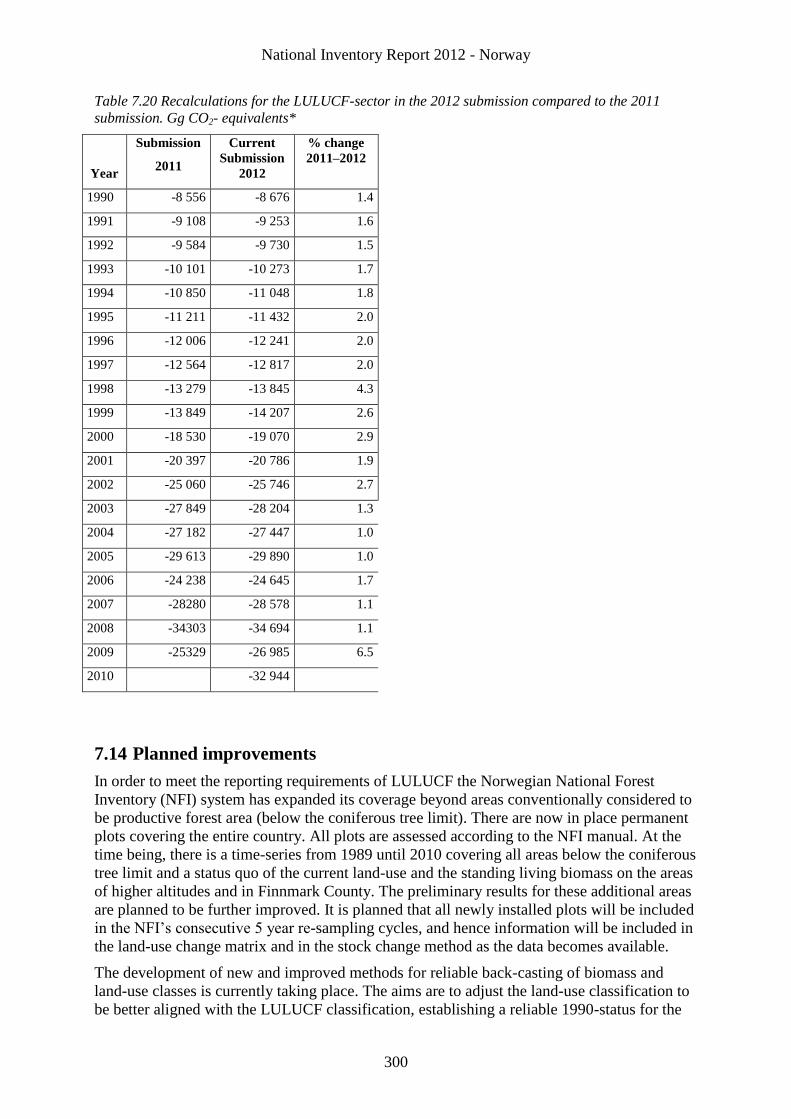
National Inventory Report 2012 - Norway
300
Table 7.20 Recalculations for the LULUCF-sector in the 2012 submission compared to the 2011
submission. Gg CO2- equivalents*
Year
Submission
2011
Current
Submission
2012
% change
2011–2012
1990 -8 556 -8 676 1.4
1991 -9 108 -9 253 1.6
1992 -9 584 -9 730 1.5
1993 -10 101 -10 273 1.7
1994 -10 850 -11 048 1.8
1995 -11 211 -11 432 2.0
1996 -12 006 -12 241 2.0
1997 -12 564 -12 817 2.0
1998 -13 279 -13 845 4.3
1999 -13 849 -14 207 2.6
2000 -18 530 -19 070 2.9
2001 -20 397 -20 786 1.9
2002 -25 060 -25 746 2.7
2003 -27 849 -28 204 1.3
2004 -27 182 -27 447 1.0
2005 -29 613 -29 890 1.0
2006 -24 238 -24 645 1.7
2007 -28280 -28 578 1.1
2008 -34303 -34 694 1.1
2009 -25329 -26 985 6.5
2010 -32 944
7.14 Planned improvements
In order to meet the reporting requirements of LULUCF the Norwegian National Forest
Inventory (NFI) system has expanded its coverage beyond areas conventionally considered to
be productive forest area (below the coniferous tree limit). There are now in place permanent
plots covering the entire country. All plots are assessed according to the NFI manual. At the
time being, there is a time-series from 1989 until 2010 covering all areas below the coniferous
tree limit and a status quo of the current land-use and the standing living biomass on the areas
of higher altitudes and in Finnmark County. The preliminary results for these additional areas
are planned to be further improved. It is planned that all newly installed plots will be included
in the NFI’s consecutive 5 year re-sampling cycles, and hence information will be included in
the land-use change matrix and in the stock change method as the data becomes available.
The development of new and improved methods for reliable back-casting of biomass and
land-use classes is currently taking place. The aims are to adjust the land-use classification to
be better aligned with the LULUCF classification, establishing a reliable 1990-status for the

National Inventory Report 2012 - Norway
301
entire country, and improved estimates for the annual change in living biomass from 1990 up
to today. The methods will include information extracted from ortophotoes that are made
available through a web-based service starting in 2007 (www.norgeibilder.no), old aerial
photographs, maps and land use classification and forest data coming from the consecutive
NFI cycles. The plan is to include updated time-series for the entire country in the 2014
report.
It is planned to improve the estimates of net change in soil organic carbon for mineral soils at
forest land remaining forest land, land converted to forest land and forest land converted to
other land-use categories. It is planned to use the Yasso07 model for these calculations.
Furthermore, it is planned to update all required input values covering the entire country when
they are available from the NFI and research projects, and at latest for the reporting in 2014.
The plans also include validation of output estimates.
In 2010 the NFI started a survey of dead wood on the ground at all inventory plots in the
entire country. The results will be used in the inventory consecutively when available.
Within 2013 it is planned to evaluate the methods used for assessing emissions and removals
for cropland and grassland.
National Inventory Report 2012 - Norway
302
8 Waste
8.1 Overview
This sector includes emissions from landfills (6A), wastewater handling (6B) and
small scale waste incineration (6C). Waste incineration from plants with energy
utilization is accounted for under 1A (Energy combustion). Waste incineration
included here are emissions of other greenhouse gases than CO2 from methane flared
at landfills and combustion of hospital waste in hospital incinerators until 2005 and
cremations.
The emissions of greenhouse gases from the waste sector were decreased by 31.4 per
cent (0.572 million ton CO2 eq.) from 1990 to 2010. The reduction were due to
decreased CH4 emissions from landfills 35.8 per cent (0.602 million ton CO2 eq.)
while the source category Domestic and Commercial Wastewater increased their
emissions by 0.030 ton million ton CO2 eq.
Solid waste disposal on land (i.e. in landfills) is the main emission category within the
waste sector, accounting for in 2010 about 87 per cent of the sector’s total emissions.
Wastewater handling in domestic and commercial sector accounts for approximately
13 per cent of the sectors emission in 2010. From the other sectors there are only
minor emissions. The waste sector accounted for 2.3 per cent of the total GHG
emissions in Norway in 2010.
8.2 Managed Waste Disposal on Land – CH4 – 6A1 (Key Category)
8.2.1 Description
CH4 and non-fossil CO2 are emitted during biological decomposition of waste. This
transformation of organic matter takes place in several steps. During the first weeks or
months, decomposition is aerobic, and the main decomposition product is CO2. When
there is no more oxygen left, the decomposition becomes anaerobic, and methane
emissions start to increase. After a year or so, CH4 emissions reach a peak, after that
the emissions will decrease over some decades (SFT (1999b) and Barlaz (2004)).
The emissions of methane from landfills have decreased slightly since 1990 and
specifically after 1998 due to reduction of the amount of degradable waste disposed at
disposal sites. This reduction in emissions is the result of several policy and measures
which were introduced in the waste sector particularly in the 1990s. With some few
exceptions, notably the mixed waste from households in municipalities with a source
separation of food waste, it was then prohibited to dispose easy degradable organic
waste, sewage sludge included, at landfills in Norway.
From July 1 2009 it was banned to deposit degradable organic waste to landfills and
due to that this will result in further reduction of methane emissions. The tax was in
2011 280 NOK per ton waste deposit. However, there is a possibility of exemption
from the prohibition of depositing waste at landfills in a short period and for waste
landfilled with an exemption the tax is 463 NOK per ton waste deposited.
In addition to the above described policy and measures, landfills receiving
biodegradable waste (waste containing degradable organic carbon (DOC)) are
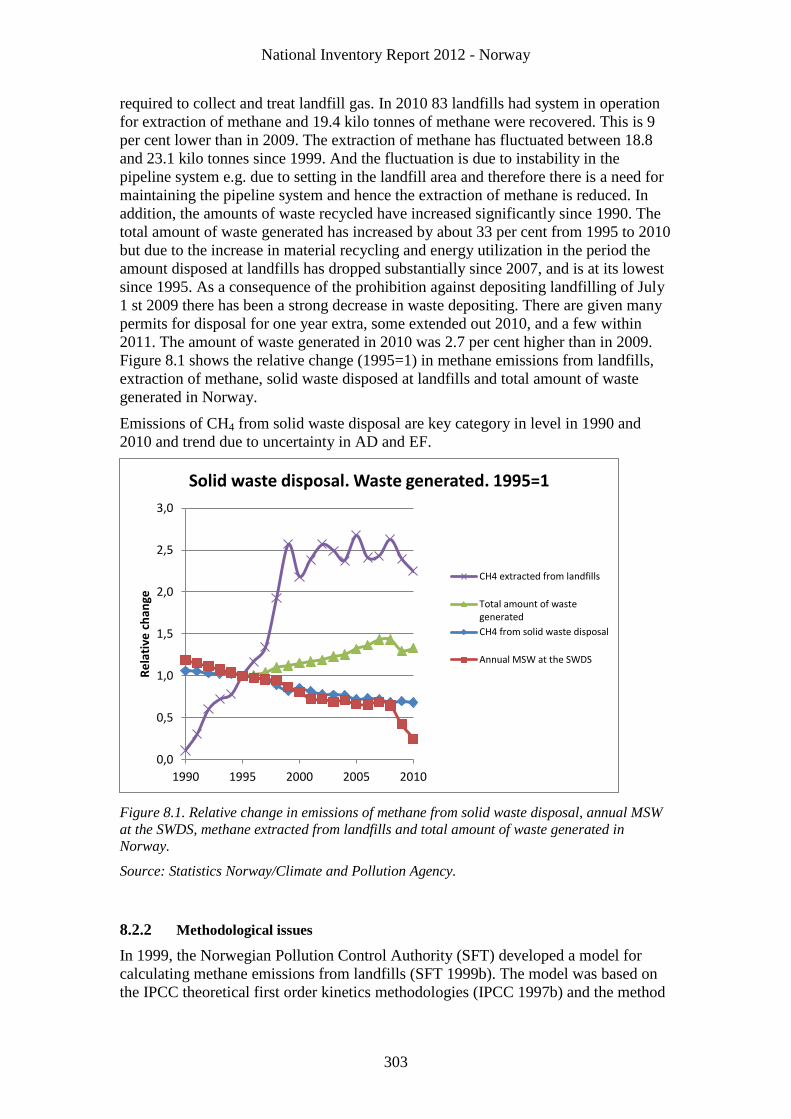
National Inventory Report 2012 - Norway
303
required to collect and treat landfill gas. In 2010 83 landfills had system in operation
for extraction of methane and 19.4 kilo tonnes of methane were recovered. This is 9
per cent lower than in 2009. The extraction of methane has fluctuated between 18.8
and 23.1 kilo tonnes since 1999. And the fluctuation is due to instability in the
pipeline system e.g. due to setting in the landfill area and therefore there is a need for
maintaining the pipeline system and hence the extraction of methane is reduced. In
addition, the amounts of waste recycled have increased significantly since 1990. The
total amount of waste generated has increased by about 33 per cent from 1995 to 2010
but due to the increase in material recycling and energy utilization in the period the
amount disposed at landfills has dropped substantially since 2007, and is at its lowest
since 1995. As a consequence of the prohibition against depositing landfilling of July
1 st 2009 there has been a strong decrease in waste depositing. There are given many
permits for disposal for one year extra, some extended out 2010, and a few within
2011. The amount of waste generated in 2010 was 2.7 per cent higher than in 2009.
Figure 8.1 shows the relative change (1995=1) in methane emissions from landfills,
extraction of methane, solid waste disposed at landfills and total amount of waste
generated in Norway.
Emissions of CH4 from solid waste disposal are key category in level in 1990 and
2010 and trend due to uncertainty in AD and EF.
Figure 8.1. Relative change in emissions of methane from solid waste disposal, annual MSW
at the SWDS, methane extracted from landfills and total amount of waste generated in
Norway.
Source: Statistics Norway/Climate and Pollution Agency.
8.2.2 Methodological issues
In 1999, the Norwegian Pollution Control Authority (SFT) developed a model for
calculating methane emissions from landfills (SFT 1999b). The model was based on
the IPCC theoretical first order kinetics methodologies (IPCC 1997b) and the method
0,0
0,5
1,0
1,5
2,0
2,5
3,0
1990 1995 2000 2005 2010
Re
lati
ve c
han
ge
Solid waste disposal. Waste generated. 1995=1
CH4 extracted from landfills
Total amount of wastegenerated
CH4 from solid waste disposal
Annual MSW at the SWDS
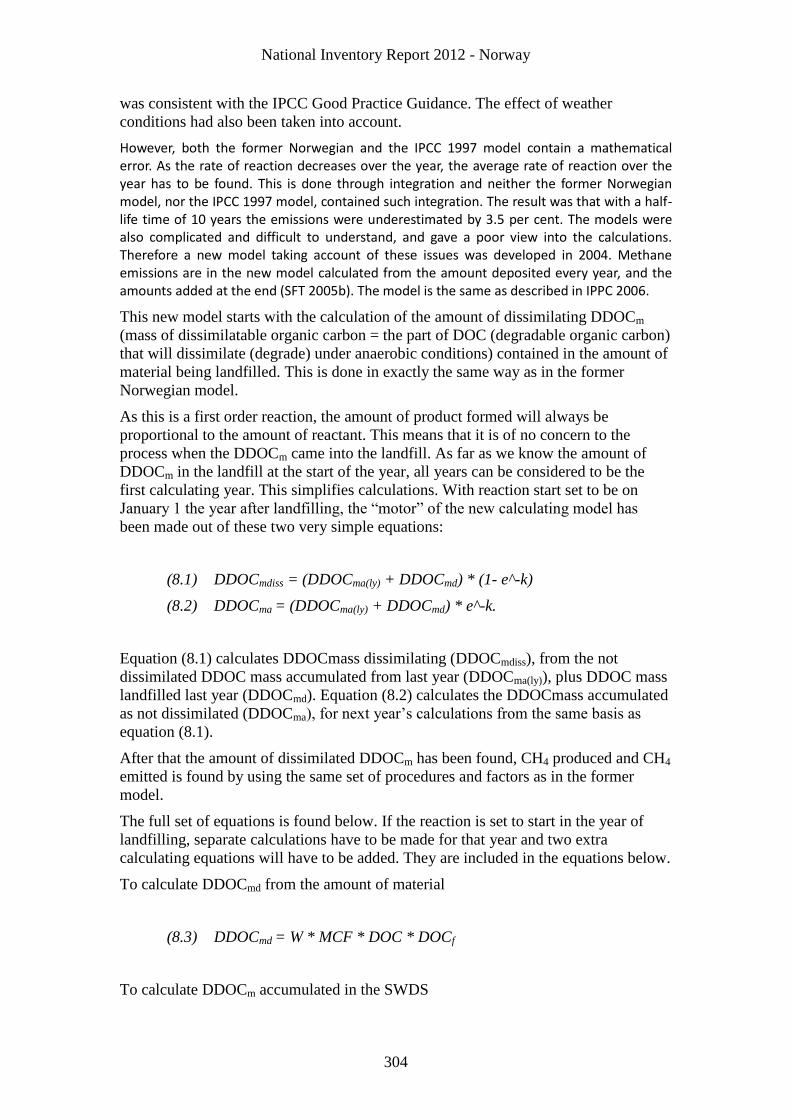
National Inventory Report 2012 - Norway
304
was consistent with the IPCC Good Practice Guidance. The effect of weather
conditions had also been taken into account.
However, both the former Norwegian and the IPCC 1997 model contain a mathematical error. As the rate of reaction decreases over the year, the average rate of reaction over the year has to be found. This is done through integration and neither the former Norwegian model, nor the IPCC 1997 model, contained such integration. The result was that with a half-life time of 10 years the emissions were underestimated by 3.5 per cent. The models were also complicated and difficult to understand, and gave a poor view into the calculations. Therefore a new model taking account of these issues was developed in 2004. Methane emissions are in the new model calculated from the amount deposited every year, and the amounts added at the end (SFT 2005b). The model is the same as described in IPPC 2006.
This new model starts with the calculation of the amount of dissimilating DDOCm
(mass of dissimilatable organic carbon = the part of DOC (degradable organic carbon)
that will dissimilate (degrade) under anaerobic conditions) contained in the amount of
material being landfilled. This is done in exactly the same way as in the former
Norwegian model.
As this is a first order reaction, the amount of product formed will always be
proportional to the amount of reactant. This means that it is of no concern to the
process when the DDOCm came into the landfill. As far as we know the amount of
DDOCm in the landfill at the start of the year, all years can be considered to be the
first calculating year. This simplifies calculations. With reaction start set to be on
January 1 the year after landfilling, the “motor” of the new calculating model has
been made out of these two very simple equations:
(8.1) DDOCmdiss = (DDOCma(ly) + DDOCmd) * (1- e^-k)
(8.2) DDOCma = (DDOCma(ly) + DDOCmd) * e^-k.
Equation (8.1) calculates DDOCmass dissimilating (DDOCmdiss), from the not
dissimilated DDOC mass accumulated from last year (DDOCma(ly)), plus DDOC mass
landfilled last year (DDOCmd). Equation (8.2) calculates the DDOCmass accumulated
as not dissimilated (DDOCma), for next year’s calculations from the same basis as
equation (8.1).
After that the amount of dissimilated DDOCm has been found, CH4 produced and CH4
emitted is found by using the same set of procedures and factors as in the former
model.
The full set of equations is found below. If the reaction is set to start in the year of
landfilling, separate calculations have to be made for that year and two extra
calculating equations will have to be added. They are included in the equations below.
To calculate DDOCmd from the amount of material
(8.3) DDOCmd = W * MCF * DOC * DOCf
To calculate DDOCm accumulated in the SWDS
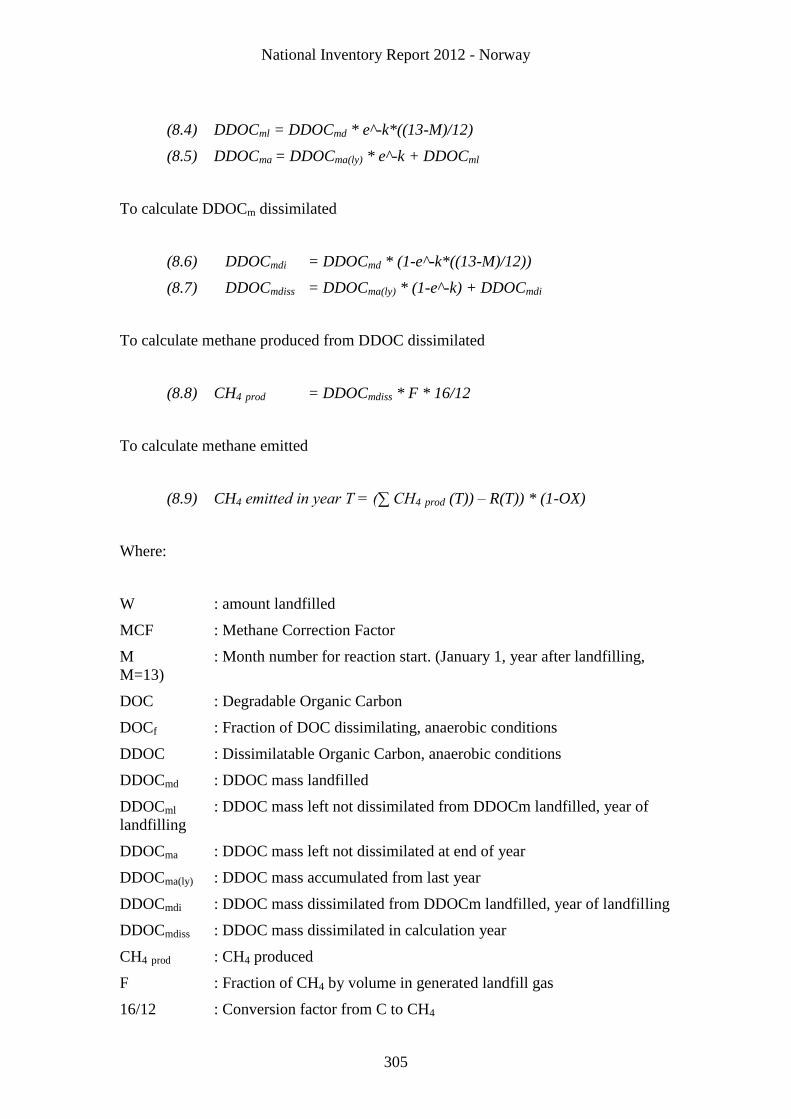
National Inventory Report 2012 - Norway
305
(8.4) DDOCml = DDOCmd * e^-k*((13-M)/12)
(8.5) DDOCma = DDOCma(ly) * e^-k + DDOCml
To calculate DDOCm dissimilated
(8.6) DDOCmdi = DDOCmd * (1-e^-k*((13-M)/12))
(8.7) DDOCmdiss = DDOCma(ly) * (1-e^-k) + DDOCmdi
To calculate methane produced from DDOC dissimilated
(8.8) CH4 prod = DDOCmdiss * F * 16/12
To calculate methane emitted
(8.9) CH4 emitted in year T = (∑ CH4 prod (T)) – R(T)) * (1-OX)
Where:
W : amount landfilled
MCF : Methane Correction Factor
M : Month number for reaction start. (January 1, year after landfilling,
M=13)
DOC : Degradable Organic Carbon
DOCf : Fraction of DOC dissimilating, anaerobic conditions
DDOC : Dissimilatable Organic Carbon, anaerobic conditions
DDOCmd : DDOC mass landfilled
DDOCml : DDOC mass left not dissimilated from DDOCm landfilled, year of
landfilling
DDOCma : DDOC mass left not dissimilated at end of year
DDOCma(ly) : DDOC mass accumulated from last year
DDOCmdi : DDOC mass dissimilated from DDOCm landfilled, year of landfilling
DDOCmdiss : DDOC mass dissimilated in calculation year
CH4 prod : CH4 produced
F : Fraction of CH4 by volume in generated landfill gas
16/12 : Conversion factor from C to CH4
National Inventory Report 2012 - Norway
306
R(T) : Recovered CH4 in year of calculation
OX : Oxidation factor (fraction).
8.2.3 Activity data
The methane is formed by decomposition of biological waste in landfills. The
decomposition time varies from material to material. Easy degradable waste (food,
etc.) has shortest decomposition time, while wood waste has the longest
decomposition time. Other materials do not emit methane at all, either because they
are inorganic (metal, glass, etc.) or because they break down extremely slowly
(plastic). It is therefore of vital importance for the calculations that the waste
quantities used as input to the model are correct, both total quantity and the
distribution by material.
Data over the amount of different waste materials is taken from Statistics Norway's
waste accounts. Statistics Norway's waste accounts consist of data from several
sources, such as special surveys, register data and statistics, indirect data sources as
production statistics, foreign trade statistics and different factors combined with
activity data. Data from all these sources are put together and used in the waste
accounts, which give an overview of waste quantities in Norway, divided into type of
product, material, industry and method of treatment.
Historic data have been recalculated from the former waste category basis, to a waste
material basis. The amount of each material type deposited is estimated based on
surveys and sorting analyses. The model is based on types of waste materials for
instance food waste, paper, wood and textiles. All sources of waste, MSW, industrial,
commercial, construction and demolition waste are accounted for in these annual
surveys.
Municipal landfills
Historical data for years before 1973 on municipal solid waste deposited are based
upon:
1. New statistics on municipal waste, divided into household waste and industrial
waste (1974 to 1997)
2. Estimates based on population
3. Assumption that less people were connected to public waste management
during the forties and fifties.
Since 1974 the amount of municipal waste is based upon questionnaires and linear
interpolation. Surveys were held in 1974, 1980 and 1985. The amount of waste going
to landfills is allocated to material based on sorting analyses. For the period 1995-
2008 the amounts of waste is taken from the waste accounts, with three exceptions:
Wood content in sludge deposited at industrial sites is added to the amount
of deposited wood from the waste accounts.
Textiles are supposed to consist of 50 per cent plastic (SFT 2005b). The
plastic fraction of deposited textiles is therefore subtracted from the
amount of deposited textiles and added to deposited plastic.
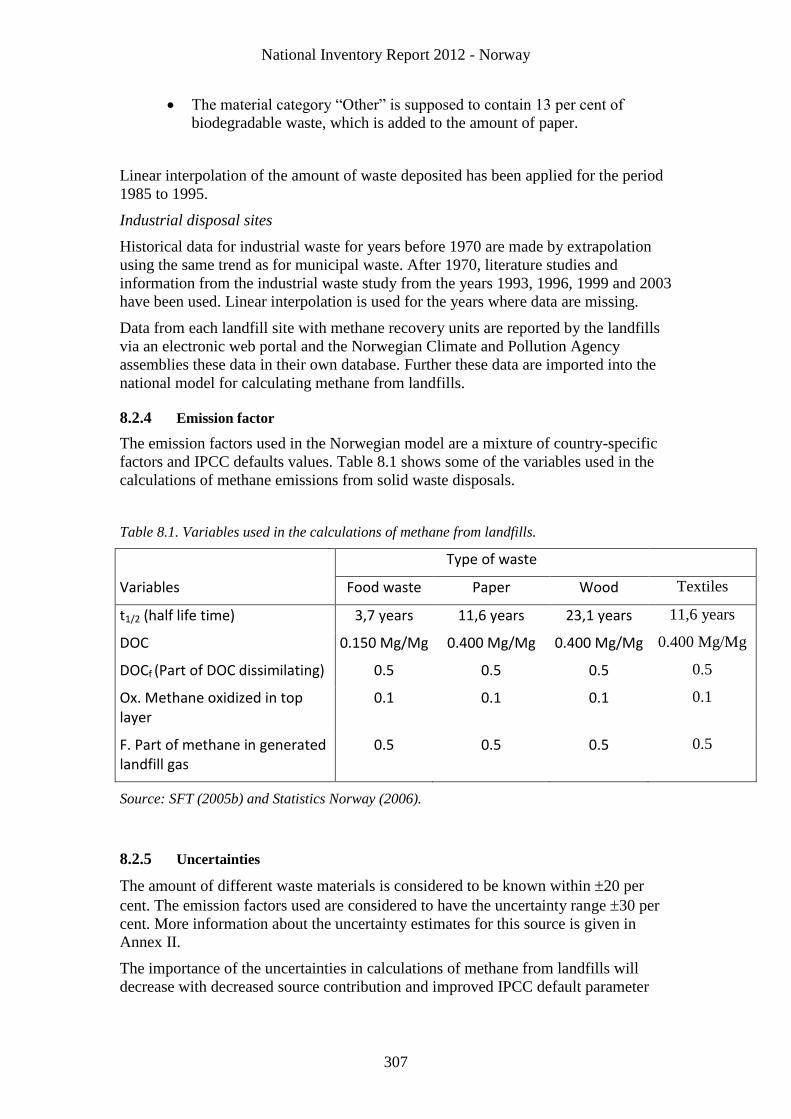
National Inventory Report 2012 - Norway
307
The material category “Other” is supposed to contain 13 per cent of
biodegradable waste, which is added to the amount of paper.
Linear interpolation of the amount of waste deposited has been applied for the period
1985 to 1995.
Industrial disposal sites
Historical data for industrial waste for years before 1970 are made by extrapolation
using the same trend as for municipal waste. After 1970, literature studies and
information from the industrial waste study from the years 1993, 1996, 1999 and 2003
have been used. Linear interpolation is used for the years where data are missing.
Data from each landfill site with methane recovery units are reported by the landfills
via an electronic web portal and the Norwegian Climate and Pollution Agency
assemblies these data in their own database. Further these data are imported into the
national model for calculating methane from landfills.
8.2.4 Emission factor
The emission factors used in the Norwegian model are a mixture of country-specific
factors and IPCC defaults values. Table 8.1 shows some of the variables used in the
calculations of methane emissions from solid waste disposals.
Table 8.1. Variables used in the calculations of methane from landfills.
Type of waste
Variables Food waste Paper Wood Textiles
t1/2 (half life time) 3,7 years 11,6 years 23,1 years 11,6 years
DOC 0.150 Mg/Mg 0.400 Mg/Mg 0.400 Mg/Mg 0.400 Mg/Mg
DOCf (Part of DOC dissimilating) 0.5 0.5 0.5 0.5
Ox. Methane oxidized in top layer
0.1 0.1 0.1 0.1
F. Part of methane in generated landfill gas
0.5 0.5 0.5 0.5
Source: SFT (2005b) and Statistics Norway (2006).
8.2.5 Uncertainties
The amount of different waste materials is considered to be known within 20 per
cent. The emission factors used are considered to have the uncertainty range 30 per
cent. More information about the uncertainty estimates for this source is given in
Annex II.
The importance of the uncertainties in calculations of methane from landfills will
decrease with decreased source contribution and improved IPCC default parameter
National Inventory Report 2012 - Norway
308
values, but most likely it will still remain among the main uncertainties in the
Norwegian GHG inventory.
The methodology Statistics Norway/the Climate and Pollution Agency use to
calculate methane emissions from landfills is identical for the whole time series. The
quality of the activity data used in the model has been improved in the last years. This
is also the case regarding the data for recovered methane.
8.2.6 Source specific QA/QC and verification
Internal checks of time series for all emission sources are made every year when an
emission calculation for a new year is done.
Internal checks of time series of waste data, methane recovered at landfill sites and
calculated methane emissions from the model are carried out and corrections are made
if any kinds of errors are found. If there is a change in the trend of methane recovered
from a landfill site, the site is contacted to identify a plausible explanation.
Corrections are made if there is no plausible explanation of the change.
8.2.7 Recalculations
6 A Solid waste disposal on land
Correction of error. A significant amount of mixed waste, 30 000 tonnes in
1990 increasing to 180 000 tonnes in 2008, have been included in the
inventory. The amount is allocated to all waste fractions in the same way as
mixed waste from households.
Revised activity data and correction of error. A sample survey on waste from
manufacturing industries has been carried out for 2008. This has led to
updated figures for 2008. In addition figures for 2003 have been corrected.
Waste from manufacturing industries has been updated for all years since
2000 due to interpolation.
Revised activity data. Reported figures on disposed waste in Statistics
Norway’s waste statistics have replaced estimates for 2009. New waste
statistics shows a somewhat different trend than the preliminary estimates
indicated. Since July 2009 it has been prohibited to dispose organic matter at
landfills in Norway.
These changes have led to increased emissions of methane for all years after 1990.
The emissions rose from 0.1 per cent in 1990 to 1 per cent for 2008 and 0.9 percent
for 2009.
8.2.8 Planned improvements
There is for the moment no planned activity that will improve the data quality for NIR
2013.
8.3 Unmanaged Waste Disposal Sites – 6A2
In Norway landfilling of solid waste has been regulated and controlled for some
decades, and unmanaged landfills are from before 1970. Furthermore, the methane
emissions for all years have been calculated from the total amounts of landfilled
National Inventory Report 2012 - Norway
309
materials. Therefore Norway does not separately report emissions from
unauthorized/unmanaged SWDSs.
8.4 Wastewater handling – N2O – 6B (Key category)
8.4.1 Description
Emissions of CH4 and N2O from Wastewater handling has been relative stable during
the 1990 to 2006, with a small increase for CH4. The emission trend for this period is
described in Section 2.3.
According to the Tier 2 key category analysis emissions of N2O from wastewater
handling are key category in level in 1990 and 2010.
8.4.2 Methodological issue
CH4
Emissions of methane from domestic and commercial waste water have been
calculated. Emissions from water consumption in food processing industries
(breweries, dairies and slaughterhouses) are included for all years since 1990.
Emissions of methane from industries with their own waste water treatment plants are
small, because the plants are mainly. CH4 from domestic sludge is calculated together
with the waste water emissions.
Emissions of methane from domestic waste water are calculated according to the
IPCC default methodology:
(8.10) MCFBDNE ii 0
E: Emissions of methane
N: Population in Norway
D: Organic load in biochemical oxygen demand (kg BOD/1000
persons/year)
B0: Maximum methane-producing capacity (kg CH4/kg DC)
MCF: Methane conversion factor
i: Year
Emissions of methane from water consumption in each food processing industries are
calculated using the same equation as for domestic water, except that for COD is
estimated based on water consumption multiplied with mg COD/l wastewater.
(8.11) Ei = Wi * CODi * B0* MCF
National Inventory Report 2012 - Norway
310
E: Emissions of methane
W: Water consumption/economic turnover (million NOK)
COD: Organic load in chemical oxygen demand (kg COD/unit wastewater)
B0: Maximum methane-producing capacity (kg CH4/kg DC)
MCF: Methane conversion factor
i: Industry
N2O
For this source emissions of nitrous oxide from domestic and commercial wastewater
have been calculated. Until this year only N2O emissions from the part of the
population and the part of the industry that is connected to large waste water treatment
plants (>50 pe) have been estimated. As recommended by the review team Norway
now estimates N2O emissions from human sewage, which is not treated in sewage
treatment plants. Emissions of N2O from industries with their own waste water
treatment plants are not estimated.
N2O emissions from the part of the population and the part of the industry connected
to large treatment plants (>((>50 pe) are calculated from nitrification/denitrification
that occurs in the pipelines and the N2O emissions that occur as a by-product in
biological nitrogen-removal plants. This is assumed to be a more precise method than
the recommended IPCC method that is based on the annual per capita protein intake.
The N2O from sewage sludge applied on fields is included under Agriculture in
chapter 6.
For the part of the population connected to treatment plants (> 50 pe), the N2O
emissions are estimated like this:
N2O emissions from pipelines
N2O(S) = Nsupplied to pipelines x 0,01 x 1.57
For the part of the population that is connected to large treatment plants the N2O
emissions are calculated by multiplying the total amount of nitrate supplied to the
pipelines by the IPCC default emission factor of 0.01 kg N2O-N/kg sewage-N
produced. Conversion factor of N2O-N to N2O is 1.57.
N2O emissions in biological nitrogen removal-plants:
N2O(S) = Nremoved x 0.02 x 1.57
It is assumed that 2 per cent of the nitrogen removed from plants will form N2O. This
country-specific emission factor is given in SFT (1992), and the assumption is based
on measurements in plants and comparisons with factors used in Sweden. The amount
of N removed is multiplied with 0.02 and then multiplied with the factor of 1.57 for
conversion of N-removed to N2O-N.
For the part of the population that is not connected to large treatment plants, the N2O
emissions are estimated as recommended by the IPCC review team. The IPCC
method based on the annual per capita protein intake is being used.
National Inventory Report 2012 - Norway
311
Emissions of N2O from the part of the population not connected to large waste water
plants (> 50 pe) are estimated by Tier 1 method. Emissions are calculated using the
Equation:
(8.12) N2O(S) = Protein x FracNPR x NRPEOPLE x EF6
N2O(s): N2O emissions from human sewage (kg N2O –N/ yr)
Protein: annual per capita protein intake (kg/person/yr)
NRPEOPLE : Number of people not connected to treatment plants
EF6: emissions factor (default 0.01 (0.002-0.12) kg N2O –N/kg
sewage- N produced)
FracNPR: Fraction of nitrogen in protein (default = 0.16 kg N/kg
protein).
The N2O from sewage sludge applied on fields is included under Chapter 6,
Agriculture.
8.4.3 Activity data
CH4
Data for the number of residents in Norway are given from Statistics Norway's
population statistics. Population for a year is calculated by the average of the
population at the beginning of the year and the end of the same year. The IPCC
default value of 18 250 kg BOD/1000 persons/year is used for D, the degradable
organic component in the waste, for all years.
Industrial wastewater from breweries, dairies and slaughterhouses are released into
domestic sewer systems. Emissions of methane from industries with their own
wastewater treatment plants are small, because the plants are mainly aerobic or the
methane gas is being recovered.
As recommended by the review team Norway has estimated emissions of CH4 from
food processing industry. The estimations are based on water consumption, in NACE
15 for the year 2004 (Stave, 2006) and information from National Accounts on Gross
values from industry (NACE 15) in constant 2000 prices for the period 1990 to 2008.
Data for the economic turnover in million NOK for each industry are given from
Statistics Norway’s National Accounts on Gross values from industry (NACE 15).
N2O
A yearly estimate for the amount of nitrate supplied to the pipelines is obtained from
Statistics Norway’s waste water statistics (http://www.ssb.no/avlut_en/about.html).
These figures are used for estimating N2O emissions from the part of the population
and the part of industry connected to large waste water treatment plants.
Data for the amount of nitrogen that is removed in the biological step in the actual
waste water plants is obtained from Statistics Norway’s waste water statistics
National Inventory Report 2012 - Norway
312
(http://www.ssb.no/avlut_en/about.html). An oversight of which plants that removes
nitrogen is given by the Climate and Pollution Agency.
Data for the number of people in Norway connected to waste water treatment plants
are obtained from the waste water statistics at Statistics Norway. We know the
number of inhabitants connected to large treatment plants (>50 pe) for the years after
1990, and the number of inhabitants connected to small treatment plants (<50 pe) for
the years after 2002. We have also received the percentage connected for 1990, which
were 75 per cent. For the years between 1990 and 2002 the percentage connected is
interpolated. The number of people connected to different treatment systems one year
is calculated by the average of the number of people connected at the beginning of the
year and the end of the same year.
8.4.4 Emission factor
CH4
The IPCC emission factor for B0 of 0.6 kg CH4/kg DC is used. The methane
conversion factor (MCF) is, according to good practice, given by the fraction of BOD
that will ultimately degrade anaerobically. Country-specific MCF factors are
estimated by Statistics Norway for the years after 2000, based on the part of the
population connected to tanks with anaerobic conditions. The factors are from
Statistics Norway (waste water statistics), and corresponds to the fraction of the waste
water plants that are categorized as "Sealed tank" and partly the category "Separate
toilet system". The MCF factor is about 0.01 (1 per cent) for the years after 2000. We
assume that in 1990, 2 per cent of the population was connected to anaerobic
treatment systems for waste water and that the share gradually has decreased until
2000. From our best knowledge we therefore assume that the MCF-factor of 0.02 is
reflecting the condition in 1990 and that the factor for 1990 is consistent with the
calculated factors for the years after 2000.
Emissions from water consumption in food processing industries are calculated using
the average MCF–factor (0.01) for wastewater. The IPCC emission factor for B0 of
0.6 kg CH4/kg DC is used. The COD factors for the different groups are taken from
IPPC 2006 and some are average factors made by Statistics Norway. Based on the
water consumption and Gross values from industry in 2004 we know the water
consumption per economic turnover. The same factor is used for all years for the
different products, see table 8.2. The table also shows the default COD factors for the
different products. COD factors for manufacture of animal feeds and dry general food
products are the average of all the others.
National Inventory Report 2012 - Norway
313
Table 8.2. The developed water consumption coefficients and chemical oxygen demand in
m3/million NOK and mg/l.
m3/mill NOK COD mg/l
Manufacture of meat products and cooking oil 125 2.9
Manufacture of fish products 476 2.5
Manufacture of fruit, vegetables and grain mill
products 499 5.2
Manufacture of dairy products 314 1.5
Manufacture of animal feeds 154 2.72
Manufacture of dry general food products 170 2.72
Manufacture of beverages 317 1.5
Source: IPPC (2006) and Statistics Norway.
N2O
For the part of the population and the part of the industry that are connected to large
treatment plants the N2O emissions are calculated by multiplying the total amount of
nitrate supplied to the pipelines by the IPCC default emission factor of 0.01 kg N2O-
N/kg sewage-N produced. The conversion factor of N2O-N to N2O is 1.57. N2O
emissions also occur as a by-product in biological nitrogen removal plants. It is
assumed that 2 per cent of the nitrogen removed from plants will form N2O (country-
specific EF). The amount of N removed at the plant is multiplied with 0.02 and then
multiplied with the factor of 1.57 for conversion of N-removed to N2O-N.
For the part of the population that is not connected to large treatment plants, the
emissions factors are as follow: The IPCC emission factors for EF6 of 0.01kg N2O/kg
sewage-N produced is used, and the fraction of nitrogen in protein, FracNPR, is 0.16 kg
N/kg protein.
Protein is annual per capita protein intake (kg/person/year).
A report from the Directorate for Health and Social Affairs estimates the amount of
daily per capita protein intake for Norway for 1997 (Johansson and Solvoll, 1999).
There has not been done any other survey like this, where the daily per capita protein
intake for Norway has been estimated.
In 1997 the daily per capita protein intake for Norway was 86 gram, which gives
31.39 kilo per year. For the years 1990, 1995, 2000, 2003, 2004 and 2005 the
Directorate for Health and Social Affairs has made estimations of the potential protein
intake for the population (Directorate for Health and Social Affairs 2006).
This is estimated based on the equation:
(8.13) Potential protein intake = production + import – export
This estimation does not reflect that the actual consumption is lower because not
everything is eaten. Parts of the food end up as waste. Norway uses an estimated
protein intake of 31.39 kilos per person for 1997 and the trend in potential protein
intake when making the time series. Statistics Norway has estimated the intermediate
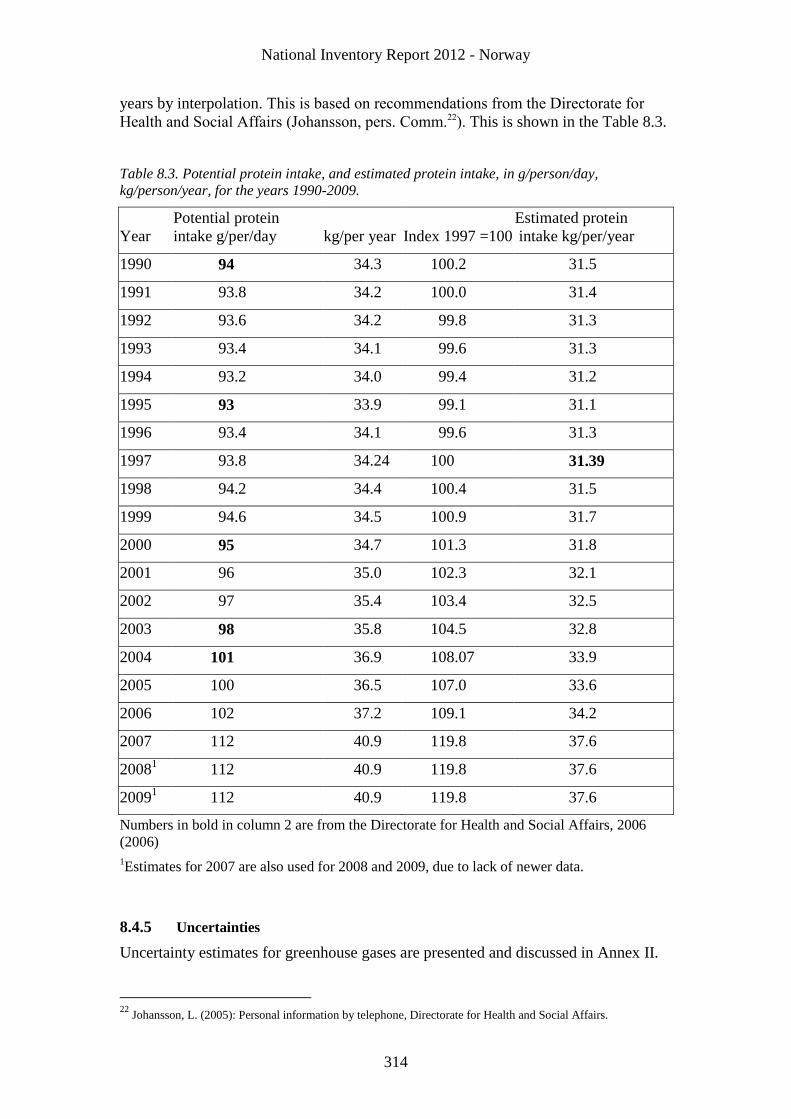
National Inventory Report 2012 - Norway
314
years by interpolation. This is based on recommendations from the Directorate for
Health and Social Affairs (Johansson, pers. Comm.22). This is shown in the Table 8.3.
Table 8.3. Potential protein intake, and estimated protein intake, in g/person/day,
kg/person/year, for the years 1990-2009.
Year
Potential protein
intake g/per/day kg/per year Index 1997 =100
Estimated protein
intake kg/per/year
1990 94 34.3 100.2 31.5
1991 93.8 34.2 100.0 31.4
1992 93.6 34.2 99.8 31.3
1993 93.4 34.1 99.6 31.3
1994 93.2 34.0 99.4 31.2
1995 93 33.9 99.1 31.1
1996 93.4 34.1 99.6 31.3
1997 93.8 34.24 100 31.39
1998 94.2 34.4 100.4 31.5
1999 94.6 34.5 100.9 31.7
2000 95 34.7 101.3 31.8
2001 96 35.0 102.3 32.1
2002 97 35.4 103.4 32.5
2003 98 35.8 104.5 32.8
2004 101 36.9 108.07 33.9
2005 100 36.5 107.0 33.6
2006
102 37.2 109.1 34.2
2007 112 40.9 119.8 37.6
20081
112 40.9 119.8 37.6
20091 112 40.9 119.8 37.6
Numbers in bold in column 2 are from the Directorate for Health and Social Affairs, 2006
(2006)
1Estimates for 2007 are also used for 2008 and 2009, due to lack of newer data.
8.4.5 Uncertainties
Uncertainty estimates for greenhouse gases are presented and discussed in Annex II.
22
Johansson, L. (2005): Personal information by telephone, Directorate for Health and Social Affairs.
National Inventory Report 2012 - Norway
315
8.4.6 Source specific QA/QC and verification
There is no source specific QA/QC procedure for this sector. See Section 1.6 for the
description of the general QA/QC procedure.
8.4.7 Recalculations
6 B2 Domestic and commercial wastewater
Correction of error. Due to the use of wrong emission factors, previously
calculated CH4 emissions were somewhat too low in 2008 and too high in 2009.
Insignificant changes
Revised data. The number of inhabitant connected to small treatment plants for
the years 2008-2009 have been replaced with the average of the population at
the beginning of the year and the end of the same year when calculating CH4
emissions from waste water handling. Insignificant changes in emissions.
8.4.8 Planned improvements
There is for the moment no planned activity that will improve the data quality for NIR
2013.
National Inventory Report 2012 - Norway
316
8.5 Waste incineration – CO2 – 6C
8.5.1 Description
Emissions from waste incineration in district heating plants are reported under energy
(IPCC 1A1a), as the energy is utilized, and therefore described in Chapter 3. In 2010,
there were 15 waste incineration plants where household waste is incinerated. In
addition, some incineration plants burn waste other than household waste, mainly
wooden waste, paper, pasteboard and cardboard. These emissions are reported and
described under energy (IPCC 1A2d). Waste, other than household waste, is also used
as energy source in some manufacturing industries. In this chapter, the focus will be
on waste reported in IPCC sector 6C. This includes emissions from flaring, except
flaring from energy sectors, and emissions from cremation and hospital waste until
2005.
8.5.2 Methodological issues
Emissions from flaring of landfill gas by landfills are estimated. However, CO2
emissions from flaring of landfills are not included in the inventory, as these are
considered as being of biogenic origin. The emissions are estimated by multiplying
the amount of gas flared with the emission factors shown in Table 8.2.
Emissions from cremation are estimated by emission factors multiplied with activity
data that is the number of cremated bodies. Emissions from combustion of hospital
waste were until 2006 calculated based on an emission factor multiplied by the
amount hospital waste incinerated. After that hospital waste is incinerated in
municipal waste incineration plants and emissions are reported under energy.
8.5.3 Activity data
Landfill gas
The total amount of landfill gas extracted each year is reported by landfill owners to
the Climate and Pollution Agency. Statistics Norway subtracts the amount utilized for
district heating and thermal power, which is given by the energy statistics in Statistics
Norway. Information on the amount flared is given by the Climate and Pollution
Agency.
Natural gas
The amount of natural gas flared by the production of methanol is, as recommended
by the ERT, reported under 2B5.
Hospital waste
The amount of hospital waste was reported to Statistics Norway for the years 1998
and 1999. For the period 1990-1997 the average for 1998 and 1999 has been used.
After 1999 there has been no collection of hospital waste data. Due to the lack of
better information, the waste amount for 1999 has been used to calculate the
emissions for subsequent years. The hospital incinerators have gradually been closed
down, mainly due to new limits of emission. From 2006 and onwards there has been
no hospital incinerators running. Today hospital waste is incinerated in incinerators
for municipal waste and emissions are included under 1A1a).
Cremation
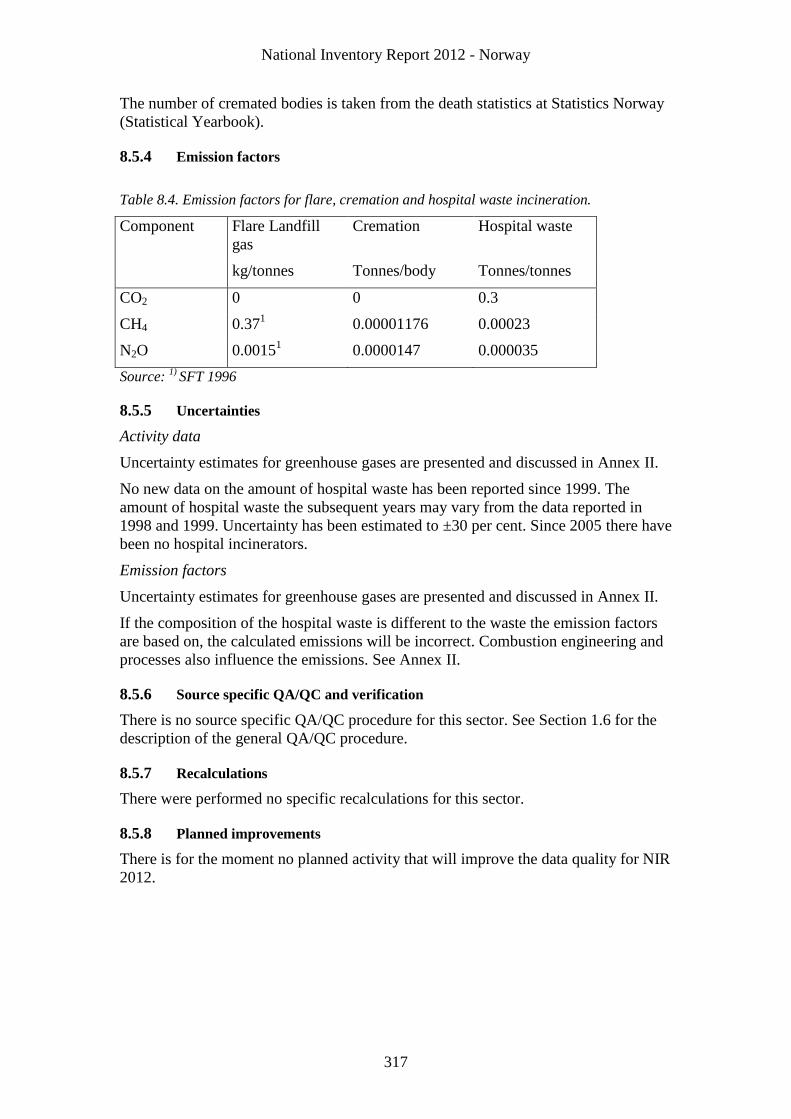
National Inventory Report 2012 - Norway
317
The number of cremated bodies is taken from the death statistics at Statistics Norway
(Statistical Yearbook).
8.5.4 Emission factors
Table 8.4. Emission factors for flare, cremation and hospital waste incineration.
Component Flare Landfill
gas
Cremation Hospital waste
kg/tonnes Tonnes/body Tonnes/tonnes
CO2 0 0 0.3
CH4 0.371 0.00001176 0.00023
N2O 0.00151 0.0000147 0.000035
Source: 1)
SFT 1996
8.5.5 Uncertainties
Activity data
Uncertainty estimates for greenhouse gases are presented and discussed in Annex II.
No new data on the amount of hospital waste has been reported since 1999. The
amount of hospital waste the subsequent years may vary from the data reported in
1998 and 1999. Uncertainty has been estimated to ±30 per cent. Since 2005 there have
been no hospital incinerators.
Emission factors
Uncertainty estimates for greenhouse gases are presented and discussed in Annex II.
If the composition of the hospital waste is different to the waste the emission factors
are based on, the calculated emissions will be incorrect. Combustion engineering and
processes also influence the emissions. See Annex II.
8.5.6 Source specific QA/QC and verification
There is no source specific QA/QC procedure for this sector. See Section 1.6 for the
description of the general QA/QC procedure.
8.5.7 Recalculations
There were performed no specific recalculations for this sector.
8.5.8 Planned improvements
There is for the moment no planned activity that will improve the data quality for NIR
2012.
National Inventory Report 2012 - Norway
318
9 Recalculations
9.1 Overall description of recalculations
The Norwegian greenhouse gas emission inventory has in 2012 been recalculated for
the entire time series 1990-2009 for all components and sources, to account for new
knowledge on activity data and emission factors and to correct for discovered errors
in the calculations. There is also a continuous process for improving and correcting
the inventory and the documentation of the methodologies employed, based on
questions and comments received in connection with the annual reviews performed by
UNFCCC. The figures in this inventory are therefore, as far as possible, consistent
through the whole time series.
The driving force for making improvements in the emission inventory is to meet the
reporting requirements in the UNFCCC Reporting Guidelines on Annual Inventories
as adopted by the COP by its Decision 18/CP. In addition, it is important for decision
makers and others to have accurate emission estimates as basis for making decisions
of what measures to introduce to reduce emissions.
The most important recalculations for greenhouse gases in the 2012 submission are
1. Revised activity data for waste deposited on landfills have caused increased
emission of CH4 for the whole time series in 6A Solid waste disposal on land. The
impact of the changes has led to increased emissions of total CH4 from less than
0.1 per cent in the first years till about 1 per cent in the last years in the period.
2. Revised factors in the calculation of N2O emissions in several agricultural groups
have caused increased emissions for all years.
3. A reallocation of use of refinery gas between 1A1b Petroleum refining and 1B2c
2ii Flaring of gas has caused changes for CO2, CH4 and N2O for all years in these
groups.
4. Emissions previously reported under 2C1 Pig iron, have been moved to 2B5
Titanium dioxide production for the whole time period.
9.2 Specific description of the recalculations
9.2.1 Energy
Most of the recalculations have been performed for 2009, because the energy figures
for 2009 used in the previous inventory were preliminary. There will always be some
changes in the energy figures, e.g. some figures on energy use in manufacturing
industries will be adjusted, which will lead to adjustments in other sectors, as total use
of oil products must sum up to national sales. Now the final figures for energy use are
available and are used in the emission calculations. Changes in the emission figures
due to such changes in the energy statistics will not be commented on specifically
under each IPCC code. In the following, reported emissions are defined as emissions
calculated by the plants and reported to the Climate and Pollution Agency, whereas
calculated emissions are emissions calculated by Statistics Norway, based on figures
on energy use reported to Statistics Norway.
National Inventory Report 2012 - Norway
319
1A 1a Public electricity and heat production
Revised data. Reported N2O emissions from one district heating plant in 2008
has been somewhat increased. For two plants, reported figures for 2009
replaces previously used 2008 figures. There is a minor change in the reported
N2O figure for 2009 for another plant. For yet another plant the figure on use
of fuel oil in 2009 has been marginally reduced, causing corresponding
emission reductions.
Revised data. Figures on use of wood waste at one district heating plant have
been somewhat adjusted for 2006-2009, causing marginal emission changes.
Revised data. A minor reduction in use of light fuel oil in 2008 causes
marginal emission reductions. This reduction should have been reflected in an
increase in another sector, in order to include total sales in the energy statistics
and emission calculations. Unfortunately, this transfer has not taken place,
which means that total CO2 emissions in 2008 are approximately 4 500 tonnes
too small. The error will be corrected in the 2013 submission.
New method. As one pulp and paper producing plant also produces electricity,
the use of factor calculations of emissions instead of reported figures for CH4
and N2O as described under 1A2d, also cause emission changes for all years in
1A1a.
1A 1b Petroleum refining
Reallocation. Previously, the same key for distribution between flaring and
energy utilisation of refinery gas was used for all years in the whole period
1990-2009. Now plant and year specific figures have been used instead. This
causes a reallocation of emissions between 1A1b and 1B2c, but there is no
change in total emissions. The reallocation causes higher emissions for 1A1b
in 1991, 1995 and 2003-2009, whereas the emissions have been reduced in
1990, 1992-1994, and 1996-2002. Emissions of CO2, CH4 and N2O are
affected by the change.
Correction of error. The removal of a previous double counting for CO2 and
CH4 in 2008 and 2009 has counteracted the emission increase caused by the
reallocation mentioned above, and caused an overall reduction in CO2
emissions for 2008 and a reduced increase for CH4 in 2008 and for both CO2
and CH4 in 2009. The removal of a previous double counting for CO2 and CH4
in 2008 and 2009 has, in addition to the reallocation mentioned above, caused
a further reduction in CO2 and CH4 emissions for these years.
1A 1c Manufacture of solid fuels and other energy industries
Reallocation/revised data. Part of the 2008 CO2 figure for one plant,
previously registered as emission from venting, has been reallocated to
combustion. At the same time, parts of the CH4 figures 2007-2009 for the
same plant, previously registered as combustion emissions, have been
reallocated to 1B2aiii. There are also changes in total CH4 figures for this
plant.
Correction of error: CO2 and CH4 for 1A1C (Manufacture of solid fuels and
other energy industries) and 1A3D (National navigation) in 2005. In the
previous submission, emissions from drilling at moveable offshore
installations were reallocated from 1A3D to 1A1C. In that operation, a
mistake was made for certain components in 2005. This mistake has now been
corrected. Total emissions for the two sectors were reduced.
National Inventory Report 2012 - Norway
320
Reallocation: As part of the correction mentioned above, an amount of fuel oil
was reallocated from 1A3D (National navigation) to 1A1C (Manufacture of
solid fuels and other energy industries) in 2005. All components are affected.
Total emissions for N2O for the two sectors were unchanged, whereas for CO2
and CH4 there was an additional correction as mentioned above.
1A 2 c Chemicals
Revised data. Reported figures on CH4 from one plant have been adjusted
downwards for 2005-2007.
Reallocation. CO2 figures for one plant, previously registered as combustion
emissions, have now been split between combustion and process. This causes
an annual reduction in the size of 10-15 ktonnes for all years 1990-2008.
1A 2 d Pulp and paper
New method. Previously, reported emissions for CH4 and N2O from two
plants and CH4 from another plant were used in the inventory. They have now
been replaced by factor estimations based on registered use of different energy
commodities for all years 1990-2009.
Revised data. A revised reported CH4 figure for one plant in 2008 has caused
an emission reduction.
1A 2 f Other
Revised data. For two rock wool producing plants, there are minor changes in
reported CO2 figures for 2005-2008.
1A 3a Civil aviation
Correction of error. For 2007-2009, the key for distribution of jet fuel between
airplanes and helicopters were, due to an error, previously not updated. The
correction of this error has led to a minor shift between LTO and cruise, as the
distribution between airplanes and helicopters in these groups differs. For
CH4, also the emission factors vary between the two groups, causing a minor
reduction in overall emissions from civil aviation.
1A 3 b i-iii Road transport
Revised data. The consumption of auto diesel includes a certain amount of
biodiesel. The emission factor for CO2 is reduced to account for this effect.
Due to revised figures on total sales of auto diesel for the year 2009, the
emission factor for CO2 has been upwards adjusted.
Revised data. The consumption of gasoline includes a certain amount of
bioethanol, but until 2010 the amount has been insignificant. However, while
gathering bioethanol data also information on 2008-2009 was obtained. The
emission factor for CO2 is reduced by ca. 0.1% to account for this effect.
1A 3d National navigation
Correction of error. Due to the use of a wrong figure for marine gas oil in
ships used in oil and gas extraction in 2007 (32 300 tonnes too low), emissions
from this source have increased by (per cent increase): CO2 4.7, CH4 1.4, N2O
1.3.
Correction of error: CO2 and CH4 for 1A1C (Manufacture of solid fuels and
National Inventory Report 2012 - Norway
321
other energy industries) and 1A3D (National navigation) in 2005. In the
previous submission, emissions from drilling at moveable offshore
installations were reallocated from 1A3D to 1A1C. In that operation, a
mistake was made for certain components in 2005. This mistake has now been
corrected. Total emissions for the two sectors were reduced.
Reallocation: As part of the correction mentioned above, an amount of fuel oil
was reallocated from 1A3D (National navigation) to 1A1C (Manufacture of
solid fuels and other energy industries) in 2005. All components are affected.
Total emissions for N2O for the two sectors were unchanged, whereas for CO2
and CH4 there was an additional correction as mentioned above.
1A 3 eii Other mobile sources and machinery
Revised data. A small rise in 2008 emissions of CO2, CH4 and N2O, due to the
inclusion of a minor auto diesel figure for one plant.
Reallocation. Due to a reallocation of auto diesel 2000-2009 between forestry
and other mobile sources and machinery, there is a small increase of emissions
of all components these years. The reallocation is due to an error in the
estimation of diesel use in forestry, which has given too high figures for the
years in question. As total use is defined as equal to total sales, the amounts
subtracted from forestry have been transferred to 1A3eii.
1 A 4 a Commercial / Institutional: Stationary
Correction of error. 1.6 ktonnes of coal coke has been removed from this
category in 2009. However, because of higher use of other energy goods, there
is still an overall emission increase in 1A4a.
1A 4 b Residential
Revised activity data. For the years 2005-2009 the amount of wood burned in
private households has been revised due to a new weighting of figures from
the survey used to calculate wood consumption. This has led to increased
emissions of all components included in the national inventory, included CH4,
for 2007-2009 and reduced emissions 2005-2006.
1A 4 c Agriculture/Forestry/Fishing
Reallocation. Due to a reallocation of auto diesel 2000-2009 between forestry
and other mobile sources and machinery, there is a small decrease in
emissions of all components these years. The reallocation is due an error in the
estimation of diesel use in forestry, which has given too high figures for the
years in question.
1 B 2 a iii Oil exploration, production, transport
Revised data. CH4 emissions have been increased by 391 tonnes in 2009 due
to a revised reported figure on loading of oil at one plant on shore.
Reallocation/revised data. Parts of CH4 figures 2007-2009 for one plant,
previously registered as combustion emissions, have been reallocated to
1B2aiii. There are also changes in total CH4 emissions for this plant.
1B 2a v Distribution of oil products
Revised data. Due to revised figures in the sales statistics for petroleum
products, indirect emissions of CO2 from petrol distribution in 2006-2009
National Inventory Report 2012 - Norway
322
have been somewhat altered. The figures for 2006 and 2007 have increased by
1 tonne, emissions in 2008 have been reduced by 20 tonnes and the figures for
2009 are 199 tonnes higher.
1B 2b Natural gas – gas distribution
Revised data. Revised figures on use of natural gas caused a minor decrease in
CH4 emissions in 2008 and an increase in 2009.
1B 2c1iii Venting combined
Revised data. New reported figures for two oil and gas extraction fields have
increased the CH4 emissions in 2009 by 444 tonnes. Indirect CO2 emissions
from CH4 and NMVOC have increased by 4478 tonnes.
New data. CO2 emissions in 2007 have risen by 70 500 tonnes, due to the
inclusion of a previously not registered figure for one plant.
Reallocation. A part of the previously registered CO2 figure for one plant has
been reallocated to combustion.
1B 2c2ii Flaring of gas
Reallocation. As mentioned above in 1A 1b the same key for distribution
between flaring and energy utilisation of refinery gas previously has been used
for all years in the whole period 1990-2009. Now plant and year specific
figures have been used instead. This causes a reallocation of emissions
between 1A1b and 1B2c, but there is no change in total emissions. The
reallocation causes lower emissions for 1B2c in 1991, 1995 and 2003-2009,
whereas the emissions have been increased in 1990, 1992-1994, and 1996-
2002. Emissions of CO2, CH4 and N2O are affected by the change.
Correction of error. The removal of a previous double counting for CO2 and
CH4 in 2008 and 2009 has, in addition to the reallocation mentioned above,
caused a further reduction in CO2 and CH4 emissions for these years.
Reallocation/revised data. Parts of the CH4 figures 2007-2009 for one plant,
previously registered as emissions from flaring, have been reallocated to
process. There are also changes in total CH4 figures for this plant.
9.2.2 Industrial processes
2 A 2 Lime production
Revised data. For one plant, the reported CO2 emissions 1990-2007 have been
adjusted, partly upwards, partly downwards. Only minor changes for all years.
2 B5 Plastic
Reallocation. CO2 figures for one plant, previously registered as combustion
emissions, have now been split between combustion and process. This causes
an annual rise in the size of 10-15 ktonnes for all years 1990-2008.
2 B5 Titanium dioxide production
Reallocation. As recommended by the ERT, emissions previously reported
under 2C1 Pig iron, have been moved to 2B5 Titanium dioxide production for
the whole time period.
2 C 1 Iron and steel production
National Inventory Report 2012 - Norway
323
Revised data. For one plant, the reported CO2 figure for 2009 has been
increased by 2 000 tonnes.
Reallocation. As recommended by the ERT, emissions previously reported
under 2C1 Pig iron, have been moved to 2B5 Titanium dioxide production for
the whole time period.
2 C 2 Ferroalloys production
Revised data. For one plant, the reported CO2 figures have been marginally
adjusted downwards for 2007 and increased by 10 000 tonnes for 2008.
2 C 3 Aluminium productions
Revised data. PFC emissions in 2009 from four plants have been revised due
to decimal errors in the figures used in the 2011 submission. The CF4 and C2F6
emissions reported by three of the plants were in thousand tonnes e.g. 29000
tonnes CF4 and corrected to 28 989 tonne CF4. For the fourth plant the
emissions was included in the inventory with two decimals and now is
included with three decimals.
2 F 8 Electrical equipment
Revised data. For one plant, the reported SF6 emission has been revised
downwards for 2003 and 2009.
9.2.3 Solvents and other product use
3A, 3B, 3C, 3D Solvent losses
Revised data on use of formic acid used for ensilage means and cosmetics. Indirect emissions of CO2 have decreased by 8 729 tonnes in 2005, 9 510 tonnes in 2006, 10 234 tonnes in 2007, 10 041 tonnes in 2008 and 8 798 tonnes in 2009.
9.2.4 Agriculture
4B11_Liquid systems and 4B12_Solid storage and dry lot
The factors for the production of N in faeces and urine of slaughter pigs and
poultry have been corrected. Estimated N excretion factors per slaughtered
animal were previously linked to stalls (places). Since the number of
slaughtered animals exceeds the number of stalls manifolds, the corrections
have increased the estimated production of N in manure, and have
consequently led to a minor increase in the estimated emissions of NH3 and
N2O from the manure of slaughter hogs and poultry. Approximately 70 per
cent of the produced manure from pigs and poultry is linked to liquid systems,
while the rest is disposed in solid storage and dry lot.
Emission factors for NH3 losses from the manure of sheep and goats stalled in
barns have been corrected. These factors were previously set equal to the
factors of pigs, but have been changed so that they correspond to the factors of
other ruminants. These factors are lower, which in turn has led to reduced NH3
emissions. The remaining N-pool in the manure has consequently increased
correspondingly, which in turn has led to a slight increase in N2O emissions.
Slightly less than 50 per cent of the manure produced in barns from sheep and
is linked to liquid systems, while the rest is disposed in solid storage and dry
lot.
National Inventory Report 2012 - Norway
324
The total effect of the revised nitrogen excretion factors for pigs and poultry and
the revised emission factors for NH3 losses from the manure of sheep and goats in
barns are an increase in the N2O emissions from the category 4D Manure
managements for the whole time series (386-517 tonnes N2O).
4D1.2_ Animal Manure Applied to Soils
As explained in the paragraph above, corrections in the use of N-excretion
factor for hogs and poultry and NH3 losses from sheep and goats in barns have
led to a higher estimate of N in the remaining manure. Consequently, the
estimated amount of N in manure applied to soils has also increased for the
whole time series. Total effect of the recalculations was increased emissions
for the whole time series (72-143 tonnes N2O).
4D3.1_ Atmospheric Deposition
The corrections of the factors for NH3 losses from the manure of sheep and
goats in barns have reduced the estimated NH3 losses. Consequently, the
subsequent depositions of NH3, and thereby the N2O emissions from these
depositions had also a minor decrease. The higher N amount in the manure
spread due to revised N excretion factors for slaughter pigs and poultry has
reduced the decrease.
4D3.2_ Nitrogen Leaching and Run-off
Increased application of N in manure to the soils due to revised N excretion
factors for slaughter pigs and poultry (see the previous paragraphs) increases
the N2O emissions from leaching and runoff for the whole time series (26-51
tonnes N2O).
4F Burning of crop residues
Burning of crop residues in the fields are in general the residues of grain and
oilseed. The residues of oil seed have been omitted in the calculations
previously, but were included in 2012. This has led to a minor increase for the
whole time series in the estimated emissions from this source, compared to
previous estimations.
9.2.5 Waste
6 A Solid waste disposal on land
Correction of error. A significant amount of mixed waste, 30 000 tonnes in 1990
increasing to 180 000 tonnes in 2008, have been included in the inventory. The
amount is allocated to all waste fractions in the same way as mixed waste from
households.
Revised activity data and correction of error. A sample survey on waste from
manufacturing industries has been carried out for 2008. This has led to updated
figures for 2008. In addition figures for 2003 have been corrected. Waste from
manufacturing industries has been updated for all years since 2000 due to
interpolation.
Revised activity data. Reported figures on disposed waste in Statistics Norway’s
waste statistics have replaced estimates for 2009. New waste statistics shows a
somewhat different trend than the preliminary estimates indicated. Since July
2009 it has been prohibited to dispose organic matter at landfills in Norway.
National Inventory Report 2012 - Norway
325
These changes have led to increased emissions of methane for all years after 1990.
The emissions rose from 0.1 per cent in 1990 to 1 per cent for 2008 and 0.9 per cent
for 2009.
6 B2 Domestic and commercial wastewater
Correction of error. Due to the use of wrong emission factors, previously
calculated CH4 emissions were somewhat too low in 2008 and too high in 2009.
Insignificant changes
Revised data. The number of inhabitant connected to small treatment plants for
the years 2008-2009 have been replaced with the average of the population at
the beginning of the year and the end of the same year when calculating CH4
emissions from waste water handling. Insignificant changes in emissions.
9.2.6 Land-Use, Land-Use Change and Forestry
No major changes in methods and Efs used compared to the reporting in 2011.
The whole time-series has been recalculated due to;
• Updating of activity data, due to new data and continuous quality control of the data bases used.
5A1 Forest land remaining forest land
• Compared to the submission of 2011 the whole time-series has been
recalculated due to a updating of the activity data.
• The net removals for forest land remaining forest land was 35 446 Gg CO2 in
2010. When including emissions of CH4 and N2O the net removals were
estimated to 35 433 CO2-equivalents.
5A2 Land converted to forest land
The whole time-series has been recalculated due to a updating of the activity
data.
• In 2010 the land-use category land converted to forest land contributed with a
total amount of removals of431 Gg CO2. Settlements converted to forest land
were the largest contributor with 338 Gg CO2. The increase in soil organic
carbon aggregated areas from 1990 constitutes a large part of the removals.
See further explanation in section 7.3.2.1 under subtitle "Land converted to
forest land".
5B1 Cropland remaining cropland
• The whole time-series has of the total area of cropland has been recalculated
due to a updating of the activity data.
• The emissions from cropland remaining cropland were 42 Gg CO2 in 2010.
National Inventory Report 2012 - Norway
326
5B2 Land converted to cropland
• The whole time-series has been recalculated due to a updating of the activity
data. Area of organic soil (Histosoil) is now in accordance with the area used
in the agricultural sector (CRF table 4.D).
• Emissions from forest land converted to cropland are recorded for the whole
time-series. In 2010 there was an emission of 25 Gg CO2 from land converted
to cropland.
5C1 Grassland remaining grassland
• The area of grassland remaining grassland is recalculated for the whole time-
series due to a updating of the activity data.
• The emissions from grassland remaining grassland are estimated to be 1 606
Gg CO2 in 2010.
5C2 Land converted to grassland
The whole time-series has been recalculated due to a updating of the activity
data.
• An emission of 75 Gg CO2 was estimated for this category in 2010. This is
due to a reduction of living biomass of fruit trees.
5D1 Wetlands remaining wetlands
• The total area of wetlands is recalculated due to a updating of the activity data.
• The emissions from wetlands remaining wetlands are coming from peat
extraction. There is assumed no annual changes in this activity and therefore
the emissions are equal to 3.4 Gg CO2 every year in the time-period 1990–
2010.
5E2 Land converted to settlements
The whole time series has been recalculated due to a updating of the activity
data.
Emissions from forest land converted to settlements were estimated to 1 155
Gg CO2 in 2010.
5F2 Land converted to other land
The whole time series has been recalculated due to a updating of the activity
data.
No emissions or removals of CO2 were reported for land converted to other
land in 2010.
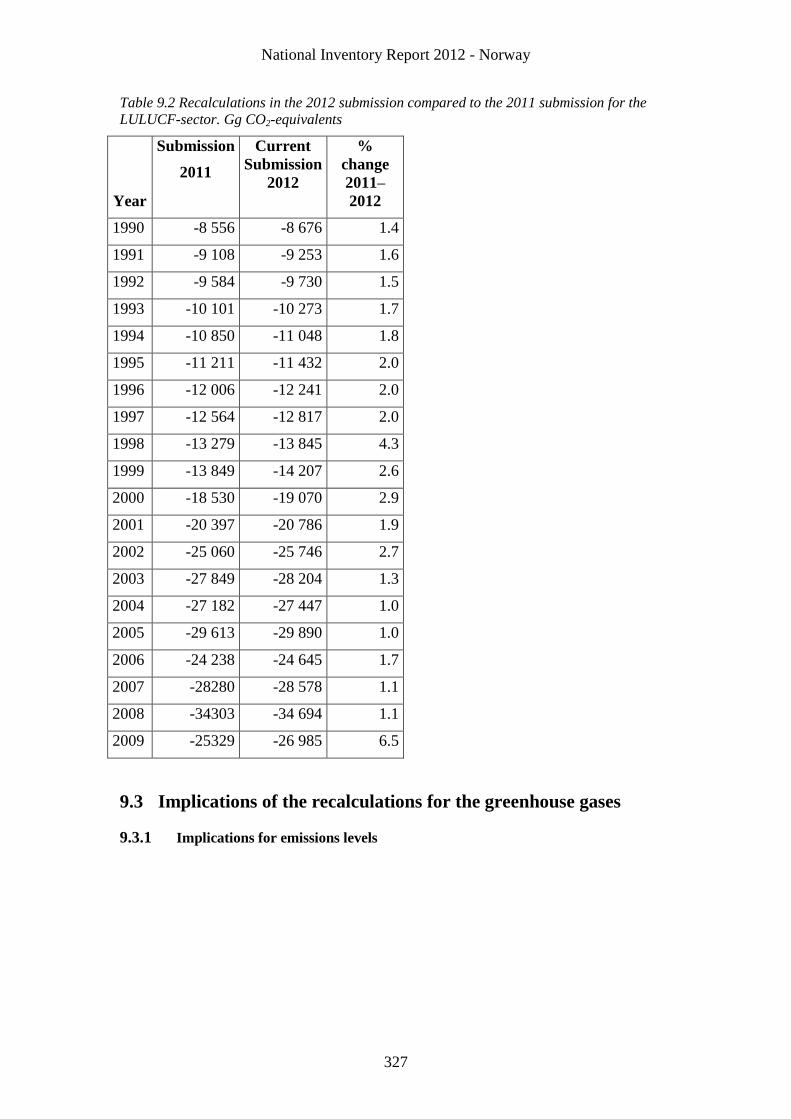
National Inventory Report 2012 - Norway
327
Table 9.2 Recalculations in the 2012 submission compared to the 2011 submission for the
LULUCF-sector. Gg CO2-equivalents
Year
Submission
2011
Current
Submission
2012
%
change
2011–
2012
1990 -8 556 -8 676 1.4
1991 -9 108 -9 253 1.6
1992 -9 584 -9 730 1.5
1993 -10 101 -10 273 1.7
1994 -10 850 -11 048 1.8
1995 -11 211 -11 432 2.0
1996 -12 006 -12 241 2.0
1997 -12 564 -12 817 2.0
1998 -13 279 -13 845 4.3
1999 -13 849 -14 207 2.6
2000 -18 530 -19 070 2.9
2001 -20 397 -20 786 1.9
2002 -25 060 -25 746 2.7
2003 -27 849 -28 204 1.3
2004 -27 182 -27 447 1.0
2005 -29 613 -29 890 1.0
2006 -24 238 -24 645 1.7
2007 -28280 -28 578 1.1
2008 -34303 -34 694 1.1
2009 -25329 -26 985 6.5
9.3 Implications of the recalculations for the greenhouse gases
9.3.1 Implications for emissions levels
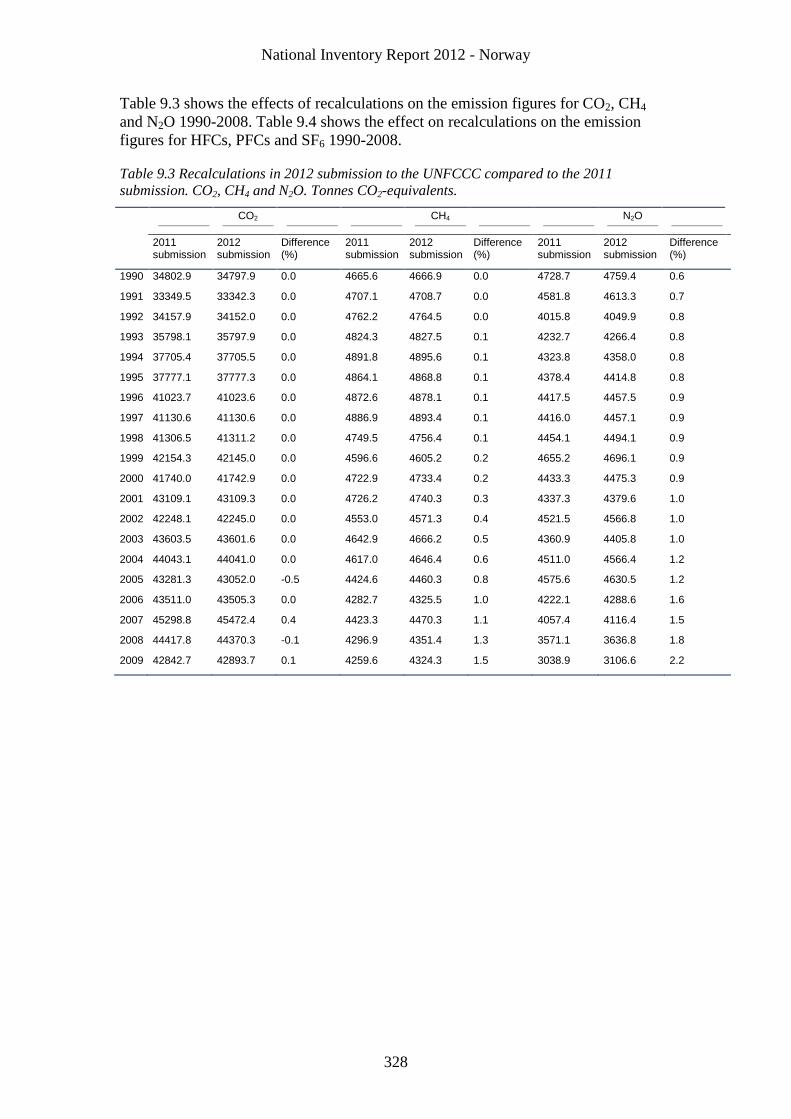
National Inventory Report 2012 - Norway
328
Table 9.3 shows the effects of recalculations on the emission figures for CO2, CH4
and N2O 1990-2008. Table 9.4 shows the effect on recalculations on the emission
figures for HFCs, PFCs and SF6 1990-2008.
Table 9.3 Recalculations in 2012 submission to the UNFCCC compared to the 2011
submission. CO2, CH4 and N2O. Tonnes CO2-equivalents.
CO2 CH4 N2O
2011 submission
2012 submission
Difference (%)
2011 submission
2012 submission
Difference (%)
2011 submission
2012 submission
Difference (%)
1990 34802.9 34797.9 0.0 4665.6 4666.9 0.0 4728.7 4759.4 0.6
1991 33349.5 33342.3 0.0 4707.1 4708.7 0.0 4581.8 4613.3 0.7
1992 34157.9 34152.0 0.0 4762.2 4764.5 0.0 4015.8 4049.9 0.8
1993 35798.1 35797.9 0.0 4824.3 4827.5 0.1 4232.7 4266.4 0.8
1994 37705.4 37705.5 0.0 4891.8 4895.6 0.1 4323.8 4358.0 0.8
1995 37777.1 37777.3 0.0 4864.1 4868.8 0.1 4378.4 4414.8 0.8
1996 41023.7 41023.6 0.0 4872.6 4878.1 0.1 4417.5 4457.5 0.9
1997 41130.6 41130.6 0.0 4886.9 4893.4 0.1 4416.0 4457.1 0.9
1998 41306.5 41311.2 0.0 4749.5 4756.4 0.1 4454.1 4494.1 0.9
1999 42154.3 42145.0 0.0 4596.6 4605.2 0.2 4655.2 4696.1 0.9
2000 41740.0 41742.9 0.0 4722.9 4733.4 0.2 4433.3 4475.3 0.9
2001 43109.1 43109.3 0.0 4726.2 4740.3 0.3 4337.3 4379.6 1.0
2002 42248.1 42245.0 0.0 4553.0 4571.3 0.4 4521.5 4566.8 1.0
2003 43603.5 43601.6 0.0 4642.9 4666.2 0.5 4360.9 4405.8 1.0
2004 44043.1 44041.0 0.0 4617.0 4646.4 0.6 4511.0 4566.4 1.2
2005 43281.3 43052.0 -0.5 4424.6 4460.3 0.8 4575.6 4630.5 1.2
2006 43511.0 43505.3 0.0 4282.7 4325.5 1.0 4222.1 4288.6 1.6
2007 45298.8 45472.4 0.4 4423.3 4470.3 1.1 4057.4 4116.4 1.5
2008 44417.8 44370.3 -0.1 4296.9 4351.4 1.3 3571.1 3636.8 1.8
2009 42842.7 42893.7 0.1 4259.6 4324.3 1.5 3038.9 3106.6 2.2
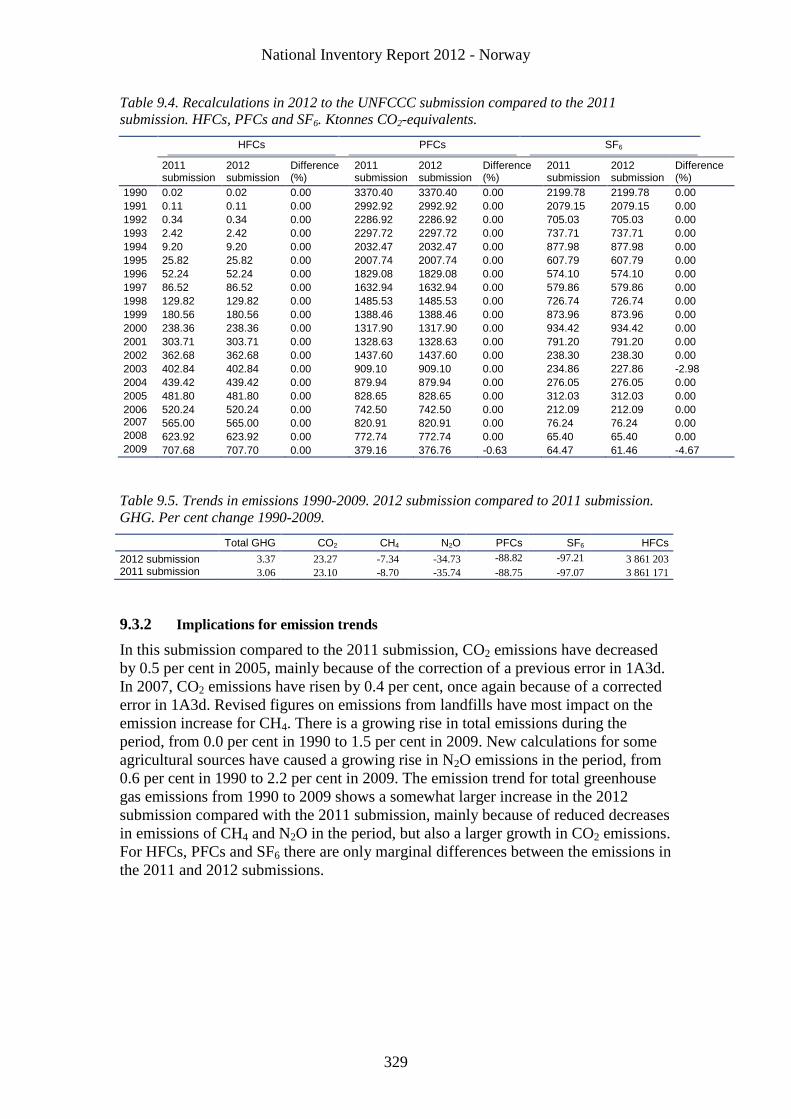
National Inventory Report 2012 - Norway
329
Table 9.4. Recalculations in 2012 to the UNFCCC submission compared to the 2011
submission. HFCs, PFCs and SF6. Ktonnes CO2-equivalents.
HFCs PFCs SF6
2011 submission
2012 submission
Difference (%)
2011 submission
2012 submission
Difference (%)
2011 submission
2012 submission
Difference (%)
1990 0.02 0.02 0.00 3370.40 3370.40 0.00 2199.78 2199.78 0.00
1991 0.11 0.11 0.00 2992.92 2992.92 0.00 2079.15 2079.15 0.00
1992 0.34 0.34 0.00 2286.92 2286.92 0.00 705.03 705.03 0.00
1993 2.42 2.42 0.00 2297.72 2297.72 0.00 737.71 737.71 0.00
1994 9.20 9.20 0.00 2032.47 2032.47 0.00 877.98 877.98 0.00
1995 25.82 25.82 0.00 2007.74 2007.74 0.00 607.79 607.79 0.00
1996 52.24 52.24 0.00 1829.08 1829.08 0.00 574.10 574.10 0.00
1997 86.52 86.52 0.00 1632.94 1632.94 0.00 579.86 579.86 0.00
1998 129.82 129.82 0.00 1485.53 1485.53 0.00 726.74 726.74 0.00
1999 180.56 180.56 0.00 1388.46 1388.46 0.00 873.96 873.96 0.00
2000 238.36 238.36 0.00 1317.90 1317.90 0.00 934.42 934.42 0.00
2001 303.71 303.71 0.00 1328.63 1328.63 0.00 791.20 791.20 0.00
2002 362.68 362.68 0.00 1437.60 1437.60 0.00 238.30 238.30 0.00
2003 402.84 402.84 0.00 909.10 909.10 0.00 234.86 227.86 -2.98
2004 439.42 439.42 0.00 879.94 879.94 0.00 276.05 276.05 0.00
2005 481.80 481.80 0.00 828.65 828.65 0.00 312.03 312.03 0.00
2006 520.24 520.24 0.00 742.50 742.50 0.00 212.09 212.09 0.00 2007 565.00 565.00 0.00 820.91 820.91 0.00 76.24 76.24 0.00 2008 623.92 623.92 0.00 772.74 772.74 0.00 65.40 65.40 0.00 2009 707.68 707.70 0.00 379.16 376.76 -0.63 64.47 61.46 -4.67
Table 9.5. Trends in emissions 1990-2009. 2012 submission compared to 2011 submission.
GHG. Per cent change 1990-2009.
Total GHG CO2 CH4 N2O PFCs SF6 HFCs
2012 submission 3.37 23.27 -7.34 -34.73 -88.82 -97.21 3 861 203
2011 submission 3.06 23.10 -8.70 -35.74 -88.75 -97.07 3 861 171
9.3.2 Implications for emission trends
In this submission compared to the 2011 submission, CO2 emissions have decreased
by 0.5 per cent in 2005, mainly because of the correction of a previous error in 1A3d.
In 2007, CO2 emissions have risen by 0.4 per cent, once again because of a corrected
error in 1A3d. Revised figures on emissions from landfills have most impact on the
emission increase for CH4. There is a growing rise in total emissions during the
period, from 0.0 per cent in 1990 to 1.5 per cent in 2009. New calculations for some
agricultural sources have caused a growing rise in N2O emissions in the period, from
0.6 per cent in 1990 to 2.2 per cent in 2009. The emission trend for total greenhouse
gas emissions from 1990 to 2009 shows a somewhat larger increase in the 2012
submission compared with the 2011 submission, mainly because of reduced decreases
in emissions of CH4 and N2O in the period, but also a larger growth in CO2 emissions.
For HFCs, PFCs and SF6 there are only marginal differences between the emissions in
the 2011 and 2012 submissions.

National Inventory Report 2012 - Norway
330
10 Other (CRF sector 7) (if applicable)
Intentionally blank
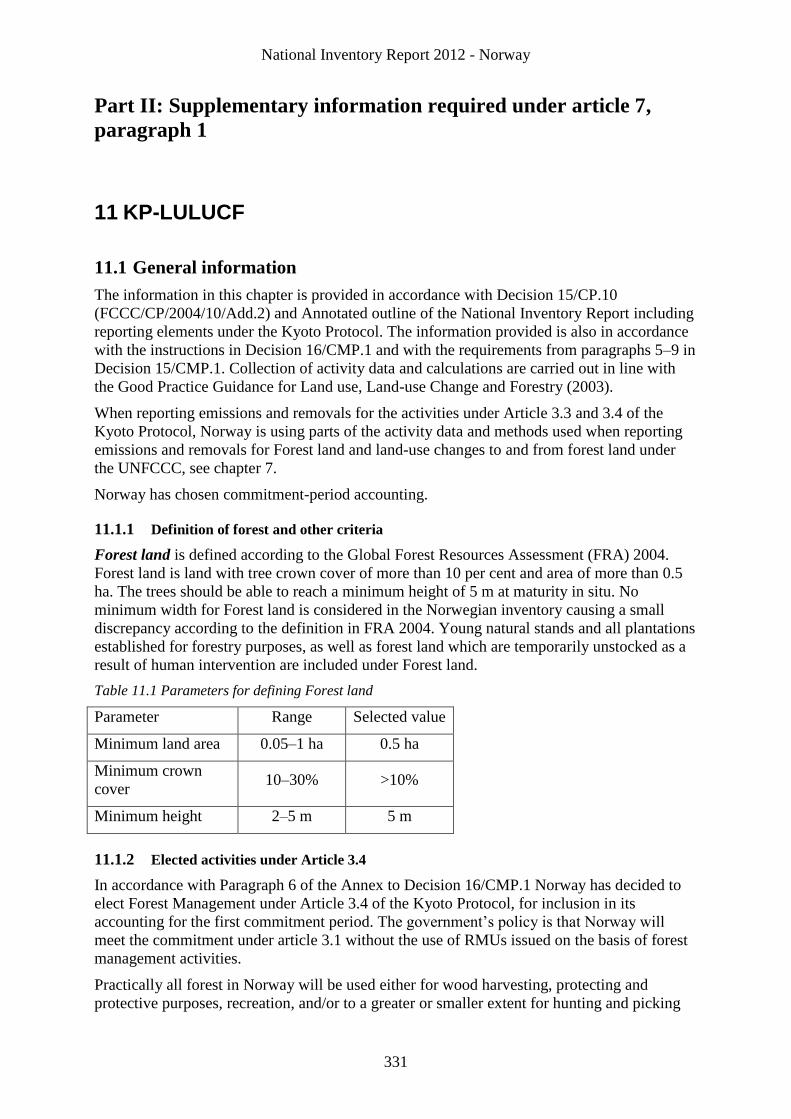
National Inventory Report 2012 - Norway
331
Part II: Supplementary information required under article 7,
paragraph 1
11 KP-LULUCF
11.1 General information
The information in this chapter is provided in accordance with Decision 15/CP.10
(FCCC/CP/2004/10/Add.2) and Annotated outline of the National Inventory Report including
reporting elements under the Kyoto Protocol. The information provided is also in accordance
with the instructions in Decision 16/CMP.1 and with the requirements from paragraphs 5–9 in
Decision 15/CMP.1. Collection of activity data and calculations are carried out in line with
the Good Practice Guidance for Land use, Land-use Change and Forestry (2003).
When reporting emissions and removals for the activities under Article 3.3 and 3.4 of the
Kyoto Protocol, Norway is using parts of the activity data and methods used when reporting
emissions and removals for Forest land and land-use changes to and from forest land under
the UNFCCC, see chapter 7.
Norway has chosen commitment-period accounting.
11.1.1 Definition of forest and other criteria
Forest land is defined according to the Global Forest Resources Assessment (FRA) 2004.
Forest land is land with tree crown cover of more than 10 per cent and area of more than 0.5
ha. The trees should be able to reach a minimum height of 5 m at maturity in situ. No
minimum width for Forest land is considered in the Norwegian inventory causing a small
discrepancy according to the definition in FRA 2004. Young natural stands and all plantations
established for forestry purposes, as well as forest land which are temporarily unstocked as a
result of human intervention are included under Forest land.
Table 11.1 Parameters for defining Forest land
Parameter Range Selected value
Minimum land area 0.05–1 ha 0.5 ha
Minimum crown
cover 10–30% >10%
Minimum height 2–5 m 5 m
11.1.2 Elected activities under Article 3.4
In accordance with Paragraph 6 of the Annex to Decision 16/CMP.1 Norway has decided to
elect Forest Management under Article 3.4 of the Kyoto Protocol, for inclusion in its
accounting for the first commitment period. The government’s policy is that Norway will
meet the commitment under article 3.1 without the use of RMUs issued on the basis of forest
management activities.
Practically all forest in Norway will be used either for wood harvesting, protecting and
protective purposes, recreation, and/or to a greater or smaller extent for hunting and picking
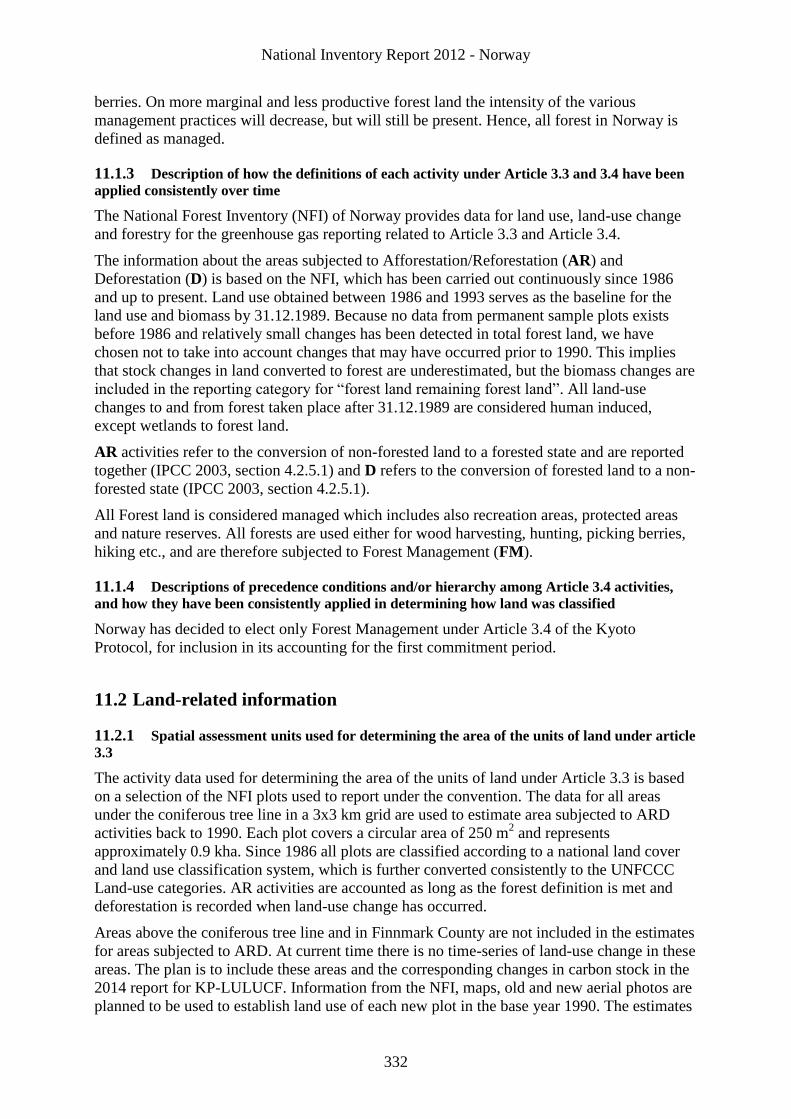
National Inventory Report 2012 - Norway
332
berries. On more marginal and less productive forest land the intensity of the various
management practices will decrease, but will still be present. Hence, all forest in Norway is
defined as managed.
11.1.3 Description of how the definitions of each activity under Article 3.3 and 3.4 have been
applied consistently over time
The National Forest Inventory (NFI) of Norway provides data for land use, land-use change
and forestry for the greenhouse gas reporting related to Article 3.3 and Article 3.4.
The information about the areas subjected to Afforestation/Reforestation (AR) and
Deforestation (D) is based on the NFI, which has been carried out continuously since 1986
and up to present. Land use obtained between 1986 and 1993 serves as the baseline for the
land use and biomass by 31.12.1989. Because no data from permanent sample plots exists
before 1986 and relatively small changes has been detected in total forest land, we have
chosen not to take into account changes that may have occurred prior to 1990. This implies
that stock changes in land converted to forest are underestimated, but the biomass changes are
included in the reporting category for “forest land remaining forest land”. All land-use
changes to and from forest taken place after 31.12.1989 are considered human induced,
except wetlands to forest land.
AR activities refer to the conversion of non-forested land to a forested state and are reported
together (IPCC 2003, section 4.2.5.1) and D refers to the conversion of forested land to a non-
forested state (IPCC 2003, section 4.2.5.1).
All Forest land is considered managed which includes also recreation areas, protected areas
and nature reserves. All forests are used either for wood harvesting, hunting, picking berries,
hiking etc., and are therefore subjected to Forest Management (FM).
11.1.4 Descriptions of precedence conditions and/or hierarchy among Article 3.4 activities,
and how they have been consistently applied in determining how land was classified
Norway has decided to elect only Forest Management under Article 3.4 of the Kyoto
Protocol, for inclusion in its accounting for the first commitment period.
11.2 Land-related information
11.2.1 Spatial assessment units used for determining the area of the units of land under article
3.3
The activity data used for determining the area of the units of land under Article 3.3 is based
on a selection of the NFI plots used to report under the convention. The data for all areas
under the coniferous tree line in a 3x3 km grid are used to estimate area subjected to ARD
activities back to 1990. Each plot covers a circular area of 250 m2 and represents
approximately 0.9 kha. Since 1986 all plots are classified according to a national land cover
and land use classification system, which is further converted consistently to the UNFCCC
Land-use categories. AR activities are accounted as long as the forest definition is met and
deforestation is recorded when land-use change has occurred.
Areas above the coniferous tree line and in Finnmark County are not included in the estimates
for areas subjected to ARD. At current time there is no time-series of land-use change in these
areas. The plan is to include these areas and the corresponding changes in carbon stock in the
2014 report for KP-LULUCF. Information from the NFI, maps, old and new aerial photos are
planned to be used to establish land use of each new plot in the base year 1990. The estimates
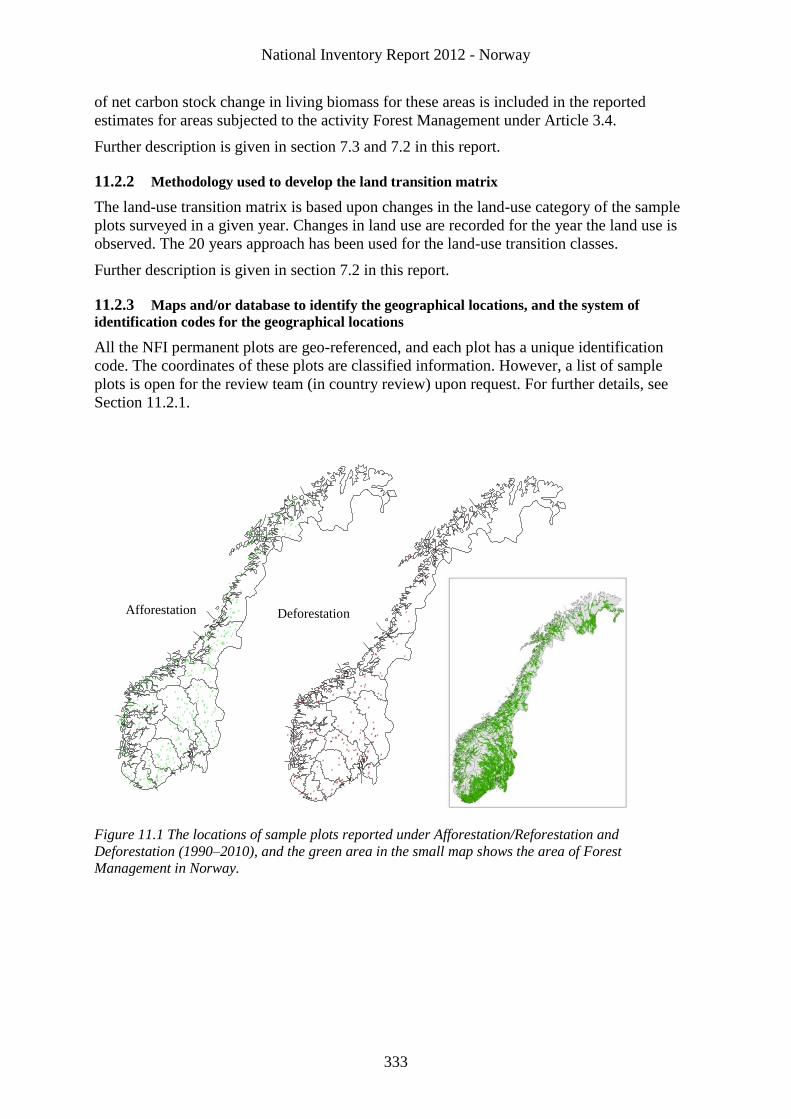
National Inventory Report 2012 - Norway
333
of net carbon stock change in living biomass for these areas is included in the reported
estimates for areas subjected to the activity Forest Management under Article 3.4.
Further description is given in section 7.3 and 7.2 in this report.
11.2.2 Methodology used to develop the land transition matrix
The land-use transition matrix is based upon changes in the land-use category of the sample
plots surveyed in a given year. Changes in land use are recorded for the year the land use is
observed. The 20 years approach has been used for the land-use transition classes.
Further description is given in section 7.2 in this report.
11.2.3 Maps and/or database to identify the geographical locations, and the system of
identification codes for the geographical locations
All the NFI permanent plots are geo-referenced, and each plot has a unique identification
code. The coordinates of these plots are classified information. However, a list of sample
plots is open for the review team (in country review) upon request. For further details, see
Section 11.2.1.
Figure 11.1 The locations of sample plots reported under Afforestation/Reforestation and
Deforestation (1990–2010), and the green area in the small map shows the area of Forest
Management in Norway.
#
# ##
##
##
# ##
# ## #
#
# #
#
#
# ##
# #
## #
# #
#
#
### #
# #
###
#####
## ###
## #
#
##
## ###
##
# ## ###
#
# # ####
# ## # #
#
## # #
#
#
##
#
# #
#
##
## #
#
##
##
###
# #
#
## # ##
####
#
# #####
# # ######
# ##
# ##
#
#
##
##
## #### # #
#
#
##
#
# #####
##
###
#
#
# # #
# #
##
#
##
#
#
###
#
# #
#
####
###
#
## #
##
##
#
#
##
##
#
# ##
# #
##
#
# # ##
## #
##
## ##
# # #
#
##
##
#
###
##
#
## #
# ##
# ##
##
###
#
##
## ##
#
#
## ##
#
#
#
##
##
###
##
#
#
##
#
#
##
###
#
# ##
# ###
##
# ## # ##
###
# ###
#
#
#
#
#
#### #
#
## #####
###
##
## ##
##
#
###
#
#
####
##
##
# #
#
##
# ##
#
##
#
# #
##
##
#
#
#
# ##### ##
### ##
###
##
#
#
#
#
##
###
##
###
##
####
##
##
#
####
# # #
# #
##
#
#
##
##
# ##
##
# ##
## #
###
###
###
##
#
## #
####
#
# ## #
#
##
# # ###
#
#
##
#
##
# #
##
# # #### ##
#
#
###
#
##
##
#
###
# #
##
##
## ## #
##
#
##
#
#
## #
##
#
#
#
##
## #
##
## #
##
##
#
#
#
# ####
#
# #
# ####
#
## #
#
# ##
##
###
##
#
##
###
#
##
#
###
####
#
#
##
#
#
#
##
#
#
# ##
##
#
###
###
#
#
##
####
# ##
##
####
####
### #
# ##
#
##
## #
#
#
##
# #
##
#
# ##
# #
##
###
#
#
#
#
##
#
#
#
#
#
##
#
####
##
# #
# #
##
##
#
Afforestation Deforestation
National Inventory Report 2012 - Norway
334
11.3 Activity specific Information
11.3.1 Methods for carbon stock change and GHG emission and removal estimates
11.3.1.1 Description of the methodologies and the underlying assumptions used
Carbon stock changes in living biomass
The calculations of carbon stock changes in living biomass are based on data obtained from
the NFI. The reported carbon refers to the biomass of all living trees with a height of at least
1.3 m. Thus, small trees, shrubs and other vegetation, such as herbs are not included in the
figures for areas subject to activities under Article 3.3. The biomass of trees with a stem
diameter larger than 50 mm measured 1.3 m above the ground is individually monitored.
Swedish single tree allometric regression functions developed for Norway spruce, Scots pine
and birch are applied to estimate the biomass (Marklund 1988, Petersson and Ståhl 2006). It is
possible to match the biomass to land use for each tree.
The estimates reported for areas subject to Forest Management under Article 3.4 are
calculated by using the activity data and methods for forest land remaining forest land
described in 7.2.1.1 and 7.3.1. The same method as described above for Article 3.3 is used to
calculate carbon stock change in living biomass for Forest Management. In addition, the
estimate for Forest Management also includes carbon stock for small trees, mountain birch
areas and forests in Finnmark County. This is further described in chapter 7.3.1.1.
Norway has selected to use the stock change method to estimate emissions and removals for
forest land remaining forest land, land converted to forest land and forest land converted to
other land-use categories, and hence for land subject to ARD activities. Fixed emission
factors (Mg CO2ha-1
) are therefore not used in the current submission.
Further description is given in section 7.3 Forest land in this report.
Change in carbon stock in dead organic matter and in soil
The dynamic soil model Yasso as described in detail by Liski et al. (2005), and for Norwegian
conditions by de Wit et al. (2006), is used to calculate changes in carbon stock in dead
organic matter and in soil for Forest Management. The calculations are hence done according
to a Tier 3 method. The current implementation of the Yasso model is not designed for
obtaining estimates of dead organic matter and soil organic carbon for disaggregated areas or
land-use categories other than forest land remaining forest land. Therefore, we have applied
the soil carbon model Yasso07 for the land converted to forest land (AR) and forest land
converted to Settlements and Other land (D) (Liski et al 2009). For Forest land converted to
Cropland or Grassland emission factors are used. The model produced an aggregated estimate
of carbon stock change for the total of the litter, dead wood and soil organic matter. It is not
possible to obtain separate estimates for these components with the current version of the
model.
Further description is given in Chapter 7.3.1 and 7.3.2.
11.3.1.2 Justification when omitting any carbon pool or GHG emissions/removals from
activities under Article 3.3 and elected activities under Article 3.4
With the current system it is not possible to obtain separate estimates for net carbon stock
change for litter, dead wood and soil for areas subjected to ARD. The model Yasso07
produced an aggregate estimate for carbon stock change for the total of litter, dead wood and
soil organic matter. The aggregated value is reported under soil for areas subject to ARD
National Inventory Report 2012 - Norway
335
activities. Therefore, the notation key IE is used for the carbon pools litter and dead wood in
NIR 1.
During the centralized review in 2010, Norway provided (in the answer to the Saturday paper)
preliminary estimates for carbon stock changes in dead wood for areas subjected to ARD. The
material and methods used was based on data of dead wood observed on the permanent NFI
plots. Further description can be found in the paper “The Reponses to the Potential Problems
and Further Questions from the ERT formulated in the course of the 2010 review of the
greenhouse gas inventories of Norway submitted in 2010: KP-LULUCF“, which is available
on request. The dataset used for areas subjected to AR was small as it covers only one year
out of the five year cycle (2010-2014). The preliminary results indicate that dead wood
represents a sink (12.09 Gg carbon year-1
) on areas subjected to AR. Norway assumes that all
carbon in dead wood is released at the time of deforestation, and hence dead wood became a
source of CO2 emission (10.61 Gg carbon year-1
). The estimate of carbon in dead wood is an
average value based on the amount of dead wood on forest land prior to deforestation, hence
the value is fixed for all years. These estimates cannot at the moment be used to verify or
demonstrate that dead wood in afforestation/reforestation (AR) and deforestation (D) areas are
not a net source or a sink of anthropogenic greenhouse gas emissions, because the uncertainty
in these estimates is very high. This will, however, be improved when the current NFI cycle is
completed after 5 years in 2014. Since Norway are providing aggregated estimates for carbon
stock change for the total of litter, dead wood and soil organic matter based on the Yasso07
model, the preliminary estimates of removals and emission for dead wood on areas subjected
to ARD are not included in the inventory in order to avoid double accounting.
Controlled biomass burning does not occur on land subjected to ARD and FM activities. The
reported emission for biomass burning is in accordance with wild fires. It is not possible to
assign the wild fire statistics to land subject to ARD activities. Therefore, the emissions are
reported as IE and included under FM (R in NIR 1). CO2 emissions from biomass burning
caused by wildfires are included under changes in carbon stock (IE in NIR 1). This is due to
the use of the stock change method.
Middle aged or older forest stands on mineral soils are sometimes fertilized to increase the
forest production. All fertilization is therefore assumed to occur on Forest land remaining
Forest land and reported as IE for AR in NIR 1. Furthermore, the available statistics on
applied amount of fertilizers is not designed for obtaining estimates of emission for
disaggregated areas subjected to AR activities.
Within current agricultural practice, lime is applied almost exclusively on cropland. Lime is
applied on agricultural soil but not on forest soils. Furthermore, the available statistics of
applied amount of lime is not designed for obtaining estimates of emission for disaggregated
areas. Thus, all lime has been reported as occurring in cropland remaining cropland (IE in
NIR 1).
11.3.1.3 Information on whether or not indirect and natural GHG emissions and
removals have been factored out
Indirect and natural GHG emissions and removals have not been factored out.
11.3.1.4 Changes in data and methods since the previous submission (recalculations)
The activity data has been updated. All given estimates are carried out in accordance to the
IPCC Good practice guidance for LULUCF (2003). The same method as used in the 2011
National Inventory Report 2012 - Norway
336
submission, to estimate carbon stock change in soil for areas subject to ARD activities is
applied.
11.3.1.5 Uncertainty estimates
Uncertainty estimates for Article 3.3 and 3.4 are required according to Marrakesh Accords.
Norway is not able to provide uncertainty estimates for Article 3.3 and 3.4 for this inventory.
The Norwegian Forest and Landscape Institute started a project 01.09.2011, that has as the
goal to provide uncertainty estimates both for Article 3.3 and 3.4. The uncertainty estimates
used in the Key category analysis for the LULUCF sector are mainly based on Expert
judgments. The plan is to provide preliminary estimates at the latest in 2013 and the final
estimates in the submission of 2014.
11.3.1.6 Information on other methodological issues
The methods used to estimate emissions and removals from ARD activities are of the same
tier method as those used for the UNFCCC reporting.
11.3.1.7 The year of the onset of an activity, if after 2008
Not applicable for this submission.
11.4 Article 3.3
11.4.1 Information that demonstrates that activities under Article 3.3 began on or after l
January 1990 and before 31 December 2012 and are direct human-induced
The NFI will cover the period of consideration. The permanent plots were installed from 1986
until 1993. From 1994 and onwards the plots have been surveyed continuously in a five year
cycle. By assessing the national land cover- and land use class for all the plots the NFI records
directly land-use changes to and from forest. Since 1994 all the ARD activities are considered
to be human induced.
11.4.2 Information on how harvesting or forest disturbance that is followed by the re-
establishment of forest is distinguished from deforestation
Young natural stands and all plantations established for forestry purposes, as well as forest
land which are temporarily unstocked as a result of human intervention, are included under
Forest land and not treated as deforestation. The NFI teams assess land cover and land use
according to national criteria (see Table 7.3 in section 7.2 Source category descriptions – NIR
2012) that are defined in the field instruction23. They are also trained to distinguish between
forest management operations and land-use change. The basic steps or a decision tree to
explain how this is done are planned to be included in future annual submissions, at least
when the reporting for the commitment period is due in 2014.
11.4.3 Information on the size and geographical location of forest areas that have lost forest
cover but which are not yet classified as deforested.
Not applicable for this submission.
23
Landsskogtakseringens feltinstruks 2010,
http://www.skogoglandskap.no/publikasjon/landsskogtakseringens_feltinstruks_2010

National Inventory Report 2012 - Norway
337
11.5 Article 3.4
11.5.1 Information that demonstrates that activities under Article 3.4 have occurred since l
January 1990 and are human-induced
All forests in Norway are subjected to FM. Hence, all land-use change to and from Forest
land occurred after 1990 are human-induced. The permanent NFI plots were installed from
1986 until 1993. From 1994 and onwards the plots have been surveyed continuously in a five
year cycle. By assessing the national land cover- and land use class for all plots the NFI
records directly land use changes to and from forests (see Table 7.3 in section 7.2 Source
category descriptions – NIR 2012).
11.5.2 Information relating to Cropland Management, Grazing Land Management and
Revegetation, if elected, for the base year
Norway has not elected Cropland Management, Grazing Land Management and Revegetation
and have therefore used the notation key NA in Table NIR 1.
11.5.3 Information relating to Forest Management:
For the purpose of the reporting under the Kyoto Protocol the definition of forest is in
accordance with the definition in item 11.1.1 above.
Practically all forest in Norway will be used either for wood harvesting, protecting and
protective purposes, recreation, and/or to a greater or smaller extent for hunting and picking
berries. On more marginal and less productive forest land the intensity of the various
management practices will decrease, but will still be present. Hence, all forest in Norway is
defined as managed.
11.6 Other information
11.6.1 Key category analysis for Article 3.3 activities and any elected activities under Article
3.4.
Information in NIR 3 is provided for FM in this submission. A description of the key
categories can however be seen in Section 7.1.3 in NIR 2012. According to the level
assessment analysis Land converted to Settlements – living biomass is a key category and
according to the trend assessment Land converted to forest land – living biomass is a Key
category.
11.7 Information relating to Article 6
There are no Article 6 activities concerning the LULUCF sector in Norway.
National Inventory Report 2012 - Norway
338
12 Information on accounting of Kyoto units
12.1 Background information
Norway’s Standard Electronic Format (SEF) report for 2011 containing the
information required in paragraph 11 of the annex to decision 15/CMP.1 and adhering
to the guidelines of the SEF can be found in annex VIII to this document. The file is
named SEF_NO_2012_1_12-54-24 15-2-2012.xls.
12.2 Summary of information reported in the SEF tables
There were 270,075,620 AAUs in Norway’s national registry at the end of the year
2011. Of these units, 197,478,782 units were held in Party holding accounts;
18,785,282 units in entity holding accounts; 32,966 units in other cancellation
accounts and 53,778,590 units in the retirement account.
There were 747,944 ERUs in the registry at the end of 2011. The Party holding
accounts held 95,123 ERUs; the entity holding accounts held 309,303 ERUs and the
retirement account held 343,518 ERUs.
There were 9,057,797 CERs in the registry at the end of 2011. 2,284,852 CERs were
held in Party holding accounts; 2,942,117 CERs were held in entity holding accounts;
60,305 CERs were held in other cancellation accounts and 3,770,523 CERs were held
in the retirement account.
The registry did not contain any RMUs, tCERs or lCERs. The following account
types did not contain any units:
Article 3.3/3.4 net source cancellation accounts
Non-compliance cancellation accounts
tCER replacement account for expiry
lCER replacement account for expiry
lCER replacement account for reversal of storage
lCER replacement account for non-submission of certification report
The total amount of the units in the registry at the end of 2011 corresponded to
279,881,361 tonnes of CO2 eq. Norway’s assigned amount is 250,576,797 tonnes of
CO2 eq.
National Inventory Report 2012 - Norway
339
12.3 Discrepancies and notifications
Annual Submission Item Reporting information
15/CMP.1 annex I.E paragraph 12:
List of discrepant transactions
No discrepant transactions occurred in 2011.
15/CMP.1 annex I.E paragraph 13 & 14:
List of CDM notifications
No CDM notifications occurred in 2011.
15/CMP.1 annex I.E paragraph 15:
List of non-replacements
No non-replacements occurred in 2011.
15/CMP.1 annex I.E paragraph 16:
List of invalid units
No invalid units exist as at 31 December 2011.
15/CMP.1 annex I.E paragraph 17
Actions and changes to address
discrepancies
No actions were taken or changes made to address
discrepancies for the period under review, ref
information given to submission item 15/CMP.1
annex I.E paragraph 12.
12.4 Publicly accessible information
Information relating to the Norwegian registry which is deemed to be public
information can be accessed via the webpage of the Norwegian registry –
www.kvoteregister.no/publicreports.
In accordance with the requirements of Annex E to Decision 13/CMP.1, all required
information for a Party with an active Kyoto registry is provided with the exceptions
as outlined below:.
Account Information (Paragraph 45) and Account holders authorised to hold Kyoto
units in their account (Paragraph 48)
In light of the amendments of Regulation (EC) No 2216/2004 introduced by Article
78 of Regulation (EC) No 920/2010 (EU Registries Regulation24) and for security
reasons, it is considered that the account representative information as required in
paragraph 45 and paragraph 48 is held as confidential. This information is therefore
not publicly available.
JI projects in Norway (Paragraph 46)
No information on Article 6 (Joint Implementation) projects is publicly available as
conversion to an ERU under an Article 6 project did not occur in Norway in 2011.
Holding and transaction information of units (Paragraph 47)
General remarks
24
Norway is one of three EFTA states which have signed an agreement with the EU creating the European
Economic Area – the EEA agreement. All new relevant EU legislation is (with minor exceptions)
dynamically incorporated into the Agreement and thus applies throughout the EEA. Any
reference to EU legislation in this chapter thus applies to Norway
National Inventory Report 2012 - Norway
340
Holding and transaction information is provided on a holding type level due to more
detailed information being declared confidential by EU Regulation, ref. paragraph
47(a), 47(d), 47(f) and 47(l).
Article 10 of Regulation (EC) 2216/2004, provides that “All information, including
the holdings of all accounts and all transactions made, held in the registries and the
Community independent transaction log shall be considered confidential for any
purpose other than the implementation of the requirements of this Regulation,
Directive 2003/87/EC or national law.”
Paragraph 47I
Norway does not host JI projects. Therefore no ERUs have been issued on the basis of
Article 6 projects.
Paragraph 47I
Norway does not perform LULUCF activities and therefore does not issue RMUs
Paragraph 47(g)
No ERUs, CERs, AAUs and RMUs were cancelled on the basis of activities under
Article 3, paragraphs 3 and 4 in 2011
Paragraph 47(h)
No ERUs, CERs, AAUs and RMUs were cancelled following determination by the
Compliance Committee that the Party is not in compliance with its commitment under
Article 3, paragraph 1 in 2011.
Paragraph 47k
There is no previous commitment period to carry ERUs, CERs, and AAUs over from.
12.5 Calculation of the commitment period reserve (CPR)
The reporting of the calculation of the commitment period reserve, pursuant to
decision 18/CMP.1, annex I.E is as follows:
The commitment period reserve is the lower of the two values given by 90 percent of
the assigned amount and five times 100 percent of the total emissions in the most
recently reviewed inventory. In the report of the review of the Initial Report, the
assigned amount was determined to be 250,576,797 tonnes CO2 equivalents. 90
percent of the assigned amount is 225,519,117 tonnes CO2 equivalents. The inventory
for the year 2008, submitted in 2010, is the most recently reviewed inventory for
Norway (FCCC/ARR/2010/NOR). The total emissions in 2008 amounted to
53,705,780 tonnes CO2 equivalents. (The emission estimate of 54,407,796 tonnes CO2
equivalents in Norways re-submission in November 2010 is incorrect, as
communicated by the Climate and Pollution Agency to the UNFCCC secretariat).
Five times 53,705,780 tonnes CO2 equivalents amounts to 268,528,900 tonnes CO2
equivalents. The value of 90 percent of the assigned amount is lower than the value
of five times 100 percent of the total emissions in 2008. Therefore, the commitment
period reserve is 225,519,117 tonnes CO2 equivalents.
National Inventory Report 2012 - Norway
341
13 Information on changes in the National System
13.1 Changes in the National Greenhouse Gas Inventory System
Comprehensive information regarding the national greenhouse gas inventory system
in Norway can be found in Annex V.
Annex V reflects the following changes in Norway's national system:
New routines for input data control were completed and implemented.
Reported emissions, emission factors and activity data for the latest inventory
year are routinely compared to those of the previous inventory year. In
addition, implied emissions factors are calculated for emissions from
stationary combustion at point sources and are compared to previous inventory
year.
A reorganisation at Statistics Norway that merges the emission inventory
group with the energy statistics.
The Climate and Pollution Agency has started to build up a physical and
electronic library with the most important methodology reports. More details
are found in Annex V.
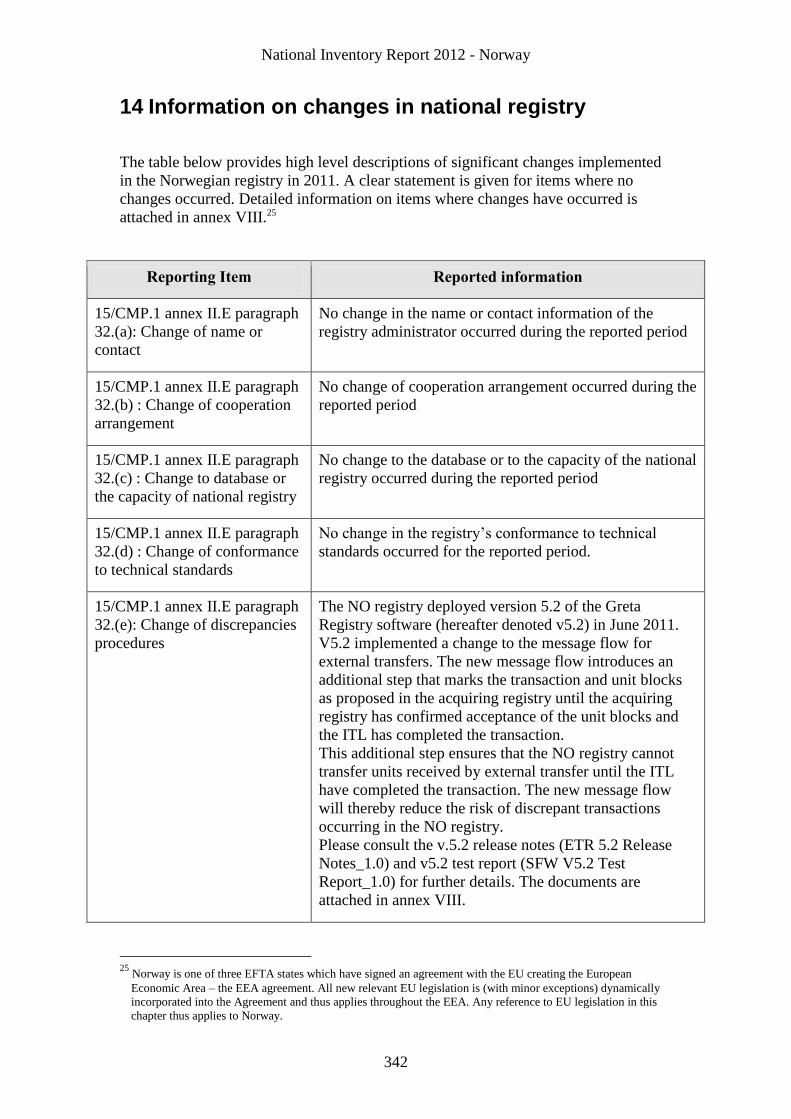
National Inventory Report 2012 - Norway
342
14 Information on changes in national registry
The table below provides high level descriptions of significant changes implemented
in the Norwegian registry in 2011. A clear statement is given for items where no
changes occurred. Detailed information on items where changes have occurred is
attached in annex VIII.25
Reporting Item Reported information
15/CMP.1 annex II.E paragraph
32.(a): Change of name or
contact
No change in the name or contact information of the
registry administrator occurred during the reported period
15/CMP.1 annex II.E paragraph
32.(b) : Change of cooperation
arrangement
No change of cooperation arrangement occurred during the
reported period
15/CMP.1 annex II.E paragraph
32.(c) : Change to database or
the capacity of national registry
No change to the database or to the capacity of the national
registry occurred during the reported period
15/CMP.1 annex II.E paragraph
32.(d) : Change of conformance
to technical standards
No change in the registry’s conformance to technical
standards occurred for the reported period.
15/CMP.1 annex II.E paragraph
32.(e): Change of discrepancies
procedures
The NO registry deployed version 5.2 of the Greta
Registry software (hereafter denoted v5.2) in June 2011.
V5.2 implemented a change to the message flow for
external transfers. The new message flow introduces an
additional step that marks the transaction and unit blocks
as proposed in the acquiring registry until the acquiring
registry has confirmed acceptance of the unit blocks and
the ITL has completed the transaction.
This additional step ensures that the NO registry cannot
transfer units received by external transfer until the ITL
have completed the transaction. The new message flow
will thereby reduce the risk of discrepant transactions
occurring in the NO registry.
Please consult the v.5.2 release notes (ETR 5.2 Release
Notes_1.0) and v5.2 test report (SFW V5.2 Test
Report_1.0) for further details. The documents are
attached in annex VIII.
25
Norway is one of three EFTA states which have signed an agreement with the EU creating the European
Economic Area – the EEA agreement. All new relevant EU legislation is (with minor exceptions) dynamically
incorporated into the Agreement and thus applies throughout the EEA. Any reference to EU legislation in this
chapter thus applies to Norway.
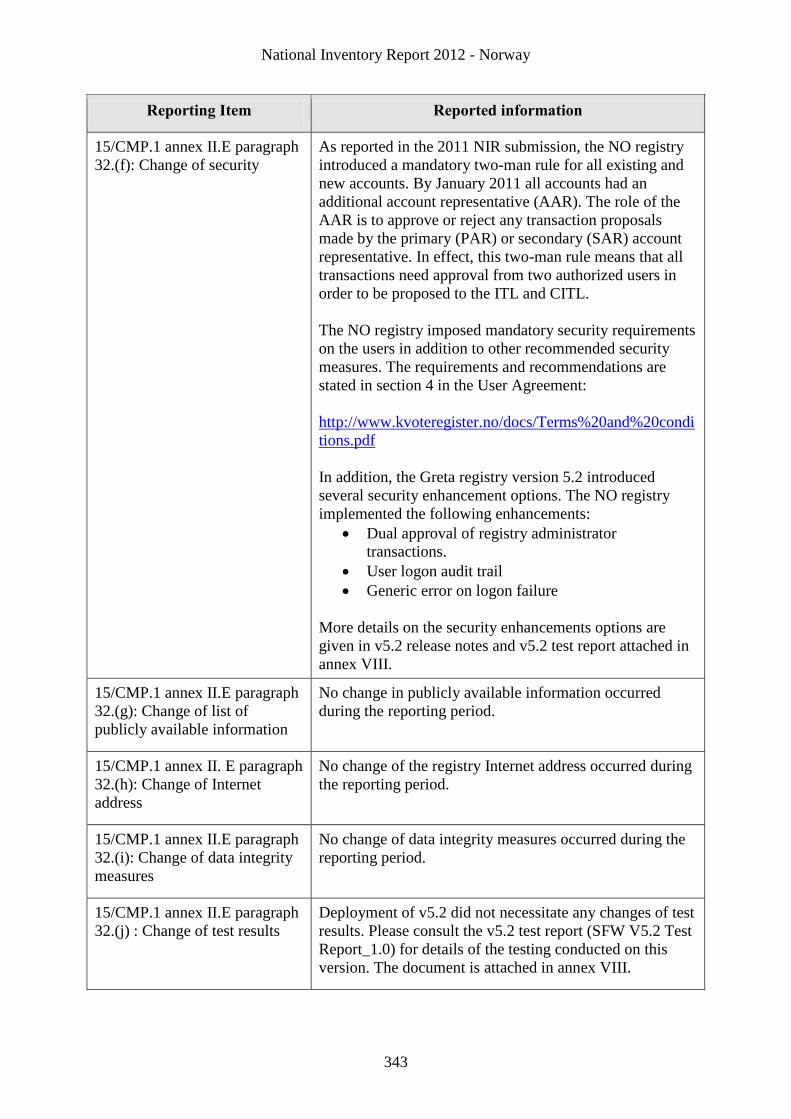
National Inventory Report 2012 - Norway
343
Reporting Item Reported information
15/CMP.1 annex II.E paragraph
32.(f): Change of security
As reported in the 2011 NIR submission, the NO registry
introduced a mandatory two-man rule for all existing and
new accounts. By January 2011 all accounts had an
additional account representative (AAR). The role of the
AAR is to approve or reject any transaction proposals
made by the primary (PAR) or secondary (SAR) account
representative. In effect, this two-man rule means that all
transactions need approval from two authorized users in
order to be proposed to the ITL and CITL.
The NO registry imposed mandatory security requirements
on the users in addition to other recommended security
measures. The requirements and recommendations are
stated in section 4 in the User Agreement:
http://www.kvoteregister.no/docs/Terms%20and%20condi
tions.pdf
In addition, the Greta registry version 5.2 introduced
several security enhancement options. The NO registry
implemented the following enhancements:
Dual approval of registry administrator
transactions.
User logon audit trail
Generic error on logon failure
More details on the security enhancements options are
given in v5.2 release notes and v5.2 test report attached in
annex VIII.
15/CMP.1 annex II.E paragraph
32.(g): Change of list of
publicly available information
No change in publicly available information occurred
during the reporting period.
15/CMP.1 annex II. E paragraph
32.(h): Change of Internet
address
No change of the registry Internet address occurred during
the reporting period.
15/CMP.1 annex II.E paragraph
32.(i): Change of data integrity
measures
No change of data integrity measures occurred during the
reporting period.
15/CMP.1 annex II.E paragraph
32.(j) : Change of test results
Deployment of v5.2 did not necessitate any changes of test
results. Please consult the v5.2 test report (SFW V5.2 Test
Report_1.0) for details of the testing conducted on this
version. The document is attached in annex VIII.

National Inventory Report 2012 - Norway
344
Reporting Item Reported information
Previous Annual Review
recommendations, ref
FCCC/ARR/2009/NOR
There are no recommendations related to registry
operations in the review report FCCC/ARR/2010/NOR.
No notices or recommendations are stated in section 1.2
Summary of Findings of the SIAR Part 2 Report
IAR/2010/NOR/2/1.
National Inventory Report 2012 - Norway
345
15 Information on minimization of adverse impacts in accordance with Article 3. Paragraph 14
Norway approaches the report on activities under Article 3.14 from the perspective of
being a major exporter of fossil fuels, although we recognize that this is only one
aspect of the potential social, environmental and economic impacts of mitigation.
Norway is well aware that taxation of fossil fuels, as well as other policies and
measures that influence demand of these, has implications for price and thus has
implications for the revenue earned by exporters. This is one of the reasons why
Norway emphasizes the need to devise cost-effective policies, thereby minimizing
such impacts. The final consequences are, however, uncertain and will generally also
depend on policies implemented by the producers.
Norway’s share of global consumption is so small that it is unlikely to significantly
affect these markets. Cost efficiency across all emission sources and sinks has guided
the development of policies and measures since Norway started to implement
measures to mitigate climate change two decades ago, and is applied when
implementing its commitments under Article 3.1 of the Kyoto Protocol.
Market prices and externalities:
In its economic, energy and environmental policies Norway strives to have a market-
based approach where prices reflect costs, including for externalities. The reflection
of the costs of externalities with respect to emissions of greenhouses gases is
undertaken through levies and the establishment of an emissions trading scheme. A
description of the structure of levies on energy commodities, as well as design of the
emissions trading scheme, can be found in chapter 4 of the Fifth National
Communication (NC 5).
Further, both the trading scheme and the levies are designed so that the international
price of emissions for units under the Clean Development Mechanism and the
European trading scheme is reflected in the domestic cost of emissions. The state has
also established a purchase programme which acquires the necessary number of
Kyoto units to comply with the commitments under Article 3.1, as well as the
unilateral target of reducing emissions by 10 percentage points more than its Kyoto
commitments (see NC 5 chapter 4.3.1.9). This programme, the design of the levy and
of the emissions trading system contributes to a cost-effective balance between
domestic measures and use of the Kyoto mechanisms.
Unsafe and unsound technologies:
Norway does not subsidize environmentally unsound and unsafe technologies, and
hence phasing out subsidies is not applicable. Norway is also a member of The
Friends of Fossil Fuel Subsidy Reform group.
Cooperation on carbon capture and storage
Due to its large mitigation potential, Norway has prioritized the development of
carbon capture and storage as a mitigation option. As a petroleum producer Norway
strives to reduce the emissions from the production and refining of petroleum. The
national carbon capture and storage projects already in operation, the Sleipner and

National Inventory Report 2012 - Norway
346
Snøhvit projects, and the newly approved Gudrun project, are in the petroleum sector.
Norway has taken steps to disseminate information and lessons learned. These efforts
are made both through international fora such as the Carbon Sequestration Leadership
Forum, and through bilateral cooperation with both developing and developed
countries. The results from the Sleipner Project are made available to interested
Parties.
The Storting (Norwegian parliament) has endorsed an action plan for dissemination of
information on carbon capture and storage as a mitigation option. Four geographical
areas have been given priority: Southern Africa, Indonesia, China and the Gulf States
(Saudi Arabia, Kuwait, The United Arab Emirates and Qatar). In addition the
Norwegian petroleum company Statoil ASA, which operates the Norwegian storage
projects, is a partner in the Algerian carbon capture and storage project in Salah. The
South African energy company Sasol is a partner in a test centre for CO2 capture
(Technology Centre Mongstad, please view NC 5 chapter 4.3.9).
Cooperation with developing countries related to fossil fuels – “Oil for Development”
The Norwegian Oil for Development (OfD) initiative aims at assisting developing
countries, at their request, in their efforts to manage petroleum resources in a way that
generates economic growth and promotes the welfare of the whole population in an
environmentally sustainable way. A description of the OfD programme can be found
at www.norad.no.
Decades of experience in the oil and gas sector has given Norway valuable expertise
on how to manage petroleum resources in a sustainable way. The Norwegian
expertise could be useful for developing countries with petroleum resources, or
countries that are in the exploration phase.
OfD takes a holistic approach through capacity and institution building of public
authorities in the partner countries. OfD's assistance covers technical assistance in the
following areas: the establishment of legal frameworks, administration and
supervision mechanisms, licensing and tendering processes, public/ private interfaces
of petroleum governance, local content and industrial development. In the
environmental management area, impact assessment studies are emphasized, so as to
consider the potential social and environmental impacts that petroleum activities may
have. Moreover, reducing emissions from gas flaring is another crucial element.
Revenue management considers the establishment of government take systems,
taxation, anti-corruption and petroleum funds.
As of 2011, Norway is primarily working with eight countries; Angola, Bolivia,
Ghana, Mozambique, Sudan, South-Sudan, Timor-Leste and Uganda, while 16
countries receive limited assistance. These are Afghanistan, Bangladesh, Ecuador,
Iraq, Ivory Coast, Kenya, Lebanon, Mauretania, Nicaragua, Nigeria, the Palestinian
Territory, São Tomé and Príncipe, South Africa, Tanzania, Vietnam and Zambia.
The OfD initiative was launched in 2005. The resources allocated to OfD grew from
about NOK 80 million in 2006 to NOK 205 million in 2008 and NOK 340 million in
2011. However, Norway through the Norwegian Petroleum Directorate and other
agencies has assisted developing countries with petroleum resources for almost 30
years. A Steering Committee has been established to formulate strategic direction,
guidelines and priorities for the OfD. The Steering Committee consists of the Ministry
of Foreign Affairs (Chair), the Ministry of Petroleum and Energy, the Ministry of
Finance and the Ministry of the Environment. The OfD secretariat is part of the
National Inventory Report 2012 - Norway
347
Norwegian Agency for Development Cooperation (Norad), and is responsible for the
coordination and implementation of the initiative. The Norwegian embassies play an
essential role in the OfD, as they have extensive development cooperation
responsibilities.
Key implementing agencies include the Norwegian Petroleum Directorate, Petrad
(International programme for petroleum management and administration), the Climate
and Pollution Agency, the Directorate for Nature Management and the Petroleum
Safety Authority. A range of consultancies and research institutions are also involved.
National and international NGOs are involved in the OfD initiative. These
organizations are involved in building civil society’s capacity on issues related to
governance and petroleum activities in OfD partner countries. Moreover, Norway
gives priority to the Extractive Industries Transparency Initiative (EITI. OfD also
works with the World Bank, International Monetary Fund, African Development
Bank and the UNDP. The Norwegian oil and gas industry is also drawn upon in
transferring expertise and knowledge.
National Inventory Report 2012 - Norway
348
REFERENCES
AEA (2007) UK's national atmospheric inventory http://www.naei.org.uk/
Aker
Engineering
(1992)
Direct Hydrocarbon Gas Emissions from Production and Riser Platforms
Anon (2006a) Estimates of emissions and removals resulting
from activities under article 3.3 and 3.4 of the
Kyoto protocol. Commissioned Report by Skog
og landskap 2/06.
Anon (2006b) Framework for reporting under Article 3.3 and 3.4 of the Kyoto Protocol. Commissioned
Report by Skog og landskap 1/06
. Austria NIR
2010
Austria’s National Inventory Report 2010. SREPORT REP-0265Framework Convention on
Climate Change and the Kyoto Protocol. Environment Agency Austria.
Avfall Norge
2006
Fornybar andel i avfall til norske forbrenningsanlegg. Rapport av Mepex Consult AS/PROFU
AB. Avfall Norge 2006. ISBN 82-8035-059-4
Bang, J. (1993) Utslipp fra dieseldrevne anleggsmaskiner, arbeidsredskaper, traktorer og lokomotiver
(Emissions from diesel-powered construction machinery, tools, tractors and locomotives), Oslo:
National Institute of Technology.
Bang, J. (1996) Utslipp av NMVOC fra fritidsbåter og bensindrevne motorredskaper (Emissions of NMVOC
from leisure craft and gasoline-powered equipment), Oslo: National Institute of Technology.
Barlaz, M.
(2004):
National Council for Air and Stream Improvement USA, Technical Bulletin no. 872, March
2004.
Bengtson, G.
(1975)
Riksstaxeringens inventering av virkesspill 1975. Institusjonen för skogtaxering.
Skoghögskolan, Stockholm. PHU-rapport nr. 19, 34 s.
Bergfald & Co
as (2000)
Emissions of methane from coal mining at Svalbard. (Only in Norwegian)
Bjørketun and
Nilsson (2007)
Skaderisker för motorcyklister, Rapport 566, Linköping: VTI
Bolstad, T.
(1994)
Utskilling av nitrogen og fosfor i gjødsel og urin frå husdyr i Norge (Nitrogen and phosphorus
in manure and urine from domestic animals in Norway), Department of animal science, Ås:
Agricultural University of Norway.
Braastad, H.
(1966) Volumtabeller for bjørk. Meddelelser fra det norske Skogforsøksvesen. 21:23-78.
Brantseg, A.
(1967) Furu sønnafjells. Kubering av stående skog. Funksjoner og tabeller. Meddr norske SkogforsVes. 22:689-739.
National Inventory Report 2012 - Norway
349
Bye, A.S.,
Gundersen, G.I.
and Stave, S.E.
(2002)
Resultatkontroll i jordbruket 2002. Jordbruk og miljø. Oslo-Konsgvinger. Rapporter 2002/19
Bye, A.S.,
Gundersen,
G.I., Sandmo,
T. and Berge,
G. (2005)
Resultatkontroll i jordbruket 2005. Jordbruk og miljø. Rapporter 2005/31
Climate and
Pollution
Agency
(2011a)
http://www.klif.no/Tema/Klima-og-ozon/CO2-kvoter/Klimakvoter-for-2008/
Climate and
Pollution
Agency
(2011b)
CO2 –faktor for fossil del av avfallet som blir brent i avfallsforbrenningsanlegg i Norge. (CO2
emission factor for the fossil part of waste combusted in waste incineration plants in Norway).
Note from Climate and Pollution Agency, Eilev Gjerald, 20.1.2011.
Denmark NIR
(2010)
National Inventory Report, Danmark, til UNFCCC. 2010.
http://unfccc.int/files/national_reports/annex_i_ghg_inventories/national_inventories_submissio
ns/application/zip/dnk-2010-nir-27may.zip
Dämmgen et al
(2002)
GAS-EM – A Procedure to Calculate Gaseous Emissions from Agriculture, Landbauforschung
Völkenrode, 52, 19-42. Dämmgen, U., Lüttich, M., Döhler, H., Eurich-Menden, B. and
Osterburg, B.
de Wit, H. A.
and S.
Kvindesland
(1999)
Carbon in Norwegian forest soils and effects of forest management on carbon storage. Rapport
fra Skogforskningen. Aas, Norwegian Forest Research Institute: 52.
De Wit, H.A.,
Palosuo, T,
Hylen, G. and
Liski, J. (2006)
A carbon budget of forest biomass and soils in southeast Norway calculated using a widely applicable method. Forest Ecology and Management, 225 (1-3): 15-16.
Directorate for
Health and
Social Affairs
2006
Utviklingen i Norsk kosthold. Matforsyningsstatistikk og Forbruksundersøkelser. Sosial- og
helsedirektoratet (2006). 12/2006. IS-1407
Daasvatn et al.
(1992) Modell for beregning av nasjonale utslipp til luft. Dokumentasjon (Model for calculation of national air emissions. Documentation). Daasvatn L., K. Flugsrud, H. Høie, K. Rypdal, T. Sandmo. Interne notater 92/17, Statistics Norway.
Daasvatn et al.
(1994)
Beregning av regionaliserte utslipp til luft. Beskrivelse av modellog metoder for estimering
(Calculation of emissions to air on a regional basis. Description of a model and estimation
methods). Daasvatn, L., K. Flugsrud, O.K. Hunnes and K. Rypdal. Notater 94/16, Statistics
Norway.
ECETOC
(1994)
Ammonia Emissions to Air in Western Europe, ECETOC Technical report No. 62, Brussels,
Belgium.
EEA (1996) EMEP/Corinair. The Atmospheric Emission Inventory Guidebook.
First edition, Copenhagen: European Environmental Agency.
National Inventory Report 2012 - Norway
350
EEA (2001) Atmospheric Emission Inventory Guidebook.
EMEP. CORINAIR. 3rd
Edition. November 2001
EEA (2007) Emission Inventory Guidebook – 2007 (Internet version). Group 6. A joint EMEP/CORINAIR
Production http://reports.eea.europa.eu/EMEPCORINAIR5/en/page002.html
EEA (2009) EMEP/EEA air pollutant emission inventory guidebook – 2009, Technical report No 6/2009
Copenhagen: European environment agency http://www.eea.europa.eu/publications/emep-eea-
emission-inventory-guidebook-2009/
EPA (1986) Ferro-alloy industy particulate emissions: Source category report, EPA/600/7-86/039, U.S.
environmental protection agency.
EU project
NNE-1999-
00521
Final Technical Report of the SACS2 project, issued 30. Aug. 2002
FAO/ECE
(1985)
The forest resources of the ECE region (Europe, the USSR, North America). Report No. UN-
ECE—TIM(27), Geneva.
Geological
Society of
London
Memoir
4D seismic imaging of an injected CO2 plume at the Sleipner field, central North Sea (under
publishing)
Grønlund, A.,
Hauge, A. og
Hovde A.
(2008a)
Carbon loss estimates from cultivated peat soils in Norway: a comparison of three methods.
Nutr. Cycl. Agroecosyst. 81:157-167.
Grønlund, A.,
Knoth de
Zarruk, K.,
Rasse, D.,
Riley, H.,
Klakegg O og
Nystuen, I.
(2008b)
Kunnskapsstatus for utslipp og binding av karbon i jordbruksjord. Bioforsk Rapport vol. 3
(132).
Gustafsson
(2005)
Improved structures for uncertainty analysis in the Swedish Greenhouse Gas Emission
Inventory. SMED, Swedish Methodology for Environmental Data
Hohle, E.E.ed.)
(2005)
Bioenergi. Miljø, teknikk og marked (Bio energy. Environment, technology and market),
Brandbu: Energigården.
Holmengen, N.
and Kittilsen,
M. O. (2009)
Revised method for estimating emissions of NMVOC from solvent and other product use in
Norway. Report 2009/14, Statistics Norway
Hutchings et al.
(2001)
A detailed ammonia emission inventory for Denmark. Hutchings, N.J., Sommer, S.G.,
Andersen, J.M. and Asman, W.A.H. 2001, Atmospheric Environment 35:1959-1968
IAI (2005) The aluminium sector greenhouse gas protocol, 2005.
IMC (2000) Seam Gas Content Analysis. Technical Services Limited.
National Inventory Report 2012 - Norway
351
INFRAS
(2009)
Handbook emission factors for road transport (HBEFA). INFRAS 2009.
http://www.hbefa.net/e/index.html
Institute of
transport
economics
(1993)
Norske reisevaner. Dokumentasjonsrapport for den landsomfattende reisevaneundersøkelsen
1991-92, Oslo: Institute of transport economics
IPCC (1997a) Greenhouse Gas Inventory. Workbook. IPCC Guidelines for National Greenhouse Gas
Inventories, Volume 2, London: Intergovernmental Panel on Climate Change.
IPCC (1997b) Greenhouse Gas Inventory. Reference Manual. Revised 1996. IPCC Guidelines for National
Greenhouse Gas Inventories, Volume 3, London: Intergovernmental Panel on Climate Change.
IPCC (2000) Good Practice Guidance and Uncertainty Management in National Greenhouse Gas Inventories, Prepared by the National Greenhouse Gas Inventories Programme, J Penman, D Kruger, I Galbally, T Hiraishi, B Nyenzi, S Emmanul, L Buendia, R Hoppaus, T Martinsen, J Meijer, K Miwa and K Tanabe. Published for the IPCC by the Institute for Global Environmental Strategies, Japan.
IPCC (2001) Intergovernmental Panel on Climate Change (IPCC), Climate Change 2001. The Scientific
Basis. EDS J.T. Houghton, Y.Ding, D.J. Griggs, M.Noguer, P.J. van der Linden, X.Dai, K.
Maskell and C.A. Johnson, Cambridge University Press, New York. Pp. 881, 2001.
IPCC (2003) Good Practice Guidance for Land Use, Land-Use Change and Forestry. (J. Penman et al., eds.).
IPCC National Greenhouse Gas Inventories Programme. Institute for Global Environmental
Strategies, Hayama, Kanagawa, Japan. ISBN 4-88788-003-0.
IPCC (2006) 2006 IPCC Guidelines for National Greenhouse Gas Inventories, Prepared by the National
Greenhouse Gas Inventories Programme, Eggleston H.S., Buendia L., Miwa K., Ngara T. and
Tanabe K. (eds).Published: IGES, Japan.
IVAM (2005) VOC emissions from cosmetics and cleaning agents. – IVAM research and consultancy on
sustainability, Amsterdam, the Netherlands.
Johansson and
Solvoll (1999)
Landsomfattende kostholdsundersøkelse blant menn og kvinner i alderen 16-79 år. Johansson
L. and K.Solvoll (1999). Norkost 1997, Rapport nr. 2/1999
http://www.shdir.no/vp/multimedia/archive/00003/IS-0168_3745a.pdf.
Jonson, T.
(1928)
Några nya metoder för beräkning av stamvolym och tillväxt hos stående träd (Some new
methods for calculating volume and increment of standing timber). Särtryck ur
Skogshögskolans festskrift 1928. Svenska Skogsvårdsföreningens Förlag.
Larsson, J.Y &
Hylen, G.
(2007)
Skog i Norge. Statistikk over skogforhold og skogressurser i Norge registrert i perioden 2000-
2004 [Statistics of forest conditions and forest resources in Norway]. Viten fra Skog og
landskap 1/07:91 s.
Liski, J.,
Palosuo, T.,
Peltoniemi, M.
And Sievänen,
R. (2005)
Carbon and decomposition model Yasso for forest soil. Ecol. Modell. 189, 168-182
National Inventory Report 2012 - Norway
352
MARINTEK
(2010)
Emissions factors for CH4, NOX, particulates and black carbon for domestic shipping in
Norway, revision 1. Authors: Jørgen B. Nielsen and Dag Stenersen.
Report 222232.00.02.
http://www.klif.no/no/Publikasjoner/Publikasjoner/2010/November/Emission-factors-for-CH4-
NOx-particulates-and-black-carbon-for-domestic-shipping-in-Norway-revision-1/
Marklund,
L.G., (1988)
Biomassefunktioner för tall, gran och björk i Sverige. Biomass functions for pine, spruce and
birch in Sweden. Institusjonen för skogtaxering. Sveriges Lantbruksuniversitet. Rapport 45, 1-
73.
Morken, J.
(2003)
Evaluering av ammoniakkutslippsmodellen (Evaluation of the ammonia emission model),
internal note, Department of Agricultural Engineering, Norwegian University of Life Sciences.
Morken, J. and
L. Nesheim
(2004)
Utnytting og tap av næringsstoff i husdyrgjødsel – framtidige utfordringar, Grønn kunnskap
Vol. 8 Nr. 3-2004, 51-64.
NIJOS (2005) Emissions and removals of greenhouse gases from land use, land-use change and forestry in
Norway Report 11/05, Ås: Norwegian institute of land inventory (NIJOS). Rypdal, K., Bloch,
V.V.H., Flugsrud, K., Gobakken, T., Hoem, B., Tomter, S.M. and Aalde. H.
http://www.skogoglandskap.no/publikasjon/nj_rapport_11_05
NILF (2010) Totalkalkylen for jordbruket
http://www.nilf.no/Totalkalkylen/Bm/2009/BMposter/BM_R_220B.shtml
Norcem (2006) Usikkerhet i utslippsfaktorer i forbindelse med rapporteringen av CO2-utslipp. Rapport nr 9A-
R06-002
Norddal (2010) Miljørapport for innenriks ferjetrafikk 2009. Norddal, T. Sjøfratsdirektoratet, Statens vegvesen,
Rederienes Landsforening.
Norwegian
Food Safety
Authority
(Annually):
Statistikk. Mineralgjødsel
http://www.mattilsynet.no/planter/gjodsler/omsetningsstatistikker/statistikk__mineralgj_dsel_18
420
NPD (2001) Forskrift om måling av petroleum for fiskale formål og for beregning av CO2-avgift
(Regulation on measurements of petroleum for fiscal purposes and for the calculation of the
CO2 tax) – 1. november 2001 Oljedirektoratet (OD)
http://www.npd.no/regelverk/r2002/frame_n.htm
OED/NPD
(2011)
Facts 2011 - The Norwegian petroleum sector. The Ministry of Petroleum and Energy together
with the Norwegian Petroleum Directorate. Published June 2011.
http://www.npd.no/en/Publications/Facts/Facts-2011/
OED (2002)
St. prop. Nr 35 (2001-2002) Utbygging, anlegg og drift av Snøhvit LNG. The Ministry of
Petroleum and Energy
OLF (1993) OLF Environmental Programme. Phase II. Summary Report. March 1993, Stavanger:
Norwegian Oil Industry Association.
OLF (2008) Veiledning til den årlige utslippsrapportering. Krav til rapportering fra offshore
petroleumsvirksomhet på norsk kontinentalsokkel. (Recommended guidelines for emission
calculations. Identification, quantification and reporting of emissions from activities in the
Norwegian oil and gas sector. Stavanger : The Norwegian Oil Industry Association. April 2008
OLF (2009) http://www.olf.no/PageFiles/6542/Veiledning%20til%20utslippsrapportering%202009.pdf
National Inventory Report 2012 - Norway
353
Olivier, J.G.J.
(1991)
Inventory of aircraft Emissions: A review of Recent Literature, Report no. 736 301 008,
Bilthoven: National Institute of Public Health and Environmental Protection
Petersen, S.O.
and Olesen J.E.
(2002)
Greenhouse Gas Inventories for Agriculture in the Nordic Countries, Proceedings from an
international workshop, Helsingør, Denmark 24-25 January 2002, funded by the Nordic Council
of Ministers, DIAS report Plant Production no. 81, Danish Institute of Agricultural Sciences)
Petersson, H.
and Ståhl, G.
(2006)
Functions for below-ground biomass of Pinus sylvestris , Picea abies, Betula pendula and,
Betula pubescens in Sweden. Scandinavian Journal of Forest Research, Volume 21, Supplement
7, pp. 84-93(10)
Product
Register (2007)
Guidelines for declaration of chemical products. Appendix 7: Codes for product use (UCN)
PROFU (2006) Analys av den fossila andelen av norsk avfall med hänsyn til energiinnhåll. PROFU AB
5.5.2006
Riley, H. og
Bakkegård, M.
(2006)
Declines of soil organic matter content under arable cropping southeast Norway. Acta Agric.
Scand. Sect. B-Soil and plant Science 56:217-223.
Rosland, A.
(1987) Utslipps-koeffisienter. Oversikt over koeffsienter for utslipp til luft og metoder for å beregne disse. SFT, luftseksjonen.
Rypdal, K.,
Rasse, A,
Grønlund, A.
and Tomter, S.
(2006)
Electing Cropland Management as an Article 3.4 Activity under the Kyoto Protocol.
Considerations for Norway. CICERO policy Note 2005:01. 20pp.
SFT (1990) Klimagassregnskap for Norge. Beskrivelse av utslippsmengder, drivhusstyrke og
utslippsfaktorer. Bidrag til den interdepartementale klimautredningen. (Greenhouse gas
inventory for Norway. Emissions figures, global warming potentials and emission factors.
Contribution to the interministerial climate report). SFT-report.
SFT (1993) Utslipp fra veitrafikk i Norge. Dokumentasjon av beregningsmetode, data og resultater
(Emissions from road traffic in Norway – Method for estimation, input data and emisson
estimates).
J. Bang, E. Figenbaum, K. Flugsrud, S. Larssen, K. Rypdal and C. Torp. SFT-report 99:04.
SFT (1996) Utslipp ved håndtering av kommunalt avfall. SFT-report 96:16.TA number 1366/1996.
SFT (1999a) Calculations of emissions of HFCs and PFCs in Norway. Tier 2 method. Hans T. Haukås,
Sigurd Holtskog (Statistics Norway) and Marit Viktoria Pettersen (SFT). SFT-report 99:03.
SFT (1999b) Beregningsmodell for utslipp av metangass fra norske deponier (Model for estimation of CH4
from landfills in Norway).
Jens Erling Frøiland Jensen, Torkil Williksen and Jørgen Bartnes. Norconsult. SFT-report
99:16.
SFT (1999c) Utslipp fra vegtrafikk i Norge. Dokumentasjon av beregningsmetode, data og resultater
(Emissions from road traffic in Norway - Method for estimation, input data and emission
estimates), Report 99:04 (Updated SFT report 93:12, Author: Bang, J., K. Flugsrud, G.
Haakonsen, S. Holtskog, S. Larssen, K.O. Maldum, K. Rypdal and A. Skedsmo), Oslo:
Norwegian Pollution Control Authority.
National Inventory Report 2012 - Norway
354
SFT (1999d) Materialstrømsanalyse av SF6. Beregning av potensielt og faktisk utslipp over tid (Material flow
analysis of SF6. Calculation of potential and actual emissions over time), Report 99:14, Oslo:
Norwegian Pollution Control Authority.
SFT (2005a) Kartlegging av omsetning av enkelte miljøskadelige stoffer i legemidler og kosmetikk (Survey of
turnover of some environmentally hazardous substances in pharmaceuticals and cosmetics).
Norwegian Pollution Control Authority, Oslo, Norway.
SFT (2005b) Methane emissions from solid waste disposal sites. TA- 2079. ISBN 82-7655-246-3.
http://www.sft.no/publikasjoner/luft/2079/ta2079.pdf
SFT (2006) Documentation of methodology and results: QA/QC performed for Greenhouse Gas Emissions
for Industrial plants included in the National Inventory.
SFT/Statistics
Norway (1999)
Evaluation of uncertainty in the Norwegian emission inventory.
Kristin Rypdal. Statistics Norway. SFT-report 99:01.
SFT/Statistics
Norway (2000)
Verification of the Norwegian Emission Inventory comparing emission intensity values with
similar countries.
Elin Kvingedal, Bente Tornsjø, Sigurd Holtskog, Gisle Haakonsen and Kristin Rypdal.
Statistics Norway. SFT-report 2000:1736.
Singh, B.R. and
Lal, R, (2001)
The potential of Norwegian soils to sequester carbon through land use conversion and
improved management practices. Printed at the Ohio State University.
Singh, B.R. and
Lal, R, (2004)
The potential of soil carbon sequestration through improved management practices in Norway,
Environment, Development and Sustainability. (in press)
SINTEF (1995) Round robin test of wood stove-emissions. SINTEF Report STF12 F95012. E. Karlsvik,
Trondheim: Institute of Social Research in Industry (SINTEF).
SINTEF
(1998a)
Emisjonsfaktorer for CO2-utslipp fra sementproduksjon i Norge for 1990 og 1997 (Emission
factors for CO2 emissions from cement production in Norway for 1990 and 1997), SINTEF
Report STF66 A98511 (Authors: Andersen, T. and K.H.Karstensen), Oslo: SINTEF (Institute of
Social Research in Industry).
SINTEF
(1998b)
Omregningsfaktorer for CO2-utslipp fra metallurgisk industri og sementproduksjon. Delprosjekt
1. CO2-utslipp fra forskjellige typer reduksjonsmaterialer (Conversion factors for CO2 emissions
from metal manufacturing and cement production. Part 1. CO2 emissions from various types of
reducing agents), Revised edition, SINTEF Report STF24 A98550 (Author: Raaness, O.),
Trondheim: SINTEF (Institute of Social Research in Industry).
SINTEF
(1998c)
Omregningsfaktorer for CO2-utslipp fra metallurgisk industri og sementproduksjon. Delprosjekt
2. Produksjon av ferrosilisium og silisiummetall i Norge (Conversion factors for CO2 emissions
from metal manufacturing and cement production. Part 2. Production of ferro silicon and silicon
metal in Norway), Revised edition, SINTEF Report STF24 A98537 (Author: Monsen, B.),
Trondheim: SINTEF (Institute of Social Research in Industry).
SINTEF
(1998d)
Omregningsfaktorer for CO2-utslipp fra metallurgisk industri og sementproduksjon. Delprosjekt
3. Produksjon av ferromangan, silikomangan og ferrokrom i Norge (Conversion factors for CO2
emissions from metal manufacturing and cement production. Part 3. Production of ferro
manganese, silicon manganese and ferro chromium in Norway), ST24 A98548 (Authors:
Monsen, B. and S.E. Olsen), Trondheim: SINTEF (Institute of Social Research in Industry).
National Inventory Report 2012 - Norway
355
SINTEF
(1998e)
Omregningsfaktorer for CO2-utslipp fra metallurgisk industri og sementproduksjon. Delprosjekt
4. Utslipp av CO2 ved produksjon av silisiumkarbid og kalsiumkarbid (Conversion factors for
CO2 emissions from metal manufacturing and cement production. Part 4. CO2 emissions from
production of silicon carbide and calcium carbide), SINTEF Report STF24 A98549 (Authors:
Raaness, O. and S. Olsen), Trondheim: SINTEF (Institute of Social Research in Industry).
SINTEF
(1998f)
Omregningsfaktorer for CO2-utslipp fra metallurgisk industri og sementproduksjon. Delprosjekt
5. Produksjon av magnesium (Conversion factors for CO2 emissions from metal manufacturing
and cement production. Part 5. Magnesium production), SINTEF Report STF24 A98574
(Authors: Olsen, K., T. Støre and R. Tunold), Trondheim: SINTEF (Institute of Social Research
in Industry).
SINTEF
(2004a)
Utslipp av klimagasser fra Si- prosessen hos Elkem Thamshavn og Holla Metall med fokus på
NOx reduksjon (Emissions of GHG from Si-process at Elkem Thamshavn and Holla Metall with
focus on reduction of emissions of NOX). SINTEF report STF24F03555
SINTEF
(2004b)
A summary of the report SINTEF (2004a) is given in the publication Reduction of emissions
from ferroalloy furnaces.
Skårman, T.,
Danielsson, H.,
Henningsson,
E. and
Östmann, M.
(2006)
Revised method for estimating emissions of NMVOC from solvent and other product use i
Sweden. Swedish Methodology for Environmental Data.
Statistics
Finland (2009)
Greenhouse Gas Emissions in Finland 1990-2007. National Inventory Report under the
UNFCCC and the Kyoto Protocol, Statistics Finland.
Statistics
Norway (2000)
Uncertainties in the Norwegian greenhouse Gas Emission Inventory.
Kristin Rypdal and Li-Chung Zhang. Statistics Norway-report 2000:13.
Statistics
Norway
(2001a)
Utslipp til luft fra innenriks sjøfart, fiske og annen sjøtrafikk mellom norske havner. (Emissions to Air from Fishing Fleet and Sea Traffic between Norwegian Harbours). Bente Tornsjø. Statistics Norway-report 2001:6.
Statistics
Norway
(2001b)
Lagring og bruk av husdyrgjødsel (Storage and use of manure). Gundersen, G. I. and O.
Rognstad (2001). Statistics Norway-report 2001:39.
Statistics
Norway
(2001c)
Uncertainties in Emissions of Long-Range Air Pollutants. Kristin Rypdal and Li-Chun Zhang.
Statistics Norway-report 2001:37
Statistics
Norway
(2001d)
CO2 emission estimates for Norway. Methodological difficulties.
Kristin Rypdal. Statistics Norway-document 2001:14.
Statistics
Norway
(2001e)
Sensitivity Analysis as a Tool for Systematic Reductions in GHG Inventory Uncertainties.
Rypdal, K. and Flugsrud K. Statistics Norway. Environmental Policy and Science. Vol 4/2-3. pp
117-135.
Statistics
Norway
(2001f)
Natural resources and the environment 2001. Norway, Statistical Analyses 47, ISBN 82-537-
4995-3.
Statistics
Norway
(2002a)
Utslipp til luft fra norsk luftfart 1989-2000 (Emissions to Air from Norwegian Air Traffic 1989-
2000). Anne Finstad, Ketil Flugsrud og Kristin Rypdal. Statistics Norway-report 2002:08.
National Inventory Report 2012 - Norway
356
Statistics
Norway
(2002b)
Sample survey of agriculture and forestry. http://www.ssb.no/lu_en/
Statistics
Norway
(2003a)
Census of agriculture 1999. Official statistics of Norway C746. http://www.ssb.no/jt1999_en/
Statistics
Norway
(2003b)
Standard Industrial Classification (SIC2002), internet version only,
http://www3.ssb.no/stabas/ItemsFrames.asp?ID=3152101&Language=en&VersionLevel=classv
ersion&MenuChoice=Language
Statistics
Norway (2004) Sample Survey of agriculture and forestry 2003, Statistics Norway.
Statistics
Norway (2006)
Methane emissions from Norwegian landfills. Revised calculations for waste landfilled 1945-
2004. Håkon Skullerud. Document 2006/7.
http://www.ssb.no/emner/01/04/10/doc_200607/doc_200607.pdf
Statistics
Norway
(2007a)
Sample Survey of agriculture and forestry 2007, Statistics Norway.
Statistics
Norway
(2007b)
Emission from consumption of HFCs, PFCs and SF6 in Norway. Kathrine Loe Hansen.
Document 2007/8. http://www.ssb.no/emner/01/04/10/doc_200708/doc_200708.pdf
Statistics
Norway
(2010a)
Registered distances covered by vehicles 2009
http://www.ssb.no/english/subjects/10/12/20/klreg_en/
Statistics
Norway
(2010b)
Road goods transport http://www.ssb.no/english/subjects/10/12/20/lbunasj_en/
Statistics
Norway
(2010c)
The Norwegian Emission Inventory 2010. Documentation of methodologies for estimating
emissions of greenhouse gases and long-range transboundary air pollutants. Trond Sandmo
(ed.). Document 2010/21
http://www.ssb.no/emner/01/90/doc_201021/doc_201021.pdf
Statistics
Norway
(2011a)
The Norwegian Emission Inventory 2011. Documentation of methodologies for estimating
emissions of greenhouse gases and long-range transboundary air pollutants. Trond Sandmo
(ed.). Document 2011/21
http://www.ssb.no/emner/01/90/doc_201121/index.html/doc_201121_en.pdf
Statistics
Norway
(2011b)
Uncertainties in the Norwegian greenhouse gas emission inventory. Ketil Flugsrud and Britta
Hoem. Reports 35/2011. http://www.ssb.no/english/subjects/01/04/10/rapp_201135_en/
Statistics
Norway (2012
unpublished)
The Norwegian Emission Inventory 2012. Documentation of methodologies for estimating
emissions of greenhouse gases and long-range transboundary air pollutants. Trond Sandmo
(ed.). Unpublished.
Statistics
Norway
(Annually)
Sales of petroleum products http://www.ssb.no/english/subjects/10/10/10/petroleumsalg_en/
Stave (2006) Water consumption in the Food Processing and the Service Industries in Norway. Stave S.E.
(2006). Documents 2006/12, Statistics Norway
http://www.ssb.no/emner/01/04/20/doc_200612/doc_200612.pdf

National Inventory Report 2012 - Norway
357
Sundstøl, F.
and Z. Mroz
(1988)
Utskillelse av nitrogen og fosfor i gjødsel og urin fra husdyr i Norge (Nitrogen and phosphorus
in manure and urine from domestic animals in Norway) (se Bolstad 1994), Report no. 4 from
the project "Agricultural policy and environmental management", Ås: Agricultural University of
Norway.
Swedish
Environmental
Protection
Agency (2005)
Sweden's National Inventory Report 2005 - Submission under the EC Monitoring Mechanism,
Vienna: Swedish Environmental Protection Agency.
Swedish
Environmental
Protection
Agency (2009)
National Inventory Report 2009 Sweden. Submitted under the United Nations Framework
Convention on Climate Change and the Kyoto Protocol, Swedish Environmental Protection
Agency.
(Swedish
environmental
protection
agency (2011)
http://www.naturvardsverket.se/upload/05_klimat_i_forandring/statistik/2010/NIR-submission-
2011-Annex.pdf
TI (1991) Tiltak 11. Reduksjon av VOC-utslipp fra totaktsmotorer. Rapport utarbeidet av Teknologisk
Institutt for Statens Forurensningstilsyn (Reduction of VOC-emissions from two stroke
engines), Oslo: National Institute of Technology.
Tine BA
(annually)
Nøkkeltall http://medlem.tine.no/cf/nokkeltall.cfm
Tomter, S.
(1997)
Country report for Norway. IN: Study on European Forestry Information and Communication
system. Reports on Foresty Inventory and Survey Systems. Luxemburg, Netherlands, Norway,
Portugal, Spain, Sweeden, Switzerland, United Kingdom, Czech Republic, Hungary, Poland.
European Commission. Volum 2: 799-860.
Tomter, S. M.,
(1998)
Grunnlaget for beregninger av effekt av artikkel 3.3: Beregning av volum de første år etter
bestandsetablering. NIJOS, unpublished working paper.
Tuomi, M. and
Liski, J. (2009)
Yasso07 (Y07 0.2). Model description and parameter values. www.ymparisto.fi/syke/yasso
Tuomi, M.,
Thum, T.
Jävinen, H.,
Fronzek, S.,
Berg, B.,
Harmon, M.,
Trofymow JA.,
Servanto, S.
and Liski, J.
(2009)
Lea flitter decomposition – Estimates of global variability based on Yasso07 model. Ecological
Modelling 220:3326-3371.
Uhlen, G.
(1991)
Long-term effects of fertilizers, manure straw and crop rotation on total-N and total-C in soil.
Acta Agric. Scand. 41:119-127.
Uppenberg, S.,
Zetterberg, L.,
and Åhman, M.
(2001)
Climate change Impact from Peat utilization in Sweden. IVL B 1423.
http://www.ivl.se/rapporter/
National Inventory Report 2012 - Norway
358
Van Balken,
J.A.M. (2005)
Vanninen, P.,
Ylitalo, H.,
Sievänen, R.
and Mäkelä, A.
(1996)
Personal communication from J.A.M. van Balken (European Fertilizer Manufacturers
Association). From IPCC (2006).Effects of age and site quality on the distribution of biomass in
Scots pine (Pinus sylvestris L.). Trees 10: 231-238
Vestjordet, E.
(1967)
Funksjoner og tabeller for kubering av stående gran. Meddelelser fra Det norske
SkogforsøksVesen 22:539-574.
Vestjordet, E.
(1968)
Volum av nyttbart virke hos gran og furu basert på relative høyde og diameter brysthøyde eller
ved 2,5 m stubbeavskjær. Meddelelser fra Det norske Skogforsøksvesen 25:411-459.
Vågane and
Rideng (2010)
Transportytelser i Norge 1946-2009, Report 1090/2010 (in Norwegian), Oslo: Institute of
transport economics
Vagstad et al
(1998):
Report from the monitoring of nutrients in 1997. Ås: Centre for soil and environmental research.
Vagstad, N., Bechmann, M., Stålnacke, P., Eggestad, H.O. and Deelstra, J.
Aakra, Å. and
M.A. Bleken
(1997)
N2O Emissions from Norwegian Agriculture as Estimated by the IPCC Methodology.
Departement of Biotechnological Sciences, Ås: Norwegian University of Life Sciences.
7th Greenhouse
Gas Control
Technologies
Conference
(GHGT7)
Vancouver
2004
Recent time-lapse seismic data show no indication of leakage at the Sleipner CO2-injection site
Climate and Pollution Agency
P.O. Box 8100 Dep
N-0032 Oslo
Tel: +47 22 57 34 00
Fax: +47 22 67 67 06
E-mail: [email protected]
Internet: www.klif.no
Street address: Strømsveien 96, Helsfyr, Oslo
Climate and Pollution Agency
The Climate and Pollution Agency reports to the
Ministry of the Environment and has 325 employees,
based mainly in Oslo. We implement government policy
on pollution. We act as advisors, guardians and
stewards for the environment. Our most important fields
of work include climate change, chemicals, marine and
freshwater environment, waste management, air quality
and noise. Our vision is a future without pollution.
We are working to
reduce greenhouse gas emissions
reduce the spread of hazardous substances
harmful to health and the environment
achieve integrated and ecosystem-based
management of the marine and freshwater
environment
increase waste recovery and reduce
emissions from waste
reduce the harmful effects of air pollution and
noise
TA-2915 /2012


