Embed Size (px)
Citation preview
16th World Conference on Earthquake, 16WCEE 2017
Santiago Chile, January 9th to 13th 2017
Paper N° 4629
Registration Code: S-M1464744619
NCh2369 vs ASCE7 - STRENGTH vs DUCTILITY?
INDUSTRIAL STEEL MOMENT FRAMES
M. Medalla (1), C. Peña (2), D. Lopez-Garcia (3),(4), R. Illanes (5)
(1) Civil Engineer, M. Eng., P&M Structural/Seismic Engineering, [email protected] (2) Civil Engineer, M. Eng., P&M Structural/Seismic Engineering, [email protected] (3) Associate Professor, Department of Structural & Geotechnical Engineering, Pontificia Universidad Catolica de Chile, [email protected] (4) Researcher, National Research Center for Integrated Natural Disaster Management CONICYT FONDAP 15110017, [email protected] (5) Civil Engineer, [email protected]
Abstract Earthquake-resistant design philosophies behind ASCE7-10/AISC341-10 and NCh2369.Of2003 are different. The differences make very difficult the task of satisfying simultaneously both design criteria, both from the conceptual and the practical points of view.
This paper presents the comparison of the inelastic seismic response of a moment frames of an industrial structure. The structure was designed to meet independently with both American and Chilean Codes provisions. The comparison of the seismic response is made at three levels of earthquake excitations: for a standard earthquake demand, (10% of exceedance in a 50-year period), for a maximum credible demand, (2% of exceedance in 50-year period), and for an operational level earthquake, (50% of exceedance in a 30-year period). Each of these earthquake levels is represented by a set of artificial ground motions compatibles with the corresponding design spectra. Additionally, some design aspects showing the differences among the design philosophies are presented.
The results obtained after the analysis show a similar behavior for the both operant and standard level design. Relative to maximum credible design the results show a best performance in the Chilean design, with interstory displacement and base shear reduction about 30%. In this way and considering the target of the industrial Chilean code (limited shutdown period after the earthquake) it can be seen that codes responses are according with their own philosophies. Finally, the measure responses modification factors after nonlinear analysis show a best assessment from the ASCE7-10/AISC341-10 design.
Keywords: Industrial structures; Steel moment frames.
16th World Conference on Earthquake, 16WCEE 2017
Santiago Chile, January 9th to 13th 2017
1. Introduction Earthquake-resistant design philosophies behind ASCE7-10/AISC341-10, [1,4], and NCh2369.Of2003, [2], show significant differences. American provisions intend to provide a moderate lateral strength with development of high levels of ductility under severe earthquake ground motions. Consequently, they require a stringent detailed design of members and connections. On the other hand, seismic design used in Chile requires higher lateral strength associated to moderate requirements of seismic inelastic behavior under similar events. Then, the required level of seismic detailing is smaller than that used in American practice. This Chilean practice showed successful results as evidenced by the behavior of industrial structures during the February 27, 2010 earthquake. Structures designed with Chilean Code NCh2369 showed limited incursions into the inelastic behavior, very small or no structural damage and limited shutdown period of industrial facilities after the earthquake. All these characteristics meet the performance objectives of industrial facilities required by Code NCh2369 under severe earthquakes.
In Chile it is not unusual that special important projects, such as Thermoelectric Power Plants, be designed using Seismic Design Criteria based on ASCE 7 “Minimum Design Loads for Buildings and other Structures”, [1]. Additionally, seismic design must meet minimum requirements specified by Chilean Code NCh2369, [2]. In such cases, the differences in the design philosophy of both documents make it difficult to satisfy simultaneously the provisions of both documents, both from conceptual and practical points of view. This paper presents design aspects that highlight these conceptual differences between both philosophies, as well as results of inelastic time-history analyses and ductility demands for a moment frames industrial building, designed according to the requirements of both Chilean and American Codes.
2. Differences between ASCE7-10/AISC341-10 and NCh2369.Of2003 Design philosophies mentioned above originate different provisions and design requirements in both Chilean and American Codes. Some of them are summarized in the following:
a) ASCE 7-10, [1], is a document with a strong theoretical and conceptual background. It is mostly based on American research and has evolved from the seismic design provisions developed by SEAOC in California since 1960. However, it does not have the practical assessment of their provisions through the study of the behavior experienced by structures designed according to them, after severe earthquake ground motions. On the other hand, Chilean Code provisions are the result of seismic design criteria used in Chile since 1960 in many industrial projects. These provisions have been tested by several severe earthquakes, particularly in March 1985 and February 2010. These tests have permitted to evaluate and improve these seismic design provisions, and allow the engineers to expect a satisfactory future seismic behavior of structures and facilities designed according to the Chilean Code. It is worthwhile to note that Chile has different earthquake-resistant Codes for apartment or office buildings, (NCh433, [5]), or industrial structures and facilities, (NCh2369, [2]). In the first Code the performance objective is to prevent loss of lives under extreme earthquakes, while in the industrial Code the controlling objective is to maintain continuity of operation or limited shutdown periods under such events.
b) Lateral strength seismic design demand of ASCE 7-10 is relatively moderate as compared to that of NCh2369.Of2003, although elastic design spectra used to calculate the seismic forces are similar. The difference arises from the simultaneous effect of the following factors:
• Larger values of ASCE 7-10 response modification factor R.
• Damping ratio of ASCE 7-10 is 5% for all steel structures. NCh2369.Of2003 considers damping ratios of 2% and 3%, more representatives of industrial structures.
• Load combinations are different in both documents. LRFD amplification is 1.4 for the Chilean Code, while this factor is 1.0 in ASCE 7-10.
2
16th World Conference on Earthquake, 16WCEE 2017
Santiago Chile, January 9th to 13th 2017
• Minimum base shear in NCh2369.Of2003 is generally larger than minimum base shear required by ASCE 7-10.
c) The design of structural steel elements to prevent local or global buckling prior to development of inelastic behavior is also different in both Codes. ASCE 7 requires the use of AISC 360-10, [3], and AISC 341-10, [4], while NCh2369.Of2003, Chapter 8, [2], specifies less stringent requirements that have proved to be enough for the reduced ductility demand observed during past severe earthquakes. This reduced ductility demand is consistent with the larger lateral strength requirements specified by NCh2369.
d) The reasoning behind paragraph (c) is also applicable to the seismic design of connections. Although both Codes design a connection that is stronger than the connecting members, ASCE 7-10 requires the connection to transfer the expected capacity of the member, while NCh2369.Of2003 only requires transferring the nominal member capacity. In a simplified way, the difference between both levels may be represented by factor Ry, which for Chilean steel materials varies between 1.3 and 1.5.
e) A special case relative to the paragraph (d) is the column bases. The concept used in Chile is the axial yielding of the anchor bolt, these elements are the principal system to dissipate seismic energy, for these reason all of the other element of the anchor system (base plate, stiffeners, second base plate, etc.) are designed for the expected axial yielding force of the anchors system bolt (capacity design). For the other side the concept of ASCE7 consider that the plastic bending hinges of the base of column are the source of the dissipation of seismic energy.
f) As an additional comment, it has to be considered that occurrence of earthquakes in California and in Chile is due to different tectonic mechanisms. Ground motion characteristics, such as duration of shaking, peak ground acceleration, seismic zoning, frequency content, maximum acceleration, destructive potential, Arias’ intensity, among others, may induce different structural responses for ground motions of comparable severity occurring in California and in Chile.
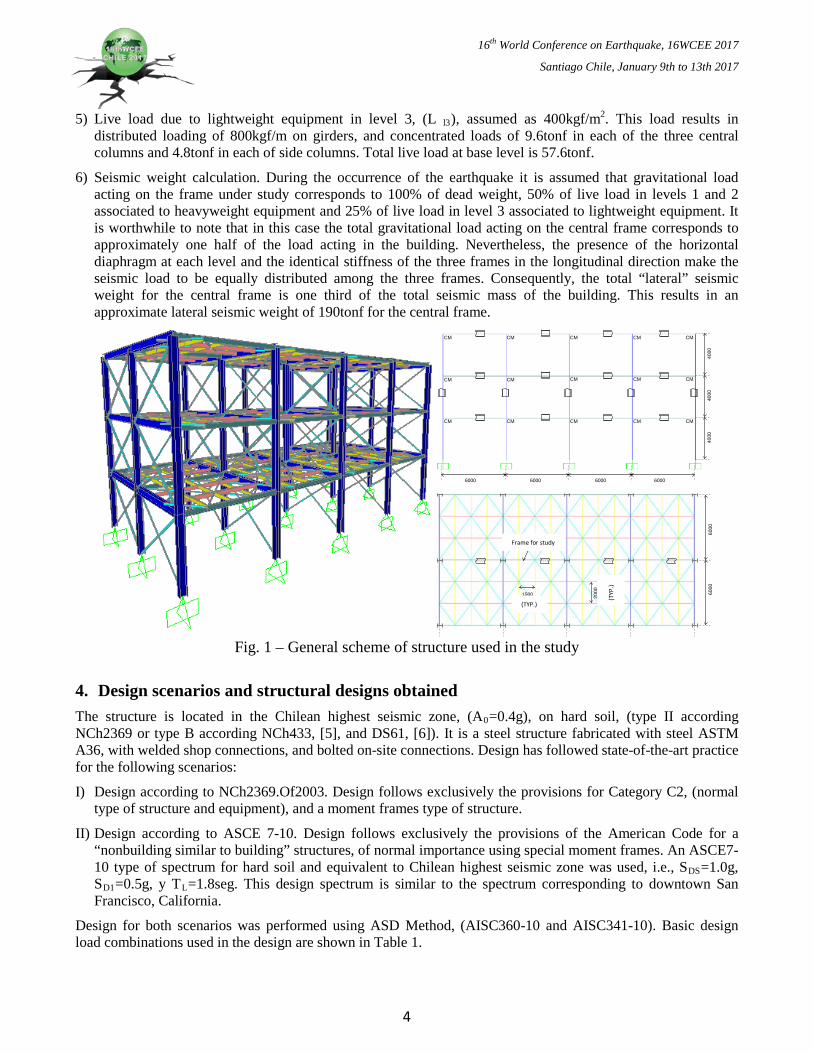
3. Characteristics of the structure and general design requirements Figure 1 shows a scheme of the moment frames structure that has been used in this study, which is part of an industrial structure having three identical resisting vertical planes in the earthquake direction under study. The frame used in this study corresponds to the central frame. The structure is 4 meter-high, has four 6-meter bays in the longitudinal direction and two 6-meter bays in the transverse direction. All frames in the transverse direction are concentrically braced frame. Main longitudinal platform girders at each level are separated at 2 meters, are braced against lateral torsion at 1.5 meters and are supported by main girders of the concentrically braced frame. Each story has a horizontal truss diaphragm at the platform level.
Design loads of the structure include the following:
1) Own dead weight of the main structure, which depends on the design process. However, this load is not relevant in comparison with other loadings, (8tons approximately).
2) Own dead weight of platforms, floor grating and others. It is assumed as 100kgf/m2. This value results in a distributed load of 200kgf/m in girders for each of the three floors, and concentrated loads of 2.4tonf in each of the three central columns and 1.2tonf in each of the side columns. Total dead weight at base level is 43.2tonf.
3) Equipment weight. Equipment are assumed in the part of the frame associated to the three central columns, with a total tributary load of 100tonf for the frame under study. This results in concentrated loads of 50tonf for the central column and 25tonf for the lateral columns.
4) Live load due to heavyweight equipment in levels 1 and 2, (L l1 and L l2), assumed as 800kgf/m2. This load results in distributed loading of 1600kgf/m on girders, and concentrated loads of 19.2tonf in each of the three central columns and 9.6tonf in each of side columns. Total live load at base level is 230.4tonf.
3
16th World Conference on Earthquake, 16WCEE 2017
Santiago Chile, January 9th to 13th 2017
5) Live load due to lightweight equipment in level 3, (L l3), assumed as 400kgf/m2. This load results in distributed loading of 800kgf/m on girders, and concentrated loads of 9.6tonf in each of the three central columns and 4.8tonf in each of side columns. Total live load at base level is 57.6tonf.
6) Seismic weight calculation. During the occurrence of the earthquake it is assumed that gravitational load acting on the frame under study corresponds to 100% of dead weight, 50% of live load in levels 1 and 2 associated to heavyweight equipment and 25% of live load in level 3 associated to lightweight equipment. It is worthwhile to note that in this case the total gravitational load acting on the central frame corresponds to approximately one half of the load acting in the building. Nevertheless, the presence of the horizontal diaphragm at each level and the identical stiffness of the three frames in the longitudinal direction make the seismic load to be equally distributed among the three frames. Consequently, the total “lateral” seismic weight for the central frame is one third of the total seismic mass of the building. This results in an approximate lateral seismic weight of 190tonf for the central frame.
4000
6000 600060006000
CM
CM
CM
CM
CM
CM
CM
CM
CM
CM
CM
CM
CM
CM
CM
4000
4000
6000
6000
1500(TIP) 20
00(T
IP)
Marco en estudio
Fig. 1 – General scheme of structure used in the study
4. Design scenarios and structural designs obtained The structure is located in the Chilean highest seismic zone, (A0=0.4g), on hard soil, (type II according NCh2369 or type B according NCh433, [5], and DS61, [6]). It is a steel structure fabricated with steel ASTM A36, with welded shop connections, and bolted on-site connections. Design has followed state-of-the-art practice for the following scenarios:
I) Design according to NCh2369.Of2003. Design follows exclusively the provisions for Category C2, (normal type of structure and equipment), and a moment frames type of structure.
II) Design according to ASCE 7-10. Design follows exclusively the provisions of the American Code for a “nonbuilding similar to building” structures, of normal importance using special moment frames. An ASCE7-10 type of spectrum for hard soil and equivalent to Chilean highest seismic zone was used, i.e., SDS=1.0g, SD1=0.5g, y TL=1.8seg. This design spectrum is similar to the spectrum corresponding to downtown San Francisco, California.
Design for both scenarios was performed using ASD Method, (AISC360-10 and AISC341-10). Basic design load combinations used in the design are shown in Table 1.
Frame for study
(TYP.) (T
YP.)
4
16th World Conference on Earthquake, 16WCEE 2017
Santiago Chile, January 9th to 13th 2017
It’s worthwhile to note that, according specific requirements of AISC341 some members must be designed using amplified seismic forces and particularly stringent boundary conditions, consistent with the expected collapse mechanism.
Table 1-Basic design load combinations.
Scenario L.C D L n1 & n2 L n3 Eh Ev
I A1 1.000 1.000 1.000 - -
A2 0.750 0.375 0.188 0.750 -
II A1 1.000 1.000 1.000 - -
A2 1.000 0.375 0.188 0.683 0.525
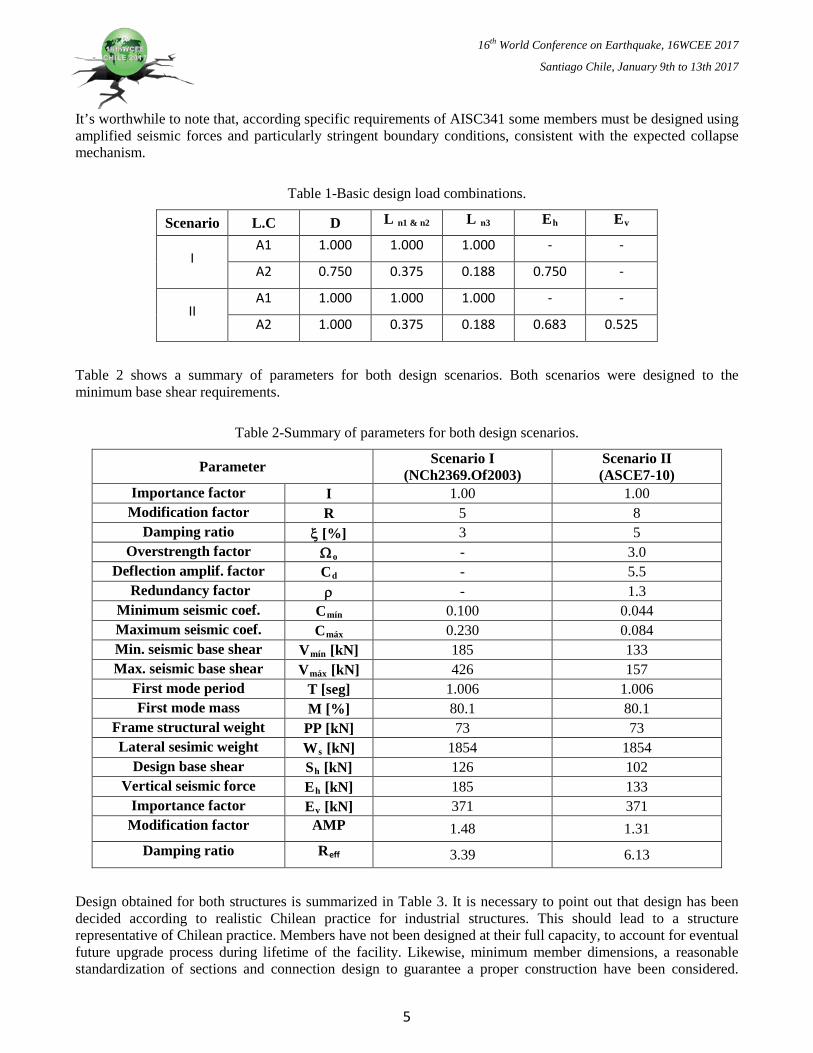
Table 2 shows a summary of parameters for both design scenarios. Both scenarios were designed to the minimum base shear requirements.
Table 2-Summary of parameters for both design scenarios.
Parameter Scenario I (NCh2369.Of2003)
Scenario II (ASCE7-10)
Importance factor I 1.00 1.00 Modification factor R 5 8
Damping ratio ξ [%] 3 5 Overstrength factor Ωo - 3.0
Deflection amplif. factor Cd - 5.5 Redundancy factor ρ - 1.3
Minimum seismic coef. Cmín 0.100 0.044 Maximum seismic coef. Cmáx 0.230 0.084 Min. seismic base shear Vmín [kN] 185 133 Max. seismic base shear Vmáx [kN] 426 157
First mode period T [seg] 1.006 1.006 First mode mass M [%] 80.1 80.1
Frame structural weight PP [kN] 73 73 Lateral sesimic weight Ws [kN] 1854 1854
Design base shear Sh [kN] 126 102 Vertical seismic force Eh [kN] 185 133
Importance factor Ev [kN] 371 371 Modification factor AMP 1.48 1.31
Damping ratio Reff 3.39 6.13
Design obtained for both structures is summarized in Table 3. It is necessary to point out that design has been decided according to realistic Chilean practice for industrial structures. This should lead to a structure representative of Chilean practice. Members have not been designed at their full capacity, to account for eventual future upgrade process during lifetime of the facility. Likewise, minimum member dimensions, a reasonable standardization of sections and connection design to guarantee a proper construction have been considered.
5
16th World Conference on Earthquake, 16WCEE 2017
Santiago Chile, January 9th to 13th 2017
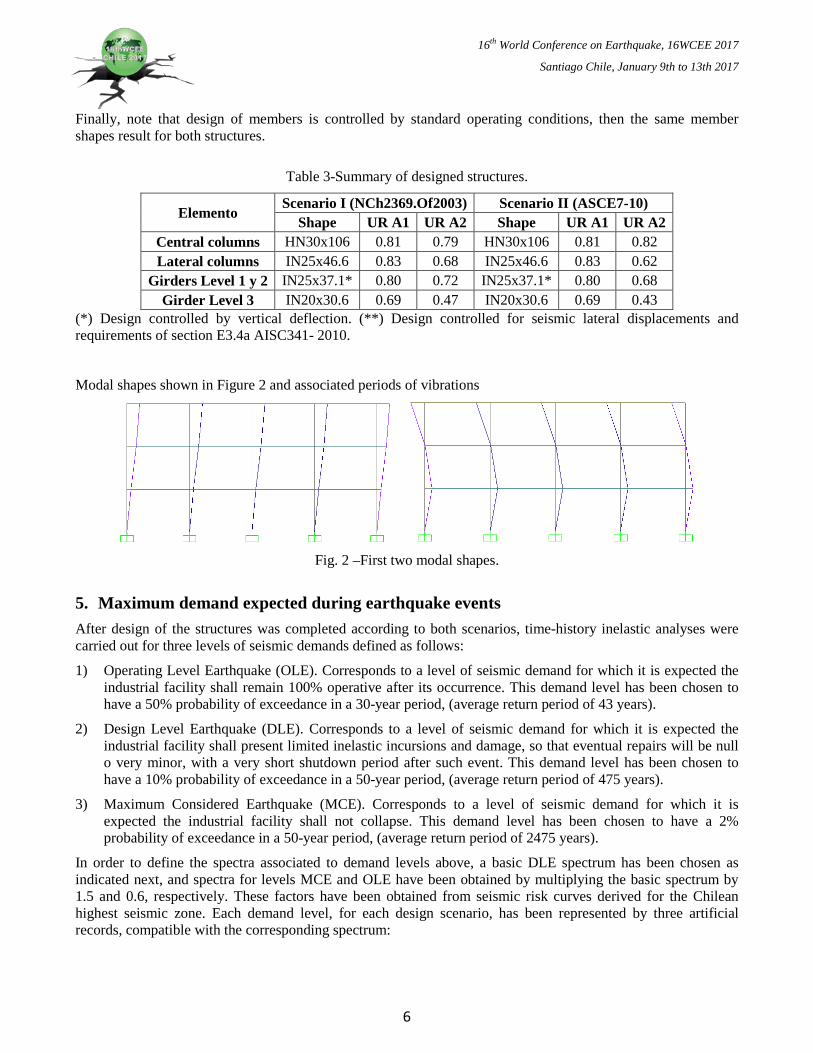
Finally, note that design of members is controlled by standard operating conditions, then the same member shapes result for both structures.
Table 3-Summary of designed structures.
Elemento Scenario I (NCh2369.Of2003) Scenario II (ASCE7-10)
Shape UR A1 UR A2 Shape UR A1 UR A2 Central columns HN30x106 0.81 0.79 HN30x106 0.81 0.82 Lateral columns IN25x46.6 0.83 0.68 IN25x46.6 0.83 0.62
Girders Level 1 y 2 IN25x37.1* 0.80 0.72 IN25x37.1* 0.80 0.68 Girder Level 3 IN20x30.6 0.69 0.47 IN20x30.6 0.69 0.43
(*) Design controlled by vertical deflection. (**) Design controlled for seismic lateral displacements and requirements of section E3.4a AISC341- 2010.
Modal shapes shown in Figure 2 and associated periods of vibrations
Fig. 2 –First two modal shapes.
5. Maximum demand expected during earthquake events After design of the structures was completed according to both scenarios, time-history inelastic analyses were carried out for three levels of seismic demands defined as follows:
1) Operating Level Earthquake (OLE). Corresponds to a level of seismic demand for which it is expected the industrial facility shall remain 100% operative after its occurrence. This demand level has been chosen to have a 50% probability of exceedance in a 30-year period, (average return period of 43 years).
2) Design Level Earthquake (DLE). Corresponds to a level of seismic demand for which it is expected the industrial facility shall present limited inelastic incursions and damage, so that eventual repairs will be null o very minor, with a very short shutdown period after such event. This demand level has been chosen to have a 10% probability of exceedance in a 50-year period, (average return period of 475 years).
3) Maximum Considered Earthquake (MCE). Corresponds to a level of seismic demand for which it is expected the industrial facility shall not collapse. This demand level has been chosen to have a 2% probability of exceedance in a 50-year period, (average return period of 2475 years).
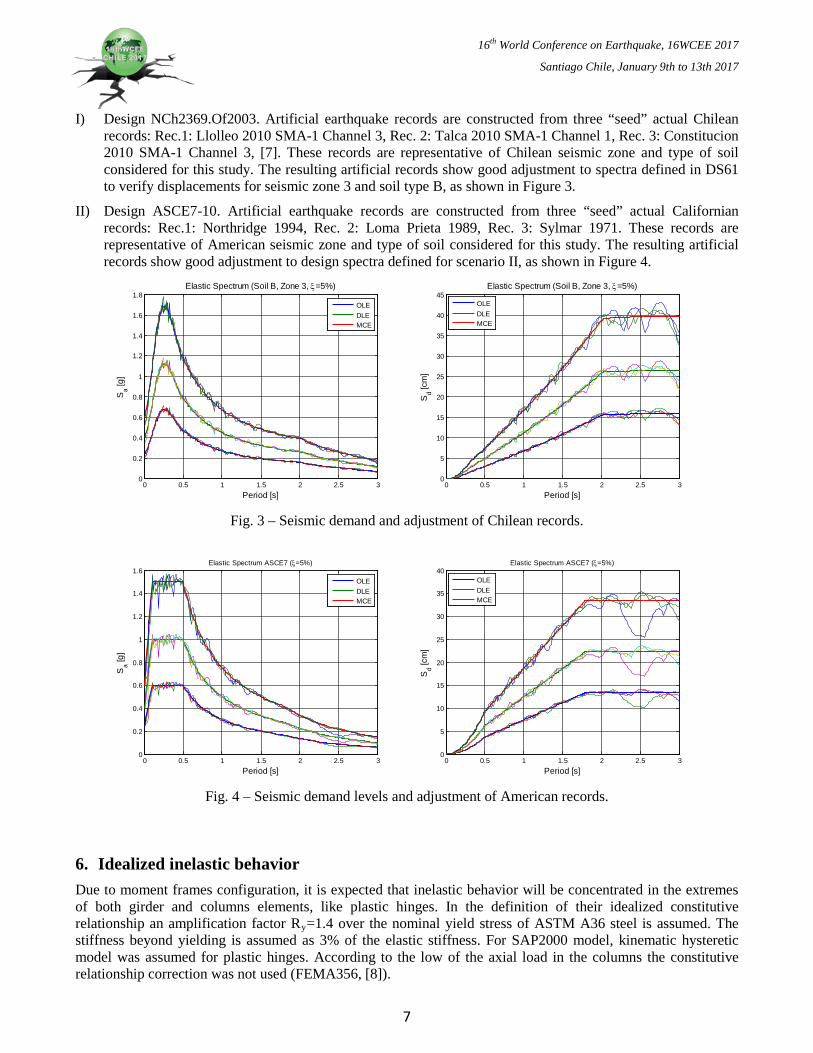
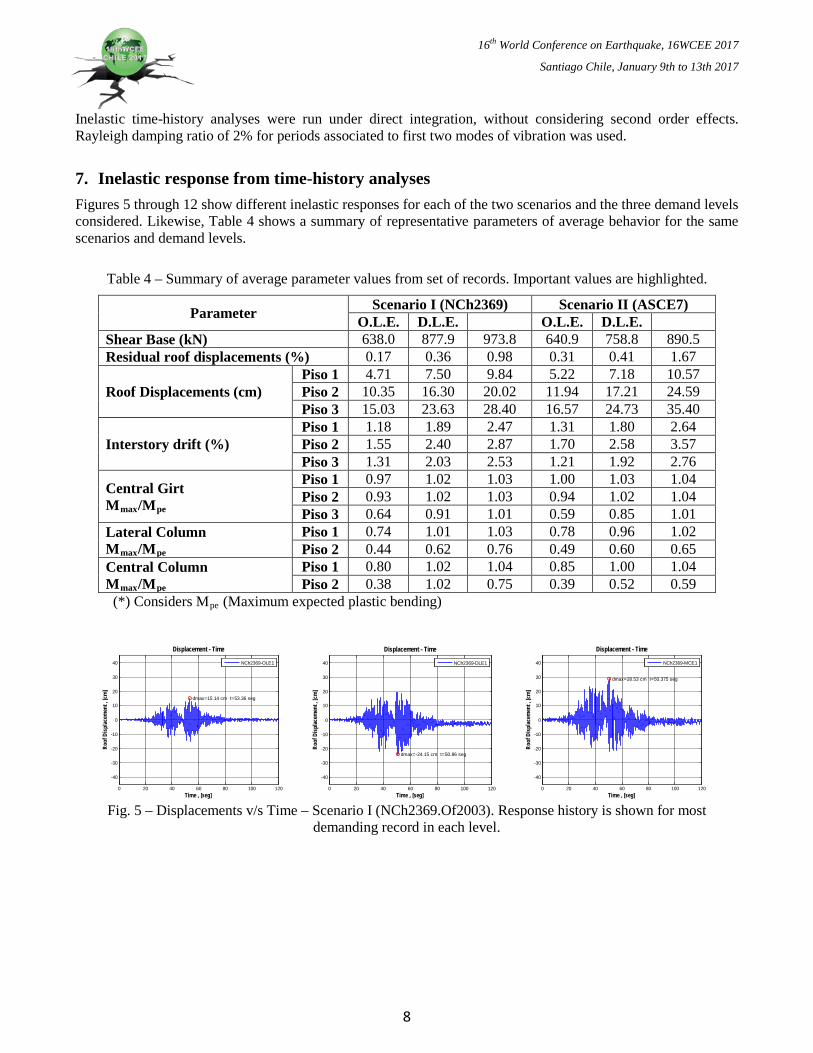
In order to define the spectra associated to demand levels above, a basic DLE spectrum has been chosen as indicated next, and spectra for levels MCE and OLE have been obtained by multiplying the basic spectrum by 1.5 and 0.6, respectively. These factors have been obtained from seismic risk curves derived for the Chilean highest seismic zone. Each demand level, for each design scenario, has been represented by three artificial records, compatible with the corresponding spectrum:
6
16th World Conference on Earthquake, 16WCEE 2017
Santiago Chile, January 9th to 13th 2017
I) Design NCh2369.Of2003. Artificial earthquake records are constructed from three “seed” actual Chilean records: Rec.1: Llolleo 2010 SMA-1 Channel 3, Rec. 2: Talca 2010 SMA-1 Channel 1, Rec. 3: Constitucion 2010 SMA-1 Channel 3, [7]. These records are representative of Chilean seismic zone and type of soil considered for this study. The resulting artificial records show good adjustment to spectra defined in DS61 to verify displacements for seismic zone 3 and soil type B, as shown in Figure 3.
II) Design ASCE7-10. Artificial earthquake records are constructed from three “seed” actual Californian records: Rec.1: Northridge 1994, Rec. 2: Loma Prieta 1989, Rec. 3: Sylmar 1971. These records are representative of American seismic zone and type of soil considered for this study. The resulting artificial records show good adjustment to design spectra defined for scenario II, as shown in Figure 4.
0 0.5 1 1.5 2 2.5 30
0.2
0.4
0.6
0.8
1
1.2
1.4
1.6
1.8
Period [s]
Sa [g
]
Elastic Spectrum (Soil B, Zone 3, ξ=5%)
OLEDLEMCE
0 0.5 1 1.5 2 2.5 30
5
10
15
20
25
30
35
40
45
Period [s]
Sd [c
m]
Elastic Spectrum (Soil B, Zone 3, ξ=5%)
OLEDLEMCE
Fig. 3 – Seismic demand and adjustment of Chilean records.
0 0.5 1 1.5 2 2.5 30
0.2
0.4
0.6
0.8
1
1.2
1.4
1.6
Period [s]
Sa [g
]
Elastic Spectrum ASCE7 (ξ=5%)
OLEDLEMCE
0 0.5 1 1.5 2 2.5 30
5
10
15
20
25
30
35
40
Period [s]
Sd [c
m]
Elastic Spectrum ASCE7 (ξ=5%)
OLEDLEMCE
Fig. 4 – Seismic demand levels and adjustment of American records.
6. Idealized inelastic behavior Due to moment frames configuration, it is expected that inelastic behavior will be concentrated in the extremes of both girder and columns elements, like plastic hinges. In the definition of their idealized constitutive relationship an amplification factor Ry=1.4 over the nominal yield stress of ASTM A36 steel is assumed. The stiffness beyond yielding is assumed as 3% of the elastic stiffness. For SAP2000 model, kinematic hysteretic model was assumed for plastic hinges. According to the low of the axial load in the columns the constitutive relationship correction was not used (FEMA356, [8]).
7
16th World Conference on Earthquake, 16WCEE 2017
Santiago Chile, January 9th to 13th 2017
Inelastic time-history analyses were run under direct integration, without considering second order effects. Rayleigh damping ratio of 2% for periods associated to first two modes of vibration was used.
7. Inelastic response from time-history analyses Figures 5 through 12 show different inelastic responses for each of the two scenarios and the three demand levels considered. Likewise, Table 4 shows a summary of representative parameters of average behavior for the same scenarios and demand levels.
Table 4 – Summary of average parameter values from set of records. Important values are highlighted.
Parameter Scenario I (NCh2369) Scenario II (ASCE7) O.L.E. D.L.E. O.L.E. D.L.E. Shear Base (kN) 638.0 877.9 973.8 640.9 758.8 890.5
Residual roof displacements (%) 0.17 0.36 0.98 0.31 0.41 1.67
Roof Displacements (cm) Piso 1 4.71 7.50 9.84 5.22 7.18 10.57 Piso 2 10.35 16.30 20.02 11.94 17.21 24.59 Piso 3 15.03 23.63 28.40 16.57 24.73 35.40
Interstory drift (%) Piso 1 1.18 1.89 2.47 1.31 1.80 2.64 Piso 2 1.55 2.40 2.87 1.70 2.58 3.57 Piso 3 1.31 2.03 2.53 1.21 1.92 2.76
Central Girt Mmax/Mpe
Piso 1 0.97 1.02 1.03 1.00 1.03 1.04 Piso 2 0.93 1.02 1.03 0.94 1.02 1.04 Piso 3 0.64 0.91 1.01 0.59 0.85 1.01
Lateral Column Mmax/Mpe
Piso 1 0.74 1.01 1.03 0.78 0.96 1.02 Piso 2 0.44 0.62 0.76 0.49 0.60 0.65
Central Column Mmax/Mpe
Piso 1 0.80 1.02 1.04 0.85 1.00 1.04 Piso 2 0.38 1.02 0.75 0.39 0.52 0.59
(*) Considers Mpe (Maximum expected plastic bending)
0 20 40 60 80 100 120
-40
-30
-20
-10
0
10
20
30
40
dmax=15.14 cm t=53.36 seg
Displacement - Time
Time , [seg]
Roof
Disp
lacem
ent ,
[cm
]
NCh2369-OLE1
0 20 40 60 80 100 120
-40
-30
-20
-10
0
10
20
30
40
dmax=-24.15 cm t=50.86 seg
Displacement - Time
Time , [seg]
Roof
Disp
lacem
ent ,
[cm
]
NCh2369-DLE1
0 20 40 60 80 100 120
-40
-30
-20
-10
0
10
20
30
40
dmax=28.53 cm t=50.375 seg
Displacement - Time
Time , [seg]
Roof
Disp
lacem
ent ,
[cm
]
NCh2369-MCE1
Fig. 5 – Displacements v/s Time – Scenario I (NCh2369.Of2003). Response history is shown for most
demanding record in each level.
8
16th World Conference on Earthquake, 16WCEE 2017
Santiago Chile, January 9th to 13th 2017
0 2 4 6 8 10 12 14 16 18 20
-40
-30
-20
-10
0
10
20
30
40
dmax=17.96 cm t=14.72 se
Displacement - Time
Time , [seg]
Roof
Disp
lacem
ent ,
[cm
]
ASCE7-OLE2
0 2 4 6 8 10 12 14 16 18 20
-40
-30
-20
-10
0
10
20
30
40
dmax=25.48 cm t=12.72 seg
Displacement - Time
Time , [seg]
Roof
Disp
lacem
ent ,
[cm
]
ASCE7-DLE2
0 2 4 6 8 10 12 14 16 18 20
-40
-30
-20
-10
0
10
20
30
40 dmax=38.46 cm t=12.73 seg
Displacement - Time
Time , [seg]
Roof
Disp
lacem
ent ,
[cm
]
ASCE7-MCE2
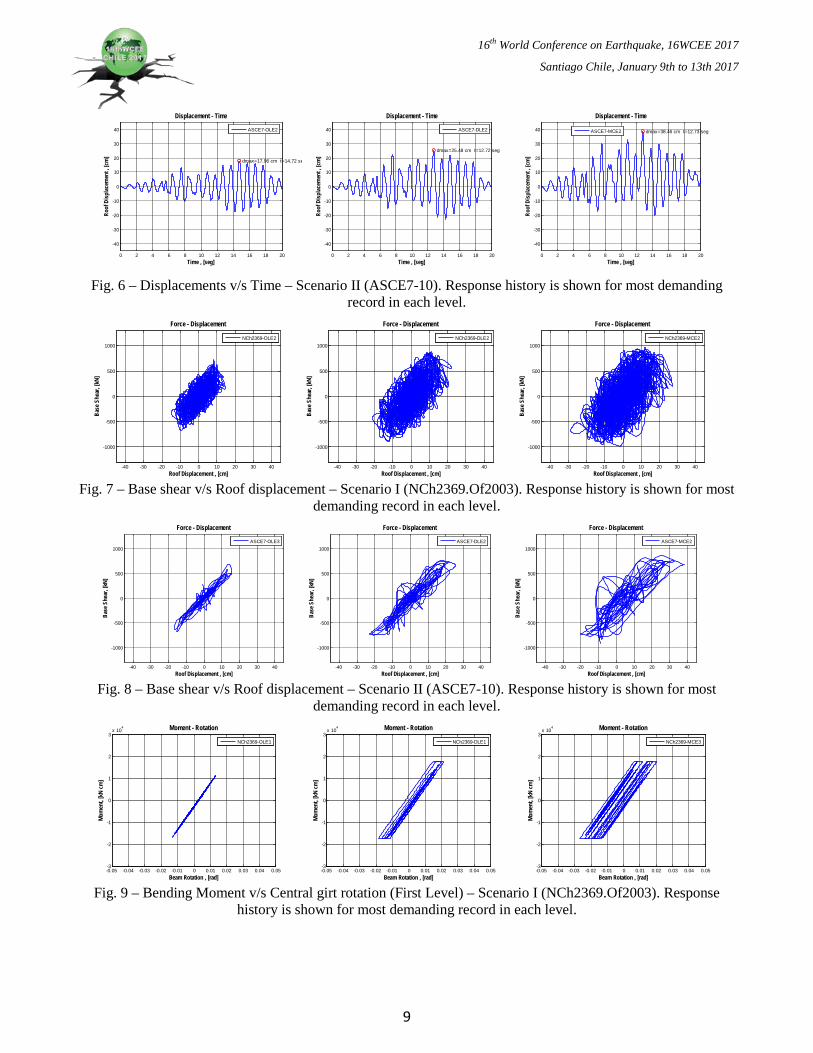
Fig. 6 – Displacements v/s Time – Scenario II (ASCE7-10). Response history is shown for most demanding
record in each level.
-40 -30 -20 -10 0 10 20 30 40
-1000
-500
0
500
1000
Force - Displacement
Roof Displacement , [cm]
Base
She
ar, [
kN]
NCh2369-OLE2
-40 -30 -20 -10 0 10 20 30 40
-1000
-500
0
500
1000
Force - Displacement
Roof Displacement , [cm]
Base
She
ar, [
kN]
NCh2369-DLE2
-40 -30 -20 -10 0 10 20 30 40
-1000
-500
0
500
1000
Force - Displacement
Roof Displacement , [cm]
Base
She
ar, [
kN]
NCh2369-MCE2
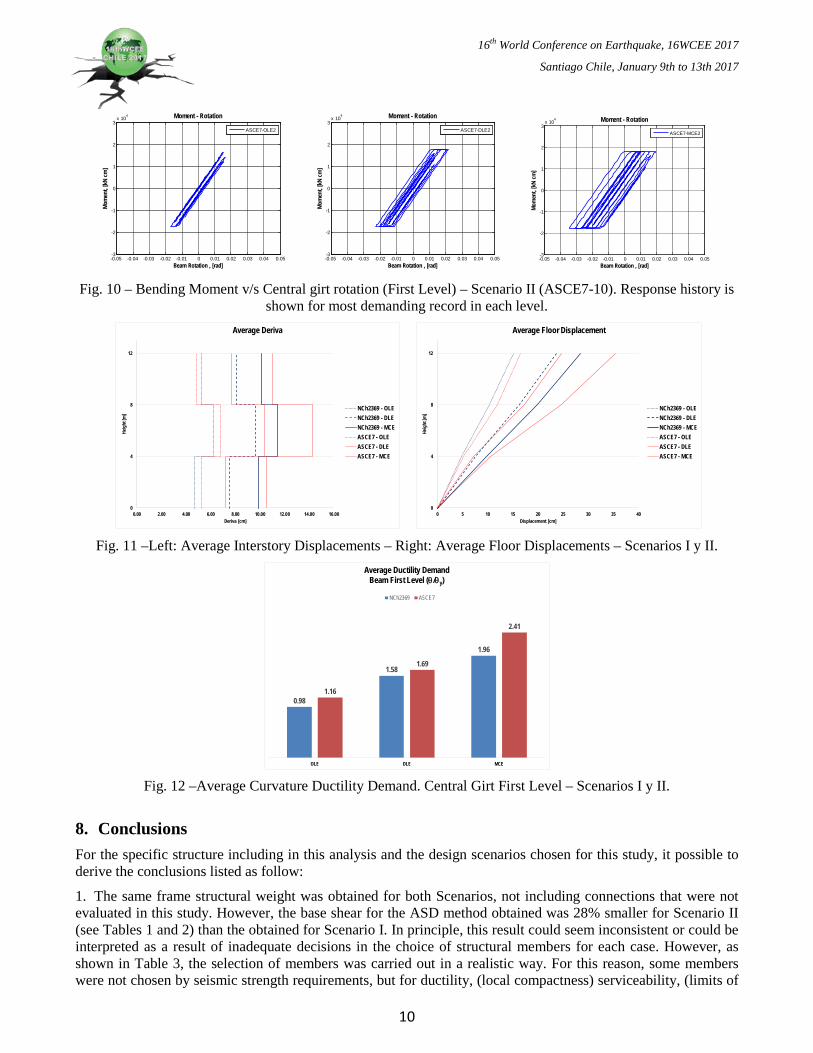
Fig. 7 – Base shear v/s Roof displacement – Scenario I (NCh2369.Of2003). Response history is shown for most
demanding record in each level.
-40 -30 -20 -10 0 10 20 30 40
-1000
-500
0
500
1000
Force - Displacement
Roof Displacement , [cm]
Base
She
ar, [
kN]
ASCE7-OLE3
-40 -30 -20 -10 0 10 20 30 40
-1000
-500
0
500
1000
Force - Displacement
Roof Displacement , [cm]
Base
She
ar, [
kN]
ASCE7-DLE2
-40 -30 -20 -10 0 10 20 30 40
-1000
-500
0
500
1000
Force - Displacement
Roof Displacement , [cm]
Base
She
ar, [
kN]
ASCE7-MCE2
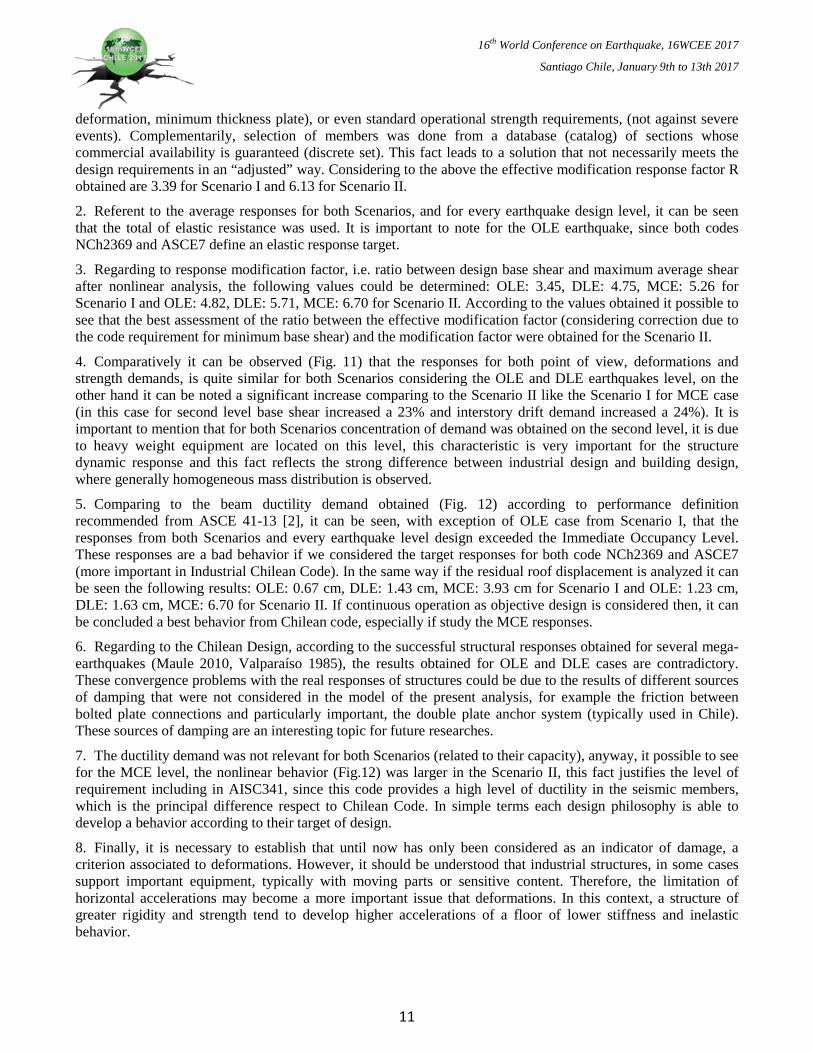
Fig. 8 – Base shear v/s Roof displacement – Scenario II (ASCE7-10). Response history is shown for most
demanding record in each level.
-0.05 -0.04 -0.03 -0.02 -0.01 0 0.01 0.02 0.03 0.04 0.05-3
-2
-1
0
1
2
3x 10
4 Moment - Rotation
Beam Rotation , [rad]
Mom
ent,
[kN cm
]
NCh2369-OLE1
-0.05 -0.04 -0.03 -0.02 -0.01 0 0.01 0.02 0.03 0.04 0.05-3
-2
-1
0
1
2
3x 10
4 Moment - Rotation
Beam Rotation , [rad]
Mom
ent,
[kN cm
]
NCh2369-DLE1
-0.05 -0.04 -0.03 -0.02 -0.01 0 0.01 0.02 0.03 0.04 0.05-3
-2
-1
0
1
2
3x 10
4 Moment - Rotation
Beam Rotation , [rad]
Mom
ent,
[kN cm
]
NCh2369-MCE3
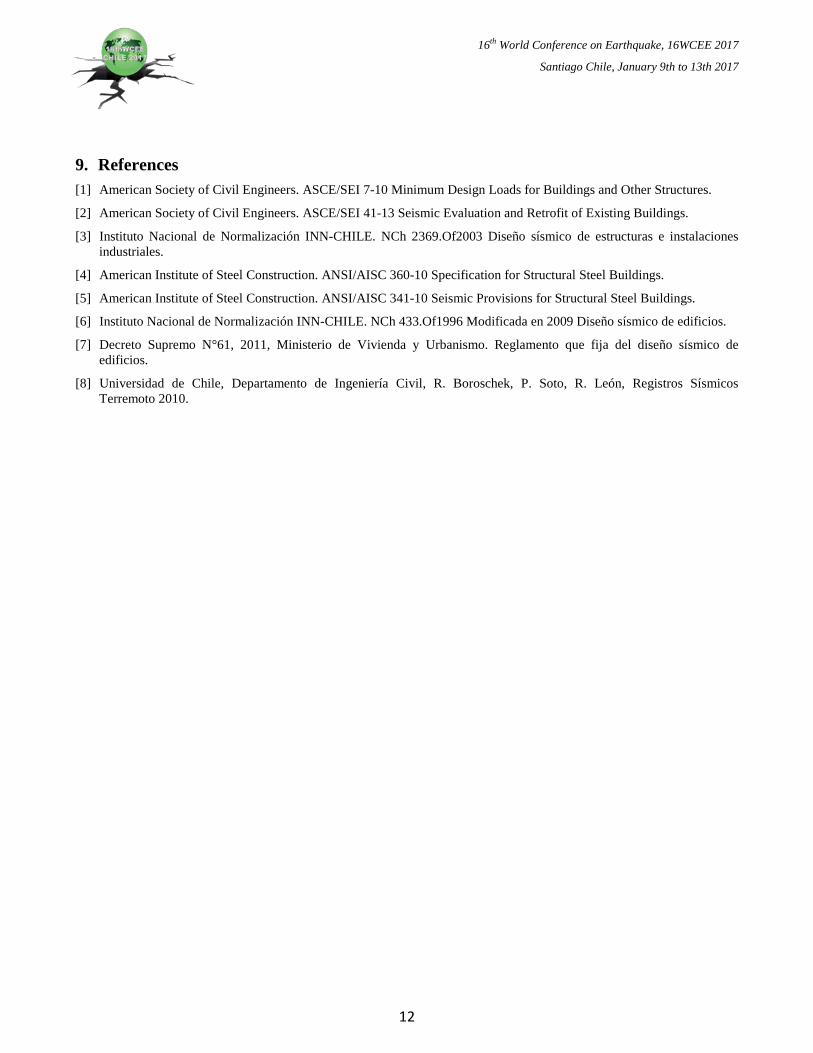
Fig. 9 – Bending Moment v/s Central girt rotation (First Level) – Scenario I (NCh2369.Of2003). Response
history is shown for most demanding record in each level.
9
16th World Conference on Earthquake, 16WCEE 2017
Santiago Chile, January 9th to 13th 2017
-0.05 -0.04 -0.03 -0.02 -0.01 0 0.01 0.02 0.03 0.04 0.05-3
-2
-1
0
1
2
3x 10
4 Moment - Rotation
Beam Rotation , [rad]
Mom
ent,
[kN cm
]
ASCE7-OLE2
-0.05 -0.04 -0.03 -0.02 -0.01 0 0.01 0.02 0.03 0.04 0.05-3
-2
-1
0
1
2
3x 10
4 Moment - Rotation
Beam Rotation , [rad]
Mom
ent,
[kN cm
]
ASCE7-DLE2
-0.05 -0.04 -0.03 -0.02 -0.01 0 0.01 0.02 0.03 0.04 0.05-3
-2
-1
0
1
2
3x 10
4 Moment - Rotation
Beam Rotation , [rad]
Mom
ent,
[kN cm
]
ASCE7-MCE2
Fig. 10 – Bending Moment v/s Central girt rotation (First Level) – Scenario II (ASCE7-10). Response history is
shown for most demanding record in each level.
0
4
8
12
0.00 2.00 4.00 6.00 8.00 10.00 12.00 14.00 16.00
Heig
ht [m
]
Deriva [cm]
Average Deriva
NCh2369 - OLENCh2369 - DLENCh2369 - MCEASCE7 - OLEASCE7 - DLEASCE7 - MCE
0
4
8
12
0 5 10 15 20 25 30 35 40
Heig
ht [m
]
Displacement [cm]
Average Floor Displacement
NCh2369 - OLENCh2369 - DLENCh2369 - MCEASCE7 - OLEASCE7 - DLEASCE7 - MCE
Fig. 11 –Left: Average Interstory Displacements – Right: Average Floor Displacements – Scenarios I y II.
0.98
1.58
1.96
1.16
1.69
2.41
OLE DLE MCE
Average Ductility Demand Beam First Level (θ/θy)
NCh2369 ASCE7
Fig. 12 –Average Curvature Ductility Demand. Central Girt First Level – Scenarios I y II.
8. Conclusions For the specific structure including in this analysis and the design scenarios chosen for this study, it possible to derive the conclusions listed as follow:
1. The same frame structural weight was obtained for both Scenarios, not including connections that were not evaluated in this study. However, the base shear for the ASD method obtained was 28% smaller for Scenario II (see Tables 1 and 2) than the obtained for Scenario I. In principle, this result could seem inconsistent or could be interpreted as a result of inadequate decisions in the choice of structural members for each case. However, as shown in Table 3, the selection of members was carried out in a realistic way. For this reason, some members were not chosen by seismic strength requirements, but for ductility, (local compactness) serviceability, (limits of
10
16th World Conference on Earthquake, 16WCEE 2017
Santiago Chile, January 9th to 13th 2017
deformation, minimum thickness plate), or even standard operational strength requirements, (not against severe events). Complementarily, selection of members was done from a database (catalog) of sections whose commercial availability is guaranteed (discrete set). This fact leads to a solution that not necessarily meets the design requirements in an “adjusted” way. Considering to the above the effective modification response factor R obtained are 3.39 for Scenario I and 6.13 for Scenario II.
2. Referent to the average responses for both Scenarios, and for every earthquake design level, it can be seen that the total of elastic resistance was used. It is important to note for the OLE earthquake, since both codes NCh2369 and ASCE7 define an elastic response target.
3. Regarding to response modification factor, i.e. ratio between design base shear and maximum average shear after nonlinear analysis, the following values could be determined: OLE: 3.45, DLE: 4.75, MCE: 5.26 for Scenario I and OLE: 4.82, DLE: 5.71, MCE: 6.70 for Scenario II. According to the values obtained it possible to see that the best assessment of the ratio between the effective modification factor (considering correction due to the code requirement for minimum base shear) and the modification factor were obtained for the Scenario II.
4. Comparatively it can be observed (Fig. 11) that the responses for both point of view, deformations and strength demands, is quite similar for both Scenarios considering the OLE and DLE earthquakes level, on the other hand it can be noted a significant increase comparing to the Scenario II like the Scenario I for MCE case (in this case for second level base shear increased a 23% and interstory drift demand increased a 24%). It is important to mention that for both Scenarios concentration of demand was obtained on the second level, it is due to heavy weight equipment are located on this level, this characteristic is very important for the structure dynamic response and this fact reflects the strong difference between industrial design and building design, where generally homogeneous mass distribution is observed.
5. Comparing to the beam ductility demand obtained (Fig. 12) according to performance definition recommended from ASCE 41-13 [2], it can be seen, with exception of OLE case from Scenario I, that the responses from both Scenarios and every earthquake level design exceeded the Immediate Occupancy Level. These responses are a bad behavior if we considered the target responses for both code NCh2369 and ASCE7 (more important in Industrial Chilean Code). In the same way if the residual roof displacement is analyzed it can be seen the following results: OLE: 0.67 cm, DLE: 1.43 cm, MCE: 3.93 cm for Scenario I and OLE: 1.23 cm, DLE: 1.63 cm, MCE: 6.70 for Scenario II. If continuous operation as objective design is considered then, it can be concluded a best behavior from Chilean code, especially if study the MCE responses.
6. Regarding to the Chilean Design, according to the successful structural responses obtained for several mega-earthquakes (Maule 2010, Valparaíso 1985), the results obtained for OLE and DLE cases are contradictory. These convergence problems with the real responses of structures could be due to the results of different sources of damping that were not considered in the model of the present analysis, for example the friction between bolted plate connections and particularly important, the double plate anchor system (typically used in Chile). These sources of damping are an interesting topic for future researches.
7. The ductility demand was not relevant for both Scenarios (related to their capacity), anyway, it possible to see for the MCE level, the nonlinear behavior (Fig.12) was larger in the Scenario II, this fact justifies the level of requirement including in AISC341, since this code provides a high level of ductility in the seismic members, which is the principal difference respect to Chilean Code. In simple terms each design philosophy is able to develop a behavior according to their target of design.
8. Finally, it is necessary to establish that until now has only been considered as an indicator of damage, a criterion associated to deformations. However, it should be understood that industrial structures, in some cases support important equipment, typically with moving parts or sensitive content. Therefore, the limitation of horizontal accelerations may become a more important issue that deformations. In this context, a structure of greater rigidity and strength tend to develop higher accelerations of a floor of lower stiffness and inelastic behavior.
11
16th World Conference on Earthquake, 16WCEE 2017
Santiago Chile, January 9th to 13th 2017
9. References [1] American Society of Civil Engineers. ASCE/SEI 7-10 Minimum Design Loads for Buildings and Other Structures.
[2] American Society of Civil Engineers. ASCE/SEI 41-13 Seismic Evaluation and Retrofit of Existing Buildings.
[3] Instituto Nacional de Normalización INN-CHILE. NCh 2369.Of2003 Diseño sísmico de estructuras e instalaciones industriales.
[4] American Institute of Steel Construction. ANSI/AISC 360-10 Specification for Structural Steel Buildings.
[5] American Institute of Steel Construction. ANSI/AISC 341-10 Seismic Provisions for Structural Steel Buildings.
[6] Instituto Nacional de Normalización INN-CHILE. NCh 433.Of1996 Modificada en 2009 Diseño sísmico de edificios.
[7] Decreto Supremo N°61, 2011, Ministerio de Vivienda y Urbanismo. Reglamento que fija del diseño sísmico de edificios.
[8] Universidad de Chile, Departamento de Ingeniería Civil, R. Boroschek, P. Soto, R. León, Registros Sísmicos Terremoto 2010.
12