Embed Size (px)
Citation preview
Contents lists available at ScienceDirect
Engineering Structures
journal homepage: www.elsevier.com/locate/engstruct
Ductility of RC beams under torsion
M.M. Teixeira, L.F.A. Bernardo⁎
University of Beira Interior, C-MADE – Centre of Materials and Building Technologies, Covilhã, Portugal
A R T I C L E I N F O
Keywords:Reinforced concreteBeamsTorsionDuctilityCodes of practice
A B S T R A C T
In this article, the torsional ductility of reinforced concrete (RC) beams with rectangular cross section is studied.For this, the experimental results of several RC beams found in the literature were compiled and analyzed. Atorsional ductility index was used to characterize the torsional ductility of the studied beams. The followingvariables study were considered: compressive concrete strength, torsional reinforcement ratio and cross sectiontype (plain or hollow). The influence of each variable study on the torsional ductility is studied and importantfindings are pointed out which could help for the design of RC beams under torsion. An additional comparativeanalysis with the rules from some codes of practice in use is also performed. It is shown that, in general, thecodes are too much restrictive as far as the maximum torsional reinforcement is concerned. As a consequence,this can leads to the unacceptance of several beams with ductile behavior.
1. Introduction
Nowadays, it is well known that plastic deformation capacity con-stitutes an important requirement to ensure the redistribution capacityof internal forces in structures, in order to prevent a sudden and pro-gressive structural collapse. This property, which depends on the duc-tility of the critical sections of reinforced concrete (RC) members, isimportant because it is related with the structural safety for the ulti-mate limit states.
Over the last decades, many experimental studies have shown thatthe critical cross sections of RC members, namely beams, can providesufficient ductility after the yielding of the reinforcement to ensure theredistribution capacity of the internal forces for the ultimate state. Thisis particularly accepted for RC beams under bending, including high-strength concrete beams [1–3]. For RC members under shear force,doubts about the ductile behavior may still exist. However, experi-mental researches show that RC members under shear, including high-strength concrete panels, can also present good levels of ductility [4,5].This is because the softening effect (influence of diagonal cracking onthe strength and deformation capacity of concrete in compression)leads to internal energy dissipation through appreciable levels of plasticshear deformation.
The above considerations about RC members under shear can alsobe extended to RC beams under torsion, due to the prevalence of aninternal shear stress state imposed by the external torsional moments.Few previous researches on RC beams under torsion have shown thatthese structural elements can also present appreciable ductility and
plastic twist capacity in their critical sections [6,7]. These studies alsoshow that, as for bending and shear force, some requirements are needto ensure torsional ductility in RC beams. For instance, a minimum andmaximum amount of torsional reinforcement must be provided, inorder to avoid a brittle and premature failure due to the yielding of thereinforcement right after cracking or a brittle failure due to compressiveconcrete crushing. When compared with the bending case, these studiesseems to show that the range for the amount of torsional reinforcementcompatible with ductility is much narrower. Additionally, special caremust also be given to the detailing of the torsional reinforcement. Forinstance, spacing between steel bars cannot be exaggerated so thatcracks are always intersected by bars.
Older experimental studies also show that RC hollow beams are lessductile when compared to similar RC plain beams [8]. Since hollowbeams are commonly used, this observation becomes very important.
In order to provide sufficient ductility in structural members,structural engineers usually follow the rules from codes of practice. ForRC beams under bending and shear forces, codes of practice in useprovide sufficient information. However, for torsion specific rules toensure ductility are much scarcer. For instance, in some codes theminimum amount of torsional reinforcement, which can be considereda basic requirement, is still inexistent. Additionally, the maximumtorsional reinforcement can indirectly be satisfied by checking themaximum compressive stress allowed in the concrete struts. This limitis usually given in the codes. However, some codes continue to refer tosome ductility rules for bending and shear forces, as far as longitudinaland transverse torsional reinforcement is concerned.
https://doi.org/10.1016/j.engstruct.2018.05.021Received 16 December 2017; Received in revised form 13 April 2018; Accepted 7 May 2018
⁎ Corresponding author at: University of Beira Interior, Department of Civil Engineering and Architecture, Edifício II das Engenharias, Calçada Fonte do Lameiro, 6201-001 Covilhã,Portugal.
E-mail address: [email protected] (L.F.A. Bernardo).
Engineering Structures 168 (2018) 759–769
0141-0296/ © 2018 Elsevier Ltd. All rights reserved.
T
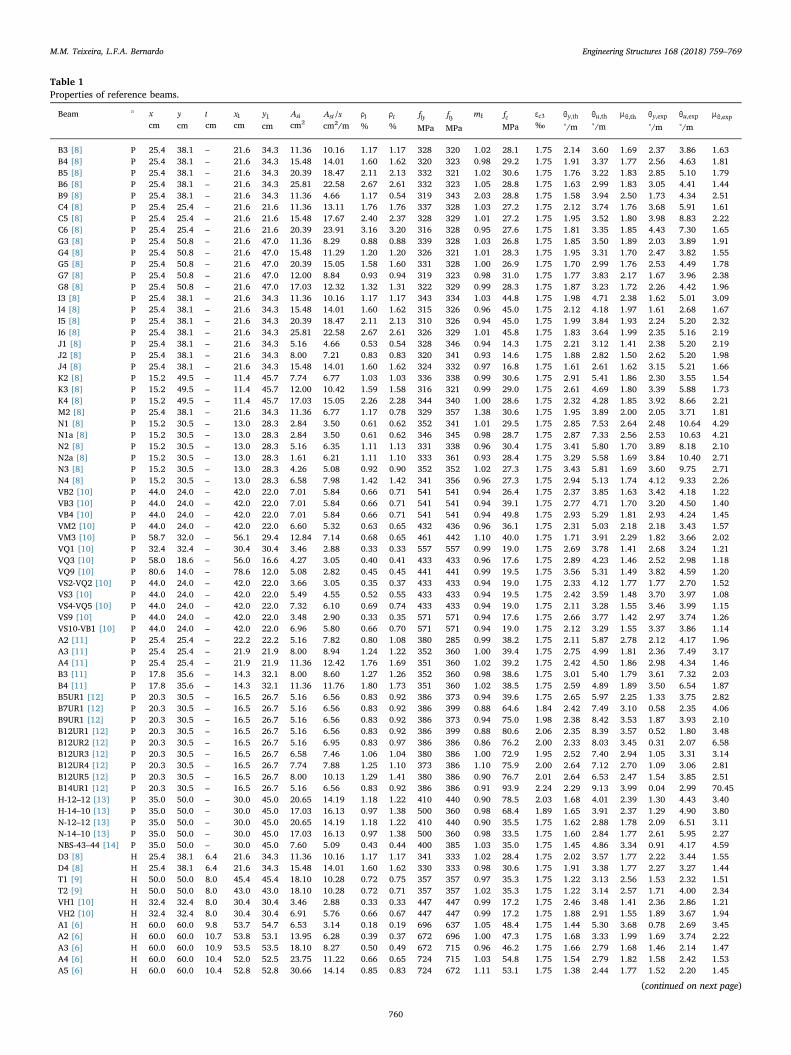
Table 1Properties of reference beams.
Beam a xcm
ycm
tcm
x1cm
y1cm
Aslcm2
A s/stcm2/m
ρl%
ρt%
flyMPa
ftyMPa
mb fcMPa
εc3‰
θy,th
°/mθu,th°/m
μθ,th θy,exp
°/mθu,exp
°/m
μθ,exp
B3 [8] P 25.4 38.1 – 21.6 34.3 11.36 10.16 1.17 1.17 328 320 1.02 28.1 1.75 2.14 3.60 1.69 2.37 3.86 1.63B4 [8] P 25.4 38.1 – 21.6 34.3 15.48 14.01 1.60 1.62 320 323 0.98 29.2 1.75 1.91 3.37 1.77 2.56 4.63 1.81B5 [8] P 25.4 38.1 – 21.6 34.3 20.39 18.47 2.11 2.13 332 321 1.02 30.6 1.75 1.76 3.22 1.83 2.85 5.10 1.79B6 [8] P 25.4 38.1 – 21.6 34.3 25.81 22.58 2.67 2.61 332 323 1.05 28.8 1.75 1.63 2.99 1.83 3.05 4.41 1.44B9 [8] P 25.4 38.1 – 21.6 34.3 11.36 4.66 1.17 0.54 319 343 2.03 28.8 1.75 1.58 3.94 2.50 1.73 4.34 2.51C4 [8] P 25.4 25.4 – 21.6 21.6 11.36 13.11 1.76 1.76 337 328 1.03 27.2 1.75 2.12 3.74 1.76 3.68 5.91 1.61C5 [8] P 25.4 25.4 – 21.6 21.6 15.48 17.67 2.40 2.37 328 329 1.01 27.2 1.75 1.95 3.52 1.80 3.98 8.83 2.22C6 [8] P 25.4 25.4 – 21.6 21.6 20.39 23.91 3.16 3.20 316 328 0.95 27.6 1.75 1.81 3.35 1.85 4.43 7.30 1.65G3 [8] P 25.4 50.8 – 21.6 47.0 11.36 8.29 0.88 0.88 339 328 1.03 26.8 1.75 1.85 3.50 1.89 2.03 3.89 1.91G4 [8] P 25.4 50.8 – 21.6 47.0 15.48 11.29 1.20 1.20 326 321 1.01 28.3 1.75 1.95 3.31 1.70 2.47 3.82 1.55G5 [8] P 25.4 50.8 – 21.6 47.0 20.39 15.05 1.58 1.60 331 328 1.00 26.9 1.75 1.70 2.99 1.76 2.53 4.49 1.78G7 [8] P 25.4 50.8 – 21.6 47.0 12.00 8.84 0.93 0.94 319 323 0.98 31.0 1.75 1.77 3.83 2.17 1.67 3.96 2.38G8 [8] P 25.4 50.8 – 21.6 47.0 17.03 12.32 1.32 1.31 322 329 0.99 28.3 1.75 1.87 3.23 1.72 2.26 4.42 1.96I3 [8] P 25.4 38.1 – 21.6 34.3 11.36 10.16 1.17 1.17 343 334 1.03 44.8 1.75 1.98 4.71 2.38 1.62 5.01 3.09I4 [8] P 25.4 38.1 – 21.6 34.3 15.48 14.01 1.60 1.62 315 326 0.96 45.0 1.75 2.12 4.18 1.97 1.61 2.68 1.67I5 [8] P 25.4 38.1 – 21.6 34.3 20.39 18.47 2.11 2.13 310 326 0.94 45.0 1.75 1.99 3.84 1.93 2.24 5.20 2.32I6 [8] P 25.4 38.1 – 21.6 34.3 25.81 22.58 2.67 2.61 326 329 1.01 45.8 1.75 1.83 3.64 1.99 2.35 5.16 2.19J1 [8] P 25.4 38.1 – 21.6 34.3 5.16 4.66 0.53 0.54 328 346 0.94 14.3 1.75 2.21 3.12 1.41 2.38 5.20 2.19J2 [8] P 25.4 38.1 – 21.6 34.3 8.00 7.21 0.83 0.83 320 341 0.93 14.6 1.75 1.88 2.82 1.50 2.62 5.20 1.98J4 [8] P 25.4 38.1 – 21.6 34.3 15.48 14.01 1.60 1.62 324 332 0.97 16.8 1.75 1.61 2.61 1.62 3.15 5.21 1.66K2 [8] P 15.2 49.5 – 11.4 45.7 7.74 6.77 1.03 1.03 336 338 0.99 30.6 1.75 2.91 5.41 1.86 2.30 3.55 1.54K3 [8] P 15.2 49.5 – 11.4 45.7 12.00 10.42 1.59 1.58 316 321 0.99 29.0 1.75 2.61 4.69 1.80 3.39 5.88 1.73K4 [8] P 15.2 49.5 – 11.4 45.7 17.03 15.05 2.26 2.28 344 340 1.00 28.6 1.75 2.32 4.28 1.85 3.92 8.66 2.21M2 [8] P 25.4 38.1 – 21.6 34.3 11.36 6.77 1.17 0.78 329 357 1.38 30.6 1.75 1.95 3.89 2.00 2.05 3.71 1.81N1 [8] P 15.2 30.5 – 13.0 28.3 2.84 3.50 0.61 0.62 352 341 1.01 29.5 1.75 2.85 7.53 2.64 2.48 10.64 4.29N1a [8] P 15.2 30.5 – 13.0 28.3 2.84 3.50 0.61 0.62 346 345 0.98 28.7 1.75 2.87 7.33 2.56 2.53 10.63 4.21N2 [8] P 15.2 30.5 – 13.0 28.3 5.16 6.35 1.11 1.13 331 338 0.96 30.4 1.75 3.41 5.80 1.70 3.89 8.18 2.10N2a [8] P 15.2 30.5 – 13.0 28.3 1.61 6.21 1.11 1.10 333 361 0.93 28.4 1.75 3.29 5.58 1.69 3.84 10.40 2.71N3 [8] P 15.2 30.5 – 13.0 28.3 4.26 5.08 0.92 0.90 352 352 1.02 27.3 1.75 3.43 5.81 1.69 3.60 9.75 2.71N4 [8] P 15.2 30.5 – 13.0 28.3 6.58 7.98 1.42 1.42 341 356 0.96 27.3 1.75 2.94 5.13 1.74 4.12 9.33 2.26VB2 [10] P 44.0 24.0 – 42.0 22.0 7.01 5.84 0.66 0.71 541 541 0.94 26.4 1.75 2.37 3.85 1.63 3.42 4.18 1.22VB3 [10] P 44.0 24.0 – 42.0 22.0 7.01 5.84 0.66 0.71 541 541 0.94 39.1 1.75 2.77 4.71 1.70 3.20 4.50 1.40VB4 [10] P 44.0 24.0 – 42.0 22.0 7.01 5.84 0.66 0.71 541 541 0.94 49.8 1.75 2.93 5.29 1.81 2.93 4.24 1.45VM2 [10] P 44.0 24.0 – 42.0 22.0 6.60 5.32 0.63 0.65 432 436 0.96 36.1 1.75 2.31 5.03 2.18 2.18 3.43 1.57VM3 [10] P 58.7 32.0 – 56.1 29.4 12.84 7.14 0.68 0.65 461 442 1.10 40.0 1.75 1.71 3.91 2.29 1.82 3.66 2.02VQ1 [10] P 32.4 32.4 – 30.4 30.4 3.46 2.88 0.33 0.33 557 557 0.99 19.0 1.75 2.69 3.78 1.41 2.68 3.24 1.21VQ3 [10] P 58.0 18.6 – 56.0 16.6 4.27 3.05 0.40 0.41 433 433 0.96 17.6 1.75 2.89 4.23 1.46 2.52 2.98 1.18VQ9 [10] P 80.6 14.0 – 78.6 12.0 5.08 2.82 0.45 0.45 441 441 0.99 19.5 1.75 3.56 5.31 1.49 3.82 4.59 1.20VS2-VQ2 [10] P 44.0 24.0 – 42.0 22.0 3.66 3.05 0.35 0.37 433 433 0.94 19.0 1.75 2.33 4.12 1.77 1.77 2.70 1.52VS3 [10] P 44.0 24.0 – 42.0 22.0 5.49 4.55 0.52 0.55 433 433 0.94 19.5 1.75 2.42 3.59 1.48 3.70 3.97 1.08VS4-VQ5 [10] P 44.0 24.0 – 42.0 22.0 7.32 6.10 0.69 0.74 433 433 0.94 19.0 1.75 2.11 3.28 1.55 3.46 3.99 1.15VS9 [10] P 44.0 24.0 – 42.0 22.0 3.48 2.90 0.33 0.35 571 571 0.94 17.6 1.75 2.66 3.77 1.42 2.97 3.74 1.26VS10-VB1 [10] P 44.0 24.0 – 42.0 22.0 6.96 5.80 0.66 0.70 571 571 0.94 19.0 1.75 2.12 3.29 1.55 3.37 3.86 1.14A2 [11] P 25.4 25.4 – 22.2 22.2 5.16 7.82 0.80 1.08 380 285 0.99 38.2 1.75 2.11 5.87 2.78 2.12 4.17 1.96A3 [11] P 25.4 25.4 – 21.9 21.9 8.00 8.94 1.24 1.22 352 360 1.00 39.4 1.75 2.75 4.99 1.81 2.36 7.49 3.17A4 [11] P 25.4 25.4 – 21.9 21.9 11.36 12.42 1.76 1.69 351 360 1.02 39.2 1.75 2.42 4.50 1.86 2.98 4.34 1.46B3 [11] P 17.8 35.6 – 14.3 32.1 8.00 8.60 1.27 1.26 352 360 0.98 38.6 1.75 3.01 5.40 1.79 3.61 7.32 2.03B4 [11] P 17.8 35.6 – 14.3 32.1 11.36 11.76 1.80 1.73 351 360 1.02 38.5 1.75 2.59 4.89 1.89 3.50 6.54 1.87B5UR1 [12] P 20.3 30.5 – 16.5 26.7 5.16 6.56 0.83 0.92 386 373 0.94 39.6 1.75 2.65 5.97 2.25 1.33 3.75 2.82B7UR1 [12] P 20.3 30.5 – 16.5 26.7 5.16 6.56 0.83 0.92 386 399 0.88 64.6 1.84 2.42 7.49 3.10 0.58 2.35 4.06B9UR1 [12] P 20.3 30.5 – 16.5 26.7 5.16 6.56 0.83 0.92 386 373 0.94 75.0 1.98 2.38 8.42 3.53 1.87 3.93 2.10B12UR1 [12] P 20.3 30.5 – 16.5 26.7 5.16 6.56 0.83 0.92 386 399 0.88 80.6 2.06 2.35 8.39 3.57 0.52 1.80 3.48B12UR2 [12] P 20.3 30.5 – 16.5 26.7 5.16 6.95 0.83 0.97 386 386 0.86 76.2 2.00 2.33 8.03 3.45 0.31 2.07 6.58B12UR3 [12] P 20.3 30.5 – 16.5 26.7 6.58 7.46 1.06 1.04 380 386 1.00 72.9 1.95 2.52 7.40 2.94 1.05 3.31 3.14B12UR4 [12] P 20.3 30.5 – 16.5 26.7 7.74 7.88 1.25 1.10 373 386 1.10 75.9 2.00 2.64 7.12 2.70 1.09 3.06 2.81B12UR5 [12] P 20.3 30.5 – 16.5 26.7 8.00 10.13 1.29 1.41 380 386 0.90 76.7 2.01 2.64 6.53 2.47 1.54 3.85 2.51B14UR1 [12] P 20.3 30.5 – 16.5 26.7 5.16 6.56 0.83 0.92 386 386 0.91 93.9 2.24 2.29 9.13 3.99 0.04 2.99 70.45H-12–12 [13] P 35.0 50.0 – 30.0 45.0 20.65 14.19 1.18 1.22 410 440 0.90 78.5 2.03 1.68 4.01 2.39 1.30 4.43 3.40H-14–10 [13] P 35.0 50.0 – 30.0 45.0 17.03 16.13 0.97 1.38 500 360 0.98 68.4 1.89 1.65 3.91 2.37 1.29 4.90 3.80N-12–12 [13] P 35.0 50.0 – 30.0 45.0 20.65 14.19 1.18 1.22 410 440 0.90 35.5 1.75 1.62 2.88 1.78 2.09 6.51 3.11N-14–10 [13] P 35.0 50.0 – 30.0 45.0 17.03 16.13 0.97 1.38 500 360 0.98 33.5 1.75 1.60 2.84 1.77 2.61 5.95 2.27NBS-43–44 [14] P 35.0 50.0 – 30.0 45.0 7.60 5.09 0.43 0.44 400 385 1.03 35.0 1.75 1.45 4.86 3.34 0.91 4.17 4.59D3 [8] H 25.4 38.1 6.4 21.6 34.3 11.36 10.16 1.17 1.17 341 333 1.02 28.4 1.75 2.02 3.57 1.77 2.22 3.44 1.55D4 [8] H 25.4 38.1 6.4 21.6 34.3 15.48 14.01 1.60 1.62 330 333 0.98 30.6 1.75 1.91 3.38 1.77 2.27 3.27 1.44T1 [9] H 50.0 50.0 8.0 45.4 45.4 18.10 10.28 0.72 0.75 357 357 0.97 35.3 1.75 1.22 3.13 2.56 1.53 2.32 1.51T2 [9] H 50.0 50.0 8.0 43.0 43.0 18.10 10.28 0.72 0.71 357 357 1.02 35.3 1.75 1.22 3.14 2.57 1.71 4.00 2.34VH1 [10] H 32.4 32.4 8.0 30.4 30.4 3.46 2.88 0.33 0.33 447 447 0.99 17.2 1.75 2.46 3.48 1.41 2.36 2.86 1.21VH2 [10] H 32.4 32.4 8.0 30.4 30.4 6.91 5.76 0.66 0.67 447 447 0.99 17.2 1.75 1.88 2.91 1.55 1.89 3.67 1.94A1 [6] H 60.0 60.0 9.8 53.7 54.7 6.53 3.14 0.18 0.19 696 637 1.05 48.4 1.75 1.44 5.30 3.68 0.78 2.69 3.45A2 [6] H 60.0 60.0 10.7 53.8 53.1 13.95 6.28 0.39 0.37 672 696 1.00 47.3 1.75 1.68 3.33 1.99 1.69 3.74 2.22A3 [6] H 60.0 60.0 10.9 53.5 53.5 18.10 8.27 0.50 0.49 672 715 0.96 46.2 1.75 1.66 2.79 1.68 1.46 2.14 1.47A4 [6] H 60.0 60.0 10.4 52.0 52.5 23.75 11.22 0.66 0.65 724 715 1.03 54.8 1.75 1.54 2.79 1.82 1.58 2.42 1.53A5 [6] H 60.0 60.0 10.4 52.8 52.8 30.66 14.14 0.85 0.83 724 672 1.11 53.1 1.75 1.38 2.44 1.77 1.52 2.20 1.45
(continued on next page)
M.M. Teixeira, L.F.A. Bernardo Engineering Structures 168 (2018) 759–769
760
In this article, the torsional ductility of RC beams with rectangularcross section is studied. For this, several experimental results of RCbeams tested under pure torsion and collected from literature are used.A torsional ductility index is used to characterize the ductility of thestudied beams under torsion. The influence of the following variablesstudy is evaluated: compressive concrete strength, torsional reinforce-ment ratio and cross section type (plain or hollow). Additionally, acomparative analysis with the rules from some codes of practice in useis also performed, in order to check their adequacy to guarantee theductility of RC beams under torsion.
It should be referred that in real structures torsion is usually com-bined with other internal forces (bending moments, shear and axialforces) in the critical sections. However, in current structures torsioncan be one of the primary internal forces for the design. Moreover, asusually required by the codes of practice, the design for combinedloading requires to design the cross section separately for each internalforce and, eventually, complement the analysis with interaction re-quirements. From this point of view, the study of RC beams under puretorsion can be considered important.
2. Research significance
Specific studies on the torsional ductility of RC beams are veryscarce [6,7]. Moreover, these studies only focused RC hollow beams. Inthe literature, no additional studies were found on the torsional duc-tility of RC plain beams, neither comparative analyses between similarplain and hollow RC beams. In [7] it was shown, from numericalanalyses with continuous and curved RC beams, that the redistributioncapacity of torsional moments is as much important as for bending. Thisrequires that sufficient torsional ductility must be ensured in the criticalsections.
The lack of specific studies on this subject is reflected in the limitedrules for most of codes of practice in use. For instance, when comparedwith the ductility rules for bending, the number of ductility rules di-rectly related with torsion is much lesser or even inexistent.
For these reasons, a specific study on the torsional ductility of RCbeams can be considered important.
3. Reference beams
From the literature, several RC beams with rectangular cross sectionand tested under torsion were collected for this study. These beamscome from the following studies: Hsu in 1968 [8], Lampert and Thur-limann in 1969 [9], Leonhardt and Schelling in 1974 [10], McMullenand Rangan in 1978 [11], Koutchkali and Belarbi in 2001 [12], Fangand Shiau in 2004 [13], Chiu et al. in 2007 [14], Bernardo and Lopes in2009 [6], Peng and Wong in 2011 [15] and Jeng in 2015 [16]. Beamsfrom other studies found in literature and some of the beams belonging
to the all set from the previous studies were discarded because of theapplied criteria. The criteria to select the beams for this study were thefollowing;
– The complete experimental curve Torque (T ) – Twist (θ) should begiven for the beam. This is because the torsional ductility is char-acterized from this curve (Section 4);
– The beam should have a typical behavior under torsion. To checkthis, the experimental −T θ curve was qualitatively analyzed. Thiscurve should show a typical shape with all the behavioral stagesuntil failure, such as described in [8];
– In addition to the previous criterion, basic and current requirementswere also checked by using ACI Code [17]. This code was usedbecause it constitutes one of the codes in use with higher number ofspecific rules for torsion, in order to impose a good behavior for aRC beam under torsion. These requirements included: proper de-tailing and proper solution for the torsional reinforcement, max-imum spacing between bars, minimum diameter for the bars andminimum size for the walls (hollow beams). Some beams that do notrespected requirements related with the minimum and maximumamount of torsional reinforcement were considered because they areof interest for this study (Section 6);
– The beam should have a minimum ductile failure. This was checkedby visualizing qualitatively the experimental −T θ curve in the ulti-mate stage. This one should show inelastic deformations for thepeak load and eventually also a post-peak descending branch. Thisshape indicates that the test was carried out with sufficient controlto register the experimental inelastic deformations in the ultimatestage. In general, such behavior occurs when the torsional re-inforcement yields before the maximum torque is reached.However, ductile behavior was also observed for some beams forwhich this condition did not occurred. This will be discussed in thenext section.
Table 1 presents some of the geometrical and mechanical propertiesfor the reference beams that were effectively used in this study, namely:the width (x) and the height (y) of the cross section, the thickness of thewalls for hollow sections (t), the total area of longitudinal reinforce-ment (Asl), the distributed area of the transverse reinforcement (A s/st ,with Ast the area for one bar of the hoop and s the longitudinal spacingbetween hoops), the longitudinal reinforcement ratio ( = A xyρ /l sl ), thetransverse reinforcement ratio ( = A u A sρ /t st c , with = +u x y2( )1 1 and
=A xyc , being x1 and y1 the average width and height of the transversereinforcement), the average yielding stress for the longitudinal andtransverse reinforcement ( fly and fty, respectively), the effective balancebetween longitudinal and transverse reinforcement for the ultimatestate ( = = +m f f A s A x y f f(ρ )/(ρ ) [ /( 2( ))]( / )b l ly t ty sl t ly ty1 1 ) and the averagecompressive strength for concrete ( fc). Parameter mb represents the
Table 1 (continued)
Beam a xcm
ycm
tcm
x1cm
y1cm
Aslcm2
A s/stcm2/m
ρl%
ρt%
flyMPa
ftyMPa
mb fcMPa
εc3‰
θy,th
°/mθu,th°/m
μθ,th θy,exp
°/mθu,exp
°/m
μθ,exp
B2 [6] H 60.0 60.0 10.8 53.3 53.4 14.58 6.70 0.41 0.40 672 696 0.99 69.8 1.91 1.61 3.02 1.88 1.68 2.89 1.73B3 [6] H 60.0 60.0 10.9 53.5 53.7 23.75 11.22 0.66 0.67 724 715 1.00 77.8 2.02 1.76 3.10 1.76 1.42 1.98 1.39B4 [6] H 60.0 60.0 11.2 52.3 53.6 32.17 15.08 0.89 0.89 724 672 1.09 79.8 2.05 1.67 2.79 1.67 1.25 1.66 1.32B5 [6] H 60.0 60.0 11.7 51.8 51.8 40.21 18.85 1.12 1.09 724 672 1.11 76.4 2.00 1.48 2.57 1.73 1.15 1.56 1.36C1 [6] H 60.0 60.0 9.7 54.0 54.9 6.53 3.14 0.18 0.19 696 637 1.04 91.7 2.21 1.43 7.28 5.09 1.13 2.03 1.80C2 [6] H 60.0 60.0 10.0 53.2 53.3 13.95 6.28 0.39 0.37 672 696 1.01 94.8 2.26 1.58 2.77 1.75 1.41 2.18 1.55C3 [6] H 60.0 60.0 10.3 54.5 54.0 23.75 10.47 0.66 0.63 724 715 1.06 91.6 2.21 1.91 3.32 1.73 1.37 1.63 1.19C4 [6] H 60.0 60.0 10.3 54.6 54.5 30.66 14.14 0.85 0.86 724 672 1.07 91.4 2.21 1.88 2.96 1.58 1.47 1.77 1.21C5 [6] H 60.0 60.0 10.4 54.0 54.3 36.69 17.40 1.02 1.05 724 672 1.05 96.7 2.28 1.79 2.82 1.57 1.35 1.63 1.20C6 [6] H 60.0 60.0 10.4 53.3 52.9 48.25 22.62 1.34 1.34 724 672 1.08 87.5 2.16 1.51 2.57 1.71 1.13 1.47 1.30C065a [16] H 49.5 78.1 8.5 43.5 72.1 20.00 9.93 0.52 0.59 338 376 0.78 78.8 2.04 0.76 4.63 6.08 0.13 0.86 6.59C100a [16] H 49.9 72.3 12.7 43.9 66.3 28.39 12.90 0.79 0.79 466 447 1.04 90.6 2.20 1.16 3.79 3.26 0.96 2.23 2.31D090a [16] H 50.1 72.2 10.5 44.1 66.2 28.39 12.90 0.79 0.79 466 447 1.04 105.7 2.41 1.11 3.96 3.58 0.73 2.06 2.81
a P – Plain section; H – Hollow section.
M.M. Teixeira, L.F.A. Bernardo Engineering Structures 168 (2018) 759–769
761
ratio between the mechanical ratios of the longitudinal reinforcementto the transverse reinforcement. The other parameters presented inTable 1 will be explained later. Some of the properties for the materialsare usually not given by the authors, namely the average Young’sModulus for steel and concrete (Es and Ec, respectively). For concrete,the Young’s Modulus was computed from the European code EC 2 [18]by correlation with fc. For steel bars, the Young’s Modulus was con-sidered to be 200 GPa [18].
Some of the properties presented in Table 1 are related with thevariables study to be analyzed (Section 5) and are also need to computeboth the experimental and theoretical ductility indexes (Section 4).
4. Torsional ductility index
In this study, the same torsional ductility index μθ defined and usedby Bernardo and Lopes in 2015 [6] was used. This index, based on theangular deformation per unit meter (twist), is defined as follows:
=μ θθ
u
yθ (1)
where
θu =ultimate twist (corresponding to the ultimate torque Tu);θy =yielding twist (corresponding to the yielding torque Ty).
In this study, the experimental and theoretical values for μθ arecomputed for the reference beams. The experimental values are ob-tained from the experimental −T θ curves. The theoretical values areobtained from the theoretical −T θ curves computed from theGeneralized Softened Variable Angle Truss Model (GSVATM). Thisanalytical model was chosen because it provides good predictions forthe behavior of RC beams under torsion [19].
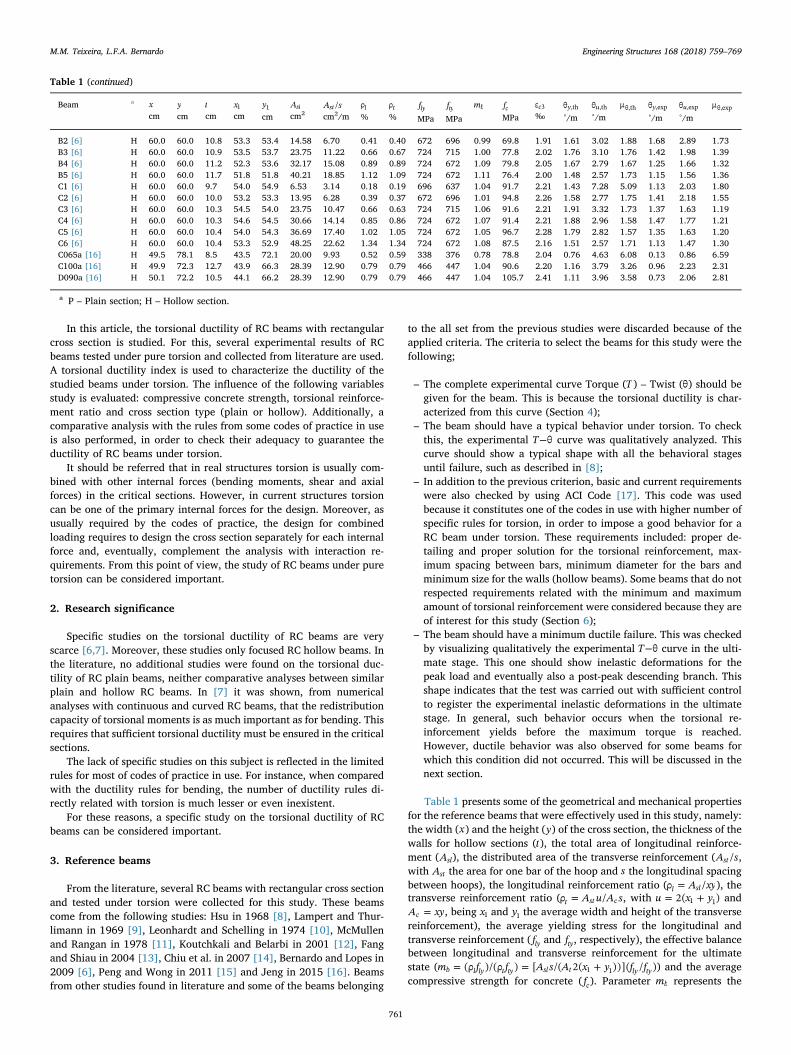
The yielding twist θy is defined from the key point of the −T θ curvecorresponding to the yielding of the torsional reinforcement (point withcoordinates T(θ ; )y y ). For beams with balanced torsional reinforcement( ≈m 1b ), both longitudinal and transverse reinforcements generallyyield at the same time (or almost). In this situation, only one yieldingpoint is defined in the −T θ curve. If two closely yielding points areidentified (one for each torsional reinforcement), then an average pointis defined. This situation is exemplified in Fig. 1 for Beam G4 [8]. For
beams with unbalanced torsional reinforcement, longitudinal andtransverse reinforcement do not yield at the same time. In this case twoyielding points far apart exist in the −T θ curve (or even only one if thereinforcements are highly unbalanced). In this case, the chosen cri-terion was defined from the observation of the shape of the −T θ curveimmediately after the first yielding point. If a pronounced nonlinearshape starts to develop right after this point (deformation rate starts toincrease when compared with torque rate), then the effective yieldingpoint is attributed to the first yielding point (or to the unique one if onlyone of the torsional reinforcement yielded). These situations are ex-emplified in Fig. 1 for Beams B9 and M2 [8]. If the nonlinear shapestarts only after the second yielding point, either this second point isconsidered the effective yielding point, either an average point is de-fined if the two yielding points are not too far apart.
It should be referred that the theoretical −T θ curve was sometimesused to check the location of the yielding key point for the referencebeams for which the authors did not provide sufficient data to identifyclearly this point. This can be done because it is known that theGSVATM provides good predictions, including for the cracking andmaximum torque [19]. For such beams, the location of the experi-mental yielding point was obtained from an interpolation between thecracking and maximum torque in the experimental −T θ curve, byknowing the relative location of this point between the cracking andmaximum torque in the theoretical −T θ curve. In the end, the locationof the yielding point in the experimental −T θ curve was confirmed froma qualitative analysis of the shape of the curve right after this point. InFig. 1, it can be seen that this procedure is quite acceptable fromcomparison between the experimental and theoretical −T θ curves,namely for the torque levels and the relative location of the yieldingpoint between the cracking and maximum torque (see Beams G4 and B9in Fig. 1).
Still related with the yielding point of the −T θ curve, it was ob-served that for some reference beams a ductile behavior (inelastic de-formations) rises before the yielding of the torsional reinforcement.This situation is exemplified in Fig. 1 for Beams I5 and K3 [8]. For thislast one, the torsional reinforcement did not yielded. This occurs par-ticularly in beams with normal strength concrete and with moderate orhigh torsional reinforcement ratio. This behavior is not new and can beexplained due to the nonlinear behavior of the compressive concretebefore the peak stress due to the initiation of the crushing phenomena.
0
10
20
30
40
50
60
70
80
0.0 1.0 2.0 3.0 4.0 5.0 6.0 7.0
T[k
N.m
]
θ [º/m]
Exp. B9
Theor. B9
Exp. G4
Theor. G4
Exp.I5
Theor. I5
Exp. K3
Theor. K3
Exp. M2
Theor. M2
Equiv. Yielding
Yielding Asl
Yielding Ast
Fig. 1. Experimental and theoretical −T θcurves for some reference beams.
M.M. Teixeira, L.F.A. Bernardo Engineering Structures 168 (2018) 759–769
762
In current situations with over-reinforced sections in bending, an ap-propriate design based on the strain control for the reinforcement canmaximize this favorable behavior of the compressive concrete [20]. Forthe reference beams that show this behavior, this ductile behavior mustbe considered and a criterion is need to define an equivalent yieldingpoint in the −T θ curve. The chosen criterion was to attribute for theequivalent yielding point, the point in the −T θ curve for which thestrain in the concrete in compression reaches the strain correspondingto the peak stress. This was done with the help of the theoretical resultsfrom the GSVATM, since experimental data for the strain in the com-pressive concrete in the principal direction of stresses are not usuallyprovided in the studies. To compute a reference value for the straincorresponding to the peak stress for the concrete in compression, threevalues from EC 2 [18] were tested: εc1 from a nonlinear stress (σ) –strain (ε) relationship, εc2 from a parabola-rectangle −σ ε relationshipand εc3 from a bilinear −σ ε relationship. After the calculations and acomparative analysis between the concerned referred beams, it wasfound that εc3 from a bilinear −σ ε relationship is more realistic to es-timate the equivalent yielding point in the −T θ curve. Table 1 presentsthe values for εc3 computed from EC 2 [18] for the reference beams. Forall the remaining reference beams, it was checked that the equivalentyielding point (concrete) is located to the right of the yielding point(torsional reinforcement) in the −T θ curves.
The location and verification of the key point corresponding to εc3 inthe experimental −T θ curve was obtained in a similar way as previouslyexplained for the yielding point. The location of the equivalent yieldingpoint is exemplified in Fig. 1 for Beams I5 and K3 [8].
From the referred above, and by knowing the location of theyielding point (or equivalent yielding point), the value for θy was ob-tained for both the theoretical and experimental −T θ curves (θy,th andθy,exp, respectively). These values are presented in Table 1.
The ultimate twist θu is defined from the key point of the −T θ curve,in the post-peak descending branch, for which the beam no longer re-sists high torques. For this study, the same criterion discussed and usedby Bernardo and Lopes in 2009 [6] is adopted. This criterion assumesthat the ultimate twist corresponds to the key point with 80% of themaximum torque. This situation applies to Beam G4 [8] illustrated inFig. 1. For the beams for which the last point of the −T θ curve corre-sponds to a torque higher than 80% of the maximum torque, the keypoint to define the ultimate twist is assumed to be the last point of the
−T θ curve (point with maximum twist). For instance, this situationapplies for Beam B9 illustrated in Fig. 1.
From the referred above, and by knowing the location of the keypoint to define the ultimate twist, the value for θu was obtained for boththe theoretical and experimental −T θ curves (θu,th and θu,exp, respec-tively). These values are presented in Table 1.
Table 1 also presents, for each reference beam, the theoretical andexperimental torsional ductility index, μθ,th and μθ,exp respectively,computed from Eq. (1). From Table 1, it should be noted that
appreciable differences exist between μθ,th and μθ,exp for some of thereference beams. This is because the theoretical and experimental −T θcurves usually show different shapes in the ending. This occur becauseGSVATM incorporates criteria to stop the calculations, namely con-ventional limits for the strains in the materials. For this reason, in thisstudy the theoretical values for the torsional ductility index are onlyused to validate the experimental trends observed with the same ex-perimental values (Section 5), which are expected to present higherdispersion. Since the theoretical −T θ curves are computed with thesame stopping criteria for all the reference beams, it is assumed that theobtained theoretical trends are valid to check the experimental ones.
5. Analysis of the torsional ductility index
The aim of this section is to analyze qualitatively, with scattergraphs, the evolution of the torsional ductility index as function of somevariables study related with the characteristics of the reference beams.The analysis of the results from previous experimental researches car-ried out over the last decades allow to state that the ultimate behaviorof RC beams under torsion, with rectangular cross section, is influencedby the following variables [7,8,10,21]:
– concrete compressive strength ( fc);– total ratio of torsional reinforcement ρtot (beams with balanced re-inforcement);
– section type (plain or hollow);– unbalance of torsional reinforcement (characterized with parameter
mb);– height to width ratio (y x/ ) of the rectangular cross section.
Among these variables, the first three are those that show notableinfluence in the ultimate behavior of the beams, namely for the ultimatedeformations, provided that mb and y x/ are not very far from unity(common situation for beams in pure torsion). This is also true for thetorsional ductility.
The aim of this study is to investigate the influence of each of thepreviously referred variables study on the torsional ductility of the re-ference beams. For this and from Table 1, groups of beams are createdaccording to the chosen variable to be studied. In each group, thevariable study to be analyzed varies while the other variables are keptconstant (or approximately). To study the influence of the variables fc,ρtot , mb and y x/ on the torsional ductility index, the reference beamswere also separated into two groups: plain and hollow cross section.
For each group of beams, a minimum number of beams must exist toprovide a sufficient number of points in the graphs to show reliabletrends. This condition somewhat limited the number of analysis thatcould be performed.
1.0
1.5
2.0
2.5
3.0
3.5
4.0
4.5
0 20 40 60 80
μ θ,e
xp
fc [MPa]
0 20 40 60 80 100
μθ,
th
A: 0.00-0.99%
B: 1.00-1.99%
C: 2.00-2.99%
D: 3.00-3.99%
E: 4.00-4.99%
F: 5.00-5.99%
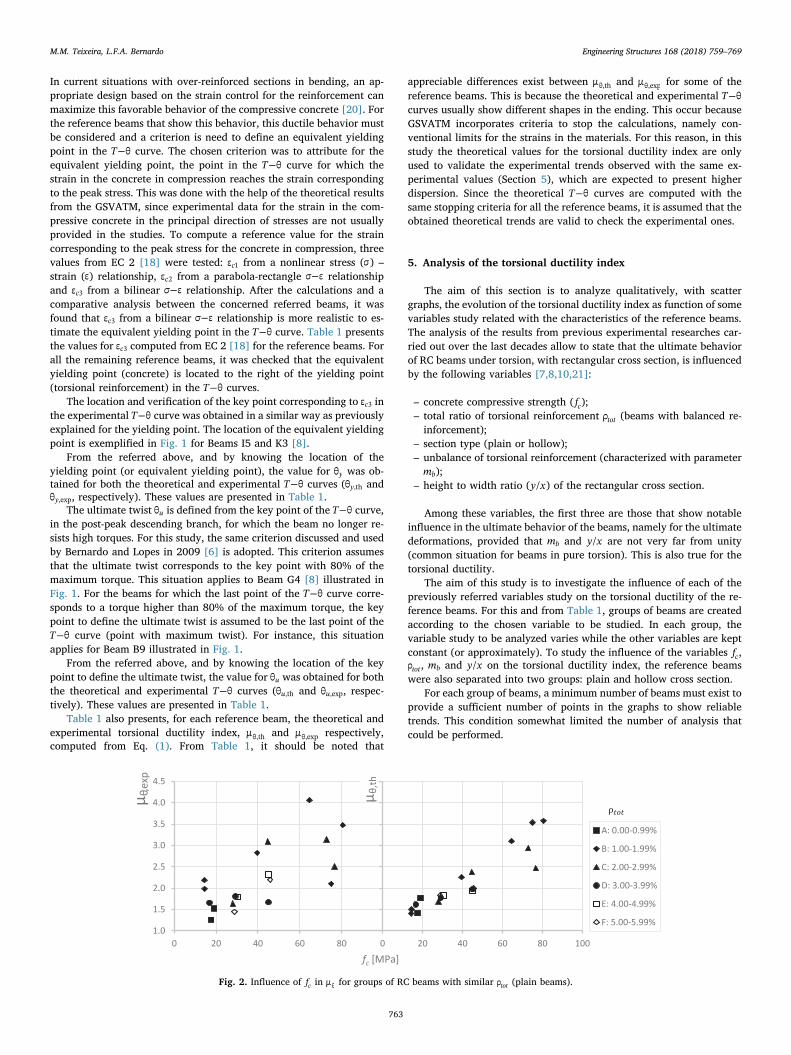
Fig. 2. Influence of fc in μθ for groups of RC beams with similar ρtot (plain beams).
M.M. Teixeira, L.F.A. Bernardo Engineering Structures 168 (2018) 759–769
763
5.1. Concrete compressive strength
Fig. 2 shows the influence of the concrete compressive strength, fc,in the torsional ductility index μθ for some groups with plain beamshaving equal or similar total reinforcement ratio, ρtot. A range of 1% forρtot was considered to provide a sufficient number of beams for eachgroup. As previously referred, variables mb and y x/ show to have asmall effect in the ultimate stage, namely in the torsional ductility,provided that they are not very far from unity. For this reason, and toprovide a sufficient number of beams and groups for the analysis, thesevariables were allowed to vary in the following ranges:
⩽ ⩽m0.90 1.10b and ⩽ ⩽y x0.50 / 2.00. The studied groups include thefollowing beams: Group A – VS9 and VS2-VQ2 [10]; Group B – J1 andJ2 [8] + B5UR1, B7UR1, B9UR1 and B12UR1 [12]; Group C: B3 and I3[8] + B12UR3 and B12UR5 [12]; Group D: J4, B4 and I4 [8]; Group E:B5 and I5 [8]; Group F: B6 and I6 [8]. Fig. 2 presents both the ex-perimental and theoretical torsional ductility indexes for the same re-ference beams (μθ,exp and μθ,th, respectively).
As expected, Fig. 2 shows larger dispersion of the results for theexperimental torsional ductility indexes, when compared to the theo-retical ones. Some dispersion is also observed for the theoretical results.This is probably related with the size of the interval that was consideredfor the torsional reinforcement ratio, ρtot , for each group. Fig. 2 alsoshows that, for a given range of ρtot , torsional ductility tends to increaseas the concrete compressive strength fc increases, regardless of beingnormal or high strength concrete. For this latter, this constitutes a po-sitive observation. This trend is observed for both the experimental andtheoretical torsional ductility indexes. For this reason, the observedexperimental trend can be considered reliable.
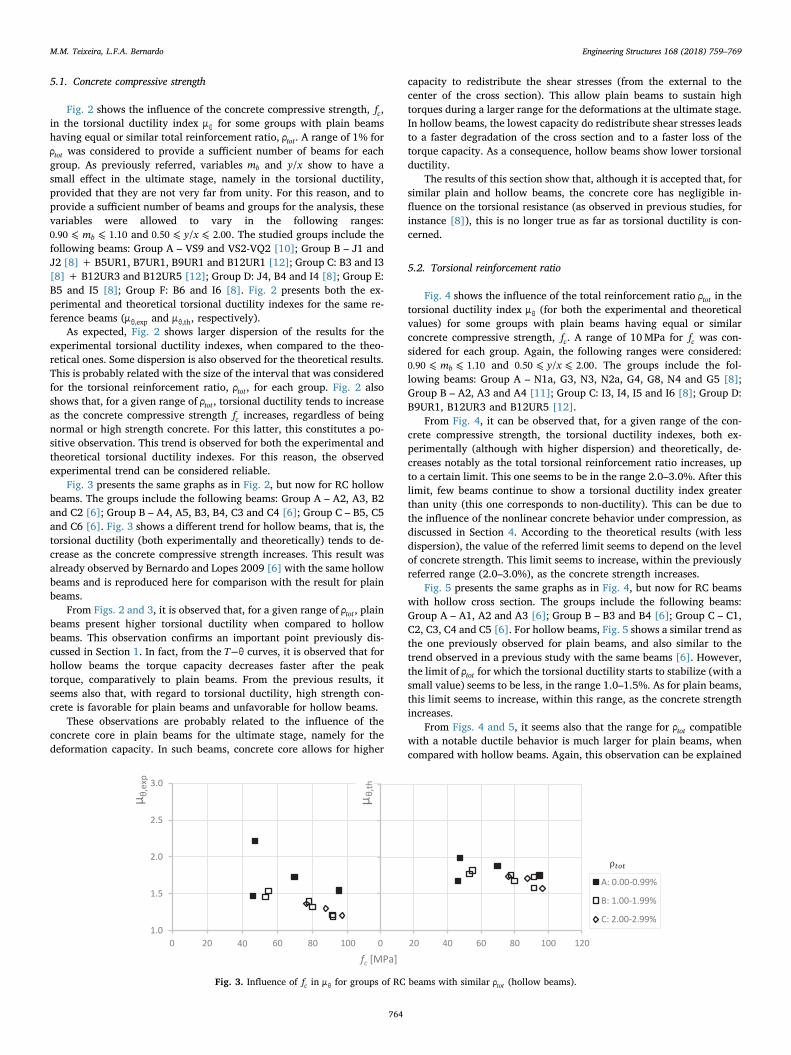
Fig. 3 presents the same graphs as in Fig. 2, but now for RC hollowbeams. The groups include the following beams: Group A – A2, A3, B2and C2 [6]; Group B – A4, A5, B3, B4, C3 and C4 [6]; Group C – B5, C5and C6 [6]. Fig. 3 shows a different trend for hollow beams, that is, thetorsional ductility (both experimentally and theoretically) tends to de-crease as the concrete compressive strength increases. This result wasalready observed by Bernardo and Lopes 2009 [6] with the same hollowbeams and is reproduced here for comparison with the result for plainbeams.
From Figs. 2 and 3, it is observed that, for a given range of ρtot , plainbeams present higher torsional ductility when compared to hollowbeams. This observation confirms an important point previously dis-cussed in Section 1. In fact, from the −T θ curves, it is observed that forhollow beams the torque capacity decreases faster after the peaktorque, comparatively to plain beams. From the previous results, itseems also that, with regard to torsional ductility, high strength con-crete is favorable for plain beams and unfavorable for hollow beams.
These observations are probably related to the influence of theconcrete core in plain beams for the ultimate stage, namely for thedeformation capacity. In such beams, concrete core allows for higher
capacity to redistribute the shear stresses (from the external to thecenter of the cross section). This allow plain beams to sustain hightorques during a larger range for the deformations at the ultimate stage.In hollow beams, the lowest capacity do redistribute shear stresses leadsto a faster degradation of the cross section and to a faster loss of thetorque capacity. As a consequence, hollow beams show lower torsionalductility.
The results of this section show that, although it is accepted that, forsimilar plain and hollow beams, the concrete core has negligible in-fluence on the torsional resistance (as observed in previous studies, forinstance [8]), this is no longer true as far as torsional ductility is con-cerned.
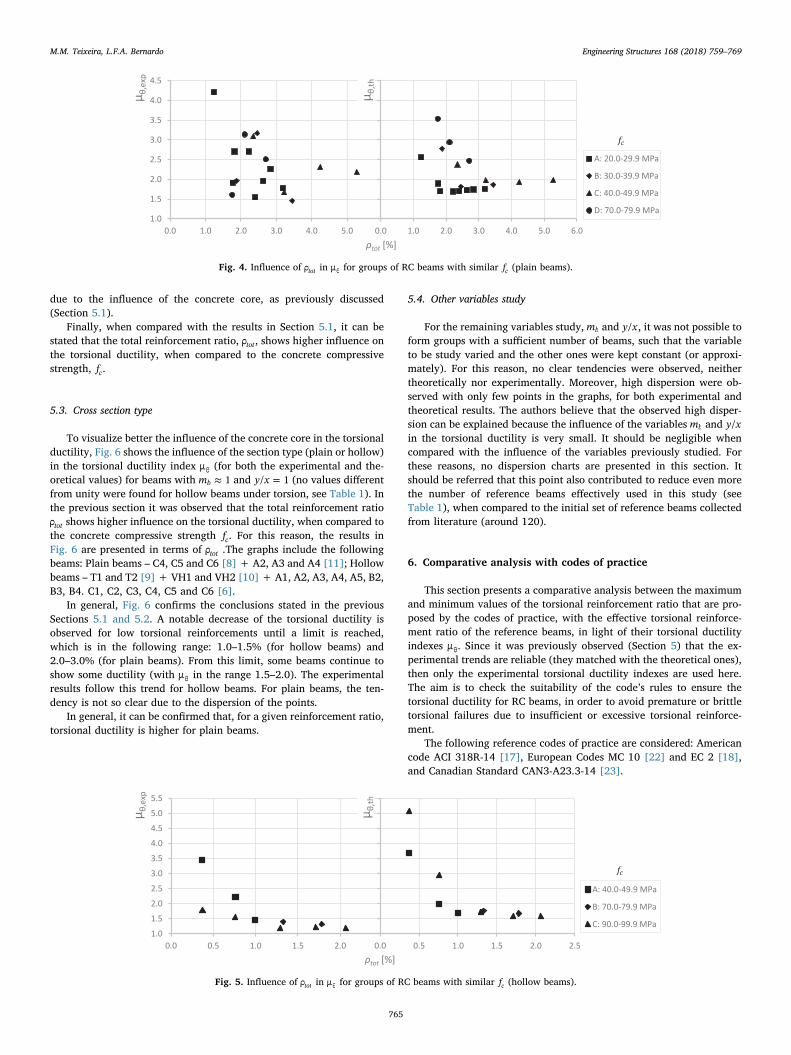
5.2. Torsional reinforcement ratio
Fig. 4 shows the influence of the total reinforcement ratio ρtot in thetorsional ductility index μθ (for both the experimental and theoreticalvalues) for some groups with plain beams having equal or similarconcrete compressive strength, fc. A range of 10MPa for fc was con-sidered for each group. Again, the following ranges were considered:
⩽ ⩽m0.90 1.10b and ⩽ ⩽y x0.50 / 2.00. The groups include the fol-lowing beams: Group A – N1a, G3, N3, N2a, G4, G8, N4 and G5 [8];Group B – A2, A3 and A4 [11]; Group C: I3, I4, I5 and I6 [8]; Group D:B9UR1, B12UR3 and B12UR5 [12].
From Fig. 4, it can be observed that, for a given range of the con-crete compressive strength, the torsional ductility indexes, both ex-perimentally (although with higher dispersion) and theoretically, de-creases notably as the total torsional reinforcement ratio increases, upto a certain limit. This one seems to be in the range 2.0–3.0%. After thislimit, few beams continue to show a torsional ductility index greaterthan unity (this one corresponds to non-ductility). This can be due tothe influence of the nonlinear concrete behavior under compression, asdiscussed in Section 4. According to the theoretical results (with lessdispersion), the value of the referred limit seems to depend on the levelof concrete strength. This limit seems to increase, within the previouslyreferred range (2.0–3.0%), as the concrete strength increases.
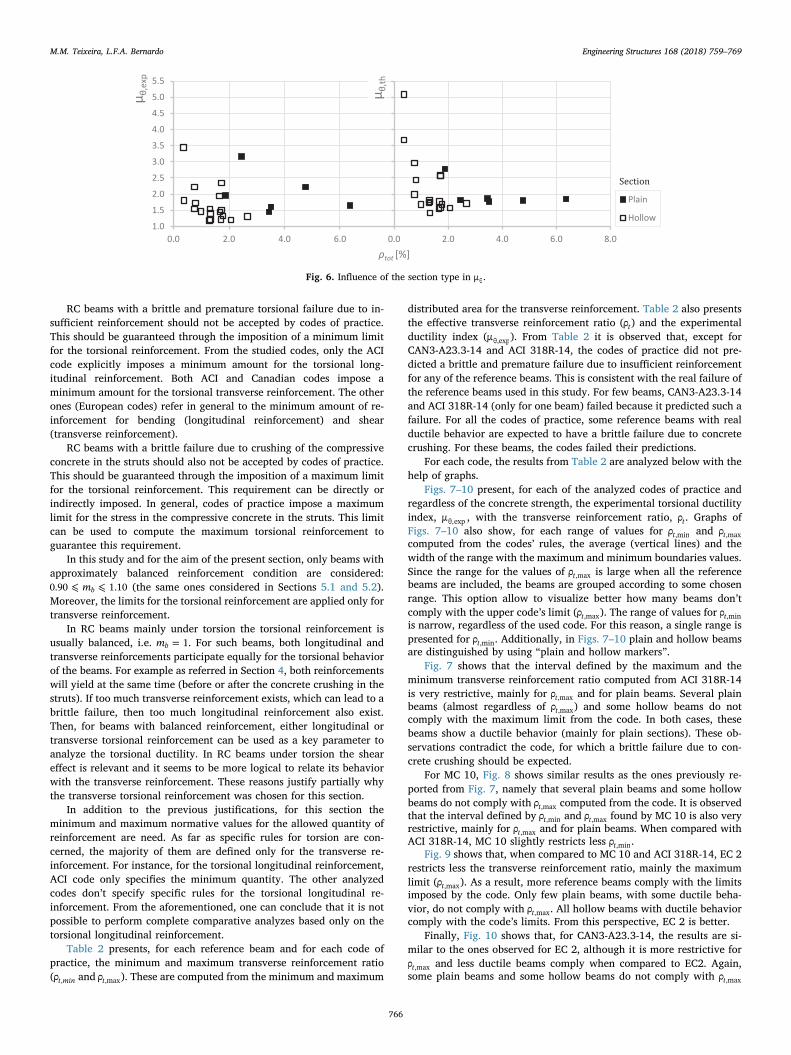
Fig. 5 presents the same graphs as in Fig. 4, but now for RC beamswith hollow cross section. The groups include the following beams:Group A – A1, A2 and A3 [6]; Group B – B3 and B4 [6]; Group C – C1,C2, C3, C4 and C5 [6]. For hollow beams, Fig. 5 shows a similar trend asthe one previously observed for plain beams, and also similar to thetrend observed in a previous study with the same beams [6]. However,the limit of ρtot for which the torsional ductility starts to stabilize (with asmall value) seems to be less, in the range 1.0–1.5%. As for plain beams,this limit seems to increase, within this range, as the concrete strengthincreases.
From Figs. 4 and 5, it seems also that the range for ρtot compatiblewith a notable ductile behavior is much larger for plain beams, whencompared with hollow beams. Again, this observation can be explained
1.0
1.5
2.0
2.5
3.0
0 20 40 60 80 100
μ θ,e
xp
fc [MPa]
0 20 40 60 80 100 120
μθ,
th
A: 0.00-0.99%
B: 1.00-1.99%
C: 2.00-2.99%
Fig. 3. Influence of fc in μθ for groups of RC beams with similar ρtot (hollow beams).
M.M. Teixeira, L.F.A. Bernardo Engineering Structures 168 (2018) 759–769
764
due to the influence of the concrete core, as previously discussed(Section 5.1).
Finally, when compared with the results in Section 5.1, it can bestated that the total reinforcement ratio, ρtot , shows higher influence onthe torsional ductility, when compared to the concrete compressivestrength, fc.
5.3. Cross section type
To visualize better the influence of the concrete core in the torsionalductility, Fig. 6 shows the influence of the section type (plain or hollow)in the torsional ductility index μθ (for both the experimental and the-oretical values) for beams with ≈m 1b and =y x/ 1 (no values differentfrom unity were found for hollow beams under torsion, see Table 1). Inthe previous section it was observed that the total reinforcement ratioρtot shows higher influence on the torsional ductility, when compared tothe concrete compressive strength fc. For this reason, the results inFig. 6 are presented in terms of ρtot .The graphs include the followingbeams: Plain beams – C4, C5 and C6 [8] + A2, A3 and A4 [11]; Hollowbeams – T1 and T2 [9] + VH1 and VH2 [10] + A1, A2, A3, A4, A5, B2,B3, B4. C1, C2, C3, C4, C5 and C6 [6].
In general, Fig. 6 confirms the conclusions stated in the previousSections 5.1 and 5.2. A notable decrease of the torsional ductility isobserved for low torsional reinforcements until a limit is reached,which is in the following range: 1.0–1.5% (for hollow beams) and2.0–3.0% (for plain beams). From this limit, some beams continue toshow some ductility (with μθ in the range 1.5–2.0). The experimentalresults follow this trend for hollow beams. For plain beams, the ten-dency is not so clear due to the dispersion of the points.
In general, it can be confirmed that, for a given reinforcement ratio,torsional ductility is higher for plain beams.
5.4. Other variables study
For the remaining variables study, mb and y x/ , it was not possible toform groups with a sufficient number of beams, such that the variableto be study varied and the other ones were kept constant (or approxi-mately). For this reason, no clear tendencies were observed, neithertheoretically nor experimentally. Moreover, high dispersion were ob-served with only few points in the graphs, for both experimental andtheoretical results. The authors believe that the observed high disper-sion can be explained because the influence of the variables mb and y x/in the torsional ductility is very small. It should be negligible whencompared with the influence of the variables previously studied. Forthese reasons, no dispersion charts are presented in this section. Itshould be referred that this point also contributed to reduce even morethe number of reference beams effectively used in this study (seeTable 1), when compared to the initial set of reference beams collectedfrom literature (around 120).
6. Comparative analysis with codes of practice
This section presents a comparative analysis between the maximumand minimum values of the torsional reinforcement ratio that are pro-posed by the codes of practice, with the effective torsional reinforce-ment ratio of the reference beams, in light of their torsional ductilityindexes μθ. Since it was previously observed (Section 5) that the ex-perimental trends are reliable (they matched with the theoretical ones),then only the experimental torsional ductility indexes are used here.The aim is to check the suitability of the code’s rules to ensure thetorsional ductility for RC beams, in order to avoid premature or brittletorsional failures due to insufficient or excessive torsional reinforce-ment.
The following reference codes of practice are considered: Americancode ACI 318R-14 [17], European Codes MC 10 [22] and EC 2 [18],and Canadian Standard CAN3-A23.3-14 [23].
1.0
1.5
2.0
2.5
3.0
3.5
4.0
4.5
0.0 1.0 2.0 3.0 4.0 5.0
μ θ,e
xp
ρtot [%]0.0 1.0 2.0 3.0 4.0 5.0 6.0
μ θ,t
h
A: 20.0-29.9 MPa
B: 30.0-39.9 MPa
C: 40.0-49.9 MPa
D: 70.0-79.9 MPa
Fig. 4. Influence of ρtot in μθ for groups of RC beams with similar fc (plain beams).
1.0
1.5
2.0
2.5
3.0
3.5
4.0
4.5
5.0
5.5
0.0 0.5 1.0 1.5 2.0
μ θ,e
xp
ρtot [%]0.0 0.5 1.0 1.5 2.0 2.5
μ θ,t
h
A: 40.0-49.9 MPa
B: 70.0-79.9 MPa
C: 90.0-99.9 MPa
Fig. 5. Influence of ρtot in μθ for groups of RC beams with similar fc (hollow beams).
M.M. Teixeira, L.F.A. Bernardo Engineering Structures 168 (2018) 759–769
765
RC beams with a brittle and premature torsional failure due to in-sufficient reinforcement should not be accepted by codes of practice.This should be guaranteed through the imposition of a minimum limitfor the torsional reinforcement. From the studied codes, only the ACIcode explicitly imposes a minimum amount for the torsional long-itudinal reinforcement. Both ACI and Canadian codes impose aminimum amount for the torsional transverse reinforcement. The otherones (European codes) refer in general to the minimum amount of re-inforcement for bending (longitudinal reinforcement) and shear(transverse reinforcement).
RC beams with a brittle failure due to crushing of the compressiveconcrete in the struts should also not be accepted by codes of practice.This should be guaranteed through the imposition of a maximum limitfor the torsional reinforcement. This requirement can be directly orindirectly imposed. In general, codes of practice impose a maximumlimit for the stress in the compressive concrete in the struts. This limitcan be used to compute the maximum torsional reinforcement toguarantee this requirement.
In this study and for the aim of the present section, only beams withapproximately balanced reinforcement condition are considered:
⩽ ⩽m0.90 1.10b (the same ones considered in Sections 5.1 and 5.2).Moreover, the limits for the torsional reinforcement are applied only fortransverse reinforcement.
In RC beams mainly under torsion the torsional reinforcement isusually balanced, i.e. =m 1b . For such beams, both longitudinal andtransverse reinforcements participate equally for the torsional behaviorof the beams. For example as referred in Section 4, both reinforcementswill yield at the same time (before or after the concrete crushing in thestruts). If too much transverse reinforcement exists, which can lead to abrittle failure, then too much longitudinal reinforcement also exist.Then, for beams with balanced reinforcement, either longitudinal ortransverse torsional reinforcement can be used as a key parameter toanalyze the torsional ductility. In RC beams under torsion the sheareffect is relevant and it seems to be more logical to relate its behaviorwith the transverse reinforcement. These reasons justify partially whythe transverse torsional reinforcement was chosen for this section.
In addition to the previous justifications, for this section theminimum and maximum normative values for the allowed quantity ofreinforcement are need. As far as specific rules for torsion are con-cerned, the majority of them are defined only for the transverse re-inforcement. For instance, for the torsional longitudinal reinforcement,ACI code only specifies the minimum quantity. The other analyzedcodes don’t specify specific rules for the torsional longitudinal re-inforcement. From the aforementioned, one can conclude that it is notpossible to perform complete comparative analyzes based only on thetorsional longitudinal reinforcement.
Table 2 presents, for each reference beam and for each code ofpractice, the minimum and maximum transverse reinforcement ratio(ρt min, and ρt,max). These are computed from the minimum and maximum
distributed area for the transverse reinforcement. Table 2 also presentsthe effective transverse reinforcement ratio (ρt) and the experimentalductility index (μθ,exp). From Table 2 it is observed that, except forCAN3-A23.3-14 and ACI 318R-14, the codes of practice did not pre-dicted a brittle and premature failure due to insufficient reinforcementfor any of the reference beams. This is consistent with the real failure ofthe reference beams used in this study. For few beams, CAN3-A23.3-14and ACI 318R-14 (only for one beam) failed because it predicted such afailure. For all the codes of practice, some reference beams with realductile behavior are expected to have a brittle failure due to concretecrushing. For these beams, the codes failed their predictions.
For each code, the results from Table 2 are analyzed below with thehelp of graphs.
Figs. 7–10 present, for each of the analyzed codes of practice andregardless of the concrete strength, the experimental torsional ductilityindex, μθ,exp , with the transverse reinforcement ratio, ρt . Graphs ofFigs. 7–10 also show, for each range of values for ρt,min and ρt,maxcomputed from the codes’ rules, the average (vertical lines) and thewidth of the range with the maximum and minimum boundaries values.Since the range for the values of ρt,max is large when all the referencebeams are included, the beams are grouped according to some chosenrange. This option allow to visualize better how many beams don’tcomply with the upper code’s limit (ρt,max). The range of values for ρt,minis narrow, regardless of the used code. For this reason, a single range ispresented for ρt,min. Additionally, in Figs. 7–10 plain and hollow beamsare distinguished by using “plain and hollow markers”.
Fig. 7 shows that the interval defined by the maximum and theminimum transverse reinforcement ratio computed from ACI 318R-14is very restrictive, mainly for ρt,max and for plain beams. Several plainbeams (almost regardless of ρt,max) and some hollow beams do notcomply with the maximum limit from the code. In both cases, thesebeams show a ductile behavior (mainly for plain sections). These ob-servations contradict the code, for which a brittle failure due to con-crete crushing should be expected.
For MC 10, Fig. 8 shows similar results as the ones previously re-ported from Fig. 7, namely that several plain beams and some hollowbeams do not comply with ρt,max computed from the code. It is observedthat the interval defined by ρt,min and ρt,max found by MC 10 is also veryrestrictive, mainly for ρt,max and for plain beams. When compared withACI 318R-14, MC 10 slightly restricts less ρt,min.
Fig. 9 shows that, when compared to MC 10 and ACI 318R-14, EC 2restricts less the transverse reinforcement ratio, mainly the maximumlimit (ρt,max). As a result, more reference beams comply with the limitsimposed by the code. Only few plain beams, with some ductile beha-vior, do not comply with ρt,max. All hollow beams with ductile behaviorcomply with the code’s limits. From this perspective, EC 2 is better.
Finally, Fig. 10 shows that, for CAN3-A23.3-14, the results are si-milar to the ones observed for EC 2, although it is more restrictive forρt,max and less ductile beams comply when compared to EC2. Again,some plain beams and some hollow beams do not comply with ρt,max
1.0
1.5
2.0
2.5
3.0
3.5
4.0
4.5
5.0
5.5
0.0 2.0 4.0 6.0
μ θ,e
xp
ρtot [%]0.0 2.0 4.0 6.0 8.0
μ θ,th
Plain
Hollow
Fig. 6. Influence of the section type in μθ.
M.M. Teixeira, L.F.A. Bernardo Engineering Structures 168 (2018) 759–769
766
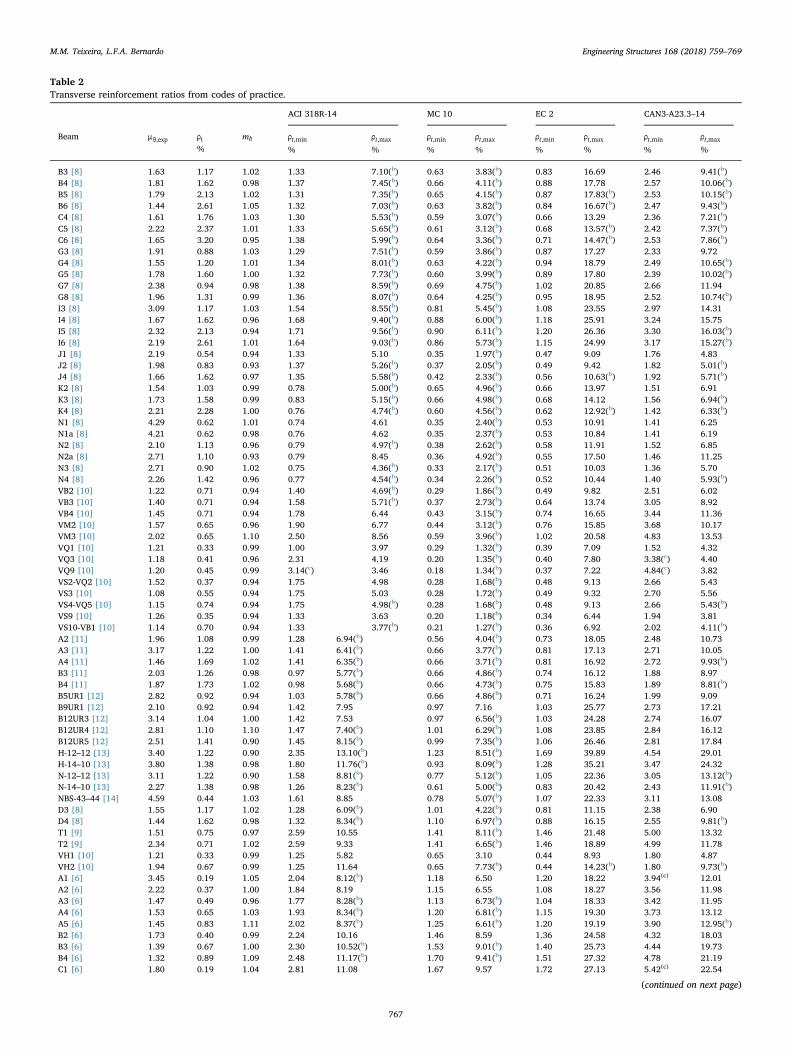
Table 2Transverse reinforcement ratios from codes of practice.
ACI 318R-14 MC 10 EC 2 CAN3-A23.3–14
Beam μθ,exp ρt%
mb ρt,min%
ρt,max%
ρt,min%
ρt,max%
ρt,min%
ρt,max%
ρt,min%
ρt,max%
B3 [8] 1.63 1.17 1.02 1.33 7.10(b) 0.63 3.83(b) 0.83 16.69 2.46 9.41(b)B4 [8] 1.81 1.62 0.98 1.37 7.45(b) 0.66 4.11(b) 0.88 17.78 2.57 10.06(b)B5 [8] 1.79 2.13 1.02 1.31 7.35(b) 0.65 4.15(b) 0.87 17.83(b) 2.53 10.15(b)B6 [8] 1.44 2.61 1.05 1.32 7.03(b) 0.63 3.82(b) 0.84 16.67(b) 2.47 9.43(b)C4 [8] 1.61 1.76 1.03 1.30 5.53(b) 0.59 3.07(b) 0.66 13.29 2.36 7.21(b)C5 [8] 2.22 2.37 1.01 1.33 5.65(b) 0.61 3.12(b) 0.68 13.57(b) 2.42 7.37(b)C6 [8] 1.65 3.20 0.95 1.38 5.99(b) 0.64 3.36(b) 0.71 14.47(b) 2.53 7.86(b)G3 [8] 1.91 0.88 1.03 1.29 7.51(b) 0.59 3.86(b) 0.87 17.27 2.33 9.72G4 [8] 1.55 1.20 1.01 1.34 8.01(b) 0.63 4.22(b) 0.94 18.79 2.49 10.65(b)G5 [8] 1.78 1.60 1.00 1.32 7.73(b) 0.60 3.99(b) 0.89 17.80 2.39 10.02(b)G7 [8] 2.38 0.94 0.98 1.38 8.59(b) 0.69 4.75(b) 1.02 20.85 2.66 11.94G8 [8] 1.96 1.31 0.99 1.36 8.07(b) 0.64 4.25(b) 0.95 18.95 2.52 10.74(b)I3 [8] 3.09 1.17 1.03 1.54 8.55(b) 0.81 5.45(b) 1.08 23.55 2.97 14.31I4 [8] 1.67 1.62 0.96 1.68 9.40(b) 0.88 6.00(b) 1.18 25.91 3.24 15.75I5 [8] 2.32 2.13 0.94 1.71 9.56(b) 0.90 6.11(b) 1.20 26.36 3.30 16.03(b)I6 [8] 2.19 2.61 1.01 1.64 9.03(b) 0.86 5.73(b) 1.15 24.99 3.17 15.27(b)J1 [8] 2.19 0.54 0.94 1.33 5.10 0.35 1.97(b) 0.47 9.09 1.76 4.83J2 [8] 1.98 0.83 0.93 1.37 5.26(b) 0.37 2.05(b) 0.49 9.42 1.82 5.01(b)J4 [8] 1.66 1.62 0.97 1.35 5.58(b) 0.42 2.33(b) 0.56 10.63(b) 1.92 5.71(b)K2 [8] 1.54 1.03 0.99 0.78 5.00(b) 0.65 4.96(b) 0.66 13.97 1.51 6.91K3 [8] 1.73 1.58 0.99 0.83 5.15(b) 0.66 4.98(b) 0.68 14.12 1.56 6.94(b)K4 [8] 2.21 2.28 1.00 0.76 4.74(b) 0.60 4.56(b) 0.62 12.92(b) 1.42 6.33(b)N1 [8] 4.29 0.62 1.01 0.74 4.61 0.35 2.40(b) 0.53 10.91 1.41 6.25N1a [8] 4.21 0.62 0.98 0.76 4.62 0.35 2.37(b) 0.53 10.84 1.41 6.19N2 [8] 2.10 1.13 0.96 0.79 4.97(b) 0.38 2.62(b) 0.58 11.91 1.52 6.85N2a [8] 2.71 1.10 0.93 0.79 8.45 0.36 4.92(b) 0.55 17.50 1.46 11.25N3 [8] 2.71 0.90 1.02 0.75 4.36(b) 0.33 2.17(b) 0.51 10.03 1.36 5.70N4 [8] 2.26 1.42 0.96 0.77 4.54(b) 0.34 2.26(b) 0.52 10.44 1.40 5.93(b)VB2 [10] 1.22 0.71 0.94 1.40 4.69(b) 0.29 1.86(b) 0.49 9.82 2.51 6.02VB3 [10] 1.40 0.71 0.94 1.58 5.71(b) 0.37 2.73(b) 0.64 13.74 3.05 8.92VB4 [10] 1.45 0.71 0.94 1.78 6.44 0.43 3.15(b) 0.74 16.65 3.44 11.36VM2 [10] 1.57 0.65 0.96 1.90 6.77 0.44 3.12(b) 0.76 15.85 3.68 10.17VM3 [10] 2.02 0.65 1.10 2.50 8.56 0.59 3.96(b) 1.02 20.58 4.83 13.53VQ1 [10] 1.21 0.33 0.99 1.00 3.97 0.29 1.32(b) 0.39 7.09 1.52 4.32VQ3 [10] 1.18 0.41 0.96 2.31 4.19 0.20 1.35(b) 0.40 7.80 3.38(c) 4.40VQ9 [10] 1.20 0.45 0.99 3.14(c) 3.46 0.18 1.34(b) 0.37 7.22 4.84(c) 3.82VS2-VQ2 [10] 1.52 0.37 0.94 1.75 4.98 0.28 1.68(b) 0.48 9.13 2.66 5.43VS3 [10] 1.08 0.55 0.94 1.75 5.03 0.28 1.72(b) 0.49 9.32 2.70 5.56VS4-VQ5 [10] 1.15 0.74 0.94 1.75 4.98(b) 0.28 1.68(b) 0.48 9.13 2.66 5.43(b)VS9 [10] 1.26 0.35 0.94 1.33 3.63 0.20 1.18(b) 0.34 6.44 1.94 3.81VS10-VB1 [10] 1.14 0.70 0.94 1.33 3.77(b) 0.21 1.27(b) 0.36 6.92 2.02 4.11(b)A2 [11] 1.96 1.08 0.99 1.28 6.94(b) 0.56 4.04(b) 0.73 18.05 2.48 10.73A3 [11] 3.17 1.22 1.00 1.41 6.41(b) 0.66 3.77(b) 0.81 17.13 2.71 10.05A4 [11] 1.46 1.69 1.02 1.41 6.35(b) 0.66 3.71(b) 0.81 16.92 2.72 9.93(b)B3 [11] 2.03 1.26 0.98 0.97 5.77(b) 0.66 4.86(b) 0.74 16.12 1.88 8.97B4 [11] 1.87 1.73 1.02 0.98 5.68(b) 0.66 4.73(b) 0.75 15.83 1.89 8.81(b)B5UR1 [12] 2.82 0.92 0.94 1.03 5.78(b) 0.66 4.86(b) 0.71 16.24 1.99 9.09B9UR1 [12] 2.10 0.92 0.94 1.42 7.95 0.97 7.16 1.03 25.77 2.73 17.21B12UR3 [12] 3.14 1.04 1.00 1.42 7.53 0.97 6.56(b) 1.03 24.28 2.74 16.07B12UR4 [12] 2.81 1.10 1.10 1.47 7.40(b) 1.01 6.29(b) 1.08 23.85 2.84 16.12B12UR5 [12] 2.51 1.41 0.90 1.45 8.15(b) 0.99 7.35(b) 1.06 26.46 2.81 17.84H-12–12 [13] 3.40 1.22 0.90 2.35 13.10(b) 1.23 8.51(b) 1.69 39.89 4.54 29.01H-14–10 [13] 3.80 1.38 0.98 1.80 11.76(b) 0.93 8.09(b) 1.28 35.21 3.47 24.32N-12–12 [13] 3.11 1.22 0.90 1.58 8.81(b) 0.77 5.12(b) 1.05 22.36 3.05 13.12(b)N-14–10 [13] 2.27 1.38 0.98 1.26 8.23(b) 0.61 5.00(b) 0.83 20.42 2.43 11.91(b)NBS-43–44 [14] 4.59 0.44 1.03 1.61 8.85 0.78 5.07(b) 1.07 22.33 3.11 13.08D3 [8] 1.55 1.17 1.02 1.28 6.09(b) 1.01 4.22(b) 0.81 11.15 2.38 6.90D4 [8] 1.44 1.62 0.98 1.32 8.34(b) 1.10 6.97(b) 0.88 16.15 2.55 9.81(b)T1 [9] 1.51 0.75 0.97 2.59 10.55 1.41 8.11(b) 1.46 21.48 5.00 13.32T2 [9] 2.34 0.71 1.02 2.59 9.33 1.41 6.65(b) 1.46 18.89 4.99 11.78VH1 [10] 1.21 0.33 0.99 1.25 5.82 0.65 3.10 0.44 8.93 1.80 4.87VH2 [10] 1.94 0.67 0.99 1.25 11.64 0.65 7.73(b) 0.44 14.23(b) 1.80 9.73(b)A1 [6] 3.45 0.19 1.05 2.04 8.12(b) 1.18 6.50 1.20 18.22 3.94(c) 12.01A2 [6] 2.22 0.37 1.00 1.84 8.19 1.15 6.55 1.08 18.27 3.56 11.98A3 [6] 1.47 0.49 0.96 1.77 8.28(b) 1.13 6.73(b) 1.04 18.33 3.42 11.95A4 [6] 1.53 0.65 1.03 1.93 8.34(b) 1.20 6.81(b) 1.15 19.30 3.73 13.12A5 [6] 1.45 0.83 1.11 2.02 8.37(b) 1.25 6.61(b) 1.20 19.19 3.90 12.95(b)B2 [6] 1.73 0.40 0.99 2.24 10.16 1.46 8.59 1.36 24.58 4.32 18.03B3 [6] 1.39 0.67 1.00 2.30 10.52(b) 1.53 9.01(b) 1.40 25.73 4.44 19.73B4 [6] 1.32 0.89 1.09 2.48 11.17(b) 1.70 9.41(b) 1.51 27.32 4.78 21.19C1 [6] 1.80 0.19 1.04 2.81 11.08 1.67 9.57 1.72 27.13 5.42(c) 22.54
(continued on next page)
M.M. Teixeira, L.F.A. Bernardo Engineering Structures 168 (2018) 759–769
767
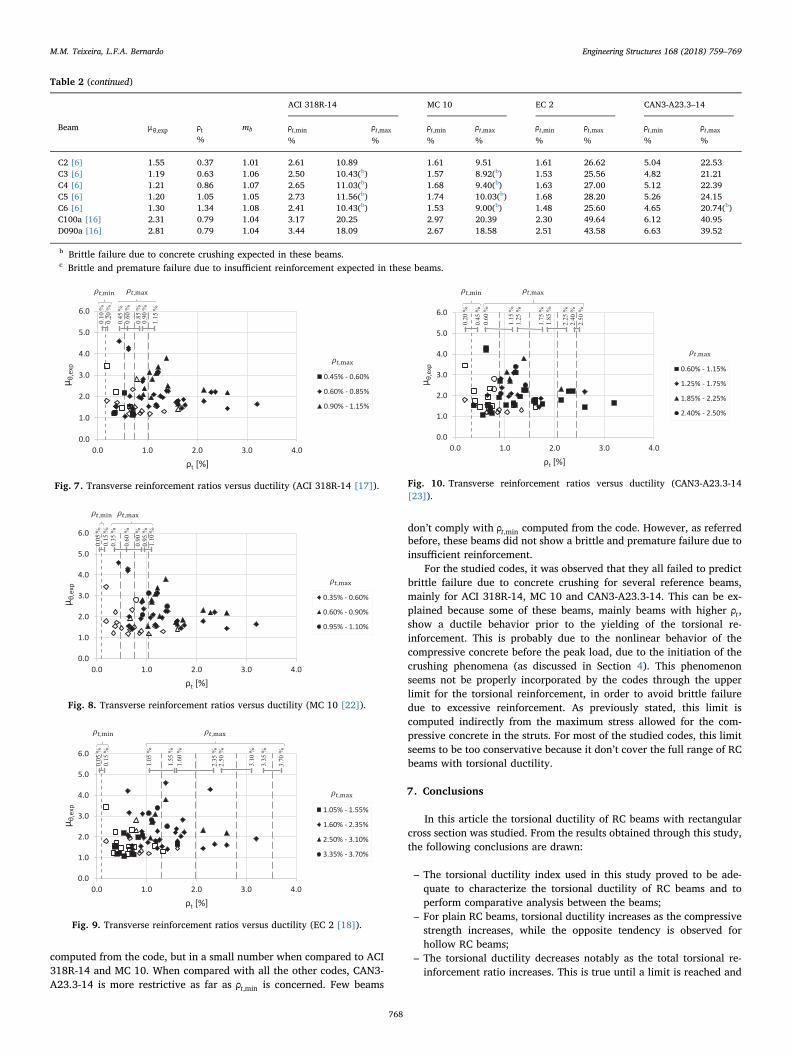
computed from the code, but in a small number when compared to ACI318R-14 and MC 10. When compared with all the other codes, CAN3-A23.3-14 is more restrictive as far as ρt,min is concerned. Few beams
don’t comply with ρt,min computed from the code. However, as referredbefore, these beams did not show a brittle and premature failure due toinsufficient reinforcement.
For the studied codes, it was observed that they all failed to predictbrittle failure due to concrete crushing for several reference beams,mainly for ACI 318R-14, MC 10 and CAN3-A23.3-14. This can be ex-plained because some of these beams, mainly beams with higher ρt ,show a ductile behavior prior to the yielding of the torsional re-inforcement. This is probably due to the nonlinear behavior of thecompressive concrete before the peak load, due to the initiation of thecrushing phenomena (as discussed in Section 4). This phenomenonseems not be properly incorporated by the codes through the upperlimit for the torsional reinforcement, in order to avoid brittle failuredue to excessive reinforcement. As previously stated, this limit iscomputed indirectly from the maximum stress allowed for the com-pressive concrete in the struts. For most of the studied codes, this limitseems to be too conservative because it don’t cover the full range of RCbeams with torsional ductility.
7. Conclusions
In this article the torsional ductility of RC beams with rectangularcross section was studied. From the results obtained through this study,the following conclusions are drawn:
– The torsional ductility index used in this study proved to be ade-quate to characterize the torsional ductility of RC beams and toperform comparative analysis between the beams;
– For plain RC beams, torsional ductility increases as the compressivestrength increases, while the opposite tendency is observed forhollow RC beams;
– The torsional ductility decreases notably as the total torsional re-inforcement ratio increases. This is true until a limit is reached and
Table 2 (continued)
ACI 318R-14 MC 10 EC 2 CAN3-A23.3–14
Beam μθ,exp ρt%
mb ρt,min
%
ρt,max
%
ρt,min
%
ρt,max
%
ρt,min
%
ρt,max
%
ρt,min
%
ρt,max
%
C2 [6] 1.55 0.37 1.01 2.61 10.89 1.61 9.51 1.61 26.62 5.04 22.53C3 [6] 1.19 0.63 1.06 2.50 10.43(b) 1.57 8.92(b) 1.53 25.56 4.82 21.21C4 [6] 1.21 0.86 1.07 2.65 11.03(b) 1.68 9.40(b) 1.63 27.00 5.12 22.39C5 [6] 1.20 1.05 1.05 2.73 11.56(b) 1.74 10.03(b) 1.68 28.20 5.26 24.15C6 [6] 1.30 1.34 1.08 2.41 10.43(b) 1.53 9.00(b) 1.48 25.60 4.65 20.74(b)C100a [16] 2.31 0.79 1.04 3.17 20.25 2.97 20.39 2.30 49.64 6.12 40.95D090a [16] 2.81 0.79 1.04 3.44 18.09 2.67 18.58 2.51 43.58 6.63 39.52
b Brittle failure due to concrete crushing expected in these beams.c Brittle and premature failure due to insufficient reinforcement expected in these beams.
0.0
1.0
2.0
3.0
4.0
5.0
6.0
0.0 1.0 2.0 3.0 4.0
μ θ,e
xp
ρt [%]
0.45% - 0.60%
0.60% - 0.85%
0.90% - 1.15%
0.10
%
0.45
%0.
60 %
0.90
%
0.20
%
0.85
%
1.15
%
Fig. 7. Transverse reinforcement ratios versus ductility (ACI 318R-14 [17]).
0.0
1.0
2.0
3.0
4.0
5.0
6.0
0.0 1.0 2.0 3.0 4.0
μ θ,e
xp
ρt [%]
0.35% - 0.60%
0.60% - 0.90%
0.95% - 1.10%
0.05
%
0.60
%
0.95
%
0.15
%
1.10
%
0.90
%
0.35
%
Fig. 8. Transverse reinforcement ratios versus ductility (MC 10 [22]).
0.0
1.0
2.0
3.0
4.0
5.0
6.0
0.0 1.0 2.0 3.0 4.0
μ θ,e
xp
ρt [%]
1.05% - 1.55%
1.60% - 2.35%
2.50% - 3.10%
3.35% - 3.70%
1.60
%1.
55 %
2.35
%2.
50 %
3.10
%
3.35
%
3.70
%
0.05
%0.
15 %
1.05
%
Fig. 9. Transverse reinforcement ratios versus ductility (EC 2 [18]).
0.0
1.0
2.0
3.0
4.0
5.0
6.0
0.0 1.0 2.0 3.0 4.0
μ θ,e
xp
ρt [%]
0.60% - 1.15%
1.25% - 1.75%
1.85% - 2.25%
2.40% - 2.50%
0.45
%
0.20
%
0.60
%
1.15
%1.
25 %
1.75
%1.
85 %
2.25
%2.
40 %
2.50
%
Fig. 10. Transverse reinforcement ratios versus ductility (CAN3-A23.3-14[23]).
M.M. Teixeira, L.F.A. Bernardo Engineering Structures 168 (2018) 759–769
768
from which a residual ductile behavior seems to be observed (whichis higher for plain beams). This limit seems to increase as the con-crete strength increases and has a value in the range 2.0–3.0% forplain beams and 1.0–1.5% for hollow beams;
– Similar RC beams with plain and hollow cross sections show dif-ferent level of torsional ductility due to the influence of the concretecore. For a given reinforcement ratio, plain beams are more ductilethan hollow beams. Plain beams also show a ductile behavior for alarger range of the torsional reinforcement ratio;
– The total reinforcement ratio shows higher influence on the tor-sional ductility when compared to the concrete compressivestrength;
– For ACI 318R-14, MC 10 and EC2, it was observed that the rule todefine the minimum torsional transverse reinforcement for RCbeams with approximately balanced reinforcement, in order toavoid brittle and premature failure due to insufficient reinforce-ment, is adequate. For CAN3-A23.3–14, this limit seems to beslightly excessive;
– ACI 318R-14 and MC 10, as well as CAN3-A23.3–14 although to aless lesser extent, are excessively restrictive with respect to themaximum torsional transverse reinforcement and lead to the un-acceptance of RC beams with ductile behavior under torsion. This ismainly true for plain beams, again with approximately balancedreinforcement. From the studied codes, EC 2 is the one that hasshown to be the better with regard to the maximum torsionaltransverse reinforcement. For the other studied codes, the value forthe maximum stress allowed for the compressive concrete in thestruts seems to be too conservative and should be reviewed.
References
[1] Bernardo LFA, Lopes SMR. Plastic analysis of HSC beams in flexure. Mater Struct2009;42(1):51–69.
[2] Carmo RNF, Lopes SMR. Ductility and linear analysis with moment redistribution inreinforced high strength concrete beams. Can J Civ Eng 2005;32(1):194–203.
[3] Pecce M, Fabbrocino G. Plastic rotation capacity of beams in normal and high-performance concrete. ACI Struct J 1999;96(2):290–6.
[4] Pang XB, Hsu TTC. Behavior of reinforced concrete membrane elements in shear.ACI Struct J 1995;92(6):665–79.
[5] Zhang LX, Hsu TTC. Behavior and analysis of 100 MPa concrete membrane ele-ments. J Struct Eng 1998;124(1):24–34.
[6] Bernardo LFA, Lopes SMR. Torsion in HSC hollow beams: strength and ductilityanalysis. ACI Struct J 2009;106(1):39–48.
[7] Lopes SMR, Bernardo LFA. Twist behavior of high-strength concrete hollow beams –formation of plastic hinges along the length. Eng Struct 2009;31(1):138–49.
[8] Hsu TTC. Torsion of structural concrete – behavior of reinforced concrete rectan-gular members. Torsion of structural concrete, SP-18. American Concrete Institute;1968. p. 261–306.
[9] Lampert P, Thürlimann B. Essais de Poutre en Béton Armé sous Torsion Simple etFlexion Combinées (Torsionsversuche und Torsions-Biege-Versuche anStahlbetonbalken). Comitée Européen du Béton, B.I. no 71; 1969. p. 177–207.
[10] Leonhardt F, Schelling G. Torsionsversuche na Stahlbetonbalken. Bulletin No. 239.Deutscher Ausschuss für Stahlbeton; 1974. 122 pp.
[11] McMullen AE, Rangan BV. Pure torsion in rectangular sections – a re-examination. JAm Concrete Inst 1978;75(10):511–9.
[12] Koutchoukali N-E, Belarbi A. Torsion of high-strength reinforced concrete beamsand minimum reinforcement requirement. ACI Struct J 2001;98(4):462–9.
[13] Fang IK, Shiau JK. Torsional behavior of normal- and high-strength concrete beams.ACI Struct J 2004;101(3):304–13.
[14] Chiu H-J, Fang I-K, Young W-T, Shiau J-K. Behavior of reinforced concrete beamswith minimum torsional reinforcement. Eng Struct 2007;29:2193–205.
[15] Peng X-N, Wong Y-L. Behavior of reinforced concrete walls subjected to monotonicpure torsion – an experimental study. Eng Struct 2011;33:2495–508.
[16] Jeng CH. Unified softened membrane model for torsion in hollow and solid re-inforced concrete members modeling the entire pre- and post-cracking behavior. JStruct Eng 2015;141(10).
[17] ACI Committee 318. Building code requirements for reinforced concrete (ACI 318-14) and commentary (ACI 318R-14). Detroit (MI): American Concrete Institute;2014.
[18] NP EN 1992-1-1. Eurocode 2: design of concrete structures – Part 1: general rulesand rules for buildings; 2010.
[19] Bernardo LFA, Andrade JMA, Nunes NCG. Generalized softened variable angletruss-model for reinforcement concrete beams under torsion. Mater Struct2015;48:2169–93.
[20] Pilakoutas K, Neocleous K, Guadagnini M. Design philosophy issues of fiber re-inforced polymer reinforced concrete structures. J Compos Constr2002;6(3):154–61.
[21] Teixeira MM. Ductility of reinforced concrete beams under torsion. Master thesis.Covilhã (Portugal): Department of Civil Engineering and Architecture, University ofBeira Interior; 2015 [in Portuguese].
[22] CEB-FIP MODEL CODE. Suisse: Comité Euro-International du Béton; 2010.[23] CSA Standard. Design of concrete structures – A23.3-14. Missisauga: Canadian
Standards Association; 2014.
M.M. Teixeira, L.F.A. Bernardo Engineering Structures 168 (2018) 759–769
769

![output RC N16 [146pag]](https://img.dokumen.tips/doc/110x75/631ddc5c85e2495e150fa703/output-rc-n16-146pag.jpg)


