Embed Size (px)
Citation preview
UNIVERSITY OF TRINIDAD AND TOBAGO Bachelor of Applied Science (B.A.Sc.)
Engineering Science
ENSC1001
Lab: Torsion Test Hardness Test
Due Date: Wednesday 13th November, 2013
Prepared by:
Curlin Alexander Teelucksingh 63881Janiero Meosa 64481Darrel Sawh 64712Dillon Ramdhan 58439
TABLE OF CONTENTS
Hardness Test
……………………………………………………………………………………………………………3
Torsion Test
......................................................................
......................................................................
.......11
2 | P a g e
TITLE
Hardness Test
OBJECTIVE
To determine the Rockwell hardness value of three materials.
APPARATUS
Rockwell Hardness Testing machine
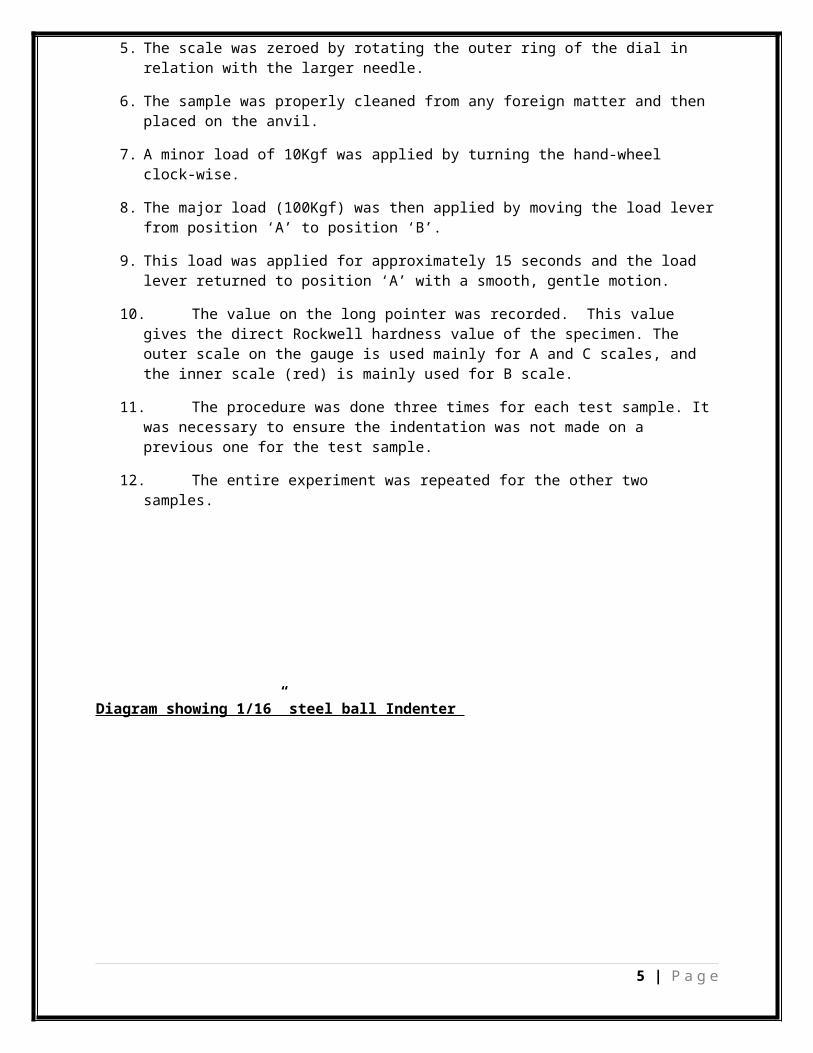
Test pieces ( Aluminum, Brass, Mild Steel)
Stop clock
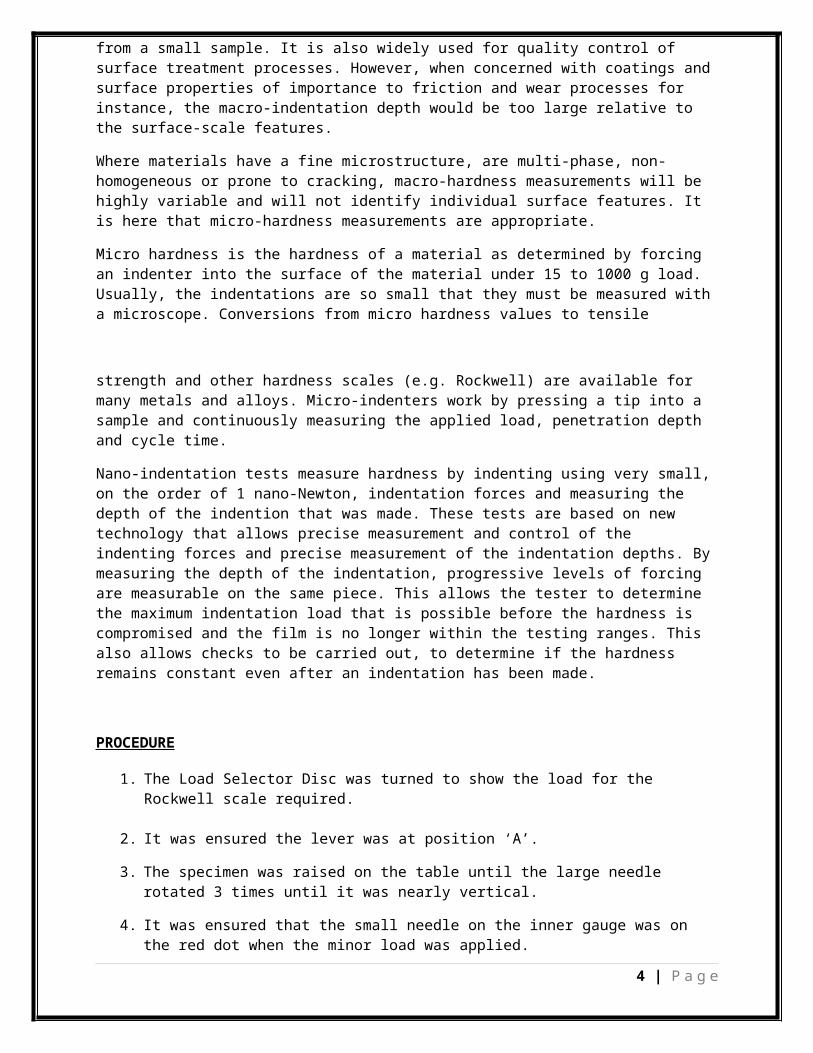
1/16” steel ball Indenter (Rockwell B)
Emery paper
THEORY
Hardness is defined as the resistance of a metal to plastic deformation usually by indentation. This term can also apply to deformation from scratching, cutting or bending. It is the property ofa metal, which gives it the ability to resist being permanently deformed (bent, broken, or have its shape changed) when a load is applied. The greater the hardness of the metal implies the greater itsresistance to deformation. In mineralogy this property of matter is commonly described as the resistance of a substance to being scratchedby another. In metallurgy hardness is defined as the ability of a material to resist plastic deformation. The dictionary definition of metallurgy defines the indentation hardness as the resistance of a material to indentation. This is the usual type of hardness test, in which a pointed or rounded indenter is pressed into a surface under a substantially static load. Hardness measurement can be defined as macro-, micro- or nano- scale according to the forces applied and displacements obtained.
Measurement of the macro-hardness of materials is a quick and simple method of obtaining mechanical property data for the bulk material
3 | P a g e
from a small sample. It is also widely used for quality control of surface treatment processes. However, when concerned with coatings andsurface properties of importance to friction and wear processes for instance, the macro-indentation depth would be too large relative to the surface-scale features.
Where materials have a fine microstructure, are multi-phase, non-homogeneous or prone to cracking, macro-hardness measurements will be highly variable and will not identify individual surface features. It is here that micro-hardness measurements are appropriate.
Micro hardness is the hardness of a material as determined by forcing an indenter into the surface of the material under 15 to 1000 g load. Usually, the indentations are so small that they must be measured witha microscope. Conversions from micro hardness values to tensile
strength and other hardness scales (e.g. Rockwell) are available for many metals and alloys. Micro-indenters work by pressing a tip into a sample and continuously measuring the applied load, penetration depth and cycle time.
Nano-indentation tests measure hardness by indenting using very small,on the order of 1 nano-Newton, indentation forces and measuring the depth of the indention that was made. These tests are based on new technology that allows precise measurement and control of the indenting forces and precise measurement of the indentation depths. Bymeasuring the depth of the indentation, progressive levels of forcing are measurable on the same piece. This allows the tester to determine the maximum indentation load that is possible before the hardness is compromised and the film is no longer within the testing ranges. This also allows checks to be carried out, to determine if the hardness remains constant even after an indentation has been made.
PROCEDURE
1. The Load Selector Disc was turned to show the load for the Rockwell scale required.
2. It was ensured the lever was at position ‘A’.
3. The specimen was raised on the table until the large needle rotated 3 times until it was nearly vertical.
4. It was ensured that the small needle on the inner gauge was on the red dot when the minor load was applied.
4 | P a g e
5. The scale was zeroed by rotating the outer ring of the dial in relation with the larger needle.
6. The sample was properly cleaned from any foreign matter and then placed on the anvil.
7. A minor load of 10Kgf was applied by turning the hand-wheel clock-wise.
8. The major load (100Kgf) was then applied by moving the load leverfrom position ‘A’ to position ‘B’.
9. This load was applied for approximately 15 seconds and the load lever returned to position ‘A’ with a smooth, gentle motion.
10. The value on the long pointer was recorded. This value gives the direct Rockwell hardness value of the specimen. The outer scale on the gauge is used mainly for A and C scales, and the inner scale (red) is mainly used for B scale.
11. The procedure was done three times for each test sample. It was necessary to ensure the indentation was not made on a previous one for the test sample.
12. The entire experiment was repeated for the other two samples.
Diagram showing 1/16” steel ball Indenter
5 | P a g e
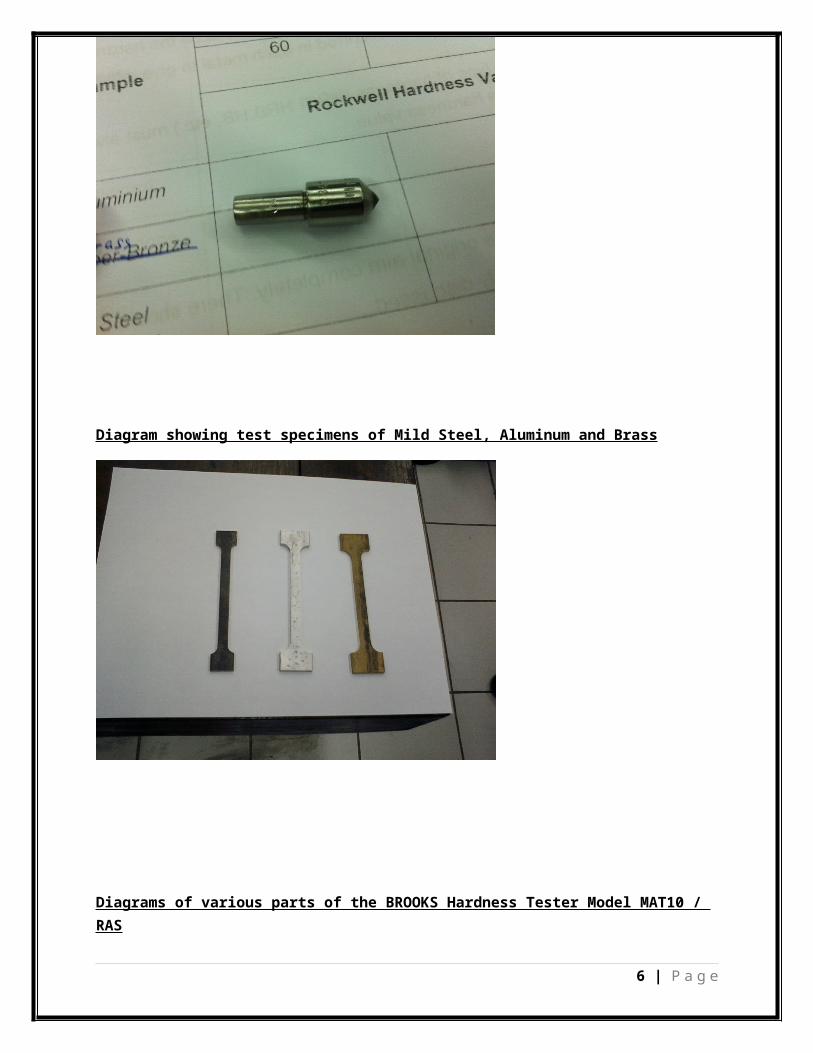
Diagram showing test specimens of Mild Steel, Aluminum and Brass
Diagrams of various parts of the BROOKS Hardness Tester Model MAT10 / RAS
6 | P a g e
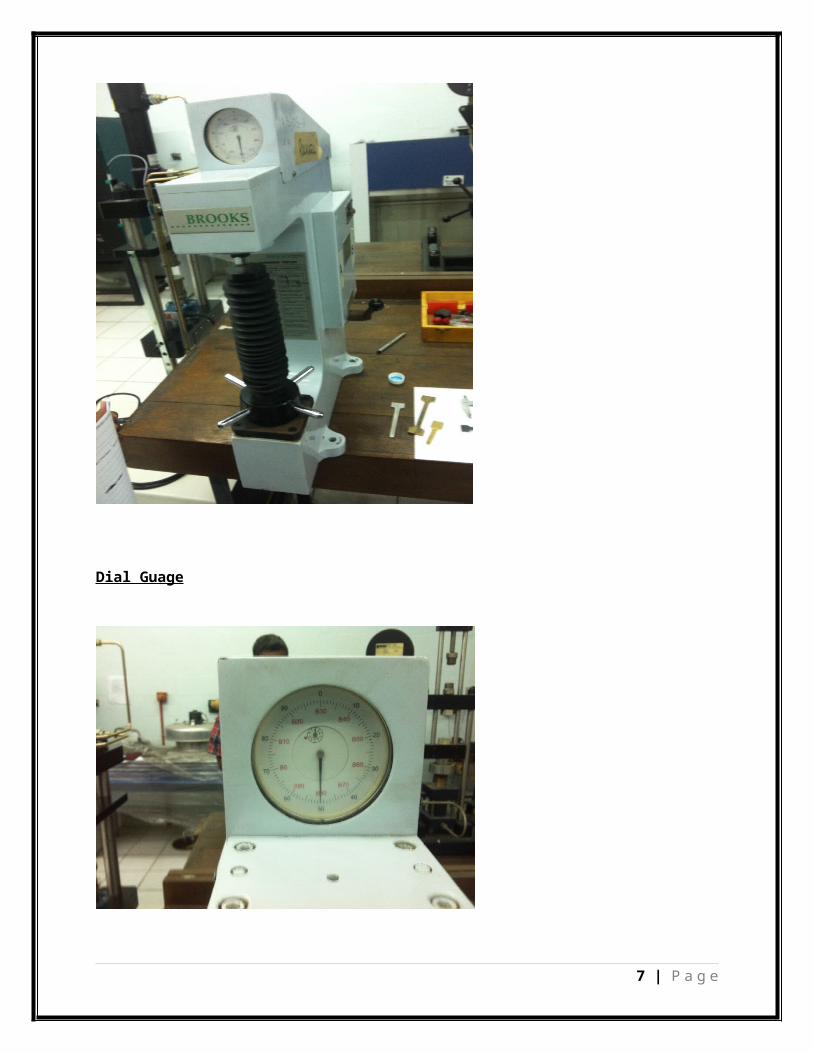
Dial Guage
7 | P a g e
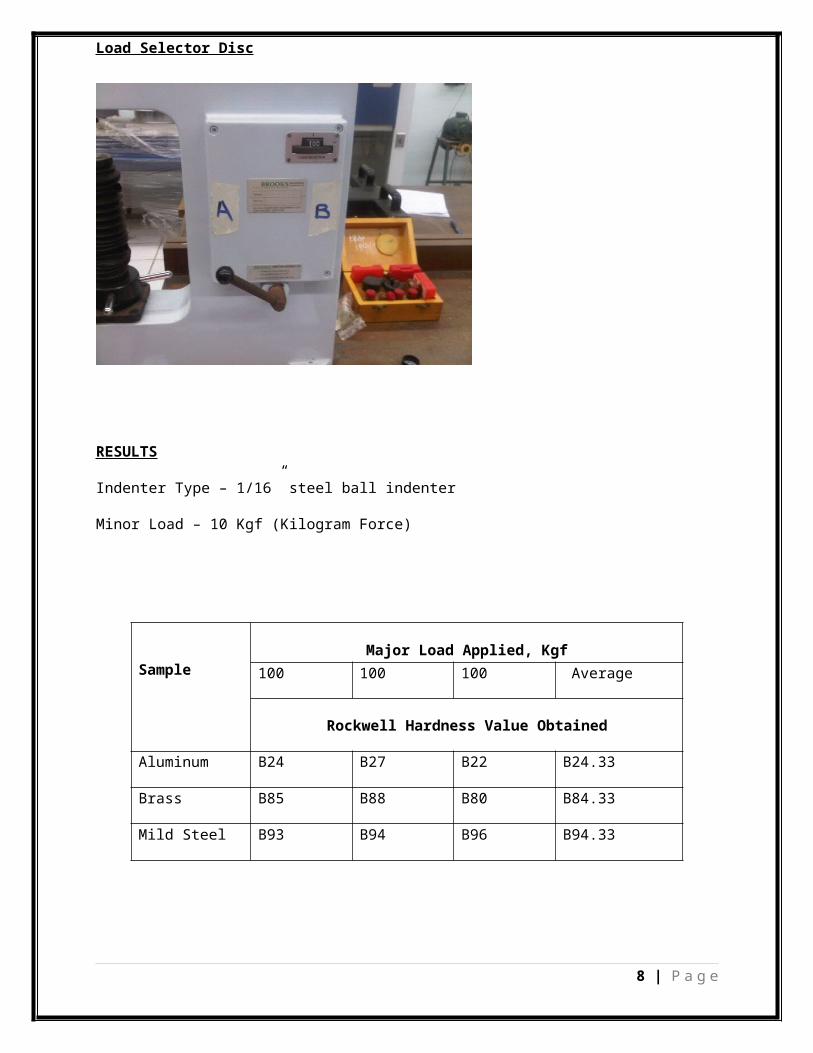
Load Selector Disc
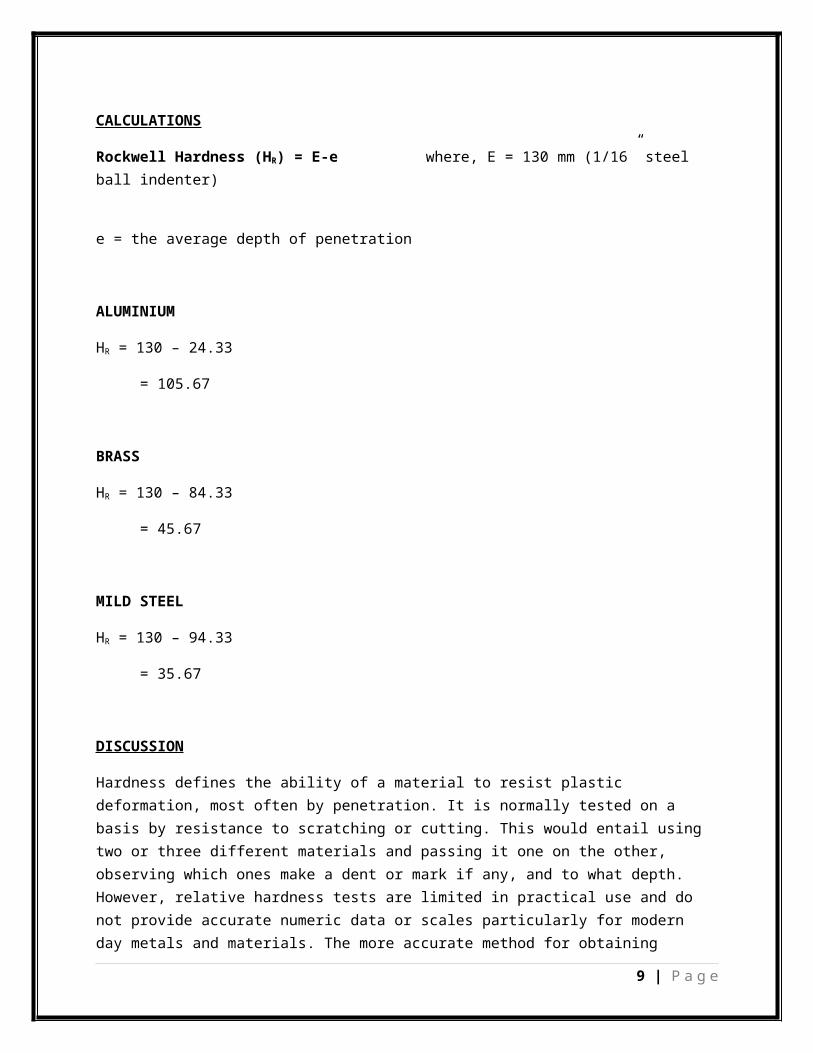
RESULTS
Indenter Type – 1/16” steel ball indenter
Minor Load – 10 Kgf (Kilogram Force)
SampleMajor Load Applied, Kgf
100 100 100 Average
Rockwell Hardness Value Obtained
Aluminum B24 B27 B22 B24.33
Brass B85 B88 B80 B84.33
Mild Steel B93 B94 B96 B94.33
8 | P a g e
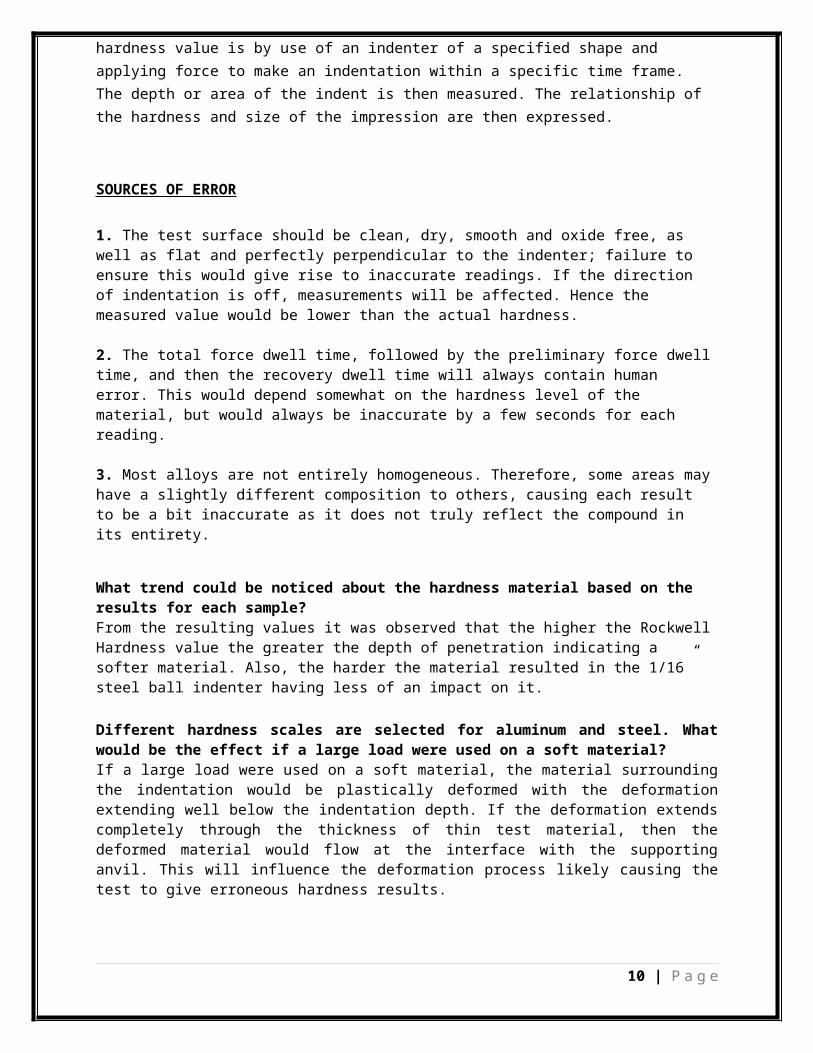
CALCULATIONS
Rockwell Hardness (HR) = E-e where, E = 130 mm (1/16” steel ball indenter)
e = the average depth of penetration
ALUMINIUM
HR = 130 – 24.33
= 105.67
BRASS
HR = 130 – 84.33
= 45.67
MILD STEEL
HR = 130 – 94.33
= 35.67
DISCUSSION
Hardness defines the ability of a material to resist plastic deformation, most often by penetration. It is normally tested on a basis by resistance to scratching or cutting. This would entail using two or three different materials and passing it one on the other, observing which ones make a dent or mark if any, and to what depth. However, relative hardness tests are limited in practical use and do not provide accurate numeric data or scales particularly for modern day metals and materials. The more accurate method for obtaining
9 | P a g e
hardness value is by use of an indenter of a specified shape and applying force to make an indentation within a specific time frame. The depth or area of the indent is then measured. The relationship of the hardness and size of the impression are then expressed.
SOURCES OF ERROR
1. The test surface should be clean, dry, smooth and oxide free, as well as flat and perfectly perpendicular to the indenter; failure to ensure this would give rise to inaccurate readings. If the direction of indentation is off, measurements will be affected. Hence the measured value would be lower than the actual hardness.
2. The total force dwell time, followed by the preliminary force dwelltime, and then the recovery dwell time will always contain human error. This would depend somewhat on the hardness level of the material, but would always be inaccurate by a few seconds for each reading.
3. Most alloys are not entirely homogeneous. Therefore, some areas mayhave a slightly different composition to others, causing each result to be a bit inaccurate as it does not truly reflect the compound in its entirety.
What trend could be noticed about the hardness material based on the results for each sample?From the resulting values it was observed that the higher the RockwellHardness value the greater the depth of penetration indicating a softer material. Also, the harder the material resulted in the 1/16” steel ball indenter having less of an impact on it.
Different hardness scales are selected for aluminum and steel. Whatwould be the effect if a large load were used on a soft material?If a large load were used on a soft material, the material surroundingthe indentation would be plastically deformed with the deformationextending well below the indentation depth. If the deformation extendscompletely through the thickness of thin test material, then thedeformed material would flow at the interface with the supportinganvil. This will influence the deformation process likely causing thetest to give erroneous hardness results.
10 | P a g e
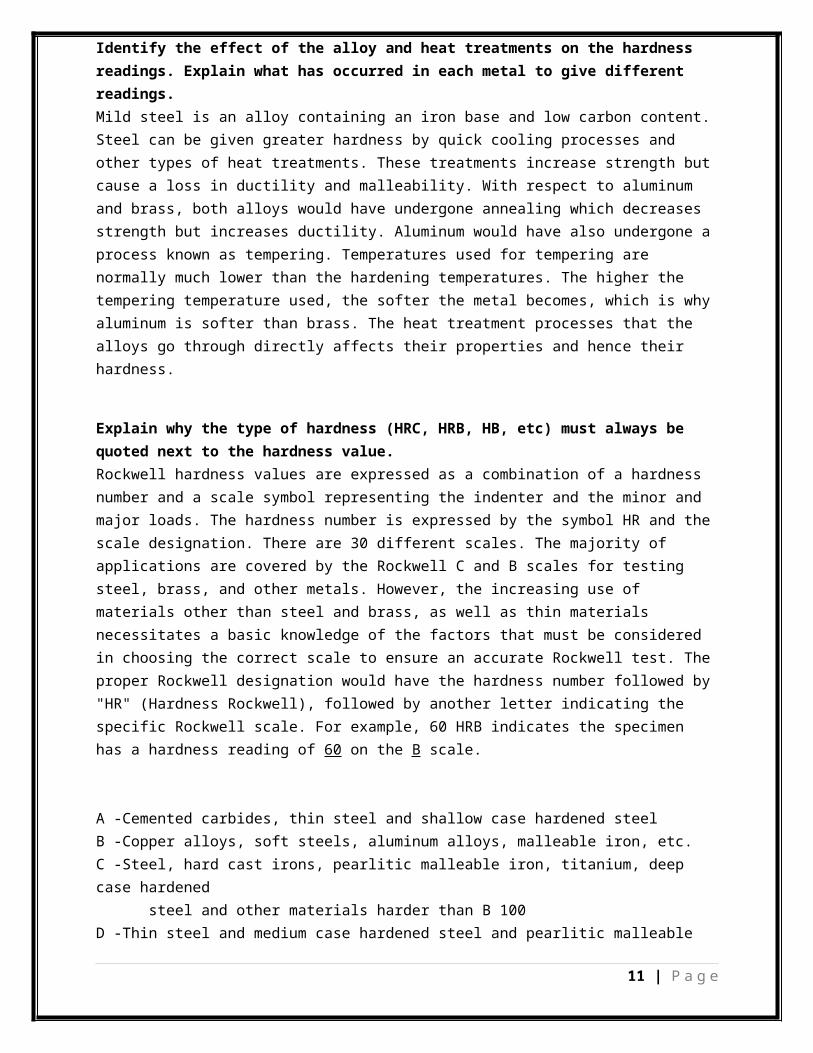
Identify the effect of the alloy and heat treatments on the hardness readings. Explain what has occurred in each metal to give different readings.Mild steel is an alloy containing an iron base and low carbon content.Steel can be given greater hardness by quick cooling processes and other types of heat treatments. These treatments increase strength butcause a loss in ductility and malleability. With respect to aluminum and brass, both alloys would have undergone annealing which decreases strength but increases ductility. Aluminum would have also undergone aprocess known as tempering. Temperatures used for tempering are normally much lower than the hardening temperatures. The higher the tempering temperature used, the softer the metal becomes, which is whyaluminum is softer than brass. The heat treatment processes that the alloys go through directly affects their properties and hence their hardness.
Explain why the type of hardness (HRC, HRB, HB, etc) must always be quoted next to the hardness value.Rockwell hardness values are expressed as a combination of a hardness number and a scale symbol representing the indenter and the minor and major loads. The hardness number is expressed by the symbol HR and thescale designation. There are 30 different scales. The majority of applications are covered by the Rockwell C and B scales for testing steel, brass, and other metals. However, the increasing use of materials other than steel and brass, as well as thin materials necessitates a basic knowledge of the factors that must be considered in choosing the correct scale to ensure an accurate Rockwell test. Theproper Rockwell designation would have the hardness number followed by"HR" (Hardness Rockwell), followed by another letter indicating the specific Rockwell scale. For example, 60 HRB indicates the specimen has a hardness reading of 60 on the B scale.
A -Cemented carbides, thin steel and shallow case hardened steelB -Copper alloys, soft steels, aluminum alloys, malleable iron, etc.C -Steel, hard cast irons, pearlitic malleable iron, titanium, deep case hardened steel and other materials harder than B 100D -Thin steel and medium case hardened steel and pearlitic malleable
11 | P a g e
ironE -Cast iron, aluminum and magnesium alloys, bearing metalsF -Annealed copper alloys, thin soft sheet metalsG –Copper-nickel-zinc alloys, malleable ironsH -Aluminum, zinc, leadK -Bearing metals and other very soft or thin materials including plastics.
CONCLUSION
Three metals were tested: Aluminum, Brass and Iron. Of these three, aluminum had the highest Rockwell Hardness value (105.67), implying itwas the softest material, while iron had the lowest Rockwell Hardness value (35.67), proving it was the hardest material. The brass specimenshowed a Rockwell Hardness value of 45.67, which implies it, was softer than iron but harder than aluminum.
12 | P a g e
TITLE
Torsion Test
AIM
To carry out a torsion test to destruction in order to determine for aspecimen:
a) The modulus of rigidity
b) The shear stress at the limit of proportionality
c) The general characteristics of the torque, angle of twist relationship
APPARATUS
Torsiometer
Torsion Testing Machine
Vernier Caliper
Steel Rule
Micrometer
Specimen – Brass CZ106 –MTX
Marker
Pencil
THEORY
Torsion is the stress that is associated with twisting forces (torque). The torsion test is a method used to determine the behavior of a metal subjected to twisting loads. Data from torsion test is used
13 | P a g e
to construct a stress-strain diagram and to determine elastic limit, torsional modulus of elasticity, modulus of rupture in torsion, and torsional strength Shear properties are often determined in a torsion test. For this lab the following formula is applied.
TJ=Gθl
=τr
The variables stated are defined below:
T = Applied torque Nm or lbf in
J = Polar second moment of area mm or in
G = Modulus of rigidity N/mm2 of lbf/in2
Θ = Angle of twist (over length) radians
l = Gauge length mm or in
τ = Shear stress at radius r N/mm2 or lbf/in2
r = Radius mm or in
PROCEDURE
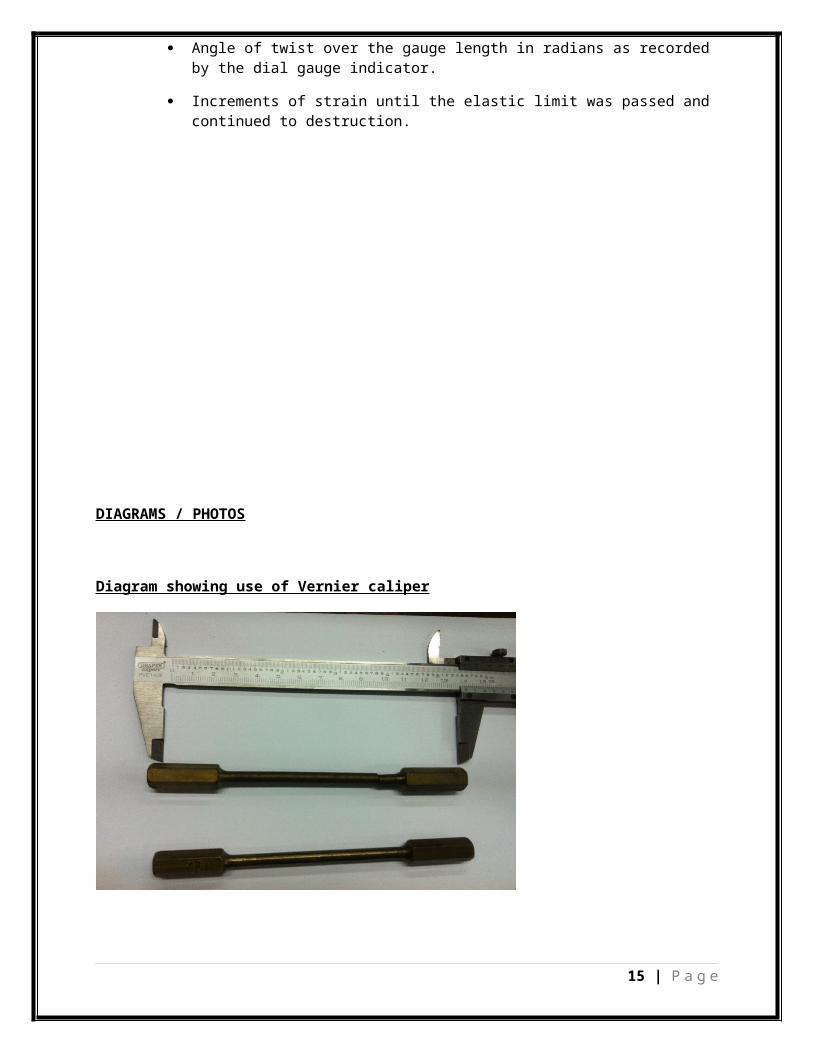
1. The overall length and diameter were measured using a Vernier Caliper and recorded. Note : the degree of accuracy for this experiment =0.005mm
2. A line was drawn with a pencil, along the length of the test section of the specimen; so as to aid recognizing the degree of twist being put on the specimen during the loading.
3. The specimen was mounted firmly on the machine. For each increment of strain, the following was recorded:
Angle of twist of the specimen in degrees
Applied torque
14 | P a g e
Angle of twist over the gauge length in radians as recorded by the dial gauge indicator.
Increments of strain until the elastic limit was passed and continued to destruction.
DIAGRAMS / PHOTOS
Diagram showing use of Vernier caliper
15 | P a g e
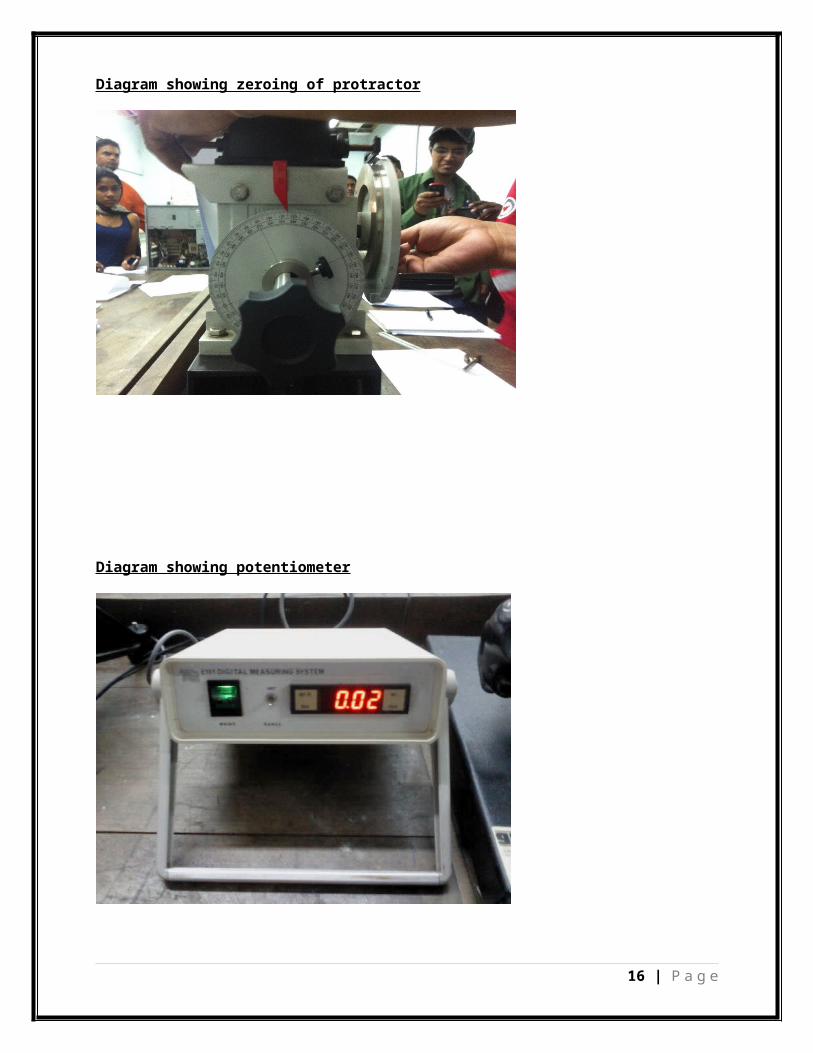
Diagram showing zeroing of protractor
Diagram showing potentiometer
16 | P a g e
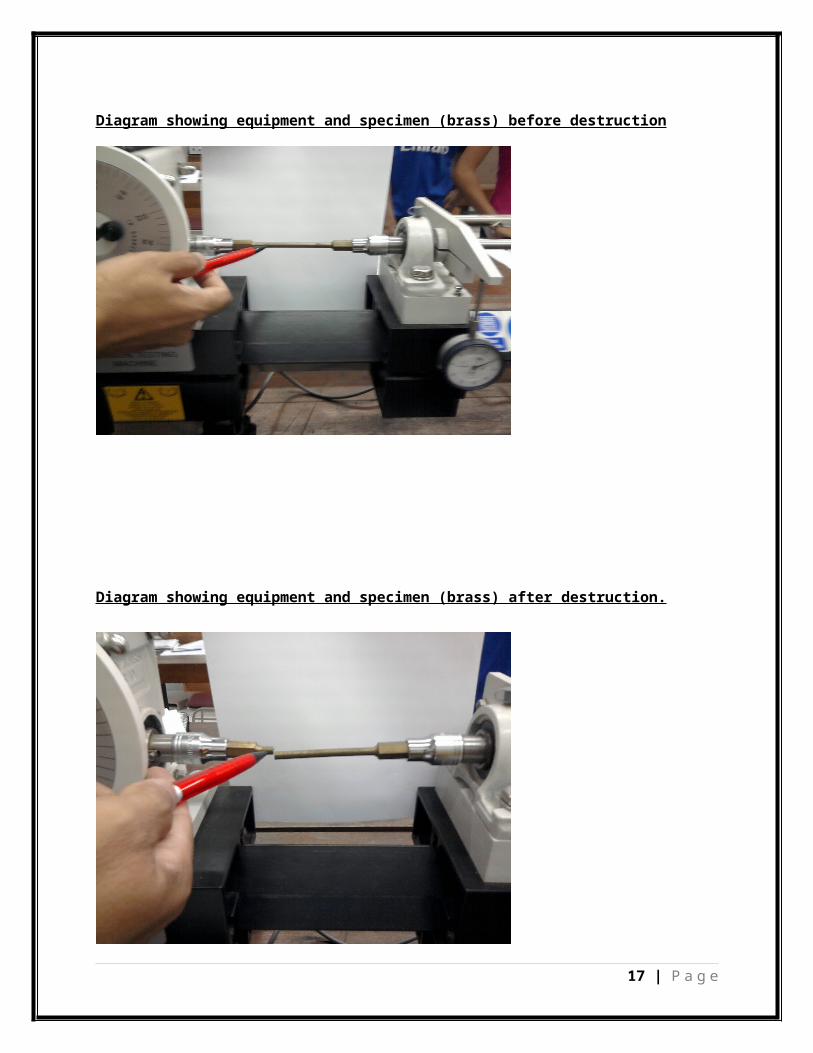
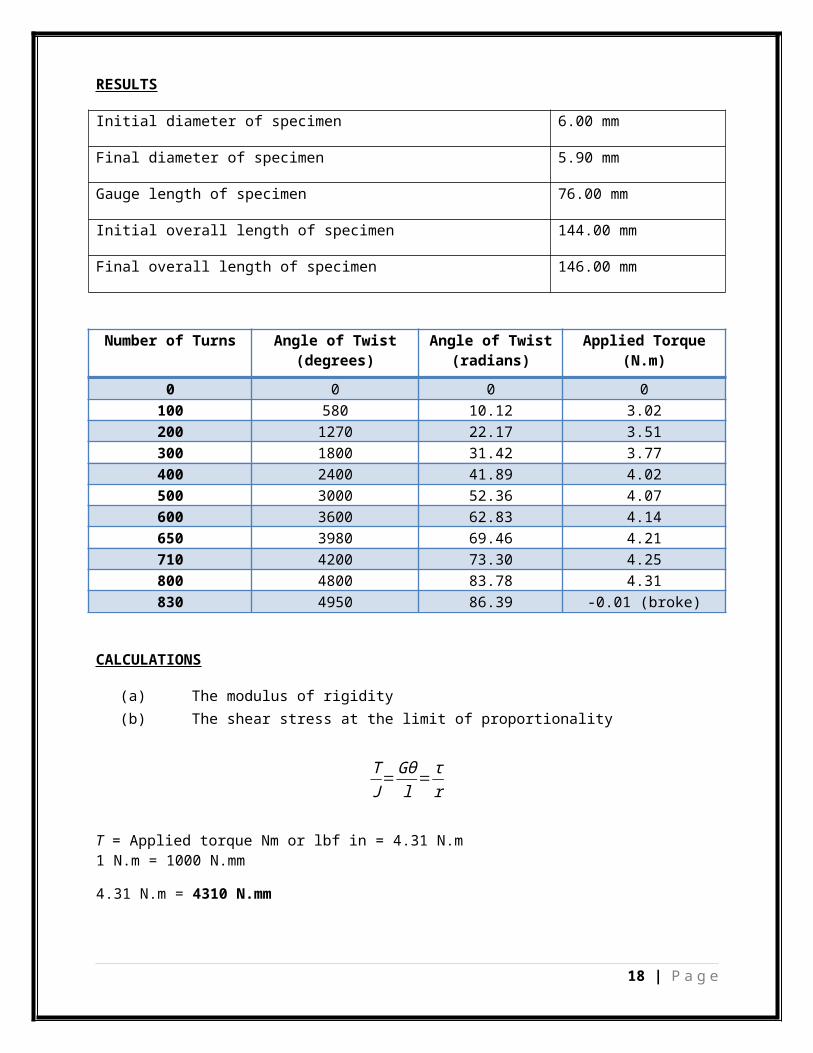
Diagram showing equipment and specimen (brass) before destruction
Diagram showing equipment and specimen (brass) after destruction.
17 | P a g e
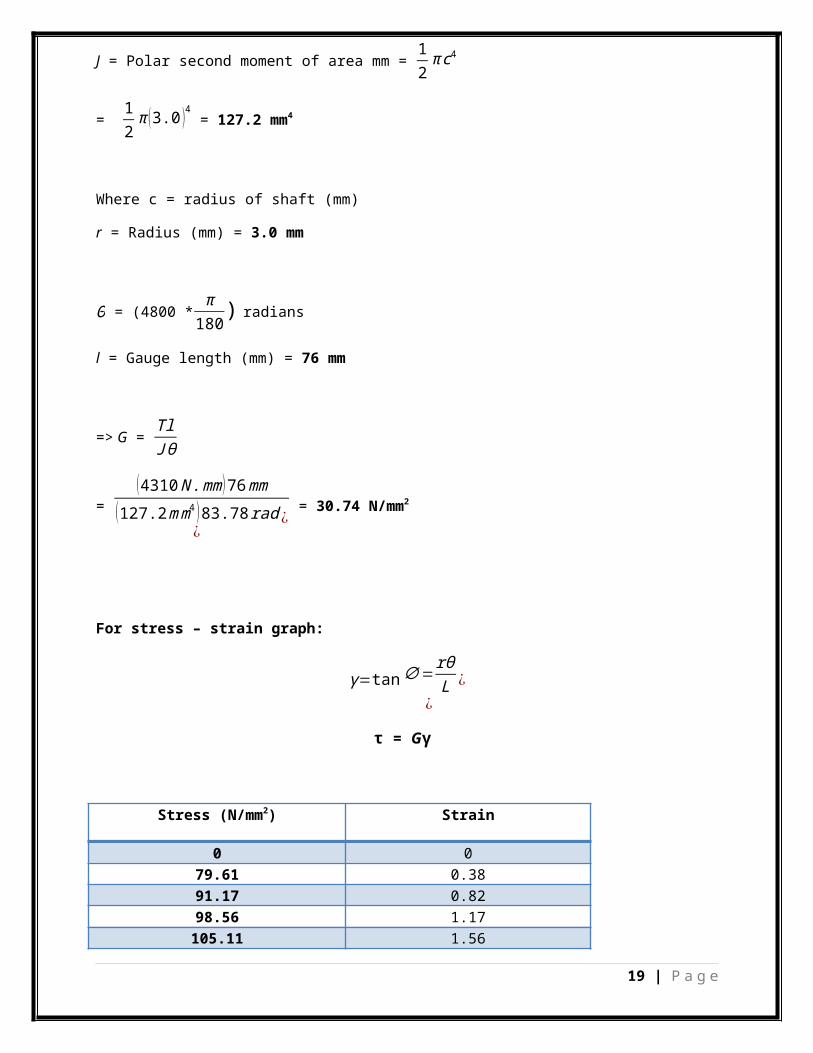
RESULTS
Initial diameter of specimen 6.00 mm
Final diameter of specimen 5.90 mm
Gauge length of specimen 76.00 mm
Initial overall length of specimen 144.00 mm
Final overall length of specimen 146.00 mm
Number of Turns Angle of Twist(degrees)
Angle of Twist(radians)
Applied Torque(N.m)
0 0 0 0100 580 10.12 3.02200 1270 22.17 3.51300 1800 31.42 3.77400 2400 41.89 4.02500 3000 52.36 4.07600 3600 62.83 4.14650 3980 69.46 4.21710 4200 73.30 4.25800 4800 83.78 4.31830 4950 86.39 -0.01 (broke)
CALCULATIONS
(a) The modulus of rigidity(b) The shear stress at the limit of proportionality
TJ=Gθ
l=τr
T = Applied torque Nm or lbf in = 4.31 N.m1 N.m = 1000 N.mm
4.31 N.m = 4310 N.mm
18 | P a g e
J = Polar second moment of area mm = 12πc4
= 12π (3.0 )4 = 127.2 mm4
Where c = radius of shaft (mm)
r = Radius (mm) = 3.0 mm
Θ = (4800 * π180)
radians
l = Gauge length (mm) = 76 mm
=> G = TlJθ
= (4310N.mm)76mm
(127.2mm4 )83.78rad¿
¿ = 30.74 N/mm2
For stress – strain graph:
γ=tan∅=rθL
¿¿
τ = Gγ
Stress (N/mm2) Strain
0 079.61 0.3891.17 0.8298.56 1.17105.11 1.56
19 | P a g e
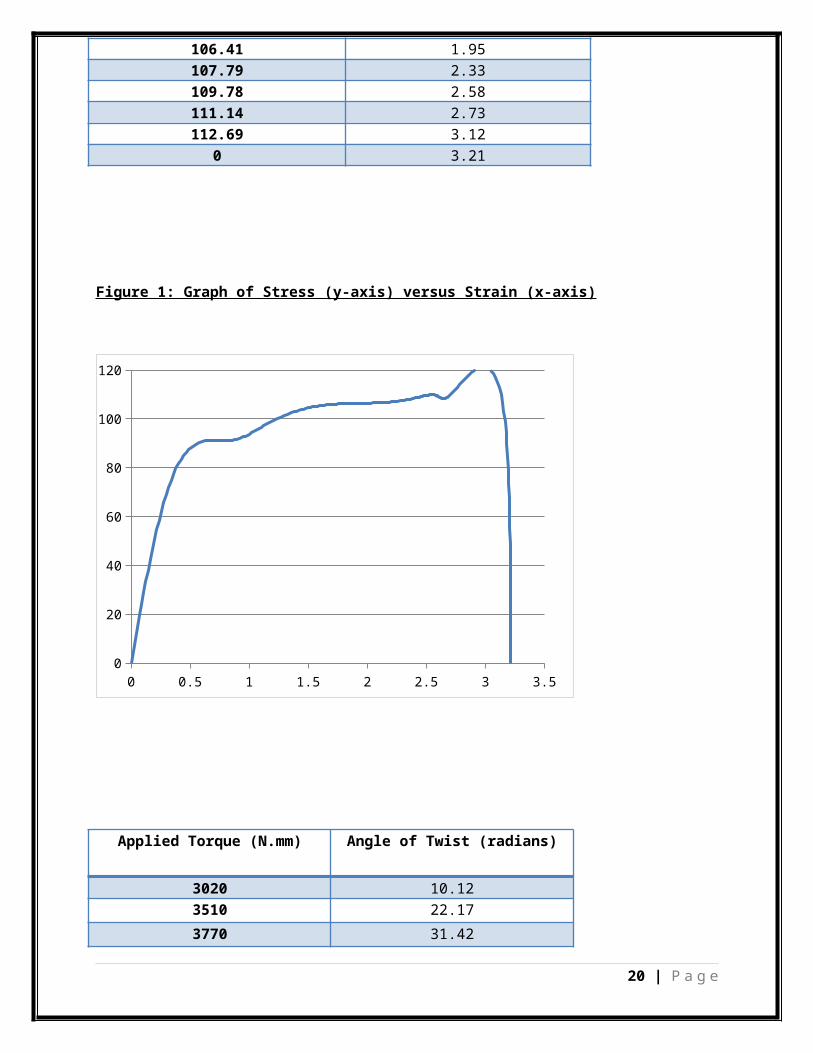
106.41 1.95107.79 2.33109.78 2.58111.14 2.73112.69 3.12
0 3.21
Figure 1: Graph of Stress (y-axis) versus Strain (x-axis)
0 0.5 1 1.5 2 2.5 3 3.50
20
40
60
80
100
120
Applied Torque (N.mm) Angle of Twist (radians)
3020 10.123510 22.173770 31.42
20 | P a g e
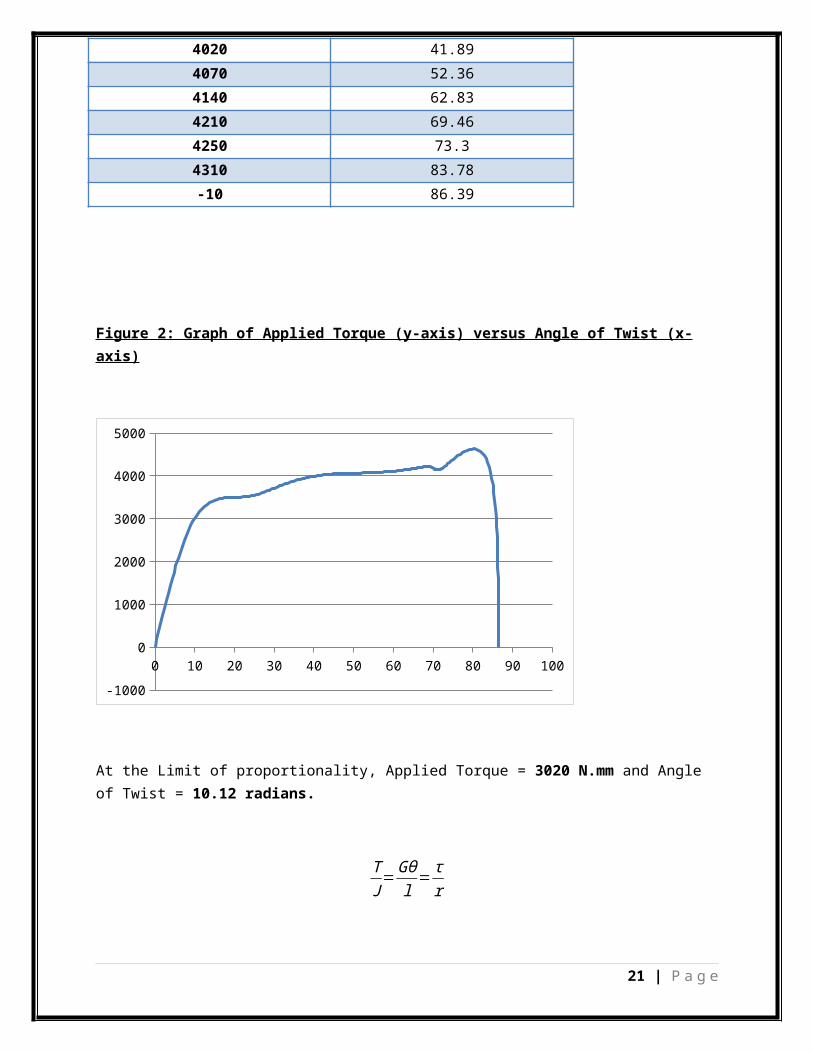
4020 41.894070 52.364140 62.834210 69.464250 73.34310 83.78-10 86.39
Figure 2: Graph of Applied Torque (y-axis) versus Angle of Twist (x-axis)
0 10 20 30 40 50 60 70 80 90 100-1000
0
1000
2000
3000
4000
5000
At the Limit of proportionality, Applied Torque = 3020 N.mm and Angle of Twist = 10.12 radians.
TJ=Gθl
=τr
21 | P a g e
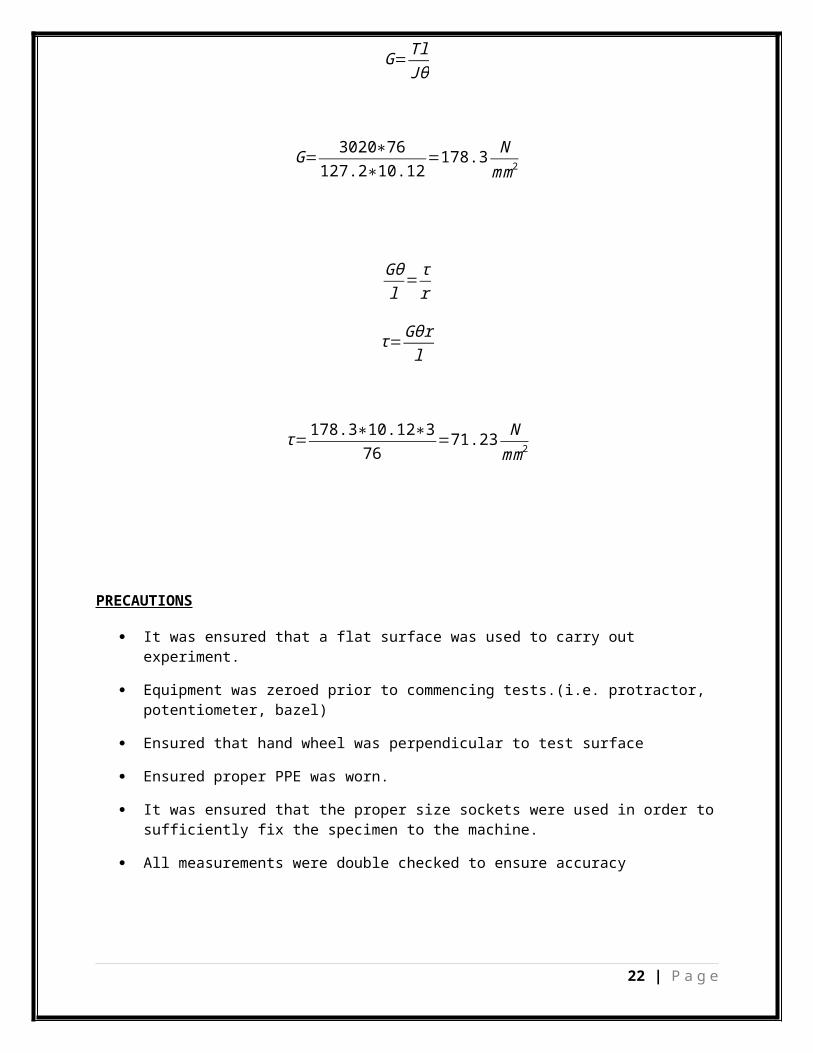
G=TlJθ
G=3020∗76
127.2∗10.12=178.3 N
mm2
Gθl
=τr
τ=Gθrl
τ=178.3∗10.12∗3
76=71.23 N
mm2
PRECAUTIONS
It was ensured that a flat surface was used to carry out experiment.
Equipment was zeroed prior to commencing tests.(i.e. protractor, potentiometer, bazel)
Ensured that hand wheel was perpendicular to test surface
Ensured proper PPE was worn.
It was ensured that the proper size sockets were used in order tosufficiently fix the specimen to the machine.
All measurements were double checked to ensure accuracy
22 | P a g e
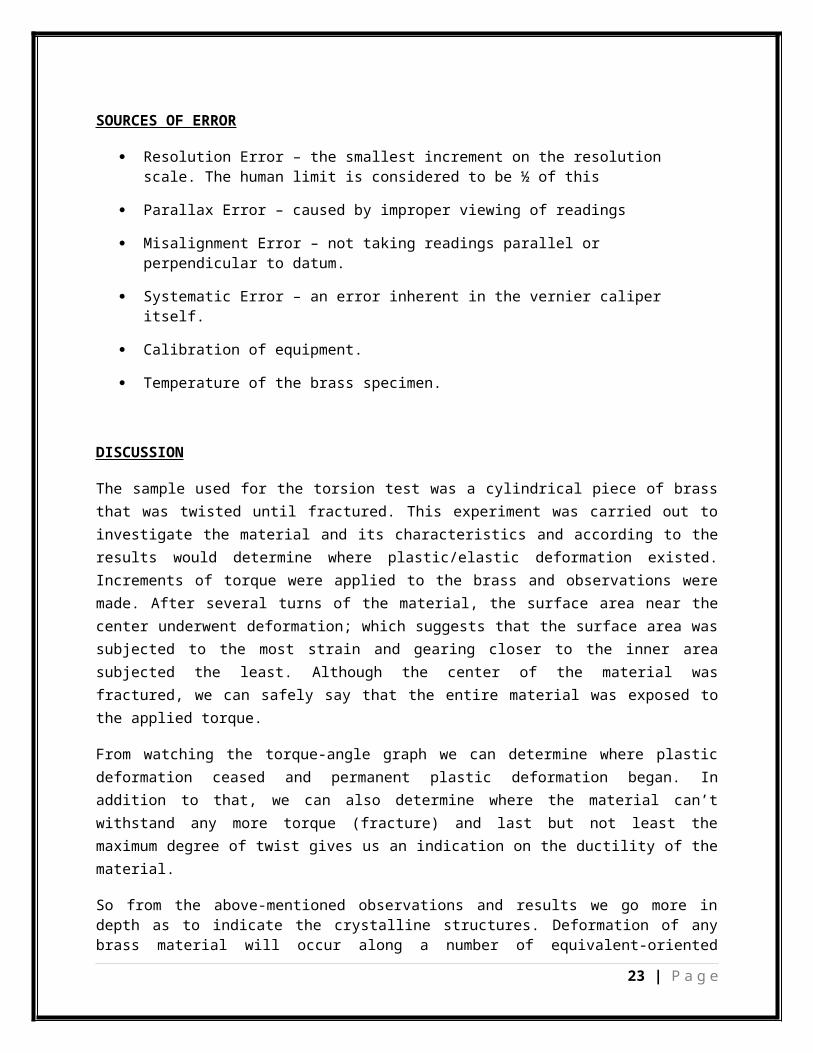
SOURCES OF ERROR
Resolution Error – the smallest increment on the resolution scale. The human limit is considered to be ½ of this
Parallax Error – caused by improper viewing of readings
Misalignment Error – not taking readings parallel or perpendicular to datum.
Systematic Error – an error inherent in the vernier caliper itself.
Calibration of equipment.
Temperature of the brass specimen.
DISCUSSION
The sample used for the torsion test was a cylindrical piece of brassthat was twisted until fractured. This experiment was carried out toinvestigate the material and its characteristics and according to theresults would determine where plastic/elastic deformation existed.Increments of torque were applied to the brass and observations weremade. After several turns of the material, the surface area near thecenter underwent deformation; which suggests that the surface area wassubjected to the most strain and gearing closer to the inner areasubjected the least. Although the center of the material wasfractured, we can safely say that the entire material was exposed tothe applied torque.
From watching the torque-angle graph we can determine where plasticdeformation ceased and permanent plastic deformation began. Inaddition to that, we can also determine where the material can’twithstand any more torque (fracture) and last but not least themaximum degree of twist gives us an indication on the ductility of thematerial.
So from the above-mentioned observations and results we go more indepth as to indicate the crystalline structures. Deformation of anybrass material will occur along a number of equivalent-oriented
23 | P a g e
planes. Directions at these various positions along with the lengthwould determine the outcome. The slip deformation happens in minorsteps around each crystal that are parallel to each other. Brass whichfollows a body centered crystalline structure begins to slip along thesecond slip system which defines the material to a certain extent;where increased torsional forces result in increased slip step width.
CONCLUSION
The brass specimen investigated in this experiment was found to be ductile in nature. Its modulus of rigidity was found to be 30.74 N/mm2
. Its shear stress at the limit of proportionality was 71.23 N/mm2.
24 | P a g e