Embed Size (px)
Citation preview

http://www.iaeme.com/IJCIET/index.asp 354 [email protected]
International Journal of Civil Engineering and Technology (IJCIET) Volume 7, Issue 3, May–June 2016, pp. 354–364, Article ID: IJCIET_07_03_036 Available online at http://www.iaeme.com/IJCIET/issues.asp?JType=IJCIET&VType=7&IType=3 Journal Impact Factor (2016): 9.7820 (Calculated by GISI) www.jifactor.com ISSN Print: 0976-6308 and ISSN Online: 0976-6316
© IAEME Publication
ANALYSIS AND COMPARATIVE STUDY OF
COMPOSITE BRIDGE GIRDERS
Patil M.B
PG Student, SKN Sinhgad College of Engineering,
Korti, Pandharpur, Maharastra, India
Y.P.Pawar, S.S.Kadam, D.D.Mohite, S.V. Lale, C.M. Deshmukh
Assistant Professor,
Department of Civil Engineering, SKN Sinhgad College of Engineering, Korti, Pandharpur, India
C.P. Pise
Associate Professor & HOD,
Department Civil Engineering Department,
SKN Sinhgad College of Engineering, Korti, Pandharpur, Maharastra, India
ABSTRACT
The composite bridge gives the maximum strength in comparison to other bridges. The design and analysis of various girders for steel and concrete by
using various software, in that paper for composite bridge calculate the bending moment for T girder and finding which is more effective. The efforts will make to carry out to check the analysis of bridge by using SAP 2000
software. To determine the static analysis of T girder by using manual method as well as software. The results obtained from the software in structural
analysis are compare the results obtained from manual calculations.
Key words : T Girder, IRC AA Loading, SAP2000 Software
Cite this Article: Patil M.B, Y.P.Pawar, S.S.Kadam, D.D.Mohite, S.V. Lale,
C.M. Deshmukh and C.P. Pise, Analysis and Comparative Study of Composite Bridge Girders. International Journal of Civil Engineering and Technology,
7(3), 2016, pp.354–364. http://www.iaeme.com/IJCIET/issues.asp?JType=IJCIET&VType=7&IType=3
1. INTRODUCTION
T-beam, used in construction, is a load-bearing structure of reinforced concrete, Wood or metal, with a t-shaped cross section. The top of the T-shaped cross section serves
as a flange or compression member in resisting compressive stresses. The web of the

Analysis and Comparative Study of Composite Bridge Girders
http://www.iaeme.com/IJCIET/index.asp 355 [email protected]
beam below the compression flange serves to resist shear stress and to provide greater separation for the coupled forces of bending. [1]
A cross girder at the middle is more effective than two cross girders at the third points and the presence of two cross girders at quarter points in addition to the one at
the middle may be and may not improve the load distribution and in both cases the change is small.[2]
The complexity nature of composite box girder bridges makes it difficult to
accurately predict their structural response under loading. However, that difficulty in the analysis and design of composite box girder bridges can be handled by the use of
the digital computers in the design. [3]
Static analysis is used to determine displacements, stresses, etc. under static loading conditions. Static structural analysis is one in which the load/field conditions
does not vary with time and the assumption here is that the load or field conditions are gradually applied. [4]
IRC Class A loading bridge responses such as Bending Moment (BM) and deflection are obtained to assess the serviceability.[5]
Due to efficient dissemination of congested traffic, economic considerations, and
aesthetic desirability horizontally curved steel box girder bridges have become increasingly popular nowadays in modern highway systems, including urban
interchanges. Currently curved girders have replaced straight segments because in urban areas where elevated highways and multi- level structures are necessary, modern highway bridges are often subjected to severe geometric restrictions; therefore they
must be built in curved alignment. Even though the cost of the superstructure for the curved girder is higher, the total cost of the curved girder system is reduced
considerably since the number of intermediate supports, expansion joints and bearing details is reduced. [6]
The process undergoes many manual iterations before the design can be finalized
making it a slow and very costly process. [7] The typical multi-girder steel-concrete composite bridge, which consists of a number of steel girders with bracing in between
and a slab on top, and a ladder deck bridge, which consists of two main girders with a number of secondary cross girders in between that support and act with a deck slab.[8]
The relative economy of the box-girder bridges contributed greatly to its popularity, as it has relatively slender and unencumbered appearance. The structural
simplicity of the box-girder bridges, particularly in continuous structures of medium to long spans, has been well demonstrated. The efficiency of the cross-section for positive and negative longitudinal bending moments, as well as torsional moments is
apparent even to casual observer.[9] The deck and the steel support girders acted in a non-composite manner. This was evident from visual inspection of the bridge that
there had been obvious differential movement between the deck and the girders, this was also evident from the results of the tests that were run.[10] The steel girders, defined as beam elements, were positioned on a separate plane of nodes parallel with
the deck. The girder nodes were defined by copying a nodal layer of the deck to a new plane. [11]
The main objectives of the proposed work are:
1. To study the structural behavior of bridge under Static analysis.
2. To identify the suitability of the composite Bridge girder.

Patil M.B, Y.P.Pawar, S.S.Kadam, D.D.Mohite, S.V. Lale, C.M. Deshmukh and C.P. Pise
http://www.iaeme.com/IJCIET/index.asp 356 [email protected]
3. Compare its results numerically to know the suitability of the composite bridges for Experiments have shown that steel material when coated with resin and used performs better. SAP2000 is used to perform Finite Element Analysis of the composite member using which, basic structural properties of the composite are calculated.
2. PIGEAUD’S METHOD
Pigeaud’s method for the design of bridge slab consist of series chart that are used for determine the longitudinal and transverse BM in abridge slab due to a wheel load
occupying a small rectangular area. The slab of loaded area is assumed to transmit at a 450 angle.
From geometry of pressure area the width u and the length v calculated, according
to the geometry of slab and beam system, the slab span between diaphragm B and the slab width between longitudinal beams L are calculated, and from the distance B/L,
u/B and v/L are determined. The ratio B/L determines which chart to use and plotting the value of u/B & v/L result in a moment M1 or M2 which are functions of B and L respectively. (The charts are solutions to the LaGrange equation for wide ranges of
slab dimension ratios and ratios of sides to loaded areas.) From the determinations of M1 and M2, MB and ML are calculated from the following equations where 0.15 is
Poisson’s ratio for concrete:
MB= (M1+0.15M2)*W in- lb/in
ML= (M2+0.15M1)*W in- lb/in
Where W is the concentrated load or wheel load in pounds. MB and ML are the transverse and longitudinal moments per unit width respectively and can be
considered positive at the mid span of the panel and negative over the supports. [11]
3. PROBLEM STATEMENT
The problem taken for the comparison, typical bridge span without pre stressing or
post tensioning is considered, the bridge is analyzed for the two continuous spans with three piers in series to get the proper load distribution on the pier. The CLASS 70 R
Tracked loading is considered or the analysis as per IRC code. Solution of above problem solving by pigeaud’s method.
3.1. Required data
Effective Span =16.000 m.
Total length of Deck =8.700 m.
Carriage way width =7.500 m.
Width of Parapet including Kerb =0.600 m. Width of Footpath =1.000 m
Thickness of Slab =0.200 m. No of Longitudinal Girder =4.000 m
Height of Longitudinal Girder =1.500 m.
Spacing of Longitudinal Girder =2.500 m
Cantilever Length =1.125 m, Thickness of Web =0.250 m.
Thickness of Footpath=0.350 m, Thickness of Kerb =0.450 m.
Thickness of Parapet =0.200 m, Height of Parapet above Kerb =0.900 m.
No of Cross Girder =5.000 m. Spacing of Cross Girder Spacing =4.000 m.
Thickness of Cross Girder =0.300m. Height of Cross Girder =1.500m.

Analysis and Comparative Study of Composite Bridge Girders
http://www.iaeme.com/IJCIET/index.asp 357 [email protected]
Density of RCC =25.000kN/m3. Wearing Coat Thickness =0.080m.
Density of Wearing Coat =22.000kN/m3.
Solution-Design of Deck Interior Slab Panel
3.1.1 Live Load
Considering 70R Tracked vehicle =2.500m which is placed at the center of panel as shown in fig. Contact area of vehicle is, 0.84m in transverse direction, 4.57m in longitudinal direction.
Figure 1 Loading placed Center of panel
u=0.84 + (2 * 0.08) =1.00m
v=4.57 + (2 * 0.08) = 4.73m>4.000 m.
Hence, v = 4.000
Mu =1.00 u/B = 1/2.5 = 0.4
v/L = 4/4 = 1.00
K = B/L = 2.5/4 = 0.625 say 0.7
Referring to Pigeaud's curves corresponding to 'K'=7' values, the values of moment Coefficients are,
m1 =0.08, m2 =0.03.
70RTracked load for two track =700.00KN
70R Tracked load for one track =350.00KN.
MB=W * (m1 + (0.15 * m2) =350 * (0.08 + (0.15 * 0.034)) =29.575KNm.
ML=W * (m2 + 0.15 * m1) =350 (0.03 + (0.15 * 0.08)) =14.7KN-m.
As the slab is continuous, the design bending moments are obtained by applying
the continuity factor as, 40% is given by, MB =1.4*29.575=41.41KN-m
ML=1.4*14.7=20.58KN-m

Patil M.B, Y.P.Pawar, S.S.Kadam, D.D.Mohite, S.V. Lale, C.M. Deshmukh and C.P. Pise
http://www.iaeme.com/IJCIET/index.asp 358 [email protected]
3.1.2 Dead Load
Dead weight of slab= 0.200 * 25.000 = 5 KN/m2.
Dead weight of wearing coat = 0.080 * 22.000 = 1.76 KN/m2.
Total weight = 6.76 KN/m2.
Dead load bending moments are computed using Pigeaud's Curves
Dead Load = 6.76 KN/m2.
Total DL on panel = (6.76 * 4 * 2.5) = 67.5KN.
Plate load and self-weight=3.16 + 5.05 = 8.21KN. Total D.L= 67.5 + 8.21 =75.71KN. ( u / B ) = (v/L) =1 as panel is loaded with UDL, K =B/L =2.500 /4.000=0.625
From Pigeaud's Curves read out the Co-efficient are m1 =0.04, m2 =0.02. Taking
the continuity effect, the design moments are,
MB = (W) * (m1 + 0.15 * m2) = 75.71 * (0.04 + (0.15 * 0.02)) = 3.25KN-m.
ML= (W) * (m2 + 0.15 * m1) =75.71 *(0.02 + (0.15 * 0.04)) = 1.96KN-m.
As the slab is continuous, the design bending moments are obtained by applying the continuity factor as, 40%
MB = 1.4 * 3.25 = 4.55KNm.
ML= 1.4 * 1.96 = 2.744KNm. Hence final design moments in the slabs are obtained as,
MB = 41.41 + 4.55 = 45.96kN-m. ML= 20.58 + 2.744 = 23.324kN-m.
3.1.3 Design parameters
Grade of concrete = M - 35 = 35N/mm2.
Grade of Steel Fe = Fe - 415 = 415N/mm2.
According to IRC-21:2000
Design Constants: σcbc = 11.67N/mm2
σst = 200N/mm2, m =10.
k = (m * σcbc / (mσcbc + σst )) = (10 * 11.667) / ((10 * 11.66) + 200) = 0.37
j = 1 - (k/3) = 1 - 0.373 = 0.88. Q = 0.5 * σcbc * j * k = 0.5 * 11.667 * 0.88 * 0.37 = 1.89
N/mm2
dreq = *1*106)
/ (1.89*1000) = 159.9mm. Diameter of rod = 16 mm Overall Depth Provided = 250 mm Clear Cover =40mm Center of reinforcement = 8mm Effective depth Provided = 202mm< dreq.
Hence OK.
Area of Steel required = (M * 106) / (j * σst * d) Area of Steel Required = (23.32 * 106) / (0.877 * 200 * 202) = 658.18 mm2 /m Minimum reinforcement required =0.12
% of cross sectional area=0.12% *1000 * 250=300mm2 /m Ast req > Ast min Hence required Ast = 658.18mm2/m
Steel Provided = Pro steel/m =Provide 16 mm dia, 150mm c/c 804 mm2 /m
Total Steel Provided on Embankment Face = 804 mm2/m. OK and SAFE Area of Steel Required =45.96 * 106 / 0.877 * 200 * 202 = 1297.18mm2 /m. Minimum
reinforcement required = 0.12 % of cross sectional area = 0.12% * 1000 * 250 = 300mm2 /m.

Analysis and Comparative Study of Composite Bridge Girders
http://www.iaeme.com/IJCIET/index.asp 359 [email protected]
Ast req>Ast min
Hence required Ast =1297.18mm2 /m.
Steel Provided = Pro steel/m = Provide 16mm dia, 150mm c/c =1297.18mm2 /m. Total Steel Provided on Embankment Face = 1407.43 mm2 /m. Hence OK.
3.1.4 DESIGN OF CANTILIVER SLAB
Bellow figure shows the cantilever portion of the Tee beam and slab bridge deck with dimensional details of cantilever projection, kerb, handrails and footpath
a) Dead Load Calculation
i) Deck slab = (0.2 * 1.00 * 25) = 5KN/m.
ii) Haunch at support = (0.10 * 25) = 2.5KN/m.
iii) Foot path = (0.35 * 1.00 * 25) = 8.75KN/m.
iv) Kerb above Footpath = (0.10 * 0.60 * 25) =1.5KN/m.
v) Parapet = (0.90 * 0.20 * 25) = 4.5kN/m.
Total load= (5 + 2.5 + 8.75 + 1.5 + 4.5) = 22.25kNm. Moment= (22.25 * 1 * 0.5) =11.125kNm.
b). Live Load Calculation
Here only footpath live load is considered, because footpath is covering the whole cantilever portion. According to IRC-6:2010, Cl: 209.
Figure 2 Uniformly distributed load on Cantilever
i. Footpath load taken 5.00KN/m. Taking Moments at the support = 2*0.40*0.2 =
0.16kN-m
ii. Maximum Bending Moment at Support
Dead Load Moment =11.125KN-m Live Load Moment = 0.16KN-m Total
Moment= 11.285KN-m.

Patil M.B, Y.P.Pawar, S.S.Kadam, D.D.Mohite, S.V. Lale, C.M. Deshmukh and C.P. Pise
http://www.iaeme.com/IJCIET/index.asp 360 [email protected]
4. SAP 2000 SOFTWARE
Figure 3 Section of Bridge
T-SECTION
a) live load
Load for one lane (W) = 350KN
Area of rectangle(AR)= (B * L) = (2.5 * 4) = 10 m2
Area load A = (W/AR) = 350/10 = 35 KN/m2
Area of triangle = (1/2 * B * B) = (1/2 * 2.5 * (2.5/2))
=1.5625 m2 =2*1.5625=3.125 m2
Area of trapezoidal(AT) = (AR - 3.125)/2 =3.4375m2
Point load on trapezoid = (AT*A) =(35 * 3.4375) = 120.3125 KN.
UDL on one trap (120.3125/4) =30.078125 KN/m
UDL on two trap = 60.156 KN/m
point load on triangle = (Area of triangle * A) =1.5625*35 = 54.6875 KNm2
UDL on triangle = 54.6875/2.5
=21.875 KN/m

Analysis and Comparative Study of Composite Bridge Girders
http://www.iaeme.com/IJCIET/index.asp 361 [email protected]
b) Dead load
Total point load = Point load of slab + Point load W.C = 50 + 17.6 = 67.6 KN
Plate load = 3.16KN.
Self-weight of Box girder = 3.05KN
W= 67.6 + 3.16 + 5.05 = 75.81KN
Area of rectangle(AR)=(B * L)=(2.5 * 4)=10 m2
Area load A=W/AR = 75.81 / 10 = 7.581KN/m2
Area of triangle=1/2 * B * B = ½ * 2.5 * (2.5/2) = 1.5625 m2
= 2 * 1.5625=3.125 m2
Area of trapezoidal(AT) = (AR - 3.125)/2 =3.4375m2
Point load on trapezoid =AT * A= 7.581 * 3.4375 = 26.05969KN.
UDL on one trap= 26.05969/4= 6.514922KN/m
UDL on two trap =13.02984 KN/m
point load on triangle = Area of triangle *A =1.5625 * 7.581 = 11.84531 KNm2
UDL on triangle = 11.84531/2.5 = 4.738 KN/m
Figure 4 Bending Moment of T section for long span

Patil M.B, Y.P.Pawar, S.S.Kadam, D.D.Mohite, S.V. Lale, C.M. Deshmukh and C.P. Pise
http://www.iaeme.com/IJCIET/index.asp 362 [email protected]
Figure 5 Bending Moment of T section for short span
5. RESULTS
5.1. Variation in the manual analysis and in SAP2000 comparison
Table 1 Bending moment in KNm
Short Span Long span
Manual SAP Manual SAP
T 23.3 25.88 45.96 44.67
6. CONCLUSIONS
The variation of 10% is seen in between manual and SAP analysis for T section along
short span.
Analysis and Comparative Study of Composite Bridge Girders
http://www.iaeme.com/IJCIET/index.asp 363 [email protected]
Figure 6 Variation in BM for short spanT section
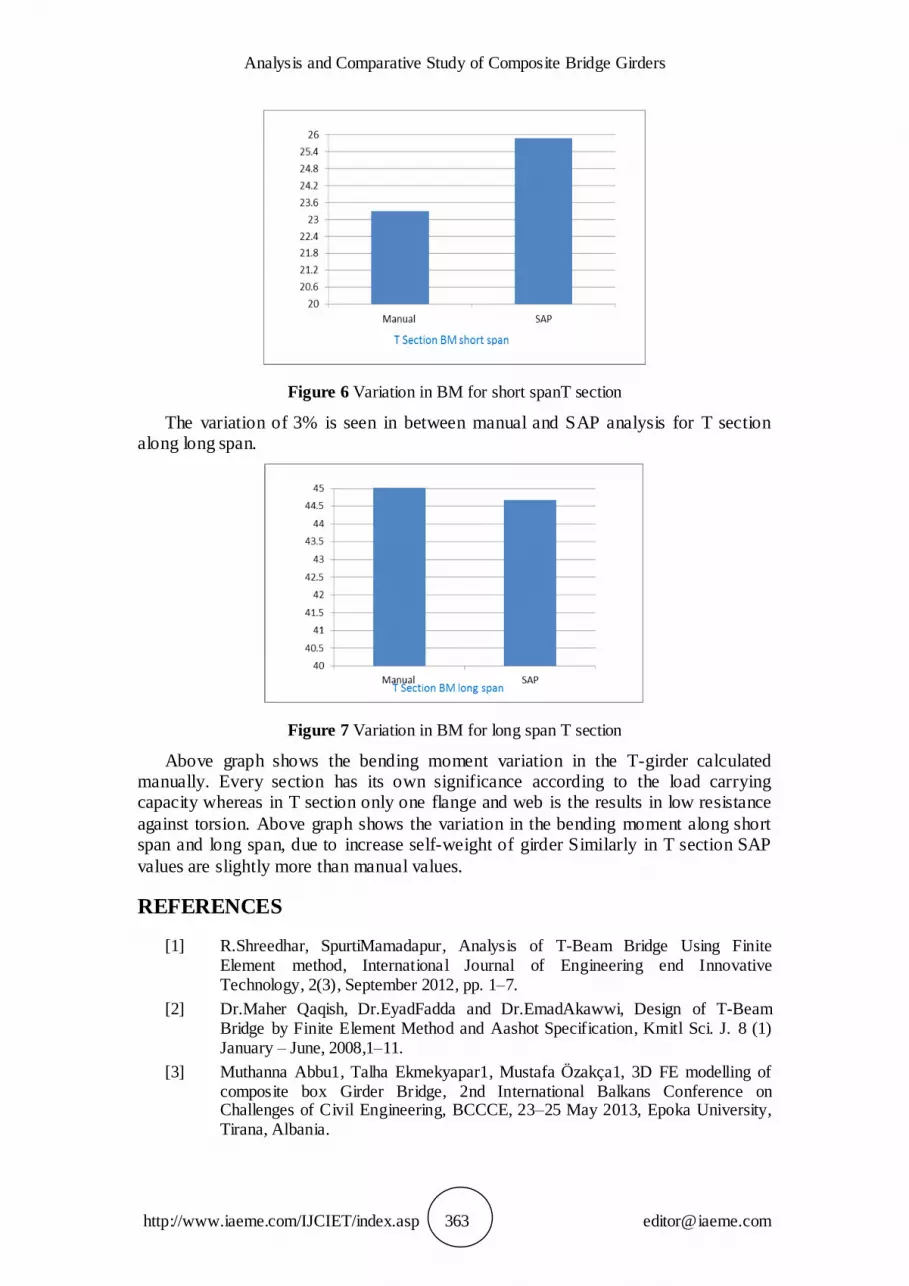
The variation of 3% is seen in between manual and SAP analysis for T section along long span.
Figure 7 Variation in BM for long span T section
Above graph shows the bending moment variation in the T-girder calculated manually. Every section has its own significance according to the load carrying capacity whereas in T section only one flange and web is the results in low resistance
against torsion. Above graph shows the variation in the bending moment along short span and long span, due to increase self-weight of girder Similarly in T section SAP
values are slightly more than manual values.
REFERENCES
[1] R.Shreedhar, SpurtiMamadapur, Analysis of T-Beam Bridge Using Finite Element method, International Journal of Engineering end Innovative Technology, 2(3), September 2012, pp. 1–7.
[2] Dr.Maher Qaqish, Dr.EyadFadda and Dr.EmadAkawwi, Design of T-Beam Bridge by Finite Element Method and Aashot Specification, Kmitl Sci. J. 8 (1) January – June, 2008,1–11.
[3] Muthanna Abbu1, Talha Ekmekyapar1, Mustafa Özakça1, 3D FE modelling of composite box Girder Bridge, 2nd International Balkans Conference on Challenges of Civil Engineering, BCCCE, 23–25 May 2013, Epoka University, Tirana, Albania.

Patil M.B, Y.P.Pawar, S.S.Kadam, D.D.Mohite, S.V. Lale, C.M. Deshmukh and C.P. Pise
http://www.iaeme.com/IJCIET/index.asp 364 [email protected]
[4] Surendra K.Waghmare, Analysis and Simulation of Composite Bridge for Electrostatic MEMS Switch , International Journal of Emerging Technology and Advanced Engineering, 3(8) August 2013) 387.
[5] Supriya Madda1, Kalyanshetti M.G2, Dynamic analysis of T-Beam bridge superstructure, International Journal of Civil and Structural Engineering, 3(3), 2013.
[6] Professor Chung C. Fu, Analysis and Behavior Investigations of Box Girder Bridges, Zakia Begum, MS, 2010.
[7] S. Rana & R.Ahsan, Design of Pre stressed concrete I-girder bridge superstructure using optimization Algorithm, IABSE-JSCE Joint Conference on Advances in Bridge Engineering-II, August 8–10, 2010, Dhaka, Bangladesh.
[8] Raed El Sarraf, HERA, Auckland, David Iles, SCI, Ascot, United Kingdom, Amin Momtahan, David Easey, AECOM, Stephen Hicks, HERA, Auckland, New Zealand, Steel-concrete composite bridge design guide, Sept 2013.
[9] Dr. Husain M. Husain Mohanned I. Mohammed Hussein Professor / University of Tikrit M.Sc. / University of Baghdad, Finite Element Analysis of Post-Tensioned Concrete Box Girders, Volume 3 march 2011.
[10] Marvin Halling, Kevin Womack, Ph.D., P.E. Stephen Bott , Static and Dynamic Testing of A Curved, Steel Girder Bridge In Salt Lake City, Utah, Utah Department of Transportation Research Division August 2001.
[11] M. Ameerutheen and Sri. Aravindan, Study of Stresses on Composite Girder Bridge Over Square and Skew Span. International Journal of Civil Engineering and Technology, 5(2), 2014, pp.88–96.
[12] Vikas Gandhe and Dr. Peeyush Chowdhary, Modified Form of Plate Girder Bridge For Economic Consideration. International Journal of Civil Engineering and Technology, 6(4), 2015, 120–126.
[13] Robert T. Reese, Load Distribution in Highway Bridge floor, Brigham Young University, March 1966, pp.17–18.


