Embed Size (px)
Citation preview
Final Report The Study on Arterial Road Network Development Plan for Sulawesi Island and Feasibility Study on Priority Arterial Road Development for South Sulawesi Province March 2008
7-72
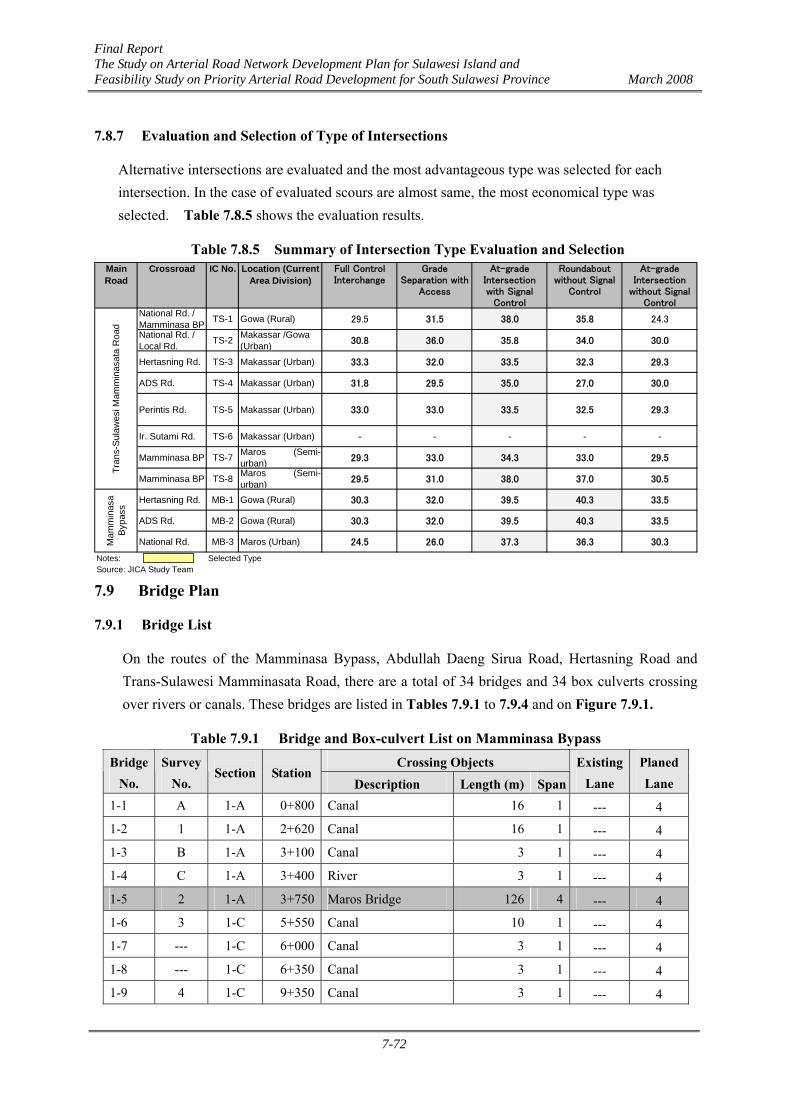
7.8.7 Evaluation and Selection of Type of Intersections
Alternative intersections are evaluated and the most advantageous type was selected for each intersection. In the case of evaluated scours are almost same, the most economical type was selected. Table 7.8.5 shows the evaluation results.
Table 7.8.5 Summary of Intersection Type Evaluation and Selection MainRoad
Crossroad IC No. Location (CurrentArea Division)
Full ControlInterchange
GradeSeparation with
Access
At-gradeIntersectionwith Signal
Control
Roundaboutwithout Signal
Control
At-gradeIntersection
without SignalControl
National Rd. /Mamminasa BP TS-1 Gowa (Rural) 29.5 31.5 38.0 35.8 24.3
National Rd. /Local Rd. TS-2 Makassar /Gowa
(Urban) 30.8 36.0 35.8 34.0 30.0
Hertasning Rd. TS-3 Makassar (Urban) 33.3 32.0 33.5 32.3 29.3
ADS Rd. TS-4 Makassar (Urban) 31.8 29.5 35.0 27.0 30.0
Perintis Rd. TS-5 Makassar (Urban) 33.0 33.0 33.5 32.5 29.3
Ir. Sutami Rd. TS-6 Makassar (Urban) - - - - -
Mamminasa BP TS-7 Maros (Semi-urban) 29.3 33.0 34.3 33.0 29.5
Mamminasa BP TS-8 Maros (Semi-urban) 29.5 31.0 38.0 37.0 30.5
Hertasning Rd. MB-1 Gowa (Rural) 30.3 32.0 39.5 40.3 33.5
ADS Rd. MB-2 Gowa (Rural) 30.3 32.0 39.5 40.3 33.5
National Rd. MB-3 Maros (Urban) 24.5 26.0 37.3 36.3 30.3
Notes: Selected TypeSource: JICA Study Team
Mam
min
asa
Bypa
ssTr
ans-
Sula
wes
i Mam
min
asat
a R
oad
7.9 Bridge Plan
7.9.1 Bridge List
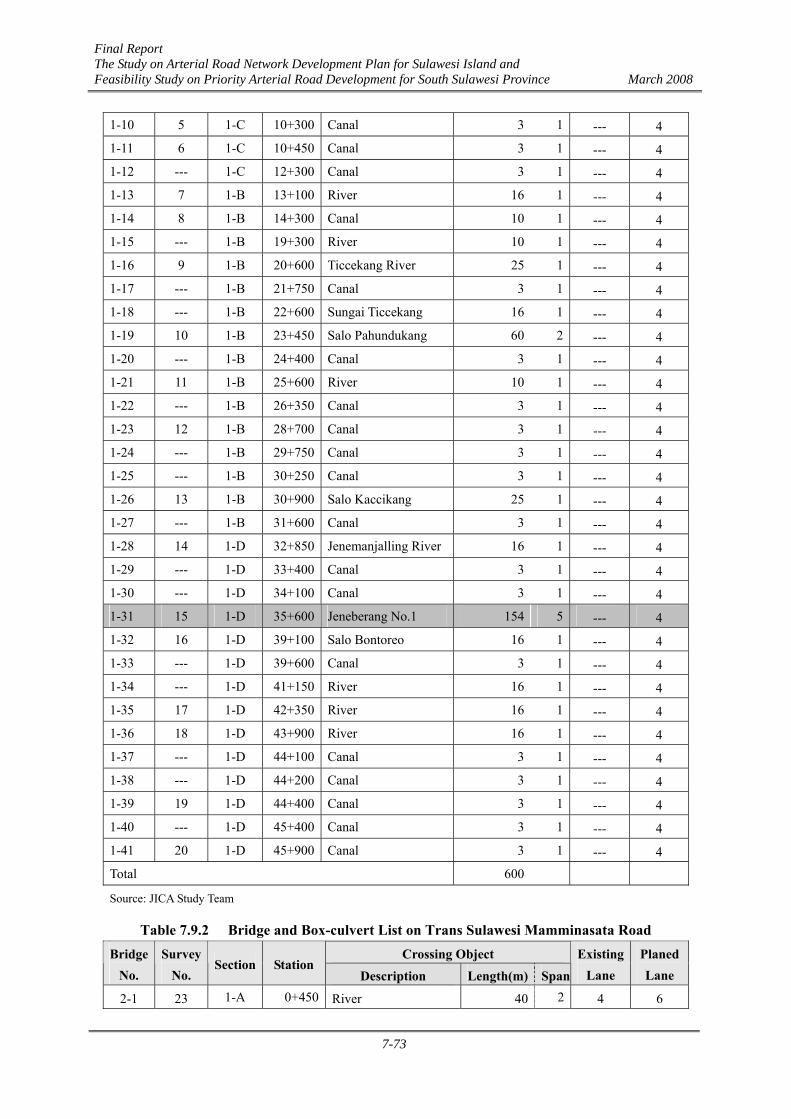
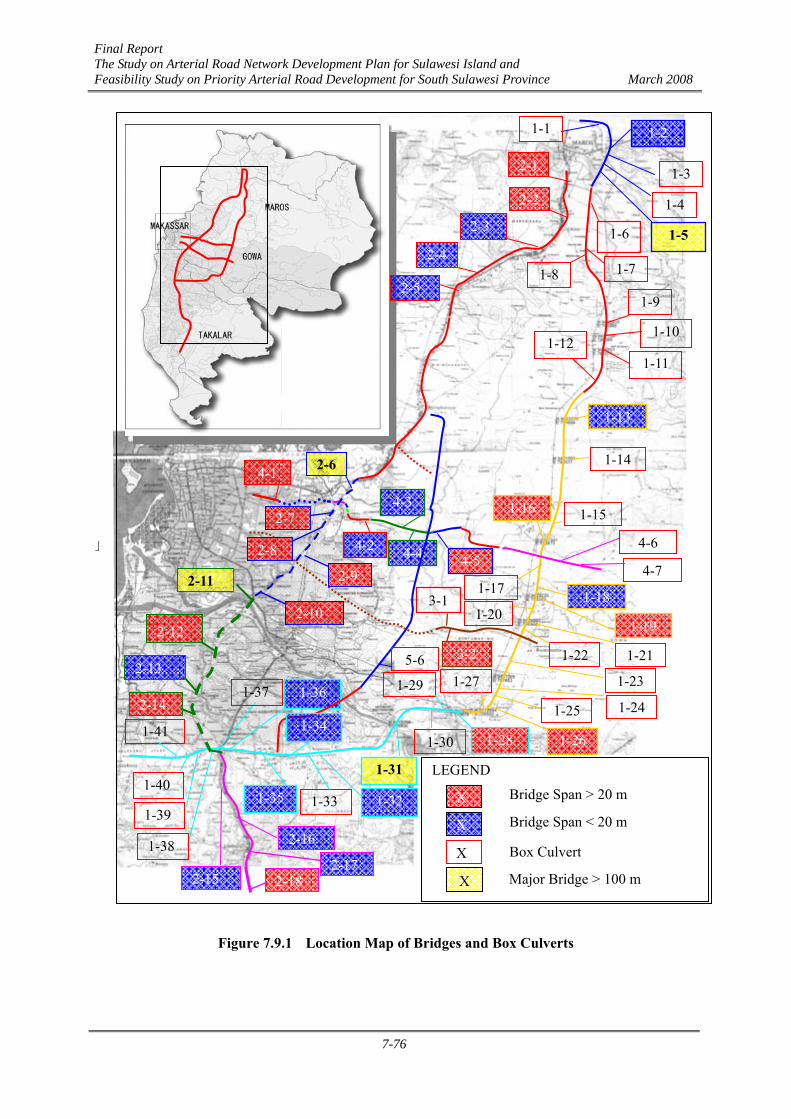
On the routes of the Mamminasa Bypass, Abdullah Daeng Sirua Road, Hertasning Road and Trans-Sulawesi Mamminasata Road, there are a total of 34 bridges and 34 box culverts crossing over rivers or canals. These bridges are listed in Tables 7.9.1 to 7.9.4 and on Figure 7.9.1.
Table 7.9.1 Bridge and Box-culvert List on Mamminasa Bypass Crossing Objects Bridge
No. Survey
No. Section Station
Description Length (m) Span
Existing Lane
PlanedLane
1-1 A 1-A 0+800 Canal 16 1 --- 4
1-2 1 1-A 2+620 Canal 16 1 --- 4 1-3 B 1-A 3+100 Canal 3 1 --- 4 1-4 C 1-A 3+400 River 3 1 --- 4
1-5 2 1-A 3+750 Maros Bridge 126 4 --- 4 1-6 3 1-C 5+550 Canal 10 1 --- 4 1-7 --- 1-C 6+000 Canal 3 1 --- 4
1-8 --- 1-C 6+350 Canal 3 1 --- 4 1-9 4 1-C 9+350 Canal 3 1 --- 4
Final Report The Study on Arterial Road Network Development Plan for Sulawesi Island and Feasibility Study on Priority Arterial Road Development for South Sulawesi Province March 2008
7-73
1-10 5 1-C 10+300 Canal 3 1 --- 4 1-11 6 1-C 10+450 Canal 3 1 --- 4 1-12 --- 1-C 12+300 Canal 3 1 --- 4 1-13 7 1-B 13+100 River 16 1 --- 4
1-14 8 1-B 14+300 Canal 10 1 --- 4 1-15 --- 1-B 19+300 River 10 1 --- 4 1-16 9 1-B 20+600 Ticcekang River 25 1 --- 4
1-17 --- 1-B 21+750 Canal 3 1 --- 4 1-18 --- 1-B 22+600 Sungai Ticcekang 16 1 --- 4 1-19 10 1-B 23+450 Salo Pahundukang 60 2 --- 4
1-20 --- 1-B 24+400 Canal 3 1 --- 4 1-21 11 1-B 25+600 River 10 1 --- 4 1-22 --- 1-B 26+350 Canal 3 1 --- 4
1-23 12 1-B 28+700 Canal 3 1 --- 4 1-24 --- 1-B 29+750 Canal 3 1 --- 4 1-25 --- 1-B 30+250 Canal 3 1 --- 4
1-26 13 1-B 30+900 Salo Kaccikang 25 1 --- 4 1-27 --- 1-B 31+600 Canal 3 1 --- 4 1-28 14 1-D 32+850 Jenemanjalling River 16 1 --- 4
1-29 --- 1-D 33+400 Canal 3 1 --- 4 1-30 --- 1-D 34+100 Canal 3 1 --- 4 1-31 15 1-D 35+600 Jeneberang No.1 154 5 --- 4
1-32 16 1-D 39+100 Salo Bontoreo 16 1 --- 4 1-33 --- 1-D 39+600 Canal 3 1 --- 4 1-34 --- 1-D 41+150 River 16 1 --- 4
1-35 17 1-D 42+350 River 16 1 --- 4 1-36 18 1-D 43+900 River 16 1 --- 4 1-37 --- 1-D 44+100 Canal 3 1 --- 4
1-38 --- 1-D 44+200 Canal 3 1 --- 4 1-39 19 1-D 44+400 Canal 3 1 --- 4 1-40 --- 1-D 45+400 Canal 3 1 --- 4
1-41 20 1-D 45+900 Canal 3 1 --- 4 Total 600
Source: JICA Study Team
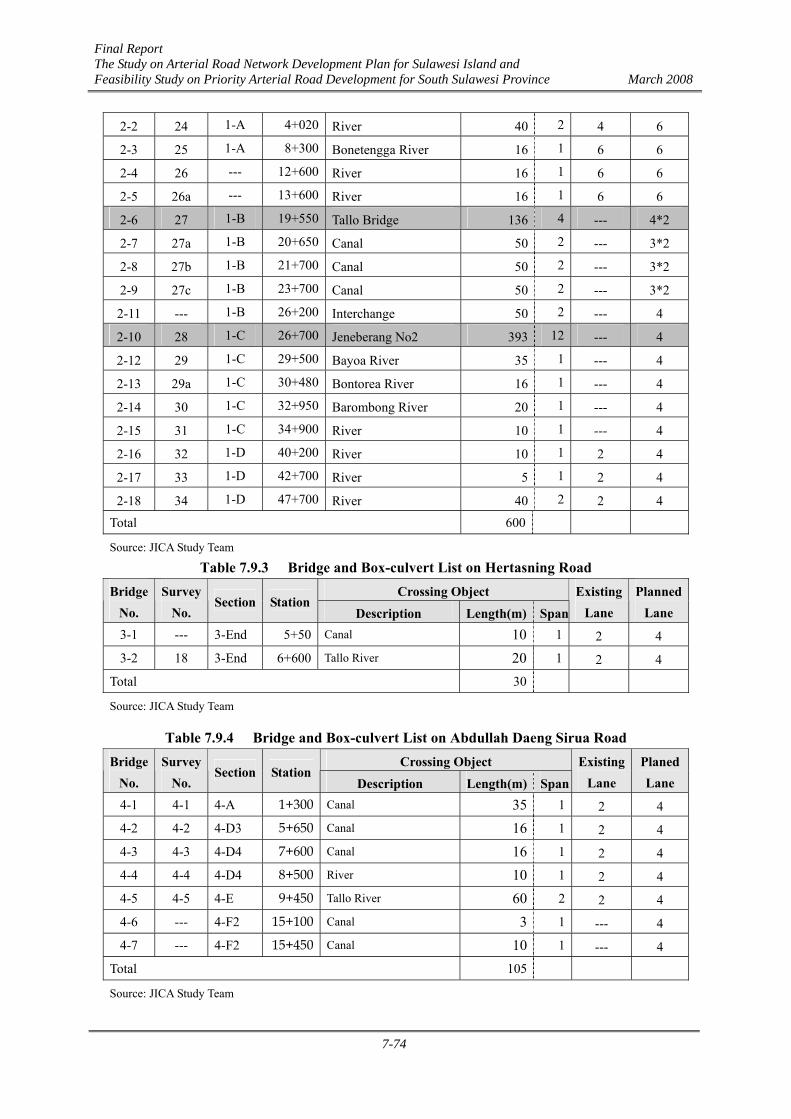
Table 7.9.2 Bridge and Box-culvert List on Trans Sulawesi Mamminasata Road Crossing Object Bridge
No. Survey
No. Section Station
Description Length(m) Span
Existing Lane
PlanedLane
2-1 23 1-A 0+450 River 40 2 4 6
Final Report The Study on Arterial Road Network Development Plan for Sulawesi Island and Feasibility Study on Priority Arterial Road Development for South Sulawesi Province March 2008
7-74
2-2 24 1-A 4+020 River 40 2 4 6
2-3 25 1-A 8+300 Bonetengga River 16 1 6 6
2-4 26 --- 12+600 River 16 1 6 6
2-5 26a --- 13+600 River 16 1 6 6
2-6 27 1-B 19+550 Tallo Bridge 136 4 --- 4*2
2-7 27a 1-B 20+650 Canal 50 2 --- 3*2
2-8 27b 1-B 21+700 Canal 50 2 --- 3*2
2-9 27c 1-B 23+700 Canal 50 2 --- 3*2
2-11 --- 1-B 26+200 Interchange 50 2 --- 4
2-10 28 1-C 26+700 Jeneberang No2 393 12 --- 4
2-12 29 1-C 29+500 Bayoa River 35 1 --- 4
2-13 29a 1-C 30+480 Bontorea River 16 1 --- 4
2-14 30 1-C 32+950 Barombong River 20 1 --- 4
2-15 31 1-C 34+900 River 10 1 --- 4
2-16 32 1-D 40+200 River 10 1 2 4
2-17 33 1-D 42+700 River 5 1 2 4
2-18 34 1-D 47+700 River 40 2 2 4 Total 600
Source: JICA Study Team
Table 7.9.3 Bridge and Box-culvert List on Hertasning Road Crossing Object Bridge
No. Survey
No. Section Station
Description Length(m) Span
Existing Lane
PlannedLane
3-1 --- 3-End 5+50 Canal 10 1 2 4
3-2 18 3-End 6+600 Tallo River 20 1 2 4 Total 30
Source: JICA Study Team
Table 7.9.4 Bridge and Box-culvert List on Abdullah Daeng Sirua Road Crossing Object Bridge
No. Survey
No. Section Station
Description Length(m) Span
Existing Lane
PlanedLane
4-1 4-1 4-A 1+300 Canal 35 1 2 4 4-2 4-2 4-D3 5+650 Canal 16 1 2 4
4-3 4-3 4-D4 7+600 Canal 16 1 2 4 4-4 4-4 4-D4 8+500 River 10 1 2 4 4-5 4-5 4-E 9+450 Tallo River 60 2 2 4
4-6 --- 4-F2 15+100 Canal 3 1 --- 4 4-7 --- 4-F2 15+450 Canal 10 1 --- 4
Total 105
Source: JICA Study Team
Final Report The Study on Arterial Road Network Development Plan for Sulawesi Island and Feasibility Study on Priority Arterial Road Development for South Sulawesi Province March 2008
7-75
For the minor bridges with a length of more than 10 m, the standard PC I girder was applied and a preliminary cost estimate was made by span (35m, 30m, 25m, 20m and 16m). As to the remaining structures of a length of less than 10 m, the standard box culverts were used and a preliminary cost estimate was made for each pattern (span 10m, 5m and 3m).
The following four bridges having a length of more than 100 m were categorized as major bridges in the F/S and subjected to a structure scale examination and subjected to preliminary design:
i) Bridge No.1-5, Maros Bridge (length 126 m) on Mamminasa Bypass
ii) Bridge No.1-15, Jeneberang No.1 Bridge (length 154 m) on Mamminasa Bypass
iii) Bridge No.2-6, Tallo Bridge (length 136 m) on Trans-Sulawesi Mamminasata Road
iv) Bridge No.2-10, Jeneberang No.2 Bridge (length 393 m) on Trans-Sulawesi Mamminasata Road.
Final Report The Study on Arterial Road Network Development Plan for Sulawesi Island and Feasibility Study on Priority Arterial Road Development for South Sulawesi Province March 2008
7-76
」
Figure 7.9.1 Location Map of Bridges and Box Culverts
1-5
1-2
1-6
4-1
4-5
1-36
1-35 1-32
1-31
4-2
3-2
1-28 1-26
1-23
4-3
4-4
1-11
1-9
1-10
1-14
1-13
1-16
1-19
LEGEND
X
X
X
Bridge Span > 20 m
Bridge Span < 20 m
Box Culvert
5-6
1-39
1-41
1-1
1-3
1-4
1-7 1-8
1-12
1-15
1-17 1-18 1-20
1-22
1-25 1-24
1-271-29
1-30
1-33
1-34
1-37
1-38
1-40
3-1
1-21
4-6
4-7
2-1
2-2
2-3
2-4
2-5
2-6
2-11
2-12
2-13
2-14
2-7
2-8
2-9
2-18 2-17
2-16
2-15
2-10
Major Bridge > 100 m X
Final Report The Study on Arterial Road Network Development Plan for Sulawesi Island and Feasibility Study on Priority Arterial Road Development for South Sulawesi Province March 2008
7-77
7.9.2 Design Standard
The Indonesian Standard “Bridge Design Code and Manual (BMS 1993)” was applied in bridge design for the F/S. The design loads applied in the design are as follows:
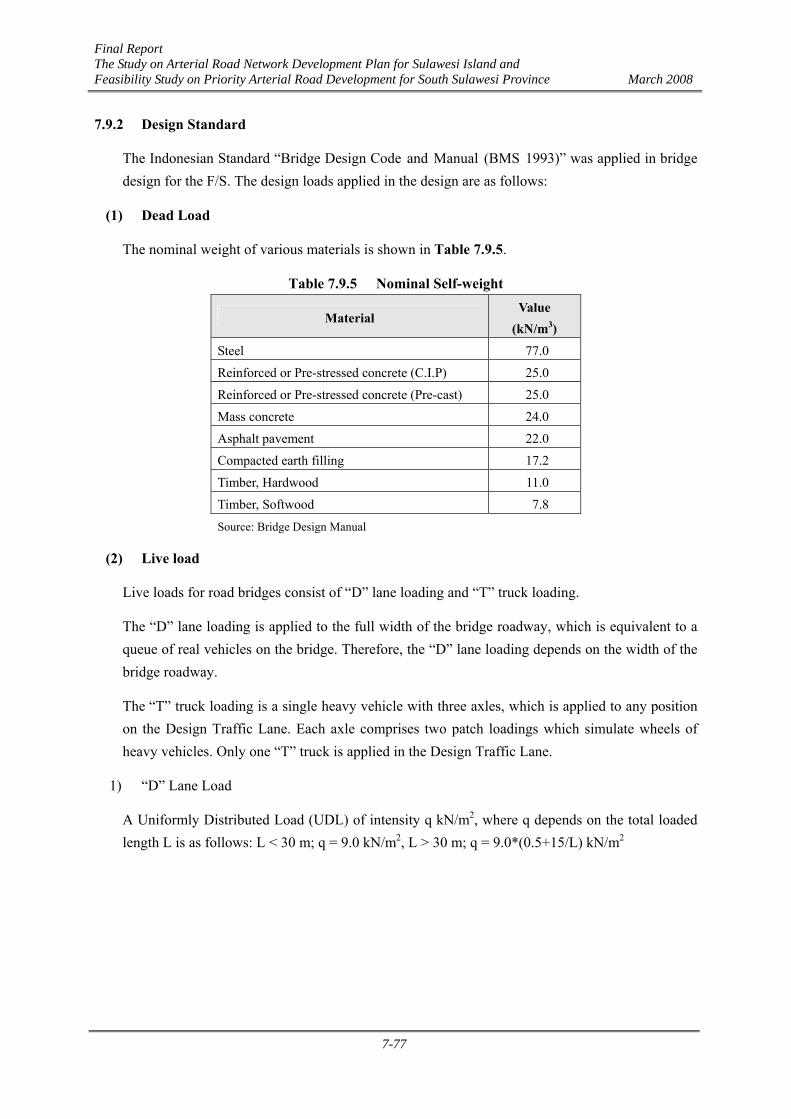
(1) Dead Load
The nominal weight of various materials is shown in Table 7.9.5.
Table 7.9.5 Nominal Self-weight
Material Value
(kN/m3)
Steel 77.0
Reinforced or Pre-stressed concrete (C.I.P) 25.0
Reinforced or Pre-stressed concrete (Pre-cast) 25.0
Mass concrete 24.0
Asphalt pavement 22.0
Compacted earth filling 17.2
Timber, Hardwood 11.0
Timber, Softwood 7.8
Source: Bridge Design Manual
(2) Live load
Live loads for road bridges consist of “D” lane loading and “T” truck loading.
The “D” lane loading is applied to the full width of the bridge roadway, which is equivalent to a queue of real vehicles on the bridge. Therefore, the “D” lane loading depends on the width of the bridge roadway.
The “T” truck loading is a single heavy vehicle with three axles, which is applied to any position on the Design Traffic Lane. Each axle comprises two patch loadings which simulate wheels of heavy vehicles. Only one “T” truck is applied in the Design Traffic Lane.
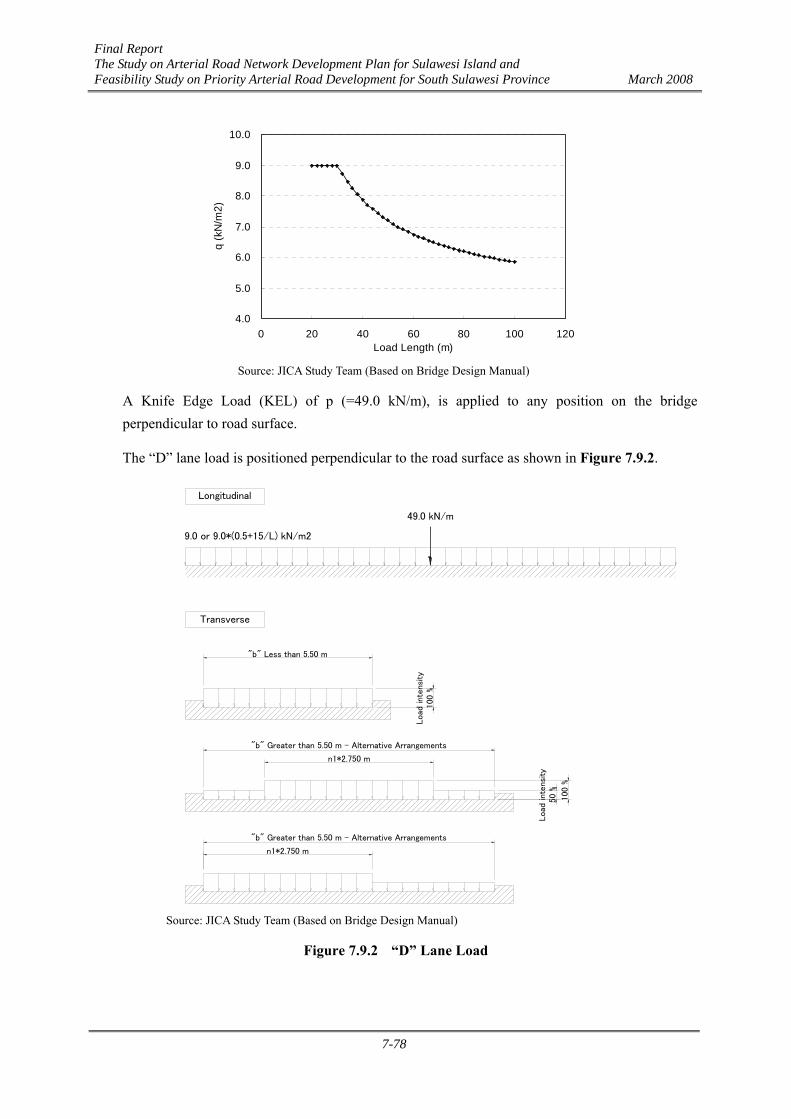
1) “D” Lane Load
A Uniformly Distributed Load (UDL) of intensity q kN/m2, where q depends on the total loaded length L is as follows: L < 30 m; q = 9.0 kN/m2, L > 30 m; q = 9.0*(0.5+15/L) kN/m2
Final Report The Study on Arterial Road Network Development Plan for Sulawesi Island and Feasibility Study on Priority Arterial Road Development for South Sulawesi Province March 2008
7-78
4.0
5.0
6.0
7.0
8.0
9.0
10.0
0 20 40 60 80 100 120Load Length (m)
q (k
N/m
2)
Source: JICA Study Team (Based on Bridge Design Manual)
A Knife Edge Load (KEL) of p (=49.0 kN/m), is applied to any position on the bridge perpendicular to road surface.
The “D” lane load is positioned perpendicular to the road surface as shown in Figure 7.9.2.
"b" Greater than 5.50 m - Alternative Arrangements
"b" Greater than 5.50 m - Alternative Arrangements
Load
inte
nsity
100 %
49.0 kN/m
n1*2.750 m
"b" Less than 5.50 m
n1*2.750 m
Transverse
9.0 or 9.0*(0.5+15/L) kN/m2
Longitudinal
Load
inte
nsi
ty50 %
100 %
Source: JICA Study Team (Based on Bridge Design Manual)
Figure 7.9.2 “D” Lane Load
Final Report The Study on Arterial Road Network Development Plan for Sulawesi Island and Feasibility Study on Priority Arterial Road Development for South Sulawesi Province March 2008
7-79
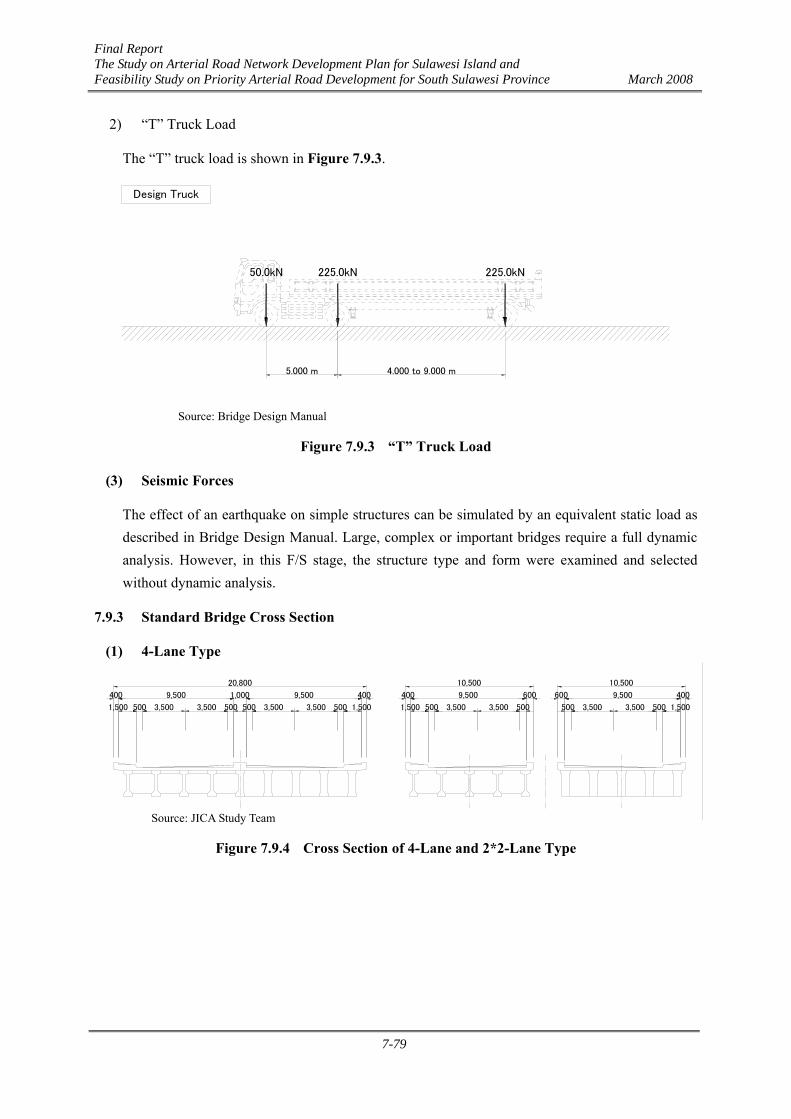
2) “T” Truck Load
The “T” truck load is shown in Figure 7.9.3.
4.000 to 9.000 m5.000 m
50.0kN 225.0kN
Design Truck
225.0kN
Source: Bridge Design Manual
Figure 7.9.3 “T” Truck Load
(3) Seismic Forces
The effect of an earthquake on simple structures can be simulated by an equivalent static load as described in Bridge Design Manual. Large, complex or important bridges require a full dynamic analysis. However, in this F/S stage, the structure type and form were examined and selected without dynamic analysis.
7.9.3 Standard Bridge Cross Section
(1) 4-Lane Type
500
9,500
20,800
1,500
9,500400 1,000
500500 3,500 3,500 500 3,500 3,500
600
3,500
9,500
10,500
400
1,500 5001,500
400
500
600
3,500 500
9,500
10,500
500 3,500 3,500
400
1,500
Source: JICA Study Team
Figure 7.9.4 Cross Section of 4-Lane and 2*2-Lane Type
Final Report The Study on Arterial Road Network Development Plan for Sulawesi Island and Feasibility Study on Priority Arterial Road Development for South Sulawesi Province March 2008
7-80
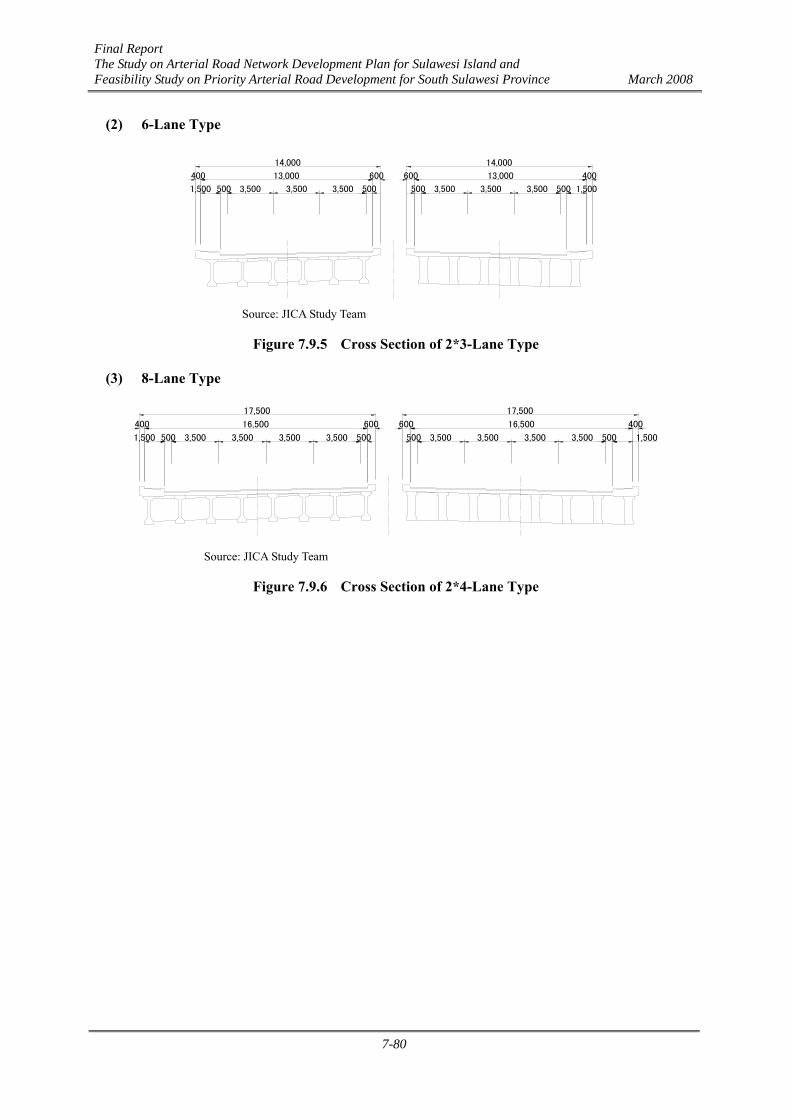
(2) 6-Lane Type
3,500
13,000
14,000
3,500 3,5005001,500
400
14,000
13,000
500
600
500
600
500 3,500 3,500 3,500
400
1,500
Source: JICA Study Team
Figure 7.9.5 Cross Section of 2*3-Lane Type
(3) 8-Lane Type
3,500
17,500
16,500
3,500
400
1,500 500 3,500 3,500 3,500
16,500
17,500
3,500
600 600
500 500 3,500 3,500
400
500 1,500
Source: JICA Study Team
Figure 7.9.6 Cross Section of 2*4-Lane Type
Final Report The Study on Arterial Road Network Development Plan for Sulawesi Island and Feasibility Study on Priority Arterial Road Development for South Sulawesi Province March 2008
7-81
7.9.4 Major Bridges
(1) Site Condition
Although the number of bridges located in this project area is more than 40, only the following four bridges which have a length of more than 100 m were examined for their structure scale by preliminary design.
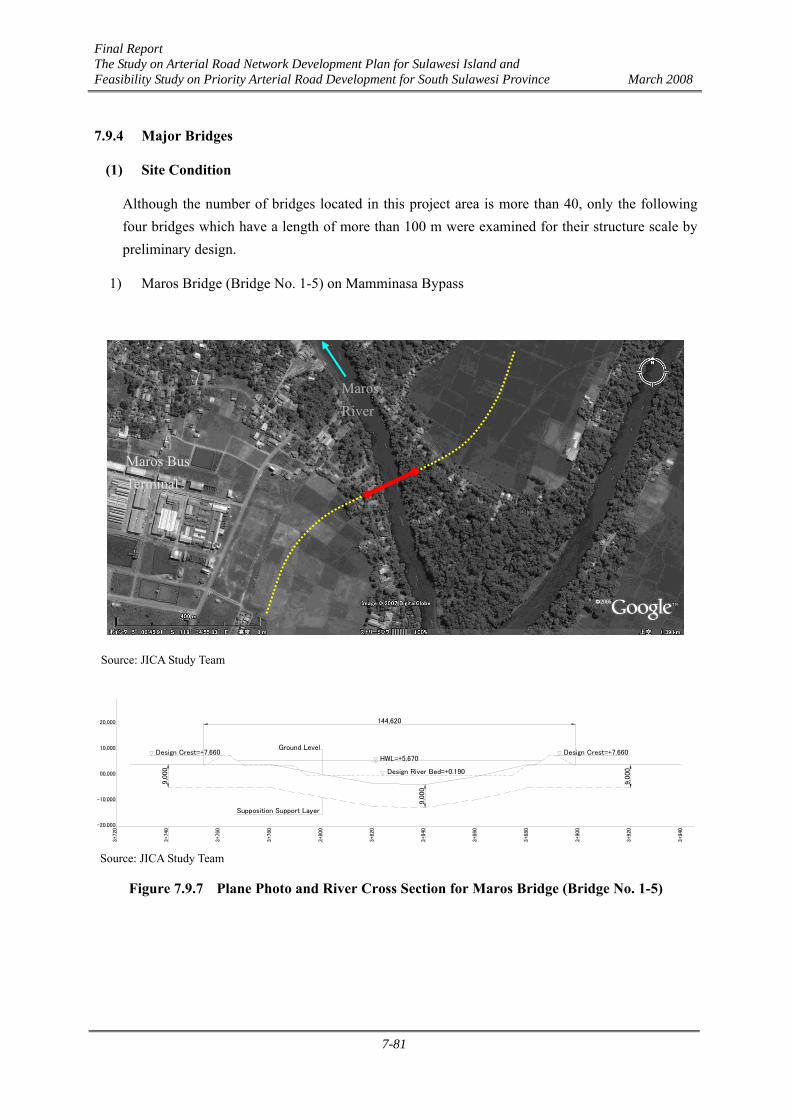
1) Maros Bridge (Bridge No. 1-5) on Mamminasa Bypass
Source: JICA Study Team
HWL=+5.670
Design River Bed=+0.190
144,620
-20.000
3+720
3+740
3+760
00.000
-10.000
20.000
10.000Design Crest=+7.660
9,0
00
3+780
3+800
3+820
Supposition Support Layer
Ground LevelDesign Crest=+7.660
3+840
3+860
3+880
9,0
00
3+900
3+920
3+940
9,0
00
Source: JICA Study Team
Figure 7.9.7 Plane Photo and River Cross Section for Maros Bridge (Bridge No. 1-5)
Maros Bus Terminal
Maros River
Final Report The Study on Arterial Road Network Development Plan for Sulawesi Island and Feasibility Study on Priority Arterial Road Development for South Sulawesi Province March 2008
7-82
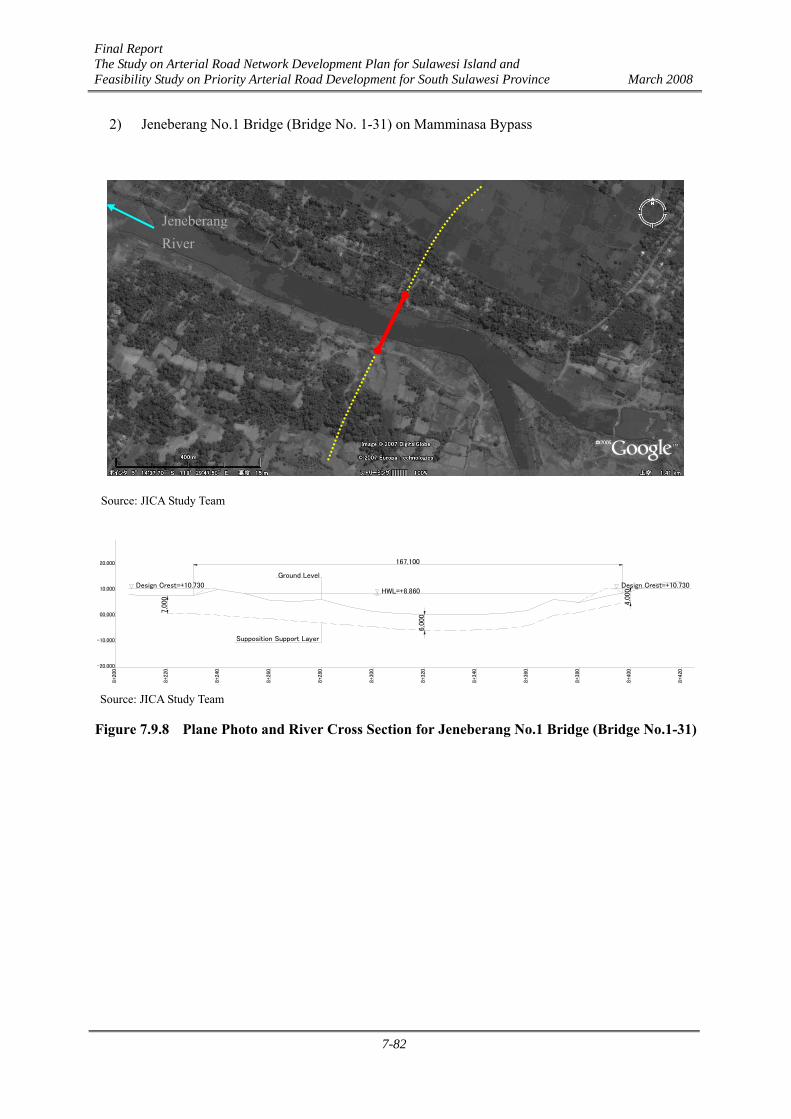
2) Jeneberang No.1 Bridge (Bridge No. 1-31) on Mamminasa Bypass
Source: JICA Study Team
167,100
8+24
0
-20.000
8+20
0
8+22
0
-10.000
00.000
10.000
20.000
7,0
00
Design Crest=+10.730HWL=+8.860
8+26
0
8+28
0
8+30
0
Ground Level
Supposition Support Layer
8+32
0
8+34
0
8+36
0
6,0
00
8+38
0
8+40
0
8+42
0
Design Crest=+10.730
4,0
00
Source: JICA Study Team
Figure 7.9.8 Plane Photo and River Cross Section for Jeneberang No.1 Bridge (Bridge No.1-31)
Jeneberang River
Final Report The Study on Arterial Road Network Development Plan for Sulawesi Island and Feasibility Study on Priority Arterial Road Development for South Sulawesi Province March 2008
7-83
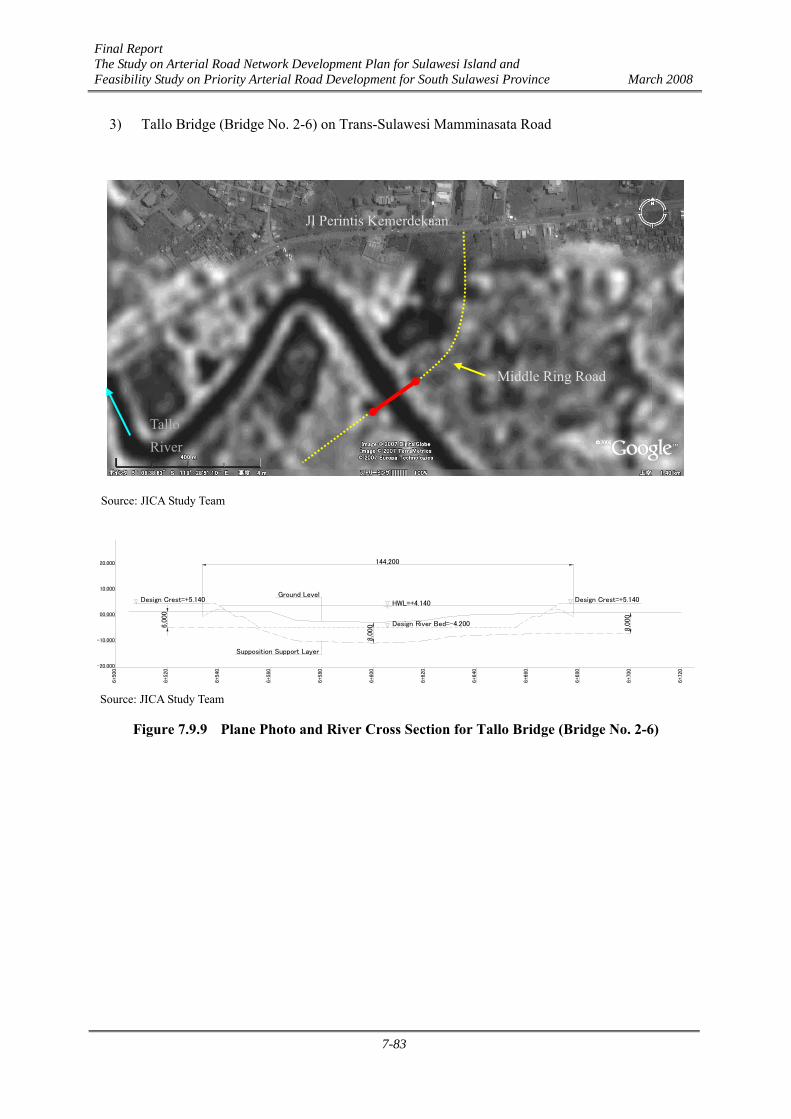
3) Tallo Bridge (Bridge No. 2-6) on Trans-Sulawesi Mamminasata Road
Source: JICA Study Team
144,200
6+54
0
-20.000
6+50
0
6+52
0
-10.000
00.000
20.000
10.000
Design Crest=+5.140
6,0
00
6+56
0
6+58
0
6+60
0
Ground Level
Supposition Support Layer
8,0
00
6+62
0
6+64
0
6+66
0
Design River Bed=-4.200
HWL=+4.140
6+68
0
6+70
0
6+72
0
Design Crest=+5.140
8,0
00
Source: JICA Study Team
Figure 7.9.9 Plane Photo and River Cross Section for Tallo Bridge (Bridge No. 2-6)
Jl Perintis Kemerdekaan
Middle Ring Road
Tallo River
Final Report The Study on Arterial Road Network Development Plan for Sulawesi Island and Feasibility Study on Priority Arterial Road Development for South Sulawesi Province March 2008
7-84
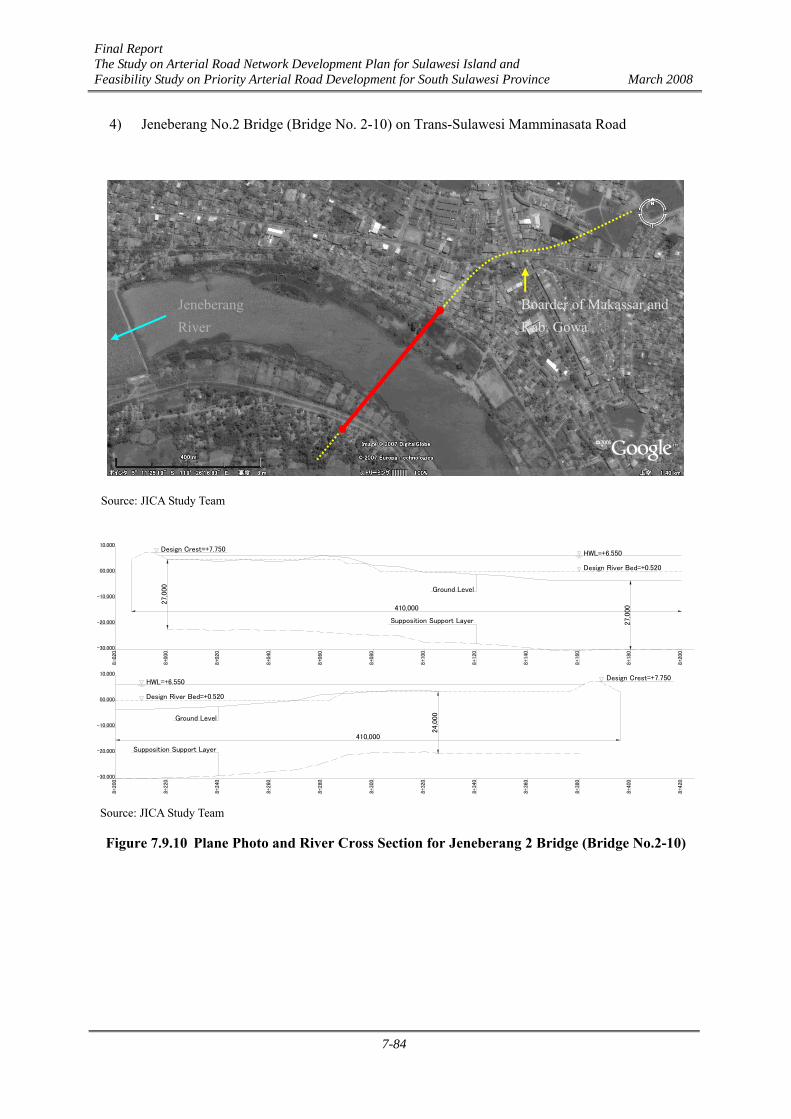
4) Jeneberang No.2 Bridge (Bridge No. 2-10) on Trans-Sulawesi Mamminasata Road
Source: JICA Study Team
410,000
410,000
Design Crest=+7.750
8+02
0
Design River Bed=+0.520
Supposition Support Layer
Ground Level
8+24
0
27,0
00
-30.000
8+20
0
8+22
0
-10.000
-20.000
00.000
8-02
0
10.000
-20.000
-30.000
HWL=+6.550
8+00
0
10.000
-10.000
00.000
8+26
0
8+28
0
8+30
0
8+04
0
8+06
0
8+08
0
8+32
0
8+34
0
8+36
0
Supposition Support Layer
24,0
00
8+10
0
8+12
0
8+14
0
Ground Level
27,
000
8+38
0
8+40
0
8+42
0Design Crest=+7.750
8+16
0
8+18
0
8+20
0
Design River Bed=+0.520
HWL=+6.550
Source: JICA Study Team
Figure 7.9.10 Plane Photo and River Cross Section for Jeneberang 2 Bridge (Bridge No.2-10)
Boarder of Makassar and Kab. Gowa
Jeneberang River
Final Report The Study on Arterial Road Network Development Plan for Sulawesi Island and Feasibility Study on Priority Arterial Road Development for South Sulawesi Province March 2008
7-85
(2) Selection of Structure Type
As the first step to determine the structure type, particular site conditions and design constraints are identified by site survey, and then the most appropriate structure is selected from viable alternatives. Aesthetic superstructure was also included in the study as an alternative for the bridges located in urban area.
1) Superstructure
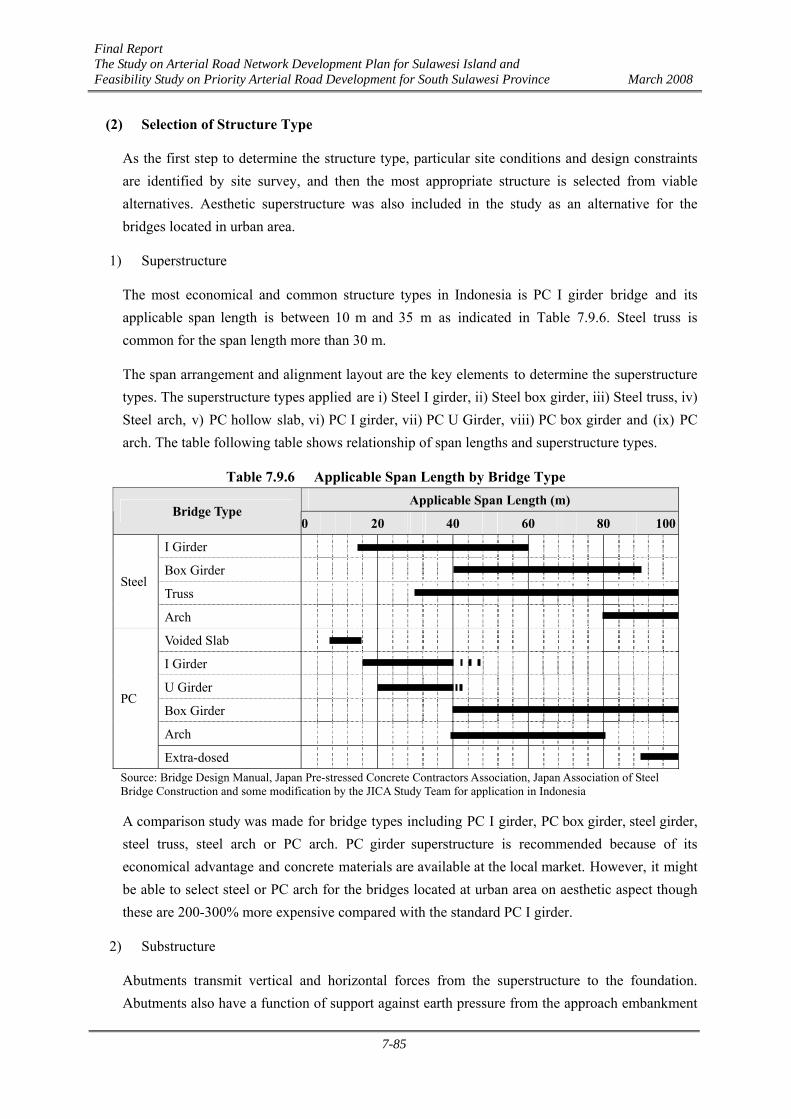
The most economical and common structure types in Indonesia is PC I girder bridge and its applicable span length is between 10 m and 35 m as indicated in Table 7.9.6. Steel truss is common for the span length more than 30 m.
The span arrangement and alignment layout are the key elements to determine the superstructure types. The superstructure types applied are i) Steel I girder, ii) Steel box girder, iii) Steel truss, iv) Steel arch, v) PC hollow slab, vi) PC I girder, vii) PC U Girder, viii) PC box girder and (ix) PC arch. The table following table shows relationship of span lengths and superstructure types.
Table 7.9.6 Applicable Span Length by Bridge Type Applicable Span Length (m)
Bridge Type 0 20 40 60 80 100
I Girder
Box Girder
Truss Steel
Arch
Voided Slab
I Girder
U Girder
Box Girder
Arch
PC
Extra-dosed Source: Bridge Design Manual, Japan Pre-stressed Concrete Contractors Association, Japan Association of Steel Bridge Construction and some modification by the JICA Study Team for application in Indonesia
A comparison study was made for bridge types including PC I girder, PC box girder, steel girder, steel truss, steel arch or PC arch. PC girder superstructure is recommended because of its economical advantage and concrete materials are available at the local market. However, it might be able to select steel or PC arch for the bridges located at urban area on aesthetic aspect though these are 200-300% more expensive compared with the standard PC I girder.
2) Substructure
Abutments transmit vertical and horizontal forces from the superstructure to the foundation. Abutments also have a function of support against earth pressure from the approach embankment
Final Report The Study on Arterial Road Network Development Plan for Sulawesi Island and Feasibility Study on Priority Arterial Road Development for South Sulawesi Province March 2008
7-86
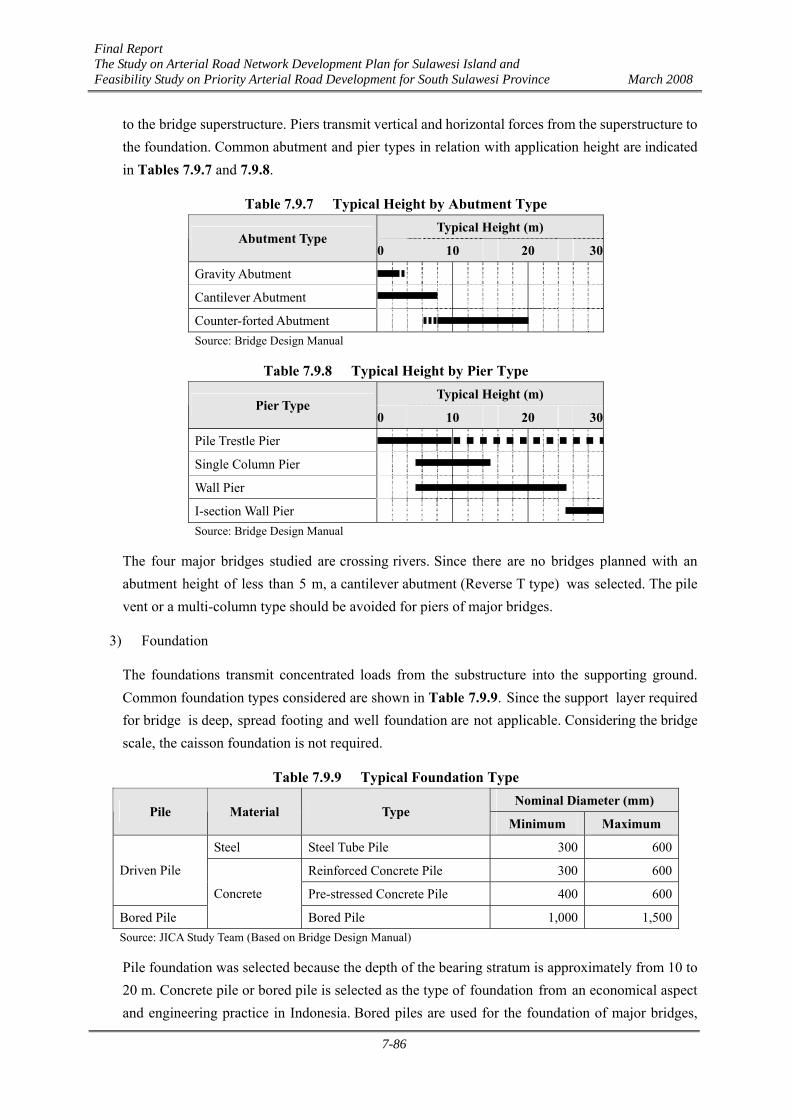
to the bridge superstructure. Piers transmit vertical and horizontal forces from the superstructure to the foundation. Common abutment and pier types in relation with application height are indicated in Tables 7.9.7 and 7.9.8.
Table 7.9.7 Typical Height by Abutment Type Typical Height (m)
Abutment Type 0 10 20 30
Gravity Abutment
Cantilever Abutment
Counter-forted Abutment Source: Bridge Design Manual
Table 7.9.8 Typical Height by Pier Type Typical Height (m)
Pier Type 0 10 20 30
Pile Trestle Pier
Single Column Pier
Wall Pier
I-section Wall Pier Source: Bridge Design Manual
The four major bridges studied are crossing rivers. Since there are no bridges planned with an abutment height of less than 5 m, a cantilever abutment (Reverse T type) was selected. The pile vent or a multi-column type should be avoided for piers of major bridges.
3) Foundation
The foundations transmit concentrated loads from the substructure into the supporting ground. Common foundation types considered are shown in Table 7.9.9. Since the support layer required for bridge is deep, spread footing and well foundation are not applicable. Considering the bridge scale, the caisson foundation is not required.
Table 7.9.9 Typical Foundation Type Nominal Diameter (mm)
Pile Material Type Minimum Maximum
Steel Steel Tube Pile 300 600
Reinforced Concrete Pile 300 600 Driven Pile
Pre-stressed Concrete Pile 400 600
Bored Pile
Concrete
Bored Pile 1,000 1,500 Source: JICA Study Team (Based on Bridge Design Manual)
Pile foundation was selected because the depth of the bearing stratum is approximately from 10 to 20 m. Concrete pile or bored pile is selected as the type of foundation from an economical aspect and engineering practice in Indonesia. Bored piles are used for the foundation of major bridges,
Final Report The Study on Arterial Road Network Development Plan for Sulawesi Island and Feasibility Study on Priority Arterial Road Development for South Sulawesi Province March 2008
7-87
and PC piles (tube or square piles) for the foundation of minor bridges.
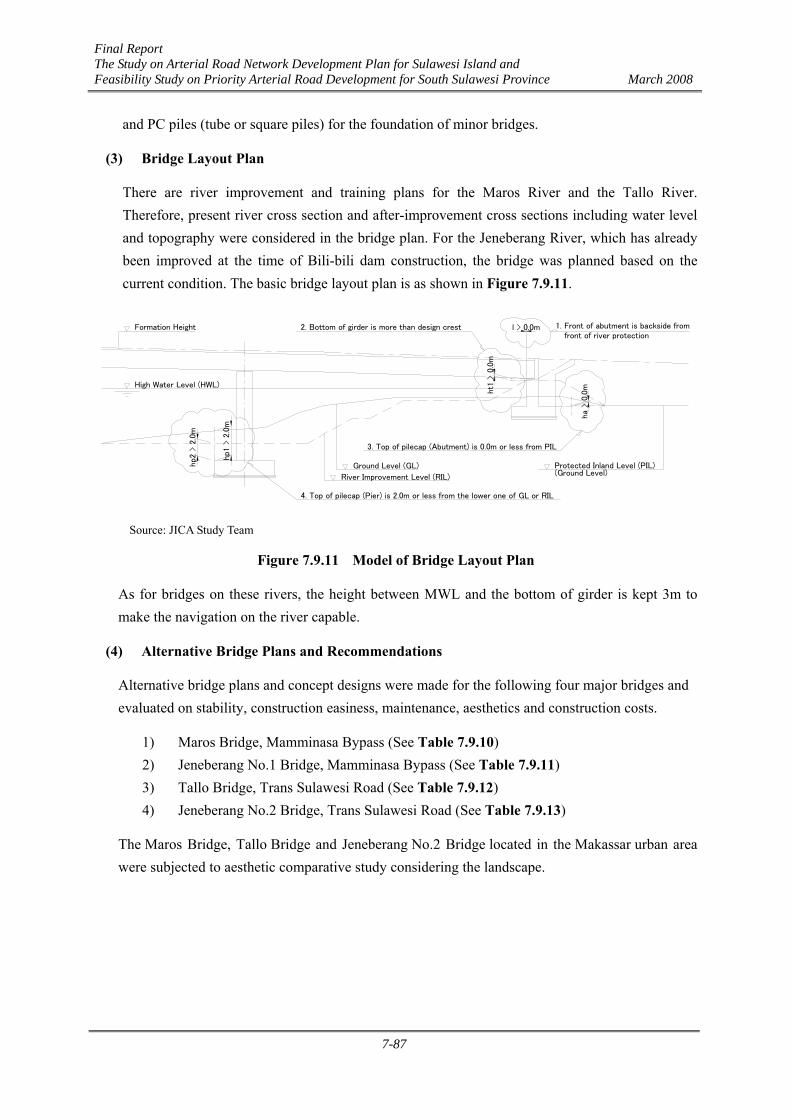
(3) Bridge Layout Plan
There are river improvement and training plans for the Maros River and the Tallo River. Therefore, present river cross section and after-improvement cross sections including water level and topography were considered in the bridge plan. For the Jeneberang River, which has already been improved at the time of Bili-bili dam construction, the bridge was planned based on the current condition. The basic bridge layout plan is as shown in Figure 7.9.11.
4. Top of pilecap (Pier) is 2.0m or less from the lower one of GL or RIL
3. Top of pilecap (Abutment) is 0.0m or less from PIL
ht1
> 0
.0m
hp1
> 2
.0m
hp2
> 2
.0m
Ground Level (GL)
River Improvement Level (RIL)
High Water Level (HWL)
Formation Height 2. Bottom of girder is more than design crest
Protected Inland Level (PIL)(Ground Level)
1. Front of abutment is backside from front of river protection
l > 0.0m
ha
> 0
.0m
Source: JICA Study Team
Figure 7.9.11 Model of Bridge Layout Plan
As for bridges on these rivers, the height between MWL and the bottom of girder is kept 3m to make the navigation on the river capable.
(4) Alternative Bridge Plans and Recommendations
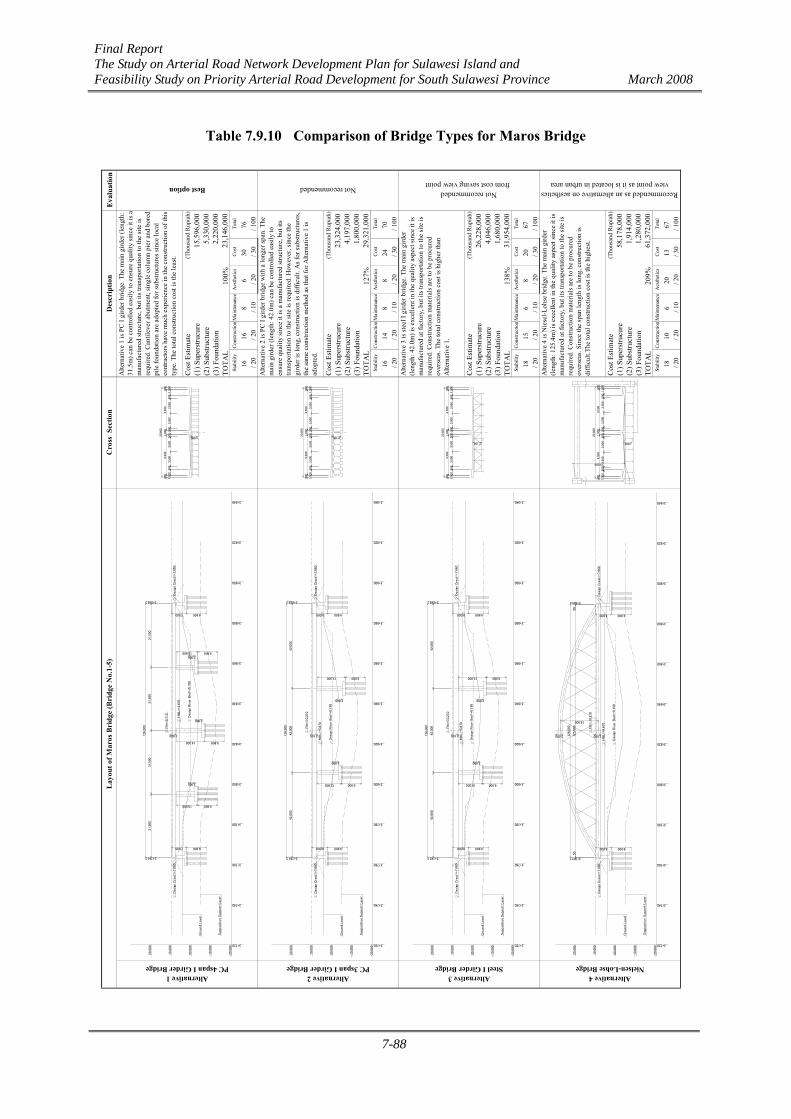
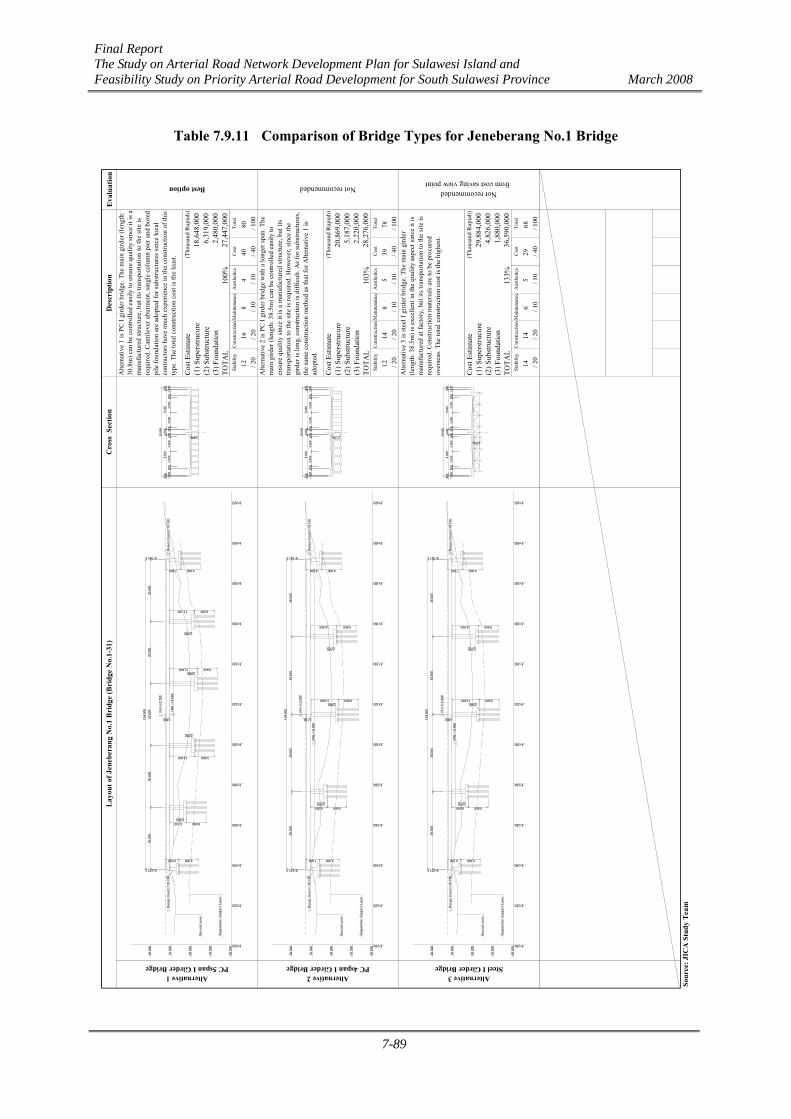
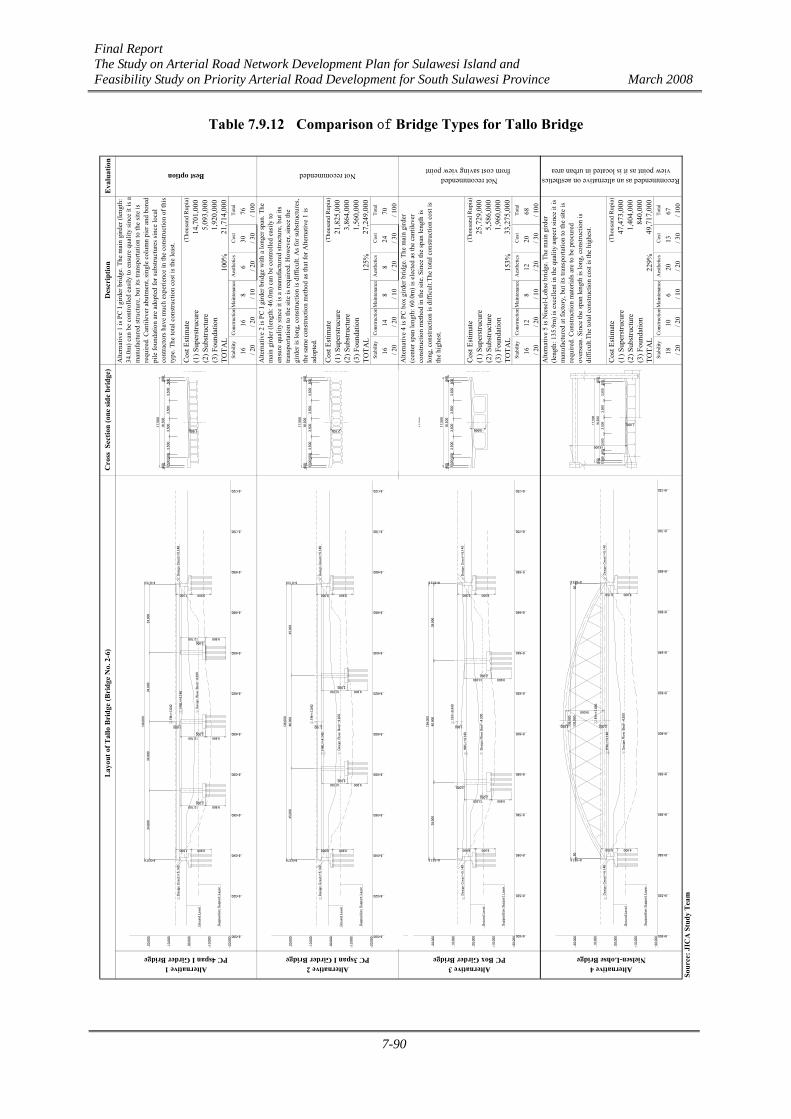
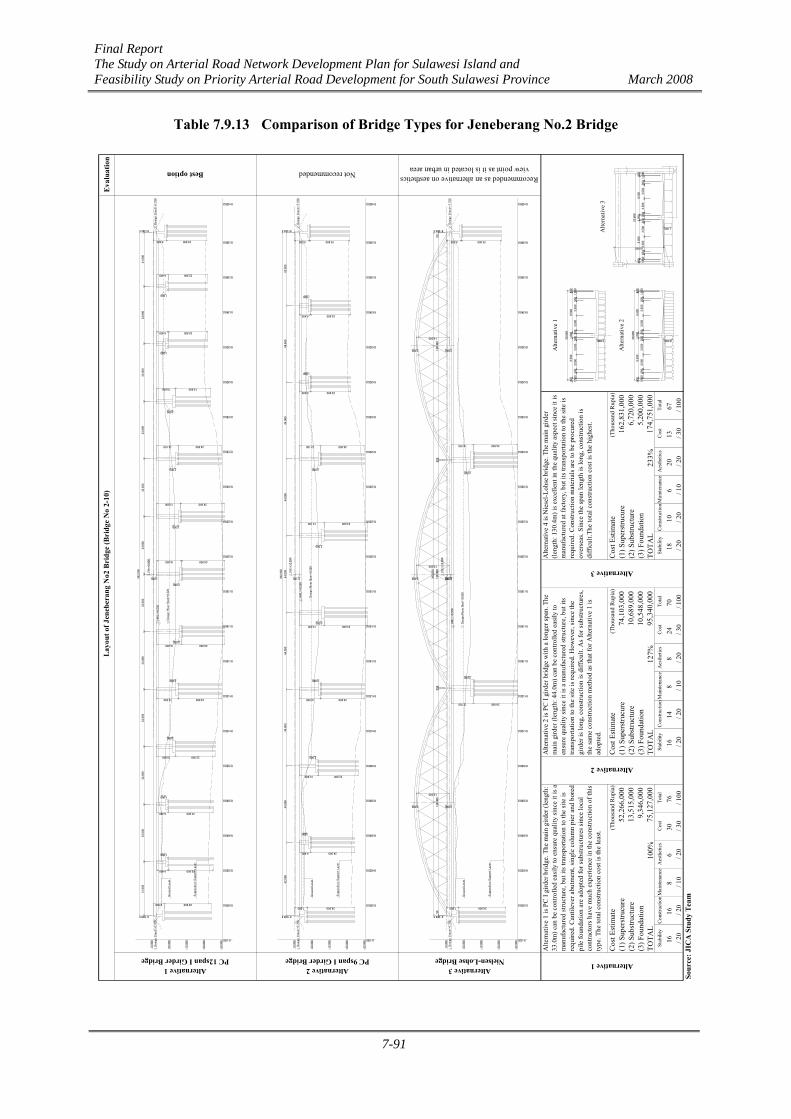
Alternative bridge plans and concept designs were made for the following four major bridges and evaluated on stability, construction easiness, maintenance, aesthetics and construction costs.
1) Maros Bridge, Mamminasa Bypass (See Table 7.9.10) 2) Jeneberang No.1 Bridge, Mamminasa Bypass (See Table 7.9.11) 3) Tallo Bridge, Trans Sulawesi Road (See Table 7.9.12) 4) Jeneberang No.2 Bridge, Trans Sulawesi Road (See Table 7.9.13)
The Maros Bridge, Tallo Bridge and Jeneberang No.2 Bridge located in the Makassar urban area were subjected to aesthetic comparative study considering the landscape.
Final Report The Study on Arterial Road Network Development Plan for Sulawesi Island and Feasibility Study on Priority Arterial Road Development for South Sulawesi Province March 2008
7-88
Table 7.9.10 Comparison of Bridge Types for Maros Bridge
Eva
luat
ion
Cos
t Est
imat
e(T
hous
and
Rup
iah)
(1) S
uper
stru
cure
(2) S
ubst
ruct
ure
(3) F
ound
atio
nTO
TAL
100%
Stab
ility
Con
stru
ctio
nM
aint
enan
ceA
esth
etic
sC
ost
Tota
l
1616
86
3076
/ 20
/ 20
/ 10
/ 20
/ 30
/ 100
Cos
t Est
imat
e(T
hous
and
Rup
iah)
(1) S
uper
stru
cure
(2) S
ubst
ruct
ure
(3) F
ound
atio
nTO
TAL
127%
Stab
ility
Con
stru
ctio
nM
aint
enan
ceA
esth
etic
sC
ost
Tota
l
1614
88
2470
/ 20
/ 20
/ 10
/ 20
/ 30
/ 100
Cos
t Est
imat
e(T
hous
and
Rup
iah)
(1) S
uper
stru
cure
(2) S
ubst
ruct
ure
(3) F
ound
atio
nTO
TAL
138%
Stab
ility
Con
stru
ctio
nM
aint
enan
ceA
esth
etic
sC
ost
Tota
l
1815
68
2067
/ 20
/ 20
/ 10
/ 20
/ 30
/ 100
Cos
t Est
imat
e(T
hous
and
Rup
iah)
(1) S
uper
stru
cure
(2) S
ubst
ruct
ure
(3) F
ound
atio
nTO
TAL
209%
Stab
ility
Con
stru
ctio
nM
aint
enan
ceA
esth
etic
sC
ost
Tota
l
1810
620
1367
/ 20
/ 20
/ 10
/ 20
/ 30
/ 100
Des
crip
tion
Alternative 1PC 4span I Girder Bridge
Alternative 2PC 3span I Girder Bridge
Alternative 3Steel I Girder Bridge
Lay
out o
f Mar
os B
ridg
e (B
ridg
e N
o.1-
5)
15,5
96,0
00
4,19
7,00
01,
800,
000
Recommended as an alternative on aestheticsview point as it is located in urban area
Cro
ss S
ectio
nA
ltern
ativ
e 1
is P
C I
gird
er b
ridge
. The
mai
n gi
rder
(len
gth:
31.5
m) c
an b
e co
ntro
lled
easi
ly to
ens
ure
qual
ity si
nce
it is
am
anuf
actu
red
stru
ctur
e, b
ut it
s tra
nspo
rtatio
n to
the
site
isre
quire
d. C
antil
ever
abu
tmen
t, si
ngle
col
umn
pier
and
bor
edpi
le fo
unda
tion
are
adop
ted
for s
ubst
ruct
ures
sinc
e lo
cal
cont
ract
ors h
ave
muc
h ex
perie
nce
in th
e co
nstru
ctio
n of
this
type
. The
tota
l con
stru
ctio
n co
st is
the
leas
t.
Alte
rnat
ive
2 is
PC
I gi
rder
brid
ge w
ith a
long
er sp
an. T
hem
ain
gird
er (l
engt
h: 4
2.0m
) can
be
cont
rolle
d ea
sily
toen
sure
qua
lity
sinc
e it
is a
man
ufac
ture
d st
ruct
ure,
but
its
trans
porta
tion
to th
e si
te is
requ
ired.
How
ever
, sin
ce th
egi
rder
is lo
ng, c
onst
ruct
ion
is d
iffic
ult.
As f
or su
bstru
ctur
es,
the
sam
e co
nstru
ctio
n m
etho
d as
that
for A
ltern
ativ
e 1
isad
opte
d.
23,1
46,0
00
Best option Not recommended Not recommended from cost saving view point
29,3
21,0
00
Alternative 4Nielsen-Lohse Bridge
Alte
rnat
ive
3 is
stee
l I g
irder
brid
ge. T
he m
ain
gird
er(le
ngth
: 42.
0m) i
s exc
elle
nt in
the
qual
ity a
spec
t sin
ce it
ism
anuf
actu
red
at fa
ctor
y, b
ut it
s tra
nspo
rtatio
n to
the
site
isre
quire
d. C
onst
ruct
ion
mat
eria
ls a
re to
be
proc
ured
over
seas
. The
tota
l con
stru
ctio
n co
st is
hig
her t
han
Alte
rnat
ive
1.
31,9
54,0
00
Alte
rnat
ive
4 is
Nie
sel-L
ohse
brid
ge. T
he m
ain
gird
er(le
ngth
: 125
.4m
) is e
xcel
lent
in th
e qu
ality
asp
ect s
ince
it is
man
ufac
ture
d at
fact
ory,
but
its t
rans
porta
tion
to th
e si
te is
requ
ired.
Con
stru
ctio
n m
ater
ials
are
to b
e pr
ocur
edov
erse
as. S
ince
the
span
leng
th is
long
, con
stru
ctio
n is
diffi
cult.
The
tota
l con
stru
ctio
n co
st is
the
high
est.1,
680,
000
58,1
78,0
001,
914,
000
1,28
0,00
061
,372
,000
4,04
6,00
026
,228
,000
23,3
24,0
00
5,33
0,00
02,
220,
000
FH
=+9.7
10
126,0
00
2,000
31,5
00
31,5
00
7,500
-20.0
00
3+720
3+740
3+760
Supposi
tion S
upport
Lay
er
Gro
und L
eve
l
00.0
00
-10.0
00
20.0
00
10.0
00
Desi
gn C
rest
=+7.6
60
3+763.2
9,900
3+780
3+800
3+820
31,5
00
9,900
10,800 9,900
1,600
2,000
14,300
Desi
gn C
rest
=+7.6
60
3+840
3+860
3+880
31,5
00
9,90010,8002,000
Desi
gn R
iver
Bed=+0.1
90
HW
L=+5.6
70
7,500 9,900
3+889.2
3+900
3+920
3+940
HW
L=+5.6
70
Desi
gn R
iver
Bed=
+0.1
90
FH
=+10.2
10
126,0
00
42,0
00
42,0
00
8,000
-20.0
00
3+720
3+740
3+760
Supposi
tion S
upport
Lay
er
Gro
und
Leve
l
00.0
00
-10.0
00
20.0
00
10.0
00
Desi
gn C
rest
=+7.6
60
3+763.2
3+780
3+800
3+820
9,900
2,100
12,000
2,000
9,900
Desi
gn C
rest
=+7.6
60
9,900
3+840
3+860
3+880
42,0
00
2,000
13,900
8,000 9,900
3+889.2
3+900
3+920
3+940
20,
800
9,5
00
9,500
400
1,000
400
3,5
00
3,500
1,5
0050
0
1,600
3,500
500
500
1,5
00
3,5
00
500
20,
800
9,5
00
9,500
400
1,0
00
400
3,5
003,5
00
1,500
500
2,100
3,500
500
500
1,5
00
3,5
00
500
20,
800
9,5
00
9,500
400
1,000
400
3,5
00
3,500
1,5
0050
0
2,100
3,500
500
500
1,5
00
3,5
00
500
HW
L=+5
.670
Desi
gn R
iver
Bed=
+0.1
90
FH
=+10.2
10
125,9
00
126,0
00
19,000
50
8,000
-20.0
00
3+720
3+740
3+760
Supposi
tion S
upport
Lay
er
Gro
und
Leve
l
00.0
00
-10.0
00
20.0
00
10.0
00
Desi
gn C
rest
=+7.6
60
3+763.2
3+780
3+800
3+820
9,900
2,0002,000
Desi
gn C
rest
=+7.6
60
3+840
3+860
3+880
8,000 9,900
3+889.2
50
3+900
3+920
3+940
19,000
20,8
00
9,5
00
9,5
00
400
1,0
00
400
3,5
00
500
3,5
00
500
1,5
00
1,800
3,5
00
500
1,5
00
3,5
00
500
Final Report The Study on Arterial Road Network Development Plan for Sulawesi Island and Feasibility Study on Priority Arterial Road Development for South Sulawesi Province March 2008
7-89
Table 7.9.11 Comparison of Bridge Types for Jeneberang No.1 Bridge
Eva
luat
ion
Cos
t Est
imat
e(T
hous
and
Rup
iah)
(1) S
uper
stru
cure
(2) S
ubst
ruct
ure
(3) F
ound
atio
nTO
TAL
100%
Stab
ility
Con
stru
ctio
nM
aint
enan
ceA
esth
etic
sC
ost
Tota
l
1216
84
4080
/ 20
/ 20
/ 10
/ 10
/ 40
/ 100
Cos
t Est
imat
e(T
hous
and
Rup
iah)
(1) S
uper
stru
cure
(2) S
ubst
ruct
ure
(3) F
ound
atio
nTO
TAL
103%
Stab
ility
Con
stru
ctio
nM
aint
enan
ceA
esth
etic
sC
ost
Tota
l
1214
85
3978
/ 20
/ 20
/ 10
/ 10
/ 40
/ 100
Cos
t Est
imat
e(T
hous
and
Rup
iah)
(1) S
uper
stru
cure
(2) S
ubst
ruct
ure
(3) F
ound
atio
nTO
TAL
133%
Stab
ility
Con
stru
ctio
nM
aint
enan
ceA
esth
etic
sC
ost
Tota
l
1414
65
2968
/ 20
/ 20
/ 10
/ 10
/ 40
/ 100
Sour
ce: J
ICA
Stu
dy T
eam
18,6
48,0
00
20,8
69,0
00
29,8
84,0
00
5,18
7,00
02,
220,
000
4,82
6,00
01,
880,
000
Des
crip
tion
Alternative 1PC 5span I Girder Bridge
Alternative 2PC 4span I Girder Bridge
Alternative 3Steel I Girder Bridge
Lay
out o
f Jen
eber
ang
No.
1 B
ridg
e (B
ridg
e N
o.1-
31)
Best option Not recommended Not recommended from cost saving view point
28,2
76,0
00
6,31
9,00
02,
480,
000
Cro
ss S
ectio
nA
ltern
ativ
e 1
is P
C I
gird
er b
ridge
. The
mai
n gi
rder
(len
gth:
30.8
m) c
an b
e co
ntro
lled
easi
ly to
ens
ure
qual
ity si
nce
it is
am
anuf
actu
red
stru
ctur
e, b
ut it
s tra
nspo
rtatio
n to
the
site
isre
quire
d. C
antil
ever
abu
tmen
t, si
ngle
col
umn
pier
and
bor
edpi
le fo
unda
tion
are
adop
ted
for s
ubst
ruct
ures
sinc
e lo
cal
cont
ract
ors h
ave
muc
h ex
perie
nce
in th
e co
nstru
ctio
n of
this
type
. The
tota
l con
stru
ctio
n co
st is
the
leas
t.
Alte
rnat
ive
2 is
PC
I gi
rder
brid
ge w
ith a
long
er sp
an. T
hem
ain
gird
er (l
engt
h: 3
8.5m
) can
be
cont
rolle
d ea
sily
toen
sure
qua
lity
sinc
e it
is a
man
ufac
ture
d st
ruct
ure,
but
its
trans
porta
tion
to th
e si
te is
requ
ired.
How
ever
, sin
ce th
egi
rder
is lo
ng, c
onst
ruct
ion
is d
iffic
ult.
As f
or su
bstru
ctur
es,
the
sam
e co
nstru
ctio
n m
etho
d as
that
for A
ltern
ativ
e 1
isad
opte
d.
27,4
47,0
00
Alte
rnat
ive
3 is
stee
l I g
irder
brid
ge. T
he m
ain
gird
er(le
ngth
: 38.
5m) i
s exc
elle
nt in
the
qual
ity a
spec
t sin
ce it
ism
anuf
actu
red
at fa
ctor
y, b
ut it
s tra
nspo
rtatio
n to
the
site
isre
quire
d. C
onst
ruct
ion
mat
eria
ls a
re to
be
proc
ured
over
seas
. The
tota
l con
stru
ctio
n co
st is
the
high
est.
36,5
90,0
00
30,8
00
154,0
00
8+240
30,8
00
6,500
-20.0
00
8+200
8+220
Supposi
tion S
upport
Lay
er
Gro
und
Leve
l
-10.0
00
00.0
00
20.0
00
10.0
00
Desi
gn C
rest
=+10.7
30
8+237.5
2,000
30,8
00
8+260
8+280
8+300
30,8
00
8,100
9,900
9,9002,000
12,400 9,900
8+320
8+340
8+360
30,8
00
9,90013,400
HW
L=+8.8
60
2,000
FH
=+12.7
80
1,600
12,100
2,000
9,900
8+380
8+400
8+420
Desi
gn C
rest
=+10.7
30
7,500 9,900
8+391.5
38,5
00
154,0
00
8+240
38,5
00
7,000
-20.0
00
8+200
8+220
Supposi
tion S
upport
Lay
er
Gro
und
Leve
l
-10.0
00
00.0
00
20.0
00
10.0
00
Desi
gn C
rest
=+10.7
30
8+237.5
HW
L=+8.8
60
38,5
00
8+260
8+280
8+300
8,000 9,9002,000
9,900
8+320
8+340
8+360
38,5
00
13,400 9,9002,000
FH
=+13.2
80
2,100
12,900
2,000
9,900
8+380
8+400
8+420
Desi
gn C
rest
=+10.7
30
8,000 9,900
8+391.5
38,5
00
154,0
00
8+240
38,5
00
6,700
-20.0
00
8+200
8+220
Supposi
tion S
upport
Lay
er
Gro
und
Leve
l
-10.0
00
00.0
00
20.0
00
10.0
00
Desi
gn C
rest
=+10.7
30
8+237.5
HW
L=+8.8
60
38,5
00
8+260
8+280
8+300
8,000 9,9002,000
9,900
8+320
8+340
8+360
38,5
00
13,400 9,9002,000
FH
=+12.9
80
1,800
12,900
2,000
9,900
8+380
8+400
8+420
Desi
gn C
rest
=+10.7
30
7,700 9,900
8+391.5
20,
800
9,5
00
9,5
0040
01,
000
400
3,5
003,
500
1,5
00
500
2,100
3,5
00500
500
1,5
003,5
00
500
20,8
00
9,5
009,
500
400
1,0
00
400
3,5
003,
500
1,5
0050
0
1,600
3,500
500
500
1,500
3,5
00500
20,
800
9,5
00
9,5
00400
1,000
400
3,5
00
3,5
001,5
00
500
1,800
3,5
00500
500
1,5
003,5
00
500
Final Report The Study on Arterial Road Network Development Plan for Sulawesi Island and Feasibility Study on Priority Arterial Road Development for South Sulawesi Province March 2008
7-90
Table 7.9.12 Comparison of Bridge Types for Tallo Bridge E
valu
atio
n
Cos
t Est
imat
e(T
hous
and
Rup
ia)
(1) S
uper
stru
cure
(2) S
ubst
ruct
ure
(3) F
ound
atio
nTO
TAL
100%
Stab
ility
Con
stru
ctio
nM
aint
enan
ceA
esth
etic
sC
ost
Tota
l
1616
86
3076
/ 20
/ 20
/ 10
/ 20
/ 30
/ 100
Cos
t Est
imat
e(T
hous
and
Rup
ia)
(1) S
uper
stru
cure
(2) S
ubst
ruct
ure
(3) F
ound
atio
nTO
TAL
125%
Stab
ility
Con
stru
ctio
nM
aint
enan
ceA
esth
etic
sC
ost
Tota
l
1614
88
2470
/ 20
/ 20
/ 10
/ 20
/ 30
/ 100
Cos
t Est
imat
e(T
hous
and
Rup
ia)
(1) S
uper
stru
cure
(2) S
ubst
ruct
ure
(3) F
ound
atio
nTO
TAL
153%
Stab
ility
Con
stru
ctio
nM
aint
enan
ceA
esth
etic
sC
ost
Tota
l
1612
812
2068
/ 20
/ 20
/ 10
/ 20
/ 30
/ 100
Cos
t Est
imat
e(T
hous
and
Rup
ia)
(1) S
uper
stru
cure
(2) S
ubst
ruct
ure
(3) F
ound
atio
nTO
TAL
229%
Stab
ility
Con
stru
ctio
nM
aint
enan
ceA
esth
etic
sC
ost
Tota
l
1810
620
1367
/ 20
/ 20
/ 10
/ 20
/ 30
/ 100
Sour
ce: J
ICA
Stu
dy T
eam
Alternative 3PC Box Girder Bridge
33,2
75,0
00
Alte
rnat
ive
4 is
PC
box
gird
er b
ridge
. The
mai
n gi
rder
(cen
ter s
pan
leng
th: 6
0.0m
) is e
lect
ed a
s the
can
tilev
erco
nstru
ctio
n m
etho
d in
the
site
. Sin
ce th
e sp
an le
ngth
islo
ng, c
onst
ruct
ion
is d
iffic
ult.T
he to
tal c
onst
ruct
ion
cost
isth
e hi
ghes
t.
5,58
6,00
01,
960,
000
25,7
29,0
00
Alternative 1PC 4span I Girder Bridge
5,09
3,00
01,
920,
000
3,86
4,00
01,
560,
000
Alternative 2PC 3span I Girder Bridge
Lay
out o
f Tal
lo B
ridg
e (B
ridg
e N
o. 2
-6)
Not recommended from cost saving view point
Cro
ss S
ectio
n (o
ne si
de b
ridg
e)A
ltern
ativ
e 1
is P
C I
gird
er b
ridge
. The
mai
n gi
rder
(len
gth:
34.0
m) c
an b
e co
ntro
lled
easi
ly to
ens
ure
qual
ity si
nce
it is
am
anuf
actu
red
stru
ctur
e, b
ut it
s tra
nspo
rtatio
n to
the
site
isre
quire
d. C
antil
ever
abu
tmen
t, si
ngle
col
umn
pier
and
bor
edpi
le fo
unda
tion
are
adop
ted
for s
ubst
ruct
ures
sinc
e lo
cal
cont
ract
ors h
ave
muc
h ex
perie
nce
in th
e co
nstru
ctio
n of
this
type
. The
tota
l con
stru
ctio
n co
st is
the
leas
t.
Alte
rnat
ive
2 is
PC
I gi
rder
brid
ge w
ith a
long
er sp
an. T
hem
ain
gird
er (l
engt
h: 4
6.0m
) can
be
cont
rolle
d ea
sily
toen
sure
qua
lity
sinc
e it
is a
man
ufac
ture
d st
ruct
ure,
but
its
trans
porta
tion
to th
e si
te is
requ
ired.
How
ever
, sin
ce th
egi
rder
is lo
ng, c
onst
ruct
ion
is d
iffic
ult.
As f
or su
bstru
ctur
es,
the
sam
e co
nstru
ctio
n m
etho
d as
that
for A
ltern
ativ
e 1
isad
opte
d.
21,7
14,0
00
Des
crip
tion
Best option Not recommended
27,2
49,0
00
14,7
01,0
00
21,8
25,0
00
Alternative 4Nielsen-Lohse Bridge
Alte
rnat
ive
5 is
Nie
sel-L
ohse
brid
ge. T
he m
ain
gird
er(le
ngth
: 135
.9m
) is e
xcel
lent
in th
e qu
ality
asp
ect s
ince
it is
man
ufac
ture
d at
fact
ory,
but
its t
rans
porta
tion
to th
e si
te is
requ
ired.
Con
stru
ctio
n m
ater
ials
are
to b
e pr
ocur
edov
erse
as. S
ince
the
span
leng
th is
long
, con
stru
ctio
n is
diffi
cult.
The
tota
l con
stru
ctio
n co
st is
the
high
est.
Recommended as an alternative on aestheticsview point as it is located in urban area
47,4
73,0
001,
404,
000
840,
000
49,7
17,0
00
9,9007,500
136,0
00
34,0
00
6+540
34,0
00
7,500
-20.0
00
6+500
6+520S
uppo
sition
Supp
ort
Lay
er
Gro
und
Leve
l
-10.0
00
00.0
00
20.0
00
10.0
00
Des
ign
Cre
st=+5.1
40
6+537.6
12,700
34,0
00
1,600
9,900
9,900
6+560
6+580
6+600
9,900
12,7002,000
2,000
9,900
6+620
6+640
6+660
34,0
00
12,700
FH
=+7.0
40
HW
L=+4.1
40
Des
ign
Riv
er
Bed=
-4.2
00
2,000
6+680
6+700
6+720
Des
ign
Cre
st=+5.1
40
6+673.6
9,9008,000
136,0
00
45,0
00
6+540
45,0
00
8,000
-20.0
00
6+500
6+520
Sup
posi
tion
Supp
ort
Lay
er
Gro
und
Leve
l
-10.0
00
00.0
00
20.0
00
10.0
00
Des
ign
Cre
st=+5.1
40
6+537.6
Des
ign
Riv
er
Bed=
-4.2
00
46,0
00
2,100
9,900
6+560
6+580
6+600
9,900
12,7002,000
HW
L=+
4.1
40
9,9006+620
6+640
6+660
FH
=+7.5
40
12,7002,000
6+680
6+700
6+720
Des
ign
Cre
st=+5.1
40
6+673.6
9,9008,200
136,0
00
45,0
00
6+540
45,0
00
8,200
-20.0
00
6+500
6+520
Sup
posi
tion
Supp
ort
Lay
er
Gro
und
Leve
l
-10.0
00
00.0
00
20.0
00
10.0
00
Des
ign
Cre
st=+5.1
40
6+537.6
Des
ign
Riv
er
Bed=
-4.2
00
46,0
00
2,300
9,900
6+560
6+580
6+600
9,900
12,7002,000
HW
L=+
4.1
40
9,9006+620
6+640
6+660
12,7002,000
FH
=+7.7
40
6+680
6+700
6+720
Des
ign
Cre
st=+5.1
40
6+673.6
17,
500
16,5
00
3,50
0
400
1,50
050
03,5
00
1,600
600
500
3,5
003,
500
17,
500
16,5
00
3,50
0
2,100
1,50
0
400
500
3,5
00
600
500
3,5
003,
500
17,
500
16,5
00
3,50
0
2,300
400
1,50
050
03,5
00
600
500
3,5
003,
500
17,
500
16,5
00
3,50
0
3,000
400
1,50
050
03,5
00
600
500
3,5
003,
500
136,0
00
38,0
00
9,9008,900
6+540
38,0
00
8,900
-20.0
00
6+500
6+520
Supp
osi
tion S
upp
ort
Lay
er
Gro
und
Leve
l
-10.0
00
00.0
00
20.0
00
10.0
00
Desi
gn C
rest
=+5.1
40
6+537.6
Desi
gn R
iver
Bed=
-4.2
00
60,0
00
1,800
9,900
6+560
6+580
6+600
13,200
9,900
2,000
3,000
HW
L=+4.1
40
9,900
6+620
6+640
6+660
2,00013,200
FH
=+8.4
40
6+680
6+700
6+720
Desi
gn C
rest
=+5.1
40
6+673.6
17,5
00
16,5
00
400
600
19,000
3,5
00
3,5
00500
1,500
1,800
3,5
00
3,5
00500
136,0
00
9,9008,150
135,9
00
6+540
8,150
50
-20
.000
6+500
6+520
Sup
posi
tion
Supp
ort
Lay
er
Gro
und
Leve
l
-10.0
00
00.0
00
20.0
00
10.0
00
Des
ign
Cre
st=+5
.140
6+537.6
Desi
gn R
iver
Bed
=-4
.200
2,000 2,000
6+560
6+580
6+600
9,900
HW
L=+4.1
40
6+620
6+640
6+660
19,000
FH
=+7.
690
6+680
6+700
6+720
50
Desi
gn C
rest
=+5.1
40
6+673.6
Final Report The Study on Arterial Road Network Development Plan for Sulawesi Island and Feasibility Study on Priority Arterial Road Development for South Sulawesi Province March 2008
7-91
Table 7.9.13 Comparison of Bridge Types for Jeneberang No.2 Bridge
Eva
luat
ion
Cos
t Est
imat
e(T
hous
and
Rup
ia)
Cos
t Est
imat
e(T
hous
and
Rup
ia)
Cos
t Est
imat
e(T
hous
and
Rup
ia)
(1) S
uper
stru
cure
(1) S
uper
stru
cure
(1) S
uper
stru
cure
(2) S
ubst
ruct
ure
(2) S
ubst
ruct
ure
(2) S
ubst
ruct
ure
(3) F
ound
atio
n(3
) Fou
ndat
ion
(3) F
ound
atio
nTO
TAL
100%
TOTA
L12
7%TO
TAL
233%
Stab
ility
Con
stru
ctio
nM
aint
enan
ceA
esth
etic
sC
ost
Tota
lSt
abili
tyC
onst
ruct
ion
Mai
nten
ance
Aes
thet
ics
Cos
tTo
tal
Stab
ility
Con
stru
ctio
nM
aint
enan
ceA
esth
etic
sC
ost
Tota
l
1616
86
3076
1614
88
2470
1810
620
1367
/ 20
/ 20
/ 10
/ 20
/ 30
/ 100
/ 20
/ 20
/ 10
/ 20
/ 30
/ 100
/ 20
/ 20
/ 10
/ 20
/ 30
/ 100
Sour
ce: J
ICA
Stu
dy T
eam
Alternative 1PC 12span I Girder Bridge
Alternative 2PC 9span I Girder Bridge
Alternative 3Nielsen-Lohse Bridge
Lay
out o
f Jen
eber
ang
No2
Bri
dge
(Bri
dge
No
2-10
)
Best option Not recommended Recommended as an alternative on aestheticsview point as it is located in urban area
5,20
0,00
0
Alte
rnat
ive
1
Alte
rnat
ive
2
Alte
rnat
ive
3
174,
751,
000
Alternative 3A
ltern
ativ
e 4
is N
iese
l-Loh
se b
ridge
. The
mai
n gi
rder
(leng
th: 1
30.4
m) i
s exc
elle
nt in
the
qual
ity a
spec
t sin
ce it
ism
anuf
actu
red
at fa
ctor
y, b
ut it
s tra
nspo
rtatio
n to
the
site
isre
quire
d. C
onst
ruct
ion
mat
eria
ls a
re to
be
proc
ured
over
seas
. Sin
ce th
e sp
an le
ngth
is lo
ng, c
onst
ruct
ion
isdi
fficu
lt.Th
e to
tal c
onst
ruct
ion
cost
is th
e hi
ghes
t.
162,
831,
000
6,72
0,00
0
Alternative 2
10,6
89,0
0010
,548
,000
95,3
40,0
00
Alte
rnat
ive
2 is
PC
I gi
rder
brid
ge w
ith a
long
er sp
an. T
hem
ain
gird
er (l
engt
h: 4
4.0m
) can
be
cont
rolle
d ea
sily
toen
sure
qua
lity
sinc
e it
is a
man
ufac
ture
d st
ruct
ure,
but
its
trans
porta
tion
to th
e si
te is
requ
ired.
How
ever
, sin
ce th
egi
rder
is lo
ng, c
onst
ruct
ion
is d
iffic
ult.
As f
or su
bstru
ctur
es,
the
sam
e co
nstru
ctio
n m
etho
d as
that
for A
ltern
ativ
e 1
isad
opte
d.
74,1
03,0
00
Alternative 1
13,5
15,0
009,
346,
000
75,1
27,0
00
Alte
rnat
ive
1 is
PC
I gi
rder
brid
ge. T
he m
ain
gird
er (l
engt
h:33
.0m
) can
be
cont
rolle
d ea
sily
to e
nsur
e qu
ality
sinc
e it
is a
man
ufac
ture
d st
ruct
ure,
but
its t
rans
porta
tion
to th
e si
te is
requ
ired.
Can
tilev
er a
butm
ent,
sing
le c
olum
n pi
er a
nd b
ored
pile
foun
datio
n ar
e ad
opte
d fo
r sub
stru
ctur
es si
nce
loca
lco
ntra
ctor
s hav
e m
uch
expe
rienc
e in
the
cons
truct
ion
of th
isty
pe. T
he to
tal c
onst
ruct
ion
cost
is th
e le
ast.
52,2
66,0
00
392,
000
44,0
0042
,000
8+000.0
8+020.0
8-020
Des
ign
Cre
st=+
7.75
0
-30.
000
-20.
000
-10.
000
00.0
00
10.0
00
26,900
Supp
ositio
n Supp
ort
Lay
er
Gro
und
Lev
el
7,000
8-006.5
8+100.044,0
00
8+080.0
8+060.0
8+040.044
,000
24,9006,400
1,000
22,90010,600
2,000
8+120.0
8+140.0
8+160.024,900
44,0
00
24,90012,200
2,000
14,2002,000
44,
000
44,0
00
8+180.0
8+220.0
8+200.0
8+240.0
24,900
FH
=+10
.300
Des
ign
Riv
er B
ed=+
0.52
0
HW
L=+
6.55
0
2,100
2,000
14,100
8+260.0
8+280.0
8+300.0
44,
000
24,90012,100
2,000
22,9006,400
1,000
Des
ign
Cre
st=+
7.75
0
8+320.0
8+340.0
8+360.0
8+380.0
42,
000
22,9006,400
1,000
22,9008,500
8+385.5
8+400.0
Desi
gn R
iver
Bed=
+0.5
20
392,0
00
33,0
00
33,0
00
8+000.0
8+020.0
8-020
Desi
gn C
rest
=+7.7
50
-30.0
00
-20.0
00
-10.0
00
00.0
00
10.0
00
25,900
26,900
Supposi
tion S
upp
ort
Lay
er
Gro
und
Leve
l
31,0
00
6,500
8-006.5
6,400
8+100.0
33,0
00
8+080.0
8+060.0
8+040.0
33,0
00
25,900
1,000
6,400
1,000
22,90010,600
2,000
8+120.0
8+140.0
8+160.0
24,900
33,0
00
24,90012,200
2,000
14,2002,000
HW
L=+6.5
50
1,000
33,0
00
33,0
00
8+180.0
8+220.0
8+200.0
8+240.0
24,900
24,900
33,0
00
2,000
14,200
FH
=+9.8
00
1,600
13,800
2,000
8+260.0
8+280.0
8+300.0
2,000
33,0
00
24,90012,100
2,000
19,90010,600
Desi
gn C
rest
=+7.7
50
8+320.0
8+340.0
8+360.0
8+380.0
33,0
00
22,9006,400
1,000
22,900
22,900
31,0
00
6,400
8,000
8+385.5
8+400.0
Des
ign
Riv
er B
ed=+
0.52
0
392,
000
130,
400
130,
400
8+000.0
8+020.0
8-020
Des
ign
Cre
st=+
7.75
0
-30.
000
-20.
000
-10.
000
00.0
00
10.0
00
26,900
Supp
ositio
n Supp
ort
Lay
er
Gro
und
Lev
el
7,000
8-006.5
50
19,000
8+100.0
8+080.0
8+060.0
8+040.0
2,000
8+120.0
8+140.0
8+160.0
24,90012,700
2,000
350
HW
L=+6
.550
2,000
130,
400
2,000 2,000
19,000
8+180.0
8+220.0
8+200.0
8+240.0
FH
=+10
.300
2,000 2,100
8+260.0
8+280.0
8+300.0
24,90012,700
2,000
350
2,000
19,000
Des
ign
Cre
st=+
7.75
0
8+320.0
8+340.0
8+360.0
8+380.022,9008,500
8+385.5
50
8+400.0
20,8
00
9,5
00
9,5
0040
01,0
00
400
3,500
3,500
1,5
00
500
1,600
3,5
00
500
500
1,5
00
3,5
00
500
20,8
00
9,5
00
9,5
0040
01,0
00
400
3,500
3,500
1,5
00
500
2,100
3,5
00
500
500
1,5
00
3,5
00
500
20,
800
9,500
9,5
0040
01,
000
400
19,000
3,50
0500
3,5
0050
01,
500
1,800
3,500
500
1,50
03,5
0050
0
Final Report The Study on Arterial Road Network Development Plan for Sulawesi Island and Feasibility Study on Priority Arterial Road Development for South Sulawesi Province March 2008
7-92
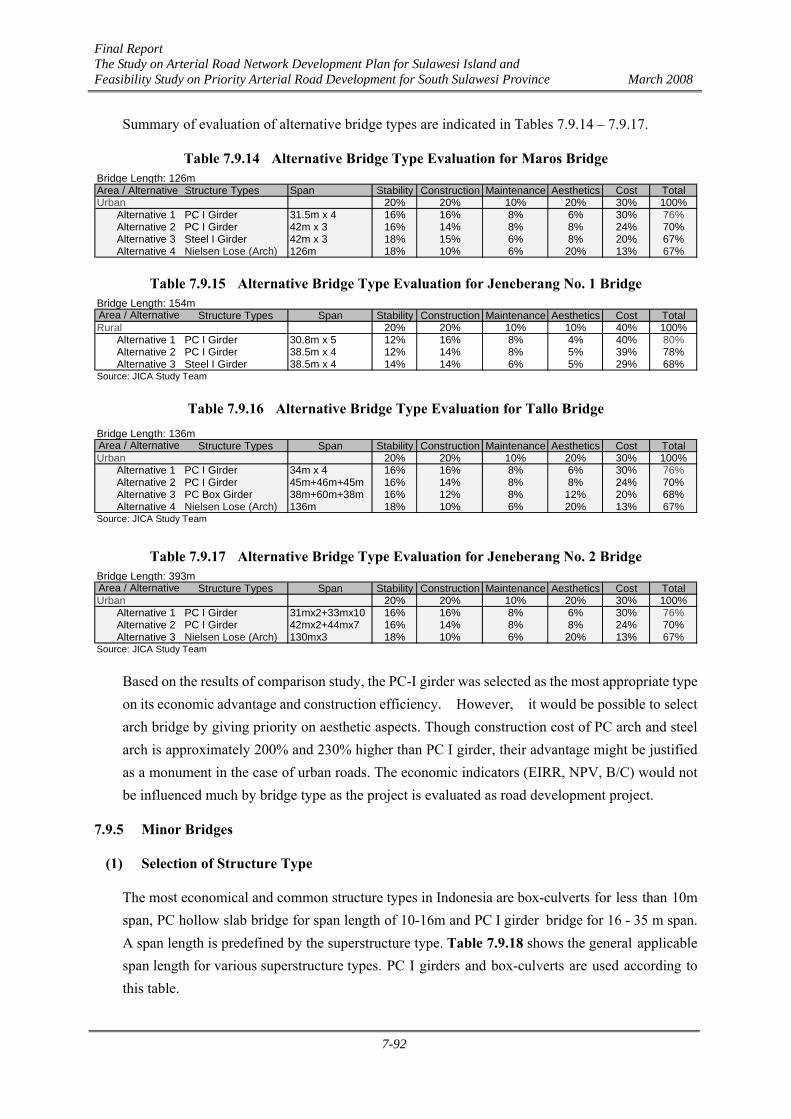
Summary of evaluation of alternative bridge types are indicated in Tables 7.9.14 – 7.9.17.
Table 7.9.14 Alternative Bridge Type Evaluation for Maros Bridge Bridge Length: 126mArea / Alternative Structure Types Span Stability Construction Maintenance Aesthetics Cost TotalUrban 20% 20% 10% 20% 30% 100%
Alternative 1 PC I Girder 31.5m x 4 16% 16% 8% 6% 30% 76%Alternative 2 PC I Girder 42m x 3 16% 14% 8% 8% 24% 70%Alternative 3 Steel I Girder 42m x 3 18% 15% 6% 8% 20% 67%Alternative 4 Nielsen Lose (Arch) 126m 18% 10% 6% 20% 13% 67%
Table 7.9.15 Alternative Bridge Type Evaluation for Jeneberang No. 1 Bridge Bridge Length: 154m
Structure Types Span Stability Construction Maintenance Aesthetics Cost TotalRural 20% 20% 10% 10% 40% 100%
Alternative 1 PC I Girder 30.8m x 5 12% 16% 8% 4% 40% 80%Alternative 2 PC I Girder 38.5m x 4 12% 14% 8% 5% 39% 78%Alternative 3 Steel I Girder 38.5m x 4 14% 14% 6% 5% 29% 68%
Source: JICA Study Team
Area / Alternative
Table 7.9.16 Alternative Bridge Type Evaluation for Tallo Bridge Bridge Length: 136m
Structure Types Span Stability Construction Maintenance Aesthetics Cost TotalUrban 20% 20% 10% 20% 30% 100%
Alternative 1 PC I Girder 34m x 4 16% 16% 8% 6% 30% 76%Alternative 2 PC I Girder 45m+46m+45m 16% 14% 8% 8% 24% 70%Alternative 3 PC Box Girder 38m+60m+38m 16% 12% 8% 12% 20% 68%Alternative 4 Nielsen Lose (Arch) 136m 18% 10% 6% 20% 13% 67%
Source: JICA Study Team
Area / Alternative
Table 7.9.17 Alternative Bridge Type Evaluation for Jeneberang No. 2 Bridge Bridge Length: 393m
Structure Types Span Stability Construction Maintenance Aesthetics Cost TotalUrban 20% 20% 10% 20% 30% 100%
Alternative 1 PC I Girder 31mx2+33mx10 16% 16% 8% 6% 30% 76%Alternative 2 PC I Girder 42mx2+44mx7 16% 14% 8% 8% 24% 70%Alternative 3 Nielsen Lose (Arch) 130mx3 18% 10% 6% 20% 13% 67%
Source: JICA Study Team
Area / Alternative
Based on the results of comparison study, the PC-I girder was selected as the most appropriate type on its economic advantage and construction efficiency. However, it would be possible to select arch bridge by giving priority on aesthetic aspects. Though construction cost of PC arch and steel arch is approximately 200% and 230% higher than PC I girder, their advantage might be justified as a monument in the case of urban roads. The economic indicators (EIRR, NPV, B/C) would not be influenced much by bridge type as the project is evaluated as road development project.
7.9.5 Minor Bridges
(1) Selection of Structure Type
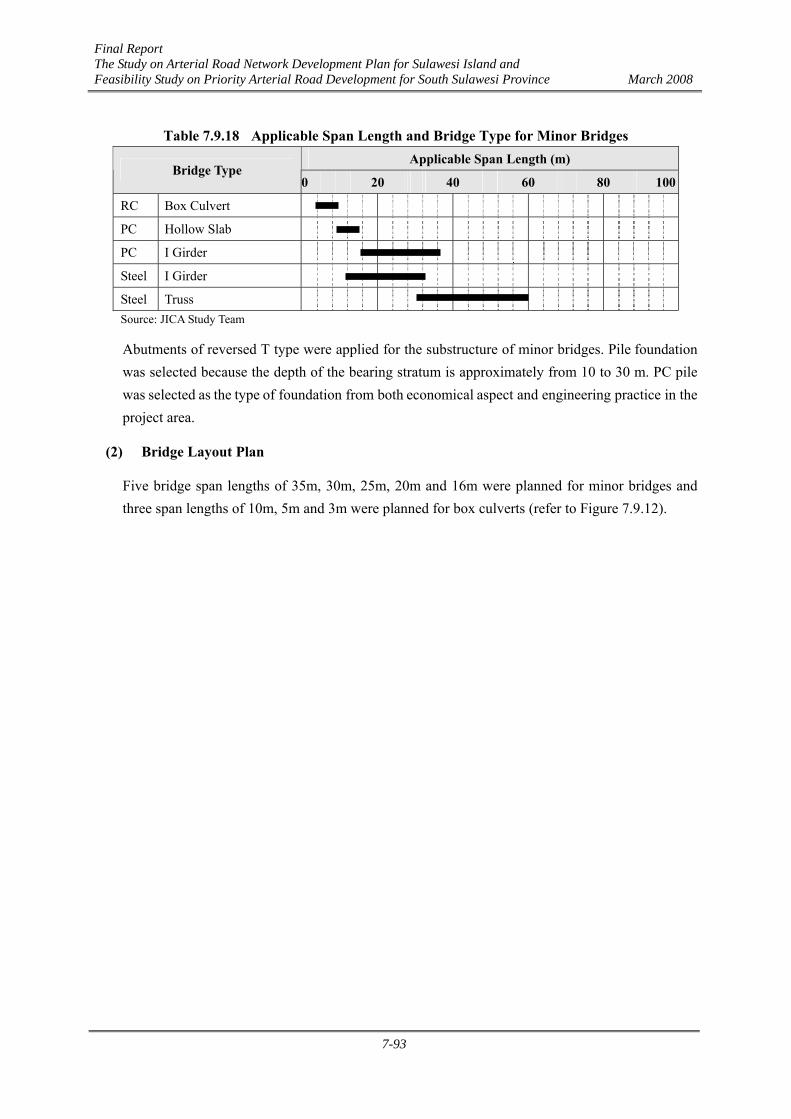
The most economical and common structure types in Indonesia are box-culverts for less than 10m span, PC hollow slab bridge for span length of 10-16m and PC I girder bridge for 16 - 35 m span. A span length is predefined by the superstructure type. Table 7.9.18 shows the general applicable span length for various superstructure types. PC I girders and box-culverts are used according to this table.
Final Report The Study on Arterial Road Network Development Plan for Sulawesi Island and Feasibility Study on Priority Arterial Road Development for South Sulawesi Province March 2008
7-93
Table 7.9.18 Applicable Span Length and Bridge Type for Minor Bridges Applicable Span Length (m)
Bridge Type 0 20 40 60 80 100
RC Box Culvert
PC Hollow Slab
PC I Girder
Steel I Girder
Steel Truss Source: JICA Study Team
Abutments of reversed T type were applied for the substructure of minor bridges. Pile foundation was selected because the depth of the bearing stratum is approximately from 10 to 30 m. PC pile was selected as the type of foundation from both economical aspect and engineering practice in the project area.
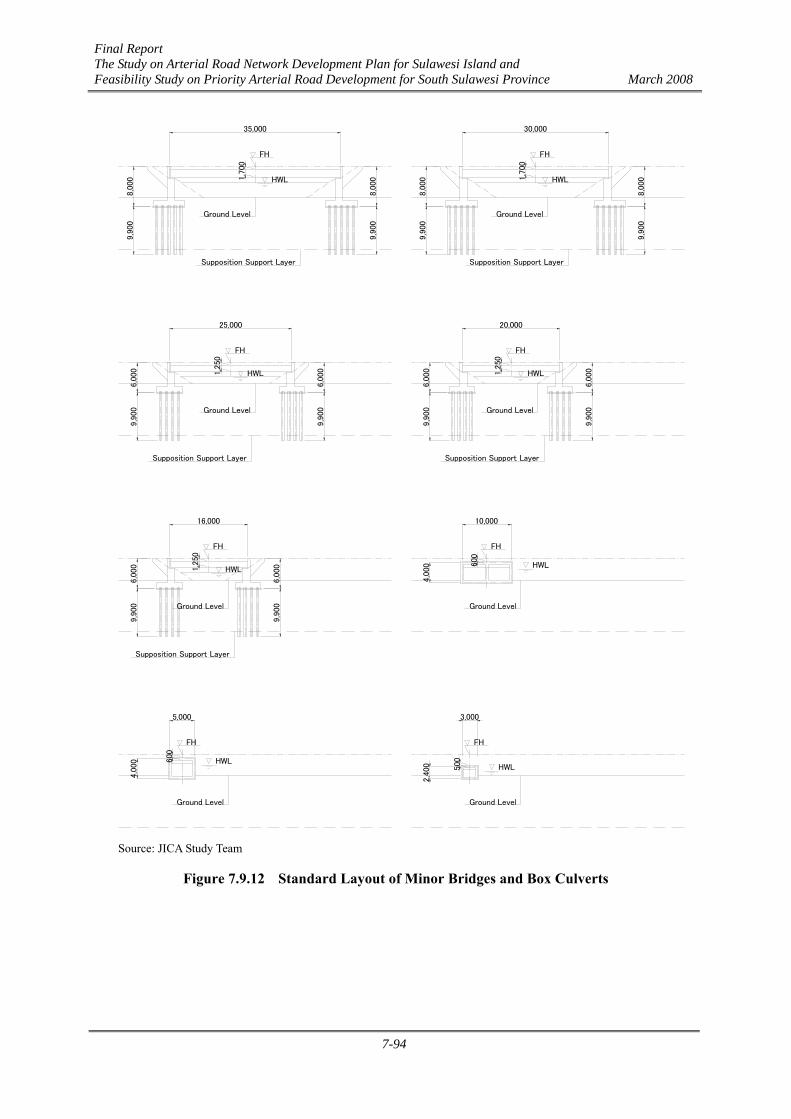
(2) Bridge Layout Plan
Five bridge span lengths of 35m, 30m, 25m, 20m and 16m were planned for minor bridges and three span lengths of 10m, 5m and 3m were planned for box culverts (refer to Figure 7.9.12).
Final Report The Study on Arterial Road Network Development Plan for Sulawesi Island and Feasibility Study on Priority Arterial Road Development for South Sulawesi Province March 2008
7-94
Supposition Support Layer Supposition Support Layer
Ground Level
9,90
0
9,90
0
Supposition Support Layer
4,0
00
600
5,000
FH
HWL
16,000
1,2
50
Ground Level
6,0
00
FH
HWL
6,0
00
Ground Level
4,0
002,4
00
3,000
500
FH
HWL
10,000
FH
Ground Level
600
HWL
Supposition Support Layer
35,000
25,000
8,0
009,
900
Ground Level
6,0
009,9
00
HWL1,2
50
FH
Ground Level
1,7
00
HWL
FH
30,000
9,9
006,0
00
6,0
009,9
00
8,0
009,
900
9,90
08,0
00
Ground Level
HWL
20,000
1,2
50
FH
6,0
009,9
00
Ground Level
Supposition Support Layer
1,7
00
HWL
FH
9,90
08,0
00
Source: JICA Study Team
Figure 7.9.12 Standard Layout of Minor Bridges and Box Culverts
Final Report The Study on Arterial Road Network Development Plan for Sulawesi Island and Feasibility Study on Priority Arterial Road Development for South Sulawesi Province March 2008
7-95
7.10 Preliminary Design of F/S Roads
7.10.1 General
The Study Team has designed roadways, intersections, bridges, pavement, drainage and other structures for the F/S roads in accordance with the design standards, road development concept, and route alignments established in Sections 7.4 – 7.9. The engineering design was based on the results of natural condition survey (topography, hydrology and geotechnical conditions) and their analysis. Overall accuracy of preliminary designs is within 10 - 15% allowable for the F/S stage.
The design results are reflected to the Drawings in Volume 2-2 (Preliminary Design Drawings). The road sections which are currently under execution or going to be implemented by 2010 by DGH and/or regional governments were not included in the preliminary design.
7.10.2 Roadways
The preliminary design of roadways was made for the Trans-Sulawesi Mamminasata Road, Mamminasa Bypass, Hertasning Road and Abdullah Daeng Sirua Road on the topographic survey maps. Topographic survey data, including the photo-mosaic of the road from aerial survey, were calibrated when drawing the horizontal alignments on the topographic maps. Digital Terrain Model was then prepared from the cross section survey point data and contours from ortho-photo after creating 3-dimensional features like existing road, existing ditches, canal, etc. and other road features. Typical cross section templates for the FS road were created and used for calculating the earthworks and other works quantities.
(1) Preliminary Design of Horizontal Alignment
1) Trans-Sulawesi Mamminasata Road
The project road alignment starts at Maros about 900 m south of the existing Maros Bridge on national road. Horizontal alignment design of Section-A of the Trans-Sulawesi Road follows the existing road, since the Right-of-Way has already been fixed at 21m on each side of the existing center-line (42m in total). As the existing road alignment fairly complies with the minimum design speed of 60 km/hr, modification of the existing alignment is not required. The total length of the road from the beginning point to the intersection with Ir Sutami Toll Road is about 8.7km. The road length from Ir Sutami Toll Road intersection to the beginning of Section-B on Perintis Kemerdekaan Road is about 10.3km, which will be widened from 4 lanes to 6 lanes with central median under ongoing projects of DGH. From Ir Sutami Toll Road intersection to Daya intersection (Sta.14+100) of Perintis Kemerdekaan Road (a part of Trans-Sulawesi Section-A) will however be winded from then 6 lanes to 8 lanes in the future.
Land acquisition has been in progress for Section-B of the Trans-Sulawesi Road (Middle Ring Road). The limits of ROW were obtained from the topographic survey and information of the ROW drawings from Dinas PU Makassar. The horizontal alignment was designed based on these
Final Report The Study on Arterial Road Network Development Plan for Sulawesi Island and Feasibility Study on Priority Arterial Road Development for South Sulawesi Province March 2008
7-96
data. Some adjustments will be required during the detailed design stage, especially at sharp curves. The total length of Section-B is about 7.3km from Sta.18+960 to Sta.26+300.
The road alignment in Section-C basically followed the route alignment established on Google maps during the route selection stage, except some minor modifications made as results of topographic survey and minimizing resettlement along the route. The total length of this section is about 8.6km from Sta.26+300 to Sta.34+900.
Section-D is basically widening of the existing national road from 2 lanes to 4 lanes. It passes through semi-urban to rural areas except a few locations, where it passes through urbanized areas. The most important control point in this section is the existing irrigation canal on the left side of the road. The distance of the canal from the road edge varies. In order to minimize land acquisition, avoid relocation of the canal and utilize the existing road width maximum, utmost care was given in the alignment design. Where the canal is close to the edge of the existing road, the new centerline is designed such that the edge of the existing road and that of the new road left travelway coincide on the left. Similarly, where the canal is relatively far from the existing road, the land between the existing road and the canal is utilized to reduce resettlement of houses on the opposite side. On the other hand, where the road passes through urban areas, the design centerline basically follows the existing centerline. The total length of this section is about 22.35km from Sta.30+000 to Sta.57+350 in the Takalar Town center.
2) Mamminasa Bypass
North Section
The project road alignment starts from national road in Maros about 1,800 m north of the existing Maros Bridge. Horizontal alignment design of the north section of the Mamminasa Bypass complied with the design speed of 60 - 80 km/hr since these are new road alignment and not restricted by the existing road. Major control points are a flood retarding basin at Maros, a crossing point of the Maros River, and connection points to the national road. The horizontal alignment is designed to avoid the planned flood retarding basin. It passes behind of the Bupati’s office (Office of Regency Governor) after crossing the Maros River. This route also crosses the national road going to the east coast (Watampone / Bjoe Port). Through traffic to and from the north and the east will use this road as a bypass (Maros Town Bypass). The total length of the road from the beginning point to the intersection with the national road is about 5.6km. The north section will be developed to 4 lanes with 10.5m median which is reserved for future 6 lanes widening.
Middle Section Horizontal alignment design of Middle Section of the Mamminasa Bypass is complied with the design speed of 60 – 80 km/hr, since this is new road alignment. Major control points are Kariango Hill (elevation 115 m), Kostrad Kariango (army quarters), a new runway for Hasanuddin Airport and Mt. Moncongloe (elevation 314 m). The horizontal alignment of the Middle Section was
Final Report The Study on Arterial Road Network Development Plan for Sulawesi Island and Feasibility Study on Priority Arterial Road Development for South Sulawesi Province March 2008
7-97
designed to avoid these control points and the alignment was designed passing through a rolling land (elevation 20-40m) of approximately 4,000 ha at the Makassar side of Mt. Moncongloe on where a new satellite town development is planned as suggested in the Mamminasata Plan (refer to Section 4.5 of this Report). The total length of the Middle Section is 27.0 km up to Jl Malino and it will be developed to 4 lanes with 10.5m median reserved for future widening.
South Section
Horizontal alignment design of South Section of the Mamminasa Bypass is complied with the design speed of 60 - 80 km/hr, since all alignments are new. The South Section is about 16.7 km in length and it starts at Jl Malino, crossing the Jeneberang River, crossing national road at Boka approximately 5.3 km south of the Sungguminasa Bridge and ends at Tj Bunga-Takalar road. There are no major control points except Jeneberang River crossing point. The horizontal alignment is designed to minimize resettlement. The South Section will be developed to 4 lanes with 10.5m median reserved for future widening.
3) Hertasning Road
Hertasning Road is divided into four (4) sections. Preliminary design was carried out only for Section D because Sections A, B and C have been implemented by Provincial Government. Horizontal alignment design of the Section D follows the existing road. As the existing road alignment mostly complies with the design speed of 60 km/hr. The total length of Section D is about 4.9 km and the existing road will be widened from 2 lanes to 4 lanes with 4 m median.
4) Abdullah Daeng Sirua Road
Makassar City Section (Sections A, C and D)
Abdullah Daeng Sirua Road is divided into six (6) sections. Sections A-D are in the Makkassar City and Sections E and F are in the Maros and Gowa Regencies. Horizontal alignment of Section A follows existing road. As the existing road alignment mostly complies with the design speed of 60 km/hr, modification of the alignment is not required. However, Section A is difficult to widen the existing 2 lanes to 4 lanes without a land adjustment method and, therefore, the existing 2-lane will be used with one-way traffic control in the short to middle term.
The existing road in Section B is located on the south side of the PDAM canal. A new 2-lane road is under construction by Makassar City and, therefore, this section was excluded from the F/S.
Horizontal alignment of Section C follows existing road. As the existing road alignment mostly complies with the design speed of 60 km/hr, modification of the existing alignment is not required.
Section D is 2-lane road along the ROW of PDAM and the existing road. Two methods are adopted. One is to construct a new road opposite the PDAM canal and the other is to construct a new road over the PDAM canal replacing it with concrete lined steel pipes (Dia.1200mm x 2 pieces). The section from Sta. 3+850 to Sta. 4+400 is designed as a new road opposite the PDAM
Final Report The Study on Arterial Road Network Development Plan for Sulawesi Island and Feasibility Study on Priority Arterial Road Development for South Sulawesi Province March 2008
7-98
canal to conserve water frontage environment. The section from Sta. 4+400 to Sta. 6+100 is designed with concrete lined steel pipes to minimize resettlement. After these subsections, horizontal alignment of Section D follows existing road and some resettlements are required. As the existing road alignment mostly complies with the design speed of 60 km/hr, modification of the existing alignment is not required.
Maros and Gowa Regency Section (Sections E and F)
The section starts from the Tallo River Bridge where the Makassar – Maros boarder exist. Horizontal alignment of Section E follows existing road and straight embankment section. The existing alignment can be used.
Section F is the end section of Abdullah Daeng Sirua Road. The road will be connected to a satellite town as its direct access road. The road meets the Mamminasa Bypass at the middle of this section and it also connects to KIWA. Horizontal alignment of Section E was designed to minimize resettlement.
(2) Preliminary Design of Vertical Alignment
1) Trans-Sulawesi Mamminasata Road
Section-A of the Trans-Sulawesi Road will be constructed by widening the existing road and, therefore, following the existing road profile with additional height (thickness) for pavement overlay. Since the design centerline also follows the existing centerline, profile correction for pavement cross slope is not required. The existing profile complies with the design speed of 60 km/hr and no modification is required. Section-B is a new construction. The profile of the initial section is controlled by the existing road level at Jl Perintis Kemerdekaan (Sta.19+100), the bridge elevation over the Tallo River (Sta.19+600), the existing road level of Abdullah Daeng Sirua Road (Sta.20+300) just after the bridge, Hertasning Road (Sta.23+900), several other crossing roads, and finally by the level of the flyover (26+200) at the end of section of Jl Sultan Alauddin. The embankment is 4.5m high in stretch of about 500m after the Tallo Bridge up to Abdullah Daeng Sirua Road on average to cross the Tallo River basin. The average embankment height in the stretch from Abdullah Daeng Sirua Road to Hertasning Road is 2m to 3m. The rest of section has an average embankment height of 0.5m to 1m.
The profile grade at the beginning of Section C is controlled by the profile of the flyover at Sultan Alauddin Road and the Jeneberang Bridge (Sta.26+700). Section-C passes through paddy field and the average embankment height is 0.5m to 1m. Section D is a widening section of the existing national road and hence its profile mostly follows the existing road elevations.
2) Mamminasa Bypass
Final Report The Study on Arterial Road Network Development Plan for Sulawesi Island and Feasibility Study on Priority Arterial Road Development for South Sulawesi Province March 2008
7-99
Mamminasa Bypass is a new construction and located in flat terrain. The profile grade of the North Section is controlled by the existing national road (Sta.0+000) and elevation of the Maros River Bridge. The average embankment height of the North Section is 1.0m to 1.5m. The Middle Section mostly passes through paddy field and the average embankment height is 0.5m to 1m. The profile grades for some sections are controlled by rolling terrains located at Sta.17+850, Sta.18+950, Sta.19+650 and a bridge at Sta.23+400. The maximum profile grade of 5% is adopted for these sub-sections. The South Section is controlled by profile grade at the bridge over the Jeneberang River and the existing road level at the Trans-Sulawesi Road (Sta.43+650). The average embankment height is 0.5m to 1.5m.
3) Hertasning Road
The profile grade of Section D of Hertasning Road is constructed by widening the existing road and, therefore, mostly follows the existing road profile. The existing profile complies the design speed of 60 km/hr and no modification is required.
4) Abdullah Daeng Sirua Road
Section A of Abdullah Daeng Sirua Road is use of the existing 2 lanes as it is since 4 lane widening is difficult except a short stretch of the end section. Sections C, D and E of Abdullah Daeng Sirua Road are widening the existing road or construction of additional 2 lanes on PDAM canal, running in parallel with the existing road. Therefore, profile is basically follows the existing road. The existing profile complies with requirements for the design speed of 60 km/hr and no modification is required. Section F passes through paddy or crop field and the average embankment height is 0m to 1.0m. The profile grade of some sections is controlled by rolling terrains at Sta.13+700, Sta.14+050 and Sta.14+950. The profile grade of 3% to 5% is used for these sections.
(3) Preliminary Design of Cross Section
1) Trans-Sulawesi Mamminasata Road
For the subsection from Maros to Jl Tol Ir Sutami IC in Section A, typical cross section has 6 lanes (3 lanes for each direction) by widening of existing road. Lane arrangements consist of a lane width of 3.5m x 6 lanes, planting zone of 1.5m, sidewalk of 3m and drainage on both sides, based on the Standard Specifications for Geometric Design of Urban Roads of Indonesia, as presented earlier in Section 7.5. The ROW is 42m, 21m on each side from the road centerline. Future widening to 8 lanes can be made by covering the drainage channel and using it as sidewalk.
The ROW for Section B, Middle Ring Road is 40m and land acquisition has been in progress. Typical cross section for this section is designed with stage construction approach. In the first stage, 6 lanes are constructed with wide median, which can be reduced to a standard width of 3m, when widening the road to 8 lanes in the future. In order to fit the cross section within the ROW,
Final Report The Study on Arterial Road Network Development Plan for Sulawesi Island and Feasibility Study on Priority Arterial Road Development for South Sulawesi Province March 2008
7-100
two of the outside lanes are designed with a lane width of 3.25m. Sidewalk is provided by covering the drainage.
Construction of Section C, Middle Ring Approach is also based on stage construction approach. In the first stage, 4 lanes (2 lanes in each direction) are constructed with a wide median. Widening to 6 lanes in future can be made by widening the road to inside. Design cross sections in Section D require careful planning because of the existing canal. Three typical cross sections are designed. When the road passes through urban areas and the existing canal is located far from the road, widening to 4 lanes is made by widening on both sides. When the existing road is close to the canal, widening is made on the opposite side of existing canal. On the other hand, when the existing road is relatively far from the canal and enough space is available between the existing road and the canal, widening is made in the canal side. Relocation of existing canal is avoided in all cases.
2) Mamminasa Bypass
As the Mamminasa Bypass is new construction, a typical cross section was used with 4 lanes (2 lanes in each direction). Lane arrangements are made with a lane width of 3.5m, planting zone of 1.0m, sidewalk of 3m and drainage on both sides, based on the Standard Specifications for Geometric Design of Urban Roads of Indonesia. The ROW is 40m. A wide median of 10.5m is provided for future widening to 6 lanes by using this median.
3) Hertasning Road
Typical cross section for Section D of Hertasning Road is widening to 4 lanes (2 lanes in each direction). Lane arrangements are 3.5m x 4 lanes, planting zone of 1.5m, sidewalk of 3m and drainage on both sides within 34m ROW, based on the Standard Specifications for Geometric Design of Urban Roads.
4) Abdullah Daeng Sirua Road
Three typical cross sections are designed for Abdullah Daeng Sirua Road. A typical cross section for general application consists of 4 lanes (2 lanes in each direction). Lane arrangements are made with 3.5m x 4 lanes, sidewalk of 3m and drainage on both sides within the 25m ROW.
A typical cross section for part of the Section C from Sta. 3+850 to Sta. 4+400 consists of 2 new lanes (2 lanes in each direction together with the existing road) with a lane width of 3.5m x 4 and sidewalk of 3m x 2 and covered drainage within the 15m ROW. A typical cross section for part of the Sections C and D from Sta. 4+400 to Sta. 6+100 has 4 lanes (2 lanes in each direction). Lane arrangement is a lane width of 3.5m x 4 and sidewalk of 3m x 4, constructed on the canal replaced by concrete lined steel pipes, within the 25m ROW. These typical cross sections are based on the Standard Specifications for Geometric Design of Urban Roads of Indonesia.
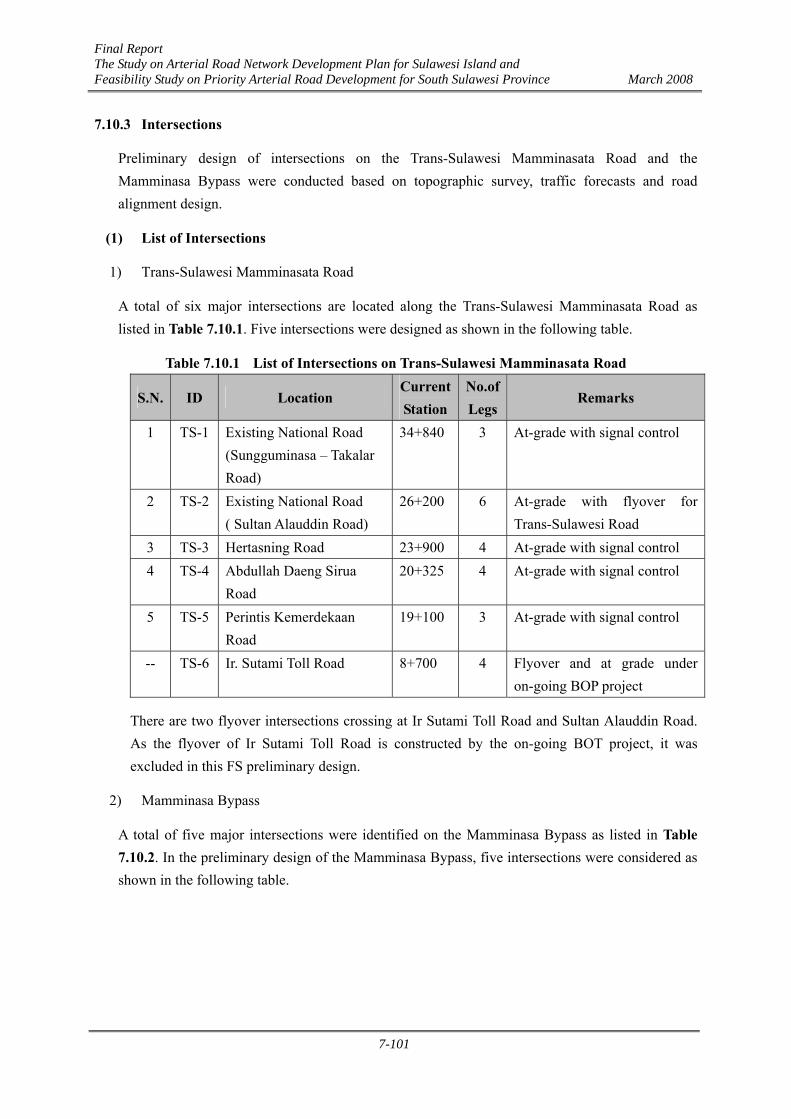
Final Report The Study on Arterial Road Network Development Plan for Sulawesi Island and Feasibility Study on Priority Arterial Road Development for South Sulawesi Province March 2008
7-101
7.10.3 Intersections
Preliminary design of intersections on the Trans-Sulawesi Mamminasata Road and the Mamminasa Bypass were conducted based on topographic survey, traffic forecasts and road alignment design.
(1) List of Intersections
1) Trans-Sulawesi Mamminasata Road
A total of six major intersections are located along the Trans-Sulawesi Mamminasata Road as listed in Table 7.10.1. Five intersections were designed as shown in the following table.
Table 7.10.1 List of Intersections on Trans-Sulawesi Mamminasata Road
S.N. ID Location Current Station
No.of Legs
Remarks
1 TS-1 Existing National Road (Sungguminasa – Takalar Road)
34+840 3 At-grade with signal control
2 TS-2 Existing National Road ( Sultan Alauddin Road)
26+200 6 At-grade with flyover for Trans-Sulawesi Road
3 TS-3 Hertasning Road 23+900 4 At-grade with signal control 4 TS-4 Abdullah Daeng Sirua
Road 20+325 4 At-grade with signal control
5 TS-5 Perintis Kemerdekaan Road
19+100 3 At-grade with signal control
-- TS-6 Ir. Sutami Toll Road 8+700 4 Flyover and at grade under on-going BOP project
There are two flyover intersections crossing at Ir Sutami Toll Road and Sultan Alauddin Road. As the flyover of Ir Sutami Toll Road is constructed by the on-going BOT project, it was excluded in this FS preliminary design.
2) Mamminasa Bypass
A total of five major intersections were identified on the Mamminasa Bypass as listed in Table 7.10.2. In the preliminary design of the Mamminasa Bypass, five intersections were considered as shown in the following table.
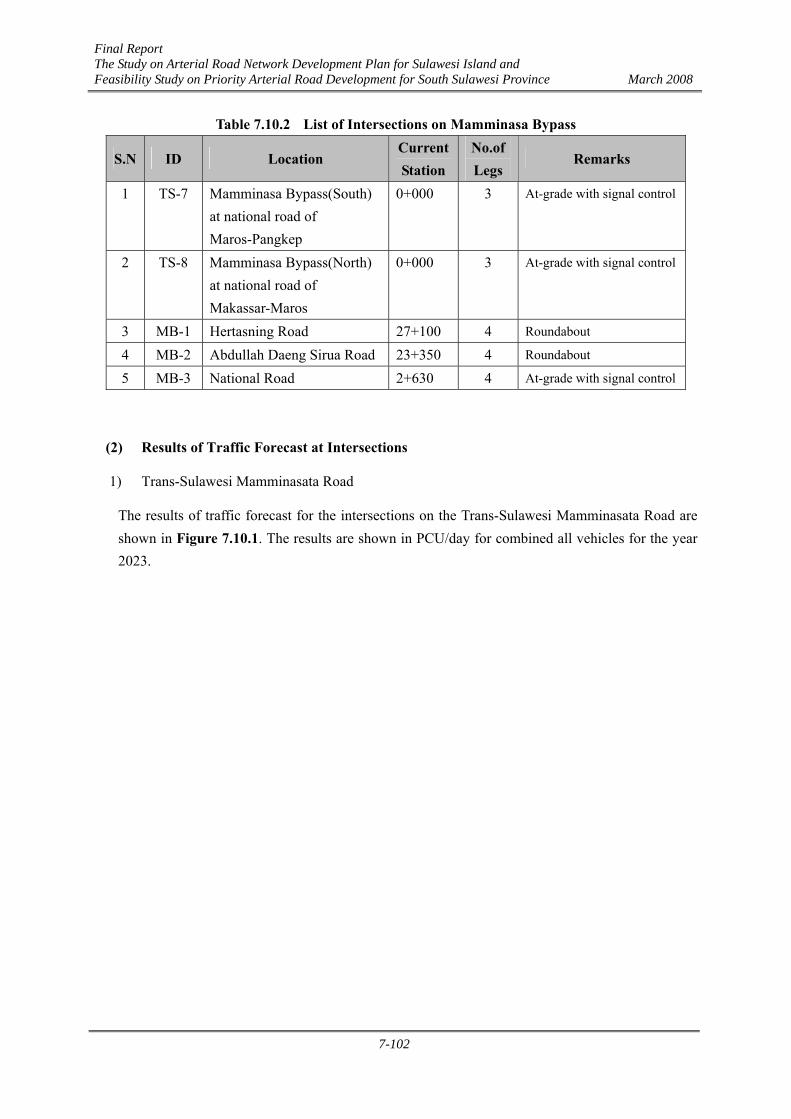
Final Report The Study on Arterial Road Network Development Plan for Sulawesi Island and Feasibility Study on Priority Arterial Road Development for South Sulawesi Province March 2008
7-102
Table 7.10.2 List of Intersections on Mamminasa Bypass
S.N ID Location Current Station
No.of Legs
Remarks
1 TS-7 Mamminasa Bypass(South) at national road of Maros-Pangkep
0+000 3 At-grade with signal control
2 TS-8 Mamminasa Bypass(North) at national road of Makassar-Maros
0+000 3 At-grade with signal control
3 MB-1 Hertasning Road 27+100 4 Roundabout
4 MB-2 Abdullah Daeng Sirua Road 23+350 4 Roundabout
5 MB-3 National Road 2+630 4 At-grade with signal control
(2) Results of Traffic Forecast at Intersections
1) Trans-Sulawesi Mamminasata Road
The results of traffic forecast for the intersections on the Trans-Sulawesi Mamminasata Road are shown in Figure 7.10.1. The results are shown in PCU/day for combined all vehicles for the year 2023.
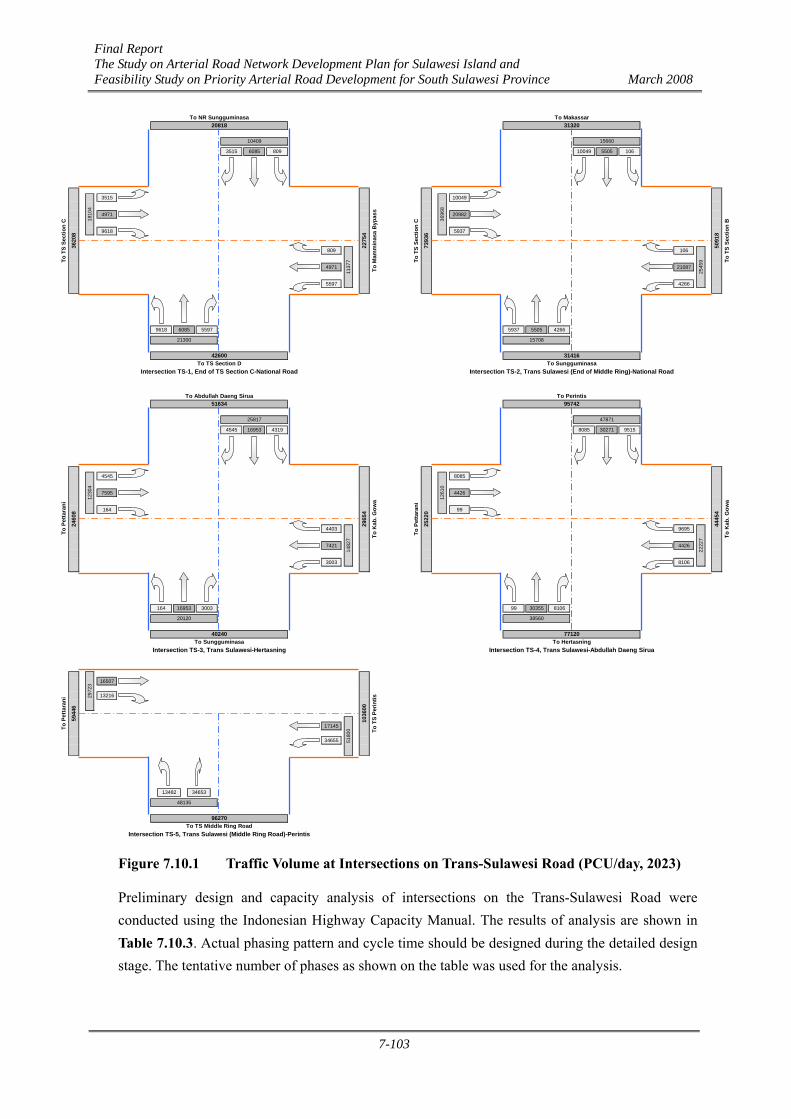
Final Report The Study on Arterial Road Network Development Plan for Sulawesi Island and Feasibility Study on Priority Arterial Road Development for South Sulawesi Province March 2008
7-103
3515 10049
4971 20982
9618 5937
809 106
4971 21087
5597 4266
4545 8085
7595 4426
164 99
4403 9695
7421 4426
3003 8106
16507
13216
17145
34655
13482 34653
Intersection TS-4, Trans Sulawesi-Abdullah Daeng Sirua
30355 8106
20120 38560
164 16953 3003 99
To
Petta
rani
2460
8
2965
4
To K
ab. G
owa12
304
To Abdullah Daeng Sirua To Perintis51634 95742
To TS Middle Ring RoadIntersection TS-5, Trans Sulawesi (Middle Ring Road)-Perintis
To P
etta
rani
5944
6
2972
3
48135
96270
1036
00
To T
S Pe
rintis
5180
0
25817
4545 16953 4319
47871
Intersection TS-3, Trans Sulawesi-Hertasning
40240 77120To Sungguminasa To Hertasning
8085 30271 9515
To P
etta
rani
4445
4
To K
ab. G
owa
1482
7
2222
7
2522
0
1261
0
Intersection TS-2, Trans Sulawesi (End of Middle Ring)-National Road
To T
S Se
ctio
n C
To T
S Se
ctio
n B36
968
2545
9
5937 5505 4266
5091
8
7393
6
To Makassar31320
15660
10049 5505 106
31416To Sungguminasa
1570821300
42600
To NR Sungguminasa
To M
amm
inas
a B
ypas
s
20818
3515 6085 809
10409
To T
S Se
ctio
n C
Intersection TS-1, End of TS Section C-National Road
1137
7
2275
4To TS Section D
1810
4
3620
8
9618 6085 5597
Figure 7.10.1 Traffic Volume at Intersections on Trans-Sulawesi Road (PCU/day, 2023)
Preliminary design and capacity analysis of intersections on the Trans-Sulawesi Road were conducted using the Indonesian Highway Capacity Manual. The results of analysis are shown in Table 7.10.3. Actual phasing pattern and cycle time should be designed during the detailed design stage. The tentative number of phases as shown on the table was used for the analysis.
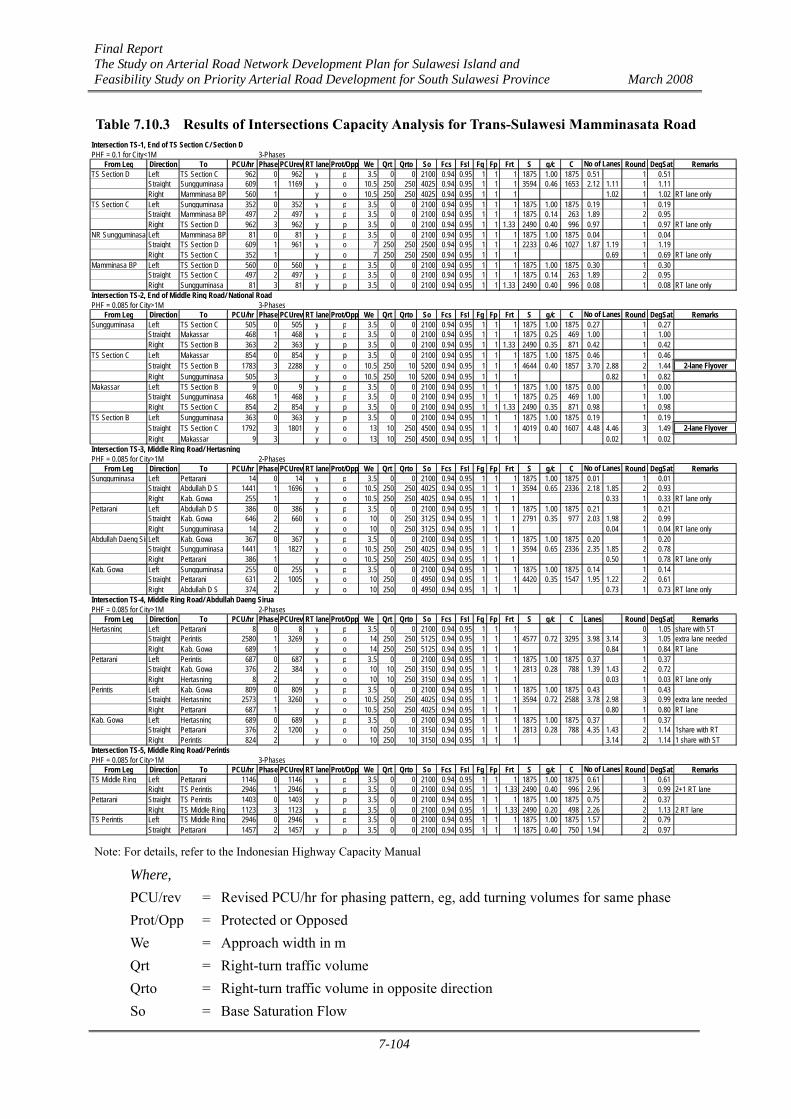
Final Report The Study on Arterial Road Network Development Plan for Sulawesi Island and Feasibility Study on Priority Arterial Road Development for South Sulawesi Province March 2008
7-104
Table 7.10.3 Results of Intersections Capacity Analysis for Trans-Sulawesi Mamminasata Road Intersection TS-1, End of TS Section C/ Section DPHF = 0.1 for City<1M 3-Phases
From Leg Direction To PCU/hr Phase PCUrev RT lane Prot/Opp We Qrt Qrto So Fcs Fsf Fg Fp Frt S g/c C Round DegSat RemarksTS Section D Left TS Section C 962 0 962 y p 3.5 0 0 2100 0.94 0.95 1 1 1 1875 1.00 1875 0.51 1 0.51
Straight Sungguminasa 609 1 1169 y o 10.5 250 250 4025 0.94 0.95 1 1 1 3594 0.46 1653 2.12 1.11 1 1.11Right Mamminasa BP 560 1 y o 10.5 250 250 4025 0.94 0.95 1 1 1 1.02 1 1.02 RT lane only
TS Section C Left Sungguminasa 352 0 352 y p 3.5 0 0 2100 0.94 0.95 1 1 1 1875 1.00 1875 0.19 1 0.19Straight Mamminasa BP 497 2 497 y p 3.5 0 0 2100 0.94 0.95 1 1 1 1875 0.14 263 1.89 2 0.95Right TS Section D 962 3 962 y p 3.5 0 0 2100 0.94 0.95 1 1 1.33 2490 0.40 996 0.97 1 0.97 RT lane only
NR Sungguminasa Left Mamminasa BP 81 0 81 y p 3.5 0 0 2100 0.94 0.95 1 1 1 1875 1.00 1875 0.04 1 0.04Straight TS Section D 609 1 961 y o 7 250 250 2500 0.94 0.95 1 1 1 2233 0.46 1027 1.87 1.19 1 1.19Right TS Section C 352 1 y o 7 250 250 2500 0.94 0.95 1 1 1 0.69 1 0.69 RT lane only
Mamminasa BP Left TS Section D 560 0 560 y p 3.5 0 0 2100 0.94 0.95 1 1 1 1875 1.00 1875 0.30 1 0.30Straight TS Section C 497 2 497 y p 3.5 0 0 2100 0.94 0.95 1 1 1 1875 0.14 263 1.89 2 0.95Right Sungguminasa 81 3 81 y p 3.5 0 0 2100 0.94 0.95 1 1 1.33 2490 0.40 996 0.08 1 0.08 RT lane only
Intersection TS-2, End of Middle Ring Road/ National RoadPHF = 0.085 for City>1M 3-Phases
From Leg Direction To PCU/hr Phase PCUrev RT lane Prot/Opp We Qrt Qrto So Fcs Fsf Fg Fp Frt S g/c C Round DegSat RemarksSungguminasa Left TS Section C 505 0 505 y p 3.5 0 0 2100 0.94 0.95 1 1 1 1875 1.00 1875 0.27 1 0.27
Straight Makassar 468 1 468 y p 3.5 0 0 2100 0.94 0.95 1 1 1 1875 0.25 469 1.00 1 1.00Right TS Section B 363 2 363 y p 3.5 0 0 2100 0.94 0.95 1 1 1.33 2490 0.35 871 0.42 1 0.42
TS Section C Left Makassar 854 0 854 y p 3.5 0 0 2100 0.94 0.95 1 1 1 1875 1.00 1875 0.46 1 0.46Straight TS Section B 1783 3 2288 y o 10.5 250 10 5200 0.94 0.95 1 1 1 4644 0.40 1857 3.70 2.88 2 1.44 2-lane FlyoverRight Sungguminasa 505 3 y o 10.5 250 10 5200 0.94 0.95 1 1 1 0.82 1 0.82
Makassar Left TS Section B 9 0 9 y p 3.5 0 0 2100 0.94 0.95 1 1 1 1875 1.00 1875 0.00 1 0.00Straight Sungguminasa 468 1 468 y p 3.5 0 0 2100 0.94 0.95 1 1 1 1875 0.25 469 1.00 1 1.00Right TS Section C 854 2 854 y p 3.5 0 0 2100 0.94 0.95 1 1 1.33 2490 0.35 871 0.98 1 0.98
TS Section B Left Sungguminasa 363 0 363 y p 3.5 0 0 2100 0.94 0.95 1 1 1 1875 1.00 1875 0.19 1 0.19Straight TS Section C 1792 3 1801 y o 13 10 250 4500 0.94 0.95 1 1 1 4019 0.40 1607 4.48 4.46 3 1.49 2-lane FlyoverRight Makassar 9 3 y o 13 10 250 4500 0.94 0.95 1 1 1 0.02 1 0.02
Intersection TS-3, Middle Ring Road/ HertasningPHF = 0.085 for City>1M 2-Phases
From Leg Direction To PCU/hr Phase PCUrev RT lane Prot/Opp We Qrt Qrto So Fcs Fsf Fg Fp Frt S g/c C Round DegSat RemarksSungguminasa Left Pettarani 14 0 14 y p 3.5 0 0 2100 0.94 0.95 1 1 1 1875 1.00 1875 0.01 1 0.01
Straight Abdullah D S 1441 1 1696 y o 10.5 250 250 4025 0.94 0.95 1 1 1 3594 0.65 2336 2.18 1.85 2 0.93Right Kab. Gowa 255 1 y o 10.5 250 250 4025 0.94 0.95 1 1 1 0.33 1 0.33 RT lane only
Pettarani Left Abdullah D S 386 0 386 y p 3.5 0 0 2100 0.94 0.95 1 1 1 1875 1.00 1875 0.21 1 0.21Straight Kab. Gowa 646 2 660 y o 10 0 250 3125 0.94 0.95 1 1 1 2791 0.35 977 2.03 1.98 2 0.99Right Sungguminasa 14 2 y o 10 0 250 3125 0.94 0.95 1 1 1 0.04 1 0.04 RT lane only
Abdullah Daeng SirLeft Kab. Gowa 367 0 367 y p 3.5 0 0 2100 0.94 0.95 1 1 1 1875 1.00 1875 0.20 1 0.20Straight Sungguminasa 1441 1 1827 y o 10.5 250 250 4025 0.94 0.95 1 1 1 3594 0.65 2336 2.35 1.85 2 0.78Right Pettarani 386 1 y o 10.5 250 250 4025 0.94 0.95 1 1 1 0.50 1 0.78 RT lane only
Kab. Gowa Left Sungguminasa 255 0 255 y p 3.5 0 0 2100 0.94 0.95 1 1 1 1875 1.00 1875 0.14 1 0.14Straight Pettarani 631 2 1005 y o 10 250 0 4950 0.94 0.95 1 1 1 4420 0.35 1547 1.95 1.22 2 0.61Right Abdullah D S 374 2 y o 10 250 0 4950 0.94 0.95 1 1 1 0.73 1 0.73 RT lane only
Intersection TS-4, Middle Ring Road/ Abdullah Daeng SiruaPHF = 0.085 for City>1M 2-Phases
From Leg Direction To PCU/hr Phase PCUrev RT lane Prot/Opp We Qrt Qrto So Fcs Fsf Fg Fp Frt S g/c C Lanes Round DegSat RemarksHertasning Left Pettarani 8 0 8 y p 3.5 0 0 2100 0.94 0.95 1 1 1 0 1.05 share with ST
Straight Perintis 2580 1 3269 y o 14 250 250 5125 0.94 0.95 1 1 1 4577 0.72 3295 3.98 3.14 3 1.05 extra lane neededRight Kab. Gowa 689 1 y o 14 250 250 5125 0.94 0.95 1 1 1 0.84 1 0.84 RT lane
Pettarani Left Perintis 687 0 687 y p 3.5 0 0 2100 0.94 0.95 1 1 1 1875 1.00 1875 0.37 1 0.37Straight Kab. Gowa 376 2 384 y o 10 10 250 3150 0.94 0.95 1 1 1 2813 0.28 788 1.39 1.43 2 0.72Right Hertasning 8 2 y o 10 10 250 3150 0.94 0.95 1 1 1 0.03 1 0.03 RT lane only
Perintis Left Kab. Gowa 809 0 809 y p 3.5 0 0 2100 0.94 0.95 1 1 1 1875 1.00 1875 0.43 1 0.43Straight Hertasning 2573 1 3260 y o 10.5 250 250 4025 0.94 0.95 1 1 1 3594 0.72 2588 3.78 2.98 3 0.99 extra lane neededRight Pettarani 687 1 y o 10.5 250 250 4025 0.94 0.95 1 1 1 0.80 1 0.80 RT lane
Kab. Gowa Left Hertasning 689 0 689 y p 3.5 0 0 2100 0.94 0.95 1 1 1 1875 1.00 1875 0.37 1 0.37Straight Pettarani 376 2 1200 y o 10 250 10 3150 0.94 0.95 1 1 1 2813 0.28 788 4.35 1.43 2 1.14 1share with RTRight Perintis 824 2 y o 10 250 10 3150 0.94 0.95 1 1 1 3.14 2 1.14 1 share with ST
Intersection TS-5, Middle Ring Road/ PerintisPHF = 0.085 for City>1M 3-Phases
From Leg Direction To PCU/hr Phase PCUrev RT lane Prot/Opp We Qrt Qrto So Fcs Fsf Fg Fp Frt S g/c C Round DegSat RemarksTS Middle Ring Left Pettarani 1146 0 1146 y p 3.5 0 0 2100 0.94 0.95 1 1 1 1875 1.00 1875 0.61 1 0.61
Right TS Perintis 2946 1 2946 y p 3.5 0 0 2100 0.94 0.95 1 1 1.33 2490 0.40 996 2.96 3 0.99 2+1 RT lanePettarani Straight TS Perintis 1403 0 1403 y p 3.5 0 0 2100 0.94 0.95 1 1 1 1875 1.00 1875 0.75 2 0.37
Right TS Middle Ring 1123 3 1123 y p 3.5 0 0 2100 0.94 0.95 1 1 1.33 2490 0.20 498 2.26 2 1.13 2 RT laneTS Perintis Left TS Middle Ring 2946 0 2946 y p 3.5 0 0 2100 0.94 0.95 1 1 1 1875 1.00 1875 1.57 2 0.79
Straight Pettarani 1457 2 1457 y p 3.5 0 0 2100 0.94 0.95 1 1 1 1875 0.40 750 1.94 2 0.97
No of Lanes
No of Lanes
No of Lanes
No of Lanes
Note: For details, refer to the Indonesian Highway Capacity Manual
Where, PCU/rev = Revised PCU/hr for phasing pattern, eg, add turning volumes for same phase Prot/Opp = Protected or Opposed We = Approach width in m Qrt = Right-turn traffic volume Qrto = Right-turn traffic volume in opposite direction So = Base Saturation Flow
Final Report The Study on Arterial Road Network Development Plan for Sulawesi Island and Feasibility Study on Priority Arterial Road Development for South Sulawesi Province March 2008
7-105
Fcs = Adjustment factor for city size Fsf = Adjustment factor for side friction Fg = Adjustment factor for gradient Fp = Adjustment factor for parking Frt = Adjustment factor for right-turns only for protected approach S = Adjusted flow g/c = Percentage green in each phase C = Capacity for each group in the phase DegSat = Approximate degree of saturation
The number of lanes required for each leg was determined from Table 7.10.3. The preliminary lane arrangements for the intersections are shown in Figure 7.10.2.
* In the Progress Report (1), TS-5 was recommended as a grade-separated intersection with trumpet type. However, it was modified to at-grade intersection with signal control based. According to the traffic forecast, it can be managed by signal control without the saturation and it will not exceed 1.0 until the year 2023 as shown in Table 7.10.3.
* TS-2 with a 2-lane flyover in each direction is recommended for the through traffic on the Trans-Sulawesi Road as analyzed in Section 7.8.
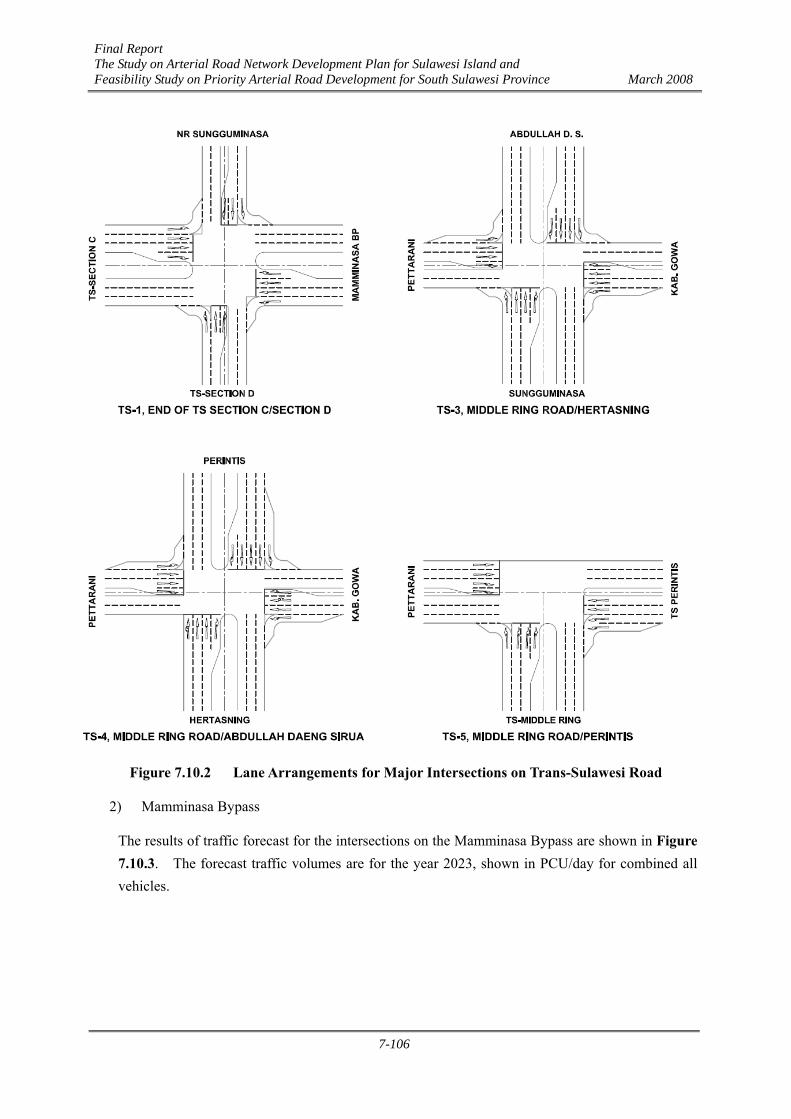
Final Report The Study on Arterial Road Network Development Plan for Sulawesi Island and Feasibility Study on Priority Arterial Road Development for South Sulawesi Province March 2008
7-106
Figure 7.10.2 Lane Arrangements for Major Intersections on Trans-Sulawesi Road
2) Mamminasa Bypass
The results of traffic forecast for the intersections on the Mamminasa Bypass are shown in Figure 7.10.3. The forecast traffic volumes are for the year 2023, shown in PCU/day for combined all vehicles.
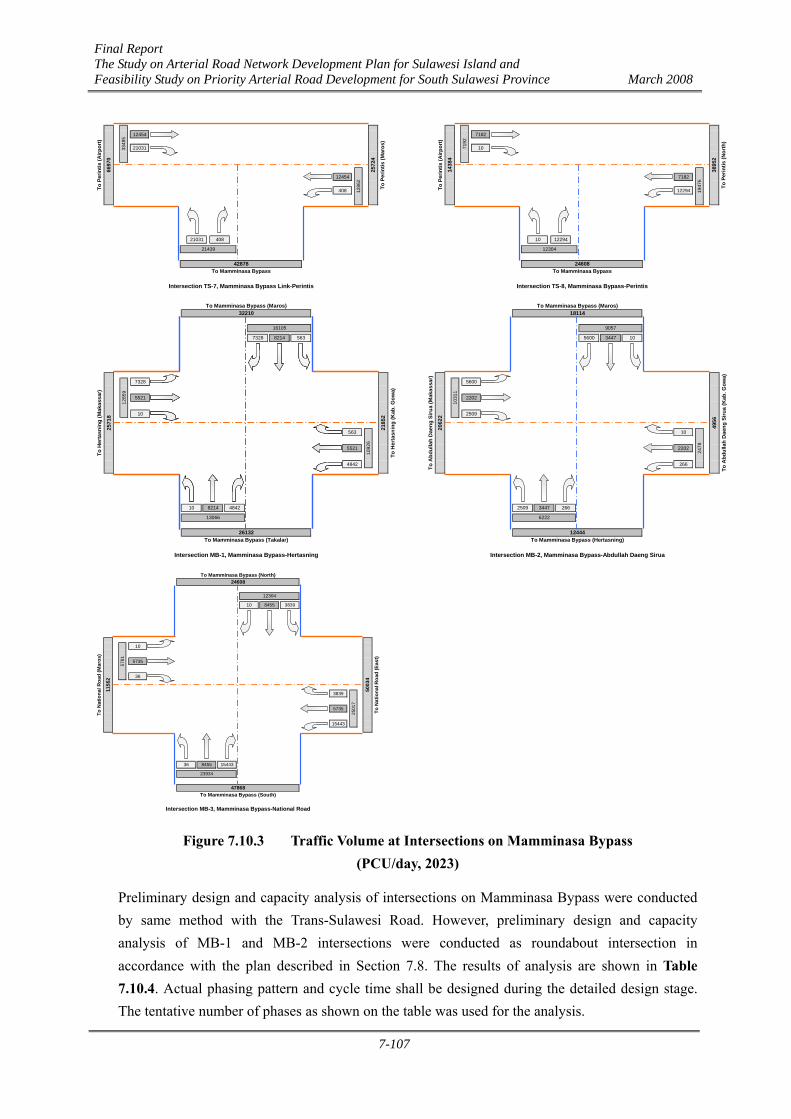
Final Report The Study on Arterial Road Network Development Plan for Sulawesi Island and Feasibility Study on Priority Arterial Road Development for South Sulawesi Province March 2008
7-107
12454 7182
21031 10
12454 7182
408 12294
3895
2
To P
erin
tis (N
orth
)
1947
6
12294
12304
24608To Mamminasa Bypass
Intersection TS-8, Mamminasa Bypass-Perintis
10
To P
erin
tis (A
irpor
t)
1438
4
7192
21439
42878To Mamminasa Bypass
Intersection TS-7, Mamminasa Bypass Link-Perintis
To P
erin
tis (M
aros
)
1286
2
21031 408
To P
erin
tis (A
irpor
t)
6697
0
3348
5
2572
4
7328 5600
5521 2202
10 2509
563 10
5521 2202
4842 266
12444To Mamminasa Bypass (Hertasning)
Intersection MB-2, Mamminasa Bypass-Abdullah Daeng Sirua
2509 3447 266
6222
2062
2
4956
To A
bdul
lah
Dae
ng S
irua
(Kab
. Gow
a)
1031
1
2478
26132To Mamminasa Bypass (Takalar)
Intersection MB-1, Mamminasa Bypass-Hertasning
To Mamminasa Bypass (Maros)18114
9057
5600 3447 10
To A
bdul
lah
Dae
ng S
irua
(Mak
assa
r)
10 8214 4842
13066
To H
erta
snin
g (M
akas
sar)
2571
8
2185
2
To H
erta
snin
g (K
ab. G
owa)
1285
9
1092
6
To Mamminasa Bypass (Maros)32210
16105
7328 8214 563
10
5735
36
3839
5735
15443
47868To Mamminasa Bypass (South)
Intersection MB-3, Mamminasa Bypass-National Road
36 8455 15443
23934
To N
atio
nal R
oad
(Mar
os)
1156
2
5003
4
To N
atio
nal R
oad
(Eas
t)
5781
2501
7
To Mamminasa Bypass (North)24608
12304
10 8455 3839
Figure 7.10.3 Traffic Volume at Intersections on Mamminasa Bypass (PCU/day, 2023)
Preliminary design and capacity analysis of intersections on Mamminasa Bypass were conducted by same method with the Trans-Sulawesi Road. However, preliminary design and capacity analysis of MB-1 and MB-2 intersections were conducted as roundabout intersection in accordance with the plan described in Section 7.8. The results of analysis are shown in Table 7.10.4. Actual phasing pattern and cycle time shall be designed during the detailed design stage. The tentative number of phases as shown on the table was used for the analysis.
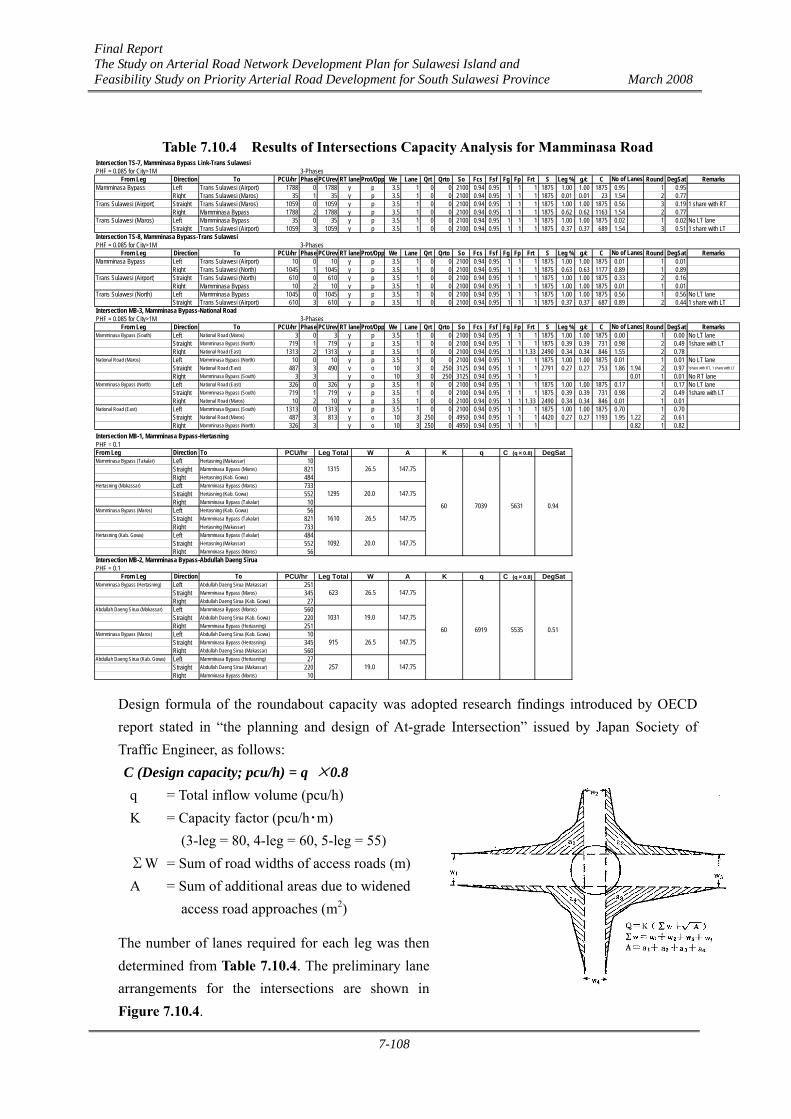
Final Report The Study on Arterial Road Network Development Plan for Sulawesi Island and Feasibility Study on Priority Arterial Road Development for South Sulawesi Province March 2008
7-108
Table 7.10.4 Results of Intersections Capacity Analysis for Mamminasa Road
Intersection TS-7, Mamminasa Bypass Link-Trans SulawesiPHF = 0.085 for City>1M 3-Phases
From Leg Direction To PCU/hr Phase PCUrev RT lane Prot/Opp We Lane Qrt Qrto So Fcs Fsf Fg Fp Frt S Leg % g/c C Round DegSat RemarksMamminasa Bypass Left Trans Sulawesi (Airport) 1788 0 1788 y p 3.5 1 0 0 2100 0.94 0.95 1 1 1 1875 1.00 1.00 1875 0.95 1 0.95
Right Trans Sulawesi (Maros) 35 1 35 y p 3.5 1 0 0 2100 0.94 0.95 1 1 1 1875 0.01 0.01 23 1.54 2 0.77Trans Sulawesi (Airport) Straight Trans Sulawesi (Maros) 1059 0 1059 y p 3.5 1 0 0 2100 0.94 0.95 1 1 1 1875 1.00 1.00 1875 0.56 3 0.19 1 share with RT
Right Mamminasa Bypass 1788 2 1788 y p 3.5 1 0 0 2100 0.94 0.95 1 1 1 1875 0.62 0.62 1163 1.54 2 0.77Trans Sulawesi (Maros) Left Mamminasa Bypass 35 0 35 y p 3.5 1 0 0 2100 0.94 0.95 1 1 1 1875 1.00 1.00 1875 0.02 1 0.02 No LT lane
Straight Trans Sulawesi (Airport) 1059 3 1059 y p 3.5 1 0 0 2100 0.94 0.95 1 1 1 1875 0.37 0.37 689 1.54 3 0.51 1 share with LTIntersection TS-8, Mamminasa Bypass-Trans SulawesiPHF = 0.085 for City>1M 3-Phases
From Leg Direction To PCU/hr Phase PCUrev RT lane Prot/Opp We Lane Qrt Qrto So Fcs Fsf Fg Fp Frt S Leg % g/c C Round DegSat RemarksMamminasa Bypass Left Trans Sulawesi (Airport) 10 0 10 y p 3.5 1 0 0 2100 0.94 0.95 1 1 1 1875 1.00 1.00 1875 0.01 1 0.01
Right Trans Sulawesi (North) 1045 1 1045 y p 3.5 1 0 0 2100 0.94 0.95 1 1 1 1875 0.63 0.63 1177 0.89 1 0.89Trans Sulawesi (Airport) Straight Trans Sulawesi (North) 610 0 610 y p 3.5 1 0 0 2100 0.94 0.95 1 1 1 1875 1.00 1.00 1875 0.33 2 0.16
Right Mamminasa Bypass 10 2 10 y p 3.5 1 0 0 2100 0.94 0.95 1 1 1 1875 1.00 1.00 1875 0.01 1 0.01Trans Sulawesi (North) Left Mamminasa Bypass 1045 0 1045 y p 3.5 1 0 0 2100 0.94 0.95 1 1 1 1875 1.00 1.00 1875 0.56 1 0.56 No LT lane
Straight Trans Sulawesi (Airport) 610 3 610 y p 3.5 1 0 0 2100 0.94 0.95 1 1 1 1875 0.37 0.37 687 0.89 2 0.44 1 share with LTIntersection MB-3, Mamminasa Bypass-National RoadPHF = 0.085 for City>1M 3-Phases
From Leg Direction To PCU/hr Phase PCUrev RT lane Prot/Opp We Lane Qrt Qrto So Fcs Fsf Fg Fp Frt S Leg % g/c C Round DegSat RemarksMamminasa Bypass (South) Left National Road (Maros) 3 0 3 y p 3.5 1 0 0 2100 0.94 0.95 1 1 1 1875 1.00 1.00 1875 0.00 1 0.00 No LT lane
Straight Mamminasa Bypass (North) 719 1 719 y p 3.5 1 0 0 2100 0.94 0.95 1 1 1 1875 0.39 0.39 731 0.98 2 0.49 1share with LTRight National Road (East) 1313 2 1313 y p 3.5 1 0 0 2100 0.94 0.95 1 1 1.33 2490 0.34 0.34 846 1.55 2 0.78
National Road (Maros) Left Mamminasa Bypass (North) 10 0 10 y p 3.5 1 0 0 2100 0.94 0.95 1 1 1 1875 1.00 1.00 1875 0.01 1 0.01 No LT laneStraight National Road (East) 487 3 490 y o 10 3 0 250 3125 0.94 0.95 1 1 1 2791 0.27 0.27 753 1.86 1.94 2 0.97 1share with RT, 1 share with LT
Right Mamminasa Bypass (South) 3 3 y o 10 3 0 250 3125 0.94 0.95 1 1 1 0.01 1 0.01 No RT laneMamminasa Bypass (North) Left National Road (East) 326 0 326 y p 3.5 1 0 0 2100 0.94 0.95 1 1 1 1875 1.00 1.00 1875 0.17 1 0.17 No LT lane
Straight Mamminasa Bypass (South) 719 1 719 y p 3.5 1 0 0 2100 0.94 0.95 1 1 1 1875 0.39 0.39 731 0.98 2 0.49 1share with LTRight National Road (Maros) 10 2 10 y p 3.5 1 0 0 2100 0.94 0.95 1 1 1.33 2490 0.34 0.34 846 0.01 1 0.01
National Road (East) Left Mamminasa Bypass (South) 1313 0 1313 y p 3.5 1 0 0 2100 0.94 0.95 1 1 1 1875 1.00 1.00 1875 0.70 1 0.70Straight National Road (Maros) 487 3 813 y o 10 3 250 0 4950 0.94 0.95 1 1 1 4420 0.27 0.27 1193 1.95 1.22 2 0.61Right Mamminasa Bypass (North) 326 3 y o 10 3 250 0 4950 0.94 0.95 1 1 1 0.82 1 0.82
No of Lanes
No of Lanes
No of Lanes
Intersection MB-1, Mamminasa Bypass-HertasningPHF = 0.1From Leg Direction To PCU/hr Leg Total W A K q C (q×0.8) DegSatMamminasa Bypass (Takalar) Left Hertasning (Makassar) 10
Straight Mamminasa Bypass (Maros) 821Right Hertasning (Kab. Gowa) 484
Hertasning (Makassar) Left Mamminasa Bypass (Maros) 733Straight Hertasning (Kab. Gowa) 552Right Mamminasa Bypass (Takalar) 10
Mamminasa Bypass (Maros) Left Hertasning (Kab. Gowa) 56Straight Mamminasa Bypass (Takalar) 821Right Hertasning (Makassar) 733
Hertasning (Kab. Gowa) Left Mamminasa Bypass (Takalar) 484Straight Hertasning (Makassar) 552Right Mamminasa Bypass (Maros) 56
Intersection MB-2, Mamminasa Bypass-Abdullah Daeng SiruaPHF = 0.1
From Leg Direction To PCU/hr Leg Total W A K q C (q×0.8) DegSatMamminasa Bypass (Hertasning) Left Abdullah Daeng Sirua (Makassar) 251
Straight Mamminasa Bypass (Maros) 345Right Abdullah Daeng Sirua (Kab. Gowa) 27
Abdullah Daeng Sirua (Makassar) Left Mamminasa Bypass (Maros) 560Straight Abdullah Daeng Sirua (Kab. Gowa) 220Right Mamminasa Bypass (Hertasning) 251
Mamminasa Bypass (Maros) Left Abdullah Daeng Sirua (Kab. Gowa) 10Straight Mamminasa Bypass (Hertasning) 345Right Abdullah Daeng Sirua (Makassar) 560
Abdullah Daeng Sirua (Kab. Gowa) Left Mamminasa Bypass (Hertasning) 27Straight Abdullah Daeng Sirua (Makassar) 220Right Mamminasa Bypass (Maros) 10
5535
7039 0.94
1295 20.0 147.75
5631
1315 26.5 147.75
60
1610 26.5 147.75
1092 20.0 147.75
623 26.5 147.75
60
147.75
6919 0.51
1031 19.0 147.75
915 26.5 147.75
257 19.0
Design formula of the roundabout capacity was adopted research findings introduced by OECD report stated in “the planning and design of At-grade Intersection” issued by Japan Society of Traffic Engineer, as follows: C (Design capacity; pcu/h) = q ×0.8 q = Total inflow volume (pcu/h) K = Capacity factor (pcu/h・m)
(3-leg = 80, 4-leg = 60, 5-leg = 55) ΣW = Sum of road widths of access roads (m) A = Sum of additional areas due to widened
access road approaches (m2)
The number of lanes required for each leg was then determined from Table 7.10.4. The preliminary lane arrangements for the intersections are shown in Figure 7.10.4.
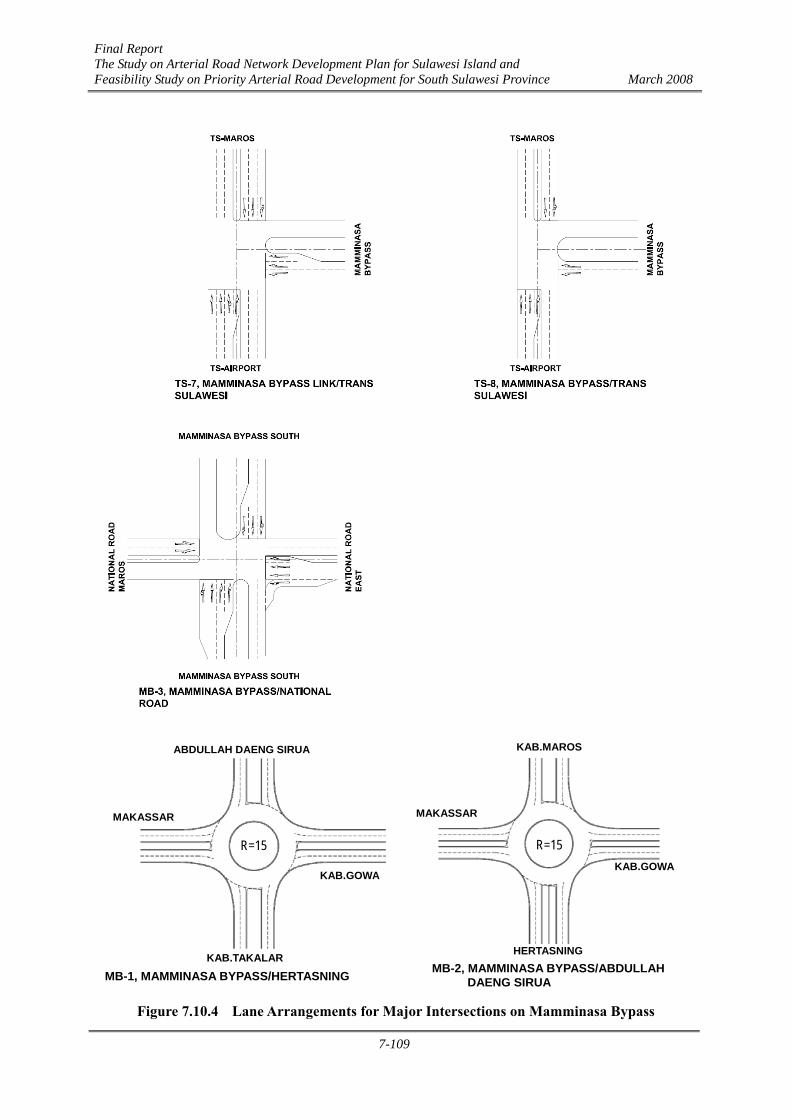
Final Report The Study on Arterial Road Network Development Plan for Sulawesi Island and Feasibility Study on Priority Arterial Road Development for South Sulawesi Province March 2008
7-109
Figure 7.10.4 Lane Arrangements for Major Intersections on Mamminasa Bypass
KAB.MAROS
HERTASNING
KAB.GOWA
MAKASSAR
MB-2, MAMMINASA BYPASS/ABDULLAH DAENG SIRUA
R=15
ABDULLAH DAENG SIRUA
KAB.GOWA
MAKASSAR
KAB.TAKALAR
MB-1, MAMMINASA BYPASS/HERTASNING
R=15
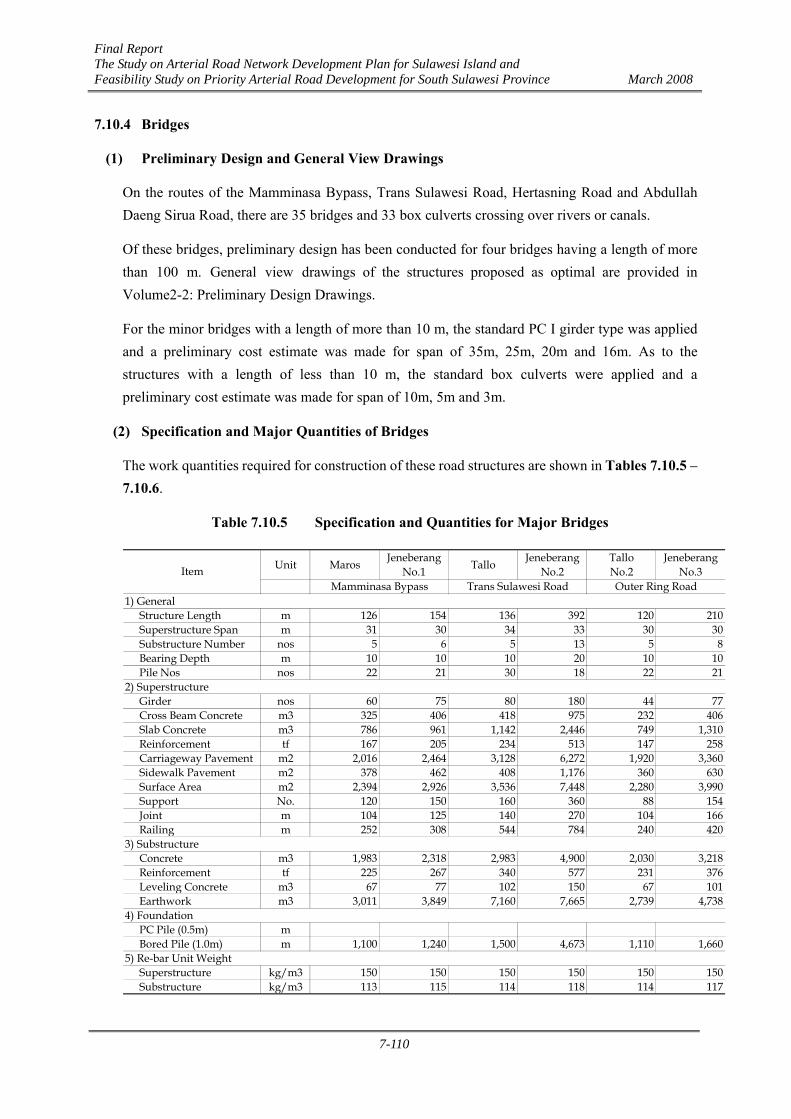
Final Report The Study on Arterial Road Network Development Plan for Sulawesi Island and Feasibility Study on Priority Arterial Road Development for South Sulawesi Province March 2008
7-110
7.10.4 Bridges
(1) Preliminary Design and General View Drawings
On the routes of the Mamminasa Bypass, Trans Sulawesi Road, Hertasning Road and Abdullah Daeng Sirua Road, there are 35 bridges and 33 box culverts crossing over rivers or canals.
Of these bridges, preliminary design has been conducted for four bridges having a length of more than 100 m. General view drawings of the structures proposed as optimal are provided in Volume2-2: Preliminary Design Drawings.
For the minor bridges with a length of more than 10 m, the standard PC I girder type was applied and a preliminary cost estimate was made for span of 35m, 25m, 20m and 16m. As to the structures with a length of less than 10 m, the standard box culverts were applied and a preliminary cost estimate was made for span of 10m, 5m and 3m.
(2) Specification and Major Quantities of Bridges
The work quantities required for construction of these road structures are shown in Tables 7.10.5 – 7.10.6.
Table 7.10.5 Specification and Quantities for Major Bridges
Unit Maros JeneberangNo.1 Tallo Jeneberang
No.2TalloNo.2
JeneberangNo.3
1) GeneralStructure Length m 126 154 136 392 120 210Superstructure Span m 31 30 34 33 30 30Substructure Number nos 5 6 5 13 5 8Bearing Depth m 10 10 10 20 10 10Pile Nos nos 22 21 30 18 22 21
2) SuperstructureGirder nos 60 75 80 180 44 77Cross Beam Concrete m3 325 406 418 975 232 406Slab Concrete m3 786 961 1,142 2,446 749 1,310Reinforcement tf 167 205 234 513 147 258Carriageway Pavement m2 2,016 2,464 3,128 6,272 1,920 3,360Sidewalk Pavement m2 378 462 408 1,176 360 630Surface Area m2 2,394 2,926 3,536 7,448 2,280 3,990Support No. 120 150 160 360 88 154Joint m 104 125 140 270 104 166Railing m 252 308 544 784 240 420
3) SubstructureConcrete m3 1,983 2,318 2,983 4,900 2,030 3,218Reinforcement tf 225 267 340 577 231 376Leveling Concrete m3 67 77 102 150 67 101Earthwork m3 3,011 3,849 7,160 7,665 2,739 4,738
4) FoundationPC Pile (0.5m) mBored Pile (1.0m) m 1,100 1,240 1,500 4,673 1,110 1,660
5) Re-bar Unit WeightSuperstructure kg/m3 150 150 150 150 150 150Substructure kg/m3 113 115 114 118 114 117
Mamminasa Bypass Trans Sulawesi Road Outer Ring RoadItem
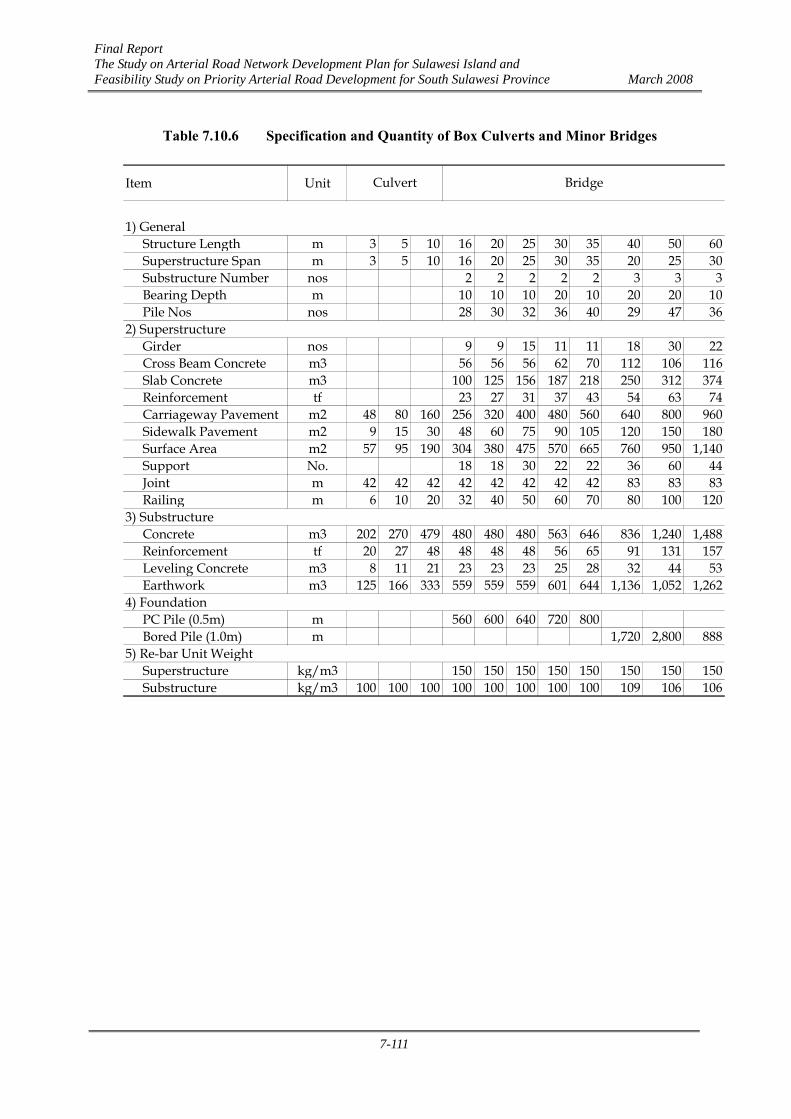
Final Report The Study on Arterial Road Network Development Plan for Sulawesi Island and Feasibility Study on Priority Arterial Road Development for South Sulawesi Province March 2008
7-111
Table 7.10.6 Specification and Quantity of Box Culverts and Minor Bridges
Item Unit
1) GeneralStructure Length m 3 5 10 16 20 25 30 35 40 50 60Superstructure Span m 3 5 10 16 20 25 30 35 20 25 30Substructure Number nos 2 2 2 2 2 3 3 3Bearing Depth m 10 10 10 20 10 20 20 10Pile Nos nos 28 30 32 36 40 29 47 36
2) SuperstructureGirder nos 9 9 15 11 11 18 30 22Cross Beam Concrete m3 56 56 56 62 70 112 106 116Slab Concrete m3 100 125 156 187 218 250 312 374Reinforcement tf 23 27 31 37 43 54 63 74Carriageway Pavement m2 48 80 160 256 320 400 480 560 640 800 960Sidewalk Pavement m2 9 15 30 48 60 75 90 105 120 150 180Surface Area m2 57 95 190 304 380 475 570 665 760 950 1,140Support No. 18 18 30 22 22 36 60 44Joint m 42 42 42 42 42 42 42 42 83 83 83Railing m 6 10 20 32 40 50 60 70 80 100 120
3) SubstructureConcrete m3 202 270 479 480 480 480 563 646 836 1,240 1,488Reinforcement tf 20 27 48 48 48 48 56 65 91 131 157Leveling Concrete m3 8 11 21 23 23 23 25 28 32 44 53Earthwork m3 125 166 333 559 559 559 601 644 1,136 1,052 1,262
4) FoundationPC Pile (0.5m) m 560 600 640 720 800Bored Pile (1.0m) m 1,720 2,800 888
5) Re-bar Unit WeightSuperstructure kg/m3 150 150 150 150 150 150 150 150Substructure kg/m3 100 100 100 100 100 100 100 100 109 106 106
BridgeCulvert
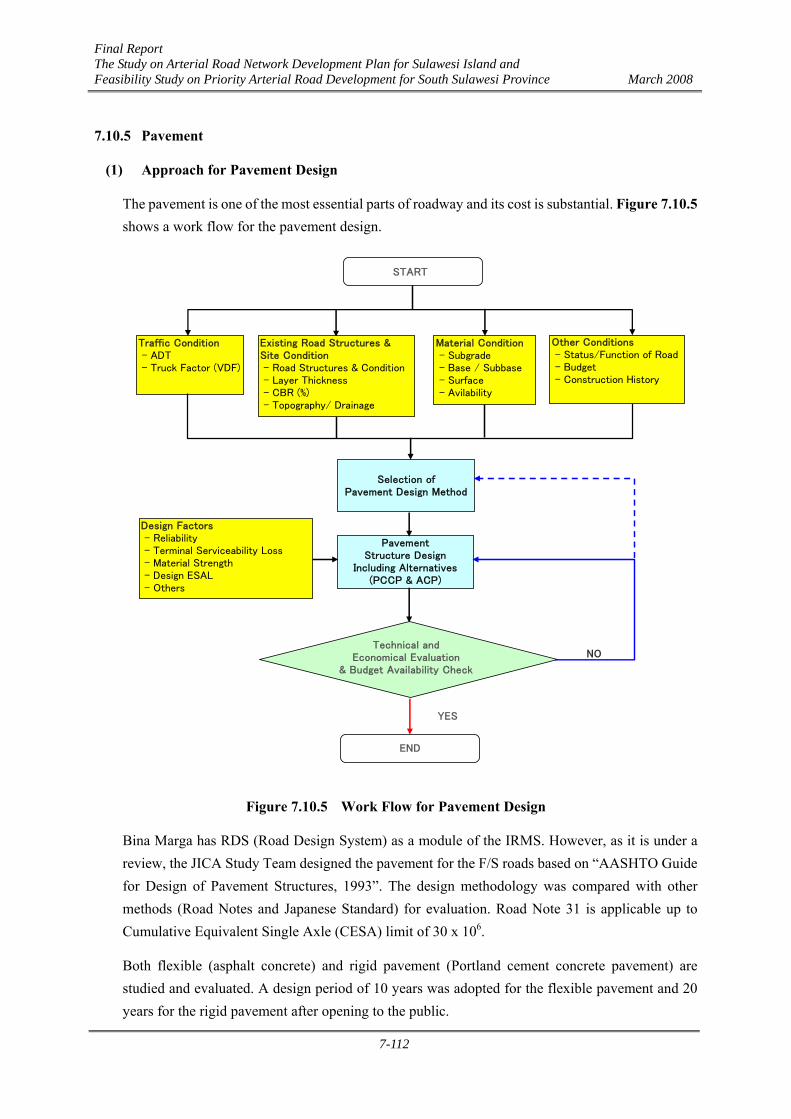
Final Report The Study on Arterial Road Network Development Plan for Sulawesi Island and Feasibility Study on Priority Arterial Road Development for South Sulawesi Province March 2008
7-112
7.10.5 Pavement
(1) Approach for Pavement Design
The pavement is one of the most essential parts of roadway and its cost is substantial. Figure 7.10.5 shows a work flow for the pavement design.
NO
YES
Traffic Condition - ADT - Truck Factor (VDF)
Material Condition - Subgrade - Base / Subbase - Surface - Avilability
Selection ofPavement Design Method
START
PavementStructure Design
Including Alternatives(PCCP & ACP)
Technical andEconomical Evaluation
& Budget Availability Check
Other Conditions - Status/Function of Road - Budget - Construction History
Existing Road Structures &Site Condition - Road Structures & Condition - Layer Thickness - CBR (%) - Topography/ Drainage
END
Design Factors - Reliability - Terminal Serviceability Loss - Material Strength - Design ESAL - Others
Figure 7.10.5 Work Flow for Pavement Design
Bina Marga has RDS (Road Design System) as a module of the IRMS. However, as it is under a review, the JICA Study Team designed the pavement for the F/S roads based on “AASHTO Guide for Design of Pavement Structures, 1993”. The design methodology was compared with other methods (Road Notes and Japanese Standard) for evaluation. Road Note 31 is applicable up to Cumulative Equivalent Single Axle (CESA) limit of 30 x 106.
Both flexible (asphalt concrete) and rigid pavement (Portland cement concrete pavement) are studied and evaluated. A design period of 10 years was adopted for the flexible pavement and 20 years for the rigid pavement after opening to the public.
Final Report The Study on Arterial Road Network Development Plan for Sulawesi Island and Feasibility Study on Priority Arterial Road Development for South Sulawesi Province March 2008
7-113
Comprehensive data (traffic, site condition, materials, etc.) collected and/or analyzed through field surveys and traffic surveys were used for the pavement design. The latest technical specifications of Bina Marga were referred to in material selection.
(2) Design Conditions
1) Design Traffic and CESA (Cumulative Equivalent Single Axle Load)
CESA was computed from several relevant factors including ESA, AADT, traffic growth rate, loading/empty ratio, directional distribution and lane distribution. The design traffic (AADT) and traffic growth rate used for CESA were based on the Traffic Analysis in Chapter 5. Directional distribution was assumed to be 55% and 45%. The lane distribution of 80 – 100% and 60% - 80% was used for 4-lane roads (4/2D) and 6-lane roads (6/2D), respectively.
In general, only buses and trucks are accounted for in estimating the pavement design load as the effect of light vehicles is small. However, as the F/S roads are located in the urban area, mini-buses and pickups are also included in the CESA estimation as their number is large. Loading and empty ratios were adopted referring to the loading condition survey of the Mamminasa Study. The VDF (Vehicle Damage Factor) used for CESA estimation is as shown in Table 7.10.7.
Table 7.10.7 Vehicle Damage Factor (VDF)
Vehicle Type
VDF/Veh VDF/Veh VDF/Veh VDF/VehMini Bus/Pickup 30% 0 70% 0.00066 30% 0 70% 0.00066Large Bus 10% 0.04 90% 0.57 10% 0.04 90% 0.57Truck (2-Axles) 30% 0.08 70% 1.41 30% 0.08 70% 1.41Truck (3-Axles)* 30% 0.43 70% 1.71 30% 0.43 70% 2.09Note: VDF (Truck Factor) was estimated based on Appendix D of AASHTO Pavement GuideSource: JICA Study Team
Flexible Pavement Rigid PavementEmpty Loaded Empty Loaded
The design ESAL was estimated for a period of 10 years for flexible pavement and for 20 years for rigid pavement. Overloaded condition was not considered much as it should be controlled by weigh bridge stations located at inlets/outlets of the F/S roads. Table 7.10.8 shows the CESA for the F/S roads used for the pavement design (refer to Appendix D as to details of CESA estimation by road link and road section).
Final Report The Study on Arterial Road Network Development Plan for Sulawesi Island and Feasibility Study on Priority Arterial Road Development for South Sulawesi Province March 2008
7-114
Table 7.10.8 Cumulative Equivalent Standard Axles for F/S Roads (CESA)
Road LinkFlexible
PavementRigid
PavementA Maros-Jl.Ir.Sutami IC 15 34B Middle Ring 9 21C Middle Ring Access 9D Boka-Takalar 4A North Section 4B Middle Section 4C South Section 4
Jl. Hertasning Gowa Section 4A Makkassar City 4B Maros/Gowa Section 4
Source: JICA Study Team
Trans-SulawesiMamminasata Road
Mamminasa Bypass
Jl.Abdullah DaengSirua Road
Design CESASection
2) Design CBR and Resilient Modules (MR)
The CBR values of soil along the road alignment vary from 2% to 10%. Substantial parts are embankment sections and CBR of borrow materials is more than 6%. The design CBR of subgrade (1m-depth from the formation level) used for flexible pavement is 8% throughout the F/S roads. To maintain the design CBR, it may require 20-30cm of capping layer (selected material of CBR 30%), especially at cut sections, if the CBR of subgrade soil is less than 8%. The average CBR value is calculated by the following formula:
CBRm = {(h1 x CBR1
1/3 + h2 x CBR21/3 + . . . . . + h n x CBR n1/3) / 100}3
where:
CBRm = average CBR for individual spots CBR1, CBR2….CBRn = CBR value of soil layers
h1, h2…….hn = thickness of soil layers in cm (Note: 100cm= total depth of h1,h2….hn)
The design CBR of subgrade (1m-depth from the formation level) used for rigid pavement is 6% throughout the F/S roads as the rigid pavement thickness is not influenced much by the subgrade strength.
There are several methods to define Subgrade Resilient Modules (MR) as shown in Figure 7.10.6 and the Study Team applied the conservative values. The MR used for flexible pavement is 8,200 psi for 8% CBR and that for rigid pavement is 6,700 psi for 6% CBR.
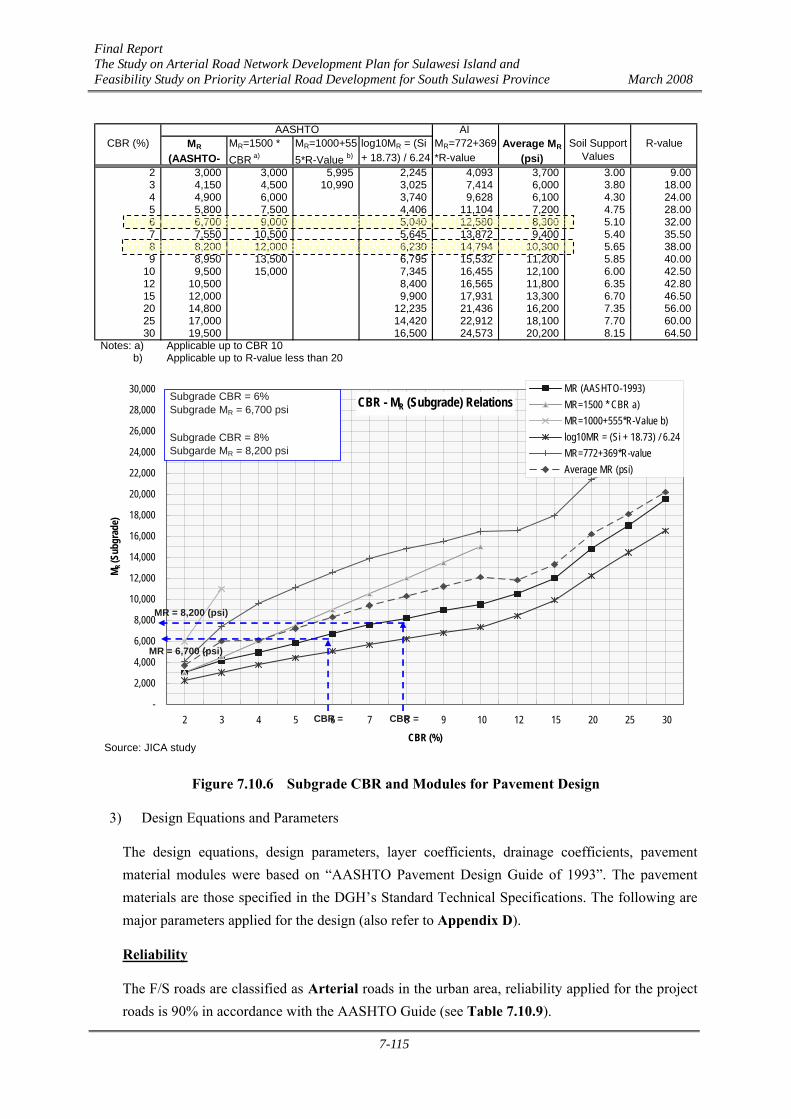
Final Report The Study on Arterial Road Network Development Plan for Sulawesi Island and Feasibility Study on Priority Arterial Road Development for South Sulawesi Province March 2008
7-115
AI CBR (%) MR
(AASHTO-MR=1500 *CBR a)
MR=1000+555*R-Value b)
log10MR = (Si+ 18.73) / 6.24
MR=772+369*R-value
Average MR
(psi)Soil Support
ValuesR-value
2 3,000 3,000 5,995 2,245 4,093 3,700 3.00 9.00 3 4,150 4,500 10,990 3,025 7,414 6,000 3.80 18.00 4 4,900 6,000 3,740 9,628 6,100 4.30 24.00 5 5,800 7,500 4,406 11,104 7,200 4.75 28.00 6 6,700 9,000 5,040 12,580 8,300 5.10 32.00 7 7,550 10,500 5,645 13,872 9,400 5.40 35.50 8 8,200 12,000 6,230 14,794 10,300 5.65 38.00 9 8,950 13,500 6,795 15,532 11,200 5.85 40.00
10 9,500 15,000 7,345 16,455 12,100 6.00 42.50 12 10,500 8,400 16,565 11,800 6.35 42.80 15 12,000 9,900 17,931 13,300 6.70 46.50 20 14,800 12,235 21,436 16,200 7.35 56.00 25 17,000 14,420 22,912 18,100 7.70 60.00 30 19,500 16,500 24,573 20,200 8.15 64.50
Notes: a) Applicable up to CBR 10 b) Applicable up to R-value less than 20
AASHTO
CBR - MR (Subgrade) Relations
-
2,000
4,000
6,000
8,000
10,000
12,000
14,000
16,000
18,000
20,000
22,000
24,000
26,000
28,000
30,000
2 3 4 5 6 7 8 9 10 12 15 20 25 30CBR (%)
M R (S
ubgr
ade)
MR (AASHTO-1993)MR=1500 * CBR a)MR=1000+555*R-Value b)log10MR = (Si + 18.73) / 6.24MR=772+369*R-valueAverage MR (psi)
CBR =
MR = 6,700 (psi)
Subgrade CBR = 6% Subgrade MR = 6,700 psi
Subgrade CBR = 8% Subgarde MR = 8,200 psi
CBR =
MR = 8,200 (psi)
Source: JICA study
Figure 7.10.6 Subgrade CBR and Modules for Pavement Design
3) Design Equations and Parameters
The design equations, design parameters, layer coefficients, drainage coefficients, pavement material modules were based on “AASHTO Pavement Design Guide of 1993”. The pavement materials are those specified in the DGH’s Standard Technical Specifications. The following are major parameters applied for the design (also refer to Appendix D).
Reliability
The F/S roads are classified as Arterial roads in the urban area, reliability applied for the project roads is 90% in accordance with the AASHTO Guide (see Table 7.10.9).
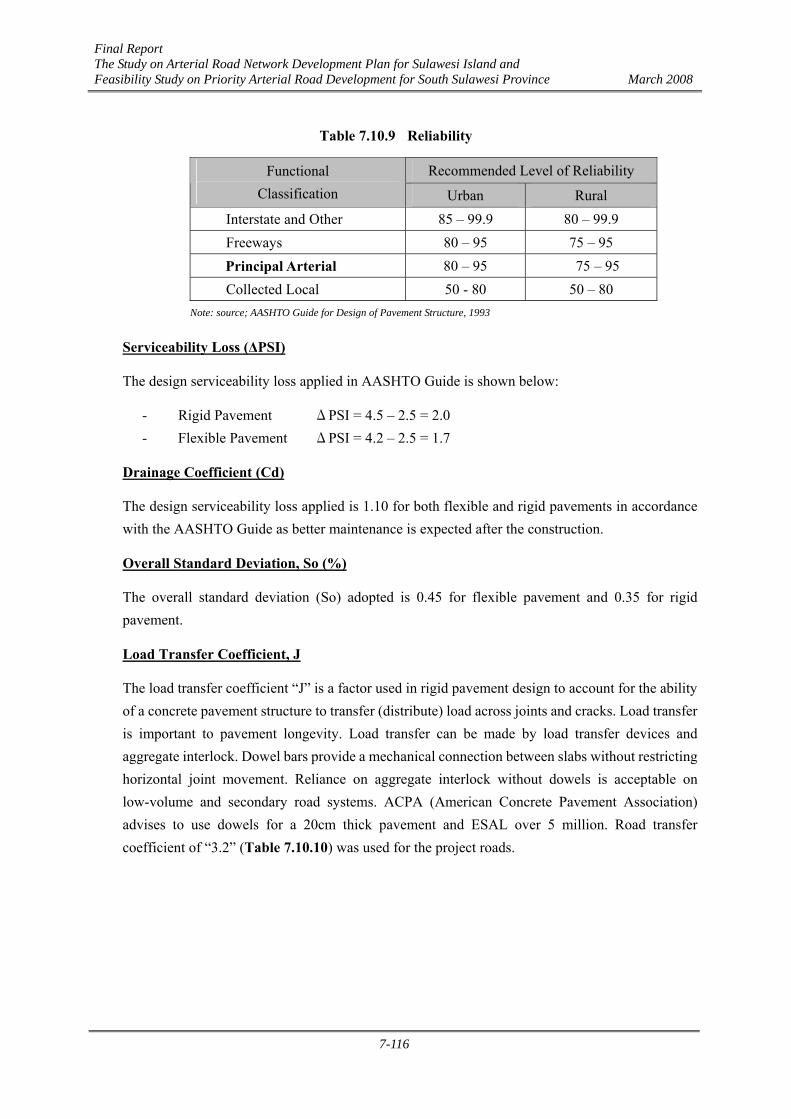
Final Report The Study on Arterial Road Network Development Plan for Sulawesi Island and Feasibility Study on Priority Arterial Road Development for South Sulawesi Province March 2008
7-116
Table 7.10.9 Reliability
Recommended Level of Reliability Functional Classification Urban Rural
Interstate and Other 85 – 99.9 80 – 99.9 Freeways 80 – 95 75 – 95 Principal Arterial 80 – 95 75 – 95 Collected Local 50 - 80 50 – 80
Note: source; AASHTO Guide for Design of Pavement Structure, 1993
Serviceability Loss (ΔPSI)
The design serviceability loss applied in AASHTO Guide is shown below:
- Rigid Pavement ΔPSI = 4.5 – 2.5 = 2.0 - Flexible Pavement ΔPSI = 4.2 – 2.5 = 1.7
Drainage Coefficient (Cd)
The design serviceability loss applied is 1.10 for both flexible and rigid pavements in accordance with the AASHTO Guide as better maintenance is expected after the construction.
Overall Standard Deviation, So (%)
The overall standard deviation (So) adopted is 0.45 for flexible pavement and 0.35 for rigid pavement.
Load Transfer Coefficient, J
The load transfer coefficient “J” is a factor used in rigid pavement design to account for the ability of a concrete pavement structure to transfer (distribute) load across joints and cracks. Load transfer is important to pavement longevity. Load transfer can be made by load transfer devices and aggregate interlock. Dowel bars provide a mechanical connection between slabs without restricting horizontal joint movement. Reliance on aggregate interlock without dowels is acceptable on low-volume and secondary road systems. ACPA (American Concrete Pavement Association) advises to use dowels for a 20cm thick pavement and ESAL over 5 million. Road transfer coefficient of “3.2” (Table 7.10.10) was used for the project roads.
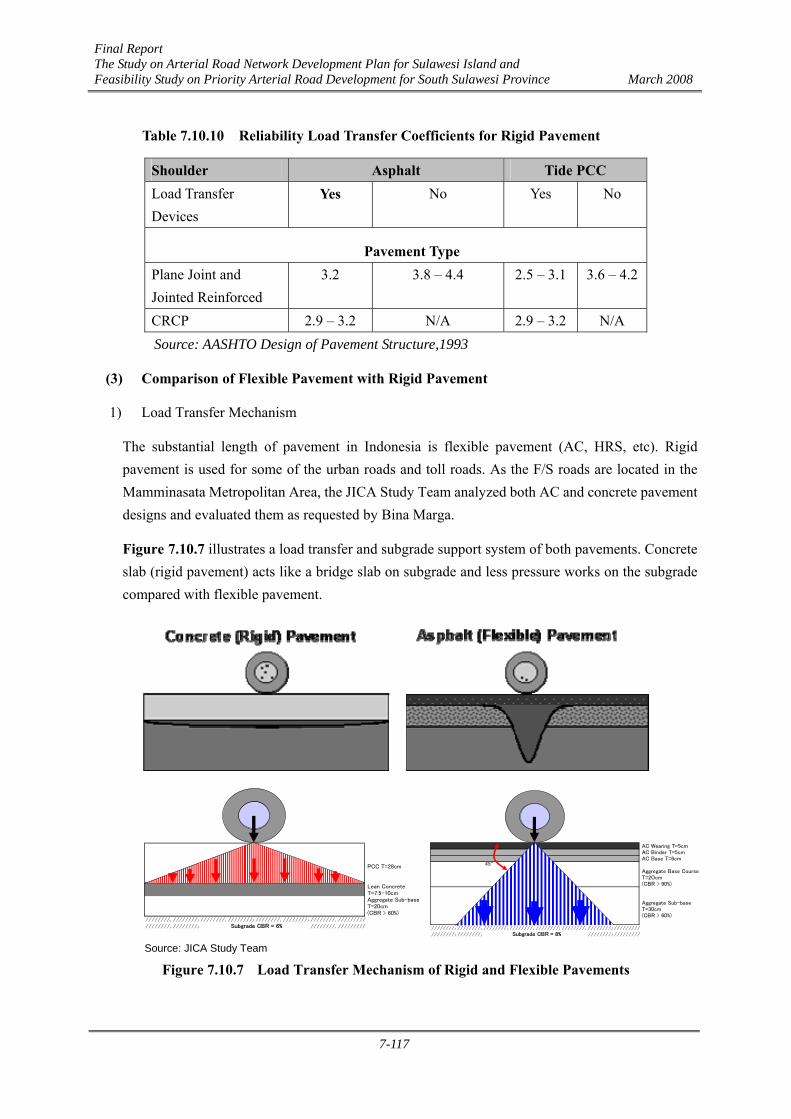
Final Report The Study on Arterial Road Network Development Plan for Sulawesi Island and Feasibility Study on Priority Arterial Road Development for South Sulawesi Province March 2008
7-117
Table 7.10.10 Reliability Load Transfer Coefficients for Rigid Pavement
Shoulder Asphalt Tide PCC Load Transfer Devices
Yes No Yes No
Pavement Type Plane Joint and Jointed Reinforced
3.2 3.8 – 4.4
2.5 – 3.1 3.6 – 4.2
CRCP 2.9 – 3.2 N/A 2.9 – 3.2 N/A Source: AASHTO Design of Pavement Structure,1993
(3) Comparison of Flexible Pavement with Rigid Pavement
1) Load Transfer Mechanism
The substantial length of pavement in Indonesia is flexible pavement (AC, HRS, etc). Rigid pavement is used for some of the urban roads and toll roads. As the F/S roads are located in the Mamminasata Metropolitan Area, the JICA Study Team analyzed both AC and concrete pavement designs and evaluated them as requested by Bina Marga.
Figure 7.10.7 illustrates a load transfer and subgrade support system of both pavements. Concrete slab (rigid pavement) acts like a bridge slab on subgrade and less pressure works on the subgrade compared with flexible pavement.
Source: JICA Study Team
PCC T=28cm
Lean Concrete T=7.5-10cm Aggregate Sub-base T=20cm (CBR > 60%)
////////////////////////////////////////////////////////////////////////////////////////// ////////////////// Subgrade CBR = 6%
AC Wearing T=5cm AC Binder T=5cm AC Base T=6cm
Aggregate Base Course T=20cm (CBR > 90%)
Aggregate Sub-base T=30cm (CBR > 60%)
////////////////////////////////////////////////////////////////////////////////////////// ////////////////// Subgrade CBR = 8%
45o
Figure 7.10.7 Load Transfer Mechanism of Rigid and Flexible Pavements
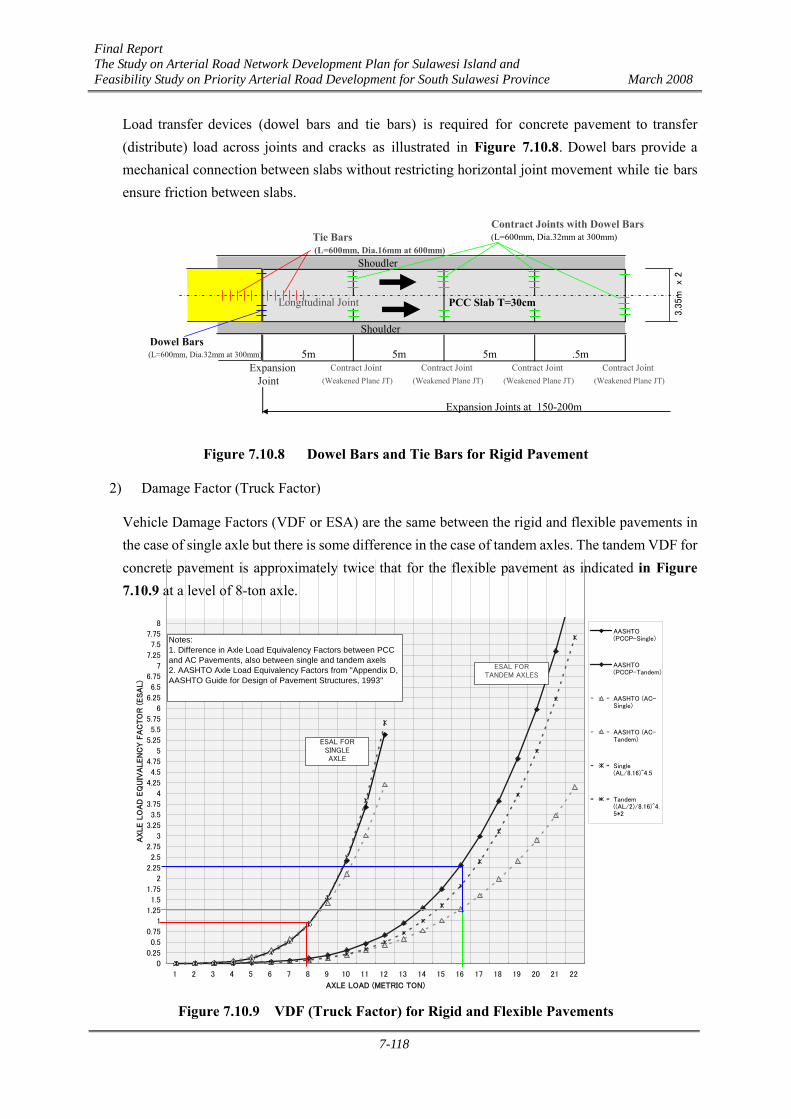
Final Report The Study on Arterial Road Network Development Plan for Sulawesi Island and Feasibility Study on Priority Arterial Road Development for South Sulawesi Province March 2008
7-118
Load transfer devices (dowel bars and tie bars) is required for concrete pavement to transfer (distribute) load across joints and cracks as illustrated in Figure 7.10.8. Dowel bars provide a mechanical connection between slabs without restricting horizontal joint movement while tie bars ensure friction between slabs.
Contract Joints with Dowel Bars Tie Bars (L=600mm, Dia.32mm at 300mm) (L=600mm, Dia.16mm at 600mm)
Shoudler
Longitudinal Joint PCC Slab T=30cm
Shoulder Dowel Bars (L=600mm, Dia.32mm at 300mm)
Expansion Contract Joint Contract Joint Contract Joint Contract Joint Joint (Weakened Plane JT) (Weakened Plane JT) (Weakened Plane JT) (Weakened Plane JT)
Expansion Joints at 150-200m
5m 5m 5m .5m
3.3
5m
x 2
Figure 7.10.8 Dowel Bars and Tie Bars for Rigid Pavement
2) Damage Factor (Truck Factor)
Vehicle Damage Factors (VDF or ESA) are the same between the rigid and flexible pavements in the case of single axle but there is some difference in the case of tandem axles. The tandem VDF for concrete pavement is approximately twice that for the flexible pavement as indicated in Figure 7.10.9 at a level of 8-ton axle.
0
0.25
0.5
0.75
1
1.25
1.5
1.75
2
2.25
2.5
2.75
3
3.25
3.5
3.75
4
4.25
4.5
4.75
5
5.25
5.5
5.75
6
6.25
6.5
6.75
7
7.25
7.5
7.75
8
1 2 3 4 5 6 7 8 9 10 11 12 13 14 15 16 17 18 19 20 21 22
AXLE LOAD (METRIC TON)
AXLE L
OA
D E
QU
IVA
LEN
CY F
AC
TO
R (
ESA
L)
AASHTO(PCCP-Single)
AASHTO(PCCP-Tandem)
AASHTO (AC-Single)
AASHTO (AC-Tandem)
Single(AL/8.16)^4.5
Tandem((AL/2)/8.16)^4.5*2
Notes:1. Difference in Axle Load Equivalency Factors between PCCand AC Pavements, also between single and tandem axels2. AASHTO Axle Load Equivalency Factors from "Appendix D,AASHTO Guide for Design of Pavement Structures, 1993"
ESAL FORSINGLEAXLE
ESAL FORTANDEM AXLES
Figure 7.10.9 VDF (Truck Factor) for Rigid and Flexible Pavements
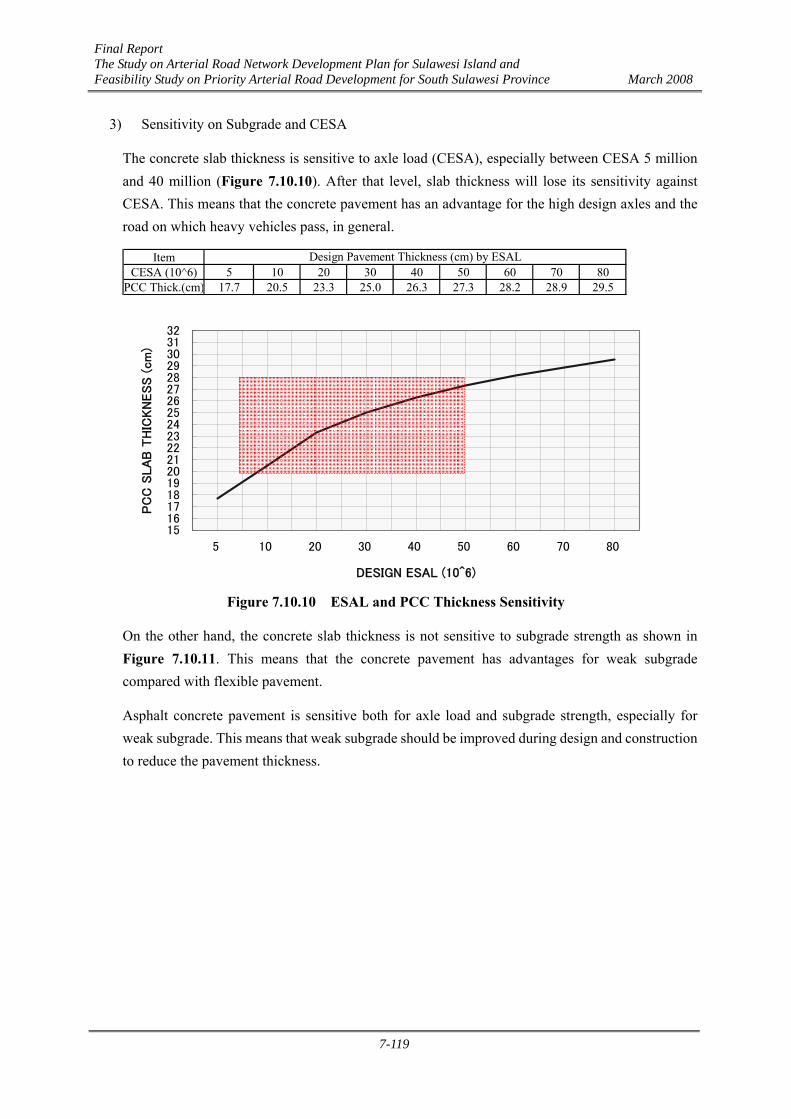
Final Report The Study on Arterial Road Network Development Plan for Sulawesi Island and Feasibility Study on Priority Arterial Road Development for South Sulawesi Province March 2008
7-119
3) Sensitivity on Subgrade and CESA
The concrete slab thickness is sensitive to axle load (CESA), especially between CESA 5 million and 40 million (Figure 7.10.10). After that level, slab thickness will lose its sensitivity against CESA. This means that the concrete pavement has an advantage for the high design axles and the road on which heavy vehicles pass, in general.
ItemCESA (10^6) 5 10 20 30 40 50 60 70 80
PCC Thick.(cm) 17.7 20.5 23.3 25.0 26.3 27.3 28.2 28.9 29.5
Design Pavement Thickness (cm) by ESAL
151617181920212223242526272829303132
5 10 20 30 40 50 60 70 80
DESIGN ESAL (10^6)
PC
C S
LA
B T
HIC
KN
ESS
(cm
)
Figure 7.10.10 ESAL and PCC Thickness Sensitivity
On the other hand, the concrete slab thickness is not sensitive to subgrade strength as shown in Figure 7.10.11. This means that the concrete pavement has advantages for weak subgrade compared with flexible pavement.
Asphalt concrete pavement is sensitive both for axle load and subgrade strength, especially for weak subgrade. This means that weak subgrade should be improved during design and construction to reduce the pavement thickness.
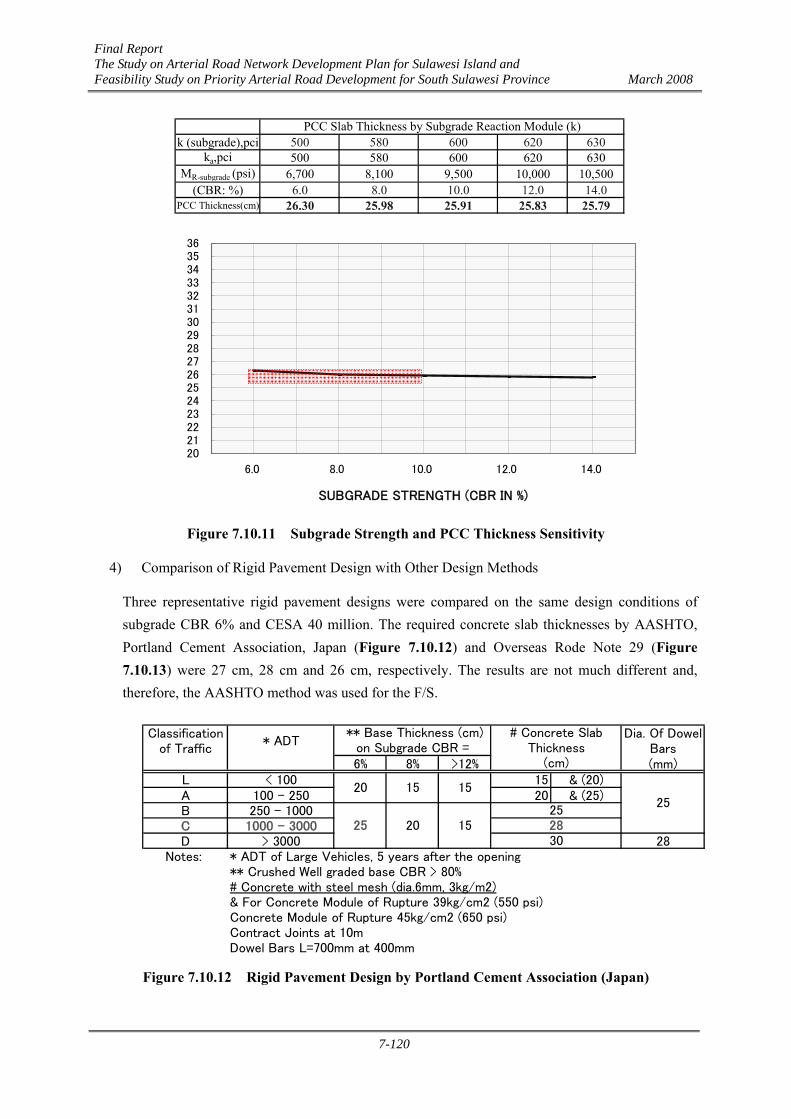
Final Report The Study on Arterial Road Network Development Plan for Sulawesi Island and Feasibility Study on Priority Arterial Road Development for South Sulawesi Province March 2008
7-120
k (subgrade),pci 500 580 600 620 630ka,pci 500 580 600 620 630
MR-subgrade (psi) 6,700 8,100 9,500 10,000 10,500(CBR: %) 6.0 8.0 10.0 12.0 14.0
PCC Thickness(cm) 26.30 25.98 25.91 25.83 25.79
PCC Slab Thickness by Subgrade Reaction Module (k)
2021222324252627282930313233343536
6.0 8.0 10.0 12.0 14.0
SUBGRADE STRENGTH (CBR IN %)
Figure 7.10.11 Subgrade Strength and PCC Thickness Sensitivity
4) Comparison of Rigid Pavement Design with Other Design Methods
Three representative rigid pavement designs were compared on the same design conditions of subgrade CBR 6% and CESA 40 million. The required concrete slab thicknesses by AASHTO, Portland Cement Association, Japan (Figure 7.10.12) and Overseas Rode Note 29 (Figure 7.10.13) were 27 cm, 28 cm and 26 cm, respectively. The results are not much different and, therefore, the AASHTO method was used for the F/S.
Classificationof Traffic
* ADTDia. Of Dowel
Bars6% 8% >12% (mm)
L < 100 15 & (20)A 100 - 250 20 & (25)B 250 - 1000C 1000 - 3000D > 3000 28
Notes: * ADT of Large Vehicles, 5 years after the opening** Crushed Well graded base CBR > 80%# Concrete with steel mesh (dia.6mm, 3kg/m2)& For Concrete Module of Rupture 39kg/cm2 (550 psi)Concrete Module of Rupture 45kg/cm2 (650 psi)Contract Joints at 10mDowel Bars L=700mm at 400mm
# Concrete SlabThickness
** Base Thickness (cm)on Subgrade CBR =
20 15 15
(cm)
25
25 20 15252830
Figure 7.10.12 Rigid Pavement Design by Portland Cement Association (Japan)
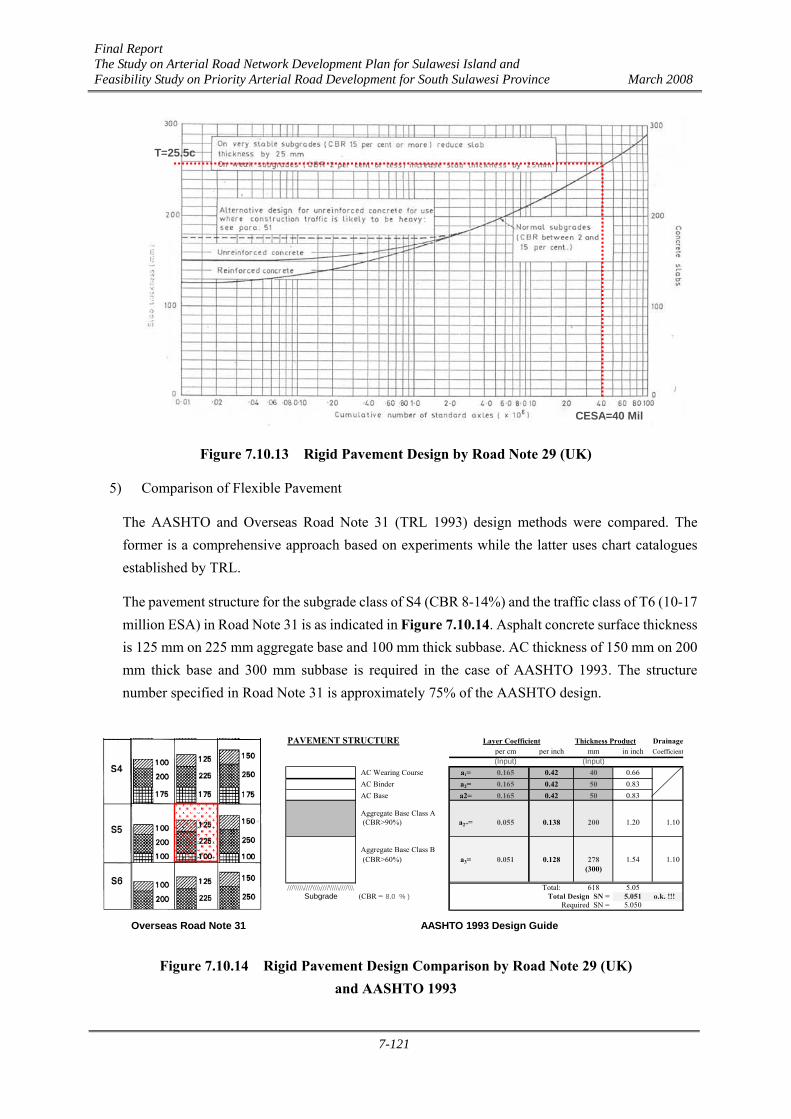
Final Report The Study on Arterial Road Network Development Plan for Sulawesi Island and Feasibility Study on Priority Arterial Road Development for South Sulawesi Province March 2008
7-121
T=25.5c
CESA=40 Mil
Figure 7.10.13 Rigid Pavement Design by Road Note 29 (UK)
5) Comparison of Flexible Pavement
The AASHTO and Overseas Road Note 31 (TRL 1993) design methods were compared. The former is a comprehensive approach based on experiments while the latter uses chart catalogues established by TRL.
The pavement structure for the subgrade class of S4 (CBR 8-14%) and the traffic class of T6 (10-17 million ESA) in Road Note 31 is as indicated in Figure 7.10.14. Asphalt concrete surface thickness is 125 mm on 225 mm aggregate base and 100 mm thick subbase. AC thickness of 150 mm on 200 mm thick base and 300 mm subbase is required in the case of AASHTO 1993. The structure number specified in Road Note 31 is approximately 75% of the AASHTO design.
Overseas Road Note 31 AASHTO 1993 Design Guide
PAVEMENT STRUCTURE Thickness Product Drainageper cm per inch mm in inch Coefficient(Input) (Input)
AC Wearing Course a1= 0.165 0.42 40 0.66 AC Binder a2= 0.165 0.42 50 0.83 AC Base a2= 0.165 0.42 50 0.83
Aggregate Base Class A (CBR>90%) a2"= 0.055 0.138 200 1.20 1.10
Aggregate Base Class B (CBR>60%) a3= 0.051 0.128 278 1.54 1.10
(300)
///\\\\\////\\\\////\\\\\////\\\ Total: 618 5.05(CBR = 8.0 % ) Total Design SN = 5.051 o.k. !!!
Required SN = 5.050Subgrade
Layer Coefficient
Figure 7.10.14 Rigid Pavement Design Comparison by Road Note 29 (UK) and AASHTO 1993
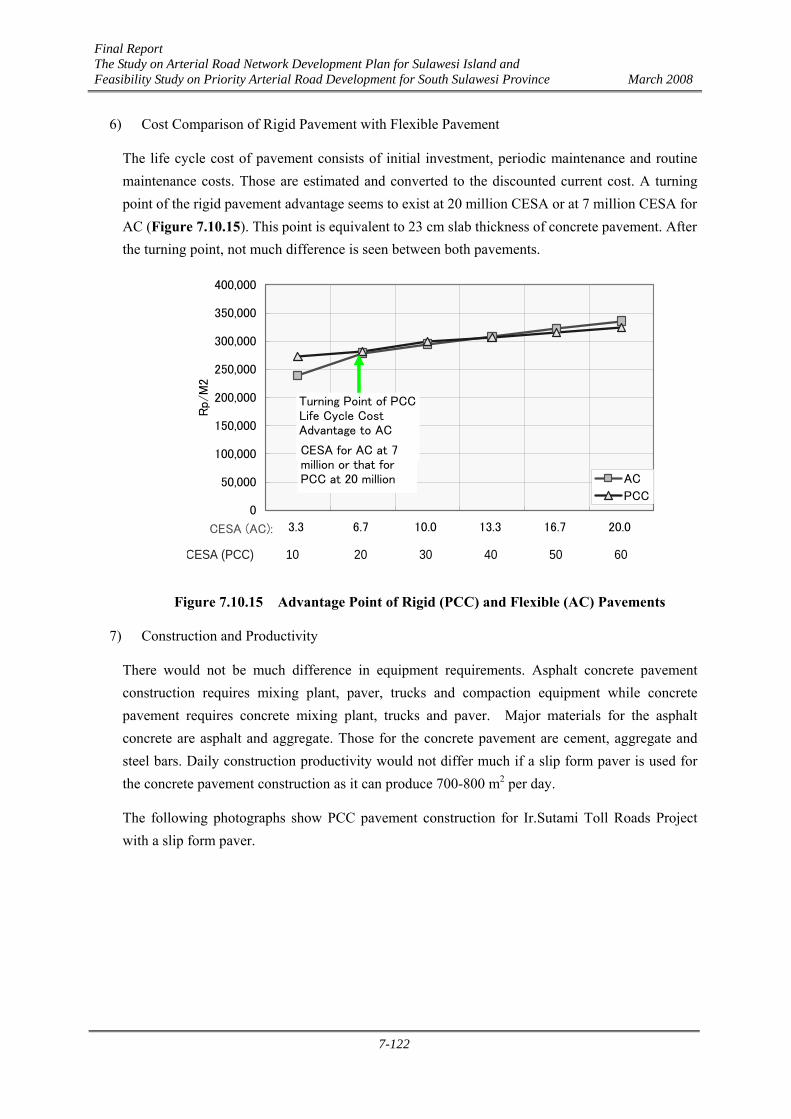
Final Report The Study on Arterial Road Network Development Plan for Sulawesi Island and Feasibility Study on Priority Arterial Road Development for South Sulawesi Province March 2008
7-122
6) Cost Comparison of Rigid Pavement with Flexible Pavement
The life cycle cost of pavement consists of initial investment, periodic maintenance and routine maintenance costs. Those are estimated and converted to the discounted current cost. A turning point of the rigid pavement advantage seems to exist at 20 million CESA or at 7 million CESA for AC (Figure 7.10.15). This point is equivalent to 23 cm slab thickness of concrete pavement. After the turning point, not much difference is seen between both pavements.
0
50,000
100,000
150,000
200,000
250,000
300,000
350,000
400,000
3.3 6.7 10.0 13.3 16.7 20.0CESA (AC):
Rp/M
2
AC
PCC
CESA (PCC) 10 20 30 40 50 60
Turning Point of PCCLife Cycle CostAdvantage to AC
CESA for AC at 7million or that forPCC at 20 million
Figure 7.10.15 Advantage Point of Rigid (PCC) and Flexible (AC) Pavements
7) Construction and Productivity
There would not be much difference in equipment requirements. Asphalt concrete pavement construction requires mixing plant, paver, trucks and compaction equipment while concrete pavement requires concrete mixing plant, trucks and paver. Major materials for the asphalt concrete are asphalt and aggregate. Those for the concrete pavement are cement, aggregate and steel bars. Daily construction productivity would not differ much if a slip form paver is used for the concrete pavement construction as it can produce 700-800 m2 per day.
The following photographs show PCC pavement construction for Ir.Sutami Toll Roads Project with a slip form paver.
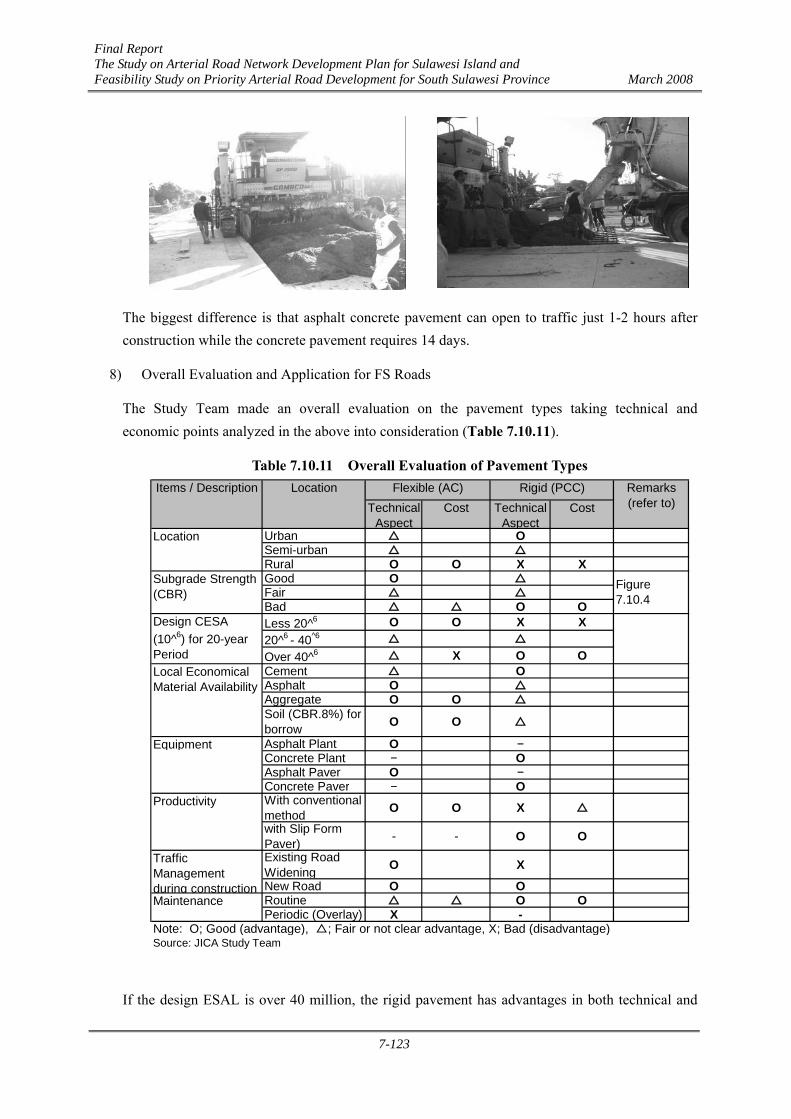
Final Report The Study on Arterial Road Network Development Plan for Sulawesi Island and Feasibility Study on Priority Arterial Road Development for South Sulawesi Province March 2008
7-123
To Makassar To Up-stream
The biggest difference is that asphalt concrete pavement can open to traffic just 1-2 hours after construction while the concrete pavement requires 14 days.
8) Overall Evaluation and Application for FS Roads
The Study Team made an overall evaluation on the pavement types taking technical and economic points analyzed in the above into consideration (Table 7.10.11).
Table 7.10.11 Overall Evaluation of Pavement Types Location
TechnicalAspect
Cost TechnicalAspect
Cost
Location Urban △ OSemi-urban △ △Rural O O X XGood O △Fair △ △Bad △ △ O OLess 20^6 O O X X20^6 - 40^6 △ △
Over 40^6 △ X O OCement △ OAsphalt O △Aggregate O O △Soil (CBR.8%) forborrow O O △
Equipment Asphalt Plant O -Concrete Plant - OAsphalt Paver O -Concrete Paver - O
Productivity With conventionalmethod O O X △
with Slip FormPaver) - - O OExisting RoadWidening O X
New Road O OMaintenance Routine △ △ O O
Periodic (Overlay) X -Note: O; Good (advantage), △; Fair or not clear advantage, X; Bad (disadvantage)Source: JICA Study Team
Remarks(refer to)
TrafficManagementduring construction
Figure7.10.4
Rigid (PCC)Items / Description Flexible (AC)
Design CESA(10^6) for 20-yearPeriodLocal EconomicalMaterial Availability
Subgrade Strength(CBR)
If the design ESAL is over 40 million, the rigid pavement has advantages in both technical and
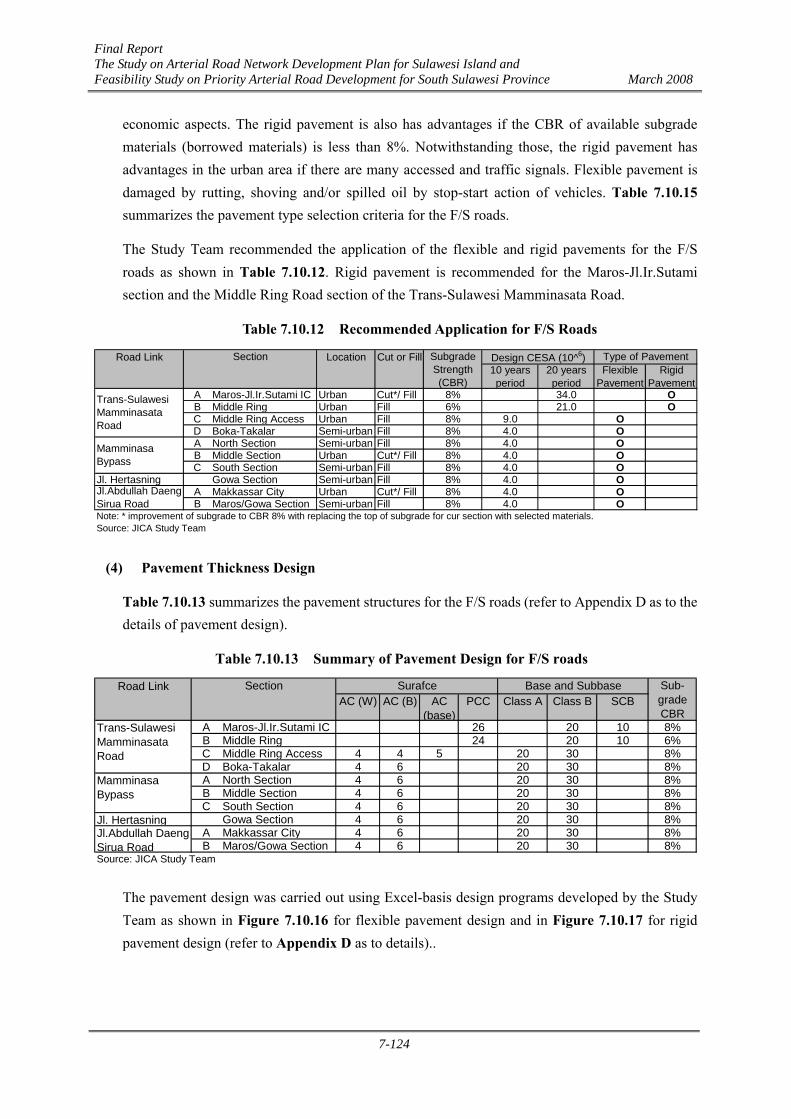
Final Report The Study on Arterial Road Network Development Plan for Sulawesi Island and Feasibility Study on Priority Arterial Road Development for South Sulawesi Province March 2008
7-124
economic aspects. The rigid pavement is also has advantages if the CBR of available subgrade materials (borrowed materials) is less than 8%. Notwithstanding those, the rigid pavement has advantages in the urban area if there are many accessed and traffic signals. Flexible pavement is damaged by rutting, shoving and/or spilled oil by stop-start action of vehicles. Table 7.10.15 summarizes the pavement type selection criteria for the F/S roads.
The Study Team recommended the application of the flexible and rigid pavements for the F/S roads as shown in Table 7.10.12. Rigid pavement is recommended for the Maros-Jl.Ir.Sutami section and the Middle Ring Road section of the Trans-Sulawesi Mamminasata Road.
Table 7.10.12 Recommended Application for F/S Roads
Road Link Location Cut or Fill10 yearsperiod
20 yearsperiod
FlexiblePavement
RigidPavement
A Maros-Jl.Ir.Sutami IC Urban Cut*/ Fill 8% 34.0 OB Middle Ring Urban Fill 6% 21.0 OC Middle Ring Access Urban Fill 8% 9.0 OD Boka-Takalar Semi-urban Fill 8% 4.0 OA North Section Semi-urban Fill 8% 4.0 OB Middle Section Urban Cut*/ Fill 8% 4.0 OC South Section Semi-urban Fill 8% 4.0 O
Jl. Hertasning Gowa Section Semi-urban Fill 8% 4.0 OA Makkassar City Urban Cut*/ Fill 8% 4.0 OB Maros/Gowa Section Semi-urban Fill 8% 4.0 O
Note: * improvement of subgrade to CBR 8% with replacing the top of subgrade for cur section with selected materials.Source: JICA Study Team
Trans-SulawesiMamminasataRoad
MamminasaBypass
Jl.Abdullah DaengSirua Road
Type of PavementSection Design CESA (10^6)SubgradeStrength(CBR)
(4) Pavement Thickness Design
Table 7.10.13 summarizes the pavement structures for the F/S roads (refer to Appendix D as to the details of pavement design).
Table 7.10.13 Summary of Pavement Design for F/S roads
Road LinkAC (W) AC (B) AC
(base)PCC Class A Class B SCB
A Maros-Jl.Ir.Sutami IC 26 20 10 8%B Middle Ring 24 20 10 6%C Middle Ring Access 4 4 5 20 30 8%D Boka-Takalar 4 6 20 30 8%A North Section 4 6 20 30 8%B Middle Section 4 6 20 30 8%C South Section 4 6 20 30 8%
Jl. Hertasning Gowa Section 4 6 20 30 8%A Makkassar City 4 6 20 30 8%B Maros/Gowa Section 4 6 20 30 8%
Source: JICA Study Team
Sub-gradeCBR
Trans-SulawesiMamminasataRoad
MamminasaBypass
Jl.Abdullah DaengSirua Road
Section Base and SubbaseSurafce
The pavement design was carried out using Excel-basis design programs developed by the Study Team as shown in Figure 7.10.16 for flexible pavement design and in Figure 7.10.17 for rigid pavement design (refer to Appendix D as to details)..
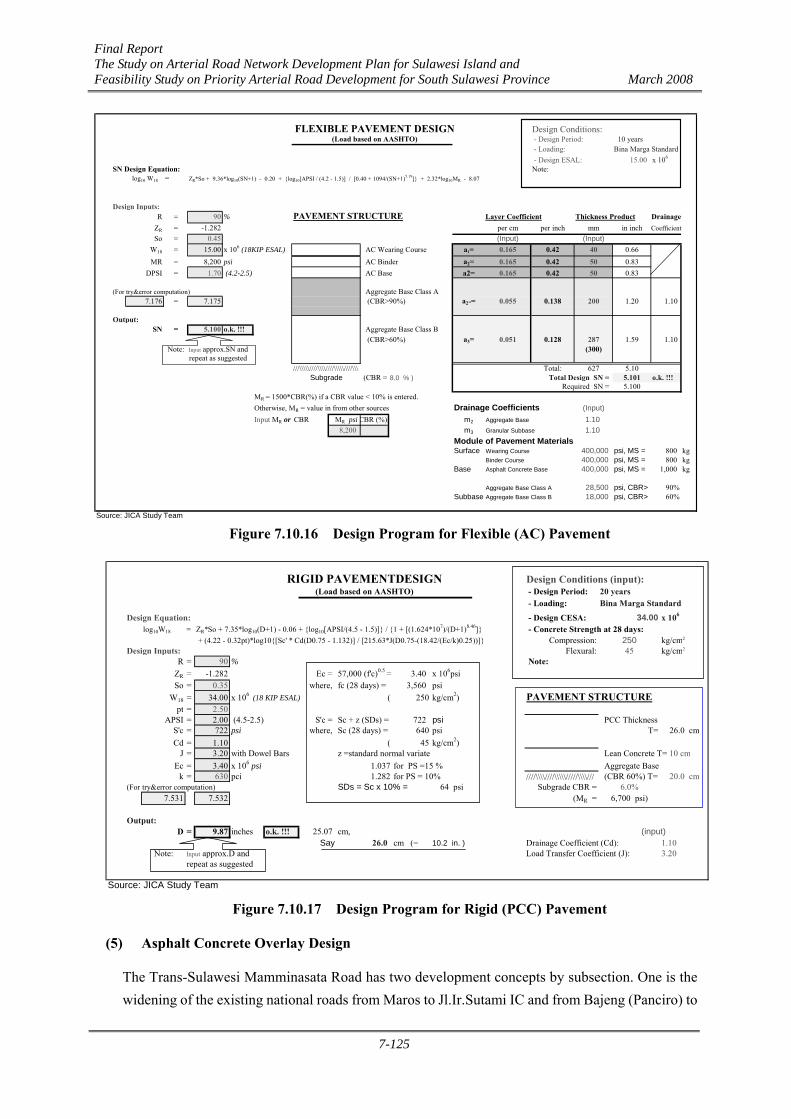
Final Report The Study on Arterial Road Network Development Plan for Sulawesi Island and Feasibility Study on Priority Arterial Road Development for South Sulawesi Province March 2008
7-125
FLEXIBLE PAVEMENT DESIGN Design Conditions:(Load based on AASHTO) - Design Period: 10 years
- Loading: Bina Marga Standard - Design ESAL: 15.00 x 10⁶
SN Design Equation: Note:log10 W18 = ZR*So + 9.36*log10(SN+1) - 0.20 + {log10[APSI / (4.2 - 1.5)] / [0.40 + 1094/(SN+1)5.19]} + 2.32*log10MR - 8.07
Design Inputs:R = 90 % PAVEMENT STRUCTURE Thickness Product Drainage
ZR = -1.282 per cm per inch mm in inch CoefficientSo = 0.45 (Input) (Input)
W18 = 15.00 x 10⁶ (18KIP ESAL) AC Wearing Course a1= 0.165 0.42 40 0.66MR = 8,200 psi AC Binder a2= 0.165 0.42 50 0.83
DPSI = 1.70 (4.2-2.5) AC Base a2= 0.165 0.42 50 0.83
(For try&error computation) Aggregate Base Class A7.176 = 7.175 (CBR>90%) a2"= 0.055 0.138 200 1.20 1.10
Output:SN = 5.100 o.k. !!! Aggregate Base Class B
(CBR>60%) a3= 0.051 0.128 287 1.59 1.10Note: Input approx.SN and (300)
repeat as suggested///\\\\\////\\\\////\\\\\////\\\ Total: 627 5.10
(CBR = 8.0 % ) Total Design SN = 5.101 o.k. !!!Required SN = 5.100
MR = 1500*CBR(%) if a CBR value < 10% is entered.Otherwise, MR = value in from other sources Drainage Coefficients (Input)Input MR or CBR MR psi CBR (%) m2 Aggregate Base 1.10
8,200 m3 Granular Subbase 1.10Module of Pavement MaterialsSurface Wearing Course 400,000 psi, MS = 800 kg
Binder Course 400,000 psi, MS = 800 kgBase Asphalt Concrete Base 400,000 psi, MS = 1,000 kg
Aggregate Base Class A 28,500 psi, CBR> 90%Subbase Aggregate Base Class B 18,000 psi, CBR> 60%
Source: JICA Study Team
Subgrade
Layer Coefficient
Figure 7.10.16 Design Program for Flexible (AC) Pavement
RIGID PAVEMENTDESIGN Design Conditions (input): (Load based on AASHTO) - Design Period: 20 years
- Loading: Bina Marga Standard
Design Equation: - Design CESA: 34.00 x 10⁶
log10W18 = ZR*So + 7.35*log10(D+1) - 0.06 + {log10[APSI/(4.5 - 1.5)]} / {1 + [(1.624*107)/(D+1)8.46]} - Concrete Strength at 28 days: + (4.22 - 0.32pt)*log10{[Sc' * Cd(D0.75 - 1.132)] / [215.63*J(D0.75-(18.42/(Ec/k)0.25))]} Compression: 250 kg/cm2
Design Inputs: Flexural: 45 kg/cm2
R = 90 % Note:ZR = -1.282 Ec = 57,000 (f'c)0.5 = 3.40 x 10⁶psiSo = 0.35 where, fc (28 days) = 3,560 psi
W18 = 34.00 x 10⁶ (18 KIP ESAL) ( 250 kg/cm2) PAVEMENT STRUCTUREpt = 2.50
APSI = 2.00 (4.5-2.5) S'c = Sc + z (SDs) = 722 psi PCC ThicknessS'c = 722 psi where, Sc (28 days) = 640 psi T= 26.0 cmCd = 1.10 ( 45 kg/cm2)
J = 3.20 with Dowel Bars z =standard normal variate Lean Concrete T= 10 cmEc = 3.40 x 10⁶ psi 1.037 for PS =15 % Aggregate Base
k = 630 pci 1.282 for PS = 10% ////\\\\////\\\\\/////\\\\/// (CBR 60%) T= 20.0 cm(For try&error computation) SDs = Sc x 10% = 64 psi Subgrade CBR = 6.0%
7.531 7.532 (MR = 6,700 psi)
Output:D = 9.87 inches o.k. !!! 25.07 cm,
Say 26.0 cm (= 10.2 in. ) Drainage Coefficient (Cd): 1.10Note: Input approx.D and Load Transfer Coefficient (J): 3.20
repeat as suggested
Source: JICA Study Team
(input)
Figure 7.10.17 Design Program for Rigid (PCC) Pavement
(5) Asphalt Concrete Overlay Design
The Trans-Sulawesi Mamminasata Road has two development concepts by subsection. One is the widening of the existing national roads from Maros to Jl.Ir.Sutami IC and from Bajeng (Panciro) to
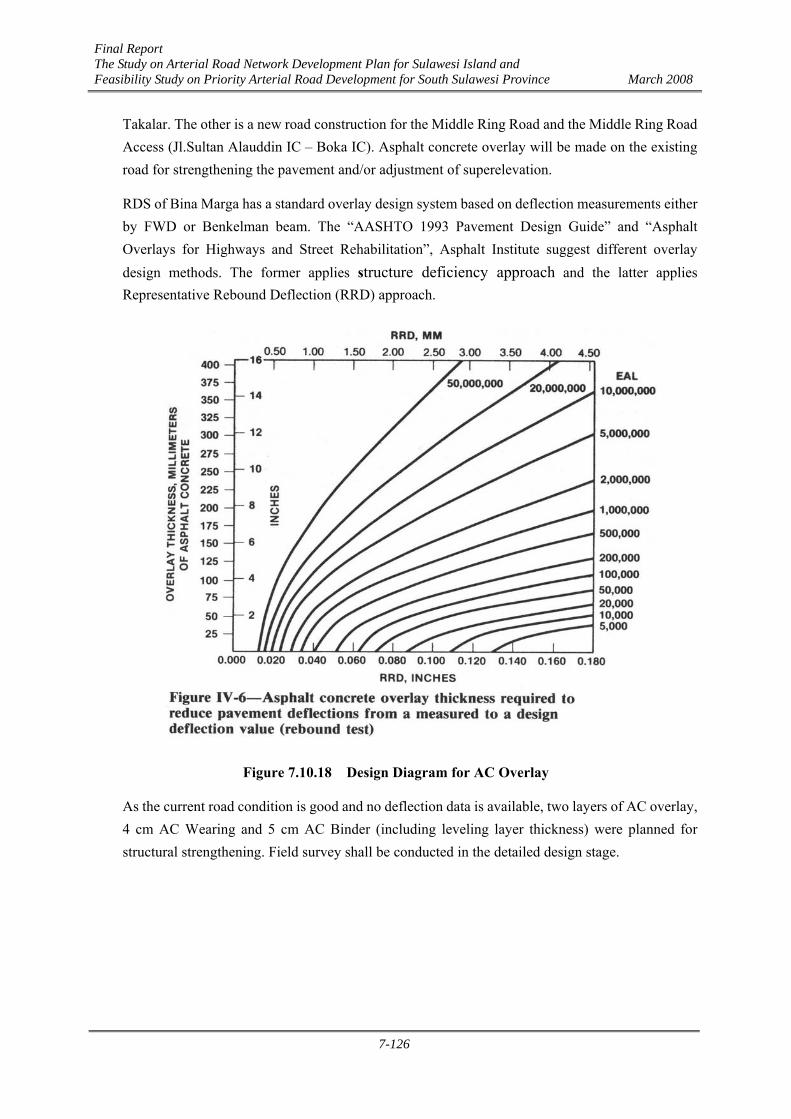
Final Report The Study on Arterial Road Network Development Plan for Sulawesi Island and Feasibility Study on Priority Arterial Road Development for South Sulawesi Province March 2008
7-126
Takalar. The other is a new road construction for the Middle Ring Road and the Middle Ring Road Access (Jl.Sultan Alauddin IC – Boka IC). Asphalt concrete overlay will be made on the existing road for strengthening the pavement and/or adjustment of superelevation.
RDS of Bina Marga has a standard overlay design system based on deflection measurements either by FWD or Benkelman beam. The “AASHTO 1993 Pavement Design Guide” and “Asphalt Overlays for Highways and Street Rehabilitation”, Asphalt Institute suggest different overlay design methods. The former applies structure deficiency approach and the latter applies Representative Rebound Deflection (RRD) approach.
Figure 7.10.18 Design Diagram for AC Overlay
As the current road condition is good and no deflection data is available, two layers of AC overlay, 4 cm AC Wearing and 5 cm AC Binder (including leveling layer thickness) were planned for structural strengthening. Field survey shall be conducted in the detailed design stage.
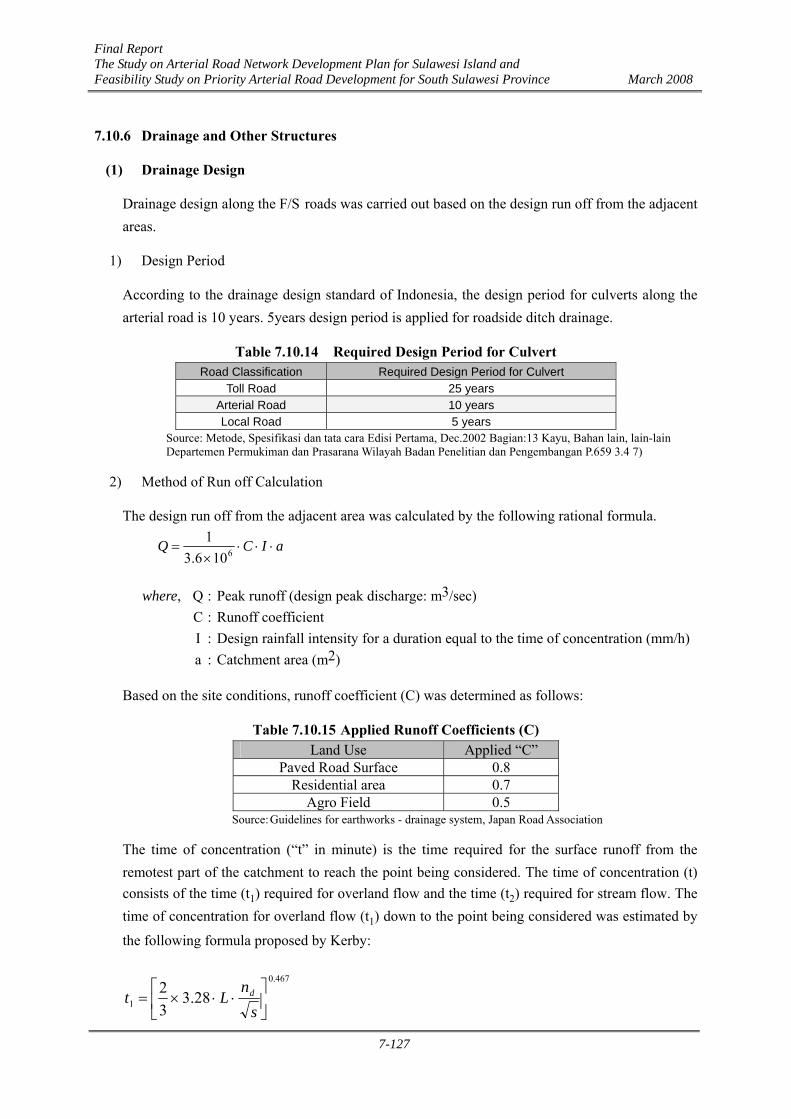
Final Report The Study on Arterial Road Network Development Plan for Sulawesi Island and Feasibility Study on Priority Arterial Road Development for South Sulawesi Province March 2008
7-127
7.10.6 Drainage and Other Structures
(1) Drainage Design
Drainage design along the F/S roads was carried out based on the design run off from the adjacent areas.
1) Design Period
According to the drainage design standard of Indonesia, the design period for culverts along the arterial road is 10 years. 5years design period is applied for roadside ditch drainage.
Table 7.10.14 Required Design Period for Culvert Road Classification Required Design Period for Culvert
Toll Road 25 years Arterial Road 10 years Local Road 5 years
Source: Metode, Spesifikasi dan tata cara Edisi Pertama, Dec.2002 Bagian:13 Kayu, Bahan lain, lain-lain Departemen Permukiman dan Prasarana Wilayah Badan Penelitian dan Pengembangan P.659 3.4 7)
2) Method of Run off Calculation
The design run off from the adjacent area was calculated by the following rational formula.
aICQ ⋅⋅⋅×
= 6106.31
where, Q : Peak runoff (design peak discharge: m3/sec) C : Runoff coefficient I : Design rainfall intensity for a duration equal to the time of concentration (mm/h) a : Catchment area (m2)
Based on the site conditions, runoff coefficient (C) was determined as follows:
Table 7.10.15 Applied Runoff Coefficients (C) Land Use Applied “C”
Paved Road Surface 0.8 Residential area 0.7
Agro Field 0.5 Source: Guidelines for earthworks - drainage system, Japan Road Association
The time of concentration (“t” in minute) is the time required for the surface runoff from the remotest part of the catchment to reach the point being considered. The time of concentration (t) consists of the time (t1) required for overland flow and the time (t2) required for stream flow. The time of concentration for overland flow (t1) down to the point being considered was estimated by
the following formula proposed by Kerby:
467.0
1 28.332
⎥⎦
⎤⎢⎣
⎡⋅⋅×=
sn
Lt d
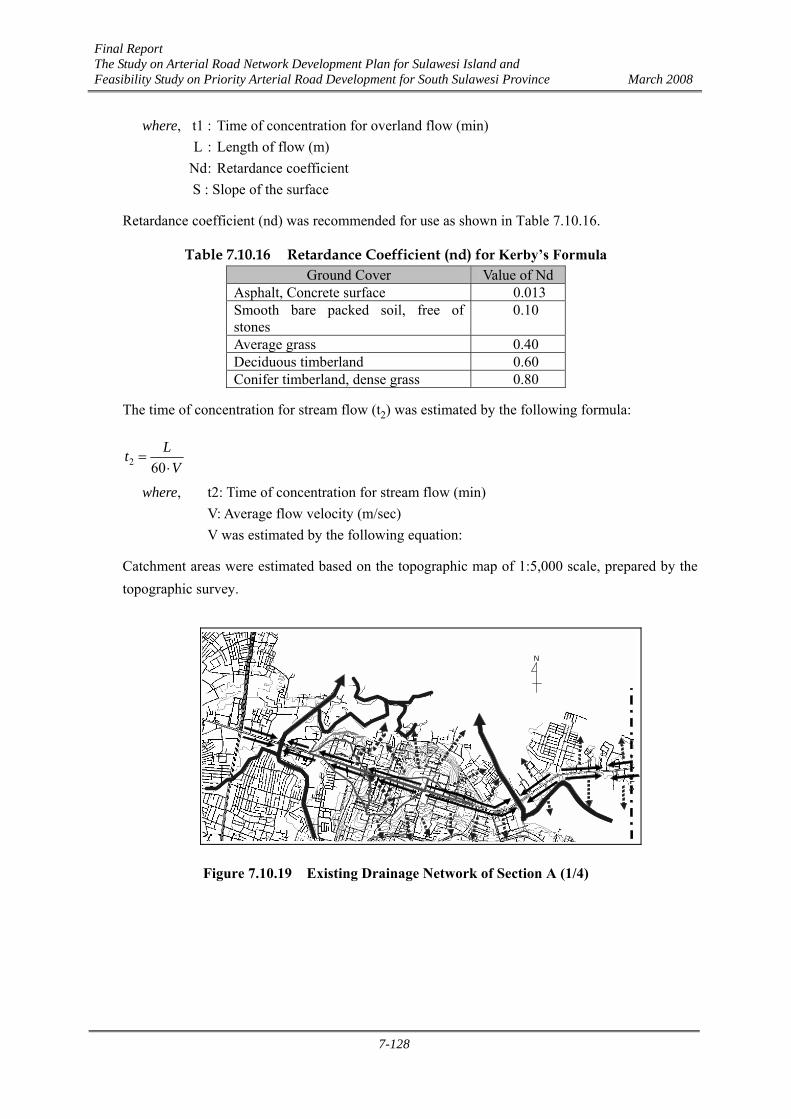
Final Report The Study on Arterial Road Network Development Plan for Sulawesi Island and Feasibility Study on Priority Arterial Road Development for South Sulawesi Province March 2008
7-128
where, t1 : Time of concentration for overland flow (min) L : Length of flow (m) Nd : Retardance coefficient S : Slope of the surface
Retardance coefficient (nd) was recommended for use as shown in Table 7.10.16.
Table 7.10.16 Retardance Coefficient (nd) for Kerby’s Formula Ground Cover Value of Nd
Asphalt, Concrete surface 0.013 Smooth bare packed soil, free of stones
0.10
Average grass 0.40 Deciduous timberland 0.60 Conifer timberland, dense grass 0.80
The time of concentration for stream flow (t2) was estimated by the following formula:
VLt⋅
=602
where, t2: Time of concentration for stream flow (min) V: Average flow velocity (m/sec) V was estimated by the following equation:
Catchment areas were estimated based on the topographic map of 1:5,000 scale, prepared by the topographic survey.
N
Figure 7.10.19 Existing Drainage Network of Section A (1/4)
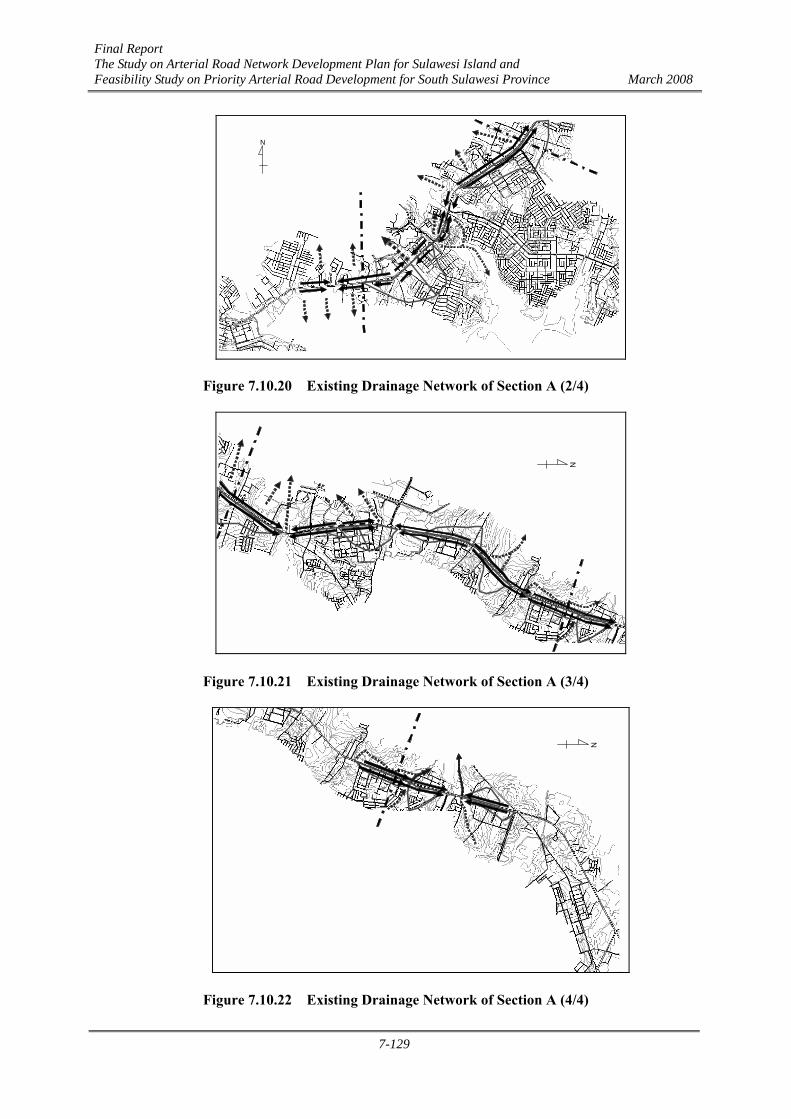
Final Report The Study on Arterial Road Network Development Plan for Sulawesi Island and Feasibility Study on Priority Arterial Road Development for South Sulawesi Province March 2008
7-129
N
Figure 7.10.20 Existing Drainage Network of Section A (2/4)
N
Figure 7.10.21 Existing Drainage Network of Section A (3/4)
N
Figure 7.10.22 Existing Drainage Network of Section A (4/4)
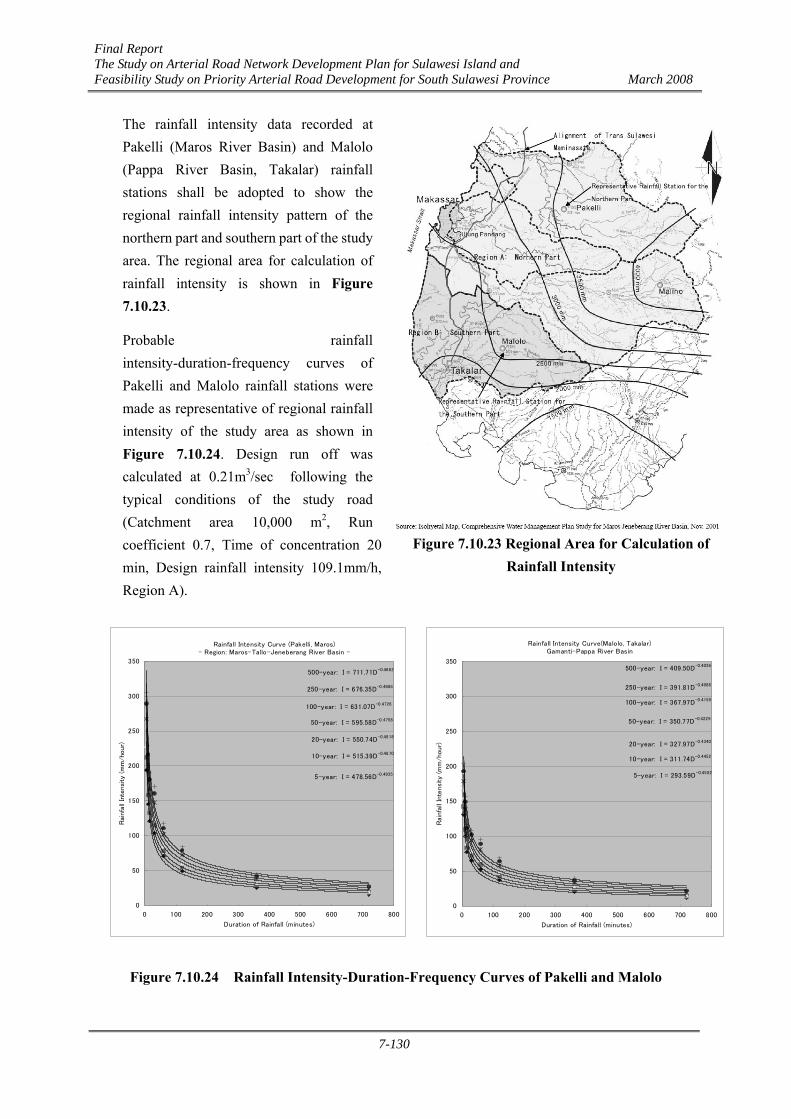
Final Report The Study on Arterial Road Network Development Plan for Sulawesi Island and Feasibility Study on Priority Arterial Road Development for South Sulawesi Province March 2008
7-130
The rainfall intensity data recorded at Pakelli (Maros River Basin) and Malolo (Pappa River Basin, Takalar) rainfall stations shall be adopted to show the regional rainfall intensity pattern of the northern part and southern part of the study area. The regional area for calculation of rainfall intensity is shown in Figure 7.10.23.
Probable rainfall intensity-duration-frequency curves of Pakelli and Malolo rainfall stations were made as representative of regional rainfall intensity of the study area as shown in Figure 7.10.24. Design run off was calculated at 0.21m3/sec following the typical conditions of the study road (Catchment area 10,000 m2, Run coefficient 0.7, Time of concentration 20 min, Design rainfall intensity 109.1mm/h, Region A).
Figure 7.10.24 Rainfall Intensity-Duration-Frequency Curves of Pakelli and Malolo
Rainfall Intensity Curve(Malolo, Takalar)Gamanti-Pappa River Basin
5-year: I = 293.59D-0.4582
10-year: I = 311.74D-0.4452
20-year: I = 327.97D-0.4340
50-year: I = 350.77D-0.4229
100-year: I = 367.97D-0.4159
250-year: I = 391.81D-0.4086
500-year: I = 409.50D-0.4036
0
50
100
150
200
250
300
350
0 100 200 300 400 500 600 700 800
Duration of Rainfall (minutes)
Rain
fall
Inte
nsi
ty (
mm
/hour)
Rainfall Intensity Curve (Pakelli, Maros)- Region: Maros-Tallo-Jeneberang River Basin -
5-year: I = 478.56D-0.4935
10-year: I = 515.39D-0.4870
20-year: I = 550.74D-0.4818
50-year: I = 595.58D-0.4758
100-year: I = 631.07D-0.4726
250-year: I = 676.35D-0.4685
500-year: I = 711.71D-0.4662
0
50
100
150
200
250
300
350
0 100 200 300 400 500 600 700 800
Duration of Rainfall (minutes)
Rai
nfa
ll In
tensi
ty (
mm
/ho
ur)
Figure 7.10.23 Regional Area for Calculation of Rainfall Intensity
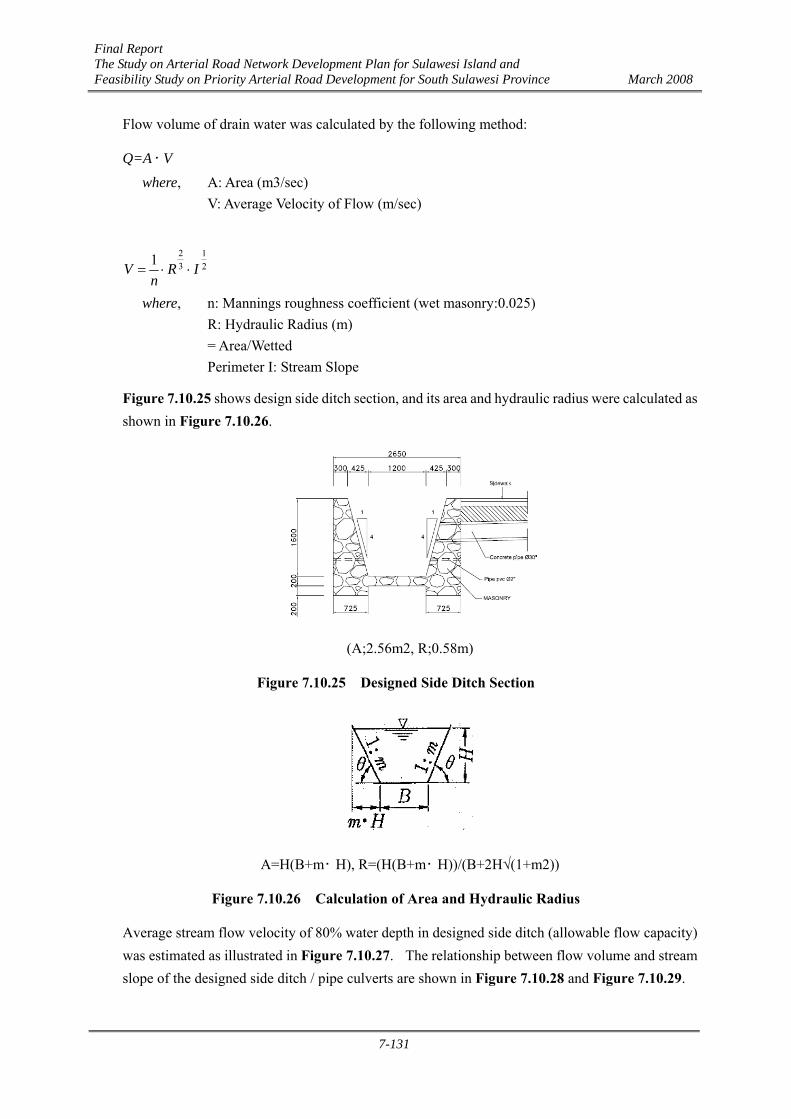
Final Report The Study on Arterial Road Network Development Plan for Sulawesi Island and Feasibility Study on Priority Arterial Road Development for South Sulawesi Province March 2008
7-131
Flow volume of drain water was calculated by the following method:
・Q=A V
where, A: Area (m3/sec) V: Average Velocity of Flow (m/sec)
21
321 IR
nV ⋅⋅=
where, n: Mannings roughness coefficient (wet masonry:0.025) R: Hydraulic Radius (m) = Area/Wetted Perimeter I: Stream Slope
Figure 7.10.25 shows design side ditch section, and its area and hydraulic radius were calculated as shown in Figure 7.10.26.
(A;2.56m2, R;0.58m)
Figure 7.10.25 Designed Side Ditch Section
A=H(B+m・ H), R=(H(B+m・ H))/(B+2H√(1+m2))
Figure 7.10.26 Calculation of Area and Hydraulic Radius
Average stream flow velocity of 80% water depth in designed side ditch (allowable flow capacity) was estimated as illustrated in Figure 7.10.27. The relationship between flow volume and stream slope of the designed side ditch / pipe culverts are shown in Figure 7.10.28 and Figure 7.10.29.
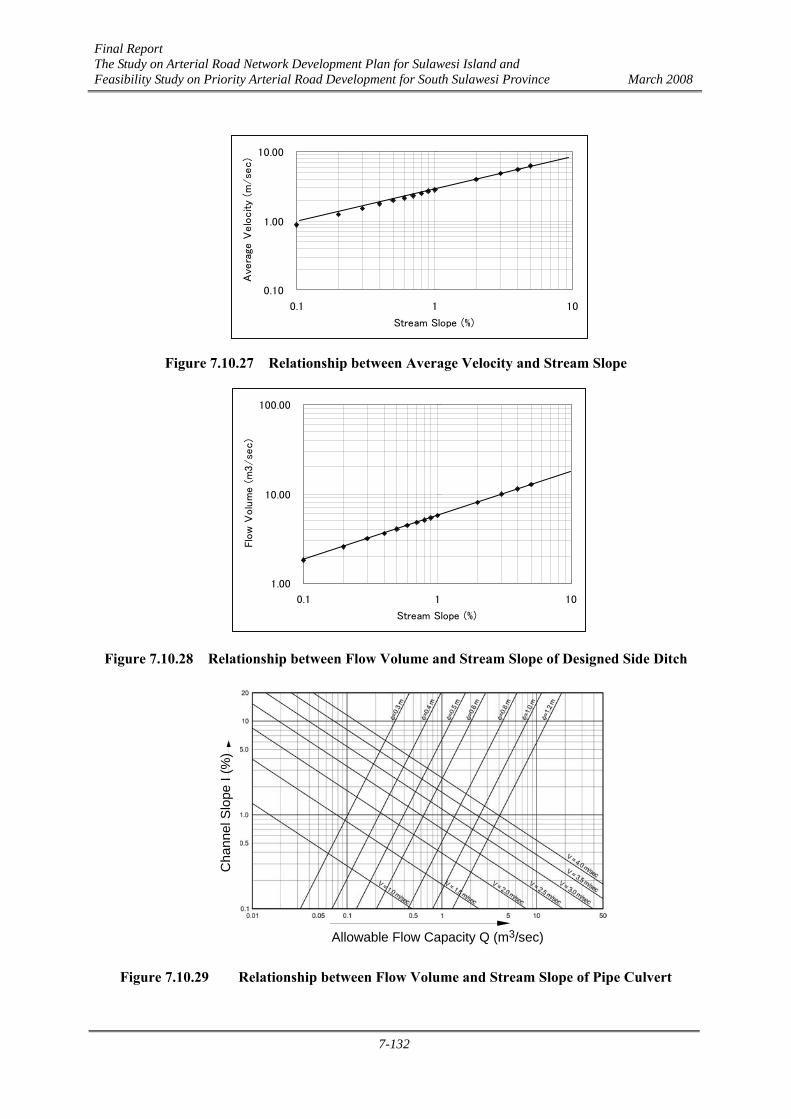
Final Report The Study on Arterial Road Network Development Plan for Sulawesi Island and Feasibility Study on Priority Arterial Road Development for South Sulawesi Province March 2008
7-132
Figure 7.10.27 Relationship between Average Velocity and Stream Slope
Figure 7.10.28 Relationship between Flow Volume and Stream Slope of Designed Side Ditch
Figure 7.10.29 Relationship between Flow Volume and Stream Slope of Pipe Culvert
Allowable Flow Capacity Q (m3/sec)
Cha
nnel
Slo
pe I
(%)
0.10
1.00
10.00
0.1 1 10
Stream Slope (%)
Ave
rage
Velo
city
(m/se
c)
1.00
10.00
100.00
0.1 1 10
Stream Slope (%)
Flo
w V
olu
me (
m3/se
c)
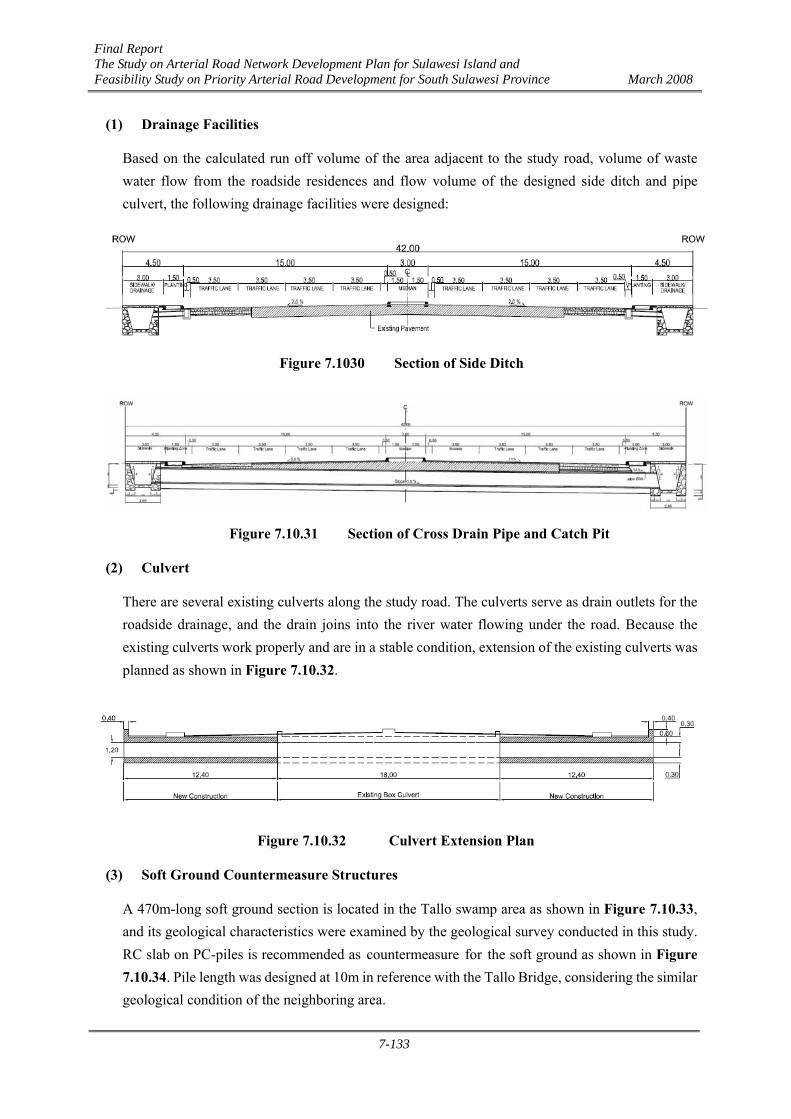
Final Report The Study on Arterial Road Network Development Plan for Sulawesi Island and Feasibility Study on Priority Arterial Road Development for South Sulawesi Province March 2008
7-133
(1) Drainage Facilities
Based on the calculated run off volume of the area adjacent to the study road, volume of waste water flow from the roadside residences and flow volume of the designed side ditch and pipe culvert, the following drainage facilities were designed:
Figure 7.1030 Section of Side Ditch
Figure 7.10.31 Section of Cross Drain Pipe and Catch Pit
(2) Culvert
There are several existing culverts along the study road. The culverts serve as drain outlets for the roadside drainage, and the drain joins into the river water flowing under the road. Because the existing culverts work properly and are in a stable condition, extension of the existing culverts was planned as shown in Figure 7.10.32.
Figure 7.10.32 Culvert Extension Plan
(3) Soft Ground Countermeasure Structures
A 470m-long soft ground section is located in the Tallo swamp area as shown in Figure 7.10.33, and its geological characteristics were examined by the geological survey conducted in this study. RC slab on PC-piles is recommended as countermeasure for the soft ground as shown in Figure 7.10.34. Pile length was designed at 10m in reference with the Tallo Bridge, considering the similar geological condition of the neighboring area.
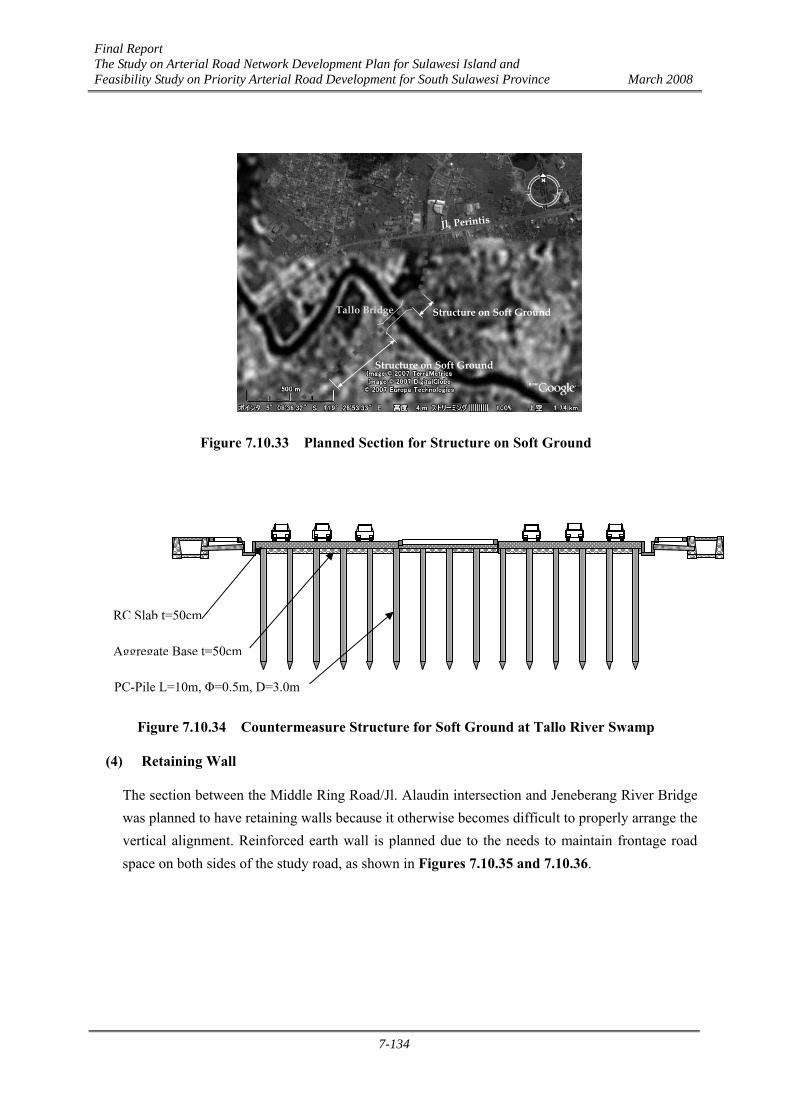
Final Report The Study on Arterial Road Network Development Plan for Sulawesi Island and Feasibility Study on Priority Arterial Road Development for South Sulawesi Province March 2008
7-134
Tallo Bridge
Jl. Perintis
Structure on Soft Ground
Structure on Soft GroundTallo Bridge
Jl. Perintis
Structure on Soft Ground
Structure on Soft Ground
Figure 7.10.33 Planned Section for Structure on Soft Ground
Figure 7.10.34 Countermeasure Structure for Soft Ground at Tallo River Swamp
(4) Retaining Wall
The section between the Middle Ring Road/Jl. Alaudin intersection and Jeneberang River Bridge was planned to have retaining walls because it otherwise becomes difficult to properly arrange the vertical alignment. Reinforced earth wall is planned due to the needs to maintain frontage road space on both sides of the study road, as shown in Figures 7.10.35 and 7.10.36.
RC Slab t=50cm
Aggregate Base t=50cm
PC-Pile L=10m, Φ=0.5m, D=3.0m
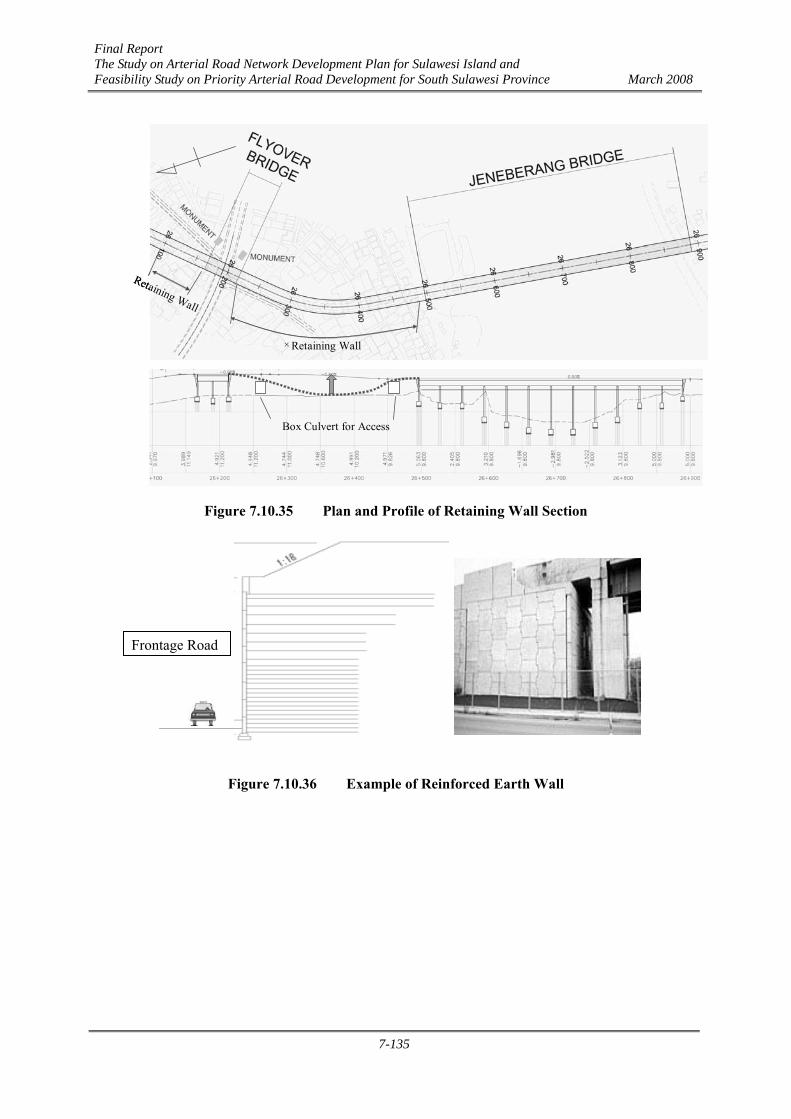
Final Report The Study on Arterial Road Network Development Plan for Sulawesi Island and Feasibility Study on Priority Arterial Road Development for South Sulawesi Province March 2008
7-135
Retaining Wall
Box Culvert for Access
Retaining Wall
Retaining Wall
Box Culvert for Access
Retaining Wall
Figure 7.10.35 Plan and Profile of Retaining Wall Section
Figure 7.10.36 Example of Reinforced Earth Wall
Frontage Road
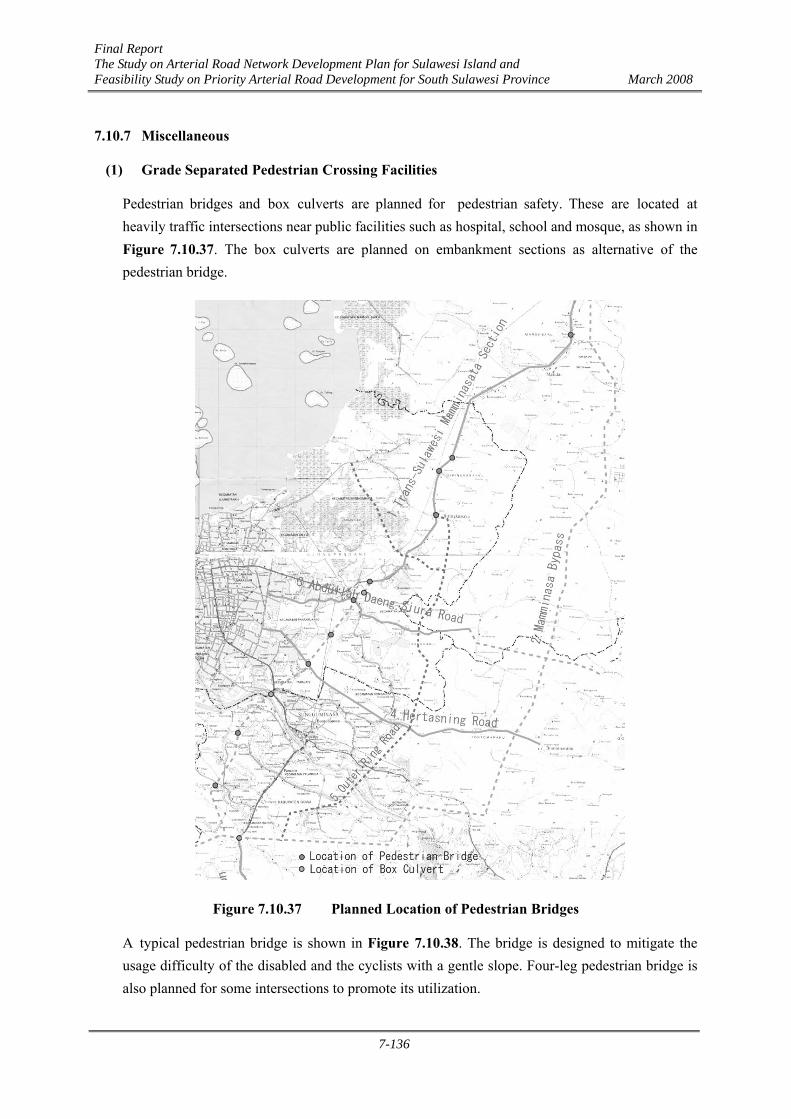
Final Report The Study on Arterial Road Network Development Plan for Sulawesi Island and Feasibility Study on Priority Arterial Road Development for South Sulawesi Province March 2008
7-136
7.10.7 Miscellaneous
(1) Grade Separated Pedestrian Crossing Facilities
Pedestrian bridges and box culverts are planned for pedestrian safety. These are located at heavily traffic intersections near public facilities such as hospital, school and mosque, as shown in Figure 7.10.37. The box culverts are planned on embankment sections as alternative of the pedestrian bridge.
Figure 7.10.37 Planned Location of Pedestrian Bridges
A typical pedestrian bridge is shown in Figure 7.10.38. The bridge is designed to mitigate the usage difficulty of the disabled and the cyclists with a gentle slope. Four-leg pedestrian bridge is also planned for some intersections to promote its utilization.
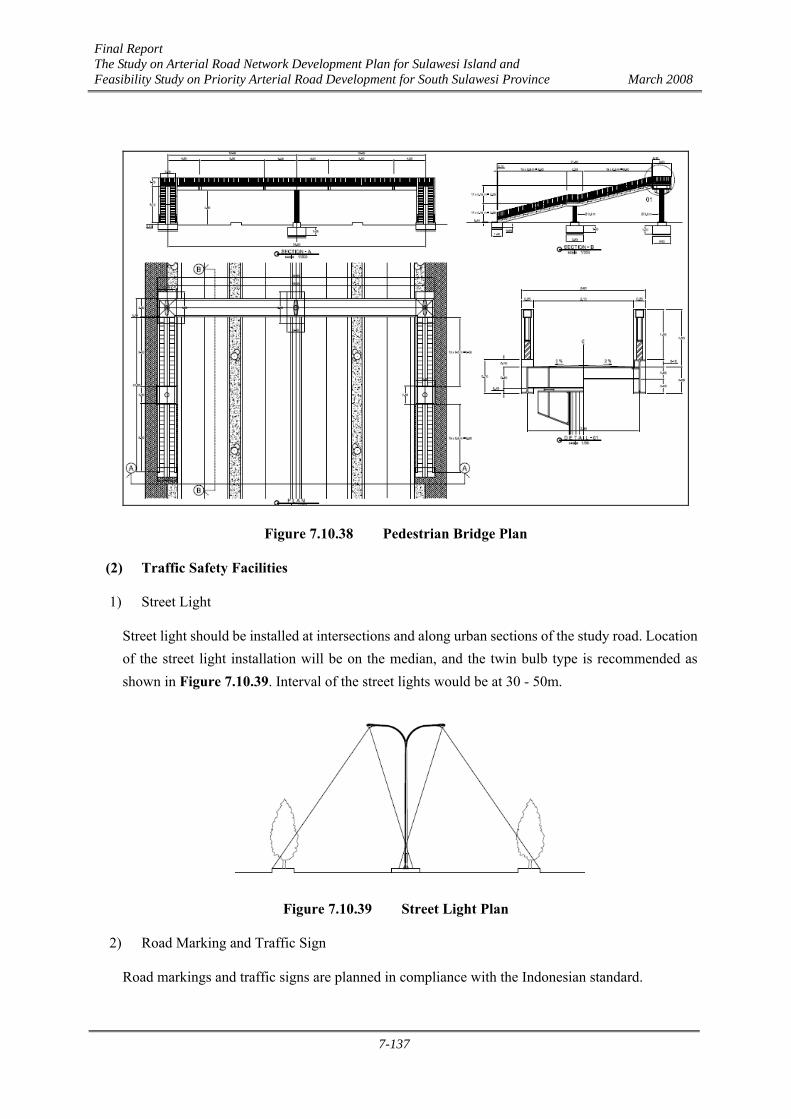
Final Report The Study on Arterial Road Network Development Plan for Sulawesi Island and Feasibility Study on Priority Arterial Road Development for South Sulawesi Province March 2008
7-137
Figure 7.10.38 Pedestrian Bridge Plan
(2) Traffic Safety Facilities
1) Street Light
Street light should be installed at intersections and along urban sections of the study road. Location of the street light installation will be on the median, and the twin bulb type is recommended as shown in Figure 7.10.39. Interval of the street lights would be at 30 - 50m.
Figure 7.10.39 Street Light Plan
2) Road Marking and Traffic Sign
Road markings and traffic signs are planned in compliance with the Indonesian standard.
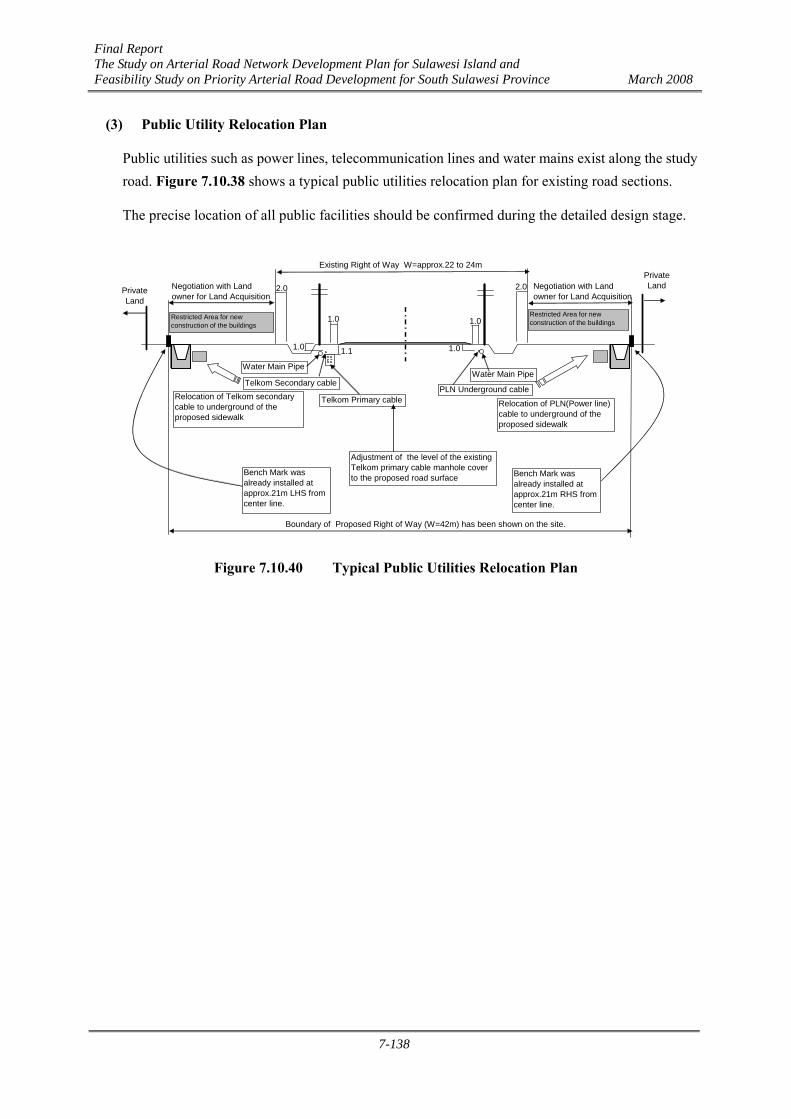
Final Report The Study on Arterial Road Network Development Plan for Sulawesi Island and Feasibility Study on Priority Arterial Road Development for South Sulawesi Province March 2008
7-138
(3) Public Utility Relocation Plan
Public utilities such as power lines, telecommunication lines and water mains exist along the study road. Figure 7.10.38 shows a typical public utilities relocation plan for existing road sections.
The precise location of all public facilities should be confirmed during the detailed design stage.
Figure 7.10.40 Typical Public Utilities Relocation Plan
2.0 2.0PrivateLandPrivate
Land
Existing Right of Way W=approx.22 to 24m
Boundary of Proposed Right of Way (W=42m) has been shown on the site.
Negotiation with Landowner for Land Acquisition
1.0
1.11.0
Telkom Secondary cable
Telkom Primary cable
1.0
1.0
PLN Underground cable
Water Main PipeWater Main Pipe
Adjustment of the level of the existingTelkom primary cable manhole coverto the proposed road surface Bench Mark was
already installed atapprox.21m RHS fromcenter line.
Bench Mark wasalready installed atapprox.21m LHS fromcenter line.
Negotiation with Landowner for Land Acquisition
Restricted Area for newconstruction of the buildings
Restricted Area for newconstruction of the buildings
Relocation of PLN(Power line)cable to underground of theproposed sidewalk
Relocation of Telkom secondarycable to underground of theproposed sidewalk


