Embed Size (px)
Citation preview

DISTRICT SURVEY REPORT
WASHIM 2018-2019
FOR
SAND MINING AND MINOR MINERALS
PREPARED BY
DISTRICT MINING OFFICE
WASHIM
Prepared under
A) Appendix –X of MoEFCC, GOI notification S.O. 141(E) dated 15.1.2016
B) Sustainable Sand Mining Guidelines
C) MoEFCC, GOI notification S.O. 3611(E) dated 25.07.2018
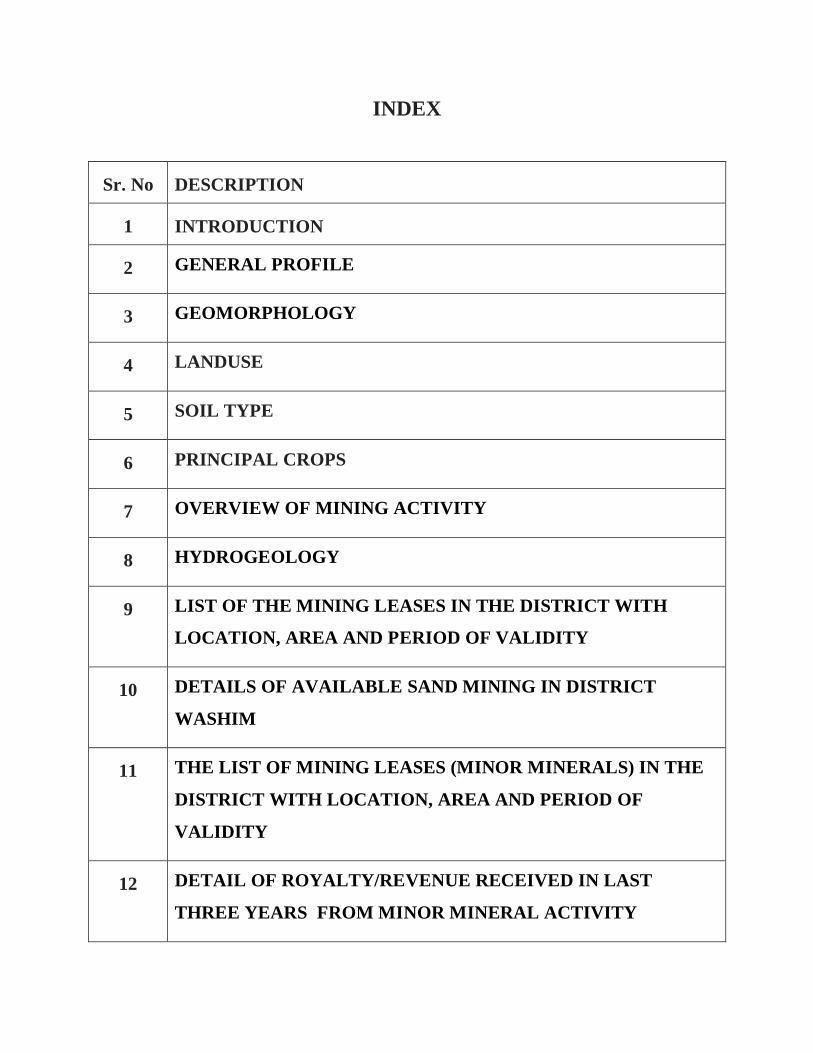
INDEX
Sr. No DESCRIPTION
1 INTRODUCTION
2 GENERAL PROFILE
3 GEOMORPHOLOGY
4 LANDUSE
5 SOIL TYPE
6 PRINCIPAL CROPS
7 OVERVIEW OF MINING ACTIVITY
8 HYDROGEOLOGY
9 LIST OF THE MINING LEASES IN THE DISTRICT WITH
LOCATION, AREA AND PERIOD OF VALIDITY
10 DETAILS OF AVAILABLE SAND MINING IN DISTRICT
WASHIM
11 THE LIST OF MINING LEASES (MINOR MINERALS) IN THE
DISTRICT WITH LOCATION, AREA AND PERIOD OF
VALIDITY
12 DETAIL OF ROYALTY/REVENUE RECEIVED IN LAST
THREE YEARS FROM MINOR MINERAL ACTIVITY
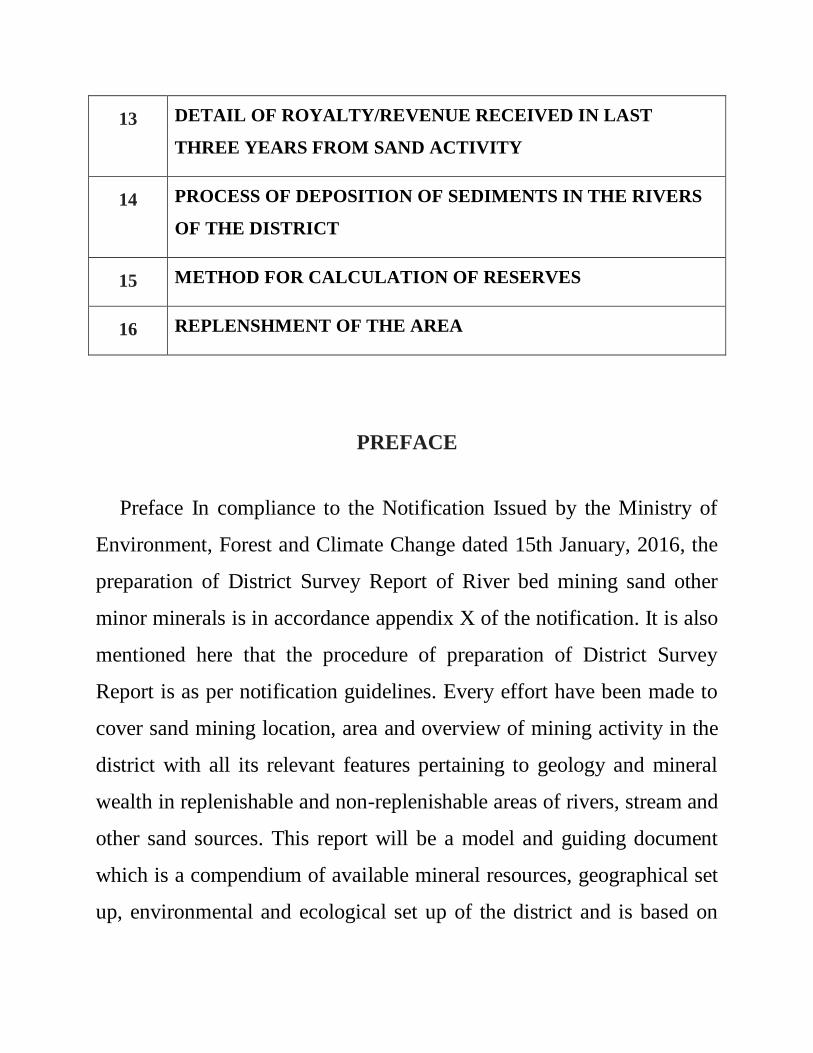
13 DETAIL OF ROYALTY/REVENUE RECEIVED IN LAST
THREE YEARS FROM SAND ACTIVITY
14 PROCESS OF DEPOSITION OF SEDIMENTS IN THE RIVERS
OF THE DISTRICT
15 METHOD FOR CALCULATION OF RESERVES
16 REPLENSHMENT OF THE AREA
PREFACE
Preface In compliance to the Notification Issued by the Ministry of
Environment, Forest and Climate Change dated 15th January, 2016, the
preparation of District Survey Report of River bed mining sand other
minor minerals is in accordance appendix X of the notification. It is also
mentioned here that the procedure of preparation of District Survey
Report is as per notification guidelines. Every effort have been made to
cover sand mining location, area and overview of mining activity in the
district with all its relevant features pertaining to geology and mineral
wealth in replenishable and non-replenishable areas of rivers, stream and
other sand sources. This report will be a model and guiding document
which is a compendium of available mineral resources, geographical set
up, environmental and ecological set up of the district and is based on
data of various departments, published reports, and websites. The data
may vary due to floods, heavy rains and other natural calamities.
Therefore, it is recommended that Sub divisional Level Committee may
take into consideration all its relevant aspects/data while scrutinizing and
recommending the application for EC to the concerned authority.
DISTRICT SURVEY REPORT FOR RIVER SAND MINING
PROJECT DISTRICT – WASHIM
As per Gazette Notification of 15th January 2016 of Ministry of
Environment, Forest and Climate change a Survey shall be carried out
by the District Environment Impact Assessment Authority (DEIAA)
with assistance of irrigation department, Drainage department, Forest
department, Mining Department and Revenue department in the district
for preparation of District Survey Report as per the sustainable Sand
Mining can be allowed; and identification of areas of erosion and
proximity to infrastructural structures and installations where mining
should be prohibited and calculation of annual rate of replenishment and
allowing time for replenishment after mining in that area. Every efforts
have been made to cover sand mining locations, areas and overview of
Mining activity in the district with all its relevant features pertaining to
geology and mineral wealth in replenish-able and non-replenish-able
areas of rivers, stream and other sand sources. The mineral potential is
calculated based on field investigation and geology of the catchment
area of the river or streams. Also as per the site conditions and location,
depth of minable mineral is defined. The area for removal of the mineral
in a river or stream is decided depending on geomorphology and other
factors, it can be 50% to 60% of the area of a particular river or stream.
Other constituents like clay and silt are excluded as waste while
calculating the mineral potential of particular river or stream. This
District Survey Report shall form the basis for application for
environment clearance, preparation of reports and appraisal of projects.
The report shall be updated once every five years.
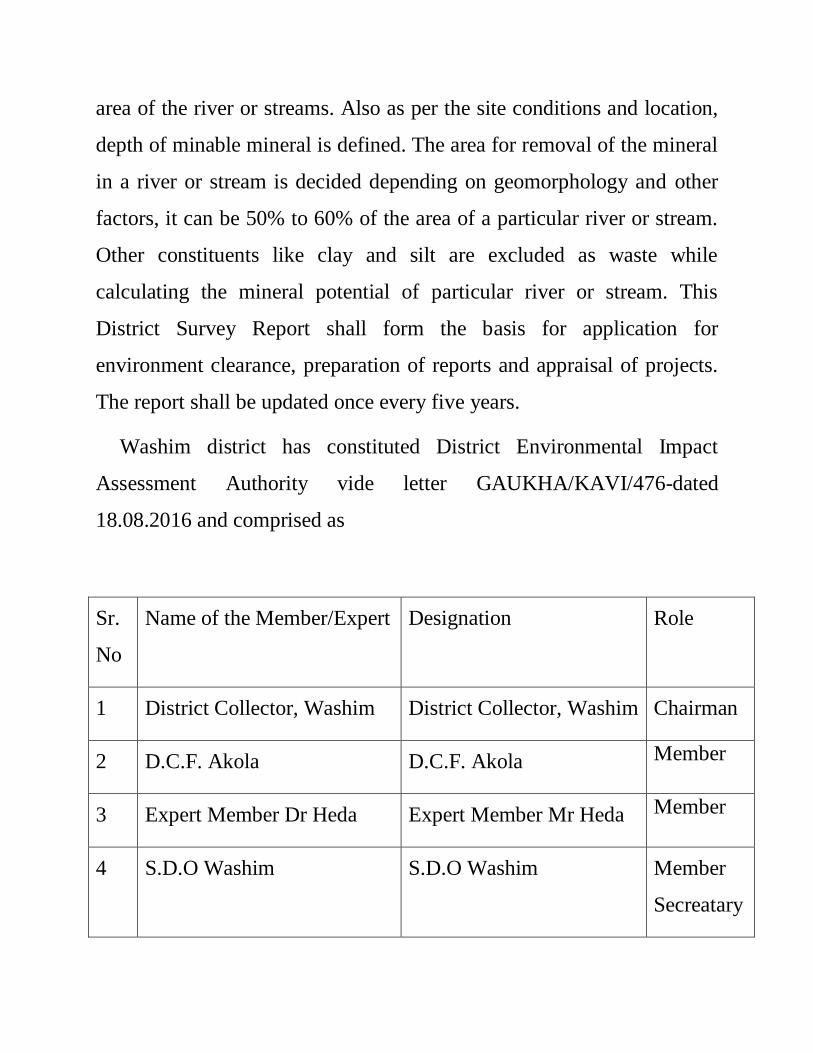
Washim district has constituted District Environmental Impact
Assessment Authority vide letter GAUKHA/KAVI/476-dated
18.08.2016 and comprised as
Sr.
No
Name of the Member/Expert Designation Role
1 District Collector, Washim District Collector, Washim Chairman
2 D.C.F. Akola D.C.F. Akola Member
3 Expert Member Dr Heda Expert Member Mr Heda Member
4 S.D.O Washim S.D.O Washim Member
Secreatary
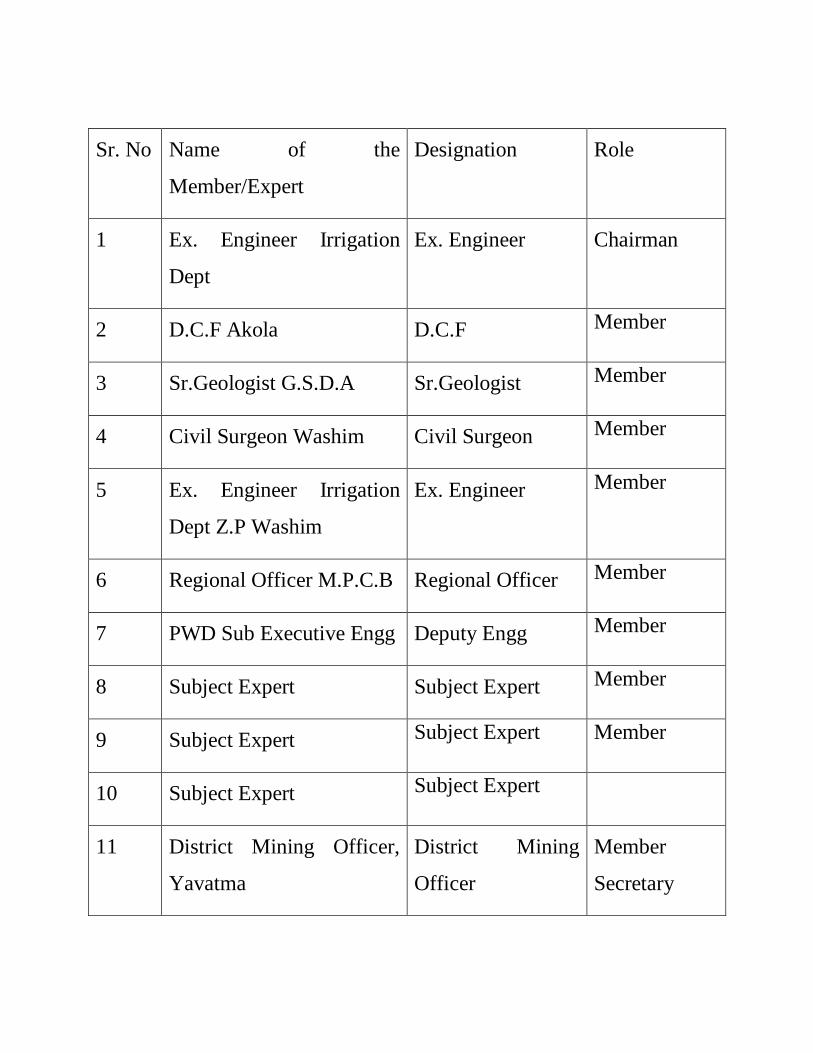
Sr. No Name of the
Member/Expert
Designation Role
1 Ex. Engineer Irrigation
Dept
Ex. Engineer Chairman
2 D.C.F Akola D.C.F Member
3 Sr.Geologist G.S.D.A Sr.Geologist Member
4 Civil Surgeon Washim Civil Surgeon Member
5 Ex. Engineer Irrigation
Dept Z.P Washim
Ex. Engineer Member
6 Regional Officer M.P.C.B Regional Officer Member
7 PWD Sub Executive Engg Deputy Engg Member
8 Subject Expert Subject Expert Member
9 Subject Expert Subject Expert Member
10 Subject Expert Subject Expert
11 District Mining Officer,
Yavatma
District Mining
Officer
Member
Secretary
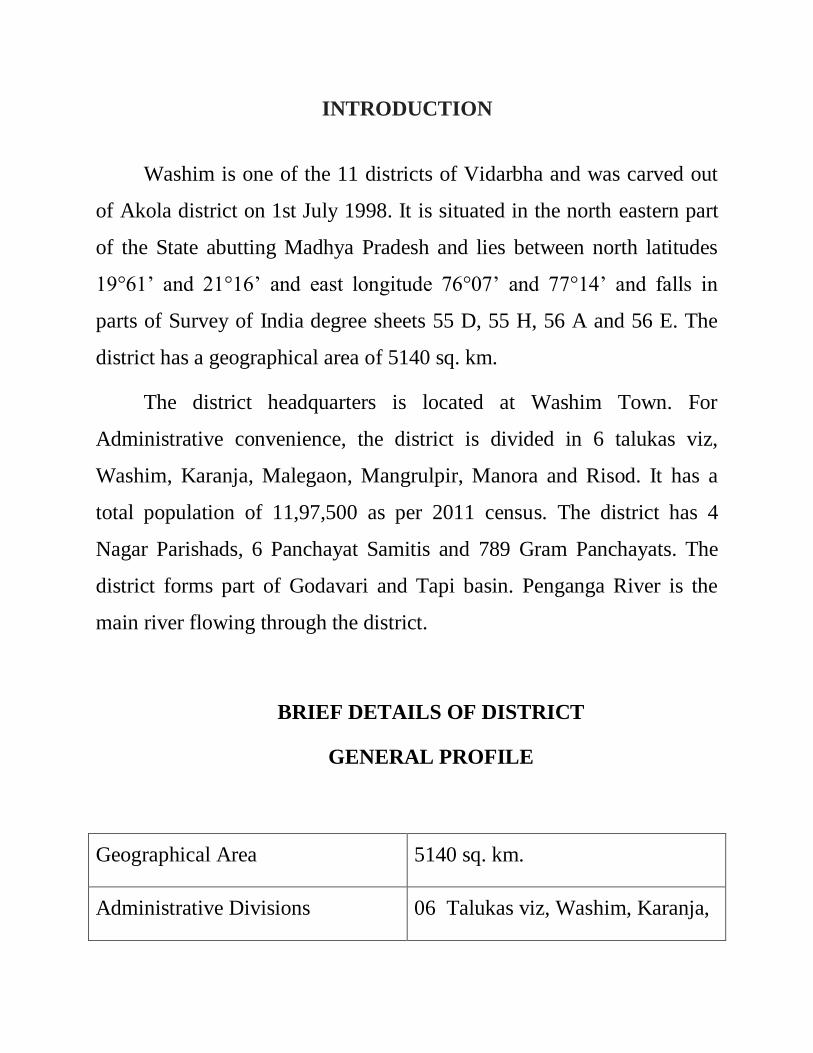
INTRODUCTION
Washim is one of the 11 districts of Vidarbha and was carved out
of Akola district on 1st July 1998. It is situated in the north eastern part
of the State abutting Madhya Pradesh and lies between north latitudes
19°61’ and 21°16’ and east longitude 76°07’ and 77°14’ and falls in
parts of Survey of India degree sheets 55 D, 55 H, 56 A and 56 E. The
district has a geographical area of 5140 sq. km.
The district headquarters is located at Washim Town. For
Administrative convenience, the district is divided in 6 talukas viz,
Washim, Karanja, Malegaon, Mangrulpir, Manora and Risod. It has a
total population of 11,97,500 as per 2011 census. The district has 4
Nagar Parishads, 6 Panchayat Samitis and 789 Gram Panchayats. The
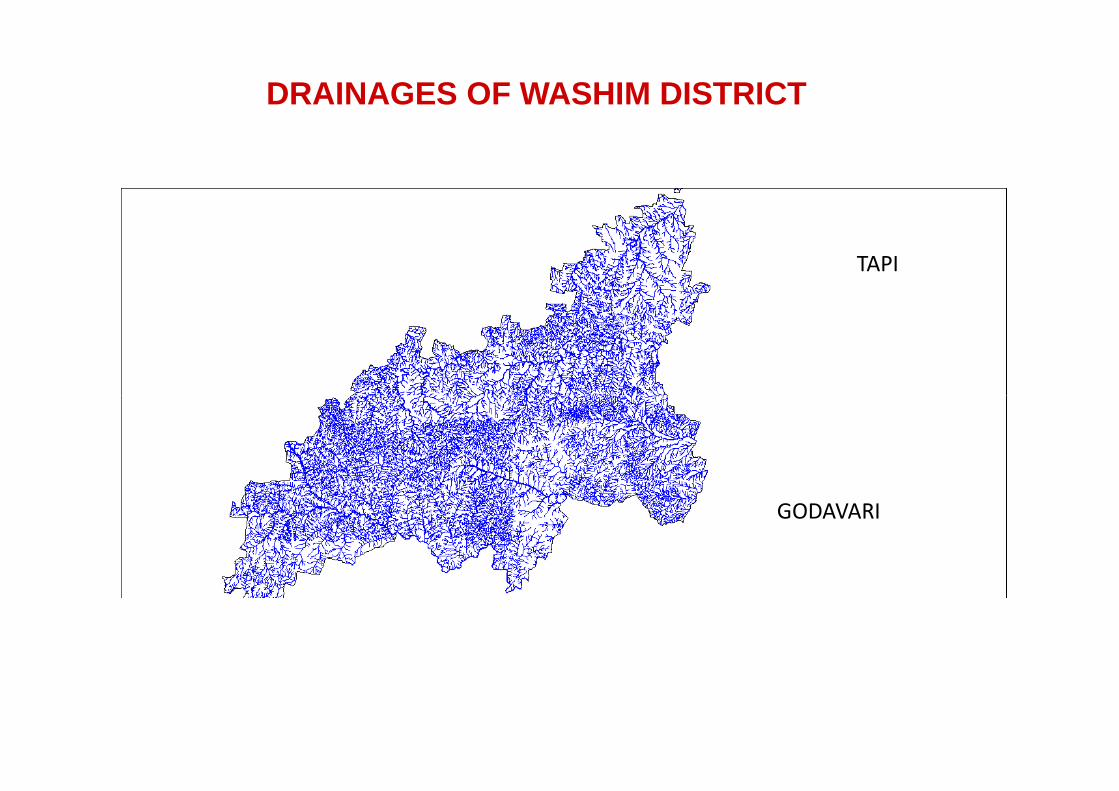
district forms part of Godavari and Tapi basin. Penganga River is the
main river flowing through the district.
BRIEF DETAILS OF DISTRICT
GENERAL PROFILE
Geographical Area 5140 sq. km.
Administrative Divisions 06 Talukas viz, Washim, Karanja,
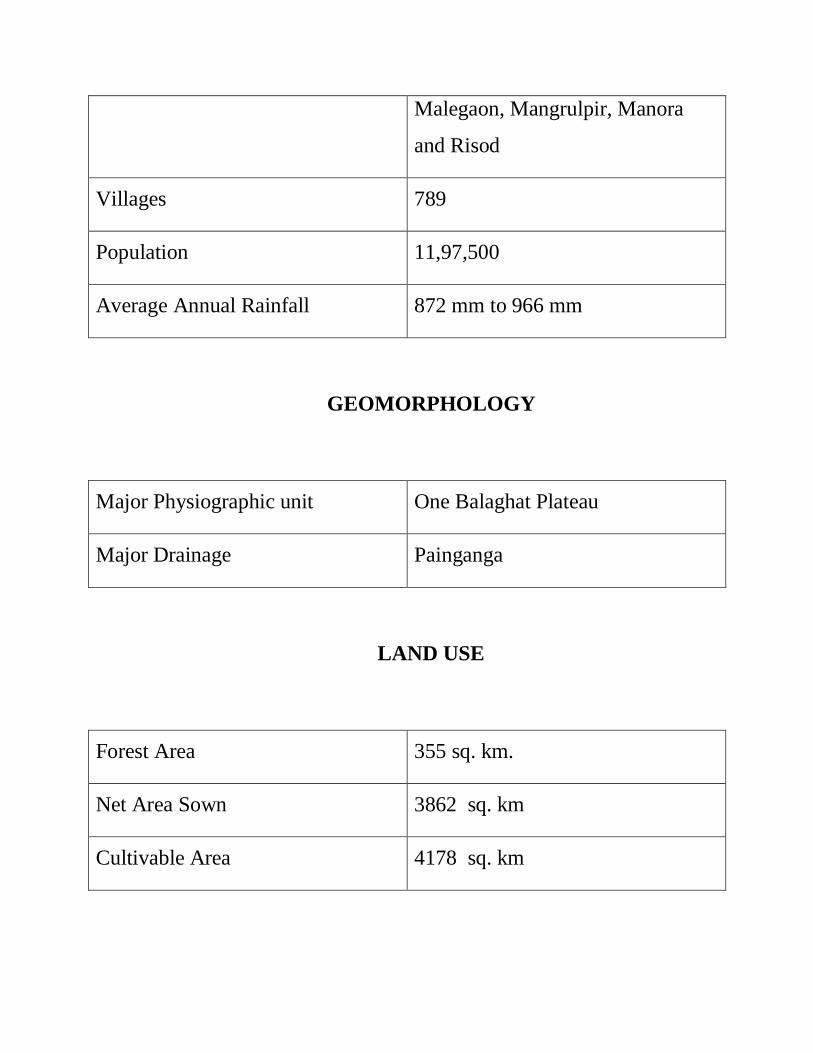
Malegaon, Mangrulpir, Manora
and Risod
Villages 789
Population 11,97,500
Average Annual Rainfall 872 mm to 966 mm
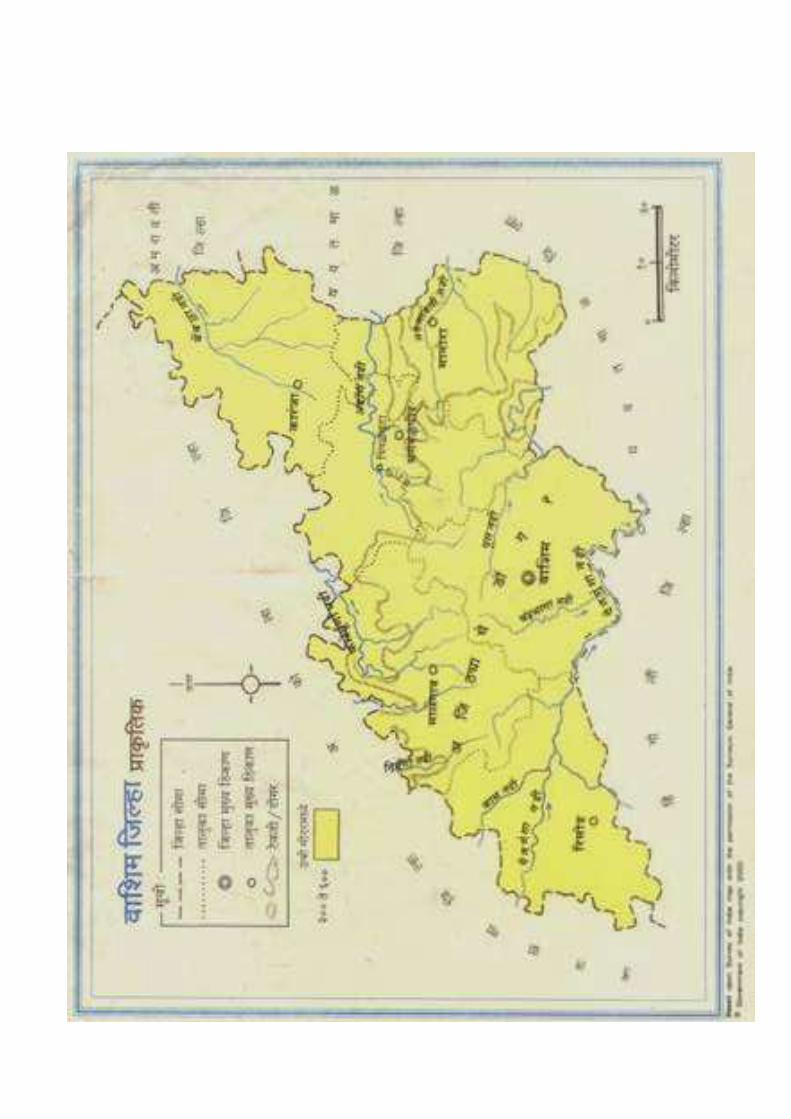
GEOMORPHOLOGY
Major Physiographic unit One Balaghat Plateau
Major Drainage Painganga
LAND USE
Forest Area 355 sq. km.
Net Area Sown 3862 sq. km
Cultivable Area 4178 sq. km
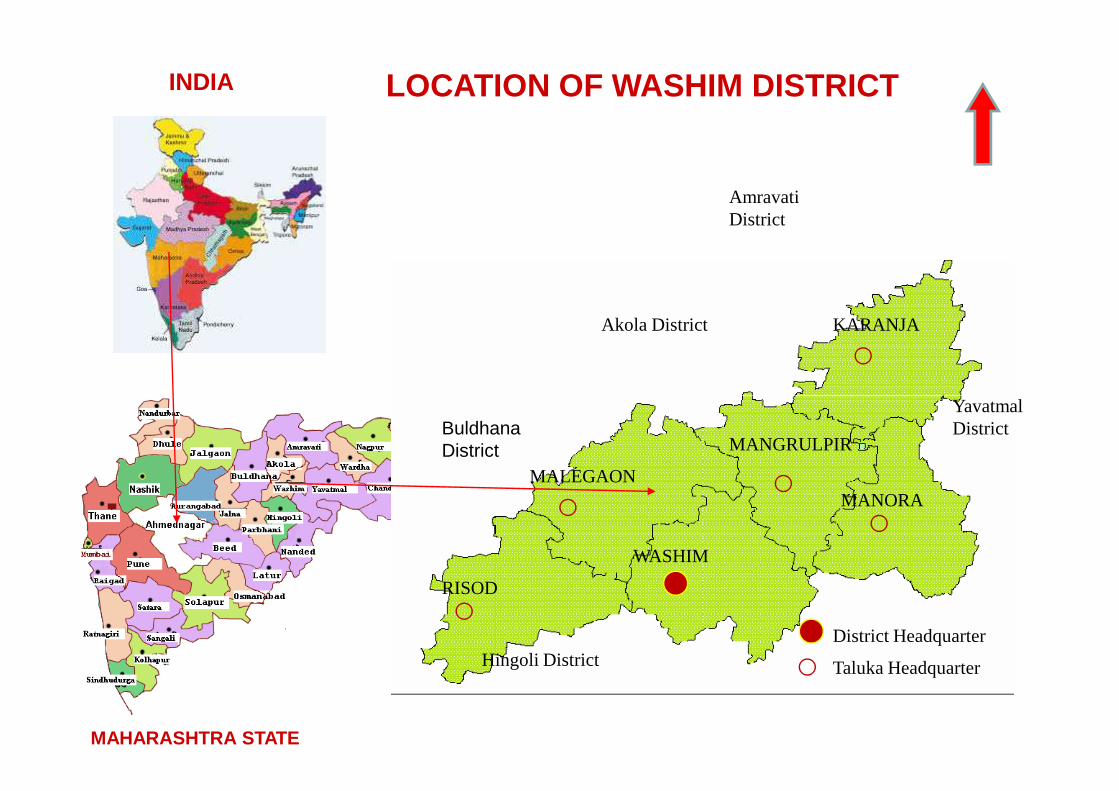
LOCATION OF WASHIM DISTRICT
Yavatmal
Akola District KARANJA
Amravati District
INDIA
MAHARASHTRA STATE
YavatmalDistrictBuldhana
District
Hingoli DistrictDistrict Headquarter
Taluka Headquarter
MALEGAON
MANGRULPIR
MANORA
WASHIM
RISOD

N
YavatmalDistrict
Akola District
Buldhana MALEGAON
MANGRULPIR
KARANJA
GEOLOGY OF WASHIM DISTRICT
Total Area -5153 sq km
Deccan trap-5153 sq km
DECCAN TRAP
TQ BOUNDRY
DistrictBuldhanaDistrict
Hingoli District
District Headquarter
Taluka Headquarter
MALEGAON MANORA
WASHIMRISOD
TAPI
DRAINAGES OF WASHIM DISTRICT
GODAVARI
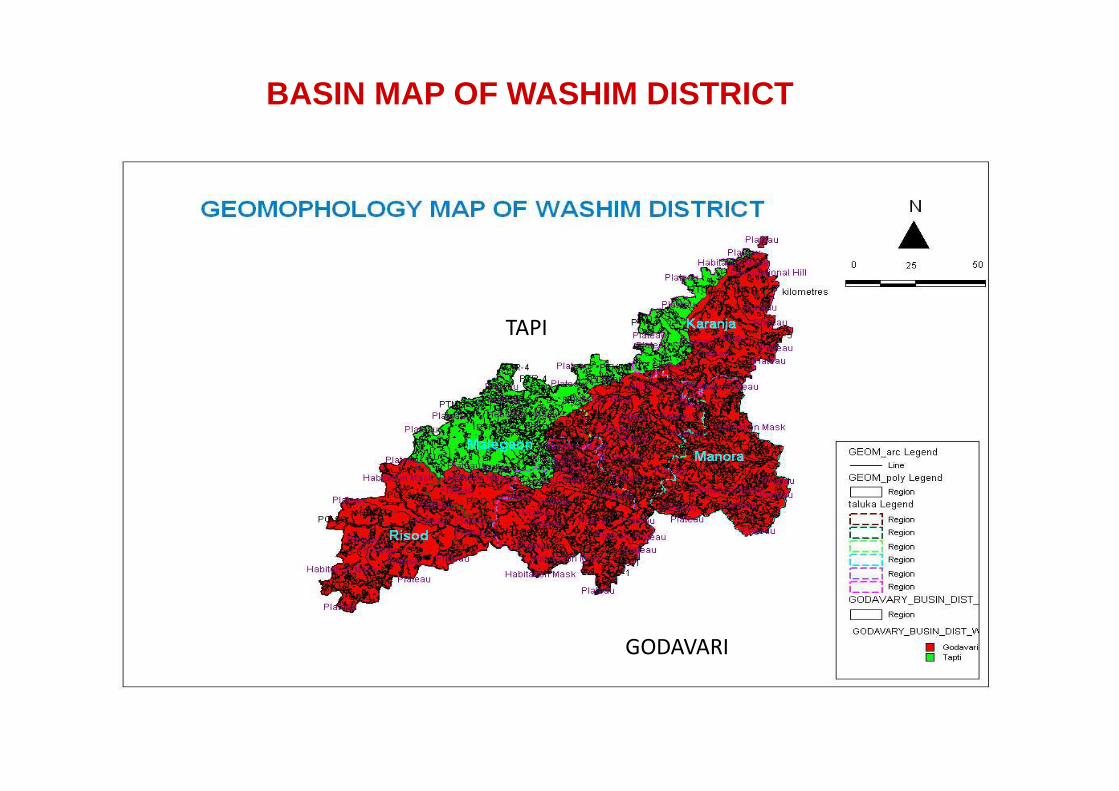
BASIN MAP OF WASHIM DISTRICT
TAPI
GODAVARI
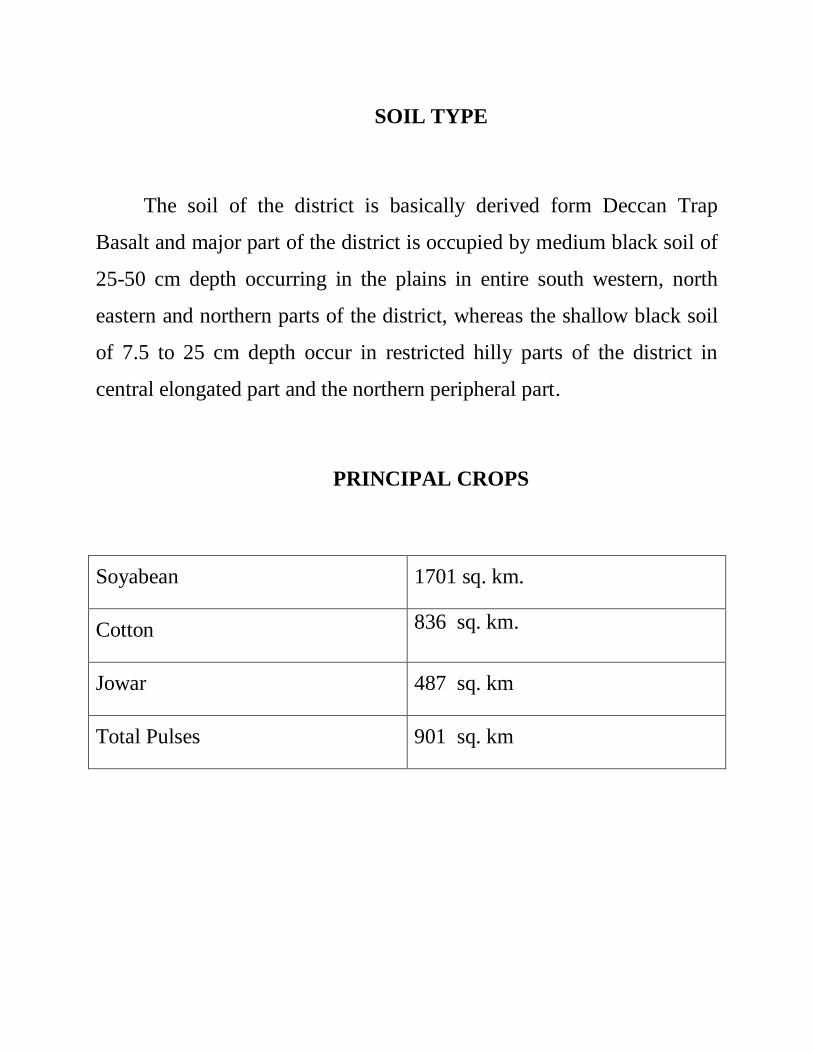
SOIL TYPE
The soil of the district is basically derived form Deccan Trap
Basalt and major part of the district is occupied by medium black soil of
25-50 cm depth occurring in the plains in entire south western, north
eastern and northern parts of the district, whereas the shallow black soil
of 7.5 to 25 cm depth occur in restricted hilly parts of the district in
central elongated part and the northern peripheral part.
PRINCIPAL CROPS
Soyabean 1701 sq. km.
Cotton 836 sq. km.
Jowar 487 sq. km
Total Pulses 901 sq. km
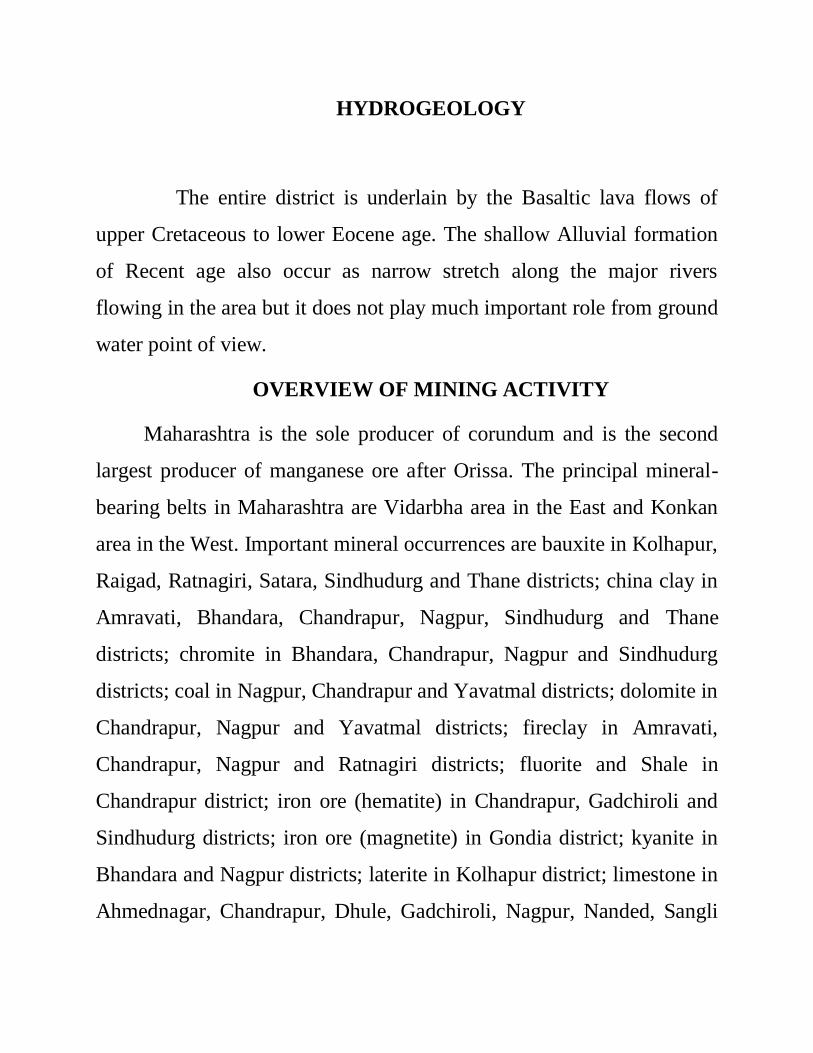
HYDROGEOLOGY
The entire district is underlain by the Basaltic lava flows of
upper Cretaceous to lower Eocene age. The shallow Alluvial formation
of Recent age also occur as narrow stretch along the major rivers
flowing in the area but it does not play much important role from ground
water point of view.
OVERVIEW OF MINING ACTIVITY
Maharashtra is the sole producer of corundum and is the second
largest producer of manganese ore after Orissa. The principal mineral-
bearing belts in Maharashtra are Vidarbha area in the East and Konkan
area in the West. Important mineral occurrences are bauxite in Kolhapur,
Raigad, Ratnagiri, Satara, Sindhudurg and Thane districts; china clay in
Amravati, Bhandara, Chandrapur, Nagpur, Sindhudurg and Thane
districts; chromite in Bhandara, Chandrapur, Nagpur and Sindhudurg
districts; coal in Nagpur, Chandrapur and Yavatmal districts; dolomite in
Chandrapur, Nagpur and Yavatmal districts; fireclay in Amravati,
Chandrapur, Nagpur and Ratnagiri districts; fluorite and Shale in
Chandrapur district; iron ore (hematite) in Chandrapur, Gadchiroli and
Sindhudurg districts; iron ore (magnetite) in Gondia district; kyanite in
Bhandara and Nagpur districts; laterite in Kolhapur district; limestone in
Ahmednagar, Chandrapur, Dhule, Gadchiroli, Nagpur, Nanded, Sangli
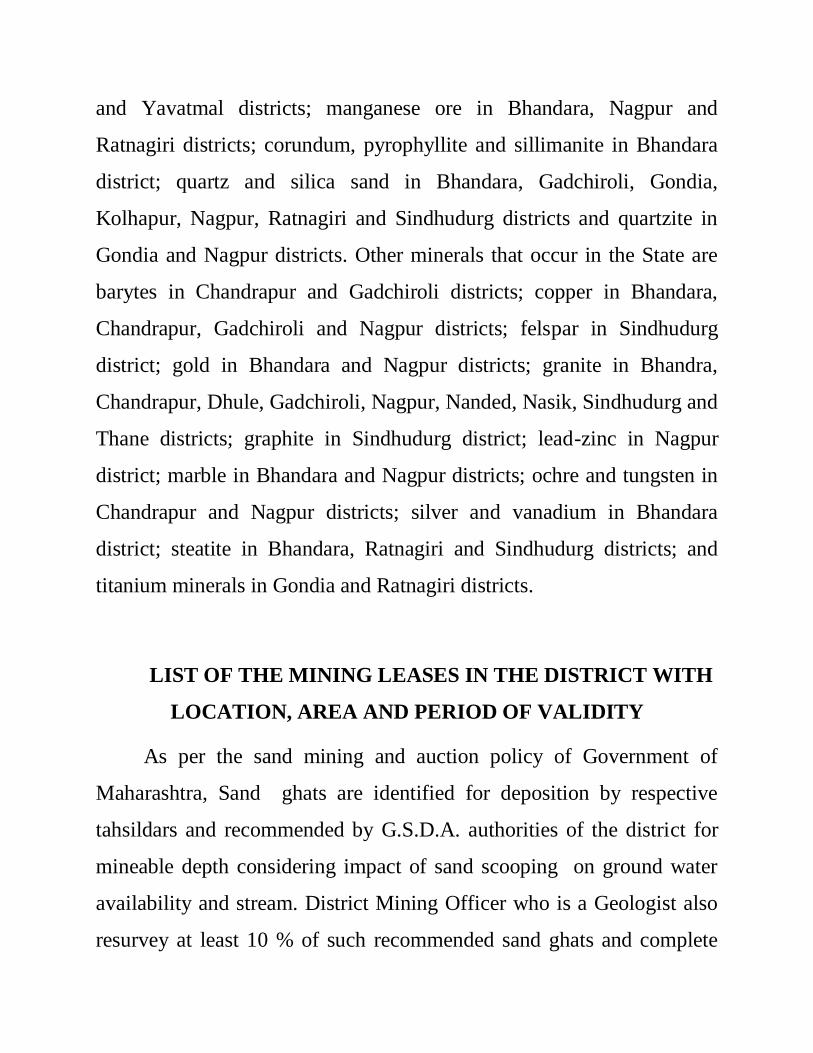
and Yavatmal districts; manganese ore in Bhandara, Nagpur and
Ratnagiri districts; corundum, pyrophyllite and sillimanite in Bhandara
district; quartz and silica sand in Bhandara, Gadchiroli, Gondia,
Kolhapur, Nagpur, Ratnagiri and Sindhudurg districts and quartzite in
Gondia and Nagpur districts. Other minerals that occur in the State are
barytes in Chandrapur and Gadchiroli districts; copper in Bhandara,
Chandrapur, Gadchiroli and Nagpur districts; felspar in Sindhudurg
district; gold in Bhandara and Nagpur districts; granite in Bhandra,
Chandrapur, Dhule, Gadchiroli, Nagpur, Nanded, Nasik, Sindhudurg and
Thane districts; graphite in Sindhudurg district; lead-zinc in Nagpur
district; marble in Bhandara and Nagpur districts; ochre and tungsten in
Chandrapur and Nagpur districts; silver and vanadium in Bhandara
district; steatite in Bhandara, Ratnagiri and Sindhudurg districts; and
titanium minerals in Gondia and Ratnagiri districts.
LIST OF THE MINING LEASES IN THE DISTRICT WITH
LOCATION, AREA AND PERIOD OF VALIDITY
As per the sand mining and auction policy of Government of
Maharashtra, Sand ghats are identified for deposition by respective
tahsildars and recommended by G.S.D.A. authorities of the district for
mineable depth considering impact of sand scooping on ground water
availability and stream. District Mining Officer who is a Geologist also
resurvey at least 10 % of such recommended sand ghats and complete
further procedures for auction including pricing and approval of
Divisional Commissioner.
Tahsildar at Headquarter is the holder and the project proponent
for the sand ghats. After auction of sand ghats for period specified at
rule 9(A)1 of sand mining and auction policy of Govt. of Maharashtra
dated 03.01.2018, all rights to comply the terms and conditions for
scooping of sand from sand ghats are transferred to Successful Bidder.
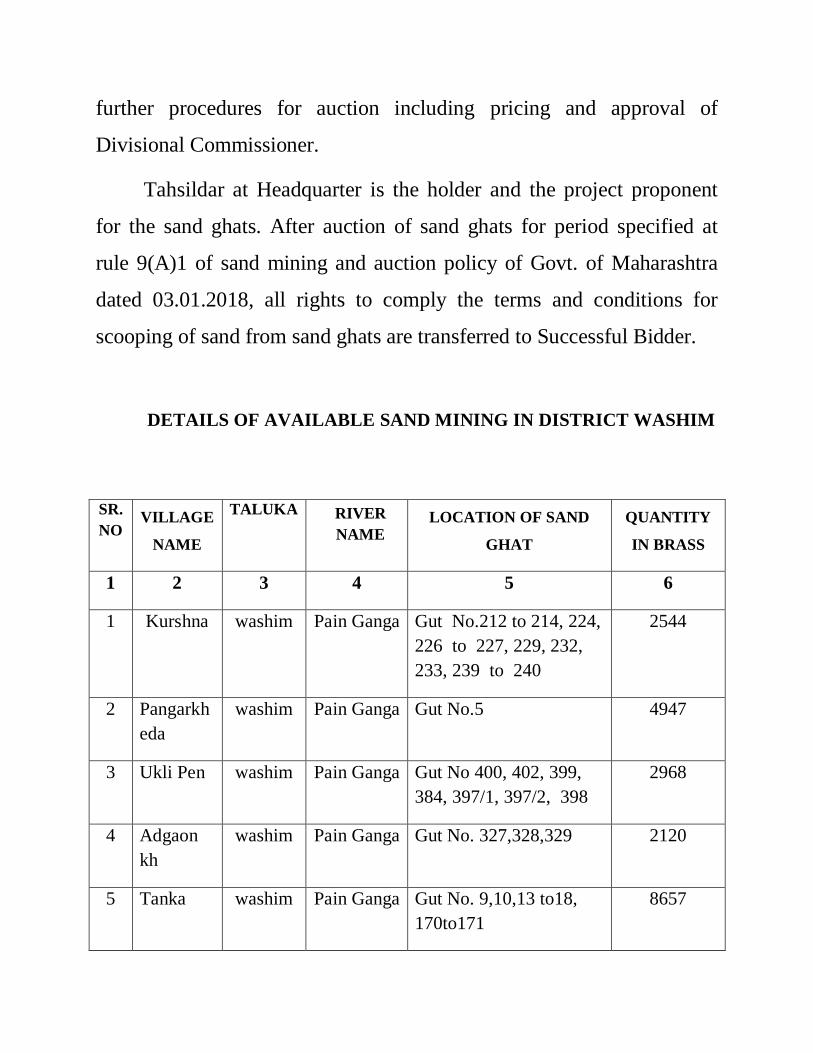
DETAILS OF AVAILABLE SAND MINING IN DISTRICT WASHIM
SR.
NO VILLAGE
NAME
TALUKA RIVER
NAME LOCATION OF SAND
GHAT
QUANTITY
IN BRASS
1 2 3 4 5 6
1 Kurshna washim Pain Ganga Gut No.212 to 214, 224,
226 to 227, 229, 232,
233, 239 to 240
2544
2 Pangarkh
eda
washim Pain Ganga Gut No.5 4947
3 Ukli Pen washim Pain Ganga Gut No 400, 402, 399,
384, 397/1, 397/2, 398
2968
4 Adgaon
kh
washim Pain Ganga Gut No. 327,328,329 2120
5 Tanka washim Pain Ganga Gut No. 9,10,13 to18,
170to171
8657
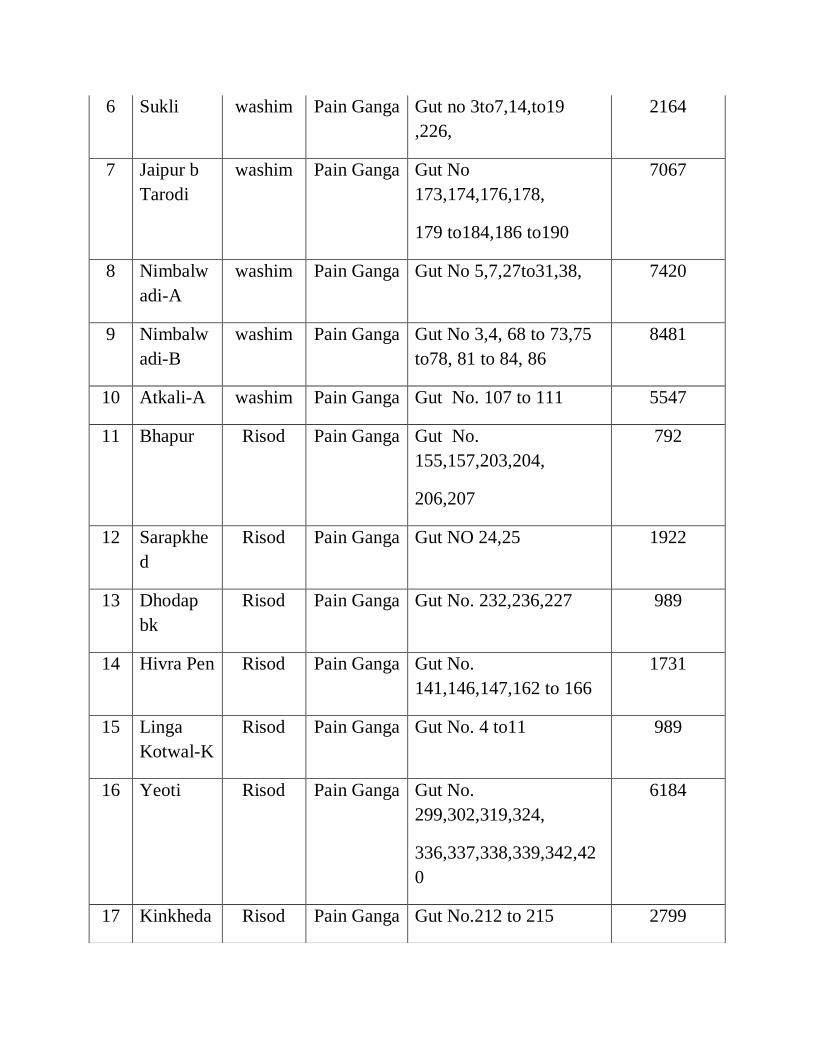
6 Sukli washim Pain Ganga Gut no 3to7,14,to19
,226,
2164
7 Jaipur b
Tarodi
washim Pain Ganga Gut No
173,174,176,178,
179 to184,186 to190
7067
8 Nimbalw
adi-A
washim Pain Ganga Gut No 5,7,27to31,38, 7420
9 Nimbalw
adi-B
washim Pain Ganga Gut No 3,4, 68 to 73,75
to78, 81 to 84, 86
8481
10 Atkali-A washim Pain Ganga Gut No. 107 to 111 5547
11 Bhapur Risod Pain Ganga Gut No.
155,157,203,204,
206,207
792
12 Sarapkhe
d
Risod Pain Ganga Gut NO 24,25 1922
13 Dhodap
bk
Risod Pain Ganga Gut No. 232,236,227 989
14 Hivra Pen Risod Pain Ganga Gut No.
141,146,147,162 to 166
1731
15 Linga
Kotwal-K
Risod Pain Ganga Gut No. 4 to11 989
16 Yeoti Risod Pain Ganga Gut No.
299,302,319,324,
336,337,338,339,342,42
0
6184
17 Kinkheda Risod Pain Ganga Gut No.212 to 215 2799
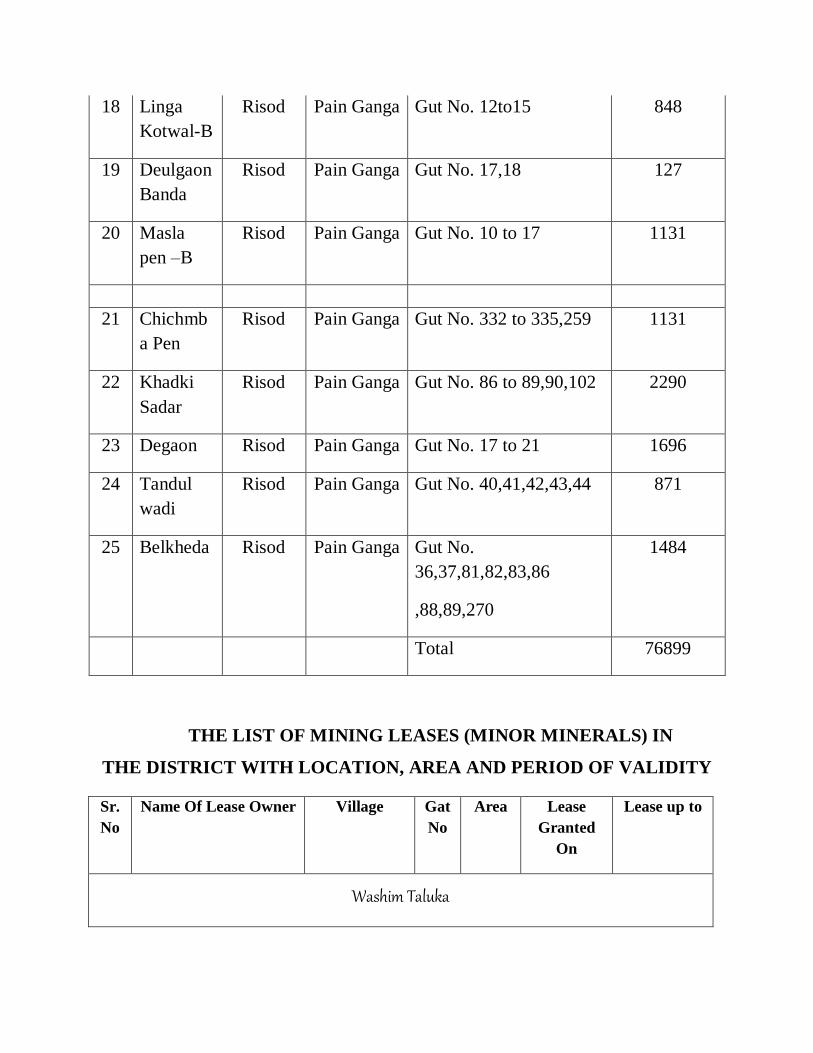
THE LIST OF MINING LEASES (MINOR MINERALS) IN
THE DISTRICT WITH LOCATION, AREA AND PERIOD OF VALIDITY
Sr.
No
Name Of Lease Owner Village Gat
No
Area Lease
Granted
On
Lease up to
Washim Taluka
18 Linga
Kotwal-B
Risod Pain Ganga Gut No. 12to15 848
19 Deulgaon
Banda
Risod Pain Ganga Gut No. 17,18 127
20 Masla
pen –B
Risod Pain Ganga Gut No. 10 to 17 1131
21 Chichmb
a Pen
Risod Pain Ganga Gut No. 332 to 335,259 1131
22 Khadki
Sadar
Risod Pain Ganga Gut No. 86 to 89,90,102 2290
23 Degaon Risod Pain Ganga Gut No. 17 to 21 1696
24 Tandul
wadi
Risod Pain Ganga Gut No. 40,41,42,43,44 871
25 Belkheda Risod Pain Ganga Gut No.
36,37,81,82,83,86
,88,89,270
1484
Total 76899
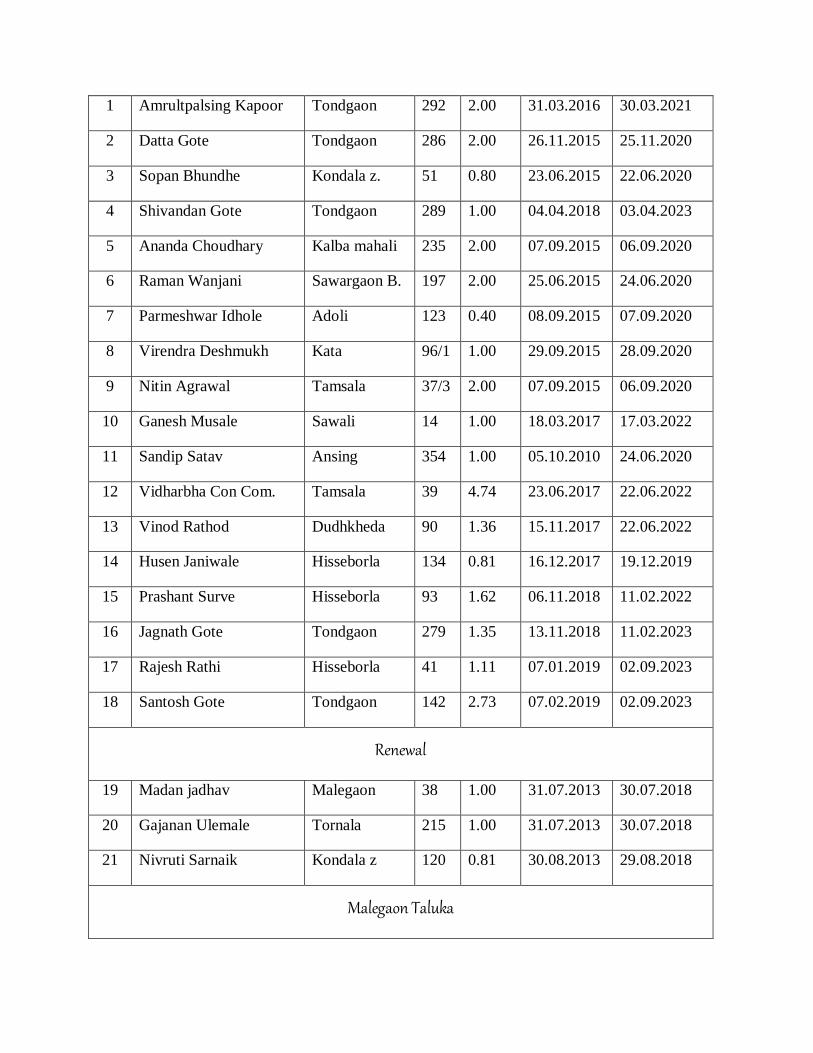
1 Amrultpalsing Kapoor Tondgaon 292 2.00 31.03.2016 30.03.2021
2 Datta Gote Tondgaon 286 2.00 26.11.2015 25.11.2020
3 Sopan Bhundhe Kondala z. 51 0.80 23.06.2015 22.06.2020
4 Shivandan Gote Tondgaon 289 1.00 04.04.2018 03.04.2023
5 Ananda Choudhary Kalba mahali 235 2.00 07.09.2015 06.09.2020
6 Raman Wanjani Sawargaon B. 197 2.00 25.06.2015 24.06.2020
7 Parmeshwar Idhole Adoli 123 0.40 08.09.2015 07.09.2020
8 Virendra Deshmukh Kata 96/1 1.00 29.09.2015 28.09.2020
9 Nitin Agrawal Tamsala 37/3 2.00 07.09.2015 06.09.2020
10 Ganesh Musale Sawali 14 1.00 18.03.2017 17.03.2022
11 Sandip Satav Ansing 354 1.00 05.10.2010 24.06.2020
12 Vidharbha Con Com. Tamsala 39 4.74 23.06.2017 22.06.2022
13 Vinod Rathod Dudhkheda 90 1.36 15.11.2017 22.06.2022
14 Husen Janiwale Hisseborla 134 0.81 16.12.2017 19.12.2019
15 Prashant Surve Hisseborla 93 1.62 06.11.2018 11.02.2022
16 Jagnath Gote Tondgaon 279 1.35 13.11.2018 11.02.2023
17 Rajesh Rathi Hisseborla 41 1.11 07.01.2019 02.09.2023
18 Santosh Gote Tondgaon 142 2.73 07.02.2019 02.09.2023
Renewal
19 Madan jadhav Malegaon 38 1.00 31.07.2013 30.07.2018
20 Gajanan Ulemale Tornala 215 1.00 31.07.2013 30.07.2018
21 Nivruti Sarnaik Kondala z 120 0.81 30.08.2013 29.08.2018
Malegaon Taluka
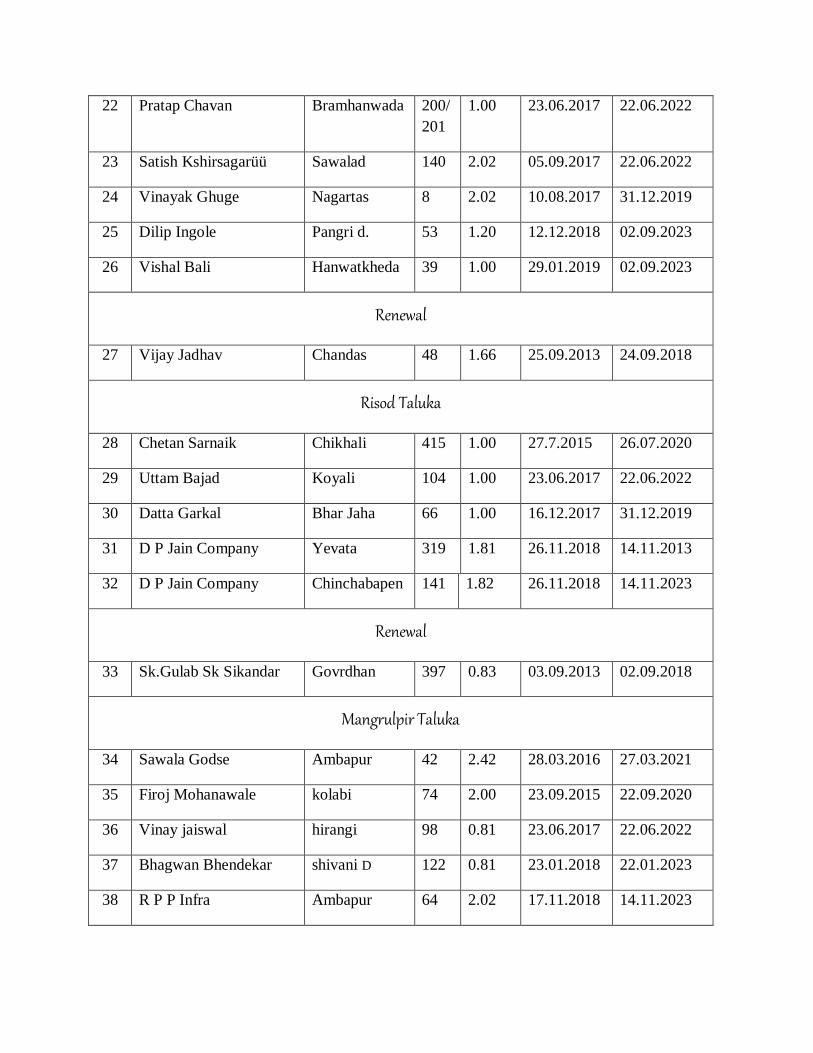
22 Pratap Chavan Bramhanwada 200/
201
1.00 23.06.2017 22.06.2022
23 Satish Kshirsagarüü Sawalad 140 2.02 05.09.2017 22.06.2022
24 Vinayak Ghuge Nagartas 8 2.02 10.08.2017 31.12.2019
25 Dilip Ingole Pangri d. 53 1.20 12.12.2018 02.09.2023
26 Vishal Bali Hanwatkheda 39 1.00 29.01.2019 02.09.2023
Renewal
27 Vijay Jadhav Chandas 48 1.66 25.09.2013 24.09.2018
Risod Taluka
28 Chetan Sarnaik Chikhali 415 1.00 27.7.2015 26.07.2020
29 Uttam Bajad Koyali 104 1.00 23.06.2017 22.06.2022
30 Datta Garkal Bhar Jaha 66 1.00 16.12.2017 31.12.2019
31 D P Jain Company Yevata 319 1.81 26.11.2018 14.11.2013
32 D P Jain Company Chinchabapen 141 1.82 26.11.2018 14.11.2023
Renewal
33 Sk.Gulab Sk Sikandar Govrdhan 397 0.83 03.09.2013 02.09.2018
Mangrulpir Taluka
34 Sawala Godse Ambapur 42 2.42 28.03.2016 27.03.2021
35 Firoj Mohanawale kolabi 74 2.00 23.09.2015 22.09.2020
36 Vinay jaiswal hirangi 98 0.81 23.06.2017 22.06.2022
37 Bhagwan Bhendekar shivani D 122 0.81 23.01.2018 22.01.2023
38 R P P Infra Ambapur 64 2.02 17.11.2018 14.11.2023
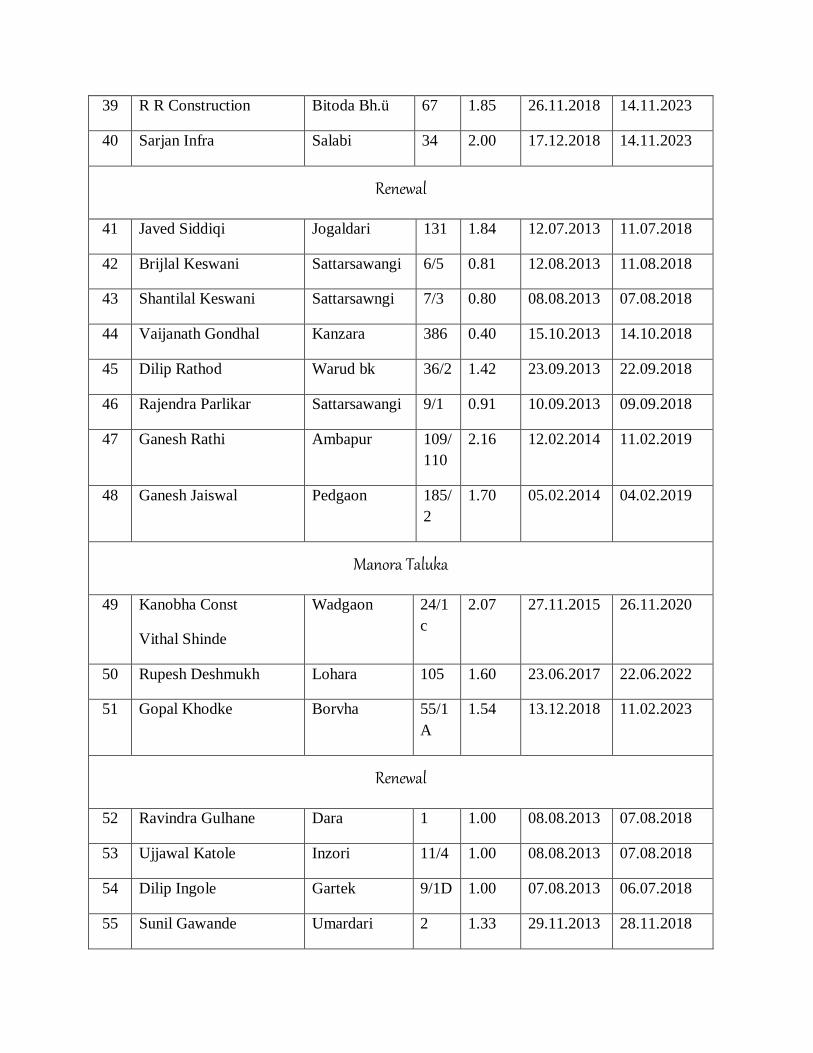
39 R R Construction Bitoda Bh.ü 67 1.85 26.11.2018 14.11.2023
40 Sarjan Infra Salabi 34 2.00 17.12.2018 14.11.2023
Renewal
41 Javed Siddiqi Jogaldari 131 1.84 12.07.2013 11.07.2018
42 Brijlal Keswani Sattarsawangi 6/5 0.81 12.08.2013 11.08.2018
43 Shantilal Keswani Sattarsawngi 7/3 0.80 08.08.2013 07.08.2018
44 Vaijanath Gondhal Kanzara 386 0.40 15.10.2013 14.10.2018
45 Dilip Rathod Warud bk 36/2 1.42 23.09.2013 22.09.2018
46 Rajendra Parlikar Sattarsawangi 9/1 0.91 10.09.2013 09.09.2018
47 Ganesh Rathi Ambapur 109/
110
2.16 12.02.2014 11.02.2019
48 Ganesh Jaiswal Pedgaon 185/
2
1.70 05.02.2014 04.02.2019
Manora Taluka
49 Kanobha Const
Vithal Shinde
Wadgaon 24/1
c
2.07 27.11.2015 26.11.2020
50 Rupesh Deshmukh Lohara 105 1.60 23.06.2017 22.06.2022
51 Gopal Khodke Borvha 55/1
A
1.54 13.12.2018 11.02.2023
Renewal
52 Ravindra Gulhane Dara 1 1.00 08.08.2013 07.08.2018
53 Ujjawal Katole Inzori 11/4 1.00 08.08.2013 07.08.2018
54 Dilip Ingole Gartek 9/1D 1.00 07.08.2013 06.07.2018
55 Sunil Gawande Umardari 2 1.33 29.11.2013 28.11.2018

Karanja Taluka
56 Yunus khan chote khan Dadgaon 40/2
B
1.00 01.02.2016 30.01.2021
57 Dipak Thokal Palana 59 1.62 18.03.2017 17.03.2022
58 R R construction Dhotra Ja 118 1.21 26.11.2018 14.11.2023
59 Mirza Iafaz Beg Ujjaleshwar 11/2 1.62 19.12.2018 02.09.2023
Renewal
60 Manohar bardiya Kisan Nagar 51/
164
2.00 19.07.2013 18.07.2018
61 Dipak Makadiya Alimurdapur 4/1 1.20 08.11.2013 07.11.2018
62 Wasudev Keswani Kamathwada 7/3 0.81 22.11.2013 21.11.2018
63 Vipul Lale Bramhanwada 189 1.60 24.05.2012 23.05.2017
64 Sujit Jichkar Dadgaon 35/1 2.02 02.05.2012 01.05.2017
DETAIL OF ROYALTY/REVENUE RECEIVED IN LAST
THREE YEARS FROM MINOR MINERAL ACTIVITY
Financial Year Revenue in Rs (Crores)
F.Y 2015-2016 1618.34 Lakh
F.Y 2016-2017 2270.09 Lakh
F.Y 2017-2018 2428.62 Lakh
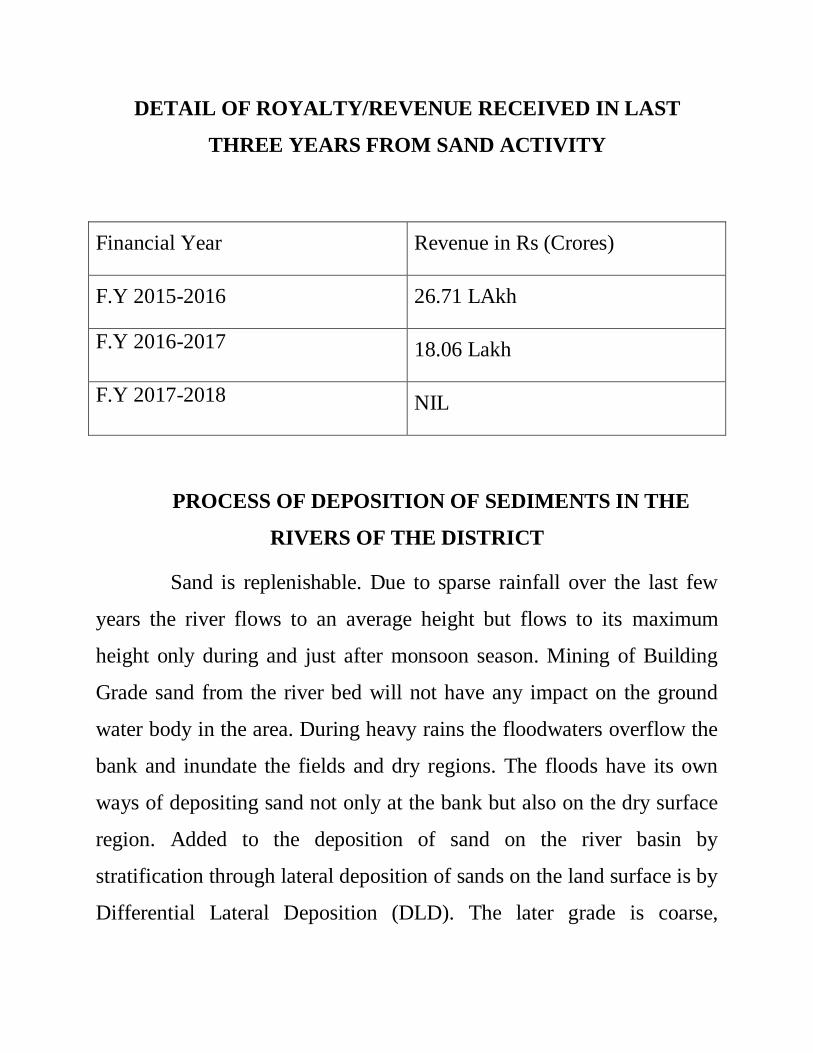
DETAIL OF ROYALTY/REVENUE RECEIVED IN LAST
THREE YEARS FROM SAND ACTIVITY
Financial Year Revenue in Rs (Crores)
F.Y 2015-2016 26.71 LAkh
F.Y 2016-2017 18.06 Lakh
F.Y 2017-2018 NIL
PROCESS OF DEPOSITION OF SEDIMENTS IN THE
RIVERS OF THE DISTRICT
Sand is replenishable. Due to sparse rainfall over the last few
years the river flows to an average height but flows to its maximum
height only during and just after monsoon season. Mining of Building
Grade sand from the river bed will not have any impact on the ground
water body in the area. During heavy rains the floodwaters overflow the
bank and inundate the fields and dry regions. The floods have its own
ways of depositing sand not only at the bank but also on the dry surface
region. Added to the deposition of sand on the river basin by
stratification through lateral deposition of sands on the land surface is by
Differential Lateral Deposition (DLD). The later grade is coarse,
medium and fine sand to mud and soil beyond. In this soil, agricultural
operation goes on from the bank to the cultivated land surface. The
yearly deposition of sand is by natural filling during flood season with
slight variation depending upon the amount of river flow, the quantity of
water flowing and the amount of sand load carried during the river flow.
The deposition pattern will be monitored every year & measurements
will be carried out as soon as the monsoon comes to an end. Deposition
rate for the year 2018-19 is monitored, calculated and mapped with the
help of technical consultant. Data for gauging of stream is mapped and
enclosed below. Data for Siltation is mapped and enclosed.. Based on
siltation rate and survey every year sand ghats are proposed for scooping
of sand and auctioned as per the State Government Policy empowered
under rule 15 of Mines and Minerals (Development and Regulation) Act
1957 and amendments thereof.
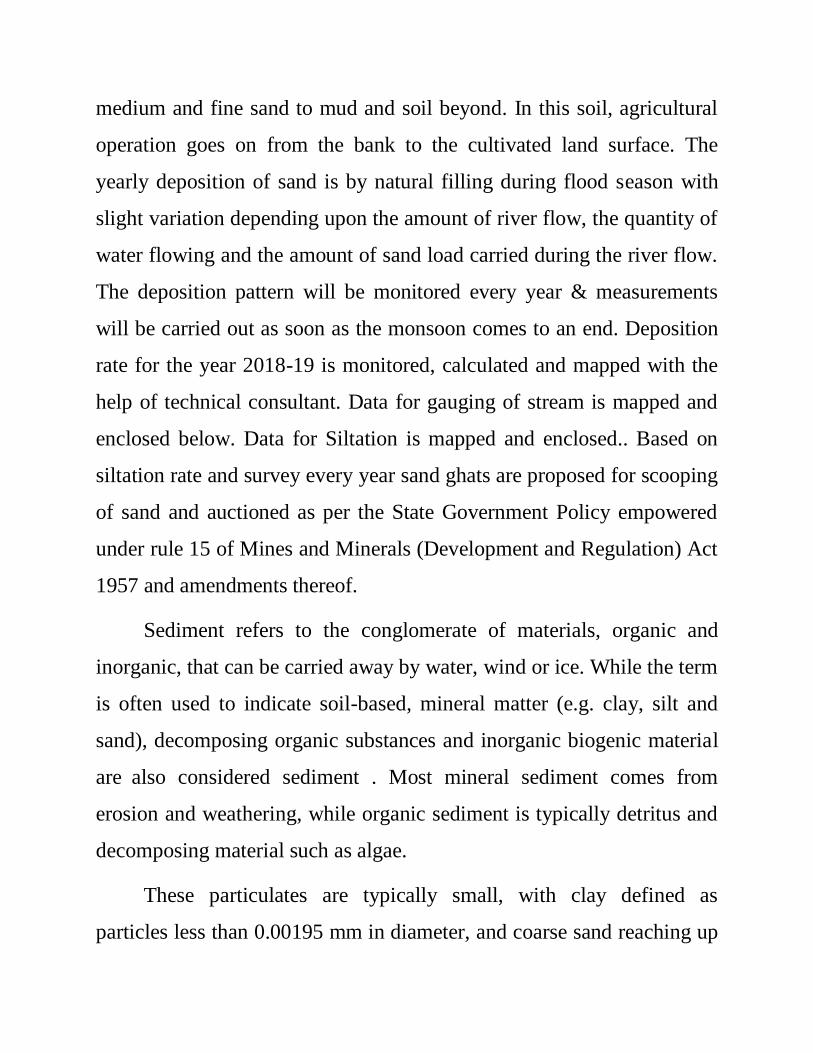
Sediment refers to the conglomerate of materials, organic and
inorganic, that can be carried away by water, wind or ice. While the term
is often used to indicate soil-based, mineral matter (e.g. clay, silt and
sand), decomposing organic substances and inorganic biogenic material
are also considered sediment . Most mineral sediment comes from
erosion and weathering, while organic sediment is typically detritus and
decomposing material such as algae.
These particulates are typically small, with clay defined as
particles less than 0.00195 mm in diameter, and coarse sand reaching up

only to 1.5 mm in diameter. However, during a flood or other high flow
event, even large rocks can be classified as sediment as they are carried
downstream . Sediment is a naturally occurring element in many bodies
of water, though it can be influenced by anthropogenic factors .
In an aquatic environment, sediment can either be suspended
(floating in the water column) or bedded (settled on the bottom of a body
of water). In other words water flow tries to scour its surface whenever it
flows in the channel. Silt or gravels enen larger boulders are detached
from its bed or banks. The moving water sweeps these detached particles
in downstream along its flow. Silting and scouring is not very
uncommon and must be avoided by proper designs. It reduces supply
level of water. The channel section gets reduced by silt and reduces
discharging capacity. Sediments seriously threaten various projects due
to silt carried out by rivers up to point of interceptions. Sediment is also
threatening denudation of forests. Sediment is a major obstruction on the
flow line . It shorten longevity of channel. It causes soil erosion.
Therefore data base must be needed forpolicy making and planning.
Sediments are calculated as sediment load.
There are three types of sediments
Coarse
Sediments
Particle size above
0.2mm
Water sample passing
through 100/72 mesh sieve
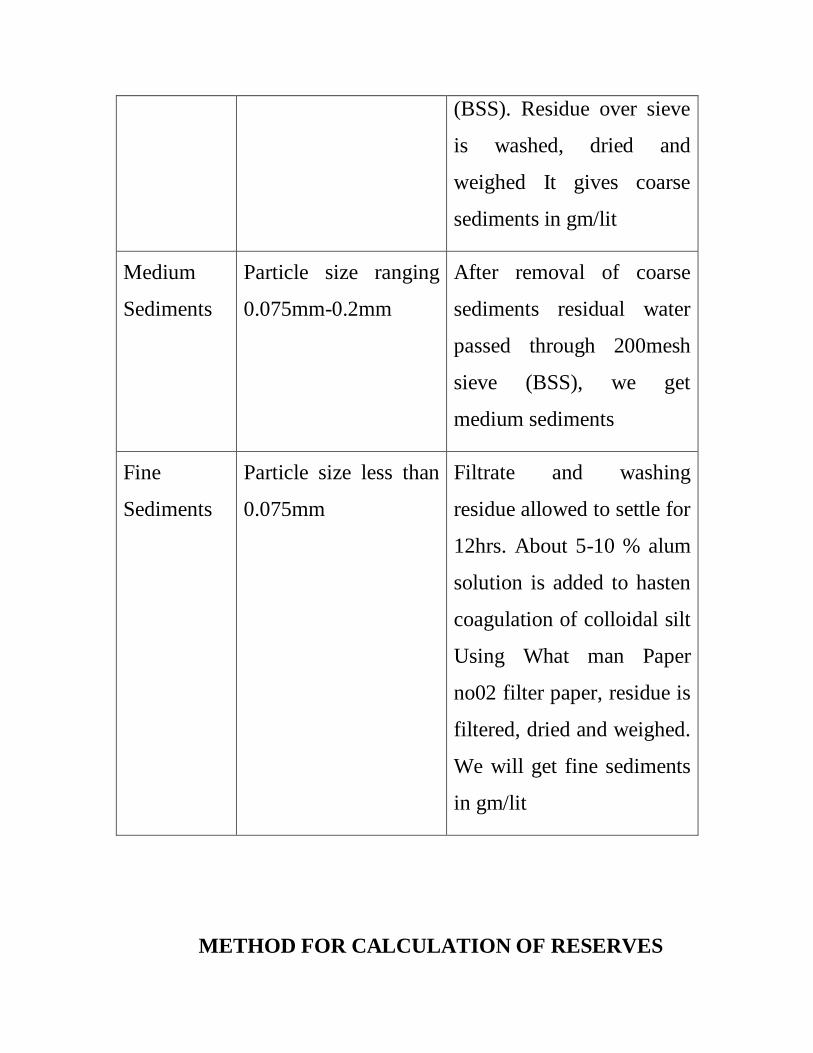
(BSS). Residue over sieve
is washed, dried and
weighed It gives coarse
sediments in gm/lit
Medium
Sediments
Particle size ranging
0.075mm-0.2mm
After removal of coarse
sediments residual water
passed through 200mesh
sieve (BSS), we get
medium sediments
Fine
Sediments
Particle size less than
0.075mm
Filtrate and washing
residue allowed to settle for
12hrs. About 5-10 % alum
solution is added to hasten
coagulation of colloidal silt
Using What man Paper
no02 filter paper, residue is
filtered, dried and weighed.
We will get fine sediments
in gm/lit
METHOD FOR CALCULATION OF RESERVES
For the calculation of total reserves of minor minerals available in
the river bed, length, average width and depth of the river bed for which
the exploitation is to be carried out / allowed under rule / prevailing
instructions of the Govt. was taken into consideration. The volume thus
obtained is multiplied with the bulk density.
Total reserves of minor minerals (M.T.) = Length x Width x
Height i.e. Depth x Density.
For the annual replenishment of minor mineral reserves, the
average annual mean depth up to which the replenishment of minor
mineral takes place annually, has been taken into consideration which
depends upon the annual rainfall factor and geology of the catchments
area.
REPLENISHMENT OF THE AREA
The rate of gross or absolute silt production (erosion) in the
watershed and the ability of the stream system to transport the eroded
material in a river and then to a reservoir has the direct relation with the
quantity of sediment delivered into a reservoir. The rate of gross erosion
is dependent upon many physical factors live climatic conditions, nature
of soil, slope of the area, topography and the land use. Hydro-physical
conditions of the watershed govern the capability of transporting the
eroded material. It has been observed that the average rate of sediment
production decreases as the size of drainage area increase and the larger
watershed the lesser is the variation between the rates. The larger
watershed presents more opportunity for deposition of silt during its
traverse from the point of production. The watershed with maximum
land use class of forest generate very low rate of production unless the
forest are degraded or open forest. The cultivated watersheds with
unscientific farming produce very high rate of silt production. The total
amount of eroded material, which reaches a particular hydraulic control
point, is termed as sediment yield. The sediment control of inflow is
governed by Character of run-off; Susceptibility of soils; the extent and
density of vegetative cover in the area; and the hydraulic efficiency of
the drainage system. The rotational mining is being adopted to facilitate
the replenishment of the excavated pits during rainy season. Thus the
mineable area has been divided in five blocks i.e. the upstream block
and the downstream block. The Mining of these blocks is suggested on
rotation basis in such a way that pit of previous year mining will act as
depository for the monsoon season. Sand is extracted from the said lot
during one year; more than the extracted quantity of the same are
automatically replenished by rainfall in the monsoon by the river/ nallah
itself on account of its flow and velocity.