Embed Size (px)
Citation preview
Project Paper 7
Survey reportFinal Version, updated 1-10-2012
Responsibleinstitution: International Migration Institute
Authors: Evelyn Ersanilli
Contents
Introduction................................................................................................................................... 3
Fieldwork....................................................................................................................................... 4
Fieldwork period ......................................................................................................................... 4
Interview duration ....................................................................................................................... 5
Language ................................................................................................................................... 6
Collaboration with local authorities ............................................................................................. 8
Problems encountered during fieldwork...................................................................................... 8
Suspicion and security issues ................................................................................................ 8
Problems with reaching the target population......................................................................... 9
Problems with questions ........................................................................................................ 9
Sampling ..................................................................................................................................... 11
Response rates ........................................................................................................................ 18
Bias .......................................................................................................................................... 21
Data entry and cleaning.............................................................................................................. 25
Weights........................................................................................................................................ 26
References .................................................................................................................................. 27
Appendices ................................................................................................................................. 28
Random sticker syntax for Stata............................................................................................... 28
Interviewer characteristics ........................................................................................................ 29
3
Introduction
The EUMAGINE project focuses on four countries; Morocco, Turkey, Senegal and the Ukraine.
Within these countries four research areas (see table 1) have been selected for data collection. A
survey was conducted in the first half of 2011. The aim was to survey a representative random
sample of 500 members of the population aged 18-39 in each research area. Fieldwork was orga-
nized by the local EUMAGINE consortium members; for Morocco by Université Mohammed V-
Agdal, Rabat; for Turkey by Koç University, Istanbul; for Senegal by Université Cheikh Anta Diop
de Dakar; and for Ukraine by the Centre of Sociological Research, Ternopil.
Table 1 Research Area codes
Morocco Turkey Senegal Ukraine
11 Todgha Valley 21 Emirdağ 31 Darou Mousty 41 Zbarazh Rayon
12 Central Plateau 22 Dinar 32 Lambaye 42 Znamyanska Rayon
13 Tanger 23 Fatih 33 Golf Sud 43 Solomyansky Rayon
14 Tounfite 24 Van Merkez 34 Orkadiere 44 Novovodolaz’ka Rayon
In preparation of the quantitative data collection project-wide guidelines were developed (see Er-
sanilli, Carling and De Haas, 2011) to ensure high quality data and comparable collection proce-
dures across the four countries. These guidelines had been refined during two rounds of pilot tests
held in 2010. At the end of data collection a fieldwork report was written for each research area
and submitted to the work package coordinator, IMI.
Drawing on the fieldwork reports, this paper presents an overview of the fieldwork and sampling
procedures, noting problems encountered and divergences from the general guidelines. It also
presents response rates. The challenges that research teams faced varied across countries and
research areas. This variation is closely related to cultural factors such as levels of social trust,
family structure and life rhythm.
The paper finishes by discussing data cleaning procedures and explaining how the survey weights
were calculated.
Researchers planning to use the EUMAGINE dataset are strongly advised to read this report be-
fore doing their analyses.
4
Fieldwork
Before the start of fieldwork all interviewers received 1-2 days of intensive training. During the
training the questionnaire and data collection guidelines were discussed. To ensure that interview-
ers had a good understanding of the more complex parts of the questionnaire, the trainings includ-
ed a series of test cases for the household definition, migration scenarios and principal activity cod-
ing. Like the guidelines and survey, the test cases were translated into the language of the train-
ings. Supervisors received additional instructions on the sampling procedure.
Data was collected using paper questionnaires and pencils. The questionnaire consisted of two
parts; a household grid and an individual questionnaire (see Ersanilli, Carling and de Haas, 2011).
The respondent for the individual questionnaire was selected randomly from all eligible household
members (see below for details).
Several of the survey questions make reference to the name of the research area (e.g. questions
HH12, HH17, MG9, MG25, A31, A10, A11, P12). For the neighbourhoods of some of the major
cities it was decided to have these questions refer to the city as a whole and not to the neighbour-
hood. In Fatih (23) the questions referred to ‘Istanbul’, in Solomyansky (43) to ‘Kyiv’. In Golf Sud
the reference was to ‘Golf Sud’ and no to Dakar, as people perceive this as their place of resi-
dence.
Fieldwork period
The length of the fieldwork period and the number of interviewers in the field varied across coun-
tries and research area. Table 2 displays the length of the fieldwork period and the number of in-
terviewers and supervisors in each area. In the Ukraine fieldwork was hindered by prolonged win-
ter weather. Not all teams worked every day of the fieldwork period. Teams usually worked from
early morning to late evening on weekdays and also on weekends to reach a maximum number of
respondents and reduce the risk of non-response bias. Interviewer teams were always accompa-
nied by supervisors who were responsible for sampling. The supervisors also checked completed
questionnaires for inconsistencies with help of a checklist. When necessary, interviewers were sent
back to a household to complete missing information. In the Ukraine and Senegal the phone
numbers of participating households were collected so that they could be reached for later data
checks.

5
Table 2 Fieldwork period and team size per Research Area
Research Area Fieldwork period Nr of interviewers Nr of supervisors
11 Todgha Valley 14 - 20 March 8 2
12 Central Plateau 22 Feb – 2 March 8 2
13 Tanger 11- 20 April 8 2
14 Tounfite 24 April – 4 May 8 2
21 Emirdağ 12 -24 April 14 1
22 Dinar 12 -25 April 12 1
23 Fatih 24 Feb. – 25 March 8 2
24 Van Merkez 7 – 15 March 15 2
31 Darou Mousty 15 – 24 March 13 2
32 Lambaye 23 – 29 April 12 2
33 Golf Sud 26 May – 2 June 7 2
34 Orkadiere 26 Feb – 10 March 11 2
41 Zbarazh Rayon 7 March – 20 May 11 1
42 Znamyanska Rayon 19 March – 15 May 17 2
43 Solomyansky Rayon 19 March – 22 May 22 2
44 Novovodolaz’ka Rayon 13 March – 27 May 24 2
Interview duration
The length of the interviews varied across research areas and countries, partly as a function of
household size. Table 3 displays the average and median duration of the household interview and
individual interview by research area. As to be expected, the household interviews took longest in
the three research areas in Senegal where polygamy and intergenerational households have lead
to large and complex household structures.
Table 3 Average interview duration in minutes – unweighted
Research Area Household questionnaire Individual questionnaire
mean medianmean
household size
N mean median N
11 Todgha Valley 7.0 5 6.3 487 15.5 14 488
12 Central Plateau 7.8 6 5.1 485 16.5 15 479
13 Tanger 6.7 5 5.4 488 14.5 13 489
14 Tounfite 5.8 5 5.6 490 10.8 10 470
21 Emirdağ 6.0 5 4.3 500 21.9 20 500
22 Dinar 5.8 5 4.2 500 23.1 23 499
23 Fatih 6.1 5 3.6 500 22.9 22 496
24 Van Merkez 8.2 7 6.1 500 20.8 19 493
31 Darou Mousty 26.8 21 11.4 477 29.0 25 479
32 Lambaye 22.6 17 13.5 488 20.2 17 481
33 Golf Sud 12.6 10 6.7 470 20.1 17 474
34 Orkadiere 28.4 23 13.6 489 26.0 22 483
41 Zbarazh Rayon 6.7 6 4.5 496 21.7 20 490
42 Znamyanska Rayon 9.0 10 3.3 498 23.7 20 498
43 Solomyansky Rayon 9.8 10 2.9 493 24.5 22 493
44 Novovodolaz’ka Rayon 13.2 11 3.5 493 28.9 28 493
Source: EUMAGINE dataset version 20121001, unweighted. N<500 due to missing values

6
Language
All countries in EUMAGINE have linguistic pluralism, mostly related to national minorities. In
Morocco, the main language spoken by the population, colloquial Arabic or ‘Darija’, is not a written
language. The questionnaire was therefore translated in the Modern Standard Arabic. To ensure
that respondents understood the questions and interviewers did not need to do ‘on-the-spot’
translations, key concepts and phrases (incl. all answers scales and attitude questions) were
translated into Darija and written phonetically. These translations were created in extensive
discussions within the fieldwork team and with duo-partner IMI. Many Moroccans have one of the
Berber (Tamazight) languages as mother tongue. Tamazight is also a common language in several
of the EUMAGINE research areas. However it was decided not to make a written translation into
Tamazight because of the strong regional variations and low levels of standardisation. Only in one
village in Tounfite (14) (village code 1421) it was deemed necessary to have linguistic assistance.
However this was more a trust issue than a linguistic one. Three local youth were recruited to
assist the interviewers. These youngsters (aged 18-22) were trained by one of the supervisors who
is a native speaker of Tamazight. The interviews were conducted in the presence of these
youngsters, who, when necessary, translated the questions into Tamazight. These interviews were
incorrectly registered as being conducted fully in Arabic. As part of the data cleaning process it was
recoded that a second language was used (iq3=1) namely Tamazight (iq4=2).
In Turkey the research area of Van Merkez (24) posed a linguistic challenge as most of the
population is Kurdish. During the pilot in Van a Kurdish translation of the questionnaire was used.
This translation however proved to be of little use because the language was too formal. Therefore
in preparation for the actual survey another translation was made of all key concepts and phrases.
This translation and the full translation were discussed with a group of interviewers familiar with the
Kurdish dialect in Van, to come to a translation that is as close as possible to common language in
the area. Where necessary (for instance questions W8, W11, W16) the Turkish terms were also
included in the questionnaire. The interviewers were equipped with both Kurdish and Turkish
versions of the questionnaire. When a respondent had problems understanding a question in the
main language of that questionnaire (either Kurdish or Turkish), the interviewer repeated the
question in the other language.
Senegal has seven national languages - French, Wolof, Peul/Pulaar, Sérère, Diola, Mandingue,
and Soninké. In the EUMAGINE research areas Wolof and Pulaar are the most important
languages. Though both languages have a standardized written version, the fact that French is the
language of education has led to low proficiency in written Wolof and Pulaar. Most interviewers
were not familiar with reading and writing their mother tongues or other Senegalese languages. It
was therefore decided to use a French standardized questionnaire translation in which key
concepts and phrases were printed in both French and Wolof, or French and Pulaar.
For example
7
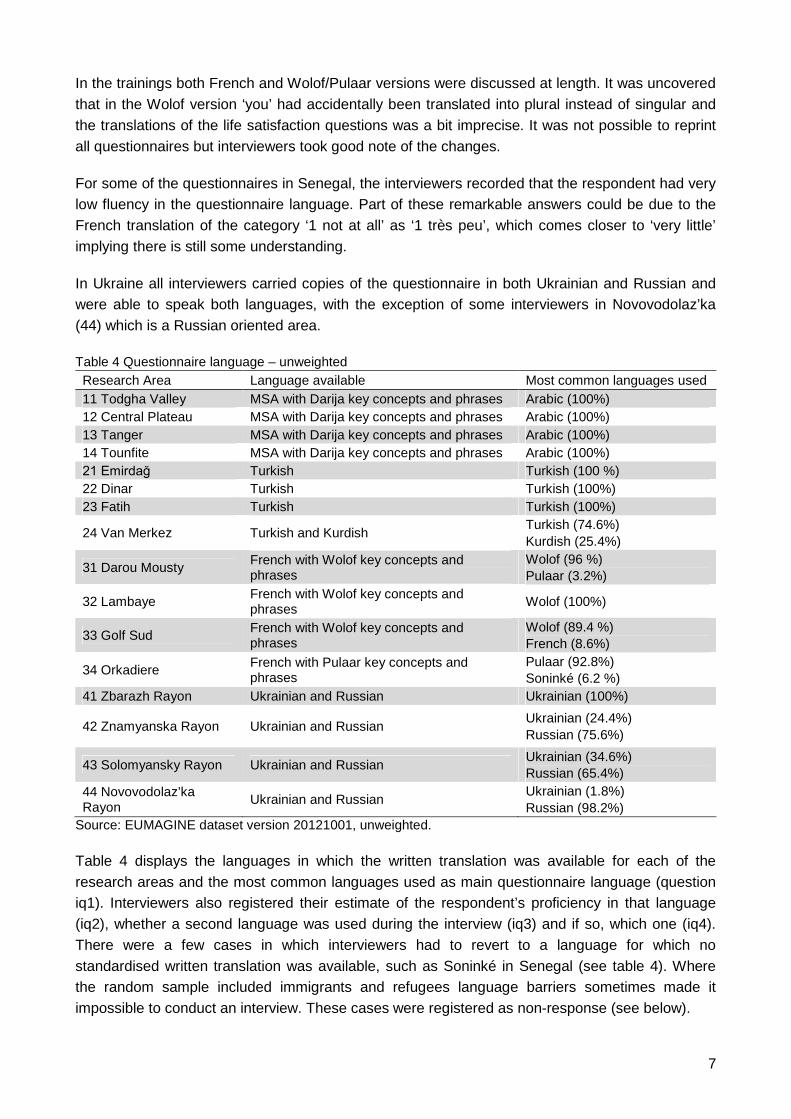
In the trainings both French and Wolof/Pulaar versions were discussed at length. It was uncovered
that in the Wolof version ‘you’ had accidentally been translated into plural instead of singular and
the translations of the life satisfaction questions was a bit imprecise. It was not possible to reprint
all questionnaires but interviewers took good note of the changes.
For some of the questionnaires in Senegal, the interviewers recorded that the respondent had very
low fluency in the questionnaire language. Part of these remarkable answers could be due to the
French translation of the category ‘1 not at all’ as ‘1 très peu’, which comes closer to ‘very little’
implying there is still some understanding.
In Ukraine all interviewers carried copies of the questionnaire in both Ukrainian and Russian and
were able to speak both languages, with the exception of some interviewers in Novovodolaz’ka
(44) which is a Russian oriented area.
Table 4 Questionnaire language – unweighted
Research Area Language available Most common languages used
11 Todgha Valley MSA with Darija key concepts and phrases Arabic (100%)
12 Central Plateau MSA with Darija key concepts and phrases Arabic (100%)
13 Tanger MSA with Darija key concepts and phrases Arabic (100%)
14 Tounfite MSA with Darija key concepts and phrases Arabic (100%)
21 Emirdağ Turkish Turkish (100 %)
22 Dinar Turkish Turkish (100%)
23 Fatih Turkish Turkish (100%)
24 Van Merkez Turkish and KurdishTurkish (74.6%)
Kurdish (25.4%)
31 Darou MoustyFrench with Wolof key concepts andphrases
Wolof (96 %)
Pulaar (3.2%)
32 LambayeFrench with Wolof key concepts andphrases
Wolof (100%)
33 Golf SudFrench with Wolof key concepts andphrases
Wolof (89.4 %)
French (8.6%)
34 OrkadiereFrench with Pulaar key concepts andphrases
Pulaar (92.8%)
Soninké (6.2 %)
41 Zbarazh Rayon Ukrainian and Russian Ukrainian (100%)
42 Znamyanska Rayon Ukrainian and RussianUkrainian (24.4%)
Russian (75.6%)
43 Solomyansky Rayon Ukrainian and RussianUkrainian (34.6%)
Russian (65.4%)
44 Novovodolaz’kaRayon
Ukrainian and RussianUkrainian (1.8%)
Russian (98.2%)
Source: EUMAGINE dataset version 20121001, unweighted.
Table 4 displays the languages in which the written translation was available for each of the
research areas and the most common languages used as main questionnaire language (question
iq1). Interviewers also registered their estimate of the respondent’s proficiency in that language
(iq2), whether a second language was used during the interview (iq3) and if so, which one (iq4).
There were a few cases in which interviewers had to revert to a language for which no
standardised written translation was available, such as Soninké in Senegal (see table 4). Where
the random sample included immigrants and refugees language barriers sometimes made it
impossible to conduct an interview. These cases were registered as non-response (see below).
8
Collaboration with local authorities
In Senegal and Morocco the fieldwork teams worked closely with the local authorities. This was a
necessity partly because of local custom and a lack of up-to-date area maps and population
information, but teams also felt it was an advantage because these intermediaries could instill trust
in the respondents. By and large the interviews took place without the presence of the
representatives of the local authorities.
In Morocco the team worked with the village and neighbourhood chiefs (moqaddems). In towns
moqaddems helped determine the boundaries of the neighbourhoods and accompanied
interviewers on their random walks. In villages they often helped the supervisors with creating a list
of households and their location.
In the Senegalese research area of Darou Mousty (31) contacts were established not only with the
village chiefs but also with the religious authority, the khalif, and his relatives, because they play an
important role in that area. In all areas the team contacted the village chief, or in the case of Dakar
the neighbourhood chief, before commencing the survey. In Darou Mousty (31) a radio
announcement was made by the local authorities encouraging people to participate in the survey.
In Orkadiere (34) a similar announcement was made via the loudspeakers of the mosques. In
Darou Mousty a local official who knew the area and its population well accompanied the team to
help them locate the villages to be surveyed (good quality maps are absent). His presence had a
reassuring effect on the villagers.
In Turkey and the Ukraine the teams only contacted local authorities to request research permits.
Problems encountered during fieldwork
In most research areas fieldwork went smoothly and teams were able to finish within the planned
time frame. Only in the Ukraine a long cold winter and high non-response (see below) led to delays
in the data collection. The fieldwork teams encountered a number of problems. Most problems can
be grouped into three categories; suspicion, reaching the target population, and question
understanding.
Suspicion and security issues
In the Turkish research areas of Emirdağ (21) and Dinar (22) the interviewers were repeatedly met
with suspicion by residents and in some locations also by the police or lower authorities. The team
was always able to clear up the situation by showing their permits and talking to higher-level
authorities. In Van (24) a recent terror incident in a nearby district had led to tensions and a highly
visible presence of the military. The data collection was therefore done as quickly as possible. It is
possible that the high tensions have influenced the answers of the respondents in Van. In Zbarazh
(41) and Solomyanska (43) some residents feared that the interviewers were not part of a research
project but of a criminal group looking for households to rob. In Novovodolaz’ka (44) the fear was
so strong that the supervisor decided to contact the local authorities to clarify the reasons for their
presence in the area. In Zbarazh (41) and Novovodolaz’ka (44) respondents were reluctant to
answer questions related to household assets. This might be related to the recent introduction of a
new tax code in the Ukraine; respondents might have feared that the information they gave would
9
be communicated to the tax office. In Fatih (23) interviewers were harassed and in Zbarazh (41)
even threatened.
Problems with reaching the target population
In some of the villages selected in the samples for Turkey and the Ukraine, it turned out to be
impossible to complete a full batch of 10 interviews. This was partly because the population
records used overestimated the population size (many emigrants do not notify the authorities that
they have left) and partly because too few members of the population belonged to the EUMAGINE
target group of 18-39 year olds. In these cases additional villages were sampled in order to
complete the 500 interviews.
In the Solomyanska rayon in Kyiv (43) a particular challenge was getting access to the sampled
buildings. The almost exclusively high-rise buildings in this area are locked with downstairs doors
and without a clear doorbell system. Some buildings have concierges sitting downstairs. These
concierges sometimes allowed conducting the interviews, but at times to the displeasure of the
inhabitants who sent the interviewers out from the building and in one case even called the police.
The interviewers often had little alternative but to just wait around for the door to open and try to
get into the building. These problems severely lengthened the fieldwork duration in Kyiv.
Problems with questions
Consistency checks on the data done by IMI, showed that in several countries there were
problems with coding family relations. Two key problems were the absence of codes for certain
types of family relations and cultural differences in the conceptions of family relations. In Morocco
and Senegal and to a lesser extent in Turkey, daughters-in-law were sometimes coded as ‘non-
family’. Similarly in Senegal heads of household often refer to their nephews as their sons. The
codes for relationships with the head of household did not fully cover the complex nature of
Senegalese household where polygamy is frequent. The codes do not allow a distinction between
siblings from the same mother and from those of the other wives. Polygamy also complicated the
coding of question hh10 on the current location of the partner; the answer categories do not
include the option of a partner living elsewhere in the same village/city. Unfortunately the
interviewers have used different systems in coding this type of situation and sometimes coded
them as ‘0’ and sometimes as ‘1’. The information on the location of polygamous heads of
household should therefore be interpreted with care. It is unclear why these problems with the
family relation and partner location codes were not detected during the two rounds of pilot testing
in 2010. Possibly the size of the pilot studies, 30 interviews in each of the four research areas, is a
factor.
In Van (24) heads of household did not automatically mention female household members when
listing all household members at the start of the survey. When this was discovered, field
supervisors required the interviewers to ask additional questions such as “Do you have any
daughters or daughters-in-law living with you?”. Respondents often also listed family members who
live outside the household for more than three months. This was easily uncovered when such a
person was selected for the individual questionnaire. Interviewers were warned to be very careful
about this.
10
Moroccan-Arabic does not clearly distinguish between family and household. Since some of the
questions in the English language questionnaire refer to ‘household’ and others to ‘family’ this can
lead to incorrect answers. Interviewers were instructed to make sure that the respondents were
answering for the correct unit, and to verify with the respondent in case of doubt, but it is possible
that some answers are incorrect.
For the fieldwork in Central Plateau (12) in Morocco, an old version of the principal activity (ques-
tion HH8) code sheet was used. This was uncovered during the first day of fieldwork in Todgha
Valley (11), the second area to be surveyed. Interviewers in Togdha therefore wrote down the
names of the activities instead of the codes. The codes were added later on, before data entry.
The codes for Central Plateau were adjusted to the correct version of the code sheet. Because it
was not possible to recode all professions from the old to the new version, the code “404 artisan”
was added. This code has only been used in Morocco. It was noted that the principal activity codes
do not account for the difference between people in (regular) employment and day labourers, even
though this is an important factor impacting socio-economic status. Also in Senegal several profes-
sions were not captured by the list of codes. This was the case for the ‘griots’ (story tellers) and
other artists who were later assigned code ‘700’.
Questions about year of birth of household members were often seen as difficult in Senegal, rural
Morocco and Van. In Van (24) the official year of birth sometimes differed from the known year of
birth; in these cases the known year of birth was taken.
Education was measured in years. A nation-specific coding scheme has been developed to con-
sistently transfer a certain level of schooling to a certain number of years. This scheme was printed
on the code sheets. Quran school and literacy education were given special codes (55 and 56 re-
spectively). However in Senegal the years spent in Quran school have sometimes been added to
years of regular education. This means that for example a person who has been to both Quran
school and completed elementary school may have a higher score on the education variable (hh7)
than a person who has only gone to elementary school. In Morocco time spent in kindergarten was
in some cases added to the years of education. It is not possible to fully determine in which cases
this addition has occurred. However it can be assumed that in most cases where the difference
between the number of years spent in education and the age of the household member is less than
4 years (implying that s/he started school before the age of 4) is incorrect. No such rudimentary
check is available for people who have left education more than 4 years ago. This means that the
variable ‘years of education’ (hh7) should be taken as an approximate indicator rather than a pre-
cise measure.
In the Ukraine some respondents were confused by the terms ‘nationality’ and ‘citizenship’ in ques-
tions i9 and i10. This can be related to Soviet times, when people had Soviet citizenship but their
identity cards also registered their nationality (more or less their ethnicity). This may mean that
some of the information in the questions i9 and i10 is not correct.
In Morocco the translation of ‘dating website’ (t5) has led to confusion. The connotation of the term
used in the translation is more of a general chat room than a dating website, which probably ex-
plains why a relatively large share of married people gave an affirmative answer. In Senegal where
dating website was translated as ‘site de rencontre’, also a word with a more general social conno-
tation, a similar problem may have occurred.
11
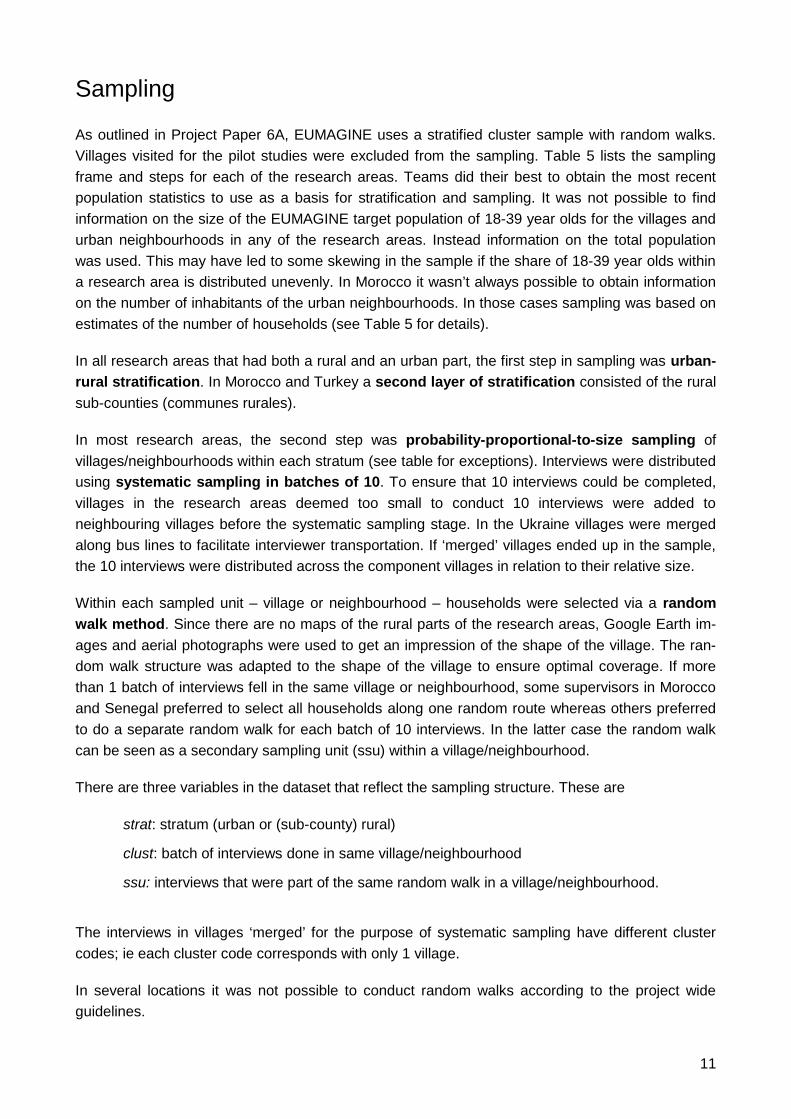
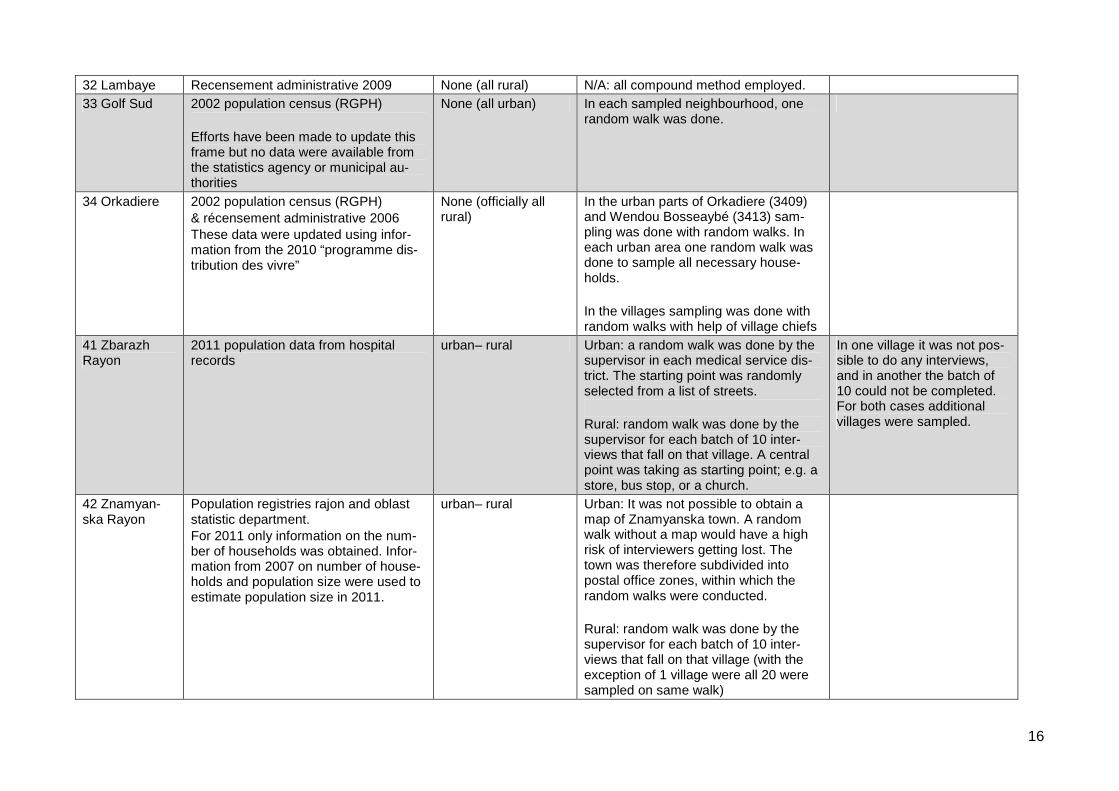
Sampling
As outlined in Project Paper 6A, EUMAGINE uses a stratified cluster sample with random walks.
Villages visited for the pilot studies were excluded from the sampling. Table 5 lists the sampling
frame and steps for each of the research areas. Teams did their best to obtain the most recent
population statistics to use as a basis for stratification and sampling. It was not possible to find
information on the size of the EUMAGINE target population of 18-39 year olds for the villages and
urban neighbourhoods in any of the research areas. Instead information on the total population
was used. This may have led to some skewing in the sample if the share of 18-39 year olds within
a research area is distributed unevenly. In Morocco it wasn’t always possible to obtain information
on the number of inhabitants of the urban neighbourhoods. In those cases sampling was based on
estimates of the number of households (see Table 5 for details).
In all research areas that had both a rural and an urban part, the first step in sampling was urban-
rural stratification. In Morocco and Turkey a second layer of stratification consisted of the rural
sub-counties (communes rurales).
In most research areas, the second step was probability-proportional-to-size sampling of
villages/neighbourhoods within each stratum (see table for exceptions). Interviews were distributed
using systematic sampling in batches of 10. To ensure that 10 interviews could be completed,
villages in the research areas deemed too small to conduct 10 interviews were added to
neighbouring villages before the systematic sampling stage. In the Ukraine villages were merged
along bus lines to facilitate interviewer transportation. If ‘merged’ villages ended up in the sample,
the 10 interviews were distributed across the component villages in relation to their relative size.
Within each sampled unit – village or neighbourhood – households were selected via a random
walk method. Since there are no maps of the rural parts of the research areas, Google Earth im-
ages and aerial photographs were used to get an impression of the shape of the village. The ran-
dom walk structure was adapted to the shape of the village to ensure optimal coverage. If more
than 1 batch of interviews fell in the same village or neighbourhood, some supervisors in Morocco
and Senegal preferred to select all households along one random route whereas others preferred
to do a separate random walk for each batch of 10 interviews. In the latter case the random walk
can be seen as a secondary sampling unit (ssu) within a village/neighbourhood.
There are three variables in the dataset that reflect the sampling structure. These are
strat: stratum (urban or (sub-county) rural)
clust: batch of interviews done in same village/neighbourhood
ssu: interviews that were part of the same random walk in a village/neighbourhood.
The interviews in villages ‘merged’ for the purpose of systematic sampling have different cluster
codes; ie each cluster code corresponds with only 1 village.
In several locations it was not possible to conduct random walks according to the project wide
guidelines.
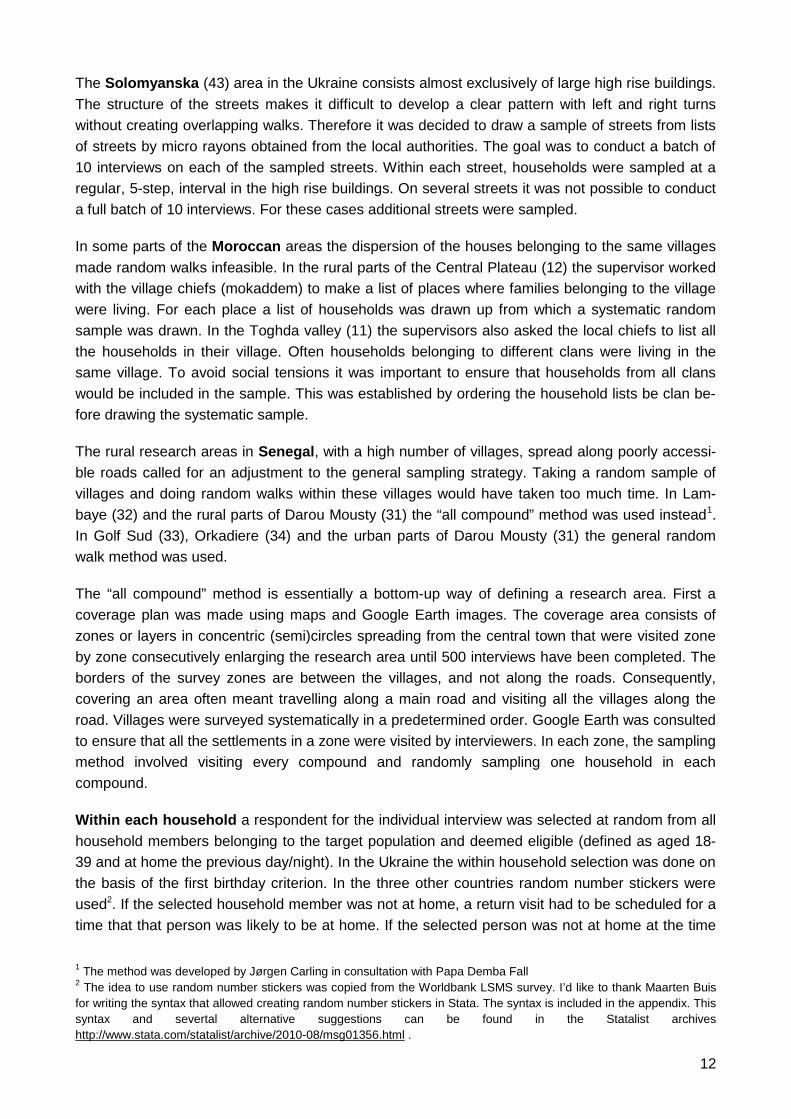
12
The Solomyanska (43) area in the Ukraine consists almost exclusively of large high rise buildings.
The structure of the streets makes it difficult to develop a clear pattern with left and right turns
without creating overlapping walks. Therefore it was decided to draw a sample of streets from lists
of streets by micro rayons obtained from the local authorities. The goal was to conduct a batch of
10 interviews on each of the sampled streets. Within each street, households were sampled at a
regular, 5-step, interval in the high rise buildings. On several streets it was not possible to conduct
a full batch of 10 interviews. For these cases additional streets were sampled.
In some parts of the Moroccan areas the dispersion of the houses belonging to the same villages
made random walks infeasible. In the rural parts of the Central Plateau (12) the supervisor worked
with the village chiefs (mokaddem) to make a list of places where families belonging to the village
were living. For each place a list of households was drawn up from which a systematic random
sample was drawn. In the Toghda valley (11) the supervisors also asked the local chiefs to list all
the households in their village. Often households belonging to different clans were living in the
same village. To avoid social tensions it was important to ensure that households from all clans
would be included in the sample. This was established by ordering the household lists be clan be-
fore drawing the systematic sample.
The rural research areas in Senegal, with a high number of villages, spread along poorly accessi-
ble roads called for an adjustment to the general sampling strategy. Taking a random sample of
villages and doing random walks within these villages would have taken too much time. In Lam-
baye (32) and the rural parts of Darou Mousty (31) the “all compound” method was used instead1.
In Golf Sud (33), Orkadiere (34) and the urban parts of Darou Mousty (31) the general random
walk method was used.
The “all compound” method is essentially a bottom-up way of defining a research area. First a
coverage plan was made using maps and Google Earth images. The coverage area consists of
zones or layers in concentric (semi)circles spreading from the central town that were visited zone
by zone consecutively enlarging the research area until 500 interviews have been completed. The
borders of the survey zones are between the villages, and not along the roads. Consequently,
covering an area often meant travelling along a main road and visiting all the villages along the
road. Villages were surveyed systematically in a predetermined order. Google Earth was consulted
to ensure that all the settlements in a zone were visited by interviewers. In each zone, the sampling
method involved visiting every compound and randomly sampling one household in each
compound.
Within each household a respondent for the individual interview was selected at random from all
household members belonging to the target population and deemed eligible (defined as aged 18-
39 and at home the previous day/night). In the Ukraine the within household selection was done on
the basis of the first birthday criterion. In the three other countries random number stickers were
used2. If the selected household member was not at home, a return visit had to be scheduled for a
time that that person was likely to be at home. If the selected person was not at home at the time
1The method was developed by Jørgen Carling in consultation with Papa Demba Fall
2The idea to use random number stickers was copied from the Worldbank LSMS survey. I’d like to thank Maarten Buis
for writing the syntax that allowed creating random number stickers in Stata. The syntax is included in the appendix. This
syntax and severtal alternative suggestions can be found in the Statalist archives
http://www.stata.com/statalist/archive/2010-08/msg01356.html .

13
of the return visit, a second random selection was made among the remaining eligible household
members (variable id2). In rural areas supervisors often decided to make a second draw
immediately if the randomly selected household member was not present, as the travel time made
it infeasible to return to these households at a later point. The Turkish team decided to only select
one respondent in each household and do up to two return visits to contact this person. The team
has been able to locate absentee selected household members elsewhere, such as at work or in
the coffee house. In other cases they had to proceed to another household. In Senegal it was
sometimes deemed necessary to make a third random selection (variable id3).
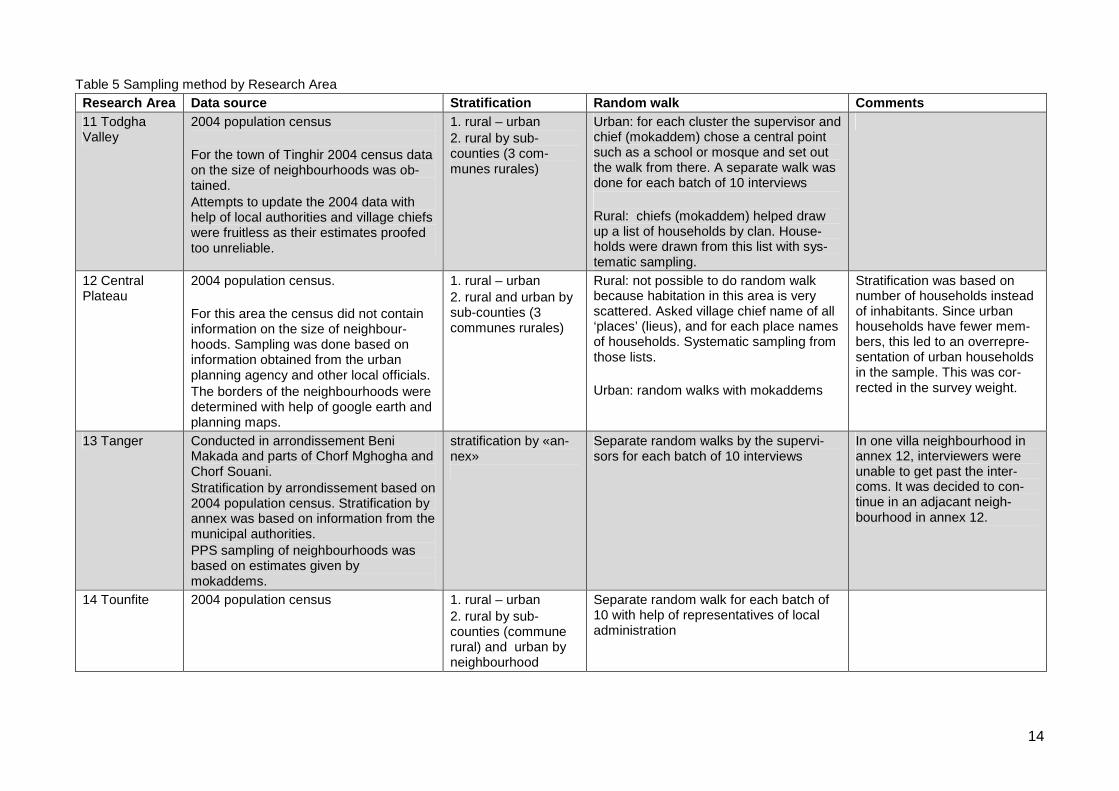
14
Table 5 Sampling method by Research Area
Research Area Data source Stratification Random walk Comments
11 TodghaValley
2004 population census
For the town of Tinghir 2004 census dataon the size of neighbourhoods was ob-tained.Attempts to update the 2004 data withhelp of local authorities and village chiefswere fruitless as their estimates proofedtoo unreliable.
1. rural – urban2. rural by sub-counties (3 com-munes rurales)
Urban: for each cluster the supervisor andchief (mokaddem) chose a central pointsuch as a school or mosque and set outthe walk from there. A separate walk wasdone for each batch of 10 interviews
Rural: chiefs (mokaddem) helped drawup a list of households by clan. House-holds were drawn from this list with sys-tematic sampling.
12 CentralPlateau
2004 population census.
For this area the census did not containinformation on the size of neighbour-hoods. Sampling was done based oninformation obtained from the urbanplanning agency and other local officials.The borders of the neighbourhoods weredetermined with help of google earth andplanning maps.
1. rural – urban2. rural and urban bysub-counties (3communes rurales)
Rural: not possible to do random walkbecause habitation in this area is veryscattered. Asked village chief name of all‘places’ (lieus), and for each place namesof households. Systematic sampling fromthose lists.
Urban: random walks with mokaddems
Stratification was based onnumber of households insteadof inhabitants. Since urbanhouseholds have fewer mem-bers, this led to an overrepre-sentation of urban householdsin the sample. This was cor-rected in the survey weight.
13 Tanger Conducted in arrondissement BeniMakada and parts of Chorf Mghogha andChorf Souani.Stratification by arrondissement based on2004 population census. Stratification byannex was based on information from themunicipal authorities.PPS sampling of neighbourhoods wasbased on estimates given bymokaddems.
stratification by «an-nex»
Separate random walks by the supervi-sors for each batch of 10 interviews
In one villa neighbourhood inannex 12, interviewers wereunable to get past the inter-coms. It was decided to con-tinue in an adjacant neigh-bourhood in annex 12.
14 Tounfite 2004 population census 1. rural – urban
2. rural by sub-counties (communerural) and urban byneighbourhood
Separate random walk for each batch of10 with help of representatives of localadministration
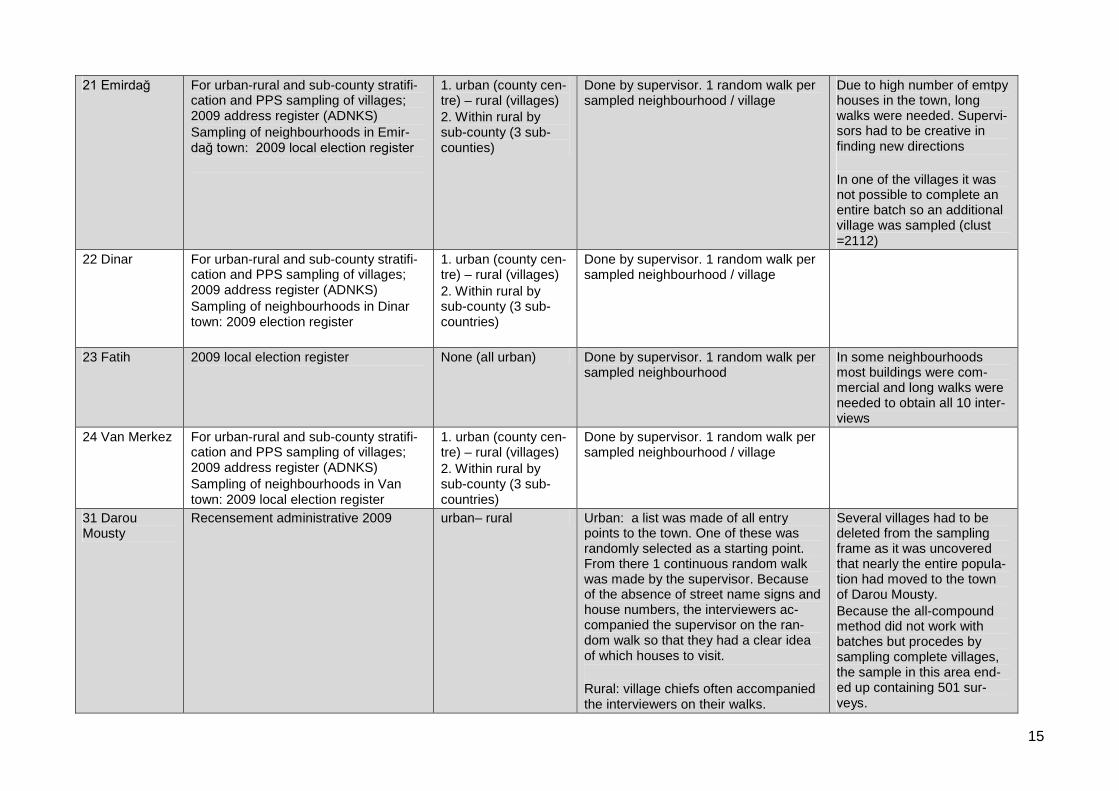
15
21 Emirdağ For urban-rural and sub-county stratifi-cation and PPS sampling of villages;2009 address register (ADNKS)Sampling of neighbourhoods in Emir-dağ town: 2009 local election register
1. urban (county cen-tre) – rural (villages)2. Within rural bysub-county (3 sub-counties)
Done by supervisor. 1 random walk persampled neighbourhood / village
Due to high number of emtpyhouses in the town, longwalks were needed. Supervi-sors had to be creative infinding new directions
In one of the villages it wasnot possible to complete anentire batch so an additionalvillage was sampled (clust=2112)
22 Dinar For urban-rural and sub-county stratifi-cation and PPS sampling of villages;2009 address register (ADNKS)Sampling of neighbourhoods in Dinartown: 2009 election register
1. urban (county cen-tre) – rural (villages)
2. Within rural bysub-county (3 sub-countries)
Done by supervisor. 1 random walk persampled neighbourhood / village
23 Fatih 2009 local election register None (all urban) Done by supervisor. 1 random walk persampled neighbourhood
In some neighbourhoodsmost buildings were com-mercial and long walks wereneeded to obtain all 10 inter-views
24 Van Merkez For urban-rural and sub-county stratifi-cation and PPS sampling of villages;2009 address register (ADNKS)Sampling of neighbourhoods in Vantown: 2009 local election register
1. urban (county cen-tre) – rural (villages)2. Within rural bysub-county (3 sub-countries)
Done by supervisor. 1 random walk persampled neighbourhood / village
31 DarouMousty
Recensement administrative 2009 urban– rural Urban: a list was made of all entrypoints to the town. One of these wasrandomly selected as a starting point.From there 1 continuous random walkwas made by the supervisor. Becauseof the absence of street name signs andhouse numbers, the interviewers ac-companied the supervisor on the ran-dom walk so that they had a clear ideaof which houses to visit.
Rural: village chiefs often accompaniedthe interviewers on their walks.
Several villages had to bedeleted from the samplingframe as it was uncoveredthat nearly the entire popula-tion had moved to the townof Darou Mousty.
Because the all-compoundmethod did not work withbatches but procedes bysampling complete villages,the sample in this area end-ed up containing 501 sur-veys.
16
32 Lambaye Recensement administrative 2009 None (all rural) N/A: all compound method employed.
33 Golf Sud 2002 population census (RGPH)
Efforts have been made to update thisframe but no data were available fromthe statistics agency or municipal au-thorities
None (all urban) In each sampled neighbourhood, onerandom walk was done.
34 Orkadiere 2002 population census (RGPH)
& récensement administrative 2006These data were updated using infor-mation from the 2010 “programme dis-tribution des vivre”
None (officially allrural)
In the urban parts of Orkadiere (3409)and Wendou Bosseaybé (3413) sam-pling was done with random walks. Ineach urban area one random walk wasdone to sample all necessary house-holds.
In the villages sampling was done withrandom walks with help of village chiefs
41 ZbarazhRayon
2011 population data from hospitalrecords
urban– rural Urban: a random walk was done by thesupervisor in each medical service dis-trict. The starting point was randomlyselected from a list of streets.
Rural: random walk was done by thesupervisor for each batch of 10 inter-views that fall on that village. A centralpoint was taking as starting point; e.g. astore, bus stop, or a church.
In one village it was not pos-sible to do any interviews,and in another the batch of10 could not be completed.For both cases additionalvillages were sampled.
42 Znamyan-ska Rayon
Population registries rajon and oblaststatistic department.For 2011 only information on the num-ber of households was obtained. Infor-mation from 2007 on number of house-holds and population size were used toestimate population size in 2011.
urban– rural Urban: It was not possible to obtain amap of Znamyanska town. A randomwalk without a map would have a highrisk of interviewers getting lost. Thetown was therefore subdivided intopostal office zones, within which therandom walks were conducted.
Rural: random walk was done by thesupervisor for each batch of 10 inter-views that fall on that village (with theexception of 1 village were all 20 weresampled on same walk)
17
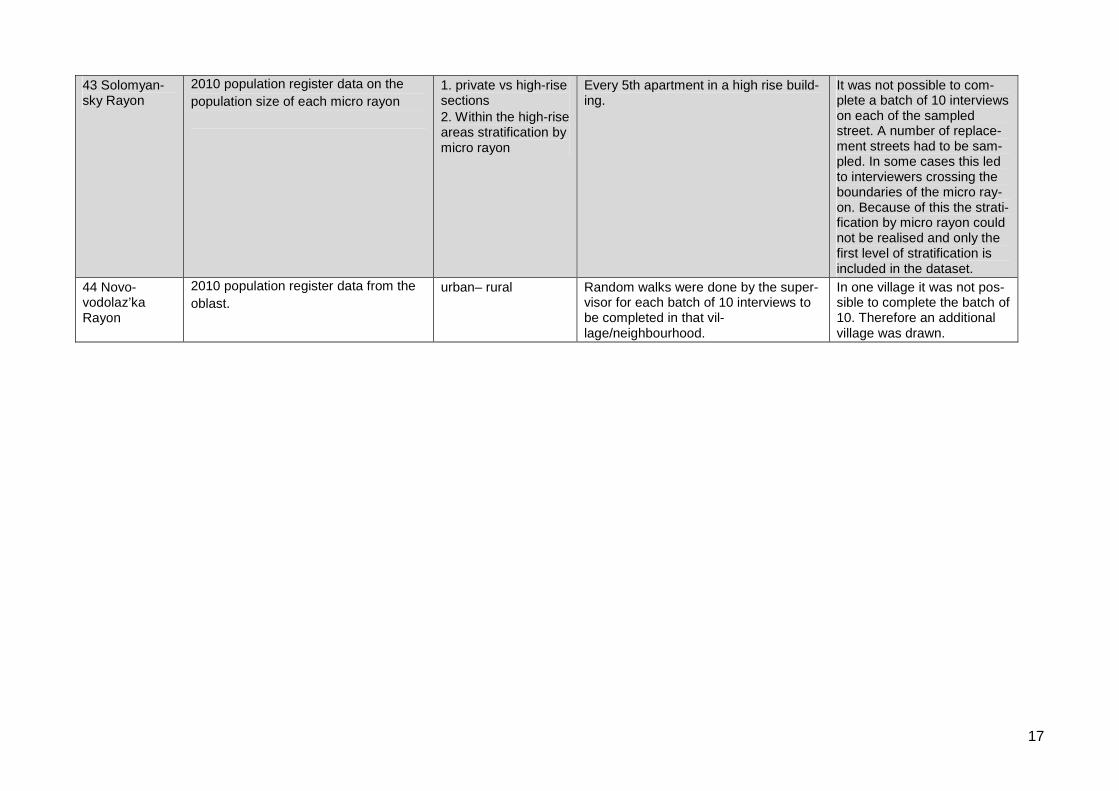
43 Solomyan-sky Rayon
2010 population register data on the
population size of each micro rayon1. private vs high-risesections2. Within the high-riseareas stratification bymicro rayon
Every 5th apartment in a high rise build-ing.
It was not possible to com-plete a batch of 10 interviewson each of the sampledstreet. A number of replace-ment streets had to be sam-pled. In some cases this ledto interviewers crossing theboundaries of the micro ray-on. Because of this the strati-fication by micro rayon couldnot be realised and only thefirst level of stratification isincluded in the dataset.
44 Novo-vodolaz’kaRayon
2010 population register data from the
oblast.urban– rural Random walks were done by the super-
visor for each batch of 10 interviews tobe completed in that vil-lage/neighbourhood.
In one village it was not pos-sible to complete the batch of10. Therefore an additionalvillage was drawn.
18
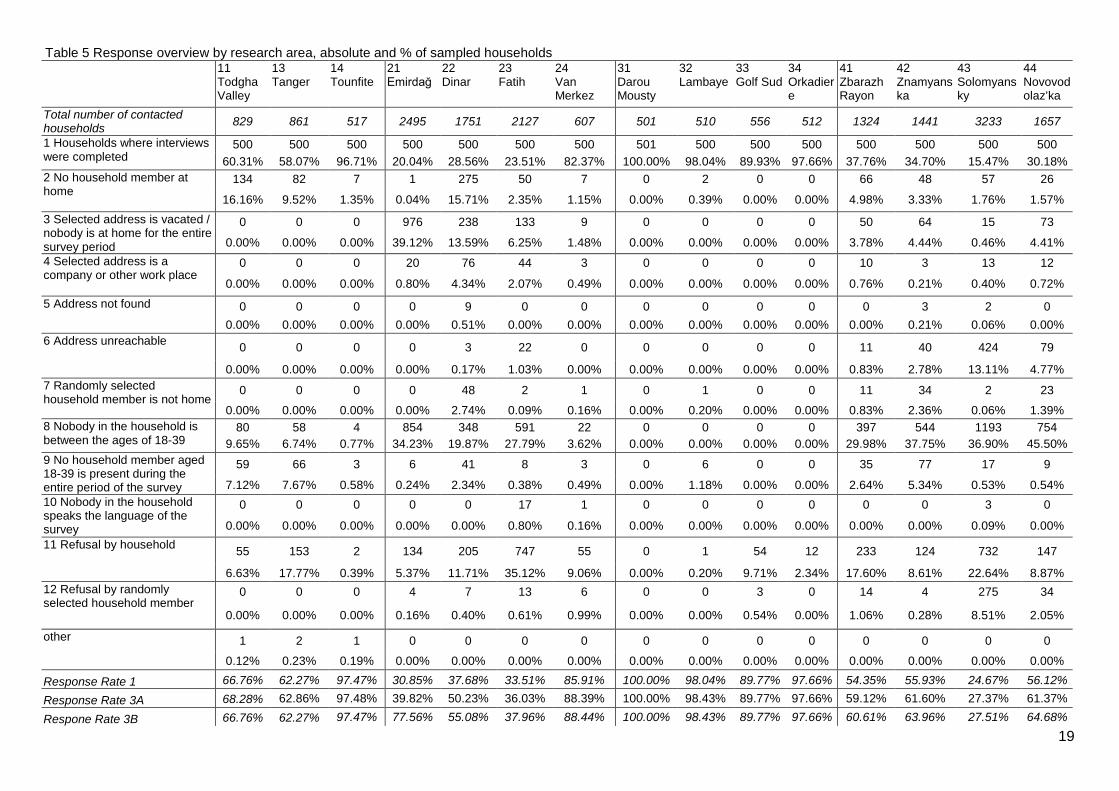
Response rates
To register response and different types of non-response sample tracking forms were
developed (see EUMAGINE Project Paper 6A for an example). In Morocco there were
problems with these forms, leading to no registration of response in the Central Plateau (12).
In the three other regions a slightly adapted response registration form was used. This form
only distinguished “completed interviews”, “vacant / no-one at home” (combination of
categories 2 and 3 of the original form), “nobody in the household is between the ages of 18-
39”, “no household member aged 18-39 is present during the entire period of the survey”,
“refusal” (combination of categories 2 and 3 of the original form) and “other".
Table 5 presents the sample size and types of response for each of the research areas
where response was tracked. From the table it becomes clear that there is a strong variation
in the number of households contacted in order to achieve the desired 500 interviews.
There is a range of different ways to calculate the response rate of a survey. We follow the
guidelines of the AAPOR3. The basic formula for calculating the response rate is
response rate 1 = I/(I+P) + (R+NC+O) + (UH+UO)
where
I: Interview
P: Partial interview
R: Refusal
NC: non-contact
O: Other
UH: Unknown household
UO: Unknown other
However since EUMAGINE focuses on a specific target population – 18-39 year olds – it is
likely that there are some ineligible households hiding in the non-response. For example,
part of the households that were not reached because all members were absent, will not
have had any members in the EUMAGINE age group and should therefore not be treated as
non-response.
To correct for eligibility, AAPOR has developed another response rate formula:
response rate 3 = I/(I+P) + (R+NC+O) + e*(UH+UO)
where
e: estimated proportion of cases of unknown eligibility that are eligible
3http://www.aapor.org/Standard_Definitions2.htm
19
Table 5 Response overview by research area, absolute and % of sampled households11TodghaValley
13Tanger
14Tounfite
21Emirdağ
22Dinar
23Fatih
24VanMerkez
31DarouMousty
32Lambaye
33Golf Sud
34Orkadiere
41ZbarazhRayon
42Znamyanska
43Solomyansky
44Novovodolaz’ka
Total number of contactedhouseholds
829 861 517 2495 1751 2127 607 501 510 556 512 1324 1441 3233 1657
1 Households where interviewswere completed
500 500 500 500 500 500 500 501 500 500 500 500 500 500 500
60.31% 58.07% 96.71% 20.04% 28.56% 23.51% 82.37% 100.00% 98.04% 89.93% 97.66% 37.76% 34.70% 15.47% 30.18%
2 No household member athome
134 82 7 1 275 50 7 0 2 0 0 66 48 57 26
16.16% 9.52% 1.35% 0.04% 15.71% 2.35% 1.15% 0.00% 0.39% 0.00% 0.00% 4.98% 3.33% 1.76% 1.57%
3 Selected address is vacated /nobody is at home for the entiresurvey period
0 0 0 976 238 133 9 0 0 0 0 50 64 15 73
0.00% 0.00% 0.00% 39.12% 13.59% 6.25% 1.48% 0.00% 0.00% 0.00% 0.00% 3.78% 4.44% 0.46% 4.41%
4 Selected address is acompany or other work place
0 0 0 20 76 44 3 0 0 0 0 10 3 13 12
0.00% 0.00% 0.00% 0.80% 4.34% 2.07% 0.49% 0.00% 0.00% 0.00% 0.00% 0.76% 0.21% 0.40% 0.72%
5 Address not found 0 0 0 0 9 0 0 0 0 0 0 0 3 2 0
0.00% 0.00% 0.00% 0.00% 0.51% 0.00% 0.00% 0.00% 0.00% 0.00% 0.00% 0.00% 0.21% 0.06% 0.00%
6 Address unreachable0 0 0 0 3 22 0 0 0 0 0 11 40 424 79
0.00% 0.00% 0.00% 0.00% 0.17% 1.03% 0.00% 0.00% 0.00% 0.00% 0.00% 0.83% 2.78% 13.11% 4.77%
7 Randomly selectedhousehold member is not home
0 0 0 0 48 2 1 0 1 0 0 11 34 2 23
0.00% 0.00% 0.00% 0.00% 2.74% 0.09% 0.16% 0.00% 0.20% 0.00% 0.00% 0.83% 2.36% 0.06% 1.39%
8 Nobody in the household isbetween the ages of 18-39
80 58 4 854 348 591 22 0 0 0 0 397 544 1193 754
9.65% 6.74% 0.77% 34.23% 19.87% 27.79% 3.62% 0.00% 0.00% 0.00% 0.00% 29.98% 37.75% 36.90% 45.50%
9 No household member aged18-39 is present during theentire period of the survey
59 66 3 6 41 8 3 0 6 0 0 35 77 17 9
7.12% 7.67% 0.58% 0.24% 2.34% 0.38% 0.49% 0.00% 1.18% 0.00% 0.00% 2.64% 5.34% 0.53% 0.54%
10 Nobody in the householdspeaks the language of thesurvey
0 0 0 0 0 17 1 0 0 0 0 0 0 3 0
0.00% 0.00% 0.00% 0.00% 0.00% 0.80% 0.16% 0.00% 0.00% 0.00% 0.00% 0.00% 0.00% 0.09% 0.00%
11 Refusal by household55 153 2 134 205 747 55 0 1 54 12 233 124 732 147
6.63% 17.77% 0.39% 5.37% 11.71% 35.12% 9.06% 0.00% 0.20% 9.71% 2.34% 17.60% 8.61% 22.64% 8.87%
12 Refusal by randomlyselected household member
0 0 0 4 7 13 6 0 0 3 0 14 4 275 34
0.00% 0.00% 0.00% 0.16% 0.40% 0.61% 0.99% 0.00% 0.00% 0.54% 0.00% 1.06% 0.28% 8.51% 2.05%
other 1 2 1 0 0 0 0 0 0 0 0 0 0 0 0
0.12% 0.23% 0.19% 0.00% 0.00% 0.00% 0.00% 0.00% 0.00% 0.00% 0.00% 0.00% 0.00% 0.00% 0.00%
Response Rate 1 66.76% 62.27% 97.47% 30.85% 37.68% 33.51% 85.91% 100.00% 98.04% 89.77% 97.66% 54.35% 55.93% 24.67% 56.12%
Response Rate 3A 68.28% 62.86% 97.48% 39.82% 50.23% 36.03% 88.39% 100.00% 98.43% 89.77% 97.66% 59.12% 61.60% 27.37% 61.37%
Respone Rate 3B 66.76% 62.27% 97.47% 77.56% 55.08% 37.96% 88.44% 100.00% 98.43% 89.77% 97.66% 60.61% 63.96% 27.51% 64.68%
20
We treat “No household member at home” and “Selected address is vacated / nobody is at home
for the entire survey period” as instances of UH, but refusal by the household as a refusal and not
as UH because the interviewers were often able to establish the presence or absence of target
group members. It is difficult to determine how to treat the category “3 selected house is vacated /
nobody is at home for the entire survey period”. Migrants who live elsewhere often still have a
house in the village of origin or even build one after migration. Certain high migration areas have a
high number of ‘migrant houses’ that are only inhabited during the summer and should therefore be
treated as uneligible. It is however hard for interviewers to determine whether a houe is just vacat-
ed for the time of the survey or for most of the year. Therefore two variations of response rate 3
have been calculated, 3A in which this category is treated as non-response, and 3B where it is
treated as not-eligible.
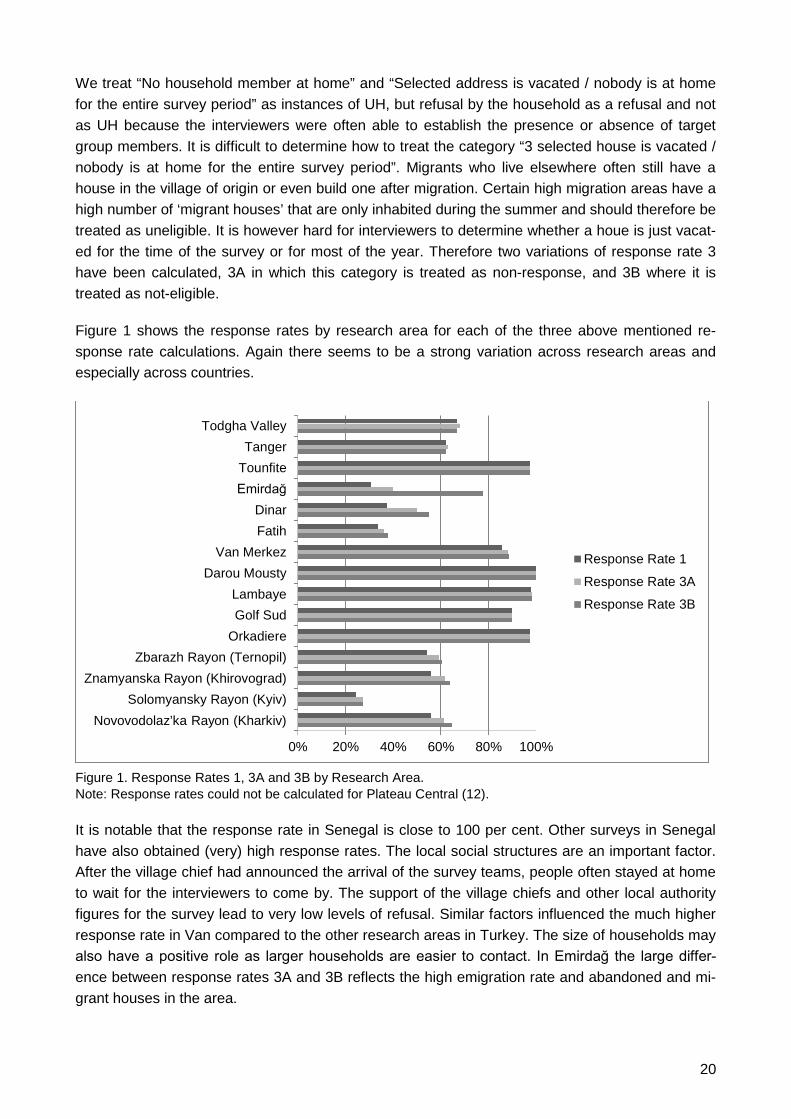
Figure 1 shows the response rates by research area for each of the three above mentioned re-
sponse rate calculations. Again there seems to be a strong variation across research areas and
especially across countries.
Figure 1. Response Rates 1, 3A and 3B by Research Area.Note: Response rates could not be calculated for Plateau Central (12).
It is notable that the response rate in Senegal is close to 100 per cent. Other surveys in Senegal
have also obtained (very) high response rates. The local social structures are an important factor.
After the village chief had announced the arrival of the survey teams, people often stayed at home
to wait for the interviewers to come by. The support of the village chiefs and other local authority
figures for the survey lead to very low levels of refusal. Similar factors influenced the much higher
response rate in Van compared to the other research areas in Turkey. The size of households may
also have a positive role as larger households are easier to contact. In Emirdağ the large differ-
ence between response rates 3A and 3B reflects the high emigration rate and abandoned and mi-
grant houses in the area.
0% 20% 40% 60% 80% 100%
Todgha Valley
Tanger
Tounfite
Emirdağ
Dinar
Fatih
Van Merkez
Darou Mousty
Lambaye
Golf Sud
Orkadiere
Zbarazh Rayon (Ternopil)
Znamyanska Rayon (Khirovograd)
Solomyansky Rayon (Kyiv)
Novovodolaz’ka Rayon (Kharkiv)
Response Rate 1
Response Rate 3A
Response Rate 3B

21
Bias
If the within household selection of the respondent for the individual questionnaire was truly
random, the respondents of the individual questionnaire should constitute a representative sample
of all eligible household members in that research area. Figures 2 through 9 compare the
respondents of the individual interview (weighted) to all eligible household members in that
research area for a number of key demographic variables. The figures show the mean scores and
error bars for the 95%-Confidence Interval. If the confidence intervals of the respondents of the
individual interview overlap with all eligible respondents there is no significant difference between
the two. If the intervals do not overlap, there is a statistically significant difference.
For the most part the two groups are highly similar. There are however also some noteworthy dif-
ferences. In Tanger women are significantly underrepresented among respondents of the individu-
al questionnaire, whereas in Fatih and Zbarazh there is a significant overrepresentation. Women
are often overrepresented in survey research due to their higher likelihood of being at home and
higher willingness to participate. The underrepresentation in Tanger might be due to the relu-
catance of some women to be interviewd by (male) interviewers. Despite the underrepresentation
of women in Tanger there is a significant overrepresentation of people involved in housework. In
Dinar and Fatih there is a significant underrepresentation of people doing housework among the
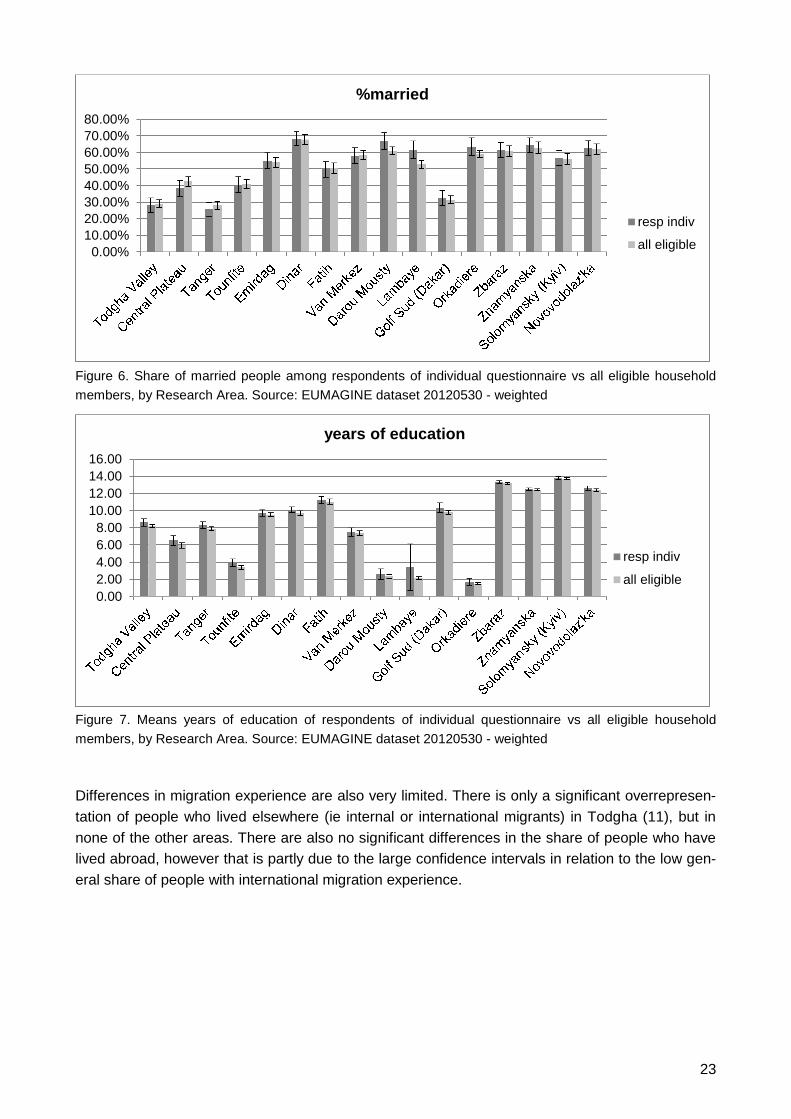
respondents of the individual interview. There are no significant differences for unemployment,
share of married people or years of education.
Figure 2. Mean age of respondents of individual questionnaire vs all eligible household members, by Re-
search Area. Source: EUMAGINE dataset 20120530 - weighted
18.00
20.00
22.00
24.00
26.00
28.00
30.00
32.00
age
resp indiv
all eligible

22
Figure 3. Share of women among respondents of individual questionnaire vs all eligible household members,
by Research Area. Source: EUMAGINE dataset 20120530 - weighted
Figure 4. Share of people doing housework among respondents of individual questionnaire vs all eligible
household members, by Research Area. Source: EUMAGINE dataset 20120530 - weighted
Figure 5. Share of unemployed among respondents of individual questionnaire vs all eligible household
members, by Research Area. Source: EUMAGINE dataset 20120530 - weighted
0.00%
10.00%
20.00%
30.00%
40.00%
50.00%
60.00%
70.00%
80.00%
%women
resp indiv
all eligible
0.00%
10.00%
20.00%
30.00%
40.00%
50.00%
60.00%
70.00%
%housework
resp indiv
all eligible
0.00%
5.00%
10.00%
15.00%
20.00%
25.00%
% unemployed
resp indiv
all eligible
23
Figure 6. Share of married people among respondents of individual questionnaire vs all eligible household
members, by Research Area. Source: EUMAGINE dataset 20120530 - weighted
Figure 7. Means years of education of respondents of individual questionnaire vs all eligible household
members, by Research Area. Source: EUMAGINE dataset 20120530 - weighted
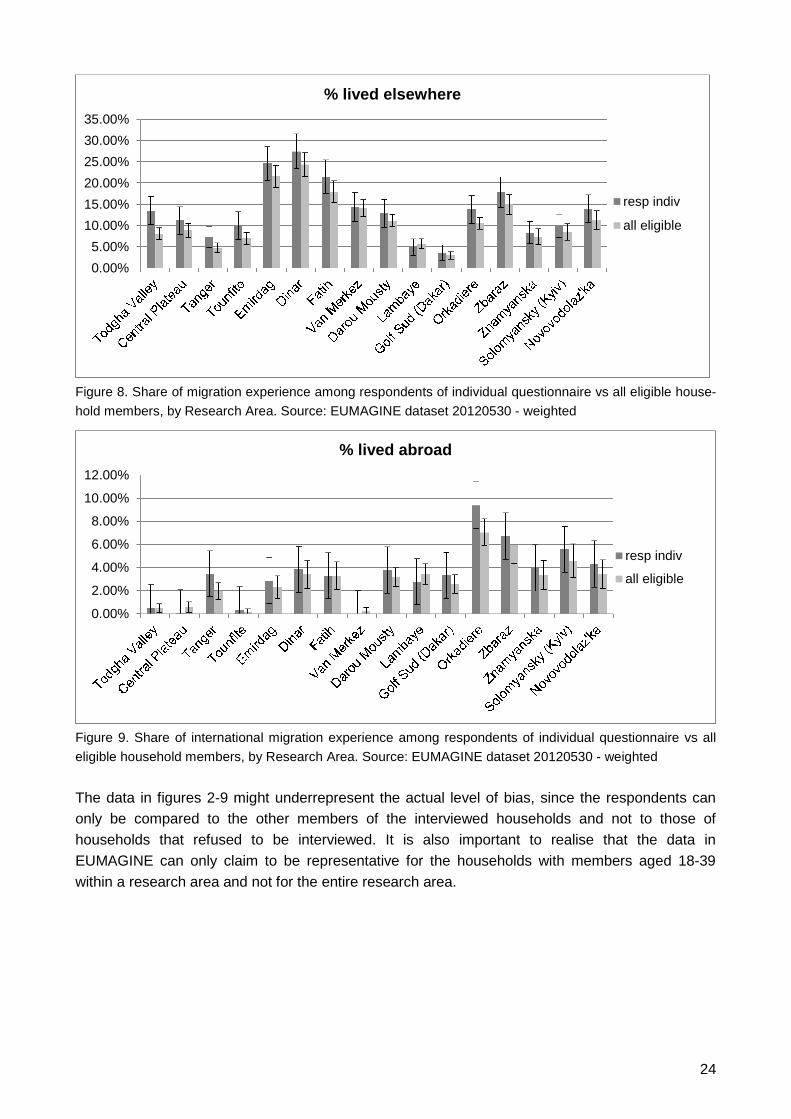
Differences in migration experience are also very limited. There is only a significant overrepresen-
tation of people who lived elsewhere (ie internal or international migrants) in Todgha (11), but in
none of the other areas. There are also no significant differences in the share of people who have
lived abroad, however that is partly due to the large confidence intervals in relation to the low gen-
eral share of people with international migration experience.
0.00%
10.00%
20.00%
30.00%40.00%
50.00%
60.00%
70.00%
80.00%
%married
resp indiv
all eligible
0.00
2.00
4.00
6.00
8.00
10.00
12.00
14.00
16.00
years of education
resp indiv
all eligible
24
Figure 8. Share of migration experience among respondents of individual questionnaire vs all eligible house-
hold members, by Research Area. Source: EUMAGINE dataset 20120530 - weighted
Figure 9. Share of international migration experience among respondents of individual questionnaire vs all
eligible household members, by Research Area. Source: EUMAGINE dataset 20120530 - weighted
The data in figures 2-9 might underrepresent the actual level of bias, since the respondents can
only be compared to the other members of the interviewed households and not to those of
households that refused to be interviewed. It is also important to realise that the data in
EUMAGINE can only claim to be representative for the households with members aged 18-39
within a research area and not for the entire research area.
0.00%
5.00%
10.00%
15.00%
20.00%
25.00%
30.00%
35.00%
% lived elsewhere
resp indiv
all eligible
0.00%
2.00%
4.00%
6.00%
8.00%
10.00%
12.00%
% lived abroad
resp indiv
all eligible
25
Data entry and cleaning
After the teams involved in data collection entered the data and conducted some checks in SPSS
the data was sent to IMI for verification. IMI performed a number of consistency checks. Data
collection teams were sent lists of comments based on these consistency checks. Based on the
outcomes of these checks, data collection teams verified if the data had been entered correctly.
The teams were also requested to double check extreme values (high contact or remittance
frequencies) and unusual destination countries. Where inconsistencies were not due to data entry
but to mistakes made in the field by interviewers or respondents, some could be repaired by
contacting the respondents. The Senegalese team had often taken pictures of the interviewed
households. These pictures allowed a detailed reconstruction of household relations to help the
data verifications. In most cases however the inconsistencies had to be left as they were.
All people who were listed in the household grid but coded as current migrants (hh13=1, hh14=0)
were deleted from the household grid. If necessary the person numbering (PERSONid) in the
household grid was adjusted to ensure consecutive numbers. A similar procedure was followed for
relations listed in migrant grid 1 with who there had been no contact during the past 12 months
(mg7=0).
Most inconsistencies were found in the household grid. It was not always possible to reconstruct
the household structure. Most mistakes were found in the coding of the relation to the head of
household (hh2) and the marital status (hh9). The former type of inconsistencies was partly caused
by culture dependent interpretations and expressions of relations (see above).
Especially the polygamous households in Senegal show a highly complex structure that is not
always well-captured by the available answer categories. For instance there are cases of
polygamous households where one of the wives is listed as the head of household and the other
wives as partner of the head of household. The household relations and the information on the
location of the partner (question hh10) should therefore always be treated with care.
Often information on the year of events is inaccurate. This is most evident in cases where the
year of birth and the year of migration are inconsistent (ie the year of migration, hh12, lies before
the year of birth, hh4), or where the years in education (hh7) are close to or even exceed the age
of the respondent. It is not always clear what information is most accurate. It is likely that often
these years are ‘estimates’ by the respondent that lie close to the actual year. It is up to the
individual user of the EUMAGINE data to determine how to best deal with these types of situations.
Some of the respondents of the individual interview are (just) outside of the target group – ie they
are either younger than 18 or older than 39. They were nevertheless kept in the dataset to maintain
500 surveys per research area.
Data in the household grid suggest that some respondents have misunderstood the questions on
place of birth (hh11) and have listed household members born in hospital in nearby towns as
being ‘born elsewhere’ and migrated to the place of survey in the year of birth (hh12). This can
potentially lead to an overestimation of the number of people who have migrated internally.
26
It is also likely that the time and date registration of the interview contains inaccuracies. Ex-
treme values (interviews lasting 1 minute or several hours) have been set to missing.
Because contrary to the questionnaire instructions some of the interviewers only wrote down
country codes and not country names it was not always possible to ascertain if unusual migration
destinations reflected the answers of the respondents or mistakes by the interviewers. Therefore it
is recommended to be careful with the interpretation of unusual destination choices.
For some of the variables additional codes had to be generated, for example for certain
geographical regions and the generic religion category “muslim other” (for question i3). The
codebook lists all these additional codes.
In several countries interviewers come across hard to code principle activities (hh8). Only ‘griots’
in Senegal were encountered on a sufficiently large scale to warrant a new code. The professional
footballer and wrestler in Golf Sud (13) were coded as “503 skilled manual”, a musician in Turkey
was coded as “506 skilled non-manual”. In Morocco a number of people aged over 16 had been
incorrectly coded as “102 child 6-16 not in school not working”. This is most likely due to the initial
use of an old version of the codesheet (see above). Most cases were women; these were all re-
coded as “103 housework”. The six male cases were recoded as “104 unemployed”.
With the first use of the full database more errors will likely be revealed. The database will subse-
quently be updated. It is therefore essential to always mention the version number of the database
with all presentations of results.
Weights
Since EUMAGINE is not based on a Simple Random Sample, weights are needed to account for
differences in selection probability. It is generally recommended to calculate selection weights for
each step of the sampling procedure. For EUMAGINE that would be the selection of households
within villages and then people within households.
To our knowledge there is no recent population data on the number of households with members
belonging to the EUMAGINE target group within each village/neighbourhood in the research areas
– and for several areas not even on the number of households. The dataset does contain infor-
mation on the number of households at the selected address, but since there has not been a
household listing in the selected villages there is no exact knowledge on the number of house-
holds. Because there is no reliable data available on the number of households with members be-
longing to the EUMAGINE target group within each village/neighbourhood, it was decided to only
calculate a selection probability weight for the within-household selection.
This weight has been calculated within each stratum and was normalised to maintain a weighted N
of 500 per research area. The formula is:
ws=ே�௦௧௧௨
ே��௦௧௧௨* Neligible member in household

27
For Central Plateau this weight was further adjusted to correct for the urban-rural stratification er-
ror.
Despite some apparent biases between the respondents of the individual interviews and all eligible
household members it was decided not to add post-stratification weights. Without reliable infor-
mation on the composition of all households in the research areas instead of only those inter-
viewed, it is impossible to correctly determine the size of the bias and the introduction of poststrati-
fication weights might do more harm than good.
References
Ersanilli, Evelyn, Jørgen Carling & Hein de Haas (2011) Methodology for quantitative data collec-
tion. EUMAGINE Project paper 6A.
28
Appendices
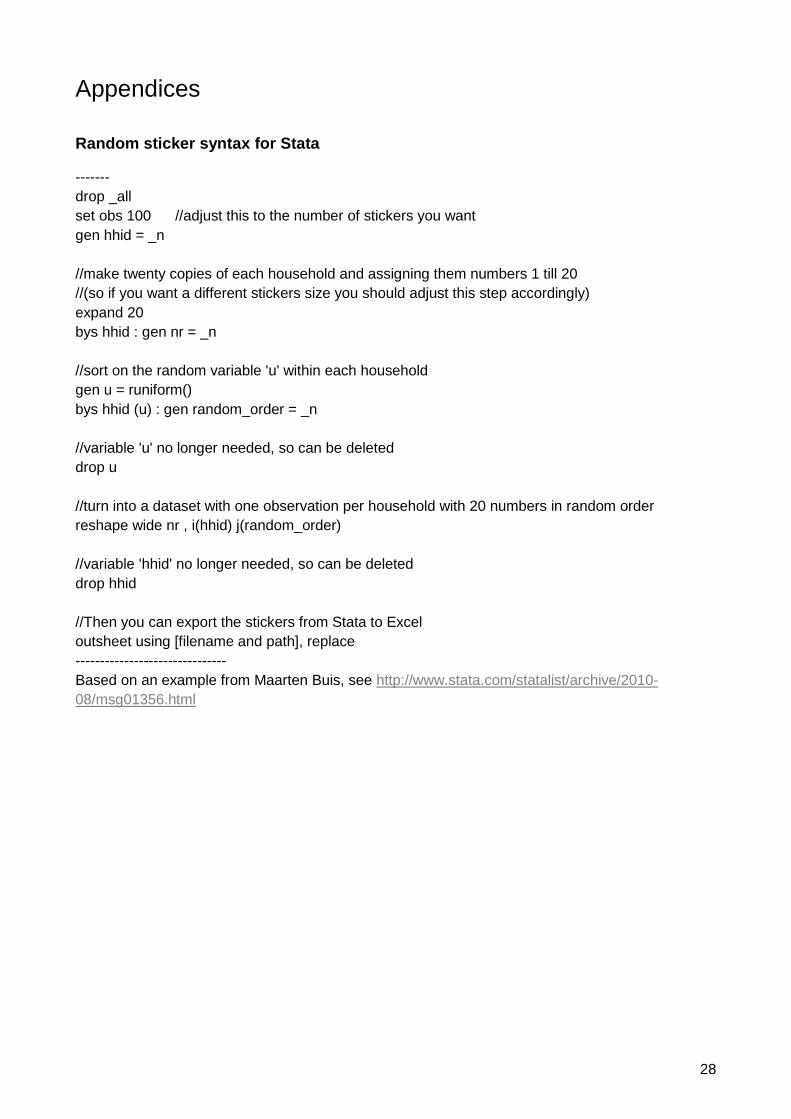
Random sticker syntax for Stata
-------
drop _all
set obs 100 //adjust this to the number of stickers you want
gen hhid = _n
//make twenty copies of each household and assigning them numbers 1 till 20
//(so if you want a different stickers size you should adjust this step accordingly)
expand 20
bys hhid : gen nr = _n
//sort on the random variable 'u' within each household
gen u = runiform()
bys hhid (u) : gen random_order = _n
//variable 'u' no longer needed, so can be deleted
drop u
//turn into a dataset with one observation per household with 20 numbers in random order
reshape wide nr , i(hhid) j(random_order)
//variable 'hhid' no longer needed, so can be deleted
drop hhid
//Then you can export the stickers from Stata to Excel
outsheet using [filename and path], replace
-------------------------------
Based on an example from Maarten Buis, see http://www.stata.com/statalist/archive/2010-
08/msg01356.html
29
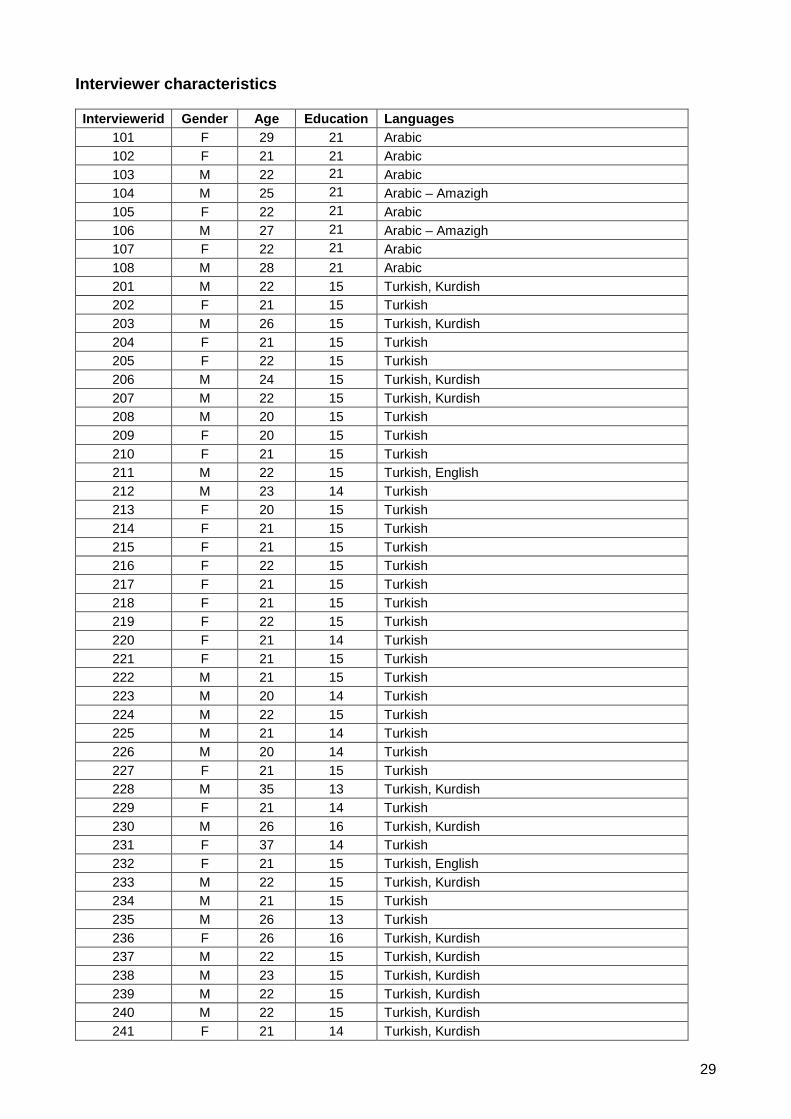
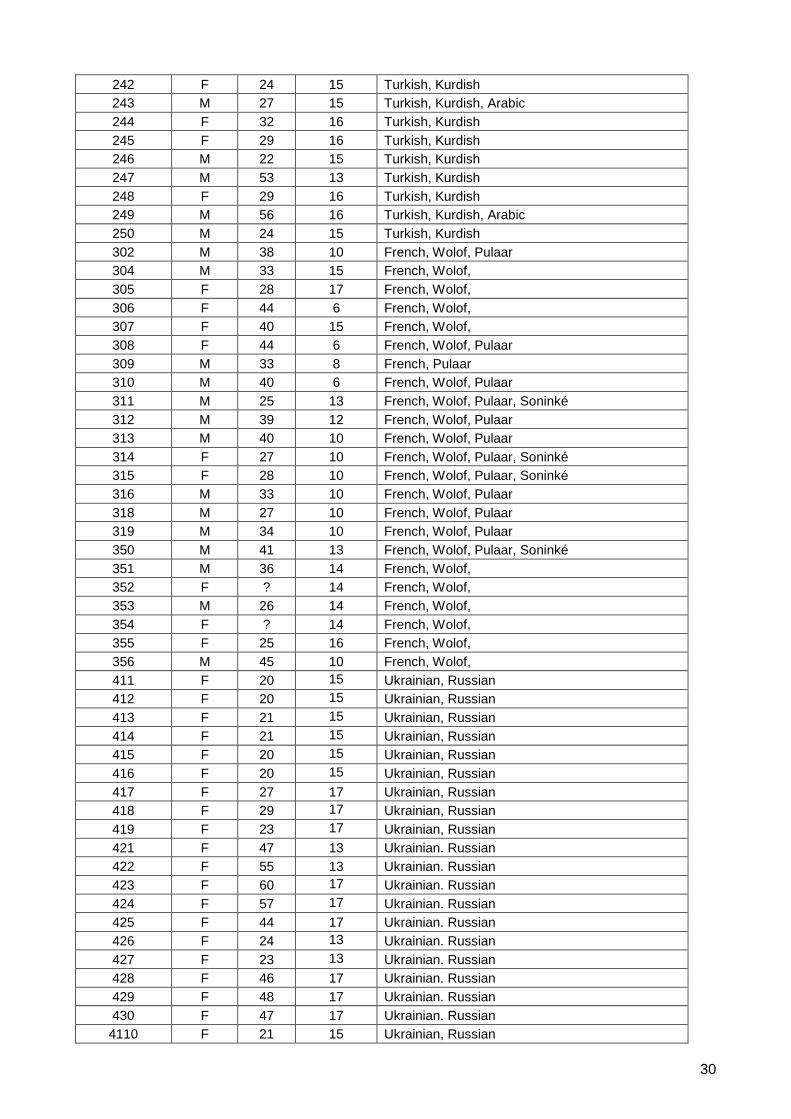
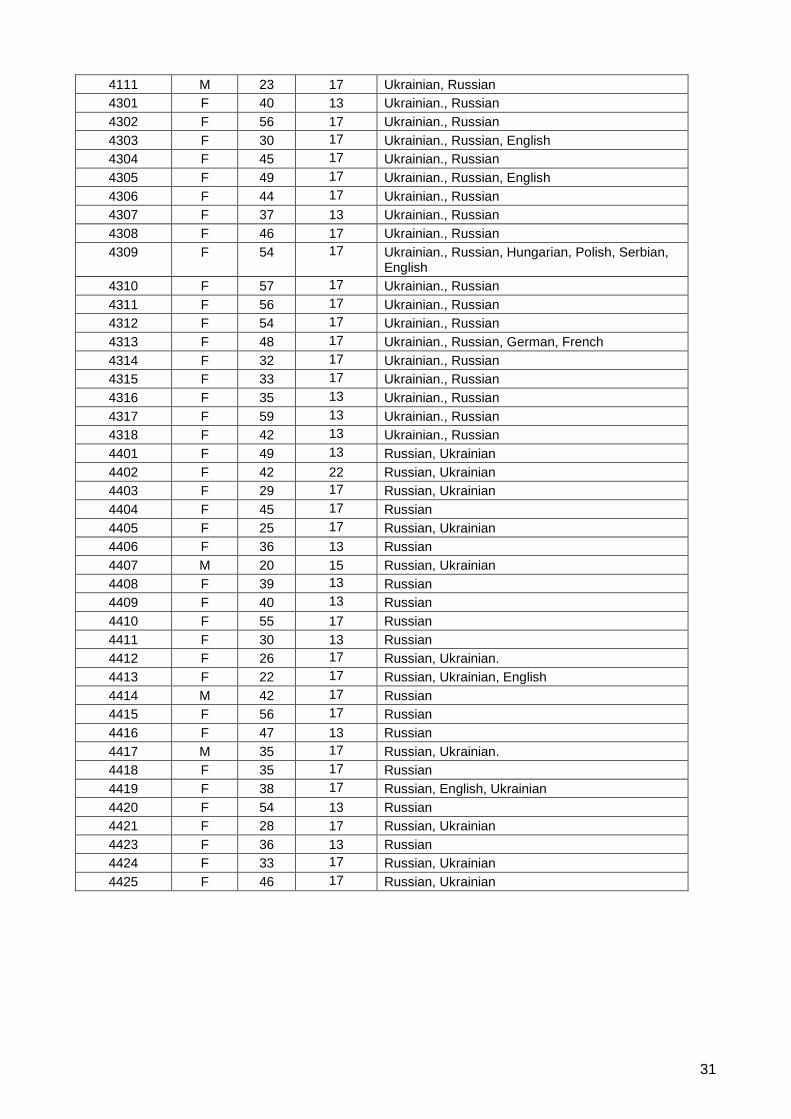
Interviewer characteristics
Interviewerid Gender Age Education Languages
101 F 29 21 Arabic
102 F 21 21 Arabic
103 M 22 21 Arabic
104 M 25 21 Arabic – Amazigh
105 F 22 21 Arabic
106 M 27 21 Arabic – Amazigh
107 F 22 21 Arabic
108 M 28 21 Arabic
201 M 22 15 Turkish, Kurdish
202 F 21 15 Turkish
203 M 26 15 Turkish, Kurdish
204 F 21 15 Turkish
205 F 22 15 Turkish
206 M 24 15 Turkish, Kurdish
207 M 22 15 Turkish, Kurdish
208 M 20 15 Turkish
209 F 20 15 Turkish
210 F 21 15 Turkish
211 M 22 15 Turkish, English
212 M 23 14 Turkish
213 F 20 15 Turkish
214 F 21 15 Turkish
215 F 21 15 Turkish
216 F 22 15 Turkish
217 F 21 15 Turkish
218 F 21 15 Turkish
219 F 22 15 Turkish
220 F 21 14 Turkish
221 F 21 15 Turkish
222 M 21 15 Turkish
223 M 20 14 Turkish
224 M 22 15 Turkish
225 M 21 14 Turkish
226 M 20 14 Turkish
227 F 21 15 Turkish
228 M 35 13 Turkish, Kurdish
229 F 21 14 Turkish
230 M 26 16 Turkish, Kurdish
231 F 37 14 Turkish
232 F 21 15 Turkish, English
233 M 22 15 Turkish, Kurdish
234 M 21 15 Turkish
235 M 26 13 Turkish
236 F 26 16 Turkish, Kurdish
237 M 22 15 Turkish, Kurdish
238 M 23 15 Turkish, Kurdish
239 M 22 15 Turkish, Kurdish
240 M 22 15 Turkish, Kurdish
241 F 21 14 Turkish, Kurdish
30
242 F 24 15 Turkish, Kurdish
243 M 27 15 Turkish, Kurdish, Arabic
244 F 32 16 Turkish, Kurdish
245 F 29 16 Turkish, Kurdish
246 M 22 15 Turkish, Kurdish
247 M 53 13 Turkish, Kurdish
248 F 29 16 Turkish, Kurdish
249 M 56 16 Turkish, Kurdish, Arabic
250 M 24 15 Turkish, Kurdish
302 M 38 10 French, Wolof, Pulaar
304 M 33 15 French, Wolof,
305 F 28 17 French, Wolof,
306 F 44 6 French, Wolof,
307 F 40 15 French, Wolof,
308 F 44 6 French, Wolof, Pulaar
309 M 33 8 French, Pulaar
310 M 40 6 French, Wolof, Pulaar
311 M 25 13 French, Wolof, Pulaar, Soninké
312 M 39 12 French, Wolof, Pulaar
313 M 40 10 French, Wolof, Pulaar
314 F 27 10 French, Wolof, Pulaar, Soninké
315 F 28 10 French, Wolof, Pulaar, Soninké
316 M 33 10 French, Wolof, Pulaar
318 M 27 10 French, Wolof, Pulaar
319 M 34 10 French, Wolof, Pulaar
350 M 41 13 French, Wolof, Pulaar, Soninké
351 M 36 14 French, Wolof,
352 F ? 14 French, Wolof,
353 M 26 14 French, Wolof,
354 F ? 14 French, Wolof,
355 F 25 16 French, Wolof,
356 M 45 10 French, Wolof,
411 F 20 15 Ukrainian, Russian
412 F 20 15 Ukrainian, Russian
413 F 21 15 Ukrainian, Russian
414 F 21 15 Ukrainian, Russian
415 F 20 15 Ukrainian, Russian
416 F 20 15 Ukrainian, Russian
417 F 27 17 Ukrainian, Russian
418 F 29 17 Ukrainian, Russian
419 F 23 17 Ukrainian, Russian
421 F 47 13 Ukrainian. Russian
422 F 55 13 Ukrainian. Russian
423 F 60 17 Ukrainian. Russian
424 F 57 17 Ukrainian. Russian
425 F 44 17 Ukrainian. Russian
426 F 24 13 Ukrainian. Russian
427 F 23 13 Ukrainian. Russian
428 F 46 17 Ukrainian. Russian
429 F 48 17 Ukrainian. Russian
430 F 47 17 Ukrainian. Russian
4110 F 21 15 Ukrainian, Russian
31
4111 M 23 17 Ukrainian, Russian
4301 F 40 13 Ukrainian., Russian
4302 F 56 17 Ukrainian., Russian
4303 F 30 17 Ukrainian., Russian, English
4304 F 45 17 Ukrainian., Russian
4305 F 49 17 Ukrainian., Russian, English
4306 F 44 17 Ukrainian., Russian
4307 F 37 13 Ukrainian., Russian
4308 F 46 17 Ukrainian., Russian
4309 F 54 17 Ukrainian., Russian, Hungarian, Polish, Serbian,English
4310 F 57 17 Ukrainian., Russian
4311 F 56 17 Ukrainian., Russian
4312 F 54 17 Ukrainian., Russian
4313 F 48 17 Ukrainian., Russian, German, French
4314 F 32 17 Ukrainian., Russian
4315 F 33 17 Ukrainian., Russian
4316 F 35 13 Ukrainian., Russian
4317 F 59 13 Ukrainian., Russian
4318 F 42 13 Ukrainian., Russian
4401 F 49 13 Russian, Ukrainian
4402 F 42 22 Russian, Ukrainian
4403 F 29 17 Russian, Ukrainian
4404 F 45 17 Russian
4405 F 25 17 Russian, Ukrainian
4406 F 36 13 Russian
4407 M 20 15 Russian, Ukrainian
4408 F 39 13 Russian
4409 F 40 13 Russian
4410 F 55 17 Russian
4411 F 30 13 Russian
4412 F 26 17 Russian, Ukrainian.
4413 F 22 17 Russian, Ukrainian, English
4414 M 42 17 Russian
4415 F 56 17 Russian
4416 F 47 13 Russian
4417 M 35 17 Russian, Ukrainian.
4418 F 35 17 Russian
4419 F 38 17 Russian, English, Ukrainian
4420 F 54 13 Russian
4421 F 28 17 Russian, Ukrainian
4423 F 36 13 Russian
4424 F 33 17 Russian, Ukrainian
4425 F 46 17 Russian, Ukrainian


