Embed Size (px)
Citation preview
1
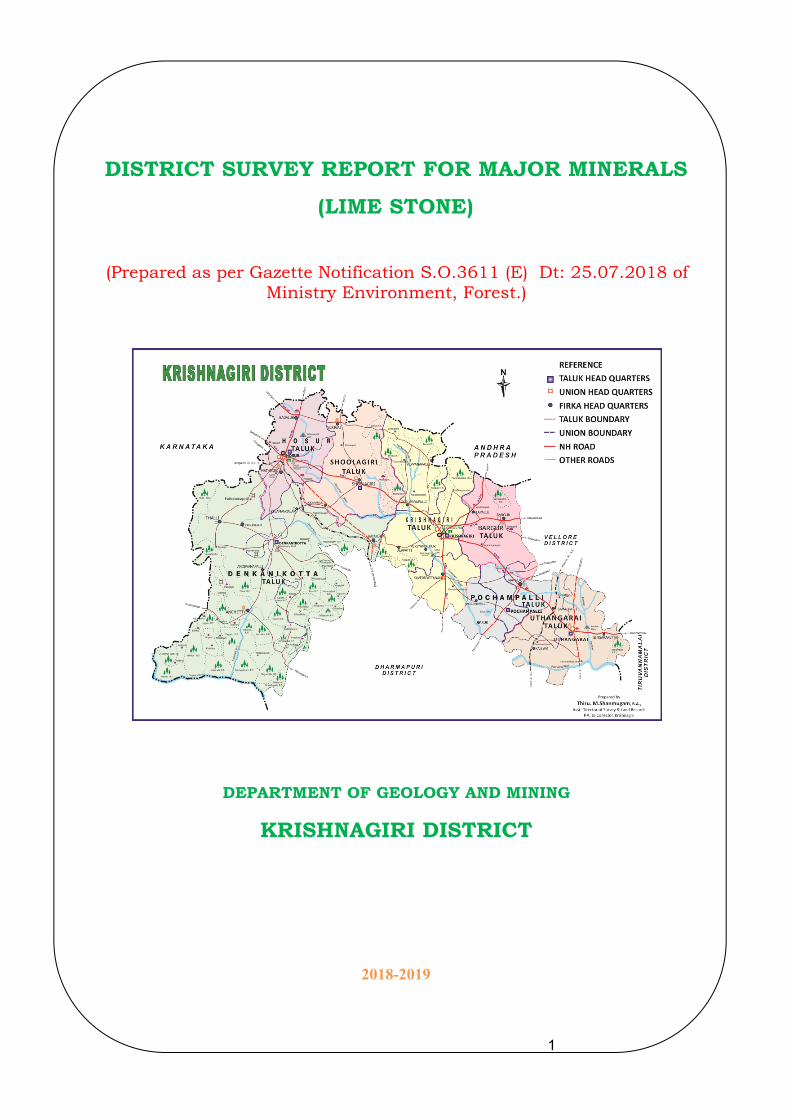
DISTRICT SURVEY REPORT FOR MAJOR MINERALS(LIME STONE)
(Prepared as per Gazette Notification S.O.3611 (E) Dt: 25.07.2018 ofMinistry Environment, Forest.)
DEPARTMENT OF GEOLOGY AND MINING
KRISHNAGIRI DISTRICT
2018-2019
2
CONTENTS
Chapter
Content PageNo.
1. Introduction 3
2. Overview of Mining Activity in the District 3-4
3. General Profile of the District 4-12
4. Geology of Krishnagiri District 12-14
5. Drainage of Irrigation pattern 15
6. Land Utilisation Pattern in the District: Forest,Agricultural, Horticultural, Mining etc.,
15-16
7. Surface Water and Ground Water scenario of the District 16-208. Climate and Rainfall of the District 20-21
9. Details of Mining Leases in the District 21
10. Details of Royalty or Revenue received in last three years 22
11. Details of Production of Minor Mineral in last three years 22
12. Mineral Map of the District 23
13. List of Letter of Intent (LOI) Holder in the District alongwith its validity
23
14. Total Mineral Reserve available in the district 24
15. Quality/Grade of Mineral available in the district 25
16. Use of Mineral 2517. Demand and supply of the Mineral in the last three
years25
18. Mining Leases marked on the map of the district 26
19. Details of the area of where there is a cluster of themining leases
26
20. Details of Eco-sensitive area 27-28
21. Impact on the environment due to Mining activity 29-31
22. Remedial measures to mitigate the impact of mining onthe environment
31-33
23. Reclamation of the mined out area 33
24. Risk assessment & Disaster Management Plan 34-35
25. Details of Occupational health issue in the District 36
26. Plantation and Green belt development in respect ofleases already granted in the district
36
27. Any other information 36
3
DISTRICT SURVEY REPORT FOR MAJOR MINERALS
(LIME STONE)
DISTRICT: KRISHNAGIRI
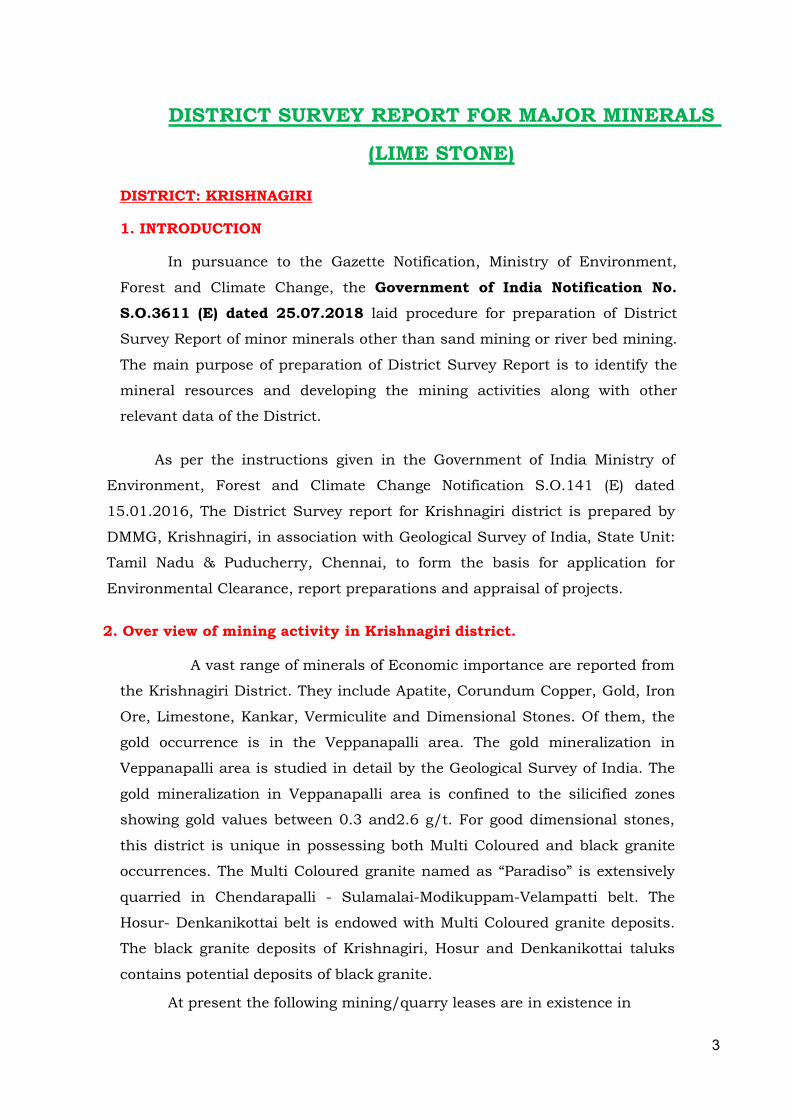
1. INTRODUCTION
In pursuance to the Gazette Notification, Ministry of Environment,
Forest and Climate Change, the Government of India Notification No.S.O.3611 (E) dated 25.07.2018 laid procedure for preparation of District
Survey Report of minor minerals other than sand mining or river bed mining.
The main purpose of preparation of District Survey Report is to identify the
mineral resources and developing the mining activities along with other
relevant data of the District.
As per the instructions given in the Government of India Ministry of
Environment, Forest and Climate Change Notification S.O.141 (E) dated
15.01.2016, The District Survey report for Krishnagiri district is prepared by
DMMG, Krishnagiri, in association with Geological Survey of India, State Unit:
Tamil Nadu & Puducherry, Chennai, to form the basis for application for
Environmental Clearance, report preparations and appraisal of projects.
2. Over view of mining activity in Krishnagiri district.
A vast range of minerals of Economic importance are reported from
the Krishnagiri District. They include Apatite, Corundum Copper, Gold, Iron
Ore, Limestone, Kankar, Vermiculite and Dimensional Stones. Of them, the
gold occurrence is in the Veppanapalli area. The gold mineralization in
Veppanapalli area is studied in detail by the Geological Survey of India. The
gold mineralization in Veppanapalli area is confined to the silicified zones
showing gold values between 0.3 and2.6 g/t. For good dimensional stones,
this district is unique in possessing both Multi Coloured and black granite
occurrences. The Multi Coloured granite named as “Paradiso” is extensively
quarried in Chendarapalli - Sulamalai-Modikuppam-Velampatti belt. The
Hosur- Denkanikottai belt is endowed with Multi Coloured granite deposits.
The black granite deposits of Krishnagiri, Hosur and Denkanikottai taluks
contains potential deposits of black granite.
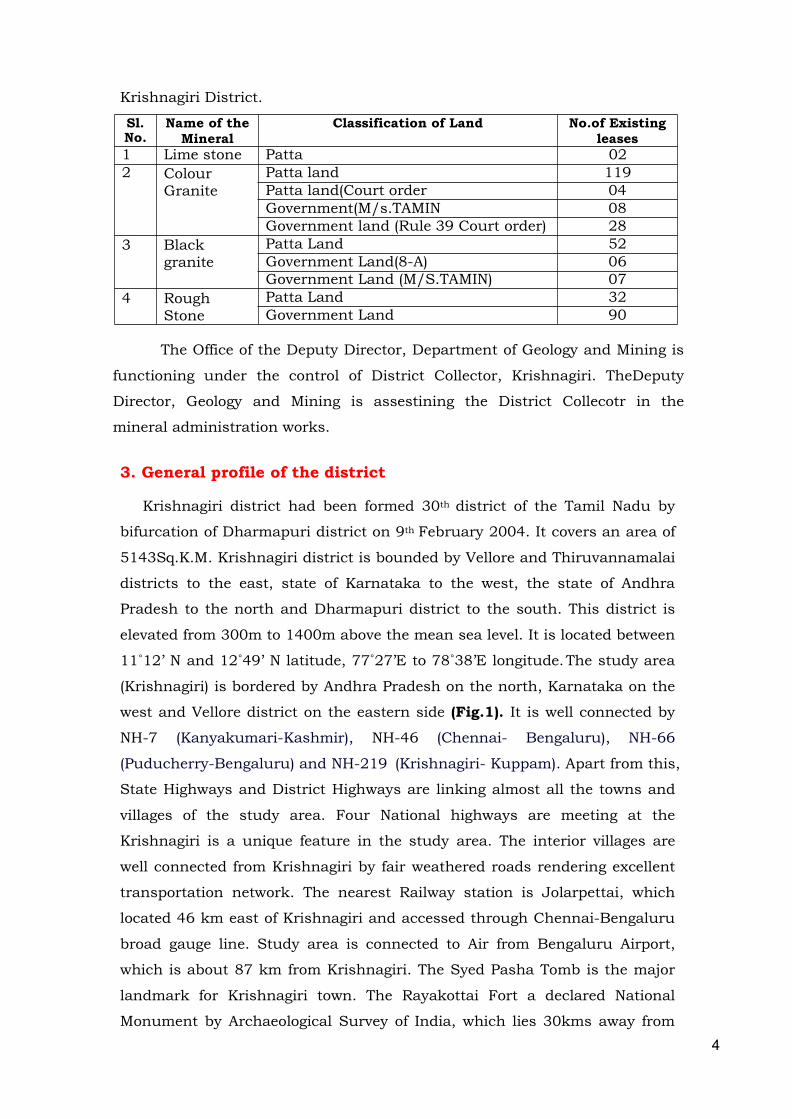
At present the following mining/quarry leases are in existence in
4
Krishnagiri District.
Sl.No.
Name of theMineral
Classification of Land No.of Existingleases
1 Lime stone Patta 022 Colour
GranitePatta land 119Patta land(Court order 04Government(M/s.TAMIN 08Government land (Rule 39 Court order) 28
3 Blackgranite
Patta Land 52Government Land(8-A) 06Government Land (M/S.TAMIN) 07
4 RoughStone
Patta Land 32Government Land 90
The Office of the Deputy Director, Department of Geology and Mining is
functioning under the control of District Collector, Krishnagiri. TheDeputy
Director, Geology and Mining is assestining the District Collecotr in the
mineral administration works.
3. General profile of the district
Krishnagiri district had been formed 30th district of the Tamil Nadu by
bifurcation of Dharmapuri district on 9th February 2004. It covers an area of
5143Sq.K.M. Krishnagiri district is bounded by Vellore and Thiruvannamalai
districts to the east, state of Karnataka to the west, the state of Andhra
Pradesh to the north and Dharmapuri district to the south. This district is
elevated from 300m to 1400m above the mean sea level. It is located between
11˚12’ N and 12˚49’ N latitude, 77˚27’E to 78˚38’E longitude.The study area
(Krishnagiri) is bordered by Andhra Pradesh on the north, Karnataka on the
west and Vellore district on the eastern side (Fig.1). It is well connected by
NH-7 (Kanyakumari-Kashmir), NH-46 (Chennai- Bengaluru), NH-66
(Puducherry-Bengaluru) and NH-219 (Krishnagiri- Kuppam). Apart from this,
State Highways and District Highways are linking almost all the towns and
villages of the study area. Four National highways are meeting at the
Krishnagiri is a unique feature in the study area. The interior villages are
well connected from Krishnagiri by fair weathered roads rendering excellent
transportation network. The nearest Railway station is Jolarpettai, which
located 46 km east of Krishnagiri and accessed through Chennai-Bengaluru
broad gauge line. Study area is connected to Air from Bengaluru Airport,
which is about 87 km from Krishnagiri. The Syed Pasha Tomb is the major
landmark for Krishnagiri town. The Rayakottai Fort a declared National
Monument by Archaeological Survey of India, which lies 30kms away from
5
Krishnagiri.
It is basically has a mountainous terrain. The flatlands are irrigated by
the South Pennar River. The eastern part of the district experiences a hot
climate and the western part contrastingly has a pleasant climate. The
average rainfall is 830mm per year. March-June is the summer season.
July-November is the rainy season and during December-February winter
prevails.
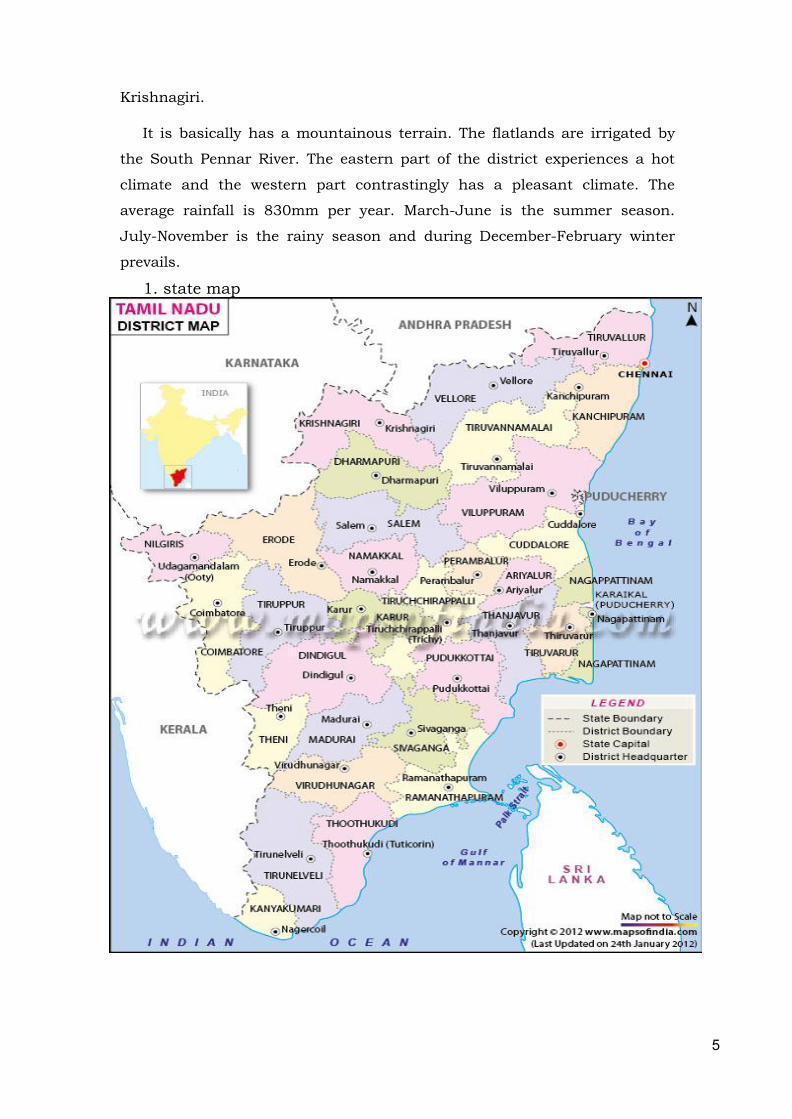
1. state map
6
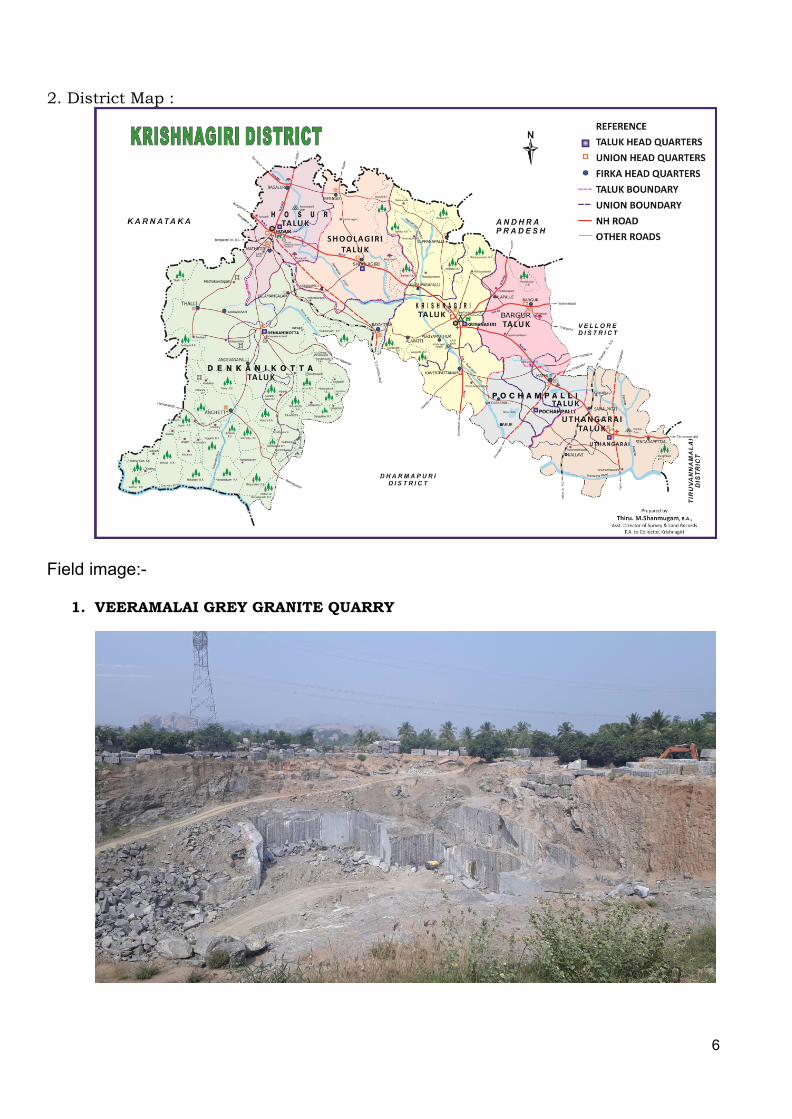
2. District Map :
Field image:-
1. VEERAMALAI GREY GRANITE QUARRY
7
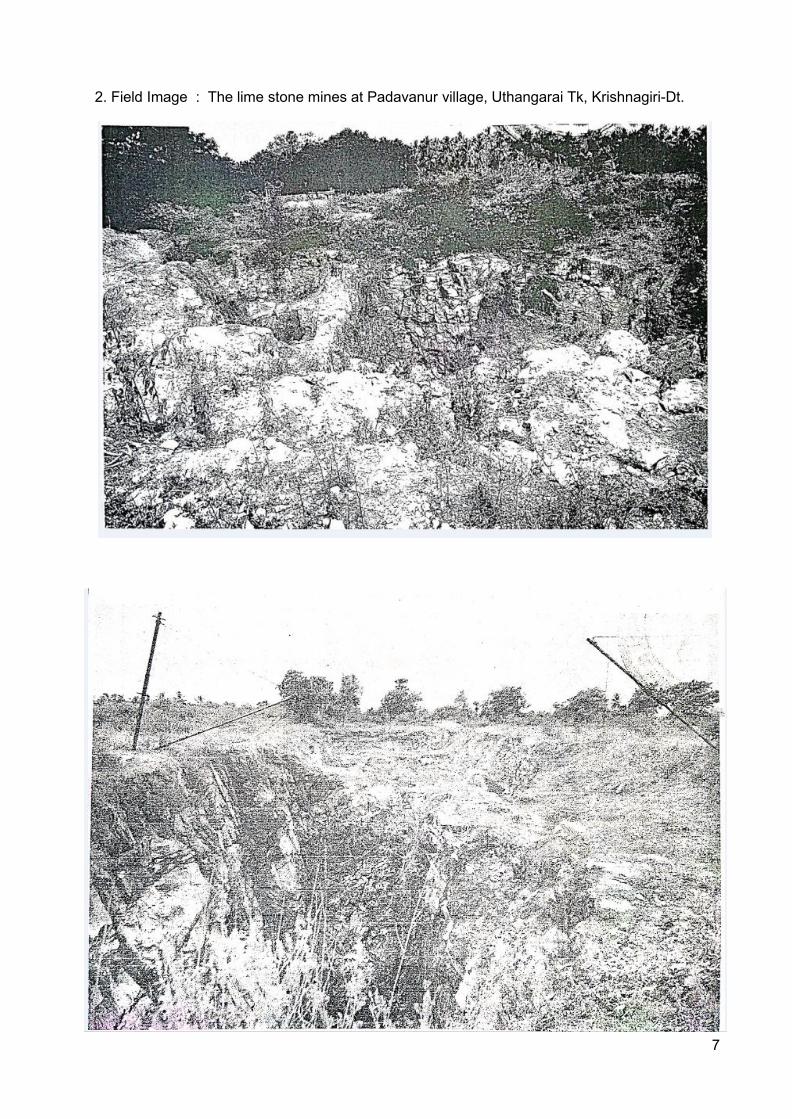
2. Field Image : The lime stone mines at Padavanur village, Uthangarai Tk, Krishnagiri-Dt.
8
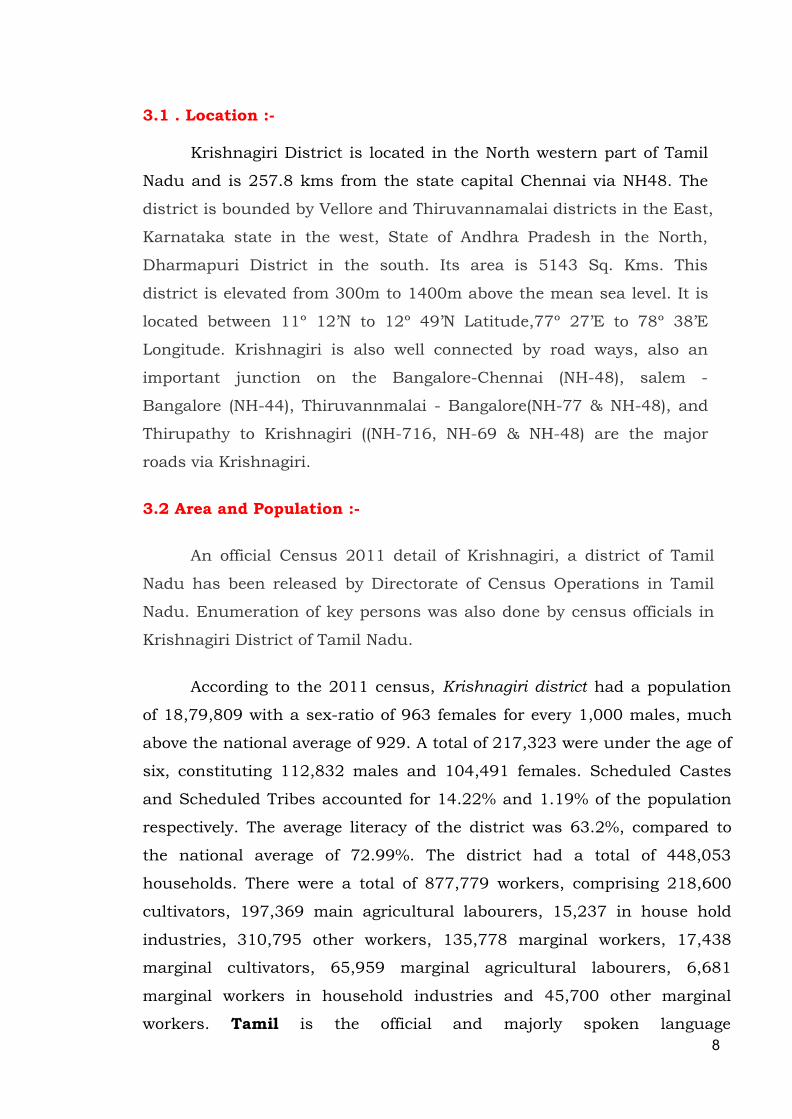
3.1 . Location :-
Krishnagiri District is located in the North western part of Tamil
Nadu and is 257.8 kms from the state capital Chennai via NH48. The
district is bounded by Vellore and Thiruvannamalai districts in the East,
Karnataka state in the west, State of Andhra Pradesh in the North,
Dharmapuri District in the south. Its area is 5143 Sq. Kms. This
district is elevated from 300m to 1400m above the mean sea level. It is
located between 11º 12’N to 12º 49’N Latitude,77º 27’E to 78º 38’E
Longitude. Krishnagiri is also well connected by road ways, also an
important junction on the Bangalore-Chennai (NH-48), salem -
Bangalore (NH-44), Thiruvannmalai - Bangalore(NH-77 & NH-48), and
Thirupathy to Krishnagiri ((NH-716, NH-69 & NH-48) are the major
roads via Krishnagiri.
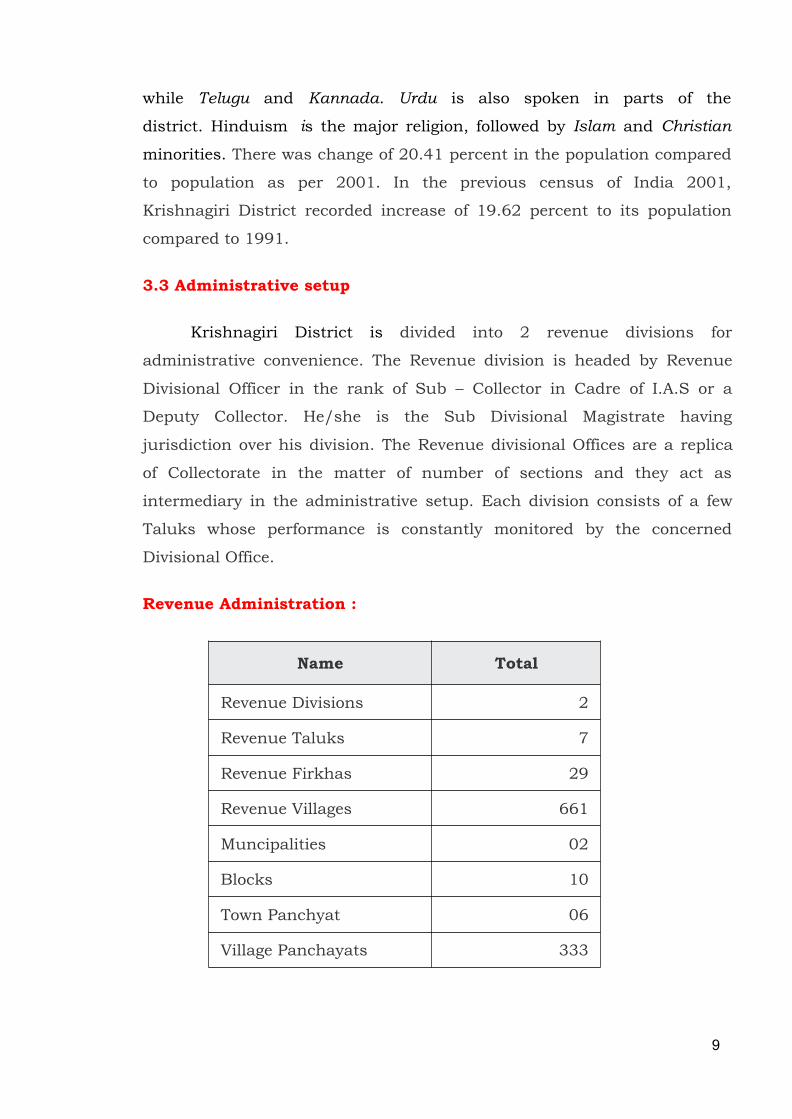
3.2 Area and Population :-
An official Census 2011 detail of Krishnagiri, a district of Tamil
Nadu has been released by Directorate of Census Operations in Tamil
Nadu. Enumeration of key persons was also done by census officials in
Krishnagiri District of Tamil Nadu.
According to the 2011 census, Krishnagiri district had a population
of 18,79,809 with a sex-ratio of 963 females for every 1,000 males, much
above the national average of 929. A total of 217,323 were under the age of
six, constituting 112,832 males and 104,491 females. Scheduled Castes
and Scheduled Tribes accounted for 14.22% and 1.19% of the population
respectively. The average literacy of the district was 63.2%, compared to
the national average of 72.99%. The district had a total of 448,053
households. There were a total of 877,779 workers, comprising 218,600
cultivators, 197,369 main agricultural labourers, 15,237 in house hold
industries, 310,795 other workers, 135,778 marginal workers, 17,438
marginal cultivators, 65,959 marginal agricultural labourers, 6,681
marginal workers in household industries and 45,700 other marginal
workers. Tamil is the official and majorly spoken language
9
while Telugu and Kannada. Urdu is also spoken in parts of the
district. Hinduism is the major religion, followed by Islam and Christian
minorities. There was change of 20.41 percent in the population compared
to population as per 2001. In the previous census of India 2001,
Krishnagiri District recorded increase of 19.62 percent to its population
compared to 1991.
3.3 Administrative setup
Krishnagiri District is divided into 2 revenue divisions for
administrative convenience. The Revenue division is headed by Revenue
Divisional Officer in the rank of Sub – Collector in Cadre of I.A.S or a
Deputy Collector. He/she is the Sub Divisional Magistrate having
jurisdiction over his division. The Revenue divisional Offices are a replica
of Collectorate in the matter of number of sections and they act as
intermediary in the administrative setup. Each division consists of a few
Taluks whose performance is constantly monitored by the concerned
Divisional Office.
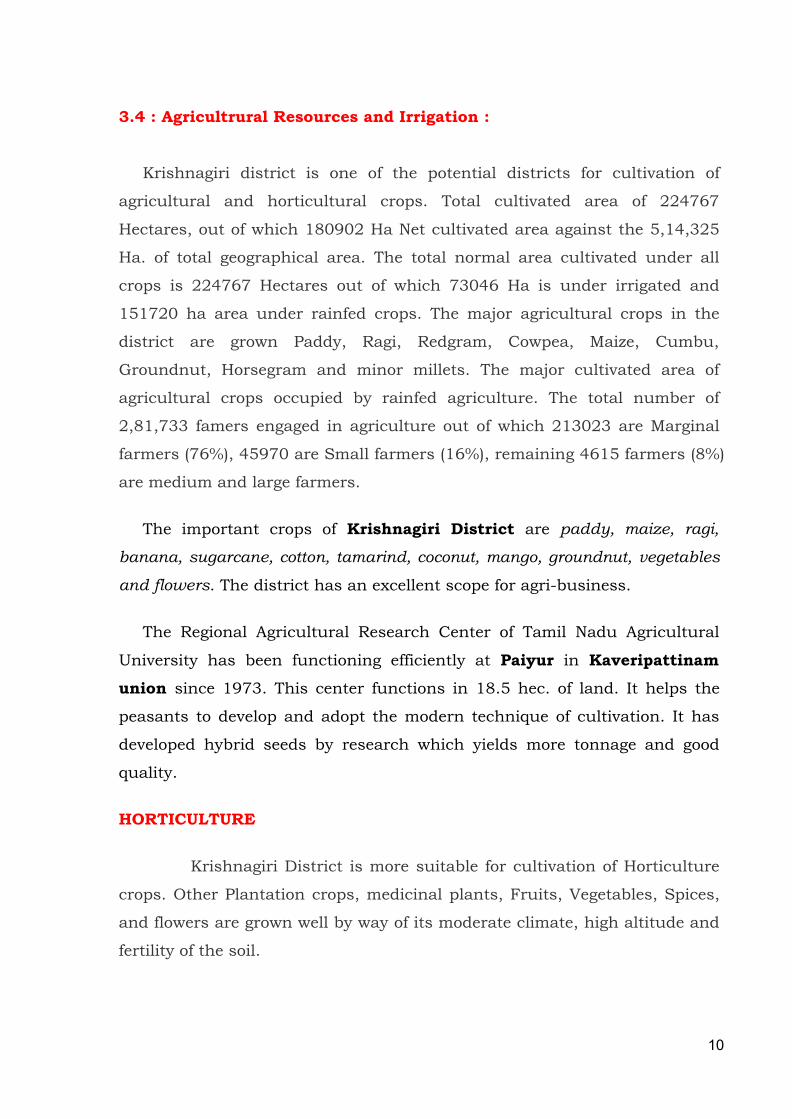
Revenue Administration :
Name Total
Revenue Divisions 2
Revenue Taluks 7
Revenue Firkhas 29
Revenue Villages 661
Muncipalities 02
Blocks 10
Town Panchyat 06
Village Panchayats 333
10
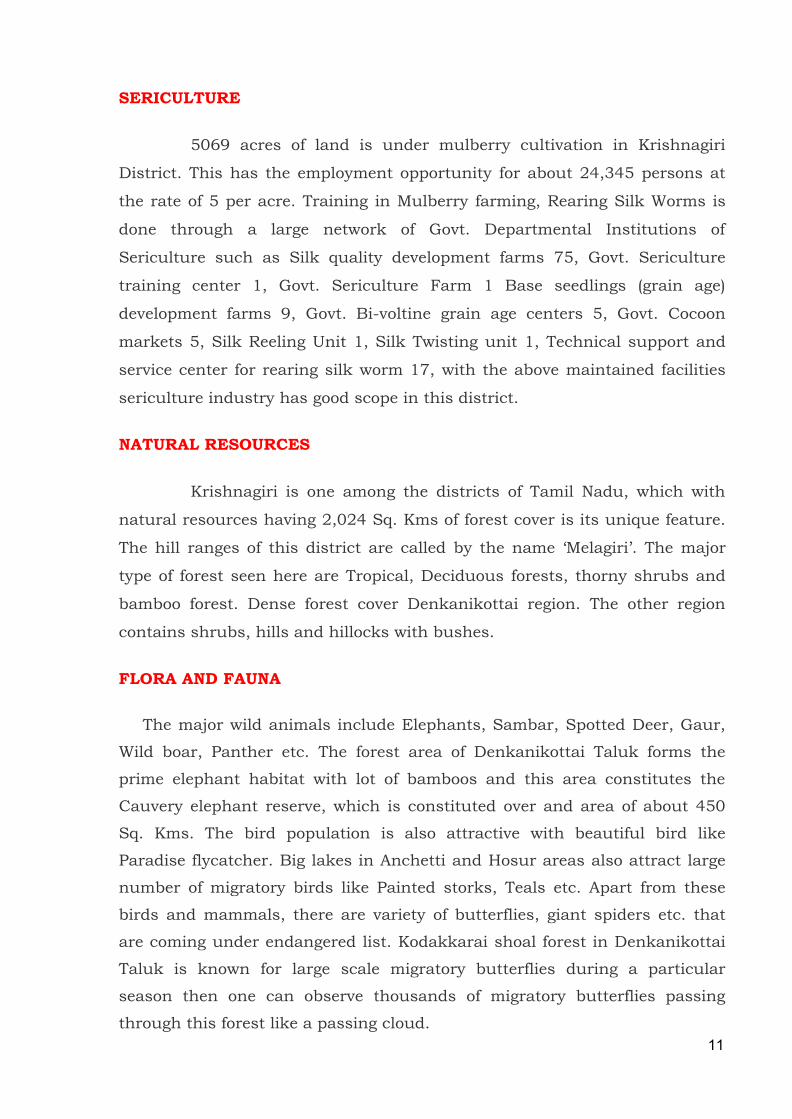
3.4 : Agricultrural Resources and Irrigation :
Krishnagiri district is one of the potential districts for cultivation of
agricultural and horticultural crops. Total cultivated area of 224767
Hectares, out of which 180902 Ha Net cultivated area against the 5,14,325
Ha. of total geographical area. The total normal area cultivated under all
crops is 224767 Hectares out of which 73046 Ha is under irrigated and
151720 ha area under rainfed crops. The major agricultural crops in the
district are grown Paddy, Ragi, Redgram, Cowpea, Maize, Cumbu,
Groundnut, Horsegram and minor millets. The major cultivated area of
agricultural crops occupied by rainfed agriculture. The total number of
2,81,733 famers engaged in agriculture out of which 213023 are Marginal
farmers (76%), 45970 are Small farmers (16%), remaining 4615 farmers (8%)
are medium and large farmers.
The important crops of Krishnagiri District are paddy, maize, ragi,
banana, sugarcane, cotton, tamarind, coconut, mango, groundnut, vegetables
and flowers. The district has an excellent scope for agri-business.
The Regional Agricultural Research Center of Tamil Nadu Agricultural
University has been functioning efficiently at Paiyur in Kaveripattinamunion since 1973. This center functions in 18.5 hec. of land. It helps the
peasants to develop and adopt the modern technique of cultivation. It has
developed hybrid seeds by research which yields more tonnage and good
quality.
HORTICULTURE
Krishnagiri District is more suitable for cultivation of Horticulture
crops. Other Plantation crops, medicinal plants, Fruits, Vegetables, Spices,
and flowers are grown well by way of its moderate climate, high altitude and
fertility of the soil.
11
SERICULTURE
5069 acres of land is under mulberry cultivation in Krishnagiri
District. This has the employment opportunity for about 24,345 persons at
the rate of 5 per acre. Training in Mulberry farming, Rearing Silk Worms is
done through a large network of Govt. Departmental Institutions of
Sericulture such as Silk quality development farms 75, Govt. Sericulture
training center 1, Govt. Sericulture Farm 1 Base seedlings (grain age)
development farms 9, Govt. Bi-voltine grain age centers 5, Govt. Cocoon
markets 5, Silk Reeling Unit 1, Silk Twisting unit 1, Technical support and
service center for rearing silk worm 17, with the above maintained facilities
sericulture industry has good scope in this district.
NATURAL RESOURCES
Krishnagiri is one among the districts of Tamil Nadu, which with
natural resources having 2,024 Sq. Kms of forest cover is its unique feature.
The hill ranges of this district are called by the name ‘Melagiri’. The major
type of forest seen here are Tropical, Deciduous forests, thorny shrubs and
bamboo forest. Dense forest cover Denkanikottai region. The other region
contains shrubs, hills and hillocks with bushes.
FLORA AND FAUNA
The major wild animals include Elephants, Sambar, Spotted Deer, Gaur,
Wild boar, Panther etc. The forest area of Denkanikottai Taluk forms the
prime elephant habitat with lot of bamboos and this area constitutes the
Cauvery elephant reserve, which is constituted over and area of about 450
Sq. Kms. The bird population is also attractive with beautiful bird like
Paradise flycatcher. Big lakes in Anchetti and Hosur areas also attract large
number of migratory birds like Painted storks, Teals etc. Apart from these
birds and mammals, there are variety of butterflies, giant spiders etc. that
are coming under endangered list. Kodakkarai shoal forest in Denkanikottai
Taluk is known for large scale migratory butterflies during a particular
season then one can observe thousands of migratory butterflies passing
through this forest like a passing cloud.
12
The district is a paradise for natural lovers. The flora include
variety of timber trees like Rose wood, Teak, Sandal etc. Hundereds of
medicinal herbs, minor forest plants like nelli, kadukkai, cheekai, pungam
etc. The following trees like ‘Charakkonnai’ (‘Cassia histula’). Since pungam
trees are found in abundance in this forest pungam oil is extracted from this
seeds of this tress which is a non pollutant Bio-fuel.
RAINFALL
The total rainfall received during 2017 is 1130mm against the
Normal rainfall of 842mm with average of 59 rainy days.
3.5 TRADE AND COMMERCE :
Internal trade of the district is developing on a large scale. The
Mangoes, Rose and Mulberry are the major crops in the District. These
products enter into the market in different parts of the country and also
exported to many countries. Market Committees are functioning in the
district for the purchase and sale of Mangoes, Rose and Mulberry,
groundnut, ragi, paddy and vegetables and other edible oil products. The co-
operative societies for milk are functioning at all parts of the district. At
Hosur, Agricultural primary complex functioning with all facilities to assist
the farmers for marketing their agricultural products.
4. GEOLOGY OF THE DISTRICT:
The geological formations of the district belong mainly to Archaean
age along with rock of Proterozoic age. The former is rerpresented by
Khondalite Group of rocks, Charnockite Group of rocks, Migmatites
Complex, Sathyamangalam Group of rocks, while the latter is represented
by Alkaline rocks. The Khondalite Group includes garnet sillimanite gneiss
and quartzite which occur as small patches. The migmatite complex
includes garnetiferous quartzofeldspathic gneiss and hornblends biotite
gneiss, the former exposed on the western part of the district. The
Sathyamangalam Group includes fuchsite quartzite, sillimanite mica schist
and amphibolites. The Bhavani Group in this area includes fissile
13
hornblende-biotite gneiss, granitoid gneiss and pink migmatite.
Amphibolites with barbed ferruginous quartzite and associated quartzo-
feldspathic rocks (Champion Gneiss) represent the Kolar group and are
found west and southwest of Veppanapalli. Following this there are basic
intrusions occurring as dykes.
The Charnockite Group occupies a major part of the south-west
portion of this district with small bands of Garnetiferous quartzo-
feldspathic gneiss, Granite gneiss and dolerite dykes. The North-East and
Northern part of the District mainly consist of granite gneiss with small
patches of Pink Migmatite, hornblende-biotite gneiss and dolerite dykes.
The Eastern part of the district consists of Epidote-Hornblende Gneiss,
Ultra Mafics, Syenite and Carbonatite.
The Alkaline Complex is represented by epidote-hornblende gneiss,
ultramafics, syenite and carbonatite and these are distributed in the
eastern part of the district. Innumerable basic dykes and felsites, quartz,
barites and pegmatite veins form part of the Alkali Complex.
The crystalline lime stone deposits in the areas of the villages of
samalpatti / Padavanur, Uthangarai Taluk of Krishnagiri District is fine
grained and are mainly made up of aggregate of calcite with subordinate
amount of quartz and silicate minerals. They occur as long, narrow bands
and as veins within the gneissic country rocks. The lime stone are
generally white, pink and grey in colour. The main impurity in the
limestone is silica. As for as the grade of the lime stone is concerned it is of
‘Cement and Refractory Grade’. The calcium carbonate is about 85% and
the rest is mainly made up of silica in the form of free silica or as silicate
minerals such as woolostonite, feldspar.
14
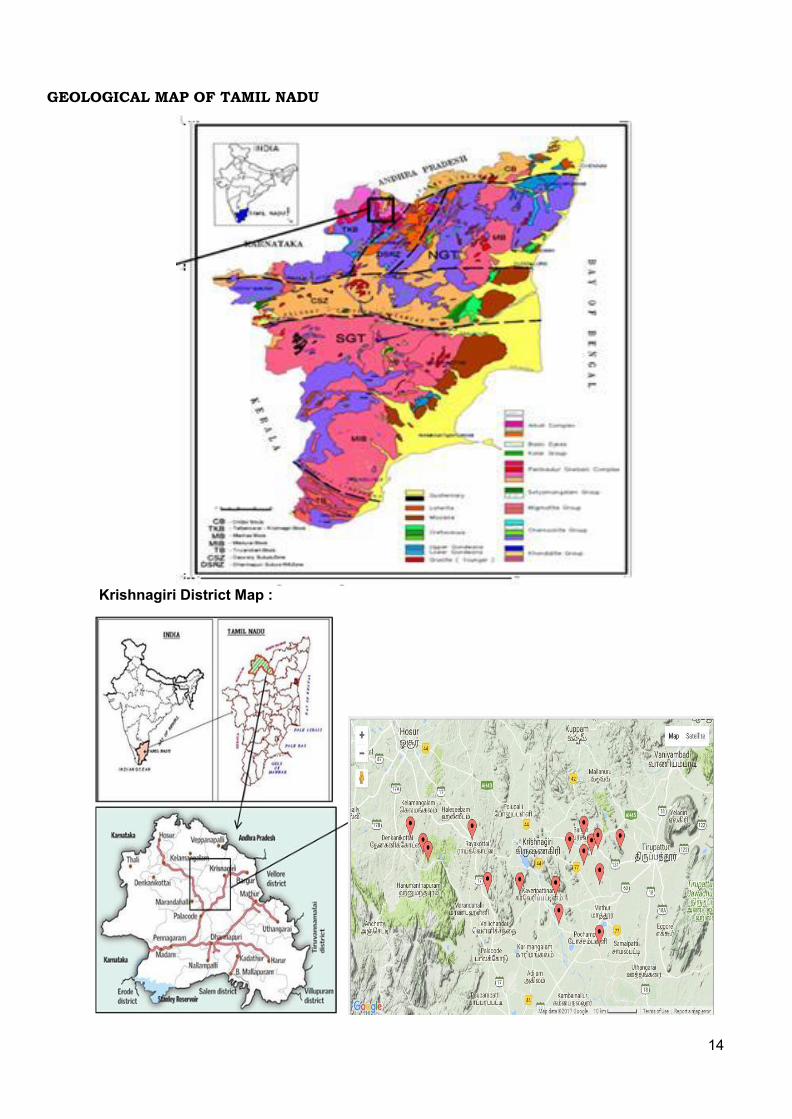
GEOLOGICAL MAP OF TAMIL NADU
Krishnagiri District Map :
15
5. Drainage of Irrigation pattern
Krishnagiri district basically has a mountainous terrain. The
General regional slop is towards east. The various land forms occurring
in the districts such as structural hills, erosional plains residual hills,
rolling uplands of different facies belonging to the denudational and
structural land forms. Cauvery River forms the southwestern boundary
of the district. Pennaiyar is the major river draining the district and is
ephemeral in nature. The major reservoirs are KRP dam, Kelavarapalli
Dam and Barur Lake. The prominent dams in the district namely KRP
dam has a present water level at 39.05ft as against the full capacity of
52ft with command area of 9012 acre, Kelavarapalli dam water level
41.50ft against the full capacity of 44.28 feet with command area of 9083
acre and Barur Lake 12.900 feet with command area 2400 acre. The
other major reservoirs are Pambar and Shoolagiri Chinnar with storage
280 Million Cubic feet and 112 Million cubic feet. It originates from
Nandhi hills in Karnataka, enters Tamil Nadu west of Bagalur and flows
almost in a southeasterly direction till it reaches Manjamedu from where
it flows along the district boundary before entering the district, again
near Hanuman Tirtham. After flowing for a short distance in an easterly
direction, it again follows the district boundary before entering the
neighboring Dharmapuri district. Pambar and Burgur Ar., are among the
important tributaries of Pennaiyar draining part of the district.
6. Land utilization pattern in the districts.
Krishnagiri district is one of the potential districts for cultivation of
agricultural and horticultural crops. Total cultivated area of 224767
Hectares, out of which 172884 Ha Net cultivated area against the 5,14,325
Ha. of total geographical area. The total normal area cultivated under all
crops is 224767 Hectares out of which 73046 Ha is under irrigated and
151720 ha area under rainfed crops. The major cultivated area of
agricultural crops occupied by rainfed agriculture.
16
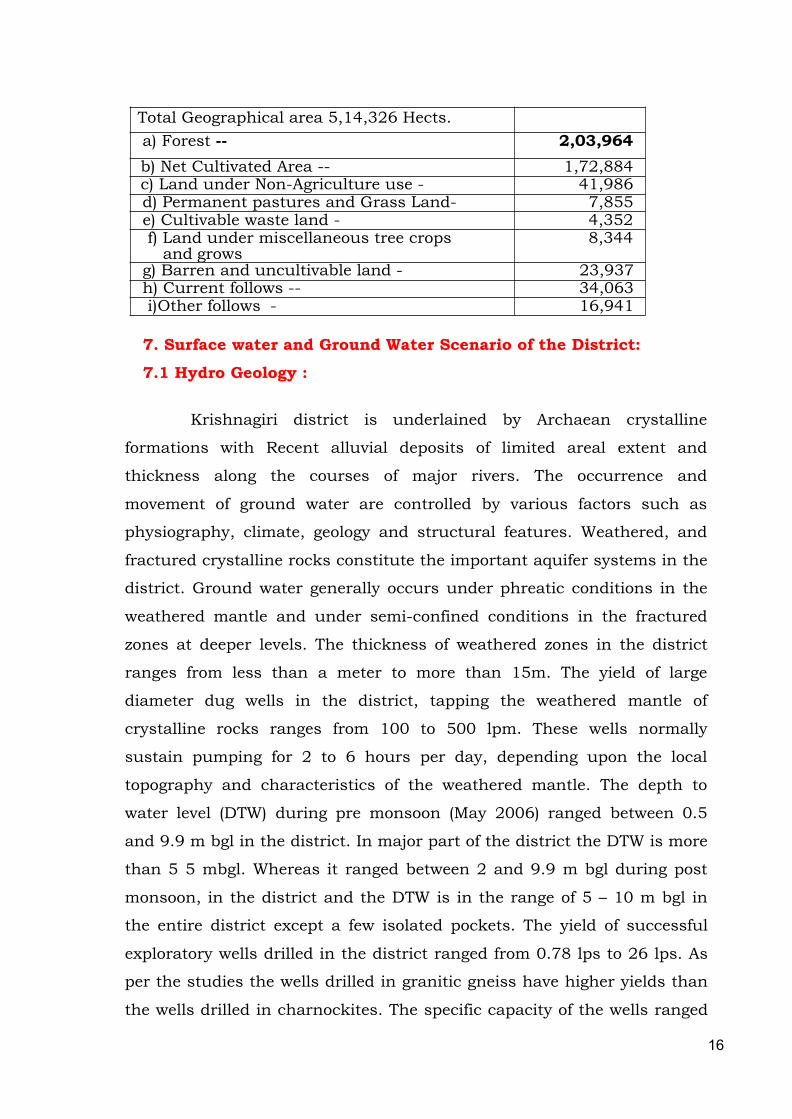
Total Geographical area 5,14,326 Hects.a) Forest -- 2,03,964b) Net Cultivated Area -- 1,72,884c) Land under Non-Agriculture use - 41,986d) Permanent pastures and Grass Land- 7,855e) Cultivable waste land - 4,352f) Land under miscellaneous tree cropsand grows
8,344
g) Barren and uncultivable land - 23,937h) Current follows -- 34,063i)Other follows - 16,941
7. Surface water and Ground Water Scenario of the District:7.1 Hydro Geology :
Krishnagiri district is underlained by Archaean crystalline
formations with Recent alluvial deposits of limited areal extent and
thickness along the courses of major rivers. The occurrence and
movement of ground water are controlled by various factors such as
physiography, climate, geology and structural features. Weathered, and
fractured crystalline rocks constitute the important aquifer systems in the
district. Ground water generally occurs under phreatic conditions in the
weathered mantle and under semi-confined conditions in the fractured
zones at deeper levels. The thickness of weathered zones in the district
ranges from less than a meter to more than 15m. The yield of large
diameter dug wells in the district, tapping the weathered mantle of
crystalline rocks ranges from 100 to 500 lpm. These wells normally
sustain pumping for 2 to 6 hours per day, depending upon the local
topography and characteristics of the weathered mantle. The depth to
water level (DTW) during pre monsoon (May 2006) ranged between 0.5
and 9.9 m bgl in the district. In major part of the district the DTW is more
than 5 5 mbgl. Whereas it ranged between 2 and 9.9 m bgl during post
monsoon, in the district and the DTW is in the range of 5 – 10 m bgl in
the entire district except a few isolated pockets. The yield of successful
exploratory wells drilled in the district ranged from 0.78 lps to 26 lps. As
per the studies the wells drilled in granitic gneiss have higher yields than
the wells drilled in charnockites. The specific capacity of the wells ranged
17
from 1.2 to 118.0 lpm/m/dd. The piezometric head of fracture zones
varied between 0.50 and 18.45 m bgl.
Long Term fluctuation (1998-2007) :The long-term water level fluctuation for the period of 1998-2007
indicates a rise in water level in the range of 0.098-0.414 m/year whereas
the fall in water level ranges between 0.0666 and 1.618 m/year.
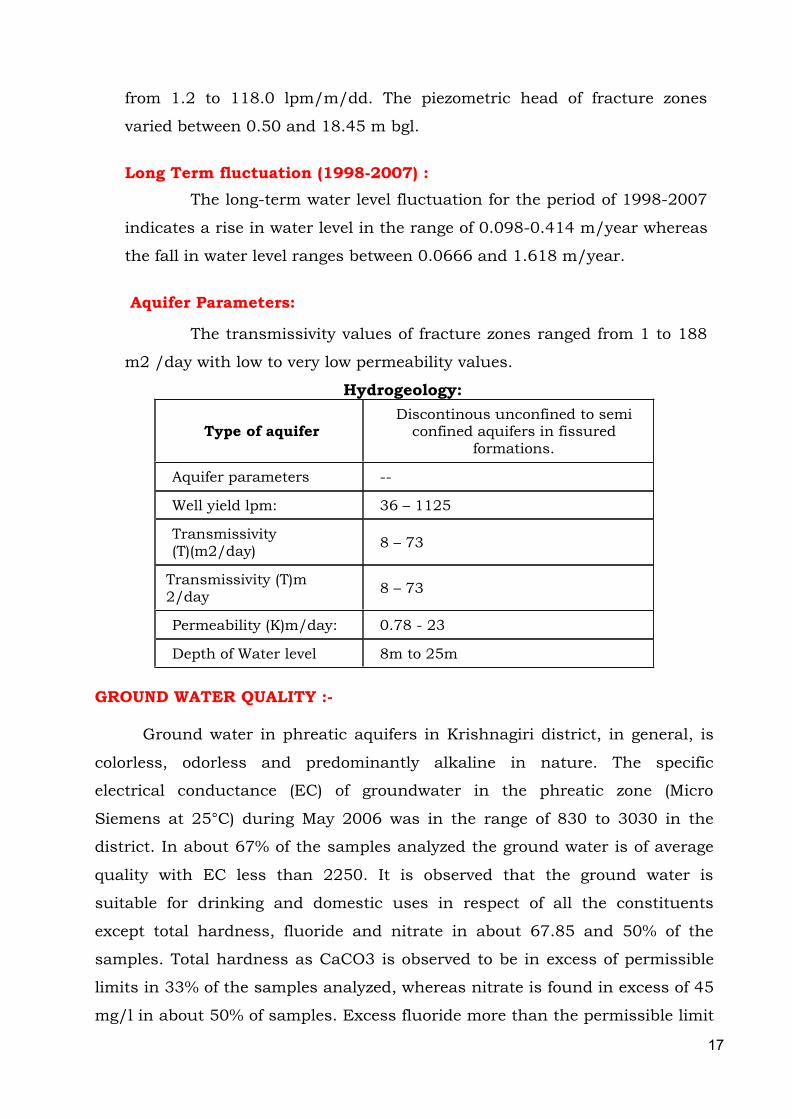
Aquifer Parameters:
The transmissivity values of fracture zones ranged from 1 to 188
m2 /day with low to very low permeability values.
Hydrogeology:
Type of aquiferDiscontinous unconfined to semiconfined aquifers in fissured
formations.
Aquifer parameters --
Well yield lpm: 36 – 1125
Transmissivity(T)(m2/day) 8 – 73
Transmissivity (T)m2/day 8 – 73
Permeability (K)m/day: 0.78 - 23
Depth of Water level 8m to 25m
GROUND WATER QUALITY :-
Ground water in phreatic aquifers in Krishnagiri district, in general, is
colorless, odorless and predominantly alkaline in nature. The specific
electrical conductance (EC) of groundwater in the phreatic zone (Micro
Siemens at 25°C) during May 2006 was in the range of 830 to 3030 in the
district. In about 67% of the samples analyzed the ground water is of average
quality with EC less than 2250. It is observed that the ground water is
suitable for drinking and domestic uses in respect of all the constituents
except total hardness, fluoride and nitrate in about 67.85 and 50% of the
samples. Total hardness as CaCO3 is observed to be in excess of permissible
limits in 33% of the samples analyzed, whereas nitrate is found in excess of 45
mg/l in about 50% of samples. Excess fluoride more than the permissible limit
18
of 1.5 mg/l is observed 8 at K.Vetrapatti and Karukanchavadi areas. The
incidence of high total hardness is attributed to the composition of litho-units
constituting the aquifers in the district, whereas nitrate pollution is most
likely due to the use of fertilizers and other improper waste disposal.
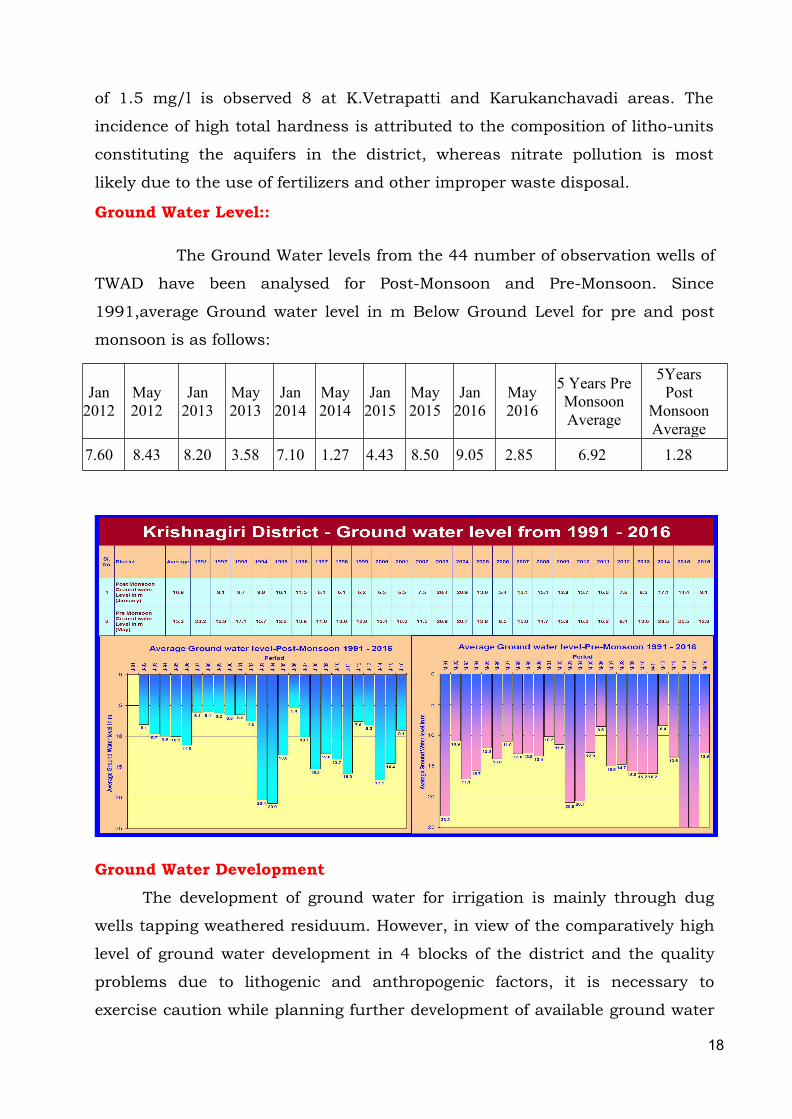
Ground Water Level::
The Ground Water levels from the 44 number of observation wells of
TWAD have been analysed for Post-Monsoon and Pre-Monsoon. Since
1991,average Ground water level in m Below Ground Level for pre and post
monsoon is as follows:
Jan2012
May2012
Jan2013
May2013
Jan2014
May2014
Jan2015
May2015
Jan2016
May2016
5 Years PreMonsoonAverage
5YearsPost
MonsoonAverage
7.60 8.43 8.20 3.58 7.10 1.27 4.43 8.50 9.05 2.85 6.92 1.28
Ground Water DevelopmentThe development of ground water for irrigation is mainly through dug
wells tapping weathered residuum. However, in view of the comparatively high
level of ground water development in 4 blocks of the district and the quality
problems due to lithogenic and anthropogenic factors, it is necessary to
exercise caution while planning further development of available ground water
19
resources in the district. Dug wells tapping the weathered mantle with
horizontal bores wherever feasible are ideally suited for the terrain. The
narrow linear valley fill deposits are also suited for development through
shallow tube wells drilled down to 30 m bgl. However the actual number of
wells will depend on several factors such as availability of land for
construction, nature of weathered formation, their water bearing
characteristics, etc.
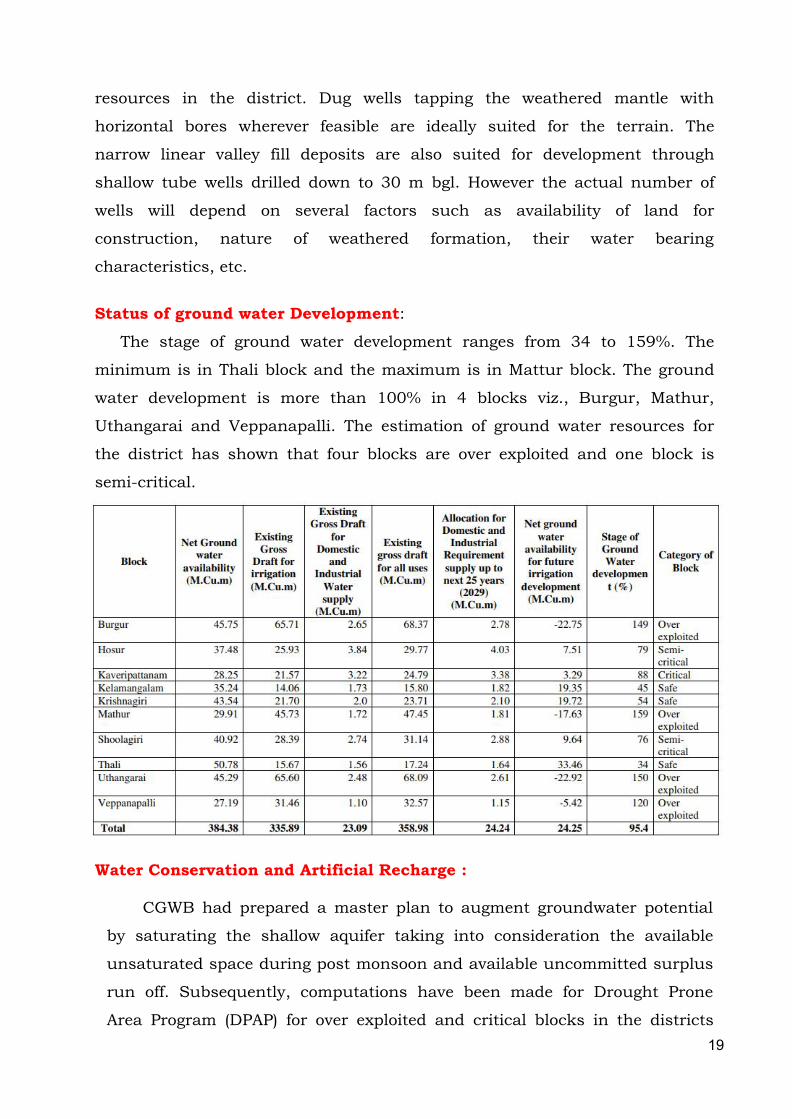
Status of ground water Development:The stage of ground water development ranges from 34 to 159%. The
minimum is in Thali block and the maximum is in Mattur block. The ground
water development is more than 100% in 4 blocks viz., Burgur, Mathur,
Uthangarai and Veppanapalli. The estimation of ground water resources for
the district has shown that four blocks are over exploited and one block is
semi-critical.
Water Conservation and Artificial Recharge :
CGWB had prepared a master plan to augment groundwater potential
by saturating the shallow aquifer taking into consideration the available
unsaturated space during post monsoon and available uncommitted surplus
run off. Subsequently, computations have been made for Drought Prone
Area Program (DPAP) for over exploited and critical blocks in the districts
20
warranting immediate attention. Institute of Remote Sensing, Anna
University had prepared block wise maps demarcating potential zones for
artificial recharge for the State of Tamil Nadu. Subsequently, State
Government agencies have constructed artificial recharge structures with
their own fund or with fund from Central Government, dovetailing various
government programs. Ministry of Water Resources, Government of India
has initiated Dug Well Recharge Scheme in the State. The scheme is being
implemented by the Nodal Department (SG&SWRDC, PWD, WRO,
Government of Tamil Nadu) with the technical guidance of CGWB. The
subsidy of Rs. 4000/- for small and marginal farmers and Rs. 2000/- for the
other farmers is credited to the beneficiaries’ bank account through NABARD.
The scheme after implementation will prove to be beneficial to the irrigation
sector. The available uncommitted surplus run off has to be recomputed,
taking into consideration the quantum of recharge effected through existing
irrigation dug wells also. The existing structures and uncommitted surplus
flow should be considered for further planning of artificial recharge program.
9, On the basis of experimental studies, it has been found that de-silting of
existing tanks followed by percolation pond with recharge wells, recharge
shafts are economical. There is considerable scope for implementation of
roof – top rainwater harvesting in the district. Recharge pits / Shafts /
trenches of suitable design are ideal structures for rainwater harvesting in
such areas. Central Ground Water Board is also providing free technical
guidance for implementation of rooftop rainwater harvesting schemes.
8. Climate and Rain fall of the District:8.1 Climate :
Eastern part of the district experiences hot climate and Western part
has a contrasting cold climate. the average normal rainfall is 850.88 mm per
annum. March - June is summer season. July - November is Rainy Season
and between December - February winter prevails.
21
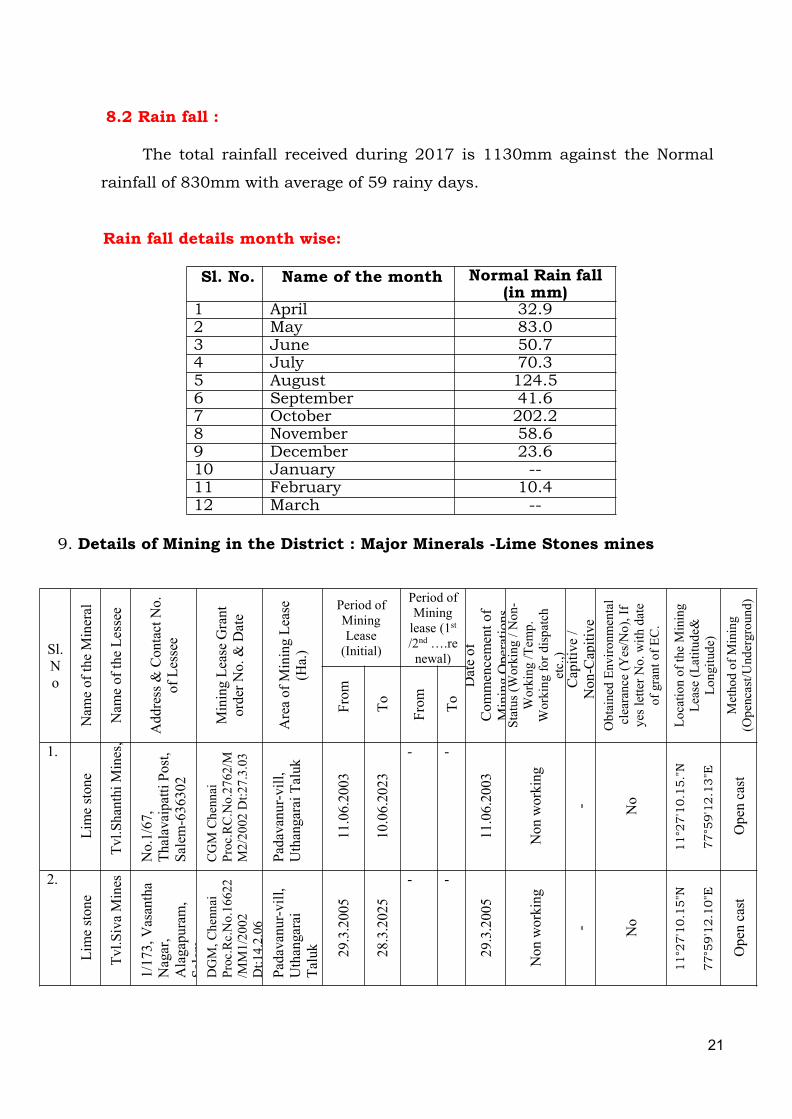
8.2 Rain fall :
The total rainfall received during 2017 is 1130mm against the Normal
rainfall of 830mm with average of 59 rainy days.
Rain fall details month wise:
Sl. No. Name of the month Normal Rain fall(in mm)
1 April 32.92 May 83.03 June 50.74 July 70.35 August 124.56 September 41.67 October 202.28 November 58.69 December 23.610 January --11 February 10.412 March --
9. Details of Mining in the District : Major Minerals -Lime Stones mines
Sl.No
Nam
eoftheMineral
Nam
eoftheLessee
Address&ContactNo.
ofLessee
MiningLeaseGrant
orderN
o.&Date
AreaofMiningLease
(Ha.)
Period ofMiningLease(Initial)
Period ofMininglease (1st/2nd ….renewal)
Dateof
Com
mencementof
MiningOperations
Status
(Working
/Non-
Working
/Tem
p.Working
fordispatch
etc.,)
Capitive
/Non-Capitive
ObtainedEnvironm
ental
clearance(Yes/No),If
yesletterN
o.with
date
ofgrantofE
C.
LocationoftheMining
Lease(Latitude&
Longitude)
MethodofMining
(Opencast/U
nderground)
From
To From To
1.
Limestone
Tvl.ShanthiMines,
No.1/67,
ThalavaipattiPost,
Salem-636302
CGM
Chennai
Proc.RC.No.2762/M
M2/2002
Dt:27.3.03
Padavanur-v
ill,
UthangaraiT
aluk
11.06.2003
10.06.2023
- -
11.06.2003
Non
working
- No
11°27'10
.15."N
77°59'12
.13"E
Opencast
2.
Limestone
Tvl.SivaMines
1/173,Vasantha
Nagar,
Alagapuram,
Salem
DGM,C
hennai
Proc.Rc.No.16622
/MM1/2002
Dt:14.2.06
Padavanur-v
ill,
Uthangarai
Taluk 29.3.2005
28.3.2025
- -
29.3.2005
Non
working
- No
11°27'10
.15"N
77°59'12
.10"E
Opencast

22
10. Details of royalty realized in the last three years.
11. Details of production of Minerals in last three years.
Sl.No. Name of themineral
Royalty collected (In Rupees)
2016-17 2017-18 2018-19
1 Lime Stone 7,19,678 -- --
Sl. No. Name of themineral
Quantity produced (in MT)
2016-17 2017-18 2018-19
1 Lime Stone 7,270 -- --

23
12. Mineral map of the District:-
Map showing the Location of Granite, Rough stone quarries and limestone mines in
Krishnagiri District.
13. List of letter of Indent (LOI) holders for Lime stone quarrying inKrishnagiri District.
S.No.
Name ofthe Mineral
Name oftheLease
Details of PreciseAreaCommunication
Extent (InHect.)
Taluk/Village
SF.No.Location ofthe MiningLease
--------------------- Nil -----------------------
24
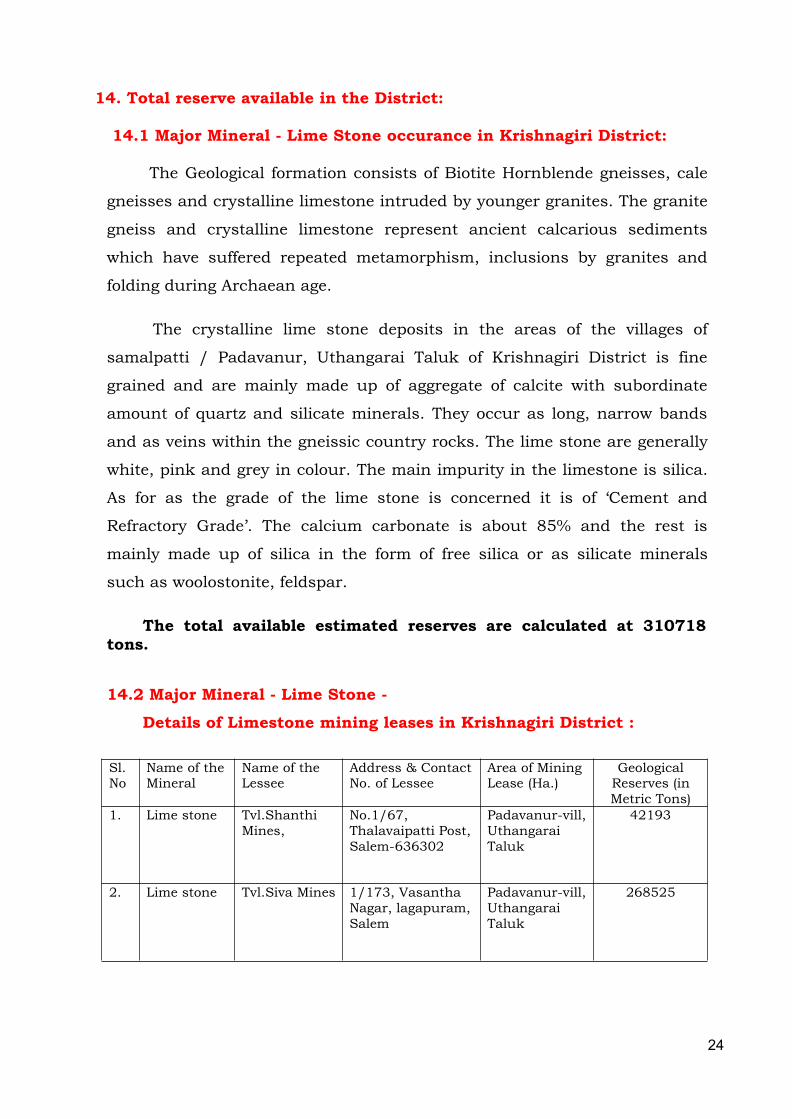
14. Total reserve available in the District:
14.1 Major Mineral - Lime Stone occurance in Krishnagiri District:
The Geological formation consists of Biotite Hornblende gneisses, cale
gneisses and crystalline limestone intruded by younger granites. The granite
gneiss and crystalline limestone represent ancient calcarious sediments
which have suffered repeated metamorphism, inclusions by granites and
folding during Archaean age.
The crystalline lime stone deposits in the areas of the villages of
samalpatti / Padavanur, Uthangarai Taluk of Krishnagiri District is fine
grained and are mainly made up of aggregate of calcite with subordinate
amount of quartz and silicate minerals. They occur as long, narrow bands
and as veins within the gneissic country rocks. The lime stone are generally
white, pink and grey in colour. The main impurity in the limestone is silica.
As for as the grade of the lime stone is concerned it is of ‘Cement and
Refractory Grade’. The calcium carbonate is about 85% and the rest is
mainly made up of silica in the form of free silica or as silicate minerals
such as woolostonite, feldspar.
The total available estimated reserves are calculated at 310718tons.
14.2 Major Mineral - Lime Stone -Details of Limestone mining leases in Krishnagiri District :
Sl.No
Name of theMineral
Name of theLessee
Address & ContactNo. of Lessee
Area of MiningLease (Ha.)
GeologicalReserves (inMetric Tons)
1. Lime stone Tvl.ShanthiMines,
No.1/67,Thalavaipatti Post,Salem-636302
Padavanur-vill,UthangaraiTaluk
42193
2. Lime stone Tvl.Siva Mines 1/173, VasanthaNagar, lagapuram,Salem
Padavanur-vill,UthangaraiTaluk
268525
25
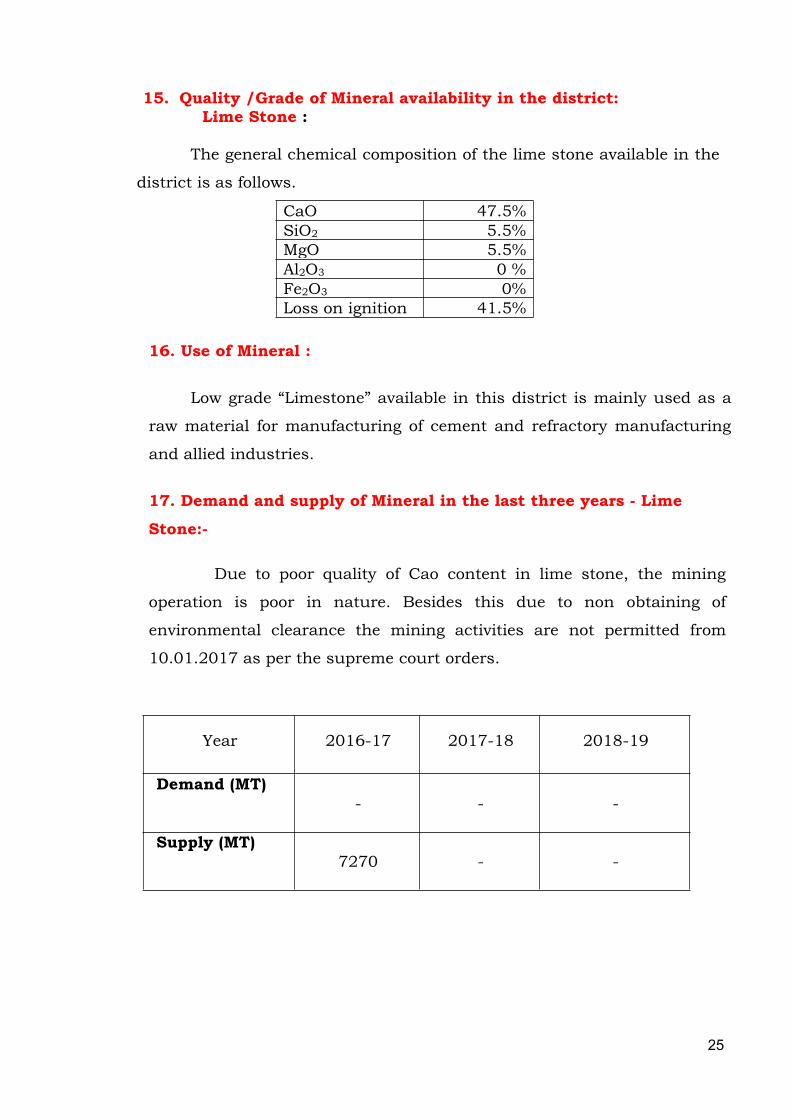
15. Quality /Grade of Mineral availability in the district:Lime Stone :
The general chemical composition of the lime stone available in the
district is as follows.
CaO 47.5%SiO2 5.5%MgO 5.5%Al2O3 0 %Fe2O3 0%Loss on ignition 41.5%
16. Use of Mineral :
Low grade “Limestone” available in this district is mainly used as a
raw material for manufacturing of cement and refractory manufacturing
and allied industries.
17. Demand and supply of Mineral in the last three years - LimeStone:-
Due to poor quality of Cao content in lime stone, the mining
operation is poor in nature. Besides this due to non obtaining of
environmental clearance the mining activities are not permitted from
10.01.2017 as per the supreme court orders.
Year 2016-17 2017-18 2018-19
Demand (MT)- - -
Supply (MT)7270 - -
26
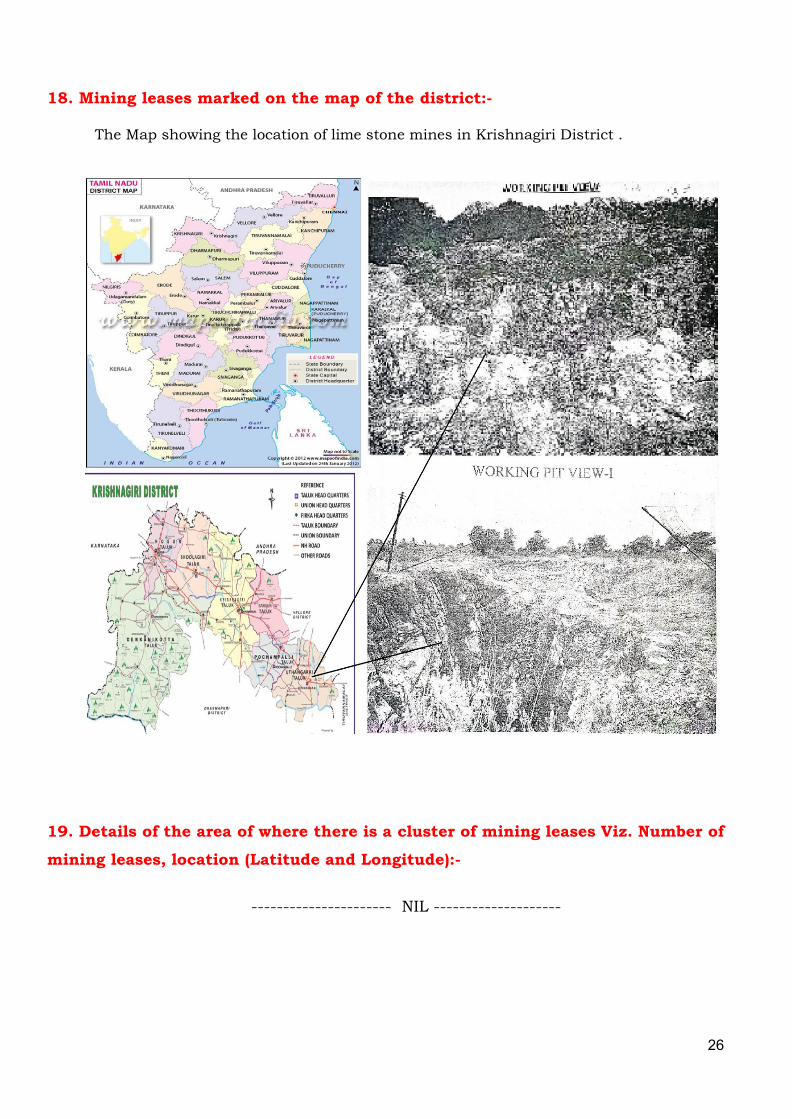
18. Mining leases marked on the map of the district:-
The Map showing the location of lime stone mines in Krishnagiri District .
19. Details of the area of where there is a cluster of mining leases Viz. Number ofmining leases, location (Latitude and Longitude):-
---------------------- NIL --------------------
27
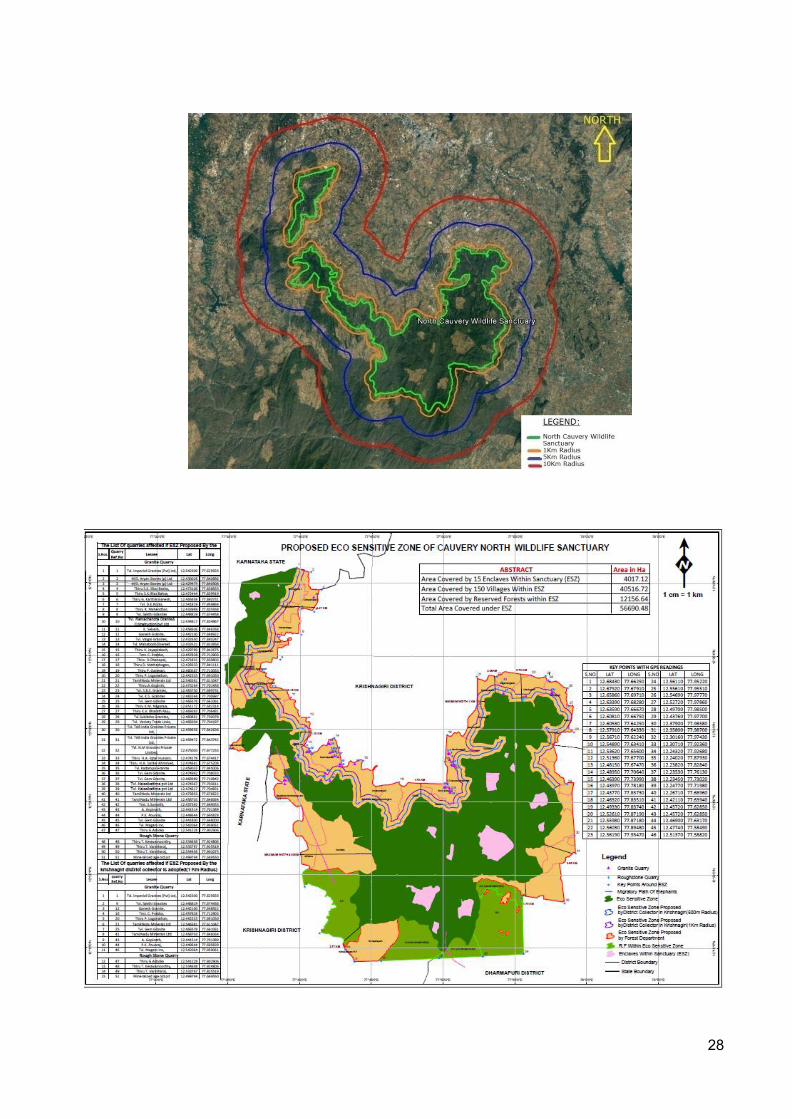
20. Details of Eco-Sensitive area, if any in the district:-
The Cauvery North Wild Life sanctuary located in Krishnagiri District
measuring between 12.23450 N and 12.68430N Latitude and 77.63410E and
77.98700 E Longitude over an extent of 566.90 Sq.km covering 150 villages
and reserve forests, has been carved out and from the forest of Hosur Division
and published in Govt. of Tamilnadu Gazeet No.10 (Part-2) -section-2
Dt:12.03.2014. based on the direction of the Hon’ble supreme court of India,
Ministry of Forest Environment and Climate change Division the Eco Sensetive
zone proposal on the Cauvery North Wild Life sanctuary has been prepared in
consultation with the District Administartion of Krishnagiri District and the
local people and the Eco-sensetive zone proposal has been submitted to the
Principal Chief conservator of Forest and Chief Wild life warden for publication
under the colum ‘Activity proposed to be permitted, regulated and probhited
within the Eco sensetive zone’, No Mining activity has been proposed within
500mts from the boundary of the wild life sanctuary.
Government of India, Ministry of Enviroment Forest office Memorandum
No.L-11011/ 47/2011-1A-11 (M) Dt:18.05.2012. and as per the guidelines
issued in office memorandum F.No.J-11013/41/2006-1A-II (I) (Part)
Dt:20.08.2014 by the ministry of Forest and Environment climate change, Govt.
of India, New Delhi, if the site of quarrying is located within 10kms from the
boundry of protected areas such as national parks and sanctuaries, wildlife
cleareance form the standing committee of national board for wildlife (NBWL)
has to be obtained. According to the guidelines issued by the GOI the
cleareance under the national board for wildlife is mandatory.
The map showing the proposed Eco sensitive zone of the Cauvery North
Wild Life sanctuary.
28
29
21. Impact on the Environment (Air, Water, Noise, Soil Flora & Fauna, Landuse, Agriculture, Forest etc.,) due to Mining Activity “
Mining and allied operations may affect the existing environmental setup
in the area unless proper mitigation measures are not taken. Hence it is
essential to assess the impacts of mining on various environmental parameters
so that abatement measures could be planned in advance for systematic,
sustainable and eco-friendly mining in the area.
21.1 Air EnvironmentThe mining and allied operations may cause deterioration of air quality
due to pollution if prompt care is not taken. The principal sources of air
pollution in general due to mining and allied activities will be the dust
generation in the mine due to:
Excavation of lime stone.
Movement of HEMM such as excavators, tippers etc.,
Loading and unloading operation
Overburden & lime stone mineral transportation
Beside the above mentioned fugitive dust emissions, atmospheric fugitive
dust emissions, atmospheric pollution can occur as a result of emission of SO2,
Nox, CO etc., from diesel driven mining equipment, compressors, generators
etc., Larger suspended particles are generally filtered in the nose and throat
and do not cause problems.
Particulate matter smaller than 10 microns, referred to as PM10, cn
settle in the bronchi and lungs and cause health problems like Bronchitis,
Emphysema, Bronchi Asthma, Irritation of mucus membranes of eyes etc.
Particles smaller than 2.5 micrometers (PM 2.5), tend to penetrate into the
lungs and very small particles (<100 nanometers) may pass through the lungs
to affect other programs.
21.2 Water EnvironmentThe major sources of water pollution normally associated due to mining
and allied operations are:
30
Generation of Industrial effluent water from workshop, service building.
Disturbance to drainage course or water bodies in the project area, if any.
Washouts from waste dumps/embankment, if any.
Domestic effluent
Mine discharge water pumped out from opencast mines, if any and effect
on ground water table.
Direct impact on human beings due to poor water quality consequent
to mining operation can lead to various water borne diseases like
diarrhoea, jaundice, dysentery, typhoid etc. Besides, the polluted water
may not be useful for animal or human consumption, vegetation and
may affect aquatic life, if effluents are not properly treated to remove the
harmful pollutants.
21.3 Noise & Vibration:-The impact prediction and control measure for noise environment
due to mining and allied activities are described below:
Noise is one of the inevitable causes of pollution in mining
operations largely due to the extensive mechanization adopted. Since, the
lime stone in the district is of metamorphic in nature drilling and blasting
is required for excavation. Hence the major source of noise will be from by
blasting activity and by the equipment’s used such as Excavation, loading
& unloading & movement of vehicles etc., will produce noise of
considerable magnitude in mining operations. Prolonged exposure to a
high noise level is harmful to the human auditory system and can create
mental fatigue, rebellious attitude, annoyance and carelessness, which
may lead to neglect of work and also results in accidents.
Since, the rock formations in this district belongs mainly to
Archaean age and are hard in nature, quarrying activity requires drilling
and blasting makes vibrations.
31
21.4 Impact on Land Environment:
Mining can cause physical disturbances to the landscape, creating
eyesores such as waste-rock piles and open pits. Such disturbances may
contribute to the decline of wildlife and plant species in an area. In addition,
it is possible that many of the premining surface features cannot be replaced
after mining ceases. Mine subsidence (ground movements of the earth's
surface due to the collapse of overlying strata and sliding of quarry side
portions) can cause damage to buildings and roads.
21.5 Impact on Biological Environment:
The major possible impact on biological environment due to mining is
given below:
Clearance of vegetation due to mining and allied activities
Retardation of tree growth, tip burning etc., due to deposition of dust and
the particulate matter generated from the mining operation.
Presence of Schedule-I fauna in the mining area.
Proposed impact on surface water quality that also provides water to
wildlife
Risk of fall/slip or cause death to wild animals due to project activities
The project releases effluents into water bodies that also supplies water
to wildlife
Diversion of Agricultural and forest lands for mining
22. Remedial Measure to mitigate the impact of Mining on theEnvironment:-
The following remedial measures to be taken during mining.
22.1 Remedial Measures to mitigate Air Pollution The emission of contaminants to the atmosphere by proper planning and
zoning of quarrying areas.
Water sprinkling on mineral transport road from the mines to the main
road
Black topping of the main transportation roads to the possible extent.
32
Avoiding crowding of trucks by properly spacing them to avoid the
concentration of dust emission at any time
Covering the trucks by tarpaulin sheets during ore transportation
Proper maintenance of HEMM to minimize gaseous emission
Imparting sufficient training to operators on safety and environmental
parameters
Development of green belt / plantation around mine, along the roads,
backfilled area in various undisturbed areas within the mine lease areas
etc.,
22.2 Remedial Measures to mitigate water Pollution
Industrial effluent treatment systems wherever necessary to be introduced
and maintained properly.
Safety barriers to be provided for all water bodies and no mining activities
should be carried out in the safety barrier area.
Mitigative measures like construction of garland drains formation of earth
bunds to be followed in the waste dumping areas to avoid wash off.
Domestic effluents to be treated in scientific manner
Required statutory clearances to be obtained and all precautionary
measures to be adopted wherever pumping of ground water is involved.
Recycling of water used in crusher units and prevention measures of
polluted water into water bodies by proper storage within the unit so as to
avoid water contamimation.
22.3 Remedial Measures to reduce Noise & Vibration Planting rows of native trees around mine, along the roads, other noise
generating centres to act as acoustic barriers.
Sound proof operator’s cabin for equipment may lead to less noise
generation.
Proper and regular maintenance of equipment may lead to less noise
generation
Air silencers of suitable type that can modulate the noise of the engines
of machinery to be utilized and will be maintained effectively.
Providing in-built mechanism for reducing sound emissions.
33
Providing ear muff’s to workers exposed to higher noise level and to those
persons operating or working close to any machine.
Conducting regular health check-up of workers including Audiometric
test for the workers engaged in noise prone area.
22.4 Remedial measures to reduce Impact on Land Environment:
Scientific reclamation measures to be adopted to reduce the impact of land
environment due to mining. The lime stone being in shallow depth, back
filling of mined out areas may be practiced to avoid land degradation.
22.5 Remedial measures to reduce Impact on Biological environment:
The quarrying areas in the district are mostly of dry areas, afforestation
to be carried out in the quarrying areas.
Necessary mitigative measures like dust suppression, proper
maintenance of equipments, black topping of roads etc., to be carried out to
prevent dust generation & any further impact on the vegetation.
Conservation plan for schedule –I species if any to be prepared in
consultation with the Forest Department and the proposals given in the
conservation plan to be strictly implemented.
Effluents generated in the mining areas to be treated properly.
23. Reclamation of Mined out Area (Best practice already implementedin the district, requirement as per rules and regulations,proposedreclamation plan).
Regarding land reclamation, in the mind out pits after back filling and
development of plantation/afforestation in the back filled areas will be the
best practice of reclamation. The unfilled pits may be used as ground water
recharge pits.
34
24. Risk Assessment & Disaster Management Plan
Risk Assessment and Disaster Management plan in connection
with mining and allied operations should be spelt out in detail to cover
possible dangers /risks/explosions/accidents etc., likely to arise from the
project operations including onsite and off-site emergency plans to meet the
disastrous situations if any.
The management is able to deal with the situation efficiently to
reduce confusion keeping in view of the likely sources of danger in the mine.
1) Outline of Disaster management plan :-The purpose of disaster management plan is to restore the
normalcy for early resumption of mining operation due to an unexpected,
sudden occurrence resulting to abnormality in the course of mining activity
leading to a serious danger to workers or any machinery or the environment.
2) System of communication:-An internal communication system should be provided. Telephone
nos. and addresses of adjoining mines, rescue station, police station, Fire
service station, local hospital, electricity supply agency and standing
consultative committee members should be properly updated and displayed.
3) Consultative committee:-A standing consultative committee will be formed under the head
of Mines. The members consists of Mines manager /safety officer / medical
officer / public relation officer/Foreman/ and environmental engineer.
4) Facilities & Accommodation:-Accommodation and facilities for medical centre, rescue room and for
various working groups shall be provided. Regular checking of these
facilities shall be undertaken.
35
5) First Aid & medical facilities:-The mine management should be having first aid / medical centre for
use in emergency situation. All casualties should be registered and should
be given first aid. The centre should have facilities for first aid & minor
treatment, resuscitation, ambulance and transport. Proper telephone /
wireless should be provided for quick communication with hospitals where
the complicated cases are to be referred. Regular checking of these facilities
shall be undertaken by the doctor and the in charge of the first aid room.
6) Stores and equipment :-A detailed list of equipment available, its type & capacity and items
reserved for emergency should be maintained.
7) Transport services:-A well defined transport control system should be provided to deal with
the situation.
8) Functions of public relations group:-Liaison with representatives of the mine workers is required to ameliorate
the situation of panic, tension, sentiments, grievances and misgivings
created by any disaster. Management is required to ameliorate the injured,
survivors and family members of affected persons by providing material,
finance, moral support and establishing contact with relatives of victims.
The consultative committee formed, especially the nominated public relation
officer shall look into these aspects.
9) Security :-Manning of security posts is very essential during the disaster
management.
10) Catering & Refreshment:-Arrangement will be made for the victims, rescue teams and others.
36
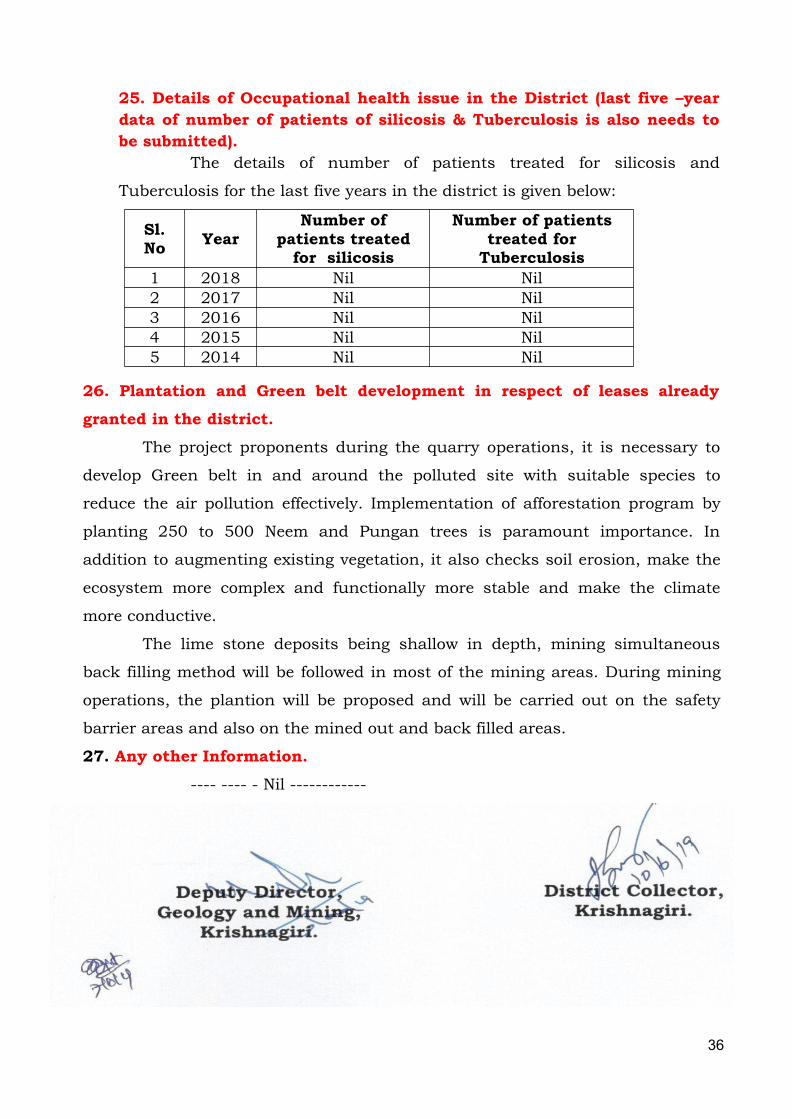
25. Details of Occupational health issue in the District (last five –yeardata of number of patients of silicosis & Tuberculosis is also needs tobe submitted).
The details of number of patients treated for silicosis and
Tuberculosis for the last five years in the district is given below:
Sl.No Year
Number ofpatients treatedfor silicosis
Number of patientstreated forTuberculosis
1 2018 Nil Nil2 2017 Nil Nil3 2016 Nil Nil4 2015 Nil Nil5 2014 Nil Nil
26. Plantation and Green belt development in respect of leases alreadygranted in the district.
The project proponents during the quarry operations, it is necessary to
develop Green belt in and around the polluted site with suitable species to
reduce the air pollution effectively. Implementation of afforestation program by
planting 250 to 500 Neem and Pungan trees is paramount importance. In
addition to augmenting existing vegetation, it also checks soil erosion, make the
ecosystem more complex and functionally more stable and make the climate
more conductive.
The lime stone deposits being shallow in depth, mining simultaneous
back filling method will be followed in most of the mining areas. During mining
operations, the plantion will be proposed and will be carried out on the safety
barrier areas and also on the mined out and back filled areas.
27. Any other Information.---- ---- - Nil ------------