Embed Size (px)
Citation preview
ANNUAL
REPORT2020/21
Welcome to NPDC’s Annual Report for 2020/21The Annual Report is our way of being accountable to you.
It sets out what we have achieved in the last year and looks at the progress we have made in providing the sort of district that you have said is important.
This Annual Report compares our achievements and progress to what was planned in our Long-Term Plan 2018-2028 and Annual Plan 2020/21.
Under the Local Government Act 2002, all councils must produce an Annual Report and have certain information audited. Audit New Zealand has successfully completed this audit and their opinion can be found on page 144.
INTRODUCTION I ANNUAL REPORT 2020/21 1
ContentsMayor and Chief Executive’s message .............................................................. 2
Our Strategic Framework....................................................................................... 3
Covid-19 ‘Getting Us Back On Our Feet’ stimulus ......................................... 4
Our year in review .................................................................................................... 6
2020/21 projects update ....................................................................................... 8
Financial summary .................................................................................................10
Council Services ................................................................... 15Introduction to Council Services ......................................................................16
Community Partnerships.....................................................................................19
Customer and Regulatory Solutions ...............................................................22
Economic Development ......................................................................................27
Emergency Management and Business Continuance ..............................30
Flood Protection and Control Works ...............................................................33
Governance ..............................................................................................................35
Govett-Brewster Art Gallery/Len Lye Centre ................................................37
Management of Investments and Funding ..................................................40
Parks and Open Spaces .......................................................................................42
Puke Ariki and Community Libraries ..............................................................45
Stormwater Management ..................................................................................48
Transportation ........................................................................................................51
Venues and Events .................................................................................................55
Waste Management and Minimisation ..........................................................58
Wastewater Treatment .........................................................................................61
Water Supply ............................................................................................................64
Financial Statements .......................................................... 69Financial Statements .............................................................................................70
Notes to the Financial Statements ...................................................................75
Funding Impact Statement .............................................................................. 131
Disclosure Statement ......................................................................................... 132
Council Controlled Organisations .................................. 135Forestry ................................................................................................................... 136
New Plymouth PIF Guardians Limited ......................................................... 137
Papa Rererangi i Puketapu Limited ............................................................... 138
Tasmanian Land Company Limited .............................................................. 140
Venture Taranaki Trust ....................................................................................... 141
Auditor’s Report ................................................................. 144
Statement of Compliance and Responsibility .............. 148
2 ANNUAL REPORT 2020/21 I INTRODUCTION
Mayor and Chief Executive’s messageAs we write this our District, like the rest of Aotearoa, has been pushed back into lockdown with the arrival of the Delta strain of Covid-19.
Once again this period reinforces the uncertain times we face as we collectively work together to Build a Sustainable Lifestyle Capital in the face of a global pandemic.
At NPDC, we worked hard to overcome the challenges of last year’s pandemic lockdown, putting together a $20 million Getting Us Back On Our Feet stimulus package to help kick-start the local economy. With a forecast deficit of $5.4m, we tightened our belts, were prudent with our spending and finished the financial year with a $750,000 general rates surplus as the post-Covid economy rebounded. So today, while we continue to face the uncertainty of future lockdowns, we can look back and know the work we put in over the past 12 months leaves us well positioned to move forward and face the challenges ahead.
At the forefront was the work we did on our Long-Term Plan, setting out a $3 billion work programme to tackle those changes head-on. Almost 5,000 people took the time to share their views on our plan to Fix the Plumbing, including investing $248m on upgrading the three waters network and introducing water meters for every home.
We will implement our plan to Green our Place, which covers extending the Coastal Walkway from Bell Block inland to Waitara, as well as planting 34 hectares of urban forest over the next 20 years and investing in greener vehicles.
Finally we look to Pay it Forward for our children and grandchildren, through a $40m investment to help Sport Taranaki develop a multi-purpose sport and recreation hub.
Our Perpetual Investment Fund bounced back from the first effects of Covid to grow to more than $346.5m. This fund offsets your rates by around $9m each year and we were pleased the independent, international rating agency S&P Global gave NPDC a long-term rating of AA+, the highest possible rating for local government in New Zealand, reflecting our prudent financial management.
One of more significant achievements in the last year has been the establishment of a Māori ward for the New Plymouth District ahead of the 2022 and 2025 elections. We were also involved in successfully lobbying for a law change for Maori wards.
These achievements were on top of all the usual work as we oversee and manage an organisation with just over $3b worth of assets. This includes looking after 1,600 hectares of parks and open spaces, running Puke Ariki, and the Govett-Brewster Art Gallery, a zoo, sports stadiums, a theatre/events centre and amazing events like the TSB Festival of Lights. Our Summer at the Bowl season was also a fantastic success with 60,000 people rocking up to enjoy highly successful concerts, such as L.A.B and Six60.
In this time of global disruption we were pleased to be able to allocate $1.9m to underwrite the iconic WOMAD festival. This will ensure the Taranaki Arts Festival Trust can run the 2022 festival at its NZ home in the Bowl of Brooklands. We also signed a five-year hosting agreement with WOMAD’s parent company in the UK to enable this magical and popular event to be retained in Taranaki for the foreseeable future.
This continued work, along with the ongoing and outstanding contribution from our community over the past year gives us confidence we are well set for our future and on track with our goals for our Sustainable Lifestyle Capital in the years ahead.
Ngā mihi nui
Neil Holdom Craig StevensonNew Plymouth District Mayor NPDC Chief Executive
INTRODUCTION I ANNUAL REPORT 2020/21 3
Our Strategic FrameworkStrategic Framework
Place Tiakina
PeopleHe Tangata
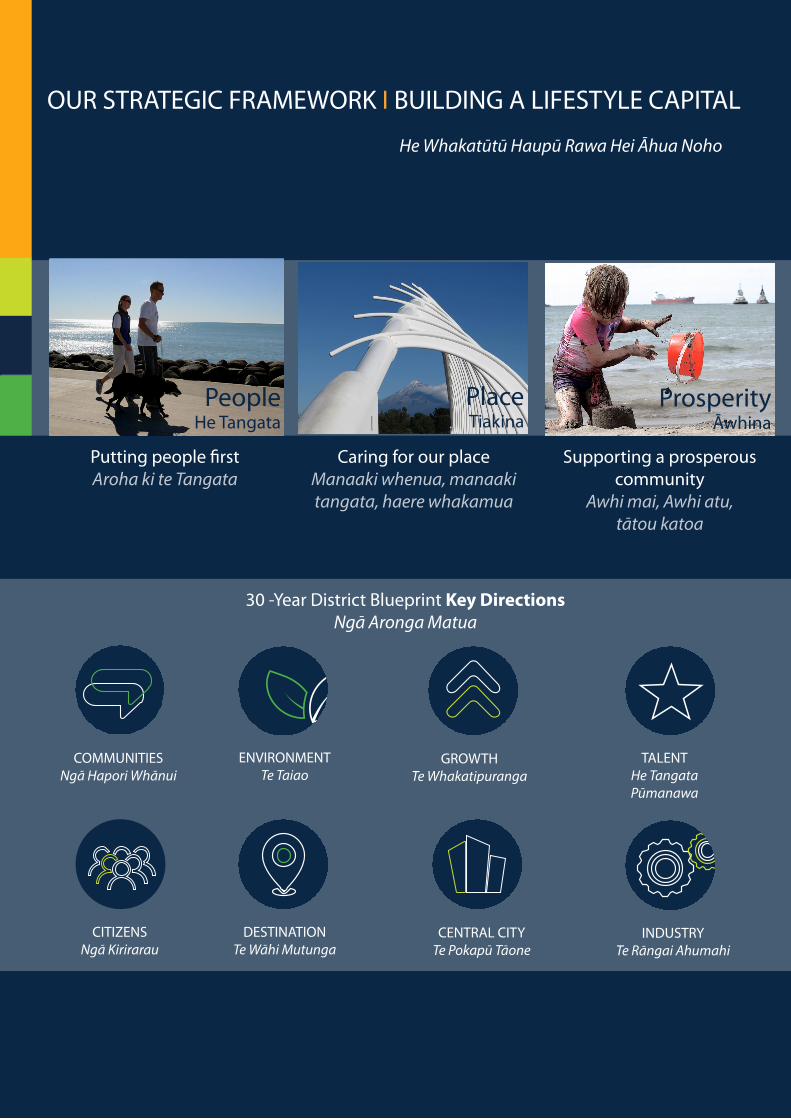
Caring for our place Manaaki whenua, manaaki tangata, haere whakamua
Supporting a prosperous community
Awhi mai, Awhi atu, tātou katoa
30 -Year District Blueprint Key DirectionsNgā Aronga Matua
COMMUNITIESNgā Hapori Whānui
ENVIRONMENT Te Taiao
GROWTHTe Whakatipuranga
TALENTHe Tangata Pūmanawa
CITIZENSNgā Kirirarau
DESTINATIONTe Wāhi Mutunga
CENTRAL CITYTe Pokapū Tāone
INDUSTRYTe Rāngai Ahumahi
OUR STRATEGIC FRAMEWORK I BUILDING A LIFESTYLE CAPITAL
He Whakatūtū Haupū Rawa Hei Āhua Noho
Putting people firstAroha ki te Tangata
ProsperityĀwhina
4 ANNUAL REPORT 2020/21 I INTRODUCTION
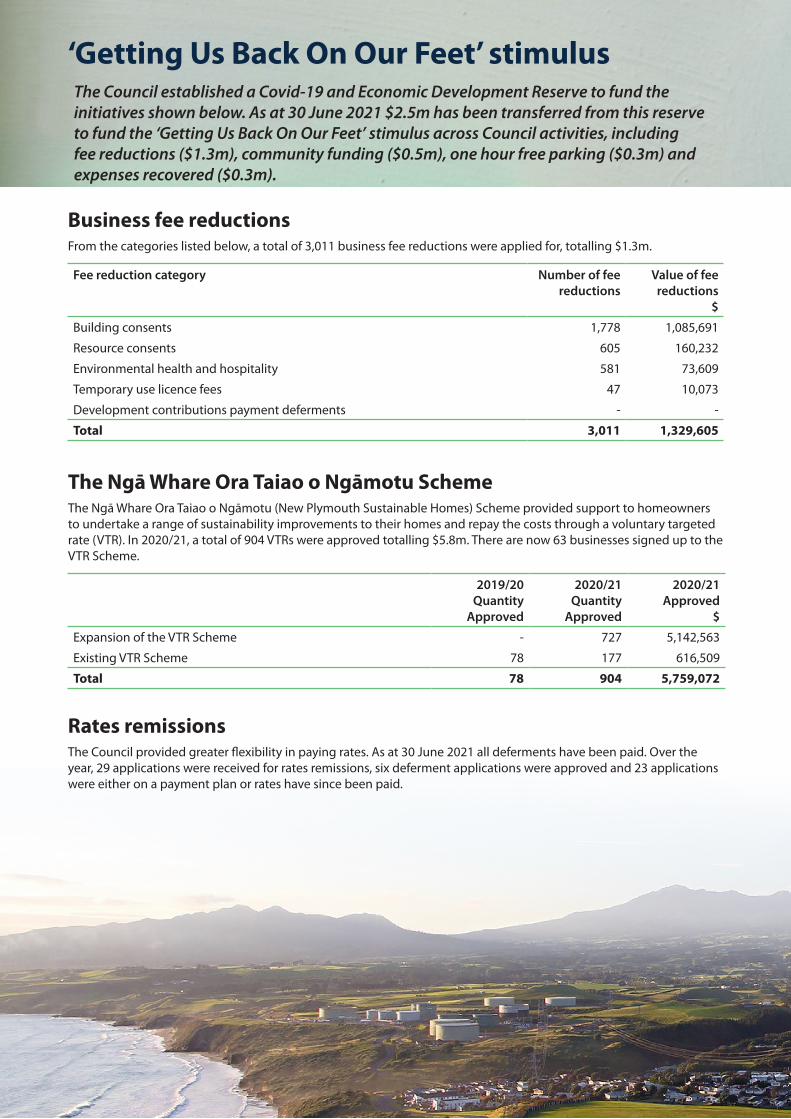
The Council established a Covid-19 and Economic Development Reserve to fund the initiatives shown below. As at 30 June 2021 $2.5m has been transferred from this reserve to fund the ‘Getting Us Back On Our Feet’ stimulus across Council activities, including fee reductions ($1.3m), community funding ($0.5m), one hour free parking ($0.3m) and expenses recovered ($0.3m).
Business fee reductionsFrom the categories listed below, a total of 3,011 business fee reductions were applied for, totalling $1.3m.
Fee reduction category Number of fee reductions
Value of fee reductions
$
Building consents 1,778 1,085,691
Resource consents 605 160,232
Environmental health and hospitality 581 73,609
Temporary use licence fees 47 10,073
Development contributions payment deferments - -
Total 3,011 1,329,605
‘Getting Us Back On Our Feet’ stimulus
The Ngā Whare Ora Taiao o Ngāmotu SchemeThe Ngā Whare Ora Taiao o Ngāmotu (New Plymouth Sustainable Homes) Scheme provided support to homeowners to undertake a range of sustainability improvements to their homes and repay the costs through a voluntary targeted rate (VTR). In 2020/21, a total of 904 VTRs were approved totalling $5.8m. There are now 63 businesses signed up to the VTR Scheme.
2019/20 Quantity
Approved
2020/21 Quantity
Approved
2020/21 Approved
$
Expansion of the VTR Scheme - 727 5,142,563
Existing VTR Scheme 78 177 616,509
Total 78 904 5,759,072
Rates remissionsThe Council provided greater flexibility in paying rates. As at 30 June 2021 all deferments have been paid. Over the year, 29 applications were received for rates remissions, six deferment applications were approved and 23 applications were either on a payment plan or rates have since been paid.
INTRODUCTION I ANNUAL REPORT 2020/21 5
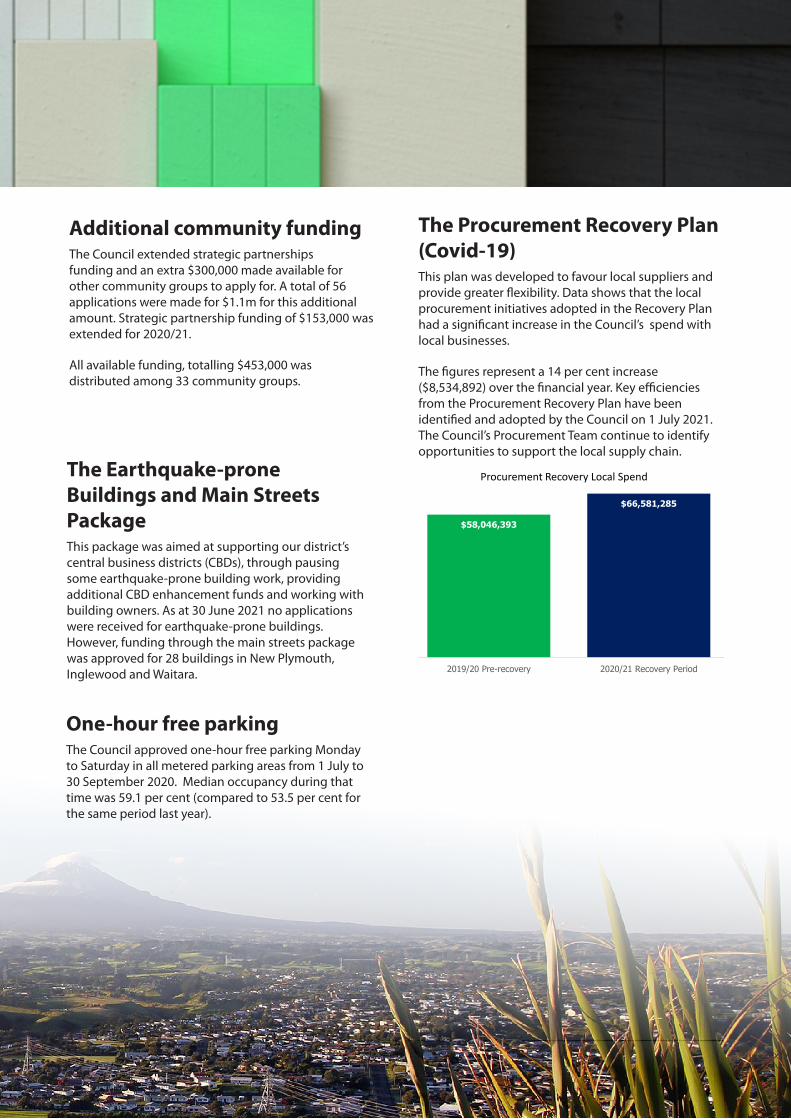
The Procurement Recovery Plan (Covid-19)This plan was developed to favour local suppliers and provide greater flexibility. Data shows that the local procurement initiatives adopted in the Recovery Plan had a significant increase in the Council’s spend with local businesses.
The figures represent a 14 per cent increase ($8,534,892) over the financial year. Key efficiencies from the Procurement Recovery Plan have been identified and adopted by the Council on 1 July 2021. The Council’s Procurement Team continue to identify opportunities to support the local supply chain.
Additional community fundingThe Council extended strategic partnerships funding and an extra $300,000 made available for other community groups to apply for. A total of 56 applications were made for $1.1m for this additional amount. Strategic partnership funding of $153,000 was extended for 2020/21.
All available funding, totalling $453,000 was distributed among 33 community groups.
The Earthquake-prone Buildings and Main Streets PackageThis package was aimed at supporting our district’s central business districts (CBDs), through pausing some earthquake-prone building work, providing additional CBD enhancement funds and working with building owners. As at 30 June 2021 no applications were received for earthquake-prone buildings. However, funding through the main streets package was approved for 28 buildings in New Plymouth, Inglewood and Waitara.
One-hour free parkingThe Council approved one-hour free parking Monday to Saturday in all metered parking areas from 1 July to 30 September 2020. Median occupancy during that time was 59.1 per cent (compared to 53.5 per cent for the same period last year).
$58,046,393
$66,581,285
2019/20 Pre-recovery 2020/21 Recovery Period
Procurement Recovery Local Spend
6 ANNUAL REPORT 2020/21 I INTRODUCTION
Our year in review
• Covid-19. The flow on effects of Covid-19 continued to impact on Council services. Moves to Alert Level 2 through the year had implications for a number of services with border closures and supply chain disruptions impacted across the Council.
• Sound financial management. The independent global rating agency Standard and Poor’s confirmed NPDC’s credit rating had been upgraded from AA to AA+, reflecting its sound financial management.
• Manaaki Urupā grants. A Manaaki Urupā Grants Scheme was adopted to help cover urupā maitenance costs.
• Citizens Awards. The Council honoured 11 local legends in the annual Citizens Awards.
• HMNZS Aotearoa. In April 2021, the Council hosted several civic functions to commemorate the inaugural visit of HMNZS Aotearoa to her home port (New Plymouth).
• Building consents. The Council’s building consents process moved online on 22 October 2020 allowing applicants to apply, pay and track their applications online from start to finish.
• Downtown Carpark. This carpark was closed on 19 December 2020 due to an earthquake risk assessment.
• Coastal Walkway. The Wind Wand pier got its first major repairs in 20 years. The Te Rewa Rewa bridge underwent a trial makeover to test products to better withstand the elements.
• Pukekura Park desilting. The desilting works for Pukekura Park lakes was completed in November 2020.
• Summer at the Bowl series. Three months of major events starting with L.A.B in January attracting 12,000 people, Synthony, Six60 and Crowded House followed.
• WOMAD. The Council secured a five year host city deal and agreed to a $2m underwrite to keep WOMAD at Brooklands Park. Unfortunately WOMAD was not held in 2021 due to the impacts of Covid-19.
• The Junction Zero waste hub. The hub marks its first birthday after a year with about 13,000 visitors and 34,000 items sold.
• Thermal Drying Facility. The Council received a confirmation of $37m grant from the government to replace the Thermal Drying Facility. The design and planning phases have been completed with work due to start in November 2021.
• Wastewater Treatment Plant. Work began to remove sludge from the lagoon.
• Inglewood’s drinking water. Main trunk main completed and continuing to renew pipes within the township.
• Carbon footprint. The Council’s carbon footprint has halved over the past 15 years through implementation energy saving measures.
• Consultation on LTP 2021-2031. Our consultation on our LTP 2021-2031 saw the largest ever response with 4,563 submissions.
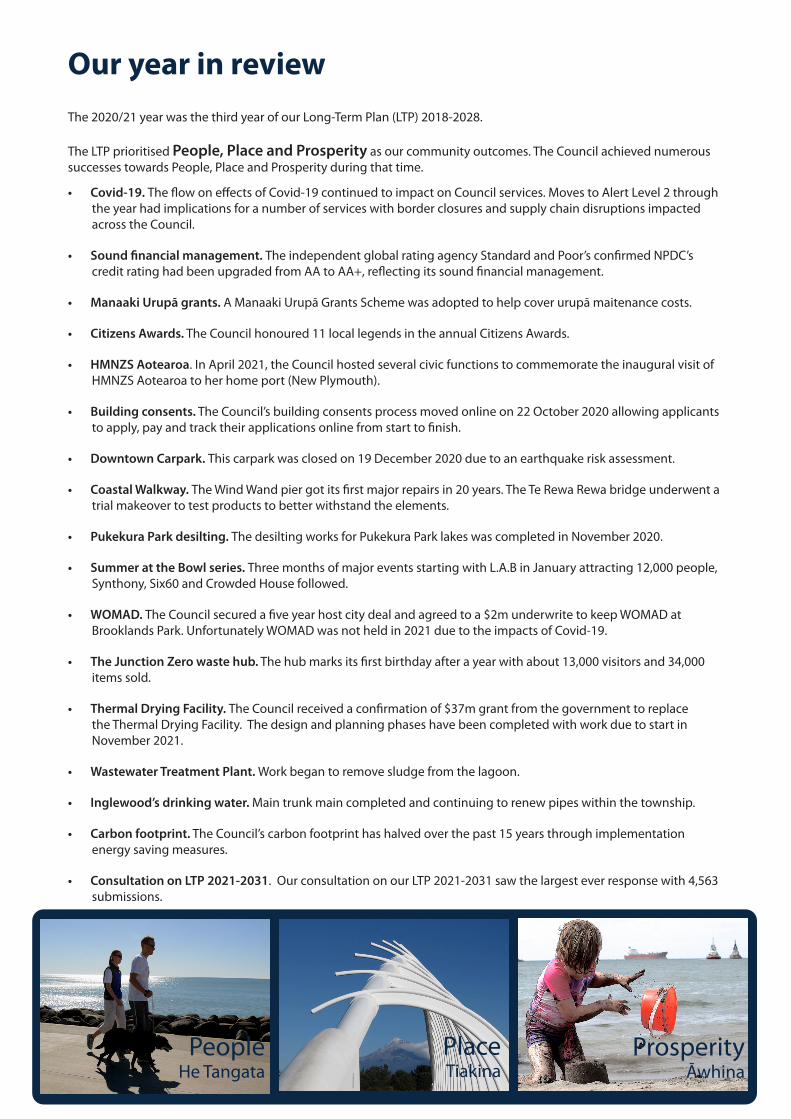
The 2020/21 year was the third year of our Long-Term Plan (LTP) 2018-2028.
The LTP prioritised People, Place and Prosperity as our community outcomes. The Council achieved numerous successes towards People, Place and Prosperity during that time.
PeopleHe Tangata
ProsperityĀwhina
Place Tiakina
INTRODUCTION I ANNUAL REPORT 2020/21 7
Our year in review
Working together with MāoriWe acknowledge as tangata whenua those hapū and iwi, who by ahikā (unbroken occupation), exercise mana whenua (protection, care and sustainable management of culturally important natural and physical resources) within the New Plymouth District.
Te Huinga Taumatua continued as a joint committee for mana whenua input into Council decision-making.
The Council consulted hapū and iwi for the purpose of the Resource Management Act 1991, and where there was mutual agreement between the Council, hapū and iwi exercised mana whenua. The Council acknowledges that specific iwi, hapū and whānau have historical and spiritual ties to sites and areas of cultural significance within Council’s boundaries.
Making a unique and valued contribution to the district, the Council continued to recognise the importance of providing opportunities for Māori to contribute to our decision-making processes.
Acknowledging their response and contribution during the initial Covid-19 response, iwi are now represented at all levels of the Civil Defence Emergency Management governance structure at both district and regional levels in Taranaki – a national first.
The eight iwi of Taranaki also sit on the Regional Leadership Team, which provides governance for the ongoing Council-led Covid-19 recovery response. With the development in 2020 of the Ngā Iwi o Taranaki Covid-19 Recovery Plan, together with the Taranaki 2050 and Tapuae Roa strategies, iwi are leading the achievement of key priorities, with the Council providing support.
The Council resolved in 2020 to establish a Māori Ward within the district ahead of the 2022 and 2025 triennial elections. We were involved in successfully lobbying for a law change for Maori wards and the Minister of Local Government announced the law change in February 2021 in the Council Chamber.
8 ANNUAL REPORT 2020/21 I INTRODUCTION
Projects 2020/21 update
Stormwater Management
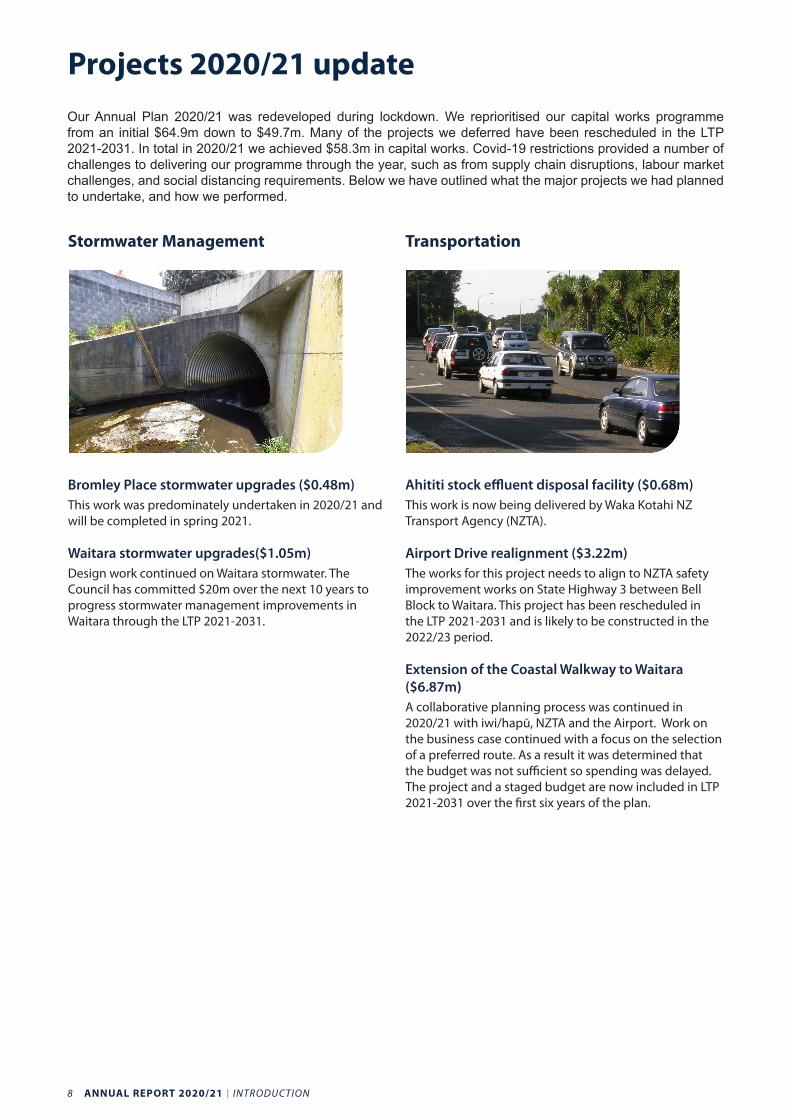
Bromley Place stormwater upgrades ($0.48m)This work was predominately undertaken in 2020/21 and will be completed in spring 2021.
Waitara stormwater upgrades($1.05m)Design work continued on Waitara stormwater. The Council has committed $20m over the next 10 years to progress stormwater management improvements in Waitara through the LTP 2021-2031.
Transportation
Ahititi stock effluent disposal facility ($0.68m)This work is now being delivered by Waka Kotahi NZ Transport Agency (NZTA).
Airport Drive realignment ($3.22m)The works for this project needs to align to NZTA safety improvement works on State Highway 3 between Bell Block to Waitara. This project has been rescheduled in the LTP 2021-2031 and is likely to be constructed in the 2022/23 period.
Extension of the Coastal Walkway to Waitara ($6.87m)A collaborative planning process was continued in 2020/21 with iwi/hapū, NZTA and the Airport. Work on the business case continued with a focus on the selection of a preferred route. As a result it was determined that the budget was not sufficient so spending was delayed. The project and a staged budget are now included in LTP 2021-2031 over the first six years of the plan.
Our Annual Plan 2020/21 was redeveloped during lockdown. We reprioritised our capital works programme from an initial $64.9m down to $49.7m. Many of the projects we deferred have been rescheduled in the LTP 2021-2031. In total in 2020/21 we achieved $58.3m in capital works. Covid-19 restrictions provided a number of challenges to delivering our programme through the year, such as from supply chain disruptions, labour market challenges, and social distancing requirements. Below we have outlined what the major projects we had planned to undertake, and how we performed.
INTRODUCTION I ANNUAL REPORT 2020/21 9
Projects 2020/21 update
Wastewater Management
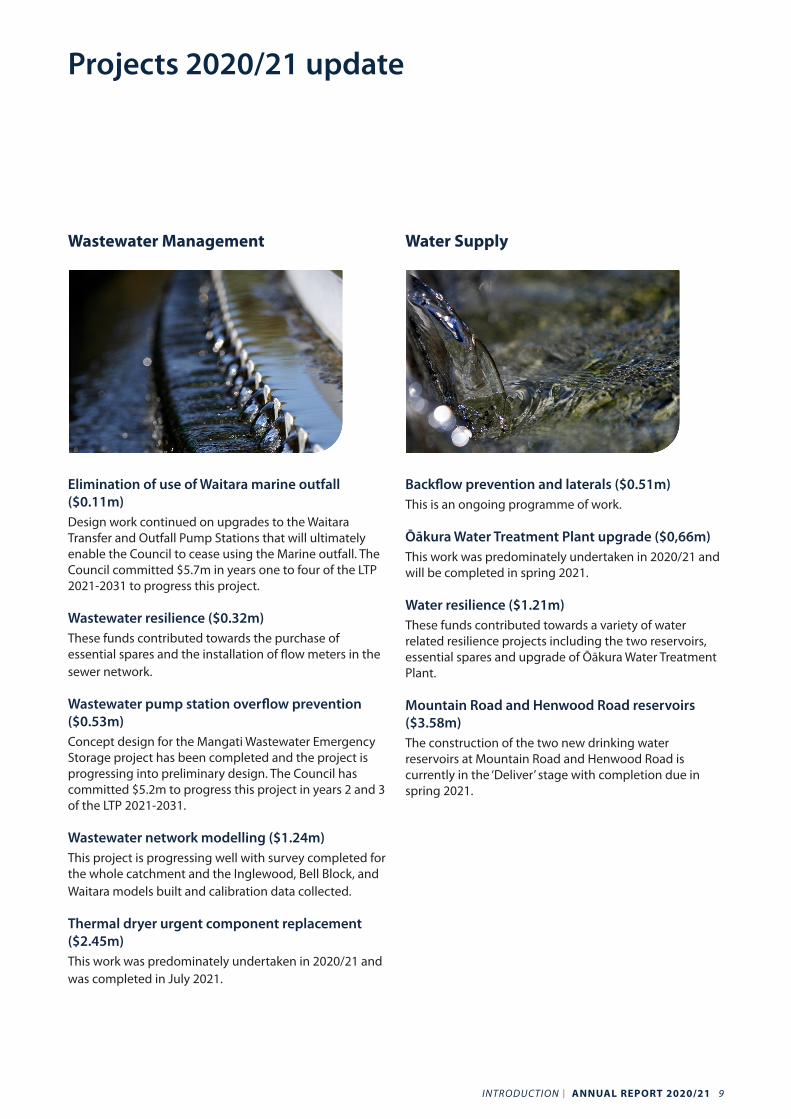
Elimination of use of Waitara marine outfall ($0.11m)Design work continued on upgrades to the Waitara Transfer and Outfall Pump Stations that will ultimately enable the Council to cease using the Marine outfall. The Council committed $5.7m in years one to four of the LTP 2021-2031 to progress this project.
Wastewater resilience ($0.32m)These funds contributed towards the purchase of essential spares and the installation of flow meters in the sewer network.
Wastewater pump station overflow prevention ($0.53m)Concept design for the Mangati Wastewater Emergency Storage project has been completed and the project is progressing into preliminary design. The Council has committed $5.2m to progress this project in years 2 and 3 of the LTP 2021-2031.
Wastewater network modelling ($1.24m)This project is progressing well with survey completed for the whole catchment and the Inglewood, Bell Block, and Waitara models built and calibration data collected.
Thermal dryer urgent component replacement ($2.45m)This work was predominately undertaken in 2020/21 and was completed in July 2021.
Water Supply
Backflow prevention and laterals ($0.51m)This is an ongoing programme of work.
Ōākura Water Treatment Plant upgrade ($0,66m)This work was predominately undertaken in 2020/21 and will be completed in spring 2021.
Water resilience ($1.21m)These funds contributed towards a variety of water related resilience projects including the two reservoirs, essential spares and upgrade of Ōākura Water Treatment Plant.
Mountain Road and Henwood Road reservoirs ($3.58m)The construction of the two new drinking water reservoirs at Mountain Road and Henwood Road is currently in the ‘Deliver’ stage with completion due in spring 2021.
10 ANNUAL REPORT 2020/21 I INTRODUCTION
Financial summaryOverall results at a glanceThe Council recorded a surplus for the year of $49.8m compared to a budget loss of $10.4m. The primary driver of the variance to budget are the $50.8m in gains on the Perpetual Investment Fund (PIF) investment during the year.
PIF investmentThe PIF finished the year up $54.2m to $346.5m after payment of releases of $9.1m for the year. Since inception the PIF has paid $230.6m in release payments to the Council and achieved an annual return of 7.3 per cent per annum.
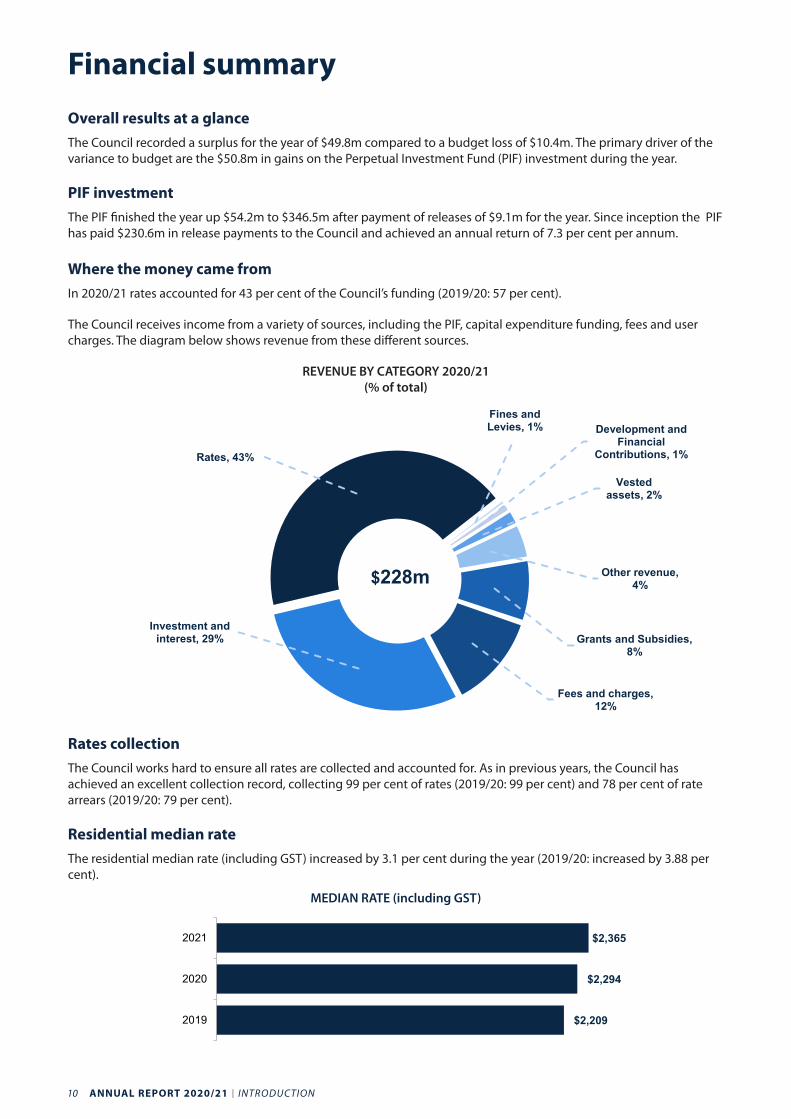
Where the money came fromIn 2020/21 rates accounted for 43 per cent of the Council’s funding (2019/20: 57 per cent).
The Council receives income from a variety of sources, including the PIF, capital expenditure funding, fees and user charges. The diagram below shows revenue from these different sources.
REVENUE BY CATEGORY 2020/21 (% of total)
Fines and Levies, 1% Development and
Financial Contributions, 1%
Vested assets, 2%
Other revenue, 4%
Grants and Subsidies, 8%
Fees and charges, 12%
Investment and interest, 29%
Rates, 43%
$228m
Rates collectionThe Council works hard to ensure all rates are collected and accounted for. As in previous years, the Council has achieved an excellent collection record, collecting 99 per cent of rates (2019/20: 99 per cent) and 78 per cent of rate arrears (2019/20: 79 per cent).
Residential median rateThe residential median rate (including GST) increased by 3.1 per cent during the year (2019/20: increased by 3.88 per cent).
MEDIAN RATE (including GST)
$2,209
$2,294
$2,365
2019
2020
2021
INTRODUCTION I ANNUAL REPORT 2020/21 11
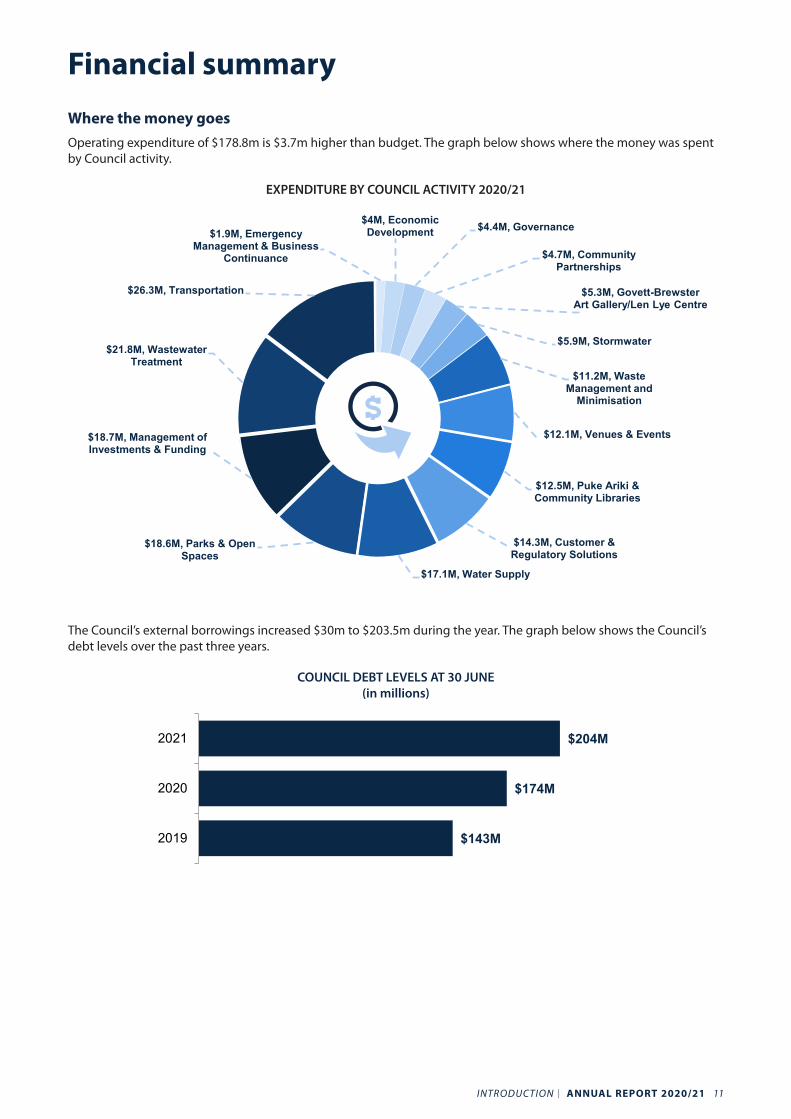
Financial summaryWhere the money goesOperating expenditure of $178.8m is $3.7m higher than budget. The graph below shows where the money was spent by Council activity.
EXPENDITURE BY COUNCIL ACTIVITY 2020/21
$1.9M, Emergency Management & Business
Continuance
$4M, Economic Development $4.4M, Governance
$4.7M, Community Partnerships
$5.3M, Govett-Brewster Art Gallery/Len Lye Centre
$5.9M, Stormwater
$11.2M, Waste Management and
Minimisation
$12.1M, Venues & Events
$12.5M, Puke Ariki & Community Libraries
$14.3M, Customer & Regulatory Solutions
$17.1M, Water Supply
$18.6M, Parks & Open Spaces
$18.7M, Management of Investments & Funding
$21.8M, Wastewater Treatment
$26.3M, Transportation
The Council’s external borrowings increased $30m to $203.5m during the year. The graph below shows the Council’s debt levels over the past three years.
COUNCIL DEBT LEVELS AT 30 JUNE(in millions)
$143M
$174M
$204M
2019
2020
2021
12 ANNUAL REPORT 2020/21 I INTRODUCTION
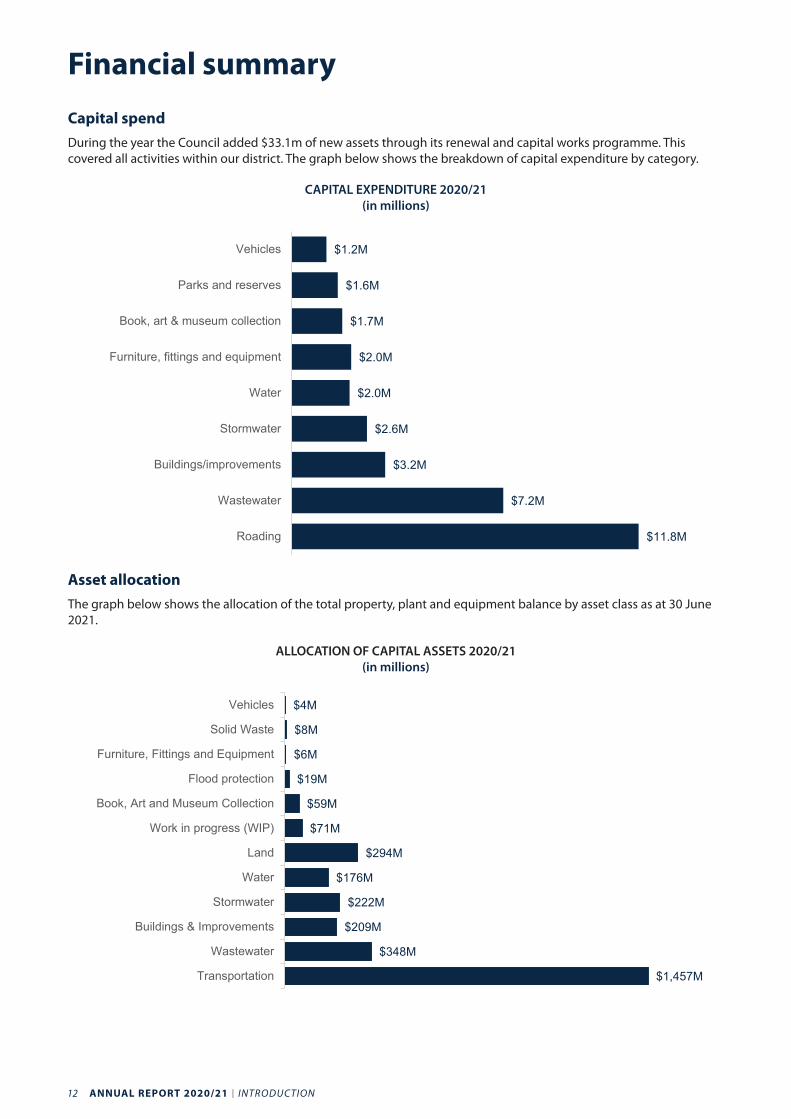
Capital spendDuring the year the Council added $33.1m of new assets through its renewal and capital works programme. This covered all activities within our district. The graph below shows the breakdown of capital expenditure by category.
CAPITAL EXPENDITURE 2020/21 (in millions)
$11.8M
$7.2M
$3.2M
$2.6M
$2.0M
$2.0M
$1.7M
$1.6M
$1.2M
Roading
Wastewater
Buildings/improvements
Stormwater
Water
Furniture, fittings and equipment
Book, art & museum collection
Parks and reserves
Vehicles
Asset allocationThe graph below shows the allocation of the total property, plant and equipment balance by asset class as at 30 June 2021.
ALLOCATION OF CAPITAL ASSETS 2020/21 (in millions)
$4M
$8M
$6M
$19M
$59M
$71M
$294M
$176M
$222M
$209M
$348M
$1,457M
Vehicles
Solid Waste
Furniture, Fittings and Equipment
Flood protection
Book, Art and Museum Collection
Work in progress (WIP)
Land
Water
Stormwater
Buildings & Improvements
Wastewater
Transportation
Financial summary
INTRODUCTION I ANNUAL REPORT 2020/21 13
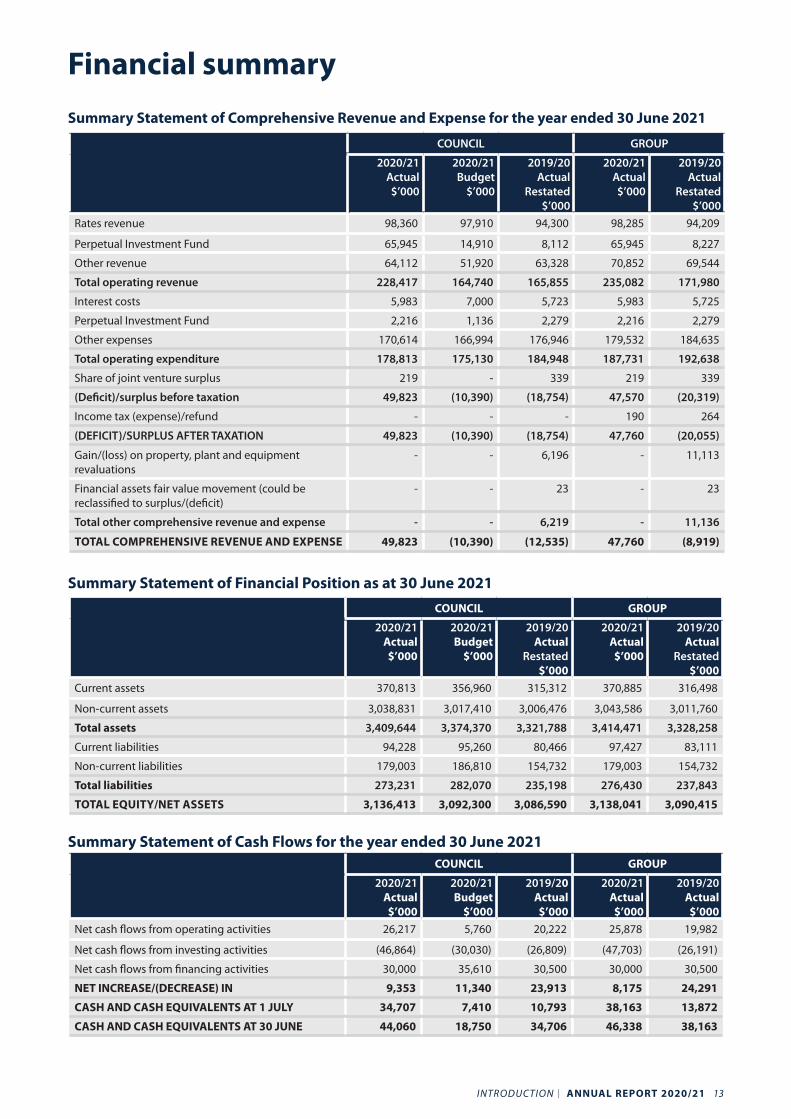
Summary Statement of Comprehensive Revenue and Expense for the year ended 30 June 2021
COUNCIL GROUP
2020/21 Actual $’000
2020/21 Budget
$’000
2019/20 Actual
Restated $’000
2020/21 Actual $’000
2019/20 Actual
Restated $’000
Rates revenue 98,360 97,910 94,300 98,285 94,209
Perpetual Investment Fund 65,945 14,910 8,112 65,945 8,227
Other revenue 64,112 51,920 63,328 70,852 69,544
Total operating revenue 228,417 164,740 165,855 235,082 171,980
Interest costs 5,983 7,000 5,723 5,983 5,725
Perpetual Investment Fund 2,216 1,136 2,279 2,216 2,279
Other expenses 170,614 166,994 176,946 179,532 184,635
Total operating expenditure 178,813 175,130 184,948 187,731 192,638
Share of joint venture surplus 219 - 339 219 339
(Deficit)/surplus before taxation 49,823 (10,390) (18,754) 47,570 (20,319)
Income tax (expense)/refund - - - 190 264
(DEFICIT)/SURPLUS AFTER TAXATION 49,823 (10,390) (18,754) 47,760 (20,055)
Gain/(loss) on property, plant and equipment revaluations
- - 6,196 - 11,113
Financial assets fair value movement (could be reclassified to surplus/(deficit)
- - 23 - 23
Total other comprehensive revenue and expense - - 6,219 - 11,136
TOTAL COMPREHENSIVE REVENUE AND EXPENSE 49,823 (10,390) (12,535) 47,760 (8,919)
Summary Statement of Financial Position as at 30 June 2021
COUNCIL GROUP
2020/21 Actual $’000
2020/21 Budget
$’000
2019/20 Actual
Restated $’000
2020/21 Actual $’000
2019/20 Actual
Restated $’000
Current assets 370,813 356,960 315,312 370,885 316,498
Non-current assets 3,038,831 3,017,410 3,006,476 3,043,586 3,011,760
Total assets 3,409,644 3,374,370 3,321,788 3,414,471 3,328,258
Current liabilities 94,228 95,260 80,466 97,427 83,111
Non-current liabilities 179,003 186,810 154,732 179,003 154,732
Total liabilities 273,231 282,070 235,198 276,430 237,843
TOTAL EQUITY/NET ASSETS 3,136,413 3,092,300 3,086,590 3,138,041 3,090,415
Summary Statement of Cash Flows for the year ended 30 June 2021COUNCIL GROUP
2020/21 Actual $’000
2020/21 Budget
$’000
2019/20 Actual $’000
2020/21 Actual $’000
2019/20 Actual $’000
Net cash flows from operating activities 26,217 5,760 20,222 25,878 19,982
Net cash flows from investing activities (46,864) (30,030) (26,809) (47,703) (26,191)
Net cash flows from financing activities 30,000 35,610 30,500 30,000 30,500
NET INCREASE/(DECREASE) IN 9,353 11,340 23,913 8,175 24,291
CASH AND CASH EQUIVALENTS AT 1 JULY 34,707 7,410 10,793 38,163 13,872
CASH AND CASH EQUIVALENTS AT 30 JUNE 44,060 18,750 34,706 46,338 38,163
Financial summary

14 ANNUAL REPORT 2020/21 I INTRODUCTION

COUNCIL SERVICES I ANNUAL REPORT 2020/21 15
Council Services
16 ANNUAL REPORT 2020/21 I COUNCIL SERVICES
4
6
4
1
3
4
2
4
5
5
4
1
2
5
8
1
1
1
2
1
2
2
3
3
3
1
1
3
0 1 2 3 4 5 6 7 8 9 10 11
Community Partnerships
Customer and Regulatory Solutions
Economic Development
Emergency Management & Business Continuance
Flood Protection and Control Works
Governance
Govett-Brewster Art Gallery/Len Lye Centre
Management of Investments and Funding
Parks and Open Spaces
Puke Ariki and Community Libraries
Stormwater Management
Transportation
Venues and Events
Waste Management and Minimisation
Wastewater Treatment
Water Supply
Number of performance measures
Achieved Within 2% of target Target not met
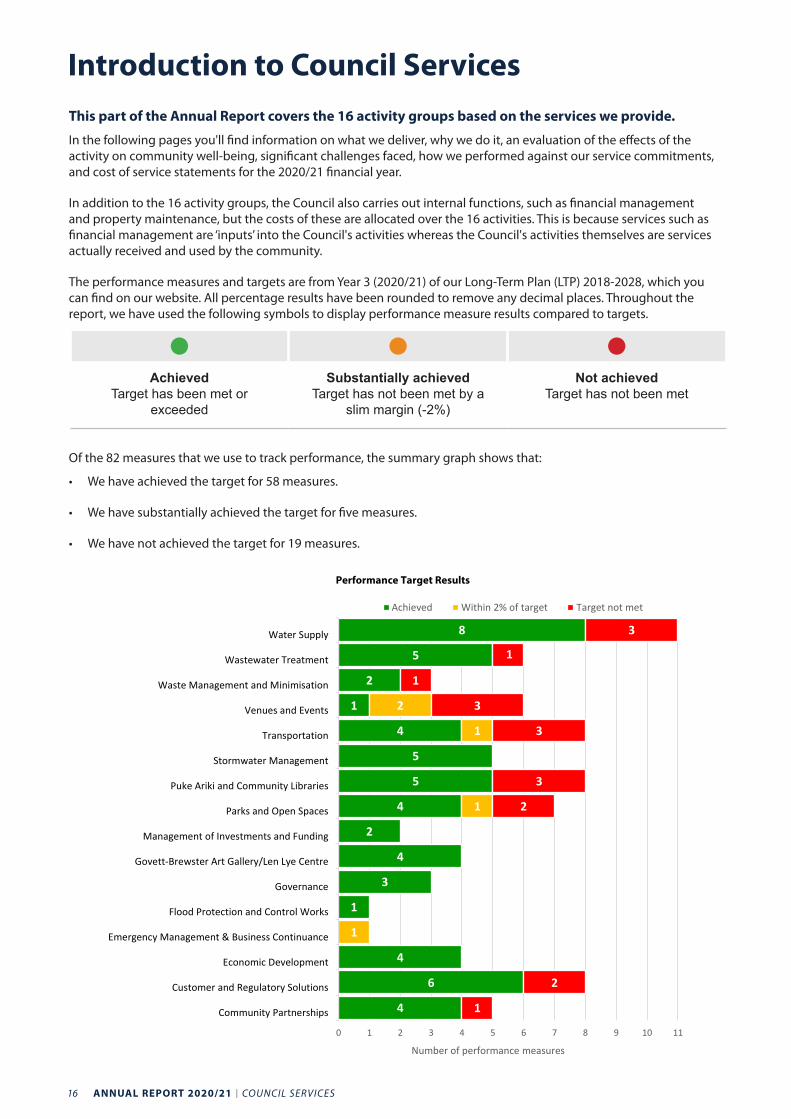
Performance Target Results
Introduction to Council ServicesThis part of the Annual Report covers the 16 activity groups based on the services we provide.
In the following pages you'll find information on what we deliver, why we do it, an evaluation of the effects of the activity on community well-being, significant challenges faced, how we performed against our service commitments, and cost of service statements for the 2020/21 financial year.
In addition to the 16 activity groups, the Council also carries out internal functions, such as financial management and property maintenance, but the costs of these are allocated over the 16 activities. This is because services such as financial management are ‘inputs’ into the Council's activities whereas the Council's activities themselves are services actually received and used by the community.
The performance measures and targets are from Year 3 (2020/21) of our Long-Term Plan (LTP) 2018-2028, which you can find on our website. All percentage results have been rounded to remove any decimal places. Throughout the report, we have used the following symbols to display performance measure results compared to targets.
Achieved
Target has been met or exceeded
Substantially achievedTarget has not been met by a
slim margin (-2%)
Not achievedTarget has not been met
Of the 82 measures that we use to track performance, the summary graph shows that:
• We have achieved the target for 58 measures.
• We have substantially achieved the target for five measures.
• We have not achieved the target for 19 measures.
COUNCIL SERVICES I ANNUAL REPORT 2020/21 17
Introduction to Council ServicesCommunity satisfaction survey performance measures
Change of service providerThe LTP 2018-2028 and the Annual Plan 2020/21 stated that the Council would use the National Research Bureau (NRB) Communitrak survey results to assess the satisfaction of the community for various Council services as part of our key performance indicators (KPIs).
The NRB Communitrak survey was a statistically valid representative sample of the New Plymouth District. NRB informed the Council in early 2021 that it would be unable to undertake the Communitrak Survey on behalf of the Council for the 2020/21 financial year.
The Council therefore commissioned Research First to undertake a different, but still statistically valid representative sample instead. Both NRB and Research First use statistical sampling techniques to ensure the survey is representative of the community (within a margin of error). The Council is satisfied that the change to Research First does not constitute a significant change to the approach in measuring the community’s satisfaction with Council services for these KPIs.
Three performance indicators measure the community’s satisfaction with Council services against a peer group average (Community Partnerships, Customer and Regulatory Solutions, and Govett-Brewster Art Gallery/Len Lye Centre). The Research First survey has no peer group average for two of these services and the other has a smaller selection of comparators. This may have a greater impact on results, and should therefore be treated with more caution as to whether or not the Council has achieved the stated performance measure. The Council has included the 2019/20 NRB Communitrak survey peer group results as a further comparator for these three KPIs.
About the resultsThe Research First survey takes a sample of just over 500 people based on the five community areas used for New Plymouth District. The survey is conducted in a way that provides results which have a margin of error of plus or minus 4.3 per cent at the 95 per cent confidence interval.
The satisfaction levels for the NRB and Research First surveys include the removal of those people who did not have a view on satisfaction or dissatisfaction or simply did not know due to not using the facility or service. Removing the 'don’t knows' from the calculation enables better comparison between our activities, allowing for more informed Council decision-making.
In-house surveys
The Council also uses a number of in-house surveys for some KPIs. These are used to find the views of users of particular services. The Council does not use sampling methodologiers for these surveys that are statistically valid.
18 ANNUAL REPORT 2020/21 I COUNCIL SERVICES
Community Outcomes
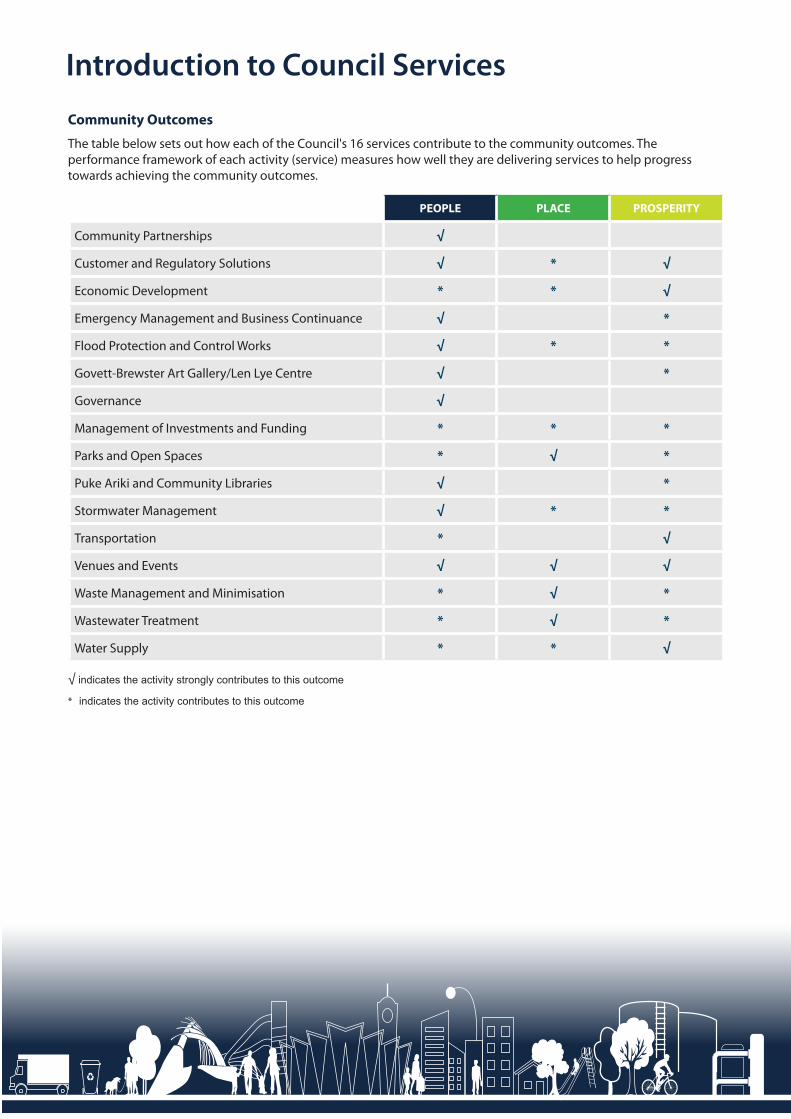
The table below sets out how each of the Council's 16 services contribute to the community outcomes. The performance framework of each activity (service) measures how well they are delivering services to help progress towards achieving the community outcomes.
PEOPLE PLACE PROSPERITY
Community Partnerships √
Customer and Regulatory Solutions √ * √
Economic Development * * √
Emergency Management and Business Continuance √ *
Flood Protection and Control Works √ * *
Govett-Brewster Art Gallery/Len Lye Centre √ *
Governance √
Management of Investments and Funding * * *
Parks and Open Spaces * √ *
Puke Ariki and Community Libraries √ *
Stormwater Management √ * *
Transportation * √
Venues and Events √ √ √
Waste Management and Minimisation * √ *
Wastewater Treatment * √ *
Water Supply * * √
√ indicates the activity strongly contributes to this outcome
* indicates the activity contributes to this outcome
Introduction to Council Services
COUNCIL SERVICES I ANNUAL REPORT 2020/21 19
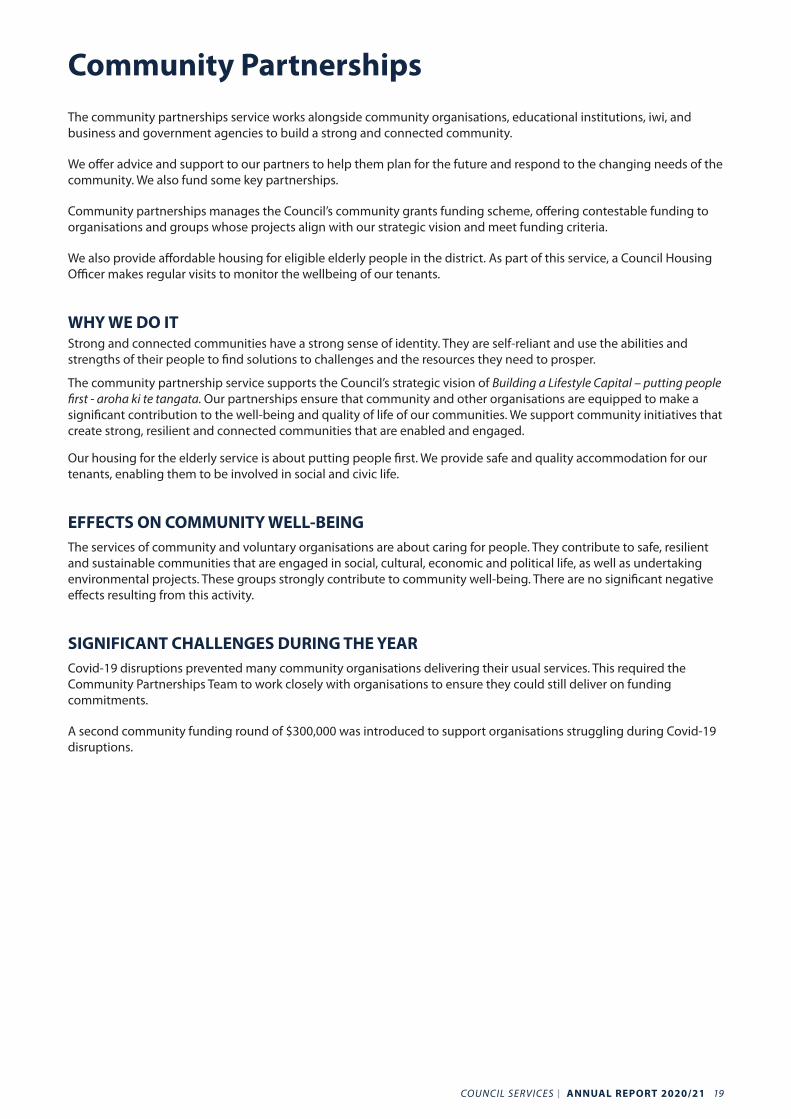
The community partnerships service works alongside community organisations, educational institutions, iwi, and business and government agencies to build a strong and connected community.
We offer advice and support to our partners to help them plan for the future and respond to the changing needs of the community. We also fund some key partnerships.
Community partnerships manages the Council’s community grants funding scheme, offering contestable funding to organisations and groups whose projects align with our strategic vision and meet funding criteria.
We also provide affordable housing for eligible elderly people in the district. As part of this service, a Council Housing Officer makes regular visits to monitor the wellbeing of our tenants.
WHY WE DO ITStrong and connected communities have a strong sense of identity. They are self-reliant and use the abilities and strengths of their people to find solutions to challenges and the resources they need to prosper.
The community partnership service supports the Council’s strategic vision of Building a Lifestyle Capital – putting people first - aroha ki te tangata. Our partnerships ensure that community and other organisations are equipped to make a significant contribution to the well-being and quality of life of our communities. We support community initiatives that create strong, resilient and connected communities that are enabled and engaged.
Our housing for the elderly service is about putting people first. We provide safe and quality accommodation for our tenants, enabling them to be involved in social and civic life.
EFFECTS ON COMMUNITY WELL-BEINGThe services of community and voluntary organisations are about caring for people. They contribute to safe, resilient and sustainable communities that are engaged in social, cultural, economic and political life, as well as undertaking environmental projects. These groups strongly contribute to community well-being. There are no significant negative effects resulting from this activity.
SIGNIFICANT CHALLENGES DURING THE YEARCovid-19 disruptions prevented many community organisations delivering their usual services. This required the Community Partnerships Team to work closely with organisations to ensure they could still deliver on funding commitments.
A second community funding round of $300,000 was introduced to support organisations struggling during Covid-19 disruptions.
Community Partnerships
20 ANNUAL REPORT 2020/21 I COUNCIL SERVICES
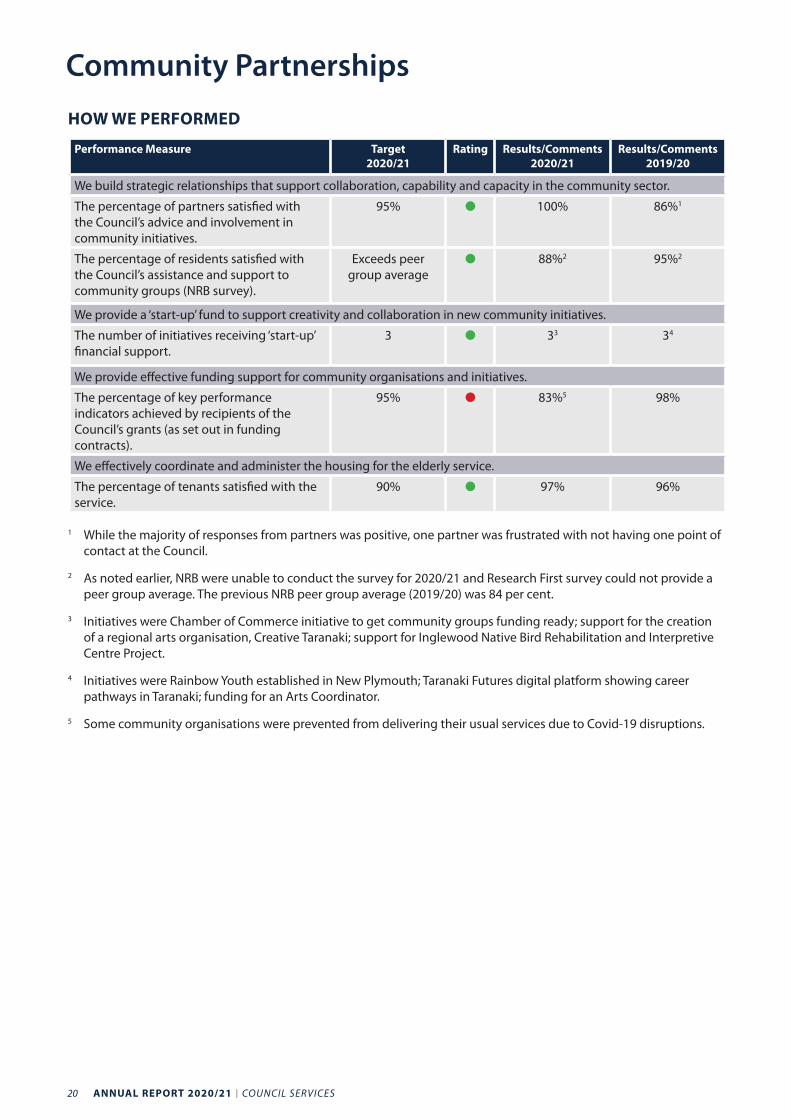
HOW WE PERFORMED
Performance Measure Target2020/21
Rating Results/Comments2020/21
Results/Comments2019/20
We build strategic relationships that support collaboration, capability and capacity in the community sector.
The percentage of partners satisfied with the Council’s advice and involvement in community initiatives.
95% 100% 86%1
The percentage of residents satisfied with the Council’s assistance and support to community groups (NRB survey).
Exceeds peer group average
88%2 95%2
We provide a ‘start-up’ fund to support creativity and collaboration in new community initiatives.
The number of initiatives receiving ‘start-up’ financial support.
3 33 34
We provide effective funding support for community organisations and initiatives.
The percentage of key performance indicators achieved by recipients of the Council’s grants (as set out in funding contracts).
95% 83%5 98%
We effectively coordinate and administer the housing for the elderly service.
The percentage of tenants satisfied with the service.
90% 97% 96%
1 While the majority of responses from partners was positive, one partner was frustrated with not having one point of contact at the Council.
2 As noted earlier, NRB were unable to conduct the survey for 2020/21 and Research First survey could not provide a peer group average. The previous NRB peer group average (2019/20) was 84 per cent.
3 Initiatives were Chamber of Commerce initiative to get community groups funding ready; support for the creation of a regional arts organisation, Creative Taranaki; support for Inglewood Native Bird Rehabilitation and Interpretive Centre Project.
4 Initiatives were Rainbow Youth established in New Plymouth; Taranaki Futures digital platform showing career pathways in Taranaki; funding for an Arts Coordinator.
5 Some community organisations were prevented from delivering their usual services due to Covid-19 disruptions.
Community Partnerships
COUNCIL SERVICES I ANNUAL REPORT 2020/21 21
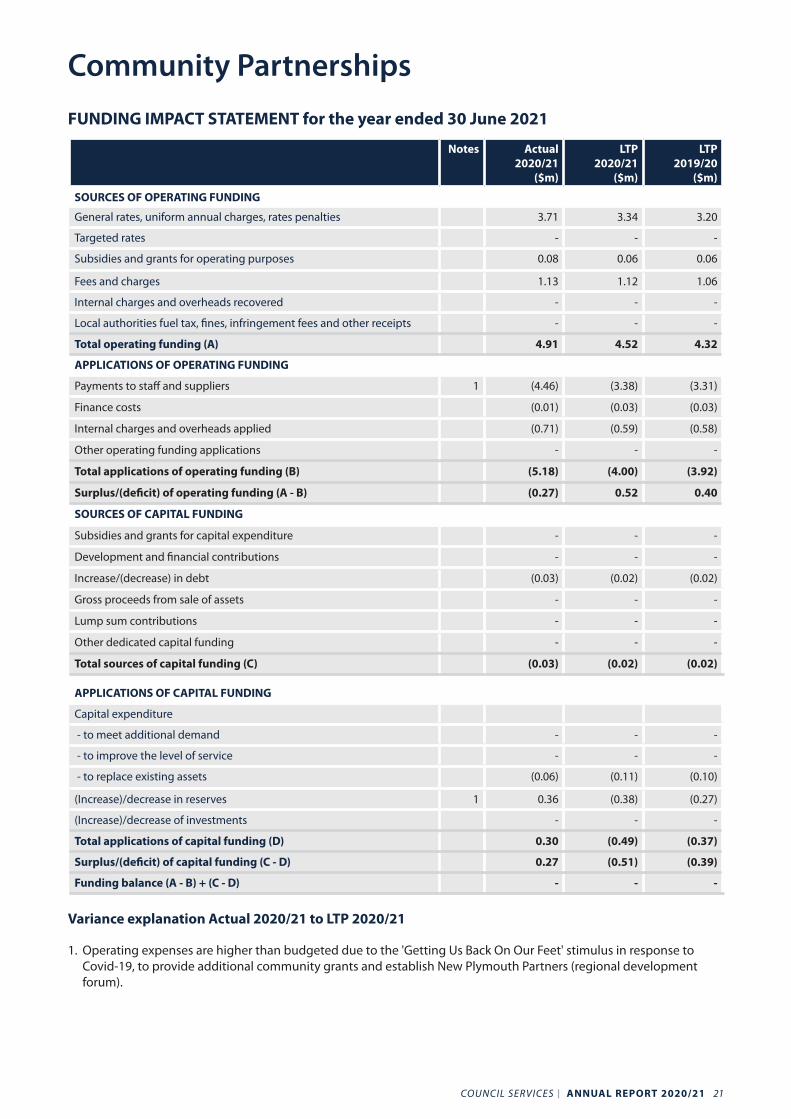
FUNDING IMPACT STATEMENT for the year ended 30 June 2021
Notes Actual2020/21
($m)
LTP 2020/21
($m)
LTP 2019/20
($m)
SOURCES OF OPERATING FUNDING
General rates, uniform annual charges, rates penalties 3.71 3.34 3.20
Targeted rates - - -
Subsidies and grants for operating purposes 0.08 0.06 0.06
Fees and charges 1.13 1.12 1.06
Internal charges and overheads recovered - - -
Local authorities fuel tax, fines, infringement fees and other receipts - - -
Total operating funding (A) 4.91 4.52 4.32
APPLICATIONS OF OPERATING FUNDING
Payments to staff and suppliers 1 (4.46) (3.38) (3.31)
Finance costs (0.01) (0.03) (0.03)
Internal charges and overheads applied (0.71) (0.59) (0.58)
Other operating funding applications - - -
Total applications of operating funding (B) (5.18) (4.00) (3.92)
Surplus/(deficit) of operating funding (A - B) (0.27) 0.52 0.40
SOURCES OF CAPITAL FUNDING
Subsidies and grants for capital expenditure - - -
Development and financial contributions - - -
Increase/(decrease) in debt (0.03) (0.02) (0.02)
Gross proceeds from sale of assets - - -
Lump sum contributions - - -
Other dedicated capital funding - - -
Total sources of capital funding (C) (0.03) (0.02) (0.02)
APPLICATIONS OF CAPITAL FUNDING
Capital expenditure
- to meet additional demand - - -
- to improve the level of service - - -
- to replace existing assets (0.06) (0.11) (0.10)
(Increase)/decrease in reserves 1 0.36 (0.38) (0.27)
(Increase)/decrease of investments - - -
Total applications of capital funding (D) 0.30 (0.49) (0.37)
Surplus/(deficit) of capital funding (C - D) 0.27 (0.51) (0.39)
Funding balance (A - B) + (C - D) - - -
Variance explanation Actual 2020/21 to LTP 2020/21
1. Operating expenses are higher than budgeted due to the 'Getting Us Back On Our Feet' stimulus in response to Covid-19, to provide additional community grants and establish New Plymouth Partners (regional development forum).
Community Partnerships
22 ANNUAL REPORT 2020/21 I COUNCIL SERVICES
The first point of contact for the Council’s regulatory services is our Customer Services Team, who assist customers by telephone, email or in person at the Civic Centre. Enquiries that need further input are recorded as service requests and forwarded to the relevant teams in the organisation.
Our regulatory teams process building, land use and subdivision consents, food, alcohol, health and encroachment licences and issue dog licences. We monitor and enforce legislation and bylaws for all of these functions as well as parking control, and health and noise nuisances. We develop the District Plan and other policies that guide the future development of the district. We also provide case management for projects and events that require involvement of multiple Council teams.
WHY WE DO ITThe customer and regulatory solutions service plans for the future, supporting the Council’s strategic vision of Building a Lifestyle Capital – putting people first, supporting a prosperous community and caring for our place.
The customer and regulatory solutions service promotes putting people first - aroha ki te tangata . Enforcing environmental health legislation ensures businesses selling food and alcohol meet their public health obligations and that people can enjoy their lifestyle free of nuisance or risk. Animal control activities, including the regulation of dog ownership, ensures people and wildlife are protected from nuisance or injury caused by dogs and that owners are educated and informed about the way their animals should be managed. Enforcing parking regulations makes sure there is fair, safe and easy access to the city and its suburbs.
Our customer service teams make it easy to do business with us, again putting people first. People are our priority and we make sure our customers have access to the information and services they need.
Forward planning and regulation helps mitigate potential negative effects of growth and development and supports sustainable management of the district’s economic and environmental resources. Our work ensures there is adequate and appropriate land for residential, commercial, industrial and agricultural use and that buildings in the New Plymouth District are safe, healthy and durable. This contributes to supporting a prosperous community - awhi mai, awhi atu, tātou katoa.
Our district planning work, alongside our monitoring and enforcement activities, promotes caring for our place - manaaki whenua, manaaki tangata, haere whakamua.
EFFECTS ON COMMUNITY WELL-BEINGCustomer and Regulatory Solutions promotes the social, cultural, economic and environmental well-being of the community.
Social well-being is promoted through protecting people from negative harms, such as through alcohol and food regulation, and animal control. Social well-being is also promoted through the District Plan and resource consents by regulating development to provide a more livable environment.
Cultural well-being is promoted through the District Plan and resource consents to protect sites of cultural importance, such as heritage buildings and wāhi tapu.
Economic well-being is promoted through building consents and resource consents being issued in a timely manner, as well as through providing the community with assurances around food and alcohol regulation to promote trust in those services. Parking regulations ensure that parking in business areas promotes sufficient parking turnover to maximise customers.
Environmental well-being is promoted through the District Plan and resource consents by protecting areas of native bush on private property.
Potential negative effects are identified in the following table.
Customer and Regulatory Solutions
COUNCIL SERVICES I ANNUAL REPORT 2020/21 23
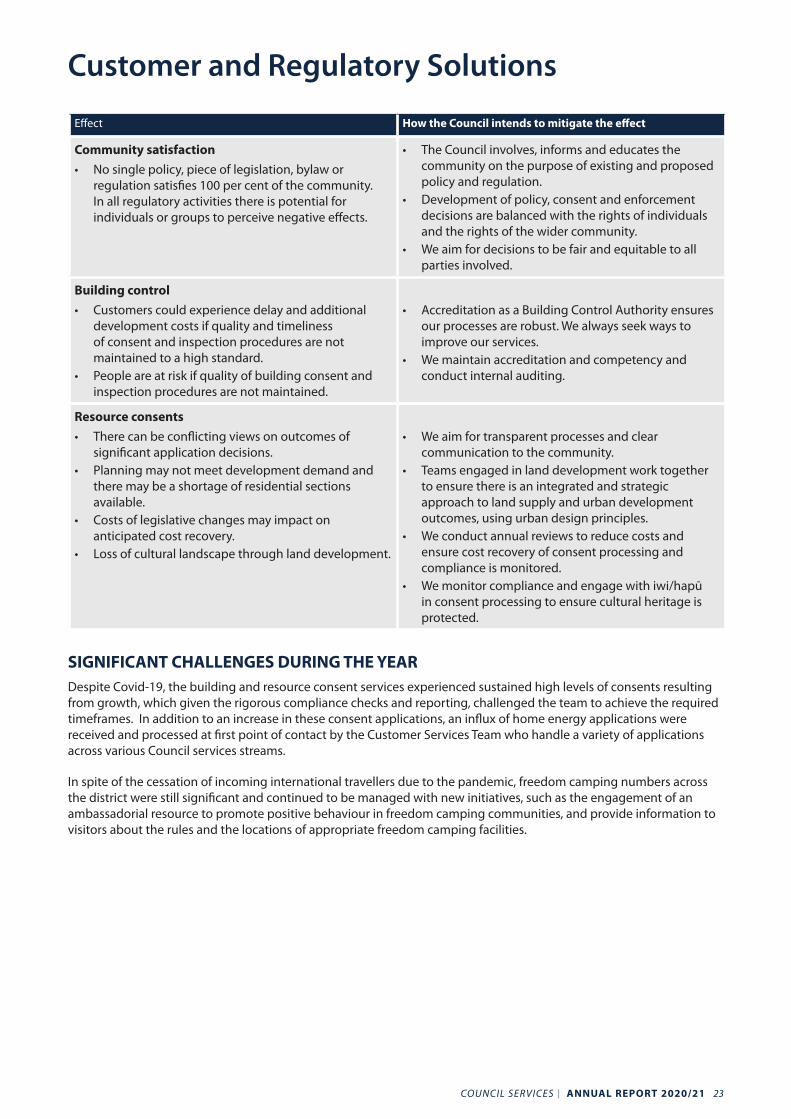
Effect How the Council intends to mitigate the effect
Community satisfaction• No single policy, piece of legislation, bylaw or
regulation satisfies 100 per cent of the community. In all regulatory activities there is potential for individuals or groups to perceive negative effects.
• The Council involves, informs and educates the community on the purpose of existing and proposed policy and regulation.
• Development of policy, consent and enforcement decisions are balanced with the rights of individuals and the rights of the wider community.
• We aim for decisions to be fair and equitable to all parties involved.
Building control • Customers could experience delay and additional
development costs if quality and timeliness of consent and inspection procedures are not maintained to a high standard.
• People are at risk if quality of building consent and inspection procedures are not maintained.
• Accreditation as a Building Control Authority ensures
our processes are robust. We always seek ways to improve our services.
• We maintain accreditation and competency and conduct internal auditing.
Resource consents• There can be conflicting views on outcomes of
significant application decisions.• Planning may not meet development demand and
there may be a shortage of residential sections available.
• Costs of legislative changes may impact on anticipated cost recovery.
• Loss of cultural landscape through land development.
• We aim for transparent processes and clear
communication to the community.• Teams engaged in land development work together
to ensure there is an integrated and strategic approach to land supply and urban development outcomes, using urban design principles.
• We conduct annual reviews to reduce costs and ensure cost recovery of consent processing and compliance is monitored.
• We monitor compliance and engage with iwi/hapū in consent processing to ensure cultural heritage is protected.
SIGNIFICANT CHALLENGES DURING THE YEARDespite Covid-19, the building and resource consent services experienced sustained high levels of consents resulting from growth, which given the rigorous compliance checks and reporting, challenged the team to achieve the required timeframes. In addition to an increase in these consent applications, an influx of home energy applications were received and processed at first point of contact by the Customer Services Team who handle a variety of applications across various Council services streams.
In spite of the cessation of incoming international travellers due to the pandemic, freedom camping numbers across the district were still significant and continued to be managed with new initiatives, such as the engagement of an ambassadorial resource to promote positive behaviour in freedom camping communities, and provide information to visitors about the rules and the locations of appropriate freedom camping facilities.
Customer and Regulatory Solutions
24 ANNUAL REPORT 2020/21 I COUNCIL SERVICES
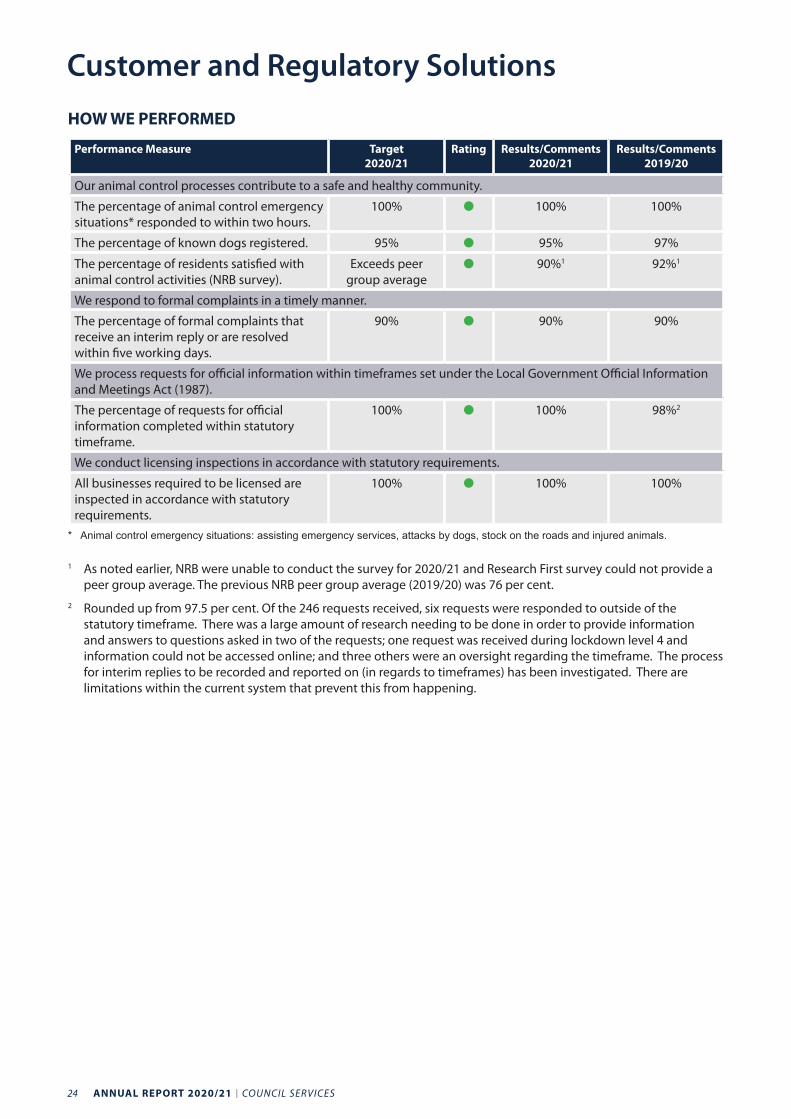
HOW WE PERFORMED
Performance Measure Target2020/21
Rating Results/Comments2020/21
Results/Comments2019/20
Our animal control processes contribute to a safe and healthy community.
The percentage of animal control emergency situations* responded to within two hours.
100% 100% 100%
The percentage of known dogs registered. 95% 95% 97%
The percentage of residents satisfied with animal control activities (NRB survey).
Exceeds peer group average
90%1 92%1
We respond to formal complaints in a timely manner.
The percentage of formal complaints that receive an interim reply or are resolved within five working days.
90% 90% 90%
We process requests for official information within timeframes set under the Local Government Official Information and Meetings Act (1987).
The percentage of requests for official information completed within statutory timeframe.
100% 100% 98%2
We conduct licensing inspections in accordance with statutory requirements.
All businesses required to be licensed are inspected in accordance with statutory requirements.
100% 100% 100%
* Animal control emergency situations: assisting emergency services, attacks by dogs, stock on the roads and injured animals.
1 As noted earlier, NRB were unable to conduct the survey for 2020/21 and Research First survey could not provide a peer group average. The previous NRB peer group average (2019/20) was 76 per cent.
2 Rounded up from 97.5 per cent. Of the 246 requests received, six requests were responded to outside of the statutory timeframe. There was a large amount of research needing to be done in order to provide information and answers to questions asked in two of the requests; one request was received during lockdown level 4 and information could not be accessed online; and three others were an oversight regarding the timeframe. The process for interim replies to be recorded and reported on (in regards to timeframes) has been investigated. There are limitations within the current system that prevent this from happening.
Customer and Regulatory Solutions
COUNCIL SERVICES I ANNUAL REPORT 2020/21 25
Performance Measure Target2020/21
Rating Results/Comments2020/21
Results/Comments2019/20
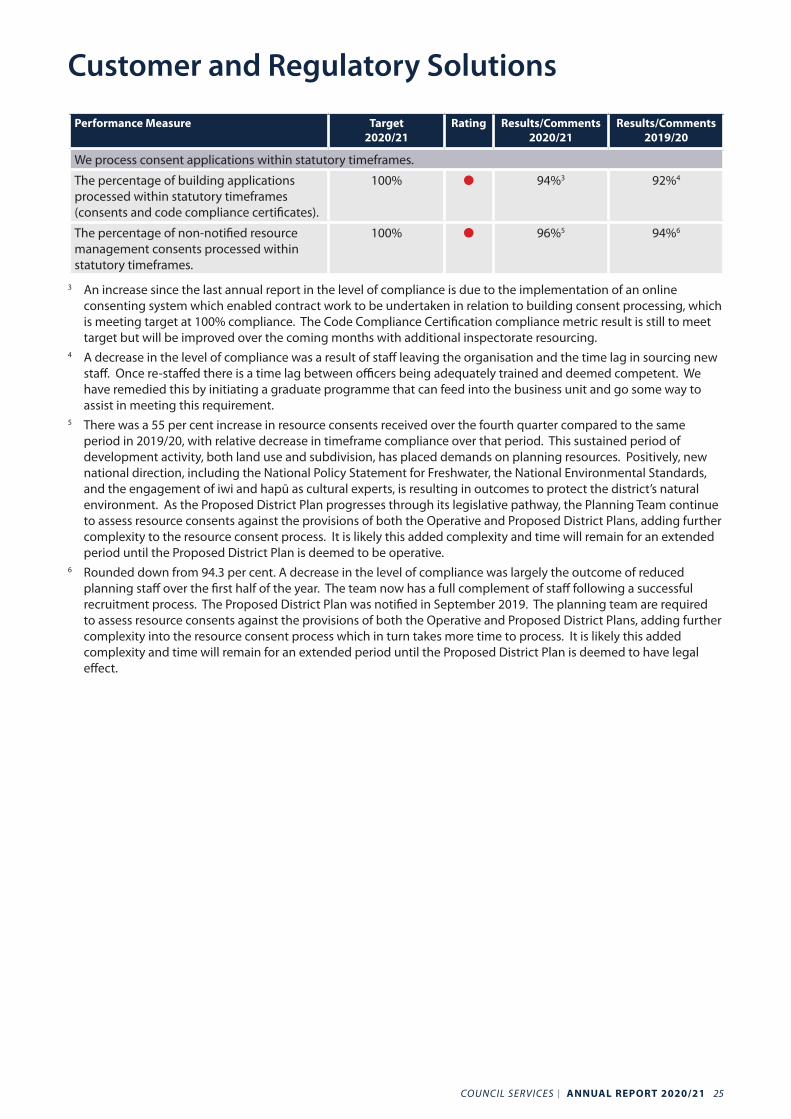
We process consent applications within statutory timeframes.
The percentage of building applications processed within statutory timeframes (consents and code compliance certificates).
100% 94%3 92%4
The percentage of non-notified resource management consents processed within statutory timeframes.
100% 96%5 94%6
3 An increase since the last annual report in the level of compliance is due to the implementation of an online consenting system which enabled contract work to be undertaken in relation to building consent processing, which is meeting target at 100% compliance. The Code Compliance Certification compliance metric result is still to meet target but will be improved over the coming months with additional inspectorate resourcing.
4 A decrease in the level of compliance was a result of staff leaving the organisation and the time lag in sourcing new staff. Once re-staffed there is a time lag between officers being adequately trained and deemed competent. We have remedied this by initiating a graduate programme that can feed into the business unit and go some way to assist in meeting this requirement.
5 There was a 55 per cent increase in resource consents received over the fourth quarter compared to the same period in 2019/20, with relative decrease in timeframe compliance over that period. This sustained period of development activity, both land use and subdivision, has placed demands on planning resources. Positively, new national direction, including the National Policy Statement for Freshwater, the National Environmental Standards, and the engagement of iwi and hapū as cultural experts, is resulting in outcomes to protect the district’s natural environment. As the Proposed District Plan progresses through its legislative pathway, the Planning Team continue to assess resource consents against the provisions of both the Operative and Proposed District Plans, adding further complexity to the resource consent process. It is likely this added complexity and time will remain for an extended period until the Proposed District Plan is deemed to be operative.
6 Rounded down from 94.3 per cent. A decrease in the level of compliance was largely the outcome of reduced planning staff over the first half of the year. The team now has a full complement of staff following a successful recruitment process. The Proposed District Plan was notified in September 2019. The planning team are required to assess resource consents against the provisions of both the Operative and Proposed District Plans, adding further complexity into the resource consent process which in turn takes more time to process. It is likely this added complexity and time will remain for an extended period until the Proposed District Plan is deemed to have legal effect.
Customer and Regulatory Solutions
26 ANNUAL REPORT 2020/21 I COUNCIL SERVICES
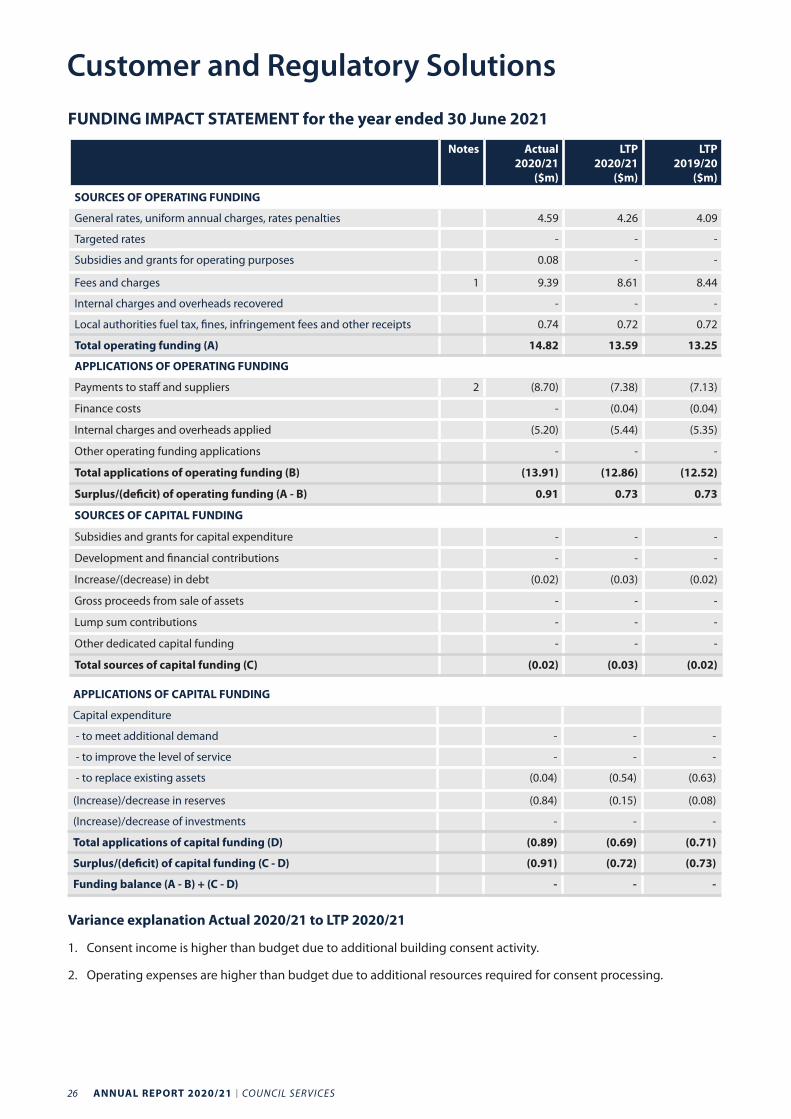
FUNDING IMPACT STATEMENT for the year ended 30 June 2021
Notes Actual2020/21
($m)
LTP 2020/21
($m)
LTP 2019/20
($m)
SOURCES OF OPERATING FUNDING
General rates, uniform annual charges, rates penalties 4.59 4.26 4.09
Targeted rates - - -
Subsidies and grants for operating purposes 0.08 - -
Fees and charges 1 9.39 8.61 8.44
Internal charges and overheads recovered - - -
Local authorities fuel tax, fines, infringement fees and other receipts 0.74 0.72 0.72
Total operating funding (A) 14.82 13.59 13.25
APPLICATIONS OF OPERATING FUNDING
Payments to staff and suppliers 2 (8.70) (7.38) (7.13)
Finance costs - (0.04) (0.04)
Internal charges and overheads applied (5.20) (5.44) (5.35)
Other operating funding applications - - -
Total applications of operating funding (B) (13.91) (12.86) (12.52)
Surplus/(deficit) of operating funding (A - B) 0.91 0.73 0.73
SOURCES OF CAPITAL FUNDING
Subsidies and grants for capital expenditure - - -
Development and financial contributions - - -
Increase/(decrease) in debt (0.02) (0.03) (0.02)
Gross proceeds from sale of assets - - -
Lump sum contributions - - -
Other dedicated capital funding - - -
Total sources of capital funding (C) (0.02) (0.03) (0.02)
APPLICATIONS OF CAPITAL FUNDING
Capital expenditure
- to meet additional demand - - -
- to improve the level of service - - -
- to replace existing assets (0.04) (0.54) (0.63)
(Increase)/decrease in reserves (0.84) (0.15) (0.08)
(Increase)/decrease of investments - - -
Total applications of capital funding (D) (0.89) (0.69) (0.71)
Surplus/(deficit) of capital funding (C - D) (0.91) (0.72) (0.73)
Funding balance (A - B) + (C - D) - - -
Variance explanation Actual 2020/21 to LTP 2020/21
1. Consent income is higher than budget due to additional building consent activity.
2. Operating expenses are higher than budget due to additional resources required for consent processing.
Customer and Regulatory Solutions
COUNCIL SERVICES I ANNUAL REPORT 2020/21 27
We work collaboratively with the Taranaki councils, central government and other agencies in the region to develop and improve the local economy. This includes directly funding and overseeing Venture Taranaki Trust, the Council Controlled Organisation responsible for regional development and tourism industry support services in the district. Venture Taranaki Trust also has agreements with South Taranaki District Council and Stratford District Council to deliver similar services in those districts.
The Council’s priorities for economic development are set out in Tapuae Roa: Make Way for Taranaki – the Regional Economic Development Strategy and Action Plan adopted in February 2018. The Strategy takes a cross-regional approach, focusing on unlocking opportunities for economic growth in the region. The Strategy’s mission statement: Taranaki, where talent becomes enterprise – Kia eke panuku, captures the regional vision for Taranaki as a place that offers an attractive lifestyle for talented people, in a high value economy.
Economic development priorities were also guided by the Taranaki 2050 Roadmap developed in response to central government decisions related to climate change and carbon emissions and the Taranaki Recovery Plan. The Taranaki Recovery Plan was developed by iwi in response to Covid-19 and has been adopted by the Regional Leadership Group to help guide the region's recovery efforts.
WHY WE DO ITThe Government has a vested interest in ensuring New Zealand’s regions enjoy prosperity and success. We work collaboratively with the other Taranaki councils, central government and the private sector toward sustainable development of the region.
Our activities contribute to the Council’s strategic vision of Building a Lifestyle Capital – supporting a prosperous community – awhi mai, awhi atu, tātou katoa. To help ensure a vibrant economy, we support local businesses, encouraging a diverse range of industries that will grow jobs in the district. We aim to make it easy to do business here, to encourage inclusive growth and diversity and to build resilience and sustainability across our communities.
EFFECTS ON COMMUNITY WELL-BEINGThe economic development service supports resilient, productive and sustainable communities that enjoy prosperity and success. A strong economy with decent jobs, higher incomes and opportunities for all current and future residents, alongside the protection and enhancement of the natural environment, greatly improves the community well-being. There are no significant negative effects identified from this activity.
SIGNIFICANT CHALLENGES DURING THE YEARCovid-19 continued to provide challenges for organisations in the district, such as the uncertainty and disruptions from changing alert levels. However domestic tourism and spending numbers have greatly improved.
The construction sector was busier than ever but constrained by materials and skilled labour shortages. A worsening housing shortage, and related rising house prices, increased the gap between those well-off and the most vulnerable in our society. For Venture Taranaki, the demand in the enterprise area was extremely high for startup clinics, client engagements and enterprise support as people looked to new or diversified business opportunities post Covid.
Economic Development
28 ANNUAL REPORT 2020/21 I COUNCIL SERVICES
HOW WE PERFORMED
Performance Measure Target2020/21
Rating Results/Comments2020/21
Results/Comments2019/20
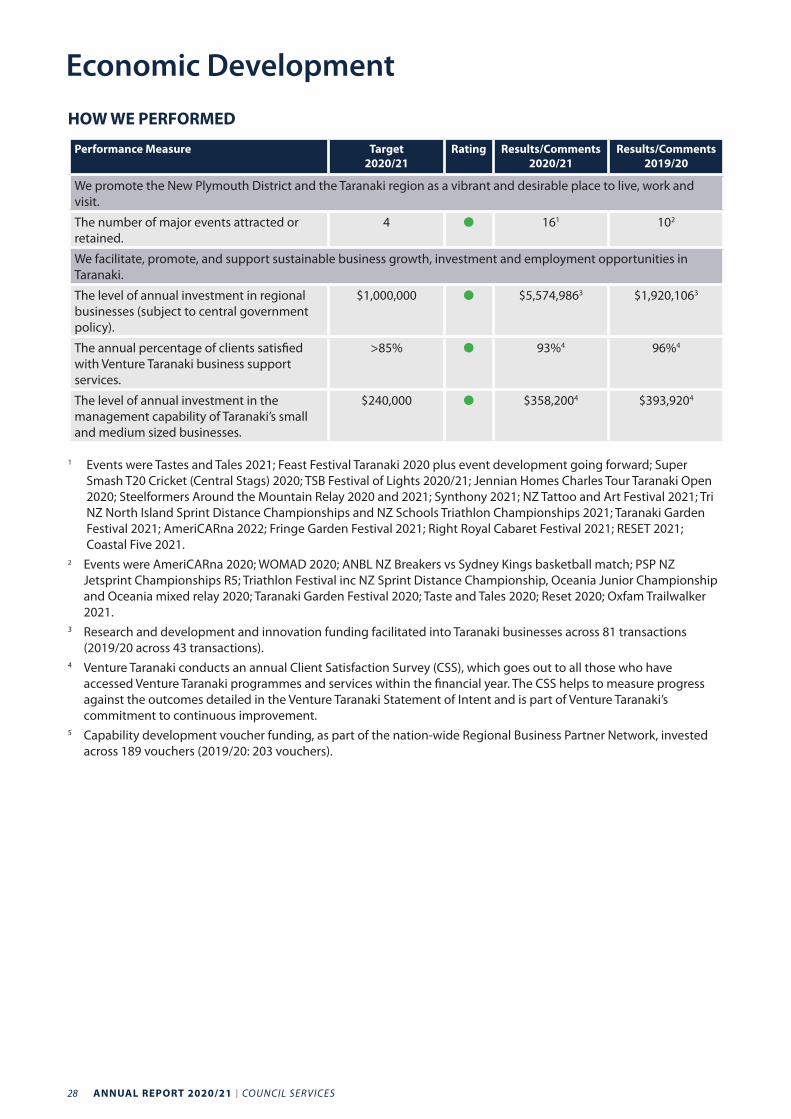
We promote the New Plymouth District and the Taranaki region as a vibrant and desirable place to live, work and visit.
The number of major events attracted or retained.
4 161 102
We facilitate, promote, and support sustainable business growth, investment and employment opportunities in Taranaki.
The level of annual investment in regional businesses (subject to central government policy).
$1,000,000 $5,574,9863 $1,920,1063
The annual percentage of clients satisfied with Venture Taranaki business support services.
>85% 93%4 96%4
The level of annual investment in the management capability of Taranaki’s small and medium sized businesses.
$240,000 $358,2004 $393,9204
1 Events were Tastes and Tales 2021; Feast Festival Taranaki 2020 plus event development going forward; Super Smash T20 Cricket (Central Stags) 2020; TSB Festival of Lights 2020/21; Jennian Homes Charles Tour Taranaki Open 2020; Steelformers Around the Mountain Relay 2020 and 2021; Synthony 2021; NZ Tattoo and Art Festival 2021; Tri NZ North Island Sprint Distance Championships and NZ Schools Triathlon Championships 2021; Taranaki Garden Festival 2021; AmeriCARna 2022; Fringe Garden Festival 2021; Right Royal Cabaret Festival 2021; RESET 2021; Coastal Five 2021.
2 Events were AmeriCARna 2020; WOMAD 2020; ANBL NZ Breakers vs Sydney Kings basketball match; PSP NZ Jetsprint Championships R5; Triathlon Festival inc NZ Sprint Distance Championship, Oceania Junior Championship and Oceania mixed relay 2020; Taranaki Garden Festival 2020; Taste and Tales 2020; Reset 2020; Oxfam Trailwalker 2021.
3 Research and development and innovation funding facilitated into Taranaki businesses across 81 transactions (2019/20 across 43 transactions).
4 Venture Taranaki conducts an annual Client Satisfaction Survey (CSS), which goes out to all those who have accessed Venture Taranaki programmes and services within the financial year. The CSS helps to measure progress against the outcomes detailed in the Venture Taranaki Statement of Intent and is part of Venture Taranaki’s commitment to continuous improvement.
5 Capability development voucher funding, as part of the nation-wide Regional Business Partner Network, invested across 189 vouchers (2019/20: 203 vouchers).
Economic Development
COUNCIL SERVICES I ANNUAL REPORT 2020/21 29
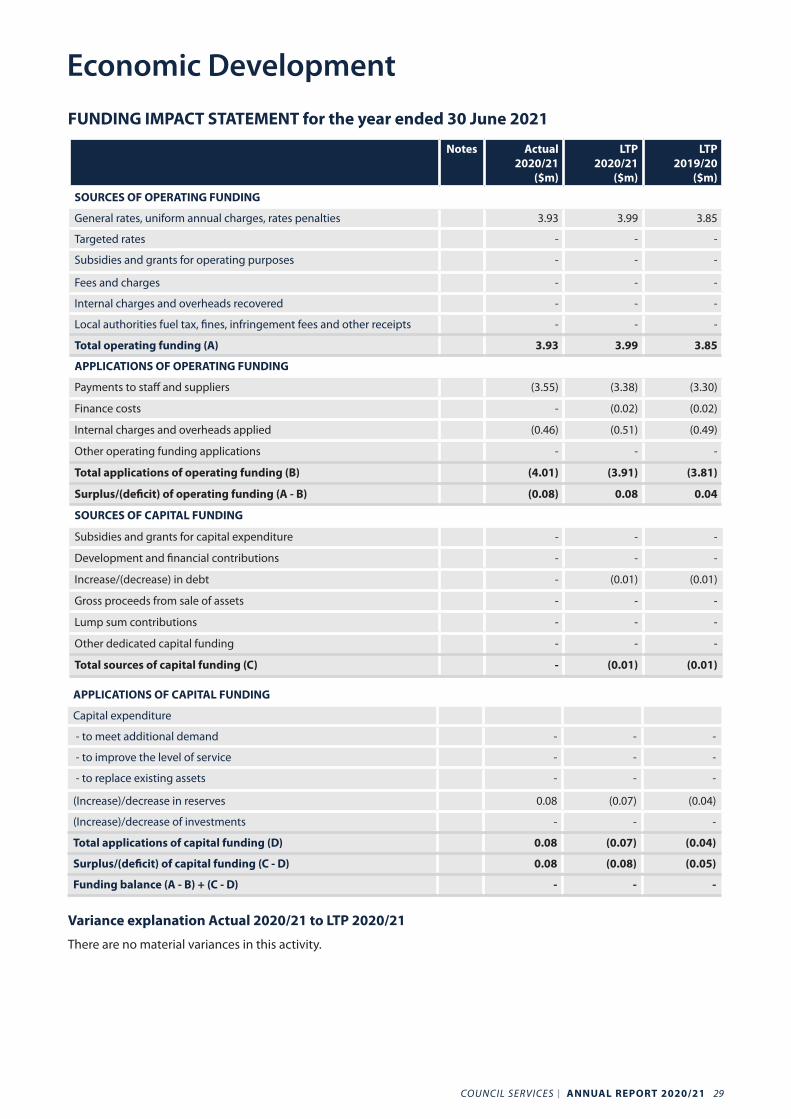
FUNDING IMPACT STATEMENT for the year ended 30 June 2021
Notes Actual2020/21
($m)
LTP 2020/21
($m)
LTP 2019/20
($m)
SOURCES OF OPERATING FUNDING
General rates, uniform annual charges, rates penalties 3.93 3.99 3.85
Targeted rates - - -
Subsidies and grants for operating purposes - - -
Fees and charges - - -
Internal charges and overheads recovered - - -
Local authorities fuel tax, fines, infringement fees and other receipts - - -
Total operating funding (A) 3.93 3.99 3.85
APPLICATIONS OF OPERATING FUNDING
Payments to staff and suppliers (3.55) (3.38) (3.30)
Finance costs - (0.02) (0.02)
Internal charges and overheads applied (0.46) (0.51) (0.49)
Other operating funding applications - - -
Total applications of operating funding (B) (4.01) (3.91) (3.81)
Surplus/(deficit) of operating funding (A - B) (0.08) 0.08 0.04
SOURCES OF CAPITAL FUNDING
Subsidies and grants for capital expenditure - - -
Development and financial contributions - - -
Increase/(decrease) in debt - (0.01) (0.01)
Gross proceeds from sale of assets - - -
Lump sum contributions - - -
Other dedicated capital funding - - -
Total sources of capital funding (C) - (0.01) (0.01)
APPLICATIONS OF CAPITAL FUNDING
Capital expenditure
- to meet additional demand - - -
- to improve the level of service - - -
- to replace existing assets - - -
(Increase)/decrease in reserves 0.08 (0.07) (0.04)
(Increase)/decrease of investments - - -
Total applications of capital funding (D) 0.08 (0.07) (0.04)
Surplus/(deficit) of capital funding (C - D) 0.08 (0.08) (0.05)
Funding balance (A - B) + (C - D) - - -
Variance explanation Actual 2020/21 to LTP 2020/21
There are no material variances in this activity.
Economic Development
30 ANNUAL REPORT 2020/21 I COUNCIL SERVICES
As a member of the Taranaki Civil Defence Emergency Management Group (CDEM), NPDC works with the other Taranaki councils, the community and other agencies to plan for and manage the regional response to major or widespread emergency events. These activities ensure that there is a strong regional response to any civil defence emergency in the region. They also ensure our communities are aware of the hazards in the region and know how to prepare and recover from emergencies associated with those hazards.
We also manage NPDC’s internal crisis management response outside of civil defence activation. This includes planning systems and processes to ensure NPDC continues to operate as well as possible during an emergency event, both major and minor.
WHY WE DO ITActivities within the Taranaki CDEM Group are driven by key legislation such as the Civil Defence Emergency Management Act 2002. This Act requires councils to take responsibility for the reduction of, readiness for, response to, and recovery from risks and events associated with emergency management.
All of our activities aim to reduce the effect of emergency events on the quality of life of our residents and ensure that NPDC services are maintained or restored as quickly as possible following an emergency event.
The emergency management and business continuance service supports the Council’s strategic vision of Building a Lifestyle Capital – putting people first and supporting a prosperous community.
We support putting people first– aroha ki te tangata through supporting the community to reduce, prepare, respond and recover from natural disasters. Our civil defence work puts people first through the protection of people and property.
Our emergency planning and management also aims to reduce the economic impacts of an emergency event and ensure a fast recovery. In doing so, we contribute to supporting a prosperous community – awhi mai, awhi atu, tātou katoa.
EFFECTS ON COMMUNITY WELL-BEINGAll of our activities are about protecting people and property in the event of an emergency or a widespread event. This promotes social, economic and cultural well-being through protecting people, businesses and community facilities from emergencies and events. There are no significant negative effects identified from this activity.
SIGNIFICANT CHALLENGES DURING THE YEARThe Covid-19 lockdowns in 2019/20 created significant challenges in 2020/21, combined with the ongoing threat of a Covid-19 pandemic and the potential for local or national outbreaks and lockdowns. This included the requirement for the secondment of staff to the Taranaki Regional Covid Recovery Team and the backfilling of roles within the CDEM Team. This has impacted on our ability to deliver key outcomes. The number of experienced response staff that can, and are willing to, assist during a response in the Emergency Operation Centre has also been identified as a risk. A draft Regional Resurgence Plan that details a regional response in the event of a Covid-19 outbreak consistent with the National Resurgence Plan is currently being reviewed by key local government agencies.
Emergency Management and Business Continuance
COUNCIL SERVICES I ANNUAL REPORT 2020/21 31
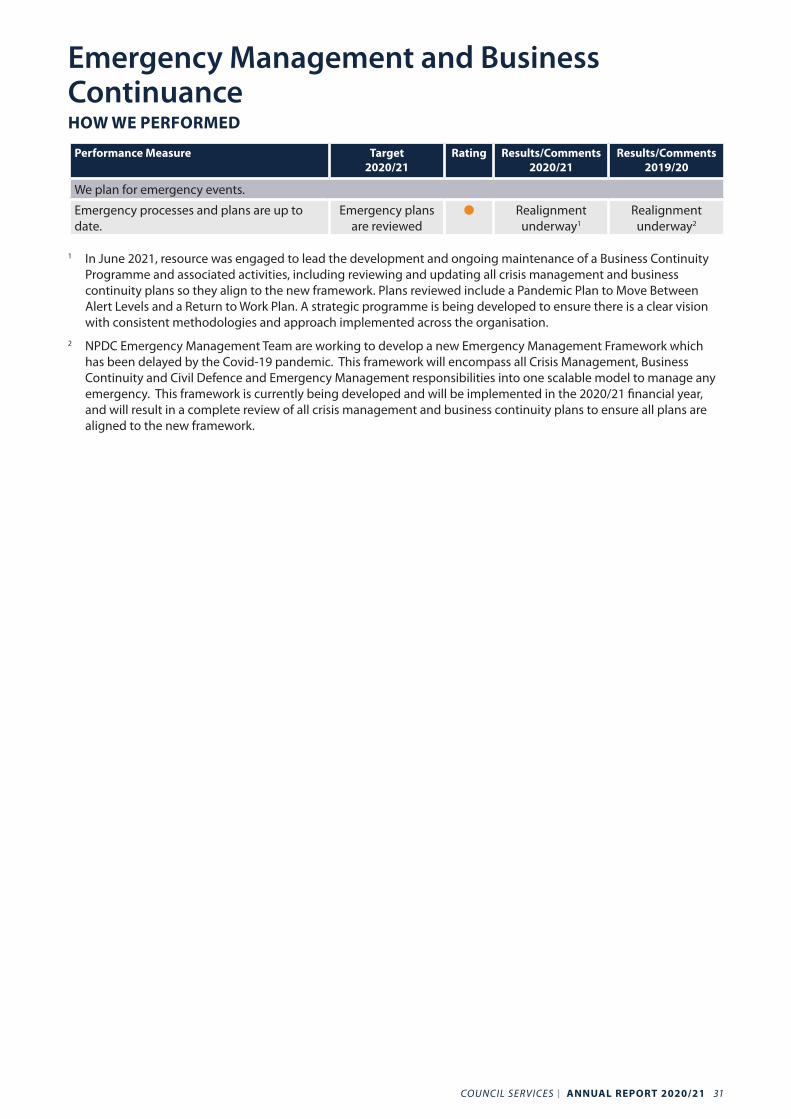
HOW WE PERFORMED
Performance Measure Target2020/21
Rating Results/Comments2020/21
Results/Comments2019/20
We plan for emergency events.
Emergency processes and plans are up to date.
Emergency plans are reviewed
Realignment underway1
Realignment underway2
1 In June 2021, resource was engaged to lead the development and ongoing maintenance of a Business Continuity Programme and associated activities, including reviewing and updating all crisis management and business continuity plans so they align to the new framework. Plans reviewed include a Pandemic Plan to Move Between Alert Levels and a Return to Work Plan. A strategic programme is being developed to ensure there is a clear vision with consistent methodologies and approach implemented across the organisation.
2 NPDC Emergency Management Team are working to develop a new Emergency Management Framework which has been delayed by the Covid-19 pandemic. This framework will encompass all Crisis Management, Business Continuity and Civil Defence and Emergency Management responsibilities into one scalable model to manage any emergency. This framework is currently being developed and will be implemented in the 2020/21 financial year, and will result in a complete review of all crisis management and business continuity plans to ensure all plans are aligned to the new framework.
Emergency Management and Business Continuance
32 ANNUAL REPORT 2020/21 I COUNCIL SERVICES
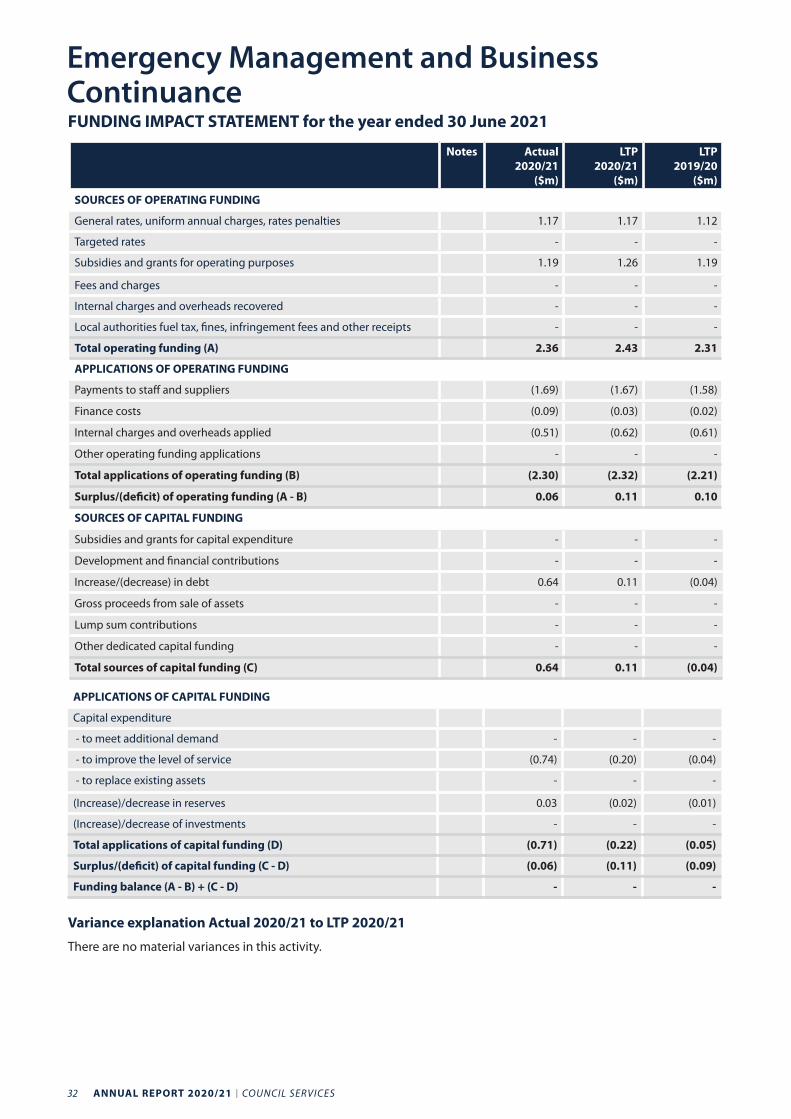
FUNDING IMPACT STATEMENT for the year ended 30 June 2021
Notes Actual2020/21
($m)
LTP 2020/21
($m)
LTP 2019/20
($m)
SOURCES OF OPERATING FUNDING
General rates, uniform annual charges, rates penalties 1.17 1.17 1.12
Targeted rates - - -
Subsidies and grants for operating purposes 1.19 1.26 1.19
Fees and charges - - -
Internal charges and overheads recovered - - -
Local authorities fuel tax, fines, infringement fees and other receipts - - -
Total operating funding (A) 2.36 2.43 2.31
APPLICATIONS OF OPERATING FUNDING
Payments to staff and suppliers (1.69) (1.67) (1.58)
Finance costs (0.09) (0.03) (0.02)
Internal charges and overheads applied (0.51) (0.62) (0.61)
Other operating funding applications - - -
Total applications of operating funding (B) (2.30) (2.32) (2.21)
Surplus/(deficit) of operating funding (A - B) 0.06 0.11 0.10
SOURCES OF CAPITAL FUNDING
Subsidies and grants for capital expenditure - - -
Development and financial contributions - - -
Increase/(decrease) in debt 0.64 0.11 (0.04)
Gross proceeds from sale of assets - - -
Lump sum contributions - - -
Other dedicated capital funding - - -
Total sources of capital funding (C) 0.64 0.11 (0.04)
APPLICATIONS OF CAPITAL FUNDING
Capital expenditure
- to meet additional demand - - -
- to improve the level of service (0.74) (0.20) (0.04)
- to replace existing assets - - -
(Increase)/decrease in reserves 0.03 (0.02) (0.01)
(Increase)/decrease of investments - - -
Total applications of capital funding (D) (0.71) (0.22) (0.05)
Surplus/(deficit) of capital funding (C - D) (0.06) (0.11) (0.09)
Funding balance (A - B) + (C - D) - - -
Variance explanation Actual 2020/21 to LTP 2020/21
There are no material variances in this activity.
Emergency Management and Business Continuance
COUNCIL SERVICES I ANNUAL REPORT 2020/21 33
The Council’s flood protection and control works service provides flood protection systems to urban areas in the district. We monitor and maintain three flood protection dams, three diversion tunnels, several bunded ponding areas and a weir.
WHY WE DO ITThe flood protection and control works service supports the Council’s strategic vision of Building a Lifestyle Capital - putting people first, caring for our place, and supporting a prosperous community.
Reducing flood risk promotes putting people first - Aroha ki te tangata through protecting people and property from the effects of flooding from rivers and streams in severe storm events, enabling residents to continue with their daily lives after a significant rainfall event.
Reducing flood risk helps the Council in supporting a prosperous community - awhi mai, awhi atu, tātou katoa by protecting businesses and industry from flood risk, including through the Waimea, Mangaotuku and Huatoki dam scheme reducing flood impacts on the central business district.
Our flood protection and control works also protect our natural environment and outdoor lifestyle opportunities, promoting Caring for our place - manaaki whenua, manaaki tangata, haere whakamua.
EFFECTS ON COMMUNITY WELL-BEINGFlood protection and control works can have a range of effects on the community. Flood protection and control works protect people and property from damage, and therefore promote social, economic and community well-being. Potential negative effects are identified in the following table.
Effect How the Council Intends to Mitigate the Effect
In severe storms, flood water has the potential to overwhelm flood protection infrastructure and harm people and buildings.
To reduce this risk, we take the probability of severe storm events into account when designing the capacity of the protection systems.
We also identify at-risk flood areas, taking steps to manage development in these areas.
Flood protection and control works interrupt the natural state of controlled rivers, and may have a negative impact on environmental well-being.
There is limited ability to mitigate this effect.
SIGNIFICANT CHALLENGES DURING THE YEARThere were no significant challenges during the year.
HOW WE PERFORMED
Performance Measure Target2020/21
Rating Results/Comments2020/21
Results/Comments2019/20
We effectively maintain the Council’s flood protection and control works.
Major flood protection and control works are maintained, repaired and renewed in accordance with the Asset Management Plan and annual works programme.
Achieved Achieved Achieved
Flood Protection and Control Works
34 ANNUAL REPORT 2020/21 I COUNCIL SERVICES
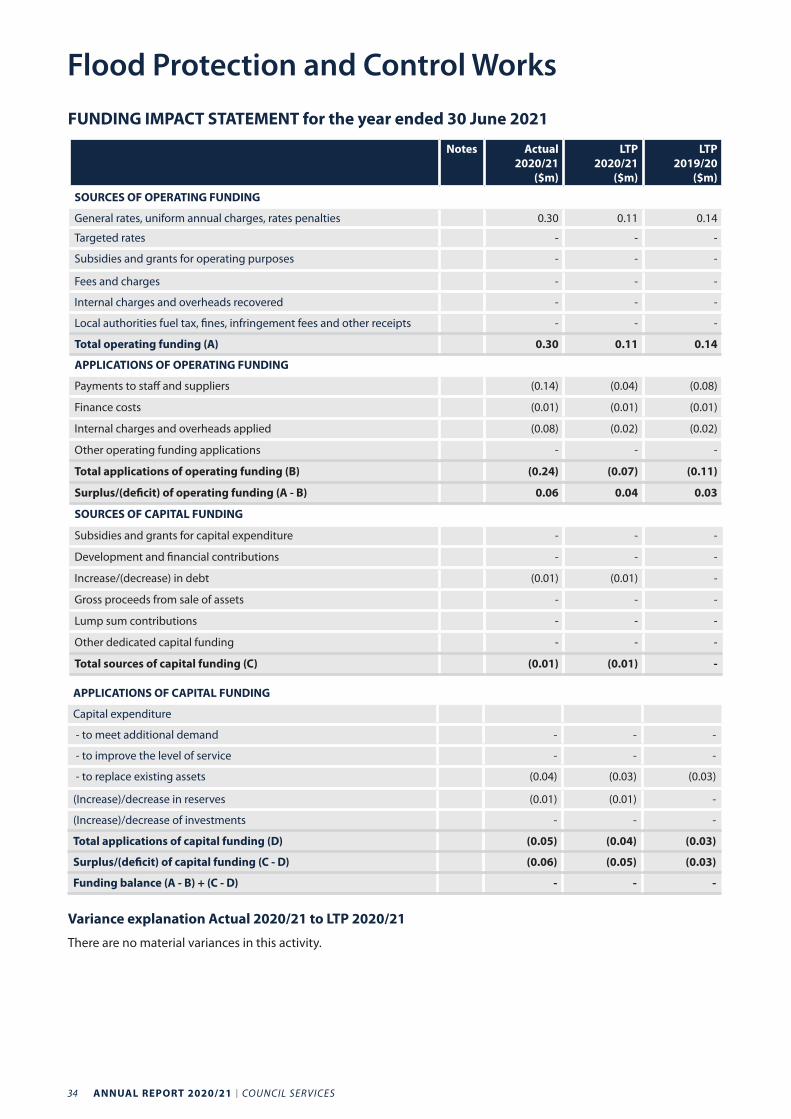
FUNDING IMPACT STATEMENT for the year ended 30 June 2021
Notes Actual2020/21
($m)
LTP 2020/21
($m)
LTP 2019/20
($m)
SOURCES OF OPERATING FUNDING
General rates, uniform annual charges, rates penalties 0.30 0.11 0.14
Targeted rates - - -
Subsidies and grants for operating purposes - - -
Fees and charges - - -
Internal charges and overheads recovered - - -
Local authorities fuel tax, fines, infringement fees and other receipts - - -
Total operating funding (A) 0.30 0.11 0.14
APPLICATIONS OF OPERATING FUNDING
Payments to staff and suppliers (0.14) (0.04) (0.08)
Finance costs (0.01) (0.01) (0.01)
Internal charges and overheads applied (0.08) (0.02) (0.02)
Other operating funding applications - - -
Total applications of operating funding (B) (0.24) (0.07) (0.11)
Surplus/(deficit) of operating funding (A - B) 0.06 0.04 0.03
SOURCES OF CAPITAL FUNDING
Subsidies and grants for capital expenditure - - -
Development and financial contributions - - -
Increase/(decrease) in debt (0.01) (0.01) -
Gross proceeds from sale of assets - - -
Lump sum contributions - - -
Other dedicated capital funding - - -
Total sources of capital funding (C) (0.01) (0.01) -
APPLICATIONS OF CAPITAL FUNDING
Capital expenditure
- to meet additional demand - - -
- to improve the level of service - - -
- to replace existing assets (0.04) (0.03) (0.03)
(Increase)/decrease in reserves (0.01) (0.01) -
(Increase)/decrease of investments - - -
Total applications of capital funding (D) (0.05) (0.04) (0.03)
Surplus/(deficit) of capital funding (C - D) (0.06) (0.05) (0.03)
Funding balance (A - B) + (C - D) - - -
Variance explanation Actual 2020/21 to LTP 2020/21
There are no material variances in this activity.
Flood Protection and Control Works
COUNCIL SERVICES I ANNUAL REPORT 2020/21 35
The governance service supports the Mayor, councillors and community board members to be effective, representative and accountable decision-makers. We facilitate and administer Council, committee and community board meetings and coordinate a range of civic functions. We also manage local authority elections.
We make sure that people have easy access to the information they need to be involved in Council decision-making.
WHY WE DO ITUnder the Local Government Act 2002, elected members must represent their communities and make decisions in an open, transparent and accountable manner. The governance service ensures the Council makes quality decisions in accordance with statutory requirements.
Robust decision-making processes that are aligned with our key strategic aims supports the Council’s vision of Building a Lifestyle Capital – putting people first.
In particular, providing a democratic system of governance, through elections and consultation processes, promotes putting people first - aroha ki te tangata. This enables the Council to fulfil its vision for the district.
EFFECTS ON COMMUNITY WELL-BEINGThe governance service supports an engaged community that participates in the democratic process. This promotes the social well-being of the community. The Council’s Te Huinga Taumatua Committee brings an iwi perspective to the governance processes and promotes cultural well-being. Effective governance can also help to promote economic and environmental well-being through good decision-making processes. There are no negative effects associated with this service.
SIGNIFICANT CHALLENGES DURING THE YEARIn July 2020, the Council voted to establish a Māori ward to ensure Māori have representation around the Council table and to build on partnerships that already exist. The ward will take effect from the 2022 triennial election.
A further by-election was required for the Inglewood Community Board following the resignation of Phil Hird. Christine Fabish was elected unopposed in January 2021.
In April 2021, the Council hosted several civic functions to commemorate the inaugural visit of HMNZS Aotearoa to her home port (New Plymouth).
HOW WE PERFORMED
Performance Measure Target2020/21
Rating Results/Comments2020/21
Results/Comments2019/20
We effectively manage local elections in accordance with statutory requirements.
Elections and polls comply with the provisions of the Local Electoral Act 2001 and are without successful petitions for inquiry into the conduct of elections.
* Achieved1 Achieved2
Council processes comply with statutory requirements.
The Long-Term Plan, Annual Plan and Annual Report are each adopted within statutory timeframes.
Full compliance Achieved3 Achieved3
Meeting agendas are available as specified by legislation.
Full compliance Achieved Achieved
* No triennial elections in this year.
1 Inglewood Community Board by-election.2 Triennial election and three community board by-elections completed (target full compliance).3 Parliament extended the annual report timeframes as a flow-on impact from Covid-19.
Governance
36 ANNUAL REPORT 2020/21 I COUNCIL SERVICES
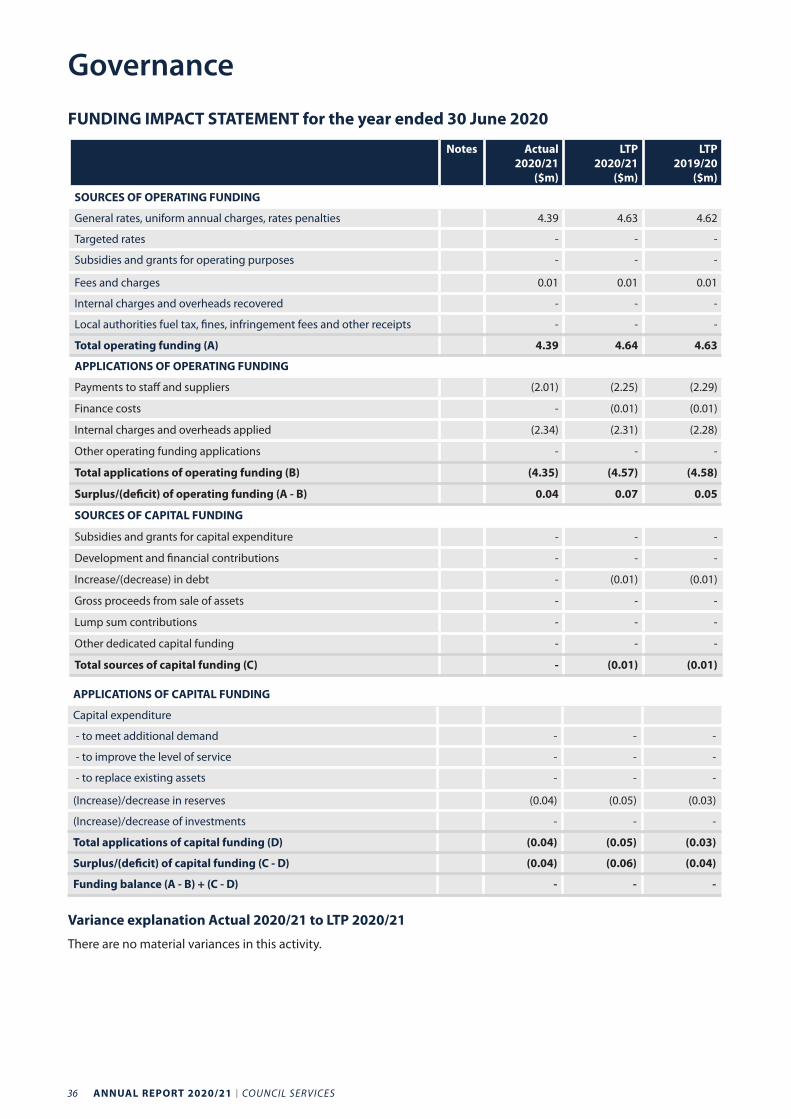
FUNDING IMPACT STATEMENT for the year ended 30 June 2020
Notes Actual2020/21
($m)
LTP 2020/21
($m)
LTP 2019/20
($m)
SOURCES OF OPERATING FUNDING
General rates, uniform annual charges, rates penalties 4.39 4.63 4.62
Targeted rates - - -
Subsidies and grants for operating purposes - - -
Fees and charges 0.01 0.01 0.01
Internal charges and overheads recovered - - -
Local authorities fuel tax, fines, infringement fees and other receipts - - -
Total operating funding (A) 4.39 4.64 4.63
APPLICATIONS OF OPERATING FUNDING
Payments to staff and suppliers (2.01) (2.25) (2.29)
Finance costs - (0.01) (0.01)
Internal charges and overheads applied (2.34) (2.31) (2.28)
Other operating funding applications - - -
Total applications of operating funding (B) (4.35) (4.57) (4.58)
Surplus/(deficit) of operating funding (A - B) 0.04 0.07 0.05
SOURCES OF CAPITAL FUNDING
Subsidies and grants for capital expenditure - - -
Development and financial contributions - - -
Increase/(decrease) in debt - (0.01) (0.01)
Gross proceeds from sale of assets - - -
Lump sum contributions - - -
Other dedicated capital funding - - -
Total sources of capital funding (C) - (0.01) (0.01)
APPLICATIONS OF CAPITAL FUNDING
Capital expenditure
- to meet additional demand - - -
- to improve the level of service - - -
- to replace existing assets - - -
(Increase)/decrease in reserves (0.04) (0.05) (0.03)
(Increase)/decrease of investments - - -
Total applications of capital funding (D) (0.04) (0.05) (0.03)
Surplus/(deficit) of capital funding (C - D) (0.04) (0.06) (0.04)
Funding balance (A - B) + (C - D) - - -
Variance explanation Actual 2020/21 to LTP 2020/21
There are no material variances in this activity.
Governance
COUNCIL SERVICES I ANNUAL REPORT 2020/21 37
The Govett-Brewster Art Gallery is Aotearoa’s leading contemporary art museum. Recognised nationally and internationally for its dedication to contemporary art and commitment to art from the Pacific, the gallery offers a wide range of dynamic exhibitions, community events and education programmes.
In 2015, the Len Lye Centre opened as an extension to the Govett-Brewster Art Gallery. New Zealand’s first institution dedicated to a single artist, it is a facility of local, national and international significance. The Len Lye Centre provides a continuous, accessible and stimulating programme that explores the art and ideas of this pioneering filmmaker and kinetic sculptor.
WHY WE DO ITProviding high quality and diverse cultural and recreational experiences supports the Council’s strategic vision of Building a Lifestyle Capital – putting people first and supporting a prosperous community.
The activities of this service contribute to the quality of life and cultural well-being of our people, and support the district’s reputation as a national and international destination of choice.
The Govett-Brewster Art Gallery and Len Lye Centre (the Gallery) continually develops challenging and changing exhibitions, programmes and events as part of its role in contributing to putting people first - aroha ki te tangata.
The Gallery contributes to supporting a prosperous community - awhi mai, awhi atu, tātou katoa as the combined facility is a major contributor to the region’s tourism sector, attracting out-of-region visitors, including international visitors. This contributes to a vibrant economy and raises the national and international profile of the New Plymouth district as a cultural tourism experience.
EFFECTS ON COMMUNITY WELL-BEINGOur exhibitions and community programmes are accessible and engaging for residents and visitors from diverse communities, including iwi. These programmes promote both the social and cultural well-being of the community. The Gallery also promotes economic well-being as one of the major visitor attractions in the New Plymouth District. There are no significant negative effects identified from this activity.
SIGNIFICANT CHALLENGES DURING THE YEARWhile the Gallery lacked international tourism during the year (international visitor numbers were down from 20.1 per cent to 1.5 per cent), renewed national visitation during a time of closed borders topped up audience numbers. Student visits were down considerably over the financial year, due to the impact of Covid-19 disruption to the 2020 school year, and a slow return to offsite visits. Gallery operations were affected by the flow on of lockdown until March 2021 when a new director was appointed. Collection storage and system constraints have also presented operational challenges.
Govett-Brewster Art Gallery/Len Lye Centre
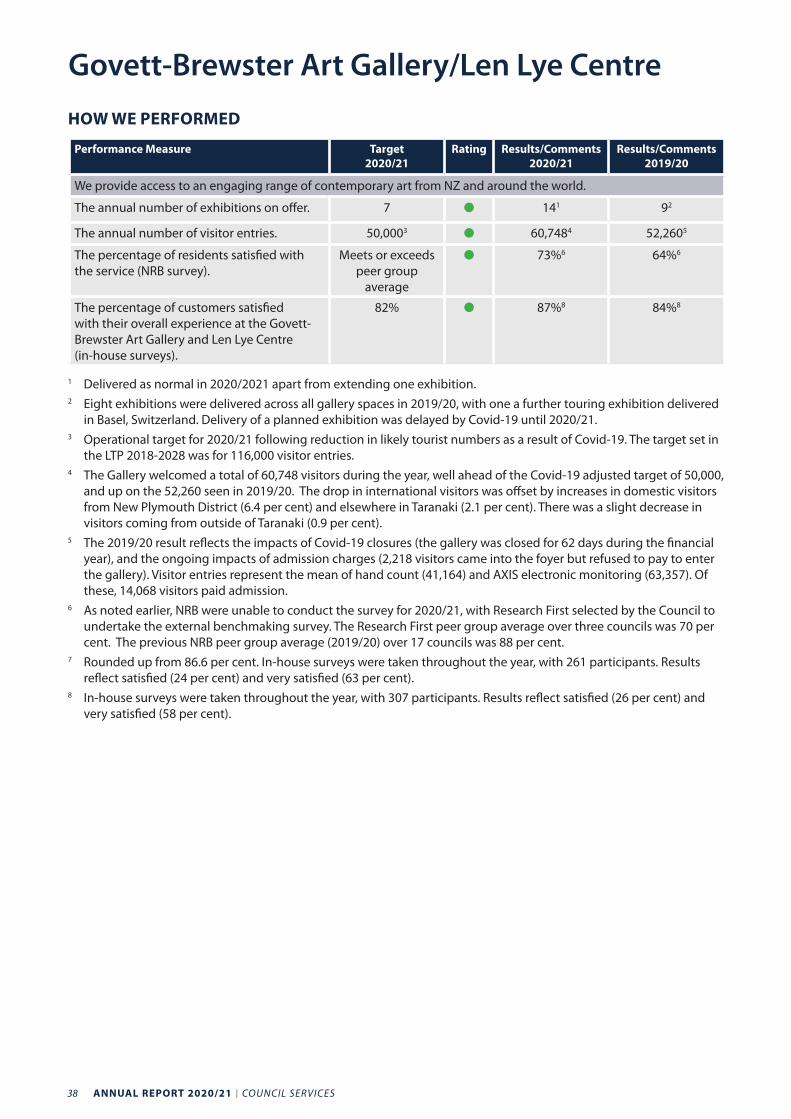
38 ANNUAL REPORT 2020/21 I COUNCIL SERVICES
HOW WE PERFORMED
Performance Measure Target2020/21
Rating Results/Comments2020/21
Results/Comments2019/20
We provide access to an engaging range of contemporary art from NZ and around the world.
The annual number of exhibitions on offer. 7 141 92
The annual number of visitor entries. 50,0003 60,7484 52,2605
The percentage of residents satisfied with the service (NRB survey).
Meets or exceeds peer group
average
73%6 64%6
The percentage of customers satisfied with their overall experience at the Govett-Brewster Art Gallery and Len Lye Centre (in-house surveys).
82% 87%8 84%8
1 Delivered as normal in 2020/2021 apart from extending one exhibition. 2 Eight exhibitions were delivered across all gallery spaces in 2019/20, with one a further touring exhibition delivered
in Basel, Switzerland. Delivery of a planned exhibition was delayed by Covid-19 until 2020/21. 3 Operational target for 2020/21 following reduction in likely tourist numbers as a result of Covid-19. The target set in
the LTP 2018-2028 was for 116,000 visitor entries.4 The Gallery welcomed a total of 60,748 visitors during the year, well ahead of the Covid-19 adjusted target of 50,000,
and up on the 52,260 seen in 2019/20. The drop in international visitors was offset by increases in domestic visitors from New Plymouth District (6.4 per cent) and elsewhere in Taranaki (2.1 per cent). There was a slight decrease in visitors coming from outside of Taranaki (0.9 per cent).
5 The 2019/20 result reflects the impacts of Covid-19 closures (the gallery was closed for 62 days during the financial year), and the ongoing impacts of admission charges (2,218 visitors came into the foyer but refused to pay to enter the gallery). Visitor entries represent the mean of hand count (41,164) and AXIS electronic monitoring (63,357). Of these, 14,068 visitors paid admission.
6 As noted earlier, NRB were unable to conduct the survey for 2020/21, with Research First selected by the Council to undertake the external benchmaking survey. The Research First peer group average over three councils was 70 per cent. The previous NRB peer group average (2019/20) over 17 councils was 88 per cent.
7 Rounded up from 86.6 per cent. In-house surveys were taken throughout the year, with 261 participants. Results reflect satisfied (24 per cent) and very satisfied (63 per cent).
8 In-house surveys were taken throughout the year, with 307 participants. Results reflect satisfied (26 per cent) and very satisfied (58 per cent).
Govett-Brewster Art Gallery/Len Lye Centre
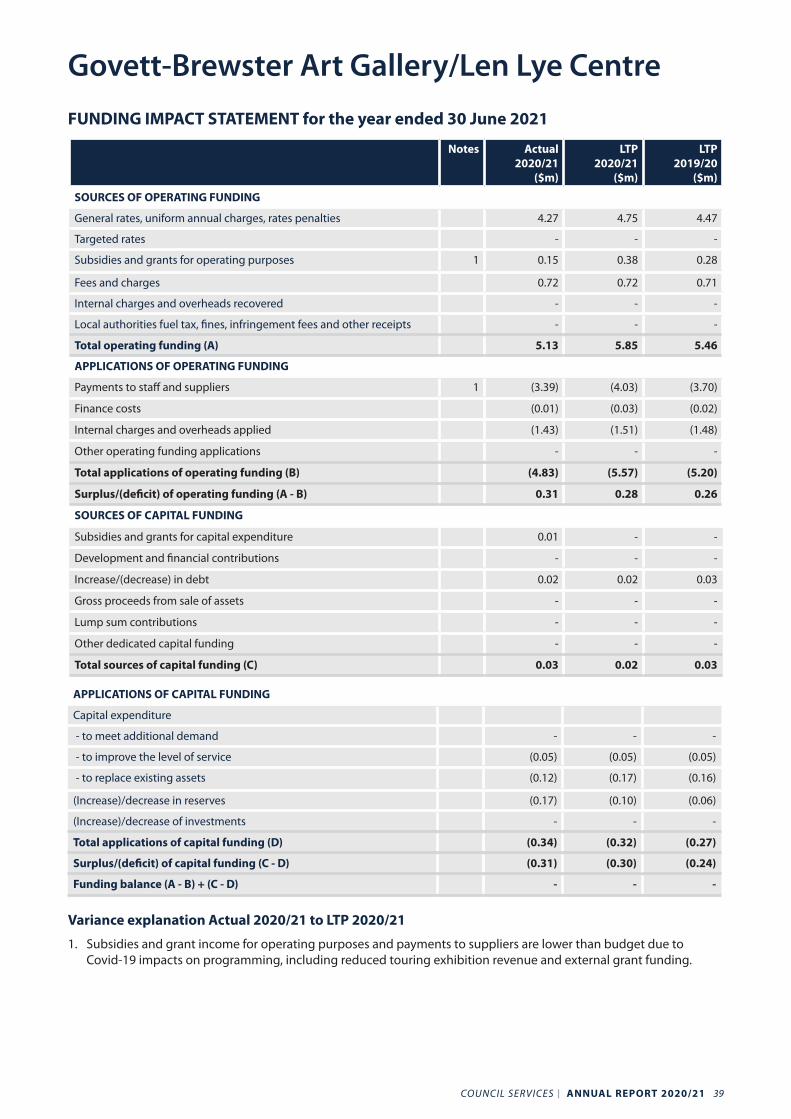
COUNCIL SERVICES I ANNUAL REPORT 2020/21 39
FUNDING IMPACT STATEMENT for the year ended 30 June 2021
Notes Actual2020/21
($m)
LTP 2020/21
($m)
LTP 2019/20
($m)
SOURCES OF OPERATING FUNDING
General rates, uniform annual charges, rates penalties 4.27 4.75 4.47
Targeted rates - - -
Subsidies and grants for operating purposes 1 0.15 0.38 0.28
Fees and charges 0.72 0.72 0.71
Internal charges and overheads recovered - - -
Local authorities fuel tax, fines, infringement fees and other receipts - - -
Total operating funding (A) 5.13 5.85 5.46
APPLICATIONS OF OPERATING FUNDING
Payments to staff and suppliers 1 (3.39) (4.03) (3.70)
Finance costs (0.01) (0.03) (0.02)
Internal charges and overheads applied (1.43) (1.51) (1.48)
Other operating funding applications - - -
Total applications of operating funding (B) (4.83) (5.57) (5.20)
Surplus/(deficit) of operating funding (A - B) 0.31 0.28 0.26
SOURCES OF CAPITAL FUNDING
Subsidies and grants for capital expenditure 0.01 - -
Development and financial contributions - - -
Increase/(decrease) in debt 0.02 0.02 0.03
Gross proceeds from sale of assets - - -
Lump sum contributions - - -
Other dedicated capital funding - - -
Total sources of capital funding (C) 0.03 0.02 0.03
APPLICATIONS OF CAPITAL FUNDING
Capital expenditure
- to meet additional demand - - -
- to improve the level of service (0.05) (0.05) (0.05)
- to replace existing assets (0.12) (0.17) (0.16)
(Increase)/decrease in reserves (0.17) (0.10) (0.06)
(Increase)/decrease of investments - - -
Total applications of capital funding (D) (0.34) (0.32) (0.27)
Surplus/(deficit) of capital funding (C - D) (0.31) (0.30) (0.24)
Funding balance (A - B) + (C - D) - - -
Variance explanation Actual 2020/21 to LTP 2020/21
1. Subsidies and grant income for operating purposes and payments to suppliers are lower than budget due to Covid-19 impacts on programming, including reduced touring exhibition revenue and external grant funding.
Govett-Brewster Art Gallery/Len Lye Centre
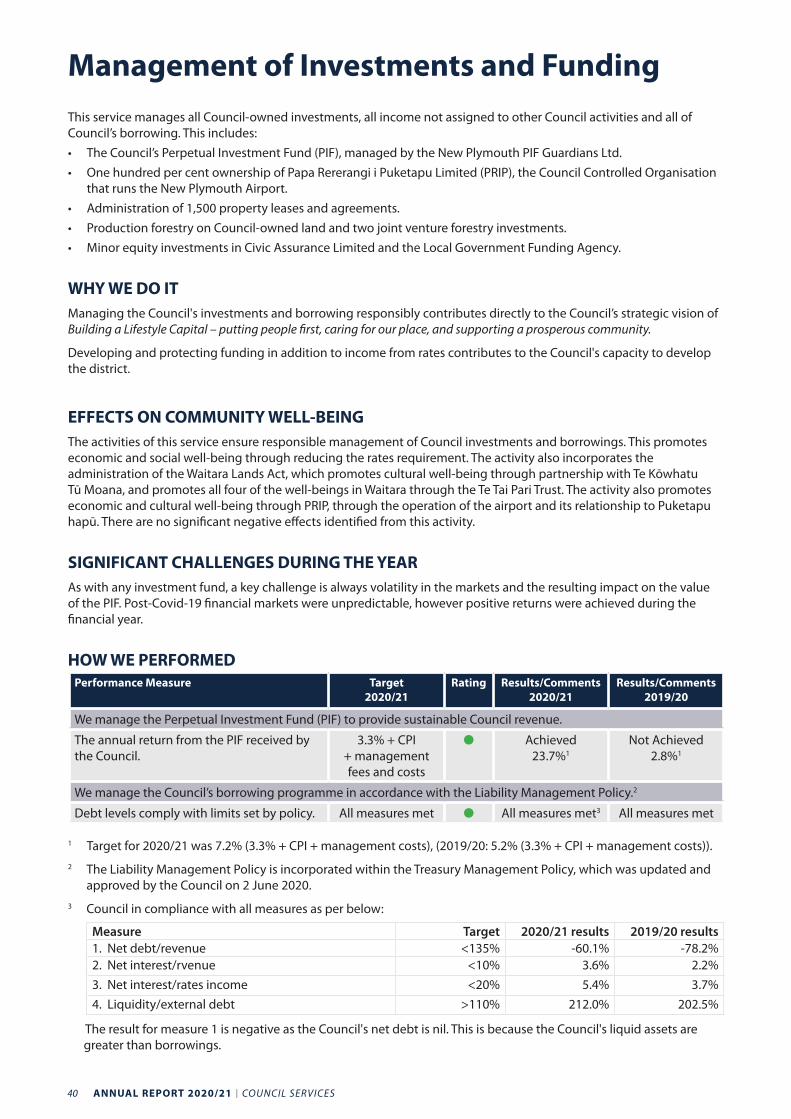
40 ANNUAL REPORT 2020/21 I COUNCIL SERVICES
This service manages all Council-owned investments, all income not assigned to other Council activities and all of Council’s borrowing. This includes:• The Council’s Perpetual Investment Fund (PIF), managed by the New Plymouth PIF Guardians Ltd.• One hundred per cent ownership of Papa Rererangi i Puketapu Limited (PRIP), the Council Controlled Organisation
that runs the New Plymouth Airport.• Administration of 1,500 property leases and agreements.• Production forestry on Council-owned land and two joint venture forestry investments.• Minor equity investments in Civic Assurance Limited and the Local Government Funding Agency.
WHY WE DO ITManaging the Council's investments and borrowing responsibly contributes directly to the Council’s strategic vision of Building a Lifestyle Capital – putting people first, caring for our place, and supporting a prosperous community.
Developing and protecting funding in addition to income from rates contributes to the Council's capacity to develop the district.
EFFECTS ON COMMUNITY WELL-BEING The activities of this service ensure responsible management of Council investments and borrowings. This promotes economic and social well-being through reducing the rates requirement. The activity also incorporates the administration of the Waitara Lands Act, which promotes cultural well-being through partnership with Te Kōwhatu Tū Moana, and promotes all four of the well-beings in Waitara through the Te Tai Pari Trust. The activity also promotes economic and cultural well-being through PRIP, through the operation of the airport and its relationship to Puketapu hapū. There are no significant negative effects identified from this activity.
SIGNIFICANT CHALLENGES DURING THE YEARAs with any investment fund, a key challenge is always volatility in the markets and the resulting impact on the value of the PIF. Post-Covid-19 financial markets were unpredictable, however positive returns were achieved during the financial year.
HOW WE PERFORMEDPerformance Measure Target
2020/21Rating Results/Comments
2020/21Results/Comments
2019/20
We manage the Perpetual Investment Fund (PIF) to provide sustainable Council revenue.
The annual return from the PIF received by the Council.
3.3% + CPI + management fees and costs
Achieved 23.7%1
Not Achieved 2.8%1
We manage the Council’s borrowing programme in accordance with the Liability Management Policy.2
Debt levels comply with limits set by policy. All measures met All measures met3 All measures met
1 Target for 2020/21 was 7.2% (3.3% + CPI + management costs), (2019/20: 5.2% (3.3% + CPI + management costs)).2 The Liability Management Policy is incorporated within the Treasury Management Policy, which was updated and
approved by the Council on 2 June 2020.3 Council in compliance with all measures as per below:
Measure Target 2020/21 results 2019/20 results1. Net debt/revenue <135% -60.1% -78.2%2. Net interest/rvenue <10% 3.6% 2.2%3. Net interest/rates income <20% 5.4% 3.7%4. Liquidity/external debt >110% 212.0% 202.5%
The result for measure 1 is negative as the Council's net debt is nil. This is because the Council's liquid assets are greater than borrowings.
Management of Investments and Funding
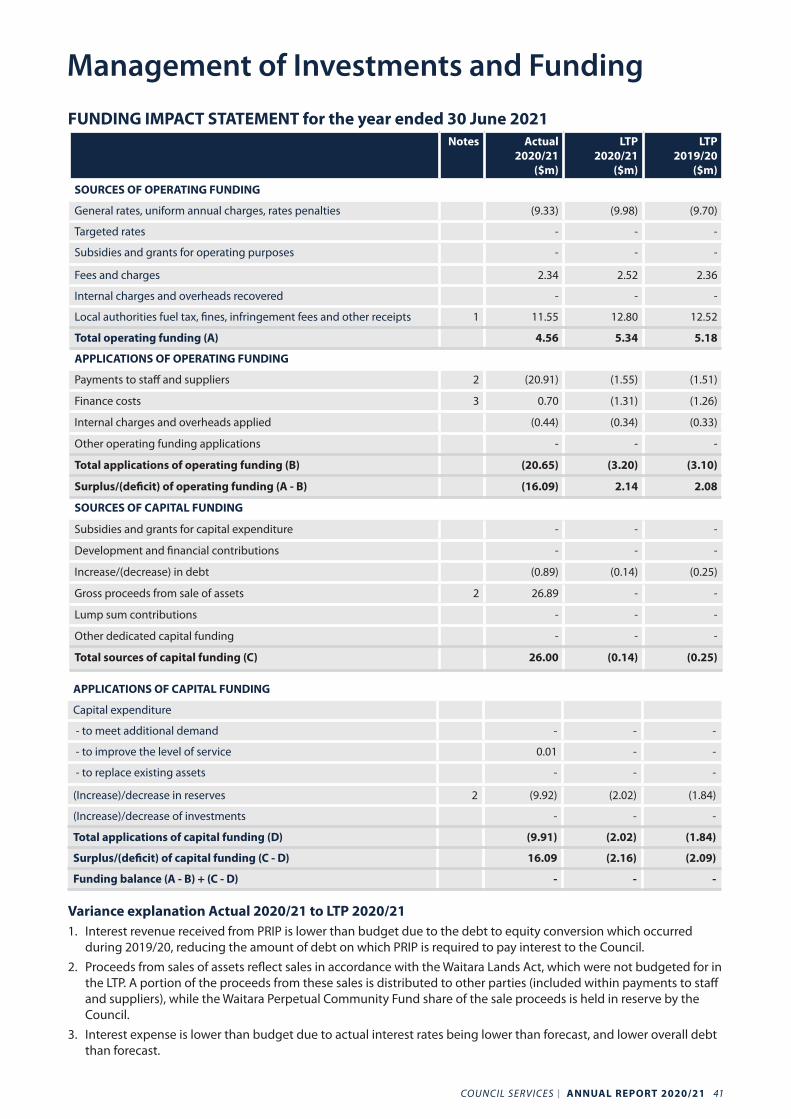
COUNCIL SERVICES I ANNUAL REPORT 2020/21 41
FUNDING IMPACT STATEMENT for the year ended 30 June 2021Notes Actual
2020/21($m)
LTP 2020/21
($m)
LTP 2019/20
($m)
SOURCES OF OPERATING FUNDING
General rates, uniform annual charges, rates penalties (9.33) (9.98) (9.70)
Targeted rates - - -
Subsidies and grants for operating purposes - - -
Fees and charges 2.34 2.52 2.36
Internal charges and overheads recovered - - -
Local authorities fuel tax, fines, infringement fees and other receipts 1 11.55 12.80 12.52
Total operating funding (A) 4.56 5.34 5.18
APPLICATIONS OF OPERATING FUNDING
Payments to staff and suppliers 2 (20.91) (1.55) (1.51)
Finance costs 3 0.70 (1.31) (1.26)
Internal charges and overheads applied (0.44) (0.34) (0.33)
Other operating funding applications - - -
Total applications of operating funding (B) (20.65) (3.20) (3.10)
Surplus/(deficit) of operating funding (A - B) (16.09) 2.14 2.08
SOURCES OF CAPITAL FUNDING
Subsidies and grants for capital expenditure - - -
Development and financial contributions - - -
Increase/(decrease) in debt (0.89) (0.14) (0.25)
Gross proceeds from sale of assets 2 26.89 - -
Lump sum contributions - - -
Other dedicated capital funding - - -
Total sources of capital funding (C) 26.00 (0.14) (0.25)
APPLICATIONS OF CAPITAL FUNDING
Capital expenditure
- to meet additional demand - - -
- to improve the level of service 0.01 - -
- to replace existing assets - - -
(Increase)/decrease in reserves 2 (9.92) (2.02) (1.84)
(Increase)/decrease of investments - - -
Total applications of capital funding (D) (9.91) (2.02) (1.84)
Surplus/(deficit) of capital funding (C - D) 16.09 (2.16) (2.09)
Funding balance (A - B) + (C - D) - - -
Variance explanation Actual 2020/21 to LTP 2020/211. Interest revenue received from PRIP is lower than budget due to the debt to equity conversion which occurred
during 2019/20, reducing the amount of debt on which PRIP is required to pay interest to the Council.2. Proceeds from sales of assets reflect sales in accordance with the Waitara Lands Act, which were not budgeted for in
the LTP. A portion of the proceeds from these sales is distributed to other parties (included within payments to staff and suppliers), while the Waitara Perpetual Community Fund share of the sale proceeds is held in reserve by the Council.
3. Interest expense is lower than budget due to actual interest rates being lower than forecast, and lower overall debt than forecast.
Management of Investments and Funding
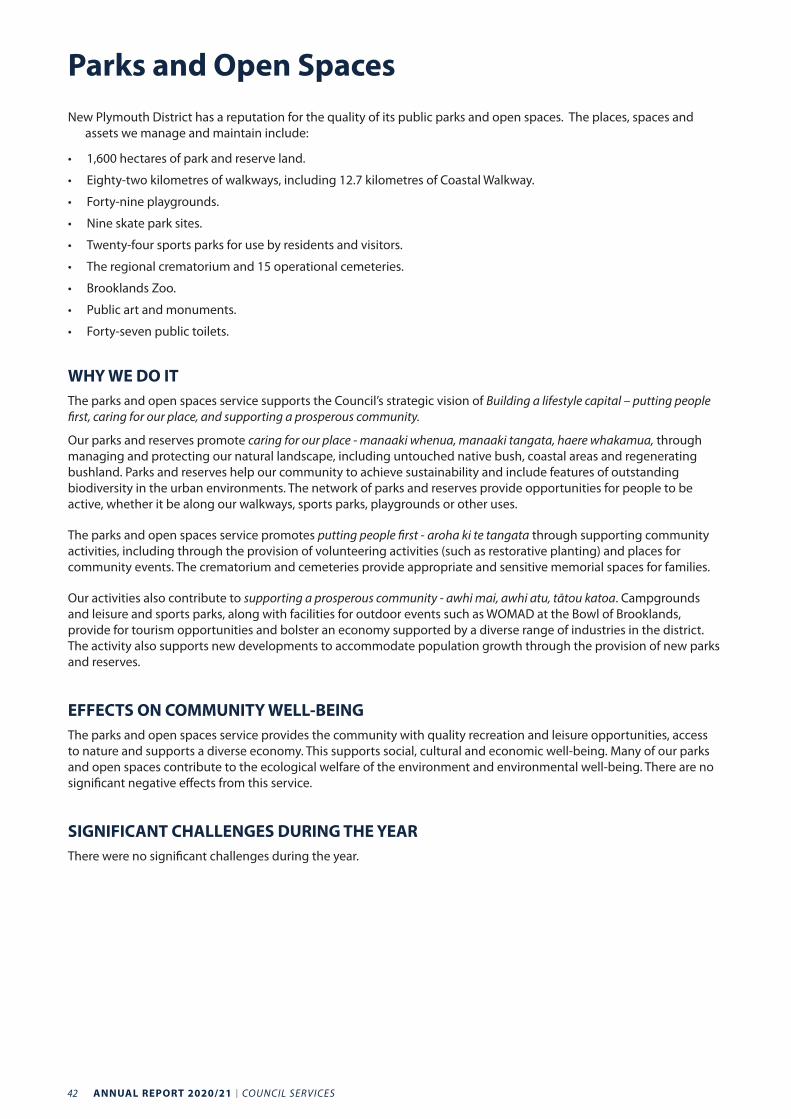
42 ANNUAL REPORT 2020/21 I COUNCIL SERVICES
New Plymouth District has a reputation for the quality of its public parks and open spaces. The places, spaces and assets we manage and maintain include:
• 1,600 hectares of park and reserve land.
• Eighty-two kilometres of walkways, including 12.7 kilometres of Coastal Walkway.
• Forty-nine playgrounds.
• Nine skate park sites.
• Twenty-four sports parks for use by residents and visitors.
• The regional crematorium and 15 operational cemeteries.
• Brooklands Zoo.
• Public art and monuments.
• Forty-seven public toilets.
WHY WE DO ITThe parks and open spaces service supports the Council’s strategic vision of Building a lifestyle capital – putting people first, caring for our place, and supporting a prosperous community.
Our parks and reserves promote caring for our place - manaaki whenua, manaaki tangata, haere whakamua, through managing and protecting our natural landscape, including untouched native bush, coastal areas and regenerating bushland. Parks and reserves help our community to achieve sustainability and include features of outstanding biodiversity in the urban environments. The network of parks and reserves provide opportunities for people to be active, whether it be along our walkways, sports parks, playgrounds or other uses.
The parks and open spaces service promotes putting people first - aroha ki te tangata through supporting community activities, including through the provision of volunteering activities (such as restorative planting) and places for community events. The crematorium and cemeteries provide appropriate and sensitive memorial spaces for families.
Our activities also contribute to supporting a prosperous community - awhi mai, awhi atu, tātou katoa. Campgrounds and leisure and sports parks, along with facilities for outdoor events such as WOMAD at the Bowl of Brooklands, provide for tourism opportunities and bolster an economy supported by a diverse range of industries in the district. The activity also supports new developments to accommodate population growth through the provision of new parks and reserves.
EFFECTS ON COMMUNITY WELL-BEINGThe parks and open spaces service provides the community with quality recreation and leisure opportunities, access to nature and supports a diverse economy. This supports social, cultural and economic well-being. Many of our parks and open spaces contribute to the ecological welfare of the environment and environmental well-being. There are no significant negative effects from this service.
SIGNIFICANT CHALLENGES DURING THE YEARThere were no significant challenges during the year.
Parks and Open Spaces
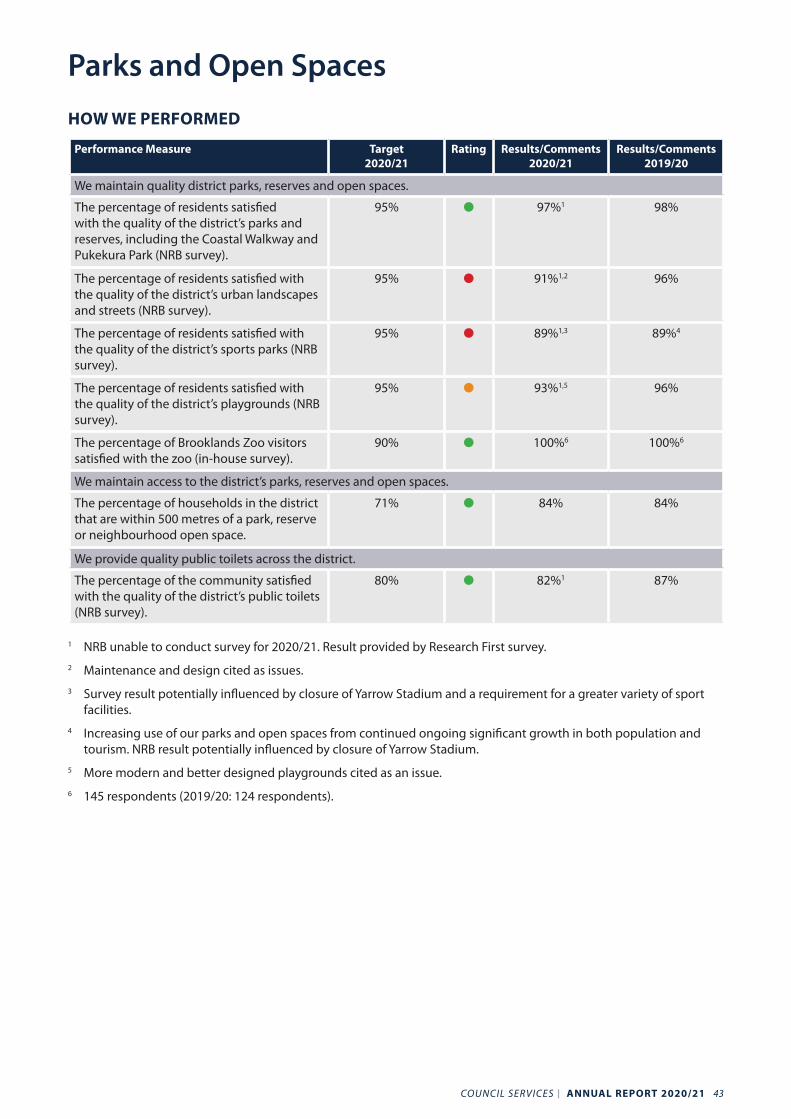
COUNCIL SERVICES I ANNUAL REPORT 2020/21 43
HOW WE PERFORMED
Performance Measure Target2020/21
Rating Results/Comments2020/21
Results/Comments2019/20
We maintain quality district parks, reserves and open spaces.
The percentage of residents satisfied with the quality of the district’s parks and reserves, including the Coastal Walkway and Pukekura Park (NRB survey).
95% 97%1 98%
The percentage of residents satisfied with the quality of the district’s urban landscapes and streets (NRB survey).
95% 91%1,2 96%
The percentage of residents satisfied with the quality of the district’s sports parks (NRB survey).
95% 89%1,3 89%4
The percentage of residents satisfied with the quality of the district’s playgrounds (NRB survey).
95% 93%1,5 96%
The percentage of Brooklands Zoo visitors satisfied with the zoo (in-house survey).
90% 100%6 100%6
We maintain access to the district’s parks, reserves and open spaces.
The percentage of households in the district that are within 500 metres of a park, reserve or neighbourhood open space.
71% 84% 84%
We provide quality public toilets across the district.
The percentage of the community satisfied with the quality of the district’s public toilets (NRB survey).
80% 82%1 87%
1 NRB unable to conduct survey for 2020/21. Result provided by Research First survey. 2 Maintenance and design cited as issues.3 Survey result potentially influenced by closure of Yarrow Stadium and a requirement for a greater variety of sport
facilities.4 Increasing use of our parks and open spaces from continued ongoing significant growth in both population and
tourism. NRB result potentially influenced by closure of Yarrow Stadium.5 More modern and better designed playgrounds cited as an issue.6 145 respondents (2019/20: 124 respondents).
Parks and Open Spaces

44 ANNUAL REPORT 2020/21 I COUNCIL SERVICES
FUNDING IMPACT STATEMENT for the year ended 30 June 2021
Notes Actual2020/21
($m)
LTP 2020/21
($m)
LTP 2019/20
($m)
SOURCES OF OPERATING FUNDING
General rates, uniform annual charges, rates penalties 15.09 15.60 14.63
Targeted rates - - -
Subsidies and grants for operating purposes 0.10 0.01 0.01
Fees and charges 2.18 2.03 2.00
Internal charges and overheads recovered - - -
Local authorities fuel tax, fines, infringement fees and other receipts - - -
Total operating funding (A) 17.36 17.64 16.64
APPLICATIONS OF OPERATING FUNDING
Payments to staff and suppliers 1 (12.53) (11.14) (13.54)
Finance costs (0.59) (0.90) (0.71)
Internal charges and overheads applied (2.92) (2.76) (2.71)
Other operating funding applications - - -
Total applications of operating funding (B) (16.04) (14.80) (16.96)
Surplus/(deficit) of operating funding (A - B) 1.33 2.84 (0.32)
SOURCES OF CAPITAL FUNDING
Subsidies and grants for capital expenditure (0.02) - 0.72
Development and financial contributions 2 0.04 0.92 0.81
Increase/(decrease) in debt 1,2 4.21 2.74 3.84
Gross proceeds from sale of assets - - -
Lump sum contributions - - -
Other dedicated capital funding - - -
Total sources of capital funding (C) 4.24 3.65 5.37
APPLICATIONS OF CAPITAL FUNDING
Capital expenditure
- to meet additional demand (0.12) (0.43) (0.85)
- to improve the level of service 3 (2.70) (3.82) (2.32)
- to replace existing assets (1.79) (1.73) (1.34)
(Increase)/decrease in reserves (0.95) (0.51) (0.54)
(Increase)/decrease of investments - - -
Total applications of capital funding (D) (5.56) (6.49) (5.05)
Surplus/(deficit) of capital funding (C - D) (1.32) (2.84) 0.32
Funding balance (A - B) + (C - D) - - -
Variance explanation Actual 2020/21 to LTP 2020/21
1. Payments to staff and suppliers and increase in debt funding are higher than budget due to completion of the Pukekura Park lake dredging project during 2020/21. This project was budgeted in the LTP to be completed during 2019/20, but was delayed due to the impact of Covid-19.
2. Development and financial contributions are lower than budget due to delays in residential development in Bell Block.
3. Capital funding is lower than budget due to delays in the Coastal Walkway railway safety improvements project.
Parks and Open Spaces
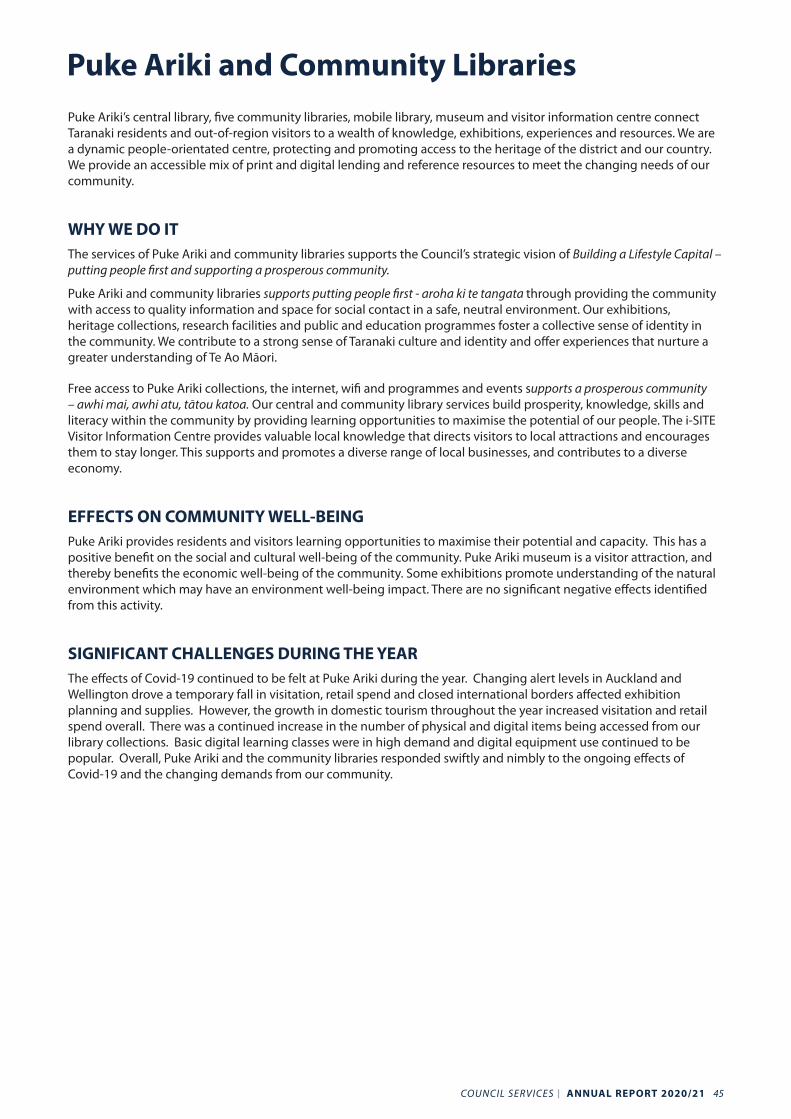
COUNCIL SERVICES I ANNUAL REPORT 2020/21 45
Puke Ariki’s central library, five community libraries, mobile library, museum and visitor information centre connect Taranaki residents and out-of-region visitors to a wealth of knowledge, exhibitions, experiences and resources. We are a dynamic people-orientated centre, protecting and promoting access to the heritage of the district and our country. We provide an accessible mix of print and digital lending and reference resources to meet the changing needs of our community.
WHY WE DO ITThe services of Puke Ariki and community libraries supports the Council’s strategic vision of Building a Lifestyle Capital – putting people first and supporting a prosperous community.
Puke Ariki and community libraries supports putting people first - aroha ki te tangata through providing the community with access to quality information and space for social contact in a safe, neutral environment. Our exhibitions, heritage collections, research facilities and public and education programmes foster a collective sense of identity in the community. We contribute to a strong sense of Taranaki culture and identity and offer experiences that nurture a greater understanding of Te Ao Māori.
Free access to Puke Ariki collections, the internet, wifi and programmes and events supports a prosperous community – awhi mai, awhi atu, tātou katoa. Our central and community library services build prosperity, knowledge, skills and literacy within the community by providing learning opportunities to maximise the potential of our people. The i-SITE Visitor Information Centre provides valuable local knowledge that directs visitors to local attractions and encourages them to stay longer. This supports and promotes a diverse range of local businesses, and contributes to a diverse economy.
EFFECTS ON COMMUNITY WELL-BEING Puke Ariki provides residents and visitors learning opportunities to maximise their potential and capacity. This has a positive benefit on the social and cultural well-being of the community. Puke Ariki museum is a visitor attraction, and thereby benefits the economic well-being of the community. Some exhibitions promote understanding of the natural environment which may have an environment well-being impact. There are no significant negative effects identified from this activity.
SIGNIFICANT CHALLENGES DURING THE YEARThe effects of Covid-19 continued to be felt at Puke Ariki during the year. Changing alert levels in Auckland and Wellington drove a temporary fall in visitation, retail spend and closed international borders affected exhibition planning and supplies. However, the growth in domestic tourism throughout the year increased visitation and retail spend overall. There was a continued increase in the number of physical and digital items being accessed from our library collections. Basic digital learning classes were in high demand and digital equipment use continued to be popular. Overall, Puke Ariki and the community libraries responded swiftly and nimbly to the ongoing effects of Covid-19 and the changing demands from our community.
Puke Ariki and Community Libraries
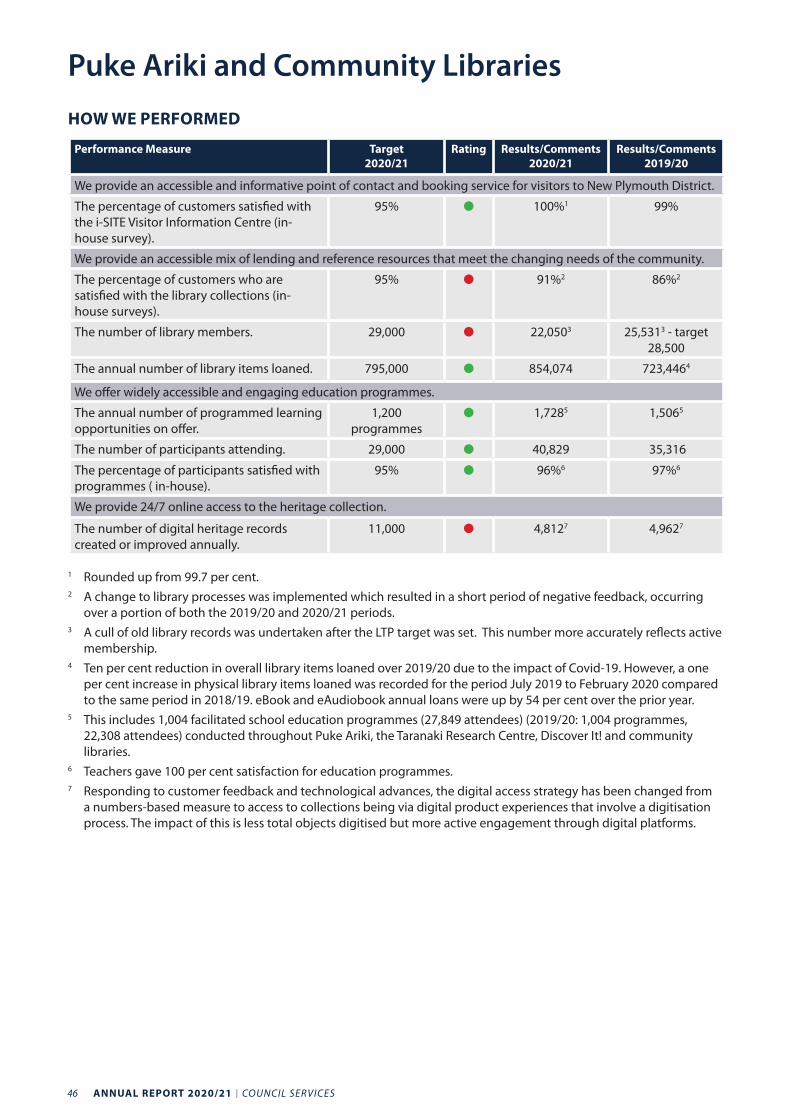
46 ANNUAL REPORT 2020/21 I COUNCIL SERVICES
HOW WE PERFORMED
Performance Measure Target2020/21
Rating Results/Comments2020/21
Results/Comments2019/20
We provide an accessible and informative point of contact and booking service for visitors to New Plymouth District.
The percentage of customers satisfied with the i-SITE Visitor Information Centre (in-house survey).
95% 100%1 99%
We provide an accessible mix of lending and reference resources that meet the changing needs of the community.
The percentage of customers who are satisfied with the library collections (in-house surveys).
95% 91%2 86%2
The number of library members. 29,000 22,0503 25,5313 - target 28,500
The annual number of library items loaned. 795,000 854,074 723,4464
We offer widely accessible and engaging education programmes.
The annual number of programmed learning opportunities on offer.
1,200 programmes
1,7285 1,5065
The number of participants attending. 29,000 40,829 35,316
The percentage of participants satisfied with programmes ( in-house).
95% 96%6 97%6
We provide 24/7 online access to the heritage collection.
The number of digital heritage records created or improved annually.
11,000 4,8127 4,9627
1 Rounded up from 99.7 per cent.2 A change to library processes was implemented which resulted in a short period of negative feedback, occurring
over a portion of both the 2019/20 and 2020/21 periods.3 A cull of old library records was undertaken after the LTP target was set. This number more accurately reflects active
membership. 4 Ten per cent reduction in overall library items loaned over 2019/20 due to the impact of Covid-19. However, a one
per cent increase in physical library items loaned was recorded for the period July 2019 to February 2020 compared to the same period in 2018/19. eBook and eAudiobook annual loans were up by 54 per cent over the prior year.
5 This includes 1,004 facilitated school education programmes (27,849 attendees) (2019/20: 1,004 programmes, 22,308 attendees) conducted throughout Puke Ariki, the Taranaki Research Centre, Discover It! and community libraries.
6 Teachers gave 100 per cent satisfaction for education programmes.7 Responding to customer feedback and technological advances, the digital access strategy has been changed from
a numbers-based measure to access to collections being via digital product experiences that involve a digitisation process. The impact of this is less total objects digitised but more active engagement through digital platforms.
Puke Ariki and Community Libraries
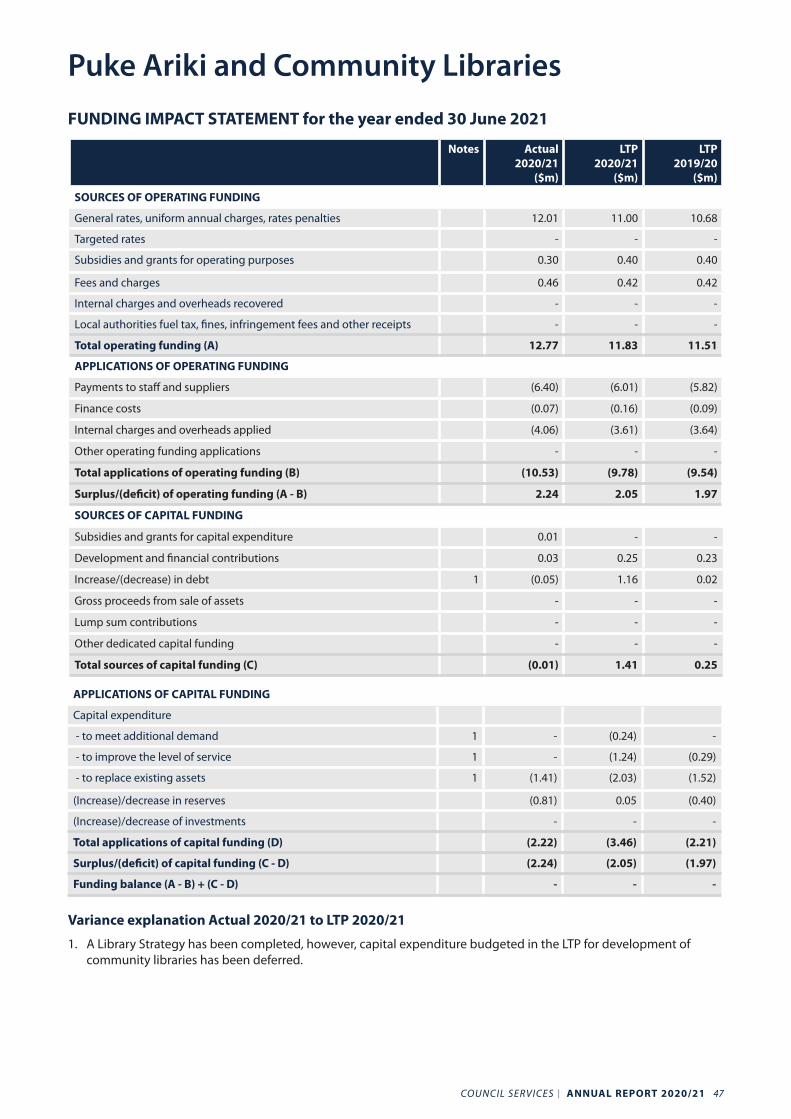
COUNCIL SERVICES I ANNUAL REPORT 2020/21 47
FUNDING IMPACT STATEMENT for the year ended 30 June 2021
Notes Actual2020/21
($m)
LTP 2020/21
($m)
LTP 2019/20
($m)
SOURCES OF OPERATING FUNDING
General rates, uniform annual charges, rates penalties 12.01 11.00 10.68
Targeted rates - - -
Subsidies and grants for operating purposes 0.30 0.40 0.40
Fees and charges 0.46 0.42 0.42
Internal charges and overheads recovered - - -
Local authorities fuel tax, fines, infringement fees and other receipts - - -
Total operating funding (A) 12.77 11.83 11.51
APPLICATIONS OF OPERATING FUNDING
Payments to staff and suppliers (6.40) (6.01) (5.82)
Finance costs (0.07) (0.16) (0.09)
Internal charges and overheads applied (4.06) (3.61) (3.64)
Other operating funding applications - - -
Total applications of operating funding (B) (10.53) (9.78) (9.54)
Surplus/(deficit) of operating funding (A - B) 2.24 2.05 1.97
SOURCES OF CAPITAL FUNDING
Subsidies and grants for capital expenditure 0.01 - -
Development and financial contributions 0.03 0.25 0.23
Increase/(decrease) in debt 1 (0.05) 1.16 0.02
Gross proceeds from sale of assets - - -
Lump sum contributions - - -
Other dedicated capital funding - - -
Total sources of capital funding (C) (0.01) 1.41 0.25
APPLICATIONS OF CAPITAL FUNDING
Capital expenditure
- to meet additional demand 1 - (0.24) -
- to improve the level of service 1 - (1.24) (0.29)
- to replace existing assets 1 (1.41) (2.03) (1.52)
(Increase)/decrease in reserves (0.81) 0.05 (0.40)
(Increase)/decrease of investments - - -
Total applications of capital funding (D) (2.22) (3.46) (2.21)
Surplus/(deficit) of capital funding (C - D) (2.24) (2.05) (1.97)
Funding balance (A - B) + (C - D) - - -
Variance explanation Actual 2020/21 to LTP 2020/21
1. A Library Strategy has been completed, however, capital expenditure budgeted in the LTP for development of community libraries has been deferred.
Puke Ariki and Community Libraries
48 ANNUAL REPORT 2020/21 I COUNCIL SERVICES
Stormwater is rainwater that flows from surfaces like roofs, gardens, footpaths and roads. The Council’s stormwater drainage schemes collect, manage and dispose of stormwater run-off from around 6,600 hectares of urban area in the district, covering New Plymouth, Bell Block, Waitara, Inglewood, Urenui, Onaero, Lepperton, Egmont Village, Ōākura and Ōkato.
We operate and maintain 310 kilometres of stormwater pipes and a number of detention areas and engineered wetlands to help manage stormwater in the district.
WHY WE DO ITAn inadequate stormwater system can lead to ponding which can damage property, pose risks to people’s safety and create inflow into wastewater pipes leading to wastewater overflows to the environment. Our service manages stormwater run-off in urban areas by ensuring there is a consistent standard of design and protection to reduce these risks.
The stormwater management service supports the Council’s strategic vision of Building a Lifestyle Capital – putting people first, caring for our place, and supporting a prosperous community.
Managing stormwater contributes to putting people first - aroha ki te tangata, by protecting people and property from the effects of stormwater run-off and localised flooding after a significant rainfall event.
Effective stormwater management contributes to caring for our place - manaaki whenua, manaaki tangata, haere whakamua by also protecting our natural resource.
Our planning for future challenges, such as an increased rainfall and climate change, supports a prosperous community - awhi mai, awhi atu, tātou katoa in the district by minimising potential risks to property and industry. Our stormwater activity also accommodates development for population growth through providing new stormwater systems.
EFFECTS ON COMMUNITY WELL-BEINGStormwater management can have a range of effects on the community. Stormwater management protects people and property, thereby having a positive impact on economic, social and cultural well-being. Potential negative effects are identified in the following table.
Effect How the Council intends to mitigate the effect
Heavy rain has the potential to overwhelm stormwater systems and affect community well-being. Discharge of polluted stormwater into waterways could also harm the environment.
We reduce this risk by ensuring a consistent standard of design and level of protection.
SIGNIFICANT CHALLENGES DURING THE YEARDuring the year we resumed closed-circuit television inspection of our stormwater assets. We inspected 11.4 kilometres of mains and found 3.65 kilometres which fail our service levels and need preventative maintenance (i.e. they are blocked with debris) and 1.3 kilometres which have structural fails and need repair or replacement. Undertaking these repairs is constrained due to lack of available engineering and contractor resources.
We experienced delays in repairing a large culvert under Waiwaka Terrace due to lack of access (subsequently addressed via the purchase of land) and the need for a land use consent.
Looking forward, we continue to create the stormwater model for Waitara and define the options to find a solution to the stormwater issues which meets technical, social and cultural requirements.
Stormwater Management
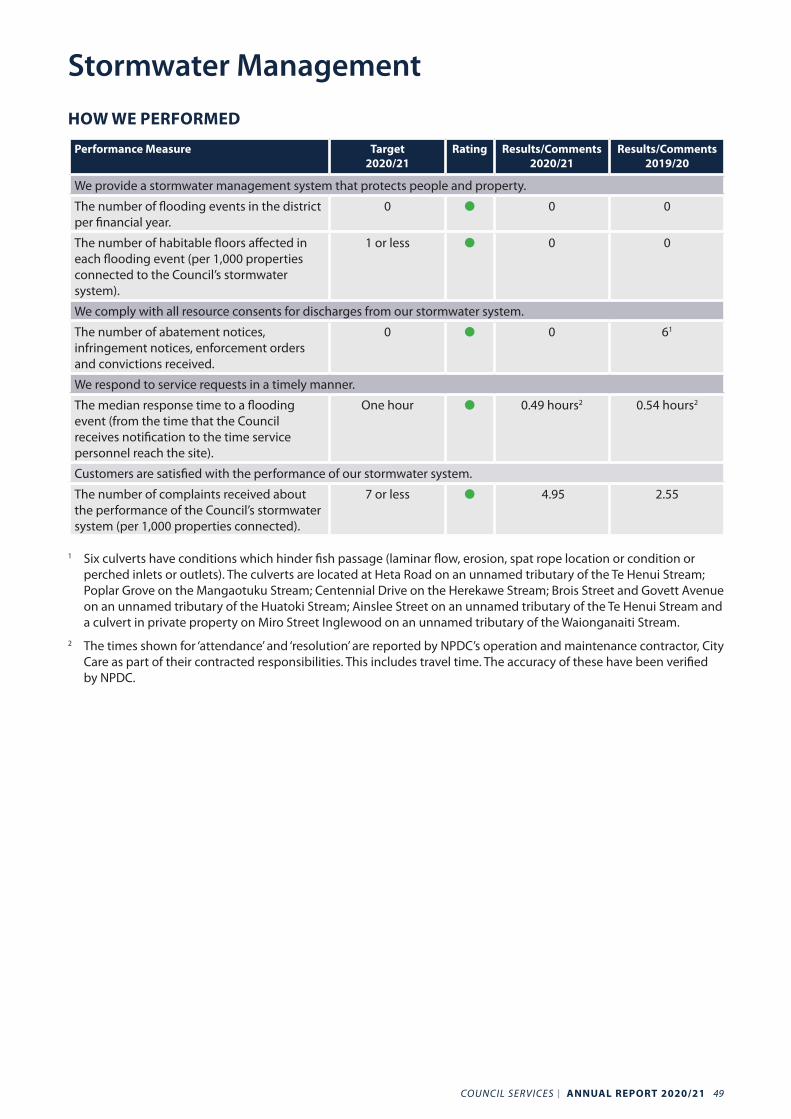
COUNCIL SERVICES I ANNUAL REPORT 2020/21 49
HOW WE PERFORMED
Performance Measure Target2020/21
Rating Results/Comments2020/21
Results/Comments2019/20
We provide a stormwater management system that protects people and property.
The number of flooding events in the district per financial year.
0 0 0
The number of habitable floors affected in each flooding event (per 1,000 properties connected to the Council’s stormwater system).
1 or less 0 0
We comply with all resource consents for discharges from our stormwater system.
The number of abatement notices, infringement notices, enforcement orders and convictions received.
0 0 61
We respond to service requests in a timely manner.
The median response time to a flooding event (from the time that the Council receives notification to the time service personnel reach the site).
One hour 0.49 hours2 0.54 hours2
Customers are satisfied with the performance of our stormwater system.
The number of complaints received about the performance of the Council’s stormwater system (per 1,000 properties connected).
7 or less 4.95 2.55
1 Six culverts have conditions which hinder fish passage (laminar flow, erosion, spat rope location or condition or perched inlets or outlets). The culverts are located at Heta Road on an unnamed tributary of the Te Henui Stream; Poplar Grove on the Mangaotuku Stream; Centennial Drive on the Herekawe Stream; Brois Street and Govett Avenue on an unnamed tributary of the Huatoki Stream; Ainslee Street on an unnamed tributary of the Te Henui Stream and a culvert in private property on Miro Street Inglewood on an unnamed tributary of the Waionganaiti Stream.
2 The times shown for ‘attendance’ and ‘resolution’ are reported by NPDC’s operation and maintenance contractor, City Care as part of their contracted responsibilities. This includes travel time. The accuracy of these have been verified by NPDC.
Stormwater Management
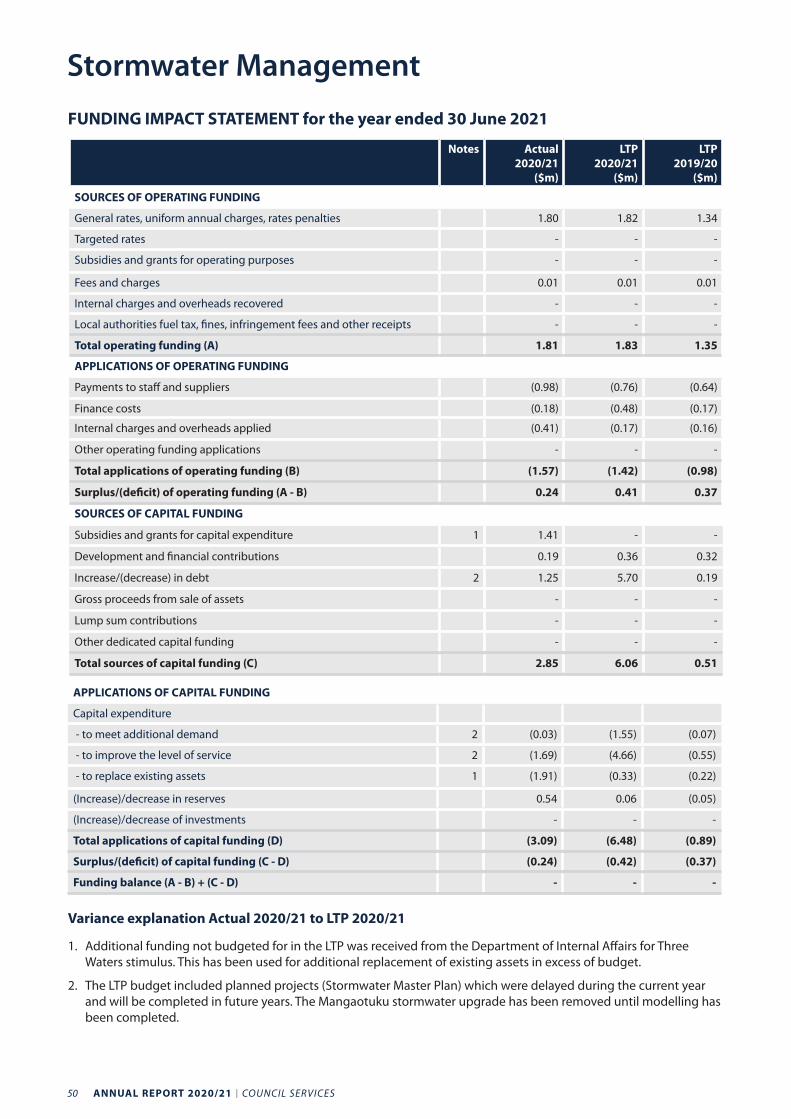
50 ANNUAL REPORT 2020/21 I COUNCIL SERVICES
FUNDING IMPACT STATEMENT for the year ended 30 June 2021
Notes Actual2020/21
($m)
LTP 2020/21
($m)
LTP 2019/20
($m)
SOURCES OF OPERATING FUNDING
General rates, uniform annual charges, rates penalties 1.80 1.82 1.34
Targeted rates - - -
Subsidies and grants for operating purposes - - -
Fees and charges 0.01 0.01 0.01
Internal charges and overheads recovered - - -
Local authorities fuel tax, fines, infringement fees and other receipts - - -
Total operating funding (A) 1.81 1.83 1.35
APPLICATIONS OF OPERATING FUNDING
Payments to staff and suppliers (0.98) (0.76) (0.64)
Finance costs (0.18) (0.48) (0.17)
Internal charges and overheads applied (0.41) (0.17) (0.16)
Other operating funding applications - - -
Total applications of operating funding (B) (1.57) (1.42) (0.98)
Surplus/(deficit) of operating funding (A - B) 0.24 0.41 0.37
SOURCES OF CAPITAL FUNDING
Subsidies and grants for capital expenditure 1 1.41 - -
Development and financial contributions 0.19 0.36 0.32
Increase/(decrease) in debt 2 1.25 5.70 0.19
Gross proceeds from sale of assets - - -
Lump sum contributions - - -
Other dedicated capital funding - - -
Total sources of capital funding (C) 2.85 6.06 0.51
APPLICATIONS OF CAPITAL FUNDING
Capital expenditure
- to meet additional demand 2 (0.03) (1.55) (0.07)
- to improve the level of service 2 (1.69) (4.66) (0.55)
- to replace existing assets 1 (1.91) (0.33) (0.22)
(Increase)/decrease in reserves 0.54 0.06 (0.05)
(Increase)/decrease of investments - - -
Total applications of capital funding (D) (3.09) (6.48) (0.89)
Surplus/(deficit) of capital funding (C - D) (0.24) (0.42) (0.37)
Funding balance (A - B) + (C - D) - - -
Variance explanation Actual 2020/21 to LTP 2020/21
1. Additional funding not budgeted for in the LTP was received from the Department of Internal Affairs for Three Waters stimulus. This has been used for additional replacement of existing assets in excess of budget.
2. The LTP budget included planned projects (Stormwater Master Plan) which were delayed during the current year and will be completed in future years. The Mangaotuku stormwater upgrade has been removed until modelling has been completed.
Stormwater Management
COUNCIL SERVICES I ANNUAL REPORT 2020/21 51
The Council’s transportation service manages a safe and efficient transport network that enables effective movement of people, goods and services around the district. We operate and maintain the district’s existing transport network and plan for the future growth and development of the network.
Transportation activities are influenced by a complex mix of policy, legislation and national and regional strategies. We work within this framework to develop, maintain and renew assets in the network and conduct traffic management on all roads, except state highways. Our service covers:
• 1,305 kilometres of roads.
• 370 bridges.
• 9,490 street lights.
• 11,758 traffic signs.
• Five tunnels.
WHY WE DO ITThe transportation service supports the Council’s strategic vision of Building a Lifestyle Capital – supporting a prosperous community and putting people first by providing a transport network that enables cyclists, pedestrians and vehicles to travel throughout the district.
Our service is critical in supporting a prosperous community - awhi mai, awhi atu, tātou katou. The Taranaki economy, of which New Plymouth district is an integral part, relies heavily on road transport to move people, goods and services between homes, farms, factories and offices, as well as in and out of the region. Our services support industry and development by providing roads and footpaths that give public access to key industry facilities. The service also supports new developments through the provision of new roads and footpaths.
Maintaining road surfaces and providing traffic management and control systems is essential to community safety and well-being, contributing to putting people first – aroha ki te tangata. Streetlights provide night time safety for all road users, including pedestrians. Well designed and maintained streets also promote community cohesion, providing people with a sense of place and safe public places.
EFFECTS ON COMMUNITY WELL-BEINGTransportation can have a range of effects on the community. Transportation is important to the movement of goods and people, and therefore promotes economic well-being. A connected and active community promotes social well-being. Potential negative effects are identified in the following table.
Effect How the Council intends to mitigate the effect
Roadworks and construction can have negative environmental and social effects on the community, including congestion, delays and noise and air pollution. Delays can have economic impacts and road construction can have cultural effects if significant sites are disturbed during activity.
The Council seeks to minimise these effects through robust planning and contractual conditions.
Users of the network are exposed to the risks of crashes and injuries from mistakes, poor infrastructure, inappropriate speeds and risk taking.
We provide high quality infrastructure that users can easily understand and respond to with appropriate user behaviour. We provide education programmes and implement speed and intersection controls that reduce the risk of crashes. We promote respect, tolerance and understanding between user groups and their respective needs and vulnerabilities.
Transportation

52 ANNUAL REPORT 2020/21 I COUNCIL SERVICES
SIGNIFICANT CHALLENGES DURING THE YEARDeclining levels of community satisfaction continue. This reflected challenges with renewal of our deteriorating urban arterial roads, the management of ageing structures (bridges and retaining walls), the increasing impact of forestry activity on rural low volume roads and the high trend of crashes at intersections. It is considered that these challenges reflect increasing budget pressures to maintain existing levels of service.
In response, along with this year’s budget increases, we have also looked to improve our services through a collaborative (but commercially tensioned) supply chain contract that has enabled the Council to be more agile and front-foot these significant challenges. Indication of improvement was supported by an independent Road Efficiency Group review giving us high praise for the quality of our network and asset management practices and the Infrastructure Term Services contract being awarded the Civil Contractor NZ winner in the ‘excellence in maintenance and management of assets’ category.
HOW WE PERFORMED
Performance Measure Target2020/21
Rating Results/Comments2020/21
Results/Comments2019/20
We provide a local roading network that is safe for all road users.
The change from the previous financial year1 in the number of fatalities and serious injury crashes on the district’s local roading network, expressed as a number.
Reducing -42,3 -62,3
We provide good quality district roads.
The average quality of ride on the district’s sealed local road network, as measured by smooth travel exposure.
88% 88% 85%4
The percentage of residents satisfied with the overall quality of the district’s roads (NRB survey).
85% 67%5 81%6
1 Measured for the period 1 July to 30 June.2 Results extracted from Crash Analysis System in July 2021, but data reliability dependent on input timeliness in data
processing. 3
2020/21 2019/20 2018/19Change Actual Change Actual Change Actual
Fatal crashes +1 2 -2 1 +1 3Serious injury crashes -5 19 -2 24 +13 28
4 Highly affected by the deteriorating condition of our arterial roads (where one per cent of our road network carries 20 per cent of all traffic movements). Consequently our 2021 to 2031 programme is focused on rehabilitating these roads, while maintaining the rest at current levels.
5 NRB were unable to conduct the survey for 2020/21. This result is provided by the Research First survey. With the lowest result since 2005 there has been a marked decline in the overall satisfaction with quality of the roads. The survey shows community dissatisfaction is due to potholes, quality and lack of maintenance, and road surface issues. Comments in the survey suggest these concerns are largely about community dissatisfaction with state highways rather than NPDC’s local roads.
6 The reason for the NRB result not meeting this performance measure is due to poor condition, poor quality of work and need for maintenance.
Transportation
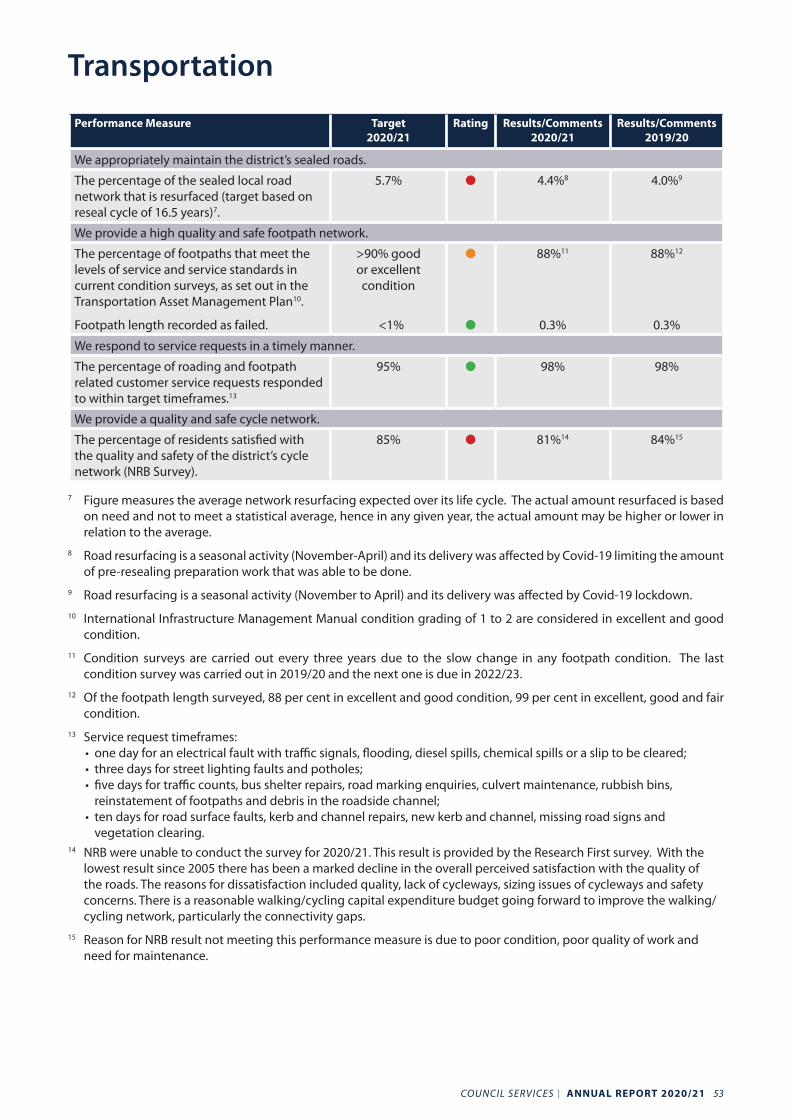
COUNCIL SERVICES I ANNUAL REPORT 2020/21 53
Performance Measure Target2020/21
Rating Results/Comments2020/21
Results/Comments2019/20
We appropriately maintain the district’s sealed roads.
The percentage of the sealed local road network that is resurfaced (target based on reseal cycle of 16.5 years)7.
5.7% 4.4%8 4.0%9
We provide a high quality and safe footpath network.
The percentage of footpaths that meet the levels of service and service standards in current condition surveys, as set out in the Transportation Asset Management Plan10.
Footpath length recorded as failed.
>90% good or excellent condition
<1%
88%11
0.3%
88%12
0.3%
We respond to service requests in a timely manner.
The percentage of roading and footpath related customer service requests responded to within target timeframes.13
95% 98% 98%
We provide a quality and safe cycle network.
The percentage of residents satisfied with the quality and safety of the district’s cycle network (NRB Survey).
85% 81%14 84%15
7 Figure measures the average network resurfacing expected over its life cycle. The actual amount resurfaced is based on need and not to meet a statistical average, hence in any given year, the actual amount may be higher or lower in relation to the average.
8 Road resurfacing is a seasonal activity (November-April) and its delivery was affected by Covid-19 limiting the amount of pre-resealing preparation work that was able to be done.
9 Road resurfacing is a seasonal activity (November to April) and its delivery was affected by Covid-19 lockdown. 10 International Infrastructure Management Manual condition grading of 1 to 2 are considered in excellent and good
condition.11 Condition surveys are carried out every three years due to the slow change in any footpath condition. The last
condition survey was carried out in 2019/20 and the next one is due in 2022/23.12 Of the footpath length surveyed, 88 per cent in excellent and good condition, 99 per cent in excellent, good and fair
condition.13 Service request timeframes:
• one day for an electrical fault with traffic signals, flooding, diesel spills, chemical spills or a slip to be cleared; • three days for street lighting faults and potholes; • five days for traffic counts, bus shelter repairs, road marking enquiries, culvert maintenance, rubbish bins,
reinstatement of footpaths and debris in the roadside channel; • ten days for road surface faults, kerb and channel repairs, new kerb and channel, missing road signs and
vegetation clearing. 14 NRB were unable to conduct the survey for 2020/21. This result is provided by the Research First survey. With the
lowest result since 2005 there has been a marked decline in the overall perceived satisfaction with the quality of the roads. The reasons for dissatisfaction included quality, lack of cycleways, sizing issues of cycleways and safety concerns. There is a reasonable walking/cycling capital expenditure budget going forward to improve the walking/cycling network, particularly the connectivity gaps.
15 Reason for NRB result not meeting this performance measure is due to poor condition, poor quality of work and need for maintenance.
Transportation
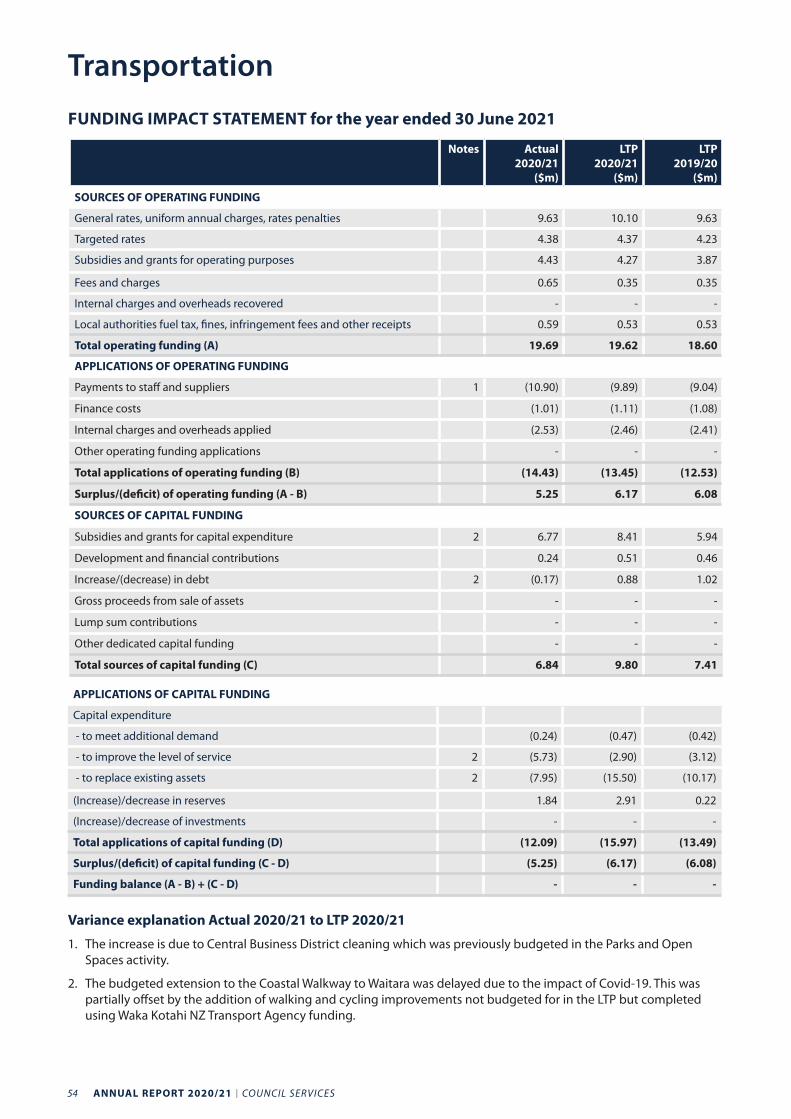
54 ANNUAL REPORT 2020/21 I COUNCIL SERVICES
FUNDING IMPACT STATEMENT for the year ended 30 June 2021
Notes Actual2020/21
($m)
LTP 2020/21
($m)
LTP 2019/20
($m)
SOURCES OF OPERATING FUNDING
General rates, uniform annual charges, rates penalties 9.63 10.10 9.63
Targeted rates 4.38 4.37 4.23
Subsidies and grants for operating purposes 4.43 4.27 3.87
Fees and charges 0.65 0.35 0.35
Internal charges and overheads recovered - - -
Local authorities fuel tax, fines, infringement fees and other receipts 0.59 0.53 0.53
Total operating funding (A) 19.69 19.62 18.60
APPLICATIONS OF OPERATING FUNDING
Payments to staff and suppliers 1 (10.90) (9.89) (9.04)
Finance costs (1.01) (1.11) (1.08)
Internal charges and overheads applied (2.53) (2.46) (2.41)
Other operating funding applications - - -
Total applications of operating funding (B) (14.43) (13.45) (12.53)
Surplus/(deficit) of operating funding (A - B) 5.25 6.17 6.08
SOURCES OF CAPITAL FUNDING
Subsidies and grants for capital expenditure 2 6.77 8.41 5.94
Development and financial contributions 0.24 0.51 0.46
Increase/(decrease) in debt 2 (0.17) 0.88 1.02
Gross proceeds from sale of assets - - -
Lump sum contributions - - -
Other dedicated capital funding - - -
Total sources of capital funding (C) 6.84 9.80 7.41
APPLICATIONS OF CAPITAL FUNDING
Capital expenditure
- to meet additional demand (0.24) (0.47) (0.42)
- to improve the level of service 2 (5.73) (2.90) (3.12)
- to replace existing assets 2 (7.95) (15.50) (10.17)
(Increase)/decrease in reserves 1.84 2.91 0.22
(Increase)/decrease of investments - - -
Total applications of capital funding (D) (12.09) (15.97) (13.49)
Surplus/(deficit) of capital funding (C - D) (5.25) (6.17) (6.08)
Funding balance (A - B) + (C - D) - - -
Variance explanation Actual 2020/21 to LTP 2020/21
1. The increase is due to Central Business District cleaning which was previously budgeted in the Parks and Open Spaces activity.
2. The budgeted extension to the Coastal Walkway to Waitara was delayed due to the impact of Covid-19. This was partially offset by the addition of walking and cycling improvements not budgeted for in the LTP but completed using Waka Kotahi NZ Transport Agency funding.
Transportation
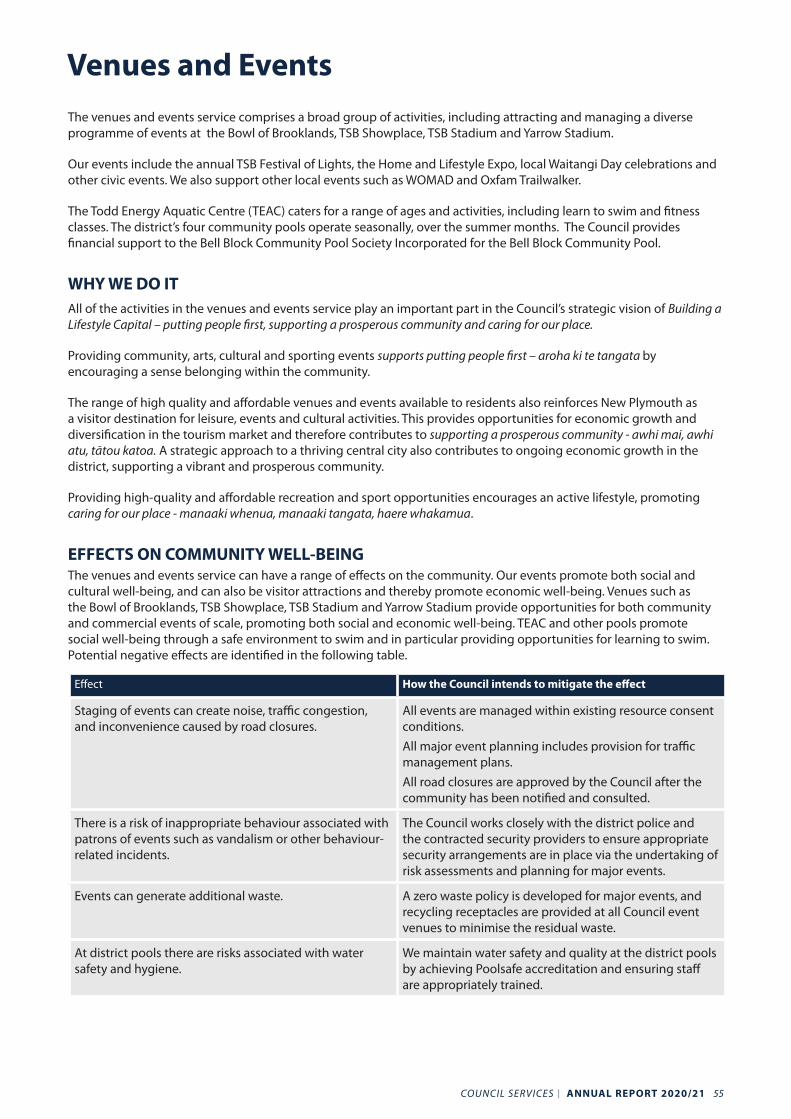
COUNCIL SERVICES I ANNUAL REPORT 2020/21 55
The venues and events service comprises a broad group of activities, including attracting and managing a diverse programme of events at the Bowl of Brooklands, TSB Showplace, TSB Stadium and Yarrow Stadium.
Our events include the annual TSB Festival of Lights, the Home and Lifestyle Expo, local Waitangi Day celebrations and other civic events. We also support other local events such as WOMAD and Oxfam Trailwalker.
The Todd Energy Aquatic Centre (TEAC) caters for a range of ages and activities, including learn to swim and fitness classes. The district’s four community pools operate seasonally, over the summer months. The Council provides financial support to the Bell Block Community Pool Society Incorporated for the Bell Block Community Pool.
WHY WE DO ITAll of the activities in the venues and events service play an important part in the Council’s strategic vision of Building a Lifestyle Capital – putting people first, supporting a prosperous community and caring for our place.
Providing community, arts, cultural and sporting events supports putting people first – aroha ki te tangata by encouraging a sense belonging within the community.
The range of high quality and affordable venues and events available to residents also reinforces New Plymouth as a visitor destination for leisure, events and cultural activities. This provides opportunities for economic growth and diversification in the tourism market and therefore contributes to supporting a prosperous community - awhi mai, awhi atu, tātou katoa. A strategic approach to a thriving central city also contributes to ongoing economic growth in the district, supporting a vibrant and prosperous community.
Providing high-quality and affordable recreation and sport opportunities encourages an active lifestyle, promoting caring for our place - manaaki whenua, manaaki tangata, haere whakamua.
EFFECTS ON COMMUNITY WELL-BEINGThe venues and events service can have a range of effects on the community. Our events promote both social and cultural well-being, and can also be visitor attractions and thereby promote economic well-being. Venues such as the Bowl of Brooklands, TSB Showplace, TSB Stadium and Yarrow Stadium provide opportunities for both community and commercial events of scale, promoting both social and economic well-being. TEAC and other pools promote social well-being through a safe environment to swim and in particular providing opportunities for learning to swim. Potential negative effects are identified in the following table.
Effect How the Council intends to mitigate the effect
Staging of events can create noise, traffic congestion, and inconvenience caused by road closures.
All events are managed within existing resource consent conditions.All major event planning includes provision for traffic management plans.All road closures are approved by the Council after the community has been notified and consulted.
There is a risk of inappropriate behaviour associated with patrons of events such as vandalism or other behaviour-related incidents.
The Council works closely with the district police and the contracted security providers to ensure appropriate security arrangements are in place via the undertaking of risk assessments and planning for major events.
Events can generate additional waste. A zero waste policy is developed for major events, and recycling receptacles are provided at all Council event venues to minimise the residual waste.
At district pools there are risks associated with water safety and hygiene.
We maintain water safety and quality at the district pools by achieving Poolsafe accreditation and ensuring staff are appropriately trained.
Venues and Events
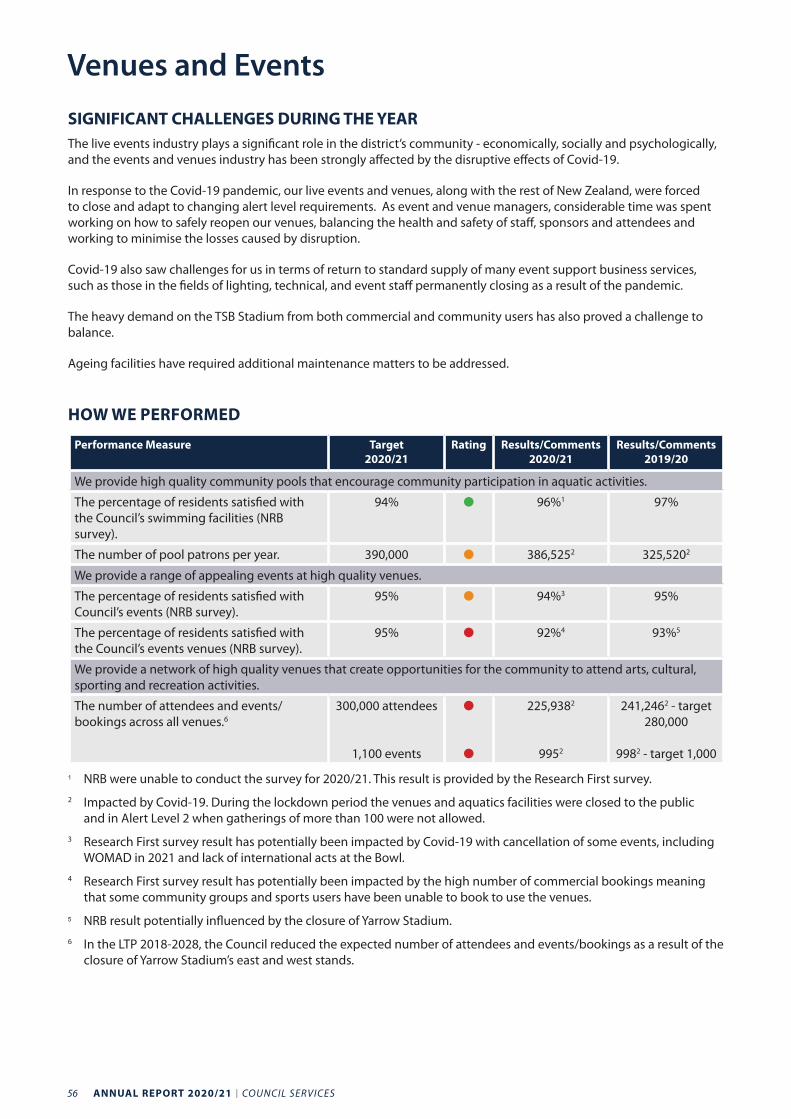
56 ANNUAL REPORT 2020/21 I COUNCIL SERVICES
SIGNIFICANT CHALLENGES DURING THE YEARThe live events industry plays a significant role in the district’s community - economically, socially and psychologically, and the events and venues industry has been strongly affected by the disruptive effects of Covid-19.
In response to the Covid-19 pandemic, our live events and venues, along with the rest of New Zealand, were forced to close and adapt to changing alert level requirements. As event and venue managers, considerable time was spent working on how to safely reopen our venues, balancing the health and safety of staff, sponsors and attendees and working to minimise the losses caused by disruption.
Covid-19 also saw challenges for us in terms of return to standard supply of many event support business services, such as those in the fields of lighting, technical, and event staff permanently closing as a result of the pandemic.
The heavy demand on the TSB Stadium from both commercial and community users has also proved a challenge to balance.
Ageing facilities have required additional maintenance matters to be addressed.
HOW WE PERFORMED
Performance Measure Target2020/21
Rating Results/Comments2020/21
Results/Comments2019/20
We provide high quality community pools that encourage community participation in aquatic activities.
The percentage of residents satisfied with the Council’s swimming facilities (NRB survey).
94% 96%1 97%
The number of pool patrons per year. 390,000 386,5252 325,5202
We provide a range of appealing events at high quality venues.
The percentage of residents satisfied with Council’s events (NRB survey).
95% 94%3 95%
The percentage of residents satisfied with the Council’s events venues (NRB survey).
95% 92%4 93%5
We provide a network of high quality venues that create opportunities for the community to attend arts, cultural, sporting and recreation activities.
The number of attendees and events/bookings across all venues.6
300,000 attendees
1,100 events
225,9382
9952
241,2462 - target 280,000
9982 - target 1,000
1 NRB were unable to conduct the survey for 2020/21. This result is provided by the Research First survey. 2 Impacted by Covid-19. During the lockdown period the venues and aquatics facilities were closed to the public
and in Alert Level 2 when gatherings of more than 100 were not allowed.3 Research First survey result has potentially been impacted by Covid-19 with cancellation of some events, including
WOMAD in 2021 and lack of international acts at the Bowl. 4 Research First survey result has potentially been impacted by the high number of commercial bookings meaning
that some community groups and sports users have been unable to book to use the venues.5 NRB result potentially influenced by the closure of Yarrow Stadium.6 In the LTP 2018-2028, the Council reduced the expected number of attendees and events/bookings as a result of the
closure of Yarrow Stadium’s east and west stands.
Venues and Events
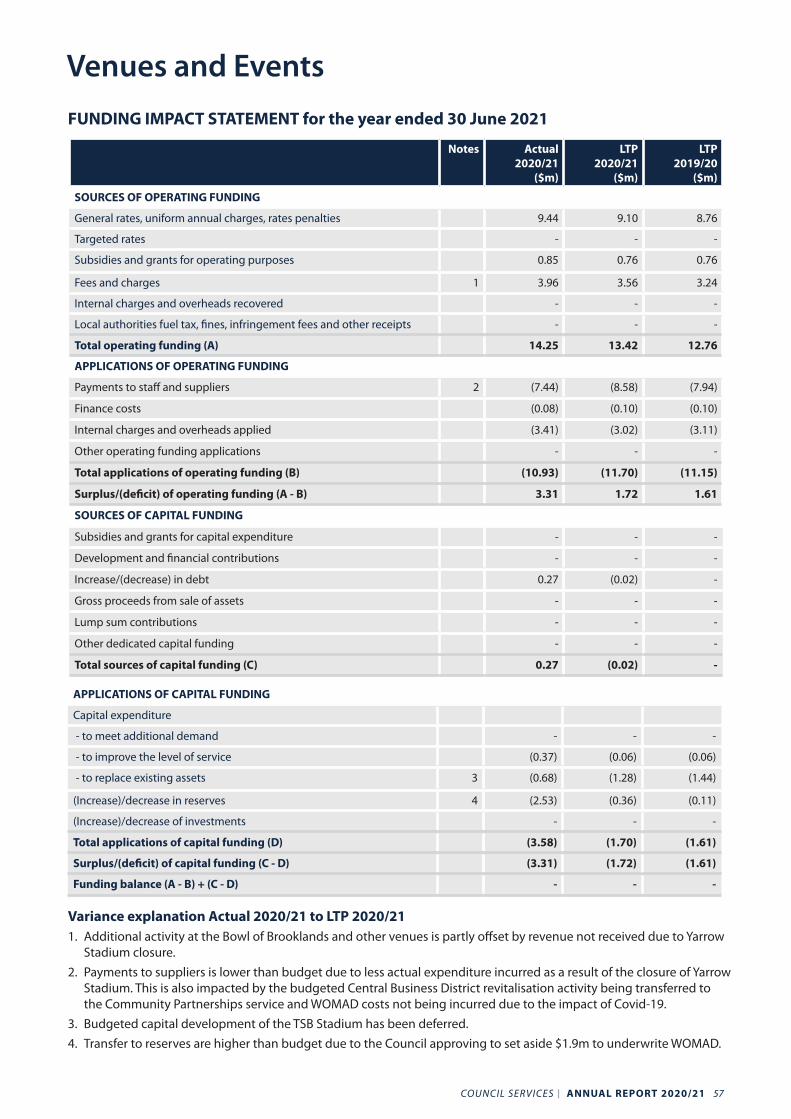
COUNCIL SERVICES I ANNUAL REPORT 2020/21 57
FUNDING IMPACT STATEMENT for the year ended 30 June 2021
Notes Actual2020/21
($m)
LTP 2020/21
($m)
LTP 2019/20
($m)
SOURCES OF OPERATING FUNDING
General rates, uniform annual charges, rates penalties 9.44 9.10 8.76
Targeted rates - - -
Subsidies and grants for operating purposes 0.85 0.76 0.76
Fees and charges 1 3.96 3.56 3.24
Internal charges and overheads recovered - - -
Local authorities fuel tax, fines, infringement fees and other receipts - - -
Total operating funding (A) 14.25 13.42 12.76
APPLICATIONS OF OPERATING FUNDING
Payments to staff and suppliers 2 (7.44) (8.58) (7.94)
Finance costs (0.08) (0.10) (0.10)
Internal charges and overheads applied (3.41) (3.02) (3.11)
Other operating funding applications - - -
Total applications of operating funding (B) (10.93) (11.70) (11.15)
Surplus/(deficit) of operating funding (A - B) 3.31 1.72 1.61
SOURCES OF CAPITAL FUNDING
Subsidies and grants for capital expenditure - - -
Development and financial contributions - - -
Increase/(decrease) in debt 0.27 (0.02) -
Gross proceeds from sale of assets - - -
Lump sum contributions - - -
Other dedicated capital funding - - -
Total sources of capital funding (C) 0.27 (0.02) -
APPLICATIONS OF CAPITAL FUNDING
Capital expenditure
- to meet additional demand - - -
- to improve the level of service (0.37) (0.06) (0.06)
- to replace existing assets 3 (0.68) (1.28) (1.44)
(Increase)/decrease in reserves 4 (2.53) (0.36) (0.11)
(Increase)/decrease of investments - - -
Total applications of capital funding (D) (3.58) (1.70) (1.61)
Surplus/(deficit) of capital funding (C - D) (3.31) (1.72) (1.61)
Funding balance (A - B) + (C - D) - - -
Variance explanation Actual 2020/21 to LTP 2020/211. Additional activity at the Bowl of Brooklands and other venues is partly offset by revenue not received due to Yarrow
Stadium closure.2. Payments to suppliers is lower than budget due to less actual expenditure incurred as a result of the closure of Yarrow
Stadium. This is also impacted by the budgeted Central Business District revitalisation activity being transferred to the Community Partnerships service and WOMAD costs not being incurred due to the impact of Covid-19.
3. Budgeted capital development of the TSB Stadium has been deferred.4. Transfer to reserves are higher than budget due to the Council approving to set aside $1.9m to underwrite WOMAD.
Venues and Events
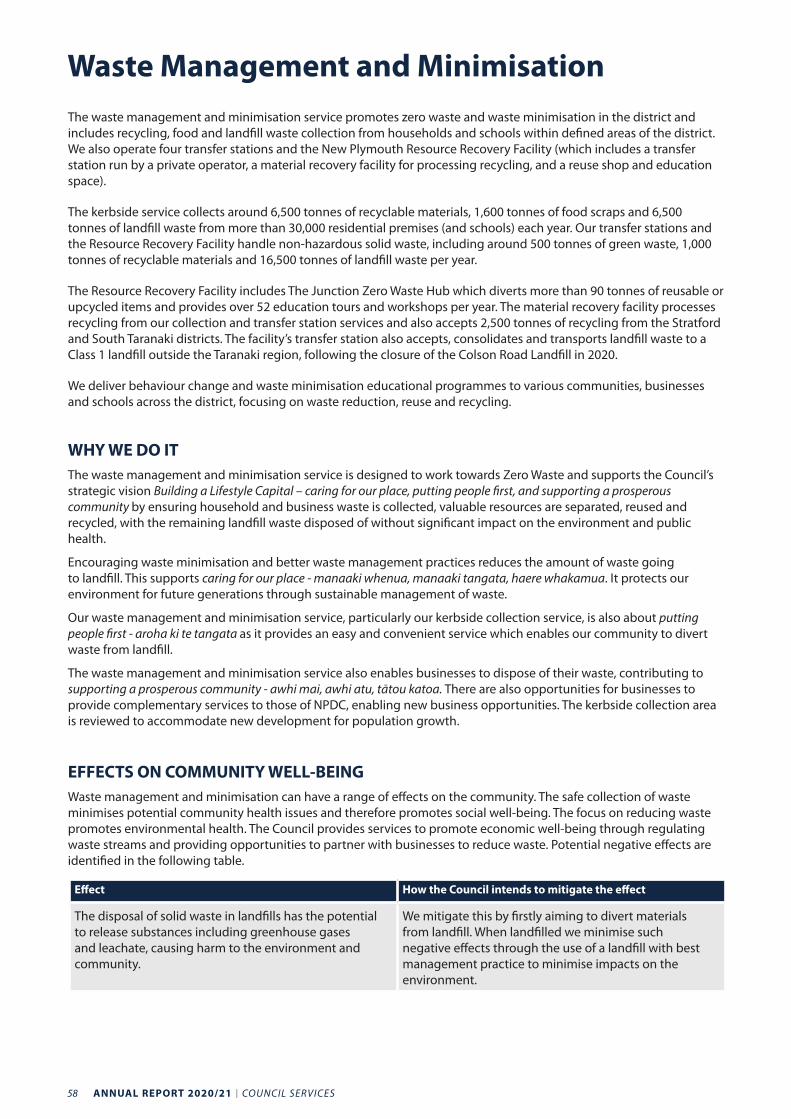
58 ANNUAL REPORT 2020/21 I COUNCIL SERVICES
The waste management and minimisation service promotes zero waste and waste minimisation in the district and includes recycling, food and landfill waste collection from households and schools within defined areas of the district. We also operate four transfer stations and the New Plymouth Resource Recovery Facility (which includes a transfer station run by a private operator, a material recovery facility for processing recycling, and a reuse shop and education space).
The kerbside service collects around 6,500 tonnes of recyclable materials, 1,600 tonnes of food scraps and 6,500 tonnes of landfill waste from more than 30,000 residential premises (and schools) each year. Our transfer stations and the Resource Recovery Facility handle non-hazardous solid waste, including around 500 tonnes of green waste, 1,000 tonnes of recyclable materials and 16,500 tonnes of landfill waste per year.
The Resource Recovery Facility includes The Junction Zero Waste Hub which diverts more than 90 tonnes of reusable or upcycled items and provides over 52 education tours and workshops per year. The material recovery facility processes recycling from our collection and transfer station services and also accepts 2,500 tonnes of recycling from the Stratford and South Taranaki districts. The facility’s transfer station also accepts, consolidates and transports landfill waste to a Class 1 landfill outside the Taranaki region, following the closure of the Colson Road Landfill in 2020.
We deliver behaviour change and waste minimisation educational programmes to various communities, businesses and schools across the district, focusing on waste reduction, reuse and recycling.
WHY WE DO ITThe waste management and minimisation service is designed to work towards Zero Waste and supports the Council’s strategic vision Building a Lifestyle Capital – caring for our place, putting people first, and supporting a prosperous community by ensuring household and business waste is collected, valuable resources are separated, reused and recycled, with the remaining landfill waste disposed of without significant impact on the environment and public health.
Encouraging waste minimisation and better waste management practices reduces the amount of waste going to landfill. This supports caring for our place - manaaki whenua, manaaki tangata, haere whakamua. It protects our environment for future generations through sustainable management of waste.
Our waste management and minimisation service, particularly our kerbside collection service, is also about putting people first - aroha ki te tangata as it provides an easy and convenient service which enables our community to divert waste from landfill.
The waste management and minimisation service also enables businesses to dispose of their waste, contributing to supporting a prosperous community - awhi mai, awhi atu, tātou katoa. There are also opportunities for businesses to provide complementary services to those of NPDC, enabling new business opportunities. The kerbside collection area is reviewed to accommodate new development for population growth.
EFFECTS ON COMMUNITY WELL-BEINGWaste management and minimisation can have a range of effects on the community. The safe collection of waste minimises potential community health issues and therefore promotes social well-being. The focus on reducing waste promotes environmental health. The Council provides services to promote economic well-being through regulating waste streams and providing opportunities to partner with businesses to reduce waste. Potential negative effects are identified in the following table.
Effect How the Council intends to mitigate the effect
The disposal of solid waste in landfills has the potential to release substances including greenhouse gases and leachate, causing harm to the environment and community.
We mitigate this by firstly aiming to divert materials from landfill. When landfilled we minimise such negative effects through the use of a landfill with best management practice to minimise impacts on the environment.
Waste Management and Minimisation
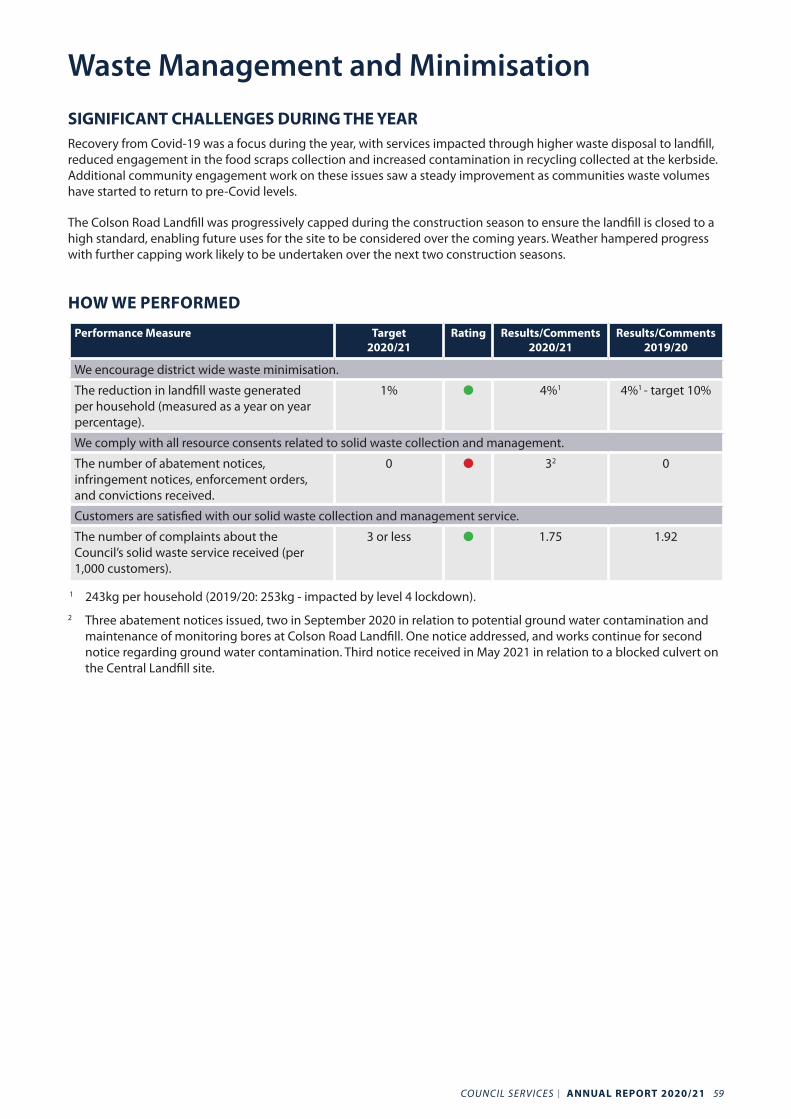
COUNCIL SERVICES I ANNUAL REPORT 2020/21 59
SIGNIFICANT CHALLENGES DURING THE YEARRecovery from Covid-19 was a focus during the year, with services impacted through higher waste disposal to landfill, reduced engagement in the food scraps collection and increased contamination in recycling collected at the kerbside. Additional community engagement work on these issues saw a steady improvement as communities waste volumes have started to return to pre-Covid levels.
The Colson Road Landfill was progressively capped during the construction season to ensure the landfill is closed to a high standard, enabling future uses for the site to be considered over the coming years. Weather hampered progress with further capping work likely to be undertaken over the next two construction seasons.
HOW WE PERFORMED
Performance Measure Target2020/21
Rating Results/Comments2020/21
Results/Comments2019/20
We encourage district wide waste minimisation.
The reduction in landfill waste generated per household (measured as a year on year percentage).
1% 4%1 4%1 - target 10%
We comply with all resource consents related to solid waste collection and management.
The number of abatement notices, infringement notices, enforcement orders, and convictions received.
0 32 0
Customers are satisfied with our solid waste collection and management service.
The number of complaints about the Council’s solid waste service received (per 1,000 customers).
3 or less 1.75 1.92
1 243kg per household (2019/20: 253kg - impacted by level 4 lockdown).2 Three abatement notices issued, two in September 2020 in relation to potential ground water contamination and
maintenance of monitoring bores at Colson Road Landfill. One notice addressed, and works continue for second notice regarding ground water contamination. Third notice received in May 2021 in relation to a blocked culvert on the Central Landfill site.
Waste Management and Minimisation
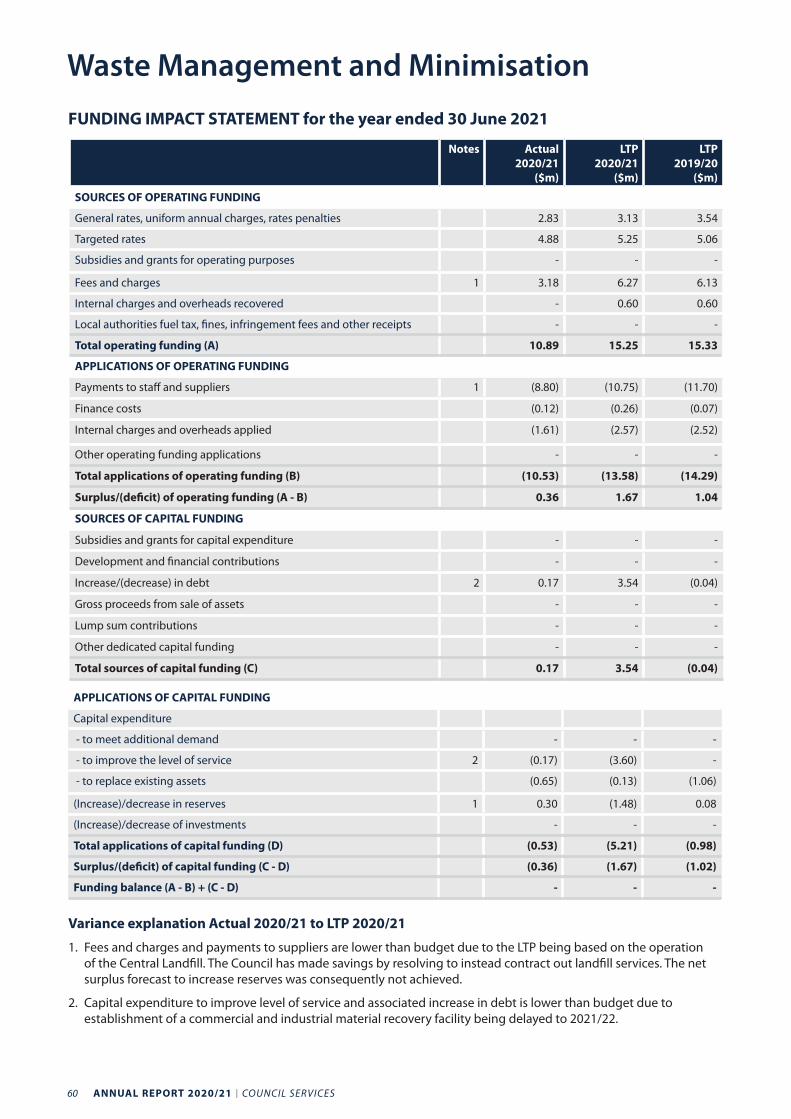
60 ANNUAL REPORT 2020/21 I COUNCIL SERVICES
FUNDING IMPACT STATEMENT for the year ended 30 June 2021
Notes Actual2020/21
($m)
LTP 2020/21
($m)
LTP 2019/20
($m)
SOURCES OF OPERATING FUNDING
General rates, uniform annual charges, rates penalties 2.83 3.13 3.54
Targeted rates 4.88 5.25 5.06
Subsidies and grants for operating purposes - - -
Fees and charges 1 3.18 6.27 6.13
Internal charges and overheads recovered - 0.60 0.60
Local authorities fuel tax, fines, infringement fees and other receipts - - -
Total operating funding (A) 10.89 15.25 15.33
APPLICATIONS OF OPERATING FUNDING
Payments to staff and suppliers 1 (8.80) (10.75) (11.70)
Finance costs (0.12) (0.26) (0.07)
Internal charges and overheads applied (1.61) (2.57) (2.52)
Other operating funding applications - - -
Total applications of operating funding (B) (10.53) (13.58) (14.29)
Surplus/(deficit) of operating funding (A - B) 0.36 1.67 1.04
SOURCES OF CAPITAL FUNDING
Subsidies and grants for capital expenditure - - -
Development and financial contributions - - -
Increase/(decrease) in debt 2 0.17 3.54 (0.04)
Gross proceeds from sale of assets - - -
Lump sum contributions - - -
Other dedicated capital funding - - -
Total sources of capital funding (C) 0.17 3.54 (0.04)
APPLICATIONS OF CAPITAL FUNDING
Capital expenditure
- to meet additional demand - - -
- to improve the level of service 2 (0.17) (3.60) -
- to replace existing assets (0.65) (0.13) (1.06)
(Increase)/decrease in reserves 1 0.30 (1.48) 0.08
(Increase)/decrease of investments - - -
Total applications of capital funding (D) (0.53) (5.21) (0.98)
Surplus/(deficit) of capital funding (C - D) (0.36) (1.67) (1.02)
Funding balance (A - B) + (C - D) - - -
Variance explanation Actual 2020/21 to LTP 2020/21
1. Fees and charges and payments to suppliers are lower than budget due to the LTP being based on the operation of the Central Landfill. The Council has made savings by resolving to instead contract out landfill services. The net surplus forecast to increase reserves was consequently not achieved.
2. Capital expenditure to improve level of service and associated increase in debt is lower than budget due to establishment of a commercial and industrial material recovery facility being delayed to 2021/22.
Waste Management and Minimisation
COUNCIL SERVICES I ANNUAL REPORT 2020/21 61
The wastewater treatment service provides a network of infrastructure to manage domestic and industrial wastewater in the district. We collect and treat sewage from the urban areas of New Plymouth, Bell Block, Waitara, Inglewood and Ōākura and return clean water to the environment
Our activities include operating and maintaining a centralised treatment plant, 37 pump stations and 700 kilometres of sewer network. We also monitor the flow of trade waste into the network. On average, we handle 22 million litres of wastewater each day, servicing around 27,000 properties.
WHY WE DO ITThe wastewater treatment service supports the Council’s strategic vision of Building a Lifestyle Capital – caring for our place, putting people first and supporting a prosperous community.
Treating wastewater contributes to caring for our place - manaaki whenua, manaaki tangata, haere whakamua. Treating potentially hazardous wastewater makes it safe for both people and the natural environment. It reduces significant environmental health issues from sewage.
The collection and treatment of wastewater in a safe and efficient manner also contributes to putting people first - aroha ki te tangata. It protects the health of our people, supporting a liveable environment for our community.
Wastewater treatment is also critical to supporting a prosperous community - awhi mai, awhi atu, tātou katoa through the provision of core infrastructure for industry and to accommodate growth in population and development.
EFFECTS ON COMMUNITY WELL-BEINGWastewater treatment can have a range of effects on the community. Wastewater promotes the health of our community and waterways, benefiting social, cultural and environmental well-being. Wastewater also promotes economic activity. Potential negative effects are identified in the following table.
Effect How NPDC intends to mitigate the effect
Managing wastewater comes with the risk of system overflows into rivers and streams, which can affect the environmental and social well-being of the community.
We minimise the likelihood of such overflows through regular inspections of equipment, maintenance programmes, renewal and lining of old and/or leaky pipes. We also use sound design, construction and operations practices.
SIGNIFICANT CHALLENGES DURING THE YEARThe Council received a confirmation of $37m grant from the government to replace the Thermal Drying Facility. This required diversion of resources to enable this project to be delivered within the programme. The design and planning phases have been completed with work due to start in November 2021.
The Council was convicted and fined in February for the overflow from the Mangati Pump Station. A project has been included in the LTP 2021-2031 for the installation of emergency storage at this pump station.
Wastewater Treatment
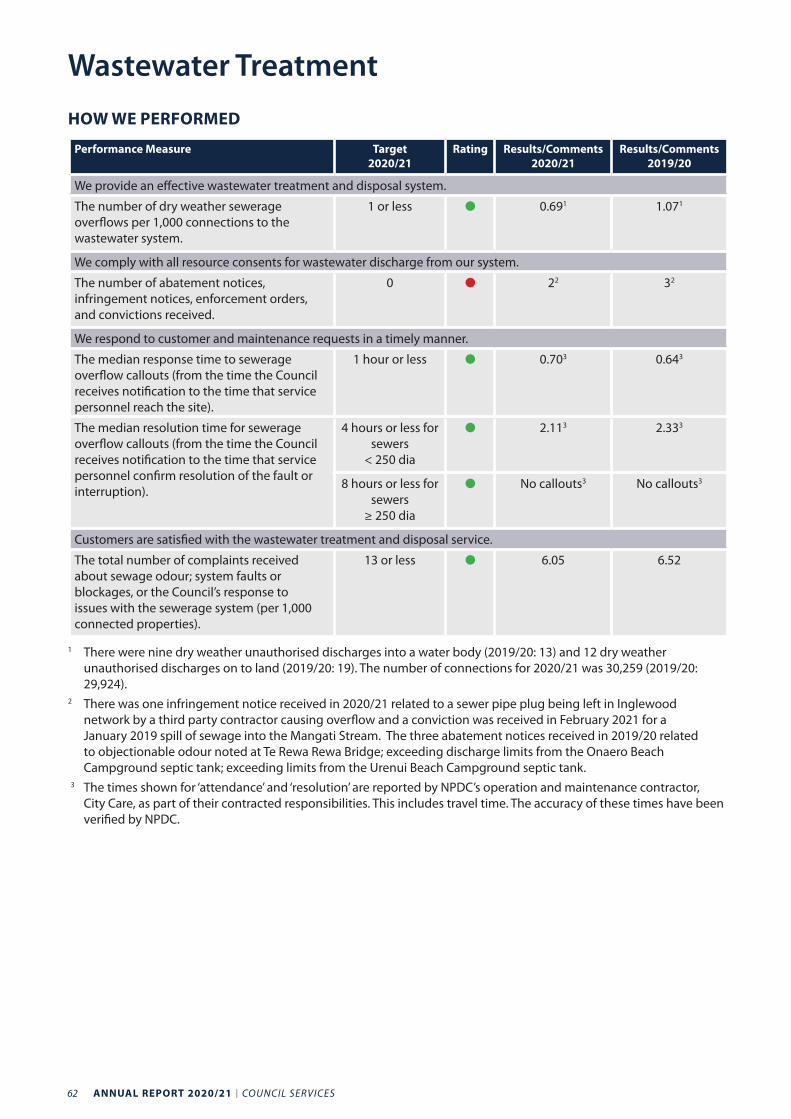
62 ANNUAL REPORT 2020/21 I COUNCIL SERVICES
HOW WE PERFORMED
Performance Measure Target2020/21
Rating Results/Comments2020/21
Results/Comments2019/20
We provide an effective wastewater treatment and disposal system.
The number of dry weather sewerage overflows per 1,000 connections to the wastewater system.
1 or less 0.691 1.071
We comply with all resource consents for wastewater discharge from our system.
The number of abatement notices, infringement notices, enforcement orders, and convictions received.
0 22 32
We respond to customer and maintenance requests in a timely manner.
The median response time to sewerage overflow callouts (from the time the Council receives notification to the time that service personnel reach the site).
1 hour or less 0.703 0.643
The median resolution time for sewerage overflow callouts (from the time the Council receives notification to the time that service personnel confirm resolution of the fault or interruption).
4 hours or less for sewers
< 250 dia
2.113 2.33 3
8 hours or less for sewers
≥ 250 dia
No callouts3 No callouts3
Customers are satisfied with the wastewater treatment and disposal service.
The total number of complaints received about sewage odour; system faults or blockages, or the Council’s response to issues with the sewerage system (per 1,000 connected properties).
13 or less 6.05 6.52
1 There were nine dry weather unauthorised discharges into a water body (2019/20: 13) and 12 dry weather unauthorised discharges on to land (2019/20: 19). The number of connections for 2020/21 was 30,259 (2019/20: 29,924).
2 There was one infringement notice received in 2020/21 related to a sewer pipe plug being left in Inglewood network by a third party contractor causing overflow and a conviction was received in February 2021 for a January 2019 spill of sewage into the Mangati Stream. The three abatement notices received in 2019/20 related to objectionable odour noted at Te Rewa Rewa Bridge; exceeding discharge limits from the Onaero Beach Campground septic tank; exceeding limits from the Urenui Beach Campground septic tank.
3 The times shown for ‘attendance’ and ‘resolution’ are reported by NPDC’s operation and maintenance contractor, City Care, as part of their contracted responsibilities. This includes travel time. The accuracy of these times have been verified by NPDC.
Wastewater Treatment
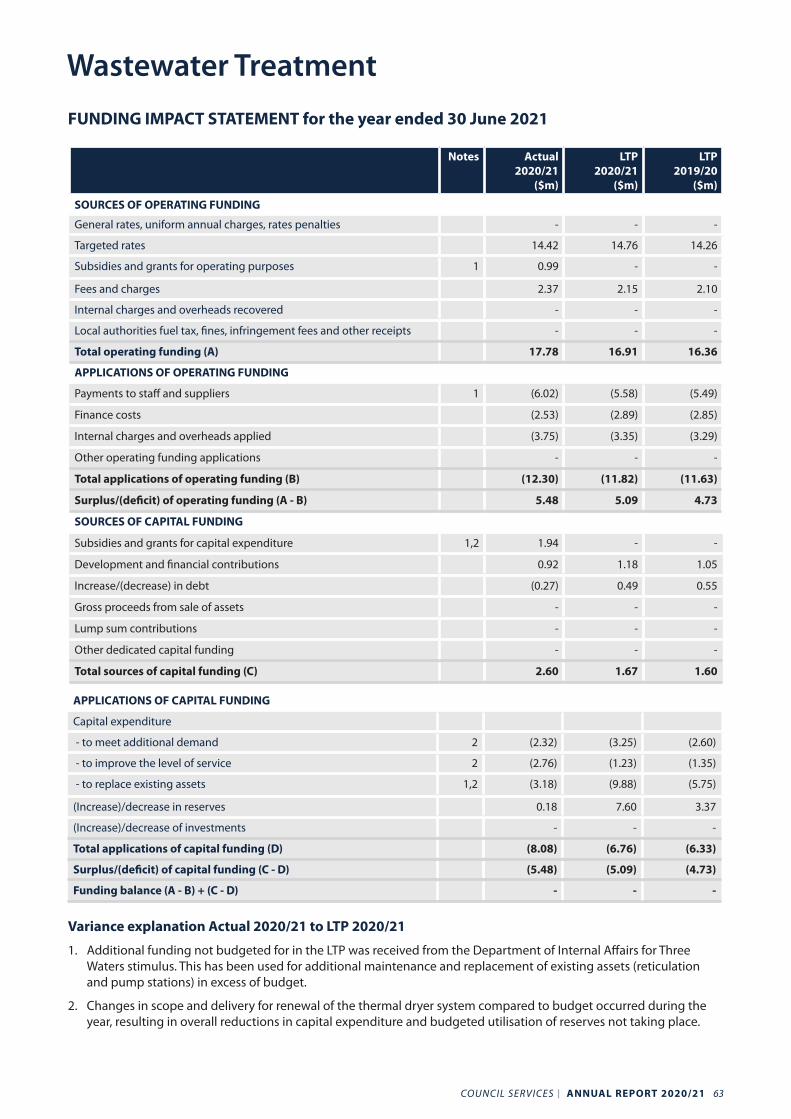
COUNCIL SERVICES I ANNUAL REPORT 2020/21 63
FUNDING IMPACT STATEMENT for the year ended 30 June 2021
Notes Actual2020/21
($m)
LTP 2020/21
($m)
LTP 2019/20
($m)
SOURCES OF OPERATING FUNDING
General rates, uniform annual charges, rates penalties - - -
Targeted rates 14.42 14.76 14.26
Subsidies and grants for operating purposes 1 0.99 - -
Fees and charges 2.37 2.15 2.10
Internal charges and overheads recovered - - -
Local authorities fuel tax, fines, infringement fees and other receipts - - -
Total operating funding (A) 17.78 16.91 16.36
APPLICATIONS OF OPERATING FUNDING
Payments to staff and suppliers 1 (6.02) (5.58) (5.49)
Finance costs (2.53) (2.89) (2.85)
Internal charges and overheads applied (3.75) (3.35) (3.29)
Other operating funding applications - - -
Total applications of operating funding (B) (12.30) (11.82) (11.63)
Surplus/(deficit) of operating funding (A - B) 5.48 5.09 4.73
SOURCES OF CAPITAL FUNDING
Subsidies and grants for capital expenditure 1,2 1.94 - -
Development and financial contributions 0.92 1.18 1.05
Increase/(decrease) in debt (0.27) 0.49 0.55
Gross proceeds from sale of assets - - -
Lump sum contributions - - -
Other dedicated capital funding - - -
Total sources of capital funding (C) 2.60 1.67 1.60
APPLICATIONS OF CAPITAL FUNDING
Capital expenditure
- to meet additional demand 2 (2.32) (3.25) (2.60)
- to improve the level of service 2 (2.76) (1.23) (1.35)
- to replace existing assets 1,2 (3.18) (9.88) (5.75)
(Increase)/decrease in reserves 0.18 7.60 3.37
(Increase)/decrease of investments - - -
Total applications of capital funding (D) (8.08) (6.76) (6.33)
Surplus/(deficit) of capital funding (C - D) (5.48) (5.09) (4.73)
Funding balance (A - B) + (C - D) - - -
Variance explanation Actual 2020/21 to LTP 2020/21
1. Additional funding not budgeted for in the LTP was received from the Department of Internal Affairs for Three Waters stimulus. This has been used for additional maintenance and replacement of existing assets (reticulation and pump stations) in excess of budget.
2. Changes in scope and delivery for renewal of the thermal dryer system compared to budget occurred during the year, resulting in overall reductions in capital expenditure and budgeted utilisation of reserves not taking place.
Wastewater Treatment
64 ANNUAL REPORT 2020/21 I COUNCIL SERVICES
The Council’s water supply service treats and distributes water that we source from groundwater bores and rivers in the district. We develop, operate and maintain water treatment plants to meet water quality standards. We also manage pump stations, pipe networks and storage facilities such as reservoirs, to ensure our community has a reliable and sustainable supply of fresh water.
There are four separate water supplies in the district: New Plymouth (includes Ōmata, Bell Block, Waitara and Urenui), Inglewood, Ōākura and Ōkato. Combined, these facilities supply approximately 33 million litres of water per day to just over 31,000 households and businesses via 1,026 kilometres of pipes in defined urban and rural areas.
We ensure our water supply complies with the New Zealand Drinking Water Standards and that it is used sustainably, particularly when demand is high. We also make sure there is water available for firefighting in urban areas.
WHY WE DO ITThe water supply service supports the Council’s strategic vision of Building a Lifestyle Capital – supporting a prosperous community, putting people first and caring for our place.
A reliable water supply contributes to supporting a prosperous community - awhi mai, awhi atu, tātou katoa as it is critical to many business operations and supports a diverse range of industries in the district. Our continued investment in resilient water supply infrastructure supports industry and development for all of our communities.
Water supply contributes to putting people first – aroha ki te tangata by providing connected properties with a safe, reliable and affordable water supply and ensures an adequate supply for urban firefighting.
Managing our water resources contributes to caring for our place - manaaki whenua, manaaki tangata, haere whakamua through ensuring compliance with resource consents for water takes and managing our water resources more sustainably for future generations.
EFFECTS ON COMMUNITY WELL-BEINGWater supply can have a range of effects on the community. A safe drinking water supply network promotes both economic and social well-being. Potential negative effects are identified in the following table.
Effect How the Council intends to mitigate the effect
Extracting water from streams and underground aquifers can reduce the amount of water available for future use and therefore negatively impacts on environmental and cultural well-being.
We minimise the amount of water we extract by operating demand management measures such as water restrictions during dry periods, by reducing pressure to minimise leakage and consumption, by promoting efficient water use, and by regular inspection and maintenance of pipework.
SIGNIFICANT CHALLENGES DURING THE YEARThe Council successfully prepared and obtained approval from the Ministry of Health for its Water Safety Plan. This document specifies how the Council will ensure that the water it supplies is safe.
The Council considered options for how to manage the increasing growth and demand experienced on its water supply, which is expected to lead to water shortages in 10 to 20 years time. The Council, as part of its water conservation measures, included in the LTP 2021-2031 the introduction of water meters.
Water Supply
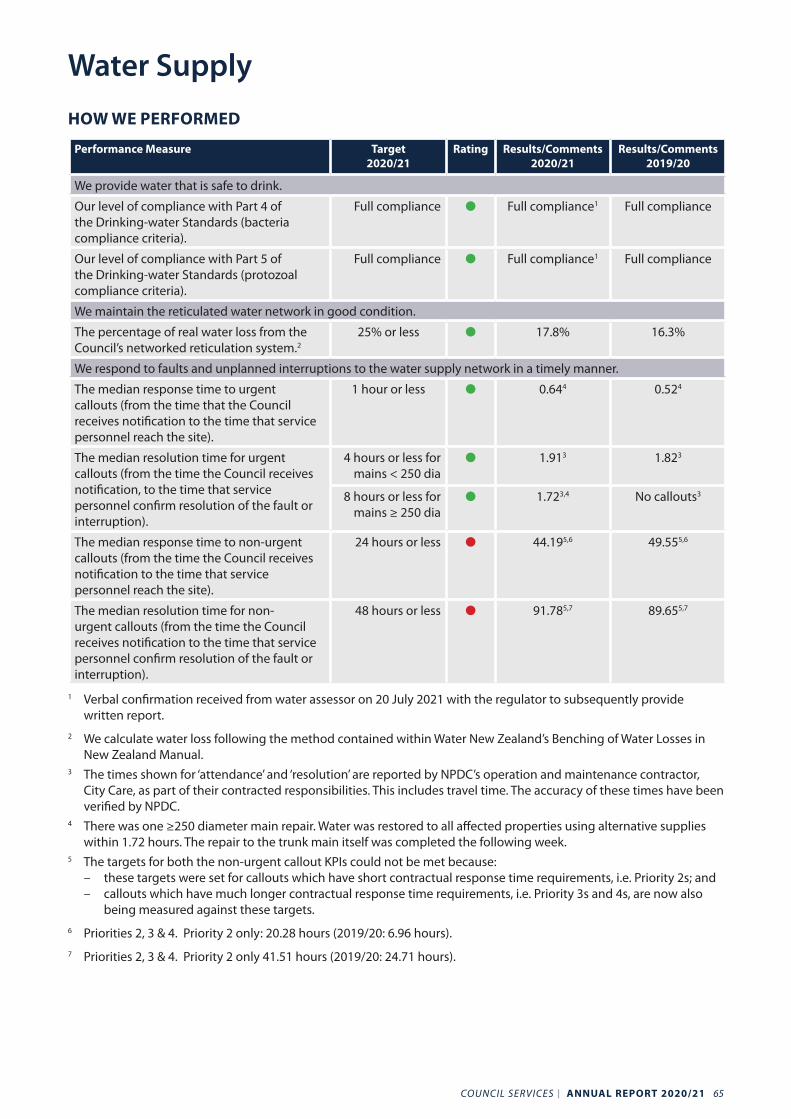
COUNCIL SERVICES I ANNUAL REPORT 2020/21 65
HOW WE PERFORMED
Performance Measure Target2020/21
Rating Results/Comments2020/21
Results/Comments2019/20
We provide water that is safe to drink.
Our level of compliance with Part 4 of the Drinking-water Standards (bacteria compliance criteria).
Full compliance Full compliance1 Full compliance
Our level of compliance with Part 5 of the Drinking-water Standards (protozoal compliance criteria).
Full compliance Full compliance1 Full compliance
We maintain the reticulated water network in good condition.
The percentage of real water loss from the Council’s networked reticulation system.2
25% or less 17.8% 16.3%
We respond to faults and unplanned interruptions to the water supply network in a timely manner.
The median response time to urgent callouts (from the time that the Council receives notification to the time that service personnel reach the site).
1 hour or less 0.644 0.524
The median resolution time for urgent callouts (from the time the Council receives notification, to the time that service personnel confirm resolution of the fault or interruption).
4 hours or less for mains < 250 dia
1.913 1.823
8 hours or less for mains ≥ 250 dia
1.723,4 No callouts3
The median response time to non-urgent callouts (from the time the Council receives notification to the time that service personnel reach the site).
24 hours or less 44.195,6 49.555,6
The median resolution time for non-urgent callouts (from the time the Council receives notification to the time that service personnel confirm resolution of the fault or interruption).
48 hours or less 91.785,7 89.655,7
1 Verbal confirmation received from water assessor on 20 July 2021 with the regulator to subsequently provide written report.
2 We calculate water loss following the method contained within Water New Zealand’s Benching of Water Losses in New Zealand Manual.
3 The times shown for ‘attendance’ and ‘resolution’ are reported by NPDC’s operation and maintenance contractor, City Care, as part of their contracted responsibilities. This includes travel time. The accuracy of these times have been verified by NPDC.
4 There was one ≥250 diameter main repair. Water was restored to all affected properties using alternative supplies within 1.72 hours. The repair to the trunk main itself was completed the following week.
5 The targets for both the non-urgent callout KPIs could not be met because: – these targets were set for callouts which have short contractual response time requirements, i.e. Priority 2s; and – callouts which have much longer contractual response time requirements, i.e. Priority 3s and 4s, are now also
being measured against these targets.6 Priorities 2, 3 & 4. Priority 2 only: 20.28 hours (2019/20: 6.96 hours). 7 Priorities 2, 3 & 4. Priority 2 only 41.51 hours (2019/20: 24.71 hours).
Water Supply
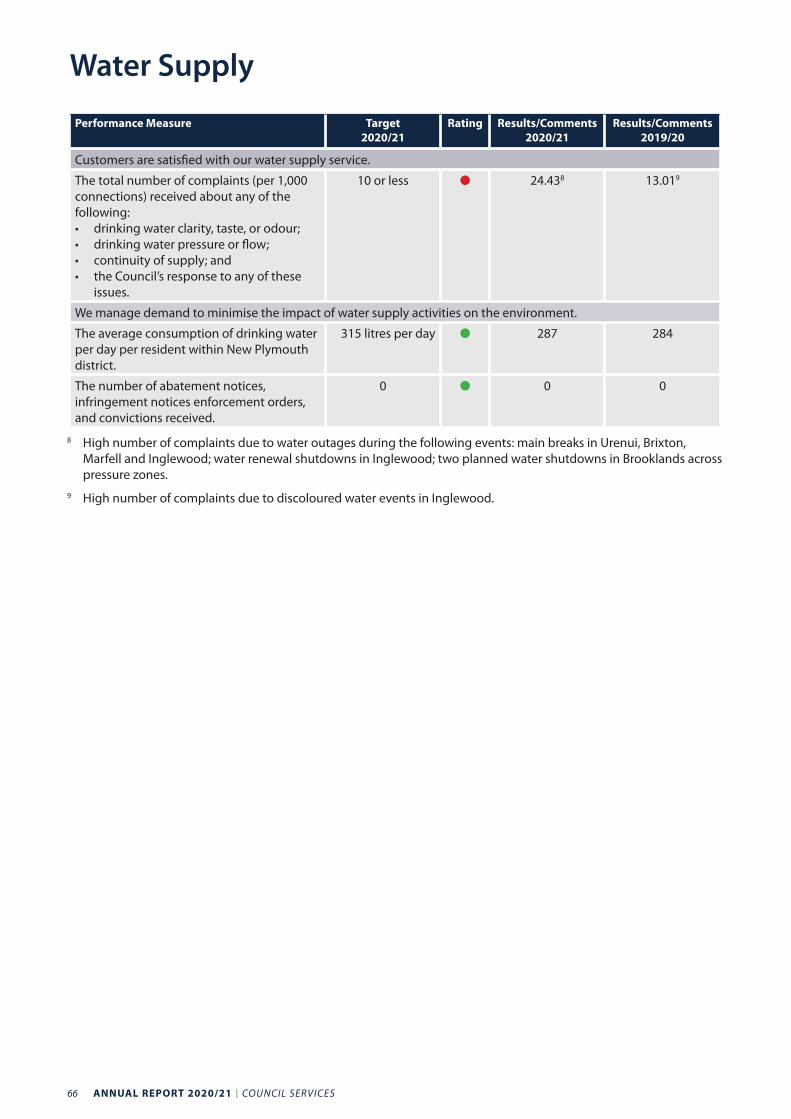
66 ANNUAL REPORT 2020/21 I COUNCIL SERVICES
Performance Measure Target2020/21
Rating Results/Comments2020/21
Results/Comments2019/20
Customers are satisfied with our water supply service.
The total number of complaints (per 1,000 connections) received about any of the following:• drinking water clarity, taste, or odour; • drinking water pressure or flow;• continuity of supply; and• the Council’s response to any of these
issues.
10 or less 24.438 13.019
We manage demand to minimise the impact of water supply activities on the environment.
The average consumption of drinking water per day per resident within New Plymouth district.
315 litres per day 287 284
The number of abatement notices, infringement notices enforcement orders, and convictions received.
0 0 0
8 High number of complaints due to water outages during the following events: main breaks in Urenui, Brixton, Marfell and Inglewood; water renewal shutdowns in Inglewood; two planned water shutdowns in Brooklands across pressure zones.
9 High number of complaints due to discoloured water events in Inglewood.
Water Supply
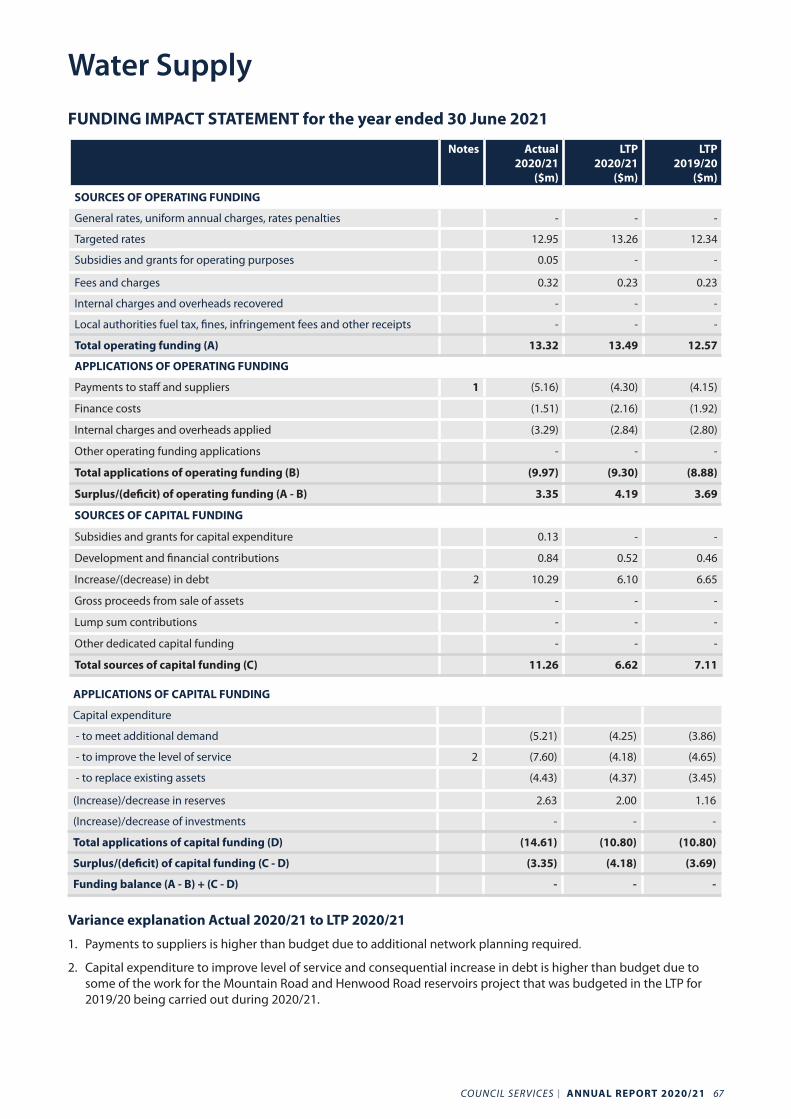
COUNCIL SERVICES I ANNUAL REPORT 2020/21 67
FUNDING IMPACT STATEMENT for the year ended 30 June 2021
Notes Actual2020/21
($m)
LTP 2020/21
($m)
LTP 2019/20
($m)
SOURCES OF OPERATING FUNDING
General rates, uniform annual charges, rates penalties - - -
Targeted rates 12.95 13.26 12.34
Subsidies and grants for operating purposes 0.05 - -
Fees and charges 0.32 0.23 0.23
Internal charges and overheads recovered - - -
Local authorities fuel tax, fines, infringement fees and other receipts - - -
Total operating funding (A) 13.32 13.49 12.57
APPLICATIONS OF OPERATING FUNDING
Payments to staff and suppliers 1 (5.16) (4.30) (4.15)
Finance costs (1.51) (2.16) (1.92)
Internal charges and overheads applied (3.29) (2.84) (2.80)
Other operating funding applications - - -
Total applications of operating funding (B) (9.97) (9.30) (8.88)
Surplus/(deficit) of operating funding (A - B) 3.35 4.19 3.69
SOURCES OF CAPITAL FUNDING
Subsidies and grants for capital expenditure 0.13 - -
Development and financial contributions 0.84 0.52 0.46
Increase/(decrease) in debt 2 10.29 6.10 6.65
Gross proceeds from sale of assets - - -
Lump sum contributions - - -
Other dedicated capital funding - - -
Total sources of capital funding (C) 11.26 6.62 7.11
APPLICATIONS OF CAPITAL FUNDING
Capital expenditure
- to meet additional demand (5.21) (4.25) (3.86)
- to improve the level of service 2 (7.60) (4.18) (4.65)
- to replace existing assets (4.43) (4.37) (3.45)
(Increase)/decrease in reserves 2.63 2.00 1.16
(Increase)/decrease of investments - - -
Total applications of capital funding (D) (14.61) (10.80) (10.80)
Surplus/(deficit) of capital funding (C - D) (3.35) (4.18) (3.69)
Funding balance (A - B) + (C - D) - - -
Variance explanation Actual 2020/21 to LTP 2020/21
1. Payments to suppliers is higher than budget due to additional network planning required.
2. Capital expenditure to improve level of service and consequential increase in debt is higher than budget due to some of the work for the Mountain Road and Henwood Road reservoirs project that was budgeted in the LTP for 2019/20 being carried out during 2020/21.
Water Supply

68 ANNUAL REPORT 2020/21 I COUNCIL SERVICES
Financial StatementsFinancial Statements:
Statement of Comprehensive Revenue and Expense ...................................70Statement of Financial Position .............................................................................71Statement of Changes in Net Assets/Equity ......................................................72Statement of Cash Flows ..........................................................................................73
Notes to the Financial Statements:
1. Basis of preparation ...........................................................................................752. Explanation of major variances against budget ....................................813. Revenue classified as exchange or non-exchange transactions .......824. Rates .......................................................................................................................835. Breakdown of subsidies and grants ............................................................836. Other revenue .....................................................................................................847. Personnel costs ..................................................................................................858. Other expenses ...................................................................................................879. Property, plant and equipment ...................................................................8910. Investment property ......................................................................................10111. Intangible assets ..............................................................................................10212. Forestry assets ..................................................................................................10313. Equity accounted invesments (joint ventures) ....................................10414. Other financial assets .....................................................................................10515. Waitara Lands Act ...........................................................................................10816. Cash and cash equivalents ..........................................................................11017. Debtors and other receivables ...................................................................11118. Creditors and other payables .....................................................................11319. Borrowings ........................................................................................................11320. Provisions ...........................................................................................................11521. Employee entitlements .................................................................................11622. Tax .........................................................................................................................11723. Equity and capital management ..............................................................11824. Financial risk management ........................................................................12125. Related party transactions ...........................................................................12826. Contingent liabilities and assets ................................................................12927. Finance income and finance costs ............................................................13028. Events occurring after the balance date .................................................130
Funding Impact Statement ...............................................................131
Disclosure Statement ........................................................................132
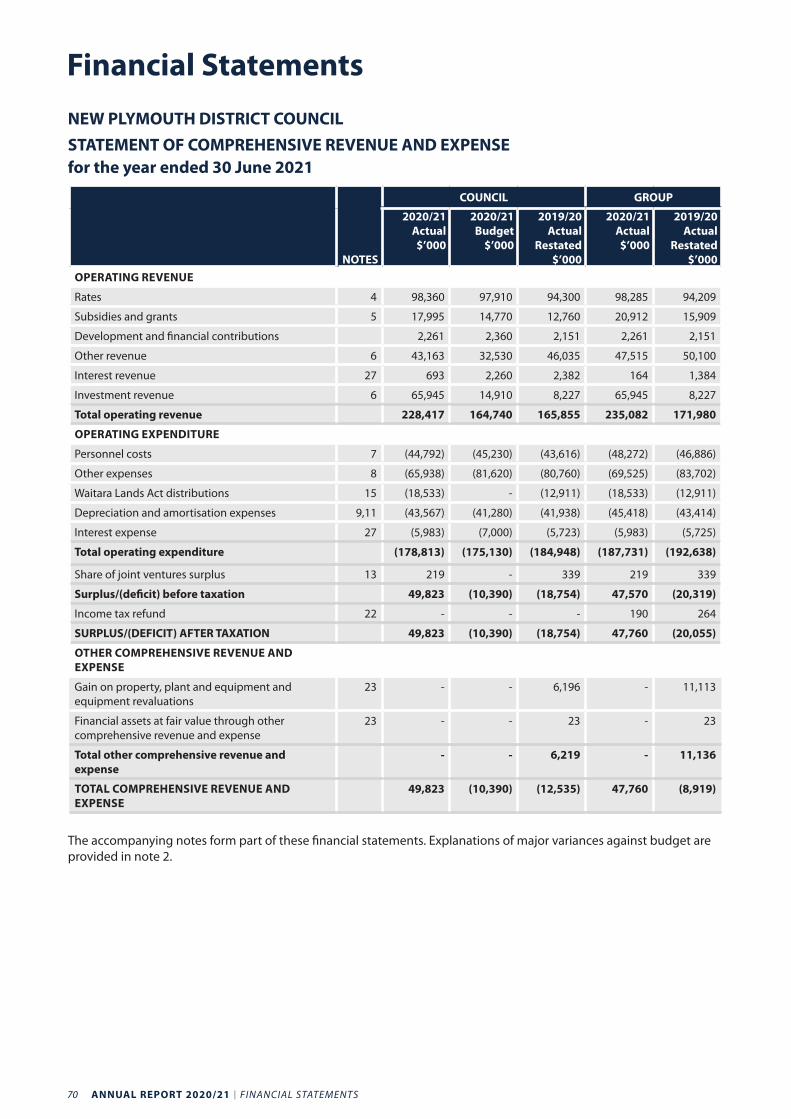
70 ANNUAL REPORT 2020/21 I FINANCIAL STATEMENTS
Financial StatementsNEW PLYMOUTH DISTRICT COUNCILSTATEMENT OF COMPREHENSIVE REVENUE AND EXPENSEfor the year ended 30 June 2021
NOTES
COUNCIL GROUP
2020/21 Actual $’000
2020/21 Budget
$’000
2019/20 Actual
Restated $’000
2020/21 Actual $’000
2019/20 Actual
Restated $’000
OPERATING REVENUE
Rates 4 98,360 97,910 94,300 98,285 94,209
Subsidies and grants 5 17,995 14,770 12,760 20,912 15,909
Development and financial contributions 2,261 2,360 2,151 2,261 2,151
Other revenue 6 43,163 32,530 46,035 47,515 50,100
Interest revenue 27 693 2,260 2,382 164 1,384
Investment revenue 6 65,945 14,910 8,227 65,945 8,227
Total operating revenue 228,417 164,740 165,855 235,082 171,980
OPERATING EXPENDITURE
Personnel costs 7 (44,792) (45,230) (43,616) (48,272) (46,886)
Other expenses 8 (65,938) (81,620) (80,760) (69,525) (83,702)
Waitara Lands Act distributions 15 (18,533) - (12,911) (18,533) (12,911)
Depreciation and amortisation expenses 9,11 (43,567) (41,280) (41,938) (45,418) (43,414)
Interest expense 27 (5,983) (7,000) (5,723) (5,983) (5,725)
Total operating expenditure (178,813) (175,130) (184,948) (187,731) (192,638)
Share of joint ventures surplus 13 219 - 339 219 339
Surplus/(deficit) before taxation 49,823 (10,390) (18,754) 47,570 (20,319)
Income tax refund 22 - - - 190 264
SURPLUS/(DEFICIT) AFTER TAXATION 49,823 (10,390) (18,754) 47,760 (20,055)
OTHER COMPREHENSIVE REVENUE AND EXPENSE
Gain on property, plant and equipment and equipment revaluations
23 - - 6,196 - 11,113
Financial assets at fair value through other comprehensive revenue and expense
23 - - 23 - 23
Total other comprehensive revenue and expense
- - 6,219 - 11,136
TOTAL COMPREHENSIVE REVENUE AND EXPENSE
49,823 (10,390) (12,535) 47,760 (8,919)
The accompanying notes form part of these financial statements. Explanations of major variances against budget are provided in note 2.
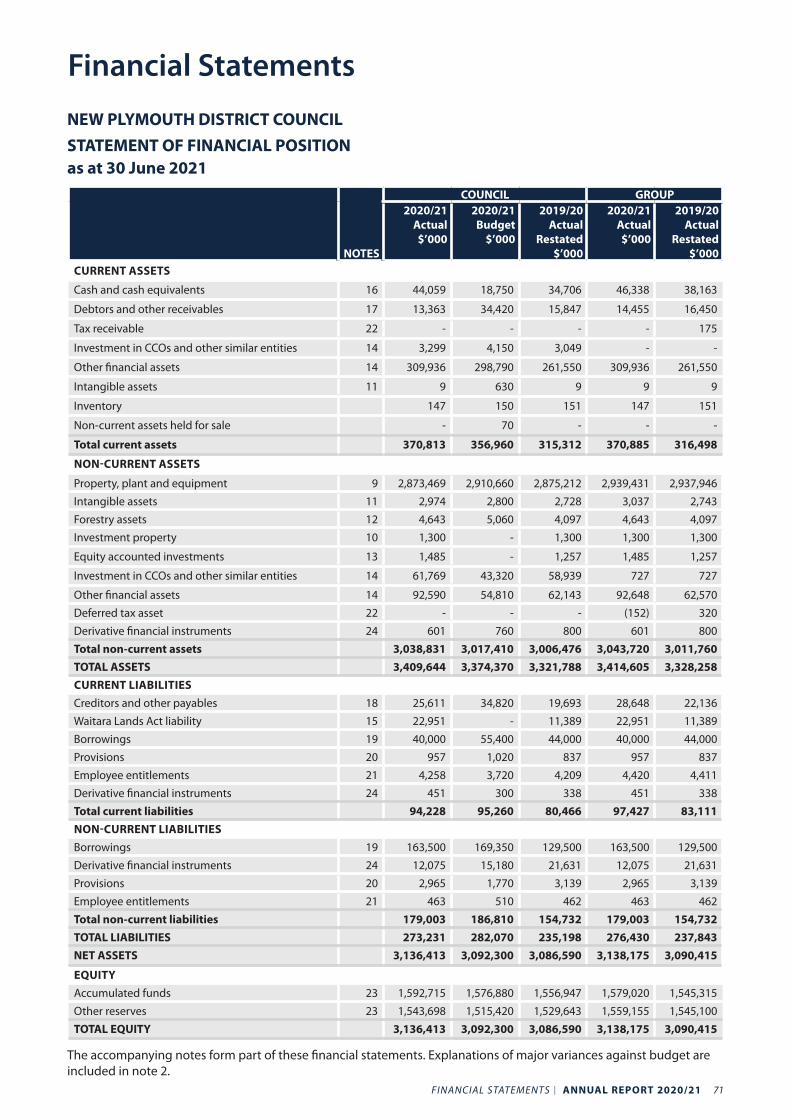
FINANCIAL STATEMENTS I ANNUAL REPORT 2020/21 71
NEW PLYMOUTH DISTRICT COUNCIL STATEMENT OF FINANCIAL POSITION as at 30 June 2021
NOTES
COUNCIL GROUP2020/21
Actual $’000
2020/21 Budget
$’000
2019/20 Actual
Restated $’000
2020/21 Actual $’000
2019/20 Actual
Restated $’000
CURRENT ASSETS
Cash and cash equivalents 16 44,059 18,750 34,706 46,338 38,163
Debtors and other receivables 17 13,363 34,420 15,847 14,455 16,450
Tax receivable 22 - - - - 175
Investment in CCOs and other similar entities 14 3,299 4,150 3,049 - -
Other financial assets 14 309,936 298,790 261,550 309,936 261,550
Intangible assets 11 9 630 9 9 9
Inventory 147 150 151 147 151
Non-current assets held for sale - 70 - - -
Total current assets 370,813 356,960 315,312 370,885 316,498
NON-CURRENT ASSETS
Property, plant and equipment 9 2,873,469 2,910,660 2,875,212 2,939,431 2,937,946
Intangible assets 11 2,974 2,800 2,728 3,037 2,743
Forestry assets 12 4,643 5,060 4,097 4,643 4,097
Investment property 10 1,300 - 1,300 1,300 1,300
Equity accounted investments 13 1,485 - 1,257 1,485 1,257
Investment in CCOs and other similar entities 14 61,769 43,320 58,939 727 727
Other financial assets 14 92,590 54,810 62,143 92,648 62,570
Deferred tax asset 22 - - - (152) 320
Derivative financial instruments 24 601 760 800 601 800
Total non-current assets 3,038,831 3,017,410 3,006,476 3,043,720 3,011,760 TOTAL ASSETS 3,409,644 3,374,370 3,321,788 3,414,605 3,328,258 CURRENT LIABILITIESCreditors and other payables 18 25,611 34,820 19,693 28,648 22,136
Waitara Lands Act liability 15 22,951 - 11,389 22,951 11,389
Borrowings 19 40,000 55,400 44,000 40,000 44,000
Provisions 20 957 1,020 837 957 837
Employee entitlements 21 4,258 3,720 4,209 4,420 4,411
Derivative financial instruments 24 451 300 338 451 338
Total current liabilities 94,228 95,260 80,466 97,427 83,111 NON-CURRENT LIABILITIESBorrowings 19 163,500 169,350 129,500 163,500 129,500
Derivative financial instruments 24 12,075 15,180 21,631 12,075 21,631
Provisions 20 2,965 1,770 3,139 2,965 3,139
Employee entitlements 21 463 510 462 463 462
Total non-current liabilities 179,003 186,810 154,732 179,003 154,732 TOTAL LIABILITIES 273,231 282,070 235,198 276,430 237,843 NET ASSETS 3,136,413 3,092,300 3,086,590 3,138,175 3,090,415
EQUITYAccumulated funds 23 1,592,715 1,576,880 1,556,947 1,579,020 1,545,315
Other reserves 23 1,543,698 1,515,420 1,529,643 1,559,155 1,545,100
TOTAL EQUITY 3,136,413 3,092,300 3,086,590 3,138,175 3,090,415
The accompanying notes form part of these financial statements. Explanations of major variances against budget are included in note 2.
Financial Statements
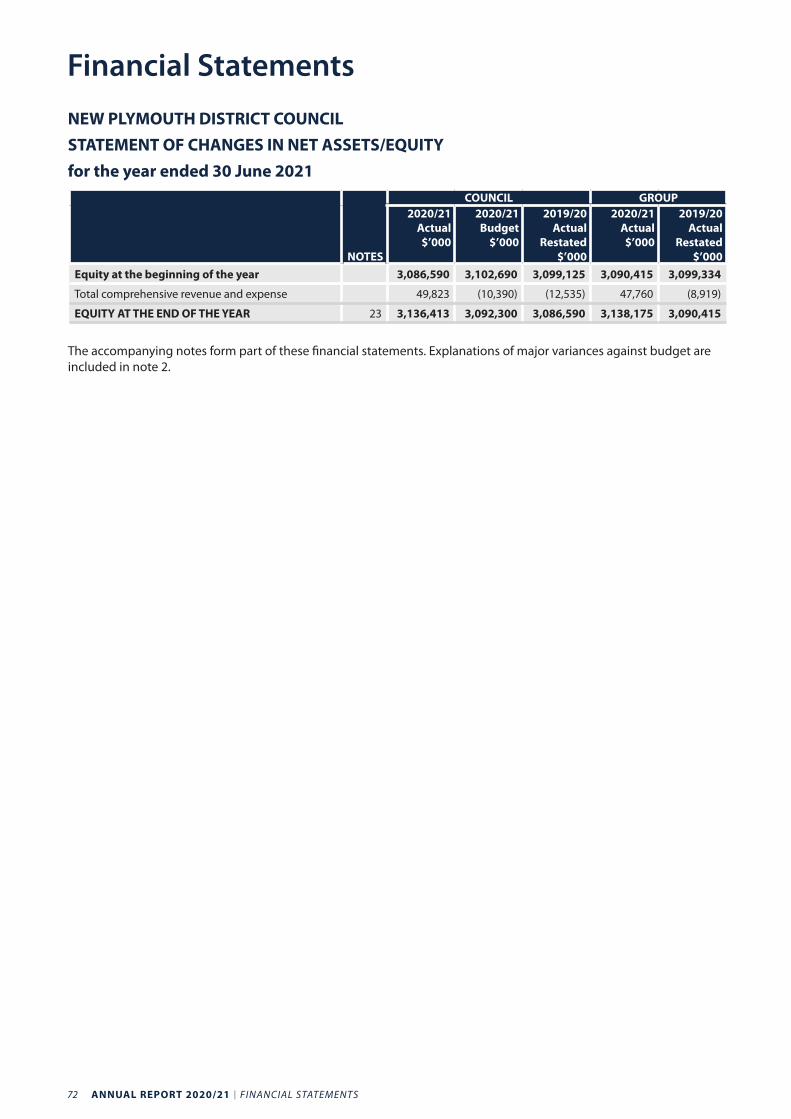
72 ANNUAL REPORT 2020/21 I FINANCIAL STATEMENTS
NEW PLYMOUTH DISTRICT COUNCIL STATEMENT OF CHANGES IN NET ASSETS/EQUITYfor the year ended 30 June 2021
NOTES
COUNCIL GROUP2020/21
Actual $’000
2020/21 Budget
$’000
2019/20 Actual
Restated $’000
2020/21 Actual $’000
2019/20 Actual
Restated $’000
Equity at the beginning of the year 3,086,590 3,102,690 3,099,125 3,090,415 3,099,334
Total comprehensive revenue and expense 49,823 (10,390) (12,535) 47,760 (8,919)
EQUITY AT THE END OF THE YEAR 23 3,136,413 3,092,300 3,086,590 3,138,175 3,090,415
The accompanying notes form part of these financial statements. Explanations of major variances against budget are included in note 2.
Financial Statements
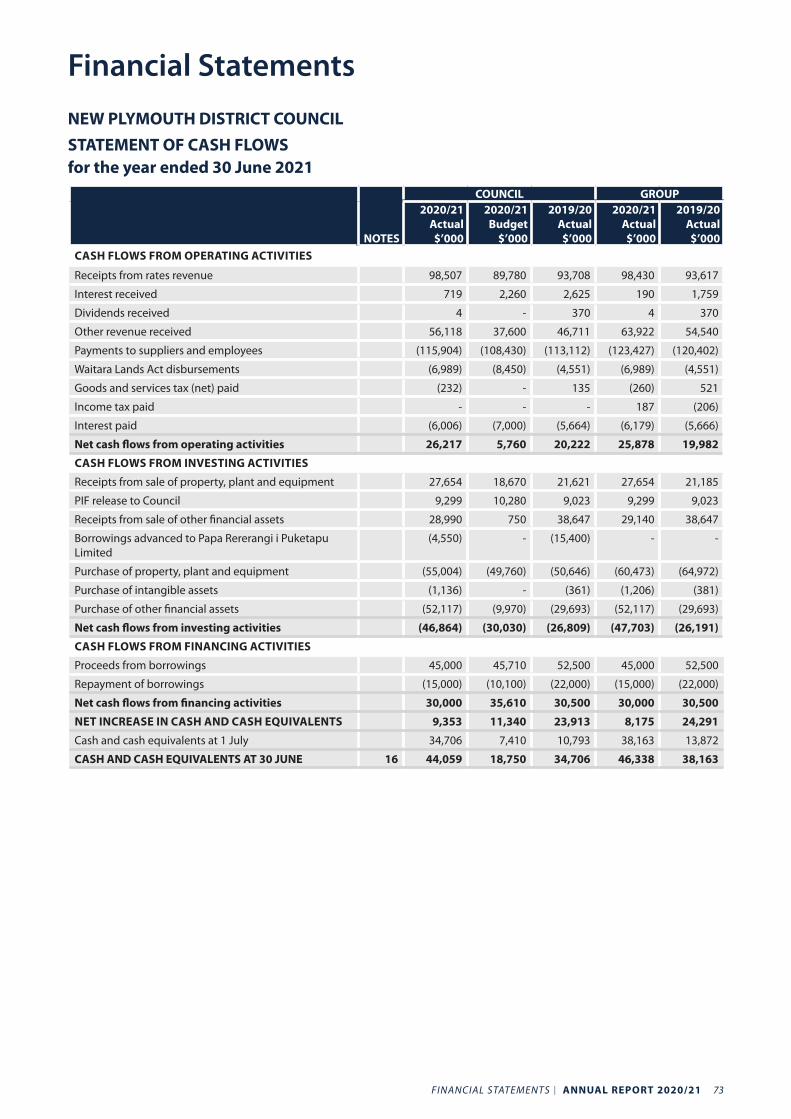
FINANCIAL STATEMENTS I ANNUAL REPORT 2020/21 73
Financial StatementsNEW PLYMOUTH DISTRICT COUNCIL STATEMENT OF CASH FLOWS for the year ended 30 June 2021
NOTES
COUNCIL GROUP2020/21
Actual $’000
2020/21 Budget
$’000
2019/20 Actual $’000
2020/21 Actual $’000
2019/20 Actual $’000
CASH FLOWS FROM OPERATING ACTIVITIES
Receipts from rates revenue 98,507 89,780 93,708 98,430 93,617
Interest received 719 2,260 2,625 190 1,759
Dividends received 4 - 370 4 370
Other revenue received 56,118 37,600 46,711 63,922 54,540
Payments to suppliers and employees (115,904) (108,430) (113,112) (123,427) (120,402)
Waitara Lands Act disbursements (6,989) (8,450) (4,551) (6,989) (4,551)
Goods and services tax (net) paid (232) - 135 (260) 521
Income tax paid - - - 187 (206)
Interest paid (6,006) (7,000) (5,664) (6,179) (5,666)
Net cash flows from operating activities 26,217 5,760 20,222 25,878 19,982
CASH FLOWS FROM INVESTING ACTIVITIES
Receipts from sale of property, plant and equipment 27,654 18,670 21,621 27,654 21,185
PIF release to Council 9,299 10,280 9,023 9,299 9,023
Receipts from sale of other financial assets 28,990 750 38,647 29,140 38,647
Borrowings advanced to Papa Rererangi i Puketapu Limited
(4,550) - (15,400) - -
Purchase of property, plant and equipment (55,004) (49,760) (50,646) (60,473) (64,972)
Purchase of intangible assets (1,136) - (361) (1,206) (381)
Purchase of other financial assets (52,117) (9,970) (29,693) (52,117) (29,693)
Net cash flows from investing activities (46,864) (30,030) (26,809) (47,703) (26,191)
CASH FLOWS FROM FINANCING ACTIVITIES
Proceeds from borrowings 45,000 45,710 52,500 45,000 52,500
Repayment of borrowings (15,000) (10,100) (22,000) (15,000) (22,000)
Net cash flows from financing activities 30,000 35,610 30,500 30,000 30,500
NET INCREASE IN CASH AND CASH EQUIVALENTS 9,353 11,340 23,913 8,175 24,291
Cash and cash equivalents at 1 July 34,706 7,410 10,793 38,163 13,872
CASH AND CASH EQUIVALENTS AT 30 JUNE 16 44,059 18,750 34,706 46,338 38,163
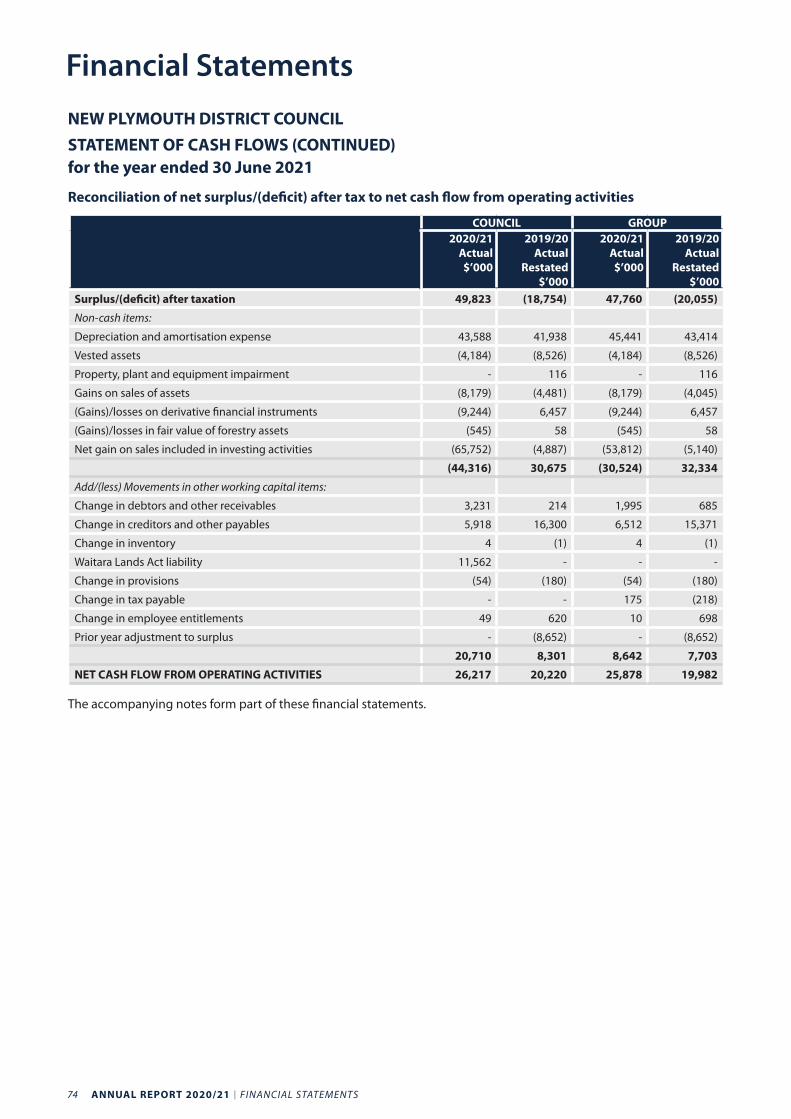
74 ANNUAL REPORT 2020/21 I FINANCIAL STATEMENTS
NEW PLYMOUTH DISTRICT COUNCIL STATEMENT OF CASH FLOWS (CONTINUED)for the year ended 30 June 2021
Reconciliation of net surplus/(deficit) after tax to net cash flow from operating activities
COUNCIL GROUP2020/21
Actual $’000
2019/20 Actual
Restated $’000
2020/21 Actual $’000
2019/20 Actual
Restated $’000
Surplus/(deficit) after taxation 49,823 (18,754) 47,760 (20,055)
Non-cash items:
Depreciation and amortisation expense 43,588 41,938 45,441 43,414
Vested assets (4,184) (8,526) (4,184) (8,526)
Property, plant and equipment impairment - 116 - 116
Gains on sales of assets (8,179) (4,481) (8,179) (4,045)
(Gains)/losses on derivative financial instruments (9,244) 6,457 (9,244) 6,457
(Gains)/losses in fair value of forestry assets (545) 58 (545) 58
Net gain on sales included in investing activities (65,752) (4,887) (53,812) (5,140)
(44,316) 30,675 (30,524) 32,334
Add/(less) Movements in other working capital items:
Change in debtors and other receivables 3,231 214 1,995 685
Change in creditors and other payables 5,918 16,300 6,512 15,371
Change in inventory 4 (1) 4 (1)
Waitara Lands Act liability 11,562 - - -
Change in provisions (54) (180) (54) (180)
Change in tax payable - - 175 (218)
Change in employee entitlements 49 620 10 698
Prior year adjustment to surplus - (8,652) - (8,652)
20,710 8,301 8,642 7,703
NET CASH FLOW FROM OPERATING ACTIVITIES 26,217 20,220 25,878 19,982
The accompanying notes form part of these financial statements.
Financial Statements
FINANCIAL STATEMENTS I ANNUAL REPORT 2020/21 75
Notes to the Financial Statements1. BASIS OF PREPARATION
1.1 Reporting Entity
New Plymouth District Council (NPDC) is a territorial authority, domiciled in New Zealand. It is governed by the following legislation:• Local Government Act 2002 (LGA).
• The Local Government (Rating) Act 2002 (LG(R)A).
The financial statements presented are those of the New Plymouth District Council (the Council) together with its Council Controlled Organisations (CCOs) and joint ventures (the Group). The group consists of:• Papa Rererangi i Puketapu Limited – 100% owned (Council Controlled Trading Organisation).• New Plymouth PIF Guardians Limited – 100% owned.• Venture Taranaki Trust – 100% owned.• Tasmanian Land Company Limited – 100% owned.• McKay Family Joint Venture – 56.50% owned.• Duthie Joint Venture – 54.82% owned.
The Council’s primary objective is to provide goods or services and benefit for the community rather than making a financial return. Accordingly, the Council designates itself and the Group as public benefit entities (PBEs) and applies Tier 1 PBE Accounting Standards. These standards are based on International Public Sector Accounting Standards (IPSAS), with amendments for the New Zealand environment.
The financial statements are for the year ended 30 June 2021. The Council authorised them for issue on 21 December 2021.
1.2 Basis of preparation
This section sets out the significant accounting policies that relate to these financial statements as a whole. Significant accounting policies have also been included in the related note disclosures.
The notes include information which is required to understand the financial statements and is material and relevant to the financial position and performance of NPDC. Information is considered relevant and material if:
• The amount is significant due to its size or nature.
• The amount is important to understanding the financial statements.
• It helps to explain the impact of significant changes in how the Council operates.
• It relates to an aspect of the Council’s operations that is important to the community.
Statement of compliance
The financial statements have been prepared:
• In line with New Zealand Generally Accepted Accounting Practice (NZ GAAP), the LGA, the Local Government (Financial Reporting and Prudence) Regulations 2014 (LG(FRP)R) and comply with PBE Accounting Standards.
• On a historical cost basis, except for financial instruments which have been measured at fair value (note 24) and certain classes of property, plant and equipment (note 9) which have been subsequently measured at fair value.
• On the going concern basis and the accounting policies have been applied consistently throughout the period.
• In New Zealand dollars (functional and reporting currency), rounded to the nearest thousand ($000), unless stated otherwise.
Value-in-use for non-cash-generating assetsNon-cash-generating assets are those assets that are not held with the primary objective of generating a commercial return. For non-cash-generating assets, value-in-use is determined using an approach based on either a depreciated replacement cost approach, a restoration cost approach, or a service units approach. The most appropriate approach used to measure value in use depends on the nature of the impairment and availability of information.
76 ANNUAL REPORT 2020/21 I FINANCIAL STATEMENTS
Value-in-use cash-generating assetsCash generating assets are those assets held with the primary objective of generating a commercial return. The value-in-use for cash-generating assets and cash-generating units is the present value of expected future cash flows.
Foreign currency transactionsForeign currency transactions are translated into NZD (the functional currency) using the spot exchange rate at the dates of the transactions. Foreign exchanges gains and losses resulting from the settlement of such transactions and from the translation at year-end exchange rates of monetary assets and liabilities denominated in foreign currencies are recognised in the surplus or deficit.
Budget figuresThe budget figures are those approved by the Council in its Annual Plan (AP) 2020/21 and have been prepared in accordance with NZ GAAP, using accounting policies that are consistent with those adopted by the Council in preparing these financial statements.
Goods and Services Tax (GST) All items in the financial statements are stated exclusive of GST, except billed receivables and payables which include GST. Where GST is not recoverable as input tax then it is recognised as part of the related asset or expense.
The net amount of GST recoverable from, or payable to the Inland Revenue Department (IRD) is included as part of receivables or payables in the Statement of Financial Position.
The net GST paid to, or received from the IRD, including the GST relating to investing and financing activities, is classified as an operating cash flow in the Statement of Cash Flows.
Commitments and contingencies are disclosed exclusive of GST.
Cost allocationThe costs of providing support services for the Council are accumulated and allocated to each Council activity using appropriate allocation bases which reflect the usage and/or capacity for each activity.
• Direct costs directly attributable to a significant activity are charged directly to that activity.
• Indirect costs are those costs that cannot be identified in an economically feasible manner with a specific significant activity. Indirect costs are charged to significant activities using appropriate cost drivers such as actual usage, staff numbers and floor area.
Changes in accounting policiesThe standards and amendments below are effective for the 2020/21 financial reporting, however there were no effects for Council and Group from these changes.
• 2018 Omnibus Amendments to PBE Standards. The XRB have issued an omnibus of amendments to a number of PBE standards. The amendments are applicable for annual periods beginning on or after 1 January 2019, except for the amendments to PBE IPSAS 2, which are applicable for annual periods beginning on or after 1 January 2021. The changes most relevant to the Council and Group are:
– Going Concern Disclosures (Amendments to PBE IPSAS 1).
– Uncertainty over Income Tax Treatments (Amendments to PBE IPSAS 12).
– PBE Interest Rate Benchmark Reform (Amendments to PBE IPSAS 41, PBE IPSAS 9, PBE IPSAS 29 and PBE IPSAS 30).
• 2019 Amendments to XRB A1 Application of the Accounting Standards framework. Other than the adoption of the new PBE standards and amendments disclosed above, all accounting policies are consistent with those applied by the Council and Group in the previous financial year.
• PBE IPSAS 37 Joint Arrangements. The amendment clarifies that when an entity obtains control of a business that is a joint operation, then it does not premeasure previously held interest in that business.
• PBE IFRS 3 Business Combinations. The amendments clarify that when an entity obtains control of a business that is a joint operation, it premeasures previously held interests in that business.
Notes to the Financial Statements
FINANCIAL STATEMENTS I ANNUAL REPORT 2020/21 77
Standards, amendments and interpretations issued that are not yet effective and have not been early adoptedStandards, amendments and interpretations issued but not yet effective that have not been early adopted, and which are relevant to the Entity and Group, are:• PBE IPSAS 2 Cash Flow Statements. The amendments require entities to provide disclosures that enable users of
financial statements to evaluate changes in liabilities arising from financing activities, including both changes arising from cash flows and non-cash changes. This amendment is effective for annual periods beginning on or after 1 January 2021.
• PBE IPSAS 40 PBE Combinations.• PBE Interest Rate Benchmark Reform - Phase 2 (Amendments to PBE IPSAS 41, PBE IFRS 9, PBE IPSAS 29 and
PBE IPSAS 30.• 2018 Omnibus Amendments to PBE Standards (PBE IPSAS 2).
Financial instrumentsPBE IPSAS 41 Financial Instruments replaces PBE IPSAS 29 Financial Instruments: Recognition and Measurement and PBE IFRS 9 Financial Instruments and is effective for financial years beginning on or after 1 January 2022, with earlier adoption permitted.
The main changes compared to PBE IPSAS 29 that are relevant to the Council and Group are:
• New financial asset classification requirements for determining whether an asset is measured at fair value or amortised cost.
• A new impairment model for financial assets based on expected losses, which might result in the earlier recognition of impairment losses.
The Council plans to apply this standard in preparing its 30 June 2023 financial statements. The Council and Group have not yet assessed the effects of the new standard.
Service performance reportingThe New Zealand Accounting Standards Board (NZASB) has issued PBE FRS 48 Service Performance Reporting effective for periods beginning on or after 1 January 2022, with early application permitted.
The Council plans to apply this standard in preparing its 30 June 2023 financial statements. The Council and Group have not yet assessed the effects of the new standard.
In addition to the standards described above, there are various other standards and amendments which have been issued but are not yet effective. These are not expected to impact on the Council and Group’s financial statements.
Critical accounting estimates and assumptionsFinancial statement preparation requires judgements, estimates and assumptions that affect the application of policies and reported amounts of assets, liabilities, revenue and expenses. Actual results may differ from those estimates.
Estimates are continually evaluated and are based on historical experience and other factors, including expectations or future events that are considered reasonable under the circumstances.
The significant estimates and assumptions that have the greatest risk of causing a material adjustment to the reported amounts are: • Estimating the fair value of infrastructural assets – refer note 9.• Estimating the fair value of land and buildings – refer note 9.• Estimating the value of forestry assets – refer note 12.• Estimating the landfill aftercare provision – refer note 20.
Impairment of assetsAt each balance date the carrying amounts of tangible and intangible assets are reviewed to determine whether there is any indication that those assets have suffered an impairment loss. If any such indication exists (including indefinite life intangibles) the recoverable amount of the asset is estimated in order to determine the extent of the impairment loss (if any). Where it is not possible to estimate the recoverable amount of an individual asset, estimates are made of the recoverable amount of the cash-generating unit to which the asset belongs.
Notes to the Financial Statements
78 ANNUAL REPORT 2020/21 I FINANCIAL STATEMENTS
Recoverable amount is the greater of market value less costs to sell and value-in-use. If the recoverable amount of an asset (or cash-generating unit) is estimated to be less than its carrying amount, the carrying amount of the asset (or cash-generating unit) is reduced to its recoverable amount with the expense being recognised in the surplus or deficit.
For non-revalued assets impairment losses are recognised as an expense immediately.
For revalued assets, other than investment property, the impairment loss is treated as a revaluation decrease to the extent it reverses previously accumulated revaluation increments for that asset class.
The reversal of an impairment loss on a revalued asset is credited to other comprehensive revenue and expense and increases the asset revaluation reserve for that class of asset. However, to the extent that an impairment loss for that class of asset was previously recognised in the surplus or deficit, a reversal of the impairment loss is also recognised in the surplus or deficit.
1.3 Basis of consolidation
The group financial statements are prepared by adding together like items of assets, liabilities, equity, revenue and expenses on a line-by-line basis. Significant transactions and balances between the Council and its subsidiaries are eliminated in preparing the group financial statements.
The group financial statements are prepared using uniform accounting policies for like transactions and other events in similar circumstances. The consolidation of an entity begins from the date the Council obtains control of the entity and ceases when it loses that control.
1.4 Operating revenue
Accounting policy
Exchange and non-exchange revenueMost of the Council’s revenue is from non-exchange transactions accounted for under PBE IPSAS 23 (i.e. rates, subsidies and grants, provision of services partial cost recovery/subsidised, vested assets and financial/development contributions). Exchange transactions are recognised under PBE IPSAS 9 (i.e. targeted rates for water supply, provision of services full cost recovery, sale of goods, interest and dividends).
Professional judgement is exercised to determine whether the substance of a transaction is non-exchange or exchange. Revenue is measured at fair value which is usually the cash value of a transaction. For non-exchange revenue there is a recognition of a liability to the extent of unfulfilled conditions.
Rates revenue• General rates and uniform annual general charges (UAC) excluding water-by-meter, are recognised at the start
of the financial year to which the Council rates resolution relates. They are recognised at the amounts due. The Council considers that the effect of payment of rates by instalments is not sufficient to require discounting of rates receivables and subsequent recognition of interest revenue.
• Revenue arising from late payment penalties are recognised as revenue when rates become overdue.
• Revenue from water-by-meter rates is recognised on an accrual basis. Revenue is based on the actual usage as a result of meter reading. Unbilled usage, as a result of unread meters at year end, is accrued on an average usage basis.
• Rates remissions are recognised as a reduction of rates revenue when the Council has received an application that satisfies its rates remission policy.
• Rates collected on behalf of the Taranaki Regional Council (TRC) are not recognised in the financial statements, as the Council is acting as an agent for the TRC.
Development and financial contributionsDevelopment and financial contributions are recognised as revenue when the Council provides, or is able to provide, the service for which the contribution was charged. Otherwise, development and financial contributions are allocated to the appropriate reserve until such time as the Council provides, or is able to provide, the service.
Notes to the Financial Statements
FINANCIAL STATEMENTS I ANNUAL REPORT 2020/21 79
Waka Kotahi NZ Transport Agency (Waka Kotahi (NZTA)) roading subsidiesThe Council receives funding assistance from Waka Kotahi (NZTA) which subsidises part of the costs of maintenance and capital expenditure on the local roading infrastructure. Roading claim payments (reimbursements) are recognised as revenue upon entitlement, which is when conditions pertaining to eligible expenditure have been fulfilled.
Other grantsOther grants are recognised as revenue when they become receivable unless there is an obligation in substance to return the funds if conditions of the grant are not met. If there is such an obligation, the grants are initially recorded as grants received in advance and recognised as revenue when conditions of the grant are satisfied.
Landfill feesFees for disposing of waste at the Council’s landfill are recognised as waste is disposed by users.
Sales of goodsRevenue from the sale of goods is recognised when a product is sold to the customer and title has passed.
Infringement fees and finesInfringement fees and fines mostly relate to traffic and parking infringements and are recognised when the infringement notice is issued.
Vested or donated physical assetsFor assets received for no or nominal consideration, the asset is recognised at its fair value when the Council obtains control of the asset. The fair value of the asset is recognised as revenue, unless there is a use or return condition attached to the asset.
The fair value of vested or donated assets is usually determined by reference to the cost of constructing the asset. For assets received from property developments, the fair value is based on construction price information provided by the property developer.
Interest and dividendsInterest revenue is recognised using the effective interest method.
Dividends are recognised when the right to receive payment has been established.
1.5 Prior year adjustmentsThe Council and Group has identified that the accounting treatment applied in prior years to proceeds received from the sale of Council-owned properties in Waitara does not accurately reflect the underlying substance of these transactions. Therefore the Council and Group has adjusted its comparative year financial statements for the year ended 30 June 2020. The adjustment includes $1m that should have been corrected through the 2019 opening equity but that has been included in the 30 June 2020 expenditure instead due to the amount being immaterial.
A portion of the proceeds received by the Council from the sale of Council-owned properties in Waitara are held in the Waitara Perpetual Community Fund established by the Council. Previously, an expense and corresponding liability were recognised to reflect the sale proceeds invested in the Fund by the Council which are intended to be distributed in future years. However, as the Council controls the fund, rather than recognising an expense and liability when amounts were invested in the fund, the balance of funds held in the Waitara Perpetual Community Fund should instead be recognised as an asset and a restricted reserve within total accumulated funds. An expense and liability is recognised when the annual releases are determined by the Council for distribution in accordance with the Council’s Long Term policy.
The adjustments are shown in the table on the next page.
Notes to the Financial Statements
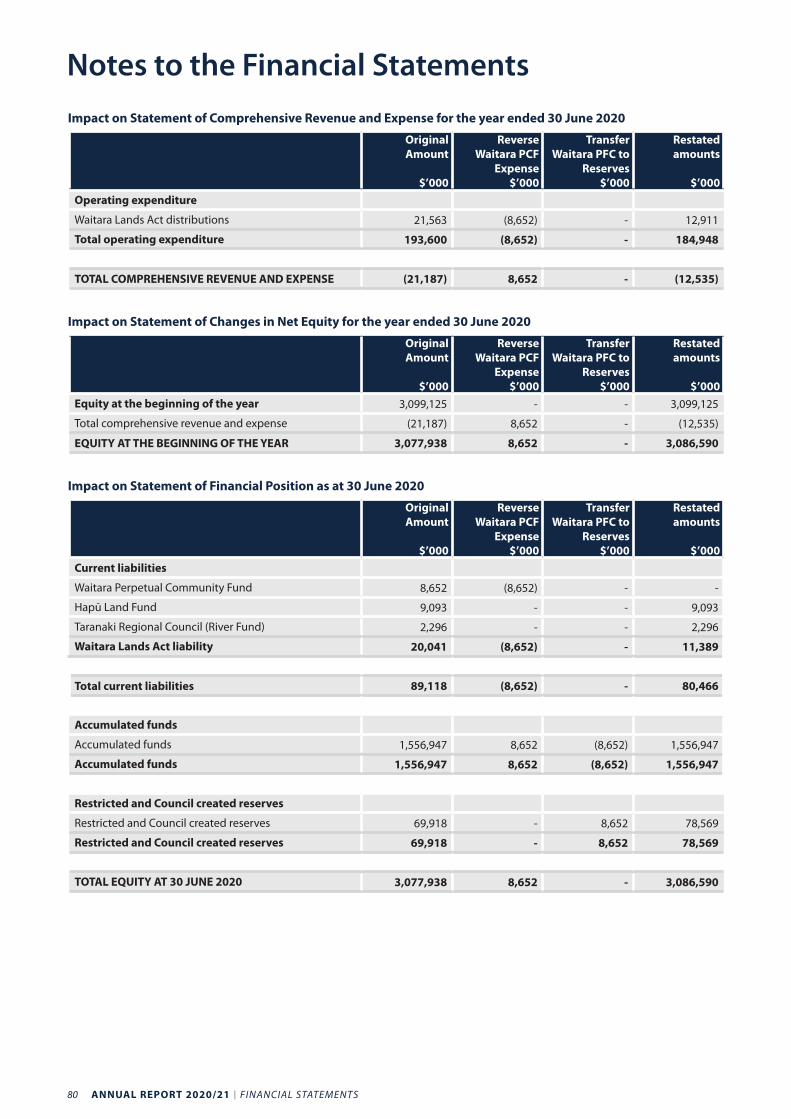
80 ANNUAL REPORT 2020/21 I FINANCIAL STATEMENTS
Impact on Statement of Comprehensive Revenue and Expense for the year ended 30 June 2020
Original Amount
$’000
Reverse Waitara PCF
Expense $’000
Transfer Waitara PFC to
Reserves $’000
Restated amounts
$’000
Operating expenditure
Waitara Lands Act distributions 21,563 (8,652) - 12,911
Total operating expenditure 193,600 (8,652) - 184,948
TOTAL COMPREHENSIVE REVENUE AND EXPENSE (21,187) 8,652 - (12,535)
Impact on Statement of Changes in Net Equity for the year ended 30 June 2020
Original Amount
$’000
Reverse Waitara PCF
Expense $’000
Transfer Waitara PFC to
Reserves $’000
Restated amounts
$’000
Equity at the beginning of the year 3,099,125 - - 3,099,125
Total comprehensive revenue and expense (21,187) 8,652 - (12,535)
EQUITY AT THE BEGINNING OF THE YEAR 3,077,938 8,652 - 3,086,590
Impact on Statement of Financial Position as at 30 June 2020
Original Amount
$’000
Reverse Waitara PCF
Expense $’000
Transfer Waitara PFC to
Reserves $’000
Restated amounts
$’000
Current liabilities
Waitara Perpetual Community Fund 8,652 (8,652) - -
Hapū Land Fund 9,093 - - 9,093
Taranaki Regional Council (River Fund) 2,296 - - 2,296
Waitara Lands Act liability 20,041 (8,652) - 11,389
Total current liabilities 89,118 (8,652) - 80,466
Accumulated funds
Accumulated funds 1,556,947 8,652 (8,652) 1,556,947
Accumulated funds 1,556,947 8,652 (8,652) 1,556,947
Restricted and Council created reserves
Restricted and Council created reserves 69,918 - 8,652 78,569
Restricted and Council created reserves 69,918 - 8,652 78,569
TOTAL EQUITY AT 30 JUNE 2020 3,077,938 8,652 - 3,086,590
Notes to the Financial Statements
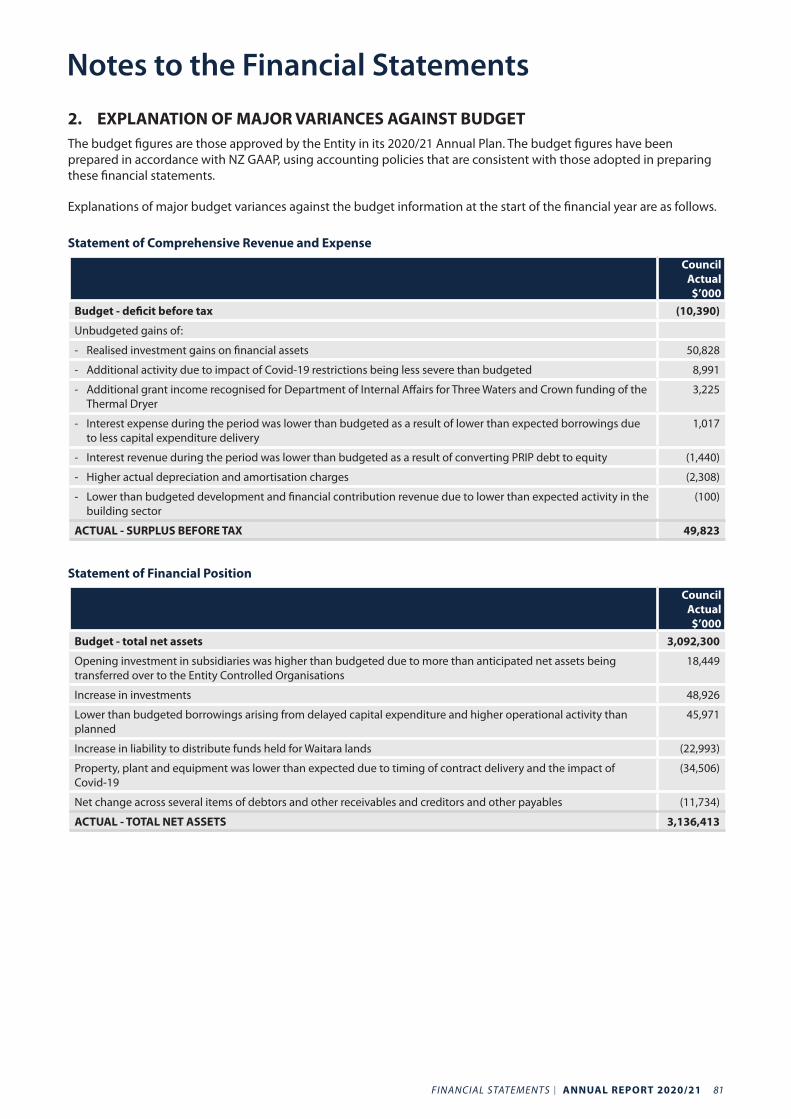
FINANCIAL STATEMENTS I ANNUAL REPORT 2020/21 81
2. EXPLANATION OF MAJOR VARIANCES AGAINST BUDGETThe budget figures are those approved by the Entity in its 2020/21 Annual Plan. The budget figures have been prepared in accordance with NZ GAAP, using accounting policies that are consistent with those adopted in preparing these financial statements.
Explanations of major budget variances against the budget information at the start of the financial year are as follows.
Statement of Comprehensive Revenue and Expense
Council Actual $’000
Budget - deficit before tax (10,390)
Unbudgeted gains of:
- Realised investment gains on financial assets 50,828
- Additional activity due to impact of Covid-19 restrictions being less severe than budgeted 8,991
- Additional grant income recognised for Department of Internal Affairs for Three Waters and Crown funding of the Thermal Dryer
3,225
- Interest expense during the period was lower than budgeted as a result of lower than expected borrowings due to less capital expenditure delivery
1,017
- Interest revenue during the period was lower than budgeted as a result of converting PRIP debt to equity (1,440)
- Higher actual depreciation and amortisation charges (2,308)
- Lower than budgeted development and financial contribution revenue due to lower than expected activity in the building sector
(100)
ACTUAL - SURPLUS BEFORE TAX 49,823
Statement of Financial Position
Council Actual $’000
Budget - total net assets 3,092,300
Opening investment in subsidiaries was higher than budgeted due to more than anticipated net assets being transferred over to the Entity Controlled Organisations
18,449
Increase in investments 48,926
Lower than budgeted borrowings arising from delayed capital expenditure and higher operational activity than planned
45,971
Increase in liability to distribute funds held for Waitara lands (22,993)
Property, plant and equipment was lower than expected due to timing of contract delivery and the impact of Covid-19
(34,506)
Net change across several items of debtors and other receivables and creditors and other payables (11,734)
ACTUAL - TOTAL NET ASSETS 3,136,413
Notes to the Financial Statements
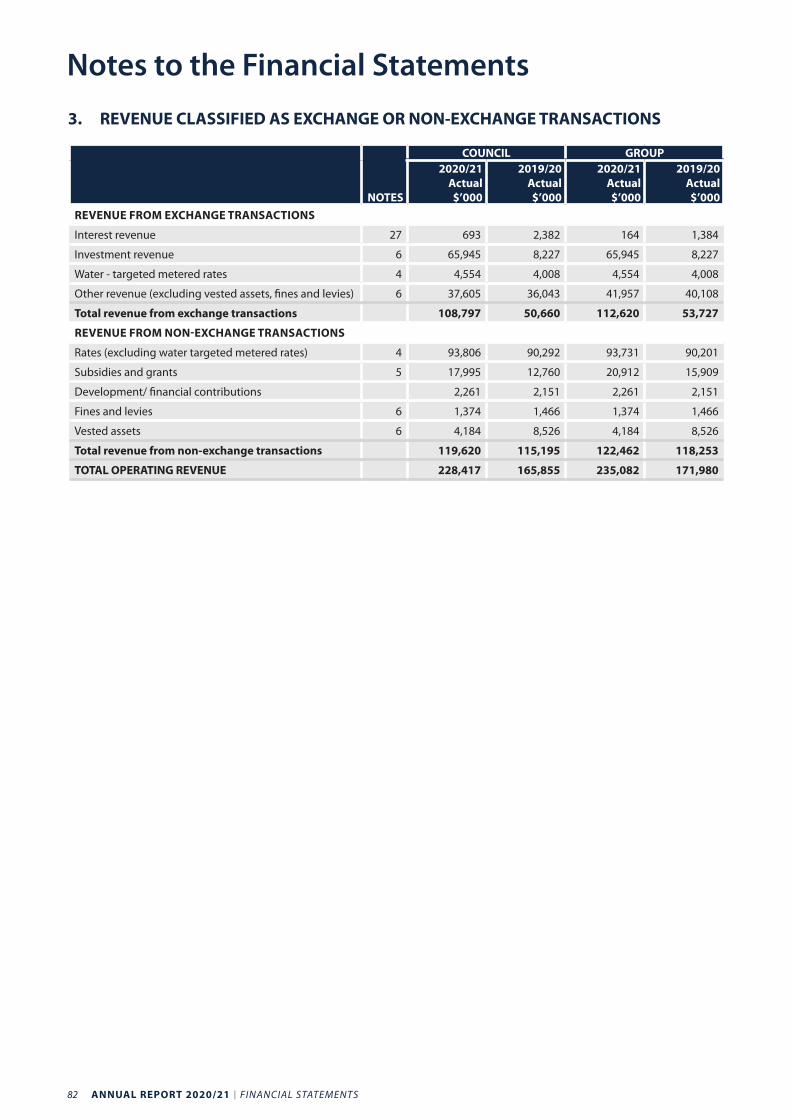
82 ANNUAL REPORT 2020/21 I FINANCIAL STATEMENTS
3. REVENUE CLASSIFIED AS EXCHANGE OR NON-EXCHANGE TRANSACTIONS
NOTES
COUNCIL GROUP2020/21
Actual $’000
2019/20 Actual $’000
2020/21 Actual $’000
2019/20 Actual $’000
REVENUE FROM EXCHANGE TRANSACTIONS
Interest revenue 27 693 2,382 164 1,384
Investment revenue 6 65,945 8,227 65,945 8,227
Water - targeted metered rates 4 4,554 4,008 4,554 4,008
Other revenue (excluding vested assets, fines and levies) 6 37,605 36,043 41,957 40,108
Total revenue from exchange transactions 108,797 50,660 112,620 53,727
REVENUE FROM NON-EXCHANGE TRANSACTIONS
Rates (excluding water targeted metered rates) 4 93,806 90,292 93,731 90,201
Subsidies and grants 5 17,995 12,760 20,912 15,909
Development/ financial contributions 2,261 2,151 2,261 2,151
Fines and levies 6 1,374 1,466 1,374 1,466
Vested assets 6 4,184 8,526 4,184 8,526
Total revenue from non-exchange transactions 119,620 115,195 122,462 118,253
TOTAL OPERATING REVENUE 228,417 165,855 235,082 171,980
Notes to the Financial Statements
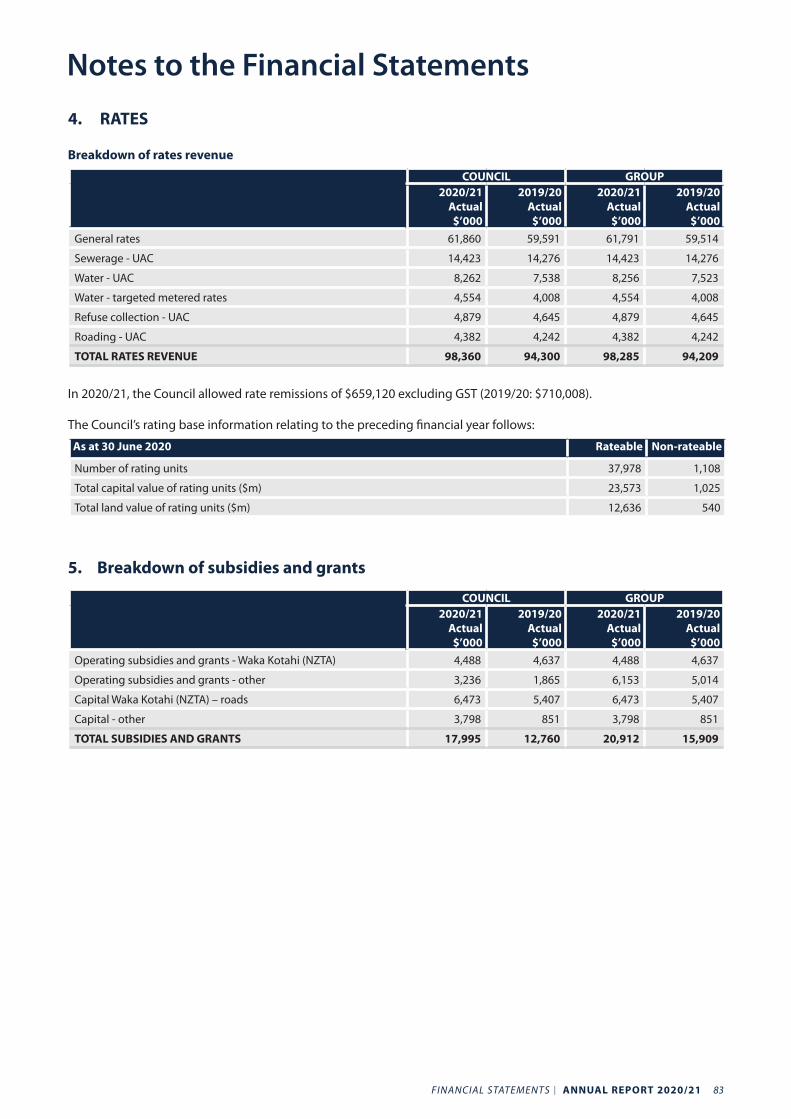
FINANCIAL STATEMENTS I ANNUAL REPORT 2020/21 83
4. RATES
Breakdown of rates revenue
COUNCIL GROUP2020/21
Actual $’000
2019/20 Actual $’000
2020/21 Actual $’000
2019/20 Actual $’000
General rates 61,860 59,591 61,791 59,514
Sewerage - UAC 14,423 14,276 14,423 14,276
Water - UAC 8,262 7,538 8,256 7,523
Water - targeted metered rates 4,554 4,008 4,554 4,008
Refuse collection - UAC 4,879 4,645 4,879 4,645
Roading - UAC 4,382 4,242 4,382 4,242
TOTAL RATES REVENUE 98,360 94,300 98,285 94,209
In 2020/21, the Council allowed rate remissions of $659,120 excluding GST (2019/20: $710,008).
The Council’s rating base information relating to the preceding financial year follows:
As at 30 June 2020 Rateable Non-rateable
Number of rating units 37,978 1,108
Total capital value of rating units ($m) 23,573 1,025
Total land value of rating units ($m) 12,636 540
5. Breakdown of subsidies and grants
COUNCIL GROUP2020/21
Actual $’000
2019/20 Actual $’000
2020/21 Actual $’000
2019/20 Actual $’000
Operating subsidies and grants - Waka Kotahi (NZTA) 4,488 4,637 4,488 4,637
Operating subsidies and grants - other 3,236 1,865 6,153 5,014
Capital Waka Kotahi (NZTA) – roads 6,473 5,407 6,473 5,407
Capital - other 3,798 851 3,798 851
TOTAL SUBSIDIES AND GRANTS 17,995 12,760 20,912 15,909
Notes to the Financial Statements
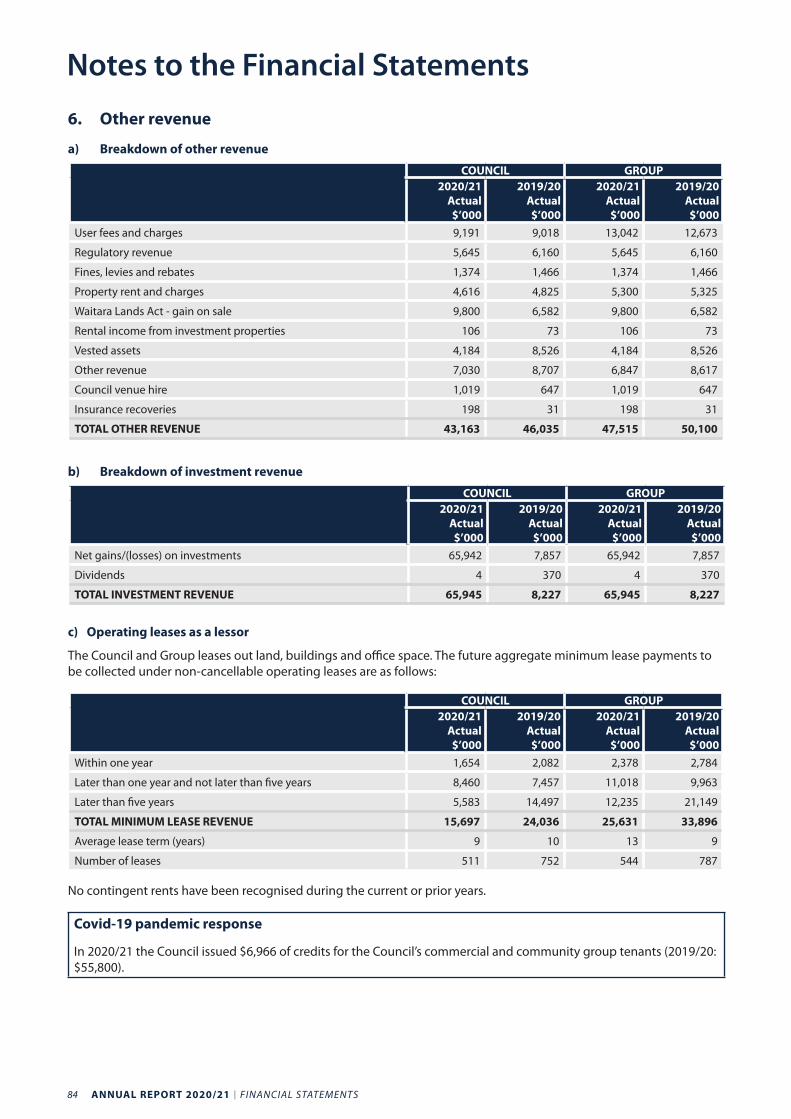
84 ANNUAL REPORT 2020/21 I FINANCIAL STATEMENTS
6. Other revenue
a) Breakdown of other revenue
COUNCIL GROUP2020/21
Actual $’000
2019/20 Actual $’000
2020/21 Actual $’000
2019/20 Actual $’000
User fees and charges 9,191 9,018 13,042 12,673
Regulatory revenue 5,645 6,160 5,645 6,160
Fines, levies and rebates 1,374 1,466 1,374 1,466
Property rent and charges 4,616 4,825 5,300 5,325
Waitara Lands Act - gain on sale 9,800 6,582 9,800 6,582
Rental income from investment properties 106 73 106 73
Vested assets 4,184 8,526 4,184 8,526
Other revenue 7,030 8,707 6,847 8,617
Council venue hire 1,019 647 1,019 647
Insurance recoveries 198 31 198 31
TOTAL OTHER REVENUE 43,163 46,035 47,515 50,100
b) Breakdown of investment revenue
COUNCIL GROUP2020/21
Actual $’000
2019/20 Actual $’000
2020/21 Actual $’000
2019/20 Actual $’000
Net gains/(losses) on investments 65,942 7,857 65,942 7,857
Dividends 4 370 4 370
TOTAL INVESTMENT REVENUE 65,945 8,227 65,945 8,227
c) Operating leases as a lessor
The Council and Group leases out land, buildings and office space. The future aggregate minimum lease payments to be collected under non-cancellable operating leases are as follows:
COUNCIL GROUP2020/21
Actual $’000
2019/20 Actual $’000
2020/21 Actual $’000
2019/20 Actual $’000
Within one year 1,654 2,082 2,378 2,784
Later than one year and not later than five years 8,460 7,457 11,018 9,963
Later than five years 5,583 14,497 12,235 21,149
TOTAL MINIMUM LEASE REVENUE 15,697 24,036 25,631 33,896
Average lease term (years) 9 10 13 9
Number of leases 511 752 544 787
No contingent rents have been recognised during the current or prior years.
Covid-19 pandemic response
In 2020/21 the Council issued $6,966 of credits for the Council’s commercial and community group tenants (2019/20: $55,800).
Notes to the Financial Statements
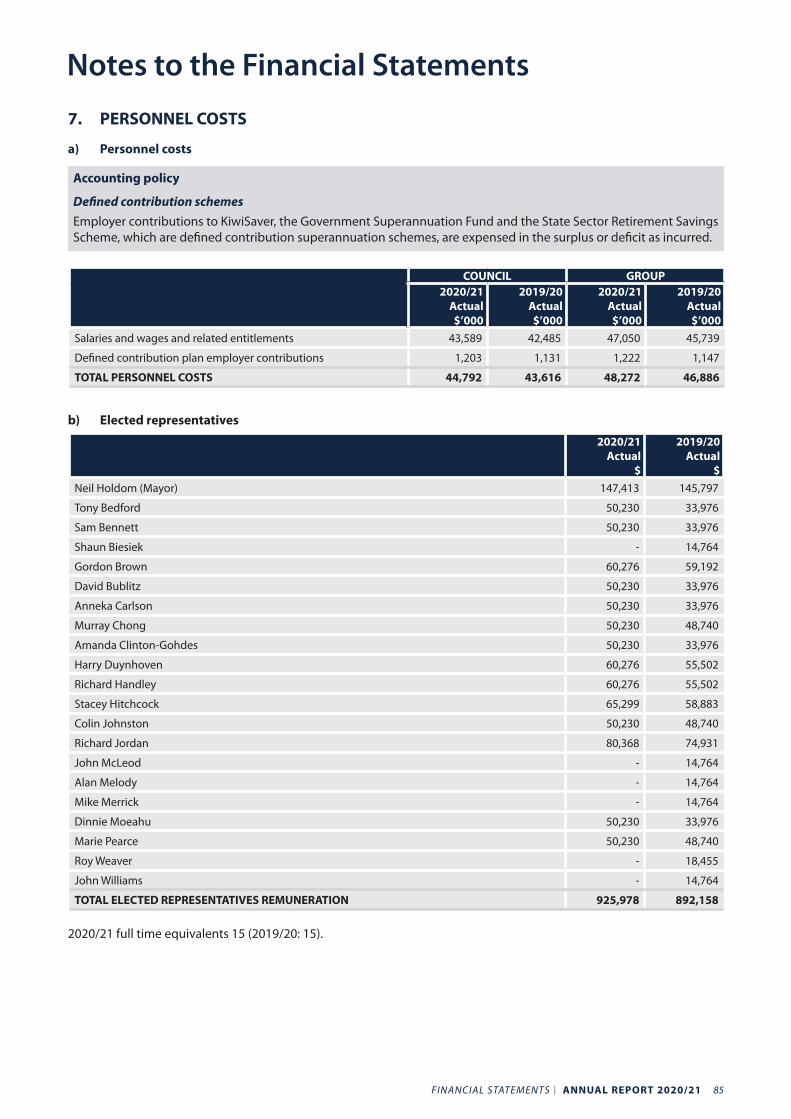
FINANCIAL STATEMENTS I ANNUAL REPORT 2020/21 85
7. PERSONNEL COSTS
a) Personnel costs
Accounting policy
Defined contribution schemesEmployer contributions to KiwiSaver, the Government Superannuation Fund and the State Sector Retirement Savings Scheme, which are defined contribution superannuation schemes, are expensed in the surplus or deficit as incurred.
COUNCIL GROUP2020/21
Actual $’000
2019/20 Actual $’000
2020/21 Actual $’000
2019/20 Actual $’000
Salaries and wages and related entitlements 43,589 42,485 47,050 45,739
Defined contribution plan employer contributions 1,203 1,131 1,222 1,147
TOTAL PERSONNEL COSTS 44,792 43,616 48,272 46,886
b) Elected representatives
2020/21 Actual
$
2019/20 Actual
$Neil Holdom (Mayor) 147,413 145,797
Tony Bedford 50,230 33,976
Sam Bennett 50,230 33,976
Shaun Biesiek - 14,764
Gordon Brown 60,276 59,192
David Bublitz 50,230 33,976
Anneka Carlson 50,230 33,976
Murray Chong 50,230 48,740
Amanda Clinton-Gohdes 50,230 33,976
Harry Duynhoven 60,276 55,502
Richard Handley 60,276 55,502
Stacey Hitchcock 65,299 58,883
Colin Johnston 50,230 48,740
Richard Jordan 80,368 74,931
John McLeod - 14,764
Alan Melody - 14,764
Mike Merrick - 14,764
Dinnie Moeahu 50,230 33,976
Marie Pearce 50,230 48,740
Roy Weaver - 18,455
John Williams - 14,764
TOTAL ELECTED REPRESENTATIVES REMUNERATION 925,978 892,158
2020/21 full time equivalents 15 (2019/20: 15).
Notes to the Financial Statements
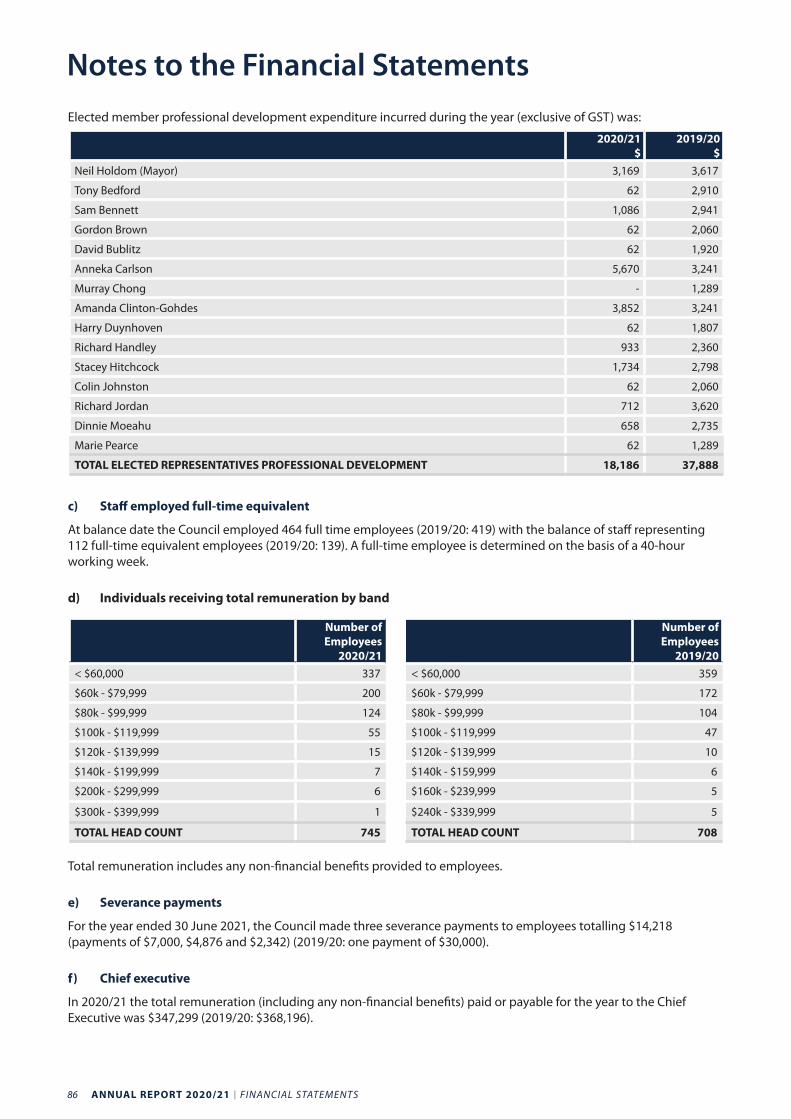
86 ANNUAL REPORT 2020/21 I FINANCIAL STATEMENTS
Elected member professional development expenditure incurred during the year (exclusive of GST) was:
2020/21 $
2019/20 $
Neil Holdom (Mayor) 3,169 3,617
Tony Bedford 62 2,910
Sam Bennett 1,086 2,941
Gordon Brown 62 2,060
David Bublitz 62 1,920
Anneka Carlson 5,670 3,241
Murray Chong - 1,289
Amanda Clinton-Gohdes 3,852 3,241
Harry Duynhoven 62 1,807
Richard Handley 933 2,360
Stacey Hitchcock 1,734 2,798
Colin Johnston 62 2,060
Richard Jordan 712 3,620
Dinnie Moeahu 658 2,735
Marie Pearce 62 1,289
TOTAL ELECTED REPRESENTATIVES PROFESSIONAL DEVELOPMENT 18,186 37,888
c) Staff employed full-time equivalent
At balance date the Council employed 464 full time employees (2019/20: 419) with the balance of staff representing 112 full-time equivalent employees (2019/20: 139). A full-time employee is determined on the basis of a 40-hour working week.
d) Individuals receiving total remuneration by band
Number of Employees
2020/21
Number of Employees
2019/20< $60,000 337 < $60,000 359
$60k - $79,999 200 $60k - $79,999 172
$80k - $99,999 124 $80k - $99,999 104
$100k - $119,999 55 $100k - $119,999 47
$120k - $139,999 15 $120k - $139,999 10
$140k - $199,999 7 $140k - $159,999 6
$200k - $299,999 6 $160k - $239,999 5
$300k - $399,999 1 $240k - $339,999 5
TOTAL HEAD COUNT 745 TOTAL HEAD COUNT 708
Total remuneration includes any non-financial benefits provided to employees.
e) Severance payments
For the year ended 30 June 2021, the Council made three severance payments to employees totalling $14,218 (payments of $7,000, $4,876 and $2,342) (2019/20: one payment of $30,000).
f) Chief executive
In 2020/21 the total remuneration (including any non-financial benefits) paid or payable for the year to the Chief Executive was $347,299 (2019/20: $368,196).
Notes to the Financial Statements
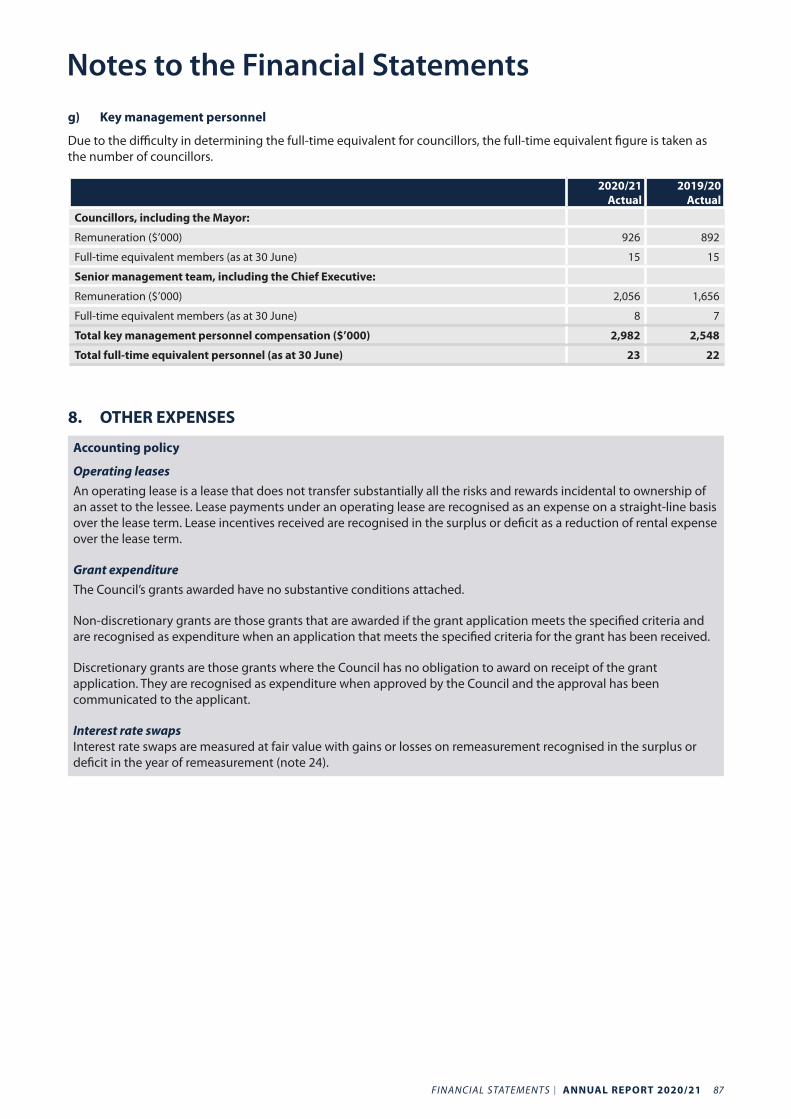
FINANCIAL STATEMENTS I ANNUAL REPORT 2020/21 87
g) Key management personnel
Due to the difficulty in determining the full-time equivalent for councillors, the full-time equivalent figure is taken as the number of councillors.
2020/21 Actual
2019/20 Actual
Councillors, including the Mayor:
Remuneration ($’000) 926 892
Full-time equivalent members (as at 30 June) 15 15
Senior management team, including the Chief Executive:
Remuneration ($’000) 2,056 1,656
Full-time equivalent members (as at 30 June) 8 7
Total key management personnel compensation ($’000) 2,982 2,548
Total full-time equivalent personnel (as at 30 June) 23 22
8. OTHER EXPENSES
Accounting policy
Operating leasesAn operating lease is a lease that does not transfer substantially all the risks and rewards incidental to ownership of an asset to the lessee. Lease payments under an operating lease are recognised as an expense on a straight-line basis over the lease term. Lease incentives received are recognised in the surplus or deficit as a reduction of rental expense over the lease term.
Grant expenditureThe Council’s grants awarded have no substantive conditions attached.
Non-discretionary grants are those grants that are awarded if the grant application meets the specified criteria and are recognised as expenditure when an application that meets the specified criteria for the grant has been received.
Discretionary grants are those grants where the Council has no obligation to award on receipt of the grant application. They are recognised as expenditure when approved by the Council and the approval has been communicated to the applicant.
Interest rate swapsInterest rate swaps are measured at fair value with gains or losses on remeasurement recognised in the surplus or deficit in the year of remeasurement (note 24).
Notes to the Financial Statements
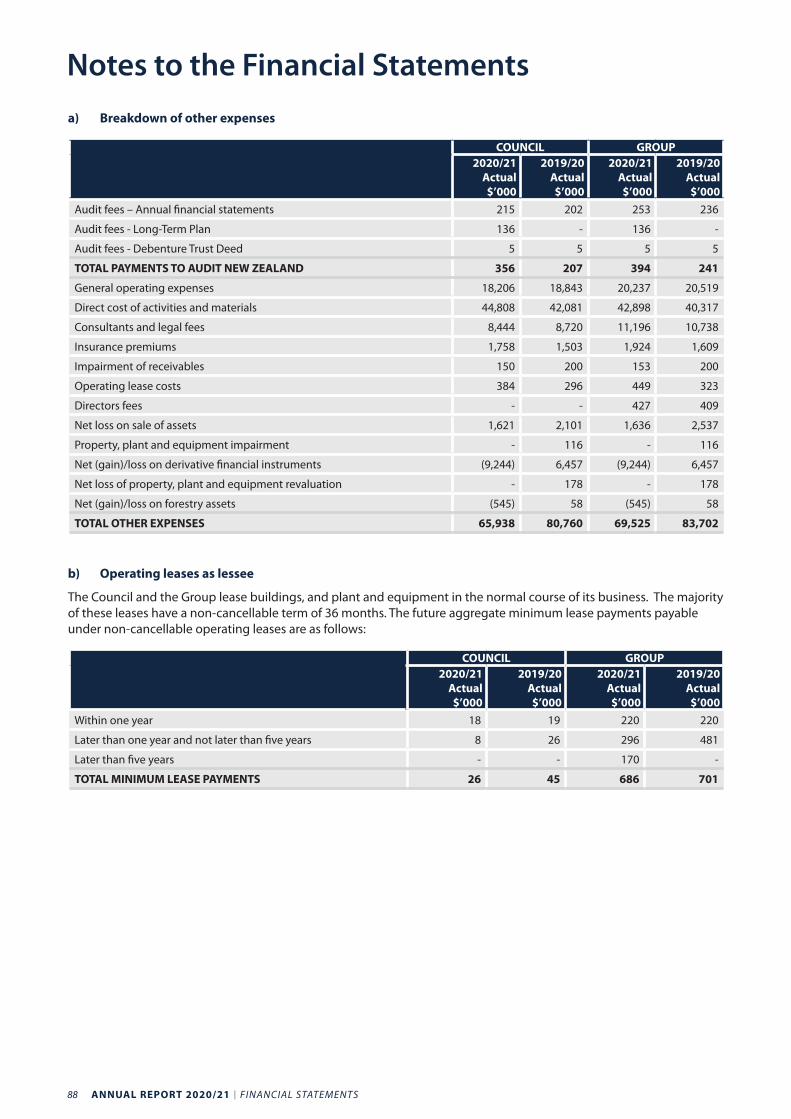
88 ANNUAL REPORT 2020/21 I FINANCIAL STATEMENTS
a) Breakdown of other expenses
COUNCIL GROUP2020/21
Actual $’000
2019/20 Actual $’000
2020/21 Actual $’000
2019/20 Actual $’000
Audit fees – Annual financial statements 215 202 253 236
Audit fees - Long-Term Plan 136 - 136 -
Audit fees - Debenture Trust Deed 5 5 5 5
TOTAL PAYMENTS TO AUDIT NEW ZEALAND 356 207 394 241
General operating expenses 18,206 18,843 20,237 20,519
Direct cost of activities and materials 44,808 42,081 42,898 40,317
Consultants and legal fees 8,444 8,720 11,196 10,738
Insurance premiums 1,758 1,503 1,924 1,609
Impairment of receivables 150 200 153 200
Operating lease costs 384 296 449 323
Directors fees - - 427 409
Net loss on sale of assets 1,621 2,101 1,636 2,537
Property, plant and equipment impairment - 116 - 116
Net (gain)/loss on derivative financial instruments (9,244) 6,457 (9,244) 6,457
Net loss of property, plant and equipment revaluation - 178 - 178
Net (gain)/loss on forestry assets (545) 58 (545) 58
TOTAL OTHER EXPENSES 65,938 80,760 69,525 83,702
b) Operating leases as lessee
The Council and the Group lease buildings, and plant and equipment in the normal course of its business. The majority of these leases have a non-cancellable term of 36 months. The future aggregate minimum lease payments payable under non-cancellable operating leases are as follows:
COUNCIL GROUP2020/21
Actual $’000
2019/20 Actual $’000
2020/21 Actual $’000
2019/20 Actual $’000
Within one year 18 19 220 220
Later than one year and not later than five years 8 26 296 481
Later than five years - - 170 -
TOTAL MINIMUM LEASE PAYMENTS 26 45 686 701
Notes to the Financial Statements
FINANCIAL STATEMENTS I ANNUAL REPORT 2020/21 89
9. PROPERTY, PLANT AND EQUIPMENT
Accounting policy
Asset categoriesOperational assets: These are land, buildings (including any improvements), vehicles, furniture, fittings and equipment and library books. Land is measured and fair value and buildings and the Puke Ariki book collection are measured at fair value less accumulated depreciation. Vehicles and furniture, fittings and equipment are measured at cost less accumulated depreciation and impairment losses.
Restricted assets: These are land and buildings that are subject to restrictions on use, disposal, or both. This includes restrictions from legislation (such as land declared as a reserve under the Reserves Act 1977) or other restrictions (such as bequest land or buildings or donation that restricts the purpose for which the assets can be used). These assets are measured at fair value.
Infrastructural assets: These are the fixed utility systems owned by the Council. They usually display some or all of the following characteristics: part of a system or network, specialised in nature and usually do not have alternative uses, immoveable and may be subject to constraints on disposal. Examples are road networks, sewer systems and water systems. These assets are measured at fair value less accumulated depreciation.
RevaluationAll property, plant and equipment except for operational motor vehicles, furniture, fittings and equipment and work-in-progress are revalued with sufficient regularity to ensure that their carrying amount does not differ materially from fair value, at least every three years.
Fair value is determined by reference to the depreciated replacement cost or market value on an asset class basis. The carrying values of revalued assets are assessed annually to ensure they do not differ materially from the assets fair values. If there is a material difference then the off-cycle asset classes are revalued.
Revaluation movements are accounted for on a class-of-asset basis.
The net revaluation results are credited or debited to other comprehensive revenue and expense and are accumulated to an asset revaluation reserve in equity for that class of asset. Where this would result in a debit balance in the asset revaluation reserve, this balance is not recognised in other comprehensive revenue and expense but is recognised in the surplus or deficit. Any subsequent increase on revaluation that reverses a previous decrease in value recognised in the surplus or deficit will be recognised first in the surplus or deficit up to the amount previously expensed and then recognised in other comprehensive revenue and expense.
AdditionsThe cost of an item of property, plant and equipment is recognised as an asset only when it is probable that future economic benefits or service potential associated with the item will flow to the Council and the cost of the item can be measured reliably.
Work in progress is recognised at cost less impairment and is not depreciated.
In most instances, an item of property, plant and equipment is recognised at cost. Where an asset is acquired at no cost, or a nominal cost (e.g. vested asset), it is recognised at fair value at the date of acquisition.
Costs incurred subsequent to initial acquisition are capitalised only when it is probable that future economic benefits or service potential associated with the cost will flow to the Council and the cost of the item can be measured reliably.
The costs of servicing property, plant and equipment are recognised in the surplus or deficit as they are incurred.
Notes to the Financial Statements
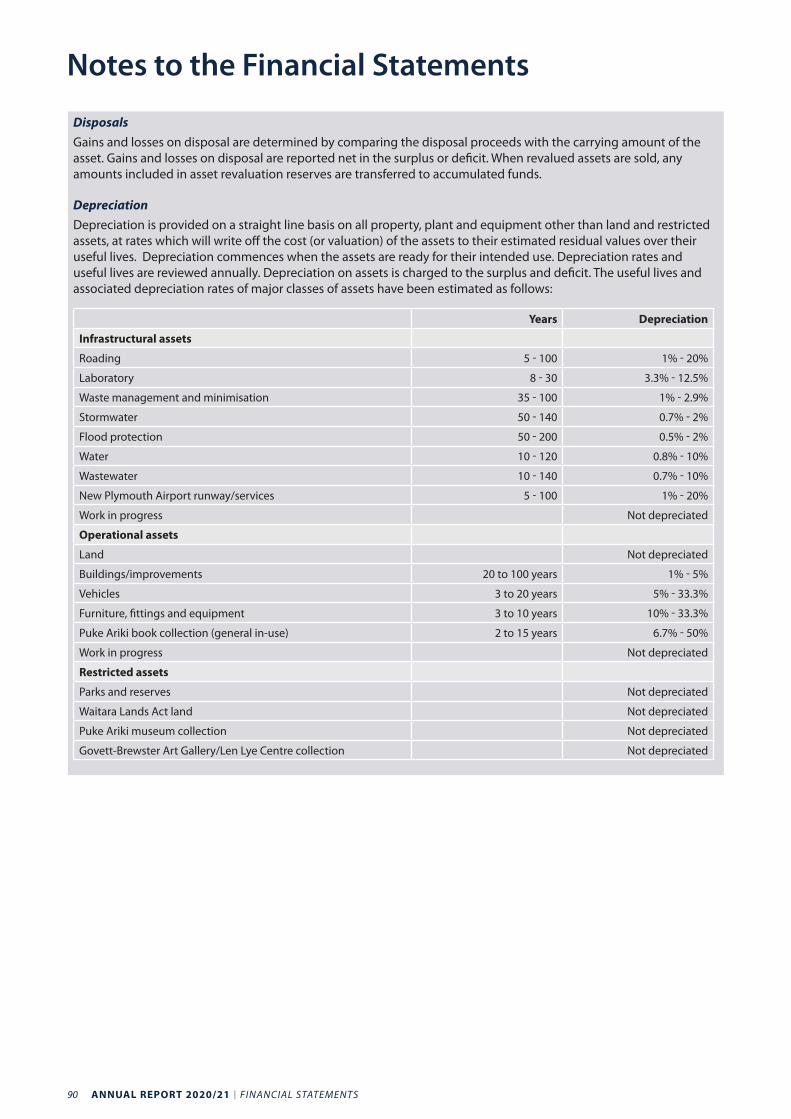
90 ANNUAL REPORT 2020/21 I FINANCIAL STATEMENTS
DisposalsGains and losses on disposal are determined by comparing the disposal proceeds with the carrying amount of the asset. Gains and losses on disposal are reported net in the surplus or deficit. When revalued assets are sold, any amounts included in asset revaluation reserves are transferred to accumulated funds.
DepreciationDepreciation is provided on a straight line basis on all property, plant and equipment other than land and restricted assets, at rates which will write off the cost (or valuation) of the assets to their estimated residual values over their useful lives. Depreciation commences when the assets are ready for their intended use. Depreciation rates and useful lives are reviewed annually. Depreciation on assets is charged to the surplus and deficit. The useful lives and associated depreciation rates of major classes of assets have been estimated as follows:
Years Depreciation
Infrastructural assets
Roading 5 - 100 1% - 20%
Laboratory 8 - 30 3.3% - 12.5%
Waste management and minimisation 35 - 100 1% - 2.9%
Stormwater 50 - 140 0.7% - 2%
Flood protection 50 - 200 0.5% - 2%
Water 10 - 120 0.8% - 10%
Wastewater 10 - 140 0.7% - 10%
New Plymouth Airport runway/services 5 - 100 1% - 20%
Work in progress Not depreciated
Operational assets
Land Not depreciated
Buildings/improvements 20 to 100 years 1% - 5%
Vehicles 3 to 20 years 5% - 33.3%
Furniture, fittings and equipment 3 to 10 years 10% - 33.3%
Puke Ariki book collection (general in-use) 2 to 15 years 6.7% - 50%
Work in progress Not depreciated
Restricted assets
Parks and reserves Not depreciated
Waitara Lands Act land Not depreciated
Puke Ariki museum collection Not depreciated
Govett-Brewster Art Gallery/Len Lye Centre collection Not depreciated
Notes to the Financial Statements
FINANCIAL STATEMENTS I ANNUAL REPORT 2020/21 91
Critical accounting estimates and assumptions
Estimating fair value
Infrastructural assets All infrastructural assets, excluding New Plymouth Airport runway/services and work in progress, were independently valued at depreciated replacement cost at 30 June 2019. The valuation was performed by independent registered valuer Alun James of WSP Opus.
There are a number of estimates and assumptions exercised when valuing infrastructural assets using the depreciated replacement cost method. These include:
• Estimating any obsolescence or surplus capacity of the asset.
• Estimating the replacement cost of the asset. The replacement cost is derived from recent construction. Unit rates can vary based on asset location, topography and ground conditions.
• Contracts in the region for similar assets.
• Roads include derived values for land not held on title (road reserve). The average value of the road reserve is the current average land value calculated for each government roll number. The following factors have been applied: - unformed roads 80% of average value- formed roads (urban) 70% of average value- formed roads (rural) 50% of average value
• Estimates are made when determining the remaining useful life over which the assets will be depreciated. These estimates can be affected by local conditions, for example, weather patterns, and traffic growth.
If useful lives do not reflect the consumption of the benefits of the asset, then the Council could be under or over estimating the annual depreciation charge recognised as an expense in the Statement of Comprehensive Revenue and Expense. To minimise this risk the Council has determined the infrastructural asset useful lives with reference to NZ Infrastructural Asset Valuation and Depreciation Guidelines published by the National Asset Management Steering Group, and have been adjusted for local conditions based on past experience. Asset inspections, deterioration, and condition modelling are also carried out regularly as part of the Councils’ asset management planning activities, which gives the Council further assurance over its useful life estimates.
• The physical deterioration and condition of the assets. For example, the Council could be carrying an asset at an amount that does not reflect its physical condition. This is particularly relevant for those assets which are not visible such as stormwater, wastewater and water supply pipes that are underground. The risk is minimised by the Council performing a number of physical inspections and condition modelling assessments of assets.
Impact of Covid-19 pandemic on infrastructure asset values The Covid-19 pandemic has not impacted the value of the Council’s infrastructure assets due to the Council operating an Infrastructure Term Service Contract. This contract covers a significant proportion of the renewal of the Council’s core infrastructure. It is an open book based contract that applies for 10 years from its commencement on 1 July 2019. The contract schedule of rates were used as the basis for the 2019 asset valuation. The price adjustment inflationary provisions within the contract are based on NZTA indexes. When applied to the agreed contract weightings the inflationary adjustment for the year ended 30 June 2021 is 0.8 per cent, which is not considered a material movement to the fair value of the infrastructure assets.
Land (operational) and parks and reserves (restricted assets) These assets were independently valued by Mike Drew, Director (BBS (VPM) ANZIV, MPINZ), TelferYoung (Taranaki) Limited (registered valuers).
Operational land is valued as at 30 June 2019 at fair value with reference to highest and best use.
Adjustments have been made to the ‘unencumbered’ land value where there is a designation against the land or the use of the land is restricted because of reserve or endowment status. These adjustments are intended to reflect the negative effect on the value of the land where an owner is unable to use the land more intensely. Such land is valued based on rural land value plus a location adjustment to reflect different zoning, which rely on the valuer’s judgement.
Notes to the Financial Statements
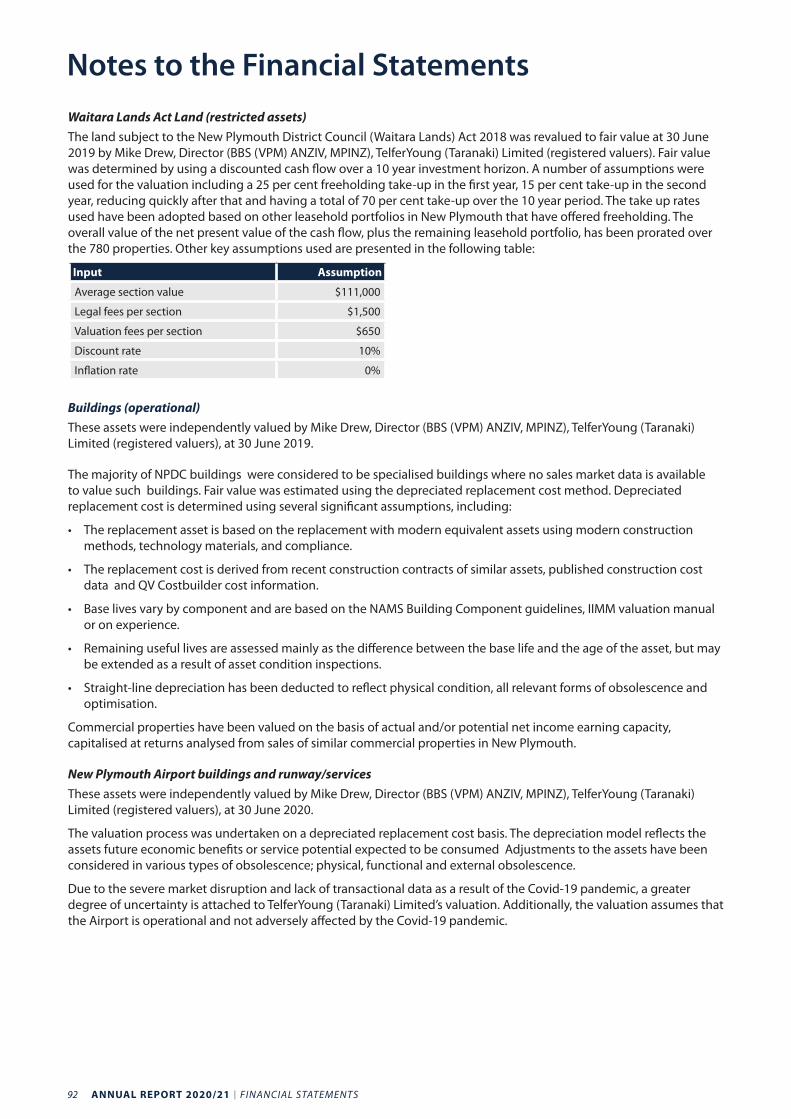
92 ANNUAL REPORT 2020/21 I FINANCIAL STATEMENTS
Waitara Lands Act Land (restricted assets)The land subject to the New Plymouth District Council (Waitara Lands) Act 2018 was revalued to fair value at 30 June 2019 by Mike Drew, Director (BBS (VPM) ANZIV, MPINZ), TelferYoung (Taranaki) Limited (registered valuers). Fair value was determined by using a discounted cash flow over a 10 year investment horizon. A number of assumptions were used for the valuation including a 25 per cent freeholding take-up in the first year, 15 per cent take-up in the second year, reducing quickly after that and having a total of 70 per cent take-up over the 10 year period. The take up rates used have been adopted based on other leasehold portfolios in New Plymouth that have offered freeholding. The overall value of the net present value of the cash flow, plus the remaining leasehold portfolio, has been prorated over the 780 properties. Other key assumptions used are presented in the following table:
Input Assumption
Average section value $111,000
Legal fees per section $1,500
Valuation fees per section $650
Discount rate 10%
Inflation rate 0%
Buildings (operational)These assets were independently valued by Mike Drew, Director (BBS (VPM) ANZIV, MPINZ), TelferYoung (Taranaki)Limited (registered valuers), at 30 June 2019.
The majority of NPDC buildings were considered to be specialised buildings where no sales market data is available to value such buildings. Fair value was estimated using the depreciated replacement cost method. Depreciated replacement cost is determined using several significant assumptions, including:
• The replacement asset is based on the replacement with modern equivalent assets using modern construction methods, technology materials, and compliance.
• The replacement cost is derived from recent construction contracts of similar assets, published construction cost data and QV Costbuilder cost information.
• Base lives vary by component and are based on the NAMS Building Component guidelines, IIMM valuation manual or on experience.
• Remaining useful lives are assessed mainly as the difference between the base life and the age of the asset, but may be extended as a result of asset condition inspections.
• Straight-line depreciation has been deducted to reflect physical condition, all relevant forms of obsolescence and optimisation.
Commercial properties have been valued on the basis of actual and/or potential net income earning capacity, capitalised at returns analysed from sales of similar commercial properties in New Plymouth.
New Plymouth Airport buildings and runway/servicesThese assets were independently valued by Mike Drew, Director (BBS (VPM) ANZIV, MPINZ), TelferYoung (Taranaki)Limited (registered valuers), at 30 June 2020.
The valuation process was undertaken on a depreciated replacement cost basis. The depreciation model reflects the assets future economic benefits or service potential expected to be consumed Adjustments to the assets have been considered in various types of obsolescence; physical, functional and external obsolescence.
Due to the severe market disruption and lack of transactional data as a result of the Covid-19 pandemic, a greater degree of uncertainty is attached to TelferYoung (Taranaki) Limited’s valuation. Additionally, the valuation assumes that the Airport is operational and not adversely affected by the Covid-19 pandemic.
Notes to the Financial Statements
FINANCIAL STATEMENTS I ANNUAL REPORT 2020/21 93
Notes to the Financial StatementsPuke Ariki book and museum collections (restricted assets)Library collections are valued at depreciated replacement cost. Museum collections are valued at optimised replacement cost. The most recent valuation was undertaken by the Council as at 30 June 2020 and reviewed by Kees Beentjes BSc, BE(Hons) and Chris Jenkins BE(Hons), MIPENZ, MInstD of SPM Assets Ltd. The economic impact of the Covid-19 pandemic is unlikely to significantly alter the previously used lives.
Govett-Brewster Art Gallery/Len Lye Centre collectionThe most recent valuation of these assets was performed by Ben Plumbly BA, First Class Honors, Director of Art, Art + Object, the 21st Century Auction House. The last revaluation was effective as at 30 June 2020.
This collection is valued at fair value using various methods as follows:
• Reference to observable prices in an active market. Where that market exists for the same or similar asset the market prices are deemed to be fair value. The values ascribed are primarily based on observable prices in both the primary retail market and the secondary auction market.
• If there is no active market, fair value is determined by other market based evidence adjudged by the valuers as active and knowledgeable participants in the market.
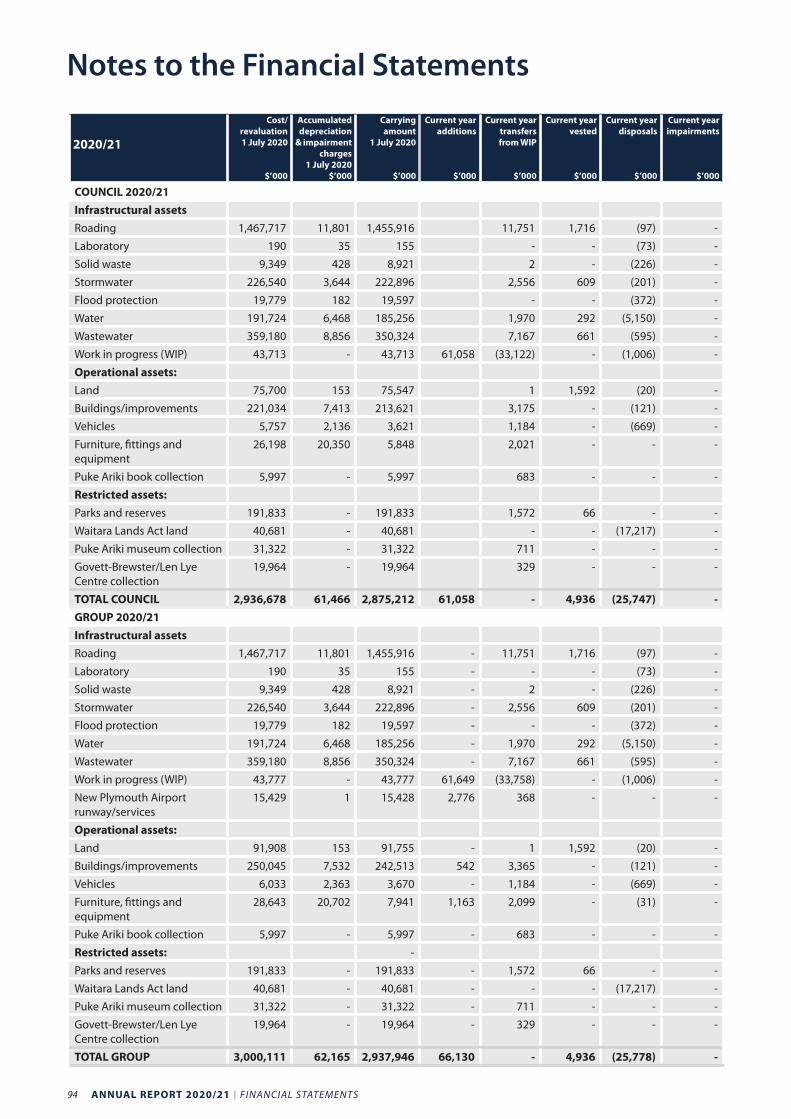
94 ANNUAL REPORT 2020/21 I FINANCIAL STATEMENTS
2020/21
Cost/revaluation 1 July 2020
$’000
Accumulated depreciation
& impairment charges
1 July 2020 $’000
Carrying amount
1 July 2020
$’000
Current year additions
$’000
Current year transfers from WIP
$’000
Current year vested
$’000
Current year disposals
$’000
Current year impairments
$’000
COUNCIL 2020/21Infrastructural assetsRoading 1,467,717 11,801 1,455,916 11,751 1,716 (97) -
Laboratory 190 35 155 - - (73) -
Solid waste 9,349 428 8,921 2 - (226) -
Stormwater 226,540 3,644 222,896 2,556 609 (201) -
Flood protection 19,779 182 19,597 - - (372) -
Water 191,724 6,468 185,256 1,970 292 (5,150) -
Wastewater 359,180 8,856 350,324 7,167 661 (595) -
Work in progress (WIP) 43,713 - 43,713 61,058 (33,122) - (1,006) -
Operational assets:Land 75,700 153 75,547 1 1,592 (20) -
Buildings/improvements 221,034 7,413 213,621 3,175 - (121) -
Vehicles 5,757 2,136 3,621 1,184 - (669) -
Furniture, fittings and equipment
26,198 20,350 5,848 2,021 - - -
Puke Ariki book collection 5,997 - 5,997 683 - - -
Restricted assets:Parks and reserves 191,833 - 191,833 1,572 66 - -
Waitara Lands Act land 40,681 - 40,681 - - (17,217) -
Puke Ariki museum collection 31,322 - 31,322 711 - - -
Govett-Brewster/Len Lye Centre collection
19,964 - 19,964 329 - - -
TOTAL COUNCIL 2,936,678 61,466 2,875,212 61,058 - 4,936 (25,747) - GROUP 2020/21Infrastructural assetsRoading 1,467,717 11,801 1,455,916 - 11,751 1,716 (97) -
Laboratory 190 35 155 - - - (73) -
Solid waste 9,349 428 8,921 - 2 - (226) -
Stormwater 226,540 3,644 222,896 - 2,556 609 (201) -
Flood protection 19,779 182 19,597 - - - (372) -
Water 191,724 6,468 185,256 - 1,970 292 (5,150) -
Wastewater 359,180 8,856 350,324 - 7,167 661 (595) -
Work in progress (WIP) 43,777 - 43,777 61,649 (33,758) - (1,006) -
New Plymouth Airport runway/services
15,429 1 15,428 2,776 368 - - -
Operational assets:Land 91,908 153 91,755 - 1 1,592 (20) -
Buildings/improvements 250,045 7,532 242,513 542 3,365 - (121) -
Vehicles 6,033 2,363 3,670 - 1,184 - (669) -
Furniture, fittings and equipment
28,643 20,702 7,941 1,163 2,099 - (31) -
Puke Ariki book collection 5,997 - 5,997 - 683 - - -
Restricted assets: -
Parks and reserves 191,833 - 191,833 - 1,572 66 - -
Waitara Lands Act land 40,681 - 40,681 - - - (17,217) -
Puke Ariki museum collection 31,322 - 31,322 - 711 - - -
Govett-Brewster/Len Lye Centre collection
19,964 - 19,964 - 329 - - -
TOTAL GROUP 3,000,111 62,165 2,937,946 66,130 - 4,936 (25,778) -
Notes to the Financial Statements
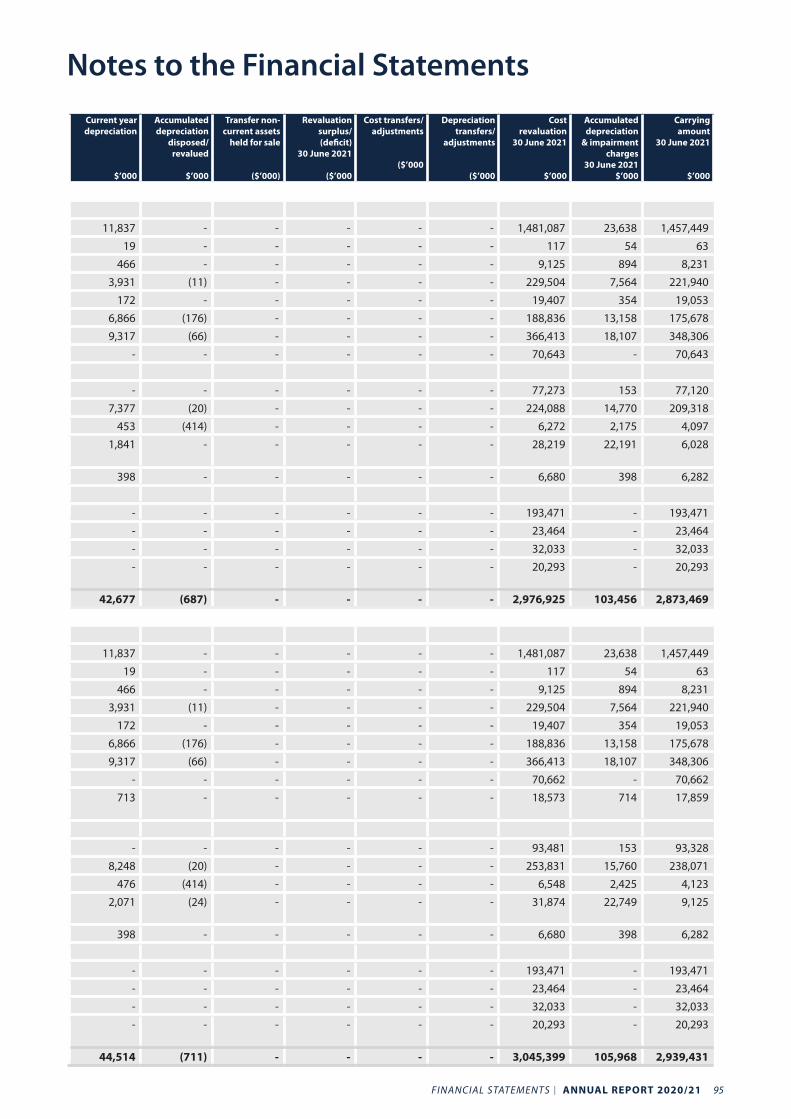
FINANCIAL STATEMENTS I ANNUAL REPORT 2020/21 95
Notes to the Financial StatementsCurrent year depreciation
$’000
Accumulated depreciation
disposed/revalued
$’000
Transfer non-current assets
held for sale
($’000)
Revaluation surplus/(deficit)
30 June 2021
($’000
Cost transfers/adjustments
($’000
Depreciation transfers/
adjustments
($’000
Cost revaluation
30 June 2021
$’000
Accumulated depreciation
& impairment charges
30 June 2021 $’000
Carrying amount
30 June 2021
$’000
11,837 - - - - - 1,481,087 23,638 1,457,449
19 - - - - - 117 54 63
466 - - - - - 9,125 894 8,231
3,931 (11) - - - - 229,504 7,564 221,940
172 - - - - - 19,407 354 19,053
6,866 (176) - - - - 188,836 13,158 175,678
9,317 (66) - - - - 366,413 18,107 348,306
- - - - - - 70,643 - 70,643
- - - - - - 77,273 153 77,120
7,377 (20) - - - - 224,088 14,770 209,318
453 (414) - - - - 6,272 2,175 4,097
1,841
- - - - - 28,219 22,191 6,028
398 - - - - - 6,680 398 6,282
- - - - - - 193,471 - 193,471
- - - - - - 23,464 - 23,464
- - - - - - 32,033 - 32,033
- - - - - - 20,293 - 20,293
42,677 (687) - - - - 2,976,925 103,456 2,873,469
11,837 - - - - - 1,481,087 23,638 1,457,449
19 - - - - - 117 54 63
466 - - - - - 9,125 894 8,231
3,931 (11) - - - - 229,504 7,564 221,940
172 - - - - - 19,407 354 19,053
6,866 (176) - - - - 188,836 13,158 175,678
9,317 (66) - - - - 366,413 18,107 348,306
- - - - - - 70,662 - 70,662
713 - - - - - 18,573 714 17,859
- - - - - - 93,481 153 93,328
8,248 (20) - - - - 253,831 15,760 238,071
476 (414) - - - - 6,548 2,425 4,123
2,071
(24) - - - - 31,874 22,749 9,125
398 - - - - - 6,680 398 6,282
- - - - - - 193,471 - 193,471
- - - - - - 23,464 - 23,464
- - - - - - 32,033 - 32,033
- - - - - - 20,293 - 20,293
44,514 (711) - - - - 3,045,399 105,968 2,939,431
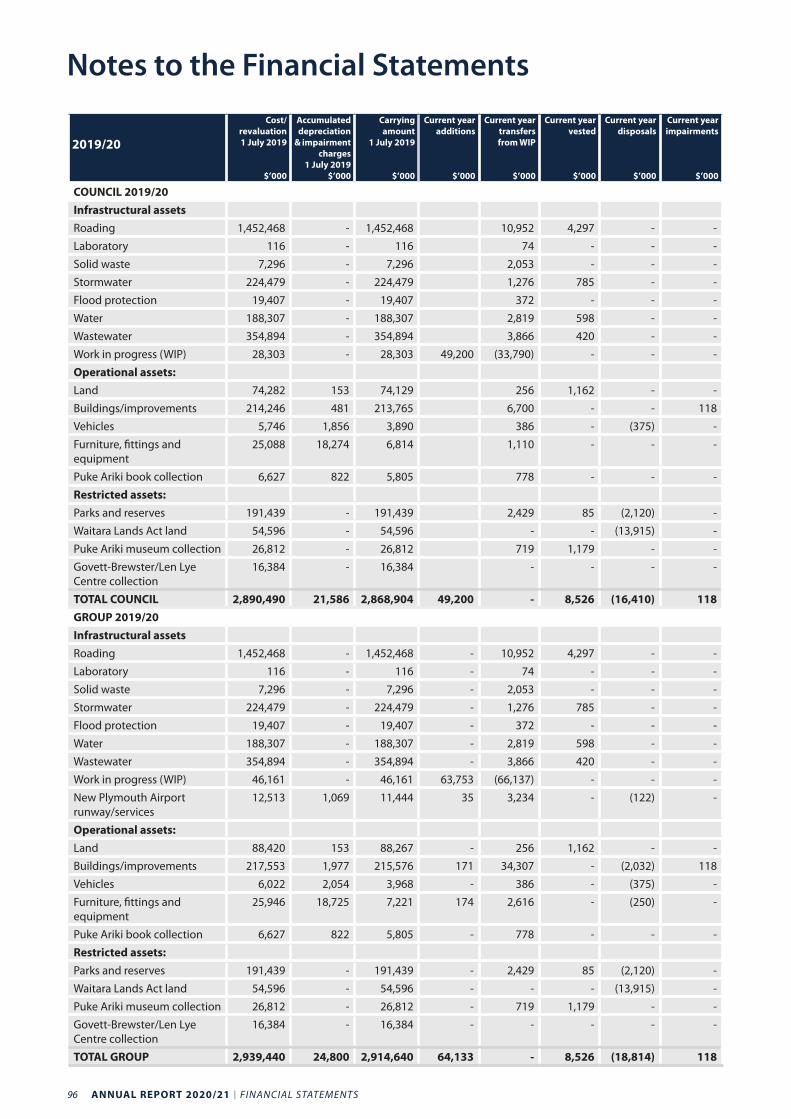
96 ANNUAL REPORT 2020/21 I FINANCIAL STATEMENTS
2019/20
Cost/revaluation 1 July 2019
$’000
Accumulated depreciation
& impairment charges
1 July 2019 $’000
Carrying amount
1 July 2019
$’000
Current year additions
$’000
Current year transfers from WIP
$’000
Current year vested
$’000
Current year disposals
$’000
Current year impairments
$’000
COUNCIL 2019/20Infrastructural assetsRoading 1,452,468 - 1,452,468 10,952 4,297 - -
Laboratory 116 - 116 74 - - -
Solid waste 7,296 - 7,296 2,053 - - -
Stormwater 224,479 - 224,479 1,276 785 - -
Flood protection 19,407 - 19,407 372 - - -
Water 188,307 - 188,307 2,819 598 - -
Wastewater 354,894 - 354,894 3,866 420 - -
Work in progress (WIP) 28,303 - 28,303 49,200 (33,790) - - -
Operational assets:Land 74,282 153 74,129 256 1,162 - -
Buildings/improvements 214,246 481 213,765 6,700 - - 118
Vehicles 5,746 1,856 3,890 386 - (375) -
Furniture, fittings and equipment
25,088 18,274 6,814 1,110 - - -
Puke Ariki book collection 6,627 822 5,805 778 - - -
Restricted assets:Parks and reserves 191,439 - 191,439 2,429 85 (2,120) -
Waitara Lands Act land 54,596 - 54,596 - - (13,915) -
Puke Ariki museum collection 26,812 - 26,812 719 1,179 - -
Govett-Brewster/Len Lye Centre collection
16,384 - 16,384 - - - -
TOTAL COUNCIL 2,890,490 21,586 2,868,904 49,200 - 8,526 (16,410) 118 GROUP 2019/20Infrastructural assetsRoading 1,452,468 - 1,452,468 - 10,952 4,297 - -
Laboratory 116 - 116 - 74 - - -
Solid waste 7,296 - 7,296 - 2,053 - - -
Stormwater 224,479 - 224,479 - 1,276 785 - -
Flood protection 19,407 - 19,407 - 372 - - -
Water 188,307 - 188,307 - 2,819 598 - -
Wastewater 354,894 - 354,894 - 3,866 420 - -
Work in progress (WIP) 46,161 - 46,161 63,753 (66,137) - - -
New Plymouth Airport runway/services
12,513 1,069 11,444 35 3,234 - (122) -
Operational assets:Land 88,420 153 88,267 - 256 1,162 - -
Buildings/improvements 217,553 1,977 215,576 171 34,307 - (2,032) 118
Vehicles 6,022 2,054 3,968 - 386 - (375) -
Furniture, fittings and equipment
25,946 18,725 7,221 174 2,616 - (250) -
Puke Ariki book collection 6,627 822 5,805 - 778 - - -
Restricted assets:Parks and reserves 191,439 - 191,439 - 2,429 85 (2,120) -
Waitara Lands Act land 54,596 - 54,596 - - - (13,915) -
Puke Ariki museum collection 26,812 - 26,812 - 719 1,179 - -
Govett-Brewster/Len Lye Centre collection
16,384 - 16,384 - - - - -
TOTAL GROUP 2,939,440 24,800 2,914,640 64,133 - 8,526 (18,814) 118
Notes to the Financial Statements
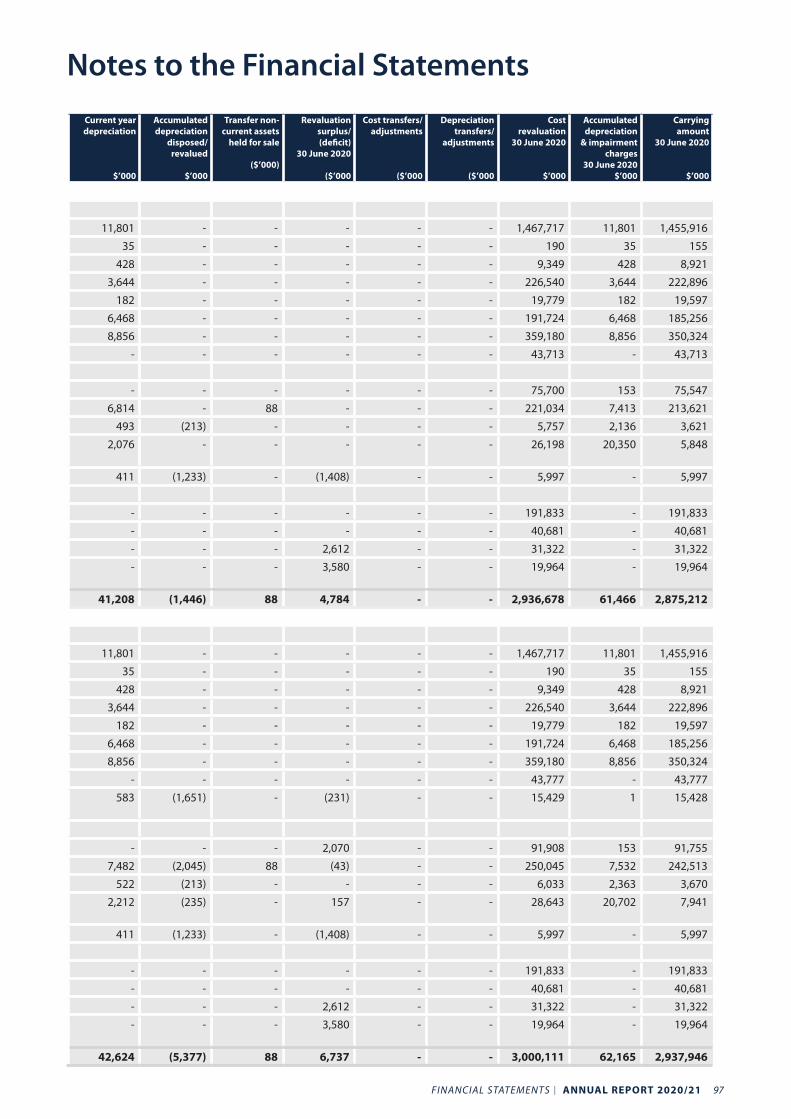
FINANCIAL STATEMENTS I ANNUAL REPORT 2020/21 97
Current year depreciation
$’000
Accumulated depreciation
disposed/revalued
$’000
Transfer non-current assets
held for sale
($’000)
Revaluation surplus/(deficit)
30 June 2020
($’000
Cost transfers/adjustments
($’000
Depreciation transfers/
adjustments
($’000
Cost revaluation
30 June 2020
$’000
Accumulated depreciation
& impairment charges
30 June 2020 $’000
Carrying amount
30 June 2020
$’000
11,801 - - - - - 1,467,717 11,801 1,455,916
35 - - - - - 190 35 155
428 - - - - - 9,349 428 8,921
3,644 - - - - - 226,540 3,644 222,896
182 - - - - - 19,779 182 19,597
6,468 - - - - - 191,724 6,468 185,256
8,856 - - - - - 359,180 8,856 350,324
- - - - - - 43,713 - 43,713
- - - - - - 75,700 153 75,547
6,814 - 88 - - - 221,034 7,413 213,621
493 (213) - - - - 5,757 2,136 3,621
2,076
- - - - - 26,198 20,350 5,848
411 (1,233) - (1,408) - - 5,997 - 5,997
- - - - - - 191,833 - 191,833
- - - - - - 40,681 - 40,681
- - - 2,612 - - 31,322 - 31,322
-
- - 3,580 - - 19,964 - 19,964
41,208 (1,446) 88 4,784 - - 2,936,678 61,466 2,875,212
11,801 - - - - - 1,467,717 11,801 1,455,916
35 - - - - - 190 35 155
428 - - - - - 9,349 428 8,921
3,644 - - - - - 226,540 3,644 222,896
182 - - - - - 19,779 182 19,597
6,468 - - - - - 191,724 6,468 185,256
8,856 - - - - - 359,180 8,856 350,324
- - - - - - 43,777 - 43,777
583
(1,651) - (231) - - 15,429 1 15,428
- - - 2,070 - - 91,908 153 91,755
7,482 (2,045) 88 (43) - - 250,045 7,532 242,513
522 (213) - - - - 6,033 2,363 3,670
2,212
(235) - 157 - - 28,643 20,702 7,941
411 (1,233) - (1,408) - - 5,997 - 5,997
- - - - - - 191,833 - 191,833
- - - - - - 40,681 - 40,681
- - - 2,612 - - 31,322 - 31,322
-
- - 3,580 - - 19,964 - 19,964
42,624 (5,377) 88 6,737 - - 3,000,111 62,165 2,937,946
Notes to the Financial Statements
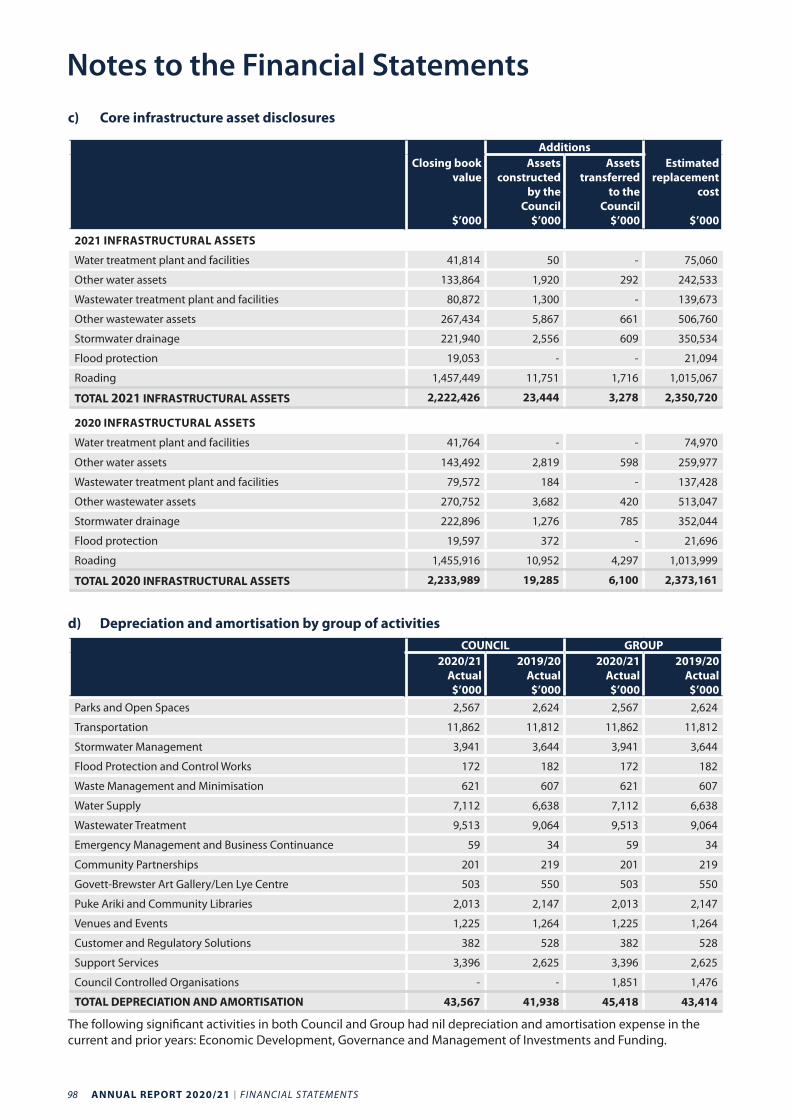
98 ANNUAL REPORT 2020/21 I FINANCIAL STATEMENTS
Notes to the Financial Statementsc) Core infrastructure asset disclosures
AdditionsClosing book
value
$’000
Assets constructed
by the Council
$’000
Assets transferred
to the Council
$’000
Estimated replacement
cost
$’000
2021 INFRASTRUCTURAL ASSETS
Water treatment plant and facilities 41,814 50 - 75,060
Other water assets 133,864 1,920 292 242,533
Wastewater treatment plant and facilities 80,872 1,300 - 139,673
Other wastewater assets 267,434 5,867 661 506,760
Stormwater drainage 221,940 2,556 609 350,534
Flood protection 19,053 - - 21,094
Roading 1,457,449 11,751 1,716 1,015,067
TOTAL 2021 INFRASTRUCTURAL ASSETS 2,222,426 23,444 3,278 2,350,720
2020 INFRASTRUCTURAL ASSETS
Water treatment plant and facilities 41,764 - - 74,970
Other water assets 143,492 2,819 598 259,977
Wastewater treatment plant and facilities 79,572 184 - 137,428
Other wastewater assets 270,752 3,682 420 513,047
Stormwater drainage 222,896 1,276 785 352,044
Flood protection 19,597 372 - 21,696
Roading 1,455,916 10,952 4,297 1,013,999
TOTAL 2020 INFRASTRUCTURAL ASSETS 2,233,989 19,285 6,100 2,373,161
d) Depreciation and amortisation by group of activitiesCOUNCIL GROUP
2020/21 Actual $’000
2019/20 Actual $’000
2020/21 Actual $’000
2019/20 Actual $’000
Parks and Open Spaces 2,567 2,624 2,567 2,624
Transportation 11,862 11,812 11,862 11,812
Stormwater Management 3,941 3,644 3,941 3,644
Flood Protection and Control Works 172 182 172 182
Waste Management and Minimisation 621 607 621 607
Water Supply 7,112 6,638 7,112 6,638
Wastewater Treatment 9,513 9,064 9,513 9,064
Emergency Management and Business Continuance 59 34 59 34
Community Partnerships 201 219 201 219
Govett-Brewster Art Gallery/Len Lye Centre 503 550 503 550
Puke Ariki and Community Libraries 2,013 2,147 2,013 2,147
Venues and Events 1,225 1,264 1,225 1,264
Customer and Regulatory Solutions 382 528 382 528
Support Services 3,396 2,625 3,396 2,625
Council Controlled Organisations - - 1,851 1,476
TOTAL DEPRECIATION AND AMORTISATION 43,567 41,938 45,418 43,414
The following significant activities in both Council and Group had nil depreciation and amortisation expense in the current and prior years: Economic Development, Governance and Management of Investments and Funding.
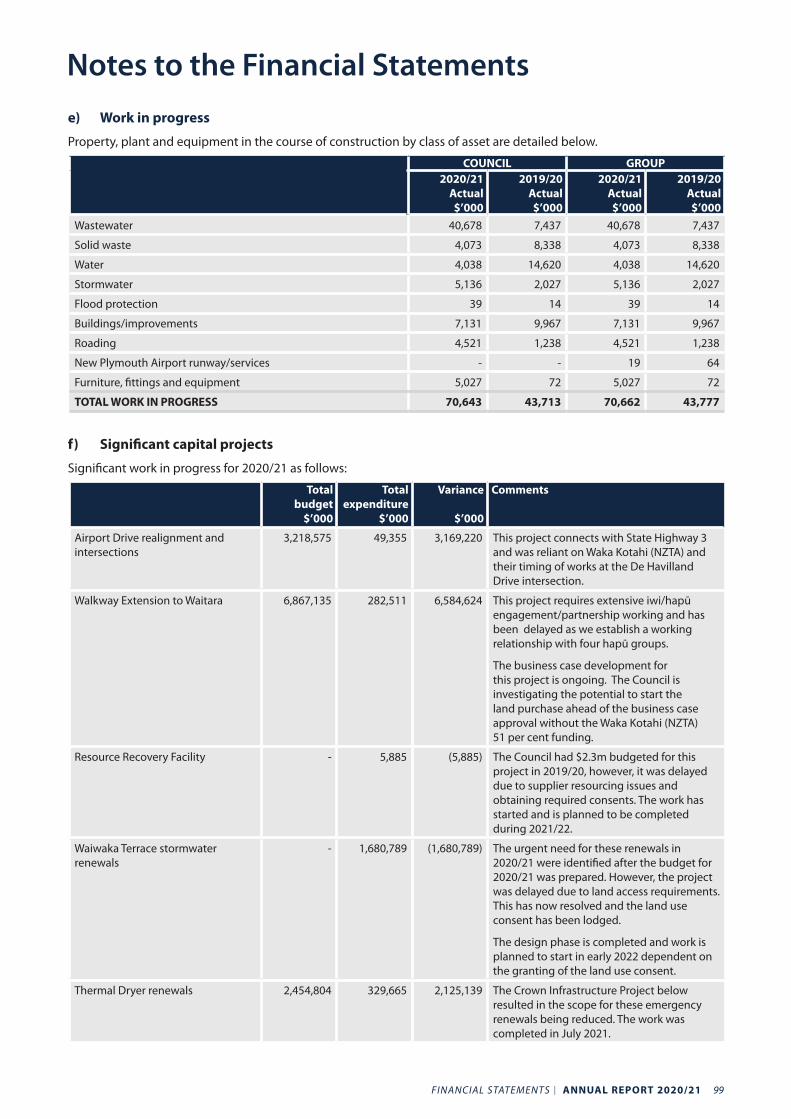
FINANCIAL STATEMENTS I ANNUAL REPORT 2020/21 99
e) Work in progress
Property, plant and equipment in the course of construction by class of asset are detailed below.
COUNCIL GROUP2020/21
Actual $’000
2019/20 Actual $’000
2020/21 Actual $’000
2019/20 Actual $’000
Wastewater 40,678 7,437 40,678 7,437
Solid waste 4,073 8,338 4,073 8,338
Water 4,038 14,620 4,038 14,620
Stormwater 5,136 2,027 5,136 2,027
Flood protection 39 14 39 14
Buildings/improvements 7,131 9,967 7,131 9,967
Roading 4,521 1,238 4,521 1,238
New Plymouth Airport runway/services - - 19 64
Furniture, fittings and equipment 5,027 72 5,027 72
TOTAL WORK IN PROGRESS 70,643 43,713 70,662 43,777
f) Significant capital projects
Significant work in progress for 2020/21 as follows:
Total budget
$’000
Total expenditure
$’000
Variance
$’000
Comments
Airport Drive realignment and intersections
3,218,575 49,355 3,169,220 This project connects with State Highway 3 and was reliant on Waka Kotahi (NZTA) and their timing of works at the De Havilland Drive intersection.
Walkway Extension to Waitara 6,867,135 282,511 6,584,624 This project requires extensive iwi/hapū engagement/partnership working and has been delayed as we establish a working relationship with four hapū groups.
The business case development for this project is ongoing. The Council is investigating the potential to start the land purchase ahead of the business case approval without the Waka Kotahi (NZTA) 51 per cent funding.
Resource Recovery Facility - 5,885 (5,885) The Council had $2.3m budgeted for this project in 2019/20, however, it was delayed due to supplier resourcing issues and obtaining required consents. The work has started and is planned to be completed during 2021/22.
Waiwaka Terrace stormwater renewals
- 1,680,789 (1,680,789) The urgent need for these renewals in 2020/21 were identified after the budget for 2020/21 was prepared. However, the project was delayed due to land access requirements. This has now resolved and the land use consent has been lodged.
The design phase is completed and work is planned to start in early 2022 dependent on the granting of the land use consent.
Thermal Dryer renewals 2,454,804 329,665 2,125,139 The Crown Infrastructure Project below resulted in the scope for these emergency renewals being reduced. The work was completed in July 2021.
Notes to the Financial Statements
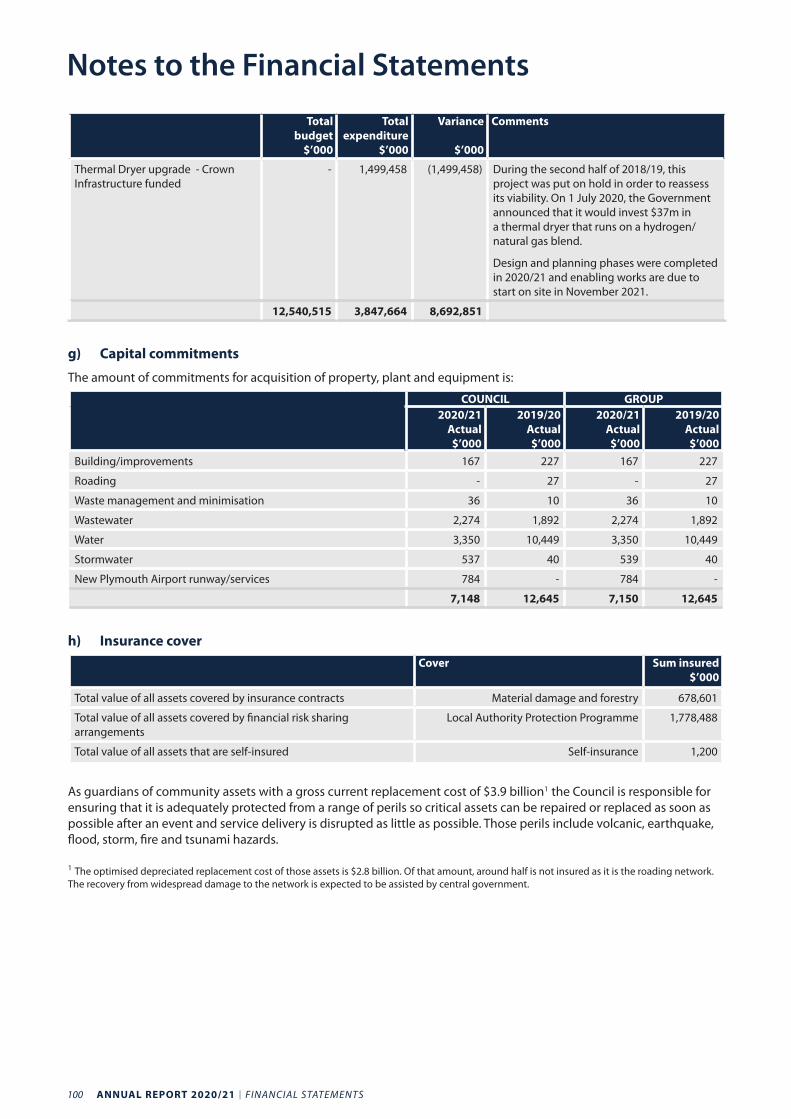
100 ANNUAL REPORT 2020/21 I FINANCIAL STATEMENTS
Notes to the Financial Statements
Total budget
$’000
Total expenditure
$’000
Variance
$’000
Comments
Thermal Dryer upgrade - Crown Infrastructure funded
- 1,499,458 (1,499,458) During the second half of 2018/19, this project was put on hold in order to reassess its viability. On 1 July 2020, the Government announced that it would invest $37m in a thermal dryer that runs on a hydrogen/natural gas blend.
Design and planning phases were completed in 2020/21 and enabling works are due to start on site in November 2021.
12,540,515 3,847,664 8,692,851
g) Capital commitments
The amount of commitments for acquisition of property, plant and equipment is:
COUNCIL GROUP2020/21
Actual $’000
2019/20 Actual $’000
2020/21 Actual $’000
2019/20 Actual $’000
Building/improvements 167 227 167 227
Roading - 27 - 27
Waste management and minimisation 36 10 36 10
Wastewater 2,274 1,892 2,274 1,892
Water 3,350 10,449 3,350 10,449
Stormwater 537 40 539 40
New Plymouth Airport runway/services 784 - 784 -
7,148 12,645 7,150 12,645
h) Insurance coverCover Sum insured
$’000
Total value of all assets covered by insurance contracts Material damage and forestry 678,601
Total value of all assets covered by financial risk sharing arrangements
Local Authority Protection Programme 1,778,488
Total value of all assets that are self-insured Self-insurance 1,200
As guardians of community assets with a gross current replacement cost of $3.9 billion1 the Council is responsible for ensuring that it is adequately protected from a range of perils so critical assets can be repaired or replaced as soon as possible after an event and service delivery is disrupted as little as possible. Those perils include volcanic, earthquake, flood, storm, fire and tsunami hazards.
1 The optimised depreciated replacement cost of those assets is $2.8 billion. Of that amount, around half is not insured as it is the roading network. The recovery from widespread damage to the network is expected to be assisted by central government.
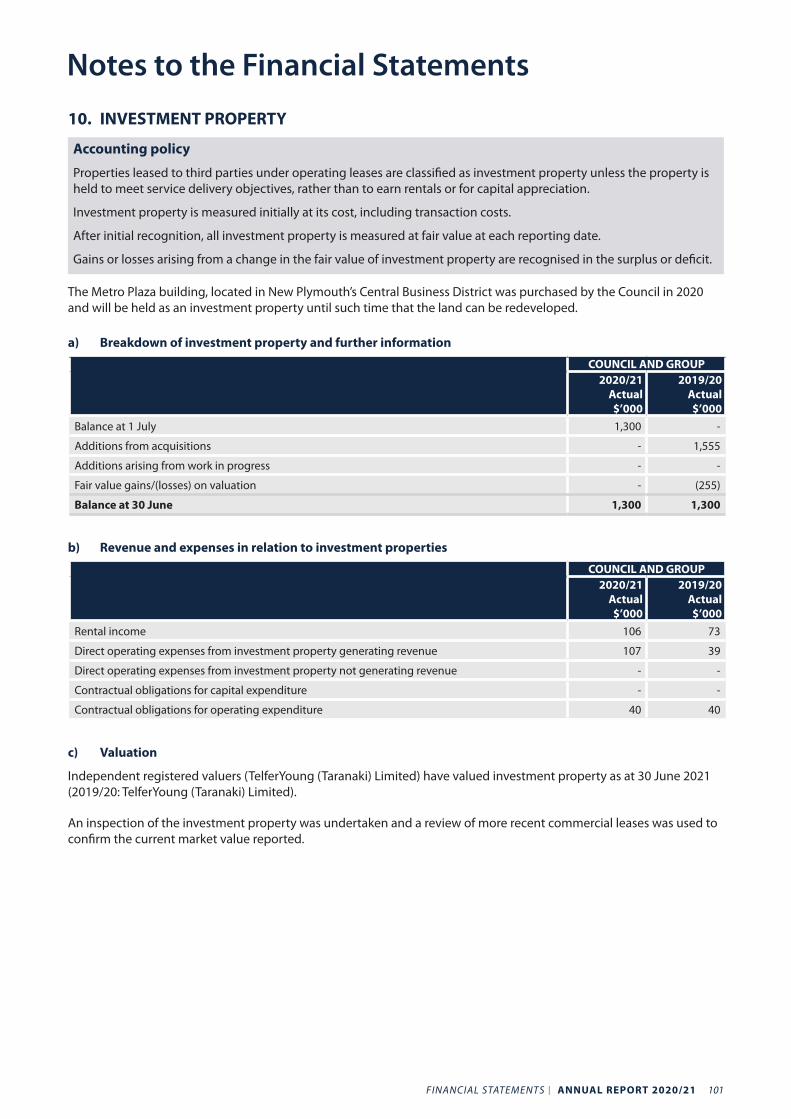
FINANCIAL STATEMENTS I ANNUAL REPORT 2020/21 101
10. INVESTMENT PROPERTY
Accounting policy
Properties leased to third parties under operating leases are classified as investment property unless the property is held to meet service delivery objectives, rather than to earn rentals or for capital appreciation.
Investment property is measured initially at its cost, including transaction costs.
After initial recognition, all investment property is measured at fair value at each reporting date.
Gains or losses arising from a change in the fair value of investment property are recognised in the surplus or deficit.
The Metro Plaza building, located in New Plymouth’s Central Business District was purchased by the Council in 2020 and will be held as an investment property until such time that the land can be redeveloped.
a) Breakdown of investment property and further information
COUNCIL AND GROUP2020/21
Actual $’000
2019/20 Actual $’000
Balance at 1 July 1,300 -
Additions from acquisitions - 1,555
Additions arising from work in progress - -
Fair value gains/(losses) on valuation - (255)
Balance at 30 June 1,300 1,300
b) Revenue and expenses in relation to investment properties
COUNCIL AND GROUP2020/21
Actual $’000
2019/20 Actual $’000
Rental income 106 73
Direct operating expenses from investment property generating revenue 107 39
Direct operating expenses from investment property not generating revenue - -
Contractual obligations for capital expenditure - -
Contractual obligations for operating expenditure 40 40
c) Valuation
Independent registered valuers (TelferYoung (Taranaki) Limited) have valued investment property as at 30 June 2021 (2019/20: TelferYoung (Taranaki) Limited).
An inspection of the investment property was undertaken and a review of more recent commercial leases was used to confirm the current market value reported.
Notes to the Financial Statements
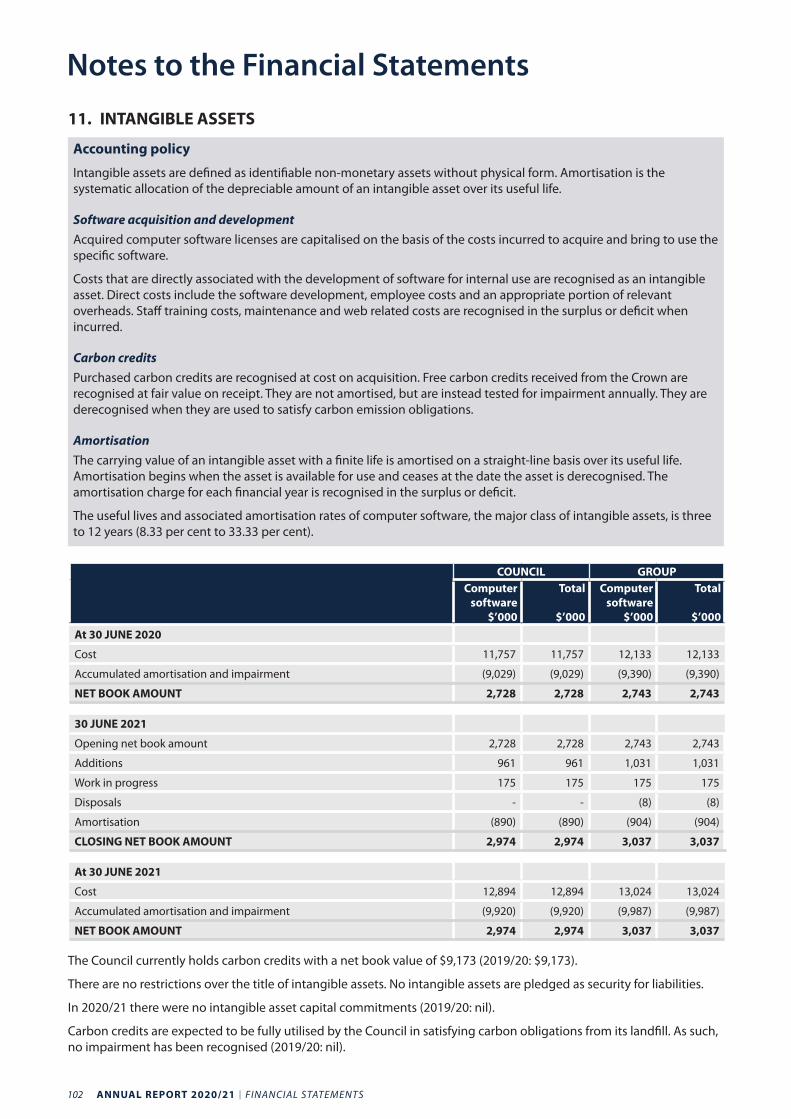
102 ANNUAL REPORT 2020/21 I FINANCIAL STATEMENTS
Notes to the Financial Statements
11. INTANGIBLE ASSETS
Accounting policy
Intangible assets are defined as identifiable non-monetary assets without physical form. Amortisation is the systematic allocation of the depreciable amount of an intangible asset over its useful life.
Software acquisition and developmentAcquired computer software licenses are capitalised on the basis of the costs incurred to acquire and bring to use the specific software.
Costs that are directly associated with the development of software for internal use are recognised as an intangible asset. Direct costs include the software development, employee costs and an appropriate portion of relevant overheads. Staff training costs, maintenance and web related costs are recognised in the surplus or deficit when incurred.
Carbon creditsPurchased carbon credits are recognised at cost on acquisition. Free carbon credits received from the Crown are recognised at fair value on receipt. They are not amortised, but are instead tested for impairment annually. They are derecognised when they are used to satisfy carbon emission obligations.
AmortisationThe carrying value of an intangible asset with a finite life is amortised on a straight-line basis over its useful life. Amortisation begins when the asset is available for use and ceases at the date the asset is derecognised. The amortisation charge for each financial year is recognised in the surplus or deficit.
The useful lives and associated amortisation rates of computer software, the major class of intangible assets, is three to 12 years (8.33 per cent to 33.33 per cent).
COUNCIL GROUPComputer
software $’000
Total
$’000
Computer software
$’000
Total
$’000At 30 JUNE 2020
Cost 11,757 11,757 12,133 12,133
Accumulated amortisation and impairment (9,029) (9,029) (9,390) (9,390)
NET BOOK AMOUNT 2,728 2,728 2,743 2,743
30 JUNE 2021
Opening net book amount 2,728 2,728 2,743 2,743
Additions 961 961 1,031 1,031
Work in progress 175 175 175 175
Disposals - - (8) (8)
Amortisation (890) (890) (904) (904)
CLOSING NET BOOK AMOUNT 2,974 2,974 3,037 3,037
At 30 JUNE 2021
Cost 12,894 12,894 13,024 13,024
Accumulated amortisation and impairment (9,920) (9,920) (9,987) (9,987)
NET BOOK AMOUNT 2,974 2,974 3,037 3,037
The Council currently holds carbon credits with a net book value of $9,173 (2019/20: $9,173).
There are no restrictions over the title of intangible assets. No intangible assets are pledged as security for liabilities.
In 2020/21 there were no intangible asset capital commitments (2019/20: nil).
Carbon credits are expected to be fully utilised by the Council in satisfying carbon obligations from its landfill. As such, no impairment has been recognised (2019/20: nil).
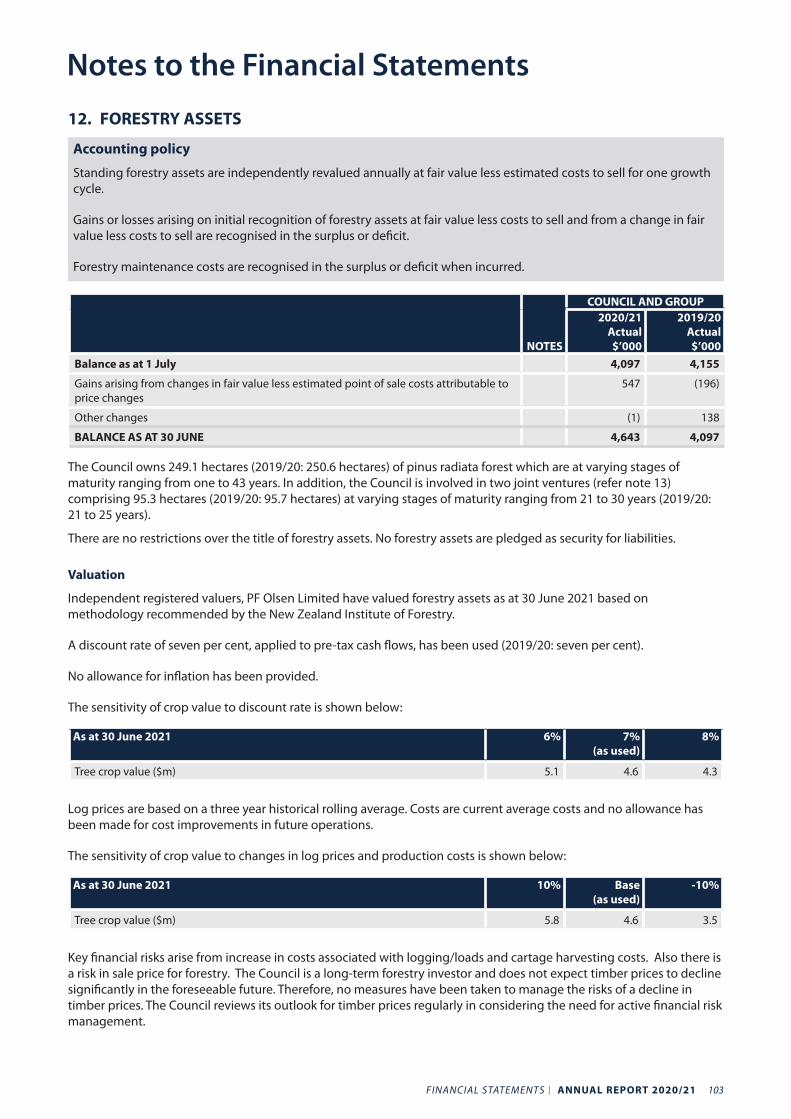
FINANCIAL STATEMENTS I ANNUAL REPORT 2020/21 103
12. FORESTRY ASSETS
Accounting policy
Standing forestry assets are independently revalued annually at fair value less estimated costs to sell for one growth cycle.
Gains or losses arising on initial recognition of forestry assets at fair value less costs to sell and from a change in fair value less costs to sell are recognised in the surplus or deficit.
Forestry maintenance costs are recognised in the surplus or deficit when incurred.
NOTES
COUNCIL AND GROUP2020/21
Actual $’000
2019/20 Actual $’000
Balance as at 1 July 4,097 4,155
Gains arising from changes in fair value less estimated point of sale costs attributable to price changes
547 (196)
Other changes (1) 138
BALANCE AS AT 30 JUNE 4,643 4,097
The Council owns 249.1 hectares (2019/20: 250.6 hectares) of pinus radiata forest which are at varying stages of maturity ranging from one to 43 years. In addition, the Council is involved in two joint ventures (refer note 13) comprising 95.3 hectares (2019/20: 95.7 hectares) at varying stages of maturity ranging from 21 to 30 years (2019/20: 21 to 25 years).
There are no restrictions over the title of forestry assets. No forestry assets are pledged as security for liabilities.
Valuation
Independent registered valuers, PF Olsen Limited have valued forestry assets as at 30 June 2021 based on methodology recommended by the New Zealand Institute of Forestry.
A discount rate of seven per cent, applied to pre-tax cash flows, has been used (2019/20: seven per cent).
No allowance for inflation has been provided.
The sensitivity of crop value to discount rate is shown below:
As at 30 June 2021 6% 7% (as used)
8%
Tree crop value ($m) 5.1 4.6 4.3
Log prices are based on a three year historical rolling average. Costs are current average costs and no allowance has been made for cost improvements in future operations.
The sensitivity of crop value to changes in log prices and production costs is shown below:
As at 30 June 2021 10% Base (as used)
-10%
Tree crop value ($m) 5.8 4.6 3.5
Key financial risks arise from increase in costs associated with logging/loads and cartage harvesting costs. Also there is a risk in sale price for forestry. The Council is a long-term forestry investor and does not expect timber prices to decline significantly in the foreseeable future. Therefore, no measures have been taken to manage the risks of a decline in timber prices. The Council reviews its outlook for timber prices regularly in considering the need for active financial risk management.
Notes to the Financial Statements

104 ANNUAL REPORT 2020/21 I FINANCIAL STATEMENTS
Notes to the Financial Statements
13. EQUITY ACCOUNTED INVESTMENTS (JOINT VENTURES)
Accounting policy
A joint venture is a binding arrangement whereby two or more parties are committed to undertake an activity that is subject to joint control. Joint control is the agreed sharing of control over an activity.
Equity method of accounting in group financial statementsInvestments in joint ventures are accounted for in the Council’s financial statements using the equity method of accounting. The investment is initially recognised at cost. The carrying amount is increased or decreased to recognise the Council’s share of the change in the net assets of the entity after the date of acquisition. The Council’s share of the surplus or deficit is recognised in the Council’s surplus or deficit.
If the share of deficits of the joint venture equals or exceeds the interest in the joint venture, the Council discontinues recognising its share of further deficits. After the Council’s interest is reduced to zero, additional deficits are provided as a liability to the extent that the Council has incurred legal or constructive obligations or made payments on behalf of the joint venture. If the joint venture subsequently reports surpluses, the Council will resume recognising its share of those surpluses after its share of the surpluses equals the share of deficits not recognised.
Breakdown of investment in joint venture and further informationAs at 30 June 2021, the Council is involved in two forestry joint venture agreements (2019/20: two forestry joint ventures) - Duthie Joint Venture (Council share 54.8 per cent) and McKay Joint Venture (Council share 56.5 per cent). Both joint ventures are domiciled in New Zealand.
The Council’s interest in the forestry joint ventures is measured using the equity method of accounting in the group financial statements.
DUTHIE JV MCKAY JV TOTAL Council & Group
2020/21 Actual $’000
2019/20 Actual $’000
2020/21 Actual $’000
2019/20 Actual $’000
2020/21 Actual $’000
2019/20 Actual $’000
Investment (at cost) 192 192 568 568 760 760
Summarised financial information of joint ventures:
- Non-current assets: forestry 510 464 2,139 1,785 2,649 2,249
- Current liabilities: creditors and other payables
(2) (3) (4) (2) (6 ) (5)
Net assets 508 461 2,135 1,783 2,643 2,244
Gain on forestry assets 47 49 365 580 412 629
Operating expenditure ( 7) (5) (6) (10) (13) (15)
Net surplus/(deficit) 40 43 359 570 399 613
Attributable to Council and Group1 19 22 200 317 219 339
Reconciliation to equity accounted carrying amount
Joint ventures net assets ($’000) 508 461 2,135 1,782 2,643 2,243
Council and Group’s share 54.82% 54.82% 56.50% 56.50% - -
Equity accounted carrying amount ($’000)
278 252 1,207 1,006 1,485 1,257
Risks associated with the Council’s investment in joint ventures
Shareholder funding commitments for next three years
21 21 16 23 37 44
1 Share of joint venture surplus attributable to Council and Group = gain on forestry assets x Council and Group share of joint venture - total operating expenditure.
FINANCIAL STATEMENTS I ANNUAL REPORT 2020/21 105
14. OTHER FINANCIAL ASSETS
Accounting policy
a) Financial assets at fair value through surplus or deficitFinancial assets at fair value through surplus or deficit include financial assets held for trading. A financial asset is classified in this category if acquired principally for the purpose of selling in the short term or if it is part of a portfolio of identified financial instruments that are managed together and for which there is evidence of short term profit taking. Financial assets in this category are included in current assets. After initial recognition, financial assets in this category are measured at their fair values with gains or losses on re-measurement recognised in the surplus or deficit.
Included in this category is the Council’s investment in Tasmanian Land Company Limited and the Perpetual Investment Fund.
b) Loans and receivablesLoans and receivables are non-derivative financial assets with fixed or determinable payments that are not quoted in an active market. They are included in current assets, except for maturities greater than 12 months after the balance date, which are included in non-current assets.
After initial recognition financial assets in this category are measured at amortised cost using the effective interest rate method less impairment. Gains and losses when the asset is impaired or derecognised are recognised in the surplus or deficit. The difference between the face value and present value of the expected future cash flows of the loan is recognised in the surplus or deficit as interest. The Council’s loans and receivables comprise debtors and other receivables, LGFA borrower notes, term deposits, related party loans and community loans.
ImpairmentFinancial assets are assessed for objective evidence of impairment at each balance date. Impairment losses are recognised in the surplus or deficit. Impairment is established when there is objective evidence that the Council will not be able to collect amounts due according to the original terms of the debt. The Council has no impairment for the year ended 30 June 2021 (2019/20: Nil).
c) Fair value through other comprehensive revenue and expense
Financial assets at fair value through other comprehensive revenue and expense are those that are designated into the category at initial recognition or are not classified in any of the other categories above. They are included in non-current assets unless management intends to dispose of, or realise, the investment within 12 months of balance date. The Council includes in this category:
• investments that it intends to hold long-term but which may be realised before maturity; and• bonds and shareholdings in NZ Local Government Funding Agency (NZ LGFA) and shareholdings in Civic Financial
Services Limited.
d) Subsidiaries The Council consolidates in the group financial assets those entities it controls. Control exists if all three of the following elements are present: power over the entity, exposure to variable returns from the entity and the ability for the Council to use its power to affect those variable returns.
Control is reassessed whenever facts and circumstances indicate that there may be a change in any of these elements of control. The financial statements of the Group’s controlled entities are included in the Group financial statements from the date that control commences until the date that control ceases.
The Council’s investment in its subsidiaries (Papa Rererangi i Puketapu Limited, New Plymouth PIF Guardians limited and Venture Taranaki Trust) are carried at cost in the Council’s financial statements and are consolidated at Group level.
Notes to the Financial Statements
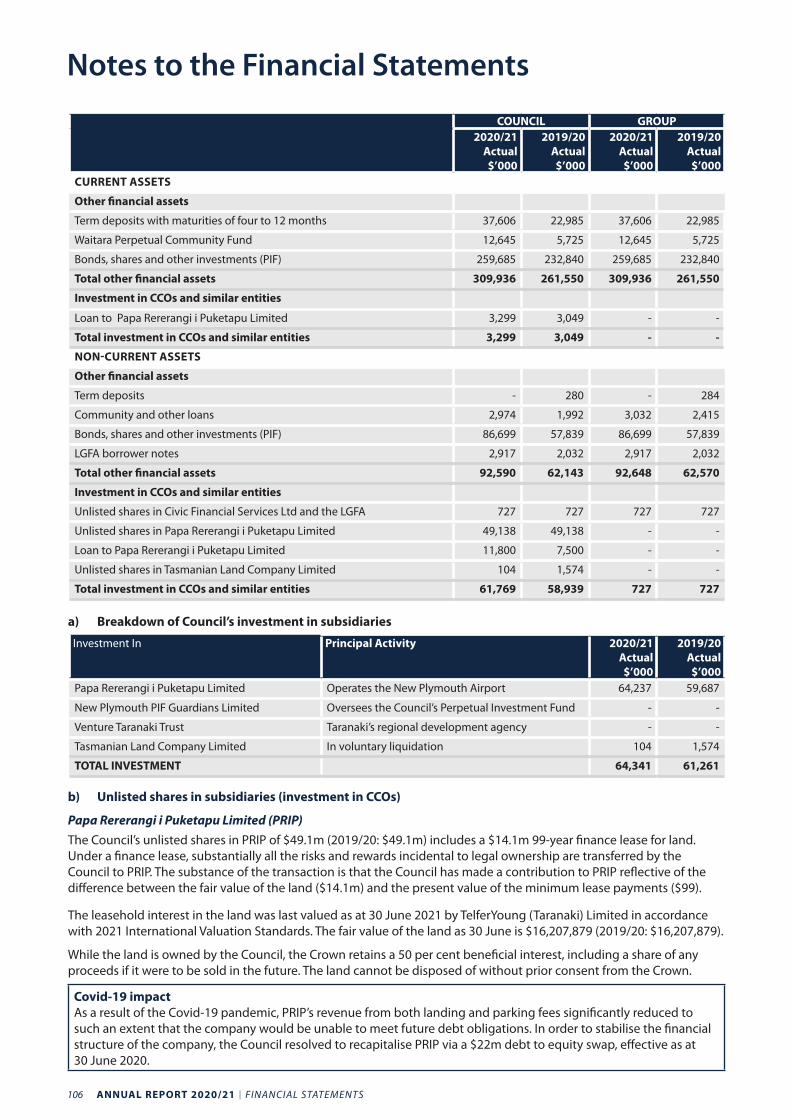
106 ANNUAL REPORT 2020/21 I FINANCIAL STATEMENTS
Notes to the Financial Statements
COUNCIL GROUP2020/21
Actual $’000
2019/20 Actual $’000
2020/21 Actual $’000
2019/20 Actual $’000
CURRENT ASSETS
Other financial assets
Term deposits with maturities of four to 12 months 37,606 22,985 37,606 22,985
Waitara Perpetual Community Fund 12,645 5,725 12,645 5,725
Bonds, shares and other investments (PIF) 259,685 232,840 259,685 232,840
Total other financial assets 309,936 261,550 309,936 261,550
Investment in CCOs and similar entities
Loan to Papa Rererangi i Puketapu Limited 3,299 3,049 - -
Total investment in CCOs and similar entities 3,299 3,049 - -
NON-CURRENT ASSETS
Other financial assets
Term deposits - 280 - 284
Community and other loans 2,974 1,992 3,032 2,415
Bonds, shares and other investments (PIF) 86,699 57,839 86,699 57,839
LGFA borrower notes 2,917 2,032 2,917 2,032
Total other financial assets 92,590 62,143 92,648 62,570
Investment in CCOs and similar entities
Unlisted shares in Civic Financial Services Ltd and the LGFA 727 727 727 727
Unlisted shares in Papa Rererangi i Puketapu Limited 49,138 49,138 - -
Loan to Papa Rererangi i Puketapu Limited 11,800 7,500 - -
Unlisted shares in Tasmanian Land Company Limited 104 1,574 - -
Total investment in CCOs and similar entities 61,769 58,939 727 727
a) Breakdown of Council’s investment in subsidiaries
Investment In Principal Activity 2020/21 Actual $’000
2019/20 Actual $’000
Papa Rererangi i Puketapu Limited Operates the New Plymouth Airport 64,237 59,687
New Plymouth PIF Guardians Limited Oversees the Council’s Perpetual Investment Fund - -
Venture Taranaki Trust Taranaki’s regional development agency - -
Tasmanian Land Company Limited In voluntary liquidation 104 1,574
TOTAL INVESTMENT 64,341 61,261
b) Unlisted shares in subsidiaries (investment in CCOs)
Papa Rererangi i Puketapu Limited (PRIP)The Council’s unlisted shares in PRIP of $49.1m (2019/20: $49.1m) includes a $14.1m 99-year finance lease for land. Under a finance lease, substantially all the risks and rewards incidental to legal ownership are transferred by the Council to PRIP. The substance of the transaction is that the Council has made a contribution to PRIP reflective of the difference between the fair value of the land ($14.1m) and the present value of the minimum lease payments ($99).
The leasehold interest in the land was last valued as at 30 June 2021 by TelferYoung (Taranaki) Limited in accordance with 2021 International Valuation Standards. The fair value of the land as 30 June is $16,207,879 (2019/20: $16,207,879).
While the land is owned by the Council, the Crown retains a 50 per cent beneficial interest, including a share of any proceeds if it were to be sold in the future. The land cannot be disposed of without prior consent from the Crown.
Covid-19 impactAs a result of the Covid-19 pandemic, PRIP’s revenue from both landing and parking fees significantly reduced to such an extent that the company would be unable to meet future debt obligations. In order to stabilise the financial structure of the company, the Council resolved to recapitalise PRIP via a $22m debt to equity swap, effective as at 30 June 2020.
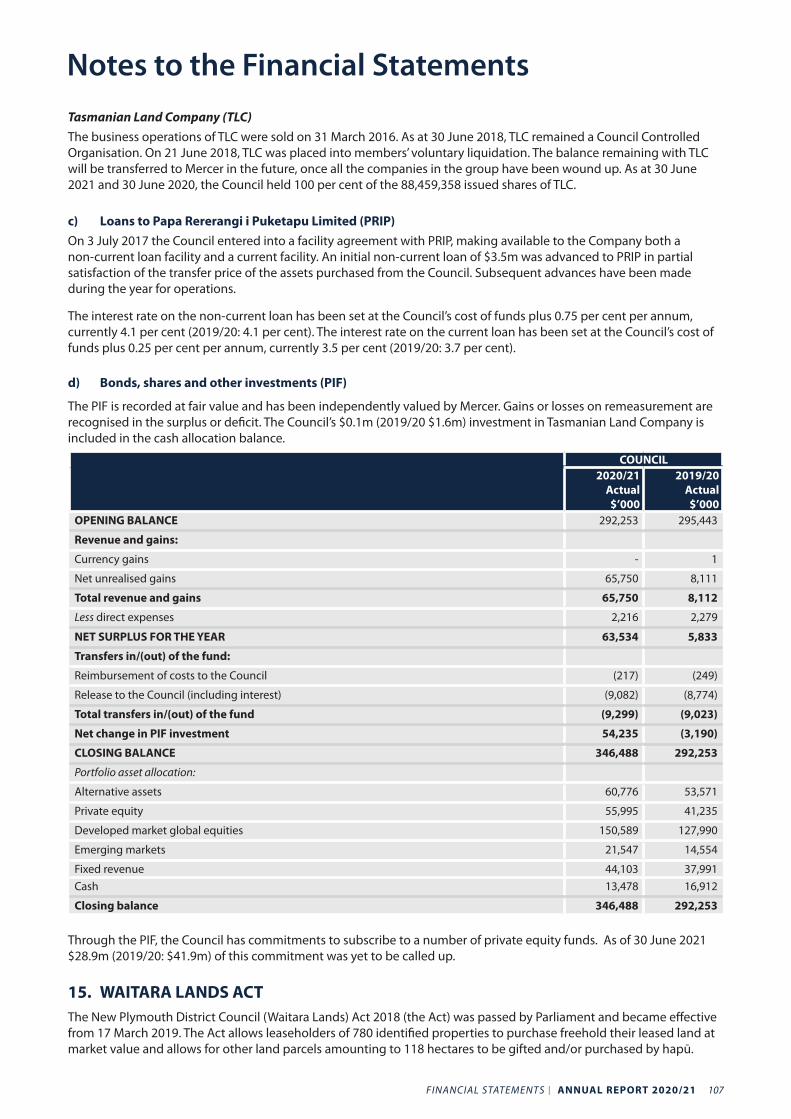
FINANCIAL STATEMENTS I ANNUAL REPORT 2020/21 107
Tasmanian Land Company (TLC)The business operations of TLC were sold on 31 March 2016. As at 30 June 2018, TLC remained a Council Controlled Organisation. On 21 June 2018, TLC was placed into members’ voluntary liquidation. The balance remaining with TLC will be transferred to Mercer in the future, once all the companies in the group have been wound up. As at 30 June 2021 and 30 June 2020, the Council held 100 per cent of the 88,459,358 issued shares of TLC.
c) Loans to Papa Rererangi i Puketapu Limited (PRIP)On 3 July 2017 the Council entered into a facility agreement with PRIP, making available to the Company both a non-current loan facility and a current facility. An initial non-current loan of $3.5m was advanced to PRIP in partial satisfaction of the transfer price of the assets purchased from the Council. Subsequent advances have been made during the year for operations.
The interest rate on the non-current loan has been set at the Council’s cost of funds plus 0.75 per cent per annum, currently 4.1 per cent (2019/20: 4.1 per cent). The interest rate on the current loan has been set at the Council’s cost of funds plus 0.25 per cent per annum, currently 3.5 per cent (2019/20: 3.7 per cent).
d) Bonds, shares and other investments (PIF)
The PIF is recorded at fair value and has been independently valued by Mercer. Gains or losses on remeasurement are recognised in the surplus or deficit. The Council’s $0.1m (2019/20 $1.6m) investment in Tasmanian Land Company is included in the cash allocation balance.
COUNCIL2020/21
Actual $’000
2019/20 Actual $’000
OPENING BALANCE 292,253 295,443
Revenue and gains:
Currency gains - 1
Net unrealised gains 65,750 8,111
Total revenue and gains 65,750 8,112
Less direct expenses 2,216 2,279
NET SURPLUS FOR THE YEAR 63,534 5,833
Transfers in/(out) of the fund:
Reimbursement of costs to the Council (217) (249)
Release to the Council (including interest) (9,082) (8,774)
Total transfers in/(out) of the fund (9,299) (9,023)
Net change in PIF investment 54,235 (3,190)
CLOSING BALANCE 346,488 292,253
Portfolio asset allocation:
Alternative assets 60,776 53,571
Private equity 55,995 41,235
Developed market global equities 150,589 127,990
Emerging markets 21,547 14,554
Fixed revenue 44,103 37,991 Cash 13,478 16,912
Closing balance 346,488 292,253
Through the PIF, the Council has commitments to subscribe to a number of private equity funds. As of 30 June 2021 $28.9m (2019/20: $41.9m) of this commitment was yet to be called up.
15. WAITARA LANDS ACTThe New Plymouth District Council (Waitara Lands) Act 2018 (the Act) was passed by Parliament and became effective from 17 March 2019. The Act allows leaseholders of 780 identified properties to purchase freehold their leased land at market value and allows for other land parcels amounting to 118 hectares to be gifted and/or purchased by hapū.
Notes to the Financial Statements
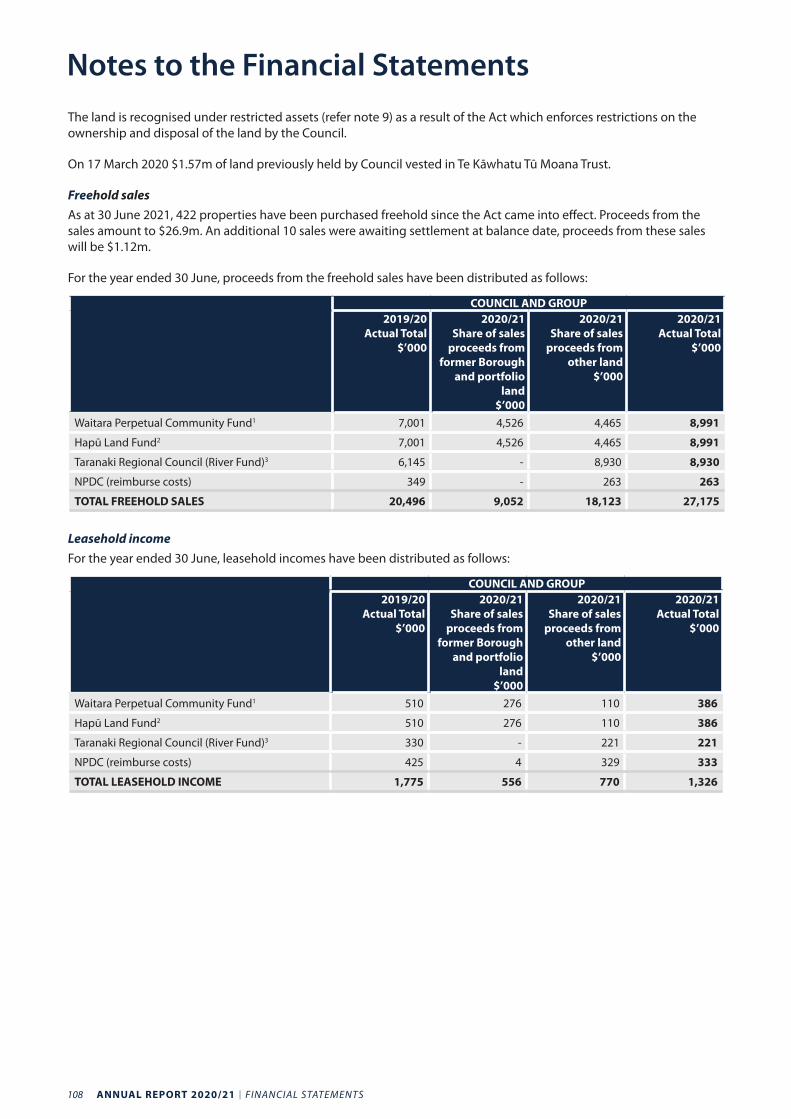
108 ANNUAL REPORT 2020/21 I FINANCIAL STATEMENTS
Notes to the Financial StatementsThe land is recognised under restricted assets (refer note 9) as a result of the Act which enforces restrictions on the ownership and disposal of the land by the Council.
On 17 March 2020 $1.57m of land previously held by Council vested in Te Kāwhatu Tū Moana Trust.
Freehold salesAs at 30 June 2021, 422 properties have been purchased freehold since the Act came into effect. Proceeds from the sales amount to $26.9m. An additional 10 sales were awaiting settlement at balance date, proceeds from these sales will be $1.12m.
For the year ended 30 June, proceeds from the freehold sales have been distributed as follows:
COUNCIL AND GROUP2019/20
Actual Total $’000
2020/21 Share of sales
proceeds from former Borough
and portfolio land
$’000
2020/21 Share of sales
proceeds from other land
$’000
2020/21 Actual Total
$’000
Waitara Perpetual Community Fund1 7,001 4,526 4,465 8,991
Hapū Land Fund2 7,001 4,526 4,465 8,991
Taranaki Regional Council (River Fund)3 6,145 - 8,930 8,930
NPDC (reimburse costs) 349 - 263 263
TOTAL FREEHOLD SALES 20,496 9,052 18,123 27,175
Leasehold incomeFor the year ended 30 June, leasehold incomes have been distributed as follows:
COUNCIL AND GROUP2019/20
Actual Total $’000
2020/21 Share of sales
proceeds from former Borough
and portfolio land
$’000
2020/21 Share of sales
proceeds from other land
$’000
2020/21 Actual Total
$’000
Waitara Perpetual Community Fund1 510 276 110 386
Hapū Land Fund2 510 276 110 386
Taranaki Regional Council (River Fund)3 330 - 221 221
NPDC (reimburse costs) 425 4 329 333
TOTAL LEASEHOLD INCOME 1,775 556 770 1,326
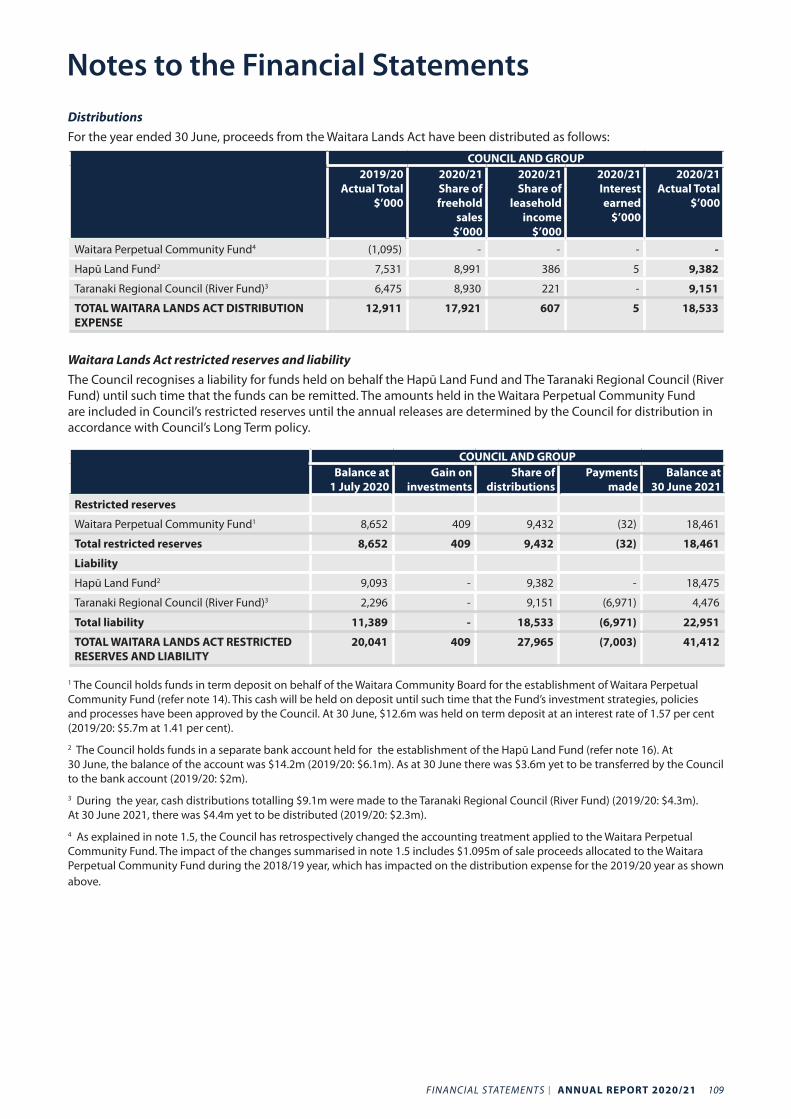
FINANCIAL STATEMENTS I ANNUAL REPORT 2020/21 109
Distributions For the year ended 30 June, proceeds from the Waitara Lands Act have been distributed as follows:
COUNCIL AND GROUP2019/20
Actual Total $’000
2020/21 Share of freehold
sales $’000
2020/21 Share of
leasehold income
$’000
2020/21 Interest earned
$’000
2020/21 Actual Total
$’000
Waitara Perpetual Community Fund4 (1,095) - - - -
Hapū Land Fund2 7,531 8,991 386 5 9,382
Taranaki Regional Council (River Fund)3 6,475 8,930 221 - 9,151
TOTAL WAITARA LANDS ACT DISTRIBUTION EXPENSE
12,911 17,921 607 5 18,533
Waitara Lands Act restricted reserves and liabilityThe Council recognises a liability for funds held on behalf the Hapū Land Fund and The Taranaki Regional Council (River Fund) until such time that the funds can be remitted. The amounts held in the Waitara Perpetual Community Fund are included in Council’s restricted reserves until the annual releases are determined by the Council for distribution in accordance with Council’s Long Term policy.
COUNCIL AND GROUPBalance at
1 July 2020Gain on
investmentsShare of
distributionsPayments
madeBalance at
30 June 2021Restricted reserves
Waitara Perpetual Community Fund1 8,652 409 9,432 (32) 18,461
Total restricted reserves 8,652 409 9,432 (32) 18,461
Liability
Hapū Land Fund2 9,093 - 9,382 - 18,475
Taranaki Regional Council (River Fund)3 2,296 - 9,151 (6,971) 4,476
Total liability 11,389 - 18,533 (6,971) 22,951
TOTAL WAITARA LANDS ACT RESTRICTED RESERVES AND LIABILITY
20,041 409 27,965 (7,003) 41,412
1 The Council holds funds in term deposit on behalf of the Waitara Community Board for the establishment of Waitara Perpetual Community Fund (refer note 14). This cash will be held on deposit until such time that the Fund’s investment strategies, policies and processes have been approved by the Council. At 30 June, $12.6m was held on term deposit at an interest rate of 1.57 per cent (2019/20: $5.7m at 1.41 per cent). 2 The Council holds funds in a separate bank account held for the establishment of the Hapū Land Fund (refer note 16). At 30 June, the balance of the account was $14.2m (2019/20: $6.1m). As at 30 June there was $3.6m yet to be transferred by the Council to the bank account (2019/20: $2m).3 During the year, cash distributions totalling $9.1m were made to the Taranaki Regional Council (River Fund) (2019/20: $4.3m). At 30 June 2021, there was $4.4m yet to be distributed (2019/20: $2.3m).4 As explained in note 1.5, the Council has retrospectively changed the accounting treatment applied to the Waitara Perpetual Community Fund. The impact of the changes summarised in note 1.5 includes $1.095m of sale proceeds allocated to the Waitara Perpetual Community Fund during the 2018/19 year, which has impacted on the distribution expense for the 2019/20 year as shown above.
Notes to the Financial Statements
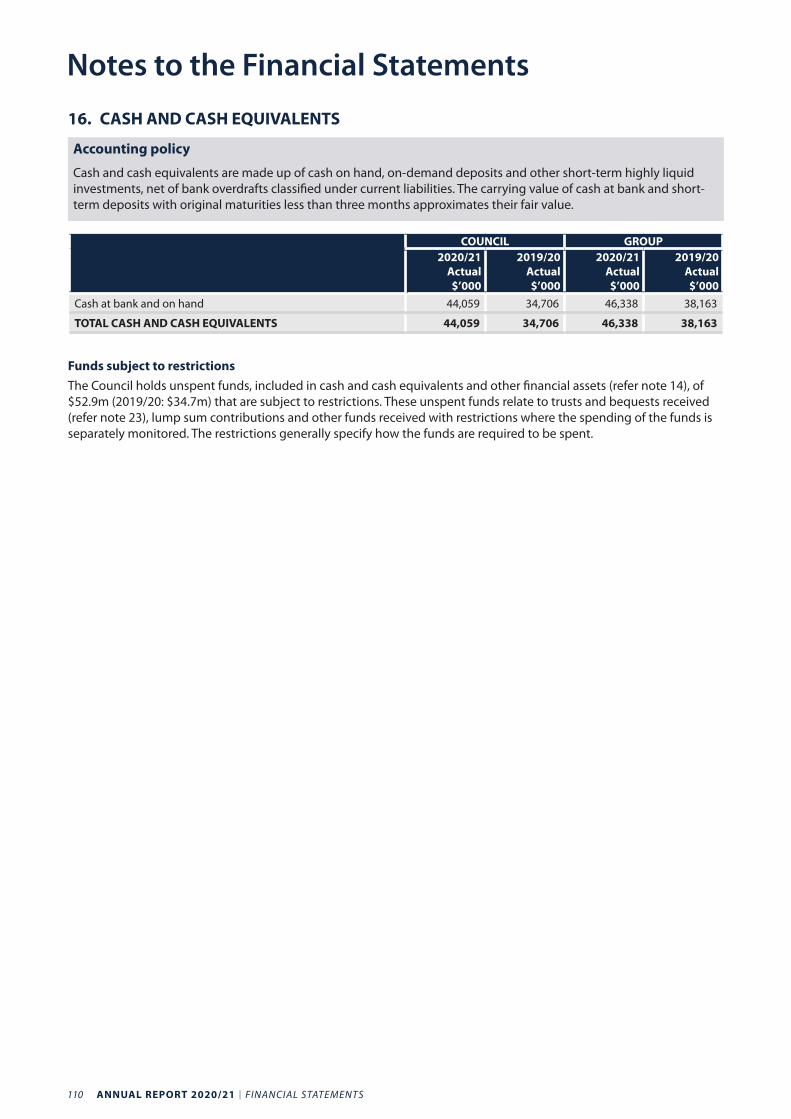
110 ANNUAL REPORT 2020/21 I FINANCIAL STATEMENTS
Notes to the Financial Statements
16. CASH AND CASH EQUIVALENTS
Accounting policy
Cash and cash equivalents are made up of cash on hand, on-demand deposits and other short-term highly liquid investments, net of bank overdrafts classified under current liabilities. The carrying value of cash at bank and short-term deposits with original maturities less than three months approximates their fair value.
COUNCIL GROUP2020/21
Actual $’000
2019/20 Actual $’000
2020/21 Actual $’000
2019/20 Actual $’000
Cash at bank and on hand 44,059 34,706 46,338 38,163
TOTAL CASH AND CASH EQUIVALENTS 44,059 34,706 46,338 38,163
Funds subject to restrictionsThe Council holds unspent funds, included in cash and cash equivalents and other financial assets (refer note 14), of $52.9m (2019/20: $34.7m) that are subject to restrictions. These unspent funds relate to trusts and bequests received (refer note 23), lump sum contributions and other funds received with restrictions where the spending of the funds is separately monitored. The restrictions generally specify how the funds are required to be spent.
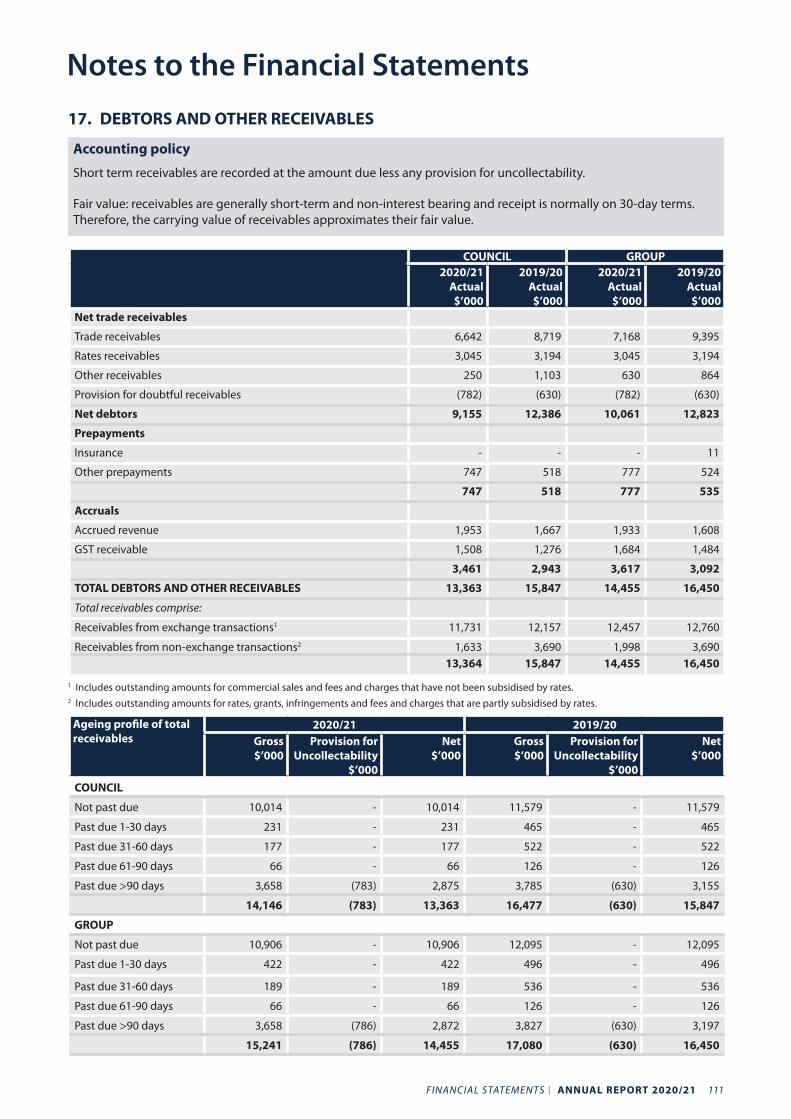
FINANCIAL STATEMENTS I ANNUAL REPORT 2020/21 111
17. DEBTORS AND OTHER RECEIVABLES
Accounting policy
Short term receivables are recorded at the amount due less any provision for uncollectability.
Fair value: receivables are generally short-term and non-interest bearing and receipt is normally on 30-day terms. Therefore, the carrying value of receivables approximates their fair value.
COUNCIL GROUP2020/21
Actual $’000
2019/20 Actual $’000
2020/21 Actual $’000
2019/20 Actual $’000
Net trade receivables
Trade receivables 6,642 8,719 7,168 9,395
Rates receivables 3,045 3,194 3,045 3,194
Other receivables 250 1,103 630 864
Provision for doubtful receivables (782) (630) (782) (630)
Net debtors 9,155 12,386 10,061 12,823
Prepayments
Insurance - - - 11
Other prepayments 747 518 777 524
747 518 777 535
Accruals
Accrued revenue 1,953 1,667 1,933 1,608
GST receivable 1,508 1,276 1,684 1,484
3,461 2,943 3,617 3,092
TOTAL DEBTORS AND OTHER RECEIVABLES 13,363 15,847 14,455 16,450
Total receivables comprise:
Receivables from exchange transactions1 11,731 12,157 12,457 12,760
Receivables from non-exchange transactions2 1,633 3,690 1,998 3,690 13,364 15,847 14,455 16,450
1 Includes outstanding amounts for commercial sales and fees and charges that have not been subsidised by rates.2 Includes outstanding amounts for rates, grants, infringements and fees and charges that are partly subsidised by rates.
Ageing profile of total receivables
2020/21 2019/20Gross $’000
Provision for Uncollectability
$’000
Net $’000
Gross $’000
Provision for Uncollectability
$’000
Net $’000
COUNCIL
Not past due 10,014 - 10,014 11,579 - 11,579
Past due 1-30 days 231 - 231 465 - 465
Past due 31-60 days 177 - 177 522 - 522
Past due 61-90 days 66 - 66 126 - 126
Past due >90 days 3,658 (783) 2,875 3,785 (630) 3,155
14,146 (783) 13,363 16,477 (630) 15,847
GROUP
Not past due 10,906 - 10,906 12,095 - 12,095
Past due 1-30 days 422 - 422 496 - 496
Past due 31-60 days 189 - 189 536 - 536
Past due 61-90 days 66 - 66 126 - 126
Past due >90 days 3,658 (786) 2,872 3,827 (630) 3,197
15,241 (786) 14,455 17,080 (630) 16,450
Notes to the Financial Statements
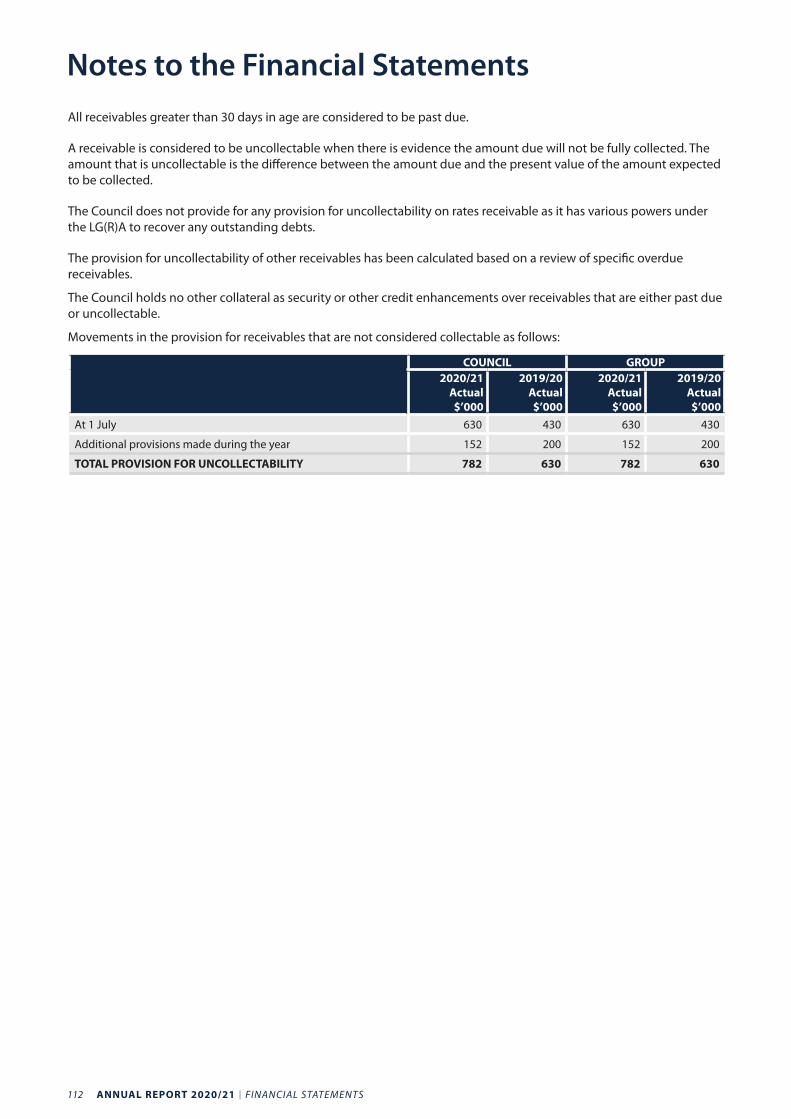
112 ANNUAL REPORT 2020/21 I FINANCIAL STATEMENTS
Notes to the Financial StatementsAll receivables greater than 30 days in age are considered to be past due.
A receivable is considered to be uncollectable when there is evidence the amount due will not be fully collected. The amount that is uncollectable is the difference between the amount due and the present value of the amount expected to be collected.
The Council does not provide for any provision for uncollectability on rates receivable as it has various powers under the LG(R)A to recover any outstanding debts.
The provision for uncollectability of other receivables has been calculated based on a review of specific overdue receivables.
The Council holds no other collateral as security or other credit enhancements over receivables that are either past due or uncollectable.
Movements in the provision for receivables that are not considered collectable as follows:
COUNCIL GROUP2020/21
Actual $’000
2019/20 Actual $’000
2020/21 Actual $’000
2019/20 Actual $’000
At 1 July 630 430 630 430
Additional provisions made during the year 152 200 152 200
TOTAL PROVISION FOR UNCOLLECTABILITY 782 630 782 630
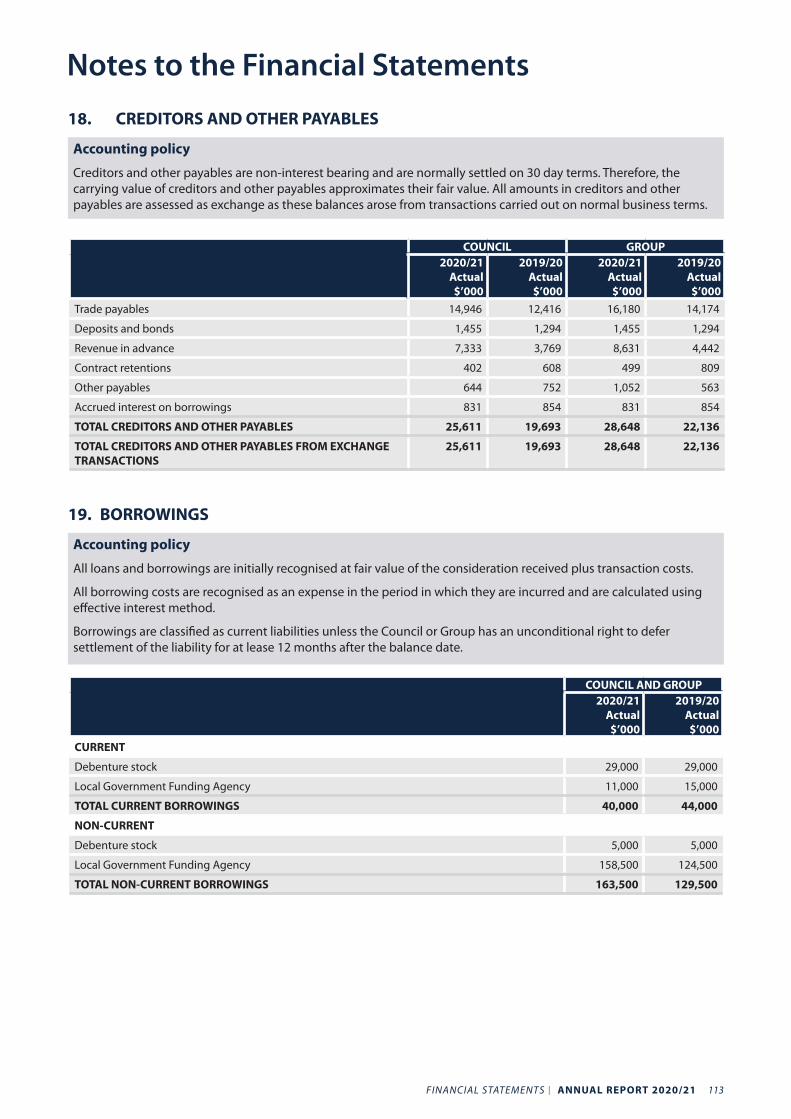
FINANCIAL STATEMENTS I ANNUAL REPORT 2020/21 113
18. CREDITORS AND OTHER PAYABLES
Accounting policy
Creditors and other payables are non-interest bearing and are normally settled on 30 day terms. Therefore, the carrying value of creditors and other payables approximates their fair value. All amounts in creditors and other payables are assessed as exchange as these balances arose from transactions carried out on normal business terms.
COUNCIL GROUP2020/21
Actual $’000
2019/20 Actual $’000
2020/21 Actual $’000
2019/20 Actual $’000
Trade payables 14,946 12,416 16,180 14,174
Deposits and bonds 1,455 1,294 1,455 1,294
Revenue in advance 7,333 3,769 8,631 4,442
Contract retentions 402 608 499 809
Other payables 644 752 1,052 563
Accrued interest on borrowings 831 854 831 854
TOTAL CREDITORS AND OTHER PAYABLES 25,611 19,693 28,648 22,136
TOTAL CREDITORS AND OTHER PAYABLES FROM EXCHANGE TRANSACTIONS
25,611 19,693 28,648 22,136
19. BORROWINGS
Accounting policy
All loans and borrowings are initially recognised at fair value of the consideration received plus transaction costs.
All borrowing costs are recognised as an expense in the period in which they are incurred and are calculated using effective interest method.
Borrowings are classified as current liabilities unless the Council or Group has an unconditional right to defer settlement of the liability for at lease 12 months after the balance date.
COUNCIL AND GROUP2020/21
Actual $’000
2019/20 Actual $’000
CURRENT
Debenture stock 29,000 29,000
Local Government Funding Agency 11,000 15,000
TOTAL CURRENT BORROWINGS 40,000 44,000
NON-CURRENT
Debenture stock 5,000 5,000
Local Government Funding Agency 158,500 124,500
TOTAL NON-CURRENT BORROWINGS 163,500 129,500
Notes to the Financial Statements
114 ANNUAL REPORT 2020/21 I FINANCIAL STATEMENTS
Notes to the Financial StatementsInterest terms The Council has $54.5m of its total debt of $203.5m issued at fixed rates of interest (2019/20: $54.5m of $173.5m). The remainder of the Council’s loans are issued at floating interest rates. For floating rate debt, the interest rate is reset quarterly based on the 90-day bank bill rate plus a margin for credit risk.
Interest rates range from 0.3 per cent to 5.5 per cent (2019/20: 0.3 per cent to 5.5 per cent) – weighted average rate of 2.9 per cent (2019/20: 3.3 per cent). Total interest costs were $6m (2019/20: $6m).
The Council has a number of interest rate swaps and forward interest rates swaps in place to fix and manage interest payments (refer note 24).
SecurityThe Council’s loans have been issued in accordance with the LGA. The loans are secured through the debenture trust deed over all rates. As at 30 June 2021, the Council has issued to its bankers security certificates totalling $14.4b (2019/20: $12.7b) to secure the various bank loan facilities, bank overdraft and guarantees issued on behalf of the Council.
Fair valueDue to interest rates on debt resetting to the market rate every three months, the carrying amounts of the majority of secured loans approximates their fair value. There are $54.5m of secured loans that have been issued at fixed rate and have greater than 12 months to maturity. The fair value of these loans is $54.9m (2019/20: $57.8m). Fair value has been determined using contractual cash flows discounted using a rate based on market borrowing rates at balance date of 2.82 per cent (2019/20: 2.82 per cent).
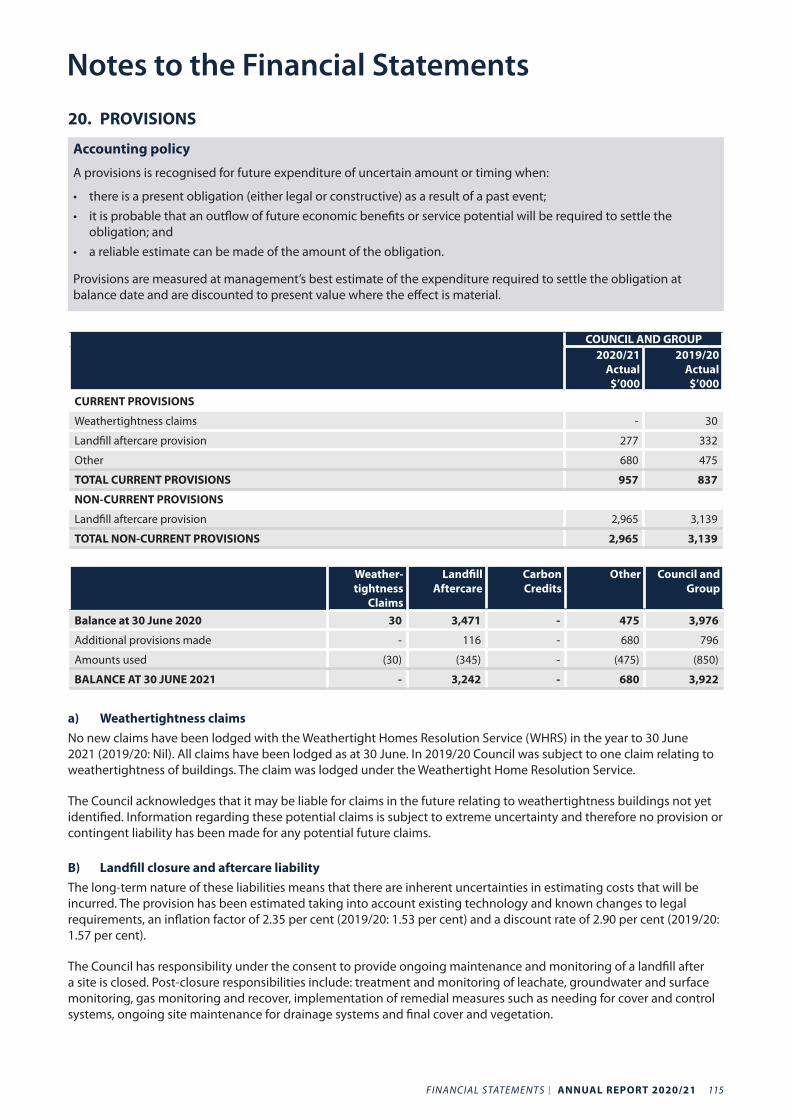
FINANCIAL STATEMENTS I ANNUAL REPORT 2020/21 115
20. PROVISIONS
Accounting policy
A provisions is recognised for future expenditure of uncertain amount or timing when:
• there is a present obligation (either legal or constructive) as a result of a past event;• it is probable that an outflow of future economic benefits or service potential will be required to settle the
obligation; and• a reliable estimate can be made of the amount of the obligation.
Provisions are measured at management’s best estimate of the expenditure required to settle the obligation at balance date and are discounted to present value where the effect is material.
COUNCIL AND GROUP2020/21
Actual $’000
2019/20 Actual $’000
CURRENT PROVISIONS
Weathertightness claims - 30
Landfill aftercare provision 277 332
Other 680 475
TOTAL CURRENT PROVISIONS 957 837
NON-CURRENT PROVISIONS
Landfill aftercare provision 2,965 3,139
TOTAL NON-CURRENT PROVISIONS 2,965 3,139
Weather-tightness
Claims
Landfill Aftercare
Carbon Credits
Other Council and Group
Balance at 30 June 2020 30 3,471 - 475 3,976
Additional provisions made - 116 - 680 796
Amounts used (30) (345) - (475) (850)
BALANCE AT 30 JUNE 2021 - 3,242 - 680 3,922
a) Weathertightness claimsNo new claims have been lodged with the Weathertight Homes Resolution Service (WHRS) in the year to 30 June 2021 (2019/20: Nil). All claims have been lodged as at 30 June. In 2019/20 Council was subject to one claim relating to weathertightness of buildings. The claim was lodged under the Weathertight Home Resolution Service.
The Council acknowledges that it may be liable for claims in the future relating to weathertightness buildings not yet identified. Information regarding these potential claims is subject to extreme uncertainty and therefore no provision or contingent liability has been made for any potential future claims.
B) Landfill closure and aftercare liabilityThe long-term nature of these liabilities means that there are inherent uncertainties in estimating costs that will be incurred. The provision has been estimated taking into account existing technology and known changes to legal requirements, an inflation factor of 2.35 per cent (2019/20: 1.53 per cent) and a discount rate of 2.90 per cent (2019/20: 1.57 per cent).
The Council has responsibility under the consent to provide ongoing maintenance and monitoring of a landfill after a site is closed. Post-closure responsibilities include: treatment and monitoring of leachate, groundwater and surface monitoring, gas monitoring and recover, implementation of remedial measures such as needing for cover and control systems, ongoing site maintenance for drainage systems and final cover and vegetation.
Notes to the Financial Statements
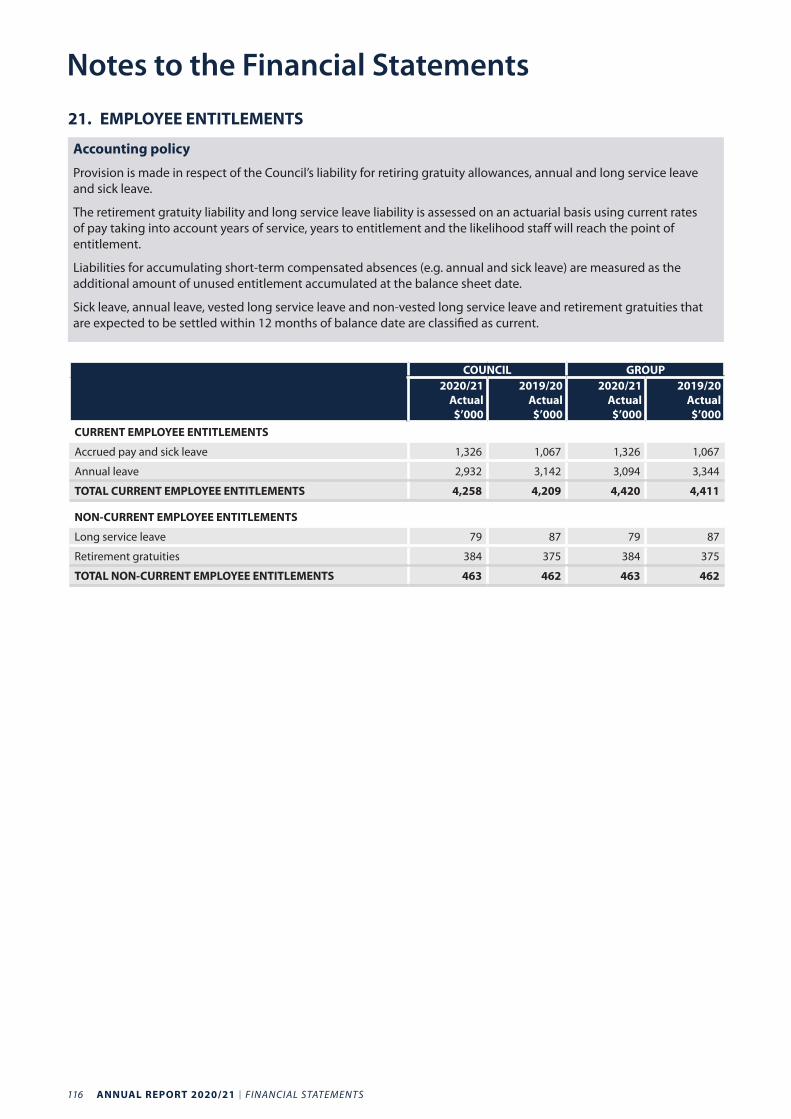
116 ANNUAL REPORT 2020/21 I FINANCIAL STATEMENTS
Notes to the Financial Statements
21. EMPLOYEE ENTITLEMENTS
Accounting policy
Provision is made in respect of the Council’s liability for retiring gratuity allowances, annual and long service leave and sick leave.
The retirement gratuity liability and long service leave liability is assessed on an actuarial basis using current rates of pay taking into account years of service, years to entitlement and the likelihood staff will reach the point of entitlement.
Liabilities for accumulating short-term compensated absences (e.g. annual and sick leave) are measured as the additional amount of unused entitlement accumulated at the balance sheet date.
Sick leave, annual leave, vested long service leave and non-vested long service leave and retirement gratuities that are expected to be settled within 12 months of balance date are classified as current.
COUNCIL GROUP2020/21
Actual $’000
2019/20 Actual $’000
2020/21 Actual $’000
2019/20 Actual $’000
CURRENT EMPLOYEE ENTITLEMENTS
Accrued pay and sick leave 1,326 1,067 1,326 1,067
Annual leave 2,932 3,142 3,094 3,344
TOTAL CURRENT EMPLOYEE ENTITLEMENTS 4,258 4,209 4,420 4,411
NON-CURRENT EMPLOYEE ENTITLEMENTS
Long service leave 79 87 79 87
Retirement gratuities 384 375 384 375
TOTAL NON-CURRENT EMPLOYEE ENTITLEMENTS 463 462 463 462
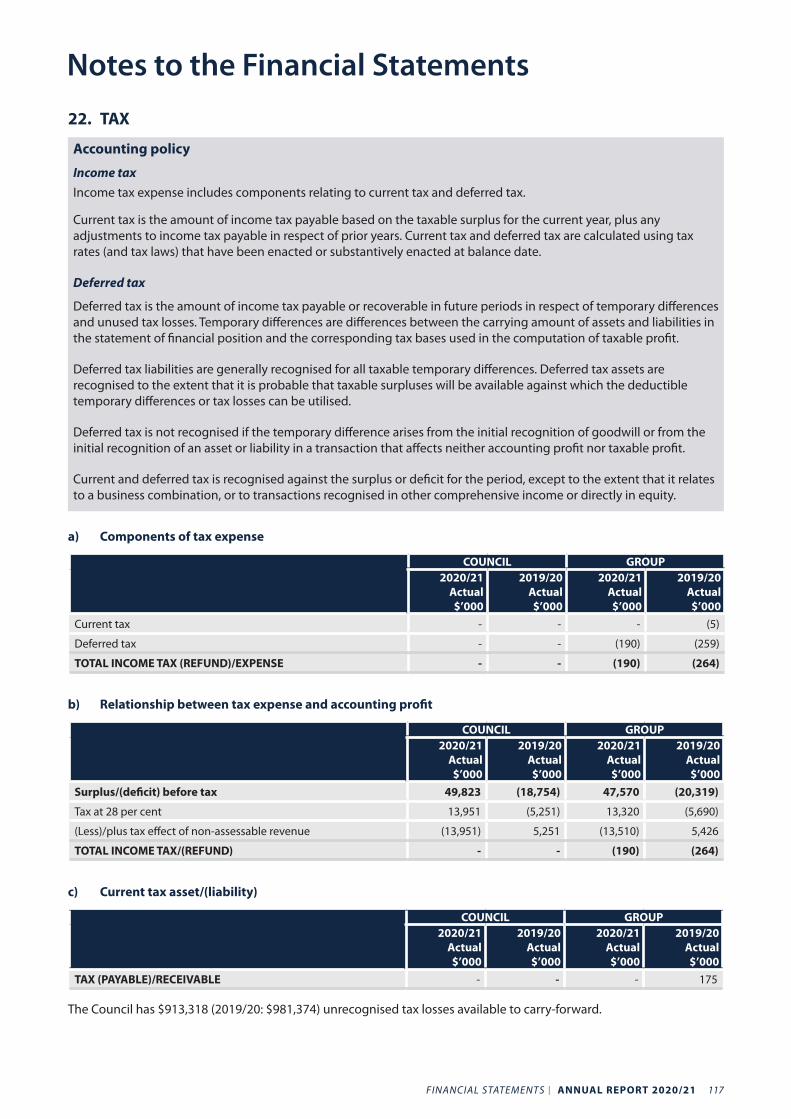
FINANCIAL STATEMENTS I ANNUAL REPORT 2020/21 117
22. TAX
Accounting policy
Income taxIncome tax expense includes components relating to current tax and deferred tax.
Current tax is the amount of income tax payable based on the taxable surplus for the current year, plus any adjustments to income tax payable in respect of prior years. Current tax and deferred tax are calculated using tax rates (and tax laws) that have been enacted or substantively enacted at balance date.
Deferred tax
Deferred tax is the amount of income tax payable or recoverable in future periods in respect of temporary differences and unused tax losses. Temporary differences are differences between the carrying amount of assets and liabilities in the statement of financial position and the corresponding tax bases used in the computation of taxable profit.
Deferred tax liabilities are generally recognised for all taxable temporary differences. Deferred tax assets are recognised to the extent that it is probable that taxable surpluses will be available against which the deductible temporary differences or tax losses can be utilised.
Deferred tax is not recognised if the temporary difference arises from the initial recognition of goodwill or from the initial recognition of an asset or liability in a transaction that affects neither accounting profit nor taxable profit.
Current and deferred tax is recognised against the surplus or deficit for the period, except to the extent that it relates to a business combination, or to transactions recognised in other comprehensive income or directly in equity.
a) Components of tax expense
COUNCIL GROUP2020/21
Actual $’000
2019/20 Actual $’000
2020/21 Actual $’000
2019/20 Actual $’000
Current tax - - - (5)
Deferred tax - - (190) (259)
TOTAL INCOME TAX (REFUND)/EXPENSE - - (190) (264)
b) Relationship between tax expense and accounting profit
COUNCIL GROUP2020/21
Actual $’000
2019/20 Actual $’000
2020/21 Actual $’000
2019/20 Actual $’000
Surplus/(deficit) before tax 49,823 (18,754) 47,570 (20,319)
Tax at 28 per cent 13,951 (5,251) 13,320 (5,690)
(Less)/plus tax effect of non-assessable revenue (13,951) 5,251 (13,510) 5,426
TOTAL INCOME TAX/(REFUND) - - (190) (264)
c) Current tax asset/(liability)
COUNCIL GROUP2020/21
Actual $’000
2019/20 Actual $’000
2020/21 Actual $’000
2019/20 Actual $’000
TAX (PAYABLE)/RECEIVABLE - - - 175
The Council has $913,318 (2019/20: $981,374) unrecognised tax losses available to carry-forward.
Notes to the Financial Statements
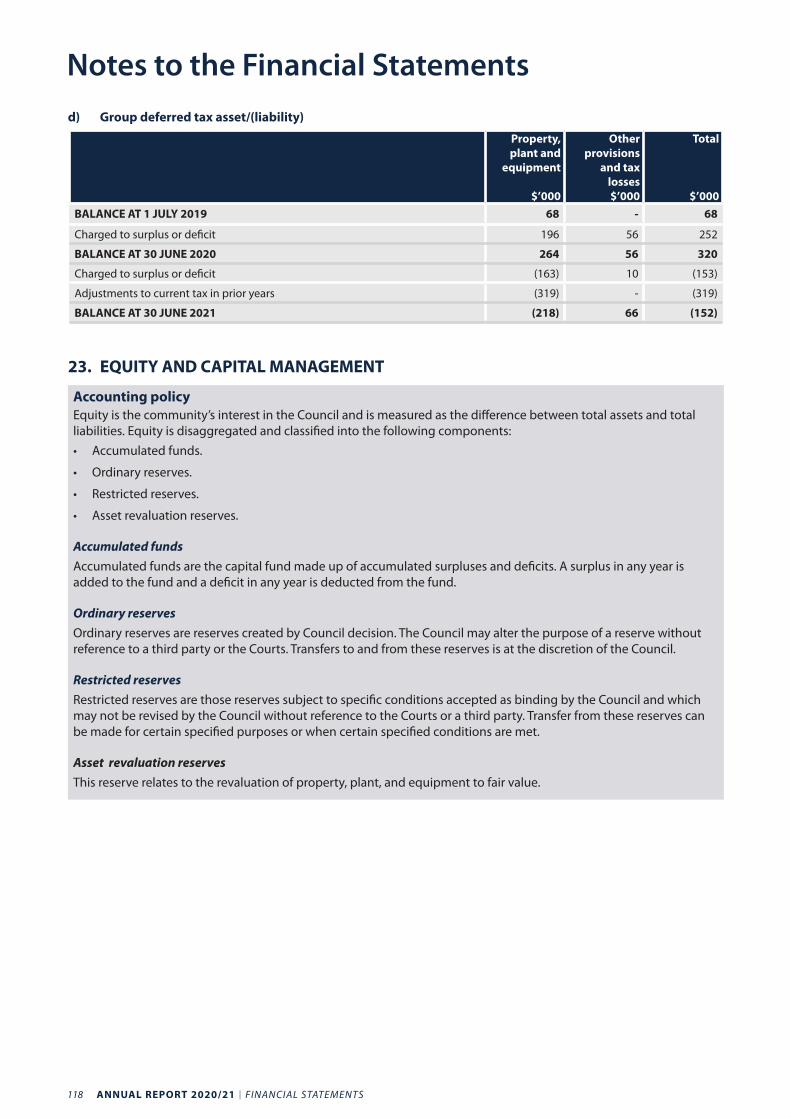
118 ANNUAL REPORT 2020/21 I FINANCIAL STATEMENTS
d) Group deferred tax asset/(liability)
Property, plant and
equipment
$’000
Other provisions
and tax losses $’000
Total
$’000BALANCE AT 1 JULY 2019 68 - 68
Charged to surplus or deficit 196 56 252
BALANCE AT 30 JUNE 2020 264 56 320
Charged to surplus or deficit (163) 10 (153)
Adjustments to current tax in prior years (319) - (319)
BALANCE AT 30 JUNE 2021 (218) 66 (152)
23. EQUITY AND CAPITAL MANAGEMENT
Accounting policyEquity is the community’s interest in the Council and is measured as the difference between total assets and total liabilities. Equity is disaggregated and classified into the following components: • Accumulated funds.
• Ordinary reserves.
• Restricted reserves.
• Asset revaluation reserves.
Accumulated fundsAccumulated funds are the capital fund made up of accumulated surpluses and deficits. A surplus in any year is added to the fund and a deficit in any year is deducted from the fund.
Ordinary reservesOrdinary reserves are reserves created by Council decision. The Council may alter the purpose of a reserve without reference to a third party or the Courts. Transfers to and from these reserves is at the discretion of the Council.
Restricted reservesRestricted reserves are those reserves subject to specific conditions accepted as binding by the Council and which may not be revised by the Council without reference to the Courts or a third party. Transfer from these reserves can be made for certain specified purposes or when certain specified conditions are met.
Asset revaluation reservesThis reserve relates to the revaluation of property, plant, and equipment to fair value.
Notes to the Financial Statements
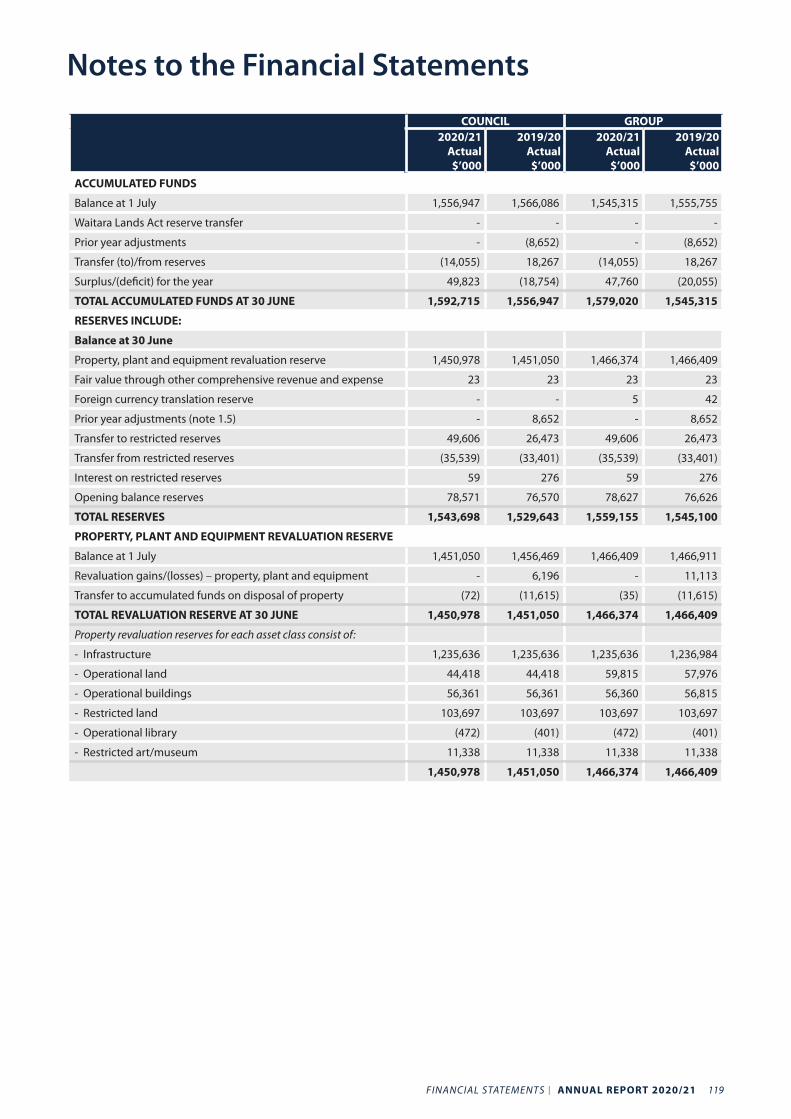
FINANCIAL STATEMENTS I ANNUAL REPORT 2020/21 119
COUNCIL GROUP2020/21
Actual $’000
2019/20 Actual $’000
2020/21 Actual $’000
2019/20 Actual $’000
ACCUMULATED FUNDS
Balance at 1 July 1,556,947 1,566,086 1,545,315 1,555,755
Waitara Lands Act reserve transfer - - - -
Prior year adjustments - (8,652) - (8,652)
Transfer (to)/from reserves (14,055) 18,267 (14,055) 18,267
Surplus/(deficit) for the year 49,823 (18,754) 47,760 (20,055)
TOTAL ACCUMULATED FUNDS AT 30 JUNE 1,592,715 1,556,947 1,579,020 1,545,315
RESERVES INCLUDE:
Balance at 30 June
Property, plant and equipment revaluation reserve 1,450,978 1,451,050 1,466,374 1,466,409
Fair value through other comprehensive revenue and expense 23 23 23 23
Foreign currency translation reserve - - 5 42
Prior year adjustments (note 1.5) - 8,652 - 8,652
Transfer to restricted reserves 49,606 26,473 49,606 26,473
Transfer from restricted reserves (35,539) (33,401) (35,539) (33,401)
Interest on restricted reserves 59 276 59 276
Opening balance reserves 78,571 76,570 78,627 76,626
TOTAL RESERVES 1,543,698 1,529,643 1,559,155 1,545,100
PROPERTY, PLANT AND EQUIPMENT REVALUATION RESERVE
Balance at 1 July 1,451,050 1,456,469 1,466,409 1,466,911
Revaluation gains/(losses) – property, plant and equipment - 6,196 - 11,113
Transfer to accumulated funds on disposal of property (72) (11,615) (35) (11,615)
TOTAL REVALUATION RESERVE AT 30 JUNE 1,450,978 1,451,050 1,466,374 1,466,409
Property revaluation reserves for each asset class consist of:
- Infrastructure 1,235,636 1,235,636 1,235,636 1,236,984
- Operational land 44,418 44,418 59,815 57,976
- Operational buildings 56,361 56,361 56,360 56,815
- Restricted land 103,697 103,697 103,697 103,697
- Operational library (472) (401) (472) (401)
- Restricted art/museum 11,338 11,338 11,338 11,338
1,450,978 1,451,050 1,466,374 1,466,409
Notes to the Financial Statements
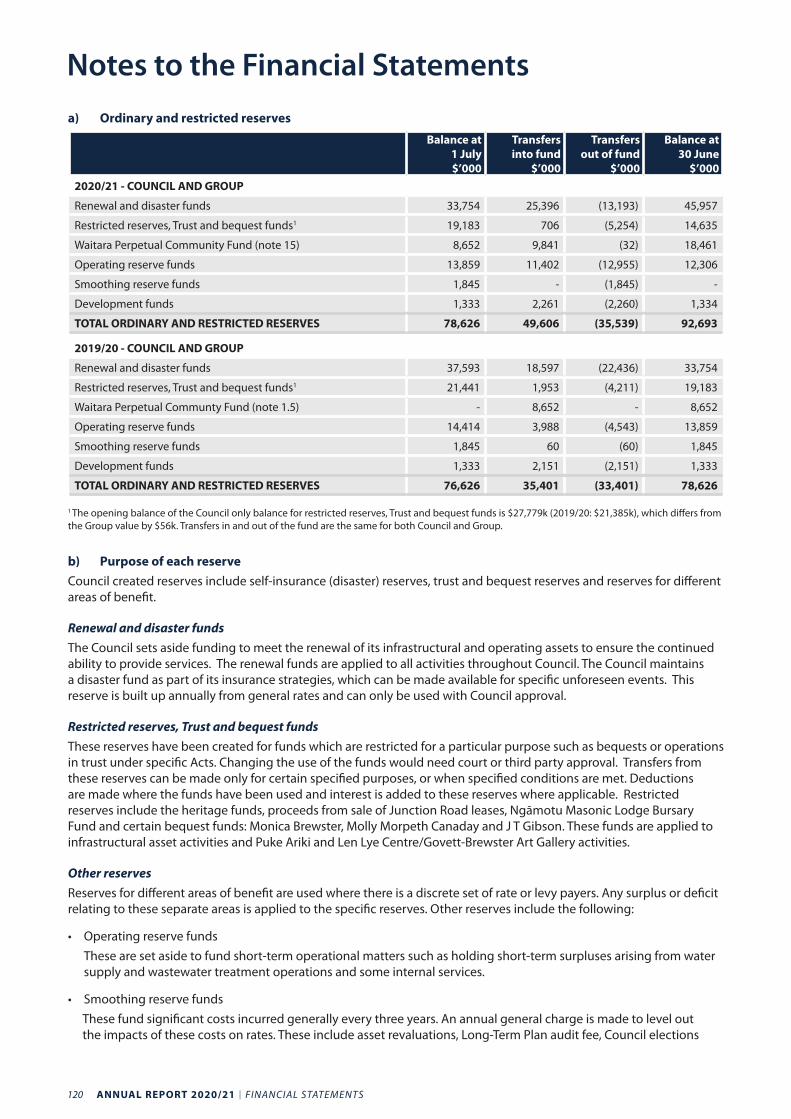
120 ANNUAL REPORT 2020/21 I FINANCIAL STATEMENTS
a) Ordinary and restricted reserves
Balance at 1 July $’000
Transfers into fund
$’000
Transfers out of fund
$’000
Balance at 30 June
$’0002020/21 - COUNCIL AND GROUP
Renewal and disaster funds 33,754 25,396 (13,193) 45,957
Restricted reserves, Trust and bequest funds1 19,183 706 (5,254) 14,635
Waitara Perpetual Community Fund (note 15) 8,652 9,841 (32) 18,461
Operating reserve funds 13,859 11,402 (12,955) 12,306
Smoothing reserve funds 1,845 - (1,845) -
Development funds 1,333 2,261 (2,260) 1,334
TOTAL ORDINARY AND RESTRICTED RESERVES 78,626 49,606 (35,539) 92,693
2019/20 - COUNCIL AND GROUP
Renewal and disaster funds 37,593 18,597 (22,436) 33,754
Restricted reserves, Trust and bequest funds1 21,441 1,953 (4,211) 19,183
Waitara Perpetual Communty Fund (note 1.5) - 8,652 - 8,652
Operating reserve funds 14,414 3,988 (4,543) 13,859
Smoothing reserve funds 1,845 60 (60) 1,845
Development funds 1,333 2,151 (2,151) 1,333
TOTAL ORDINARY AND RESTRICTED RESERVES 76,626 35,401 (33,401) 78,626
1 The opening balance of the Council only balance for restricted reserves, Trust and bequest funds is $27,779k (2019/20: $21,385k), which differs from the Group value by $56k. Transfers in and out of the fund are the same for both Council and Group.
b) Purpose of each reserveCouncil created reserves include self-insurance (disaster) reserves, trust and bequest reserves and reserves for different areas of benefit.
Renewal and disaster fundsThe Council sets aside funding to meet the renewal of its infrastructural and operating assets to ensure the continued ability to provide services. The renewal funds are applied to all activities throughout Council. The Council maintains a disaster fund as part of its insurance strategies, which can be made available for specific unforeseen events. This reserve is built up annually from general rates and can only be used with Council approval.
Restricted reserves, Trust and bequest fundsThese reserves have been created for funds which are restricted for a particular purpose such as bequests or operations in trust under specific Acts. Changing the use of the funds would need court or third party approval. Transfers from these reserves can be made only for certain specified purposes, or when specified conditions are met. Deductions are made where the funds have been used and interest is added to these reserves where applicable. Restricted reserves include the heritage funds, proceeds from sale of Junction Road leases, Ngāmotu Masonic Lodge Bursary Fund and certain bequest funds: Monica Brewster, Molly Morpeth Canaday and J T Gibson. These funds are applied to infrastructural asset activities and Puke Ariki and Len Lye Centre/Govett-Brewster Art Gallery activities.
Other reservesReserves for different areas of benefit are used where there is a discrete set of rate or levy payers. Any surplus or deficit relating to these separate areas is applied to the specific reserves. Other reserves include the following:
• Operating reserve fundsThese are set aside to fund short-term operational matters such as holding short-term surpluses arising from water supply and wastewater treatment operations and some internal services.
• Smoothing reserve fundsThese fund significant costs incurred generally every three years. An annual general charge is made to level out the impacts of these costs on rates. These include asset revaluations, Long-Term Plan audit fee, Council elections
Notes to the Financial Statements
FINANCIAL STATEMENTS I ANNUAL REPORT 2020/21 121
and orthophotography. These funds are applied to infrastructural services, some internal services and civic and democracy services.
• Development fundsThese arise from development and financial contributions levied by the Council for capital works and are intended to contribute to the growth related capital expenditure in the infrastructural asset activities of Roads, Water Supply, Wastewater, Stormwater, Flood Protection, Parks, Recreation and Events, Puke Ariki and Govett-Brewster Art Gallery/ Len Lye Centre. These reserves also include the waste management and minimisation fund which was set up for capital, renewal and emergency maintenance works associated with the District’s solid waste disposal systems.
c) Capital management
The Council’s capital is its equity (or ratepayers’ funds), which comprise accumulated funds and reserves. Equity is represented by net assets.
The LGA requires the Council to manage its revenues, expenses, assets, liabilities, investments and general financial dealings prudently and in a manner that promotes the current and future interest of the community. Ratepayers’ funds are largely managed as a by-product of managing revenues, expenses, assets, liabilities, investments and other financial dealings.
The objective of managing these items is to achieve intergenerational equity, which is a principle promoted in the LGA and applied by the Council. Intergenerational equity requires today’s ratepayers to meet the costs of utilising the Council’s assets and not expecting them to meet the full cost of long-term assets that will benefit ratepayers in future generations. Additionally, the Council has in place asset management plans for major classes of assets detailing renewal and maintenance programmes, to ensure that ratepayers in future generations are not required to meet the costs of deferred renewals and maintenance.
The LGA requires the Council to make adequate and effective provision in its Long-Term Plan and in its Annual Plan (where applicable) to meet the expenditure needs identified in those plans. The LGA also sets out the factors that the Council is required to consider when determining the most appropriate sources of funding for each of its activities. The sources and levels of funding are set out in the funding and financial policies in the Council’s Long-Term Plan.
24. FINANCIAL RISK MANAGEMENT
Accounting policy
Derivative financial instruments
Derivative financial instruments are initially recognised at fair value on the date the contract is entered into. They are subsequently re-measured to fair value each month with the associated gains or losses recognised in the surplus or deficit.
Derivative financial instruments are carried as assets when their fair value is positive and as liabilities when their fair value is negative. Derivative financials instruments that are settled within 12 months are treated as current.
The Council does not designate any derivatives as hedging instruments.
a) Market risk
Interest rate riskInterest rate risk is the risk that the Council may be affected by changes in the general level of interest rates. The Council is exposed to interest rate risk as it borrows funds at floating interest rates. The risk is managed by the use of interest rate swaps contracts (derivative financial instruments).
Under interest rate swap contracts the Council agrees to exchange the difference between fixed and floating rate interest amounts calculated on agreed notional principal amounts. Such contracts enable the Council to mitigate the risk of changing interest rates on debt held.
Notes to the Financial Statements
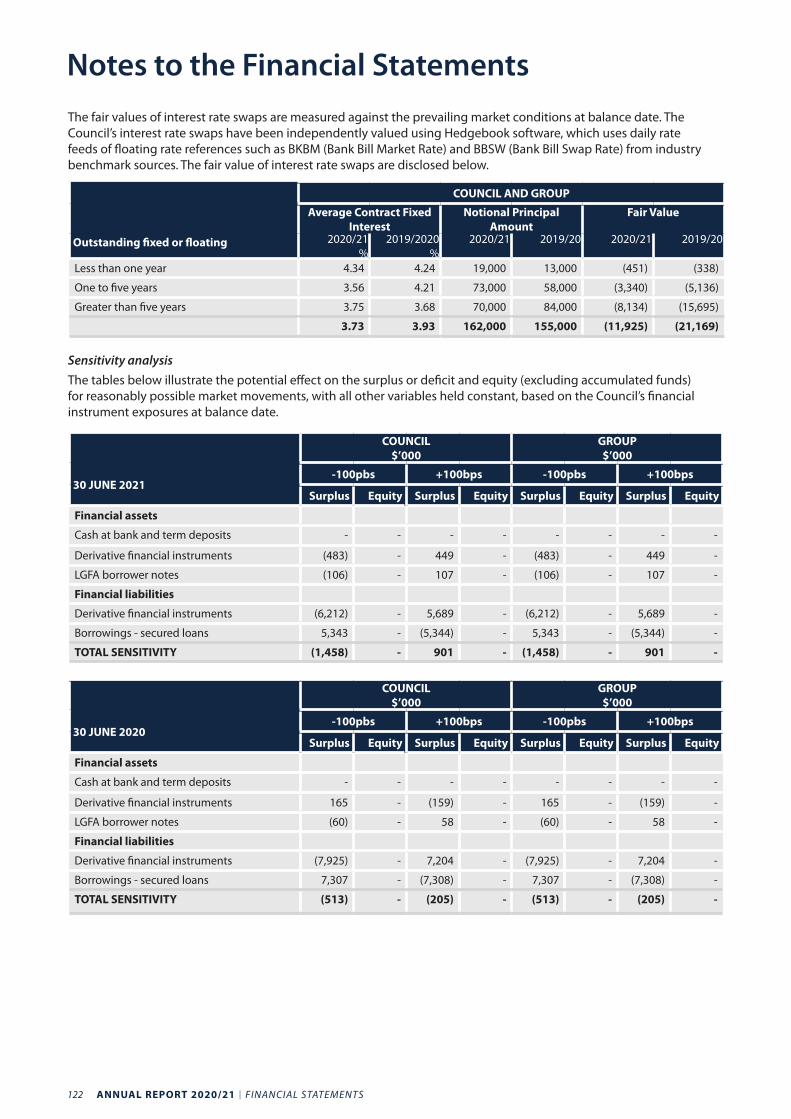
122 ANNUAL REPORT 2020/21 I FINANCIAL STATEMENTS
The fair values of interest rate swaps are measured against the prevailing market conditions at balance date. The Council’s interest rate swaps have been independently valued using Hedgebook software, which uses daily rate feeds of floating rate references such as BKBM (Bank Bill Market Rate) and BBSW (Bank Bill Swap Rate) from industry benchmark sources. The fair value of interest rate swaps are disclosed below.
COUNCIL AND GROUP
Average Contract Fixed Interest
Notional Principal Amount
Fair Value
Outstanding fixed or floating 2020/21 %
2019/2020 %
2020/21 2019/20 2020/21 2019/20
Less than one year 4.34 4.24 19,000 13,000 (451) (338)
One to five years 3.56 4.21 73,000 58,000 (3,340) (5,136)
Greater than five years 3.75 3.68 70,000 84,000 (8,134) (15,695)
3.73 3.93 162,000 155,000 (11,925) (21,169)
Sensitivity analysisThe tables below illustrate the potential effect on the surplus or deficit and equity (excluding accumulated funds) for reasonably possible market movements, with all other variables held constant, based on the Council’s financial instrument exposures at balance date.
30 JUNE 2021
COUNCIL $’000
GROUP $’000
-100pbs +100bps -100pbs +100bps
Surplus Equity Surplus Equity Surplus Equity Surplus Equity
Financial assets
Cash at bank and term deposits - - - - - - - -
Derivative financial instruments (483) - 449 - (483) - 449 -
LGFA borrower notes (106) - 107 - (106) - 107 -
Financial liabilities
Derivative financial instruments (6,212) - 5,689 - (6,212) - 5,689 -
Borrowings - secured loans 5,343 - (5,344) - 5,343 - (5,344) -
TOTAL SENSITIVITY (1,458) - 901 - (1,458) - 901 -
30 JUNE 2020
COUNCIL $’000
GROUP $’000
-100pbs +100bps -100pbs +100bps
Surplus Equity Surplus Equity Surplus Equity Surplus Equity
Financial assets
Cash at bank and term deposits - - - - - - - -
Derivative financial instruments 165 - (159) - 165 - (159) -
LGFA borrower notes (60) - 58 - (60) - 58 -
Financial liabilities
Derivative financial instruments (7,925) - 7,204 - (7,925) - 7,204 -
Borrowings - secured loans 7,307 - (7,308) - 7,307 - (7,308) -
TOTAL SENSITIVITY (513) - (205) - (513) - (205) -
Notes to the Financial Statements
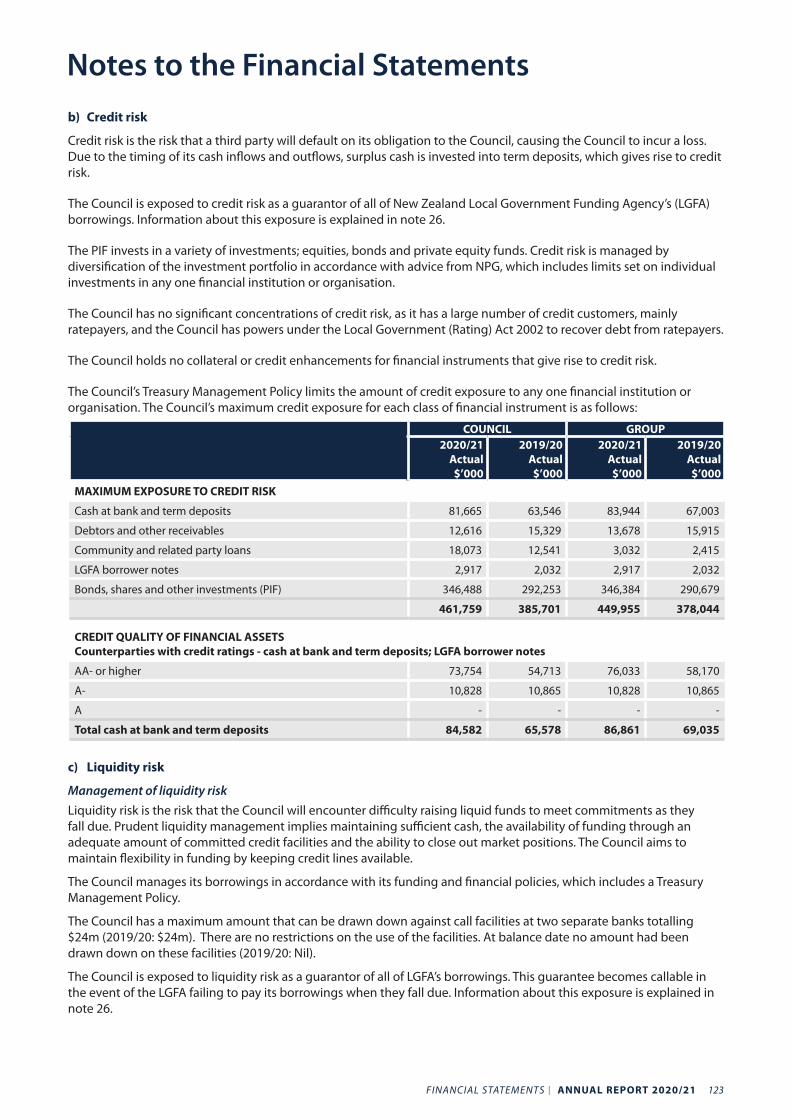
FINANCIAL STATEMENTS I ANNUAL REPORT 2020/21 123
b) Credit risk
Credit risk is the risk that a third party will default on its obligation to the Council, causing the Council to incur a loss. Due to the timing of its cash inflows and outflows, surplus cash is invested into term deposits, which gives rise to credit risk.
The Council is exposed to credit risk as a guarantor of all of New Zealand Local Government Funding Agency’s (LGFA) borrowings. Information about this exposure is explained in note 26.
The PIF invests in a variety of investments; equities, bonds and private equity funds. Credit risk is managed by diversification of the investment portfolio in accordance with advice from NPG, which includes limits set on individual investments in any one financial institution or organisation.
The Council has no significant concentrations of credit risk, as it has a large number of credit customers, mainly ratepayers, and the Council has powers under the Local Government (Rating) Act 2002 to recover debt from ratepayers.
The Council holds no collateral or credit enhancements for financial instruments that give rise to credit risk.
The Council’s Treasury Management Policy limits the amount of credit exposure to any one financial institution or organisation. The Council’s maximum credit exposure for each class of financial instrument is as follows:
COUNCIL GROUP2020/21
Actual $’000
2019/20 Actual $’000
2020/21 Actual $’000
2019/20 Actual $’000
MAXIMUM EXPOSURE TO CREDIT RISK
Cash at bank and term deposits 81,665 63,546 83,944 67,003
Debtors and other receivables 12,616 15,329 13,678 15,915
Community and related party loans 18,073 12,541 3,032 2,415
LGFA borrower notes 2,917 2,032 2,917 2,032
Bonds, shares and other investments (PIF) 346,488 292,253 346,384 290,679
461,759 385,701 449,955 378,044
CREDIT QUALITY OF FINANCIAL ASSETSCounterparties with credit ratings - cash at bank and term deposits; LGFA borrower notes
AA- or higher 73,754 54,713 76,033 58,170
A- 10,828 10,865 10,828 10,865
A - - - -
Total cash at bank and term deposits 84,582 65,578 86,861 69,035
c) Liquidity risk
Management of liquidity riskLiquidity risk is the risk that the Council will encounter difficulty raising liquid funds to meet commitments as they fall due. Prudent liquidity management implies maintaining sufficient cash, the availability of funding through an adequate amount of committed credit facilities and the ability to close out market positions. The Council aims to maintain flexibility in funding by keeping credit lines available.
The Council manages its borrowings in accordance with its funding and financial policies, which includes a Treasury Management Policy.
The Council has a maximum amount that can be drawn down against call facilities at two separate banks totalling $24m (2019/20: $24m). There are no restrictions on the use of the facilities. At balance date no amount had been drawn down on these facilities (2019/20: Nil).
The Council is exposed to liquidity risk as a guarantor of all of LGFA’s borrowings. This guarantee becomes callable in the event of the LGFA failing to pay its borrowings when they fall due. Information about this exposure is explained in note 26.
Notes to the Financial Statements
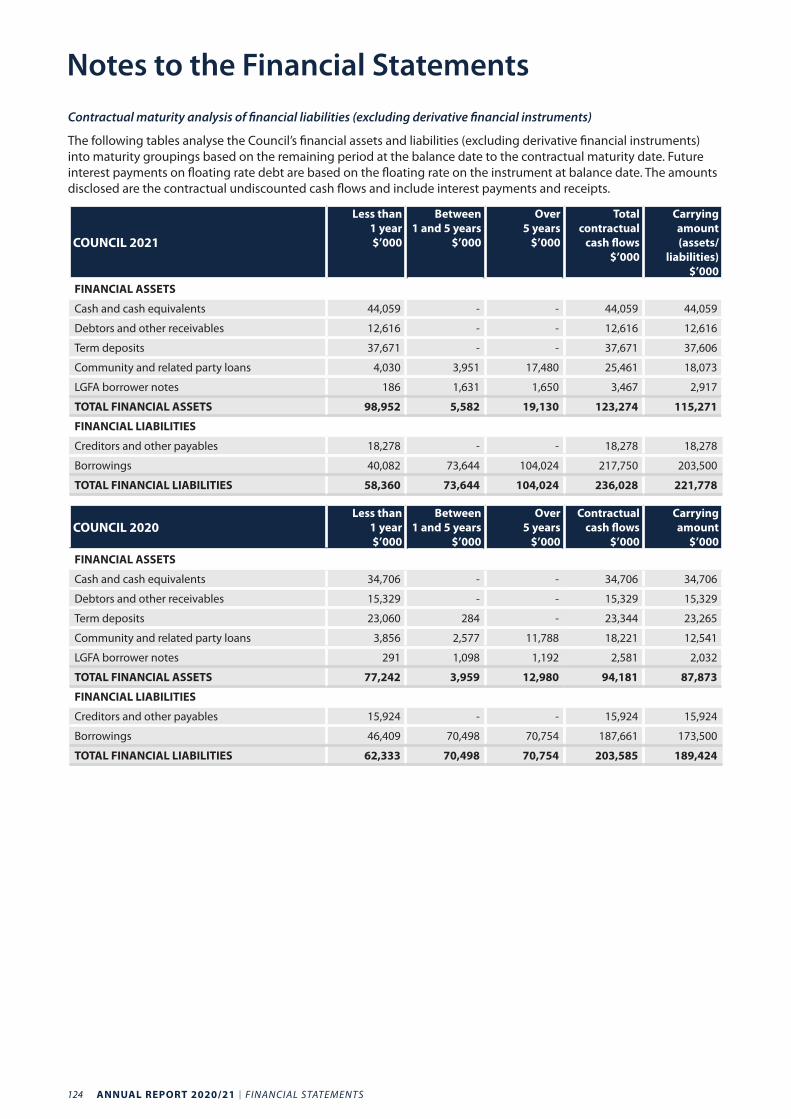
124 ANNUAL REPORT 2020/21 I FINANCIAL STATEMENTS
Contractual maturity analysis of financial liabilities (excluding derivative financial instruments)
The following tables analyse the Council’s financial assets and liabilities (excluding derivative financial instruments) into maturity groupings based on the remaining period at the balance date to the contractual maturity date. Future interest payments on floating rate debt are based on the floating rate on the instrument at balance date. The amounts disclosed are the contractual undiscounted cash flows and include interest payments and receipts.
COUNCIL 2021
Less than 1 year $’000
Between 1 and 5 years
$’000
Over 5 years
$’000
Total contractual
cash flows $’000
Carrying amount (assets/
liabilities) $’000
FINANCIAL ASSETS
Cash and cash equivalents 44,059 - - 44,059 44,059
Debtors and other receivables 12,616 - - 12,616 12,616
Term deposits 37,671 - - 37,671 37,606
Community and related party loans 4,030 3,951 17,480 25,461 18,073
LGFA borrower notes 186 1,631 1,650 3,467 2,917
TOTAL FINANCIAL ASSETS 98,952 5,582 19,130 123,274 115,271
FINANCIAL LIABILITIES
Creditors and other payables 18,278 - - 18,278 18,278
Borrowings 40,082 73,644 104,024 217,750 203,500
TOTAL FINANCIAL LIABILITIES 58,360 73,644 104,024 236,028 221,778
COUNCIL 2020Less than
1 year $’000
Between 1 and 5 years
$’000
Over 5 years
$’000
Contractual cash flows
$’000
Carrying amount
$’000FINANCIAL ASSETS
Cash and cash equivalents 34,706 - - 34,706 34,706
Debtors and other receivables 15,329 - - 15,329 15,329
Term deposits 23,060 284 - 23,344 23,265
Community and related party loans 3,856 2,577 11,788 18,221 12,541
LGFA borrower notes 291 1,098 1,192 2,581 2,032
TOTAL FINANCIAL ASSETS 77,242 3,959 12,980 94,181 87,873
FINANCIAL LIABILITIES
Creditors and other payables 15,924 - - 15,924 15,924
Borrowings 46,409 70,498 70,754 187,661 173,500
TOTAL FINANCIAL LIABILITIES 62,333 70,498 70,754 203,585 189,424
Notes to the Financial Statements
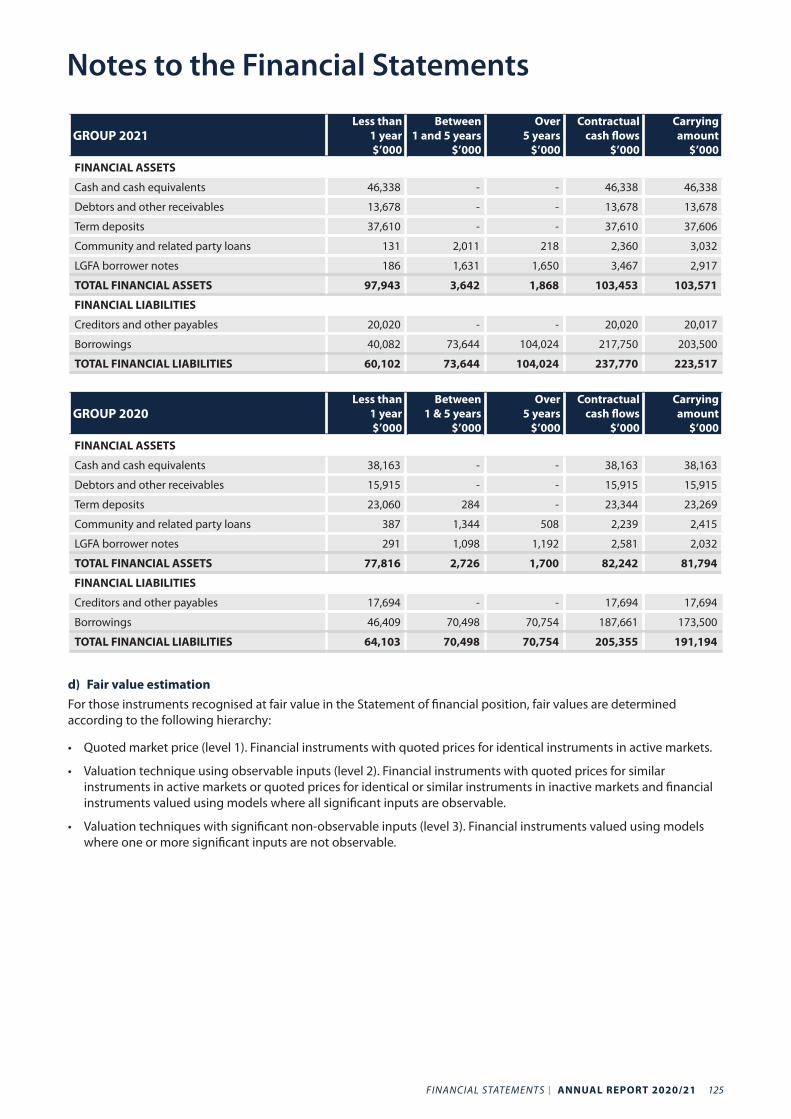
FINANCIAL STATEMENTS I ANNUAL REPORT 2020/21 125
GROUP 2021Less than
1 year $’000
Between 1 and 5 years
$’000
Over 5 years
$’000
Contractual cash flows
$’000
Carrying amount
$’000FINANCIAL ASSETS
Cash and cash equivalents 46,338 - - 46,338 46,338
Debtors and other receivables 13,678 - - 13,678 13,678
Term deposits 37,610 - - 37,610 37,606
Community and related party loans 131 2,011 218 2,360 3,032
LGFA borrower notes 186 1,631 1,650 3,467 2,917
TOTAL FINANCIAL ASSETS 97,943 3,642 1,868 103,453 103,571
FINANCIAL LIABILITIES
Creditors and other payables 20,020 - - 20,020 20,017
Borrowings 40,082 73,644 104,024 217,750 203,500
TOTAL FINANCIAL LIABILITIES 60,102 73,644 104,024 237,770 223,517
GROUP 2020Less than
1 year $’000
Between 1 & 5 years
$’000
Over 5 years
$’000
Contractual cash flows
$’000
Carrying amount
$’000FINANCIAL ASSETS
Cash and cash equivalents 38,163 - - 38,163 38,163
Debtors and other receivables 15,915 - - 15,915 15,915
Term deposits 23,060 284 - 23,344 23,269
Community and related party loans 387 1,344 508 2,239 2,415
LGFA borrower notes 291 1,098 1,192 2,581 2,032
TOTAL FINANCIAL ASSETS 77,816 2,726 1,700 82,242 81,794
FINANCIAL LIABILITIES
Creditors and other payables 17,694 - - 17,694 17,694
Borrowings 46,409 70,498 70,754 187,661 173,500
TOTAL FINANCIAL LIABILITIES 64,103 70,498 70,754 205,355 191,194
d) Fair value estimation For those instruments recognised at fair value in the Statement of financial position, fair values are determined according to the following hierarchy:
• Quoted market price (level 1). Financial instruments with quoted prices for identical instruments in active markets.
• Valuation technique using observable inputs (level 2). Financial instruments with quoted prices for similar instruments in active markets or quoted prices for identical or similar instruments in inactive markets and financial instruments valued using models where all significant inputs are observable.
• Valuation techniques with significant non-observable inputs (level 3). Financial instruments valued using models where one or more significant inputs are not observable.
Notes to the Financial Statements
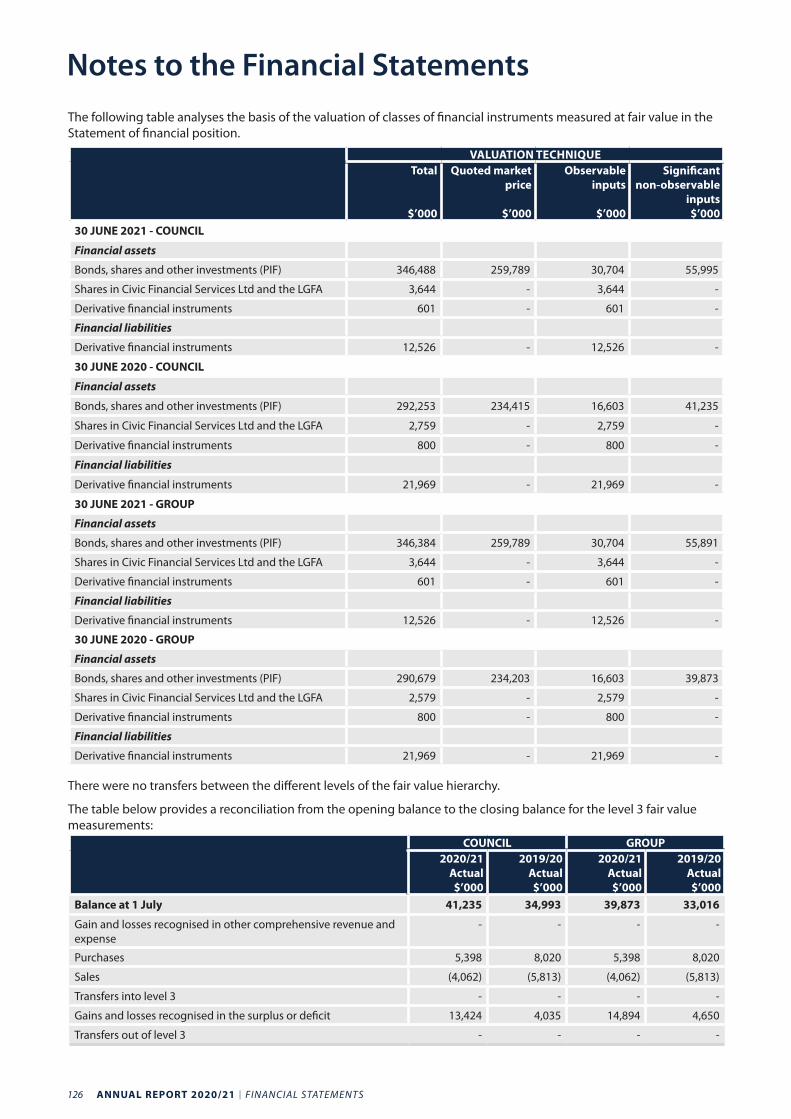
126 ANNUAL REPORT 2020/21 I FINANCIAL STATEMENTS
The following table analyses the basis of the valuation of classes of financial instruments measured at fair value in the Statement of financial position.
VALUATION TECHNIQUETotal
$’000
Quoted market price
$’000
Observable inputs
$’000
Significant non-observable
inputs $’000
30 JUNE 2021 - COUNCIL
Financial assets
Bonds, shares and other investments (PIF) 346,488 259,789 30,704 55,995
Shares in Civic Financial Services Ltd and the LGFA 3,644 - 3,644 -
Derivative financial instruments 601 - 601 -
Financial liabilities
Derivative financial instruments 12,526 - 12,526 -
30 JUNE 2020 - COUNCIL
Financial assets
Bonds, shares and other investments (PIF) 292,253 234,415 16,603 41,235
Shares in Civic Financial Services Ltd and the LGFA 2,759 - 2,759 -
Derivative financial instruments 800 - 800 -
Financial liabilities
Derivative financial instruments 21,969 - 21,969 -
30 JUNE 2021 - GROUP
Financial assets
Bonds, shares and other investments (PIF) 346,384 259,789 30,704 55,891
Shares in Civic Financial Services Ltd and the LGFA 3,644 - 3,644 -
Derivative financial instruments 601 - 601 -
Financial liabilities
Derivative financial instruments 12,526 - 12,526 -
30 JUNE 2020 - GROUP
Financial assets
Bonds, shares and other investments (PIF) 290,679 234,203 16,603 39,873
Shares in Civic Financial Services Ltd and the LGFA 2,579 - 2,579 -
Derivative financial instruments 800 - 800 -
Financial liabilities
Derivative financial instruments 21,969 - 21,969 -
There were no transfers between the different levels of the fair value hierarchy.
The table below provides a reconciliation from the opening balance to the closing balance for the level 3 fair value measurements:
COUNCIL GROUP2020/21
Actual $’000
2019/20 Actual $’000
2020/21 Actual $’000
2019/20 Actual $’000
Balance at 1 July 41,235 34,993 39,873 33,016
Gain and losses recognised in other comprehensive revenue and expense
- - - -
Purchases 5,398 8,020 5,398 8,020
Sales (4,062) (5,813) (4,062) (5,813)
Transfers into level 3 - - - -
Gains and losses recognised in the surplus or deficit 13,424 4,035 14,894 4,650
Transfers out of level 3 - - - -
Notes to the Financial Statements
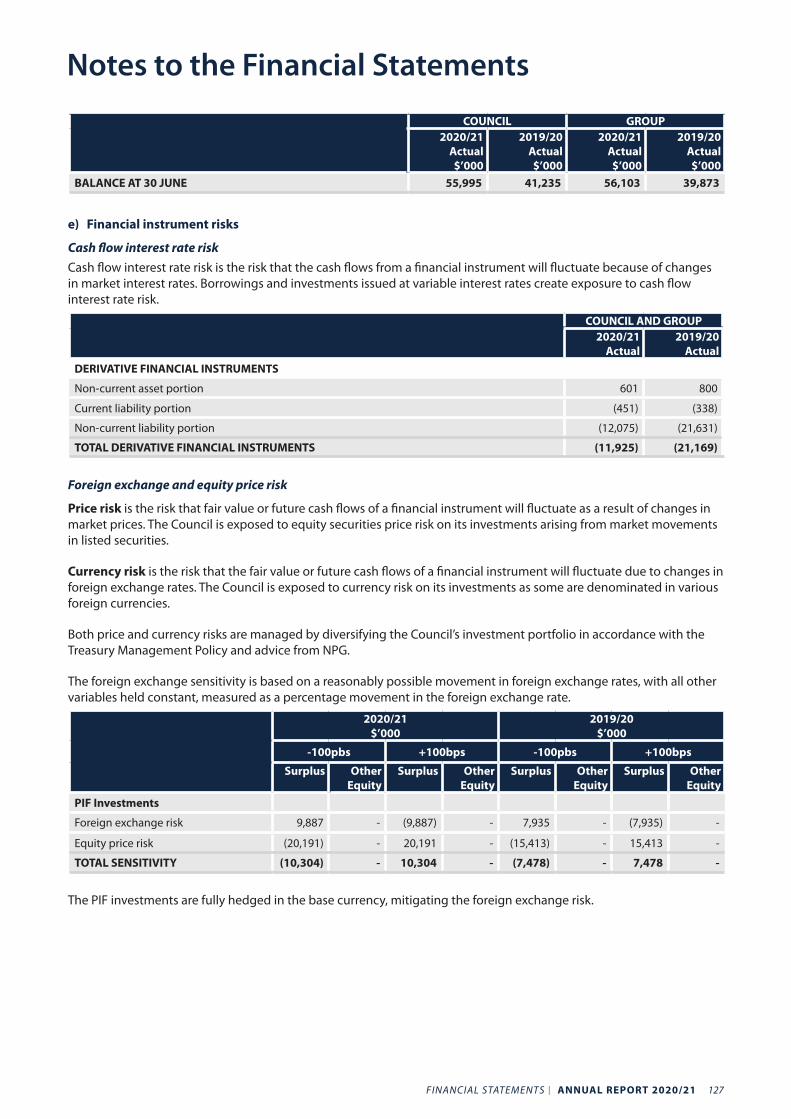
FINANCIAL STATEMENTS I ANNUAL REPORT 2020/21 127
COUNCIL GROUP2020/21
Actual $’000
2019/20 Actual $’000
2020/21 Actual $’000
2019/20 Actual $’000
BALANCE AT 30 JUNE 55,995 41,235 56,103 39,873
e) Financial instrument risks
Cash flow interest rate riskCash flow interest rate risk is the risk that the cash flows from a financial instrument will fluctuate because of changes in market interest rates. Borrowings and investments issued at variable interest rates create exposure to cash flow interest rate risk.
COUNCIL AND GROUP2020/21
Actual2019/20
ActualDERIVATIVE FINANCIAL INSTRUMENTS
Non-current asset portion 601 800
Current liability portion (451) (338)
Non-current liability portion (12,075) (21,631)
TOTAL DERIVATIVE FINANCIAL INSTRUMENTS (11,925) (21,169)
Foreign exchange and equity price risk
Price risk is the risk that fair value or future cash flows of a financial instrument will fluctuate as a result of changes in market prices. The Council is exposed to equity securities price risk on its investments arising from market movements in listed securities.
Currency risk is the risk that the fair value or future cash flows of a financial instrument will fluctuate due to changes in foreign exchange rates. The Council is exposed to currency risk on its investments as some are denominated in various foreign currencies.
Both price and currency risks are managed by diversifying the Council’s investment portfolio in accordance with the Treasury Management Policy and advice from NPG.
The foreign exchange sensitivity is based on a reasonably possible movement in foreign exchange rates, with all other variables held constant, measured as a percentage movement in the foreign exchange rate.
2020/21 $’000
2019/20 $’000
-100pbs +100bps -100pbs +100bps
Surplus Other Equity
Surplus Other Equity
Surplus Other Equity
Surplus Other Equity
PIF Investments
Foreign exchange risk 9,887 - (9,887) - 7,935 - (7,935) -
Equity price risk (20,191) - 20,191 - (15,413) - 15,413 -
TOTAL SENSITIVITY (10,304) - 10,304 - (7,478) - 7,478 -
The PIF investments are fully hedged in the base currency, mitigating the foreign exchange risk.
Notes to the Financial Statements
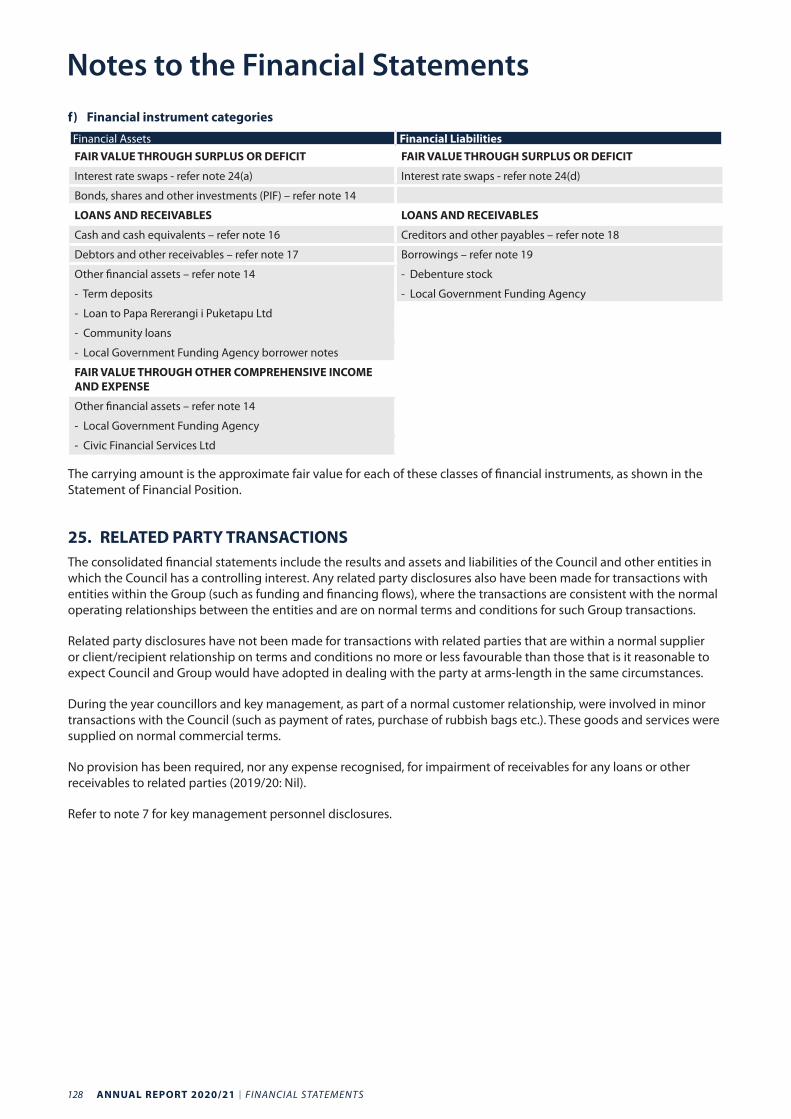
128 ANNUAL REPORT 2020/21 I FINANCIAL STATEMENTS
f) Financial instrument categories
Financial Assets Financial LiabilitiesFAIR VALUE THROUGH SURPLUS OR DEFICIT FAIR VALUE THROUGH SURPLUS OR DEFICIT
Interest rate swaps - refer note 24(a) Interest rate swaps - refer note 24(d)
Bonds, shares and other investments (PIF) – refer note 14
LOANS AND RECEIVABLES LOANS AND RECEIVABLES
Cash and cash equivalents – refer note 16 Creditors and other payables – refer note 18
Debtors and other receivables – refer note 17 Borrowings – refer note 19
Other financial assets – refer note 14 - Debenture stock
- Term deposits - Local Government Funding Agency
- Loan to Papa Rererangi i Puketapu Ltd
- Community loans
- Local Government Funding Agency borrower notes
FAIR VALUE THROUGH OTHER COMPREHENSIVE INCOME AND EXPENSE
Other financial assets – refer note 14
- Local Government Funding Agency
- Civic Financial Services Ltd
The carrying amount is the approximate fair value for each of these classes of financial instruments, as shown in the Statement of Financial Position.
25. RELATED PARTY TRANSACTIONSThe consolidated financial statements include the results and assets and liabilities of the Council and other entities in which the Council has a controlling interest. Any related party disclosures also have been made for transactions with entities within the Group (such as funding and financing flows), where the transactions are consistent with the normal operating relationships between the entities and are on normal terms and conditions for such Group transactions.
Related party disclosures have not been made for transactions with related parties that are within a normal supplier or client/recipient relationship on terms and conditions no more or less favourable than those that is it reasonable to expect Council and Group would have adopted in dealing with the party at arms-length in the same circumstances.
During the year councillors and key management, as part of a normal customer relationship, were involved in minor transactions with the Council (such as payment of rates, purchase of rubbish bags etc.). These goods and services were supplied on normal commercial terms.
No provision has been required, nor any expense recognised, for impairment of receivables for any loans or other receivables to related parties (2019/20: Nil).
Refer to note 7 for key management personnel disclosures.
Notes to the Financial Statements
FINANCIAL STATEMENTS I ANNUAL REPORT 2020/21 129
26. CONTINGENT LIABILITIES AND ASSETS
Contingent liabilities
Contingent liabilities include those items where a liability may be incurred if certain events or outcomes occur, or where a present obligation exists but the extent of the liability cannot be measured reliably for recognition in the financial statements.
Management consider the likelihood of a particular event or outcome occurring to determine whether a contingent liability should be disclosed. No disclosure is made when the possibility of an outflow of resources is considered to be remote. Where amounts are disclosed the amount shown is the maximum potential cost.
Emissions Trading Scheme (ETS)The Council has 235.9 hectares (2019/20: 235.9 hectares) of pre-1990 forest land determined under the Climate Change Response Act 2002 (CCR). Under the ETS, the Council will incur financial penalties should the land be deforested as defined by CCR. At year end approximately 0.4 hectares (2019/20: 0.4 hectares) had been harvested but not yet replanted. There is a four year stand- down period allowed between harvest and replanting. The Council intends to replant and/or let that portion naturally regenerate and has not given notice of intention to deforest. The Council does not consider it has a contingent liability in relation to this matter.
Local Government Funding Agency (LGFA)The Council is a shareholder and guarantor of the LGFA. The LGFA was incorporated in December 2011 with the purpose of providing debt funding to local authorities in New Zealand. It has a current credit rating from Standard and Poor’s of AA+ as at 22 February 2021.
The Council is one of 31 local authority shareholders and 52 local authority guarantors of the LGFA. The aggregate amount of uncalled shareholder capital is available in the event that an imminent default is identified. Also, together with the other shareholders and guarantors, the Council is a guarantor of LGFA’s borrowings. This is based on the Council’s rates as a proportion of the total rates for all guaranteeing local authorities. At 30 June 2021 LGFA had borrowings totalling $13.6b (2019/20: $11.9b).
Financial reporting standards require the Council to recognise the guarantee liability at fair value. However, the Council has been unable to determine a sufficiently reliable fair value for the guarantee, and therefore has not recognised a liability. The Council considers the risk of LGFA defaulting on repayment of interest or capital to be very low on the basis that the Council is not aware of any local authority debt default events in New Zealand and local government legislation would enable local authorities to levy a rate to recover sufficient funds to meet any debt obligations if further funds were required.
RiskPoolRiskPool provides public liability and professional indemnity insurance for its members. The Council is a member of RiskPool. The Trust Deed of RiskPool provides that, if there is a shortfall (whereby claims exceed contributions of members and reinsurance recoveries) in any fund year, then the board may make a call on members for the fund year. The Council has been asked to make calls in the past for fund years as a result of deficits incurred due to the leaky building issue.
A call for $100,000 was made by the board of Civic Liability RiskPool during the year to 30 June 2019. The board have indicated that another final call is likely to be made in 2022 or 2023. It is expected that the amount of the call will be less than $100,000. No call was made during the year to 30 June 2021 (2019/20: nil).
There are no other known material contingent liabilities as at 30 June 2021 (2019/20: nil).
Contingent assets
There are no known material contingent assets as at 30 June 2021 (2019/20: nil).
Notes to the Financial Statements
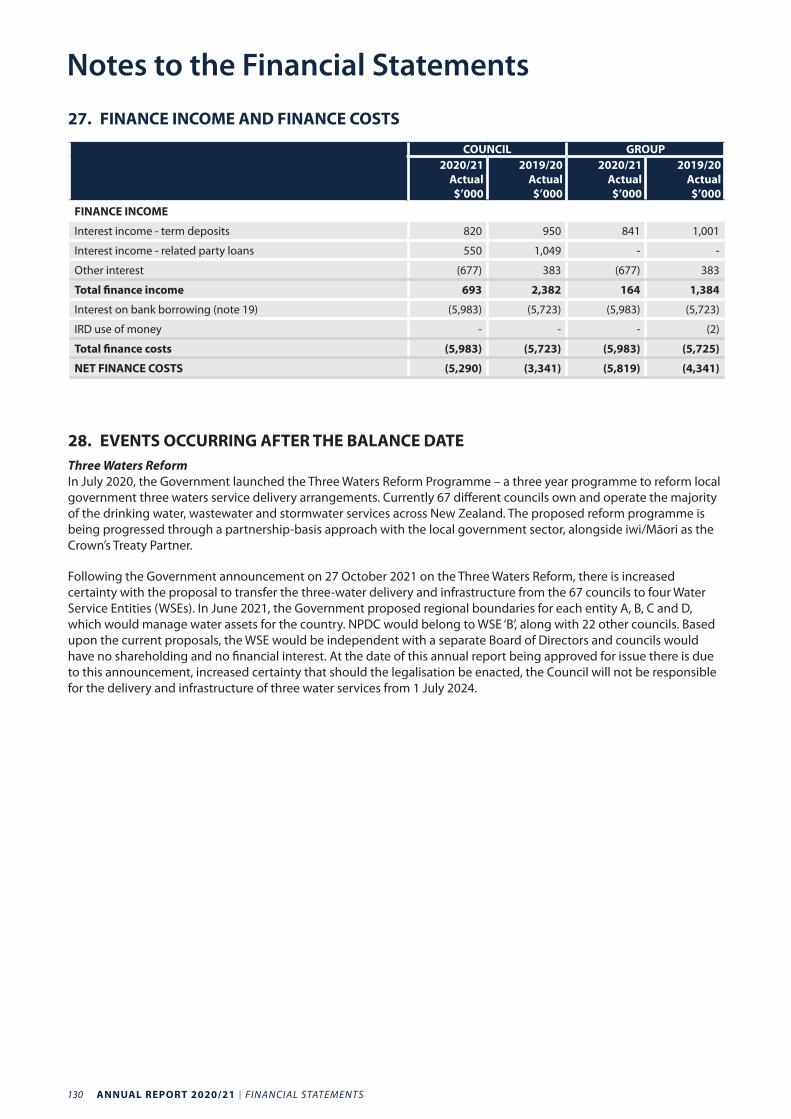
130 ANNUAL REPORT 2020/21 I FINANCIAL STATEMENTS
27. FINANCE INCOME AND FINANCE COSTS
COUNCIL GROUP2020/21
Actual $’000
2019/20 Actual $’000
2020/21 Actual $’000
2019/20 Actual $’000
FINANCE INCOME
Interest income - term deposits 820 950 841 1,001
Interest income - related party loans 550 1,049 - -
Other interest (677) 383 (677) 383
Total finance income 693 2,382 164 1,384
Interest on bank borrowing (note 19) (5,983) (5,723) (5,983) (5,723)
IRD use of money - - - (2)
Total finance costs (5,983) (5,723) (5,983) (5,725)
NET FINANCE COSTS (5,290) (3,341) (5,819) (4,341)
28. EVENTS OCCURRING AFTER THE BALANCE DATEThree Waters ReformIn July 2020, the Government launched the Three Waters Reform Programme – a three year programme to reform local government three waters service delivery arrangements. Currently 67 different councils own and operate the majority of the drinking water, wastewater and stormwater services across New Zealand. The proposed reform programme is being progressed through a partnership-basis approach with the local government sector, alongside iwi/Māori as the Crown’s Treaty Partner.
Following the Government announcement on 27 October 2021 on the Three Waters Reform, there is increased certainty with the proposal to transfer the three-water delivery and infrastructure from the 67 councils to four Water Service Entities (WSEs). In June 2021, the Government proposed regional boundaries for each entity A, B, C and D, which would manage water assets for the country. NPDC would belong to WSE ‘B’, along with 22 other councils. Based upon the current proposals, the WSE would be independent with a separate Board of Directors and councils would have no shareholding and no financial interest. At the date of this annual report being approved for issue there is due to this announcement, increased certainty that should the legalisation be enacted, the Council will not be responsible for the delivery and infrastructure of three water services from 1 July 2024.
Notes to the Financial Statements
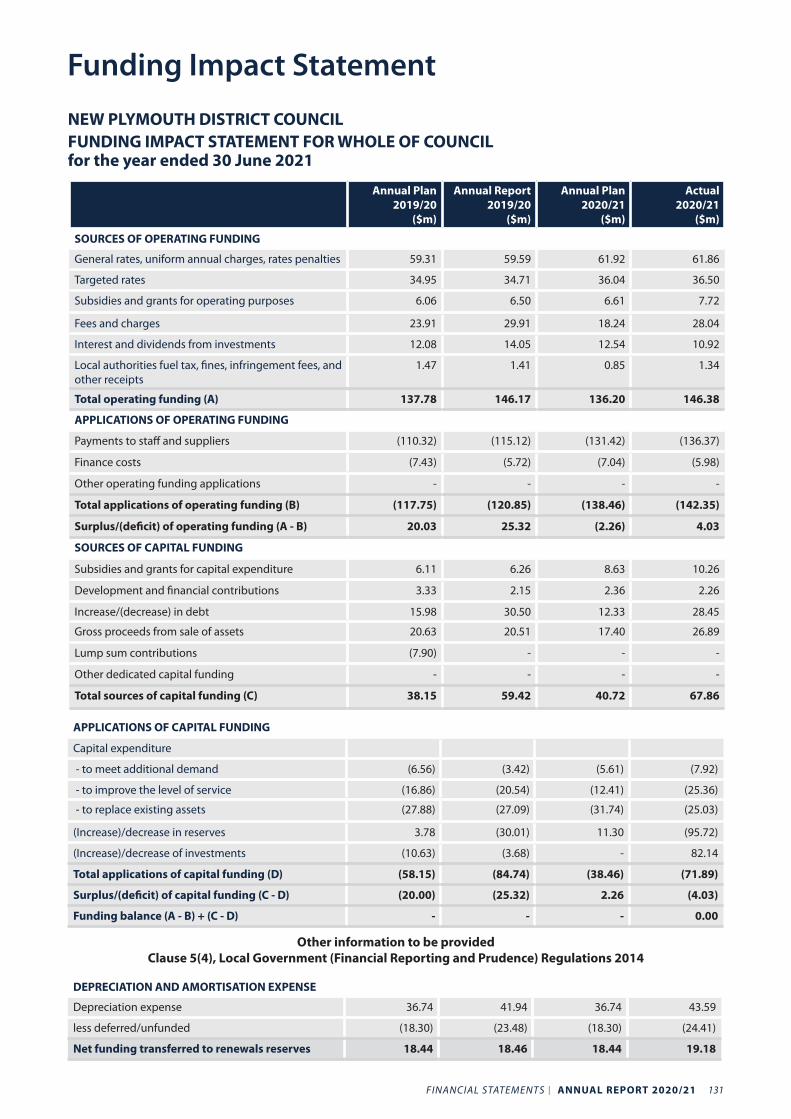
FINANCIAL STATEMENTS I ANNUAL REPORT 2020/21 131
Funding Impact Statement
NEW PLYMOUTH DISTRICT COUNCILFUNDING IMPACT STATEMENT FOR WHOLE OF COUNCIL for the year ended 30 June 2021
Annual Plan 2019/20
($m)
Annual Report 2019/20
($m)
Annual Plan 2020/21
($m)
Actual2020/21
($m)
SOURCES OF OPERATING FUNDING
General rates, uniform annual charges, rates penalties 59.31 59.59 61.92 61.86
Targeted rates 34.95 34.71 36.04 36.50
Subsidies and grants for operating purposes 6.06 6.50 6.61 7.72
Fees and charges 23.91 29.91 18.24 28.04
Interest and dividends from investments 12.08 14.05 12.54 10.92
Local authorities fuel tax, fines, infringement fees, and other receipts
1.47 1.41 0.85 1.34
Total operating funding (A) 137.78 146.17 136.20 146.38
APPLICATIONS OF OPERATING FUNDING
Payments to staff and suppliers (110.32) (115.12) (131.42) (136.37)
Finance costs (7.43) (5.72) (7.04) (5.98)
Other operating funding applications - - - -
Total applications of operating funding (B) (117.75) (120.85) (138.46) (142.35)
Surplus/(deficit) of operating funding (A - B) 20.03 25.32 (2.26) 4.03
SOURCES OF CAPITAL FUNDING
Subsidies and grants for capital expenditure 6.11 6.26 8.63 10.26
Development and financial contributions 3.33 2.15 2.36 2.26
Increase/(decrease) in debt 15.98 30.50 12.33 28.45
Gross proceeds from sale of assets 20.63 20.51 17.40 26.89
Lump sum contributions (7.90) - - -
Other dedicated capital funding - - - -
Total sources of capital funding (C) 38.15 59.42 40.72 67.86
APPLICATIONS OF CAPITAL FUNDING
Capital expenditure
- to meet additional demand (6.56) (3.42) (5.61) (7.92)
- to improve the level of service (16.86) (20.54) (12.41) (25.36)
- to replace existing assets (27.88) (27.09) (31.74) (25.03)
(Increase)/decrease in reserves 3.78 (30.01) 11.30 (95.72)
(Increase)/decrease of investments (10.63) (3.68) - 82.14
Total applications of capital funding (D) (58.15) (84.74) (38.46) (71.89)
Surplus/(deficit) of capital funding (C - D) (20.00) (25.32) 2.26 (4.03)
Funding balance (A - B) + (C - D) - - - 0.00
Other information to be provided Clause 5(4), Local Government (Financial Reporting and Prudence) Regulations 2014
DEPRECIATION AND AMORTISATION EXPENSE
Depreciation expense 36.74 41.94 36.74 43.59
less deferred/unfunded (18.30) (23.48) (18.30) (24.41)
Net funding transferred to renewals reserves 18.44 18.46 18.44 19.18
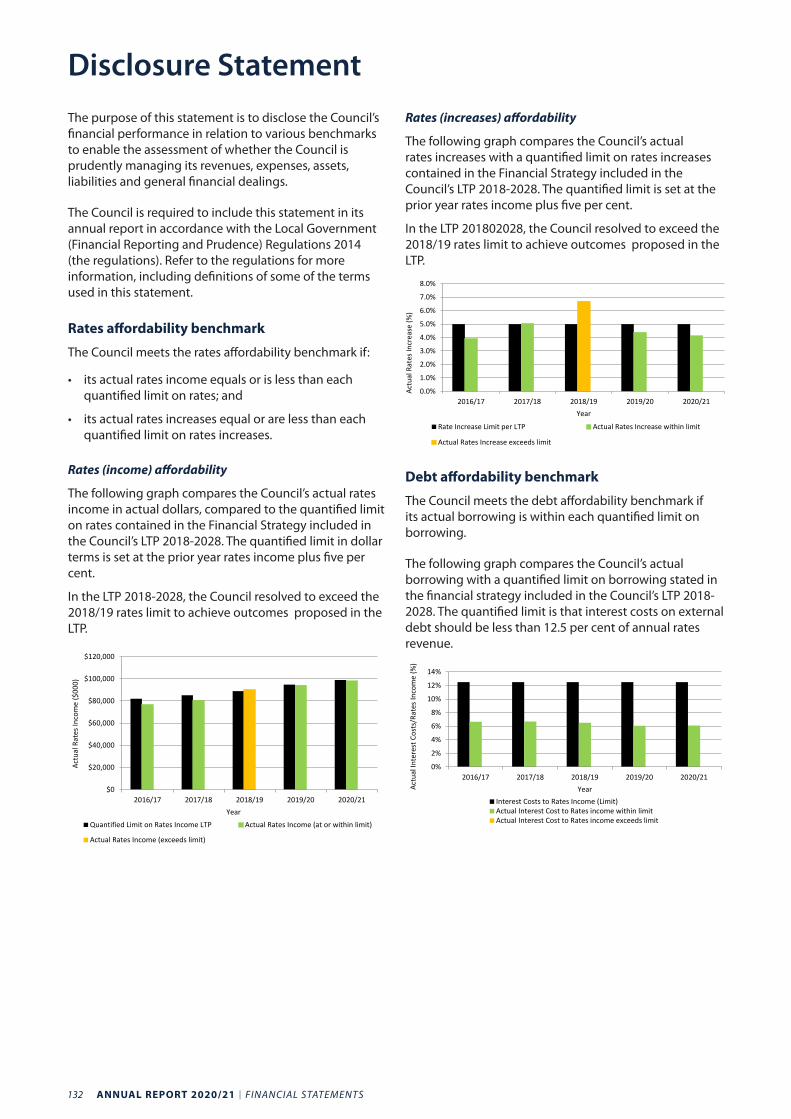
132 ANNUAL REPORT 2020/21 I FINANCIAL STATEMENTS
The purpose of this statement is to disclose the Council’s financial performance in relation to various benchmarks to enable the assessment of whether the Council is prudently managing its revenues, expenses, assets, liabilities and general financial dealings.
The Council is required to include this statement in its annual report in accordance with the Local Government (Financial Reporting and Prudence) Regulations 2014 (the regulations). Refer to the regulations for more information, including definitions of some of the terms used in this statement.
Rates affordability benchmark
The Council meets the rates affordability benchmark if:
• its actual rates income equals or is less than each quantified limit on rates; and
• its actual rates increases equal or are less than each quantified limit on rates increases.
Rates (income) affordability
The following graph compares the Council’s actual rates income in actual dollars, compared to the quantified limit on rates contained in the Financial Strategy included in the Council’s LTP 2018-2028. The quantified limit in dollar terms is set at the prior year rates income plus five per cent.
In the LTP 2018-2028, the Council resolved to exceed the 2018/19 rates limit to achieve outcomes proposed in the LTP.
$0
$20,000
$40,000
$60,000
$80,000
$100,000
$120,000
2016/17 2017/18 2018/19 2019/20 2020/21
Actu
al R
ates
Inco
me
($00
0)
Year
Quantified Limit on Rates Income LTP Actual Rates Income (at or within limit)
Actual Rates Income (exceeds limit)
Rates (increases) affordability
The following graph compares the Council’s actual rates increases with a quantified limit on rates increases contained in the Financial Strategy included in the Council’s LTP 2018-2028. The quantified limit is set at the prior year rates income plus five per cent.
In the LTP 201802028, the Council resolved to exceed the 2018/19 rates limit to achieve outcomes proposed in the LTP.
0.0%
1.0%
2.0%
3.0%
4.0%
5.0%
6.0%
7.0%
8.0%
2016/17 2017/18 2018/19 2019/20 2020/21Ac
tual
Rat
es In
crea
se (%
)Year
Rate Increase Limit per LTP Actual Rates Increase within limit
Actual Rates Increase exceeds limit
Debt affordability benchmark
The Council meets the debt affordability benchmark if its actual borrowing is within each quantified limit on borrowing.
The following graph compares the Council’s actual borrowing with a quantified limit on borrowing stated in the financial strategy included in the Council’s LTP 2018-2028. The quantified limit is that interest costs on external debt should be less than 12.5 per cent of annual rates revenue.
0%
2%
4%
6%
8%
10%
12%
14%
2016/17 2017/18 2018/19 2019/20 2020/21
Actu
al In
tere
st C
osts
/Rat
es In
com
e (%
)
YearInterest Costs to Rates Income (Limit)Actual Interest Cost to Rates income within limitActual Interest Cost to Rates income exceeds limit
Disclosure Statement
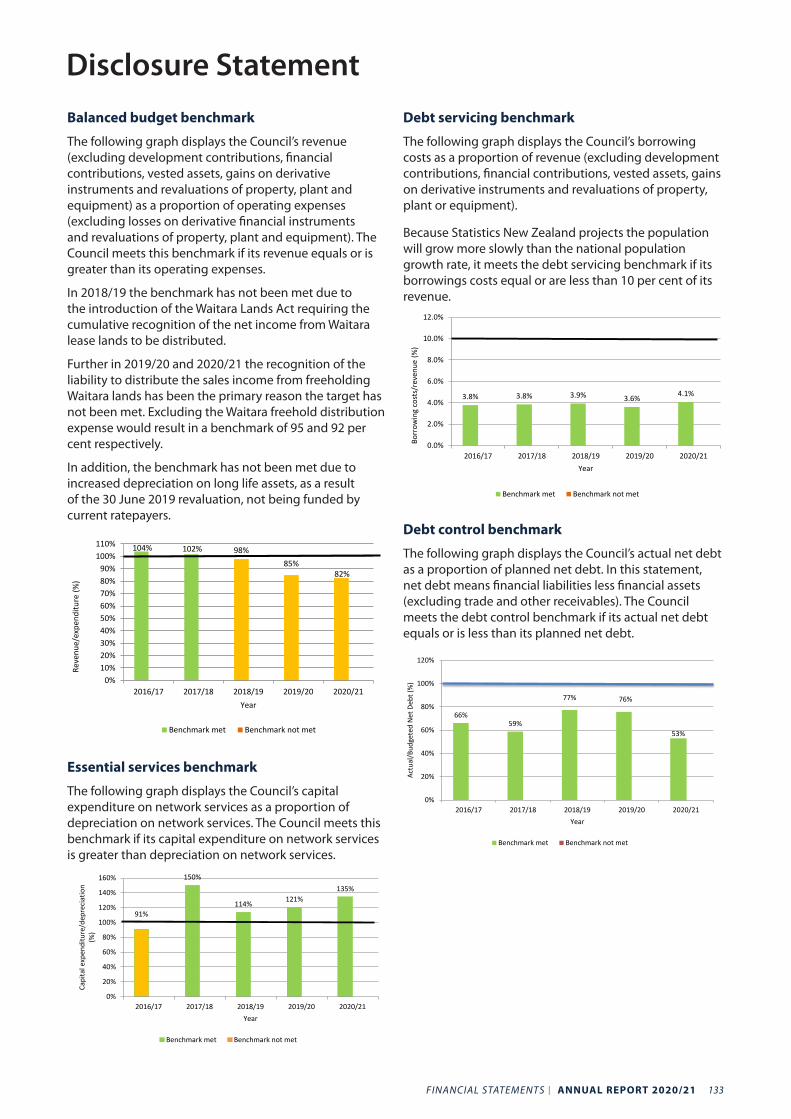
FINANCIAL STATEMENTS I ANNUAL REPORT 2020/21 133
Balanced budget benchmark
The following graph displays the Council’s revenue (excluding development contributions, financial contributions, vested assets, gains on derivative instruments and revaluations of property, plant and equipment) as a proportion of operating expenses (excluding losses on derivative financial instruments and revaluations of property, plant and equipment). The Council meets this benchmark if its revenue equals or is greater than its operating expenses.
In 2018/19 the benchmark has not been met due to the introduction of the Waitara Lands Act requiring the cumulative recognition of the net income from Waitara lease lands to be distributed.
Further in 2019/20 and 2020/21 the recognition of the liability to distribute the sales income from freeholding Waitara lands has been the primary reason the target has not been met. Excluding the Waitara freehold distribution expense would result in a benchmark of 95 and 92 per cent respectively.
In addition, the benchmark has not been met due to increased depreciation on long life assets, as a result of the 30 June 2019 revaluation, not being funded by current ratepayers.
104% 102% 98%85%
82%
0%10%20%30%40%50%60%70%80%90%
100%110%
2016/17 2017/18 2018/19 2019/20 2020/21
Reve
nue/
expe
nditu
re (%
)
Year
Benchmark met Benchmark not met
Essential services benchmark
The following graph displays the Council’s capital expenditure on network services as a proportion of depreciation on network services. The Council meets this benchmark if its capital expenditure on network services is greater than depreciation on network services.
91%
150%
114% 121%135%
0%
20%
40%
60%
80%
100%
120%
140%
160%
2016/17 2017/18 2018/19 2019/20 2020/21
Capi
tal e
xpen
ditu
re/d
epre
ciat
ion
(%)
Year
Benchmark met Benchmark not met
Debt servicing benchmark
The following graph displays the Council’s borrowing costs as a proportion of revenue (excluding development contributions, financial contributions, vested assets, gains on derivative instruments and revaluations of property, plant or equipment).
Because Statistics New Zealand projects the population will grow more slowly than the national population growth rate, it meets the debt servicing benchmark if its borrowings costs equal or are less than 10 per cent of its revenue.
3.8% 3.8% 3.9% 3.6% 4.1%
0.0%
2.0%
4.0%
6.0%
8.0%
10.0%
12.0%
2016/17 2017/18 2018/19 2019/20 2020/21Year
Benchmark met Benchmark not met
Borr
owin
gco
sts/
reve
nue
(%)
Debt control benchmark
The following graph displays the Council’s actual net debt as a proportion of planned net debt. In this statement, net debt means financial liabilities less financial assets (excluding trade and other receivables). The Council meets the debt control benchmark if its actual net debt equals or is less than its planned net debt.
66%59%
77% 76%
53%
0%
20%
40%
60%
80%
100%
120%
2016/17 2017/18 2018/19 2019/20 2020/21
Actu
al/B
udge
ted
Net
Deb
t (%
)
Year
Benchmark met Benchmark not met
Disclosure Statement
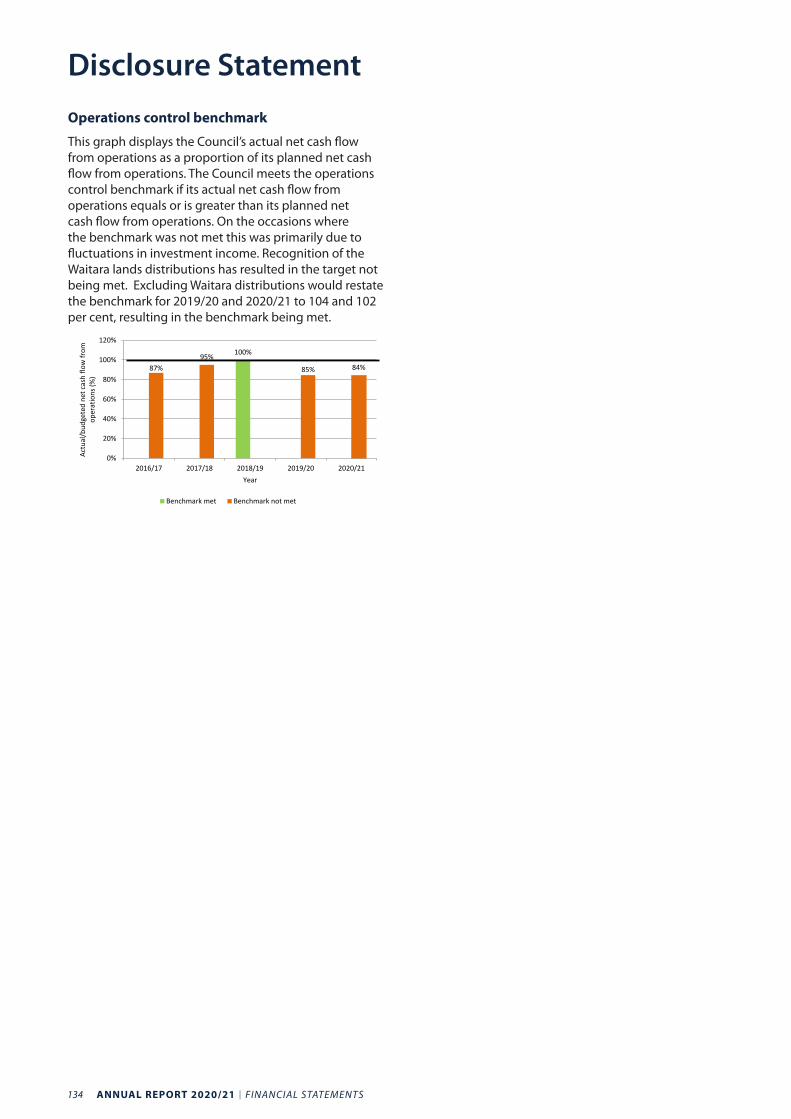
134 ANNUAL REPORT 2020/21 I FINANCIAL STATEMENTS
Operations control benchmark
This graph displays the Council’s actual net cash flow from operations as a proportion of its planned net cash flow from operations. The Council meets the operations control benchmark if its actual net cash flow from operations equals or is greater than its planned net cash flow from operations. On the occasions where the benchmark was not met this was primarily due to fluctuations in investment income. Recognition of the Waitara lands distributions has resulted in the target not being met. Excluding Waitara distributions would restate the benchmark for 2019/20 and 2020/21 to 104 and 102 per cent, resulting in the benchmark being met.
100%
87%95%
85% 84%
0%
20%
40%
60%
80%
100%
120%
2016/17 2017/18 2018/19 2019/20 2020/21
Actu
al/b
udge
ted
net c
ash
flow
from
oper
atio
ns (%
)
Year
Benchmark met Benchmark not met
Disclosure Statement
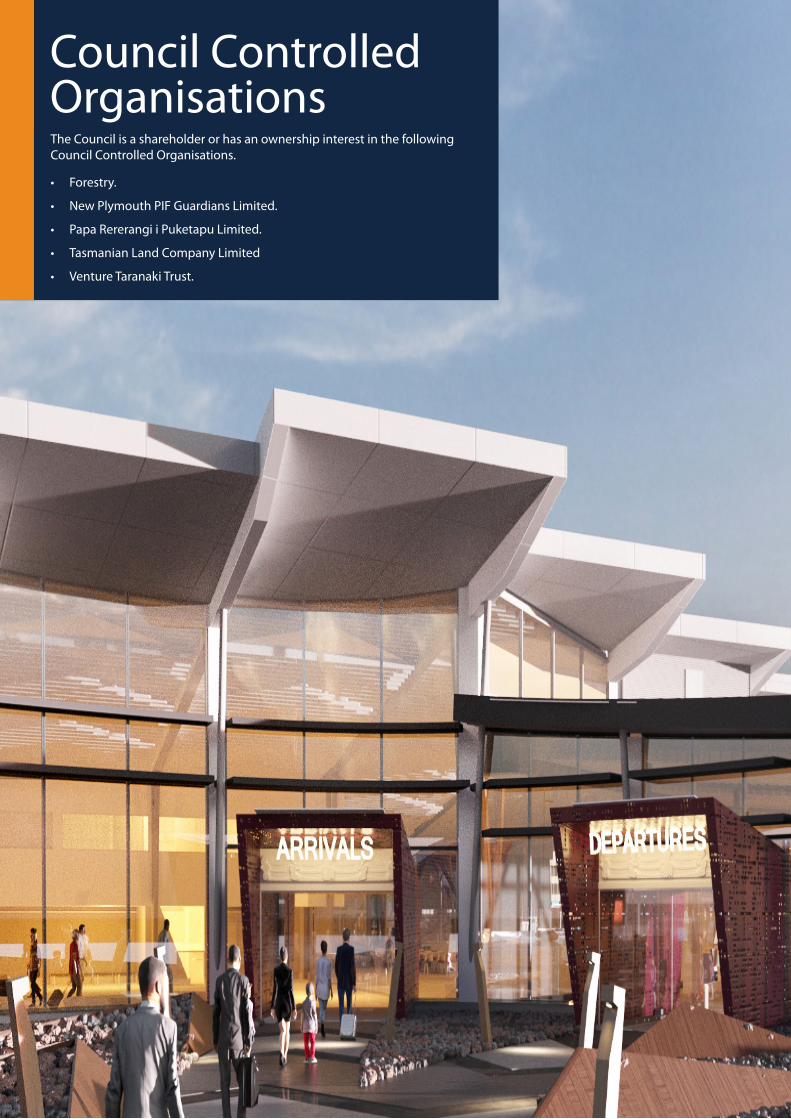
COUNCIL CONTROLLED ORGANISATIONS I ANNUAL REPORT 2020/21 135
Council-controlled Organisations
Council Controlled OrganisationsThe Council is a shareholder or has an ownership interest in the following Council Controlled Organisations.
• Forestry.
• New Plymouth PIF Guardians Limited.
• Papa Rererangi i Puketapu Limited.
• Tasmanian Land Company Limited
• Venture Taranaki Trust.
136 ANNUAL REPORT 2020/21 I COUNCIL CONTROLLED ORGANISATIONS
SUMMARY OF 2020/21 STATEMENT OF INTENTThe Council has two joint venture forestry developments that have varying levels of Council ownership (55 to 57 per cent) and are therefore deemed to be Council Controlled Organisations (CCOs). For convenience they are covered by one combined statement of intent. The woodlots complement the harvest regime of the Council’s own forestry investment activities.
Forest plantations have been established under the following agreements:
• McKay Family Joint Venture (56.5 per cent) - 74.2 hectares.
• Duthie Joint Venture (54.8 per cent) - 21.2 hectares.
During the year, a total of 95.3 hectares of forests (including Tarata Ngatimaru Pukehou) were managed under joint venture agreements in which the landowner provides land and property related inputs. The Council provides management and tending programmes for the crop, and both parties share the returns from the forest harvest on an agreed ratio of respective inputs.
The Council’s longer term objective for these investments is to review its involvement after each joint venture is harvested.
PERFORMANCE RESULTS FOR 2020/21Complete all programmes outlined in the Forest Management Plans and Agreements.
Assessment: All programmes outlined in the Forest Management Plan for 2020/21 have been completed.
Report annually in compliance with agreements.
Assessment: The joint venture forests have been valued by PF Olsen Limited with reports sent to the owners annually.
SIGNIFICANT POLICIES AND OBJECTIVES ON OWNERSHIP AND CONTROLThese joint ventures were originally set up to augment the harvest rotation for Council-owned forestry. The Council will retain the joint ventures to harvest and then review its future position. There are no formal board structures.
FINANCIAL PLAN
Actual2020/21
$’000
Budget 2020/21
$’000
Projected 2021/22
$’000
Projected 2022/23
$’000
Operating expenditure (NPDC funded) 13 14 14 16
Forestry
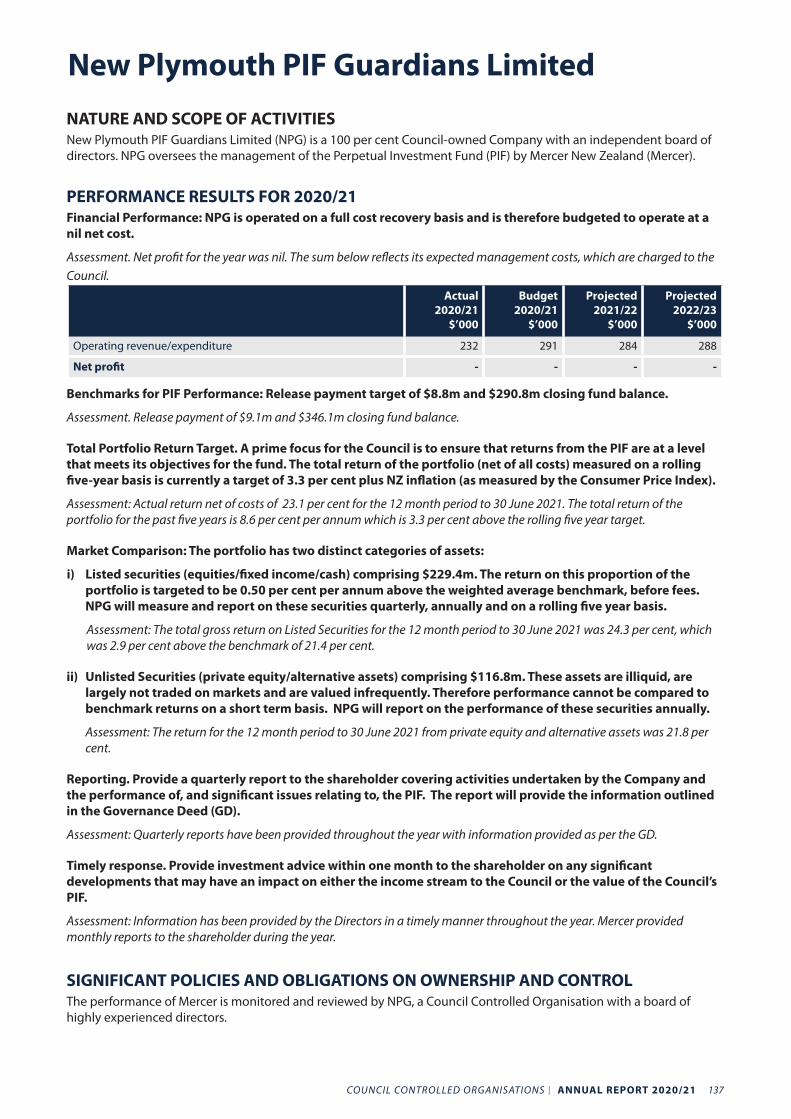
COUNCIL CONTROLLED ORGANISATIONS I ANNUAL REPORT 2020/21 137
NATURE AND SCOPE OF ACTIVITIESNew Plymouth PIF Guardians Limited (NPG) is a 100 per cent Council-owned Company with an independent board of directors. NPG oversees the management of the Perpetual Investment Fund (PIF) by Mercer New Zealand (Mercer).
PERFORMANCE RESULTS FOR 2020/21Financial Performance: NPG is operated on a full cost recovery basis and is therefore budgeted to operate at a nil net cost.
Assessment. Net profit for the year was nil. The sum below reflects its expected management costs, which are charged to the Council.
Actual2020/21
$’000
Budget 2020/21
$’000
Projected 2021/22
$’000
Projected 2022/23
$’000
Operating revenue/expenditure 232 291 284 288
Net profit - - - -
Benchmarks for PIF Performance: Release payment target of $8.8m and $290.8m closing fund balance.
Assessment. Release payment of $9.1m and $346.1m closing fund balance.
Total Portfolio Return Target. A prime focus for the Council is to ensure that returns from the PIF are at a level that meets its objectives for the fund. The total return of the portfolio (net of all costs) measured on a rolling five-year basis is currently a target of 3.3 per cent plus NZ inflation (as measured by the Consumer Price Index).
Assessment: Actual return net of costs of 23.1 per cent for the 12 month period to 30 June 2021. The total return of the portfolio for the past five years is 8.6 per cent per annum which is 3.3 per cent above the rolling five year target.
Market Comparison: The portfolio has two distinct categories of assets:
i) Listed securities (equities/fixed income/cash) comprising $229.4m. The return on this proportion of the portfolio is targeted to be 0.50 per cent per annum above the weighted average benchmark, before fees. NPG will measure and report on these securities quarterly, annually and on a rolling five year basis.
Assessment: The total gross return on Listed Securities for the 12 month period to 30 June 2021 was 24.3 per cent, which was 2.9 per cent above the benchmark of 21.4 per cent.
ii) Unlisted Securities (private equity/alternative assets) comprising $116.8m. These assets are illiquid, are largely not traded on markets and are valued infrequently. Therefore performance cannot be compared to benchmark returns on a short term basis. NPG will report on the performance of these securities annually.
Assessment: The return for the 12 month period to 30 June 2021 from private equity and alternative assets was 21.8 per cent.
Reporting. Provide a quarterly report to the shareholder covering activities undertaken by the Company and the performance of, and significant issues relating to, the PIF. The report will provide the information outlined in the Governance Deed (GD).
Assessment: Quarterly reports have been provided throughout the year with information provided as per the GD.
Timely response. Provide investment advice within one month to the shareholder on any significant developments that may have an impact on either the income stream to the Council or the value of the Council’s PIF.
Assessment: Information has been provided by the Directors in a timely manner throughout the year. Mercer provided monthly reports to the shareholder during the year.
SIGNIFICANT POLICIES AND OBLIGATIONS ON OWNERSHIP AND CONTROLThe performance of Mercer is monitored and reviewed by NPG, a Council Controlled Organisation with a board of highly experienced directors.
New Plymouth PIF Guardians Limited
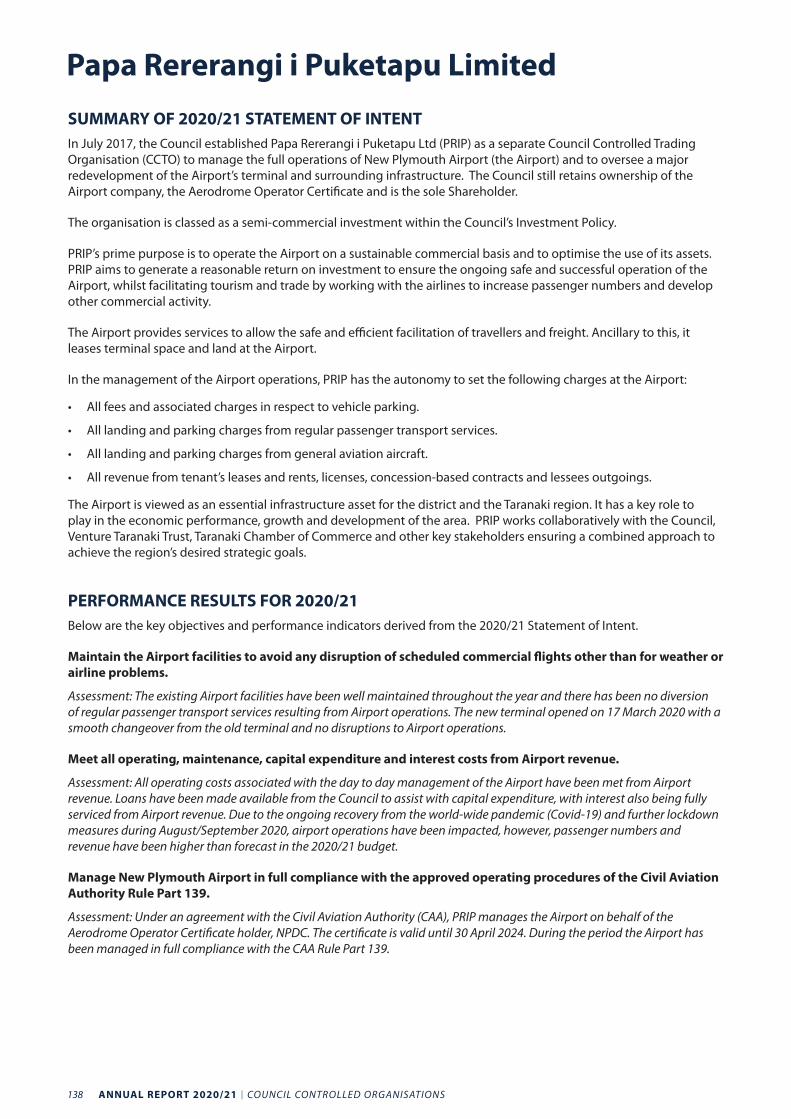
138 ANNUAL REPORT 2020/21 I COUNCIL CONTROLLED ORGANISATIONS
SUMMARY OF 2020/21 STATEMENT OF INTENTIn July 2017, the Council established Papa Rererangi i Puketapu Ltd (PRIP) as a separate Council Controlled Trading Organisation (CCTO) to manage the full operations of New Plymouth Airport (the Airport) and to oversee a major redevelopment of the Airport’s terminal and surrounding infrastructure. The Council still retains ownership of the Airport company, the Aerodrome Operator Certificate and is the sole Shareholder.
The organisation is classed as a semi-commercial investment within the Council’s Investment Policy.
PRIP’s prime purpose is to operate the Airport on a sustainable commercial basis and to optimise the use of its assets. PRIP aims to generate a reasonable return on investment to ensure the ongoing safe and successful operation of the Airport, whilst facilitating tourism and trade by working with the airlines to increase passenger numbers and develop other commercial activity.
The Airport provides services to allow the safe and efficient facilitation of travellers and freight. Ancillary to this, it leases terminal space and land at the Airport.
In the management of the Airport operations, PRIP has the autonomy to set the following charges at the Airport:
• All fees and associated charges in respect to vehicle parking.
• All landing and parking charges from regular passenger transport services.
• All landing and parking charges from general aviation aircraft.
• All revenue from tenant’s leases and rents, licenses, concession-based contracts and lessees outgoings.
The Airport is viewed as an essential infrastructure asset for the district and the Taranaki region. It has a key role to play in the economic performance, growth and development of the area. PRIP works collaboratively with the Council, Venture Taranaki Trust, Taranaki Chamber of Commerce and other key stakeholders ensuring a combined approach to achieve the region’s desired strategic goals.
PERFORMANCE RESULTS FOR 2020/21Below are the key objectives and performance indicators derived from the 2020/21 Statement of Intent.
Maintain the Airport facilities to avoid any disruption of scheduled commercial flights other than for weather or airline problems.
Assessment: The existing Airport facilities have been well maintained throughout the year and there has been no diversion of regular passenger transport services resulting from Airport operations. The new terminal opened on 17 March 2020 with a smooth changeover from the old terminal and no disruptions to Airport operations.
Meet all operating, maintenance, capital expenditure and interest costs from Airport revenue.
Assessment: All operating costs associated with the day to day management of the Airport have been met from Airport revenue. Loans have been made available from the Council to assist with capital expenditure, with interest also being fully serviced from Airport revenue. Due to the ongoing recovery from the world-wide pandemic (Covid-19) and further lockdown measures during August/September 2020, airport operations have been impacted, however, passenger numbers and revenue have been higher than forecast in the 2020/21 budget.
Manage New Plymouth Airport in full compliance with the approved operating procedures of the Civil Aviation Authority Rule Part 139.
Assessment: Under an agreement with the Civil Aviation Authority (CAA), PRIP manages the Airport on behalf of the Aerodrome Operator Certificate holder, NPDC. The certificate is valid until 30 April 2024. During the period the Airport has been managed in full compliance with the CAA Rule Part 139.
Papa Rererangi i Puketapu Limited
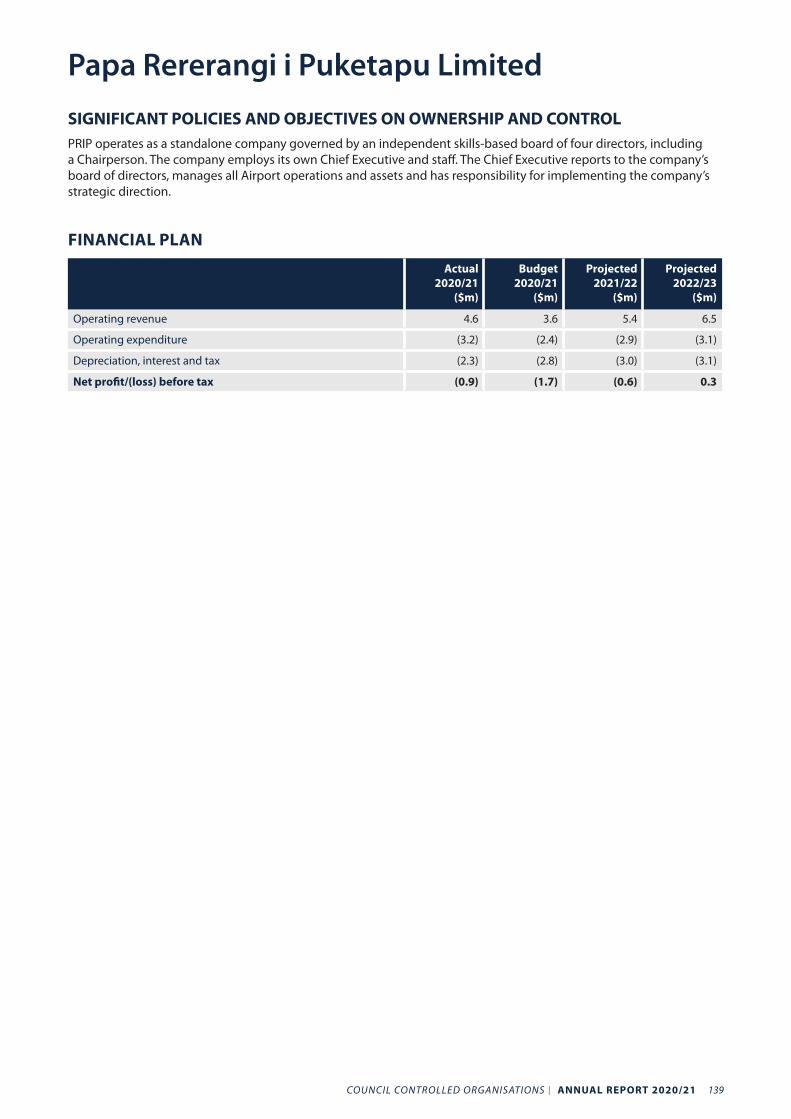
COUNCIL CONTROLLED ORGANISATIONS I ANNUAL REPORT 2020/21 139
SIGNIFICANT POLICIES AND OBJECTIVES ON OWNERSHIP AND CONTROLPRIP operates as a standalone company governed by an independent skills-based board of four directors, including a Chairperson. The company employs its own Chief Executive and staff. The Chief Executive reports to the company’s board of directors, manages all Airport operations and assets and has responsibility for implementing the company’s strategic direction.
FINANCIAL PLAN
Actual2020/21
($m)
Budget 2020/21
($m)
Projected 2021/22
($m)
Projected 2022/23
($m)
Operating revenue 4.6 3.6 5.4 6.5
Operating expenditure (3.2) (2.4) (2.9) (3.1)
Depreciation, interest and tax (2.3) (2.8) (3.0) (3.1)
Net profit/(loss) before tax (0.9) (1.7) (0.6) 0.3
Papa Rererangi i Puketapu Limited
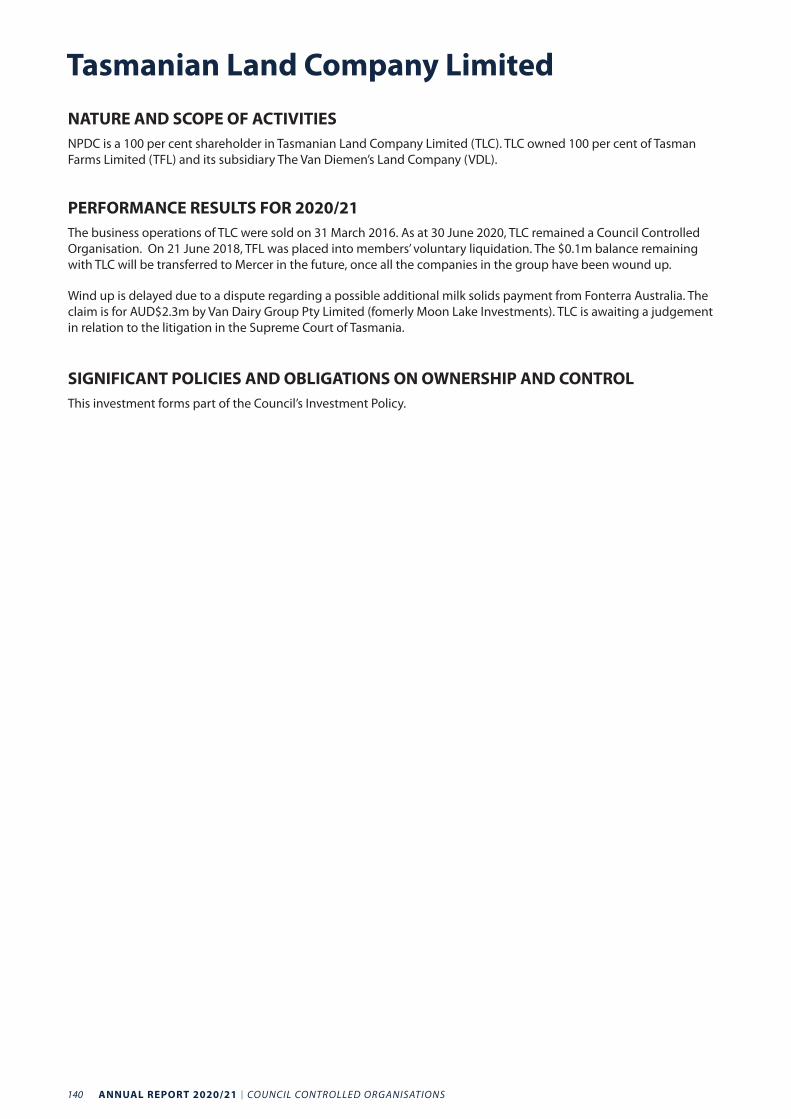
140 ANNUAL REPORT 2020/21 I COUNCIL CONTROLLED ORGANISATIONS
NATURE AND SCOPE OF ACTIVITIESNPDC is a 100 per cent shareholder in Tasmanian Land Company Limited (TLC). TLC owned 100 per cent of Tasman Farms Limited (TFL) and its subsidiary The Van Diemen’s Land Company (VDL).
PERFORMANCE RESULTS FOR 2020/21The business operations of TLC were sold on 31 March 2016. As at 30 June 2020, TLC remained a Council Controlled Organisation. On 21 June 2018, TFL was placed into members’ voluntary liquidation. The $0.1m balance remaining with TLC will be transferred to Mercer in the future, once all the companies in the group have been wound up.
Wind up is delayed due to a dispute regarding a possible additional milk solids payment from Fonterra Australia. The claim is for AUD$2.3m by Van Dairy Group Pty Limited (fomerly Moon Lake Investments). TLC is awaiting a judgement in relation to the litigation in the Supreme Court of Tasmania.
SIGNIFICANT POLICIES AND OBLIGATIONS ON OWNERSHIP AND CONTROLThis investment forms part of the Council’s Investment Policy.
Tasmanian Land Company Limited
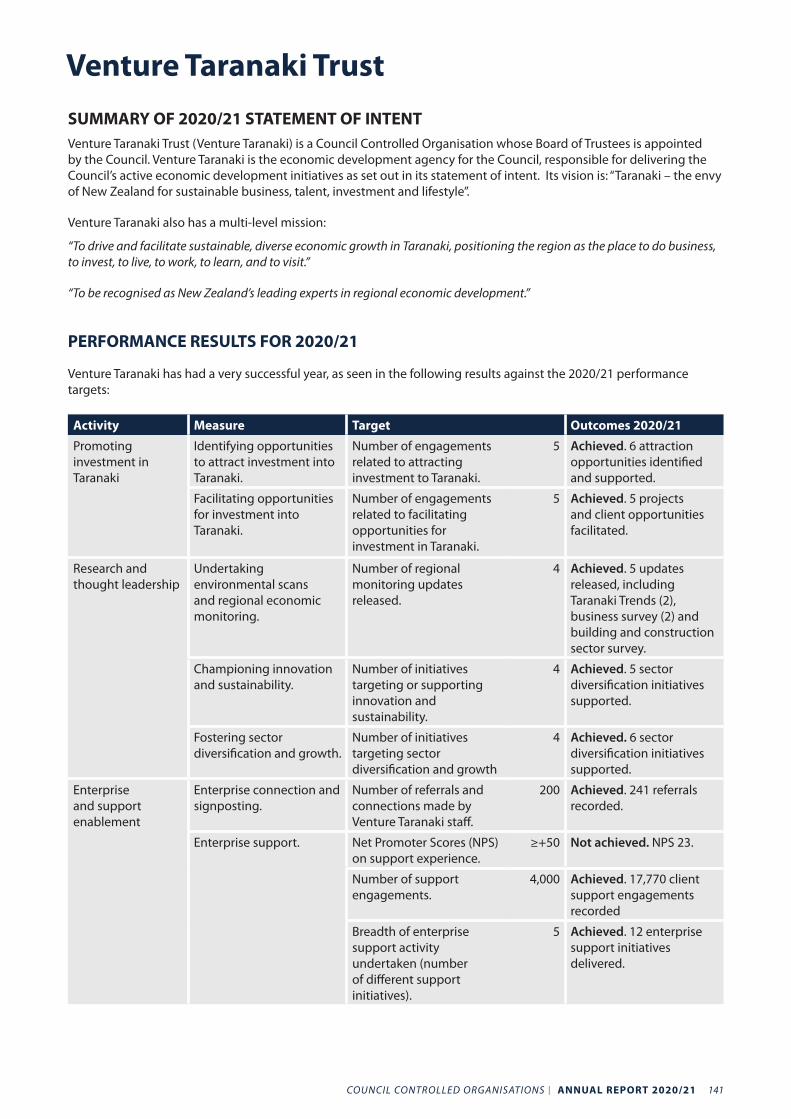
COUNCIL CONTROLLED ORGANISATIONS I ANNUAL REPORT 2020/21 141
Venture Taranaki TrustSUMMARY OF 2020/21 STATEMENT OF INTENTVenture Taranaki Trust (Venture Taranaki) is a Council Controlled Organisation whose Board of Trustees is appointed by the Council. Venture Taranaki is the economic development agency for the Council, responsible for delivering the Council’s active economic development initiatives as set out in its statement of intent. Its vision is: “Taranaki – the envy of New Zealand for sustainable business, talent, investment and lifestyle”.
Venture Taranaki also has a multi-level mission:
“To drive and facilitate sustainable, diverse economic growth in Taranaki, positioning the region as the place to do business, to invest, to live, to work, to learn, and to visit.”
“To be recognised as New Zealand’s leading experts in regional economic development.”
PERFORMANCE RESULTS FOR 2020/21
Venture Taranaki has had a very successful year, as seen in the following results against the 2020/21 performance targets:
Activity Measure Target Outcomes 2020/21
Promoting investment in Taranaki
Identifying opportunities to attract investment into Taranaki.
Number of engagements related to attracting investment to Taranaki.
5 Achieved. 6 attraction opportunities identified and supported.
Facilitating opportunities for investment into Taranaki.
Number of engagements related to facilitating opportunities for investment in Taranaki.
5 Achieved. 5 projects and client opportunities facilitated.
Research and thought leadership
Undertaking environmental scans and regional economic monitoring.
Number of regional monitoring updates released.
4 Achieved. 5 updates released, including Taranaki Trends (2), business survey (2) and building and construction sector survey.
Championing innovation and sustainability.
Number of initiatives targeting or supporting innovation and sustainability.
4 Achieved. 5 sector diversification initiatives supported.
Fostering sector diversification and growth.
Number of initiatives targeting sector diversification and growth
4 Achieved. 6 sector diversification initiatives supported.
Enterprise and support enablement
Enterprise connection and signposting.
Number of referrals and connections made by Venture Taranaki staff.
200 Achieved. 241 referrals recorded.
Enterprise support. Net Promoter Scores (NPS) on support experience.
≥+50 Not achieved. NPS 23.
Number of support engagements.
4,000 Achieved. 17,770 client support engagements recorded
Breadth of enterprise support activity undertaken (number of different support initiatives).
5 Achieved. 12 enterprise support initiatives delivered.
142 ANNUAL REPORT 2020/21 I COUNCIL CONTROLLED ORGANISATIONS
Activity Measure Target Outcomes 2020/21
Enterprise and support enablement (continued)
Enterprise support (continued).
Number of engagements related to the development and implementation of a regional events strategy.
25 Achieved. 98 engagements recorded. This project was completed during the year.
Number of major events funded in accordance with the criteria of NPDC’s major events fund.
4 Achieved. 16 events (meeting NPDC criteria) attracted or retained.
Number of destination promotion campaigns.
2 Achieved. 12 campaigns delivered.
Number of engagements with visitor industry operators (including local operators, other regional tour organisations, national and international tourism agencies).
100 Achieved. 3,294 visitor industry engagements recorded.
Number of talent initiatives.
2 Achieved. 13 talent initiatives delivered.
SIGNIFICANT POLICIES AND OBJECTIVES ON OWNERSHIP AND CONTROLThe Council controls the Venture Taranaki Trust by appointing its trustees. This is to ensure the necessary independence, public credibility and specialised governance that the Trust needs in order to be effective in delivering economic development programmes, while retaining accountability to the district’s community.
FINANCIAL PLAN
Actual2020/21
($m)
Budget 2020/21
($m)
Projected 2021/22
($m)
Projected 2022/23
($m)
Operating expenditure (NPDC funded) 3.5 3.4 3.4 3.5
Venture Taranaki Trust
AUDIT REPORT I ANNUAL REPORT 2020/21 143
Auditor’s Report
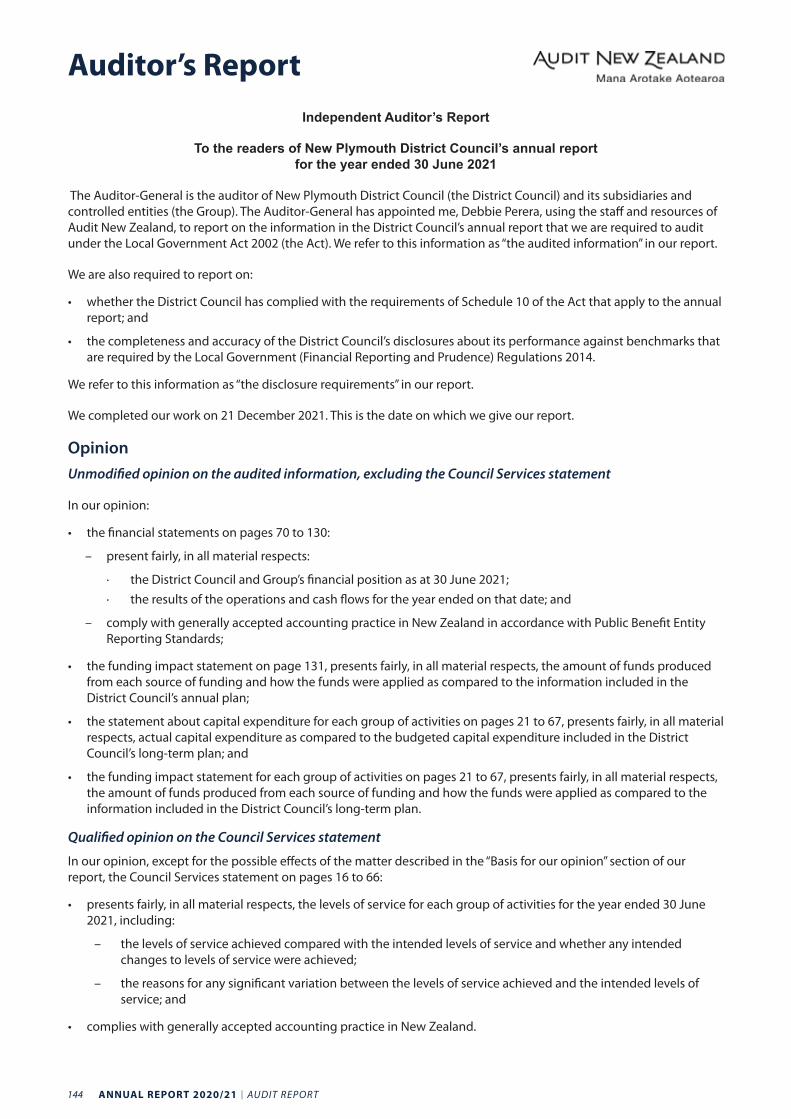
144 ANNUAL REPORT 2020/21 I AUDIT REPORT
Independent Auditor’s Report
To the readers of New Plymouth District Council’s annual report for the year ended 30 June 2021
The Auditor-General is the auditor of New Plymouth District Council (the District Council) and its subsidiaries and controlled entities (the Group). The Auditor-General has appointed me, Debbie Perera, using the staff and resources of Audit New Zealand, to report on the information in the District Council’s annual report that we are required to audit under the Local Government Act 2002 (the Act). We refer to this information as “the audited information” in our report.
We are also required to report on:
• whether the District Council has complied with the requirements of Schedule 10 of the Act that apply to the annual report; and
• the completeness and accuracy of the District Council’s disclosures about its performance against benchmarks that are required by the Local Government (Financial Reporting and Prudence) Regulations 2014.
We refer to this information as “the disclosure requirements” in our report.
We completed our work on 21 December 2021. This is the date on which we give our report.
OpinionUnmodified opinion on the audited information, excluding the Council Services statement
In our opinion:
• the financial statements on pages 70 to 130:
– present fairly, in all material respects:
· the District Council and Group’s financial position as at 30 June 2021; · the results of the operations and cash flows for the year ended on that date; and
– comply with generally accepted accounting practice in New Zealand in accordance with Public Benefit Entity Reporting Standards;
• the funding impact statement on page 131, presents fairly, in all material respects, the amount of funds produced from each source of funding and how the funds were applied as compared to the information included in the District Council’s annual plan;
• the statement about capital expenditure for each group of activities on pages 21 to 67, presents fairly, in all material respects, actual capital expenditure as compared to the budgeted capital expenditure included in the District Council’s long-term plan; and
• the funding impact statement for each group of activities on pages 21 to 67, presents fairly, in all material respects, the amount of funds produced from each source of funding and how the funds were applied as compared to the information included in the District Council’s long-term plan.
Qualified opinion on the Council Services statement
In our opinion, except for the possible effects of the matter described in the “Basis for our opinion” section of our report, the Council Services statement on pages 16 to 66:
• presents fairly, in all material respects, the levels of service for each group of activities for the year ended 30 June 2021, including:
– the levels of service achieved compared with the intended levels of service and whether any intended changes to levels of service were achieved;
– the reasons for any significant variation between the levels of service achieved and the intended levels of service; and
• complies with generally accepted accounting practice in New Zealand.
Auditor’s Report
AUDIT REPORT I ANNUAL REPORT 2020/21 145
Report on the disclosure requirements We report that the District Council has:
• complied with the requirements of Schedule 10 of the Act that apply to the annual report; and
• made the disclosures about performance against benchmarks as required by the Local Government (Financial Reporting and Prudence Regulations 2014) on pages 132 to 134, which represent a complete list of required disclosures and accurately reflects the information drawn from the District Council’s audited information and, where applicable, the District Council’s long-term plan and annual plans.
Basis for our opinion on the audited informationOur work was limited in the prior year with respect to the verification of the number of complaints for some services
The District Council is required to report against the performance measures set out in the Non-Financial Performance Measure Rules 2013 (the Rules) made by the Secretary for Local Government. These mandatory performance measures include the total number of complaints (per 1,000 connections) received about the following:
• drinking water clarity, taste, odour, pressure or flow, continuity of supply, and the District Council’s response to any of these issues.
• sewage odour, sewerage system faults or blockages, and the District Council’s response to issues with the sewerage system.
• the performance of the stormwater system.
These measures are important because the number of complaints is indicative of the quality of services received by ratepayers.
The Department of Internal Affairs has issued guidance to assist local authorities in applying the Rules, including on how to count complaints. Our audit testing in the prior year found that the District Council had not been counting complaints in accordance with this guidance and that the District Council’s method of counting was likely to have understated the actual number of complaints received in the comparative year to 30 June 2020. Complete records for all complaints made to the District Council were not available in the prior year and we were unable to determine whether the District Council’s reported results for these performance measures were materially correct in the comparative year only.
As a result, our work was limited and there were no practicable audit procedures we could apply to obtain assurance over the number of complaints reported against these three performance measures for in the prior year. Our audit opinion on the Council Services statement for the year ended 30 June 2020 was modified accordingly.
This issue has been resolved for the 30 June 2021 year. As the limitation cannot be resolved for the 30 June 2020 year, the District Council’s performance information reported for these performance measures for the 30 June 2021 year may not be directly comparable to the 30 June 2020 performance information.
We carried out our audit in accordance with the Auditor-General’s Auditing Standards, which incorporate the Professional and Ethical Standards and the International Standards on Auditing (New Zealand) issued by the New Zealand Auditing and Assurance Standards Board. We describe our responsibilities under those standards further in the “Responsibilities of the auditor for the audited information” section of this report.
We have fulfilled our responsibilities in accordance with the Auditor-General’s Auditing Standards.
We believe that the audit evidence we have obtained is sufficient and appropriate to provide a basis for our opinion on the audited information.
Emphasis of matter – The Government’s three waters reform programme announcementWithout further modifying our opinion, we draw attention to note 28 on page 130, which outlines that subsequent to year-end, the Government announced it will introduce legislation to establish four publicly owned water services entities to take over responsibilities for service delivery and infrastructure from local authorities from 1 July 2024. The impact of these reforms, once legislated, will mean that the District Council will no longer deliver three waters services.
Auditor’s Report
146 ANNUAL REPORT 2020/21 I AUDIT REPORT
Responsibilities of the Council for the audited informationThe Council is responsible for meeting all legal requirements that apply to its annual report.
The Council’s responsibilities arise under the Local Government Act 2002 and the Local Government (Financial Reporting and Prudence) Regulations 2014.
The Council is responsible for such internal control as it determines is necessary to enable it to prepare the information we audit that is free from material misstatement, whether due to fraud or error.
In preparing the information we audit the Council is responsible for assessing its ability to continue as a going concern. The Council is also responsible for disclosing, as applicable, matters related to going concern and using the going concern basis of accounting, unless there is an intention to amalgamate or cease all of the functions of the District Council and the Group or there is no realistic alternative but to do so.
Responsibilities of the auditor for the audited informationOur objectives are to obtain reasonable assurance about whether the audited information, as a whole, is free from material misstatement, whether due to fraud or error, and to issue an audit report that includes our opinion.
Reasonable assurance is a high level of assurance, but is not a guarantee that an audit carried out in accordance with the Auditor-General’s Auditing Standards will always detect a material misstatement when it exists. Misstatements are differences or omissions of amounts or disclosures, and can arise from fraud or error. Misstatements are considered material if, individually or in the aggregate, they could reasonably be expected to influence the decisions of readers taken on the basis of this audited information.
For the budget information reported in the audited information, our procedures were limited to checking that the budget information agreed to the District Council’s annual plan.
We did not evaluate the security and controls over the electronic publication of the audited information.
As part of an audit in accordance with the Auditor-General’s Auditing Standards, we exercise professional judgement and maintain professional scepticism throughout the audit. Also:
• We identify and assess the risks of material misstatement of the audited information, whether due to fraud or error, design and perform audit procedures responsive to those risks, and obtain audit evidence that is sufficient and appropriate to provide a basis for our opinion. The risk of not detecting a material misstatement resulting from fraud is higher than for one resulting from error, as fraud may involve collusion, forgery, intentional omissions, misrepresentations, or the override of internal control.
• We obtain an understanding of internal control relevant to the audit in order to design audit procedures that are appropriate in the circumstances, but not for the purpose of expressing an opinion on the effectiveness of the District Council and Group’s internal control.
• We evaluate the appropriateness of accounting policies used and the reasonableness of accounting estimates and related disclosures made by the Council.
• We determine the appropriateness of the reported intended levels of service in the Council Services statement, as a reasonable basis for assessing the levels of service achieved and reported by the District Council.
• We conclude on the appropriateness of the use of the going concern basis of accounting by the Council and, based on the audit evidence obtained, whether a material uncertainty exists related to events or conditions that may cast a significant doubt on the District Council and Group’s ability to continue as a going concern. If we conclude that a material uncertainty exists, we are required to draw attention in our audit report to the related disclosures in the audited information or, if such disclosures are inadequate, to modify our opinion. Our conclusions are based on the audit evidence obtained up to the date of our audit report. However, future events or conditions may cause the District Council and the Group to cease to continue as a going concern.
• We evaluate the overall presentation, structure and content of the audited information, including the disclosures, and whether the audited information represents, where applicable, the underlying transactions and events in a manner that achieves fair presentation.
• We obtain sufficient appropriate audit evidence regarding the entities or business activities within the Group to express an opinion on the consolidated audited information.
Auditor’s Report
AUDIT REPORT I ANNUAL REPORT 2020/21 147
We communicate with the Council regarding, among other matters, the planned scope and timing of the audit and significant audit findings, including any significant deficiencies in internal control that we identify during our audit.
Other InformationThe Council is responsible for the other information included in the annual report. The other information comprises the information included on pages 1 to 14 but does not include the audited information and the disclosure requirements.
Our opinion on the audited information and our report on the disclosure requirements do not cover the other information.
Our responsibility is to read the other information. In doing so, we consider whether the other information is materially inconsistent with the audited information and the disclosure requirements, or our knowledge obtained during our work, or otherwise appears to be materially misstated. If, based on our work, we conclude that there is a material misstatement of this other information, we are required to report that fact. We have nothing to report in this regard.
IndependenceWe are independent of the District Council and Group in accordance with the independence requirements of the Auditor-General’s Auditing Standards, which incorporate the independence requirements of Professional and Ethical Standard 1: International Code of Ethics for Assurance Practitioners issued by the New Zealand Auditing and Assurance Standards Board.
In addition to our audit and our report on the disclosure requirements, we have audited the District Council’s 2021-2031 long-term plan and performed a limited assurance engagement related to the District Council’s debenture trust deed. These engagements are compatible with those independence requirements.
Other than these engagements, we have no relationship with or interests in the District Council or its subsidiaries and controlled entities.
Debbie PereraAudit New ZealandOn behalf of the Auditor-GeneralPalmerston North, New Zealand
Auditor’s Report
148 ANNUAL REPORT 2020/21 I AUDIT REPORT
Statement of Compliance and Responsibility
The Council and management of New Plymouth District Council confirm that all statutory requirements of the Local Government Act 2002 in relation to the Annual Report have been complied with.
RESPONSIBILITY
The Council and management of New Plymouth District Council accept responsibility for the preparation of the annual financial statements and the judgements used in them.
The Council and management of New Plymouth District Council accept responsibility for establishing and maintaining a system of internal control designed to provide reasonable assurance as to the integrity and reliability of financial reporting.
In the opinion of the Council and the management of New Plymouth District Council, the annual financial statements for the year ended 30 June 2021 fairly reflect the financial position, operations and service performance of New Plymouth District Council.
Neil Holdom Craig StevensonMayor Chief Executive

AUDIT REPORT I ANNUAL REPORT 2020/21 149

150 ANNUAL REPORT 2020/21 I AUDIT REPORT
Contact NPDC P: 06-759 6060 E: [email protected]
NewPlymouthDistrictCouncil @NPDCouncil More information: npdc.govt.nz


