Embed Size (px)
Citation preview
District Level Household and Facility Survey
2007-08
Madhya Pradesh
2010
Ministry of Health and Family Welfare New Delhi-110011
International Institute for Population Sciences (Deemed University)
Mumbai-400088
Suggested citation:- International Institute for Population Sciences (IIPS), 2010.
District Level Household and Facility Survey (DLHS-3), 2007-08: India. Madhya Pradesh: Mumbai: IIPS.
For additional information, please contact: Director/Project Coordinator (DLHS-3) International Institute for Population Sciences Govandi Station Road, Deonar Mumbai - 400 088 (India) Telephone: 022-2556 3254/5, 022-4237 2465, 42372411, 42372400 Fax: 022-25563257, 25555895 Email: [email protected], [email protected] Website: http://www.rchiips.org
http://www.iipsindia.org
Additional Director General (Stat.) Ministry of Health and Family Welfare Government of India Nirman Bhavan New Delhi 110 011 Telephone: 011 - 23061334 Fax: 011 - 23061334 Email: [email protected] Chief Director (Stat.) Ministry of Health and Family Welfare Government of India Nirman Bhavan New Delhi 110 011 Telephone: 011 - 23062699 Fax: 011 - 23062699 Email: [email protected] Website: http: //www.mohfw.nic.in
DLHS-3 Project Coordinators
F. Ram L. Ladusingh B. Paswan Sayeed Unisa Rajiva Prasad T.V. Sekher Chander Shekhar
Research Staff
Akash Wankhede, B.Amenla Nuken
Sumoni Mukherjee Namrata Mondal Rajesh Kr. Rai Prakash Malin S. Priyokumar Meitei Ranjan Kr. Prusty L. Priyananda Singh Mamta Erica Kharsyntiew Amrita Gupta Arpita Das Prakash C.D. Meher
IMPORTANT INSTRUCTIONS TO READERS:
This report is based on data collected from 51,419 households from Madhya Pradesh
during 2007-08. From these households, 46,634 ever-married women aged 15-49 years
and 9,940 unmarried women aged 15-24 years were interviewed. Most of the tables and
analysis presented in the report is based on ever-married women aged 15-49 years.
However, for the purpose of comparison with DLHS-2 (2002-04) and the Fact Sheet of
DLHS-3, we also provided some indicators based on currently married women aged
15-44 years in selected tables. We request the readers to keep this distinction in mind
while using and comparing the DLHS-3 indicators with other surveys.
For more information, visit DLHS website: http://www.rchiips.org.
CONTENTS
Page
Background and Objectives of the Survey…………………………………………….... 1
Survey Design, Sample Size and Design Weight…………………..…………………… 2
Implementation and Quality Control…………………..………………….……………. 4
Survey Instruments…..………………………………….……………………….……… 4
Household and Village Background...……………………………………………..……. 6
Characteristics of Women and Fertility…….…………………………………………… 8
Maternal Health Care…………………………………………………………………… 10
Child Health Care and Immunization…………………………………………………… 14
Family Planning and Contraceptive Use……………………………………….………. 17
Reproductive Health and Awareness of RTIs/STIs and HIV/AIDS…………….……… 22
Infertility and Childlessness………………………………………………………..…… 24
Family Life Education among Unmarried Women…………………….………….……. 25
Reproductive Health and Awareness of Contraceptives, RTIs/STIs and HIV/AIDS among Unmarried Women………………………………………………………..….…. 26
Health Facilities - Availability and Quality………………………………………...…… 28
TABLES
APPENDIX
Sampling Error for Selected Indicators…………………………………………..……... 183
viii
LIST OF TABLES PageTable 1.1 Number of households, ever married women & unmarried women interviewed………..……..…… 33
Table 1.2 Basic demographic indicators…………………………………………………………………..…… 35
Table 2.1 Household population by age and sex……………………………………………………..…..……. 39
Table 2.2 Marital status of the household population………………………………………………...…….….. 40
Table 2.3 Age at marriage……………………………………………………………………………....……… 41
Table 2.4 Educational level of the household population…………………………………………….…...…… 42
Table 2.5 Currently attending school………………………………………………………………................... 45
Table 2.6 Reasons for dropping out of school……………………………………………………….…..…….. 45
Table 2.7 Household characteristics………………………………………………………………….…..……. 46
Table 2.8 Housing characteristics and assets…………………………………………………………...…….... 47
Table 2.9 Housing characteristics by districts………………………………………………………................. 48
Table 2.10 Distance from the nearest educational facility……………………………………………..……….. 49
Table 2.11 Distance from the nearest health facility……………………………………………………..……... 49
Table 2.12 Availability of facility and health personnel by districts…………………………………..……..…. 50
Table 2.13 Knowledge about government health programmes…………………………………………...……... 51
Table 3.1 Background characteristics of ever married women………………………………………..……….. 55
Table 3.2 Level of education of ever married women……………………………………...........…………….. 56
Table 3.3 Birth order…………………………………………………………………………………..……….. 57
Table 3.4 Birth order distribution by districts……………………………………………………...…............... 58
Table 3.5 Children ever born………………………………………………………………………......….…..... 59
Table 3.6 Fertility preferences………………………………………………………………………...………... 60
Table 3.7 Outcomes of pregnancy …………………………………………………………………..….……… 61
Table 3.8 Outcome of pregnancy by districts …………………………………………………………..……... 62
Table 4.1 Place of antenatal check-up…………………………………………………………………...……... 65
Table 4.2 Place of antenatal care by districts…………………………………………………………...……… 66
Table 4.3 Components of antenatal check-up………………………………………………………..…..…….. 67
Table 4.4 Women received advice during antenatal care……………………………………..……....………... 68
Table 4.5 (A) Antenatal care: ANC visits and time of first ANC check-up……………………….........…….……. 69
Table 4.5 (B) Antenatal care: TT, IFA and ANC……………………………………………………..…….……… 70
Table 4.6 Antenatal care indicators and complications by districts……………………………....……………. 71
Table 4.7 Place of delivery and assistance ……………….................................................................................. 72
Table 4.8 Mode of transportation used for delivery and arrangement of transportation…………..…. ………. 73
Table 4.9 Place of delivery and assistance characteristics by districts…………………………………...……. 74
Table 4.10 Reasons for not going to health institutions for delivery…………………………....……................. 75
Table 4.11 Delivery complications…………………………………………………………………...…..……… 76
Table 4.12 Post delivery complications……………………………………………………………...…..………. 77
Table 4.13 Any check-up after delivery …………………………………………………………....…………… 78 2
ix
LIST OF TABLES Page
Table 4.14 Complications during pregnancy, delivery and post delivery period ………….………….……….... 79
Table 4.15 Complications during pregnancy, delivery and post delivery period by districts………….……..…. 80
Table 4.16 Knowledge of danger sign of new born……………………………………………………..…..…… 81
Table 5.1 Timing and place of early childhood check-up by background characteristics………….……..…..... 85
Table 5.2 Initiation of breastfeeding by background characteristics …………………………..………............. 86
Table 5.3 Breastfeeding and weaning status by children’s age……………………………………………..….. 87
Table 5.4 Exclusive breastfeeding by background characteristics………………………………………..……. 88
Table 5.5 Breastfeeding by districts……………………………………………………………………..……… 89
Table 5.6 Vaccination of children by background characteristics …………………………............................... 90
Table 5.7 Childhood vaccination by districts……………………………………………………………..…….. 91
Table 5.8 Place of childhood vaccination by background characteristics ………………………………............ 92
Table 5.9 Vitamin A and hepatitis-B supplementation for children by background characteristics ………..…. 93
Table 5.10 Knowledge regarding diarrhoea management by background characteristics ……………….........… 94
Table 5.11 Treatment of diarrhoea by background characteristics …………………………………………..….. 95
Table 5.12 Knowledge and treatment of acute respiratory infection (ARI) by background characteristics …..… 96
Table 5.13 Knowledge of ORS and acute respiratory infection (ARI) by districts…………………..………..… 97
Table 6.1 Awareness of contraceptive methods by place of residence...……………………………………..… 101
Table 6.2 Awareness of contraceptive methods by background characteristics…………………………..……. 102
Table 6.3 Awareness of contraceptive methods by districts………………………………………………..…... 103
Table 6.4 Ever use of contraceptive methods………………………………………………………..……..…... 105
Table 6.5 (A) Current use of contraceptive methods……………………………………………………..….…..….. 106
Table 6.5 (B) Duration of use of spacing methods…………………………………………………….…….….….. 108
Table 6.6 Age at the time of sterilization…………………………………………………………………..…… 109
Table 6.7 Contraceptive prevalence rate by districts………………………………………………………..….. 110
Table 6.8 Sources of modern contraceptive methods………………………………………………………..…. 111
Table 6.9 Cash benefits received after sterilization………………………………………………….……..…... 112
Table 6.10 Health problems with current use of contraception and treatment received……………………...….. 113
Table 6.11 Reasons for discontinuation of contraception……………………………………………..………..... 114
Table 6.12 Future intention to use……………………………………………………………………………..…. 115
Table 6.13 Advice on contraceptive use…………………………………………………………….………..….. 116
Table 6.14 Reasons for not using modern contraceptive method among rhythm and withdrawal method users………………………………………………………..…………………………….......……..… 117
Table 6.15 Unmet need for family planning services…………………………………………………………..... 118
Table 6.16 Unmet need for family planning services by districts………………………………….………..…… 119
Table 7.1 Menstruation related problems by background characteristics……………………............................. 123
Table 7.2 Source of knowledge about RTI/STI by background characteristics …………………………........... 125
Table 7.3 Knowledge of mode of transmission of RTI/STI by background characteristics ……………..…….. 127
Table 7.4 Symptoms of RTI/STI by background characteristics …………………………………………......... 128
Table 7.5 Discussed about RTI/STI problems with husband and sought treatment by background characteristics …………………………............................................................................................... 130

x
LIST OF TABLES Page
Table 7.6 RTI/STI indicators by districts…………………………………………………………….………... 131
Table 7.7 Knowledge of HIV/AIDS by background characteristics ………………………….......................... 132
Table 7.8 Knowledge about mode of transmission of HIV/AIDS by background characteristics …………… 134
Table 7.9 Knowledge of HIV/AIDS prevention methods by background characteristics …………………..... 135
Table 7.10 Misconception about transmission of HIV/AIDS by background characteristics ……………......... 136
Table 7.11 Knowledge about the place where HIV/AIDS test can be done by background characteristics …... 137
Table 7.12 Undergone HIV/AIDS test by background characteristics ……………………………………….... 139
Table 7.13 HIV/AIDS indicators by districts……………………………………………………………….….. 140
Table 7.14 Ever had infertility problem by background characteristics ……………………………………...... 141
Table 7.15 Childlessness and infertility by background characteristics ……………………………………...... 142
Table 7.16 Treatment for infertility by background characteristics …………………………………………..... 143
Table 7.17 Infertility problem and sought treatment by districts…………………………….............………… 144
Table 8.1 Background characteristics of unmarried women………………………………………………….. 147
Table 8.2 At what age and standard family life education should be to given……………………………….. 148
Table 8.3 Sources of family life education………………………………………………………….………... 149
Table 8.4 Ever received family life education by sources……………………………………………………. 150
Table 8.5 Knowledge of legal age at marriage and reported ideal age at marriage for boys and girls ……… 151
Table 8.6 Current status of menstruation and experienced menstruation related problems during last three months and reported problems ………………………………………………………………….….. 152
Table 8.7 Practices during menstrual period……………………………………………………………….….. 153
Table 8.8 Knowledge of contraceptive methods………………………………………………………….…… 154
Table 8.9 Sources from where to get pill and condom…………………………………………………….….. 155
Table 8.10 Discussion about family planning method by source of information…………………….……..….. 156
Table 8.11 Knowledge of RTI and STI by sources…………………………………………………..…….…… 157
Table 8.12 Knowledge of RTI/STI transmission……………………………………………...............….…….. 158
Table 8.13 Knowledge of HIV/AIDS by sources…………………………………………………….….……... 159
Table 8.14 Knowledge of HIV/AIDS transmission………………………………………….............…….…… 160
Table 8.15 Misconception of HIV/AIDS ………………………………………………………………….…… 161
Table 8.16 Knowledge about how to avoid or reduce the chances of infecting HIV/AIDS…………………… 162
Table 8.17 Knowledge where to get tested for HIV/AIDS and sources…………………………………….….. 163
Table 8.18 Knowledge of some selected statements……………………………………………………….…… 164
Table 8.19 Awareness of Reproductive Health Issues…………………………………………………..……… 165
Table 9.1 Average population covered by health facility by districts ……………………………………….. 169
Table 9.2 Percentage of villages having Sub-Centre within villages & ANM available at Sub-Centre and staying in Sub-Centre quarter by districts …………………………..……………………………… 170
Table 9.3 Status of infrastructure at Sub-Centre functioning in government building by districts……........… 171
Table 9.4 Number of Sub-Centres having adequately equipped and essential drugs by districts ……….....… 172
Table 9.5 Number of Sub-Centres having different activities by districts.......................................................... 173
Table 9.6 Available human resources at Primary Health Centres by districts……. ………………………….. 174
xi
LIST OF TABLES Page
Table 9.7 Available infrastructures at Primary Health Centres by districts……………….………….…..…… 175
Table 9.8 Specific health facilities available at Primary Health Centres by districts ……………..…….……. 176
Table 9.9 Number of Primary Health Centres having different activities by districts…........................……… 177
Table 9.10 Human resources available at Community Health Centres by districts ……………………….…… 178
Table 9.11 Specific health care facilities available at Community Health Centres by districts ……..………… 179
Table 9.12 Number of Community Health Centres having different activities by districts …………....……… 180
LIST OF FIGURES
Figure 1 Proportion of households by wealth quintile………………………...............……….……….......…. 7 Figure 2 Age-sex pyramid………………………………………………………………………….….…..….. 7 Figure 3 Percentage literate by age and sex………..……………………………………………….…...…..… 8 Figure 4 Mean children ever-born by districts……………………………………………………..….…….… 9 Figure 5 Fertility preference of currently married women………………………………………....……....… 10 Figure 6 Any ANC by background characteristics………………………………………………....………..… 10 Figure 7 Progress in institutional delivery…………………………………………………………...…….….. 12 Figure 8 Change in full immunization coverage of children………………………………………...…...…… 15 Figure 9 Percent currently married women who currently using contraceptive methods……………......…… 18 Figure 10 Progress in contraceptive prevalence rate by any method………………………….......................…. 19 Figure 11 Progress in unmet need for contraception………………………………………………..……….…. 20 Figure 12 Contraceptive prevalence rate and unmet need by districts.………………………………...………. 21 Figure 13 Heard about RTIs/STIs by background characteristics………………………………………...…… 22 Figure 14 Knowledge about mode of transmission of HIV/AIDS…………………………………..…….…… 24 Figure 15 Knowledge about minimum legal age at marriage of boys and girls by background characteristics.. 26
LIST OF MAPS
Map 1 Full ante-natal check up by districts…........................................………………………….......…….. 12
Map 2 Institutional delivery by districts…………………………………..………………………………… 13
Map 3 Full immunization coverage of children aged 12-23 months by districts………………………….... 16
Map 4 Contraceptive prevalence rate for any method by districts………………………………..……..….. 19


Preface and Acknowledgements
The District Level Household and Facility Survey (DLHS-3) is a nationwide survey covering 601 districts from 34 states and union territories of India. This is the third round of the district level household survey which was conducted during December 2007 to December 2008. The survey was funded by the Union Ministry of Health and Family Welfare, United Nations Population Fund (UNFPA) and United Nations Children’s Fund (UNICEF).
We are very grateful to the Ministry of Health & Family Welfare, Government of India for designating the International Institute for Population Sciences (IIPS) as the nodal agency for the DLHS-3 Project and providing an opportunity to work closely with the health and programme officials. In particular, we would like thank Ms. K. Sujatha Rao, Secretary-Ministry of Health and Family Welfare (MoHFW), Government of India for her advice, suggestions and support. We also thank Shri Naresh Dayal, former Secretary-Ministry of Health and Family Welfare (MoHFW), Government of India for the advice and valuable support extended to the project. Our special thanks to Smt. Madhu Bala, the Additional Director General, Dr. Rattan Chand, the Chief Director and Shri. Rajesh Bhatia, the Director-Statistics Division, Ministry of Health and Family Welfare, Government of India for their active involvement and suggestions. We are also thankful to Dr. V.K. Malhotra and Shri S.K. Das, former Additional Director Generals, Shri Partha Chattopadhyay, former Chief Director, Shri K. D. Maiti, former Director and Ms. Rashmi Verma, former Deputy Director-Statistics Division, MoHFW, Government of India for the co-operation and support at various stages of this project. We are grateful to Dr. P. N. Mari Bhat, former Director, IIPS and Dr. S. Lahiri, former Officiating Director, IIPS for their keen interest and guidance in the initial stages of the project. We acknowledge the contributions of the TALEEM Research Foundation, Ahmadabad the Regional Agency for the field implementation of DLHS-3 in Madhya Pradesh state. The monitoring of the field survey was done independently by Population Research Centre, Lucknow under the guidance of National Institute of Health and Family Welfare, New Delhi. Our thanks to the members of Technical Advisory Committee (TAC) of DLHS-3 and especially to its Chairman, Dr. P. M. Kulkarni, Professor, Jawaharlal Nehru University, New Delhi. We also thank Dr. N.K. Singh for guiding the software development and CSPro training for the project staff. We gratefully acknowledge the immense contributions of DLHS-3 project team at IIPS in developing survey instruments, training field staff, monitoring field work, data processing, preparation of district and state level fact sheets, and drafting the reports.
Finally, special thanks to all respondents who spared their valuable time and cooperated with us by providing the required information.
DLHS-3 Coordinators International Institute for Population Sciences

BACKGROUND AND OBJECTIVES OF THE SURVEY
The National Rural Health Mission (2005-2012) was launched by the Government of India (GoI) in 2005-06 to provide effective health care to rural population in the country with special focus on states which have poorer health outcomes and inadequate public health infrastructure and manpower. The primary focus of the mission is to improve access of rural people, especially women and children, to equitable and affordable primary health care. The main goal of NRHM is to reduce infant mortality rate (IMR) and maternal mortality ratio (MMR) by promoting new born care, immunization, antenatal care, institutional delivery and post-partum care.
The National Rural Health Mission (NRHM) foundation is built on community involvement in drawing a village health plan under the auspices of Health & Sanitation Committee of the Panchayat, making rural primary health care services accountable to the community and giving authority to the District Health Mission for implementation of inter-sectoral District Health Plan including drinking water, sanitation, hygiene and nutrition. The interface between the community and the public health system at the village level is entrusted to a female Accredited Social Health Activist (ASHA), a health volunteer receiving performance based compensation for promotion of universal immunization, referral and escort services for reproductive & child health (RCH), construction of household toilets, and other health care delivery programmes. To promote institutional delivery, cash incentive programme under Janani Suraksha Yojana (JSY) is made an integral component of NRHM.
The third round of the District Level Household and Facility Survey (DLHS-3) carried out during 2007-08 was designed to collect data at district level on various aspects of health care utilization for Reproductive & Child Health (RCH), accessibility of health facilities, assess the effectiveness of ASHA and JSY in promoting RCH care, to assess health facility capacity and preparedness in terms of infrastructure of DLHS-3. The integration of facility survey with the household survey was done with a view to link the RCH care outcomes to health facility accessibility, availability of medical & paramedical manpower and other village infrastructures. The broad objective of DLHS-3 is to provide RCH outcome indicators at the district level in order to monitor and provide corrective measures to the NRHM. The other important objective being, to assess the contribution of decentralization of primary health care at the district level and below by way of involving village health committees under the Panchayats in implementation of health care programmes. The main focus and objective of DLHS-3 is providing RCH indicators covering the following aspects: Coverage of antenatal check up and immunization services
• Institutional/safe deliveries • JSY Beneficiaries • Contraceptive prevalence rates • ASHA’s involvement • Unmet need for family planning • Awareness about RTIs/STIs and HIV/AIDS • Family life education among unmarried adolescent girls • Health facility and infrastructure
2
The District Level Household and Facility Survey, 2007-08 (DLHS-3) is the third in the series of district level household surveys. The first one was conducted in 1998-99 followed by the second in 2002-04. For all the three DLHS, the Ministry of Health and Family Welfare (MoHFW), Government of India (GoI) designated the International Institute for Population Sciences (IIPS), Mumbai, as the Nodal Agency responsible for the development of survey design, instruments, data entry and tabulation software, training, supervision of field work, analysis and report writing. The sources of funds for DLHS-3 are the MoHFW, GoI and United Nations Population Fund (UNFPA) and United Nations Children’s Fund (UNICEF).
A Technical Advisory Committee (TAC) constituted by the MoHFW, GoI guided the designing, implementation, progress, tabulation, basis of selection of RCH indicators and consistency issues. SURVEY DESIGN, SAMPLE SIZE AND DESIGN WEIGHT A multi-stage stratified systematic sampling design was adopted for DLHS-3. In each district, 50 primary sampling units (PSUs) which were census villages in rural areas and census enumeration blocks (CEBs) in urban areas. In rural areas, villages were selected by probability proportional to size (PPS) systematic sampling and in the second stage households were selected by systematic sampling. For urban areas first wards were selected by PPS systematic sampling, in the second stage CEBs by PPS sampling and households in the third stage by systematic sampling. The Census of India, 2001 was the sampling frame for DLHS-3. All villages and urban wards in a district were stratified by household size into three strata of less than 50, 50-300 and 300+ households, percent of SC/ST population into two strata- below and above 20 percent and implicitly by three alternating order of female literacy. These variables used for stratification are from the 2001 Census. The number of households representing a district is either 1000 or 1200 or 1500 considering the levels of immunization, antenatal check up and institutional delivery as given by DLHS-2 plus 10 percent over sampling to cushion for non-response. The PSUs are allocated to rural and urban areas of each district proportionally to the actual rural-urban population ratio and within the rural-urban domains. The PSUs are further distributed proportionately to the different sub-strata of combinations of household size, percent of SC/ST population and levels of female literacy. To make a proper rural PSU, selected villages with less than 50 households were linked with another contiguous village and selection probability is adjusted accordingly. Selected villages with more than 300 households were further divided into two or more segments and one or more segments were selected so as to have standard size PSUs. The numbers of households drawn from a PSU of districts represented by 1000, 1200 and 1500 households are 22, 27 and 33 households respectively. All ever married women age 15-49 years and adolescent’s age 15-24 years from the sampled households are the respondents for questions on RCH and family life education, while any adult household member is the respondent for household related questions in DLHS-3. Sampling weight for household, ever married women and unmarried women were generated for each district. These design weights were used for computations of district level demographic and RCH indicators. The selection probabilities fi
1, fi2 and fi
3 at different stages of randomization pertaining to the ith PSU of a district were the main inputs for generation of design weight. These selection probabilities are defined as follows:
3
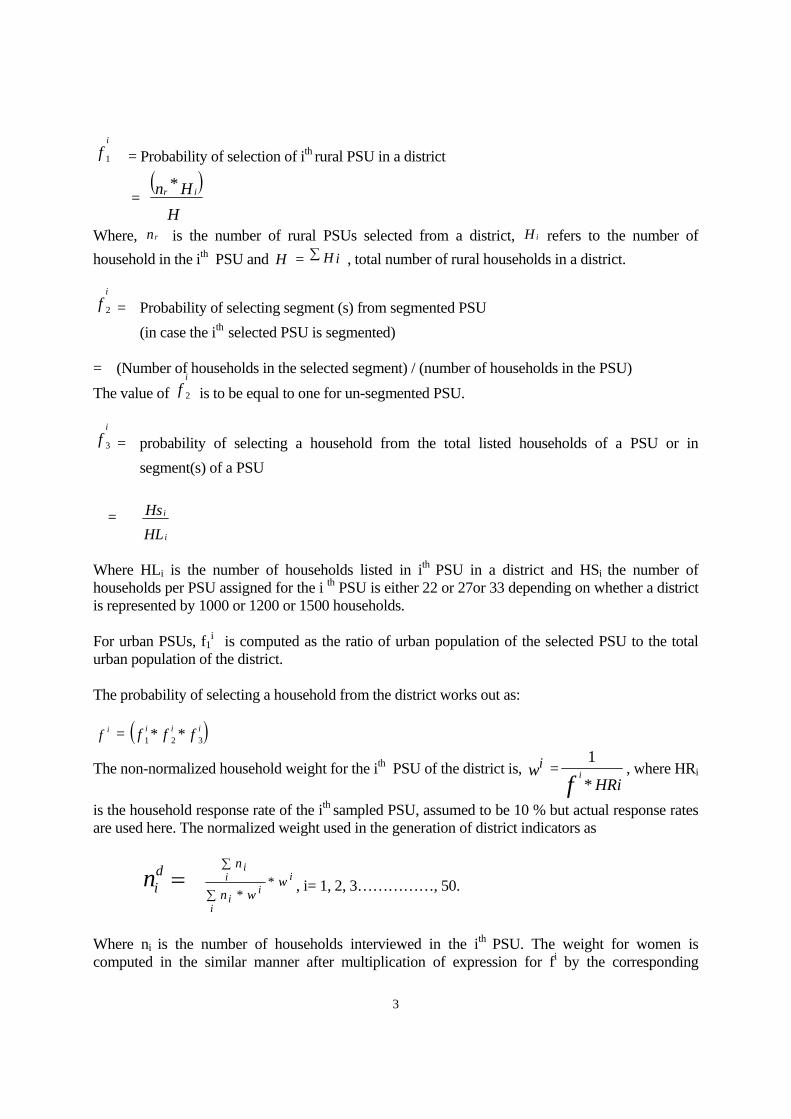
fi
1 = Probability of selection of ith rural PSU in a district
= )(
HHn ir *
Where, nr is the number of rural PSUs selected from a district, H i refers to the number of
household in the ith PSU and H = ∑ H i , total number of rural households in a district. f
i
2 = Probability of selecting segment (s) from segmented PSU
(in case the ith selected PSU is segmented) = (Number of households in the selected segment) / (number of households in the PSU) The value of f
i
2 is to be equal to one for un-segmented PSU.
f
i
3 = probability of selecting a household from the total listed households of a PSU or in
segment(s) of a PSU
= HLHs
i
i
Where HLi is the number of households listed in ith PSU in a district and HSi the number of households per PSU assigned for the i th PSU is either 22 or 27or 33 depending on whether a district is represented by 1000 or 1200 or 1500 households. For urban PSUs, f1
i is computed as the ratio of urban population of the selected PSU to the total urban population of the district. The probability of selecting a household from the district works out as: f i = ( )fff iii
321 **
The non-normalized household weight for the ith PSU of the district is, wi =HRif i
*
1, where HRi
is the household response rate of the ith sampled PSU, assumed to be 10 % but actual response rates are used here. The normalized weight used in the generation of district indicators as
=din
i
i
ii
ii
wwn
n*
*∑
∑
, i= 1, 2, 3……………, 50.
Where ni is the number of households interviewed in the ith PSU. The weight for women is computed in the similar manner after multiplication of expression for fi by the corresponding
4
response rate. State weights for households, women and husbands are further derived from the district weights nd
i for the ith PSU in dth district using external control so that sample results do not deviate from the corresponding information about the population. Let, ns = ∑
i
din and Nsc
= ∑i
diN , denote the number of households in the sample and census of
a particular state, then state level households weights work out as:
n si = nd
i *
⎟⎟⎠
⎞⎜⎜⎝
⎛
⎟⎟⎠
⎞⎜⎜⎝
⎛
nn
NN
s
d
i
sc
d
i , where ndi represents household sample in ith district, n s is the total
sample in the state. These households’ weights are computed for rural-urban areas separately. Considering sample and census currently married women age between 15-49 years and married males above 15 years for specified state by districts and rural-urban residence, state level women weights are obtained for estimation of state level indicators. IMPLEMENTATION AND QUALITY CONTROL Actual field operation of DLHS-3 in different states and union territories were implemented by Regional Agencies (RA) selected by the MoHFW through a competitive bidding process, TALEEM research Foundation, Ahmadabad was designated as RA for implementation of DLHS-3 in Madhya Pradesh. Data from the selected PSUs were collected by a team of 5 persons consisting of one Supervisor, one field Editor and three Female Investigators who are graduates at least. A minimum of two days visit to each sampled PSU is followed to ensure 100 percent coverage of selected households, ever married women and unmarried women. Independent team of Health Investigators, mostly paramedics were entrusted the work of carrying out the accompanying Facility Survey. A strict quality check protocol was put in place by the Nodal Agency by way of spot and back checks by an independent team. The Quality team comprised of two females and one male investigator and was headed by a Research Officer from the monitoring agency. One Research Officer from IIPS was stationed in each state throughout the period of the field work. SURVEY INSTRUMENTS
The main instrument for collection of data in DLHS-3 was a set of structured questionnaires, namely, household, ever married woman, unmarried woman and village questionnaires. Sub-centre, primary health centre (PHC), community health centre (CHC) and district hospital (DH) questionnaires were used to conduct the facility survey. All household level questionnaires were bilingual, with questions in regional and English languages. Household Questionnaire
The household questionnaire lists all usual residents in each sample household including visitors who had stayed the night before the interview. For individual household member information on age, sex, marital status, relationship to the head of the household and education were collected. Marriages and deaths of members of household were also recorded. Efforts

5
were made to get information about maternal deaths. Information was also collected on the main source of drinking water, type of toilet facility, source of lighting, type of cooking fuel, religion and caste of household head and ownership of durable goods in the household. The other information collected relates to awareness of government programmes. Ever Married Women’s Questionnaire
The respondents for the ever married women’s questionnaire were ever married women age 15-49 years living in the sampled households. Details on age, age at marriage and place of birth, educational attainment, number of biological children ever born and surviving by sex were collected. Accounts of antenatal check-up, experience of pregnancy related complications, place of delivery, delivery attendant and post-partum care, together with history of contraceptive use, sex preference of children and fertility intentions were recorded. For the recent births, immunizations status of children was collected either from the vaccination card or by asking the mother about the status of immunization of the child. The other information collected includes knowledge and awareness about RTIs/STIs and HIV/AIDS by source and treatment seeking behaviour for RTIs/STIs.
Unmarried Women’s Questionnaire
Information that was collected from unmarried women age 15-24 years (those under 18 years with consent from the parents) included knowledge of family life education, awareness about legal age at marriage, awareness about contraception, menstruation related problems, and knowledge of RTIs/STIs and HIV/AIDS by source of information.
Village Questionnaire
This questionnaire was designed to collect information on availability and accessibility of education, health, transport and communication facilities at village level. Functioning of village committees and utilization of untied funds were additionally collected from the sampled villages of DLHS.
Facility Survey Questionnaires
In the facility survey the information collected at the Sub-Centre level was availability of human resources, physical infrastructure, equipments and essential drugs and RCH service provided during the one month preceding the survey. Additional information collected at Primary health centre (PHC) level was availability of Lady Medical Officer, functional Labour Room, Operation Theatre, number of beds, drug storage facilities, waiting room for OPD, availability of RCH related equipments, essential drugs and essential laboratory testing facilities. Information that was collected for Community health centre (CHC) included status of in-position clinical, supporting and Para-medical staffs, availability of specialists trained for NSV (Non Scalpel Vasectomy), emergency obstetric, medically terminated pregnancy (MTP), new born care, treatment of RTIs/STIs, IMNCI, ECG etc. Physical infrastructures of CHC such as, water supply, electricity, communication, waste disposal facilities, OT, Labour Room and availability of residential quarters for medical doctors were also collected in the facility survey. (The questionnaires are available at DLHS-3 website: www.rchiips.org).
6
HOUSEHOLD AND VILLAGE BACKGROUND
DLHS-3 Coverage and Response Rate
DLHS-3 surveyed a total of 51,419 households, 46,634 ever-married women and 9,940 unmarried women in Madhya Pradesh state (Table 1.1). The response rates are 90.7, 82.7 and 81.1 percent for households, ever-married and unmarried women respectively. The lowest response rates for household are found in Jhabua (80.0 percent), for ever-married women in Mandsaur 76.7 percent and for unmarried women in Jhabua, 59 percent respectively. As far as the demographic indicators of Madhya Pradesh are concerned, from 2001 census it can be noted that the overall sex ratio of 920 female per 1,000 males is below the national figure of 933 and there are twenty districts out of the 45 districts where the sex ratio is above 900 and among them 19 districts are above the national average. Mandla (1,002 females per 1,000 males) and Balaghat (1,022 females per 1,000 males) are the two districts where the sex ratio indicate more females than males (Table 1.2). Village Characteristics
As regards the accessibility of health facilities to the sampled villages, 26 percent of villages have Sub-Centres within the village itself and as many as 75 percent of the villages are within 5 km. distance from a Sub-Centre. In Madhya Pradesh, 2 percent of the villages have a government dispensary within the village and 5 percent have Primary Health Centres (PHC). In Madhya Pradesh, 8 percent villages have private clinics within the villages (Table 2.11). Twelve percent of the rural population are treated by doctors and variation is from 2.4 percent in Shivpuri, Tikamgarh, Rewa and Shaiapur to 47 percent in Indore. Most of the villages (92 percent) have an Anganwadi worker (Table 2.12). Household Characteristics
DLHS-3 surveyed a total of 418,401 persons (Table 2.1) from 51,419 households (Table 2.8) in Madhya Pradesh covering all the forty-five districts of which 77.4 percent are in rural areas and the remaining 22.6 percent in urban areas. In Madhya Pradesh, 94.5 percent of household heads are Hindus and 4.5 percent are Muslims (Table 2.7). About 5.8 percent of household heads are females. The average household size in the state is 5.6 persons and there is not much difference in rural and urban areas. Sixteen percent of household heads belong to scheduled castes, 24.4 percent belongs to scheduled tribe 41.5 percent belongs to other backward classes and 17.6 percent to others. The median age of household heads is 45 years (Table 2.7). More than three-fourths (75.6 Percent) of households in Madhya Pradesh have electricity connection, 80.8 percent of households have access to improved source of water, 9.2 percent of the households have access to piped water for drinking into dwelling/yard/plot, 21.1 percent of households have provision for flush toilet, 12.1 percent of households use LPG for cooking, 18.5 percent live in pucca houses and 39.4 percent households have at least 3 rooms (Table 2.8). For the state of Madhya Pradesh, 42.3 percent of households have BPL (below poverty line) cards and it varies from a low of 19.6 percent in Gwalior to a high of 62.9 percent in Rajgarh (Table 2.9).

7
7 6 5 4 3 2 1 0 1 2 3 4 5 6 7
0-45-9
10-1415-1920-2425-2930-3435-3940-4445-4950-5455-5960-6465-6970-7475-79
80+
Percent
FIGURE 2AGE SEX PYRAMID
FemaleMale
Household Wealth Index
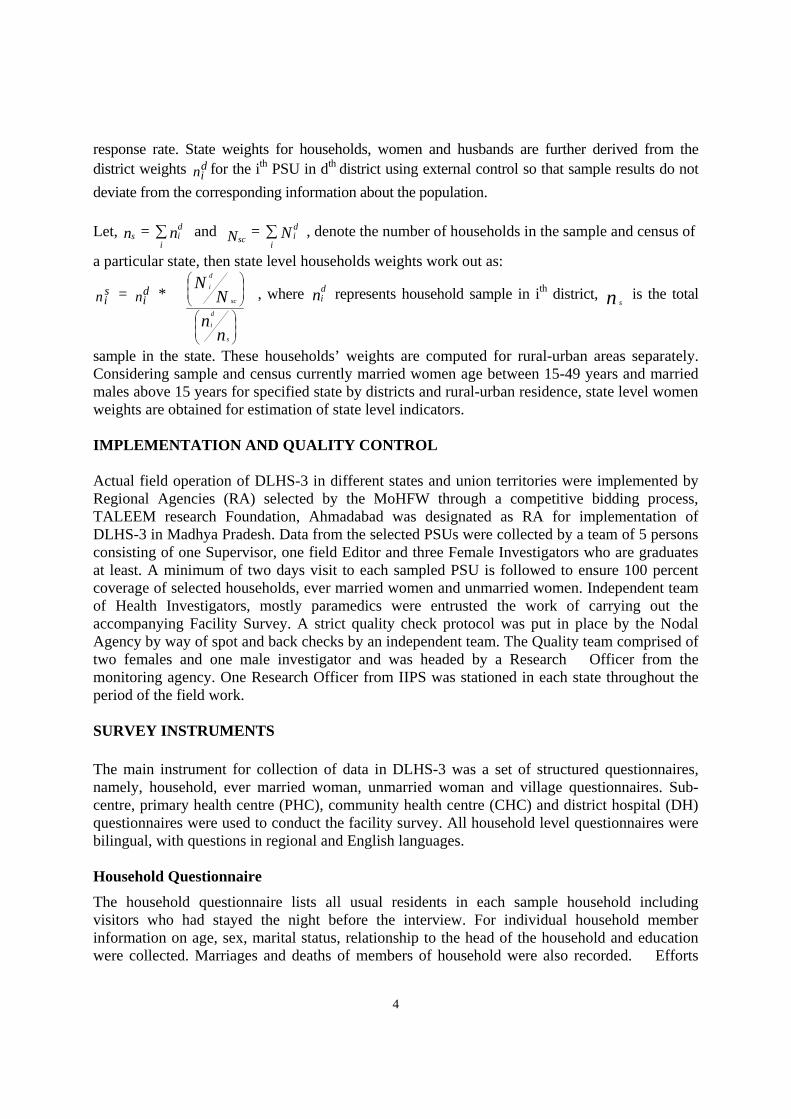
Combining household amenities, assets and durables, a wealth index has been computed at the national level and divided into quintiles. Households are categorized from the poorest to the richest groups corresponding from the lowest to the highest quintiles at the national level. Based on national cut-off points, in Madhya Pradesh more than one fourths (29 percent) of the households are in the lowest wealth quintile and only around 13 percent households are in the highest wealth quintile (Table 2.8). In rural areas more than two-thirds of the households (68 percent) are in the lowest or in the second lowest wealth quintile and in urban areas about three-fourths of the households (70.2 percent) are in the highest or in the fourth highest wealth quintile, shown in Fig. 1.
Age-Sex Composition The overall sex ratio in Madhya Pradesh is 945 females per 1000 males. The age-sex pyramid (Fig.2) depict a scenario of declining fertility with a shrinking base of 34.8 percent of the total population below 15 years and 5.2 percent of the population being above the age of 65 years. The remaining 60 percent of the population is in the 15-64 years age group. There are more children (36.4 percent) in rural areas than the in urban areas (29.6 percent) (Table 2.1). The mean age at marriage of boys and girls in Madhya Pradesh are 21.7 years and 18.4 years respectively. In Madhya Pradesh, 40.5 percent of boys and 29 percent of girls were married off before attaining the minimum legal age for marriage (Table 2.3).
29
36
5
27
33
10
18
18
15
13
10
25
13
4
46
MADHYA PRADESH
Rural
Urban
FIGURE 1PROPORTION OF HOUSEHOLDS BY WEALTH QUINTILE
Lowest Second Middle Fourth Highest

8
74
89 89
7485
77
7-9 10-14 15-19
FIG URE 3PERCENTAGE LITERATE BY AGE AND SEX
MALE FEMALE
Literacy by Age and Sex
Thirty-seven percent of the population 7 years and above are non-literate and there is wide gender disparity with corresponding figures for males and females being 26 and 48.7 percent respectively. There are noticeable gender gaps in rural areas in the age groups 10-14 (12.7 percent for male and 17.3 percent for female) and 15-19 years (12.9 percent for males and 27.9 percent for females) (Table 2.4). Figure 3 capture the proportion literates for broad age groups 7-9, 10-14 and 15-19 years by sex. The information on the main reasons for dropping out of school was also collected in
DLHS-3. For girls below 18 years as many as 18.4 percent stated that they were required for household work followed by 11.7 percent said that they were not interested in studies and 11.2 percents who said further education were not necessary as the main reason for dropping out of school respectively. The reported main reason for dropping out of school for boys are not very different, 21.7 percent boys said that they were not interested in studies, followed by 12.6 percent who stated they were required for household work (Table 2.6). CHARACTERISTICS OF WOMEN AND FERTILITY
Age at consummation of marriage is at least 18 years for 58 percent of ever married sampled women between 15-49 years irrespective of residence. Proportion of non-literate women is more in rural areas (64.4 percent) than in urban areas (31.3 percent) of Madhya Pradesh. In urban areas, the proportion of husbands who are non-literate are lesser than that of women, only 13.6 percent of husbands are non-literate in urban areas. In Madhya Pradesh, 11 percent of married women and 26 percent of married men have at least 10 years education. More than half (51 percent) of ever married women were married for 15 years or more and the other half of ever married women is almost equally distributed in the categories of less than 5 years, 5-9 and 10-14 years marital duration, about 17 percent in each category (Table 3.1). In Madhya Pradesh 24.6 and 26.6 percent of women belong to households in the lowest and second lowest wealth quintiles. In rural areas women belong to the lowest and second lowest wealth quintile are respectively 30.7 and 31.9 percent while in urban areas these are 3.6 and 8.4 percents respectively. Mean Children Ever Born by Districts
Mean children ever born (CEB) to ever married women between 15-49 years is found to be 3.1 with a small differential by residence (3.2 in rural and 2.8 in urban), while it is 3.7 for non-literate and 1.9 for women with at least 10 years of education. The completed fertility measured in terms of average children ever born to ever married women between 40-49 years is 4.6
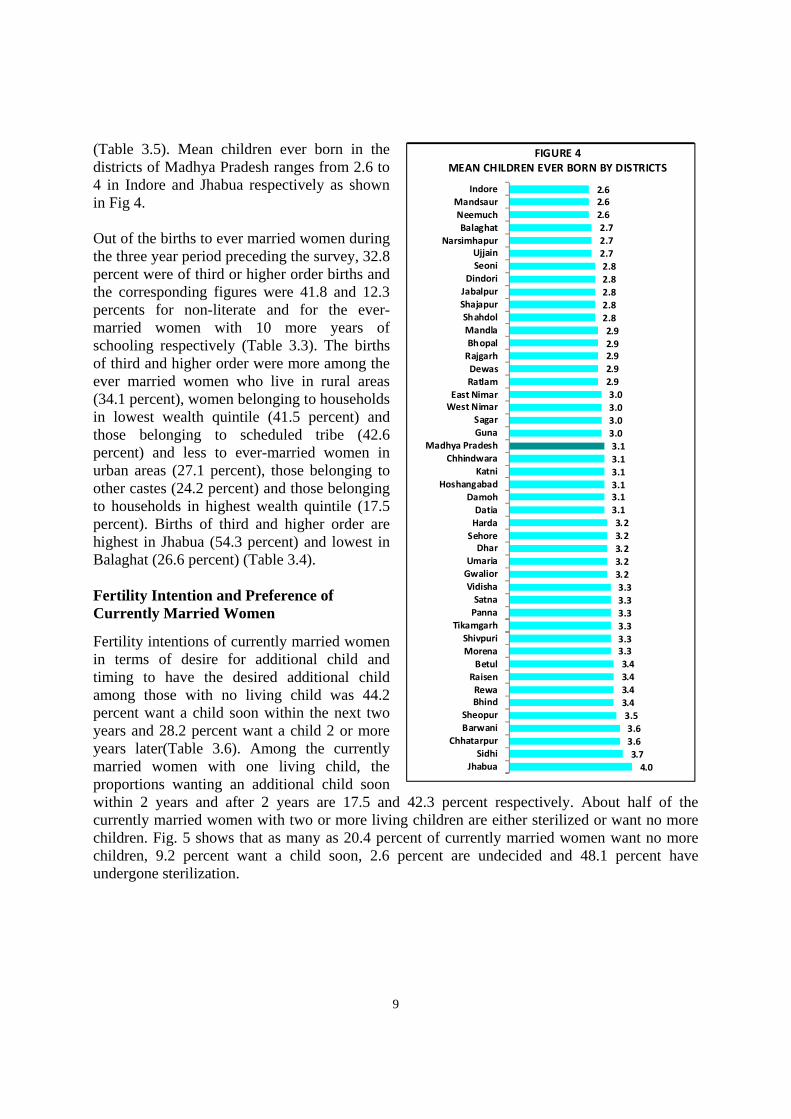
9
(Table 3.5). Mean children ever born in the districts of Madhya Pradesh ranges from 2.6 to 4 in Indore and Jhabua respectively as shown in Fig 4. Out of the births to ever married women during the three year period preceding the survey, 32.8 percent were of third or higher order births and the corresponding figures were 41.8 and 12.3 percents for non-literate and for the ever-married women with 10 more years of schooling respectively (Table 3.3). The births of third and higher order were more among the ever married women who live in rural areas (34.1 percent), women belonging to households in lowest wealth quintile (41.5 percent) and those belonging to scheduled tribe (42.6 percent) and less to ever-married women in urban areas (27.1 percent), those belonging to other castes (24.2 percent) and those belonging to households in highest wealth quintile (17.5 percent). Births of third and higher order are highest in Jhabua (54.3 percent) and lowest in Balaghat (26.6 percent) (Table 3.4). Fertility Intention and Preference of Currently Married Women
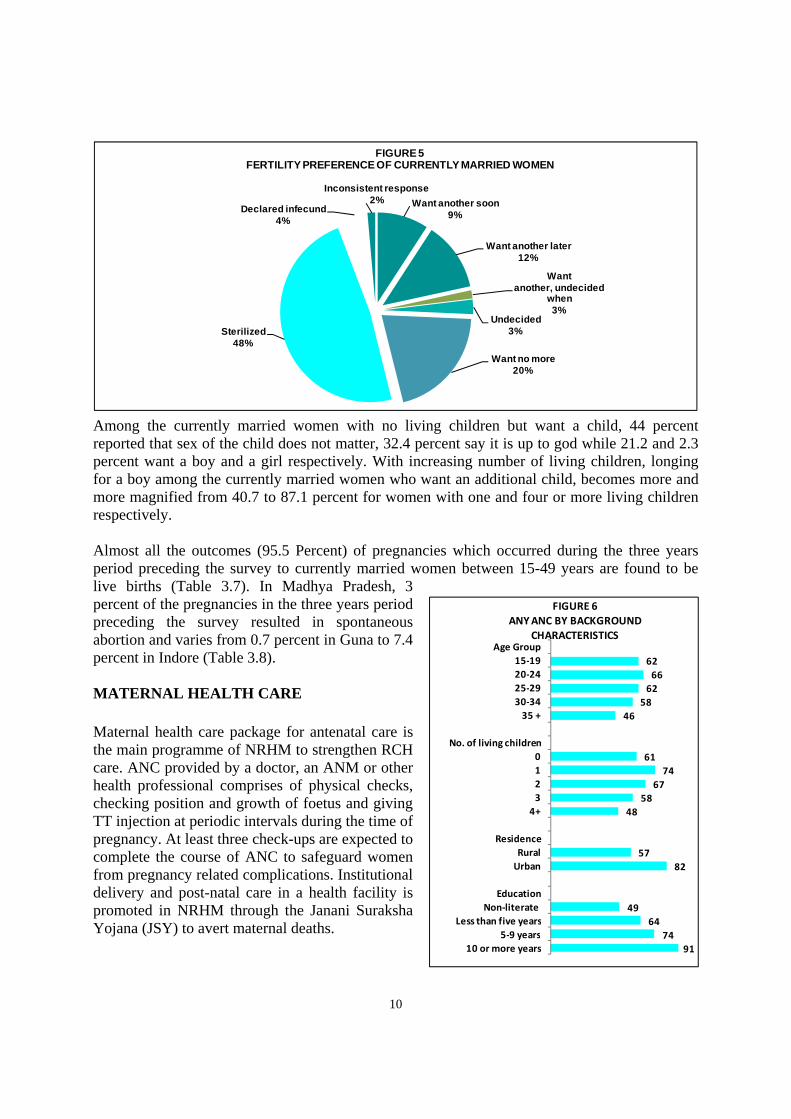
Fertility intentions of currently married women in terms of desire for additional child and timing to have the desired additional child among those with no living child was 44.2 percent want a child soon within the next two years and 28.2 percent want a child 2 or more years later(Table 3.6). Among the currently married women with one living child, the proportions wanting an additional child soon within 2 years and after 2 years are 17.5 and 42.3 percent respectively. About half of the currently married women with two or more living children are either sterilized or want no more children. Fig. 5 shows that as many as 20.4 percent of currently married women want no more children, 9.2 percent want a child soon, 2.6 percent are undecided and 48.1 percent have undergone sterilization.
4.03.73.63.63.53.43.43.43.43.33.33.33.33.33.33.23.23.23.23.23.13.13.13.13.13.13.03.03.03.02.92.92.92.92.92.82.82.82.82.82.72.72.72.62.62.6
JhabuaSidhi
ChhatarpurBarwaniSheopur
BhindRewaRaisenBetul
MorenaShivpuri
TikamgarhPannaSatna
VidishaGwaliorUmariaDhar
SehoreHardaDatia
DamohHoshangabad
KatniChhindwara
Madhya PradeshGunaSagar
West NimarEast Nimar
RatlamDewasRajgarhBhopalMandlaShahdolShajapurJabalpurDindoriSeoniUjjain
NarsimhapurBalaghatNeemuchMandsaur
Indore
FIGURE 4MEAN CHILDREN EVER BORN BY DISTRICTS
10
Among the currently married women with no living children but want a child, 44 percent reported that sex of the child does not matter, 32.4 percent say it is up to god while 21.2 and 2.3 percent want a boy and a girl respectively. With increasing number of living children, longing for a boy among the currently married women who want an additional child, becomes more and more magnified from 40.7 to 87.1 percent for women with one and four or more living children respectively. Almost all the outcomes (95.5 Percent) of pregnancies which occurred during the three years period preceding the survey to currently married women between 15-49 years are found to be live births (Table 3.7). In Madhya Pradesh, 3 percent of the pregnancies in the three years period preceding the survey resulted in spontaneous abortion and varies from 0.7 percent in Guna to 7.4 percent in Indore (Table 3.8). MATERNAL HEALTH CARE
Maternal health care package for antenatal care is the main programme of NRHM to strengthen RCH care. ANC provided by a doctor, an ANM or other health professional comprises of physical checks, checking position and growth of foetus and giving TT injection at periodic intervals during the time of pregnancy. At least three check-ups are expected to complete the course of ANC to safeguard women from pregnancy related complications. Institutional delivery and post-natal care in a health facility is promoted in NRHM through the Janani Suraksha Yojana (JSY) to avert maternal deaths.
9174
6449
8257
4858
6774
61
4658626662
10 or more years5‐9 years
Less than five yearsNon‐literate
Education
UrbanRural
Residence
4+3210
No. of living children
35 +30‐3425‐2920‐2415‐19
Age Group
FIGURE 6ANY ANC BY BACKGROUND
CHARACTERISTICS
Want another soon9%
Want another later12%
Want another, undecided
when3%
Undecided3%
Want no more20%
Sterilized48%
Declared infecund 4%
Inconsistent response2%
FIGURE 5FERTILITY PREFERENCE OF CURRENTLY MARRIED WOMEN
11
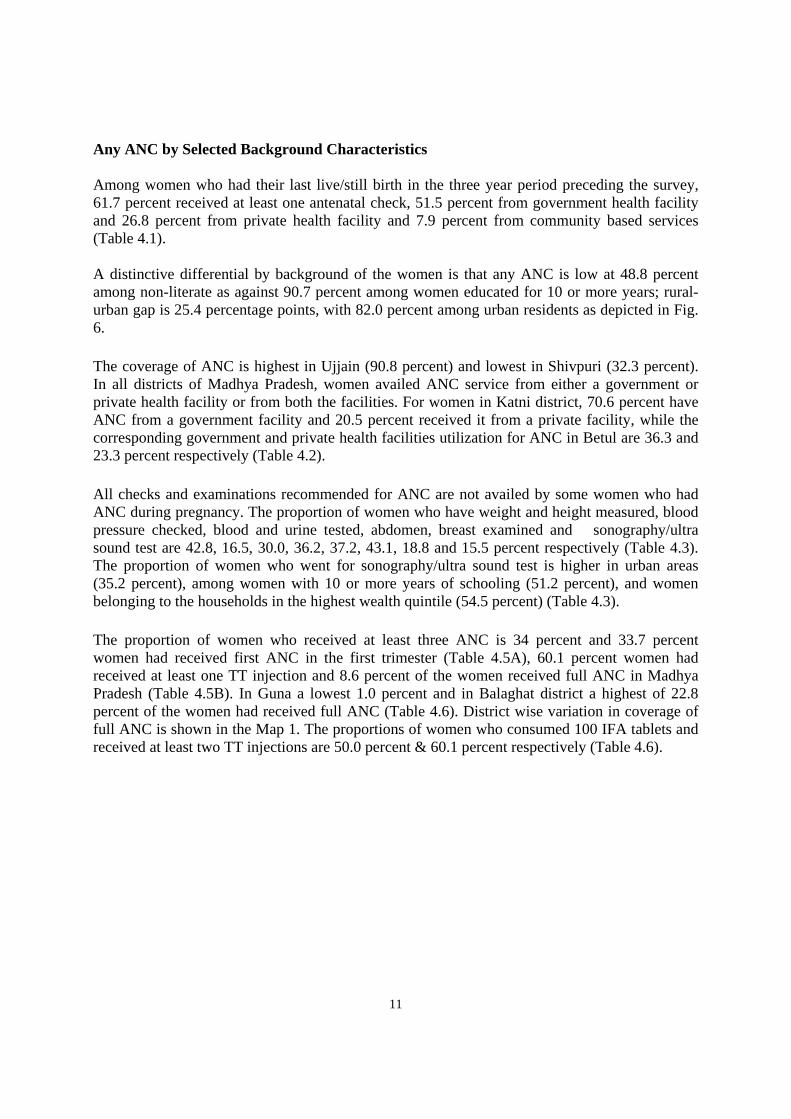
Any ANC by Selected Background Characteristics Among women who had their last live/still birth in the three year period preceding the survey, 61.7 percent received at least one antenatal check, 51.5 percent from government health facility and 26.8 percent from private health facility and 7.9 percent from community based services (Table 4.1). A distinctive differential by background of the women is that any ANC is low at 48.8 percent among non-literate as against 90.7 percent among women educated for 10 or more years; rural-urban gap is 25.4 percentage points, with 82.0 percent among urban residents as depicted in Fig. 6. The coverage of ANC is highest in Ujjain (90.8 percent) and lowest in Shivpuri (32.3 percent). In all districts of Madhya Pradesh, women availed ANC service from either a government or private health facility or from both the facilities. For women in Katni district, 70.6 percent have ANC from a government facility and 20.5 percent received it from a private facility, while the corresponding government and private health facilities utilization for ANC in Betul are 36.3 and 23.3 percent respectively (Table 4.2). All checks and examinations recommended for ANC are not availed by some women who had ANC during pregnancy. The proportion of women who have weight and height measured, blood pressure checked, blood and urine tested, abdomen, breast examined and sonography/ultra sound test are 42.8, 16.5, 30.0, 36.2, 37.2, 43.1, 18.8 and 15.5 percent respectively (Table 4.3). The proportion of women who went for sonography/ultra sound test is higher in urban areas (35.2 percent), among women with 10 or more years of schooling (51.2 percent), and women belonging to the households in the highest wealth quintile (54.5 percent) (Table 4.3). The proportion of women who received at least three ANC is 34 percent and 33.7 percent women had received first ANC in the first trimester (Table 4.5A), 60.1 percent women had received at least one TT injection and 8.6 percent of the women received full ANC in Madhya Pradesh (Table 4.5B). In Guna a lowest 1.0 percent and in Balaghat district a highest of 22.8 percent of the women had received full ANC (Table 4.6). District wise variation in coverage of full ANC is shown in the Map 1. The proportions of women who consumed 100 IFA tablets and received at least two TT injections are 50.0 percent & 60.1 percent respectively (Table 4.6).
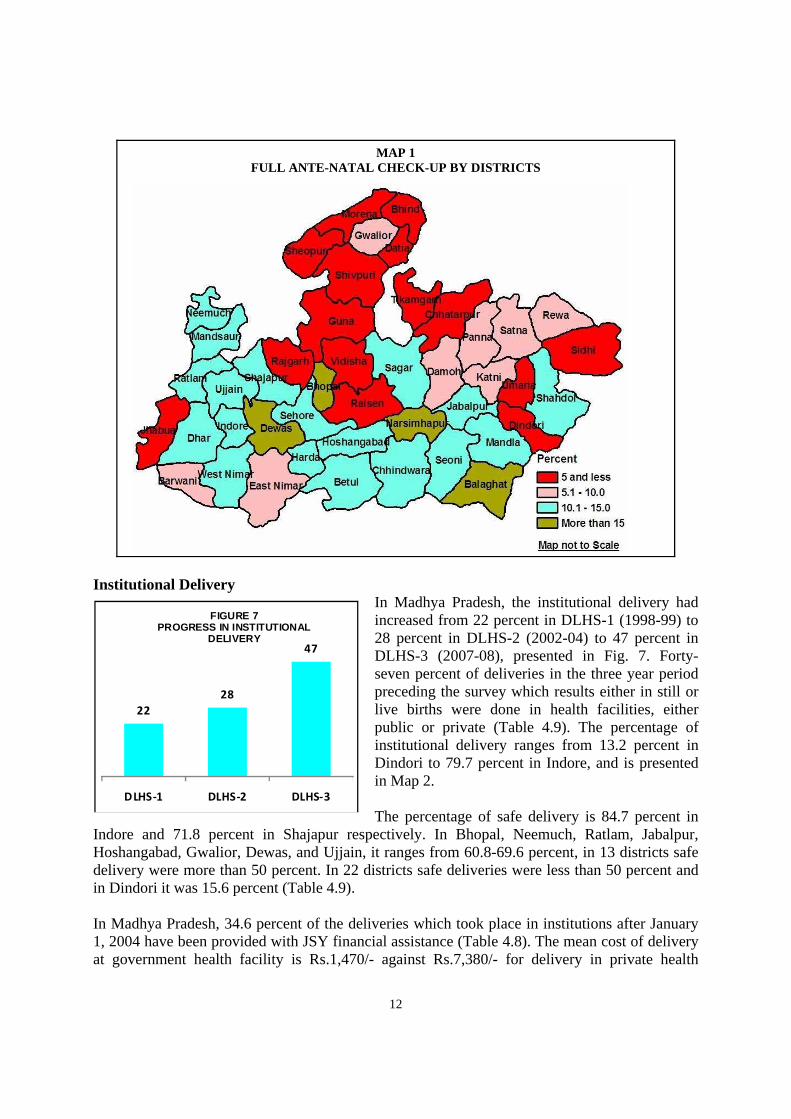
12
2228
47
DLHS‐1 DLHS‐2 DLHS‐3
FIGURE 7PROGRESS IN INSTITUTIONAL
DELIVERY
MAP 1 FULL ANTE-NATAL CHECK-UP BY DISTRICTS
Institutional Delivery
In Madhya Pradesh, the institutional delivery had increased from 22 percent in DLHS-1 (1998-99) to 28 percent in DLHS-2 (2002-04) to 47 percent in DLHS-3 (2007-08), presented in Fig. 7. Forty-seven percent of deliveries in the three year period preceding the survey which results either in still or live births were done in health facilities, either public or private (Table 4.9). The percentage of institutional delivery ranges from 13.2 percent in Dindori to 79.7 percent in Indore, and is presented in Map 2. The percentage of safe delivery is 84.7 percent in
Indore and 71.8 percent in Shajapur respectively. In Bhopal, Neemuch, Ratlam, Jabalpur, Hoshangabad, Gwalior, Dewas, and Ujjain, it ranges from 60.8-69.6 percent, in 13 districts safe delivery were more than 50 percent. In 22 districts safe deliveries were less than 50 percent and in Dindori it was 15.6 percent (Table 4.9). In Madhya Pradesh, 34.6 percent of the deliveries which took place in institutions after January 1, 2004 have been provided with JSY financial assistance (Table 4.8). The mean cost of delivery at government health facility is Rs.1,470/- against Rs.7,380/- for delivery in private health

13
facility. Woman who had used an ambulance or jeep or car as the mode of transport for delivery the mean cost of transportation is transportation is Rs.435/-. The main reasons for not going to health institutions as reported by women who have delivery at the home are no time to go (32.8 percent), and not necessary (27.2 percent) (Table 4.10).
MAP 2 INSTITUTIONAL DELIVERY BY DISTRICTS
Complications during Pregnancy, Delivery and Post-delivery Period
Women who either do not take ANC or take an incomplete course of ANC are exposed to the risk of maternal death. In Madhya Pradesh, as much as 61.3 percent of women had some complications during pregnancy (Table 4.14). This varies from 78.6 percent in Bhopal to 39.9 percent in Shivpuri (Table 4.15). Only in 9 districts out of 45 districts in Madhya Pradesh less than fifty percent of women had pregnancy complications- Shivpuri (39.9 percent), Guna (41.8 percent), Bhind (44.9 percent), East Nimar (46.1 percent), Vidisha (47.4 percent), West Nimar (47.5 percent), Morena (47.9 percent), Balaghat (49.6 percent) and Datia (49.8 percent). On the other hand in more than seventy percent of women had delivery complications, 14 districts viz. Sheopur (70.3 percent), Sagar (70.3 percent), Ujjain (70.5 percent), Mandla ( 70.9 percent), Tikamgarh (71.6 percent), Satna (71.7 percent), Sehore (72 percent), Raisen (72.1 percent), Neemuch (72.3 percent), Umaria (72.6 percent), Narsimhapur (73 percent), Dewas (74.6 percent), Indore (76.3 percent) and Bhopal (78.6 percent) majority of the women had pregnancy complications. Among the women, who had complications during pregnancy 50 percent of them sought treatment (Table 4.15).
14
About two-thirds (66.5 percent) of women in Madhya Pradesh had faced at least one delivery complication (Table 4.11). The main cause of delivery complications are premature labour (55 Percent), prolonged labour and obstructed labour (38.2 percent each). Delivery complication is lowest in Vidisha (33.9 percent) and highest in Umaria (93.3 percent). In eighteen districts more than 70 percent of women experienced delivery complications and in only three districts less than 50 percent women had delivery complications, the districts of Vidisha (33.9 percent), Shivpuri (34.6 percent) and Betul (42.8 percent) (Table 4.15). More than two-fifths (41.6 percent) of women in Madhya Pradesh had post-delivery complications. The major problem during post delivery period were high fever (59.8 percent) followed by lower abdominal pain (59 percent) (Table 4.12). Among the women who had post-delivery complications, 48.8 percent had sought treatment. The highest is 71.2 in Shajapur and the lowest is 24.6 percent in Sidhi. In 20 districts out of 45 districts 51.5-63.8 percent women who had post-delivery complications sought treatment; on the other hand, in the 24 districts 33.7 - 49.9 percent women sought treatment for post delivery complications in Madhya Pradesh (Table 4.15). CHILD HEALTH CARE AND IMMUNIZATION
To promote child survival and prevent infant mortality, NRHM envisages new born care, breastfeeding and food supplementation at the right time and a complete package of immunization for children. Little less than two-fifths (39.4 percent) of newborns during the three year period preceding the survey were examined within 24 hours of birth. More newborns to women of urban residents (59.4 percent), newborns to women educated up to 10 or more years (72.3 percent) and belonging to Jain (85.2 percent) have received newborn care within 24 hours compared to others. More than three-fourths (76.5 percent) of the women in Madhya Pradesh who had delivered in the three year period preceding the survey availed newborn check up within 24 hours from government facility. Women who availed newborn cares from a private health facility constitute 19.3 percent as compared to home (3.7 percent) and others (0.5 percent) (Table 5.1). Eighty-three percent of children below 3 years, born after January 1, 2004 were fed with colostrum (Table 5.2). Women who have urban residence (85.6 percent), more than 10 years of education (91.1 percent), belonging to Jain religion (96.4 percent) and from richest households (88.6 percent) are more likely to give colostrum to their child than their counterparts who live in rural areas (82.4 percent), non-literate (79.2 percent), and from poorest households (79.8 percent) (Table 5.2). There is visible variation across districts, in the districts of Dewas, Rewa, Bhopal, Raisen, Damoh, Jabalpur, Shajapur, Jhabua, Satna, Sidhi, Balaghat, Betul, Sehore, Shahdol, Umaria, Dindori, Ujjain, Sagar, Chhindwara more than 90 percent of children being fed colostrum and in the other districts it ranges from 57.3 to 89.8 percent (Table 5.5). Median duration of exclusive breastfeeding of the youngest surviving child is 4.3 months (Table 5.3). For those children who had started food supplementation while still breastfeeding, median age in months at the time of other fluids, semi-solid food and solid food supplementation are 6.0 months, 8.4 months and 11.8 months respectively. The proportion of youngest surviving who have exclusively breastfed for 6 months is 51.3 percent (Table 5.4).
15
Little more than two-fifths (42.7 percent) of women had initiated breast milk within one hour of birth of the child. The initiation of breastfeeding within one hour of birth is least practiced among women in Sheopur (27.8 percent) and most widely practiced in Betul (70.9 percent). Seventy-two percent of women initiate breastfeeding within 24 hours of the birth of their children, and this range from 55.6 percent in Tikamgarh to 87.9 percent in Betul (Table 5.5). Immunization Coverage of Children Aged 12-23 Months
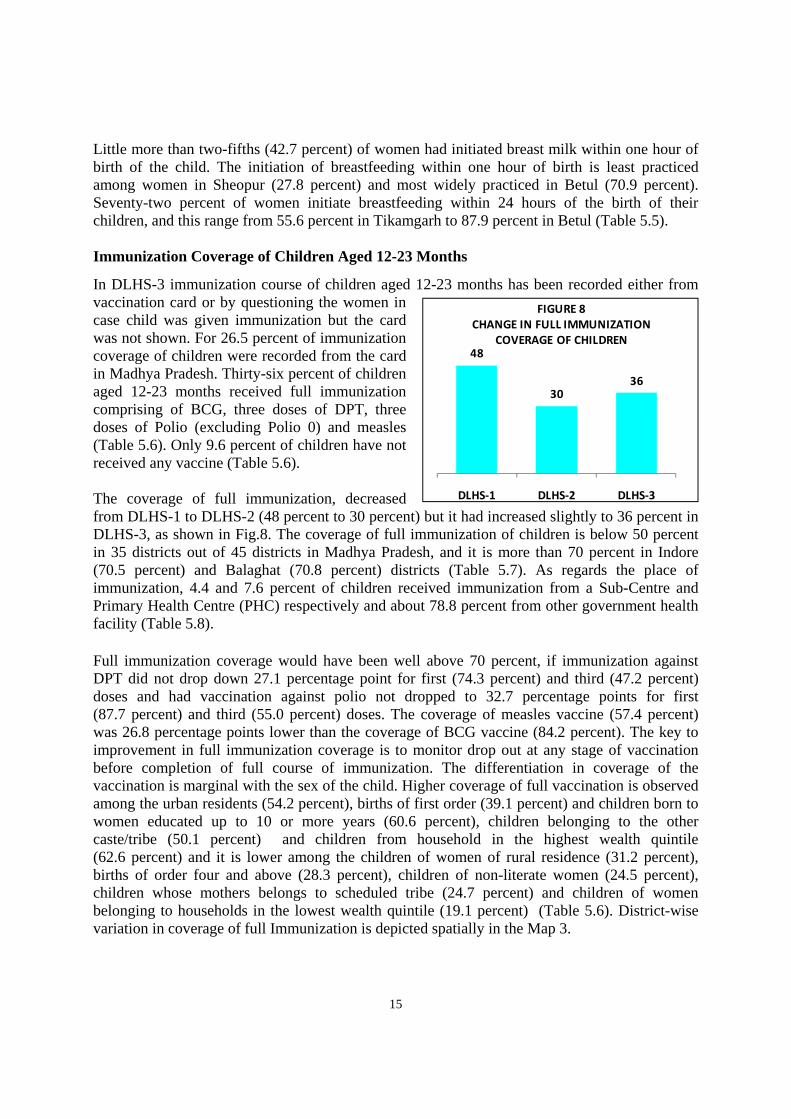
In DLHS-3 immunization course of children aged 12-23 months has been recorded either from vaccination card or by questioning the women in case child was given immunization but the card was not shown. For 26.5 percent of immunization coverage of children were recorded from the card in Madhya Pradesh. Thirty-six percent of children aged 12-23 months received full immunization comprising of BCG, three doses of DPT, three doses of Polio (excluding Polio 0) and measles (Table 5.6). Only 9.6 percent of children have not received any vaccine (Table 5.6). The coverage of full immunization, decreased from DLHS-1 to DLHS-2 (48 percent to 30 percent) but it had increased slightly to 36 percent in DLHS-3, as shown in Fig.8. The coverage of full immunization of children is below 50 percent in 35 districts out of 45 districts in Madhya Pradesh, and it is more than 70 percent in Indore (70.5 percent) and Balaghat (70.8 percent) districts (Table 5.7). As regards the place of immunization, 4.4 and 7.6 percent of children received immunization from a Sub-Centre and Primary Health Centre (PHC) respectively and about 78.8 percent from other government health facility (Table 5.8).
Full immunization coverage would have been well above 70 percent, if immunization against DPT did not drop down 27.1 percentage point for first (74.3 percent) and third (47.2 percent) doses and had vaccination against polio not dropped to 32.7 percentage points for first (87.7 percent) and third (55.0 percent) doses. The coverage of measles vaccine (57.4 percent) was 26.8 percentage points lower than the coverage of BCG vaccine (84.2 percent). The key to improvement in full immunization coverage is to monitor drop out at any stage of vaccination before completion of full course of immunization. The differentiation in coverage of the vaccination is marginal with the sex of the child. Higher coverage of full vaccination is observed among the urban residents (54.2 percent), births of first order (39.1 percent) and children born to women educated up to 10 or more years (60.6 percent), children belonging to the other caste/tribe (50.1 percent) and children from household in the highest wealth quintile (62.6 percent) and it is lower among the children of women of rural residence (31.2 percent), births of order four and above (28.3 percent), children of non-literate women (24.5 percent), children whose mothers belongs to scheduled tribe (24.7 percent) and children of women belonging to households in the lowest wealth quintile (19.1 percent) (Table 5.6). District-wise variation in coverage of full Immunization is depicted spatially in the Map 3.
48
3036
DLHS‐1 DLHS‐2 DLHS‐3
FIGURE 8CHANGE IN FULL IMMUNIZATION
COVERAGE OF CHILDREN
16
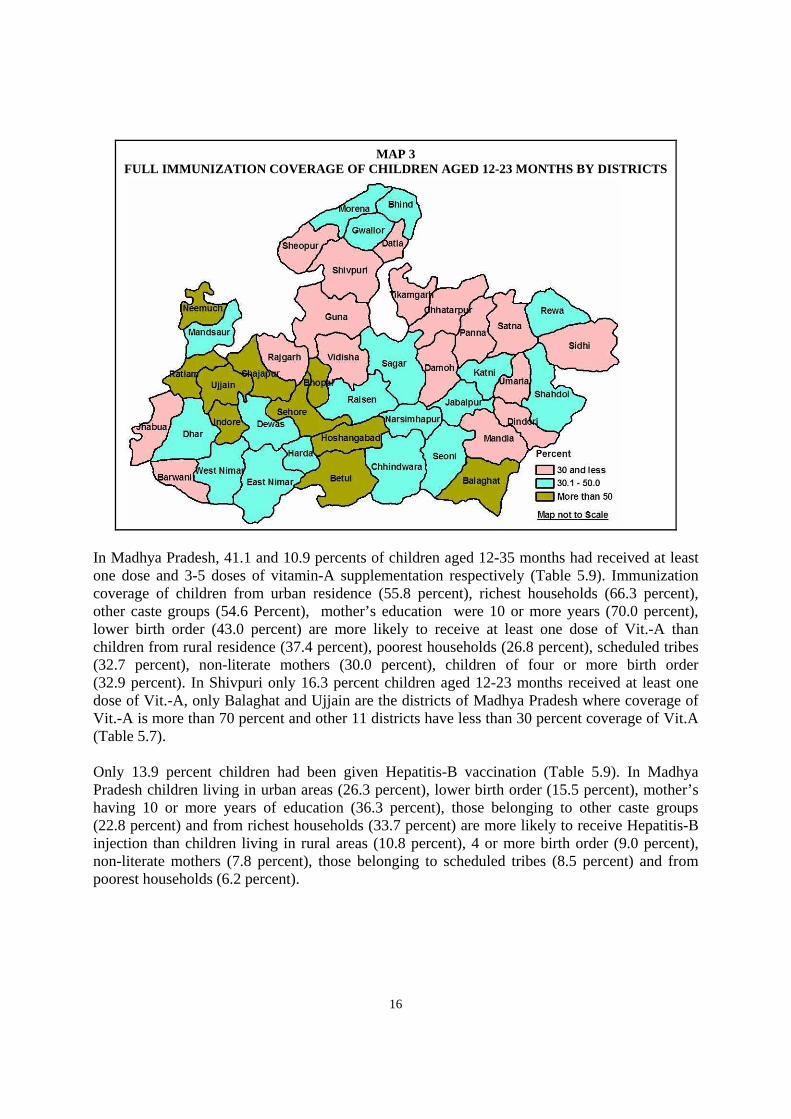
MAP 3 FULL IMMUNIZATION COVERAGE OF CHILDREN AGED 12-23 MONTHS BY DISTRICTS
In Madhya Pradesh, 41.1 and 10.9 percents of children aged 12-35 months had received at least one dose and 3-5 doses of vitamin-A supplementation respectively (Table 5.9). Immunization coverage of children from urban residence (55.8 percent), richest households (66.3 percent), other caste groups (54.6 Percent), mother’s education were 10 or more years (70.0 percent), lower birth order (43.0 percent) are more likely to receive at least one dose of Vit.-A than children from rural residence (37.4 percent), poorest households (26.8 percent), scheduled tribes (32.7 percent), non-literate mothers (30.0 percent), children of four or more birth order (32.9 percent). In Shivpuri only 16.3 percent children aged 12-23 months received at least one dose of Vit.-A, only Balaghat and Ujjain are the districts of Madhya Pradesh where coverage of Vit.-A is more than 70 percent and other 11 districts have less than 30 percent coverage of Vit.A (Table 5.7). Only 13.9 percent children had been given Hepatitis-B vaccination (Table 5.9). In Madhya Pradesh children living in urban areas (26.3 percent), lower birth order (15.5 percent), mother’s having 10 or more years of education (36.3 percent), those belonging to other caste groups (22.8 percent) and from richest households (33.7 percent) are more likely to receive Hepatitis-B injection than children living in rural areas (10.8 percent), 4 or more birth order (9.0 percent), non-literate mothers (7.8 percent), those belonging to scheduled tribes (8.5 percent) and from poorest households (6.2 percent).
17
Diarrhoea and Acute Respiratory Infection (ARI) Management DLHS-3 collected information on knowledge of diarrhoea and ARI management from women respondents as a part of assessment of child care knowledge. More than two-thirds (68.2 percent) of women have knowledge of diarrhoea management (Table 5.10) and are aware of danger signs of ARI (66.0 percent) (Table 5.12). The common practice followed by women for treatment of children who had diarrhoea was to give ORS (53.8 percent), salt and sugar solution (41.3 percent), continue normal food (11.9 percent) and plenty of fluids (11.7 percent) (Table 5.10). Thirty percent children who suffered from diarrhoea were treated by ORS, and 64.0 percent of them sought advice/treatment (Table 5.11). Only 39 percent children who had suffered from diarrhoea are treated in a government health facility and 61.2 percent in a private health facility (Table 5.11). In Sheopur 25.3 percent children suffered from diarrhoea in the last two weeks prior to the survey and among them 56.2 percent sought advice/treatment and in East Nimar 2.3 percent children suffered from diarrhoea and 69.2 percent of them sought advice/treatment. There are seven districts where less than 50 percent children sought treatment for diarrhoea in Madhya Pradesh (Table 5.13). Two-thirds of women are aware about the danger signs of ARI in Madhya Pradesh. Among the women aware of danger signs of ARI 63.9, 63.4, 57.2 and 52.1 percent of women know that difficulty in breathing, pain in chest and productive cough, wheezing/whistling and rapid breathings are the danger signs of ARI respectively (Table 5.12). Thirteen percent of the children had suffered from ARI in the last two weeks prior to the survey. Sixty-eight percent of the children who had suffered from ARI or fever two weeks prior to the survey had sought advice/treatment mostly at a private health facility (66.5 percent) (Table 5.12). The prevalence of ARI among children varies from 1.2 percent in East Nimar to 30.7 percent in Dindori. In seven districts of Madhya Pradesh the percentage who sought advice/treatment for ARI or fever is above 80 percent, in rest of the districts it varies from 35.0 percent to 78.8 percent (Table 5.13). FAMILY PLANNING AND CONTRACEPTIVE USE
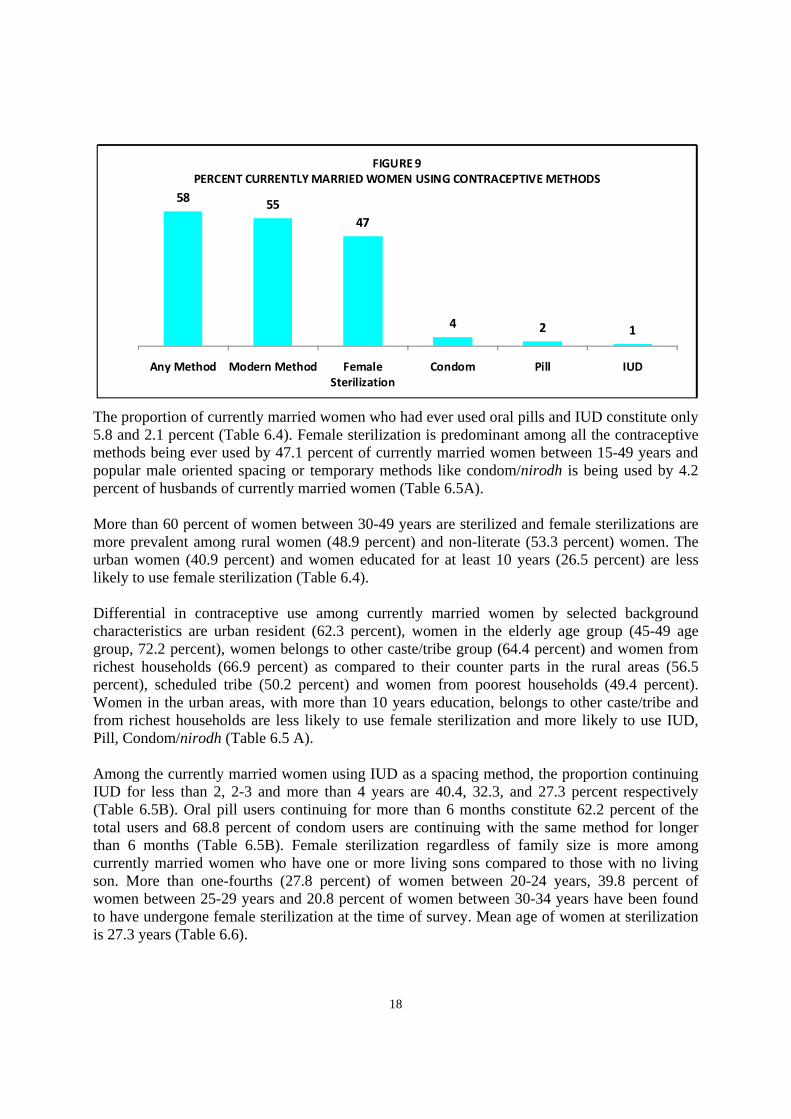
To achieve population stabilization and promote healthy married life, NRHM promotes contraceptive use on voluntary basis through a comprehensive package of improved accessibility and incentive programme. There is near universal awareness of sterilization for limiting and IUD, Pills and Condom for spacing of children among ever married and currently married women in Madhya Pradesh (Table 6.1). Female condom is least known among women with just 8.5 percent being aware of this contraceptive method. Emergency contraceptive pills, injectables, withdrawal and rhythm method were known to 28.5, 49.4, 28.8, and 38.9 percent of currently married women. Similar pattern of knowledge and awareness of different contraceptives are also found in all the districts of Madhya Pradesh (Table 6.3). Among the currently married women, the proportion using any modern method is 54.8 percent, while 63 percent of currently married women had ever used either modern or traditional methods (Table 6.5A) (Fig.9).
18
58 5547
4 2 1
Any Method Modern Method Female Sterilization
Condom Pill IUD
FIGURE 9PERCENT CURRENTLY MARRIED WOMEN USING CONTRACEPTIVE METHODS
The proportion of currently married women who had ever used oral pills and IUD constitute only 5.8 and 2.1 percent (Table 6.4). Female sterilization is predominant among all the contraceptive methods being ever used by 47.1 percent of currently married women between 15-49 years and popular male oriented spacing or temporary methods like condom/nirodh is being used by 4.2 percent of husbands of currently married women (Table 6.5A). More than 60 percent of women between 30-49 years are sterilized and female sterilizations are more prevalent among rural women (48.9 percent) and non-literate (53.3 percent) women. The urban women (40.9 percent) and women educated for at least 10 years (26.5 percent) are less likely to use female sterilization (Table 6.4). Differential in contraceptive use among currently married women by selected background characteristics are urban resident (62.3 percent), women in the elderly age group (45-49 age group, 72.2 percent), women belongs to other caste/tribe group (64.4 percent) and women from richest households (66.9 percent) as compared to their counter parts in the rural areas (56.5 percent), scheduled tribe (50.2 percent) and women from poorest households (49.4 percent). Women in the urban areas, with more than 10 years education, belongs to other caste/tribe and from richest households are less likely to use female sterilization and more likely to use IUD, Pill, Condom/nirodh (Table 6.5 A). Among the currently married women using IUD as a spacing method, the proportion continuing IUD for less than 2, 2-3 and more than 4 years are 40.4, 32.3, and 27.3 percent respectively (Table 6.5B). Oral pill users continuing for more than 6 months constitute 62.2 percent of the total users and 68.8 percent of condom users are continuing with the same method for longer than 6 months (Table 6.5B). Female sterilization regardless of family size is more among currently married women who have one or more living sons compared to those with no living son. More than one-fourths (27.8 percent) of women between 20-24 years, 39.8 percent of women between 25-29 years and 20.8 percent of women between 30-34 years have been found to have undergone female sterilization at the time of survey. Mean age of women at sterilization is 27.3 years (Table 6.6).
19
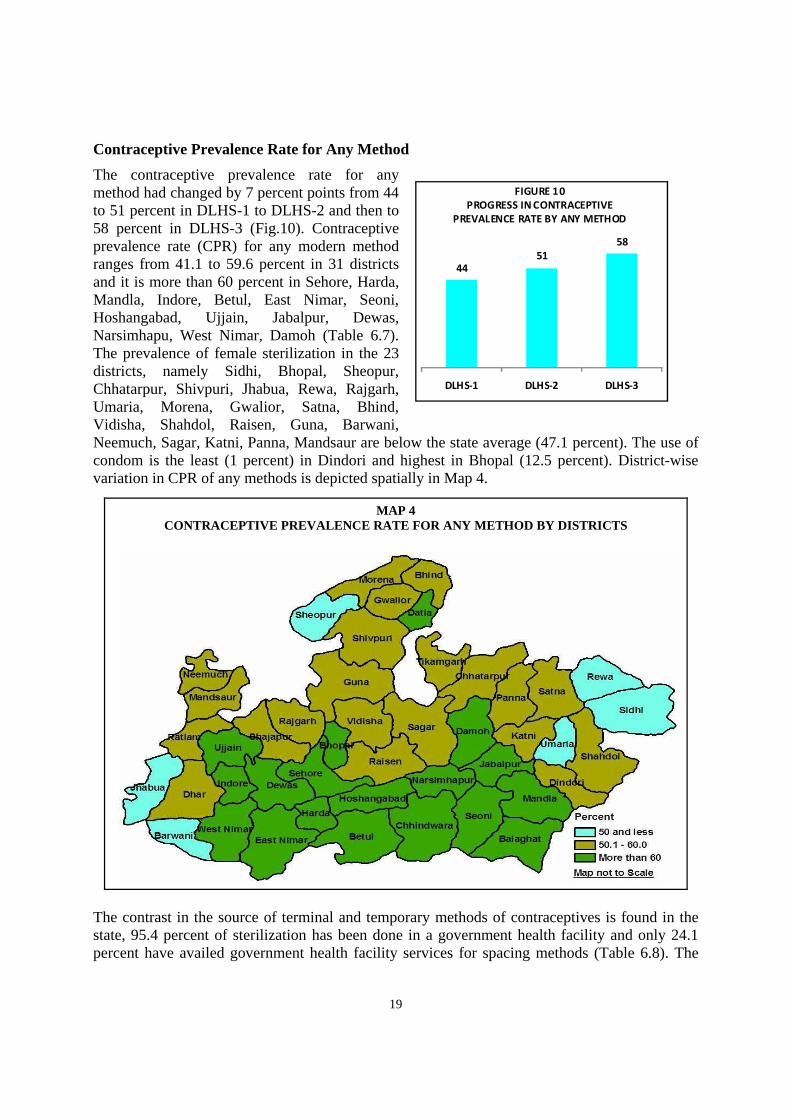
Contraceptive Prevalence Rate for Any Method
The contraceptive prevalence rate for any method had changed by 7 percent points from 44 to 51 percent in DLHS-1 to DLHS-2 and then to 58 percent in DLHS-3 (Fig.10). Contraceptive prevalence rate (CPR) for any modern method ranges from 41.1 to 59.6 percent in 31 districts and it is more than 60 percent in Sehore, Harda, Mandla, Indore, Betul, East Nimar, Seoni, Hoshangabad, Ujjain, Jabalpur, Dewas, Narsimhapu, West Nimar, Damoh (Table 6.7). The prevalence of female sterilization in the 23 districts, namely Sidhi, Bhopal, Sheopur, Chhatarpur, Shivpuri, Jhabua, Rewa, Rajgarh, Umaria, Morena, Gwalior, Satna, Bhind, Vidisha, Shahdol, Raisen, Guna, Barwani, Neemuch, Sagar, Katni, Panna, Mandsaur are below the state average (47.1 percent). The use of condom is the least (1 percent) in Dindori and highest in Bhopal (12.5 percent). District-wise variation in CPR of any methods is depicted spatially in Map 4.
The contrast in the source of terminal and temporary methods of contraceptives is found in the state, 95.4 percent of sterilization has been done in a government health facility and only 24.1 percent have availed government health facility services for spacing methods (Table 6.8). The
MAP 4 CONTRACEPTIVE PREVALENCE RATE FOR ANY METHOD BY DISTRICTS
4451
58
DLHS‐1 DLHS‐2 DLHS‐3
FIGURE 10PROGRESS IN CONTRACEPTIVE
PREVALENCE RATE BY ANY METHOD

20
21
18
DLHS‐2 DLHS‐3
FIGURE 11PROGRESS IN UNMET NEED FOR
CONTRACEPTION
high and low utilization rate of government health facility for limiting and spacing methods is true for all the districts of Madhya Pradesh. In Madhya Pradesh more than three-fourths (78.5 percent) of sterilized women and wives of sterilized men who had undergone sterilization three years preceding the survey got monetary compensation for sterilization and as much as 95.5 percent of them at the time of discharge. In Indore the lowest proportion is 52.9 percent and 92.9 percent in Dindori received cash benefits for sterilization (Table 6.9). In Madhya Pradesh, 33.2, 44.6 and 33.2 percents of sterilized women, users of IUD and Pills were informed about the side effects before the adoption and 18.7, 10.6 and 11.4 percent of women using the aforesaid methods have experienced side effects or health problems respectively (Table 6.10). The main health problems/side effects faced by women who have undergone sterilization are body/back ache (57.5 percent), abdominal pain (54.1 percent), weakness/inability to work (50.5 percent) followed by irregular periods (17.6 percent). For women using IUD, the main problem is irregular periods (43 percent), weakness/inability to work (35.5 percent), body/back ache (34.4 percent), abdominal pain (31.5 percent) followed by excessive bleeding (30.7 percent) and spotting (13.4 percent). Among the Pill users the main problem was dizziness (42.9 percent), weakness/inability to work (32.1 percent), and irregular periods (29.9 percent) followed by body/back ache (24.6 percent), Nausea/vomiting (21 percent) (Table 6.10). Among currently married women who have discontinued contraception the main reason cited was related to fertility (72.1 percent), while 9.7 percent mentioned side effects and 18.2 percent cited other reasons For younger women between 15-29 years reasons for discontinuation of contraception are mostly fertility related and it is also true for women with no living children or women having only one child (Table 6.11). Twenty-one percent of currently married women between 15-49 years not using any contraceptive method intend to adopt limiting and 1.3 percent spacing method in future (Table 6.12). Among the women who intended to adopt either limiting or spacing methods in future, 29.4 percent want to use it within 12 months and 17.8 percent want to use it after 12 months. The remaining 52.8 percent women are still undecided about the timing for adopting any family planning method. Unmet Need for Contraception
The total unmet need for contraception either for spacing or limiting is 18.1 percent. Currently married women physiologically fertile for conceiving and who want more children after two or more years are considered to have unmet need of contraceptive for spacing. The Unmet need for contraception during DLHS-2 to DLHS-3 has decreased from 21 percent to 18 percent as shown in the Fig. 11. In Madhya Pradesh, 7.8 and 10.3 percent of currently married women have unmet need for spacing and limiting respectively (Table 6.15). Unmet need for spacing is 29.3 percent for
women with one living child and in the range of 21.0-25.3 percents for women under 25 years.
21
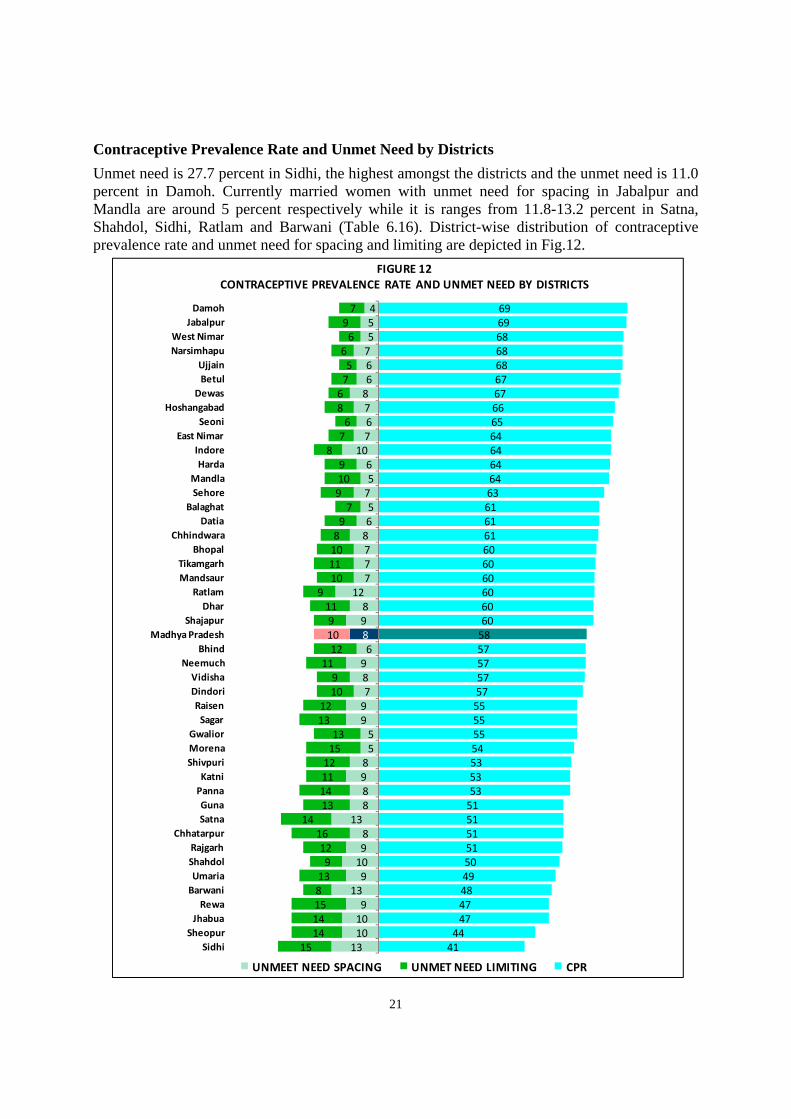
Contraceptive Prevalence Rate and Unmet Need by Districts Unmet need is 27.7 percent in Sidhi, the highest amongst the districts and the unmet need is 11.0 percent in Damoh. Currently married women with unmet need for spacing in Jabalpur and Mandla are around 5 percent respectively while it is ranges from 11.8-13.2 percent in Satna, Shahdol, Sidhi, Ratlam and Barwani (Table 6.16). District-wise distribution of contraceptive prevalence rate and unmet need for spacing and limiting are depicted in Fig.12.
1310109
1391098
13889855
997896898
12777865756
107678667554
1514141581391216
14131411121513
1312109
111210911
9101110897
9109
876
86756697
41444747484950515151515353535455555557575757586060606060606161616364646464656667676868686969
SidhiSheopurJhabuaRewa
BarwaniUmariaShahdolRajgarh
ChhatarpurSatnaGunaPannaKatni
ShivpuriMorenaGwalior
SagarRaisenDindoriVidisha
NeemuchBhind
Madhya PradeshShajapur
DharRatlam
MandsaurTikamgarh
BhopalChhindwara
DatiaBalaghatSehoreMandlaHardaIndore
East NimarSeoni
HoshangabadDewasBetulUjjain
NarsimhapuWest Nimar
JabalpurDamoh
FIGURE 12CONTRACEPTIVE PREVALENCE RATE AND UNMET NEED BY DISTRICTS
UNMEET NEED SPACING UNMET NEED LIMITING CPR

22
4622
159
2913
15181819
1415181819
1612
10 or more years5‐9 years
Less than five yearsNon‐literate
Education
UrbanRural
Residence
15+10‐145‐90‐4
Marital Duration
45‐4940‐4435‐3930‐3425‐2920‐2415‐19
Age Group
FIGURE 13HEARD ABOUT RTIs/STIs BY BACKGROUND
CHARACTERISTICS
On the other hand, currently married women who are still physiologically fertile for conceiving and want no more children are categorized as having unmet need for limiting. The unmet need of contraceptive for limiting is highest at 15.6 percent in Chhatapur and 5.2 percent (the lowest) in Ujjain (Table 6.16). It can be noted that unmet need for contraception is low for districts with higher contraceptive prevalence rates. REPRODUCTIVE HEALTH AND AWARENESS OF RTIs/STIs AND HIV/AIDS
RTIs/STIs
An integrated agenda of NRHM is to promote awareness and knowledge on RTIs/STIs and HIV/AIDS and to make health facilities accessible for checking and treatment seeking to ensure healthy sexual life, free from fatal infection. One of the responsibilities of health personnel is to provide correct knowledge of reproductive tract infection (RTI)/sexually transmitted infection (STI), HIV/AIDS and to encourage checking and treatment.
Among ever married women between 15-49 years, 27.4 percent have experienced one or the other menstruation related problems; largely painful periods (77.5 percent) high among women in the young age group, rural residents, newly married, non-literate to low educational level, scheduled tribe and women belonging from poorest households. Prolonged bleeding (11.7 percent), frequent or short periods (11.6 percent), blood clots/excessive bleeding (7.2 percent), scanty bleeding (10.6 percent) are invariant with the residence, educational level of the women (Table 7.1). Seventeen percent of ever married women have heard about RTIs/STIs and it is more often heard by urban women (29.4 percent), recently married (marital duration 0-4 months) women (18.5 percent), women with more than 10 years education (45.9 percent) and women married to more educated husbands (29.5 percent) than women living in rural areas (12.7 percent), non-literate (8.8 percent) and those married to non-literate husbands (8.1 percent) (Table 7.2) and also shown in Fig. 13. Women have heard about RTIs/STIs from multiple sources, 53.8,
44.9, 24.6, 16.8 and 15.0 percent from television (TV), relatives/friends, radio, print media, and health personnel respectively, but only 1.4 percent from school/adult education programmes (Table 7.2). Among those who have heard about RTIs/STIs, 59.2, 39.1, 30.0, 28.7, 19.9 and 17.8 percents have reported unsafe sex with persons who have many partners, unsafe delivery, unsafe sex with sex worker, unsafe abortion, unsafe sex with homosexuals, unsafe IUD insertion, respectively as the reasons for transmission of RTIs/STIs (Table 7.3). The knowledge about

23
transmission varies by residence, marital duration and educational attainment in favour of recently married and more educated urban women. One-quarter (25 percent) of ever married women between 15-49 years reported to have experienced abnormal vaginal discharge and 26.5 percent reported having symptoms of RTIs/STIs. Among the women who had any RTIs/STIs symptoms the prevalence of RTIs/STIs symptoms ranges from 8.9-0.7 percents, pain in lower abdomen not related to period, spotting after sexual intercourse (Table 7.4). Most of the women (74.9 percent) discussed RTIs/STIs related problems with their husbands and among the women having RTIs/STIs symptoms, 30.3 percent have taken treatment, mainly from private doctors (58.4 percent) and also from a government health facility (37.6 percent) (Table 7.5).
Rajgarh and Betul are the two extreme districts as far as ever married women who have heard about RTIs/STIs are concerned, with 5.0 and 44.3 percents having heard of it (Table 7.6). In the districts of Tikamgarh, Indore, Chhatarpur and Harda 30.1-41.8 percent of ever married women have heard about RTIs/STIs. Women who have reported having abnormal vaginal discharge and any symptom of RTIs/STIs in Balaghat are 8.5 and 15.6 percents respectively and in Sehore district, it is 40.4 and 37.1 percent respectively. In Chhatarpur, Datia, Tikamgarh, Shivpuri, Sheopur, Guna and Sidhi 10.5- 18.5 percent women sought for treatment for any RTIs/STIs and in Balaghat, Narsimhapur, Bhopal, Hoshangabad, Barwani and Indore 40.0-45.7 percent women sought treatment for the any symptoms of RTIs/STIs (Table 7.6). HIV/AIDS
Among the ever married women between 15-49 years, 32.0 percent have heard of HIV/AIDS and the source of HIV/AIDS information is mostly from TV (83.5 percent), Radio (40.3 percent), relatives/friends (24.1 percent), and print media (19.7 percent). About 11 percent have heard about it from their husbands and from health personnel. Unlike in the case of RTIs/STIs, school/adult education program (1.9 percent) and leaders/community meeting (3.6 percent) are not a rich source of knowledge for HIV/AIDS (Table 7.7). The main mode of transmission of HIV/AIDS reported by women are transfusion of infected blood (64.8 percent), unsafe sex with person having multiple partners (60.8 percent), mother to child (46.8 percent), unprotected sex with an HIV/AIDS infected person (45.7 percent), unsafe sex with sex worker (38.0 percent) and unsafe sex with homosexuals (21.2 percent) (Table 7.8). This is presented in Fig.14. The knowledge regarding the mode of transmission of HIV/AIDS is high among women with more than 10 years of education and women from the richest households (Table 7.8). In Dindori district women have least heard about HIV/AIDS (11.2 percent) and most women (72.5 percent) in Bhopal have heard of HIV/AIDS (Table 7.13). At the state level only 46.8 percent of women have the right knowledge regarding the possibility of transmission of HIV/AIDS from mother to child. Out of the 45 districts of Madhya Pradesh, only in eleven districts, namely West Nimar, Jabalpur, Neemuch, Barwani, Sidhi, Sheopur, Raisen, Satna, Chhindwara, Ujjain and Bhopal, more than half of women (50.2 - 64.7 percent) have this correct knowledge and just one-quarter (24.8 percent) of women in Shivpuri know that HIV/AIDS can be transmitted from mother to her child (Table 7.13).

24
65 61
47 4638
21
Transfusion of infected blood
Unsafe sex with person having many partners
Infected mother to child
Unprotected sex with HIV/AIDS infected person
Unsafe sex with sex workers
Unsafe sex with homosexuals
FIGURE 14KNOWLEDGE ABOUT MODE OF TRANSMISSION OF HIV/AIDS
Among women who have heard of HIV/AIDS and reported that transmission of HIV/AIDS can be prevented by having sex with one partner or avoiding sex with homosexuals constitute 56.9 percent, safe blood transmission or avoiding sex with persons who inject drugs comprises of 52.9 percent and using condom correctly in each sexual act makes up 47.9 percent (Table 7.9). The right knowledge that HIV/AIDS transmission can be prevented by using condom is least in Panna (18.7 percent) and highest in Guna (70.1 percent) (Table 7.13). The most common misconception about transmission of HIV/AIDS among the ever married women is that one can get HIV/AIDS from mosquito, flea or bug bites as reported by 12.6 percent of them (Table 7.10). This misconception is more among younger women, rural residents, and non-literate women. The proportion of women who have the misconception that HIV/AIDS can be transmitted by shaking hand and hugging, sharing clothes, sharing food and stepping on others urine/stool are 5.9, 7.5, 9.1 and 7.9 percent respectively (Table 7.10). Regardless of background characteristics, more than half of ever married women (52 percent) know the place where HIV/AIDS can be tested (Table 7.11). More than 60 percent of women in Tikamgarh, Panna, Shahdol, Chhindwara, Ujjain, East Nimar, Sagar, Katni, Mandla, Narsimhapur and Chhatarpur know the place for testing and 22.7- 39.1 percent of women in Guna, Dewas, Shivpuri, Morena, Dhar, Indore, Datia, Ratlam and Damoh are aware of the same (Table 7.13). Most women (66.6 percent) reported HIV/AIDS test can be done in a government hospital/dispensary followed by 22.2 percent reporting private hospital/clinic as the place for testing HIV/AIDS (Table 7.11). Just about 1.9 percent of ever married women have undergone HIV/AIDS test, among them 51.8 percent have done it more than a year ago and 48.2 percent in the last one year period (Table 7.12). INFERTILITY AND CHILDLESSNESS
Seven percent of ever married women age 15-49 years in Madhya Pradesh have infertility problem, and among them 5.1 and 1.8 percent had primary and secondary infertility respectively (Table 7.14). A sizeable 72.8 percent of ever married women reported to have experienced problems in conceiving for the first time, 12.1 percent had problems conceiving after still/live birth and 6.4 percent after undergoing induced abortion (Table 7.14). More than 40 percent of
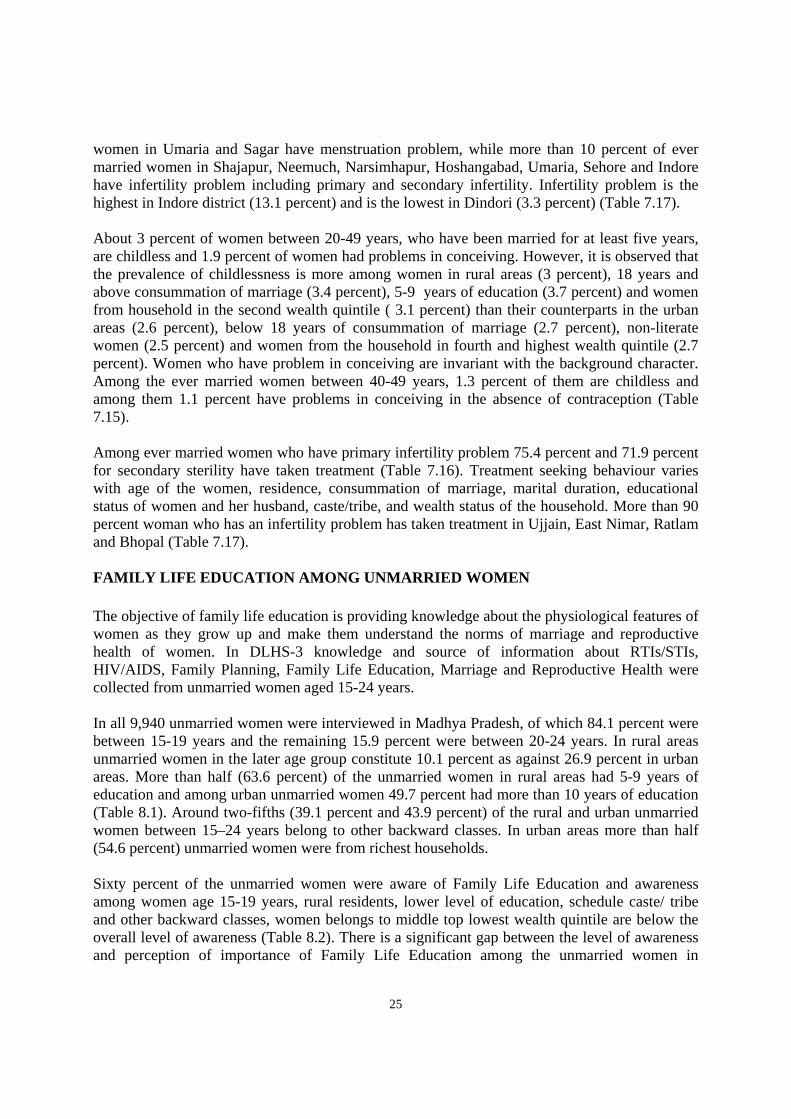
25
women in Umaria and Sagar have menstruation problem, while more than 10 percent of ever married women in Shajapur, Neemuch, Narsimhapur, Hoshangabad, Umaria, Sehore and Indore have infertility problem including primary and secondary infertility. Infertility problem is the highest in Indore district (13.1 percent) and is the lowest in Dindori (3.3 percent) (Table 7.17). About 3 percent of women between 20-49 years, who have been married for at least five years, are childless and 1.9 percent of women had problems in conceiving. However, it is observed that the prevalence of childlessness is more among women in rural areas (3 percent), 18 years and above consummation of marriage (3.4 percent), 5-9 years of education (3.7 percent) and women from household in the second wealth quintile ( 3.1 percent) than their counterparts in the urban areas (2.6 percent), below 18 years of consummation of marriage (2.7 percent), non-literate women (2.5 percent) and women from the household in fourth and highest wealth quintile (2.7 percent). Women who have problem in conceiving are invariant with the background character. Among the ever married women between 40-49 years, 1.3 percent of them are childless and among them 1.1 percent have problems in conceiving in the absence of contraception (Table 7.15). Among ever married women who have primary infertility problem 75.4 percent and 71.9 percent for secondary sterility have taken treatment (Table 7.16). Treatment seeking behaviour varies with age of the women, residence, consummation of marriage, marital duration, educational status of women and her husband, caste/tribe, and wealth status of the household. More than 90 percent woman who has an infertility problem has taken treatment in Ujjain, East Nimar, Ratlam and Bhopal (Table 7.17). FAMILY LIFE EDUCATION AMONG UNMARRIED WOMEN
The objective of family life education is providing knowledge about the physiological features of women as they grow up and make them understand the norms of marriage and reproductive health of women. In DLHS-3 knowledge and source of information about RTIs/STIs, HIV/AIDS, Family Planning, Family Life Education, Marriage and Reproductive Health were collected from unmarried women aged 15-24 years. In all 9,940 unmarried women were interviewed in Madhya Pradesh, of which 84.1 percent were between 15-19 years and the remaining 15.9 percent were between 20-24 years. In rural areas unmarried women in the later age group constitute 10.1 percent as against 26.9 percent in urban areas. More than half (63.6 percent) of the unmarried women in rural areas had 5-9 years of education and among urban unmarried women 49.7 percent had more than 10 years of education (Table 8.1). Around two-fifths (39.1 percent and 43.9 percent) of the rural and urban unmarried women between 15–24 years belong to other backward classes. In urban areas more than half (54.6 percent) unmarried women were from richest households. Sixty percent of the unmarried women were aware of Family Life Education and awareness among women age 15-19 years, rural residents, lower level of education, schedule caste/ tribe and other backward classes, women belongs to middle top lowest wealth quintile are below the overall level of awareness (Table 8.2). There is a significant gap between the level of awareness and perception of importance of Family Life Education among the unmarried women in
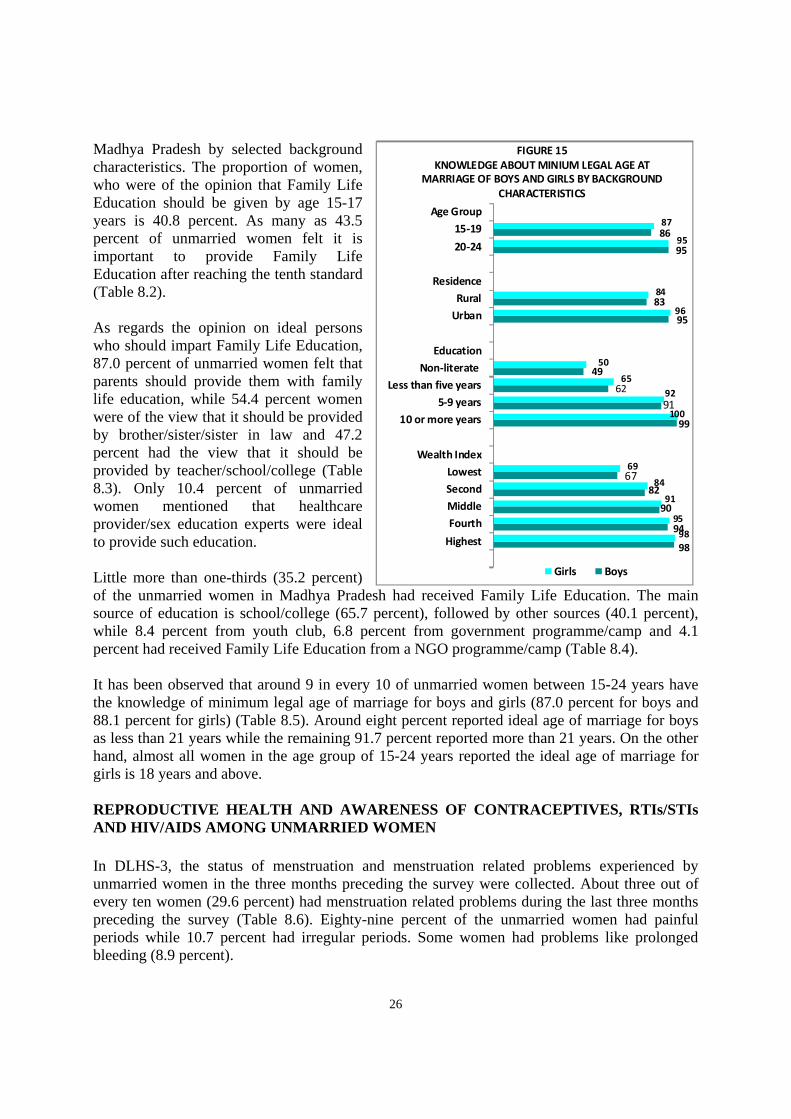
26
98
94
90
8267
99
9162
49
95
83
95
86
98
95
91
84
69
100
9265
50
96
84
95
87
Highest
FourthMiddleSecondLowest
Wealth Index
10 or more years5‐9 years
Less than five yearsNon‐literate
Education
Urban
RuralResidence
20‐24
15‐19
Age Group
FIGURE 15KNOWLEDGE ABOUT MINIUM LEGAL AGE AT
MARRIAGE OF BOYS AND GIRLS BY BACKGROUND CHARACTERISTICS
Girls Boys
Madhya Pradesh by selected background characteristics. The proportion of women, who were of the opinion that Family Life Education should be given by age 15-17 years is 40.8 percent. As many as 43.5 percent of unmarried women felt it is important to provide Family Life Education after reaching the tenth standard (Table 8.2). As regards the opinion on ideal persons who should impart Family Life Education, 87.0 percent of unmarried women felt that parents should provide them with family life education, while 54.4 percent women were of the view that it should be provided by brother/sister/sister in law and 47.2 percent had the view that it should be provided by teacher/school/college (Table 8.3). Only 10.4 percent of unmarried women mentioned that healthcare provider/sex education experts were ideal to provide such education. Little more than one-thirds (35.2 percent) of the unmarried women in Madhya Pradesh had received Family Life Education. The main source of education is school/college (65.7 percent), followed by other sources (40.1 percent), while 8.4 percent from youth club, 6.8 percent from government programme/camp and 4.1 percent had received Family Life Education from a NGO programme/camp (Table 8.4). It has been observed that around 9 in every 10 of unmarried women between 15-24 years have the knowledge of minimum legal age of marriage for boys and girls (87.0 percent for boys and 88.1 percent for girls) (Table 8.5). Around eight percent reported ideal age of marriage for boys as less than 21 years while the remaining 91.7 percent reported more than 21 years. On the other hand, almost all women in the age group of 15-24 years reported the ideal age of marriage for girls is 18 years and above. REPRODUCTIVE HEALTH AND AWARENESS OF CONTRACEPTIVES, RTIs/STIs AND HIV/AIDS AMONG UNMARRIED WOMEN
In DLHS-3, the status of menstruation and menstruation related problems experienced by unmarried women in the three months preceding the survey were collected. About three out of every ten women (29.6 percent) had menstruation related problems during the last three months preceding the survey (Table 8.6). Eighty-nine percent of the unmarried women had painful periods while 10.7 percent had irregular periods. Some women had problems like prolonged bleeding (8.9 percent).
27
The practices followed during menstruation period are important from the consideration of RTI and personal hygiene. Currently menstruating women were asked about the practices followed during the menstrual period. Almost all women (90.0 percent) of the currently menstruating unmarried women used cloths while 9.4 percent use sanitary napkins and 7.7 percent used locally prepared napkins (Table 8.7). Education on contraceptive means and methods is an integral component of Family Life Education besides the knowledge acquired from exposure to mass media. It is imperative to assess the knowledge of contraceptive means and methods among unmarried women. About 71.2 percent of unmarried women between 15-24 years had the knowledge of male sterilization and 88.4 percent had knowledge of female sterilization (Table 8.8). Regarding spacing methods, 71.1 percent had knowledge of pills, 53.1 percent had knowledge of condom/nirodh and 38.7 percent had knowledge of IUD. Little more than one-forth of unmarried women had knowledge of emergency contraception and about two-fifths have knowledge about injectables (25.6 and 39.9 percents respectively). Information was sought from the sampled unmarried women about the places from where one can get pills and condoms. About two-thirds (62.1 percent) women were of the opinion that pills and condoms can be obtained from government health facilities and another 39.6 percent said it can be had from private facility too (Table 8.9). The unmarried women were further asked about their involvement in discussion on family planning. It has been found that 16.3 percent women had ever discussed about family planning with anyone. More than one-fourths (27.7 percent) had discussed with parents, 49.8 percent had discussed with brother/sister/sister-in-law, 73.3 percent with friends/peers, and more than 8.2 percent had discussed with teacher/school/college (Table 8.10). About one-fifths (19.3 percent) of unmarried women had heard of RTIs/STIs (Table 8.11). Majority (68.3 percent) of unmarried women know about RTIs/STIs from television, 39 percent know about RTIs/STIs from newspaper/books/magazines, about one-third know about RTIs/STIs from radio, 31.7 percent knew about RTIs/STIs from relatives/friends. Another 22 percent among unmarried women reported that they knew about RTIs/STIs from adult education programme/school teachers. The other sources of information are cinema, health personnel, partner, and religious/political leader/community meetings/exhibition/mela (Table 8.11). About two-thirds (64.6 percent) of women mentioned that RTIs/STIs can be transmitted through unsafe sex with persons who have many partners, around one-fourth (24.6 percent) were of the opinion that it can be transmitted through unsafe sex with homosexuals. The proportions of unmarried women were of the view that RTIs/STIs can be transmitted through unsafe delivery; unsafe abortion and unsafe IUD insertion are 33, 25.5 and 14.2 percent respectively (Table 8.12). More than 60 percent of unmarried women had ever heard of HIV/AIDS (Table 8.13). More than four-fifths (82.8 percent) off women knew about HIV/AIDS from TV, 42 percent from radio, 41.1 percent from newspaper books/magazines, while 9.1, 7.7 and 1.3 percent from cinema, health personnel and adult education programme. Among them about 74.5 percent said that HIV/AIDS can be transmitted through transfusion of blood, 54.7 percent said through unsafe sex with persons who have many partners, 53.1 percent said from infected mother to child, 44.3 percent said through unprotected sex with HIV/AIDS infected person (Table 8.14). Around one-

28
third were of the opinion that it can be transmitted through unsafe sex with sex workers and 20.1 percent said through unsafe sex with homosexual. There are many misconceptions about transmission of HIV/AIDS. Thirteen percent of unmarried women were of the view that one can get HIV/AIDS by mosquito/flea or bedbug bites, 6.7- 8.8 percent were of view that one can get HIV/AIDS by stepping on urine/stools of someone who has AIDS, by sharing food with them or by kissing or hugging (Table 8.15). These women were further asked about how to avoid or reduce the chances of getting HIV/AIDS. More than half of the women (58.3 percent) feel that it can be avoided by limiting sex with one who injects drugs, 46.8 percent feel they could avoid by limiting the number of sexual partners and avoid sex with sex workers, 40.3 percent feel that the correct use of condom during each sexual act many reduce chance of infecting HIV/AIDS (Table 8.16). About one-thirds (30.5 percent) of women said avoidance of pregnancy when having HIV/AIDS and 26.6 percent feel abstaining from sex may also reduce the chances of infection of HIV/AIDS (Table 8.16). In Madhya Pradesh 58.2 percent of women were aware of the place where HIV/AIDS could be tested (Table 8.17). They knew that it can be done at government/private hospitals, CHC/PHC/Sub-Centre and VCTC/ICTC clinics. Unmarried women knew that it was possible to know the sex of the baby before the baby was born by a medical test (Table 8.18). They also knew that pregnancy cannot occur after kissing or hugging. While more than one-fourth women knew that it can occur when a women has intercourse. One in every nine women (11.8 percent) were of the opinion that a woman was most likely to get pregnant if she had sexual intercourse half way between her periods.
HEALTH FACILITIES - AVAILABILITY AND QUALITY
Health Facility Survey is a companion survey of the household survey in DLHS-3. It includes Sub-Centres, Primary Health Centres (PHC) and Community Health Centres (CHC) which cater to the RCH services of sampled villages. The basic objective of facility survey is to collect data on health personnel, availability of drugs/medicines, equipments, basic RCH care amenities, communication means and infrastructures at the level of Sub-Centre, PHC and CHC, in order to assess the adequacy of RCH services in rural areas. The average sampled rural population served per Sub-Centre, PHC and CHC in Madhya Pradesh are 5,912; 43,390; and 149,413 respectively (Table 9.1). In all 1,718 villages were surveyed in DLHS-3 and the RCH services of these sampled villages were catered by 1,362 Sub-Centres, 476 PHCs and 259 CHCs (Table 9.2 through Table 9.10). One-fourths (25.6 percent) of sampled villages have Sub-Centre within the villages, while the corresponding proportion is 14.6 and 42.9 percent in Damoh and Dhar respectively (Table 9.2). More than 90 percent of sampled Sub-Centre have an ANM/Female Health Worker (FHW) in position and 63.9 percent of sampled Sub-Centre had an ANM/FHW residing in Sub-Centre quarter. Out of sampled 35 Sub-Centres in Bhind which have ANMs in position, only 13.6 percent of the ANMs reside in Sub-Centre quarter while in all sampled Sub-Centres, of Shajapur, Indore, East Nimar, and Harda ANMs stay in Sub-Centre quarter. Out of the 757 sampled Sub-Centres in public building only 49 (6.5 percent) Sub-Centres have regular electricity. In Bhind, Jhabua, Morena, Seoni and West Nimar the regular electricity connections ranges from 4.3-5.3
29
percents and it is 46.2 percent in Katni. In 420 (55.5 percent) of the Sub-Centres located in government buildings have labour rooms and out of this only 60 (14.3 percent) of the labour rooms are currently in use (Table 9.3). In the sampled Sub-Centres of Dindori there was no labour room. There is toilet facility in 554 (73.2 percent) of the sampled Sub-Centres located in public buildings and more than two-thirds (66.7 percent) of Sub-Centres house in government buildings have provision for water. In order to assess the adequacy of the equipments in the sampled Sub-Centres, the Sub-Centres having 60 percent of essential equipments for RCH services are categorized as adequately equipped, otherwise inadequately equipped. A similar categorization of Sub-Centres having adequate stock of essential drugs for RCH services is followed. Distribution of adequately equipped Sub-Centres and Sub-Centres having adequate stock of essential drugs by districts are shown in Table 9.4. It is being noted that 1259 (92.4 percent) of the sampled Sub-Centres in Madhya Pradesh are adequately equipped and in the districts of Datia, Neemuch, Ratlam, Rajgarh, Vidisha, Bhopal, Betul, Jabalpur and Mandla, hundred percent adequacy of equipments in the sampled Sub-Centres were observed. On the other hand, 1275 (93.7 percent) of the sampled Sub-Centres have adequate stock/supply of essential drugs for RCH services except in nine districts of Tikamgarh, Katni, Damoh, Bhind, Rajgarh, West Nimar, Panna, Harda and Sheopur where the sampled Sub-Centres have 71.9 - 89.7 percent adequacy of essential drugs. Citizen’s charter is displayed in 40 percent of the sampled 545 Sub-Centres (Table 9.5). The proportion of sampled Sub-Centres facilitated by Village Health & Sanitation Committee (VHSC) and those that received untied funds is 78.8 and 86.8 percent respectively. There are PHCs serving 8-19 sampled villages in Bhopal, Indore, Gwalior, Jabalpur and East Nimar (Table 9.6). There is no Lady Medical Officer (LMO) in the sampled PHC from Sheopur, Shivpuri, Damoh, Umaria, Sidhi, Mandsaur, Ujjain, Rajgarh, Sehore, Betul, Hoshangabad, Katni, Narsimhapur, Dindori and Balaghat (Table 9.6). There are LMOs in position in 64 (13.5 percent) of the 476 sampled PHCs, Medical Officers (MO) in position in 314 (66 percent) in the sampled PHCs, only 40 (8.4 percent) PHCs there are AYUSH doctor in position and 153 (32.1 percent) Pharmacist are in position of the sampled PHCs. About two-thirds (63.5 percent) of the 476 sampled PHCs have residential quarters available for MO (Table 9.7). Among the 476 sampled PHCs 347, (73 percent) PHCs were functioning 24 hours. More than two-thirds (66.6 percent) of the sampled PHCs catering to the sampled villages have at least 4 beds and such facilities are available in all the districts. In contrast to the condition of Sub-Centre, 97 (20.4 percent) sampled PHCs have regular power supply and only 138 (29 percent) have functional vehicles. New born care equipments are available in 30 percent of the sampled PHCs, 78.4 percent have functional OTs and 67.7 percent provide referral services for delivery (Table 9.8). More than half (52.7 percent) of the PHCs in Madhya Pradesh have at least 60 percent of essential drugs and about half of the PHCs (49.4 percent) have at least 60 percent cold storage systems. More than four-fifths (82.1 percent) of the PHCs in all the districts have conducted at least 10 deliveries in the last one month. Untied funds have been utilized by 358 of the 475 sampled PHCs and all sampled PHCs in Sagar, Ratlam, Shajapur and Indore have utilized untied funds, Rogi Kalyan

30
Samiti (RKS) have been constituted in 432 (90.8 percent) of the sampled 476 PHCs and Citizen’s Charter displayed in 265 (55.7 percent) of sampled PHCs. The distribution of 259 sampled CHCs among the districts in Madhya Pradesh is uneven with Chhindwara having 13 of them and just 2 in Datia, Bhopal and Harda (Table 9.10). In Datia, Bhopal, Harda, Umaria, Raisen, Chhatarpur, Panna, Ratlam, West Nimar, Hoshangabad, Katni, Shivpuri, Tikamgarh, Damoh, Satna, Vidisha, Dindori, Seoni, Shajapur, East Nimar, Betul and Sidhi of the sampled CHCs serving the sampled villages have no gynaecologists in position and only in 41 (15.8 percent) CHCs have gynaecologists. The proportion of sampled CHCs which have a Paediatrician, Anaesthetist and Health Manager are 18.5, 10.4 and 9.3 percent respectively. In 10 districts of Madhya Pradesh of the sampled CHCs which provide RCH services to the sampled villages has blood storage facility (Table 9.11). For the state as a whole only 10 (6.3 percent) of the sampled 259 CHCs have blood storage facility. All the sampled CHCs in Morena, Guna and East Nimar to name a few, are designated FRUs and overall 61.4 percent of the sampled CHCs in Madhya Pradesh are designated FRUs. Out of the 259 sampled CHCs, 183 (70.7 percent), 137 (86.2 percent) and 131(50.6 percent) have functional OTs, new born care and low birth weight (LBW) management facilities (Table 9.11). Out of the sampled 259 CHCs, 96.9 percent of sampled CHCs, RKS has been constituted and 97.6 percent of the constituted RKS are monitored regularly (Table 9.12).
RESPONSE RATES AND DEMOGRAPHIC INDICATORS

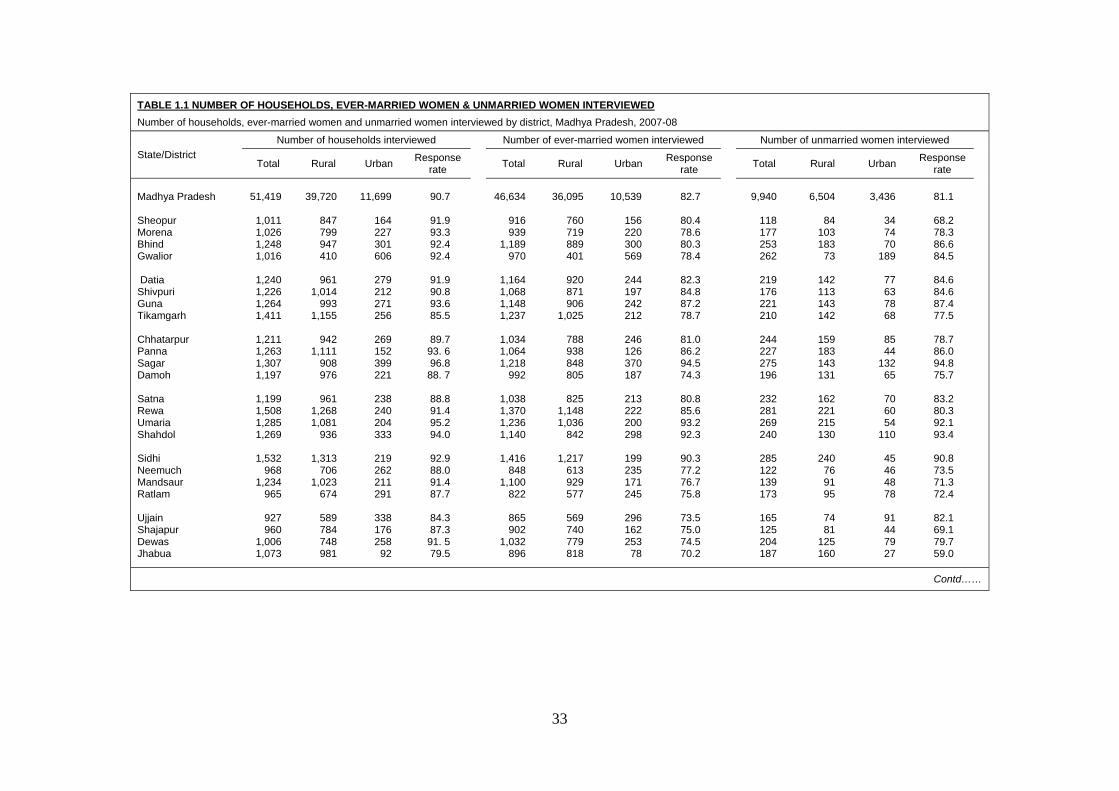
33
TABLE 1.1 NUMBER OF HOUSEHOLDS, EVER-MARRIED WOMEN & UNMARRIED WOMEN INTERVIEWED Number of households, ever-married women and unmarried women interviewed by district, Madhya Pradesh, 2007-08
State/District Number of households interviewed
Number of ever-married women interviewed
Number of unmarried women interviewed
Total Rural Urban Response rate Total Rural Urban Response
rate Total Rural Urban Response rate
Madhya Pradesh Sheopur Morena Bhind Gwalior Datia Shivpuri Guna Tikamgarh Chhatarpur Panna Sagar Damoh Satna Rewa Umaria Shahdol Sidhi Neemuch Mandsaur Ratlam Ujjain Shajapur Dewas Jhabua
51,419
1,011
1,026 1,248 1,016
1,240 1,226 1,264 1,411
1,211 1,263 1,307 1,197
1,199 1,508 1,285 1,269
1,532
968 1,234
965
927 960
1,006 1,073
39,720
847 799 947 410
961
1,014 993
1,155
942 1,111
908 976
961
1,268 1,081
936
1,313 706
1,023 674
589 784 748 981
11,699
164 227 301 606
279 212 271 256
269 152 399 221
238 240 204 333
219 262 211 291
338 176 258
92
90.7
91.9 93.3 92.4 92.4
91.9 90.8 93.6 85.5
89.7
93. 6 96.8
88. 7
88.8 91.4 95.2 94.0
92.9 88.0 91.4 87.7
84.3 87.3
91. 5 79.5
46,634
916 939
1,189 970
1,164 1,068 1,148 1,237
1,034 1,064 1,218
992
1,038 1,370 1,236 1,140
1,416
848 1,100
822
865 902
1,032 896
36,095
760 719 889 401
920 871 906
1,025
788 938 848 805
825
1,148 1,036
842
1,217 613 929 577
569 740 779 818
10,539
156 220 300 569
244 197 242 212
246 126 370 187
213 222 200 298
199 235 171 245
296 162 253
78
82.7
80.4 78.6 80.3 78.4
82.3 84.8 87.2 78.7
81.0 86.2 94.5 74.3
80.8 85.6 93.2 92.3
90.3 77.2 76.7 75.8
73.5 75.0 74.5 70.2
9,940
118
177 253 262
219 176 221 210
244 227 275 196
232 281 269 240
285 122 139 173
165 125 204 187
6,504
84
103 183
73
142 113 143 142
159 183 143 131
162 221 215 130
240
76 91 95
74 81
125 160
3,436
34 74 70
189
77 63 78 68
85 44
132 65
70 60 54
110
45 46 48 78
91 44 79 27
81.1
68.2 78.3 86.6 84.5
84.6 84.6 87.4 77.5
78.7 86.0 94.8 75.7
83.2 80.3 92.1 93.4
90.8 73.5 71.3 72.4
82.1 69.1 79.7 59.0
Contd……
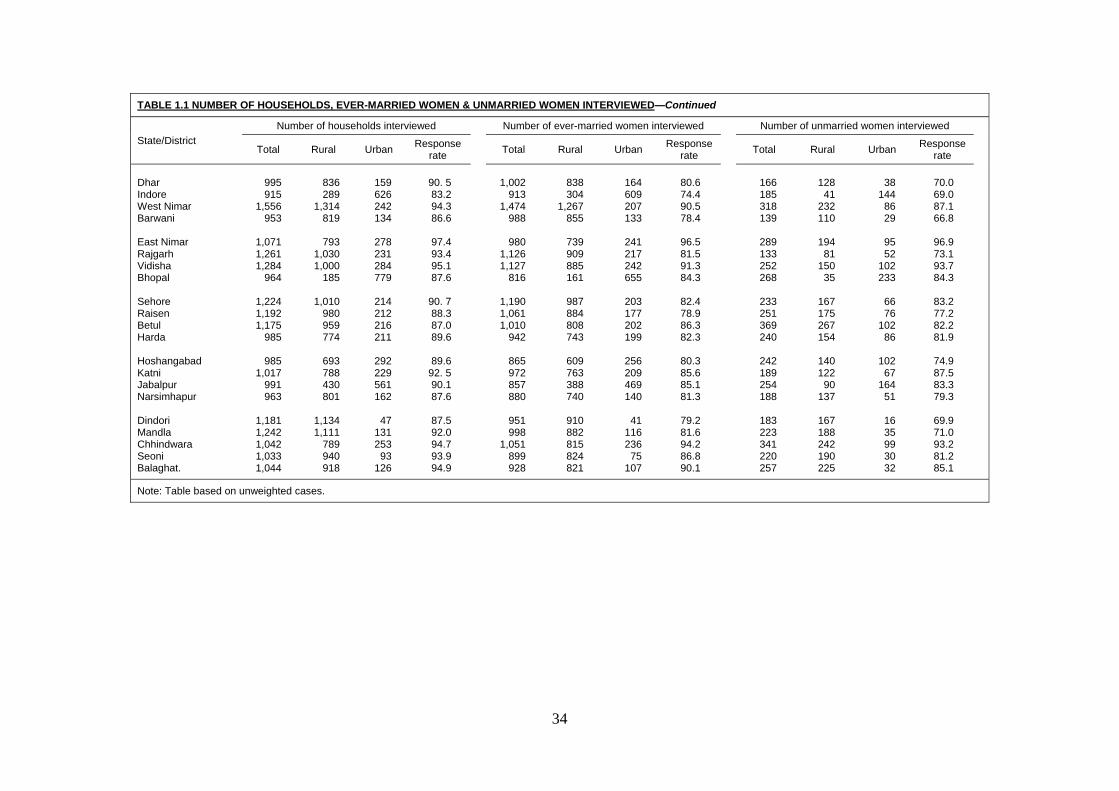
34
TABLE 1.1 NUMBER OF HOUSEHOLDS, EVER-MARRIED WOMEN & UNMARRIED WOMEN INTERVIEWED—Continued
State/District Number of households interviewed
Number of ever-married women interviewed
Number of unmarried women interviewed
Total Rural Urban Response rate Total Rural Urban Response
rate Total Rural Urban Response rate
Dhar Indore West Nimar Barwani East Nimar Rajgarh Vidisha Bhopal Sehore Raisen Betul Harda Hoshangabad Katni Jabalpur Narsimhapur Dindori Mandla Chhindwara Seoni Balaghat.
995 915
1,556 953
1,071 1,261 1,284
964
1,224 1,192 1,175
985
985 1,017
991 963
1,181 1,242 1,042 1,033 1,044
836 289
1,314 819
793
1,030 1,000
185
1,010 980 959 774
693 788 430 801
1,134 1,111
789 940 918
159 626 242 134
278 231 284 779
214 212 216 211
292 229 561 162
47
131 253
93 126
90. 5 83.2 94.3 86.6
97.4 93.4 95.1 87.6
90. 7 88.3 87.0 89.6
89.6
92. 5 90.1 87.6
87.5 92.0 94.7 93.9 94.9
1,002
913 1,474
988
980 1,126 1,127
816
1,190 1,061 1,010
942
865 972 857 880
951 998
1,051 899 928
838 304
1,267 855
739 909 885 161
987 884 808 743
609 763 388 740
910 882 815 824 821
164 609 207 133
241 217 242 655
203 177 202 199
256 209 469 140
41
116 236
75 107
80.6 74.4 90.5 78.4
96.5 81.5 91.3 84.3
82.4 78.9 86.3 82.3
80.3 85.6 85.1 81.3
79.2 81.6 94.2 86.8 90.1
166 185 318 139
289 133 252 268
233 251 369 240
242 189 254 188
183 223 341 220 257
128
41 232 110
194
81 150
35
167 175 267 154
140 122
90 137
167 188 242 190 225
38
144 86 29
95 52
102 233
66 76
102 86
102
67 164
51
16 35 99 30 32
70.0 69.0 87.1 66.8
96.9 73.1 93.7 84.3
83.2 77.2 82.2 81.9
74.9 87.5 83.3 79.3
69.9 71.0 93.2 81.2 85.1
Note: Table based on unweighted cases.
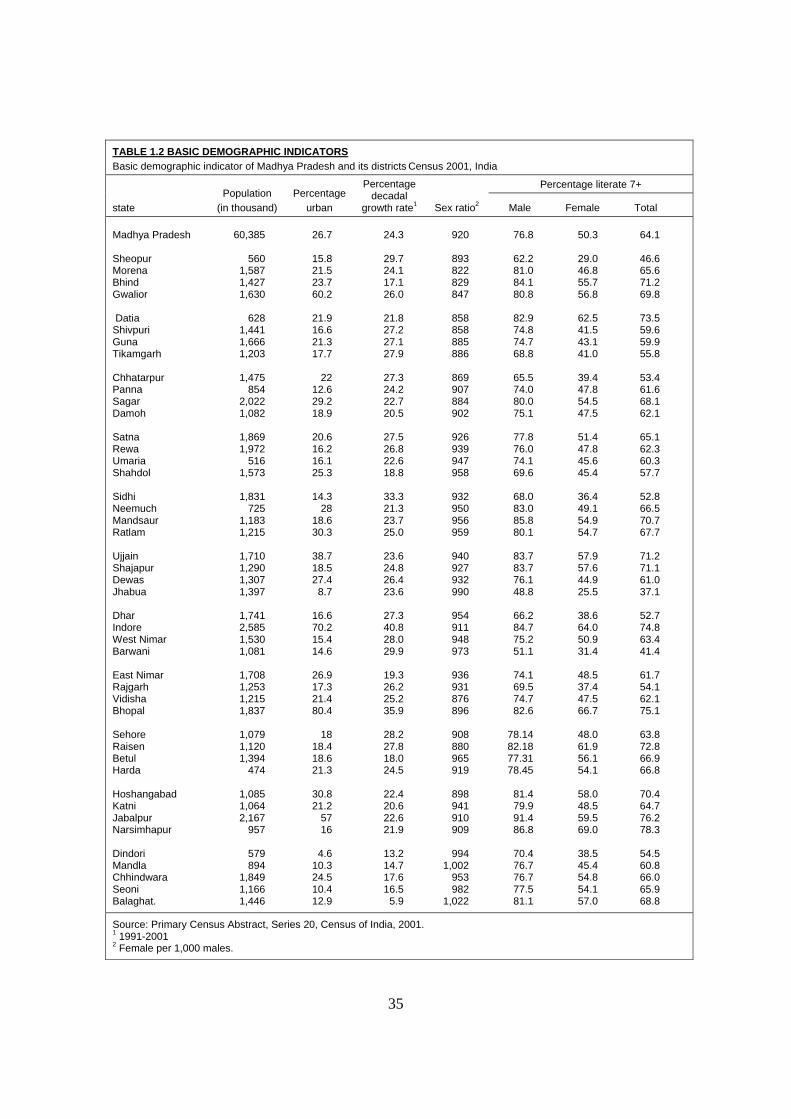
35
TABLE 1.2 BASIC DEMOGRAPHIC INDICATORS Basic demographic indicator of Madhya Pradesh and its districts Census 2001, India
state Population
(in thousand) Percentage
urban
Percentage decadal
growth rate1 Sex ratio2
Percentage literate 7+
Male Female Total
Madhya Pradesh Sheopur Morena Bhind Gwalior Datia Shivpuri Guna Tikamgarh Chhatarpur Panna Sagar Damoh Satna Rewa Umaria Shahdol Sidhi Neemuch Mandsaur Ratlam Ujjain Shajapur Dewas Jhabua Dhar Indore West Nimar Barwani East Nimar Rajgarh Vidisha Bhopal Sehore Raisen Betul Harda Hoshangabad Katni Jabalpur Narsimhapur Dindori Mandla Chhindwara Seoni Balaghat.
60,385
560
1,587 1,427 1,630
628
1,441 1,666 1,203
1,475
854 2,022 1,082
1,869 1,972
516 1,573
1,831
725 1,183 1,215
1,710 1,290 1,307 1,397
1,741 2,585 1,530 1,081
1,708 1,253 1,215 1,837
1,079 1,120 1,394
474
1,085 1,064 2,167
957
579 894
1,849 1,166 1,446
26.7
15.8 21.5 23.7 60.2
21.9 16.6 21.3 17.7
22
12.6 29.2 18.9
20.6 16.2 16.1 25.3
14.3
28 18.6 30.3
38.7 18.5 27.4
8.7
16.6 70.2 15.4 14.6
26.9 17.3 21.4 80.4
18
18.4 18.6 21.3
30.8 21.2
57 16
4.6
10.3 24.5 10.4 12.9
24.3
29.7 24.1 17.1 26.0
21.8 27.2 27.1 27.9
27.3 24.2 22.7 20.5
27.5 26.8 22.6 18.8
33.3 21.3 23.7 25.0
23.6 24.8 26.4 23.6
27.3 40.8 28.0 29.9
19.3 26.2 25.2 35.9
28.2 27.8 18.0 24.5
22.4 20.6 22.6 21.9
13.2 14.7 17.6 16.5
5.9
920
893 822 829 847
858 858 885 886
869 907 884 902
926 939 947 958
932 950 956 959
940 927 932 990
954 911 948 973
936 931 876 896
908 880 965 919
898 941 910 909
994
1,002 953 982
1,022
76.8
62.2 81.0 84.1 80.8
82.9 74.8 74.7 68.8
65.5 74.0 80.0 75.1
77.8 76.0 74.1 69.6
68.0 83.0 85.8 80.1
83.7 83.7 76.1 48.8
66.2 84.7 75.2 51.1
74.1 69.5 74.7 82.6
78.14 82.18 77.31 78.45
81.4 79.9 91.4 86.8
70.4 76.7 76.7 77.5 81.1
50.3
29.0 46.8 55.7 56.8
62.5 41.5 43.1 41.0
39.4 47.8 54.5 47.5
51.4 47.8 45.6 45.4
36.4 49.1 54.9 54.7
57.9 57.6 44.9 25.5
38.6 64.0 50.9 31.4
48.5 37.4 47.5 66.7
48.0 61.9 56.1 54.1
58.0 48.5 59.5 69.0
38.5 45.4 54.8 54.1 57.0
64.1
46.6
65.6 71.2 69.8
73.5 59.6 59.9 55.8
53.4 61.6 68.1 62.1
65.1 62.3 60.3 57.7
52.8 66.5 70.7 67.7
71.2 71.1 61.0 37.1
52.7 74.8 63.4 41.4
61.7 54.1 62.1 75.1
63.8 72.8 66.9 66.8
70.4 64.7 76.2 78.3
54.5 60.8 66.0 65.9 68.8
Source: Primary Census Abstract, Series 20, Census of India, 2001. 1 1991-2001 2 Female per 1,000 males.

BACKGROUND CHARACTERISTICS OF HOUSEHOLDS

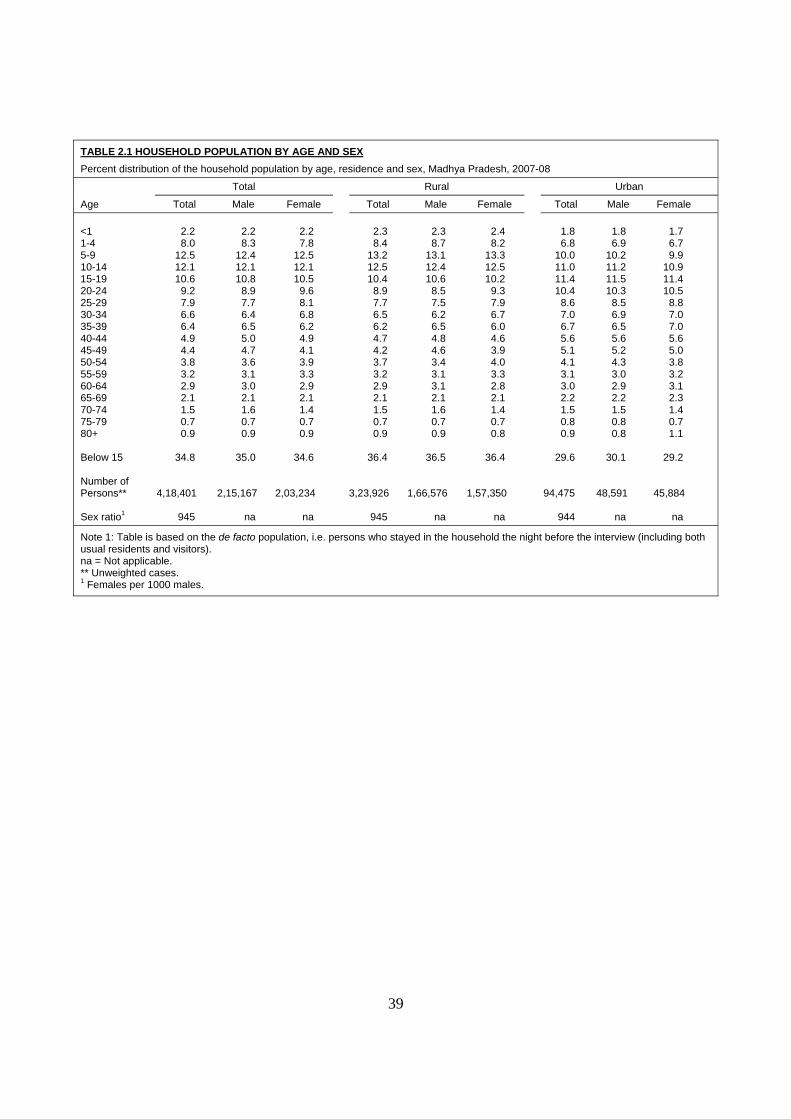
39
TABLE 2.1 HOUSEHOLD POPULATION BY AGE AND SEX Percent distribution of the household population by age, residence and sex, Madhya Pradesh, 2007-08
Age
Total Rural Urban
Total Male Female Total Male Female Total Male Female <1 1-4 5-9 10-14 15-19 20-24 25-29 30-34 35-39 40-44 45-49 50-54 55-59 60-64 65-69 70-74 75-79 80+ Below 15 Number of Persons** Sex ratio1
2.2 8.0
12.5 12.1 10.6
9.2 7.9 6.6 6.4 4.9 4.4 3.8 3.2 2.9 2.1 1.5 0.7 0.9
34.8
4,18,401
945
2.2 8.3
12.4 12.1 10.8
8.9 7.7 6.4 6.5 5.0 4.7 3.6 3.1 3.0 2.1 1.6 0.7 0.9
35.0
2,15,167
na
2.2 7.8
12.5 12.1 10.5
9.6 8.1 6.8 6.2 4.9 4.1 3.9 3.3 2.9 2.1 1.4 0.7 0.9
34.6
2,03,234
na
2.3 8.4
13.2 12.5 10.4
8.9 7.7 6.5 6.2 4.7 4.2 3.7 3.2 2.9 2.1 1.5 0.7 0.9
36.4
3,23,926
945
2.3 8.7
13.1 12.4 10.6
8.5 7.5 6.2 6.5 4.8 4.6 3.4 3.1 3.1 2.1 1.6 0.7 0.9
36.5
1,66,576
na
2.4 8.2
13.3 12.5 10.2
9.3 7.9 6.7 6.0 4.6 3.9 4.0 3.3 2.8 2.1 1.4 0.7 0.8
36.4
1,57,350
na
1.8 6.8
10.0 11.0 11.4 10.4
8.6 7.0 6.7 5.6 5.1 4.1 3.1 3.0 2.2 1.5 0.8 0.9
29.6
94,475
944
1.8 6.9
10.2 11.2 11.5 10.3
8.5 6.9 6.5 5.6 5.2 4.3 3.0 2.9 2.2 1.5 0.8 0.8
30.1
48,591
na
1.7 6.7 9.9
10.9 11.4 10.5
8.8 7.0 7.0 5.6 5.0 3.8 3.2 3.1 2.3 1.4 0.7 1.1
29.2
45,884
na
Note 1: Table is based on the de facto population, i.e. persons who stayed in the household the night before the interview (including both usual residents and visitors). na = Not applicable. ** Unweighted cases. 1 Females per 1000 males.
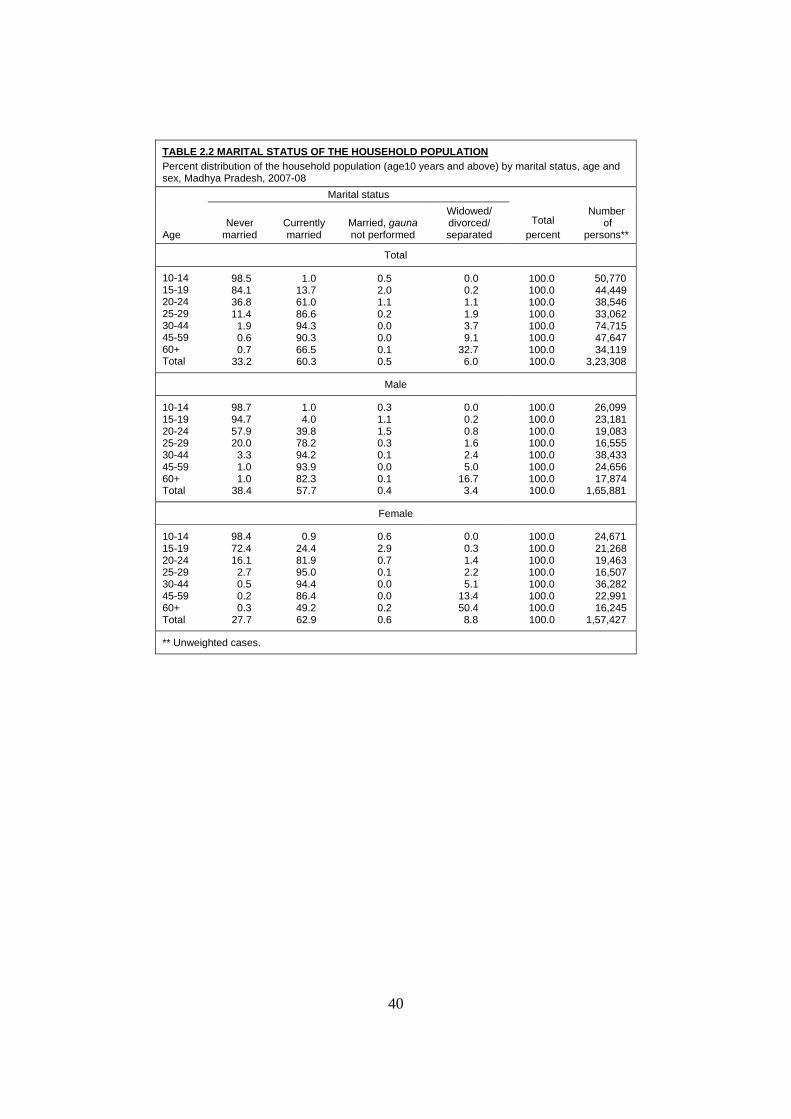
40
TABLE 2.2 MARITAL STATUS OF THE HOUSEHOLD POPULATION Percent distribution of the household population (age10 years and above) by marital status, age and sex, Madhya Pradesh, 2007-08
Age
Marital status
Total percent
Number of
persons** Never
married Currently married
Married, gauna not performed
Widowed/ divorced/ separated
Total
10-14 15-19 20-24 25-29 30-44 45-59 60+ Total
98.5 84.1 36.8 11.4
1.9 0.6 0.7
33.2
1.0 13.7 61.0 86.6 94.3 90.3 66.5 60.3
0.5 2.0 1.1 0.2 0.0 0.0 0.1 0.5
0.0 0.2 1.1 1.9 3.7 9.1
32.7 6.0
100.0 100.0 100.0 100.0 100.0 100.0 100.0 100.0
50,770 44,449 38,546 33,062 74,715 47,647 34,119
3,23,308
Male
10-14 15-19 20-24 25-29 30-44 45-59 60+ Total
98.7 94.7 57.9 20.0
3.3 1.0 1.0
38.4
1.0 4.0
39.8 78.2 94.2 93.9 82.3 57.7
0.3 1.1 1.5 0.3 0.1 0.0 0.1 0.4
0.0 0.2 0.8 1.6 2.4 5.0
16.7 3.4
100.0 100.0 100.0 100.0 100.0 100.0 100.0 100.0
26,099 23,181 19,083 16,555 38,433 24,656 17,874
1,65,881
Female
10-14 15-19 20-24 25-29 30-44 45-59 60+ Total
98.4 72.4 16.1
2.7 0.5 0.2 0.3
27.7
0.9 24.4 81.9 95.0 94.4 86.4 49.2 62.9
0.6 2.9 0.7 0.1 0.0 0.0 0.2 0.6
0.0 0.3 1.4 2.2 5.1
13.4 50.4 8.8
100.0 100.0 100.0 100.0 100.0 100.0 100.0 100.0
24,671 21,268 19,463 16,507 36,282 22,991 16,245
1,57,427
** Unweighted cases.
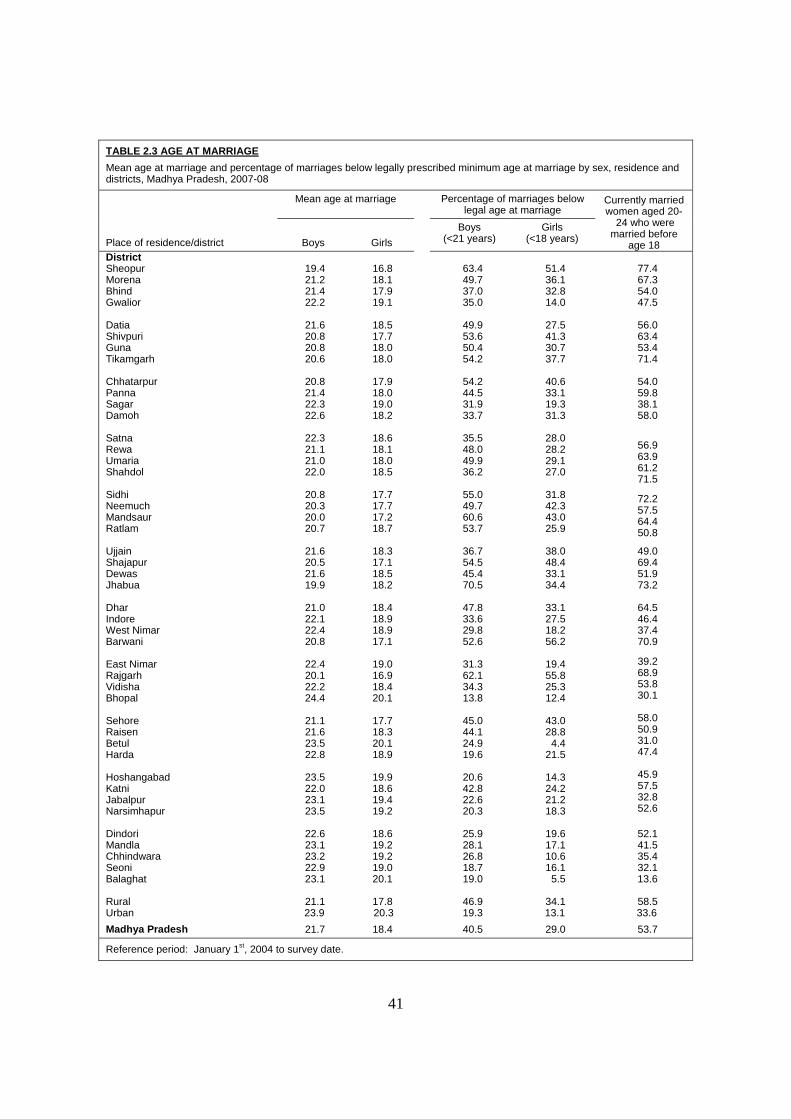
41
TABLE 2.3 AGE AT MARRIAGE Mean age at marriage and percentage of marriages below legally prescribed minimum age at marriage by sex, residence and districts, Madhya Pradesh, 2007-08
Place of residence/district
Mean age at marriage Percentage of marriages below legal age at marriage
Currently married women aged 20-
24 who were married before
age 18 Boys Girls Boys
(<21 years) Girls
(<18 years)
District Sheopur Morena Bhind Gwalior Datia Shivpuri Guna Tikamgarh Chhatarpur Panna Sagar Damoh Satna Rewa Umaria Shahdol Sidhi Neemuch Mandsaur Ratlam Ujjain Shajapur Dewas Jhabua Dhar Indore West Nimar Barwani East Nimar Rajgarh Vidisha Bhopal Sehore Raisen Betul Harda Hoshangabad Katni Jabalpur Narsimhapur Dindori Mandla Chhindwara Seoni Balaghat Rural Urban
Madhya Pradesh
19.4 21.2 21.4 22.2
21.6 20.8 20.8 20.6
20.8 21.4 22.3 22.6
22.3 21.1 21.0 22.0
20.8 20.3 20.0 20.7
21.6 20.5 21.6 19.9
21.0 22.1 22.4 20.8
22.4 20.1 22.2 24.4
21.1 21.6 23.5 22.8
23.5 22.0 23.1 23.5
22.6 23.1 23.2 22.9 23.1
21.1
23.9
21.7
16.8 18.1 17.9 19.1
18.5 17.7 18.0 18.0
17.9 18.0 19.0 18.2
18.6 18.1 18.0 18.5
17.7 17.7 17.2 18.7
18.3 17.1 18.5 18.2
18.4 18.9 18.9 17.1
19.0 16.9 18.4 20.1
17.7 18.3 20.1 18.9
19.9 18.6 19.4 19.2
18.6 19.2 19.2 19.0 20.1
17.8
20.3
18.4
63.4 49.7 37.0 35.0
49.9 53.6 50.4 54.2
54.2 44.5 31.9 33.7
35.5 48.0 49.9 36.2
55.0 49.7 60.6 53.7
36.7 54.5 45.4 70.5
47.8 33.6 29.8 52.6
31.3 62.1 34.3 13.8
45.0 44.1 24.9 19.6
20.6 42.8 22.6 20.3
25.9 28.1 26.8 18.7 19.0
46.9
19.3
40.5
51.4 36.1 32.8 14.0
27.5 41.3 30.7 37.7
40.6 33.1 19.3 31.3
28.0 28.2 29.1 27.0
31.8 42.3 43.0 25.9
38.0 48.4 33.1 34.4
33.1 27.5 18.2 56.2
19.4 55.8 25.3 12.4
43.0 28.8
4.4 21.5
14.3 24.2 21.2 18.3
19.6 17.1 10.6 16.1
5.5
34.1 13.1
29.0
77.4 67.3 54.0 47.5
56.0 63.4 53.4 71.4
54.0 59.8 38.1 58.0
56.9 63.9 61.2 71.5
72.2 57.5 64.4 50.8
49.0 69.4 51.9 73.2
64.5 46.4 37.4 70.9
39.2 68.9 53.8 30.1
58.0 50.9 31.0 47.4
45.9 57.5 32.8 52.6
52.1 41.5 35.4 32.1
13.6
58.5 33.6
53.7
Reference period: January 1st, 2004 to survey date.

42
TABLE 2.4 EDUCATIONAL LEVEL OF THE HOUSEHOLD POPULATION Percent distribution of household population age 7 years and above by literacy levels and years of schooling, age, residence and sex, Madhya Pradesh, 2007-08
Age Non-
literate
Years of schooling among those who are literate
Missing Total
Percent
Number of
persons**
Less than 5 6 - 8 9 - 10
11 or more
Total
7-9 10-14 15-19 20-29 30-39 40-49 50+ Total
26.2 13.1 16.8 30.9 45.7 52.5 65.6 36.6
99.3 62.5 18.2 22.3 28.7 38.1 47.2 41.8
0.6 34.6 41.2 30.1 27.1 25.5 20.8 28.2
0.0 2.8
27.7 21.5 16.6
9.9 8.8
13.8
0.0 0.1
12.8 25.9 27.0 25.9 22.1 15.8
0.1 0.1 0.1 0.3 0.5 0.6 1.2 0.3
100.0 100.0 100.0 100.0 100.0 100.0 100.0 100.0
29,867 50,770 44,449 71,608 54,090 39,157 63,234
3,53,175
Male
7-9 10-14 15-19 20-29 30-39 40-49 50+ Total
26.2 11.2 11.1 18.1 29.6 36.0 47.6 26.0
99.2 62.0 16.0 17.7 23.6 34.7 45.0 37.9
0.7 35.1 40.9 29.4 27.4 26.6 21.1 28.1
0.0 2.8
30.1 24.8 19.1 10.9
9.4 15.6
0.0 0.0
12.9 27.9 29.5 27.3 23.4 18.0
0.1 0.1 0.1 0.2 0.5 0.5 1.1 0.3
100.0 100.0 100.0 100.0 100.0 100.0 100.0 100.0
15,161 26,099 23,181 35,638 27,688 20,927 32,348
1,81,042
Female
7-9 10-14 15-19 20-29 30-39 40-49 50+ Total
26.3 15.0 22.9 43.7 62.6 71.3 84.5 48.7
99.4 63.0 20.9 28.9 38.9 46.7 55.2 47.8
0.5 34.1 41.5 31.0 26.6 22.4 19.4 28.3
0.0 2.8
24.7 16.7 11.7
7.4 6.6
11.2
0.0 0.1
12.7 22.9 22.2 22.5 17.4 12.4
0.1 0.1 0.2 0.3 0.6 1.0 1.4 0.3
100.0 100.0 100.0 100.0 100.0 100.0 100.0 100.0
14,706 24,671 21,268 35,970 26,402 18,230 30,886
1,72,133
Contd...…
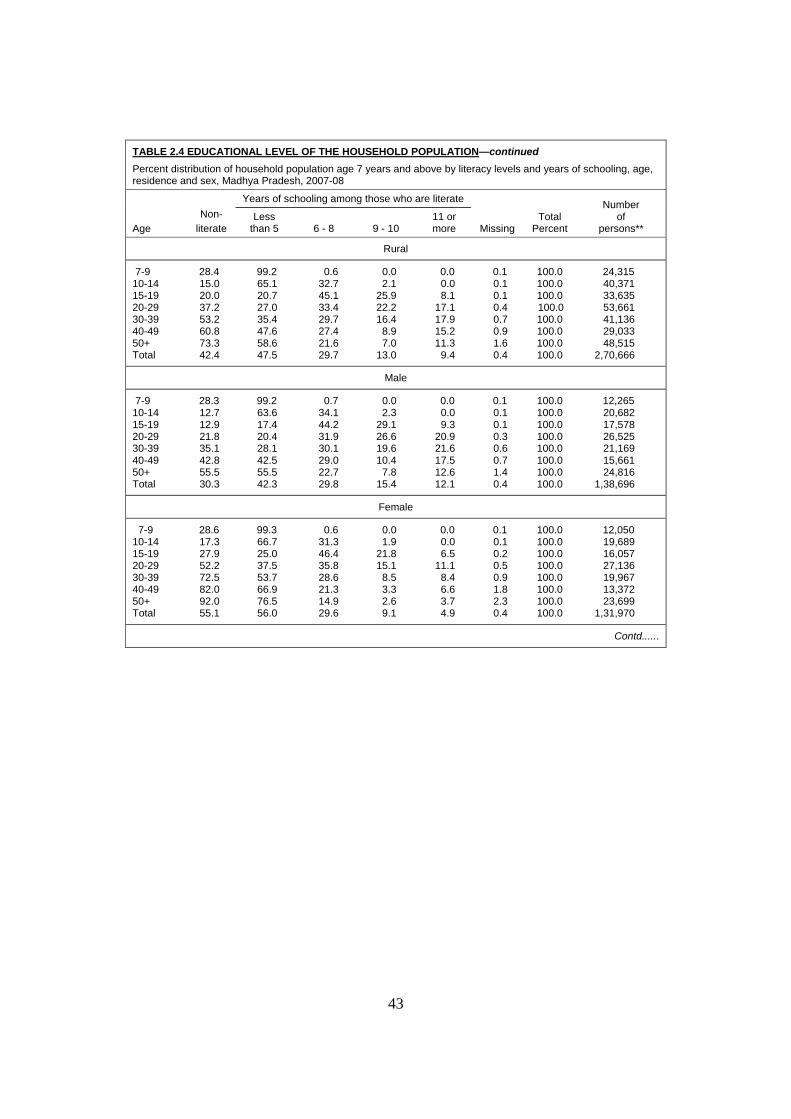
43
TABLE 2.4 EDUCATIONAL LEVEL OF THE HOUSEHOLD POPULATION—continued Percent distribution of household population age 7 years and above by literacy levels and years of schooling, age, residence and sex, Madhya Pradesh, 2007-08
Age Non-
literate
Years of schooling among those who are literate
Missing Total
Percent
Number of
persons** Less
than 5 6 - 8 9 - 10 11 or more
Rural
7-9 10-14 15-19 20-29 30-39 40-49 50+ Total
28.4 15.0 20.0 37.2 53.2 60.8 73.3 42.4
99.2 65.1 20.7 27.0 35.4 47.6 58.6 47.5
0.6 32.7 45.1 33.4 29.7 27.4 21.6 29.7
0.0 2.1
25.9 22.2 16.4
8.9 7.0
13.0
0.0 0.0 8.1
17.1 17.9 15.2 11.3
9.4
0.1 0.1 0.1 0.4 0.7 0.9 1.6 0.4
100.0 100.0 100.0 100.0 100.0 100.0 100.0 100.0
24,315 40,371 33,635 53,661 41,136 29,033 48,515
2,70,666
Male
7-9 10-14 15-19 20-29 30-39 40-49 50+ Total
28.3 12.7 12.9 21.8 35.1 42.8 55.5 30.3
99.2 63.6 17.4 20.4 28.1 42.5 55.5 42.3
0.7 34.1 44.2 31.9 30.1 29.0 22.7 29.8
0.0 2.3
29.1 26.6 19.6 10.4
7.8 15.4
0.0 0.0 9.3
20.9 21.6 17.5 12.6 12.1
0.1 0.1 0.1 0.3 0.6 0.7 1.4 0.4
100.0 100.0 100.0 100.0 100.0 100.0 100.0 100.0
12,265 20,682 17,578 26,525 21,169 15,661 24,816
1,38,696
Female
7-9 10-14 15-19 20-29 30-39 40-49 50+ Total
28.6 17.3 27.9 52.2 72.5 82.0 92.0 55.1
99.3 66.7 25.0 37.5 53.7 66.9 76.5 56.0
0.6 31.3 46.4 35.8 28.6 21.3 14.9 29.6
0.0 1.9
21.8 15.1
8.5 3.3 2.6 9.1
0.0 0.0 6.5
11.1 8.4 6.6 3.7 4.9
0.1 0.1 0.2 0.5 0.9 1.8 2.3 0.4
100.0 100.0 100.0 100.0 100.0 100.0 100.0 100.0
12,050 19,689 16,057 27,136 19,967 13,372 23,699
1,31,970
Contd......

44
TABLE 2.4 EDUCATIONAL LEVEL OF THE HOUSEHOLD POPULATION—continued Percent distribution of household population age 7 years and above by literacy levels and years of schooling, age, residence and sex, Madhya Pradesh, 2007-08
Age Non-
literate
Years of schooling among those who are literate
Missing Total
Percent
Number of
persons**
Less than 5 6 - 8 9 - 10
11 or more
Urban
7-9 10-14 15-19 20-29 30-39 40-49 50+ Total
16.6 5.7 6.5
12.1 21.6 28.3 40.1 19.3
99.5 53.3 11.4 12.3 16.1 23.0 30.4 28.4
0.5 41.3 30.7 22.9 22.3 22.4 19.6 24.6
0.0 5.2
32.4 20.0 16.8 11.6 11.4 15.8
0.0 0.2
25.4 44.8 44.5 42.8 38.1 31.0
0.0 0.0 0.0 0.1 0.2 0.2 0.5 0.2
100.0 100.0 100.0 100.0 100.0 100.0 100.0 100.0
5,552 10,399 10,814 17,947 12,954 10,124 14,719 82,509
Male
7-9 10-14 15-19 20-29 30-39 40-49 50+ Total
17.4 5.7 5.7 7.2
11.7 15.9 21.5 11.8
99.4 56.2 11.9 11.2 12.9 18.8 25.2 26.5
0.6 39.0 31.5 23.2 20.9 21.8 18.2 23.8
0.0 4.7
33.2 20.2 17.8 12.0 12.5 16.1
0.0 0.1
23.5 45.3 48.3 47.2 43.7 33.6
0.0 0.0 0.0 0.1 0.1 0.2 0.4 0.1
100.0 100.0 100.0 100.0 100.0 100.0 100.0
100.0
2,896 5,417 5,603 9,113 6,519 5,266 7,532
42,346
Female
7-9 10-14 15-19 20-29 30-39 40-49 50+ Total
15.7 5.7 7.4
17.2 31.6 41.7 59.7 27.3
99.6 50.2 10.9 13.6 20.3 29.4 41.1 30.9
0.4 43.7 29.8 22.5 24.1 23.4 22.4 25.7
0.0 5.7
31.6 19.6 15.6 10.9
9.3 15.4
0.0 0.2
27.6 44.1 39.6 36.1 26.5 27.7
0.0 0.0 0.1 0.1 0.3 0.3 0.8 0.2
100.0 100.0 100.0 100.0 100.0 100.0 100.0
100.0
2,656 4,982 5,211 8,834 6,435 4,858 7,187
40,163
Note: Years of schooling is applicable to those who are literate. ** Unweighted cases.
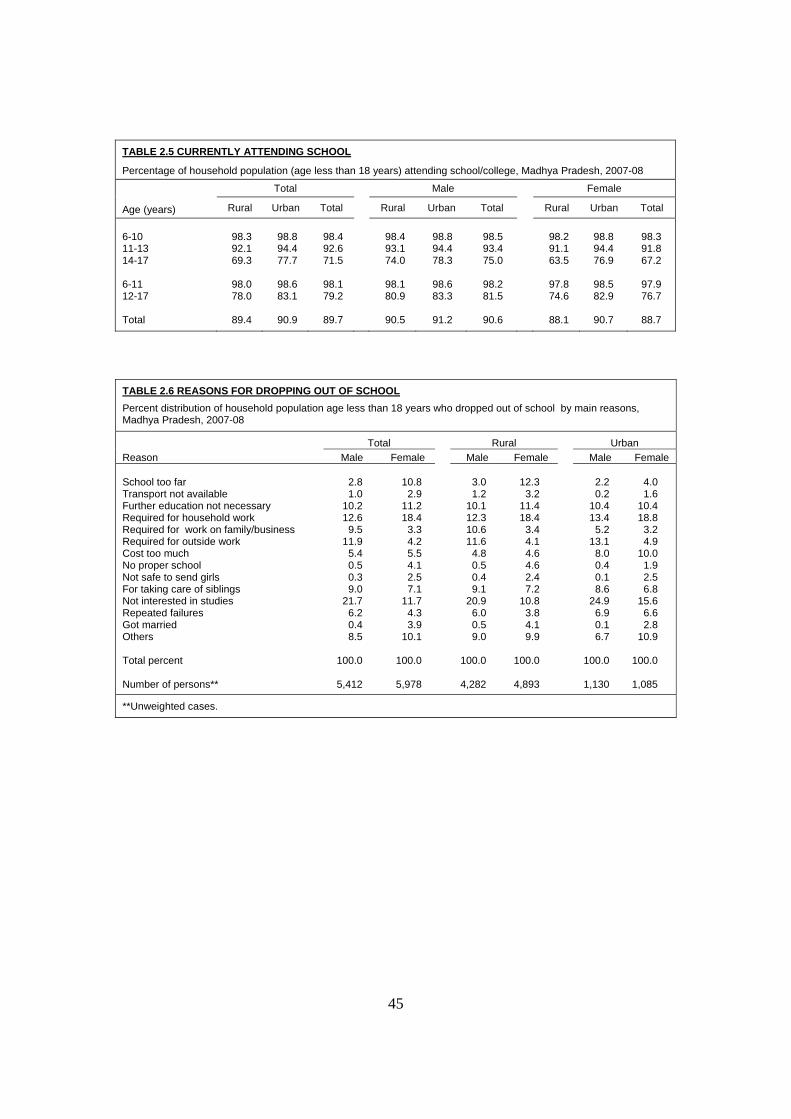
45
TABLE 2.5 CURRENTLY ATTENDING SCHOOL
Percentage of household population (age less than 18 years) attending school/college, Madhya Pradesh, 2007-08 Age (years)
Total Male Female
Rural Urban Total Rural Urban Total Rural Urban Total 6-10 11-13 14-17 6-11 12-17 Total
98.3 92.1 69.3
98.0 78.0
89.4
98.8 94.4 77.7
98.6 83.1
90.9
98.4 92.6 71.5
98.1 79.2
89.7
98.4 93.1 74.0
98.1 80.9
90.5
98.8 94.4 78.3
98.6 83.3
91.2
98.5 93.4 75.0
98.2 81.5
90.6
98.2 91.1 63.5
97.8 74.6
88.1
98.8 94.4 76.9
98.5 82.9
90.7
98.3 91.8 67.2
97.9 76.7
88.7
TABLE 2.6 REASONS FOR DROPPING OUT OF SCHOOL Percent distribution of household population age less than 18 years who dropped out of school by main reasons, Madhya Pradesh, 2007-08
Reason Total Rural Urban
Male Female Male Female Male Female School too far Transport not available Further education not necessary Required for household work Required for work on family/business Required for outside work Cost too much No proper school Not safe to send girls For taking care of siblings Not interested in studies Repeated failures Got married Others Total percent Number of persons**
2.8 1.0
10.2 12.6
9.5 11.9
5.4 0.5 0.3 9.0
21.7 6.2 0.4 8.5
100.0
5,412
10.8
2.9 11.2 18.4
3.3 4.2 5.5 4.1 2.5 7.1
11.7 4.3 3.9
10.1
100.0
5,978
3.0 1.2
10.1 12.3 10.6 11.6
4.8 0.5 0.4 9.1
20.9 6.0 0.5 9.0
100.0
4,282
12.3
3.2 11.4 18.4
3.4 4.1 4.6 4.6 2.4 7.2
10.8 3.8 4.1 9.9
100.0
4,893
2.2 0.2
10.4 13.4
5.2 13.1
8.0 0.4 0.1 8.6
24.9 6.9 0.1 6.7
100.0
1,130
4.0 1.6
10.4 18.8
3.2 4.9
10.0 1.9 2.5 6.8
15.6 6.6 2.8
10.9
100.0
1,085
**Unweighted cases.
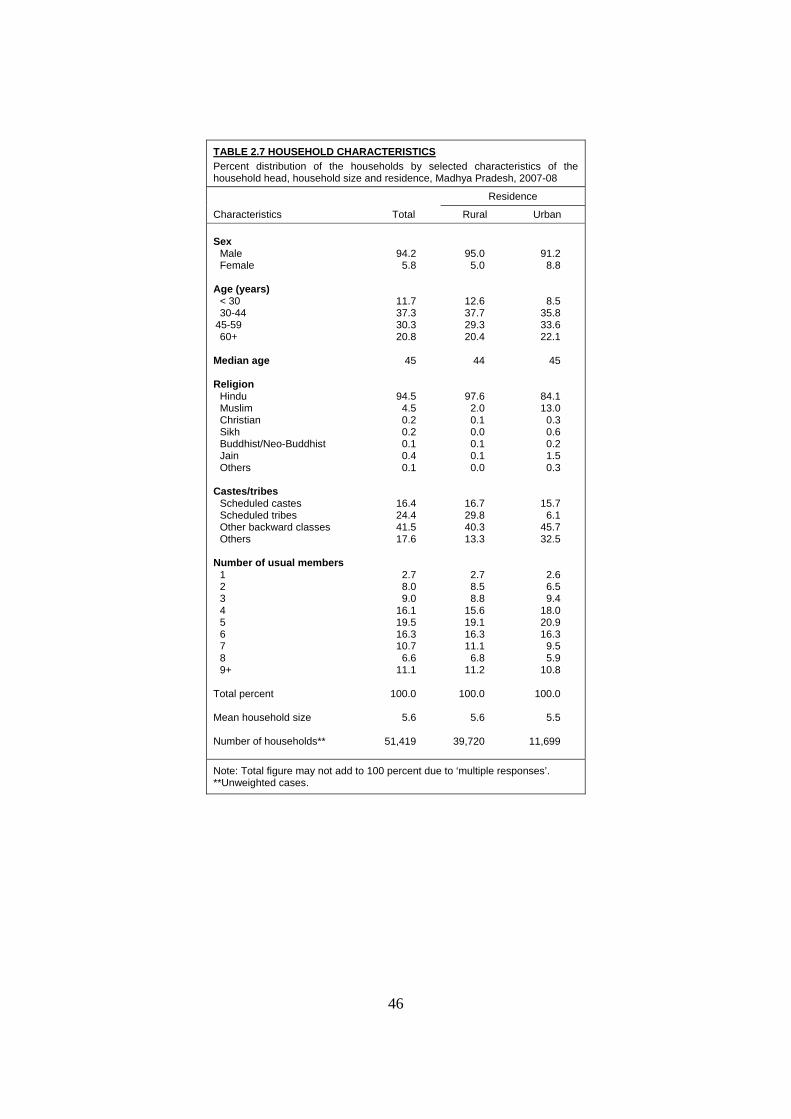
46
TABLE 2.7 HOUSEHOLD CHARACTERISTICS Percent distribution of the households by selected characteristics of the household head, household size and residence, Madhya Pradesh, 2007-08
Characteristics Total
Residence
Rural Urban
Sex Male Female
Age (years) < 30 30-44
45-59 60+
Median age
Religion Hindu Muslim Christian Sikh Buddhist/Neo-Buddhist Jain Others
Castes/tribes Scheduled castes Scheduled tribes Other backward classes Others
Number of usual members 1 2 3 4 5 6 7 8 9+
Total percent
Mean household size
Number of households**
94.2 5.8
11.7 37.3 30.3 20.8
45
94.5 4.5 0.2 0.2 0.1 0.4 0.1
16.4 24.4 41.5 17.6
2.7 8.0 9.0
16.1 19.5 16.3 10.7
6.6 11.1
100.0
5.6
51,419
95.0 5.0
12.6 37.7 29.3 20.4
44
97.6 2.0 0.1 0.0 0.1 0.1 0.0
16.7 29.8 40.3 13.3
2.7 8.5 8.8
15.6 19.1 16.3 11.1
6.8 11.2
100.0
5.6
39,720
91.2 8.8
8.5 35.8 33.6 22.1
45
84.1 13.0
0.3 0.6 0.2 1.5 0.3
15.7 6.1
45.7 32.5
2.6 6.5 9.4
18.0 20.9 16.3
9.5 5.9
10.8
100.0
5.5
11,699
Note: Total figure may not add to 100 percent due to ‘multiple responses’. **Unweighted cases.
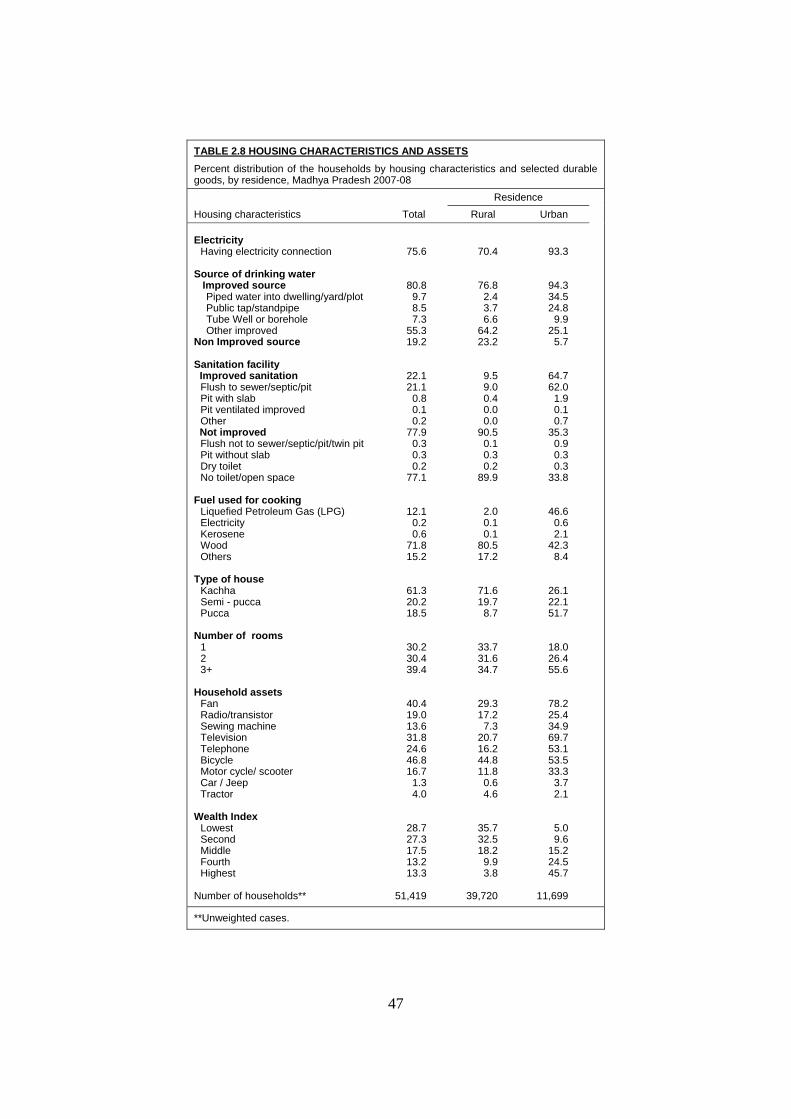
47
TABLE 2.8 HOUSING CHARACTERISTICS AND ASSETS Percent distribution of the households by housing characteristics and selected durable goods, by residence, Madhya Pradesh 2007-08
Housing characteristics Total Residence
Rural Urban Electricity
Having electricity connection Source of drinking water Improved source
Piped water into dwelling/yard/plot Public tap/standpipe Tube Well or borehole Other improved
Non Improved source Sanitation facility Improved sanitation
Flush to sewer/septic/pit Pit with slab Pit ventilated improved Other
Not improved Flush not to sewer/septic/pit/twin pit Pit without slab Dry toilet No toilet/open space
Fuel used for cooking
Liquefied Petroleum Gas (LPG) Electricity Kerosene Wood Others
Type of house
Kachha Semi - pucca Pucca
Number of rooms
1 2 3+
Household assets
Fan Radio/transistor Sewing machine Television Telephone Bicycle Motor cycle/ scooter Car / Jeep Tractor
Wealth Index
Lowest Second Middle Fourth Highest
Number of households**
75.6
80.8 9.7 8.5 7.3
55.3 19.2
22.1 21.1
0.8 0.1 0.2
77.9 0.3 0.3 0.2
77.1
12.1 0.2 0.6
71.8 15.2
61.3 20.2 18.5
30.2 30.4 39.4
40.4 19.0 13.6 31.8 24.6 46.8 16.7
1.3 4.0
28.7 27.3 17.5 13.2 13.3
51,419
70.4
76.8 2.4 3.7 6.6
64.2 23.2
9.5 9.0 0.4 0.0 0.0
90.5 0.1 0.3 0.2
89.9
2.0 0.1 0.1
80.5 17.2
71.6 19.7
8.7
33.7 31.6 34.7
29.3 17.2
7.3 20.7 16.2 44.8 11.8
0.6 4.6
35.7 32.5 18.2
9.9 3.8
39,720
93.3
94.3 34.5 24.8
9.9 25.1
5.7
64.7 62.0
1.9 0.1 0.7
35.3 0.9 0.3 0.3
33.8
46.6 0.6 2.1
42.3 8.4
26.1 22.1 51.7
18.0 26.4 55.6
78.2 25.4 34.9 69.7 53.1 53.5 33.3
3.7 2.1
5.0 9.6
15.2 24.5 45.7
11,699
**Unweighted cases.
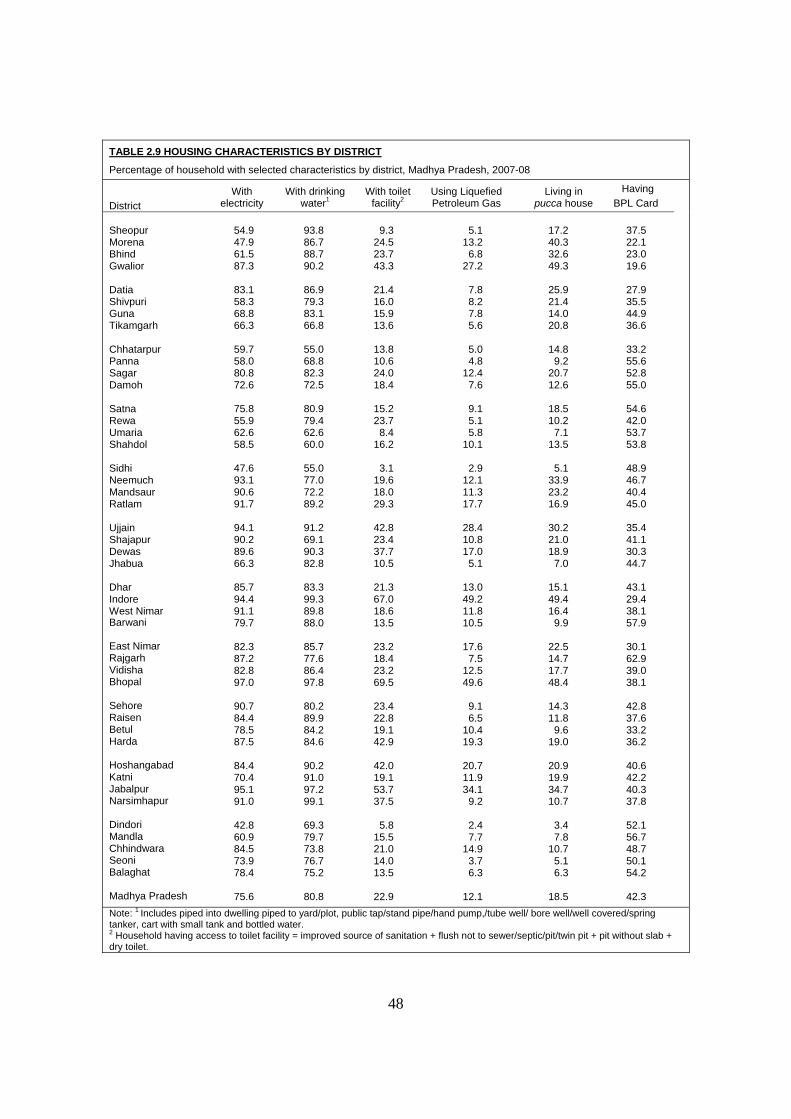
48
TABLE 2.9 HOUSING CHARACTERISTICS BY DISTRICT
Percentage of household with selected characteristics by district, Madhya Pradesh, 2007-08
District With
electricity With drinking
water1 With toilet
facility2 Using Liquefied Petroleum Gas
Living in pucca house
Having BPL Card
Sheopur Morena Bhind Gwalior Datia Shivpuri Guna Tikamgarh Chhatarpur Panna Sagar Damoh Satna Rewa Umaria Shahdol Sidhi Neemuch Mandsaur Ratlam Ujjain Shajapur Dewas Jhabua Dhar Indore West Nimar Barwani East Nimar Rajgarh Vidisha Bhopal Sehore Raisen Betul Harda Hoshangabad Katni Jabalpur Narsimhapur Dindori Mandla Chhindwara Seoni Balaghat Madhya Pradesh
54.9 47.9 61.5 87.3
83.1 58.3 68.8 66.3
59.7 58.0 80.8 72.6
75.8 55.9 62.6 58.5
47.6 93.1 90.6 91.7
94.1 90.2 89.6 66.3
85.7 94.4 91.1 79.7
82.3 87.2 82.8 97.0
90.7 84.4 78.5 87.5
84.4 70.4 95.1 91.0
42.8 60.9 84.5 73.9 78.4
75.6
93.8 86.7 88.7 90.2
86.9 79.3 83.1 66.8
55.0 68.8 82.3 72.5
80.9 79.4 62.6 60.0
55.0 77.0 72.2 89.2
91.2 69.1 90.3 82.8
83.3 99.3 89.8 88.0
85.7 77.6 86.4 97.8
80.2 89.9 84.2 84.6
90.2 91.0 97.2 99.1
69.3 79.7 73.8 76.7 75.2
80.8
9.3
24.5 23.7 43.3
21.4 16.0 15.9 13.6
13.8 10.6 24.0 18.4
15.2 23.7
8.4 16.2
3.1
19.6 18.0 29.3
42.8 23.4 37.7 10.5
21.3 67.0 18.6 13.5
23.2 18.4 23.2 69.5
23.4 22.8 19.1 42.9
42.0 19.1 53.7 37.5
5.8
15.5 21.0 14.0 13.5
22.9
5.1
13.2 6.8
27.2
7.8 8.2 7.8 5.6
5.0 4.8
12.4 7.6
9.1 5.1 5.8
10.1
2.9 12.1 11.3 17.7
28.4 10.8 17.0
5.1
13.0 49.2 11.8 10.5
17.6
7.5 12.5 49.6
9.1 6.5
10.4 19.3
20.7 11.9 34.1
9.2
2.4 7.7
14.9 3.7 6.3
12.1
17.2 40.3 32.6 49.3
25.9 21.4 14.0 20.8
14.8
9.2 20.7 12.6
18.5 10.2
7.1 13.5
5.1
33.9 23.2 16.9
30.2 21.0 18.9
7.0
15.1 49.4 16.4
9.9
22.5 14.7 17.7 48.4
14.3 11.8
9.6 19.0
20.9 19.9 34.7 10.7
3.4 7.8
10.7 5.1 6.3
18.5
37.5 22.1 23.0 19.6
27.9 35.5 44.9 36.6
33.2 55.6 52.8 55.0
54.6 42.0 53.7 53.8
48.9 46.7 40.4 45.0
35.4 41.1 30.3 44.7
43.1 29.4 38.1 57.9
30.1 62.9 39.0 38.1
42.8 37.6 33.2 36.2
40.6 42.2 40.3 37.8
52.1 56.7 48.7 50.1 54.2
42.3
Note: 1 Includes piped into dwelling piped to yard/plot, public tap/stand pipe/hand pump,/tube well/ bore well/well covered/spring tanker, cart with small tank and bottled water. 2 Household having access to toilet facility = improved source of sanitation + flush not to sewer/septic/pit/twin pit + pit without slab + dry toilet.
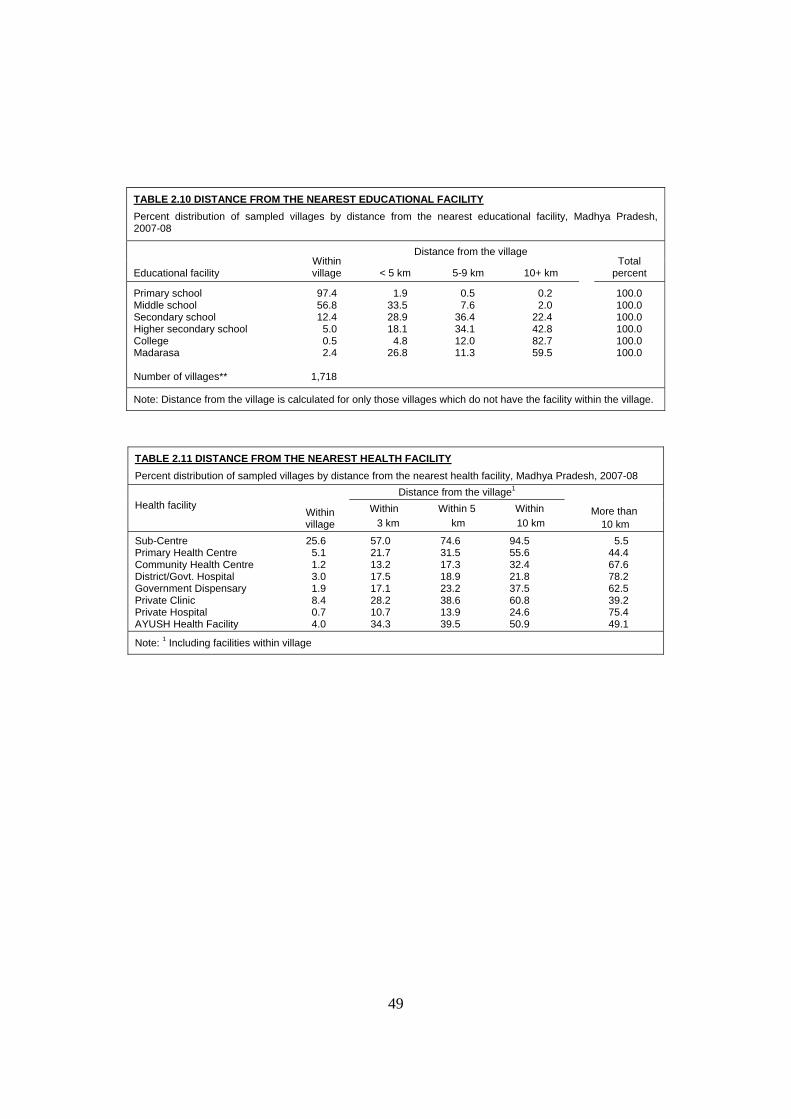
49
TABLE 2.10 DISTANCE FROM THE NEAREST EDUCATIONAL FACILITY Percent distribution of sampled villages by distance from the nearest educational facility, Madhya Pradesh, 2007-08
Educational facility
Within village
Distance from the village Total
percent < 5 km 5-9 km 10+ km
Primary school Middle school Secondary school Higher secondary school College Madarasa Number of villages**
97.4 56.8 12.4
5.0 0.5 2.4
1,718
1.9 33.5 28.9 18.1
4.8 26.8
0.5 7.6
36.4 34.1 12.0 11.3
0.2 2.0
22.4 42.8 82.7 59.5
100.0 100.0 100.0 100.0 100.0 100.0
Note: Distance from the village is calculated for only those villages which do not have the facility within the village.
TABLE 2.11 DISTANCE FROM THE NEAREST HEALTH FACILITY Percent distribution of sampled villages by distance from the nearest health facility, Madhya Pradesh, 2007-08
Health facility
Within village
Distance from the village1
More than 10 km
Within 3 km
Within 5 km
Within 10 km
Sub-Centre Primary Health Centre Community Health Centre District/Govt. Hospital Government Dispensary Private Clinic Private Hospital AYUSH Health Facility
25.6 5.1 1.2 3.0 1.9 8.4 0.7 4.0
57.0 21.7 13.2 17.5 17.1 28.2 10.7 34.3
74.6 31.5 17.3 18.9 23.2 38.6 13.9 39.5
94.5 55.6 32.4 21.8 37.5 60.8 24.6 50.9
5.5 44.4 67.6 78.2 62.5 39.2 75.4 49.1
Note: 1 Including facilities within village
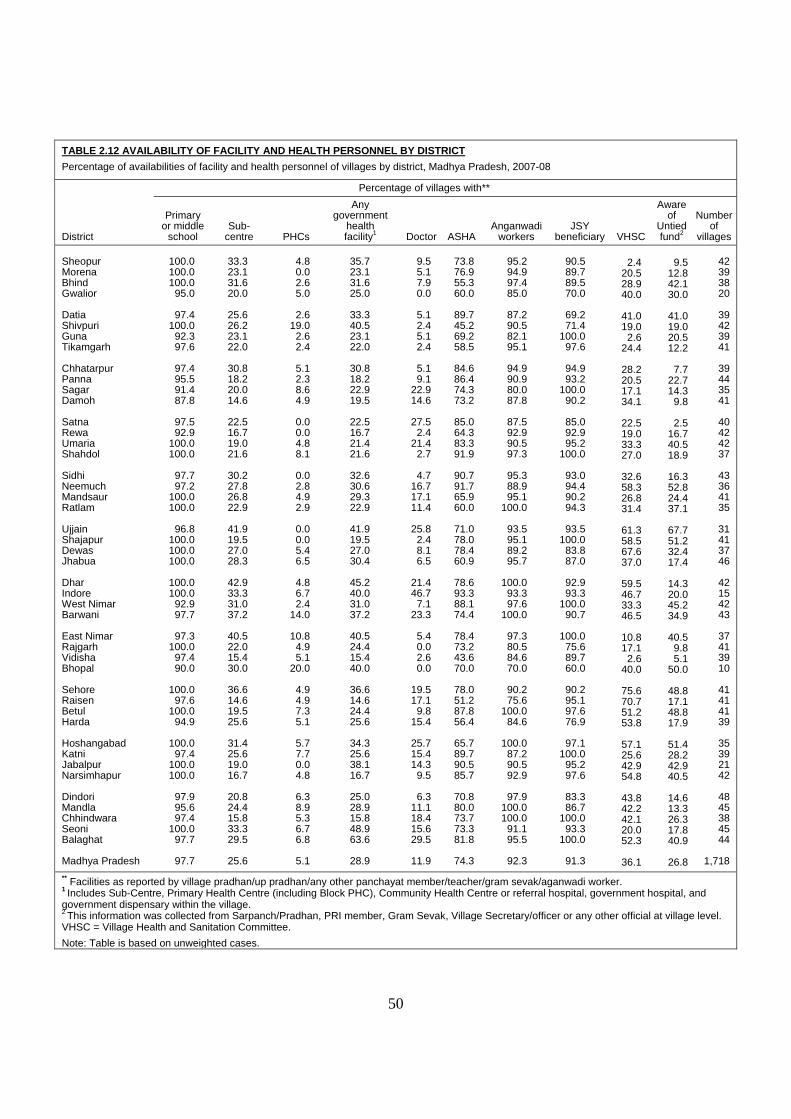
50
TABLE 2.12 AVAILABILITY OF FACILITY AND HEALTH PERSONNEL BY DISTRICT Percentage of availabilities of facility and health personnel of villages by district, Madhya Pradesh, 2007-08
District
Percentage of villages with**
Primary or middle
school Sub-
centre PHCs
Any government
health facility1 Doctor ASHA
Anganwadi workers
JSY beneficiary VHSC
Aware of
Untied fund2
Number of
villages Sheopur Morena Bhind Gwalior Datia Shivpuri Guna Tikamgarh Chhatarpur Panna Sagar Damoh Satna Rewa Umaria Shahdol Sidhi Neemuch Mandsaur Ratlam Ujjain Shajapur Dewas Jhabua Dhar Indore West Nimar Barwani East Nimar Rajgarh Vidisha Bhopal Sehore Raisen Betul Harda Hoshangabad Katni Jabalpur Narsimhapur Dindori Mandla Chhindwara Seoni Balaghat Madhya Pradesh
100.0 100.0 100.0
95.0
97.4 100.0
92.3 97.6
97.4 95.5 91.4 87.8
97.5 92.9
100.0 100.0
97.7 97.2
100.0 100.0
96.8
100.0 100.0 100.0
100.0 100.0
92.9 97.7
97.3
100.0 97.4 90.0
100.0
97.6 100.0
94.9
100.0 97.4
100.0 100.0
97.9 95.6 97.4
100.0 97.7
97.7
33.3 23.1 31.6 20.0
25.6 26.2 23.1 22.0
30.8 18.2 20.0 14.6
22.5 16.7 19.0 21.6
30.2 27.8 26.8 22.9
41.9 19.5 27.0 28.3
42.9 33.3 31.0 37.2
40.5 22.0 15.4 30.0
36.6 14.6 19.5 25.6
31.4 25.6 19.0 16.7
20.8 24.4 15.8 33.3 29.5
25.6
4.8 0.0 2.6 5.0
2.6
19.0 2.6 2.4
5.1 2.3 8.6 4.9
0.0 0.0 4.8 8.1
0.0 2.8 4.9 2.9
0.0 0.0 5.4 6.5
4.8 6.7 2.4
14.0
10.8 4.9 5.1
20.0
4.9 4.9 7.3 5.1
5.7 7.7 0.0 4.8
6.3 8.9 5.3 6.7 6.8
5.1
35.7 23.1 31.6 25.0
33.3 40.5 23.1 22.0
30.8 18.2 22.9 19.5
22.5 16.7 21.4 21.6
32.6 30.6 29.3 22.9
41.9 19.5 27.0 30.4
45.2 40.0 31.0 37.2
40.5 24.4 15.4 40.0
36.6 14.6 24.4 25.6
34.3 25.6 38.1 16.7
25.0 28.9 15.8 48.9 63.6
28.9
9.5 5.1 7.9 0.0
5.1 2.4 5.1 2.4
5.1 9.1
22.9 14.6
27.5
2.4 21.4
2.7
4.7 16.7 17.1 11.4
25.8
2.4 8.1 6.5
21.4 46.7
7.1 23.3
5.4 0.0 2.6 0.0
19.5 17.1
9.8 15.4
25.7 15.4 14.3
9.5
6.3 11.1 18.4 15.6 29.5
11.9
73.8 76.9 55.3 60.0
89.7 45.2 69.2 58.5
84.6 86.4 74.3 73.2
85.0 64.3 83.3 91.9
90.7 91.7 65.9 60.0
71.0 78.0 78.4 60.9
78.6 93.3 88.1 74.4
78.4 73.2 43.6 70.0
78.0 51.2 87.8 56.4
65.7 89.7 90.5 85.7
70.8 80.0 73.7 73.3 81.8
74.3
95.2 94.9 97.4 85.0
87.2 90.5 82.1 95.1
94.9 90.9 80.0 87.8
87.5 92.9 90.5 97.3
95.3 88.9 95.1
100.0
93.5 95.1 89.2 95.7
100.0
93.3 97.6
100.0
97.3 80.5 84.6 70.0
90.2 75.6
100.0 84.6
100.0
87.2 90.5 92.9
97.9
100.0 100.0
91.1 95.5
92.3
90.5 89.7 89.5 70.0
69.2 71.4
100.0 97.6
94.9 93.2
100.0 90.2
85.0 92.9 95.2
100.0
93.0 94.4 90.2 94.3
93.5
100.0 83.8 87.0
92.9 93.3
100.0 90.7
100.0
75.6 89.7 60.0
90.2 95.1 97.6 76.9
97.1
100.0 95.2 97.6
83.3 86.7
100.0 93.3
100.0
91.3
2.4
20.5 28.9 40.0
41.0 19.0
2.6 24.4
28.2 20.5 17.1 34.1
22.5 19.0 33.3 27.0
32.6 58.3 26.8 31.4
61.3 58.5 67.6 37.0
59.5 46.7 33.3 46.5
10.8 17.1
2.6 40.0
75.6 70.7 51.2 53.8
57.1 25.6 42.9 54.8
43.8 42.2 42.1 20.0 52.3
36.1
9.5
12.8 42.1 30.0
41.0 19.0 20.5 12.2
7.7
22.7 14.3
9.8
2.5 16.7 40.5 18.9
16.3 52.8 24.4 37.1
67.7 51.2 32.4 17.4
14.3 20.0 45.2 34.9
40.5
9.8 5.1
50.0
48.8 17.1 48.8 17.9
51.4 28.2 42.9 40.5
14.6 13.3 26.3 17.8 40.9
26.8
42 39 38 20
39 42 39 41
39 44 35 41
40 42 42 37
43 36 41 35
31 41 37 46
42 15 42 43
37 41 39 10
41 41 41 39
35 39 21 42
48 45 38 45 44
1,718
** Facilities as reported by village pradhan/up pradhan/any other panchayat member/teacher/gram sevak/aganwadi worker. 1 Includes Sub-Centre, Primary Health Centre (including Block PHC), Community Health Centre or referral hospital, government hospital, and government dispensary within the village. 2 This information was collected from Sarpanch/Pradhan, PRI member, Gram Sevak, Village Secretary/officer or any other official at village level. VHSC = Village Health and Sanitation Committee. Note: Table is based on unweighted cases.
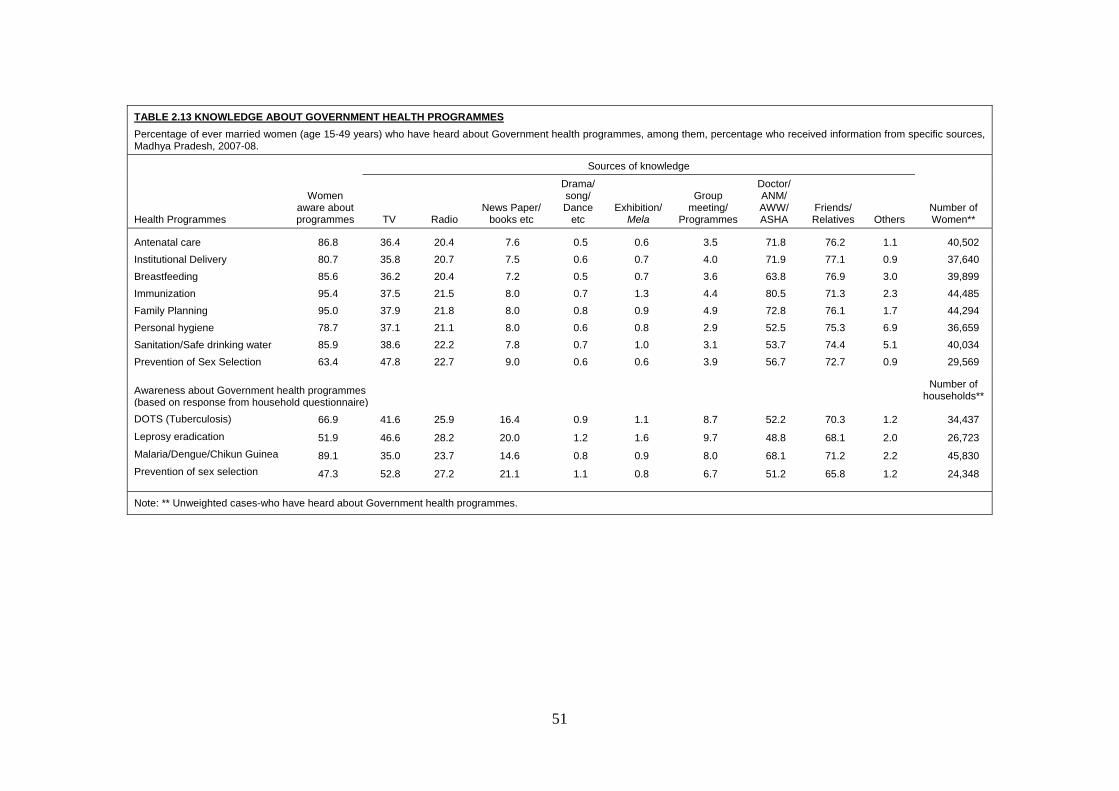
51
TABLE 2.13 KNOWLEDGE ABOUT GOVERNMENT HEALTH PROGRAMMES Percentage of ever married women (age 15-49 years) who have heard about Government health programmes, among them, percentage who received information from specific sources, Madhya Pradesh, 2007-08.
Health Programmes
Women aware about programmes
Sources of knowledge
Number of Women** TV Radio
News Paper/ books etc
Drama/ song/ Dance
etc Exhibition/
Mela
Group meeting/
Programmes
Doctor/ ANM/ AWW/ ASHA
Friends/ Relatives Others
Antenatal care 86.8 36.4 20.4 7.6 0.5 0.6 3.5 71.8 76.2 1.1 40,502 Institutional Delivery 80.7 35.8 20.7 7.5 0.6 0.7 4.0 71.9 77.1 0.9 37,640 Breastfeeding 85.6 36.2 20.4 7.2 0.5 0.7 3.6 63.8 76.9 3.0 39,899 Immunization 95.4 37.5 21.5 8.0 0.7 1.3 4.4 80.5 71.3 2.3 44,485 Family Planning 95.0 37.9 21.8 8.0 0.8 0.9 4.9 72.8 76.1 1.7 44,294 Personal hygiene 78.7 37.1 21.1 8.0 0.6 0.8 2.9 52.5 75.3 6.9 36,659 Sanitation/Safe drinking water 85.9 38.6 22.2 7.8 0.7 1.0 3.1 53.7 74.4 5.1 40,034 Prevention of Sex Selection 63.4 47.8 22.7 9.0 0.6 0.6 3.9 56.7 72.7 0.9 29,569 Awareness about Government health programmes (based on response from household questionnaire)
Number of households**
DOTS (Tuberculosis)
Leprosy eradication
Malaria/Dengue/Chikun Guinea
Prevention of sex selection
66.9
51.9
89.1
47.3
41.6
46.6
35.0
52.8
25.9
28.2
23.7
27.2
16.4
20.0
14.6
21.1
0.9
1.2
0.8
1.1
1.1
1.6
0.9
0.8
8.7
9.7
8.0
6.7
52.2
48.8
68.1
51.2
70.3
68.1
71.2
65.8
1.2
2.0
2.2
1.2
34,437
26,723
45,830
24,348
Note: ** Unweighted cases-who have heard about Government health programmes.

CHARACTERISTICS OF WOMEN AND FERTILITY

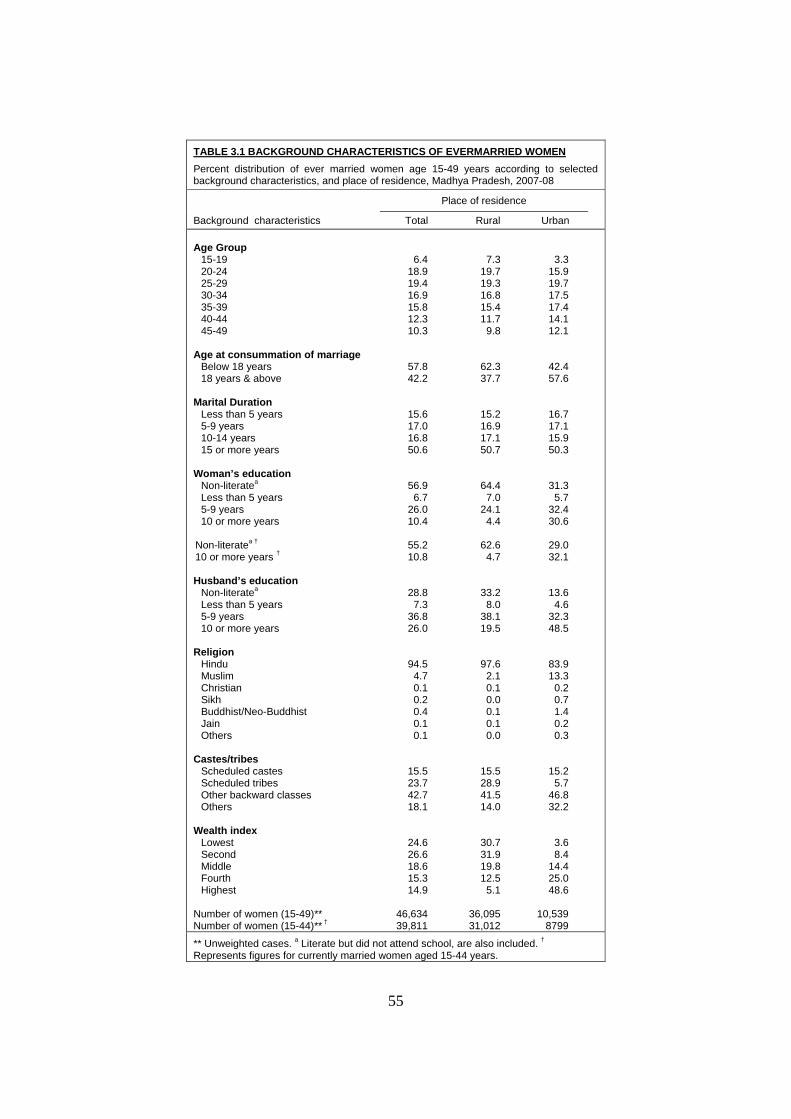
55
TABLE 3.1 BACKGROUND CHARACTERISTICS OF EVERMARRIED WOMEN Percent distribution of ever married women age 15-49 years according to selected background characteristics, and place of residence, Madhya Pradesh, 2007-08
Background characteristics
Place of residence
Total Rural Urban Age Group 15-19 20-24 25-29 30-34 35-39 40-44 45-49 Age at consummation of marriage Below 18 years 18 years & above Marital Duration Less than 5 years 5-9 years 10-14 years 15 or more years Woman’s education Non-literatea Less than 5 years 5-9 years 10 or more years Non-literatea † 10 or more years † Husband’s education Non-literatea Less than 5 years 5-9 years 10 or more years Religion Hindu Muslim Christian Sikh Buddhist/Neo-Buddhist Jain Others Castes/tribes Scheduled castes Scheduled tribes Other backward classes Others Wealth index Lowest Second Middle Fourth Highest Number of women (15-49)** Number of women (15-44)** †
6.4 18.9 19.4 16.9 15.8 12.3 10.3
57.8 42.2
15.6 17.0 16.8 50.6
56.9 6.7
26.0 10.4
55.2 10.8
28.8 7.3
36.8 26.0
94.5 4.7 0.1 0.2 0.4 0.1 0.1
15.5 23.7 42.7 18.1
24.6 26.6 18.6 15.3 14.9
46,634 39,811
7.3 19.7 19.3 16.8 15.4 11.7
9.8
62.3 37.7
15.2 16.9 17.1 50.7
64.4 7.0
24.1 4.4
62.6
4.7
33.2 8.0
38.1 19.5
97.6 2.1 0.1 0.0 0.1 0.1 0.0
15.5 28.9 41.5 14.0
30.7 31.9 19.8 12.5
5.1
36,095 31,012
3.3 15.9 19.7 17.5 17.4 14.1 12.1
42.4 57.6
16.7 17.1 15.9 50.3
31.3 5.7
32.4 30.6
29.0 32.1
13.6 4.6
32.3 48.5
83.9 13.3
0.2 0.7 1.4 0.2 0.3
15.2 5.7
46.8 32.2
3.6 8.4
14.4 25.0 48.6
10,539
8799
** Unweighted cases. a Literate but did not attend school, are also included. †
Represents figures for currently married women aged 15-44 years.
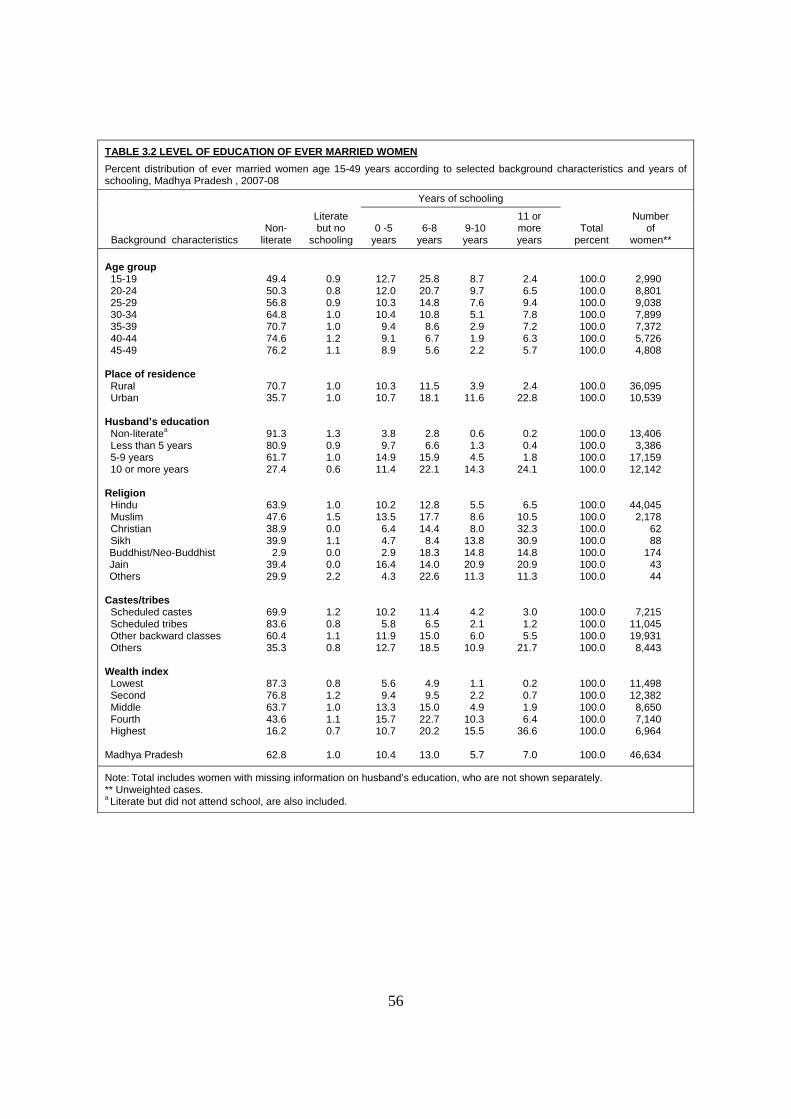
56
TABLE 3.2 LEVEL OF EDUCATION OF EVER MARRIED WOMEN Percent distribution of ever married women age 15-49 years according to selected background characteristics and years of schooling, Madhya Pradesh , 2007-08
Background characteristics Non-
literate
Literate but no
schooling
Years of schooling
Total percent
Number of
women** 0 -5
years 6-8
years 9-10 years
11 or more years
Age group 15-19 20-24 25-29 30-34 35-39 40-44 45-49 Place of residence Rural Urban Husband’s education Non-literatea Less than 5 years 5-9 years 10 or more years Religion Hindu Muslim Christian Sikh Buddhist/Neo-Buddhist Jain Others Castes/tribes Scheduled castes Scheduled tribes Other backward classes Others Wealth index Lowest Second Middle Fourth Highest Madhya Pradesh
49.4 50.3 56.8 64.8 70.7 74.6 76.2
70.7 35.7
91.3 80.9 61.7 27.4
63.9 47.6 38.9 39.9
2.9 39.4 29.9
69.9 83.6 60.4 35.3
87.3 76.8 63.7 43.6 16.2
62.8
0.9 0.8 0.9 1.0 1.0 1.2 1.1
1.0 1.0
1.3 0.9 1.0 0.6
1.0 1.5 0.0 1.1 0.0 0.0 2.2
1.2 0.8 1.1 0.8
0.8 1.2 1.0 1.1 0.7
1.0
12.7 12.0 10.3 10.4
9.4 9.1 8.9
10.3 10.7
3.8 9.7
14.9 11.4
10.2 13.5
6.4 4.7 2.9
16.4 4.3
10.2 5.8
11.9 12.7
5.6 9.4
13.3 15.7 10.7
10.4
25.8 20.7 14.8 10.8
8.6 6.7 5.6
11.5 18.1
2.8 6.6
15.9 22.1
12.8 17.7 14.4
8.4 18.3 14.0 22.6
11.4 6.5
15.0 18.5
4.9 9.5
15.0 22.7 20.2
13.0
8.7 9.7 7.6 5.1 2.9 1.9 2.2
3.9 11.6
0.6 1.3 4.5
14.3
5.5 8.6 8.0
13.8 14.8 20.9 11.3
4.2 2.1 6.0
10.9
1.1 2.2 4.9
10.3 15.5
5.7
2.4 6.5 9.4 7.8 7.2 6.3 5.7
2.4 22.8
0.2 0.4 1.8
24.1
6.5 10.5 32.3 30.9 14.8 20.9 11.3
3.0 1.2 5.5
21.7
0.2 0.7 1.9 6.4
36.6
7.0
100.0 100.0 100.0 100.0 100.0 100.0 100.0
100.0 100.0
100.0 100.0 100.0 100.0
100.0 100.0 100.0 100.0 100.0 100.0 100.0
100.0 100.0 100.0 100.0
100.0 100.0 100.0 100.0 100.0
100.0
2,990 8,801 9,038 7,899 7,372 5,726 4,808
36,095 10,539
13,406 3,386
17,159 12,142
44,045 2,178
62 88
174 43 44
7,215 11,045 19,931
8,443
11,498 12,382
8,650 7,140 6,964
46,634
Note: Total includes women with missing information on husband’s education, who are not shown separately. ** Unweighted cases. a Literate but did not attend school, are also included.
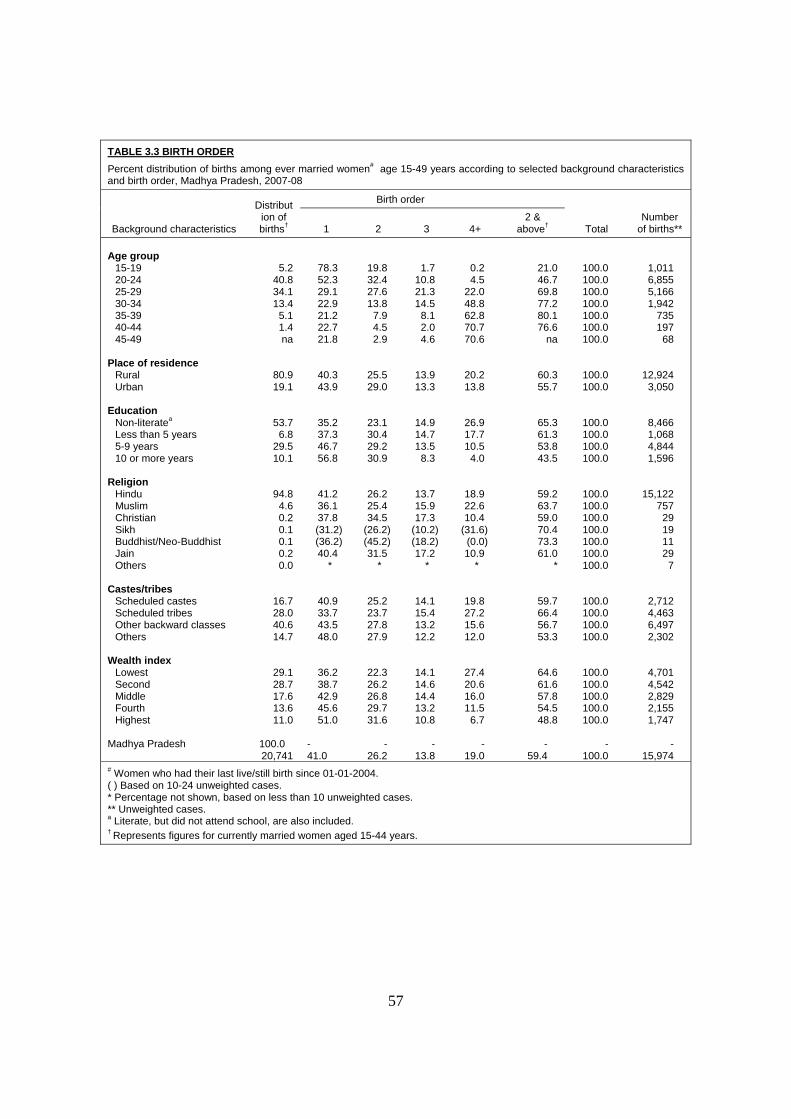
57
TABLE 3.3 BIRTH ORDER Percent distribution of births among ever married women# age 15-49 years according to selected background characteristics and birth order, Madhya Pradesh, 2007-08
Background characteristics
Distribution of births†
Birth order
Total Number
of births** 1 2 3 4+ 2 &
above† Age group 15-19 20-24 25-29 30-34 35-39 40-44 45-49 Place of residence Rural Urban Education Non-literatea Less than 5 years 5-9 years 10 or more years Religion Hindu Muslim Christian Sikh Buddhist/Neo-Buddhist Jain Others Castes/tribes Scheduled castes Scheduled tribes Other backward classes Others Wealth index Lowest Second Middle Fourth Highest Madhya Pradesh
5.2 40.8 34.1 13.4
5.1 1.4 na
80.9 19.1
53.7 6.8
29.5 10.1
94.8 4.6 0.2 0.1 0.1 0.2 0.0
16.7 28.0 40.6 14.7
29.1 28.7 17.6 13.6 11.0
100.0 20,741
78.3 52.3 29.1 22.9 21.2 22.7 21.8
40.3 43.9
35.2 37.3 46.7 56.8
41.2 36.1 37.8 (31.2) (36.2) 40.4
*
40.9 33.7 43.5 48.0
36.2 38.7 42.9 45.6 51.0
- 41.0
19.8 32.4 27.6 13.8
7.9 4.5 2.9
25.5 29.0
23.1 30.4 29.2 30.9
26.2 25.4 34.5
(26.2) (45.2) 31.5
*
25.2 23.7 27.8 27.9
22.3 26.2 26.8 29.7 31.6
-
26.2
1.7 10.8 21.3 14.5
8.1 2.0 4.6
13.9 13.3
14.9 14.7 13.5
8.3
13.7 15.9 17.3
(10.2) (18.2) 17.2
*
14.1 15.4 13.2 12.2
14.1 14.6 14.4 13.2 10.8
-
13.8
0.2 4.5
22.0 48.8 62.8 70.7 70.6
20.2 13.8
26.9 17.7 10.5
4.0
18.9 22.6 10.4
(31.6) (0.0) 10.9
*
19.8 27.2 15.6 12.0
27.4 20.6 16.0 11.5
6.7
- 19.0
21.0 46.7 69.8 77.2 80.1 76.6
na
60.3 55.7
65.3 61.3 53.8 43.5
59.2 63.7 59.0 70.4 73.3 61.0
*
59.7 66.4 56.7 53.3
64.6 61.6 57.8 54.5 48.8
-
59.4
100.0 100.0 100.0 100.0 100.0 100.0 100.0
100.0 100.0
100.0 100.0 100.0 100.0
100.0 100.0 100.0 100.0 100.0 100.0 100.0
100.0 100.0 100.0 100.0
100.0 100.0 100.0 100.0 100.0
-
100.0
1,011 6,855 5,166 1,942
735 197
68
12,924 3,050
8,466 1,068 4,844 1,596
15,122 757
29 19 11 29
7
2,712 4,463 6,497 2,302
4,701 4,542 2,829 2,155 1,747
-
15,974 # Women who had their last live/still birth since 01-01-2004. ( ) Based on 10-24 unweighted cases. * Percentage not shown, based on less than 10 unweighted cases. ** Unweighted cases. a Literate, but did not attend school, are also included. † Represents figures for currently married women aged 15-44 years.
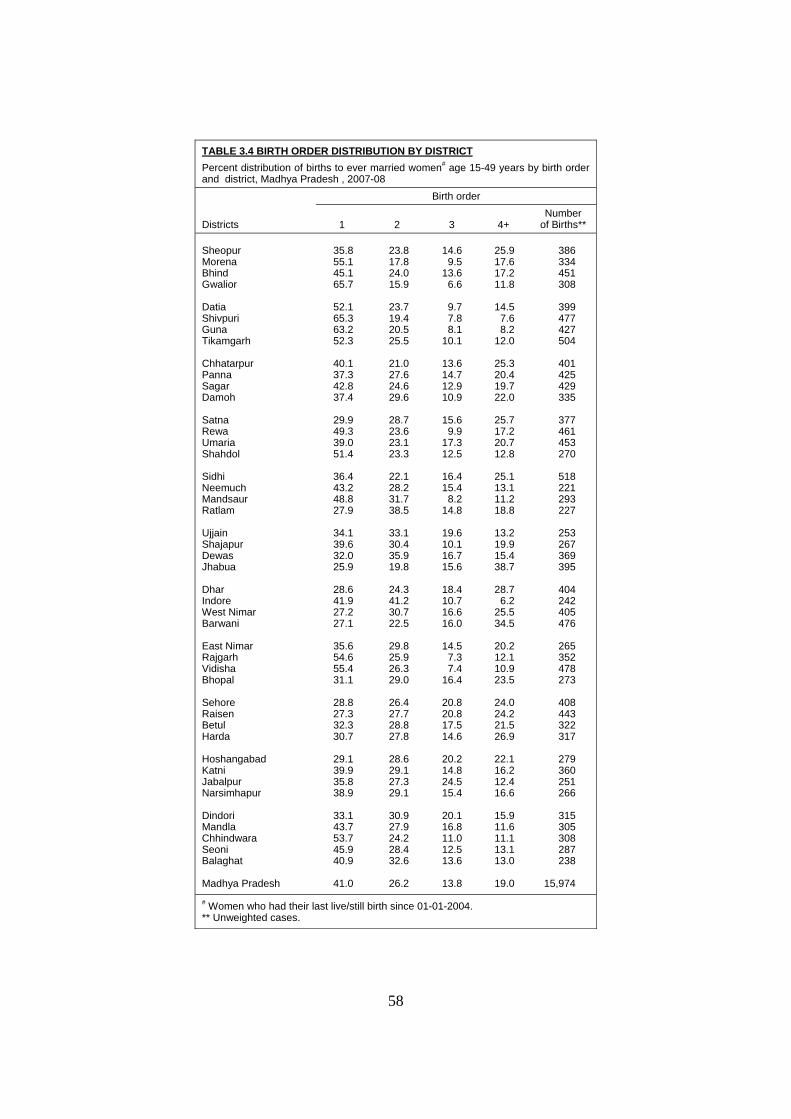
58
TABLE 3.4 BIRTH ORDER DISTRIBUTION BY DISTRICT Percent distribution of births to ever married women# age 15-49 years by birth order and district, Madhya Pradesh , 2007-08
Districts
Birth order
1 2 3 4+ Number
of Births**
Sheopur Morena Bhind Gwalior Datia Shivpuri Guna Tikamgarh Chhatarpur Panna Sagar Damoh Satna Rewa Umaria Shahdol Sidhi Neemuch Mandsaur Ratlam Ujjain Shajapur Dewas Jhabua Dhar Indore West Nimar Barwani East Nimar Rajgarh Vidisha Bhopal Sehore Raisen Betul Harda Hoshangabad Katni Jabalpur Narsimhapur Dindori Mandla Chhindwara Seoni Balaghat Madhya Pradesh
35.8 55.1 45.1 65.7
52.1 65.3 63.2 52.3
40.1 37.3 42.8 37.4
29.9 49.3 39.0 51.4
36.4 43.2 48.8 27.9
34.1 39.6 32.0 25.9
28.6 41.9 27.2 27.1
35.6 54.6 55.4 31.1
28.8 27.3 32.3 30.7
29.1 39.9 35.8 38.9
33.1 43.7 53.7 45.9 40.9
41.0
23.8 17.8 24.0 15.9
23.7 19.4 20.5 25.5
21.0 27.6 24.6 29.6
28.7 23.6 23.1 23.3
22.1 28.2 31.7 38.5
33.1 30.4 35.9 19.8
24.3 41.2 30.7 22.5
29.8 25.9 26.3 29.0
26.4 27.7 28.8 27.8
28.6 29.1 27.3 29.1
30.9 27.9 24.2 28.4 32.6
26.2
14.6 9.5
13.6 6.6
9.7 7.8 8.1
10.1
13.6 14.7 12.9 10.9
15.6
9.9 17.3 12.5
16.4 15.4
8.2 14.8
19.6 10.1 16.7 15.6
18.4 10.7 16.6 16.0
14.5
7.3 7.4
16.4
20.8 20.8 17.5 14.6
20.2 14.8 24.5 15.4
20.1 16.8 11.0 12.5 13.6
13.8
25.9 17.6 17.2 11.8
14.5
7.6 8.2
12.0
25.3 20.4 19.7 22.0
25.7 17.2 20.7 12.8
25.1 13.1 11.2 18.8
13.2 19.9 15.4 38.7
28.7
6.2 25.5 34.5
20.2 12.1 10.9 23.5
24.0 24.2 21.5 26.9
22.1 16.2 12.4 16.6
15.9 11.6 11.1 13.1 13.0
19.0
386 334 451 308
399 477 427 504
401 425 429 335
377 461 453 270
518 221 293 227
253 267 369 395
404 242 405 476
265 352 478 273
408 443 322 317
279 360 251 266
315 305 308 287 238
15,974
# Women who had their last live/still birth since 01-01-2004. ** Unweighted cases.
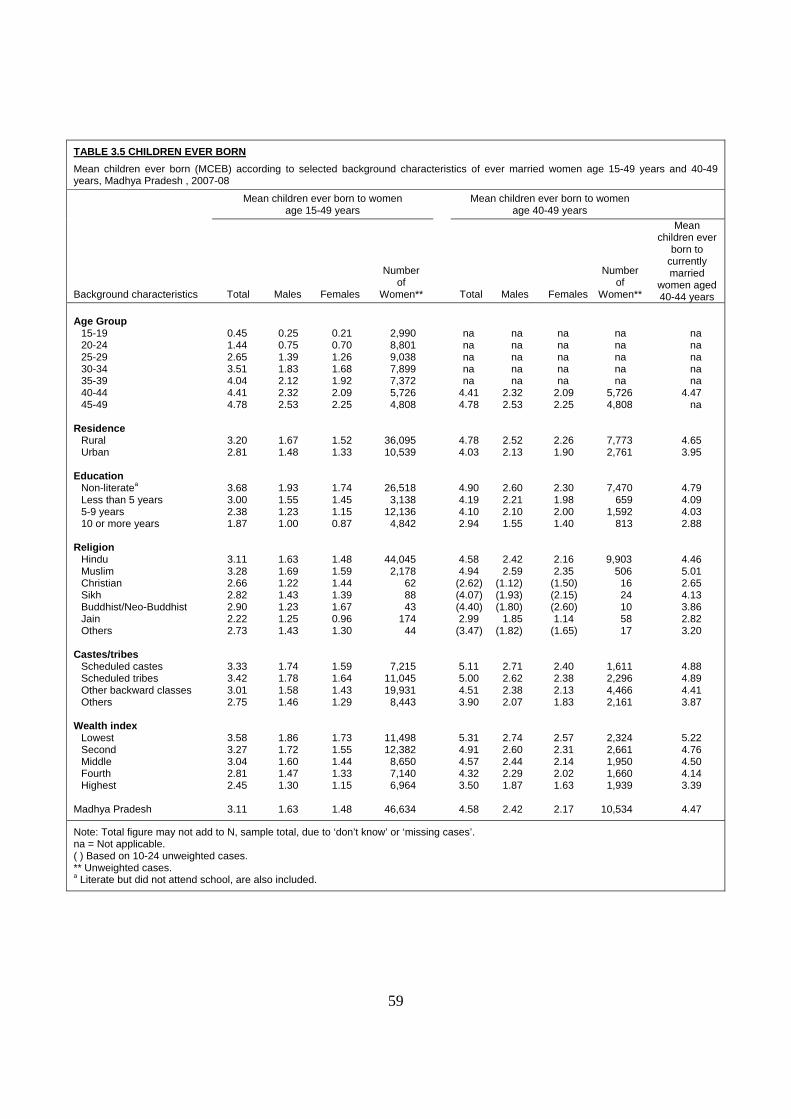
59
TABLE 3.5 CHILDREN EVER BORN Mean children ever born (MCEB) according to selected background characteristics of ever married women age 15-49 years and 40-49 years, Madhya Pradesh , 2007-08
Background characteristics
Mean children ever born to women age 15-49 years
Mean children ever born to women age 40-49 years
Total Males Females
Number of
Women** Total Males Females
Number of
Women**
Mean children ever
born to currently married
women aged 40-44 years
Age Group 15-19 20-24 25-29 30-34 35-39 40-44 45-49 Residence Rural Urban Education Non-literatea Less than 5 years 5-9 years 10 or more years Religion Hindu Muslim Christian Sikh Buddhist/Neo-Buddhist Jain Others Castes/tribes Scheduled castes Scheduled tribes Other backward classes Others Wealth index Lowest Second Middle Fourth Highest Madhya Pradesh
0.45 1.44 2.65 3.51 4.04 4.41 4.78
3.20 2.81
3.68 3.00 2.38 1.87
3.11 3.28 2.66 2.82 2.90 2.22 2.73
3.33 3.42 3.01 2.75
3.58 3.27 3.04 2.81 2.45
3.11
0.25 0.75 1.39 1.83 2.12 2.32 2.53
1.67 1.48
1.93 1.55 1.23 1.00
1.63 1.69 1.22 1.43 1.23 1.25 1.43
1.74 1.78 1.58 1.46
1.86 1.72 1.60 1.47 1.30
1.63
0.21 0.70 1.26 1.68 1.92 2.09 2.25
1.52 1.33
1.74 1.45 1.15 0.87
1.48 1.59 1.44 1.39 1.67 0.96 1.30
1.59 1.64 1.43 1.29
1.73 1.55 1.44 1.33 1.15
1.48
2,990 8,801 9,038 7,899 7,372 5,726 4,808
36,095 10,539
26,518 3,138
12,136 4,842
44,045 2,178
62 88 43
174 44
7,215 11,045 19,931
8,443
11,498 12,382
8,650 7,140 6,964
46,634
na na na na na
4.41 4.78
4.78 4.03
4.90 4.19 4.10 2.94
4.58 4.94
(2.62) (4.07) (4.40) 2.99
(3.47)
5.11 5.00 4.51 3.90
5.31 4.91 4.57 4.32 3.50
4.58
na na na na na
2.32 2.53
2.52 2.13
2.60 2.21 2.10 1.55
2.42 2.59
(1.12) (1.93) (1.80)
1.85 (1.82)
2.71 2.62 2.38 2.07
2.74 2.60 2.44 2.29 1.87
2.42
na na na na na
2.09 2.25
2.26 1.90
2.30 1.98 2.00 1.40
2.16 2.35
(1.50) (2.15) (2.60) 1.14
(1.65)
2.40 2.38 2.13 1.83
2.57 2.31 2.14 2.02 1.63
2.17
na na na na na
5,726 4,808
7,773 2,761
7,470 659
1,592 813
9,903 506
16 24 10 58 17
1,611 2,296 4,466 2,161
2,324 2,661 1,950 1,660 1,939
10,534
na na na na na
4.47 na
4.65 3.95
4.79 4.09 4.03 2.88
4.46 5.01 2.65 4.13 3.86 2.82 3.20
4.88 4.89 4.41 3.87
5.22 4.76 4.50 4.14 3.39
4.47
Note: Total figure may not add to N, sample total, due to ‘don’t know’ or ‘missing cases’. na = Not applicable. ( ) Based on 10-24 unweighted cases. ** Unweighted cases. a Literate but did not attend school, are also included.
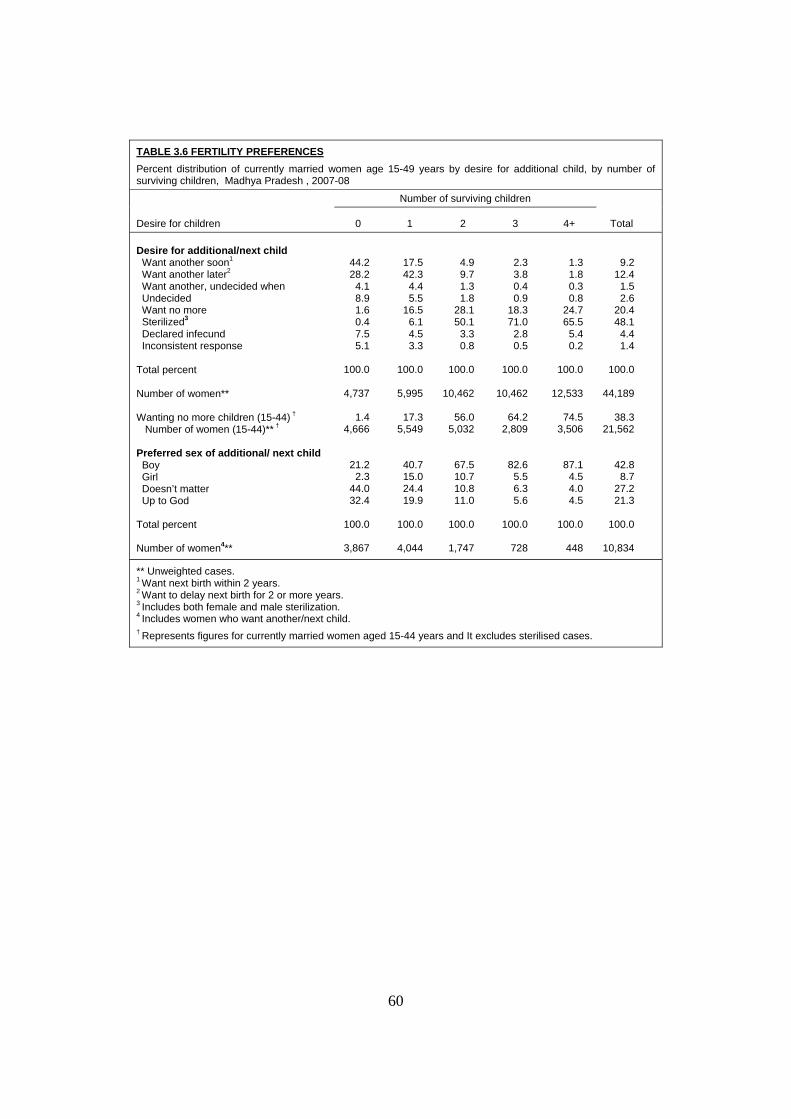
60
TABLE 3.6 FERTILITY PREFERENCES Percent distribution of currently married women age 15-49 years by desire for additional child, by number of surviving children, Madhya Pradesh , 2007-08
Desire for children
Number of surviving children
Total
0 1 2 3 4+ Desire for additional/next child Want another soon1 Want another later2 Want another, undecided when Undecided Want no more Sterilized3 Declared infecund Inconsistent response
Total percent Number of women** Wanting no more children (15-44) † Number of women (15-44)** † Preferred sex of additional/ next child Boy Girl Doesn’t matter Up to God
Total percent Number of women4**
44.2 28.2
4.1 8.9 1.6 0.4 7.5 5.1
100.0
4,737
1.4
4,666
21.2 2.3
44.0 32.4
100.0
3,867
17.5 42.3
4.4 5.5
16.5 6.1 4.5 3.3
100.0
5,995
17.3
5,549
40.7 15.0 24.4 19.9
100.0
4,044
4.9 9.7 1.3 1.8
28.1 50.1
3.3 0.8
100.0
10,462
56.0
5,032
67.5 10.7 10.8 11.0
100.0
1,747
2.3 3.8 0.4 0.9
18.3 71.0
2.8 0.5
100.0
10,462
64.2
2,809
82.6 5.5 6.3 5.6
100.0
728
1.3 1.8 0.3 0.8
24.7 65.5
5.4 0.2
100.0
12,533
74.5
3,506
87.1 4.5 4.0 4.5
100.0
448
9.2 12.4
1.5 2.6
20.4 48.1
4.4 1.4
100.0
44,189
38.3
21,562
42.8 8.7
27.2 21.3
100.0
10,834
** Unweighted cases. 1 Want next birth within 2 years. 2 Want to delay next birth for 2 or more years. 3 Includes both female and male sterilization. 4 Includes women who want another/next child. † Represents figures for currently married women aged 15-44 years and It excludes sterilised cases.
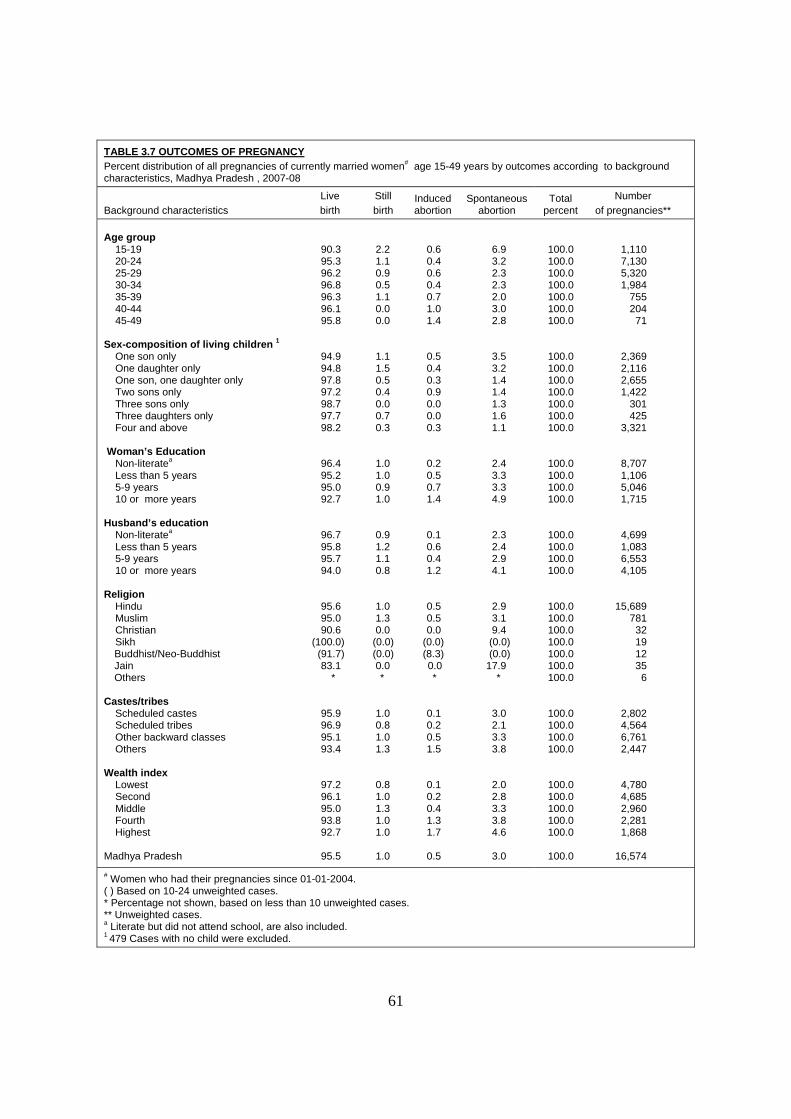
61
TABLE 3.7 OUTCOMES OF PREGNANCY Percent distribution of all pregnancies of currently married women# age 15-49 years by outcomes according to background characteristics, Madhya Pradesh , 2007-08
Background characteristics Live birth
Still birth
Induced abortion
Spontaneous abortion
Total percent
Number of pregnancies**
Age group 15-19 20-24 25-29 30-34 35-39 40-44 45-49
Sex-composition of living children 1 One son only One daughter only One son, one daughter only Two sons only Three sons only Three daughters only Four and above
Woman’s Education Non-literatea Less than 5 years 5-9 years 10 or more years
Husband’s education Non-literatea Less than 5 years 5-9 years 10 or more years
Religion Hindu Muslim Christian Sikh
Buddhist/Neo-Buddhist Jain Others Castes/tribes Scheduled castes Scheduled tribes Other backward classes Others
Wealth index Lowest Second Middle Fourth Highest
Madhya Pradesh
90.3 95.3 96.2 96.8 96.3 96.1 95.8
94.9 94.8 97.8 97.2 98.7 97.7 98.2
96.4 95.2 95.0 92.7
96.7 95.8 95.7 94.0
95.6 95.0 90.6
(100.0) (91.7) 83.1
*
95.9 96.9 95.1 93.4
97.2 96.1 95.0 93.8 92.7
95.5
2.2 1.1 0.9 0.5 1.1 0.0 0.0
1.1 1.5 0.5 0.4 0.0 0.7 0.3
1.0 1.0 0.9 1.0
0.9 1.2 1.1 0.8
1.0 1.3 0.0
(0.0) (0.0) 0.0 *
1.0 0.8 1.0 1.3
0.8 1.0 1.3 1.0 1.0
1.0
0.6 0.4 0.6 0.4 0.7 1.0 1.4
0.5 0.4 0.3 0.9 0.0 0.0 0.3
0.2 0.5 0.7 1.4
0.1 0.6 0.4 1.2
0.5 0.5 0.0
(0.0) (8.3) 0.0 *
0.1 0.2 0.5 1.5
0.1 0.2 0.4 1.3 1.7
0.5
6.9 3.2 2.3 2.3 2.0 3.0 2.8
3.5 3.2 1.4 1.4 1.3 1.6 1.1
2.4 3.3 3.3 4.9
2.3 2.4 2.9 4.1
2.9 3.1 9.4 (0.0) (0.0)
17.9 *
3.0 2.1 3.3 3.8
2.0 2.8 3.3 3.8 4.6
3.0
100.0 100.0 100.0 100.0 100.0 100.0 100.0
100.0 100.0 100.0 100.0 100.0 100.0 100.0
100.0 100.0 100.0 100.0
100.0 100.0 100.0 100.0
100.0 100.0 100.0 100.0 100.0 100.0 100.0
100.0 100.0 100.0 100.0
100.0 100.0 100.0 100.0 100.0
100.0
1,110 7,130 5,320 1,984
755 204
71
2,369 2,116 2,655 1,422
301 425
3,321
8,707 1,106 5,046 1,715
4,699 1,083 6,553 4,105
15,689 781
32 19 12 35
6
2,802 4,564 6,761 2,447
4,780 4,685 2,960 2,281 1,868
16,574
# Women who had their pregnancies since 01-01-2004. ( ) Based on 10-24 unweighted cases. * Percentage not shown, based on less than 10 unweighted cases. ** Unweighted cases. a Literate but did not attend school, are also included. 1 479 Cases with no child were excluded.

62
TABLE 3.8 OUTCOME OF PREGNANCY BY DISTRICTS Percent distribution of all pregnancies of currently married women# aged 15-49 years by outcomes three year preceding the survey, by districts, Madhya Pradesh, 2007-08
Districts Live birth
Still birth
Induced abortion
Spontaneous
abortion Total
percent
Number of
pregnancies**
Sheopur Morena Bhind Gwalior Datia Shivpuri Guna Tikamgarh Chhatarpur Panna Sagar Damoh Satna Rewa Umaria Shahdol Sidhi Neemuch Mandsaur Ratlam Ujjain Shajapur Dewas Jhabua Dhar Indore West Nimar Barwani East Nimar Rajgarh Vidisha Bhopal Sehore Raisen Betul Harda Hoshangabad Katni Jabalpur Narsimhapur Dindori Mandla Chhindwara Seoni Balaghat Madhya Pradesh
96.2 96.3 95.4 91.5
94.5 96.0 98.4 89.4
92.2 96.2 96.9 95.5
97.3 98.6 93.7 97.1
98.2 94.6 96.2 98.4
94.2 94.3 95.1 96.3
93.7 87.7 95.7 96.2
97.6 97.7 97.9 92.9
94.2 95.5 96.1 90.5
97.8 97.6 96.6 93.4
98.3 96.8 97.4 96.5 95.0
95.5
0.5 0.8 0.8 1.0
0.0 1.3 0.6 3.1
2.0 0.9 0.6 1.3
1.1 0.2 1.4 0.7
1.2 0.0 0.8 0.0
1.1 1.5 0.9 1.7
0.8 0.7 1.0 0.9
0.0 1.1 0.2 1.8
0.8 0.5 0.3 2.7
0.6 0.9 0.4 0.8
0.0 0.6 0.7 1.0 0.4
1.0
0.5 0.3 0.4 0.7
0.5 1.0 0.0 0.4
1.1 0.6 0.0 0.6
0.6 0.0 0.0 1.0
0.0 0.9 0.0 0.3
0.0 1.5 0.3 0.3
1.2 4.1 0.2 0.3
0.0 0.4 0.0 1.9
0.4 0.6 0.1 1.5
0.0 0.0 0.5 0.0
0.7 0.0 0.1 0.3 0.8
0.5
2.8 2.6 3.4 6.7
4.9 1.7 1.0 7.1
4.6 2.3 2.5 2.5
1.1 1.2 4.9 1.2
0.7 4.5 3.0 1.3
4.7 2.6 3.7 1.7
4.2 7.4 3.1 2.6
2.4 0.8 1.9 3.4
4.6 3.3 3.5 5.3
1.6 1.5 2.5 5.8
1.0 2.6 1.8 2.2 3.8
3.0
100.0 100.0 100.0 100.0
100.0 100.0 100.0 100.0
100.0 100.0 100.0 100.0
100.0 100.0 100.0 100.0
100.0 100.0 100.0 100.0
100.0 100.0 100.0 100.0
100.0 100.0 100.0 100.0
100.0 100.0 100.0 100.0
100.0 100.0 100.0 100.0
100.0 100.0 100.0 100.0
100.0 100.0 100.0 100.0 100.0
100.0
395 347 470 333
422 494 433 558
438 438 438 347
384 465 475 275
521 232 303 229
265 281 381 408
427 264 421 491
264 356 487 290
428 457 334 346
285 365 261 278
319 314 310 297 248
16,574
# Women who had their last live/still birth since 01-01-2004. ** Unweighted cases (Based on district weight).
MATERNAL HEALTH CARE

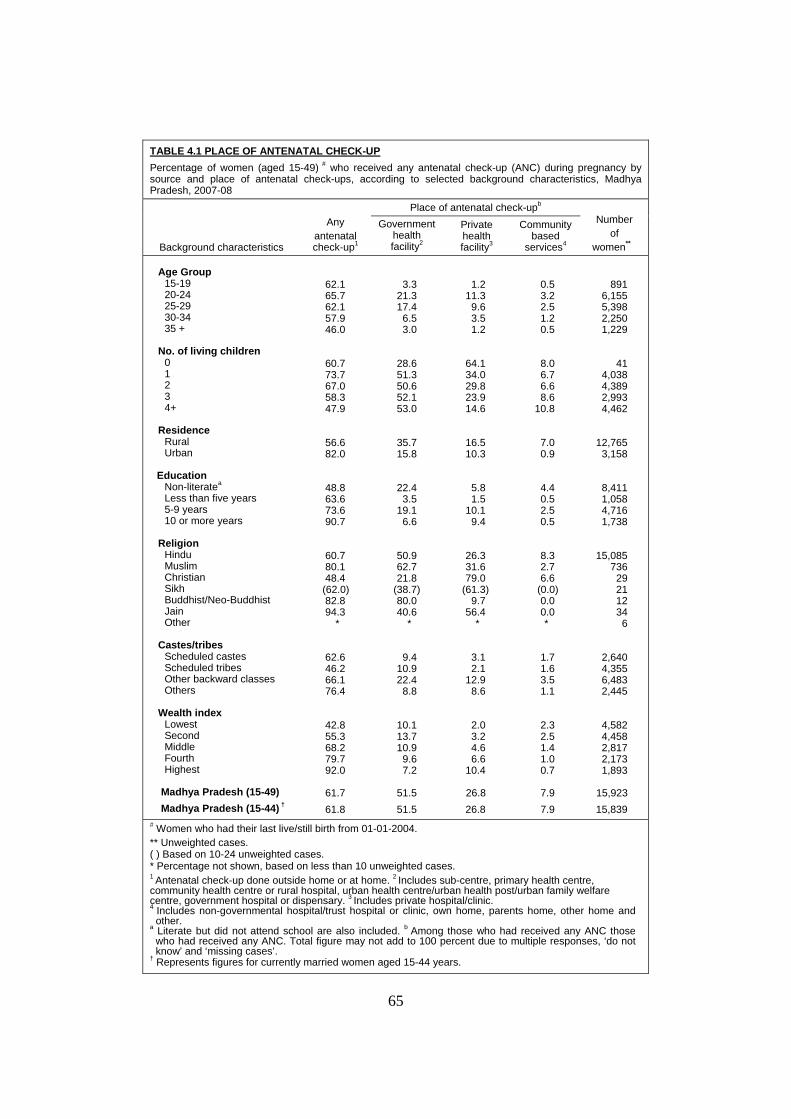
65
TABLE 4.1 PLACE OF ANTENATAL CHECK-UP Percentage of women (aged 15-49) # who received any antenatal check-up (ANC) during pregnancy by source and place of antenatal check-ups, according to selected background characteristics, Madhya Pradesh, 2007-08
Background characteristics
Any
antenatal check-up1
Place of antenatal check-upb Number
of women**
Government health facility2
Private health facility3
Community
based services4
Age Group 15-19 20-24 25-29 30-34 35 +
No. of living children
0 1 2 3 4+
Residence
Rural Urban
Education
Non-literatea Less than five years 5-9 years 10 or more years
Religion
Hindu Muslim Christian Sikh Buddhist/Neo-Buddhist Jain Other
Castes/tribes
Scheduled castes Scheduled tribes Other backward classes Others
Wealth index
Lowest Second Middle Fourth Highest
Madhya Pradesh (15-49) Madhya Pradesh (15-44) †
62.1 65.7 62.1 57.9 46.0
60.7 73.7 67.0 58.3 47.9
56.6 82.0
48.8 63.6 73.6 90.7
60.7 80.1 48.4 (62.0) 82.8 94.3
*
62.6 46.2 66.1 76.4
42.8 55.3 68.2 79.7 92.0
61.7 61.8
3.3
21.3 17.4
6.5 3.0
28.6 51.3 50.6 52.1 53.0
35.7 15.8
22.4 3.5
19.1 6.6
50.9 62.7 21.8
(38.7) 80.0 40.6
*
9.4 10.9 22.4
8.8
10.1 13.7 10.9
9.6 7.2
51.5 51.5
1.2
11.3 9.6 3.5 1.2
64.1 34.0 29.8 23.9 14.6
16.5 10.3
5.8 1.5
10.1 9.4
26.3 31.6 79.0
(61.3) 9.7
56.4 *
3.1 2.1
12.9 8.6
2.0 3.2 4.6 6.6
10.4
26.8 26.8
0.5 3.2 2.5 1.2 0.5
8.0 6.7 6.6 8.6
10.8
7.0 0.9
4.4 0.5 2.5 0.5
8.3 2.7 6.6
(0.0) 0.0 0.0 *
1.7 1.6 3.5 1.1
2.3 2.5 1.4 1.0 0.7
7.9 7.9
891 6,155 5,398 2,250 1,229
41 4,038 4,389 2,993 4,462
12,765 3,158
8,411 1,058 4,716 1,738
15,085 736
29 21 12 34
6
2,640 4,355 6,483 2,445
4,582 4,458 2,817 2,173 1,893
15,923 15,839
# Women who had their last live/still birth from 01-01-2004. ** Unweighted cases. ( ) Based on 10-24 unweighted cases. * Percentage not shown, based on less than 10 unweighted cases. 1 Antenatal check-up done outside home or at home. 2 Includes sub-centre, primary health centre, community health centre or rural hospital, urban health centre/urban health post/urban family welfare centre, government hospital or dispensary. 3 Includes private hospital/clinic. 4 Includes non-governmental hospital/trust hospital or clinic, own home, parents home, other home and
other. a Literate but did not attend school are also included. b Among those who had received any ANC those
who had received any ANC. Total figure may not add to 100 percent due to multiple responses, ‘do not know’ and ‘missing cases’.
† Represents figures for currently married women aged 15-44 years.
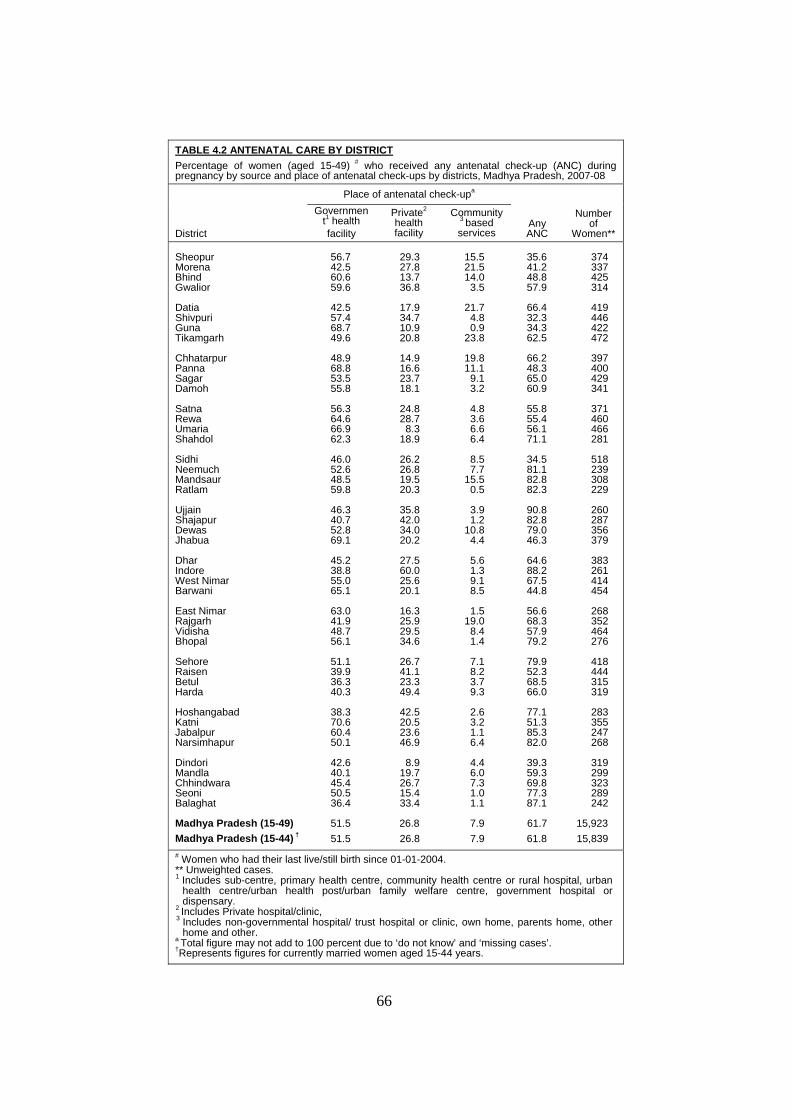
66
TABLE 4.2 ANTENATAL CARE BY DISTRICT Percentage of women (aged 15-49) # who received any antenatal check-up (ANC) during pregnancy by source and place of antenatal check-ups by districts, Madhya Pradesh, 2007-08
District
Place of antenatal check-upa
Any ANC
Number of
Women**
Government1 health facility
Private2 health facility
Community3 based services
Sheopur Morena Bhind Gwalior Datia Shivpuri Guna Tikamgarh Chhatarpur Panna Sagar Damoh Satna Rewa Umaria Shahdol Sidhi Neemuch Mandsaur Ratlam Ujjain Shajapur Dewas Jhabua Dhar Indore West Nimar Barwani East Nimar Rajgarh Vidisha Bhopal Sehore Raisen Betul Harda Hoshangabad Katni Jabalpur Narsimhapur Dindori Mandla Chhindwara Seoni Balaghat Madhya Pradesh (15-49) Madhya Pradesh (15-44) †
56.7 42.5 60.6 59.6
42.5 57.4 68.7 49.6
48.9 68.8 53.5 55.8
56.3 64.6 66.9 62.3
46.0 52.6 48.5 59.8
46.3 40.7 52.8 69.1
45.2 38.8 55.0 65.1
63.0 41.9 48.7 56.1
51.1 39.9 36.3 40.3
38.3 70.6 60.4 50.1
42.6 40.1 45.4 50.5 36.4
51.5 51.5
29.3 27.8 13.7 36.8
17.9 34.7 10.9 20.8
14.9 16.6 23.7 18.1
24.8 28.7
8.3 18.9
26.2 26.8 19.5 20.3
35.8 42.0 34.0 20.2
27.5 60.0 25.6 20.1
16.3 25.9 29.5 34.6
26.7 41.1 23.3 49.4
42.5 20.5 23.6 46.9
8.9
19.7 26.7 15.4 33.4
26.8 26.8
15.5 21.5 14.0
3.5
21.7 4.8 0.9
23.8
19.8 11.1
9.1 3.2
4.8 3.6 6.6 6.4
8.5 7.7
15.5 0.5
3.9 1.2
10.8 4.4
5.6 1.3 9.1 8.5
1.5
19.0 8.4 1.4
7.1 8.2 3.7 9.3
2.6 3.2 1.1 6.4
4.4 6.0 7.3 1.0 1.1
7.9 7.9
35.6 41.2 48.8 57.9
66.4 32.3 34.3 62.5
66.2 48.3 65.0 60.9
55.8 55.4 56.1 71.1
34.5 81.1 82.8 82.3
90.8 82.8 79.0 46.3
64.6 88.2 67.5 44.8
56.6 68.3 57.9 79.2
79.9 52.3 68.5 66.0
77.1 51.3 85.3 82.0
39.3 59.3 69.8 77.3 87.1
61.7 61.8
374 337 425 314
419 446 422 472
397 400 429 341
371 460 466 281
518 239 308 229
260 287 356 379
383 261 414 454
268 352 464 276
418 444 315 319
283 355 247 268
319 299 323 289 242
15,923 15,839
# Women who had their last live/still birth since 01-01-2004. ** Unweighted cases. 1 Includes sub-centre, primary health centre, community health centre or rural hospital, urban
health centre/urban health post/urban family welfare centre, government hospital or dispensary.
2 Includes Private hospital/clinic, 3 Includes non-governmental hospital/ trust hospital or clinic, own home, parents home, other
home and other. a Total figure may not add to 100 percent due to ‘do not know’ and ‘missing cases’. †Represents figures for currently married women aged 15-44 years.
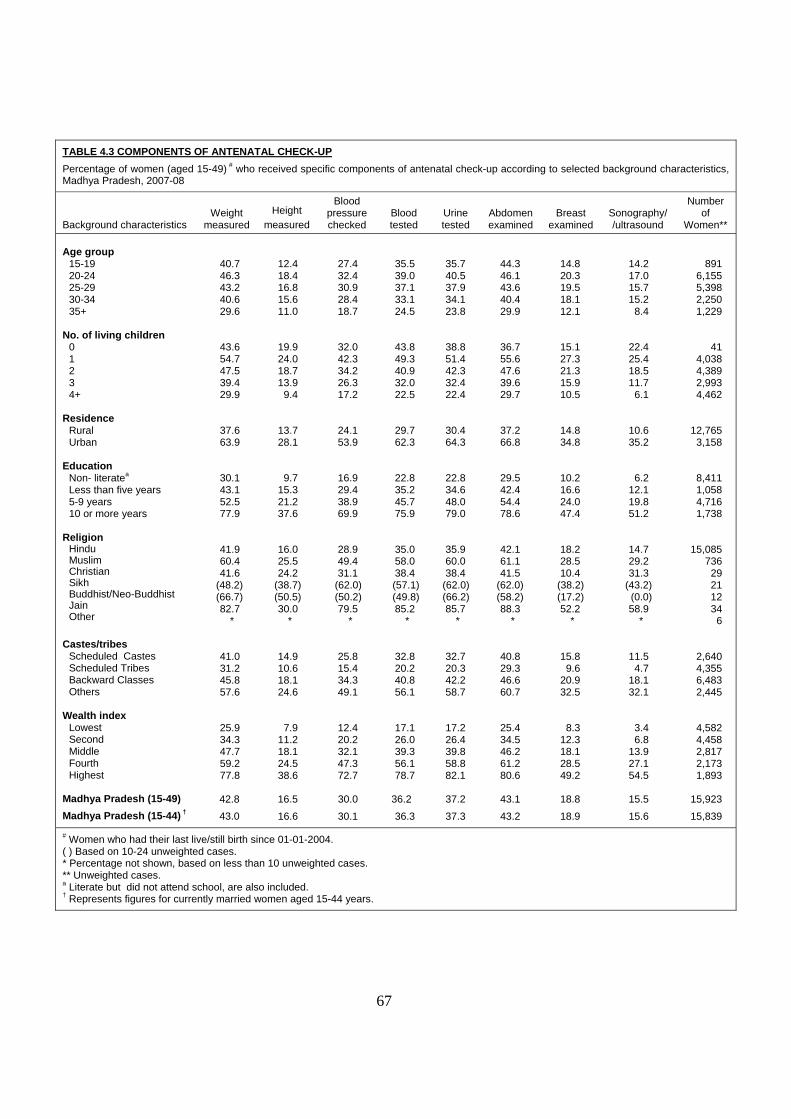
67
TABLE 4.3 COMPONENTS OF ANTENATAL CHECK-UP Percentage of women (aged 15-49) # who received specific components of antenatal check-up according to selected background characteristics, Madhya Pradesh, 2007-08
Background characteristics Weight
measured Height
measured
Blood pressure checked
Blood tested
Urine tested
Abdomen examined
Breast examined
Sonography/ /ultrasound
Number of
Women** Age group
15-19 20-24 25-29 30-34 35+
No. of living children
0 1 2 3 4+
Residence
Rural Urban
Education
Non- literatea Less than five years 5-9 years 10 or more years
Religion
Hindu Muslim Christian Sikh Buddhist/Neo-Buddhist Jain Other
Castes/tribes
Scheduled Castes Scheduled Tribes Backward Classes Others
Wealth index
Lowest Second Middle Fourth Highest
Madhya Pradesh (15-49) Madhya Pradesh (15-44) †
40.7 46.3 43.2 40.6 29.6
43.6 54.7 47.5 39.4 29.9
37.6 63.9
30.1 43.1 52.5 77.9
41.9 60.4 41.6
(48.2) (66.7) 82.7
*
41.0 31.2 45.8 57.6
25.9 34.3 47.7 59.2 77.8
42.8 43.0
12.4 18.4 16.8 15.6 11.0
19.9 24.0 18.7 13.9
9.4
13.7 28.1
9.7 15.3 21.2 37.6
16.0 25.5 24.2
(38.7) (50.5) 30.0
*
14.9 10.6 18.1 24.6
7.9 11.2 18.1 24.5 38.6
16.5 16.6
27.4 32.4 30.9 28.4 18.7
32.0 42.3 34.2 26.3 17.2
24.1 53.9
16.9 29.4 38.9 69.9
28.9 49.4 31.1
(62.0) (50.2) 79.5
*
25.8 15.4 34.3 49.1
12.4 20.2 32.1 47.3 72.7
30.0 30.1
35.5 39.0 37.1 33.1 24.5
43.8 49.3 40.9 32.0 22.5
29.7 62.3
22.8 35.2 45.7 75.9
35.0 58.0 38.4 (57.1) (49.8) 85.2
*
32.8 20.2 40.8 56.1
17.1 26.0 39.3 56.1 78.7
36.2 36.3
35.7 40.5 37.9 34.1 23.8
38.8 51.4 42.3 32.4 22.4
30.4 64.3
22.8 34.6 48.0 79.0
35.9 60.0 38.4
(62.0) (66.2) 85.7
*
32.7 20.3 42.2 58.7
17.2 26.4 39.8 58.8 82.1
37.2 37.3
44.3 46.1 43.6 40.4 29.9
36.7 55.6 47.6 39.6 29.7
37.2 66.8
29.5 42.4 54.4 78.6
42.1 61.1 41.5
(62.0) (58.2) 88.3
*
40.8 29.3 46.6 60.7
25.4 34.5 46.2 61.2 80.6
43.1 43.2
14.8 20.3 19.5 18.1 12.1
15.1 27.3 21.3 15.9 10.5
14.8 34.8
10.2 16.6 24.0 47.4
18.2 28.5 10.4
(38.2) (17.2) 52.2
*
15.8 9.6
20.9 32.5
8.3 12.3 18.1 28.5 49.2
18.8 18.9
14.2 17.0 15.7 15.2
8.4
22.4 25.4 18.5 11.7
6.1
10.6 35.2
6.2 12.1 19.8 51.2
14.7 29.2 31.3
(43.2) (0.0) 58.9
*
11.5 4.7
18.1 32.1
3.4 6.8
13.9 27.1 54.5
15.5 15.6
891 6,155 5,398 2,250 1,229
41 4,038 4,389 2,993 4,462
12,765 3,158
8,411 1,058 4,716 1,738
15,085 736
29 21 12 34
6
2,640 4,355 6,483 2,445
4,582 4,458 2,817 2,173 1,893
15,923 15,839
# Women who had their last live/still birth since 01-01-2004. ( ) Based on 10-24 unweighted cases. * Percentage not shown, based on less than 10 unweighted cases. ** Unweighted cases. a Literate but did not attend school, are also included. † Represents figures for currently married women aged 15-44 years.
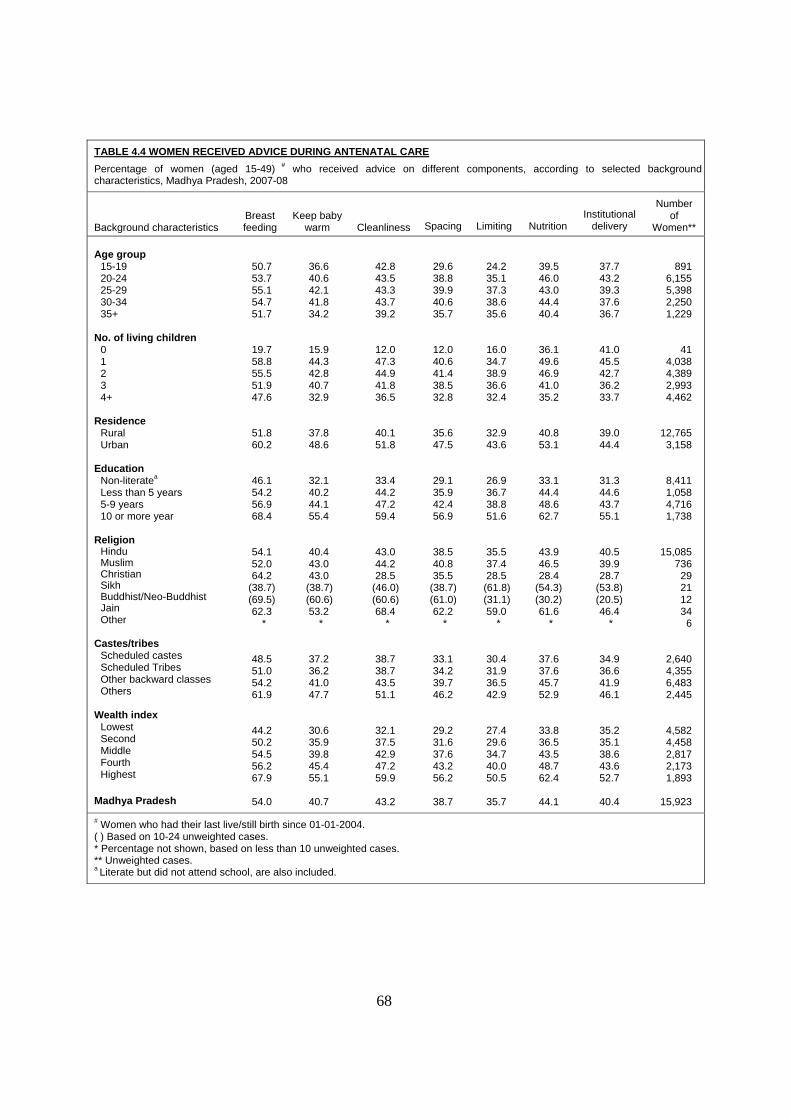
68
TABLE 4.4 WOMEN RECEIVED ADVICE DURING ANTENATAL CARE Percentage of women (aged 15-49) # who received advice on different components, according to selected background characteristics, Madhya Pradesh, 2007-08
Background characteristics Breast feeding
Keep baby warm
Cleanliness Spacing Limiting Nutrition
Institutional delivery
Number of
Women** Age group
15-19 20-24 25-29 30-34 35+
No. of living children
0 1 2 3 4+
Residence
Rural Urban
Education
Non-literatea Less than 5 years 5-9 years 10 or more year
Religion
Hindu Muslim Christian Sikh Buddhist/Neo-Buddhist Jain Other
Castes/tribes
Scheduled castes Scheduled Tribes Other backward classes Others
Wealth index
Lowest Second Middle Fourth Highest
Madhya Pradesh
50.7 53.7 55.1 54.7 51.7
19.7 58.8 55.5 51.9 47.6
51.8 60.2
46.1 54.2 56.9 68.4
54.1 52.0 64.2
(38.7) (69.5) 62.3
*
48.5 51.0 54.2 61.9
44.2 50.2 54.5 56.2 67.9
54.0
36.6 40.6 42.1 41.8 34.2
15.9 44.3 42.8 40.7 32.9
37.8 48.6
32.1 40.2 44.1 55.4
40.4 43.0 43.0 (38.7) (60.6) 53.2
*
37.2 36.2 41.0 47.7
30.6 35.9 39.8 45.4 55.1
40.7
42.8 43.5 43.3 43.7 39.2
12.0 47.3 44.9 41.8 36.5
40.1 51.8
33.4 44.2 47.2 59.4
43.0 44.2 28.5
(46.0) (60.6) 68.4
*
38.7 38.7 43.5 51.1
32.1 37.5 42.9 47.2 59.9
43.2
29.6 38.8 39.9 40.6 35.7
12.0 40.6 41.4 38.5 32.8
35.6 47.5
29.1 35.9 42.4 56.9
38.5 40.8 35.5
(38.7) (61.0) 62.2
*
33.1 34.2 39.7 46.2
29.2 31.6 37.6 43.2 56.2
38.7
24.2 35.1 37.3 38.6 35.6
16.0 34.7 38.9 36.6 32.4
32.9 43.6
26.9 36.7 38.8 51.6
35.5 37.4 28.5 (61.8) (31.1) 59.0
*
30.4 31.9 36.5 42.9
27.4 29.6 34.7 40.0 50.5
35.7
39.5 46.0 43.0 44.4 40.4
36.1 49.6 46.9 41.0 35.2
40.8 53.1
33.1 44.4 48.6 62.7
43.9 46.5 28.4
(54.3) (30.2) 61.6
*
37.6 37.6 45.7 52.9
33.8 36.5 43.5 48.7 62.4
44.1
37.7 43.2 39.3 37.6 36.7
41.0 45.5 42.7 36.2 33.7
39.0 44.4
31.3 44.6 43.7 55.1
40.5 39.9 28.7
(53.8) (20.5) 46.4
*
34.9 36.6 41.9 46.1
35.2 35.1 38.6 43.6 52.7
40.4
891 6,155 5,398 2,250 1,229
41 4,038 4,389 2,993 4,462
12,765 3,158
8,411 1,058 4,716 1,738
15,085 736
29 21 12 34
6
2,640 4,355 6,483 2,445
4,582 4,458 2,817 2,173 1,893
15,923
# Women who had their last live/still birth since 01-01-2004. ( ) Based on 10-24 unweighted cases. * Percentage not shown, based on less than 10 unweighted cases. ** Unweighted cases. a Literate but did not attend school, are also included.
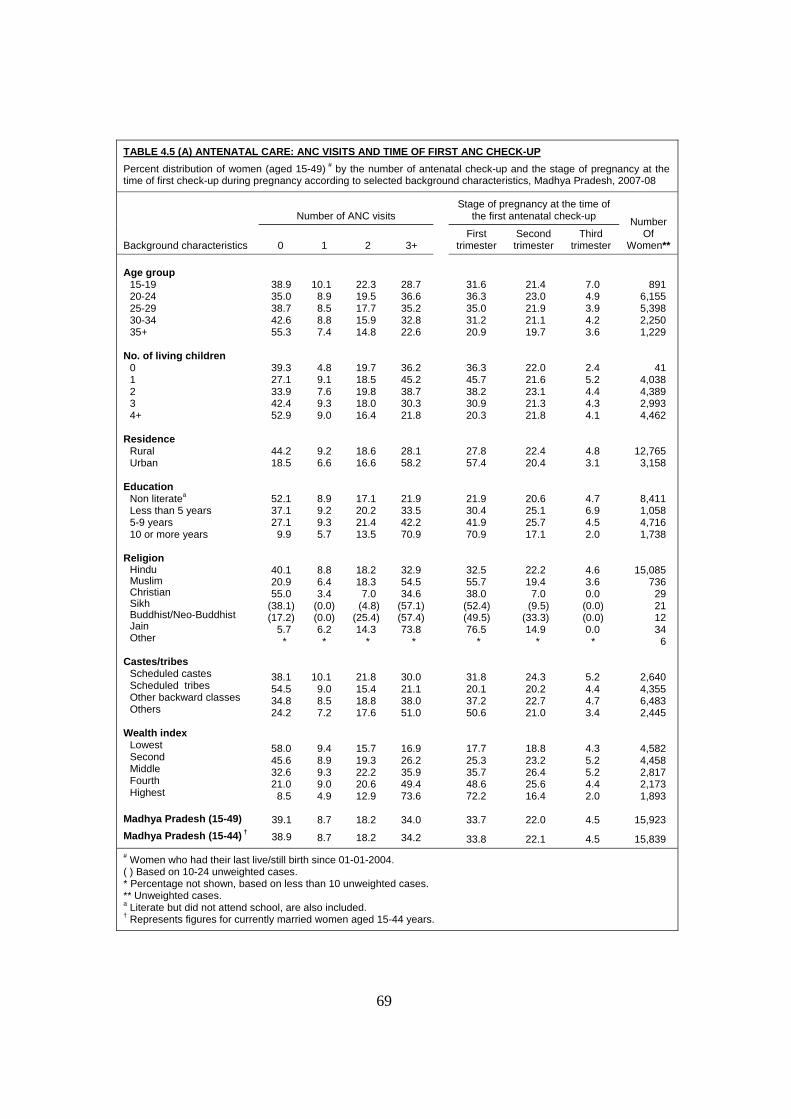
69
TABLE 4.5 (A) ANTENATAL CARE: ANC VISITS AND TIME OF FIRST ANC CHECK-UP Percent distribution of women (aged 15-49) # by the number of antenatal check-up and the stage of pregnancy at the time of first check-up during pregnancy according to selected background characteristics, Madhya Pradesh, 2007-08
Background characteristics
Number of ANC visits Stage of pregnancy at the time of
the first antenatal check-up Number Of
Women** 0 1 2 3+ First
trimester Second trimester
Third trimester
Age group
15-19 20-24 25-29 30-34 35+
No. of living children
0 1 2 3 4+
Residence
Rural Urban
Education
Non literatea Less than 5 years 5-9 years 10 or more years
Religion
Hindu Muslim Christian Sikh Buddhist/Neo-Buddhist Jain Other
Castes/tribes
Scheduled castes Scheduled tribes Other backward classes Others
Wealth index
Lowest Second Middle Fourth Highest
Madhya Pradesh (15-49) Madhya Pradesh (15-44) †
38.9 35.0 38.7 42.6 55.3
39.3 27.1 33.9 42.4 52.9
44.2 18.5
52.1 37.1 27.1
9.9
40.1 20.9 55.0
(38.1) (17.2)
5.7 *
38.1 54.5 34.8 24.2
58.0 45.6 32.6 21.0
8.5
39.1 38.9
10.1 8.9 8.5 8.8 7.4
4.8 9.1 7.6 9.3 9.0
9.2 6.6
8.9 9.2 9.3 5.7
8.8 6.4 3.4
(0.0) (0.0) 6.2 *
10.1 9.0 8.5 7.2
9.4 8.9 9.3 9.0 4.9
8.7
8.7
22.3 19.5 17.7 15.9 14.8
19.7 18.5 19.8 18.0 16.4
18.6 16.6
17.1 20.2 21.4 13.5
18.2 18.3
7.0 (4.8)
(25.4) 14.3
*
21.8 15.4 18.8 17.6
15.7 19.3 22.2 20.6 12.9
18.2
18.2
28.7 36.6 35.2 32.8 22.6
36.2 45.2 38.7 30.3 21.8
28.1 58.2
21.9 33.5 42.2 70.9
32.9 54.5 34.6
(57.1) (57.4) 73.8
*
30.0 21.1 38.0 51.0
16.9 26.2 35.9 49.4 73.6
34.0
34.2
31.6 36.3 35.0 31.2 20.9
36.3 45.7 38.2 30.9 20.3
27.8 57.4
21.9 30.4 41.9 70.9
32.5 55.7 38.0
(52.4) (49.5) 76.5
*
31.8 20.1 37.2 50.6
17.7 25.3 35.7 48.6 72.2
33.7
33.8
21.4 23.0 21.9 21.1 19.7
22.0 21.6 23.1 21.3 21.8
22.4 20.4
20.6 25.1 25.7 17.1
22.2 19.4
7.0 (9.5)
(33.3) 14.9
*
24.3 20.2 22.7 21.0
18.8 23.2 26.4 25.6 16.4
22.0
22.1
7.0 4.9 3.9 4.2 3.6
2.4 5.2 4.4 4.3 4.1
4.8 3.1
4.7 6.9 4.5 2.0
4.6 3.6 0.0
(0.0) (0.0) 0.0 *
5.2 4.4 4.7 3.4
4.3 5.2 5.2 4.4 2.0
4.5
4.5
891 6,155 5,398 2,250 1,229
41 4,038 4,389 2,993 4,462
12,765 3,158
8,411 1,058 4,716 1,738
15,085 736
29 21 12 34
6
2,640 4,355 6,483 2,445
4,582 4,458 2,817 2,173 1,893
15,923
15,839 # Women who had their last live/still birth since 01-01-2004. ( ) Based on 10-24 unweighted cases. * Percentage not shown, based on less than 10 unweighted cases. ** Unweighted cases. a Literate but did not attend school, are also included. † Represents figures for currently married women aged 15-44 years.
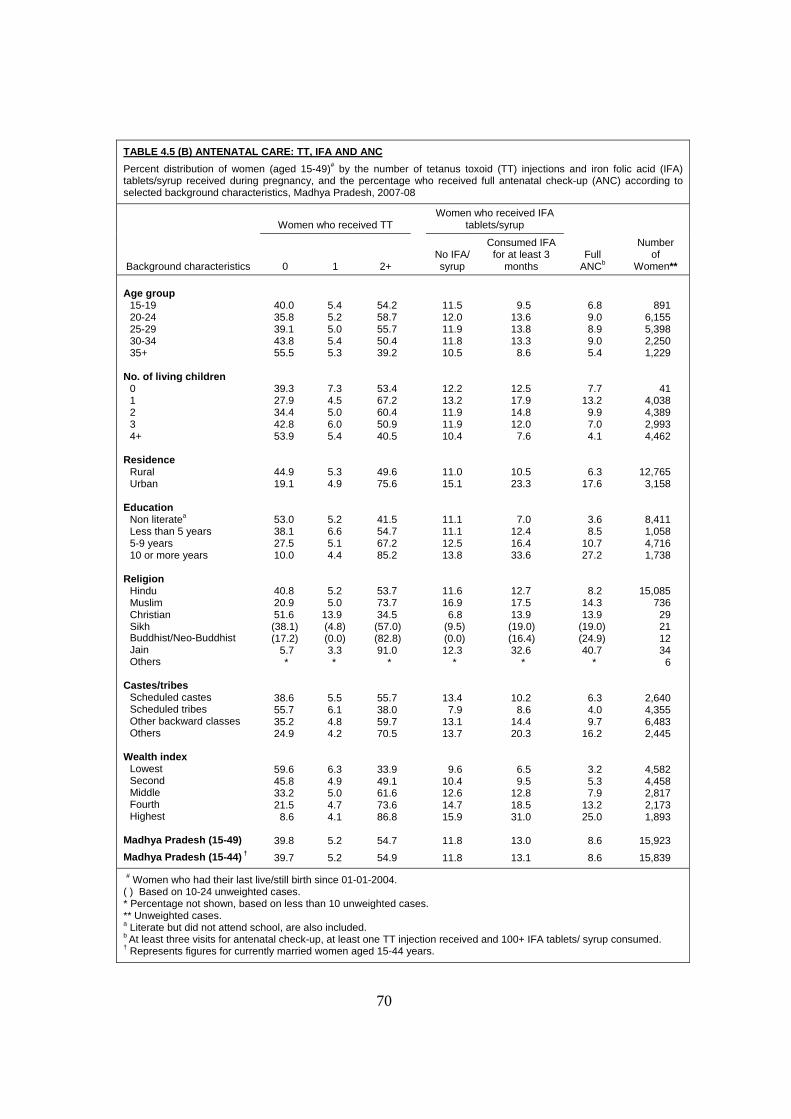
70
TABLE 4.5 (B) ANTENATAL CARE: TT, IFA AND ANC Percent distribution of women (aged 15-49)# by the number of tetanus toxoid (TT) injections and iron folic acid (IFA) tablets/syrup received during pregnancy, and the percentage who received full antenatal check-up (ANC) according to selected background characteristics, Madhya Pradesh, 2007-08
Background characteristics
Women who received TT Women who received IFA
tablets/syrup
0 1 2+ No IFA/ syrup
Consumed IFA for at least 3
months
Full
ANCb
Number of
Women** Age group
15-19 20-24 25-29 30-34 35+
No. of living children
0 1 2 3 4+
Residence
Rural Urban
Education
Non literatea Less than 5 years 5-9 years 10 or more years
Religion
Hindu Muslim Christian Sikh Buddhist/Neo-Buddhist Jain Others
Castes/tribes
Scheduled castes Scheduled tribes Other backward classes Others
Wealth index
Lowest Second Middle Fourth Highest
Madhya Pradesh (15-49) Madhya Pradesh (15-44) †
40.0 35.8 39.1 43.8 55.5
39.3 27.9 34.4 42.8 53.9
44.9 19.1
53.0 38.1 27.5 10.0
40.8 20.9 51.6 (38.1) (17.2)
5.7 *
38.6 55.7 35.2 24.9
59.6 45.8 33.2 21.5
8.6
39.8 39.7
5.4 5.2 5.0 5.4 5.3
7.3 4.5 5.0 6.0 5.4
5.3 4.9
5.2 6.6 5.1 4.4
5.2 5.0
13.9 (4.8) (0.0) 3.3 *
5.5 6.1 4.8 4.2
6.3 4.9 5.0 4.7 4.1
5.2 5.2
54.2 58.7 55.7 50.4 39.2
53.4 67.2 60.4 50.9 40.5
49.6 75.6
41.5 54.7 67.2 85.2
53.7 73.7 34.5 (57.0) (82.8) 91.0
*
55.7 38.0 59.7 70.5
33.9 49.1 61.6 73.6 86.8
54.7 54.9
11.5 12.0 11.9 11.8 10.5
12.2 13.2 11.9 11.9 10.4
11.0 15.1
11.1 11.1 12.5 13.8
11.6 16.9
6.8 (9.5) (0.0) 12.3
*
13.4
7.9 13.1 13.7
9.6 10.4 12.6 14.7 15.9
11.8 11.8
9.5 13.6 13.8 13.3
8.6
12.5 17.9 14.8 12.0
7.6
10.5 23.3
7.0 12.4 16.4 33.6
12.7 17.5 13.9 (19.0) (16.4) 32.6
*
10.2
8.6 14.4 20.3
6.5 9.5
12.8 18.5 31.0
13.0 13.1
6.8 9.0 8.9 9.0 5.4
7.7 13.2
9.9 7.0 4.1
6.3 17.6
3.6 8.5
10.7 27.2
8.2 14.3 13.9
(19.0) (24.9) 40.7
*
6.3 4.0 9.7
16.2
3.2 5.3 7.9
13.2 25.0
8.6 8.6
891 6,155 5,398 2,250 1,229
41 4,038 4,389 2,993 4,462
12,765 3,158
8,411 1,058 4,716 1,738
15,085 736
29 21 12 34
6
2,640 4,355 6,483 2,445
4,582 4,458 2,817 2,173 1,893
15,923 15,839
# Women who had their last live/still birth since 01-01-2004. ( ) Based on 10-24 unweighted cases. * Percentage not shown, based on less than 10 unweighted cases. ** Unweighted cases. a Literate but did not attend school, are also included. b At least three visits for antenatal check-up, at least one TT injection received and 100+ IFA tablets/ syrup consumed. † Represents figures for currently married women aged 15-44 years.
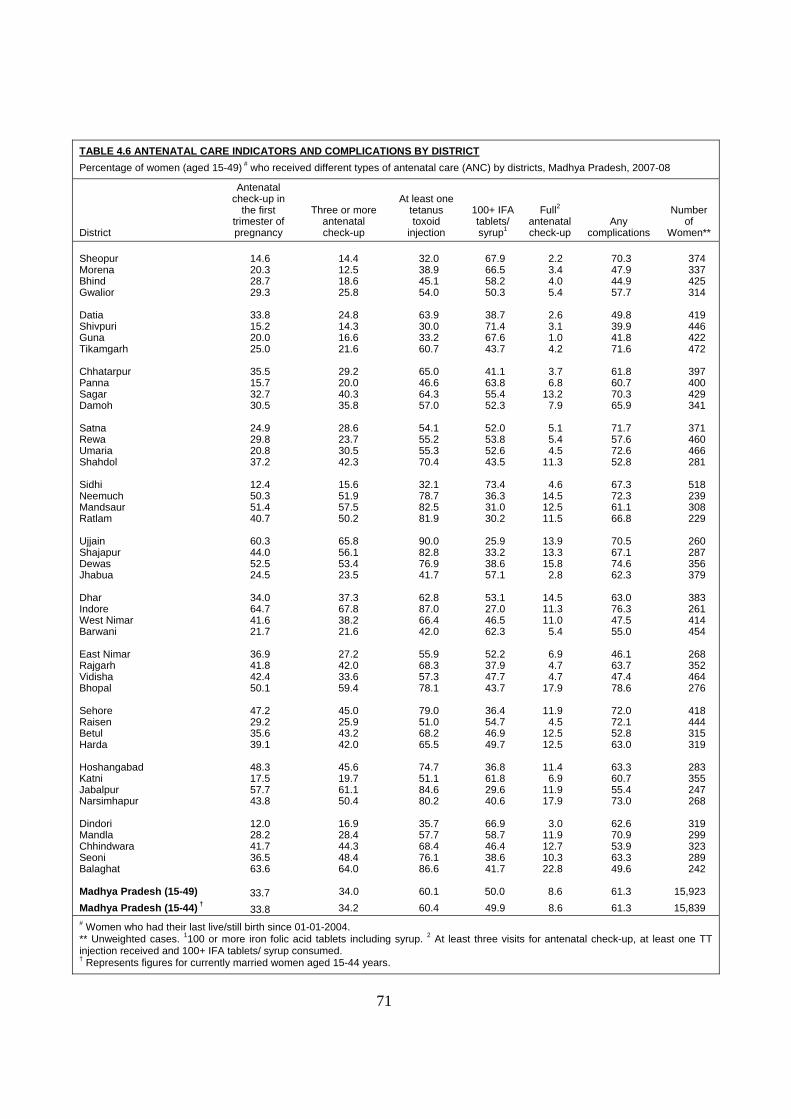
71
TABLE 4.6 ANTENATAL CARE INDICATORS AND COMPLICATIONS BY DISTRICT Percentage of women (aged 15-49) # who received different types of antenatal care (ANC) by districts, Madhya Pradesh, 2007-08
District
Antenatal check-up in
the first trimester of pregnancy
Three or more antenatal check-up
At least one tetanus toxoid
injection
100+ IFA
tablets/ syrup1
Full2
antenatal check-up
Any complications
Number of
Women** Sheopur Morena Bhind Gwalior Datia Shivpuri Guna Tikamgarh Chhatarpur Panna Sagar Damoh Satna Rewa Umaria Shahdol Sidhi Neemuch Mandsaur Ratlam Ujjain Shajapur Dewas Jhabua Dhar Indore West Nimar Barwani East Nimar Rajgarh Vidisha Bhopal Sehore Raisen Betul Harda Hoshangabad Katni Jabalpur Narsimhapur Dindori Mandla Chhindwara Seoni Balaghat Madhya Pradesh (15-49) Madhya Pradesh (15-44) †
14.6 20.3 28.7 29.3
33.8 15.2 20.0 25.0
35.5 15.7 32.7 30.5
24.9 29.8 20.8 37.2
12.4 50.3 51.4 40.7
60.3 44.0 52.5 24.5
34.0 64.7 41.6 21.7
36.9 41.8 42.4 50.1
47.2 29.2 35.6 39.1
48.3 17.5 57.7 43.8
12.0 28.2 41.7 36.5 63.6
33.7 33.8
14.4 12.5 18.6 25.8
24.8 14.3 16.6 21.6
29.2 20.0 40.3 35.8
28.6 23.7 30.5 42.3
15.6 51.9 57.5 50.2
65.8 56.1 53.4 23.5
37.3 67.8 38.2 21.6
27.2 42.0 33.6 59.4
45.0 25.9 43.2 42.0
45.6 19.7 61.1 50.4
16.9 28.4 44.3 48.4 64.0
34.0 34.2
32.0 38.9 45.1 54.0
63.9 30.0 33.2 60.7
65.0 46.6 64.3 57.0
54.1 55.2 55.3 70.4
32.1 78.7 82.5 81.9
90.0 82.8 76.9 41.7
62.8 87.0 66.4 42.0
55.9 68.3 57.3 78.1
79.0 51.0 68.2 65.5
74.7 51.1 84.6 80.2
35.7 57.7 68.4 76.1 86.6
60.1 60.4
67.9 66.5 58.2 50.3
38.7 71.4 67.6 43.7
41.1 63.8 55.4 52.3
52.0 53.8 52.6 43.5
73.4 36.3 31.0 30.2
25.9 33.2 38.6 57.1
53.1 27.0 46.5 62.3
52.2 37.9 47.7 43.7
36.4 54.7 46.9 49.7
36.8 61.8 29.6 40.6
66.9 58.7 46.4 38.6 41.7
50.0 49.9
2.2 3.4 4.0 5.4
2.6 3.1 1.0 4.2
3.7 6.8
13.2 7.9
5.1 5.4 4.5
11.3
4.6 14.5 12.5 11.5
13.9 13.3 15.8
2.8
14.5 11.3 11.0
5.4
6.9 4.7 4.7
17.9
11.9 4.5
12.5 12.5
11.4
6.9 11.9 17.9
3.0
11.9 12.7 10.3 22.8
8.6 8.6
70.3 47.9 44.9 57.7
49.8 39.9 41.8 71.6
61.8 60.7 70.3 65.9
71.7 57.6 72.6 52.8
67.3 72.3 61.1 66.8
70.5 67.1 74.6 62.3
63.0 76.3 47.5 55.0
46.1 63.7 47.4 78.6
72.0 72.1 52.8 63.0
63.3 60.7 55.4 73.0
62.6 70.9 53.9 63.3 49.6
61.3 61.3
374 337 425 314
419 446 422 472
397 400 429 341
371 460 466 281
518 239 308 229
260 287 356 379
383 261 414 454
268 352 464 276
418 444 315 319
283 355 247 268
319 299 323 289 242
15,923 15,839
# Women who had their last live/still birth since 01-01-2004. ** Unweighted cases. 1100 or more iron folic acid tablets including syrup. 2 At least three visits for antenatal check-up, at least one TT injection received and 100+ IFA tablets/ syrup consumed. † Represents figures for currently married women aged 15-44 years.

72
TABLE 4.7 PLACE OF DELIVERY AND ASSISTANCE Percent distribution of women (aged 15-49) # according to place of delivery, assistance during home deliveries, and safe deliveries according to background characteristics, Madhya Pradesh, 2007-08
Background characteristics
Percentage of women who had
institutional delivery
Percentage of women who had delivery at home
Home delivery assisted by
skilled persons1
Percentage of safe
delivery2
Number of
women** Age group
15-19 20-24 25-29 30-34 35+
No. of living children
0 1 2 3 4+
Residence
Rural Urban
Education
Non literatea Less than 5 years 5-9 years 10 or more years
Religion
Hindu Muslim Christian Sikh Buddhist/Neo-Buddhist Jain Others
Castes/tribes
Scheduled castes Scheduled tribes Other backward classes Others
Wealth index
Lowest Second Middle Fourth Highest
Madhya Pradesh (15-49) Madhya Pradesh (15-44) †
59.4 53.2 43.4 42.0 30.4
75.9 65.9 49.6 40.8 30.9
40.7 72.1
35.1 45.2 55.6 81.5
45.8 67.4 38.3
(66.7) (48.5) 85.5
*
48.9 28.5 51.8 64.7
29.7 39.1 51.2 61.7 83.6
46.9 47.1
39.7 46.0 55.8 57.1 68.9
19.3 33.5 49.8 58.1 68.3
58.5 27.5
64.0 54.2 43.7 18.0
53.4 32.1 58.3
(33.3) (51.5) 14.5
*
50.2 70.5 47.6 34.6
69.3 60.2 48.2 37.6 15.7
52.3 52.1
1.6 2.8 3.4 3.2 3.3
2.3 2.7 2.9 3.3 3.1
2.6 4.6
2.4 3.6 3.4 4.3
3.0 4.0 0.0 (0.0) (0.0) 2.9 *
2.4 2.3 3.3 3.9
2.4 2.7 3.0 4.2 3.7
3.0 3.0
61.0 56.0 46.8 45.2 33.7
78.2 68.6 52.5 44.1 34.0
43.3 76.7
37.5 48.8 59.0 85.8
48.8 71.4 38.3
(66.7) (48.5) 88.4
*
51.3 30.8 55.1 68.6
32.1 41.8 54.2 65.9 87.3
49.9 50.1
891 6,155 5,398 2,250 1,229
41 4,038 4,389 2,993 4,462
12,765 3,158
8,411 1,058 4,716 1,738
15,085 736
29 21 12 34
6
2,640 4,355 6,483 2,445
4,582 4,458 2,817 2,173 1,893
15,923 15,839
Note: Percent distribution of institutional and home delivery may not add to 100.0, because the places of delivery are on the way to the institute, working place and other places. # Women who had their last live/still birth since 01-01-2004. ( ) Based on 10-24 unweighted cases. * Percentage not shown, based on less than 10 unweighted cases. ** Unweighted cases. 1 Includes Doctor/ANM/Nurse. 2 Either institutional delivery or home delivery assisted by skilled person. a Literate but did not attend school, are also included. † Represents figures for currently married women aged 15-44 years.
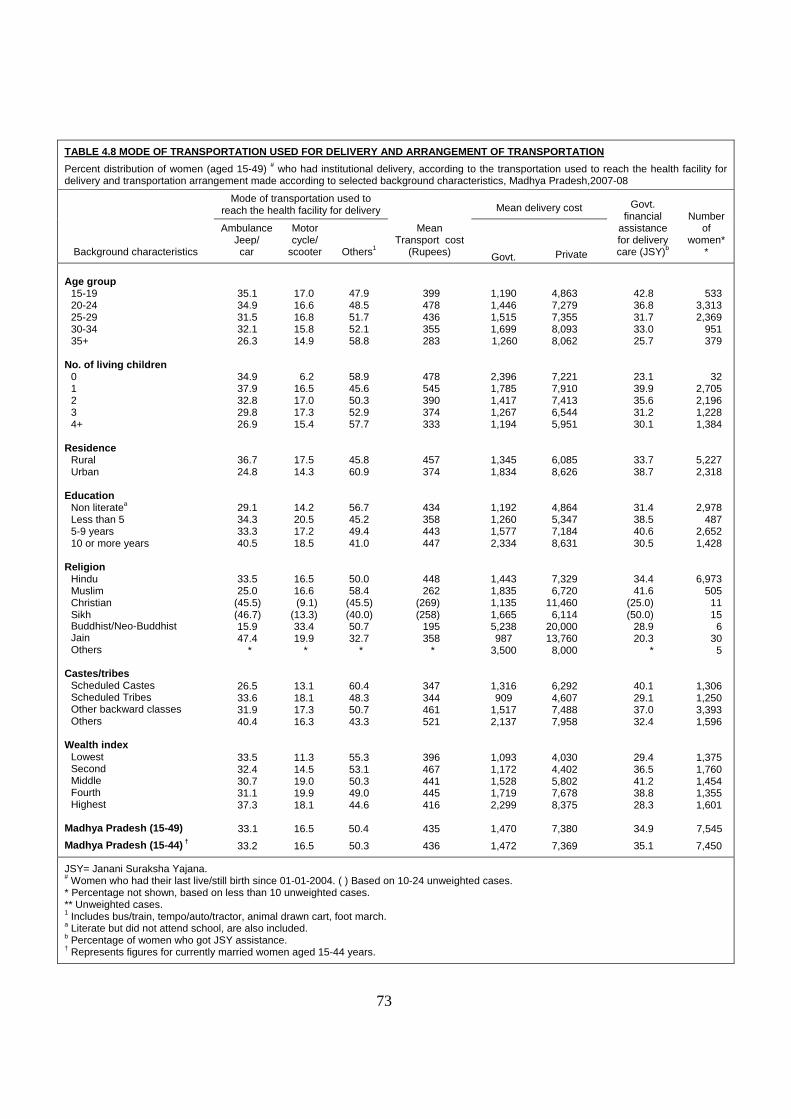
73
TABLE 4.8 MODE OF TRANSPORTATION USED FOR DELIVERY AND ARRANGEMENT OF TRANSPORTATION Percent distribution of women (aged 15-49) # who had institutional delivery, according to the transportation used to reach the health facility for delivery and transportation arrangement made according to selected background characteristics, Madhya Pradesh,2007-08
Background characteristics
Mode of transportation used to reach the health facility for delivery
Mean Transport cost
(Rupees)
Mean delivery cost Govt. financial
assistance for delivery care (JSY)b
Number of
women**
Ambulance Jeep/ car
Motor cycle/
scooter Others1 Govt. Private Age group
15-19 20-24 25-29 30-34 35+
No. of living children
0 1 2 3 4+
Residence
Rural Urban
Education
Non literatea Less than 5 5-9 years 10 or more years
Religion
Hindu Muslim Christian Sikh Buddhist/Neo-Buddhist Jain Others
Castes/tribes
Scheduled Castes Scheduled Tribes Other backward classes Others
Wealth index
Lowest Second Middle Fourth Highest
Madhya Pradesh (15-49) Madhya Pradesh (15-44) †
35.1 34.9 31.5 32.1 26.3
34.9 37.9 32.8 29.8 26.9
36.7 24.8
29.1 34.3 33.3 40.5
33.5 25.0
(45.5) (46.7) 15.9 47.4
*
26.5 33.6 31.9 40.4
33.5 32.4 30.7 31.1 37.3
33.1 33.2
17.0 16.6 16.8 15.8 14.9
6.2 16.5 17.0 17.3 15.4
17.5 14.3
14.2 20.5 17.2 18.5
16.5 16.6 (9.1)
(13.3) 33.4 19.9
*
13.1 18.1 17.3 16.3
11.3 14.5 19.0 19.9 18.1
16.5 16.5
47.9 48.5 51.7 52.1 58.8
58.9 45.6 50.3 52.9 57.7
45.8 60.9
56.7 45.2 49.4 41.0
50.0 58.4
(45.5) (40.0) 50.7 32.7
*
60.4 48.3 50.7 43.3
55.3 53.1 50.3 49.0 44.6
50.4 50.3
399 478 436 355 283
478 545 390 374 333
457 374
434 358 443 447
448 262
(269) (258)
195 358
*
347 344 461 521
396 467 441 445 416
435 436
1,190 1,446 1,515 1,699
1,260
2,396 1,785 1,417 1,267 1,194
1,345 1,834
1,192 1,260 1,577 2,334
1,443 1,835 1,135 1,665 5,238 987
3,500
1,316 909
1,517 2,137
1,093 1,172 1,528 1,719 2,299
1,470 1,472
4,863 7,279 7,355 8,093 8,062
7,221 7,910 7,413 6,544 5,951
6,085 8,626
4,864 5,347 7,184 8,631
7,329 6,720
11,460 6,114
20,000 13,760
8,000
6,292 4,607 7,488 7,958
4,030 4,402 5,802 7,678 8,375
7,380 7,369
42.8 36.8 31.7 33.0 25.7
23.1 39.9 35.6 31.2 30.1
33.7 38.7
31.4 38.5 40.6 30.5
34.4 41.6
(25.0) (50.0)
28.9 20.3
*
40.1 29.1 37.0 32.4
29.4 36.5 41.2 38.8 28.3
34.9 35.1
533 3,313 2,369
951 379
32 2,705 2,196 1,228 1,384
5,227 2,318
2,978 487
2,652 1,428
6,973 505
11 15
6 30
5
1,306 1,250 3,393 1,596
1,375 1,760 1,454 1,355 1,601
7,545 7,450
JSY= Janani Suraksha Yajana. # Women who had their last live/still birth since 01-01-2004. ( ) Based on 10-24 unweighted cases. * Percentage not shown, based on less than 10 unweighted cases. ** Unweighted cases. 1 Includes bus/train, tempo/auto/tractor, animal drawn cart, foot march. a Literate but did not attend school, are also included. b Percentage of women who got JSY assistance. † Represents figures for currently married women aged 15-44 years.
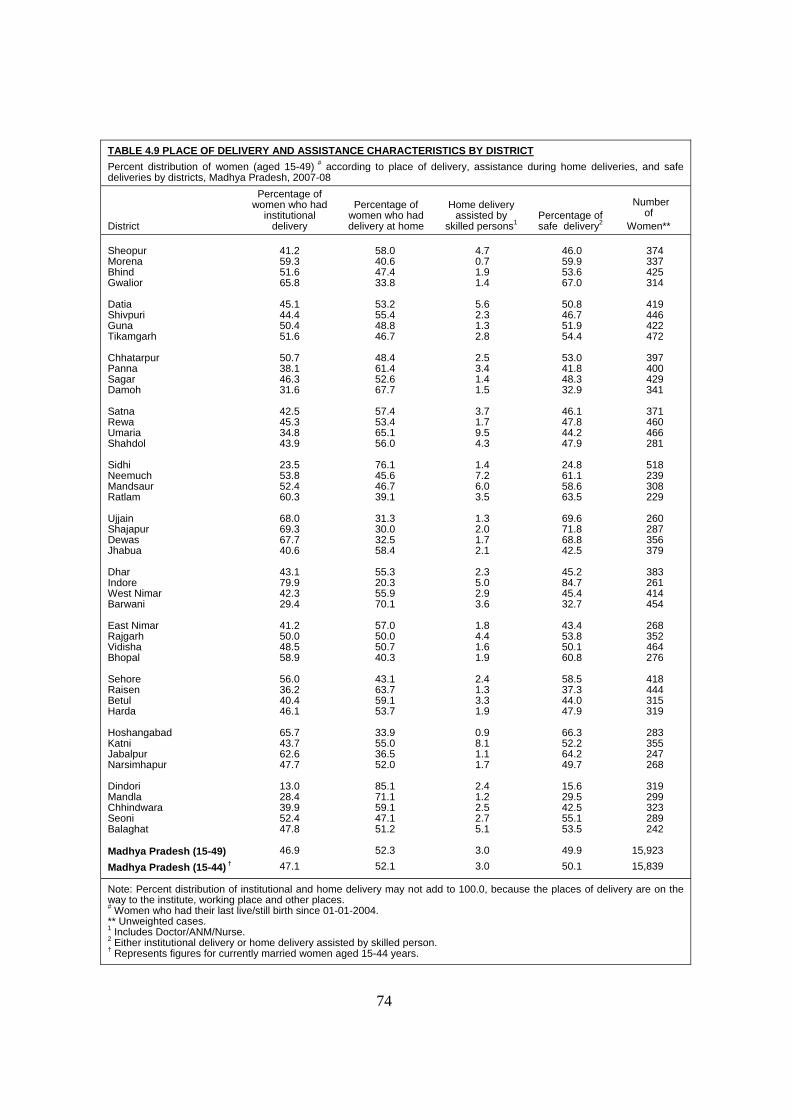
74
TABLE 4.9 PLACE OF DELIVERY AND ASSISTANCE CHARACTERISTICS BY DISTRICT Percent distribution of women (aged 15-49) # according to place of delivery, assistance during home deliveries, and safe deliveries by districts, Madhya Pradesh, 2007-08
District
Percentage of women who had
institutional delivery
Percentage of women who had delivery at home
Home delivery assisted by
skilled persons1 Percentage of safe delivery2
Number of
Women** Sheopur Morena Bhind Gwalior Datia Shivpuri Guna Tikamgarh Chhatarpur Panna Sagar Damoh Satna Rewa Umaria Shahdol Sidhi Neemuch Mandsaur Ratlam Ujjain Shajapur Dewas Jhabua Dhar Indore West Nimar Barwani East Nimar Rajgarh Vidisha Bhopal Sehore Raisen Betul Harda Hoshangabad Katni Jabalpur Narsimhapur Dindori Mandla Chhindwara Seoni Balaghat Madhya Pradesh (15-49) Madhya Pradesh (15-44) †
41.2 59.3 51.6 65.8
45.1 44.4 50.4 51.6
50.7 38.1 46.3 31.6
42.5 45.3 34.8 43.9
23.5 53.8 52.4 60.3
68.0 69.3 67.7 40.6
43.1 79.9 42.3 29.4
41.2 50.0 48.5 58.9
56.0 36.2 40.4 46.1
65.7 43.7 62.6 47.7
13.0 28.4 39.9 52.4 47.8
46.9 47.1
58.0 40.6 47.4 33.8
53.2 55.4 48.8 46.7
48.4 61.4 52.6 67.7
57.4 53.4 65.1 56.0
76.1 45.6 46.7 39.1
31.3 30.0 32.5 58.4
55.3 20.3 55.9 70.1
57.0 50.0 50.7 40.3
43.1 63.7 59.1 53.7
33.9 55.0 36.5 52.0
85.1 71.1 59.1 47.1 51.2
52.3 52.1
4.7 0.7 1.9 1.4
5.6 2.3 1.3 2.8
2.5 3.4 1.4 1.5
3.7 1.7 9.5 4.3
1.4 7.2 6.0 3.5
1.3 2.0 1.7 2.1
2.3 5.0 2.9 3.6
1.8 4.4 1.6 1.9
2.4 1.3 3.3 1.9
0.9 8.1 1.1 1.7
2.4 1.2 2.5 2.7 5.1
3.0 3.0
46.0 59.9 53.6 67.0
50.8 46.7 51.9 54.4
53.0 41.8 48.3 32.9
46.1 47.8 44.2 47.9
24.8 61.1 58.6 63.5
69.6 71.8 68.8 42.5
45.2 84.7 45.4 32.7
43.4 53.8 50.1 60.8
58.5 37.3 44.0 47.9
66.3 52.2 64.2 49.7
15.6 29.5 42.5 55.1 53.5
49.9 50.1
374 337 425 314
419 446 422 472
397 400 429 341
371 460 466 281
518 239 308 229
260 287 356 379
383 261 414 454
268 352 464 276
418 444 315 319
283 355 247 268
319 299 323 289 242
15,923 15,839
Note: Percent distribution of institutional and home delivery may not add to 100.0, because the places of delivery are on the way to the institute, working place and other places. # Women who had their last live/still birth since 01-01-2004. ** Unweighted cases. 1 Includes Doctor/ANM/Nurse. 2 Either institutional delivery or home delivery assisted by skilled person. † Represents figures for currently married women aged 15-44 years.
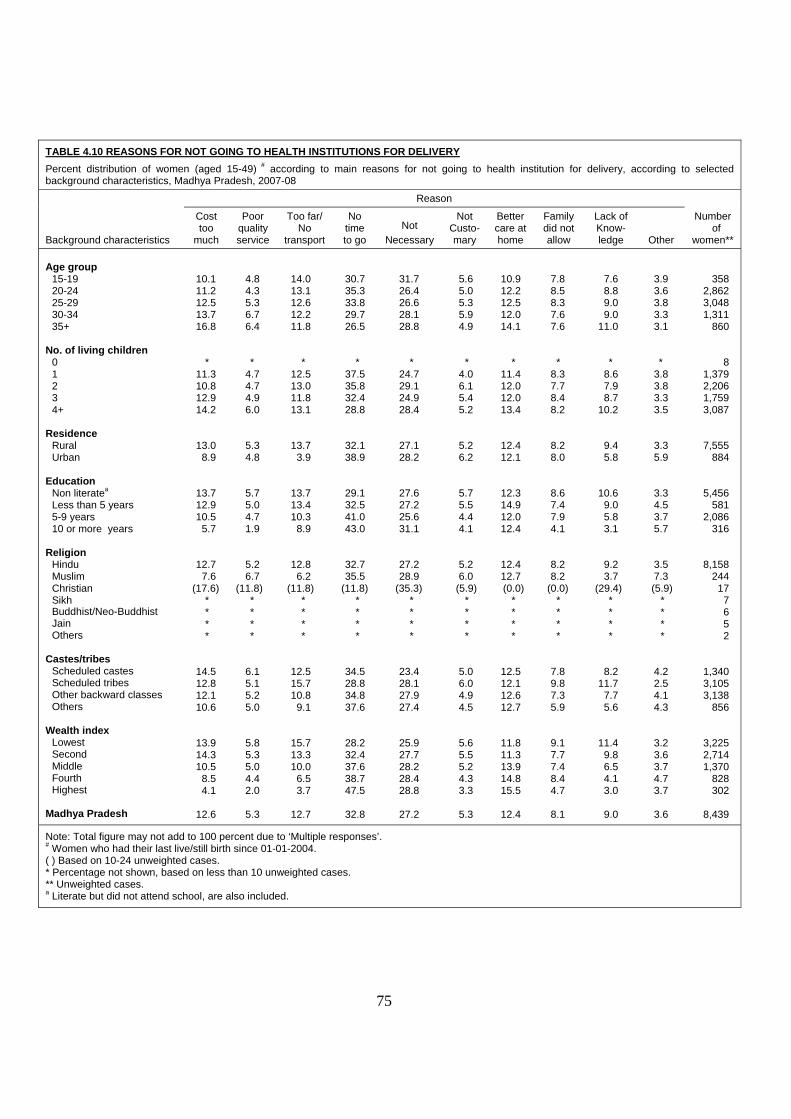
75
TABLE 4.10 REASONS FOR NOT GOING TO HEALTH INSTITUTIONS FOR DELIVERY Percent distribution of women (aged 15-49) # according to main reasons for not going to health institution for delivery, according to selected background characteristics, Madhya Pradesh, 2007-08
Background characteristics
Reason
Number of
women**
Cost too
much
Poor quality service
Too far/ No
transport
No time to go
Not Necessary
Not Custo-mary
Better care at home
Family did not allow
Lack of Know- ledge Other
Age group
15-19 20-24 25-29 30-34 35+
No. of living children
0 1 2 3 4+
Residence
Rural Urban
Education
Non literatea Less than 5 years 5-9 years 10 or more years
Religion
Hindu Muslim Christian Sikh Buddhist/Neo-Buddhist Jain Others
Castes/tribes
Scheduled castes Scheduled tribes Other backward classes Others
Wealth index
Lowest Second Middle Fourth Highest
Madhya Pradesh
10.1 11.2 12.5 13.7 16.8
* 11.3 10.8 12.9 14.2
13.0 8.9
13.7 12.9 10.5
5.7
12.7 7.6
(17.6) * * * *
14.5 12.8 12.1 10.6
13.9 14.3 10.5
8.5 4.1
12.6
4.8 4.3 5.3 6.7 6.4
* 4.7 4.7 4.9 6.0
5.3 4.8
5.7 5.0 4.7 1.9
5.2 6.7
(11.8) * * * *
6.1 5.1 5.2 5.0
5.8 5.3 5.0 4.4 2.0
5.3
14.0 13.1 12.6 12.2 11.8
* 12.5 13.0 11.8 13.1
13.7 3.9
13.7 13.4 10.3
8.9
12.8 6.2
(11.8) * * * *
12.5 15.7 10.8
9.1
15.7 13.3 10.0
6.5 3.7
12.7
30.7 35.3 33.8 29.7 26.5
* 37.5 35.8 32.4 28.8
32.1 38.9
29.1 32.5 41.0 43.0
32.7 35.5
(11.8) * * * *
34.5 28.8 34.8 37.6
28.2 32.4 37.6 38.7 47.5
32.8
31.7 26.4 26.6 28.1 28.8
* 24.7 29.1 24.9 28.4
27.1 28.2
27.6 27.2 25.6 31.1
27.2 28.9
(35.3) * * * *
23.4 28.1 27.9 27.4
25.9 27.7 28.2 28.4 28.8
27.2
5.6 5.0 5.3 5.9 4.9
* 4.0 6.1 5.4 5.2
5.2 6.2
5.7 5.5 4.4 4.1
5.2 6.0
(5.9) * * * *
5.0 6.0 4.9 4.5
5.6 5.5 5.2 4.3 3.3
5.3
10.9 12.2 12.5 12.0 14.1
* 11.4 12.0 12.0 13.4
12.4 12.1
12.3 14.9 12.0 12.4
12.4 12.7 (0.0)
* * * *
12.5 12.1 12.6 12.7
11.8 11.3 13.9 14.8 15.5
12.4
7.8 8.5 8.3 7.6 7.6
* 8.3 7.7 8.4 8.2
8.2 8.0
8.6 7.4 7.9 4.1
8.2 8.2
(0.0) * * * *
7.8 9.8 7.3 5.9
9.1 7.7 7.4 8.4 4.7
8.1
7.6 8.8 9.0 9.0
11.0
* 8.6 7.9 8.7
10.2
9.4 5.8
10.6 9.0 5.8 3.1
9.2 3.7
(29.4) * * * *
8.2 11.7
7.7 5.6
11.4 9.8 6.5 4.1 3.0
9.0
3.9 3.6 3.8 3.3 3.1
* 3.8 3.8 3.3 3.5
3.3 5.9
3.3 4.5 3.7 5.7
3.5 7.3 (5.9)
* * * *
4.2 2.5 4.1 4.3
3.2 3.6 3.7 4.7 3.7
3.6
358 2,862 3,048 1,311
860
8 1,379 2,206 1,759 3,087
7,555 884
5,456 581
2,086 316
8,158 244
17 7 6 5 2
1,340 3,105 3,138
856
3,225 2,714 1,370
828 302
8,439
Note: Total figure may not add to 100 percent due to ‘Multiple responses’. # Women who had their last live/still birth since 01-01-2004. ( ) Based on 10-24 unweighted cases. * Percentage not shown, based on less than 10 unweighted cases. ** Unweighted cases. a Literate but did not attend school, are also included.
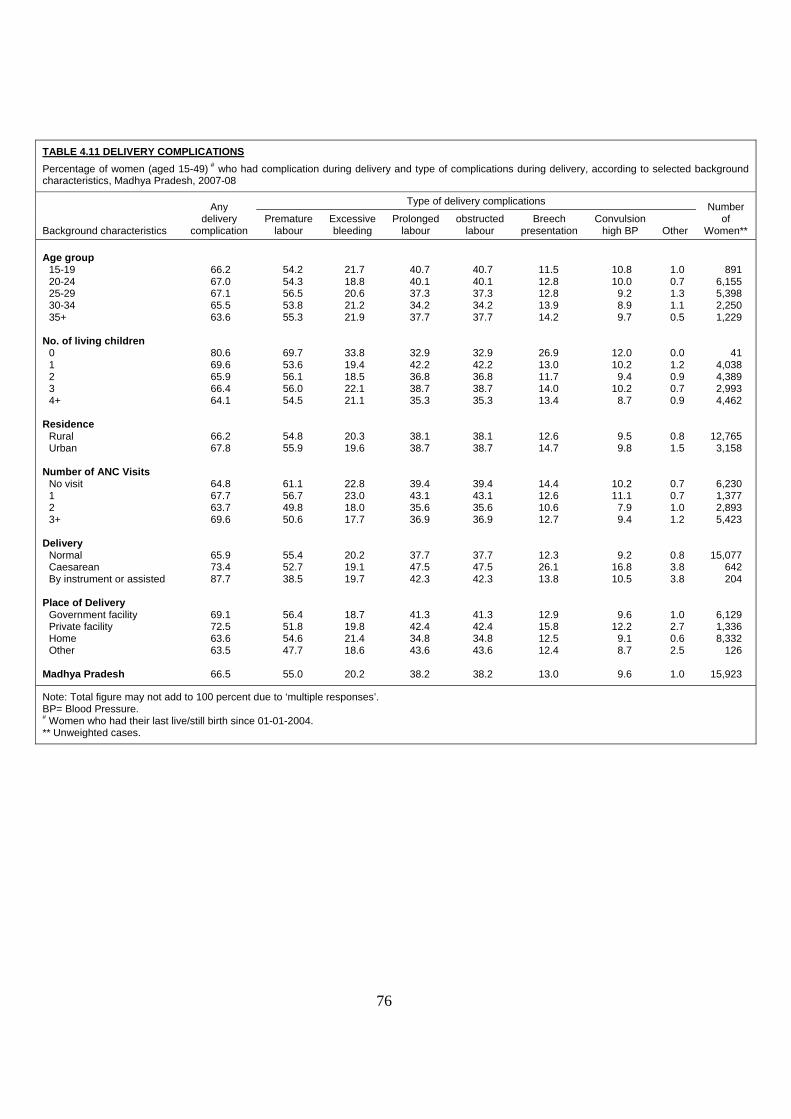
76
TABLE 4.11 DELIVERY COMPLICATIONS Percentage of women (aged 15-49) # who had complication during delivery and type of complications during delivery, according to selected background characteristics, Madhya Pradesh, 2007-08
Background characteristics
Any delivery
complication
Type of delivery complications Number of
Women** Premature
labour Excessive bleeding
Prolonged labour
obstructed labour
Breech presentation
Convulsion high BP Other
Age group
15-19 20-24 25-29 30-34 35+
No. of living children
0 1 2 3 4+
Residence
Rural Urban
Number of ANC Visits
No visit 1 2 3+
Delivery
Normal Caesarean By instrument or assisted
Place of Delivery Government facility Private facility Home Other
Madhya Pradesh
66.2 67.0 67.1 65.5 63.6
80.6 69.6 65.9 66.4 64.1
66.2 67.8
64.8 67.7 63.7 69.6
65.9 73.4 87.7
69.1 72.5 63.6 63.5
66.5
54.2 54.3 56.5 53.8 55.3
69.7 53.6 56.1 56.0 54.5
54.8 55.9
61.1 56.7 49.8 50.6
55.4 52.7 38.5
56.4 51.8 54.6 47.7
55.0
21.7 18.8 20.6 21.2 21.9
33.8 19.4 18.5 22.1 21.1
20.3 19.6
22.8 23.0 18.0 17.7
20.2 19.1 19.7
18.7 19.8 21.4 18.6
20.2
40.7 40.1 37.3 34.2 37.7
32.9 42.2 36.8 38.7 35.3
38.1 38.7
39.4 43.1 35.6 36.9
37.7 47.5 42.3
41.3 42.4 34.8 43.6
38.2
40.7 40.1 37.3 34.2 37.7
32.9 42.2 36.8 38.7 35.3
38.1 38.7
39.4 43.1 35.6 36.9
37.7 47.5 42.3
41.3 42.4 34.8 43.6
38.2
11.5 12.8 12.8 13.9 14.2
26.9 13.0 11.7 14.0 13.4
12.6 14.7
14.4 12.6 10.6 12.7
12.3 26.1 13.8
12.9 15.8 12.5 12.4
13.0
10.8 10.0
9.2 8.9 9.7
12.0 10.2
9.4 10.2
8.7
9.5 9.8
10.2 11.1
7.9 9.4
9.2 16.8 10.5
9.6 12.2
9.1 8.7
9.6
1.0 0.7 1.3 1.1 0.5
0.0 1.2 0.9 0.7 0.9
0.8 1.5
0.7 0.7 1.0 1.2
0.8 3.8 3.8
1.0 2.7 0.6 2.5
1.0
891 6,155 5,398 2,250 1,229
41 4,038 4,389 2,993 4,462
12,765 3,158
6,230 1,377 2,893 5,423
15,077 642 204
6,129 1,336 8,332
126
15,923
Note: Total figure may not add to 100 percent due to ‘multiple responses’. BP= Blood Pressure. # Women who had their last live/still birth since 01-01-2004. ** Unweighted cases.
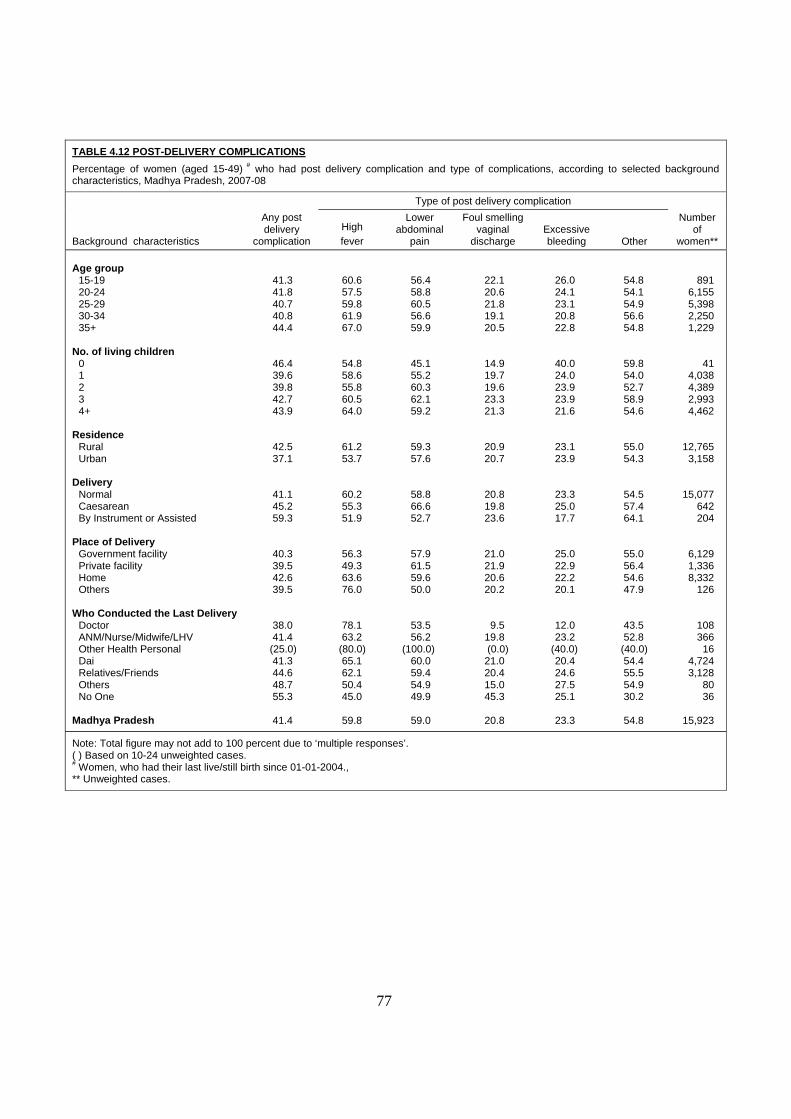
77
TABLE 4.12 POST-DELIVERY COMPLICATIONS Percentage of women (aged 15-49) # who had post delivery complication and type of complications, according to selected background characteristics, Madhya Pradesh, 2007-08
Background characteristics
Any post delivery
complication
Type of post delivery complication Number
of women**
High fever
Lower abdominal
pain
Foul smelling vaginal
discharge Excessive bleeding Other
Age group
15-19 20-24 25-29 30-34 35+
No. of living children
0 1 2 3 4+
Residence
Rural Urban
Delivery
Normal Caesarean By Instrument or Assisted
Place of Delivery
Government facility Private facility Home Others
Who Conducted the Last Delivery
Doctor ANM/Nurse/Midwife/LHV Other Health Personal Dai Relatives/Friends Others No One
Madhya Pradesh
41.3 41.8 40.7 40.8 44.4
46.4 39.6 39.8 42.7 43.9
42.5 37.1
41.1 45.2 59.3
40.3 39.5 42.6 39.5
38.0 41.4
(25.0) 41.3 44.6 48.7 55.3
41.4
60.6 57.5 59.8 61.9 67.0
54.8 58.6 55.8 60.5 64.0
61.2 53.7
60.2 55.3 51.9
56.3 49.3 63.6 76.0
78.1 63.2
(80.0) 65.1 62.1 50.4 45.0
59.8
56.4 58.8 60.5 56.6 59.9
45.1 55.2 60.3 62.1 59.2
59.3 57.6
58.8 66.6 52.7
57.9 61.5 59.6 50.0
53.5 56.2
(100.0) 60.0 59.4 54.9 49.9
59.0
22.1 20.6 21.8 19.1 20.5
14.9 19.7 19.6 23.3 21.3
20.9 20.7
20.8 19.8 23.6
21.0 21.9 20.6 20.2
9.5 19.8 (0.0)
21.0 20.4 15.0 45.3
20.8
26.0 24.1 23.1 20.8 22.8
40.0 24.0 23.9 23.9 21.6
23.1 23.9
23.3 25.0 17.7
25.0 22.9 22.2 20.1
12.0 23.2
(40.0) 20.4 24.6 27.5 25.1
23.3
54.8 54.1 54.9 56.6 54.8
59.8 54.0 52.7 58.9 54.6
55.0 54.3
54.5 57.4 64.1
55.0 56.4 54.6 47.9
43.5 52.8
(40.0) 54.4 55.5 54.9 30.2
54.8
891 6,155 5,398 2,250 1,229
41 4,038 4,389 2,993 4,462
12,765 3,158
15,077 642 204
6,129 1,336 8,332
126
108 366
16 4,724 3,128
80 36
15,923
Note: Total figure may not add to 100 percent due to ‘multiple responses’. ( ) Based on 10-24 unweighted cases. # Women, who had their last live/still birth since 01-01-2004., ** Unweighted cases.
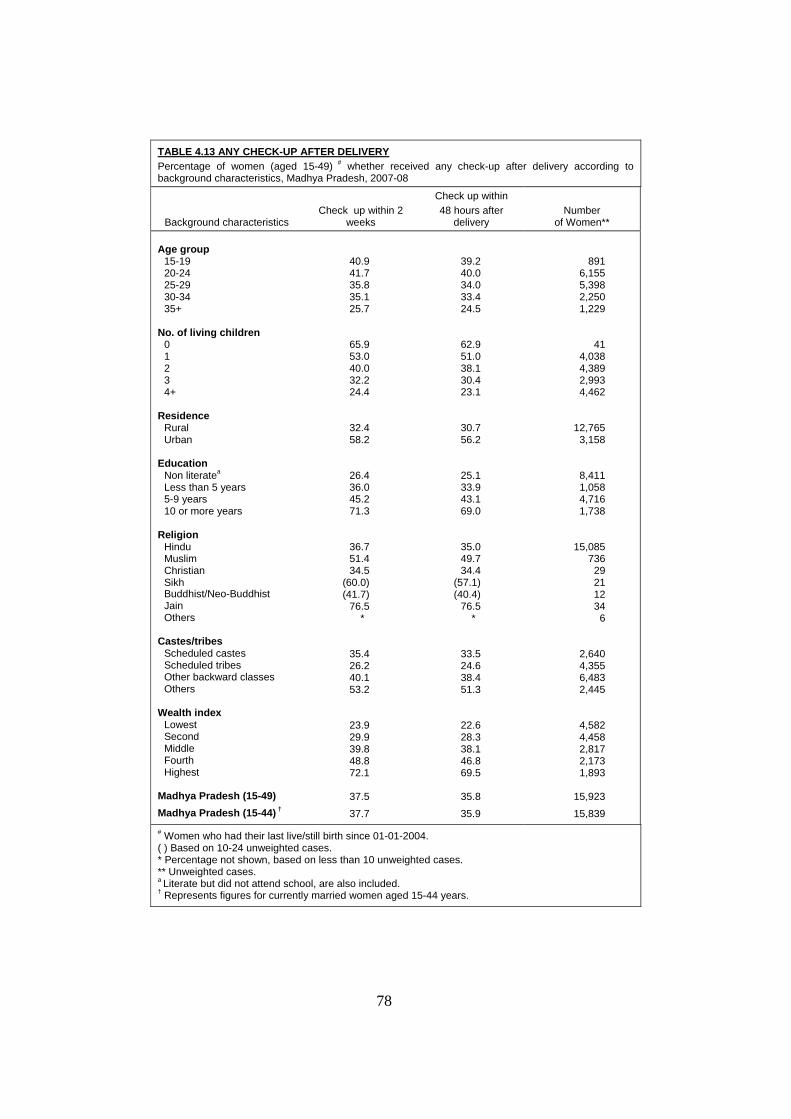
78
TABLE 4.13 ANY CHECK-UP AFTER DELIVERY Percentage of women (aged 15-49) # whether received any check-up after delivery according to background characteristics, Madhya Pradesh, 2007-08
Background characteristics
Check up within 2 weeks
Check up within 48 hours after
delivery Number
of Women** Age group
15-19 20-24 25-29 30-34 35+
No. of living children
0 1 2 3 4+
Residence
Rural Urban
Education
Non literatea Less than 5 years 5-9 years 10 or more years
Religion
Hindu Muslim Christian Sikh Buddhist/Neo-Buddhist Jain Others
Castes/tribes
Scheduled castes Scheduled tribes Other backward classes Others
Wealth index
Lowest Second Middle Fourth Highest
Madhya Pradesh (15-49) Madhya Pradesh (15-44) †
40.9 41.7 35.8 35.1 25.7
65.9 53.0 40.0 32.2 24.4
32.4 58.2
26.4 36.0 45.2 71.3
36.7 51.4 34.5
(60.0) (41.7)
76.5 *
35.4 26.2 40.1 53.2
23.9 29.9 39.8 48.8 72.1
37.5 37.7
39.2 40.0 34.0 33.4 24.5
62.9 51.0 38.1 30.4 23.1
30.7 56.2
25.1 33.9 43.1 69.0
35.0 49.7 34.4
(57.1) (40.4)
76.5 *
33.5 24.6 38.4 51.3
22.6 28.3 38.1 46.8 69.5
35.8
35.9
891 6,155 5,398 2,250 1,229
41 4,038 4,389 2,993 4,462
12,765 3,158
8,411 1,058 4,716 1,738
15,085 736
29 21 12 34
6
2,640 4,355 6,483 2,445
4,582 4,458 2,817 2,173 1,893
15,923 15,839
# Women who had their last live/still birth since 01-01-2004. ( ) Based on 10-24 unweighted cases. * Percentage not shown, based on less than 10 unweighted cases. ** Unweighted cases. a Literate but did not attend school, are also included. † Represents figures for currently married women aged 15-44 years.

79
TABLE 4.14 COMPLICATIONS DURING PREGNANCY, DELIVERY AND POST DELIVERY PERIOD Percentage of women (aged 15-49) # who had extent of pregnancy, delivery and post-delivery complications and sought treatment for the problem according to background characteristics, Madhya Pradesh, 2007-08
Background characteristics
Who had complication
during pregnancy
Sought treatment for pregnancy
complication1
Who had delivery
complication
Who had post-
delivery complication
Sought treatment for post-delivery complication2
Number of
women** Age group
15-19 20-24 25-29 30-34 35+
No. of living children
0 1 2 3 4+
Residence
Rural Urban
Education
Non literatea Less than five years 5-9 years 10 or more years
Religion
Hindu Muslim Christian Sikh Buddhist/Neo-Buddhist Jain Others
Castes/tribes
Scheduled castes Scheduled tribes Other backward classes Others
Wealth index
Lowest Second Middle Fourth Highest
Madhya Pradesh
61.3 61.5 62.3 59.7 58.3
56.1 63.4 61.3 60.2 60.0
60.0 66.2
58.3 65.8 63.1 68.0
60.7 70.5 89.6
(90.5) (66.2) 65.4
*
63.7 57.6 61.1 65.6
58.3 60.3 61.5 64.0 67.2
61.3
52.4 52.0 51.2 48.8 43.6
67.0 59.0 52.7 47.1 43.0
45.7 69.1
39.7 51.1 57.9 78.1
49.6 68.2 42.6
(68.4) (51.3) 78.9
*
50.7 34.8 54.6 66.1
36.4 42.3 53.5 65.2 79.0
50.7
66.2 67.0 67.1 65.5 63.6
80.6 69.6 65.9 66.4 64.1
66.2 67.8
64.8 69.7 68.5 67.3
66.2 70.8 72.3
(85.7) (83.0) 73.4
*
66.0 67.2 66.4 65.9
65.0 66.9 67.4 67.1 67.0
66.5
41.3 41.8 40.7 40.8 44.4
46.4 39.6 39.8 42.7 43.9
42.5 37.1
41.5 47.5 42.0 36.1
41.3 44.8 41.3 (66.7) (66.1) 72.7
*
43.6 42.9 40.7 38.4
45.2 42.6 40.6 39.0 33.6
41.4
48.4 51.8 48.1 49.0 44.1
70.0 55.5 50.2 46.8 45.1
47.0 60.5
42.8 47.5 56.1 66.5
48.7 62.2 42.3 (50.0) (25.7) 41.7
*
50.7 37.8 52.8 61.3
38.9 45.8 54.8 61.6 68.2
49.4
891 6,155 5,398 2,250 1,229
41 4,038 4,389 2,993 4,462
12,765 3,158
8,411 1,058 4,716 1,738
15,085 736
29 21 12 34
6
2,640 4,355 6,483 2,445
4,582 4,458 2,817 2,173 1,893
15,923
# Women who had their last live/still birth since 01-01-2004. ( ) Based on 10-24 unweighted cases. * Percentage not shown, based on less than 10 unweighted cases. ** Unweighted cases. 1 Women who reported at least one complication of pregnancy. 2 Women who reported at least one post delivery complication. a Literate but did not attend school, are also included.
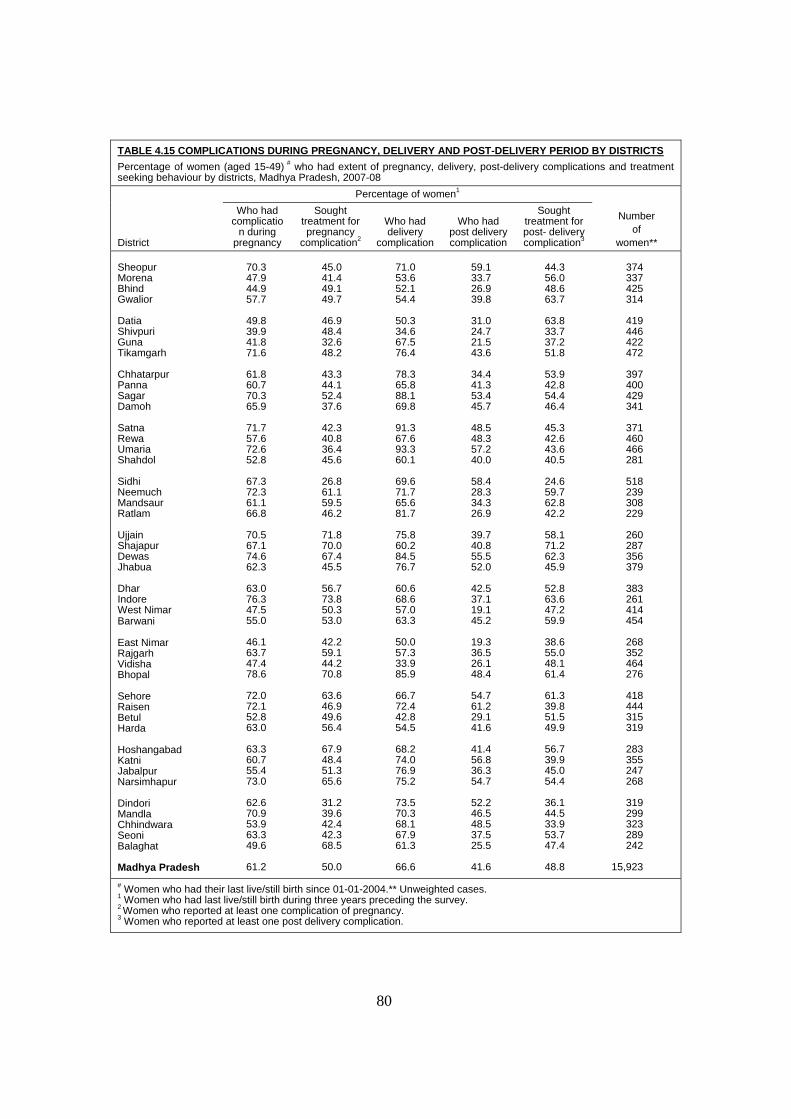
80
TABLE 4.15 COMPLICATIONS DURING PREGNANCY, DELIVERY AND POST-DELIVERY PERIOD BY DISTRICTS Percentage of women (aged 15-49) # who had extent of pregnancy, delivery, post-delivery complications and treatment seeking behaviour by districts, Madhya Pradesh, 2007-08
District
Percentage of women1
Number of
women**
Who had complicatio
n during pregnancy
Sought treatment for pregnancy
complication2
Who had delivery
complication
Who had post delivery complication
Sought treatment for post- delivery complication3
Sheopur Morena Bhind Gwalior Datia Shivpuri Guna Tikamgarh Chhatarpur Panna Sagar Damoh Satna Rewa Umaria Shahdol Sidhi Neemuch Mandsaur Ratlam Ujjain Shajapur Dewas Jhabua Dhar Indore West Nimar Barwani East Nimar Rajgarh Vidisha Bhopal Sehore Raisen Betul Harda Hoshangabad Katni Jabalpur Narsimhapur Dindori Mandla Chhindwara Seoni Balaghat Madhya Pradesh
70.3 47.9 44.9 57.7
49.8 39.9 41.8 71.6
61.8 60.7 70.3 65.9
71.7 57.6 72.6 52.8
67.3 72.3 61.1 66.8
70.5 67.1 74.6 62.3
63.0 76.3 47.5 55.0
46.1 63.7 47.4 78.6
72.0 72.1 52.8 63.0
63.3 60.7 55.4 73.0
62.6 70.9 53.9 63.3 49.6
61.2
45.0 41.4 49.1 49.7
46.9 48.4 32.6 48.2
43.3 44.1 52.4 37.6
42.3 40.8 36.4 45.6
26.8 61.1 59.5 46.2
71.8 70.0 67.4 45.5
56.7 73.8 50.3 53.0
42.2 59.1 44.2 70.8
63.6 46.9 49.6 56.4
67.9 48.4 51.3 65.6
31.2 39.6 42.4 42.3 68.5
50.0
71.0 53.6 52.1 54.4
50.3 34.6 67.5 76.4
78.3 65.8 88.1 69.8
91.3 67.6 93.3 60.1
69.6 71.7 65.6 81.7
75.8 60.2 84.5 76.7
60.6 68.6 57.0 63.3
50.0 57.3 33.9 85.9
66.7 72.4 42.8 54.5
68.2 74.0 76.9 75.2
73.5 70.3 68.1 67.9 61.3
66.6
59.1 33.7 26.9 39.8
31.0 24.7 21.5 43.6
34.4 41.3 53.4 45.7
48.5 48.3 57.2 40.0
58.4 28.3 34.3 26.9
39.7 40.8 55.5 52.0
42.5 37.1 19.1 45.2
19.3 36.5 26.1 48.4
54.7 61.2 29.1 41.6
41.4 56.8 36.3 54.7
52.2 46.5 48.5 37.5 25.5
41.6
44.3 56.0 48.6 63.7
63.8 33.7 37.2 51.8
53.9 42.8 54.4 46.4
45.3 42.6 43.6 40.5
24.6 59.7 62.8 42.2
58.1 71.2 62.3 45.9
52.8 63.6 47.2 59.9
38.6 55.0 48.1 61.4
61.3 39.8 51.5 49.9
56.7 39.9 45.0 54.4
36.1 44.5 33.9 53.7 47.4
48.8
374 337 425 314
419 446 422 472
397 400 429 341
371 460 466 281
518 239 308 229
260 287 356 379
383 261 414 454
268 352 464 276
418 444 315 319
283 355 247 268
319 299 323 289 242
15,923
# Women who had their last live/still birth since 01-01-2004.** Unweighted cases. 1 Women who had last live/still birth during three years preceding the survey. 2 Women who reported at least one complication of pregnancy. 3 Women who reported at least one post delivery complication.

81
TABLE 4.16 KNOWLEDGE OF DANGER SIGN OF NEW BORN Percentage of women (aged 15-49) # who had knowledge of the danger signs of new born, according to selected background characteristics, Madhya Pradesh, 2007-08
Background characteristic
Blue tongue & lips
Difficulty in
breathing
Cold/ hot to touch
Develop yellow staining on palm
and soles Abnormal movement
Poor sucking of
breast
Baby did not
cry
Number of
Women** Age group 15-19 20-24 25-29 30-34 35+ No. of living children 0 1 2 3 4+ Residence Rural Urban Education Non literatea Less than 5 years 9-10 years 10 or more years Religion
Hindu Muslim Christian Sikh Buddhist/Neo-Buddhist Jain Others
Castes/tribes Scheduled castes Scheduled tribes Other backward classes Others Wealth index Lowest Second Middle Fourth Highest Madhya Pradesh
13.6 16.5 18.6 17.9 16.7
9.6 19.2 17.7 17.4 15.1
16.2 21.4
14.1 15.4 20.0 26.6
17.1 17.9 34.4
(28.6) (17.3) 39.0
*
16.5 12.9 18.2 23.3
13.2 16.3 18.2 19.7 25.3
17.3
22.8 26.7 27.9 26.9 27.2
12.0 28.1 27.7 26.6 25.6
26.3 29.7
22.6 29.6 30.5 37.2
26.7 30.5 34.8 (42.9) (17.2) 49.8
*
25.7 23.2 28.4 31.3
24.3 25.0 27.0 29.6 35.0
27.0
21.3 24.5 25.5 24.3 23.8
14.3 25.5 25.3 24.3 23.3
24.3 25.9
21.4 26.8 26.9 32.4
24.6 23.3 31.3
(47.6) (17.2) 47.3
*
22.9 22.8 25.6 27.0
23.1 23.6 25.0 24.8 29.7
24.6
8.7 10.2 11.3 10.9
9.6
2.3 11.6 10.7 11.2
9.1
9.8 13.6
8.3 9.0
12.2 18.0
10.4 13.3
7.0 (38.1)
(0.0) 27.2
*
9.2 8.8
10.6 15.0
8.7 9.4 9.9
11.6 17.3
10.5
8.7 11.2 11.6 11.2 10.0
2.4 12.5 11.7 10.8 9.5
10.3 14.5
8.7 9.7
12.7 19.1
10.9 14.0 13.8
(33.3) (0.0) 27.0
*
9.8 8.5
11.6 15.9
8.8 8.7
11.4 13.2 19.6
11.1
21.2 27.6 28.7 28.5 26.0
12.0 28.5 29.0 27.7 25.7
26.9 30.6
23.1 30.2 31.1 39.0
27.3 33.0 34.4
(57.1) (8.0) 38.7
*
22.8 26.2 28.7 32.5
25.1 25.5 27.3 30.0 36.7
27.6
19.9 25.2 25.9 25.7 23.7
9.7 26.1 26.6 24.9 23.1
24.2 28.9
21.2 27.4 27.2 36.9
24.9 29.7 20.7
(28.6) (0.0) 50.2
*
21.7 22.4 25.7 32.1
21.1 22.0 25.9 30.0 35.5
25.1
891 6,155 5,398 2,250 1,229
41 4,038 4,389 2,993 4,462
12,765 3,158
8,411 1,058 4,716 1,738
15,085 736
29 21 12 34
6
2,640 4,355 6,483 2,445
4,582 4,458 2,817 2,173 1,893
15,923
Note: Total figure may not add to 100 percent due to ‘multiple responses’. # Women who had their last live/still birth since 01-01-2004. ( ) Based on 10-24 unweighted cases. * Percentage not shown, based on less than 10 unweighted cases. ** Unweighted cases. a Literate but did not attend school, are also included.


CHILD HEALTH CARE AND IMMUNIZATION

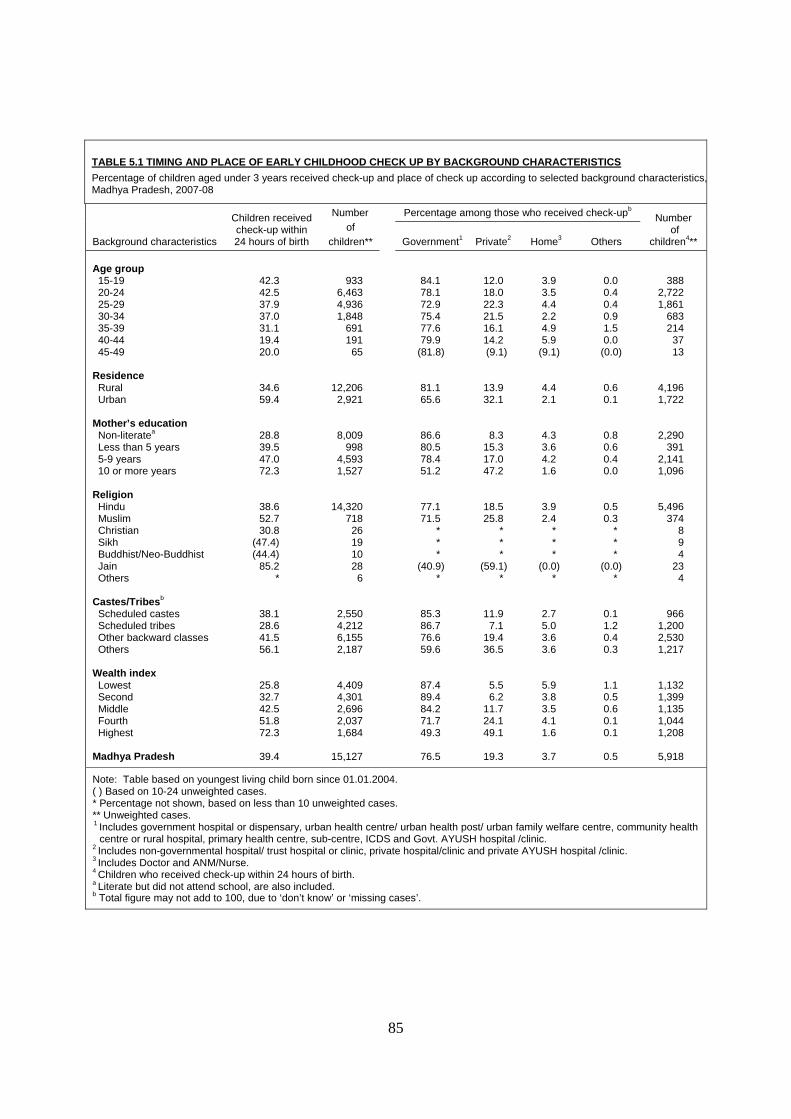
85
TABLE 5.1 TIMING AND PLACE OF EARLY CHILDHOOD CHECK UP BY BACKGROUND CHARACTERISTICS Percentage of children aged under 3 years received check-up and place of check up according to selected background characteristics,Madhya Pradesh, 2007-08
Background characteristics
Children received check-up within 24 hours of birth
Number of
children**
Percentage among those who received check-upb Number of
children4** Government1 Private2 Home3 Others Age group 15-19 20-24 25-29 30-34 35-39 40-44 45-49
Residence Rural Urban
Mother’s education Non-literatea Less than 5 years 5-9 years 10 or more years
Religion Hindu Muslim Christian Sikh Buddhist/Neo-Buddhist Jain Others
Castes/Tribesb Scheduled castes Scheduled tribes Other backward classes Others
Wealth index Lowest Second Middle Fourth Highest
Madhya Pradesh
42.3 42.5 37.9 37.0 31.1 19.4 20.0
34.6 59.4
28.8 39.5 47.0 72.3
38.6 52.7 30.8
(47.4) (44.4)
85.2 *
38.1 28.6 41.5 56.1
25.8 32.7 42.5 51.8 72.3
39.4
933 6,463 4,936 1,848
691 191
65
12,206 2,921
8,009 998
4,593 1,527
14,320 718
26 19 10 28 6
2,550 4,212 6,155 2,187
4,409 4,301 2,696 2,037 1,684
15,127
84.1 78.1 72.9 75.4 77.6 79.9
(81.8)
81.1 65.6
86.6 80.5 78.4 51.2
77.1 71.5
* * *
(40.9) *
85.3 86.7 76.6 59.6
87.4 89.4 84.2 71.7 49.3
76.5
12.0 18.0 22.3 21.5 16.1 14.2 (9.1)
13.9 32.1
8.3 15.3 17.0 47.2
18.5 25.8
* * *
(59.1) *
11.9 7.1
19.4 36.5
5.5 6.2
11.7 24.1 49.1
19.3
3.9 3.5 4.4 2.2 4.9 5.9
(9.1)
4.4 2.1
4.3 3.6 4.2 1.6
3.9 2.4
* * *
(0.0) *
2.7 5.0 3.6 3.6
5.9 3.8 3.5 4.1 1.6
3.7
0.0 0.4 0.4 0.9 1.5 0.0
(0.0)
0.6 0.1
0.8 0.6 0.4 0.0
0.5 0.3
* * *
(0.0) *
0.1 1.2 0.4 0.3
1.1 0.5 0.6 0.1 0.1
0.5
388 2,722 1,861
683 214
37 13
4,196 1,722
2,290 391
2,141 1,096
5,496 374
8 9 4
23 4
966 1,200 2,530 1,217
1,132 1,399 1,135 1,044 1,208
5,918
Note: Table based on youngest living child born since 01.01.2004. ( ) Based on 10-24 unweighted cases. * Percentage not shown, based on less than 10 unweighted cases. ** Unweighted cases. 1 Includes government hospital or dispensary, urban health centre/ urban health post/ urban family welfare centre, community health
centre or rural hospital, primary health centre, sub-centre, ICDS and Govt. AYUSH hospital /clinic. 2 Includes non-governmental hospital/ trust hospital or clinic, private hospital/clinic and private AYUSH hospital /clinic. 3 Includes Doctor and ANM/Nurse. 4 Children who received check-up within 24 hours of birth. a Literate but did not attend school, are also included. b Total figure may not add to 100, due to ‘don’t know’ or ‘missing cases’.
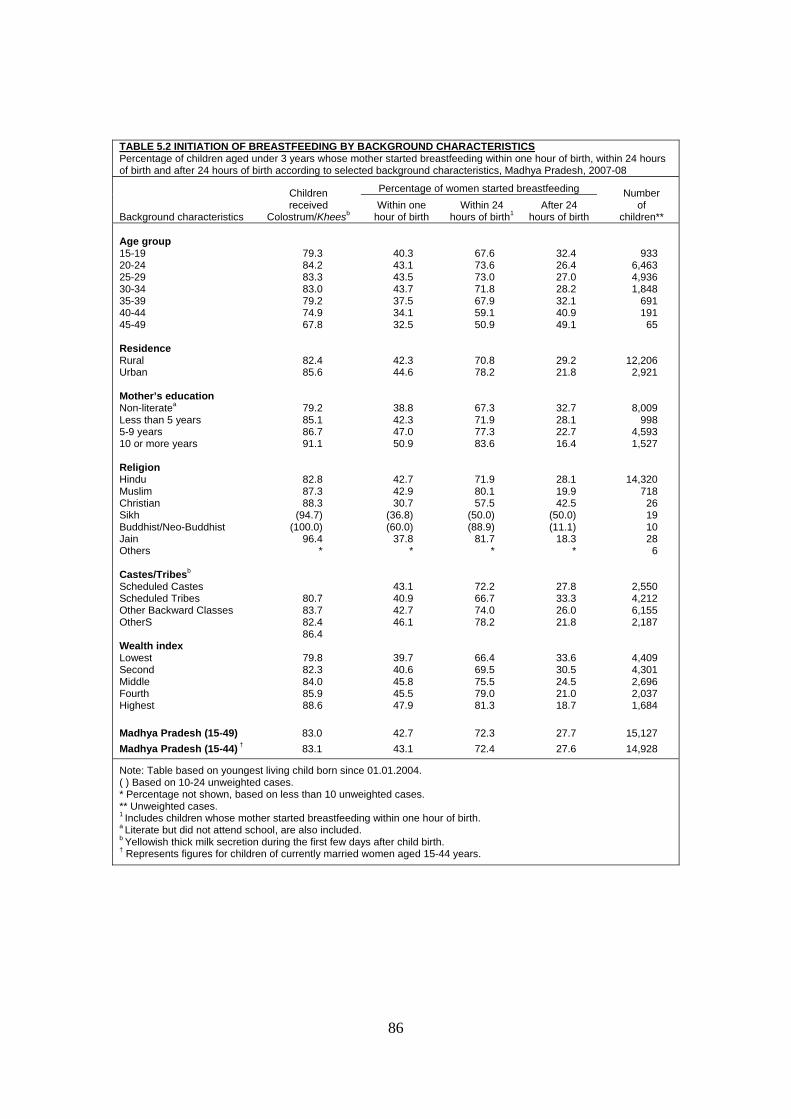
86
TABLE 5.2 INITIATION OF BREASTFEEDING BY BACKGROUND CHARACTERISTICSPercentage of children aged under 3 years whose mother started breastfeeding within one hour of birth, within 24 hours of birth and after 24 hours of birth according to selected background characteristics, Madhya Pradesh, 2007-08
Background characteristics
Children received
Colostrum/Kheesb
Percentage of women started breastfeeding Number of
children** Within one
hour of birth Within 24
hours of birth1 After 24
hours of birth Age group 15-19 20-24 25-29 30-34 35-39 40-44 45-49 Residence Rural Urban Mother’s education Non-literatea Less than 5 years 5-9 years 10 or more years Religion Hindu Muslim Christian Sikh Buddhist/Neo-Buddhist Jain Others Castes/Tribesb Scheduled Castes Scheduled Tribes Other Backward Classes OtherS Wealth index Lowest Second Middle Fourth Highest Madhya Pradesh (15-49) Madhya Pradesh (15-44) †
79.3 84.2 83.3 83.0 79.2 74.9 67.8
82.4 85.6
79.2 85.1 86.7 91.1
82.8 87.3 88.3
(94.7) (100.0)
96.4 *
80.7 83.7 82.4 86.4
79.8 82.3 84.0 85.9 88.6
83.0 83.1
40.3 43.1 43.5 43.7 37.5 34.1 32.5
42.3 44.6
38.8 42.3 47.0 50.9
42.7 42.9 30.7
(36.8) (60.0)
37.8 *
43.1 40.9 42.7 46.1
39.7 40.6 45.8 45.5 47.9
42.7 43.1
67.6 73.6 73.0 71.8 67.9 59.1 50.9
70.8 78.2
67.3 71.9 77.3 83.6
71.9 80.1 57.5
(50.0) (88.9)
81.7 *
72.2 66.7 74.0 78.2
66.4 69.5 75.5 79.0 81.3
72.3 72.4
32.4 26.4 27.0 28.2 32.1 40.9 49.1
29.2 21.8
32.7 28.1 22.7 16.4
28.1 19.9 42.5
(50.0) (11.1)
18.3 *
27.8 33.3 26.0 21.8
33.6 30.5 24.5 21.0 18.7
27.7 27.6
933 6,463 4,936 1,848
691 191
65
12,206 2,921
8,009 998
4,593 1,527
14,320 718
26 19 10 28
6
2,550 4,212 6,155 2,187
4,409 4,301 2,696 2,037 1,684
15,127 14,928
Note: Table based on youngest living child born since 01.01.2004. ( ) Based on 10-24 unweighted cases. * Percentage not shown, based on less than 10 unweighted cases. ** Unweighted cases. 1 Includes children whose mother started breastfeeding within one hour of birth. a Literate but did not attend school, are also included. b Yellowish thick milk secretion during the first few days after child birth. † Represents figures for children of currently married women aged 15-44 years.
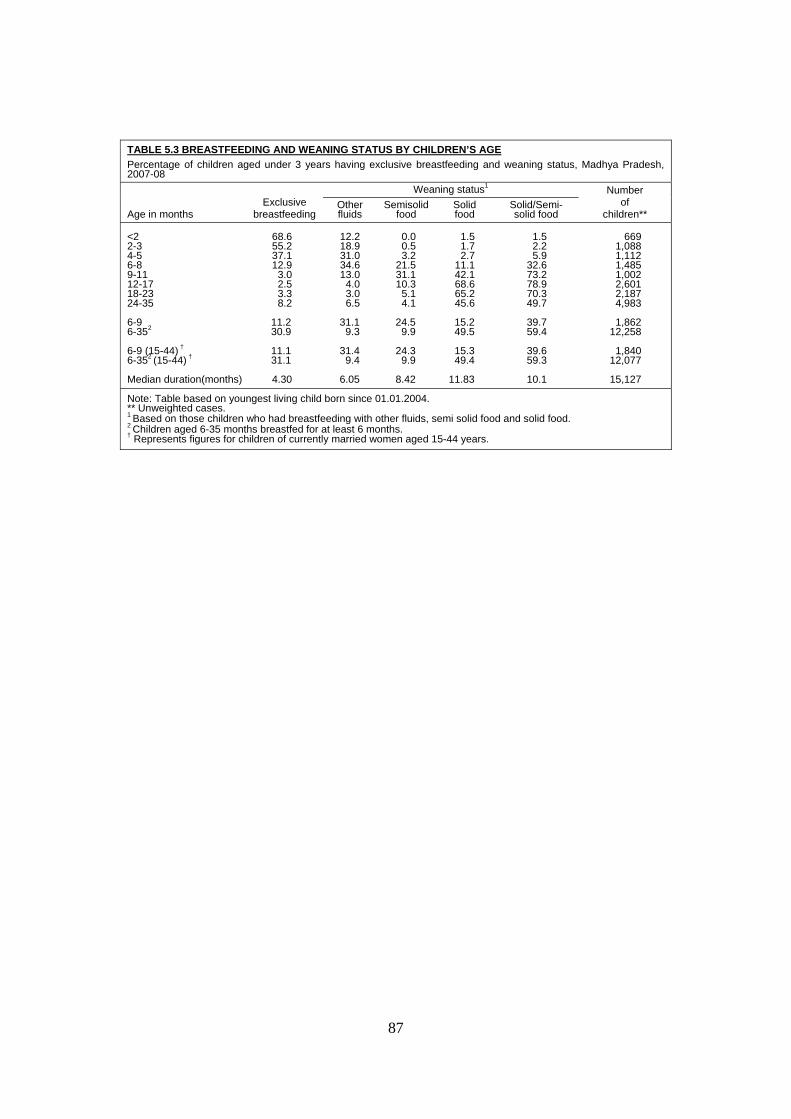
87
TABLE 5.3 BREASTFEEDING AND WEANING STATUS BY CHILDREN’S AGE Percentage of children aged under 3 years having exclusive breastfeeding and weaning status, Madhya Pradesh, 2007-08
Age in months Exclusive
breastfeeding
Weaning status1 Number of
children** Other fluids
Semisolid food
Solid food
Solid/Semi-solid food
<2 2-3 4-5 6-8 9-11 12-17 18-23 24-35 6-9 6-352
6-9 (15-44) † 6-352 (15-44) †
Median duration(months)
68.6 55.2 37.1 12.9
3.0 2.5 3.3 8.2
11.2 30.9
11.1 31.1
4.30
12.2 18.9 31.0 34.6 13.0
4.0 3.0 6.5
31.1
9.3
31.4 9.4
6.05
0.0 0.5 3.2
21.5 31.1 10.3
5.1 4.1
24.5
9.9
24.3 9.9
8.42
1.5 1.7 2.7
11.1 42.1 68.6 65.2 45.6
15.2 49.5
15.3 49.4
11.83
1.5 2.2 5.9
32.6 73.2 78.9 70.3 49.7
39.7 59.4
39.6 59.3
10.1
669
1,088 1,112 1,485 1,002 2,601 2,187 4,983
1,862
12,258
1,840 12,077
15,127
Note: Table based on youngest living child born since 01.01.2004. ** Unweighted cases. 1 Based on those children who had breastfeeding with other fluids, semi solid food and solid food. 2 Children aged 6-35 months breastfed for at least 6 months. † Represents figures for children of currently married women aged 15-44 years.

88
TABLE 5.4 EXLUSIVE BREASTFEEDING BY BACKGROUNDCHARACTERISTICS Percentage of children aged 0-5 months who received exclusive breastfeeding according to selected background characteristics, Madhya Pradesh, 2007-08
Background characteristics
Exclusive breastfeeding
0-5 months
Number of
children** Age group 15-19 20-24 25-29 30-34 35-39 40-44 45-49
Residence Rural Urban
Mother’s education Non-literatea Less than 5 years 5-9 years 10 or more years
Religion Hindu Muslim Christian Sikh Buddhist/Neo-Buddhist Jain Others
Castes/Tribes b Scheduled castes Scheduled tribes Other backward classes Others
Wealth index Lowest Second Middle Fourth Highest
Madhya Pradesh (15-49) Madhya Pradesh (15-44) †
50.5 50.8 50.7 54.6 56.9 42.9
*
52.3 46.4
49.6 55.4 51.4 57.8
51.8 42.1
(40.0) * * * *
48.9 56.3 48.9 50.4
52.5 54.1 49.3 43.6 54.3
51.3 51.5
309
1,324 787 313 102
28 6
2,362 507
1.505 186 915 263
2.719 126
10 4 3 5 2
483 858
1.158 369
853 825 527 406 258
2,869 2,851
Note: Table based on youngest living child born since 01.01.2004. ( ) Based on 10-24 unweighted cases. * Percentage not shown, based on less than 10 unweighted cases. ** Unweighted cases. a Literate but did not attend school, are also included. b Total figure may not add to N, sample total, due to ‘don’t know’ or ‘missing cases’. † Represents figures for children of currently married women aged 15-44 years.
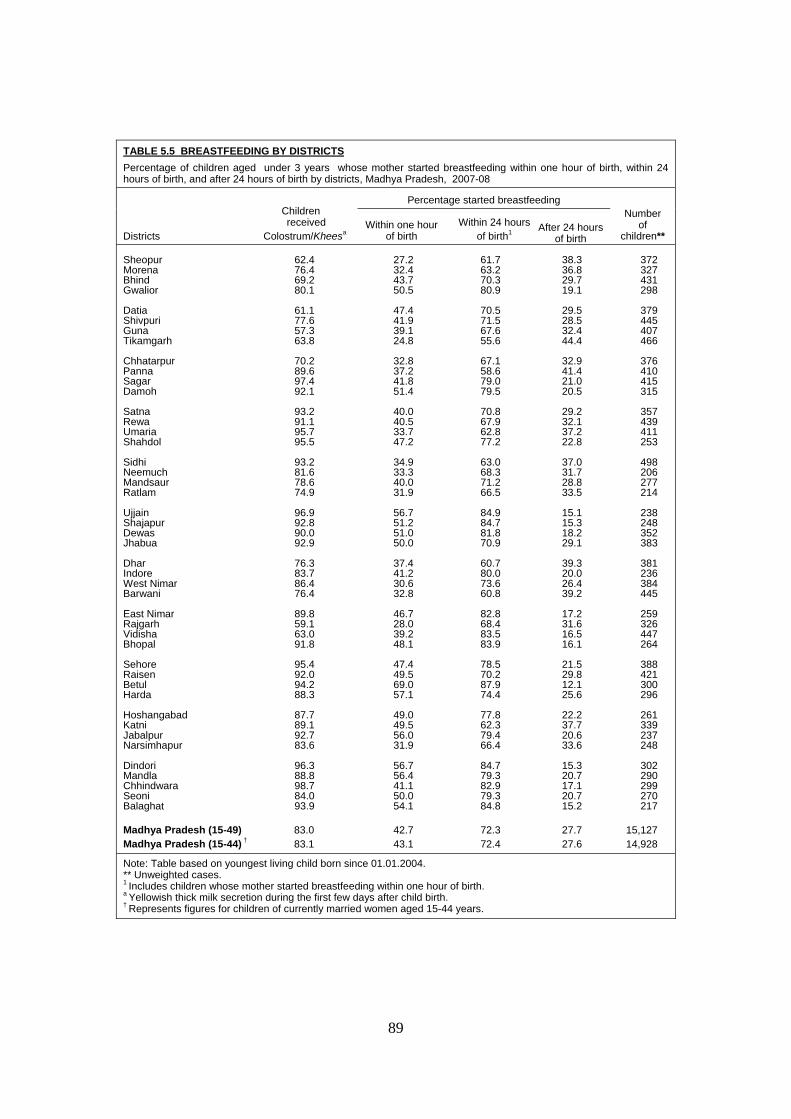
89
TABLE 5.5 BREASTFEEDING BY DISTRICTS Percentage of children aged under 3 years whose mother started breastfeeding within one hour of birth, within 24 hours of birth, and after 24 hours of birth by districts, Madhya Pradesh, 2007-08
Districts
Children received
Colostrum/Kheesa
Percentage started breastfeeding Number
of children**
Within one hour of birth
Within 24 hours of birth1
After 24 hours of birth
Sheopur Morena Bhind Gwalior Datia Shivpuri Guna Tikamgarh Chhatarpur Panna Sagar Damoh Satna Rewa Umaria Shahdol Sidhi Neemuch Mandsaur Ratlam Ujjain Shajapur Dewas Jhabua Dhar Indore West Nimar Barwani East Nimar Rajgarh Vidisha Bhopal Sehore Raisen Betul Harda Hoshangabad Katni Jabalpur Narsimhapur Dindori Mandla Chhindwara Seoni Balaghat Madhya Pradesh (15-49) Madhya Pradesh (15-44) †
62.4 76.4 69.2 80.1
61.1 77.6 57.3 63.8
70.2 89.6 97.4 92.1
93.2 91.1 95.7 95.5
93.2 81.6 78.6 74.9
96.9 92.8 90.0 92.9
76.3 83.7 86.4 76.4
89.8 59.1 63.0 91.8
95.4 92.0 94.2 88.3
87.7 89.1 92.7 83.6
96.3 88.8 98.7 84.0 93.9
83.0 83.1
27.2 32.4 43.7 50.5
47.4 41.9 39.1 24.8
32.8 37.2 41.8 51.4
40.0 40.5 33.7 47.2
34.9 33.3 40.0 31.9
56.7 51.2 51.0 50.0
37.4 41.2 30.6 32.8
46.7 28.0 39.2 48.1
47.4 49.5 69.0 57.1
49.0 49.5 56.0 31.9
56.7 56.4 41.1 50.0 54.1
42.7 43.1
61.7 63.2 70.3 80.9
70.5 71.5 67.6 55.6
67.1 58.6 79.0 79.5
70.8 67.9 62.8 77.2
63.0 68.3 71.2 66.5
84.9 84.7 81.8 70.9
60.7 80.0 73.6 60.8
82.8 68.4 83.5 83.9
78.5 70.2 87.9 74.4
77.8 62.3 79.4 66.4
84.7 79.3 82.9 79.3 84.8
72.3 72.4
38.3 36.8 29.7 19.1
29.5 28.5 32.4 44.4
32.9 41.4 21.0 20.5
29.2 32.1 37.2 22.8
37.0 31.7 28.8 33.5
15.1 15.3 18.2 29.1
39.3 20.0 26.4 39.2
17.2 31.6 16.5 16.1
21.5 29.8 12.1 25.6
22.2 37.7 20.6 33.6
15.3 20.7 17.1 20.7 15.2
27.7 27.6
372 327 431 298
379 445 407 466
376 410 415 315
357 439 411 253
498 206 277 214
238 248 352 383
381 236 384 445
259 326 447 264
388 421 300 296
261 339 237 248
302 290 299 270 217
15,127 14,928
Note: Table based on youngest living child born since 01.01.2004. ** Unweighted cases. 1 Includes children whose mother started breastfeeding within one hour of birth. a Yellowish thick milk secretion during the first few days after child birth. † Represents figures for children of currently married women aged 15-44 years.
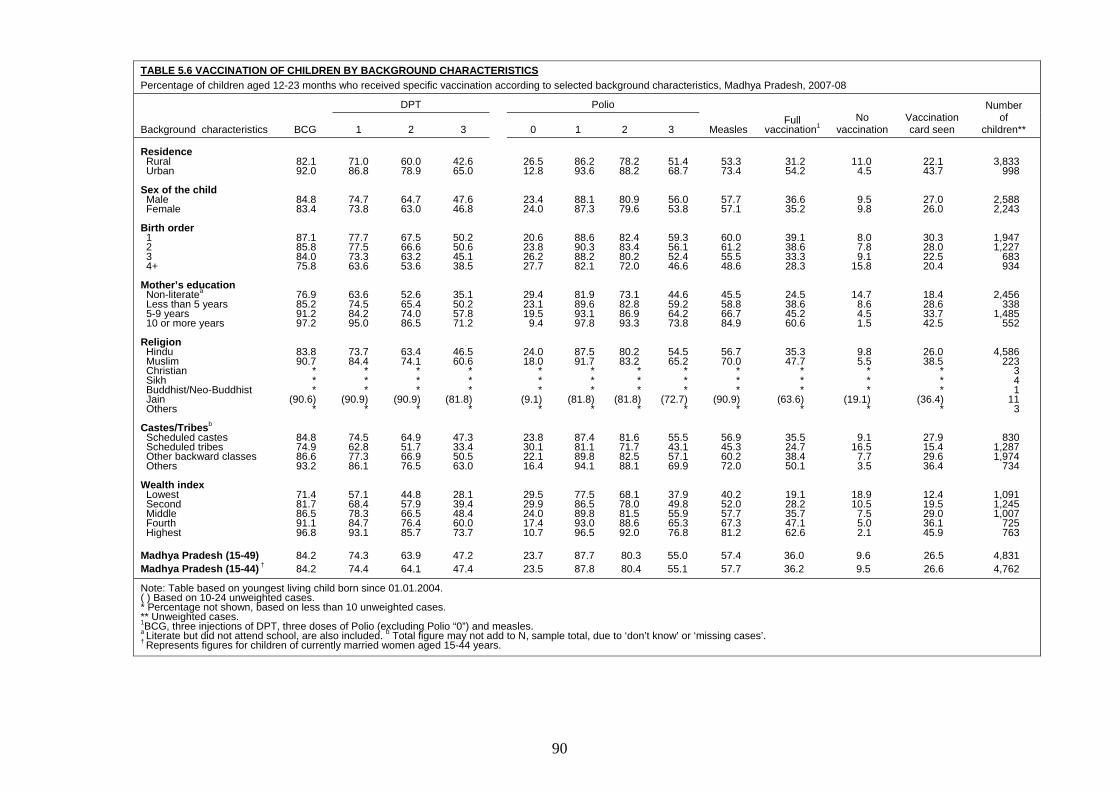
90
TABLE 5.6 VACCINATION OF CHILDREN BY BACKGROUND CHARACTERISTICS Percentage of children aged 12-23 months who received specific vaccination according to selected background characteristics, Madhya Pradesh, 2007-08
Background characteristics BCG
DPT Polio
Measles Full
vaccination1 No
vaccination Vaccination card seen
Number of
children** 1 2 3 0 1 2 3 Residence Rural Urban
Sex of the child Male Female
Birth order 1 2 3 4+
Mother’s education Non-literatea Less than 5 years 5-9 years 10 or more years
Religion Hindu Muslim Christian Sikh Buddhist/Neo-Buddhist Jain Others
Castes/Tribesb Scheduled castes Scheduled tribes Other backward classes Others
Wealth index Lowest Second Middle Fourth Highest
Madhya Pradesh (15-49) Madhya Pradesh (15-44) †
82.1 92.0
84.8 83.4
87.1 85.8 84.0 75.8
76.9 85.2 91.2 97.2
83.8 90.7
* * *
(90.6) *
84.8 74.9 86.6 93.2
71.4 81.7 86.5 91.1 96.8
84.2 84.2
71.0 86.8
74.7 73.8
77.7 77.5 73.3 63.6
63.6 74.5 84.2 95.0
73.7 84.4
* * *
(90.9) *
74.5 62.8 77.3 86.1
57.1 68.4 78.3 84.7 93.1
74.3 74.4
60.0 78.9
64.7 63.0
67.5 66.6 63.2 53.6
52.6 65.4 74.0 86.5
63.4 74.1
* * *
(90.9) *
64.9 51.7 66.9 76.5
44.8 57.9 66.5 76.4 85.7
63.9 64.1
42.6 65.0
47.6 46.8
50.2 50.6 45.1 38.5
35.1 50.2 57.8 71.2
46.5 60.6
* * *
(81.8) *
47.3 33.4 50.5 63.0
28.1 39.4 48.4 60.0 73.7
47.2 47.4
26.5 12.8
23.4 24.0
20.6 23.8 26.2 27.7
29.4 23.1 19.5 9.4
24.0 18.0
* * *
(9.1) *
23.8 30.1 22.1 16.4
29.5 29.9 24.0 17.4 10.7
23.7 23.5
86.2 93.6
88.1 87.3
88.6 90.3 88.2 82.1
81.9 89.6 93.1 97.8
87.5 91.7
* * *
(81.8) *
87.4 81.1 89.8 94.1
77.5 86.5 89.8 93.0 96.5
87.7 87.8
78.2 88.2
80.9 79.6
82.4 83.4 80.2 72.0
73.1 82.8 86.9 93.3
80.2 83.2
* * *
(81.8) *
81.6 71.7 82.5 88.1
68.1 78.0 81.5 88.6 92.0
80.3 80.4
51.4 68.7
56.0 53.8
59.3 56.1 52.4 46.6
44.6 59.2 64.2 73.8
54.5 65.2
* * *
(72.7) *
55.5 43.1 57.1 69.9
37.9 49.8 55.9 65.3 76.8
55.0 55.1
53.3 73.4
57.7 57.1
60.0 61.2 55.5 48.6
45.5 58.8 66.7 84.9
56.7 70.0
* * *
(90.9) *
56.9 45.3 60.2 72.0
40.2 52.0 57.7 67.3 81.2
57.4 57.7
31.2 54.2
36.6 35.2
39.1 38.6 33.3 28.3
24.5 38.6 45.2 60.6
35.3 47.7
* * *
(63.6) *
35.5 24.7 38.4 50.1
19.1 28.2 35.7 47.1 62.6
36.0 36.2
11.0
4.5
9.5 9.8
8.0 7.8 9.1
15.8
14.7 8.6 4.5 1.5
9.8 5.5
* * *
(19.1) *
9.1
16.5 7.7 3.5
18.9 10.5
7.5 5.0 2.1
9.6 9.5
22.1 43.7
27.0 26.0
30.3 28.0 22.5 20.4
18.4 28.6 33.7 42.5
26.0 38.5
* * *
(36.4) *
27.9 15.4 29.6 36.4
12.4 19.5 29.0 36.1 45.9
26.5 26.6
3,833 998
2,588 2,243
1,947 1,227
683 934
2,456 338
1,485 552
4,586 223
3 4 1
11 3
830 1,287 1,974
734
1,091 1,245 1,007
725 763
4,831
4,762
Note: Table based on youngest living child born since 01.01.2004. ( ) Based on 10-24 unweighted cases. * Percentage not shown, based on less than 10 unweighted cases. ** Unweighted cases. 1BCG, three injections of DPT, three doses of Polio (excluding Polio “0”) and measles. a Literate but did not attend school, are also included. b Total figure may not add to N, sample total, due to ‘don’t know’ or ‘missing cases’. † Represents figures for children of currently married women aged 15-44 years.
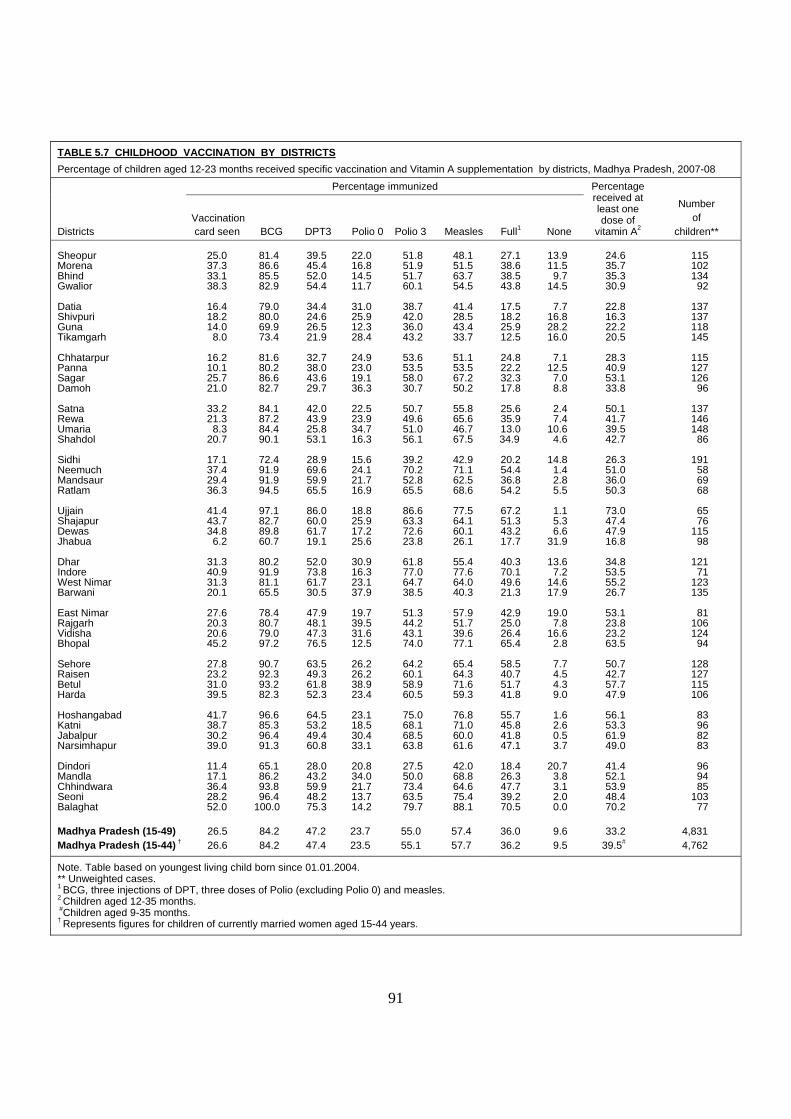
91
TABLE 5.7 CHILDHOOD VACCINATION BY DISTRICTS Percentage of children aged 12-23 months received specific vaccination and Vitamin A supplementation by districts, Madhya Pradesh, 2007-08
Districts
Percentage immunized Percentage received at least one dose of
vitamin A2
Number of
children** Vaccinationcard seen BCG DPT3 Polio 0 Polio 3 Measles Full1 None
Sheopur Morena Bhind Gwalior Datia Shivpuri Guna Tikamgarh Chhatarpur Panna Sagar Damoh Satna Rewa Umaria Shahdol Sidhi Neemuch Mandsaur Ratlam Ujjain Shajapur Dewas Jhabua Dhar Indore West Nimar Barwani East Nimar Rajgarh Vidisha Bhopal Sehore Raisen Betul Harda Hoshangabad Katni Jabalpur Narsimhapur Dindori Mandla Chhindwara Seoni Balaghat Madhya Pradesh (15-49) Madhya Pradesh (15-44) †
25.0 37.3 33.1 38.3
16.4 18.2 14.0
8.0
16.2 10.1 25.7 21.0
33.2 21.3
8.3 20.7
17.1 37.4 29.4 36.3
41.4 43.7 34.8
6.2
31.3 40.9 31.3 20.1
27.6 20.3 20.6 45.2
27.8 23.2 31.0 39.5
41.7 38.7 30.2 39.0
11.4 17.1 36.4 28.2 52.0
26.5 26.6
81.4 86.6 85.5 82.9
79.0 80.0 69.9 73.4
81.6 80.2 86.6 82.7
84.1 87.2 84.4 90.1
72.4 91.9 91.9 94.5
97.1 82.7 89.8 60.7
80.2 91.9 81.1 65.5
78.4 80.7 79.0 97.2
90.7 92.3 93.2 82.3
96.6 85.3 96.4 91.3
65.1 86.2 93.8 96.4
100.0
84.2 84.2
39.5 45.4 52.0 54.4
34.4 24.6 26.5 21.9
32.7 38.0 43.6 29.7
42.0 43.9 25.8 53.1
28.9 69.6 59.9 65.5
86.0 60.0 61.7 19.1
52.0 73.8 61.7 30.5
47.9 48.1 47.3 76.5
63.5 49.3 61.8 52.3
64.5 53.2 49.4 60.8
28.0 43.2 59.9 48.2 75.3
47.2 47.4
22.0 16.8 14.5 11.7
31.0 25.9 12.3 28.4
24.9 23.0 19.1 36.3
22.5 23.9 34.7 16.3
15.6 24.1 21.7 16.9
18.8 25.9 17.2 25.6
30.9 16.3 23.1 37.9
19.7 39.5 31.6 12.5
26.2 26.2 38.9 23.4
23.1 18.5 30.4 33.1
20.8 34.0 21.7 13.7 14.2
23.7 23.5
51.8 51.9 51.7 60.1
38.7 42.0 36.0 43.2
53.6 53.5 58.0 30.7
50.7 49.6 51.0 56.1
39.2 70.2 52.8 65.5
86.6 63.3 72.6 23.8
61.8 77.0 64.7 38.5
51.3 44.2 43.1 74.0
64.2 60.1 58.9 60.5
75.0 68.1 68.5 63.8
27.5 50.0 73.4 63.5 79.7
55.0 55.1
48.1 51.5 63.7 54.5
41.4 28.5 43.4 33.7
51.1 53.5 67.2 50.2
55.8 65.6 46.7 67.5
42.9 71.1 62.5 68.6
77.5 64.1 60.1 26.1
55.4 77.6 64.0 40.3
57.9 51.7 39.6 77.1
65.4 64.3 71.6 59.3
76.8 71.0 60.0 61.6
42.0 68.8 64.6 75.4 88.1
57.4 57.7
27.1 38.6 38.5 43.8
17.5 18.2 25.9 12.5
24.8 22.2 32.3 17.8
25.6 35.9 13.0
34.9
20.2 54.4 36.8 54.2
67.2 51.3 43.2 17.7
40.3 70.1 49.6 21.3
42.9 25.0 26.4 65.4
58.5 40.7 51.7 41.8
55.7 45.8 41.8 47.1
18.4 26.3 47.7 39.2 70.5
36.0 36.2
13.9 11.5
9.7 14.5
7.7
16.8 28.2 16.0
7.1
12.5 7.0 8.8
2.4 7.4
10.6 4.6
14.8
1.4 2.8 5.5
1.1 5.3 6.6
31.9
13.6 7.2
14.6 17.9
19.0
7.8 16.6
2.8
7.7 4.5 4.3 9.0
1.6 2.6 0.5 3.7
20.7
3.8 3.1 2.0 0.0
9.6 9.5
24.6 35.7 35.3 30.9
22.8 16.3 22.2 20.5
28.3 40.9 53.1 33.8
50.1 41.7 39.5 42.7
26.3 51.0 36.0 50.3
73.0 47.4 47.9 16.8
34.8 53.5 55.2 26.7
53.1 23.8 23.2 63.5
50.7 42.7 57.7 47.9
56.1 53.3 61.9 49.0
41.4 52.1 53.9 48.4 70.2
33.2
39.5#
115 102 134
92
137 137 118 145
115 127 126
96
137 146 148
86
191 58 69 68
65 76
115 98
121
71 123 135
81
106 124
94
128 127 115 106
83 96 82 83
96 94 85
103 77
4,831 4,762
Note. Table based on youngest living child born since 01.01.2004. ** Unweighted cases. 1 BCG, three injections of DPT, three doses of Polio (excluding Polio 0) and measles. 2 Children aged 12-35 months. #Children aged 9-35 months. † Represents figures for children of currently married women aged 15-44 years.
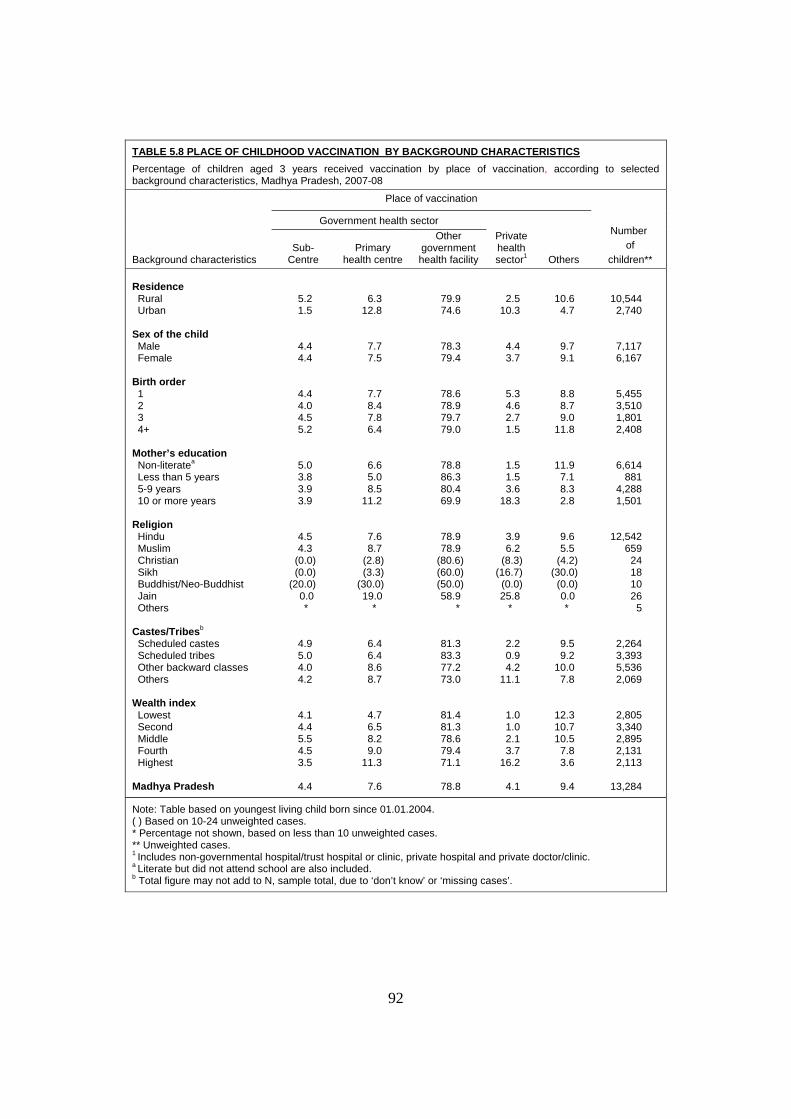
92
TABLE 5.8 PLACE OF CHILDHOOD VACCINATION BY BACKGROUND CHARACTERISTICS Percentage of children aged 3 years received vaccination by place of vaccination, according to selected background characteristics, Madhya Pradesh, 2007-08
Background characteristics
Place of vaccination
Number of
children**
Government health sector Private health sector1 Others
Sub- Centre
Primary health centre
Other government health facility
Residence Rural Urban
Sex of the child Male Female
Birth order 1 2 3 4+
Mother’s education Non-literatea Less than 5 years 5-9 years 10 or more years
Religion Hindu Muslim Christian Sikh Buddhist/Neo-Buddhist Jain Others
Castes/Tribesb Scheduled castes Scheduled tribes Other backward classes Others
Wealth index Lowest Second Middle Fourth Highest
Madhya Pradesh
5.2 1.5
4.4 4.4
4.4 4.0 4.5 5.2
5.0 3.8 3.9 3.9
4.5 4.3
(0.0) (0.0)
(20.0) 0.0 *
4.9 5.0 4.0 4.2
4.1 4.4 5.5 4.5 3.5
4.4
6.3 12.8
7.7 7.5
7.7 8.4 7.8 6.4
6.6 5.0 8.5
11.2
7.6 8.7
(2.8) (3.3)
(30.0) 19.0
*
6.4 6.4 8.6 8.7
4.7 6.5 8.2 9.0
11.3
7.6
79.9 74.6
78.3 79.4
78.6 78.9 79.7 79.0
78.8 86.3 80.4 69.9
78.9 78.9
(80.6) (60.0) (50.0) 58.9
*
81.3 83.3 77.2 73.0
81.4 81.3 78.6 79.4 71.1
78.8
2.5 10.3
4.4 3.7
5.3 4.6 2.7 1.5
1.5 1.5 3.6
18.3
3.9 6.2
(8.3) (16.7)
(0.0) 25.8
*
2.2 0.9 4.2
11.1
1.0 1.0 2.1 3.7
16.2
4.1
10.6 4.7
9.7 9.1
8.8 8.7 9.0
11.8
11.9 7.1 8.3 2.8
9.6 5.5
(4.2) (30.0)
(0.0) 0.0 *
9.5 9.2
10.0 7.8
12.3 10.7 10.5
7.8 3.6
9.4
10,544 2,740
7,117 6,167
5,455 3,510 1,801 2,408
6,614 881
4,288 1,501
12,542 659
24 18 10 26
5
2,264 3,393 5,536 2,069
2,805 3,340 2,895 2,131 2,113
13,284
Note: Table based on youngest living child born since 01.01.2004. ( ) Based on 10-24 unweighted cases. * Percentage not shown, based on less than 10 unweighted cases. ** Unweighted cases. 1 Includes non-governmental hospital/trust hospital or clinic, private hospital and private doctor/clinic. a Literate but did not attend school are also included. b Total figure may not add to N, sample total, due to ‘don’t know’ or ‘missing cases’.
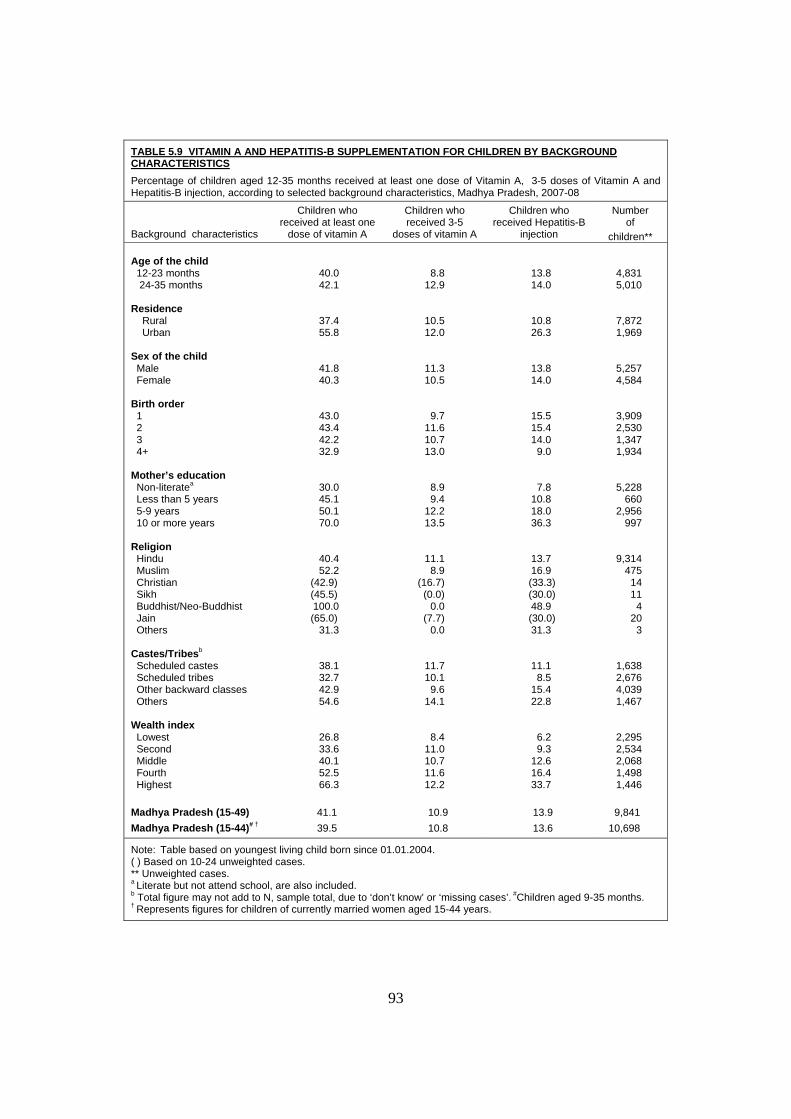
93
TABLE 5.9 VITAMIN A AND HEPATITIS-B SUPPLEMENTATION FOR CHILDREN BY BACKGROUND CHARACTERISTICS Percentage of children aged 12-35 months received at least one dose of Vitamin A, 3-5 doses of Vitamin A and Hepatitis-B injection, according to selected background characteristics, Madhya Pradesh, 2007-08
Background characteristics
Children who received at least one
dose of vitamin A
Children who received 3-5
doses of vitamin A
Children who received Hepatitis-B
injection
Number of
children** Age of the child 12-23 months 24-35 months
Residence Rural Urban
Sex of the child Male Female
Birth order 1 2 3 4+
Mother’s education Non-literatea Less than 5 years 5-9 years 10 or more years
Religion Hindu Muslim Christian Sikh Buddhist/Neo-Buddhist Jain Others
Castes/Tribesb Scheduled castes Scheduled tribes Other backward classes Others
Wealth index Lowest Second Middle Fourth Highest
Madhya Pradesh (15-49) Madhya Pradesh (15-44)# †
40.0 42.1
37.4 55.8
41.8 40.3
43.0 43.4 42.2 32.9
30.0 45.1 50.1 70.0
40.4 52.2
(42.9) (45.5) 100.0 (65.0)
31.3
38.1 32.7 42.9 54.6
26.8 33.6 40.1 52.5 66.3
41.1 39.5
8.8 12.9
10.5 12.0
11.3 10.5
9.7 11.6 10.7 13.0
8.9 9.4
12.2 13.5
11.1 8.9
(16.7) (0.0)
0.0 (7.7)
0.0
11.7 10.1
9.6 14.1
8.4 11.0 10.7 11.6 12.2
10.9 10.8
13.8 14.0
10.8 26.3
13.8 14.0
15.5 15.4 14.0
9.0
7.8 10.8 18.0 36.3
13.7 16.9 (33.3) (30.0) 48.9 (30.0) 31.3
11.1 8.5
15.4 22.8
6.2 9.3
12.6 16.4 33.7
13.9 13.6
4,831 5,010
7,872 1,969
5,257 4,584
3,909 2,530 1,347 1,934
5,228 660
2,956 997
9,314 475
14 11
4 20
3
1,638 2,676 4,039 1,467
2,295 2,534 2,068 1,498 1,446
9,841
10,698
Note: Table based on youngest living child born since 01.01.2004. ( ) Based on 10-24 unweighted cases. ** Unweighted cases. a Literate but not attend school, are also included. b Total figure may not add to N, sample total, due to ‘don’t know’ or ‘missing cases’. #Children aged 9-35 months. † Represents figures for children of currently married women aged 15-44 years.
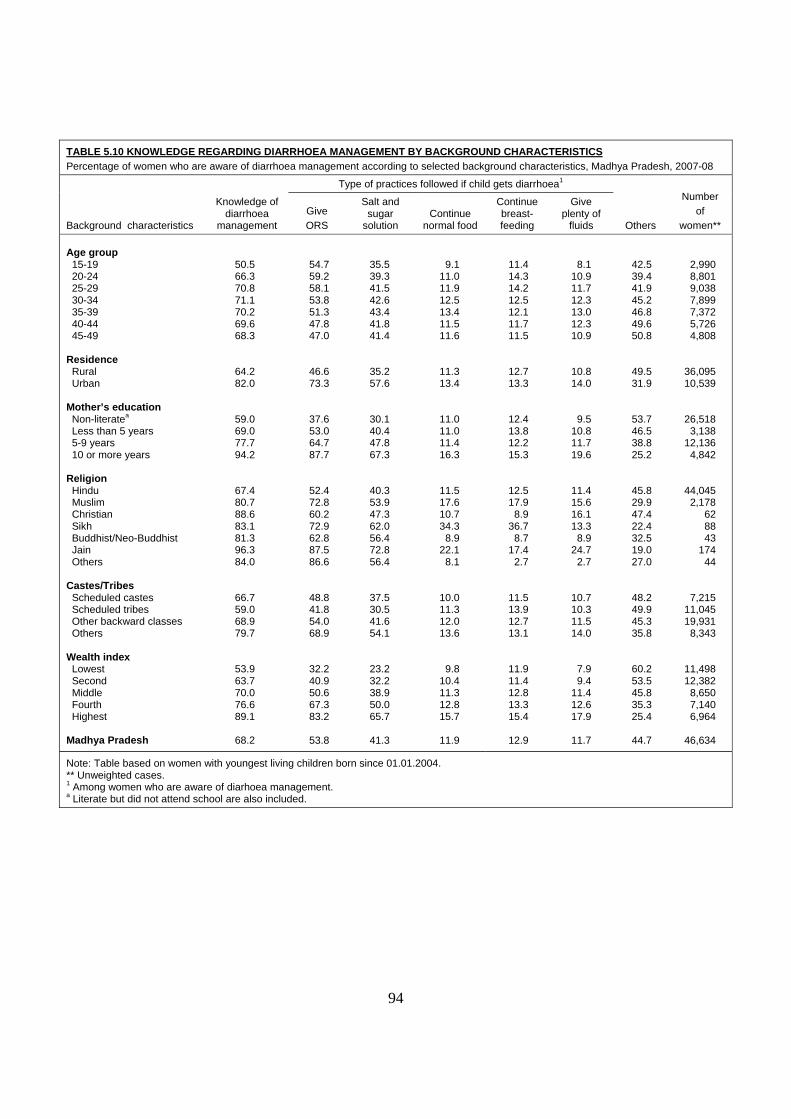
94
TABLE 5.10 KNOWLEDGE REGARDING DIARRHOEA MANAGEMENT BY BACKGROUND CHARACTERISTICS Percentage of women who are aware of diarrhoea management according to selected background characteristics, Madhya Pradesh, 2007-08
Background characteristics
Knowledge of diarrhoea
management
Type of practices followed if child gets diarrhoea1
Others
Number of
women** Give ORS
Salt and sugar
solution Continue
normal food
Continue breast- feeding
Give plenty of
fluids Age group 15-19 20-24 25-29 30-34 35-39 40-44 45-49
Residence Rural Urban
Mother’s education Non-literatea Less than 5 years 5-9 years 10 or more years
Religion Hindu Muslim Christian Sikh Buddhist/Neo-Buddhist Jain Others
Castes/Tribes Scheduled castes Scheduled tribes Other backward classes Others
Wealth index Lowest Second Middle Fourth Highest
Madhya Pradesh
50.5 66.3 70.8 71.1 70.2 69.6 68.3
64.2 82.0
59.0 69.0 77.7 94.2
67.4 80.7 88.6 83.1 81.3 96.3 84.0
66.7 59.0 68.9 79.7
53.9 63.7 70.0 76.6 89.1
68.2
54.7 59.2 58.1 53.8 51.3 47.8 47.0
46.6 73.3
37.6 53.0 64.7 87.7
52.4 72.8 60.2 72.9 62.8 87.5 86.6
48.8 41.8 54.0 68.9
32.2 40.9 50.6 67.3 83.2
53.8
35.5 39.3 41.5 42.6 43.4 41.8 41.4
35.2 57.6
30.1 40.4 47.8 67.3
40.3 53.9 47.3 62.0 56.4 72.8 56.4
37.5 30.5 41.6 54.1
23.2 32.2 38.9 50.0 65.7
41.3
9.1 11.0 11.9 12.5 13.4 11.5 11.6
11.3 13.4
11.0 11.0 11.4 16.3
11.5 17.6 10.7 34.3
8.9 22.1
8.1
10.0 11.3 12.0 13.6
9.8 10.4 11.3 12.8 15.7
11.9
11.4 14.3 14.2 12.5 12.1 11.7 11.5
12.7 13.3
12.4 13.8 12.2 15.3
12.5 17.9
8.9 36.7
8.7 17.4
2.7
11.5 13.9 12.7 13.1
11.9 11.4 12.8 13.3 15.4
12.9
8.1 10.9 11.7 12.3 13.0 12.3 10.9
10.8 14.0
9.5 10.8 11.7 19.6
11.4 15.6 16.1 13.3
8.9 24.7
2.7
10.7 10.3 11.5 14.0
7.9 9.4
11.4 12.6 17.9
11.7
42.5 39.4 41.9 45.2 46.8 49.6 50.8
49.5 31.9
53.7 46.5 38.8 25.2
45.8 29.9 47.4 22.4 32.5 19.0 27.0
48.2 49.9 45.3 35.8
60.2 53.5 45.8 35.3 25.4
44.7
2,990 8,801 9,038 7,899 7,372 5,726 4,808
36,095 10,539
26,518 3,138
12,136 4,842
44,045 2,178
62 88 43
174 44
7,215 11,045 19,931
8,343
11,498 12,382
8,650 7,140 6,964
46,634
Note: Table based on women with youngest living children born since 01.01.2004. ** Unweighted cases. 1 Among women who are aware of diarhoea management. a Literate but did not attend school are also included.
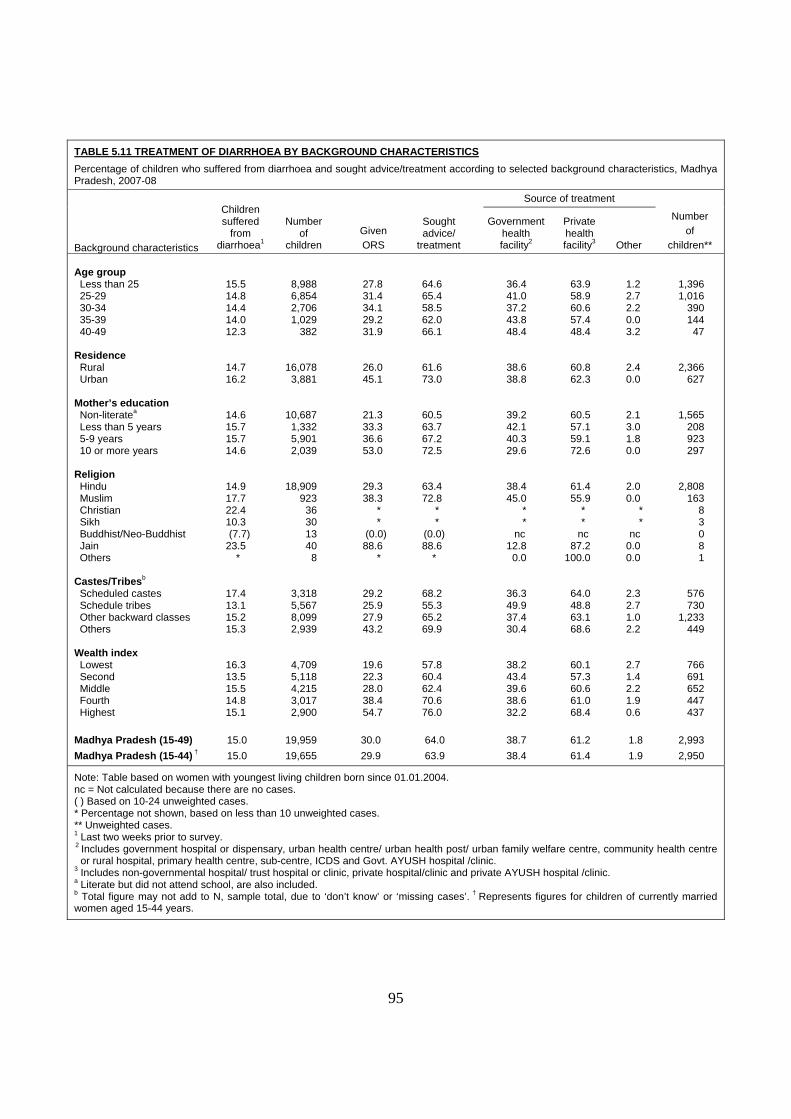
95
TABLE 5.11 TREATMENT OF DIARRHOEA BY BACKGROUND CHARACTERISTICS Percentage of children who suffered from diarrhoea and sought advice/treatment according to selected background characteristics, Madhya Pradesh, 2007-08
Background characteristics
Children suffered
from diarrhoea1
Number of
children
Source of treatment
Number of
children**
Given ORS
Sought advice/
treatment
Government health facility2
Private health facility3
Other
Age group Less than 25 25-29 30-34 35-39 40-49
Residence Rural Urban
Mother’s education Non-literatea Less than 5 years 5-9 years 10 or more years
Religion Hindu Muslim Christian Sikh Buddhist/Neo-Buddhist Jain Others
Castes/Tribesb Scheduled castes Schedule tribes Other backward classes Others
Wealth index Lowest Second Middle Fourth Highest
Madhya Pradesh (15-49) Madhya Pradesh (15-44) †
15.5 14.8 14.4 14.0 12.3
14.7 16.2
14.6 15.7 15.7 14.6
14.9 17.7 22.4 10.3 (7.7)
23.5 *
17.4 13.1 15.2 15.3
16.3 13.5 15.5 14.8 15.1
15.0 15.0
8,988 6,854 2,706 1,029
382
16,078 3,881
10,687 1,332 5,901 2,039
18,909 923
36 30 13 40
8
3,318 5,567 8,099 2,939
4,709 5,118 4,215 3,017 2,900
19,959 19,655
27.8 31.4 34.1 29.2 31.9
26.0 45.1
21.3 33.3 36.6 53.0
29.3 38.3
* *
(0.0) 88.6
*
29.2 25.9 27.9 43.2
19.6 22.3 28.0 38.4 54.7
30.0 29.9
64.6 65.4 58.5 62.0 66.1
61.6 73.0
60.5 63.7 67.2 72.5
63.4 72.8
* *
(0.0) 88.6
*
68.2 55.3 65.2 69.9
57.8 60.4 62.4 70.6 76.0
64.0 63.9
36.4 41.0 37.2 43.8 48.4
38.6 38.8
39.2 42.1 40.3 29.6
38.4 45.0
* *
nc 12.8
0.0
36.3 49.9 37.4 30.4
38.2 43.4 39.6 38.6 32.2
38.7 38.4
63.9 58.9 60.6 57.4 48.4
60.8 62.3
60.5 57.1 59.1 72.6
61.4 55.9
* *
nc 87.2
100.0
64.0 48.8 63.1 68.6
60.1 57.3 60.6 61.0 68.4
61.2 61.4
1.2 2.7 2.2 0.0 3.2
2.4 0.0
2.1 3.0 1.8 0.0
2.0 0.0
* *
nc 0.0 0.0
2.3 2.7 1.0 2.2
2.7 1.4 2.2 1.9 0.6
1.8 1.9
1,396 1,016
390 144
47
2,366 627
1,565 208 923 297
2,808 163
8 3 0 8 1
576 730
1,233 449
766 691 652 447 437
2,993 2,950
Note: Table based on women with youngest living children born since 01.01.2004. nc = Not calculated because there are no cases. ( ) Based on 10-24 unweighted cases. * Percentage not shown, based on less than 10 unweighted cases. ** Unweighted cases. 1 Last two weeks prior to survey. 2 Includes government hospital or dispensary, urban health centre/ urban health post/ urban family welfare centre, community health centre or rural hospital, primary health centre, sub-centre, ICDS and Govt. AYUSH hospital /clinic.
3 Includes non-governmental hospital/ trust hospital or clinic, private hospital/clinic and private AYUSH hospital /clinic. a Literate but did not attend school, are also included. b Total figure may not add to N, sample total, due to ‘don’t know’ or ‘missing cases’. † Represents figures for children of currently married women aged 15-44 years.

96
TABLE 5.12 KNOWLEDGE AND TREATMENT OF ACUTE RESPIRATORY INFECTION (ARI) BY BACKGROUND CHARACTERISTICS Percentage of women who are aware of danger signs of ARI and whose children suffer from ARI and sought advice/treatment according to selected background characteristics, Madhya Pradesh, 2007-08
Background characteristics
Women aware of danger signs of
ARI
Number of
women**
Danger signs of Acute Respiratory Infection (ARI)1 Children suffered
from ARI3
Children sought advice/
treatment4
Source of treatment5
Number of
children**
Difficulty in
breathing
Pain in chest and productive
cough Wheezing/ whistling
Rapid breathing Other
SIigns2
Government health facility6
Private health facility7 Others
Age group 15-19 20-24 25-29 30-34 35-39 40-44 45-49
Residence Rural Urban
Mother’s education Non-literatea Less than 5 years 5-9 years 10 or more years
Religion Hindu Muslim Christian Sikh Buddhist/Neo-Buddhist Jain Others
Castes/Tribesb Scheduled castes Scheduled Tribes Other Backward Classes Others
Wealth index Lowest Second Middle Fourth Highest
Madhya Pradesh (15-49) Madhya Pradesh (15-44)†
41.0 58.8 67.0 69.6 71.1 71.0 73.2
63.4 74.8
61.4 66.8 69.0 83.1
65.3 77.3 66.1 84.0 27.8 16.0 16.3
64.5 57.6 67.4 75.1
54.6 63.5 67.9 73.0 79.7
66.0
65.7
2,990 8,801 9,038 7,899 7,372 5,726 4,808
36,095 10,539
26,518 3,138
12,136 4,842
44,045 2,178
62 88 43
174 44
7,215 11,045 19,931
8,343
11,498 12,382
8,650 7,140 6,964
46,634
39,811
62.0 64.2 64.0 64.1 64.0 62.7 64.6
62.2 68.8
61.4 64.0 65.2 70.9
63.6 68.5 61.7 68.4 51.5 68.0 59.7
62.6 61.1 65.2 64.7
61.0 60.9 62.8 66.2 70.1
63.9
63.7
57.1 61.5 63.1 64.2 64.2 65.1 64.4
62.5 65.9
61.5 63.9 64.4 68.6
63.2 65.4 55.0 74.7 67.8 64.7 78.1
60.9 60.9 63.7 66.9
59.0 60.9 64.3 65.5 68.9
63.4
63.2
52.4 55.3 56.6 57.6 57.8 59.0 58.9
56.5 59.2
55.3 56.1 58.5 62.7
57.1 58.9 50.8 61.8 77.4 55.3 73.0
55.6 53.8 57.2 61.7
52.4 56.4 57.4 58.8 62.0
57.2
56.9
47.6 51.3 52.2 52.4 52.5 52.6 52.6
51.2 54.5
49.9 50.9 54.1 57.1
51.8 55.6 51.1 61.7 51.4 50.0 52.0
48.5 50.1 52.1 56.6
47.1 51.4 53.0 53.3 56.4
52.1
52.1
53.6 57.0 58.3 57.6 58.5 57.1 53.5
56.4 59.2
54.8 55.2 58.7 63.9
56.8 61.1 60.8 66.4 55.6 64.3 49.3
56.9 54.1 57.5 59.3
54.4 56.6 56.6 57.2 61.2
57.1
57.7
16.5 13.7 12.5 10.4 13.0 12.5 14.9
13.0 12.5
12.6 14.0 14.2 10.2
13.0 12.4 13.9 17.9
(0.0) 12.2 12.5
14.6 12.3 12.7 12.9
14.7 12.8 12.3 12.4 11.8
12.9
13.0
63.0 70.5 68.6 66.6 61.7 66.0 44.4
65.5 80.2
62.8 63.8 73.7 84.8
67.6 82.4 70.0 50.0 (0.0)
100.0 *
71.8 57.5 70.0 79.3
56.4 63.4 68.7 78.7 87.6
68.4
68.5
25.2 31.9 28.6 36.7 19.8 36.7 50.0
30.8 29.7
33.2 26.6 30.6 22.0
30.3 33.8 57.1 33.3 (0.0) 25.0
*
31.3 38.2 28.3 25.6
37.4 30.8 31.7 28.5 22.8
30.6
30.2
69.8 65.4 68.6 60.2 77.4 60.0 50.0
65.9 68.4
64.1 69.6 65.6 77.6
66.8 64.0 42.9 66.7 (0.0) 75.0
*
66.4 58.4 68.5 72.1
58.7 67.5 64.6 67.3 76.0
66.5
66.9
5.0 2.7 2.8 3.1 2.8 3.3 0.0
3.2 1.8
2.7 3.8 3.8 0.4
3.0 2.2 0.0 0.0
(0.0) 0.0
*
2.3 3.4 3.2 2.2
3.9 1.7 3.7 4.1 1.2
2.9
2.9
1,008 7,980 6,854 2,706 1,029
288 94
16,078 3,881
10,687 1,332 5,901 2,039
18,909 923
36 30 13 40
8
3,318 5,567 8,099 2,939
4,709 5,118 4,215 3,017 2,900
19,959
19,655
Note: Table based on women with youngest living children born since 01.01.2004. ( ) Based on 10-24 unweighted cases.** Unweighted cases. 1 Among women who are aware of any danger signs of ARI. 2 Includes not able to drink or take a feed, excessive drowsy and difficulty to keep awake, running nose and others.3 Last two weeks prior to survey. 4 Among children with ARI or fever in last two weeks who sought advice/ treatment 5 Among children who sought advice/treatment. 6 Includes government hospital or dispensary, urban health centre/urban health post/urban family welfare centre, community health centre or rural hospital, primary health centre, sub-centre, ICDS and Govt. AYUSH hospital/clinic. 7 Includes non-governmental hospital/trust hospital or clinic, private hospital/clinic and private AYUSH hospital/clinic. a Literate but did not attend school are also included. † Represents figures for children of currently married women aged 15-44 years.
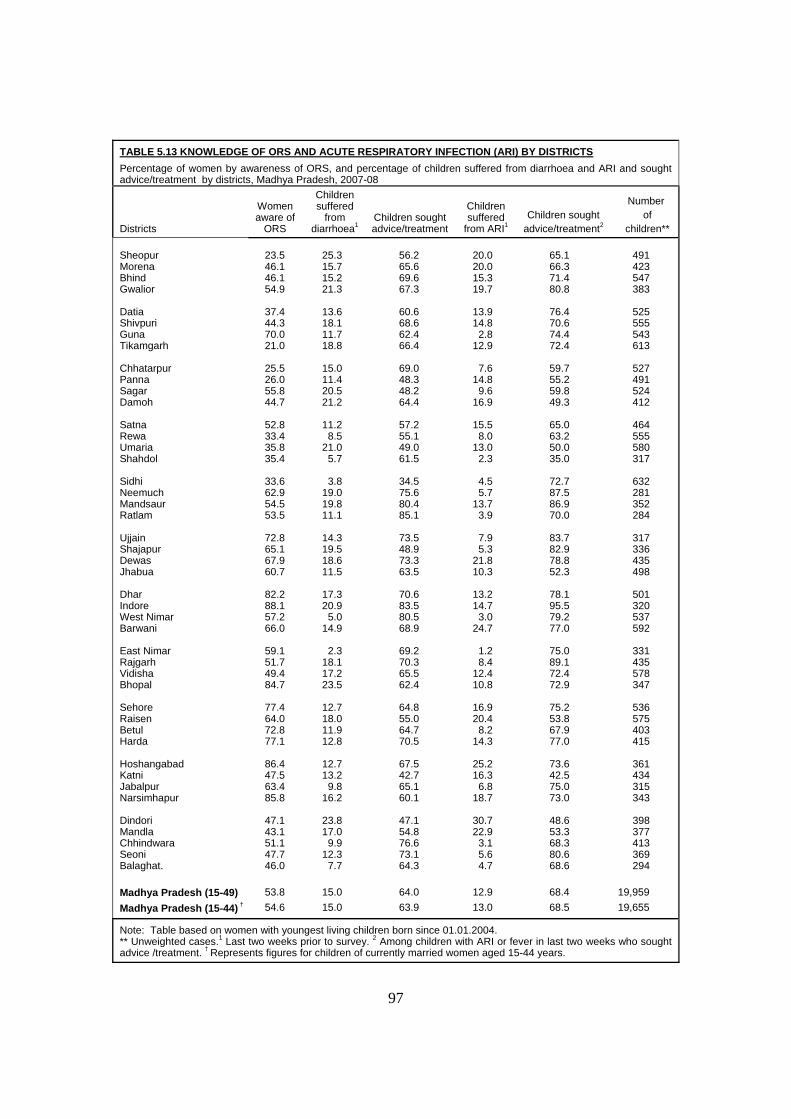
97
TABLE 5.13 KNOWLEDGE OF ORS AND ACUTE RESPIRATORY INFECTION (ARI) BY DISTRICTS Percentage of women by awareness of ORS, and percentage of children suffered from diarrhoea and ARI and sought advice/treatment by districts, Madhya Pradesh, 2007-08
Districts
Women aware of
ORS
Children suffered
from diarrhoea1
Children sought advice/treatment
Children suffered
from ARI1 Children sought
advice/treatment2
Number of
children** Sheopur Morena Bhind Gwalior Datia Shivpuri Guna Tikamgarh Chhatarpur Panna Sagar Damoh Satna Rewa Umaria Shahdol Sidhi Neemuch Mandsaur Ratlam Ujjain Shajapur Dewas Jhabua Dhar Indore West Nimar Barwani East Nimar Rajgarh Vidisha Bhopal Sehore Raisen Betul Harda Hoshangabad Katni Jabalpur Narsimhapur Dindori Mandla Chhindwara Seoni Balaghat. Madhya Pradesh (15-49) Madhya Pradesh (15-44) †
23.5 46.1 46.1 54.9
37.4 44.3 70.0 21.0
25.5 26.0 55.8 44.7
52.8 33.4 35.8 35.4
33.6 62.9 54.5 53.5
72.8 65.1 67.9 60.7
82.2 88.1 57.2 66.0
59.1 51.7 49.4 84.7
77.4 64.0 72.8 77.1
86.4 47.5 63.4 85.8
47.1 43.1 51.1 47.7 46.0
53.8 54.6
25.3 15.7 15.2 21.3
13.6 18.1 11.7 18.8
15.0 11.4 20.5 21.2
11.2
8.5 21.0
5.7
3.8 19.0 19.8 11.1
14.3 19.5 18.6 11.5
17.3 20.9
5.0 14.9
2.3
18.1 17.2 23.5
12.7 18.0 11.9 12.8
12.7 13.2
9.8 16.2
23.8 17.0
9.9 12.3
7.7
15.0 15.0
56.2 65.6 69.6 67.3
60.6 68.6 62.4 66.4
69.0 48.3 48.2 64.4
57.2 55.1 49.0 61.5
34.5 75.6 80.4 85.1
73.5 48.9 73.3 63.5
70.6 83.5 80.5 68.9
69.2 70.3 65.5 62.4
64.8 55.0 64.7 70.5
67.5 42.7 65.1 60.1
47.1 54.8 76.6 73.1 64.3
64.0 63.9
20.0 20.0 15.3 19.7
13.9 14.8
2.8 12.9
7.6
14.8 9.6
16.9
15.5 8.0
13.0 2.3
4.5 5.7
13.7 3.9
7.9 5.3
21.8 10.3
13.2 14.7
3.0 24.7
1.2 8.4
12.4 10.8
16.9 20.4
8.2 14.3
25.2 16.3
6.8 18.7
30.7 22.9
3.1 5.6 4.7
12.9 13.0
65.1 66.3 71.4 80.8
76.4 70.6 74.4 72.4
59.7 55.2 59.8 49.3
65.0 63.2 50.0 35.0
72.7 87.5 86.9 70.0
83.7 82.9 78.8 52.3
78.1 95.5 79.2 77.0
75.0 89.1 72.4 72.9
75.2 53.8 67.9 77.0
73.6 42.5 75.0 73.0
48.6 53.3 68.3 80.6 68.6
68.4 68.5
491 423 547 383
525 555 543 613
527 491 524 412
464 555 580 317
632 281 352 284
317 336 435 498
501 320 537 592
331 435 578 347
536 575 403 415
361 434 315 343
398 377 413 369 294
19,959 19,655
Note: Table based on women with youngest living children born since 01.01.2004. ** Unweighted cases.1 Last two weeks prior to survey. 2 Among children with ARI or fever in last two weeks who sought advice /treatment. † Represents figures for children of currently married women aged 15-44 years.


FAMILY PLANNING

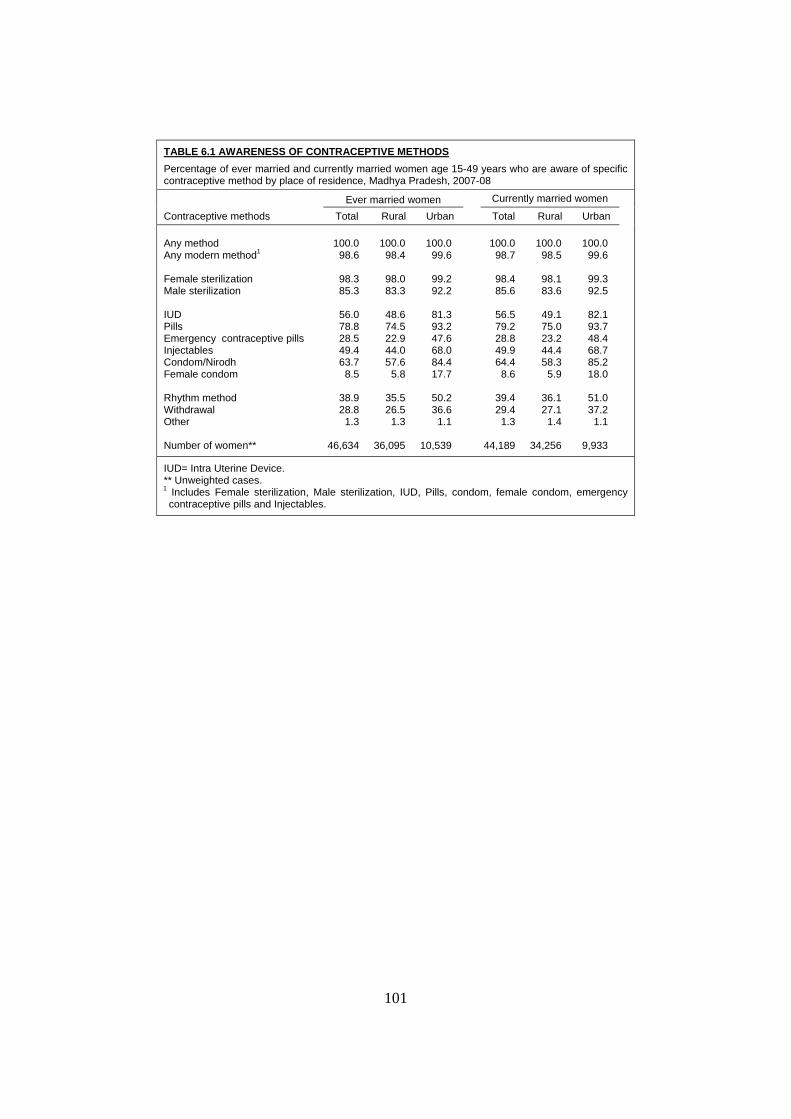
101
TABLE 6.1 AWARENESS OF CONTRACEPTIVE METHODS Percentage of ever married and currently married women age 15-49 years who are aware of specific contraceptive method by place of residence, Madhya Pradesh, 2007-08
Contraceptive methods Ever married women Currently married women
Total Rural Urban Total Rural Urban Any method Any modern method1 Female sterilization Male sterilization IUD Pills Emergency contraceptive pills Injectables Condom/Nirodh Female condom Rhythm method Withdrawal Other Number of women**
100.0
98.6
98.3 85.3
56.0 78.8 28.5 49.4 63.7
8.5
38.9 28.8
1.3
46,634
100.0
98.4
98.0 83.3
48.6 74.5 22.9 44.0 57.6
5.8
35.5 26.5
1.3
36,095
100.0
99.6
99.2 92.2
81.3 93.2 47.6 68.0 84.4 17.7
50.2 36.6
1.1
10,539
100.0
98.7
98.4 85.6
56.5 79.2 28.8 49.9 64.4
8.6
39.4 29.4
1.3
44,189
100.0
98.5
98.1 83.6
49.1 75.0 23.2 44.4 58.3
5.9
36.1 27.1
1.4
34,256
100.0
99.6
99.3 92.5
82.1 93.7 48.4 68.7 85.2 18.0
51.0 37.2
1.1
9,933
IUD= Intra Uterine Device. ** Unweighted cases. 1 Includes Female sterilization, Male sterilization, IUD, Pills, condom, female condom, emergency contraceptive pills and Injectables.

102
TABLE 6.2 AWARENESS OF CONTRACEPTIVE METHODS Percentage of currently married women age 15-49 years who are aware of specific contraceptive method according to selected background characteristics, Madhya Pradesh, 2007-08
Background characteristics Any
method
Any modern method
Male sterili- zation
Female sterili- zation IUD Pill ECP
Inject- ables
Condom/Nirodh
Female condom
Rhythm method
With-drawal Other
Number of
Women** Age group 15-24 25-29 30-34 35-39 40-49
No. of living children 0 1 2 3 4+
Residence Rural Urban
Education Non-literatea Less than five years 5-9 years 10 or more years
Religion Hindu Muslim Christian Sikh Buddhist/neo-Buddhist Jain Others
Castes/tribes Scheduled castes Scheduled tribes Other backward classes Others
Wealth index Lowest Second Middle Fourth Highest
Madhya Pradesh
100.0 100.0 100.0 100.0 100.0
100.0 100.0 100.0 100.0 100.0
100.0 100.0
100.0 100.0 100.0 100.0
100.0 100.0 100.0 100.0 100.0 100.0 100.0
100.0 100.0 100.0 100.0
100.0 100.0 100.0 100.0 100.0
100.0
97.3 99.0 99.2 99.3 99.3
96.1 98.1 99.1 99.5 99.1
98.5 99.6
98.3 98.9 99.2 99.9
98.7 99.5
100.0 100.0 100.0 100.0
97.4
99.0 97.1 99.2 99.5
97.2 98.4 99.1 99.5 99.8
98.7
83.4 85.9 86.6 85.7 87.0
83.4 86.2 87.9 86.3 83.7
83.6 92.5
81.1 87.0 90.4 97.0
85.2 92.5 95.1 90.5 95.0 91.5 97.4
85.0 78.3 87.4 91.3
76.2 82.5 85.9 90.1 94.5
85.6
96.4 98.7 99.1 99.2 99.2
95.1 97.2 98.9 99.3 99.0
98.1 99.3
98.0 98.5 98.7 99.7
98.3 99.1
100.0 100.0 100.0
99.4 97.4
98.5 96.8 98.9 99.2
96.7 97.9 98.8 99.1 99.4
98.4
53.4 59.9 58.9 57.6 54.2
52.3 59.5 62.6 57.4 50.9
49.1 82.1
43.4 57.5 70.3 92.9
55.1 79.6 61.0 81.8 68.1 92.1 71.1
54.1 33.6 60.6 78.7
31.5 43.1 54.4 69.6 88.1
56.5
79.6 82.3 80.2 79.4 75.2
79.3 82.1 82.9 80.0 74.2
75.0 93.7
70.0 83.3 90.7 98.2
78.5 92.9 80.5 85.2 92.6 97.5 89.6
79.7 62.0 83.5 91.3
59.5 73.0 81.5 88.5 96.2
79.2
27.8 32.7 30.2 28.2 25.8
28.7 34.5 33.6 27.9 22.9
23.2 48.4
18.6 25.7 37.2 65.2
28.0 42.0 38.0 50.7 43.6 67.4 28.3
25.9 15.0 29.8 47.0
14.0 19.4 25.5 33.4 54.7
28.8
49.2 52.7 51.6 49.9 46.8
48.2 54.1 54.4 50.2 44.5
44.4 68.7
38.8 50.3 61.7 80.7
49.0 64.6 53.0 64.4 56.3 74.9 63.7
48.9 30.2 53.5 68.0
31.3 40.6 48.4 58.8 73.5
49.9
65.8 68.3 66.5 63.4 58.2
65.7 69.5 69.3 64.3 57.4
58.3 85.2
52.2 64.8 78.3 95.4
63.3 82.1 60.9 82.0 85.0 90.8 81.6
65.4 41.5 69.2 82.1
41.5 53.8 64.3 75.8 90.0
64.4
8.2 9.9 9.2 8.5 7.4
9.6 10.8 11.0
8.1 5.6
5.9 18.0
4.3 6.5
10.9 27.5
8.2 13.1 18.0 36.9 16.8 29.2 10.6
7.3 3.7 8.3
16.7
2.8 4.4 6.4 9.5
21.3
8.6
36.0 40.7 40.7 40.9 40.2
32.7 41.8 42.6 39.9 37.8
36.1 51.0
33.4 36.5 44.4 61.7
39.0 46.4 44.4 50.8 75.7 57.6 43.0
38.9 27.9 40.7 51.9
27.0 34.7 38.9 43.2 55.4
39.4
27.0 30.6 30.7 30.0 29.5
24.3 31.4 31.3 29.5 28.7
27.1 37.2
25.0 27.2 32.7 46.3
29.0 35.1 31.1 27.7 75.6 35.6 38.4
29.4 19.1 30.4 40.4
19.2 24.6 29.4 34.2 41.0
29.4
0.8 1.1 1.4 1.5 1.9
0.6 0.9 1.3 1.4 1.7
1.4 1.1
1.3 1.5 1.3 1.2
1.3 1.5 0.0 1.2
14.7 1.8 0.0
1.3 1.9 1.1 1.0
1.6 1.5 1.3 1.0 1.2
1.3
11,084 8,808 7,619 6,998 9,680
4,737 5,995
10,462 10,462 12,533
34,256 9,933
25,106 2,954
11,487 4,642
41,747 2,050
61 81 41
170 39
6,818 10,488 18,836 8,047
10,786 11,719 8,199 6,786 6,699
44,189
Note: IUD= Intra Uterine Device; ECP = Emergency contraceptive pills. ** Unweighted cases. a Literate but did not attend school, are also included.
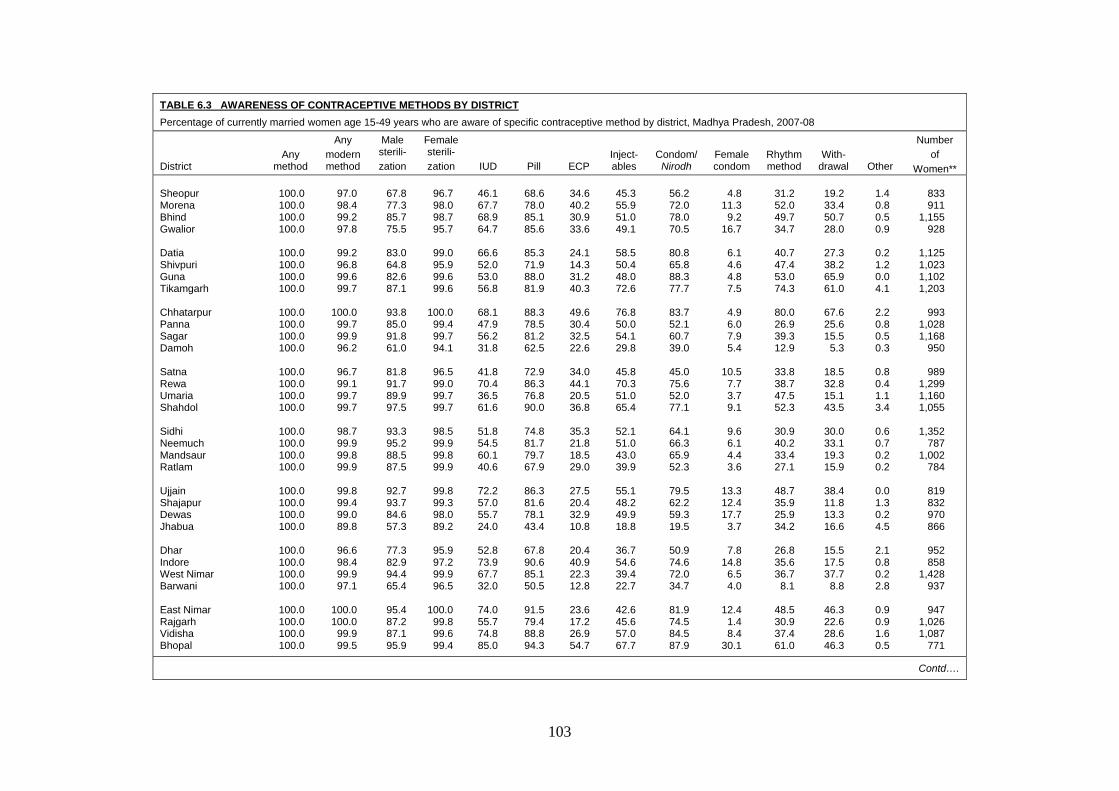
103
TABLE 6.3 AWARENESS OF CONTRACEPTIVE METHODS BY DISTRICT Percentage of currently married women age 15-49 years who are aware of specific contraceptive method by district, Madhya Pradesh, 2007-08
District Any
method
Any modern method
Male sterili- zation
Female sterili- zation IUD Pill ECP
Inject-ables
Condom/Nirodh
Female condom
Rhythm method
With-drawal Other
Number of
Women** Sheopur Morena Bhind Gwalior Datia Shivpuri Guna Tikamgarh Chhatarpur Panna Sagar Damoh Satna Rewa Umaria Shahdol Sidhi Neemuch Mandsaur Ratlam Ujjain Shajapur Dewas Jhabua Dhar Indore West Nimar Barwani East Nimar Rajgarh Vidisha Bhopal
100.0 100.0 100.0 100.0
100.0 100.0 100.0 100.0
100.0 100.0 100.0 100.0
100.0 100.0 100.0 100.0
100.0 100.0 100.0 100.0
100.0 100.0 100.0 100.0
100.0 100.0 100.0 100.0
100.0 100.0 100.0 100.0
97.0 98.4 99.2 97.8
99.2 96.8 99.6 99.7
100.0
99.7 99.9 96.2
96.7 99.1 99.7 99.7
98.7 99.9 99.8 99.9
99.8 99.4 99.0 89.8
96.6 98.4 99.9 97.1
100.0 100.0
99.9 99.5
67.8 77.3 85.7 75.5
83.0 64.8 82.6 87.1
93.8 85.0 91.8 61.0
81.8 91.7 89.9 97.5
93.3 95.2 88.5 87.5
92.7 93.7 84.6 57.3
77.3 82.9 94.4 65.4
95.4 87.2 87.1 95.9
96.7 98.0 98.7 95.7
99.0 95.9 99.6 99.6
100.0
99.4 99.7 94.1
96.5 99.0 99.7 99.7
98.5 99.9 99.8 99.9
99.8 99.3 98.0 89.2
95.9 97.2 99.9 96.5
100.0
99.8 99.6 99.4
46.1 67.7 68.9 64.7
66.6 52.0 53.0 56.8
68.1 47.9 56.2 31.8
41.8 70.4 36.5 61.6
51.8 54.5 60.1 40.6
72.2 57.0 55.7 24.0
52.8 73.9 67.7 32.0
74.0 55.7 74.8 85.0
68.6 78.0 85.1 85.6
85.3 71.9 88.0 81.9
88.3 78.5 81.2 62.5
72.9 86.3 76.8 90.0
74.8 81.7 79.7 67.9
86.3 81.6 78.1 43.4
67.8 90.6 85.1 50.5
91.5 79.4 88.8 94.3
34.6 40.2 30.9 33.6
24.1 14.3 31.2 40.3
49.6 30.4 32.5 22.6
34.0 44.1 20.5 36.8
35.3 21.8 18.5 29.0
27.5 20.4 32.9 10.8
20.4 40.9 22.3 12.8
23.6 17.2 26.9 54.7
45.3 55.9 51.0 49.1
58.5 50.4 48.0 72.6
76.8 50.0 54.1 29.8
45.8 70.3 51.0 65.4
52.1 51.0 43.0 39.9
55.1 48.2 49.9 18.8
36.7 54.6 39.4 22.7
42.6 45.6 57.0 67.7
56.2 72.0 78.0 70.5
80.8 65.8 88.3 77.7
83.7 52.1 60.7 39.0
45.0 75.6 52.0 77.1
64.1 66.3 65.9 52.3
79.5 62.2 59.3 19.5
50.9 74.6 72.0 34.7
81.9 74.5 84.5 87.9
4.8
11.3 9.2
16.7
6.1 4.6 4.8 7.5
4.9 6.0 7.9 5.4
10.5
7.7 3.7 9.1
9.6 6.1 4.4 3.6
13.3 12.4 17.7
3.7
7.8 14.8
6.5 4.0
12.4
1.4 8.4
30.1
31.2 52.0 49.7 34.7
40.7 47.4 53.0 74.3
80.0 26.9 39.3 12.9
33.8 38.7 47.5 52.3
30.9 40.2 33.4 27.1
48.7 35.9 25.9 34.2
26.8 35.6 36.7
8.1
48.5 30.9 37.4 61.0
19.2 33.4 50.7 28.0
27.3 38.2 65.9 61.0
67.6 25.6 15.5
5.3
18.5 32.8 15.1 43.5
30.0 33.1 19.3 15.9
38.4 11.8 13.3 16.6
15.5 17.5 37.7
8.8
46.3 22.6 28.6 46.3
1.4 0.8 0.5 0.9
0.2 1.2 0.0 4.1
2.2 0.8 0.5 0.3
0.8 0.4 1.1 3.4
0.6 0.7 0.2 0.2
0.0 1.3 0.2 4.5
2.1 0.8 0.2 2.8
0.9 0.9 1.6 0.5
833 911
1,155 928
1,125 1,023 1,102 1,203
993
1,028 1,168
950
989 1,299 1,160 1,055
1,352
787 1,002
784
819 832 970 866
952 858
1,428 937
947
1,026 1,087
771
Contd….
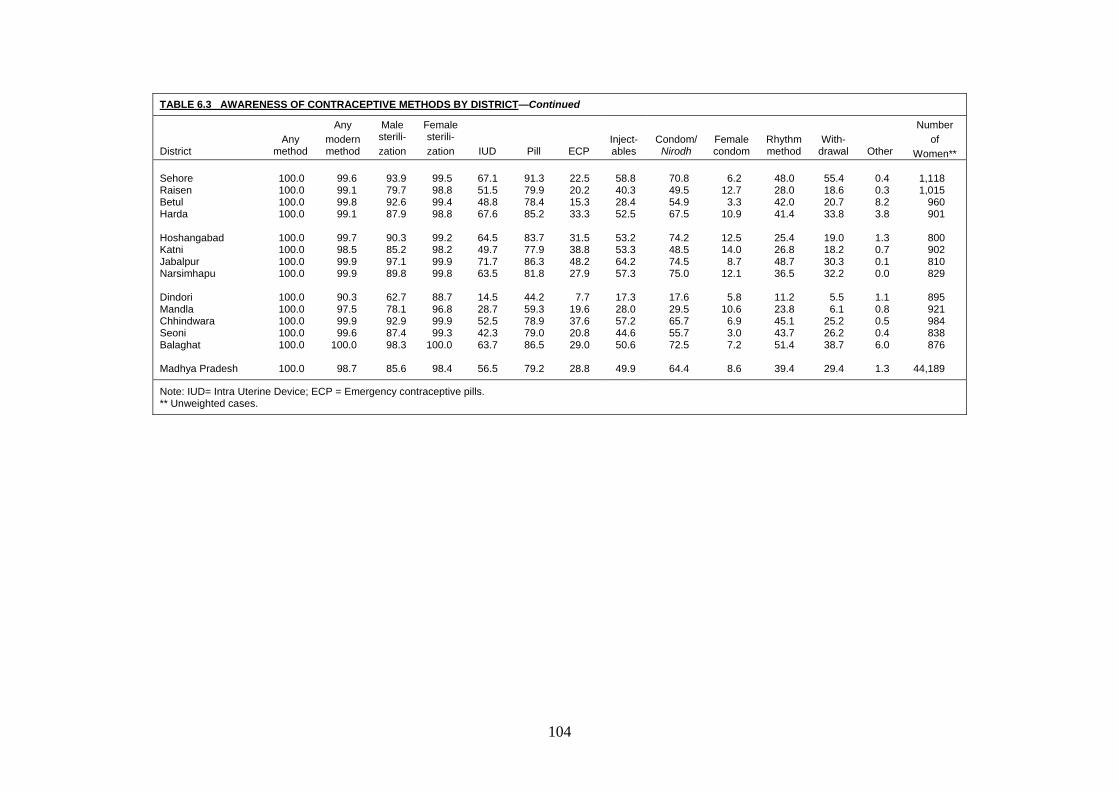
104
TABLE 6.3 AWARENESS OF CONTRACEPTIVE METHODS BY DISTRICT—Continued
District Any
method
Any modern method
Male sterili- zation
Female sterili- zation IUD Pill ECP
Inject-ables
Condom/Nirodh
Female condom
Rhythm method
With-drawal Other
Number of
Women** Sehore Raisen Betul Harda Hoshangabad Katni Jabalpur Narsimhapu Dindori Mandla Chhindwara Seoni Balaghat Madhya Pradesh
100.0 100.0 100.0 100.0
100.0 100.0 100.0 100.0
100.0 100.0 100.0 100.0 100.0
100.0
99.6 99.1 99.8 99.1
99.7 98.5 99.9 99.9
90.3 97.5 99.9 99.6
100.0
98.7
93.9 79.7 92.6 87.9
90.3 85.2 97.1 89.8
62.7 78.1 92.9 87.4 98.3
85.6
99.5 98.8 99.4 98.8
99.2 98.2 99.9 99.8
88.7 96.8 99.9 99.3
100.0
98.4
67.1 51.5 48.8 67.6
64.5 49.7 71.7 63.5
14.5 28.7 52.5 42.3 63.7
56.5
91.3 79.9 78.4 85.2
83.7 77.9 86.3 81.8
44.2 59.3 78.9 79.0 86.5
79.2
22.5 20.2 15.3 33.3
31.5 38.8 48.2 27.9
7.7
19.6 37.6 20.8 29.0
28.8
58.8 40.3 28.4 52.5
53.2 53.3 64.2 57.3
17.3 28.0 57.2 44.6 50.6
49.9
70.8 49.5 54.9 67.5
74.2 48.5 74.5 75.0
17.6 29.5 65.7 55.7 72.5
64.4
6.2
12.7 3.3
10.9
12.5 14.0
8.7 12.1
5.8
10.6 6.9 3.0 7.2
8.6
48.0 28.0 42.0 41.4
25.4 26.8 48.7 36.5
11.2 23.8 45.1 43.7 51.4
39.4
55.4 18.6 20.7 33.8
19.0 18.2 30.3 32.2
5.5 6.1
25.2 26.2 38.7
29.4
0.4 0.3 8.2 3.8
1.3 0.7 0.1 0.0
1.1 0.8 0.5 0.4 6.0
1.3
1,118 1,015
960 901
800 902 810 829
895 921 984 838 876
44,189
Note: IUD= Intra Uterine Device; ECP = Emergency contraceptive pills. ** Unweighted cases.
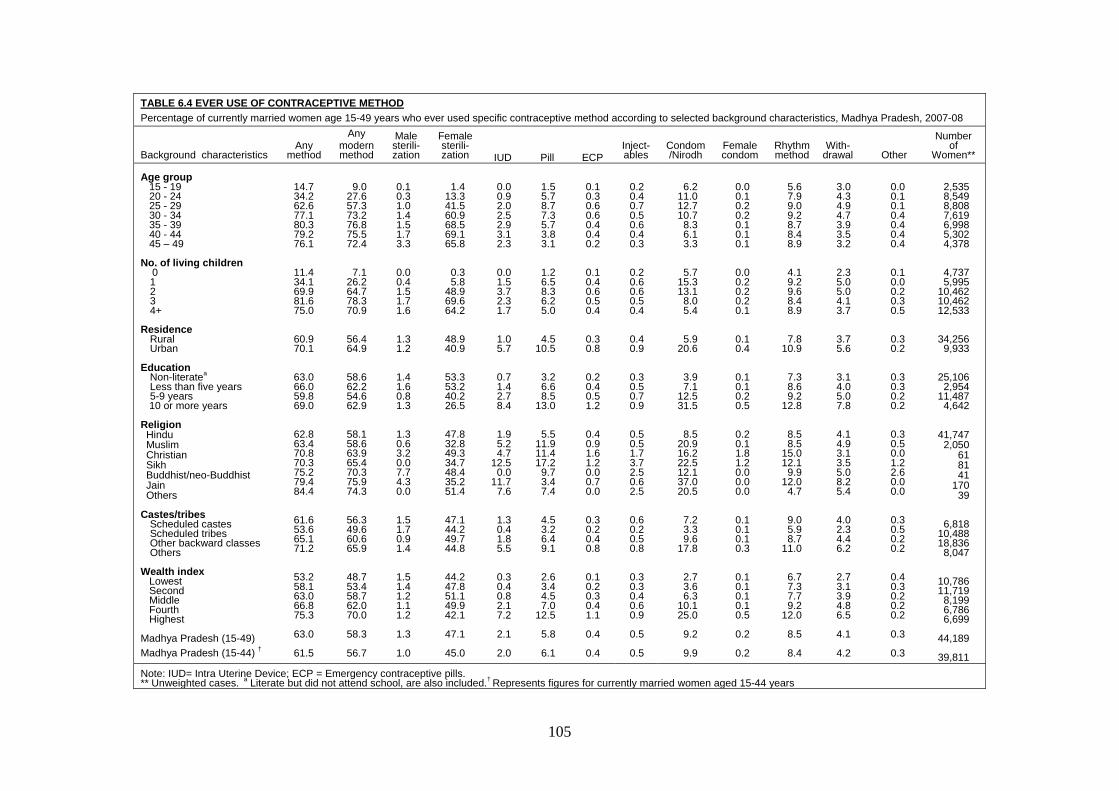
105
TABLE 6.4 EVER USE OF CONTRACEPTIVE METHOD Percentage of currently married women age 15-49 years who ever used specific contraceptive method according to selected background characteristics, Madhya Pradesh, 2007-08
Background characteristics Any
method
Any modern method
Male sterili- zation
Female sterili- zation IUD Pill ECP
Inject-ables
Condom /Nirodh
Female condom
Rhythm method
With-drawal Other
Number of
Women** Age group 15 - 19 20 - 24 25 - 29 30 - 34 35 - 39 40 - 44 45 – 49 No. of living children
0 1 2 3 4+
Residence Rural Urban Education Non-literatea Less than five years 5-9 years 10 or more years Religion Hindu Muslim Christian Sikh Buddhist/neo-Buddhist Jain Others
Castes/tribes Scheduled castes Scheduled tribes Other backward classes Others Wealth index Lowest Second Middle Fourth Highest Madhya Pradesh (15-49) Madhya Pradesh (15-44) †
14.7 34.2 62.6 77.1 80.3 79.2 76.1
11.4 34.1 69.9 81.6 75.0
60.9 70.1
63.0 66.0 59.8 69.0
62.8 63.4 70.8 70.3 75.2 79.4 84.4
61.6 53.6 65.1 71.2
53.2 58.1 63.0 66.8 75.3
63.0
61.5
9.0
27.6 57.3 73.2 76.8 75.5 72.4
7.1 26.2 64.7 78.3 70.9
56.4 64.9
58.6 62.2 54.6 62.9
58.1 58.6 63.9 65.4 70.3 75.9 74.3
56.3 49.6 60.6 65.9
48.7 53.4 58.7 62.0 70.0
58.3
56.7
0.1 0.3 1.0 1.4 1.5 1.7 3.3
0.0 0.4 1.5 1.7 1.6
1.3 1.2
1.4 1.6 0.8 1.3
1.3 0.6 3.2 0.0 7.7 4.3 0.0
1.5 1.7 0.9 1.4
1.5 1.4 1.2 1.1 1.2
1.3
1.0
1.4
13.3 41.5 60.9 68.5 69.1 65.8
0.3 5.8
48.9 69.6 64.2
48.9 40.9
53.3 53.2 40.2 26.5
47.8 32.8 49.3 34.7 48.4 35.2 51.4
47.1 44.2 49.7 44.8
44.2 47.8 51.1 49.9 42.1
47.1
45.0
0.0 0.9 2.0 2.5 2.9 3.1 2.3
0.0 1.5 3.7 2.3 1.7
1.0 5.7
0.7 1.4 2.7 8.4
1.9 5.2 4.7
12.5 0.0
11.7 7.6
1.3 0.4 1.8 5.5
0.3 0.4 0.8 2.1 7.2
2.1
2.0
1.5 5.7 8.7 7.3 5.7 3.8 3.1
1.2 6.5 8.3 6.2 5.0
4.5 10.5
3.2 6.6 8.5
13.0
5.5 11.9 11.4 17.2
9.7 3.4 7.4
4.5 3.2 6.4 9.1
2.6 3.4 4.5 7.0
12.5
5.8
6.1
0.1 0.3 0.6 0.6 0.4 0.4 0.2
0.1 0.4 0.6 0.5 0.4
0.3 0.8
0.2 0.4 0.5 1.2
0.4 0.9 1.6 1.2 0.0 0.7 0.0
0.3 0.2 0.4 0.8
0.1 0.2 0.3 0.4 1.1
0.4
0.4
0.2 0.4 0.7 0.5 0.6 0.4 0.3
0.2 0.6 0.6 0.5 0.4
0.4 0.9
0.3 0.5 0.7 0.9
0.5 0.5 1.7 3.7 2.5 0.6 2.5
0.6 0.2 0.5 0.8
0.3 0.3 0.4 0.6 0.9
0.5
0.5
6.2
11.0 12.7 10.7
8.3 6.1 3.3
5.7 15.3 13.1
8.0 5.4
5.9 20.6
3.9 7.1
12.5 31.5
8.5 20.9 16.2 22.5 12.1 37.0 20.5
7.2 3.3 9.6
17.8
2.7 3.6 6.3
10.1 25.0
9.2
9.9
0.0 0.1 0.2 0.2 0.1 0.1 0.1
0.0 0.2 0.2 0.2 0.1
0.1 0.4
0.1 0.1 0.2 0.5
0.2 0.1 1.8 1.2 0.0 0.0 0.0
0.1 0.1 0.1 0.3
0.1 0.1 0.1 0.1 0.5
0.2
0.2
5.6 7.9 9.0 9.2 8.7 8.4 8.9
4.1 9.2 9.6 8.4 8.9
7.8 10.9
7.3 8.6 9.2
12.8
8.5 8.5
15.0 12.1
9.9 12.0
4.7
9.0 5.9 8.7
11.0
6.7 7.3 7.7 9.2
12.0
8.5
8.4
3.0 4.3 4.9 4.7 3.9 3.5 3.2
2.3 5.0 5.0 4.1 3.7
3.7 5.6
3.1 4.0 5.0 7.8
4.1 4.9 3.1 3.5 5.0 8.2 5.4
4.0 2.3 4.4 6.2
2.7 3.1 3.9 4.8 6.5
4.1
4.2
0.0 0.1 0.1 0.4 0.4 0.4 0.4
0.1 0.0 0.2 0.3 0.5
0.3 0.2
0.3 0.3 0.2 0.2
0.3 0.5 0.0 1.2 2.6 0.0 0.0
0.3 0.5 0.2 0.2
0.4 0.3 0.2 0.2 0.2
0.3
0.3
2,535 8,549 8,808 7,619 6,998 5,302 4,378
4,737 5,995
10,462 10,462 12,533
34,256 9,933
25,106 2,954
11,487 4,642
41,747 2,050
61 81 41
170 39
6,818 10,488 18,836
8,047
10,786 11,719
8,199 6,786 6,699
44,189
39,811
Note: IUD= Intra Uterine Device; ECP = Emergency contraceptive pills. ** Unweighted cases. a Literate but did not attend school, are also included.† Represents figures for currently married women aged 15-44 years
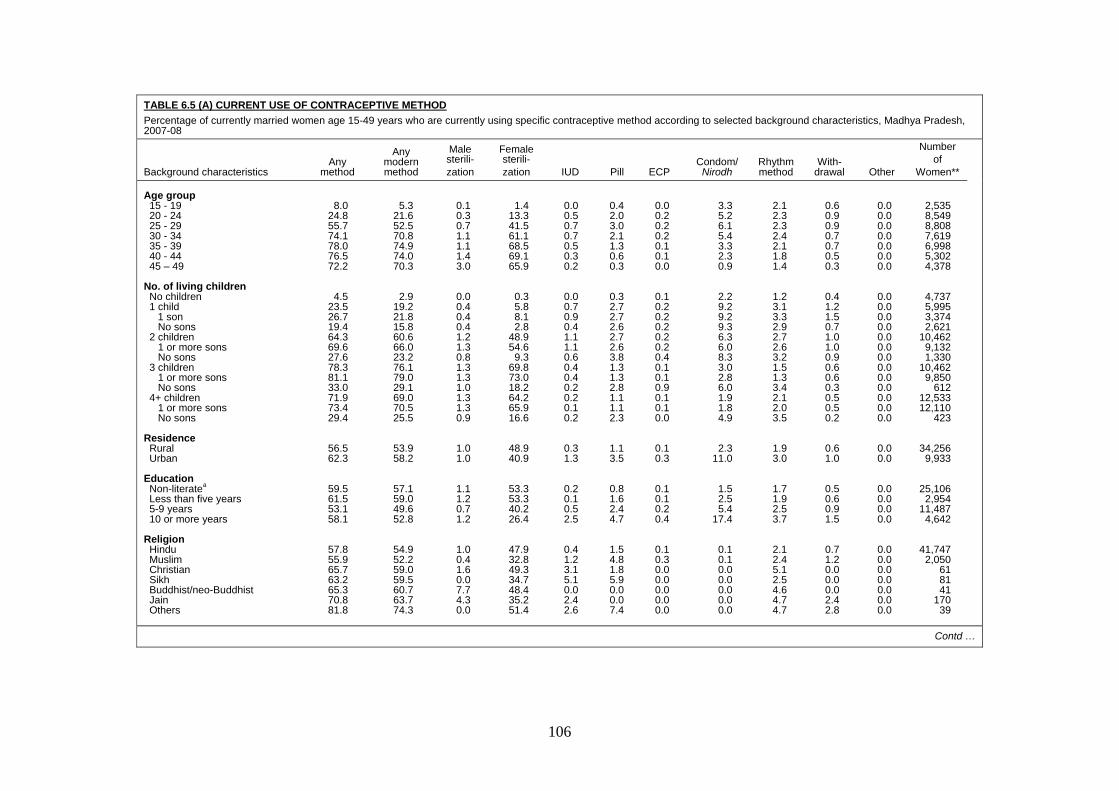
106
TABLE 6.5 (A) CURRENT USE OF CONTRACEPTIVE METHOD Percentage of currently married women age 15-49 years who are currently using specific contraceptive method according to selected background characteristics, Madhya Pradesh, 2007-08
Background characteristics Any
method
Any modern method
Male sterili- zation
Female sterili- zation
IUD Pill ECP
Condom/ Nirodh
Rhythm method
With-drawal Other
Number of
Women** Age group 15 - 19 20 - 24 25 - 29 30 - 34 35 - 39 40 - 44 45 – 49
No. of living children No children 1 child 1 son No sons 2 children 1 or more sons No sons 3 children 1 or more sons No sons 4+ children 1 or more sons No sons
Residence Rural Urban
Education Non-literatea Less than five years 5-9 years 10 or more years
Religion Hindu Muslim Christian Sikh Buddhist/neo-Buddhist Jain Others
8.0
24.8 55.7 74.1 78.0 76.5 72.2
4.5 23.5 26.7 19.4 64.3 69.6 27.6 78.3 81.1 33.0 71.9 73.4 29.4
56.5 62.3
59.5 61.5 53.1 58.1
57.8 55.9 65.7 63.2 65.3 70.8 81.8
5.3
21.6 52.5 70.8 74.9 74.0 70.3
2.9 19.2 21.8 15.8 60.6 66.0 23.2 76.1 79.0 29.1 69.0 70.5 25.5
53.9 58.2
57.1 59.0 49.6 52.8
54.9 52.2 59.0 59.5 60.7 63.7 74.3
0.1 0.3 0.7 1.1 1.1 1.4 3.0
0.0 0.4 0.4 0.4 1.2 1.3 0.8 1.3 1.3 1.0 1.3 1.3 0.9
1.0 1.0
1.1 1.2 0.7 1.2
1.0 0.4 1.6 0.0 7.7 4.3 0.0
1.4
13.3 41.5 61.1 68.5 69.1 65.9
0.3 5.8 8.1 2.8
48.9 54.6
9.3 69.8 73.0 18.2 64.2 65.9 16.6
48.9 40.9
53.3 53.3 40.2 26.4
47.9 32.8 49.3 34.7 48.4 35.2 51.4
0.0 0.5 0.7 0.7 0.5 0.3 0.2
0.0 0.7 0.9 0.4 1.1 1.1 0.6 0.4 0.4 0.2 0.2 0.1 0.2
0.3 1.3
0.2 0.1 0.5 2.5
0.4 1.2 3.1 5.1 0.0 2.4 2.6
0.4 2.0 3.0 2.1 1.3 0.6 0.3
0.3 2.7 2.7 2.6 2.7 2.6 3.8 1.3 1.3 2.8 1.1 1.1 2.3
1.1 3.5
0.8 1.6 2.4 4.7
1.5 4.8 1.8 5.9 0.0 0.0 7.4
0.0 0.2 0.2 0.2 0.1 0.1 0.0
0.1 0.2 0.2 0.2 0.2 0.2 0.4 0.1 0.1 0.9 0.1 0.1 0.0
0.1 0.3
0.1 0.1 0.2 0.4
0.1 0.3 0.0 0.0 0.0 0.0 0.0
3.3 5.2 6.1 5.4 3.3 2.3 0.9
2.2 9.2 9.2 9.3 6.3 6.0 8.3 3.0 2.8 6.0 1.9 1.8 4.9
2.3 11.0
1.5 2.5 5.4
17.4
0.1 0.1 0.0 0.0 0.0 0.0 0.0
2.1 2.3 2.3 2.4 2.1 1.8 1.4
1.2 3.1 3.3 2.9 2.7 2.6 3.2 1.5 1.3 3.4 2.1 2.0 3.5
1.9 3.0
1.7 1.9 2.5 3.7
2.1 2.4 5.1 2.5 4.6 4.7 4.7
0.6 0.9 0.9 0.7 0.7 0.5 0.3
0.4 1.2 1.5 0.7 1.0 1.0 0.9 0.6 0.6 0.3 0.5 0.5 0.2
0.6 1.0
0.5 0.6 0.9 1.5
0.7 1.2 0.0 0.0 0.0 2.4 2.8
0.0 0.0 0.0 0.0 0.0 0.0 0.0
0.0 0.0 0.0 0.0 0.0 0.0 0.0 0.0 0.0 0.0 0.0 0.0 0.0
0.0 0.0
0.0 0.0 0.0 0.0
0.0 0.0 0.0 0.0 0.0 0.0 0.0
2,535 8,549 8,808 7,619 6,998 5,302 4,378
4,737 5,995 3,374 2,621
10,462 9,132 1,330
10,462 9,850
612 12,533 12,110
423
34,256 9,933
25,106 2,954
11,487 4,642
41,747 2,050
61 81 41
170 39
Contd …
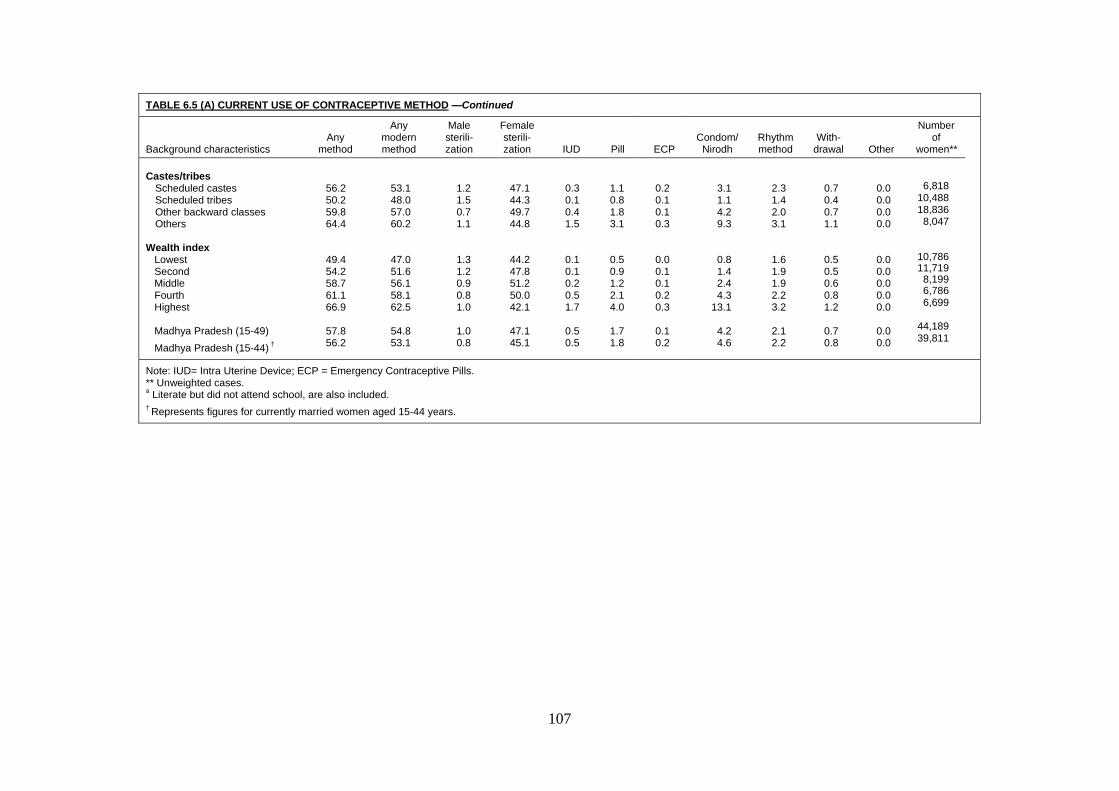
107
TABLE 6.5 (A) CURRENT USE OF CONTRACEPTIVE METHOD —Continued
Background characteristics Any
method
Any modern method
Male sterili- zation
Female sterili- zation
IUD Pill ECP
Condom/ Nirodh
Rhythm method
With-drawal Other
Number of
women**
Castes/tribes Scheduled castes Scheduled tribes Other backward classes Others Wealth index Lowest Second Middle Fourth Highest Madhya Pradesh (15-49)
Madhya Pradesh (15-44) †
56.2 50.2 59.8 64.4
49.4 54.2 58.7 61.1 66.9
57.8 56.2
53.1 48.0 57.0 60.2
47.0 51.6 56.1 58.1 62.5
54.8 53.1
1.2 1.5 0.7 1.1
1.3 1.2 0.9 0.8 1.0
1.0 0.8
47.1 44.3 49.7 44.8
44.2 47.8 51.2 50.0 42.1
47.1 45.1
0.3 0.1 0.4 1.5
0.1 0.1 0.2 0.5 1.7
0.5 0.5
1.1 0.8 1.8 3.1
0.5 0.9 1.2 2.1 4.0
1.7 1.8
0.2 0.1 0.1 0.3
0.0 0.1 0.1 0.2 0.3
0.1 0.2
3.1 1.1 4.2 9.3
0.8 1.4 2.4 4.3
13.1
4.2 4.6
2.3 1.4 2.0 3.1
1.6 1.9 1.9 2.2 3.2
2.1 2.2
0.7 0.4 0.7 1.1
0.5 0.5 0.6 0.8 1.2
0.7 0.8
0.0 0.0 0.0 0.0
0.0 0.0 0.0 0.0 0.0
0.0 0.0
6,818
10,488 18,836
8,047
10,786 11,719
8,199 6,786 6,699
44,189 39,811
Note: IUD= Intra Uterine Device; ECP = Emergency Contraceptive Pills. ** Unweighted cases. a Literate but did not attend school, are also included. † Represents figures for currently married women aged 15-44 years.
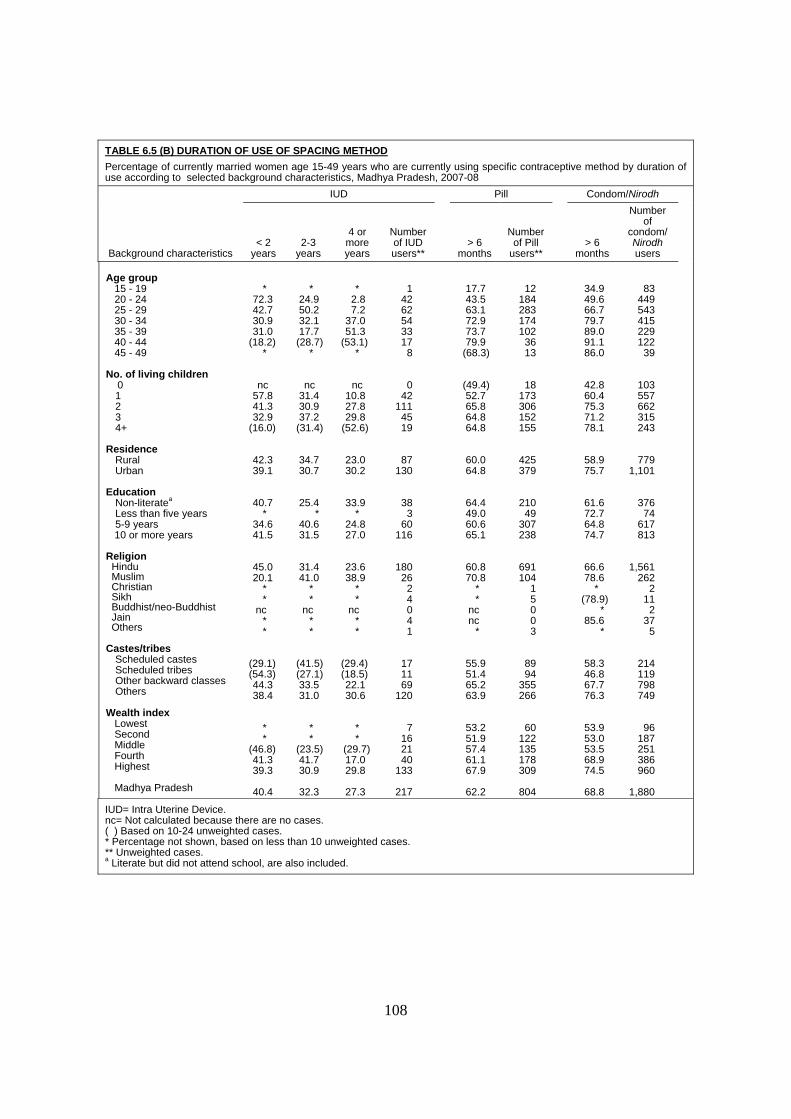
108
TABLE 6.5 (B) DURATION OF USE OF SPACING METHOD Percentage of currently married women age 15-49 years who are currently using specific contraceptive method by duration of use according to selected background characteristics, Madhya Pradesh, 2007-08
Background characteristics
IUD Pill Condom/Nirodh
< 2 years
2-3 years
4 or more years
Number of IUD users**
> 6 months
Number of Pill
users**
> 6 months
Number of
condom/ Nirodh users
Age group 15 - 19 20 - 24 25 - 29 30 - 34 35 - 39 40 - 44 45 - 49 No. of living children 0 1 2 3 4+ Residence Rural Urban Education Non-literatea Less than five years 5-9 years 10 or more years Religion Hindu Muslim Christian Sikh Buddhist/neo-Buddhist Jain Others
Castes/tribes Scheduled castes Scheduled tribes Other backward classes Others Wealth index Lowest Second Middle Fourth Highest Madhya Pradesh
* 72.3 42.7 30.9 31.0
(18.2) *
nc 57.8 41.3 32.9
(16.0)
42.3 39.1
40.7 *
34.6 41.5
45.0 20.1
* *
nc * *
(29.1) (54.3) 44.3 38.4
* *
(46.8) 41.3 39.3
40.4
* 24.9 50.2 32.1 17.7 (28.7)
*
nc 31.4 30.9 37.2 (31.4)
34.7 30.7
25.4 *
40.6 31.5
31.4 41.0
* *
nc * *
(41.5) (27.1) 33.5 31.0
* *
(23.5) 41.7 30.9
32.3
*
2.8 7.2
37.0 51.3
(53.1) *
nc 10.8 27.8 29.8
(52.6)
23.0 30.2
33.9 *
24.8 27.0
23.6 38.9
* *
nc * *
(29.4) (18.5) 22.1 30.6
* *
(29.7) 17.0 29.8
27.3
1
42 62 54 33 17
8
0 42
111 45 19
87 130
38 3
60 116
180 26
2 4 0 4 1
17 11 69
120
7 16 21 40
133
217
17.7 43.5 63.1 72.9 73.7 79.9
(68.3)
(49.4) 52.7 65.8 64.8 64.8
60.0 64.8
64.4 49.0 60.6 65.1
60.8 70.8
* *
nc nc
*
55.9 51.4 65.2 63.9
53.2 51.9 57.4 61.1 67.9
62.2
12
184 283 174 102
36 13
18 173 306 152 155
425 379
210 49
307 238
691 104
1 5 0 0 3
89 94
355 266
60 122 135 178 309
804
34.9 49.6 66.7 79.7 89.0 91.1 86.0
42.8 60.4 75.3 71.2 78.1
58.9 75.7
61.6 72.7 64.8 74.7
66.6 78.6
* (78.9)
* 85.6
*
58.3 46.8 67.7 76.3
53.9 53.0 53.5 68.9 74.5
68.8
83 449 543 415 229 122
39
103 557 662 315 243
779 1,101
376 74
617 813
1,561 262
2 11
2 37
5
214 119 798 749
96 187 251 386 960
1,880
IUD= Intra Uterine Device. nc= Not calculated because there are no cases. ( ) Based on 10-24 unweighted cases. * Percentage not shown, based on less than 10 unweighted cases. ** Unweighted cases. a Literate but did not attend school, are also included.
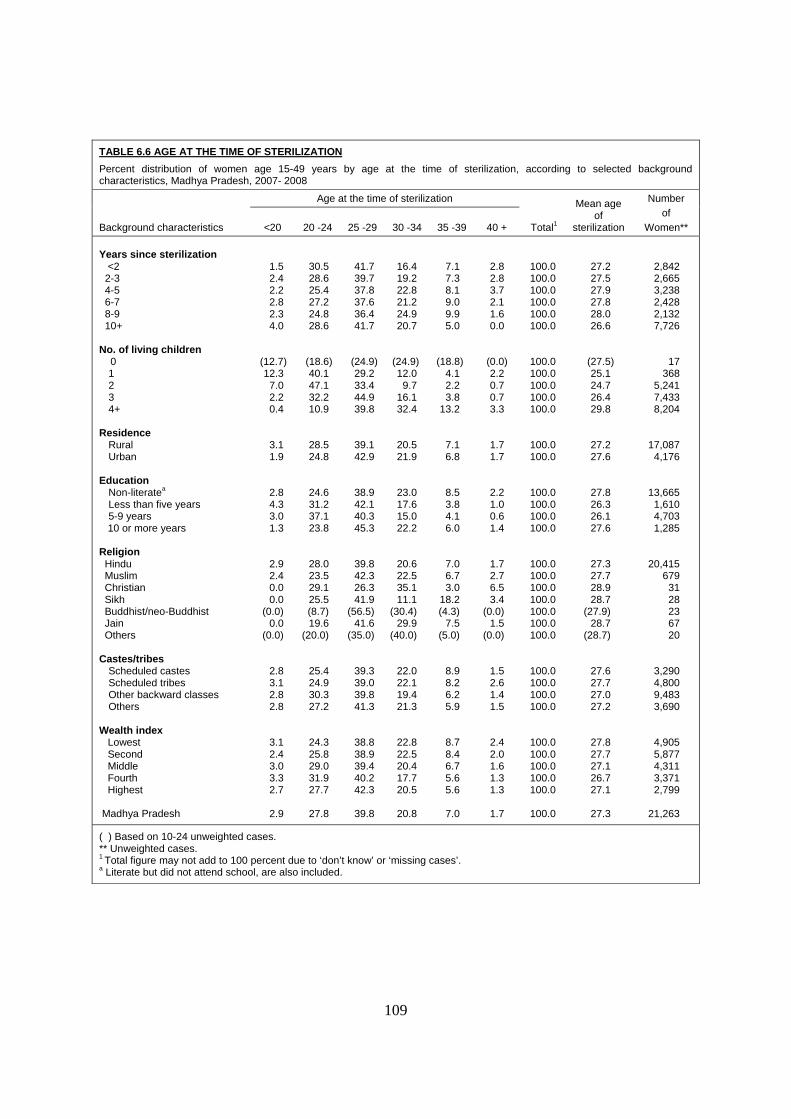
109
TABLE 6.6 AGE AT THE TIME OF STERILIZATION Percent distribution of women age 15-49 years by age at the time of sterilization, according to selected background characteristics, Madhya Pradesh, 2007- 2008
Background characteristics
Age at the time of sterilization
Total1
Mean age of
sterilization
Number of
Women** <20 20 -24 25 -29 30 -34 35 -39 40 + Years since sterilization <2 2-3 4-5 6-7 8-9 10+ No. of living children 0
1 2 3 4+ Residence Rural Urban Education Non-literatea Less than five years 5-9 years 10 or more years Religion Hindu Muslim Christian Sikh Buddhist/neo-Buddhist Jain Others
Castes/tribes Scheduled castes Scheduled tribes Other backward classes Others Wealth index Lowest Second Middle Fourth Highest
Madhya Pradesh
1.5 2.4 2.2 2.8 2.3 4.0
(12.7) 12.3
7.0 2.2 0.4
3.1 1.9
2.8 4.3 3.0 1.3
2.9 2.4 0.0 0.0
(0.0) 0.0
(0.0)
2.8 3.1 2.8 2.8
3.1 2.4 3.0 3.3 2.7
2.9
30.5 28.6 25.4 27.2 24.8 28.6
(18.6) 40.1 47.1 32.2 10.9
28.5 24.8
24.6 31.2 37.1 23.8
28.0 23.5 29.1 25.5 (8.7) 19.6
(20.0)
25.4 24.9 30.3 27.2
24.3 25.8 29.0 31.9 27.7
27.8
41.7 39.7 37.8 37.6 36.4 41.7
(24.9) 29.2 33.4 44.9 39.8
39.1 42.9
38.9 42.1 40.3 45.3
39.8 42.3 26.3 41.9
(56.5) 41.6
(35.0)
39.3 39.0 39.8 41.3
38.8 38.9 39.4 40.2 42.3
39.8
16.4 19.2 22.8 21.2 24.9 20.7
(24.9) 12.0
9.7 16.1 32.4
20.5 21.9
23.0 17.6 15.0 22.2
20.6 22.5 35.1 11.1
(30.4) 29.9
(40.0)
22.0 22.1 19.4 21.3
22.8 22.5 20.4 17.7 20.5
20.8
7.1 7.3 8.1 9.0 9.9 5.0
(18.8) 4.1 2.2 3.8
13.2
7.1 6.8
8.5 3.8 4.1 6.0
7.0 6.7 3.0
18.2 (4.3)
7.5 (5.0)
8.9 8.2 6.2 5.9
8.7 8.4 6.7 5.6 5.6
7.0
2.8 2.8 3.7 2.1 1.6 0.0
(0.0) 2.2 0.7 0.7 3.3
1.7 1.7
2.2 1.0 0.6 1.4
1.7 2.7 6.5 3.4
(0.0) 1.5
(0.0)
1.5 2.6 1.4 1.5
2.4 2.0 1.6 1.3 1.3
1.7
100.0 100.0 100.0 100.0 100.0 100.0
100.0 100.0 100.0 100.0 100.0
100.0 100.0
100.0 100.0 100.0 100.0
100.0 100.0 100.0 100.0 100.0 100.0 100.0
100.0 100.0 100.0 100.0
100.0 100.0 100.0 100.0 100.0
100.0
27.2 27.5 27.9 27.8 28.0 26.6
(27.5) 25.1 24.7 26.4 29.8
27.2 27.6
27.8 26.3 26.1 27.6
27.3 27.7 28.9 28.7
(27.9) 28.7
(28.7)
27.6 27.7 27.0 27.2
27.8 27.7 27.1 26.7 27.1
27.3
2,842 2,665 3,238 2,428 2,132 7,726
17 368
5,241 7,433 8,204
17,087 4,176
13,665 1,610 4,703 1,285
20,415 679
31 28 23 67 20
3,290 4,800 9,483 3,690
4,905 5,877 4,311 3,371 2,799
21,263
( ) Based on 10-24 unweighted cases. ** Unweighted cases. 1 Total figure may not add to 100 percent due to ‘don’t know’ or ‘missing cases’. a Literate but did not attend school, are also included.
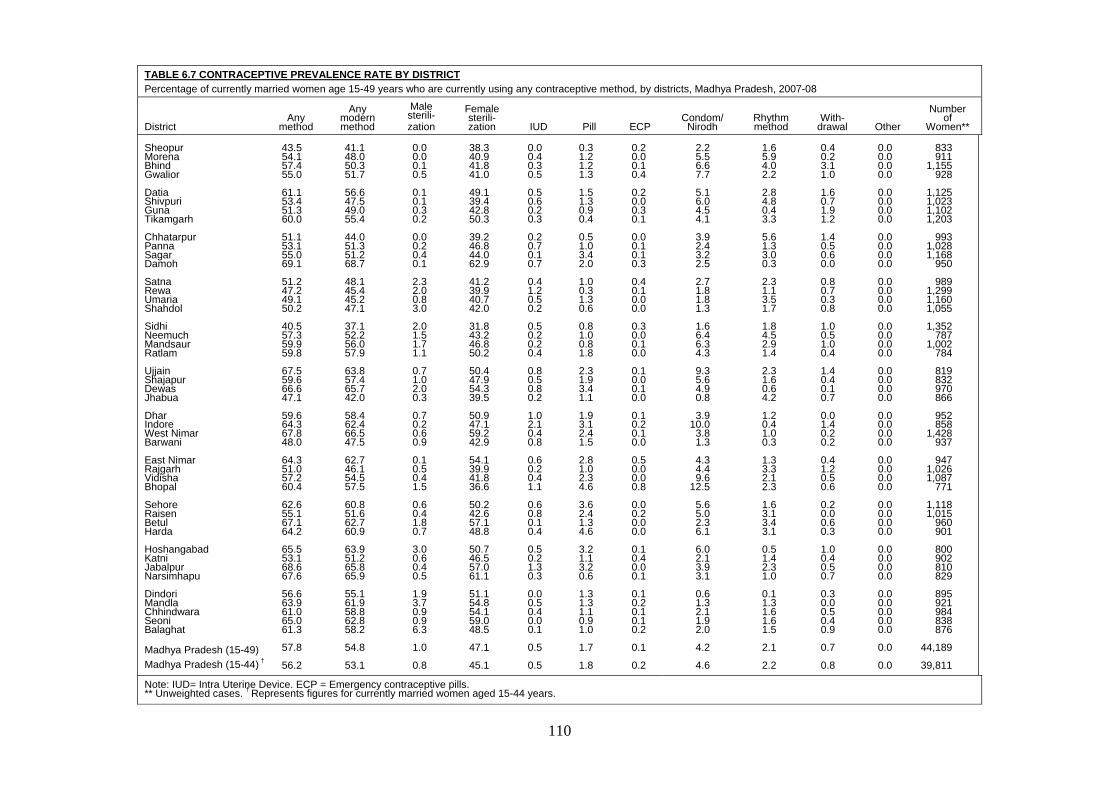
110
TABLE 6.7 CONTRACEPTIVE PREVALENCE RATE BY DISTRICT Percentage of currently married women age 15-49 years who are currently using any contraceptive method, by districts, Madhya Pradesh, 2007-08
District Any
method
Any modern method
Male sterili- zation
Female sterili- zation IUD Pill ECP
Condom/ Nirodh
Rhythm method
With-drawal Other
Number of
Women** Sheopur Morena Bhind Gwalior Datia Shivpuri Guna Tikamgarh Chhatarpur Panna Sagar Damoh Satna Rewa Umaria Shahdol Sidhi Neemuch Mandsaur Ratlam Ujjain Shajapur Dewas Jhabua Dhar Indore West Nimar Barwani East Nimar Rajgarh Vidisha Bhopal Sehore Raisen Betul Harda Hoshangabad Katni Jabalpur Narsimhapu Dindori Mandla Chhindwara Seoni Balaghat Madhya Pradesh (15-49)
Madhya Pradesh (15-44) †
43.5 54.1 57.4 55.0
61.1 53.4 51.3 60.0
51.1 53.1 55.0 69.1
51.2 47.2 49.1 50.2
40.5 57.3 59.9 59.8
67.5 59.6 66.6 47.1
59.6 64.3 67.8 48.0
64.3 51.0 57.2 60.4
62.6 55.1 67.1 64.2
65.5 53.1 68.6 67.6
56.6 63.9 61.0 65.0 61.3
57.8
56.2
41.1 48.0 50.3 51.7
56.6 47.5 49.0 55.4
44.0 51.3 51.2 68.7
48.1 45.4 45.2 47.1
37.1 52.2 56.0 57.9
63.8 57.4 65.7 42.0
58.4 62.4 66.5 47.5
62.7 46.1 54.5 57.5
60.8 51.6 62.7 60.9
63.9 51.2 65.8 65.9
55.1 61.9 58.8 62.8 58.2
54.8
53.1
0.0 0.0 0.1 0.5
0.1 0.1 0.3 0.2
0.0 0.2 0.4 0.1
2.3 2.0 0.8 3.0
2.0 1.5 1.7 1.1
0.7 1.0 2.0 0.3
0.7 0.2 0.6 0.9
0.1 0.5 0.4 1.5
0.6 0.4 1.8 0.7
3.0 0.6 0.4 0.5
1.9 3.7 0.9 0.9 6.3
1.0
0.8
38.3 40.9 41.8 41.0
49.1 39.4 42.8 50.3
39.2 46.8 44.0 62.9
41.2 39.9 40.7 42.0
31.8 43.2 46.8 50.2
50.4 47.9 54.3 39.5
50.9 47.1 59.2 42.9
54.1 39.9 41.8 36.6
50.2 42.6 57.1 48.8
50.7 46.5 57.0 61.1
51.1 54.8 54.1 59.0 48.5
47.1
45.1
0.0 0.4 0.3 0.5
0.5 0.6 0.2 0.3
0.2 0.7 0.1 0.7
0.4 1.2 0.5 0.2
0.5 0.2 0.2 0.4
0.8 0.5 0.8 0.2
1.0 2.1 0.4 0.8
0.6 0.2 0.4 1.1
0.6 0.8 0.1 0.4
0.5 0.2 1.3 0.3
0.0 0.5 0.4 0.0 0.1
0.5
0.5
0.3 1.2 1.2 1.3
1.5 1.3 0.9 0.4
0.5 1.0 3.4 2.0
1.0 0.3 1.3 0.6
0.8 1.0 0.8 1.8
2.3 1.9 3.4 1.1
1.9 3.1 2.4 1.5
2.8 1.0 2.3 4.6
3.6 2.4 1.3 4.6
3.2 1.1 3.2 0.6
1.3 1.3 1.1 0.9 1.0
1.7
1.8
0.2 0.0 0.1 0.4
0.2 0.0 0.3 0.1
0.0 0.1 0.1 0.3
0.4 0.1 0.0 0.0
0.3 0.0 0.1 0.0
0.1 0.0 0.1 0.0
0.1 0.2 0.1 0.0
0.5 0.0 0.0 0.8
0.0 0.2 0.0 0.0
0.1 0.4 0.0 0.1
0.1 0.2 0.1 0.1 0.2
0.1
0.2
2.2 5.5 6.6 7.7
5.1 6.0 4.5 4.1
3.9 2.4 3.2 2.5
2.7 1.8 1.8 1.3
1.6 6.4 6.3 4.3
9.3 5.6 4.9 0.8
3.9
10.0 3.8 1.3
4.3 4.4 9.6
12.5
5.6 5.0 2.3 6.1
6.0 2.1 3.9 3.1
0.6 1.3 2.1 1.9 2.0
4.2
4.6
1.6 5.9 4.0 2.2
2.8 4.8 0.4 3.3
5.6 1.3 3.0 0.3
2.3 1.1 3.5 1.7
1.8 4.5 2.9 1.4
2.3 1.6 0.6 4.2
1.2 0.4 1.0 0.3
1.3 3.3 2.1 2.3
1.6 3.1 3.4 3.1
0.5 1.4 2.3 1.0
0.1 1.3 1.6 1.6 1.5
2.1
2.2
0.4 0.2 3.1 1.0
1.6 0.7 1.9 1.2
1.4 0.5 0.6 0.0
0.8 0.7 0.3 0.8
1.0 0.5 1.0 0.4
1.4 0.4 0.1 0.7
0.0 1.4 0.2 0.2
0.4 1.2 0.5 0.6
0.2 0.0 0.6 0.3
1.0 0.4 0.5 0.7
0.3 0.0 0.5 0.4 0.9
0.7
0.8
0.0 0.0 0.0 0.0
0.0 0.0 0.0 0.0
0.0 0.0 0.0 0.0
0.0 0.0 0.0 0.0
0.0 0.0 0.0 0.0
0.0 0.0 0.0 0.0
0.0 0.0 0.0 0.0
0.0 0.0 0.0 0.0
0.0 0.0 0.0 0.0
0.0 0.0 0.0 0.0
0.0 0.0 0.0 0.0 0.0
0.0
0.0
833 911
1,155 928
1,125 1,023 1,102 1,203
993
1,028 1,168
950
989 1,299 1,160 1,055
1,352
787 1,002
784
819 832 970 866
952 858
1,428 937
947
1,026 1,087
771
1,118 1,015
960 901
800 902 810 829
895 921 984 838 876
44,189
39,811
Note: IUD= Intra Uterine Device. ECP = Emergency contraceptive pills. ** Unweighted cases. † Represents figures for currently married women aged 15-44 years.
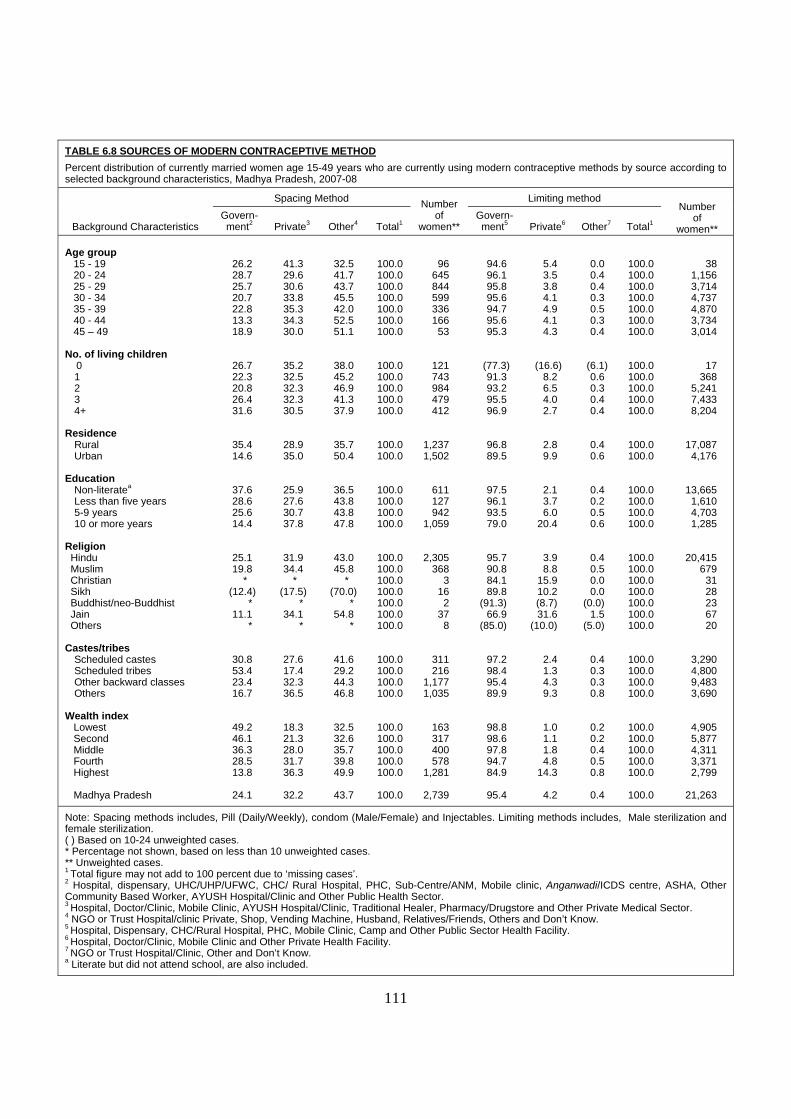
111
TABLE 6.8 SOURCES OF MODERN CONTRACEPTIVE METHOD Percent distribution of currently married women age 15-49 years who are currently using modern contraceptive methods by source according to selected background characteristics, Madhya Pradesh, 2007-08
Background Characteristics
Spacing Method Number of
women**
Limiting method Number
of women**
Govern-ment2 Private3 Other4 Total1
Govern-ment5 Private6 Other7 Total1
Age group 15 - 19 20 - 24 25 - 29 30 - 34 35 - 39 40 - 44 45 – 49 No. of living children 0
1 2 3 4+ Residence Rural Urban Education Non-literatea Less than five years 5-9 years 10 or more years Religion Hindu Muslim Christian Sikh Buddhist/neo-Buddhist Jain Others
Castes/tribes Scheduled castes Scheduled tribes Other backward classes Others Wealth index Lowest Second Middle Fourth Highest Madhya Pradesh
26.2 28.7 25.7 20.7 22.8 13.3 18.9
26.7 22.3 20.8 26.4 31.6
35.4 14.6
37.6 28.6 25.6 14.4
25.1 19.8
* (12.4)
* 11.1
*
30.8 53.4 23.4 16.7
49.2 46.1 36.3 28.5 13.8
24.1
41.3 29.6 30.6 33.8 35.3 34.3 30.0
35.2 32.5 32.3 32.3 30.5
28.9 35.0
25.9 27.6 30.7 37.8
31.9 34.4
* (17.5)
* 34.1
*
27.6 17.4 32.3 36.5
18.3 21.3 28.0 31.7 36.3
32.2
32.5 41.7 43.7 45.5 42.0 52.5 51.1
38.0 45.2 46.9 41.3 37.9
35.7 50.4
36.5 43.8 43.8 47.8
43.0 45.8
* (70.0)
* 54.8
*
41.6 29.2 44.3 46.8
32.5 32.6 35.7 39.8 49.9
43.7
100.0 100.0 100.0 100.0 100.0 100.0 100.0
100.0 100.0 100.0 100.0 100.0
100.0 100.0
100.0 100.0 100.0 100.0
100.0 100.0 100.0 100.0 100.0 100.0 100.0
100.0 100.0 100.0 100.0
100.0 100.0 100.0 100.0 100.0
100.0
96
645 844 599 336 166
53
121 743 984 479 412
1,237 1,502
611 127 942
1,059
2,305 368
3 16
2 37
8
311 216
1,177 1,035
163 317 400 578
1,281
2,739
94.6 96.1 95.8 95.6 94.7 95.6 95.3
(77.3) 91.3 93.2 95.5 96.9
96.8 89.5
97.5 96.1 93.5 79.0
95.7 90.8 84.1 89.8
(91.3) 66.9
(85.0)
97.2 98.4 95.4 89.9
98.8 98.6 97.8 94.7 84.9
95.4
5.4 3.5 3.8 4.1 4.9 4.1 4.3
(16.6) 8.2 6.5 4.0 2.7
2.8 9.9
2.1 3.7 6.0
20.4
3.9 8.8
15.9 10.2 (8.7) 31.6
(10.0)
2.4 1.3 4.3 9.3
1.0 1.1 1.8 4.8
14.3
4.2
0.0 0.4 0.4 0.3 0.5 0.3 0.4
(6.1) 0.6 0.3 0.4 0.4
0.4 0.6
0.4 0.2 0.5 0.6
0.4 0.5 0.0 0.0
(0.0) 1.5
(5.0)
0.4 0.3 0.3 0.8
0.2 0.2 0.4 0.5 0.8
0.4
100.0 100.0 100.0 100.0 100.0 100.0 100.0
100.0 100.0 100.0 100.0 100.0
100.0 100.0
100.0 100.0 100.0 100.0
100.0 100.0 100.0 100.0 100.0 100.0 100.0
100.0 100.0 100.0 100.0
100.0 100.0 100.0 100.0 100.0
100.0
38
1,156 3,714 4,737 4,870 3,734 3,014
17 368
5,241 7,433 8,204
17,087 4,176
13,665 1,610 4,703 1,285
20,415 679
31 28 23 67 20
3,290 4,800 9,483 3,690
4,905 5,877 4,311 3,371 2,799
21,263
Note: Spacing methods includes, Pill (Daily/Weekly), condom (Male/Female) and Injectables. Limiting methods includes, Male sterilization and female sterilization. ( ) Based on 10-24 unweighted cases. * Percentage not shown, based on less than 10 unweighted cases. ** Unweighted cases. 1 Total figure may not add to 100 percent due to ‘missing cases’. 2 Hospital, dispensary, UHC/UHP/UFWC, CHC/ Rural Hospital, PHC, Sub-Centre/ANM, Mobile clinic, Anganwadi/ICDS centre, ASHA, Other Community Based Worker, AYUSH Hospital/Clinic and Other Public Health Sector. 3 Hospital, Doctor/Clinic, Mobile Clinic, AYUSH Hospital/Clinic, Traditional Healer, Pharmacy/Drugstore and Other Private Medical Sector. 4 NGO or Trust Hospital/clinic Private, Shop, Vending Machine, Husband, Relatives/Friends, Others and Don’t Know. 5 Hospital, Dispensary, CHC/Rural Hospital, PHC, Mobile Clinic, Camp and Other Public Sector Health Facility. 6 Hospital, Doctor/Clinic, Mobile Clinic and Other Private Health Facility. 7 NGO or Trust Hospital/Clinic, Other and Don’t Know. a Literate but did not attend school, are also included.
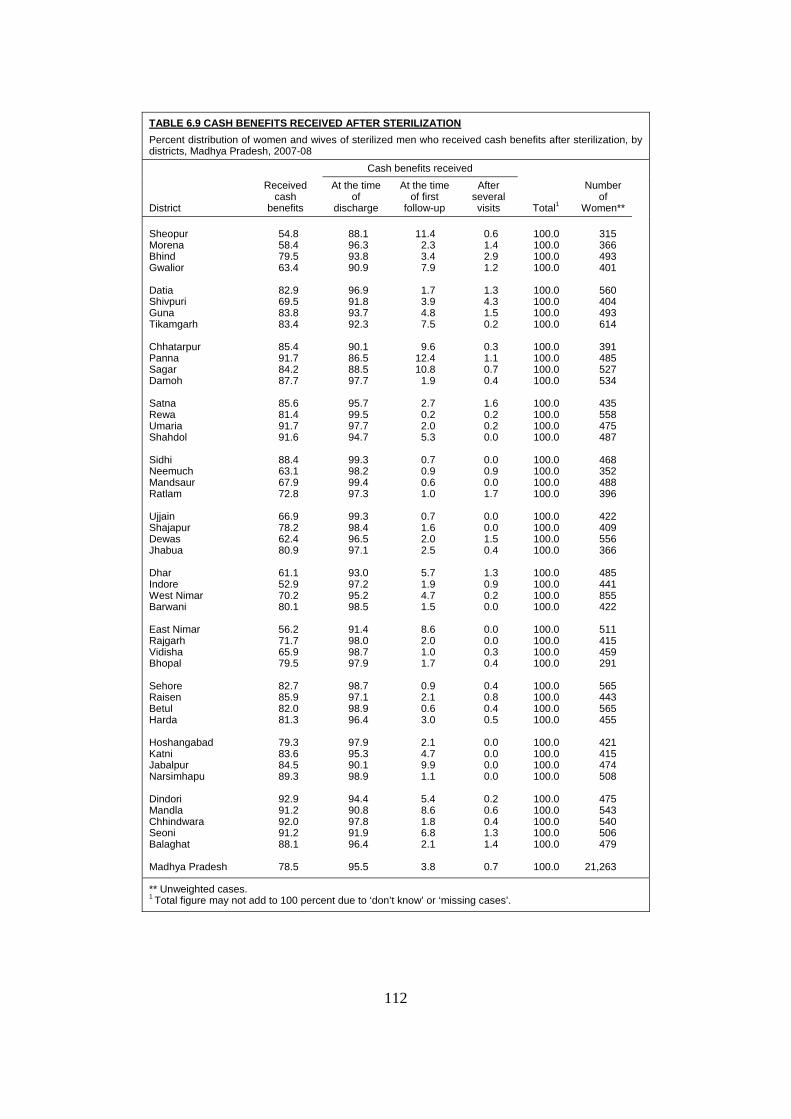
112
TABLE 6.9 CASH BENEFITS RECEIVED AFTER STERILIZATION Percent distribution of women and wives of sterilized men who received cash benefits after sterilization, by districts, Madhya Pradesh, 2007-08
District
Received cash
benefits
Cash benefits received
Total1
Number of
Women**
At the time of
discharge
At the time of first
follow-up
After several visits
Sheopur Morena Bhind Gwalior Datia Shivpuri Guna Tikamgarh Chhatarpur Panna Sagar Damoh Satna Rewa Umaria Shahdol Sidhi Neemuch Mandsaur Ratlam Ujjain Shajapur Dewas Jhabua Dhar Indore West Nimar Barwani East Nimar Rajgarh Vidisha Bhopal Sehore Raisen Betul Harda Hoshangabad Katni Jabalpur Narsimhapu Dindori Mandla Chhindwara Seoni Balaghat Madhya Pradesh
54.8 58.4 79.5 63.4
82.9 69.5 83.8 83.4
85.4 91.7 84.2 87.7
85.6 81.4 91.7 91.6
88.4 63.1 67.9 72.8
66.9 78.2 62.4 80.9
61.1 52.9 70.2 80.1
56.2 71.7 65.9 79.5
82.7 85.9 82.0 81.3
79.3 83.6 84.5 89.3
92.9 91.2 92.0 91.2 88.1
78.5
88.1 96.3 93.8 90.9
96.9 91.8 93.7 92.3
90.1 86.5 88.5 97.7
95.7 99.5 97.7 94.7
99.3 98.2 99.4 97.3
99.3 98.4 96.5 97.1
93.0 97.2 95.2 98.5
91.4 98.0 98.7 97.9
98.7 97.1 98.9 96.4
97.9 95.3 90.1 98.9
94.4 90.8 97.8 91.9 96.4
95.5
11.4 2.3 3.4 7.9
1.7 3.9 4.8 7.5
9.6
12.4 10.8
1.9
2.7 0.2 2.0 5.3
0.7 0.9 0.6 1.0
0.7 1.6 2.0 2.5
5.7 1.9 4.7 1.5
8.6 2.0 1.0 1.7
0.9 2.1 0.6 3.0
2.1 4.7 9.9 1.1
5.4 8.6 1.8 6.8 2.1
3.8
0.6 1.4 2.9 1.2
1.3 4.3 1.5 0.2
0.3 1.1 0.7 0.4
1.6 0.2 0.2 0.0
0.0 0.9 0.0 1.7
0.0 0.0 1.5 0.4
1.3 0.9 0.2 0.0
0.0 0.0 0.3 0.4
0.4 0.8 0.4 0.5
0.0 0.0 0.0 0.0
0.2 0.6 0.4 1.3 1.4
0.7
100.0 100.0 100.0 100.0
100.0 100.0 100.0 100.0
100.0 100.0 100.0 100.0
100.0 100.0 100.0 100.0
100.0 100.0 100.0 100.0
100.0 100.0 100.0 100.0
100.0 100.0 100.0 100.0
100.0 100.0 100.0 100.0
100.0 100.0 100.0 100.0
100.0 100.0 100.0 100.0
100.0 100.0 100.0 100.0 100.0
100.0
315 366 493 401
560 404 493 614
391 485 527 534
435 558 475 487
468 352 488 396
422 409 556 366
485 441 855 422
511 415 459 291
565 443 565 455
421 415 474 508
475 543 540 506 479
21,263
** Unweighted cases. 1 Total figure may not add to 100 percent due to ‘don’t know’ or ‘missing cases’.
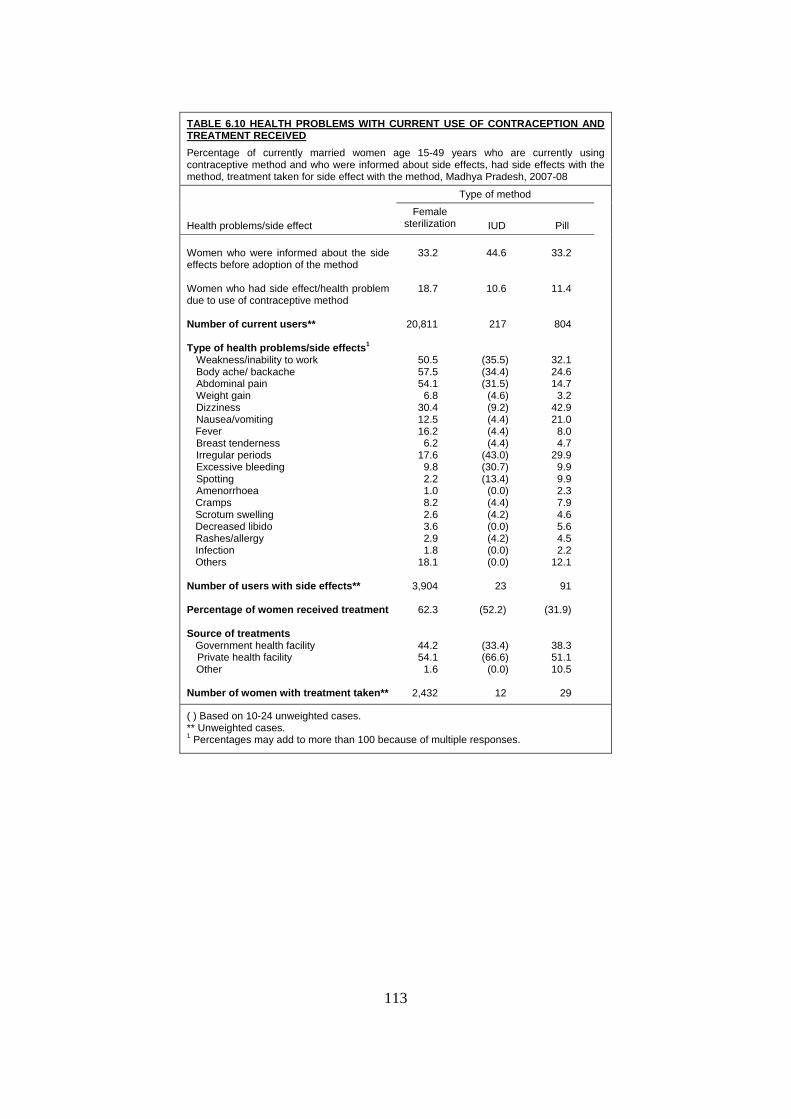
113
TABLE 6.10 HEALTH PROBLEMS WITH CURRENT USE OF CONTRACEPTION AND TREATMENT RECEIVED Percentage of currently married women age 15-49 years who are currently using contraceptive method and who were informed about side effects, had side effects with the method, treatment taken for side effect with the method, Madhya Pradesh, 2007-08
Health problems/side effect
Type of method
Female sterilization IUD Pill
Women who were informed about the side effects before adoption of the method Women who had side effect/health problem due to use of contraceptive method Number of current users** Type of health problems/side effects1 Weakness/inability to work Body ache/ backache Abdominal pain Weight gain Dizziness Nausea/vomiting Fever Breast tenderness Irregular periods Excessive bleeding Spotting Amenorrhoea Cramps Scrotum swelling Decreased libido Rashes/allergy Infection Others Number of users with side effects** Percentage of women received treatment Source of treatments Government health facility Private health facility Other Number of women with treatment taken**
33.2
18.7
20,811
50.5 57.5 54.1
6.8 30.4 12.5 16.2
6.2 17.6
9.8 2.2 1.0 8.2 2.6 3.6 2.9 1.8
18.1
3,904
62.3
44.2 54.1
1.6
2,432
44.6
10.6
217
(35.5) (34.4) (31.5)
(4.6) (9.2) (4.4) (4.4) (4.4)
(43.0) (30.7) (13.4)
(0.0) (4.4) (4.2) (0.0) (4.2) (0.0) (0.0)
23
(52.2)
(33.4) (66.6)
(0.0)
12
33.2
11.4
804
32.1 24.6 14.7
3.2 42.9 21.0
8.0 4.7
29.9 9.9 9.9 2.3 7.9 4.6 5.6 4.5 2.2
12.1
91
(31.9)
38.3 51.1 10.5
29
( ) Based on 10-24 unweighted cases. ** Unweighted cases. 1 Percentages may add to more than 100 because of multiple responses.

114
TABLE 6.11 REASONS FOR DISCONTINUATION OF CONTRACEPTION
Percent distribution of currently married women age 15-49 years who are past users (currently non-users) of contraceptive by reason for discontinuation of the contraceptive method according to selected background characteristics, Madhya Pradesh, 2007-08
Background characteristics
Reasons for discontinuation Number of
Women**
Fertility related1
Side effect related Others2
Age group 15 - 19 20 - 24 25 - 29 30 - 34 35 - 39 40 - 44 45 - 49 No. of living children
0 1 2 3 4+
Residence Rural Urban Education Non-literatea Less than five years 5-9 years 10 or more years Religion Hindu Muslim Christian Sikh Buddhist/neo-Buddhist Jain Others
Castes/tribes Scheduled castes Scheduled tribes Other backward classes Others Wealth index Lowest Second Middle Fourth Highest Madhya Pradesh
81.9 84.8 75.3 67.5 44.3 32.1 31.8
87.0 83.6 66.9 65.7 52.3
73.4 69.5
72.2 71.0 73.1 70.6
72.5 69.1
* * *
(64.3) *
76.1 72.4 73.4 67.0
72.1 74.5 76.2 75.1 66.0
72.1
5.3 5.4 9.6
11.0 18.4 24.0 21.0
4.5 5.4
13.0 10.1 16.7
8.9 11.5
8.9 15.9
9.0 10.7
9.6 11.4
* * *
(7.1) *
7.4 9.5 9.8
11.3
7.9 8.5 8.2 8.9
13.0
9.7
12.8 9.8
15.1 21.6 37.3 44.0 47.2
8.5 11.0 20.1 24.2 31.1
17.7 19.1
18.9 13.1 17.9 18.7
17.9 19.5
* * *
(28.6) *
16.5 18.1 16.8 21.7
20.0 17.0 15.6 16.0 21.0
18.2
170 790 616 236 158 105 100
316 623 562 326 348
1,455 720
822 132 747 474
2,007 140
4 6 3
14 1
340 355 956 524
398 443 378 429 527
2,175
( ) Based on 10-24 unweighted cases. * Percentage not shown, based on less than 10 unweighted cases. ** Unweighted cases 1 Wanted Child, Method Failed/Become pregnant. 2 Others include supply not available, difficult to get method, lack of pleasure, method
was inconvenient, cost too much, family/husband opposed, not having sex, infrequent sex, husband away and others.
a Literate but did not attend school, are also included.

115
TABLE 6.12 FUTURE INTENTION TO USE Percent distribution of currently married women aged 15-49 years who are not using contraceptive method but having intention to use contraception in future by background characteristics, Madhya Pradesh, 2007-08
Background Characteristics
Future intention to use1 Want to use any family planning method Number of
non- users**
Spacing Method
Limiting Method
Within 12 months
12 months and more Undecided
Age group 15 - 19 20 - 24 25 - 29 30 - 34 35 - 39 40 - 44 45 - 49 No. of living children 0
1 2 3 4+ Residence Rural Urban Education Non-literatea Less than five years 5-9 years 10 or more years Religion Hindu Muslim Christian Sikh Buddhist/neo-Buddhist Jain Others
Castes/tribes Scheduled castes Scheduled tribes Other backward classes Others Wealth index Lowest Second Middle Fourth Highest Madhya Pradesh
2.2 1.7 1.4 0.7 0.8 0.4 0.1
1.0 2.4 1.0 1.0 0.9
1.2 1.7
0.6 1.2 2.2 2.9
1.3 1.8
(0.0) 0.0
(0.0) 0.0
*
1.1 0.9 1.4 2.2
0.6 0.8 1.6 1.9 2.2
1.3
17.5 23.8 31.4 26.6 15.4 3.6 1.9
8.9 21.3 31.1 31.0 21.3
22.2 18.3
20.3 24.7 23.3 20.3
21.6 16.8
(47.6) 31.9
(14.3) 18.3
*
22.8 21.5 21.5 19.8
22.0 22.3 21.7 21.6 18.5
21.4
12.6 22.8 35.8 39.5 43.7 48.4 62.2
5.2 10.6 33.8 43.7 51.4
28.8 31.8
31.4 30.7 27.0 26.3
29.3 36.0
(30.0) 0.0
(25.0) 0.0
*
29.5 27.0 31.8 27.1
29.5 29.9 30.5 28.8 27.3
29.4
13.2 16.5 20.5 20.0 18.2 16.4 12.4
6.3 16.3 19.4 22.8 20.3
17.9 17.6
19.0 16.2 17.5 14.5
17.8 18.2
(20.0) 9.7
(0.0) 27.9
*
19.6 20.0 15.7 18.0
20.1 17.6 17.6 16.1 17.0
17.8
74.2 60.6 43.8 40.5 38.1 35.2 25.4
88.6 73.1 46.8 33.5 28.3
53.3 50.6
49.5 53.2 55.5 59.1
52.9 45.8
(50.0) 90.3
(75.0) 72.1
*
51.0 53.0 52.6 55.0
50.4 52.5 51.9 55.1 55.6
52.8
2,333 6,426 3,901 1,969 1,539 1,249 1,220
4,523 4,582 3,733 2,271 3,528
14,914 3,723
10,183 1,138 5,379 1,937
17,614 901
21 30 14 50
7
2,986 5,223 7,564 2,864
5,426 5,199 3,262 2,574 2,176
18,637
Note: Spacing methods includes IUD, pills, condom (Male/Female) and Injectables. Limiting methods include male sterilization and female sterilization. ( ) Based on 10-24 unweighted cases. ** Unweighted cases. 1 Total figure may not add to 100 percent due to exclusion of other methods (Rhythm/ Periodic abstinence, Withdrawal, Undecided and Others).
a Literate but did not attend school, are also included.
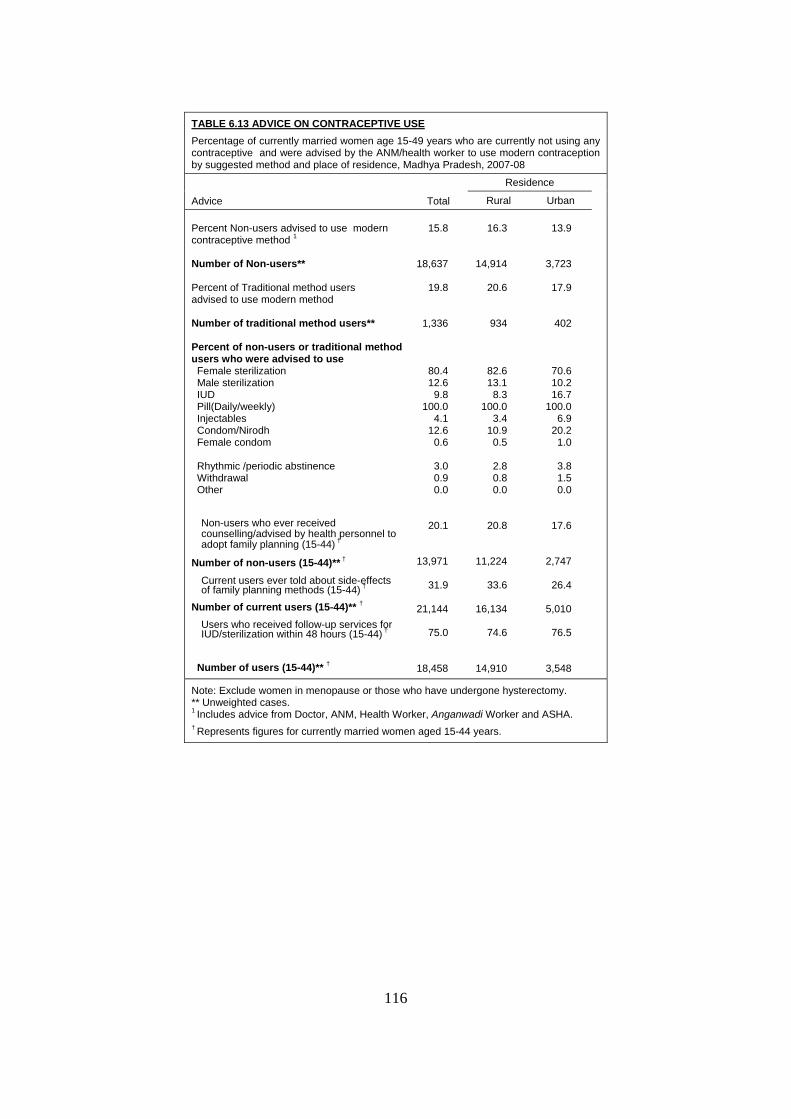
116
TABLE 6.13 ADVICE ON CONTRACEPTIVE USE Percentage of currently married women age 15-49 years who are currently not using any contraceptive and were advised by the ANM/health worker to use modern contraception by suggested method and place of residence, Madhya Pradesh, 2007-08
Advice Total
Residence
Rural Urban Percent Non-users advised to use modern contraceptive method 1
Number of Non-users** Percent of Traditional method users advised to use modern method Number of traditional method users** Percent of non-users or traditional method users who were advised to use Female sterilization Male sterilization IUD Pill(Daily/weekly) Injectables Condom/Nirodh Female condom Rhythmic /periodic abstinence Withdrawal Other Non-users who ever received counselling/advised by health personnel to adopt family planning (15-44) †
Number of non-users (15-44)** †
Current users ever told about side-effects of family planning methods (15-44) †
Number of current users (15-44)** † Users who received follow-up services for IUD/sterilization within 48 hours (15-44) †
Number of users (15-44)** †
15.8
18,637
19.8
1,336
80.4 12.6
9.8 100.0
4.1 12.6
0.6
3.0 0.9 0.0
20.1
13,971
31.9
21,144
75.0
18,458
16.3
14,914
20.6
934
82.6 13.1
8.3 100.0
3.4 10.9
0.5
2.8 0.8 0.0
20.8
11,224
33.6
16,134
74.6
14,910
13.9
3,723
17.9
402
70.6 10.2 16.7
100.0 6.9
20.2 1.0
3.8 1.5
0.0
17.6
2,747
26.4
5,010
76.5
3,548
Note: Exclude women in menopause or those who have undergone hysterectomy. ** Unweighted cases. 1 Includes advice from Doctor, ANM, Health Worker, Anganwadi Worker and ASHA. † Represents figures for currently married women aged 15-44 years.
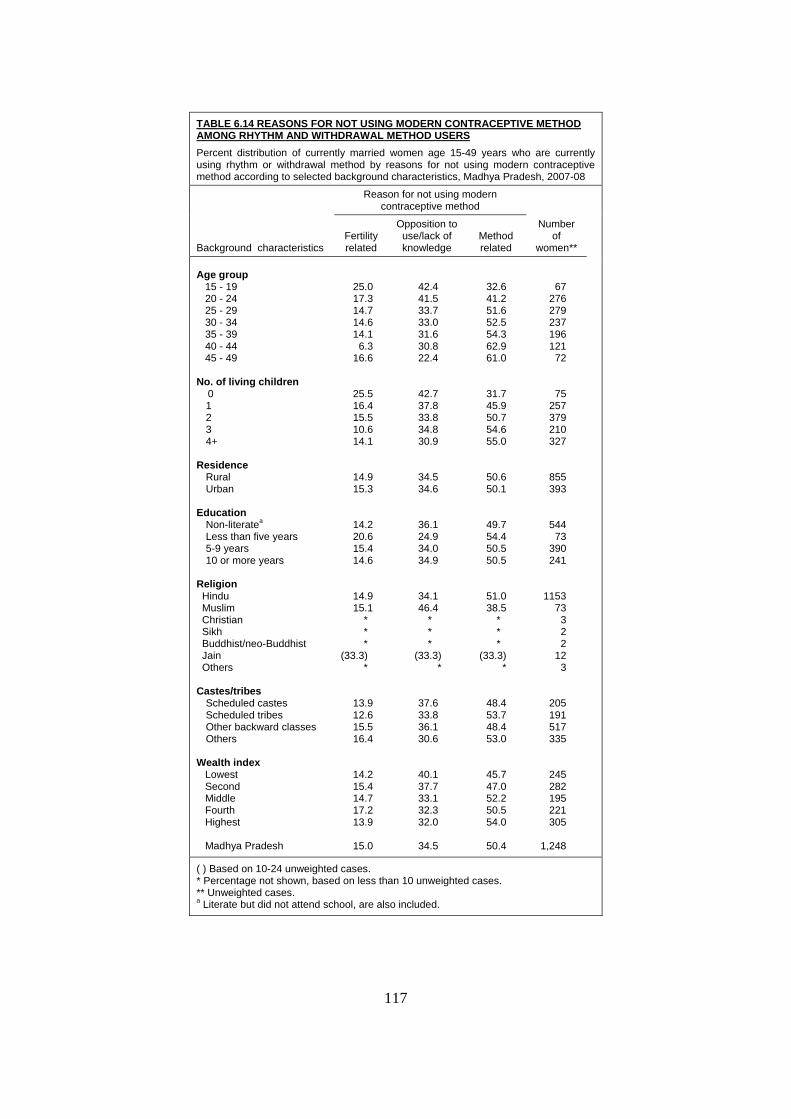
117
TABLE 6.14 REASONS FOR NOT USING MODERN CONTRACEPTIVE METHOD AMONG RHYTHM AND WITHDRAWAL METHOD USERS Percent distribution of currently married women age 15-49 years who are currently using rhythm or withdrawal method by reasons for not using modern contraceptive method according to selected background characteristics, Madhya Pradesh, 2007-08
Background characteristics
Reason for not using modern contraceptive method
Number of
women**
Fertility related
Opposition to use/lack of knowledge
Method related
Age group 15 - 19 20 - 24 25 - 29 30 - 34 35 - 39 40 - 44 45 - 49
No. of living children 0
1 2 3 4+
Residence Rural Urban
Education Non-literatea Less than five years 5-9 years 10 or more years
Religion Hindu Muslim Christian Sikh Buddhist/neo-Buddhist Jain Others
Castes/tribes Scheduled castes Scheduled tribes Other backward classes Others
Wealth index Lowest Second Middle Fourth Highest
Madhya Pradesh
25.0 17.3 14.7 14.6 14.1
6.3 16.6
25.5 16.4 15.5 10.6 14.1
14.9 15.3
14.2 20.6 15.4 14.6
14.9 15.1
* * *
(33.3) *
13.9 12.6 15.5 16.4
14.2 15.4 14.7 17.2 13.9
15.0
42.4 41.5 33.7 33.0 31.6 30.8 22.4
42.7 37.8 33.8 34.8 30.9
34.5 34.6
36.1 24.9 34.0 34.9
34.1 46.4
* * *
(33.3) *
37.6 33.8 36.1 30.6
40.1 37.7 33.1 32.3 32.0
34.5
32.6 41.2 51.6 52.5 54.3 62.9 61.0
31.7 45.9 50.7 54.6 55.0
50.6 50.1
49.7 54.4 50.5 50.5
51.0 38.5
* * *
(33.3) *
48.4 53.7 48.4 53.0
45.7 47.0 52.2 50.5 54.0
50.4
67 276 279 237 196 121
72
75 257 379 210 327
855 393
544 73
390 241
1153 73
3 2 2
12 3
205 191 517 335
245 282 195 221 305
1,248
( ) Based on 10-24 unweighted cases. * Percentage not shown, based on less than 10 unweighted cases. ** Unweighted cases. a Literate but did not attend school, are also included.
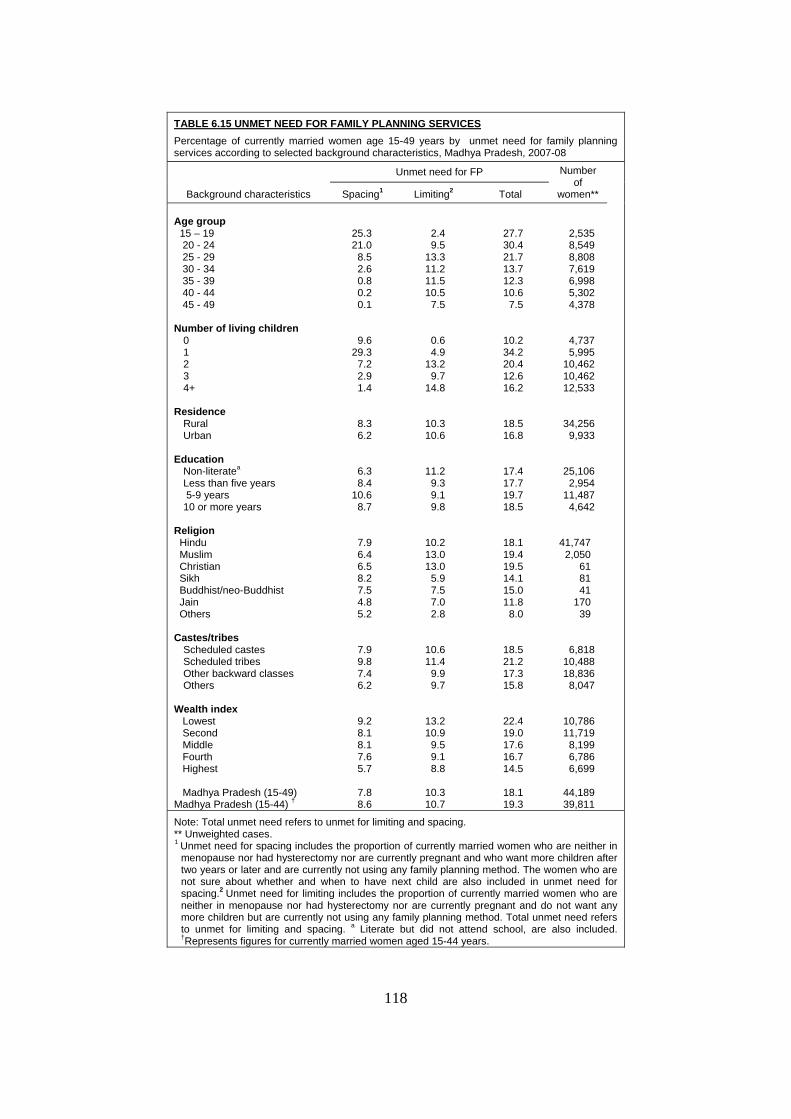
118
TABLE 6.15 UNMET NEED FOR FAMILY PLANNING SERVICES Percentage of currently married women age 15-49 years by unmet need for family planning services according to selected background characteristics, Madhya Pradesh, 2007-08
Background characteristics
Unmet need for FP Number of
women**
Spacing1 Limiting2 Total Age group 15 – 19 20 - 24 25 - 29 30 - 34 35 - 39 40 - 44 45 - 49 Number of living children 0 1 2 3 4+ Residence Rural Urban Education Non-literatea Less than five years 5-9 years 10 or more years Religion Hindu Muslim Christian Sikh Buddhist/neo-Buddhist Jain Others
Castes/tribes Scheduled castes Scheduled tribes Other backward classes Others Wealth index Lowest Second Middle Fourth Highest Madhya Pradesh (15-49) Madhya Pradesh (15-44) †
25.3 21.0
8.5 2.6 0.8 0.2 0.1
9.6 29.3
7.2 2.9 1.4
8.3 6.2
6.3 8.4
10.6 8.7
7.9 6.4 6.5 8.2 7.5 4.8 5.2
7.9 9.8 7.4 6.2
9.2 8.1 8.1 7.6 5.7
7.8 8.6
2.4 9.5
13.3 11.2 11.5 10.5
7.5
0.6 4.9
13.2 9.7
14.8
10.3 10.6
11.2 9.3 9.1 9.8
10.2 13.0 13.0
5.9 7.5 7.0 2.8
10.6 11.4
9.9 9.7
13.2 10.9
9.5 9.1 8.8
10.3 10.7
27.7 30.4 21.7 13.7 12.3 10.6
7.5
10.2 34.2 20.4 12.6 16.2
18.5 16.8
17.4 17.7 19.7 18.5
18.1 19.4 19.5 14.1 15.0 11.8
8.0
18.5 21.2 17.3 15.8
22.4 19.0 17.6 16.7 14.5
18.1 19.3
2,535 8,549 8,808 7,619 6,998 5,302 4,378
4,737 5,995
10,462 10,462 12,533
34,256 9,933
25,106 2,954
11,487 4,642
41,747 2,050
61 81 41
170 39
6,818 10,488 18,836
8,047
10,786 11,719
8,199 6,786 6,699
44,189 39,811
Note: Total unmet need refers to unmet for limiting and spacing. ** Unweighted cases. 1 Unmet need for spacing includes the proportion of currently married women who are neither in
menopause nor had hysterectomy nor are currently pregnant and who want more children after two years or later and are currently not using any family planning method. The women who are not sure about whether and when to have next child are also included in unmet need for spacing.2 Unmet need for limiting includes the proportion of currently married women who are neither in menopause nor had hysterectomy nor are currently pregnant and do not want any more children but are currently not using any family planning method. Total unmet need refers to unmet for limiting and spacing. a Literate but did not attend school, are also included. †Represents figures for currently married women aged 15-44 years.
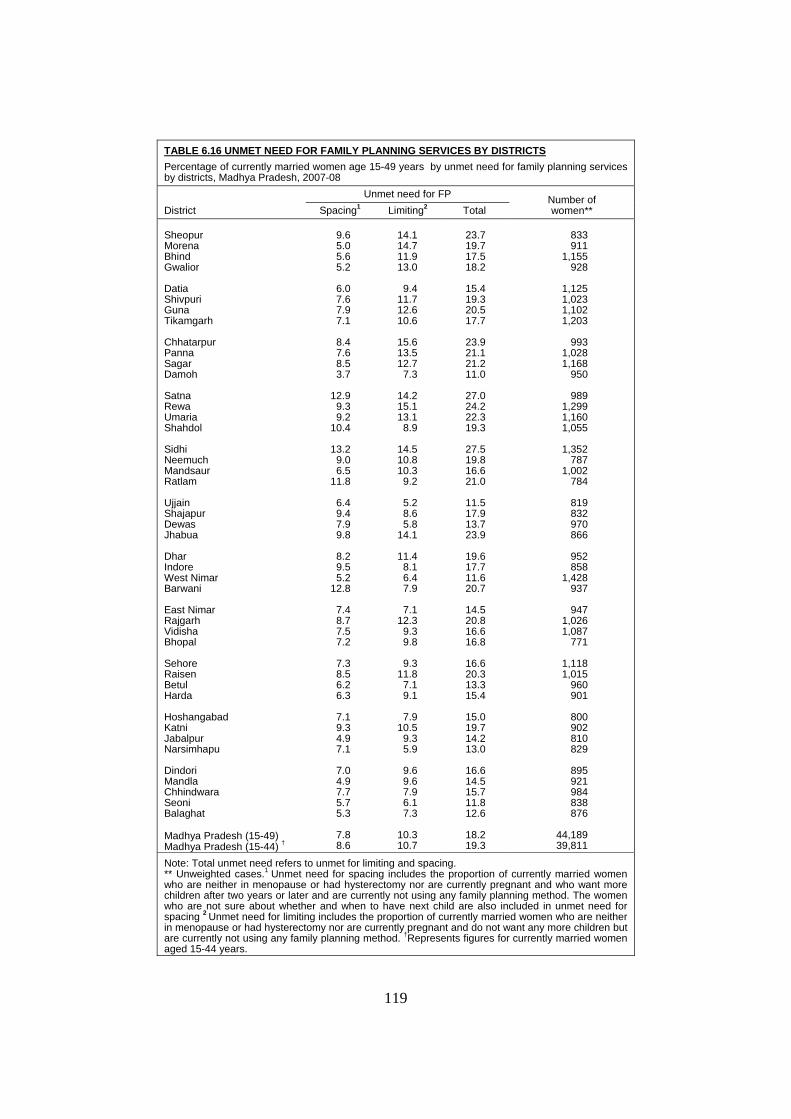
119
TABLE 6.16 UNMET NEED FOR FAMILY PLANNING SERVICES BY DISTRICTS Percentage of currently married women age 15-49 years by unmet need for family planning services by districts, Madhya Pradesh, 2007-08
District Unmet need for FP Number of
women** Spacing1 Limiting2 Total Sheopur Morena Bhind Gwalior Datia Shivpuri Guna Tikamgarh Chhatarpur Panna Sagar Damoh Satna Rewa Umaria Shahdol Sidhi Neemuch Mandsaur Ratlam Ujjain Shajapur Dewas Jhabua Dhar Indore West Nimar Barwani East Nimar Rajgarh Vidisha Bhopal Sehore Raisen Betul Harda Hoshangabad Katni Jabalpur Narsimhapu Dindori Mandla Chhindwara Seoni Balaghat Madhya Pradesh (15-49) Madhya Pradesh (15-44) †
9.6 5.0 5.6 5.2
6.0 7.6 7.9 7.1
8.4 7.6 8.5 3.7
12.9
9.3 9.2
10.4
13.2 9.0 6.5
11.8
6.4 9.4 7.9 9.8
8.2 9.5 5.2
12.8
7.4 8.7 7.5 7.2
7.3 8.5 6.2 6.3
7.1 9.3 4.9 7.1
7.0 4.9 7.7 5.7 5.3
7.8 8.6
14.1 14.7 11.9 13.0
9.4
11.7 12.6 10.6
15.6 13.5 12.7
7.3
14.2 15.1 13.1
8.9
14.5 10.8 10.3
9.2
5.2 8.6 5.8
14.1
11.4 8.1 6.4 7.9
7.1
12.3 9.3 9.8
9.3
11.8 7.1 9.1
7.9
10.5 9.3 5.9
9.6 9.6 7.9 6.1 7.3
10.3 10.7
23.7 19.7 17.5 18.2
15.4 19.3 20.5 17.7
23.9 21.1 21.2 11.0
27.0 24.2 22.3 19.3
27.5 19.8 16.6 21.0
11.5 17.9 13.7 23.9
19.6 17.7 11.6 20.7
14.5 20.8 16.6 16.8
16.6 20.3 13.3 15.4
15.0 19.7 14.2 13.0
16.6 14.5 15.7 11.8 12.6
18.2 19.3
833 911
1,155 928
1,125 1,023 1,102 1,203
993
1,028 1,168
950
989 1,299 1,160 1,055
1,352
787 1,002
784
819 832 970 866
952 858
1,428 937
947
1,026 1,087
771
1,118 1,015
960 901
800 902 810 829
895 921 984 838 876
44,189 39,811
Note: Total unmet need refers to unmet for limiting and spacing. ** Unweighted cases.1 Unmet need for spacing includes the proportion of currently married women who are neither in menopause or had hysterectomy nor are currently pregnant and who want more children after two years or later and are currently not using any family planning method. The women who are not sure about whether and when to have next child are also included in unmet need for spacing 2 Unmet need for limiting includes the proportion of currently married women who are neither in menopause or had hysterectomy nor are currently pregnant and do not want any more children but are currently not using any family planning method. †Represents figures for currently married women aged 15-44 years.

REPRODUCTIVE HEALTH PROBLEMS AND AWARENESS

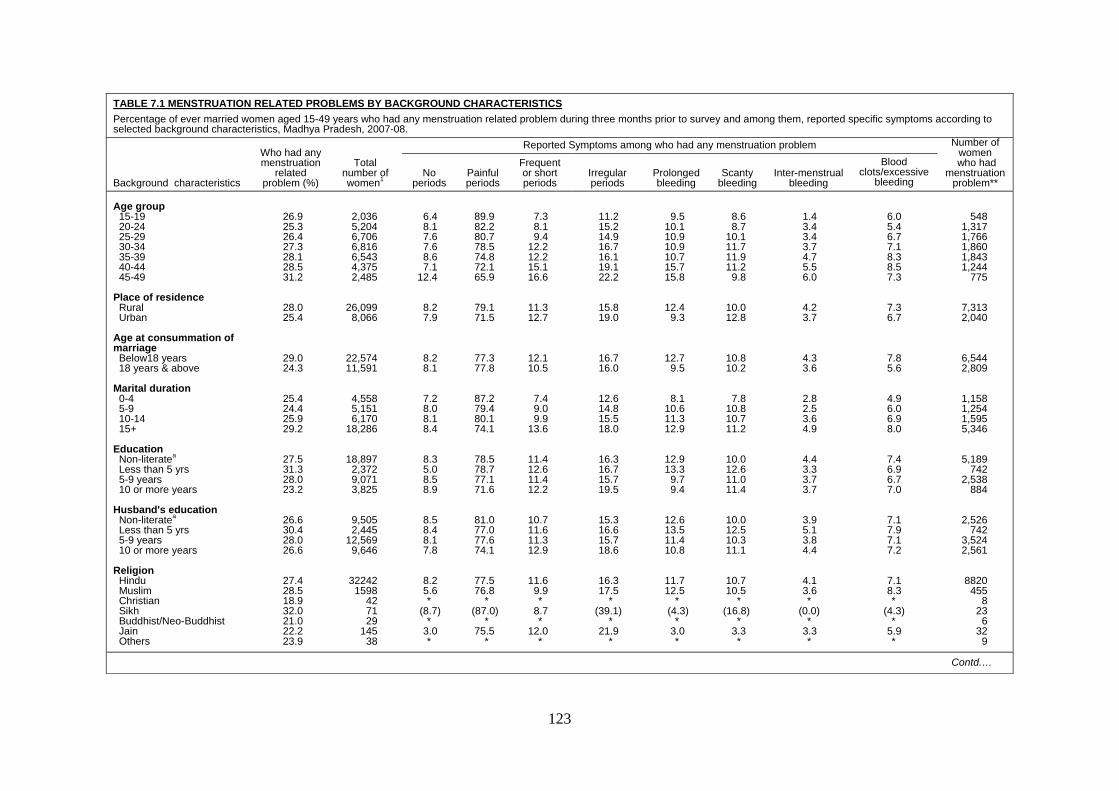
123
TABLE 7.1 MENSTRUATION RELATED PROBLEMS BY BACKGROUND CHARACTERISTICS Percentage of ever married women aged 15-49 years who had any menstruation related problem during three months prior to survey and among them, reported specific symptoms according to selected background characteristics, Madhya Pradesh, 2007-08.
Background characteristics
Who had any menstruation
related problem (%)
Total number of women1
Reported Symptoms among who had any menstruation problem Number of women
who had menstruation
problem** No
periods Painful periods
Frequent or short periods
Irregular periods
Prolonged bleeding
Scanty bleeding
Inter-menstrual bleeding
Blood clots/excessive
bleeding Age group 15-19 20-24 25-29 30-34 35-39 40-44 45-49 Place of residence Rural Urban Age at consummation of marriage Below18 years 18 years & above Marital duration 0-4 5-9 10-14 15+ Education Non-literatea Less than 5 yrs 5-9 years 10 or more years Husband's education Non-literatea Less than 5 yrs 5-9 years 10 or more years Religion Hindu Muslim Christian Sikh Buddhist/Neo-Buddhist Jain Others
26.9 25.3 26.4 27.3 28.1 28.5 31.2
28.0 25.4
29.0 24.3
25.4 24.4 25.9 29.2
27.5 31.3 28.0 23.2
26.6 30.4 28.0 26.6
27.4 28.5 18.9 32.0 21.0 22.2 23.9
2,036
5,204 6,706 6,816 6,543 4,375 2,485
26,099 8,066
22,574 11,591
4,558 5,151 6,170
18,286
18,897 2,372 9,071 3,825
9,505 2,445
12,569 9,646
32242 1598
42 71 29
145 38
6.4 8.1 7.6 7.6 8.6 7.1
12.4
8.2 7.9
8.2 8.1
7.2 8.0 8.1 8.4
8.3 5.0 8.5 8.9
8.5 8.4 8.1 7.8
8.2 5.6 *
(8.7) *
3.0 *
89.9
82.2 80.7 78.5 74.8 72.1 65.9
79.1 71.5
77.3 77.8
87.2 79.4 80.1 74.1
78.5 78.7 77.1 71.6
81.0 77.0 77.6 74.1
77.5 76.8
* (87.0)
* 75.5
*
7.3 8.1 9.4
12.2 12.2 15.1 16.6
11.3 12.7
12.1 10.5
7.4 9.0 9.9
13.6
11.4 12.6 11.4 12.2
10.7 11.6 11.3 12.9
11.6 9.9 *
8.7 *
12.0 *
11.2 15.2 14.9 16.7 16.1 19.1 22.2
15.8 19.0
16.7 16.0
12.6 14.8 15.5 18.0
16.3 16.7 15.7 19.5
15.3 16.6 15.7 18.6
16.3 17.5
* (39.1)
* 21.9
*
9.5
10.1 10.9 10.9 10.7 15.7 15.8
12.4 9.3
12.7 9.5
8.1 10.6 11.3 12.9
12.9 13.3
9.7 9.4
12.6 13.5 11.4 10.8
11.7 12.5
* (4.3)
* 3.0 *
8.6 8.7
10.1 11.7 11.9 11.2
9.8
10.0 12.8
10.8 10.2
7.8 10.8 10.7 11.2
10.0 12.6 11.0 11.4
10.0 12.5 10.3 11.1
10.7 10.5
* (16.8)
* 3.3 *
1.4 3.4 3.4 3.7 4.7 5.5 6.0
4.2 3.7
4.3 3.6
2.8 2.5 3.6 4.9
4.4 3.3 3.7 3.7
3.9 5.1 3.8 4.4
4.1 3.6 *
(0.0) *
3.3 *
6.0 5.4 6.7 7.1 8.3 8.5 7.3
7.3 6.7
7.8 5.6
4.9 6.0 6.9 8.0
7.4 6.9 6.7 7.0
7.1 7.9 7.1 7.2
7.1 8.3 *
(4.3) *
5.9 *
548 1,317 1,766 1,860 1,843 1,244
775
7,313 2,040
6,544 2,809
1,158 1,254 1,595 5,346
5,189 742
2,538 884
2,526 742
3,524 2,561
8820 455
8 23
6 32
9
Contd.…
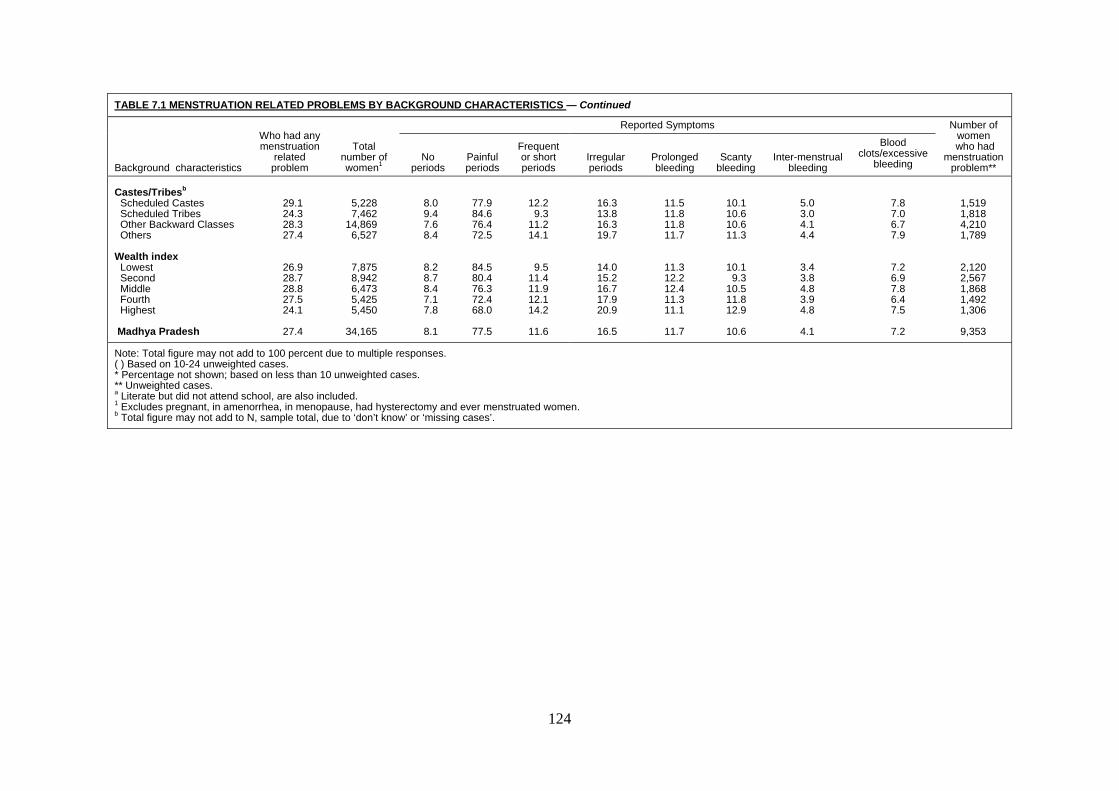
124
TABLE 7.1 MENSTRUATION RELATED PROBLEMS BY BACKGROUND CHARACTERISTICS — Continued
Background characteristics
Who had any menstruation
related problem
Total number of women1
Reported Symptoms Number of women
who had menstruation
problem** No
periods Painful periods
Frequent or short periods
Irregular periods
Prolonged bleeding
Scanty bleeding
Inter-menstrual bleeding
Blood clots/excessive
bleeding
Castes/Tribesb Scheduled Castes Scheduled Tribes Other Backward Classes Others Wealth index Lowest Second Middle Fourth Highest Madhya Pradesh
29.1 24.3 28.3 27.4
26.9 28.7 28.8 27.5 24.1
27.4
5,228 7,462
14,869 6,527
7,875 8,942 6,473 5,425 5,450
34,165
8.0 9.4 7.6 8.4
8.2 8.7 8.4 7.1 7.8
8.1
77.9 84.6 76.4 72.5
84.5 80.4 76.3 72.4 68.0
77.5
12.2
9.3 11.2 14.1
9.5 11.4 11.9 12.1 14.2
11.6
16.3 13.8 16.3 19.7
14.0 15.2 16.7 17.9 20.9
16.5
11.5 11.8 11.8 11.7
11.3 12.2 12.4 11.3 11.1
11.7
10.1 10.6 10.6 11.3
10.1 9.3
10.5 11.8 12.9
10.6
5.0 3.0 4.1 4.4
3.4 3.8 4.8 3.9 4.8
4.1
7.8 7.0 6.7 7.9
7.2 6.9 7.8 6.4 7.5
7.2
1,519 1,818 4,210 1,789
2,120 2,567 1,868 1,492 1,306
9,353
Note: Total figure may not add to 100 percent due to multiple responses. ( ) Based on 10-24 unweighted cases. * Percentage not shown; based on less than 10 unweighted cases. ** Unweighted cases. a Literate but did not attend school, are also included. 1 Excludes pregnant, in amenorrhea, in menopause, had hysterectomy and ever menstruated women. b Total figure may not add to N, sample total, due to ‘don’t know’ or ‘missing cases’.

125
TABLE 7.2 SOURCE OF KNOWLEDGE ABOUT RTI/STI BY BACKGROUND CHARACTERISTICS Percentage of ever married women aged 15- 49 years who have heard about RTI/STI, among them, who received information from specific sources according to selected background characteristics, Madhya Pradesh, 2007-08
Background characteristics
Who have heard
RTI/STI
Total number of women**
Source of Knowledge Number of
women heard of
RTI/STI** Radio T.V. Cinema Print
media1 Health
personnel2
School/ adult
education programs3
Leaders/ community
meeting4 Husband Relative/ friends Other
Age group 15-19 20-24 25-29 30-34 35-39 40-44 45-49 Residence Rural Urban Age at consummation of marriage Below 18 years 18 years & above Marital duration 0-4 5-9 10-14 15+ Education Non-literatea Less than 5 yrs 5-9 years 10 or more years Husband's education Non-literatea Less than 5 years 5-9 years 10 or more years Religion Hindu Muslim Christian Sikh Buddhist/Neo-Buddhist Jain Others
11.7 16.0 18.5 17.6 17.6 15.2 14.4
12.7 29.4
12.8 23.5
18.5 17.9 17.5 15.0
8.8 14.5 21.9 45.9
8.1 11.0 14.7 29.5
16.0 22.4 30.6 27.8 18.5 46.5 31.6
2,990 8,801 9,038 7,899 7,372 5,726 4,808
36,095 10,539
30,815 15,819
7,249 7,928 7,839
23,618
26,518 3,138
12,136 4,842
13,705 3,386
17,159 12,384
44045 2,178
62 88 43
174 44
29.3 27.3 25.9 23.7 22.9 20.7 23.7
26.5 21.8
22.0 27.3
29.2 26.5 25.5 21.7
17.5 17.7 28.9 28.4
16.1 20.8 23.7 28.2
24.9 19.3
(47.4) (54.2)
* 16.6
(28.6)
51.2 56.1 57.8 53.1 53.4 49.6 47.7
40.8 72.9
41.6 66.7
64.0 59.5 55.1 47.1
26.8 39.9 58.7 79.2
23.4 31.8 46.6 70.2
52.2 68.3
(78.9) (87.5)
* 79.2
(71.4)
4.3 5.2 5.7 5.8 4.9 5.6 5.0
3.3 8.4
3.4 7.5
6.7 5.9 5.7 4.5
1.9 1.8 4.4
10.9
2.0 2.8 3.1 8.2
5.2 5.2 (5.3)
(16.7) *
13.6 (0.0)
14.6 15.6 19.2 17.5 15.9 16.1 15.7
9.2 28.0
7.6 26.5
22.0 21.0 17.4 12.9
1.4 3.6
13.8 39.4
3.4 5.3 9.7
27.0
2.6 4.7
(19.4) (10.2)
* 14.1
(11.4)
11.2 14.1 14.6 16.3 15.9 14.5 16.1
17.1 11.9
15.3 14.7
13.3 13.1 16.4 15.9
16.3 16.5 14.6 13.8
17.9 19.6 15.8 13.1
2.4 2.6
(8.1) (5.7)
* 4.6
(4.5)
3.2 1.6 1.8 1.1 1.1 1.0 1.2
1.1 1.9
0.8 2.1
3.6 1.1 1.3 0.8
0.3 0.7 1.0 3.4
0.4 0.8 1.0 2.1
1.4 0.8
(0.0) (12.5)
* 2.5
(0.0)
3.5 3.7 4.3 4.5 3.7 5.0 5.8
5.2 3.0
4.6 4.0
3.9 3.7 4.6 4.6
4.1 4.7 4.4 4.3
4.6 3.8 4.7 4.0
4.4 4.0
(0.0) (4.2)
* 2.6
(0.0)
9.2
10.7 10.3 10.2
8.9 8.2 7.8
10.2 8.8
8.5 10.8
10.2 11.3 10.8
8.2
8.0 10.4 10.2 10.4
6.4 9.4 8.2
11.5
9.6 10.2
(15.8) (16.7)
* 3.6
(7.1)
44.9 43.4 41.9 43.7 45.5 51.4 48.2
53.3 32.4
53.4 35.8
37.7 40.8 42.4 50.2
65.4 56.7 41.5 24.9
65.7 61.0 50.2 33.2
46.0 33.6 (36.8) (33.3)
* 22.7 (14.3)
5.4 4.5 5.1 6.5 6.3 6.8 6.3
7.1 3.7
6.9 4.5
3.9 4.6 6.4 6.6
7.6 4.6 5.3 4.5
10.5 6.5 6.1 4.0
5.9 3.8
(15.8) (0.0)
* 1.2
(7.1)
348 1,408 1,668 1,389 1,300
872 696
4,579 3,102
3,957 3,724
1,342 1,422 1,375 3,542
2,344 455
2,659 2,223
1,115 375
2,528 3,663
7,050 486
19 24
8 80 14
Contd.…
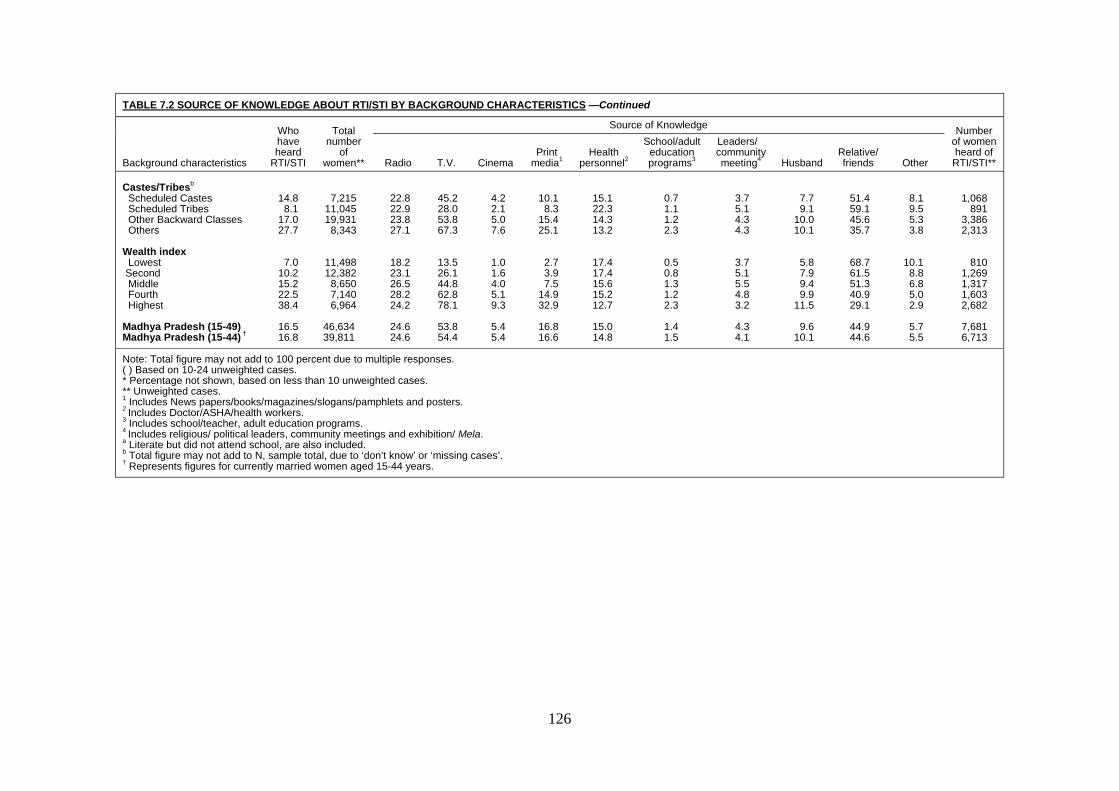
126
TABLE 7.2 SOURCE OF KNOWLEDGE ABOUT RTI/STI BY BACKGROUND CHARACTERISTICS —Continued
Background characteristics
Who have heard
RTI/STI
Total number
of women**
Source of Knowledge Number of women heard of
RTI/STI** Radio T.V. Cinema Print
media1 Health
personnel2
School/adult education programs3
Leaders/ community meeting4 Husband
Relative/ friends Other
Castes/Tribesb Scheduled Castes Scheduled Tribes Other Backward Classes Others Wealth index Lowest Second Middle Fourth Highest Madhya Pradesh (15-49) Madhya Pradesh (15-44) †
14.8 8.1
17.0 27.7
7.0 10.2 15.2 22.5 38.4
16.5 16.8
7,215
11,045 19,931
8,343
11,498 12,382
8,650 7,140 6,964
46,634 39,811
22.8 22.9 23.8 27.1
18.2 23.1 26.5 28.2 24.2
24.6 24.6
45.2 28.0 53.8 67.3
13.5 26.1 44.8 62.8 78.1
53.8 54.4
4.2 2.1 5.0 7.6
1.0 1.6 4.0 5.1 9.3
5.4 5.4
10.1
8.3 15.4 25.1
2.7 3.9 7.5
14.9 32.9
16.8 16.6
15.1 22.3 14.3 13.2
17.4 17.4 15.6 15.2 12.7
15.0 14.8
0.7 1.1 1.2 2.3
0.5 0.8 1.3 1.2 2.3
1.4 1.5
3.7 5.1 4.3 4.3
3.7 5.1 5.5 4.8 3.2
4.3 4.1
7.7 9.1
10.0 10.1
5.8 7.9 9.4 9.9
11.5
9.6 10.1
51.4 59.1 45.6 35.7
68.7 61.5 51.3 40.9 29.1
44.9 44.6
8.1 9.5 5.3 3.8
10.1 8.8 6.8 5.0 2.9
5.7 5.5
1,068 891
3,386 2,313
810 1,269 1,317 1,603 2,682
7,681 6,713
Note: Total figure may not add to 100 percent due to multiple responses. ( ) Based on 10-24 unweighted cases. * Percentage not shown, based on less than 10 unweighted cases. ** Unweighted cases. 1 Includes News papers/books/magazines/slogans/pamphlets and posters. 2 Includes Doctor/ASHA/health workers. 3 Includes school/teacher, adult education programs. 4 Includes religious/ political leaders, community meetings and exhibition/ Mela. a Literate but did not attend school, are also included. b Total figure may not add to N, sample total, due to ‘don’t know’ or ‘missing cases’. † Represents figures for currently married women aged 15-44 years.
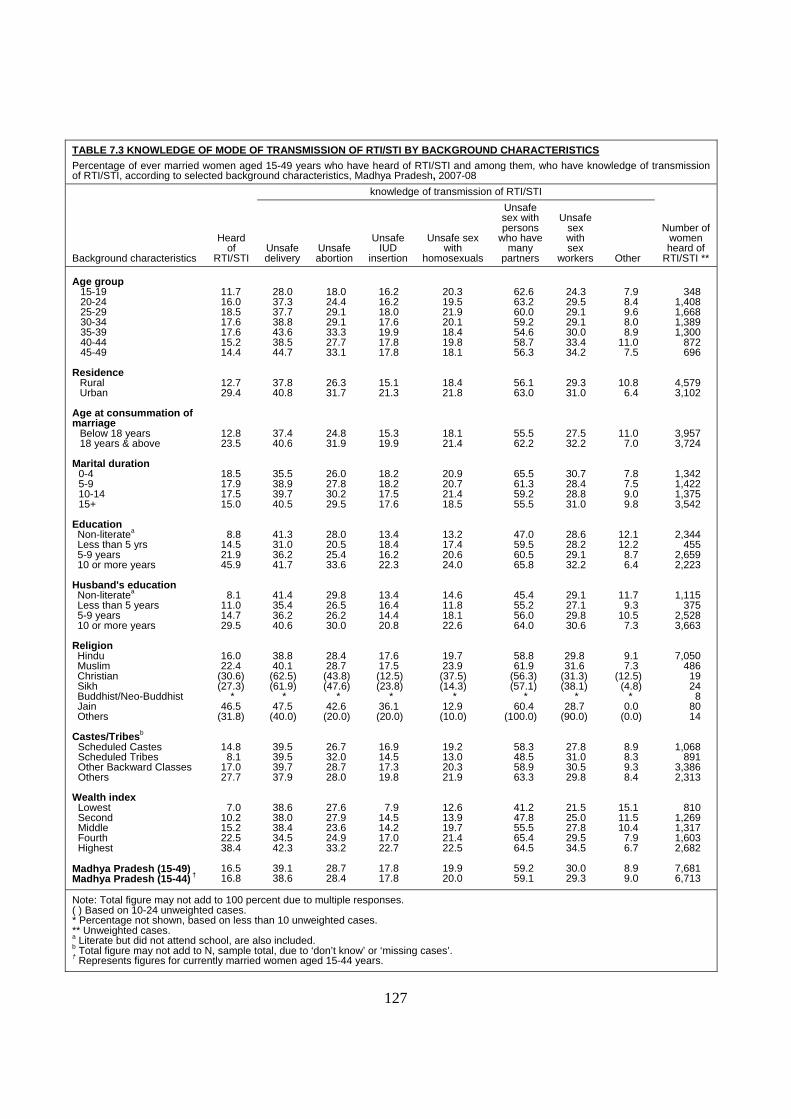
127
TABLE 7.3 KNOWLEDGE OF MODE OF TRANSMISSION OF RTI/STI BY BACKGROUND CHARACTERISTICS Percentage of ever married women aged 15-49 years who have heard of RTI/STI and among them, who have knowledge of transmission of RTI/STI, according to selected background characteristics, Madhya Pradesh, 2007-08
Background characteristics
Heard of
RTI/STI
knowledge of transmission of RTI/STI
Number of women heard of
RTI/STI ** Unsafe delivery
Unsafe abortion
Unsafe IUD
insertion
Unsafe sex with
homosexuals
Unsafe sex with persons
who have many
partners
Unsafe sex with sex
workers Other
Age group 15-19 20-24 25-29 30-34 35-39 40-44 45-49
Residence
Rural Urban
Age at consummation of marriage
Below 18 years 18 years & above
Marital duration
0-4 5-9 10-14 15+
Education Non-literatea Less than 5 yrs 5-9 years 10 or more years
Husband's education Non-literatea Less than 5 years 5-9 years 10 or more years
Religion Hindu Muslim Christian Sikh Buddhist/Neo-Buddhist Jain Others
Castes/Tribesb Scheduled Castes Scheduled Tribes Other Backward Classes Others Wealth index Lowest Second Middle Fourth Highest Madhya Pradesh (15-49) Madhya Pradesh (15-44) †
11.7 16.0 18.5 17.6 17.6 15.2 14.4
12.7 29.4
12.8 23.5
18.5 17.9 17.5 15.0
8.8 14.5 21.9 45.9
8.1 11.0 14.7 29.5
16.0 22.4
(30.6) (27.3)
* 46.5
(31.8)
14.8 8.1
17.0 27.7
7.0 10.2 15.2 22.5 38.4
16.5 16.8
28.0 37.3 37.7 38.8 43.6 38.5 44.7
37.8 40.8
37.4 40.6
35.5 38.9 39.7 40.5
41.3 31.0 36.2 41.7
41.4 35.4 36.2 40.6
38.8 40.1
(62.5) (61.9)
* 47.5
(40.0)
39.5 39.5 39.7 37.9
38.6 38.0 38.4 34.5 42.3
39.1 38.6
18.0 24.4 29.1 29.1 33.3 27.7 33.1
26.3 31.7
24.8 31.9
26.0 27.8 30.2 29.5
28.0 20.5 25.4 33.6
29.8 26.5 26.2 30.0
28.4 28.7 (43.8) (47.6)
* 42.6 (20.0)
26.7 32.0 28.7 28.0
27.6 27.9 23.6 24.9 33.2
28.7 28.4
16.2 16.2 18.0 17.6 19.9 17.8 17.8
15.1 21.3
15.3 19.9
18.2 18.2 17.5 17.6
13.4 18.4 16.2 22.3
13.4 16.4 14.4 20.8
17.6 17.5 (12.5) (23.8)
* 36.1 (20.0)
16.9 14.5 17.3 19.8
7.9 14.5 14.2 17.0 22.7
17.8 17.8
20.3 19.5 21.9 20.1 18.4 19.8 18.1
18.4 21.8
18.1 21.4
20.9 20.7 21.4 18.5
13.2 17.4 20.6 24.0
14.6 11.8 18.1 22.6
19.7 23.9
(37.5) (14.3)
* 12.9
(10.0)
19.2 13.0 20.3 21.9
12.6 13.9 19.7 21.4 22.5
19.9 20.0
62.6 63.2 60.0 59.2 54.6 58.7 56.3
56.1 63.0
55.5 62.2
65.5 61.3 59.2 55.5
47.0 59.5 60.5 65.8
45.4 55.2 56.0 64.0
58.8 61.9
(56.3) (57.1)
* 60.4
(100.0)
58.3 48.5 58.9 63.3
41.2 47.8 55.5 65.4 64.5
59.2 59.1
24.3 29.5 29.1 29.1 30.0 33.4 34.2
29.3 31.0
27.5 32.2
30.7 28.4 28.8 31.0
28.6 28.2 29.1 32.2
29.1 27.1 29.8 30.6
29.8 31.6
(31.3) (38.1)
* 28.7
(90.0)
27.8 31.0 30.5 29.8
21.5 25.0 27.8 29.5 34.5
30.0 29.3
7.9 8.4 9.6 8.0 8.9
11.0 7.5
10.8 6.4
11.0 7.0
7.8 7.5 9.0 9.8
12.1 12.2
8.7 6.4
11.7 9.3
10.5 7.3
9.1 7.3
(12.5) (4.8)
* 0.0
(0.0)
8.9 8.3 9.3 8.4
15.1 11.5 10.4
7.9 6.7
8.9 9.0
348
1,408 1,668 1,389 1,300
872 696
4,579 3,102
3,957 3,724
1,342 1,422 1,375 3,542
2,344 455
2,659 2,223
1,115 375
2,528 3,663
7,050 486
19 24
8 80 14
1,068 891
3,386 2,313
810 1,269 1,317 1,603 2,682
7,681 6,713
Note: Total figure may not add to 100 percent due to multiple responses. ( ) Based on 10-24 unweighted cases. * Percentage not shown, based on less than 10 unweighted cases. ** Unweighted cases. a Literate but did not attend school, are also included. b Total figure may not add to N, sample total, due to ‘don’t know’ or ‘missing cases’. † Represents figures for currently married women aged 15-44 years.
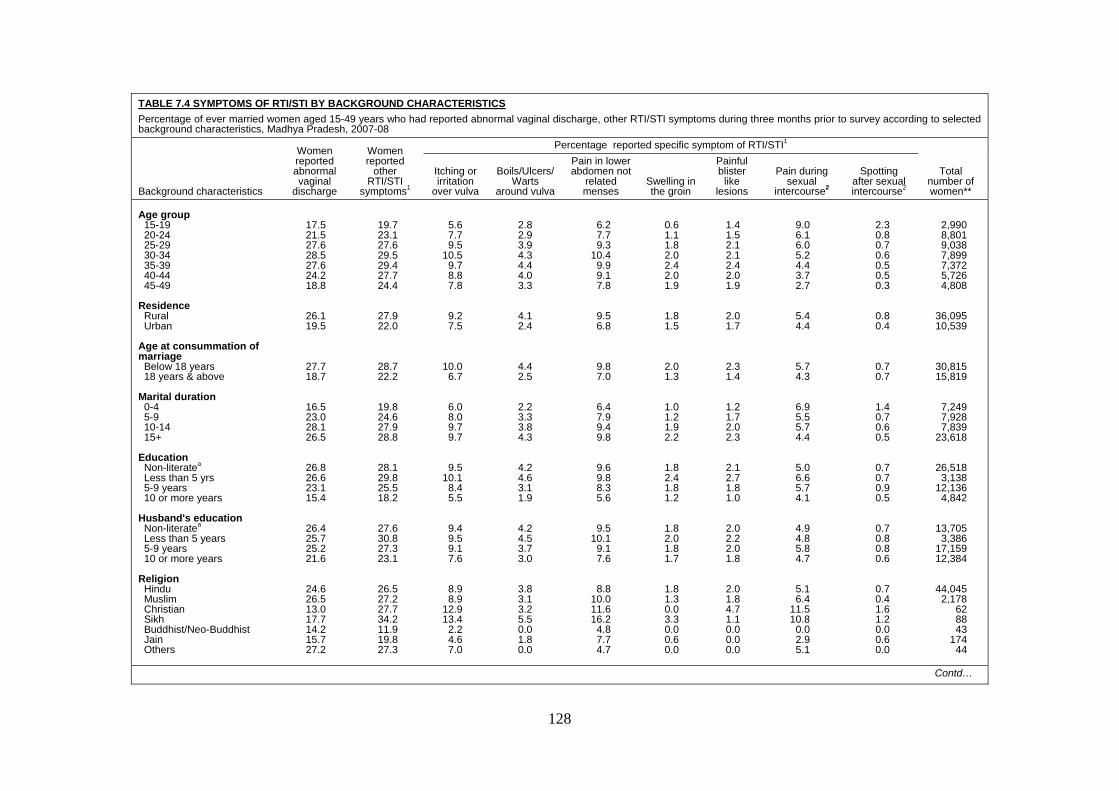
128
TABLE 7.4 SYMPTOMS OF RTI/STI BY BACKGROUND CHARACTERISTICS Percentage of ever married women aged 15-49 years who had reported abnormal vaginal discharge, other RTI/STI symptoms during three months prior to survey according to selected background characteristics, Madhya Pradesh, 2007-08
Background characteristics
Women reported abnormal vaginal
discharge
Women reported
other RTI/STI
symptoms1
Percentage reported specific symptom of RTI/STI1
Total number of women**
Itching or irritation
over vulva
Boils/Ulcers/ Warts
around vulva
Pain in lower abdomen not
related menses
Swelling in the groin
Painful blister
like lesions
Pain during sexual
intercourse2
Spotting after sexual intercourse2
Age group 15-19 20-24 25-29 30-34 35-39 40-44 45-49 Residence Rural Urban Age at consummation of marriage Below 18 years 18 years & above Marital duration 0-4 5-9 10-14 15+ Education Non-literatea Less than 5 yrs 5-9 years 10 or more years Husband's education Non-literatea Less than 5 years 5-9 years 10 or more years Religion Hindu Muslim Christian Sikh Buddhist/Neo-Buddhist Jain Others
17.5 21.5 27.6 28.5 27.6 24.2 18.8
26.1 19.5
27.7 18.7
16.5 23.0 28.1 26.5
26.8 26.6 23.1 15.4
26.4 25.7 25.2 21.6
24.6 26.5 13.0 17.7 14.2 15.7 27.2
19.7 23.1 27.6 29.5 29.4 27.7 24.4
27.9 22.0
28.7 22.2
19.8 24.6 27.9 28.8
28.1 29.8 25.5 18.2
27.6 30.8 27.3 23.1
26.5 27.2 27.7 34.2 11.9 19.8 27.3
5.6 7.7 9.5
10.5 9.7 8.8 7.8
9.2 7.5
10.0 6.7
6.0 8.0 9.7 9.7
9.5 10.1
8.4 5.5
9.4 9.5 9.1 7.6
8.9 8.9
12.9 13.4
2.2 4.6 7.0
2.8 2.9 3.9 4.3 4.4 4.0 3.3
4.1 2.4
4.4 2.5
2.2 3.3 3.8 4.3
4.2 4.6 3.1 1.9
4.2 4.5 3.7 3.0
3.8 3.1 3.2 5.5 0.0 1.8 0.0
6.2 7.7 9.3
10.4 9.9 9.1 7.8
9.5 6.8
9.8 7.0
6.4 7.9 9.4 9.8
9.6 9.8 8.3 5.6
9.5 10.1
9.1 7.6
8.8 10.0 11.6 16.2
4.8 7.7 4.7
0.6 1.1 1.8 2.0 2.4 2.0 1.9
1.8 1.5
2.0 1.3
1.0 1.2 1.9 2.2
1.8 2.4 1.8 1.2
1.8 2.0 1.8 1.7
1.8 1.3 0.0 3.3 0.0 0.6 0.0
1.4 1.5 2.1 2.1 2.4 2.0 1.9
2.0 1.7
2.3 1.4
1.2 1.7 2.0 2.3
2.1 2.7 1.8 1.0
2.0 2.2 2.0 1.8
2.0 1.8 4.7 1.1 0.0 0.0 0.0
9.0 6.1 6.0 5.2 4.4 3.7 2.7
5.4 4.4
5.7 4.3
6.9 5.5 5.7 4.4
5.0 6.6 5.7 4.1
4.9 4.8 5.8 4.7
5.1 6.4
11.5 10.8
0.0 2.9 5.1
2.3 0.8 0.7 0.6 0.5 0.5 0.3
0.8 0.4
0.7 0.7
1.4 0.7 0.6 0.5
0.7 0.7 0.9 0.5
0.7 0.8 0.8 0.6
0.7 0.4 1.6 1.2 0.0 0.6 0.0
2,990 8,801 9,038 7,899 7,372 5,726 4,808
36,095 10,539
30,815 15,819
7,249 7,928 7,839
23,618
26,518 3,138
12,136 4,842
13,705 3,386
17,159 12,384
44,045 2,178
62 88 43
174 44
Contd…

129
TABLE 7.4 SYMPTOMS OF RTI/STI BY BACKGROUND CHARACTERISTICS — Continued
Background characteristics
Women reported abnormal vaginal
discharge
Women reported
other RTI/STI
symptoms1
Percentage reported specific symptom of RTI/STI1
Total number of women**
Itching or irritation
over vulva
Boils/Ulcers/ Warts
around vulva
Pain in lower abdomen not
related menses
Swelling in the groin
Painful blister
like lesions
Pain during sexual
intercourse2
Spotting after sexual intercourse2
Castes/Tribesb Scheduled Castes Scheduled Tribes Other Backward Classes Others Wealth index Lowest Second Middle Fourth Highest Madhya Pradesh (15-49) Madhya Pradesh (15-44) †
27.5 21.0 26.0 23.7
25.6 27.3 26.8 23.7 16.5
24.6 25.5
27.4 27.1 26.9 24.3
28.3 28.5 28.0 25.5 19.4
26.5 27.1
9.8 7.8 9.1 8.8
9.5 9.1 9.5 9.0 6.4
8.8 9.1
4.4 3.7 3.7 3.3
4.5 4.1 4.0 3.2 2.1
3.7 3.8
9.9 9.2 8.6 8.4
9.5 9.7 9.4 8.5 6.2
8.9 9.1
2.0 1.3 2.0 1.8
1.7 1.9 2.0 1.9 1.3
1.8 1.8
2.2 1.4 2.2 2.0
1.9 2.0 2.3 2.1 1.4
2.0 2.0
5.9 4.7 5.3 4.9
5.1 5.8 5.7 5.4 3.3
5.2 5.5
0.7 0.8 0.7 0.6
0.9 0.9 0.7 0.6 0.3
0.7 0.7
7,215
11,045 19,931
8,343
11,498 12,382
8,650 7,140 6,964
46,634 39,811
Note: Total figure may not add to 100 percent due to ‘do not know’ or ‘missing cases’. ** Unweighted cases. a Literate but did not attend school, are also included. 1 Excluding women having abnormal vaginal discharge problem. 2 Only for currently married women.
b Total figure may not add to N, sample total, due to ‘don’t know’ or ‘missing cases’. † Represents figures for currently married women aged 15-44 years.
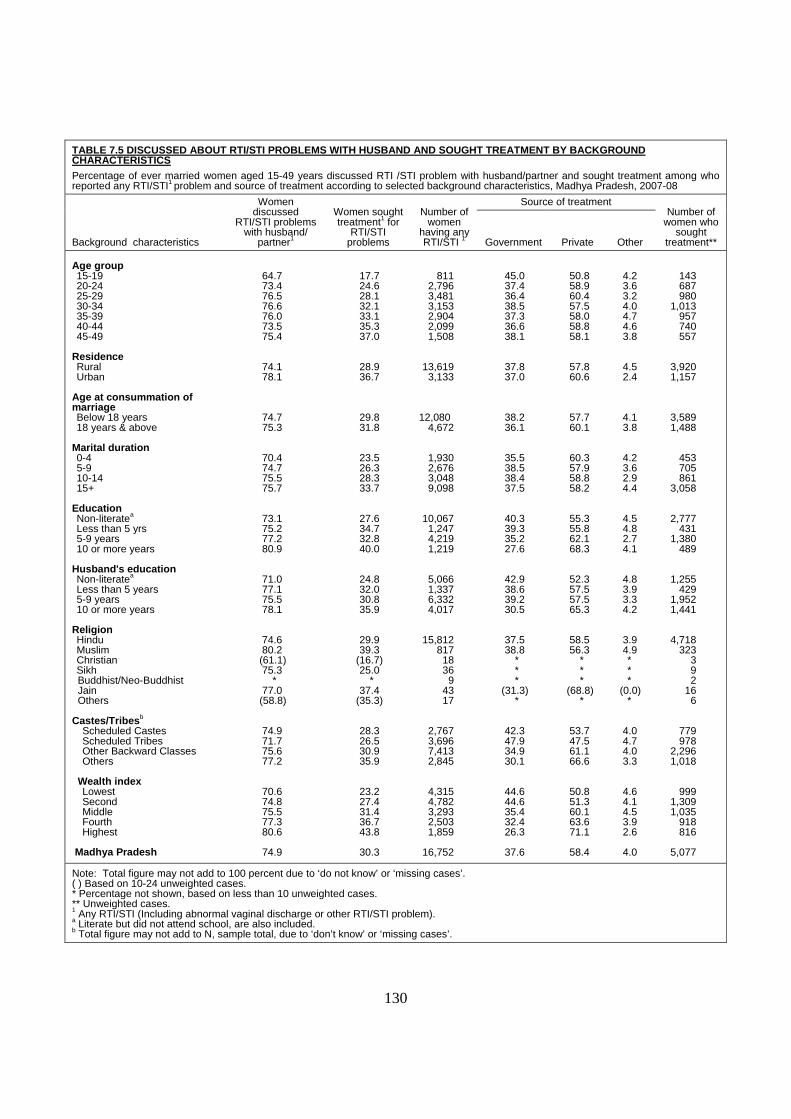
130
TABLE 7.5 DISCUSSED ABOUT RTI/STI PROBLEMS WITH HUSBAND AND SOUGHT TREATMENT BY BACKGROUND CHARACTERISTICS Percentage of ever married women aged 15-49 years discussed RTI /STI problem with husband/partner and sought treatment among who reported any RTI/STI1 problem and source of treatment according to selected background characteristics, Madhya Pradesh, 2007-08
Background characteristics
Women discussed
RTI/STI problems with husband/
partner1
Women sought treatment1 for
RTI/STI problems
Number of women
having any RTI/STI 1
Source of treatment Number of
women who sought
treatment** Government Private Other Age group 15-19 20-24 25-29 30-34 35-39 40-44 45-49
Residence Rural Urban
Age at consummation of marriage Below 18 years 18 years & above
Marital duration 0-4 5-9 10-14 15+
Education Non-literatea Less than 5 yrs 5-9 years 10 or more years
Husband's education Non-literatea Less than 5 years 5-9 years 10 or more years
Religion Hindu Muslim Christian Sikh
Buddhist/Neo-Buddhist Jain Others Castes/Tribesb Scheduled Castes Scheduled Tribes Other Backward Classes Others
Wealth index Lowest Second Middle Fourth Highest
Madhya Pradesh
64.7 73.4 76.5 76.6 76.0 73.5 75.4
74.1 78.1
74.7 75.3
70.4 74.7 75.5 75.7
73.1 75.2 77.2 80.9
71.0 77.1 75.5 78.1
74.6 80.2 (61.1) 75.3
* 77.0 (58.8)
74.9 71.7 75.6 77.2
70.6 74.8 75.5 77.3 80.6
74.9
17.7 24.6 28.1 32.1 33.1 35.3 37.0
28.9 36.7
29.8 31.8
23.5 26.3 28.3 33.7
27.6 34.7 32.8 40.0
24.8 32.0 30.8 35.9
29.9 39.3
(16.7) 25.0
* 37.4
(35.3)
28.3 26.5 30.9 35.9
23.2 27.4 31.4 36.7 43.8
30.3
811
2,796 3,481 3,153 2,904 2,099 1,508
13,619 3,133
12,080
4,672
1,930 2,676 3,048 9,098
10,067 1,247 4,219 1,219
5,066 1,337 6,332 4,017
15,812 817
18 36
9 43 17
2,767 3,696 7,413 2,845
4,315 4,782 3,293 2,503 1,859
16,752
45.0 37.4 36.4 38.5 37.3 36.6 38.1
37.8 37.0
38.2 36.1
35.5 38.5 38.4 37.5
40.3 39.3 35.2 27.6
42.9 38.6 39.2 30.5
37.5 38.8
* * *
(31.3) *
42.3 47.9 34.9 30.1
44.6 44.6 35.4 32.4 26.3
37.6
50.8 58.9 60.4 57.5 58.0 58.8 58.1
57.8 60.6
57.7 60.1
60.3 57.9 58.8 58.2
55.3 55.8 62.1 68.3
52.3 57.5 57.5 65.3
58.5 56.3
* * *
(68.8) *
53.7 47.5 61.1 66.6
50.8 51.3 60.1 63.6 71.1
58.4
4.2 3.6 3.2 4.0 4.7 4.6 3.8
4.5 2.4
4.1 3.8
4.2 3.6 2.9 4.4
4.5 4.8 2.7 4.1
4.8 3.9 3.3 4.2
3.9 4.9 * * *
(0.0) *
4.0 4.7 4.0 3.3
4.6 4.1 4.5 3.9 2.6
4.0
143 687 980
1,013 957 740 557
3,920 1,157
3,589 1,488
453 705 861
3,058
2,777 431
1,380 489
1,255 429
1,952 1,441
4,718 323
3 9 2
16 6
779 978
2,296 1,018
999 1,309 1,035
918 816
5,077
Note: Total figure may not add to 100 percent due to ‘do not know’ or ‘missing cases’. ( ) Based on 10-24 unweighted cases. * Percentage not shown, based on less than 10 unweighted cases. ** Unweighted cases. 1 Any RTI/STI (Including abnormal vaginal discharge or other RTI/STI problem). a Literate but did not attend school, are also included. b Total figure may not add to N, sample total, due to ‘don’t know’ or ‘missing cases’.
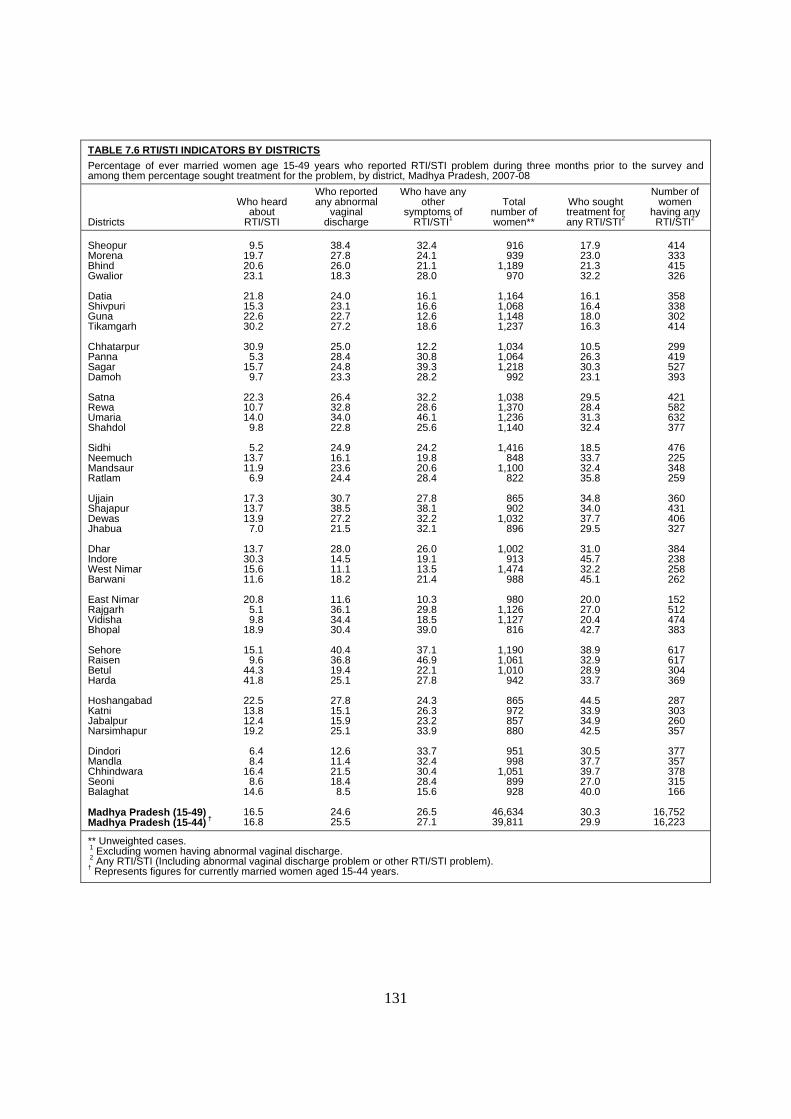
131
TABLE 7.6 RTI/STI INDICATORS BY DISTRICTS Percentage of ever married women age 15-49 years who reported RTI/STI problem during three months prior to the survey and among them percentage sought treatment for the problem, by district, Madhya Pradesh, 2007-08
Districts
Who heard about
RTI/STI
Who reported any abnormal
vaginal discharge
Who have any other
symptoms of RTI/STI1
Total number of women**
Who sought treatment for any RTI/STI2
Number of women
having any RTI/STI2
Sheopur Morena Bhind Gwalior Datia Shivpuri Guna Tikamgarh Chhatarpur Panna Sagar Damoh Satna Rewa Umaria Shahdol Sidhi Neemuch Mandsaur Ratlam Ujjain Shajapur Dewas Jhabua Dhar Indore West Nimar Barwani East Nimar Rajgarh Vidisha Bhopal Sehore Raisen Betul Harda Hoshangabad Katni Jabalpur Narsimhapur Dindori Mandla Chhindwara Seoni Balaghat Madhya Pradesh (15-49) Madhya Pradesh (15-44) †
9.5
19.7 20.6 23.1
21.8 15.3 22.6 30.2
30.9
5.3 15.7
9.7
22.3 10.7 14.0
9.8
5.2 13.7 11.9
6.9
17.3 13.7 13.9
7.0
13.7 30.3 15.6 11.6
20.8
5.1 9.8
18.9
15.1 9.6
44.3 41.8
22.5 13.8 12.4 19.2
6.4 8.4
16.4 8.6
14.6
16.5 16.8
38.4
27.8 26.0 18.3
24.0 23.1 22.7 27.2
25.0 28.4 24.8 23.3
26.4 32.8 34.0 22.8
24.9 16.1 23.6 24.4
30.7 38.5 27.2 21.5
28.0 14.5 11.1 18.2
11.6 36.1 34.4 30.4
40.4 36.8 19.4 25.1
27.8 15.1 15.9 25.1
12.6 11.4 21.5 18.4
8.5
24.6 25.5
32.4 24.1 21.1 28.0
16.1 16.6 12.6 18.6
12.2 30.8 39.3 28.2
32.2 28.6 46.1 25.6
24.2 19.8 20.6 28.4
27.8 38.1 32.2 32.1
26.0 19.1 13.5 21.4
10.3 29.8 18.5 39.0
37.1 46.9 22.1 27.8
24.3 26.3 23.2 33.9
33.7 32.4 30.4 28.4 15.6
26.5 27.1
916 939
1,189 970
1,164 1,068 1,148 1,237
1,034 1,064 1,218
992
1,038 1,370 1,236 1,140
1,416
848 1,100
822
865 902
1,032 896
1,002
913 1,474
988
980 1,126 1,127
816
1,190 1,061 1,010
942
865 972 857 880
951 998
1,051 899 928
46,634 39,811
17.9 23.0 21.3 32.2
16.1 16.4 18.0 16.3
10.5 26.3 30.3 23.1
29.5 28.4 31.3 32.4
18.5 33.7 32.4 35.8
34.8 34.0 37.7 29.5
31.0 45.7 32.2 45.1
20.0 27.0 20.4 42.7
38.9 32.9 28.9 33.7
44.5 33.9 34.9 42.5
30.5 37.7 39.7 27.0 40.0
30.3 29.9
414 333 415 326
358 338 302 414
299 419 527 393
421 582 632 377
476 225 348 259
360 431 406 327
384 238 258 262
152 512 474 383
617 617 304 369
287 303 260 357
377 357 378 315 166
16,752 16,223
** Unweighted cases. 1 Excluding women having abnormal vaginal discharge. 2 Any RTI/STI (Including abnormal vaginal discharge problem or other RTI/STI problem). † Represents figures for currently married women aged 15-44 years.
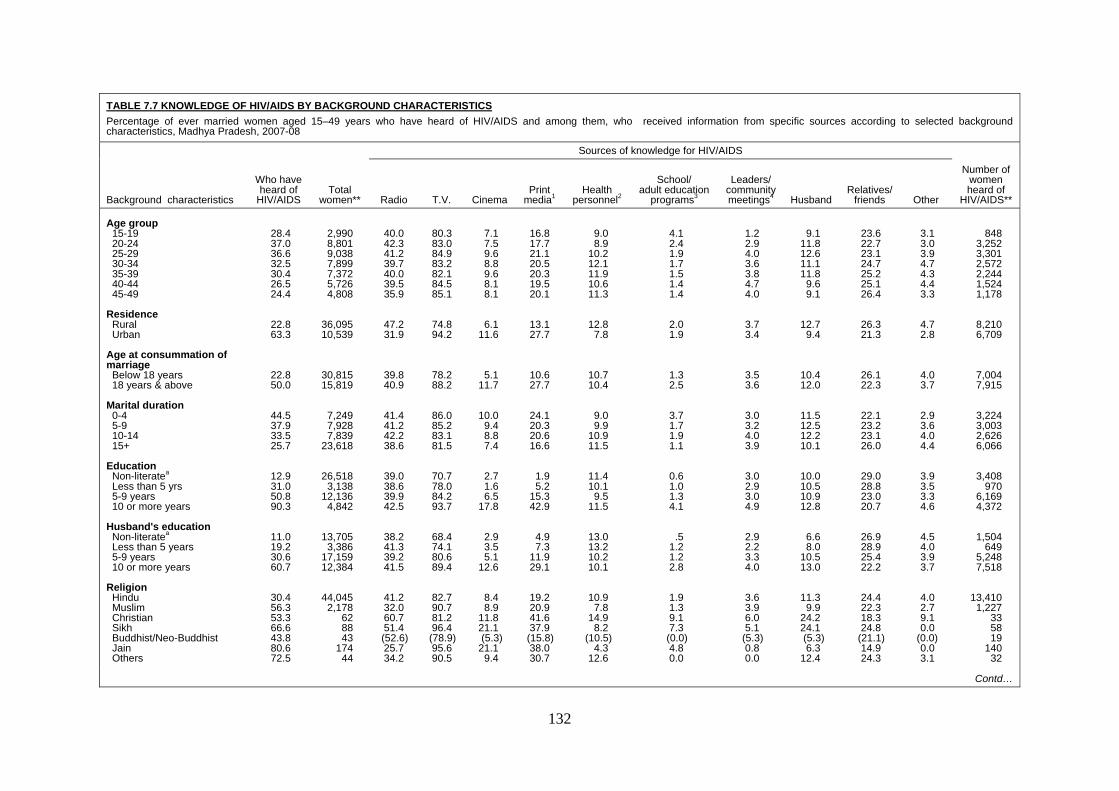
132
TABLE 7.7 KNOWLEDGE OF HIV/AIDS BY BACKGROUND CHARACTERISTICS Percentage of ever married women aged 15–49 years who have heard of HIV/AIDS and among them, who received information from specific sources according to selected background characteristics, Madhya Pradesh, 2007-08
Background characteristics
Who have heard of
HIV/AIDS Total
women**
Sources of knowledge for HIV/AIDS
Number of women heard of
HIV/AIDS** Radio T.V. Cinema Print
media1 Health
personnel2
School/ adult education
programs3
Leaders/ community meetings4 Husband
Relatives/ friends Other
Age group 15-19 20-24 25-29 30-34 35-39 40-44 45-49 Residence Rural Urban Age at consummation of marriage Below 18 years 18 years & above Marital duration 0-4 5-9 10-14 15+ Education Non-literatea Less than 5 yrs 5-9 years 10 or more years Husband's education Non-literatea Less than 5 years 5-9 years 10 or more years Religion Hindu Muslim Christian Sikh Buddhist/Neo-Buddhist Jain Others
28.4 37.0 36.6 32.5 30.4 26.5 24.4
22.8 63.3
22.8 50.0
44.5 37.9 33.5 25.7
12.9 31.0 50.8 90.3
11.0 19.2 30.6 60.7
30.4 56.3 53.3 66.6 43.8 80.6 72.5
2,990 8,801 9,038 7,899 7,372 5,726 4,808
36,095 10,539
30,815 15,819
7,249 7,928 7,839
23,618
26,518 3,138
12,136 4,842
13,705 3,386
17,159 12,384
44,045 2,178
62 88 43
174 44
40.0 42.3 41.2 39.7 40.0 39.5 35.9
47.2 31.9
39.8 40.9
41.4 41.2 42.2 38.6
39.0 38.6 39.9 42.5
38.2 41.3 39.2 41.5
41.2 32.0 60.7 51.4 (52.6) 25.7 34.2
80.3 83.0 84.9 83.2 82.1 84.5 85.1
74.8 94.2
78.2 88.2
86.0 85.2 83.1 81.5
70.7 78.0 84.2 93.7
68.4 74.1 80.6 89.4
82.7 90.7 81.2 96.4 (78.9) 95.6 90.5
7.1 7.5 9.6 8.8 9.6 8.1 8.1
6.1 11.6
5.1 11.7
10.0 9.4 8.8 7.4
2.7 1.6 6.5
17.8
2.9 3.5 5.1
12.6
8.4 8.9
11.8 21.1 (5.3)
21.1 9.4
16.8 17.7 21.1 20.5 20.3 19.5 20.1
13.1 27.7
10.6 27.7
24.1 20.3 20.6 16.6
1.9 5.2
15.3 42.9
4.9 7.3
11.9 29.1
19.2 20.9 41.6 37.9 (15.8) 38.0 30.7
9.0 8.9
10.2 12.1 11.9 10.6 11.3
12.8 7.8
10.7 10.4
9.0 9.9
10.9 11.5
11.4 10.1
9.5 11.5
13.0 13.2 10.2 10.1
10.9 7.8
14.9 8.2
(10.5) 4.3
12.6
4.1 2.4 1.9 1.7 1.5 1.4 1.4
2.0 1.9
1.3 2.5
3.7 1.7 1.9 1.1
0.6 1.0 1.3 4.1
.5 1.2 1.2 2.8
1.9 1.3 9.1 7.3 (0.0) 4.8 0.0
1.2 2.9 4.0 3.6 3.8 4.7 4.0
3.7 3.4
3.5 3.6
3.0 3.2 4.0 3.9
3.0 2.9 3.0 4.9
2.9 2.2 3.3 4.0
3.6 3.9 6.0 5.1
(5.3) 0.8 0.0
9.1
11.8 12.6 11.1 11.8
9.6 9.1
12.7 9.4
10.4 12.0
11.5 12.5 12.2 10.1
10.0 10.5 10.9 12.8
6.6 8.0
10.5 13.0
11.3 9.9
24.2 24.1 (5.3) 6.3
12.4
23.6 22.7 23.1 24.7 25.2 25.1 26.4
26.3 21.3
26.1 22.3
22.1 23.2 23.1 26.0
29.0 28.8 23.0 20.7
26.9 28.9 25.4 22.2
24.4 22.3 18.3 24.8
(21.1) 14.9 24.3
3.1 3.0 3.9 4.7 4.3 4.4 3.3
4.7 2.8
4.0 3.7
2.9 3.6 4.0 4.4
3.9 3.5 3.3 4.6
4.5 4.0 3.9 3.7
4.0 2.7 9.1 0.0
(0.0) 0.0 3.1
848 3,252 3,301 2,572 2,244 1,524 1,178
8,210 6,709
7,004 7,915
3,224 3,003 2,626 6,066
3,408 970
6,169 4,372
1,504 649
5,248 7,518
13,410 1,227
33 58 19
140 32
Contd…
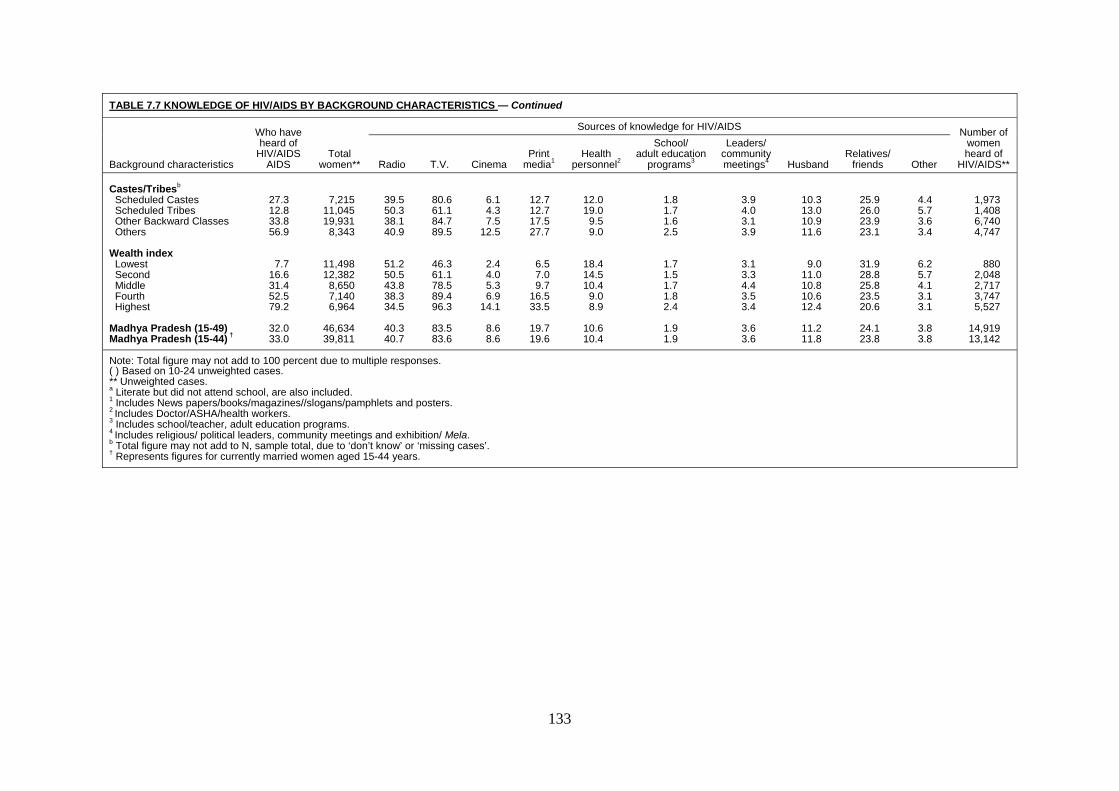
133
TABLE 7.7 KNOWLEDGE OF HIV/AIDS BY BACKGROUND CHARACTERISTICS — Continued
Background characteristics
Who have heard of
HIV/AIDS AIDS
Total women**
Sources of knowledge for HIV/AIDS Number of women heard of
HIV/AIDS** Radio T.V. Cinema Print
media1 Health
personnel2
School/ adult education
programs3
Leaders/ community meetings4 Husband
Relatives/ friends Other
Castes/Tribesb Scheduled Castes Scheduled Tribes Other Backward Classes Others Wealth index Lowest Second Middle Fourth Highest Madhya Pradesh (15-49) Madhya Pradesh (15-44) †
27.3 12.8 33.8 56.9
7.7 16.6 31.4 52.5 79.2
32.0 33.0
7,215
11,045 19,931
8,343
11,498 12,382
8,650 7,140 6,964
46,634 39,811
39.5 50.3 38.1 40.9
51.2 50.5 43.8 38.3 34.5
40.3 40.7
80.6 61.1 84.7 89.5
46.3 61.1 78.5 89.4 96.3
83.5 83.6
6.1 4.3 7.5
12.5
2.4 4.0 5.3 6.9
14.1
8.6 8.6
12.7 12.7 17.5 27.7
6.5 7.0 9.7
16.5 33.5
19.7 19.6
12.0 19.0
9.5 9.0
18.4 14.5 10.4
9.0 8.9
10.6 10.4
1.8 1.7 1.6 2.5
1.7 1.5 1.7 1.8 2.4
1.9 1.9
3.9 4.0 3.1 3.9
3.1 3.3 4.4 3.5 3.4
3.6 3.6
10.3 13.0 10.9 11.6
9.0 11.0 10.8 10.6 12.4
11.2 11.8
25.9 26.0 23.9 23.1
31.9 28.8 25.8 23.5 20.6
24.1 23.8
4.4 5.7 3.6 3.4
6.2 5.7 4.1 3.1 3.1
3.8 3.8
1,973 1,408 6,740 4,747
880 2,048 2,717 3,747 5,527
14,919 13,142
Note: Total figure may not add to 100 percent due to multiple responses. ( ) Based on 10-24 unweighted cases. ** Unweighted cases. a Literate but did not attend school, are also included. 1 Includes News papers/books/magazines//slogans/pamphlets and posters. 2 Includes Doctor/ASHA/health workers. 3 Includes school/teacher, adult education programs. 4 Includes religious/ political leaders, community meetings and exhibition/ Mela. b Total figure may not add to N, sample total, due to ‘don’t know’ or ‘missing cases’. † Represents figures for currently married women aged 15-44 years.
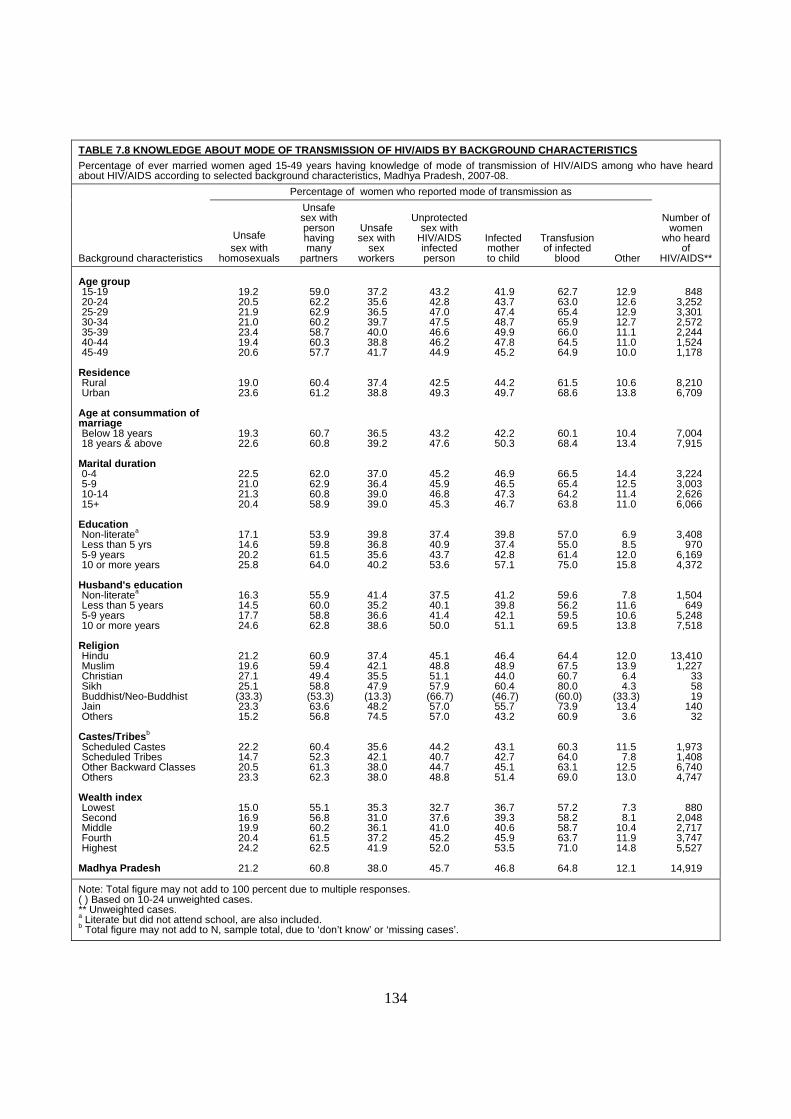
134
TABLE 7.8 KNOWLEDGE ABOUT MODE OF TRANSMISSION OF HIV/AIDS BY BACKGROUND CHARACTERISTICS Percentage of ever married women aged 15-49 years having knowledge of mode of transmission of HIV/AIDS among who have heard about HIV/AIDS according to selected background characteristics, Madhya Pradesh, 2007-08.
Background characteristics
Percentage of women who reported mode of transmission as
Number of women
who heard of
HIV/AIDS**
Unsafe sex with
homosexuals
Unsafe sex with person having many
partners
Unsafe sex with
sex workers
Unprotected sex with
HIV/AIDS infected person
Infected mother to child
Transfusion of infected
blood Other Age group 15-19 20-24 25-29 30-34 35-39 40-44 45-49
Residence Rural Urban
Age at consummation of marriage Below 18 years 18 years & above
Marital duration 0-4 5-9 10-14 15+
Education Non-literatea Less than 5 yrs 5-9 years 10 or more years
Husband's education Non-literatea Less than 5 years 5-9 years 10 or more years
Religion Hindu Muslim Christian Sikh Buddhist/Neo-Buddhist Jain Others
Castes/Tribesb Scheduled Castes Scheduled Tribes Other Backward Classes Others
Wealth index Lowest Second Middle Fourth Highest
Madhya Pradesh
19.2 20.5 21.9 21.0 23.4 19.4 20.6
19.0 23.6
19.3 22.6
22.5 21.0 21.3 20.4
17.1 14.6 20.2 25.8
16.3 14.5 17.7 24.6
21.2 19.6 27.1 25.1 (33.3) 23.3 15.2
22.2 14.7 20.5 23.3
15.0 16.9 19.9 20.4 24.2
21.2
59.0 62.2 62.9 60.2 58.7 60.3 57.7
60.4 61.2
60.7 60.8
62.0 62.9 60.8 58.9
53.9 59.8 61.5 64.0
55.9 60.0 58.8 62.8
60.9 59.4 49.4 58.8 (53.3) 63.6 56.8
60.4 52.3 61.3 62.3
55.1 56.8 60.2 61.5 62.5
60.8
37.2 35.6 36.5 39.7 40.0 38.8 41.7
37.4 38.8
36.5 39.2
37.0 36.4 39.0 39.0
39.8 36.8 35.6 40.2
41.4 35.2 36.6 38.6
37.4 42.1 35.5 47.9
(13.3) 48.2 74.5
35.6 42.1 38.0 38.0
35.3 31.0 36.1 37.2 41.9
38.0
43.2 42.8 47.0 47.5 46.6 46.2 44.9
42.5 49.3
43.2 47.6
45.2 45.9 46.8 45.3
37.4 40.9 43.7 53.6
37.5 40.1 41.4 50.0
45.1 48.8 51.1 57.9
(66.7) 57.0 57.0
44.2 40.7 44.7 48.8
32.7 37.6 41.0 45.2 52.0
45.7
41.9 43.7 47.4 48.7 49.9 47.8 45.2
44.2 49.7
42.2 50.3
46.9 46.5 47.3 46.7
39.8 37.4 42.8 57.1
41.2 39.8 42.1 51.1
46.4 48.9 44.0 60.4 (46.7) 55.7 43.2
43.1 42.7 45.1 51.4
36.7 39.3 40.6 45.9 53.5
46.8
62.7 63.0 65.4 65.9 66.0 64.5 64.9
61.5 68.6
60.1 68.4
66.5 65.4 64.2 63.8
57.0 55.0 61.4 75.0
59.6 56.2 59.5 69.5
64.4 67.5 60.7 80.0 (60.0) 73.9 60.9
60.3 64.0 63.1 69.0
57.2 58.2 58.7 63.7 71.0
64.8
12.9 12.6 12.9 12.7 11.1 11.0 10.0
10.6 13.8
10.4 13.4
14.4 12.5 11.4 11.0
6.9 8.5
12.0 15.8
7.8 11.6 10.6 13.8
12.0 13.9
6.4 4.3
(33.3) 13.4
3.6
11.5 7.8
12.5 13.0
7.3 8.1
10.4 11.9 14.8
12.1
848
3,252 3,301 2,572 2,244 1,524 1,178
8,210 6,709
7,004 7,915
3,224 3,003 2,626 6,066
3,408 970
6,169 4,372
1,504 649
5,248 7,518
13,410 1,227
33 58 19
140 32
1,973 1,408 6,740 4,747
880 2,048 2,717 3,747 5,527
14,919
Note: Total figure may not add to 100 percent due to multiple responses. ( ) Based on 10-24 unweighted cases. ** Unweighted cases. a Literate but did not attend school, are also included. b Total figure may not add to N, sample total, due to ‘don’t know’ or ‘missing cases’.
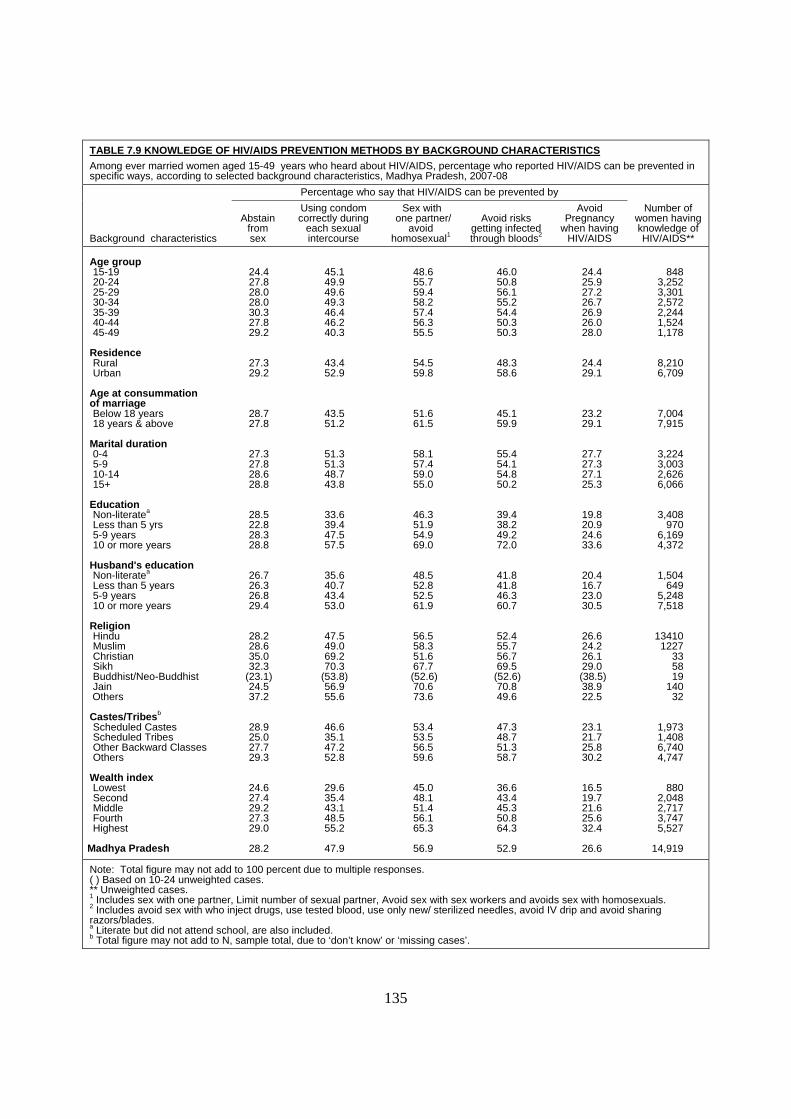
135
TABLE 7.9 KNOWLEDGE OF HIV/AIDS PREVENTION METHODS BY BACKGROUND CHARACTERISTICS Among ever married women aged 15-49 years who heard about HIV/AIDS, percentage who reported HIV/AIDS can be prevented in specific ways, according to selected background characteristics, Madhya Pradesh, 2007-08
Background characteristics
Percentage who say that HIV/AIDS can be prevented by Number of
women having knowledge of HIV/AIDS**
Abstain from sex
Using condom correctly during
each sexual intercourse
Sex with one partner/
avoid homosexual1
Avoid risks getting infected through bloods2
Avoid Pregnancy
when having HIV/AIDS
Age group 15-19 20-24 25-29 30-34 35-39 40-44 45-49
Residence Rural Urban
Age at consummation of marriage Below 18 years 18 years & above
Marital duration 0-4 5-9 10-14 15+
Education Non-literatea Less than 5 yrs 5-9 years 10 or more years
Husband's education Non-literatea Less than 5 years 5-9 years 10 or more years
Religion Hindu Muslim Christian Sikh Buddhist/Neo-Buddhist Jain
Others Castes/Tribesb Scheduled Castes Scheduled Tribes Other Backward Classes Others
Wealth index Lowest Second Middle Fourth Highest
Madhya Pradesh
24.4 27.8 28.0 28.0 30.3 27.8 29.2
27.3 29.2
28.7 27.8
27.3 27.8 28.6 28.8
28.5 22.8 28.3 28.8
26.7 26.3 26.8 29.4
28.2 28.6 35.0 32.3
(23.1) 24.5 37.2
28.9 25.0 27.7 29.3
24.6 27.4 29.2 27.3 29.0
28.2
45.1 49.9 49.6 49.3 46.4 46.2 40.3
43.4 52.9
43.5 51.2
51.3 51.3 48.7 43.8
33.6 39.4 47.5 57.5
35.6 40.7 43.4 53.0
47.5 49.0 69.2 70.3
(53.8) 56.9 55.6
46.6 35.1 47.2 52.8
29.6 35.4 43.1 48.5 55.2
47.9
48.6 55.7 59.4 58.2 57.4 56.3 55.5
54.5 59.8
51.6 61.5
58.1 57.4 59.0 55.0
46.3 51.9 54.9 69.0
48.5 52.8 52.5 61.9
56.5 58.3 51.6 67.7 (52.6) 70.6 73.6
53.4 53.5 56.5 59.6
45.0 48.1 51.4 56.1 65.3
56.9
46.0 50.8 56.1 55.2 54.4 50.3 50.3
48.3 58.6
45.1 59.9
55.4 54.1 54.8 50.2
39.4 38.2 49.2 72.0
41.8 41.8 46.3 60.7
52.4 55.7 56.7 69.5 (52.6) 70.8 49.6
47.3 48.7 51.3 58.7
36.6 43.4 45.3 50.8 64.3
52.9
24.4 25.9 27.2 26.7 26.9 26.0 28.0
24.4 29.1
23.2 29.1
27.7 27.3 27.1 25.3
19.8 20.9 24.6 33.6
20.4 16.7 23.0 30.5
26.6 24.2 26.1 29.0 (38.5) 38.9 22.5
23.1 21.7 25.8 30.2
16.5 19.7 21.6 25.6 32.4
26.6
848
3,252 3,301 2,572 2,244 1,524 1,178
8,210 6,709
7,004 7,915
3,224 3,003 2,626 6,066
3,408 970
6,169 4,372
1,504 649
5,248 7,518
13410 1227
33 58 19
140 32
1,973 1,408 6,740 4,747
880 2,048 2,717 3,747 5,527
14,919
Note: Total figure may not add to 100 percent due to multiple responses. ( ) Based on 10-24 unweighted cases. ** Unweighted cases. 1 Includes sex with one partner, Limit number of sexual partner, Avoid sex with sex workers and avoids sex with homosexuals. 2 Includes avoid sex with who inject drugs, use tested blood, use only new/ sterilized needles, avoid IV drip and avoid sharing razors/blades. a Literate but did not attend school, are also included. b Total figure may not add to N, sample total, due to ‘don’t know’ or ‘missing cases’.
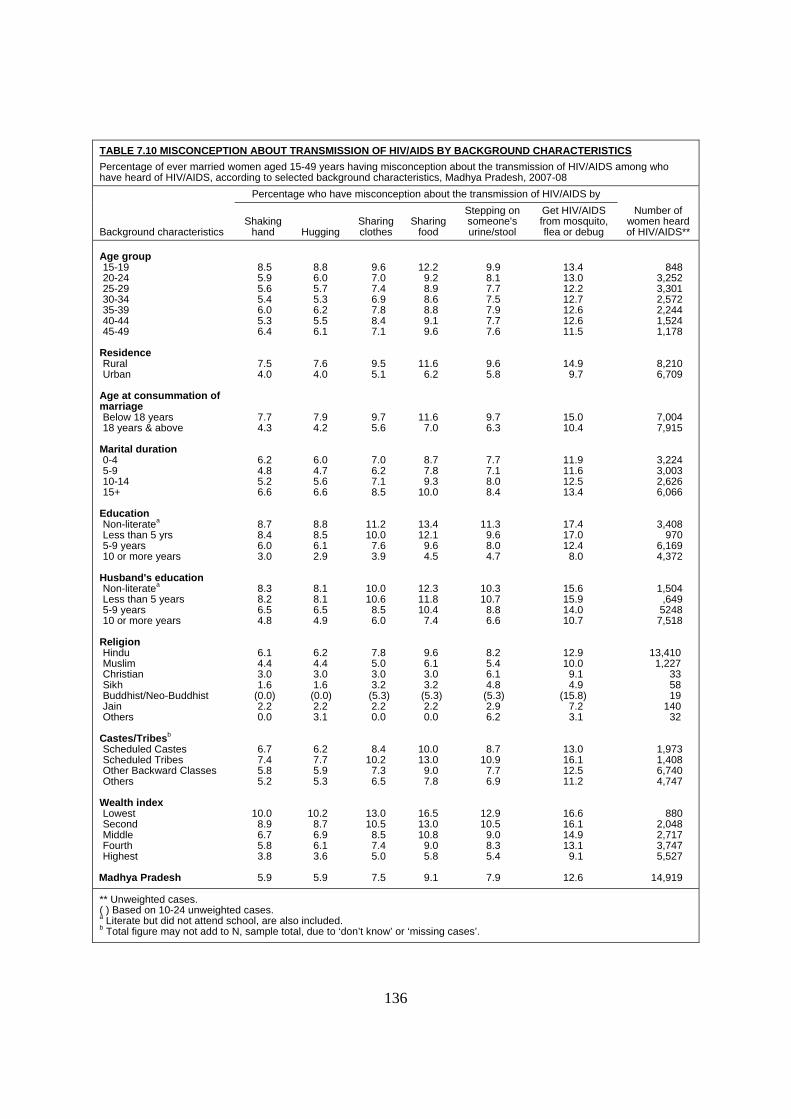
136
TABLE 7.10 MISCONCEPTION ABOUT TRANSMISSION OF HIV/AIDS BY BACKGROUND CHARACTERISTICS Percentage of ever married women aged 15-49 years having misconception about the transmission of HIV/AIDS among who have heard of HIV/AIDS, according to selected background characteristics, Madhya Pradesh, 2007-08
Background characteristics
Percentage who have misconception about the transmission of HIV/AIDS by Number of
women heard of HIV/AIDS**
Shaking hand Hugging
Sharing clothes
Sharing food
Stepping on someone's urine/stool
Get HIV/AIDS from mosquito, flea or debug
Age group 15-19 20-24 25-29 30-34 35-39 40-44 45-49
Residence Rural Urban
Age at consummation of marriage Below 18 years 18 years & above
Marital duration 0-4 5-9 10-14 15+
Education Non-literatea Less than 5 yrs 5-9 years 10 or more years
Husband's education Non-literatea Less than 5 years 5-9 years 10 or more years
Religion Hindu Muslim Christian Sikh Buddhist/Neo-Buddhist Jain Others
Castes/Tribesb Scheduled Castes Scheduled Tribes Other Backward Classes Others
Wealth index Lowest Second Middle Fourth Highest
Madhya Pradesh
8.5 5.9 5.6 5.4 6.0 5.3 6.4
7.5 4.0
7.7 4.3
6.2 4.8 5.2 6.6
8.7 8.4 6.0 3.0
8.3 8.2 6.5 4.8
6.1 4.4 3.0 1.6
(0.0) 2.2 0.0
6.7 7.4 5.8 5.2
10.0 8.9 6.7 5.8 3.8
5.9
8.8 6.0 5.7 5.3 6.2 5.5 6.1
7.6 4.0
7.9 4.2
6.0 4.7 5.6 6.6
8.8 8.5 6.1 2.9
8.1 8.1 6.5 4.9
6.2 4.4 3.0 1.6 (0.0) 2.2 3.1
6.2 7.7 5.9 5.3
10.2 8.7 6.9 6.1 3.6
5.9
9.6 7.0 7.4 6.9 7.8 8.4 7.1
9.5 5.1
9.7 5.6
7.0 6.2 7.1 8.5
11.2 10.0
7.6 3.9
10.0 10.6
8.5 6.0
7.8 5.0 3.0 3.2
(5.3) 2.2 0.0
8.4 10.2
7.3 6.5
13.0 10.5
8.5 7.4 5.0
7.5
12.2
9.2 8.9 8.6 8.8 9.1 9.6
11.6 6.2
11.6 7.0
8.7 7.8 9.3
10.0
13.4 12.1
9.6 4.5
12.3 11.8 10.4
7.4
9.6 6.1 3.0 3.2
(5.3) 2.2
0.0
10.0 13.0
9.0 7.8
16.5 13.0 10.8
9.0 5.8
9.1
9.9 8.1 7.7 7.5 7.9 7.7 7.6
9.6 5.8
9.7 6.3
7.7 7.1 8.0 8.4
11.3 9.6 8.0 4.7
10.3 10.7
8.8 6.6
8.2 5.4 6.1 4.8 (5.3) 2.9 6.2
8.7 10.9
7.7 6.9
12.9 10.5
9.0 8.3 5.4
7.9
13.4 13.0 12.2 12.7 12.6 12.6 11.5
14.9 9.7
15.0 10.4
11.9 11.6 12.5 13.4
17.4 17.0 12.4
8.0
15.6 15.9 14.0 10.7
12.9 10.0
9.1 4.9
(15.8) 7.2 3.1
13.0 16.1 12.5 11.2
16.6 16.1 14.9 13.1
9.1
12.6
848
3,252 3,301 2,572 2,244 1,524 1,178
8,210 6,709
7,004 7,915
3,224 3,003 2,626 6,066
3,408 970
6,169 4,372
1,504 ,649
5248 7,518
13,410 1,227
33 58 19
140 32
1,973 1,408 6,740 4,747
880 2,048 2,717 3,747 5,527
14,919
** Unweighted cases. ( ) Based on 10-24 unweighted cases. a Literate but did not attend school, are also included. b Total figure may not add to N, sample total, due to ‘don’t know’ or ‘missing cases’.
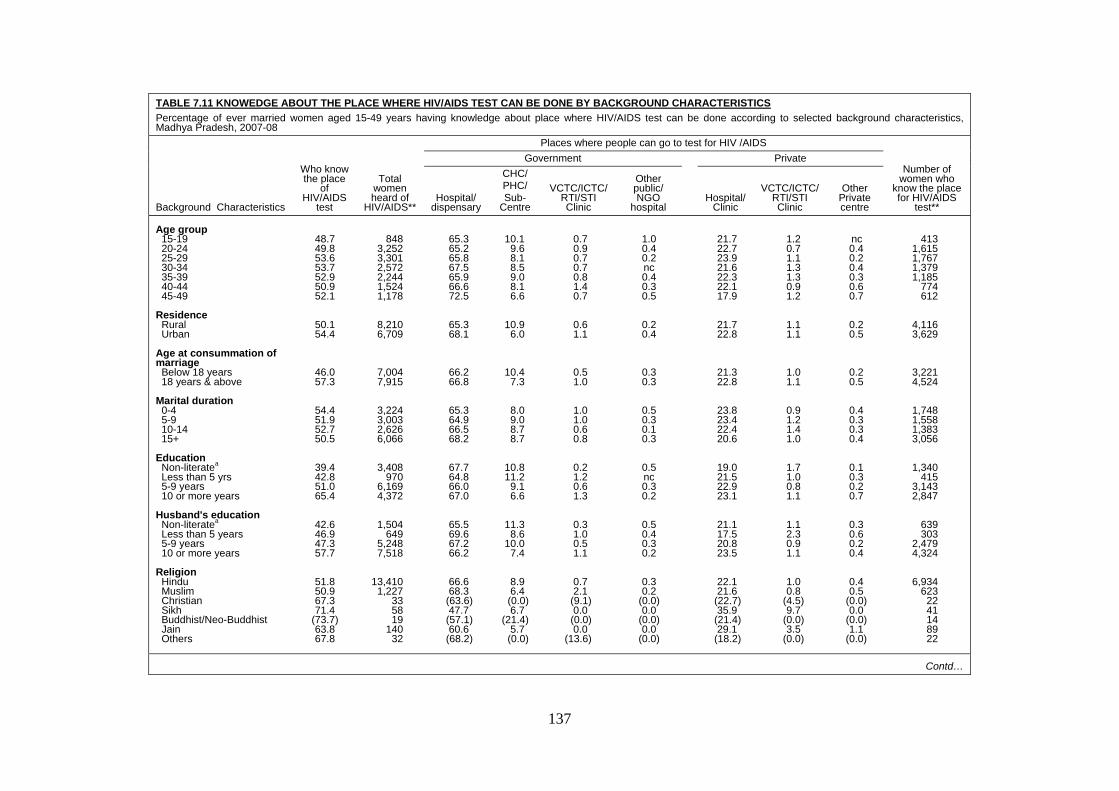
137
TABLE 7.11 KNOWEDGE ABOUT THE PLACE WHERE HIV/AIDS TEST CAN BE DONE BY BACKGROUND CHARACTERISTICS Percentage of ever married women aged 15-49 years having knowledge about place where HIV/AIDS test can be done according to selected background characteristics, Madhya Pradesh, 2007-08
Background Characteristics
Who know the place
of HIV/AIDS
test
Total women heard of
HIV/AIDS**
Places where people can go to test for HIV /AIDS
Number of women who
know the place for HIV/AIDS
test**
Government Private
Hospital/ dispensary
CHC/ PHC/ Sub-
Centre
VCTC/ICTC/ RTI/STI Clinic
Other public/ NGO
hospital Hospital/
Clinic
VCTC/ICTC/ RTI/STI Clinic
Other Private centre
Age group 15-19 20-24 25-29 30-34 35-39 40-44 45-49 Residence Rural Urban Age at consummation of marriage Below 18 years 18 years & above Marital duration 0-4 5-9 10-14 15+ Education Non-literatea Less than 5 yrs 5-9 years 10 or more years Husband's education Non-literatea Less than 5 years 5-9 years 10 or more years Religion Hindu Muslim Christian Sikh Buddhist/Neo-Buddhist Jain Others
48.7 49.8 53.6 53.7 52.9 50.9 52.1
50.1 54.4
46.0 57.3
54.4 51.9 52.7 50.5
39.4 42.8 51.0 65.4
42.6 46.9 47.3 57.7
51.8 50.9 67.3 71.4
(73.7) 63.8 67.8
848
3,252 3,301 2,572 2,244 1,524 1,178
8,210 6,709
7,004 7,915
3,224 3,003 2,626 6,066
3,408 970
6,169 4,372
1,504 649
5,248 7,518
13,410 1,227
33 58 19
140 32
65.3 65.2 65.8 67.5 65.9 66.6 72.5
65.3 68.1
66.2 66.8
65.3 64.9 66.5 68.2
67.7 64.8 66.0 67.0
65.5 69.6 67.2 66.2
66.6 68.3
(63.6) 47.7
(57.1) 60.6
(68.2)
10.1
9.6 8.1 8.5 9.0 8.1 6.6
10.9 6.0
10.4 7.3
8.0 9.0 8.7 8.7
10.8 11.2
9.1 6.6
11.3 8.6
10.0 7.4
8.9 6.4 (0.0) 6.7
(21.4) 5.7 (0.0)
0.7 0.9 0.7 0.7 0.8 1.4 0.7
0.6 1.1
0.5 1.0
1.0 1.0 0.6 0.8
0.2 1.2 0.6 1.3
0.3 1.0 0.5 1.1
0.7 2.1
(9.1) 0.0 (0.0) 0.0
(13.6)
1.0 0.4 0.2 nc 0.4 0.3 0.5
0.2 0.4
0.3 0.3
0.5 0.3 0.1 0.3
0.5 nc 0.3 0.2
0.5 0.4 0.3 0.2
0.3 0.2
(0.0) 0.0
(0.0) 0.0
(0.0)
21.7 22.7 23.9 21.6 22.3 22.1 17.9
21.7 22.8
21.3 22.8
23.8 23.4 22.4 20.6
19.0 21.5 22.9 23.1
21.1 17.5 20.8 23.5
22.1 21.6
(22.7) 35.9
(21.4) 29.1
(18.2)
1.2 0.7 1.1 1.3 1.3 0.9 1.2
1.1 1.1
1.0 1.1
0.9 1.2 1.4 1.0
1.7 1.0 0.8 1.1
1.1 2.3 0.9 1.1
1.0 0.8
(4.5) 9.7
(0.0) 3.5
(0.0)
nc 0.4 0.2 0.4 0.3 0.6 0.7
0.2 0.5
0.2 0.5
0.4 0.3 0.3 0.4
0.1 0.3 0.2 0.7
0.3 0.6 0.2 0.4
0.4 0.5
(0.0) 0.0
(0.0) 1.1
(0.0)
413
1,615 1,767 1,379 1,185
774 612
4,116 3,629
3,221 4,524
1,748 1,558 1,383 3,056
1,340 415
3,143 2,847
639 303
2,479 4,324
6,934 623
22 41 14 89 22
Contd…
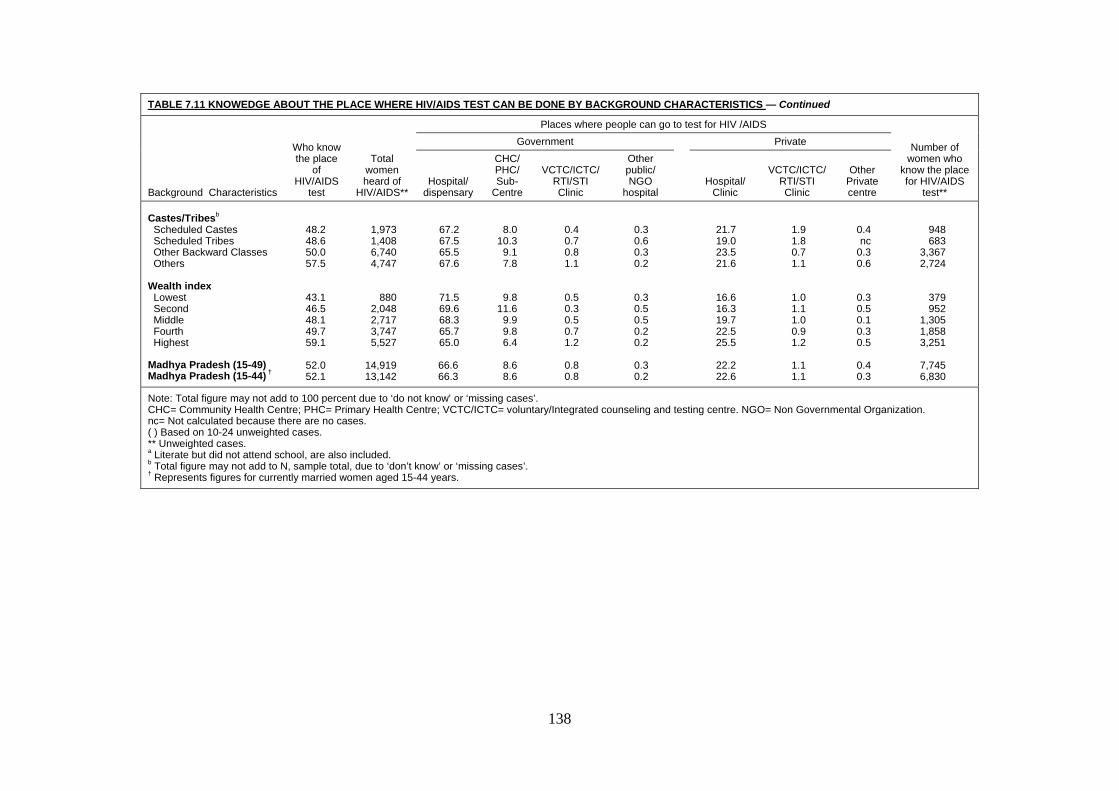
138
TABLE 7.11 KNOWEDGE ABOUT THE PLACE WHERE HIV/AIDS TEST CAN BE DONE BY BACKGROUND CHARACTERISTICS — Continued
Background Characteristics
Who know the place
of HIV/AIDS
test
Total women heard of
HIV/AIDS**
Places where people can go to test for HIV /AIDS
Number of women who
know the place for HIV/AIDS
test**
Government Private
Hospital/ dispensary
CHC/ PHC/ Sub-
Centre
VCTC/ICTC/ RTI/STI Clinic
Other public/ NGO
hospital Hospital/
Clinic
VCTC/ICTC/ RTI/STI Clinic
Other Private centre
Castes/Tribesb Scheduled Castes Scheduled Tribes Other Backward Classes Others Wealth index Lowest Second Middle Fourth Highest Madhya Pradesh (15-49) Madhya Pradesh (15-44) †
48.2 48.6 50.0 57.5
43.1 46.5 48.1 49.7 59.1
52.0 52.1
1,973 1,408 6,740 4,747
880 2,048 2,717 3,747 5,527
14,919 13,142
67.2 67.5 65.5 67.6
71.5 69.6 68.3 65.7 65.0
66.6 66.3
8.0
10.3 9.1 7.8
9.8 11.6
9.9 9.8 6.4
8.6 8.6
0.4 0.7 0.8 1.1
0.5 0.3 0.5 0.7 1.2
0.8 0.8
0.3 0.6 0.3 0.2
0.3 0.5 0.5 0.2 0.2
0.3 0.2
21.7 19.0 23.5 21.6
16.6 16.3 19.7 22.5 25.5
22.2 22.6
1.9 1.8 0.7 1.1
1.0 1.1 1.0 0.9 1.2
1.1 1.1
0.4 nc
0.3 0.6
0.3 0.5 0.1 0.3 0.5
0.4 0.3
948 683
3,367 2,724
379 952
1,305 1,858 3,251
7,745 6,830
Note: Total figure may not add to 100 percent due to ‘do not know’ or ‘missing cases’. CHC= Community Health Centre; PHC= Primary Health Centre; VCTC/ICTC= voluntary/Integrated counseling and testing centre. NGO= Non Governmental Organization. nc= Not calculated because there are no cases. ( ) Based on 10-24 unweighted cases. ** Unweighted cases. a Literate but did not attend school, are also included. b Total figure may not add to N, sample total, due to ‘don’t know’ or ‘missing cases’. † Represents figures for currently married women aged 15-44 years.
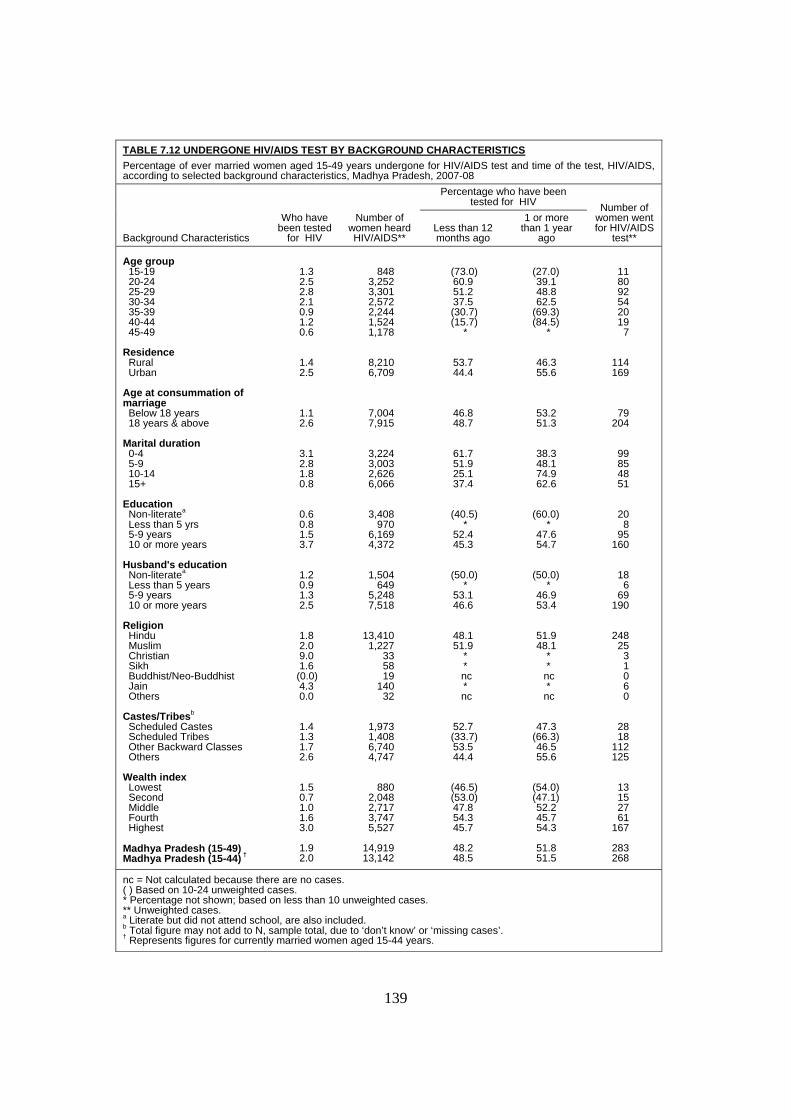
139
TABLE 7.12 UNDERGONE HIV/AIDS TEST BY BACKGROUND CHARACTERISTICS Percentage of ever married women aged 15-49 years undergone for HIV/AIDS test and time of the test, HIV/AIDS, according to selected background characteristics, Madhya Pradesh, 2007-08
Background Characteristics
Who have been tested
for HIV
Number of women heard HIV/AIDS**
Percentage who have been tested for HIV Number of
women went for HIV/AIDS
test** Less than 12 months ago
1 or more than 1 year
ago Age group 15-19 20-24 25-29 30-34 35-39 40-44 45-49 Residence Rural Urban Age at consummation of marriage Below 18 years 18 years & above Marital duration 0-4 5-9 10-14 15+ Education Non-literatea Less than 5 yrs 5-9 years 10 or more years Husband's education Non-literatea Less than 5 years 5-9 years 10 or more years Religion Hindu Muslim Christian Sikh Buddhist/Neo-Buddhist Jain Others Castes/Tribesb Scheduled Castes Scheduled Tribes Other Backward Classes Others Wealth index Lowest Second Middle Fourth Highest Madhya Pradesh (15-49) Madhya Pradesh (15-44) †
1.3 2.5 2.8 2.1 0.9 1.2 0.6
1.4 2.5
1.1 2.6
3.1 2.8 1.8 0.8
0.6 0.8 1.5 3.7
1.2 0.9 1.3 2.5
1.8 2.0 9.0 1.6 (0.0) 4.3 0.0
1.4 1.3 1.7 2.6
1.5 0.7 1.0 1.6 3.0
1.9 2.0
848
3,252 3,301 2,572 2,244 1,524 1,178
8,210 6,709
7,004 7,915
3,224 3,003 2,626 6,066
3,408 970
6,169 4,372
1,504 649
5,248 7,518
13,410 1,227
33 58 19
140 32
1,973 1,408 6,740 4,747
880 2,048 2,717 3,747 5,527
14,919 13,142
(73.0) 60.9 51.2 37.5 (30.7) (15.7)
*
53.7 44.4
46.8 48.7
61.7 51.9 25.1 37.4
(40.5) *
52.4 45.3
(50.0) *
53.1 46.6
48.1 51.9
* * nc * nc
52.7 (33.7) 53.5 44.4
(46.5) (53.0) 47.8 54.3 45.7
48.2 48.5
(27.0) 39.1 48.8 62.5
(69.3) (84.5)
*
46.3 55.6
53.2 51.3
38.3 48.1 74.9 62.6
(60.0) *
47.6 54.7
(50.0) *
46.9 53.4
51.9 48.1
* *
nc *
nc
47.3 (66.3) 46.5 55.6
(54.0) (47.1) 52.2 45.7 54.3
51.8 51.5
11 80 92 54 20 19
7
114 169
79 204
99 85 48 51
20 8
95 160
18 6
69 190
248 25
3 1 0 6 0
28 18
112 125
13 15 27 61
167
283 268
nc = Not calculated because there are no cases. ( ) Based on 10-24 unweighted cases. * Percentage not shown; based on less than 10 unweighted cases. ** Unweighted cases. a Literate but did not attend school, are also included. b Total figure may not add to N, sample total, due to ‘don’t know’ or ‘missing cases’. † Represents figures for currently married women aged 15-44 years.
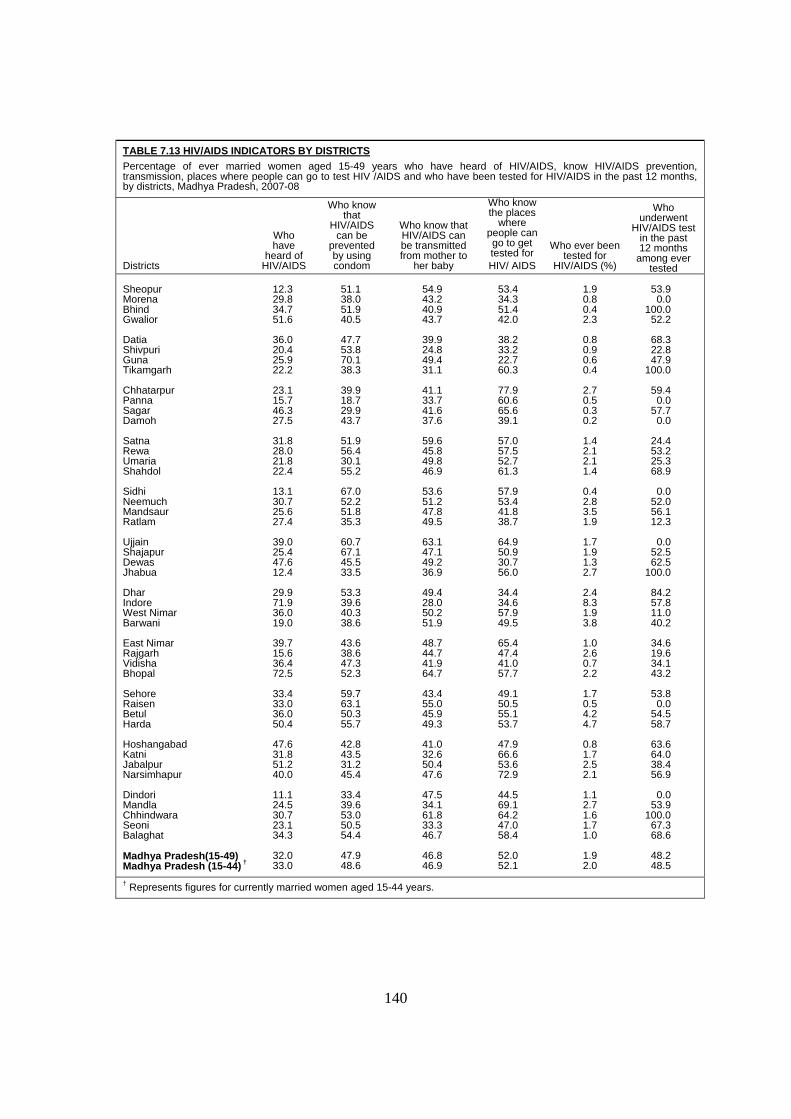
140
TABLE 7.13 HIV/AIDS INDICATORS BY DISTRICTS Percentage of ever married women aged 15-49 years who have heard of HIV/AIDS, know HIV/AIDS prevention, transmission, places where people can go to test HIV /AIDS and who have been tested for HIV/AIDS in the past 12 months, by districts, Madhya Pradesh, 2007-08
Districts
Who have
heard of HIV/AIDS
Who know that
HIV/AIDS can be
prevented by using condom
Who know that HIV/AIDS can be transmitted from mother to
her baby
Who know the places
where people can go to get tested for HIV/ AIDS
Who ever been tested for
HIV/AIDS (%)
Who underwent
HIV/AIDS test in the past 12 months
among ever tested
Sheopur Morena Bhind Gwalior Datia Shivpuri Guna Tikamgarh Chhatarpur Panna Sagar Damoh Satna Rewa Umaria Shahdol Sidhi Neemuch Mandsaur Ratlam Ujjain Shajapur Dewas Jhabua Dhar Indore West Nimar Barwani East Nimar Rajgarh Vidisha Bhopal Sehore Raisen Betul Harda Hoshangabad Katni Jabalpur Narsimhapur Dindori Mandla Chhindwara Seoni Balaghat Madhya Pradesh(15-49) Madhya Pradesh (15-44) †
12.3 29.8 34.7 51.6
36.0 20.4 25.9 22.2
23.1 15.7 46.3 27.5
31.8 28.0 21.8 22.4
13.1 30.7 25.6 27.4
39.0 25.4 47.6 12.4
29.9 71.9 36.0 19.0
39.7 15.6 36.4 72.5
33.4 33.0 36.0 50.4
47.6 31.8 51.2 40.0
11.1 24.5 30.7 23.1 34.3
32.0 33.0
51.1 38.0 51.9 40.5
47.7 53.8 70.1 38.3
39.9 18.7 29.9 43.7
51.9 56.4 30.1 55.2
67.0 52.2 51.8 35.3
60.7 67.1 45.5 33.5
53.3 39.6 40.3 38.6
43.6 38.6 47.3 52.3
59.7 63.1 50.3 55.7
42.8 43.5 31.2 45.4
33.4 39.6 53.0 50.5 54.4
47.9 48.6
54.9 43.2 40.9 43.7
39.9 24.8 49.4 31.1
41.1 33.7 41.6 37.6
59.6 45.8 49.8 46.9
53.6 51.2 47.8 49.5
63.1 47.1 49.2 36.9
49.4 28.0 50.2 51.9
48.7 44.7 41.9 64.7
43.4 55.0 45.9 49.3
41.0 32.6 50.4 47.6
47.5 34.1 61.8 33.3 46.7
46.8 46.9
53.4 34.3 51.4 42.0
38.2 33.2 22.7 60.3
77.9 60.6 65.6 39.1
57.0 57.5 52.7 61.3
57.9 53.4 41.8 38.7
64.9 50.9 30.7 56.0
34.4 34.6 57.9 49.5
65.4 47.4 41.0 57.7
49.1 50.5 55.1 53.7
47.9 66.6 53.6 72.9
44.5 69.1 64.2 47.0 58.4
52.0 52.1
1.9 0.8 0.4 2.3
0.8 0.9 0.6 0.4
2.7 0.5 0.3 0.2
1.4 2.1 2.1 1.4
0.4 2.8 3.5 1.9
1.7 1.9 1.3 2.7
2.4 8.3 1.9 3.8
1.0 2.6 0.7 2.2
1.7 0.5 4.2 4.7
0.8 1.7 2.5 2.1
1.1 2.7 1.6 1.7 1.0
1.9 2.0
53.9 0.0
100.0 52.2
68.3 22.8 47.9
100.0
59.4 0.0
57.7 0.0
24.4 53.2 25.3 68.9
0.0
52.0 56.1 12.3
0.0
52.5 62.5
100.0
84.2 57.8 11.0 40.2
34.6 19.6 34.1 43.2
53.8 0.0
54.5 58.7
63.6 64.0 38.4 56.9
0.0
53.9 100.0
67.3 68.6
48.2 48.5
† Represents figures for currently married women aged 15-44 years.
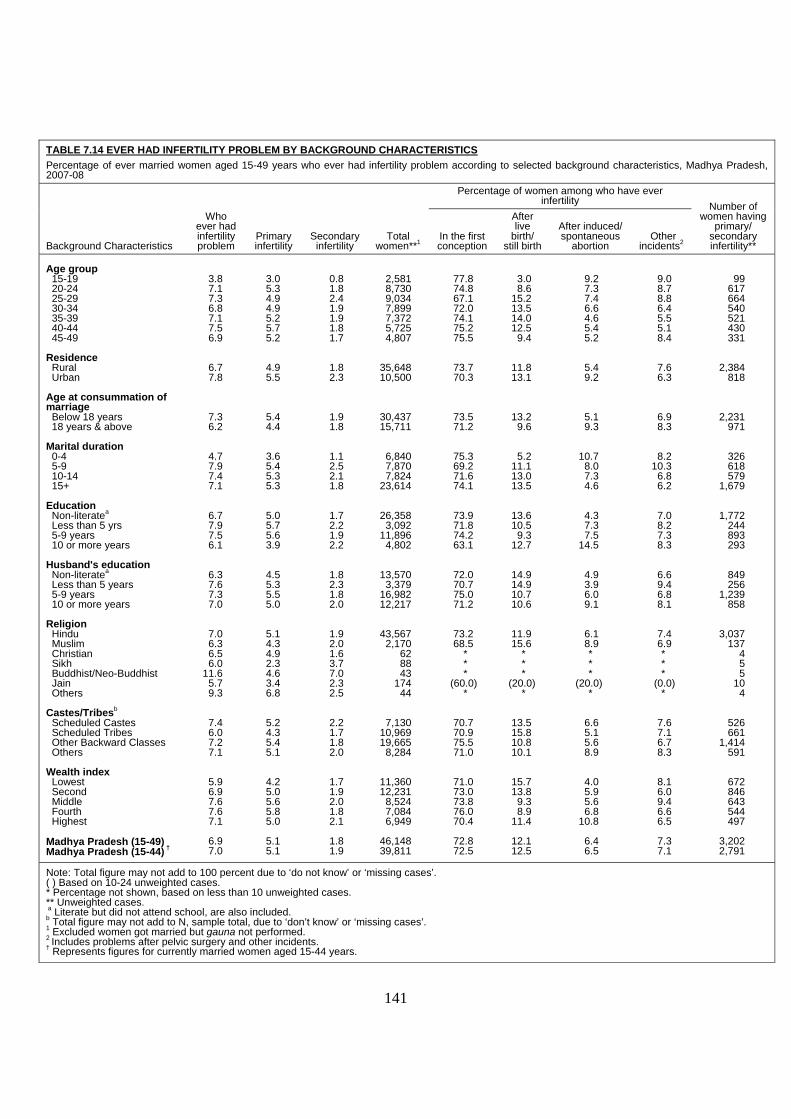
141
TABLE 7.14 EVER HAD INFERTILITY PROBLEM BY BACKGROUND CHARACTERISTICS Percentage of ever married women aged 15-49 years who ever had infertility problem according to selected background characteristics, Madhya Pradesh, 2007-08
Background Characteristics
Who ever had infertility problem
Primary infertility
Secondary infertility
Total women**1
Percentage of women among who have ever infertility Number of
women having primary/
secondary infertility**
In the first conception
After live
birth/ still birth
After induced/ spontaneous
abortion Other
incidents2 Age group 15-19 20-24 25-29 30-34 35-39 40-44 45-49 Residence Rural Urban Age at consummation of marriage Below 18 years 18 years & above Marital duration 0-4 5-9 10-14 15+ Education Non-literatea Less than 5 yrs 5-9 years 10 or more years Husband's education Non-literatea Less than 5 years 5-9 years 10 or more years Religion Hindu Muslim Christian Sikh Buddhist/Neo-Buddhist Jain Others Castes/Tribesb Scheduled Castes Scheduled Tribes Other Backward Classes Others Wealth index Lowest Second Middle Fourth Highest Madhya Pradesh (15-49) Madhya Pradesh (15-44) †
3.8 7.1 7.3 6.8 7.1 7.5 6.9
6.7 7.8
7.3 6.2
4.7 7.9 7.4 7.1
6.7 7.9 7.5 6.1
6.3 7.6 7.3 7.0
7.0 6.3 6.5 6.0
11.6 5.7 9.3
7.4 6.0 7.2 7.1
5.9 6.9 7.6 7.6 7.1
6.9 7.0
3.0 5.3 4.9 4.9 5.2 5.7 5.2
4.9 5.5
5.4 4.4
3.6 5.4 5.3 5.3
5.0 5.7 5.6 3.9
4.5 5.3 5.5 5.0
5.1 4.3 4.9 2.3 4.6 3.4 6.8
5.2 4.3 5.4 5.1
4.2 5.0 5.6 5.8 5.0
5.1 5.1
0.8 1.8 2.4 1.9 1.9 1.8 1.7
1.8 2.3
1.9 1.8
1.1 2.5 2.1 1.8
1.7 2.2 1.9 2.2
1.8 2.3 1.8 2.0
1.9 2.0 1.6 3.7 7.0 2.3 2.5
2.2 1.7 1.8 2.0
1.7 1.9 2.0 1.8 2.1
1.8 1.9
2,581 8,730 9,034 7,899 7,372 5,725 4,807
35,648 10,500
30,437 15,711
6,840 7,870 7,824
23,614
26,358 3,092
11,896 4,802
13,570 3,379
16,982 12,217
43,567 2,170
62 88 43
174 44
7,130 10,969 19,665
8,284
11,360 12,231
8,524 7,084 6,949
46,148 39,811
77.8 74.8 67.1 72.0 74.1 75.2 75.5
73.7 70.3
73.5 71.2
75.3 69.2 71.6 74.1
73.9 71.8 74.2 63.1
72.0 70.7 75.0 71.2
73.2 68.5
* * *
(60.0) *
70.7 70.9 75.5 71.0
71.0 73.0 73.8 76.0 70.4
72.8 72.5
3.0 8.6
15.2 13.5 14.0 12.5
9.4
11.8 13.1
13.2 9.6
5.2 11.1 13.0 13.5
13.6 10.5
9.3 12.7
14.9 14.9 10.7 10.6
11.9 15.6
* * *
(20.0) *
13.5 15.8 10.8 10.1
15.7 13.8
9.3 8.9
11.4
12.1 12.5
9.2 7.3 7.4 6.6 4.6 5.4 5.2
5.4 9.2
5.1 9.3
10.7 8.0 7.3 4.6
4.3 7.3 7.5
14.5
4.9 3.9 6.0 9.1
6.1 8.9 * * *
(20.0) *
6.6 5.1 5.6 8.9
4.0 5.9 5.6 6.8
10.8
6.4 6.5
9.0 8.7 8.8 6.4 5.5 5.1 8.4
7.6 6.3
6.9 8.3
8.2 10.3
6.8 6.2
7.0 8.2 7.3 8.3
6.6 9.4 6.8 8.1
7.4 6.9 * * *
(0.0) *
7.6 7.1 6.7 8.3
8.1 6.0 9.4 6.6 6.5
7.3 7.1
99
617 664 540 521 430 331
2,384 818
2,231 971
326 618 579
1,679
1,772 244 893 293
849 256
1,239 858
3,037 137
4 5 5
10 4
526 661
1,414 591
672 846 643 544 497
3,202 2,791
Note: Total figure may not add to 100 percent due to ‘do not know’ or ‘missing cases’. ( ) Based on 10-24 unweighted cases. * Percentage not shown, based on less than 10 unweighted cases. ** Unweighted cases. a Literate but did not attend school, are also included. b Total figure may not add to N, sample total, due to ‘don’t know’ or ‘missing cases’. 1 Excluded women got married but gauna not performed. 2 Includes problems after pelvic surgery and other incidents. † Represents figures for currently married women aged 15-44 years.
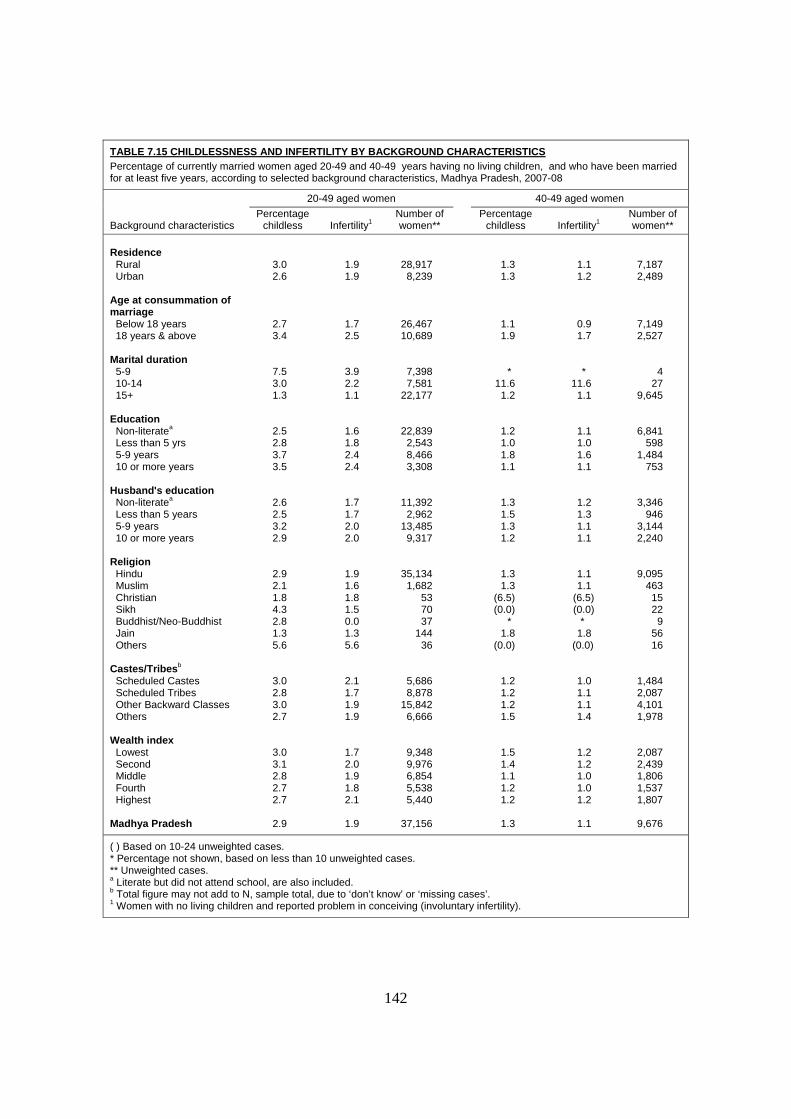
142
TABLE 7.15 CHILDLESSNESS AND INFERTILITY BY BACKGROUND CHARACTERISTICS Percentage of currently married women aged 20-49 and 40-49 years having no living children, and who have been married for at least five years, according to selected background characteristics, Madhya Pradesh, 2007-08
Background characteristics
20-49 aged women
40-49 aged women Percentage
childless Infertility1 Number of women**
Percentage childless Infertility1
Number of women**
Residence Rural Urban Age at consummation of marriage Below 18 years 18 years & above Marital duration 5-9 10-14 15+ Education Non-literatea Less than 5 yrs 5-9 years 10 or more years Husband's education Non-literatea Less than 5 years 5-9 years 10 or more years Religion Hindu Muslim Christian Sikh Buddhist/Neo-Buddhist Jain Others Castes/Tribesb Scheduled Castes Scheduled Tribes Other Backward Classes Others Wealth index Lowest Second Middle Fourth Highest Madhya Pradesh
3.0 2.6
2.7 3.4
7.5 3.0 1.3
2.5 2.8 3.7 3.5
2.6 2.5 3.2 2.9
2.9 2.1 1.8 4.3 2.8 1.3 5.6
3.0 2.8 3.0 2.7
3.0 3.1 2.8 2.7 2.7
2.9
1.9 1.9
1.7 2.5
3.9 2.2 1.1
1.6 1.8 2.4 2.4
1.7 1.7 2.0 2.0
1.9 1.6 1.8 1.5
0.0 1.3 5.6
2.1 1.7 1.9 1.9
1.7 2.0 1.9 1.8 2.1
1.9
28,917 8,239
26,467 10,689
7,398 7,581
22,177
22,839 2,543 8,466 3,308
11,392 2,962
13,485 9,317
35,134 1,682
53 70 37
144 36
5,686 8,878
15,842 6,666
9,348 9,976 6,854 5,538 5,440
37,156
1.3 1.3
1.1 1.9
* 11.6
1.2
1.2 1.0 1.8 1.1
1.3 1.5 1.3 1.2
1.3 1.3
(6.5) (0.0)
* 1.8
(0.0)
1.2 1.2 1.2 1.5
1.5 1.4 1.1 1.2 1.2
1.3
1.1 1.2
0.9 1.7
* 11.6
1.1
1.1 1.0 1.6 1.1
1.2 1.3 1.1 1.1
1.1 1.1
(6.5) (0.0)
* 1.8
(0.0)
1.0 1.1 1.1 1.4
1.2 1.2 1.0 1.0 1.2
1.1
7,187 2,489
7,149 2,527
4 27
9,645
6,841 598
1,484 753
3,346 946
3,144 2,240
9,095 463
15 22
9 56 16
1,484 2,087 4,101 1,978
2,087 2,439 1,806 1,537 1,807
9,676
( ) Based on 10-24 unweighted cases. * Percentage not shown, based on less than 10 unweighted cases. ** Unweighted cases. a Literate but did not attend school, are also included. b Total figure may not add to N, sample total, due to ‘don’t know’ or ‘missing cases’. 1 Women with no living children and reported problem in conceiving (involuntary infertility).

143
TABLE 7.16 TREATMENT FOR INFERTILITY BY BACKGROUND CHARACTERISTICS Percentage of currently married women aged 15-49 years who sought treatment for primary/secondary infertility problem, according to selected background characteristics, Madhya Pradesh, 2007-08
Background Characteristics
For primary Infertility
For secondary Infertility Percentage of women
sought treatment
Percentage of women taken
allopathic treatment
Number of women having
primary infertility**
Percentage of women
sought treatment
Percentage of women taken
allopathic treatment
Number of women having
secondary infertility**
Age group 15-19 20-24 25-29 30-34 35-39 40-44 45-49 Residence Rural Urban Age at consummation of marriage Below 18 years 18 years & above Marital duration 0-4 5-9 10-14 15+ Education Non-literatea Less than 5 yrs 5-9 years 10 or more years Husband's Education Non-literatea Less than 5 years 5-9 years 10 or more years Religion Hindu Muslim Christian Jain Buddhist/Neo-Buddhist Jain Others Castes/Tribesb Scheduled Castes Scheduled Tribes Other Backward Classes Others Wealth index Poorest Second Middle Fourth Highest Madhya Pradesh
53.2 66.2 78.8 80.8 80.3 77.9 74.0
73.0 82.9
74.2 78.4
56.4 74.0 82.9 77.1
72.9 74.2 77.5 87.1
71.9 71.8 72.9 83.8
74.7 88.2
* * * * *
73.4 69.9 76.1 81.3
69.2 69.4 75.3 79.0 90.3
75.4
35.1 49.9 60.5 52.9 55.4 47.1 46.0
47.2 66.9
47.6 62.6
43.3 57.3 62.4 48.5
42.0 52.4 63.4 82.2
38.7 43.5 48.6 73.1
50.7 79.9
* * * * *
50.8 32.9 54.8 67.5
35.4 41.0 52.0 63.0 81.3
52.0
77
461 445 389 385 324 250
1,756 575
1,641 690
245 428 414
1,244
1,309 175 662 186
611 180 929 610
2,221 94
3 2 2 6 3
372 468
1,068 419
476 617 477 413 349
2,331
(50.0) 66.7 76.9 72.1 73.9 73.6 68.6
68.1 81.7
71.5 72.8
65.5 70.1 76.2 72.3
67.2 78.3 73.7 84.1
68.1 61.0 70.9 80.2
71.3 79.5
* * * * *
68.7 62.3 75.3 78.3
62.3 69.2 70.5 72.1 90.0
71.9
(31.6) 50.1 59.0 52.9 58.3 57.8 43.7
47.3 71.0
49.7 63.1
52.9 55.4 56.0 52.8
45.2 58.2 58.3 79.4
43.0 37.0 55.8 67.5
53.1 65.2
* * * * *
52.4 35.6 57.2 68.3
35.9 48.3 52.1 62.9 80.5
54.0
22
156 219 151 135 107
81
628 243
591 280
81 190 164 436
463 69
231 108
238 75
311 247
816 43
1 3 3 4 1
154 193 347 171
195 229 169 131 147
871
* Percentage not shown; based on less than 10 unweighted cases. ** Unweighted cases. a Literate but did not attend school, are also included. b Total figure may not add to N, sample total, due to ‘don’t know’ or ‘missing cases’.
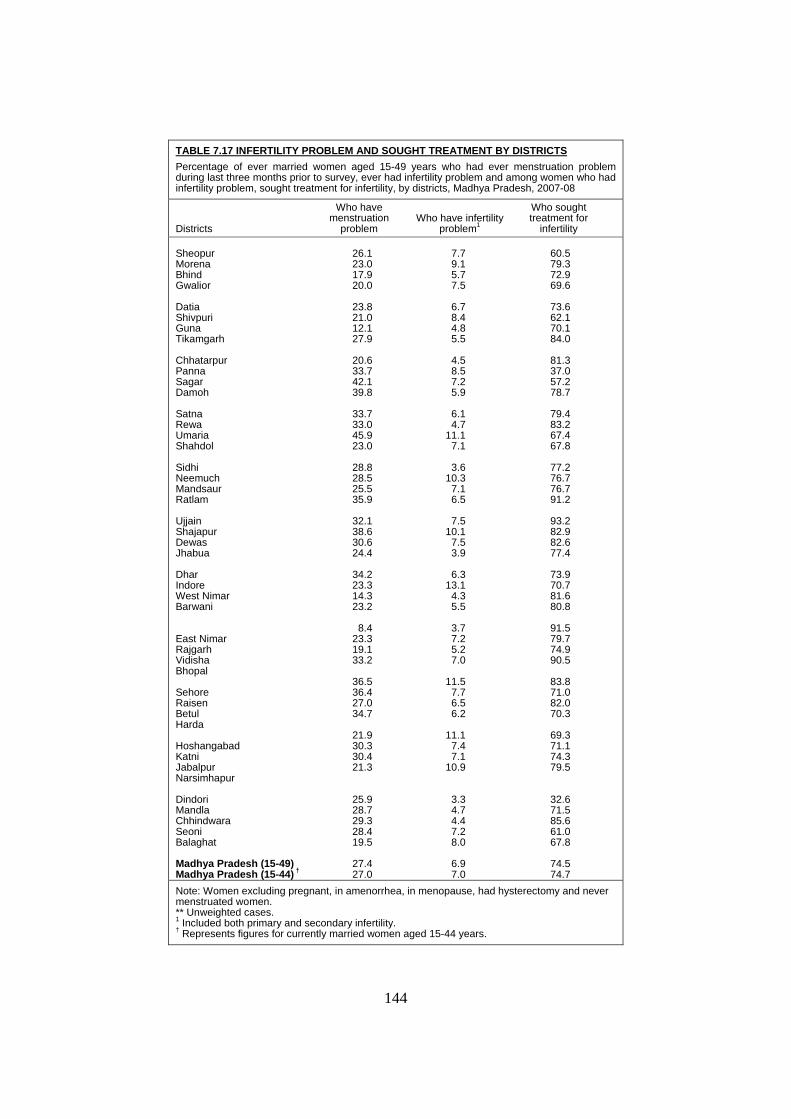
144
TABLE 7.17 INFERTILITY PROBLEM AND SOUGHT TREATMENT BY DISTRICTS Percentage of ever married women aged 15-49 years who had ever menstruation problem during last three months prior to survey, ever had infertility problem and among women who had infertility problem, sought treatment for infertility, by districts, Madhya Pradesh, 2007-08
Districts
Who have menstruation
problem Who have infertility
problem1
Who sought treatment for
infertility Sheopur Morena Bhind Gwalior Datia Shivpuri Guna Tikamgarh Chhatarpur Panna Sagar Damoh Satna Rewa Umaria Shahdol Sidhi Neemuch Mandsaur Ratlam Ujjain Shajapur Dewas Jhabua Dhar Indore West Nimar Barwani East Nimar Rajgarh Vidisha Bhopal Sehore Raisen Betul Harda Hoshangabad Katni Jabalpur Narsimhapur Dindori Mandla Chhindwara Seoni Balaghat Madhya Pradesh (15-49) Madhya Pradesh (15-44) †
26.1 23.0 17.9 20.0
23.8 21.0 12.1 27.9
20.6 33.7 42.1 39.8
33.7 33.0 45.9 23.0
28.8 28.5 25.5 35.9
32.1 38.6 30.6 24.4
34.2 23.3 14.3 23.2
8.4
23.3 19.1 33.2
36.5 36.4 27.0 34.7
21.9 30.3 30.4 21.3
25.9 28.7 29.3 28.4 19.5
27.4 27.0
7.7 9.1 5.7 7.5
6.7 8.4 4.8 5.5
4.5 8.5 7.2 5.9
6.1 4.7
11.1 7.1
3.6
10.3 7.1 6.5
7.5
10.1 7.5 3.9
6.3
13.1 4.3 5.5
3.7 7.2 5.2 7.0
11.5
7.7 6.5 6.2
11.1
7.4 7.1
10.9
3.3 4.7 4.4 7.2 8.0
6.9 7.0
60.5 79.3 72.9 69.6
73.6 62.1 70.1 84.0
81.3 37.0 57.2 78.7
79.4 83.2 67.4 67.8
77.2 76.7 76.7 91.2
93.2 82.9 82.6 77.4
73.9 70.7 81.6 80.8
91.5 79.7 74.9 90.5
83.8 71.0 82.0 70.3
69.3 71.1 74.3 79.5
32.6 71.5 85.6 61.0 67.8
74.5 74.7
Note: Women excluding pregnant, in amenorrhea, in menopause, had hysterectomy and never menstruated women. ** Unweighted cases. 1 Included both primary and secondary infertility. † Represents figures for currently married women aged 15-44 years.

CHARACTERISTICS OF UNMARRIED WOMEN


147
TABLE 8.1 BACKGROUND CHARACTERISTICS OF UNMARRIED WOMEN Percent distribution of unmarried women age 15-24 years, according to selected background characteristics, Madhya Pradesh, 2007-08
Background characteristics Total
Residence
Rural Urban Age group 15-19 84.1 89.9 73.1 20-24 15.9 10.1 26.9 Education Non-literatea 10.1 13.6 3.6 Less than five years 6.5 8.3 3.0 5-9 years 56.8 63.6 43.8 10 or more years 26.7 14.5 49.7 Religion Hindu 90.5 96.2 79.7 Muslim 8.1 3.3 17.1 Christian 0.2 0.1 0.3 Sikh 0.3 0.1 0.8 Buddhist/Neo-Buddhist 0.1 0.1 0.0 Jain 0.6 0.1 1.6 Others 0.2 0.0 0.5 Castes/tribes# Scheduled castes 15.4 14.7 16.8 Scheduled tribes 20.0 27.7 5.2 Other backward classes 40.7 39.1 43.9 Others 23.9 18.5 34.1 Wealth index Lowest 16.9 24.7 2.1 Second 21.9 30.7 5.4 Middle 18.6 21.9 12.5 Fourth 19.3 16.1 25.4 Highest 23.2 6.7 54.6 Madhya Pradesh** 9,940 6,504 3,436
** Unweighted cases. a Literate but did not attend school, are also included.
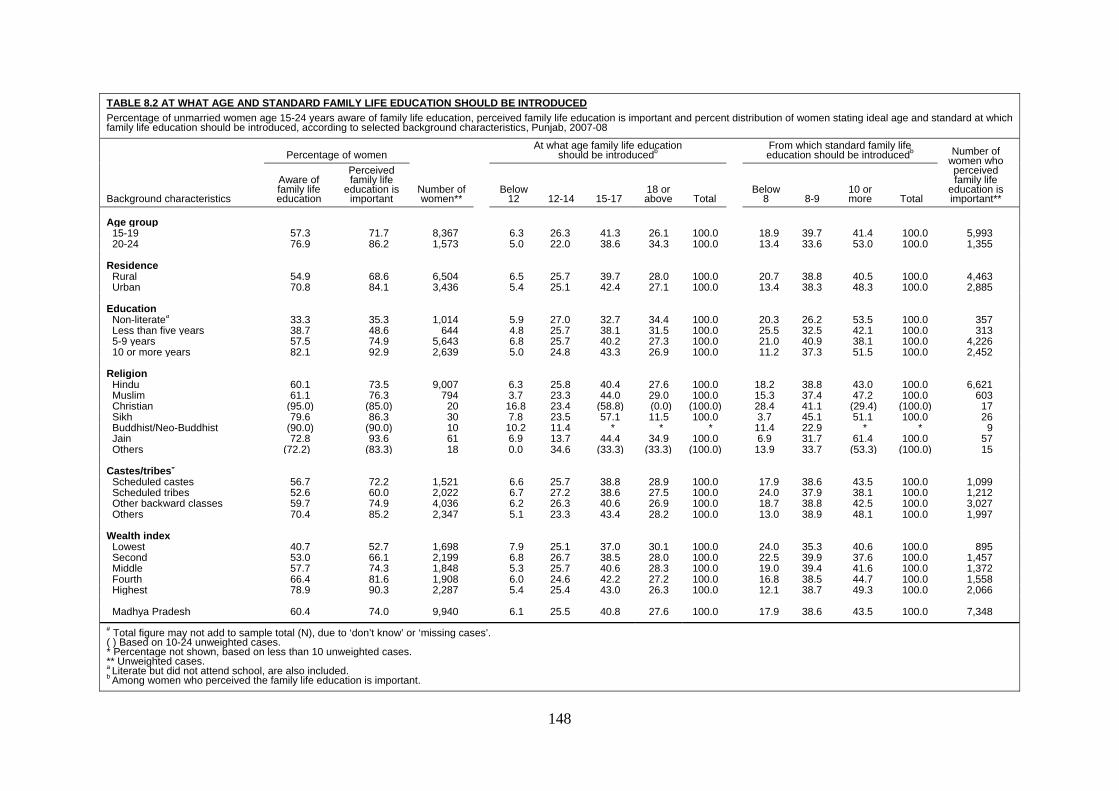
148
TABLE 8.2 AT WHAT AGE AND STANDARD FAMILY LIFE EDUCATION SHOULD BE INTRODUCED Percentage of unmarried women age 15-24 years aware of family life education, perceived family life education is important and percent distribution of women stating ideal age and standard at which family life education should be introduced, according to selected background characteristics, Punjab, 2007-08
Background characteristics
Percentage of women
Number of women**
At what age family life education should be introducedb
From which standard family life education should be introducedb Number of
women who perceived family life
education is important**
Aware of family life education
Perceived family life
education is important
Below 12 12-14 15-17
18 or above Total
Below 8 8-9
10 or more Total
Age group 15-19 57.3 71.7 8,367 6.3 26.3 41.3 26.1 100.0 18.9 39.7 41.4 100.0 5,993 20-24 76.9 86.2 1,573 5.0 22.0 38.6 34.3 100.0 13.4 33.6 53.0 100.0 1,355
Residence Rural 54.9 68.6 6,504 6.5 25.7 39.7 28.0 100.0 20.7 38.8 40.5 100.0 4,463 Urban 70.8 84.1 3,436 5.4 25.1 42.4 27.1 100.0 13.4 38.3 48.3 100.0 2,885 Education Non-literatea 33.3 35.3 1,014 5.9 27.0 32.7 34.4 100.0 20.3 26.2 53.5 100.0 357 Less than five years 38.7 48.6 644 4.8 25.7 38.1 31.5 100.0 25.5 32.5 42.1 100.0 313 5-9 years 57.5 74.9 5,643 6.8 25.7 40.2 27.3 100.0 21.0 40.9 38.1 100.0 4,226 10 or more years 82.1 92.9 2,639 5.0 24.8 43.3 26.9 100.0 11.2 37.3 51.5 100.0 2,452 Religion Hindu 60.1 73.5 9,007 6.3 25.8 40.4 27.6 100.0 18.2 38.8 43.0 100.0 6,621 Muslim 61.1 76.3 794 3.7 23.3 44.0 29.0 100.0 15.3 37.4 47.2 100.0 603 Christian (95.0) (85.0) 20 16.8 23.4 (58.8) (0.0) (100.0) 28.4 41.1 (29.4) (100.0) 17 Sikh 79.6 86.3 30 7.8 23.5 57.1 11.5 100.0 3.7 45.1 51.1 100.0 26 Buddhist/Neo-Buddhist (90.0) (90.0) 10 10.2 11.4 * * * 11.4 22.9 * * 9 Jain 72.8 93.6 61 6.9 13.7 44.4 34.9 100.0 6.9 31.7 61.4 100.0 57 Others (72.2) (83.3) 18 0.0 34.6 (33.3) (33.3) (100.0) 13.9 33.7 (53.3) (100.0) 15 Castes/tribes#
Scheduled castes 56.7 72.2 1,521 6.6 25.7 38.8 28.9 100.0 17.9 38.6 43.5 100.0 1,099 Scheduled tribes 52.6 60.0 2,022 6.7 27.2 38.6 27.5 100.0 24.0 37.9 38.1 100.0 1,212 Other backward classes 59.7 74.9 4,036 6.2 26.3 40.6 26.9 100.0 18.7 38.8 42.5 100.0 3,027 Others 70.4 85.2 2,347 5.1 23.3 43.4 28.2 100.0 13.0 38.9 48.1 100.0 1,997 Wealth index Lowest 40.7 52.7 1,698 7.9 25.1 37.0 30.1 100.0 24.0 35.3 40.6 100.0 895 Second 53.0 66.1 2,199 6.8 26.7 38.5 28.0 100.0 22.5 39.9 37.6 100.0 1,457 Middle 57.7 74.3 1,848 5.3 25.7 40.6 28.3 100.0 19.0 39.4 41.6 100.0 1,372 Fourth 66.4 81.6 1,908 6.0 24.6 42.2 27.2 100.0 16.8 38.5 44.7 100.0 1,558 Highest 78.9 90.3 2,287 5.4 25.4 43.0 26.3 100.0 12.1 38.7 49.3 100.0 2,066 Madhya Pradesh 60.4 74.0 9,940 6.1 25.5 40.8 27.6 100.0 17.9 38.6 43.5 100.0 7,348 # Total figure may not add to sample total (N), due to ‘don’t know’ or ‘missing cases’. ( ) Based on 10-24 unweighted cases. * Percentage not shown, based on less than 10 unweighted cases. ** Unweighted cases. a Literate but did not attend school, are also included. b Among women who perceived the family life education is important.
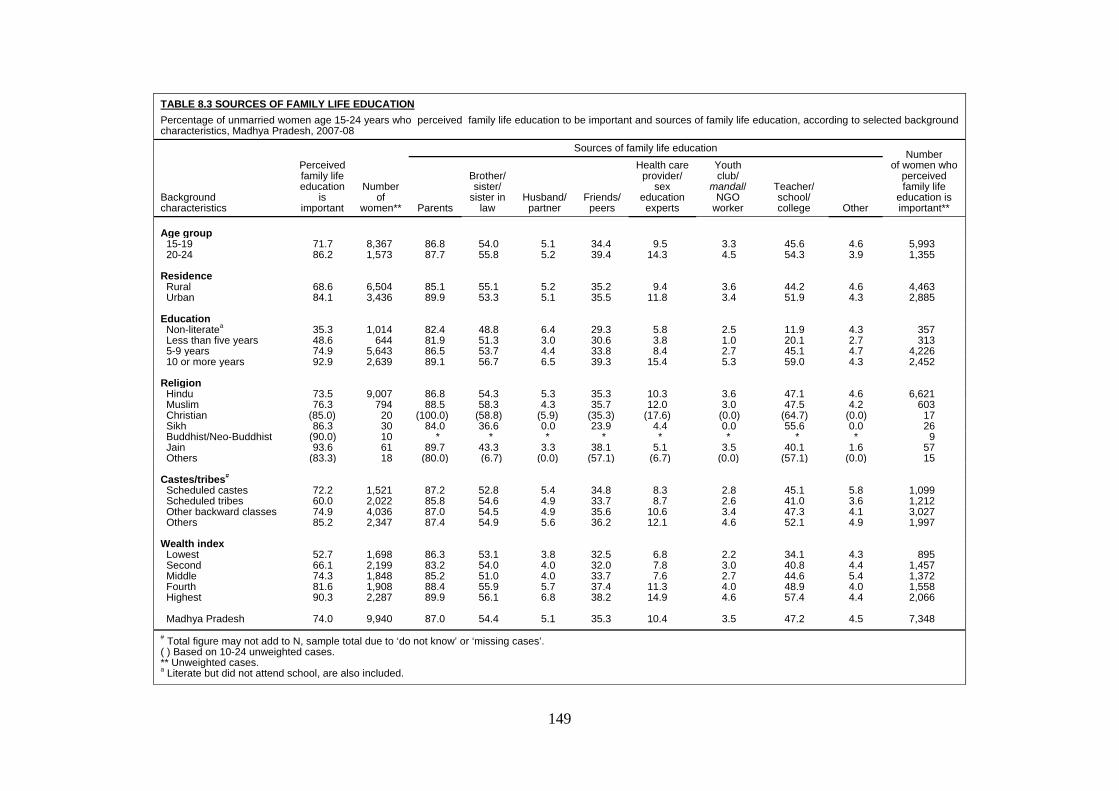
149
TABLE 8.3 SOURCES OF FAMILY LIFE EDUCATION Percentage of unmarried women age 15-24 years who perceived family life education to be important and sources of family life education, according to selected background characteristics, Madhya Pradesh, 2007-08
Background characteristics
Perceived family life education
is important
Number of
women**
Sources of family life education Number of women who
perceived family life
education is important** Parents
Brother/ sister/
sister in law
Husband/ partner
Friends/ peers
Health care provider/
sex education experts
Youth club/
mandal/ NGO
worker
Teacher/ school/ college Other
Age group 15-19 71.7 8,367 86.8 54.0 5.1 34.4 9.5 3.3 45.6 4.6 5,993 20-24 86.2 1,573 87.7 55.8 5.2 39.4 14.3 4.5 54.3 3.9 1,355
Residence Rural 68.6 6,504 85.1 55.1 5.2 35.2 9.4 3.6 44.2 4.6 4,463 Urban 84.1 3,436 89.9 53.3 5.1 35.5 11.8 3.4 51.9 4.3 2,885 Education Non-literatea 35.3 1,014 82.4 48.8 6.4 29.3 5.8 2.5 11.9 4.3 357 Less than five years 48.6 644 81.9 51.3 3.0 30.6 3.8 1.0 20.1 2.7 313 5-9 years 74.9 5,643 86.5 53.7 4.4 33.8 8.4 2.7 45.1 4.7 4,226 10 or more years 92.9 2,639 89.1 56.7 6.5 39.3 15.4 5.3 59.0 4.3 2,452 Religion Hindu 73.5 9,007 86.8 54.3 5.3 35.3 10.3 3.6 47.1 4.6 6,621 Muslim 76.3 794 88.5 58.3 4.3 35.7 12.0 3.0 47.5 4.2 603 Christian (85.0) 20 (100.0) (58.8) (5.9) (35.3) (17.6) (0.0) (64.7) (0.0) 17 Sikh 86.3 30 84.0 36.6 0.0 23.9 4.4 0.0 55.6 0.0 26 Buddhist/Neo-Buddhist (90.0) 10 * * * * * * * * 9 Jain 93.6 61 89.7 43.3 3.3 38.1 5.1 3.5 40.1 1.6 57 Others (83.3) 18 (80.0) (6.7) (0.0) (57.1) (6.7) (0.0) (57.1) (0.0) 15 Castes/tribes#
Scheduled castes 72.2 1,521 87.2 52.8 5.4 34.8 8.3 2.8 45.1 5.8 1,099 Scheduled tribes 60.0 2,022 85.8 54.6 4.9 33.7 8.7 2.6 41.0 3.6 1,212 Other backward classes 74.9 4,036 87.0 54.5 4.9 35.6 10.6 3.4 47.3 4.1 3,027 Others 85.2 2,347 87.4 54.9 5.6 36.2 12.1 4.6 52.1 4.9 1,997 Wealth index Lowest 52.7 1,698 86.3 53.1 3.8 32.5 6.8 2.2 34.1 4.3 895 Second 66.1 2,199 83.2 54.0 4.0 32.0 7.8 3.0 40.8 4.4 1,457 Middle 74.3 1,848 85.2 51.0 4.0 33.7 7.6 2.7 44.6 5.4 1,372 Fourth 81.6 1,908 88.4 55.9 5.7 37.4 11.3 4.0 48.9 4.0 1,558 Highest 90.3 2,287 89.9 56.1 6.8 38.2 14.9 4.6 57.4 4.4 2,066 Madhya Pradesh 74.0 9,940 87.0 54.4 5.1 35.3 10.4 3.5 47.2 4.5 7,348# Total figure may not add to N, sample total due to ‘do not know’ or ‘missing cases’. ( ) Based on 10-24 unweighted cases. ** Unweighted cases. a Literate but did not attend school, are also included.
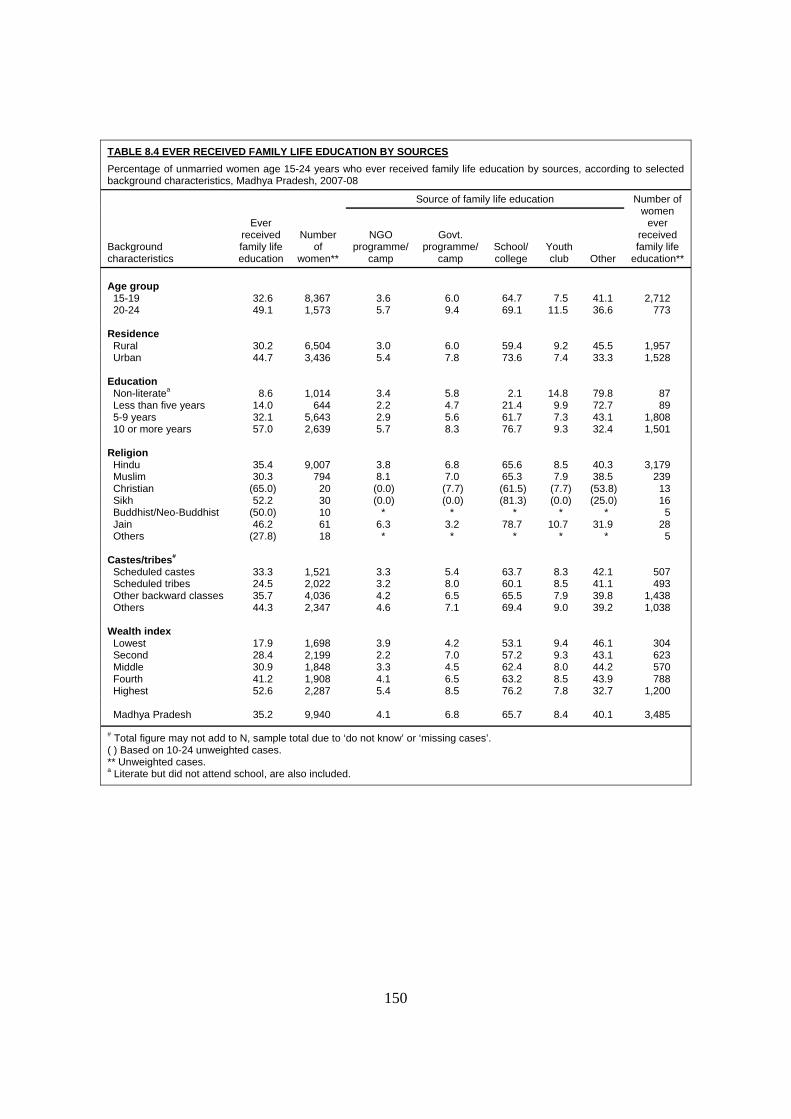
150
TABLE 8.4 EVER RECEIVED FAMILY LIFE EDUCATION BY SOURCES Percentage of unmarried women age 15-24 years who ever received family life education by sources, according to selected background characteristics, Madhya Pradesh, 2007-08
Background characteristics
Ever received family life education
Number of
women**
Source of family life education Number of women
ever received family life
education**
NGO programme/
camp
Govt. programme/
camp School/ college
Youth club Other
Age group 15-19 32.6 8,367 3.6 6.0 64.7 7.5 41.1 2,712 20-24 49.1 1,573 5.7 9.4 69.1 11.5 36.6 773
Residence Rural 30.2 6,504 3.0 6.0 59.4 9.2 45.5 1,957 Urban 44.7 3,436 5.4 7.8 73.6 7.4 33.3 1,528 Education Non-literatea 8.6 1,014 3.4 5.8 2.1 14.8 79.8 87 Less than five years 14.0 644 2.2 4.7 21.4 9.9 72.7 89 5-9 years 32.1 5,643 2.9 5.6 61.7 7.3 43.1 1,808 10 or more years 57.0 2,639 5.7 8.3 76.7 9.3 32.4 1,501 Religion Hindu 35.4 9,007 3.8 6.8 65.6 8.5 40.3 3,179 Muslim 30.3 794 8.1 7.0 65.3 7.9 38.5 239 Christian (65.0) 20 (0.0) (7.7) (61.5) (7.7) (53.8) 13 Sikh 52.2 30 (0.0) (0.0) (81.3) (0.0) (25.0) 16 Buddhist/Neo-Buddhist (50.0) 10 * * * * * 5 Jain 46.2 61 6.3 3.2 78.7 10.7 31.9 28 Others (27.8) 18 * * * * * 5 Castes/tribes# Scheduled castes 33.3 1,521 3.3 5.4 63.7 8.3 42.1 507 Scheduled tribes 24.5 2,022 3.2 8.0 60.1 8.5 41.1 493 Other backward classes 35.7 4,036 4.2 6.5 65.5 7.9 39.8 1,438 Others 44.3 2,347 4.6 7.1 69.4 9.0 39.2 1,038 Wealth index Lowest 17.9 1,698 3.9 4.2 53.1 9.4 46.1 304 Second 28.4 2,199 2.2 7.0 57.2 9.3 43.1 623 Middle 30.9 1,848 3.3 4.5 62.4 8.0 44.2 570 Fourth 41.2 1,908 4.1 6.5 63.2 8.5 43.9 788 Highest 52.6 2,287 5.4 8.5 76.2 7.8 32.7 1,200 Madhya Pradesh 35.2 9,940 4.1 6.8 65.7 8.4 40.1 3,485
# Total figure may not add to N, sample total due to ‘do not know’ or ‘missing cases’. ( ) Based on 10-24 unweighted cases. ** Unweighted cases. a Literate but did not attend school, are also included.

151
TABLE 8.5 KNOWLEDGE OF LEGAL AGE AT MARRIAGE AND REPORTED IDEAL AGE AT MARRIAGE FOR BOYS AND GIRLS Percentage of unmarried women age 15-24 years who have knowledge about legally prescribed minimum age at marriage in India for boys and girls and reported ideal age at marriage for boys and girls according to selected background characteristics, Madhya Pradesh, 2007-08
Background characteristics
Knowledge of minimum legal age
at marriage
Reported ideal age at marriage for boys
Reported ideal age at marriage for girls Number
of women** Boys Girls
Less than 21
21 and above Total
Less than 18
18 and above Total
Age group 15-19 85.5 86.8 9.0 91.0 100.0 1.7 98.3 100.0 8,367 20-24 94.6 95.0 5.1 94.9 100.0 1.0 99.0 100.0 1,573
Residence Rural 82.8 84.0 9.9 90.1 100.0 2.2 97.8 100.0 6,504 Urban 94.9 95.8 5.7 94.3 100.0 0.6 99.4 100.0 3,436 Education Non-literatea 48.9 50.3 22.4 77.6 100.0 9.2 90.8 100.0 1,014 Less than five years 62.0 65.0 22.7 77.3 100.0 5.7 94.3 100.0 644 5-9 years 90.9 92.1 8.4 91.6 100.0 1.2 98.8 100.0 5,643 10 or more years 99.1 99.5 3.2 96.8 100.0 0.3 99.7 100.0 2,639 Religion Hindu 86.4 87.5 8.4 91.6 100.0 1.6 98.4 100.0 9,007 Muslim 92.0 93.3 8.2 91.8 100.0 1.6 98.4 100.0 794 Christian (90.0) (95.0) (5.6) (94.4) (100.0) (0.0) (100.0) (100.0) 20 Sikh 97.0 97.0 11.3 88.7 100.0 3.9 96.1 100.0 30 Buddhist/Neo-Buddhist (100.0) (100.0)
(0.0) (100.0) (100.0)
(0.0) (100.0) (100.0) 10 Jain 95.1 96.6 0.0 100.0 100.0 0.0 100.0 100.0 61 Others (100.0) (100.0) (5.6) (94.4) (100.0) (0.0) (100.0) (100.0) 18 Castes/tribes#
Scheduled castes 86.9 87.9 10.0 90.0 100.0 1.4 98.6 100.0 1,521 Scheduled tribes 74.8 76.1 10.8 89.2 100.0 3.4 96.6 100.0 2,022 Other backward classes 88.3 89.5 8.2 91.8 100.0 1.5 98.5 100.0 4,036 Others 95.0 95.9 5.8 94.2 100.0 0.7 99.3 100.0 2,347 Wealth index Lowest 67.0 68.5 15.5 84.5 100.0 4.6 95.4 100.0 1,698 Second 82.1 83.5 10.1 89.9 100.0 1.7 98.3 100.0 2,199 Middle 89.6 90.8 9.3 90.7 100.0 1.8 98.2 100.0 1,848 Fourth 94.3 95.3 6.6 93.4 100.0 1.0 99.0 100.0 1,908 Highest 97.8 98.4 3.9 96.1 100.0 0.3 99.7 100.0 2,287 Madhya Pradesh 87.0 88.1 8.3 91.7 100.0 1.6 98.4 100.0 9,940
# Total figure may not add to N, sample total due to ‘do not know’ or ‘missing cases’. ( ) Based on 10-24 unweighted cases. ** Unweighted cases. a Literate but did not attend school, are also included.
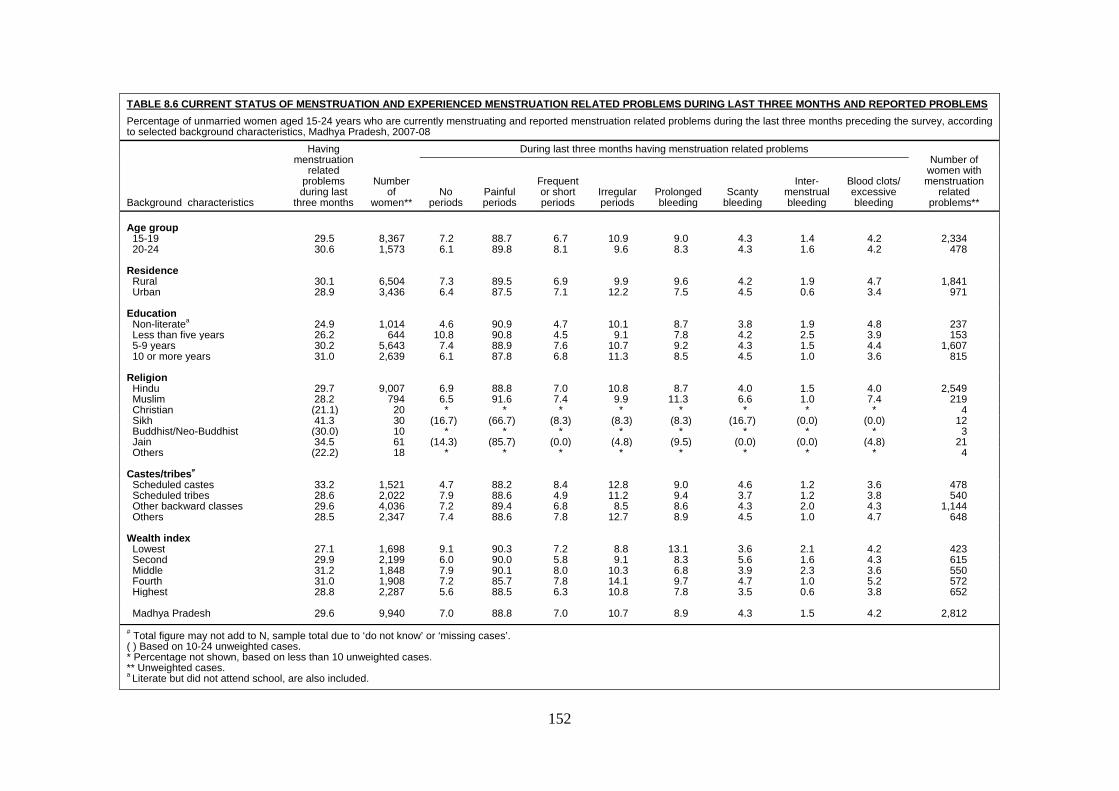
152
TABLE 8.6 CURRENT STATUS OF MENSTRUATION AND EXPERIENCED MENSTRUATION RELATED PROBLEMS DURING LAST THREE MONTHS AND REPORTED PROBLEMS Percentage of unmarried women aged 15-24 years who are currently menstruating and reported menstruation related problems during the last three months preceding the survey, according to selected background characteristics, Madhya Pradesh, 2007-08
Background characteristics
Having menstruation
related problems during last
three months
Number of
women**
During last three months having menstruation related problems Number of
women with menstruation
related problems**
No periods
Painful periods
Frequent or short periods
Irregular periods
Prolonged bleeding
Scanty bleeding
Inter-menstrual bleeding
Blood clots/ excessive bleeding
Age group 15-19 29.5 8,367 7.2 88.7 6.7 10.9 9.0 4.3 1.4 4.2 2,334 20-24 30.6 1,573 6.1 89.8 8.1 9.6 8.3 4.3 1.6 4.2 478
Residence Rural 30.1 6,504 7.3 89.5 6.9 9.9 9.6 4.2 1.9 4.7 1,841 Urban 28.9 3,436 6.4 87.5 7.1 12.2 7.5 4.5 0.6 3.4 971 Education Non-literatea 24.9 1,014 4.6 90.9 4.7 10.1 8.7 3.8 1.9 4.8 237 Less than five years 26.2 644 10.8 90.8 4.5 9.1 7.8 4.2 2.5 3.9 153 5-9 years 30.2 5,643 7.4 88.9 7.6 10.7 9.2 4.3 1.5 4.4 1,607 10 or more years 31.0 2,639 6.1 87.8 6.8 11.3 8.5 4.5 1.0 3.6 815 Religion Hindu 29.7 9,007 6.9 88.8 7.0 10.8 8.7 4.0 1.5 4.0 2,549 Muslim 28.2 794 6.5 91.6 7.4 9.9 11.3 6.6 1.0 7.4 219 Christian (21.1) 20 * * * * * * * * 4 Sikh 41.3 30 (16.7) (66.7) (8.3) (8.3) (8.3) (16.7) (0.0) (0.0) 12 Buddhist/Neo-Buddhist (30.0) 10 * * * * * * * * 3 Jain 34.5 61 (14.3) (85.7) (0.0) (4.8) (9.5) (0.0) (0.0) (4.8) 21 Others (22.2) 18 * * * * * * * * 4 Castes/tribes#
Scheduled castes 33.2 1,521 4.7 88.2 8.4 12.8 9.0 4.6 1.2 3.6 478 Scheduled tribes 28.6 2,022 7.9 88.6 4.9 11.2 9.4 3.7 1.2 3.8 540 Other backward classes 29.6 4,036 7.2 89.4 6.8 8.5 8.6 4.3 2.0 4.3 1,144 Others 28.5 2,347 7.4 88.6 7.8 12.7 8.9 4.5 1.0 4.7 648 Wealth index Lowest 27.1 1,698 9.1 90.3 7.2 8.8 13.1 3.6 2.1 4.2 423 Second 29.9 2,199 6.0 90.0 5.8 9.1 8.3 5.6 1.6 4.3 615 Middle 31.2 1,848 7.9 90.1 8.0 10.3 6.8 3.9 2.3 3.6 550 Fourth 31.0 1,908 7.2 85.7 7.8 14.1 9.7 4.7 1.0 5.2 572 Highest 28.8 2,287 5.6 88.5 6.3 10.8 7.8 3.5 0.6 3.8 652 Madhya Pradesh 29.6 9,940 7.0 88.8 7.0 10.7 8.9 4.3 1.5 4.2 2,812# Total figure may not add to N, sample total due to ‘do not know’ or ‘missing cases’. ( ) Based on 10-24 unweighted cases. * Percentage not shown, based on less than 10 unweighted cases. ** Unweighted cases. a Literate but did not attend school, are also included.
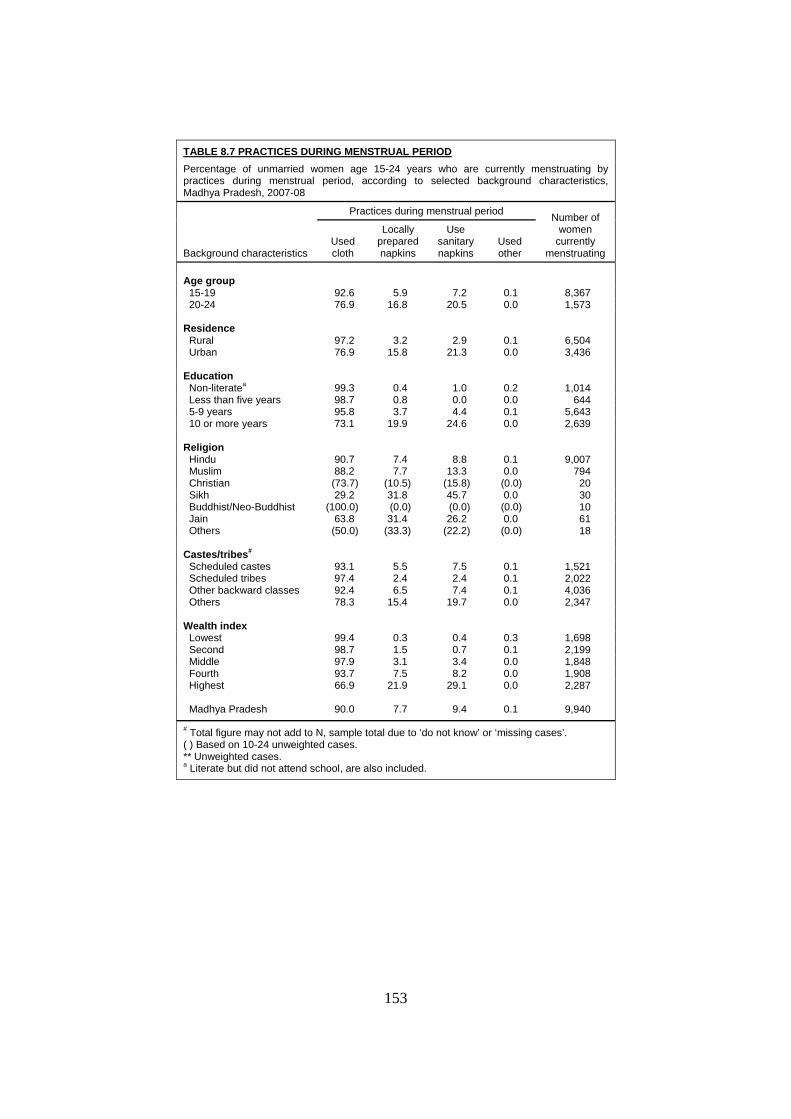
153
TABLE 8.7 PRACTICES DURING MENSTRUAL PERIOD Percentage of unmarried women age 15-24 years who are currently menstruating by practices during menstrual period, according to selected background characteristics, Madhya Pradesh, 2007-08
Background characteristics
Practices during menstrual period Number of women
currently menstruating
Used cloth
Locally prepared napkins
Use sanitary napkins
Used other
Age group 15-19 92.6 5.9 7.2 0.1 8,367 20-24 76.9 16.8 20.5 0.0 1,573
Residence Rural 97.2 3.2 2.9 0.1 6,504 Urban 76.9 15.8 21.3 0.0 3,436 Education Non-literatea 99.3 0.4 1.0 0.2 1,014 Less than five years 98.7 0.8 0.0 0.0 644 5-9 years 95.8 3.7 4.4 0.1 5,643 10 or more years 73.1 19.9 24.6 0.0 2,639 Religion Hindu 90.7 7.4 8.8 0.1 9,007 Muslim 88.2 7.7 13.3 0.0 794 Christian (73.7) (10.5) (15.8) (0.0) 20 Sikh 29.2 31.8 45.7 0.0 30 Buddhist/Neo-Buddhist (100.0) (0.0) (0.0) (0.0) 10 Jain 63.8 31.4 26.2 0.0 61 Others (50.0) (33.3) (22.2) (0.0) 18 Castes/tribes# Scheduled castes 93.1 5.5 7.5 0.1 1,521 Scheduled tribes 97.4 2.4 2.4 0.1 2,022 Other backward classes 92.4 6.5 7.4 0.1 4,036 Others 78.3 15.4 19.7 0.0 2,347 Wealth index Lowest 99.4 0.3 0.4 0.3 1,698 Second 98.7 1.5 0.7 0.1 2,199 Middle 97.9 3.1 3.4 0.0 1,848 Fourth 93.7 7.5 8.2 0.0 1,908 Highest 66.9 21.9 29.1 0.0 2,287 Madhya Pradesh 90.0 7.7 9.4 0.1 9,940
# Total figure may not add to N, sample total due to ‘do not know’ or ‘missing cases’. ( ) Based on 10-24 unweighted cases. ** Unweighted cases. a Literate but did not attend school, are also included.
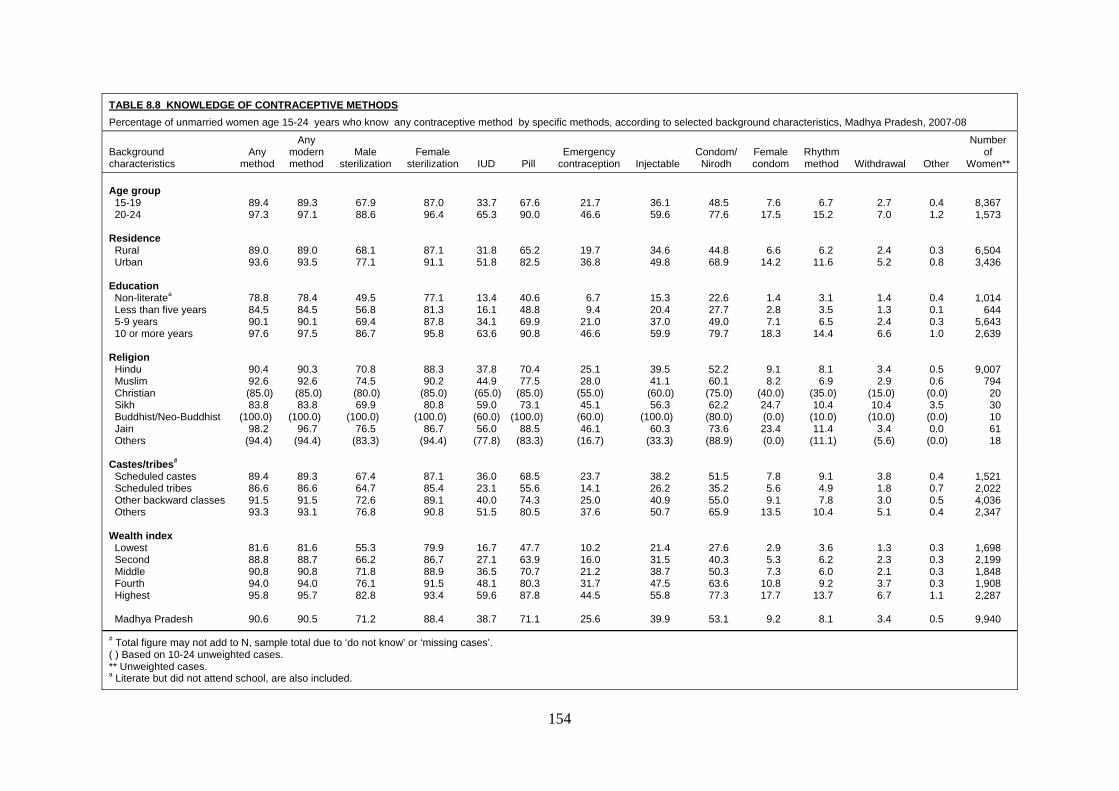
154
TABLE 8.8 KNOWLEDGE OF CONTRACEPTIVE METHODS Percentage of unmarried women age 15-24 years who know any contraceptive method by specific methods, according to selected background characteristics, Madhya Pradesh, 2007-08
Background characteristics
Any method
Any modern method
Male sterilization
Female sterilization IUD Pill
Emergency contraception Injectable
Condom/ Nirodh
Female condom
Rhythm method Withdrawal Other
Number of
Women** Age group 15-19 89.4 89.3 67.9 87.0 33.7 67.6 21.7 36.1 48.5 7.6 6.7 2.7 0.4 8,367 20-24 97.3 97.1 88.6 96.4 65.3 90.0 46.6 59.6 77.6 17.5 15.2 7.0 1.2 1,573
Residence Rural 89.0 89.0 68.1 87.1 31.8 65.2 19.7 34.6 44.8 6.6 6.2 2.4 0.3 6,504 Urban 93.6 93.5 77.1 91.1 51.8 82.5 36.8 49.8 68.9 14.2 11.6 5.2 0.8 3,436 Education Non-literatea 78.8 78.4 49.5 77.1 13.4 40.6 6.7 15.3 22.6 1.4 3.1 1.4 0.4 1,014 Less than five years 84.5 84.5 56.8 81.3 16.1 48.8 9.4 20.4 27.7 2.8 3.5 1.3 0.1 644 5-9 years 90.1 90.1 69.4 87.8 34.1 69.9 21.0 37.0 49.0 7.1 6.5 2.4 0.3 5,643 10 or more years 97.6 97.5 86.7 95.8 63.6 90.8 46.6 59.9 79.7 18.3 14.4 6.6 1.0 2,639 Religion Hindu 90.4 90.3 70.8 88.3 37.8 70.4 25.1 39.5 52.2 9.1 8.1 3.4 0.5 9,007 Muslim 92.6 92.6 74.5 90.2 44.9 77.5 28.0 41.1 60.1 8.2 6.9 2.9 0.6 794 Christian (85.0) (85.0) (80.0) (85.0) (65.0) (85.0) (55.0) (60.0) (75.0) (40.0) (35.0) (15.0) (0.0) 20 Sikh 83.8 83.8 69.9 80.8 59.0 73.1 45.1 56.3 62.2 24.7 10.4 10.4 3.5 30 Buddhist/Neo-Buddhist (100.0) (100.0) (100.0) (100.0) (60.0) (100.0) (60.0) (100.0) (80.0) (0.0) (10.0) (10.0) (0.0) 10 Jain 98.2 96.7 76.5 86.7 56.0 88.5 46.1 60.3 73.6 23.4 11.4 3.4 0.0 61 Others (94.4) (94.4) (83.3) (94.4) (77.8) (83.3) (16.7) (33.3) (88.9) (0.0) (11.1) (5.6) (0.0) 18 Castes/tribes#
Scheduled castes 89.4 89.3 67.4 87.1 36.0 68.5 23.7 38.2 51.5 7.8 9.1 3.8 0.4 1,521 Scheduled tribes 86.6 86.6 64.7 85.4 23.1 55.6 14.1 26.2 35.2 5.6 4.9 1.8 0.7 2,022 Other backward classes 91.5 91.5 72.6 89.1 40.0 74.3 25.0 40.9 55.0 9.1 7.8 3.0 0.5 4,036 Others 93.3 93.1 76.8 90.8 51.5 80.5 37.6 50.7 65.9 13.5 10.4 5.1 0.4 2,347 Wealth index Lowest 81.6 81.6 55.3 79.9 16.7 47.7 10.2 21.4 27.6 2.9 3.6 1.3 0.3 1,698 Second 88.8 88.7 66.2 86.7 27.1 63.9 16.0 31.5 40.3 5.3 6.2 2.3 0.3 2,199 Middle 90.8 90.8 71.8 88.9 36.5 70.7 21.2 38.7 50.3 7.3 6.0 2.1 0.3 1,848 Fourth 94.0 94.0 76.1 91.5 48.1 80.3 31.7 47.5 63.6 10.8 9.2 3.7 0.3 1,908 Highest 95.8 95.7 82.8 93.4 59.6 87.8 44.5 55.8 77.3 17.7 13.7 6.7 1.1 2,287 Madhya Pradesh 90.6 90.5 71.2 88.4 38.7 71.1 25.6 39.9 53.1 9.2 8.1 3.4 0.5 9,940
# Total figure may not add to N, sample total due to ‘do not know’ or ‘missing cases’. ( ) Based on 10-24 unweighted cases. ** Unweighted cases. a Literate but did not attend school, are also included.
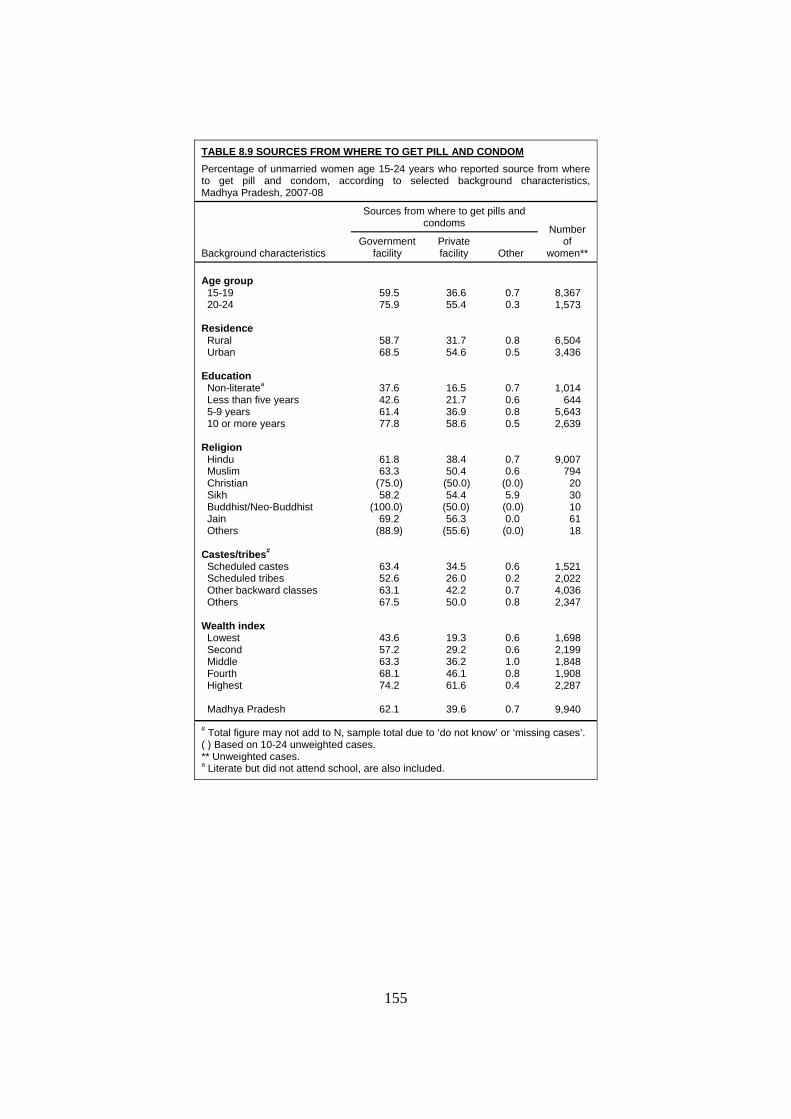
155
TABLE 8.9 SOURCES FROM WHERE TO GET PILL AND CONDOM Percentage of unmarried women age 15-24 years who reported source from where to get pill and condom, according to selected background characteristics, Madhya Pradesh, 2007-08
Background characteristics
Sources from where to get pills and condoms Number
of women**
Government facility
Private facility Other
Age group 15-19 59.5 36.6 0.7 8,367 20-24 75.9 55.4 0.3 1,573
Residence Rural 58.7 31.7 0.8 6,504 Urban 68.5 54.6 0.5 3,436 Education Non-literatea 37.6 16.5 0.7 1,014 Less than five years 42.6 21.7 0.6 644 5-9 years 61.4 36.9 0.8 5,643 10 or more years 77.8 58.6 0.5 2,639 Religion Hindu 61.8 38.4 0.7 9,007 Muslim 63.3 50.4 0.6 794 Christian (75.0) (50.0) (0.0) 20 Sikh 58.2 54.4 5.9 30 Buddhist/Neo-Buddhist (100.0) (50.0) (0.0) 10 Jain 69.2 56.3 0.0 61 Others (88.9) (55.6) (0.0) 18 Castes/tribes# Scheduled castes 63.4 34.5 0.6 1,521 Scheduled tribes 52.6 26.0 0.2 2,022 Other backward classes 63.1 42.2 0.7 4,036 Others 67.5 50.0 0.8 2,347 Wealth index Lowest 43.6 19.3 0.6 1,698 Second 57.2 29.2 0.6 2,199 Middle 63.3 36.2 1.0 1,848 Fourth 68.1 46.1 0.8 1,908 Highest 74.2 61.6 0.4 2,287 Madhya Pradesh 62.1 39.6 0.7 9,940
# Total figure may not add to N, sample total due to ‘do not know’ or ‘missing cases’. ( ) Based on 10-24 unweighted cases. ** Unweighted cases. a Literate but did not attend school, are also included.
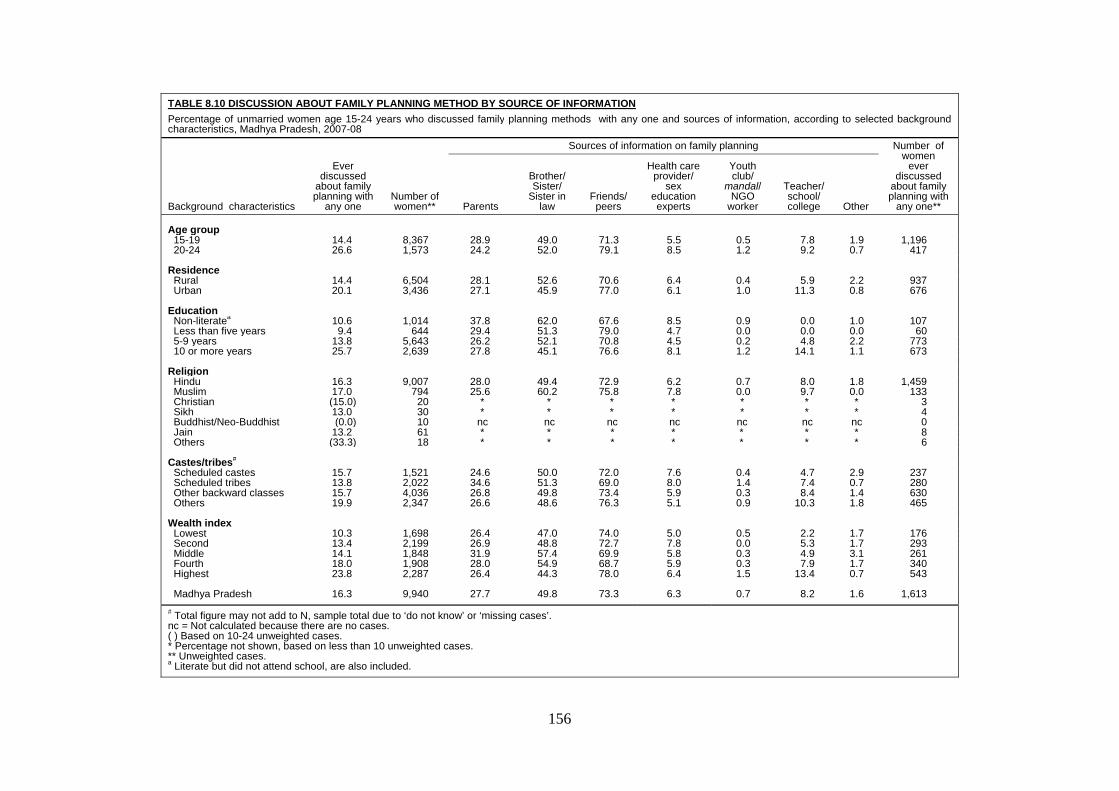
156
TABLE 8.10 DISCUSSION ABOUT FAMILY PLANNING METHOD BY SOURCE OF INFORMATION Percentage of unmarried women age 15-24 years who discussed family planning methods with any one and sources of information, according to selected background characteristics, Madhya Pradesh, 2007-08
Background characteristics
Ever discussed
about family planning with
any one Number of women**
Sources of information on family planning Number of women
ever discussed
about family planning with
any one** Parents
Brother/ Sister/
Sister in law
Friends/ peers
Health care provider/
sex education experts
Youth club/
mandal/ NGO
worker
Teacher/ school/ college Other
Age group 15-19 14.4 8,367 28.9 49.0 71.3 5.5 0.5 7.8 1.9 1,196 20-24 26.6 1,573 24.2 52.0 79.1 8.5 1.2 9.2 0.7 417
Residence Rural 14.4 6,504 28.1 52.6 70.6 6.4 0.4 5.9 2.2 937Urban 20.1 3,436 27.1 45.9 77.0 6.1 1.0 11.3 0.8 676
Education Non-literatea 10.6 1,014 37.8 62.0 67.6 8.5 0.9 0.0 1.0 107 Less than five years 9.4 644 29.4 51.3 79.0 4.7 0.0 0.0 0.0 60 5-9 years 13.8 5,643 26.2 52.1 70.8 4.5 0.2 4.8 2.2 773 10 or more years 25.7 2,639 27.8 45.1 76.6 8.1 1.2 14.1 1.1 673
Religion Hindu 16.3 9,007 28.0 49.4 72.9 6.2 0.7 8.0 1.8 1,459 Muslim 17.0 794 25.6 60.2 75.8 7.8 0.0 9.7 0.0 133 Christian (15.0) 20 * * * * * * * 3 Sikh 13.0 30 * * * * * * * 4 Buddhist/Neo-Buddhist (0.0) 10 nc nc nc nc nc nc nc 0 Jain 13.2 61 * * * * * * * 8 Others (33.3) 18 * * * * * * * 6
Castes/tribes# Scheduled castes 15.7 1,521 24.6 50.0 72.0 7.6 0.4 4.7 2.9 237 Scheduled tribes 13.8 2,022 34.6 51.3 69.0 8.0 1.4 7.4 0.7 280 Other backward classes 15.7 4,036 26.8 49.8 73.4 5.9 0.3 8.4 1.4 630 Others 19.9 2,347 26.6 48.6 76.3 5.1 0.9 10.3 1.8 465
Wealth index Lowest 10.3 1,698 26.4 47.0 74.0 5.0 0.5 2.2 1.7 176 Second 13.4 2,199 26.9 48.8 72.7 7.8 0.0 5.3 1.7 293 Middle 14.1 1,848 31.9 57.4 69.9 5.8 0.3 4.9 3.1 261 Fourth 18.0 1,908 28.0 54.9 68.7 5.9 0.3 7.9 1.7 340 Highest 23.8 2,287 26.4 44.3 78.0 6.4 1.5 13.4 0.7 543
Madhya Pradesh 16.3 9,940 27.7 49.8 73.3 6.3 0.7 8.2 1.6 1,613
# Total figure may not add to N, sample total due to ‘do not know’ or ‘missing cases’. nc = Not calculated because there are no cases. ( ) Based on 10-24 unweighted cases. * Percentage not shown, based on less than 10 unweighted cases. ** Unweighted cases. a Literate but did not attend school, are also included.

157
TABLE 8.11 KNOWLEDGE OF RTI AND STI BY SOURCES Percentage of unmarried women age 15-24 years who are aware of RTI/STI and source of information , according to selected background characteristics, Madhya Pradesh, 2007-08
Background characteristics
Ever heard of RTI/STI
Number of
women**
Sources of information Number of
women who ever
heard of
RTI/STI** Radio T.V. Cinema Print
media Health
personnel Partner Relatives/
friends
Adult Education
programme/ school teacher
Religious/ political leader/
community meetings/
exhibition/mela Others Age group 15-19 16.4 8,367 34.7 65.0 6.6 34.4 7.9 3.2 33.8 22.1 5.4 0.9 1,371 20-24 34.7 1,573 27.9 76.5 8.5 50.6 8.6 2.1 26.7 22.5 4.9 0.9 544
Residence Rural 15.7 6,504 41.4 61.2 6.2 30.4 9.5 3.7 37.7 19.7 6.3 0.8 1,024 Urban 26.2 3,436 22.9 76.3 8.3 48.8 6.6 2.0 25.0 25.0 4.0 1.1 891 Education Non-literatea 3.6 1,014 21.5 30.9 0.0 2.2 5.2 7.5 74.4 5.2 10.6 0.0 37 Less than five years 6.4 644 32.3 40.2 0.0 7.7 8.2 0.0 56.3 0.0 2.5 0.0 40 5-9 years 15.4 5,643 37.7 63.0 5.1 27.4 8.4 3.7 35.8 18.0 5.4 0.9 872 10 or more years 36.7 2,639 28.8 75.5 9.6 52.1 8.0 2.2 25.5 27.5 5.0 1.0 966 Religion Hindu 19.4 9,007 33.1 67.6 7.3 39.0 8.5 3.1 31.8 22.1 5.2 0.9 1,742 Muslim 16.1 794 26.2 74.5 4.0 41.6 3.2 1.7 30.8 20.8 4.8 0.7 130 Christian (35.0) 20 * * * * * * * * * 0.0 7 Sikh 18.2 30 * * * * * * * * * 0.0 6 Buddhist/Neo-Buddhist (40.0) 10 * * * * * * * * * * 4 Jain 40.2 61 35.8 84.1 17.1 35.9 0.0 0.0 24.1 23.8 3.6 0.0 25 Others (5.6) 18 * * * * * * * * * * 1 Castes/tribes#
Scheduled castes 19.7 1,521 33.7 67.9 7.0 31.3 9.4 2.7 31.8 19.9 3.4 0.8 298 Scheduled tribes 11.5 2,022 31.2 54.0 3.7 34.0 11.2 3.7 38.3 28.1 11.1 0.4 234 Other backward classes 19.0 4,036 32.7 68.2 6.9 38.2 8.7 3.4 31.5 20.9 4.4 1.3 763 Others 26.2 2,347 33.0 73.7 8.7 45.9 5.6 2.1 29.7 22.8 5.1 0.6 617 Wealth index Lowest 7.6 1,698 32.4 25.6 1.6 15.5 4.8 6.0 58.2 17.4 10.1 0.0 129 Second 13.0 2,199 44.3 49.5 4.9 25.4 11.1 3.8 43.5 21.8 8.6 0.3 285 Middle 16.3 1,848 42.8 67.1 6.9 31.7 10.0 3.7 30.6 20.1 4.0 0.7 303 Fourth 23.2 1,908 31.9 76.0 5.7 34.0 8.7 2.7 29.3 18.7 4.3 1.3 442 Highest 33.1 2,287 25.1 78.2 9.9 53.8 6.5 1.9 24.9 26.0 4.2 1.1 756 Madhya Pradesh 19.3 9,940 32.8 68.3 7.2 39.0 8.1 2.9 31.7 22.2 5.2 0.9 1,915
# Total figure may not add to N, sample total due to ‘do not know’ or ‘missing cases’. ( ) Based on 10-24 unweighted cases. * Percentage not shown, based on less than 10 unweighted cases. ** Unweighted cases. a Literate but did not attend school, are also included.
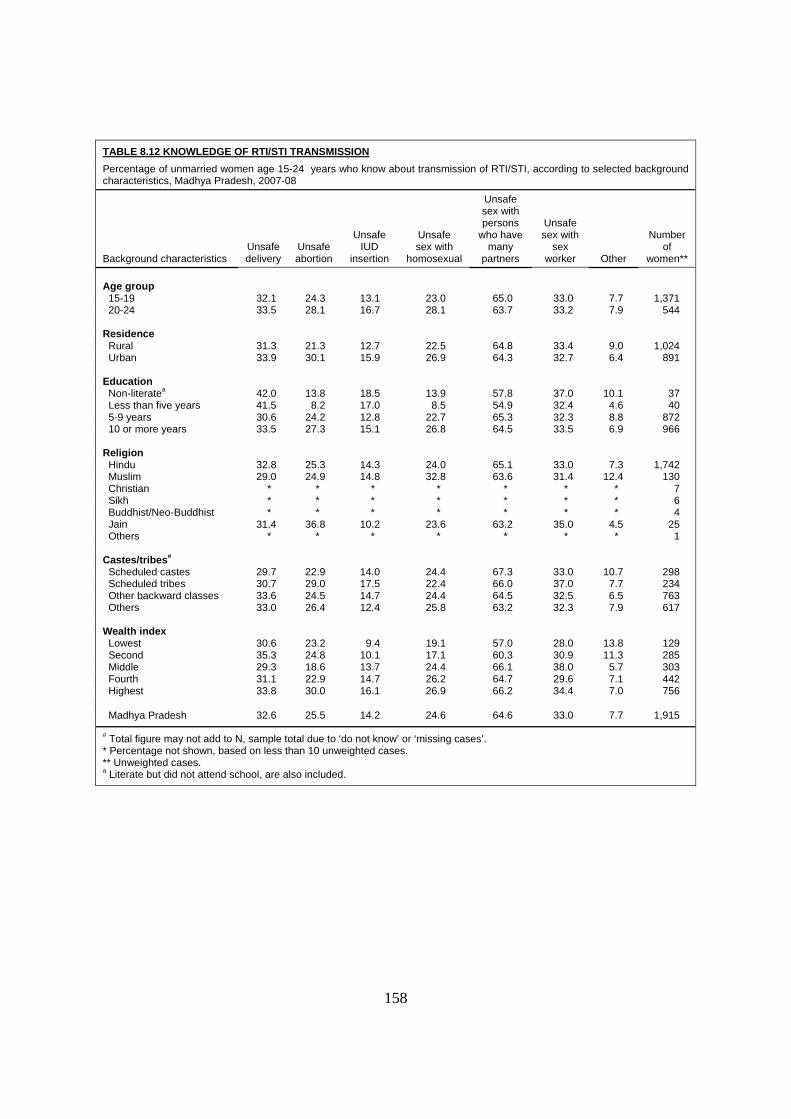
158
TABLE 8.12 KNOWLEDGE OF RTI/STI TRANSMISSION Percentage of unmarried women age 15-24 years who know about transmission of RTI/STI, according to selected background characteristics, Madhya Pradesh, 2007-08
Background characteristics Unsafe delivery
Unsafe abortion
Unsafe IUD
insertion
Unsafe sex with
homosexual
Unsafe sex with persons
who have many
partners
Unsafe sex with
sex worker Other
Number of
women** Age group 15-19 32.1 24.3 13.1 23.0 65.0 33.0 7.7 1,371 20-24 33.5 28.1 16.7 28.1 63.7 33.2 7.9 544
Residence Rural 31.3 21.3 12.7 22.5 64.8 33.4 9.0 1,024 Urban 33.9 30.1 15.9 26.9 64.3 32.7 6.4 891 Education Non-literatea 42.0 13.8 18.5 13.9 57.8 37.0 10.1 37 Less than five years 41.5 8.2 17.0 8.5 54.9 32.4 4.6 40 5-9 years 30.6 24.2 12.8 22.7 65.3 32.3 8.8 872 10 or more years 33.5 27.3 15.1 26.8 64.5 33.5 6.9 966 Religion Hindu 32.8 25.3 14.3 24.0 65.1 33.0 7.3 1,742 Muslim 29.0 24.9 14.8 32.8 63.6 31.4 12.4 130 Christian * * * * * * * 7 Sikh * * * * * * * 6 Buddhist/Neo-Buddhist * * * * * * * 4 Jain 31.4 36.8 10.2 23.6 63.2 35.0 4.5 25 Others * * * * * * * 1 Castes/tribes# Scheduled castes 29.7 22.9 14.0 24.4 67.3 33.0 10.7 298 Scheduled tribes 30.7 29.0 17.5 22.4 66.0 37.0 7.7 234 Other backward classes 33.6 24.5 14.7 24.4 64.5 32.5 6.5 763 Others 33.0 26.4 12.4 25.8 63.2 32.3 7.9 617 Wealth index Lowest 30.6 23.2 9.4 19.1 57.0 28.0 13.8 129 Second 35.3 24.8 10.1 17.1 60.3 30.9 11.3 285 Middle 29.3 18.6 13.7 24.4 66.1 38.0 5.7 303 Fourth 31.1 22.9 14.7 26.2 64.7 29.6 7.1 442 Highest 33.8 30.0 16.1 26.9 66.2 34.4 7.0 756 Madhya Pradesh 32.6 25.5 14.2 24.6 64.6 33.0 7.7 1,915
# Total figure may not add to N, sample total due to ‘do not know’ or ‘missing cases’. * Percentage not shown, based on less than 10 unweighted cases. ** Unweighted cases. a Literate but did not attend school, are also included.
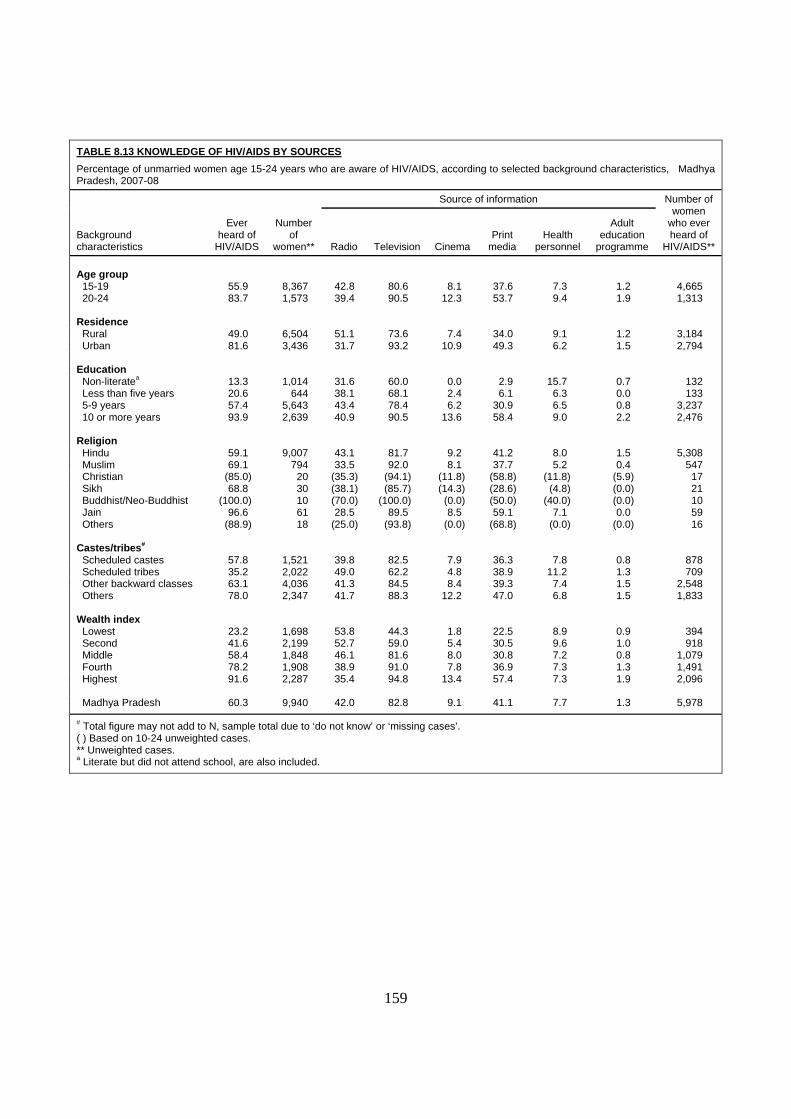
159
TABLE 8.13 KNOWLEDGE OF HIV/AIDS BY SOURCES Percentage of unmarried women age 15-24 years who are aware of HIV/AIDS, according to selected background characteristics, Madhya Pradesh, 2007-08
Background characteristics
Ever heard of
HIV/AIDS
Number of
women**
Source of information Number of women
who ever heard of
HIV/AIDS** Radio Television Cinema Print
media Health
personnel
Adult education
programme Age group 15-19 55.9 8,367 42.8 80.6 8.1 37.6 7.3 1.2 4,665 20-24 83.7 1,573 39.4 90.5 12.3 53.7 9.4 1.9 1,313
Residence Rural 49.0 6,504 51.1 73.6 7.4 34.0 9.1 1.2 3,184 Urban 81.6 3,436 31.7 93.2 10.9 49.3 6.2 1.5 2,794 Education Non-literatea 13.3 1,014 31.6 60.0 0.0 2.9 15.7 0.7 132 Less than five years 20.6 644 38.1 68.1 2.4 6.1 6.3 0.0 133 5-9 years 57.4 5,643 43.4 78.4 6.2 30.9 6.5 0.8 3,237 10 or more years 93.9 2,639 40.9 90.5 13.6 58.4 9.0 2.2 2,476 Religion Hindu 59.1 9,007 43.1 81.7 9.2 41.2 8.0 1.5 5,308 Muslim 69.1 794 33.5 92.0 8.1 37.7 5.2 0.4 547 Christian (85.0) 20 (35.3) (94.1) (11.8) (58.8) (11.8) (5.9) 17 Sikh 68.8 30 (38.1) (85.7) (14.3) (28.6) (4.8) (0.0) 21 Buddhist/Neo-Buddhist (100.0) 10 (70.0) (100.0) (0.0) (50.0) (40.0) (0.0) 10 Jain 96.6 61 28.5 89.5 8.5 59.1 7.1 0.0 59 Others (88.9) 18 (25.0) (93.8) (0.0) (68.8) (0.0) (0.0) 16 Castes/tribes# Scheduled castes 57.8 1,521 39.8 82.5 7.9 36.3 7.8 0.8 878 Scheduled tribes 35.2 2,022 49.0 62.2 4.8 38.9 11.2 1.3 709 Other backward classes 63.1 4,036 41.3 84.5 8.4 39.3 7.4 1.5 2,548 Others 78.0 2,347 41.7 88.3 12.2 47.0 6.8 1.5 1,833 Wealth index Lowest 23.2 1,698 53.8 44.3 1.8 22.5 8.9 0.9 394 Second 41.6 2,199 52.7 59.0 5.4 30.5 9.6 1.0 918 Middle 58.4 1,848 46.1 81.6 8.0 30.8 7.2 0.8 1,079 Fourth 78.2 1,908 38.9 91.0 7.8 36.9 7.3 1.3 1,491 Highest 91.6 2,287 35.4 94.8 13.4 57.4 7.3 1.9 2,096 Madhya Pradesh 60.3 9,940 42.0 82.8 9.1 41.1 7.7 1.3 5,978
# Total figure may not add to N, sample total due to ‘do not know’ or ‘missing cases’. ( ) Based on 10-24 unweighted cases. ** Unweighted cases. a Literate but did not attend school, are also included.
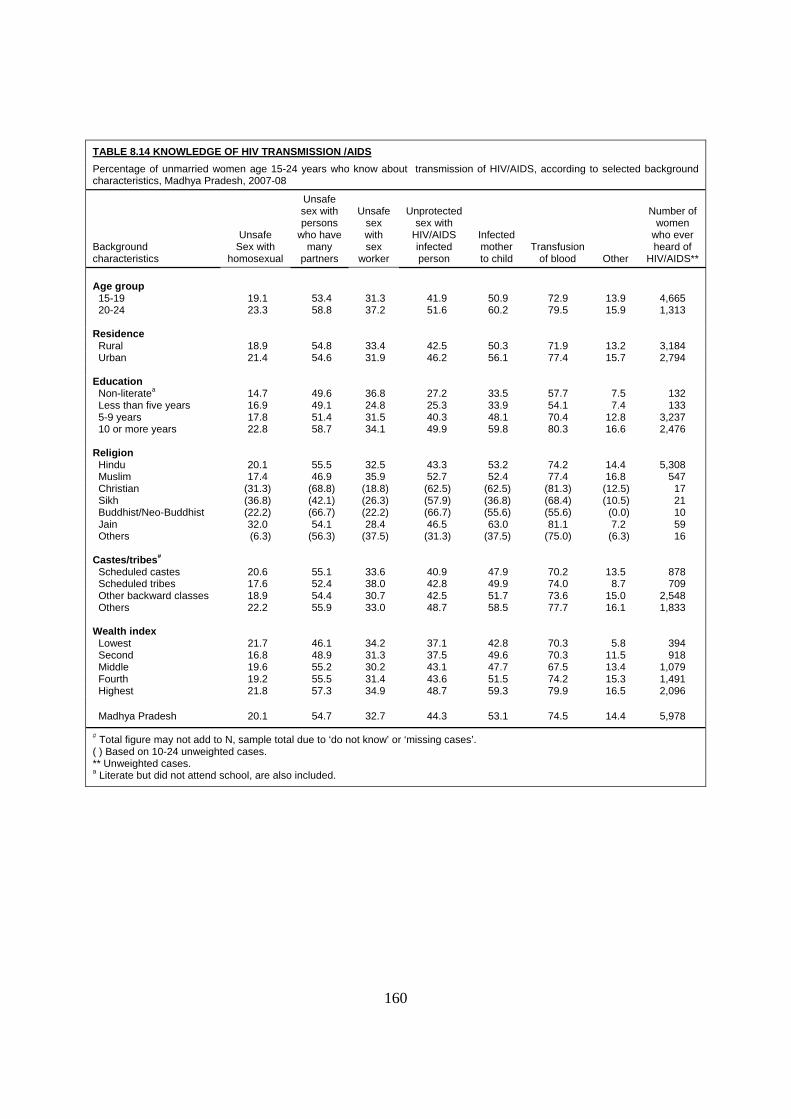
160
TABLE 8.14 KNOWLEDGE OF HIV TRANSMISSION /AIDS Percentage of unmarried women age 15-24 years who know about transmission of HIV/AIDS, according to selected background characteristics, Madhya Pradesh, 2007-08
Background characteristics
Unsafe Sex with
homosexual
Unsafe sex with persons
who have many
partners
Unsafe sex with sex
worker
Unprotected sex with
HIV/AIDS infected person
Infected mother to child
Transfusion of blood Other
Number of women
who ever heard of
HIV/AIDS** Age group 15-19 19.1 53.4 31.3 41.9 50.9 72.9 13.9 4,665 20-24 23.3 58.8 37.2 51.6 60.2 79.5 15.9 1,313
Residence Rural 18.9 54.8 33.4 42.5 50.3 71.9 13.2 3,184 Urban 21.4 54.6 31.9 46.2 56.1 77.4 15.7 2,794 Education Non-literatea 14.7 49.6 36.8 27.2 33.5 57.7 7.5 132 Less than five years 16.9 49.1 24.8 25.3 33.9 54.1 7.4 133 5-9 years 17.8 51.4 31.5 40.3 48.1 70.4 12.8 3,237 10 or more years 22.8 58.7 34.1 49.9 59.8 80.3 16.6 2,476 Religion Hindu 20.1 55.5 32.5 43.3 53.2 74.2 14.4 5,308 Muslim 17.4 46.9 35.9 52.7 52.4 77.4 16.8 547 Christian (31.3) (68.8) (18.8) (62.5) (62.5) (81.3) (12.5) 17 Sikh (36.8) (42.1) (26.3) (57.9) (36.8) (68.4) (10.5) 21 Buddhist/Neo-Buddhist (22.2) (66.7) (22.2) (66.7) (55.6) (55.6) (0.0) 10 Jain 32.0 54.1 28.4 46.5 63.0 81.1 7.2 59 Others (6.3) (56.3) (37.5) (31.3) (37.5) (75.0) (6.3) 16 Castes/tribes# Scheduled castes 20.6 55.1 33.6 40.9 47.9 70.2 13.5 878 Scheduled tribes 17.6 52.4 38.0 42.8 49.9 74.0 8.7 709 Other backward classes 18.9 54.4 30.7 42.5 51.7 73.6 15.0 2,548 Others 22.2 55.9 33.0 48.7 58.5 77.7 16.1 1,833 Wealth index Lowest 21.7 46.1 34.2 37.1 42.8 70.3 5.8 394 Second 16.8 48.9 31.3 37.5 49.6 70.3 11.5 918 Middle 19.6 55.2 30.2 43.1 47.7 67.5 13.4 1,079 Fourth 19.2 55.5 31.4 43.6 51.5 74.2 15.3 1,491 Highest 21.8 57.3 34.9 48.7 59.3 79.9 16.5 2,096 Madhya Pradesh 20.1 54.7 32.7 44.3 53.1 74.5 14.4 5,978
# Total figure may not add to N, sample total due to ‘do not know’ or ‘missing cases’. ( ) Based on 10-24 unweighted cases. ** Unweighted cases. a Literate but did not attend school, are also included.
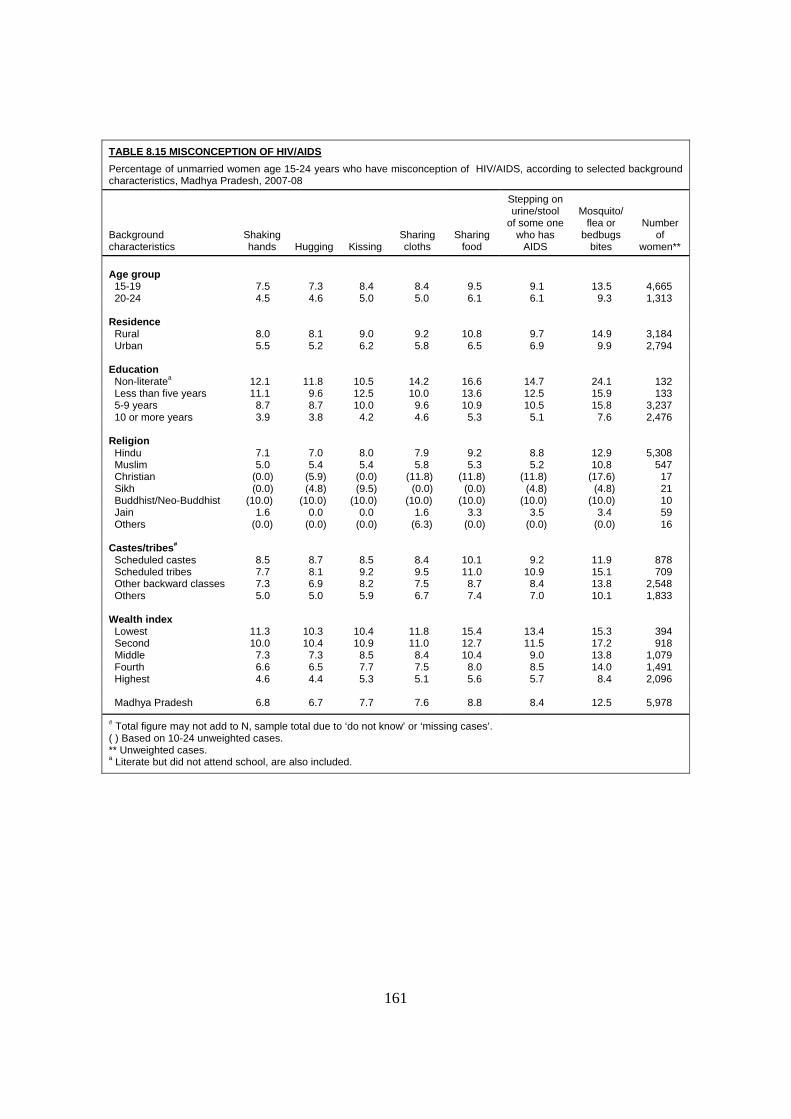
161
TABLE 8.15 MISCONCEPTION OF HIV/AIDS Percentage of unmarried women age 15-24 years who have misconception of HIV/AIDS, according to selected background characteristics, Madhya Pradesh, 2007-08
Background characteristics
Shaking hands Hugging Kissing
Sharing cloths
Sharing food
Stepping on urine/stool
of some one who has
AIDS
Mosquito/ flea or
bedbugs bites
Number of
women** Age group 15-19 7.5 7.3 8.4 8.4 9.5 9.1 13.5 4,665 20-24 4.5 4.6 5.0 5.0 6.1 6.1 9.3 1,313
Residence Rural 8.0 8.1 9.0 9.2 10.8 9.7 14.9 3,184 Urban 5.5 5.2 6.2 5.8 6.5 6.9 9.9 2,794 Education Non-literatea 12.1 11.8 10.5 14.2 16.6 14.7 24.1 132 Less than five years 11.1 9.6 12.5 10.0 13.6 12.5 15.9 133 5-9 years 8.7 8.7 10.0 9.6 10.9 10.5 15.8 3,237 10 or more years 3.9 3.8 4.2 4.6 5.3 5.1 7.6 2,476 Religion Hindu 7.1 7.0 8.0 7.9 9.2 8.8 12.9 5,308 Muslim 5.0 5.4 5.4 5.8 5.3 5.2 10.8 547 Christian (0.0) (5.9) (0.0) (11.8) (11.8) (11.8) (17.6) 17 Sikh (0.0) (4.8) (9.5) (0.0) (0.0) (4.8) (4.8) 21 Buddhist/Neo-Buddhist (10.0) (10.0) (10.0) (10.0) (10.0) (10.0) (10.0) 10 Jain 1.6 0.0 0.0 1.6 3.3 3.5 3.4 59 Others (0.0) (0.0) (0.0) (6.3) (0.0) (0.0) (0.0) 16 Castes/tribes# Scheduled castes 8.5 8.7 8.5 8.4 10.1 9.2 11.9 878 Scheduled tribes 7.7 8.1 9.2 9.5 11.0 10.9 15.1 709 Other backward classes 7.3 6.9 8.2 7.5 8.7 8.4 13.8 2,548 Others 5.0 5.0 5.9 6.7 7.4 7.0 10.1 1,833 Wealth index Lowest 11.3 10.3 10.4 11.8 15.4 13.4 15.3 394 Second 10.0 10.4 10.9 11.0 12.7 11.5 17.2 918 Middle 7.3 7.3 8.5 8.4 10.4 9.0 13.8 1,079 Fourth 6.6 6.5 7.7 7.5 8.0 8.5 14.0 1,491 Highest 4.6 4.4 5.3 5.1 5.6 5.7 8.4 2,096 Madhya Pradesh 6.8 6.7 7.7 7.6 8.8 8.4 12.5 5,978
# Total figure may not add to N, sample total due to ‘do not know’ or ‘missing cases’. ( ) Based on 10-24 unweighted cases. ** Unweighted cases. a Literate but did not attend school, are also included.

162
TABLE 8.16 KNOWLEDGE ABOUT HOW TO AVOID OR REDUCE THE CHANCES OF INFECTING HIV/AIDS Percentage of unmarried women age 15-24 years who know how to avoid or reduce the chances of getting of HIV/AIDS, according to selected background characteristics, Madhya Pradesh, 2007-08
Background characteristics
Abstain from sex
Using condom correctly
during each sexual
intercourse
Limit no. of sexual
partners and avoid sex with sex workers
Avoid sex with
person who inject
drugs
Avoid pregnancy
when having
HIV/ AIDS Other
Number of women
who ever heard of
HIV/AIDS** Age group 15-19 25.8 38.1 43.5 55.2 29.3 2.0 4,665 20-24 28.8 46.9 58.2 69.3 33.9 1.4 1,313
Residence Rural 26.2 37.1 45.3 54.4 28.8 1.9 3,184 Urban 26.9 43.6 48.4 62.7 32.3 1.8 2,794 Education Non-literatea 23.0 33.3 33.8 33.9 19.0 0.0 132 Less than five years 17.7 28.3 35.4 34.6 21.7 0.0 133 5-9 years 25.9 35.5 40.6 49.6 27.9 1.9 3,237 10 or more years 27.7 45.7 56.1 72.2 33.8 1.9 2,476 Religion Hindu 26.5 39.8 46.9 58.4 30.9 1.9 5,308 Muslim 24.7 43.2 44.7 54.8 28.0 0.8 547 Christian (42.9) (57.1) (64.7) (76.5) (28.6) (0.0) 17 Sikh (35.3) (52.9) (28.6) (61.9) (23.5) (11.8) 21 Buddhist/Neo-Buddhist (0.0) (60.0) (50.0) (40.0) (0.0) (0.0) 10 Jain 36.9 40.9 52.0 72.1 28.6 2.0 59 Others (33.3) (46.7) (50.0) (68.8) (13.3) (0.0) 16 Castes/tribes# Scheduled castes 27.0 34.2 44.3 51.2 24.8 2.9 878 Scheduled tribes 23.6 38.1 47.9 57.9 31.2 0.9 709 Other backward classes 26.0 40.0 45.0 56.7 30.0 1.5 2,548 Others 28.2 44.1 50.0 64.0 33.4 2.1 1,833 Wealth index Lowest 26.2 26.8 41.5 46.3 22.9 0.9 394 Second 26.1 30.5 39.8 49.6 23.5 1.2 918 Middle 28.6 36.5 42.5 49.1 29.3 2.6 1,079 Fourth 25.8 42.5 44.9 57.7 30.3 2.0 1,491 Highest 26.4 45.6 54.2 69.4 34.6 1.8 2,096 Madhya Pradesh 26.6 40.3 46.8 58.3 30.5 1.8 5,978
# Total figure may not add to N, sample total due to ‘do not know’ or ‘missing cases’. ( ) Based on 10-24 unweighted cases. ** Unweighted cases. a Literate but did not attend school, are also included.

163
TABLE 8.17 KNOWLEDGE WHERE TO GET TESTED FOR HIV/AIDS AND SOURCES Percentage of unmarried women aged 15-24 years who are aware where to get tested for HIV/AIDS and place for testing HIV/AIDS, according to selected background characteristics, Madhya Pradesh, 2007-08
Background characteristics
Know place where to
get Tested for
HIV/AIDS**
Number of
women**
Health Facility Number of women who Knew
place where to get
Tested for HIV/AIDS **
Government Private
Hospital
CHC/ PHC/Sub-
Centre
RTI/STI clinic
VCT/ICTC
Other public/NGO hospitals Hospital
RTI/STI VCT/ICTC
Other private
hospitals Age group 15-19 56.7 4,665 87.0 13.0 1.7 2.4 22.3 1.3 0.4 2,650 20-24 63.6 1,313 91.6 8.4 2.6 1.9 24.8 1.7 0.6 835
Residence Rural 57.6 3,184 86.2 15.2 1.2 2.5 22.3 0.9 0.4 1,834 Urban 58.9 2,794 90.1 8.3 2.7 2.0 23.6 1.9 0.5 1,651 Education Non-literatea 35.1 132 87.0 14.6 0.0 6.4 23.5 0.0 0.0 47 Less than five years 44.0 133 89.9 13.5 0.0 2.2 25.9 0.0 0.0 59 5-9 years 54.2 3,237 85.7 14.5 1.5 2.4 22.0 0.9 0.6 1,755 10 or more years 65.4 2,476 90.6 9.0 2.5 2.0 23.9 1.9 0.3 1,624 Religion Hindu 58.5 5,308 88.1 12.1 1.8 2.4 22.9 1.4 0.4 3,110 Muslim 55.1 547 87.4 10.4 2.7 1.3 21.8 1.3 0.3 301 Christian (58.8) 17 (100.0) (0.0) (0.0) (0.0) (20.0) (0.0) (0.0) 10 Sikh (76.2) 21 (87.5) (18.8) (12.5) (0.0) (50.0) (6.3) (6.3) 16 Buddhist/Neo-Buddhist (90.0) 10 * * * *
* * * 9
Jain 41.7 59 96.3 0.0 0.0 0.0 26.6 0.0 0.0 25 Others (87.5) 16 (85.7) (7.1) (0.0) (7.1) (35.7) (0.0) (0.0) 14
Castes/tribes#
Scheduled castes 56.8 878 86.9 13.9 1.3 2.2 23.9 0.5 0.6 498 Scheduled tribes 56.0 709 87.2 12.2 1.0 2.4 20.9 0.5 0.5 400 Other backward classes 57.2 2,548 86.8 13.5 2.1 2.2 23.2 1.5 0.5 1,460 Others 61.3 1,833 90.5 9.0 2.1 2.2 22.9 1.9 0.2 1,125 Wealth index
Lowest 54.6 394 87.7 14.4 0.5 1.0 18.2 0.0 1.0 215Second 53.1 918 85.8 14.4 0.6 2.5 20.9 0.6 0.2 490Middle 55.0 1,079 85.9 15.7 0.9 2.4 19.1 0.9 0.5 595Fourth 58.2 1,491 85.9 13.7 2.3 2.5 22.9 1.6 0.3 868Highest 62.7 2,096 91.4 7.7 2.8 2.1 26.1 1.9 0.4 1,317
Madhya Pradesh 58.2 5,978 88.1 11.9 1.9 2.3 22.9 1.4 0.4 3,485# Total figure may not add to N, sample total due to ‘do not know’ or ‘missing cases’. ( ) Based on 10-24 unweighted cases. * Percentage not shown, based on less than 10 unweighted cases. ** Unweighted cases. a Literate but did not attend school, are also included.
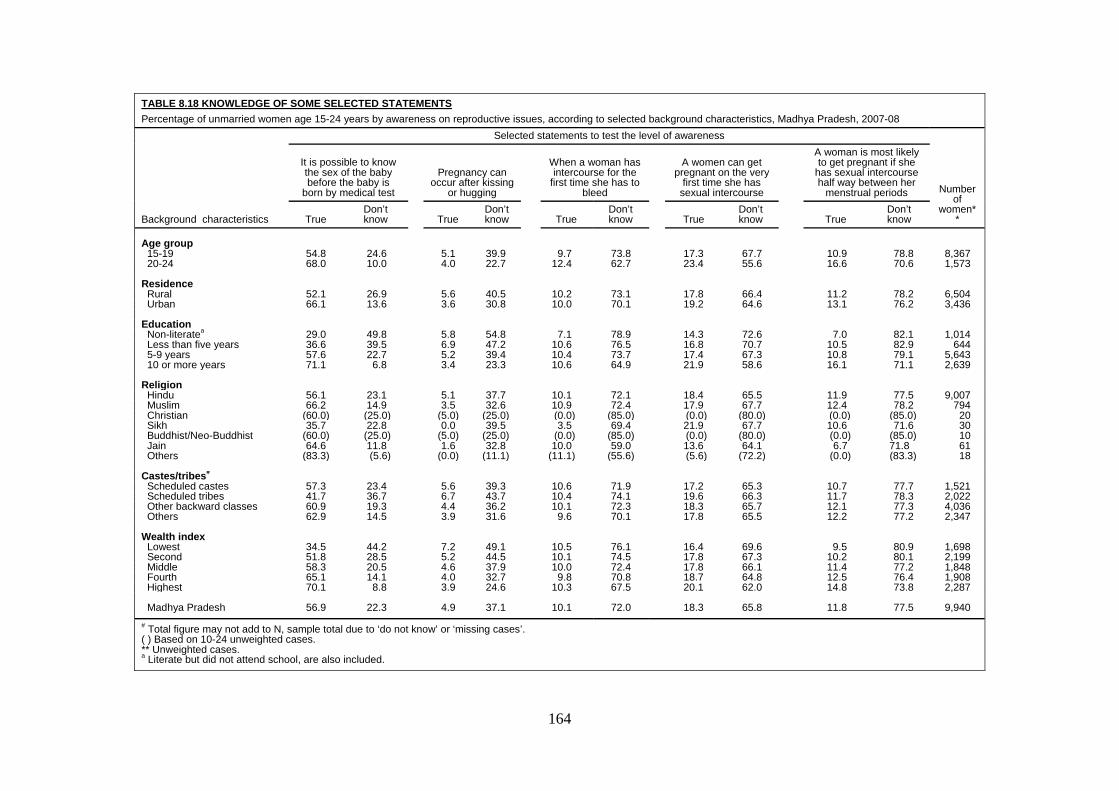
164
TABLE 8.18 KNOWLEDGE OF SOME SELECTED STATEMENTS Percentage of unmarried women age 15-24 years by awareness on reproductive issues, according to selected background characteristics, Madhya Pradesh, 2007-08
Background characteristics
Selected statements to test the level of awareness
Number of
women**
It is possible to know the sex of the baby before the baby is
born by medical test
Pregnancy can occur after kissing
or hugging
When a woman has intercourse for the
first time she has to bleed
A women can get pregnant on the very
first time she has sexual intercourse
A woman is most likely to get pregnant if she
has sexual intercourse half way between her
menstrual periods
True Don’t know True
Don’t know True
Don’t know True
Don’t know True
Don’t know
Age group 15-19 54.8 24.6 5.1 39.9 9.7 73.8 17.3 67.7 10.9 78.8 8,367 20-24 68.0 10.0 4.0 22.7 12.4 62.7 23.4 55.6 16.6 70.6 1,573
Residence Rural 52.1 26.9 5.6 40.5 10.2 73.1 17.8 66.4 11.2 78.2 6,504 Urban 66.1 13.6 3.6 30.8 10.0 70.1 19.2 64.6 13.1 76.2 3,436 Education Non-literatea 29.0 49.8 5.8 54.8 7.1 78.9 14.3 72.6
7.0 82.1 1,014 Less than five years 36.6 39.5 6.9 47.2 10.6 76.5 16.8 70.7 10.5 82.9 644 5-9 years 57.6 22.7 5.2 39.4 10.4 73.7 17.4 67.3 10.8 79.1 5,643 10 or more years 71.1 6.8 3.4 23.3 10.6 64.9 21.9 58.6 16.1 71.1 2,639 Religion Hindu 56.1 23.1 5.1 37.7 10.1 72.1 18.4 65.5 11.9 77.5 9,007 Muslim 66.2 14.9 3.5 32.6 10.9 72.4 17.9 67.7 12.4 78.2 794 Christian (60.0) (25.0) (5.0) (25.0) (0.0) (85.0) (0.0) (80.0) (0.0) (85.0) 20 Sikh 35.7 22.8 0.0 39.5 3.5 69.4 21.9 67.7 10.6 71.6 30 Buddhist/Neo-Buddhist (60.0) (25.0) (5.0) (25.0)
(0.0) (85.0)
(0.0) (80.0)
(0.0) (85.0) 10
Jain 64.6 11.8 1.6 32.8 10.0 59.0 13.6 64.1 6.7 71.8 61 Others (83.3) (5.6) (0.0) (11.1) (11.1) (55.6) (5.6) (72.2) (0.0) (83.3) 18
Castes/tribes#
Scheduled castes 57.3 23.4 5.6 39.3 10.6 71.9 17.2 65.3
10.7 77.7 1,521 Scheduled tribes 41.7 36.7 6.7 43.7 10.4 74.1 19.6 66.3 11.7 78.3 2,022 Other backward classes 60.9 19.3 4.4 36.2 10.1 72.3 18.3 65.7 12.1 77.3 4,036 Others 62.9 14.5 3.9 31.6 9.6 70.1 17.8 65.5 12.2 77.2 2,347 Wealth index Lowest 34.5 44.2 7.2 49.1 10.5 76.1 16.4 69.6 9.5 80.9 1,698 Second 51.8 28.5 5.2 44.5 10.1 74.5 17.8 67.3 10.2 80.1 2,199 Middle 58.3 20.5 4.6 37.9 10.0 72.4 17.8 66.1 11.4 77.2 1,848 Fourth 65.1 14.1 4.0 32.7 9.8 70.8 18.7 64.8 12.5 76.4 1,908 Highest 70.1 8.8 3.9 24.6 10.3 67.5 20.1 62.0 14.8 73.8 2,287 Madhya Pradesh 56.9 22.3 4.9 37.1 10.1 72.0 18.3 65.8 11.8 77.5 9,940# Total figure may not add to N, sample total due to ‘do not know’ or ‘missing cases’. ( ) Based on 10-24 unweighted cases. ** Unweighted cases. a Literate but did not attend school, are also included.
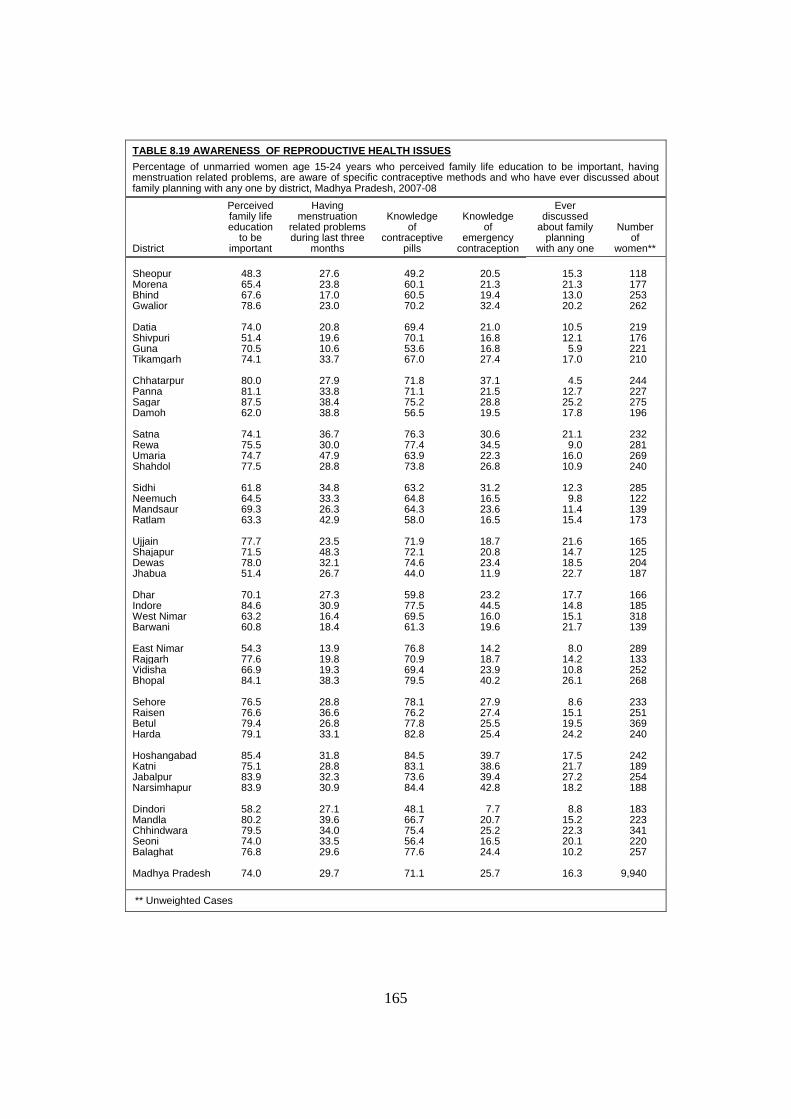
165
TABLE 8.19 AWARENESS OF REPRODUCTIVE HEALTH ISSUES Percentage of unmarried women age 15-24 years who perceived family life education to be important, having menstruation related problems, are aware of specific contraceptive methods and who have ever discussed about family planning with any one by district, Madhya Pradesh, 2007-08
District
Perceived family life education
to be important
Having menstruation
related problems during last three
months
Knowledge of
contraceptive pills
Knowledge of
emergency contraception
Ever discussed
about family planning
with any one
Number of
women** Sheopur 48.3 27.6 49.2 20.5 15.3 118 Morena 65.4 23.8 60.1 21.3 21.3 177 Bhind 67.6 17.0 60.5 19.4 13.0 253 Gwalior 78.6 23.0 70.2 32.4 20.2 262 Datia 74.0 20.8 69.4 21.0 10.5 219 Shivpuri 51.4 19.6 70.1 16.8 12.1 176 Guna 70.5 10.6 53.6 16.8 5.9 221 Tikamgarh 74.1 33.7 67.0 27.4 17.0 210 Chhatarpur 80.0 27.9 71.8 37.1 4.5 244 Panna 81.1 33.8 71.1 21.5 12.7 227 Sagar 87.5 38.4 75.2 28.8 25.2 275 Damoh 62.0 38.8 56.5 19.5 17.8 196 Satna 74.1 36.7 76.3 30.6 21.1 232 Rewa 75.5 30.0 77.4 34.5 9.0 281 Umaria 74.7 47.9 63.9 22.3 16.0 269 Shahdol 77.5 28.8 73.8 26.8 10.9 240 Sidhi 61.8 34.8 63.2 31.2 12.3 285 Neemuch 64.5 33.3 64.8 16.5 9.8 122 Mandsaur 69.3 26.3 64.3 23.6 11.4 139 Ratlam 63.3 42.9 58.0 16.5 15.4 173 Ujjain 77.7 23.5 71.9 18.7 21.6 165 Shajapur 71.5 48.3 72.1 20.8 14.7 125 Dewas 78.0 32.1 74.6 23.4 18.5 204 Jhabua 51.4 26.7 44.0 11.9 22.7 187 Dhar 70.1 27.3 59.8 23.2 17.7 166 Indore 84.6 30.9 77.5 44.5 14.8 185 West Nimar 63.2 16.4 69.5 16.0 15.1 318 Barwani 60.8 18.4 61.3 19.6 21.7 139 East Nimar 54.3 13.9 76.8 14.2 8.0 289 Rajgarh 77.6 19.8 70.9 18.7 14.2 133 Vidisha 66.9 19.3 69.4 23.9 10.8 252 Bhopal 84.1 38.3 79.5 40.2 26.1 268 Sehore 76.5 28.8 78.1 27.9 8.6 233 Raisen 76.6 36.6 76.2 27.4 15.1 251 Betul 79.4 26.8 77.8 25.5 19.5 369 Harda 79.1 33.1 82.8 25.4 24.2 240 Hoshangabad 85.4 31.8 84.5 39.7 17.5 242 Katni 75.1 28.8 83.1 38.6 21.7 189 Jabalpur 83.9 32.3 73.6 39.4 27.2 254 Narsimhapur 83.9 30.9 84.4 42.8 18.2 188 Dindori 58.2 27.1 48.1 7.7 8.8 183 Mandla 80.2 39.6 66.7 20.7 15.2 223 Chhindwara 79.5 34.0 75.4 25.2 22.3 341 Seoni 74.0 33.5 56.4 16.5 20.1 220 Balaghat 76.8 29.6 77.6 24.4 10.2 257 Madhya Pradesh 74.0 29.7 71.1 25.7 16.3 9,940 ** Unweighted Cases

HEALTH FACILITIES ‐ AVAILABILITY AND QUALITY

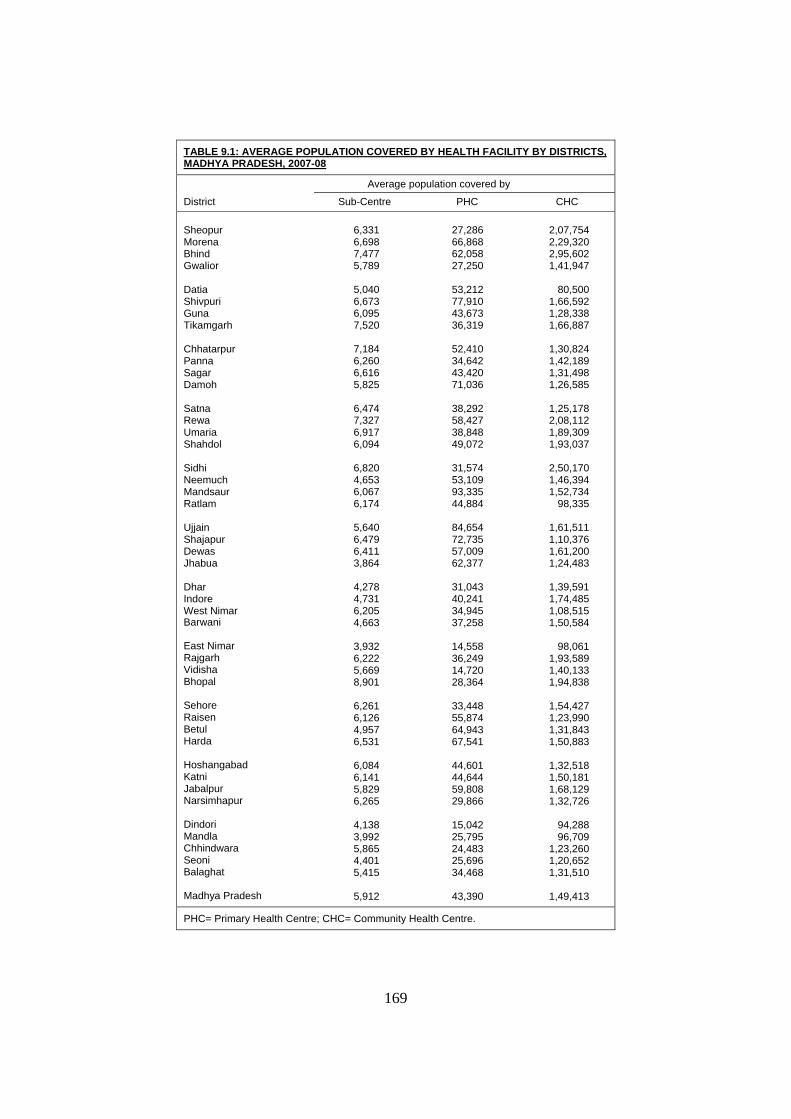
169
TABLE 9.1: AVERAGE POPULATION COVERED BY HEALTH FACILITY BY DISTRICTS, MADHYA PRADESH, 2007-08
District
Average population covered by
Sub-Centre PHC CHC Sheopur Morena Bhind Gwalior Datia Shivpuri Guna Tikamgarh Chhatarpur Panna Sagar Damoh Satna Rewa Umaria Shahdol Sidhi Neemuch Mandsaur Ratlam Ujjain Shajapur Dewas Jhabua Dhar Indore West Nimar Barwani East Nimar Rajgarh Vidisha Bhopal Sehore Raisen Betul Harda Hoshangabad Katni Jabalpur Narsimhapur Dindori Mandla Chhindwara Seoni Balaghat Madhya Pradesh
6,331 6,698 7,477 5,789
5,040 6,673 6,095 7,520
7,184 6,260 6,616 5,825
6,474 7,327 6,917 6,094
6,820 4,653 6,067 6,174
5,640 6,479 6,411 3,864
4,278 4,731 6,205 4,663
3,932 6,222 5,669 8,901
6,261 6,126 4,957 6,531
6,084 6,141 5,829 6,265
4,138 3,992 5,865 4,401 5,415
5,912
27,286 66,868 62,058 27,250
53,212 77,910 43,673 36,319
52,410 34,642 43,420 71,036
38,292 58,427 38,848 49,072
31,574 53,109 93,335 44,884
84,654 72,735 57,009 62,377
31,043 40,241 34,945 37,258
14,558 36,249 14,720 28,364
33,448 55,874 64,943 67,541
44,601 44,644 59,808 29,866
15,042 25,795 24,483 25,696 34,468
43,390
2,07,754 2,29,320 2,95,602 1,41,947
80,500
1,66,592 1,28,338 1,66,887
1,30,824 1,42,189 1,31,498 1,26,585
1,25,178 2,08,112 1,89,309 1,93,037
2,50,170 1,46,394 1,52,734
98,335
1,61,511 1,10,376 1,61,200 1,24,483
1,39,591 1,74,485 1,08,515 1,50,584
98,061
1,93,589 1,40,133 1,94,838
1,54,427 1,23,990 1,31,843 1,50,883
1,32,518 1,50,181 1,68,129 1,32,726
94,288 96,709
1,23,260 1,20,652 1,31,510
1,49,413
PHC= Primary Health Centre; CHC= Community Health Centre.
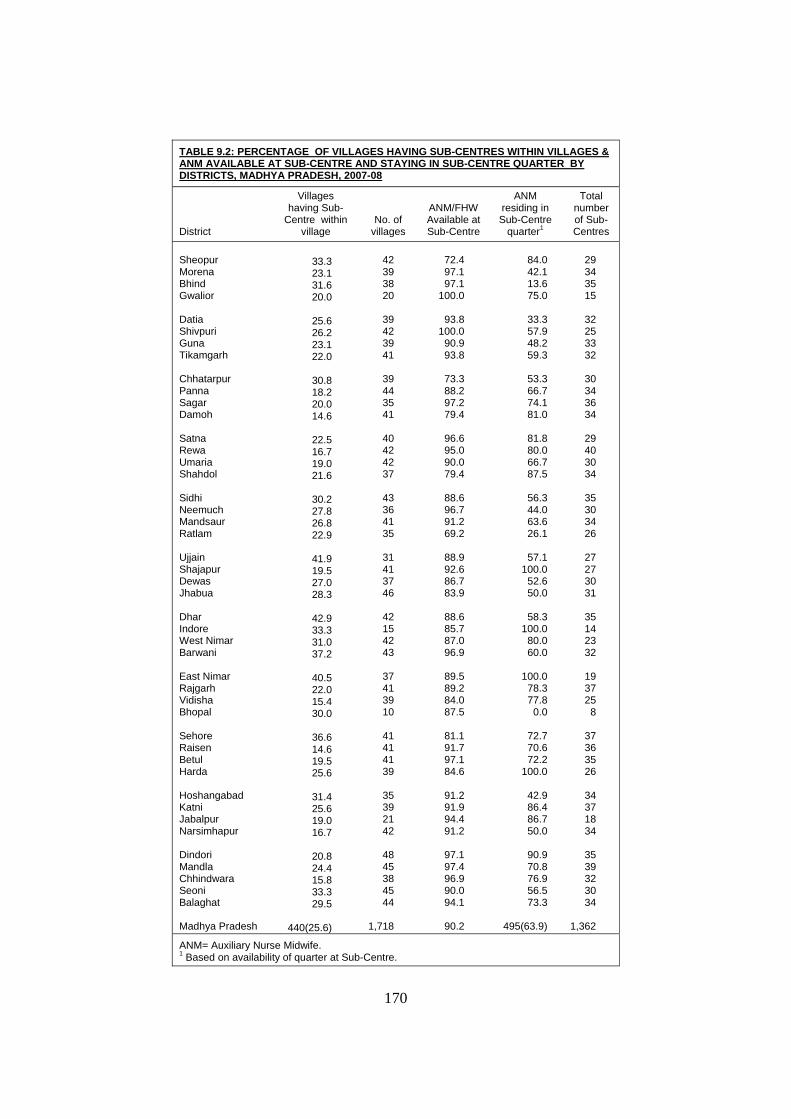
170
TABLE 9.2: PERCENTAGE OF VILLAGES HAVING SUB-CENTRES WITHIN VILLAGES & ANM AVAILABLE AT SUB-CENTRE AND STAYING IN SUB-CENTRE QUARTER BY DISTRICTS, MADHYA PRADESH, 2007-08
District
Villages having Sub-
Centre within village
No. of villages
ANM/FHW Available at Sub-Centre
ANM residing in Sub-Centre
quarter1
Total number of Sub-Centres
Sheopur Morena Bhind Gwalior Datia Shivpuri Guna Tikamgarh Chhatarpur Panna Sagar Damoh Satna Rewa Umaria Shahdol Sidhi Neemuch Mandsaur Ratlam Ujjain Shajapur Dewas Jhabua Dhar Indore West Nimar Barwani East Nimar Rajgarh Vidisha Bhopal Sehore Raisen Betul Harda Hoshangabad Katni Jabalpur Narsimhapur Dindori Mandla Chhindwara Seoni Balaghat Madhya Pradesh
33.3 23.1 31.6 20.0
25.6 26.2 23.1 22.0
30.8 18.2 20.0 14.6
22.5 16.7 19.0 21.6
30.2 27.8 26.8 22.9
41.9 19.5 27.0 28.3
42.9 33.3 31.0 37.2
40.5 22.0 15.4 30.0
36.6 14.6 19.5 25.6
31.4 25.6 19.0 16.7
20.8 24.4 15.8 33.3 29.5
440(25.6)
42 39 38 20
39 42 39 41
39 44 35 41
40 42 42 37
43 36 41 35
31 41 37 46
42 15 42 43
37 41 39 10
41 41 41 39
35 39 21 42
48 45 38 45 44
1,718
72.4 97.1 97.1
100.0
93.8 100.0
90.9 93.8
73.3 88.2 97.2 79.4
96.6 95.0 90.0 79.4
88.6 96.7 91.2 69.2
88.9 92.6 86.7 83.9
88.6 85.7 87.0 96.9
89.5 89.2 84.0 87.5
81.1 91.7 97.1 84.6
91.2 91.9 94.4 91.2
97.1 97.4 96.9 90.0 94.1
90.2
84.0 42.1 13.6 75.0
33.3 57.9 48.2 59.3
53.3 66.7 74.1 81.0
81.8 80.0 66.7 87.5
56.3 44.0 63.6 26.1
57.1
100.0 52.6 50.0
58.3
100.0 80.0 60.0
100.0
78.3 77.8
0.0
72.7 70.6 72.2
100.0
42.9 86.4 86.7 50.0
90.9 70.8 76.9 56.5 73.3
495(63.9)
29 34 35 15
32 25 33 32
30 34 36 34
29 40 30 34
35 30 34 26
27 27 30 31
35 14 23 32
19 37 25
8
37 36 35 26
34 37 18 34
35 39 32 30 34
1,362
ANM= Auxiliary Nurse Midwife. 1 Based on availability of quarter at Sub-Centre.
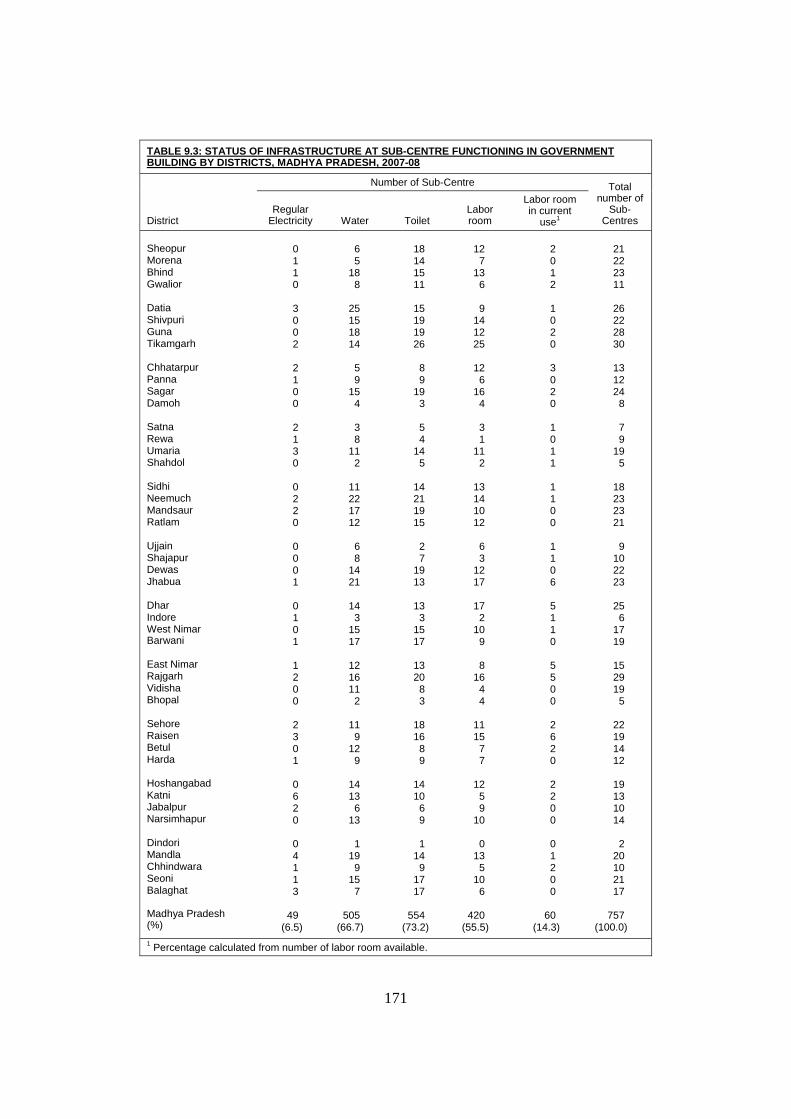
171
TABLE 9.3: STATUS OF INFRASTRUCTURE AT SUB-CENTRE FUNCTIONING IN GOVERNMENT BUILDING BY DISTRICTS, MADHYA PRADESH, 2007-08
District
Number of Sub-Centre Total number of
Sub-Centres
Regular Electricity Water Toilet
Labor room
Labor room in current
use1
Sheopur Morena Bhind Gwalior Datia Shivpuri Guna Tikamgarh Chhatarpur Panna Sagar Damoh Satna Rewa Umaria Shahdol Sidhi Neemuch Mandsaur Ratlam Ujjain Shajapur Dewas Jhabua Dhar Indore West Nimar Barwani East Nimar Rajgarh Vidisha Bhopal Sehore Raisen Betul Harda Hoshangabad Katni Jabalpur Narsimhapur Dindori Mandla Chhindwara Seoni Balaghat Madhya Pradesh (%)
0 1 1 0
3 0 0 2
2 1 0 0
2 1 3 0
0 2 2 0
0 0 0 1
0 1 0 1
1 2 0 0
2 3 0 1
0 6 2 0
0 4 1 1 3
49
(6.5)
6 5
18 8
25 15 18 14
5 9
15 4
3 8
11 2
11 22 17 12
6 8
14 21
14 3
15 17
12 16 11 2
11 9
12 9
14 13 6
13
1 19 9
15 7
505
(66.7)
18 14 15 11
15 19 19 26
8 9
19 3
5 4
14 5
14 21 19 15
2 7
19 13
13
3 15 17
13 20
8 3
18 16
8 9
14 10
6 9
1 14
9 17 17
554
(73.2)
12
7 13
6
9 14 12 25
12
6 16
4
3 1
11 2
13 14 10 12
6 3
12 17
17
2 10
9
8 16
4 4
11 15
7 7
12
5 9
10
0 13
5 10
6
420 (55.5)
2 0 1 2
1 0 2 0
3 0 2 0
1 0 1 1
1 1 0 0
1 1 0 6
5 1 1 0
5 5 0 0
2 6 2 0
2 2 0 0
0 1 2 0 0
60
(14.3)
21 22 23 11
26 22 28 30
13 12 24
8
7 9
19 5
18 23 23 21
9
10 22 23
25
6 17 19
15 29 19
5
22 19 14 12
19 13 10 14
2
20 10 21 17
757
(100.0) 1 Percentage calculated from number of labor room available.
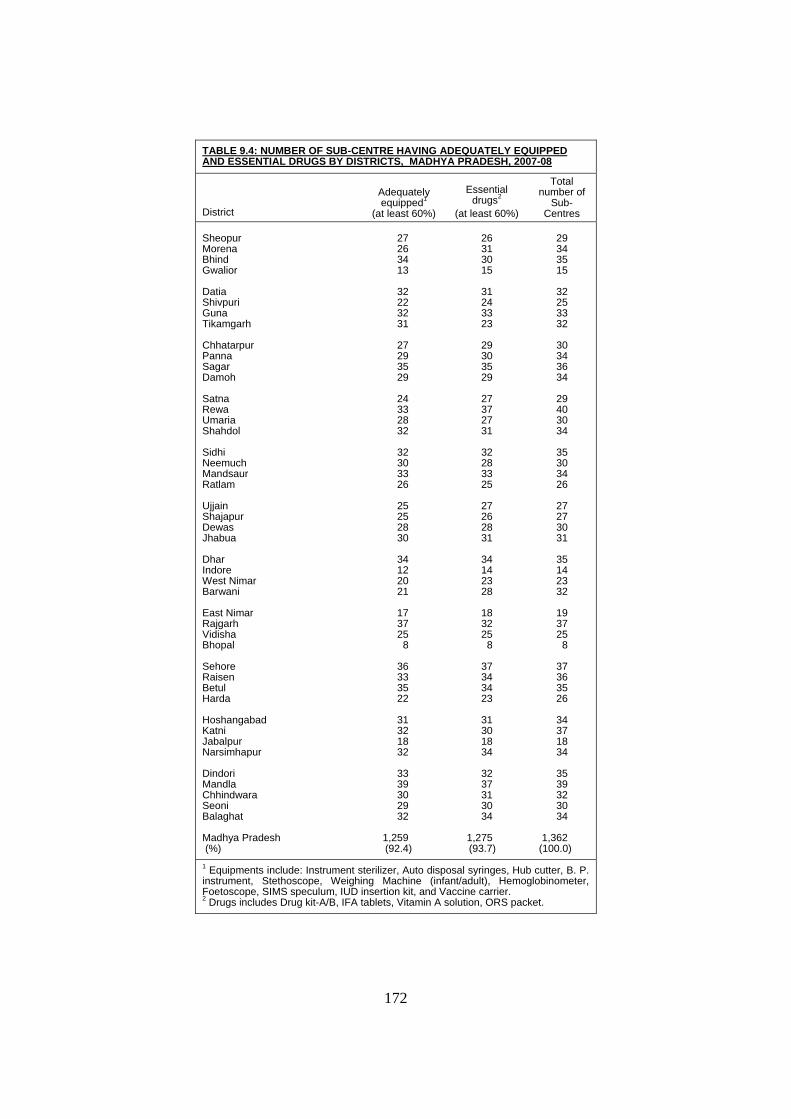
172
TABLE 9.4: NUMBER OF SUB-CENTRE HAVING ADEQUATELY EQUIPPED AND ESSENTIAL DRUGS BY DISTRICTS, MADHYA PRADESH, 2007-08
District
Adequately equipped1
(at least 60%)
Essential drugs2
(at least 60%)
Total number of
Sub-Centres
Sheopur Morena Bhind Gwalior Datia Shivpuri Guna Tikamgarh Chhatarpur Panna Sagar Damoh Satna Rewa Umaria Shahdol Sidhi Neemuch Mandsaur Ratlam Ujjain Shajapur Dewas Jhabua Dhar Indore West Nimar Barwani East Nimar Rajgarh Vidisha Bhopal Sehore Raisen Betul Harda Hoshangabad Katni Jabalpur Narsimhapur Dindori Mandla Chhindwara Seoni Balaghat Madhya Pradesh (%)
27 26 34 13
32 22 32 31
27 29 35 29
24 33 28 32
32 30 33 26
25 25 28 30
34 12 20 21
17 37 25
8
36 33 35 22
31 32 18 32
33 39 30 29 32
1,259 (92.4)
26 31 30 15
31 24 33 23
29 30 35 29
27 37 27 31
32 28 33 25
27 26 28 31
34 14 23 28
18 32 25 8
37 34 34 23
31 30 18 34
32 37 31 30 34
1,275 (93.7)
29 34 35 15
32 25 33 32
30 34 36 34
29 40 30 34
35 30 34 26
27 27 30 31
35 14 23 32
19 37 25
8
37 36 35 26
34 37 18 34
35 39 32 30 34
1,362
(100.0) 1 Equipments include: Instrument sterilizer, Auto disposal syringes, Hub cutter, B. P. instrument, Stethoscope, Weighing Machine (infant/adult), Hemoglobinometer, Foetoscope, SIMS speculum, IUD insertion kit, and Vaccine carrier. 2 Drugs includes Drug kit-A/B, IFA tablets, Vitamin A solution, ORS packet.
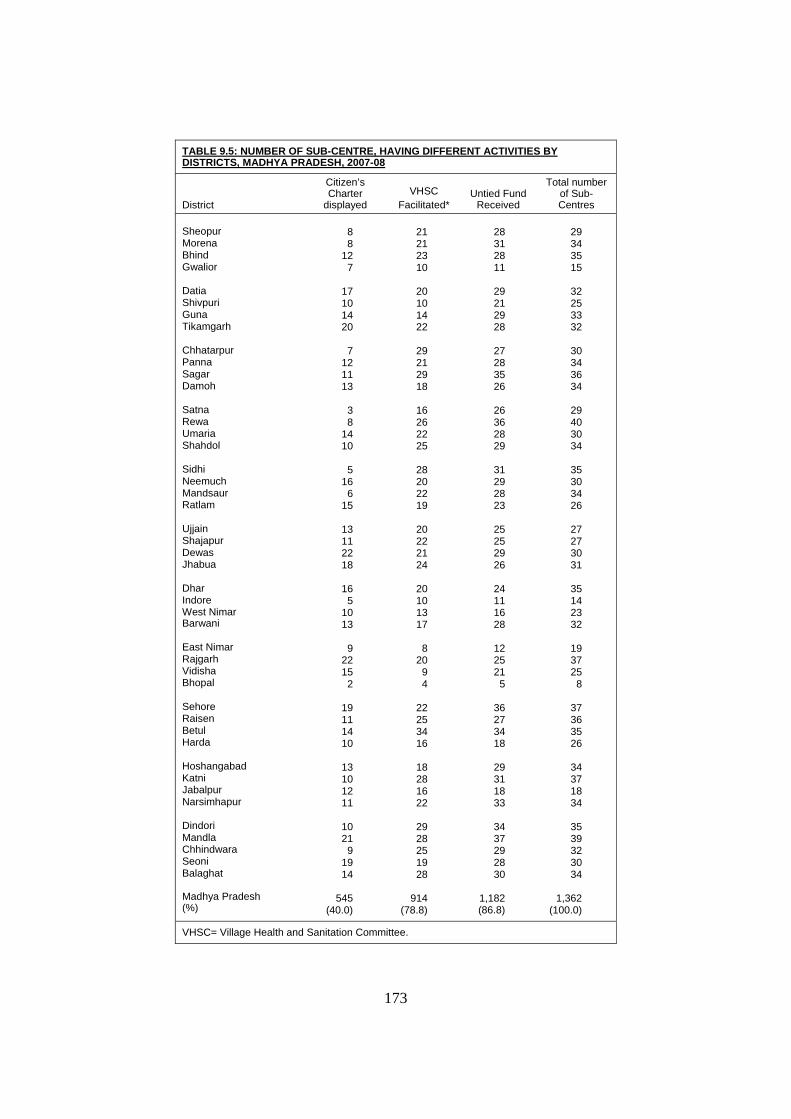
173
TABLE 9.5: NUMBER OF SUB-CENTRE, HAVING DIFFERENT ACTIVITIES BY DISTRICTS, MADHYA PRADESH, 2007-08
District
Citizen’s Charter
displayed VHSC
Facilitated* Untied Fund
Received
Total number of Sub-Centres
Sheopur Morena Bhind Gwalior Datia Shivpuri Guna Tikamgarh Chhatarpur Panna Sagar Damoh Satna Rewa Umaria Shahdol Sidhi Neemuch Mandsaur Ratlam Ujjain Shajapur Dewas Jhabua Dhar Indore West Nimar Barwani East Nimar Rajgarh Vidisha Bhopal Sehore Raisen Betul Harda Hoshangabad Katni Jabalpur Narsimhapur Dindori Mandla Chhindwara Seoni Balaghat Madhya Pradesh (%)
8 8
12 7
17 10 14 20
7
12 11 13
3 8
14 10
5
16 6
15
13 11 22 18
16
5 10 13
9
22 15
2
19 11 14 10
13 10 12 11
10 21
9 19 14
545
(40.0)
21 21 23 10
20 10 14 22
29 21 29 18
16 26 22 25
28 20 22 19
20 22 21 24
20 10 13 17
8
20 9 4
22 25 34 16
18 28 16 22
29 28 25 19 28
914
(78.8)
28 31 28 11
29 21 29 28
27 28 35 26
26 36 28 29
31 29 28 23
25 25 29 26
24 11 16 28
12 25 21
5
36 27 34 18
29 31 18 33
34 37 29 28 30
1,182 (86.8)
29 34 35 15
32 25 33 32
30 34 36 34
29 40 30 34
35 30 34 26
27 27 30 31
35 14 23 32
19 37 25
8
37 36 35 26
34 37 18 34
35 39 32 30 34
1,362
(100.0)
VHSC= Village Health and Sanitation Committee.
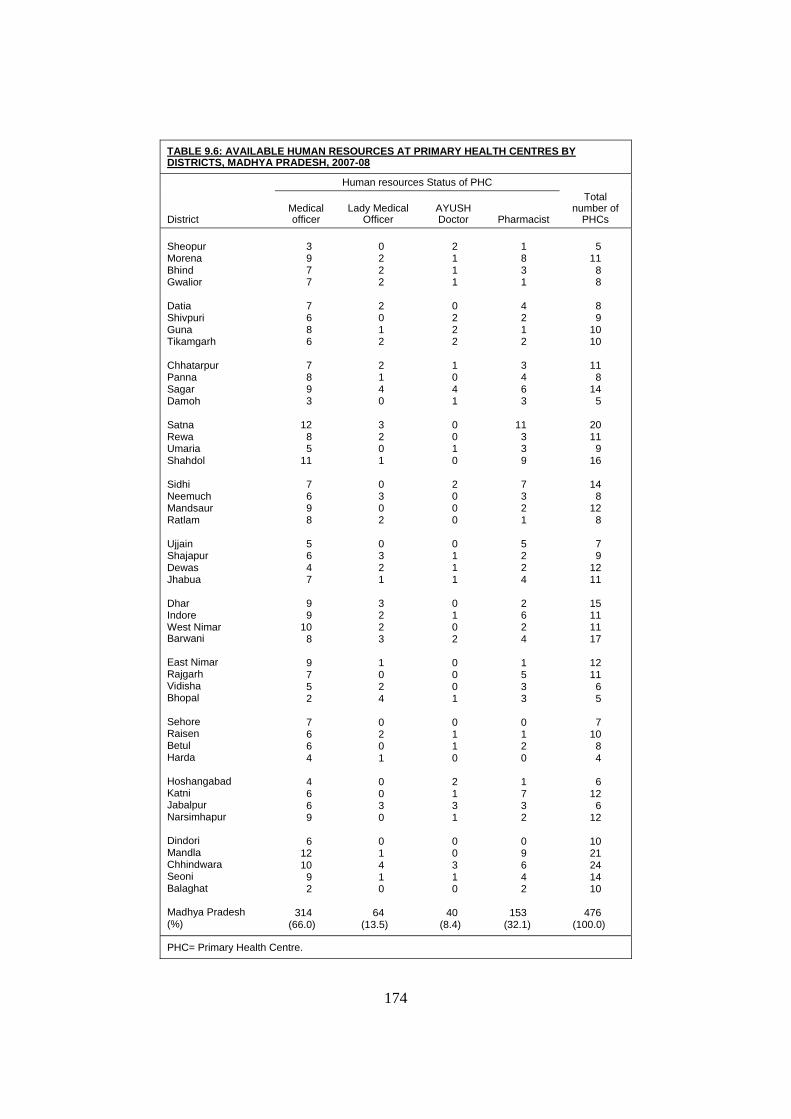
174
TABLE 9.6: AVAILABLE HUMAN RESOURCES AT PRIMARY HEALTH CENTRES BY DISTRICTS, MADHYA PRADESH, 2007-08
District
Human resources Status of PHC Total
number of PHCs
Medical officer
Lady Medical Officer
AYUSH Doctor
Pharmacist
Sheopur Morena Bhind Gwalior Datia Shivpuri Guna Tikamgarh Chhatarpur Panna Sagar Damoh Satna Rewa Umaria Shahdol Sidhi Neemuch Mandsaur Ratlam Ujjain Shajapur Dewas Jhabua Dhar Indore West Nimar Barwani East Nimar Rajgarh Vidisha Bhopal Sehore Raisen Betul Harda Hoshangabad Katni Jabalpur Narsimhapur Dindori Mandla Chhindwara Seoni Balaghat Madhya Pradesh (%)
3 9 7 7
7 6 8 6
7 8 9 3
12 8 5
11
7 6 9 8
5 6 4 7
9 9
10 8
9 7 5 2
7 6 6 4
4 6 6 9
6 12 10
9 2
314 (66.0)
0 2 2 2
2 0 1 2
2 1 4 0
3 2 0 1
0 3 0 2
0 3 2 1
3 2 2 3
1 0 2 4
0 2 0 1
0 0 3 0
0 1 4 1 0
64
(13.5)
2 1 1 1
0 2 2 2
1 0 4 1
0 0 1 0
2 0 0 0
0 1 1 1
0 1 0 2
0 0 0 1
0 1 1 0
2 1 3 1
0 0 3 1 0
40
(8.4)
1 8 3 1
4 2 1 2
3 4 6 3
11
3 3 9
7 3 2 1
5 2 2 4
2 6 2 4
1 5 3 3
0 1 2 0
1 7 3 2
0 9 6 4 2
153
(32.1)
5
11 8 8
8 9
10 10
11
8 14
5
20 11
9 16
14
8 12
8
7 9
12 11
15 11 11 17
12 11
6 5
7
10 8 4
6
12 6
12
10 21 24 14 10
476
(100.0)
PHC= Primary Health Centre.
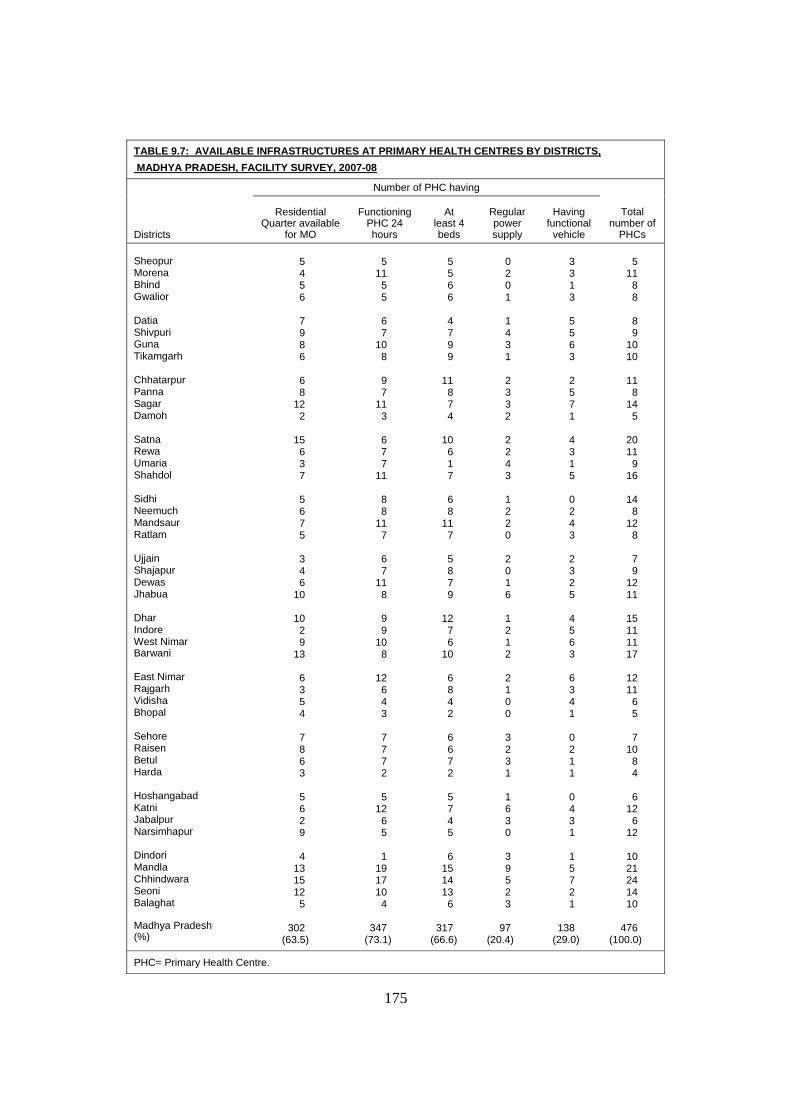
175
TABLE 9.7: AVAILABLE INFRASTRUCTURES AT PRIMARY HEALTH CENTRES BY DISTRICTS, MADHYA PRADESH, FACILITY SURVEY, 2007-08
Districts
Number of PHC having
Total number of
PHCs
Residential Quarter available
for MO
Functioning PHC 24 hours
At least 4 beds
Regular power supply
Having functional
vehicle Sheopur Morena Bhind Gwalior Datia Shivpuri Guna Tikamgarh Chhatarpur Panna Sagar Damoh Satna Rewa Umaria Shahdol Sidhi Neemuch Mandsaur Ratlam Ujjain Shajapur Dewas Jhabua Dhar Indore West Nimar Barwani East Nimar Rajgarh Vidisha Bhopal Sehore Raisen Betul Harda Hoshangabad Katni Jabalpur Narsimhapur Dindori Mandla Chhindwara Seoni Balaghat Madhya Pradesh (%)
5 4 5 6
7 9 8 6
6 8
12 2
15
6 3 7
5 6 7 5
3 4 6
10
10 2 9
13
6 3 5 4
7 8 6 3
5 6 2 9
4
13 15 12
5
302 (63.5)
5
11 5 5
6 7
10 8
9 7
11 3
6 7 7
11
8 8
11 7
6 7
11 8
9 9
10 8
12
6 4 3
7 7 7 2
5
12 6 5
1
19 17 10
4
347 (73.1)
5 5 6 6
4 7 9 9
11
8 7 4
10
6 1 7
6 8
11 7
5 8 7 9
12
7 6
10
6 8 4 2
6 6 7 2
5 7 4 5
6
15 14 13
6
317 (66.6)
0 2 0 1
1 4 3 1
2 3 3 2
2 2 4 3
1 2 2 0
2 0 1 6
1 2 1 2
2 1 0 0
3 2 3 1
1 6 3 0
3 9 5 2 3
97
(20.4)
3 3 1 3
5 5 6 3
2 5 7 1
4 3 1 5
0 2 4 3
2 3 2 5
4 5 6 3
6 3 4 1
0 2 1 1
0 4 3 1
1 5 7 2 1
138
(29.0)
5
11 8 8
8 9
10 10
11
8 14
5
20 11
9 16
14
8 12
8
7 9
12 11
15 11 11 17
12 11
6 5
7
10 8 4
6
12 6
12
10 21 24 14 10
476
(100.0)
PHC= Primary Health Centre.
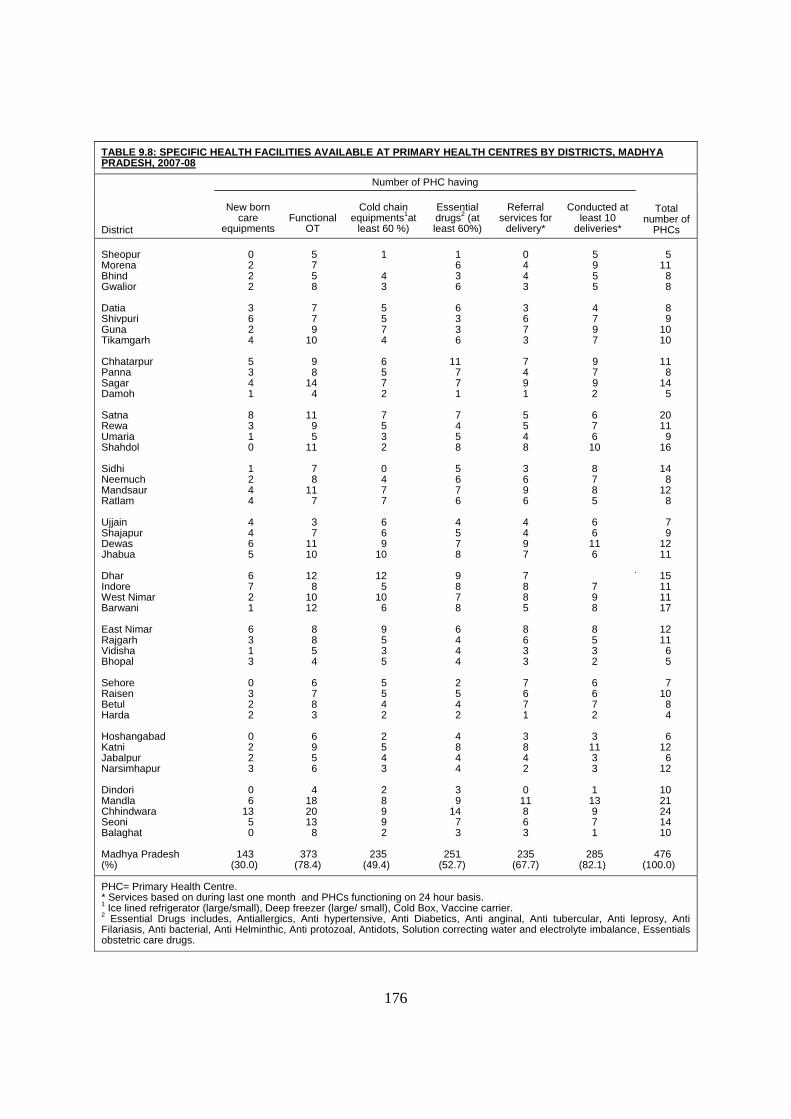
176
TABLE 9.8: SPECIFIC HEALTH FACILITIES AVAILABLE AT PRIMARY HEALTH CENTRES BY DISTRICTS, MADHYA PRADESH, 2007-08
District
Number of PHC having
Total number of
PHCs
New born care
equipments Functional
OT
Cold chain equipments1at
least 60 %)
Essential drugs2 (at least 60%)
Referral services for
delivery*
Conducted at least 10
deliveries*
Sheopur Morena Bhind Gwalior Datia Shivpuri Guna Tikamgarh Chhatarpur Panna Sagar Damoh Satna Rewa Umaria Shahdol Sidhi Neemuch Mandsaur Ratlam Ujjain Shajapur Dewas Jhabua Dhar Indore West Nimar Barwani East Nimar Rajgarh Vidisha Bhopal Sehore Raisen Betul Harda Hoshangabad Katni Jabalpur Narsimhapur Dindori Mandla Chhindwara Seoni Balaghat Madhya Pradesh (%)
0 2 2 2
3 6 2 4
5 3 4 1
8 3 1 0
1 2 4 4
4 4 6 5
6 7 2 1
6 3 1 3
0 3 2 2
0 2 2 3
0 6
13 5 0
143
(30.0)
5 7 5 8
7 7 9
10
9 8
14 4
11
9 5
11
7 8
11 7
3 7
11 10
12
8 10 12
8 8 5 4
6 7 8 3
6 9 5 6
4
18 20 13
8
373 (78.4)
1
4 3
5 5 7 4
6 5 7 2
7 5 3 2
0 4 7 7
6 6 9
10
12 5
10 6
9 5 3 5
5 5 4 2
2 5 4 3
2 8 9 9 2
235
(49.4)
1 6 3 6
6 3 3 6
11
7 7 1
7 4 5 8
5 6 7 6
4 5 7 8
9 8 7 8
6 4 4 4
2 5 4 2
4 8 4 4
3 9
14 7 3
251
(52.7)
0 4 4 3
3 6 7 3
7 4 9 1
5 5 4 8
3 6 9 6
4 4 9 7
7 8 8 5
8 6 3 3
7 6 7 1
3 8 4 2
0 11 8 6 3
235 (67.7)
5 9 5 5
4 7 9 7
9 7 9 2
6 7 6
10
8 7 8 5
6 6
11 6
7
7 9 8
8 5 3 2
6 6 7 2
3 11 3 3
1 13 9 7 1
285 (82.1)
5 11
8 8
8 9
10 10
11
8 14
5
20 11
9 16
14
8 12
8
7 9
12 11
15 11 11 17
12 11
6 5
7
10 8 4
6
12 6
12
10 21 24 14 10
476
(100.0)
PHC= Primary Health Centre. * Services based on during last one month and PHCs functioning on 24 hour basis. 1 Ice lined refrigerator (large/small), Deep freezer (large/ small), Cold Box, Vaccine carrier. 2 Essential Drugs includes, Antiallergics, Anti hypertensive, Anti Diabetics, Anti anginal, Anti tubercular, Anti leprosy, Anti Filariasis, Anti bacterial, Anti Helminthic, Anti protozoal, Antidots, Solution correcting water and electrolyte imbalance, Essentials obstetric care drugs.
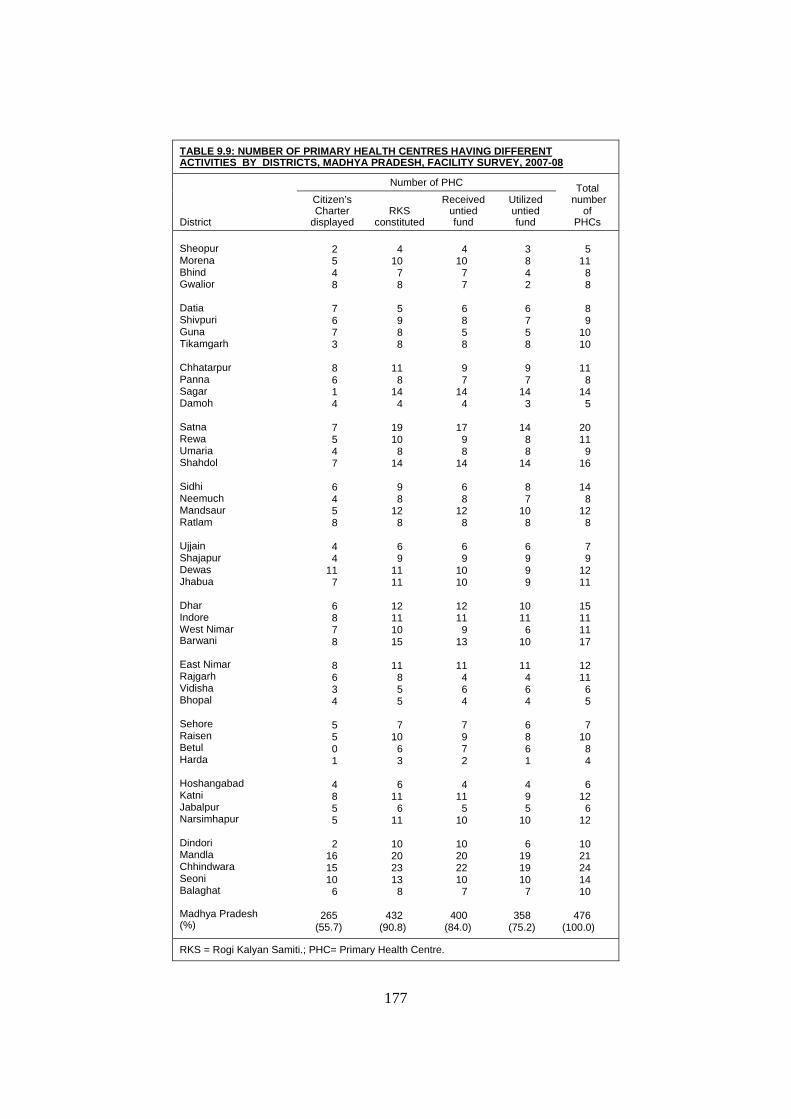
177
TABLE 9.9: NUMBER OF PRIMARY HEALTH CENTRES HAVING DIFFERENT ACTIVITIES BY DISTRICTS, MADHYA PRADESH, FACILITY SURVEY, 2007-08
District
Number of PHC Total number
of PHCs
Citizen’s Charter
displayed RKS
constituted
Received untied fund
Utilized untied fund
Sheopur Morena Bhind Gwalior Datia Shivpuri Guna Tikamgarh Chhatarpur Panna Sagar Damoh Satna Rewa Umaria Shahdol Sidhi Neemuch Mandsaur Ratlam Ujjain Shajapur Dewas Jhabua Dhar Indore West Nimar Barwani East Nimar Rajgarh Vidisha Bhopal Sehore Raisen Betul Harda Hoshangabad Katni Jabalpur Narsimhapur Dindori Mandla Chhindwara Seoni Balaghat Madhya Pradesh (%)
2 5 4 8
7 6 7 3
8 6 1 4
7 5 4 7
6 4 5 8
4 4
11 7
6 8 7 8
8 6 3 4
5 5 0 1
4 8 5 5
2
16 15 10
6
265 (55.7)
4
10 7 8
5 9 8 8
11
8 14
4
19 10
8 14
9 8
12 8
6 9
11 11
12 11 10 15
11
8 5 5
7
10 6 3
6
11 6
11
10 20 23 13
8
432 (90.8)
4
10 7 7
6 8 5 8
9 7
14 4
17
9 8
14
6 8
12 8
6 9
10 10
12 11
9 13
11
4 6 4
7 9 7 2
4
11 5
10
10 20 22 10
7
400 (84.0)
3 8 4 2
6 7 5 8
9 7
14 3
14
8 8
14
8 7
10 8
6 9 9 9
10 11
6 10
11
4 6 4
6 8 6 1
4 9 5
10
6 19 19 10
7
358 (75.2)
5
11 8 8
8 9
10 10
11
8 14
5
20 11
9 16
14
8 12
8
7 9
12 11
15 11 11 17
12 11
6 5
7
10 8 4
6
12 6
12
10 21 24 14 10
476
(100.0)
RKS = Rogi Kalyan Samiti.; PHC= Primary Health Centre.
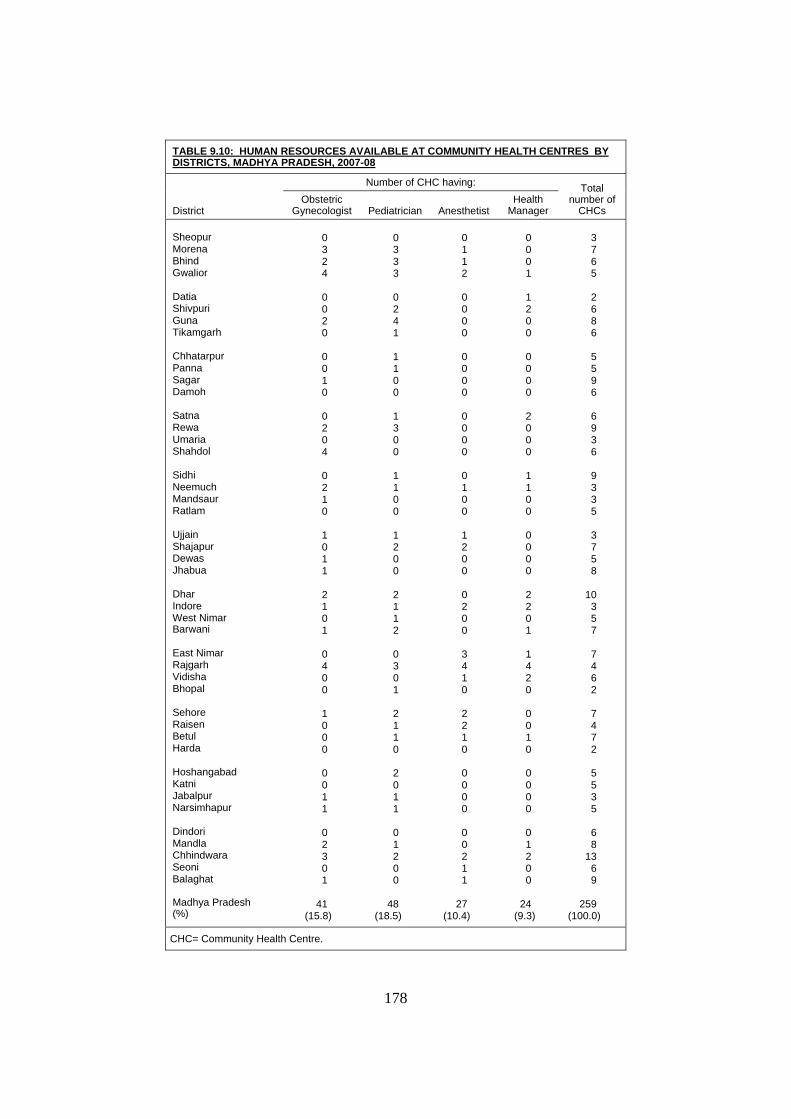
178
TABLE 9.10: HUMAN RESOURCES AVAILABLE AT COMMUNITY HEALTH CENTRES BY DISTRICTS, MADHYA PRADESH, 2007-08
District
Number of CHC having: Total number of
CHCs Obstetric
Gynecologist Pediatrician Anesthetist Health
Manager Sheopur Morena Bhind Gwalior Datia Shivpuri Guna Tikamgarh Chhatarpur Panna Sagar Damoh Satna Rewa Umaria Shahdol Sidhi Neemuch Mandsaur Ratlam Ujjain Shajapur Dewas Jhabua Dhar Indore West Nimar Barwani East Nimar Rajgarh Vidisha Bhopal Sehore Raisen Betul Harda Hoshangabad Katni Jabalpur Narsimhapur Dindori Mandla Chhindwara Seoni Balaghat Madhya Pradesh (%)
0 3 2 4
0 0 2 0
0 0 1 0
0 2 0 4
0 2 1 0
1 0 1 1
2 1 0 1
0 4 0 0
1 0 0 0
0 0 1 1
0 2 3 0 1
41
(15.8)
0 3 3 3
0 2 4 1
1 1 0 0
1 3 0 0
1 1 0 0
1 2 0 0
2 1 1 2
0 3 0 1
2 1 1 0
2 0 1 1
0 1 2 0 0
48
(18.5)
0 1 1 2
0 0 0 0
0 0 0 0
0 0 0 0
0 1 0 0
1 2 0 0
0 2 0 0
3 4 1 0
2 2 1 0
0 0 0 0
0 0 2 1 1
27
(10.4)
0 0 0 1
1 2 0 0
0 0 0 0
2 0 0 0
1 1 0 0
0 0 0 0
2 2 0 1
1 4 2 0
0 0 1 0
0 0 0 0
0 1 2 0 0
24
(9.3)
3 7 6 5
2 6 8 6
5 5 9 6
6 9 3 6
9 3 3 5
3 7 5 8
10
3 5 7
7 4 6 2
7 4 7 2
5 5 3 5
6 8
13 6 9
259
(100.0)
CHC= Community Health Centre.
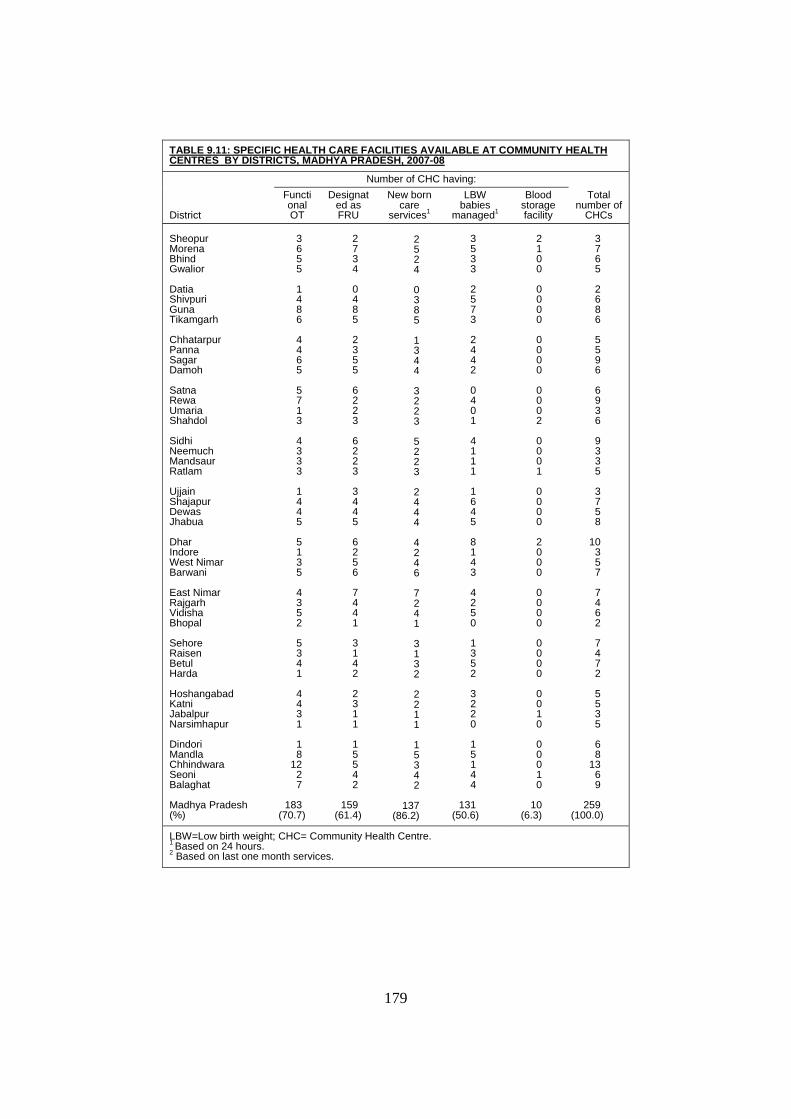
179
TABLE 9.11: SPECIFIC HEALTH CARE FACILITIES AVAILABLE AT COMMUNITY HEALTH CENTRES BY DISTRICTS, MADHYA PRADESH, 2007-08
District
Number of CHC having: Total
number of CHCs
Functional OT
Designated as FRU
New born care
services1
LBW babies
managed1
Blood storage facility
Sheopur Morena Bhind Gwalior Datia Shivpuri Guna Tikamgarh Chhatarpur Panna Sagar Damoh Satna Rewa Umaria Shahdol Sidhi Neemuch Mandsaur Ratlam Ujjain Shajapur Dewas Jhabua Dhar Indore West Nimar Barwani East Nimar Rajgarh Vidisha Bhopal Sehore Raisen Betul Harda Hoshangabad Katni Jabalpur Narsimhapur Dindori Mandla Chhindwara Seoni Balaghat Madhya Pradesh (%)
3 6 5 5
1 4 8 6
4 4 6 5
5 7 1 3
4 3 3 3
1 4 4 5
5 1 3 5
4 3 5 2
5 3 4 1
4 4 3 1
1 8
12 2 7
183
(70.7)
2 7 3 4
0 4 8 5
2 3 5 5
6 2 2 3
6 2 2 3
3 4 4 5
6 2 5 6
7 4 4 1
3 1 4 2
2 3 1 1
1 5 5 4 2
159
(61.4)
2 5 2 4
0 3 8 5
1 3 4 4
3 2 2 3
5 2 2 3
2 4 4 4
4 2 4 6
7 2 4 1
3 1 3 2
2 2 1 1
1 5 3 4 2
137
(86.2)
3 5 3 3
2 5 7 3
2 4 4 2
0 4 0 1
4 1 1 1
1 6 4 5
8 1 4 3
4 2 5 0
1 3 5 2
3 2 2 0
1 5 1 4 4
131
(50.6)
2 1 0 0
0 0 0 0
0 0 0 0
0 0 0 2
0 0 0 1
0 0 0 0
2 0 0 0
0 0 0 0
0 0 0 0
0 0 1 0
0 0 0 1 0
10
(6.3)
3 7 6 5
2 6 8 6
5 5 9 6
6 9 3 6
9 3 3 5
3 7 5 8
10
3 5 7
7 4 6 2
7 4 7 2
5 5 3 5
6 8
13 6 9
259
(100.0)
LBW=Low birth weight; CHC= Community Health Centre. 1 Based on 24 hours. 2 Based on last one month services.

180
TABLE 9.12: MONITORING AND SUPERVISION ACTIVITIES AT COMMUNITY HEALTH CENTRES BY DISTRICTS, MADHYA PRADESH, 2007-08
District
Number of CHC having: Total
number of CHCs
Citizen’s charter
displayed RKS
constituted
RKS Monitor
regularly*
Utilized untied fund
Sheopur Morena Bhind Gwalior Datia Shivpuri Guna Tikamgarh Chhatarpur Panna Sagar Damoh Satna Rewa Umaria Shahdol Sidhi Neemuch Mandsaur Ratlam Ujjain Shajapur Dewas Jhabua Dhar Indore West Nimar Barwani East Nimar Rajgarh Vidisha Bhopal Sehore Raisen Betul Harda Hoshangabad Katni Jabalpur Narsimhapur Dindori Mandla Chhindwara Seoni Balaghat Madhya Pradesh (%)
3 5 6 4
2 5 7 4
5 5 7 5
4 9 2 6
5 2 2 4
2 7 4 8
5 3 4 5
7 4 5 2
7 2 3 2
3 4 3 4
5 8
12 6 9
216
(83.4)
3 7 6 4
2 6 8 5
5 5 9 6
6 9 3 6
9 3 2 5
3 7 5 8
10
3 4 7
4 4 6 2
7 4 7 2
4 5 3 5
6 8
13 6 9
251
(96.9)
3 7 6 4
2 6 8 5
5 5 9 6
6 9 3 6
8 3 2 5
3 7 4 8
10
3 4 5
4 4 6 2
7 4 7 2
3 4 3 5
6 8
13 6 9
245
(97.6)
3 5 5 5
2 6 8 4
5 5 9 5
5 9 3 6
9 3 2 4
2 7 5 6
9 3 3 5
6 4 6 2
7 4 7 1
5 5 2 5
5 8
13 5 7
235
(90.7)
3 7 6 5
2 6 8 6
5 5 9 6
6 9 3 6
9 3 3 5
3 7 5 8
10
3 5 7
7 4 6 2
7 4 7 2
5 5 3 5
6 8
13 6 9
259
(100.0)
*RKS monitor regularly is from number of RKS in the districts.

APPENDIX
SAMPLING ERROR OF SELECTED INDICATORS

182
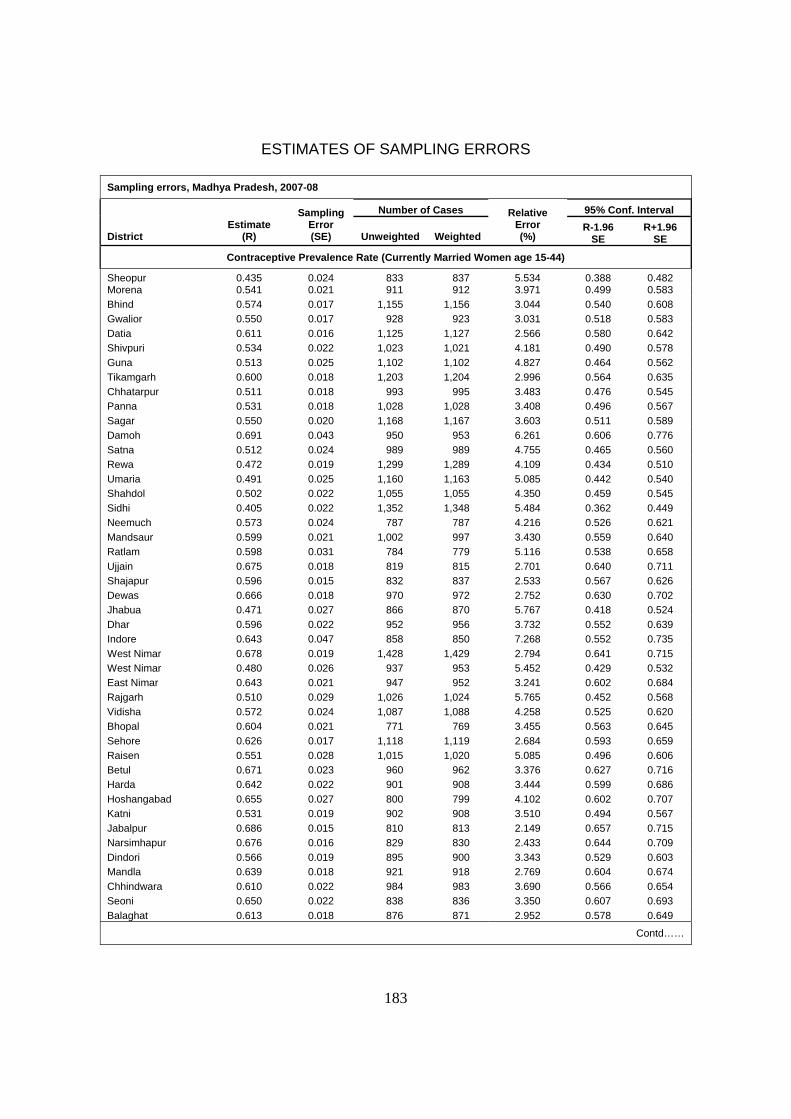
183
ESTIMATES OF SAMPLING ERRORS
Sampling errors, Madhya Pradesh, 2007-08
District
Estimate (R)
Sampling Error (SE)
Number of Cases Relative Error (%)
95% Conf. Interval
Unweighted Weighted R-1.96
SE R+1.96
SE
Contraceptive Prevalence Rate (Currently Married Women age 15-44)
Sheopur 0.435 0.024 833 837 5.534 0.388 0.482 Morena 0.541 0.021 911 912 3.971 0.499 0.583 Bhind 0.574 0.017 1,155 1,156 3.044 0.540 0.608 Gwalior 0.550 0.017 928 923 3.031 0.518 0.583 Datia 0.611 0.016 1,125 1,127 2.566 0.580 0.642 Shivpuri 0.534 0.022 1,023 1,021 4.181 0.490 0.578 Guna 0.513 0.025 1,102 1,102 4.827 0.464 0.562 Tikamgarh 0.600 0.018 1,203 1,204 2.996 0.564 0.635 Chhatarpur 0.511 0.018 993 995 3.483 0.476 0.545 Panna 0.531 0.018 1,028 1,028 3.408 0.496 0.567 Sagar 0.550 0.020 1,168 1,167 3.603 0.511 0.589 Damoh 0.691 0.043 950 953 6.261 0.606 0.776 Satna 0.512 0.024 989 989 4.755 0.465 0.560 Rewa 0.472 0.019 1,299 1,289 4.109 0.434 0.510 Umaria 0.491 0.025 1,160 1,163 5.085 0.442 0.540 Shahdol 0.502 0.022 1,055 1,055 4.350 0.459 0.545 Sidhi 0.405 0.022 1,352 1,348 5.484 0.362 0.449 Neemuch 0.573 0.024 787 787 4.216 0.526 0.621 Mandsaur 0.599 0.021 1,002 997 3.430 0.559 0.640 Ratlam 0.598 0.031 784 779 5.116 0.538 0.658 Ujjain 0.675 0.018 819 815 2.701 0.640 0.711 Shajapur 0.596 0.015 832 837 2.533 0.567 0.626 Dewas 0.666 0.018 970 972 2.752 0.630 0.702 Jhabua 0.471 0.027 866 870 5.767 0.418 0.524 Dhar 0.596 0.022 952 956 3.732 0.552 0.639 Indore 0.643 0.047 858 850 7.268 0.552 0.735 West Nimar 0.678 0.019 1,428 1,429 2.794 0.641 0.715 West Nimar 0.480 0.026 937 953 5.452 0.429 0.532 East Nimar 0.643 0.021 947 952 3.241 0.602 0.684 Rajgarh 0.510 0.029 1,026 1,024 5.765 0.452 0.568 Vidisha 0.572 0.024 1,087 1,088 4.258 0.525 0.620 Bhopal 0.604 0.021 771 769 3.455 0.563 0.645 Sehore 0.626 0.017 1,118 1,119 2.684 0.593 0.659 Raisen 0.551 0.028 1,015 1,020 5.085 0.496 0.606 Betul 0.671 0.023 960 962 3.376 0.627 0.716 Harda 0.642 0.022 901 908 3.444 0.599 0.686 Hoshangabad 0.655 0.027 800 799 4.102 0.602 0.707 Katni 0.531 0.019 902 908 3.510 0.494 0.567 Jabalpur 0.686 0.015 810 813 2.149 0.657 0.715 Narsimhapur 0.676 0.016 829 830 2.433 0.644 0.709 Dindori 0.566 0.019 895 900 3.343 0.529 0.603 Mandla 0.639 0.018 921 918 2.769 0.604 0.674 Chhindwara 0.610 0.022 984 983 3.690 0.566 0.654 Seoni 0.650 0.022 838 836 3.350 0.607 0.693 Balaghat 0.613 0.018 876 871 2.952 0.578 0.649
Contd……
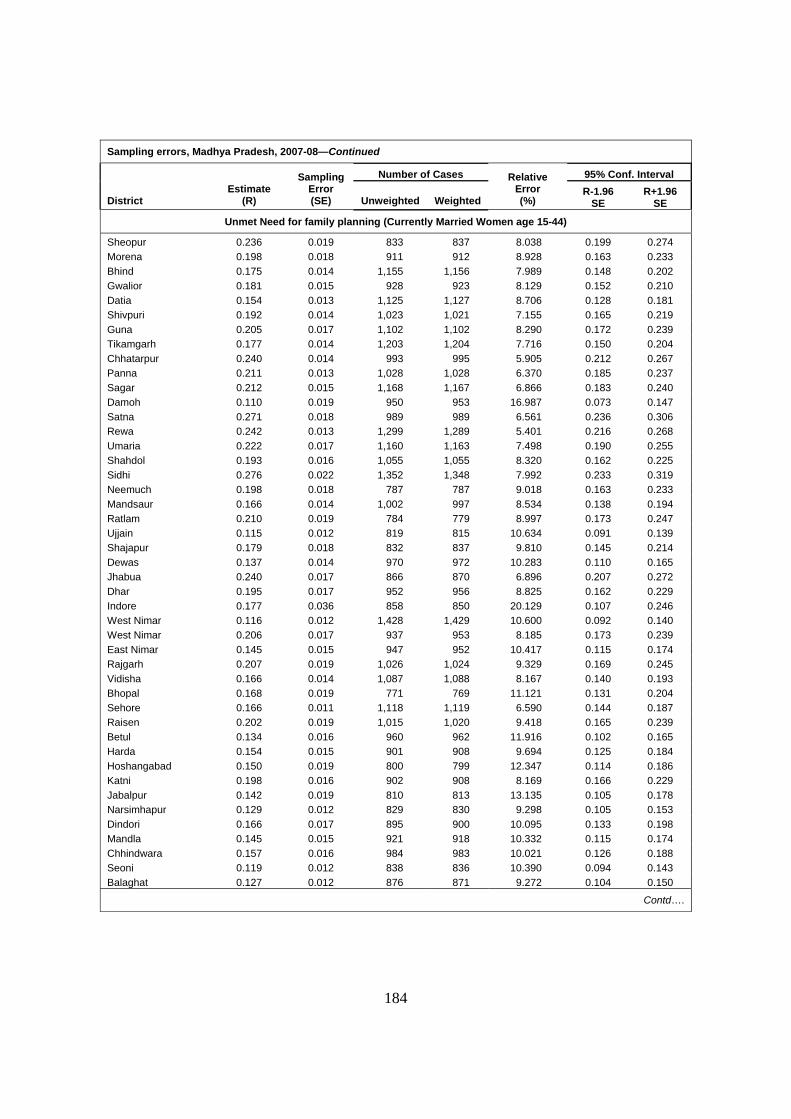
184
Sampling errors, Madhya Pradesh, 2007-08—Continued
District
Estimate (R)
Sampling Error (SE)
Number of Cases Relative Error (%)
95% Conf. Interval
Unweighted Weighted R-1.96
SE R+1.96
SE
Unmet Need for family planning (Currently Married Women age 15-44)
Sheopur 0.236 0.019 833 837 8.038 0.199 0.274 Morena 0.198 0.018 911 912 8.928 0.163 0.233 Bhind 0.175 0.014 1,155 1,156 7.989 0.148 0.202 Gwalior 0.181 0.015 928 923 8.129 0.152 0.210 Datia 0.154 0.013 1,125 1,127 8.706 0.128 0.181 Shivpuri 0.192 0.014 1,023 1,021 7.155 0.165 0.219 Guna 0.205 0.017 1,102 1,102 8.290 0.172 0.239 Tikamgarh 0.177 0.014 1,203 1,204 7.716 0.150 0.204 Chhatarpur 0.240 0.014 993 995 5.905 0.212 0.267 Panna 0.211 0.013 1,028 1,028 6.370 0.185 0.237 Sagar 0.212 0.015 1,168 1,167 6.866 0.183 0.240 Damoh 0.110 0.019 950 953 16.987 0.073 0.147 Satna 0.271 0.018 989 989 6.561 0.236 0.306 Rewa 0.242 0.013 1,299 1,289 5.401 0.216 0.268 Umaria 0.222 0.017 1,160 1,163 7.498 0.190 0.255 Shahdol 0.193 0.016 1,055 1,055 8.320 0.162 0.225 Sidhi 0.276 0.022 1,352 1,348 7.992 0.233 0.319 Neemuch 0.198 0.018 787 787 9.018 0.163 0.233 Mandsaur 0.166 0.014 1,002 997 8.534 0.138 0.194 Ratlam 0.210 0.019 784 779 8.997 0.173 0.247 Ujjain 0.115 0.012 819 815 10.634 0.091 0.139 Shajapur 0.179 0.018 832 837 9.810 0.145 0.214 Dewas 0.137 0.014 970 972 10.283 0.110 0.165 Jhabua 0.240 0.017 866 870 6.896 0.207 0.272 Dhar 0.195 0.017 952 956 8.825 0.162 0.229 Indore 0.177 0.036 858 850 20.129 0.107 0.246 West Nimar 0.116 0.012 1,428 1,429 10.600 0.092 0.140 West Nimar 0.206 0.017 937 953 8.185 0.173 0.239 East Nimar 0.145 0.015 947 952 10.417 0.115 0.174 Rajgarh 0.207 0.019 1,026 1,024 9.329 0.169 0.245 Vidisha 0.166 0.014 1,087 1,088 8.167 0.140 0.193 Bhopal 0.168 0.019 771 769 11.121 0.131 0.204 Sehore 0.166 0.011 1,118 1,119 6.590 0.144 0.187 Raisen 0.202 0.019 1,015 1,020 9.418 0.165 0.239 Betul 0.134 0.016 960 962 11.916 0.102 0.165 Harda 0.154 0.015 901 908 9.694 0.125 0.184 Hoshangabad 0.150 0.019 800 799 12.347 0.114 0.186 Katni 0.198 0.016 902 908 8.169 0.166 0.229 Jabalpur 0.142 0.019 810 813 13.135 0.105 0.178 Narsimhapur 0.129 0.012 829 830 9.298 0.105 0.153 Dindori 0.166 0.017 895 900 10.095 0.133 0.198 Mandla 0.145 0.015 921 918 10.332 0.115 0.174 Chhindwara 0.157 0.016 984 983 10.021 0.126 0.188 Seoni 0.119 0.012 838 836 10.390 0.094 0.143 Balaghat 0.127 0.012 876 871 9.272 0.104 0.150
Contd….
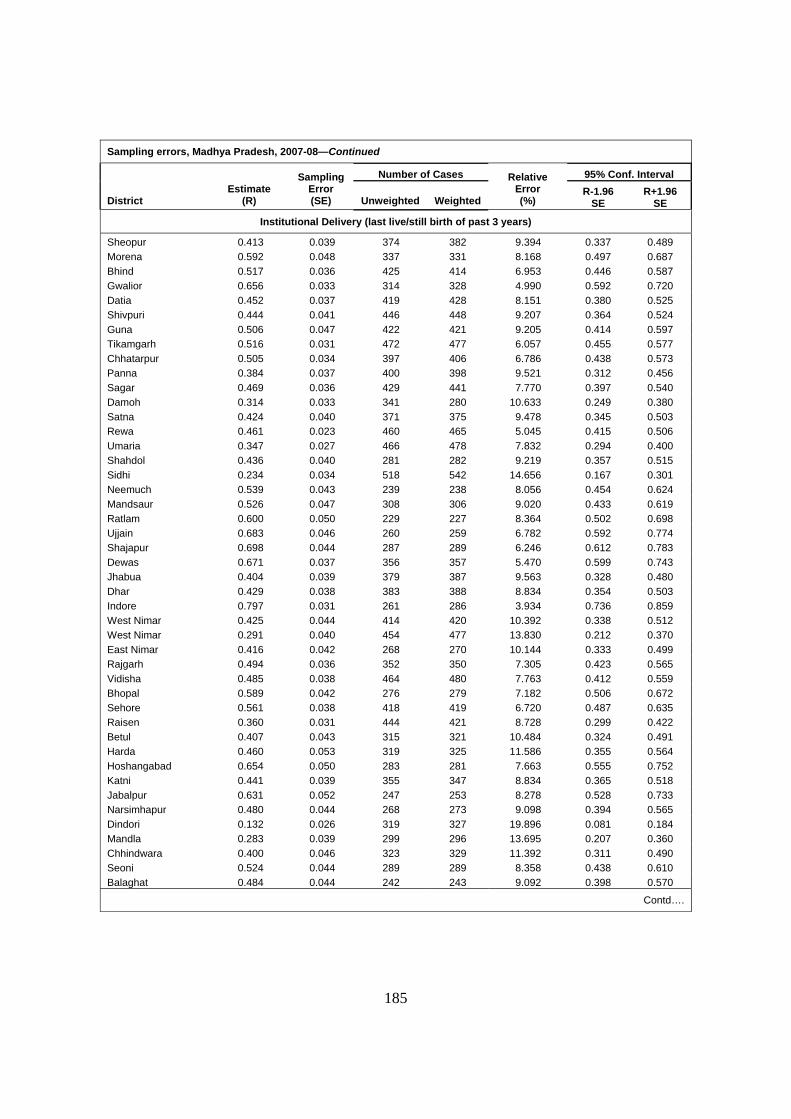
185
Sampling errors, Madhya Pradesh, 2007-08—Continued
District
Estimate (R)
Sampling Error (SE)
Number of Cases Relative Error (%)
95% Conf. Interval
Unweighted Weighted R-1.96
SE R+1.96
SE
Institutional Delivery (last live/still birth of past 3 years)
Sheopur 0.413 0.039 374 382 9.394 0.337 0.489 Morena 0.592 0.048 337 331 8.168 0.497 0.687 Bhind 0.517 0.036 425 414 6.953 0.446 0.587 Gwalior 0.656 0.033 314 328 4.990 0.592 0.720 Datia 0.452 0.037 419 428 8.151 0.380 0.525 Shivpuri 0.444 0.041 446 448 9.207 0.364 0.524 Guna 0.506 0.047 422 421 9.205 0.414 0.597 Tikamgarh 0.516 0.031 472 477 6.057 0.455 0.577 Chhatarpur 0.505 0.034 397 406 6.786 0.438 0.573 Panna 0.384 0.037 400 398 9.521 0.312 0.456 Sagar 0.469 0.036 429 441 7.770 0.397 0.540 Damoh 0.314 0.033 341 280 10.633 0.249 0.380 Satna 0.424 0.040 371 375 9.478 0.345 0.503 Rewa 0.461 0.023 460 465 5.045 0.415 0.506 Umaria 0.347 0.027 466 478 7.832 0.294 0.400 Shahdol 0.436 0.040 281 282 9.219 0.357 0.515 Sidhi 0.234 0.034 518 542 14.656 0.167 0.301 Neemuch 0.539 0.043 239 238 8.056 0.454 0.624 Mandsaur 0.526 0.047 308 306 9.020 0.433 0.619 Ratlam 0.600 0.050 229 227 8.364 0.502 0.698 Ujjain 0.683 0.046 260 259 6.782 0.592 0.774 Shajapur 0.698 0.044 287 289 6.246 0.612 0.783 Dewas 0.671 0.037 356 357 5.470 0.599 0.743 Jhabua 0.404 0.039 379 387 9.563 0.328 0.480 Dhar 0.429 0.038 383 388 8.834 0.354 0.503 Indore 0.797 0.031 261 286 3.934 0.736 0.859 West Nimar 0.425 0.044 414 420 10.392 0.338 0.512 West Nimar 0.291 0.040 454 477 13.830 0.212 0.370 East Nimar 0.416 0.042 268 270 10.144 0.333 0.499 Rajgarh 0.494 0.036 352 350 7.305 0.423 0.565 Vidisha 0.485 0.038 464 480 7.763 0.412 0.559 Bhopal 0.589 0.042 276 279 7.182 0.506 0.672 Sehore 0.561 0.038 418 419 6.720 0.487 0.635 Raisen 0.360 0.031 444 421 8.728 0.299 0.422 Betul 0.407 0.043 315 321 10.484 0.324 0.491 Harda 0.460 0.053 319 325 11.586 0.355 0.564 Hoshangabad 0.654 0.050 283 281 7.663 0.555 0.752 Katni 0.441 0.039 355 347 8.834 0.365 0.518 Jabalpur 0.631 0.052 247 253 8.278 0.528 0.733 Narsimhapur 0.480 0.044 268 273 9.098 0.394 0.565 Dindori 0.132 0.026 319 327 19.896 0.081 0.184 Mandla 0.283 0.039 299 296 13.695 0.207 0.360 Chhindwara 0.400 0.046 323 329 11.392 0.311 0.490 Seoni 0.524 0.044 289 289 8.358 0.438 0.610 Balaghat 0.484 0.044 242 243 9.092 0.398 0.570
Contd….
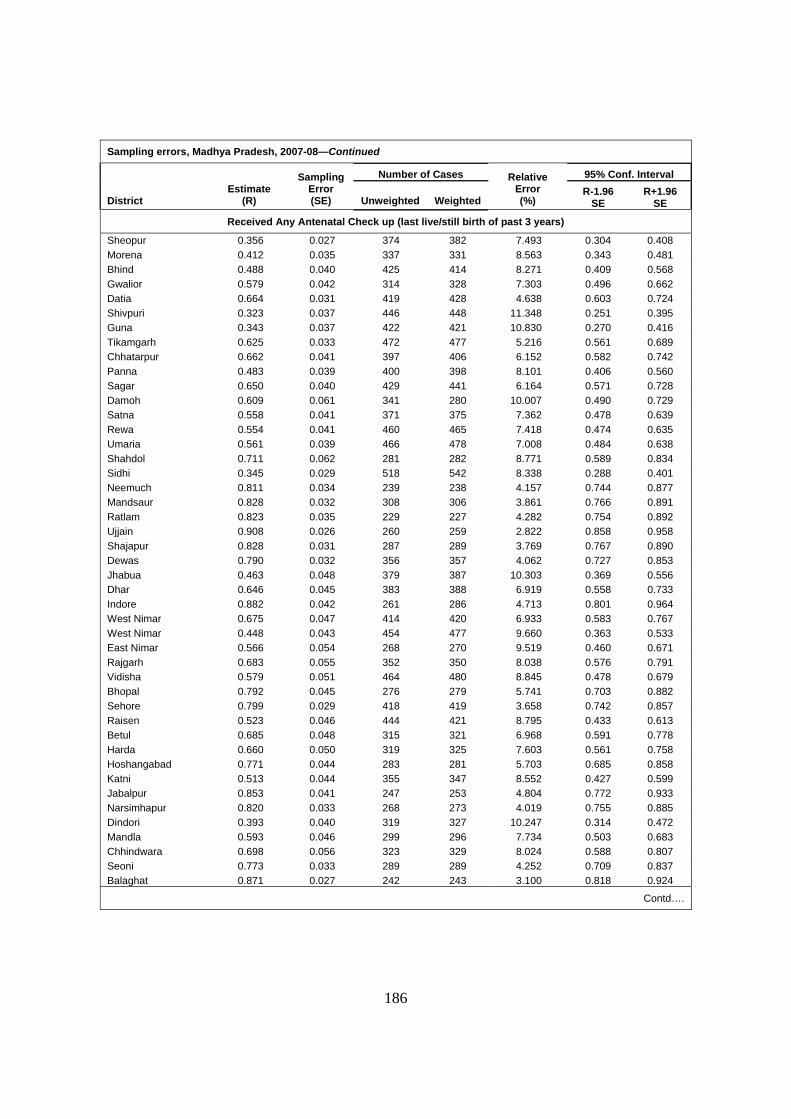
186
Sampling errors, Madhya Pradesh, 2007-08—Continued
District
Estimate (R)
Sampling Error (SE)
Number of Cases Relative Error (%)
95% Conf. Interval
Unweighted Weighted R-1.96
SE R+1.96
SE
Received Any Antenatal Check up (last live/still birth of past 3 years)
Sheopur 0.356 0.027 374 382 7.493 0.304 0.408 Morena 0.412 0.035 337 331 8.563 0.343 0.481 Bhind 0.488 0.040 425 414 8.271 0.409 0.568 Gwalior 0.579 0.042 314 328 7.303 0.496 0.662 Datia 0.664 0.031 419 428 4.638 0.603 0.724 Shivpuri 0.323 0.037 446 448 11.348 0.251 0.395 Guna 0.343 0.037 422 421 10.830 0.270 0.416 Tikamgarh 0.625 0.033 472 477 5.216 0.561 0.689 Chhatarpur 0.662 0.041 397 406 6.152 0.582 0.742 Panna 0.483 0.039 400 398 8.101 0.406 0.560 Sagar 0.650 0.040 429 441 6.164 0.571 0.728 Damoh 0.609 0.061 341 280 10.007 0.490 0.729 Satna 0.558 0.041 371 375 7.362 0.478 0.639 Rewa 0.554 0.041 460 465 7.418 0.474 0.635 Umaria 0.561 0.039 466 478 7.008 0.484 0.638 Shahdol 0.711 0.062 281 282 8.771 0.589 0.834 Sidhi 0.345 0.029 518 542 8.338 0.288 0.401 Neemuch 0.811 0.034 239 238 4.157 0.744 0.877 Mandsaur 0.828 0.032 308 306 3.861 0.766 0.891 Ratlam 0.823 0.035 229 227 4.282 0.754 0.892 Ujjain 0.908 0.026 260 259 2.822 0.858 0.958 Shajapur 0.828 0.031 287 289 3.769 0.767 0.890 Dewas 0.790 0.032 356 357 4.062 0.727 0.853 Jhabua 0.463 0.048 379 387 10.303 0.369 0.556 Dhar 0.646 0.045 383 388 6.919 0.558 0.733 Indore 0.882 0.042 261 286 4.713 0.801 0.964 West Nimar 0.675 0.047 414 420 6.933 0.583 0.767 West Nimar 0.448 0.043 454 477 9.660 0.363 0.533 East Nimar 0.566 0.054 268 270 9.519 0.460 0.671 Rajgarh 0.683 0.055 352 350 8.038 0.576 0.791 Vidisha 0.579 0.051 464 480 8.845 0.478 0.679 Bhopal 0.792 0.045 276 279 5.741 0.703 0.882 Sehore 0.799 0.029 418 419 3.658 0.742 0.857 Raisen 0.523 0.046 444 421 8.795 0.433 0.613 Betul 0.685 0.048 315 321 6.968 0.591 0.778 Harda 0.660 0.050 319 325 7.603 0.561 0.758 Hoshangabad 0.771 0.044 283 281 5.703 0.685 0.858 Katni 0.513 0.044 355 347 8.552 0.427 0.599 Jabalpur 0.853 0.041 247 253 4.804 0.772 0.933 Narsimhapur 0.820 0.033 268 273 4.019 0.755 0.885 Dindori 0.393 0.040 319 327 10.247 0.314 0.472 Mandla 0.593 0.046 299 296 7.734 0.503 0.683 Chhindwara 0.698 0.056 323 329 8.024 0.588 0.807 Seoni 0.773 0.033 289 289 4.252 0.709 0.837 Balaghat 0.871 0.027 242 243 3.100 0.818 0.924
Contd….

187
Sampling errors, Madhya Pradesh, 2007-08—Continued
District
Estimate (R)
Sampling Error (SE)
Number of Cases Relative Error (%)
95% Conf. Interval
Unweighted Weighted R-1.96
SE R+1.96
SE
Received 3+ Antenatal Check up (last live/still birth of past 3 years)
Sheopur 0.155 0.018 374 382 11.580 0.120 0.191 Morena 0.150 0.030 337 331 20.140 0.091 0.210 Bhind 0.217 0.029 425 414 13.307 0.161 0.274 Gwalior 0.291 0.037 314 328 12.808 0.218 0.364 Datia 0.259 0.024 419 428 9.393 0.211 0.307 Shivpuri 0.140 0.023 446 448 16.531 0.095 0.186 Guna 0.163 0.026 422 421 16.247 0.111 0.214 Tikamgarh 0.227 0.026 472 477 11.525 0.175 0.278 Chhatarpur 0.292 0.033 397 406 11.240 0.228 0.357 Panna 0.204 0.027 400 398 13.198 0.152 0.257 Sagar 0.391 0.043 429 441 10.948 0.307 0.475 Damoh 0.376 0.060 341 280 15.872 0.259 0.494 Satna 0.289 0.032 371 375 11.104 0.226 0.351 Rewa 0.233 0.028 460 465 12.205 0.177 0.289 Umaria 0.303 0.035 466 478 11.610 0.234 0.372 Shahdol 0.414 0.045 281 282 10.914 0.326 0.503 Sidhi 0.140 0.025 518 542 17.842 0.091 0.188 Neemuch 0.525 0.044 239 238 8.344 0.439 0.611 Mandsaur 0.606 0.040 308 306 6.521 0.529 0.684 Ratlam 0.514 0.050 229 227 9.706 0.416 0.612 Ujjain 0.651 0.036 260 259 5.509 0.581 0.721 Shajapur 0.552 0.046 287 289 8.283 0.463 0.642 Dewas 0.543 0.037 356 357 6.897 0.469 0.616 Jhabua 0.251 0.042 379 387 16.858 0.168 0.334 Dhar 0.391 0.042 383 388 10.784 0.308 0.473 Indore 0.702 0.032 261 286 4.534 0.640 0.764 West Nimar 0.412 0.055 414 420 13.478 0.303 0.521 West Nimar 0.216 0.035 454 477 16.166 0.147 0.284 East Nimar 0.265 0.041 268 270 15.593 0.184 0.346 Rajgarh 0.410 0.051 352 350 12.522 0.309 0.510 Vidisha 0.342 0.051 464 480 15.023 0.241 0.442 Bhopal 0.609 0.053 276 279 8.775 0.504 0.714 Sehore 0.453 0.039 418 419 8.560 0.377 0.529 Raisen 0.272 0.033 444 421 12.072 0.207 0.336 Betul 0.413 0.045 315 321 10.944 0.324 0.502 Harda 0.442 0.049 319 325 11.022 0.346 0.537 Hoshangabad 0.450 0.045 283 281 9.943 0.362 0.537 Katni 0.223 0.033 355 347 14.743 0.158 0.287 Jabalpur 0.645 0.063 247 253 9.716 0.522 0.768 Narsimhapur 0.488 0.051 268 273 10.492 0.388 0.588 Dindori 0.189 0.027 319 327 14.368 0.136 0.243 Mandla 0.292 0.036 299 296 12.393 0.221 0.363 Chhindwara 0.435 0.052 323 329 11.837 0.334 0.536 Seoni 0.460 0.038 289 289 8.338 0.385 0.535 Balaghat 0.645 0.041 242 243 6.381 0.564 0.726
Contd….
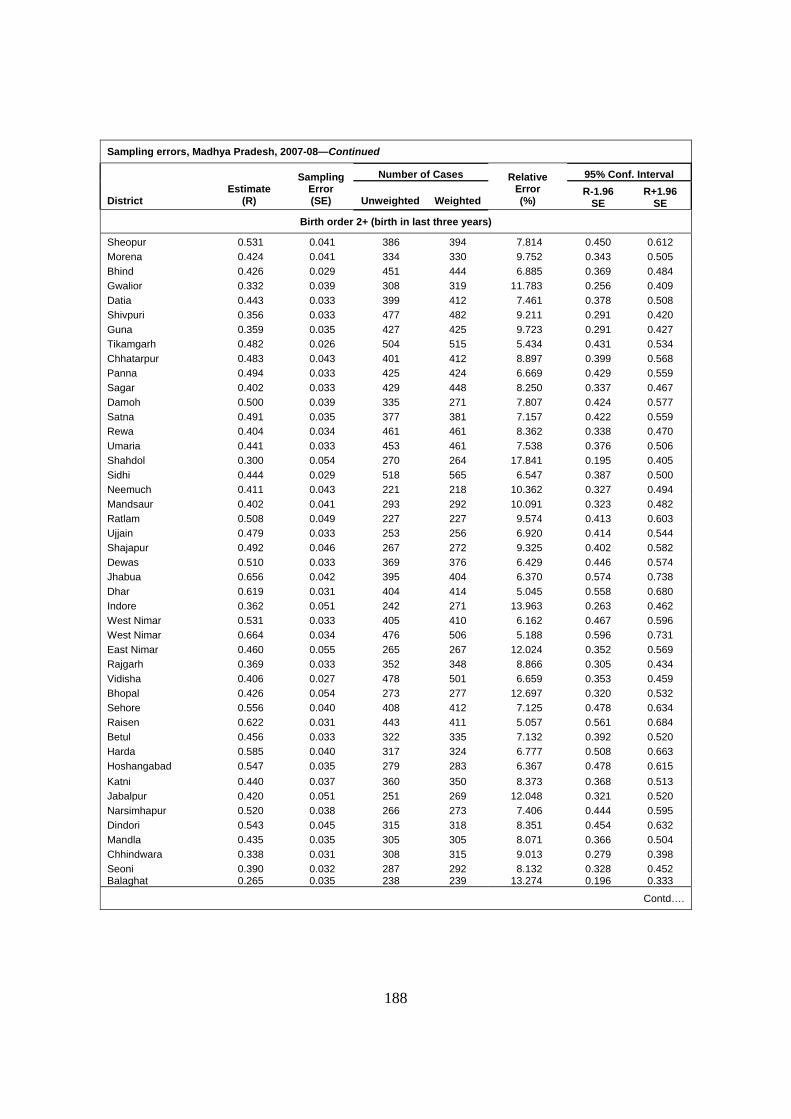
188
Sampling errors, Madhya Pradesh, 2007-08—Continued
District
Estimate (R)
Sampling Error (SE)
Number of Cases Relative Error (%)
95% Conf. Interval
Unweighted Weighted R-1.96
SE R+1.96
SE
Birth order 2+ (birth in last three years)
Sheopur 0.531 0.041 386 394 7.814 0.450 0.612 Morena 0.424 0.041 334 330 9.752 0.343 0.505 Bhind 0.426 0.029 451 444 6.885 0.369 0.484 Gwalior 0.332 0.039 308 319 11.783 0.256 0.409 Datia 0.443 0.033 399 412 7.461 0.378 0.508 Shivpuri 0.356 0.033 477 482 9.211 0.291 0.420 Guna 0.359 0.035 427 425 9.723 0.291 0.427 Tikamgarh 0.482 0.026 504 515 5.434 0.431 0.534 Chhatarpur 0.483 0.043 401 412 8.897 0.399 0.568 Panna 0.494 0.033 425 424 6.669 0.429 0.559 Sagar 0.402 0.033 429 448 8.250 0.337 0.467 Damoh 0.500 0.039 335 271 7.807 0.424 0.577 Satna 0.491 0.035 377 381 7.157 0.422 0.559 Rewa 0.404 0.034 461 461 8.362 0.338 0.470 Umaria 0.441 0.033 453 461 7.538 0.376 0.506 Shahdol 0.300 0.054 270 264 17.841 0.195 0.405 Sidhi 0.444 0.029 518 565 6.547 0.387 0.500 Neemuch 0.411 0.043 221 218 10.362 0.327 0.494 Mandsaur 0.402 0.041 293 292 10.091 0.323 0.482 Ratlam 0.508 0.049 227 227 9.574 0.413 0.603 Ujjain 0.479 0.033 253 256 6.920 0.414 0.544 Shajapur 0.492 0.046 267 272 9.325 0.402 0.582 Dewas 0.510 0.033 369 376 6.429 0.446 0.574 Jhabua 0.656 0.042 395 404 6.370 0.574 0.738 Dhar 0.619 0.031 404 414 5.045 0.558 0.680 Indore 0.362 0.051 242 271 13.963 0.263 0.462 West Nimar 0.531 0.033 405 410 6.162 0.467 0.596 West Nimar 0.664 0.034 476 506 5.188 0.596 0.731 East Nimar 0.460 0.055 265 267 12.024 0.352 0.569 Rajgarh 0.369 0.033 352 348 8.866 0.305 0.434 Vidisha 0.406 0.027 478 501 6.659 0.353 0.459 Bhopal 0.426 0.054 273 277 12.697 0.320 0.532 Sehore 0.556 0.040 408 412 7.125 0.478 0.634 Raisen 0.622 0.031 443 411 5.057 0.561 0.684 Betul 0.456 0.033 322 335 7.132 0.392 0.520 Harda 0.585 0.040 317 324 6.777 0.508 0.663 Hoshangabad 0.547 0.035 279 283 6.367 0.478 0.615 Katni 0.440 0.037 360 350 8.373 0.368 0.513 Jabalpur 0.420 0.051 251 269 12.048 0.321 0.520 Narsimhapur 0.520 0.038 266 273 7.406 0.444 0.595 Dindori 0.543 0.045 315 318 8.351 0.454 0.632 Mandla 0.435 0.035 305 305 8.071 0.366 0.504 Chhindwara 0.338 0.031 308 315 9.013 0.279 0.398 Seoni 0.390 0.032 287 292 8.132 0.328 0.452 Balaghat 0.265 0.035 238 239 13.274 0.196 0.333
Contd….
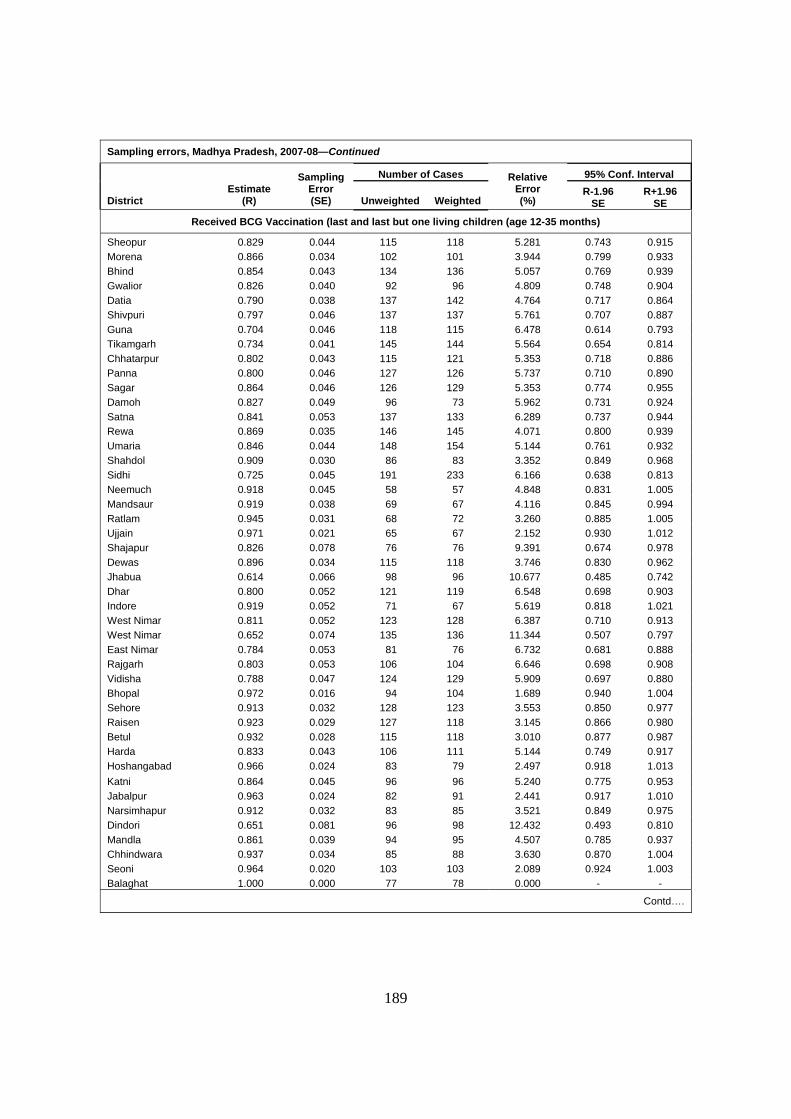
189
Sampling errors, Madhya Pradesh, 2007-08—Continued
District
Estimate (R)
Sampling Error (SE)
Number of Cases Relative Error (%)
95% Conf. Interval
Unweighted Weighted R-1.96
SE R+1.96
SE
Received BCG Vaccination (last and last but one living children (age 12-35 months)
Sheopur 0.829 0.044 115 118 5.281 0.743 0.915 Morena 0.866 0.034 102 101 3.944 0.799 0.933 Bhind 0.854 0.043 134 136 5.057 0.769 0.939 Gwalior 0.826 0.040 92 96 4.809 0.748 0.904 Datia 0.790 0.038 137 142 4.764 0.717 0.864 Shivpuri 0.797 0.046 137 137 5.761 0.707 0.887 Guna 0.704 0.046 118 115 6.478 0.614 0.793 Tikamgarh 0.734 0.041 145 144 5.564 0.654 0.814 Chhatarpur 0.802 0.043 115 121 5.353 0.718 0.886 Panna 0.800 0.046 127 126 5.737 0.710 0.890 Sagar 0.864 0.046 126 129 5.353 0.774 0.955 Damoh 0.827 0.049 96 73 5.962 0.731 0.924 Satna 0.841 0.053 137 133 6.289 0.737 0.944 Rewa 0.869 0.035 146 145 4.071 0.800 0.939 Umaria 0.846 0.044 148 154 5.144 0.761 0.932 Shahdol 0.909 0.030 86 83 3.352 0.849 0.968 Sidhi 0.725 0.045 191 233 6.166 0.638 0.813 Neemuch 0.918 0.045 58 57 4.848 0.831 1.005 Mandsaur 0.919 0.038 69 67 4.116 0.845 0.994 Ratlam 0.945 0.031 68 72 3.260 0.885 1.005 Ujjain 0.971 0.021 65 67 2.152 0.930 1.012 Shajapur 0.826 0.078 76 76 9.391 0.674 0.978 Dewas 0.896 0.034 115 118 3.746 0.830 0.962 Jhabua 0.614 0.066 98 96 10.677 0.485 0.742 Dhar 0.800 0.052 121 119 6.548 0.698 0.903 Indore 0.919 0.052 71 67 5.619 0.818 1.021 West Nimar 0.811 0.052 123 128 6.387 0.710 0.913 West Nimar 0.652 0.074 135 136 11.344 0.507 0.797 East Nimar 0.784 0.053 81 76 6.732 0.681 0.888 Rajgarh 0.803 0.053 106 104 6.646 0.698 0.908 Vidisha 0.788 0.047 124 129 5.909 0.697 0.880 Bhopal 0.972 0.016 94 104 1.689 0.940 1.004 Sehore 0.913 0.032 128 123 3.553 0.850 0.977 Raisen 0.923 0.029 127 118 3.145 0.866 0.980 Betul 0.932 0.028 115 118 3.010 0.877 0.987 Harda 0.833 0.043 106 111 5.144 0.749 0.917 Hoshangabad 0.966 0.024 83 79 2.497 0.918 1.013 Katni 0.864 0.045 96 96 5.240 0.775 0.953 Jabalpur 0.963 0.024 82 91 2.441 0.917 1.010 Narsimhapur 0.912 0.032 83 85 3.521 0.849 0.975 Dindori 0.651 0.081 96 98 12.432 0.493 0.810 Mandla 0.861 0.039 94 95 4.507 0.785 0.937 Chhindwara 0.937 0.034 85 88 3.630 0.870 1.004 Seoni 0.964 0.020 103 103 2.089 0.924 1.003 Balaghat 1.000 0.000 77 78 0.000 - -
Contd….
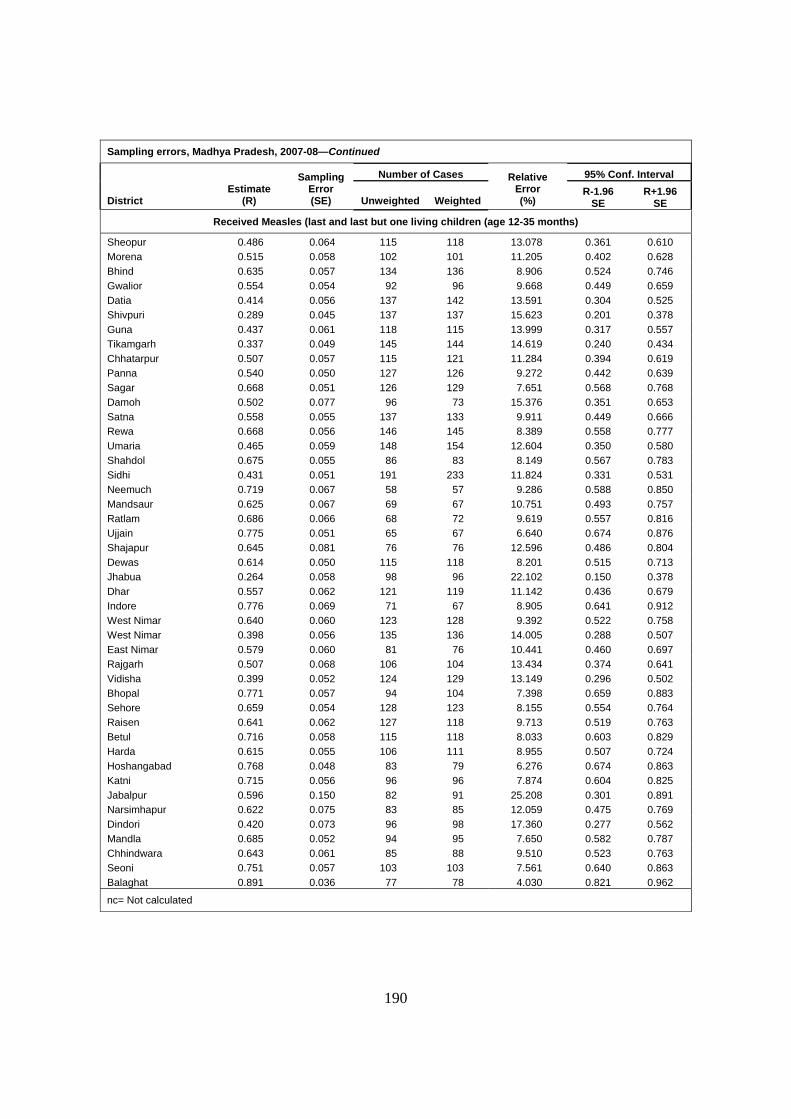
190
Sampling errors, Madhya Pradesh, 2007-08—Continued
District
Estimate (R)
Sampling Error (SE)
Number of Cases Relative Error (%)
95% Conf. Interval
Unweighted Weighted R-1.96
SE R+1.96
SE
Received Measles (last and last but one living children (age 12-35 months)
Sheopur 0.486 0.064 115 118 13.078 0.361 0.610 Morena 0.515 0.058 102 101 11.205 0.402 0.628 Bhind 0.635 0.057 134 136 8.906 0.524 0.746 Gwalior 0.554 0.054 92 96 9.668 0.449 0.659 Datia 0.414 0.056 137 142 13.591 0.304 0.525 Shivpuri 0.289 0.045 137 137 15.623 0.201 0.378 Guna 0.437 0.061 118 115 13.999 0.317 0.557 Tikamgarh 0.337 0.049 145 144 14.619 0.240 0.434 Chhatarpur 0.507 0.057 115 121 11.284 0.394 0.619 Panna 0.540 0.050 127 126 9.272 0.442 0.639 Sagar 0.668 0.051 126 129 7.651 0.568 0.768 Damoh 0.502 0.077 96 73 15.376 0.351 0.653 Satna 0.558 0.055 137 133 9.911 0.449 0.666 Rewa 0.668 0.056 146 145 8.389 0.558 0.777 Umaria 0.465 0.059 148 154 12.604 0.350 0.580 Shahdol 0.675 0.055 86 83 8.149 0.567 0.783 Sidhi 0.431 0.051 191 233 11.824 0.331 0.531 Neemuch 0.719 0.067 58 57 9.286 0.588 0.850 Mandsaur 0.625 0.067 69 67 10.751 0.493 0.757 Ratlam 0.686 0.066 68 72 9.619 0.557 0.816 Ujjain 0.775 0.051 65 67 6.640 0.674 0.876 Shajapur 0.645 0.081 76 76 12.596 0.486 0.804 Dewas 0.614 0.050 115 118 8.201 0.515 0.713 Jhabua 0.264 0.058 98 96 22.102 0.150 0.378 Dhar 0.557 0.062 121 119 11.142 0.436 0.679 Indore 0.776 0.069 71 67 8.905 0.641 0.912 West Nimar 0.640 0.060 123 128 9.392 0.522 0.758 West Nimar 0.398 0.056 135 136 14.005 0.288 0.507 East Nimar 0.579 0.060 81 76 10.441 0.460 0.697 Rajgarh 0.507 0.068 106 104 13.434 0.374 0.641 Vidisha 0.399 0.052 124 129 13.149 0.296 0.502 Bhopal 0.771 0.057 94 104 7.398 0.659 0.883 Sehore 0.659 0.054 128 123 8.155 0.554 0.764 Raisen 0.641 0.062 127 118 9.713 0.519 0.763 Betul 0.716 0.058 115 118 8.033 0.603 0.829 Harda 0.615 0.055 106 111 8.955 0.507 0.724 Hoshangabad 0.768 0.048 83 79 6.276 0.674 0.863 Katni 0.715 0.056 96 96 7.874 0.604 0.825 Jabalpur 0.596 0.150 82 91 25.208 0.301 0.891 Narsimhapur 0.622 0.075 83 85 12.059 0.475 0.769 Dindori 0.420 0.073 96 98 17.360 0.277 0.562 Mandla 0.685 0.052 94 95 7.650 0.582 0.787 Chhindwara 0.643 0.061 85 88 9.510 0.523 0.763 Seoni 0.751 0.057 103 103 7.561 0.640 0.863 Balaghat 0.891 0.036 77 78 4.030 0.821 0.962
nc= Not calculated


