Embed Size (px)
Citation preview

CENSUS OF INDIA 1981
DISTRICT CENSUS HANDBOOK
SANGLI
Compiled by
THE MAHARASHTRA CENSUS DlRECI'ORA TE BOMBAY
PRINTED IN INDIA. BY THE MANAGER, GOVERNMENT pRE.._<::S AND STATIONERY STORES, KOLHAPUR
AND PUBLISHED BY THE DIRECTOR, GOVERNMENT PRINTING. STATIONERY AND PUBLICATIONS,
MAHARASHTRA STATE. BOMBAy-400 004.
1985
)I ';f
'rJ "~6 ~" "'6
:J '" .~ ~
(!)
r
Z ~ «
~,
0"
!r ft.~b"
Ul ~
<c.'-"o~
a::: ..... ?
:! ~ .,.
<I:
4( j
::;;: I-
... !:Q
~ 11 £
0 -"
~ 11 ~ e
0
~ ~ I ]i
;; ~ ~ i
Z is ~ ~ f
..,
,. ! c
! ,2' ~
t ;; " I t:
!J! ~ I z '" ...
("
<t , ~
"\
\
iHy .~ • • 3:
§ . I ~
_g g i e I
.~ l: I :f
,g
a ." i i Ii
~ 8.
e ;! ; ~ ~
D
·Vi .S
'J
5 ! am ~"! ~E . "
j ~ DC 5; £ ~f -eo ::,.,
0 8 Ii: x
00 ..
! ~ S.
~ ~ -Ii
<5 I!
j l! " J I!
] » ~
~ j l
~ li .§: Q. Q u .!;!
" oS "0 e GO E
i (!)
9
.€
g. E

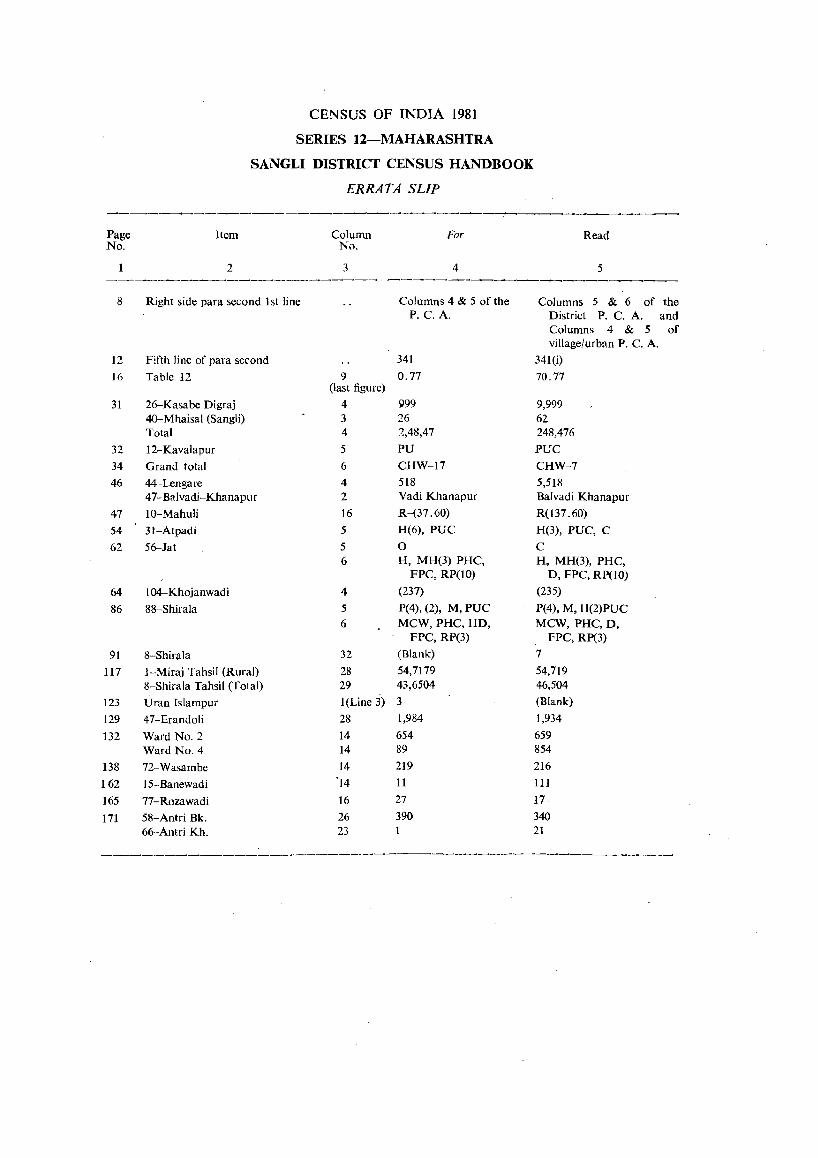
CENSUS OF INDIA 1981
SERIES 12-MAHARASHTRA
SANGLI DISTRICT CENSUS HANDBOOK
ERRATA SLIP
----------_..,-. ------~------------Page No.
Item
2
8 Right side para second 1 st line
12 Fifth line of para second
16 Table 12
31 26-Kasabe Digraj 4O-Mhaisal (SangJi) Total
32 12-Kavalapur
34 Grand total
46 44-Lengare 47-B'llvadi-Khanapur
47 lO-Mahuli
54 31-Atpadi
62 56-Jat
64 104--Khojanwadi
86 88-Shirala
91 8-Shirala
117 I-Miraj Tahsil (Rural) 8-Shirala Tahsil (Total)
123 Uran Islampur
129 47-Erandoli
132 Ward No.2 Ward No.4
138 72-Wasambe
162 15-Banewadi
165 77-Rozawadi
171 58-Antri Bk.
Column No.
3
9 (las t figure)
4 3 4
5
6
4 2
16
5
5 6
4
5 6
32
28 29
I(Line 3)
28
14 14
14 '14
16
26
For
4
Columns 4 & 5 of the P. C. A.
341
0.77
999 26 /.,48,47
PU
CHW-17
518 Vadi Khanapur
R-(37.60)
H(6), PUC
0 H, MH(3) PHC,
FPC, RP(lO)
(237)
P(4), (2), M, PUC MCW, PHC, HD,
FPC, RP(3)
(Blank)
54,7179 43,6504
3
1,984
654 89
219
11
27
390
Read
5
Columns 5 & 6 of the District P. C. A. and Colwnns 4 & 5 of village/urban P. C. A.
341(i)
70.77
9,999 62 248,476
PUC
CHW-7
5,518 Balvadi Khanapur
R(137.60)
H(3), PUC, C
C H, MH(3), PHC,
D, FPC, RP(lO)
(235)
P(4), M, H(2)PUC MCW, PHC,D,
FPC, RP(3)
7
54,719 46,504
(Blank)
1,934
659 854
216
111
17
340 66-Antri Kh. 23 21

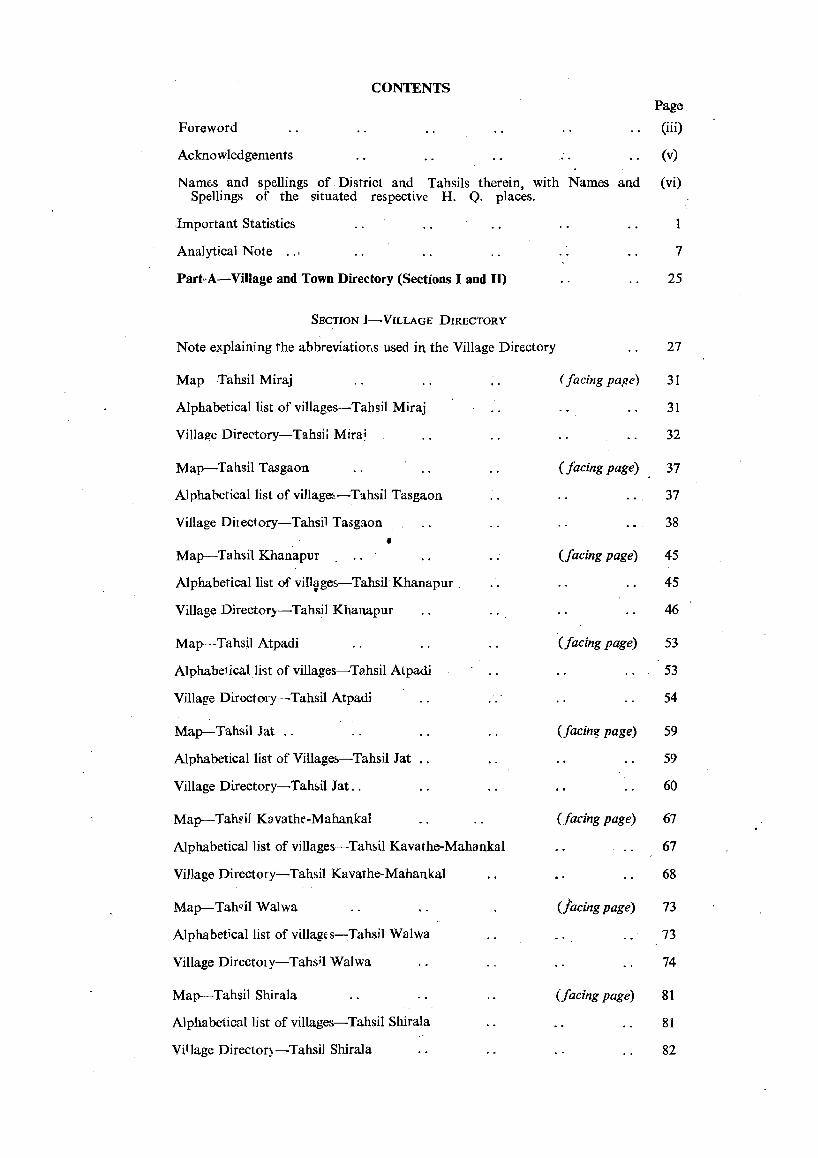
CONTENTS
Foreword
Ackno wledgements
Page
(iii)
(v)
Names and spellings of District and Tahsils therein, with Names and (vi) Spellings of the situated respective H. Q. places.
Important Statistics 1
Analytical Note .. ' 7
Part .. A-Village and Town Directory (Sections I and m 25
SECTION l-VILLAGE DIRECTORY
Note explaining the abbreviatior,s used in the Village Directory
Map--Tahsil Miraj
Alphabetical list of villages-Tahsil Miraj
Village Directory-Tahsil Mira!
Map--Tahsil Tasgaon
Alphabetical list of village~-Tahsil Tasgaon
Vil1age Directory-Tahsil Tasgaon
• Map-Tahsil Khanapur . .. .
Alphabetical list of viIl~gei',-Tahsil Khanapur .
Village Director),-Tahsil Khanapur
Map--TahsiJ Atpadi
Alphabe1icalli'it of villages-Tahsil Atpadi
Village Directory-Tahsil Atpadi
Map-Tahsi) Jat ..
Alphabetical list of Village~-Tahsil Jat
Village Directory-Tahf>il Jat ..
Map--Tah~iJ Kavathe-Mahankal
Alphabetical Jist of vilIages-Tah~il Kavathe-Mahankal
Village Directory-Tahsil Kavathe-Mahankal
Map--Tah"il Walwa
Alphabetical list of villages-:Tahsil Walwa
Village DirectOly-Tahsil Walwa
Map-Tahsil Shirala
Alphabetical list of villages-Tahsil Shirala
Village Director),-Tahsil Shirala
( faciJrg pa!!e)
(facing page)
(facing page)
(facing page)
(facing page)
(facing page)
(jacing page)
(facing page)
27
31
31
32
37
37
38
45
45
46
53
53
54
59
59
60
67
67
68
73
73
74
81
81
82
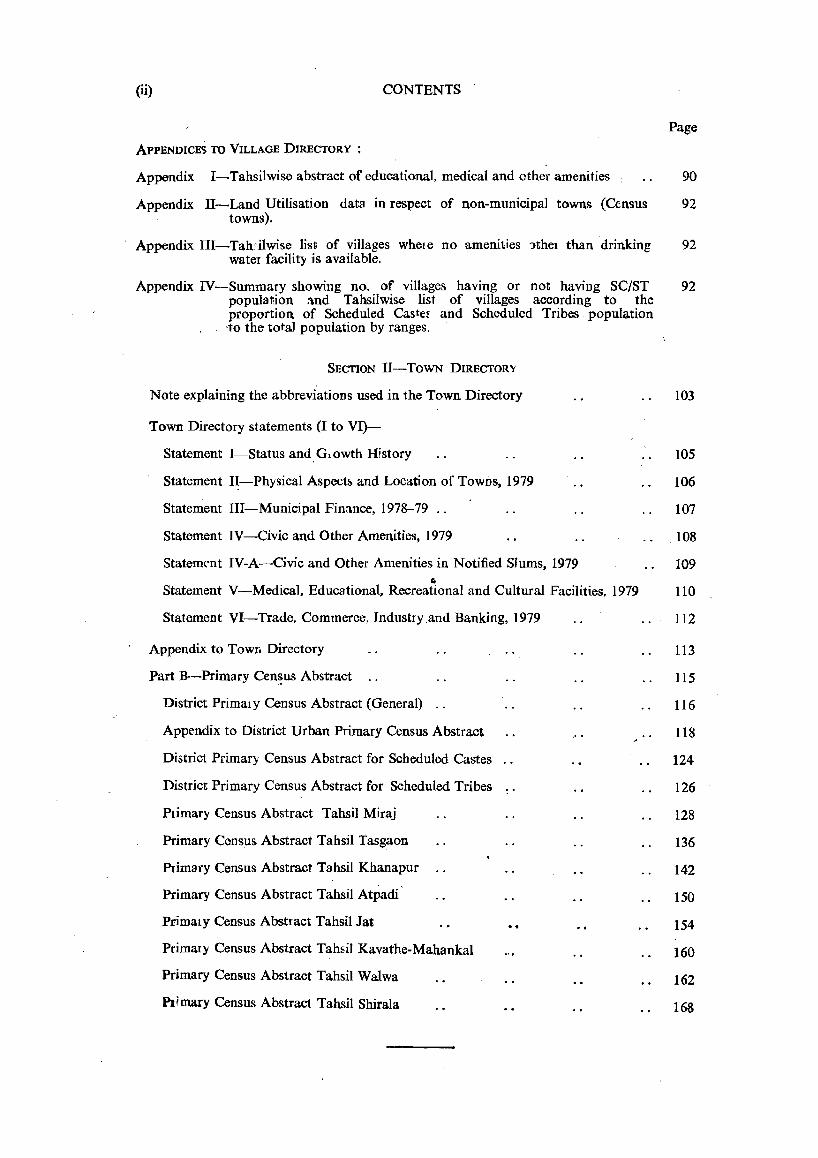
(ii) CONTENTS -
Page
ApPENDICES TO VILLAGE DIRECTORY:
Appendix 1-Tahsilwise abstract of educational. medical and other amenities 90
Appendix II-Land Utilisation data in respect of non-municipal towns (Census 92 towns).
- Appendix Ill-Tahdiwise list of vi1lages whele no amenities "lthel than drinking 92 water faciIit} is available.
Appendix IV-Summary showing no. of villages having or not having SC/ST 92 population and Tahsilwise list of villages according to the proportion of Scheduled Castcf and Scheduled Tribes population -to the total population by ranges.
SECTION II-TOWN DIRECTORY
Note explaining the abbreviations used in the Town Directory
Town Directory statements (I to VI)-
103
Statement I-Status andGlowth History 105
Statement I~-Physical Aspects and Location of Towns. 1979 106
Statement Ill-Municipa,l Fimnce, 1978-79 .. 107
Statement IV-Civic and Other Amenities, 1979 108
Statemt"nt IV-A-Civic and Other Amenities in Notified Slums, 1979 109
" Statement V-Medical, Educational, Recreational and Cultural Facilities, 1979 110
Statement VI-Trade, Commerce, Industry and Banking, 1979 112
Appendix to Town Directory 113
Part B-Primary Cen~us Abstract 115
District PrimalY Census Abstract (General) 116
Appendix to District Urban Primary Census Abstract 118
District Primary Census Abstract for Scheduled Castes 124
District Primary Census Abstract for Scheduled Tribes 126
Plimary Census Abstract Tahsil Miraj 128
Primary Census Abstract Tahsil Tasgaon 136
Primary Census Abstract Tahsil Khanapur 142
Primary Census Abstract Tahsil Atpadi 150
Pl'imalY Census Abstract Tahsil Jat 154
PrimalY Census Abstract Tahsil Kavathe-Mahankal 160
Primary Census Abstract Tahsil Walwa 162
Pl;mary Census Abstract Tahsil Shirai a 168
FOREWORD
The District Census Handbook (DCH) , cOinpiled by the Census Organisation on behalf of the State Governments, is one of the most valuable products of the Census. The DCH is constantly referred to by planners, administrators, academicians and researchers. It is inter alia used for delimitation of constituencies, formulating local level and regional plans and as an aid to District administration. The district census hand book is the only publication which provides Primary Census Abstract (PCA) data upto village level for rural areas and ward wise for each city or town. It also provides data on infrastructure and amenities in villages and towns, etc.
The district census handbook series was initiated during the 1951 Census. It contained important tables and PCA for each village and town of the district. During 1961 Census the scope of the DCH was enlarged and it contained a descriptive account of the district, administrative statistics, census· tables and a village antI town directory, including PCA. The 1971 DCH series was planned in three parts. Part-A related to village and town. directory, Part-B to village and town PCA and Part-C comprised analytical report, administrative statistics, district census tables and certain" analytical tables based on PCA and amenity data in respect of villages. However, in some st~tes it was confined to district census tables and in . a few cases altogether given up due to delay in compilation and printing.
While designing the format of 1981 DCH series some new featur~s along with the restructuring of the format of. village and town directory have been attempted. At the same. time, comparability with the 1971 data has also been kept in view. All the amenities except power supply in the village have been brought together in the village directory with the instruction that in case an amenity is not available in the referrent village the distance in broad ranges from the nearest place where the amenity is available may be given. The restructuring of the format of the village directory and incorporating more exhaustive data on infrastructure aspect particularly in relation to amenities and land-use pattern is expected to further meet the need of micro level planning for rural areas. It is expected to help not only in local area planning but regulating the provision of goods and services as well so as to minimise the regional imbalances in the process of development. A few new items ofinformation have also been introduced to meet some of the requirements of the Revised Minimum Needs Programme. Such new items of information as adult literacy centres, primary health sub-centres and community health workers in the village have been introduced in the village directory with this objective in mind. The new item on approach to the village is to have an idea about the villages in the district which are inaccessible. A new column, "total population and number of households" has been introduced to examine the correlation of the amenities with the population and number of households they serve. Addition of two more appendices listing the villages where no amenities are available and according to the proportion of SC & ST population to the total population has also been made with this view in mind.
Ya 197-1a
( iv')
The formats of the town directory have also been modified to meet the requirements of the Minimum Needs Programm~ by providing information on a few new items. A new statement on civic and other amenities in slums in Class-I and Class-II towns.(Statement IV-A) has been introduced with this objective 'in mind. It is expected that tbis will help the planners to chalk out programmes on provision of civic amenities for the improvement of slums. The columns on Scheduled Castes and Scheduled Tribes population in Statement IV relating to civic and other amenities and adult literacy classes I cent!es under educational facilities in statement V are also added inter alia with this view. A significant addition is class of town in all the seven statements of the town directory. The infrastructure of amenities in urban areas of the country can be best analysed by taking the class of towns into consideration. The addition of the columns on civic administration status and population in a few statements also serves this purpose.
The format of the primary census abstract . for the villages and towns has been formulated in the light of changes in the economic and other questions canvassed through the individual slip of 1981 Census.
In order to avoid delay in pUblication of 1981 DCH series it has been so designed that Part-A of the volume contains village and town directory and Part-B, the PCA of villages and towns including the Scheduled Castes and Scheduled Tribes PCA upto Tahsil/Town levels. At the beginning of the DCH a detailed analytical note supported by a number of inset tables based on PCA and non-census data in relation to the infrastructure has· been introduced to enhance its value.
This publication is joint venture of the State Government and the Census Organisation. The data have been collected and compiled in the State under the direction of Shri P. P. Mahana, the Director of Census Operations, Maharashtra on behalf of the State Government which has borne the cost . of printing. The task of planning, designing and co-ordination of this publication was carried out by Shri N. G. Nag, Deputy Registrar General (Social Studies) of my office. Dr. B. K. Roy, Deputy Registrar General (Map) provided the technical guidance in the preparation of the maps. Data received from Census Directorates have been scrutinised in the Social Studies Division at the headquarters under the guidance of Shri M. M. Dua, Senior _ Research Officer. I am thankful to all who have contributed in this project.
New Delhi, the 26th April 1982.
P. PADMANABHA, Registrar General, India.
ACKNOWLEDGEMENTS
The preceding foreword of the Registrar General and Census Commissioner, India, is quite exhaustive and gives the reader a complete account of the District Census Handbook project. As has been mentioned therein, the publication of District Census Handbooks of Maharashtra is a joint venture of the Government of Maharashtra and the Census Organisation of the Government of India. The design for the 1981 . District Census Handbooks was evolved . centrally by the Census Commi· ssioner, India. The contribution of the Government of Maharashtra comes by way of bearing the cost of printing. We are thankful to the Census Commissioner and to his band of devoted officers in the Social Studies Division for the valuable guidance they have given. us, and to the
. Government of Maharashtra for the readiness they have shown to print and publish these handbooks. Our grateful thanks are also due to the District Inspectors of Land Records for helping us in marking village boundaries on the tahsil maps we have prepared and presented in these handbooks, and for recording a' certificate of authenticity on each such map we referred to them.
Shri P. P. Mahana, who held the office of Director of Census Operations, Maharashtra, and guided the operations of the 1981 Census, left this organisation on 14th December 1982. The data presented in these handbooks were collected and compiled under the direction and guidance of Shri Mahana. We would deem it our duty, therefore, to offer him our sincere apd grateful thanks for all that he did for this project.
In this directorate, the undersigned exercised _ overall superVIslOn over the work of the project, while the main brunt of day-to-day .supervision was borne by Shri A. S. Dange, Deputy Director. He was ably assisted in this work by Shri Madhav Shyam, Research 'Officer (Map) and Smt. V. Y. Joshi, Shri. G. M. D. Lone and Shri. V. S. Nagle, Assistant Directors. The list of their colleagues in the District Census Handbook Unit who' put in untiring efforts to bring the project to fruition is fairly long and is not being given here for want of. space. However, all these unnamed assistants in various grades who attended to the voluminolls work of compilation, typing, comparing, checking and mapping, etc deserve our heart-felt thanks.
A. W. MAHATME, Joint Director of Census Operations
Census Directorate, Maharashtra, Bombay. Dated 26th January 1984 (Republic Day).
vi)
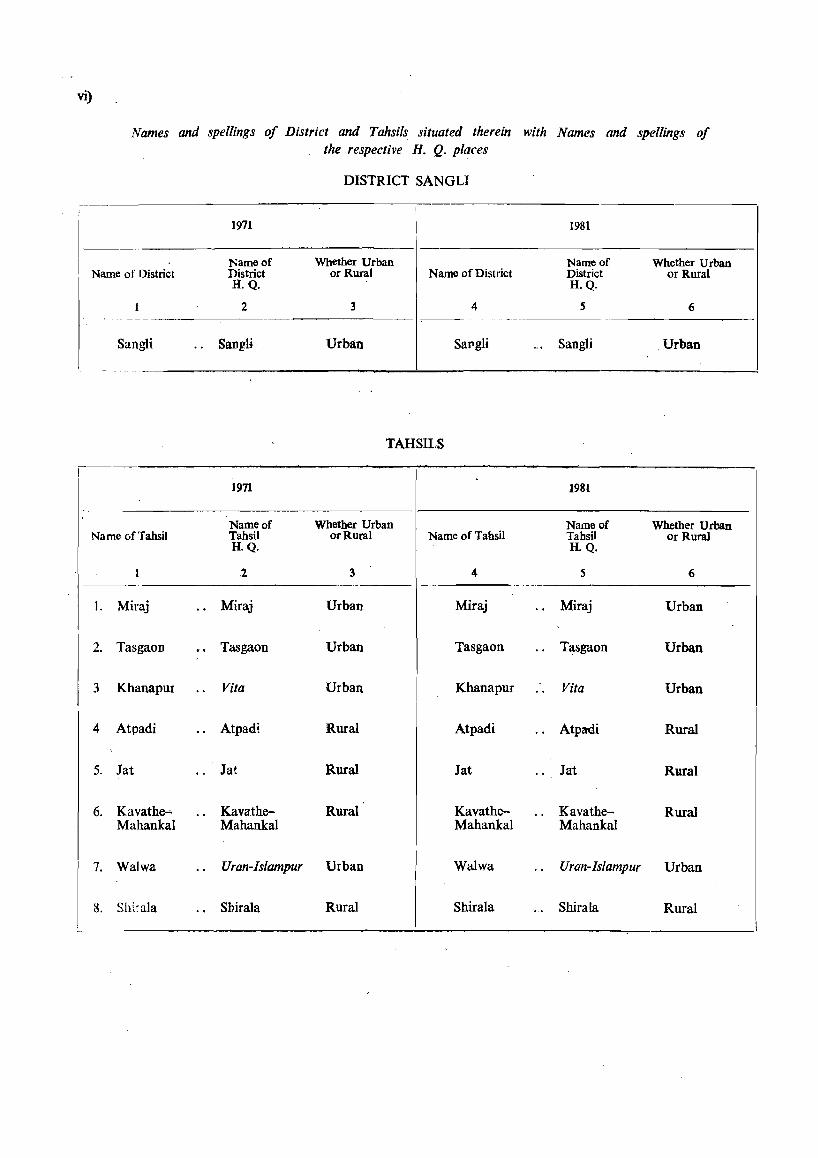
Names and spellings of District and Tahsils situated therein with Names and spellings of the respective H. Q. places
DISTRICT SANGLI
I
1971 1981
Name of Whether Urban Name of Whether Urban Name of District District or Rural Name of District District or Rural
Ii. Q. H.Q.
2 3 4 5 6 -
Ii Sang . . SangIi· Urban SaJlgli ... Sangli Urban
TAHSIl$
1971 1981
Name of Whether Urban Name of Whether Urban Name of Tahsil Tahsil or Rural Name of Tahsil Tahsil Or Rural
H.Q. H.Q.
.2 3 4 5 6
I. Miraj Miraj Urban Miraj Miraj Urban
2. Tasgaon Tasgaon Urban Tasgaon Tasgaon Urban
3 KhanapuI Vita Urban Khanapur Vita Urban
4 Atpadi Atpadi Rural Atpadi Atpadi Rural
5. Jat Jat Rural Jat Jat Rural
6. Kavathe-- Kavathe- Rural Kavathe- Kavathe- Rural Mahankal Mahankal Mahankal Mahankal
7. Walwa Uran-Islampur Urban Walwa Uran-Islampur Urban
8. Shiraia Sbirala Rural Shirala Shirala Rural
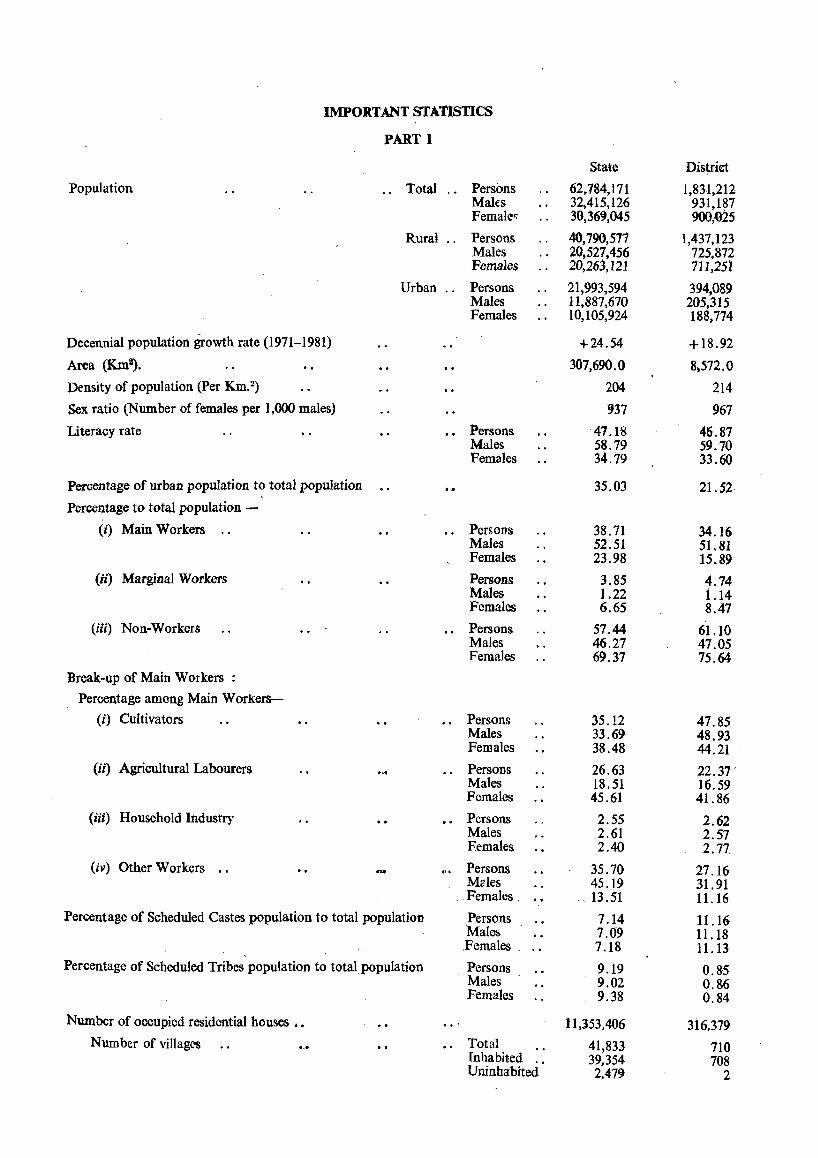
IMPORTANT STATISTICS
PART I
State District
Population . . Total .. Persons 62.184,171 1,831,212 Males 32,415,126 931,187 Female'l 30,369,045 900,025
Rural .. Persons 40,790,511 1,437,123 Males 20,527,456 725,872 Females 20,263,121 711,251
Urban .. Persons 21,993,594 394,089 Males 11,887,670 205,315 Females 10,105,924 188,774
Decennial population growth rate (1971-1981) +24.54 +18.92
Area (1{m2). 307,690.0 8,572.0
Density of population (Per KIn.2) 204 214
Sex ratio (Number of females per 1,000 males) <)37 967
Literacy rate Persons 47.18 46.87 Males 58.79 59.70 Females 34.79 33.60
Percentage of urban popUlation to total popUlation 35.03 21.52
Percentage to total population -
(i) Main Workers .. Persons 38.71 34.16 Males 52.51 51.81 Females 23.98 15.89
(ii) Marginal Workers Persons 3.85 4.74 Males 1.22 i.14 Females 6.65 8.47
(iii) Non-Workers Persons 57.44 61.10 Males 46.27 47.05 Females 69.37 75.64
Break-up of Main Workers :
Percentage among Main Workers-
(i) Cultivators Persons 35.12 47.85 Males 33.69 48.93 Females 38.48 44.21
(ii) Agricultural Labourers Persons 26.63 22.37 Males 18.51 16.59 Females 45.61 41.86
(iii) Household Industry Persons 2.55 2.62 Males 2.61 2.57 Females 2.40 2.77.
(iv) Other Workers . . ... Persons 35.70 27.16 Mzles 45.19 31.91
,.Females. , 13.51 11.16 Percentage of Scheduled Castes population to total population Persons 7.14 11.16
Males 7.()9 11.18 ,Females. , .. 7.18 11.13
Percentage of Scheduled Tribes population to total,population Persons 9.19 0.85 Males 9.02 0.S6 Females 9.38 0.84
Number of occupied residential houses •• 11,353,406 316,379 Number of villagt'S Total 41,833 710
Inhabited 39,354 70S Uninhabited' 2,479 2
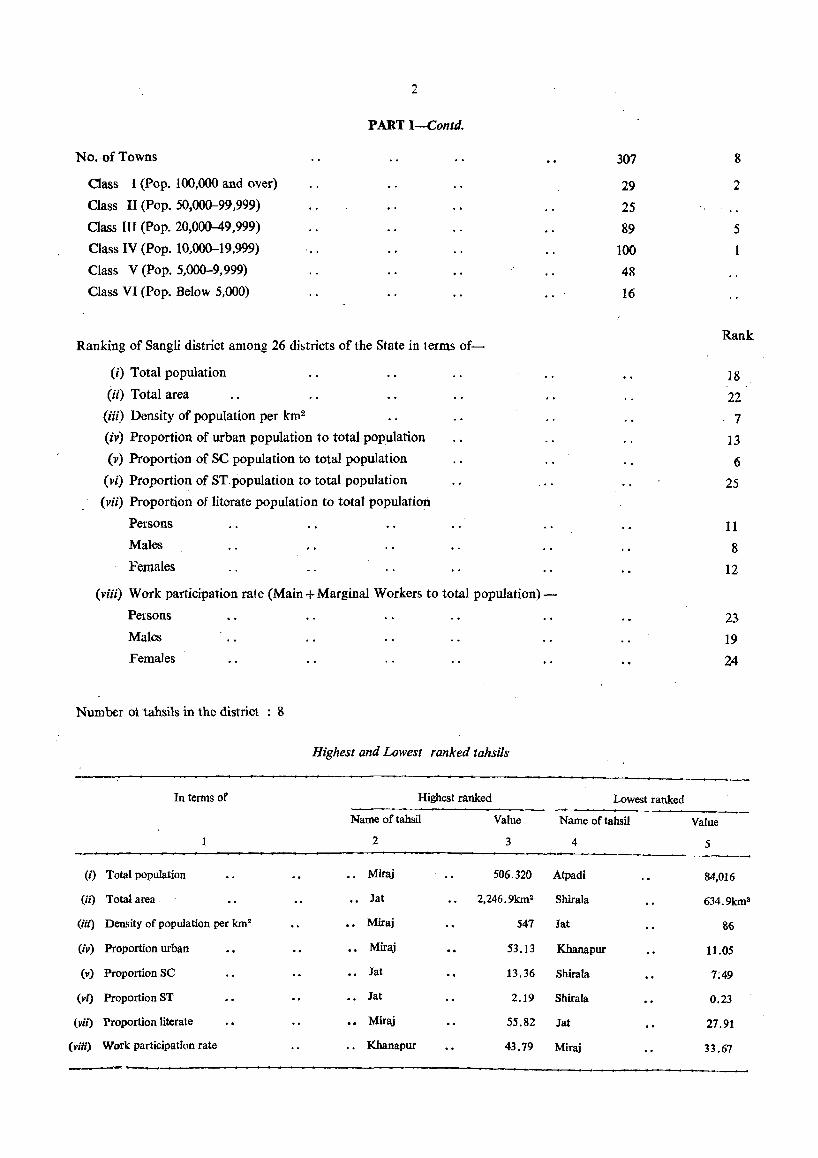
No. of Towns
Oass I (Pop. 100,000 and over)
Class II (Pop. 50,000-99,999)
Class III (Pop. 20,000-49,999)
Class IV (Pop. 10,000-19,999)
Class V (Pop. 5,000-9,999)
Class VI (Pop. Below 5,000)
2
PART I-Contd.
Ranking of Sangli district among 26 districts of the State in terms of-
(i) Total population
(ii) Total area
(iii) Density of population per km2
(iv) Proportion of urban population to total population
(v) Proportion of SC population to total population
(vi) Proportion of ST. population to total population
(vii) Proportion of literate population to total population
Persons
Males
Females
(viii) Work participation rate (Main + Marginal Workers to total population)
Persons
Males
Females
Number 01 tahsils in the district : 8
In terms of
Highest and Lowest ranked tahsils
Highest ranked
307
29
25
89
100
48 16
Lowest ranked
Name of tahsil Value Name of tahsil
2 3 4
(I') Total population .. Miraj 506.320 Atpadi
(ii) Total area .. Jat 2,246.9km2 Shirala
(iii) Density of population per km2 Miraj 547 Jat
(iv) Proportion urban Miraj 53.13 Khanapur
(v) Proportion SC Jat 13.36 Shirala
(vi) Proportion ST Jat 2.19 Shirala
(vii') Proportion literate Miraj 55.82 Jat
(viii) Work participation rate Khanapur 43.79 Miraj
---.-.-
8
2
5
1
Rank
18
22 , 7
13
6
25
11
8
12
23
19
24
Value
5
84,016
634.9km2
8~
11.05
7:49
0.23
27.91
33.67
3
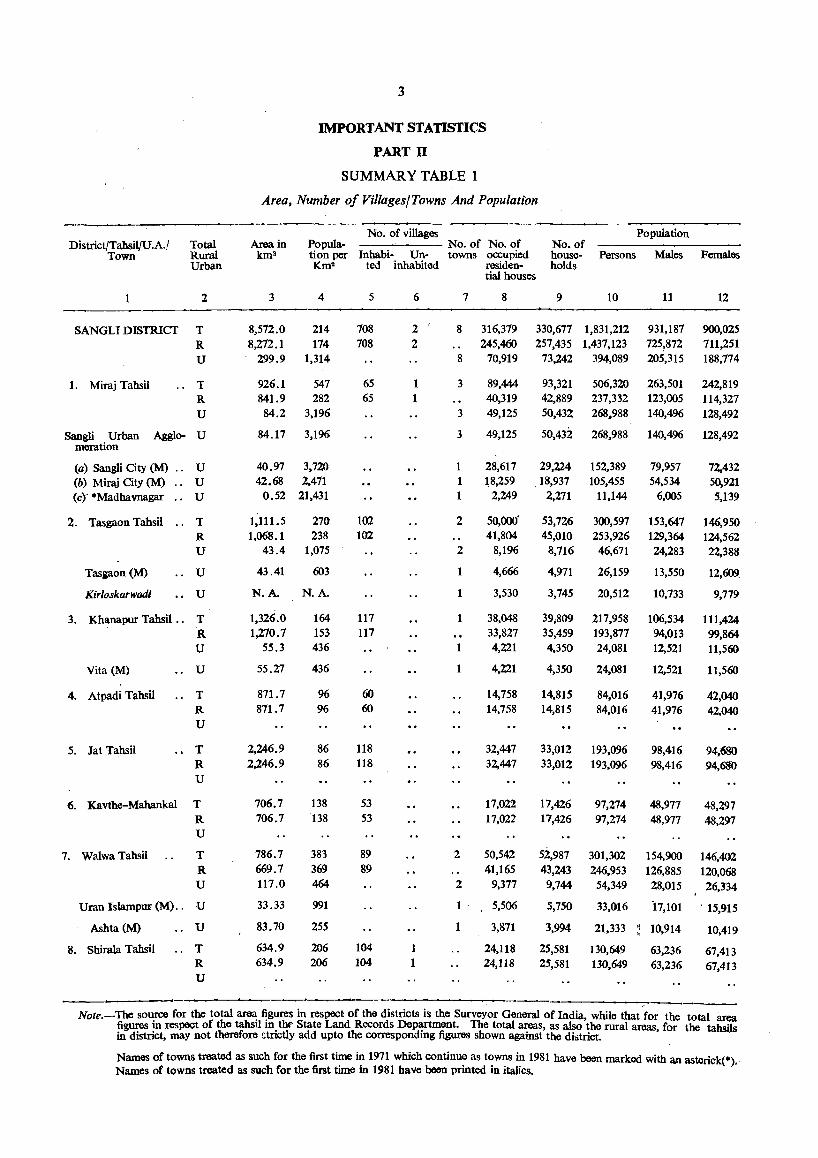
IMPORTANT STATISTICS
PART II
SUMMARY TABLE 1
Area, Number of Villages/Towns And Population
No. of villages Population District/Tahsil/U.A./ Total Area in Popula- No. of No. of No. of
Town Rural km2 tion per Inhabi- Un- towns occupied house- Persons Males Females Urban Km2 ted inhabited residen- holds
tial houses
2 3 4 5 6 7 8 9 10 11 12
SANGLI DISTRICT T 8,572.0 214 708 2 8 316,379 330,677 1,831,212 931,187 900,025
R 8,272.1 174 708 2 245,460 257,435 1,437,123 725~872 711,251
U 299.9 1,314 8 70,919 73,242 394,089 205,315 188,774
1. Miraj Tahsil .. T 926.1 547 65 1 3 89,444 93,321 506,320 263,501 242,819 R 841.9 282 65 1 40,319 42,889 237,332 123,005 114,327
U 84.2 3,196 3 49,125 50,432 268.988 140,496 128,492
Sangli Urban Agglo- U 84.17 3,196 3 49,125 50,432 268,988 140,496 128,492 meration
(a) Sangli City (M) .. U 40.97 3,720 1 28,617 29,224 152,389 79,957 72,432 (b) Miraj City (M) .. U 42.68 2,471 1 18,259 .18,937 105,455 54,534 50,921 (C) *Madhavnagar .. U 0.52 21,431 1 2,249 2,271 11,144 6,005 5,139
2. Tasgaon Tahsil .. T 1,111.5 270 102 2 50,000' 53,726 300,597 153,647 146,950 R 1,068.1 238 102 41,804 45,010 253,926 129,364 124,562 U 43.4 1,075 2 8,196 8,716 46,671 24,283 22,388
Tasgaon (M) .. U 43.41 603 1 4,666 4,971 26,159 13,550 12,609
Kirloskarwadi U N.A. N.A. 1 3,530 3,745 20,512 10,733 9,779
3. Khanapur Tahsil .. T 1,326.0 164 117 38,048 39;809 217,958 106,534 111,424 R 1,270.7 153 117 33,827 35,459 193,877 94,013 99,864 U 55.3 436 1 4,221 4,350 24,081 12,521 11,560
Vita (M) ., U 55.27 436 1 4,221 4,350 24,081 12,521 11,560
4. Atpadi Tahsil .. T 871.7 96 60 14,758 14,815 84,016 41,976 42,040 R 871.7 96 60 14,758 14,815 84,016 41,976 42,040 U
5. lat Tahsil T 2,246.9 86 118 32,447 33,012 193,096 98,416 94,680 R 2,246.9 86 118 32,447 33,012 193,096 98,416 94,680 U
6. Kavthe-Mahankal T 706.7 138 53 17,022 17,426 97,274 48,977 48,297 R 706.7 138 53 17,022 17,426 97,274 48,977 48,297 U
7. Walwa Tahsil T 786.7 383 89 2 50,542 52,987 301,302 154,900 146,402 R 669.7 369 89 41,165 43,243 246,953 126,885 120,068 U 117.0 464 2 9,377 9,744 54,349 28,015 26,334
Uran Islampur (M) .. U 33.33 991 5,506 5,750 33,016 i7,101 . 15,915
Ashta (M) U 83.70 255 1 3,871 3,994 21,333 " 10,914 10,419
8. Shirala Tahsil .. T 634.9 206 104 1 24,118 25,581 130,649 63,236 67,413 R 634.9 206 104 1 24,118 25,581 130,649 63,236 67,413 U
Note.-The source for the total area figures in respect of the districts is the Surveyor General of India while that 'for tbe total area figures in respect of the tahsil in tllf' State Land Records Department. The total areas, as also'the rural areas for the tahsBs in district, may not therefore £trictly add upto the corresponding figures shown against the dbtrict. '
Names of towns treated as such for the first time in 1971 which continue as towns in 1981 have been marked with an asterick(*). Names of towns treated as such for the first time in 1981 have been printed in italics.
4
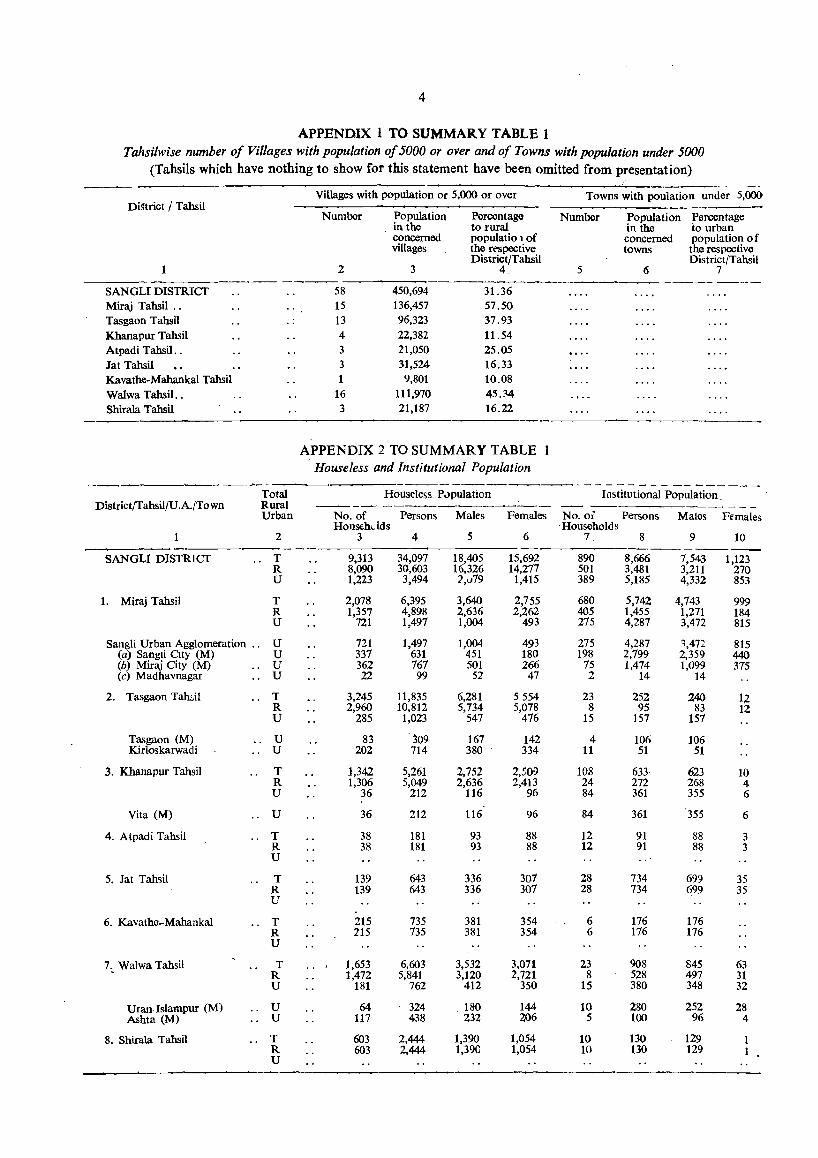
APPENDIX 1 TO SUMMARY TABLE 1 Tahsilwise number of Vii/ages with population of 5000 or over and of Towns with population under 5000
(Tahsils which have nothing to show for this statement have been omitted from presentation)
Villages with population or 5,000 or over Towns with poulation under 5,000 Di~trict / Tahsil
Population Number Percentage Number Population Percentage in the to rural in the to urban concerned popuiatio 1 of concerned population of villages the reospective towns the respective
District/Tahsil District/Tahsil 2 3 4. 5 6 7
---- ---- -----SANGLI DISTRICT 58 450,694 31.36 Miraj Tahsil .. 15 136,457 57.SO Tasgaon Tahsil 13 96,323 37.93 Khanapur Tahsil 4 22,382 11.54 Atpadi Tahsil .. 3 21,050 25.05
Jat Tahsil 3 31,524 16.33 Kavathe-Mahankal Tallsil 9,801 10.08
Walwa Tahsil .. 16 111,970 45.34
Shirala Tahsil 3 21,187 16.22
APPENDIX 2 TO SUMMARY TABLE I Houseless and Institutional Population
---_._---_- ~ - - - - - - - - _- --- ----Total Houseless P"pulation Institutional Population.
District/TahsiI/U.A./Town Rural -~--
Urban No. of Persons Males Females No. of Persons Males Females HOllst;hdds . Households
1 2 3 4 5 6 7. 8 9 10 -------
SANGLI DISTRICT .. T 9,313 34,097 18,405 15,692 890 8,666 1,543 1,123 R 8,090 30,603 16,326 14,217 501 3,481 3,211 270 U 1,223 3,494 '},v19 1,415 389 5,185 4,332 853
1. Miraj Tahsil T 2,078 6,395 3,640 2,755 680 5,742 4,143 999 R 1,351 4,898 2,636 2,262 405 1,455 1,271 184 U 721 1,497 1,004 493 215 4,287 3,472 815
Sangli Urban Agglomeration .. U 121 1,497 1,004 493 275 4,287 \472 815 (a) Sangli City (M) U 337 631 451 180 198 2,799 2,359 440 (b) Miraj City (M) .. U 362 167 501 266 15 1,474 1,099 375 (c) Madhavnagar .. U 22 99 52 47 2 14 14
2. Tasgaon Taru,il .. T 3,245 11,835 6,281 5554 23 252 240 1,2 R 2,960 10,812 5,734 5,078 8 95 83 12 U 285 1,023 547 476 15 157 151
Tasgaon (M) .. U 83 309 167 142 4 106 106 Kirloskarwadi .. U 202 714 380 334 11 51 51
3. Khanapur Tal1sil T 1,342 5,261 2,752 2,509 108 633- 623 10 R 1,306 5,049 2,636 2,413 24 272 268 4 U 36 212 116 96 84 361 355 6
Vita (M) .. U 36 212 116 96 84 361 355 6
4. Atpadi Tahsil .. T 38 181 93 88 12 91 88 3 R 38 181 93 88 12 91 88 3 U
5. Jat Tahsil T 139 643 336 301 28 734 699 35 R 139 643 336 301 28 734 699 35 U
6. Kavathe-Mahankal T 215 135 381 354 6 176 176 R 215 735 381 354 6 116 176 U
7~ Walwa Tahsil T 1,653 6,603 3,532 3,011 23 908 845 63 R 1,472 5,841 3,120 2,721 8 528 497 31 U 181 762 412 350 15 380 348 32
Uran Islampur (M) .. U 64 - 324 180 144 10 280 252 28 Ashta (M) .. U 117 438 232 206 5 100 96 4
8. Shirala Tahsil .. T 603 2,444 1,390 1,054 10 130 129 R 603 2,444 1,390 1,054 10 130 129 U
5
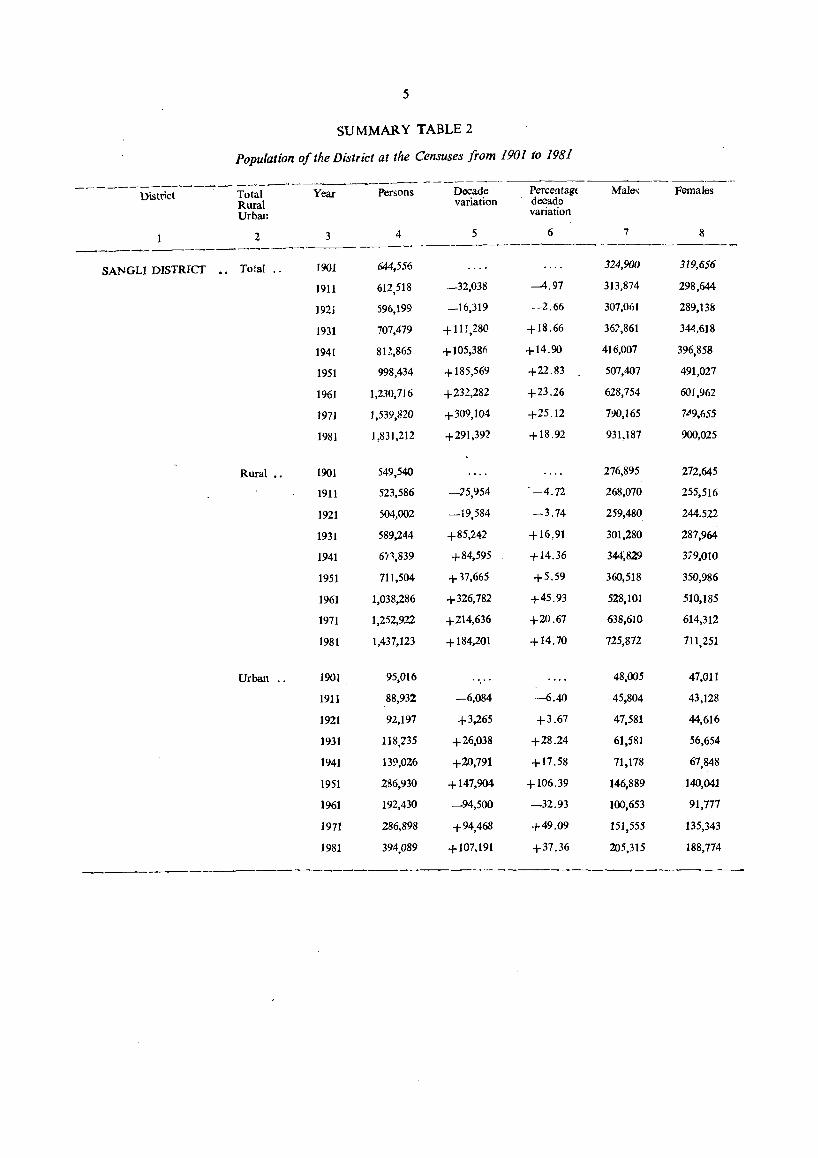
SU MMAR Y TABLE 2
Population of the District at the Censuses from 1901 to 1981
-------Di;~~---- Total--ye;----~;;ons _--D~ad;-Rural variation Urban
2 3 ---------------_._---
SANGLI DISTRICT • . Total ..
Rural ••
Urban ..
1901
1911
192i
1931
1941
1951
1961
1971
1981
1901
1911
1921
1931
1941
1951
1961
1971
1981
1901
1911
1921
1931
1941
1951
1961
1971
1981
4
644,556
612,518
596,199
707,479
812,865
998,434
1,230,716
1,539,820
1,831,212
549,540
523,586
504,002
589,244
6?\839
711,504
1,038,286
1,252,922
1,437,123
95,016
88,93%
92,197
118,135
139,026
286,930
192,430
286,898
394,089
5
-32,038
-16,319
+111,280
+105,38fi
+185,569
+232,282
+309,104
+291,392
-15,954
-19,584
+85,242
+84,595
+ ,7,665
+326,782
+214,636
+ 184,201
-6,084
+3,265
+26,038
+20,791
+147,904
-94,500
+94,468
+107,191
Percentag:< decade variation
6
-4.97
--2.66
+18.66
+14.90
+22.83
+23.26
+25.12
+18.92
-4.72
-3.74
+16.91
+14.36
+5.59
+45.93
+20.67
+14.70
-6.40
+3.67
+28.24
+17.58
+106.39
-32.93
+49.09
+37.36
------_.
Males
7
324,900
313,874
307,061
367,861
416,007
507,407
628,754
7~,165
931,187
276,895
268,070
259,480
301,280
344;829
360,518
528,101
638,610
725,872
48,005
45,804
47,581
61,581
71,178
146,889
100,653
151,555
205,315
Females
8
319,656
298,644
289,138
344,618
396,858
491,027
601,962
7J 9,r.55
900,025
272.645
255,516
244.522
287,964
379,010
350,986
510,185
614,312
711,251
47,011
43,128
44,616
56,654
67,848
140,041
91,777
135,343
188,774
I I I I I.g
I I
I I t I I
I
I! ~ ~
1C'1 J I
I
00 g
r-0\ r-
v 00
g - r-
00 IC
M 00
00 ...... ......
0\ -"<t
0\ 00
0\ -IC v·
0\
~ ....
6
I I
t
1· I I
I/') - ...... M M
00 "<t
0\ .... 00 "<t
00 ......
~ .... o -.... 00 0 • .... ....
M ....
7
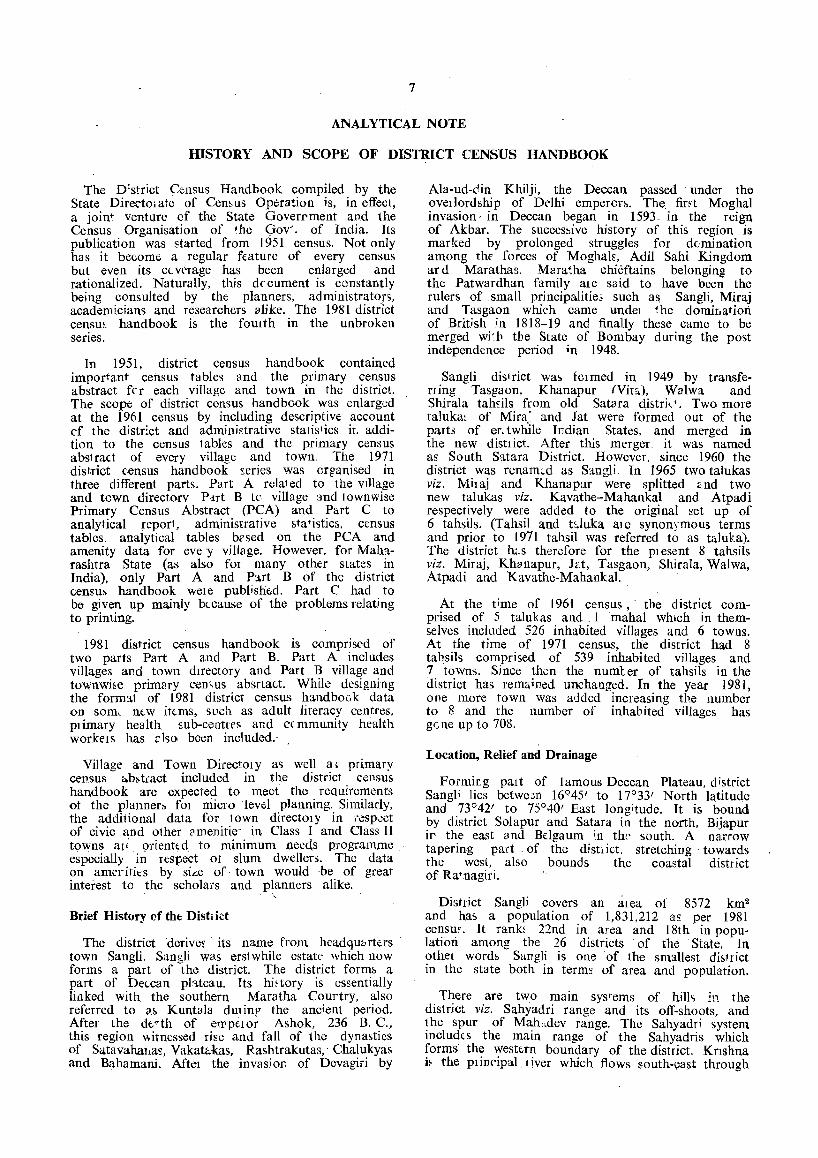
ANALYTICAL NOTE
HISTORY AND SCOPE OF DISTRICT CENSUS HANDBOOK
The D:strict Census Handbook compiled by the State Dire(.'toiate of Cen&us Operation is, in effect, a join~ venture of the State Goverrment and the Census Organisation of Ihe Gov'. of India. Its publication was started from 1951 census. Not only has it become a regular feature of every census but even its ccVC'rage has been enlarged and rationalized. Naturally, this dccument is constantly being consulted by the planners, administratoJ5, academicians and researche.rs alike. The 1981 district censm handbook i& the fOUIth in the unbroken series.
In 1951, district census handbook contained important census tables and the primary census abstract fer each village and town in the district. The scope of district census handbook was enlarged at the 1961 census by including descriptive account cf the distr:ct and administrative statistics it. addition to the census tables and the primary census abslract of every village and town. The 1971 district (·ensus handbook series was organised in three different parts. Part A rda1ed to the village and town directorv Pdrt B tc village and townwise Primary Census Abstract (PCA) and Part C to analytical report, administrative f,tatistics. census tables. analytical tables brsed on the PCA and amenity data for eve.y village. However, for Maharashtra State (as also fOI many other states in India), only Part A and P:ut B of the district (,ensu~ handbook wele publistit'.d. Part C had to be given up mainly btcause of the problems relating to printing.
1981 district census handbook is comprised of two parts Part A and Part B. Part A includes villages and town directory and Part B village and townwi~e primary cen,us absrtact. While designing the form3.t of 1981 district census handbook data on som, m w it(ms, such as adult literacy centres, plimary health sub-centn's and c( mmunity health workels has ::-lso been included.
Village and Town Directoty as well a> primary census a.bstiact included in the district census handbook are expec1·ed to meet the requirements of the planner:. fot micro levol planning. Similarly, the additional data for town directOlY in respect of civic and other ?menitie' in Class I and Class II towns ali orienttd to minimum neeos programme especially in respect ot slum dwellers. The data on ameritit:s by siLe of town would -be of great interest to the scholars and planners alike.
Brief History cf the Dish kt
The district derive!'· its name from headqubrt~rs· town Sangli. Sangli wa.s ers1while estate- which now forms a part of the district. The district form& a part of Deccan phteau. Its hi~tory is essentially linked with the southern Maratha Courtry, also referred to a,f, Kuntala dUlinp the ancient period. After the de"th of ell'pti,tor Ashok, 236 B. c., this region witnessed rise and fall of the dynasties of SatavahaItas, Vakatc.kas, Rashtrakutag,· Chalukyas and Bahamani. Aftel the invasion of Devagiri by
Ala-ud-din Khilji, the Deccan passed under the ovetlordship of Dt'lhi emperor!>. The firft Moghal invasion· in Deccan began in 1593, in the reign of Akbar. The succes~ive history of this region is marked by prolonged struggles for dcmination among the- forces of MoghalE, Adil Sahi Kingdom ar d Marathas. Mara~ha chieftains belonging to the Patwardhan family ale said to have been the rulers of .. small principalitie~ such as Sangli, Miraj and Tasgaon which came undel ~he domir,atiort of British in 1818-19 and finally these came to be merged wi'p tbe State of Bombay during the post independence period in 1948.
Sangli district wa!> formed in 1949 by transferring Tasgaon, Khanapur (Vita), Walwa. and Shirai a tah~ils from old SatMa di&tri<-'. Two more taluka~ of Mira' and Jat were formed out of the part3 of er. twhlle II!.dian States, and merged in the new district. After this merger. it was named as South Satara District. However. since 1960 the district was renam~d as Sangli. In 1965 two talukas viz. Miraj and Khanapur were splitted ~nd two new talukas viz. Kavathe-Mahankal and Atpadi respectively were added to the original set up of 6 tahsi.ls. (Tahsil and t~Juka al e synonymous terms and prior to 1971 tahsil was referred to as taluka). The district hLs therefore for the plesent 8 tahsils viz. Miraj, Khanapur, J~.t, Tasgaon, Shirala, Walwa, Atpadi and Kavathe-Mahankal.·.
At the time of 1961 census, the distdct comprised of 5 talukas and. 1 mahal WhiCh in themselves included 526 inhabited villages and 6 towns. At the time of 1971 census, the district had 8 tahsils comprised of 539 inhabited villages and 7 towns. Since then the numler of tahsils in the district has remained unchanged. In the year 1981, one more town was added increasing the number to 8 and the number of inhabited villages has gene up to 708.
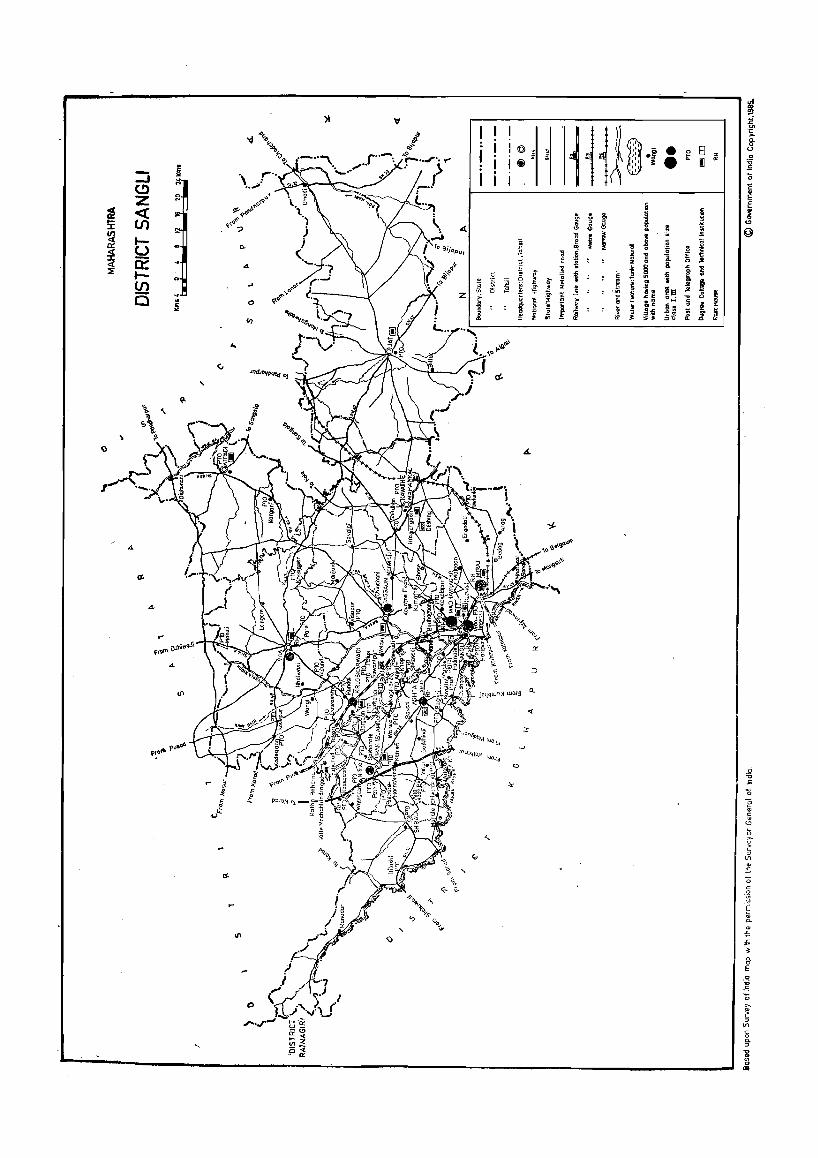
location, Relief and Drainage
Formir.g palt of famous Deccan Plateau, district Sangli lies betwe;m 16°45' to 17°33' North la,titude and 73°42' to 75°40' East longitude. It is bound by district Solapur and Satara in the north, Bijapur ir the east and Bdgaum ;n the south. A narrow tapering part. of the dishict. stretching towards the west, also bounds the coastal district of Ratnagiri.
District Sangli covers an alea 01 8572 km2
and ha& a population of 1,831,212 as per 1981 cenSUf. It rank~ 22nd in area and 18th in population among tbe 26 districts· of the State; In othel word& Sangli is one of the smallest di~lrict in the state both in term~ of area and population.
There are two main systems of hill" in the district viz. Sahyadri range and its off-shoots, and the spur of Mah::dev range. The Sahyadri system includ(s the main range of the Sahyadris which forms the weste..rn boundary of the district. Knshna h the. plinc-ipal dver which flows south-~ast through
Walwa, Tasgaon and Mil:lj tahsils., The Warana which is ore of the main tributal ;es of the Krishna tiSI;;S dose to the wester~ Clest of SahY:ldri and runs from we&t to (ast along the southern boundary of the district and Shirala and Walwa tllhsils until it jcins tht Krishna at. Sangli .. Othel impor::: tant rivers are Yella, Agram, Nannr, Manganga and Bor.
Climate
The climate of this distllct is characterised by ge.11.tIal drync;s!> in the major part. of the year. The rain) sea~on starts flOm the mIddle of June and lest!> up to tho end of SeptembeI. It is followed by sutry weather flOm tbe beginning of October to 1h( Iriddle of Novemool, wintn from the middle of Novembel to the end of Janm.ry, dry hot time flOm Februar) to the end of March and hot weathu from April to the middle of June Sea.sons do net show ablupt changes or extremes of heat or cold.
In the western part of the district, the climate is cool and healthy in the hot weather which becomes chilly during tht rainy seawn. However, the plains of Walwa and Miraj tahsils have temperate climate thlOughout the. year. Central p~rt of the district become~ conSIderably hot dUllng summer months, climate becomes hotter as one proceed~ from west to e~st of th~ . dist~ict. The average annual rainfall 1ll the dlstnct IS about 700 m. m. The rainfall in the western portIOn of the disl rict, in the regions of Sahyadri is .co~&iderably hightr than in the rest of the dIstrIct. It decreases from the western ghat towards the eastern portion of the district. Western portion of. Shirala ta~il on an average gets over 2000 m. m. of rainfall in the year. The central and eastern portion gets a rainfall of 750. m. m. The north eastern portion has the lowest raInfall about 500 m. m. in the year. The c3rotern tahsils of Jat, Kavathe-Mahankal, Atpadi and Khanapur are known as scarcity and drought prone areas.
8
has red laterite soils on upghats and reddish brown soils on hill slopes, the latter being developed on parent material of trap rock The central transition zone of Krishna valley (covering areas of Walwa, . partly of Tasgaon and part of Miraj tahsil) has deep black soils of alluvial origin. It is recognised as rich agricultural tract. The third is the eastern drier zone (comprising areas of eastern parts of Khanapur, Miraj, Tasgaon tahsils; and tahsils of Jat, Kavathe-Mahankal and Atpadi), which consists largely of granular black soils and poor shallow soils. Saline-alkaline soils are met with in the low lying patches in the areas of low rainfall.
Census Houses and Households
Columns 4 and 5 of the Primary Census Abstl"act give total number of occupied "residential census houses and the number of households. According to Indian Census, 'Census House' is a building or a part thtreof having a main entrance from the road or common courtyard or staircase etc. It may be occupied .or vacant, residential, nonresidential or both. A 'Household' is a group of persons who commonly live together and would take lheir meals from a common kitchen, unless the exigencies of work prevented them from doing so. A household may be of persons related by blood or of unrelated persons, or having a mix of both. There may· be one member or more than one me-mber household~. Houst:holds of unrelated persons termed as 'institutional households' include boarding houses, messes, hostels, residential hostels, rescue homes, jails, ashrams etc.
Houseless population or houseless. households include persons who do not have any fixed place of residence but go on. moving from place to place, camp at night, or just live· on the streets, in gardens or in open piacc5.
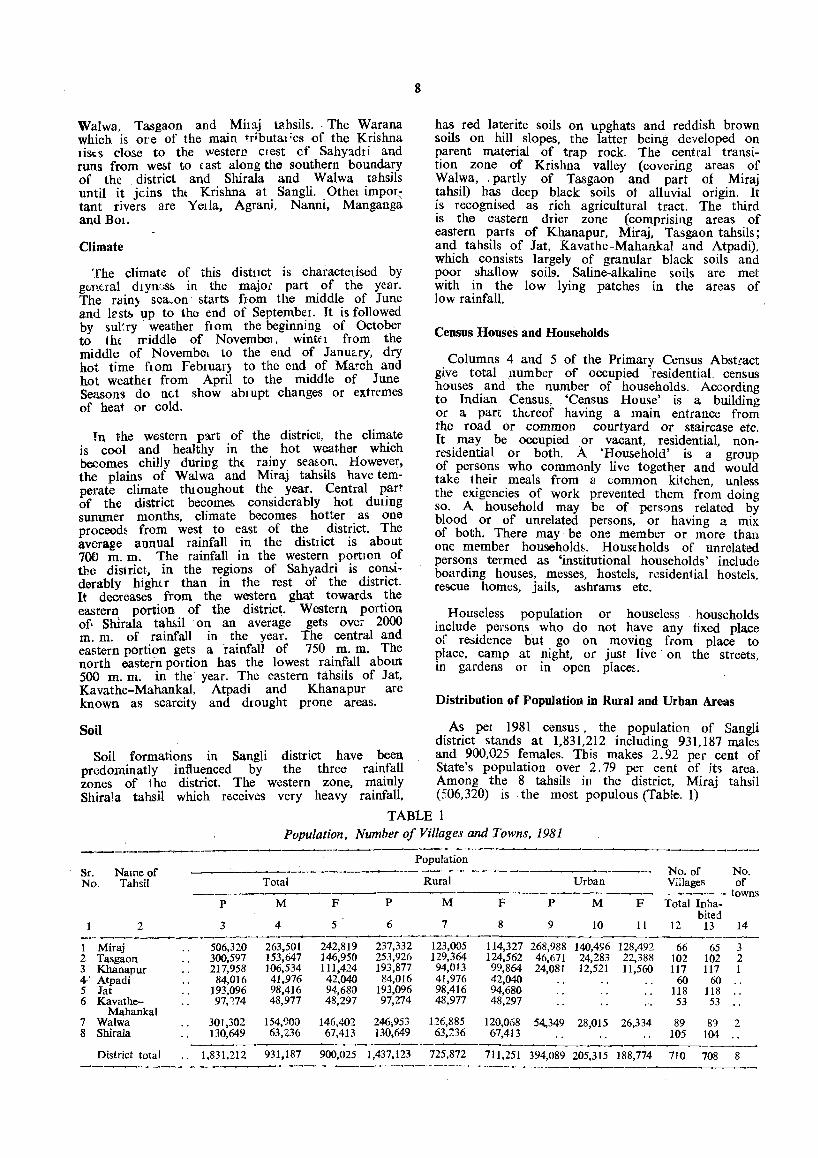
Distribution of Population in Rural and Urban Areas
Soil As per 1981 census, the popUlation of Sangli district stands at 1,831,212 including 931,187 males
Soil formations in Sangli district bave been and 900,025 females. This makes 2.92 per cent of prcdominatly influenced by the three rainfall State's population over 2.79 per cent of it') area. zones of 1he district. The western zone, mainly Among the 8 tabsils in the district, Miraj tahsil Shirala tahsil which receives very heavy rainfall, (506,320) is the most populous (Table. 1)
TABLE 1 Population, Number of Vii/ages and Towns, 1981
----.. ---~---------------Population
Sr. Name of ---......:.----_.:--------------- No. of No. No. Tahsil Total Rural Urban Villages of
towns P M F P M F P M F Total Inha-
bited 2 3 4 5 6 7 8 9 10 11 12 13 14
---------- -------_. 1 Miraj 506,320 263,501 242,819 237,332 123,005 114,327 268,988 140,4% 128,492 66 65 3 2 Tasgaon 300,597_ 153,647 146,950 253,926 129,364 124,562 46,671 24,283 22,388 102 102 2 3 Khanapur 217,958 106,534 111,424 193,877 94,013 99,864 24,081 12,521 11,560 117 117 1 4' Atpadi 84,016 41,976 42,040 84,016 41,976 42,040 60 60 .. 5 lat 193,096 98,416 94,680 193,096 98,416 94,680 118 118 .. 6 Kavathe- 97,:74 48,977 48,297 97,274 48,977 48,297 53 53 ..
Mahankal 7 Walwa 301,302 154,900 146,402 246;953 126,885 120,068 54,349 28,015 26,334 89 89 2 8 Shirala 130,649 63,236 67,413 130,649 63,236 67,413 105 104 ..
District total .. 1,831,212 931.187 900,025 1,437,123 725,872 711,251 394,089 205,315 188,774 710 708 8 ------... _ .. __ ... _---- ... _------...
Other tahsils in oider of their size of population are Walwa (301,302), Tasgaon (300,597). Khanapur (217,958), J~t (193,096), Shirala (130,649), KavatheMahankal (97,274) and Atpadi (84,016). It follews that within the district the most populous tahsil has mOle than six times the population of the Ie alit populous tahsil.
The basic unit for rural area is a levenue village. A 'village' may be' defined as a s1:atutory recognised unit having definite boundary and separate la!ld records. Urban aleas on the other hand are sp~clally defined for census purposes. The cti1eria adopted for the 1981 census is-
(a) An places with a municipality, corporation or cantonment board or notified town areas;
(b) All other places which satisfy the following criteria :-
(i) a minimum population of 5,000; ~ii) at least 75 per cent of male working
population engaged in non-agricultural (and allied) activities ;
(iii) a popUlation of at least 400 personf:> per km2 ..
Out of 1.831,212 persons in the district, 1,437,123 (78.48 %) Jive in the villages and the lemaining 394,089 (21.52 %) in the towns. Thus, in Maharashtra State (where 35.0:1 % of the total population is urban), Sangli distIict is amQng the le~s urbanized distlicts.
Size Class and Status of Towns
For the purpose of comprehensive a02:lysi!> of vatied demographic characteristics towns have been divided into the following c1asses by population size ;-
Clas~-I
Clau~-II
Class-III Cla~s-IV
Class-V Class-VI
. 100,000 and above. 50,00{}-99,999 20,000-49,999 10,00{}-19,999 5,000- 9,999
Below 5,000
In 1971, Madhavnagal in Miraj tah~iI was considued as town fot the first time. In 1981 also there has be'.n an addition in the nurrber 'Of towns, viz KirJoskarwadi in Tasgaon tahsil as it qua1ified the specific criteria to declare as a cen~ us town (Table 2).
TABLE 2 New Town/Towns declassified in 1981 Census
Name of the towns
------------(a) Added-
!i) Kirloskarwadi (C.T.) .. (b\ (ii) Declassified-Nil -
Popula~ion 1981-Census
2
20.512 Nil
Of the eight towns if. the district. two (Sangli and Miraj) are class I, five (Tasgaon, Kitloskarwadi, Vita. Uran Islampur and Ashta) ale ciass III and the remaining one (Madhavnagari is class-IV (Statement I). Except Madha\'nagar and Kir loskarwadi the n:main'f1l! towns ale mvnicipal towns.
Ya 197-2
Ubran Agglomeration
As in 1971 the concept of urban agglomeration has been adopted for 1981 census too. An, urban agglomeration may constitute :
(a) A city with continuous outgrowth (the part of outgrowth being outside the statutory limits but falling within the boundaries of adjoining village or villages) ;
(b) One town with similar outgrowth or two or more adjoining towns with their outgrowths as in (a); 01
(c) A city and one or more adjoining towns with their outgrowths all of which form a continuous spr:ad.
In Sangli district, there is only. one urban agglomeration (U. A) i. e. Sangli U.A. and its constituent units are:
(a) Sangli City (M) (b) Miraj City (M) (c) Madhavnagar.
Standard Urban Area
Standard Urban Alea (S. U.A) concept introduced in 1971, has been followed in 1981 as well. The essential requirements for th( constitution of S. U.A. are .:
(z} It should have a core town of a minimum population of 50,000 ;
(it) The contiguous areC.s made up of other urban as well as rural administra1ive units should have mutual socio-economic links with the core town; and
(iii) In all probability this entire area should get fully urbanised within a spru of two or· three decades .
The constituent' units of Sangli-Miraj standard urban areas in Sangli district are as follows:Sangli-Miraj S.U.A: Urban Components:
1. Sangli City (M). 2. Miraj City (M).
3. Madhavnagar. Rural Component~ : 1. Budhgaon 2. Kupwad. 3. Savali. 4 .. Vanleswadi. 5. Bamnoli.
. Table (3) below provides villages by population range and their percentage to total inhabited villages in the district.
TABLE 3 Distribution of Inhabited Villages by Population Ranges
No. of Percentage Range of Population villages in of villages
1 each range in each range
2 3 ---_--200 13 1.84
20(}........499 71 10.03 500-1,999 407 57.48 2,000-4,999 159 22.46 5,000- 9,999 46 6.50 10,000+ 12 1.69
All ranges 708 100.00
A village on an average has a population of 2,030 persons and 11.68 km2 of area. Of the 708 inhabited villages 13 (1. 84 %) are with a population of below 200; 71 (10.03%) in the size class 200-499; 407 (57.48 %) in the size class 500-1999; 159 (22.46%) in the size class 2000-4999; 46 (6.50 %) in the size class 5000-9999 and the remaining 12(1.69%) in the size class 10,000 and above. For a broader generalisation the villages have been turther grouped as small sized (population below 500), medium sized (500--1999), large sized (2000-4999) and exceptionally large sized (5000 and above). Within the district small sized villages share 11.87 per cent ot ~he total inhabited villages and 1.97 per cent of the rural. population in the district, medium sized 57.48 per cent of villages and 32.57 per cent
10
of population, large sized 22.46 per cent of villages and 34. 10 per cent of popuJatioD and exceptionally large sized 8.19 per cent of villages and 31.36 per cent of population.
Population Growth, Density and Sex ratio
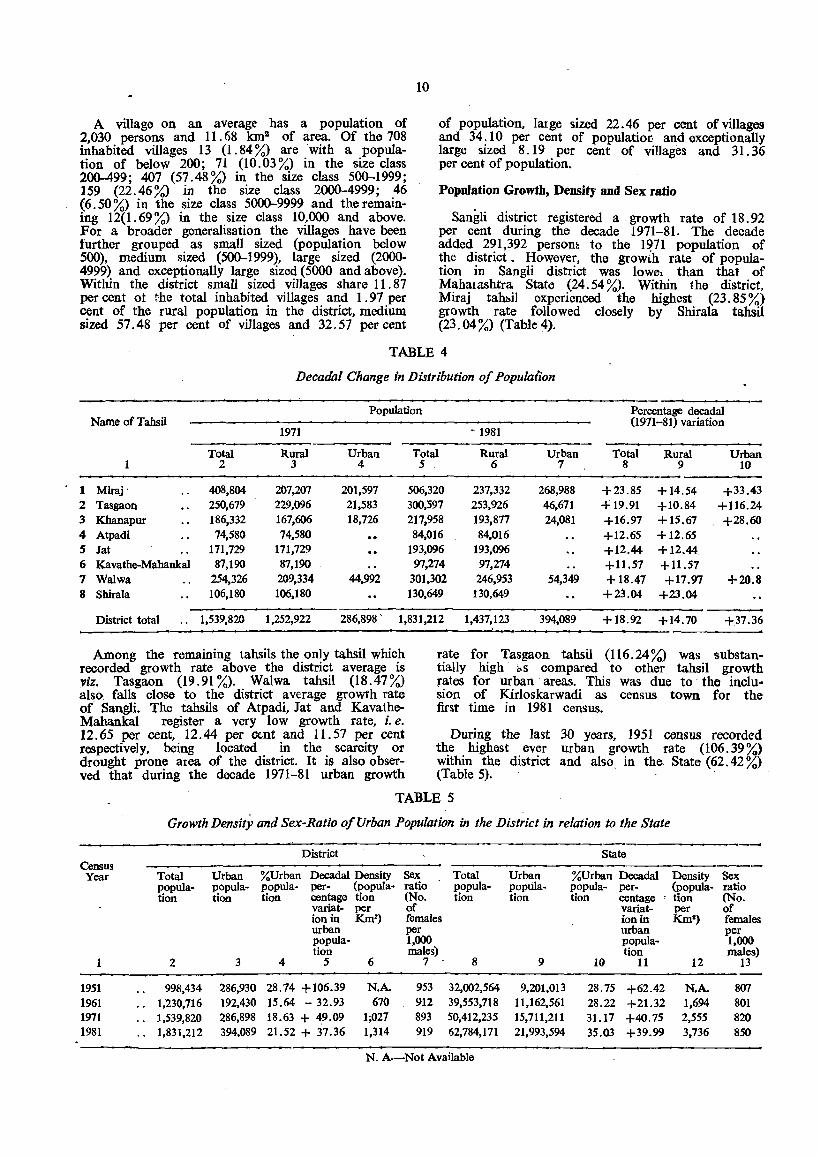
Sangli district registered a growth rate of 18. 92 per cent during the decade 1971-81. The decade added 291,392 persom to the 1971 population of the district. HOWever, the growLh raLe of population in Sangli district was lowe1 than that of Mahalashtra State (24.54 %). Within the district, Miraj taru.il experienced the highest (23.85 %) growth rate followed closely by Shirala tahsil (23.04 %) (Table 4).
TABLE 4
Decadal Change in Distribution of Population
Population Name of Tahsil
1971 ~ 1981
Percentage decadal (1911-81) variation
Total Rural Urban Total 1 2 3 4 5
1 Miraj· 408,804 207,207 201,597 506,320 2 Tasgaon 250,679 229,096 21,583 300,397 3 Khanapur 186,332 167,606 18,726 217,958 4 Atpadi 74,580 74,580 84,016 5 Jat 171,729 171,729 193,096 6 1Cavathe-~a~ 87,190 87,190 97,274 7 Walwa 254,326 209,334 44.992 301,302 8 Shirala 106,180 106,180 130,649
Rural Urban 6 7
237,332 268,988 253,926 46,671 193,877 24,081 84,016
193,096 97,274 246,953 54,349
130,649
Total 8
+23.85 + 19.91 +16.97 +12.65 +12.44 +11.57 + 18.41
+23.04
Rural 9
+14.54 +10.84 + 15.67 +12.65 +12.44 +11.57 +17.97
+23.04
Urban 10
+33.43 +116.24 +28.60
+20.8
District total .. 1,539,820 1,252,922 286,898 - 1,831,212 1,437,123 394,089 +18.92 +14.70 +37.36
Among the remaining tahsils the only tahsil which recorded growth rate above the district average is .,iz. Tasgaon (19.91 %). Walwa tahsil (18.47%) also falls close to the district average growth rate of Sangli. The tahsils of Atpadi, Jat and KavatheMahankal register a very low growth rate, i. e.
rate for Tasgaon tahsil (1l6.24%) was substantially high "'s compared to other tahsil growth :rates for urban areas. This was due to· the inclusion of Kirloskarwadi as census town for the first time in 1981 census.
12.65 per cent, 12.44 per Ctnt and 11.57 per cent During the last 30 years, 1951 census recorded respectively, being located in the scarcity or the highest ever urban growth rate (106.39%) drought prone area of the district. It is also obser- within the district and also in the State (62.42%) ved that during the decade 1971-81 urban growth (Table 5).
TABLE 5
Growth Density and Sex-Ratio of Urban Population in the District in relation to the State
---District State Census
Year Total Urban %Urban Decadal Density Sex Total Urban %Urban Decadal Density Sex popula- popuIa- popula- per- (popuIa- ratio popula- poptila- popuIa- per- (PopuIa- ratio tion tion tion centage tion (No. tion tion tion centage ' tion (No.
variat- per of variat- per of ion in Km') females ion in Km!) females urban per urban per popuIa- 1,000 popuIa- 1.000 tion males) tion males)
1 2 3 4 5 6 7 8 9 10 11 12 13
1951 998,434 286,930 28.74 +106.39 N.A. 953 32,002,564 9,201,013 28.75 +62.42 N.A. 807 1961 1,230,716 192,430 15.64 - 32.93 670 912 39.553,118 11,162.561 28.22 +21.32 1,694 801 1971 .. 1,539,820 286,898 18.63 + 49.09 1;027 893 50,412,235 15,711,211 31.17 +40.75 2,555 820 1981 .. 1,831,212 394,089 21.52 + 37.36 1.314 919 62,784,171 21,993,594 35.03 +39.99 3,736 850
N. A.-Not Available
The successive decade, 1951-61, witnessed an abrupt fall in urban growth rate in Sangli district as well as in the Mahar~shtra State as a whole. While the Sangli district registered" a negative growth of 32.93 per cent, this drop in the urban population is due to reduction in the Dumber of town~ in 1961 due to declassification of 21 towns as a result of a change in the definition. DUling 1961-71, urban areas recorded a groWth of 49.09 per cent in the district as against 40.75 per cent in the State. During the next ten years, that is 1971-81, urban growth rate lecorded. for the district was 37.36 per cent against 39.99 per cent for the State. Among" the various towns in the dilltrict, Miraj recorded the highest (35.89 %) growth rate. It is followed by Sangli (32.35 %), Vita (28.60 %), Madhavilagar (25.88 %), Uran Is]ampur (21.56 %), Tasgaon (21.20%) and Ashta (19.63 %). (statement I).
Sangli district has an average density of, 214 persons per km2• This is somewhat higher than the State average density of 204 persons per km2•
Within the district, however, one can see wide variations, Miraj with density of 547 is the most thickly populated tahsil. On the contrary Jat tahsil has a density of barely 86 persons per km2
• Atpadi tahsil is also thinly populated with density of only 96 persons per km2•
Table 6 shows distribution of villages according to density ranges.
TABLE 6
Distribution of Villages by Density
Range of den~ity (per km2)
-10 11-20 21-50 51-100
101-200 201-300 30l-500 501+ Not Known
All density ffinges
Total No. of villages in each density range
2
4 7
29 149 217 103 94 39 66
708
Percentage of villages in each density range
3
0.56 0.99 4.10
21.04 30.65 14.55 13.2& 5.51 9.32
100.00
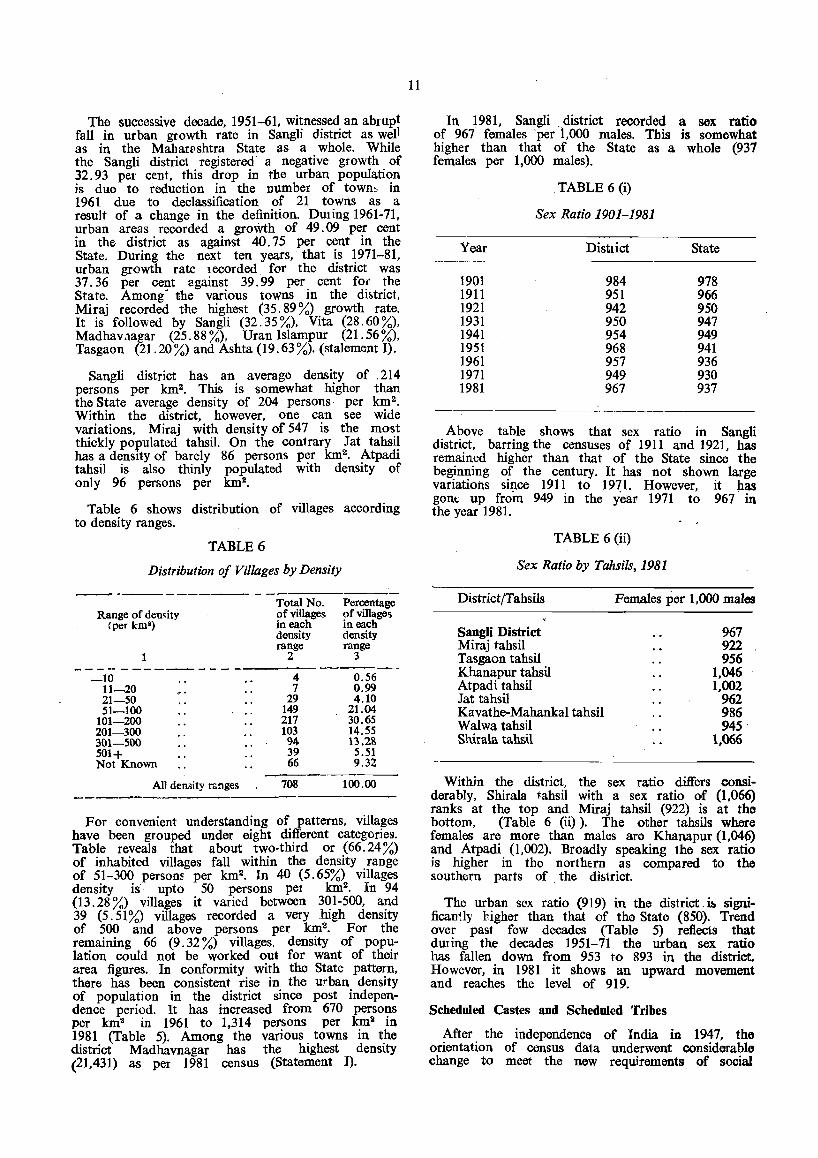
For convenient understanding of patterns, villages have been grouped under eight different categories. Table reveals that about two-third or (66.24%) of inhabited villages fall within the density range of 51-300 persons per km2• In 40 (5.65%) villages density is upto 50 persons pel km2
• In 94 (13.28%) villages it varied between 301-500, and 39 (5.51%) villages recorded a very .high density of 500 and above persons per km2• For the remaining 66 (9.32 %) villages. density of population could not be worked out for want of their area figures. In conformity with the State pattern, there has been consistent rise in the urban density of population in the district since post independence period. It has increased from 670 persons per km2 in 1961 to 1,314 persons per km2 in 1981 (Table 5). Among the various towns in the district Madhavnagar has the highest density (21,431) as per 1981 census (Statement I).
11
In 1981, Sangli 0 district recorded a sex ratio of 967 females °per 1,000 males. This is somewhat higher than that of the State as a whole (937 females per 1,000 males).
Year
1901 1911 1921 1931 1941 1951 1961 1971 1981
TABLE 6 (i)
Sex Ratio 1901-1981
District
984 951 942 950 954 968 957 949 967
State
978 966 950 947 949 941 936 930 937
Above table shows that sex ratio in Sangli district, barring the censuses of 1911 and 1921, has remained higher than that of the State since the beginning of the century. It has not shown large variations since 1911 to 1971. However, it has gont; up from 949 in the year 1971 to 967 in the year 1981.
TABLE 6 (ii)
Sex Ratio by Tahsils, 1981
District /Tahsils Females per 1,000 males
Sangli District Miraj tahsil Tasgaon tahsil Khanapur tahsil Atpadi tahsil Jat tahsil Kavathe-Mahankal tahsil Walwa tahsil Shirala tahsil
967 922 956
1,046 1,002
962 986 945
1,066
Within the district, the sex ratio differs considerably, Shirala tahsil with a sex ratio of (1,066) ranks at the top and Miraj tahsil (922) is at the bottom, (Table 6 (ii». The other tahsils where females are more than males are Khanapur (1,046) and Atpadi (1,002). Broadly speaking the sex ratio is higher in the northern as compared to the southern parts of the di!>trict.
The urban sex ratio (919) in the district" i!) significandy higher than that of the State (850). Trend over past few decades (Table 5) reflects that during the decades 1951-71 the urban sex ratio has fallen down from 953 to 893 in the district. However, in 1981 it shows an upward movement and reaches the level of 919.
Scheduled Castes and Scheduled Tribes
After the independence of India in 1947, the orientation of census data underwent considerable change to meet the new requirements. of social

planning and development. In pursuance of the nationa.l government's policy to discourage community distinctions based on caste, race etC'. , the 1951 Census, which was the first census after independence, gave up the questions on these aspects which weIe earlier given priority. The only relevent question on this aspect incorporated in the 1951 Census schedule confined itstli to 'Special groups'. viz. whether a person belonged to Scheduled Caste or a Scheduled Tribe or a Backward Class or the Anglo-Indian community, so as to meet the requirement, of the constitution for the weaker sections of the society. The 1961 Census, however, attempted in a comprehensive manner in generation of demographic d~ta on Scheduled Castes and Scheduled Tribes. The same tradition, of providing detailed information on the socio-economic charactl"Iistics of the scheduled caste and scheduled tribe popUlation, has been maintaintod in the 1971 and 1981 Censuses also. Thus censu' has been the main source (or providing demographic data on scheduled castes and scheduled tribe.). Such data are imperative for the government to evolve any suitable plan fer socio-economic uplift of these weaker sections of the society.
Then is no standard definition of scheduled castes and scheduled tribes. Scheduled castes include all of those castes communities declared as such and included in the scht.dule bv the President of India by public notification under the alticle 341 of Indian Constitution. Similarly, scheduled tribes me n all such tribal communities or sub-tribes OJ" group" thereof, which are. declared by the President of India and included in the schedule under the article 342 (i) of the Indian Constitution. According to the Scheduled Caste~. and Scheduled Tribes ordels (Amendment) Act, 1976 there are 59 scheduled cas1es and 47 scheduled tribes in Mabarashtra State. A list of scheduled castes and scheduled tribes in the State is given below.
Scheduled Castes and Scheduled Tribes in Mabarashtra State
I. UST OF SCHEDULED CASTES
1. Ager. 2. Anamuk. 3. Aray Mala. 40. Arwa Mala. 5. Bahna, Bahana. 6. Bakad, Bant. 7. Balahi, Balai. 8. Basor, Burud, Bansor, Bansodi. 9. Beda Jangam, Budga Jangam.
10. Bedar. 11. Bhambi, Bhambhi, Asadaru, Asodi, Chamadia, Chamar,
Chamari, Chambhar, Chamgar, HaraIayya, Harali, KhaIpa, Machigar, Mochigar, Madar, Madig, Mochi, Telegu Mochi, Kamati Mochi, Ranigar, Rohidas, Nona, Ramnami, Rohit, Samgar, Samagara, Satnami, Surjyabanshi, Surjyaramnami.
12. Bhangi, Mehtar, Olgana, Rukhi, Malkana, Halakhor, Lalbegi, Balmiki, Korar, Zadmalli.
13. Bindla. 14. Byagara. 15. Chalvadi, Channayya. 16. Chenna Dasar, Holaya Dasar, Holeya Dasari. 11. Dakkal, Dokkalwar. 18. Dhor, Kakkayya, Kankayya, Dohor. 19. Dom, Dumar.
12
20. Ellamalvar, YelJammalawandlu. 21. Ganda, Gandi. 22. Garoda, Garo. 23. Ghasi, Ghasia. 24. Halleer. 25. Halsar, Haslar, Hulasvar, Halasvar. 26. Holar, Valhar. 27. Holaya, Holer, Holeya. Holiya. 28. Kaikadi (in Akola Amravati, Bhandara, Buldana, Nagpur,
Wardha, and Yavatmal districts and Chandrapur distlict other than Rajura tahsil).
-29. Katia, Patharia. 30. Khangar, Kanera, Mirdha. 3}. Khatik, Chikwa, Chlk-vi. 32. KoJupulvandlu. 33. Kori. 34. Lingader. 35. Madgi. 36. Madiga. 37. Mahar, Mehra, Taral, Dhegu Megu. 38. Mahyavanshi, Dhed, Vankar, Maru-Vankar. 39. Mala. 40. Mala Dasari. 41. Mala Hannai. 42. Mala Jangam. 43. Mala Masti. 44. Mala Sale, Netkani. 45. Mala Sanyasi. 46. Mang, Matang, Minimadig. Dankhni Mang, Mang Mahashi,
Madari, Garudi, Radhe Mang. 47. Mang Garodi, Mang Garudi. 48. Manne. 49. Mashti. 50. Meghval, Menghvar. 51. Mitha Ayyalvar. 52. Mukri. 53. Nadia, Hadi. 54. Pasi. 55. San~i.
56. Shenva, Chenva, Sedma, Ravat. 57. Sindhollu, Chindollu. 58. Tirgar, Tirbanda. 59. Turi.
n. LIST OF SCHEDULED TRIBES
1. Andh. 2. Baiga. 3. Barda. 4. Bavacha. Bamcha. 5. Bhaina. 6. Bharia Bhumia, Bhuinhar, Bhumia, Pando. 7. Bhattra. 8. Bhil, BhiJ Garasia, Dholi Bhil, Dungri Bhil, Dungri-Garasia,
Mewasi Bhil, Rawal Bhil, Tadvi Bhil, Bhagalia, Bhilala, Pawra, Vasava, Vasave.
9. Bhunjia. 10. Binjhwar. 11. BirhuI, Birhor. 12. Chodhara (excluding Akola, Amravati, Bhandara, Buldana,
Chandrapur, Nagpur, Wardha, Yavatmal, Aurangabad, Beed, Nanded, Osmanabad and Parbhani districts).
13. Dhanka, Tadvi, Tetaria, Valvi. 14. Dhanwar. 15. Dhodia. 16. Dubla, Talavia, Halpati.
17. Gamit, Gamta, Gavit, Mavchi, Padvi. 18. Gond, Rajgond, Arakh, Arrakh, Agaria, Asur, Badi Maria,
Bada Maria, Bhatola, Bbimmi, Bhuta, Koilabhuta, Koila bhuti Bhar, Bisonhorn Maria, Chota Maria, Dandami Maria, Dhuru, Dhurwa, Dhoba, Dhulia, Dorla, Gaiki. Gatta, Gatti, Gaita, Gond Gawari, Hill Maria, Kandra, Kalanga, Khatola Koitar, Koya, Khirwar, Khirwara, Kucha Maria. Kuchaki Maria, Madia, Maria, Mana, Mannewar, Moghya. Mogia, Monghya, Mudia, Muria, Nagarchi, Naikpod, Nagwanshi, Ojha, Raj, Sonjhari Jhareka, Thatia, Thotya, Wade Maria, Vade Maria.
19 Halba, Balbi. 20 Kamar. 21. Kathodi, Katkari, Dhor Kathodi, Dhor Katkari, Son
Kathodi, Son Katkari. 22. KawaI, Kanwar, Kaur, Cherwa. Rathia, Tanwar, Chattri. 23. Khairwar. 24. Kharia. 25. Kokna, Kokni, Kukna. 26. Kol. 27. Kolam, Mannervarlu. 28. Koli Dhor, Tokre Koli, Kolcha, Kolgha. 29. Koli Mahadev, Dongar Koli. 30. Koli Malhar. 31. Kondh. Khond, Kandh. 32. Korku, Bopchi, Moussi, Nihal, Nahul, Bondhi, Bondeya. 33. Koya, Bhine Koya, Rajkoya. 34. Nagesia, Nagasia. 35. Naikda, Nayaka, Cholivala Nayaka, Kapadia Nayaka.
Mota Nayaka, Nana Nayaka. 36. Oraon, Dhangad. . 37. Pardhan, Pathari, Saroti. 38. Pardhi, Advichincher, Phans Pardhi, Phanse Pardhi,
Langoli Pardhi, Behelia, Bahellia, Chita Pardhi, Shikari, Takankar, Takia.
39. Parja. 40. Patelia. 41. Pomla. 42. Rathawa. 43. Sawar, Sawara. 44. Thakur, Thakar, Ka Thakur, Ka Thakar, Ma Thakur, Ma
Thakar. 45. Thoti (in Aurangabad, Beed. Nanded, Osmanabad and
Parbhani districts and Rajura tahsil of Chandrapur district). 46. Varli. ., 47. Vitolia, Kotwalia, Barodia.
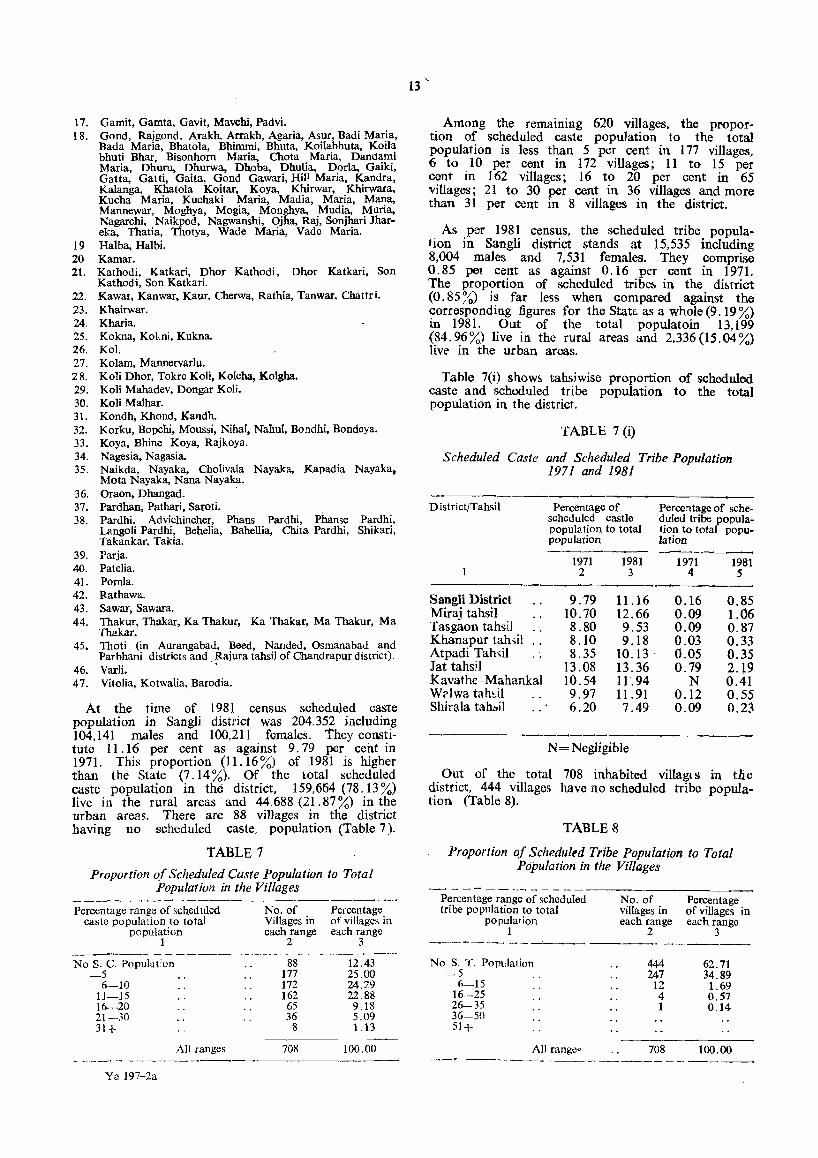
At the time of 1981 census scheduled caste population in Sangli district was 204.352 including 104,141 males and 100,211 females. they constitute 11. 16 per cent as against 9. 79 per cent in 1971. This proportion (11. 16 %) of 1981 is higher than the State (7. 14 %). Of the total scheduled caste population in the district, 159,654 (78.13 %) live in the rural areas and 44 688 (21. 87 %) in the urban areas. There are 88 villages in the district having no scheduled caste, population (Table 7).
TABLE 7
Proportion of Scheduled Caste Population to Total Population in the Villages
Percentage range of scheduled caste population to total
population 1
No S. C. Popuhlt;on -5
6-10 11-15 16--20 21-30 31+
Ya 197-2a
.,\11 ranges
No. of Villages in each range
2
Percentage of villages in each range
3 ------------_._.
88 177 172 162
65 36
8
708
12.43 25.00 24.29 22.88 9.18 5.09 1.13
100.00
13
Among the remammg 620 villages. the proportion of scheduled caste popUlation to the total population is less than 5 per cent in 177 villages. 6 to 10 per cent in 172 villages; 11 to 15 per cont in 162 villages; 16 to 20 per cent in 65 villages; 21 to 30 per cent in 36 villages and more than 31 per cent in 8 villages in the district.
As per 1981 census, the scheduled tribe populafion in Sangli district stands at 15,535 including 8,004 males and 7,531 females. They comprise 0.85 pel cent as against O. 16 per cent in 1971. The proportion of scheduled tribe& in the di&trict (0.85 %) is far less when compared against the corresponding figures for the State. as a whole (9.19 %) in 1981. Out of the total populatoin 13,199 (84.96%) live in the rural areas and 2,336 (15.04%) live in the urban areas.
Table 7(i) show!> tahsiwise proportion of scheduled caste and scheduled tribe population to the total population in the district.
TABLE 7 (i)
Scheduled Caste and Scheduled Tribe Population 1971 and 1981
D istrictJTahsil
Sangli District Miraj tahsil Tasgaon tahsil Khanapur tah,;i! Atpadi Tah,il Jat tahsil kavathe-Mahankal Wdwa tah~il Shir~la tahlJil
Percentage of scheduled castle population to total population
1971 1981 2 3
Percentage of scheduled tribe popUlation to total population
1971 1981 4 5
----9.79 11.16 0.16 0.85
10.70 12.66 0.09 1.06 8.80 9.53 0.09 0.87 8.10 9.18 0.03 0.33 8.35 10.13 . 0.05 0.35
13.08 13.36 0.79 2.19 10.54 11.94 N 0.41 9.97 11. 91 0.12 0.55 6.20 7.49 0.09 0.23
N=Negligible
Out of the total 708 inhabited villages in tlie district, 444 villages have no schoouled tribe population (Table 8).
TABLE 8
Proportion of Schedultd Tribe Population to Total Population in the Villages
-- - - - -_ -.- - - - - - -_-------__ . Percentage range of scheduled tribe population to total
population 1
No. of villages in each range
2
Percentage of villages in each range
3 _--------~--------- ---~--
No S. T. Popdation -5
6-15 16-25 26-35 36-50 51+
All rangeo
444 247
12 4 1
708
62.71 34.89 1.69 0.57 0.14
100.00 ----------------------
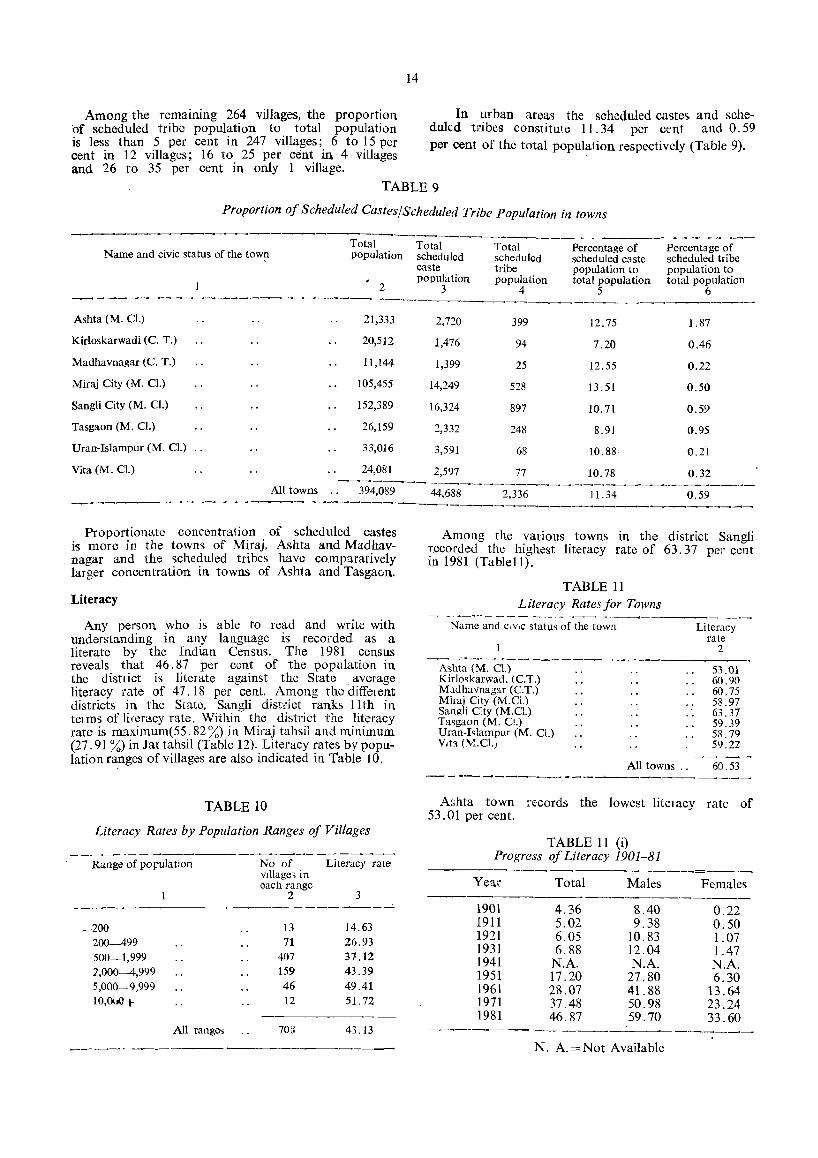
Among the remalUlUg 264 villages, the proportion of scheduled tribe population to total population is less than 5 per cent in 247 villages; 6 to 15 per cent in 12 villages; 16 to 25 per cent in 4 villages and 26 to 35 per cent in only 1 village.
14
In urban areas the scheduled castes and scheduled tribes constitu~e 11.34 per cent and 0.59 per cent of the total populafion respectively (Table 9).
TABLE 9
Proportion of Scheduled Castes/Scheduled Tribe Population in towns
Name and civic status of the tow!1 Total population
2
Total scheduled caste population
3
Total scheduled tribe population
4
Percentage of scheduled caste population to total population
5
Percentage of scheduled tribe population to total population
6 -~-_-------------_------------------_------------------_----
Ashta (M. CI.) 21,333 2,720 399 12.75 1.87
Kirloskarwadi (C. T.) 20,512 1,476 94 7.20 0.46
Madhavnagar (C. T.) 11,144 1,399 25 12.55 0.22
Miraj City (M. CI.) 105,455 14,249 528 13.51 0.50
Sangli City (M. CI.) 152,389 16,324 897 10.71 0.59
Tasgaon (M. CI.) 26,159 2,332 248 8.91 0.95
Uran-Islampur (M. CI.) .. 33,016 3,591 68 10.88 0.21
Vita (M. CI.) 24,081 2,597 77 10.78 0.32
All towns .. 394,089 44,688 -_---------_
2,336 11.34 0.59 --------------------~-------_-----------..----------~-----
Proportionate concentration of scheduled castes is more in the towns of Miraj, Ashta and Madhavnagar and the scheduled tribes have comparatively larger concentration in towns of Ash1a and Tasgaon.
Literacy
Any person who is able to read and write with understanding in any language is recorded as a literate by the Indian Census. The 1981 census reveals that 46.87 per cent of the population in the district is literate against the State . average literacy rate of 47.18 per cent. Among the diffelent districts in the State, Sangli distl"ict ranks 11th in telillS of lireracy rate. Within the district the literacy rate is maximum(55. 82 %) in Miraj tahsil and minimum (27.91 %) in Jat t~hsil (Table 12) .. Li.~eracy :ates by population ranges of villages are also mdlcated In Table to.
TABLE 10
Literacy Rates by Population Ranges of Villages
Range of porulation No of Literacy rate vtllage, in each range
2 3 ----.-------------- _-------
-200 200-499 500-1,999 7,000--4,999 5,000-9,999 10,0\J(]1 I-
All ranges
13 71
407 159 46 12
708
14.63 26.93 37.12 43.39 49.41 51.72
43.13
Among the various towns in the district Sangli r.ecorded the highest literacy rate of 63.37 per cent in 1981 (TabJell).
TABLE 11 Literacy Rates for Towns
Name and c,v.c status of the town
Ashta (M. Cl.) Kirlo~karwad, (C.T.) Madhavnagar (C.T.) Miraj City (M.O.) Sangli C'ty (M.Cl.) Tasgaon (M. 0.) Uran-I~lampur (M. Cl.) y,t'l UvLCI.}
All towns ..
Literacy rate
2
53.01 60.90 60.75 58.97 63.37 59.39 5R.79 59.22
60.53
Ashta town rc-cords the lowest litelacy rate of 53.01 per cent.
TABLE 11 (i) Progress of Literacy 1901-81
Year
1901 1911 1921 1931 1941 1951 1961 1971 1981
Total
4.36 5.02 6.05 6.88
N.A. 17.20 28.07 37.48 46.87
Males
8.40 9.38
10.83 12 04 N.A.
27.80 4l.88 50.98 59.70
Females
0.22 0.50 1.07 1.47 N.A. 6.30
13.64 23.24 33.60
---------- .-----~-------------N. A.=Not Available
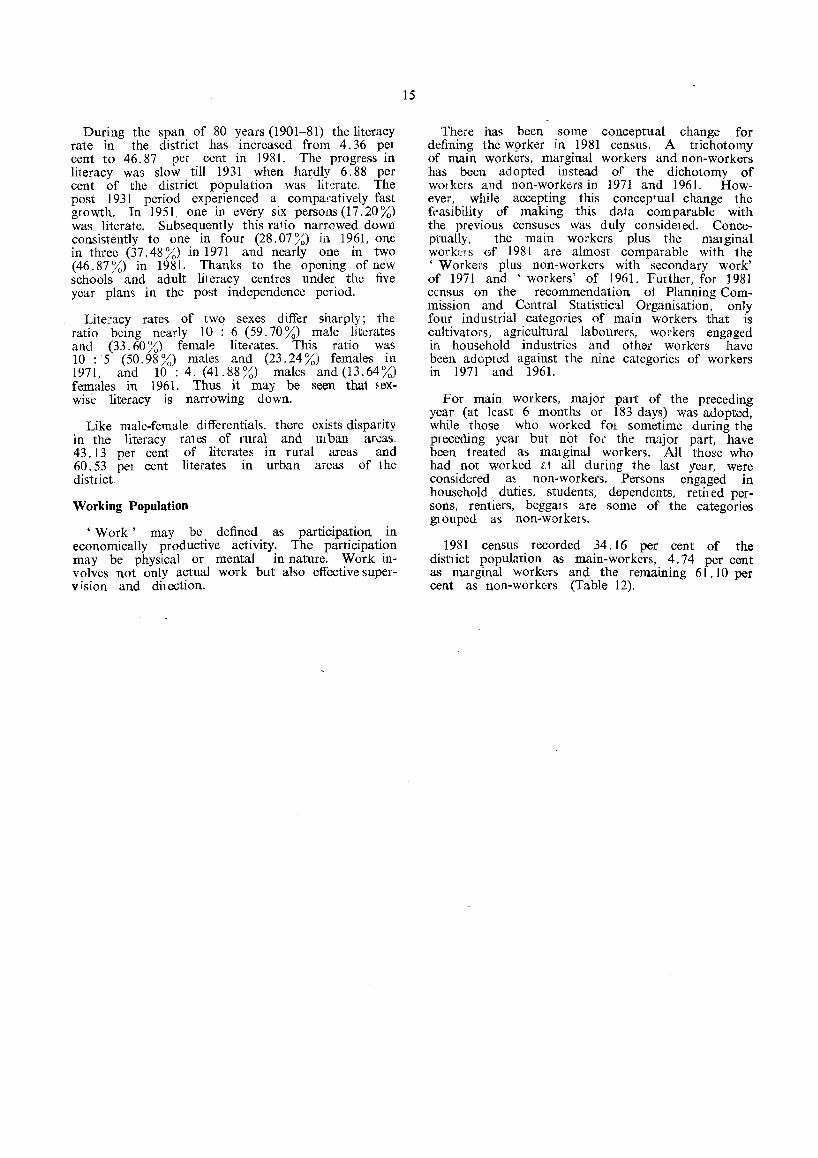
During the span of 80 years (1901-81) the literacy rate in the district has increased from 4.36 per cent to 46.87 per cent in 1981. The progress in literacy was slow till 1931 when hardly 6.88 per cent of the district population was literate. The post 1931 period experienced a comparatively fast growth. In 1951, one in every six persons (17.20 %) was literate. Subsequently this ralio narrowed down consistently to one in four (28.07%) in 1961, one in three (37.48 %) in 1971 and nearly one in two (46.87%) in 1981. Thanks to the opening of new schools and adult lil eracy centres under the five year plans in the post independence period.
Lite~'acy rates of two sexes differ sharply; the ratio b0ing nearly 10: 6 (59.70 %) male literates and (33.60 %) femak literates. This ratio was 10 : 5 (50.98%) males and (23.24%) females in 1971, and 10: 4. (41.88%) males and(13.64%) females in 1961. Thus it may be seen that ~exwise literacy is narrowing down.
Like male-female differentials, there exists disparity in the literacy rat es of rural and U1 ban areas, 43. 13 per cent of literates in rural areas and 60.53 per cent literates in urban areas of the district.
Working Population
, Work' may be defined as participation in economically productive activity. The participation may be physical or mental in nature. Work involves not only actual work but also effective supervision and dilection.
15
There has been some conceptual change for defining the w9rker in 1981 census. A trichotomy of main workers, marginal workers and non-workers has been adopted instead of the dichotomy of wOlkers and non-workers in 1971 and 1961. However, while accepting this conceptual change the fra&ibility of making this data comparable with the previous censuses was duly cOTIf,ide1ed. Conceptually, the main workers plus the matginal WOrk(;l S Cof 1981 are· almost comparable with the , Workers plus non-workers with secondary work' of 1971 and 'workers' of 1961. Further, for 1981 census on the recommendation 01 Planning Commission and Central Statistical Organisation, only four industrial categories of main workers that is cultivators, agricultural labourers, workers engaged in household industries and other workers have been adopted against the nine categories of workers in 1971 and 1961.
For main workers, major part of the preceding year (at leuf>t 6 months or 183 days) was adopted, while those who worked f01 sometime during the pleceding year but not for the major part, have been treated as mmginal worker5. All those who had not worked [.1 all during the last year, were considered a~ non-workers. Persons engaged in household duties, students, dependents, retired persons, rentiers, beggars are some of the categories grouped as non-workers.
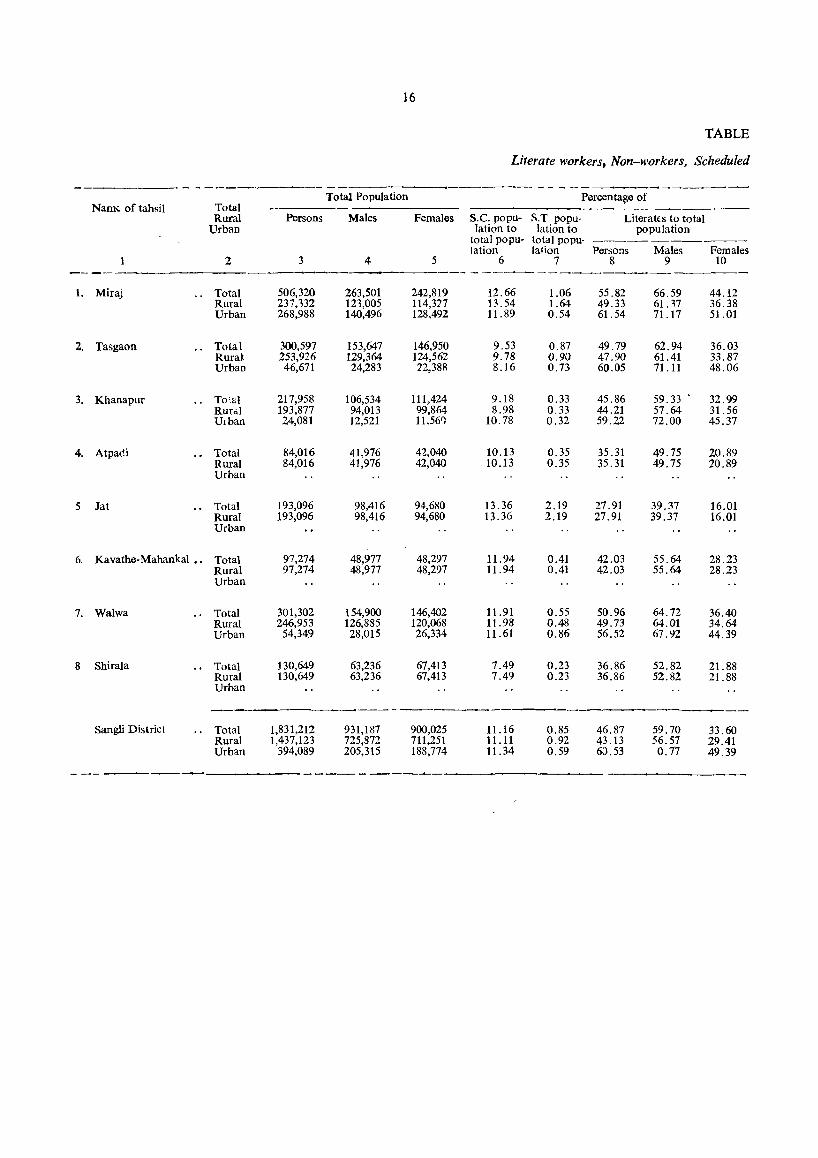
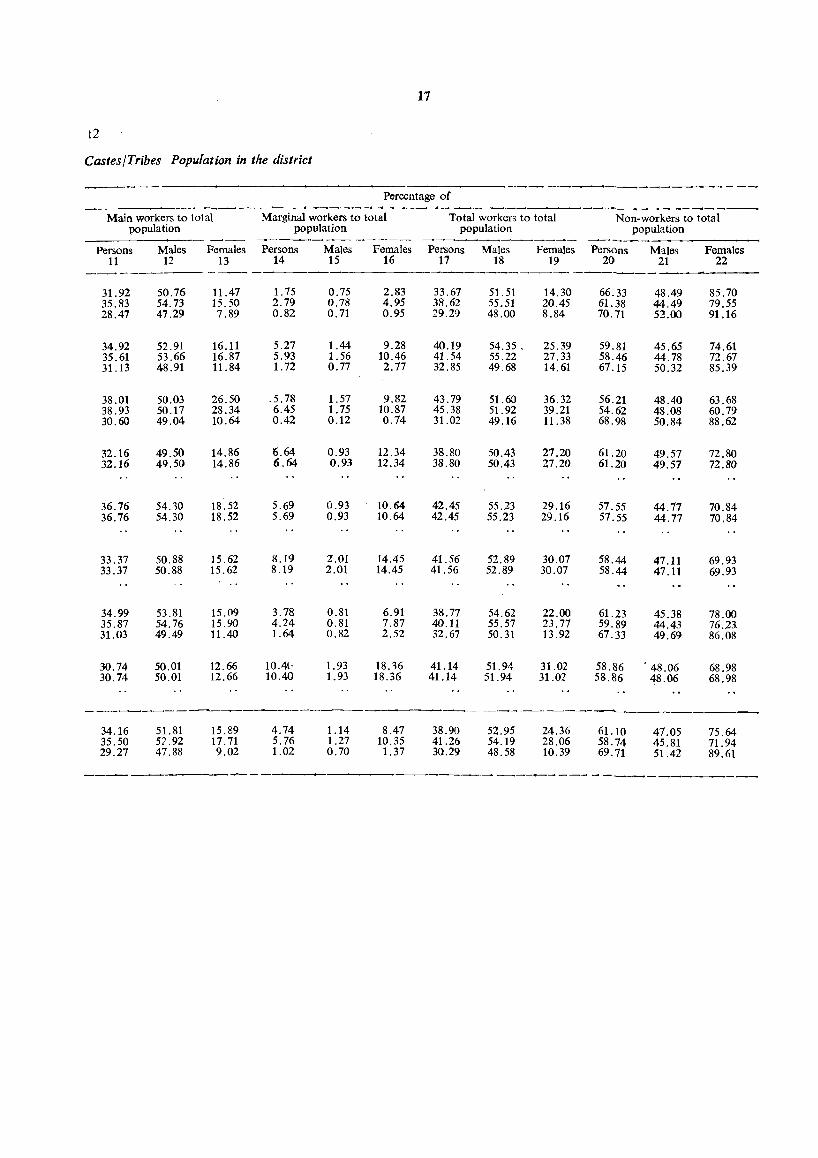
1981 census recorded 34. 16 per cent of the district population as main-workers, 4.74 per cent as marginal workers and the remaining 61.10 per cent as non-workers (Table 12).
]6
TABLE
Literate workers, Non-workers, Scheduled
- ----_.,' -------- -- - - -- ~-
Total Population Percentage of Name of tahsil Total
Rural Persons Males Females S.C. popu- S.T popu· Literat{s to total Urban lation to lation to population
total popu- total popu· -----------' lation lation Persons Males Females
2 3 4 5 6 7 8 9 10 ---- - -------
1. Miraj .. Total 506,320 263,501 242,819 12.66 1.06 55.82 66.59 44.12 Rural 237,132 121,005 114,377 13.54 1.64 49.33 61.37 36.38 Urban 268,988 140,496 128,492 11.89 0.54 61.54 71.17 51.01
2. Tasgaon Total 300,597 153,647 146,950 9.53 0.87 49.79 62.94 36.03 Rural 253,926 129,364 124,562 9.78 0.90 47.90 61.41 33.87 Urban 46,671 24,283 12,38B 8.16 0.73 60.05 71.11 48.06
3. Khanapur To',,1 217,958 106,534 111,424 9.18 0.33 45.86 59.33 32.99 Rur"l 193,877 94,013 99,864 8.98 0.33 44.21 57.64 31.56 Ulban 24,081 12,521 11.560 10.78 0.32 59.22 72.00 45.37
4. Atpadi Total 84,016 41,976 42,040 10.13 0.35 35.31 49.75 20.89 Rural 84,016 41,976 42,040 10.13 0.35 35.31 49.75 20.89 Urban
5 Jat Total 193,096 98,416 94,680 13.36 2.19 27.91 39.37 16.01 Rural 193,096 98,416 94,680 13.36 2.19 27.91 39.37 16.01 Urban
6. Kavathe-Mahankal __ Total 97,274 48,977 48,297 11.94 0.41 42.03 55.64 28.23 Rural 97,274 48,977 48,297 11.94 0.41 42.03 55.64 28.23 Urban
7. Walwa ., Total 301,302 154,900 146,402 11.91 0.55 50.96 64.72 36.40 Rural 246,953 126,885 120,068 11.98 0.48 49.73 64.01 34.64 Urban 54,349 28,015 26,334 11.61 0.86 56.52 67.92 44.39
8 Shirala Total 130,649 63,236 67,413 7.49 0.23 36.86 52.82 21.88 Rural 130,649 63,236 67,413 7.49 0.23 36.86 52.82 21.88 Urban
---_
Sangli District Total 1,831,212 931,187 900,025 11.16 0.85 46.87 59.70 33.60 Rural 1,437,123 725,872 711,251 11.11 0.92 43.13 56.57 29.41 Urban 394,089 205,315 188,774 11.34 0.59 60.53 0.77 49.39
------
11
12
Castes jTribes Population in the district
--- -~-----..._---.---- - ---Percentage of - --_--------...----Main workers to total Marginal workers to total Total workers to total Non-workers to total
population population population population ~- ---~~-- ----- ------~------
Persons Males Females Persons Males Females Persons Males Females Persons Males Females 11 12 13 14 15 16 17 18 19 20 21 22
-------~- --- --~---
31.92 50.76 11.47 1. 75 0.75 2.83 33.67 51.51 14.30 66.33 48.49 85.70 35.83 54.73 15.50 2.79 0.78 4.95 38.62 55.51 20.45 61.38 44.49 79.55 28.47 47.29 7.89 0.82 0.71 0.95 29.29 48.00 8.84 70.71 52.00 91.16
34.92 52.91 16.11 5.27 1.44 9.28 40.19 54.35. 25.39 59.81 45.65 74.61 35.61 53.66 16.87 5.93 1.56 10.46 41.54 55.22 27.33 58.46 44.78 72.67 31.13 48.91 11.84 1.72 0.77 2.77 32.85 49.68 14.61 67.15 50.32 85.39
38.01 50.03 26.50 .5.78 1.57 9.82 43.79 51.60 36.32 56.21 48.40 63.68 38.93 50.17 28.34 6.45 1.75 10.87 45.38 51.92 39.21 54.62 48.08 60.79 30.60 49.04 10.64 0.42 0.12 0.74 31.02 49.16 11.38 68.98 50.84 88.62
32.16 49.50 14.86 6.64 0.93 12.34 38.80 50.43 27.20 61.20 49.57 72.80 32.16 49.50 14.86 6.64 0.93 12.34 38.80 50.43 27.20 61.20 49.57 72.80
36.76 54.10 18.52 5.69 0.93 10.64 42.45 55.23 29.16 57.55 44.77 70.84 36.76 54.30 18.52 5.69 0.93 10.64 42.45 55.23 29.16 57.55 44.77 70.84
33.37 50.88 15.62 8.19 2.01 14.45 41.56 52.89 30.07 58.44 47.11 69.93 33.37 50.88 15.62 8.19 2.01 14.45 41.56 52.89 30.07 58.44 47.11 69.93
34.99 53.81 15.09 3.78 0.81 6.91 38.77 54.62 22.00 61.23 45.38 78.00 35.87 54.76 15.YO 4.24 0.81 7.87 40.11 55.57 23.77 59.89 44.43 76.23-31.03 49.49 11.40 1.64 0.82 2.52 32.67 50.31 13.92 67.33 49.69 86.08
30.74 50.01 12.66 10.41, 1.93 18.36 41.14 51.94 31.02 58.86 . 48.06 68.98 30.74 50.01 12.66 10.40 1.93 18.36 41.14 51.94 31.02 58.86 48.06 68.98
-------------------------------------------34.16 51.81 15.89 4.74 1.14 8.47 38.90 52.95 24.36 61.10 47.05 75.64 35.50 57.92 17.71 5.76 1.27 10.35 41.26 54.19 28.06 58.74 45.81 71.94 29.27 47.88 9.02 1.02 0.70 1.37 30.29 48.58 10.39 69.71 51.42 89.61
--- -------------
The corresponding figures for the State as a whole are 38.71 per cent, 3.85 per cent and 57.44 per cent. Thus, one-third of the population of the district is engaged in economically productive activity. Compared to 1971, there has been little rise in the work participation rate both in the district (31.09% in 1971 and 34.16% in 1981) and in the State (36.48% in 1971 and 38.71 % in 1981). Within the district participation r3.te for 1981 cem.us was highest (38.01 %) in Khanapur tah~jJ and lowest (30.74 %) in Shirala tahsil.
Male participation rate (51.81 %) is more than 3 times than that of femak (15.89%) as per 1981 census. The female participation rate in the district increased from 10 . 72 per cent in 1971 to 15. 89 per cent in 1981 (19.70% to 23.98 % in the State). By contrast there is ~light increase in the male participation rate (50.42 % in 1971 to 51. 81 % in 1981). In the State, male participation showed a marginal rise (52.09% in 1971 to 52.51 % in 1981).
1981 census results reveal that among the main workers in the district 47.85 per cent are cultivat0rs, 22.37 per cent are agricultural labourers, 2.62 per cent engaged in household industry and the remaining 27.16 per cent have been categorised as other workers. The corresponding percentages fop
18
the State arc 35.12 per cent, 26.63 per cent, 2.55 pel cent and 35.70 per cent respectively. Evidently more than 70 per cent of the working population in the district is engaged in agricultural pursuits working either as cultivators or farm labourers. The proportion of cultivators is substantially more in ~he district (47.85%) when compared with ccrrespondlng percentage fOl the State as a w~ole (35.12 %). However, this position somewhat alters in case of persons engaged as agricultural labourers, which is 22.37 per cent in the district as against 26.63 pc, cent for the State.
About 4.74 pel' cent of the persons in the district wele recorded as marginal workers (1.14 % among males and 8.4 7 % among females). The high incidence of margina.l workers among females as compared to males is undelstandable as the former. besides looking after their household duties, tend to engage themselves in some economically produc~ tive activity to lend support to their male countelparts.
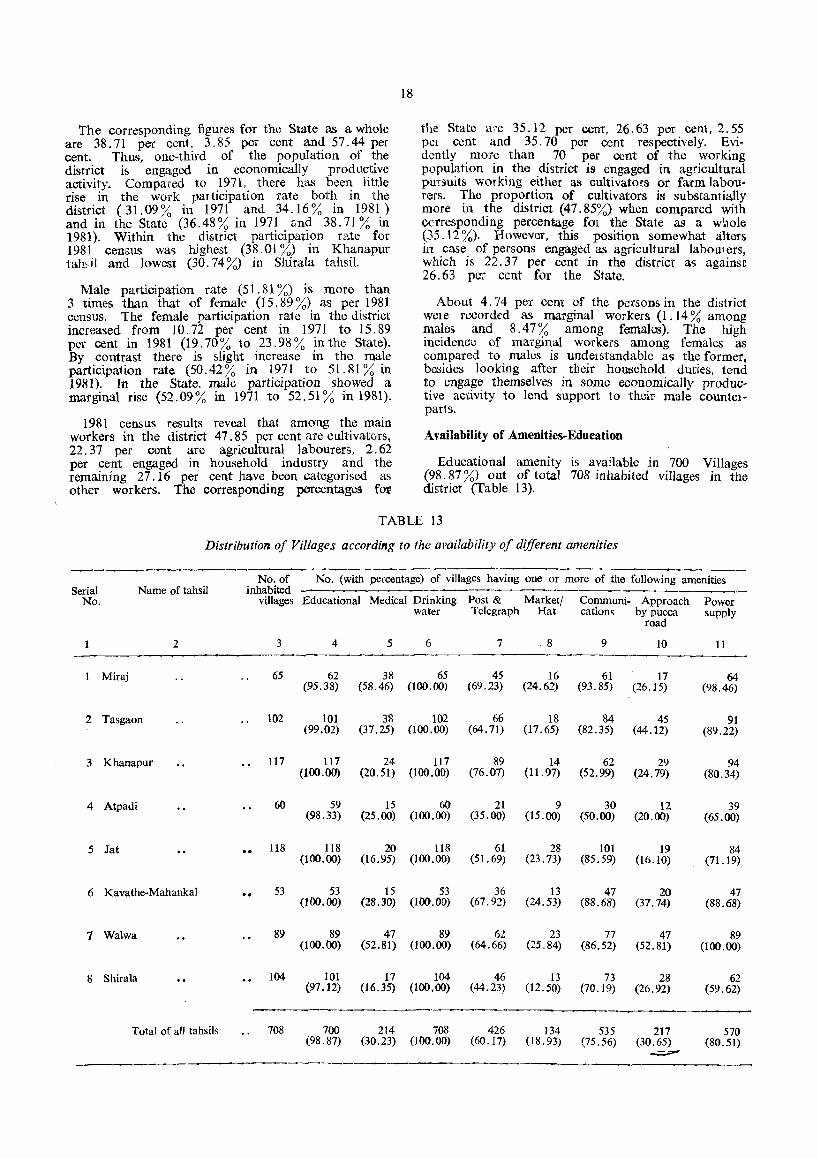
Availability of Amenities-Education
Educational amenity is available in 700 Villages (98.87 %) out of total 708 inhabited villages in the district (Table 13).
TABLE 13
Distribution of Villages according to the availability of different amenities
No. of No. (with percentage) of villages having one or more of the following amenities Serial Name of tahsil inhabited ~--------
No. villages Educational Medical Drinking Post & Market( Communi- Approach Power water Telegraph Hat cations by pucca supply
road
2 3 4 5 6 7 .8 9 10 11
Miraj 65 62 38 65 45 16 61 17 64 (95.38) (58.46) 000.00) (69.23) (24.62) (93.85) (26.15) (98.46)
2 Tasgaon 102 10] 38 102 66 18 84 45 91 (99.02) (37.25) (100.00) (64.71) (17.65) (82.35) (44.12) (89.22)
3 Khanapur 117 117 24 117 89 14 62 29 94-(100.00) (20.51) (100.00) (76.07) (11. 97) (52.99) (24.79) (80.34)
4 Atpadi 60 59 15 60 21 9 30 12 39 (98.33) (25.00) (100.00) (35.00) (15.00) (50.00) (20.00) (65.00)
5 Jat 118 118 20 118 61 28 101 19 84 (100.00) (16.95) (100.00) (51. 69) (23.73) (85.59) (16.10) (71.19)
6 Kavathe-Mahankal 53 53 15 53 36 13 47 20 47 (100.00) (28.30) (100.00) (67.9'2) (24.53) (88.68) (37.74) (88.68)
7 Walwa 89 89 47 89 62 23 77 47 89 (100.00) (52.81) (100.00) (64.66) (25.84) (86.52) (52.81) (100.00)
8 Shirala 104 101 17 104 46 13 73 28 62 (97.12) (16.35) (100.00) (44.23) (12.50) (70.19) (26.92) (59.62)
Total of all tahsils 708 700 214 708 426 134 535 217 570 (98.87) (30.23) (100.00) (60.17) (18.93) (75.56) (30.65) (80.51)
~
19
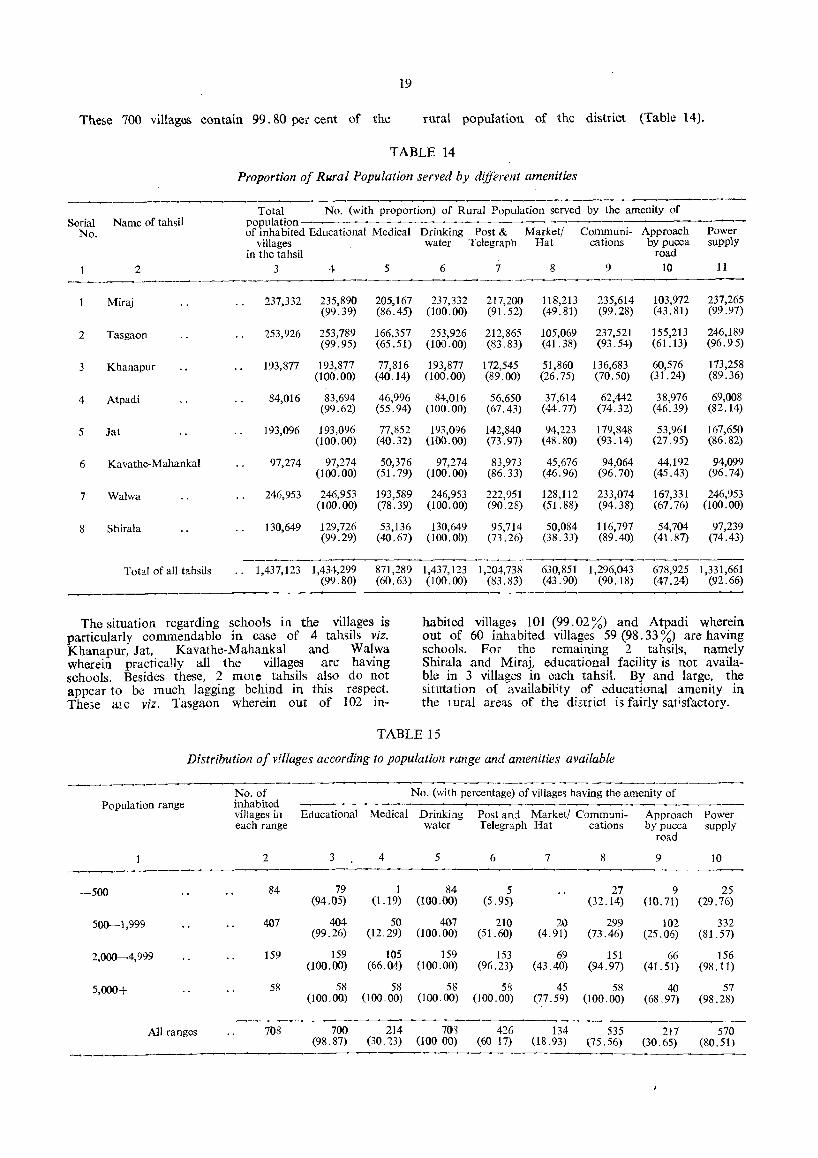
These 700 villages contain 99. 80 pe, cent of the rural population of the district (Table 14).
TABLE 14
Proportion of Rural Population served by different amenities
Total No. (with proportion) of Rural Population served by the amenity of population of inhabited Educational Medical Drinking Post & Market/ Communi- Approach Power
villages water Telegraph Hat cations by pucca supply in the tahsil road
Serial Name of tahsil No.
2 3 4 5 6 7 8 9 10 11
Miraj 237,332 235,890 205,167 237,332 217,200 118,213 235,614 103,972 237,265 (99.39) (86.45) (100.00) (91.52) (49.81) (99.28) (43.81) (99.')7)
2 Tasgaon 253,926 253,789 166,357 253,926 212,865 105,069 237,521 155,213 246,189 (99.95) (65.51) (100.00) (83.83) (41.38) (93.54) (61.13) (96.95)
3 Khanapur 193,877 193,877 77,816 193,877 172,545 51,860 136,683 60,576 173,258 (100.00) (40.14) (100.00) (89.00) (26.75) (70.50) (31.24) (89.36)
4 Atpadi 84,016 83,694 46,996 84,016 56,650 37,614 62,442 38,976 69,008 (99.62) (55.94) (100.00) (67.43) (44.77) (74.32) (46.39) (82.14)
5 Jat 193,096 193,096 77,852 193,096 142,840 94,223 179,848 53,961 167,650 (100.00) (40.32) (100.00) (73.97) (48.80) (93.14) (27.95) (86.82)
6 Kavathe-Mahankal 97,274 97,274 50,376 97,274 83,973 45,676 94,064 44,192 94,099 (100.00) (51.79) (100.00) (86.33) (46.96) (96.70) (45.43) (96.74)
7 Walwa 246,953 246,953 193,589 246,953 222,951 128,112 233,074 167,331 246,953 (100.00) (78.39) (100.00) (90.28) (51.88) (94.38) (67.76) (100.00)
8 Shirala 130,649 129,726 53,136 130,649 95,714 50,084 116,797 54,704 97,239 (99.29) (40.67) (100.00) (73.26) (38.33) (89.40) (41.87) (74.43)
Total of all tahsils .. 1,437,123 1,434,299 871,289 1,437,123 1,204,738 630,851 1,296,043 678,925 1,331,661 (99.80) (60.63) (100.00) (83.83) (43.90) (90.18) (47.24) (92.66)
The situation regarding schools ill the villages is particularly commendable in case of 4 tahsils viz. Khanapur, Jat, Kavathe-Mahankal and Walwa wherein practically all the villages are having schools. Besides these, 2 mOle tahsils also do not appear to be much Jagging behind m this respect. These me viz. Tasgaon wherein out of 102 in-
habited village~ 101 (99.02 %) and Atpadi wherein out of 60 inhabited villages 59 (98.33 %) are having schools. For the remaining 2 tahsils, namely Shirala and Miraj, educational facility is not available in 3 villages in each tahsil. By and large, the situtation of ~.vailabil1ty of educationa.l amenity in the rural areas of the district is fairly satisfactory.
TABLE 15
Distribution of vii/ages according to population range and amenities available
Population range
-500
500-1,999
2,000-4,999
5,000+
All ranges
No. of inhabited villages in each range
2
84
407
159
58
708
No. (with percentage) of villages having the amenity of ._---Educational Medical Drinking Post ani Market/ Communi- Approach Power
3
79 (94.05)
water Telegraph Hat cations by pucca supply
4 5
1 84 (1.19) (100.00)
6
5 (5.95)
road
7 8 9 10
27 9 25 (32.14) (10.71) (29.76)
404 50 407 210 2u 299 102 332 (99.26) (12.29) (100.00) (51.60) (4.91) (73.46) (25.06) (81.57)
159 105 159 153 69 151 66 156 (100.00) (66.04) (100.00) (96.23) (43.40) (94.97) (41.51) (98.11)
58 58 58 58 45 58 40 57 (100.00) (100.00) (100.00) (100.00) (77.59) (l00.00) (68.97) (98.28)
700 214 70Q 426 134 535 217 570 (98.87) (3023) (l00 00) (60 17) (18.93) (75.56) (30.65) (80.51)
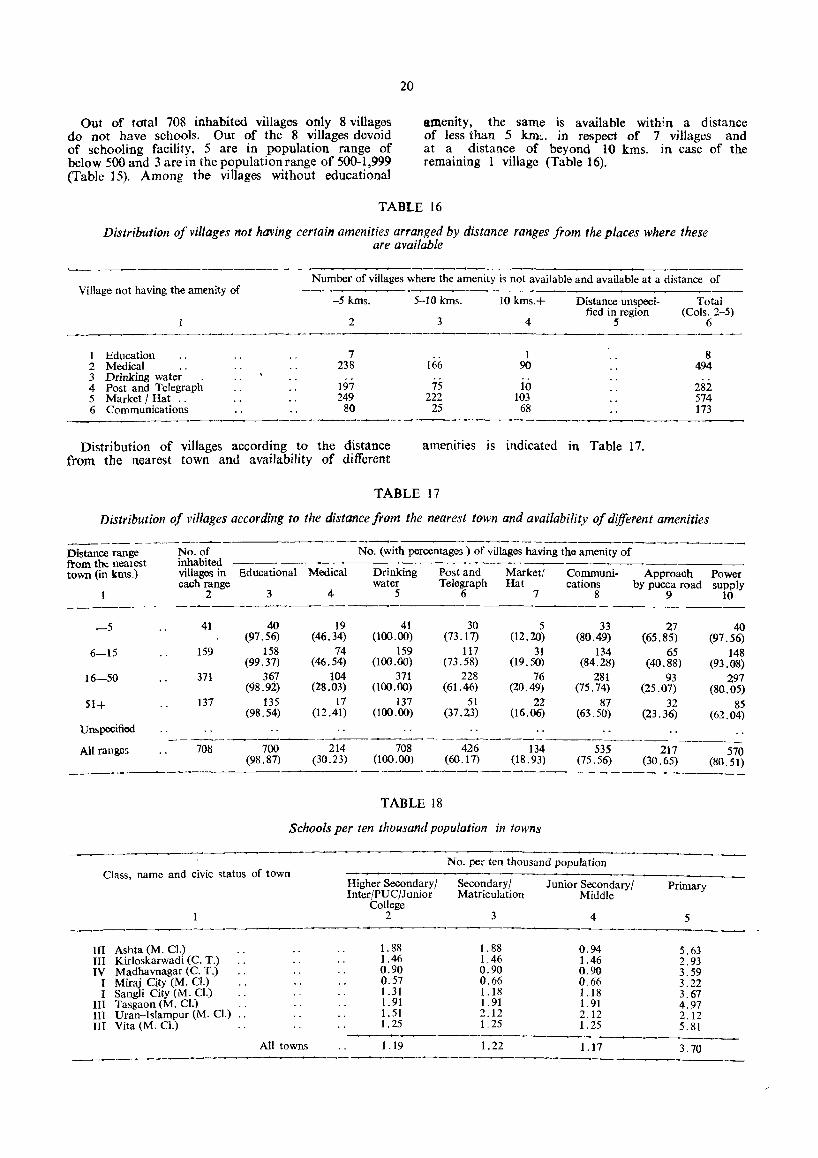
20
Out of total 708 inhabited villages only 8 villages do not have schools. Out of the 8 villages devoid of schooling facility. 5 are in population range of below 500 and 3 are in the population range of 500-1,999 (Table 15). Among the villages without educational
amenity, the same is available with;n a distance of less than 5 km~. in respect of 7 villages and at a distance of beyond 10 kms. in case of the remaining 1 village (Table 16).
TABLE 16
Distribution of villages not having certain amenities arranged by distance ranges from the places where these are available
Number of villages where the amenity is not available and available at a distance of Village not having the amenity of
-5 kms. 5-10 kms. 10 kms.+ Distance unspeci- Total
3 tied in region (Cols.2-5)
2 4 5 6
Education 7 1 8 2 Medical 238 166 90 494 3 Drinking water 4 Post and Telegraph 197 75 10 282 5 Market / Hat .. 249 222 103 574 6 Communications 80 25 68 173
Distribution of villages according to the distance from the nearest town and availability of different
amenities is indicated in Table 17.
TABLE 17
Distribution of villages according to the distance from the nearest town and availability of different amenities
------- --~ ,----Distance range No. of No. (with percentages) of villages having t116 amenity of from tlIt nealest inhabited --~-
villages in Educational Medical Drinking Post and Market! Communi- Approach town (in kms.) each range water Telegraph Hat cations by pucca road
3 4 5 6 7 2 8
-5 41 40 19 41 30 5 33 (97.56) (46.34) (100.00) (73.17) (12.20) (80.49)
6-15 159 158 74 159 117 31 134 (99.37) (46.54) (100.00) (73.58) (19.50) (84.28)
16-50 371 367 104 371 228 76 281 (98.92) (28.03) 000.00) (61.46) (20.49) (75.74)
SI+ 137 135 17 137 51 22 87 (98.54) (12.41) (100.00) (37.23) (16.06) (63.50)
Unspecified ----
All ranges 708 700 214 708 426 134 535 (98.87) (30.23) (100.00) (60.17) (18.93) (75.56)
----- ------------ - ---
TABLE 18
Schools per ten thousand population in towns
Class, name and civic status of town
---------III Ashta (M. Cl.) III Kirloskarwadi (C. T.) IV Madhavnagar (C. T.)
I Miraj City (M. CI.) I Sangli City (M. CI.)
III Tasgaon (M. CI.) III Uran-Islampur (M. Cl.) .. III Vita (M. Cl.)
All towns
---'
No. per ten thousand population
Higher Secondary/ Secondary/ Inter/PUC/Junior Matriculation
College 2 3
1. 88 1. 88 1.46 1.46 0.90 0.90 0.57 0.66 1. 31 1.18 1.91 1. 91 1.51 2.12 1. 25 1. 25
1.19 1.22
Junior Secondary/ Middle
4
0.94 1.46 0.90 0.66 1.18 1. 91 2.12 1.25
1.17
9
27 (65.85)
65 (40.88)
93 (25.07)
32 (23.36)
217 (30.65)
Primary
5
5.63 2.93 3.59 3.22 3.67 4.97 2.12 5.81
3.70
Power supply
10
40 (97.56)
148 (93.08)
297 (80.05)
85 (62.04)
570 (80.51)
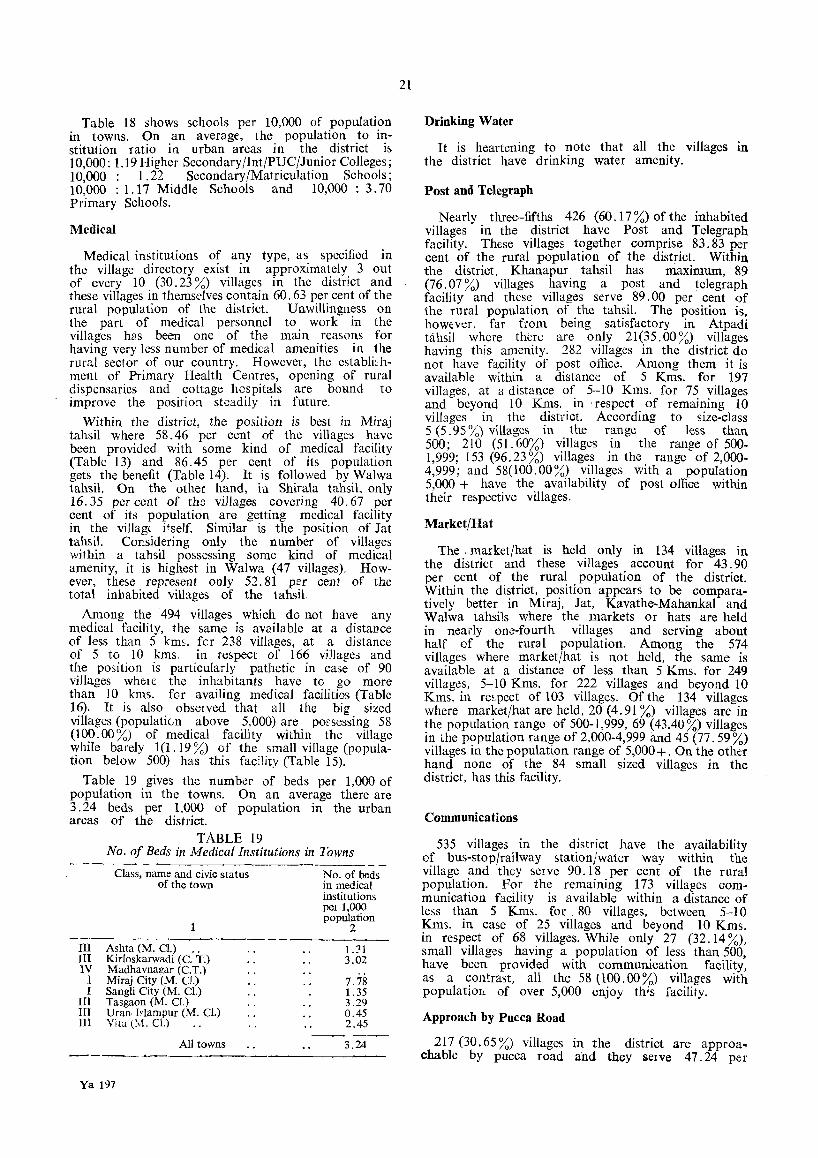
Table 18 shows schools per 10,000 of population in towns. On an average, the population to institution ratio in urban areas in the district il> 10,000: 1.19 Higher Secondary/Jnt/PUC/Junior Colleges; 10,000: 1.22 Secondary/Matriculation Schools; 10,000 : 1.17 Middle Schools and 10,000: 3.70 Primary Schools.
Medical
Medical institutions of any type, as specified in the village directory exist in approximately 3 out of every 10 (30.23 %) villages in the district and these villages in themselves contain 60.63 per cent of the rural population of the district. Unwillingness on the part of medical personnel to. work in the villages has been one of the mam reasons for having very less number of medical amenities in the rural sector of our country. However, the establi~ hment of Primary Health Centres, opening of rural dispensaries and cottage hospitals are bound to improve the position steadily in future.
Within the district, the position is best in Miraj tahsil where 58.46 per cent of the villages have been provided with some kind of medical facility (Table 13) and 86.45 per cent of its population gets the benefit (Table 14). It is followed by Walwa tahsil. On the other hand, in Shirala tahsil, only 16.35 per cent of the villages covering 40.67 per cent of its popUlation are getting medical facility in the villagt itself. Similar is the position of Jat tahsil. Considering only the number of villages within a tahsil possessing some kind of medical amenity, it is highest in Walwa (47 villages). However, these represent only 52.81 per cent of the total inhabited villages of the tahsil
Among the 494 villages which do not have any medical facility, the same is av<:dlable at a distance of less than 5 km~. fer 238 villages, at a distance of 5 to 10 kms. in respect of 166 village.> and the position is particularly pathetic in case of 90 villages whcl(:: the inhabitants have to go more than 10 killS. for availing medical facilities (Table 16). It is also observed that all the big sized villages (populatiun above 5,000) are pOfsessing 58 (100.00%) of medical facility within the village while barely 1(1.19 %) of the small village (population below 500) has this facility (Table 15).
Table 19 gives the number of beds per 1,000 of population in the towns. On an average there are 3.24 beds per 1,000 of population in the urban areas of the district.
TABLE 19 No. of Beds in Medical Institutions in lawns
Class, name and civic status of the town
III Ashta (M. CI.) .. III Kirloskarwadi (c. T.) IV Madhavnagar (C.T.)
I Miraj City eM. Cl.) I Sangli City (M. Cl.)
III Tasgaon (M. CI.) III Uran J~lampur (M. Cl.) HI Vita (M. Cl.)
All towns
Ya 197
No. of beds in medical institutions pel 1,000 population
2
1.31 3.02
7.78 1. 35 3.29 0.45 2.45
3.24
21
Drinking Water
It is heartening to note that all the villages in the district have drinking water amenity.
Post and Telegraph
Nearly three-fifths 426 (60.17 %) of the inhabited villages in the district have Post and Telegraph facility. These villages together comprise 83.83 per cent of the rural population of the district. Within the district, Khanapur tahsil has maximum, 89 (76.07 %) villages having a post and telegraph facility and these villages serve 89.00 per cent of the rural population of the tahsil. The position is, however, far from being satisfactory in Atpadi tahsil where there are only 21 (35.00 %) villages having this amenity. 282 villages in the district do not have facility of post office. Among them it is available within a distance of 5 Kms. for 197 villages, at a distance of 5-10 Kms. for 75 villages and beyond 10 Kms. in respect of remaining 10 villages in the district. According to size-class 5 (5.95 %) villages in the range of less than 500; 210 (51. 60%) villages in the range of 500-1,999; 153 (96.23%) villages in the range of 2,000-4,999; and 58(100.00%) villages with a popUlation 5,000 + have the availability of post office within their re:>pective villages.
Market/Hat
The . market/hat is held only in 134 villages in the district and these villages account for 43.90 per cent of the rural population of the district. Within the district, position appears to be comparatively better in Miraj, Jat, Kavathe-Mahankal and Walwa tahsi]s where the markets or hats are held in nearly one-fourth villages and serving about half of the rural population. Among the 574 villages where market/hat is not held, the same is available at a distance of less than 5 Kms. for 249 villages, 5-10 Kms. for 222 villages and beyond 10 Kms. in re~pect of 103 villages. Of the 134 villages where market/hat are held, 20 (4.91 %) villages are in the popUlation range of 500-1,999,69 (43.40%) villages in the popUlation range of 2,000-4,999 and 45 (77.59%) villages ill the populatton range of 5,000 +. On the other hand none of the 84 small sized villages in the district, has this facility.
Communications
535 villages in the district have the availability of bus-stop/railway station/water way within the village and they serve 90.18 per cent of the rural population. For the remaining 173 villages communication facility is available within a distance of less than 5 Kms. for 80 villages, between 5-10 Kms. in case of 25 villages and beyond 10 Kms. in respect of 68 villages. While only 27 (32.14%), small villages having a population of less than 500, have been provided with communication facility, as a contrast, all the 58 tIOO.OO%) villages with populatjoll of over 5,000 enjoy th;s racility.
Approach by Pucca Road
217 (30.65 %) villages in the district are approachable by pucca road and they serve 47.24 per
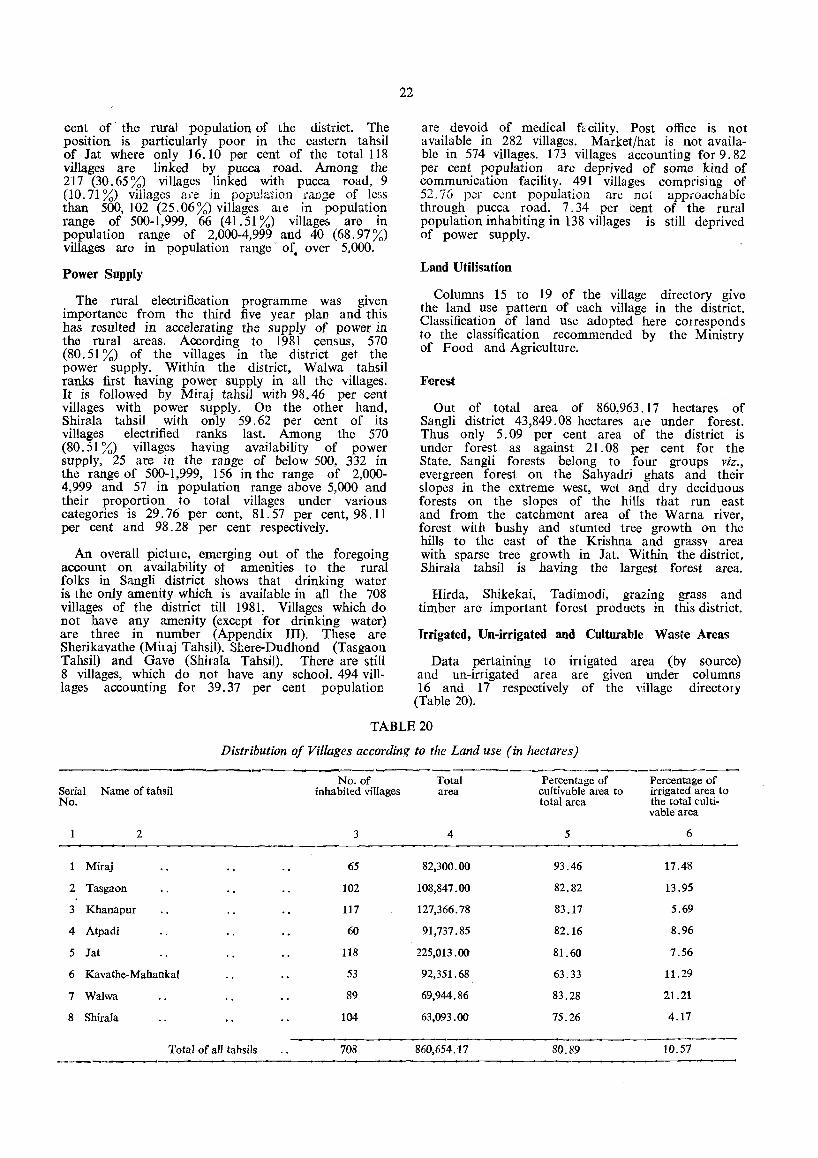
cent of the rural population of the district. The posItiOn is particularly poor in the eastern tahsil of Jat where only 16.10 per cent of the total 118 villages are linked by pucca road. Among the 217 (30.65 %) villages linked with pucca road, 9 (10.71 %) villages are in popula.tion range of less than 500, 102 (25.06 %) villages ale in population range of 500-1,999, 66 (41.51 %) village~ are in population range of 2,000-4,999 and 40 (68.97%) villages are in population range' of. over 5,000.
Power Supply
The rural electrification programme was given importance from the third five year plan and this has resulted in accelerating the supply of power in the rural areas. According to 1981 census, 570 (80. 51 %) of the villages in the district get the power supply. Within the district, Walwa tahsil ranks first having power supply in all the villages. It is followed by Miraj tahsil with 98.46 per cent villages with power supply. On the other hand, Shirala tahsil with only 59.62 per cent of its villages electrified ranks last. Among the 570 (80.51 %) villages having availability of power supply, 25 are in the range of below 500, 332 in the range of 500-1,999, 156 in the range of 2,000-4,999 and 57 in popUlation range above 5,000 and their proportion to total villages under various categories is 29.76 per cent, 81.57 per cent, 98.11 per cent and 98.28 per cent respectively.
An overall pic1Ule, emerging out of the foregoing account on availability of amenitjes to the rural folks in Sangli district shows that drinking water is the only amenity which is available in all the 708 villages of the district till 1981. Villages which do Dot have any amenity (except for drinking water) are three in number (Appendix III). These are Sherikavathe (Mitaj Tahsil). Shere-Dudhond (Tasgaon Tahsil) and Gave (Shilala Tahsil). There are still 8 villages, which do not have any school. 494 villlage:. accounting for 39.37 per cent populatior;
22
are devoid of medical fccility. Post office is not available in 282 villages. Market/hat is not available in 574 Villages. 173 villages accounting for 9.82 per cent population are deprived of some kind of communication facility. 491 villages comprising of 52.76 per cent population are not app.i'Oachable through pucca road. 7. 34 per cent of the rural population inhabiting in 138 villages is still deprived of power supply.
Land Utilisation
Columns 15 to 19 of the village directory give the land use pattern of each village in the district. Classification of land use adopted here corresponds to the classification recommended by the Ministry of Food and Agriculture.
Forest
Out of total area of 860,963. 17 hectares of Sangli district 43,849.08 hectares are under forest. Thus only 5.09 per cent area of the district is under forest as against 21.08 per cent for the State. Sangli forests belong to four groups viz., evergreen forest on the Sahyadri ghats and their slopes in the extreme west, wet and dry deciduous forests on the slopes of the hills that run east and from the catchment area of the Warna river, forest with bushy and stunted tree growth on the hills to the east of the Krishna and grassy area with sparse tree gro\\'th in Jat. Within the district, Shirala tahsil is having the largest forest area.
Hirda, Shikekai, Tadimodi, grazing grass and timber are important forest products in this district.
Irrigated, Un-irrigated and Culturable Waste Areas
Data pertaining to inigated area (by source) and un-irrigated area are given under columns 16 and 17 respectively of the village directory
(Table 20).
TABLE 20
Distribution of Villages according to the Land use (in hectares)
-------------------------~ No. of Total Percentage of Percentage of
Serial Name of tahsil inhabited villages area cultivable area to irrigated area to No. total area the total culti-
vable area
2 3 4 5 6
Miraj 65 82,300.00 93.46 17.48
2 Tasgaon 102 108,847.00 82.82 13.95
3 Khanapur 117 127,366.78 83.17 5.69
4 Atpadi 60 91,737.85 82.16 8.96
5 Jat 118 225,013.00 81.60 7.56
6 Kavathe· Mahankal 53 92,351.68 63.33 11.29
7 Walwa 89 69,944.86 83.28 21.21
8 Shirala 104 63,093.00 75.26 4.17
Total of all tahsils 708 860,654.17 80.89 10.57
In Sangli district 80.89 per cent area has been recorded as cultivable area. Among the tahsils which exceed this district average are viz., Miraj (93.46 %), Walwa (83.28 %), Khanapur (83.17 %), Tasgaon (82.82 %), Atpadi (82.16 %) and Jat (81 :-60%). The mhsil of Kavathe·Mahankal is having the lowest ( 63.33 % ) of cultivable area.
10. 57 per cent of the cultiva ble area of the district is irrigated. This percentage is highest in Walwa tahsil (21. 21 %) followed by Miraj (17.48 %), Tasgaon" (13.95 %) and Kavathe-Mahankal (11 .29 %). In the remaining 4 tahsils the proportion of inigated area to the total cultivable area is less than the district average. It is the lowest (4.17 %) in Shirala tahsil.
23
Staple Food
Kharif and Rabi, are the two important agricultural seasons in the district. The crops which are taken in the early south-west monsoon are called Kharif crops while those harvested in the winter are known as Rabi crops. The latter are grown with the help of irrigation and occasional fair weather showers due in November. Generally cereals are produced as Kharif crops while wheat, some pulses, etc., are grown in Rabi season. Millets like jowar (jondhala or javari) and bajra (bajari) constitute the main staple food for the villages in Sangli district (Table 21).
TABLE 21
Main Staple Food in the Majority of Villages in each Tahsil
Serial Name of tahsil Main staple food No.
1 2 3
1 Miraj Jowar
2 Tasgaon Jowar 3 Khanapur Jowar, Bajra 4 Atpadi Wheat, Jowar
Of these jowar is the most important cereal crop of the district and it is grown in all the tahsils of the distrkt. Bajra is the next important food crop in the district. Table 21 indicates that while jowar is the staple food in all the eight
Municipal Finance
Serial Name of tahsil Main staple food No.
1 2 3
5 Jat Jowar, Bajra 6 Kavathe-Mahankal Jowar, Bajra 7 Walwa Rice, Jowar 8 Shirala Rice, Jowar
tahsils of the district, bajra is also consumed in Khanapur, Jat and Kavathe-Mahankal tahsils. Wheat in Atpadi tahsil and rice in the western tahsils of Shirala and Walwa also constitute as a part of staple food.
Table 22 gives per capita receipt and expenditure (in rupees) for every town in th~district.
TABLE 22
Per capita receipt and expenditure in towns
Per capita --------------. ------ .. _--------------
Class, name and civic status of the town
Receipt (in Rs.)
1
III Ashta (M. Cl.)
III Kirloskarwadi (C. T.)
IV Madhavnagar (C. T.)
Total
2
34.26
9.31
13.65
I Miraj City (M. CI.) 49.13
I Sangli City (M. CI.) .. 129.59
III Tasgaon (M. ci.) 69.77
III Uran-Islampur (M. Cl.) 68.66
III Vita (M. CI.) 53.57
Total 79.64
Receipt through taxes
3
11.11
5.17
11.11
28.24
80.55
27.72
24.41
27.78
45.47
Receipt from all other sources
4
23.15
4.14
2.54
20.89
49.04
42.05
44.25
25.79
34.17
On an average the per capita receipt is Rs. 79.64 out of which Rs. 45.47 is received through local taxes and Rs. 34. 17 from all other sources. The total expenditure incurred per head is Rs. 66.32 of which Rs. 4.55 is on general administration, Rs. 23.95 on public health and conveniences,
Total expenditure
5
35.81
9.21
6.06
60.79
93.96
68.12
40.40
52.74
66.32
General administration
6
3.05
1.41
6.70
2.96
3.40
7.36
8.64
4.55
Expenditure (in Rs.)
Expendi- Public ture on works public health and conveniences
7 8
15.98
0.44
1.83
22.89
35.14
12.58
16.60
17.44
23.95
13.83
5.31
2.75
24.98
15.43
24.62
13.87
7.14
16.99
Expen- Other diture on aspects public institutions
9
0.05
0.05
0.72
22.63
1.49
0.15
0.29
9.07
10
2.90
2.05
1.43
5.50
17.80
26.03
2.42
19.23
11.76
Rs 16.99 on public works, Rs. 9.07 on public institutions and Rs. 11 .76 on all other aspects. Among all the towns, both the receipts received and the expenditure incurred per head are highest for Sangli Municipal Council.

Minerals
Limestone deposits occur around Miraj at Narwad, Waddi, Dedag, Arag, Belunki, Kannadwadi, Sawali, Tanang, Kalambi, Kupawad, Erandoli, Salgare, etc. The limestone is associated with trap formation and the quality is not unifotm. Good clay for bricks and tiles is found on the banks of the rivers. No other mineral of importance is known to occur in any part of the district.
Fisheries
Fishing operations are carried out in the two main rivers Krishna and Warna. There are six perennial tanks. Commercially impOltant valletIeS of fish which are found in Sangli distlict are Vam, Aheer, Vadshi, Mhasheed, Kolshi, Kavli, Kanas, Tambir, Wanz, Kaliwani, Valshivada, Shingala and Murrels.
Industries
In the first decade of the present century, Sangli district was very backward in industrial field. A few crafts, such as, preparation of gold and silver ornaments, copper and brass smithy, preparation
24
which later came to be known as Kirloskarwadi. This proved a land mark and a turning point in the history of the industrialisation of the district. Since then, the pace of industrialisation in the district hali been rapid.
There are 18 large scale industries in tht district employing about 12,500 workers. Out of them 3 sugar factories are in co-operati"e sector. Kirloskar Brothers Engineering Concern, Madhavnagar COTTON Mill and Marathe Engineering Industries art} the important industrial units since they are labour oriented. In addition, there are J, 700 small scale industries employing about 10,000 workers, who are engaged in cement products, foundries and engineering units. Leather products including Kolhapuri chappals are exported every year from Sangli District. 'Shetkari Sahkari Sakhar Karkhana, Sangli,'. is the largest Co-operative Sugar Factory in Asia.
Besides, musical instruments, especially of Sangli are famous throughout India. musical imtrumcnls are also exported.
Trade and commerce
'Sitar' These
of iron tools, carpentry, pottery and blanket weaving The main articles of export from the district were existent. The history of industrialisation of are groundnut, yarn, cloth, gur, grapes, turmeric. the district dates back to 1901, when the Kirloskar Besides these, Kirloskarwadi exports electric motors Brothers factory was established at Kundal Road also (Table 23).
TABLE 23 Most important commodities manufactured, imported and exported in towns
---------Most important commodities Class, name and civic status of
the town ------- - - -----
-------III Ashta (M. Cl.) III KirIoskarwadi (C. T.) IV Madhavnagar (C. T.)
I Miraj City (M. Cl.) I Sangli City (M. Cl.)
III Tasgaon (M. Cl.) III Uran-Islampur (M. Cl.) III Vita (M. Cl.)
Manufactured 2
. . Handloom Cloth
.. Electric Motors
.. Machinery spare parts
.. Cotton yarn
.. Sugar
.. Groundnut oil
. . Groundnut oil
.. Cloth - - - - - - --------_- -----
Exported 3
Groundnut Electric Motors Machinery spare parts Cotton yarn Turmeric Grapes Gur Clcth
Imported 4
Sugarcane Casting Iron Cloth Cloth Cloth Cloth Jowar Raw cotton
~--_-- -------Sugarcane, cotton, jowar and casting iron are the collected from the producers mainly at trading
msin articles of import. Agriculture produce is centres like Sangli, Tasgaon and Takari.
Table 24 indicates the proportion of slum population in Sangli City.
TABLE 24 Proportion of Slums Population in towns
-----------------_ Class, name and civic status
of the town
I Miraj City (M. Cl.)
I Sangli City (M. Cl.)
Places of tourists importance
Total
Though Sangli district does not figure in the tourist's map of India, however, it has a number of forts and old temples which may be of some interest to the visitors. One of them is fort of Bahadurvadi (located in Walwa tahsil) which belonged to the erstwhile Raja of Sangli. Another one Bhupalgad hill-fort lies at the extreme south-east of Khanapur tahsil. Bhupalgad formed the eastern out-post of Shivaji's territories. Machhindragad IS
the most southern chain forts built by
Proportion of the slums population to total population of the town
2
Density in slums (Per kms.")
3
.. (There are no notified ~lums within the ffi!.micipal limits hence the information shows nil)
0.78 60,928 ---- - -----------_--- - - - --0.78 60,928
Shivaji. It is located at a distance of about 16 kms. south-east of Karhad. In Devrastre in Khanapur there is a curious cluster of temples and ancient mankish cells. The main temple is dedicated to Samudreswar or Mahadev of the sea. Temple Dattatraya of Audumbar and Ganapati in Tasgaon tahsil are also well known. Bhose village in Miraj tahsil has cave ttmple of Dandoba Mahadev. Besides these Kundal (a village in Tasgaon tahsil lying about 8 kms. north of Walwa) has a set of ancient Brahmanical caves.
Ya 197-3
PART A--VILLAGE AND TOWN DIRECTORY
SECTION I
VILLAGE DIRECTORY

27
SECTION I-VILLAGE DIRECTORY
Note Explaining the Abbreviations used in the Village Directory
The 'Village Directory' gives the list of villages, their area, population, amenities such as educational, medical, communications, drinking water facilities etc. available to them and also the land use of each village. F or this purpose, villages have been arranged tahsilwise in order of their location code number. The irclusion of alphabetical list of villages and the map of every tahsil depicting location cf villages by population siLe, urban-spread and important infrastructural fD.cilities availabk therein will further help the readels jn identifying any village in the tahsil.
'Village' is a statutory recognised unit having a definite boundary and separate land records. In ca:;,e, a village is treated as an outgrowth of urban agglomeration, data on amenities and land use for that village have not been given in the Village Directory but shown along with the urban component. For those villages which have partly merged in an outgrowth, data peltaining to remaining part of the village is shown in the village Directory and for the part merged or treated as an oul growth, the details have been given under the concerned urban agglomeration. If a Village, has fully merged in the town, the same has been specified as such in the Village Directory. However, all such villages do appear in the Village Primary Census Abstract for any cross reference. Similarly, villages· treated as Census Towns (urban) for the first time in 1981 Census are shown both in the Village Directory and the Village Primary Census Abstract for making any CiOSS reference and no data relating to the amenities available have been
. indicated in the Village Directory. However, land use data for all such viliages can be se<'.n in the Appendix-I[ of the Village Directory.
If a vdlage has fully merged into another village, the location code number and name of the merged village are given both in the Village Primary Census Abstract and the Village Directory at the appropriate place. Data in respect of these two villages put together appear against the village with which the otber village has merged.
The "un-inhabitated" villages (villages with no popUlation) have been indicated as such after furnishing details in columns 1 to 3 i. e. the location code number, name and area of the village. In addition to all the above details, following four appendices to Village Directory have also been included :-
Appendix (i) Tahsilwise abstract of educational, medical and other amenities;
Appendix (ii) Land utilisation data for census towns;
Appendix (iii) Tahsilwist list of villages with no amenitief> available; and
Appendix (iv) Tahsilwise list of villages aycof<ling to proportion of Scheduled Castes/Scheduled Tribes population.
The first two appendices were also prepared for 1971 District Census Handbook. Appendices (iii) and (iv), added in 1981, are expected to help the planners for planniD g inputs in areas/villages where basic infrastructure is lacking and also for evolving suitable plans for. the welfare of Scheduled Castes and Scheduled Tribes.
The Village Directory form has 20 columns and the details given under each column are as under :-
Column 1 gives the location code number of each village as the same is essential for identification of the village.
Column 2 indicates name of the village. For filling up of this column, 1971 District Census Handbook has been used as the basis.
Co~umn 3 shows area figures (in hectares) as supplied by the Statl." Revenue Depaltment. For towns however, the area figures are in Km.2
Column 4, which gives popUlation and the number of households in each village has been introduced for 1981 Census to examine the correlation between the amenities available to the popUlation and the number of households. Figures given within brackets against total population in this column refer to the number of households in the village.
Data on amenities such as educational medical communications, availability of drinki~g water: days of market/hat etc. are shown under columns 5 to 11 of the Village Directory. Additional feature fOi" 1981 District Census Handbook is that in case ~f amenity is not available. within the referrent VIllage, a dash (-) is shown in the column and next to it, in brackets the distance from the village in broad ranges viz., upto 5 Kms. ~-1 ° K~~, a?d ] 0,:,- KIll to the nearest place where tne faCIlity IS avaIlable has been given. This will help ~ot only fo~. local area planning but in regulatmg the prOVISlOn of goods and services as wdl, so as to minimise the regional imbalances in the process of development.
<;?l_umn . 5 ex~ibits the availability of educational faCIlItIes VIZ. pnm~ry or elementary school, junior secondary or mIddle school, matriculation Of
second.ary . sc_ho<;>1. higher secondary/intermediate/ pre-umversl~Y !Julllor college, college, industrial school, tu:nnmg s~hool, adult literacy school/centre and orher. educat.lOnal institutions (Sanskrit Pathshala, f>emor baSIC l)chool, makhtab elc.).
If iI? a village, <)econdary school has middle and pnmary classes also the same has been counted as three schools i. e. f>econdary, middle and primary sch_ool. In case, there are more than one insti!utl.On.S of C:llY. type in a village their numbet is lDdlcat~d. Wltlun bra~kets against the prescribed abbrevlatlOn. Followlllg abbreviations have :Jeen
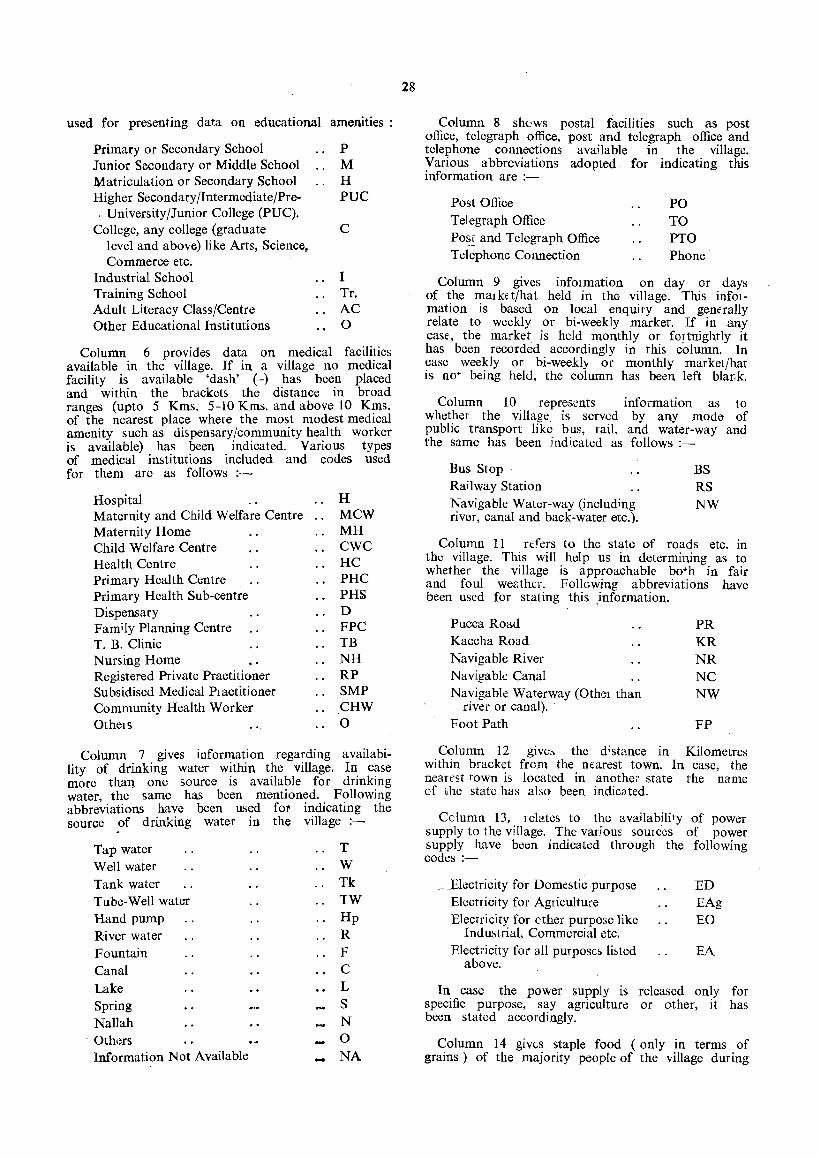
used for presenting data on educational amenities :
Primary or Secondary School P Junior Secondary or Middle School M Matriculation or Secondary School H Higher Secondary/Intermediate/Pre- PUC . University/Junior College (Puq.
College, any college (graduate C level and above) like Arts, Science, Commerce etc.
Industrial School I Training School Tr. Adult Literacy Class/Centre AC Other Educational Institutions 0
Column 6 provides data on medical facilities available in the village. If in a village no medical facility is available 'dash' (-) has been placed and within the brackets the distance in broad ranges (upto 5 Kms, 5-10 Kms. and above 10 Kms. of the nearest place where the most modest medical amenity such as dispensary/community health worker is available) has been indicated. Various types of medical institutions included and codes used for them are as follows :-
Hospital Maternity and Child Welfare Centre Maternity Home Child Welfare Centre Health Centre Primary Health Centre Primary Health Sub-centre Dispensary Family Planning Centre T. B. Clinic Nursing Home Registered Private Practitioner Subsidised Medical Plactitioner Community Health Worker Othels
H MCW MH CWC HC PHC PHS D FPC TB NH RP SMP CHW o
Column 7 gives information regarding availability of drinking water within the village. In case more thall one source is availabJe for drinking water, the same has been mentioned. Following abbreviations have been used for indicating the source of drinking water in the village :-
Tap water T
Well water W
Tank water Tk Tube-Well water TW Hand pump Hp
River water R Fountain F Canal C
Lake L
Spring S
Nallah N Others 0 Information Not Available NA
28
Column 8 shows postal facilities such as post office, telegraph office, post and telegraph office and telel?hone con~~ions available in the village. yanous . abbreVIatIOns adopted for indicating this mformatlOn are :-
Post Office Telegraph Office Po~!_ and Telegraph Office Telephone Connection
PO TO PTO Phone"
Column 9 gives infOlmation on day or days of ~he ~at k< t/ha t held in the village. This infotmatlOn lS based on local enquiry and gemrally relate to weekly or bi-weekly market. If in any case, the market is held monthly or fortnightly it has been recorded accordingly in this column. In ~ase wee~ly or bi-weekl), or monthly market/hat lS no' bemg held, the column has been left blar,k.
Column 10 represents information as to whether the village is served by any mode of public transport like bus, rail, and water-way and the same has been indicated as follows :-
Bus Stop BS Railway Station RS Navigable Water-way (including NW river, canal and back-water etc.).
Column 11 refers to the state of roads etc. in the village. This will help us in determining as to whether the village is approachable bo+h in fair and foul weather. FollGwing abbreviations have been used for stating this ,information.
Pucca Road PR Kaccha Road KR Navigable River NR Navigable Canal NC Navigable Wat.erway (Othel than NW
river or canal). " Foot Path FP
Column 12 give:, the d;stance 1ll Kilometres within bracket from the nearest town. In case the nearest town is located in anothe:;- state the ~ame of the state has also been indicated.
Column 13, relates to the availability of power supply to the village. The various sOUIc'es of power supply have been indicated through the following codes :-
~_Electricity for Domestic purpose ED Electricity for Agriculture EAg Electricity for other purpose like EO
Industrial, Commercial etc. Electricity fOi' all purpose" lib ted EA
above.
In case the power supply is released only for specific purpose, say agriculture or other, it has been stated accordingly.
Column 14 givt.s staple food (only in terms of grains) of the majority people of the village during

the major part of the year. This may be rice, wheat, jowar, maize, ragi, etc. or a combination of grains where it is difficult to determine a particular grain. .
Columns 15 to 19 give the details about land utilisation. The land use pattern given in the Village Directory conforms to 'he classification recommended by the Ministry of Food and Agriculture, Government of India, which maintains the land records under the following five categories :-
(1) Forests.
(2) Not available for cultivation-(a) lands put to non-agricultural uses. (b) barren and unculturable land.
(3) Other uncultivated lands excluding fallow land(a) permanent pastures and other grazing lands. (b) lands under miscellaneous tree crops and
groves not included in the net area sown. (c) culturable wastes.
(4) Fallow lands-(a) fallow lands other than current fallows. (b) current fallows.
(5) Net area sown.
Column 15 shows all the lands classed as forest under any legal enactment dealing with forest or administered as forests, whether State owned or privat~. In case, any portion of such land is not actually wooded but put to some agricultural use, that portion is included under the appropriate heading of cultivated or uncultivated land.
Columns 16 and 17 cover all agricultural lands including the net area sown with crops and orchard and also the current and other fallow lands. Net area sown represents the area sown under various crops and orchards. Areas sown more than once in the same year have been counted only once. Column 16 indicates extent of irrigated lands under various types of irrigation e. g. canal, tank, wells, tubewells etc. and codes adopted for indicating various sources of irrigation are as und_er;-
Government Canal Private Canal Well (without Electricity) Well (with Elctricity)
V t97-~ a
GC PC W WE
29
Tube Well (without Electricity) Tube Well (with Electricity) Tank River Lake Water Fall Others Total
TW TWE Tk R L WF o T
Column. 18 gives infor~ation on culturable wastes lands and Illcludes land avaIlable for cultivation whether or not take!! ~p for cultivation once. Area taken up for cu.ltlvatlOn cnce but not ?ultivated during the precedmg five years or more III succession is a~so covered under this column. Such lands may ~Ither be. fallow or covered with shrubs and Jungles which are not put to any use. These lands may. be assesse~ ~r unassessed and found in isolated bloC(ks or. WIthin the c~ltivating holdings. Lands under thatchmg grasses, bamboo, bushes and other groves for fuels etc., which are not included under
_ orchards .or forests, are· included in this category. All grazmg lands, whether they are permanent pastures .and meado,,:s. or not, village common ~nd gra~lllg _lands wlthlll forest areas, are also lllcluded III thIS column.
<;olumn 19 shows land not available for cultivatIOn such as barren, unculturable land and land put to ~o~-agricultural uses. All lands covered under bUIldIngs, roads, railways, rivers, canals etc. form part of the land under non-agricultural uses. Barren and unculturable lands include mountains roc~s, .deserts etc. which cannot be brought unde; CultivatIOn, except at a very high cost.
Column ?O has ~een filled up on the basis of local enqwry .. BeSIdes, recording' the particulars of places of· Importance, it gives information on number of newspapers .coming in the village, motor ~cles / sco~ters, cars / Jeeps and tractors available In the VIllages. Appropriate codes listed bdow have been used. for pr~senting this information and number of Items avaIlable is mentioned against the code used :--
N Copies of Newspapers coming in the village.
M Motor cycles/scooters available in the village.
C Cars/jeeps available in the village. T Tractors available in the village. PS Police Station,
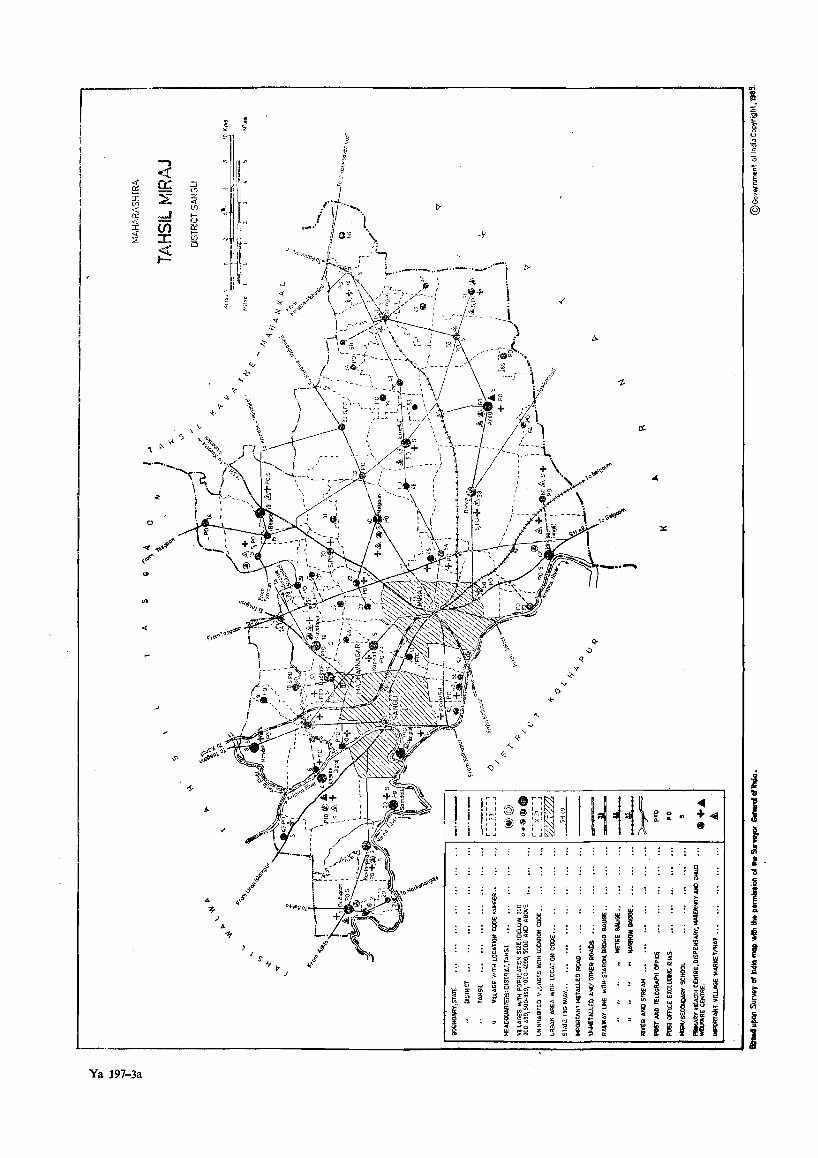
i i
I I I i
i
I
I I I ,
.n ---------------------------------------------------------.----------------------------------------------- ;
....,
... :r ~ a:
::E i (.0
" .....J n: < Ul :r: <t :r: ::>:
« ~
" c,
'\ ~
~
0
o· <:( ,.,.11 ,.r ...
'" ..
0'
Ya 197-3a
] .~
S21'
~~~~ Ill! !:h~ :J
~tllj '" z
~~t <t Vl t--u li
1" I-
'-,-l§l "i III ~m 0
JiL ~
. "
.,.. ..,.
\ .,. '<-
\ " ,~~+(:<"
)'lO-1~'"
~Qi.~~). ~9
1-
I>
'"
'0
"'; 'b
I S
"1>,
:E
~ l '0
I @
--.. ~
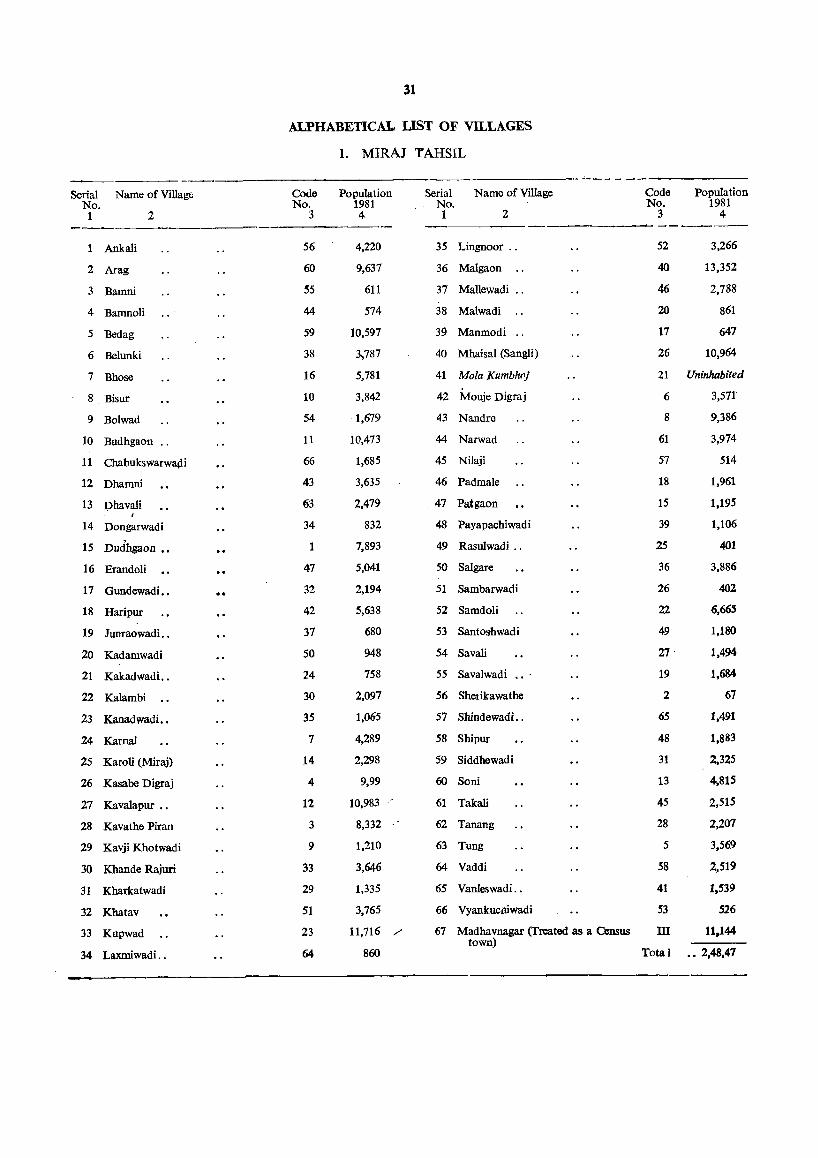
Serial Name of Village No. t 2
Ankali
2 Arag
3 Bamni
4 Bamnoli
5 Bedag
6 Belunki
7 Bhose
8 Bisur
9 Bolwad
10 Budhgaon .,
11 Chabukswarwa4ii
12 Dhamni
13 phavali
14 Dongarwadi
15 Dudhgaon ••
16 Erandoli
17 Gundewadi ••
18 Haripur
19 Junraowadi..
20 Kadamwadi
21 Kakadwadi..
22 Kalambi
23 Kanadwadi ..
24 Kamal
25 Karoli (Miraj)
26 Kasabe Digraj
27 Kavalapur .•
28 Kavathe Piran
29 Kavji Khotwadi
30 Khande Rajuri
31 Kharkatwadi
32 Khatav
33 Kupwad
34 Laxmiwadi ..
31
ALPHABETICAL UST OF VILLAGES
1. MIRA] TAHSIL
-----~- -'--- - --~_-_~--Code No.
3
56
60
55
44
59
38
16
10
54
11
66
43
63
34
1
47
32
42
37
50
24
30
35
7
14
4
12
3
9
33
29
51
23
64
Population 1981 4
4,220
9,637
611
574
10,597
3,787
5,781
3,842
1,679
10,473
1,685
3,635
2,479
832
7,893
5,041
2,194
5,638
680
948
758
2,097
1,065
4,289
2,298
9,99
10,983
8,332
1,210
3,646
1,335
3,765
11,716 /"
860
Serial Name of Village No. 1 2
Code No.
3
Population 1981
4 ------~ ---_--
35 Lingnoor ..
36 Malgaon
37 Mallewadi ..
38 Malwadi
39 Manmodi
40 Mhaisal (Sangli)
41 Mola Kumbhrj
42 Mouje Digraj
43 Nandre
44 Narwad
45 Nilaji
46 Padmale
. 47 Patgaon
48 Payapachiwadi
49 Rasulwadi ..
50 Salgare
51 Sambarwadi
52 Samdoli
53 Santoshwadi
54 Savali
55 Savalwadi
56 Shelikawathe
57 Shindewadi ..
58 Shipur
59 Siddhewadi
60 Soni
61 Takali
62 Tanang
63 Tung
64 Vaddi
65 Vanleswadi..
66 Vyankucniwadi
67 Madhavnagar (Treated as a Census town)
52 3,266
40 13,352
46 2,788
20 861
17 647
26 10,964
21 Uninhabited
6 3,571'
8 9,386
61 3,974
57 514
18 1,961
15 1,195
39 1,106
25 401
36 3,886
26 402
22 6,665
49 1,180
27' 1,494
19 1,684
2 67
65 1,491
48 1,883
31 2,325
13 4,815
45 2,515
28 2,207
5 3,569
58 2,519
41 1,539
53 526
m 11,144
Tota I •• 2,48,47
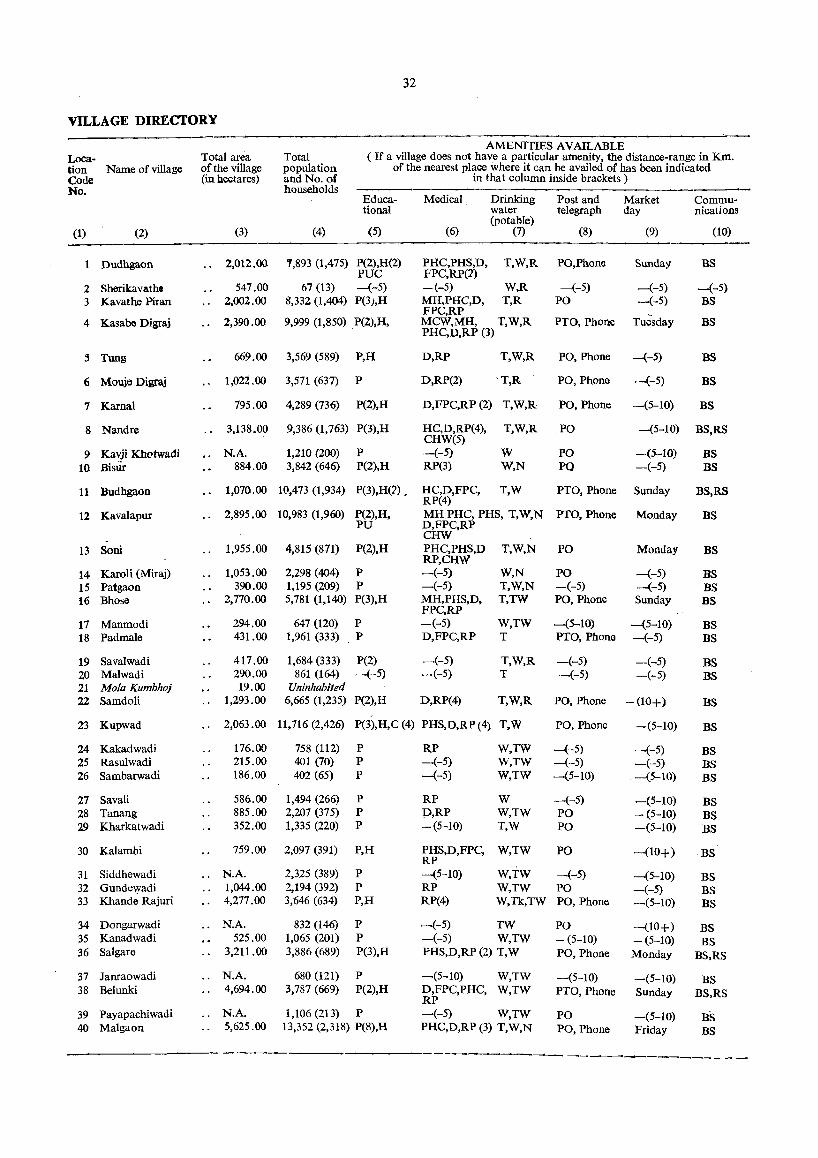
32
VILLAGE DIRECfORY
AMENITIES AVAILABLE Loca- Total area Total ( If a village does not have a particular atnenity, the distance-range in Km. tion Name of village of the village population of the nearest place where it can be availed of has been indicated Code (in hectares) and No. of in that column inside brackets) No. households
Educa- Medical Drinking Post and Market Commu-tional water telegraph day nications
(potable) (1) (2) (3) (4) (5) (6) (7) (8) (9) (10)
Dudhgaon ., 2,012.00 ',893 (1,475) P(2),H(2) PHC,PHS,D, T,W,R PO,Phone Sunday BS PUC FPC,RP(1)
2 Sherikavath. 547.00 67 (13) -(-5) -(-5) W,R -(-5) -(-5) -(-5) 3 Kavathe Piran ., 2,002.00 8,332 (1,404) P(3),H MH,PHC,D, T,R PO -(-5) BS
FPC,RP Tuesday 4 Kasabe Digraj ., 2,390.00 9,999 (1,850) ,P(2),H, MCW,MH, T,W,R PTO, Phone BS
PHC,D,RP (3)
j Tung 669.00 3,569 (589) P,H D,RP T,W,R PO, Phone -(-5) BS
6 Mouje Digraj 1,022.00 3,571 (637) P D,RP(2) 'T,R PO, Phone -(-5) BS
7 Kamal 795.00 4,289 (736) P(2),H D,FPC,RP (2) T,W,R: PO, Phone -(5-10) BS
8 Nandre 3,138.00 9,386 (1,763) P(3),H HC,D,RP(4), T,W,R PO -(5-10) BS,RS CHW(5)
9 Kavji Khotwadi .. N.A. 1,210 (200) P -(-5) W PO --(5-10) BS 10 Bisur 884.00 3,842 (646) P(2),H RP(3) W,N PO -(-5) BS
11 Budhgaon 1,070.00 1(\,473 (1,934) P(3),H(2) . HC,D,FPC, T,W RP(4)
PTO, Phone Sunday BS,RS
12 Kavalapur .' 2,895.00 10,983 (1,960) P(2),H, PU
MHPHC, PHS, T,W,N PTO, Phone D,FPC,RP
Monday BS
CHW . 13 Soni 1,955.00 4,815 (871) P(2),H PHC,PHS,D T,W,N
RP,CHW PO Monday BS
14 Karoli (Miraj) 1,053.00 2,298 (404) P -(-5) W,N PO -(-5) BS 15 Patgaon 390.00 1,195 (209) P -(-5) T,W,N -(-5) -(-5) BS 16 Bhose 2,770.00 5,781 (1,140) P(3),H MH,PHS,D, T,TW PO, Phone Sunday BS
FPC,RP 17 Manmodi 294.00 647 (120) P -(-5) W,TW -(5-10) -(5-10) BS 18 Padmale 431.00 1,961 (333) P D,FPC,RP T PTO, Phone -(-5) BS
19 Savalwadi 417.00 1,684 (333) P(2) -(-5) T,W,R -(-5) -(-5) BS 20 Malwadi 290.00 861 (164) -(-5) -(-5) T -(-5) -(-5) BS 21 Mola Kumbhoj 19.00 Uninhabited 22 Samdoli 1,293.00 6,665 (1,235) P(2),H D,RP(4) T,W,R PO, Phone -(10+) BS
" 23 Kupwad ., 2,063.00 11,716 (2,426) P(3), H,C (4) PHS,D,RP (4) T,W PO, Phone -(5-10) BS
24 Kakadwadi 176.00 758 (112) P RP W,TW -(-05) -(-5) BS 25 Rasulwadi 215.00 401 (70) P -(-5) W,TW -(-5) -(-5) BS 26 Sambarwadi 186.00 402 (65) P -(-5) W,TW -(5-10) -(5-10) BS
27 Savali 586.00 1,494 (266) P RP W -(-5) -(5-10) BS 28 Tanang 885.00 2,207 (375) P p,RP W,TW PO - (5-10) BS 29 Kharkatwadi 352.00 1,335 (220) P -(5-10) T,W PO -(5-10) BS
30 Kalambi 759.00 2,097 (391) P,H PHS,D,FPC, W,TW PO -(10+) BS RP
31 Siddhewadi ., N.A. 2,325 (389) P -(5-10) W,TW -(-5) -(5-10) BS 32 Gunde\yadi 1,044.00 2,194 (392) P RP W,TW PO -(-5) BS 33 Khande Rajuri ., 4,277 .00 3;646 (634) P,H RP(4) W,Tk,TW PO, Phone -(5-10) BS
34 Dongarwadi ., N.A. 832 (146) P -(-5) TW PO -(10+) BS 35 Kanadwadi 525.00 1,065 (201) P -(-5) W,TW - (5-10) -(5-10) BS 36 Salgare 3,211.00 3,886 (689) P(3),H PHS,D,RP (2) T,W PO, Phone Monday BS,RS
37 Janraowadi .. N.A. 680 (121) P -(5-10) W,TW -(5-10) -(5-10) BS 38 Belunki .. 4,694.00 3,787 (669) P(2),H D,FPC,PHC, W,TW PTO, Phone Sunday BS,RS
RP 39 Payapachiwadi N.A. 1,106 (213) P -(-5) W,TW PO -(5-10) BS 40 Malgaon 5,625.00 13,352 (2,318) P(8),H PHC,D,RP (3) T,W,N PO, Phone Friday BS
----- -- ------------ - - -
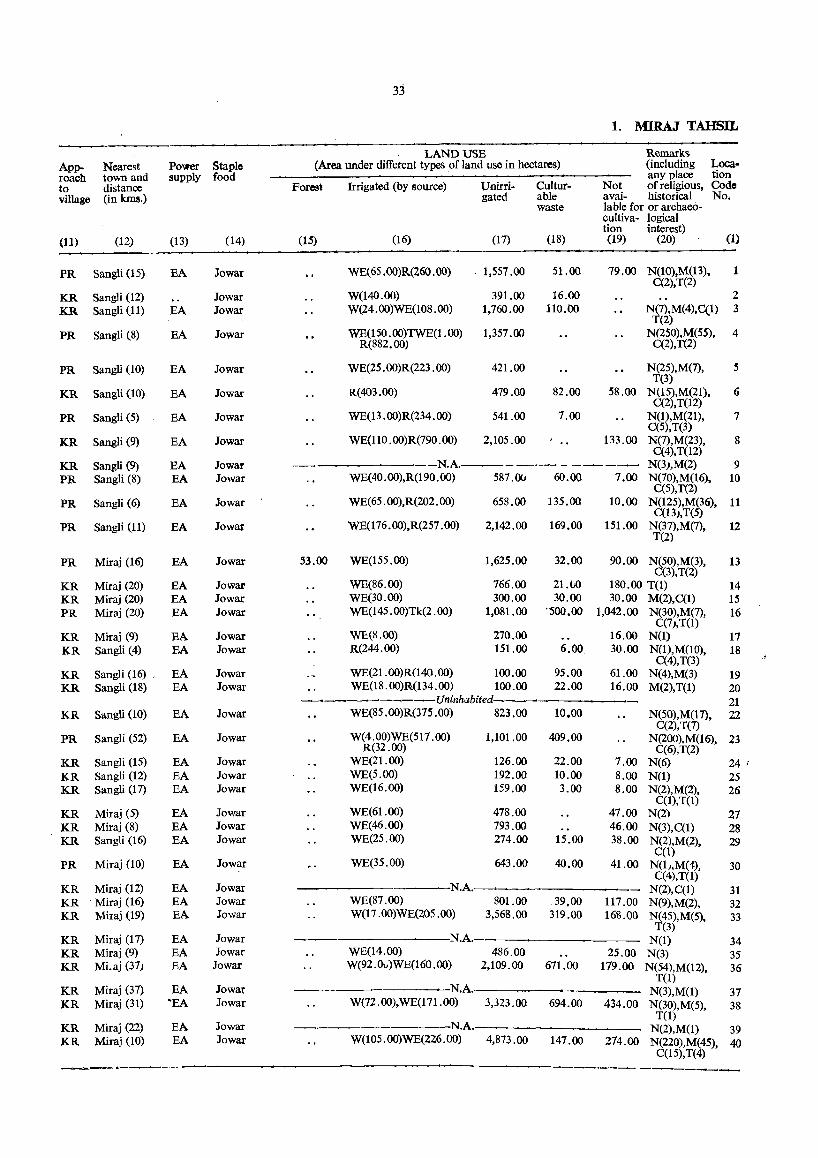
33
1. MIRAJ TAHSIL
LAND USE Remarks. App- Nearest Power Staple (Area under different types of land use in hectares) (including Loca· roach town and supply food any place tiOD
to distance Pores. Irrigated (by source) Unirri- Cultur- Not of religious, Code villago (in lons.) gated able avai- historical No.
waste lable for or archaeo-cultiva- logical tion interest)
(11) (12) (13) (14) (15) (16) (17) (18) (19) (20) (1)
PR Sangli (15) EA Jowar WE(6S .OO)R(260 .00) . 1,557.00 51.00 79.00 N(10),M(13), 1 C(2),T(2)
KR Sangli (12) Jowar W(14O.00) 391.00 16.00 2
KR Sangli (11) EA Jowar W(24.00)WE(108.00) 1,760.00 110.00 N(7),M(4),C(I) 3 T(2)
PR Sangli (8) EA Jowar WE(150.oo)TWE(I.oo) 1,357.00 N(250),M(55), 4 R(882.00) C(2),T(2)
PR Sangli (10) EA Jowar WE(25 .00)R(223 .00) 421.00 N(25),M(7), 5 T(3)
KR Sangli (10) EA Jowar R(403.oo) 479.00 82.00 58.00 N(15),M(21), 6 C(2),T(12)
PR Sangli (5) EA Jowar WE(13.00)R(234.00) 541.00 7.00 N(1),M(21), 7 C(5),T(3)
KR Sangli (9) EA Jowar WE(1l0.00)R(790.oo) 2,105.00 133.00 N(7),M(23), 8 C(4),T(12)
KR Sangli (9) EA Jowar N.A. -------~ N(3),M(2) 9 PR Sangli (8) EA Jowar WE(40.00),R(190.00) 587.()(J 60.00 7.00 N(70),M(16), 10
C(5),T(2) PR Sangli (6) EA lowar WE(65. 00),R(202. 00) 658.00 135.00 10.00 N(125),M(36), 11
C(13),T(5) PR Sangli (11) EA JowaI WE(176. 00),R(257. 00) 2,142.00 169.00 151.00 N(37),M(7), 12
T(2)
PR Miraj (16) EA Jowar 53.00 WE(155.00) 1,625.00 32.00 90.00 N(50),M(3), 13 C(3),T(2)
KR Miraj (20) EA Jowar WE(86.00) 766.00 21. ()() 180.00 T(l) 14 KR Miraj (20) EA Jowar WE(30.oo) 300.00 30.00 30.00 M(2),C(I) 15 PR Miraj (20) EA Jowar WE(l45.00)Tk(2.oo) 1,081.00 ''500.00 1,042.00 N(30),M(7), 16
c(7),T(I) KR Miraj (9) EA Jowar WE(8.00) 270.00 16.00 N(l) 17 KR Sangli (4) EA Jowar R(244.00) 151.00 6.00 30.00 N(1),M(10), 18
C(4),T(3) .i
KR Sangli (16) . EA Jowar WE(21.oo)R(140.oo) 100.00 95.00 61.00 N(4),M(3) 19 KR Sangli (18) EA Jowar WE(18. 00)R(134. 00) 100.00 22.00 16.00 M(2),T(I) 20
----~---Uninhabited---- 21 KR Sangli (10) EA lowar WE(85 .00)R(375 .00) 823.00 10.00 N(SO),M(l7),
C(2),T(7) 22
PR Sangli (52) EA Jowar W(4.00)WE(517.00) 1,101.00 409.00 N(2oo),M(16), 23 R(32.00) C(6),T(2)
KR Sangli (15) EA Jowar WE(21.00) 126.00 22.00 7.00 N(6) 24 ' KR Sangli (12) EA Jowar WE(5.oo) 192.00 10.00 8.00 N{l) 25 KR Sangli (17) EA Jowar WE(16.00) 159.00 3.00 8.00 N(2),M(2), 26
C(l),T(I) KR Miraj (5) EA Jowar WE(61.00) 478.00 47.00 N(2) 27 KR Miraj (8) EA Jowar WE(46.00) 793.00 46.00 N(3),C(l) 28 KR Sangti (16) EA Jowar WE(25.00) 274.00 15.00 38.00 N(2),M(2), 29
C(1) PR Miraj (10) EA Jowar WE(35.00) 643.00 40.00 41.00 N(tj,M(1),
C(4),T(I) 30
KR Miraj (12) EA Jowar N.A. N(2),C(t) 31 KR - Miraj (16) EA lowar WE(87.00) 801.00 39,00 117.00 N(9),M(2), 32 KR Miraj (19) EA lowar W(17 .00)WE(205 .00) 3,568.00 319.00 168.00 N(45),M(5).
T(3) 33
KR Miraj (17) EA Jowar N.A. N(l) 34 KR Miraj (9) EA Jowar WE(14.00) 486.00 25.00 N(3) 35 KR MLaj (37) EA Jowar W(92.0,,)WE(160.oo) 2,109.00 671.00 179.00 N(54),M(12), 36
T(l) N.A. KR Miraj (37) EA Jowar N(3),M(1) 37
KR Miraj (31) ·EA Jowar W(72 . 00), WE(l71 .00) 3,323.00 694.00 434.00 N(30),M(5), 38
lowar N.A. T(l)
KR Miraj (22) EA N(2),M(l) 39 KR Miraj (to) EA Jowar W(105.00)WE(226.00) 4,873.00 147.00 274.00 N(220),M(45), 40
C(15),T(4) __ .-..--~-------
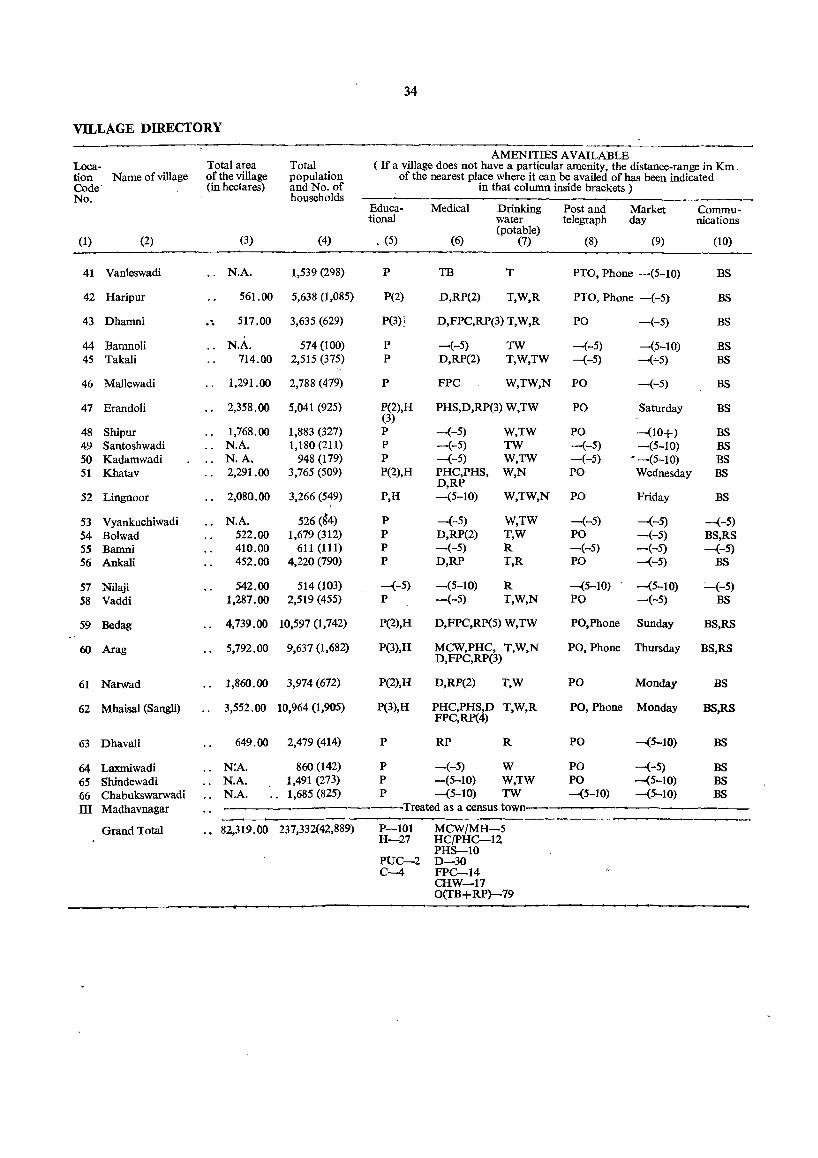
34
VILLAGE DIRECTORY
AMENITIES AVAILABLE Loca- Total area Total ( If a village does not have a particular amenity. the distance-range in Km. tion Name of village of the village population of the nearest place where it can be availed of has been indicated Code (in hectares) and No. of in that column inside brackets) No. households
Educa- Medical Drinking Post and Market Commu-tional water telegraph day nications
(3) (4) • (5) (potable)
(1) (2) (6) (7) (8) (9) (10)
41 Vanleswadi N.A. 1,539 (298) P TB T PTO, Phone -(5-10) BS
42 Haripur 561.00 5,638 (1,085) P(2) D,RP(2) T,W,R PTO, Phone -(-5) BS
43 Dhamni .. 517.00 3,635 (629) P(3): D,FPC,RP(3) T,W,R PO -(-5) BS
44 Bamnoli .. N.A. 574 (100) P -(-5) TW -(-5) -(5-10) BS 45 Takali 714.00 2,515 (375) P D,RP(2) T,W,TW -(-5) -(-5) BS
46 Mallewadi 1,291.00 2,788 (479) P FPC W,TW,N PO -(-5) BS
47 Erandoli 2,358.00 5,041 (925) P(2),H PHS,D,RP(3) W,TW PO Saturday BS (3)
48 Shipur 1,768.00 1,883 (327) P -(-5) W,TW PO -(10+) BS 49 Santoshwadi N.A. 1,180 (211) P -(-5) TW -(-5) -(5-10) BS 50 Kadamwadi .. N.A. 948 (179) P -(-5) W,TW -(-5) • -(5-10) BS 51 Khatav .. 2,291.00 3,765 (509) P(2),H PHC,PHS, W,N
D,RP PO Wednesday BS
52 Lingnoor 2,080.00 3,266 (549) P,H -(5-10) W,TW,N PO Friday BS
53 Vyankuchiwadi N.A. 526 (~4) P -(-5) W,TW -(-5) -(-5) -(-5) 54 Bolwad 522.00 1,679 (312) P D,RP(2) T,W PO -(-5) BS,RS 55 Bamni 410.00 611 (111) P -(-5) R -(-5) -(-5) -(-5) 56 Ankali 452.00 4,220 (790) P D,RP T,R PO -(-5) BS
57 Nilaji 542.00 514 (103) -(-5) -(5-10) R -(5-10) -(5-10) =-(-5) 58 Vaddi 1,287.00 2,519 (455) P -(-5) T,W,N PO -(-5) BS
59 Bedag .. 4,739.00 10,597 (1,742) P(2),H D,FPC,RP(5) W,TW PO,Phone Sunday BS,RS
60 Arag 5,792.00 9,637 (1,682) P(3),H MCW,PHC, T,W,N PO, Phone D,FPC,RP(3)
Thursday BS,RS
61 Narwad 1,860.00 3,974 (672) P(2),H D,RP(2) T,W PO Monday BS
62 Mhaisal (Sangii) 3,552.00 10,964 (1,905) P(3),H PHC,PHS,O T,W,R FPC,RP(4)
PO, Phone Monday BS,RS
63 Ohavali 649.00 2,479 (414) P RP R PO -(5-10) BS
64 Laxmiwadi .. N:A. 860 (142) P -(-5) W PO -(-5) BS 65 Shindewadi N.A. 1,491 (273) P -(5-10) W,TW PO -(5-10) BS 66 Chabukswarwadi N.A. "
1,685 (825) P -(5-10) TW -(5-10) -(5-10) BS 1lI Madhavnagar -Treated as a census town
Grand Total 82,319.00 237,332(42,889) P-I01 MCW/MH-5 H-27 HCIPHC-12
PHS-l 0 PUC-2 0-30 C-4 FPC-14
CHW-17 O(TB+RP)-79

35
1. MlRAJ TAHSn.
LAND USE Remarks App- Nearest Power Staple (Area under different types of land use in hectares) (including Loca-roach town and supply food any place tion to distance Forest Irrigated (by source) Unirri- Cultur- Not of religious, Code village (in kms.) gated able avar- historical No.
waste lable for or archaeo-cultiva- logical tion interest)
(11) (12) (13) (14) (15) (16) (17) (IS) (19) (20) (1)
PR Miraj (5) EA Jowar N.A. N(25},M(12" 41 C(7),T(l)
PR'r Sangli (3) EA Jowar R(225.00) 240.00 16.00 SO.OO N(61),M(31), 42 C(35)
PR Sangli (4) EA lowar WE(6.00)R(370.00) 93.00 48.00 N(100),M(18), 43 C(12),T(7)
KR Sangli (6) EA Jowar -----N.A. N(2) 44 KR Miraj (3) EA Jowar WB(l60 . OO)R(SO. 00) 397.00 8.00 69.00 M(12),C(1), 45
T(4) KR Miraj (10) EA lowar W(26.00)WE(62.00) 1,116.00 16.00 71.00 N(4),M(2), 46
C(l) KR Miraj (12) EA lowar WE(102.00) 2,053.00 114.00 89.00 N(45),M(11),
C(l),T(1) 47
KR Miraj (15) EA Jowar WE(150.00) 1,040.00 480.00 98.00 N(lO) 48 KR Miraj (33) EA Jowar -_------ N.A.--'- -- N(9) 49 KR Miraj (33) EA Jowar N.A. - N(12),M(4) 50 KR Miraj (28) EA Jowar W(181.00)WE(l1l.00)
Tk(5.00) 1,551.00 51.00 392.00 N(20) 51
KR Miraj (24) EA lowar W(30.00)WE(81.00) Tk(31.00)
1,SOl.00 31.00 106.00 N(25),T(1) 52
KR Miraj (14)' EA Jowar N.A. M(1),T(l) 53 KR Miraj (3) EA Jowar W(4O.00)WE(80.00) 319.00 16.00 67.00 N(1),M(5) 54 KR Miraj (4) EA Jowar W(14.OU)R(117.00) 261.00 18.00 M(l) 55 PR Sangli (3) EA Jowar WE(10.00)R(244.00) 132.00 10.00 56.00 N(25),M(25),
C(l) 56
KR Miraj (5) EA Jowar WE(Sl. 00)R(55. (0) 400.00 6.00 57 PR Miraj (3) EA lowar W(20.00)WE(104.00)
R(220.00) 832.00 111.00 N(3),M(2),
T(l) 58
KR Miraj (10) EA lowaI W(51.00)WE(35.00) 4,372.00 239.00 N(l t),M(l1) 59 R(42.00) C(4),T(8)
KR Miraj (18) EA Jowar W(:?3.00)WE(72.oo) 4,665.00 748.00 284.00 N(lO),M(22) 60 C(19),T(1)
KR Miraj (14) EA lowar W(37.00),WB(l20.00) 1,478.00 97.00 37.00 N(14),M(17), 61 R(91.00) C(5),T(4)
PR Miraj (10) EA Jowar WE(600.00)R(1.846.00) 800.00 71.00 235.00 N(60),M(31), 62
WE(19.00)R(190.00) C(30), T(22)
KR Miraj (8) EA Jowar 409.00 31.00 N(4),M(6), 63 '" T(4)
KR Miraj (18) EA Jowar -N.A.- M(1) 64 KR Miraj (23) EA Jowar ---N.A. N(5),M(2) 65 KR Miraj (43) EA Jvwar --N.A. ---- N(15),M(1) 66
--- __ _.._.._ ___ ___..._
53.00 W(S76.00)WE(4,682.00) 58,099.00 5,373.00 5,332.00 N(1739),M(559), TWE(l.00) Tk(3S.00) C(196), T(12S) R(7,846.00)
,-----------------.-~ ....... ~---.------.-N. A.-Not Available.
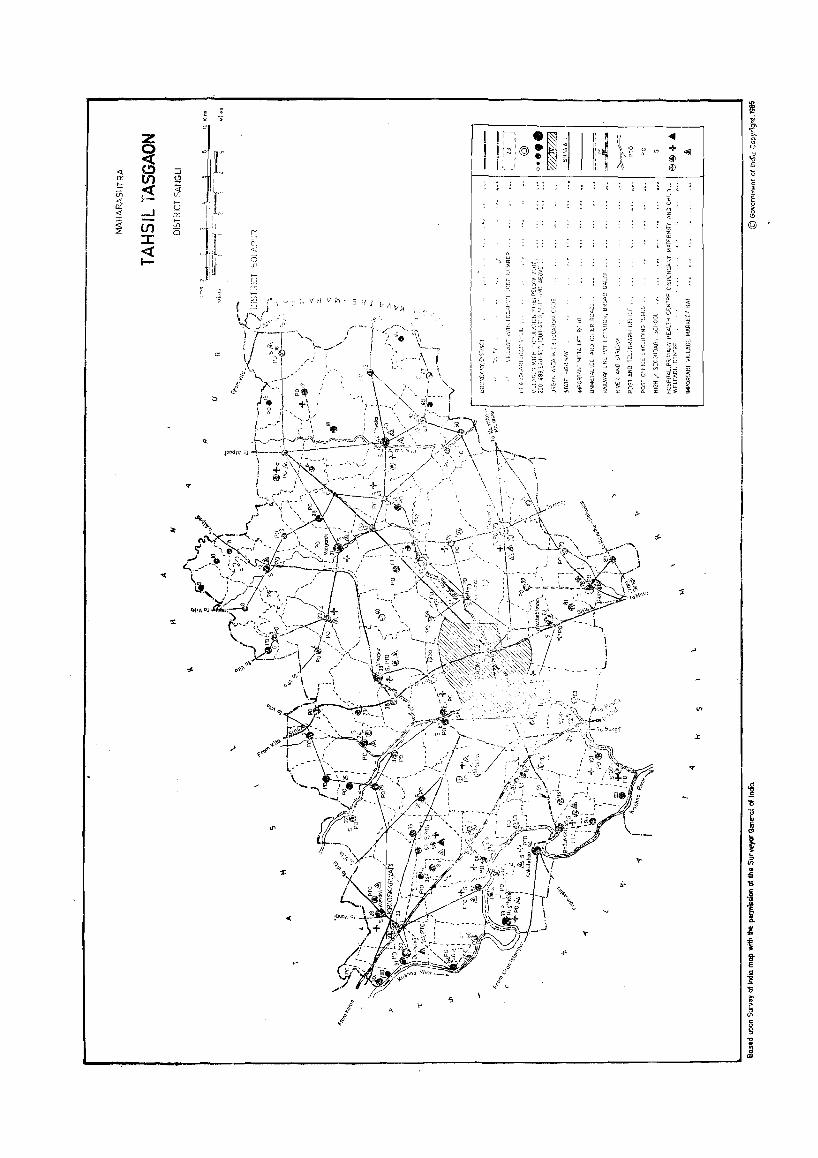
! .-.:::: >
z :f1~~ 0
~ <{ ::i i!: 0:: U) ~ ,._ :r <{ <i (f) ffI « ~- ~Il ""
I-
<t ....l '" ::r: a: 1,1,
« (f) ,_ "
::;: (f)
l (5
::r: r « °M~ t- Ji JL
! !:-: ! I:;:::@
~: I ' ; .
~. . -
'"
:x:
'" i '8
1 ~ 's
VI . -5 'I;
:t g
1 8-E .51 II '!;
A \\
g '5 Vl
~ ... :: ell

Serial Name of Village No. 1 2
Alate 2 Amanapur .. 3 Andhali 4 Anjani 5 Ankalkhop .. 6 Anugadewadi 7 Aravade 8 BaIgavade " 9 Bambavade
10 Bastavade " 11 Bendri 12 Bhairavwadi 13 Bhilavadi ..
. 14 Biranwadi 15 Borgaon 16 Bramhnal 17 Burli 18 Burungwadi 19 Chikhalgothan 20 Chinchani " 21 Ch<.. padewadi 22 Dahivadi .. 23 Dahyari 24 Dhavali 25 Dhondewadi 26 Dhulgaon " 27 Dongarsoni 28 Dorli 29 Dudhondi " 30 Gaurgaon " 31 Gavhan 32 Ghogaon .. 33 Gondilwadi 34 Gotewadi 35 Hajarwadi 36 Hatnoli 37 Hatnoor 38 Jarandi 39 Julewadi 40 Kacharewadi 41 Kaulage 42 Kavathe Ekand 43 Khalsa Dhamani 44 Khandobachiwadi 45 Khatav 46 Kholewadi ... 47 Khujgaon " 48 Kindarwadi 49 Kumathe " 50 Kundal 51 Limb 52 Lodhe 53 Lckrewadi .. 54 Malwadi
37
ALPHABETICAL LIST OF VILLAGES
2. TASGAON TAHSIL
Code Population No. 1981 3 4
2 68 27 48 94 69 41 42 36 43 84 57 95 19 24
100 67 88 1
73 98 17 30 60 7
80 45 55 32 20 50 31 63 40 86 4
22 16 87 9
54 82
5 97
1,731 4,522 2,349 2,383 9,315
231 2,858 2,152 4,716 2,707
844 407
8,745 926
4,245 2,428 4,891 2,059 1,160 6.629 1,268 1,611
827 2,364
488 1,867 \278
657 5,373 1,537 2,683 1,823 1,694 1,034
638 1,509 3,940 2,243 1,193
511 997
7,025 1,112 1,443 1,506
Serial Name of Village No. t 2
55 Manerajuri .. '56 Manjarde .. 57 Matkunki .. 58 Morale (Ped) 59 Morale (Rajapur) 60 Nagaon Kavathe 61 Nagaon Nimani 62 Nagewadi 63 Nagrale 64 Nagthane .. 65 Narsewadi .. 66 Nimani 67 Nimbalak 68 Padali 69 Palus 70 Panmalewadi 71 Ped 72 Punadi Tarf Tasgaon .. 73 Punadi Tarf Walwa 74 Pundiwadi 75 Rajapur 76 Rodewadi 77 Sandage wadi 78 Savalaj 79 Savarde 80 Sawantpur .. 81 Shere Dudhondi 82 Shirgaon Kavathe 83 Shirgaon Visapur 84 Siddhewadi (Ped) 85 Siddhewadi (Savalaj) 86 Sukhwadi .. 87 Tavdarwadi 88 Tupari 89 Turchi 90 Upalavi 91 Vajrachaunde 92 Vanjarwadi .. 93 Visapur 94 Vitthalwadi 95 Wadgaon .. 96 -Waghapur .. 97 Waifale 98 Wasagade .. 99 Wasambe ..
100 Yamgarwadi 101 Yelavi 102 Yogewadi
Code Population No. 1981 3 4
76 21 77 13 26 81 85 49 66 93 8
71 25
6 62 23 12 58 64
65 37 91 35 44 74 34 33 83 38
11 18 99 89 29 61 79 51 59 39 90 47 52 14
102
72 15 70 75
11,265 5,439 1,030
915 1,225 1,984 1,571
613 2,594 5,058
913
3,081 1,336 1,086 1,813
516 4,264 1,450 2,849
404
2,401 1,472 1,942 6,036 3,941
718 137
1,370 2,019
745 2,934 1,006 2,276 1,801 3,241 2,340
756 871
5,685 542
1,731 876.
3,799 4,547 1,582 101
92 53 10 78 28
740 1,445
544 5,178
13,000
1,056 917 590
3,111
103 Kirloskarwadi (Treated as census town) VIII
719 7,575
963 20,512
3 56 46 96
Total .. 274,438
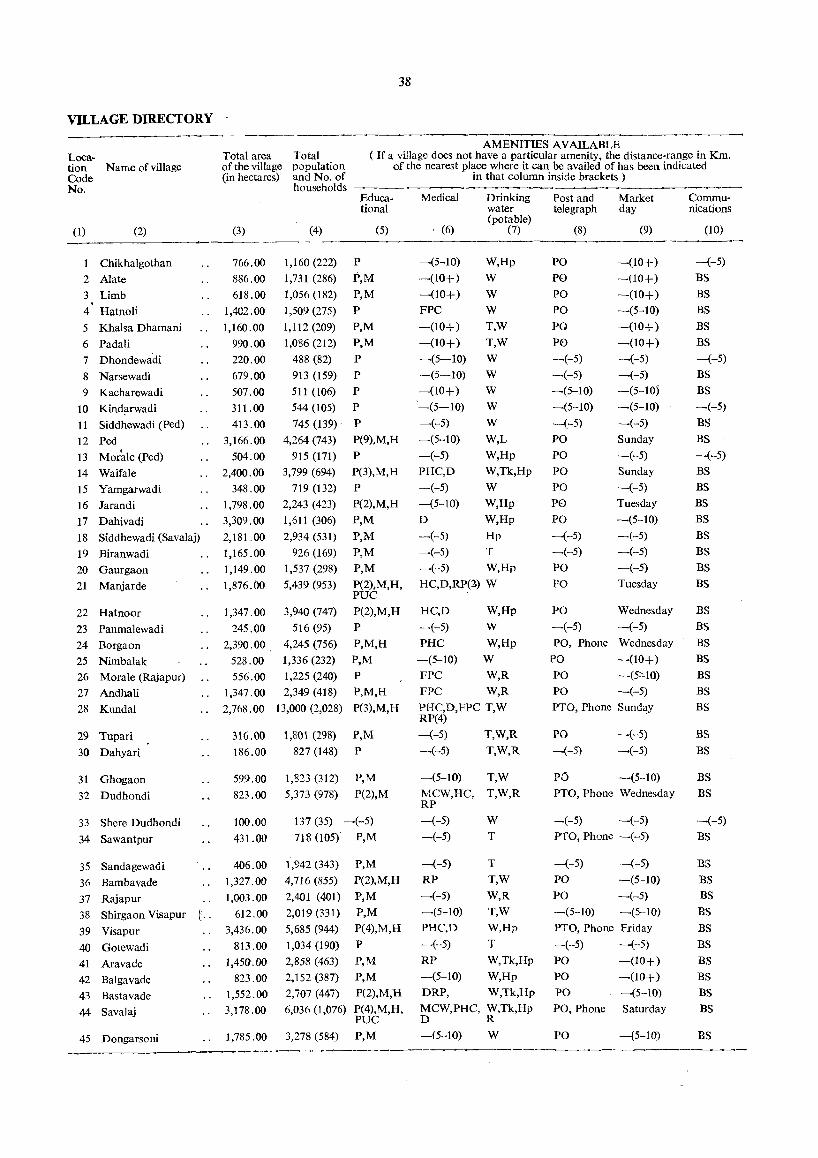
VILLAGE DIRECTORY
Loca-tion Name of village Code No.
(1) (2)
Chikhalgothan
2 Alate
3 Limb
4 Hatnoli
5 Khalsa Dhamani
6 Padali
7 Dhondewa'di
8 Narsewadi
9 Kacharewadi
10 Kindllrwadi
11 Siddhewadi (Ped)
12 Ped
13 Mor'ale (Ped)
14 Waifale
15 Yamgarwadi
16 Jarandi
17 Dahivadi
18 Siddhewadi (Savalaj)
19 Biranwadi
20 Gaurgaon
21 Manjarde
22 Hatnoor
23 Panmalewadi
24 Borgaon
25 Nimbalak 26 Morale (Rajapur)
27 Andhali
28 Kundal
29 Tupari
30 Dahyari
31 Ghogaon
32 Dudhondi
33 Shere Dudhondi
34 Sawantpur
35 Sandagewadi
36 Bambavade
37 Rajapur
38 Shirgaon Visapur r .. 39 Visapur
40 Gotewadi
41 Aravade
42 Balgavade
43 Bastavade
44 Savalaj
45 Dongarsoni
38
AMENITIES AVAILABLE Total area Total of the village population (in hectares) and No. of
(If a village does not have a particular amenity, the distance-range in Km. of the nearest place where it can be availed of has been indicated
(3)
766.00
886.00
618.00
1,402.00
1,160.00
990.00
220.00
679.00
507.00
311.00
413.00
3,166.00
504.00
2,400.00
348.00
1,798.00
3,309.00
2,181.00
1,165.00
1,149.00
1,876.00
1,347.00
245.00
households ~---
(4)
1,160 (222)
1,731 (286)
1,056 (182)
1,509 (275)
1,112 (209)
1,086 (212)
488 (82)
913 (159)
511 (106)
544 (105)
745 (139)
4,264 (743)
915 (171)
3,799 (694)
719 (132)
2,243 (423)
1,611 (306)
2,934 (531)
926 (169)
1,537 (298)
5,439 (953)
3,940 (747)
516 (95)
Educational
(5)
P
-r,M P,M
P
P,M
P,M
P
P
P
P
P P(9),M,H
P
P(3),M,H
P
P(2),M,H
P,M
P,M
P,M
P,M
P(2),M,H, PUC
P(2),M,H
P
2,390.00 4,245 (756) P,M,H
528.00 1,336 (232) P,M
556.00 1,225 (240) P
1,347.00 2,349 (418) P,M,H
2,768.00 13,000 (2,028) P(3),M,H
316.00 1,801 (298) P,M
186.00 827 (148) P
599.00 1,823 (312) P,M
823.00 5,373 (978) P(2),M
100.00 137 (35) -(-5)
431.00 718 (l05) P,M
406.00
1,327.00
1,003.00
612.00
3,436.00
813.00
1,450.00
823.00
1,552.00
3,178.00
1,785.00
1,942 (343)
4,716 (855)
2,401 (401)
2,019 (331)
5,685 (944)
1,034 (190)
2,858 (463)
2,152 (387)
2,707 (447)
P,M
P(2),M,H
P,M
P,M
P(4),M,H
P P,M
P,M
P(2),M,H
6,036 (1,076) P(4),M,H, PUC
3,278 (584) P,M
in that column inside brackets)
Medical Drinking Post and Market water telegraph day (potable)
. (6) (7) (8) (9)
-(5-10)
-(10+)
-(10+)
FPC
-(10+)
-(10+)
-(5-10)
-(5-10)
-(10+)
'-(5-10)
-(-5)
-(5-10)
-(-5)
PHC,D
-(-5)
-(5-10)
W,Hp
W
W
W
T.W
T,W
W
W
W
W
W
W,L
W,Hp
W,Tk,Hp
W
W,Hp
D W,Hp
-(-5) Hp
-(-5) T
-(-5) W,Hp
HC,D,RP(2.) W
HC,D W,Hp
-(-5) W
PHC
-(5-10)
FPC
W,Hp
W
W,R
FPC W,R
PHC,D,FPC T,W RP(4)
--(-5) T,W,R
-(-5) T,W,R
--(5-10) T,W
MCW,HC, T,W,R RP
-(-5) W
-(-5) T
-(-5)
RP
-(-5)
-(5-10)
PHC,D
-(-5)
RP
-(5-10)
T
T,W
W,R
T,W
W,Hp
T W,Tk,Hp
W,Hp
DRP, W,Tk,Hp
MCW,PHC, W,Tk,Hp D R
-(5-10) W
PO
PO PO
PO
PO
PO -(-5)
-(-5)
-(5-10)
-(5-10)
-(-5)
PO
PO PO
PO
PO PO -(-5)
-(-5)
PO PO
PO -(-5)
--(10+)
-(10+)
-(10+)
-(5-10)
-(10+)
-(10+ )
-(-5)
-(-5)
-(5-10)
-(5-10)
-(-5)
Sunday
-(-5)
Sunday
-(-5)
Tuesday
-(5-10)
-(-5)
-(-5)
-(-5)
Tuesday
Wednesday
-(-5)
po, Phone Wednesday
PO -(10+)
PO -(5:"10)
PO -(-5) PTO, Phone Sunday
PO -(-5)
-(-5) -(-5)
PO -(5-10)
PTO, Phone Wednesday
-(-5) -(-5)
PTO, Phone -(-5)
-(-5)
PO PO -(5-10)
-(-5)
-(5-10)
-(-5)
-(5--10)
PTO, Phone Friday
-(-5) -(-5)
PO -(10+)
PO -(10+)
PO -(5-10)
PO, Phone Saturday
PO -(5-10)
Communications
(10)
-(-5)
BS
BS
BS
BS
BS
-(-5)
BS
BS
-(-5)
BS
BS
-(-5)
BS
BS
BS
BS
BS
BS
BS
BS
BS
BS
BS
BS
BS
BS
BS
BS BS
BS
BS
-(-5)
BS
BS
BS
BS
BS
BS
BS
BS
BS
BS
BS
BS
--~---~------........... --------------------------------------------_-
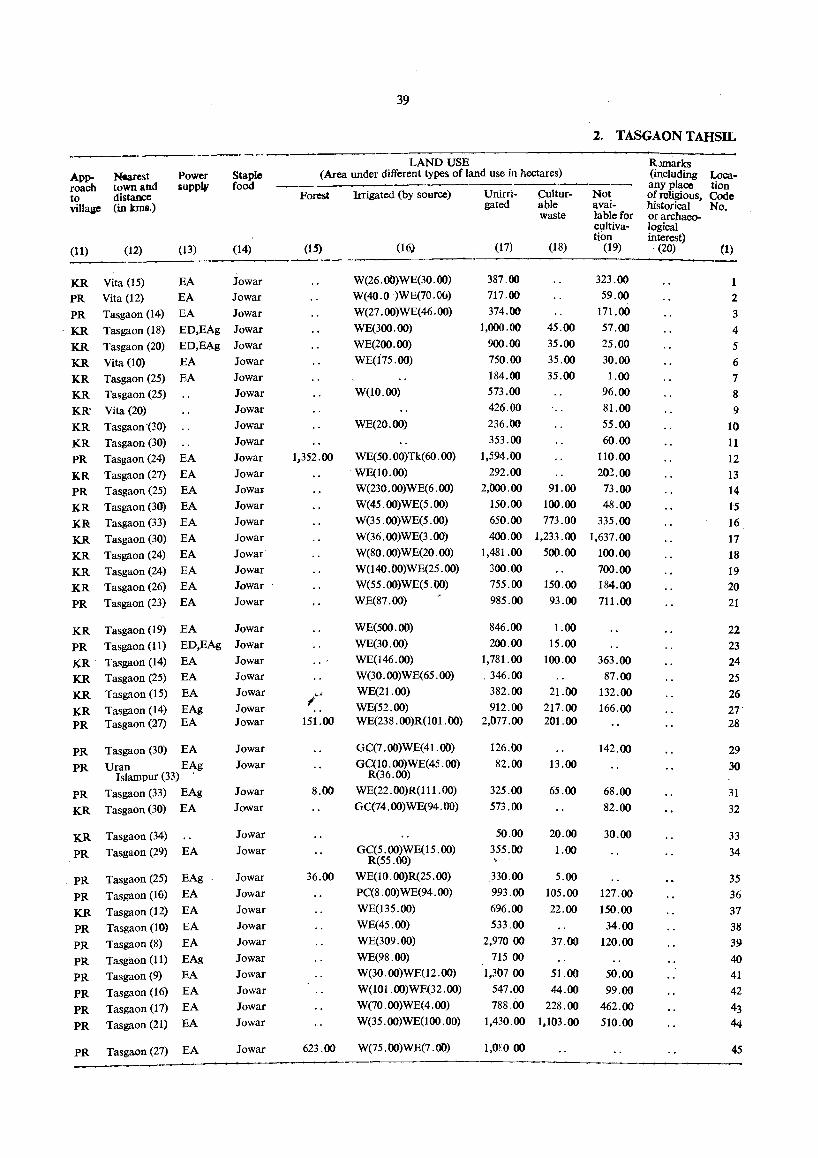
39
2. TASGAON TAHSIL
----------------- LAND USE ApI>- Nearest Power
aupp]f Staple food
(Area under different types of land use in hectares) R..Jl1larks (including any place of religious, historical orarchaeological
Location Code No.
roach town and to distance villaae (in kIn •. )
(11) (12) (13)
KR Vita (15) EA PR Vita (12) EA
PR Tasgaon (14) EA
. KR Tasgaon (18) ED,EAg
KR Tasgaon (20) ED,EAg
KR Vita (10) EA
KR Tasgaon (25) EA KR Tasgaon (25)
KR' Vita (20)
KR Tasgaon '(30)
KR Tasgaon (30)
PR Tasgaon (24) EA
KR Tasgaon (27) EA PR Tasgaon (25) EA
KR Tasgaon (30) EA
KR Tasgaon (33) EA
KR Tasgaon (30) EA
KR Tasgaon (24) EA
KR Tasgaon (24) EA KR Tasgaon (26) EA
PR Tasgaon (23) EA
KR Tasgaon (19) EA
PR Tasgaon (11) ED,EAg
KR Tasgaon (14) EA KR Tasgaon (25) EA
KR Tasgaon (15) EA
KR Tasgaon (14) EAg PR Tasgaon (27) EA
PR Tasgaon (30) EA
PR Uran EAg Isiampur (33) .
PR Tasgaon (33) EAg
KR Tasgaon (30) EA
KR Tasgaon (34)
PR Tasgaon (29) EA
. PR Tasgaon (25) EAg
PR Tasgaon (to) EA
KR Tasgaon (12) EA
PR Tasgaon (10) EA
PR Tasgaon (8) EA
PR Tasgaon (11) EAg
PR Tasgaon (9) EA
PR Tasgaon (16) EA
PR Tasgaon (17) EA
PR Tasgaon (21) EA
PR Tasgaon (27) EA
(14)
Jowar Jowar
Jowar
Jowar
Jowar
Jowar
Jowar
Jowar
Jowar
Jowar
Jowar
Jowar
Jowar Jowal"
Jowar
Jowar
Jowar
Jowar
Jowar Jowar
Jowar
Jowar
Jowar
Jowar Jowar
Jowar
Jowar Jowar
Jowar
Jowar
Jowar
Jowar
Jowar
Jowar
Jowar
Jowar
Jowar
Jowar
Jowar
Jowar
Jowar
Jowar
Jowar
Jowar
Jowar
Forest
(15)
Irrigated (by source)
(16)
W(26.00)WE(30.oo) W(4O.0 }WE(70.0o)
W(27.oo)WE(46.oo)
WE(3oo.oo)
WE(2oo.oo)
WE(i75.00)
W(10.oo)
WE(20.oo)
1,352.00 WE(50.OO)Tk(60.00)
151.00
8.00
WE(lO.OO) W(230.00)WE(6.00)
W(45.00)WE(5.00)
W(35. 00)WE(5. 00)
W(36.00)WE(3.00)
W(80. (0)WE(20. 00)
W(l4O. 00)WE(25. (0)
W(55. 00)WE(5. 00)
WE(87.00)
WE(500.00)
WE(30.00)
WE(146.oo) W(30.oo)WE(65.oo)
WE(21.00)
WE(52.00) WE(238.00)R(101.00)
GC(7.00)WE(41.00)
GC(10.oo)WE(45.00) R(36.oo)
WE(22. 00)R(111. 00)
GC(74. 00) WE(94. 00)
GC(5.00)WE(15.oo) R(55.00)
36.00 WE(IO.00)R(25.00) PC(8.00)WE(94.00)
WE(135.00)
WE(45.00)
WE(309.00)
WE(98.00) W(30.00)WE(12.00)
W(101.00)WE(32.00)
W(70.00)WE(4.oo)
W(35. OO)WE(I00. 00)
623.00 W(75 .00)WE(7 .00)
Unirri- Cultur-gated able
waste
(17) (18)
Not available for cultivation
(19) interest) . (20) (1) ----------------------
387.00 717.00
374.00
1,000.00
900.00
750.00
184.00 573.00
426.00
236.00
353.00
45.00
35.00
35.00
35.00
323.00
59.00
171.00
57.00
25.00
30.00
1.00 96.00
81.00
55.00
60.00
110.00
202.00
1,594.00
292.00 2,000.00
150.00 91.00 73.00
100.00 48.00
650.00 773.00 335.00
400.00 1,233.00 1,637.00
1,481.00 500.00 100.00
300.00 700.00 755.00 150.00 184.00
985.00 93.00 711.00
846.00
200.00
1,781.00
346.00
382.00
912.00 2,077.00
126.00
82.00
325.00
573.00
1.00
15.00
100.00
21.00 217.00 201.00
13.00
65.00
363.00
87.00
132.00
166.00
142.00
68.00
82.00
50.00 20.00 30.00 355.00 1.00
330.00 5.00
993.00 105.00 127.00
696.00 22.00 150.00
533.00 34.00
2,970.00
71500
1,30700
547.00
788.00
37.00
51.00
44.00
228.00 1,430.00 1,103.00
1,0EO.00
120.00
50.00
99.00
462.00
510.00
1 2
3
4
5
6
7 8
9 10
11
12
13
14
15 16
17
18
19 20
21
22
23
24
25
26
27 28
29
30
31
32
33
34
35
36 37
38
39
40 41 42
43 44
45

VILLAGE DIRECTORY
AMENITIES AVAILABLE Loca-tion Name of village
Total area Total of the village popula tion (in hectare~) and No. of
(If a village does not have a particular amenity, the distance-range in Km. of the nearest place where it can be availed of has been indicated
Code households
in that column inside brackets) No.
(1) (2)
46 Lokrewadi 47 Wadgaon
48 Anjani
49 Nagewadi
50 Gavhan
51 Vajrachaunde
52 Waghapur 53 Khujgaon
54 Kaul~ge
55 Dodi
56 Lodhe 57 Bhairavwadi 58 Punadi Tarf Tasgaon
59 Vanjarwadi 60 Dhavali
61 Turchi 62 Pal us
63 Gondilwadi
64 Punadi Tarf Walwa ..
65 Pundiwadi
66 Nagrale
(3)
250.00 803.00
926.00
300.00
800.00
305.00
411.00 1,954.00
262.00
393.00
215.00 353.00
1,210.00 405.00
1,205.00
1.252.00 1,882.00
334.00
(4)
590 (108) 1,731 (325)
2,383 (460)
613 (114) 2,683 (481)
756 (121)
876 (154) 1,445 (269)
997 (173) 652(115)
917 (160) 407 (75)
1,450 (275) 871 (141)
2,364 (422)
3,241 (532) 1,813 (279)
1,694 (264)
Educational
(5)
P P(2),M
P(2),M,H
P
P.M,H
P
P,M
P.M P,M P P
P P,M P P(2),M
P(3),M,H
P(3),M,H,
PUC P,M
554.00 2,849 (479) P.M
84.00 404 (63) P
606.00 2,594 (448) 'P,M
Medical
(6)
-(10+> -(10+) FPC
-(5-10)
RP
-(5-10)
-(5-10)
-(5-10) -(-5)
-(5-10)
-(5)
-(-5)
-(5-10)
-(-5)
HC,D
-(5-10)
Drinking water (potable)
(7)
w W
W,Tk
W
W.R
W,R W,Hp
W,Hp W,Hp
W
W
W
W,Hp
W,Hp
W,R
R MCW,PHC, T,W
D,FPC,RP (4)
-(-5) T
RP T,R
-(5-10) T,R
FPC T,R
67 Burli 1,345.00 4,891 (849) P(2),M,H, PHS,D,FPC, T,W,R C RP(2)
68 Amanapur 1,354.00 4,522 (796) P,M
69 Anugadewadi
70 Yelavi
71 Nimani 72 Wasambe
73 Chinchani
74 Savarde 75 Yogewadi
76 Manerajuri
, 77 Matkunki 78 Kumathe
79 Upalavi
80 Dhulgaon
52.00 2,866.00
1,105.00
755.00
2,571.00 5,482.00
630.00
.. 4,660.00
794.00 1,143.00
923.00 778.00
81 Nagaon Kavathe _ .. 947.00
82 Kavathe Ekand 2,673.00
83 Shirgaon Kavathe ..
84 BendTi 85 Nagaon Nimani
516.00 382.00
513.00
231 (41) P
7,575 (1,332) P(2),M(3). H
3,081 (554) P,M
1,582 (298) P,M
6,629 (1,191) P(3),M,H 3,941 (687) P,M,H
963 (186) P
11,265 (1,743) P (5)M,H
1,030 (169) P,M 5,178 (935) P,M,H
2,340 (415) P,M 1,867 (313) P,M 1,984 (350) P,M 7,025 (1,343) P(2),M,H
1,370 (245) P,M 844 (149) P,M
1,571 (281) P,M
D,RP
-(5-10) H,HC,D(2) RP
-(-5)
-(-5)
PHC,FPC
T,R
R
W,Hp,O
R
W,Hp
W
PHC,D W,Hp
-(-5) W,Hp
MCW,PHC, W,Hp D,RP(3) -(5-10) W
HC,D,RP(2) T,W,Hp
RP T,W -(-5) T,W
-(-5) W,Hp,O D,FPC,RP(5) W,Hp,O
HC D,RP
-(5-10)
R
W,Tk,R Hp,R
Post and telegraph
(8)
-(5-10)
PO
PO
-(-5) PO
PO
-(-5)
PO -(-5)
-(5-10)
P0 PO PD -(-5)
PO
P.o
Market day
(9)
-(10+)
-(10+) Friday
-(-5)
-(-5)
-(5-10)
-(10+) -(10+)
-(10+)
-(5-10)
-(5-W)
-(5-10)
-(5-10)
-(-5)
-(5-10)
-(5-10)
PTO, Phone Tuesday
-(-5) -(-5)
-(5-10)
-(5-10) -(5-10)
P9 -(5-10)
PTO, Phone Thursday
PO.
-(-5)
PO
PO -(-5)
PO
PO, Phone -(-5)
PO, Phone
PO PO
P0 -(5-10) -(-5)
PO
-(-5)
PO
-(-5)
-(5-10)
-(5-10)
Wednesday
--(-5)
-(-5)
-(5-10)
-(5-10)
-(-5)
Wednesday
-(5-10)
-(5-10)
-(1Of)
-(10+)
-(5-10)
-(5-10)
-(5-10) -(5-10)
-(5-10)
Communications
(10)
BS
BS
BS
BS
BS
BS
BS
BS BS
BS
BS -(-5)
BS
BS BS
BS
BS
-(-5)
BS
-(-5)
BS
BS
BS,RS
-(-5)
BS
BS
-(-5)
BS
BS
BS
BS
BS
BS
BS
BS
-(-5)
BS
BS
BS
BS
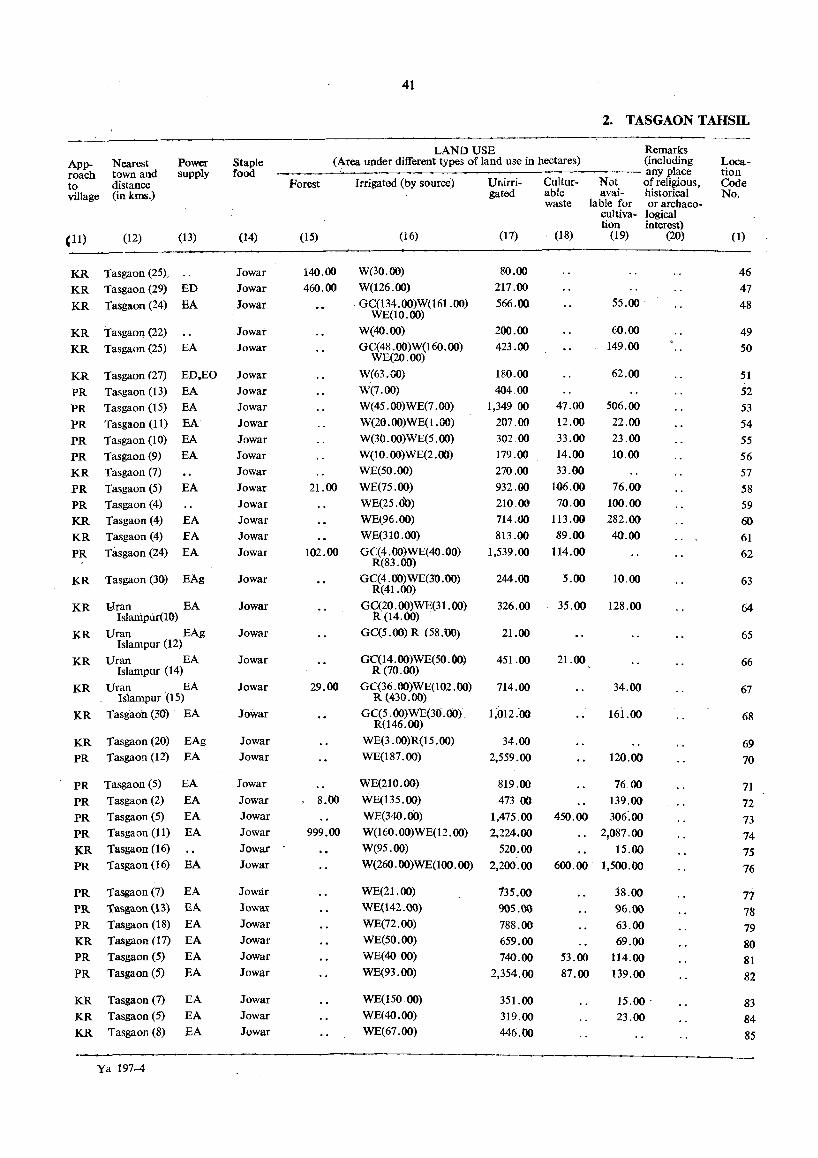
Approach to village
(11)
Nearest town and distance (in kIDs.)
(12)
Power supply
(13)
KR Tasgaon (25)
KR Tasgaon (29) ED
KR Tasgaon (24) EA
KR Tasgaon (22)
KR Tasgaon (25) EA
KR
PR PR PR PR PR KR PR PR KR KR PR
KR
KR
KR
KR
KR
KR
Tasgaon (27) ED,EO Tasgaon (13) EA Tasgaon (15) EA Tasgaon (11) EA Tasgaon (10) EA Tasgaon (9) EA Tasgaon (7)
Tasgaon (5) EA Tasgaon (4)
Tasgaon (4) EA Tasgaon (4) EA Tasgaon (24) EA
Tasgaon (30) EAg
lJran EA Islaffipur(lO)
Dran EAg Islampur (12)
Dran EA Islampur (14)
Dran EA Islampur (IS)
Tasgaon (30) EA
KR Tasgaon (20) EAg PR Tasgaon (12) EA
PR Tasgaon (5) EA PR Tasgaon (2) EA PR Tasgaon (5) EA PR Tasgaon (11) EA KR Tasgaon (16)
PR Tasgaon (16) EA
PR Tasgaon (7) EA PR Tasgaon (13) EA PR Tasgaon (18) EA KR Tasgaon (17) EA PR Tasgaon (5) EA PR Tasgaon (5) EA
KR Tasgaon (7) EA KR Tasgaon (5) EA KR Tasgaon (8) EA
.~.---
Ya 197-4
Staple food
(14)
Jowar Jowar
Iowar
Jowai" Jowar
_Iowar
Jowar Jowar Jowar Jowar Jowar Jowar Jowar Jowar Jowar Jowar JowaI
Jowar
Jowar
Jowar
Jowar
Jowar
Jowar
Jowar Jowar
Jowar Jowar Jowar Jowar
Jowar Jowar
Jowar Jowar
Jowar Jowar Jowar
Jowar
Jowar Jowar Jowar
41
2. TASGAON TAHSIL
LAND USE Remarks (Area under different types of land use in hectares) (including
,--~- any place Ur.irri- Cultur- Not of religious, Forest Irrigated (by source)
(15) (16)
140.00 W(30.00)
460.00 W(126.OO)
21.00
102.00
29.00
, 8.00
999.00
GC(134.oo)W(l61.oo) WE(IO.00)
W(4O.oo)
GC(48.oo)W(160.oo) WE(20.00)
W(63.00)
W(7.OO)
W(45 . 00)WE(7. 00)
W(20.oo)WE(1.00)
W(30.oo)WE(5.00)
W(1O.00)WE(2.00)
WE(50.oo)
WE(75.oo)
WE(25.00)
WE(96.00)
WE(310.00)
GC(4.00)WE(4O.00) R(83.oo)
GC(4. OO)WE(30.00) R(41.oo)
GC(20.oo)WE(31.oo) R (14.00)
GC(5.00) R (58.00)
GC(14.oo)WE(50.00) R(70.00)
GC(36. 00)WE(102. 00) R (430.00)
GC(5.00)WE(30.00). R(146.oo)
WE(3 . 00)R(15 .00)
WE(187. (0)
WE(21O.00)
WE(135.oo)
WE(34O.00)
W(160.00)WE(12.oo)
W(95.oo)
W(260. OO)WE(I00. 00)
WE(21.00)
WE(142.00)
WE(n.oo)
WE(50.00)
WE(4O 00)
WE(93.00)
WE(150.00)
WE(4O.oo)
WE(67.oo)
gated able avai- historical waste lable for or archaeo
cultiva- logical tion interest)
(17) (18) (19) (20)
80.00
217.00
566.00
200.00
423.00
180.00
404.00
1,349 00
207,00
30200
179.00
270.00
932.00
210.00
714.00
813.00
1,539.00
244.00
326.00
21.00
451.00
714.00
34.00
2,559.00
819.00
473.00
1,475.00
2,224.00
520.00
2,200.00
135.00
9()5.00
788.00
659.00
740.00
2,354.00
351.00
319.00
446.00
47.00
12.00
33.00
14.00
33.00
W6.00
70.00
113.00
89.00
114.00
5.00
35.00
21.00
55.00 '
60.00
149.00
62.00
506.00
22.00
23.00
10.00
76.00
100.00
282.00
40.00
10.00
128.00
34.00
16i .00
120.00
76,00
139.00
450.00 306:00
2~087.oo
15.00
600.00 1,500.00
38.00
96.00
63.00
69.00
53.00 114.00
87.00 139.00
15.00
23.00
Location Code No.
(1)
46
47
48
49
50
51
52
53
54
55
56
57
58
59
60
61
62
63
64
65
66
67
68
69
70
71
72
73
74
75
76
77
78
79
80
81
82
83
84
85
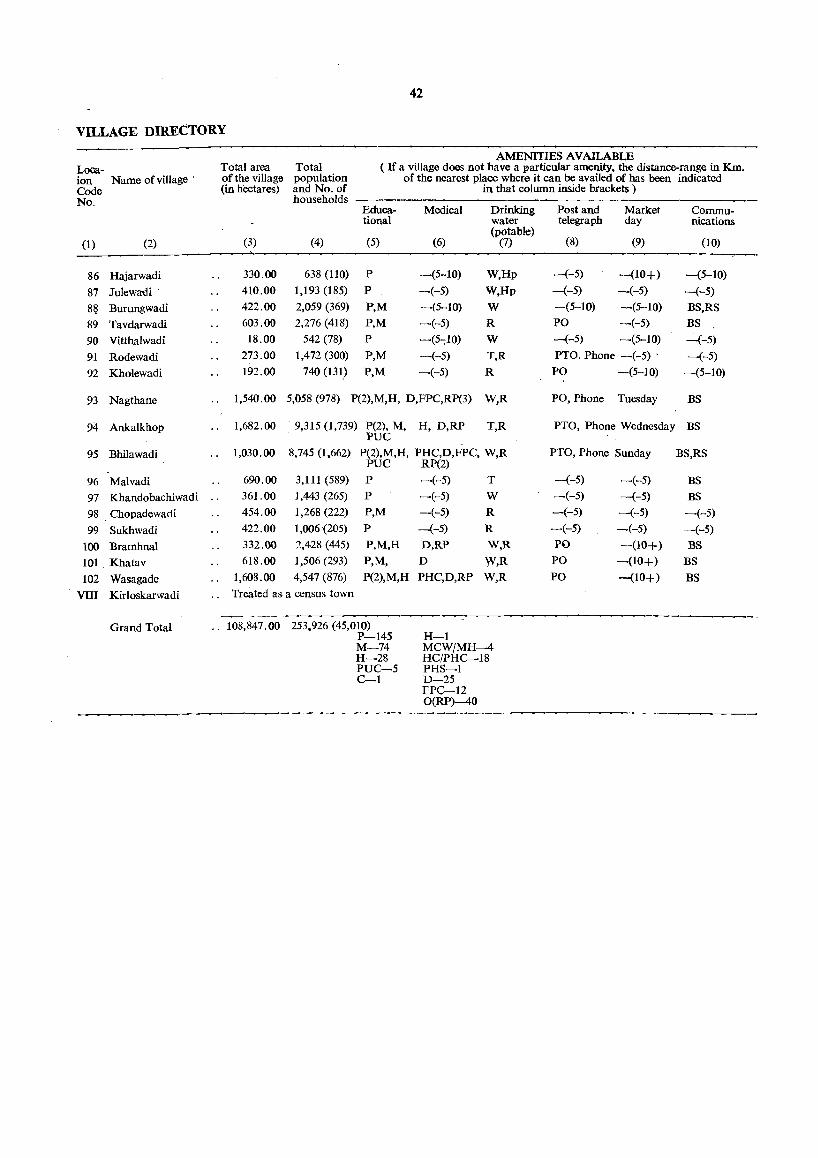
42
VILLAGE DIRECTORY
AMENITIES AVAILABLE Loca- Total area Total ( If a village does not have a fJarticular amenity, the distance-range in Km. ion Name of village ' of the village population of the nearest place where it can be availed of has been indicated Code (in hectares) and No. of in that column inside brackets) No. households
Educa- Medical Drinking Post and Market Commu-tional water telegraph day nications
(1) (2) (3) (4) (5) (6) (potable)
(7) (8) (9) (10)
86 Hajarwadi 330.00 638 (110) P -(5-10) W,Hp -(-5) -(10+) -(5-10)
87 Julewa-di 410.00 1,193 (185) P -(-5) W,Hp -(-5) -(-5) -(-5)
8~ Burungwadi 422.00 2,059 (369) P,M -(5-10) W -(5-10) -(5-10) BS,RS
89 Tavdarwadi 603.00 2,276 (418) P,M -(-5) R PO -(-5) BS
90 Vitthalwadi 18.00 542 (78) P -(5-:10) W -(-5) -(5-10) -':"(-5)
91 Rodewadi 273.00 1,472 (300) P,M -(-5) T,R PTO. Phone -(-5) - -(-5)
92 Kholewadi 192.00 740 (131) P,M -(-5) R PO -(5-10) -(5-10)
93 Nagthane 1,540.00 5,058 (978) P(2),M,H, D,FPC,RP(3) W,R PO, Phone Tuesday BS
94 Ankalkhop 1,682.00 . 9,315 (1,739) P(2), M, PUC
H, D,RP T,R PTO, Phone Wednesday BS
95 Bhilawadi 1,030.00 8,745 (1,662) P(2),M,H, PHC,D,FPC, W,R PTO, Phone Sunday BS,RS PUC RP(2)
96 Malvadi 690.00 3,111 (589) P -(-5) T -(-5) -(-5) BS
97 Khandobachiwadi .. 361.00 1,443 (265) P -(-5) W -(-5) -(-5) BS
98 . Chopadewadi 454.00 1,268 (222) P,M -(-5) R -(-5) -(-5) -(-5)
99 Sukhwadi 422.00 1,006(205) P -(-5) R -(-5) -(-5) -(-5)
100 Bramhnal 332.00 2,428 (445) P,M,H D,RP W,R PO -(10+) BS
101 Khatav 618.00 1,506 (293) P,M, D W,R PO -(10+) BS
102 Wasagade 1,608.00 4,547 (876) P(2),M,H PHC,D,R:P W,R PO -(10+) BS VIII Kirioskarwadi .. Treated as a census town
Grand Total .. 108,847.00 253,926 (45,010) P-145 H-l M-74 MCW!MH-4 H-28 HC/PRC-18 PUC-5 PHS-l C-l D-25
FPC-12 O(RP)-40
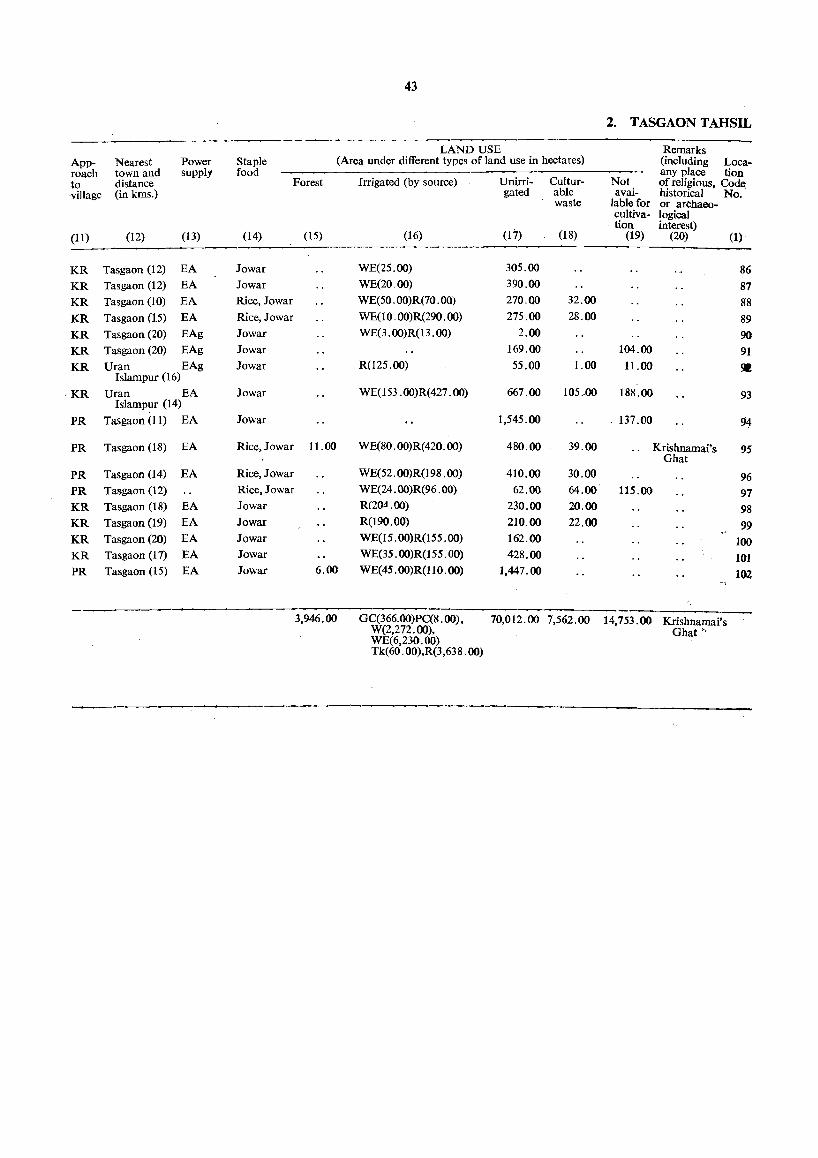
43
2. TASGAON TAHSIL
LAND USE Remarks App- Nearest Power Staple (Area under different types of land use in hectares) (including Loca-roach town and supply food any place tion to distance Forest Irrigated (by source) Unirri- Cultur- Not of religious, Code ·village (in kms.) gated able avai- historical No.
waste lable for or archaeo-cultiva- logical
. tion interest) (11) (12) (13) (14) (15) (16) (17) (18) (19) (20) (1)
KR Tasgaon (12) EA Jowar WE(25.00) 305.00 86
KR Tasgaon (12) EA Jowar WE(20.00) 390.00 87 KR Tasgaon (10) EA Rice, Jowar WEe 50. OO)R(70. 00) 270.00 32.00 88
KR Tasgaon (15) EA Rice, Jowar WEe 10 . 00)R(290. 00) 275.00 28.00 89 KR Tasgaon (20) EAg Jowar WE(3 . 00)R(13 . 00) 2.00 90
KR Tasgaon (20) EAg Jowar 169.00 104.00 91 KR Uran EAg Jowar
Islampur (16) R(l25.00) 55.00 1.00 11.00 ~
·KR Uran EA Jowar WEe 153 .OO)R( 427.00) 667.00 105 .. 00 188.00 93 Islampur (14)
PR Tasgaon (11) EA Jowar 1,545.00 137.00 94
PR Tasgaon (18) EA Rice, Jowar 11.00 WE(80.00)R(420.00) 480.00 39.00 .. Krishnamai's 95 Ghat
PR Tasgaon (14) EA Rice, Jowar WEe 52. 00)R(198 .00) 410.00 30.00 96 PR Tasgaon (12) Rice, Jowar WE(24. 00)R(96 .00) 62.00 64.00 115.00 97 KR Tasgaon (18) EA Jowar R(2OJ .(0) 230.00 W.OO 98 KR Tasgaon (19) EA Jowar R(190.00) 210.00 22.00 99 KR Tasgaon (20) EA Jowar WB(15 .OO)R(155 .00) 162.00 100 KR Tasgaon (17) EA Jowar WE(35 . 00)R(155 . 00) 428.00 101 PR Tasgaon (15) EA Jowar 6.00 WE(45.00)R(110.00) 1,447.00 102
3,946.00 GC(366.oo)PC(8.00), 70,012.00 7,562.00 14,753.00 Krishnamai's W(2,272.00), Ghat" WE(6,230.00) Tk(60.00),R(3,638.00)
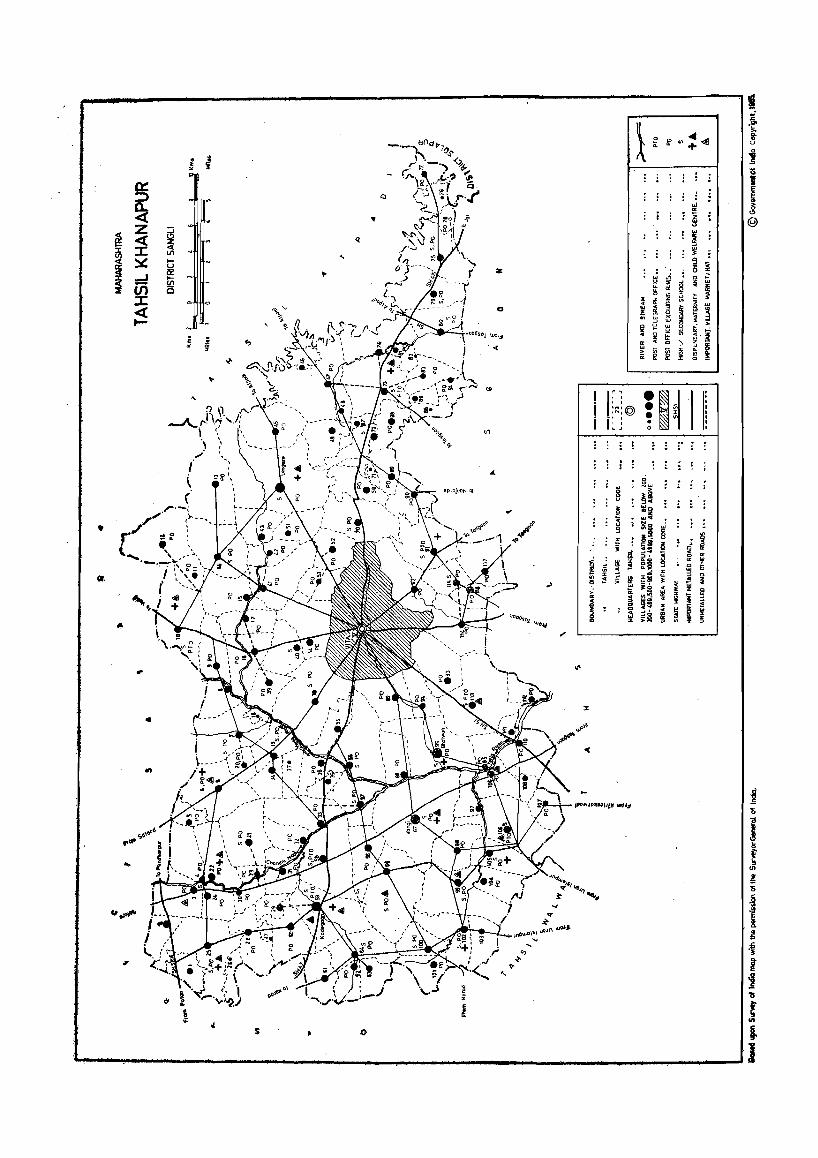
~ a.. « ~
z rii « :z ili :I: <l
III
I ~ .... u
...J If .... V; III a
Z
:I: « 0 ....
U1
•
..
..
s o
,.)
'f ~
~
JrC~1)\:: uo"n UlcWJ.
....
'"
i in ,. VI ;! ., Ii :i z g
In ' , , , ''''''@ (: , , . "
::: ::: z 9
~ ,. i
'" In
l!l '" :l ;!
; ~ ~ 0
~ '"
ul eo z t:
~ ~ g
~ ~ ~ 0 u ~ :i ~ ct
~ ~ !;1 > ..
" if i ,.
~
~ ~ I , ~ Ii " 0 w
~ z u
~ .. \i1 if '"
.. 0 \ l::' Ii;
~ x il' !Ii
i1 !( " '" ...
!f 0 ;!;
, I~I I Ii . .
.; £'"
d lI:~ ~ .. :1 § j 2:
~ >
~~ 0
g .. '" ~
~I 't'
~ !5
~i x " 0 ;0 1; li ib .. ;0 " 0 .. 51 l!1 x
~; .. ~ i ~ ~
~ '" I!
~ , !( !I' ~O ~ ;;1iI ! !!i
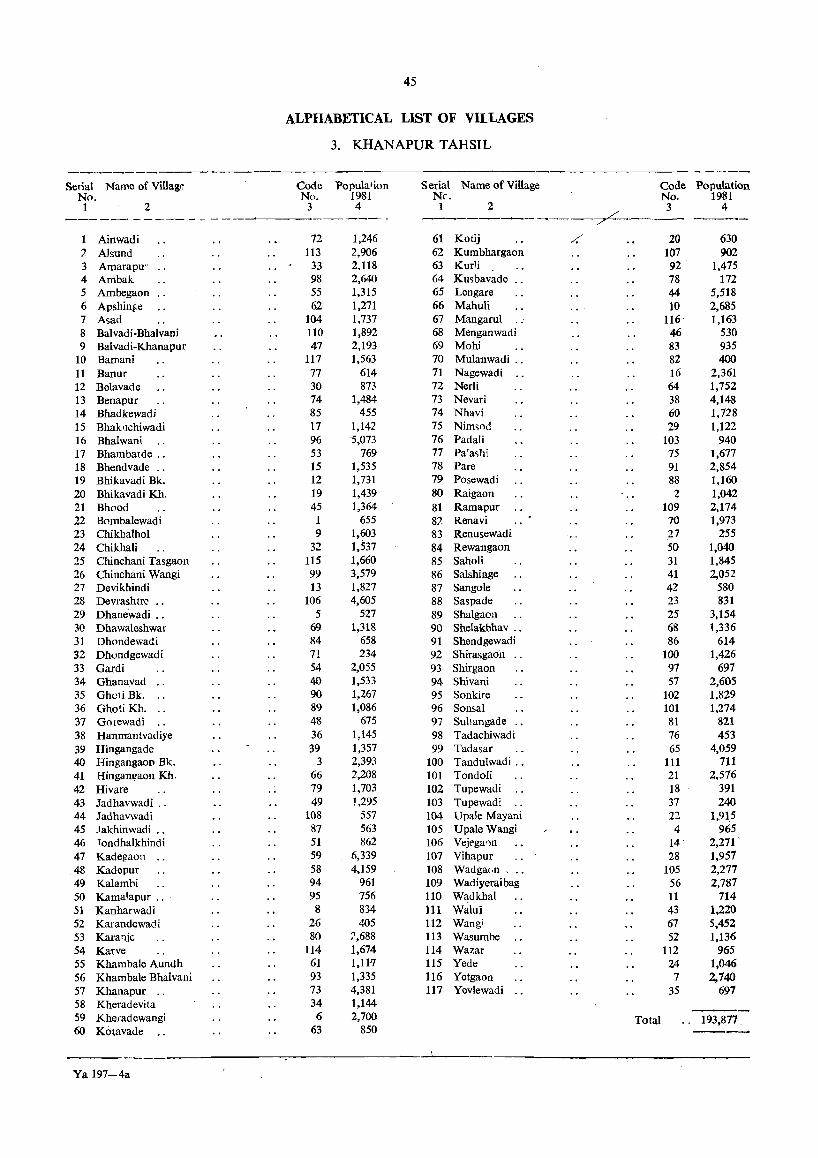
45
ALPHABETICAL LIST OF VII.,LAGES
3. KHANAPUR TAHSIL
------ _---_ Serial Name of VilIag~ Code Population Serial Name of Village Code Population
No. No. 1981 Nc. No. 1981 1 2 3 4 1 2 3 4
----~ ------ _- _--. -------------~---- --~-.
1 Ainwadi 72 1,246 61 Kotij /, 20 630 ? Alsund 113 2,906 62 Kumbhargaon 107 902 3 Amarapu:" 33 2,118 63 KurU 92 1,475 4 Ambak 98 2,640 64 Kusbavade 78 172 5 Ambegaon 55 1,315 65 Lengare 44 5,518 6 Apsbinfe 62 1,271 66 Mahuli 10 2,685 7 Asad 104 1,737 67 Mangarul 116 1,163 8 Balvadi·Bhalvani 110 1,892 68 Menganwadi 46 530 9 Batvadi-Khanapur 47 2,193 69 Mohi 83 935
10 Bamani 117 1,563 70 Mulanwadi .. 82 400 11 Banur 77 614 71 Nagewadi 16 2,361 12 Belavade 30 873 72 Nerli 64 1,752 13 Benapur 74 1,484 73 Nevari 38 4,148 14 Bhadkewadi 85 455 74 Nhavi 60 1,728 15 Bbak1lchiwadi 17 1,142 75 Niffi';od 29 1,122 16 Bhalwani 96 5,073 76 Pad ali 103 940 17 Bhambarde ., 53 769 77 Pa'a~hi 75 1,677 18 Bhendvade ., 15 1,535 78 Pare 91 2,854 19 Bhikavadi Bk. 12 1,731 79 Posewadi 88 1,160 20 Bhikavadi Kh. 19 1,439 80 Raigaon 2 1,042 21 Bhood 45 1,364 81 Ramapur 109 2,174 22 Bombalewadi 1 655 87. Rena vi 70 1,973 23 Chikhalhol 9 1,603 83 Renusewadi 27 255 24 Chikhali 32 1,537 84 Rewangaon 50 1,040 25 Chinchani Tasgaon 115 1,660 85 Saholi 31 1,845 26 Chinchani Wangi 99 3,579 86 Salshinge 41 2,052 27 Devikhindi 13 1,827 87 Sangole 42 580 28 Devrashtre .. 106 4,605 88 Saspade 23 831 29 Dhanewadi ., 5 527 89 Shalgaon 25 3,154 30 Dhawateshwar 69 1,318 90 Shelakbhav .. 68 1,336 31 Dhondewadi 84 658 91 Shendgewadi 86 614 32 Dhondgewadi 71 234 92 Shirasgaon 100 1,426 33 Gardi 54 2,055 93 Shirgaon 97 697 34 Ghanavad 40 1,533 94 Shivani 57 2,605 35 Ghc1i Bk. 90 1,267 95 Sonkire 102 1,829 36 Ghoti Kb. 89 1,086 96 Sonsal 101 1,274 37 Gorewadi 48 675 97 Sultangade 81 821 38 Hanmantvadiye 36 1,145 98 Tadachiwadi 76 453 39 Hingangade 39 1,357 99 Tadasar 65 4,059 40 Hingangaon Bk. 3 2,393 100 Tandulwadi .. 111 711 41 Hinganllaon Kh. 66 2,208 101 Tondoli 21 2,576 42 Hivare 79 1,703 102 Tupewadi 18 391 43 Jadhavwadi " . 49 1.295 103 Tupewadi 37 240 44 Jadhavwadi 108 557 104 Upale Mayani 22 1,915 45 Jakhinwadi .. 87 563 105 UpaleWangi 4 965 46 Tondhalkhindi 51 862 106 Vejt'ga0n 14 2,271' 47 Kadegaoll 59 6,339 107 Vihapur 28 1,957 48 Kadepur 58 4,159 108 Wadga(.n 105 2,277 49 Kalamhi 94 961 109 Wailiyeraibag 56 2,787 50 Kama1apur .. " 95 756 110 Wadkhal 11 714 51 Kanharwadi 8 834 111 Walui 43 1,220 52 Karandewad i 26 405 112 Wang; 67 5,452 53 KaraTljt; 80 'J,688 113 Wasumbe 52 1,136 54 Karve 114 1,674 114 Wazar 112 965 55 Khambale Aundh 61 1,11-7 115 Yede 24 1,046 56 Khambale Bhalvalli 93 1,335 116 Yetgaon 7 2,740 57 Khanapur .. 73 4,381 117 Yevlewadi 35 697 58 Kheradevita 34 1,144 59 Khecadewangi 6 2,700 Total 193,877 60 Kotavade 63 850 ---
Ya 197-4a
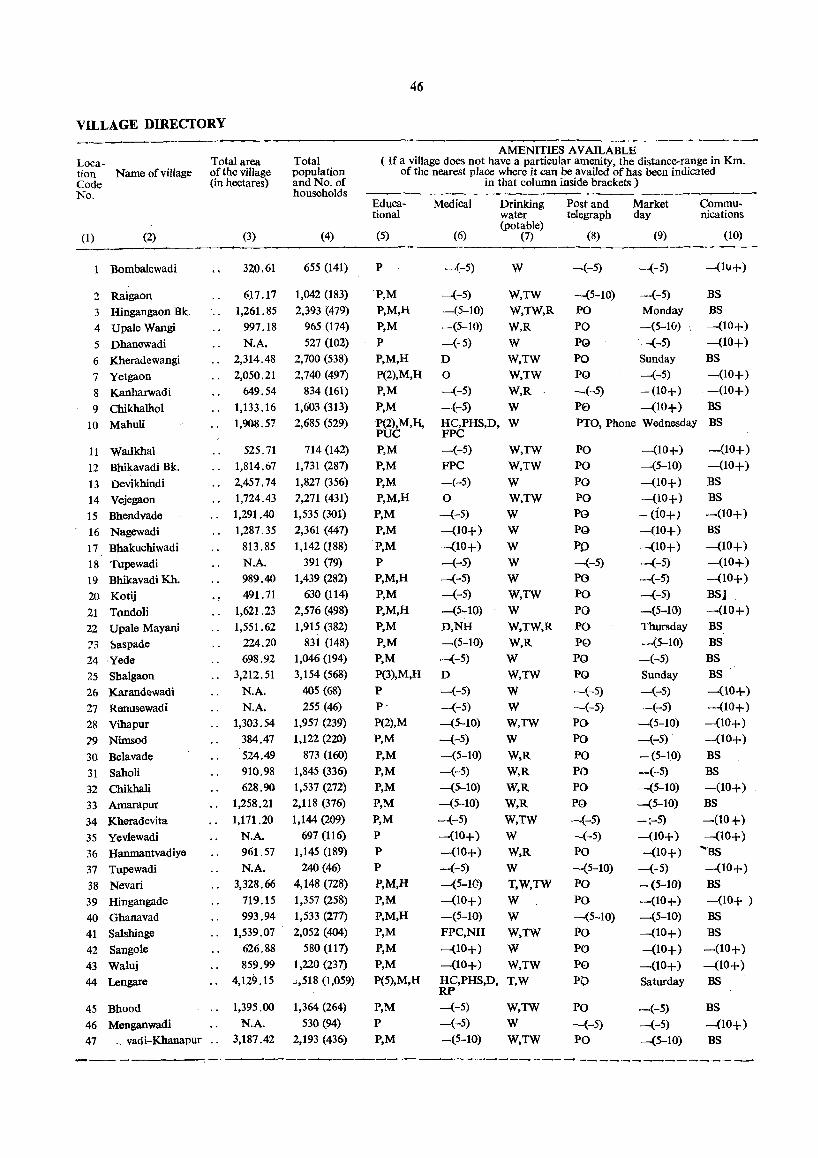
VILLAGE DIRECTORY
Loca-tion Name of village Code No.
(1) (2)
Bombalewadi
2 Raigaon 3 Hingangaon Bk. 4 Upale Wangi 5 Dhanewadi 6 Kheradewangi 7 Yetgaon 8 Kanharwadi
9 Chikhalhol
10 Mahuli
11 Wadkhal 12 Bhikavadi Bk.
13 Devikhindi 14 Vejegaon 15 Bhendvade 16 Nagewadi 17 Bhakuchiwadi 18 Tupewadi 19 Bhikavadi Kh. 20 Kotij
21 Tondoli 22 Upale Mayani 73 ~aspade
24 Yede 25 Sbalgaon 26 Karandewadi 27 Renusewadi 28 Vihapur 29 Nimsod 30 Belavade 31 Saholi 32 Chikhali
33 Amarapur 34 Kheradevita 35 Yevlewadi 36 Hanmantvadiye 37 Tupewadi
38 Nevari 39 Hingangade 40 Ghanavad 41 Salshinge 42 Sangole 43 Waluj 44 Lengare
45 Bhood 46 Menganwadi
Total area of the village (in hectares)
(3)
320.61
617.17
1,261.85
997.18
N.A. .. 2,314.48
.. 2,050.21
649.54
1,133.16
1,908.57
525.71
1,814.67
.. 2,457.74
.. 1,724.43
1,291.40
1,287.35
813.85
. ~
N.A. 989.40
491.71
1,621.23
1,551.62
224.20
698.92
.. 3,212.51
N.A. N.A.
1,303.54
384.47
524.49
910.98
628.90
1,258.21
1,171.20
N.A. 961.57
N.A. .. 3,328.66
719.15
993.94 1,539.07 .
626.88
859.99
., 4,129.15
1,395.00
N.A.
47 ., vadi-Khanapur .. 3,187.42
Total population and No. of households
(4)
655 (141)
1,042 (183)
2,393 (479)
965 (174)
527 (102)
2,700 (538)
2,740 (497)
834 (161)
1,603 (313)
2,685 (529)
714 (142)
1,731 (287)
1,827 (356)
2,271 (431)
1,535 (301)
2,361 (447)
1,142 (188)
391 (79)
1,439 (282)
630 (114)
2,576 (498)
1,915 (382)
831 (148)
1,046 (194)
3,154 (568)
405 (68)
255 (46)
1,957 (239)
1,122 (220)
873 (160)
1,845 (336)
1,537 (i72)
2,118 (376)
1.144 (209)
697 (116)
1,145 (189)
240 (46)
4,148 (728)
1,357 (258)
1,533 (277)
2,052 (404)
580 (117)
1,220 (237)
..;,518 (1,059)
1,364 (264)
530 (94)
2,193 (436)
46
AMENITIES AVAILABLE ( If a village does not have a particular amenity, the distance-range in Km.
of the nearest place where it can be availed of has been indicated
Educational
(5)
P
·P,M
P,M,H P,M
P P,M,H P(2),M,H P,M
P,M P(2),M,H, PUC P,M P,M P,M P,M,H P,M P,M P,M P P,M,H P,M P,M,H P,M P,M P,M P(3),M,H
P P-
P(2),M P,M P,M P,M P,M P,M P,M P P
P
P,M,H P,M P,M,H P,M P,M P,M P(5),M,H
P,M P P,M
Medical
(6)
-(-5)
-(-5)
-(5-10)
-(5-10)
-(-5)
D
o -(-5)
-(-5)
in that column inside brackets)
Drinking Post and Market water telegraph day (potable)
(7) (8) (9)
w
W,TW W,TW,R W,R
W W.TW W,TW W,R
W
-(-5)
-(5-10)
PO PO pg
PO pg
-(-5) pe
-(-5)
-(-5)
Monday -(5-10)
-(-5)
Sunday -(-5)
-(10+)
-(10+)
Commu~ nications
(10)
-(lI.i+)
BS BS -(10+)
-(10+)
BS -(10+)
-(10+)
BS
HC,PHS,D. W FPC
PTO, Phone Wednesday BS
-(-5)
FPC -(-5)
o -(-5)
-(10+)
-(10+) -(-5)
-(-5)
-(-5)
-(5-10)
D,NH -(5-10)
~(-5)
D
-(-5)
-(-5)
-(5-10)
-(-5)
-(5-10)
-(-5)
-(5-10)
-(5-10)
-(-5)
-(10+)
-(10+)
-(-5)
-(5-tr.)
-(10+) -(5-10)
FPC,NH
-(10+)
-(10+)
HC,PHS,D, RP -(-5)
-(-5)
-(5-10)
W,TW W,TW
W W,TW
W W W W W W,TW W W,TW,R W,R W W.TW W W W,TW
W W,R W,R W,R W,R
W,TW W W.R W T,W,TW
W W W,TW W W,TW T,W
W,TW
W W,TW
PO PO PO PO PG PO PO -(-5)
PO PO PO PO PO PO PO -(-5)
-(-5)
PO PO PO PO PO PO ~(-5)
-(-5)
PO -(5-10)
PO PO -(5-10)
PO PO P0
Pi;>
PO -(-5)
PO
-(10+)
-(5-10)
-(10+)
-(10+)
- (io+) -(10+)
-(10+)
-(-5)
-(-5)
-(-5)
-(5-10)
Thursday -(5-10)
-(-5)
Sunday -(-5)
-(-5)
-(5-10)
-(-5)
- (5-10)
-(--5) -(5-10)
-(5-10)
-;-5}
-(10+)
-(10+)
-(-5)
-(5-10) -(10+)
-(5-10)
-(10+)
-(10+)
-(10+)
Saturday
-(-5)
-(-5)
-(5-10)
-{10+)
-(10+)
BS BS ~(10+)
BS
-(10+)
-(lO+)
-(10+)
BSl -(10+)
BS BS BS BS _.
-(10+)
-(10+)
-(10+)
-(10+)
BS BS -(10+)
BS -(10+)
-(10+)
'Bs -(10+)
BS -(10+ )
BS BS -(10+)
-(10+)
BS
BS
--(10+)
BS
--~------------------~-- ----------------
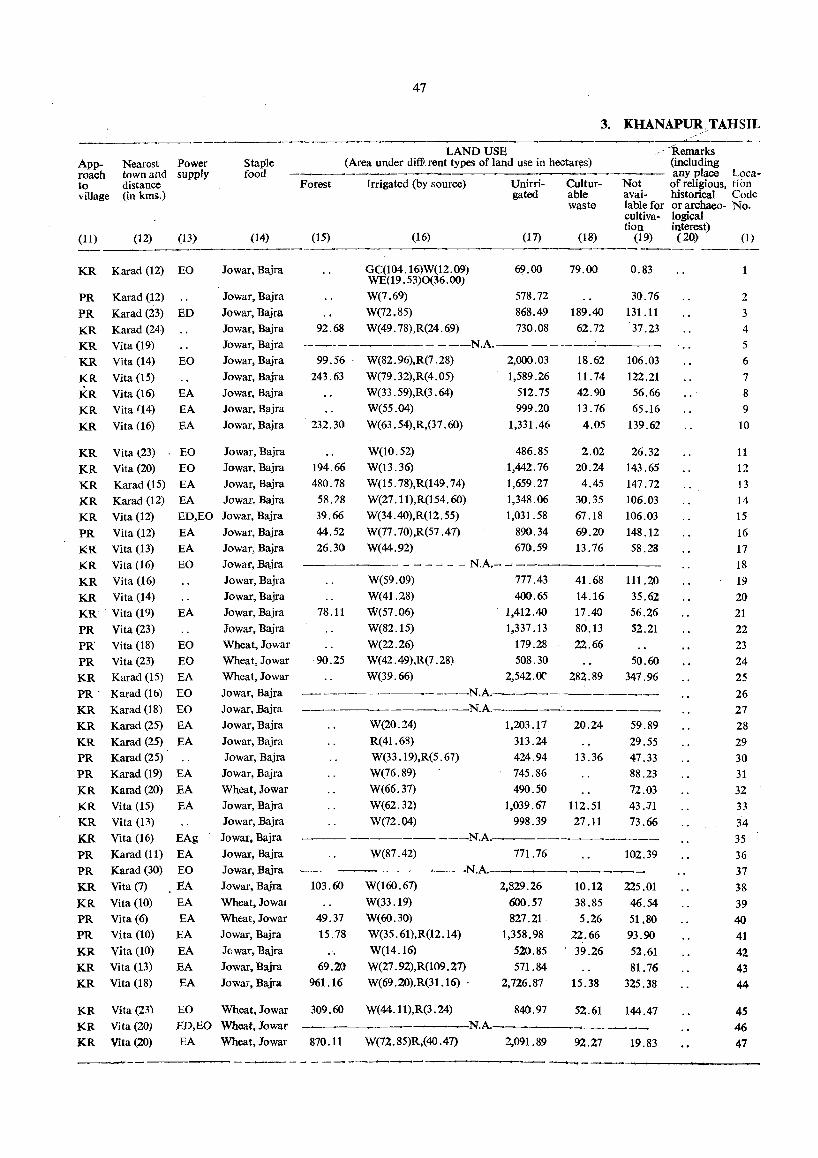
47
3. KHANAPU~,TAHSIL
.-----~ ----.--~-
Approach to village
(11)
Nearest Power town and supply distance (in lam.)
(12) (13)
KR Karad (12) EO
PR Karad (12)
PR Karad (23) ED
KR Karad (24)
KR Vita (19) KR Vita (14) EO
KR Vita (15)
KR Vita (16) EA KR Vita (14) EA
KR Vita (16) EA
KR Vita «..23) EO KR Vita (20.) EO
KR Karad (15) EA
KR Karad (12) EA
Staple food
(14)
Jowar, Bajra
Jowar, Bajra
Jowar, Bajra
Jowar, Bajra
Jowar, Bajra
Jowar, Bajra
Jowar, Bajra
Jowar, Bajra
Jowar, Bajra
Jowar, Bajra
Jowar, Bajra
Jowar, Bajra
Jowar, Bajra
Jowar. Bajra
KR Vita (12)
PR Vita (12)
KR Vita (13)
ED,EO Jowar, Bajra
EA Jowar, Bajra
EA Jowar, Bajra
KR Vita (16) EO
KR Vita (16)
KR Vita (14)
KR Vita (19) EA
PR Vita (23) PR" Vita (18) EO
PR Vita (23) EO
KR Karad (15) EA
PR' Karad (16) EO
KR Karad (18) EO
KR Karad (25) EA
KR PR
PR
KR
KR KR
KR PR
PR
KR KR PR
PR
KR KR
KR
Karad (25) EA
Karad (25)
Karad(19) EA
Karad (20.) EA
Vita (15) EA
Vita (13)
Vita (16) EAg
Karad (11) EA
Karad (3~) EO
Vita (1) EA
Vita (10.) EA
Vita (6) EA
Vita (10.) EA
Vita (10.) EA
Vita (13) EA
Vita (18) EA
Jowar, Bajra
Jowar, Bajra
Jowar, Bajra
Jowar, Bajra
Jowar, Bajra
Wheat, Jowar
Wheat, Jowar
Wheat, Jowar
Jowar, Bajra
Jowar, Bajra
Jowar, Bajra
Jowar, Bajra Jowar, Bajra
Jowar, Bajra
Wheat, Jowar
Jowar, Bajra Jowar, Bajra
JowaI, Bajra
Jowar, Bajra
Jowar, Bajra
Jowar, Bajra
Wheat, lowaI
Wheat, Jowar
Jowar, Bajra
Jo war, Bajra
Jowar, Bajra
Jowa;', Bajra
KR Vita (23)
KR Vita (20)
KR Vita (20)
EO Wheat, Jowar ED,EO Wheat, Jowar
EA Wheat, Jowar
LAND USE (Area under diffl. rent types of land use in hectar\)s)
"-Remarks (including any place Loca-
Forest Irrigated (by source) Unirri- Cultur- Not of religious, tiim gated able avai- historical Code
waste lable for or archaeo- No. cultiva- logical tion interest)
(15) (16) (17) (18) (19) (20.) (I)
GC(I04.16)W(12.0.9) WE(19. 53)0(36.00)
W(7.69)
W(72.85)
69.00
92.68 W(49. 78),R(24. 6<)
578.72
868.49
730..08
-----~-------N.A.----
99.56 W(82. 96),R(7 . 28) 2,000.0.3
243.63 W(79.32),R(4.0.5) 1,589.26
W(33. 59),R(3. 64) 512.75
W(55.04) 999.20.
232.30. W(63.54),R,(37.60) 1,331.46
W(10.52) 486.85
194.66 W(13.36) 1,442.76
480..78 W(15. 78),R(149. 74) 1,659.27
58.78 W(27. 11),R(154. 60) 1,348.0.6 39.66 W(34.4O),R(12.55) 1,0.31.58
44.52 W(77. 70.),R(57 .47) 890.34
26.30. W(44.92) 670..59
------ - --- - - N.A.-~-
78.11
90..25
W(59.09) 777.43
W(41.28) 400..65
W(57.0.6)
W(82.15)
W(22.26) W(42.49),R(7.28)
W(39.66)
1,412.40
1,337.13
179.28
50.8.30.
2,542.or
79.00
189.40
62.72
18.62
11.74
42.90
13.76
4.05
0..83
30..76
131.11
37.23
106.0.3
122.21 56.66
65.16
139.62
2.0.2 26.32
20..24 143.65
4.45 147.72
30..35 10.6.0.3
67.18 10.6.0.3
69.20. 148.12
13.76 58.28
41. 68 111.20. 14.16 35.62
17.40
80..13
22.66
282.89
56.26
52.21
50..60
347.96 --~---------N.A.-------·-_-__
-----.- N.A. ---W(20..24)
R(41.68)
1,20.3.17
313.24
20..24
W(33 . 19),R(5 . 67) 424.94 13.36
59.89
29.55
47.33
88.23
72.03
43.71
73.66
W(76.89)
W(66.37)
W(62.32)
W(72.04)
745.86
490..50.
1,0.39.67 112.51
998.39 27.11 -----------N.A .. -~--·----___ _
W(87.42) 771. 76
N.A.-~·----
10.3.60
49.37
15.78
69.20
961.16
W(160.67)
W(33.19)
W(60.30)
W(35. 61),R(12 .14)
W(14.16)
W(27 . 92),R(1 09.27)
W(69.20.),R(31.16) .
2,829.26
600.57
827.21 1,358.98
520.85
571.84
2,726.87
309.60 W(44.11),R(3.24) 840.97.
10..12
38.85
5.26
22.66 . 39.26
15.38
52.61
10.2.39
225.0.1
46.54 51,80.
93.90
52.61
81.76
325.38
144.47 ----N.A.. _________ _
870.11 W(72. 85)R,(4O.41) 2,091. 89 92.27 19.83
2 3
4
5
6
7
8
9
10
11
12
13 14 15
16
17
18
19
20.
21
22 23
24 25
26
27
28
29 3D
31
32
33
34
35
36
37
38
39
40
41
42 43
44
45
46 41
--,--------- - --- - - ----_. ----~-----

VILLAGE DIRECTORY
Loca-tion Name of village Code No.
(1) (2)
48 Gorewadi
49 Jadhavwadi
50 Rewangaon
51 Jondhalkhindi
52 Wasumbe. 53 Bhambarde
54 Gardi
55 Ambegaon 56 Wadiyenaibag
57 SlJivani
58., Kadepur
59 Kadegaon
.60 Nhavi
Total area of the village (in hectares)
(3)
N.A.
N.A.
1,227.86
784.31
870.91
717.53
1,384.88
N.A. 1,959.96
1,125.88
2,095.94
1,902.90
61 Khambale Aundh ..
62 Apshinge
1,123.04
863.63
556.06
596.53 63 Kotavade
64 NerJi
65 Tadasar 66 Hingangaon Kh. 67 Wangi
68 Shelakbhav 69 Dhawaleshwar
70 Renavi
71 Dhondgewadi
72 Ainwadi
73 Khanapur
74 Benapur
75 Palashi
76 Tadachiwadi
77 Banur
78 Kusbavade
79 Hivare
80 Karanje
81 Sultangade
82 M ulanwadi
83 Mohi
84 Dhondt'wadi
85 Bhadkewadi
86 Shendgewadi
87 lakhinwadi
88 Posewadi
89 Ghoti Kh.
90 Ghoti Bk.
91 Pare
92 Kurli
1,148.13
2,531.80
1,048.98
3,605:07
717.94
1,268.33
1,690.03
N:A.
N.A. 6,303.20
982.61
1,662.51
N.A. 1,146.9:
.227.85
1,541.91
1,809.41
117.77
N.A. 796.04
N.A. N.A. N.A. N.A.
N.A.
662.09
1,125.07
1,694.07
1,477.96
48
AMENITIES AVAILABLE Total population and No. of households
( If a village does not have a particular amenity, the distance-range in Km. of the nearest place where it can be availed of has been indicated
(4)
675 (115)
1,295 (242) 1,040 (200)
862 (155) 1,136 (215)
769 (149)
2,055 (346)
1,315 (246)
2,787 (503)
2,605 (487)
4,159 (641)
Educational
(5)
P
P,M
P,M
P,M
P,M
P P,M
P,M
P,M,H
P,M,H
P(2),M,H
6,339 (1,194) P(3),M,H, PUC
1,728 (318)
1,117 (207) 1,271 (216)
85G (156)
1,752 (320)
4,059 (780)
2,208 (400)
5,452 (948)
1,336 (232)
1,318 (250) 1,973 (390)
234 (41)
1,246 (231)
4,381(790)
1,484 (250)
1,677 (301)
453 (90)
614 (107)
172 (25)
1,703 (316)
2,688 (479)
821 (135)
400 (73)
935 (168)
658 (112)
455 (91)
614 (107)
563 (113)
1,160 (214)
1,086 (208)
1,267 (221)
2,854 (542)
1,475 {262)
P,M
P,M P,M
P
P,M,.fI P,M,H
P,M
P,M,H
P,M
P,M
P,M,H
P P,M,H
P(12),M,H, PUC
P,M
P(2),M,H
P
P,M
P
P,M,H
P(3),M,H
P,M
P
P,M
P,M
P
P P' P,M
P,M
P,M
P,M,H
P,M
in that column inside brackets)
Medical
(6)
-(5-10)
-(5-10)
-l1O+) -(-5)
-(5-10)
-(-5)
-(5-10)
-(5-10)
-(10+) -(5-10)
RP
MCW,HC, PHS, FPC,D,RP,
-(-5)
- (5-10)
--(5-10) --(5-10)
-(5-10)
RP -(-5)
HC,PHS,D, RP
-(10+) -(5-10) -(5-10)
-(5-10)
-(5-10)
HC,PHS,D, RP -(5-10)
-(5-10)
-(10+)
-(10+)
-(10+)
NH
-(5-10)
-(-5)
-(5-10)
-(5-10)
-(5-1u)
-(5-10)
-(5-10)
-(5-10)
-(-5)
-(5-10)
--(5-10)
Drinking Post and Market Communications water telegraph day
(potable) (7) (8) (9) (10)
W
W W
W,TW
T,W
W,TW
W
W,TW
W,TW!R
W,R
W,TW
W,TW
W
W
W,TW
W W
W,TW
W
W,TW
W,R
W
W,TW
W
W
T,W
W
W
TW
W
W,TW
W,TW
W,TW,R
W,TW,R
W
W
W
W,TW
W
W
T
W
W,TW
--(5-10)
-(5-1v) pa PO
PO
PO PO
--(-5)
PO PE)
-(5-10)
---(5-10)
--(10+)
-(-5)
-(5-10)
-(-5)
--(5-10)
-(5-10)
-(10+), -(5-10)
-(10+)
-(10+) BS
BS
BS
BS
BS
-(10+)
-(10+)
PTO, Phone -(-5)
BS
BS
PTO, Phone Friday BS
PO
--(-5)
PO --(5-1Q)
PO
PE> Pf)
PO
PO PE)
PO
-(5-10) -(5-10)'
-(-5) --(10+)
-(5-10) --(10+)
-(5-10) -(10+) -(5-10) -(lQ+)
-(5-10) BS
Wednesday, BS --(-5) BS
Thursday
--(-5)
-(5-10)
-(5-10) --(5-10)
-(5-10)
BS
--(10+) BS
BS
-(10+)
--(10+)
PTO, Phone Friday B5
-(5-10)
PO
-(5-10)
PO
PO
PO
PO
PO
""':'(5-10)
PO
PO
-(-5)
-(-5)
-(5-10)
PO
PO
PO
-(5-10)
-(5-10)
-(10+)
-(10+)
-(10+)
-(5-10)
-(5-10)
-(-5)
-(5-10)
-(5-10)
-(5-10)
-(5-10)
-(5-10)
-(5 -10)
-(-5)
-(5-10)
-(10+)
-(10+)
BS
~10+) -(10+)
-(10+)
BS
BS
BS
-(10+)
-(10+)
-(10+)
-(10+)
-(10+)
-(10+)
-(10+)
BS
-(10+) HC,PHS,D T, W
-(-5) T,W PTO, Phone -(5-10) BS
PO -(5-10) BS .
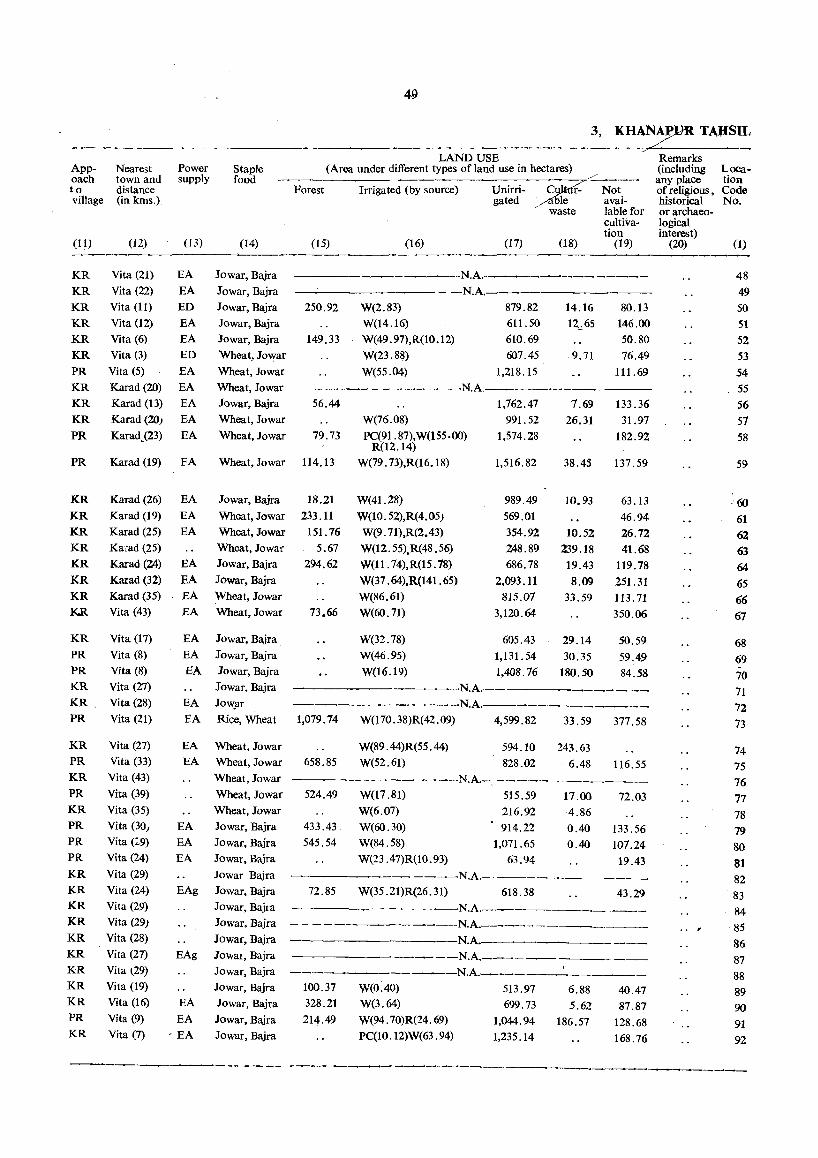
Appoach to village
(II)
KR
KR KR
KR
KR
KR
PR
KR
KR
KR
PR
PR
KR
KR KR
KR
KR
KR KR
K.R
KR
PR
PR
KR
KR
PR
KR
PR
KR
PR
KR PR
PR PR
Nearest town and distance (in kms.)
(12)
Vita (21)
Vita (22)
Vita (11)
Vita (12)
Vita (6) Vita (3)
Vita (5)
Karad (20)
Karad (13)
Karad (20)
Karad.(23)
Karad (19)
Karad (26)
Karad (19)
Karad (25)
Karad (25)
Karad (24)
Karad (32)
Karad (35) Vita (43)
Vita (17}
Vita (8)
Vita (8)
Vita (27)
Vita (28)
Vita (21)
Vita (27)
Vita (33)
Vita (43)
Vita (39)
Vita (35) Vita (30, Vita (~9)
Vita (24)
KR Vita (29)
KR Vita (24) KR Vita (29)
KR Vita (29)
KR Vita (28)
KR Vita (27)
KR Vita t29) KR Vita (19)
KR Vita (16)
PR Vita (9)
KR Vita (7)
3, KH~N? TAHSIL
Power supply
(13)
Staple food
(14)
EA Jowar, Bajra
EA Jowar, Bajra
LAND USE (Area under different types of land use in hectares)
<.: Forest
(15)
Irrigated (by source) Unirri- C1Jit.t1?-" Not gated ~le avai-
(16) (17)
waste lable for cultivation
(18) (19)
~--~--N.A..~~~-~-------
--N.A. ED
EA EA
ED
EA
EA
EA
EA
EA
JOwar, Bajra 250.92 W(2.83) 879.82 611.50
610.69
607.45
14.16
12,65
80.13
146.00
50.80
76.49
111.69
Jowar, Bajra
Jowar, Bajra 149.33
W(14.16)
W(49.97),R(10.12)
W(23.88)
W(55.04)
Wheat, Jowar 9.71 Wheat, Jowar 1,218.15
Wheat, Jowar ----- - - - -----N.A.
EA
EA
EA
EA
EA
EA
EA
EA
EA
EA
EA
EA
EA
EA
EA
Jowar, Bajra
Wheat, Jowar
Wheat, Jowar
Wheat, Jowar
Jowar, Bajra
Wheat, Jowar
Wheat, Jowar
Wheat, Jowar
Jowar, Bajra
Jowar, Bajra
Wheat, Jowar
Wheat, Jowar
Jowar, Bajra .
Jowar, Bajra
Jowar, Bajra
Jowar. Bajra Jow,ar
Rice, Wheat
Wheat, Jowar
Wheat, Jowar
Wheat, Jowar
Wheat, Jowar
Wheat, Jowar
EA Jowar, Bajra
EA Jowar, Bajra EA Jowar, Bajra
Jowar. Bajra EAg Jowar, Bajra
Jowar, Bajra
Jowar, Bajra
Jowar, Bajra EAg JowaI, Bajra
Jowar, Bajra
Jowar, Bajra
EA Jowar, Bajra
EA Jowar, Bajra , EA Jowar, Bajra
56.44
79.73
114.13
18.21
233.11
151. 76
5.67
294.62
73.66
W(76.08)
PC(91.87),W(lS5.00) R(12.14)
1,762.47
991.52
1,574.28
W(79.73),R(16.18)
W(41.28)
W(10.52),R(4.05)
W(9.71),R(2.43)
W(12. 55),R(48. 56)
Well. 74),R(15. 78)
W(37 . 64),R(14I . 65)
W(86.61)
W(60.71)
W(32.78)
W(46.95)
W(16.19)
1,516.82
989.49
569.01
354.92
248.89
686.78
2,093.11 815.07
3,120.64
605.43
1,131.54
1,408.76
N.A.-
7.69
26.31
38.45
10.93
10.52
239.18
19.43
8.09 33.59
29.14
30.35
180.50
---'--- -----N.A.-·----·--. 1,079.74 W(l70. 38)R(42 .09) 4,599.82 33.59
W(89.44)R(55.44) 594.10 243.63
133.36
31.97
182.92
137.59
63.13
46.94
26.72
41.68
119.78
251. 31
113.71 350.06
50.59
59.49
84.58
377.58
658.85 W(52.61) 828.02 6.48 116.55 ---.-- - -----N.A.-,---_-______ _
524.49 W(17.81) 515.59 17.00 72.03
433.43
545.54
72.85
W(6.07) 216.92 4.86 W(60.30) W(84.58)
W(23 .47)R(10. 93)
914.22
1,071.65
63.94
----N.A.----W(35.21)R(26.31) 618.38
0.40 0.40
133.56
107.24
19.43
43.29 .---~ -----N.A.------_____ _
100.37
328.21
214.49
--N.A.---- -N.A.----________ _
--N.A. ___ _
W(O.40) W(3.64)
W(94. 70)R(24. 69)
PC(10.12)W(63.94)
N.A.. ___ . __ _
513.97 699.73
1,044.94
1,235.14
6.88
5.62
186.57
40.47
87.87
128.68
168.76
Remarks (including anY place of religious, historical orarchaeological interest)
(20)
Location Code No.
(1)
48
49
50
51
52
53
54
55
56
57
58
59
'60 61
62
63
64
65
66 67
68
69
70
71
72 73
74 75
76
77
78 79
80
81
82
83
84
85
86
87
88
89
90
91
92
----------------
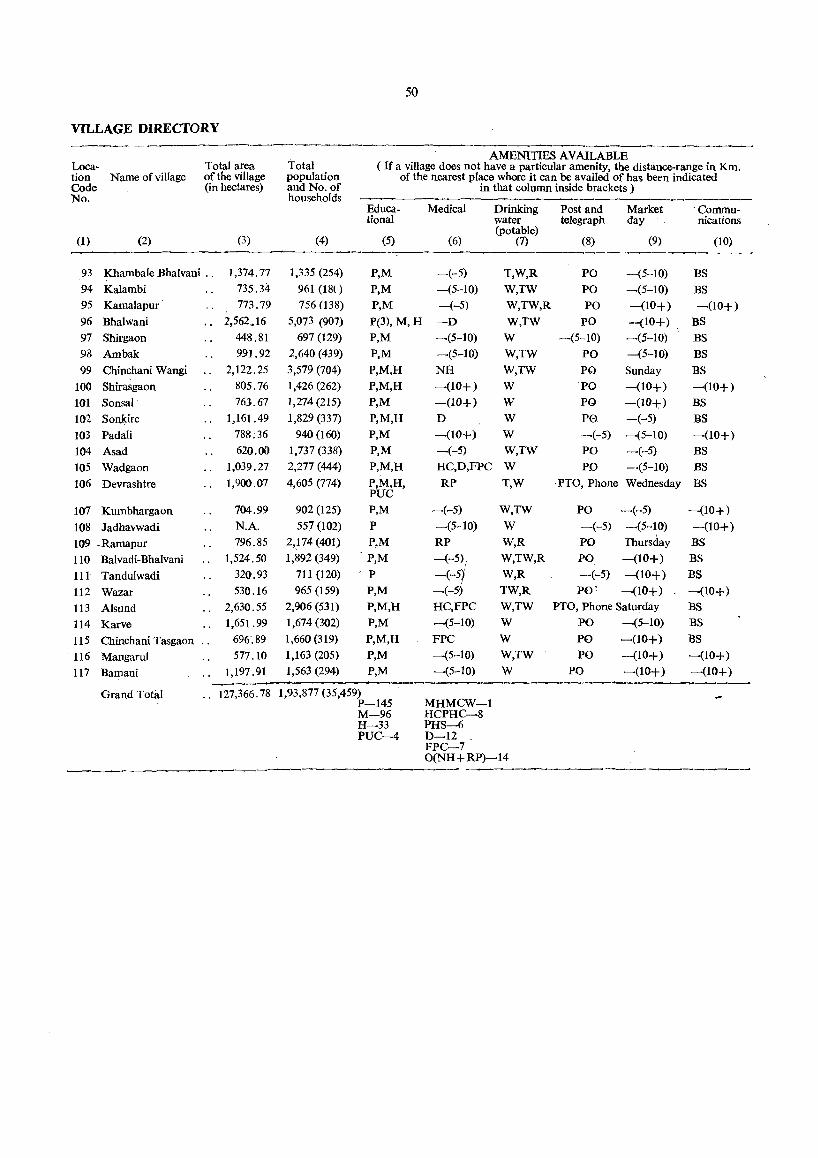
50
VILLAGE DIRECTORY
AMENITIES AVAILABLE Loca- Total area Total ( If a village does not have a particular amenity, the distance-range in Km. tion Name of village of the village population of the nearest place where it can be availed of has been indicated Code (i n hectares) and No. of in that column inside brackets) No. households
Educa- Medical Drinking Post and Market 'Commu-tional water telegraph day nications
(3) (potable)
(1) (2) (4) (5) (6) (7) (8) (9) (10)
93 Khambale Bhalvani .. 1,374.77 1,335 (254) P,M -(-5) T,W,R PO -(5-10) BS 94 Kalambi 735.34- 961 (18t) P,M -(5-10) W,TW PO -(5-10) BS 95 Kamalapur 773.79 756 (138) P,M -(-5) W,TW,R PO -(10+) -(10+) 96 Bhalwani " 2,562.16 5,073 (907) P(3), M, H -D W,TW PO -(10+) BS 97 Shirgaon 448.81 697 (129) P,M -(5-10) W -(5-10) -(5-10) BS 98 Ambak 991.92 2,640 (439) P,M -(5-10) W,TW PO --(5-10) BS
99 Chinchani Wangi 2,122.25 3,579 (704) P,M,H NH W,TW P0 Sunday BS
100 Shirasgaon 805.76 1,426 (262) P,M,H -(10+) W PO -(10+) -(10+ ) 101 Sonsal 763.67 1,274 (215) P,M -(10+) W PO -(10+) BS
102 SOnkire 1,161.49 1,829 (337) P,M,H D W PH -(-5) BS
103 Padali 788;36 940 (160) P,M -(10+) W -(-5) -(5-10) -(10+ )
104 Asad 620.00 1,737 (338) P,M -(-5) W,TW PO -(-5) BS
105 Wadgaon 1,039.27 2,277 (444) P,M,H HC,D,FPC W PD -.(5-10) BS
106 Devrashtre 1,900.07 4,605 (774) P,M,H, RP T,W ·PTO, Phone Wednesday BS PUC
107 Kumbhargaon 704.99 902 (125) P,M -(-5) W,TW PO -(-5) -(10+)
108 ladhavwadi N.A. 557 (102) P -(5-10) W -(-5) -(5-10) -(10+)
109 .Ramapur 796.85 2,174 (401) P,M RP W,R PO Thursday BS
110 Balvadi-Bhalvani 1,524.50 1,892 (349) P,M -(-5)/ W,TW,R PO -(10+) BS
111 Tandulwadi 320.93 711 (120) -P -(-51 W,R -(-5) -(10+) BS
112 Wazar 530.16 965 (159) P,M -(-5 TW,R PO~ --(10+) -(10+)
113 Alsund 2,630.55 2,906 (531) P,M,H HC,FPC W,TW PTO, Phone Saturday BS
114 Karve 1,651.99 1,674 (302) P,M -(5-10) W PO --(5-10) BS
115 Chinchani Tasgaon " 696.89 1,660 (319) P,M,H FPC W PO -(10+) BS
116 MaugaruI 577 .10 1,163 (205) P,M -(5-10) W,TW PO --(10+ ) --(10+)
117 Bamani 1,197.91 1,563 (294) P,M --(5-10) W PO -(10+) -(10+) _----_-- ~----~-............. ---.--............. ---..-.-.~---,..,........----
Grand Total " 127,366.78 1,93,877 (35,459) P-145 MHMCW-l
,.. M-96 HCPHC-8 H-33 PHS-6 PUC-4 D-12
FPC-7 O(NH + RP)-14 ---------
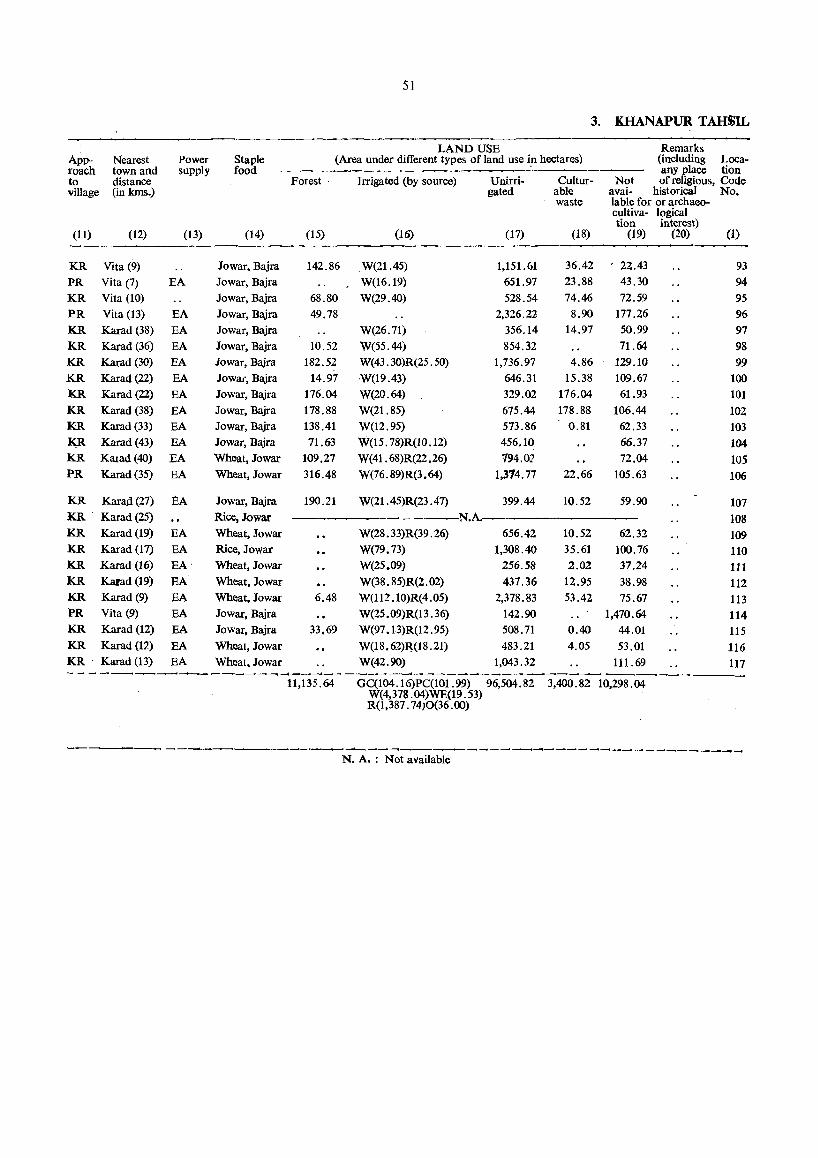
51
3. KHANAPUR TAHSiIL
LAND USE Remarks App·· Nearest Power Staple (Area under different types of land use i!l hectares) (including Loca-roach town and supply food any place tion to distance Forest· Irrigated (by source) Unirri- Cultur- Not of religious, Code village (in kms.) gated able avai- historical No.
waste lable for or archaeo-cultiva- logical tion interest)
(11) (12) (13) (14) (15) (16) (17) (18) (19) (20) (1)
KR Vita (9) Jowar. Bajra 142.86 W(21.45) 1,151.61 36.42 22.43 93
PR Vita (7) EA Jowar, Bajra W(16.19) 651.97 23.88 43.30 94
KR Vita (10) Jowar, Bajra 68.80 W(29.4O) 528.54 74.46 72.59 95
PR Vita (13) EA Jowar, Bajra 49.78 2,326.22 8.90 177.26 96
KR Karad (38) EA Jowar, Bajra W(26.71) 356.14 14.97 50.99 97
KR Karad (36) EA Jowar, Bajra 10.52 W(55.44) 854.32 71.64 98
KR Karad (30) EA Jowar, Bajra 182.52 W( 43. 30)R(25 . 50) 1,736.97 4.86 129.10 99
KR Karad (22) EA Jowac, Bajra 14.97 W(19.43) 646.31 15.38 109.67 100
KR Karad(22) EA Jowar, Bajra 176.04 W(20.64) 329.02 176.04 61.93 101
KR Karad (38) EA Jowar, Bajra 178.88 W(21.85) 675.44 178.88 106.44 102 KR Karad (33) EA Jowar, Bajra 138.41 W(12.95) 573.86 0.81 62.33 103
KR Karad (43) EA Jowar, Bajra 71.63 W(15. 78)R(10. 12) 456.10 66.37 104 KR Kaxad (40) EA Wheat, Jowar 109.27 W(41.68)R(22.26) 794.02 72.04 105 PR Karad(35) EA Wheat, Jowar 316.48 W(76.89)R(3.64) 1,374.77 22.66 105.63 106
KR Karad(27) EA Jowar, Bajra 190.21 W(21.45)R(23.41) 399.44 10.52 59.90 107 KR Karad (25) Rice, Iowar --·--N.A. 108 KR Karad (19) EA Wheat, Jowar W(28. 33)R(39. 26) 656.42 10.52 62.32 109 KR Karad (11) EA Rice, Jowar W(79.73) 1,308.40 35.61 100.76 110 KR Karad (16) EA' Wheat, Jowar W(25.09) 256.58 2.02 37.24 111 KR Karad (19) EA Wheat, Jowar W(38. 85)R(2. 02) 437.36 12.95 38.98 112 KR Karad (9) EA Wheat, Jowar 6.48 W(112.10)R(4.05) 2,378.83 53.42 75.67 113 PR Vita (9) EA Jowar, Bajra W(25.09)R(13.36) 142.90 1,470.64 114 KR Karad (12) EA Jowar, Bajra 33.69 W(97 .13)R(12 .95) 508.71 0.40 44.01 115 KR Karad (12) EA Wheat, Jowar W(18. 62)~(18 .21) 483.21 4.05 53.01 116 KR . Karad (13) EA Wheat. Jowar W(42.9O) 1,043.32 111.69 117 - - - --.-----------.~-------------------------
11,135.64 GC(104.16)PC(IOI.99) W(4,378.04)WE(19.53) R(I,387.74)0(36.oo)
96,504.82 3,400.82 10,298.04
-- '-~-------___'------------------------N. A. : Not available

MAHARASHTRA
TAHSIL ATPADI DISTRIC1 SANGLI
Kms I 0 2 6
~: I - -~ I-~
Mnes
'\ C
R
From po\a.n
o
<
BOUNDARY, OSTRICT
TAHSil
Vil-LAGE WITH LOCATION CODE NLMBER •.•
HEADOUARTal5; TAHSil ••
VIllAGES WITH POf\JLATION SIZE: BELOW lOO, 200-499,500-999,1000-':999,5000 AND ABOVE ••.
SlATE IIGIiW4r •••
IIIPClRTANT METALl.ED ROAD
I,1NMEIAUEJ) AND OffER ROADS
10 Kms ... I
Mites
'1"
C,
- - -__,::.._-. ,. 35
''''11_.,-.
A p u
© 0 ••••
SHS5A
________ w
Based upon S"rvey of India map with the pennission of the SurvevorGenerol of India.
R
o
/ • 3
"" ~,,~.,-
, • .-1'
RIVER AND STREAM '"
POST AND TELEGRAPH OfFICE •••
POST OFFICE EXCLUCiNG R.M.S.
HIGH / SECONOARY SCHOOL •••
POLICE STATION EXCLUDING RAILWA\' POUCE STATION.
PRIMARY HEALTH CENTRE,DISPENSARY, MATERNITV ANa. CHIL[ WELFARE CENTRE" ••• ... ." ... ••• ••• • ••
IMPORTANT VILLAGE MARKET / HAT •• ,
ToSan~
::)-7= Pro PO
5
PS
Vl
o
© Government of lnaia Copyright, '9~
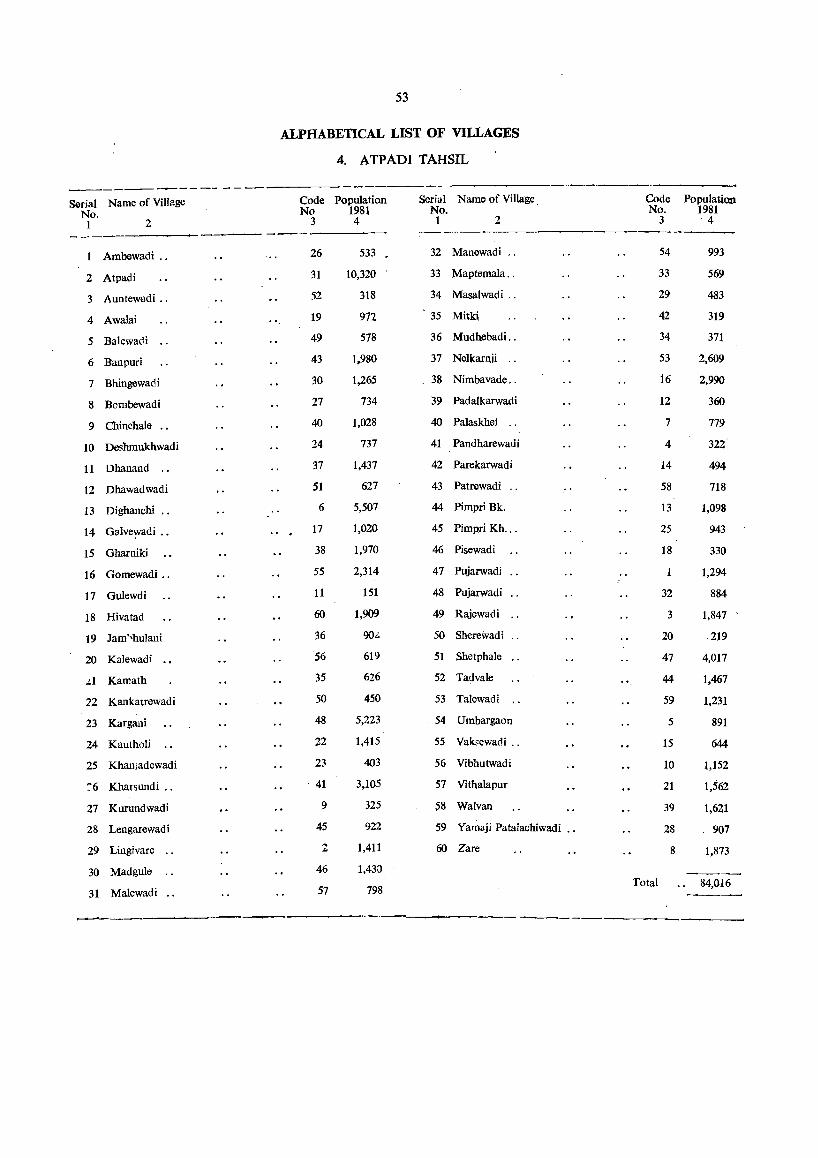
------------ --Serial Name of Village
No. 1 2
Ambewadi .,
2 Atpadi
3 Auntewadi ..
4 Awalai
5 BaJewadi
6 Banpuri
7 Bhingewadi
8 Bombewadi
9 Chinchale ..
10 Deshmukhwadi
11 Dhanand ..
12 Dhawadwadi
13 Dighanchi ..
14 Galvewadi ..
15 Gharniki
16 Gomewadi ..
17 Gulewdi
18 Hivatad
19 Jam"huJani
20 KaJewadi
.d Kamath
22 Kankatrewadi
23 Kargani
24 Kautholi
25 KhaDjadewadi
:6 Kharsundi ..
27 Kurundwadi
28 Lengarewadi
29 Lingivare ..
30 Madgule ..
31 Malewadi
53
ALPHABETICAL LIST OF VILLAGES
4. ATPADI TAHSIL
Code Population No 1981
3 4
26
31
52
19
49
43
30
27
40
24
37
51
6
17
38
55
11
60
36
56
35
50
48
22
23
41
9
45
2
46
57
533
10,320
318
972
578
1,980
1,265
734
1,028
737
1,437
627
5,507
1,020
1,970
2,314
151
1,909
619
626
450
5,223
1,415
403
3,105
325
922
1,411
1,43D
798
Serial Name of Village No. . 1 2
32 Manewadi ..
33 Maptemala ..
34 Masalwadi ..
35 Mitki
36 Mudhebadi ..
37 Nelkarnji .,
38 Nimbavade ..
39 Padalkarwadi
40 Palaskhel .,
41 Pandharewadi
42 Parekarwadi
43 Patrewadi ..
44 Pimpri Bk.
45 Pimpri Kh ...
46 Pisewadi
47 Pujarwadi
48 Pujarwadi ..
49 Rajewadi
50 Sherewad i ..
51 Shetphale
52 Ta?vale
53 Talewadi ..
54 Umbargaon
55 VakFewadi ..
56 Vibhutwadi
57 Vithalapur
58 Walvan
59 Yamaji Pataiachiwadi .'
60 Zare
Code Population No. 1981
Total
3 . 4
54
33
29
42
34
53
16
12
7
4
14
58
13
25
18
32
3
20
47
44
59
5
15
10
21
39
28
8
993
569
483
319
371
2,609
2,990
360
779
322
494
718
1,098
943
330
1,294
884
1,847
219
4,017
1,467
1,231
891
644
1,152
1,562
1,621
907
1,873
84,016
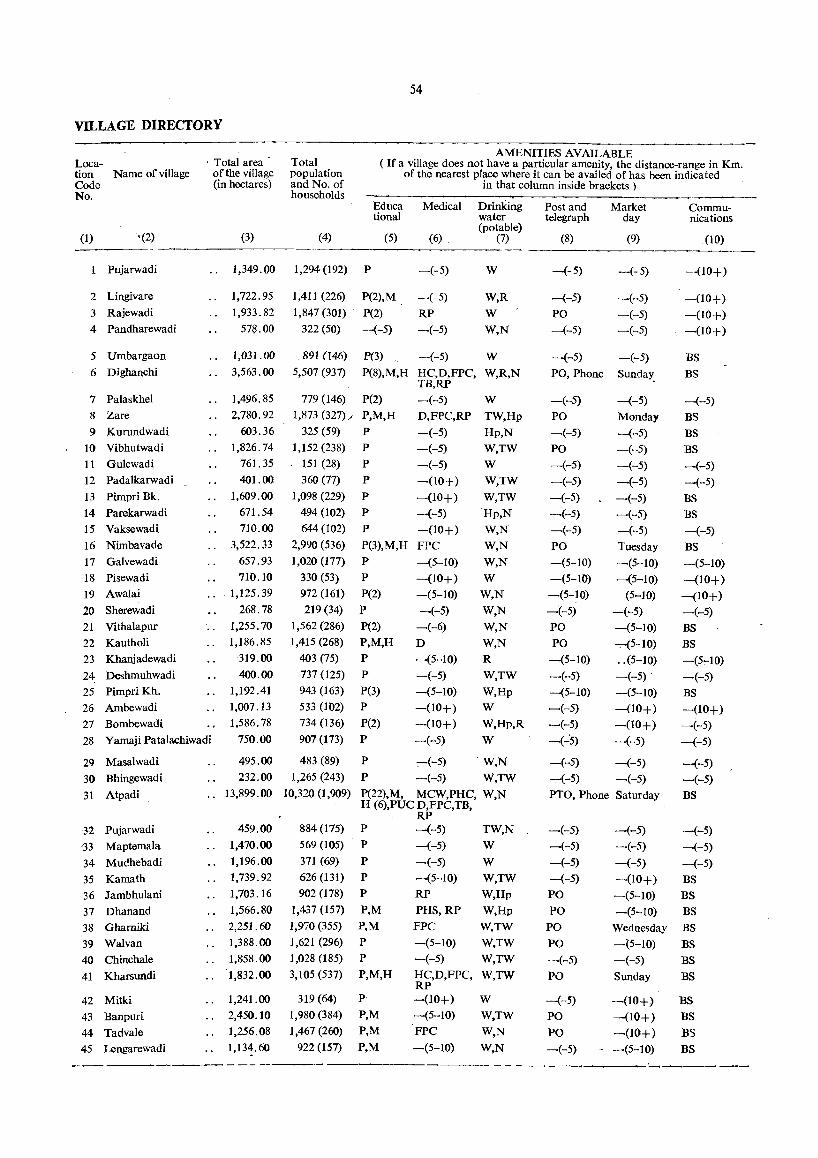
54
VILLAGE DIRECTORY
Loca-tion Name of village Code No.
(1) ;(2)
1 Pujarwadi
2 Lingivare
3 Rajewadi
4 Pandharewadi
5 Umbargaon
6 Dighanchi
7 Palaskhel
8 Zare
9 Kurundwadi
10 Vibhutwadi
11 Gulewadi 12 Padalkarwadi
13 Pimpri Bk.
14 Parekarwadi
15 Vaksewadi
16 Nimbavade
17 Galvewadi
18 Pisewadi
19 Awalai
20 Sherewadi
21 Vithalapur
22 Kautholi
23 Khanjadewadi
24 Deshmuhwadi
25 Pimpri Kh.
26 Ambewadi
27 Bombewadi
. Total area' of the village (in hectares)
(3)
1,349.00
1,722.95
1,933.82
578.00
1,031.00
3,563.00
1,496.85
2,780.92
603.36
1,826.74
761.35
401.00
1,609.00
671.54
710.00
3,522.33
657.93
710.10 .1,125.39
268.78
1,255.70
1,186.85
319.00
400.00
1,192.41
1,007.13
1,586.78
AMENITIES AVAILABLE Total population and No. of households
( If a village does not have a particular amenity, the distance-range in Km. of the nearest place where it can be availed of has been indicated
in that column inside brackets)
(4)
1,294 (192)
1,411 (226)
1,847 (301)
322 (50)
P
Educa tional
(5)
P(2),M
P(2)
-(-5)
Medical Drinking water (potable)
(6) (7)
-(-5)
--(-5)
RP
-(-5)
W
W,R
W
W,N
.891 (146) P(3) --(-5) W
5,507 (937) P(8),M,H HC,D,FPC, W,R,N TB,RP
779 (146) P(2) -(-5) W
1,873 (327)"
325 (59)
1,152 (238) , 151 (28)
360 (77)
1,098 (229)
494 (102)
644 (102)
2,990 (536)
1,020 (177)
330 (53)
972 (161)
219 (34)
P,M,H
P
P
P
P P
P P
P(3),M,H
P
P
P(2)
P P(2)
P,M,H
P P P(3)
P P(2)
D,FPC,RP
-(-5)
-(-5)
-(-5)
-(10+)
-(10+)
-(-5)
-(10+)
FPC
-(5-10)
-(10+) -(5-10)
-(-5)
-(-6)
D
-(5-10)
-(-5)
-(5-10)
-(10+)
-(10+)
TW,Hp
Hp,N
W,TW
W W,TW
W,TW Hp,N
W,N
W,N
W,N
W W,N
W,N
W,N
W,N
Post and telegraph
(8)
-(-5)
~(-5)
PO
-(-5)
Market day
(9)
-(-5)
-(-5)
-(-5)
-(-5)
-(-5) -(-5)
PO, Phone Sunda~
-(-5) -(-5)
PO
-(-5)
PO
-(-5)
-(-5)
-(-5)
-(-5)
-(-5)
PO
-(5-10)
-(5-10)
-(5-10)
-(-5)
PO
PO
-(5-10)
-(-5)
-(5-10)
-(-5)
-(-5)
Monday
-(-5)
-(-5)
-(-5)
-(-5)
-(-5)
-(-5)
-(-5)
Tuesday
-(5-10)
-(5-10)
(5-10)
-(-5)
-(5-10)
-::-(5-10)
.. (5-10)
-(-5)
-(5-10)
-(10+)
-(10+)
Communications
(10)
-(10+)
-(10+)
-(10+)
-(10+)
BS
BS
-(-5)
BS
BS
BS
-(-5)
-(-5)
BS
BS
-(-5)
BS
-(5-10)
-(10+)
-(10+) -(-5)
BS
BS
-(5:-10)
-(-5)
BS
-(10+)
-(-5) 28 Yamaji Patalachiwadi 750.00
1,562 (286)
1,415 (268)
403 (75)
737 (125)
943 (163)
533 (102) 734 (136)
907 (173) P -(-5)
R
W,TW
W,Hp
W
W,Hp,R
W -(":5) -(-5) -(-5)
29 Masalwadi
30 Bhingewadi
31 Atpadi
'32 Pujarwadi
-33 Maptemala
34 Mudhebadi
35 Kamath
36 Jambhulani
37 Dhanand
38 Gharniki
39 Walvan
40 Chinchale
41 Kharsundi
42 Mitki
43 Banpuri
44 Tadvale 45 Lengarewadi
495.00 483 (89)
232.00 1,265 (243)
.. 13,899.00 10,320(1,909)
459.00
1,470.00
1,196.00 1,739.92
1,703.16
1,566.80
.. 2,251.60 1,388.00
1,858.00
1,832.00
1,241.00
2,450.10
1,256.08
1,134.60
884 (175)
569 (105)
371 (69)
626 (131)
902 (178)
1,437 (157)
1,970 (355)
1,621 (296)
1,028 (185)
3,105 (537)
319 (64)
1,980 (384)
1,467 (260)
922 (157)
--- -----
P :--(-5) W,N
P -(-5) W,TW
P(22),M, MCW,PHC, W,N H (6),PUC D,FPC,TB,
RP P -(-5) TW,N
P -(-5) W
P -(-5) W
P -(5-10) W,TW P
P,M
P,M
P
P
P,M,H
P
P,M
P,M
P,M
RP
PHS,RP
FPC
-(5-10)
-(-5)
HC,D,FPC, RP -(10+) -(5-10)
FPC
-(5-10)
W,Hp
W,Hp
W,TW W,TW
W,TW
W,TW
W
W,TW
W,N
W,N
-(-5) -(-5) -(-5)
-:-(-5) -(-5) -(-5)
PTO, Phone Saturday BS
-(-5)
-(-5)
-(-5)
-(-5)
PO
PO
PO
PO
-(-5)
PO
-(-5)
PO
PO
-(-5)
-(-5)
-(-5)
-(-5)
-(10+) -(5-10)
-(5-10)
-(-5)
-(-5)
-(-5)
BS
BS
BS Wednesday BS
-(5-10) BS
-(-5) BS
Sunday BS
-(10+)
-(10+)
-(10+) - -(5-10)
BS
BS
BS
BS
----- -- - ---
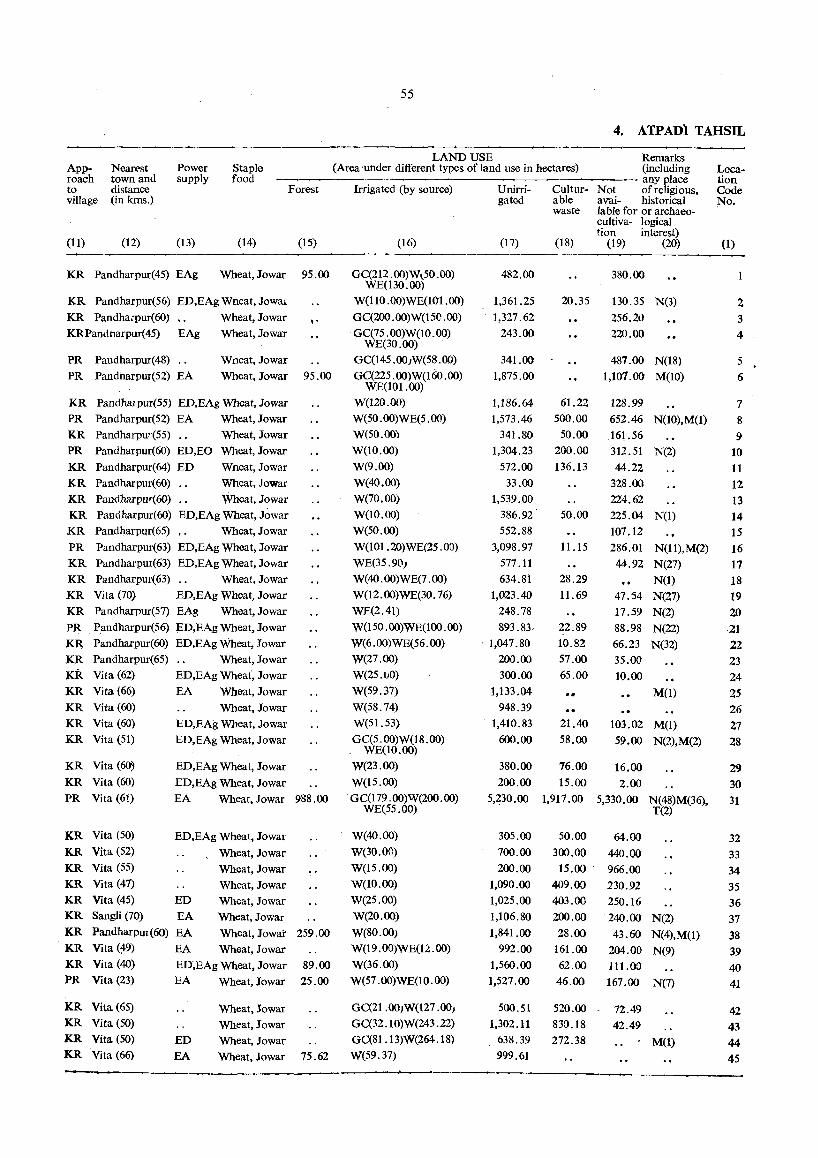
55
4. ATPADi TAHSIL
Power supply
Staple food
Approach to village
Nearest town and distance (in kms.)
Forest
(11) (12) (13) (14) (15)
KR Pandharpur(45) EAg Wheat, Jowar 95.00
KR Pandharpur(56) ED,EAg Wneat, Jowa.:
KR Pandha;pur(60) .. Wheat, Jowar I'
KRPandharpur(45) EAg Wheat, Jowar
PR Pandharpur(48)
PR Pandnarpur(S2) EA
Wneat, Jowar
Wheat,Jowar 95.00
KR Pandhalpur(55) ED,EAg Wheat, Jowar PR Pandharpur(52) EA Wheat, .lowar
KR Pandharpu"(55) .. Wheat, Jowar
PR Pandharpur(60) ED,EO Wheat, Jowar
KR Pandharpur(64) ED
KR Pandharpur(60) ..
Wneat, Jowar
Wheat, Jowar
KR Pandharpur (60) .. Wheat, Jowar
KR Pandharpur(60) ED,EAg Wheat, .lowar
KR Pandharpur(65) •. Wheat, .lowar
PR Pandharpur(63) ED,EAg Wheat, Jowar
KR Pandharpur(63) ED,EAg Wheat, Jowar
KR Pandharpur(63) .. Wheat, Jowar
KR Vita (70) ED,EAg Wheat, Jowar
KR Pandharpur(57) EAg Wheat, Jowar
PR Pandharpur(56) ED,EAg Wheat, Jowar
KR PandhaIpur(60) ED,EAg Wheat, Jowar
KR Pandharpur(65) .. Wheat, Jowar
KR Vita (62) ED,EAg Wheat, Jowar
KR Vita (66) EA Wheat, .lowar
KR Vita (60)
KR Vita (60)
KR Vita (51)
KR Vita (60')
KR Vita (60)
PR Vita (61)
KR Vita (50)
KR Vita (52)
KR Vita (55)
KR Vita (47)
Wheat, Jowar
ED,EAg Wheat, Jowar
ED,EAg Wheat, Jowar
ED,EAg Wheat, Jowar
ED,EAg Wheat, Jowar
EA Wheat, Jowar 988.00
ED,EAg Wheat, Jowar
Wheat, Jowar
Wheat, Jowar
Wheat, Jowar KR Vita (45) ED Wheat, Jowar KR Sangli (70) EA Wheat, Jowar
K.R Pandharpur(60) EA Wheat, Jowat 259.00
KR Vita (~9) EA Wheat, Jowar
KR Vita (40) ED,EAg Wheat, Jowar 89.00
PR Vita (23) EA Wheat, Jowar 25.00
LAND USE Remarks (Area 'under different types of land use in hectares) (including
,----------------- any place Irrigated (by source) Unirri- Cultur- Not of religious,
gated able avai- historical waste lable for or archaeo
cultiva- logical tion interest)
(16) (17) (18) (19) (20)
GC(212.00)W~SO.OO) WE(130.00)
W(1l0.OO)WE(101.00)
GC(200.00)W(15C .(0)
'GC(75.00)W(10.00) WE(30.00)
GC(145 .00,W(58 .(0)
GC(225.00)W(160.00) WE(101.00)
W(120.00)
W(50.00)WE(5.00) W(SO.OO)
W(lO.oo)
W(9.00)
W(40.00) W(70.00)
W(lO.00)
W(50.oo)
W(101.20)WE(25.00)
WE(3S.9l')
W(40.00)WE(7.oo)
W(12.oo)WE(30.76)
WE(2.41)
W(150.00)WE(100.00)
W(6.00)WE(56.00) W(27.00)
W(2S.()0)
W(59.37)
W(58.74)
W(51.53)
GC(5.oo)W(18.oo) . WE(lO.oo)
W(23.00)
wetS .00) GC(t79.oo)'-V(200.00)
WE(55.00)
W(40.00)
W(30.00)
W(15.00)
W(tO.OO)
W(25.00)
W(20.00)
W(80.00)
W(19.00)WE(12.00)
W(36.00)
W(57.00)WE(10.00)
482.00
1,361.25
1,327.62
243.00
341.00
1,875.00
1,186.64
1,573.46
341.80
1,304.23
572.00
33.00
1,539.00 386.92 .
552.88
3,098.97
577.11
634.81
1,023.40
248.78
893.83~
. 1,047.80
200.00
300.00
1,133.04
948.39
1,410.83 600.00 '
20.35
380.00
130.35 N(3)
256.20
220.00
487.00 N(18)
1,107.00 M(lO)
61.22 128.99
500.00 652.46 N(10),M(I)
50.00 161.56
200.00 312.51 N(2)
136.13 44.22
328.00
224.62 50.00 225.04 N(l)
107.12 11.15
28.29
11.69
22.89
10.82
57.00
65.00
21.40
58.00
286.01 N(1l),M(2) 44.92 N(27)
N(1)
47.54 N(27)
17.59 N(2)
88.98 N(22)
66.23 N(32)
35.00
10.00
M(1)
103.02 M(I)
59.00 N(2),M(2)
380.00 76.00 16.00
200.00 15.00 2.00
5,230.00 1,917.00 5,330.00 N(48)M(36), T(2)
305.00
700.00
200.00
1,090.00
1,025.00 1,106.80
1,841.00
992.00
1,560.00 1,527.00
50.00 64.00
300.00 440.00
15.00' 966.00
409.00
403.00
200.00
28.00
161.00
62.00
46.00
230.92
250.16
'240.00 N(2)
43.60 N(4),M(1) 204.00 N(9)
111.00
167.00 N(7)
K.R Vita (65)
KR Vita (SO)
KR Vita (50) KR Vita (66)
Wheat, Jowar GC(21 .OO)W(127 .oo} 500.51 520.00 72.49
42.49 ED
EA
Wht'at, Jowar GC(32 .10)W(243 .22)
Wheat, Jowar GC(81.13)W(264.18)
Wheat, Jowar 75.62 W(59. 37)
1,302.11 830.18
638.39 272.38 M(l) 999.61
Location Code No.
(1)
1
2 3
4
5
6
7
8
9
10
11
12
13
14 15
16
17 18
19
20
·21
22 23
24
25 26
27
28
29
30
31
32
33
34
35
36
37
38
39
40
41
42 43
44 45
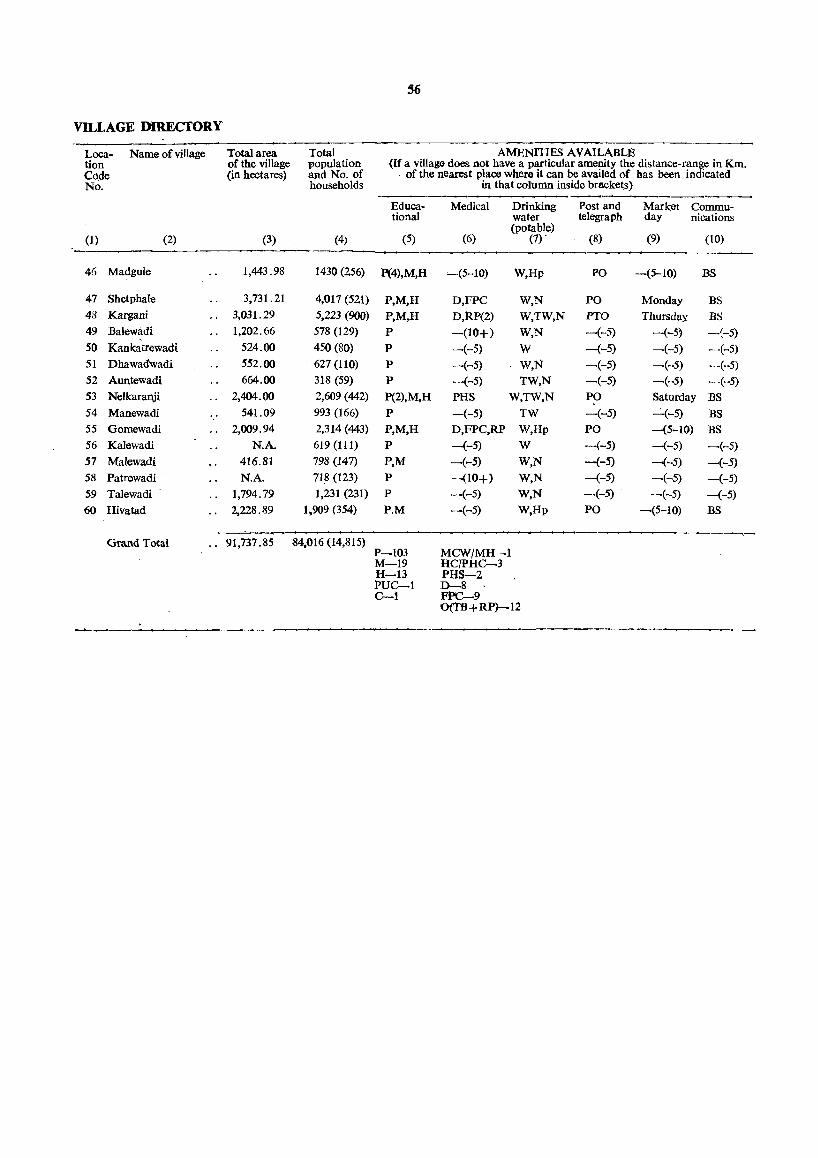
56
VILLAGE DIRECfORY
Loca- Name of village Total area Total AMENITIES AVAILABLE tion of the village population (If a village does not have a particular amenity the distance-range in Km. Code (in hectares) and No. of of the nearest place where it can be availed of bas been indicated No. households in that column inside bracket.s)
Educa- Medical Drinking Post and Market Commu-tional water telegraph day nications
(1) (2) (3) (4) (5) (6) (potable)
(7) . (8) (9) (10)
46 Madgule 1,443.98 1430 (256) P(4),M,H '-(5-10) W,Hp PO -(5-10) BS
47 Shetphale 3,731.21 4,017 (521) P,M,H D,FPC W,N PO Monday BS 43 Kargani 3,031.29 5,223 (900) P,M,H D,RP(2) W,TW,N PTO ThursdllY BS 49 Balewadi 1,202.66 578 (129) P -(10+) W,N -(-5) -(-5) -(-5) 50 Kankatrewadi 524.00 450 (80) P -(-5) W --(-5) -(-5) -(-5) 51 Dhawadwadi 552.00 627 (110) P -(-5) W,N -(-5) -(-5) -(-5) 52 Auntewadi 664.00 318 (59) P -(-5) TW,N -(-5) -(-5) -(-5) 53 Neikaranji 2,404.00 2,609 (442) P(2),M,H PHS W,TW,N PO Saturday BS
54 Manewadi 541.09 993 (166) P -(-5) TW -(-5) -(-5) BS 55 Gomewadi .. 2,009.94 2,314 (443) P,M,H D,FPC,RP W,Hp PO --(5-10) BS 56 Kalewadi N.A. 619 (111) P -(-5) W -(-5) -(-5) -(-5)
57 Malewadi 416.81 798 (147) P,M -(-5) W,N -(-5) --(-5) -(-5) 58 Patrewadi N.A. 718 (123) P -(10+) W,N -(-5) -(-5) -(-5)
59 Talewadi . 1,794.79 1,231 (231) P -(-5) W,N --(-5) -(-5) -(-5)
60 Hivatad 2,228.89 1,909 (354) P.M -(-5) W,Hp PO -(5-10) BS
Grand Total ., 91,737.85 84.016 (14,815) P-I03 MCW/MH-l M-19 HC/PHC--3 H-13 PHS-2 PUC--1 0-8 c-t FPC-9
0(TB+RP)-12
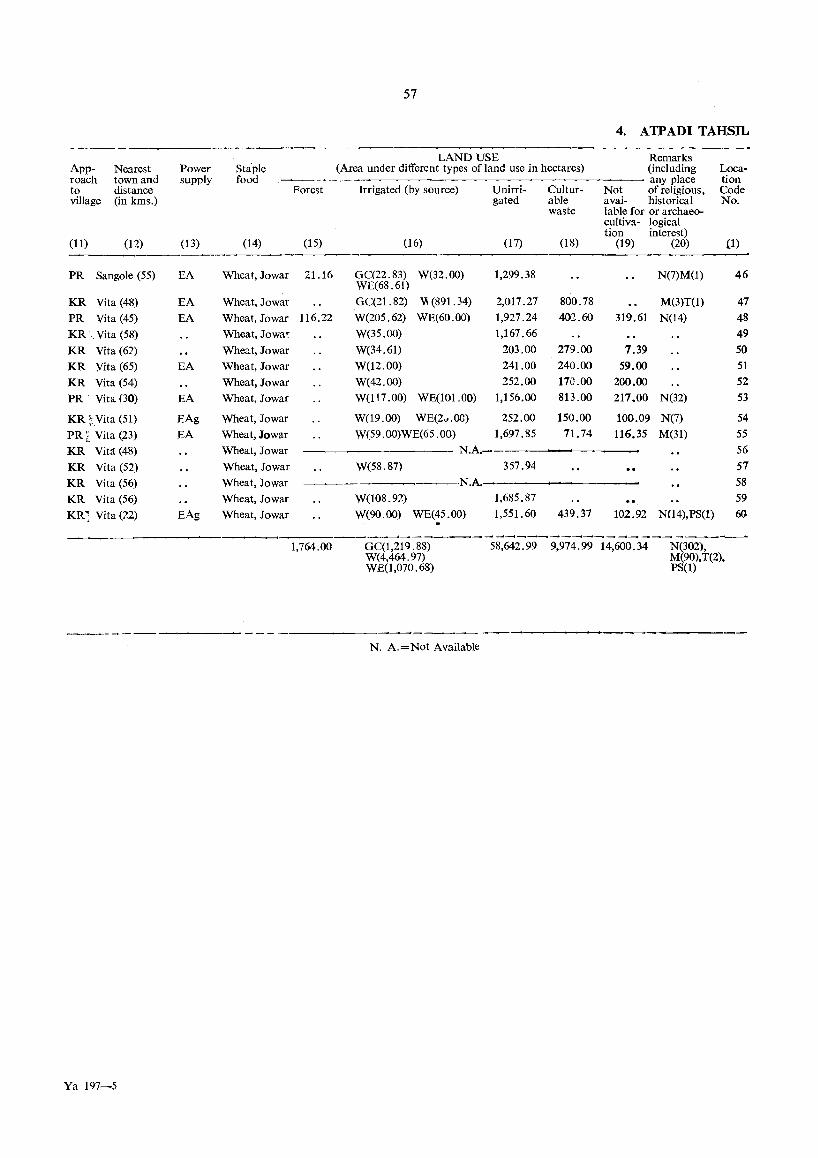
57
4. ATPADI TAHSIL -_---
LAND USE Remarks App- Nearest Power Staple (Area under different types of land use in hectares) (including Loca-roach town and supply food any place tion to distance Forest Irrigated (by source) Unirri- Cultur- Not of religious, Code village (in kms.) gated able avai- historical No.
waste lable for or archaeo-cultiva- logical tion interest)
(11) (12) (13) (14) (15) (16) (17) (18) (19) (20) (1)
PR Sangoie (55) EA Wheat, Jowar 21.16 GC(22.83) W(32.00) WE(68.61)
1,299.38 N(7)M(l) 46
KR Vita (48) EA Wheat, Jowar GC(21.82) \\ (891.34) 2,017.27 800.78 M(3)T(1) 47
PR Vita (45) EA Wheat, Jowar 116.22 W(205.62) WE(60.00) 1,927.24 402.60 319.61 N(14) 48
KR \ Vita (58) Wheat, Jowar W(35.00) 1,167.66 49
KR Vita (61) Wheat, Jowar W(34.61) 203.00 279.00 7.39 50
KR Vita (65) EA Wheat, Jowar W(12.00) 241.00 240.00 59.00 51
KR Vita (54) Wheat, Jowar W(42.00) 252.00 170.00 200.00 52
PR Vita (30) EA Wheat, Jowar W(l17.00) WE(101.00) 1,156.00 813 .00 217.00 N(32) 53
KR ;:Vita (51) EAg Wheat, Jowar W(l9.00) WE(2v.OO) 252.00 150.00 100.09 N(7) 54
PR /, Vita (23) EA Wheat, Jowar W(59 .00)WE(65 .00) 1,697.85 71.74 116.35 M(31) 55
KR Vita (48) Wheat, Jowar - N.A.- 56
KR Vita (52) Wheat, Jowar W(58.87) 357.94 57
KR Vita (56) Wheat, Jowar .N.A. 58
KR Vita (56) Wheat, Jowar W(108.92) 1,685.87 59
KR} Vita (22) EAg Wheat, Jowar W(90.00) WE(45.00) 1,551.60 439.37 102.92 N(14),PS(1) 60 ___ --t _____________________ ~
1,764.00 GC(I,219.88) 58,642.99 9,974.99 14,600.34 N(302), W( 4,464. 97) M(90), T(2), WE(I,070.68) PS(l)
--- - --------N. A.=Not Available
Ya 197-5
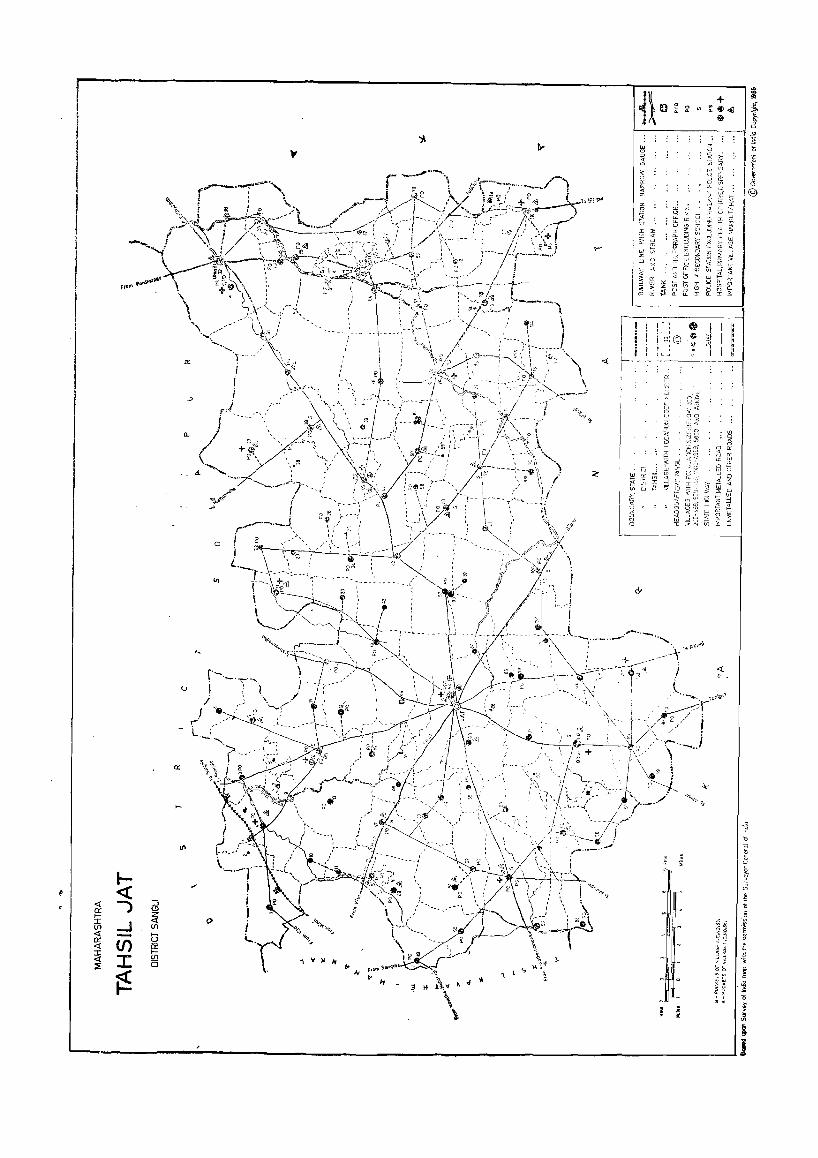
« a: lI
~ a: « I « :E
...J -(f) I
~
(J
Q
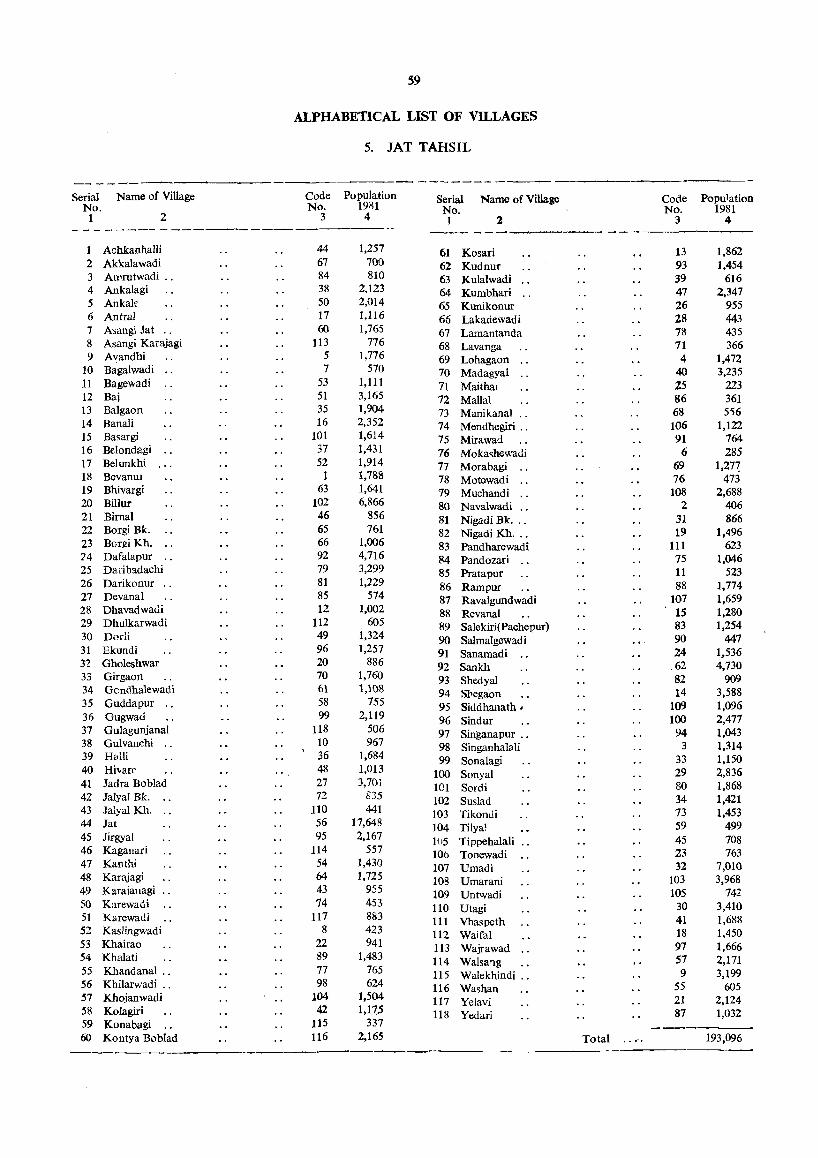
Serial No. 1
Name of Village
2
1 Achkanhalli 2 Akkalawadi 3 An'rutwadi .. 4 Ankalagi 5 Ankale 6 Antral 7 Asangi Jat 8 Asangi Karajagi 9 Avandhi
10 Bagalwadi 11 Bagewadi 12 Baj 13 BaIgaon 14 Banali 15 Basargi 16 Be.Iondagi 17 Belunkhi 18 Bevamu 19 Bhivargi 20 BilIur 21 Birnal 22 Borgi Bk. 23 Borgi Kh. 24 Dafalapur 25 Daribadachi 26 Darikonur .. 27 Devanal 28 Dhavadwadi 29 Dhulkarwadi 30 Dorli 31 Ekundi 32 Gholeshwar 33 Girgaon 34 Gcndhalewadi 35 Guddapur .. 36 Gugwad 37 Gulagunjanal 38 Gulvan~hi " 39 Halli 40 Hivarf' 41 Jadra Boblad 42 Jalyal Bk. 43 Jalyal Kh. 44 Jat 45 Jirgya! 46 Kaganari 47 Kal.1thi 48 Karajagi 49 Karaianagl 50 Karewadi 51 Karewadi 52 Kaslingwadi 53 Khairao 54 Khalati 55 Khandanal .. 56 Khilarwadi .. ~7 Kh~ianwadi 58 Kolagiri 59 Konabagi .. 60 Kontya Boblad
59
ALPHABETICAL LIST OF VILLAGES
5. JAT TAHSIL
Code No.
3
44 67 84 38 50 11 60
113 5 7
53 51 35 16
101 31 52
1 63
102 46 65 66 92 79 81 85 12
112 49 96 20 70 61 58 99
118 10 36 48 27 72
110 56 95
114 54 64 43 74
111 8
22 89 77 98
104 42
115 116
Population 19111
4
1,257 700 810
2.123 2,014 1,116 1,765
716 1,716
510 1,111 3,165 1,904 2,352 1,614 1,431 1,914 1,788 1,641 6,866
856 761
1,006 4,116 3,299 1,229
514 1,002
605 i,324 1,257
886 1,760 1,108
755 2,119
506 967
1,684 1,013 3,701
235 441
17,648 2,167
557 1,430 1,725
955 453 883 423 941
1,483 765 624
1,504 1,17.5
337 2,165
Code Population Serial Name of Village No. 1981
~o. 2 _ _:__ ___ 4 __ --- --------- ---
61 Kosari 13 1,862 62 Kudnuf 93 1,454 63 Kulalwadi 39 616 64 Kumbhari 41 2,347 65 Kunikonur 26 955 66 Lakadewadi 28 443 67 Lamantanda 78 435 68 Lavanga 71 366 69 Lohagaon 4 1,472 70 Madagyal 40 3,235 71 Maithal 25 223 12 Manal 86 361 13 Manikanal 68 556 14 Mendhegiri .. 106 1,122 15 Mirawad 91 764 16 Mokashewadi 6 285 17 Morabagi 69 1,21~ 78 Motowadi .. 76 473 79 Muchandi .. lOS 2,688 80 Navalwadi .. 2 406 81 Nigadi Bk. .. 31 866 82 Nigadi Kb ... 19 1,496 83 Pandharewadi 111 623 84 Pandozari .. 75 1,046 85 Pratapur 11 523 86 Ram pur 88 1,114 81 Ravalgundwadi 107 1,659 88 Revanal 15 1,280 89 Salekiri(Pachepur) 83 1,254
90 Salmalgewadi 90 441 91 Sanamadi 24 1,536 92 Sankh .62 4,730 93 Shedyal 82 909 94 Spegaon 14 3,588 95 Siddhanath I 109 1,096 96 Sindur 100 2,477 97 Singanapur .. 94 1,043 98 Singanhalali 3 1,314 99 Sonalagi 33 1,150
100 Sonyal 29 2,836 101 Sordi 80 1,868 102 Suslad 34 1,421 103 Tikondi 73 1,453 104 Tilyal S9 499
IUS Tippehalali 45 108 106 Tonewadi 23 163 107 Umadi 32 7,010 108 Umarani 103 3,968 109 Untwadi 105 142
110 Utagi 30 3,410 111 Yhaspeth 41 1,688 112 Waifal 18 1,450 113 Wajrawad 97 1,666 114 Walsa'1g 57 2,111 115 Walekhindi .. 9 3,199 116 Washan 55 605 111 YeJavi 21 2,124 118 Yedari 87 1,032
Total 193,096
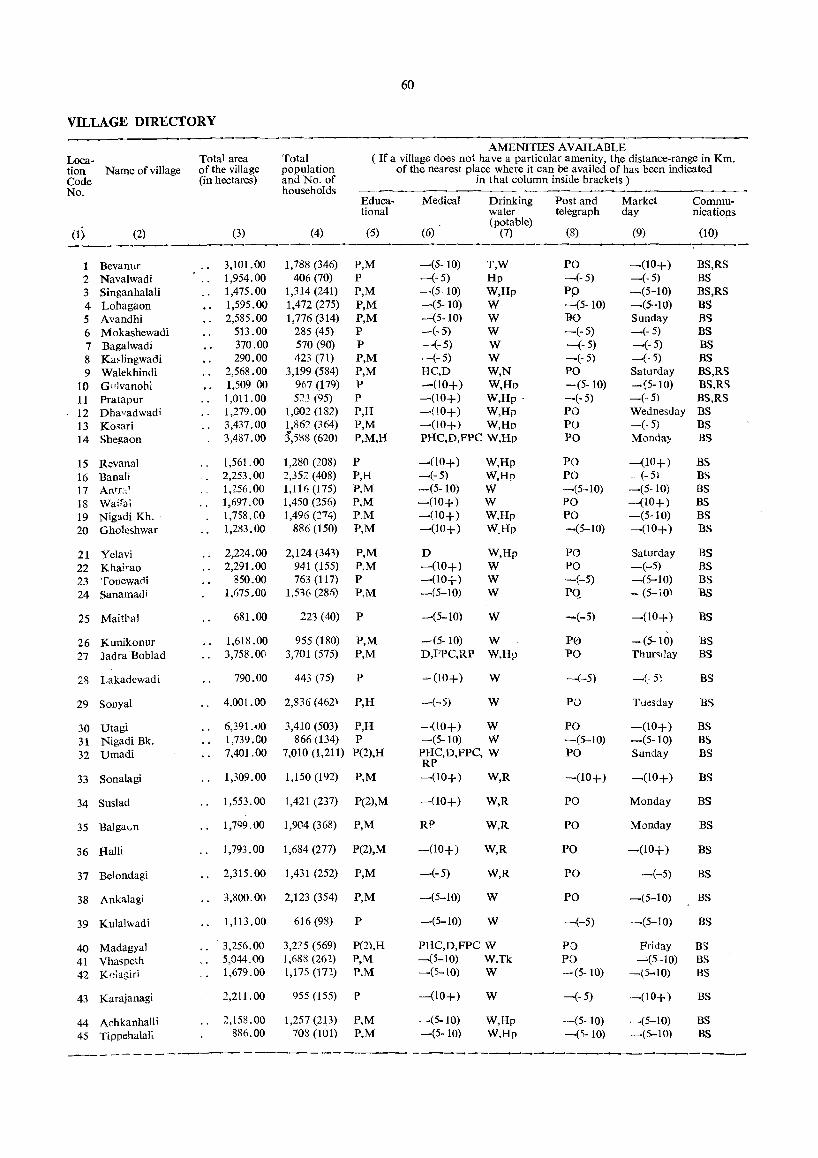
60
VILLAGE DIRECTORY
AMENITIES AVAILABLE Loca- Total area Total ( If a village does not have a particular amenity, the distance-range in Km. tion Name of village of the village population of the nearest place where it can be availed of has been indicated Code (in hectares) and No. of in that column inside brackets) No. households
Educa- Medical Drinking Post and Market Commu-tional water telegraph day nications
(4) (6) (potable)
(1) (2) (3) (5) (7) (8) (9) (10) ---I Bevanur 3,101.00 1,788 (346) P,M -(5-10) T,W PO -(10+) BS,RS 2 Navalwadi 1,954.00 406 (70) P -(-5) Hp -(-5) -(-5) BS 3 Singanhalali 1,475.00 1,314 (241) P,M -(5- 10) W,Rp PO -(5-10) BS,RS 4 Lohagaon 1,595.00 1,472 (275) P,M -(5-10) W -(5-10) -(5-10) BS 5 Avandhi 2,585.00 1,776 (314) P,M -(5-10) W 00 Sunday BS 6 Mokashewadi 513.00 285 (45) P -(-5) W -(-5) -(-5) BS 7 Bagalwadi 370.00 570 (90) P -(-5) W -(-5) -(-5) BS 8 Ka"lingwadi 290.00 423 (71) P,M -(-5) W -(-5) -(·5) BS 9 Walekhinrli 2,568.00 3,199 (584) P,M RC,D W,N PO Saturday BS,RS
10 G:dvanohi 1,509 00 %7 (1 79) P -(10+) W,Ho -(5- 10) -~5-10) BS,RS 11 Pratapur 1,011.00 5~3 (95) P -(10+) W,Rp· -(-5) -(-5) BS,RS 12 Dhavadwadi 1,279.00 I,G02 (182) P,H -(10+) W,Rp PO Wednesday BS 13 Kosari 3,437.00 1,862 (~64) P,M -(10+) W,Rp Po -(·5) BS 14 Shegaon 3,487.00 3,588 (620) P,M,R PRC,D,FPC W,Hp PO Monna) BS
15 Revanal 1,561.00 1,280 (208) P -(10+) W,Rp PO -(10+) BS 16 Banah 2,253.00 2,352 (408) P,H -(-5) W,Hp PO .. (- 51 BS 17 Antr;,~ 1,256.00 1,116 (175) P,M -(S-10) W -(5-10) -(S-10) BS 18 Waifa, 1,697.00 1,4S0 (256) P,M -(10+) W PO -(10+) BS 19 Nigadi Kh. 1,758. CO 1,496 (274) P.M -(10+) W,Hp PO -(5-10) BS 20 Gh{)leshwar 1,283.00 886 (150) P,M -(10+) W.Hp -(S-10) -(10+) BS
21 Yelavi 2,224.00 2,124 (341) P,M D W,Hp PO Saturday BS 22 Khairao 2,291.00 941 (155) P,M -(10+) W PO -(-5) BS 23 Tonewarli 350.00 763 (117) P -(10+) W -(-5) -(5-10) BS
24 Sanamadi 1,675.00 1,516 (281)) P,M -(5-10) W PQ - (5-10) BS
25 Maithal 681.00 223 (4Q) P --(5-10) W -(-5) -(10+) BS
26 Kunikonur 1,618.00 955 (180) P,M -(5-10) W P0 - (5-10) BS
27 Jadra Boblad 3,758.00 3,701 (575) P,M D,FPC,RP W,Hp PO Thunday BS
28 Lakadewadi 790.00 443 (75) P ~(1O+) W -(-5) -(-5: BS
29 SODyal .. 4,001.00 2,836 (462) P,H -(-5) W PO Tu~sday BS
30 Utagi 6,391.\10 3,410 (503) P,H ·-(10+) W PO -(10+) BS
31 Nigadi Bk. 1,739.CO 866 (134) P -(5-10) W -(5-10) -(5-10) B~
32 Umadi 7,401.00 7,010 (1,211) P(2),H PRC,D,FPC, W PO Sunday BS RP
33 Sonalagi 1,309.00 1,150 (192) P,M -(10+) W,R -(10+) -(10+) BS
34 Suslad 1,553.00 1,421 (237) P(2),M -(10+) W,R PO Monday BS
35 Balgal.-n 1,799.00 1,904 (368) P,M RP W,R PO Monday BS
36 Halli 1,793.00 1,684 (277) P(2),M -(10+) W,R PO -(10+) BS
37 Belondagi 2,315.00 1,431 (252) P,M -(-5) W,R PO -(-5) BS
38 Ankalagi 3,lloo.00 2,123 (354) P,M -(S-10) W PO -(5-10) BS
39 Kulalwadi 1,113.00 616 (98) P -(5-10) W -(-5) -(5-10) BS
40 Madagyal 3,256.00 3,2?5 (569) P(2),H PHC,D,FPC W PO Friday BS 41 Vhaspeth 5,044.00 1,688 (262) P,M ---.(5-10) W.Tk PO --=-(5-10) BS
42 Kolagiri 1,679.00 1,175 (17~) P,M -(5-10) W -(5-10) -(5-10) BS
43 Karajanagi 2,211.00 955 (155) P -(10+) W -(-5) -(10+) BS
44 Achkanhalli 2,158.00 1,257 (213) P,M -(5-10) W,Hp -(5-10) -(5-10) BS
45 Tippehalali 886.00 703 (101) P,M -(5- 10) W,Hp -(5-10) -(5-10) BS
------------------------ -~----.-----------------
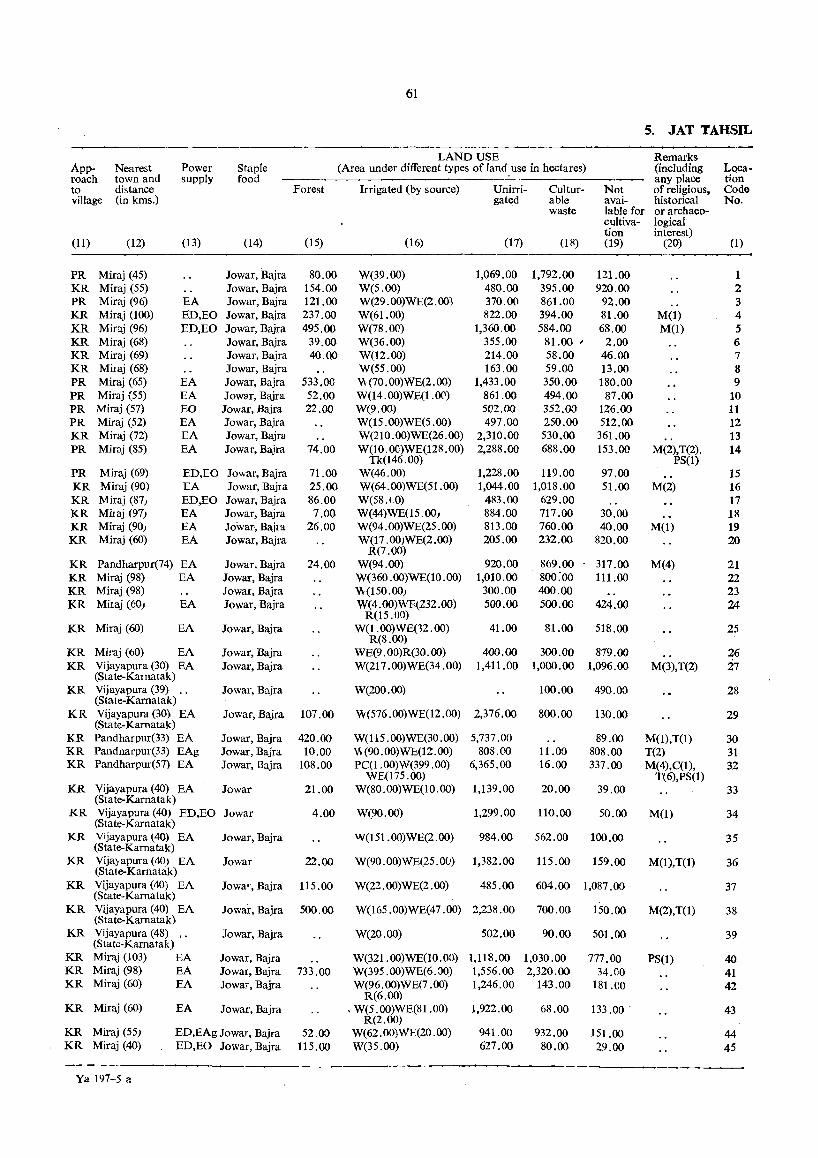
61
5. JAT TAI{SIL
LAND USE Remarks App- Nearest Power Staple (Area under different types of land use in hectares) (including Loca-roach town and supply food any place tion to distance Forest Irrigated (by source) Unirri- Cultur- Not of religious, Code village (in kms.) gated able avai- historical No.
waste lable for or archaeo-cultiva- logical tion interest)
(11) (12) (13) (14) (15) (16) (17) (18) (19) (20) 0)
PR Miraj (45) Jowar, Bajra 80.00 W(39.00) 1,069.00 1,792.00 121.00 1 KR Miraj (55) Jowar, Bajra 154.00 W(5.00) 480.00 395.00 920.00 2 PR Miraj (96) EA Jowar, Bajra 121.00 W(29.00)WE(2.00) 370.00 861.00 92.00 3 KR Miraj (100) ED,EO Jowar, Bajra 237.00 W(61.00) 822.00 394.00 81.00 M(1) 4 KR Miraj (96) ED,EO Jowar, Bajra 495.00 W(78.00) 1,360.00 584.00 68.00 M(1) 5 KR Miraj (68) Jowar, Bajra 39.00 W(36.00) 355.00 81.00 , 2.00 6 KR Miraj (69) Jowar, Bajra 40.00 W(12.00) 214.00 58.00 46.00 7 KR Milaj (68) Jowar, Bajra W(55.00) 163.00 59.00 13.00 8 PR Miraj (65) EA Jowar, Bajra 533.00 \\(70.00)WE(2.00) 1,433.00 350.00 180.00 9 PR Miraj (55) EA JOWlJf, Bajra 52.00 W(14.00)WE(1.()(I) 861.00 494.00 87.00 10 PR Miraj (57) EO Jowar, Bajra 22.00 W(9.00) 502.00 352.00 126.00 11 PR Miraj (52) EA Jowar, Bajra W(t5 .00)WE(5 .00) 497.00 250.00 512.00 12 KR Miraj (72) EA Jowar, Bajra W(21O.00)WE(26.00) 2,310.00 530.00 361.00 13 PR Miraj (85) EA Jowar, Bajra 74.00 W(10. OG)WE(128. 00) 2,288.00 688.00 153.00 M(2),T(2). 14
Tk(146.00) PS(l) PR Miraj (69) ED,EO Jowar, Bajra 71.00 W(46.00) 1,228.00 119.00 97.00 15 KR Miraj (90) EA Jowar, Bajra 25.00 W(64.00)WE(5l.00) 1,044.00 1,018.00 51.00 M(2) 16 KR· Miraj (87) ED,EO Jowar, Bajra 86.00 W(58.tO) 483.00 629.00 17 KR Mhaj (97) EA Jowar, Bajra 7.00 W(44)WE(15.00, 884.00 717.00 30.00 18 KR Miraj (90) EA Jowar, Bajra 26.00 W(94.00)WE(25.00) 813.00 760.00 40.00 M(l) 19 KR Miraj (60) EA Jowar, Bajra W(17.00)WE(2.00)
R(7.00) 205.00 232.00 820.00 20
KR Pandharpur(74) EA Jowar, Bajra 24.00 W(94.00) 920.00 869.00 317.00 M(4) 21 KR Miraj (98) EA Jowar, Bajra W(360 .(0)WE(10 .00) 1,010.00 800:00 111.00 22 KR Miraj (98) Jowar, Bajra \\(150.00, 300.00 400.00 23 KR Miraj (60) EA Iowar, Bajra W(4.00)WE(232.00)
R(15.00) 500.00 500.00 424.00 24
KR Miraj (60) EA Jowar, Bajra W(1 . (0) WE(12. 00) 41.00 81.00 518.00 25 R(8.00)
KR Miraj (60) EA Jowar, Bajra WE(9. OO)R(30. 00) 400.00 300.00 879.00 26 KR Vijayapura (30) EA
(State-Kamatak) Jowar, Bajra W(217 .00)WE(34 .00) 1,411.00 1,000.00 1,096.00 M(3),T(2) 27
KR Vijayapura (39) (State-Kamatak)
.. Iowar, Bajra W(200.00) 100.00 490.00 28
KR Vijayapura (30) EA (State-Kamatak)
Iowar, Bajra 107.00 W(576.00)WE(12.00) 2,376.00 800.00 130.00 29
KR Pandharpur(33) EA Jowar, Bajra 420.00 W(115.00)WE(30.00) 5,737.00 89.00 M(l),T(l) 30 KR Pandnarpur(33) EAg Jowar, Bajra to.OO \\(90.00)WE(12.00) 808.00 11.00 808.00 T(2) 31 KR Pandharpur(57) EA Iowar, Dajra 108.00 PC(I.00)W(399.00) 6,365.00 16.00 337.00 M(4),C(1), 32
WE(175.00) T(6),PS(I) KR Vijayapura (40) EA Jowar 2l.00
(State-Karnatak) W(80. OO)WE(l 0.00) 1,139.00 20.00 39.00 33
KR Vijayapura (40) ED,EO Jowar 4.00 W(90.00) 1,299.00 110.00 50.00 M(l) 34 (State-Karnatak)
KR Vijayapura (40) EA Jowar, Bajra 'V(151.00)WE(2.00) 984.00 562.0() 100.00 35 (State-Karnatak)
KR Vijayapura (40) EA Iowar 22.00 (State-Karnatak)
W(90. OO)WE(25. OU) 1,382.00 115.00 159.00 M(l),T(I) 36
KR Vijayapura (40) (State-Karnatak)
EA Jowa', Bajra 115.00 W(22.00)WE(2.00) 485.00 604.00 1,087.00 37
KR Vijayapura (40) EA Jowar, Bajra 500.00 W(165 .00)WE(47 .00) (State-Karnatak)
2,238.00 700.00 150.00 M(2),T(1) 38
KR Vijayapura (48) .. Iowar, Bajra (State-Karnatak)
W(20.00) 502.00 90.00 501.00 39
KR Miraj (103) EA Iowar, Bajra W(321.00)WE(10.00) 1,118.00 1,030.00 777.00 PS(I) 40 KR Miraj (98) EA Iowar, Bajra 733.00 W(395.00)WE(6.30) 1,556.00 2,320.00 34.00 41 KR Miraj (60) EA Jowar, Bajra W(96.00)WE(7.00) 1,246.00 143.00 181.GO 42
R(6.00) KR Miraj (60) EA Jowar, Bajra , W(5.00)WE(81.00) 1,922.00 68.00 133.00 43
R(2.00) KR Miraj (55) ED,EAg Iowar, Bajra 52.00 W(62.00)WE(20.00) 941.00 932.00 151.00 44 KR Miraj (40) ED,EO Jowar, Bajra 115.00 W(35.00) 627.00 80.00 29.00 45
-- - --.
Ya 197-5 a
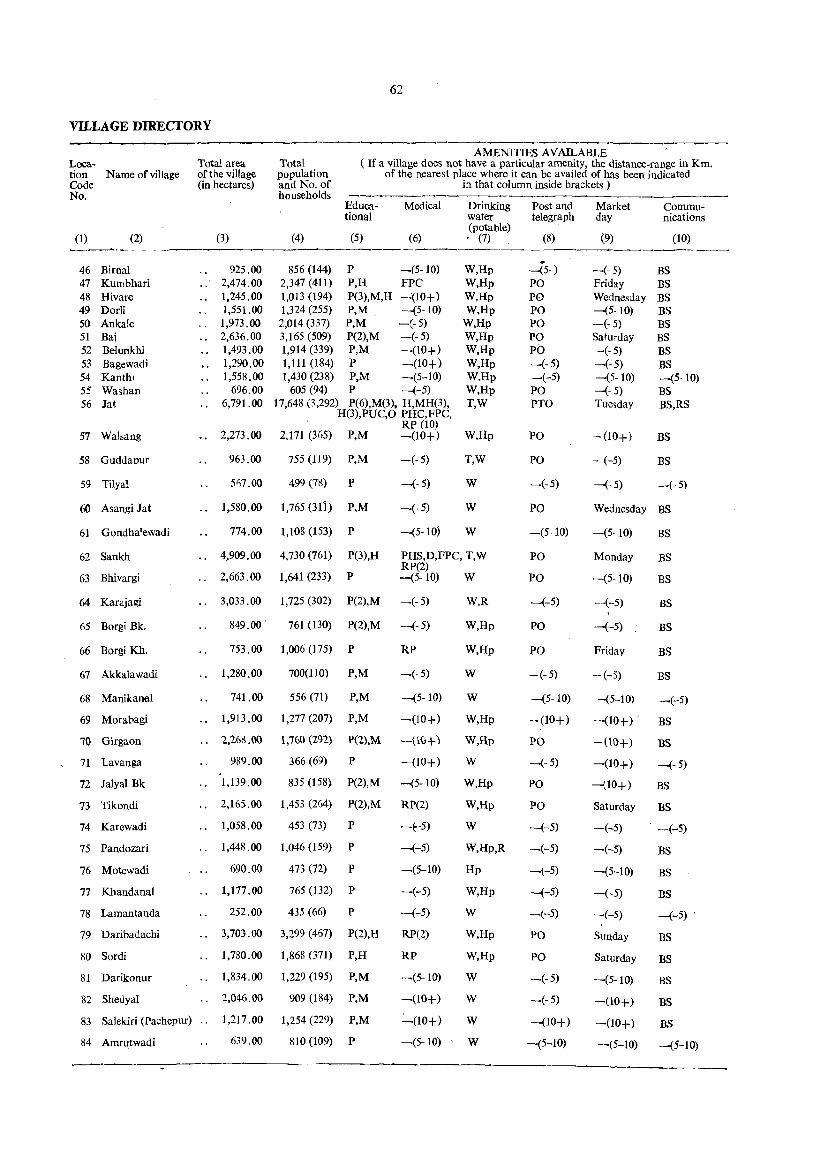
62
VILLAGE DIRECTORY
Loca-tion Name of village Code No.
(1) (2)
46 Birnal 47 Kumbhari 48 Hivare 49 DorH 50 Anka!e 51 Baj 52 Belunkhi 53 Bagewadi 54 Kanth1 55 Washan 56 Jat
57 Walsang
58 Guddaour
59 Tilyal
60 Asangi Jat
61 Gondha'ewadi
62 Sankh
63 Bhivargi
64 Karajagi
65 Borgi Bk.
66 Borgi Kh.
67 Akkaiawadi
68 ManikaooI
69 Morabagi
70 Girgaon
71 Lavanga
72 Jalyal Bk
73 Tikondi
74 Karewadi
75 Pandozari
76 Motewadi
77 KhandanaI
78 Lamantanda
79 Daribadachi
80 Sordi
81 Darikonur
82 Shedyal
AMENITIES AVAILABLE Total area of the village (in hectares)
Total population and No. of households
( If a village does not have a particular amenity, the distance-range in KIn. of the nearest place where it can be availed of has been indicated
(3)
925.00 " 2,474.00
1,245.00 1,551.00
.. 1,973.00 " 2,636.00
1,493.00 1,290.00 1,558.00
696.00 .. 6,791.00
" 2,273.00
963.00
5Fi7.oo
(4)
Educational
(5)
Medical
(6)
856 (144) P -(5-10) 2,347 (411) P,H FPC 1,013 (194) P(3),M,H -":(10+) 1,324 (255) P,M -(5- 10) 2,014 (337) P,M -(- 5) 3,165 (509) P(2),M -(- 5) 1,914 (339) P,M -(10+) 1,111 (184) P -(10+) 1,430 (238) P,M -(5-10)
605 (94) P -(-5) 17,648 (3,292) P(6),M(3). H,MH(3),
H(3),PUC,O PHC,FPC, RP (10)
2,171 (365) P,M -(10+)
755 (119) P,M -(-5)
499 (78) P --(-5)
" 1,580.00 1,765 (311) P,M -(-5)
774.00 1,108 (153) P -(5-10)
in that column inside brackets)
Drinking Post and Market water telegraph day (potable) • (7) (8) (9)
W,Hp W,Hp W,Hp W,Hp
W,Hp W,Hp W,Hp W,Hp W,Hp W,Hp T,W
W,Hp
T,W
W
-(5-) PO PO PO PO PO PO -(-5) -(-5) PO PTO
PO
PO
-(-5) Friday Wednesday -(5·10) -C-5) Satu~day
-(-5) -(-5) -(5-10) -(-5) Tuesday
-(10+)
- (-5)
-(-5)
Communications
(10)
BS BS BS BS BS BS BS BS -(5-10) B5 BS,RS
BS
BS
-(-5)
W Wednesday BS
W -(5·10) BS
" 4,909.00 4,730 (761) P(3),H PHS,D,FPC, T,W RP(2)
-(-5)
PO
-(5-10)
PO Monday BS
BS .. 2,663.00 1,641 (233) P
.. 3,033.00 1,725 (302) P(2),M
849.00· 761 (130) P(2),M
753.00 1,006 (175) P
" 1,280.00 700(110) P,M
741.00 556 (71) P,M
1,913.00 1,277 (207) P,M
.. 2,26&.00 1,760 (292) P(2),M
989.00 366 (69) P
1,139.00 835(158) P(2),M
" 2,165.00 1,453 (264) P(2),M
1,058.00 453 (73) P
1,448.00 1,046 (159) P
690.00 473 (72) P
.. 1,177.00 765 (132) P
252.00 435 (66) P
.. 3,703.00 3,299 (467) P(2),H
1,780.00 1,868 (371) P,H
" 1,834.00 1,229 (195) P,M
.. 2,046.00 909 (184) P,M
-(5-10) W
-(-5)
-(-5)
RP
-(5)
-(5-10)
-(10+)
-(1(;+)
- (10+)
-(5-10)
RP(2)
-t-5)
-(-5)
-(5-10)
-(-5)
-(-5)
RP(2)
RP
-(5-10)
-(10+)
W,R
W,Hp
W,Hp
W
W
W,Hp
W,Hp
W
W,Hp
W,Hp
W
W,Hp,R
Hp
W,Hp
W
W,Hp
W,Hp
W
W
PO
-(-5)
PO
PO
-(-5)
-(5-10)
-(10+)
PO
-(-5)
PO
PO
-(-5)
-(-5)
-l-5)
-(-5)
-(-5)
PO
PO
-(-5)
-(-5)
-(5-10)
--(-5) BS
·-(-5) BS
Friday BS
-(-5) BS
-(5-10) -(-5)
-(10+) , BS
-(10+) BS
-(10+) -(- 5)
-{10+) BS
Saturday BS
-(-5) . -(-5)
-(-5) BS
-(5-10) BS
-(-5) BS
-(-5) -(-5) .
Sunday BS
Saturday BS
-(5-10) . BS
-(10+) BS
83 Salekiri (Pachepur) " 1,217.00 1,254 (229) P,M :""(10+)
-(5-10)
W -(10+) -(10+) BS
84 Amrutwadi 639.00 810(109) P W -(5-10) -(5-10) -(5-10)
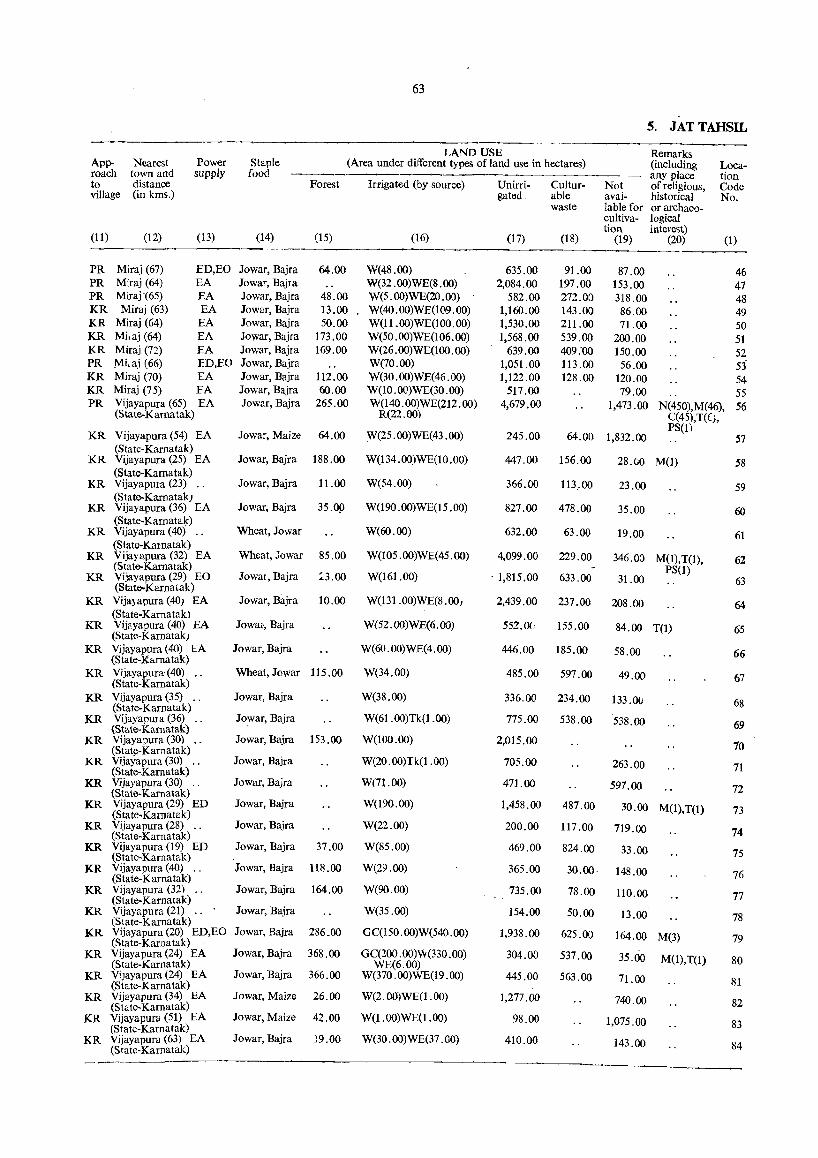
63
S. JATTAHSIL
LAND USE Remarks App- Nearest Power Staple (Area under different types of land use in hectares) (including Loca-roach town and supply food any place tion to distance Forest Irrigated (by source) Unirri- Cultur- Not of religious, Code village (in kms.) gated able avai- historical No.
waste lable for or archaeo-cultiva- logical tion interest)
(11) (12) (13) (14) (15) (16) (17) (18) (19) (20) (1)
PR Miraj (67) ED,EO Jowar, Bajra 64.00 W(48.00) 635.00 91.00 87.00 46 PR Miraj (64) EA Jowar, Bajra W(32.00)WE(8.00) 2,084.00 197.00 153.00 47 PR Miraj(65) EA Jowar, Bajra 48.00 W(5.00)WE(20.00) 582.00 272.00 318.00 48 KR Miraj (63) EA Jowar, Bajra 13.00 W(4O.OO)WE(I09.00) 1,160.00 143.00 86.00 49 KR Miraj (64) EA Jowar, Bajra 50.00 W(11.00)WE(100.00) 1,530.00 211.00 71.00 50 KR MiJaj (64) EA Jowar, Bajra 173.00 W(50.(l0)WE(106.00) 1,568.00 539.00 zoo. 00 51 KR Miraj (72) EA Jowar, Bajla 169.00 W(26.00)WE(I00.00) 639.00 409:00 150.00 52 PR Mi.aj (66) ED,EO Jowar, Bajra W(70.00) 1,051.00 113.00 56.00 53 KR Miraj (70) EA Jowar, Bajra 112.00 W(30.00)WE(46.00) 1,122.00 128.00 120.00 54 KR Miraj (75) EA Jowar, Bajra 60.00 W(1O.OO)WE(30.00) 517.00 79.00 55 PR Vijayapura (65) EA Jowar, Bajra 265.00 W(140.00)WE(212.00) 4,679.00 1,473.00 N(450),M(46), 56
(State-Karnatak) R(22.00) C(45),T(C),
Vijayapura (54) EA Jowar, Maize 64.00 ~(25 .00)WE(43 .00) 245.00 64.00 1,832.00 PS(l)
KR 57 (State-Karnatak)
KR Vijayapura (25) EA Jowar, Bajra 188.00 W(134.00)WE(10.00) 447.00 156.00 28.00 M(1) 58 (State-Kamatak)
KR Vijayapura (23) .. Jowar, Bajra 1l.00 W(54.00) 366.00 113.00 23.00 59 (State-Kamatak.l
KR Vijayapura (36) EA Jowar, Bajra 35.09 W(l90.00)WE(l5.00) 827.00 478.00 35.00 60 (State-Kamatak)
KR Vijayapura (40) .. Wheat, Jowar W(60.OO) 632.00 63.00 19.00 61 (State-Kamatak)
Wheat, Jowar W(105 .00)WE(45 .00) KR Vijayapura (32) EA 85.00 4,099.00 229.00 346.00 M(1),T(1), 62 (State-Karnatak) W(161.00)
PS(1) KR Vijayapura (29) EO Jowal, Bajra :3.00 . 1,815.00 633.00 31.00 63 (State-Karnatak) KR Vijayapura (40) EA Jowar, Bajra 10.00 W(131.00)WE(8.00j 2,439.00 237.00 208.00 64
(State-Karnatakl W(52.00)WE(6.00) 552.0(, KR Vijayapura (40) EA Jowa" Bajra 155.00 84.00 T(1) 65 (State-Karnatak)
KR Vijayapura (40) EA (State-Ramatak)
Jowar, Bajra W(60.00)WE(4.00) 446.00 185.00 58.00 66
KR Vijayapura'(40) .. (State-Kamatak)
Wheat, Jowar 115.00 W(34.00) 485.00 597.00 49.00 67
KR Vijayapura (35) .. Jowar, Bajra W(38.00) 336.00 234.00 133. ()(; 68 (State-Kamatak) KR VijayapUla (36) .. Jowar, Bajra W(61.00)Tk(I.00) 775.00 538.00 538.00 69 (State-Karnatak) KR Vijayapura (30) .. Jowar, Bajra 153.00 W(I00.00) 2,015.00
70 (State-Karnatak) KR Vijayapura (30) .. Jowar, Bajra W(20.00)Tk(I.00) 705.00 263.00 71 (State-Kamatak) KR Vijayapura (30) ..
(State-Karnatak) Jowar, Bajra W(71.00) 471.00 597.00 72
KR Vijayapura (29) ED (State·Kamatak)
Jowar, Bajra W(l90.00) 1,458.00 487.00 30.00 M(I),T(I) 73 KR Vijayapura (28) .. Jowar, Bajra W(22.00)
(State-Karnatak) 200.00 117.00 719.00 74
KR Vijayapura (19) ED Jowar, Bajra 37.00 (State-Karnatak)
W(85.00) 469.00 824.00 33.00 75 KR Vijayapura (40) ..
(State-karnatak) Jowar, Bajra 118.00 W(29.00) 365.00 30.00 148.00 76
KR Vijayapura (32) .. JowaI, Bajra 164.00 W(90.00) 735.00 78.00 110.00 77 (State-Kamatak) KR Vijayapura (21) .. Jowar, Bajra W(35.OO) 154.00 50.00 13.00 78 (State-Karnatak) KR Vijayapura (20) ED,EO
(State-Karnatak) Jowar, Bajra 286.00 GC(150. 00)W(54O. 00) 1,938.00 625.00 164.00 M(3) 79
KR Vijayapura (24) EA Jowar, Bajra 368.00 GC(2oo .00)\\«330 .00) 304.00 537.00 35.00 M(l),T(I) 80 (State-Karnatak) WE(6.00) KR ViJayapura (24) EA Jowar, Bajra 366.00 W(370.00)WE(19.00) 445.00 563.00 71.00 81 (State-Karnatak) KR Vijayapura (34) EA
(Slate-Karnatak) Jowar, Maize 26.00 W(2. OO)WE(1. 00) 1,277.00 740.00 82
KR Vijayapura (51) EA Jowar, Maize 42.00 W(I.00)WE(l.OO) 98.00 1,075.00 83 (State-Karnatak) KR Vijayapura (63) EA Jowar, Bajra 19.00 W(30 .00)WE(37 .00) 410.00 143.00 84 (State-Karnatak)
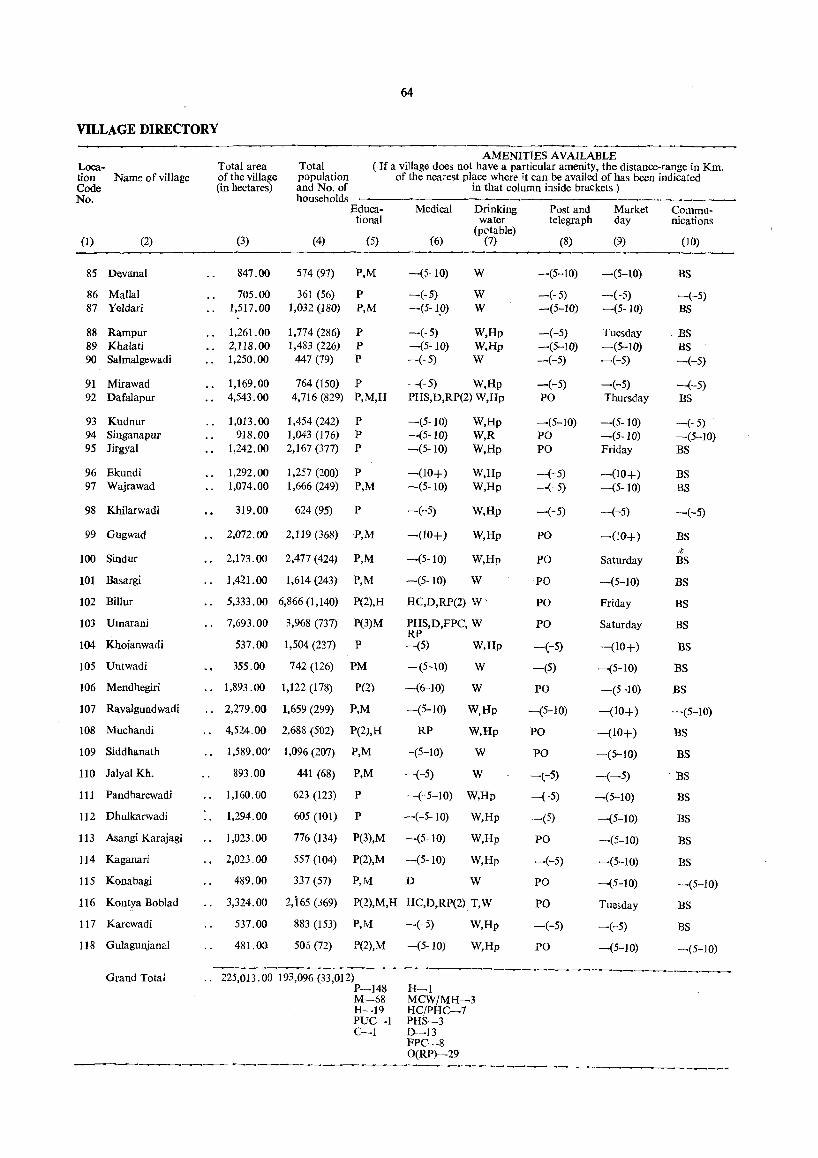
64
VD..LAGE DIRECTORY
Loca-tion Name of village Code No.
(1) (2)
85 Devanal
86 Mallal 87 Yeldari
88 Rampur 89 Khalati 90 Salmalgewadi
91 Mirawad 92 Dafalapur
93 Kudnur 94 Singanapur 95 Jirgyal
96 Ekundi 97 Wajrawad
98 Khilarwadi
99 Gugwad
100 Sindur
101 Basargi
102 Billuf
103 Umarani
104 Khoianwadi
105 Untwadi
106 Mendhegiri
107 Ravalgundwadi
108 Muchandi
109 Siddhanath
110 Jalyal Kh.
111 Pandharewadi
112 Dhulkarwadi
113 Asangi Karajagi
114 Kaganari
115 Konabagi
116 Kontya Boblad
117 Karewadi
118 Gulagunjanal
Grand Total
AMENITIES AVAILABLE Total area of the village (in hectares)
Total population and No. of households
( If a village does not have a particular amenity, the distance-range in Km. of the nearest place where it can be availed of has been indicated
in that column inside brackets)
(3)
847.00
705.00 1,517.00
1,261.00 .. 2,118.00
1,250.00
1,169.00 .. 4,543.00
1,013.00 918.00
1,242.00
1,292.00 1,074.00
319.00
Educational
(4) (5)
514 (97) P,M
361 (56) P 1,032 (180) P,M
1,774 (286) P 1,483 (226) P
447 (79) P
764 (150) P 4,716 (829) P,M,H
1,454 (242) P 1,043 (176) P 2,167 (377) P
1,257 (200) P 1,666 (249) P,M
624 (95) P
2,072.00 2,119 (368) P,M
.. 2,173.00 2,477 (424) P,M
1,421.00 1,614 (243) P,M
Medical
~6)
-(5-10)
-(-5) -(5-1.0)
-(-5) -(5-10) -(-5)
Drinking water
(p0table) (7)
W
W W
W,Hp W,Hp W
-(-5) W,Hp PHS,D,RP(2) W,Hp
-(5-10) -(5-10) -(5- 10)
-(10+) -(5- 10)
-(-5)
-(10+)
-(5- 10)
-(5-10)
W,Hp W,R W,Hp
W,Hp W,Hp
W,Hp
W,Hp
W,Hp
W
5,333.00 6,866 (1,140) P(2),H HC,D,RP(2) W'
.. 7,693.00 3,968 (137) P(3)M
537.00 1,504 (237) P
355.00 742 (126) PM
1,893.00 1,122 (118) P(2)
" 2,279.00 1,659 (299) P,M
.. 4,524.00 2,688 (502) P(2),H
1,589.00' 1,096 (207) P,M
893.00 441 (68) P,M
1,160.00
1,294.00
1,023.00
2,023.00
489.00
623 (123) P
605 (101) P
776 (134) P(3),M
557 (104) P(2),M
337 (57) P,M
PHS,D,FPC, W RP -(5) W,Hp
-(5-\0) W
-(6-10) W
-(5-10) W,Hp
RP W,Hp
-(5-10)
-(-5)
W
W
-(-5-10) W,Hp
-(-5-10)
-(5-10)
-(5- 10)
D
W,Hp
W,Hp
W,Hp
W
.. 3,324.00 2,i65 (.i69) P(2),M,H HC,D,RP(2) T,W
537.00 883 (153) P,M -(-5) W,Hp
481. 00 505 (72) P(2),M -(5- 10) W,Hp
Post and telegraph
(8)
-(5-10)
-(-5) -(5-10)
-(-5) -(5-10) -(-5)
-(-5) PO
-(5-10) PO PO
-(-5) -(-5)
-(-5)
PO
PO
-PO
PO
PO
-(-5)
-(5)
PO
-(5-10)
PO
PO
-(-5)
-( -5)
-(5)
PO
-(-5)
PO
PO
-(-5)
PO
Market day
(9)
-(5-10)
-(-5) -(5-10)
Tuesday -(5-10) -(-5)
-(-5) Thursday
-:-(5- 10) -(5-10) Friday
-(10+) -(5-10)
-(-5)
-(10+)
Saturday
-(5-10)
Friday
Saturday
-(10+)
-(5-10)
-(5-10)
-(10+)
-(10+)
-(5-10)
-(-5)
-(5-10)
-(5-10)
-(5-10)
-(5-10)
-(5-10)
Tuesday
-(-5)
-(5-10)
Communications
(10)
BS
-(-5) BS
BS BS -(-5)
-(-5) ns -(-5) -(5-10) BS
BS BS
-(-5)
BS .oJ;
BS
BS
BS
BS
BS
BS
BS
-(5-10)
BS
BS
BS
BS
BS
BS
BS
-(5-10)
BS
BS
-(5-10)
" 225,013 -:00'193,096(33:002)----------------------~--------P-148 H-I M-S8 MCW/MH-3 H--19 HCIPHC-7 PUC-I PHS-3 C-I D-I3
FPC-8 O(RP)-29
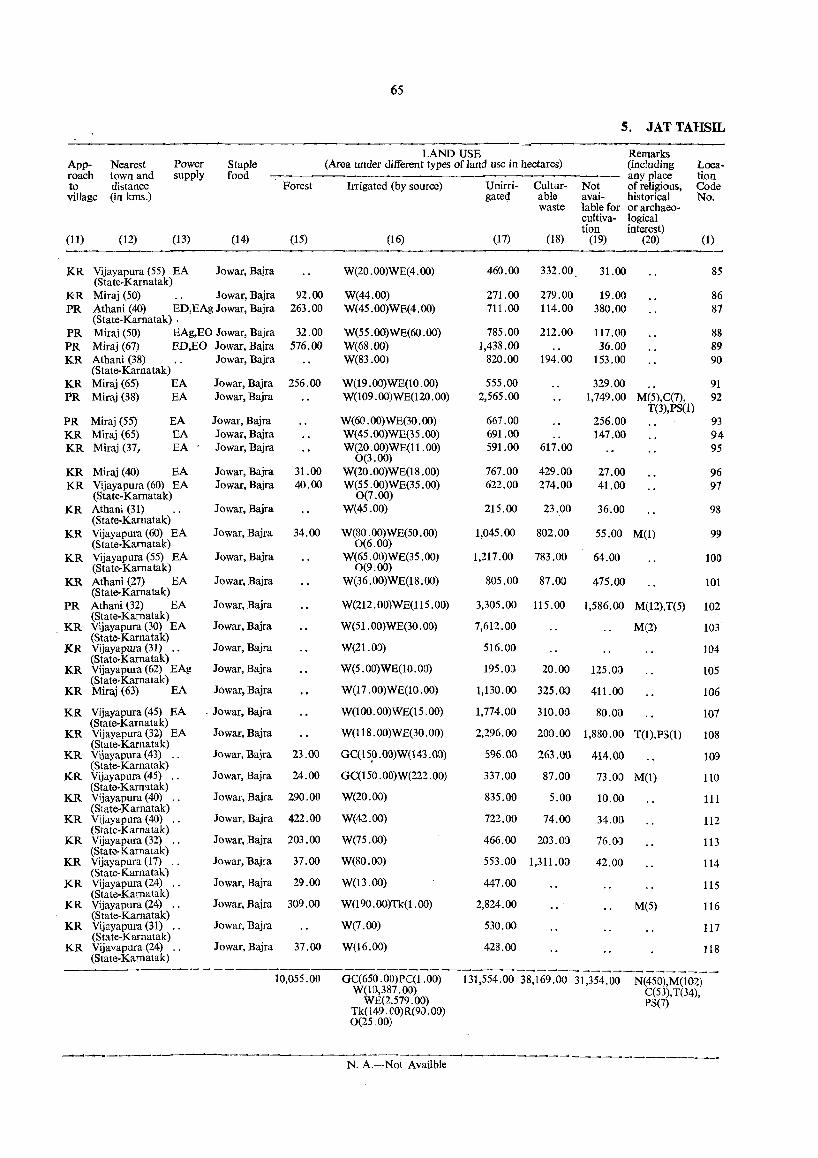
65
5. JATTAHSIL
LAND USE Remarks App- Nearest Power Staple (Area under different types of land use in hectares) (including Loca-roach town and supply food any place tion to distance Forest Irrigated (by source) Unirri- Cultur- Not of religious, Code village (in kms.) gated able avai- historical No.
waste lable for or archaeo-cultiva- logical tion interest)
(11) (12) (13) (14) (15) (16) (17) (18) (19) (20) (1)
KR Vijayapura (55) EA Jowar, Bajra W(20.00)WE(4.oo) 460.00 332.00 31.00 85 (State-Karnatak)
KR Miraj (50) Jowar, Bajra 92.00 W(44.00) 271.00 279.00 19.00 86 PR Athani (40) ED,EAg Jowar, Bajra 263.00
(State-Karnatak) , W(45.00)WE(4.oo) 711.00 114.00 380.00 87
PR Mimj (50) EAg,EO Jowar, Bajra 32.00 W(55.oo)WE(60.oo) 785.00 212.00 117.00 88 PR Miraj (67) ED,EO Jowar, Bajra 576.00 W(68.00) 1,438.00 36.00 89 KR Athani (38)
(State-Karnatak) Jowar, Bajra W(83.00) 820.00 194.00 153.00 90
KR Miraj (65) EA Jowar, Bajra 256.00 W(19.00)WE(1O.00) 555.00 329.00 91 PR Miraj (38) EA Jowar, Bajra W(109.00)WE(120.00) 2,565.00 1,749.00 M(5),C(7),
T(3),PS(1) 92
PR Miraj (55) EA JowaI, Bajra W(60.oo)WE(30.00) 667.00 256.00 93 KR Miraj (65) EA Jawar, Bajra W(45.oo)WE(35.00) 691.00 147.00 94 KR Miraj (37, EA Jawar, Bajra W(20.oo)WE(11.00) 591.00 617.00 95
0(3.00) KR Miraj (40) EA Jawar, Bajra 31.00 W(20 . 00)WE(18 .00) 767.00 429.00 27.00 96 KR Vijayapura (60) EA Jowar, Bajra 40.00 W(55 .00)WE(35 .00) 622.00 274.00 41.00 97
(State-Karnatak) 0(7.00) KR Athani (31) Jawar, Bajra W(45.00) 215.00 23.00 36.00 98
(State-Karnatak) KR Vijayapura (60) EA Jowar, Bajra 34.00 W(80. 00)WE(50 .00)
(State-Karnatak) 0(6.00) 1,045.00 802.00 55.00 M(I) 99
KR Vijayapura (55) EA (State-Karnatak)
Jawar, Bajra W(65 .OO)WE(35 .00) 0(9.00)
1,217.00 783.00 64.00 101)
KR Athani (27) EA Jawar, Bajra W(36.00)WE(18.00) 805.00 87.00 475.00 101 (State-Karnatak)
PR Athani ~32) EA Jowar, Bajra W(212.00)WE(115.00) 3,305.00 115.00 1,586.00 M(12),T(5) 102 (State-Karnatak)
KR Vijayapura (30) EA Jowar, Bajra W(51.00)WE(30.00) 7,612.00 M(2) 103 (State-Kamatak)
KR Vijayapura (31) .. Jowar, Bajra W(21.00) 516.00 104 (State-Karnatak)
Jowar, Bajra W(5.00)WE(10.00) KR Vijayapura (62) EAg 195.00 20.00 1~5.00 105 (State-Karnatak)
KR Miraj (63) EA Jowar, Bajra W(I7.00)WE(10.00) 1,130.00 325.00 411.00 106
KR Vijayapura (45) EA . Jowar, Bajra W(loo.00)WE(15.00) 1,774.00 310.00 80.00 107 (State-Karnatak)
KR Vijayapura (32) EA Jowar, Bajra W(118.00)WE(30.00) 2,296.00 200.00 1,880.00 T(l),PS(I) 108 (State-Karnatak)
KR Vijayapura (43) .. Jawar, Bajra 23.00 GC(lS.O. 00) W( 143.00) 596.00 263.00 414.00 109 (State-Karnatak)
KR Vijayapura(45) .. Jowar, Bajra 24.00 GC(150.00)W(222.00) 337.00 87.00 73.00 M(I) 110 (State-Karnatak)
KR Vijayapura (40) .. Jowar, Bajra 290.00 W(20.00) 835.00 5.00 10.00 111 (State-Karnatak)
Jawar, Bajra W(42.00) KR Vijayapura (40) .. 422.00 722.00 74.00 34.00 112 (State-Karnatak)
KR Vijayapura (32) Jowar, Bajra 203.00 W(75.00) 466.00 203.00 16.0) 113 (State-Karnatak)
KR Vijayapura(17) .. Jawar, Bajra 37.00 W(80.00) 553.00 1,311.00 42.00 114 (State-Karnatak)
Jawar, Bajra 29.00 W(B.OO) KR Vijayapura (24) .. 447.00 115 (State-Karnatak)
Jowar, Bajra KR Vijayapura (24) .. 309.00 W(190.00)Tk(1.00) 2,824.00 M(5) 116 (State-Karnatak)
KR Vijayapura (31) ., Jawar, Bajra W(7.OO) 530.00 117 (State-Karnatak)
Jowar, Bajra KR Vijavapura (24) .. (State-Karnatak)
37.00 W(16.00) 428.00 118
----------~-------------~-------10,055.00 GC(650 .OO)PC(1.00) 131,554.00 38,169.00 31,354.00 N(450),M(102) W(10,387.00) C(53), T(34),
WE(2.579.00) P3(7) Tk(l49. CO)R(9J. 00) 0(25.00)
~- ~ -------------N. A.--Nat Availble
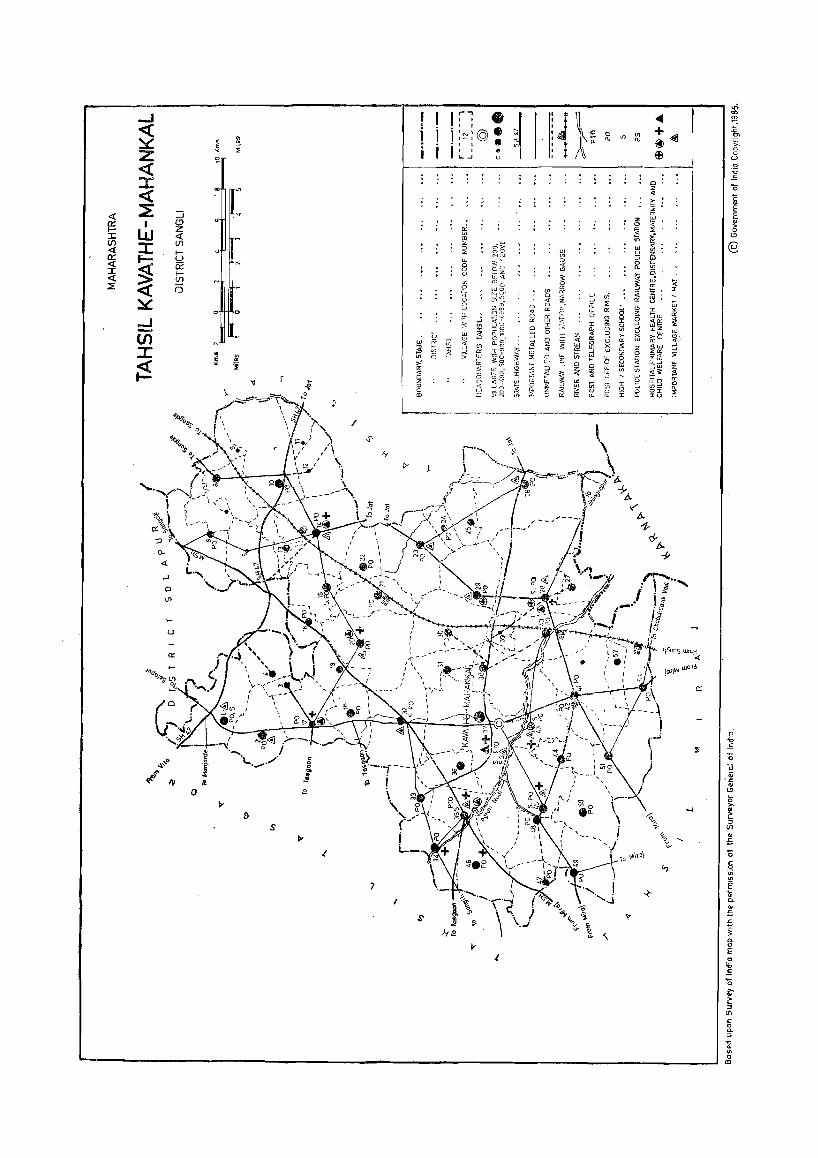
...J « ~ Z <! :r.: <
« ::i a:: I I- W :x: (J) ::r: « a:: ~ «
I « ~ ::::E
~ -I -(f) :z: ;f
-' o (fI
::::; (!) z « (/)
t-!:1 0:: t-(/)
(}
'b&, ~" :s~
o
w ~ ~ "i S'
~: ~: I
.. ~ ill
'i ..q
/
..I'
It l:>-
s
I
I I I ,-, • , ,
;1 i i i , I
:~:© • i i
, I .. i , , e
L...J 0
ffi ro :E 6~ ::0 z ~~ w
~C) 0 0 u ~Z
"' <{ z m 0 0
~ wo (",0
u i?i .J~ S Z~ 0
am '" iE ~'"f 0
3 ..J 0: v; ..JO
t; W 3 :0 0 0 0...$1 :'i ..J '" 0
~ i5 in ~ o._'" ~ ;5 ~
co c, Vl III ~~ ~
II> is ;; w w ;:: :>: >' "' 3:S? 0: :§
:J:
'" '" - !,2 '" 0 L'J<TI '" :!:
Z C (!)O>
:0 0 <1" i'! co <! ~, 0
0 W ~o :'l 'l. <D 52 <J> ~
-------
I
1, l~ I' I I I
Ul L' ~ '" 3: 0
(fO if 0 4 cl « z (.)
~ ;:;: (_j '" a: 0
W CO :l: ~ :x: 5 cO ~ :t 0 '" z 3E '" ffi ., 0: -'
~ w U, ~ z ::; 0
~ c;
~ ::r '" <i.
~ ~ "' Iii <l \'! z " :> rr: 1i a.
0 "'0 eO. -- , ,
S"'-1i
'" ~ ~ "". ..,. \
0 '" a. a.
:z 0
3 '" ~ ::; 0 a. l! ~
vi ;;
" a:
'" ;., (!)
0 <; (!) 0 0 z " :3 is u
III :3 u
>- x u cr w X S z w :z 0 >.oJ 0
~ u ~ ~ II>
I::l :I: t;;
~ (!) 0 'i: a.
, \..-,
\. \ i
'/ 'Ie tJ,\(c\
~
+ ~ SI ~
0 :2
'" ~ z ffi :;;0 :;:
~ <! Vl Z w i); is w- '<i a: 'Z " I::l
, t;:;
I os: ~w a: 4cr '" w- :>: "Z w w >u '" cr <t.
n' ::: ;; ;:rl1:
u...J
~~ 'Z :;;
iCc cr Vl:! 0
o._ 0:<: ! :<:u
Ir6uDs UlOJ_:i <i
!oJ\W w01.:!
~
.-0 ~:j.
"'0 ;;,
0
-<-
'i"
'\
.n <X)
~ :E .~ >. c. 0 u .Q
" .£ '0 c '" E ::: g 0
'" @
.E .., E. '0
E '" ·c .. '" I; >-QI
~
" Ul .. -5 15 c 0 iii VI
E l;; c:.. .. ~ :5 .~
a. 0
E .S! '" £. -0
ii;-i:: :>
(J')
" 0 a. :> ." .. VI 0
CO
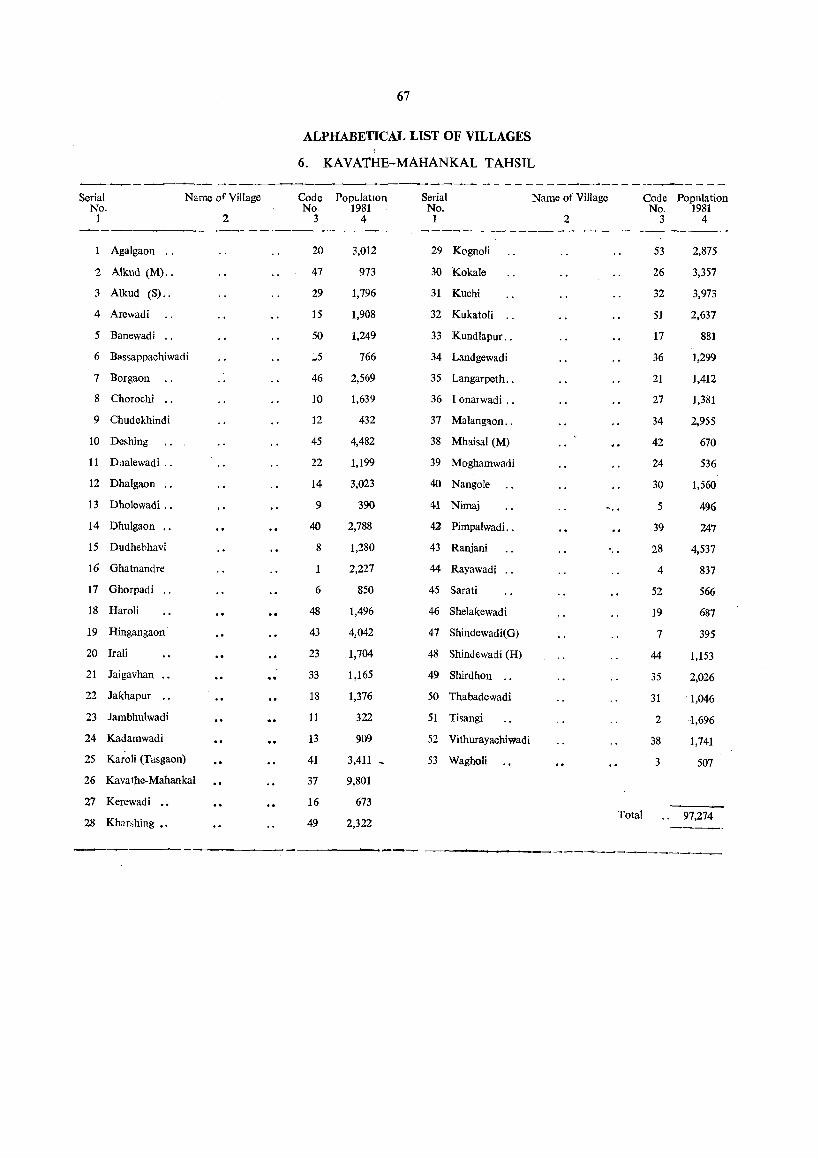
67
ALPHABETICAL LIST OF VILLAGES
6. KAVATHE-MAHANKAL TAHSIL
--~-- -- --- -- ---------------------Serial Name of Village Code PopLlatlOn Serial Name of Village Code Population
No. No 1981 No. No. 1981 1 2 3 4 1 2 3 4
----- ----..- -_,-----~-
AgaIgaon .. 20 3,012 29 Kognoli 53 2,875
2 Alkud (M) .. 47 973 30 Kokale 26 3,357
3 Alkud (S) .. 29 1,796 31 Kuehl 32 3,973
4 Arewadi 15 1,908 32 Kukatoli .. 51 2,637
5 Banewadi .. 50 1,249 33 Kundlapur .. 17 881
6 B"s~appachiwadi ~5 766 34 Landgewadi 36 1,299
7 Borgaon 46 2,569 35 Langarpeth .. 21 1,412
8 Chorochi 10 1,639 36 Ionarwadi .. 27 1,381
9 Chudekhindi 12 432 37 Malang'lon .. 34 2,955
10 Deshing 45 4,482 38 MhaisaI (M) 42 670
11 D,lalewadi .. 22 1,199 39 Moghamwadi 24 536
12 DhaIgaon .. 14 3,023 40 Nangole 30 1,560
13 Dholewadi .. 9 390 41 Nirnaj 5 496
14 Dhulgaon .• 40 2,788 42 Pimpalwadi. . 39 247
15 Dudhe.hhavi 8 1,280 43 Ranjani . .. 28 4,537
16 Ghatnandre 2,227 44 Rayawadi .. 4 837
17 Ghorpadi .. 6 850 45 Sarati 52 566
18 HaroH 48 1,496 46 Shelakewadi 19 637
19 Hingangaon 43 4,042 47 Shindewadi(G) 7 395
20 Irali 23 1,704 48 Shlnde.wadi (H) 44 1,153
21 laigavhan 33 1,165 49 Shirdhon .. 35 2,026
22 lakhapur .. 18 1,376 50 Thabadewadi 31 1,046
23 lambhulwadi 11 322 51 Ti~angi 2 ·1,696
24 Kadamwadi 13 909 52 Vithurayachiwadi 38 1,741
25 KaroH (Ta~gaon) 41 3,411 , 53 Wagholi 3 507
26 Kavathe-MahankaI 37 9,801
27 Kerewadi .. 16 673
28 Kharshing •• 49 2,322 Total .. 97,274
----. -----------
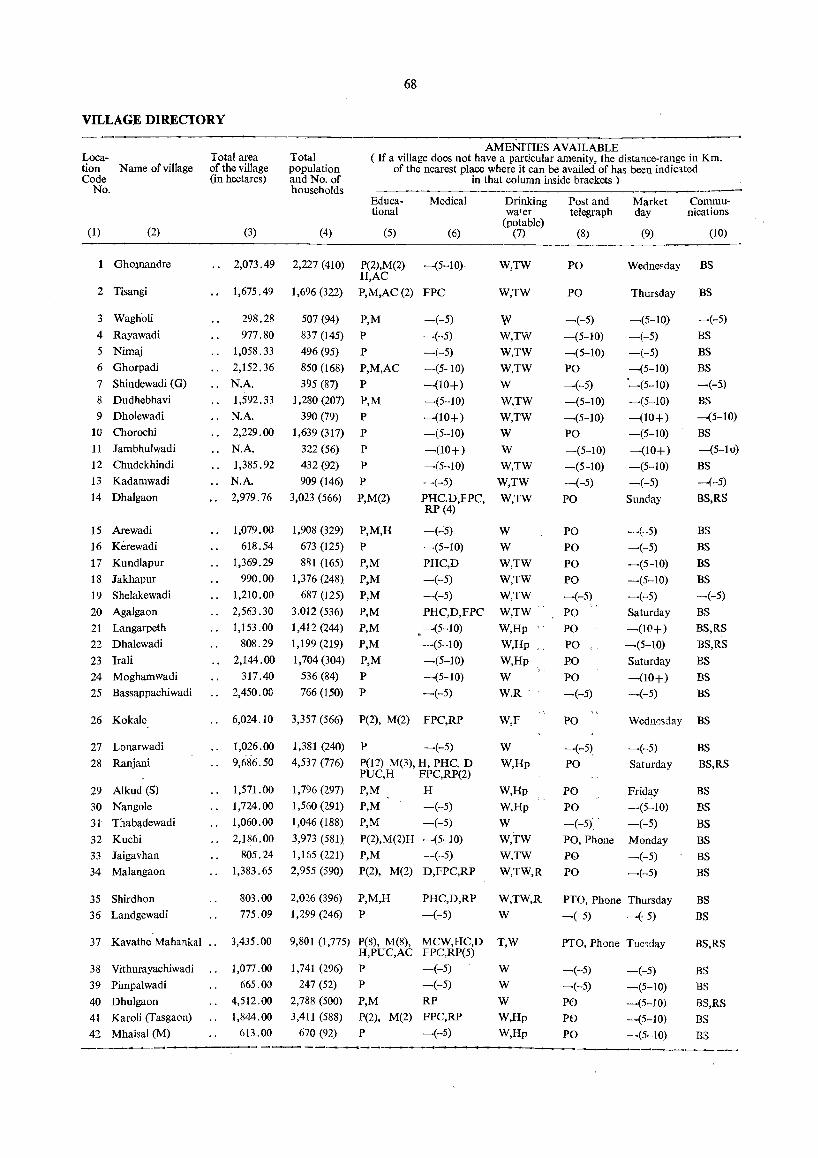
68
VILLAGE DIRECTORY
Loca-tion Name of village Code . No.
(1) (2)
2 Tisangi
3 Wagh'oli
4 Rayawadi
5 Nimaj
6 Ghorpadi
7 Shindewadi (G)
8 Dudhebhavi
9 Dholewadi
10 Chorochi
11 Jambhulwadi
12 Chudekhindi
13 Kadamwadi
14 Dhalgaon
15 Arewadi
16 Kerewadi
17 Kundlapur
18 Jakhapur
19 Shelakewadi
20 Agalgaon
21 Langarpeth
22 Dhalewadi
23 Irali
24 Moghamwadi
25 Bassappachiwadi
26 Kokale
27 Lonarwadi
28 Ranjani
29 A1kud (5)
30 Nangole
31 Thabadewadi
32 Kuchi
33 Jaigavhan
34 Malangaon
35 Shirdhon
36 Landgewadi
AMENITIES AVAILABLE Total area of the village (in hectares)
Total population and No. of households
(If a village does not have a particular amenity, the distance-range in Km. of the nearest place where it can be availed of has been indicated
in that column inside brackets) ---~-------------- --------
(3) (4)
Educational
(5)
Medical
(6)
.. 2,073.49 2,227 (410) P(2),M(2) -(5-10) H,AC
'. 1,675.49 1,696 (322) P,M,AC (2) FPC
298.28
977.80
1,058.33
.. 2,152.36
" N.A.
1,592.33
.. N.A.
" 2,229.00
.. N.A.
1,385.92
., N.A.
.. 2,979.76
1,079.00
618.54
1,369.29
990.00
1,2lO.00
.. 2,563.30
1,153.00
808.29
" 2,144.00
317.40
.. 2,450.00
.. 6,024.10
1,026.00
.. 9,686.50
1,571.00
1,724.00
1,060.00
.. 2,186.00
805.24
1,383.65
507 (94)
837 (145)
496 (95)
850 (168)
395 (87)
1,280 (207)
390 (79)
1,639 (317)
322 (56)
432 (92)
909 (146)
3,023 (566)
1,908 (329)
673 (125)
8~1 (165)
1,376 (248)
687 (125)
3.012 (536)
1,412 (244)
1,199 (219)
1,704 (304)
536 (84)
766 (I50)
3,357 (566)
1,381 (240)
4,537 (776)
P,M
P P P,M,AC
P P,M
P P
P
P
P P,M(2)
P,M,H
P
P,M
P,M
P,M
P,M
P,M
P,M
P,M
P P
-(-5)
-(-5)
-(-5)
--(5-10)
-(10+)
-(5-10)
-(10+)
-(5-10)
-(10+)
-(5-10)
-(-5)
PHC.D,FPC, RP(4)
-(":5)
-(5-10)
PHC,D
-(-5)
-(-5)
PHC,D,FPC
~ -(5-10)
-(5-10)
-(5-10)
-(5-10)
-(-5)
P(2), M(2) FPC,RP
P -(-5)
P(1:?) M(3), H, PHC, D PUC,H FPC,RP(2)
1,796 (297) P,M
1,560 (291) P,M
1,046 (188) P,M
H
-(-5)
-(-5)
3,973 (581)
1,165 (221)
2,955 (590)
P(2),M(2)H -(5-10)
P,M -(-5)
P(2), M(2) D,FPC,RP
803.00 2,026 (396) P,M,H PHC,D,RP
-(-5) 775.09 1,299 (246) P
Drinking Post and Market Commu-water telegraph day nications
(potable) (7) (8) (9) (10)
W,TW PO Wednesday BS
W,TW
W W,TW
W,TW
W,TW
W
W,TW
W,TW
W
W
W,TW
W,TW
W,TW
W
W
W,TW
W,TW.
W,TW
W,TW
W,Hp
W,Hp "
W,Hp
W
W,R'
W,F
W
W,Hp
W,Hp
W,Hp
W
W,TW
W,TW
W,TW,R
PO
-(-5)
-(5-10)
-(5-10)
PO
-(-5)
-(5-10)
-(5-10)
PO
-(5-10)
-(5-10)
-(-5)
PO
PO
PO
PO
PO
-(-5)
PO
PO
PO
PO
PO
-(-5)
PO
-(-5)
PO
PO
PO
-(-5)
PO, Phone
P0
PO
Thursday
-(5-10)
-(-5)
-(-·5)
-(5-10)
'-(5-10)
-(5-10)
-(10+)
-(5-10)
-(10+)
-(5-10)
-(-5)
Sunday
-(-5)
-(-5)
-(5-10)
-(5-10)
-(-5)
Saturday
-(10+)
-(5-10)
Saturday
-(10+)
-(-5)
Wednesday
-(-5)
Saturday
Friday
-(5-10)
-(-5)
Monday
-(-5)
-(-5)
W,TW,R PTO, Phone Thursday
W -(-5) -(,5)
BS
-(-5)
BS
BS
BS
-(-5)
BS -(5-10)
BS
-(5-10)
BS
-(-5)
BS,RS
BS
BS
BS
BS
-(-5)
BS
BS,RS
BS,RS
BS
BS
BS
BS
BS
BS,RS
BS
BS
BS
BS
BS
BS
BS
BS
37 Kavathe Mahankal .. 3,435.00 9,801 (1,775) P(8), M(8), MCW,HC,D T,W H,PUC,AC FPC,RP(5)
PTO, Phone Tuesday BS,RS
38 Vithurayachiwadi 1,077 . 00 1,741 (296) P -(-5) W
39 Pimpa!wadi 665.00 247 (52) P ,-(-5) W
40 Dhulgaon
41 Karoli (Tasgaon)
42 Mhaisal (M)
.. 4,512.00' 2,788 (500)
1,844.00 3,411 (588)
613 .00 670 (92)
P,M RP
P(2), M(2) FPC,RP
P -(-5)
W
W,Hp
W,Hp
-(-5) -(-5)
-(-5) -(5-10)
PO
PO
PO
-(5-10)
-(5-10)
-(5-10)
BS
BS BS,RS
BS
B3
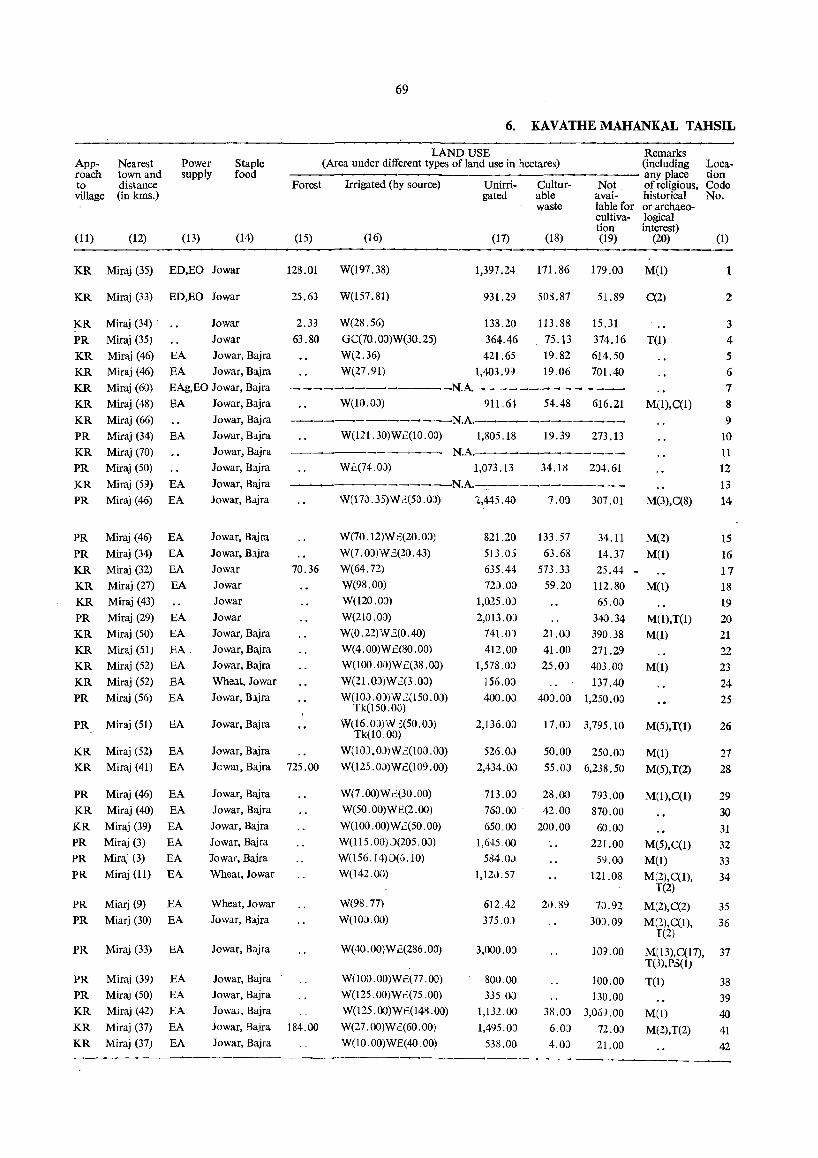
App- Nearest roach town and to distance village (in kms.)
(11) (12)
Power supply
(13)
Staple food
(14)
KR Miraj (35) ED,EO Iowar
KR Miraj (33) ED,EO Iowar
KR Miraj (34)
PR Miraj (35)
KR Miraj (46)
KR Miraj (46)
KR Miraj (60)
KR Miraj (48)
KR Miraj (66)
Iowar
Iowar
EA Iowar, Bajra
EA Iowar, Bajra
EAg,EO Iowar, Bajra
EA Iowar, Bajra
Jowar, Bajea
PR Miraj (34) EA Jowar, Bajra
Jowar, Bajra
Jowar, Bajra KR Miraj (70)
PR Miraj (50)
KR Miraj (59) EA
PR Miraj (46) EA
PR
PR
KR
KR
Miraj (46)
Miraj (34)
Miraj (32)
Miraj (27)
KR Miraj (43)
EA
EA
EA
EA
Jowar, Bajra
Jowar, Bajra
Iowar, Bajra
Iowar, Bajra
Jowar
Iowar
Jowar
Iowar
Iowar, Bajra
Iowar, Bajra
Jowar, Bajra
Wheat, Jowar
69
6. KAY ATHE MAHANKAL TAHSIL
LAND USE (Area under different types of land use in hectares)
Remarks (including
---~--------------------- any place Forest
(15)
128.01
25.63
2.33
63.80
Irrigated (by source)
(16)
W(197.38)
W(157.81)
W(28.56)
GC(70. 00)W(30. 25)
W(2.36)
W(27.91)
Unirri- Cultur-gated able
waste
(17) (18)
1,397.24
931.2()
138.20
364.46
171. 86
508.87
113.88
75.13
Not available for cultivation (19)
179.00
51.89
15.31
374.16
421.65 19.82 614.50
1,403.99 19.06 701.40
----N.A.---~~~~~-----
W(10.00) 911.64 54.48 616.21
--~N.A.----~-----
W(121. 30)WE(10.00) 1,805.18 19.39 273.13
~-- N.A. Wh(74.0J) 1,073.13 34.18 204.61
-~----~----N.A.
70.36
W(170.35)W3(50.0» 1,445.40
W(70.12)W2(20.00)
W(7 .OJ)W 2(20.43)
W(64.72)
W(98.00)
W(120.00)
W(210.00)
W(0.22)W 2(0.40)
W(4.00)W8(80.00)
W(100.OO)WE(38.00)
W(21.0J)W 3(3.00)
821.20
513 .05
635.44
72).00
I,OZ5.0J
2,013.0)
741.0)
412.00
1,578.00
156.00
7.00 307.01
133.57
63.68
573.33
59.20
21.00
41.00
25.00
34.11
14.37
25.44 -
112.80
65.00
340.34
390.38
271.29
403.00
137.40
of religious, historical or archaeological interest)
(20)
M(l)
C(2)
T(l)
M(I),C(1)
M(3),C(8)
M(2)
M(l)
M(I)
M(l),T(l)
M(l)
M(l)
Location Code No.
(1)
2
3
4 5
6 7 8
9
10
11
12
13
14
PR Miraj (29) EA
KR Miraj (50) EA
KR Miraj (51) EA.
KR Miraj (52) EA
KR Miraj (52) EA
PR Miraj (56) EA Iowar, Bljra W(lOJ. O)W 2(150.00) 400.00 400.00 1,250.00
15
16
17
18
19
20
21
22
23
24 25
PR Miraj (51) EA
KR Miraj (52) EA
KR Miraj (41) EA
PR Miraj (46) EA
KR Miraj (40) EA
KR Miraj (39) EA
PR Miraj (3) EA
PR Miraj (3) EA
PR Miraj (11) EA
PR Miarj (9) EA
PR Miarj (30) EA
PR Miraj (33) EA
PR Miraj (39) EA
PR Miraj (50) EA
KR Miraj (42) EA
KR Miraj (37) EA
KR Miraj (37) EA
Tk(150.00)
Jowar, Bajra W(16.0)W 2(50. OJ) Tk(10.00)
Iowar, Bajra W(10).0)W 2(100.00)
JowaI, Bajra 725.00 W(125.0J)W2(109.00)
Iowar, Bajra
Iowar, Bajra
Jowar, Bajra
Jowar, Bajra
Jowar, Bajra
Wheat, Jowar
Wheat, Jowar
Jowar, Bajra
Jowar, Bajra
Jowar, Bajra
Jowar, Bajra
Jowa;, Bajra
Jowar, Bajra 184.00
lowar, Bajfa
W(7.00)W2(30.00)
W(50.00)W£(2.00)
W(1 00. OO)W 2(50.00)
W(115.00)')(205.00)
W(l56. 14)0(6. 10)
W(142.00)
W(98.77)
W(IOJ.OO)
W(40.00)W2(286.00)
W(lOO.00)W2(77 .00)
W(l25 .00)W2(75 .00)
W(125 .00)W8(148 .00)
W(27.00)W2(60.00)
W(IO.00)WE(40 00)
2,136.0J 17 .OJ 3,795.10 M(5),T(1)
M(l)
M(5),T(2)
26
526.00 50.00 250.00 27
28 2,434.00 55.00 6,238.50
713 .OJ
760.00
650.00
1,645.00
584.00
1,120.57
612.42
375.0)
3,000.00
800.00
335.00
1,132.00
1,495.00
538.00
28.00
42.00
200.00
2i>.89
793.00
870.00
60.00
221.00
59.00
121.08
7il.92
M(l),C(l)
M(5),C(1)
M(I)
M(2),C(1), T(2)
M(Z),C(2)
29
30
31
32
33
34
35 300.09 M(2).C(l), 36
T(2)
10,}.00 M(13),C(17), 37 T(3),P3(1)
100.00 T(I) 38
130.00 38.0J 3,06:).00
6.0J 72.00
4.0J 21.00
M(l)
M(2),T(2)
39
40
41
42
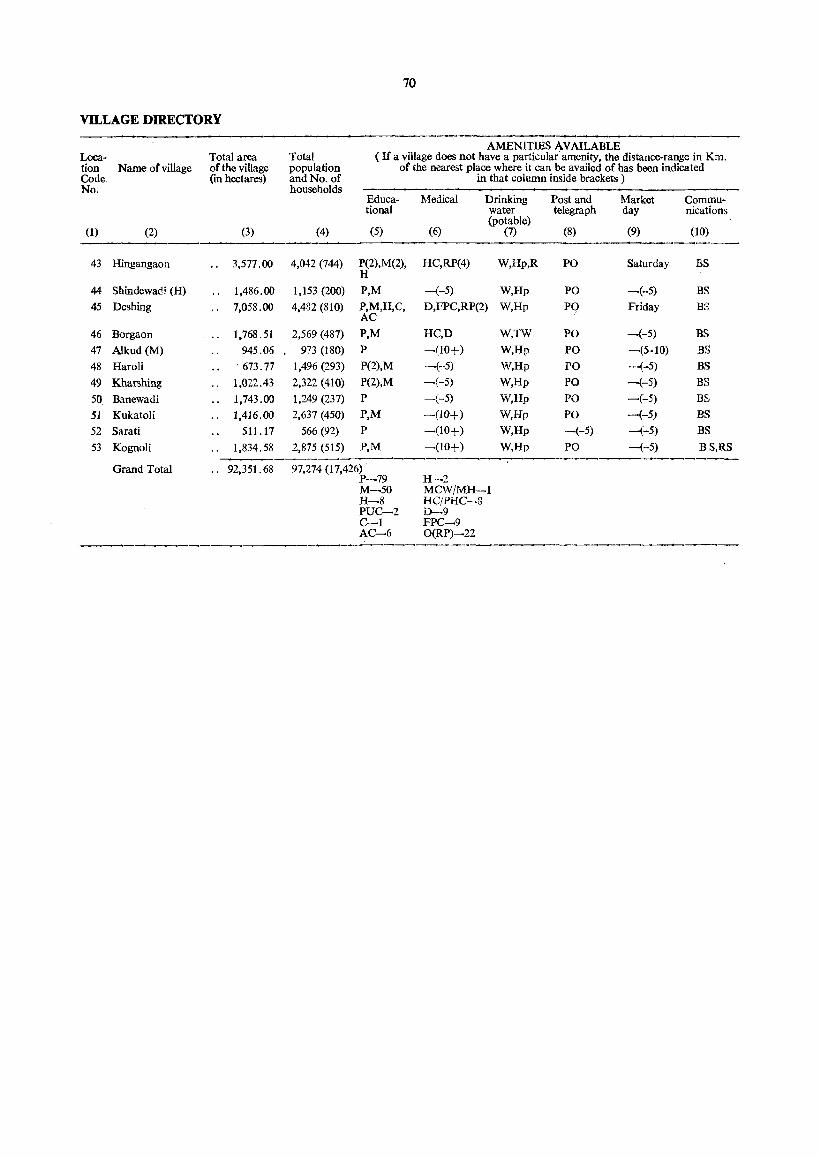
70
VILLAGE DIRECTORY
AMENITIES AVAILABLE Loca- Total area Total (If a village does not have a particular' amenity. the distance-range in Km. tion Name of village of the village population of the nearest place where it can be availed of has been indicated Code, (in hectares) and No. of in that column inside brackets) No. households
Educa- Medical Drinking Post and Market Commu-tional water telegraph day nications
(potable) (1) (2) (3) (4) (5) (6) (7) (8) (9) (10)
43 Hingangaon 3,577.00 4,042 (744) P(2),M(2), HC,RP(4) W,Hp,R PO Saturday BS H
44 Shindewadi (H) 1,486.00 1,153 (200) P,M -(-5) W,Hp PO -(-5) BS
45 Deshing 7,058.00 4,482 (810) P,M,H,C, D,FPC,RP(2) W,Hp PO Friday BS AC /
46 Borgaon 1,768.51 2,569 (487) P,M HC,D W,TW PO -(-5) BS
47 Alkud (M) 945.06 973 (180) P -(10+) W,Hp PO -(5-10) BS
48 HaroH . 673.77 1,496 (293) P(2),M -(-5) W,Hp PO -(-5) BS
49 Kharshing 1,022.43 2,322 (410) P(2),M -(-5) W,Hp PO -(-5) BS 50 Banewadi 1,743.00 1,249 (237) P -(-5) W,Hp PO -(-5) BS 51 Kukatoli 1,416.00 2,637 (450) P,M -(10+) W,Hp PO -(-5) BS
52 Sarati 511.17 566 (92) P -(10+) W,Hp -(-5) --(-5) BS
53 Kognoli 1,834.58 2,875 (515) P,M -(10+) W,Hp PO --(-5) BS,RS ~-----
Grand Total .. 92,351.68 97,274 (17,426) P-79 H-2 M-50 MCW/MH-l H-8 HC/PHC-8 PUC-2 D-9 C-l FPC-9 AC-6 O(RP)-22
'--------------------...

71
6. KAV ATHE-MAHANKAL TAHSIL
LAND USE Remarks App- Nearest Power Staple (Area under different types of land use in hectares) (including Loca-roach town and supply food any place tion
to distance Forest Irrigated (by source) Unirri- Cultur- Not of religious, Code village (in kIns.) gated able avai- historical No.
waste lable for or archaeo-cultiva- logical tion interest)
(11) (12) (13) (14) (15) (16) (17) (18) (19) (20) (1)
KR Miraj (35) EA Jowar, ~ajra 62.00 W(60.00)WE(400.00) 1,332.00 1,000.00 723.00 M(<!.),T(3) 43
KR Miraj (29) EA Jowar, Bajra W(50.00)WE(150.00) 886.00 100.00 300.00 T(I) 44 KR Miraj (22) EA Jowar, Bajra W(19. 00)WE(100. 00) 1,847.00 41.00 5,051.00 M(4),C(3), 45
T(2)
PR Miraj (11) EA Wheat, Jowar W(115.42) 140.41 105.44 1,407.24 M(I),T(I) 46 PR Miraj (20) EA Jowar, Bajra W(2.00)WE(20.00) 290.00 118.00 515.06 M(2) 47
KR Miraj (22) EA Jowar, Bajra 268.00 W(5.00)WE(4O.00) 360.77 M(l),C(2) 48 KR ,Miraj (19) EA Jowar, Bajra 96.00 W(2.00)WE(20.00) 616.00 288.43 M(2) 49
KR Miraj (25) EA Jowar, Bajra W(300.00)WE(:,00.00) 743.00 500.00 M(I),T(I) SO KR Miraj (30) EA Jowar, Bajra W(55. OO)WE(40. 00) 906.00 21.00 394.00 M(l) 51
KR Miraj (33) EA Iowar, Bajra W(11.00)WE(20.00) 333.00 5.00 142.17 52 KR Miraj (36) EA Jowar, Bajra W(40 . ()()WE(62 .00) 1,437.00 40.00 255.58 M(2) 53
1,625.13 GC(70. 00)W(3,637. 31) 47,654.05 4,231.78 32,237.48 M(70),C(39), WE(2,524. 83) T(23),PS(I) Tk(160. 00)0(211 .10)
N. A.--Not Available.
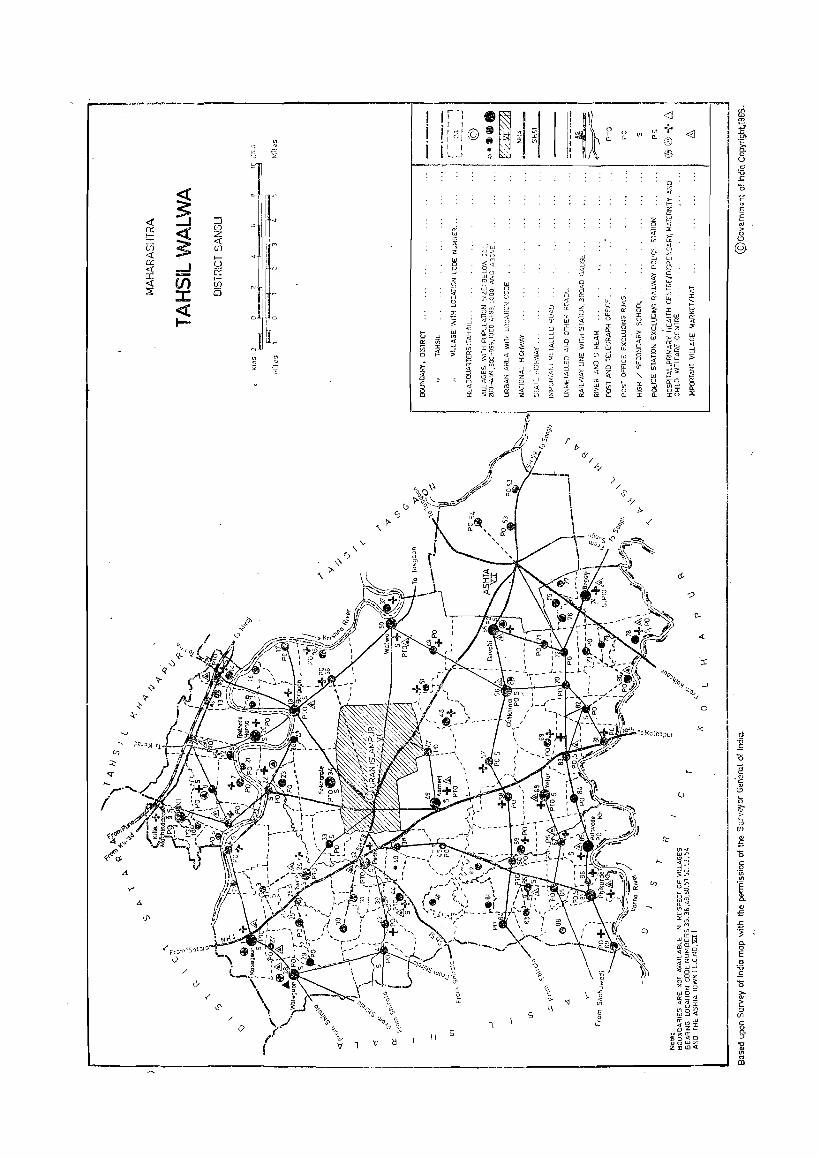
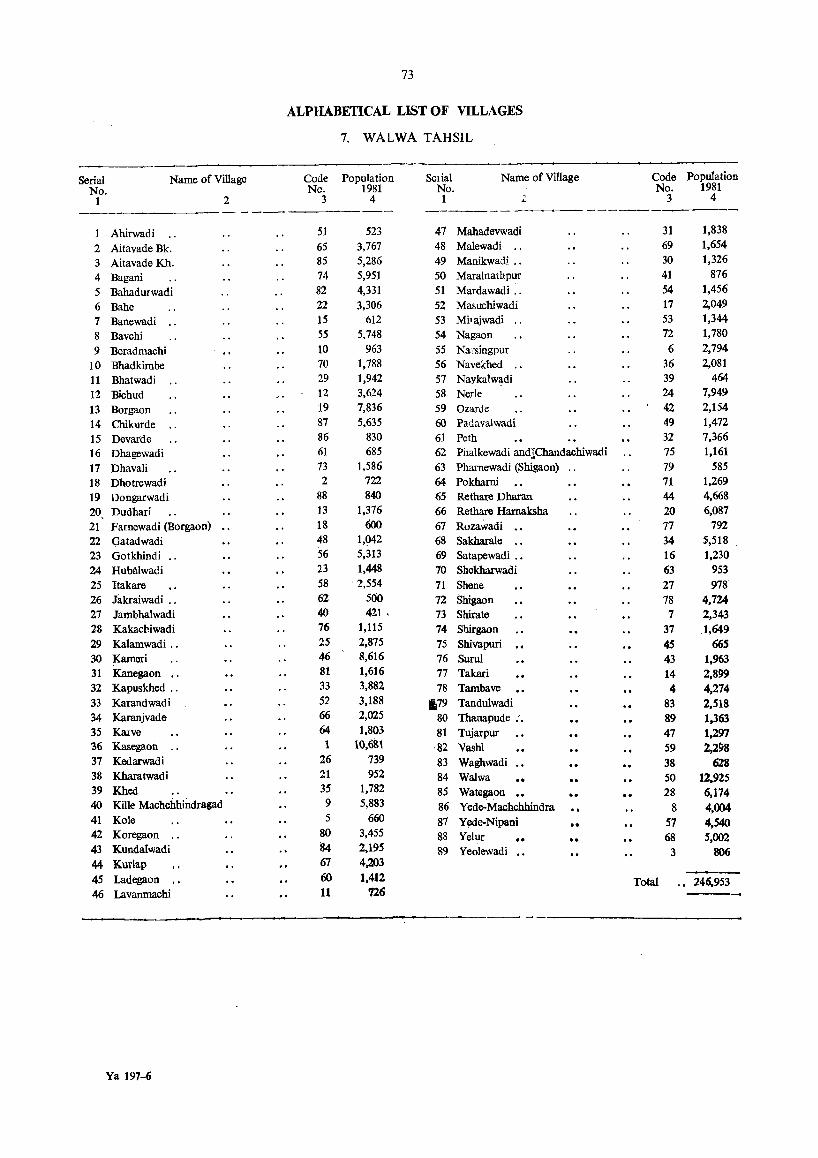
73
ALPHABETICAL LIST OF VILLAGES
7. WALWA TAHSIL
Serial Name of Village Code Population Selial Name of Village Code Population No. No. 1981 No. No. 1981
1 2 3 4 1 ,
3 4 ... ----------- ----- - --_._-- - -----
Ahirwadi ., 51 523 47 Mahadevwadi 31 1,838
2 Aitavade Bk. 65 3,767 48 Malewadi ., 69 1,654
3 Aitavade Kh. 85 5,286 49 Manikwadi ., 30 1,326
4 Bagani 74 5,951 50 Maralnathpur 41 876
5 Bahadurwadi 82 4,331 51 Mardawadi ., 54 1,456
6 Bahe 22 3,306 52 Masuchiwadi 17 2,049
7 Banewadi ., 15 612 53 Mhajwadi ., 53 1,344
8 Bavchi 55 5,748 54 Nagaon 72 1,780
9 Beradmachi 10 963 55 Na,'singpur 6 2,794
10 Bhadkimbe 70 1,788 56 Navekhed ., 36 2,081
11 Bhatwadi 29 1,942 57 Naykalw~di 39 464
12 Bichud 12 3,624 58 Nerle 24 7,949
13 Borgaon 19 7,836 59 Ozarde 42 2,154
14 Chikurde ., B7 5,635 60 Padavalwadi 49 1,472
15 Devarde 86 830 61 Peth 32 7,366
16 Dhagewadi 61 685 62 Phalkewadi andlChandachiwadi 75 1,161
17 Dhavali 73 1,586 63 Pharnewadi (Shiga on) .. 79 585
18 Dhotrewadi 2 722 64 Pokharoi 71 1,269
19 Dongarwadi 88 840 65 Rethare Dharan 44 4,668
20 Dudhari 13 1,376 66 Rethare Harnaksha 20 6,087
21 Farnewadi (Borgaon) 18 600 67 Rozawadi ., 77 792
22 Gatadwadi 48 1,042 68 Sakharale ., 34 S,518 23 Gotkhindi ., 56 5,313 69 Satapewadi ., 16 1,230
24 Hubalwadi 23 1,448 70 Shekharwadi 63 953
25 Itakare 58 2,554 71 Shene 27 978 26 Jakraiwadi ._ 62 500 72 Shigaon 78 4,724 27 Jambhalwadi 40 421. 73 Shirate 7 2,343 28 Kakachiwadi 76 1,115 74 SlUrgaon 37 1,649 29 Kalamwadi .. 25 2,875 75 Shivapuri 45 665 30 Kameri 46 8,616 76 Suru! 43 1,963 31 Kanegaon -- 81 1;616 77 Takari 14 2,899 32 Kapuskhed ., 33 3,882 78 Tambave 4 4,274 33 Karandwadi 52 3,188 179 Tandulwadi 83 2,518 34 Karanjvade 66 2,025 80 Thanapude .'. 89 1,363 35 Karve 64 1,803 81 Tujarpur 47 1,297 36 Kasegaon ., 1 10,68\ '82 Vashi S9 ~298 37 Kedarwadi 26 739 83 Waghwadi 38 628 38 Kharatwadi 21 952 84 Walwa 50 12,925 .. 39 Khed 35 1,782 85 Wategaon 28 6,174 40 Kille Machchhindragad 9 5,883 86 Yede-Machchhindra 8 4,004 41 Kole 5 660 87 Yede-Nipani 57 4,540 42 Koregaon .. 80 3,455 88 Yelur 68 5,002 " 43 Kundatwadi 84 2,195 89 Yeolewadi .. 3 806 44 Kurlap 67 4,203
45 Ladegaon .- 60 1,412 Total 246,953 46 Lavanrnachi 11 726
Ya 197-6
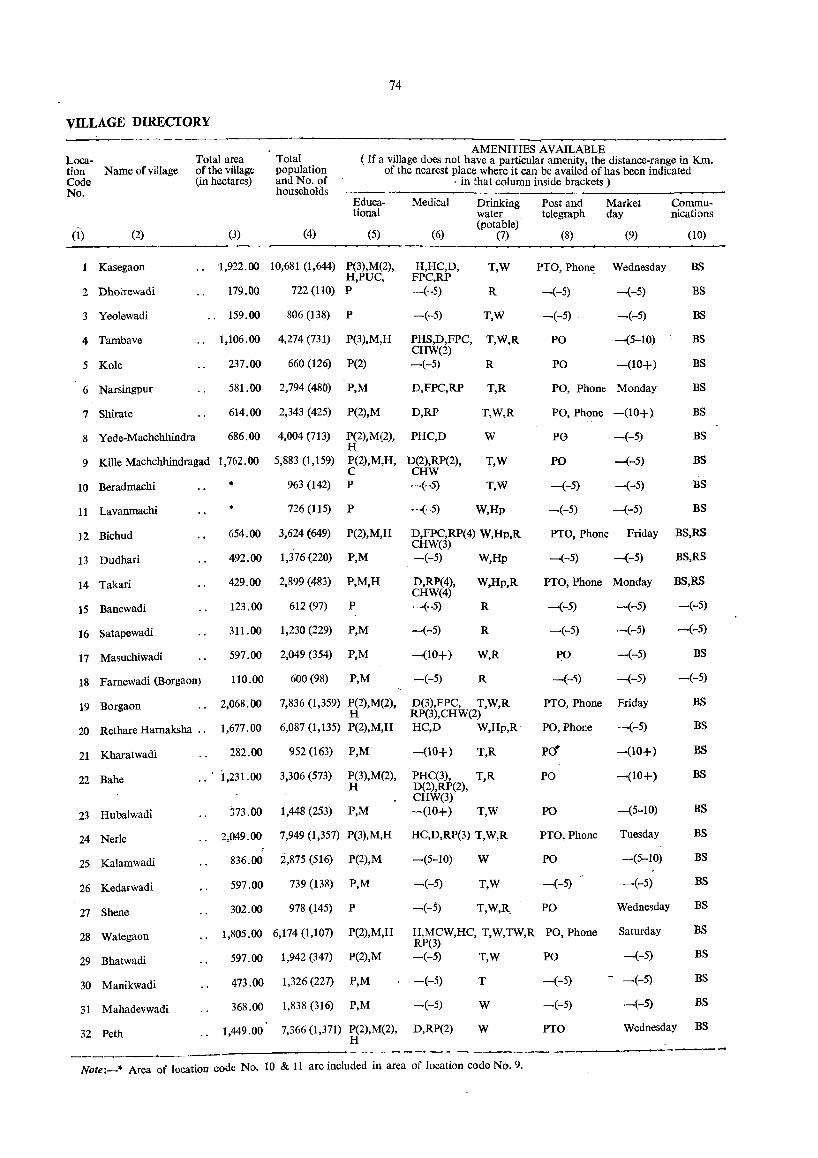
74
VILLAGE DIRECTORY
Loca-tion Name of village Code No.
Total area of the village (in hectares)
(3)
Total population and No. of households
(4)
AMENITIES AVAILABLE ( If a village does not have a particular amenity, the distance-range in Km.
of the nearest place where it can be availed of has been indicated
Educational
(5)
. in that column inside brackets) -----Medical Drinking Post and Market
water telegraph day (potable) .
(6)
Communications
(1) (2) (7) (8) (9) (10)
----------------------------------------------------------------------Kasegaon
2 Dhotrewadi
3 Yeolewadi
4 Tambave
5 Kole
6 Narsingpur
7 Shirate
8 Yede-Machchhindra
.. "1,922.00 10,681 (1,644) P(3),M(2), H,PDC,
179.00 722 (110) P
.. 159.00 806 (138) P
H,HC,D, FPC,RP -(-5)
-(-5)
T,W
R
T,W
1,106.00 4,274 (731) P(3),M,H PHS,D,FPC, T,W,R CHW(2)
237.00 660 (126) P(2) -(-5) R
581.00 2,794 (480) P,M D,FPC,RP T,R
614.00 2,343 (425) P(2),M D,RP T,W,R
686.00 PHC,D W
9 Kille Machchhindragad 1,762.00
4,004 (713)
5,883 (1,159)
963 (142)
P(2),M(2), H P(2),M,H, C
D(2),RP(2), CHW -(-5)
T,W
10 Beradmachi
11 Lavanmachi
12 Bichud
13 Dudhari
14 Takari
15 Banewadi
16 Satapewadi
17 Masuchiwadi
• P T,W
* 726 (115) P -(-5) W,Hp
654.00 3,624 (649) P(2),M,H D,FPC,RP(4) W,Hp,R CHW(3)
492.00 1,376 (220) P,M -(-5) W,Hp
429.00 2,899 (483) P,M,H
123.00 612 (97) P
311.00 1,230 (229) P,M
597.00 2,049 (354) P,M
D,RP(4), CHW(4) -(-5)
-(-5)
-(10+)
W,Hp,R
R
R
W,R
18 Farnewadi (Borgaon) 110.00 600 (98) P,M -(-5) R
19 Borgaon .. 2,068.00 7,836 (1,359) P(2),M(2), H
D(3),FPC, T,W,R RP(3),CHW(2)
20 Rethare Harnaksha .. 1,677.00 6,087 (1,135) P(2),M,H HC,D W,Hp,R
21 Kharatwadi 282.00 952 (163) P,M -(10+) T,R
22 Bahe i,231.00 3,306 (573) P(3),M(2), PHC(3), T,R H D(2),RP(2),
CHW(3)
23 Hubalwadi 373.00 1,448(253) P,M -(10+) T,W
24 Nerle .. 2,M9.00 7,949 (1,357) P(3),M,H HC,D,RP(3) T,W,R
25 Kalamwadi 836.00 2,875 (516) P(2),M -(5-10) W
26 Kedarwadi 597.00 739 (138) P,M -(-5) T,W
27 Shene 302.00 978 (145) P -(-5) T,W,R
PTO, Phone Wednesday
-(-5) -(-5)
-(-5) -(-5)
PO -(5-10)
PO -(10+)
PO, Phone Monday
PO, Phone -(10+)
PO
PO
-(-5)
-(-5)
-(-5)
-(-5)
-(-5)
-(-5)
BS
BS
BS
BS
BS
BS
BS
BS
BS
BS
BS
PTO, Phone Friday BS,RS
-(-5) -(-5) BS,RS
PTO, Phone Monday
--(-5) -(-5)
-(-5)
PO
--(-5)
PTO, Phone
PO, Phone
PO#
PO
PO
PTO, Phone
PO
-(-5)
PO
-(-5)
-(-5)
-(-5)
Friday
-(-5)
-(10+)
-(10+)
-(5-10)
Tuesday
-(5-10)
-(-5)
Wednesday
BS,RS
-(-5)
-(-5)
BS
-(-5)
BS
BS
BS
BS
BS
BS
BS
BS
BS
28 Wategaon 1,805.00 6,174 (1,107) P(2),M,H H,MCW,HC, T,W,TW,R PO, Phone RP(3)
Saturday BS
29 Bhatwadi
30 Manikwadi
31 Mahadevwadi
32 Peth
597.00 1,942 (347) P(2),M -(-5) T,W PO
473.00 1,326 (227) P,M -(-5)
368.00 1,838(316) P,M -(-5)
1,449.00 7,366 (1,371) P(2),M(2), D,RP(2) H
T
W
W
-(-5)
-(-5)
PTO
-------- - ----~ -~-----Note:-* Area of location code No. 10 & 11 are included in area of location code No.9.
-(-5)
- -(-5)
-(-5)
BS
BS
BS
Wednesday BS
---------
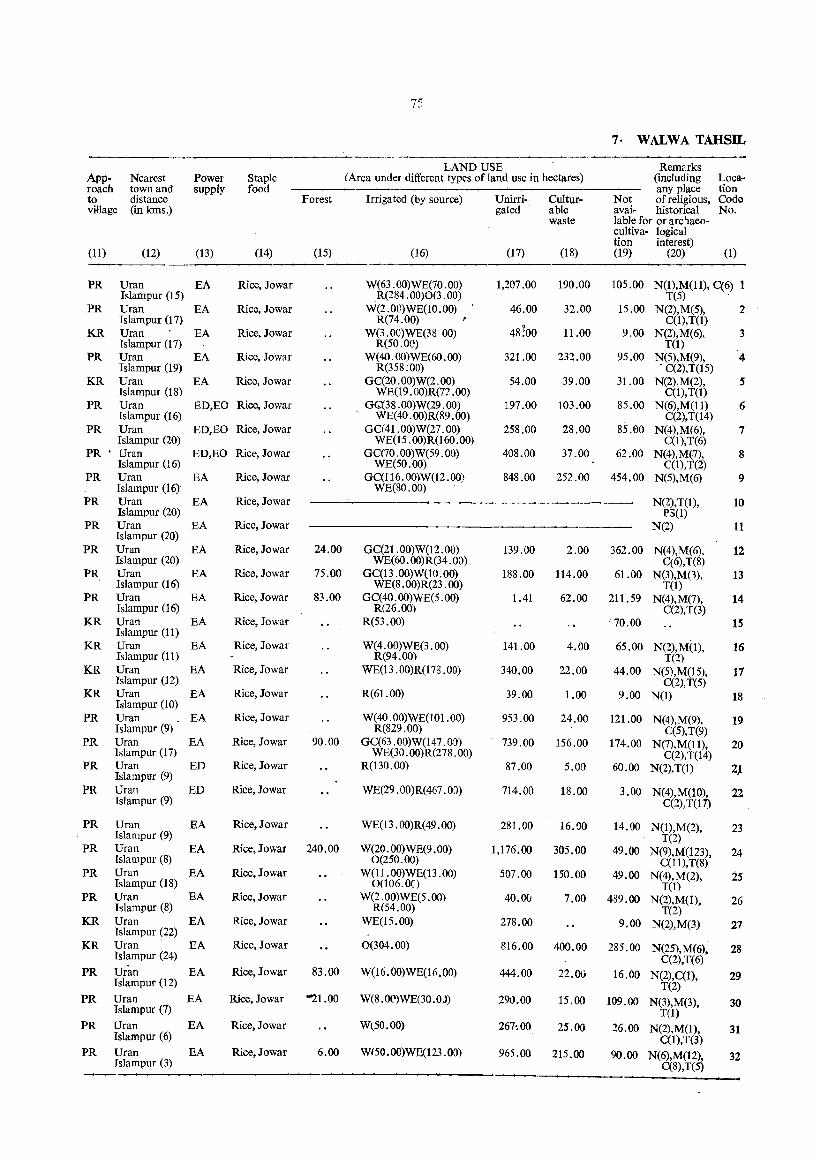
75
7· WALWA TAHSIL
LAND USE Remarks (including any place
Approach to village
Nearest town and distance (in kms.)
Power supply
Staple food
(Area under different types of land use in he<;tares) Location Code No.
Forest Irrigated (by source)
(11) (12) (13) (14) (15) (16)
PR Uran EA Rice, Jowar W(63.00)WE(70.00) R(284. 00)0(3.00) Islampur (15)
PR Uran EA Rice, Jowar W(2.00)WE(10.00) R(74.00) Islampur (17)
KR Uran Islampur (17)
EA Rice, Jowar W(3.0G)WE(38 00) R(50.0Q)
PR Uran EA Rice, Jowar W(40.00)WE(60.00) R(358 ;00) Islampur (19)
KR Uran Islampur (18)
EA Rice, Jowar GC(20.00)W(2.00) WE(19 .OO)R(7? .00)
GG(3S.00)W(29.00) WEe 40. 00)R(89 . 00)
GC(41.00)W(27.00) WE(15.00)R(160.00)
GC(70. 00)W(59. 00) WE(50.00)
GC(116.00)W(l2.00) WE(80.00)
PR Uran ED,EO Rice, Jowar Islampur (16)
PR Uran ED,EO Rice, Jowar Islampur (20)
PR • Uran Islampur (16)
ED,EO Rice, Jowar
PR Uran EA Rice, Jowar Islampur (16)'
PR Vran EA Islampur (20)
PR Uran EA Islampur (20)
PR Uran EA Islampur (20)
PR Uran EA Islampur (16)
PR Uran EA Islampur (16)
KR Uran EA Islampur (11)
KR Uran EA Islampur (11)
KR Uran EA Islampur (12)
KR Uran EA Islampur (10)
PR Uran _ EA Islampur (9)
PR Uran EA Islampur (17)
PR Uran ED Islampur (9)
PR Uran ED Islampur (9)
PR Uran EA Islampur (9)
PR Uran EA Islampur (S)
PR Uran EA Islampur (18)
PR Uran EA Islampur (8)
KR Uran FA Islampur (22)
KR Uran EA Islampur (24)
PR Urim EA Islampur (12)
PR Uran EA Islampur (7)
PR Uran EA Islampur (6)
PR Uran EA Islampur (3)
Rice, Jowar
Rice,Jowar
Rice,Jowar
Rice,Jowar
Rice, Jowar
Rice, Jowar
Rice,Jowar
Rice,Jowar
Rice,Jowar
Rice, Jowar
Rice, Jowar
Rice,Jowar
Rice, lowar
24.00 GC(21.00)W(12.00) WE(60. 00)R(34. 00)
75.00 GC(13.00)W(10.00) WE(S. 00)R(23 . 00)
S3.00 GC(40.00)WE(5.00) R(26.00)
R(53.00)
W(4.00)WE(3.00) R(94.00)
WE(13. OO)R(178. 00)
R(61.00)
W(40.00)WE(101.00) R(829.00)
90.00 GC(63.00)W(147.00) WE(30.00)R(278.00)
R(130.00)
WE(29. 00)R(467. 00)
Rice,Jowar WE(13.00)R(49.00)
Rice,Jowar 240.00 W(20.00)WE(9.00) 0(250.00)
Rice,Jowar W(I1.00)WE(13.00) 0(106.00
Rice, Jowar W(2. 00)WE(5. 00) R(54.00)
Rice,Jowar WE(15.00)
Rice, Jowar 0(304.00)
Rice,Jowar 83.00 W(16.00)WE(16.00)
Rice, Jowar ""21.00 W(8.0C')WE(30.0J)
Rice, Jowar W{50.00)
Rice, Jowar 6.00 W(50.00)WE(123.00)
Unirri- CuItur-gated able
waste
(17) (18)
1,207.00
46.00
48:00
321.00
54.00
197.00
258.00
408.00
848.00
190.00
32.00
11.00
232.00
39.00
103.00
28.00
37.00
252.00
Not of religious, avai- historical lable for or archaeocultiva- logical tion interest) (19) (20) (1)
105.00
15.00
9.00
95.00
31.00
85.00
85.aO
62.00
454.00
N(I),M(ll), C(6) 1 T(5) ,
N(2),M(5), 2 C(1),T(1)
N(2),M(6). 3 T(1)
N(5),M(9), 4 . C(2),T(15)
N(2),M(2), S C(I),T(I)
N(6),M(1l) 6 C(2),T(14)
N(4),M(6), 7 C(1),T(6)
N(4),M(7), 8 C(I),T(2)
N(5),M(6) 9
N(2),T(l), P3(1)
N(2)
10
139.00 2.00 362.00 N(4),M(6),
11
12
13
14
15
16
17
C(6),T(8) 18S.00 114.00 61.00 N(3),M(1),
T(I) 1.41 62.00 211.59 N(4),M(7),
141.00
340.00
39.00
4.00
22.00
1.00
C(2),T(3) '70.00
65.00 N(2),M(I), T(2)
44.00 N(5),M(15), C(2),T(5)
9.00 N(I) 18
953.00 24.00 121.00 N(4),M(9), 19 C(5),T(9)
739.00 156.00 174.00 N(7),M(ll). 20 C(2),T(14)
87.00 5.00 60.00 N(2),T(I) 2)
714.00 18.00 3.00 N(4),M(10), 22 C(2),T(I7)
281.00 16.00 14.00 N(1),M(2), 23 T(2)
1,176.00 305.00 49.00 N(9),M(123), 24 C(11),T(S)
507.00 150.00 49.00 N(4),M(2), i5 T(I)
40.00 7.00 489.00 N(2),M(l), 26 T(2)
278.00 9.00 N(2).M(3) 27
816.00 400.00 285.00 N(25),M(6), 28 C(2),T(6)
444.00 22.00 16.00 N(2),C(I), 29 T(2)
290.00 15.00 109.00 N(3),M(3), 30 T(l)
267-:00 25.00 26.00 N(2),M(l), 31 C(1),T(3)
965.00 215.00 90.00 N(6),M(12), 32 C(8),T(5)

76
VILLAGE DIRECTORY
Loca-tion Name of village Code No.
(1) (2)
33 Kapuskhed
34 Sakharale
35 Khed
36 Navekhed
37 Shirgaon
38 Waghwadi
39 Naykalwadi
40 Jambhalwadi
41 Maralnathpur
42 Ozarde
43 Suru!
44 Rethare Dharan
45 Shivapuri
46 Kameri
47 Tujarpur
48 Gatadwadi
49 Padavalwadi
50 Walwa
51 Ahirwadi
52 Karandwadi
53 Mirajwadi
54 Mardawadi
55 Bavchi
56 Gotkhindi
57 Yede-Nipani
'58 Itakare
59 Vashi
60 Ladegaon
61 Dhagewadi
62 Jakraiwadi
63 Shekharwadi
64 Karve
65 Aitavade Bk.
AMENITIES AVAILABLE Total area of the village (in hectares)
Total population and No. of households
(If a village does not have a particular amenity. the distance-range in Km. of the nearest place where it can be availed of has been indicated
(3) (4)
Educational
(5)
600.00 3,882 (665) P(2),M(2), H
1,213.00 5,518 (1,087) P(2),H,AC
657.25 1,782 (311) ,P,M
360.16
323.88
5;':3.00
170.00
* 450.00
798.00
1,063.00
2,081 (380) P,M
1,649 (303) P,M
628 (97) P
464 (75) P
421 (66) P
876 (148) P,M
:2,154 (359) P,M
1,963 (215) P,M,H
2,027.00 4,668 (797) P(3),M,H
584.00 665 (131) P,M
2,284.00 8,616 (1,521) P(3),M(3), H
523.00 1,297 (222) P(2),M
562.57 1,042 (173) P,M
313.90 1,472 (250) P,M
•• 3,681.41 12,925 (2,157) P(4),M, H(3),PUC
234.79 523 (80) P
616.84 3,188 (560) P(2),M(2)
441.33 1,344 (272) P,M
496.92 1,456 (262) P,M
1,689.00 5,748 (990) P,M,H
.. 2,069.92 5,313 (1,057) P,M,H
1,661.00 4,540 (796) P(2),M(2), H
911.00 2,554 (490) P,M
875.00 2,298 (404) P,M
328.00 1,412 (225) P,M
564.00 685 (136) P
235.00 500 (82) P
347.00 953 (182) P
990.00 1,803 (333) P.M
1,086.00 3,767 (791) P(2).M(2), H,PUC
in that column inside brackets)
Medical Drinking Post and Market water telegraph day
Communications
(potable) (6) (7) (8) (9) (10)
-(-5) T,W
RP(2),CHW T,W (4) HC,D,RP W,R
D,RP
D,RP
-(-5)
-(-5)
-(-5)
-(-5)
D,RP
HC
W,R
Hp,R
W
W
YI W
W
W
PHS,D(2). W FPC,RP -(-5) W
D,FPC,RP T,W,'J'k (3) -(5-10) W,Hp
D,RP W,TW
D,RP W,Hp
PO -(-5)
PTO, Phone -(-5)
PO -(5-10)
PO
-(-5)
-(-5)
-(-5)
-(-5)
-(-5)
PO
PO
-(5-10)
-(-5)
-(-5)
-(-5) ,
-(-5)
-(5-10)
-(5-10)
-(5-10)
PTO, Phone Friday
PO -(-5)
PTO, Phone Friday
. PO -(5-10)
-(-5) -( ... 5)
PO --(5-10)
-(-5)
BS
BS
BS
BS
BS
BS
-(-5)
-(-5)
BS
BS
BS
BS
BS
D,FPC,RP T,W,Hp,R PTO Friday
BS
BS
BS
BS'
D,RP TW,Hp,R -(-5) -(5-10) BS
BS RP
-(-5)
-(-5)
W
W
Hp
PO -(-5)
PO -(-5)
Pi) -(-5)
PHC,D,FPC. T,W,TW PO, Phone Tuesday
BS
BS
BS RP H,RP
D,RP(2)
D
D
-(-5)
-(-5)
-(-5)
-(-5)
-(-5)
D,RP(3)
W
W
W
W
W
W
W
W
W
W
PO, Phone Wednesday BS
PO, Phone -(-5-10) BS
PO -(-5) BS
PO -(-5) BS
PO -(-5) BS
-(-5) -(-5) -(-5)
-(-5) -(-5) BS
-(-5) -(-5) BS
PO -(-5) BS ~
PTO, Phone Tuesday qq
--------------------~~----~--.----------------------~-----~-----Note :- * Area oflocation code No. 40 is included in area of location code No. 20.
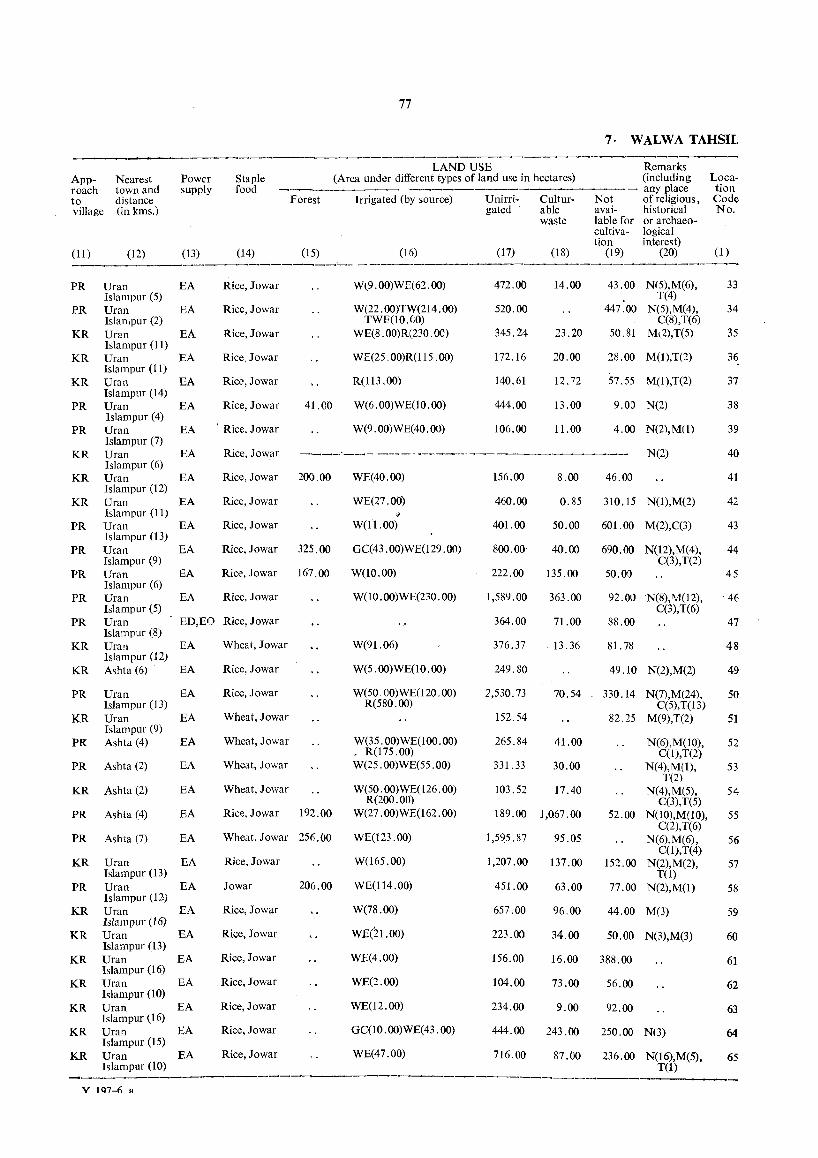
Approach to village
(II)
Nearest town and distance (in kms.)
(12)
Power supply
(13)
Staple food
(14)
77
7· WALWA TAHSIL
LAND USE Remarks (Area under different types of land use in hectares) (including
--------- -------. ---------- - any place Forest Irrigated (by source) Unirri- Cultur- Not of religious,
gated able avai- historical waste lable for or archaeo
cult iva- logical tion interest)
(IS) (16) (17) (18) (19) (20)
Location Code No.
(1)
-------------------~--:..__------------------------------------
PR
PR
KR
Dran Islampur (5) Dran Islan,pur (2) Dran Islampur (11)
EA
EA
EA
KR Dran EA Isla mpur (11)
KR Uran EA Islampur (14)
PR Dran EA Islampur (4)
Rice, Jowar
Rice, Jowar
Rice, Jowar
Rice, Jowar
Rice, Jowar
Rice, Jowar
PR Dran EA' Rice, Jowar Islampur (7)
41.CO
W~9.00)WE(62.00)
W(22. 00)TW(214. (0) TWE(IO,(JO)
WE(8 . 00)R(230. 00)
WE(25 .00)R(115 .00)
R(113.00)
W(6.00)WE(l0.00)
W(9.00)WE(40.00)
472.00
520.00
345.24
172,16
140.61
444.00
106.00
14.00
23.20
20.00
12.72
13.00
11.00
43.00
447.00
50.81
N(5),M(6), T(4)
N(5),M(4), C(8),T(6)
M(2),T(5)
28.00 M(I),T(2)
57.55 M(I),T(2)
9.00 N(2)
4.00 N(2),M(1)
KR Dran EA Rice, Jowar -~--'--- ---------------------- N(2) Islampur (6)
KR Dran EA Islampur (12)
KR Dran EA Islampur (11)
PR Dran EA lslampur (13)
PR Uran EA Islampur (9)
PR Dran EA Islampur (6)
Rice, Jowar 200.00 WE(40.00) 156.00 8.00 46.00
Rice, Jowar WE(27.00) 460.00 0.85 310.15 N(I),M(2) ~
Rice, Jowar W(II.OO) 401.00 50.00 601.00 M(2),C(3)
Rice, Jowar 325.00 GC(43.00)WE(l29.00) 800.00 40.00 690.00 N(12),M(4), C(3),T(2)
Rice,Jowar 167.00 W(10.00) 222.00 135.00 50.00
33
34
35
36
37
38
39
40
41
42
43
44
45
PR Dran EA Islampur (5)
Rice, Jowar W(lO.00)WE(230.00) 1,589.00
364.00
363.00 n.Ol) N(8),M(12), . 46
PR Dran ED,EO Rice, Jowar Islampur (8)
KR Dran EA Islampur (12)
KR Ashta (6) EA
PR Dran EA Islampur (13)
KR Uran EA Islampur (9)
PR Ashta (4) EA
PR Ashta (2) EA
KR Ashta (2) EA
PR Ashta (4) EA
PR Ashta (7) EA
KR Dran EA Islampur (13)
PR Dran EA Islampur (12)
KR Dran EA Islampur (16)
KR Uran EA Islampur (13)
KR Uran EA Islampur (16)
KR Dran EA Islampur (10)
KR Uran EA Islampur (16)
KR Dran EA Islampur (15)
KR Dran EA Islampur (10)
Wheat, Jowar
Rice, Jowar
Rice, Jowar
Wheat, Jowar
Wheat, Jowar
Wheat, Jowar
Wheat, Jowar
Rice, J owar 192.00
Wheat, Jowar 256.00
Rice, Jowar
J owar 206.00
Rice, Jowar
Rice, Jowar
Rice, Jowar
Rice,Jowar
Rice, Jowar
Rice,Jowar
Rice,Jowar
W(91.06)
W(5.00)WE(10.00)
W(50.00)WE(120.00) R(580,00)
W(35.00)WE(100.00) , R(175.00) W(25. 00)WE(55. 00)
W(50. 00)WE(l26. 00) R(200.00)
W(27.00)WE(162.00)
WE(123.00)
W(165.00)
WE(114.00)
W(78.00)
WE(21.00)
WE(4.00)
WE(2.00)
WE(12.00)
GC(IO.00)WE(43.00)
WE(47.00)
71.00
376.37 ,13.36
249.80
2,530.73 70.54
152.54
265.84 41.00
331.33 30.00
103.52 17.40
189.00 1,067.00
1,5515.87
1,207.00
451.00
657.00
223.00
95.05
137.00
63.00
96.00
34.00
C(3),T(6) 88.00
81.78
49.10 N(2),M(2)
330.14 N(7),M(24), C(5),T(13)
82.25 M(9),T(2)
N(6),M(10), C(I),T(2)
N(4),M(I), T(2)
N(4),M(5), C(3),T(5)
52.00 N(IO),M(lO), C(2),T(6)
N(6),M(6), C(l),T(4)
152.00 N(2),M(2), T(l)
77.00 N(2),M(t)
44.00 M(3)
50.00 N(3),M(3)
156.00 16.00 388.00
104.00 73.00 56.00
234.00 9.00 92.00
444.00 243,00 250.00 N(3)
716.00 87.00 236.00 N(16),M(5), T(l)
------------------------------------V lQ7-1l "
47
48
49
50
51
52
53
54
55
56
57
58
59
60
61
62
63
64
65
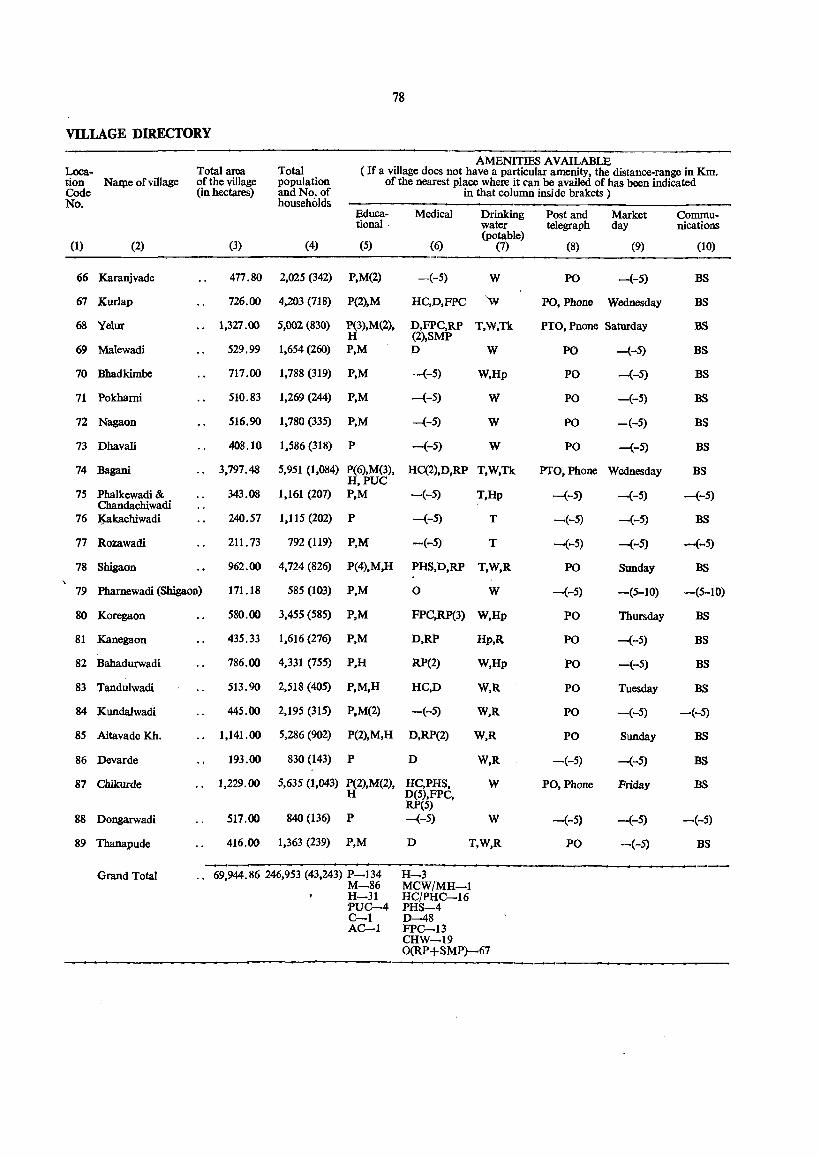
78
VILLAGE DIRECfORY
AMENITIES AVAILABLE Loca- Total area Total (If a village does not have a particular amenity, the distance-range in Km. tion Narpe of village of the village population of the nearest place where it ('an be availed of has been indicated Code (in hectares) and No. of in that column inside brakets) No. households
Educa- Medical Drinking Post and Market Commu-tiona! water telegraph day nications
(potable) (1) (2) (3) (4) (5) (6) (7) (8) (9) (10)
66 Karanjvade 477.80 2,025 (342) P,M(2) -(-5) W PO -(-5) BS
67 Kurlap 726.00 4,203 (718) P(2),M HC,D,FPC W PO, Phone Wednesday BS
68 Yelur .. 1,327.00 5,002 (830) P(3),M(2), D,FPC,RP T,W,Tk PTO, Pnone Saturday BS H (2),SMP
69 Malewadi 529.99 1,654 (260) P,M D W PO -(-5) BS
70 Bhadkimbe 717.00 1,788 (319) P,M --(-5) W,Hp PO -(-5) BS
71 Pokhami 510.83 1,269 (244) P,M -(-5) W PO -(-5) BS
72 Nagaon 516.90 1,780 (335) P,M -(-5) W PO -(-5) BS
73 Dhavali 408.10 1,586 (318) P -(-5) W PO -(-5) BS
74 Bagani .. 3,797.48 5,951 (1,084) P(6),M(3), H,PUC
HC(2),D,RP T,W,Tk PTO, Phone Wednesday BS
75 Phalkewadi & 343.08 1,161 (207) P,M -(-5) T,Hp -(-5) -(-5) -(-5) Chandachiwadi
76 ~kachiwadi 240.57 1,115 (202) P -(-5) T -(-5) -(-5) BS
77 Rozawadi 211. 73 792 (119) P,M -(-5) T -(-5) --(-5) -(-5)
78 Shigaon 962.00 4,724 (826) P(4),M,H PHS,D,RP T,W,R PO Sunday BS
79 Phamewadi (Shigaon) 171.18 585 (103) P,M 0 W --(-5) -(5-10) -(5-10)
80 Koregaon 580.00 3,455 (585) P,M FPC,RP(3) W,Hp PO Thursday BS
81 Kanegaon 435.33 1,616 (276) P,M D,RP Hp,R PO --(-5) BS
82 Bahadurwadi 786.00 4,331 (755) P,H RP(2) W,Hp PO -(-5) BS
83 Tandulwadi 513.90 2,518 (405) P,M,H HC,D W,R PO Tuesday BS
84 Kundalwadi 445.00 2,195 (315) P,M(2) -(-5) W,R PO -(-5) -(-5)
85 Aitavade Kh. .. 1,141.00 5,286 (902) P(2),M,H D,RP(2) W,R PO Sunday BS
86 Devarde 193.00 830 (143) P D W,R -(-5) -(-5) BS
87 Chikurde .. 1,229.00 5,635 (1,043) P(2),M(2), HC,PHS, W PO, Phone Friday BS H D(5),FPC,
RP(5) 88 Dongarwadi 517.00 840 (136) P -(-5) W -(-5) -(-5) -(-5)
89 Thanapude 416.00 1,363 (239) P,M D T,W,R PO -(-5) BS
---Grand Total .. 69,944.86 246,953 (43,243) P-134 H-3 M-86 MCW/MH-l H-31 HC/PHC-16 'PUC-4 PHS-4 C-l D-48 AC-l FPC-13
CHW-19 O(RP+SMP)-67
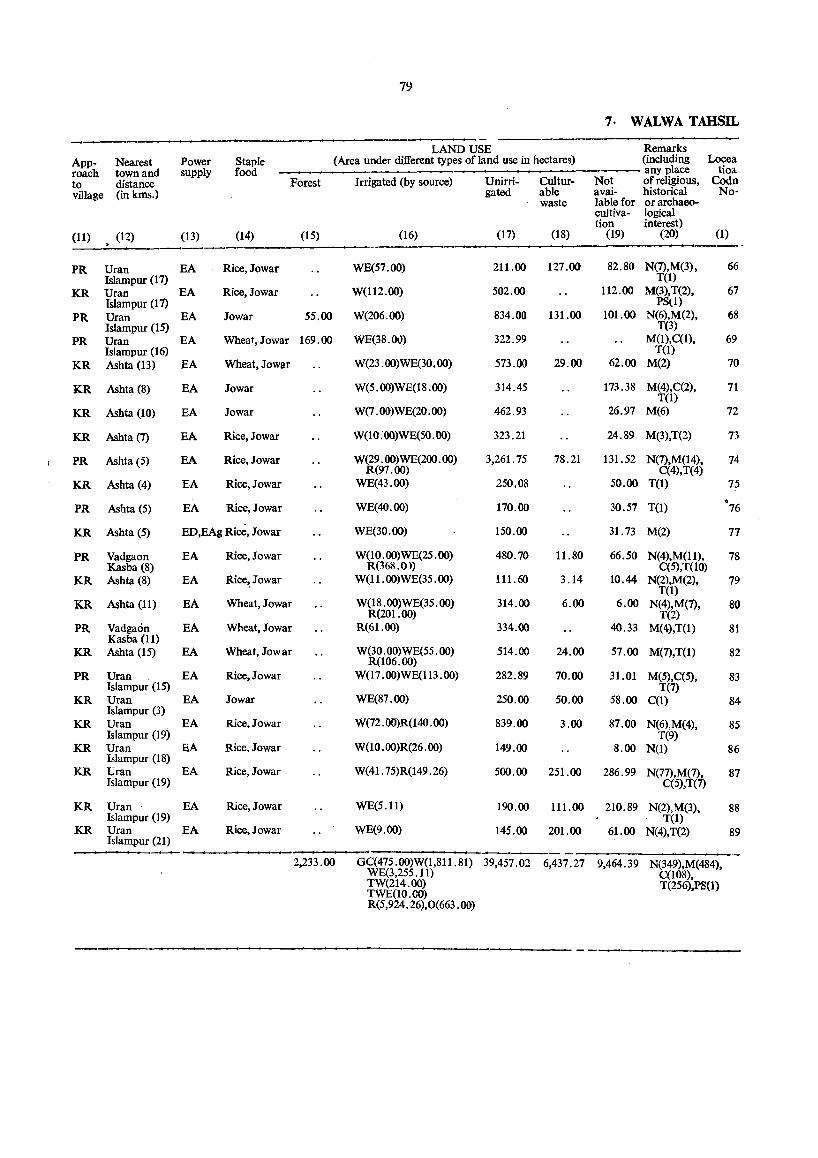
79
7· WALWA TAHSll.
LAND USE Remarks App- Nearest Power Staple (Area under different types of land use in hectares) (including Locea roach town and supply food any place tioa to distance Forest Irrigated (by source) Unirri- Cultur- Not of religious, Codn village (inkms.) gated able avai- historical No-
waste lable for orarchaeo-cultiva- logical tion interest)
(11) (12) (13) (14) (15) (16) (17) (18) (19) (20) (1)
PR Uran EA Rice, Jowar WE(57.00) 211.00 127.00 82.80 N(7),M(3), 66 Islampur (17) T(l)
KR Uran EA Rice, Jowar W(112.00) 502.00 112.00 M(3),T(2), 67 Islampur (17) PStl)
PR Uran EA Jowar 55.00 W(206.00) 834.00 131.00 101.00 N(6),M(2), 68 Islampur (15) T(3)
PR Uran EA Wheat, Jowar 169.00 WE(38. OV) 322.99 M(I),C(I), 69 Islampur (16) T(I)
KR Ashta (13) EA Wheat, Jowar W(23. 00)WE(30. 00) 573.00 29.00 62.00 M(2) 70
KR Ashta (8) EA Jowar W(5.00)WE(18.00) 314.45 173.38 M(4),C(2), 71 T(I)
KR Ashta (10) EA Jowar W(7. 00)WE(20. 00) 462.93 26.97 M(6) 72
KR Ashta (7) EA Rice, Jowar W(10.00)WE(SO.OO) 323.21 24.89 M(3},T(2} 73
PR Ashta (5) EA Rice, Jowar W(29. 00)WE(200. 00) 3,261.75 78.21 131.52 N(7),M(14). 74 R(97.00) C(4),T(4)
KR Ashta (4) EA Rice, Jowar WE(43.00) 250.08 50.00 T(l) 75
PR Asbta (5) EA Rice, Jowar WE(40.00) 170.00 30.57 T(l) • 76
KR Ashta (5) ED,EAg Rice, Jowar WE(30.00) 150.00 31. 73 M(2) 77
PR Vadgaon EA Rice, Jowar W(10.00)WE(25.00) 480.70 11.80 66.50 N(4),M(11), 78 Kasba (8) R(368.0) C(5),T(10)
KR Ashta (8) EA Rice, Jowar W(11.00)WE(35.00) Ill. 60 3.14 10.44 N(2),M(2), 79 T(l)
KR Ashta (11) EA Wheat, Jowar W(18.00)WE(35.00) R(201.00)
314.00 6.00 6.00 N(4),M(7), 80 T(2)
PR Vadgaon EA Wheat, Jowar R(61.00) 334.00 40.33 M(4),T(I) 81 Kasba (11)
KR .Ashta (15) EA Wheat, Jowar W(30.00)WE(55.00) R(106.00)
514.00 24.00 57.00 M(7),T(l) 82
PR Uran EA Rice,Iowar W(17 . 00) WE(113 .00) 282.89 70.00 31.01 M(5),C(5), 83 Islampur (15) T(7)
KR Uran EA Jowar WE(87.oo) 250.00 50.00 58.00 C(1) 84 Islampur (3)
KR Uran EA Rice, Jowar W(n . 00)R(140 . 00) 839.00 3.00 87.00 N(6),M(4), 85 Islampur (19) T(9)
KR Uran EA Rice, Jowar W(10. 00)R(26. 00) 149.00 8.00 N(t) 86 Islampur (18)
KR Uran EA Rice, Jowar W(41. 75)R(149 .26) 500.00 251.00 286.99 N(77),M(7), 87 Islampur (19) C(5),T(7)
KR Uran EA Rice, Jowar WE(5.11) 190.00 111.00 210.89 N(2),M(3), 88 Islampur (19) T(l)
KR Uran EA Rice, Jowar WE(9.00) Islampur (21)
145.00 201.00 61.00 N(4),T(2) 89
2,233.00 GC(475. 00)W(1,811. 81) 39,457.02 6,437.27 9,464.39 N(349),M( 484), WE(3,255.11) C(108), TW(214.00) T(256),PS(I) TWE(10.GO) R(5,924.26),O(663.00)
---

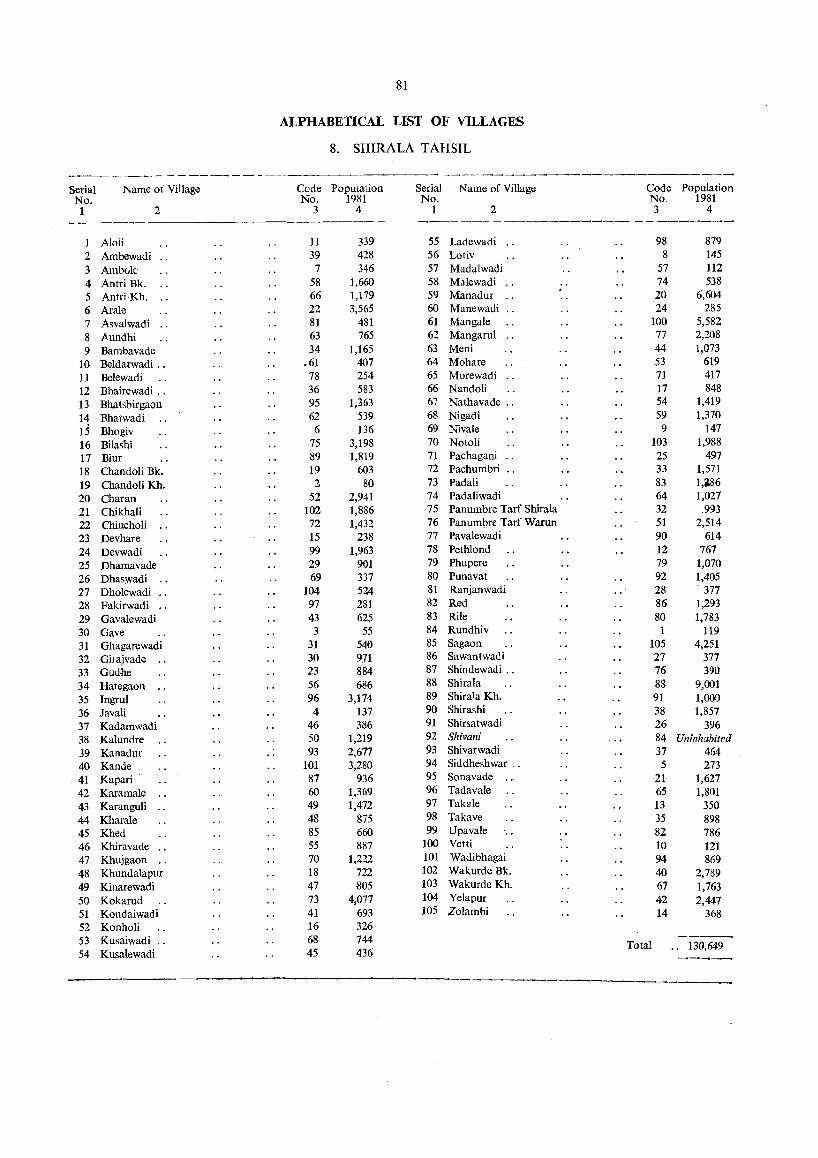
81
ALPHABETICAL LIST OF VILLAGES
8. SHIRA LA TAHSIL
-------- --_----- ---;---- - ---------------------Serial Name of Village Cede PopUlation Serial Name of Village Code Population No. No. 1981 No. No. 1981 1 2 3 4 1 2 3 4
--------------------------- .- _---------------------------
1 Aloii 11 339 55 Ladewadi · . 98 879 2 Ambewadi 39 428 56 Lotiv 8 145 3 AmbGle 7 346 57 Madalwadi 57 112 4 Antri Bk. 58 1,660 58 Malewadi · . .. 74 538 5 Antri Kh. 66 1,179 59 Manadur
< 20 6,604 6 Arale 22 3,565 60 Manewadi .. 24 285 7 Asvalwadi .. 81 481 61 Mangale 100 5,582 8 Aundhi 63 765 62 Mangarul · . 77 2,208 9 Bambavade 34 1,165 63 Meni 44 1,073
10 Beldarwadi .. .61 407 64 Mohare 53 619 11 Belewadi 78 254 65 Morewadi 71 417 12 Bhairewadi .. 36 583 66 Nandoli 17 848 13 Bhatshirgaon 95 1,363 67 Nathavade .. 54 1,419
14 Bhatwadi 62 539 68 Nigadi 59 1,370 15 Bhogiv 6 136 69 Nivale 9 147 16 Bilashi 75 3,198 70 Notoli 103 1,988 17 Biur 89 1,819 71 Pachagani 25 497 18 Chandoli Bk. 19 603 72 Pachumbri .. 33 1,571 19 Chandoli Kh. 2 80 73 Padali 83 1,.86 20 Charan 52 2,941 74 Padaliwadi 64 1,027 21 Chikhali 102 1,886 75 Panumbre Tarf Shirala 32 .993 22 Chincholi 72 1,432 76 PanumlJre Tarf Warun 51 2,514 23 Devhare 15 238 77 Pavalewadi 90 614 24 Devwadi 99 1,963 78 Pethlond 12 767 25 Dhamavade 29 901 79 Phupere 79 1,070 26 Dhaswadi 69 337 80 Punavat 92 1,405 27 Dholewadi .. 104 524 81 Ranjanwadi 28 . 377
28 Fakirwadi .. 97 281 82 Red 86 1,293 29 Gavalewadi 43 625 83 Rile 80 1,783 30 Gave 3 55 84 Rundhiv 1 119 31 Ghagarewadi 31 540 85 Sagaon 105 4,251 32 Gilajvade 30 971 86 Sawantwadi 27 377 33 Gudhe 23 884 87 Shindewadi .. 76 390 34 Hategaon 56 686 88 Shirala 88 9,001 35 IngruJ 96 3,171 89 Shira1a Kh. 91 1,000 36 Javali 4 137 90 Shirashi 38 1,857 37 Kadamwadi 46 386 91 Shirsatwadi 26 396 38 Kalundre 50 1,219 92 Shivani 84 Uninhabited
39 Kanadur 93 2,677 93 Shivarwadi 37 464 40 Kande 101 3,280 94 Siddheshwar .. 5 273 41 Kapari 87 936 95 Sonavade 21 1,627 42 Karamale .. 60 1,369 96 Tadavale 65 1,801 43 Karanguli 49 1,472 97 Taka Ie 13 350 44 Kharale 48 875 98 Takave 35 898 45 Khed 85 660 99 Upavale 82 786 46 Khiravade 55 887 100 Vetti 10 121 47 Khujgaon 70 1,222 101 Wadibhagai 94 869 48 Khundalapur 18 722 102 Wakurde Bk. 40 2,789 49 Kinarewadi 47 805 103 Wakurde Kh. 67 1,763 50 Kokarud 73 4,077 104 Yelapur 42 2,447 51 Kondaiwadi 41 693 105 Zolambi 14 368 52 Konholi 16 326 53 Kusaiwadi .. 68 744 ----54 Kusalewadi 45 436
Total .. 130,649 ----
---~ ---_._----
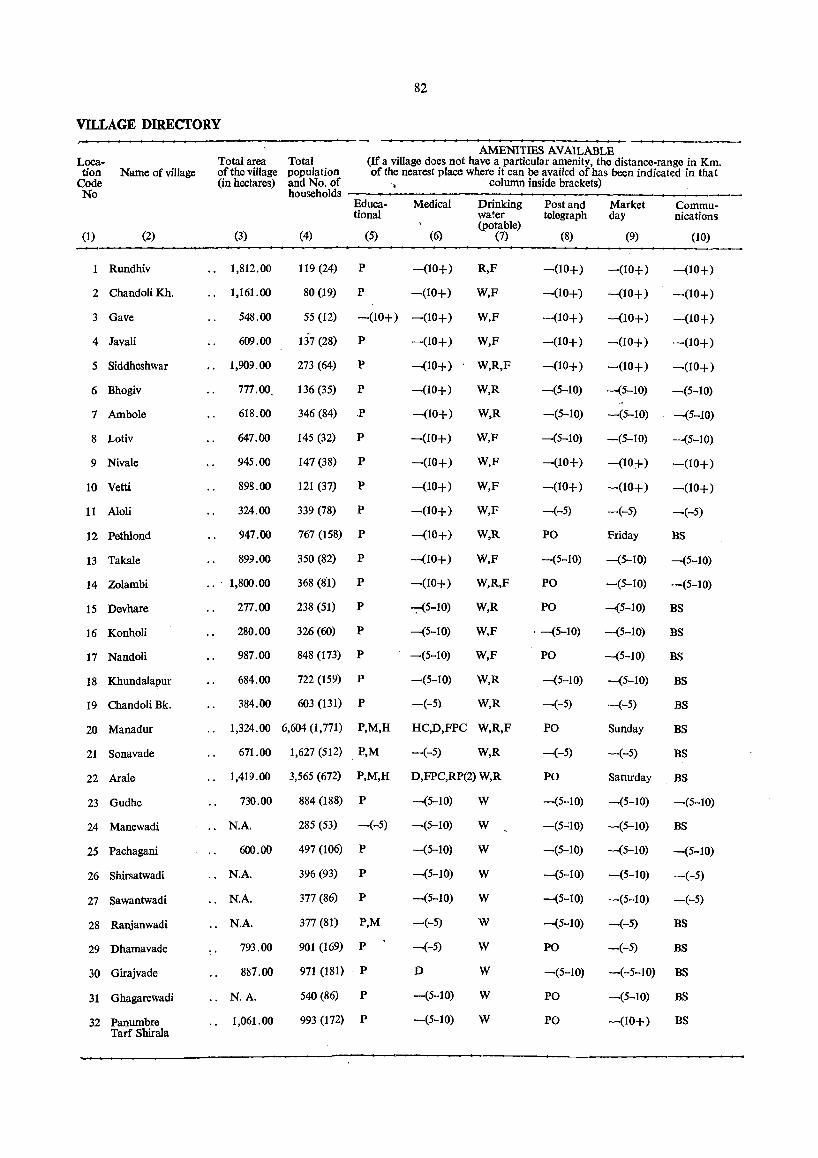
82
VILLAGE DIRECfORY
Location
Code No
Name of village
(1) (2)
1 Rundhiv
2 Chandoli Kh.
3 Gave
4 Javali
5 Siddheshwar
6 Bhogiv
7 Ambole
8 Lotiv
9 Nivale
10 Vetti
11 Aloli
12 Pethlond
13 Takale
14 Zolambi
15 Devhare
16 KonhoH
17 Nandoli
18 Khundalapur
19 Chandoli Bk.
20 Manadur
21 Sonavade
22 Arale
23 Gudhe
24 Manewadi
25 Pachagani
26 Shirsatwadi
27 Sawantwadi
28 Ranjanwadi
29 Dhamavade
30 Girajvade
31 Ghagarewadi
32 Panumbre Tarf Shirala
Total area of the village (in hectares)
(3)
" 1,812.00
.. 1,161.00
548.00
609.00
.. 1,909.00
771.00.
618.00
647.00
945.00
898.00
324.00
947.00
899.00
.. 1,800.00
277.00
280.00
987.00
684.00
384.00
AMENITmS AVAILABLE Total (If a village does not have a particular amenity, the distance-range in Km. population of the nearest place where it can be availed of has been indicated in that and No. of column inside brackets) households ---------------------__ _
(4)
Educational
(5)
119 (24) P
80 (19) P
Medical
(6)
-(10+)
-(10+)
Drinking water (potable)
(7)
R,P
W,P
Post and telegraph
(8)
-(10+)
-(10+)
Market day
(9)
-(10+)
-(10+)
Communications
(10)
-(10+)
-(10+)
55 (12) -(10+) -(10+) W,P -(10+) -(10+) -(10+)
137 (28) P
273 (64) P
136 (35) P
346 (84) .P
145 (32) P
147 (38) P
121 (37) P
339 (78) P
767 (158) P
350 (82) P
368 (81) P
238 (51) P
326 (60) P
848 (173) P
722 (159) P
603 (131) P
-(10+) W,P -(10+) -(10+) -(10+)
-(10+) W,R,P -(10+) -(10+) -(10+)
-(10+) W,R -(5-10) -(5-10) -(5-10)
-(10+) W,R -(5-10) -(5-10) -(5-10)
-(10+) W,P -(5-10) -(5-10) -(5-10)
-(10+) W,P -(10+) -(10+) -(10+)
-(10+) W,P -(10+) -(10+) -(10+)
-(10+) W,P -(-5) -(-5) -(-5)
-(10+) W,R PO Priday BS
-(10+) W,P -(5-10) -(5-10) -(5-10)
-(10+) W,R,P PO -(5-10) -(5-10)
-:--(5-10) W,R PO -(5-10) BS
-(5-10) W,P . -(5-10) -(5-10) BS
-(5-10) W,P PO -(5-10) BS
-(5-10) W,R -(5-10) -(5-10) BS
-(-5) W,R -(-5) -(-5) BS
1,324.00 6,604 (1,771) P,M,H HC,D,PPC W,R,P PO Sunday BS
671.00 1,627 (512) P,M -(-5) W,R
.. 1,419.00 3,565 (672) P,M,H D,PPC,RP(2) W,R
730.00
N.A.
600.00
.. N.A.
" N.A.
.. N.A.
793.00
887.00
.. N.A.
1,061.00
884 (188) P
285 (53) -(-5)
497 (106) P
396 (93) P
377 (86) P
377 (81) P,M
901 (169) P
971 (181) . P
540 (86) P
993 (172) P
-(5-10)
-(5-10)
-(5-10)
-(5-10)
-(5-10)
-(-5)
-(-5)
D
-(5-10)
-(5-10)
W
W
W
W
W
W
W
W
W
W
-(-5)
PO
-(5-10)
-(5";10)
-(5-10)
-(5-10)
-(5-10)
-(5-10)
PO
-(5-10)
PO
PO
-(-5) BS
Saturday BS
-(5-10)
-(5-10)
-(5-10)
-(5-10)
-(5-10)
-(-5)
-(-5)
-(5-10)
BS
-(5-10)
-(-5)
-(-5)
BS
BS
-(-5-10) BS
-(5-10)
-(10+)
BS
BS
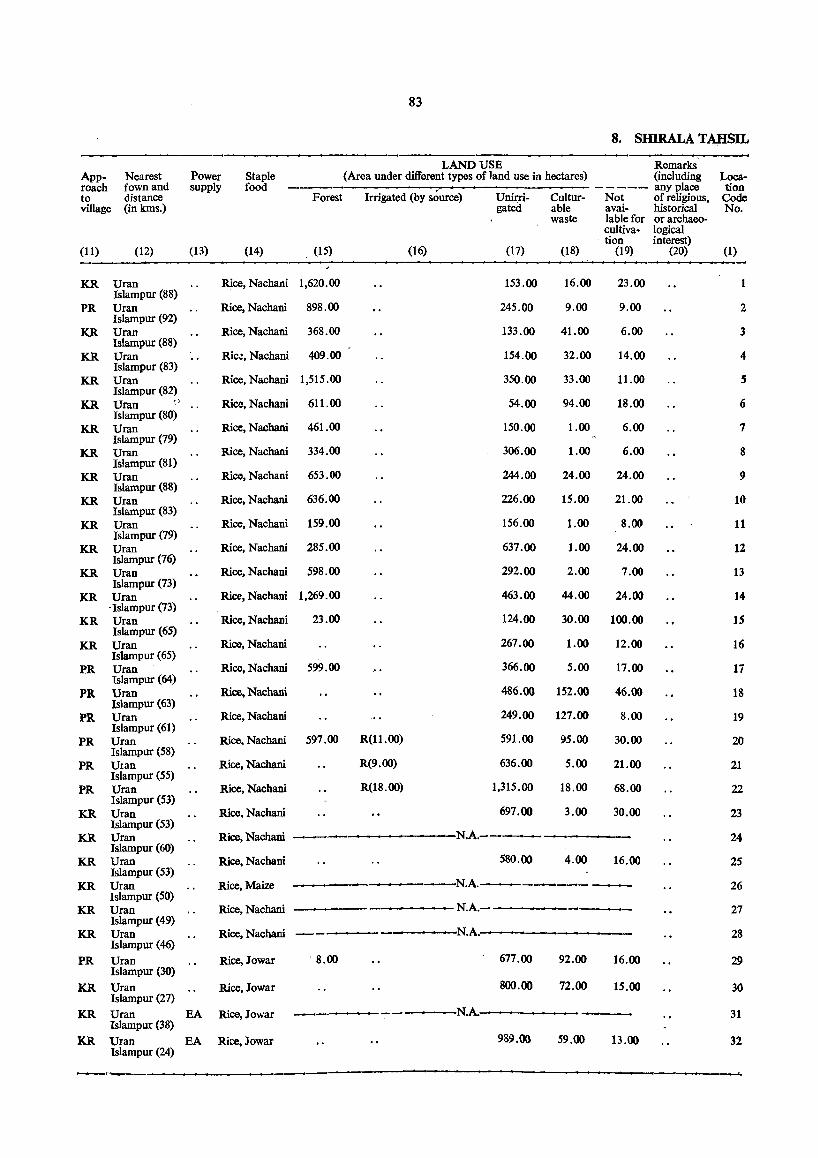
83
8. SHIRALA TAHSIL
LAND USE Remarks App- Nearest Power Staple (Area under different types of land use in hectares) (including Loca-roach fownand supply food ----- any place tion to distance Forest Irrigated (by source) Unirri- Cultur- Not of religious, Code village (in lans.) gated able avai- historical No.
waste lable for orarchaeo-cultiva- logical
. tion interest) (11) (12) (13) (14) (15) (16) (17) (18) (19) (20) (1)
KR Uran Rice, Nachani 1,620.00 153.00 16.00 23.00 Islampur (88)
PR Uran Rice, Nachani 898.00 245.00 9.00 9.00 2 Islampur (92)
KR Uran Rice, Nachani 368.00 133.00 41.00 6.00 3 lslampur (88)
KR Uran Ric.:, Nachani 409.00 154.00 32.00 14.00 4 Islampur (83)
KR Uran Rice, Nachani 1,515.00 350.00 33.00 11.00 S Islampur (82)
KR Uran ~ ) Rice, Nachani 611.00 54.00 94.00 18.00 6 Islampur (80)
KR Uran Rice, Nachani 461.00 150.00 1.00 6.00 1 Islampur (79)
KR Uran Rice, Nachani 334.00 306.00 1.00 6.00 8 Islampur (81)
KR Uran Rice, Nachani 653.00 244.00 24.00 24.00 9 Islampur (88)
KR Uran Rice, Nachani 636.00 226.00 15.00 21.00 10 lslampur (83)
KR Uran Rice, Nachani 159.00 156.00 1.00 8.00 11 Islampur (79)
KR Uran Rice, Nachani 285.00 637.00 1.00 24.00 12 Islampur (76)
KR Uran Rice, Nachani 598.00 292.00 2.00 7.00 13 Islampur (73)
KR Uran Rice, Nachani 1,269.00 463.00 44.00 24.00 14 . Islampur (73)
KR Uran Rice, Nachani 23.00 124.00 30.00 100.00 IS Islampur (65)
KR Uran Rice, Nachani 267.00 1.00 12.00 16 Islampur (65)
PR Uran Rice, Nachani 599.00 366.00 5.00 17.00 Ii lslampur (64)
PR Uran Rice, Nachani 486.00 152.00 46.00 18 Islampur (63)
PR Uran Rice, Nachani 249.00 127.00 8.00 19 Islampur (61)
PR Uran Rice. Nachani 597.00 R(II.00) 591.00 95.00 30.00 20 Islampur (58)
PR Ulan Rice, Nachani R(9.00) 636.00 5.00 21.00 21 Islampur (55)
PR Uran Rice, Nachani R(18.00) 1,315.00 18.00 68.00 22 Islampur (53)
KR Uran Rice, Nachani 697.00 3.00 30.00 23 lslampur (53)
KR Uran Rice, Nachani N.A.---- 24 Islampur (60)
KR Uran Rice, Nachani 580.00 4.00 16.00 25 Islampur (53)
KR Uran Rice, Maize N.A.------_ 26 Islampur (50)
KR Uran Rice, Nachani N.A.- 27 Islampur (49)
KR Uran Rice, Nachani N.A. 28 Islampur (46)
PR Uran Rice,Jowar 8.00 677.00 92.00 16.00 29 Islampur (30)
KR Uran Rice,Jowar 800.00 72.00 15.00 30 Islampur (27)
KR Uran EA Rice, Jowar N.A. 31 Islampur (38)
KR Uran EA Rice, Jowar 989.00 59.00 13.00 32 Islampur (24)
--
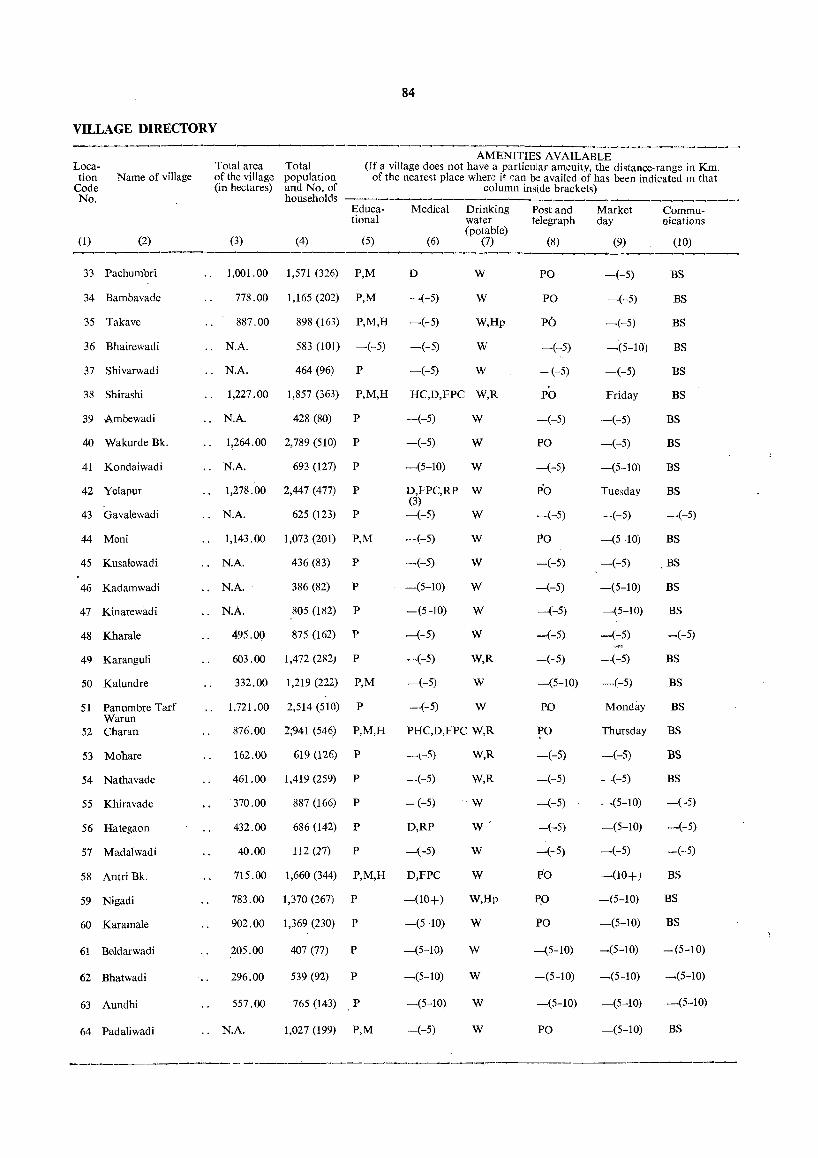
84
VILLAGE DIRECTORY ---------------------------------_-""----------------------_-Location
Code No.
(1)
Name of village
(2)
Total area of the village (in hectares)
(3)
AMENITIES AVAILABLE Total (If a village does not have a p:lrlicular amenity, the distance-range in Km. population of the neare<;t place whef'! it can be availed of has been indicated In that and No. of column inside brackets) households --------------------_______________ _
Educa- Medical Drinking Post and Market Commu-tional water telegraph day nications
(potable) (4) (5) (6) (7) (8) (9) (10)
---------------------------------------------~----------33 Pachumbri
34 Bambavade
35 Takave
36 Bhairewadi
37 Shivarwadi
38 Shirashi
39 Ambewadi
40 Wakurde Bk.
41 Kondaiwadi
42 Yelapur
43 Gavalewadi
44 Meni
45 Kusalewadi
46 Kadamwadi
47 Kinarewadi
48 Kharale
49 Karanguli
50 Kalundre
51 Panumbre Tarf Warun
52 Charan
53 Mohare
54 Nathavade
55 Khiravade
56 Hategaon
57 Madalwadi
58 Antri Bk.
59 Nigadi
60 Karamale
61 Beldarwadi
62 Bhatwadi
63 Aundhi
64 Padaliwadi
1,001.00 1,571 (326) P,M D W
778.00 1,165 (202) P,M -(-5) W
887.00 898 (163) P,M,H -(-5) W,Hp
" N.A. 583 (101) -(-5) -(-5) W
W .. N.A. 464 (96) P -(-5)
1,227.00 1,857 (363) P,M,H HC,D,FPC W,R
" N.A. 428 (80) P
1~264.00 2,789 (510) P
.. N.A. 693 (127) P
1,278.00 2,447(477) P
" N.A. 625 (123) P
1,143.00 1,073 (201) P,M
" N.A. 436 (83) P
.. N.A. 386 (82) P
.. N.A. 805 (182) P
49S.oo 87S(162) P
603.00 1,472 (2R2) P
332.00 1,219 (222) P,M
1,721.00 2,514 (SI0) P
876.00 2;941 (546) P,M,H
162.00 619(126) P
-(-5) W
-(-5) W
-(5-10) W
D,FPC,RP W (3) -(-5) W
-(-5)
-(-5)
-(5-10)
-(5-10)
-(-5)
-(-5)
-(-5)
W
W
W
W
W
W,R
W
-(-5) W
PHC,D,FPC W,R
-t-S) W,R
461.00 1,419 (259) P -(-5) W,R
370.00 887 (166) P -(-5) W
432.00 686 (142) P D,RP W '
40.00 112 (17) P -(-5) W
71S.00 1,660(344) P,M,H D,FPC W
783.00 1,370 (267) P -(10+) W,Hp
902.00 1,369(230) P -(S-lO) W
205.00 407 (77) P -(5-10) W
296.00 539 (92) P -(5-10) W
557.00 765 (143) P -(5-10) W
.. N.A. 1,027 (199) P,M -(-5) W
PO
PO
p6
-(-S)
-(-5)
PO
-(-5)
PO
-(-5)
P'O
-(-5)
-(-5)
-(-5)
-(-5)
-(S-10)
-(-5)
Friday
-(-5)
-(-5)
-(5-10)
Tuesday
-(-5)
Po -(5-10)
-(-5) -(-5)
-(-5) -(5-10)
-(-5) -(5-10)
-(-S) -(-5)
-(-5) -(-5)
-(5-10) -(-5)
BS
BS
BS
BS
BS
BS
BS
BS
BS
BS
-(-5)
BS
BS
BS
BS
-(-5)
BS
BS
PO Monday BS
PO Thursday BS
-(-S) -(-S) BS
-(-5) -(-5) BS
-(-5) -(5-10) -( -5)
-(-5) -(5-10) -(-5)
-(-5) -(-5) -(-5)
PO -(10+) BS
p.o -(5-10) BS
PO -(5-10) BS
-(5-10) -(5-10) -(5-10)
-(5-10) -(5-10) -(5-10)
-(5-10) -(5-10) -(5-10)
PO -(5-10) BS
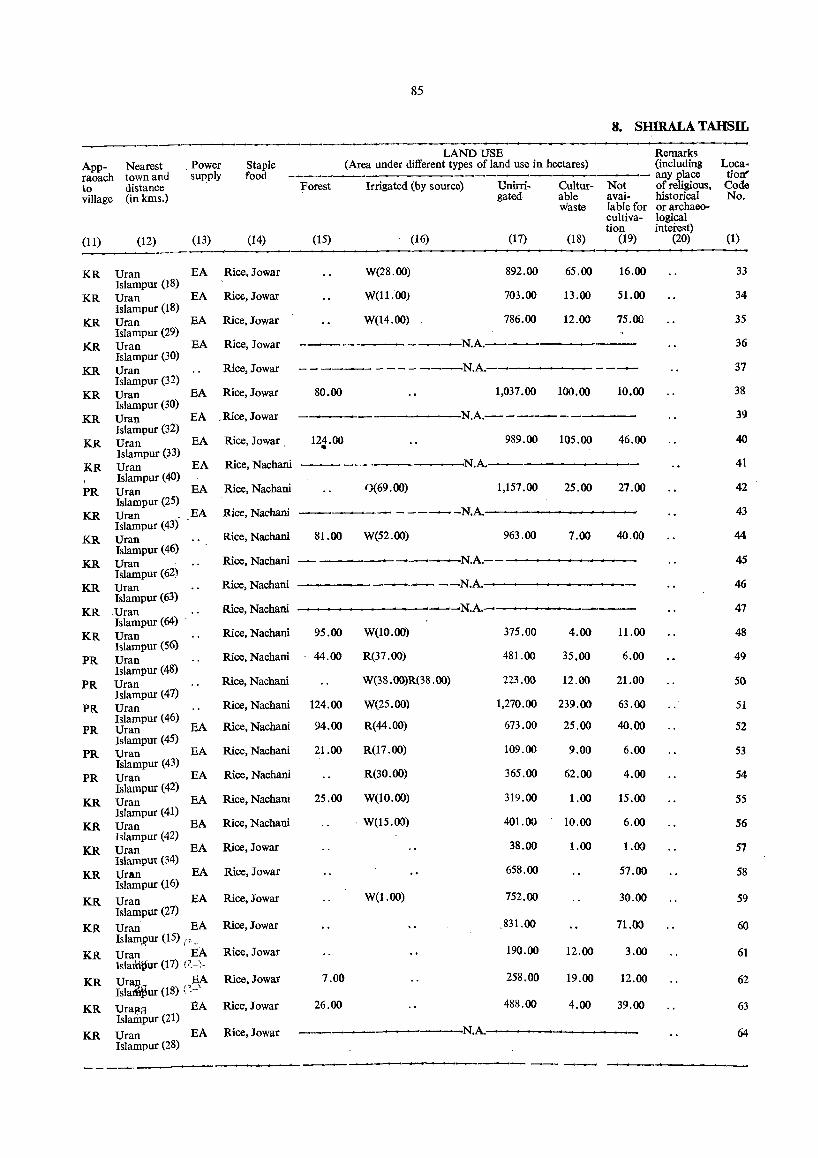
85
8. SHfRALA TAHSIL
App- Nearest raoach town and to distance village (in kms.)
(11) (12)
, Power supply
(13)
Staple food
(14)
KR Vran EA Rice, Jowar Isiampur (18)
KR Vran EA Rice, Jowar Islampur (18)
KR Vran EA Rice, Jowar Islampur (29)
KR Vran EA Rice, Jowar Islampur (30)
Forest
(15)
LAND USE (Area under different types of land use in hectares)
Irrigated (by source)
W(28.00)
W(ll.OO)
W(14.00)
(16)
Unirrigated
(17)
892.00
703.00
786.00
Cultur- Not able avai-waste lable for
cultivation
(18) (19)
65.00
13.00
12.00
16.00
51.00
75.00
-----------N.A.-------
KR Uran Rice, Jowar - - ---- - - - - ---N.A.-- -------Islampur (32)
KR Vran EA Rice, Jowar Islampur (30)
80.00 1,037.00 100.00 10.00
KR Uran EA "Rice, Jowar Islampur (32)
KR Vran EA Rice, Jowar , Islampur (33)
KR Vran EA Rice, Nachani Islampur (40)
PR Vran EA Rice, Nachani
----N.A.----------46.00 124.00
" 989.00 105.00
0(69.00)
---,----N.A.----------
27.00 1,157.00 25.00 Islampur (25)
KR Vran ,EA Rice, Nachani ----- - ----N.A.,----------Islampur (43)
KR Vran Islampur (46)
KR
KR
KR
Uran Islampur (62) Vran Islampur (63) ,Uran Islampur (64) .
KR Uran Islampur (56)
PR Vran lslampur (48)
PR Vran Islampur (47)
Rice, Nachani
Rice, Nachani
Rice, Nachani
Rice, Nachani
Rice, Nachani
Rice, Nachani
Rice, Nachani
81.00 W(52.00) 963.00 7.00 40.00
-------N.A.-----------
-----N.A.,----------
-..._.-------N.A.------·----
95.00 W(10.00)
44.00 R(37.00)
W(38. OO)R(38. (0)
375.00
481.00
223.00
11.00
6.00
PR Vran Rice, Nachani 124.00 W(25.00)
R(44.00)
1,270.00
673.00
109.00
365.00
319.00
401.00
4.00
35.00
12.00
239.00
25.00
21.00
63.00
40.00 Islampur (46)
PR Uran EA Rice, Nachani 94.00 Islampur (45)
PR Vran EA Rice, Nachani Islampur (43)
PR Vran EA Rice, Nachani Islampur (42)
KR Vran EA Rice, Nachani Islampur (41)
KR Vran EA Rice, Nachani Is!ampur (42)
KR Uran EA Rice, Jowar Islampur (34)
KR
KR
KR
KR
KR
KR
Vran EA Islampur (16) Uran EA Islampur (27) Vran EA Islamp,ur (15) e, Uran EA Islamt[ur (17) (i'_-).
Ura)}" nEf Isla~ur (18) \',"
Vrallff EA Islampur (21)
Rice, Jowar
Rice, Jowar
Rice,Jowar
Rice,Jowar
Rice, Jowar
Rice,Jowar
21.00 R(17.00)
R(30.00)
25.00 W(lO.00)
. W(15.00)
W(I.00)
7.00
26.00
38.00
658.00
752.00
,831.00
190.00
258.00
488.00
9.00
62.00
1.00
10.00
1.00
12.00
19.00
4.00
6.00
4.00
15.00
6.00
1.0()
57.00
30.00
71.00
3.00
12.00
39.00
KR Uran EA Rice, Jowar ---------N.A.,----------Islampur (28)
- - ----------------------~-'
Remarks (including any place of religious, historical orarchaeological interest)
(20)
Locatiort' Code No.
(1)
33
34
35
36
37
38
39
40
41
42
43
44
45
46
47
48
49
50
51
52
53
54
55
56
57
58
59
60
61
62
63
64
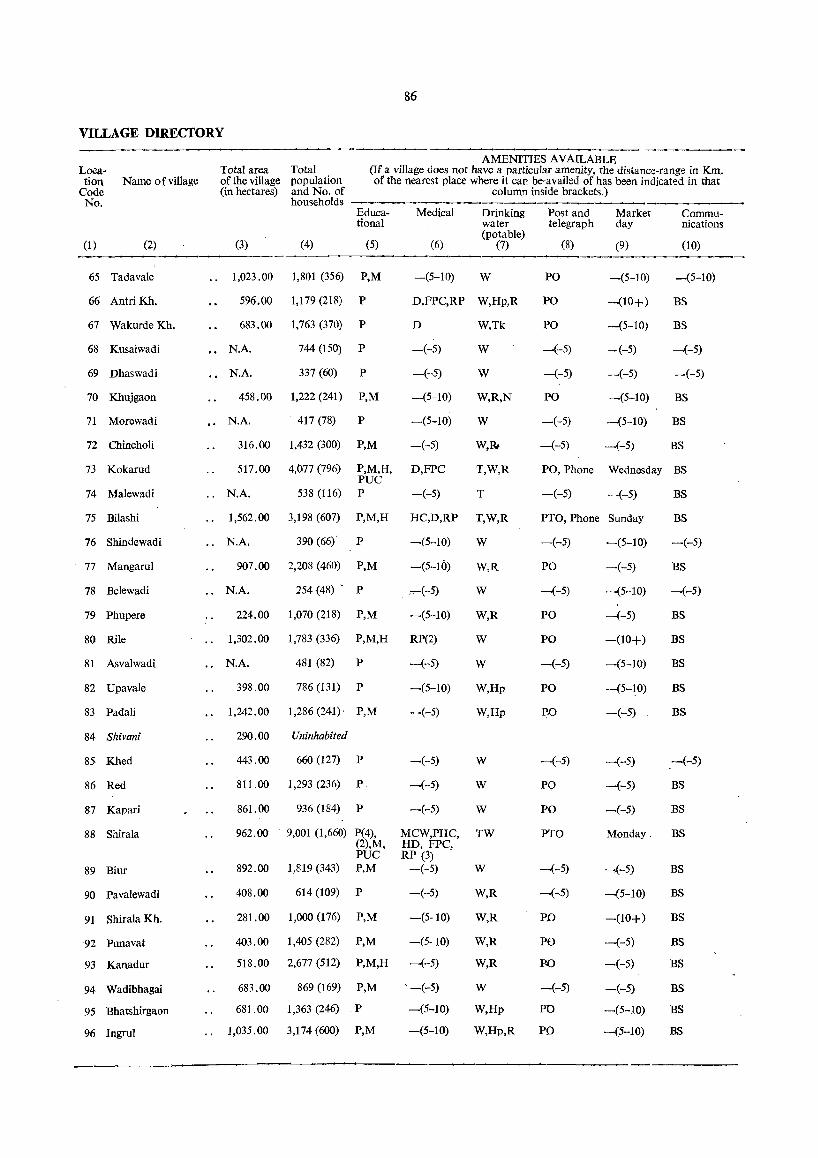
86
VILLAGE DIRECfORY
Lo\:a-tion Name of village
Code No.
(1) (2)
65 Tadavale
66 Antri Kh.
67 Wakurde Kh.
68 Kusaiwadi
69 Dhaswadi
70 Khujgaon
71 Morewadi
72 Chincholi
73 Kokarud
74 Malewadi
75 Bilashi
76 Shindewadi
77 Mangarul
78 Belewadi
79 Phupere
80 Rile
81 Asvalwadi
82 Upavale
83 Padali
84 Shivani
85 Khed
86 Red
87 Kapari
88 Shirala
89 Biur
90 Pavalewadi
91 Shirala Kh.
92 Punavat
93 Kanadur
94 Wadibhagai
95 Bhatshirgaon
96 Ingrul
-----AMENITIES AVAILABLE Total area Total of the village population (in hectares) and No. of
(If a village does not have a particular amenity, the distance-range in Km. of the nearest place where it can bt7availed of has been indicated in that
column inside brackets.) households
(3) (4)
Educational
(5)
Medical
(6)
Drinking water (potable)
(7)
Post and Market telegraph day
(8) (9)
Communications
(10) -----__ . ,---1,023.00 1,801 (356) P,M
596.00 1,179 (218) P
683.00 1,763(370) P
N.A. 744 (150) P
N.A. 337 (60) P
458.00 1,222 (241) P,M
N.A. 417 (78) P
316.00 1,432 (300) P,M
517.00
.. N.A.
4,077 (796)
538 (116)
P,M,H, PUC P
-(5-10) W
D,FPC,RP W,Hp,R
D W,Tk
-(-5) W
-(-5) W
-(5-10) W,R,N
-(5-10) W
-(-5) W,Rt
D,FPC T,W,R
-(-5) T
1,562.00 3,198 (607) P,M,H HC,D,RP T,W,R
.. N.A. 390 (66)' P -(5-10)
907.00 2,208 (460) P,M -(5-10)
.. N.A. 254 (48) - P .-(-5)
224.00 1,070 (218) P,M -(5-10)
1,302.00 1,783 (336) P,M,H RP(2)
. . N.A. 481 (82) P -(-5)
398.00 786 (131) P -(5-10)
1,242.00 1,286 (241), P,M
290.00 Uninhabited
443.00 660 (127) P
811.00 1,293 (236) P
861.00 936 (184) P
962.00
892.00
9,001 (1,660) P(4), (2),M, PUC
1,819 (343) P,M
408.00 614(109) P
281.00 1,000 (176) P,M
403.00 1,405 (282) P,M
518.00 2,677 (512) P,M,H
683.00 869 (169) P,M
681.00 1,363 (246) P
1,035.00 3,174(600) P,M
-(-5)
-(-5)
-(-5)
-(-5)
MCW,PHC, HD, FPC, RP (3)
-(-5)
-(-5)
-(5-10)
-(5-10)
-(-5)
'-(-5)
-(5-10)
-(5-10)
W
W,R
W
W,R
W
W
W,Hp
W,Hp
W
W
W
TW
W
W,R
W,R
W,R
W,R
W
W,Hp
W,Hp,R
PO
PO
PO
-(-5)
-(-5)
PO
-(-5)
---(-5)
PO, Phone
-(-5)
-(5-10) -(5-10)
-00+) BS
-(5-10) BS
-(-5) -(-5)
-(-5) -(-5)
-(5-10) BS
-(5-10) BS
-(-5) BS
Wednesday BS
-(-5) BS
PTO, Phone Sunday BS
-(-5)
PO
--(-5)
PO
PO
-(-5)
PO
P.o
-(-5)
PQ
PO
PTO
-(-5)
-(-5)
PD
PO
P.()
-(-5)
PO
PO
-(5-10)
-(-5)
-(5-10)
-(-5)
-(10+)
-(5-10)
-(5-10)
-(-5)
-(-5)
-(-5)
-(-5)
Monday.
-,(-5)
-(5-10)
-(10+)
-(-5)
-(-5)
-(-5)
-(5-10)
-(5-10)
-(-5)
BS
-(-5)
BS
BS
BS
BS '
BS
.-(-5)
BS
BS
BS
BS
BS
BS
BS
BS
BS
BS
BS
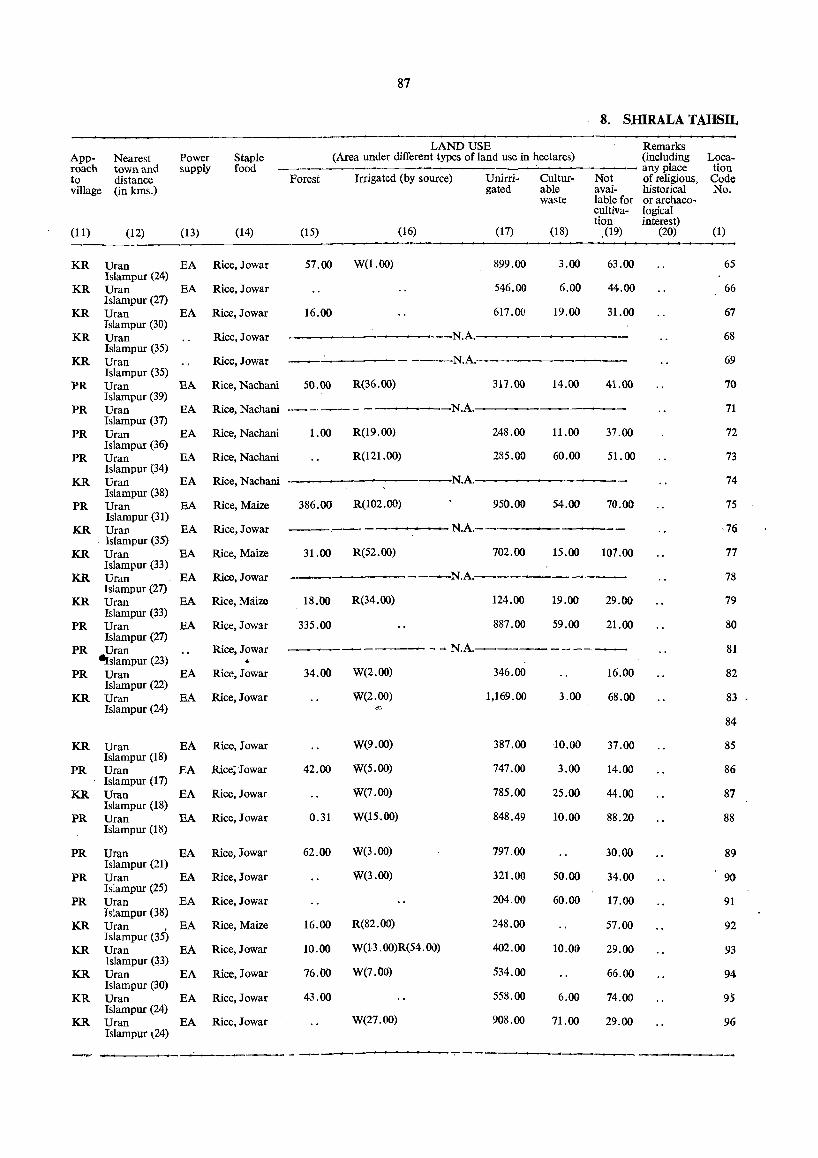
87
8. SHIRALA TAHSIL
App- Nearest roach town and to distance village (in kms.)
Power supply
Staple food
Forest
LAND USE (Area under different types of land use in hectares)
Irrigated (by source) Unirri- Cultur-gated able
waste
(11) (12) (13) (14) (15) (16) (17) (18)
KR Uran EA Rice, Jowar 57.00 W(1.OO) Islampur (24)
KR Uran EA Rice, Jowar Islampur (27)
KR Uran EA Rice, Jowar 16.00 Islampur (30).
KR Uran Rice,Jowar ---- N.A. Islampur (35)
KR Uran Rice, Jowar - ----N.A. Islampur (35)
PR Uran EA Rice, Nachani 50.00 R(36.oo) Islampur (39)
899.00
546.00
617.00
317.00
PR Uran EA Rice, Nachani --_-- - - --N.A .. -----Islampur (37)
PR Uran EA Rice, Nachani 1.00 R(19.oo) 248.00 Islampur (36)
PR Uran EA Rice, Nachani R(121.00) 285.00 Islampur (34)
3.00
6.00
19.00
14.00
11.00
60.00
Not available for cultivation
.(19)
63.00
44.00
31.00
41.00
37.00
51.00
KR Uran EA Rice, Nachani ------ -N.A.----------Islampur (38)
PR Uran EA Rice, Maize 386.00 R(102.00) 950.00 54.00 Islampur (31)
KR Uran EA Rice,Jowar ---------N.A. . Islampur (35)
KR Uran EA Rice, Maize 31.00 R(52.oo) 702.00 15.00 Isiampur (33)
KR Uran EA Rice, Jowar ---------N.A.,-------Islampur (27) Uran EA Islampur (33) Uran Islampur (27)
EA
Rice, Maize
Rice, Jowar
18.00 R(34.00)
335.00
124.00
887.00
19.00
59.00
70.00
107.00
29.00
21.00
KR
PR
PR Uran Rice, Jowar -~--------N.A.--------·-~siampur (23) ..
PR Uran EA Rice, Jowar 34.00 W(2.oo) Isiampur (22)
KR Uran EA Rice, Jowar W(2.oo) Islampur (24)
KR Uran EA Rice, Jowar W(9.oo) Islampur (18)
PR Uran EA Rice; Jowar 42.00 W(5.oo) Islampur (17)
KR Uran EA Rice, Jowar W(7.oo) Islampur (18)
PR Uran EA Rice, Jowar 0.31 W(15.00) Islampur (18)
PR Uran EA Rice, Jowar 62.00 W(3.00) Islampur (21)
PR Uran EA Rice, Jowar W(3.00) Islampur (25)
PR Uran EA Rice, Jowar Isiampur (38)
KR Uran ,EA Rice, Maize 16.00 R(82.00) Islampur (35)
KR Uran EA Rice, Jowar 10.00 W(13.00)R(54.W) Tslampur (33)
KR Uran EA Rice, ]owar 76.00 W(7.00) Islampur (30)
KR Uran EA Rice, Jowar 43.00 Islampur (24)
KR Uran EA Rice, Jowar W(27.00) Isiampur \24)
346.00
1,169.00
387.00
747.00
785.00
848.49
797.00
321.00
204,00
248.00
402.00
534.00
558.00
908.00
3.00
10.00
3.00
25.00
10.00
50.00
60.00
10.00
6.00
71.00
16.00
68.00
37.00
14.00
44.00
88.20
30.00
34.00
17.00
57.00
29.00
66.00
74.00
29.00
Remarks (including any place of religious, historical orarchaeological interest)
(20)
~-----'----- - -----------:---_._------------
Location Code No.
(1)
65
66
67
68
69
70
71
72
73
74
75
·76
77
78
79
80
81
82
83
84
85
86
87
88
89
90
91
92
93
94
95
96
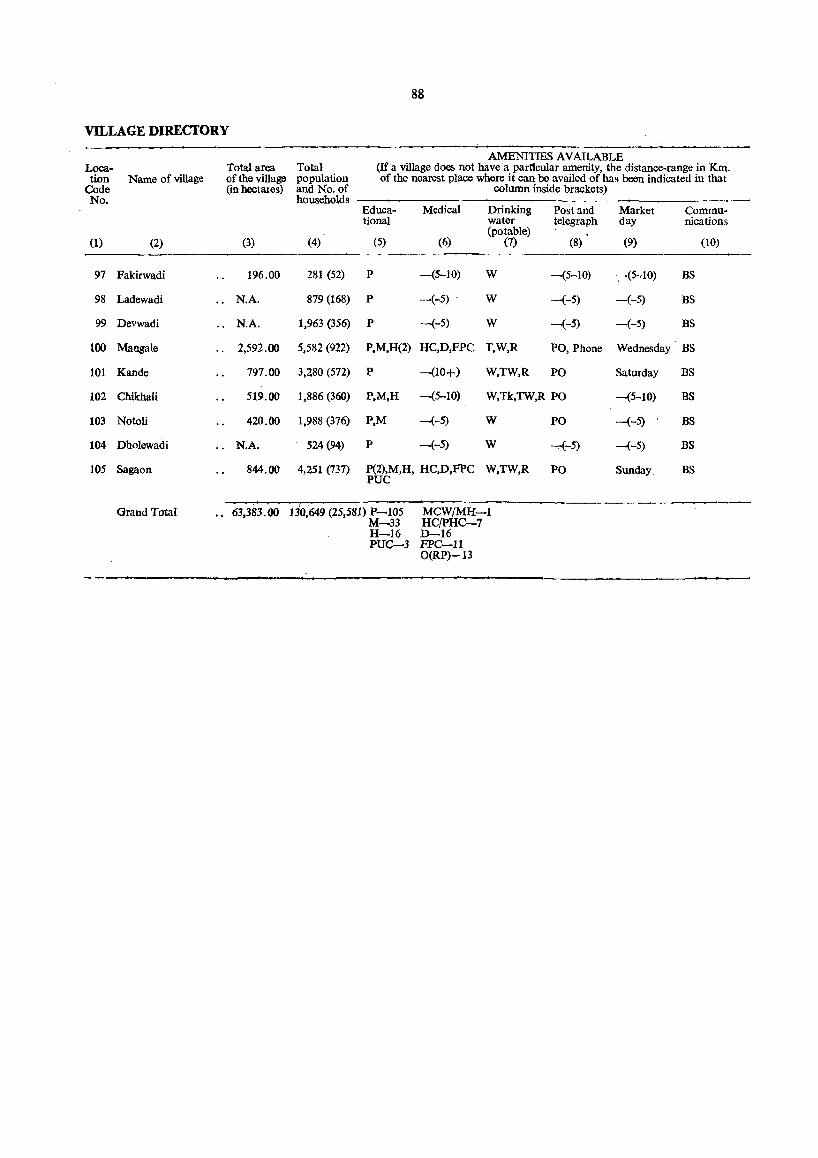
88
VILLAGE DIRECTORY
AMENITIES AVAILABLE LI)Ca- Total area Total (If a village does not have a pardcular amenity, the distance-range in Km. tion Name of village of the village population of the nearest place where it can be availed of has been indicated in that
Code (in hectares) and No. of column inside brackets) No. households
Educa- Medical Drinking Post and Market Commu-tional water telegraph day nications
(potable) (1) (2) (3) (4) (5) (6) (1) (8) (9) (10)
97 Fakirwadi 196.00 281 (52) P -(5-10) W -(5-10) -;-(5~10) BS
98 Ladewadi .. N.A. 879 (168) P -(-5) . W --(-5) -(-5) BS
99 Devwadi .. N.A. 1,963 (356) P -(-5) W -(-5) -(-5) BS
100 Mangale " 2,592.00 5,582 (922) P,M,H(2) HC,D,FPC T,W,R PO, Phone Wednesday BS
101 Kande 797.00 3,280 (572) P -(10+) W,TW,R PO Saturday BS
102 Chikhali 519.00 1,886 (360) P,M,H -(5-10) W,Tk,TW,R PO -(5-10) BS
103 Notoli 420.00 1,988 (376) P,M -(-5) W PO -(-5) BS
104 Dholewadi .. N.A. 524 (94) P -(-5) W -(-5) -(-5) BS
105 Sagaon 844.00 4,251 (737) P(2),M,H, HC,D,FPC W,TW,R PO Sunday BS PUC
Grand Total .. 63,383.00 13'0,649 (25,581) P-105 M-33
MCW/MH-l HC/PHC-7
H-16 D-16 PUC--3 FPC-U
O(RP)-13
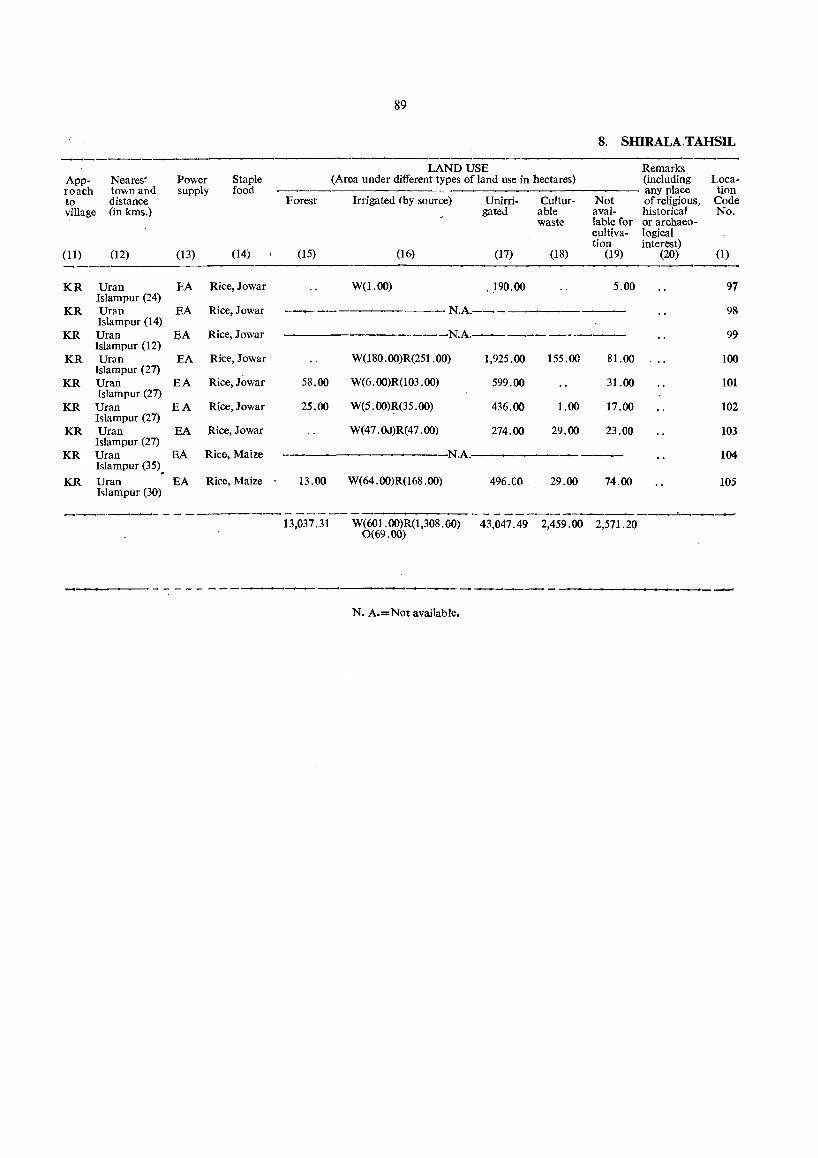
89
8. SIDRALA.TAHSIL ------
LAND USE Remarks App- Neares' Power Staple (Area under different types of land use in hectares) (including Loca-roach tov.n and supply food any place tion to distance Forest Irrigated (by source) Unirri- Cultur- Not of religious, Code village (in kms.) gated able avai- historical No.
waste lable for or archaeo-cultiva- logical tion interest)
(11) (12) (13) (14) (15) (16) (17) (18) (19) (20) (1) -----KR Uran EA Rice, Jowar W(I.oo) .190.00 5.00 97
Islampur (24) KR Uran EA Rice, Jowar ~- N.A.--- 98
Islampur (14) KR Uran EA Rice, Jowar -N.A.--------- 99
Islampur (12) KR Uran EA Rice, Jowar W(180.00)R(251.00) 1,925.00 155.00 81. 00 100
Islampur (27) KR Uran EA Rice, Jowar 58.00 W(6 .OO)R(103 .(0) 599.00 31. 00 101
Islampur (27) KR Uran EA Rice, Jowar 25.00 W(5. OO)R(35. (0) 436.00 1.00 17.00 102
Islampur (27) KR Uran EA Rice, Jowar W(47 .OJ)R(47 .00) 274.00 29.00 23.00 103
Islampur (27) KR Uran EA Rice, Maize N.A. 104
Islampur (35) . KR Uran EA Rice, Maize 13.00 W(64.00)R(168.00) 496.CO 29.00 74.00 105
I~lampur (30)
---_._---- - - ------- - - ---- - - - -----------------'----~ 13,037.31 W(601.00)R(1,308.00)
0(69.00) 43,047.49 2,459.00 2,571.20
---.,.,..--- - - - - - - ------_._--------------N. A.=Not available.

90
II") _
I
I I
I , 'I I 1 I
!
I 1
'" I ,j ;11
1 1;; 1
1;:1 1.-::: ~O\ It)o~ ~ . .:
1 '" 1
• ~ I I~ ~ I I~ 1
I
• t-
MOOOO ..... r-OO\Or--- -MOOoo ..... r-OO ..... r--"" -
. ""
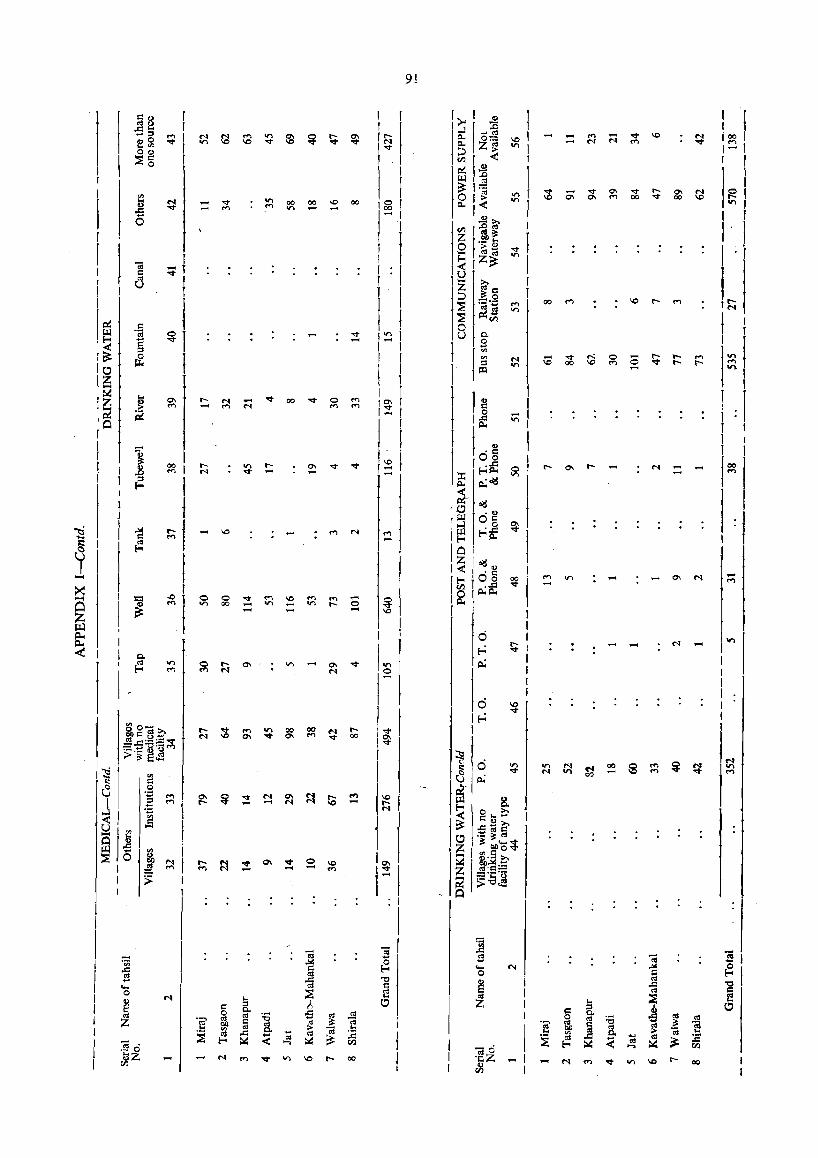
I !
I j
I I I I J I
I
d
1
-I
I
I. ~
-;; . . _ 0
~z
:;t, 1 I
~I
_ v _ M
~l ~ 1; "
t ~I ~
I I
~ f
I
V"'I 00 00 '" 00 M '"
~I ~ ~ ; ~ ~ ~ ~ §
::\1:;: ;; ~ '" .....
91
, ",I "'I
I
",J v - v ~ v ~ ~ ~ '" 1 '" ~ ~ M ~ 00_
I
vI "'I
f :;:1
1 ViI
I 1
o~
'"
~I
1 1
00 M
~f M ~
1 1 f
~I I I I I
-I I
.....
.......... M _
1 I 1 I I I
l~ I
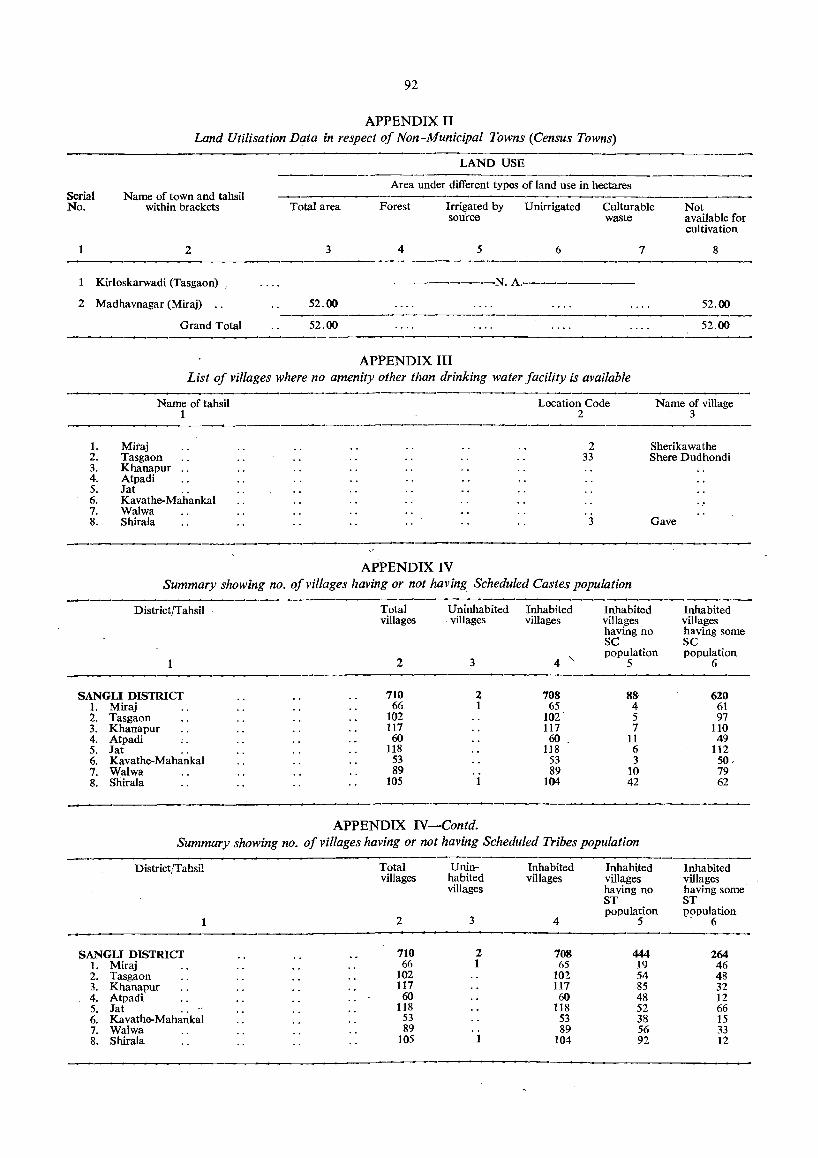
92
APPENDIX II Land Utilisation Data in respect of Non-Municipal Towns (Census Towns)
Serial Name of town and tahsil No. within brackets
2
Kirloskarwadi (Tasgaon)
2 Madhavnagar (Miraj) ..
Grand Total ------------
Total area
3
52.00
52.00
LAND USE
Area under different types of land use in hectares
Forest Irrigated by Unirrigated Culturable Not sou"rce waste . available for
cultivation
4 5 6 7 8
------N. A.---------52.00
52.00
APPENDIX III List of villages where no amenity other than drinking water facility is available
1. 2. 3. 4. 5. 6. 7. 8.
Name of tahsil 1
Mitaj Tasgaon Khanapur Atpadi Jat " Kavathe-Mahankal Walwa Shirala
APPENDIX IV
Location Code 2
2 33
3
Name of village 3
Sherikawathe Shere Dudhondi
Gave
Summary showing no. of villages having or not having Scheduled Castes population
District/Tahsil
SANGLI DISTRICT 1. Miraj 2. Tasgaon 3. Khanapur 4. Atpadi .. 5. Jat .. 6. Kavathe-Mahankal 7. Walwa 8. Sbirala
Total villages
2
710 66
102 117 60
118 53 89
105
Uninhabited Inhab:ted villages villages
3 4 "
2 708 1 65
102 117
60 118
53 89
1 104
APPENDIX IV-Contd.
Inhabited villages having no SC population
5
88 4 5 7
11 6 3
10 42
Summary showing no. of villages having or not having Scheduled Tribes population
District/Tahsi!
1
SANGLI DISTRICT 1. Miraj 2. Tasgaon 3. Khanapur 4. Atpadi 5. Jat " 6. Kavathe-Mahankal 7. Walwa 8. Shirala
Total villages
2
710 66
102 117
60 118
53 89
105
Uninhabited villages
3
2 1
1
Inhabited Inhabited villages villages
having no ST population
4 5
708 444 65 19
102 54 117 85 60 48
118 52 53 38 89 56
104 92
Inhabited villages having some SC population
6
620 61 97
110 49
112 50, 79 62
Inhabited villages having some ST population
6
264 46 48 32 12 66 15 33 12

93
APPENDIX IV-Contd.-
List of Villages according to the Proportion of Scheduled Castes and Scheduled Tribes population to the total population by ranges
No. of uninhabited villages: 1 1. MIRAJ TAHSIL No. of inhabited villages I 65
Ranges of Name of village Location Name of village Location Name of village SC,ST Location
population Code Code Code (Percentages) No. No. No.
(l) (2) (3) (2) (3) (2) (3)
A-Scheduled Cast~
0-5* 10 Bisur 24 Kakadwadi 34 Dongarwadi
37 Janraowadi 49 Santoshwadi 50 Kadamwadi 53 Vyankuchiwadi 64 Laxmiwadi 65 Shindewadi 66 Chabukswarwadi
6-10 Dudhagaon 3 Kavathe Piran 4 Kasabe Digraj 5 Tung 7 Kamal 8 Nandre
11 Budhgaon 18 Padmale 19 Savalwadi
23 Kupwad 26 Sambarwadi 29 Kharkatwadi 32 Gundewadi 39 Payapachiwadi 47 Erandoli 52 Lingnoor 59 Bedag
11-15 6 Mouje Digraj 9 Kavji Khotwadi 12 Kavalapur 13 Soni 15 Patgaon 16 Bhose 22 Samdoli 31 Siddhewadi 40 Malgaon 42 Haripur 45 Takali 46 Mallewadi 48 Shipur 60 Arag 63 DhavaJi
16-20 14 Karoli (Miraj) 20 Malwadi 33 Khande Rajuri 36 Salgare 38 Belunki 51 Khatav 55 Bamni 62 Mhaisal (Sangli)
21-30 27 Savali 28 Tanang 30 Kalambi 35 Kanadwadi 43 Dhamni 54 Bolwad 57 Nilaji 61 Narwad
31+ 41 Vanleswadi 56 Ankali 58 Vaddi
B-SchediJled Tribes
0-5* Dudhgaon 3 Kavathe Piran 4 Kasabe Digraj 5 Tung -6 Mouje Digraj 7 Kamal 8 Nandre 9 Kavji Khotwadi 10 Bisur
11 Budhgaon 12 Kavalapur 13 Soni 14 Karoli (Miraj) 16 Bhose 20 MaIwadi 22 Samdoli 23 Kupwad 24 Kakadwadi 27 Savali 28 Tanang 32 Gundewadi 36 Salgarl' 38 Belunki 40 Malgaon 41 Vanleswadi 42 Haripur 45 Takali 46 Mallewadi 47 Erandoli 48 Shipur 49 Santoshwadi 51 Khatav 52 Lingnoor 55 Bamni 56 Ankali 57 Nilaji 58 Vaddi 59 Bedag 60 Arag 61 Narwad .' 62 MhaisaT (Sangli) 63 Dhavali
6-15 18 Padmale 19 Savalwadi 33 Khande Rajuri
16-25 41 Dhamni
Ya 197-7 a
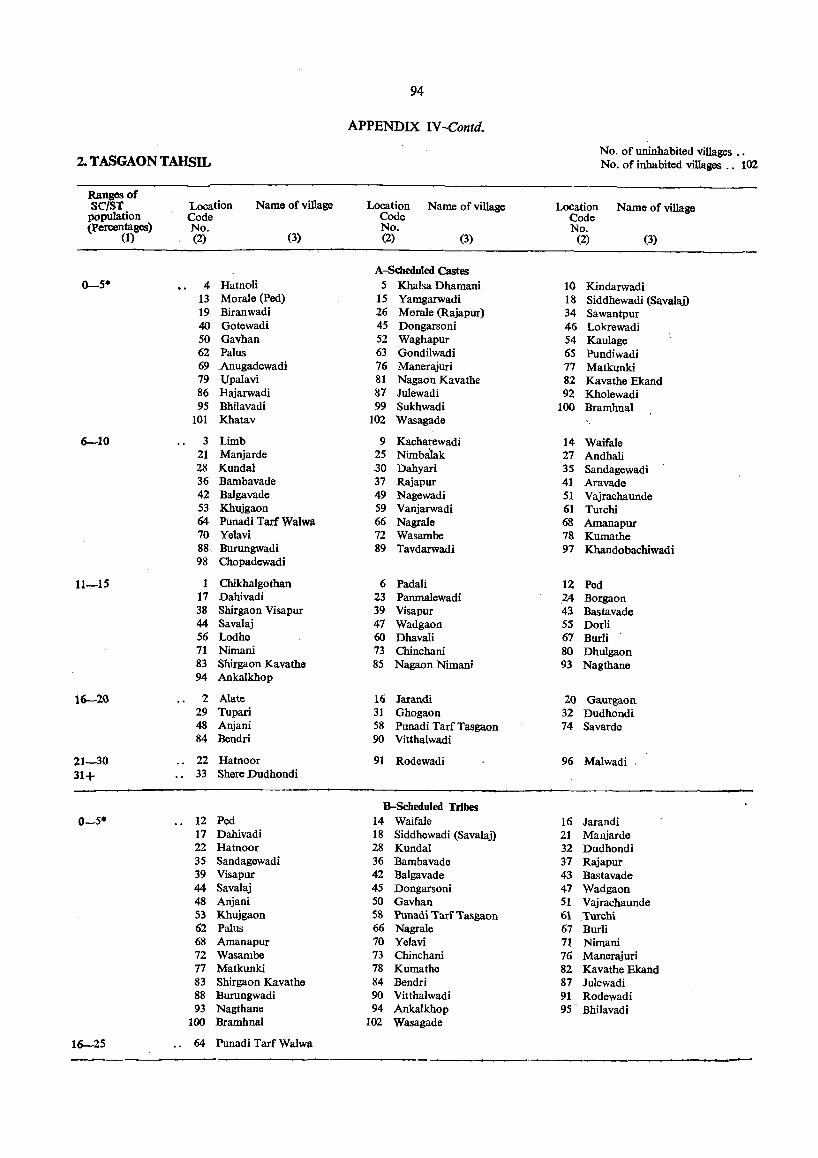
94
APPENDIX IV-Contd.
No. of uninhabited villages .• 2. TASGAON TAHSIL No. of inhabited villages .. 102
Ranges of Location Name of village Location Name of village Location SC/ST Name of village
population Code Code Code (percentages) No. No. No.
(1) (2) (3) (2) (3) (2) (3)
A-Scheduled Castes 0-5* 4 Hatnoli 5 Khalsa Dhamani 10 Kindarwadi
13 Morale (Ped) 15 Yamgarwadi 18 Siddhewadi (Savalaj) 19 Biranwadi 26 Morale "(Rajapur) 34 Sawantpur 40 Gotewadi 45 Dongarsoni 46 Lokrewadi 50 Gavhan 52 Waghapur 54 Kaulage 62 Palus 63 Gondilwadi 65 Pundiwadi 69 ,Anugadewadi 76 Manerajuri 77 Matkunki 79 Upalavi 81 Nagaon Kavathe 82 Kavathe Ekand 86 Hajarwadi 87 Julewadi 92 Kholewadi 95 BhiIavadi 99 Sukhwadi 100 BramhnaI
101 Khatav 102 Wasagade
6-10 3 Limb 9 Kacharewadi 14 Waif ale 21 Manjarde 25 Nimbalak 27 Andhali 28 Kundal 30 Dahyari 35 Sandagewadi 36 Bambavade 37 Rajapur 41 Aravade 42 BaJgavade 49 Nagewadi 51 Vajrachaunde 53 Khujgaon 59 Vanjarwadi 61 Turchi 64 Punadi Tarf Walwa 66 Nagrale 68 Amanapur 70 Yelavi 72 Wasambe 78 Kumathe 88 Burungwadi 89 Tavdarwadi 97 Khandobachiwadi 98 Chopadewadi
11-15 1 ChikhaIgothan 6 Padali 12 Ped 17 Dahivadi 23 Panmalewadi 24 Borgaon 38 Shirgaon Visapur 39 Visapur 43 Bastavade 44 Savalaj 47 Wadgaon 55 DorH 56 Lodhe 60 Dhavali 67 Burli 71 Nimani 73 Chinchani 80 Dhulgaon 83 Shirgaon Kavathe 85 Nagaon Nimani 93 Nagthane 94 Ankalkhop
16--2Q 2 Alate 16 Jarandi 20 Gaurgaon 29 Tupari 31 Ghogaon 32 Dudhondi 48 Anjani 58 Punadi Tarf Tasgaon 74 Savarde 84 Bendri 90 Vitthalwadi
21-30 22 Hatnoor 91 Rodewadi 96 Malwadi 31+ 33 Shere Dudhondi
B-Scheduled Tribes 0-5* 12 Ped 14 Waifale 16 Jarandi
17 Dahivadi 18 Siddhewadi (Savalaj) 21 Manjarde 22 Hatnoor 28 KundaI 32 Dudhondi 35 Sandagewadi 36 Bambavade 37 Rajapur 39 Visapur 42 BaIgavade 43 Bastavade 44 Savalaj 45 Dongarsoni 47 Wadgaon 48 Anjani 50 Gavhan 51 Vajrachaunde S3 Khujgaon 58 Punadi Tarf Tasgaon 61 Turchi 62 Palus 66 Nagrale 67 Burli 68 Amanapur 70 YeJavi 71 Nimani 72 Wasambe 73 Chinchani 76 Manerajuri 77 Matkunki 78 Kumathe 82 Kavathe Ekand 83 Shirgaon Kavathe 84 Bendri 87 Julewadi 88 Burungwadi 90 Vitthalwadi 91 Rodewadi 93 Nagthane 94 Ankalkhop 95 BhiIavadi
100 Bramhnal 102 Wasagade
16--25 64 Punadi Tarf WaIWil
--
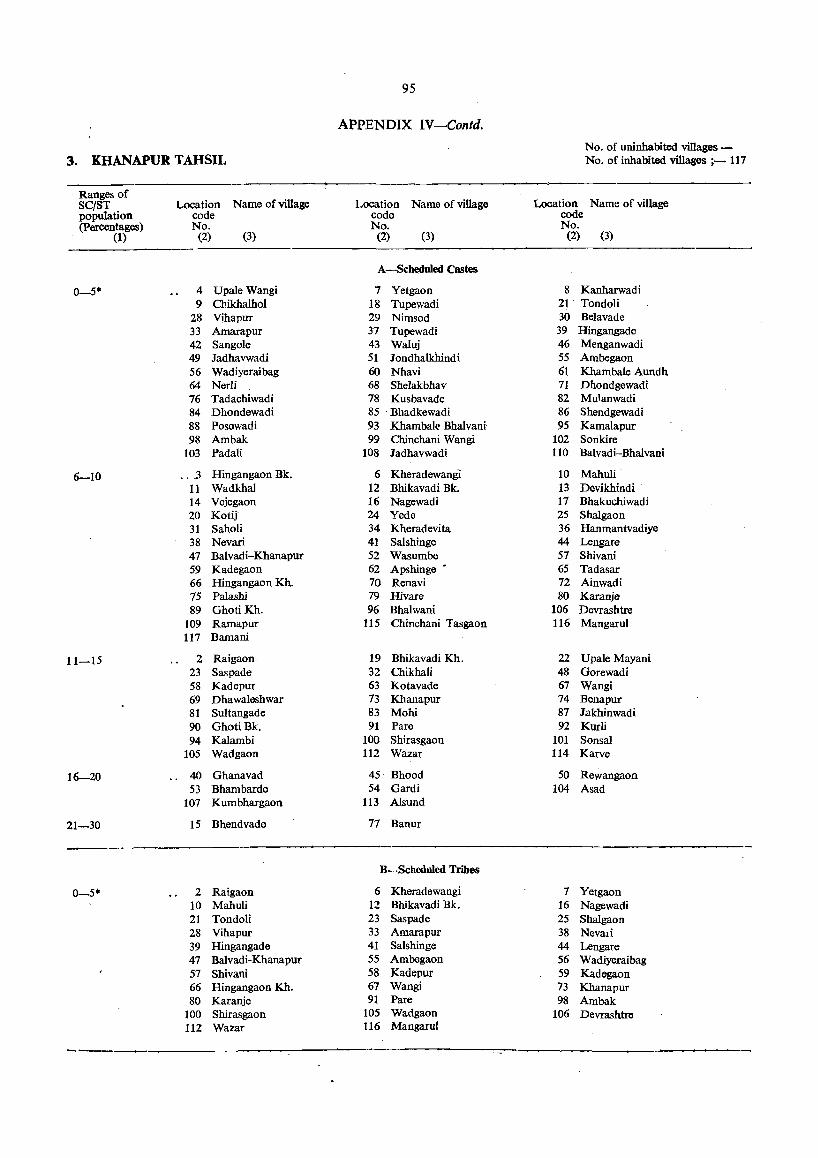
95
APPENDIX IV-Contd.
No. of uninhabited villages -3. KHANAPUR TAHSIL No. of inhabited villages ;- 117
Ranges of Name of village Location Name of village SC/ST Location Location Name of village
population code code code (Percentages) No. No. No.
(1) (2) (3) (2) (3) (2) (3)
A-Scheduled Castes
0-5* 4 UpaIeWangi 7 Yetgaon 8 Kanharwadi 9 Chikhalhol 18 Tupewadi 21 Tondoli
28 Vihapur 29 Nimsod 30 Belavade 33 Amarapur 37 Tupewadi 39 Hingangade 42 Sangole 43 WaIuj 46 Menganwadi 49 Jadhavwadi 51 Jondhaikhindi 55 Ambegaon 56 Wadiyeraibag 60 Nhavi 61 Khambale Aundh 64 Nerli 68 Shelakbhav 71 Dhondgewadi 76 Tadachiwadi 78 Kusbavade 82 Mulanwadi 84 Dhondewadi 85 Bhadkewadi 86 Shendgewadi 88 Posewadi 93 Khambale BhaIvani' 95 Kamalapur 98 Ambak 99 Chinchani Wangi 102 Sonkire
103 Padali 108 ladhavwadi 110 BaIvadi-BhaIvani
6-10 .. ) Hingangaon Bk. 6 Kheradewangi 10 Mahuli 11 Wadkhal 12. Bhikavadi Bk. 13 Devikhindi 14 Vejegaon 16 Nagewadi 17 Bhakuchiwadi 20 Kotij- 24 Yede 25 Shalgaon 31 Saholi 34 Kheradevita 36 Hanmantvadiye 38 Nevari 41 Salshinge 44 Lengare 47 Balvadi-Khanapur 52 Wasumbe 57 Shivani 59 Kadegaon 62 Apshinge - 65 Tadasar 66 Hingangaon Kh. 70 Renavi 72 Ainwadi 75 Palashi 79 Hivare 80 Karanje 89 GhotiKh. 96 Bhalwani 106 Devrashtre
109 Ramapur 115 Chinchani Tasgaon 116 Mangarul 117 Bamani
11-15 2 Raigaon· 19 Bhikavadi Kh. 22 Upale Mayani 23 Saspade 32 Chikhali 48 Gorewadi 58 Kadepur 63 Kotavade 67 Wangi 69 Dhawaleshwar 73 Khanapur 74 Benapur 81 Sultangade 83 Mohi 87 Jakhinwadi 90 GhotiBk. 91 Pare 92 Kurli 94 Kalambi 100 Shirasgaon 101 Sonsal
105 Wadgaon 112 Wazar 114 Karve
16-20 40 Ghanavad 45 Bhood 50 Rewangaon 53 Bhambarde 54 Gardi 104 Asad
107 Kumbhargaon 113 Alsund
21-30 15 Bhendvade 77 Banur
B-Scheduled Tribes
0-5* 2 Raigaon 6 Kheradewangi 7 Yetgaon 10 Mahuli 12 Bhikavadi Bk. 16 Nagewadi 21 Tondoli 23 Saspade 25 Shalgaon 28 Vihapur 33 Amarapur 38 Nevali 39 Hingangade 41 Salshinge 44 Lengare 47 BaIvadi-Khanapur 55 Ambegaon 56 Wadiyeraibag 57 Shivani 58 Kadepur 59 Kadegaon 66 Hingangaon Kh. 67 Wangi 73 Khanapur 80 Karanje 91 Pare 98 Ambak
100 Shirasgaon 105 Wadgaon 106 Devrashtre 112 Wazar 116 Mangarul
--_
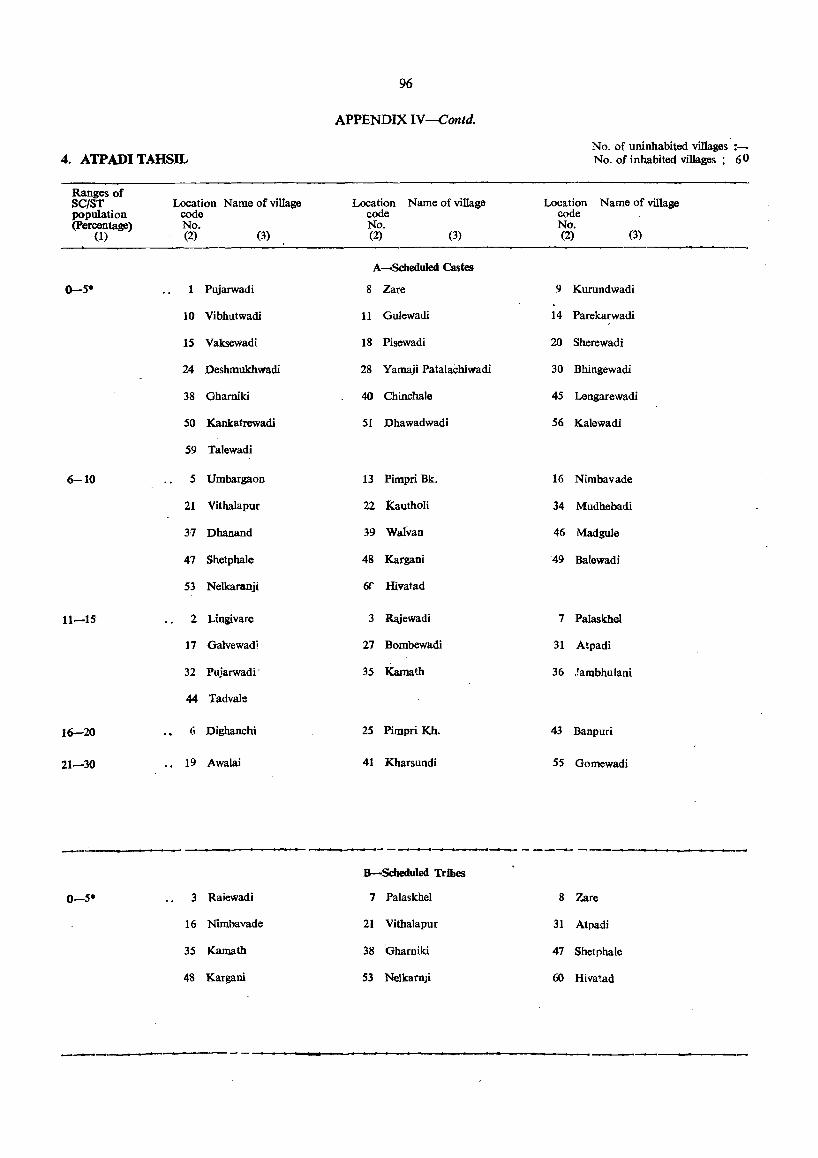
96
APPENDIX IV-Contd.
No. of uninhabited villages :-4. ATPADI TAHSIL No_ of inhabited villages ; 60
Ranges of Name of village Location Name of village Location Name of village SC/ST Location
population code code code (Percentage) No. No. No.
(1) (2) (3) (2) (3) (2) (3)
A-Scheduled Castes
0--5· 1 Pujarwadi 8 Zare 9 Kurundwadi
10 Vibhutwadi 11 Gulewadi 14 Parekarwadi
15 Vaksewadi 18 Pisewadi 20 Sherewadi
24 Deshmukhwadi 28 Yamaji Patalachiwadi 30 Bhingewadi
38 Gharniki 40 Chinchale 45 Lengarewadi
50 Kankatrewadi 51 Dhawadwadi 56 Kalewadi
59 Talewadi
6-10 5 Umbargaon 13 Pimpri Bk_ 16 Nimbavade
21 Vithalapur 22 1<.autholi 34 Mudhebadi
3-7 Dhanand 39 Wafvan 46 Madgule
47 Shetphale 48 Kargani 49 Balewadi
53 Nelkaranji 6f Hivatad
11-15 2 Lingivare 3 Rajewadi 7 Palaskhel
17 Galvewadi 27 Bombewadi 31 Atpadi
32 Pujarwadi- 35 Kamath 36 _~ambhuJani
44 Tadvale
16-20 ( ) Dighanchi 25 Pimpri Kh. 43 Banpuri
21-30 19 Awalai 41 Kharsundi 55 Gomewadi
--- ~-------
B-Scheduled Tribes
0-5· 3 Raiewadi 7 Palaskhel 8 Zare
16 Nimhavade 21 Vithalapur 31 Atpadi
35 Kamath 38 Gharniki 47 Shetphale
48 Kargani 53 Nelkarnji 60 Hivatad
.--------------------------------------------------------- ----------------
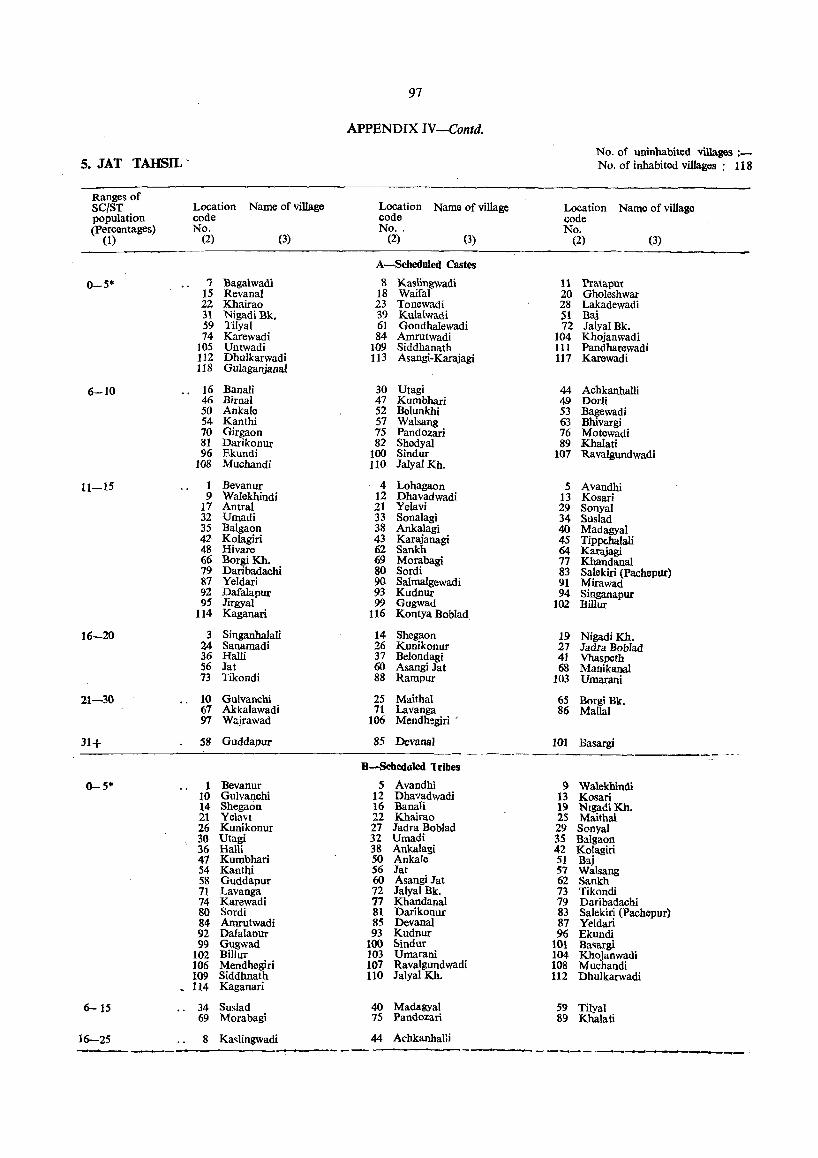
5. JAT TAHSIL'
Ranges of SC/ST population (Percentages)
(1)
Location Name of village code No.
(2) (3)
97
APPENDIX IV-Contd.
Location Name of village code No. ,
(2) (3)
No. of uninhabited villages :No. of inhabited villages: 118
Location Name of village code No.
(2) (3) ----------------~------------------------------~--------------------------
0-5*
6-10
11-15
16-20
21-30
31+
0-5*
6-15
16-25
'1 "Bagalwadi 15 Revanal 22 Khairao 31 Nigadi "Bk. 59 Tilyal 74 Karewadi
105 Untwadi 112 Dhulkarwadi 118 Gulaganjanal
16 BanaIi 46 BirnaI 50 Ankale 54 Kanthi 70 Girgaon 81 Darikonur 96 Ekundi
108 Muchandi
1 Bevanur 9 Walekhindi
17 Antral 32 Umadi 35 Balgaon 42 Kolagiri 48 Hivare 66 Borgi Kh. 79 Daribadachi 87 Yeldari 92 Dafalapur 95 Jirgyal
114 Kaganari
3 Singanhalali 24 Sanamadi 36 HaUi 56 Jat 73 Tikondi
10 Gulvanchi 67 Akkalawadi 97 Wajrawad
58 Guddapur
1 Bevanur 10 Gulvanchi 14 Shegaon 21 Yelavl 26 Kunikonur 30 Utagi 36 Ham 47 Kumbhari 54 Kantbi 58 Guddapur 71 Lavanga 74 Karewadi 80 Sordi 84 Amrutwadi 92 Dafalaour 99 Gugwad
102 BiIIur 106 Mendhegiri 109 Siddhnath
_ 114 Kaganari
34 Suslad 69 Morabagi
8 Ka~lingwadi
----~--------------
A-Scheduled Castes
8 Kaslingwadi 18 Waifal 23 Tonewadi 39 Kulalwadi 61 GondhaIewadi 84 Amrutwadi
109 Siddhanath 113 Asangi-Karajagi
30 Utagi 47 Kumbhari 52 Belunkhi 57 Walsang 75 Pandozari 82 Shedyal
100 Sindur 110 Jalyal Kb.
4 Lohagaon 12 Dhavadwadi 21 Yelavi 33 Sonalagi 38 AnkaIagi 43 Karajanagi 62 Sankh 69 Morabagi 80 Sordi 90 SalmaIgewadi 93 Kudnur 99 Gugwad
116 Kontya Boblad
14 Shegaon 26 Kunikonur 37 Be!ondagi 60 Asangi Jat 88 Rampur
25 Maithal 71 Lavanga
106 Mendhegiri'
85 Devanal
B-Scheduled 1 dbes
5 Avandhi 12 Dhavadwadi 16 Banali 22 Khairao 27 Jadra Boblad 32 Umadi 38 Ankalagi 50 Ankale 56 Jat 60 Asangi Jat 72 Jalyal Bk. 77 KhandanaI 81 Darikonur 85 Devana! 93 Kudnur
100 ~indur 103 Umarani 107 Ravalgundwadi 110 Jalyal Kh.
40 Madagyal 75 Pandozari
44 Achkanhalli
11 Pratapur 20 Gholeshwar 28 Lakadewadi 51 Baj 72 Jalyal Bk.
104 Khojanwadi 111 Pandharewadi 117 Karewadi
44 Achkanhalli 49 Dodi 53 Bagewadi 63 Bhivargi 76 Motewadi 89 KhaIati
107 Ravalgundwadi
5 Avandhi 13 Kosari 29 Sonyal 34 Suslad 40 Madagyal 45 Tippehalali 64 Karajagi 77 Khandanal 83 SaIekiri (Pachepur) 91 Mirawad 94 Singanapur
102 Billur
19 Nigadi Kh. 27 Jadra Boblad 41 Vhaspeth 68 ManikanaI
103 Umarani
65 Borgi Bk. 86 MalIal
101 Basargi
9 Walekhindi 13 Kosari 19 Ntgadi Kh. 25 Maithal 29 SonyaI 35 Balgaon 42 Kolagiri 51 Baj 57 Walsang 62 Sankh 73 Tikondi 79 Daribadachi 83 Salekiri (Pacbepur) 87 Yeldari 96 Ekundi
101 Ba<;argi 104 Khojanwadi 108 Muchandi 112 Dhulkarwadi
59 TilyaI. 89 Khalatl
,---------- - --- '---,------
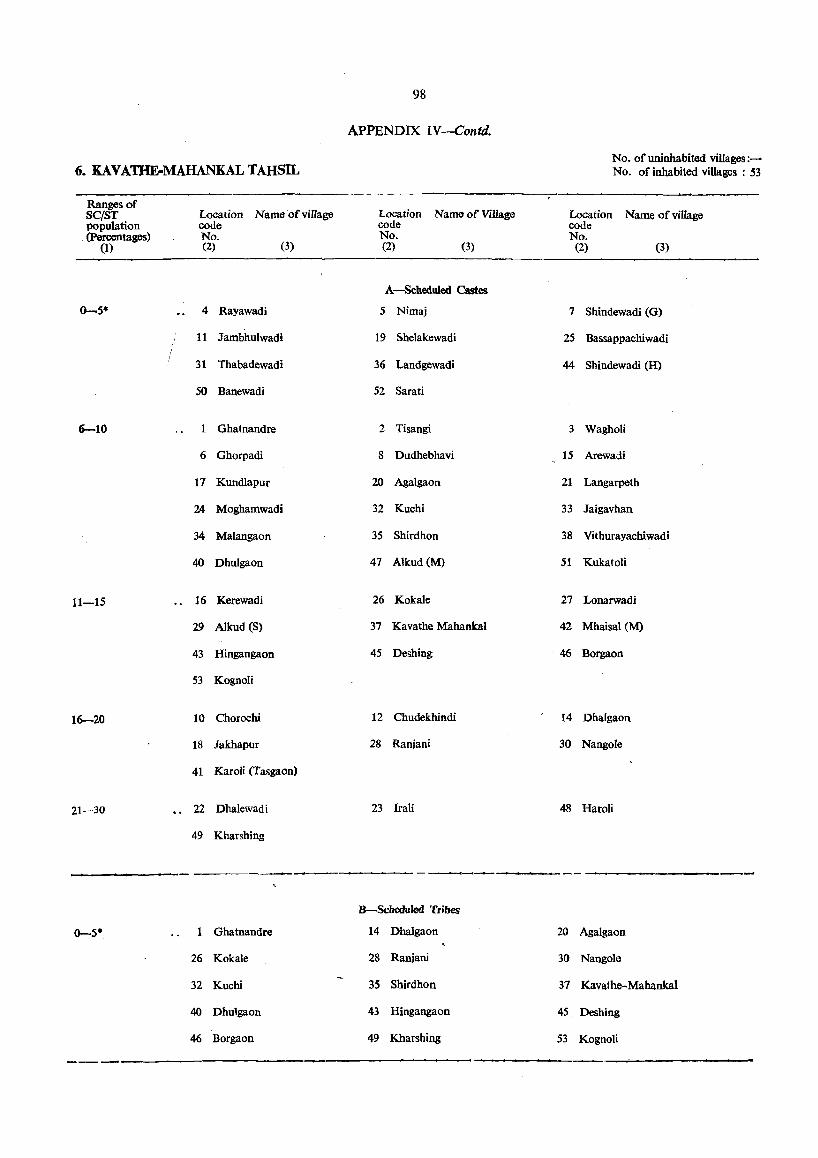
98
APPENDIX IV-Contd.
6.KAVA~~KALTAHSa No. of uninhabited villages:-No. of inhabited villages : 53
Ranges of Location Name of village Location Name of Village SC/ST Location Name of village
population code code code . (percentages) No . No. No.
(1) (2) (3) (2) (3) (2) (3)
A-8cheduled Castes
0--5$ 4 Rayawadi 5 Nimaj 7 Shindewadi (G)
11 Jambhulwadi 19 5helakewadi 25 Bassappaehiwadi
31 Thabadewadi 36 Landgewadi 44 Shindewadi (H)
50 Banewadi 52 Sarati
6-10 1 Ghatnandre 2 Tisangi 3 Wagholi
6 Ghorpadi 8 Dudhebhavi 15 Arewadi
17 Kundlapur 20 Agalgaon 21 Langarpeth
24 Moghamwadi 32 Kuehi 33 Jaigavhan
34 Malangaon 35 Shirdhon 38 Vithurayachiwadi
40 Dhulgaon 47 Alkud (M) 51 Kukatoli
11-15 16 Kerewadi 26 Kokale 27 Lonarwadi
29 Alkud (S) 37 Kavathe Mahankal 42 Mhaisal (M)
43 Hingangaon 45 Deshing 46 Borgaon
53 Kognoli
16-20 10 Chorochi 12 Chudekhindi 14 Dhalgaon
18 Jakhapur 28 Ranjani 30 Nangole
41 Karoli (Tasgaon)
21--30 22 Dhalewadi 23 Irali 48 HaroJi
49 Kharshing
---B-Scheduled Tribes
0--5* 1 Ghatnandre 14 Dhalgaon 20 Agalgaon
26 Kokale 28 Ranjani 30 Nangole
32 Kuehi 35 Shirdhon 37 Kavathe-Mahankal
40 Dhulgaon 43 Hingangaoo 45 Deshing
46 Borgaoo 49 Kharshing 53 Kognoli
---
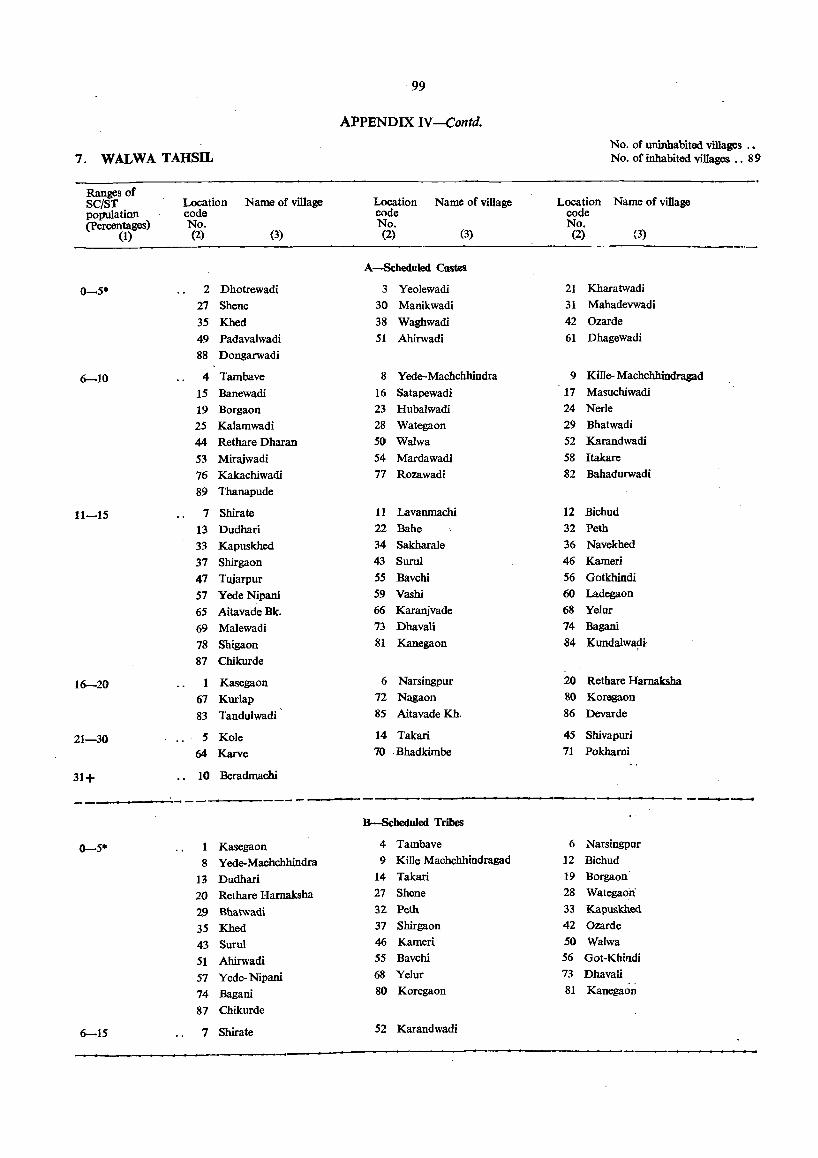
99
APPENDIX IV-Contd.
No. of uninhabited villages .• 7. WALWA TAHSIL No. or inhabited villages .. 89
Ranges of Location Name of village Location Name of village SC/ST Location Name of village
population code code code (Percentages) No. No. No.
(1) (2) (3) (2) (3) (2) (3)
A-Scheduled Castes
0-5* 2 Dhotrewadi 3 Yeolewadi 21 Kharatwadi
27 Shene 30 Manikwadi 31 Mahadevwadi
35 Khed 38 Waghwadi 42 Ozarde
49 Padavalwadi 51 Ahirwadi 61 Dhagewadi
88 Dongarwadi
6-10 4 Tambave 8 Yede-Machchhindra 9 Kille- Machchhindragad
15 Banewadi 16 Satapewadi 17 Masuchiwadi
19 Borgaon 23 Hubalwadi 24 Nerle
25 Kalamwadi 28 Wategaon 29 Bhatwadi
44 Rethare Dharan 50 Walwa 52 Karandwadi
53 Mirajwadi 54 Mardawadi 58 Itakare
76 Kakachiwadi 77 Rozawadi 82 Bahadurwadi
89 Thanapude
11-15 7 Shirate 11 Lavanmachi 12 Bichud
13 Dudhari 22 Bahe 32 Peth
33 Kapuskhed 34 Sakharale 36 Navekhed
37 Shirgaon 43 Suru} 46 Kameri
47 Tujarpur 55 Bavchi 56 Gotkhindi
57 Yede Nipani 59 Vashi 60 Ladegaon
65 Aitavade Bk. 66 Karanjvade 68 Yelur
69 Malewadi 73 Dhavali 74 Bagani
78 Shigaon 81 Kanegaon 84 Kundalwa~t
87 Chikurde
16-20 1 Kasegaon 6 Narsingpur 20 Rethare Harnaksha
67 Kurlap 72 Nagaon 80 Koregaon
83 Tandulwadi 85 Aitavade Kh. 86 Devarde
21-30 5 Kole 14 Takari 45 Shivapuri
64 Karve 70 . Bhadkimbe 71 Pokharni
31+ 10 Beradmachi
----...-~
B-Scheduled Tribes
0-5* 1 Kasegaon 4 Tambave 6 Narsingpur
8 Yede-Machchhindra 9 Kille Machchhindragad 12 Bichud
13 Dudhari 14 Takari 19 Borgaon
20 Rethare Harnaksha 27 Shene 28 Wategaoii
29 Bhatwadi 32 Peth 33 Kapuskhe<l
35 Khed 37 Shirgaon 42 Ozarde
43 Surul 46 Kameri 50 Walwa
51 Ahirwadi 55 Bavchi 56 Got-Khindi
57 Yede- Nipani 68 Yelur 73 Dhavali
74 Bagani 80 Koregaon 81 Kanegaon
87 Chikurde
6-15 1 Shirate 52 Karandwadi
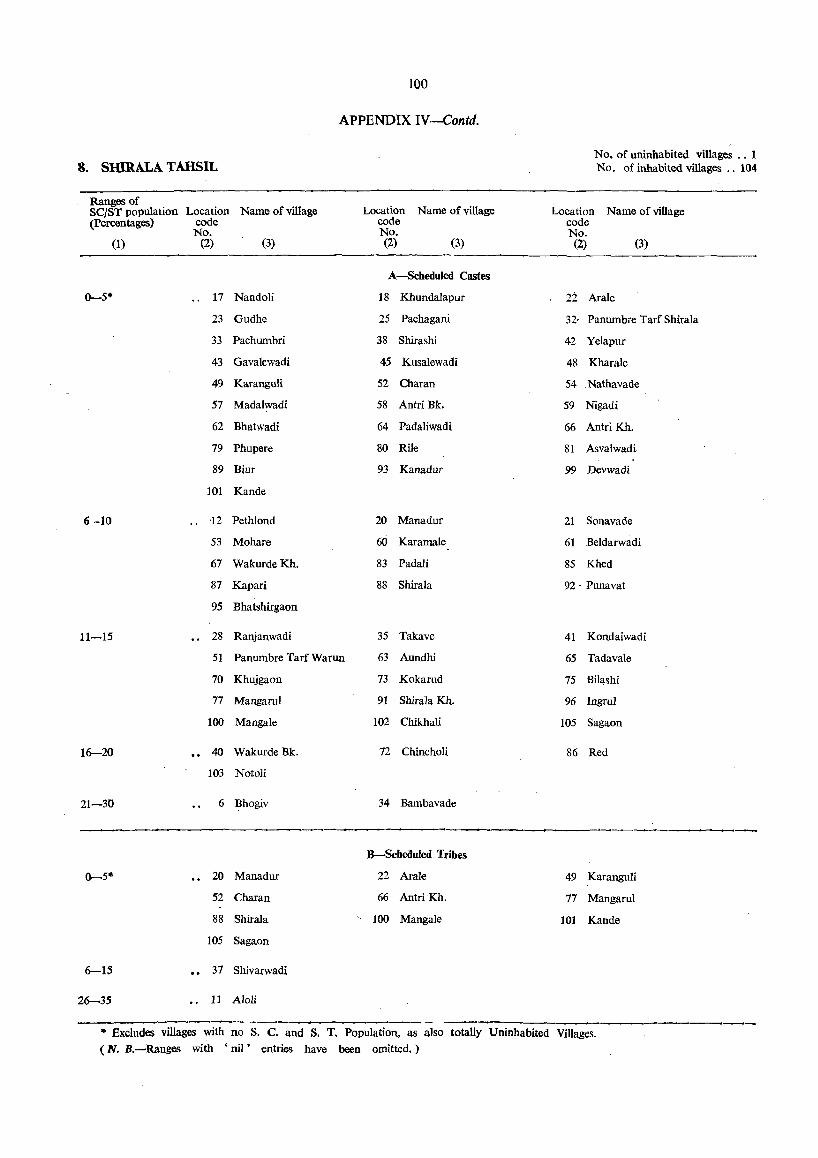
100
APPENDIX IV-Contd.
No. of uninhabited villages .. 1 8. SHIRALA TAHSIL No. of inhabited villages .. 104
Ranges of Location Name of village Location Name of village Name of village SCjST population Location
(Percentages) code code code No. No. No.
(1) (2) (3) (2) (3) (2) (3)
A-Scheduled Castes
0--5* 17 Nandoli 18 Khundalapur 22 Arale
23 Gudhe 25 Pachagani 32- Panumbre Tarf Shirala
33 Pachumbri 38 Shirashi 42 Yelapur
43 Gavalewadi 45 Kusalewadi 48 Kharale
49 Karanguli 52 Char an 54 Nathavade
57 Madalwadi 58 Antri Bk. 59 Nigadi
62 Bhatwadi 64 Padaliwadi 66 Antri Kh.
79 Phupere 80 Rile 81 Asvalwadi
89 Biur 93 Kanadur 99 Devwadi
101 Kande
6 -10 '12 Pethlond 20 Manadur 21 Sonavade
53 Mohare 66 Karamale 61 Beldarwadi
67 WakurdeKh. 83 Padali 85 Khed
87 Kapad 88 Shirala 92· Punavat
95 Bhatshirgaon
11-15 28 Ranjanwadi 35 Takave 41 Kondaiwadi
51 Panumbre Tarf Warun 63 Aundhi 65 Tadavale
70 Khujgaon 73 Kokarud 75 Bilashi
77 Mangarul 91 Shirala Kh. 96 Ingrul
100 Mangale 102 Chikhali 105 Sagaon
16-20 40 WakurdeBk. 72 Chincholi 86 Red
103 Notoli
21-30 6 Bhogiv 34 Bambavade
B-Schet1u1ed Tribes
20 Manadur 22 Arale 49 Karanguli
52 Charan 66 AntriKh. 77 Mangarul
88 Shirala 100 MangaJe 101 Kande
105 Sagaon
6-15 37 Shivarwadi
26-35 11 Aloli
---• Excludes villages with no S. C. and S. T. Population, as also totally Uninhabited Villages. (N. B.-Ranges with 'nil' entries have been omitted.)
SECTION JI
-TOWN DIRECTORY

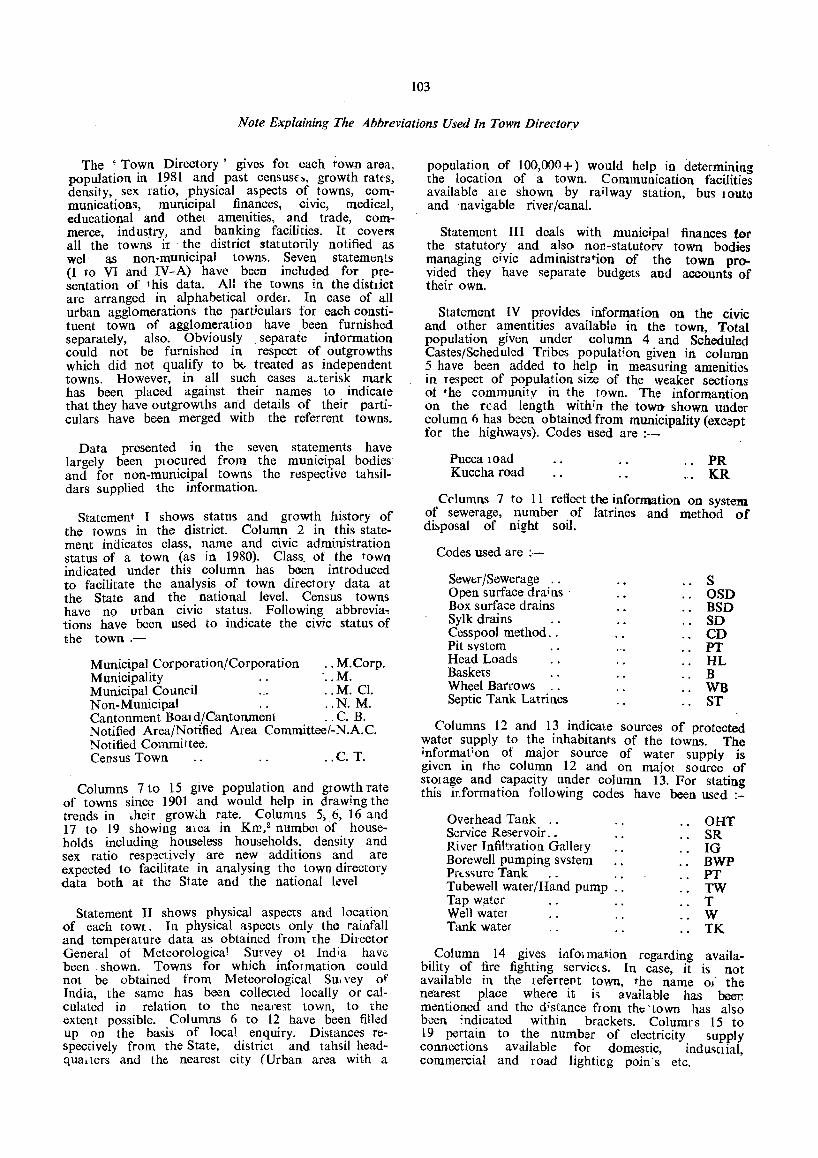
103
Note Explaining The Abbreviations Used In Town Directory
The ~ Town Directory' gives fOI each town area, population in 1~81 and. past census(:>, growth rates, density, sex ratio, physICal aspects of towns, communications, municipal finances, civic, medical, educational and othel amenitie!>, and trade, commerce industrv, and banking facilities. It covers all the towns -ir the district statutorily notified as weI as non-municipal town!>. Seven statements (I to VI and I:V-A) have been inclu~ed for. p~esentation of 1 hIS data. All the towns 1U the dlstllct are arranged in alphabetical order. In case of all urban agglomera.tions the particulars for each constituent town of agglomeration have been furnished separately, also. Obviously separate information could not be furnished in respect of outgrowths which did not qualify to be, treated as independent towns. However, in all such cases a"terisk mark has been placed against their names to indicate that they have outgrowths and details of their particulars have been merged with the referrent towns.
Data presented in the seven statements have largely been plOcured from the municipal bodies and for non-municipal towns the respective tahsildars supplied the information.
Statement I shows status and growth history of the towns in tho district. Column 2 in this statement indicates class, name and civic administration status of a town (as in 1980). Class. ot the town indicated under this column has been introduced to facilitate the analysis of town directory data at the State and the national level. Census towns have no urban civic status. Following abbrevia~ tions have. been used to indicate the civ.ic status of the town.-
Municipal Corporation/Corporation .. M.Corp. Municipality -.. M. Municipal Council .. M. Cl. Non-Municipal .. N. M. Cantonment Boald/Cantonment .. C. B. Notified Area/Notified Area Committee/-N.A.C. Notified Committee. Census Town .. c. T.
Columns 7 to 15 glve population and growth rate of towns since 1901 and would help in drawing the trends in .heir grow~h rate. Columns 5,.6, 16 and 17 to 19 showing aiea in Km,2 numbel of households including houseless households. density and sex ratio respectively are new additions and are expected to facilitate in analysing the. town directory data both at the State and the natIOnal level
Statement II shows physical aspects and location of each tOWl. In physical aspects only the rainfall and temperature data as obtained from the Director General of Meteorological Survey 01 Ind;a have been shown. Towns for which infoImation could not be obtained from Meteorological SUl vey of India, the same has been collected locally or calculated in relation to the nearest town, to the extent possible. Columns 6 to 12 have been filled up on the basis of local enquiry. Distances respectively from the State, district and tahsil headqua, Iers and the. nearest city (Urban area with a
population of 100,000 +) would help in determining the location of a town. Communication facilities available ale shown by railway station, bus lQute and navigable river/canal.
Statement III deals with municipal finances .tor the statutory and also non-statutory town bodies managing civic administra~ion of the town provided they have separate budgets and accounts of their own.
Statement IV provides information on the civic and other amentities available in the town, Total popUlation given under column 4 and Scheduled Castes/Scheduled Tribes population given in column 5 have been added to help in measuring amenitie!> in respect of population size of the weaker sections of the community in the town. The informant ion on the read length within the tOWl) shown under column (j has been obtained from municipality (exc<)pt for the highways). Codes used are :-
Pucca load Kuccha road
PR KR
Cclumns 7 to 11 reflect the information on system of sewerage, number of latrines and method of di~posal of night soil.
Codes used are :-
Sewer jSewerage Open surface drains . Box surface drains Sylk drains Cesspool method .. Pit system Head Loads Baskets Wheel Bal'rows Septic Tank Latrines
S OSD BSD SD CD PT HL B WB ST
Columns 12 and 13 indicate sources of protected water supply to the inhabitants of the towns. The information of major source of water supply is given in the column 12 and on major source of stOiage and capacity under column 13. For stating this iLformation following codes have been used :-
Overhead Tank .. Service Reservoir .. River Infiltration Gallery Borewell pumping svstem Prt.s<;ure Tank Tubewell water/Hand pump Tap water Well watel Tank water
ORT SR IG BWP PT TW T W TK
Column 14 gives illfolmation regarding availability of fire fighting servict s. In case, it is not available in the referreDt town, the name OJ' the nearest place where it is available has beer. mentioned and the distance from tht;'town has also been indicated within brackets. Columrs 15 to 19 pertain to the number of electricity supply connections available for domestic, indusctial, commercial and road lighting poin s etc.
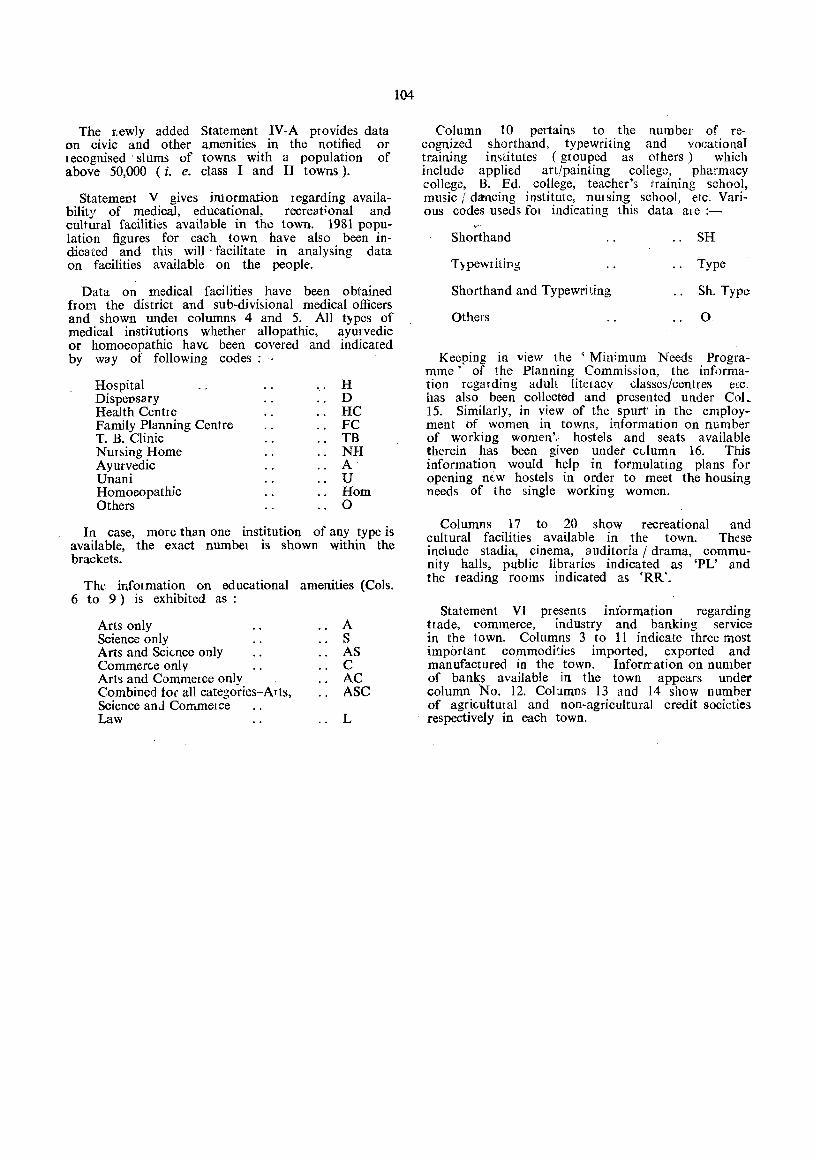
The flewly added Statement IV-A provides data on civic and other amenities in the notified or lecognised . slums of towns with a population of above 50,000 (i. e. class I and II towns).
Statement V gives information legarding availability of medical, educational, recreational and cultural facilities available in the town. 1981 population figures for each town have also been indicated and this will· facilitate in analysing data on facilities available on the people.
Data on medical facilities have been obtained from the district and sub-divhional medical officers and shown undel columns 4 and 5. All t)-pes of medical institutions whether allopathic, ayurvedic or homoeopathic have been covered and indicated by way of following codes ;--
Hospital Dispetlsary Health Centre Family Planning Centre T. B. Clinic Nursing Home Ayulvedic Unani Homoeopathic Others
H D HC FC TB NH A-U Hom o
In case, more than one institution of any type is available, the exact numbet is shown within the brackets.
Thl' infolmation on educational amenities (Cols. 6 to 9) is exhibited as;
Arts only Science only Arts and Sci(;nce only Commerce only Arts and Commerce only Combined tor all categories-Arts, Science and Commclce Law
A S AS C AC ASC
L
104
Column 10 peltains to the number of recognized shorthand, typewriting and vocational training institutes (grouped as others) which include applied art/painting college, pharmacy college, B. Ed. college, teacher's training school, music / d~cing institute, nUl sing school, etc. Various codes meds fOt indicating this data ale :-
Shorthand
TWeWl itin g
Shorthand and Typewriting
Others
SH
Type
Sh. Type
o
Keeping in view the 'Minimum Needs Programme' of the Planning Commission, the information regatding adult litetacy classes/centres etc. has also been collected and presented under CoL 15. Similarly, in view of the spurt' in the employment of women ill towns, information on number of working women',: hostels and seats available therein has been given under cvIumn 16. This information would help in formulating plans for opening nt.w hostels in order to meet the housing needs of the single working women.
Columns 17 to 20 show recreational and cultural facilities available in the town. These include stadia, cinema, auditoria / drama, community halls, public libraries indicated as 'PL' and the reading rooms indicated as 'RR·.
Statement VI presents iniormation regarding tJade, commerce, industry and banking service in the town. Columns 3 to 11 indicate three most important commodities imported, exported and manufactured in the town. Inforrration on number of banks available in the town appears under column No. 12. Columns 13 and 14 shew number of agricultUt al and non-agricultural credit societies respectively in each town.
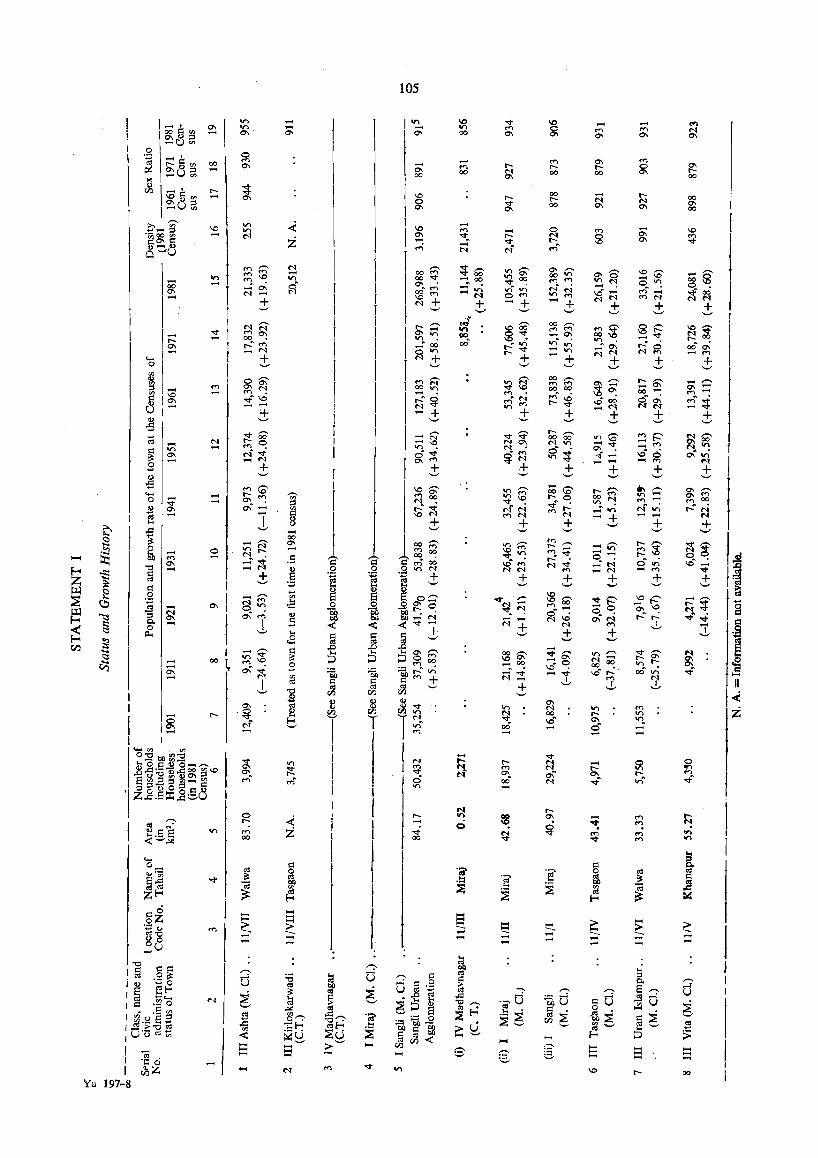
-
I::: 0\ -I~ I
~l 00 -,.... -
.,... -'<:I" -
--o ....
0\
I
I 00 ~
1 'O:EbI)~:9 $-jO~4)O_.-..
1..8 ,.Q;;::. Q;,.Q 00 '" '0
E "';:;"'<DO\~ :g-~~~~ 'j Z:l 0 g::r::o
o.5·Q ..s::;._ .d',-"U
, g ,.., 00
.... .... 0\
.... 00 0\ -.5
.~
~ --
r I
1 r
I '2 ° '';::
~ 8 ° ~ ] ::5
~ rn 8
T i
I i
I i
I
I
a ~ ~ I:::: cd rn
~, I
I i
i I
I
105
,.... .... '<:I" 00
.... .., 00
~60' - 00 . . -on -I'(
.;J on co 00·
§ -....
+ ._,
on
~. 00 ....
~ .... ....
c '-::;"
00 ,-.. ,.., ,.., _ 0\
11")'" .,.; -.,... -+
'-"
.... ,.., 0\
"'\0' -'<:I" 0\ • ~ .....
.... -+ .._,
E .... -
-,.., 0\
~$' r-. . 0.,.. .... ..,
"" '" "1-.... ....
+ '-'
00 0\ 00
\O~ Moo r-. . 00 0\ -"" + ._,
~ .... -
00
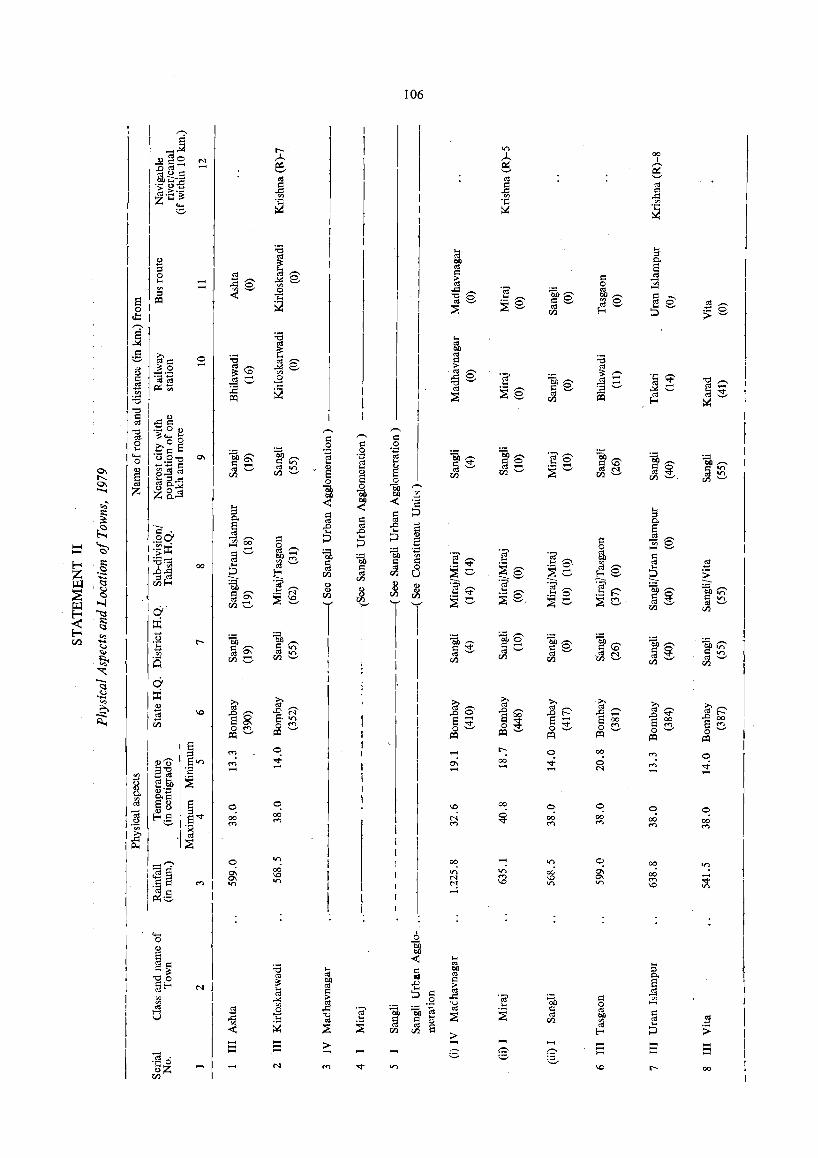
tao .- 0 ~z
en
o co <')
---
.§
.' ~ o
~
T I
106
I
I I
I I I I I I I
T T ! I I,
I I
,I 0\ -
co ~ co <')
co , 2 '-'
.2 ~
~ co <')
o co <')
co
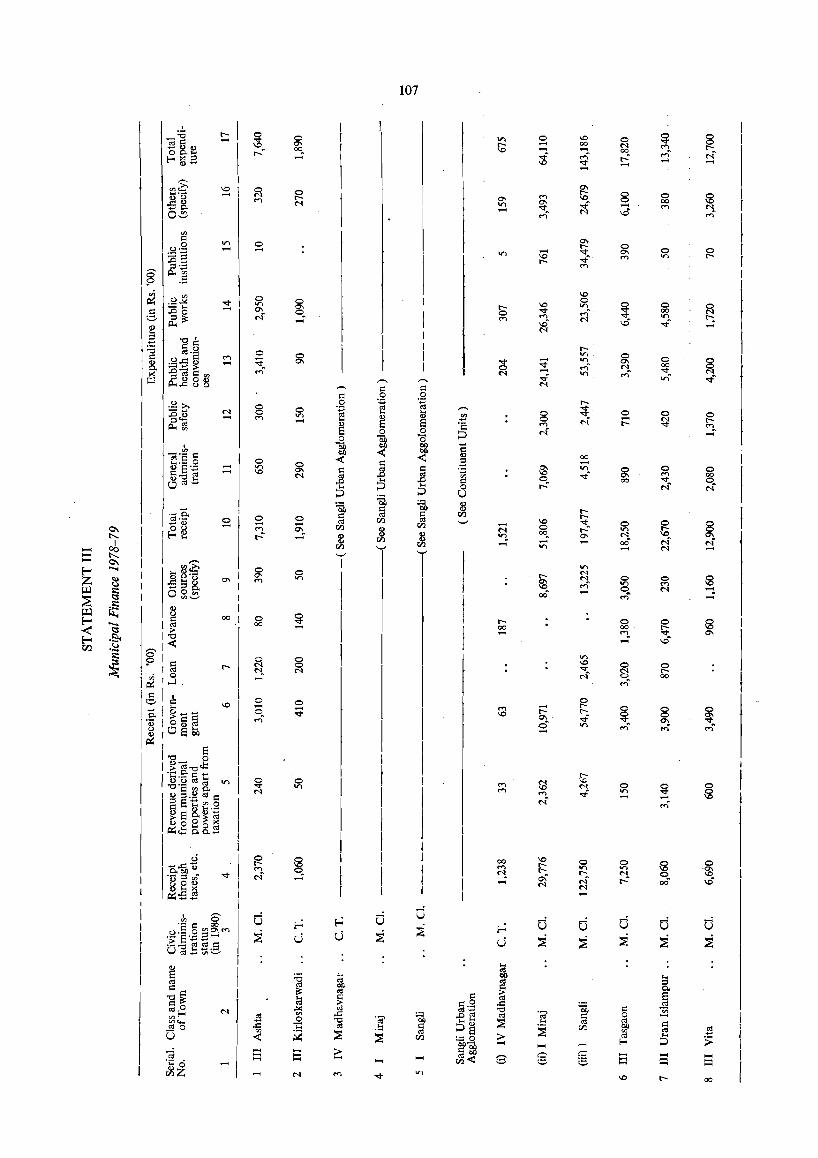
107
, ~ 8 _::0 t-
~ 0 ", 0 \0 0 ro::: .-'" to .- 00 N ...., t--QQ 00" $"
.- 00 M N" 00, ,_. 1-" M r-.: f-<i3B .-~ .- .-
/""'
'" Cl!cP \0 0 0 ..., I- 8 0 g ...... _ .- N
01 \0 QO t- oo ,.c:Q ....,
N ", ~ "'¢" .- ...., N ... 0, - M N ..0 ....," O~
I 00 01 :::
0 I 0.9 .,..,
~ .- l:t '" 0 g ~E \0 ..;:' ...., .,..,
I- ...., ::l'_
~ Il-<t;
.5 .; \0 ~ j$~ 0 0 \0
0
~ 0 0 "'¢ V) l- V) .- '"
01 "'¢ M 00 N g .DO q 0 '" In I-~~ N" ...., \0" N ..0 ..;: ...<
~ N ::l "O~
!] :::Q I-ro·_ 0 §( V) , 0 0
~ o,.c: ::: M
~ "'¢ - V)" 01 "'¢ N 00 i8- ~~~ 0 '" "'¢" M N .-V) M
I~ .gi§~ -q- V) ..;: ,..... N P-<.c::00 ::: :::
r:: .9 .9 l-
I .~ >. 0 0
.g i§ i ,..... 8 ~ 0 0 g - ... ('I 0 ro $J .g~ .- ...., V)
5 ('I" r:: ~ .-~ 's ...., ....,
I P-<oo
° ° 0 ('I" ...< 0 13 '0 , bb 01) E -< bO , ";i'S d bO -< Q 00
0 ~ ::: B .-...... _ ° 0 01 V) 0 0 Q 13'';:: .- V) ro ::: .~ ~ .- \0 01 § ro \0 "'¢" ~ 00 ~"O ro ('I ..0 0 ~ :5 ..0 00
I o rot: ~ :5 ° r-.: M" u
~ ~ ~ 8 I ~a a I-a ::: til l-I 0;1._ 0 ~ ~ til ro .- \0 V 0 0
~ ... Q .- til til 0 r-.: In to '00 ....,
'" 8 M 0- 1 , f-< ~ r-.: ...< ~ 8 "1, ~ '" N M" M
t-...
I til .- ..... 00 I I ,..... til '-' til .- V) - M -...... ~ I '-' ......
I ...... 0- I V) E-< ...... I oo.a 0 0 .... ('I g , t §·u 01 N 0 0 z ~ '" ...., .,..
I 01 ",," In ...., I 105 ::l 8- \0 q M .-Il.l ;::
00" - -I 0°'" ...., ::E 1:3 '" '-'
I Il.l ~ 8
00 I 0 ~ 0
~ g E-< I§ I-.... 00 .- 00 00 ' <t: 1:3 ,-6
I "1- '" .!::<
I .- \0" E-< 1< III .~
;:: s 0 V) 9'~ ~ \0 0 0 ~ t- o ..,.
~t t-' 10;1 I N" N N" 00 i .; I 0
"" ~ ....l. la IE I 0 0 \0 0 r:: I- 0 0 0 0 ~
...., I-0. i ~~ ..... \0 ~ 0 ~ M '" '
..;: 01 ,._ , 0::: a 0" V) ....," Q 0 Q ... - ""
...., g I 13 bIl
~I I 1"0 §
I~Cil"O<l:: l-I ,·;::.e:::;:: 0 0 N \0
0 0 0 I (1).S:a cd cd V) ...., N "0::: 00 0,
..,. V) ...., \0 ..;: V) v g N ...., -I <1> ::l.:!:l ro ::: N" ....," 1;:113;::00 0 ::: Q .... _
~ § 8~a ~<l:: 0,0, ....
1
I ... .c::~ g ~ 00 \0 0 0 ~ 0 ...., l- V) V) '0-,
I·e gp vf
..., 0" ('I"
l- I- N 0 \0 "'¢ N" .- 0\ ~ r-.: 00" ..0 <1>OQ N ~ II ~
~ ... ~
, s d r-:; 0 0 d d d d d Vl r-:;
~ r-:; ._::: 00 u.S 0 :g~~ :i u u :i u :i ~ ~ ~ ~ .~ s·..;:: ..... ,..... r:r~ ~ ~g
... S ro
::0 >" bIl ... bt ro ::I ro ro
~ 0, ~::: ~ ro = 13 ~ "O~ 1a ;;. §.g .c:: ~ ro :::0 .;.: ro 'g ::: Oil ~f-< N ro 00 ..c ~ ..oro .;:? ::: ° .... -8 "0 .;:? ...... ::E ... ro ro ::: "''_ .:E ro .l= = 05 ~ tI.l bO ro g ,!:!o 00 Vl
~ ::E ::E o;!
> ~ ... :> u -< til :.:::0 0 1Oll'Ob .... .... .... -a ..... ::::= > = lOll G S ..... ::::= ..... ...... ..... ..... ~< 8 i=I ...... ·c 6 ...... ..... ...... ::::. ::::. ...... ....
Jlz M M V V)
\0 t- oo
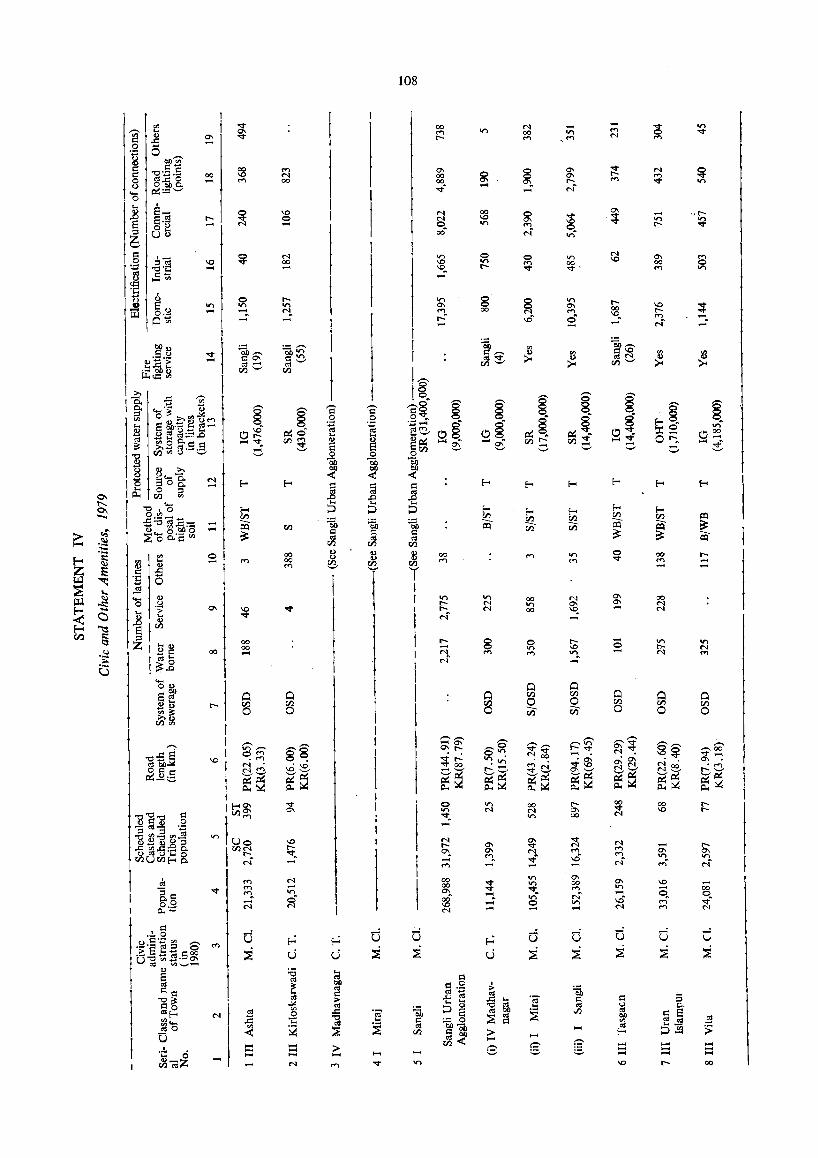
s:: o
11 I
n
m
0\ .....
00 -r--\0 -
..... -
o .....
0\
00
00 00 .....
@ o
-:::1
N co -
108
..... on
0\ co 00 ..;-
00 00 0\ 00· \C N
00 \C on
o on r-
g 00
o rJl o
..... ""'" -. -
8
N co .....
co I/") 00
o I/") .....
-...., N
o rJl o
..... I/")
r-
0\ co ....,
co <'l .....
o rJl o
8 on
r..... .....
-00 O. ;:!i
--..... 00
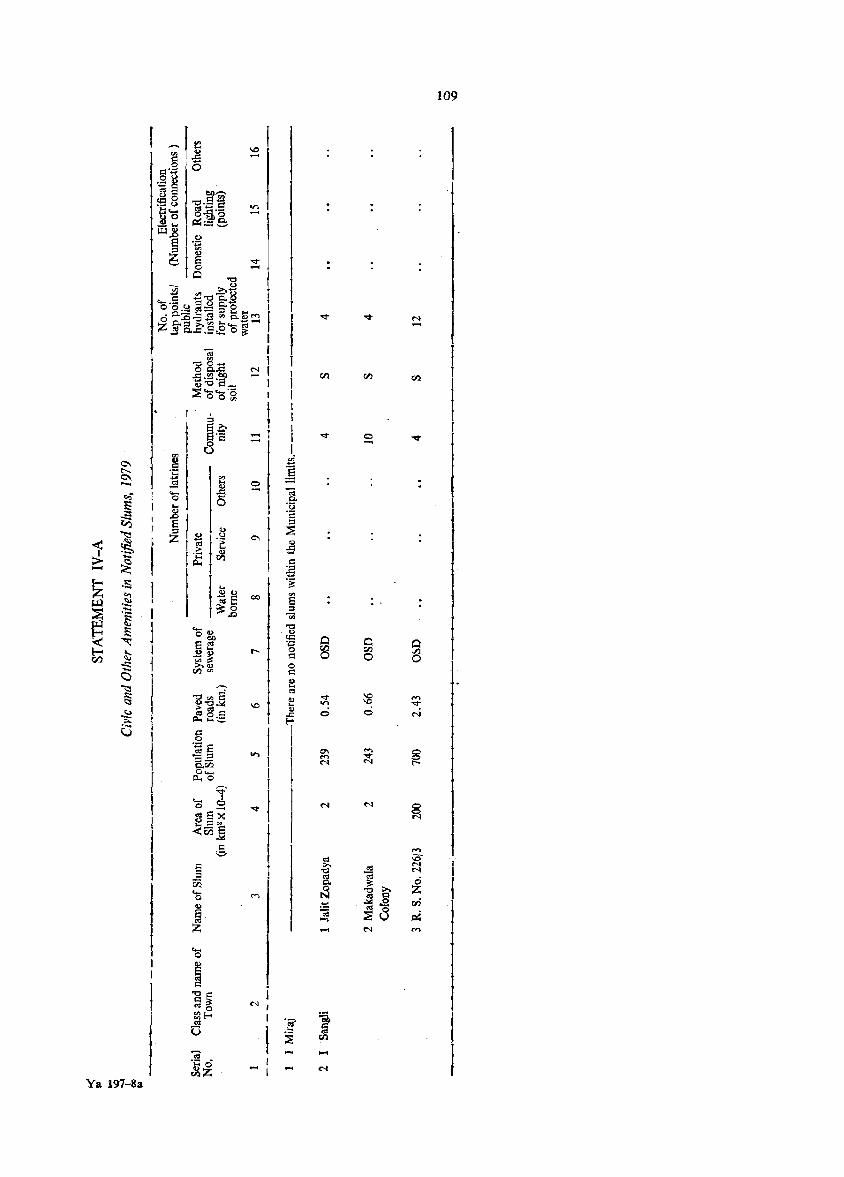
I Ya 191-8a
Q,)
5. Z
t I I f I 1 Nt
I I I
~ ::t
I t 1
I I.
z ~
t ..t:: f-"
I 1 1 , r
~ I I I i
~II f I
I N,
I
I ....
@ o ~ o
.....
109
I I t
1
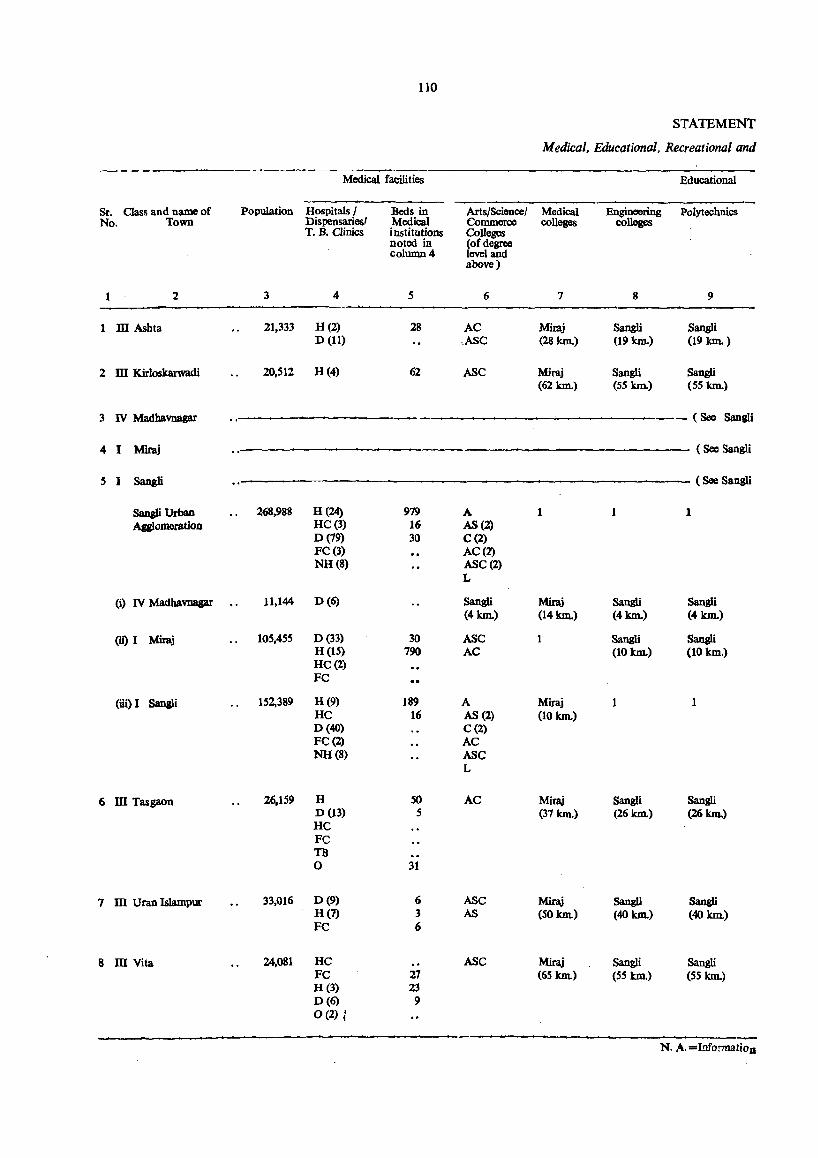
110
STATEMENT
Medical, Educational, Recreational and
Medical facilities Educational
Sr. Oass and name of Population Hospitals/ Beds in Arts/Science/ Medical Engineering Polytechnics No. Town Dispensaries! Medical Conuneroe colleges colleges
T. B. Clinics institutions Colleges noted in (of degreo column 4 level and
above)
2 3 4 5 6 7 8 9
1 ill Ashta 21,333 H(2) 28 AC Minlj Sangli Sangli D (11) ,ASC (28 km.) (l9km.) (19 kIn.)
2 ill Kirloskarwadi 20,512 H(4) 62 ASC Miraj Sangli Sangli (62 km.) (55 km.) (55 kIn.)
3 IV Madhavnagar - (See SangIi
4 I Miraj (See Sangli
5 I Sangli (See Sangli
Sa.nsli Urban 268,988 H (24) 979 A 1 1 1 Agglomeration HC(l) 16 AS (2)
D(79) 30 C(2) FC(3) AC(2) NH(8) ASC(2)
L
(i) IV Madhavnagar 11,144 D(6) Sangli Mimj Sangli Sangli (4 km.) (14 km.) (4 km.) (4 km.)
(ii) I Mimj 105,455 D (33) 3() ASC I Sangli Sang1i H{IS) 790 AC (10 knl.) (10 kID.) HC(2) FC ..
(iii) I Sangli 152,389 H(9) 189 A Miraj 1 1 He 16 AS (2) (10 km.) D(40) C(2) FC(2) AC NH(8) ASC
L
6 ill Tasgaon 26,159 H so AC Miraj Sangli Sangli D (13) 5 (37 kIn.) (26 km.) (26km.) He Fe TB 0 31
7 m Uran Islampur 33,016 D(9) 6 ASe Mimj Sangli Sang1i H(?) 3 AS (SO km.) (40 km.) (40 km.) FC 6
8 m Vita 24,081 He ASC Miraj Sangli Sang1i Fe 27 (65 km.) (55 kID.) (55 km.) H (3) 23 D(6) 9 0(2) J
N. A. =Information
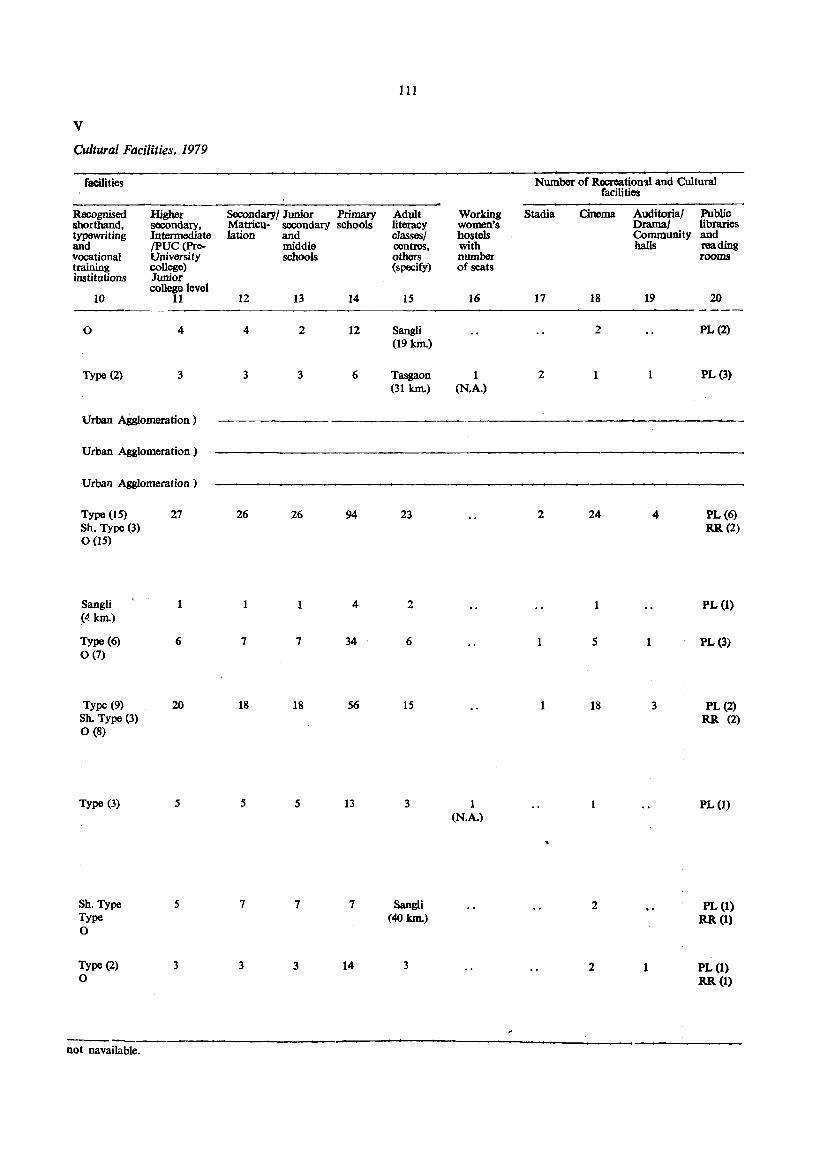
V
Cultural Facilities, 1979
facilities
Recognised Higher shorthand, sacondary, typewriting Intermediate and {pUC (Pre-vocational University training college) institutions Junior
college level 10 11
0 4
Type (2) 3
Urban A8gIomeration )
Urban Agglomeration)
Urban Agglomeration)
Type (15) Sh. Type (3) 0(15)
Sangli (4 kIn.)
Type (6) 0(7)
Type (9) Sh. Type (3) 0(8)
Type (3)
Sh. Type Type o
Type (2) o
27
1
6
20
5
5
3
Secondary/JUIrlor Primary Matricu- secondary schools lation and
middle schools
12 13 14
4 2 12
3 3 6
26 26 94
1 1 4
7 7 34
18 18 56
5 5 13
7 7 7
3 3 14
III
Adult literacy classes! centres, others (specify)
15
Sangli (19 kIn.)
Tasgaon (31 km.)
23
2
6
15
3
Sangli (40 km.)
3
Working women's hostels with number of seats
16
1 (N,A.)
1 (N.A.)
Number of Recreation'll and Cultural facilities
Stadia Cinema Auditorial Dramal Community halls
17 18 19
2
2 1 1
2 24 4
1
5 1
1 18 3
1
2
2 1
Public libraries and reading rooms
20 ----PL(2)
PL (3)
PL(6) RR(2)
PL (1)
PL(3)
PL(2) RR (2)
PL (1)
PL(I) RR(I)
PL (1) Ra(l)
--------,-----------------------------------------------------~----------------not navailable.
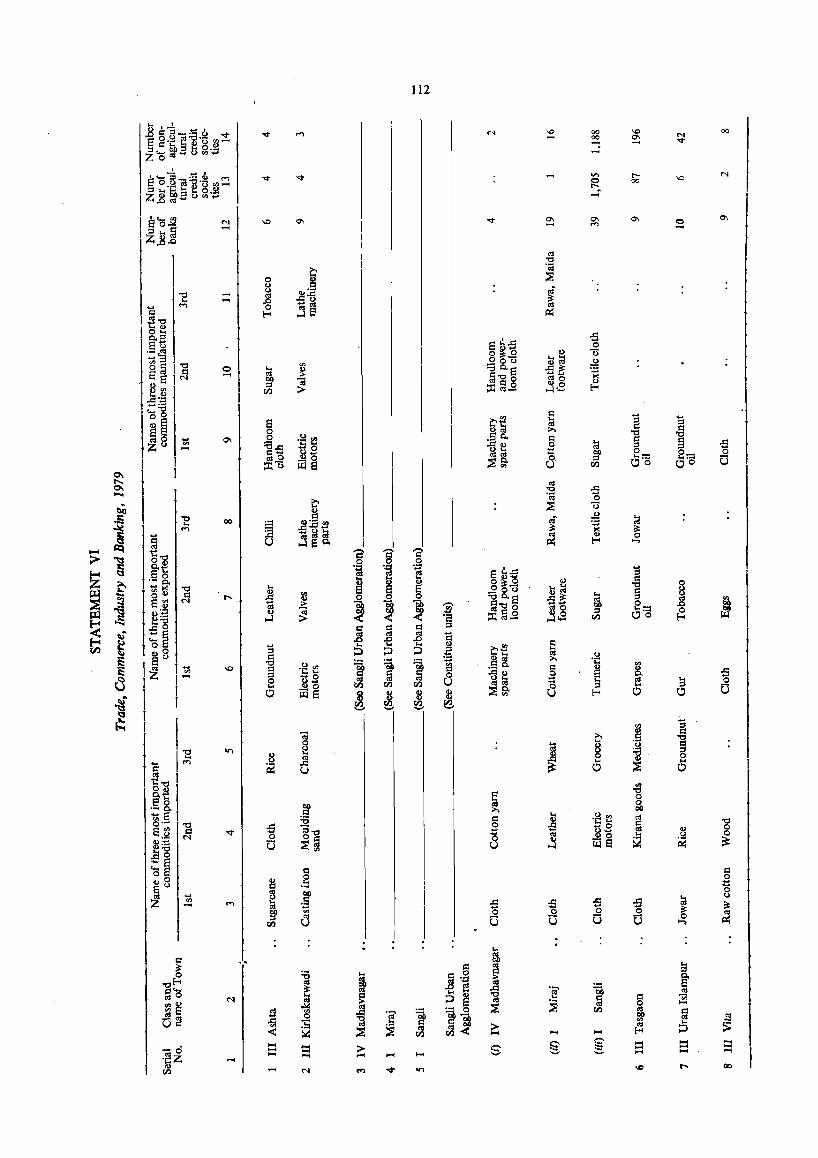
, e~8c;:a.~ M :3 .... ·C .... e g~-
Iz~~ao",''''
l e'C5.fJ N
(~j ~ I
00
-
112
I t:Il
00 00 ....
00
Serial No.
Name of the town with location code
2
113
APPENDIX TO TOWN DIRECTORY
Towns showing their outgrowths with population
Population of core town
3
Outgrowth
4
There are no outgrowths in this district, hence the information is nil.
Population of outgrowth
5

PARTB
PRIMARY CENSUS ABSTRACT
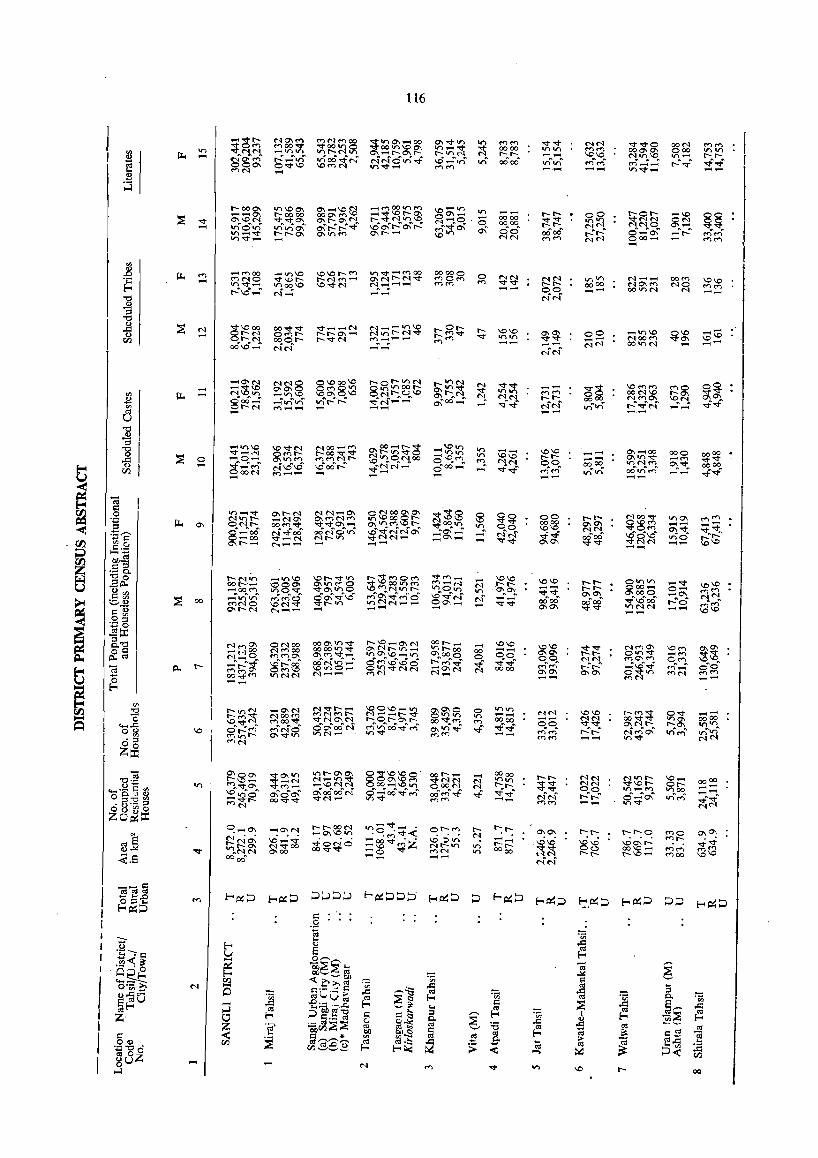
116
-""'r-- NO\r<> ('f') t"~ f'f") 00 :;t"'0\-00 0\""'''' '" r<> <"> ""'''''' <'IN ""''''''0 OOM <">M :;tOr<> MOO"Ol" ""'00"'0 00 tn\O 0\ '" -"'" "01" 0000 '" '" Mr<> 000\0\ 000 '" '" '" '" MM -"'''' "'r--N", 0\~('.0\r- [' \f') c'l M r-- r-- -- 1.0", M"'''' on_ r--r--
E Il. ~a-."'('I")'" r-:...:tr)' v-lOOv"'r"i' NMO.,.,"; \CS'-:'v)' .,; oo .... oo~ 'I')"'tn'" M('I")"' tf')'_.:'_: r:""l'''' ..;..; 000\ 0""'''' "'<">N "''''''- MM -- on"",_ --MN B ;.J
r--000\ on "'0\ ~_"\Ofa ......-If'f")OOcnM \O-on '" -- r--r-- . 00 r--Or-- -'" 00 --0\ r--oooo 00 O"'d"'j N ~~~~$ 00\- q, 00 00 "",,,,,,
'" '" ""'NN OM ~~. ::;s "'" 0-1.0 N ""''<1"0- ~:::~..; ~~~. 00 00 r--r-- C"lM "'l,"'l,0" 0\_ - ",'0"; '0'" It') 0\'" 1.00\'r-:'0\'r--'
G'" 0\ 00' 00"00" r-:'r-:' 0-0\ ~r: MM "'-"'" !::t-O\ O\onM O\r--- C"lN M'" C"lM 8 00 ...... - M '" "''''''-
'" ., _MOO -"'''' ",\Or--M tn V ,-q''f'') 00 00000 0 ~~ MM or. '" M-- OOM 1.0",
,L) Il. M O\Nr--N"'" MOM E5
<"1NO "'" \L> I'- t---N('I") ...... MM M r--r-- 0000 <'1O\M M~ MM '" ",,"- on 00 1.0 \O""'M M ...... .....-4_.-( -- 0.0_ -- ooonM --r-:\O" .....-4 ... ('f~ ,...;~
1'11'1 "<:l
~ "<:l
r--0r--] ::;s M ""'1.0 CO 00""'''''' v_.. ...... N ~~_..tn\o r-- 1.0 1.0 ~~ 00
_ on 1.0 0'" \b\:c; Ot-N OMt- t-t'--O\ ..... ",t-N"'" t- M "", ..,.
'" '" NCOM ""'~
0 - (f'j ............ -""'""' MM -- --til Ot-M 0001'- r-- '<I" <'1 -- -- C"lM COonM 00\($...;' MM ",-N-
-0\1'1 NNO 0\000'" r--Ot-"'N t-V'lN <;t ""'''''' -- "OI"~ "'MM MO O~ - -'<1"1.0 0-0-0 @~8:2 O"'~~~ 0\"'''''' on V'l M"'" 00 N 1.0 r--O\ Cf.0\ '" Il. - <'I"'''' _ '" '" ; .. ~_;~ O\t-;."'l, <'I. NN t-t- °co N""'O\ \O"'~ ..;..;-2 8.00....: -iV)"'v)' ..,.)['"'r---'" 0\'00 ....... -.;t.";- N-N' ~ .. vr r-:''';N· --'" t"-N "'-- -- -- ~-( ..... <:l U "<:l .!! ::l
- on \0 \0""'1'1 NOO~f'f") O\oo ...... t-""" _\0 on V'l -- 1.01.0 -- O\_co 000 0000 . as ""'-<4 o"'t- r- 00 .':::1""""" C"lt-on"",o o~.~ V'l 1.0", r--r-- 0\ V'l '<I" -"'" '<1""'" . .a"lq"'l,CO --f, ::;s 0 -0-0\ '" '" ~f'f")",N ... t-- '"'!_ NM qq 00 CO '" M '" 0\. "t COCO -.q ............ M M..o..o ... NN ...... 0 ... 00 ..... ..£..; V)"'v}' oO.,,"'rr:'" ..;"",' t) - 1.000r--
~- '" M --til OooN
M __ - - -- ---< ~ oa
= V'l_",," O\t-M NM-o\ oNcoO\O\ '<I"$@ 0 ~~ 00 r--l' MOO",," '" 0\ M'"
0 M '" t- _NO\ O\MNM ~~~~f::: ~ CO,"l
\0 CO CO 0\0\ OI.OM -- ~:; ... = "g Il. 0\ qN,r--, OO.'"'!_ """_ "",,,,,,0--- :} 00 \0'" C"lN ~§~ 0\"'" < ,.S'2 8- CO N""'OO oOt'foV)'" ",·";MC"l"o\' ~~= N'M' .,f"; CIO"'cO on'o to·to -00 '<I"-N Nr--"" "",M<'1_ - ""'''''' 0\0\ "01""'" '<I"MN --00. "'c. O\t-_ "'-- - -- --
~ 1:._
~.rg
I·S s. \0 t- "'" '" t-~MOM ""'M_ "'''' oonV'l 'CO t-('1\1"') -"'''' f"')~(~ - t-t- \0'" t-I'- -"'" \0'" ,.2p.. cot-· ...... 000\ 01",,,,0 -\2)f'f")~:g~ onOon M . O')_O\~ -- I'- r-- Oco_ 0- ",,,,,, 0", -coM "'0"", ""'0\\1")0
,..rgi..;..-\O \'o"'-.::::r"'M'" '" ""'. ""', 0\0\ 0\000 _0-. NN "';tr')"'V)'" i~~ ~o\',,;..o ('I" -- CK)"'OO'" ";"'·00 r-:'O ('f")"'M"' g] ::;s 00 1.0 ('1 ...... - 00'1_
""'''''' 00 CO
~ MMO t- .,., -- - - 0\0\ "01""'" "'NM -- ",,,, =(1) O\t-N 1'.-- - --0'" +::6
1-3= N"",O\ 0<'1 CO 00","""'" r-~"""O'\N COt-_ - \0", 1.0'" ""'''''' <'1MO\ 'OM 0'10\ I o."<:l NMCO OOOOV"lV ~O\G~~ V", t-OO CO -- 0\0\
~~ 0"'''''' _M $$ 0= .....r t'l 00 O\ ... ("i') ... ...q ... ~ 0\000 0, 00 00 MO\M q"'. ~ p..<:l N ......... *';" '" M 0\
O:;f 1.0'..0 0 t-.,..r "",. "",'''; """:1.0""'; C)O-,o .... r-*'OO .... OOMtr)_ "'" ~"~ ... r--"'r-'" M_ j:I., r-- ;:;:~O\ 0"'''' 1.0 'n 0 ...... gN""'<'1N -O\N C"l 0000 0\0\ 0\ 0'1 0""'''' ""'M MM E-t CIS
"'NN N-- N_ -- MN --~ OO,*M
U --E '" t-",N _O\N N~r- ...... 1.00",_", 0\0\0 0 '" '" <'1 N \D 1.0 t-"":::j: 0",," _-:sl r-M"'" <'100M ~("".I('fjr- N--r-V 0"'''' on -- qq <;t~ ~.~t-, "'0\ COCO S C MOO"'" ""'NO'IN t-;. O. t-.O\. r--, CO ""',,",!_ '" COco t-O\ ",,,, .... ,.Q
\O"",N "'MO o"o\·CO·M ~~OO~~ 0\"'''''' ..£ ..,;..; t-"r--. ",-..-\ V) ... V) .. Or-:'M·
'" '" N""'O\ O~ \0 ('I'jtr)r- 0\""'''' onM- MM -- MM -- "'''''' NN • :;J <'>N 0 0 Z::r:
"<:l~ 0\00\ ~O\'" "'t-O\O\ 0""''''\00 COI'-- _. COco
~~ NN N"'t- "'_ coCO N_tnv 000\\0("'"1 "",NN "'''' r--I.O_ _N N t-r-- NN ""'1.Ot- Ot- --'" "'"",0'1 M_ _\ONN 000_'-01£) oooN "'l, ~~
'f)_M '" CO
.,-o\oooo .... ("".f ~;iOOV ... ~ OO"'~ .... ~ ..; ...;-- --..... _ I: '" ",. ",'0· 0-."0-0\' "'" N"'(,l 0-"'0\'" V)"'~ ...
~~ 00.'·) <!) --::l"O '" -""'r- OO,,""'" ""'N ..... MM
'" '" -- "'''''' 08. 00 g MN
Zc~= trJo~- . t-:t-0_0\ -O\N r--r--CON
c:t-:«: I'- 0\0\ t-t- r--t-o MO O\~
~~ N .. _0\\011) "';oO~-.t:<t; N -...;
~~ ..0...0 Mt- ..,tv \O_<V \0::>'"
'" \0 0\ r--r-NO\ N""'''''
..q-ONO -1.0 MZ N I'- '" t-t- gg 00"'_ MM M'" .,.,r-O\ """"'''''' -0 "'" "",N '"
COco t-1N r--I.O- <'l CO ",1.0 v oo~N 0\ CO -= -,.., -- l'fN' <.-
"ada I-<~::> 1-<1='::> ::>::>::>::> f-. ~ ::> ::> ::>. E-<~::>
...., f-.~::> f-.~::> I-<~"'" I-<P:;::> ::>0 E-<P:;::>
_"',L) M ,_, ~~~ ~, ,_,
= .!2
~ ·in tr .0:::: I-< E ~ .;::-,.~ v :~~ ..... 0,",,-.,
«i ,....
~ 'EiJ::;S::;s ... 6 . Q;:::> 0 E-< ~---- ~ ...... ~ ·00 ;
I Ct-t::::;'~ <Zl <t. .... >, <:l "~ .0:::: ;:; o·_ .... N ,_.
@c6·~ ~~ .0:::: "'- 0 .0:::: CIS .;;; <:l 0. ·00 (1).0:::: ._ .;:;;
~ 6~ E-< ." S.-. = ::E .0:::: .c: E~u ...... .0:::: -£;::: ... .c. ... ~ <:l
~ ,_j CIS
::> ~.~-g §6 ::l ,-. .;:;; I I-< ~::E <:l
E-< I:: Z 0 c- o. ::;s .0:::: ~ .. ,~ ~rI'5::;S::E CIS~ '" ;s CIS <:l I z "i! ~ c ,_..
~ ~ ~ =5 ~ Q,O <::> <:l
I < a,__--~ '" "' .... <:l ~ .& ~ ~ <:l,<:; I:
~ ~ <:l .... .0:::: ~ :5:;: :E .2,g . til tf.l$e~ I-<~ ~ ;> < ~ ... 00 .... tf.)
I ~uZ .... N M V '" '" r- oo
0 ,_j
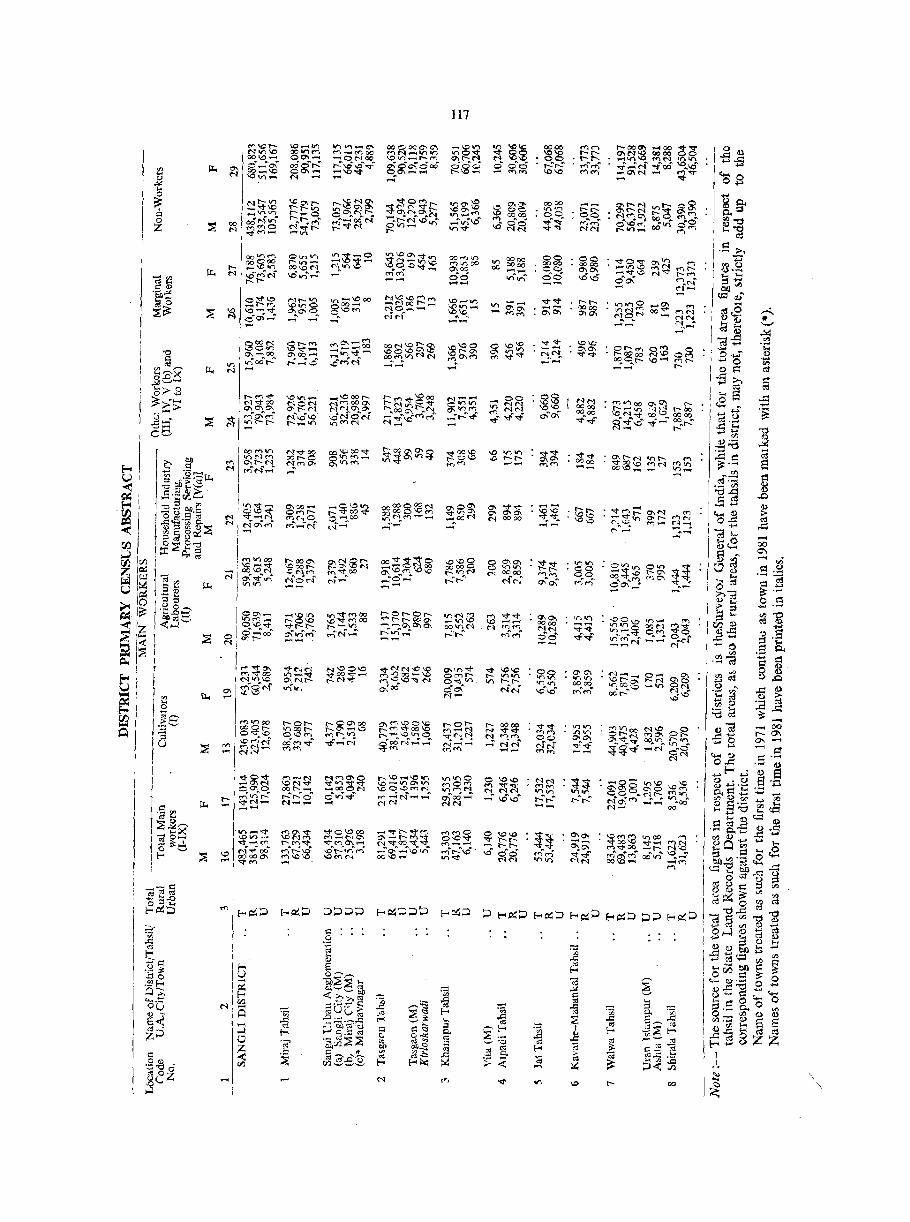
~,
u' ,..1
~I
S
~~:g I-:.~v:.
~i~~~ ,'o:::t('lf"'j~
loo~<'1 t-[ ~~~ ("1, ~-~'N
~~~ \0 \O~v f'.l. ~~o\~ ..
I~ggr;; 0\-00
V) l<)oo"'t""-'" N
I <r>"<t ....
I OIC-<t M "<t_N
'" 1 ti 0(' ......
I
, Mtnoo \C --<t _1 00 ..0('1
M 0\ '<t"",'
I""'"
"V) -,oct \CV> ~ ~~(fI ..
IC """'00 -I ~~'" I
." I ~~O I
18 I~ N,S ::l Q
~ IZl
aoo:X:O'>C\ ("f")N~lI)""" \OlI1_d-m ~o'"'o\'600 0;.0\ ....... ,...01 -
~~~~::! ~O-.""'" Ncof
~gr::~s; --..,...0\0\0-..0\ r-:-v{,...; ~-
N
117
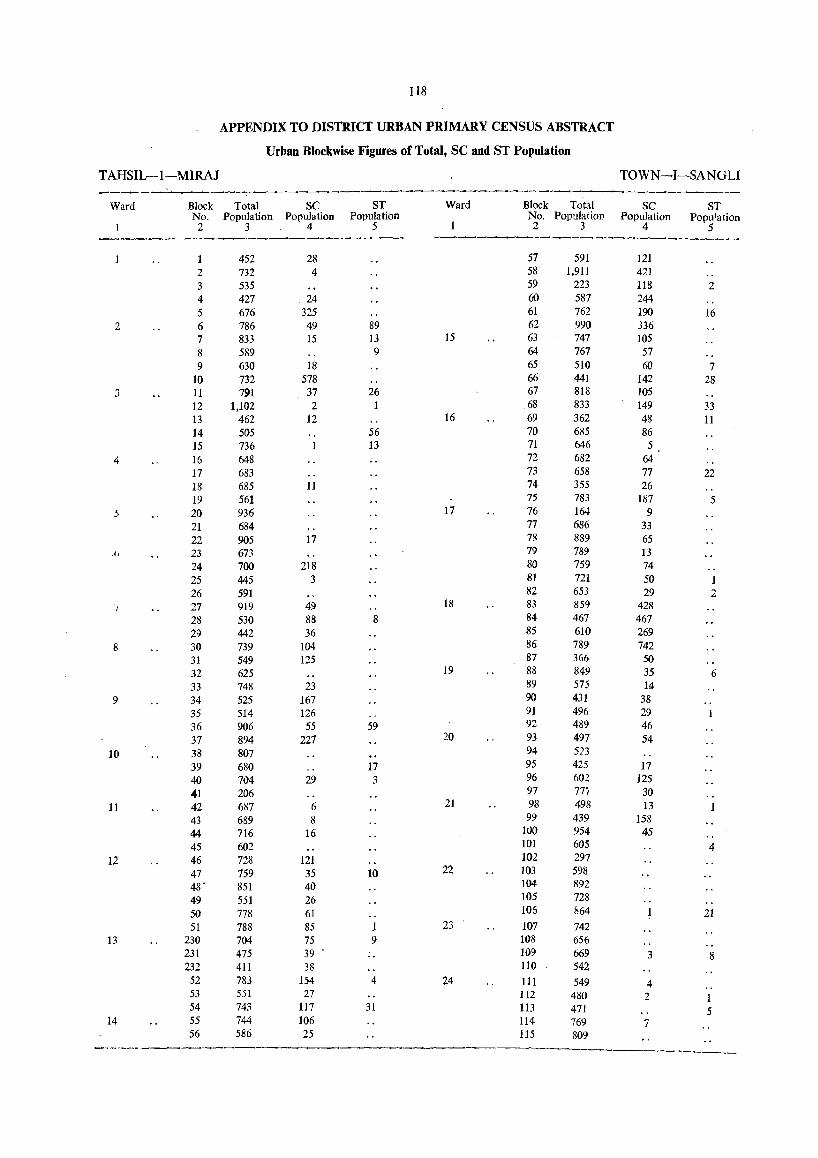
118
APPENDIX TO DISTRICT URBAN PRIMARY CENSUS ABSTRACT
Urban Blockwise Figures of Total, SC and ST Population
TAHSIL-I-MIRAJ TOWN-I-SANGLJ ~~-~~--------~-
Ward Block Total SC ST Ward Block Total SC ST No. Population Population Population No. Population Population Population 2 3 4 5 2 3 4 5 ------------~----------~
452 28 57 591 121 2 732 4 58 1,911 421 3 535 59 223 118 2 4 427 24 60 587 244 5 676 325 61 762 190 16
2 6 786 49 89 62 990 336 7 833 15 13 15 63 747 105 8 589 9 64 767 57 9 630 18 65 510 60 7
10 732 578 66 441 142 28 3 11 791 37 26 67 818 105
12 1,102 2 1 68 833 149 33 13 462 12 16 69 362 48 11 14 505 56 70 685 86 15 736 13 71 646 5
4 16 648 72 682 64 17 683 73 658 77 22 18 685 11 74 355 26 19 561 75 783 187 5
5 20 936 17 76 164 9 21 684 77 686 33 22 905 17 78 889 65
I, 23 673 79 789 13 24 700 218 80 759 74 25 445 3 81 721 50 1 26 591 82 653 29 2
/ 27 919 49 18 83 859 428 28 530 88 8 84 467 467 29 442 36 85 610 269
8 30 739 104 86 789 742 31 549 125 87 366 50 32 625 19 88 849 35 6 33 748 23 89 575 14
9 34 525 167 90 431 38 35 514 126 91 496 29 36 906 55 59 92 489 46 37 894 227 20 93 497 54
10 38 807 94 523 39 680 17 95 425 17 40 704 29 3 96 602 125 41 206 97 77i 30
11 42 687 6 21 98 498 13
43 689 8 99 439 158 44 716 16 100 954 45 45 602 101 605 4
12 46 728 121 102 297 47 759 35 10 22 103 598 48' 851 40 104 892
49 551 26 105 728 50 778 61 106 1564 21 51 788 85 23 107 742
13 230 704 75 9 108 656 231 475 39 "
109 669 3 8 232 411 38 110 542
52 783 154 4 24 111 549 4 53 551 27 112 480 2 1 54 743 117 31 113 471 5
14 55 744 106 114 769 7 56 586 25 115 809
____ •• w ... ___

119
APPENDIX--Contd. TAHSIL-I-MIRA] TOWN-I-SANGLI
._-- ----Ware! Block Total SC ST Ward Block Total SC ST
No. Population Population Population No PopUlation Population Population 2 3 4 5 2 3 4 5
--~------ --.----~--------- .
25 116 604 3 10 39 174 764 117 493 12 7 175 653 17 118 511 6 176 535 4 119 974 3 6 177 884 15 50
26 120 641 9 178 798 54 15
121 534 6 3 179 574 155 5
122 378 7 180 851 97 21
123 551 3 40 181 535
27 124 617 17 41 182 434 125 567 15 183 8(i4 18 126 557 35 184 895 39 14 127 575 30 185 641 7
28 128 730 186 367 94 129 473 5 187 481 167 130 762 3 188 764 294 131 599 5 189 368 213 132 527 42 190 643 29
29 133 632 3 191 691 14 4 134 686 5 191 81)9 36 14 135 637 14 193 423 6 136 643 43 194 492 3
30 137 659 155 195 761 21 5 138 755 153 9 196 :564 65 139 430 197 1,639 300 140 647 4 44 198 577 19
31 141 726 199 588 30 142 577 20) 571 53 143 566 19 201 497 491 144 576 47 202 368 179 145 461 6 203 709 233
32 146 711 4 204 805 45 147 437 101 205 564 32 148 836 10 11 206 641 177 9 149 693 45 207 956 7
33 150 485 10 208 757 19 151 966 35 209 866 103 1 152 651 5 210 794 48 25
34 153 863 9 46 211 653 11
154 566 7 212 840 20 155 201 11 213 835 155 14
156 701 1 214 719 175 157 406 47 215 569 488
35 158 562 3 216 561 9
159 577 217 621 7
160 729 5 218 L037 306 6
161 404 2 219 838 49
162 545 22() 386 13 10
36 163 1,245 72 48 221 548 27
164 517 222 572 35
165 801 3 223 740 19 4
553 348 224 685 39
37 166 225 763 25 167 604 492 226 675 164 15 168 647 452 227 996 105 9 169 669 193 18 228 742 170 882 368 36 229 362
38 171 312 101 172 835 38 173 876 58 10 Total .. 1,52,389 16,324 897
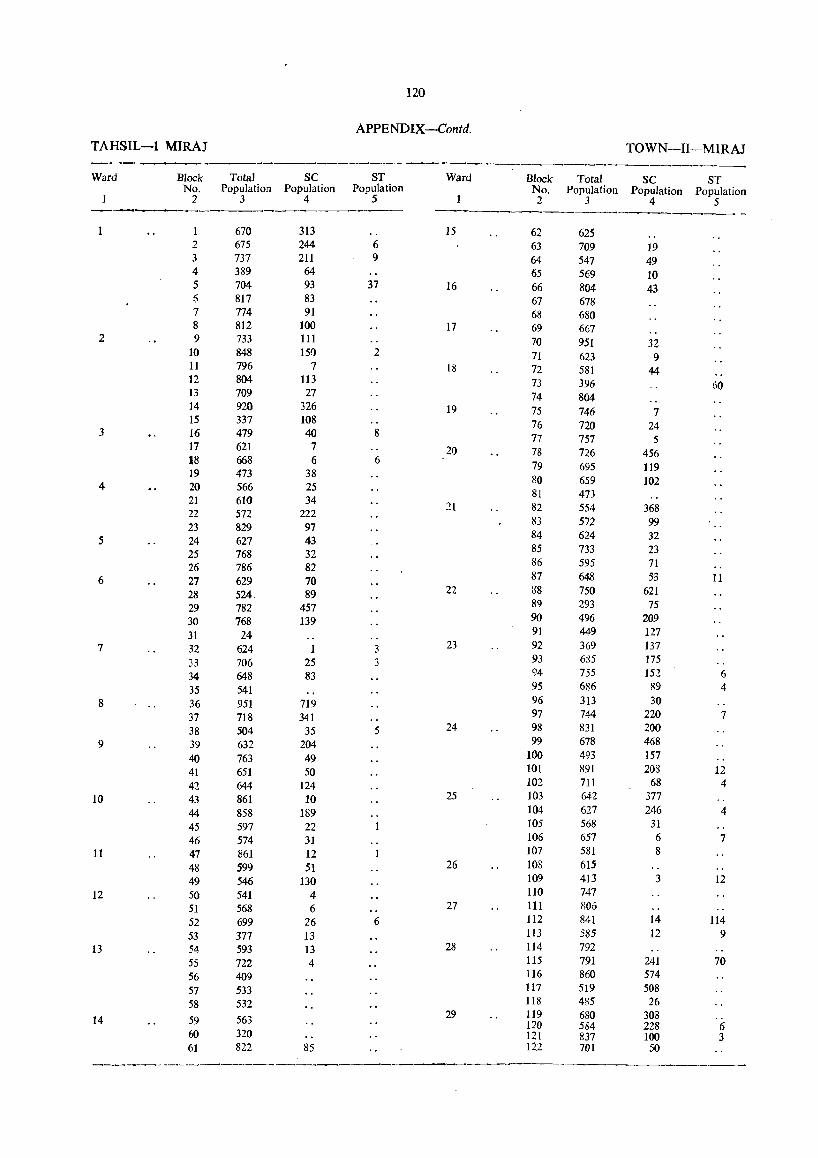
120
APPENDIX-Contd. TAHSIL-l MIRAJ TOWN-I1-MIRAJ
Ward Block Total SC ST Ward Block Total SC ST No. Population Population Population No. Population Population Population
2 3 4 5 2 3 4 5 -- ------~---------...------- -670 313 15 62 625
2 675 244 6 63 709 19 3 737 211 9 64 547 49 4 389 64 65 569 10 5 704 93 37 16 66 804 43 (1 817 83 67 678 7 774 91 68 680 8 812 100 17 69 667
2 9 733 111 70 951 32 10 848 151) 2 71 623 9 11 796 7 18 72 581 44 12 804 113 73 396 60 13 709 27 74 804 14 920 326 19 75 746 7 15 337 108 76 720 24 3 16 479 40 8 77 757 5 17 621 7 20 78 726 456 18 668 6 6 79 695 119 19 473 38 80 659 102 4 20 566 25 81 473 21 610 34 21 82 554 368 22 572 222
83 572 99 23 829 97 84 624 32 5 24 627 43 85 733 23 25 768 32
26 786 82 86 595 71
6 27 629 70 87 648 53 II 28 524 89 22 38 750 621
29 782 457 89 293 75
30 768 139 90 496 209
31 24 91 449 127 7 32 624 3 23 92 369 137
33 706 25 3 93 685 175
34 648 83 94 755 152 6 35 541 95 686 89 4
8 36 951 719 96 313 30
37 718 341 97 744 220 7
38 504 35 5 24 98 831 200 9 39 632 204 99 678 468
40 763 49 100 493 157 41 651 50 101 891 208 12 42 644 124 102 711 68 4
10 43 861 10 25 103 642 377
44 858 189 104 627 246 4 45 597 22 105 568 31 46 574 31 106 657 6 7
11 47 861 12 107 581 8 48 599 51 26 108 615 49 546 130 109 413 3 12
12 SO 541 4 110 747 SI 568 6 27 111 806 52 699 26 6 112 841 14 114 53 377 13 113 585 12 9
13 54 593 l3 28 114 792 55 722 4 115 791 241 70 56 409 116 860 574 57 533 117 519 508 58 532 118 485 26
14 59 563 29 119 680 308 .. 120 584 228 6
60 320 121 837 100 3 61 822 85 122 701 50
----- _---------
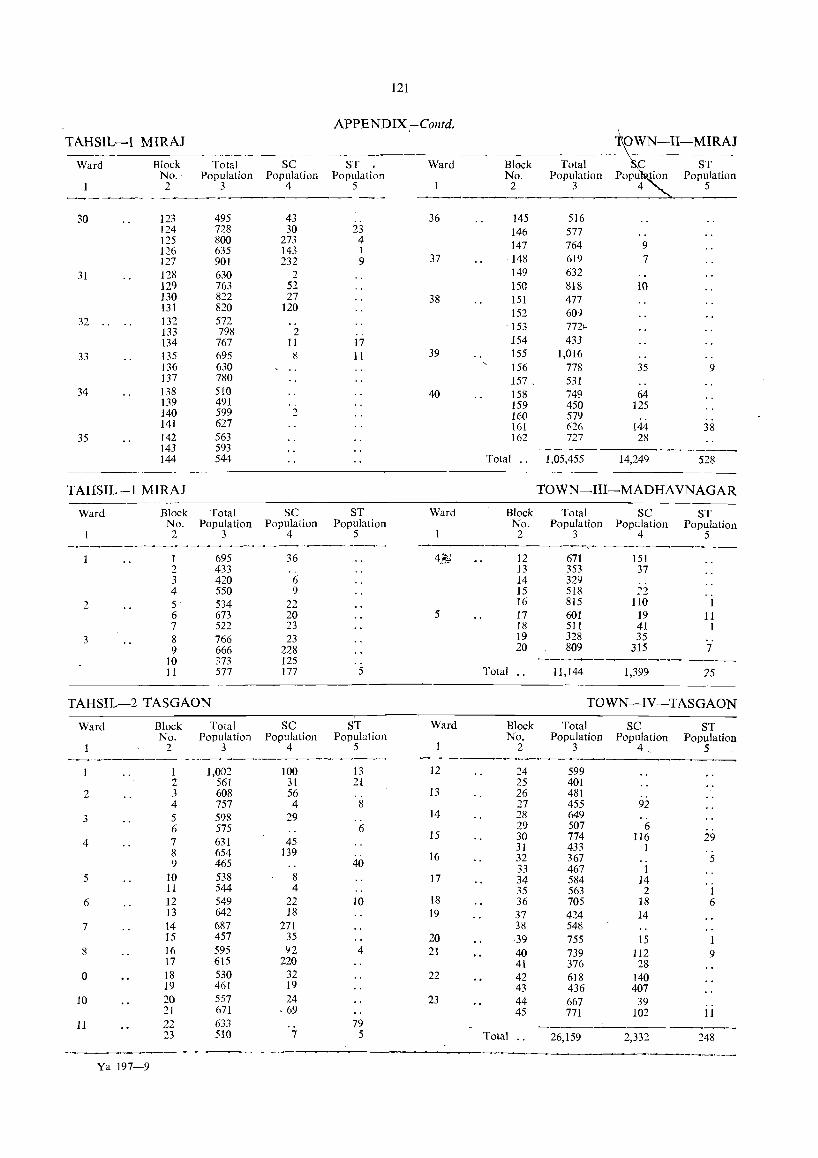
121
APPENDIX-Contd. TAHSIL-l MIRAJ
Ward Block Total SC ST Ward Block Total C ST No. Population Population Population No. Population Popu tion Population 2 3 4 5 2 3 4 5
------~-----------~- -_ -----------30 123 495 43 · . 36 145 516
124 728 30 23 146 577 125 800 273 4 147 764 9 126 635 143 1 127 901 232 9 37 148 619 7
31 128 630 2 149 632 129 763 52 150 818 10 130 822 27 38 151 477 131 820 120 152 60)
32 . . 132 572 .. 153 772,_ 133 798 2 · . 134 767 11 17 154 433
33 135 695 8 1l 39 155 1,016 136 630 156 778 35 9 137 780 157 , 531
34 138 510 40 158 749 64 139 491 .. 159 450 125 140 599 2 160 579 141 627 161 626 144 38
35 142 563 162 T"~ ~I 28 143 593 -~~---
144 544 Total .. 1,05,455 14,249 528
TAHSIL~l MIRAJ TOWN-III-MADHA VNAGAR ----
Ward Block Total SC ST Ward Block Total SC ST No. Population Population Population No. Population Population Population 2 3 4 5 2 3 4 5 _. ________________ --0 ________ • ______
I 695 36 4">0' .;-~ 12 671 151
2 433 .. 13 353 37 3 420 6 14 329 4 550 9 15 518 n ..
2 5 534 22 16 815 110 1 6 673 20 5 17 601 19 11 7 522 23 18 511 41 1 8 766 23 19 328 35 9 666 228 20 809 315 7
10 373 125 · . ---------~-~-~-11 577 177 5 Total II ,144 1,399 25
TAHSIL-2 TASGAON TOWN-IV-TASGAON
Ward Block Total SC ST Ward Block Total SC ST No. Population Population Population No. Population Population Population
2 3 4 5 2 3 4. 5 -_--1,002 100 13 12 24 599
2 561 31 21 25 401 2 3 608 56 · . 13 26 481
4 757 4 8 27 455 92 3 5 598 29 14 28 649 ..
6 575 6 29 507 6
4 7 631 45 15 30 774 116 29
31 433 1 8 654 139 · . 16 32 367 5 9 465 40 33 467 1 5 10 538 8 17 34 584 14
11 544 4 35 563 2 1 6 12 549 22 10 18 36 705 18 6
13 642 18 19 37 424 14 7 \4 687 271 38 548
15 457 35 20 39 755 15 8 16 595 n 4 21 40 739 112 9
17 6\5 220 41 376 28 0 18 530 32 22 42 618 140
19 461 19 43 436 407 10 20 557 24 23 44 667 39 ..
21 671 ·69 45 771 102 11 11 22 633 79
-~----_~- -~~--
23 510 7 5 Total 26,159 2,332 248
------Ya 197-9
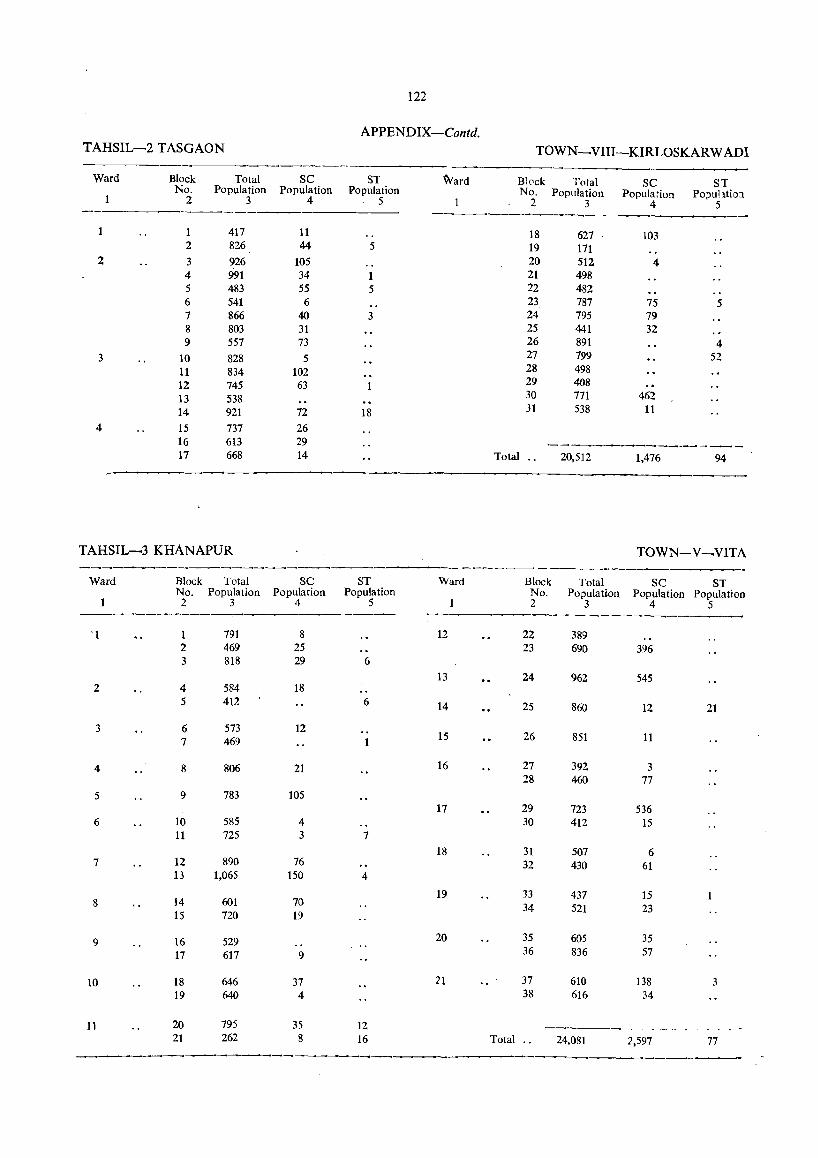
122
APPENDIX-Contd. TAHSIL-2 T ASGAON TOWN-VIII-KIRLOSKARW ADI
Ward Block Total SC ST Ward Bleck Total SC ST No. Population Population PopUlation No. Population Population Popuhtioa 1 2 3 4 5 2 3 4 5
1 1 417 11 18 627 103 2 826 44 5 19 171
2 3 926 105 20 512 4 4 991 34 1 21 498 5 483 55 5 22 482 6 541 6 23 787 75 5 7 866 40 3 24 795 79 8 803 31 25 441 32 9 557 73 26 891 4
3 10 828 5 27 799 52 11 834 102 28 498 12 745 63 29 408 13 538 30 771 462 14 921 72 18 31 538 11
4 15 737 26 16 613 29 -----17 668 14 Total .. 20,512 1,476 94
TAHSIL--3 KHANAPUR TOWN-V-VITA ----_-
Ward Block Total SC ST Ward Block Total SC ST No. Population Population Population No. Populat.ion Population Population 2 3 4 5 2 3 4 5
-----'1 1 791 8 12 22 389
2 469 25 23 690 396 3 818 29 6
13 24 962 545 2 4 584 18
5 412 6 14 25 860 12 21
3 6 573 12 15 26 851 11 7 469
4 8 806 21 16 27 392 3 28 460 77
5 9 783 105 17 29 723 536
6 10 585 4 30 412 15 11 725 3 7
18 31 507 6 7 12 890 76 32 430 61
13 1,065 150 4
19 33 437 15 8 14 601 70 34 521 23 15 720 19
9 16 529 20 35 605 35
17 617 9 36 836 57
10 18 646 37 21 37 610 138 3 19 640 4 38 616 34
11 20 795 35 12 21 262 8 16 Total .. 24,081 2,597 77
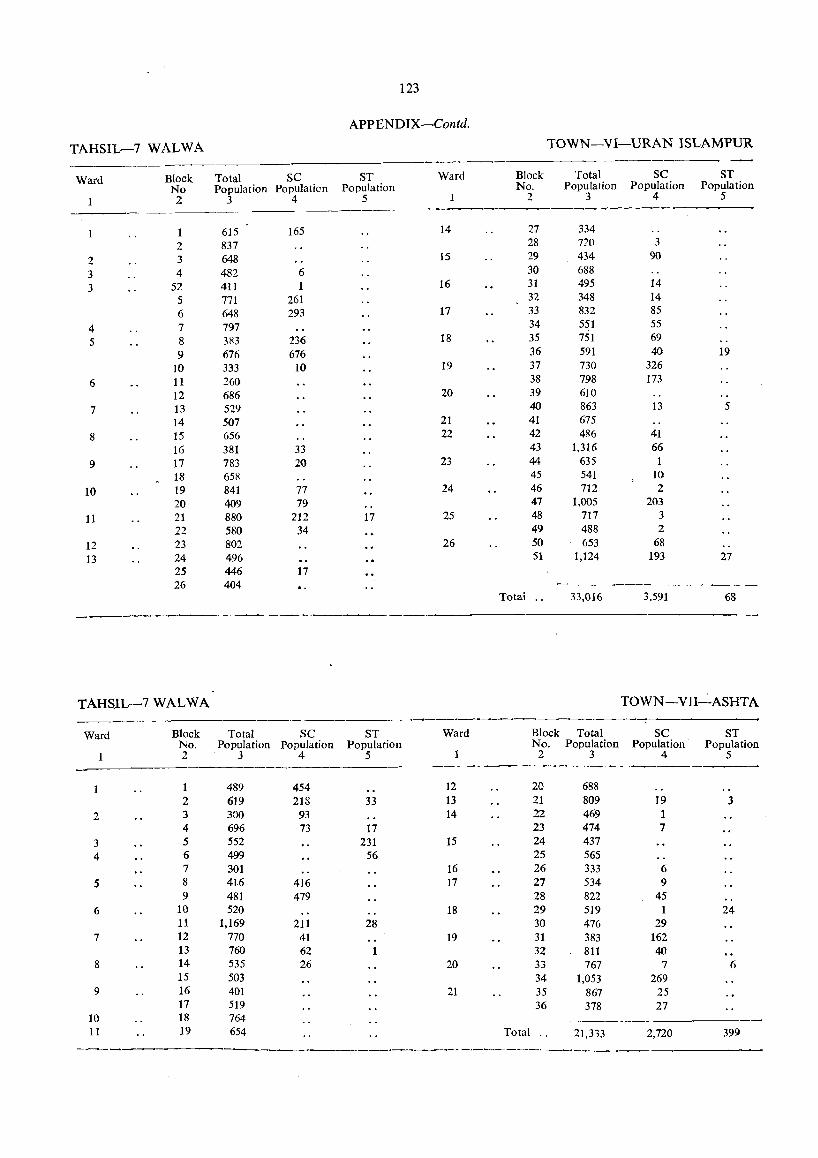
123
APPENDIX-Contd.
TAHSIL-7 WALWA TOWN-VI-URAN ISLAMPUR
Ward Block Total SC ST Ward Block Total SC ST No Population Populaticn Population No. Population Population Population 2 3 4 5 2 3 4 5
615 165 14 27 334
2 837 28 72(1 3
2 3 648 15 29 434 90
3 4 482 6 30 688
3 52 411 1 16 31 495 14
5 771 261 32 348 14
6 648 293 17 33 832 85
4 7 797 34 551 55
5 8 383 236 18 35 751 69
9 676 676 36 591 40 19 10 333 10 19 37 730 326
6 11 260 38 798 173 12 686 20 39 610
7 13 529 40 863 13 5 14 507 21 41 675
8 15 656 22 42 486 41 16 381 33 43 1,316 66
9 17 783 20 23 44 635 18 658 45 541 10
10 19 841 77 24 46 712 2 20 409 79 47 1,005 203
11 21 880 212 17 25 48 717 3 22 580 34 49 488 2
12 23 802 26 50 653 68
13 24 496 51 1,124 193 27 25 446 17 26 404
Totai .. 33,016 3.591 68
TAHSIL-7 WALWA TOWN-VII-ASHTA
Ward Block Total SC ST Ward Block Total SC ST No. Population Population Population No. Population Population Population 2 3 4 5 2 3 4 5 --- _ ___.-
1 489 454 12 2Q 688 2 619 218 33 13 21 809 19 3
2 3 300 93 14 22 469 1 4 696 73 17 23 474 7
3 5 552 231 15 24 437 4 6 499 56 25 565
7 301 16 26 333 6 5 8 41.6 416 17 27 534 9
9 481 479 28 822 45 6 10 520 18 29 519 1 24
11 1,169 211 28 30 476 29 7 12 770 41 19 31 383 162
13 760 62 1 32 811 40 8 14 535 26 20 33 767 7 6
15 503 34 1,053 269 9 16 401 21 35 867 25
17 519 36 378 27 10 18 764 -------11 19 654 Total " 21,313 2,720 399
• _____ 4 _4 __ " ___________
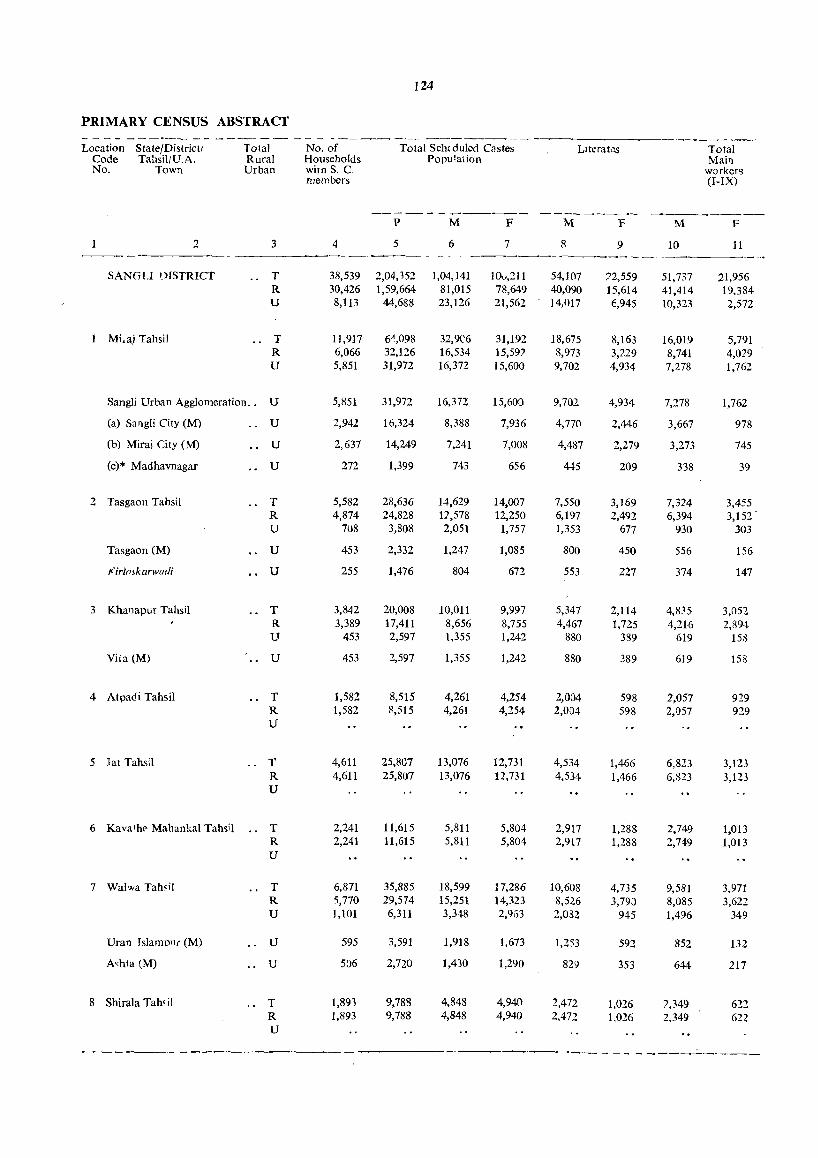
124
PRIMARY CENSUS ABSTRACT - - - - - - - "'-~ - - - _- --- - - - ~ - - --- --_ - -------Location State/Districtl Total No. of Total Scheduled Castes Llterat,~s Total
Code Tahsil/U.A. Rural Households Populalion Main No. Town Urban witn S. C workers
members (I-IX)
------~----- _-------P M F M F M F
2 3 4 5 6 7 8 9 10 11
SANGU DISTRICT T 38,539 2,04,152 1,04,141 IOv,211 54,107 72,559 51,737 21,956 R 30,426 1,59,664 81,015 78,649 40,090 15,614 41,414 19,384 U 8,113 44,688 23,126 21,562 14,017 E,945 10,323 2,572
1 Mi,aj Tahsil T 11,917 6~,098 32,9C6 31,192 18,675 8,163 16,019 5,791 R 6,066 32,126 16,534 15,597 8,973 3,229 8,741 4,079 U 5,851 31,972 16,372 15,600 9,702 4,934 7,278 1,762
Sangli Urban Agglomeration .• U 5,851 31,972 16,372 15,600 9,702 4,934 7,278 1,762
(a) SangE City (M) U 2,942 16,324 8,388 7,936 4,770 2,446 3,667 978
(b) Mirai City (M) U 2,637 14,249 7,241 7,008 4,487 2,279 3,273 745
(c)* Madhavnagar U 272 1,399 743 656 445 209 338 39
2 Tasgaon Tahsil T 5,582 28,636 14,629 14,007 7,550 3,169 7,324 3,455 R 4,874 24,828 12,578 12,250 6,197 2,492 6,394 3,152 U 708 3,808 2,051 1,757 1,353 677 930 303
Tasgaon (M) U 453 2,332 1,247 1,085 800 450 556 156
f(irl(1.~karwadi U 255 1,476 804 672 553 227 374 147
3 Khanapur Tahsil T 3,842 20,008 10,011 9,997 5,347 2,114 4,835 3,052 R 3,389 17,411 8,656 8,755 4,467 1,725 4,216 2,89-t U 453 2,597 1,355 1,242 880 389 619 158
Vita (M) U 453 2,597 1,355 1,242 880 389 619 158
4 Atpadi Tahsil T 1,582 8,515 4,261 4,254 2,004 598 2,057 929 R 1,582 8,515 4,261 4,254 2,004 598 2,057 929 U
5 Jat Tahsil T 4,611 25,807 13,076 12,731 4,534 1,466 6,823 3,123 R 4,611 25,807 13,076 12,731 4,534 1,466 6,823 3,123 U
6 Kava'hE" Mahankal Tah,il T 2,241 11,615 5,811 5,804 2,917 1,288 2,749 1,013 R 2,241 11,615 5,811 5,804 2,917 1,288 2,749 1,013 U
7 Walwa Tah~iI T 6,871 35,885 18,599 17,286 10,608 4,735 9,581 3,971 R 5,770 29,574 15,251 14,323 8,526 3,790 8,085 3,622 U 1,101 6,311 3,348 2,963 2,OaZ 945 1,496 349
Uran Tslampn{ (M) U 595 3,591 1,918 1,673 1,253 592 852 132
A~hta (M) U 506 2,720 1,430 1,290 829 353 644 217
8 Shirala Tah'il T 1,893 9,788 4,848 4,94() 2,472 1,026 7,349 622 R 1,893 9,788 4,848 4,940 2,472 1,026 2,349 622 U
-------- ---- - ~ .... - - --------_
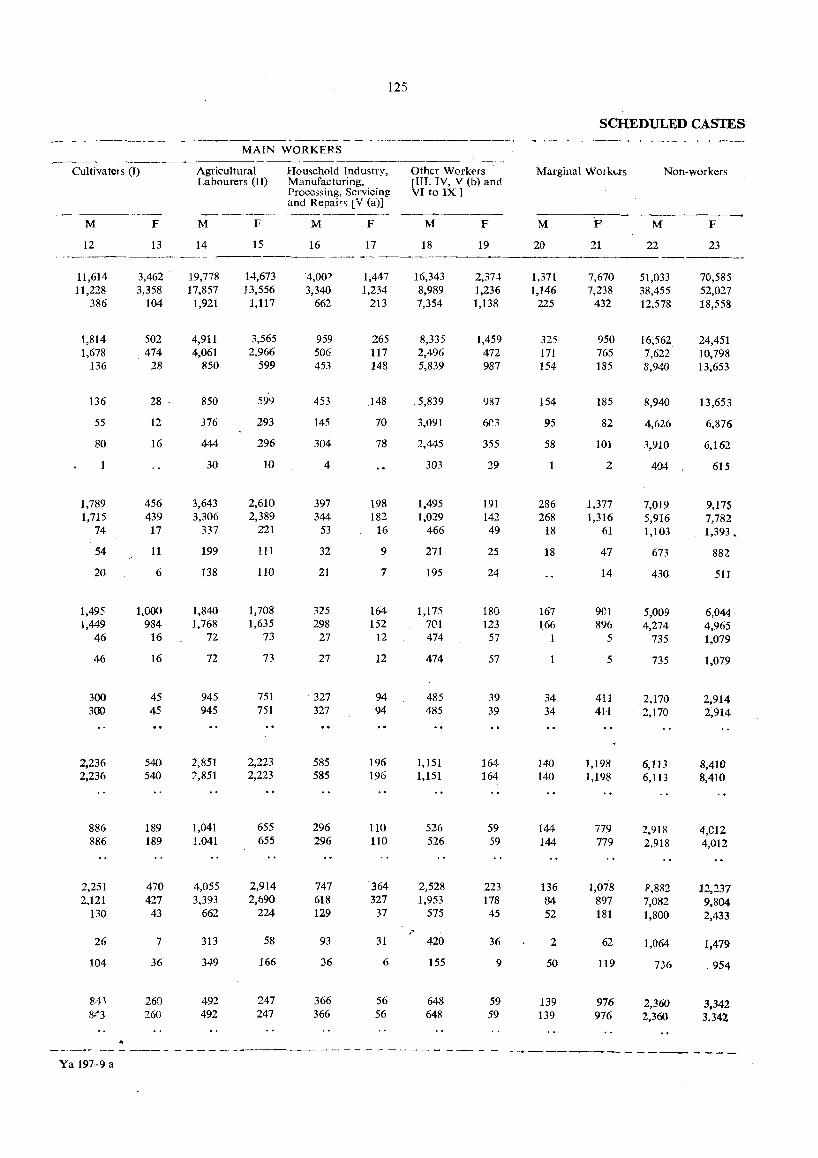
_--'----
Culti va tel s (f)
M
12
11,614 11,228
386
1,814 1,678
136
136
55
80
1,789 1,715
74
54
20
1,495 1,449
46
46
300 300
2,236 2,236
886 886
2,251 2,121
130
26
104
F
13
3,462 . 3,358
104
502 474
28
28 .
12
16
456 439
17
11
6
1,000 984
16
16
45 45
540 540
189 189
470 427 43
7
36
260 260
125
MAIN WORKERS
Agricultural Household Industry, Labourers' (II) Manufacturing,
M
14
19,778 17,857
1,921
4,911 4,061
850
850
376
444
30
3,643 3,306
337
199
138
1,840 1,768
72
72
945 945
2,851 7,851
1,041 1.041
4,055 3,393
662
313
349
492 492
F
15
14,673 13,556
1,117
3,565 2,966
599
599
293
296
10
2,610 2,389
221
111
110
1,708 1,635
73
73
751 751
2,223 2,223
655 655
2,914 2,690
224
58
166
247 247
Processing, Servicing and Repairs [V (a)]
M
16
'4,00) 3,340
662
959 506 453
453
145
304
4
397 344
53
32
21
315 298
27
27
327 327
585 585
296 296
747 618 129
93
36
366 366
F
17
1,447 1,234
213
265 117 148
,148
70
78
198 182
16
9
7
164 152
12
12
94 94
196 196
110 110
364 327
37
31
6
56 56
Other Workt'rs [HI, IV, V (b) and VI to IX]
M
18
16,343 8,989 7,354
8,335 2,496 5,839
5,839
3,091
1,445
303
1,495 1,029
466
271
195
1,175 701 474
474
485 485
1,151 1,151
526 526
2,528 1,953
575
420
155
648 648
F
19
2,37~
1,236 1,138
1,459 472 987
987
6<'3
355
29
191 142 49
25
24
180 123
57
57
39 39
164 164
59 59
223 178 45
36
9
59 59
SCHEDULED CASTES
Marginal Workl..rs Non-workers
M
20
1,371 1,146
225
325 171 154
154
95
58
286 268
18
18
167 166
1
34 34
140 140
144 144
136 84 52
2
50
139 139
F
21
M
22
F
23 ----------
7,670 7,238
432
950 765 185
185
82
101
2
1,377 1,316
61
47
14
ge1 896
5
5
411 411
1,198 1,198
779 779
1,078 897 181
62
119
976 976
51,033 38,455 12,578
16,562 7,622 8,940
8,940
4,626
3,910
404
7,019 5,916 1,103
673
430
5,009 4,274
735
735
,2,170 2,170
6,113 6,113
2,918 2,918
P,882 7,082 1,800
1,064
736
2,360 2,360
70,585 52,027 18,558
24,451 10,798 13,653
13,653
6,876
6,162
615
. 9,175 7,782 1,393.
882
511
6,044 4,965 1,079
1,079
2,914 2,914
8,410 8,410
4,C12 4,012
12,237 9,804 2,433
1,479
954
3,342 3,342
~_ ... _ .... ' ~-_ - ___ - __. - ------.---- -. - - - - - -- - -- - __ - ___ r--__ ' __ ________ _ Ya 197-9 a
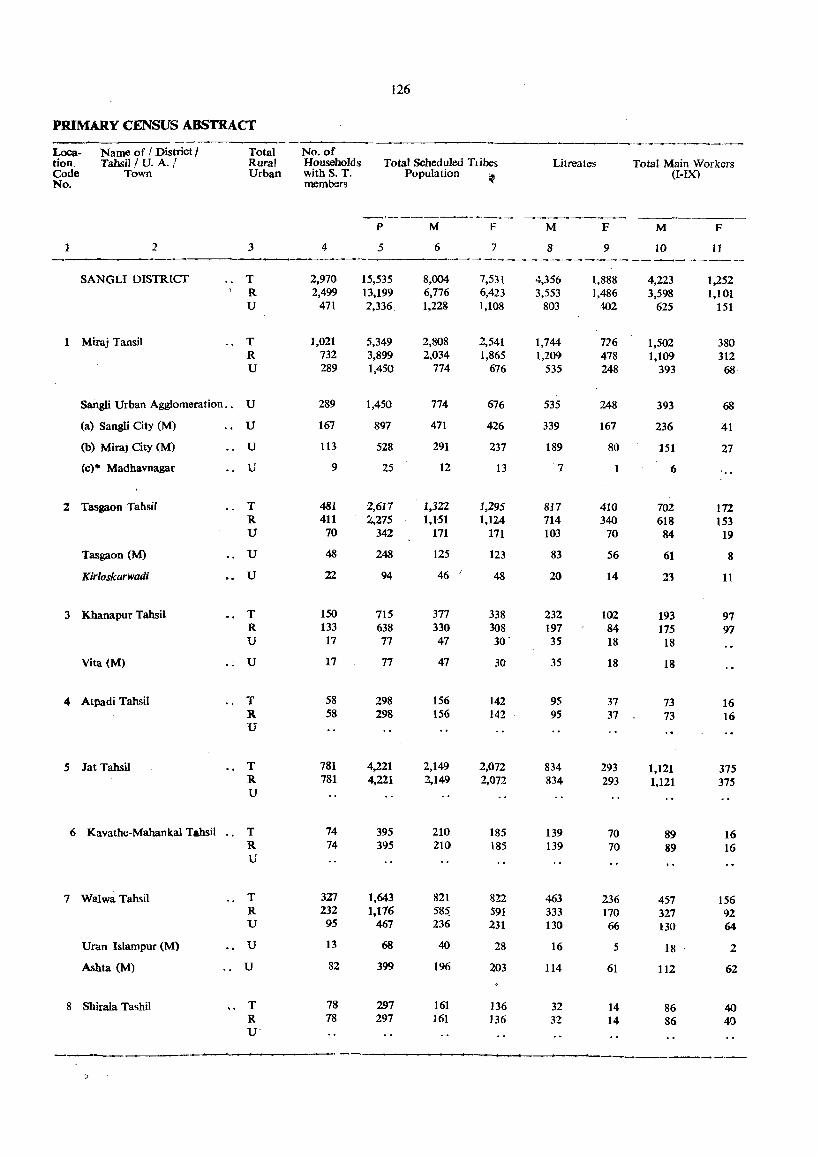
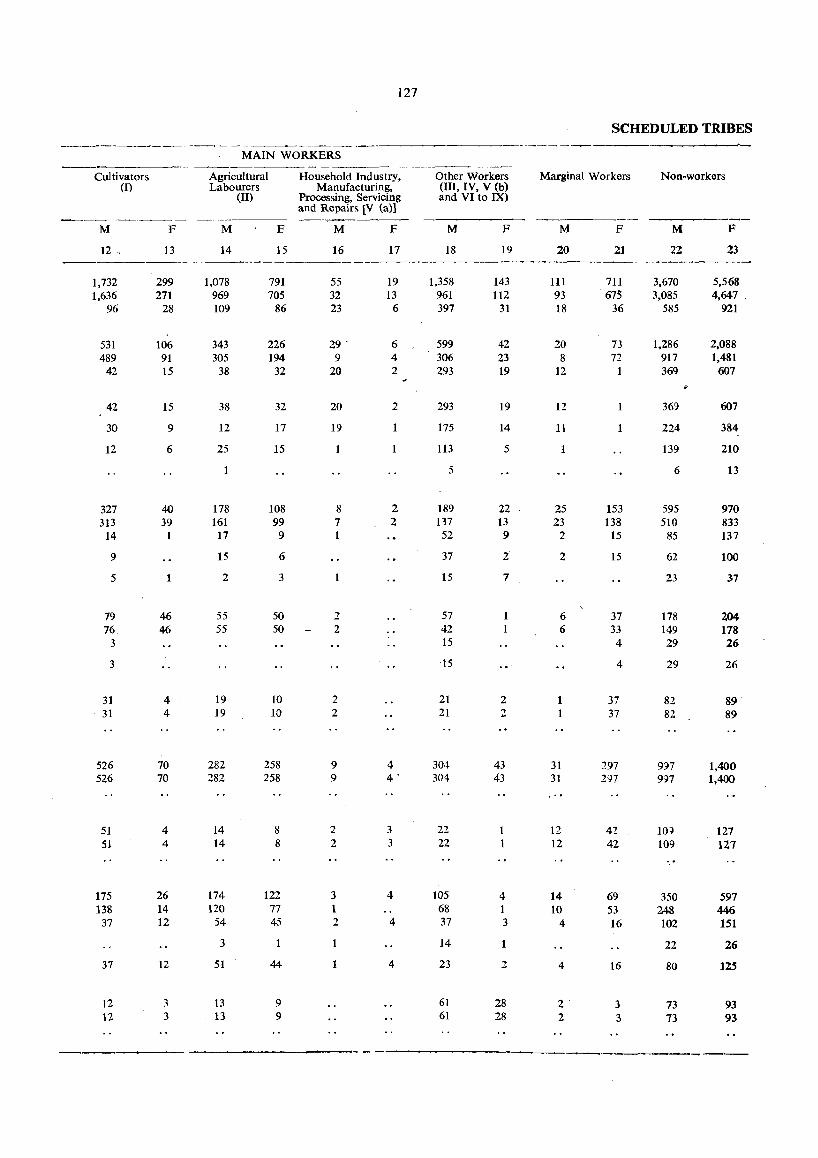
526 70 282 258 9 4 304 43 31 297 9')7 1.400 526 70 282 258 9 4' 304 43 31 297 9n 1.400
51 4 14 8 2 3 22 1 12 42 10:) 127 51 4 14 8 2 3 22 1 12 42 109 127
175 26 174 122 3 4 105 4 14 69 350 597 138 14 120 77 1 68 1 10 53 248 446
37 12 54 45 2 4 37 3 4 16 102 151
3 1 14 22 26
37 12 51 44 4 23 2 4 16 80 125
12 ~ 13 9 61 28 2· 3 73 93 12 3 13 9 61 28 2 3 73 93 -_ ----
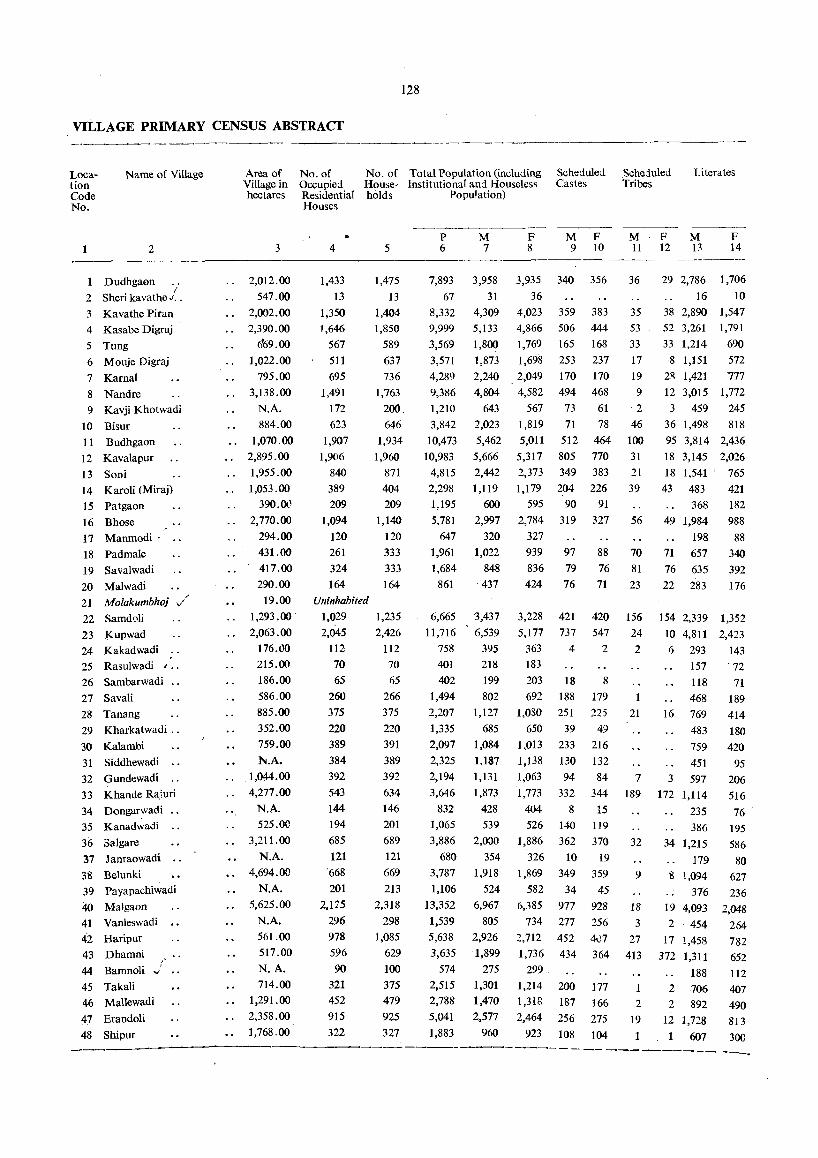
128
VILLAGE PRIMARY CENSUS ABSTRACT
Location Code No.
Name of Village
1 2
1 Dudhgaon ..
2 Sheri kavathe./.
3 Kavathe Piran 4 Kasabe Digraj
5 Tung
6 Mouje Digraj
7 Kamal
8 Nandre
9 Kavji Khotwadi
10 Bisur
11 Budhgaon
12 Kavalapur
13 Soni 14 Karoli (Miraj)
15 Patgaon
16 Bhose
17 Manmodi·
18 Padmale
19 Savalwadi
20 Malwadi
21 Molakumbhoj .. /
22 SamdQJi
23 Kupwad
24 Kakadwadi 25 Rasulwadi I ••
26 Sambarwadi
27 Savali
28 Tanang
29 Kharkatwadi ..
30 Kalambi
31 Siddhewadi ..
32 Gundewadi ..
33 Khande Ra,iuri
34 Dongarwadi
35 Kanadwadi ..
36 Salgare
37 Janraowadi
38 Belunki 39 Payapachiwadi
40 Malgaon
41 Vanleswadi
42 Haripur
43 Dhamni ,
44 Bamnoli "_/
45 Takali
46 Mallewadi
47 Erandoli
48 Shipur
Area of No. of Village in Occupied
No. of Total Population (including House- Institutional and Houseless
Scheduled Castes
hectares Residential holds Population)
3
2,012.00
547.00
2,002.00
2,390.00
669.00
1,022.00
795.00
3,138.00
N.A.
884.00
1,070.00
2,895.00
1,955.00
1,053.00
390.00
2,770.00
294.00
431.00
417.00
290.00
19.00
1,293.00
2,063.00 176.1)()
215.00
186.00
586.00
885.00
352.00
759.00
l'II.A. 1,QM.00
4,277.00
N.A.
525.OC
3,211.00
N.A.
4,694.00
N.A.
5,625.00
N.A.
561.00
517.00
N.A.
714.00
1,291.00
2,358.00
1,768.00
Houses
4
1,433
13
1,350
1,646
567
511
695
1,491
172
623
1,907
1,906
840
389
209
1,094
120
261
324
164
Uninhabited
5
1,475
13
1,404
1,850
589
637
736
1,763
200,
646
1,934
1,960
871
404
209
1,140
120
333
333
164
1,029 1,235
2,045 2,426
112 112
70 70
65 65
260 266
375 375
220 220
389 391
384 389
392 392
543 634
144 146
194
685
121
'668
201
2,125
296
978
596
90
321
452
915
322
201
689
121
669
213
2,318
298
1,085
629
100
375
479
925
327
P 6
7,893
67
8,332
9,999
3,569
3,571
4,289
9,386
1,210
3,842
10,473
10,983
4,815
2,298 1,195
5.781
647
1,961
1,684
861
6,665
11,716
758
401
402
1,494
2,207
1,335
2,097
2,325
2,194
3,646
832 1,065
3,886
680
3,787
1,106
13,352
1,539
5,638
3,635
574
2,515 2,788
5,041
1,883
M 7
3,958
31
4,309 5,133
1,800
1,873
F 8
M F 9 10
3,935 340 356
36
4,023 359 383
4,866 506 444
1,769 165 168
1,698 253 237
2,240 ,2,049 170 170
494 468 4,804 4,582
643 567 73 61
2,023 1,819 71 78
5,462 5,011 512 464
5,666 5,317 805 770
2,442 2,373 349 383
1,119 1,179 204 226
600 595 90 91
2,997 2,784 319 327
320 327
1,022 939 97 88 848 836 79 76
437 424 76 71
3,437
6,539
395
218
199
802
1,127
685
1,084
1,187
1,131
1,873
428
539
2,000
354
1,918
524
6,967
805
2,926
'1,899
275
1,301
1,470
2,577
960
3,228 421 420
5,177 737 547
363 4 2
183
203 18 8
692 188 179
1,030 251 225
650 39 49
1,013 233 216
1,138 130 132
1,063 94 84
1,773 332 344
404 8 15 526 140
1,886 362
326 10
1,869 349
582 34
6,385 977
734 277
2,712 452
1,736 434 299,
1,214 200
1,318 187
2,464 256
923 108
119
370
19
359
45
928
256
407
364
177
166
275
104
.Scheduled Tribes
Literates
M F M F 14 11 12 13
36
35
53
33
17
19
9
2
46
100
31
21
39
56
70
81
23
29 2,786 1,706
16 10
38 2,890 1,547
52 3,261 1,791
33 1,214 690
8 1,151 572
2<l 1,421 777
12 3,015 1,772
3 459 245
36 1,498 818
95 3,814 2,436
18 3,145 2,026
18 1,541 I 765
43 483 421
368 182
49 1,984 988
198 88
71 657 340
76 635 392
22 283 176
156 154 2,339 1,352
24 10 4,811 2,423
2 6 293 143 157 . 72
118 71
468 189 21 16 769 414
483 180
759 420
451 95
7 3 597 206
189 172 1,114 516
32
9
18
3
27
413
2
19
1
235 76 .
386
34 1,215
179
8 1,094
376
19 4,093
2 454
17 1,458
372 1,311
188
2 706
2 892
12 1,728
1 607
195
586
80
627
236
2,048
264
782 652
112
407
490
813
300 .--_.----------------_._------------ - -- -_ ----------..
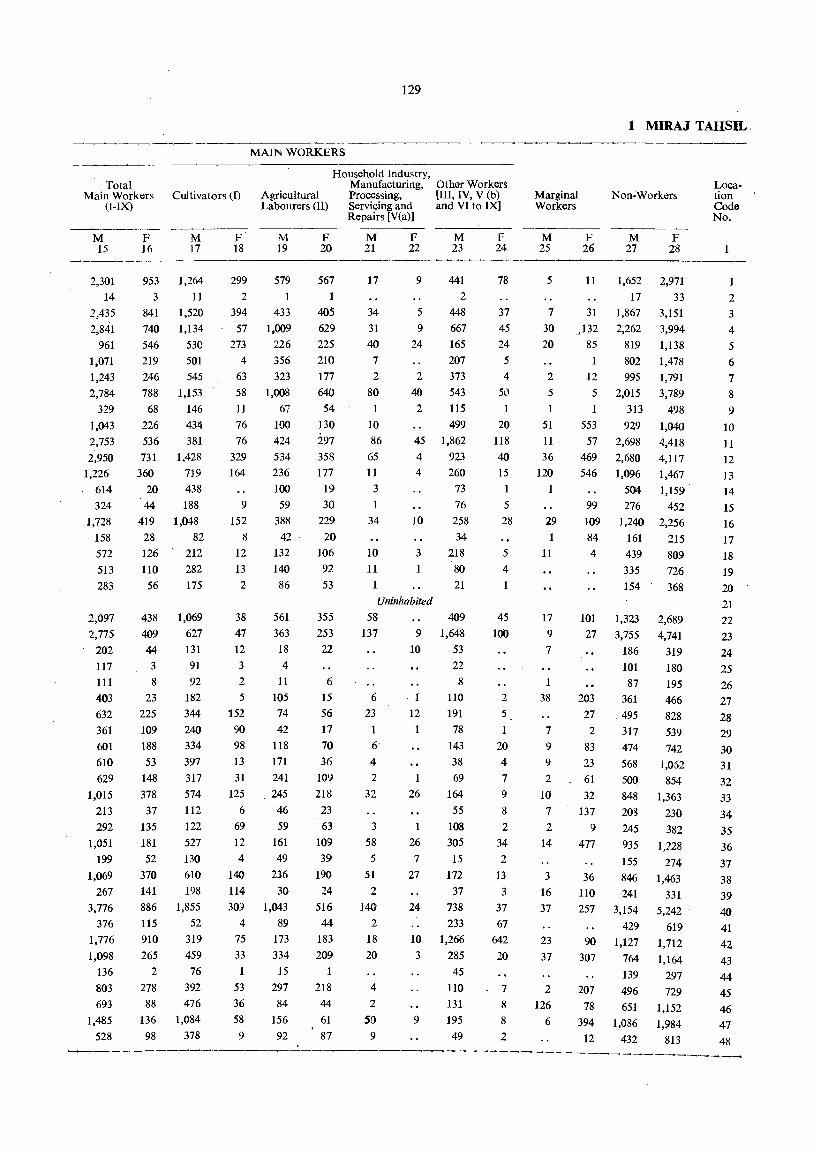
Total Main Workers
(I-IX) Cultivators (I)
M 15
2,301 14
2,435 2,841
961 1,071 1,243 2,784
329 1,043 2,753 2,950
1,226 614 324
1,728 158 572
513 283
2,097 2,775
202 117 111 403 632 361 601 610 629
1,015 213 292
1,051 199
1,069 267
3,776 376
1,776 1,098
136 803 693
1,485
528
F 16
953 3
841 740 546 219 246 788 68
226 536 731
360 20 44
419 28 126 110
56
438 409 44 3
8
23 225 109
188 53
148
378 37
135 181 52
370 141 886
M 17
1,264 11
1,520 1,134
530 501 545
1,153 146 4311 381
1,428 719 438 188
1,048 82
212 282 175
1,069 627 131 91 92
182 344 240 334 397 317 574 112 122 527 130 610
198 1,855
115 52 910 319 265 459
2 76 278 392 88 476
136 1,084 98 378
F 18
299 2
394 57
273 4
63 58 11 76 76
329 164
9
152 8
12 13 2
38 47 12 3
2
5
152 90 98 13 31
125 6
69 12 4
140 114 309
4
75 33 1
53 36 58 9
129
MAIN WORKERS
Household Industry, Manufacturing, Other Workers
Agricultural Processing, [III, IV, V (b) Labourers (II) Servicing and and VI to IX]
Repairs [V(a)]
M 19
579
433 1,009
226 356 323
1,008 67
100 424 534 236 100 59
388 42 .
132 140 86
561 363 18 4
11 105 74 42
118
171 241 245 46 59
161 49
236 30
1,043 89
173 334 15
297 84
156 92
F 20
567 1
405 629 225 210
177 640 54
130 297 358 177
19 30
229 20
106 92 53
355 253 22
6
15 56 17 70 36
109 218
23 63
109
39 190
24 516 44
183 209
1
218 44
61 87
M 21
17
34 31 40
7
2
80 1
10 86
65 11
3
34
10 11
1
F 22
9
5 9
24
2
40 2
45 4
4
10
3
1
Uninhabited
58 137 9
10
6 - 1 23 12
6
4
2
1
32 26
3 1
58 26 5 7
51 27 2
140 24 2
18 20
4
2
SO 9
10 3
9
M 23
441 2
448 667 165 207 373 543 115 499
1,862 923 260
73 76 258 34
218 80 21
409 1,648
53 22 8
110 191
78 143 38 69
164 55
108 305 15
172 37
738 233
1,266 285 45
110 131 195 49
F 24
78
37 45 24 5
4 5l)
1
20 118 40 15 1
5
28
5
4
45 100
2
5
1
20 4
7
9
8
2
34 2
13 3
37 67
642 20
7
8
8
2
1 MIRAJ TAHSIL-
Marginal Workers
Non-Workers
M 25
5
7 30 20
2
5
1
51 11
36 120
1
29 1
11
17 9
7
1
38
7
9
9
2
10
7
2
14
3
16 37
23 37
2
126 6
F 26
11
31 ,132
85
12 5
1
553 57
469 546
99 109
-84 4
101
27
203 27
2
83 23 61 32
137 9
477
36 110
M 27
1,652 17
1,867 2,262
819 802 995
2,015 313 929
2,698 2,680 1,096
504 276
1,240 161 439 335 154
1,323 3,755
186 101 87
361 _ 495
317 474 568 500 848 203 245 935 155
846 241
257 3,154 429
90 1,127 307 764
139 207 496
78 651 394 1,086
12 432
F 28
2,971 33
3,151 3,994-1,138 1,478 1,791 3,789
498 1,040
4,418 4,117 1,467 1,159 -
452 2,256
21S 809 726 368
2,689 4,741
319 180 195 466 828 539 742
1,062 854
1,363 230 382
1,728
274 1,463
331 5,242
619 1,712 1,164
297 729
1,152 1,984
813
Location Code No.
1
2 3
4
5
6
7
8
9
10
11
12 13
14 15 16 17 18 19 20 21 22
23 24 25 26 27 28 29 30 31 32 33 34 35 36 37 38 39 40
41 42 43 44 45 46 47 48
------_ ------------,-----
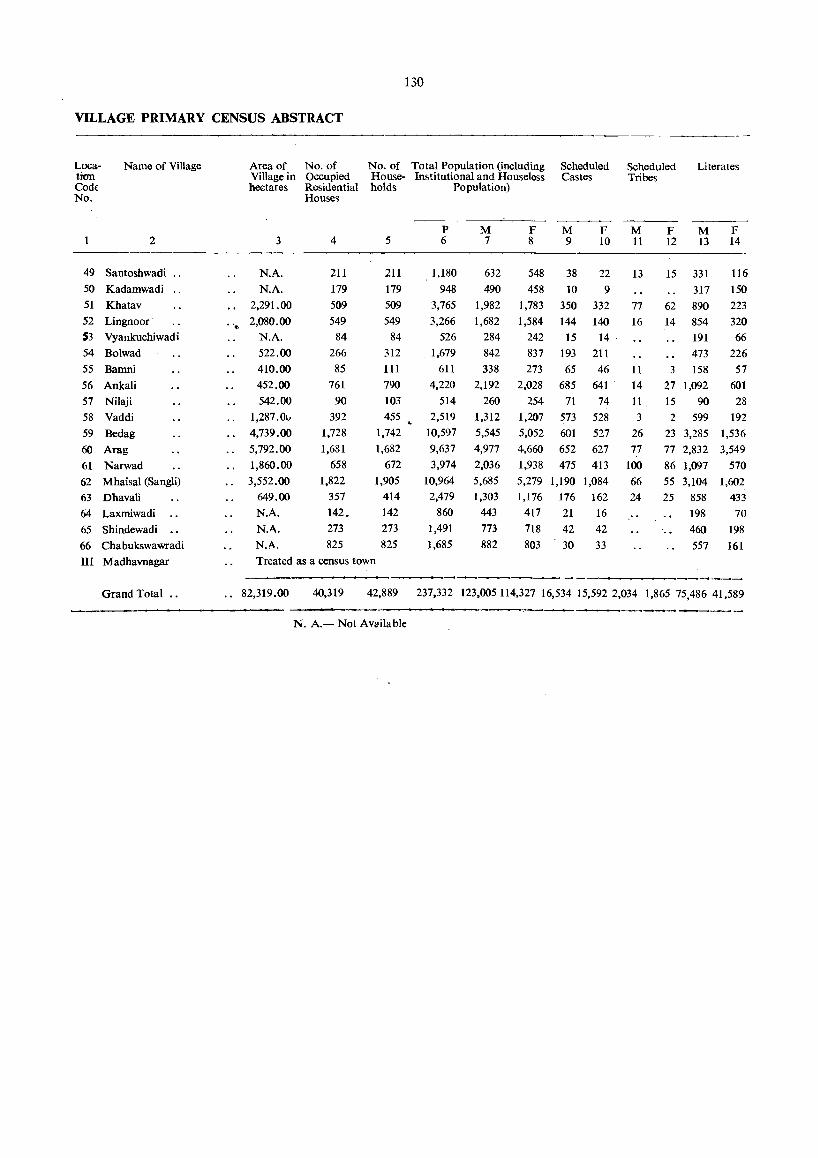
130
VILLAGE PRIMARY CENSUS ABSTRACT
Loca- Name of Village Area of No. of No. of Total Population (including Scheduled Scheduled Literates tion Village in Occupied House- Institutional and Houseless Castes Tribes CoM hectares Residential holds Population) No. Houses
-----P M F M F M F M F
2 3 4 5 6 7 8 9 10 11 12 13 14
49 Santoshwadi .. N.A. 211 211 1,180 632 548 38 22 13 15 331 116
50 Kadamwadi .. N.A. 179 179 948 490 458 10 9 317 150 51 Khatav 2,291.00 509 509 3,765 1,982 1,783 350 332 77 62 890 223 52 Lingnoor-
"f> 2,080.00 549 549 3,266 1,682 1,584 144 140 16 .14 854 320
53 Vyankuchiwadi N.A. 84 84 526 284 242 15 14 . 191 66
54 Bolwad 522.00 266 312 1,679 842 837 193 211 473 226
55 Bamni 410.00 85 111 611 338 273 65 46 11 3 158 57
56 Ankali 452.00 761 790 4,220 2,192 2,028 685 641 14 27 1,092 601
57 Nilaji 542.00 90 103 514 260 254 71 74 11 15 90 28
58 Vaddi 1,287.01l 392 455 ,. 2,519 1,312 1,207 573 528 3 2 599 192
59 Bedag 4,739.00 1,728 1,742 10,597 5,545 5,052 601 527 26 23 3,285 1,536
60 Arag 5,792.00 1,681 1,682 9,637 4,977 4,660 652 627 77 77 2,832 3,549
61 Narwad 1,860.00 658 672 3,974 2,036 1,938 475 413 100 86 1,097 570
62 Mhaisal (Sangli) 3,552.00 1,822 1,905 10,964 5,685 5,279 1,190 1,084 66 55 3,104 1,602
63 Dhavali 649.00 357 414 2,479 1,303 1,176 176 162 24 25 858 433
64 Laxmiwadi N.A. 142. 142 860 443 417 21 16 198 70
65 Shindewadi N.A. 273 273 1,491 773 718 42 42 460 198
66 Chabukswawradi N.A. 825 825 1,685 882 803 30 33 557 161
III Madhavnagar Treated as a census town
---------- ---Grand Total .. 82,319.00 40,319 42,889 237,332 123,005114,327 16,534 15,592 2,034 1,865 75,486 41,589
.,..__---------N. A.- Not AVlliiable
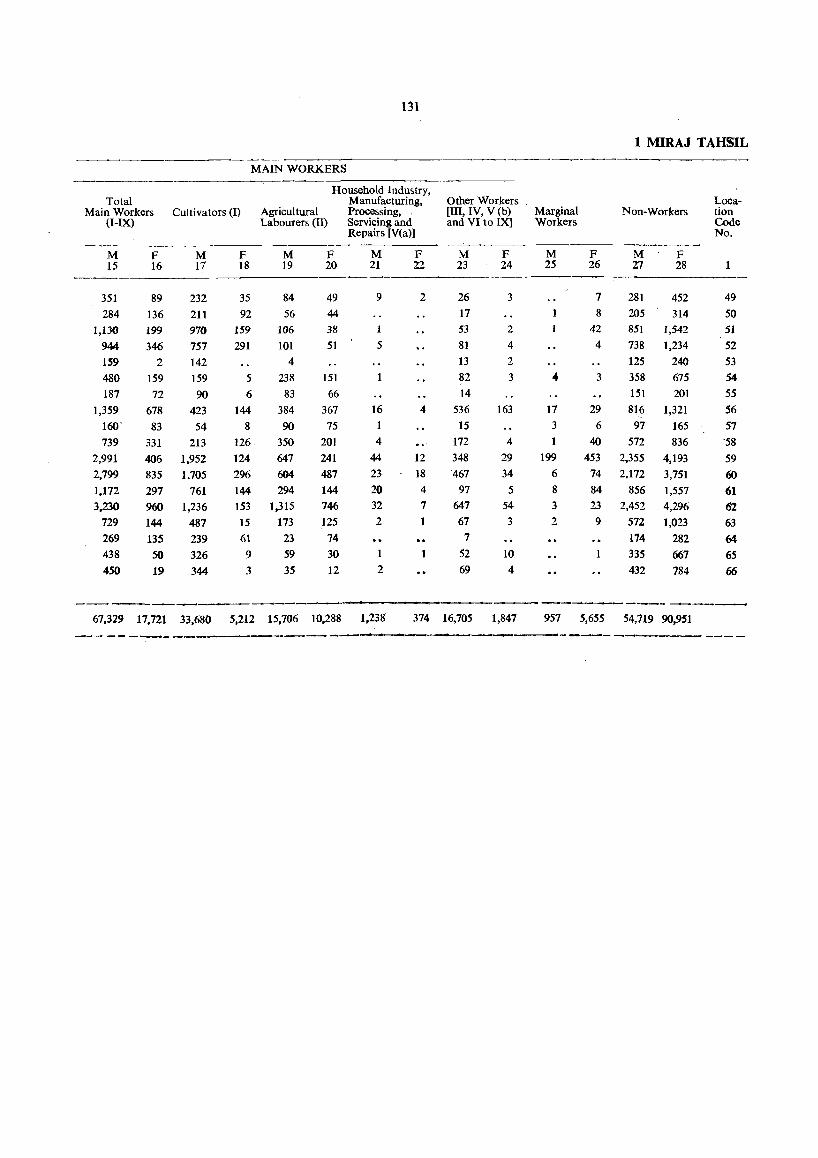
131
1 MIRAJ TAHSIL
MAIN WORKERS
Household Industry, Total Manufacturing, Other Workers Loca-
Main Workers Cultivators (I) Agricultural Processing, . [III, IV, V (b) Marginal Non-Workers tion (I-IX) Labourers (U) Servicing and and VI to IX] Workers Code
Repairs [V(a)] No.
M F M F M F M F M F M F M F 15 16 17 18 19 20 21 22 23 24 25 26 27 28
351 89 232 35 84 49 9 2 26 3 7 281 452 49 284 136 211 92 56 44 17 1 8 205 314 50
1,130 199 970 159 106 38 1 53 2 1 42 851 1,542 51 944- 346 757 291 101 51 5 81 4 4 738 1,234 52 159 2 142 4 13 2 125 240 53 480 159 159 5 238 151 82 3 4 3 358 675 54
187 72 90 6 83 66 14 151 201 55 1,359 678 423 144 384 367 16 4 536 163 17 29 816 1,321 56
160' 83 54 8 90 75 1 15 3 6 97 165 57 739 331 213 126 350 201 4 172 4 1 40 572 836 '58
2,991 406 1,952 124 647 241 44 12 348 29 199 453 2,355 4,193 59 2,799 835 1,705 296 604 487 23 18 467 34 6 74 2,172 3,751 60 1.172 297 761 144 294 144 20 4 97 5 8 84 856 1,557 61 3,230 960 1,236 153 1,315 746 32 7 647 54 3 23 2,452 4,296 62
729 144 487 15 173 125 2 1 67 3 2 9 572 1,023 63 269 135 239 61 23 74 7 174 282 64-438 50 326 9 59 30 1 52 10 335 667 65 450 19 344 3 35 12 2 69 4 432 784 66
----------- ---_.-------67.329 17.721 33,680 5,212 15,706 10,288 1,238 374 16,705 1,847 957 5,655 54,719 90,951
----------------------- - ........ ------
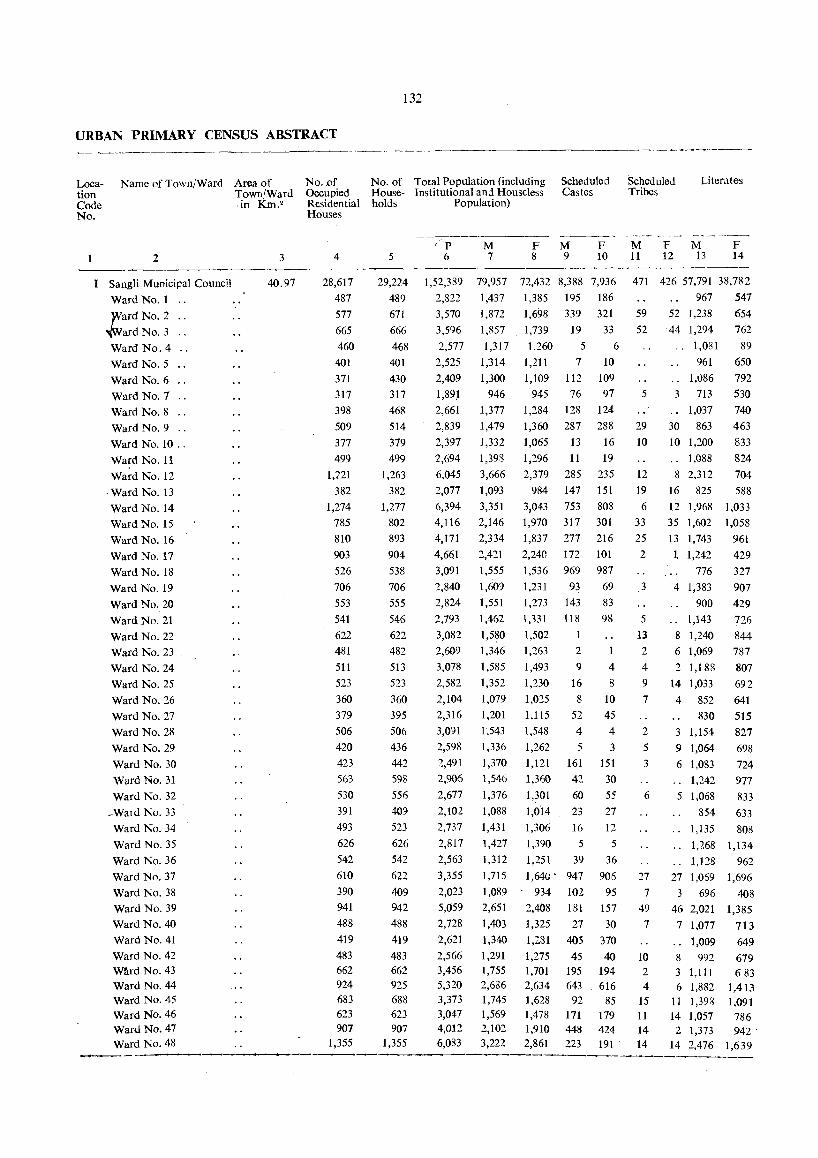
URBAN PRIMARY CENSUS ABSTRACT
Location Code No.
Name of Town/Ward Area of Town/Ward ·in Km."
2 3
I Sangli Municipal Council
Ward No.1 ..
40.97
~ard No.2 ..
~ard No.3
Ward No.4
Ward No.5 ..
Ward No.6 ..
Ward No.1 ..
Ward No.8 ..
Ward No.9 ..
Ward No. 10 .,
Ward No. 11
Ward No. 12
- Ward No. 13
Ward No. 14
Ward No. 15
Ward No. 16
Ward No. 17
Ward No. 18
Ward No. 19
Ward No. 20
Ward No. 21
Ward No. 22
Ward No. 23
Ward No. 24
Ward No. 25
Ward No. 26
Ward No. 27
Ward No. 28
Ward No. 29
Ward No. 30
Ward No. 31
Ward No. 32
_Ward No. 33
Ward No. 34
Ward No. 35
Ward No. 36
Ward No. 37
Ward No. 38 Ward No. 39
Ward No. 40
Ward No. 41
Ward No. 42 W~rd No. 43 Ward No. 44 Ward No. 45 Ward No. 46 Ward No. 47 Ward No. 48
No . .of Occupied Residential Houses
4
28,617
487
577
665
460
401
371
317
398
509
377 499
1,121
382
1,274
785
810
903
526
706
553
541
622
481
511
523
360
379 506
420
423
563
530
391 493
626
542
610
390 941
488
419
483 662 924 683 623 907
1,355
132
No. of Total Population (including House- Institutional and Housdess
Scheduled Castes
holds Population)
5 /p
6 M 7
F M 8 9
F 10
Scheduled Tribes
Literates
M 11
F M 12 13
F 14
29,224 1,52,389 79,957 72,432 8,388 7,936 471 426 57,791 38,782
489 2,822 1,437 1,385 195 186 967 541
671
666
468
401
430
317
468
514
379
499
1,263
382
1,277
802
893
904
538
706
555 546
622
482
513
523
360
395
506
436
442 598
556
409
523
626
542
622
409 942
488
419
483 662 925 688 623 907
1,355
3,570
3,596
2,577
2,525
2,409
1,89.1
2,661
2,839
2,397
2,694
6,045
2,077
6,394
4,116
4,171
4,661
3,091
2,840
2,824
2,793
3,082
2,609
3,078
2,582
2,104
2,316
3,091
2,598
2,491
2,906
2,677
2,102
2,737
2,S17
2,563
3,355
2,023
5,059
2,728
2,621
2,566 3,456 5,320 3,373 3,047 4,012 6,083
1,872 1,698 339 321
1,857 1,739 19 33
1,317 1,260 5 6
1,314 1,211 7 10
1,300 1,109 112 109
946 945 76 97
1,377 1,284 128 124
1,479 1,360 287 288
1,332 1,065 13 16
1,398
3,666
1,093
3,351
2,146
2,334
2,421
1,555
1,609
1,551
1,462
1,580
1,346
1,585
1,352
1,079
1,201
1,543
1,336
1,370
1,546
1,376
1,296 11 19
2,379 285 235
984 147 151
3,043 753 808
1,970 317 301
1,837 277 216
2,240 172 101
1,536 969 987
1,231 93 69
1,273 143 83
1,331 ll8 98
1,502 1
1,263 2
1,493 9 4
1,230 16 8
1,025 8 10
1.115 52 45
1,548 4 4
1,262 5 3
1,121 161 151
1,360 42 30
1,301 60 5~
1,088 1,014 23 27
12
5
36
906
95
157 30
370
40 194 616
1,431 1,306 16
1,427 1,390 5
1,312 1,251 39
1,715 1,64<;' 947
1,089 . 934
2,651 2,408
1,403 1,325
1,340 1,2.81
1,291 1,275 1,755 1,701 2,686 2,634 1,745 1,628 1,569 1,478 2,102 1,910 3,222 2,861
102
181
27
405
45 195 643
92 171 448 223
85 179 424
191
59
52
5
29
10
12
19
6
33
25
2
3
5
13
2
4 9
7
2
5
3
6
27
7
49
7
10 2 4
15 11 14 14
52 1,238 654
44 1,294 762
.. 1,081 89
961 650
.. 1,086 792
3 713 530
.. 1,037 740
30 863 463
10 1,200 833
.. 1,088 824
8 2,312 704
16 825 588
12 1,968 1,033
35 1,602 1,058
13 1,743 961
1 1,242 429
776 327
4 1,383 907
900 429
.. 1,143 726
8 1,240 844
6 1,069 787
2 1,188 807
14 1,033 692
4 852 641
830 515
3 1,154 827
9 1,064 698
6 1,083 724
" 1,242 977
5 1,068 833
854 633
.. 1,135 808
1,268 1,134
1,128 962
27 1,059 1,696
3 696 408
46 2,021 1,385
7 1,077 713
1,009 649
8 992 679 3 1,111 683 6 1,882 1,413
11 1,398 1,091 14 1,057 786 2 1,373 942
14 2,476 1,639

Total Main Workers
(T-IX)
M F 15 16
37,310 5,853 739 190 962 280 937 154 639 60
623 53 703 42 468 62 738 96 788 240
581 29 730 83
1,732 498
1,713 911 864
1,152 726 721 581 655 721 589 712 551 49tJ 592 715 664
586 74& 674 531 7111 682 627 787
523 ],239
640 586 6It
712
1,087
816 731
1,044 1,470
575 13
189 58 86
157 127
61 45
161 78 80 92 53 74 94
125 91 97 90 75 82 92 93 91
183 84
197 70 72
103 140 206 134 99
325 172
133
MAIN WORKERS
Household Industry, Manufacturing, Other Workers
Cultivators (I) Agricultural Labourers (II)
Processing, [III, IV, V (b) Servicing and and VI to IX]
M 17
1,790 158 189 256
7
20 20 9
16 6
41 28
212
64 5
26 1
29 8
16 36 17 12 12 8
14 7
12
22
21 68 57 12 24 36 23 11
96 23 20 11
9
25 25 h) 13 55
F 18
M 19
F 20
286 2,144 1,492 35 144 124 40 242 218 12 170 122
4 4 2 11 6
8 2 8 7
156 4 37 113
1 16 7 129
2
3 2
3
2 3
4
2
1
2
2
15
1
1
2
3
1
8
553 8
266 12 10 8
33
8
6
7
18 1
2
11 13
28 5
2
14 8
31 20 4
9
12 78 42 52 12 11 10 13
20 28
43 27 74
354 2
92 2
8
3
24 1 7 8
7 5 2
4 5
1
2
3 16
3
76 44 49 22
1
12 24 18 2
42 18 23
Repairs [V(a)]
M 21
1,140 16 32 55 19 49 37 4
14 118
1
5 11
3
52 9 8
3
31 48 8
17 18
3
27 41 49 5
26 27 15 65 14 25 16 14 1
20 23 15 8
14 6
24 28
48 41
6
21
F .~ M 22 '23
556 32,236 3 421 1 499 3 456 2 609 8 543
ill 638 12 447 32 703 61 627
539 8 681 5 956
487 10 1,331
885 5 820
1(; 1,140 3 662 6 63.6
2 559 615
21 649-15 568 45 671 17 487 11 420 38 545 53 677 27 623 7 535 1 654 2 561 5 429
23 684 635 578
5 666 4· 447 8 1,076
1,1 597 8 541
16 589 18 666
7 1,014 5 715
10 637 9 998 8 1,320
F 24
3,519 28 21 17 54 37 29 43 57 62 29 67 87 10 87 55 71
144 100 54 36
153 47 58 42 35 59 50 69 61 90 87 70 57 67 90 87
100 34
125 37 62 74 97
179 124 47
297 133
Marginal Workers
M 25
681 17 3
36
'4
15 9
4 2 4
4
8
118 9
30 19 14 10 63 16 10
9
2
3
11 5
3
5
6
2
13 6-
8
7
2
3
18 25 18 27 4
107
1 MIRAJ TAHSIL
F 26
Non-Workers
M 27
F 28
564) 41,966 66,015 48 681 1,147 6 907 1,412
25 884 1,560 1 678 1,199
691 1,158 1 593 1,066
19 463 864 34 630 1,154 6 687 1,114
749 1,036 6 664 1,207 4 1,933 1,800 3 595 968
99 1,634 2,755 1,227· 1,912
46 13
25 13
50 1
20 2
22 3
2
5
7
1
3
2
10 1
9
6 1 5
2 10 22
11 3
8
6
3
1,352 1,260
799
869 -956 797 796 741 863 792 587 606 817 667 784 797
699 552
709 743 672 922 558
1,405 761 754 674
1,025
1,574 911 811
1,054
1,645
1,705 2,070 1,384 1,157 1,178 1,169 1,404 1,181 1,379 1,174
949 1,1.116
1,416 1,170 1,024 1.270 1,223
930 1,204 1,296 1,151 1,451
849 2,206 1,255 1,207 1,162
1,539 2,417
1,491
1,371 1,579 2,686
Location Code No.
1
I
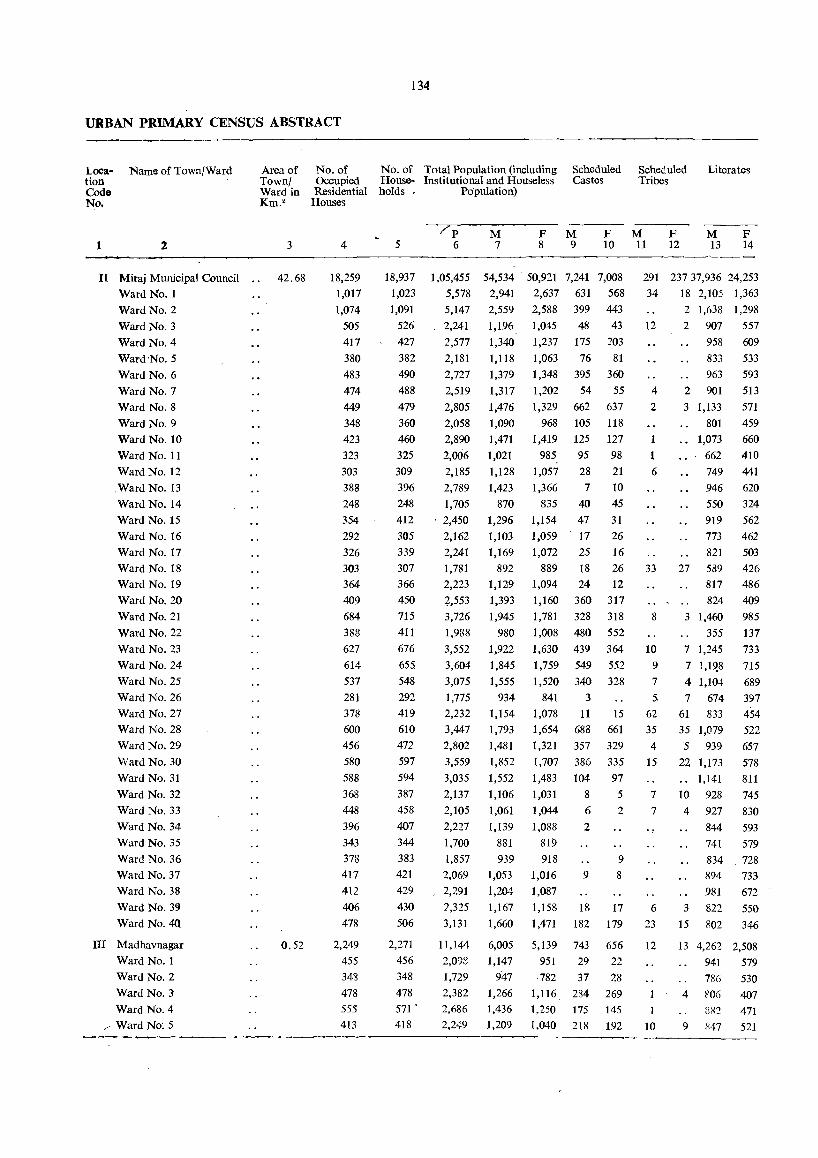
134
URBAN PRIMARY CENSUS ABSTRACT
Loca· tion Code No.
1
Name of Town/Ward
2
II Miraj Municipal Council
Ward No.1
Ward No.2
Ward No.3
Ward No.4
Ward No. 5
Ward No.6
Ward No.7
Ward No.8
Ward No.9
Ward No. 10
Ward No. 11
Ward No. 12
.Ward No. 13
Ward No. 14
Ward No. 15
Ward No. 16
Ward No. 17
Ward No. 18 Ward No. 19
Ward No. 20
Ward No. 21
Ward No. 22
Ward No. 23
Ward No. 24
Ward No. 25
Ward No. 26
Ward No. 27 Ward No. 28
Ward No. 29
Ward No. 30
Ward No. 31
Ward No. 32
Ward No. 33
Ward No. 34 Ward No. 35
Ward No. 36
Ward No. 37
Ward No. 38
Ward No. 31J
Ward No. 40.
ITl Madhavnagar
Ward No.1
Ward No.2
Ward No. J
Ward No.4
/' Ward No: 5
Area of Town/ Ward in Km. 2
3
42.68
0.52
No. of No. of Total Population (including Occupied House- Institutional and Houseless Residential holds • Population)
Houses
Scheduled Castes
Scheduled Tribes
Literates
7p 6
M 7
F M 8 9
F M F 12
M 13
F 14 4
18,259
1,017
1,074
505
417
380
483
474
449
348
423
323
303 388 248
354
292
326
303 364
409
684
388 627
614
537
281
378
600 456 580
588
368 448
396
343
378 417
412
406
478
2,249
455
348 478
555
413
5
18,937
1,023
1,091
526
427
382
490
488
479
360
460
325
309
396
248
412
305
339
307 366
450
715
411
676
655 548
292
419
610
472
597
594
387
458
407
344
383
421
429
430
506
2,271
456
348
478 571 .
418
10 11
1,05,455 54,534 50,921 7,241 7,008 5,578 2,941 2,637 631 568
5,147 2,559 2,588 399 443
2,241 1,196 1,045 48 43
2,577
2,181
2,727
2,519
2,805
2,058
2,890
2,006
2,185
2,789
1,705 . 2,450
2,162
2,241
1,781 2,223
+,553 3,726
1,988
3,552
3,604
3,075
1,775
2,232
3,447
2,802
3,559
3,035
2,137
2,105
2,227
1,700
1,857 2,069
2,291
7,325
3.131
1,340
1,118
1,379
1,317
1,476
1,090
1,471
1,021
1,128
1,423
870
1,296
1,103
1,169
892 1,129
1,393
1,945
980
1,922
1,845
1,555
934
1,154 1,793
1,481
1,852
1,552
1,106
1,061
1,139
881
1,237 175 203
1,063 76 81
1,348 395 360
1,202 54 55
1,329 662 637
968 105 118
1,419 125 127
985 95 98
1,057 28 21
1,366 7 10
835 40 45
1,154 47 31
1,059 17 26
1,072 25 16
889 18 26
1,094 24 12
1,160 360 317
1,781 328 318
1,008 480 552
1,630 439 364
1,759 549 552
1,520 340 328
841 3
1,078 11 15 1,654 688 661
1,321 357 329
1,707 386 335
1,483 104 97
1,031 8 5
1,044 6 2
1,088 2
819
939 918 9
1,053 1,016 9 8
1,204 1,087
1,167 1,158 18 17
1,660 1,471 182 179
11,144 6,005 5,139 743 656
2,0)8 1,147 951 29 22
1,729
2,382
2,686
2,249
947
1,266 1,436
1,209
·782 37
1,116 284
28
269 1,250 175 145
1,040 218 192
291 23737,936 24,253
34 18 2,105 1,363
2 1,638 1,298
12 2 907 557
958 609
833 533
963 593
4 2 901 513
2 3 1,133 571
801 459
1,073 660
1 662 410
6 749 441
946 620
550 324
919 562
773 462
821 503
33 27 589 426
8
10
9
7
5
62
35
4
15
7
7
6 23
12
10
817 486
824 409
3 1,460
355
7 1,245
7 1,1~8
4 1,104
7 674
61 833 35 1,079
5 939 22 1,173
1,141
10 928
4 927
844
741
985
137
733
715
689 397
454 522
657
578
811
745
830
593
579
834 . 728 894 733
981 672
3 822 550
15 802 346
13 4,262 2,508
941 579
4
786 FOG
8S:!
9 847
530 407 471
521
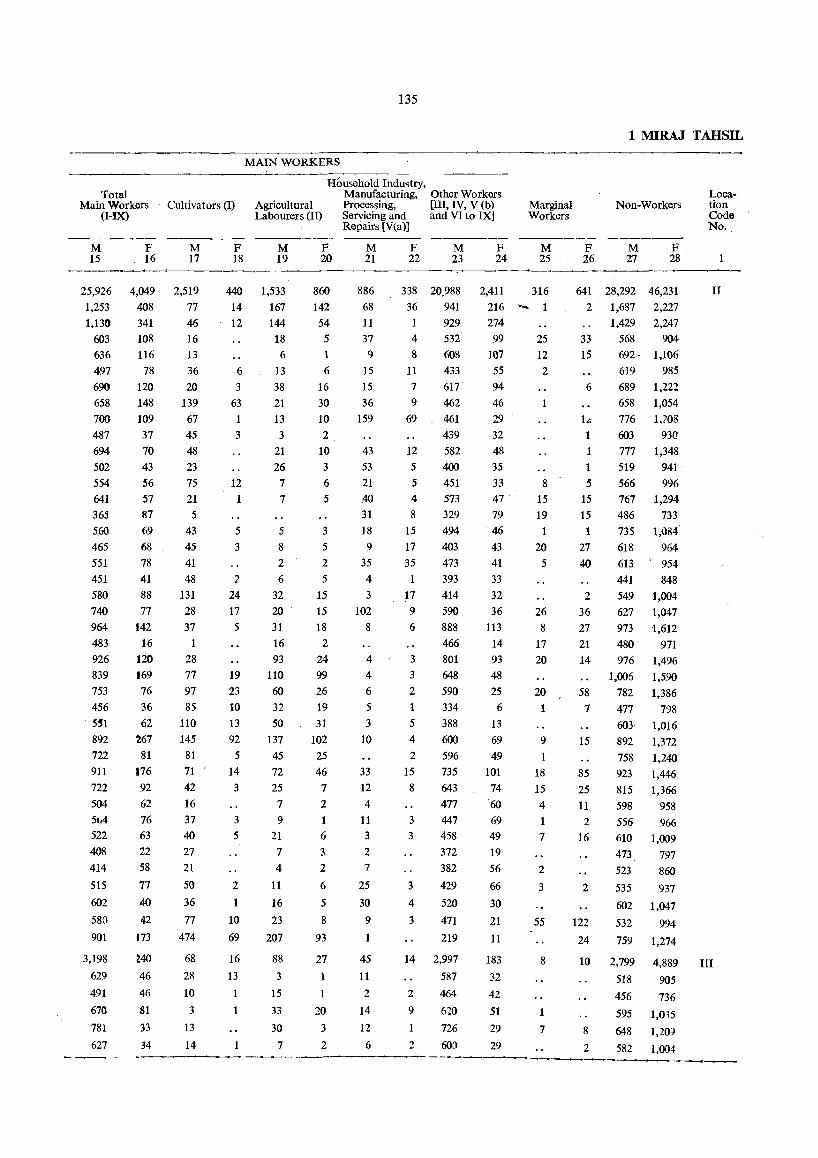
135
MAIN WORKERS
Household Industry, Total
Main Workers - Cultivators (I) (I-IX)
M 15
25,926 1,253 1,130
603 636 497 690 658 700
487 694 502 554 641 365 560 465 551 451 580 740 964 483 926 839 753 456 5S1
892 722 911 722 504 5 .... 4 522 408 414
515
602
580
901
3,198
629
491
670
781
627
F 16
4,049 408 341 108 116
78 120 148 109 37 70 43 56 57 87 69 68 78 41 88
77 142
16 120 169 76 36 62
267 81
176 92 62 76 63 22 58
77
40 42
173
240
46 46
81
33
34
M 17
2,519 77 46 16 13 36 20
139 67 45 48 23 75 21 5
43 45 41 48
131 28 37
1 28 77 97 85
110 145
81 71 42 16 37 40 27 21 50
36
77
474
68
28
10
3
13
14
F 18
440 14 12
6 3
63
3
12
5
3
'}
24 17 5
19 23 10 13
92 5
14 3
3
5
2
10
69
16
13
Agricultural Labourers (II)
M 19
1,533 167 144
18 6
13 38 21 13 3
21 26 7 7
5
8 2
6 32 20 31 16 93
110 60 32 50
137 45 72 25 7
9
21 7
4
11
16
23
207
88
3
15 33
30
7
F 20
860 142 54 5 1
6
16 30 10
2
10 3
6 5
3
5
2
5
15 15 18
2
24 99 26 19 31
102 25 46 7
2 1 6
3
2
6
5
8
93
27
1
20
3
2 ._----_--
Manufacturing, Other Workers Processing, [III, IV, V (b) Marginal
Workers Servicing and and VI to IX] Repairs [Y(a)]
M 21
886 68 11
37 9
15 15 36
159
43 53 21 40 31 18 9
35 4
3
102 8
4
4
6
5
3
10
33
12 4
11 3
2
7
25
30
9
45
11
2
14 12
6
F 22
M 23
338 20.988 36 941
929 4 532 8 608
11 433 7 617 9 462
69 461
12 5 5
4
8
15 17 35 1
17 9
6
3
3
2 1
5
4
2 15 8
3
3
3
4
3
439 582 400 451 573 329 494 403 473 393 414 590 888 466 801 648 590 334 388 600 596 735 643 477 447 458 372 382
429
520
471
219
14 2,997
5R7 2 464
9 620
726
2 600
F 24
M 25
2,411 316
216 -274 99 25
107 12 55 2 94 46 29 32 48 35 33 47 79 46 43 41 33 32 36
113 14 93 48 25 6
13
69 49
101 74 60 69 49 19 56
66
30 21
11
183
32
42
51
29
29
8
15 19 1
20 5
26 8
17 20
20 1
9
18 15 4
1 7
2
3
55
8
7
1 MlRAJ TAHSIL
F 26
Non-Workers
M 27
F 28
641 28,292 46,231 2
33
1,687 1,429
568
2,227 2,247
904 15 692· 1,106
619 985 6 689 1,222
658 1,054 La 776 1,708
1
1 5
15 15
1
27 40
2
36 27 21 14
58 7
15
85 25
11 2
16
2
122
24
603 777 519 566 767 486 735 618 613 441 549 627 973 480 976
1,006 782 477 603 892
758 923 815 598 556
610
473 523
535
602
532
759
930 1,348
941 996
1,294 733
1,084 964 954 848
1,004 1,047 -1,612
971 1,496 1,590 1,386
798
1,016 1,372 1,240 1,446 1,366
958 966
1,009 797 860
937
1,047
994
1,274
Location Code No.
IT
10 2,799 4,889 TIl
518 905
456 736
595 1,035
8 648 1,20~
2 582 1,004
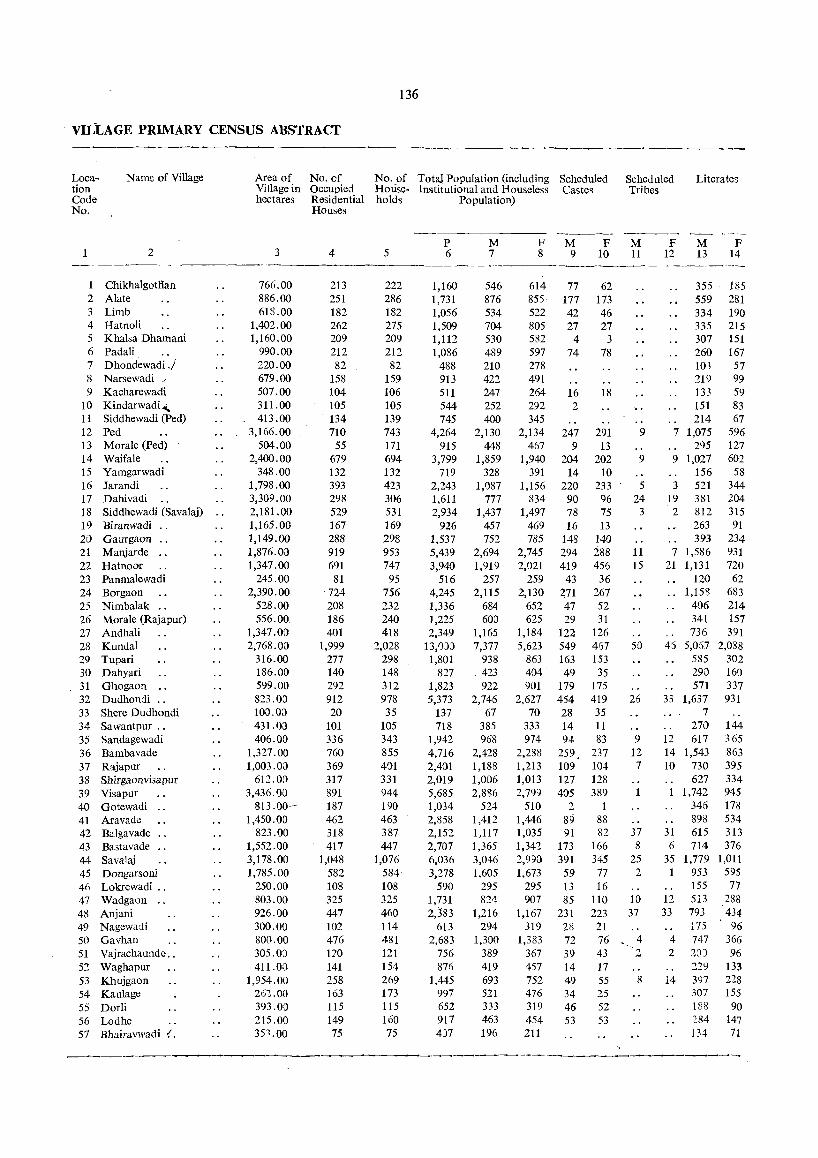
136
VILLAGE PRIMARY CENSUS ABSTRACT
Loca· Name of Village Area of No. of No. of Total Population (including Scheduled Scheduled Literates tion Village in Occupied House- Institutional and Houseless Castes Tribes Code hectares Residential holds Population) No. Houses
-_-----P M F M F M F M F
2 3 4 5 6 7 8 9 10 11 12 13 14
1 ChikhalgotHan 766.00 213 222 1,160 546 614 77 62 355 185 2 Alate 886.00 251 286 1,731 876 855 177 173 559 281 3 Limb 618.00 182 182 1,056 534 522 42 46 334 190 4 Hatnoli 1,402.00 262 275 1,509 704 805 27 27 335 215 5 Khalsa Dhamani 1,160.00 209 209 1,112 530 582 4 3 307 151 6 Padali " 990.00 212 212 1,086 489 597 74 78 260 167 7 Dhondewadi .J 220.00 82 82 488 210 278 103 57 8 Narsewadi " 679.00 158 159 913 422 491 219 99 9 Kacharewadi 507.00 104 106 511 247 264 16 18 133 59
10 Kindarwadi" 311.00 105 105 544 252 292 2 151 83 11 Siddhewadi (Ped) 413.00 134 139 745 400 345 214 67 12 Ped 3,166.00 710 743 4,264 2,130 2,134 247 291 9 7 1,075 596 13 Morale (Ped) 504.00 55 171 915 448 467 9 13 295 127 14 Waifale 2,400.00 679 694 3,799 1,859 1,940 204 202 9 9 1,027 602 15 Yamgarwadi 348.00 132 132 719 328 391 14 10 156 58 16 Jarandi 1,798.00 393 423 2,243 1,087 1,156 220 233 5 3 521 344 17 Dahivadi " 3,309.00 298 306 1,611 777 834 90 96 24 19 381 204 18 Siddhewadi (Savalaj) .. 2,181.00 529 531 2,934 1,437 1,497 78 75 3 2 812 315 19 Biranwadi .. 1,165.00 167 169 926 457 469 16 13 263 91 20 Gaurgaon " 1,149.00 288 298 1,537 752 785 143 140 393 234 21 Manjarde 1,876.00 919 953 5,439 2,694 2,745 294 288 11 7 1,586 931 22 Hatnoor 1,347.00 691 747 3,940 1,919 2,021 419 456 15 21 1,131 720 23 Panmalewadi 245.00 81 95 516 257 259 43 36 120 {i2 24 Borgaon 2,390.00 724 756 4,245 2,115 2,130 471 267 .. 1,158 683 25 Nimbalak .. 528.00 208 232 1,336 684 652 47 52 406 214 26 Morale (Rajapur) 556.00. 186 240 1,225 603 625 29 31 341 157 27 Andhali 1,347.00 401 418 2,349 1,165 1,184 122 126 736 391 28 Kundal 2,768.00 1,999 2,028 13,0:)) 7,377 5,623 549 467 50 45 5,057 2,088 29 Tupari 316.00 277 298 1,801 938 863 163 153 585 302 30 Dahyari IS6.00 140 148 827 .423 404 49 35 290 160 31 Ghogaon 599.00 292 312 1,823 922 901 179 175 571 337 32 Dudhondi 823.0:) 912 978 5,373 2,746 2,627 454 419 26 33 1,637 931 33 Shere Dudhondi 100.00 20 35 137 67 70 28 35 7 34 Sawantpur .. 431.00 101 105 718 385 333 14 11 270 144 35 Sandage wadi 406.00 336 343 1,942 968 974 94 83 9 12 617 365 36 Bambavade 1,327.00 760 855 4,716 2,428 2,288 259 237 12 14 1,543 863 37 Rajapur 1,003.00 369 401 2,401 1,188 1,213 109 104 7 10 730 395 38 Shirgaonvisapur 612.00 317 331 2,019 1,006 1,013 127 128 627 334 39 Visapur 3,436.00 891 944 5,685 2,886 2,79~ 405 389 1,742 945 40 Gotewadi 813 .OO~ 187 190 1,034 524 510 2 1 346 178 41 Aravade 1,450.0D 462 463 2,858 1,412 1,446 89 88 898 534 42 Balgavade 823.00 318 387 2,152 1,117 1,035 91 82 37 31 615 313 43 Bastavade 1,552.00 417 447 2,707 1,365 1,342 173 166 8 6 714 376 44 Savalaj 3,178.00 1,048 1,076 6,036 3,046 2,990 391 345 25 35 1,779 1,011 45 Dongarsoni 1,785.00 582 584 3,278 1,605 1,673 59 77 2 953 595 41) Lokrewadi .. 250.00 108 108 590 295 295 13 16 155 77 47 Wadgaon 803.00 325 325 1,731 824 907 85 110 10 12 513 288 48 Anjani 926.00 447 460 2,383 1,216 1,167 231 223 37 33 793 434 49 Nagewadi 300.00 102 114 613 294 319 28 21 175 96 50 Gavhan 800.00 476 481 2,683 1,300 1,383 72 76
~~, 4 4 747 366
51 Vajrachaunde .. 305.0J 170 121 756 389 367 39 43 2 2 20) 96 52 Waghapur 411.00 141 154 876 419 457 14 17 2:!9 133 53 Khujgaon 1,954.00 258 269 1,445 693 752 49 55 8 14 397 228 54 Kaulage 26~.OO 163 173 997 521 476 34 25 307 155 55 Dorli 393.00 115 115 652 333 319 46 52 188 90 56 Lodhe 215.00 149 160 917 463 454 53 53 284 147 57 Bhairavwadi .(. 351 .00 75 75 4)7 196 211 134 71
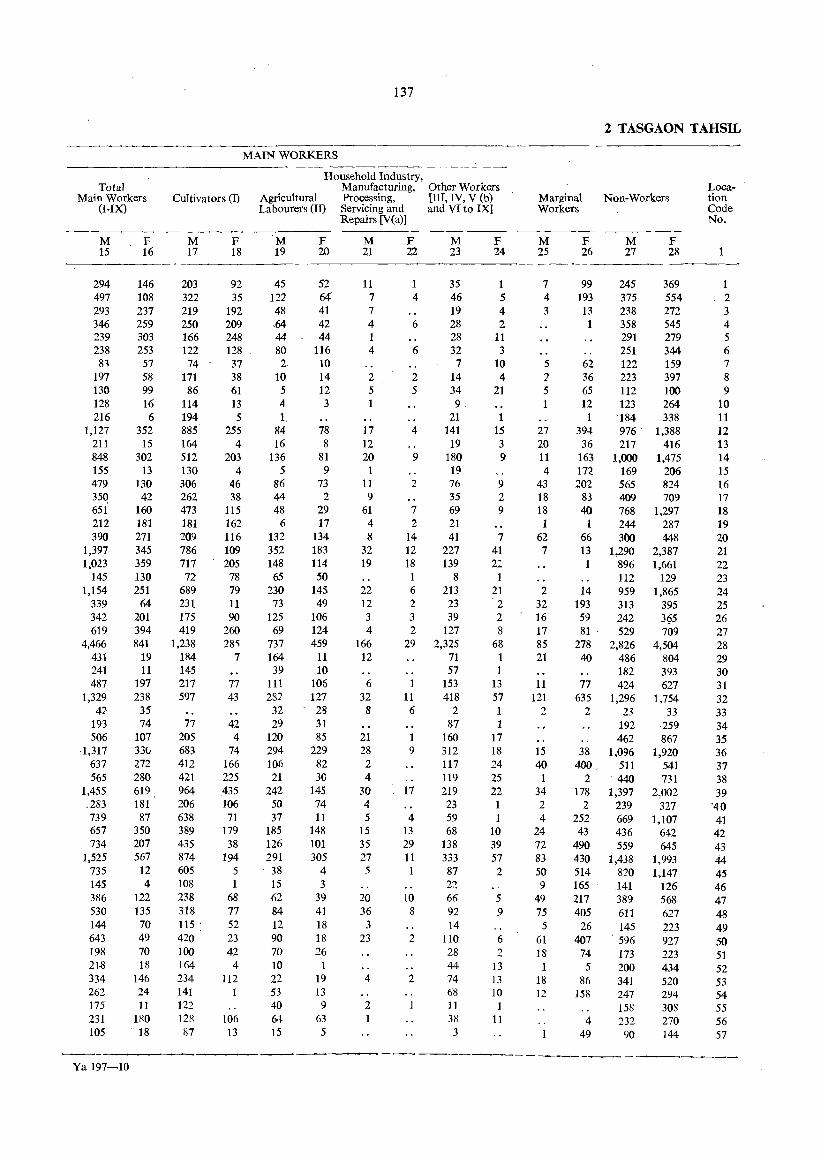
137
2 TASGAON TAHSIL
MAIN WORKERS
Household Industry, Total Manufacturing, Other Workers Loca-
Ma1n Workers Cultivators (D Agricultural Processing, [III, IV, V (b) Marginal Non-Workers tion (I·IX) Labourers (II) Servicing and and VIto IX] Workers Code
Repairs [V(a)] No.
M F M F M F M F M F M F M F 15 16 17 18 19 20 21 22 23 24 25 26 27 28 1
294 146 203 92 45 52 11 1 35 1 7 99 245 369 1 497 108 322 35 122 64" 7 4 46 5 4 193 375 554 2 293 237 219 192 48 41 7 19 4 3 13 238 272 3 346 259 250 209 ,64 42 4 6 28 2 1 358 545 4 239 303 166 248 44 44 1 28 11 291 279 5 238 253 122 128 80 116 4 6 32 3 251 344 6 83 57 74 37 2 10 7 10 5 62 122 159 7
197 58 171 38 10 14 2 2 14 4 2 36 223 397 8 130 99 86 61 5 12 5 5 34 21 5 65 112 100 9 128 16 114 13 4 3 1 9 1 12 123 264 10 216 6 194 5 1. 21 1 1 184 338 11
1,127 352 885 255 84 78 17 4 141 15 27 394 976 1,388 12 211 15 164 4 16 8 12 19 3 20 36 217 416 13 848 302 512 203 136 81 20 9 180 9 11 163 1,000 1,475 14 155 13 130 4 5 9 1 19 4 172 169 206 15 479 130 306 46 86 73 11 2 76 9 43 202 565 824 16 350 42 262 38 44 2 9 35 2 18 83 409 709 17 651 160 473 115 48 29 61 7 69 9 18 40 768 1,297 18 212 181 181 162 6 17 4 2 21 1 1 244 287 19 390 271 209 116 132 134 8 14 41 7 62 66 300 448 20
1,397 345 786 109 352 183 32 12 227 41 7 13 1,290 2,387 21 1,023 359 717 205 148 114 19 18 139 2: 1 896 1,661 22
145 130 72 78 65 50 1 8 1 112 129 23 1,154 251 689 79 230 145 22 6 213 21 2 14 959 1,865 24
339 64 231 11 73 49 12 2 23 2 32 193 313 395 25 342 201 175 90 125 106 3 3 39 2 16 59 242 3{i5 26. 619 394 419 260 69 124 4 2 127 8 17 81 ' 529 709 27
4,466 841 1,238 28~ 737 459 166 29 2,325 68 85 278 2,826 4,504 28 431 19 184 7 164 11 12 71 1 21 40 486 804 29 241 11 145 39 10 57 1 182 393 30 487 197 217 77 111 106 6 1 153 13 11 77 424 627 31
1,329 238 597 43 282 127 32 11 418 51 121 635 1,296 1,754 32 42 35 32 28 8 6 2 1 2 2 23 33 33
193 74 77 42 29 31 87 1 192 259 34 506 107 205 4 120 85 21 160 17 462 867 35
1,317 33(J 683 74 294 229 28 9 312 18 15 38 1,096 1,920 36 637 272 412 166 106 82 2 117 24 40 400 511 541 37 565 280 421 225 21 30 4 119 25 1 2 440 731 38
1,455 619 964 435 242 145 30 17 219 22 34 178 1,397 2,002 39 .283 181 206 106 50 74 4 23 1 2 2 239 327 '40 739 87- 638 71 37 11 5 4 59 1 4 252 669 1,107 41 657 350 389 179 185 148 15 13 68 10 24 43 436 642 42 734 207 435 38 126 101 35 29 138 39 72 490 559 645 43
1,525 567 874 194 291 305 27 11 333 57 83 430 1,438 1,993 44 735 12 605 5 ' 38 4 5 1 87 2 50 514 820 1,147 45 145 4 108 1 15 3 27. 9 165 141 126 46 386 122 238 68 62 39 20 10 66 5 49 217 389 568 47 530 135 318 77 84 41 36 8 92 9 75 405 611 627 48 144 70 115 ' 52 12 18 3 14 5 26 145 223 49 643 49 420 23 90 18 23 2 110 6 61 407 596 927 50 198 70 100 42 70 26 28 2 18 74 173 223 51 21-8 18 164 4 10 1 44 13 1 5 200 434 52 334 146 234 112 22 19 4 2 74 13 18 86 341 520 53 262 24 141 53 13 68 10 12 158 247 294 54 175 11 122 40 9 2 11 1 158 308 55 231 180 128 106 64 63 38 11 4 232 270 56 105 18 87 13 15 5 3 49 90 144 57
-_ --------_----- - -------Ya 197-10
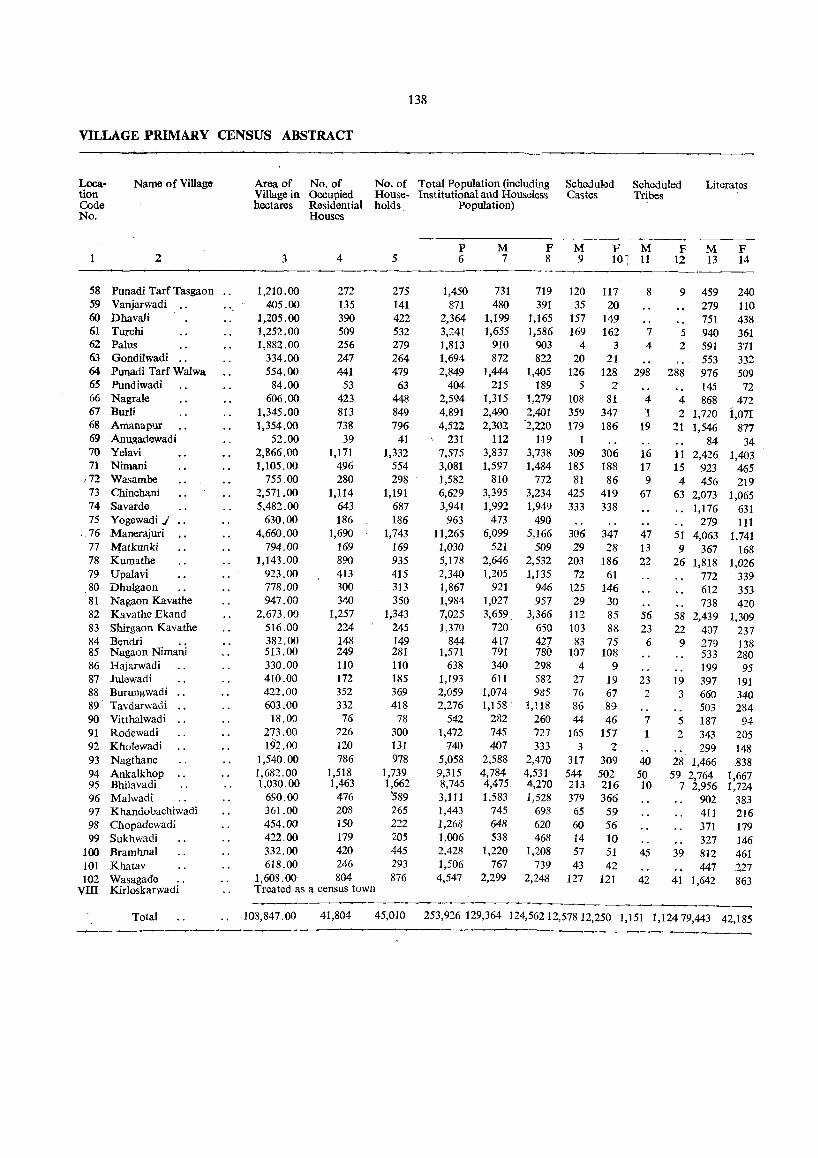
138
VILLAGE PRIMARY CENSUS ABSTRACT
Loca- Name of Village Area of No. of No. of Total Population (including Scheduled Scheduled Literates tion Village in Occupied House- Institutional and Houseless Castes Tribes Code hectares Residential holds Population) No. Houses
----_ P M F M F M F M F
2 3 4 5 6 7 8 9 101 11 12 13 14
58 Punadi Tarf Tasgaon .. 1,210.00 272 275 1,450 731 719 120 117 8 9 459 240 59 Vanjarwadi ., .. 405.00 135 141 871 480 391 35 20 279 110 60 Dhavali 1,205.00 390 422 2,364 1,199 1,165 157 149 751 438 61 Turchi 1,251.00 509 532 3,241 1,655 1,586 169 162 7 5 940 361 62 PaIus 1,882.00 256 279 1,813 910 903 4 3 4 2 591 371 63 Gondilwadi .. 334.00 247 264 1,694 872 822 20 21 553 332 64 Punadi Tarf Walwa 554.00 441 479 2,849 1,444 1,405 126 128 298 288 976 509 65 Pundiwadi 84.00 53 63 404 215 189 5 2 145 72 66 Nagrale 606.00 423 448 2,594 1,315 1,279 108 81 4 4 868 472 67 BurIi 1,345.00 813 849 4,891 2,490 2,401 359 347 1 2 1,720 1,071 68 Amanapur 1,354.00 738 796 4,522 2,302 2,220 179 186 19 21 1,546 877 69 Anugadewadi 52.00 39 41 231 112 119 1 84 34 70 Yelavi 2,866.00 1,171 1,332 7,575 3,837 3,738 309 306 16 11 2,426 1,403 71 Nimani 1,105.00 496 554 3,081 1,597 1,484 185 188 17 15 923 465
·72 Wasambe 755.00 280 298 1,582 810 772 81 86 9 4 456 219 73 Chinchani 2,571.00 1,114 1,191 6,629 3,395 3,234 425 419 67 63 2,073 1,065 74 Savarde 5,482.00 643 687 3,941 1,992 1,949 333 338
" 1,176 631 75 Yogewadi j 630.00 186 186 963 473 490 219 111
. 16 .Manerajurl 4,660.00 1,690 1,743 11,265 6,099 5,166 306 347 47 51 4,063 1,741 17 Matkunki 794.00 169 169 1,030 521 509 29 28 13 9 367 168 78 Kumathe 1,143.00 890 935 5,178 2,646 2,532 203 186 22 26 1,818 1,026 79 Upalavi 923.00 413 415 2,340 1,205 1,135 72 61 772 339 80 Dhulgaon 778.00 300 313 1,867 921 946 125 146 612 353 81 Nagaon Kavathe 947.00 340 350 1,984 1,027 957 29 30 738 420 82 Kavathe Ekand 2,673.00 1,257 1,343 1,025 3,659 3,366 112 85 56 58 2,439 1,309 83 Shirgaon Kavathe 516.00 224 245 1,370 720 650 103 88 23 22 407 237 84 Bendri 382.00 148 149 844 417 427 83 75 6 9 279 138 85 Nagaon Nimani 513.00 249 281 1,571 791 780 107 108 533 280 86 Hajarwadi 330.00 110 110 638 340 298 4 9 199 95 87 Julewadi 410.00 172 185 1,193 611 582 27 19 23 19 397 191 88 Burungwadi .. 422.00 352 369 2,059 1,074 985 76 67 2 3 660 340 89 Tavdarwadi 603.00 332 418 2,276 1,158 . 1,118 86 89 503 284 90 Vitthalwadi .. 18.00 76 78 542 282 260 44 46 7 5 187 94 91 Rodewadi 273.00 726 300 1,472 745 721 165 157 2 343 205 92 Kholewadi 192.00 120 131 740 407 333 3 2 299 148 93 Nagthane 1,540.00 786 978 5,058 2,588 2,470 317 309 40 28 1,466 .838 94 Ankalkhop 1,682.00 1,518 1,739 9,315 4,784 4,531 544 502 50 59 2,764 1,667 95 Bhilavadi 1,030.00 1,463 1,662 8,745 4,475 4,270 213 216 10 7 2,956 1,724 96 Malwadi 6~0.00 476 '.589 3,111 1,583 1,528 379 366 902 383 97 Khandobachiwadi 361.00 208 265 1,443 745 698 65 59 411 216 98 Chopadcwadi 454.00 150 222 1,268 648 620 60 56 371 179 99 Sukhwadi 422.00 179 205 1,006 538 468 14 . 10 327 146
100 Bramhnal 332.00 420 445 2,428 1,220 1,208 57 51 45 39 812 461 101 Khatav 618.00 246 293 1,506 767 739 43 42 447 227 102 Wasagade .. 1,608.00 804 876 4,547
VIII Kirloskarwadi Treated as a census town 2,299 2,248 127 121 42 41 1,642 863
Total 103,847.00 41,804 45,010 253,926 129,364 124,56212,578 12,250 1,151 1,12479,443 42,185 ~-------------
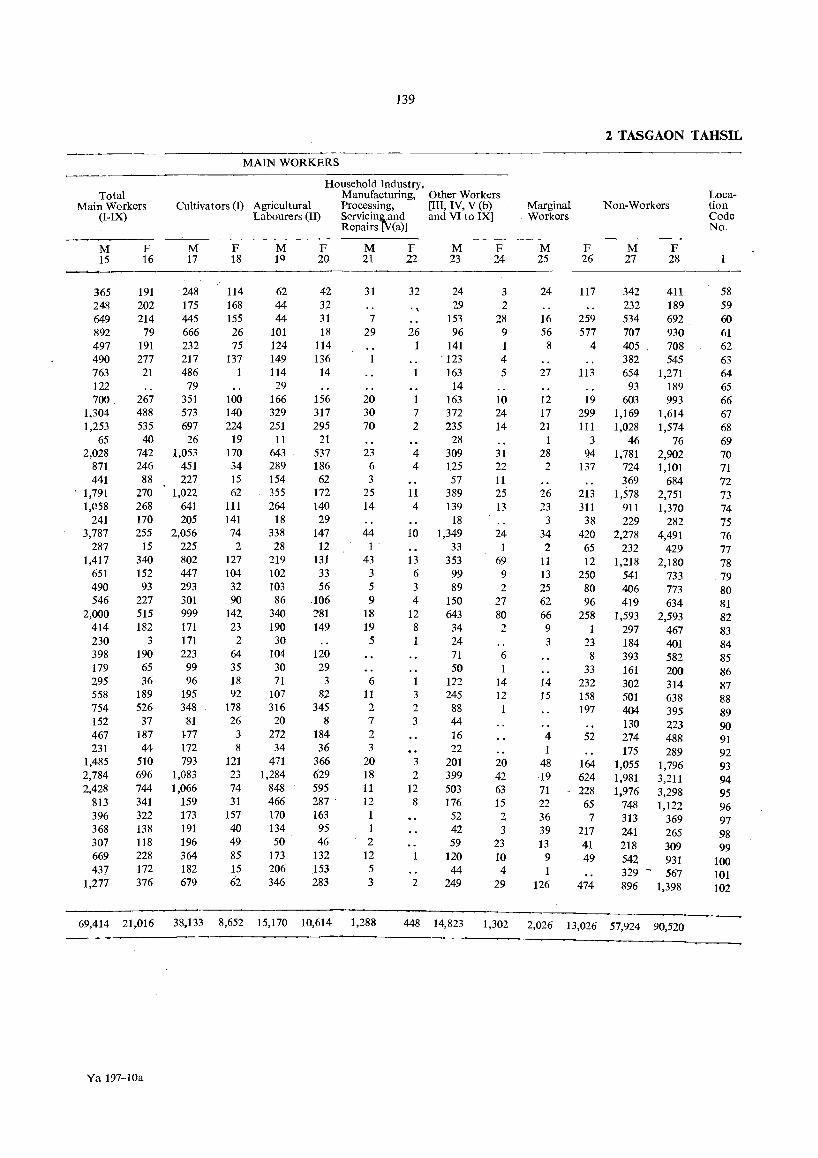
139
2 TASGAON TAHSIL
MAIN WORKERS
Household Industry, Total Manufacturing, Other Workers Loca-
Main Workers Cultivators (I) Agricultural Processing, [III, IV, V (b) Marginal Non-Workers tion (I-IX) Labourers (II) Servicin~nd and VI to IX] Workers Code
Repairs' (a)] No.
M F M F M F M F M F M F M F 15 16 17 18 19 20 21 22 23 24 25 26 27 28 1
365 191 ' 248 114 62 42 31 32 24 3 24 117 342 411 58 248 202 175 168 44 32 , \ 29 2 232 189 59 649 214 445 155 44 31 7 153 28 16 259 534 692 60 892 79 666 26 101 18 29 26 96 9 56 577 707 930 61 497 191 232 75 124 114 1 141 8 4 405 708 62 490 277 217 137 149 136 . 123 4 382 545 63 763 21 486 1 114 14 163 5 27 113 654 1,271 64 122 79 29 14 93 189 65 700 267 351 100 166 156 20 163 10 12 19 603 993 66
1,304 488 573 140 329 317 30 7 372 24 17 299 1,169 1,614 67 1,253 535 697 224 251 295 70 2 235 14 21 111 1,028 1,574 68
65 40 26 19 11 21 28 1 3 46 76 69 2,028 742 1,053 170 643 537 23 4 309 31 28 24 1,781 2,902 70
871 246 451 34 289 186 6 4 125 22 2 137 724 1,101 71 441 88 227 15 154 62 3 57 11 369 684 72
. 1,791 270 1,022 62 355 172 25 11 389 25 26 213 1,578 2,751 73 1,058 268 641 111 264 140 14 4 139 13 23 311 911 1,370 74
241 170 205 141 18 29 18 3 38 229 282 75 3,787 255 2,056 74 338 147 44 10 1,349 24 34 420 2,278 4,491 76
287 15 225 2 28 12 1 . 33 1 2 65 232 429 77 1,417 340 802 127 219 131 43 13 353 69 11 12 1,218 2,180 78
651 152 447 104 102 33 3 6 99 9 13 250 541 733 .79 490 93 293 32 103 56 5 3 89 2 25 80 406 773 80 546 227 301 90 86 106 9 4 150 27 62 96 419 634 81
2,000 515 999 142 340 281 18 12 643 80 66 258 1,593 2,593 82 414 182 171 23 190 149 19 8 34 2 9 1 297 467 83 230 3 171 2 30 5 24 3 23 184 401 84 398 190 223 64 104 120 71 6 8 393 582 85 179 65 99 35 30 29 50 1 33 161 200 86 295 36 96 18 71 3 6 122 14 14 232 302 314 87 558 189 195 92 107 82 11 3 245 12 15 158 501 638 88 754 526 348 178 316 345 2 2 88 1 197 4Q4 395 89 152 37 81 26 20 8 7 3 44 130 223 90 467 187 177 3 272 184 2 16 4 52 274 488 91 231 44 172 8 34 36 3 22 . 1 175 289 92
1,485 510 793 121 471 366 20 3 201 20 48 164 1,055 1,796 93 2,784 696 1,083 23 1,284 629 18 2 399 42 19 624 1,981 3,211 94 2,428 744 1,066 74 848 595 11 12 503 63 71 228 1,976 3,298 95
813 341 159 31 466 287 . 12 8 176 15 22 65 748 1,122 96 396 322 173 157 170 163 1 52 2 36 7 313 369 97 368 138 191 40 134 95 42 3 39 217 241 265 98 307 118 196 49 50 46 2 59 23 13 41 218 309 99 669 228 364 85 173 132 12 120 10 9 49 542 931 . 100 437 172 182 15 206 153 5 44 4 1 329 - 567 101
1,277 376 679 6'2 346 283 3 2 249 29 126 474 896 1,398 102
69,414 21,016 38,133 8,652 15,170 10,614 1,288 448 14,823 1,302 2,026 13,026 57,924 90,520 --------
Ya 197-10a
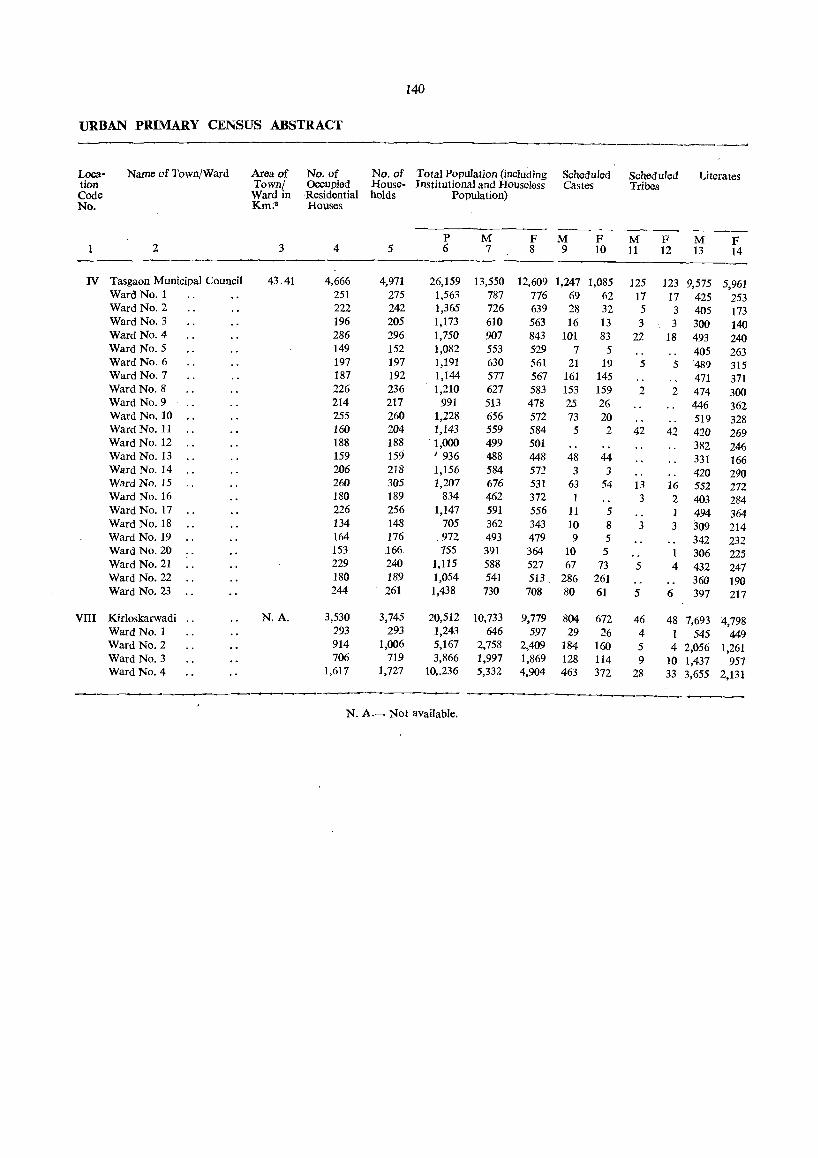
140
URBAN P~ARY CENSUS ABSTRACT
Loca- Name of Town/Ward Area of No. of No. of Total Population (including Scheduled Scheduled Literates tion Town/ Occupied House- Institutional and Houseless Castes Tribes Code Ward in Residential holds Population) No. Km.-2 Houses
--~
P M F M F M F M F 2 3 4 5 6 7 8 9 10 11 12 13 14
IV Tasgaon Municipal Council 43.41 4,666 4,971 26,159 13,550 12.609 1,247 1,085 125 123 9,575 5,961 Ward No.1 251 275 1,563 787 776 69 62 17 17 425 253 Ward No.2 222 242 1,365 726 639 28 32 5 3 405 173 Ward No.3 196 205 1,173 610 563 16 13 3 3 300 140 Ward No. 4 286 296 1,750 907 843 101 83 22 18 493 240 Ward No.5 149 152 1,082 553 5·29 7 5 405 263 Ward No.6 197 197 1,191 630 561 21 19 5 5 489 315 Ward No.7 187 192 1,144 577 567 161 145 471 371 Ward No.8 226 236 1,210 627 583 153 159 2 2 474 300 Ward No.9 214 217 991 513 478 25 26 .. 446 362 Ward No. 10 255 260 1,228 656 572 73 20 519 328 Ward No. 11 160 204 1,143 559 584 5 2 42 42 420 269 Ward No. 12 188 188 1,000 499 501 382 246 Ward No. 13 159 159 / 936 488 448 48 44 331 166 Ward No. 14 206 218 1,156 584 572 3 3 420 290 Ward No. 15 260 305 1,207 676 531 63 54 13 16 552 272 Ward No. 16 180 189 834 462 372 1 3 2 403 284 Ward No. 17 226 256 1,147 591 556 11 5 1 494 364 Ward No. 18 134 148 705 362 343 10 8 3 3 309 214 Ward No. 19 164 176 972 493 479 9 5 342 232 Ward No. 20 153 166 755 391 364 10 5 1 306 225 Ward No. 21 229 240 1,115 588 527 67 73 5 4 432 247 Ward No. 22 180 189 1,054 541 513. 286 261 360 190 Ward No. 23 244 261 1,438 730 708 80 61 5 6 397 217
VIII Kirloskarwadi .. N.A. 3,530 3,745 20,512 10,733 9,779 804 672 46 48 7,693 4,798 Ward No.1 293 293 1,243 646 597 29 26 4 1 545 449 Ward No.2 914 1,006 5,167 2,758 2,409 184 160 5 4 2,056 1,261 Ward No.3 706 119 3,866 1,997 1,869 128 114 9 10 1,437 957 Ward No.4 1,617 1,727 10,.236 5,332 4,904 463 372 28 33 3,655 2,131
~-~--...---~-
N. A.~ Not available.
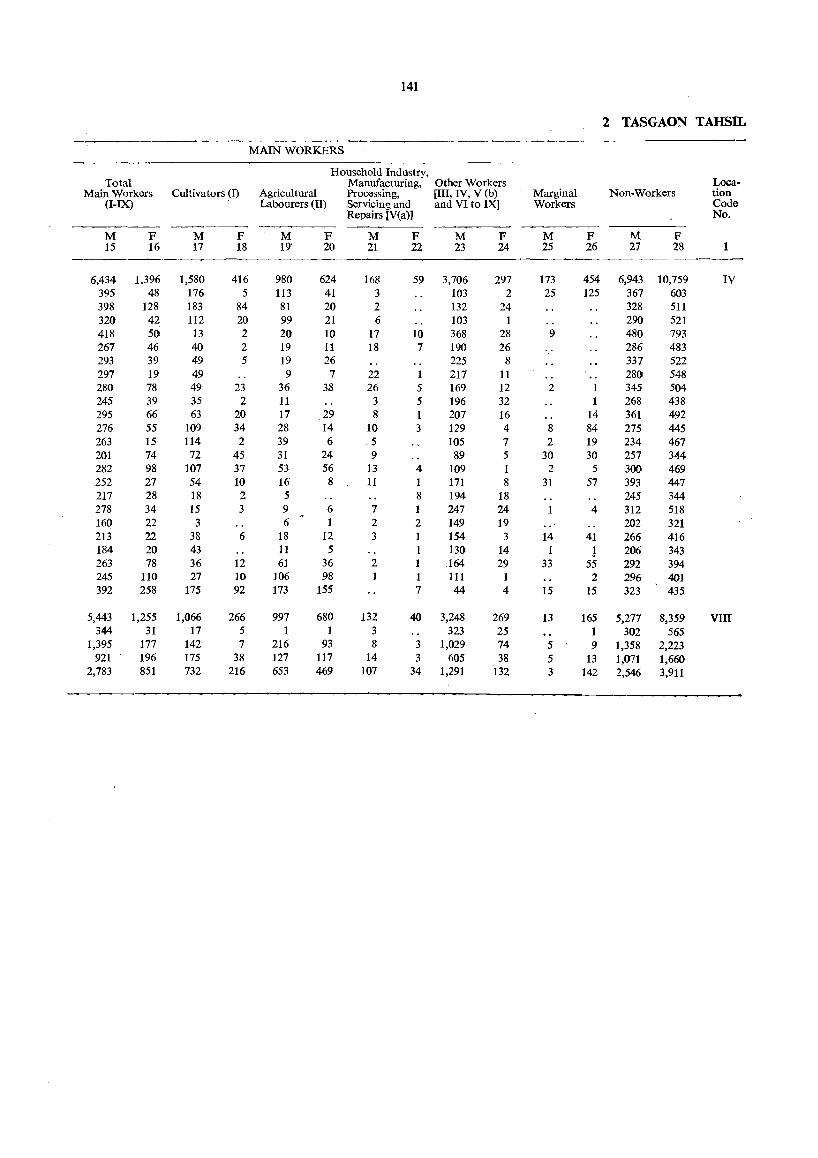
141
2 TASGAON TAHSn..
MAIN WORKERS
Household Industry, Total Manufacturing, Other Workers Loca-
Main WlJrkers Cultivators (I) Agricultural Processing, [III, IV, V (b) Marginal Non-Workers tion (I-IX) Labourers (II) Servicing and and VIto IX] Workers Code
Repairs IV(a)] No.
M F M F M F M F M F M F M F 15 16 17 18 19' 20 21 22 23 24 25 26 27 28
6,434 1,396 1,580 416 980 624 168 59 3,706 297 173 454 6,943 10,759 IV 395 48 176 5 113 41 3 103 2 25 125 367 603 398 128 183 84 81 20 2 132 24 328 511 320 42 112 20 99 21 6 103 1 290 521 418 50 13 2 20 10 17 10 368 28 9 480 793 267 46 40 2 19 11 18 7 190 26 286 483 293 39 49 5 19 26 225 8 337 522 297 19 49 9 7 22 217 11 280 548 280 78 49 23 36 3.8 26 5 169 12 2 1 345 504 245 39 35 2 11 3 5 196 32 1 268 438 295 66 63 20 17 29 8 207 16 14 361 492 276 55 109 34 28 14 10 3 129 4 8 84 275 445 263 15 114 2 39 6 5 105 7 2 19 234 467 201 74 72 45 31 24 9 89 5 30 30 257 344 282 98 107 37 53 56 13 4 109 2 5 300 469 252 27 54 10 16 8 11 1 171 8 31 57 393 447 217 28 18 2 5 8 194 18 245 344 278 34 IS 3 9 6 7 I 247 24 4 312 518 160 22 3 6 2 2 149 19 202 321 213 22 38 6 18 12 3 154 3 14 41 266 416 184 20 43 11 5 1 130 14 1 ! 206 343 263 78 36 12 61 36 2 1 164 29 33 55 292 394 245 110 27 10 106 98 1 111 1 2 296 401 392 258 175 92 173 155 7 44 4 15 15 323 435
5,443 1,255 1,066 266 997 680 132 40 3,248 269 13 165 5,277 8,359 VIII 344 31 17 5 1 1 3 323 25 1 302 565
1,395 177 142 7 216 93 8 3 1,029 74 5 9 1,358 2,223 921 196 175 38 127 117 14 3 605 38 5 13 1,071 1,660
2,783 851 732 216 653 469 107 34 1,291 132 3 142 2,546 3,911
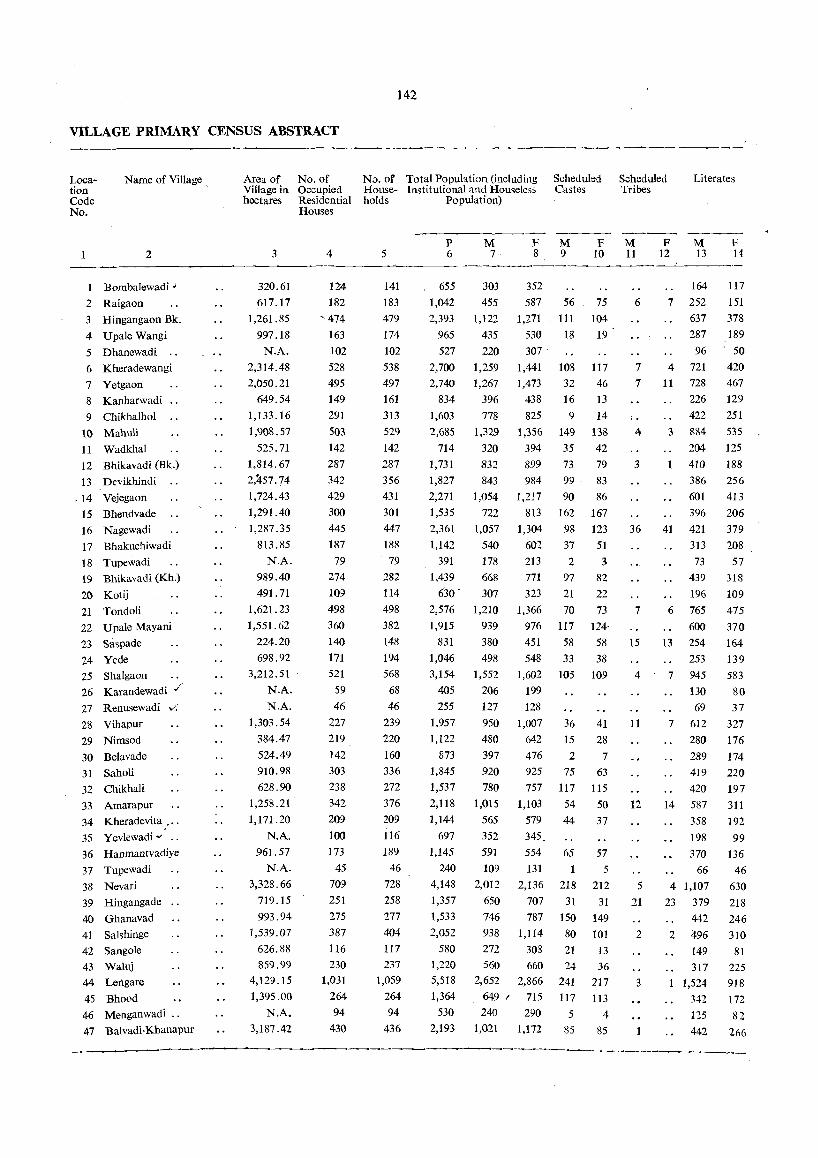
142
ViLLAGE PRIMARY CENSUS ABSTRACT
Location Code No.
Name of Village,
2
1 Bombalewadi J
2 Raigaon
3 Hingangaon Bk.
4 Upale Wangi
5 Dhanewadi ..
6 Kheradewangi
7 Yetgaon
8 Kanharwadi ..
9 Chikhalhol
10 Mahuli
11 Wadkhal
12 Bhikavadi (Bk.)
13 Devikhindi ..
,,14 Vejegaon
15 Bhendvade
16 Nagewadi
17 Bhakuchiwadi
18 Tupewadi
19 Bhikavadi (Kh.)
20 Kotij
21 Tondoli
22 U pale Mayani
23 Saspade
24 Yede 25 Shalgaon
26 Karandewadi./
27 Renusewadi v:
28 Vihapur
29 Nimsod
30 Belavade
31 Saholi
32 Chikhali
33 Amarapur
34 Kheradevita ...
35 Yevlewadi v ..
36 Hanmantvadiye
37 Tupewadi
38 Nevari
39 Hingangade
40 Ghanavad
41 Salshinge
42 Sangole
43 Waluj
44 Lengare
45 Bhood 46 Menganwadi ..
47 Balvadi·Khanapur
Area of No. of No. of Total Population (including Scheduled Scheduled Literates Village in Occupied House- Institutional and Houseless Castes Tribes hectares Residential holds Population)
Houses
3
320.61 617.17
1,261. 85 997.18
N.A. 2,314.48 2,050.21
649.54 1,133.16 1,908.57
525.71 1,814.67 2,~57. 74 1,724.43 1,291.40 1,287.35
813.85 N.A.
989.40 491. 71
1,621.23 1,551. 62
224.20 698.92
3,212.51 N.A. N.A.
1,303.54 384.47 524.49 910.98 628.90
1,258.21 '
1,171.20 N.A.
961.57 N.A.
3,328.66 719.15 993.94
1,539.07 626.88 859.99
4,129.15 1,395,00
N.A. 3,187.42
4
12:4-
182 , 474
163 102 528 495 149 291 503 142 287 342 429 300 445 187
79 274 109 498 360 140
171 521
59 46
227 219 142
303 238 342 209 100 173
45 709 251 275 387 116 230
1,031 264 94
430
5
141 183 479 174 102 538 497 161 313 529 142 287 356 431 301 447 188 79
282 114 498 382 148 194 568
68
46 239 220 160 336 272 376 209 116 189
46 728 258 277
404
117 237
1,059
264 94
436
P 6
M 7
F M 8 9
F M 10 11
655 303 352 1,042 455 587 56 75 2,393 1,122 1,271 . 111 104
965 435 530 18 19 527 220 307
2,700 1,259 1,441 108 117 2,740
834 1,603 2,685
714 1,731 1,827 2,271 1,535 2,361 1,142
391 1,439
6'30 ..
2,576 1,915
831 1,046 3,154
405
255 1,957 1,122
873 1,845 1,537 2,118 1,144
697 1,145
240 4,148 1,357 1,533 2,052
580 1,220 5,518 1,364
530 2,193
1,267 396 778
1,329 320 832 843
1,054 722
1,057 540 178 668
307 1,210
939 380 498
1,552 206 127 950 480 397 920 780
1,015 565 352 591
1,473 438 825
1,356 394 899 984
1,217 813
1,304 602 213 771 323
1,366 976 451 548
1,602 199 128
1,007 642 476 925 757
1,103 579 345, 554
32 16 9
149 35 73 99
90 162
98 37 2
97 21 70
117 58 33
105
36 15
2
75 117
54 44
65
46 13 14
138
42
79 83 86
167 123 51 3
82
22
73 124· 58 38
109
41 28
7
63 115
50 37
57 109 131 1 5
2,012 2,136 218 212 650 707 31 31 746 787 150 149 938 1,114 80 101 272 308 21 13 560 660 24 36
2,652 2,866 241 217 649 / 715 117 113 240 290 5 4
1,021 1,172 85 85
6
7 7
4
3
36
7
15
4
11
12
5
21
2
3
F 12
M 13
F 11
164 117
7 252 151 637 378 287 189
96 . 50
4 721 420 11
3
1
41
6
13
7
7
14
728 226 422 884 204 410 386 601 396 421 313 73
439 196 765 600 254 253 945 130 69
612 280 289 419 420 587 358 198 370
66
4 1,107 23 379
442 2 496
149 317
1,524 342
125 442
467 129 251 535
125 188 256 413 206 379 208 57
318 109 475 370 164 139 583
80 37
327 176 174 220 197 311 192 99
136 46
630 218 246 310
81 225
9J8 172 82
266
------------------------------

143
MAIN WORKERS
Total Main Workers
(I-IX)
M 15
135 204 598 192
91 621 574 156 359 596 154 403
401 509 396 525 269
72 314 153 537 469 167 226 751 98 61
489 212 188 492
457 540 275 183 291
39 990
341 342
513
147 232
1,250
339 lOS
529
F 16
80
20 375 63
24 717 224
7
292 232
88
426 117 507 311
567 199
79 317 28
188 229
167
212 211
99
7
49 300 38
237 224
234 58
224 83 62
403 435
66
370 17 76
644
112
608
Cultivators (I)
M 17
79 121 433 158
74 487 431 104 202 327 141 361 305 240 261 389 150
60
188 117 381 308 143 169 511
54 56
338 161 161 357 268 381 226 148 180 37
622 259 276 316
93 180 689 .
215 68
394
F 18
49 3
289 59 4
627 192
184 113
68 411
54 272 262 500 139
45 249
17 134 122 147 132
83 48
7
9
240 11
147 79 74 46
189 43 60
254 384 44
254
13
67 410
66
511
----------Ya 197-10 b
Household Industry, Manufacturing,
Agricultural Processing, Labourers (II) Servicing and
Repairs (Y(a)]
M 19
37 33 31 21 12 49 47 46
105
108 7
19 57
197 53 40 92 If 68 10 48 65 14 38 94 25
71 26 16 89
115 101 16 25 55
145 43 26
120 38 29
260
85
13 50
F 20
29
14 35 4
18 60 21 7
104
101
20
10
59 212 44
60 54 34 55
5
47 70 18 69
112
50
33
58 20
87 137
144 5
33
30
2
108 47 19 99
3
6
207
45 78
M 21
6
38 2
10 10
4
12 8
10
8
21
2
3
3
11
16 2
1
7
6
4
43
4
3
13
6
5
18
23
F 22
4
18
1,
7
3
3
3
26 2
2
5
2
7
3
8
4
6
1
3
9
Other Workers [III, IV, V(b) and VIto IX)
M 23
19
50 128 13
4
47 94 6
42 _lSI
6
23 35 60 74 86 27
1
50
26
87 94
7
16 135
18 4
64 23 10 45 73 51 27 10 52
2
180 35 37 64 10 18
283 39 24 62
F 24
2
3
47
2
12 11
4
17
4
3
16 5
4
6
10 6
4
11
11
14
2
7
3
7
9
4
2
9
33
3
11
3
24
10
3 KHANAPUR TAHSIL
Marginal Workers
Non-Workers
M 25
13
10
6
12
5
8
24 5
50 12
26
25 9
31
1
15 18
5
3
11
20
22 1
24 20
2
48
1 14 99
F 26
M 27
52 155 1 251
47 514 23 243
129 638
263 687 32 228
151 414 -89 725
174 142 424
423 392 47 533 14 326
59 506 2 271
7 106
354 154
105 648 32 461
213
272
56 770 3 108
26 65
460
12 253 57 191
428 29 318 26 472
208 279
169 89 280
70 575 1,000 33 308
250 380 162 405 180 123 161 327 380 1,354
309 51 121
144 393
F 28
220 566 849 444
283 723
986 399 382
1,035 132
473
444
663
488 678
401
127 454 295
1,073 715 284 336
1,335 97 95
958 330 381 688 504 843 313
121 382
69 1,158
239 471
582 111 423
1,842 ·715
127
420
Location Code No.
1
2
3
4
5 6
7 8
9
10 11
12 13
14 15 16 17 18
19 20 21 22
23 24 25 26 27 28 29 30 31 32 33
34 35 36 37 38 39 40
41 42
43 44 45 46 47
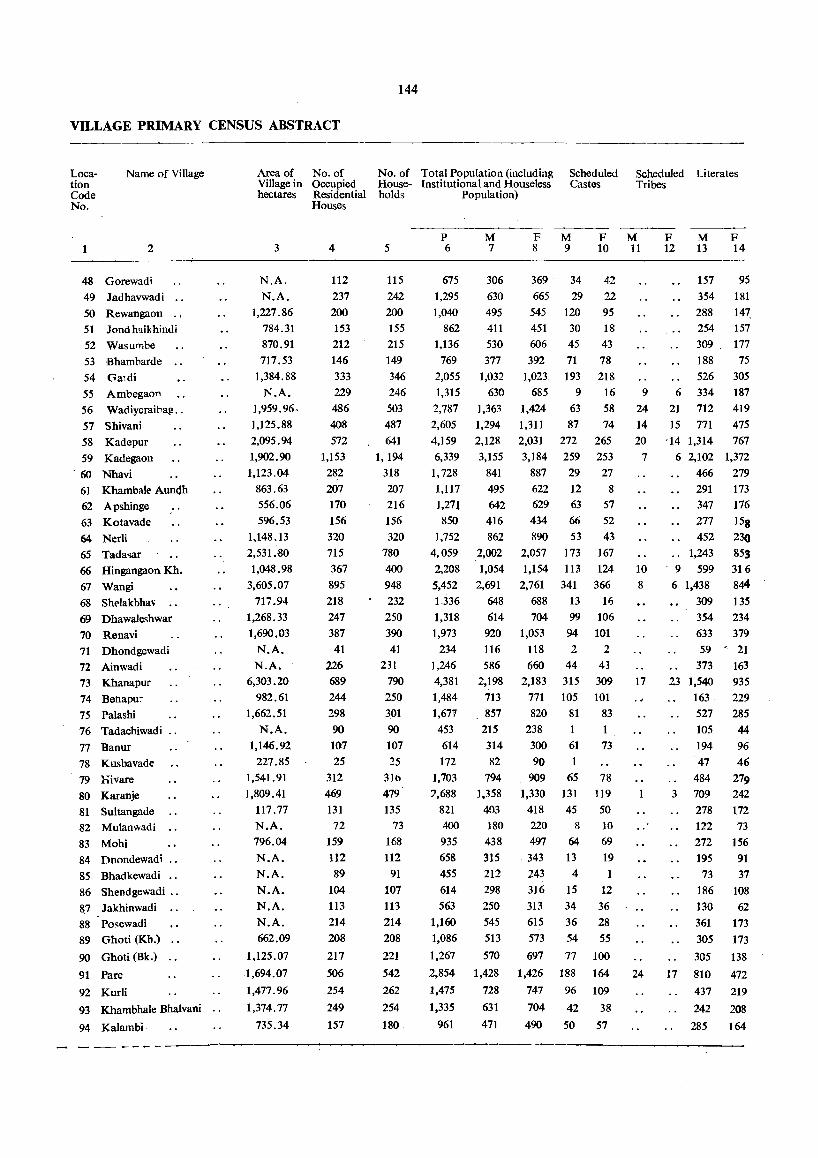
144
VILLAGE PRIMARY CENSUS ABSTRACT
Location Code No.
Name of Village Area of No. of No. of Total Population (including Scheduled Scheduled Literates Village in Occupied House- Institutional and Houseless Castes Tribes
2
48 Gorewadi
49 ladhavwadi ..
50 Rewangaon ..
51 londhalkhindi
52 Wasumbe
53 Bhambarde ..
54 0a:di
55 Ambegaon
56 Wadiyeraibag ..
57 Shivani
58 Kadepur
59 Kadegaon . 60 Nhavi
61 Khambale Aundh
62 Apshinge
63 Kotavade
64 Nerli
65 Tada'Sar
66 Hingangaon Kh.
67 Wangi
68 Sht"lakbha" ..
69 Dhawaleshwar
70 Renavi
71 Dhondgewadi
72 Ainwadi
73 Khanapur
74 Bei1apu~
75 Palashi
76 Tadachiwadi ..
77 Banur
78 Kusbavade
79 Bivare
80 Karanje
81 Sultangade
82 Mulanwadi
83 Mohi
84 Dnondewadi ..
85 Bhadkewadi ..
86 Shendgewadi ..
&7 lakhinwadi
88 Po~ewadi
89 Ghoti (Kh.)
90 Ghoti (Bk.) ..
91 Pare
92 Kurli
93 Khambhale Bhalvani "
94 Kalambi
hectares Residential holds Population) Houses
3
N.A.
N.A.
1,227.86
784.31
870.91
717.53
1,384.88
N.A.
1,959.96-
1,125.88
2,095.94
1,902.90
1,123.04
863.63
556.06
596.53
1,148.13
2,531.80
1,048.98
3,605.07
717.94
1,268.33
1,690.03
N.A.
N.A.
6,303.20
982.61
1,662.51
N.A.
1,146.92
227.85
1,541.91
1,809.41
117.77
N.A.
796.04
N.A.
N.A.
N.A.
N.A.
N.A.
662.09
1,125.07
1,694.07
1,477.96
1,374.77
735.34
4
112
237
200
153
212
146
333
229
486
408
572
1,153
282
207
170 156
320
715
367
895
218
247
387
41
226
689
244
298
90
107
25
312
469 131
72
159
112
89
104
113
214
208
217
506
254
249
157
5
115
242
200
155
215
149
346
246
503 487
641
1,194
318
207
216
156
320
780
400
948
232
250
390
41
231
790
250
301
90
107
:!5 316
479
135
73
168
112
91
107
113
214
208
221
542
262
254
180
P 6
M 7
F M F M 8 9 10 11
675
1,295
1,040
862
1,136
769
2,055
1,315
2,787
2,605
4,159
6,339
1,728
1,117 1,271
850
1,752
4,059
2,208
5,452
1.336
1,318
1,973
234
1,246
4,381
1,484
1,61'V
453
614
172
1,703
7,688
821
400
935
658
455
306
630
495
411 530
377
1,032
630
1,363
1,294
2,128
3,155
841
495
642
416
862
2,002
1,054
2,691
648
614 920
116
586
2,198
713
857
215
314
82
794
1,358
403
180
438
315
212
369 34 42
665 29 22
545 120 95
451 30 18
606 45 43
392 71 78
1,023 193 218
685 9 16
1,424 63 58
1,311 87 74
2,031 272 265
3,184 259 253
887 29 27
622 12 8
629 63 57
434 66 52
890 53 43
2,057 173 167
1,154 113 124
2,761 341 366
688 13 16
704 99 106
1,053 94 101
118 2 2
660 44 43
2,183 315 309
771 105 101
820 81 83
238 1 1
300 61 73
90
909 65 78
1,330 131 119
418 45 50
220 8 10
497 64 69
343 13 19
243 4 1
614 298 316 15 12
563 250 313 34 36
1,160 545 615 36 28
1,086 513 573 54 55
1,267 570 697 77 100
9
24
14
20
7
10
8
17
2,854 1,428 1,426 188 164 24
1,475
1,335
961
728
631
471
747 96 109
704 42 38
490 50 57
- - -- ------~.----~---------.----
F M F 12 13 14
157 95
354 181
288 147.
254 157
309. 177
188 75
526 305
6 334 187
21 712 419
15 771 475
'14 1,314 767
6 2,102 1,372
466 279
291 173 . 347 176
277 158
452 230
.. 1,243 853
9 599 316
6 1,438 844
309 135
354 234
633 379 59 ' 21
373 163
23 1,540 935
163 229
527 285
105 44
194 96
47 46
484 279 3 709 242
278 172
122 73
272 156
195 91
73 37
186 108
130 62
361 173
305 173
305 138
17 810 472
437 219
242 208
285 164
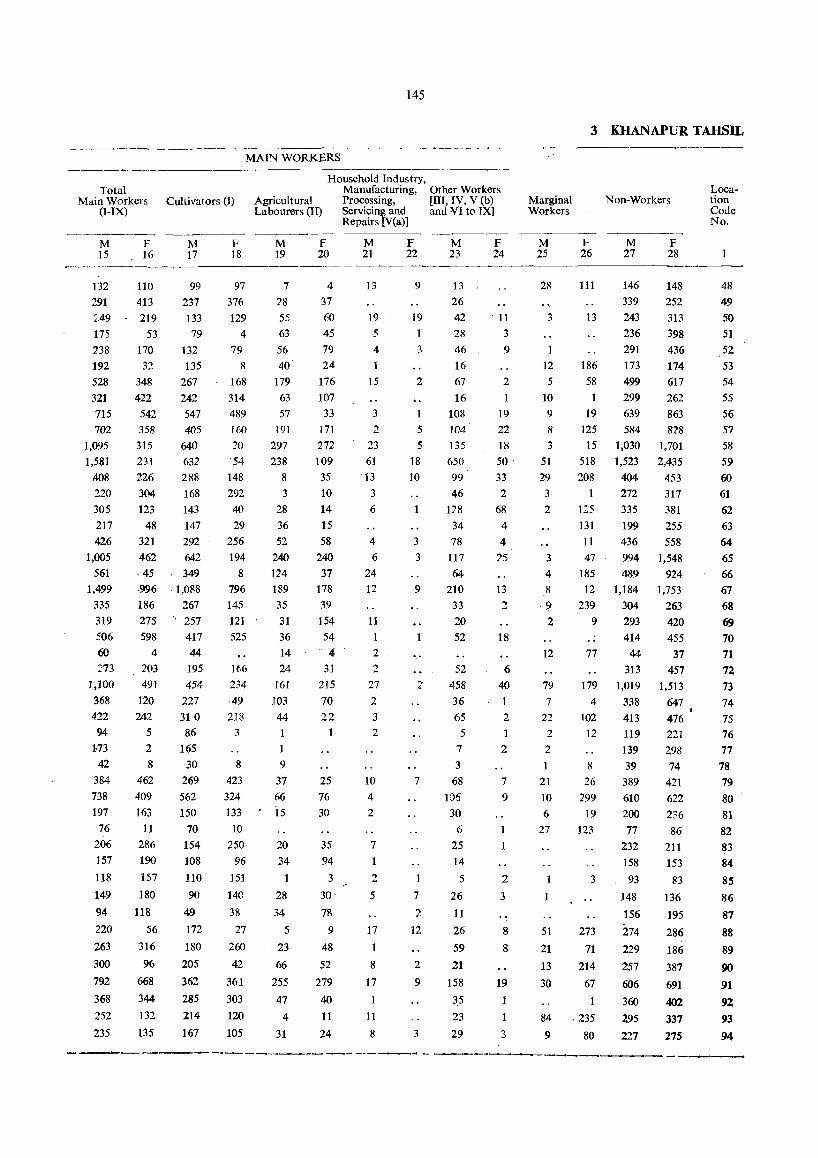
145
MAIN WORKERS
Total Main Workers
(I-IX)
M 15
F 16
110 413
219 53
170 32
348 422
542
Cultivators (I)
M 17
99 237
133 79
132 135
267
242 547
F 18
97
376 129
4 79
132 291 :49 175 238 192 528 321 715 702 358 405
8
168
314 489 160
20 '54
148 292
1,095 1,581
408 220 305 217 426
315 640 231 632
226 288 304 168 123 143 40
29 256 194
48 147 321 292
1,005 561
462 642
"45 349 8
796 145 121 525
1,499 335 319 :-06
60
:73
.996 ,1,088
186 267 275 257 598 417
4 44 203 195 166
1,100 491 454 234
368 120 227 49 422 242 31 0 218 94 5 86 3
1·73 2 165 42 8 30 8
384 462 269 423 738 409 562 324 197 163 150 133
76 11 70 10 206 286 154 250 157 190 108 96
118 157 110 151
149 180 90 140 94 118 49 38
220 56 172 27 263 316 180 260
300 96 205 42
792 668 362 361
368 344 285 303
252 132 214 120 235 135 167 105
Household Industry, Manufacturing, Other Workers
Agricultural Labourers (II)
M 19
7
28 55 63
56 40
179 63 57
191
297 238
8
3
28 36 52
240
1:24 189 35 31 36 14 24
161
103
44 1
1
9
37 66 15
20
34
28
34
5
23
66
255
47 4
31
F 20
4
37
60
45
79 24
176
107 33
171 :272 109 35 10 14 15 58
240
37 178 39 154 54 4
31 215 70 22
25 76
30
35 94
3
30'
78 9
48
52
279
40
11
24
Processing, [III, IV, V (b) Servicing and and VI to IX] Repairs [V(a)]
M 21
13
19 5
4
15
3
2 23 61 13
3
6
4
6
24 12
11
1
2
2
27
2
3 2
10 4
2
7
1
2
5
17
8
17
11
8
F 22
9
19
3
2
5
5
18 10
3
3
9
2
7
7
2
12
2
9
3
1\1 23
13 26
42 28
46 16 67
16
108
104
135 650 99
46
128 34 78
117 64
210
33
20 52
52 458 36 65
5
7
3
68 10!)
30 6
25 14
5
26
11
26
59
21
158
35
23
29
F 24
11
3
9
2
1
19 22
18 50
33
2
68
4
4
25
13 2
18
6
40
1
2 1
2
7
9
1
1
2
3
8
8
19
1
1
3
3 KHANAPUR TAHSIL
Marginal Workers
M 25
28
3
12 5
10 9
8
3 51 29
3
2
3
4
8
·9 2
12
F 26
111
13
186 58
1
19 125 15
518 208
1
1:5 131
11
47 185 12
239
9
77
Non-Workers
M 27
146
339 243 236 291
173
499 299 639 584
1,030 1,523
404
272
335 199 436
994 489
1,184 304
293 414
44 313
F 28
148 252 313 398
436 174 617
262 863 828
1,701 2,435
453 317 381
255 558
1,548 924
1,753
263 420 455
37 457
79 179 1,019 1,513 7 4 338 647
22 102 413 476 2 12 119 221
2 139 298 8 39 74
21 26 389 421 10 299 610 622 6 19 200 236
27 123 77 86
232 211 158 153
3 93 83
148 136
156 195
51 273 274 286
21 71 229 186
13 214 257 387
30 67 606 691
360 402 84 " 235 295 337
9 80 227 275
Location Code No.
48
49 50
51
52 53 54 55
56 57 58 59
60
61 62
63 64 65 66 67 68
69 70
71
72 73
74 75 76 77
78
79
80
81 82 83 84
85
86
87
88
89
90
91
92
93
94
,-------------------- - -----~-- -----------_
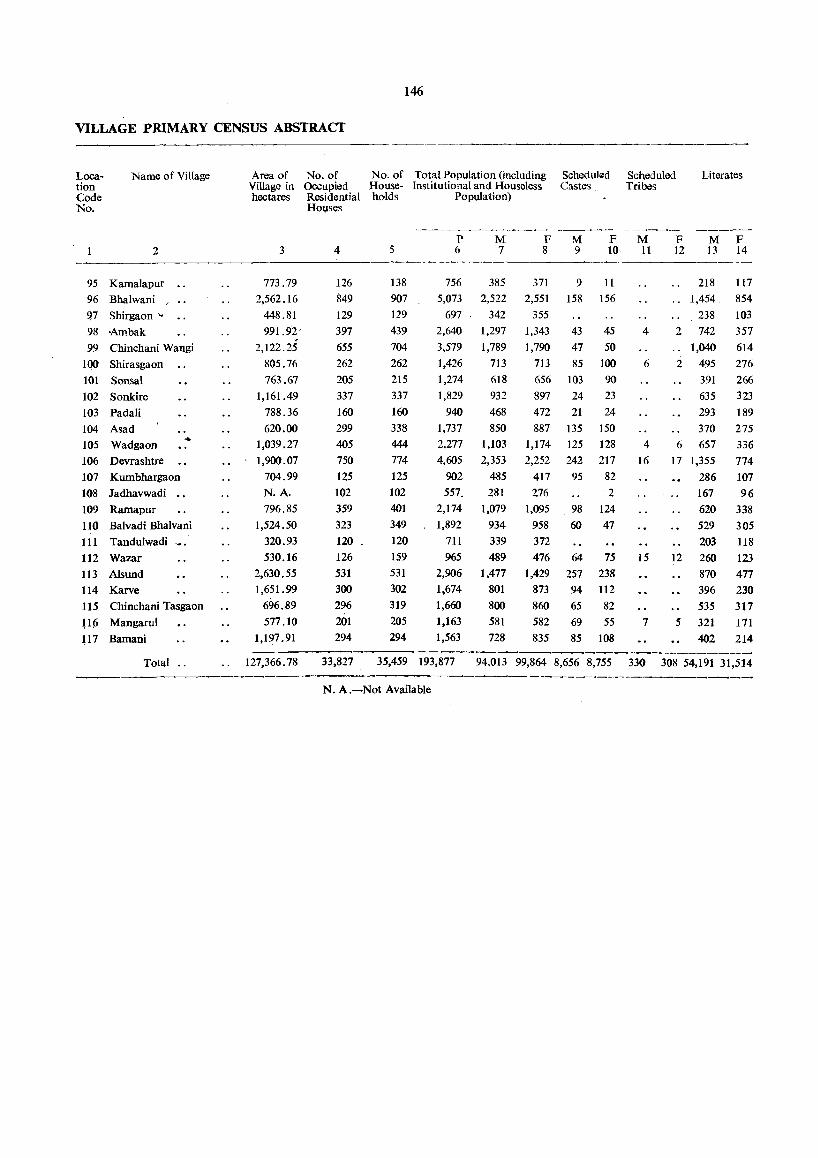
146
VILLAGE PRIMARY CENSUS ABSTRACT
Location Code No.
Name of Village
2
95 Kamalapur
96 Bhalwani
97 Shirgaon·~
98 ·Ambak
99 Chinchani Wangi
100 Shirasgaon
101 Sonsal
102 Sonkire
103 Padali
104 Asad
105 Wadgaon
106 Devrashtre
107 Kumbhargaon
108 Jadhavwadi ••
109 Ramapur
110 Balvadi Bhalvani
111 Tandulwadi
112 Wazar
113 Alsund
114 Karve
115 Chinchani Tasgaon
l16 Mangarul
117 Bamani
Total
Area of No. of No. of Total Population (including Scheduled Scheduled Literates Village in Occupied House- Institutional and Houseless Castes Tribes hectares Residential holds Population)
3
773.79
2,562.16
448.81
991.92'
2,122.25
805.76
763.67 1,161.49
788.36
620.00
1,039.27
1,900.07
704.99
N.A.
796.85
1,524.50
320.93
530.16
2,630.55
1,651.99
696.89
577.10
1,197.91
Houses
4
126
849
129
397
655
262
205
337
160 299
405 750
125
102
359
323
120 126
531
300
296
201 294
5
138
907
1L9
439
704
262
215
337
160
338
444
774
125
102 401
349
120
159 531
302
319
205
294
P 6
756
5,073
697
2,640
3,579
1,426
1,274
1,829
940
1,737
2,277
4,605 902
557.
2,174 1,892
711
965
2,906 1,674
1,660
1,163
1,563
M 7
385
2,522
342
1,297
1,789
713
618
932
468
850
1,103 2,353
485
281
1,079
934
339
489
1,477
801
800
581
728
F M 8 9
F M 10 11
371 9 11
2,551 158 156
355
1,343 43 45
1,790 47 50
713 85 100
656 103 90
897 24 23
472 21 24
887 135 150
1,174 125 128
2,252 242 217
417 95 82
276 2 1,095 98 124
958 60 47
372
476 64 75
1,429 257 23lS
873 94 112
860 65 82
582 69 55 835 85 108
4
6
4
16
15
7
F 12
M F 13 14
218
.. 1,454
238
2 742
.. 1,040
2 495
391
635
293
370
6 657
17 1,355
286
167
620
529
203
12 260
870
396
535
5 321
402
117
854
103
357
614
276
266
323
189
275
336
774
107
96
338
305
118
123
477
230
317
171
214
127,366.78 33,827 35,459 193,877 94,013 99,864 8,656 8,755 330 308 54,191 31,514
N. A.-Not Available
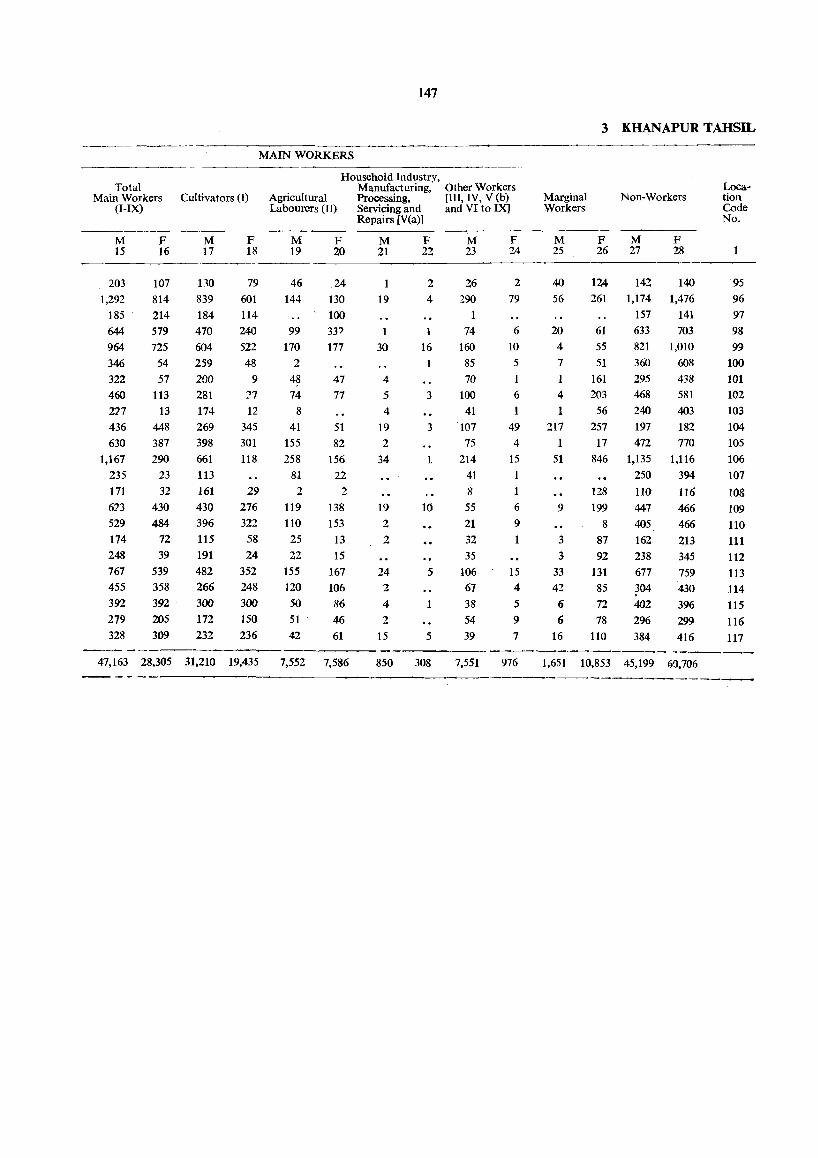
Total Main Workers
(I-IX)
M 15
203 1,292
185 644
964
346 322 460 2']7
436 630
1,167 235 171 673 529 174 248 767 455 392
279 328
F 16
107 814 214 579 725
54 57
113
13 448 387 290
23 32
430 484
72
39
539 358 392 205 309
147
MAIN WORKERS
Cultivators (I)
M 17
no 839 184 470 604 259 200 281 174 269 398 661 113 161 430 396 115
191
482 266 300
172 232
F 18
79 601 114 240
522 48
9
27
12 345 301 118
29 276 322
58 24
352 248 300
150
236
Household Industry, Manufacturing, Other Workers
Agricultural Labourers (II)
M 19
46 144
99 170
2
48 74
8
41 155 258
81
2
119 110
25 22
155 120 50
51 42
F 20
.24 130
100
33? 177
47 77
51 82
156 22
2
138
153 13 15
167 106 86 46 61
Processing, [III, IV, V (b) Servicing and and VI to IX) Repairs [V(a)]
M 21
1 19
1
30
4 5
4
19 2
34
19 2
2
24 2
4
2 15
F 22
2
4
16
3
3
1
10
5
1
5
M 23
26 290
1
74 160
85 70
100
41 107 75
214 41 8
55
21 32 35
106 67 38 54 39
F 24
2
79
6
10
5
6
1 49 4
15 1
1
6 9
1
15 4
5
9
7
Marginal Workers
M 25
40
56
20 4
7
1 4
1 217
1
51
9
3
3 33 42 6 6
16
3 KHANAPUR TAHSIL
Non-Workers
F M 26 27
124 261
61 55 51
161 203
56 257
17 846
128 199
8 87
92 131 85 72
78
110
142 1,174
157 633 821 360 295 468 240 197 472
1,135 250 110
447 405 162 238 677 304 402 296 384
F 28
140 1,476
141 703
1,010 608
438 581 403 182 770
1,116 394
116 466 466 213 345 759
430 396 299 416
Location Code No.
95 96 97 98 99
100
101 102 103 104 105 106 107
108
109
110
111 112 113
114
115 116 117
----------------------47,163 28,305 31,210 19,435 7,552 7,586 850 308 7,551 976 1,6S1 10,853 45,199 6(),706
----------

148
URBAN PRIMARY CENSUS ABSTRACT
Loca· Area of No. of No. of Total Populaticn (including Scheduled Scheduled Literates tien Name of Town/Ward Town! Occupied House- Institutional and Houseiess Castes Tribes Code Ward in Km.2 Residential holds Population! No. Houses
---- ----- ~----
P M F M F M F M F 2 3 4 5 6 7 8 9 10 11 12 13 14
_---
V Vita Municipal Council 55.27 4,221 4,350 24,081 12,521 11,560 1,355 1,242 47 30 9,015 5,245
Ward No.1 352 356 2,078 1,106 972 37 25 2 4 806 482
Ward No.2 197 210 996. 519 477 8 10 4 2 433 323
Ward No.3 183 183 1,042 551 491 8 4 L 439 274
Ward No 4 112 113 806 441 365 9 12 367 232
Ward No.5 130 133 783 416 367 63 42 299 195
Ward No.6 239 241 1,310 660 650 5 2 3 4 504 355
Ward No.7 352 356 1,955 1,013 942 123 103 3 1 689 428
Ward No.8 262 262 1,321 695 626 45 44 481 242
Ward No.9 170 193 1,146 559 587 6 3 273 107
Ward No. 10 206 209 1,286 625 661 21 20 356 159
Ward No. 11 200 207 1,057 588 469 26 17 19 9 476 280
Ward No. 12 184 184 1,079 573 506 216 180 451 230
Ward No. 13 162 162 962 487 475 263 282 330 171
Ward No. 14 140 140 860 433 427 6 6 12 9 364 297
Ward No. 15 100 169 851 431 420 5 6 349 234
Ward No. 16 170 170 852 452 400 41 39 340 183
Ward No. 17 199 199 1,135 596 539 287 264 410 157
Ward No. 18 182 182 937 478 459 36 31 359 224
Ward No. 19 214 214 958 514 444 19 19 416 275
Ward No. 20 250 250 ],441 771 670 44 48 490 244
Ward No. 21 217 217 1,226 613 613 87 85 2 1 383 153
- - --------_.
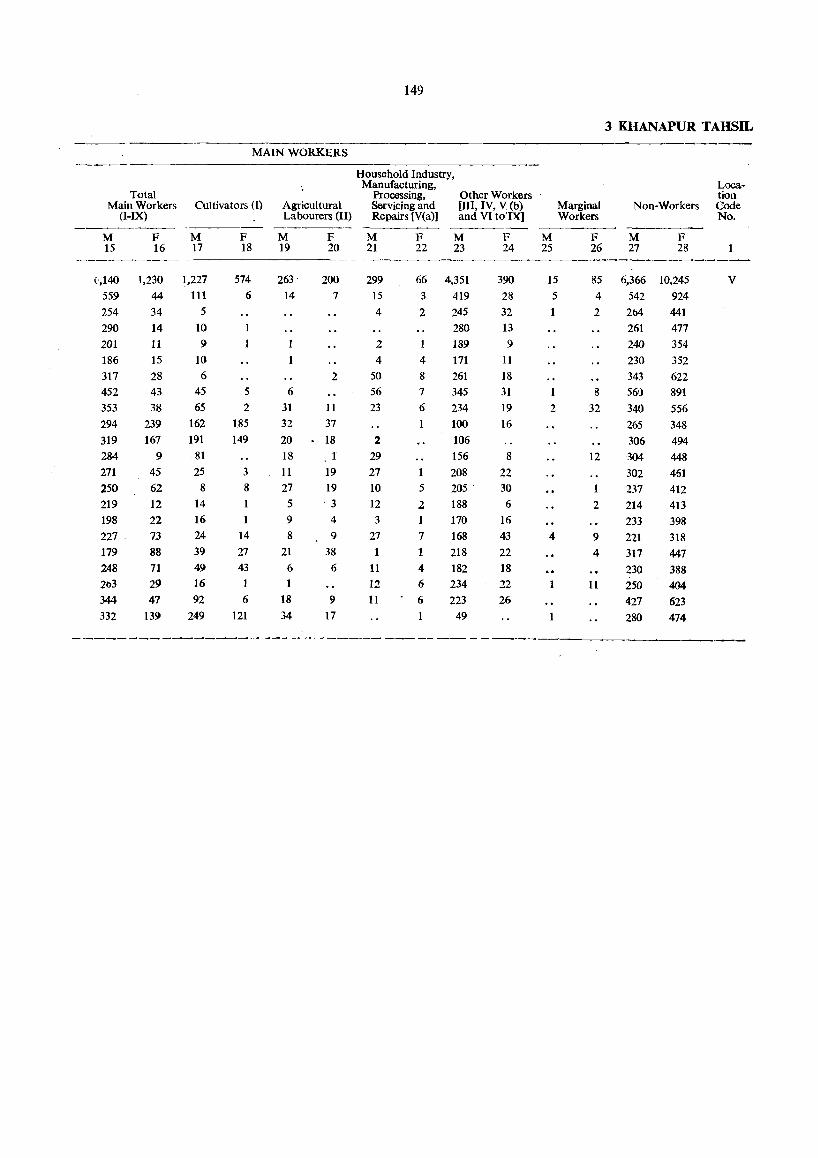
149
3 KHANAPUR TAHSIL -~---
MAIN WORKERS -----
Household Industry, Manufacturing, Loca-
Total Processing, Other Workers tion Main Workers Cultivators (I) Agricultural Servicing and [III, IV, V (b) Marginal Non-Workers Code
(I-IX) Labourers (II) Repairs [V(a)] and VI to'IXJ Workers No. ------ ---- --~-
M F M F M F M F M F M F M F 15 16 17 18 19 20 21 22 23 24 25 26 27 28
(,140 1,230 1,227 574 263- 200 299 66 4,351 390 15 85 6,366 10,245 V
559 44 111 6 14 7 15 3 419 28 5 4 542 924 254 34 5 4 2 245 32 2 204 441 290 14 10 1 280 13 261 477 201 11 9 1 2 189 9 240 354 186 15 10 4 4 171 11 230 352 317 28 6 2 50 8 261 18 343 622 452 43 45 5 6 56 7 345 31 8 56() 891 353 38 65 2 31 11 23 6 234 19 2 32 340 556 294 239 162 185 32 37 100 16 265 348 319 167 191 149 20 18 2 106 306 494 284 9 81 18 1 29 156 8 12 304 448 271 45 25 3 11 19 27 1 208 22 302 451 250 62 8 8 27 19 10 5 205 ' 30 237 412 219 12 14 5 '3 12 2 188 6 2 214 413 198 22 16 9 4 3 1 170 16 233 398 227 - 7.3 24 14 8 9 27 7 168 43 4 9 221 318 179 88 39 27 21 38 1 218 22 4 317 447 248 71 49 43 6 6 11 4 182 18 230 388 2n3 29 16 12 6 234 22 1 11 250 404 344 47 92 6 18 9 11 6 223 26 427 623 332 139 249 121 34 17 49 280 474
--------------------- - - ------ --- -- -- - -
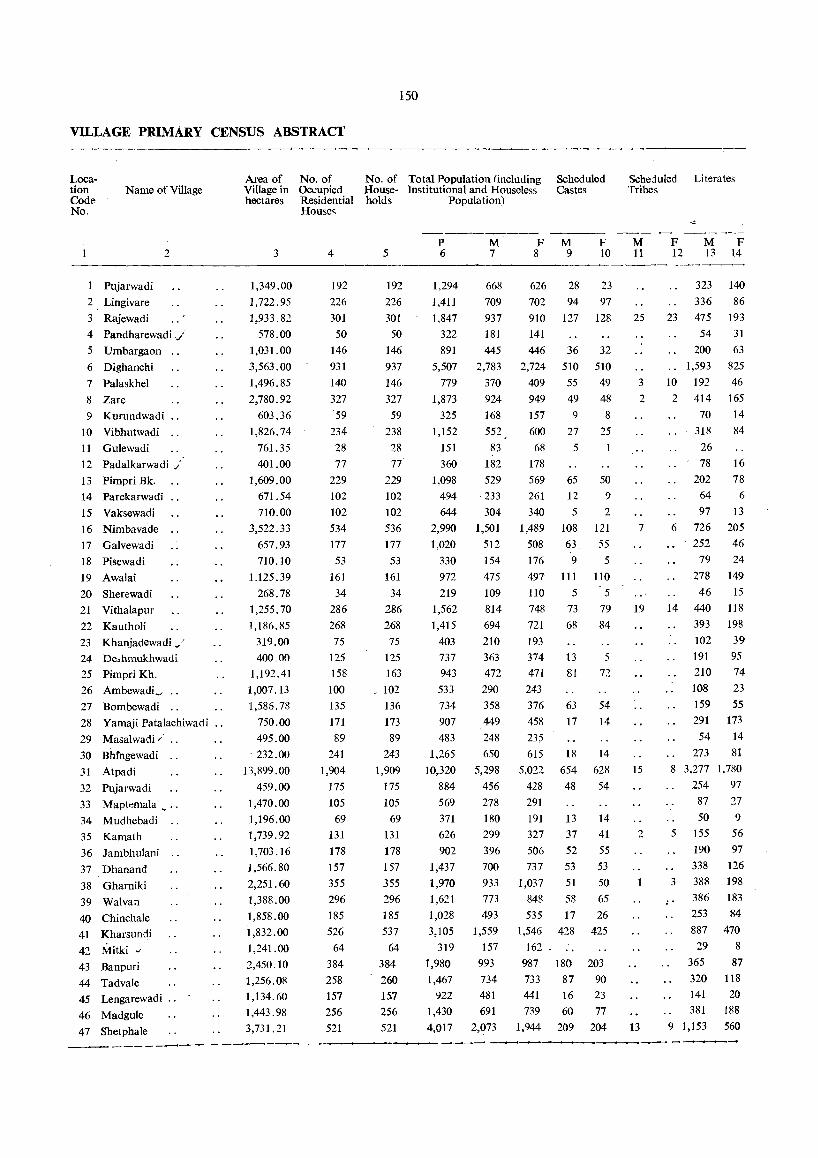
150
VILLAGE PRIMARY CENSUS ABSTRACT
Location Cod~ No.
Name of Village
Pujarwadi
2 Lingivare
3 Rajewadi
2
4 Pandharewadi.j
5 Umbargaon ..
6 Dighanchi
7 Palaskhel
8 Zare
9 Kurundwadi ..
10 Vibhutwadi "
11 Gulewadi
12 Padalkarwadi./
13 Pimpri Bk.
14 Parekarwadi ..
15 Vaksewadi
16 Nimbavade
17 Galvewadi
18 Pisewadi
19 Awalai
20 Sherewadi
21 Vithalapur
22 Kautholi
23 Khanjadewadi v'
24 De,hmukhwadi
25 Pimpri Kh.
26 AmbewadL ..
27 Bombewadi ..
28 Yamaji Patalachiwadi ..
29 Masalwadi / ..
30 Bhtngewadi ..
31 Atpadi
32 Pujarwadi
33 Maptemala ~ ..
34 Mudhebadi ..
35 Kamath
36 Jambhulani ..
37 Dhanand
38 Gharniki
39 Walvan
40 Chinchale
41 Kharsundi
42 Mitki 0/
43 Banpuri.
44 Tadvale 45 Lengarewadi ..
46 Madgule
47 Shetphale
Area of No. of No. {)f Total Population (including Scheduled Village in OCl;upied House- Institutional and Houseless Castes hectares Residential holds Population)
House,
3
1,349.00
1,722.95
1,933.82
578.00
1,031.00
3,563.00
1,496.85
2,780.92
603.36
1,826.74
761.35
401.00
1,609.00
671.54
710.00
3,522.33
657.93
710.10
1.125.39
268.78
1,255.70
1,186.85
319.00
400.00
1,192.41
1,007.13
1,586.78
750.00
495.00
. 232.00
13,899.00
4
192
226
301
50
146
931
140
327
59
234
28
77
229
102
102
534
177
53
161
34
286
268
75
125
158
100 135
171
89
241
1,904
175
105
69
131
178
157
355
296
185
526
5
192
226
301
50
146
937
146
327
59
238
28
77
229
102
102
536
177
53
161
34
286
268
75
125
163
, 102
136
173
89
243
1,909
175
105
69
131
178
157
355
296
185
537
P 6
M 7
1,294 668
1,411 709
1,847 937
322 181
891 445
5,507 2,783
779 370
1,873 924
325 168
1,152 552
151 83
360 182
1,098 529
494 ·233
644 304
2,990 1,501
1,020 512
330 154
972 475
219 109
1,562 814
1,415 694
403 210
737
943
533
734
907
483
1,265
10,320
884
569
371
626
902
1,437
1,970
1,621
1,028
3,105
319
1,980
1,467
922
1,430
363
472
290
358
449
248
650
5,298
456
278
180
299
396
700
933
773
493
1,559
157
993
734
481
691
F M 8 9
F 10
626 28 23
702 94 97
910 127 128
141
446 36 32
2,724 510 510
409 55 49
949 49 48
157 9 8
600 27 25
68 5 1
178
569 65 50
261 12 9
340 5 2
1,489 108 121
508 63 55
176 9 5
497 111 110
110 5 5
748 73 79
721 68 84
193
374
471
243
376
458
235
615
5,022
428
291
191
327
506
737
1,037
848
535
1,546
162
987
733
441
739
13
81
63
17
5
72
54
14
18 14
654 628
48 54
13 14
37 41
52 55
53 53
51 50
58 65
17 26
428 425
180 203
87 90
16 23
60 77
459.00
1,470.00
1,196.00
1,739.92
1,703.16
1,566.80
2,251. 60
1,388.00
1,858.00
1,832.00
1,241.00
2,450.10
1,256.08
1,134.60
1,443.98
3,731.21
64
384
258
157
256
521
64
384
260
157
256
521 4,017 2,073 1,944 209 204
Scheduled Literates Tribes
M 11
25
3
2
7
19
15
2
13
F M F 12 13 14
323 140
336 86
23 475 193
54 31
200 63
.. 1,593 825
10 192 46
2 414 165
70 14
318 84
26
78 16
202 78
64 6
97 13
6 726 205
252 46
79 24
278 149
46 15
14 440 118
393 198
102 39
191 95
210 74
108 23
159 55
291 173
54 14
273 81
8 3,277 1,780
254 97
87 27
50 9
5 155 56
3
;.
190 97
338
388
386
253
126
198
183
84
887 470
29 8
365 87
320 118
141 20
381 188
9 1,153 560
--------- --- ._------------- -,~--~-.---
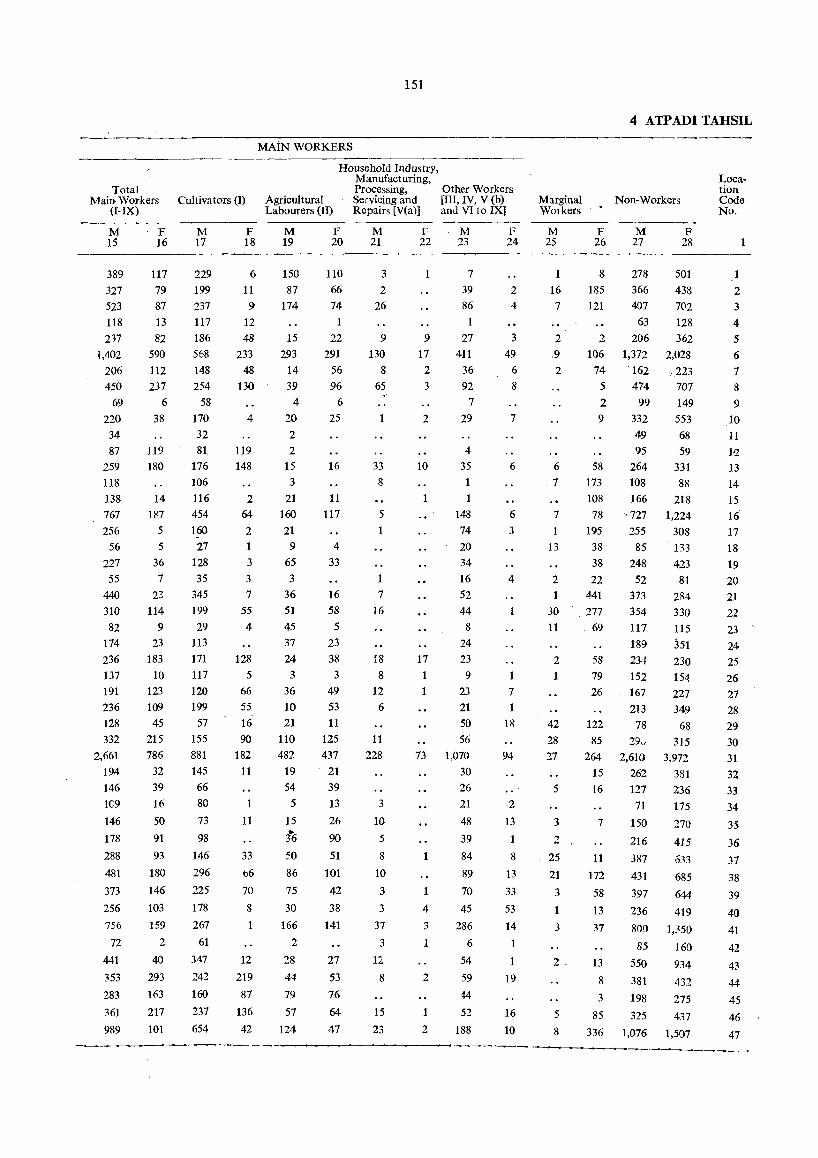
Total Main Workers
(!-IX)
M 15
389 327 523 118 237
1,402 206 450
69 220 34 87
259 118 138 767 256
56 227
55 440
310
82 174 236 137 191 236 128 332
2,661 194 146 le9
146
178
288
481
373
256
756
72
441
353
283
361
989
F 16
117 79 87 13
82 590 112 237
6 38
119 180
14 187
5
5
36 7
2~
114 9
23 183
10 123 109 45
215 786
32 39 16
50
91
93
180
146
103
159
2
40
293
163
217
101
Cultivators (1)
M 17
229 199 237 117 186 568 148 254
58 170 32 81.
176 106 116 454 160
27 128 35
345 199 29
113 171 117 120 199
57 155 881 145 66 80
73
98
146
296
225
178
267
61
347
242
160
237
654
F 18
6
11 9
12 48
233 48
130
4
119 148
2 64
2
3
3
7
55 4
128 5
66
55
16 90
182 11
1
11
33
c6
70
8
12
219
87
136
42
-----_.------------
151
MAiN WORKERS
Agricultural Labourers (II)
Household Industry, Manufacturing, Processing, Servicing and Repairs [V(a)]
M 19
150 87
174
15 293
14 39
4 20 2
2 15
3 21
160
21 9
65 3
36 51 45 37 24 3
36 10 21
110 482
19 54
5
15
36 50
86
75
30
166
2
28
44
79
57
124
F 20
110
66
74 1
22
291 56 96
6
25
16
11 117
4
33
16 58
5
23 38
3
49 53 11
125 437
21 39 13
26
90
51 101
42
38
141
27
53
76
64
47
M 21
3 2
26
9
130
8
65
33 8
5
7
16
18 8
12 6
11 228
3
10
5
8
10
3
3
37
3
1~
8
15 23
F 22
9
17 2
3
2
10
17
73
4
3
2
2
Other Workers [III, IV, V (b) and VI to IX]
M 23
7
39 86
1
27
411 36 92
7
29
4 35 1
1 148 74 20 34 16 52 44
8
24 23 9
23
21 50 56
1,070
30 26 21
48
39
84
89
70
45 286
6
54
59
44 52
188
F 24
2 4
3
49 6
8
7
6
6
3
4
7
1
18
94
2
13
8
13
33
53
14
1
19
16
10
4 ATPADI TAHSIL
Marginal WOlkers
M 25
F 26
8
16 185 7 121
2 2 ,9 106 2 74
5
2 9
6 58 .7 17>
108 7 78 1 195
13 38 38
2 22 1 441
30 277 11 69
2 58 79 26
42 122 28 85 27 264
15 5 16
3 7
2 ,
25 11
21 172
3 58
13
3 37
Non-Workers
M 27
278 366 407
63 206
1,372 162 474
99 332 49 95
264 108 166
·727 255
85 248 52
373 354 117 189 234 152 167 213
78 29v
2,610 262 127
71
150
216
387
431
397
236
F 28
501 438 702 128 362
2,028 .223
707
149 553 68 59
331 88
218 1,224
308 133
423 81
284 330
115 351
230 154 227
349 68
315 3.972
381 236 175
270
415
633
685
644 419
800 1,350
85 160 2 . 13 550 934
8 381 432
3 198 275
5 85 325 417
8 336 1,076 1,507
Location Code No.
1 2
3
4 5
6
7
8
9
10 11 1-2 13 14 15 16 17 18 19 20 21 22 23 24 25 26 27 28 29 30 31 32 33
34
35
36
37
38
39
40
41
42
43
44
45
46
47 ---.--------~---~---~--- ---------
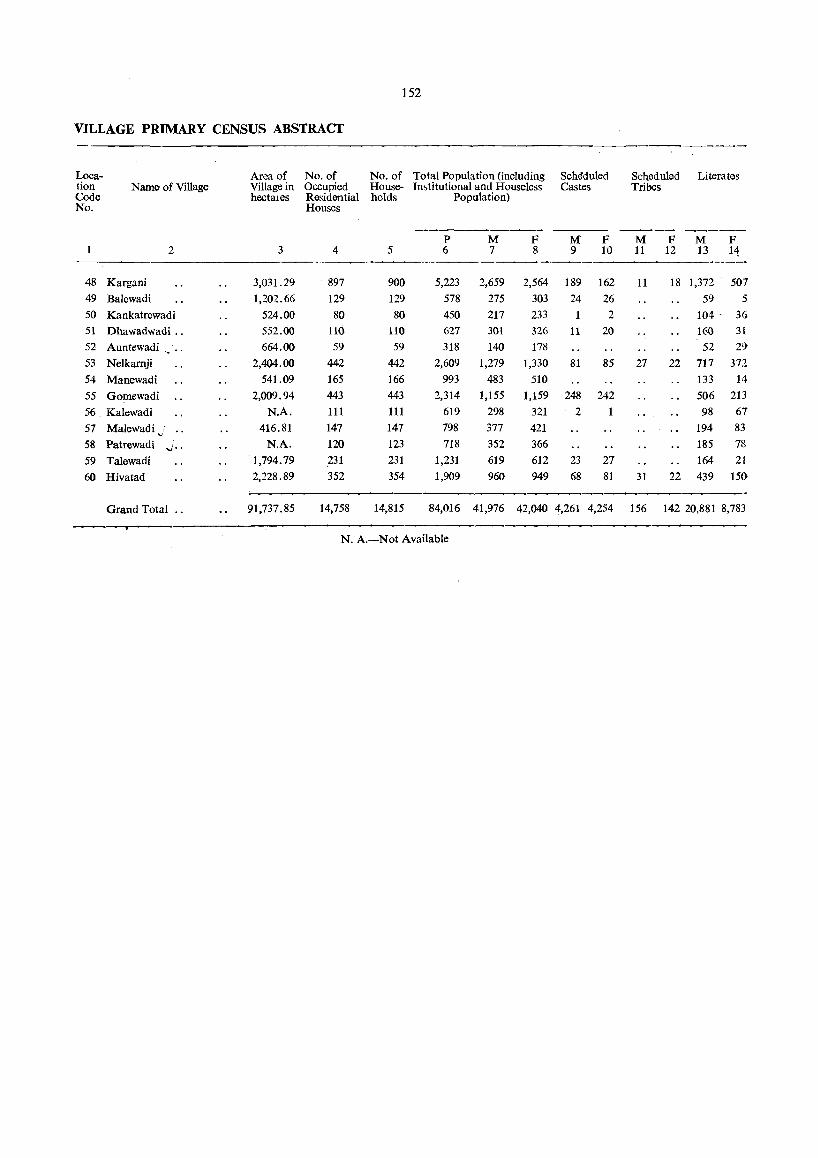
152
VILLAGE PRIMARY CENSUS ABSTRACf
Loca- Area of No. of No. of Total Population (including Scheduled Scheduled Literates tion Name of Village Village in Occupied House- In~titutional and Houseless Castes Tribes Code hectales Residential holds Population) No. Houses
-------P M F M F M F M F
2 3 4 5 6 7 8 9 10 11 12 13 14
48 Kargani 3,031.29 897 900 5,223 2,659 2,564 189 162 11 18 1,372 507 49 Balewadi 1,202.66 129 129 578 275 303 24 26 59 5 50 Kankatrewadi 524.00 80 80 450 217 233 1 2 104 - 36 51 Dhawadwadi .. 552.00 110 110 627 301 326 11 20 160 31 52 Auntewadi .~ 664.00 59 59 318 140 178 52 29 53 Nelkarnji 2,404.00 442 442 2,609 1,279 1,330 81 85 27 22 717 372 54 Manewadi 541.09 165 166 993 483 510 133 14 55 Gomewadi 2,009.94 443 443 2,314 1,155 1,159 248 242 506 213 56. Kalewadi N.A. 111 111 619 298 321 2 98 67 57 Malewadi v
416.81 141 147 798 377 421 194 83
58 Patrewadi v·· N.A. 120 123 718 352 366 185 7&
59 Talewadi 1,794.79 231 231 1,231 619 612 23 27 164 21 60 Hivatad 2,228.89 352 354 1,909 960 949 68 81 31 22 439 150
Grand Total 91,137.85 14,758 14,815 84,016 41,976 42,040 4,261 4,254 156 142 20,881 8,783
N. A.-Not Available
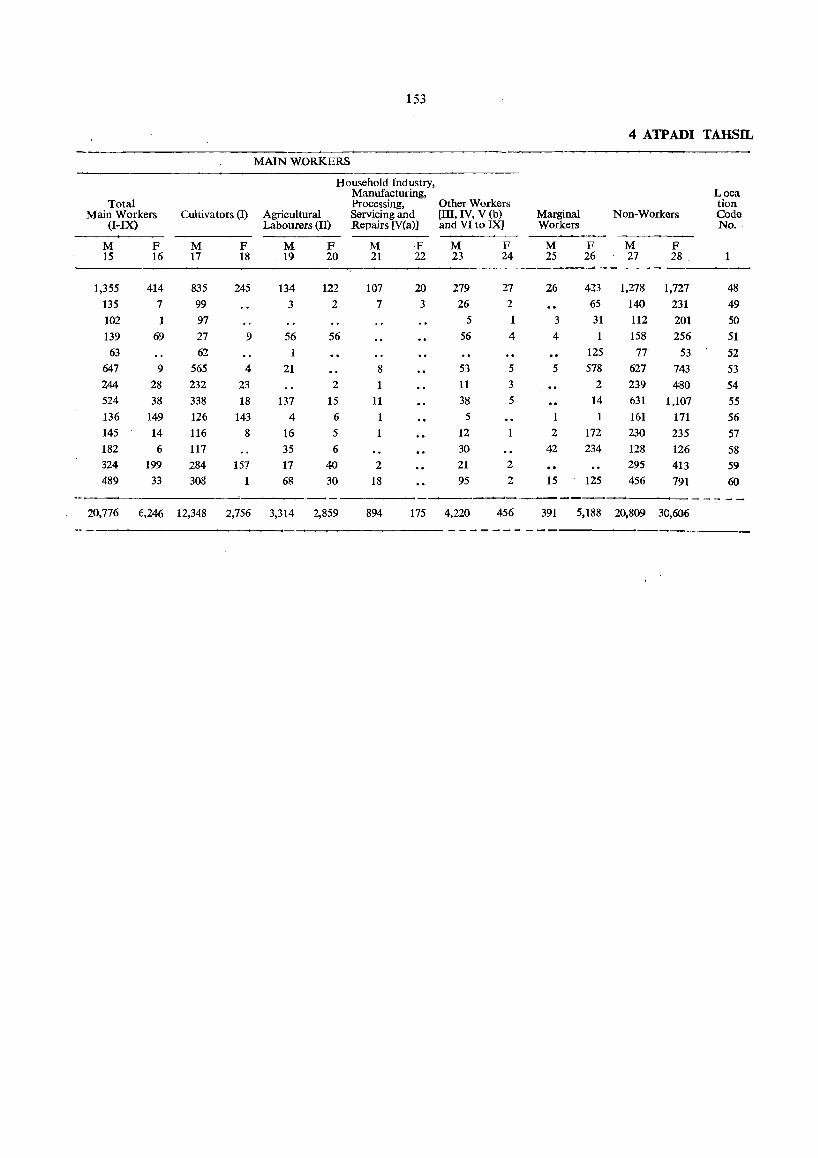
153
4 ATPADI TAHSIL
MAIN WORKERS
Household Industry, Manufacturing, Loca
Total Processing, Other Workers tion Main Workers Cultivators (I) Agricultural Servicing and [III, IV, V (b) Marginal Non-Workers Code
(I-IX) Labourers (II) Repairs [V(a)] and VI to IX] Workers No ..
M F M F M F M F M F M F M F 15 16 17 18 19 20 21 22 23 24 25 26 27 28 1
1,355 414 835 245 134 122 107 20 279 27 26 423 1,278 1,727 48 135 7 99 3 2 7 3 26 2 65 140 231 49 102 1 97 5 1 3 31 112 201 50 139 69 27 9 56 56 56 4 4 158 256 51
63 62 1 125 77 53 52 647 9 565 4 21 8 53 5 5 578 627 743 53 244 28 232 23 2 1 11 3 00 2 239 480 54 524 38 338 18 137 15 11 38 5 14 631 1,107 55 136 149 126 143 4 6 5 1 161 171 56 145 14 116 8 16 5 12 2 172 230 235 57 182 6 117 35 6 30 42 234 128 126 58 324 199 284 157 17 40 2 21 2 295 413 59 489 33 308 1 68 30 18 95 2 15 125 456 791 60
... _-- --- --20,776 6,246 12,348 2,756 3,314 2,859 894 175 4,220 456 391 5,188 20,809 30,606
- - - - - - _' ---
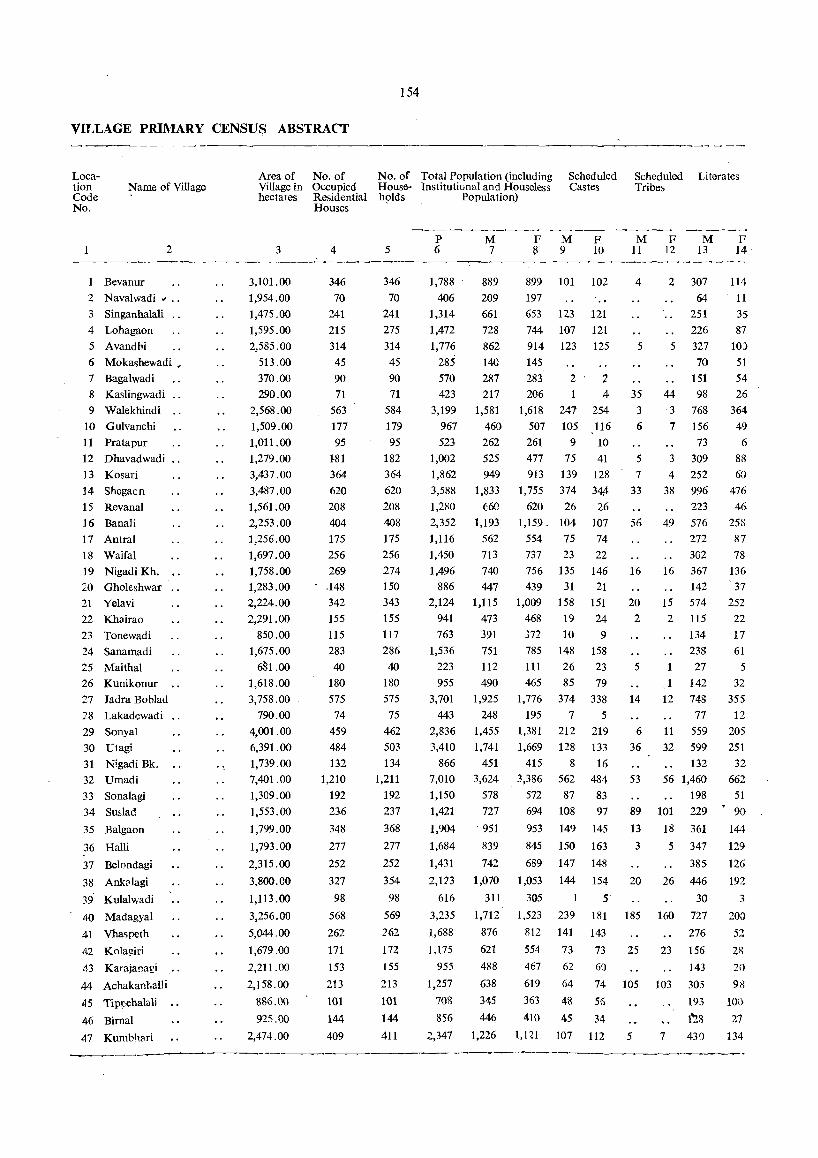
154
VILLAGE PRIMARY CENSUS ABSTRACT
Location Code No.
Name of Village
2
Bevanur
2 Navalwadi J ••
3 Singanhalali ..
4 Lohagaon
5 Avandhi
6 Mokashewadi.
7 Bagalwadi
8 Kaslingwadi
9 Walekhindi
10 Gulvanchi
11 Pratapur
12 Dhavadwadi ..
13 Kosari
14 Shegacn
15 Revanal
16 Banali
17 Antral
18 Waifal
19 Nigadi Kh.
20 Ghole.shwar
21 Yelavi
22 Khairao
23 Tonewadi
24 Sanamadi
25 Maitha1
26 Kunikonur
27 Jadra BobJad
28 Lakadewadi ..
29 Sonyal
30 Utagi
3i Nigadi Bk_
32 Umadi
33 Sonalagi
34 Suslad
35 Balgaon
36 Halli
37 Belondagi
38 Ankvlagi
39 Kulalwadi
40 Madagyal
41 Vhaspeth
42 Kolagiri
43 Karajanari
44 Achakanhalli
45 Tippehalali
46 Bimal
47 Kumbhari
.-_---_------- ---
Area of No. of No. of Total Population (including Scheduled Scheduled Literates Village in Occupied House- Institutic.nal and Houseless Castes Tribes hectares Residential holds Population)
Houses
3 4 5 P 6
M 7
F M F M F 8 9 10 11 12
M 13
F 14
._---_----------3,101.00
1,954.00
1,475.00
1,595.00
2,585.00
513.00
370.00
290.00
2,568.00
1,509.00
1,011.00
1,279.00
3,437.00
3,487.00
1,561.00
2,253.00
1,256.00
1,697.00
1,758.00
1,283.00
2,224.00
2,291.00
850.00
1,675.00
681.00
1,618.00
3,758.00
790.00
4,001.00
6,391.00
1,739.00
7,401.00
1,309.00
1,553.00
1,799.00
1,793.00
2,315.00
3,800.CO
1,113.00
3,256.00
5,044.00
1,679.00
2,211.00
2,158.00
886.00
925.00
2,474.00
346
70
241
215
314
45
90
71
563
177
95
181
364 620
208
404
175
256
269 - .148
342
155
115
283
40
180
575
74
459
484
132
1,210
192
236
348
277
252
327
98
568
262
171
153
213
101
144 409
346
70
241
275
314
45
90
71
584
179
95
182
364
620 208
408
175
256
274
150
343
155
117
286
40
180
575
75
462
503
134
1,211
192
237
368
277
252
354
98
569
262
172
155
213
101
144
411
1,788 -
406
1,314
1,472
1,776 285
570
423
3,199
967
523
1,001
1,862
3,588
1,2i10 2,352
1,116
1,450
1,496
886
2,124
941
763
1,536
223
955
3,701
443 2,836
3,410 866
7,010
1,150
1,421
1,904
1,684
1,431
2,123
616
3,235
1,688
1,175
955
1,257
70R
856
889
209
661
728
862
140
287
217
1,581
460
262
525
949
1,833 (;60
1,193
562 713
740
447 1,115
473
391
751 112
899 101
197
653 123 744 107 914 123
145
283 2 206 1
1,618 247
507 105
261 9
477 75
913 139
1,755 374
620 26
1,159. 104
554 75
737 23
756 135
439 31
1,009 158 468 19
372 10 785 148
111 26 490 465 85
374
7
212
128
8
562
1,925 1,776
248 195
1,455 1,381
1,741 1,669
451 415
3,624 . 3,386
578 572
727 694
951 953
839 845
742 689
1,070 1,053
311 305
1,712 1,523
876 812
621 554
488 467
638 619
345 363
446 410
87 108
149
150
147
144
239
141
73
62
64
48
45
102
121
121
125
'2 4
254
116
10
41
12S
34ff. 26
107
74
22 146
21
151
24
9
158 23
79
4
5
35
3
6
5
7
33
56
16
20
2
5
338 14
5
219 6
133 36
16 484 53
83
97 89
145 13
163 3
148
154 20
5
181 185
143
73 25
60
74 105
56
34
2,347 1,226 1,121 107 112 5
2
5
44 3
7
3
4
38
49
16
15
2
307
64
251 226
327
70
151
98
768
156 73
309
252
996
223
576
272
302
367
142 574 115
134
238 27
.1 142
12 748
77 11 559
32 599 132
56 1,460
198
101 229
18 361
5 347
385
26 446
30
160 727
276
23 156
143
103 30)
7
193
1'2.8
430
114
11
35
87 10:)
51
54
26
364
49 6
88
60
476
46
258 87
78
136
37
252
22 17
61
5
32
355 12
205
251
32
662 51 90
144
129
126
192
3
200
52
28
20
98
100
27 134
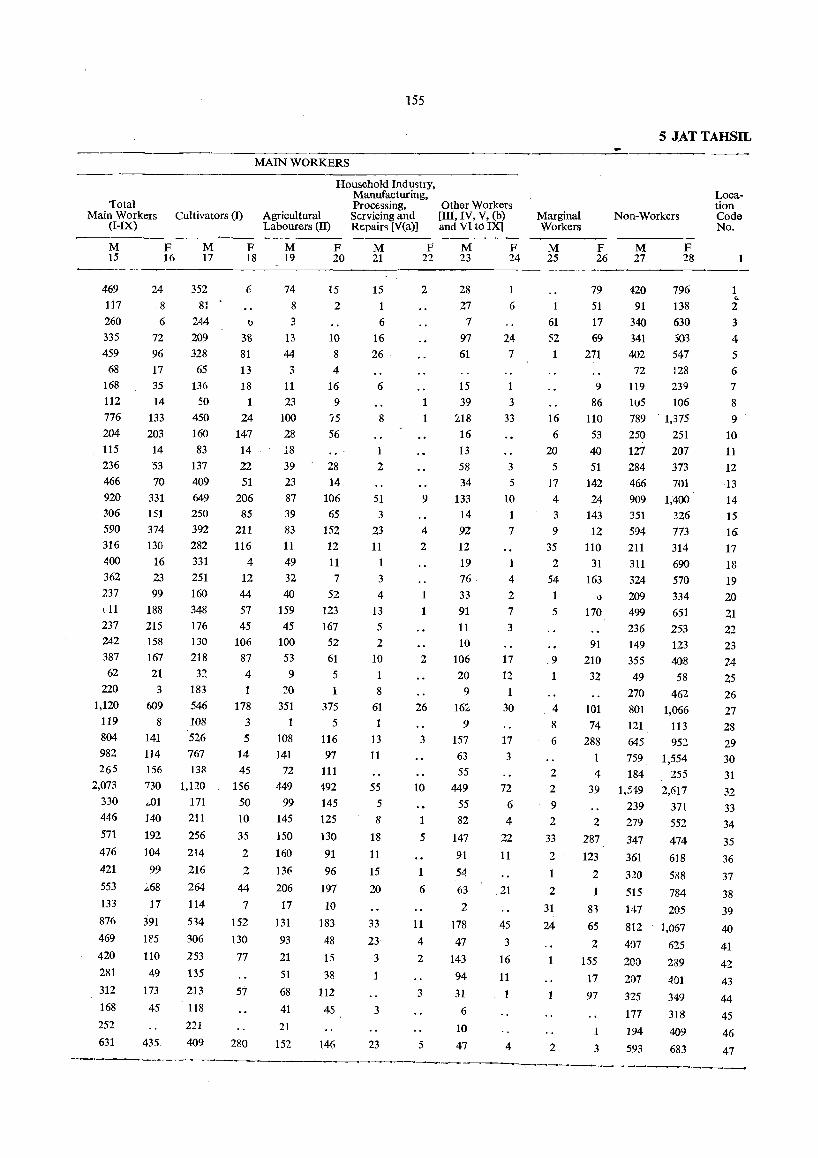
155
MAIN WORKERS
Total Main Workers
(I-IX) Cultivators (I)
M 15
469 117 260 335
459 68
168 112 776 204
115
236 466 920 306 590 316 400 362 237
l·ll 237 242 387 62
220
1,120 119
804 982 265
2,073 330
446
571 476
421
553
133
876
469
420
281
312
168
252
631
F 16
24
8
6
72
96 17 35
14 133
203 14
53
70 331 151
374 130
16
M 17
352 81
244
209 328 65
136
50 450 160 83
137
409
649 250 392 282 331
23 251 99 160
188 348 215 176 158 130 167 218 21 32 3 183
609 546 8 108
141 526 114 767
156 138
730 1,120 ",01 171
140 211
192 256
104 214
99 216
",68 264
17 114
391 514
185 306
110 253
49 135
173 213
45 118
221
435 409
F 18
6
tl
38 81 13
18 1
24 147 14
22 51
206 85
211
116
4
12 44
57 45
106 87
4
1 178
3
5
14 45
156 50 10
35
2
2
44
7
152
130
77
57
280
Agricultural Labourers (II)
Household Industry, Manufacturing, Processing, Servicing and Repairs [V(a)]
M 19
74 8
3
13
44
3 11
23 100
28 18 39 23 87 39 83 11
49 32
40
159 45
100 53 9
20 351
1
108 141
72
449 99
145
150
160
136
206
17
131
93
21
51
68
41 21
152
F 20
15
2
10
8 4
16 9
'is
56
28 14
106 65
152 12 11 7
52
123 ]67 52
61 5
1
375 5
116
97 111
492 ]45
125
130
91
96
197
10
183
48
15
38
112
45
146
M 21
15
6
16 26
6
8
1
2
51 3
23 11
3
4
13
5
2
10 1
8
6]
13 11
55
5
8
18
11
15
20
33
23
3
1
3
23
P 22
2
1
1
9
4
2
1
1
2
26
3
10
5
1
6
11
4
2
3
5
Other Workers [III, IV, V, (b) and VI to IX]
M 23
28 27
7
97 61
15 39
2.18 16 13
58 34
133
14 92 12 19 76· 33 91 11
10 106 20
9
16~
9
157 63 55
449
55 82
147 91
54
63 2
178
47
143
94
31
6
10
47
F 24
1
6
24 7
3
33
3
5
10 1
7
4
2
7
3
17 12
30
17 3
72
6
4
22
11
21
45
3
16
11
4
Marginal Workers
M 25
1
61 52
16 6
20 5
17
4 3
9
35
2
54
1 5
,9
1
4
8
6
2
2
9
2
33
2
2
31
24
2
5 JATTAHSIL
F 26
79 51 17 69
271
9
86 110
53
40
51 142 24
143 12
110
31
Non-Workers
M 27
420 91
340 341 402
72
F 28
796 138
630 503 547 128
119 239 IuS 106
789 . 1,375
250 251 127 207 284 373 466 701 909 1,400 351 326 594 773
211 314 311 690
163 324 570 ~ 209 334
170 499 651 236 253
91 149 123 210 355 408
32 49 58
270 462 101 801 1,066 74 121 113
288 645 952
1 759 1,554 4 184 255
39 1,549 2,617 239 371
2 279 552 287 347 474
123 361 618
2 320 588
515 784
8'1 147 205
65 812 1,067
2 407 625
155 200 289
17 207 401
97 325 349
177 318
1 194 409
3 593 683
Location Code No.
., 2 3
4
5
6
7 8 9'
10 11
12 13
14 15
16
17 18 19 20
21 22 23 24
25 26 27 28
29 30 31
32 33
34
35
36
37
38
39
40
41
42
43
44
45
46
47 ---:--------------------
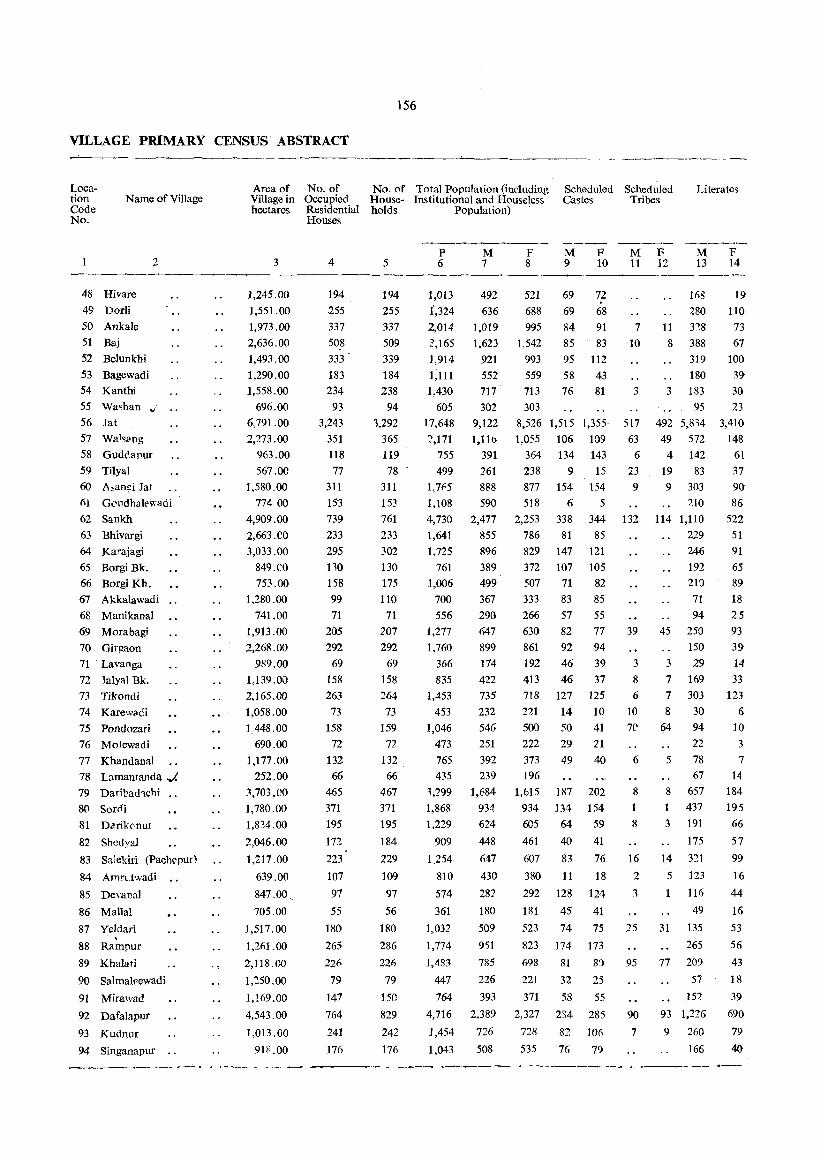
156
VILLAGE PRIMARY CENSUS ABSTRACT
Location Code No.
Name of Village
48 Hivare
49 Dorli
50 Ankale
51 Baj
52 Belunkhi
53 Bagewadi 54 Kanthi
2
55 Wa~han ..; .. 56 Jat
57 Wal~"ng
58 Guddapur
59 Tilyal
60 A,an~i Jat
61 Gc'ndhalrwadi'
62 Sankh
63 Bhivargi
64 Ka~ajagi
65 Borgi Bk. 66 Borgi Kh.
67 Akkalawadi ..
68 Manikanal
69 Morabagi
70 Girgaon
71 Lavanga
72 Jalyal Bk.
7:' Tikondi
74 Karewadi
75 Pondozari
. 76 Motewadi
77 Khandanal
78 Lamantanda.../.
79 Daribad3.chi 8(\ Sorcfi
81 DClrike·nur
82 Shcdyal
83 Salekiri (Pachepur\
84 Arnn:twadi
85 Devanal
86 Mana!
87 Yeldari , 88 Rampur
89 Khalati
90 Salmah.'ewadi
91 Mirawad
92 Dafalapur
93 Kudnur
94 Singanapur
---------_. --
._-----------,._--
Area of No. of No. of Total Population (induding Scheduled Scheduled Village in Occupied House- Institutional and Houseless Castes Tribes
Literates
hectares Residential holds Population)
3
1,245.00
1,551.00
1,973.00
2,636.00
1,493.00
1,290.00
1,558.00
696.00
6,791.00
2,273.00
963.00
567.00
1,580.00
77400
4,909.00
2,663.CO
3,033.00
849.CO
753.00
1,280.00
741.00
1,913 .00
2,268.00
989.00
1,139.0()
2.165.00
1,058.00
1,448.00
690.00
1,177.00
252.00
:',703.00
1,780.00
1,8Z4.00
2,046.00
1,217 .00
639.00
847.00,
705.00
J ,517.00
1,261.00
Z,118.GO
1;~50.00
1,169.00
4,543.00
1,013.00
918.00
Houses
4
194
255
337
508
333
183
234
93
3,243
351
118
77
311
153
739
233
295
no 158 99
71 205
292
69
158
263
73
158
72
132
66
465
371
195
172
223
107
97
55
180
265 226
79
147
764
241
176
5
194
255
337
509
339
184
238
94
1,292
365
119
78
311 153 761
233
302
130
175
110
71
207
292
69
158 264 73
159
72
132
66
467
371
195
184
229
109
97
56
180
286
226
79
150
829
242
176
P 6
1,013
1',324
2,014
3,165
1,914
1,111
1,430
605
17,648
:>,171 755
499
l.7t'5
1,108
4,730
1,641
1,725
761 1,006
700
556
1,277
1,760
366
835
1,453 453
1,046
473
765
435 ::1,299
1,86R
1,229
909
1,254
810
574
361
1,032
1,774
1,483
447
764
4,716
1,454
1,043
M 7
492
636
1,019
1.623
921
552
717 . 302
9,122
1. U()
391
261
888
590
2,477
855
896
389
499
367
290
647
899
174
422
735
232
546
251
392
239
1,684
934
624
448
647
430
282
180
509
951
785
226
393
2.389
726
508
F 8
M F 9 10
521 69 72
688 69 68
995 84 91
1,542 85 83
993 95 112
559 58 43
713 76 81
303
8,526 1,515 1,355'
1,055 106 109
364 134 143
238 9 15
877 154 154
5J8 6 5
2,253 338 344
786 81 85
829 147 121
372 107 105
507 71 82
333 83 85
266 57 55
630 82 77
861 92 94
192 46 39
413 46 37
718 127 125
221 14 10
500 50 41
222 29 21
373 49 40
196
1,615
934
605
461 607
380
292
181
523
823
698
221
371
2,327
728
535
187 202
134 154
64 59
40 41
83 76
11 18
128 124
45 41
74 75
174 173
81 8')
32 25
58 55
234 285
82 106
76 79
M F M 13
F 14 11 12
7 10
3
517
63
6
23
9
132
39
3
8
6
10
70
6
8
1
8
16
2
::I
25
95
90
7
168 19
280 110
11 328 73
8 388 67
319 100
180 ~9
3 183 30
95 23
492 5,834 3,410
49 572 148
4 142 61
19 83 37
9 303 90
JIO 86
114 1,110 522
229 51
246 91
192 65
2ID 89
71 18
94 25 45 250 93
150 39
3 29 14
7 169 33
7 303 123
8 30 6
64 94 10
22 3
5 78 7
67 14
8 657
1 437 3 191
175
14 3:'.1
5 123
1 116
49
31 135
265
77 209
57
15:'.
93 1,226
9 260
166
184
195
66
57
99
16
44
16
53
56
43 18
39
690
79
40
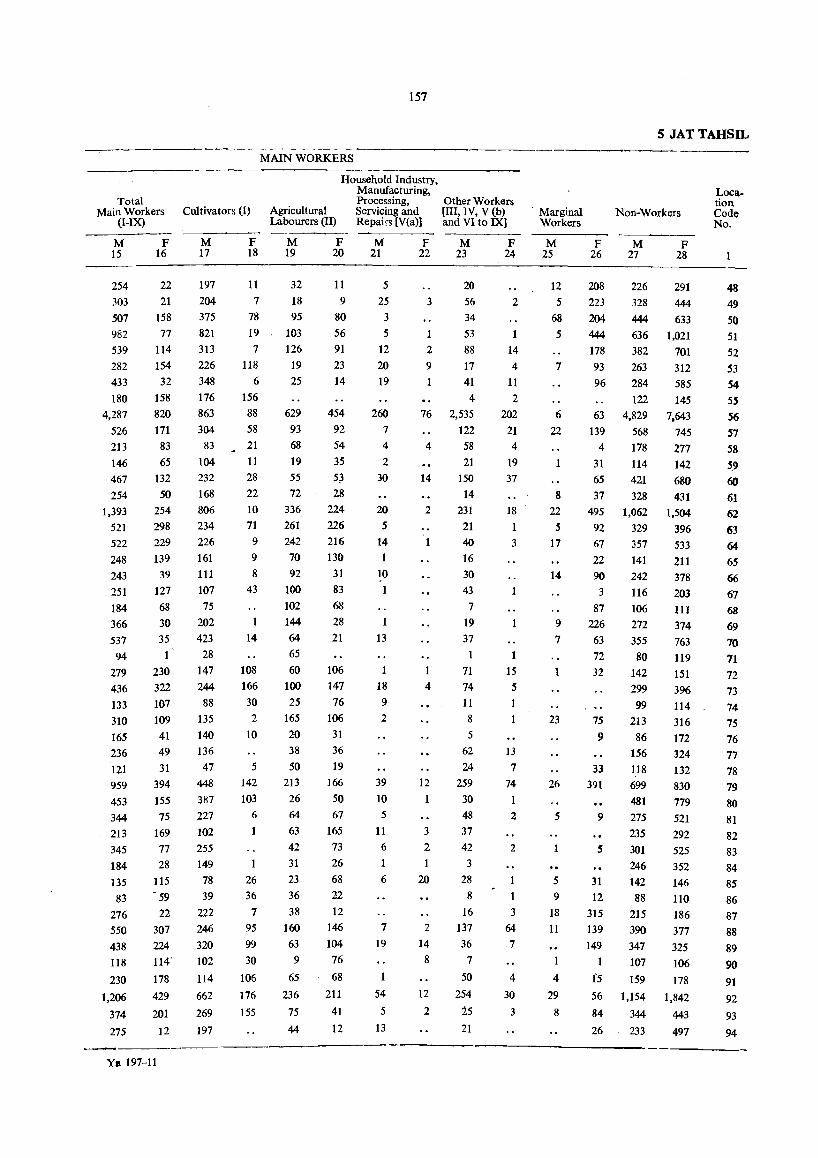
Total Main Workers
(I-IX)
M 15
254 303 507 982 539 282 433 180
4,287 526 213 146 467 254
1,393 521 522 248 243 251 184 366 537 94
279 436 133
310
165 236 121
959
453 344 213
345 184 135
83 216 550
438 118
230
1,206
374
215
F 16
22 21
158 11
114 154 32
158 820 111 83 65
132
50 254 298 229 139
39 127 68 30 35 1
230 322 107 109
41 49 31
394 155
75 169 77 28
115 - 59
22 307 224
114
178
429
201
12
Ya 197-11
Cultivators (I)
M 17
197 204 375 821 313 226 348 176 863 304
83 104 232 168 806 234 226 161 111
107 75
202
423 28
147 244 88
135
140 136 47
448 387 227 102 255
149 18 39
222 246
320
102
114
662
269
197
F 18
11
7 78 19 1
118 6
156 88 58 21 11
28 22 10 11
9
9
8 43
14
108 166 30 2
10
5
142 103
6
1
26 36
1 95 99
30
106
176
155
157
MAIN WORKERS
Agricultural Labourers (II)
Household Industry, Manufacturing, Processing, Servicing and Repairs [V(a)]
Other Workers [III, IV, V (b) and VI to IX]
M 19
32 18 95
103 126 19 25
629 93 68 19 55 12
336 261 242 70 92
100
102 144 64 65 60
100
25 165
20 38 50
213 26 64
63 42 31 23 36 38
160 63 9
65
236
15
44
F 20
11 9
80 56 91 23 14
454 92
54 35 5~
28 224 226 216 130
31 83 68
28 21
106 147 16
106 31 36 19
166 50 61
165 13 26
68 22 12
146 104
16
68
211
41 12
M 21
5
25 3
5
12 20 19
260 7 4
2 30
20
5
14 1
10
13
18 9
2
39 10 5
11
6
6
7
19
54 5
13
F 22
M 23
20 3 56
34 53
2 88 9 11 1 41
4
76 2,535 122
4 58 21
14 150 14
2 231
4
12 1
3
2
1
20
2
14 8
12
2
21 40 16 30 43 1
19 37
11 14 11
8
5 62 24
259 30 48 37 42 3
28 8
16 131 36 1
50
254
i5 21
F 24
2
14 4
11
2 202
21 4
19 37
18 1
3
15 5
1
13
7 74 1 2
2
3
64
1
4
30
3
Marginal Workers
M 25
12 5
68 5
1
6 22
8 22 5
17
14
9 7
23
26
5
1
5
9
18 11
1
4
29
8
5 JATTAHSIL
Non-Workers
Location Code No.
F 26
M 21
208 226 223 328 204 444 444 636 118 382 93 263 96 284
122 63 4,829
139 568 4 118
31 114
65 421 37 328
495 1,062 92 329 61 22 90 3
87 226
63 72
32
15 9
33
391
9
357 141 242 116
106
272 355 80
142 299
99 213
86 156 118
699 481 215 235
5 301 246
31 142 12 88
315 215
139 390 149 341
107
1'5 159
56 1,154
84 344
26 . 233
F 28
291 444 633
1,021 701 312 585
145 7,643
745 277 142 680 431
1,504
396 533 211 318 203 111 374 763
119
151 396 114 316 172 324 132
830 779
521 292 525
352 146 110
186 377
325 106
178 1,842
443
497
48 49 50
51 52 53 54 55 56 57 58
59 60
61 62 63
64
65
66
67
68
69 70 71 72
73
74 75
76 77
78 79 80 81 82 83
84 85 86 87 88
89 90
91
92
93
94

158
VILLAGE PRIMARY CENSUS ABSTRACT
Location Code No.
Name of Village
95 Jirgyal
96 Ekundi
97 Wajrawad
2
98 Khilarwadi" ..
99 Gugwad
100 Sindur
101 Basargi
102 Billur
103 Umarami
104 Khojanwadi "
105 Untwadi
106 Mendhegiri ..
107 RavaIgundwadi
108 Muchandi
109 Siddhanath ..
110 Jalyal Kh.
111 Pandharewadi
112 Dhulkarwadi ..
113 Asangi Karajagi
114 Kaganari
115 Konabagi'J
••
116 Kontya Boblad
117 Karewadi
118 Gulagunjanal
Grand Total "
Area of No. of No. of Total Population (including Scheduled Scheduled Literates Village in Occupied House- Institutional and Houseless Castes Tribes hectares Residential h(,lds Population)
3
1,242.00
1,292.00
1,074.00
319.00
2,072.00
2,173.00
1,421.00
5,333.00
7,693.00
537.00
355.00
1,893.00
2,279.00
4,524.00
1,589.00
893.00
1,160.00
1,294.00
1,023.00
2,023.00
489.00
3,324.00
537.00
481.00
Houses
4
377 180
248
93
350
424
238
1,103
718
231
122
178
288
495
207
68
120
101
134
104
57
368
153
72
5
377
200
249
95
368
424
243
1,140
737
235
126
178
299
502
207
68
123
101 134
104
57
369
153
72
P 6
M 7
2,167 1,073
1,257 674
1,666 852
624 322
2,119 1,043
2,477 1,213
1,614 809
6,866 3,527
3,968 1,935
1,504 797
742 388
1,122 582
1,659 839
2,688 1,342
1,096 573
441 207
623 320
605 309
776 420
557 282
337 167
2,165 1,119
883 448
506 255
F 8
1,094
583
814
302
1,076
1,264
805
3,339
2,033
M F 9 10
160 161 65 61
247 227
159 166
118 129
329 294
442 432
350 397
M 11
12
19
9
20
38
30 707 29 26 14
354 3 2
540 166 129 11
820 67 67 .13
1,346 128 132 30
523 23 31 12
234 17 17 4
303 19 14
296 5 5 3
356 11 6
275 27 37 16
170
1,046 156 159
435 8 7
251 13 16
F 12
M 13
348
13 270
261
15
13 270
17 344
21 350
39 1,314
39 706 16 344
132
9 132
7 335
32 609
9 177
3 79
50
3 67
147
17 93
68
373
100
106
F 14
72
77
86
93
83
178
565
347
114
31
38
130
265
52
35
10
19
28
37
22
181
7
30
2,25,013.00 32,447 33,012 1,93,096 98,416 94,680 13,076 12,731 2,f492,072 38,747 15,154

Total Main Workers
(I-IX)
M 15
640
385 516 202 640
762 478
2,038 1,229
486 195 343 482 730 339 122 193 201 226 171 104
621 228 141
F 16
124 56
261 112 303 355 234 525 215
30 93
223 399 365 323 23 39 16 13
44
43 16 61 80
Cultivators (I)
M 17
559 320 348
88 470 453 250
1,135 829 395 136 242 330
402 286
95 123 129 131 86 48
436 174 82
F 18
83 24
215 39
112
93 62
143 92
82 268 144
290 10 27
1
5
6
9
15 24
159
MAIN WORKERS
Agricultural Labourers (II)
Household Industry, Manufacturing, Processing, Servicing and Repairs [V(a)]
Other Workers [III, IV, V (b) and VI to IX]
M 19
19 39
103 28
111 135 167 524 232 45 23 85 51
132 24 11
14 22 69 42 35
120 39 16
F 20
35 30 29 54
116 201 110 299 95 28 90
140 122 111
31 12
8
15 8
35 34 51 43 74
M 21
6
3 15
4
10 27 86 47 8
24
17 14
3
1
2
2
2
F 22
15
M 23
56 23 50 86 55
1 164 1 34
45 293 8 121
38 12 16
6 84 7 182 2 26
16 49
., 48
26 41 21
5 63 15 43
F 24
6
2 16 4
15 54 1
38 20
2
3 . 43
4
3
5
6
53,444 11,532 32,034 6,550 10,289 9,374 1,461 394 9,660 1,214
Marginal Workers
M 25
2
25
31 1
2
5
8
10
4 2
35 1
1
F 26
3 64
51 43
522 668 144 14 20
1
87 22 62 58
101
160 65 9
202 10 14
5 JATTAHSI
Non-Workers
Location Code No.
M 27
433 287 336 120 403 451 331
1,464 706 311
162 232 357 610 234 85
122 100
184 107
61 463 219 113
F 28
967 463 502 147 17-3
908 511
2,292 1,150
533 181 297 420 894 178 149 206 119 183 166 118 168 358 151
95
96 91 98 99
100
101 102 103 104
105 106 101 108 109 110
111
112 113
114
115 116
117 118 .
914 10,080 44,058 67,068
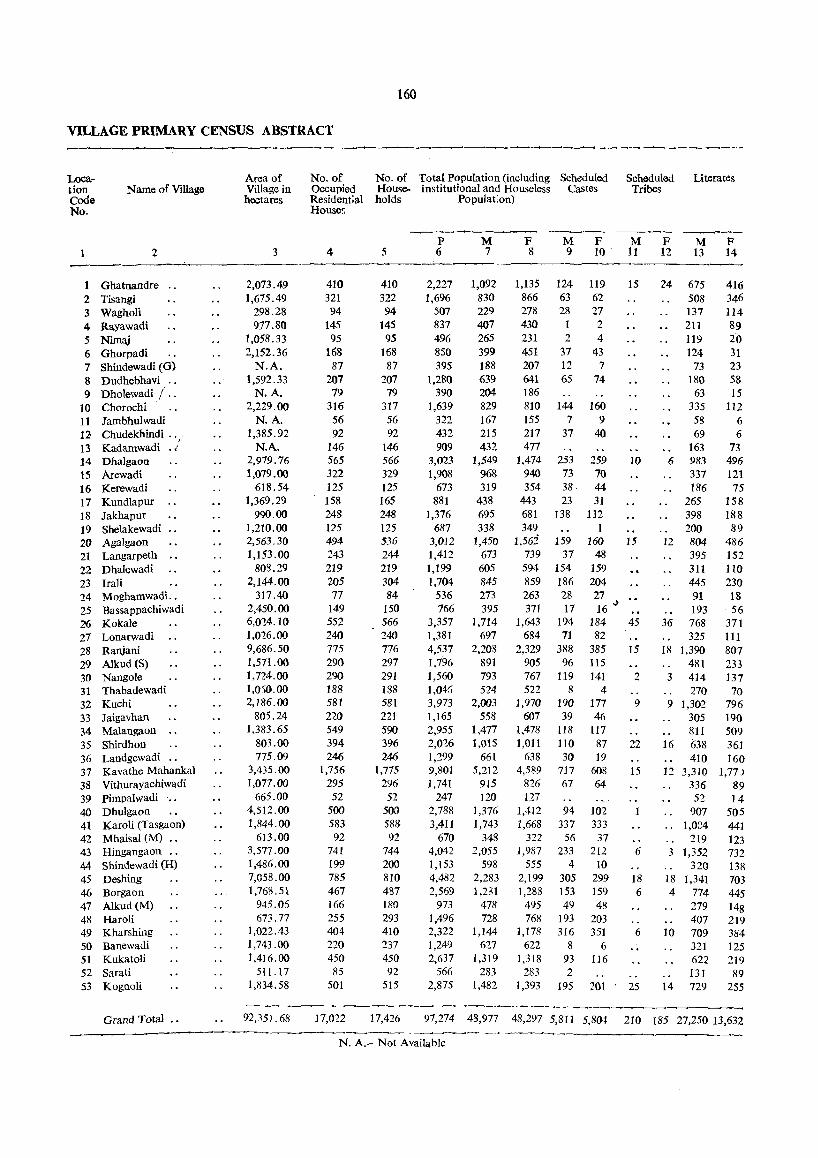
160
Vll..LAGE PRIMARY CENSUS ABSTRACT -~~
Loca- Area of No. of No. of Total Population (including Scheduled Scheduled Literates tion Name of Village Village in Occupied House- Institutional and Houseless Castes Tribes Code hectares Residential holds Populat:on) No. House<;
--- ----- -----P M F M F M F M F
1 2 3 4 5 6 7 8 9 10· 11 12 13 14
Ghatnandre " 2,073.49 410 410 2,227 1,092 1,135 124 119 15 24 675 416 2 Tisangi 1,675.49 321 322 1,696 830 866 63 62 508 346 3 Wagholi 298.28 94 94 507 229 278 28 27 137 114 4 Rayawadi 917.80 145 145 837 407 430 1 2 211 89 5 Nimaj 1,058.33 95 95 496 265 231 2 4 119 20 6 Ghorpadi 2,152.36 168 168 850 399 451 37 43 124 31 7 Shindewadi (G) N.A. 87 87 395 188 207 12 7 73 23 8 Dudhebhavi " 1,592.33 201 207 1,280 639 641 65 74 180 58 9 Dholewadi / .. N.A. 79 79 390 204 186 63 15
10 Chorochi 2,229.00 316 317 1,639 829 810 144 160 335 112 11 lambhulwadi N.A. 56 56 322 167 155 7 9 58 6 12 Chudekhindi " I 1,385.92 92 92 432 215 217 37 40 69 6 13 Kadamwadi . .( N.A. 146 146 909 432 477 163 73 14 Dhalgaon 2,919.76 565 566 3,023 1,549 1,474 253 259 10 6 983 496 15 Arewadi 1,019.00 322 329 1,908 968 940 73 70 337 121 16 Kerewadi 618.54 125 125 673 319 354 38· 44 186 75 17 Kundlapur " 1,369.29 158 165 881 438 443 23 31 265 158 18 Jakhapur 990.00 248 248 1,376 695 681 138 132 398 188 19 Shelakewadi 1,210.00 115 125 687 338 349 1 200 89 20 AgaJgaon 2,563.30 494 536 3,012 1,450 1,562 159 160 15 12 804 486 21 Langarpeth 1,153.00 243 244 1,412 673 739 37 48 395 152 22 Dhalewadi 808.29 219 219 1,199 605 594 154 159 311 110 23 Irati 2,144.00 205 304 1,704 845 859 186 204 445 230 24 Moghamwadi .. 317.40 77 84 536 273 263 28 27 91 18 25 Bassappachiwadi 2,450.00 149 150 766 395 371 17 16 .) 193 56 26 Kokale 6,0'24.10 552 566 3,357 1,714 1,643 194 184 45 36 768 371 27 Lonarwadi 1,0'26.00 240 240 1,381 697 684 71 82 325 111 28 Ranjani 9,686.50 175 776 4,537 2,208 2,329 388 385 15 18 1,390 807 29 Alkud (S) 1,571.00 290 297 1,796 891 905 96 115 481 233 30 Nangole 1,724.00 290 291 1,560 793 767 119 141 2 3 414 137 31 Thabadewadi 1,050.00 188 188 1,0:1-6 524 522 8 4 270 70 32 Kuehi 2,186.00 581 581 3,973 2,003 1,970 190 177 9 9 1,302 796 33 Jaigavhan 805.24 220 221 1,165 558 607 39 46 305 190 34 Malangaon 1,383.65 549 590 2,955 1,477 1,478 118 117 811 509 35 Shirdhon 803.00 394 396 2,016 1,015 1,011 110 87 22 16 638 361 36 Landgewadi .. 775.09 246 246 1,299 661 638 30 19 410 160 37 Kavathe Mahankal 3,435.00 1,756 1,775 9,801 5,212 4,589 717 608 15 12 3,310 l,n.) 38 Vithurayaehiwadi 1,077.00 295 296 1,741 915 826 67 64 336 89 39 Pimpalwadi .. 665.00 52 52 247 120 127 52 14 40 Dhulgaon 4,512.00 500 500 2,788 1,376 1,412 94 102 907 505 41 Karoli (Tasgaon) 1,844.00 583 58& 3,411 1,743 1,668 337 333
" I,OC4 441 42 Mhaisal (M) •. 613.00 92 92 670 348 322 56 37 219 123 43 Hingangaon .. 3,577.00 741 744 4,042 2,055 1,987 233 212 6 3 1,352 732 44 Shindewadi (H) 1,486.00 199 200 1,153 598 555 4 10 320 138 45 Deshing 7,058.00 785 810 4,482 2,283 2,199 305 299 18 18 1,341 703 46 Borgaon 1,768.51 467 487 2,569 1,281 1,288 153 159 6 4 774 445 47 Alkud(M) 945.05 166 180 973 478 495 49 48 279 148 48 Haroli 673.77 255 293 1,496 728 768 193 203 407 219 49 Kharshing 1,022.43 404 410 2,322 1,144 1,178 316 351 6 10 709 384 50 Banewadi 1,743.00 220 237 1,249 627 622 8 6 321 125 51 Kukatoli 1,416.00 450 450 2,637 1,319 1,318 93 116 622 219 52 Sarati 511.17 85 92 566 283 283 2 131 89 53 Kognoli 1,834.58 501 515 2,875 1,482 1,393 195 201 25 14 729 255
-----Grand Total 92,351. 68 17,022 17,426 97,274 48,977 48,297 5,811 5,804 210 185 27,250 13,632
N. A.- Not Available
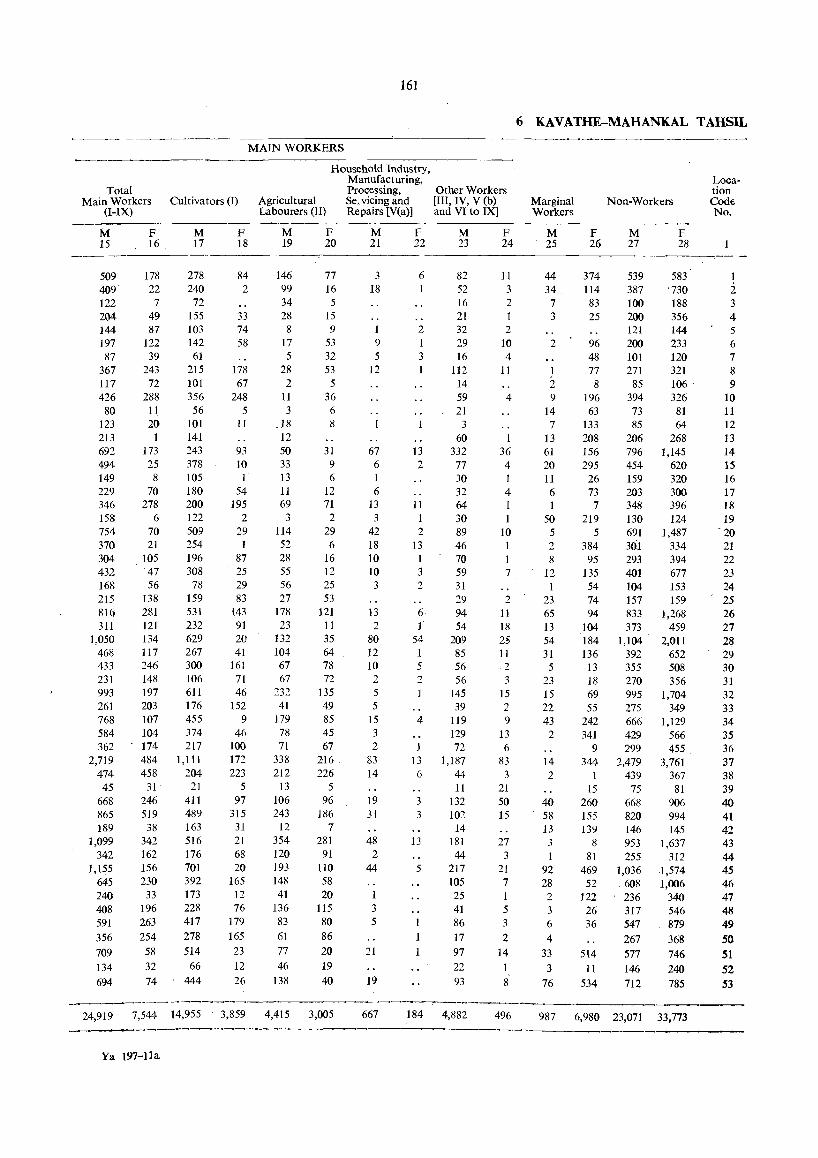
Total Main Workers
(I-IX)
M 15
509 409 122 204 144 197 87
367 117 426 80
123 213 692 494 149 229 346 158 754 370 304 432 168 215 816 311
1,050 468 433 231 993 261 768 584 362
2,719 474 45
668 865 189
1,099 342
1,155 645 240 408 591 356 709 134 694
F 16
178 22 7
49 87
122 39
243 72
288 11 2{}
173 25 8
70 278
6 70 21
105 47 56
138 281 121 134 117 246 148 197 203 107 104 174 484 458
31 246 519 38
342 162 156 230
33 196 263 254
58 32 74
161
MAIN WORKERS
Cultivators (I)
M 17
278 240
72 155 103 142
61 215 101 356 56
101 141 243 378 105 180 200 122 509 254 196 308
78 159 531 232 629 267 300 106 611 176 455 374 217
1,111 204
21 411 489 163 516 176 701 392 173 228 417 278 514
66 444
F 18
84 2
33 74 58
178 67
248 5
II
93 10 1 .
54 195
2 29 1
87 25 29 83
143 91 20 41
161 71 46
152 9
46 100 172 223
5 97
315 31 21 68 20
165 12 76
179 165 23 12 26
Household Industry, Manufacturing, Processing,
Agricultural Labourers (II)
Se" vicing and Repairs {V(a)]
M 19
146 99 34 28 8
17 5
28 2
11 3
18 12 50 33 13 11 69
3 114 52 28 55 56 27
178 23
132 104 67 67
232 41
179 78 71
338 212
13 106 243
12 354 120 193 148 41
136 83 61 77 46
138
F 20
77 16 5
15 9
53 32 53
5 36 6 8
31 9 6
12 71
2 29 6
16 12 25 53
121 11 35 64 78 72
135 49 85 45 67
216 226
5 96
186 7
281 91
110 58 20
115 80 86 20 19 40
M 21
3 18
9 5
12
67 6
6 13
3 42 18 10 10 3
13 2
80 12 10 2 5 5
15 3 2
83 14
19 31
48 2
44
3 5
21
19
F 22
6
2 1 3
13 2
11 1 2
13 1 3 2
6 1
54 1 5 2
4
13 6
3 3
13
5
Other Workers [III, IV, V (b) and VI to IX]
M 23
82 52 16 21 32 29 16
112 14 59 21
3 60
332 77 30 32 64 30 89 46 70 59 31 29 94 54
209 85 56 56
145 39
119 129 72
1,187 44 11
132 102 14
181 44
217 105 25 41 86 17 97 22 93
F 24
11 3 2
2 10 4
11
4
36 4
4 1 1
10 1
7
2 11 18 25 11 2 3
15 2 9
13 6
83 3
21 50 15
27 3
21 7
5 3
2 14 1 8
24,919 7,544 14,955 3,859 4,415 3,005 667 184 4,882 496
Ya 197-11a
6 KAVATHE-MAHANKAL TAHSIL
Marginal Workers
M 25
44 34 7 3
2
J 2 9
14 7
13 61 20 11 6 1
50 5 2 8
12
23 65 13 54 31
5 23 15 22 43 2
14 2
40 58 13 3 1
92 28 2 3 6 4
33 3
76
F 26
374 114 83 25
96 48 77
8 196 63
133 208 156 295 26 73 7
219 5
384 95
135 54 74 94
104 184 136
13 18 69 55
242 341
9 344
15 260 155 139
8 81
469 52
122 26 36
514 11
534
Non-Workers
M 27
539 387 100 200 121 200 101 271
85 394 73 85
206 796 454 159 203 348 130 691 301 293 401 104 157 833 373
1,104 392 355 270 995 275 666 429 299
2,479 439
75 668 820 146 953 255
1,036 608 236 317 547 267 577 146 712
F 28
583 '730 188 356 144 233 120 321 106 326
81 64
268 1,145
620 320 300 396 124
1,487 334 394 677 153 159
1,268 459
2,011 652 508 356
1,704 349
1,129 566 455
3,761 367
81 906 994 145
1,637 312
1,574 1,006
340 546 879 368 746 240 785
987 6,980 23,071 33,773
Location Code No,
1 2 3 4 5 6 7 8 9
10 11 12 13 14 15 16 17 18 19
. 20 21 22 23 24 25 26 27 28 29 30 31 32 33 34 35 36 37 38 39 40 41 42 43 44 45 46 47 48 49 50 51 52 53
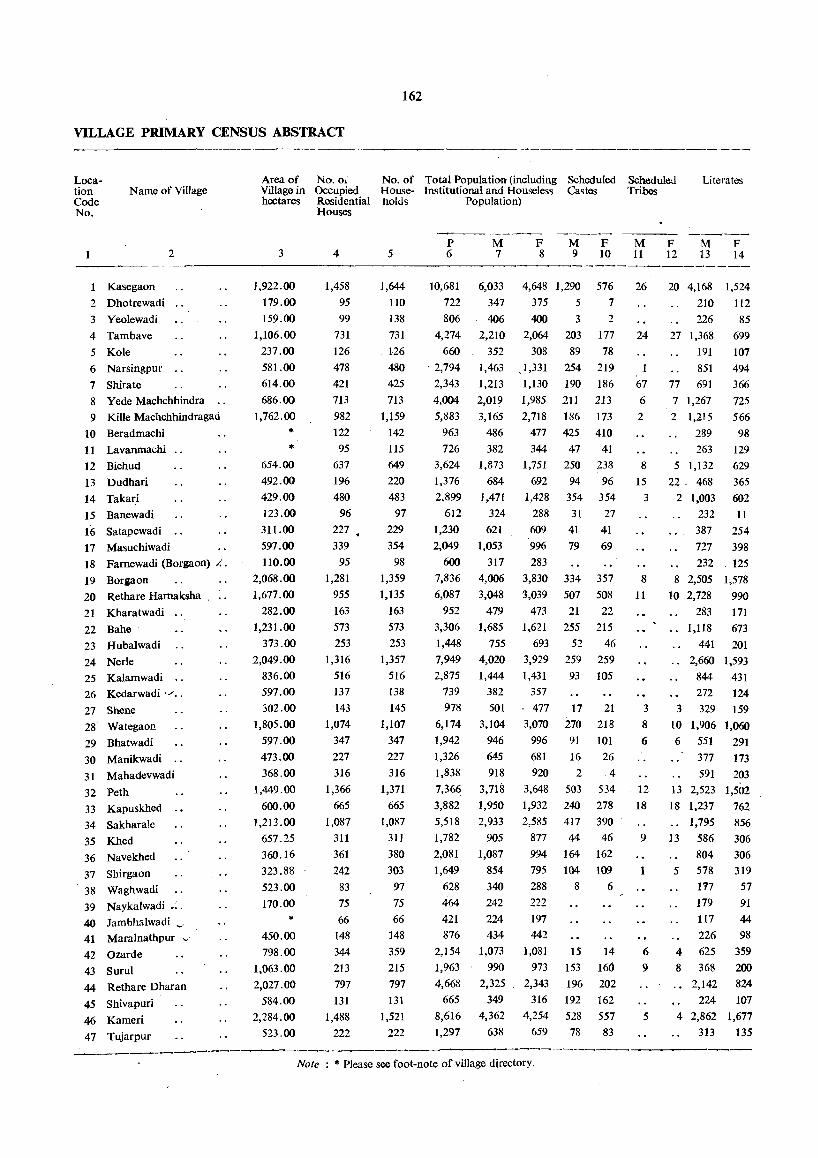
VILLAGE PRIMARY CENSUS ABSTRACT
Location Code No.
Name of Village
2
1 Kasegaon
2 Dhotrewadi ..
3 Yoolewadi
4 Tambave
5 Kole
6 Narsingpur
7 Shirate
8 Yede Machchhindra
9 Kille Machchhindragad
10 Beradmachi
11 La vanmachi
12 Bichud
13 Dudhari
14 Takari
15 Banewadi
16 Satapewadi
17 Masuchiwadi
18 Famewadi (Borgaon) /'.
19 Borgaon
20 Rethare Hamaksha
21 Kharatwadi
22 Bahe
23 Hubalwadi
24 Nerle
25 Kalarnwadi
26 Kedarwadi 'J ••
27 Shene
28 Wategaon
29 Bhatwadi
30 Manikwadi
31 Mahadevwadi
32 Peth
33 Kapuskhed
.34 Sakharalc
35 Khed
36 Navekhed
37 Shirgaon
38 Waghwadi
39 Naykalwadi.;. 40 Jamhhalwadi __ '
41 Maralnathpur~'
42 Ozarde
43 Surul
44 Rethare Dharan
45 Shivapuri
46 Kameri
47 Tujarpur
Area of No. 0,'
Village in Occupied hectares Residential
3
1,922.00
179.00
159.00
1,106.00
237.00
581.00
614.00
686.00
1,762.00
* *
654.00
492.00
429.00
123.00
311. 00
597.00
110.00
2,068.00
1,677 .00
282.00
1,231.00
373.00
2,049.00
836.00
597.00
302.00
1,805.00
597.00
473.00
368.00
1,449.00
600.00
1,213.00
657.25
360.16
323.88
523.00
170.00
* 450.00
798.00
1,063.00
2,027.00
584.00
2,284.00
523.00
Houses
4
1,458
95
99
731
126
478
421
713
982
122
95
637
196
480
96
227
339
95
1,281
955
163
573
253
1,316
516
137
143
1,074
347
227
316
1,366
665
1,087
311
361
242
83
75
66 148
344
213
797
131
1,488
222
162
No. of Total Population (including Scheduled Scheduled Literates House- Institutional and Houseless Castes Tribes holds Population)
5
1,644
110
138
731
126
480
425
713
1,159
142
115
649
220
483
97
229
354
98
1,359
1,135
163
573
253
1,357
516
138
145
1,107
347
227
316
1,371
665
1,087
311
380
303
97
75
66 148
359
215
797
131
1,521
222
P 6
10,681
722
806
4,274
660 , 2,794
2,343
4,004
5,883
963
726
3,624
1,376
2,899
612
1,230
2,049
600 7,836
6,087
952
3,306
1,448
7,949
2,875
739
978
6,174
1,942
1,326
1,838
7,366
3,882
5,518
1,782
2,081
1,649
628
464
421
876
2,154
1,963
4,668
665
8,616
1,297
M 7
6,033
347
406
2,210
352
1,463
1,213
2,019
3,165
486
382
1,873
684
1,471
324
621
1,053
317
4,006
3,048
479
1,685
755
4,020
1,444
382
501
3,104
946
645
918
3,718
1,950
2,933
905
1,087
854
340
242
224
434
1,073
990
2,325
349
4,362
638
F 8
M F 9 10
4,648 1,290 576
375 5 7
400 3 2
2,064 203 177
308 89 78
1,331 254 219
1,130 190 186
1,985 211 213
2,718 186 173
477 425 410
344 47 41
1,751 250 238
692 94 96
1,428 354 354
288
609
996
283
3,830
3,039
473
1,621
693
3,929
1,431
357
. 477
3,070
996
681
920
3,648
1,932
2,585
877
994
795
288
222
197
442
1,081
973
2,343
316
4,254
659
31 27
41 41
79 69
334 357
507 508
21 22
255 215
52 46
259 259
93 105
17 21
270 218
91 101
16 26
2 4
503 534
240 278
417 390
44 46
164 162
104 109
8 6
15 14
153 160
196 202
192 162
528 557
78 83
M 11
26
24
1
67
6
2
8
15
3
8
11
3
8
6
12
18
9
1
6
9
5
F 12
M 13
F 14
20 4,168 1,524
210 112
226 85
27 1,368 699
191 107
851 494
77 691 366
7 1,267 725
2 1,215 566
289 98
263 129
5 1,132 629
22 468 365
2 1,003 602
232 11
387 254
727 398
232 125
8 2,505 1,578
10 2,728 990
283 171
1,118 673
441 201
2,660 1,593
844 431
272 124
3 329 159
10 1,906 1,060
6 551 291
377 173
591 203
13 2,523 1,502
18 1,237 762
1,795 856
13 586 306
804 306
5 578 319
1'17 57
179 91
117 44
226 98
4 625 359
8 368 200
2,142 824
224 107
4 2,862 1,677
313 135
Note : * Please see foot-note of village directory.
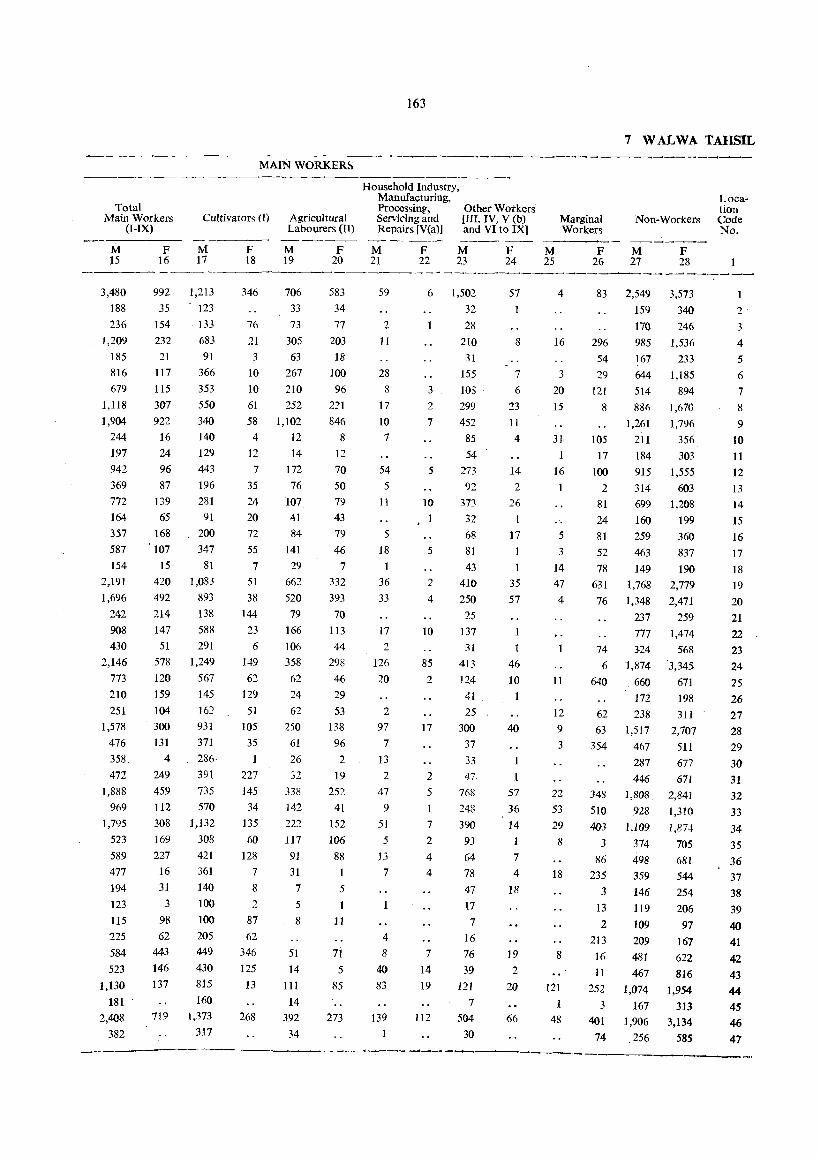
Total Main Workers
(I-IX)
M 15
3,480 188 236
1,209 185 816 679
1,118 1,904
244 197 942 369 772
164 357 587 154
2,191
1,696 242
908
430 2,146
773
210 251
1,578 476 358. 472
1,888
969 1,795
523 589 477 194 123 115 225
584 523
1,130
181
2,408 382
F 16
992 35
154 232 21
117
115 307 922
16 24 96 87
139 65
168 '107
15 420 492 214 147
51 578 120 159 104 300 131
4
249 459 112
308 169 227 16 31
3
98 62
443
146 137
719
MAIN WORKERS
Cultivator5 (1)
M 17
1,213 123 133
683 91
366 353 550 340 140 129 443 196 281
91
200 347
81 1,083
893 138
588 291
1,249
567 145
161 931 371 286 391 735 570
1,132
308 421 361
140 100 100 205 449
430 815
160 1,373
317
F 18
346
76 21 3
10 10 61 58 4
12 7
35 24 20 72
55 7
51 38
144 23 6
149 62
129
51
105 35
1
227
145 34
135
60
128 7
8
2
87 62
346 125
13
268
Agricultural Labourers (Il)
M 19
706 33
73 305 63
267 210 252
1,102 12 14
172
76 107
41 84
141 29
662 520 79
166 106 358 62 24 62
250 61 26 32
338 142 222 117 91 31
7
5
8
51 14
III
14 392
34
F 20
583 34
77
203 18
100 96
221 846
8
12 70 50 79 43
79 46
7 332
393
70 113
44
298 46 29 53
138
96
2
19 252
41 152 106
88 1
5
1
11
71 5
85
273
163
7 WALWA TAHSIL .---.--~-~------------~--
Household Industry, Manufacturing, Processing, Sen king and Repairs rV(a)]
Other Wotkers [III. IV, V (b) and VI to IX]
M 21
F 22
M 23
F 24
M 25
Marginal Workers
F 26
Non-Workers
M 27
F 28
Location Code No.
...... ----------------~---.._-----.___.--
59
2 11
28 8
17
10
7
54 5
11
5
18 1
36 33
17
2
126 20
2
97 7
13 2
47 9
51
5
13
7
4
8
40
83
139
6
3
2 7
5
10
1
5
4
10
85 2
17
2 5
1
7
2
4
4
7
14
19
112
1,502 32
28 210
31
155 108 299
452 85 54
273
92
373 32 68 81 43
410 250
25 137 31
413
124 41 25
300 37
33
47 768 248
390
93
64 78
47 11
7
16
76 39
121
7
504 30
57
8
7
6
23 11
4
14 2
26
17
1
35 57
1
46 10
40
57 36 14 1
7
4
18
19 2
20
66
4
16
3
20
15
31 1
16
5
3
14 47 4
11
12
9
3
22
53 29 8
18
8
121
48
83 2,549 159
170 296 985
54 167 29 644
121 514 8 886
1,261 105 211
17 184 100 915
2 314 81 699
24 160 81 259 52 463 78 149
631 1,768 76 1,348
237 777
74 324 6 1,874
640 660 172
62 238 63 1,517
354 467
287 446
348 1,808 510 928
403 1,109
3 374 86 498
235 359 3 146
13 119 2 109
213 209 16 481 11 467
252 1,074
3 167
401 1,906 74 256
3,573 340 246
1,536 233
1,185 894
1,670 1,796
356 303
1,555 603
1,208
199 360 837 190
2,779 2,471
259 1,474
568 3,345
671 198 311
2,707
511
677 671
2,841 1,310
1,874 705
681 544
254 206
97 167 622 816
1,954
313
3,134 585
2 3
4
5 6
1
8 9
to 11 12
13
14
15 16 17 18 19 20 21 22 23
24
25
26 27 28 29 30
31 32 33
34 35 36 37 38
39
40 41
42
43 44
45 46 47
-------.-~-------.
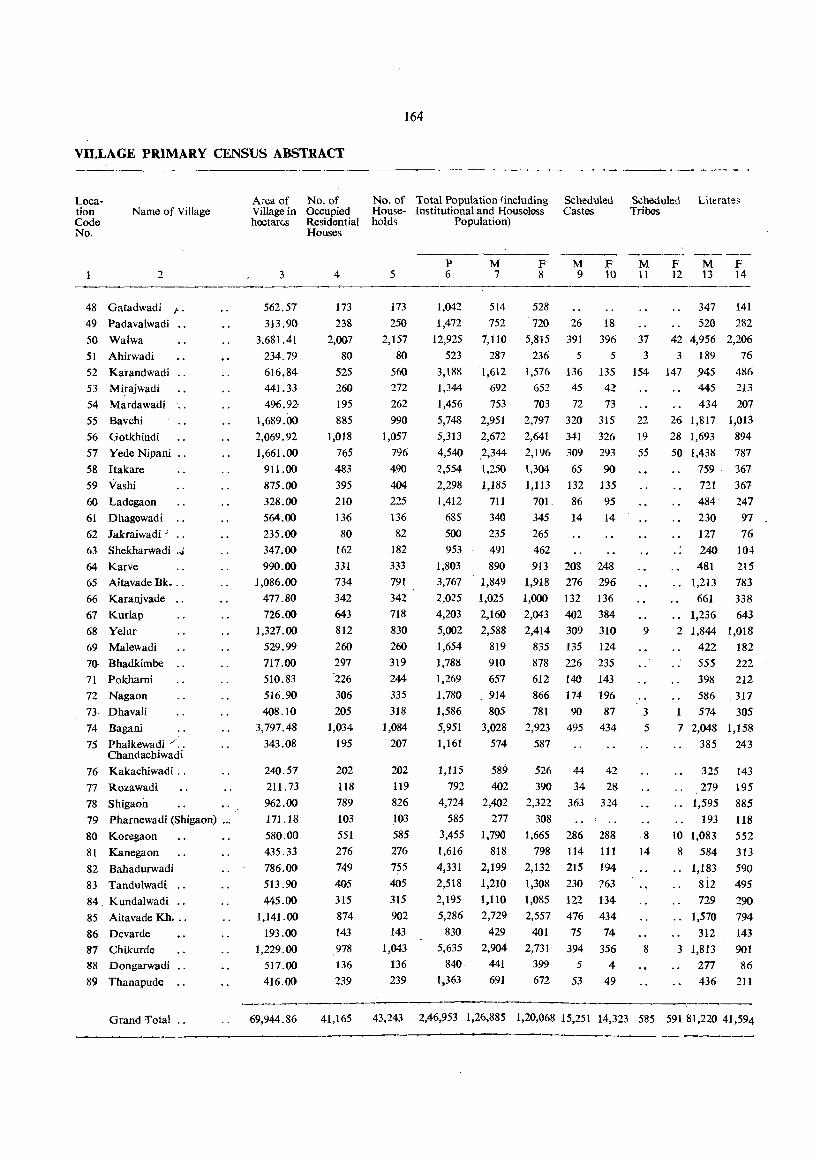
VILLAGE PRIMARY CENSUS ABSTRACT
Location Code No.
Name of Village
2
48 Gatadwadi )".
49 Padavalwadi
50 Walwa
51 Ahirwadi
52 Karandwadi
53 Mirajwadi
54 Mardawadi ..
55 Bavchi
56 Gotkhindi
57 Yede Nipani ..
58 Itakare
59 Vashi
60 Ladegaon
61 Dhagewadi 62 lakraiwadi;
63 Shekharwadi.J
64 Karve
65 Aitavade Bk •..
66 Karanjvade ..
67 Kurlap
68 YeIur
69 Malewadi
70 Bhadkimbe
71 Pokharni
72 Nagaon
73 Dhavali
74 Bagani
75 Phalkewadi / .. Chandachiwadi
76 Kakachiwadi ..
77 Rozawadi
78 Shigaon 79 Pharnewadi (Shiga on) ,,;.
80 Koregaon
81 Kanegaon
82 Bahadurwadi
83 Tandulwadi ..
84. Kundalwadi ..
85 Aitavade Kh •..
86 Devarde
87 Chikurde
88 Dongarwadi
89 Thanapude
Area of No. of Village in Occupied hectare.s Residential
3
562.57
313.90
3,681.41
234.79
616.84
441.33
496.92·
1,689.00
2,069.92
1,661.00
911.00
875.00
328.00
564.00
235.00
347.00
990.00 1,086.00
477.80
726.00
1,327.00
529.99
717.00
510.83
516.90
408.10
3,797.48
343.08
240.57
211.73
962.00
171.18
580.00
435.33
786.00
513.90.
445.00
1,141.00
193.00
1,229.00
517.00
416.00
Houses
4
173
238
2,007
80.
525
260
195
885
1,018
765
483
395
210
136
80
162
331
734
342
643
812
260
297 "226
30.6
20.5
1,034
195
202
118
789
103
551
276
749
405
315
874
143
978
136
239
164
No. of Total Population (including House- Institutional and Houseless
Scheduled Castes
holds Population)
5
173
250
2,157
80
560 272
262
990
1,057
796
490
404
225
136
82
182
333
791
342
718
830
260
319
244
335
318
1,084
207
202
119
826
103
585
276
755
405
315
902
143
1,043
136
239
P 6
1,042
1,472
12,925
523
3,188
1,344
1,456
5,748
5,313
4,540
2,554
2,298
.1,412
685
500 953
1,803
3,767
2,025
4,203
5,002
1,654
1,788
1,269
1,780
1,586
5,951
1,161
1,115
792
4,724
585
3,455
1,616
4,331
2,518
2,195
5,286
830
5,635
840
1,363
M 7
514
752
7,110
287
1,612
692
753
2,951
2,672
2,344
1,250
1,185
711
340
235
491
890
1,849
1,025
2,160
2,588
819
910
657
914
805
3,028
574
589
402
2,402
277
1,790
818
2,199
1,210
1,110
2,729
429 2,904
441
691
F 8
528
M 9
F 10
720 26 18
5,815 391 396
236 5 5
1,576 136 135
652 45 42
703 72 73
2,797 320 315
2,641 341 326
2,196 30.9 293
1,304 65 90
1,113 132 135
701, 86 95
345 14 14
265
462
913 203 248 1,918 276 296
1,000 132 136
2,043 402 384
2,414 309 310
835 135 124
878 226 235
612 140 143
866 174 196
781 90 87
2,923 495 434
587
526
390
2,322
308
1,665
798
2,132
1,308
1,085
2,557
401 2,731
399
672
44 42
34 28
363 324
286 288
114 111
215 194
230 763
122 134
476 434
75 74
394 356
5
53
4
49
S.;heduled Tribes
Literate~
M 11
37
3
154
22
19
55
9
3
5
8 14
8
F M 12 13
F 14
347 141
520 282
42 4,956 2,206
3 189 76
147 945 486
445 213
434 207
26 1,817 1,0.13
28 1,693 894
50 1,438 787
759 367
721 367
484' 247
230 97
127 76
240 104
481 215
1,213 783
661 338
1,236 643
2 1,844 1,018
422 182
555 222
398 212
586 317
1 574 305
7 2,048 1,158
385 243
325
279
1,595
193
10 1,083
8 584
.. 1,183
812
729
1,570
312
3 1,813
143
195
885
118 552
313
590
495
290
794
143
901 277 86
436 211
Grand Total .. 69,944.86 41,165 43,243 2,46,953 1,26,885 1,20,068 15,251 14,323 585 591 81,220 41,594
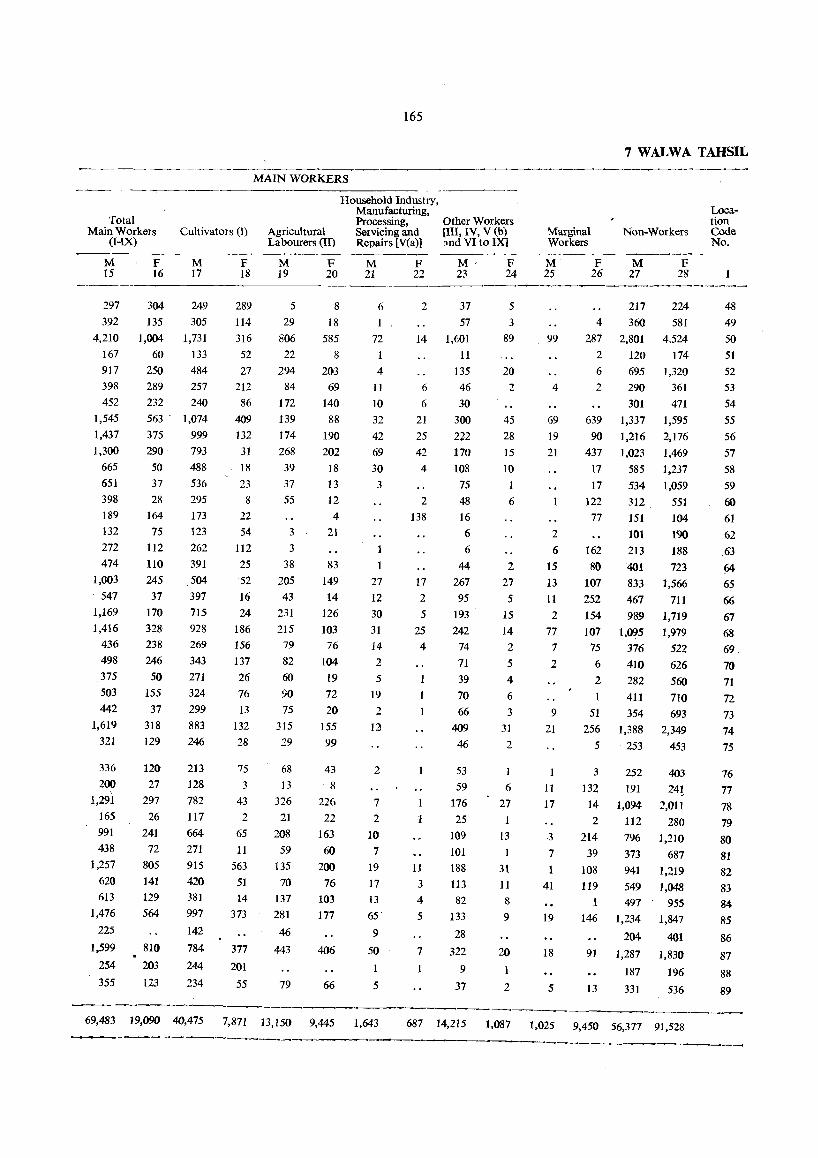
Total Main Workers
(I-IX) Cultivators (1)
M 15
297 392
4,210 167 917 398 452
1,545 1,437 1,300
665 651 398 189 132
272 474
1,003 547
1,169 1,416
436 498 375 503 442
1,619 321
336 200
1,291 165 991
438 1,257
620 613
1,476
225
1,599
254
355
F 16
304 135
1,004
60 250
M 17
249 305
1,731 133 484
289 257 232 240 563· 1,074 375 999 290 793 50 488 37 536 28 295
164 173 75 123
112 262 110 391 245 .504 31 397
170 115
328 928 238 269 246 343 50 271
155 324 37 299
318 883 129 246
120 27
297 26
241 72
805 141 129 564
810
203
123
213
128 782 117 664
271
915
420 381 997
142
784
244
234
F 18
289 114 316 52 27
212 86
409 132
31 18 23
8
22 54
112 25 52 16 24
186 156
131
26 76 13
132 28
75
3
43 2
65 11
563 51 14
373
317
201
55
165
MAIN WORKERS
Agricultural Labourers (II)
M 19
5 29
806
22 294
84 172 139 174 268 39 37 55
3
3
38 205 43
231 215
79 82 60
90 75
315
29
68 13
326 21
208 59
135 70
137 281
46
443
79
F 20
8 18
585 8
203 69
140 88
190 202 18 13
12 4
21
83 149 14
126 103 76
104
19 72
20 155 99
43 ·8
226
22 163
60
200
76 103
177
406
66
Household Industry, Manufacturing, Processing, Servicing and Repairs [V(a)]
M 21
6
72
1
4
11 10
32 42 69 30 3
27 12 30 31 14 2
5
19 2
12
2
7
2
10 7
19
17 13
65
9
50
1
5
F 22
2
14
6
6
21 25 42 4
2
138
17 2
5
25 4
1
1
11
3
4
5
7
--------~-----~---
Other Workers [ID, IV, V(b) ~nd VI to IX]
M' 23
37 57
1,601 11
135 46 30
300 222 170 108
75 48 16 6
6
44 267 95
193 242
74 71
39 70 66
409
46
53 59
176 25
109 101 188 113 82
133
28
322
9
37
F 24
5 3
89
20 2
45 28 15 10
1
6
2
27 5
15 14 2
5
4
6
3
31 2
I
6
27
13
31
11 8
9
20
2
7 WALWA TAHSIL
Marginal Workers
Non-Workers
M 25
99
4
69 19 21
2 6
15 13
11
2 77
7
2
9
21
1
11
17
3
7
41
19
18
5
F 26
M 27
217 4 36(}
287 2,801 2 120 6 695 2
639
90 437
17 17
122 77
162 80
107 252 154 107
75 6
2
51 256
5
3
132 14 2
214 39
108
119 1
146
91
13
290 301
1,337 1,216 1,023
585 534 312 151 101
213 401 833 461 989
1,095 376 410
282 411 354
1,388 253
252 191
1,094 112 796 373 941 549 497
1,234
204
1,287
187
331
F 28
224 581
4.524 174
1,320 361 471
1,595 2,176 1,469 1,237 1,059
551 104 1'90
188 723
1,566 711
1,719 1,979
522 626
560 710 693
2,349 453
403 24!
2,011
280 1,210
687 1,219 1,048
955
1,847
401
1,830
196
536
Location Code No.
48 49 50 51 52 53 54 55 56 57 58 59 60
61 62
.63 64
65 66
67 68 69 70 71 72
13 14 15
76 77 78 79 80 81 82 83 84 85
86
87
88
89
--------------69,483 19,090 40,475 7,871 13,150 9,445 1,643 687 14,215 1,087 1,025 9,450 56,377 91,528
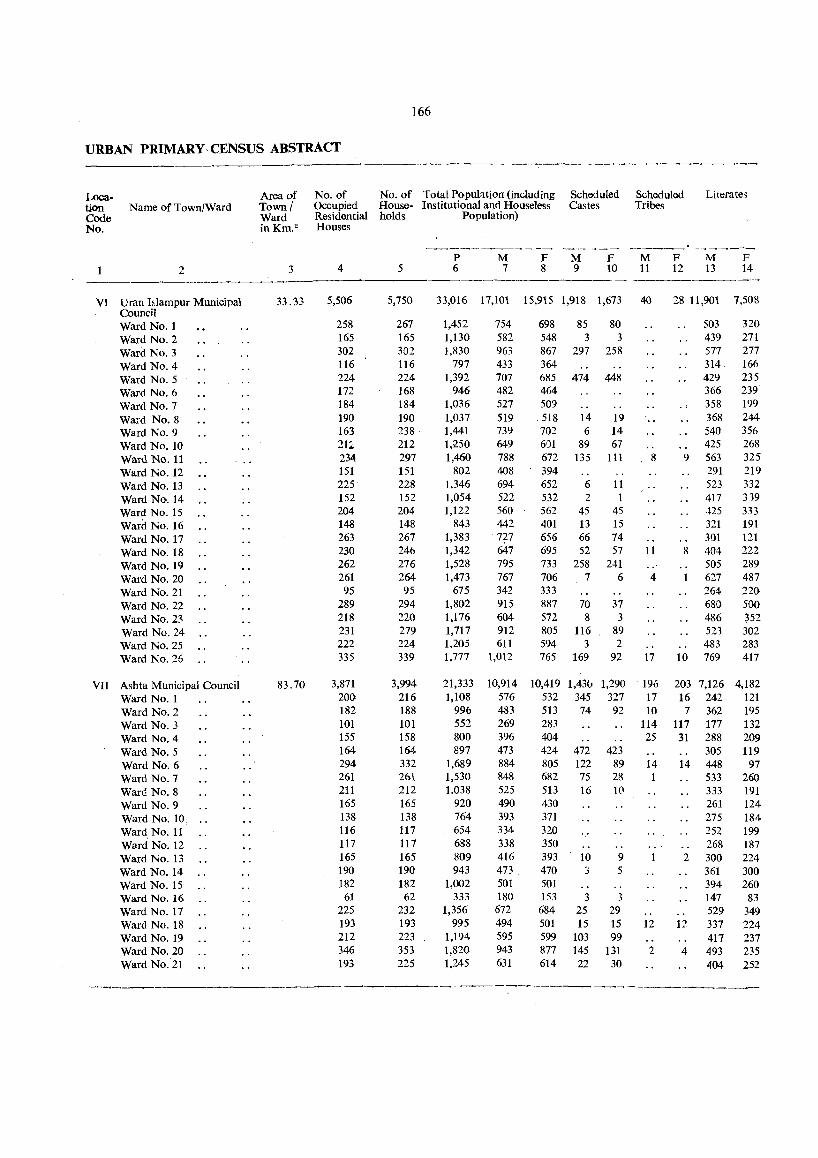
166
URBAN PRIMARY, CENSUS ABSTRACT ----~-_-
Loca- Area of No. of No. of Total Popuhtion (including Scheduled Scheduled Literates tiOn Name of Town/Ward Town I Occupied House- Institutional and Houseless Castes Tribes Code Ward Residential holds Population) No. in Km. 2 Houses
~----~-- --_ --_--- ---------_ P M F M F M F M F
2 3 4 5 6 7 8 9 10 11 12 13 14
VI Uran Ii'Jampur Municipal 33.33 5,506 5,750 33,016 17,101 15,915 1,918 1,673 40 28 11,901 7,508 Council Ward No.1 258 267 1,452 754 698 85 80 503 320 Ward No.2 165 165 1,130 582 548 3 3 439 271 Ward. No.3 302 302 1,830 963 867 297 258 577 277 Ward No.4 116 116 797 433 364 314 166 Ward No.5 224 224 1,392 707 685 474 448 429 235 Ward No.6 172 168 946 482 464 366 239 Ward No.7 184 184 1,036 527 509 358 199 Ward No.8 190 190 1,037 519 518 14 19 368 244 Ward No.9 163 238 1,441 739 702 6 14 540 356 Ward No. 10 21: 212 1,;!50 649 601 89 67 425 268 Ward No. 11 234 297 1,460 788 672 135 111 8 9 563 325 Ward No. 12 151 151 802 408 394 291 219 Ward No. 13 225 228 1,346 694 652 6 11 523 332 Ward No. 14 152 152 1,054 522 532 2 1 417 3.19 Ward No. 15 204 204 1,122 560 562 45 45 425 333 Ward. No. 16 148 148 843 442 401 13 15 321 191 Ward No. 17 263 267 1,383 727 656 66 74 301 121 Ward No. 18 230 24!:l 1,342 647 695 52 57 11 8 404 222 Ward No. 19 262 276 1,528 795 733 258 241 505 289 Ward No. 20 261 264 1,473 767 706 7 6 4 627 487 Ward No. 21 95 95 675 342 333 264 220 Ward No. 22 289 294 1,802 915 887 70 37 680 500 Ward No. 23 218 220 1,176 604 572 8 3 486 352 Ward No. 24 231 279 1,717 912 805 116 89 523 302 Ward No. 25 222 224 1,205 611 594 3 2 483 283 Ward No. 26 335 339 1,777 1,012 765 169 92 17 10 769 417
VII Ashta Municipal Council 83.70 3,871 3,994 21,333 10,914 10,419 1,43(; 1,290 196 203 7,126 4,182 Ward No.1 200 216 1,108 576 532 345 327 17 16 242 121 Ward No.2 182 188 996 483 513 74 92 10 7 362 195 Ward No.3 101 101 552 269 283 114 117 177 132 Ward No.4 155 158 800 396 404 25 31 288 209 Ward No.5 164 164 897 473 424 472 423 305 119 Ward No.6 294 332 1,689 884 805 122 89 14 14 448 97 Ward No.7 261 261 1,530 848 682 75 28 1 533 260 Ward No.8 211 212 1.038 525 513 16 1(1 333 191 Ward No.9 165 165 920 490 430 261 124 Ward No. 10. 138 138 764 393 371 275 184 Ward No. 11 116 117 654 334 320 252 199 Ward No. 12 117 117 688 338 350 268 187 Ward No. 13 165 165 809 416 393 10 9 2 300 224 Ward No. 14 190 190 943 473 470 3 5 361 300 Ward No. 15 182 182 1,002 501 501 394 260 Ward No. 16 61 62 333 180 153 3 3 147 83 Ward No. 17 225 232 1,356 672 684 25 29 529 349 Ward No. 18 193 193 995 494 501 15 15 12 12 337 224 Ward No. 19 212 223 1,194 595 599 103 99 417 237 Ward No. 20 346 353 1,820 943 877 145 131 2 4 493 235 Ward No. 21 193 225 1,245 631 614 22 30 404 252
--_-
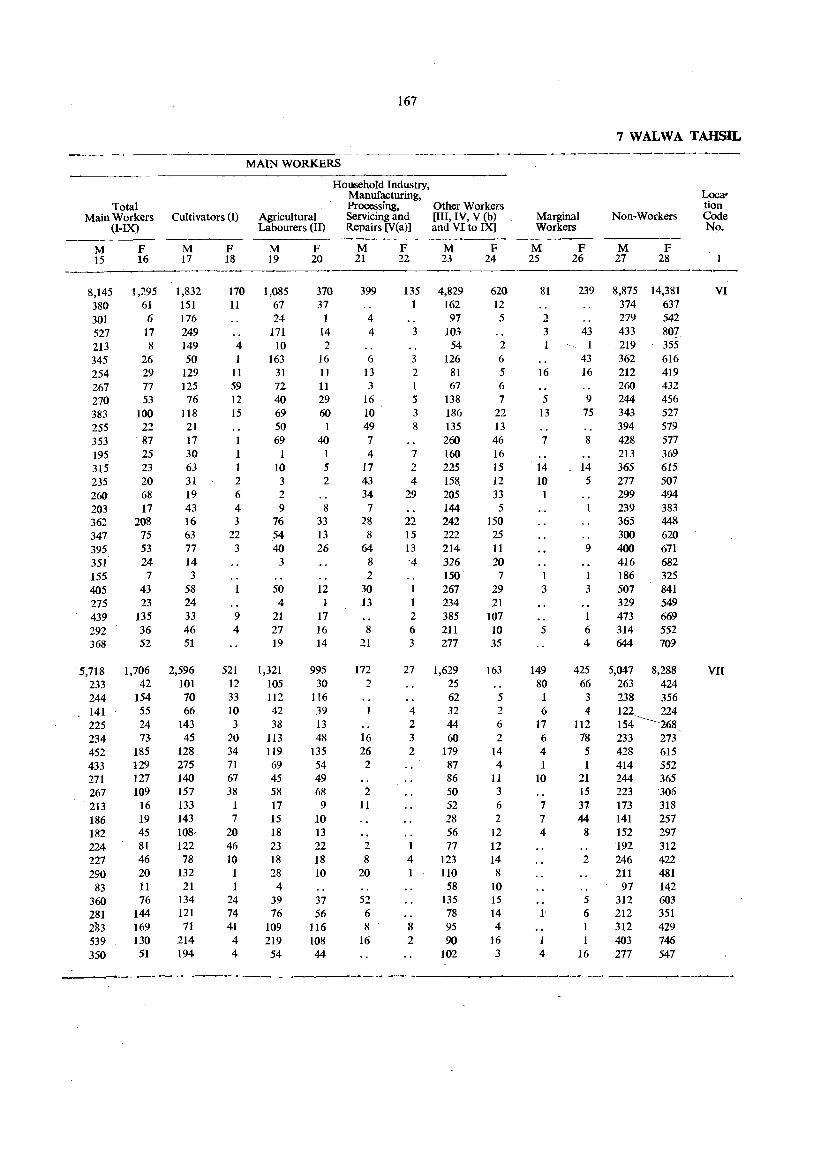
Total Main Workers
(I-IX)
M 15
8,145 380 301 527 213 345 254 267 270 383 255 353 195 315 235 260 203 362 347 395 351 155 405 275 439 292 368
5,718 233 244 141 225 234 452 433 271 267
·213
186 182 224 227 290
83 360 281 2113 539 350
F 16
1,295 61 6
17 8
26 29 77 53
100 22 87 25 23 20 68 17
208 75 53 24 7
43 23
135 36 52
1,706 42
154 55 24 73
185 129 127 109
16 19 45 81 46 20 11 76
144 169 130
51
167
MAIN WORKERS
Cultivators (1) Agricultural Labourers (In
Household Industry, Manufacturing, Processing, Servicing and Repairs [V(a)]
Other Workers [III, IV, V (b) and VI to IX]
M 17
1,832 151 176 249 149 50
129 125 76
118 21 17 30 63 31 19 43 16 63 77 14 3
58 24 33 46 51
2,596 101 70 66
143 45
128 275 140 157 133 143 108, 122 78
132 21
134 121 71
214 194
F M 18 19
170 1,085 11 61
24 171
4 10 163
11 31 59 72 12 40 15 69
50 69
1 10
2 3 6 2 4 9 3 76
22 ,54 3 40
3
50 4
9 21 4 27
521 12 33 10 3
20 34 71 67 38
7 20 46 10 1 1
24 74 41 4 4
19
1,321 105 112 42 38
113 119 69 45 58 17 15 18 23 18 28
4 39 76
109 219 54
F 20
370 37
1 14 2
16 11 11 29 60 1
40
5 2
8 33 I3 26
12 1
17 16 14
995 30
116 39 13 48
135 54 49 68
9 10 13 22 18 10
37 56
116 108 44
M 21
399
4 4
6 13 3
16 10 49 7 4
17 43 34
7 28
8 64
8 2
30 13
8 21
172 2
16 26 2
2 11
2 8
20
52 6 8
16
F M 22 23
135 4,829 1 162
97 3 103
54 3 126 2 81
67 5 138 3 186 8 135
260 7 160 2 225 4 158,
29 205 144
22 242 15 222 13 214 '4 326
150 t 267 1 234 2 385 6 211 3 277
27
4 2 3 2
1 4 1
8 2
1,629 25 62 32 44 60
179 87 86 50 52 28 56 77
123 110
58 135 78 95 90
102
F 24
620 12 5
2 6 5 6 7
22 I3 46 16 15 12 33
5 150 25 11 20
7 29 21
107 10 35
163
5 2 6 2
14 4
11 3 6 2
12 12 14 8
10 15 14 4
16 3
7 WALWA TAHSIL
Marginal Workers
Non-Workers
M 25
81
2 3
16
5 13
7
14 10
3
5
149 80 1 6
17 6 4 1
10
7 7 4
1 4
F M F 26 27 28
239 8,875 14,381 374 637 279 542
43 433 80Z 219 355
43 362 616 16 212 419
260 432 9 244 456
75 343 527 394 579
8 428 577 213 369
14 365 615 5 277 507
299 494 239 383 365 448 300 620
9 400 671 416 682
1 186 325 3 507 841
329 549 473 669
6 314 552 4 644 70~
425 66 3 4
112 78 5 1
21 15 37 44
8
2
5 6 1 1
16
5,047 8,288 263 424 238 356 122 224 154~'298, 233 273 428 615 414 552 244 365 223 306 173 318 141 257 152 297 ·192 312 246 422 211 481
97 142 312 603 212 351 312 429 403 746 277 547
Location Code No.
, 1
VI
vn
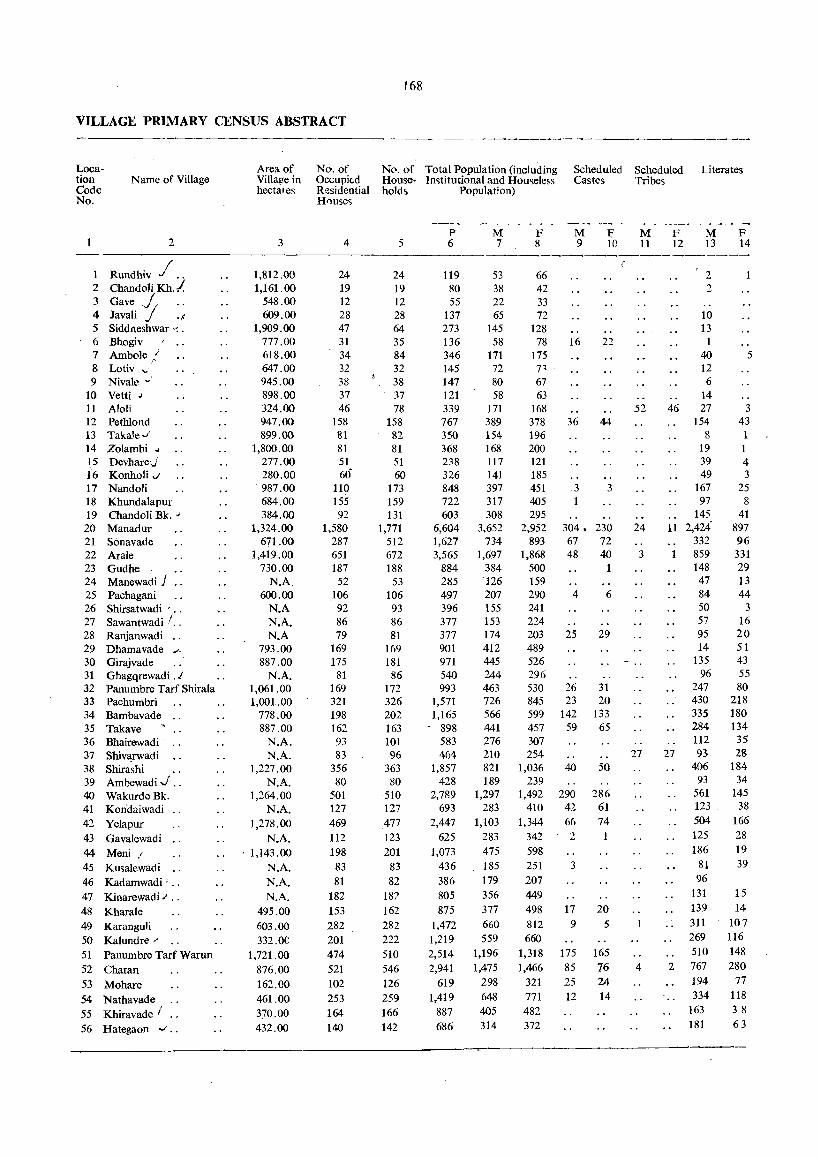
VILLAGE PRIMARY CENSUS ABSTRACT
Location Code No.
Name of Village
2
/ 1 Rundhiv J .. 2 Chandoli Kh.! 3 Gave .~ 4 Javali J ., 5 Sidd.aeshwar -: . 6 Bhogiv 7 Ambole / 8 Lotiv "c 9 Nivale ~
10 Vetti ~
11 Aloli 12 Pethlond 13 Taka1e,/ 14 ZoIambi oJ
15 Devharej 16 Konholi v 17 Nandoli 18 Khundalapur 19 Chandoli Bk. ~.
20 Manadur 21 Sonavade 22 Arale 23 Gudhe 24 Manewadi} 25 Pachagani 26 Shirsatwadi· .. 27 Sawantwadi I. . 28 Ranjanwadi 29 Dhamavade .;. 30 Girajvade 31 Ghagqrewadi. / 32 Panumbre Tarf Shirala 33 Pachumbri 34 Bambavade 35 Takave' 36 Bhairewadi 37 Shivl!twadi 38 Shirashi .. 39 Ambewadi.j .. 40 Wakurde Bk. 41 Koridaiwadi ., 42 Yelapur 43 Gavalewadi
.44 Meni.' 45 Kusalewadi 46 Kadamwadi· .. 47 Kinarewadi./ .. 48 Kharale 49 Karanguli 50 Kalundre·' 51 Panumbre Tarf Warun 52 Charan 53 Mohare 54 Nathavade 55 Khiravade I 56 Hategaon v'
Area of Villaee in hectares
3
1,812.00 1,161.00
548.00 609.00
1,909.00 777.00 618.00 647.00 945.00 898.00 324.00 947.00 899.00
1,800.00 277.00 280.00 987.00 684.00 384.00
1,324.00 671.00
1,419.00 730.00
N.A. 600.00
N.A N.A. N.A
793.00 887.00
N.A. 1,061.00 1,001.00
778.00 887.00
N.A. N.A.
1,227.00 N.A.
1,264.00 N.A.
1,278.00 N.A.
. 1,143.00 N.A. N.A. N.A.
495.00 603.00 332.0C
1,721.00 876.00 162.00 461.00 370.00 432.00
No. of Occupied Residential H()use~
4
24 19 12 28 47 31 34 32 38 37 46
158 81 81 51 60
110 155 92
1,580 287 651 187
52 106 92 86 79
169 175
81 169 321 198 162 93 83
356 80
501 127 469 112 198 83 81
182 153 282 201 474
521 102 253 164 140
168
No. of Total Population (including House· In~titutional and Housele,s hold~ Population)
5
24 19 12 28 64 35 84 32 38 37 78
158 82 81 51 60
173 159 131
1,771 512 672 188
53 106 93 86 81
169 181 86
172 326 202 163 101 96
363 80
510 127 477 123 201
83 82
187 162 282 222 510 546 126 259 166 142
P 6
119 80 55
137 273 136 346 145 147 121 339 767 350 368 238 326 848 722 603
6,604 1,627 3,565
884 285 497 396 377 377 901 971 540 993
1,571 1,165
- 898 583 464
1,857 428
2,789 693
2,447 625
1,073 436 386 805 875
1,472 1,219 2,514 2,941
619 1,419
887 686
M 7
53 38 22 65
145 58
171 72 80 58
171 389 154 168 117 141 397 317 308
3,652 734
1,697 384 126 207 155 153 174 412 445 244 463 726 566 441 276 210 821 189
1,297 283
1,103 283 475 185 179 356 377 660 559
1,196 1,475
298 648 405 314
F 8
66 42 33 72
128 78
175 T" 67 63
168 378 196 200 121 185 451 405 295
2,952 893
1,868 500 159 290 241 224 203 489 526 296 530 845 599 457 307 254
1,036 239
1,492 410
1,344 342 598 251 207 449 498 812 660
1,318 1,466
321 771 482 372
Scheduled Scheduled Literates Castes Tribes
M 9
16
36
3
304. 67 48
4
25
26 23
142 59
40
290 42 66 2
3
17 9
175 85 25 12
F. 10
22
44
3
230 72 40
1
6
29
31 20
133 65
50
286 61 74 1
20 5
165 76 24 14
M 11
.52
24
3
27
4
F 12
M 13
2 2
10 13
1 40 12 6
14 46 27
154 8
19 39 49
167 97
145 11 2,424'
332 859 148 47 84 50 57 95 14
135 96
247 430 335 284 112
27 93 406
93 561 123 504 125 186
81 96
131 139 311 269 510
2 767 194 334
163 181
F 14
1
5
3 43 1
4 3
25 8
41 897 96 331 29 13 44
3 16 20 51 43 55 80
218 180 134
35 28
184 34
145 38
166 28 19 39
15 14
107 116
148 280
77
118 38 63
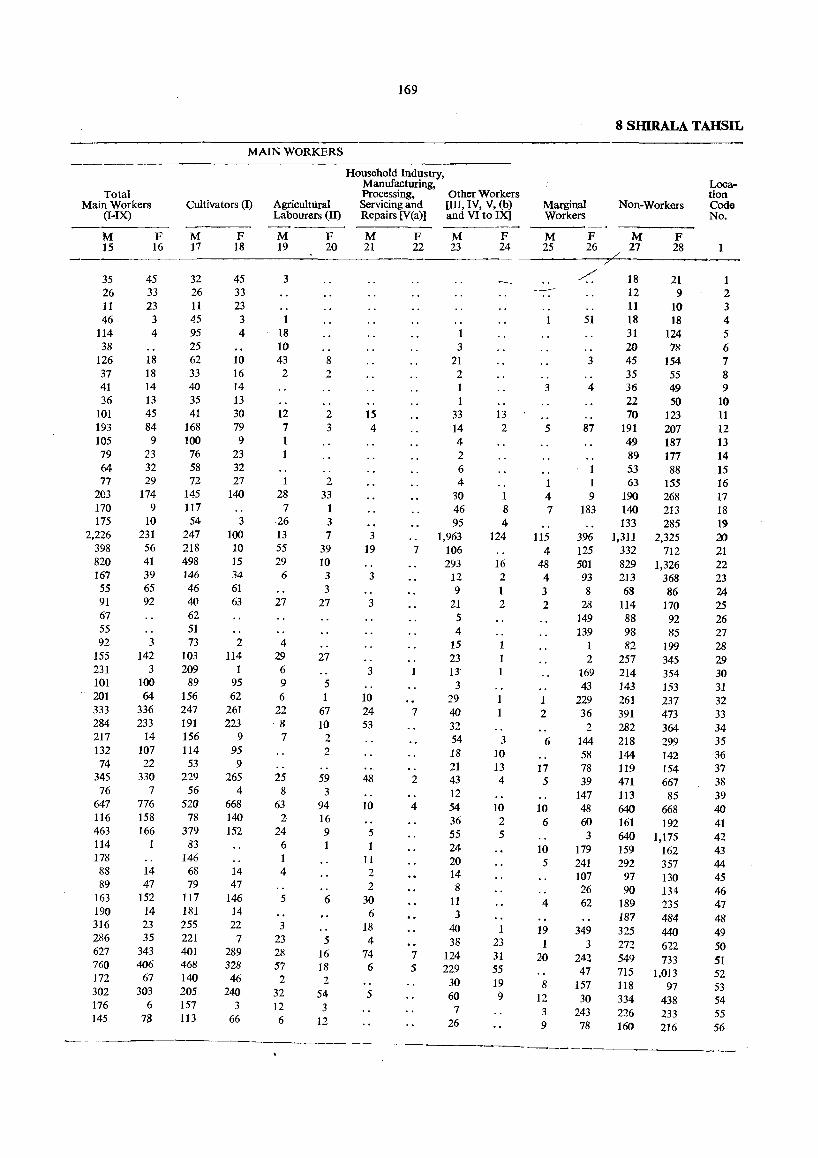
Total Main Workers
(I-IX)
M 15
35 26 11 46
114 38
126 37 41 36
101 193 105 79 64 77
203 170 175
2,226 398 820 167
55 91 67 55 92
155 231 101 201 333 284 217 132 74
345 76
647 116 463 114 178 88 89
163 190 316 286 627 760 172 302 176 145
F 16
45 33 23 3 4
18 18 14 13 45 84
9 23 32 29
174 9
10 231 56 41 39 65 92
3 142
3 100 64
336 233
14 107 22
330 7
776 158 166
1
14 47
152 14 23 35
343 406
67 303
6 78
169
MAIN WORKERS
Cultivators (1)
M ]7
32 26 11 45 95 25 62 33 40 35 41
168 100 76 58 72
145 117 54
247 218 498 146 46 40 62 51 73
103 209
89 156 247 191 156 114
53 229
56 520
78 379
83 146
68 79
117 181 255 221 401 468 140 205 157 113
F 18
45 33 23 3 4
10 16 14 13 30 79 9
23 32 27
140
3 100 10 15 34 61 63
2 114
1 95 62
261 223
9 95
9 265
4 668 140 152
14 47
146 14 22
7 289 328 46
240 3
66
Household Industry, Manufacturing, Processing, Other Workers
Agricultural Servicing and [III, IV, V, (b) Labourers (II) Repairs [V(a)] and VI to IX]
M 19
3
1 18 10 43 2
12 7 1
1 28
7 .26 13 55 29
6
27
4 29
6 9 6
22 -8
7
25 8
63 2
24 6 1 4
5
3 23 28 57 2
32 12 6
F 20
8 2
2 3
2 33
1 3 7
39 10
3 3
27
27
5 1
67 10
2 2
59 3
94 16 9 1
6
5 16 18 2
54 3
12
M 21
15 4
3 19
3
3
3
10 24 53
48
10
5
11 2 2
30 6
18 4
74 6
5
F 22
7
7
2
4
7 5
M 23
3 21
2
1 33 14 4 2 6 4
'30 46 95
1,963 106 293 12 9
21 5 4
15 23 13
3 29 40 32 54 18 21 43 12 54 36 55 24 20 14 8
11 3
40 38
124 229
30 60 7
26
F 24
13 2
8 4
124
16 2 1 2
1 1
3 10 13 4
10 2 5
1 23 31 55 19 9
8 SHIRALA TAHSIL
Marginal Workers
Non-Workers
M 25
3
5
1 4 7
115 4
48 4 3 2
1 2
6
17 5
10 6
10 5
4
19 1
20
8 12 3 9
F 26
M 27
< 18 12 11
51 18 31 20
3 45 35
4 36 22 70
87 191 49 89 53
1 63 9 190
183 140 133
396 1,311 125 332 501 829 93 213 8 68
28 114 149 88 139 98
1 82 2 257
169 214 43 143
229 261 36 391 2 282
144 218 58 144 78 119 39 471
147 113 48 640 60 161 3 640
179 159 241 292 107 97 26 90 62 189
187 349 325
3 272 242 549 47 715
157 118 30 334
243 226 78 160
F 28
21 9
10 18
124 78
154 55 49 50
123 207 187 177 88
155 268 213 285
2,325 712
1,326 368 86
170 92 85
199 345 354 153 237 473 364 299 142 154 667 85
668 192
1,175 162 357 130 134 235 484 440 622 733
1,013 97
438 233 216
Location Code No.
1 2 3 4 5 6 7 8 9
10 11 12 13 14 15 16 17 18 19 20 21 22 23 24 25 26 27 28 29 30 31 32 33 34 35 36 37 38 39 40 41 42 43 44 45 46 47 48 49 50 SI 52 53 54 55 56

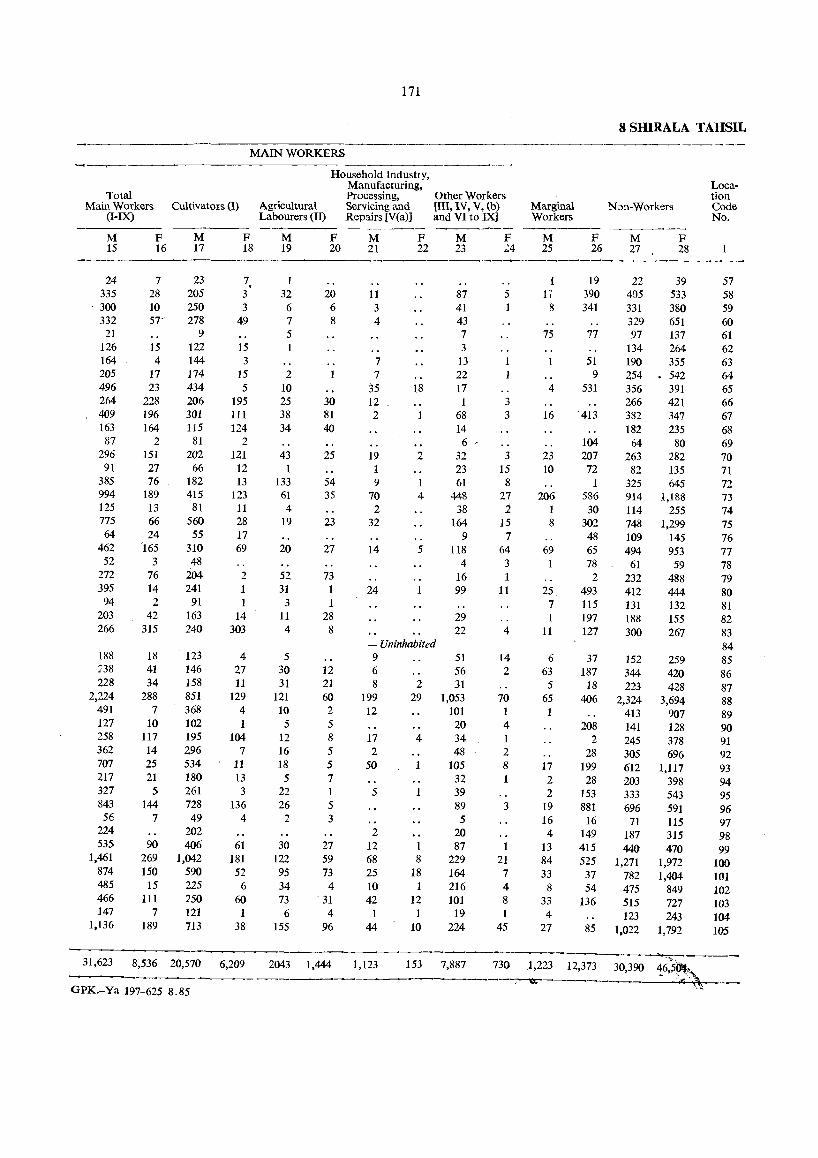
171
MAIN WORKERS
Total Main Workers
(I-IX) Cultivators (I)
M 15
24 335
. 300 332
21 126 164 205 496 264 409 163 87
296 91
385 994 125 775 64
462 52
272 395 94
203 266
188 238 228
2,224 491 127 258 362 707 217 327 843 56
224 535
1,461 874 485 466 147
1,136
F 16
M 17
7 23 28 205 10 250 57- 278
9 15 122 4 144
17 174 23 434
228 206 196 301 164 115
2 81 151 202 27 66 76 182
189 415 13 81 66 560 24 55
~165 310 3 48
76 204 14 241 2 91
42 163 315 240
18 41 34
288 7
10 117 14 25 21 5
144 7
90 269 150
15 111
7 189
123 146 158 851 368 102 195 296 534 180 261 728 49
202 406
1,042 590 225 250 121 713
31,623 8,536 20,570
GPK.-Ya 197-625-8.85
F 18
7. 3 3
49
15 3
15 5
195 111 124
2 121
12 13
123 11 28 17 69
2 1 1
14 303
4 27 11
129 4 1
104 7
11 13 3
136 4
61 181 52
6 60 1
38
6,209
Agricultural Labourers (II)
Household Industry, Manufacturing, Processing, Servicing and Repairs [V(a)]
M 19
1 32 6 7 5
2 10 25 38 34
43 1
133 61 4
19
20
52 31
3 11 4
F 20
20 6 8
30 81 40
25
54 35
23
27
73 1 1
28 8
M 21
11 3 4
7 7
35 12 2
19 1 9
70 2
32
14
24
F 22
18
2
1 4
5
Other Workers [Ill, IV, V, (b) and VI to IX]
M 23
87 41 43 7 3
13 22 17 1
68 14
6 32 23 61
448 38
164 9
118 4
16 99
29 22
F ":4
5
3 3
3 15 8
27 i
15 7
64 3 1
11
4
Marginal Workers
M 25
F 26
19 17 390
8 341
75 77
51 9
4 531
16 413
104 23 207 10 72
206 586 1 30 8 302
48 69 65
78 2
25 493 7 115 1 197
11 127
5 30 31
121 10
- Uninhabited 9 51
56 31
14 2
6 63 5
65 1
37 187
18 406
5 12 16 18
5 22 26 2
30 122 95 34 73
6 155
12 21 60 2 5 8 5 5 7 1 5 3
27 59 73
4 31 4
96
2043 1,444
6 8 2
199 29 12
17 4 2
50
5
2 12 1 68 8 25 18 10 1 42 12
1 1 44 10
1,123 153
1,053 101 20 34 48
105 32 39 89
5 20 87
229 164 216 101 19
224
7,887
70 1 4 1 2 8 1
3
1 21 7 4 8 1
45
17 2 2
19 16 4
13 84 33
8 33 4
27
208 2
28 199
28 153 881
16 149 415 525 37 54
136
85
730 1,223 12,373 -;---oc;-o
8 SHIRALA TAHSIL
N~n-Workers
M 27
F 28
22 39 405 533 331 380 329 651 97 137
134 264 190 355 254 • 542 356 391 266 421 382 347 182 235
64 80 263 282
82 135 325 645 914 1,188 114 255 748 1,299 109 145 494 953
61 59 232 488 412 444 131 132 188 155 300 267
152 344 223
2,324 413 141 245 305 612 203 333 696
71 187 440
1,271 782 475 515 123
1,022
259 420 428
3,694 907 128 378 696
1,117 398 543 591 115 315 470
1,972 1,404
849 727 243
1,792
Location Code No.
57 58 59 60 61 62 63 64 65 66 67 68 69 70 71 72 73 74 75 76 77 78 79 80 81 82 83 84 85 86 87 88 89 90 91 92 93 94 95 96 97 98 99
100 101 102 103 104 105
~::----30,390 46,5~> ...
- :c" .~£


