Embed Size (px)
Citation preview

27VATTEN · 1 · 13
Cost funCtions for prediCting Capital expenditure of small town water systems in ghana
Kostnadsfunktioner för investeringar i vattenförsörjningssystem i ghanas mindre tätorter
by Kristoffer ristinmaa 1, Kwabena biritwum nyarKo 2 and bismarK Dwumfour-asare 3
1 sjöbjörnsvägen 9, 117 67 stockholme-mail: [email protected]
2 environmental Quality engineering section, Department of Civil engineering, Kwame nkrumah university of science and technology
e-mail: [email protected] Department of environmental Health and sanitation, College of agriculture education,
asante-mampong Campus, university of education, winneba, Ghanae-mail: [email protected]
abstractUsing data gathered by the WASHCost project in Ghana, this study uses cost functions to predict capital ex-penditure for construction of piped water systems for small towns in Ghana. The data was collected from 45 small towns in peri-urban areas in the Volta, Ashanti and Northern regions of Ghana. Correlation and multiple regression analyses are used to derive cost functions for both the complete and components of water systems. The aim is to derive functions for the total capital expenditure of a small town water system and for the fixed assets components: mechanised borehole, water reservoir, pipe work and stand post. The results are presented as eight functions, representing the total capital expenditure for a water system and capital expenditure for the infrastructure components water reservoirs, pipework and stand posts. Explaining variables identified are de-sign population, length of pipeline, volume of reservoir and dummy variables for region (location). The func-tions vary in accuracy with an explanation coefficient R2 varying from 0.42 to 0.88 with limited data, but the functions are indicative for the cost of water systems with mechanised boreholes which are increasingly being used as small town water supply systems in Ghana.
Key words – Ghana, small town water system, cost function, capital expenditure, multiple regression analysis
sammanfattningGenom att använda data, insamlad av WASHCost i Ghana, undersöks vilka kostnadsdrivare som kan användas för att förutsäga kostnaderna vid nybyggnation av ett dricksvattensystem. Vattensystemen som undersöks använ-der grundvattenteknik och är avsedda för mindre orter med populationer under 20 000 invånare. WASHCost är ett pågående internationellt forskningsprojekt med holländska IRC som initiativtagare. Databasen täcker 45 tätorter ifrån tre ghananska regioner; Volta, Ashanti och Norra regionen. Huvudmålet med studien har varit att skapa en kostnadsfunktion för att i ett tidigt skede kunna få en uppfattning om de totala investeringskostna-derna vid nybyggnation av ett drickvattensystem. Sekundärt har funktioner skapats för att förutsäga kostnaderna för följande ingående komponenter i ett ghananskt vattennät: borrhål med automatisk pump, vattenreservoarer, rörledningsnät och vattenposter. För att skapa relevanta funktioner har sambandsanalys och multipel regression analys med olika modellalternativ använts. Dataunderlaget innehöll inte tillräckligt med information för att kunna skapa någon funktion för borrhålen. I resultaten redovisas åtta olika funktioner, varav två beskriver den totala investeringskostnaden. De vanligaste förekommande förklarande variablerna är: i vilken region vattensys-temet är lokaliserat, den dimensionerande populationen, den totala rörlängden och vattenreservoarens volym. Förklaringsgraden, R2, för funktionerna varierar mellan 0.42–0.88, vilket ger en stor variation i tillförlitlighet.
VATTEN – Journal of Water Management and Research 69:27–36. Lund 2013
28 VATTEN · 1 · 13
introductionGhana, according to WHO/UNICEF, has already achieved the water target of the Millennium Develop-ment Goals, among very few developing countries con-sidered to be on track in terms of water coverage. This progress covers all areas rural, small towns and urban in the country. In 2010, according to WHO’s definition of improved water, 86 % of Ghana’s population is supplied by improved water (WHO/UNICEF, 2012). Although the majority of Ghana’s population is pro-vided with water from improved systems, there are still 14 % who are not served (Ibid). In rural areas the relative number without improved water is 20 % in 2010, ac-cording to WHO/UNICEF (2012), and 40 % in 2009 according to Moriarty et al. (2010). The difference in relative number depends on how you define improved water in terms of quality, quantity, fetching time etc. as service delivery indicators. In absolute numbers, the above mentioned figures represent between two to four million people without access to improved water sys-tems. The country is still highly dependent on foreign donors. Up to 95 % of the new capital investments in the water sector comes from developing partners (mostly through loans) (Moriarty et al. 2010). One common type of improved water system, so called rural piped systems, for small towns and commu-nities in Ghana, is a water system consisting of a secured mechanized borehole with connecting pipelines to stor-age tanks and stand pipes (Nyarko 2007). It is popular in the sector that the use of these piped schemes could accelerate and widen access to water service towards the 2015 target of 76 % coverage. While the usage of this
water scheme is extensive, 451 systems as at 2009, the costs vary a lot from one system to another (Moriarty et al. 2010). The wide range of cost makes it difficult for proper planning. Thus the benefit of cost functions will be to improve financial planning for the provision of water facilities in Ghana. Several studies have been made in the field of cost estimation and water supply including those from Antoniolo and Filippini (2002), Tsegai et al. (2009), WRc (1977), Clark and Stevie (1981), Eilers (1984), Kirshen et al. (2004) and OECD (2005). Antoniolo and Filippini (2002) and Tsegai et al. (2009) targeted the maintenance and annual cost, whereas the others focus on the capital expenditure (CapEx) for water supply. This paper investigates only the capital expenditure for small town water systems in Ghana. The estimation modelling presented in this study is based on the use of multiple regression analysis. Nkrumah et al. (2011) presented the results of an investigation of the cost drivers for small towns’ water systems in Ghana and identified the main cost drivers for the evaluated water systems as technology, popula-tion density, hydrogeology of area and contract packag-ing. This paper similarly focuses on same small towns from the three regions in Ghana using the same database generated by WASHCost project hosted by the Kwame Nkrumah University of Science and Technology (KNUST) in Kumasi, Ghana, together with The Inter-national Water and Sanitation Centre (IRC). WASH-Cost is an international action research project and aims to increase the availability and use of cost information for both rural areas and small towns. WASHCost’s data-base is used in this paper to derive cost functions to en-
Figure 1. Ghana in the world. source: wikimedia Commons.
29VATTEN · 1 · 13
able estimations of CapEx of small town water systems. The main target is a function to predict the total capital expenditure (TotCapEx), in other words the total cost for a small town water system and, secondly, functions for parts of the water system will be derived. The parts that are analysed are mechanised boreholes, water reser-voirs, pipework and stand posts. The model will con-tribute to sector knowledge as a key decision making and planning tool for water service delivery in Ghana.
methoddata
The main data source has been a database from WASH-Cost project in Ghana. Other sources of data include published reports, mainly from Ghana’s Community Water and Sanitation Agency (CWSA). According to Nkrumah et al. (2011), the selection of regions was con-ducted so the data would fulfil the following criteria:
• A diversity of donors and development partners with sufficient information regarding capital cost
• A diversity of hydrogeological and hydro-climatic zones
• Different approaches of how to implement a water system
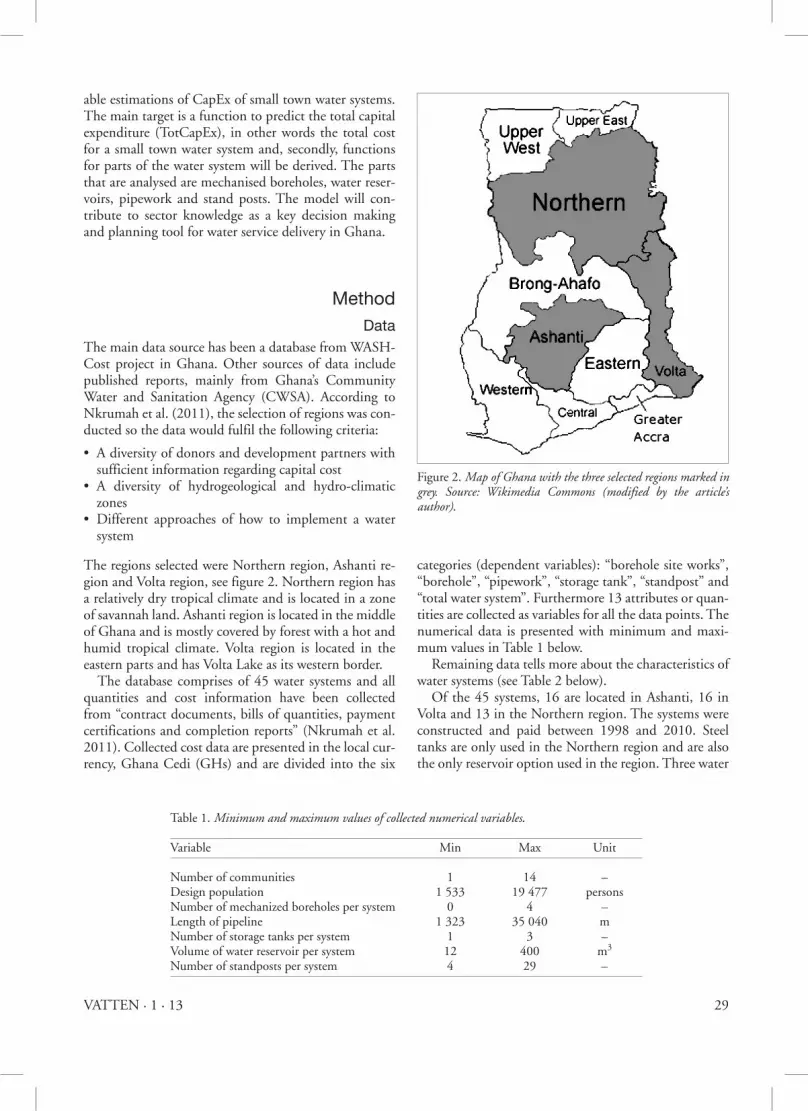
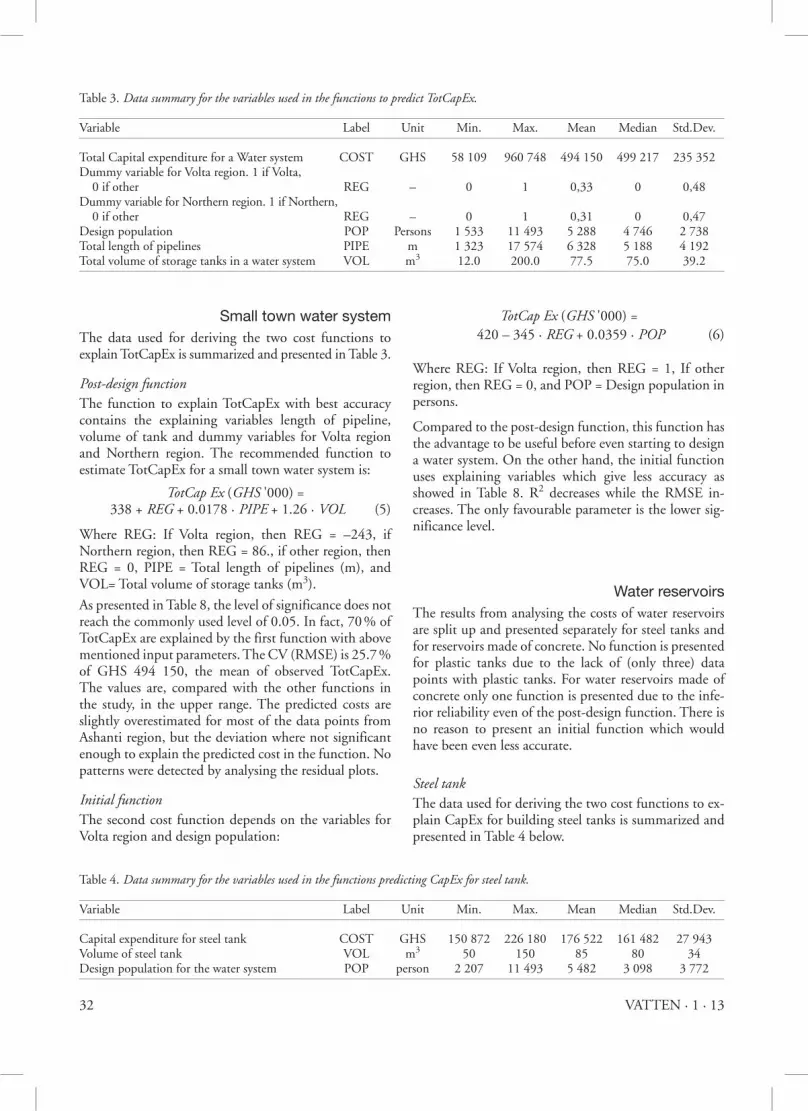
The regions selected were Northern region, Ashanti re-gion and Volta region, see figure 2. Northern region has a relatively dry tropical climate and is located in a zone of savannah land. Ashanti region is located in the middle of Ghana and is mostly covered by forest with a hot and humid tropical climate. Volta region is located in the eastern parts and has Volta Lake as its western border. The database comprises of 45 water systems and all quantities and cost information have been collected from “contract documents, bills of quantities, payment certifications and completion reports” (Nkrumah et al. 2011). Collected cost data are presented in the local cur-rency, Ghana Cedi (GHs) and are divided into the six
categories (dependent variables): “borehole site works”, “borehole”, “pipework”, “storage tank”, “standpost” and “total water system”. Furthermore 13 attributes or quan-tities are collected as variables for all the data points. The numerical data is presented with minimum and maxi-mum values in Table 1 below. Remaining data tells more about the characteristics of water systems (see Table 2 below). Of the 45 systems, 16 are located in Ashanti, 16 in Volta and 13 in the Northern region. The systems were constructed and paid between 1998 and 2010. Steel tanks are only used in the Northern region and are also the only reservoir option used in the region. Three water
Figure 2. map of Ghana with the three selected regions marked in grey. source: wikimedia Commons (modified by the article’s author).
Table 1. minimum and maximum values of collected numerical variables.
Variable Min Max Unit
Number of communities 1 14 –Design population 1 533 19 477 personsNumber of mechanized boreholes per system 0 4 –Length of pipeline 1 323 35 040 mNumber of storage tanks per system 1 3 –Volume of water reservoir per system 12 400 m3
Number of standposts per system 4 29 –
30 VATTEN · 1 · 13
systems use bulk water from GWCL and are the only systems using plastic tank. Only four water systems use solar system as power source and they are all located in Northern region. Contract packaging follows the varia-tion of region. The only contract packaging presented in Volta region is National Competitive Bidding (NCB), whereas International Competitive Bidding (ICB) is the only contract bidding system used in Ashanti and Northern region. This study uses data from towns with populations between two thousand and twenty thou-sand, which makes this study investigating the costs for both peri-urban and small urban areas. Although the sizes of the observed towns divide the data into two cat-egories of settlement, the characteristics of the water sys-tems used are similar for the settlements. The majority of the water systems in small towns or smaller urban areas observed in this article comprise of a mechanized borehole, pipework for transmission and distribution, some kind of reservoir and several stand posts.
analytical toolsDeflated costsThe data points in WASHCost’s database are from water systems built between 1998 and 2010. Small town water systems infrastructure provision contracts normally allow for payments of fluctuations due to inflation. Because of this, deflators are used to adjust past cost to current values. The cost adjuster used due to the infla-tion is the annual growth of Consumer Price Index (CPI) provided by Ghana Statistical Service. CPI meas-ures measures the annual changes in price of final goods and services used by households in the country.Together with the annual growth of Gross Domestic Product (GDP) deflator, the index is an established way to adjust for inflation. These two follow each other rather well, while one can also use another more deviating index called the Prime Building Cost Index (PBCI). The PBCI
is a measure of inflation in the construction industry while the CPI gives a measure for the whole economy. WASHCost has previously used both the PBCI deflator in Nkrumah (2010) and GDP deflator in other publica-tions. From WASHCost database, the deflator based on the CPI gives a lower inflation rate over time. The two indexes (PBCI and CPI) are presented accumulated from 1997 to 2011 in figure 3. The difference will give lower costs if the CPI is used, which is done in present article. The costs will be particularly lower further away from year 2011, which is used as base year. Both CPI and PBCI are provided by Ghana’s Statistical Service.
Correlation analysisIn this study, an approximation of the correlation coef-ficient, rxy , was estimated. Pairs of variables are taken from n data points and are placed in a series of pairs. Then the estimation, here called rxy , can be calculated
r*xy = rxy = cxy = ∑ni =1 (xi –x ) (yi –y) (1)
sx · sy √∑ni =1 (xi –x )2 √∑n
i =1 (yi –y )2
If selection of interesting independent variables is the first use of a correlation analysis; the second use for this study is to find out which variables really are independ-ent. If the correlation is very high between two inde-pendent variables, then probably they are not really in-dependent and indicates that both cannot be used in the same multiple regression analysis. In other word, the correlation analysis helps to indicate problems of multi-collinearity (Montgomery et al. 2006).
multiple regression analysis Through a regression analysis, the variety of an inde-pendent variable are sought to be described by explain-ing variables. According to previous studies (WRc (1977), Clark and Stevie (1981), Eilers (1984), Kirshen
Table 2. Presentation and brief explanation of the collected quantitative data.
Variable Description
Regions Where the system is located. The regions are Volta, Ashanti or Northern region.Year of construction When the system is constructed.Transmission and distribution pipe length Percentage of the total length of pipelines in a water system that operates for transmission versus distribution of water.Type of reservoir If a system uses ground concrete reservoir, high level concrete reservoir, steel or plastic tank. One water system can use multiple options.Technical option Sorts out if mechanized borehole is used or the system is provided with bulk water from Ghana Water Company Limited’s (GWCL)Power source Sorts out if power comes from the national grid or from a solar systemContract packaging Depending on the source of funding and could either be International Competitive Bidding (ICB) or National Competitive Bidding (NCB).

31VATTEN · 1 · 13
et al. (2004) and OECD (2005), the most common function used to derive functions for capital costs is the so-called log-log model. Beside the log-log model, a regular linear model is tested and in the cases where one explaining variable seems to be highly correlated to the capital expenditure in a polynomial way, a polynomial model is tested.
Linear model:yi = a + b1x1i + b2x2i + … + bnxni + ei (2)
Log – Log model:yi = a · x b1
1i · x b2
2i · … · x bn
ni · ei (3)
Polynomial model:yi = a + b1x1i + b2x
2i + … + bnx
ni + ei (4)
Whereyi = dependent variable from data point i,i = 1,2. … , nx1i , x2i , … , xni = explaining variables from data point ia = constant to be estimatedb1, b2, … , bn = coefficients to be estimated, relating to
explaining variables x1, x2, … , xnei = random error for data point i, ei ∈ n(0,s)
The key parameters used to analyse the accuracy and precision of a model are as follows:
• Significance level – Describes at what level all the computed factors (bi) and constants (a) in the model are significant apart from zero. Lower than 0.05 is considered as a decent significance.
• Residual Analysis – To ensure that the assumption of error, , is correct. Namely the error should be random, no patterns, and normal distributed (plots are not pre-sented).
• Coefficient of determination (R2) – To compare and valuate how well a function describes the cost. 0–1 where 1 means that the cost is fully described by the function.
• Root Mean Square Error (RMSE) =√∑ni =1 ∆y
2. To
n describe the variation around the function. If RMSE is large, then the outcome of a function has to be con-sidered with a large interval. The CV(RMSE) is also calculated which simply is the RMSE divided by the mean CapEx.
Almost half of the variables in the study are of a qualita-tive nature and dummy variables have been used as nu-meric stand-in for these qualitative data. As an example, the “region”-variable has three qualitative options. If data point X is located in Ashanti region, the dummy variable “Ashanti region” is 1 and the variables “North-ern region” and “Volta region” are 0. For mathematical reasons, 0 and 1 have to be changed to 1 and 2 when a log-log model is applied.
results and discussionThis section describes the estimated results from the analysis. Since the analysis failed to derive a function for predicting CapEx for mechanised borehole, there is no such function presented in this section. Almost all the results are presented with two recom-mended cost functions for each analysed object. The post-design function has a better accuracy, but has such variables that a first design investigation must take place before the function can be used. The initial function is therefore derived to get an estimate of the cost before even an investigation of the location for the forthcoming water system has taken place. All the functions are pre-sented in thousand (1000) Ghana Cedis (GHs, 2011). All the used parameters to evaluate the accuracy and pre-cision of the function are listed in Table 8.
Figure 3. Comparison of the two de-flators based on PbCi (grey line) and CPi (black line). the black lower line (CPi deflator) is used in present study. 1997 = GHs 100, base year. source: Ghana statistical service (2011) and world bank (2013).
32 VATTEN · 1 · 13
small town water systemThe data used for deriving the two cost functions to explain TotCapEx is summarized and presented in Table 3.
Post-design functionThe function to explain TotCapEx with best accuracy contains the explaining variables length of pipeline, volume of tank and dummy variables for Volta region and Northern region. The recommended function to estimate TotCapEx for a small town water system is:
totCap ex (GHs '000) = 338 + reG + 0.0178 · PiPe + 1.26 · VoL (5)
Where REG: If Volta region, then REG = –243, if Northern region, then REG = 86., if other region, then REG = 0, PIPE = Total length of pipelines (m), and VOL= Total volume of storage tanks (m3).
As presented in Table 8, the level of significance does not reach the commonly used level of 0.05. In fact, 70 % of TotCapEx are explained by the first function with above mentioned input parameters. The CV (RMSE) is 25.7 % of GHS 494 150, the mean of observed TotCapEx. The values are, compared with the other functions in the study, in the upper range. The predicted costs are slightly overestimated for most of the data points from Ashanti region, but the deviation where not significant enough to explain the predicted cost in the function. No patterns were detected by analysing the residual plots.
initial functionThe second cost function depends on the variables for Volta region and design population:
totCap ex (GHs '000) = 420 – 345 · reG + 0.0359 · PoP (6)
Where REG: If Volta region, then REG = 1, If other region, then REG = 0, and POP = Design population in persons.
Compared to the post-design function, this function has the advantage to be useful before even starting to design a water system. On the other hand, the initial function uses explaining variables which give less accuracy as showed in Table 8. R2 decreases while the RMSE in-creases. The only favourable parameter is the lower sig-nificance level.
water reservoirsThe results from analysing the costs of water reservoirs are split up and presented separately for steel tanks and for reservoirs made of concrete. No function is presented for plastic tanks due to the lack of (only three) data points with plastic tanks. For water reservoirs made of concrete only one function is presented due to the infe-rior reliability even of the post-design function. There is no reason to present an initial function which would have been even less accurate.
steel tankThe data used for deriving the two cost functions to ex-plain CapEx for building steel tanks is summarized and presented in Table 4 below.
Table 3. Data summary for the variables used in the functions to predict totCapex.
Variable Label Unit Min. Max. Mean Median Std.Dev.
Total Capital expenditure for a Water system COST GHS 58 109 960 748 494 150 499 217 235 352Dummy variable for Volta region. 1 if Volta, 0 if other REG – 0 1 0,33 0 0,48Dummy variable for Northern region. 1 if Northern, 0 if other REG – 0 1 0,31 0 0,47Design population POP Persons 1 533 11 493 5 288 4 746 2 738Total length of pipelines PIPE m 1 323 17 574 6 328 5 188 4 192Total volume of storage tanks in a water system VOL m3 12.0 200.0 77.5 75.0 39.2
Table 4. Data summary for the variables used in the functions predicting Capex for steel tank.
Variable Label Unit Min. Max. Mean Median Std.Dev.
Capital expenditure for steel tank COST GHS 150 872 226 180 176 522 161 482 27 943Volume of steel tank VOL m3 50 150 85 80 34Design population for the water system POP person 2 207 11 493 5 482 3 098 3 772

33VATTEN · 1 · 13
Post-design functionThe recommended function uses the designed total vol-ume of a steel tank and is written:
Capex (GHs '000) = 110.28 + 0.78 · VoL (7)
Where VOL = Designed volume of steel tank in m3.
Apart from the small number of observations, which is a weakness, this function has the strongest values of all functions in the article. This is especially observable by looking at the CV(RMSE) and the R2, see Table 8. The residuals do not have any specific pattern.
initial functionTo initially estimate the cost for a steel tank, the recom-mended function is:
Capex (GHs '000) = 145.57 + 0.00564 · PoP (8)
Where POP = Design population in persons.
The function, with only the design population as ex-plaining variable, is far from the post-design function regarding accuracy and explanation degree. Table 8 shows that the R2 drops to 0.58, but using design popu-lation as the only variable still gives a very low signifi-cance level. The user of the derived functions should consider possibilities to estimate the total need of stor-age volume in the study area to enable usage of the post-design rather than the initial function.
reservoirs made of concreteThe data used for deriving the two cost functions to ex-plain CapEx for building reservoirs made of concrete is summarized and presented in Table 5.
Post-design functionThe final recommended function for deriving cost for a concrete reservoir is built on the explaining variables: dummy for Volta region (reduces the cost), the volume of the reservoir and whether it is a normally elevated concrete tank (CT) or it is a ground concrete tank (GCT). The function is:
Capex (GHs '000) = 8519 · VoL0.37 · tyPe 0.05 · reG –0.66 (9)
Where VOL = Designed volume of concrete reservoir in m3, TYPE = 2 if concrete tank, 1 if concrete ground reservoir, and REG = 2 if Volta region, 1 if other re-gion.
The function to derive cost for a concrete reservoir has the poorest key values of all investigated assets, see Table 8. The function needs a pre-investigation of the study area to be useful and still, the output from the function is very uncertain. Therefore the function is only recom-mended in the sense of being the best possible from the input data. It does not mean that we recommend using the function to determine the potential costs. A com-parison between observed and predicted costs reveals the lack of coherence between them and underlines the un-certainty of the function.
pipeworkThe data used for deriving the two cost functions to ex-plain CapEx for building a pipeline network for water supply in a small town is summarized and presented in Table 6 below.
Table 5. Data summary for the variables used in the function predicting Capex for reservoirs made of concrete.
Variable Label Unit Min. Max. Mean Median Std.Dev.
Capital expenditure for a reservoir made of concrete COST GHS 15 829 148 222 74 289 65 865 32 746Size of the reservoir VOL m3 12.0 200.0 78.8 75.0 41.9Dummy variable for type of reservoir. 2 if CT, 1 if GCT TYPE – 1.00 2.00 1.89 2.00 0.32Dummy variable for region. 2 if Volta region, 1 if other region REG – 1.00 2.00 1.44 1.00 0.51
Table 6. Data summary for the variables used in the functions predicting Capex for pipeworks.
Variable Label Unit Min. Max. Mean Median Std.Dev.
Capital expenditure for pipework COST GHS 14 870 455 360 156 740 137 880 103 060Dummy variable for region. 1 if Volta region, 0 if other region REG – 0 1 0.36 0 0.48Total length of pipelines PIPE km 1.32 17.57 6.25 5.19 4.16Design population POP persons 1 533 15 942 5 469 4 746 3 162
34 VATTEN · 1 · 13
Post-design functionCapEx for pipework in a small town water system is best explained by the total length of pipelines in the system and if the study area is located in Volta region. The func-tion is written:
Capex (GHs '000) = 61.21 + 19.5 · PiPe – 74.50 · reG (10)
Where PIPE= Total length of pipeline in km and REG= 1 if Volta region, 0 if other region.
The number of observations is similar to all the other functions, except for the water reservoirs. The signifi-cance level is sufficiently low and the cost is well ex-plained by the two input variables with R2=0.80. An objection to use the function is the scattered residuals, especially some of the outliers that bring the values down for all the key parameters, e.g. CV(RMSE) = 29 %, see Table 8.
initial functionThe initial function is written:
Capex (GHs '000) = 472.15 · PoP 0.70 · reG –1.20 (11)
Where POP = Design population in person and REG = 2 if Volta region, 1 if other region.
As for all system characteristics above, the initial func-tion for pipework does not reach the same accuracy as the post-design function does, see Table 8. Although the significance level is decent and the R2 might be consid-ered acceptable, the RMSE shows that the residuals are very scattered. This will give a very wide interval for the predicted cost. The real prediction interval would be larger than the derived cost plus/minus the RMSE and already the RMSE interval will give a multiplicative in-terval between 0.59 and 1.41 of the predicted cost.
stand postSurprisingly, the design population gave better values than the number of stand posts in the multiple regres-sion analysis and because of the high correlation between them the model just got significant with one at a time. Therefore, the final cost function depends on the varia-
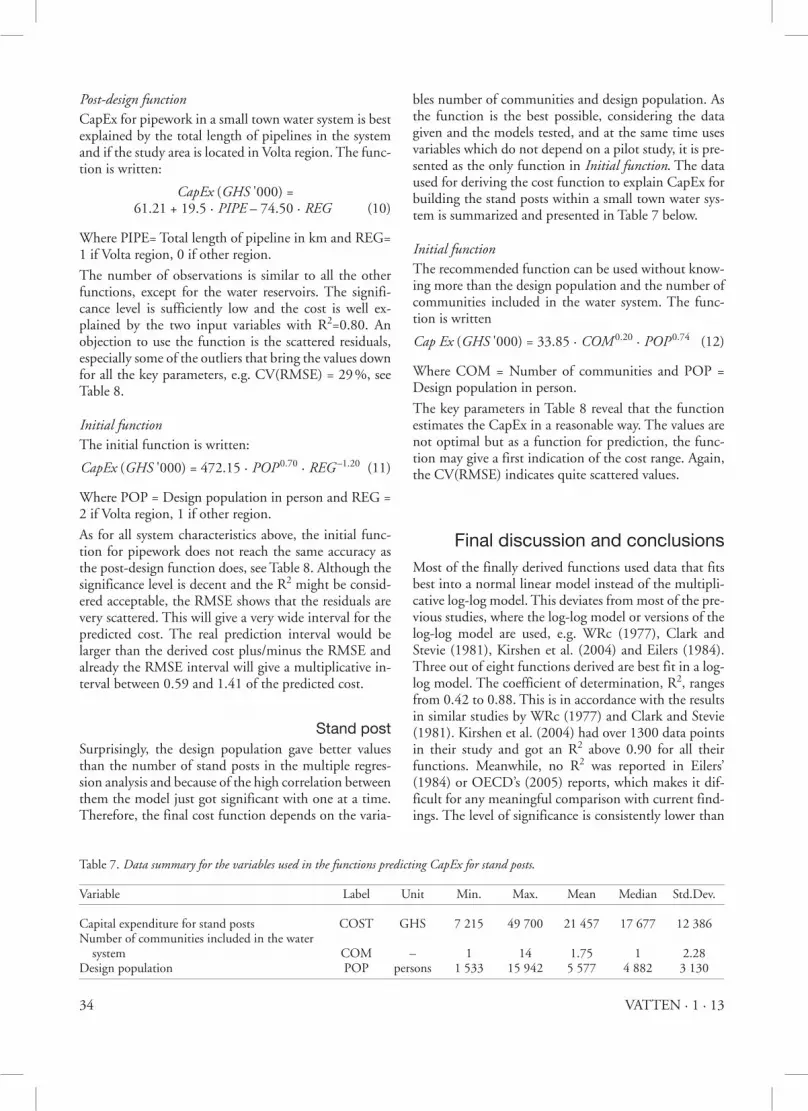
bles number of communities and design population. As the function is the best possible, considering the data given and the models tested, and at the same time uses variables which do not depend on a pilot study, it is pre-sented as the only function in initial function. The data used for deriving the cost function to explain CapEx for building the stand posts within a small town water sys-tem is summarized and presented in Table 7 below.
initial functionThe recommended function can be used without know-ing more than the design population and the number of communities included in the water system. The func-tion is written
Cap ex (GHs '000) = 33.85 · Com 0.20 · PoP 0.74 (12)
Where COM = Number of communities and POP = Design population in person.
The key parameters in Table 8 reveal that the function estimates the CapEx in a reasonable way. The values are not optimal but as a function for prediction, the func-tion may give a first indication of the cost range. Again, the CV(RMSE) indicates quite scattered values.
final discussion and conclusionsMost of the finally derived functions used data that fits best into a normal linear model instead of the multipli-cative log-log model. This deviates from most of the pre-vious studies, where the log-log model or versions of the log-log model are used, e.g. WRc (1977), Clark and Stevie (1981), Kirshen et al. (2004) and Eilers (1984). Three out of eight functions derived are best fit in a log-log model. The coefficient of determination, R2, ranges from 0.42 to 0.88. This is in accordance with the results in similar studies by WRc (1977) and Clark and Stevie (1981). Kirshen et al. (2004) had over 1300 data points in their study and got an R2 above 0.90 for all their functions. Meanwhile, no R2 was reported in Eilers’ (1984) or OECD’s (2005) reports, which makes it dif-ficult for any meaningful comparison with current find-ings. The level of significance is consistently lower than
Table 7. Data summary for the variables used in the functions predicting Capex for stand posts.
Variable Label Unit Min. Max. Mean Median Std.Dev.
Capital expenditure for stand posts COST GHS 7 215 49 700 21 457 17 677 12 386Number of communities included in the water system COM – 1 14 1.75 1 2.28Design population POP persons 1 533 15 942 5 577 4 882 3 130
35VATTEN · 1 · 13
0.10 (often <0.01) in present study which is reasonable. Although the conventional level of significance to form firm arguments is 0.05, this is still arbitrary (Stigler 2008), which leads to the conclusion that a function with level 0.10 should not be immediately rejected. In-stead it is important to evaluate the significance level together with all other key parameters, such as the RMSE and the R2. The residual analysis is used to reject function where the errors did not fulfil the criteria to be independent each other and normal distributed. All the functions presented are considered to fulfil the criteria of independence and normally distributed errors. Overall, it has been possible to derive cost functions for a small town water system in Ghana especially the post-design functions for TotCapEx and other CapEx which may be interesting to use, due to their better key values. These functions normally require a first investi-gation and design of the intended building area, but will on the other hand give more reliable cost predictions. However, in two cases it has not been possible to create functions adequate to predict the cost. In one of the cases, the key values of the function for concrete reser-voirs are not good enough and the other case is the lack of a function for mechanized boreholes. The data was insufficient to derive a function to predict the cost for mechanized boreholes. The initial functions, that are in-tended to operate as a forecaster in the early stage of a new construction project, should be used sparsely and critically. Arguing from the key parameters, the initial function for TotCapEx, CapEx for steel tank and the function for stand posts are the functions with enough accuracy to use as proxy predictions. One might also question if 13 observations are enough for the functions to predict CapEx for steel tank, but then again the number of observations has taken into account when the models has been derived and when calculating the key parameters.
The design population is used in all the initial func-tions to determine CapEx. Population is one of few variables that are available before planning a new water system and is normally, together with region, the one with most correlation to capital cost. As could have been presumed, the design population does not explain all the variability of CapEx. Nkrumah et al. (2011) suggests that the population density of an intended construction area probably could explain the cost in a good way, but data for population density is not yet collected for the observed data points. Moreover, the authors suggested pipe length/capita as a proxy for the population density, but this requires knowing the length of the designed pipework and cannot be used before planning. As the results shows, the regions often occur as ex-plaining variables. Particularly the Volta region is part of most functions and consequently reduces the cost pre-diction. Here it is important to stress that explaining versus responding variables do not imply a clear causal relationship. It is easy to understand that a region in it-self cannot drive the cost; instead it is the properties of a region which drive the cost. The problem is to deter-mine what properties that might inflate CapEx. The dif-ferences between the regions, based on the criteria for collecting the data, are possible answers to the question of what drives the cost. However, this cannot be con-cluded in this paper. Contract packaging is an example of a possible cost driver, already concluded by Nkrumah et al. (2011). For example, NCB is the only contract packaging used in Volta region, which means that it would have worked identical with a dummy variable for Volta region in a function. Still, we chose Volta region as explaining variable due to the more general character of a region. NCB as a contract package is not represented in the other two regions, Northern and Ashanti, which prevents a comparison across the regions which implies that other factors cannot be excluded as cost drivers.
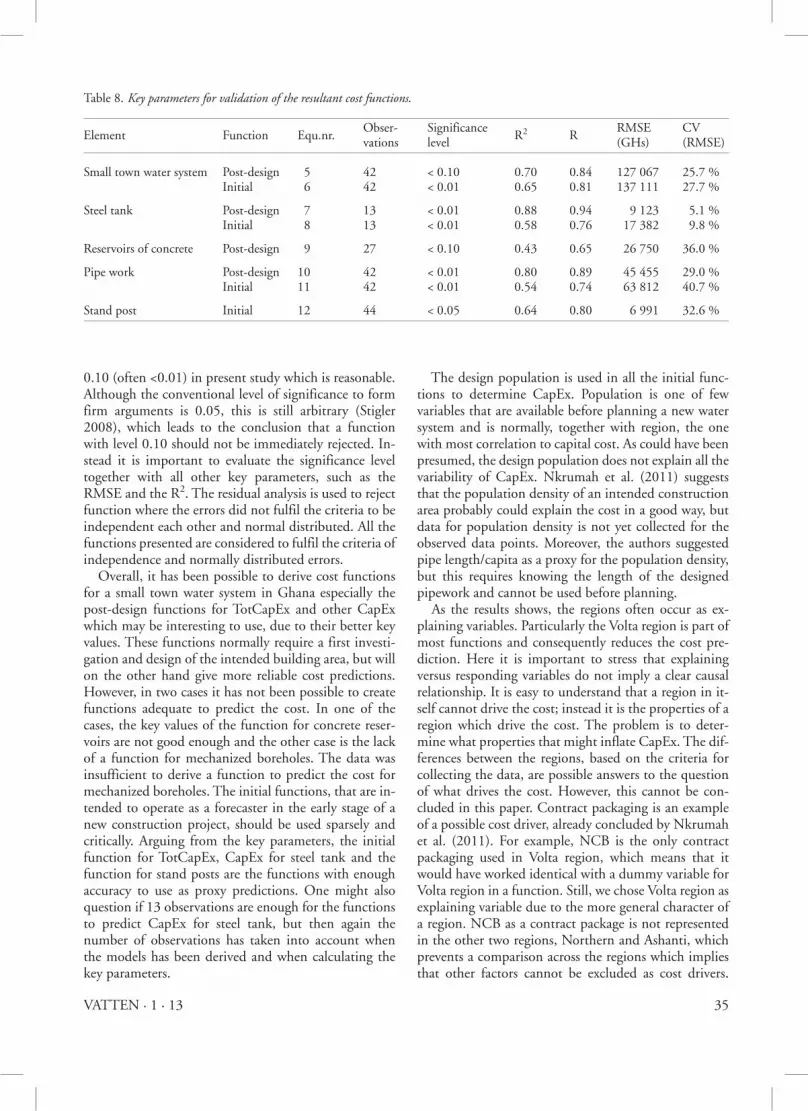
Table 8. Key parameters for validation of the resultant cost functions.
Element Function Equ.nr. Obser- Significance
R2 R RMSE CV
vations level (GHs) (RMSE)
Small town water system Post-design 5 42 < 0.10 0.70 0.84 127 067 25.7 % Initial 6 42 < 0.01 0.65 0.81 137 111 27.7 %
Steel tank Post-design 7 13 < 0.01 0.88 0.94 9 123 5.1 % Initial 8 13 < 0.01 0.58 0.76 17 382 9.8 %
Reservoirs of concrete Post-design 9 27 < 0.10 0.43 0.65 26 750 36.0 %
Pipe work Post-design 10 42 < 0.01 0.80 0.89 45 455 29.0 % Initial 11 42 < 0.01 0.54 0.74 63 812 40.7 %
Stand post Initial 12 44 < 0.05 0.64 0.80 6 991 32.6 %

36 VATTEN · 1 · 13
Moreover, there is one more problem with using region as an explaining variable; it gets more complicated to predict the cost for a water system in another region than the observed. If the functions are used for another region, the circumstances have to be well examined to ensure that the region has similar conditions as one of the regions in this study. The choice of index for cost adjustment over time has an impact on the results as well. Due to the used index, CPI, CapEx for older construction is estimated lower than if PBCI deflator from Ghana’s statistical service would have been used.
suggestions for further workBased on the study, the following recommendations are made for further research:
1. Cost drivers of mechanised boreholes to determine the relationship between cost, borehole depth, diam-eter and casing length are used.
2. Conduct more qualitative analyses to determine what really causes an inflation of CapEx instead of the re-gions.
3. Conduct a life-cycle cost analysis where functions are derived for both CapEx and recurrent cost (opera-tional and capital maintenance costs).
acknowledgementThe Authors wish to acknowledge the support of the WASHCost Project in Ghana for providing the database for analysis and also the Swedish International Develop-ment Cooperation Agency (Sida) who sponsored the lead author Kristoffer Ristinmaa with ”Minor Field Study”-scholarship to carry out field work in Ghana. The WASHCost Ghana is a five-year action research project investigating the cost of providing water, sanita-tion and hygiene services to rural and peri-urban com-munities in Ghana, Burkina Faso , Mozambique and India (Andra prdesh) (see www.washcost.info).
referencesAntonioli, B. and Filippini, M. (2002) The use of a variable
cost function in the regulation of the Italian water industry. University of Lugano, Switzerland. Link 2012-06-07:
http://doc.rero.ch/lm.php?url=1000%2C42%2C6%2C20051021110309-QZ%2F1_wp0201.pdf
Clark, R.M. and Stevie, R.G. (1981) A Water Supply Cost Model Incorporating Spatial Variables. Land Economics. Vol. 57. No. 1, pp. 18–32. University of Wisconsin.
Eilers, R.G. (1984) Cost equations for small drinking water systems. US Environmental Protection Agency, EPA.
Ghana Statistical Service (GSS) (2011) Consumer Price Index (CPI). Link 2013-02-02: http://www.statsghana.gov.gh/docfiles/CPI%20Release_pdf/cpi_national_time_series_jan1970-sept2012.pdf
Kirshen, P.H., Larsen, A.L., Vogel, R.M., Moomaw, W. (2004) Lack of influence of climate on present cost of water supply in the USA. Water Policy 6 ss 269–279.
Montgomery, D.C., Peck, E.A., Vining, G.G. (2006) Intro-duction to linear regression analysis. (4th ed.) USA: Wiley-interscience.
Moriarty, Naafs, Pezon, Fonesca, Uandela, Potter, Batchelor, Reddy, Mekala. (2010) Working paper 1 – WASHCost’s theory of change: reforms in the water sector and what they mean for the use of unit costs. IRC – International Water and Sanitation Centre. Link 2012-06-07: http://www.washcost.info/page/753
Nkrumah, E., Nyarko, K.B., Dwumfour-Asare, B., Oduro-Kwarteng, S. and Moriarty, P. (2011) Drivers of capital expenditure of rural piped water systems in Ghana: The Volta, Ashanti and Northern region, Link 2012-06-07: http://rwsnforum.files.wordpress.com/2011/11/194-dwumfour-ghana-long-paper-docx.pdf
Nyarko, K.B. (2007) Drinking water sector in Ghana – Drivers for performance. Netherlands: Taylor & Francis Group.
OECD EAP Task Force Secretariat (2005) Rural cost functions for water supply and sanitation. Link 2012-06-07: http://www.oecd.org/dataoecd/18/12/36228167.pdf
Stigler, S. (2008) Fisher and the 5% level. Chance 21 (4): 12. Link 2012-06-05: http://www.springerlink.com/content/p546581236kw3g67/
Tsegai, D.W., Linz, T., Kloos, J. (2009) Economic analysis of water supply cost structure in the Middle Olifants sub-ba-sin of South Africa. Center for Development Research ZEF Bonn, Germany. Link 2012-06-07: http://www.zef.de/file-admin/webfiles/downloads/zef_dp/zef_dp_129.pdf
WHO/UNICEF – World Health Organization & UNICEF (2010). Progress on drinking water and sanitation: 2012 update. Link 2013-01-21: http://www.who.int/water_san-itation_health/publications/2012/jmp_report/en/index.html
World Bank (2013) World DataBank. Link 2013-02-02: http://databank.worldbank.org/data/
WRc – Water Research Centre (1977) TR61 – Cost informa-tion of water supply and sewage disposal.