Embed Size (px)
Citation preview

EXPENDITURE PROPOSALREGULATORY CONTROL PERIOD 2
DECEMBER 2013
EXP
EN
DITU
RE
PR
OP
OS
AL R
EG
ULATO
RY C
ON
TRO
L PE
RIO
D 2
D
EC
EM
BE
R 2
01
3
EXPENDITURE PROPOSAL REGULATORY CONTROL PERIOD 2
DECEMBER 2013
www.transpower.co.nz

FOREWORD
MP01 – Main Proposal I
FOREWORD
For Regulatory Control Period 2 (RCP2)1 we seek approval of expenditure:
that represents a prudent, least-cost proposal for providing an appropriate transmission service for our customers in RCP2; and
reflects an optimised lifecycle cost approach to providing the transmission service during and beyond RCP2.
Context
We own and operate the New Zealand transmission system (Grid). The Grid has 230 points of service linking supply from generators to the demand of lines companies and directly connected consumers. Loading on the Grid is driven both by demand and by the location of the generation which supplies it.
Demand growth has flattened in recent years. While our economy has begun to grow again, dependence on energy intensive activities is reducing and energy efficiency improving. Further, we will likely see increases in small-scale embedded generation, such as solar panels, offsetting demand growth.
Prudent Planning
Our planning for RCP2 assumes that growth will remain flat albeit with regional variations.
Flat demand does not remove the need to invest in the Grid. As identified in Transmission Tomorrow (2011), there is an enduring need for a strong and resilient Grid. New Zealand has a large existing base of very low marginal cost, sustainable hydro, geothermal and wind generation which will continue to operate for the coming decades. These generators are remote from our major load centres (particularly, the Auckland region) and will require the transmission service to supply them.
Enhancement expenditure in RCP2, which expands Grid capability, is low but it is not zero. Even in an environment of flat aggregate demand, there will be regions of strong growth which do require investment.
Our planning approach recognises that demand patterns could be materially different from our assumptions.
We do not plan to invest in new transmission until the need is relatively certain. However, under particular scenarios, such as a reduction at the Tiwai Point aluminium smelter, Grid loading may increase sharply as generation from higher-cost thermal plant in the upper North Island is displaced by hydro generation in the lower South Island. As investments in Grid expansion have very long lead times, our plans include prudent investments to ensure we can respond quickly to these scenarios should they eventuate.
Maximising Grid Utilisation
We are investing to keep enhancement expenditure low by developing systems and technologies to deliver more service from our existing assets and Grid footprint. In Transmission Tomorrow, we set out how we would use innovation to offset or defer future Grid expansion and we have
1 The five year period from 1 July 2015 to 30 June 2020.
FOREWORD
II MP01 – Main Proposal
delivered on these initiatives during RCP1. This includes variable line ratings, demand-side participation and implementation of new technologies such as STATCOMs.2
We will continue to invest in RCP2, not just in technology, but also in demand-side response, to maximise Grid utilisation and help optimise lifecycle expenditure on assets for the benefit of all consumers.
Meeting Service Expectations
Traditionally, transmission utilities have defined their service in terms of the level of the redundancy they maintain. The level of redundancy influences, but does not define the service received by customers.
For RCP2, through consultation with customers and the wider industry, we have defined levels of service based on what matters to our customers most – how often their power is off, and for how long. Our targeted service levels vary by the type of customer and point of service – the economic cost of interruptions to a CBD or key industrial plant is higher, reflecting the greater impact of non-supply. Our targets for RCP2 represent a significant step toward the longer-term targets we believe we can cost-effectively achieve.
By differentiating between types of customer and point of service, we can prioritise our capital and maintenance expenditure to ensure it realises the largest benefit. This approach is being used increasingly during RCP1 to inform and prioritise our work and to lift overall Grid performance closer to that of our peers, while carefully managing cost. Our prioritisation will be further refined in RCP2, so that our expenditure is clearly linked to customers’ service expectations.
Our approach will be reinforced by the incentive regime we have proposed under which 1% of our transmission revenue3 will be at risk if we do not meet our service targets. Further service measures and targets will be investigated during RCP2 in preparation for RCP3.
Optimising Spend on an Aged Asset Base
We have an asset fleet that is older than our peers. We do not believe having older assets is, in itself, an issue. However, our assets have a finite life, which many are reaching. They are increasingly showing age-related deterioration. This increases pressure on investment and maintenance budgets, and expenditure is required to ensure customer expectations are met, irrespective of future trends in electricity demand.
This issue was identified in RCP1 and we sought approval for expenditure for a programme of replacement and refurbishment to address this issue. Some of this was driven by safety issues. The Commerce Commission fully supported this expenditure, as a matter of relative urgency.
The need for these programmes is ongoing. In RCP2, we will continue to improve our optimisation processes to further improve the targeting of expenditure to ensure we lower the whole-of-life cost of these assets.
Asset Management
Key to the operation and replacement of an ageing asset fleet is excellence in asset management. Our capability to identify specific improvements in Grid performance is aided by our recently commissioned asset management system (Maximo) and the introduction of asset health and criticality approaches. In RCP1, improvements in assessing the condition and criticality of key assets have reduced expenditure in some areas – transformer replacement, for instance.
2 A static synchronous compensator used for reactive power support and to provide voltage stability.
3 In terms of the regulatory framework, 1% of total maximum allowable revenue (MAR). This equates to an annual
incentive of approximately +/- $10m in RCP2.
FOREWORD
MP01 – Main Proposal III
In RCP2, we will continue the development of our asset management capability, improving both our asset knowledge and our ability to apply it. Our attention will also be on operational innovations to lift performance through how we operate and maintain the existing Grid. This will ensure expenditure occurs where it will have the greatest benefit to customers and minimise whole-of-life cost.
Investment in People
Our expenditure requirements have been assessed collectively: capital expenditure (Capex); maintenance and other operating expenditure (Opex) – with the objective of minimising whole-of-life costs.
Our capability to extract maximum value from our assets requires investment in people.
In hindsight we may have outsourced too much in the past. We are now rebuilding our internal capability – particularly in key engineering and operating areas to achieve the improvements we are seeking and to deliver the performance expected by consumers.
Investing in people to lead innovation, effectively apply asset knowledge, and ensure we make good long-term decisions, comes at a cost. Expenditure on direct staffing increased during RCP1 and will be largely unchanged in RCP2. The majority of this pays for the people who design, build, maintain, and operate the Grid. This is an essential investment in capability that will, over time, deliver increased value to consumers, not just from reductions in Capex.
Zero Harm
Safety remains our foremost organisational value. We strive for zero harm by promoting safety in our business and taking all steps to ensure an injury-free workplace. We will also continue to minimise the risks our assets and activities pose to the general public. The expenditure forecasts in this proposal include initiatives to further improve our safety performance.
PROPOSED EXPENDITURE
IV MP01 – Main Proposal
PROPOSED EXPENDITURE
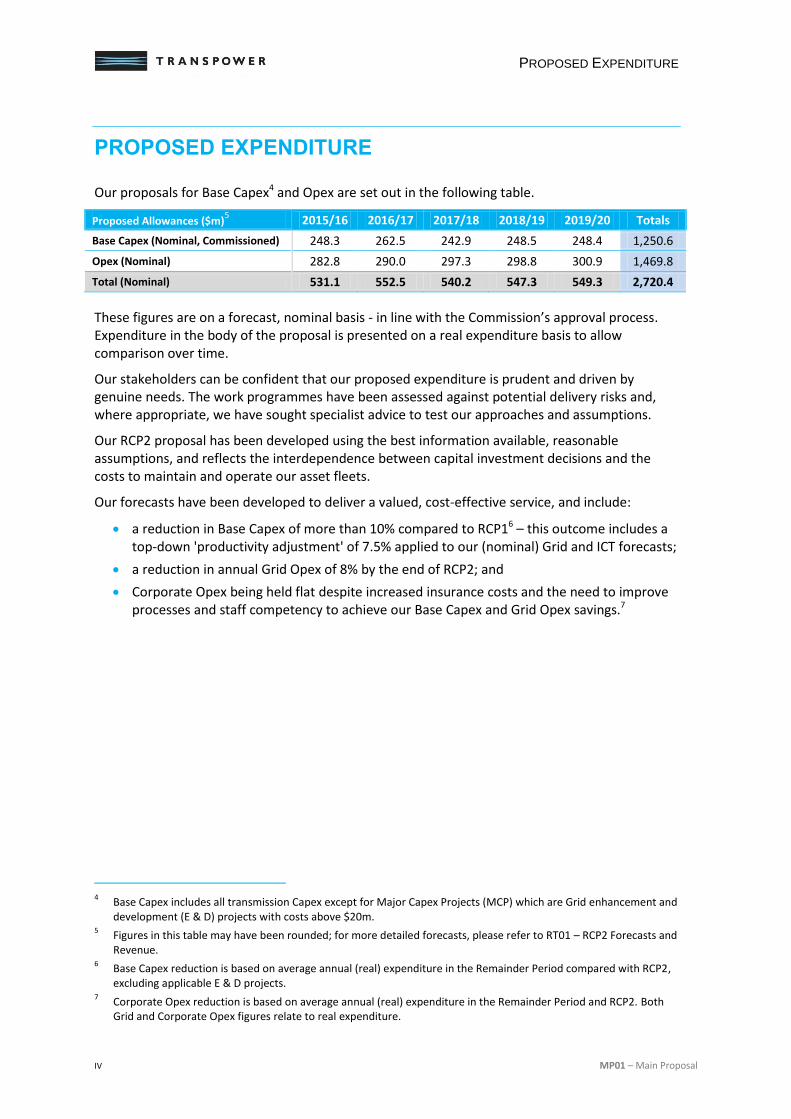
Our proposals for Base Capex4 and Opex are set out in the following table.
Proposed Allowances ($m)5 2015/16 2016/17 2017/18 2018/19 2019/20 Totals
Base Capex (Nominal, Commissioned) 248.3 262.5 242.9 248.5 248.4 1,250.6
Opex (Nominal) 282.8 290.0 297.3 298.8 300.9 1,469.8
Total (Nominal) 531.1 552.5 540.2 547.3 549.3 2,720.4
These figures are on a forecast, nominal basis - in line with the Commission’s approval process. Expenditure in the body of the proposal is presented on a real expenditure basis to allow comparison over time.
Our stakeholders can be confident that our proposed expenditure is prudent and driven by genuine needs. The work programmes have been assessed against potential delivery risks and, where appropriate, we have sought specialist advice to test our approaches and assumptions.
Our RCP2 proposal has been developed using the best information available, reasonable assumptions, and reflects the interdependence between capital investment decisions and the costs to maintain and operate our asset fleets.
Our forecasts have been developed to deliver a valued, cost-effective service, and include:
a reduction in Base Capex of more than 10% compared to RCP16 – this outcome includes a top-down 'productivity adjustment' of 7.5% applied to our (nominal) Grid and ICT forecasts;
a reduction in annual Grid Opex of 8% by the end of RCP2; and
Corporate Opex being held flat despite increased insurance costs and the need to improve processes and staff competency to achieve our Base Capex and Grid Opex savings.7
4 Base Capex includes all transmission Capex except for Major Capex Projects (MCP) which are Grid enhancement and
development (E & D) projects with costs above $20m. 5 Figures in this table may have been rounded; for more detailed forecasts, please refer to RT01 – RCP2 Forecasts and
Revenue. 6 Base Capex reduction is based on average annual (real) expenditure in the Remainder Period compared with RCP2,
excluding applicable E & D projects. 7 Corporate Opex reduction is based on average annual (real) expenditure in the Remainder Period and RCP2. Both
Grid and Corporate Opex figures relate to real expenditure.
PROPOSED EXPENDITURE
MP01 – Main Proposal V
BASE CAPEX
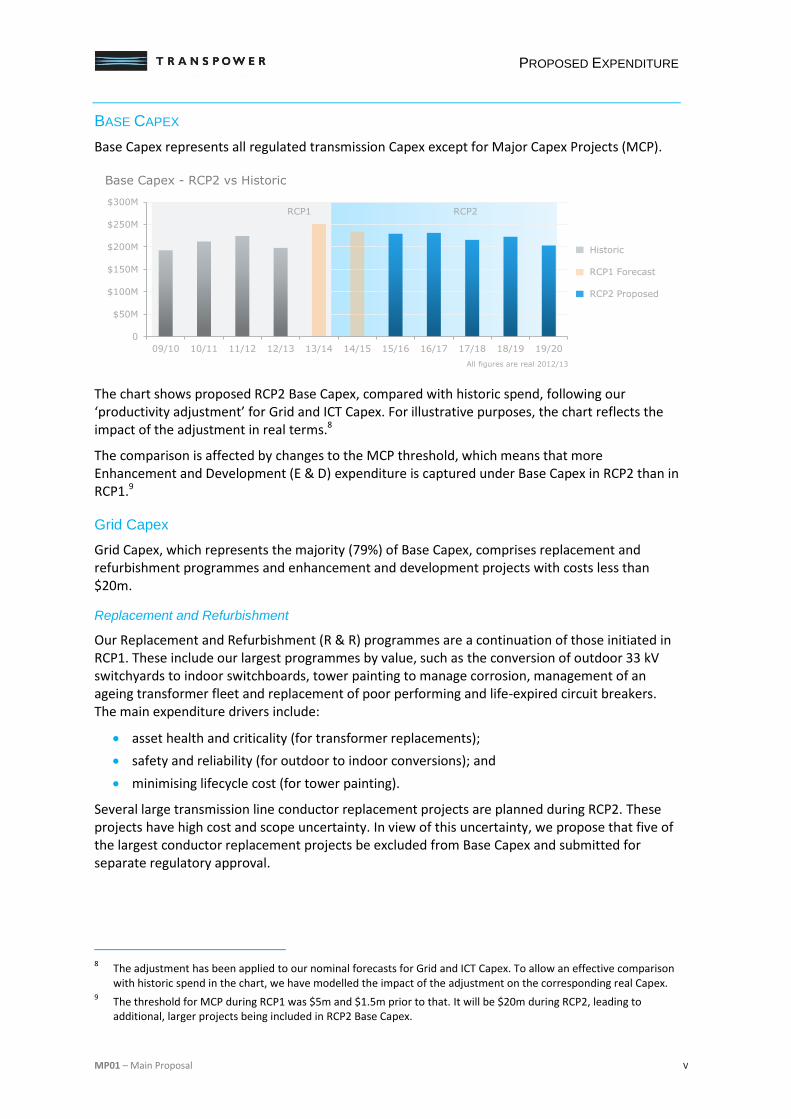
Base Capex represents all regulated transmission Capex except for Major Capex Projects (MCP).
The chart shows proposed RCP2 Base Capex, compared with historic spend, following our ‘productivity adjustment’ for Grid and ICT Capex. For illustrative purposes, the chart reflects the impact of the adjustment in real terms.8
The comparison is affected by changes to the MCP threshold, which means that more Enhancement and Development (E & D) expenditure is captured under Base Capex in RCP2 than in RCP1.9
Grid Capex
Grid Capex, which represents the majority (79%) of Base Capex, comprises replacement and refurbishment programmes and enhancement and development projects with costs less than $20m.
Replacement and Refurbishment
Our Replacement and Refurbishment (R & R) programmes are a continuation of those initiated in RCP1. These include our largest programmes by value, such as the conversion of outdoor 33 kV switchyards to indoor switchboards, tower painting to manage corrosion, management of an ageing transformer fleet and replacement of poor performing and life-expired circuit breakers. The main expenditure drivers include:
asset health and criticality (for transformer replacements);
safety and reliability (for outdoor to indoor conversions); and
minimising lifecycle cost (for tower painting).
Several large transmission line conductor replacement projects are planned during RCP2. These projects have high cost and scope uncertainty. In view of this uncertainty, we propose that five of the largest conductor replacement projects be excluded from Base Capex and submitted for separate regulatory approval.
8 The adjustment has been applied to our nominal forecasts for Grid and ICT Capex. To allow an effective comparison
with historic spend in the chart, we have modelled the impact of the adjustment on the corresponding real Capex. 9 The threshold for MCP during RCP1 was $5m and $1.5m prior to that. It will be $20m during RCP2, leading to
additional, larger projects being included in RCP2 Base Capex.
0
$50M
$100M
$150M
$200M
$250M
$300M
09/10 10/11 11/12 12/13 13/14 14/15 15/16 16/17 17/18 18/19 19/20
Base Capex - RCP2 vs Historic
All figures are real 2012/13
RCP1 RCP2
Historic
RCP1 Forecast
RCP2 Proposed
PROPOSED EXPENDITURE
VI MP01 – Main Proposal
Enhancement and Development
Enhancement and Development (E & D) expenditure will be higher in RCP2 due to the higher MCP threshold. E & D projects in RCP2 include installation of new transformers and special protection schemes.
Our proposals take account of investment deferral due to demand response initiatives and other innovations, including use of variable line ratings.
ICT Capex
ICT accounts for 18% of our proposed Base Capex. The focus of our ICT expenditure is shifting from the addition of new capability to maintaining existing capability.
The majority of proposed expenditure is to optimise and consolidate current systems. This includes the refresh of: telecommunications infrastructure; SCADA; corporate systems; and supporting ICT infrastructure.
Business Support Capex
Business Support accounts for 3% of Base Capex and includes: property acquisition; office accommodation; and motor vehicles. Proposed expenditure is strongly influenced by one-off items. The largest in RCP2 is the planned relocation of our Wellington head office.
OPEX
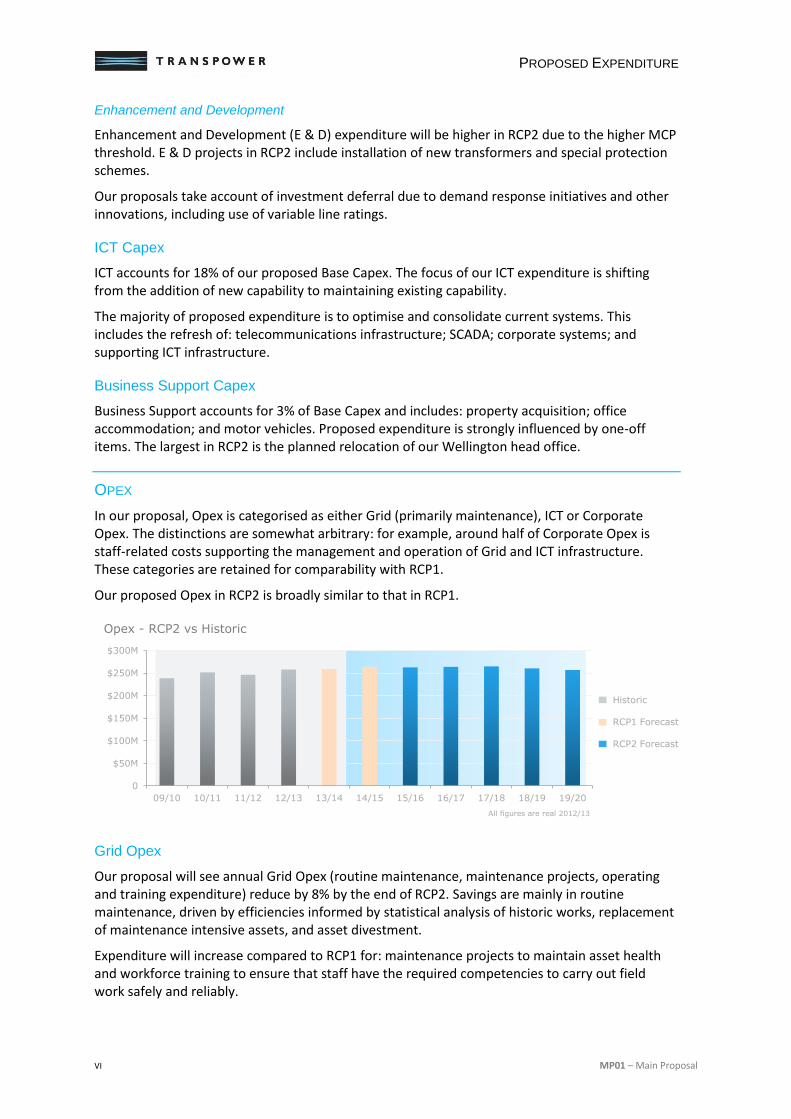
In our proposal, Opex is categorised as either Grid (primarily maintenance), ICT or Corporate Opex. The distinctions are somewhat arbitrary: for example, around half of Corporate Opex is staff-related costs supporting the management and operation of Grid and ICT infrastructure. These categories are retained for comparability with RCP1.
Our proposed Opex in RCP2 is broadly similar to that in RCP1.
Grid Opex
Our proposal will see annual Grid Opex (routine maintenance, maintenance projects, operating and training expenditure) reduce by 8% by the end of RCP2. Savings are mainly in routine maintenance, driven by efficiencies informed by statistical analysis of historic works, replacement of maintenance intensive assets, and asset divestment.
Expenditure will increase compared to RCP1 for: maintenance projects to maintain asset health and workforce training to ensure that staff have the required competencies to carry out field work safely and reliably.
0
$50M
$100M
$150M
$200M
$250M
$300M
09/10 10/11 11/12 12/13 13/14 14/15 15/16 16/17 17/18 18/19 19/20
Opex - RCP2 vs Historic
All figures are real 2012/13
Historic
RCP1 Forecast
RCP2 Forecast
PROPOSED EXPENDITURE
MP01 – Main Proposal VII
ICT Opex
ICT Opex is driven by the need to support more modular and flexible platforms, the management of new security risks, and increasing data volumes.
There is a 7% increase in ICT Opex during RCP2 compared to RCP1 due to plans to host our mission critical systems in outsourced data centres. The incremental Opex offsets Capex, otherwise required for insourced data centres, and will minimise whole-of-life costs.
Corporate Opex
Corporate Opex includes staff related costs (departmental); insurance premiums; feasibility, innovation and research spending (investigations); and power system support (ancillary services).
Proposed Corporate Opex is roughly constant in RCP2. Departmental Opex, primarily labour-related costs of which more than 50% directly relates to supporting the Grid, will be similar to RCP1. Retaining and developing our people and skills will continue to be a focus in RCP2 and a key enabler to meet our cost reduction targets for Grid Opex and Base Capex.
CONCLUSION
In summary, we have proposed a prudent level of spend for RCP2.
We emphasise the importance of taking a holistic view of our expenditure proposals which, overall, are at a level similar to RCP1.
RCP1 began a journey to lift performance and reduce the cost of our ageing asset base. In RCP2 we will use the improved knowledge and tools we have developed to further reduce the lifecycle costs of the Grid while meeting, and ultimately exceeding, the service expectations of customers.

MP01 – Main Proposal IX
TABLE OF CONTENTS
Foreword ..................................................................................................................... i
Proposed Expenditure ................................................................................................ iv
1. Introduction ...................................................................................................... 1
1.1. Regulatory Context ..................................................................................................................... 1
1.2. Document Structure .................................................................................................................... 2
2. RCP2 Objectives .............................................................................................. 3
2.1. Introduction ................................................................................................................................. 3
2.2. Commitment to Customers ......................................................................................................... 3
2.3. Ensuring Safety ........................................................................................................................... 4
2.4. Service Performance .................................................................................................................. 5
2.5. Cost Performance ....................................................................................................................... 6
2.6. New Zealand’s Communities ...................................................................................................... 7
2.7. Asset Management ..................................................................................................................... 9
3. Business and Operating Environment ............................................................ 11
3.1. Overview of Transpower ........................................................................................................... 11
3.2. Our Operating Environment ...................................................................................................... 15
3.3. Our Asset Base ......................................................................................................................... 17
4. RCP1 Progress .............................................................................................. 20
4.1. Introduction ............................................................................................................................... 20
4.2. RCP1 Initiatives ........................................................................................................................ 20
4.3. Base Capex during RCP1 ......................................................................................................... 22
4.4. Opex during RCP1 .................................................................................................................... 29
4.5. Quality Performance ................................................................................................................. 35
5. Overview of RCP2 Proposal........................................................................... 37
5.1. RCP2 Service Performance ...................................................................................................... 37
5.2. Expenditure Categories ............................................................................................................ 40
5.3. Base Capex and Opex .............................................................................................................. 40
5.4. Forecasting Methodology and Inputs........................................................................................ 43
5.5. Deliverability .............................................................................................................................. 45
5.6. Base Capex Exception ............................................................................................................. 45
5.7. RCP2 Approvals ....................................................................................................................... 46
5.8. Proposed Allowances ............................................................................................................... 47
6. Grid Capital Expenditure ................................................................................ 49
6.1. Overview ................................................................................................................................... 49
6.2. Capex Forecasting .................................................................................................................... 51
6.3. Replacement and Refurbishment Forecasts ............................................................................ 58
6.4. Enhancement and Development Forecasts ............................................................................. 66
X MP01 – Main Proposal
7. Grid Operating Expenditure ........................................................................... 69
7.1. Overview ................................................................................................................................... 69
7.2. Forecasting Approach ............................................................................................................... 72
7.3. Routine Maintenance ................................................................................................................ 76
7.4. Maintenance Projects ............................................................................................................... 80
7.5. Other Grid Opex ........................................................................................................................ 85
8. ICT Expenditure ............................................................................................. 87
8.1. Overview ................................................................................................................................... 87
8.2. ICT Governance ........................................................................................................................ 90
8.3. Expenditure Drivers .................................................................................................................. 92
8.4. Forecasting Approach ............................................................................................................... 92
8.5. ICT Capital Expenditure ............................................................................................................ 93
8.6. ICT Operating Expenditure ..................................................................................................... 103
9. Corporate & Business Support Expenditure ................................................. 108
9.1. Overview ................................................................................................................................. 108
9.2. Business Support Capex ........................................................................................................ 109
9.3. Corporate Opex ...................................................................................................................... 113
10. Service Performance Measures ................................................................... 120
10.1. Defining the Measures ............................................................................................................ 120
10.2. Background ............................................................................................................................. 121
10.3. Grid Performance Measures ................................................................................................... 123
10.4. Asset Performance Measures ................................................................................................ 127
10.5. Other Measures ...................................................................................................................... 129
10.6. Incentive regime ...................................................................................................................... 130
Appendix A – ITP Compliance ............................................................................... 134
INTRODUCTION
MP01 – Main Proposal 1
1. INTRODUCTION
This document sets out our proposed capital expenditure (Capex), operating expenditure (Opex) and performance targets for the five year regulatory control period, 1 July 2015 to 30 June 2020 (RCP2).10
1.1. REGULATORY CONTEXT
1.1.1. RCP2 SUBMISSION
Our transmission service revenue and performance targets are regulated by the Commerce Commission (Commission) under individual price-quality path (IPP) regulation as defined under Part 4 of the Commerce Act. We are presently subject to the IPP determination that was approved by the Commission (and subsequently amended) on 31 October 2012. That determination relates to the first Regulatory Control Period (RCP1) and it ceases to have effect on 30 March 2015. A second IPP will be determined by the Commission for RCP2.
Under IPP regulation we must submit to the Commission a proposal for Capex, Opex and service performance for RCP2 by 2 December 2013. The proposal and its supporting information together form our “RCP2 Submission”. We have prepared the RCP2 Submission to comply with the following Commission requirements:
Capital Expenditure Input Methodology (Capex IM); and
Section 53ZD Notice issued by the Commission on 2 July 2013.
After the Commission has considered and consulted on the RCP2 Submission, it will issue a determination that sets out our annual Base Capex and Opex allowances and service performance regime. The Commission will use this information to set our forecast maximum allowable revenue (MAR) for RCP2.
1.1.2. INCENTIVE REGULATION
IPP regulation incentivises us to deliver outcomes valued by our customers and links our service performance targets to our revenue. It includes incentives to improve efficiency, deliver outputs within approved expenditure and to improve performance over time. It allows us to retain a portion of Base Capex or Opex savings, or to bear part of any overspend.
1.1.3. INTEGRATED TRANSMISSION PLAN
Under the Capex IM, an Integrated Transmission Plan (ITP) is to be provided at the same time as the RCP2 Submission. The purpose of the ITP is to explain our views on the long-term operation and development of the New Zealand transmission system (Grid), including proposed expenditure over the next ten years.
10
The formal period runs from 1 April 2015 to 30 March 2020 which reflects our pricing year. However, the maximum allowable revenues (MARs) are based on inputs (Capex, Opex forecasts) that reflect our financial year starting 1 July. These inputs will be used to set our forecast MAR for the pricing year commencing the previous 1 April. For clarity and to align with forecast periods, RCP2 is described as 1 July 2015 to 30 June 2020.
INTRODUCTION
2 MP01 – Main Proposal
Given the significant overlap between the RCP2 Submission and ITP requirements, we have not provided a separate ITP document at this time. Instead, we have addressed the ITP requirements through the RCP2 Submission, in particular the information provided in RT06 – Integrated Transmission Plan Information (see Appendix A for further detail).
1.2. DOCUMENT STRUCTURE
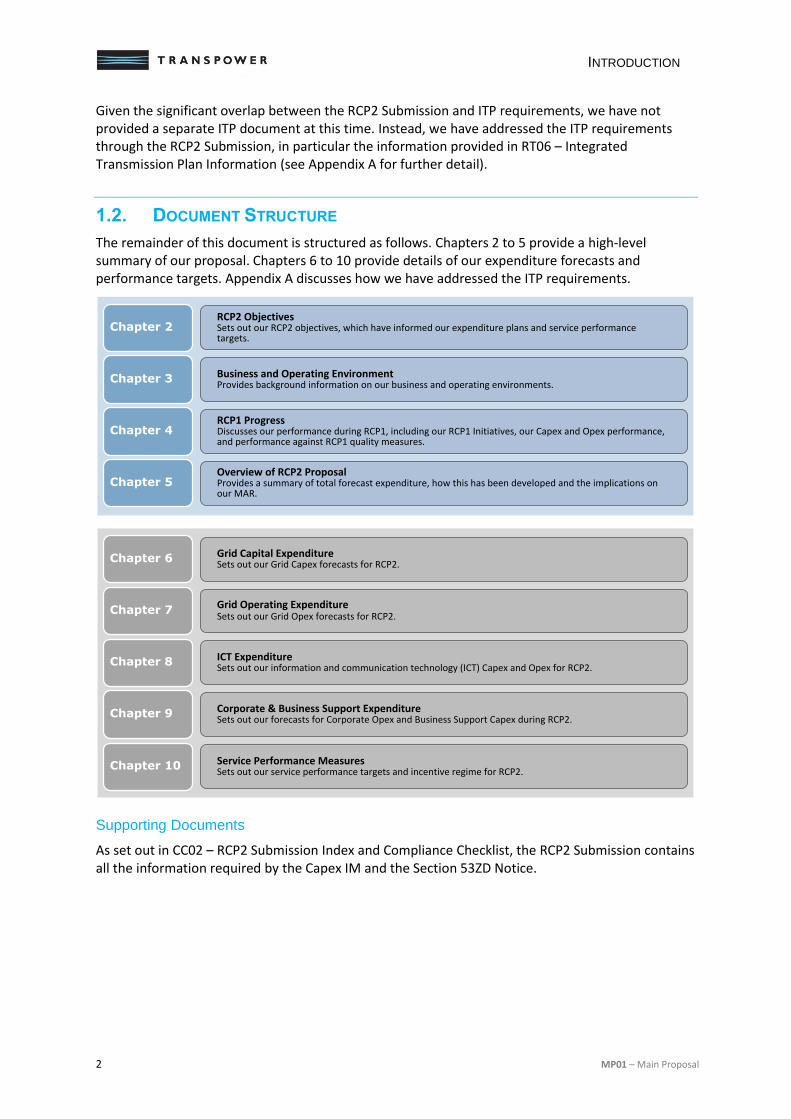
The remainder of this document is structured as follows. Chapters 2 to 5 provide a high-level summary of our proposal. Chapters 6 to 10 provide details of our expenditure forecasts and performance targets. Appendix A discusses how we have addressed the ITP requirements.
Supporting Documents
As set out in CC02 – RCP2 Submission Index and Compliance Checklist, the RCP2 Submission contains all the information required by the Capex IM and the Section 53ZD Notice.
Business and Operating EnvironmentProvides background information on our business and operating environments.
Chapter 3
RCP2 ObjectivesSets out our RCP2 objectives, which have informed our expenditure plans and service performance targets.
Chapter 2
RCP1 ProgressDiscusses our performance during RCP1, including our RCP1 Initiatives, our Capex and Opex performance, and performance against RCP1 quality measures.
Chapter 4
Overview of RCP2 ProposalProvides a summary of total forecast expenditure, how this has been developed and the implications on our MAR.
Chapter 5
Grid Operating ExpenditureSets out our Grid Opex forecasts for RCP2. Chapter 7
Grid Capital ExpenditureSets out our Grid Capex forecasts for RCP2.
Chapter 6
ICT ExpenditureSets out our information and communication technology (ICT) Capex and Opex for RCP2.
Chapter 8
Corporate & Business Support ExpenditureSets out our forecasts for Corporate Opex and Business Support Capex during RCP2.
Chapter 9
Service Performance MeasuresSets out our service performance targets and incentive regime for RCP2.
Chapter 10
RCP2 OBJECTIVES
MP01 – Main Proposal 3
2. RCP2 OBJECTIVES
This chapter sets out our objectives for RCP2 and initiatives we have put in place to support them.
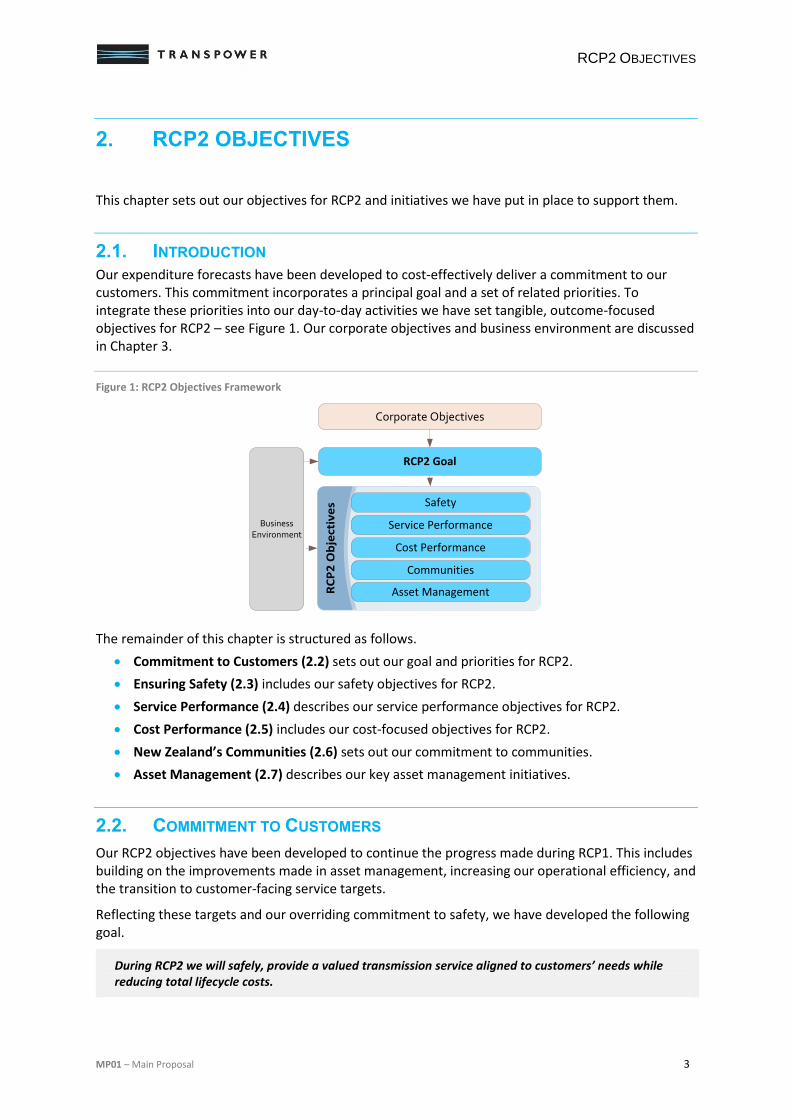
2.1. INTRODUCTION Our expenditure forecasts have been developed to cost-effectively deliver a commitment to our customers. This commitment incorporates a principal goal and a set of related priorities. To integrate these priorities into our day-to-day activities we have set tangible, outcome-focused objectives for RCP2 – see Figure 1. Our corporate objectives and business environment are discussed in Chapter 3.
Figure 1: RCP2 Objectives Framework
The remainder of this chapter is structured as follows.
Commitment to Customers (2.2) sets out our goal and priorities for RCP2.
Ensuring Safety (2.3) includes our safety objectives for RCP2.
Service Performance (2.4) describes our service performance objectives for RCP2.
Cost Performance (2.5) includes our cost-focused objectives for RCP2.
New Zealand’s Communities (2.6) sets out our commitment to communities.
Asset Management (2.7) describes our key asset management initiatives.
2.2. COMMITMENT TO CUSTOMERS
Our RCP2 objectives have been developed to continue the progress made during RCP1. This includes building on the improvements made in asset management, increasing our operational efficiency, and the transition to customer-facing service targets.
Reflecting these targets and our overriding commitment to safety, we have developed the following goal.
During RCP2 we will safely, provide a valued transmission service aligned to customers’ needs while reducing total lifecycle costs.
RC
P2
Ob
ject
ive
s
Corporate Objectives
Business Environment
RCP2 Goal
Safety
Service Performance
Cost Performance
Communities
Asset Management
RCP2 OBJECTIVES
4 MP01 – Main Proposal
This goal is expanded into five priorities, which are set out below.
2.2.1. RCP2 PRIORITIES
To deliver on our commitment to customers, we will focus on five priorities during RCP2.
1. Continue to improve our safety performance in RCP2. Safety remains our foremost priority. We are fully committed to ensuring the safety of our workforce and minimising risk to public safety. Avoiding harm goes hand-in-hand with error-free work practices and, hence, improved service performance and lower costs.
2. We will improve service performance at ‘high priority’ and ‘important’ sites and maintain service performance at other sites. Service performance measures have been re-defined to align with what customers value most. We are targeting our efforts on improvements at the key points of service where we expect the largest benefit for customers.
3. We will reduce the total lifecycle costs of our assets. Our decision making is already focused on minimising whole-of-life costs while improving our overall service. In RCP2 we will continue to develop the tools and internal capabilities necessary to achieve this.
4. We will strengthen our relationships with New Zealand’s communities and landowners. Landowners and communities that host our assets are essential partners in maintaining our ability to operate them effectively. We are committed to investing time and effort to ensure we continue to have positive relationships and their ongoing support.
5. Develop our asset management capability. Improved information and intelligence on our assets is essential to the prioritisation and optimisation of our expenditure. During RCP2 our new asset information platform will enable further optimised maintenance, reliability based interventions and drive improvements in operational practices.
The objectives that flow from these priorities are described in the rest of this chapter.
2.3. ENSURING SAFETY Safety is our foremost organisational value. We believe that all incidents are preventable and that no other objective should override the safety of our employees, service providers or the public. Our asset management policy states that we will embed a strong safety culture and strive for zero harm. We will do this by promoting the importance of safety throughout the organisation, and taking all steps to provide our employees and service providers with safe working conditions.
Reducing safety incidents will also improve our service performance, as these incidents often result in outages.
We have achieved substantial improvements11 in safety performance over recent years but we have further to go.
2.3.1. EMPLOYEE SAFETY
Electricity transmission involves significant potential hazards. Some of these hazards are inherent and cannot be eliminated. Therefore, they must be managed effectively to ensure a safe and healthy working environment. This is primarily achieved though the identification, elimination, isolation or minimisation of hazards and ensuring our ability to respond effectively to emergencies.
11
Our historic performance in terms of LTIFR (Lost Time Injury Frequency Rate) shows that there has been an improvement in performance in recent years. This rate peaked at 14.5 in 2002/03, and it has been reduced substantially since then to an average of 2.4 over the past 5 years.
RCP2 OBJECTIVES
MP01 – Main Proposal 5
Our field work is almost entirely carried out by external service providers. Recognising our responsibility to our service providers, we include all service provider and subcontractor employees in our safety performance metrics.
2.3.2. PUBLIC SAFETY
The management of risk to public safety is one of the key elements of our asset risk management. Ensuring public safety requires a systematic approach to identifying and managing risk. Any residual risks are mitigated though effective communication with the public, and by securing our installations appropriately.
2.3.3. SAFETY OBJECTIVES
We are committed to achieving an injury-free workplace for our employees and service providers, and to minimise the risks posed to the general public. Our aim is to ensure that the Grid is fundamentally safe and poses no avoidable risks.
Safety Objectives
In relation to our workforce, our objective is to ensure:
1. zero fatalities
2. zero injuries causing permanent disability
3. a sustained, declining trend in medical treatment injuries.
In relation to public safety, our objective is to:
4. take all practicable steps to ensure Grid assets do not present a risk of serious harm to any member of the public.
2.3.4. SAFETY INITIATIVES
To support these objectives, we are continuing or planning the following safety initiatives.
Public Safety Management System: this was implemented in 2012 to drive further improvements in safety performance and to ensure compliance with statutory requirements.
Safety Certification: we have begun a project to prepare for certification to BS OHSAS 18001.12 We intend to achieve certification by June 2014.
Increased Resources: our new service provider contracts include safety requirements, supported by dedicated resources to improve safety performance.
Safety Surveys: we have recently undertaken an external safety assessment and a workforce survey to assess our progress in fostering an appropriate safety culture.
Improved Reporting: we have improved our incident reporting and analysis.
Safety Training: we have expanded and improved our training programme and refined our competency requirements for safety-critical roles.
2.4. SERVICE PERFORMANCE We have developed performance measures that are meaningful to our customers and have set associated targets based on their expectations. These are discussed in detail in Chapter 10.
12
BS OHSAS 18001:2007 sets out minimum requirements for occupational health and safety management practice.
RCP2 OBJECTIVES
6 MP01 – Main Proposal
2.4.1. CUSTOMER FACING PERFORMANCE MEASURES
We have taken account of customer consultations and input from other stakeholders in developing a set of customer-facing service performance measures and targets. The targets are differentiated, based on the criticality of the point of service and signal the long-term reliability performance that customers can expect. A portion of our revenue is linked to these targets.
2.4.2. SERVICE PERFORMANCE OBJECTIVES
Previous targets were short-term and linked to historic performance. The new targets adopt a long-term horizon and seek to reflect our customers’ needs. This recognises that our customers are best placed to define what ‘value’ means to them. They have been developed to reflect what is cost-effectively achievable during RCP2.
As mentioned above, efforts to reduce service interruptions will also support our safety objectives.
Service Performance Objective
Our objective is to ensure we meet our RCP2 service performance targets, as set out in Chapter 10.
2.4.3. SERVICE PERFORMANCE INITIATIVES
To support these objectives, we are continuing or planning the following service performance initiatives.
Consultation: we have undertaken a series of consultation rounds with customers and the wider industry to understand their needs, preferences and expectations.
Risk Management: we are continuing to develop asset health and criticality measures.
Targeted Interventions: we have used the new performance measures and failure-mode analysis to target poorly performing assets that may impact our service to customers.
Corrective Action: we continue to improve our investigation, root-cause analysis and corrective action processes to manage outage events.
Outage Planning: we continue to improve works and outage scheduling to reduce planned outages.
2.5. COST PERFORMANCE
To optimise value for our stakeholders we need to maintain downward pressure on our cost base.
2.5.1. COST PERFORMANCE OBJECTIVES
Our cost forecasting combines both detailed bottom-up and top-down assessments of our expenditure needs. Our bottom-up forecasts included challenges from senior managers, the executive team and the CEO, and the Board. The top-down assessment considered our service targets, our longer term vision for the Grid and affordability for our customers. It concluded that cost reductions should be achieved during RCP2. In our view the combination of these approaches ensures that our RCP2 costs, when viewed collectively across all expenditure categories, have been optimised.
In particular, we consider that service outputs can be maintained and in some cases improved while reducing cost inputs. Reflecting this, Grid Capex, routine maintenance and ICT Capex were identified
RCP2 OBJECTIVES
MP01 – Main Proposal 7
as areas of the business that can deliver further efficiencies. Our routine maintenance forecasts include significant savings targets.
We concluded that a further ‘productivity adjustment’ should be applied to our Grid Capex and ICT Capex forecasts.
The adjustment reflects our view that asset management improvements, with continuing optimisation and reprioritisation of our plans, provide scope for efficiencies during RCP2. These efficiencies, which are yet to be identified, are reflected in our proposed allowance. Further detail on the adjustment is presented in Chapter 5.
The cost performance objectives below reflect the results of these reviews.
RCP2 Cost Performance Objectives13
We aim to provide a cost-effective service for our customers at all times. During RCP2, we will seek to achieve our safety objectives and service performance targets while reducing overall expenditure. Reflecting this, we have set cost objectives for both Base Capex and Opex.
We will continue to optimise our capital investments in RCP2 using improved risk management and increased asset utilisation. We expect this to reduce Base Capex by more than 10% compared to RCP1.
Using improved work management and targeted maintenance, we expect to reduce annual Grid Opex by 8% by the end of RCP2.
Achieving these asset management cost savings will require ongoing improvements in staff competency. We will deliver these improvements while holding Corporate Opex constant during RCP2.
2.5.2. COST PERFORMANCE INITIATIVES
Reflecting the above objectives, we are continuing or planning the following initiatives to improve overall cost performance.
Efficiency Improvements: our Grid Opex is being optimised through targeted reductions in routine maintenance expenditure.
Improved Cost Estimation: we have improved the cost estimation systems used to forecast expenditure and evaluate options.
Divestment Programme: we have reduced overall costs to end-consumers by divesting non-core assets to distribution businesses that are better placed to manage low-voltage assets.
Improved Procurement: we have put in place improved, long-term period supply contracts for our primary assets.
Targeted Investments: we have used our new performance targets and asset health analysis to prioritise spending during RCP2.
2.6. NEW ZEALAND’S COMMUNITIES
We have developed objectives centred on building effective relationships with communities. Communities can be significantly impacted by our asset management activities. A key objective for us is to mitigate these impacts.
13
Our Base Capex target is based on average annual real expenditure in both periods, excluding E & D projects and following the ‘productivity adjustment’. Both Opex targets relate to real expenditure.
RCP2 OBJECTIVES
8 MP01 – Main Proposal
2.6.1. LANDOWNERS
Our ability to maintain transmission line assets depends on a network of transmission corridors and access ways which, generally, are not supported by formal easements. We rely on the support of landowners to maintain these lines and they expect us to undertake our work safely, efficiently and respectfully. We are committed to working openly and constructively with landowners and occupiers at all times.
2.6.2. COMMUNITIES
We aim to work in partnership with communities to limit the social and environmental impacts of our activities. In particular, we consult with communities at an early stage during works planning to better understand potential impacts.
Communities are concerned about potential environmental damage, such as leaking oil from power transformers. Protecting New Zealand’s natural environment is a key focus.
2.6.3. OBJECTIVES
We will continue to respect the interests of landowners and communities impacted by our activities. We have developed supporting objectives for RCP2. These are set out below.
Landowner and Community Objectives
1. Environmental: improve environmental performance and ensure 90% compliance with environmental authorisations. Control annual SF6 emissions
14 to no more than 0.8% of total stock. Set targets for
reducing air travel emissions.
2. Access Arrangements: support the inclusion of suitable corridor rules into Territorial Authorities district plans.
3. Landowners: build fair and respectful long-term relationships with landowners, measured though surveys and feedback from the parties with whom we interact.
4. Community Engagement: continue to deliver our community and environmental partnership programmes (CommunityCare Fund and Greenline).
2.6.4. COMMUNITY INITIATIVES
To support these objectives, we are continuing or planning the following initiatives.
Greenline Projects: we are continuing our programme of community-led environmental projects.
CommunityCare Fund: during 2012 we undertook 56 community-based projects and will continue this programme during RCP2.
Greenhouse Gas Emissions: we have developed programmes to identify and remove leak prone SF6 circuit breakers.
Landowner Surveys: we will continue to undertake regular surveys to capture landowners’ views and feedback.
Monitoring and Reporting: we have improved our environmental reporting and processes to monitor environmental risk.
14
Sulphur hexafluoride (SF6) is a potent 'greenhouse' gas. Emissions of SF6 from circuit breakers are currently the largest contributor to our greenhouse gas emissions.
RCP2 OBJECTIVES
MP01 – Main Proposal 9
2.7. ASSET MANAGEMENT We place a strong emphasis on asset management, as the performance of our assets impacts our service to customers. To achieve our objective of improving service, while minimising asset lifecycle costs, we will continually improve our asset management capability.
2.7.1. ASSET MANAGEMENT FRAMEWORK
Effective asset management is critical to achieving our objectives. We have developed an asset management framework that links our corporate objectives and day-to-day activities. It comprises the following.
Asset Management Policy: aligns our asset management approach with our corporate objectives. Our asset management objectives reflect this policy by focusing on risk management and the skills and competencies of our workforce.
Asset Management Strategy: translates the asset management policy into drivers and high-level objectives.
Lifecycle Strategies: reflect our asset lifecycle model and align our high-level objectives to relevant processes and activities.
Fleet Strategies: apply our objectives to individual asset fleets and set out detailed intervention strategies.
2.7.2. ASSET RISK MANAGEMENT
Many of our assets are older than those of our peers. A key focus for RCP2 is to effectively manage the associated asset risk to achieve our service and cost performance objectives. We will prioritise our expenditure to safely deliver our targets by using innovative asset management approaches.15
We do not yet have a fully quantified asset risk assessment framework. As an interim measure, we have sought to reflect the main determinants of risk (likelihood and consequence) through an integrated framework using asset health and asset criticality as inputs.
Asset Criticality
Asset criticality is used as a proxy for the consequence of asset failure. For a transmission utility this can usefully be based on the significance of the loads served. Following consultation with customers, a criticality approach has been developed for Grid points of service. A preliminary approach has also been developed to translate point of service criticality to related assets, and is being used to prioritise replacement expenditure.
Asset Health
Asset health reflects the expected remaining life of an asset and is a proxy for the probability of failure. Asset health indices have been prepared for three classes of primary assets. They have been used to plan asset interventions and to forecast the impact of investment scenarios.
Prioritised Investment
In combination, asset health and asset criticality can be used to assign an estimate of risk to our assets. This enables us to prioritise and optimise the timing of asset interventions. A further application is their use in optimising the level of investment between portfolios. This framework has resulted in improvements in the way we quantify and use asset risk to inform our investment
15
One example is the use of modern fast-acting protection schemes on older primary plant, allowing us to safely and efficiently increase utilisation levels.
RCP2 OBJECTIVES
10 MP01 – Main Proposal
decisions. We plan to expand the use of asset health and criticality to cover at least 80% of our assets (by value) by the end of RCP1.
In addition, we have used our performance targets to prioritise and target our expenditure.
2.7.3. SKILLS AND COMPETENCY
Competent people are required if we are to manage our assets safely, efficiently and reliably. Our experience of outsourced field work suggests that skills development in the sector is not self-sustaining. There is a need to move from a passive training approach and lead competency development for the sector.
2.7.4. ASSET MANAGEMENT OBJECTIVES
Our aim is to be a leading transmission service provider. This requires us to continually improve our asset management competence. To support this aim we have developed related objectives.
Asset Management Objectives
1. Asset Health and Condition: targets have been set out in our fleet strategies that manage the risk of asset failure and the associated reliability impacts.
2. Certification: we will seek asset management (PAS 55) certification by June 2014.
3. Risk Management: we will implement an integrated asset risk framework that includes both qualitative and quantitative assessment techniques by 2015.
2.7.5. ASSET MANAGEMENT INITIATIVES
The way we manage our assets will have a large bearing on our ability to achieve our overall RCP2 objectives. Recognising the need to improve our capabilities, we have put in place a number of initiatives. The key ones are summarised below.
PAS 55: we have initiated a change management project to address identified gaps in our asset management capability, and to obtain PAS 55 certification.
Maximo: our new asset management information system was commissioned in July 2013.
Asset Health Indices: we are continuing to develop our asset health measures with a view to extending them to 80% of assets (by value) by the end of RCP1.
Prioritised Interventions: performance targets and criticality have allowed us to identify and focus on poorly performing assets.
Maintenance Study: we have developed a new long-term maintenance approach.
Asset Management Documentation: we have overhauled and expanded our asset management documentation to include a formal asset management strategy, a set of lifecycle strategies and expanded fleet strategies.
Grid Skills: this programme sets out a competency framework for technician skills.
BUSINESS AND OPERATING ENVIRONMENT
MP01 – Main Proposal 11
3. BUSINESS AND OPERATING ENVIRONMENT
This chapter discusses aspects of our business and operating environment and is structured as follows.
Overview of Transpower (3.1) provides background information on Transpower including governance arrangements, vision and values, and its stakeholders.
Our Operating Environment (3.2) discusses the environment in which we maintain and operate the Grid.
Our Asset Base (3.3) provides an overview of Grid assets and Major Capex Projects (MCP) in RCP1.
3.1. OVERVIEW OF TRANSPOWER
3.1.1. TRANSPOWER’S ROLE
Transpower has two roles.
Grid Asset Owner: responsible for the operation, maintenance, planning, and development of the Grid.
System Operator: responsible for managing the real-time operation of the electricity system and the wholesale electricity market. The costs of the System Operator are not included under the IPP regime.
3.1.2. OWNERSHIP AND GOVERNANCE
Transpower is a State-Owned Enterprise (SOE), 100% owned by the Crown.
The Crown’s shareholding is held by the Ministers of Finance and State-Owned Enterprises. The Crown Ownership Monitoring Unit (part of the New Zealand Treasury) monitors the performance of SOEs on behalf of shareholding Ministers. Pursuant to the State-Owned Enterprise Act 1986 (SOE Act), Transpower is a limited liability company incorporated on 9 March 1988.
Under Section 4 of the SOE Act, our principal objective is to be a successful business. The SOE Act defines a successful business as one that is:
as profitable and efficient as comparable businesses that are not owned by the Crown;
a good employer; and
an organisation that exhibits a sense of social responsibility by having regard to the interests of the communities in which it operates, and by endeavouring to accommodate or encourage these when able to do so.
3.1.3. CORPORATE AND ORGANISATION STRUCTURE
Board of Directors and Governance Arrangements
Transpower’s Board is appointed by the Government. The Board is responsible for Transpower’s performance, and for guiding and monitoring the company on behalf of Government. Under Part 3 of the SOE Act, the Board is required to produce a Statement of Corporate Intent (SCI) and yearly
BUSINESS AND OPERATING ENVIRONMENT
12 MP01 – Main Proposal
and half-yearly reports and accounts that are subject to audit by the Auditor-General. The SCI sets out the Board’s overall intentions and objectives for Transpower for the following three years.
Transpower’s current Board of Directors comprises: Mark Verbiest (Chair); Ian Fraser (Deputy Chair); and Directors: Professor Jan Evans-Freeman, Abby Foote, Mike Pohio, Don Huse, Keith Tempest, and Alastair Scott.
Corporate Structure
Transpower New Zealand Limited and its subsidiary companies comprise the Transpower Group. The subsidiary companies are:
Halfway Bush Finance Limited;
TB and T Limited;
Risk Reinsurance Limited; and
Transpower Finance Limited.
The subsidiaries are all New Zealand registered companies, apart from Risk Reinsurance Limited which is registered in the Cayman Islands. In addition to our subsidiaries, New Zealand Power Cayman (NZPCl)16 is a special-purpose vehicle that is consolidated for financial reporting purposes only.
Further details of Transpower’s group structure and corporate governance are contained in Transpower’s 2012/13 Annual Report.
Organisation Structure
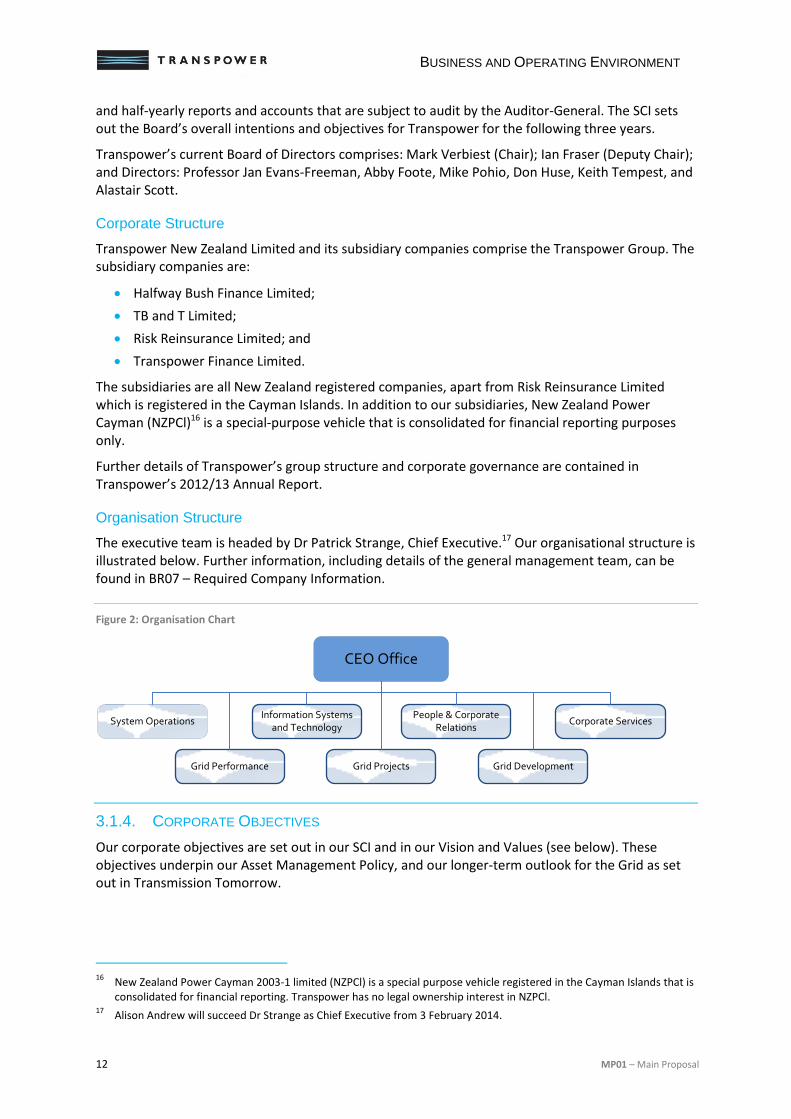
The executive team is headed by Dr Patrick Strange, Chief Executive.17 Our organisational structure is illustrated below. Further information, including details of the general management team, can be found in BR07 – Required Company Information.
Figure 2: Organisation Chart
3.1.4. CORPORATE OBJECTIVES
Our corporate objectives are set out in our SCI and in our Vision and Values (see below). These objectives underpin our Asset Management Policy, and our longer-term outlook for the Grid as set out in Transmission Tomorrow.
16
New Zealand Power Cayman 2003-1 limited (NZPCl) is a special purpose vehicle registered in the Cayman Islands that is consolidated for financial reporting. Transpower has no legal ownership interest in NZPCl.
17 Alison Andrew will succeed Dr Strange as Chief Executive from 3 February 2014.
System Operations
CEO Office
Information Systems and Technology
Grid Performance Grid Projects
Corporate ServicesPeople & Corporate
Relations
Grid Development
BUSINESS AND OPERATING ENVIRONMENT
MP01 – Main Proposal 13
3.1.5. OUR VISION AND VALUES
Our Vision
Our vision outlines what we aspire to achieve. Everything we do flows from this commitment to our customers, employees, shareholders and communities.
Our vision is that we will achieve and maintain:
respect from our customers, stakeholders and communities;
performance from our people; and
excellence from our operations.
Our Values
To complement our vision, we have defined a set of values that guide our decision making and day-to-day activities. They reflect our long-term goal to efficiently provide a safe transmission service to our customers. They represent the beliefs and cultural values that drive us as an organisation.
Safety: we put safety first and take responsibility for our personal safety and the safety of others.
Delivery: we take responsibility, individually and collectively, for achieving our business goals and take pride in delivering on our promises.
Commitment: we are committed to achieving our purpose and working in an open manner to seek solutions that balance our stakeholders’ concerns.
Community: we work together positively, value the contributions of others, and respect the interests of our stakeholders and those of New Zealand’s communities.
3.1.6. ASSET MANAGEMENT POLICY
Effective asset management is critical to achieving our objectives. As part of our asset management system we maintain a formal Asset Management Policy. This policy aligns our asset management approach to our corporate objectives. The policy states that when managing our assets we will:
embed a strong safety culture and capability, striving for zero harm to employees and members of the public;
provide an enduring, reliable and efficient transmission network to meet New Zealand's present and future needs;
maximise performance of our assets over their life, taking into account the trade-off required between cost and risk;
make asset management decisions based on complete, accurate and timely information;
ensure that the right mix of talented, competent and motivated people are developed and retained to improve our asset management capability;
build and maintain effective relationships with all New Zealanders affected by our asset-related activities; and
comply with all applicable statutory and regulatory requirements.
Our asset management objectives reflect this policy by focusing on risk management and the skills and competencies of our workforce.
BUSINESS AND OPERATING ENVIRONMENT
14 MP01 – Main Proposal
3.1.7. OUR STAKEHOLDERS
We aim to conduct our work safely, and with fairness and respect for all our stakeholders (including our shareholder, customers, regulators, communities and landowners). We place the highest priority on safety and always work in a manner that keeps our customers, the community, our employees, and service providers safe from harm.
Being open and consulting with affected communities and individuals is also a key focus. Our commitment to stakeholders is reflected in our RCP2 objectives.
Below we set out an overview of our main stakeholders and how we address their needs.
Our Customers
Our ultimate customers are electricity consumers across New Zealand, including residential, commercial and industrial users served through the networks of 29 distribution companies. Six generation customers and twelve large industrial customers connect directly to the Grid.
As set out in Chapter 2, we have developed RCP2 objectives based on our customers’ performance expectations.
Landowners
Our activities require access to private land to undertake work on our assets. Constructive relationships with landowners are therefore essential. It is important to ensure that landowners' rights are respected and upheld, while also ensuring timely and adequate access to assets. We are committed to working openly and honestly with landowners and occupiers when undertaking our activities.
The Community
The Grid has a significant impact on the communities in which we operate. Recognising this impact, our CommunityCare Fund supports these communities by assisting schools and sports clubs, and refurbishing community halls, marae and other amenities. The fund is supplemented by our environmental programme, Greenline. We also support educational programmes and other initiatives that support the future needs of the electricity industry in New Zealand.
On a practical level, it is important that we consult effectively with communities at an early stage when planning our activities so we can better understand the potential impacts.
Our Regulators
We seek to work constructively with our regulators and to comply with the regulatory frameworks in which we operate. Our key business activities are subject to regulation by two independent Crown entities.
Commerce Commission: approves and monitors our transmission service revenue and performance targets under Part 4 of the Commerce Act.
Electricity Authority: administers the Electricity Industry Participation Code that governs the New Zealand electricity market. Part 12 of the Code includes provisions regarding transmission agreements, transmission pricing, and interconnection asset services. The Authority contracts with Transpower for the system operator service under the SOSPA (System Operator Service Provider Agreement).
BUSINESS AND OPERATING ENVIRONMENT
MP01 – Main Proposal 15
Our Service Providers
We outsource field maintenance, capital project construction and other technical roles (such as detailed engineering design) to ‘service providers’. These service providers are key stakeholders in maintaining and developing the Grid. We use appropriate commercial arrangements to help us build sustainable and effective relationships with them.
Outsourcing enables us to keep core engineering competencies in-house while leveraging the expertise and resources of our service providers. While our approach has several benefits, it requires that we align our respective aims and incentives effectively.
3.1.8. TRANSMISSION TOMORROW
Transmission Tomorrow sets out our long-term vision for the Grid, including three enduring strategies that we will pursue during RCP2 and beyond.
Lifting Grid performance
We will lift the performance of the Grid by completing our asset fleet renewal and refurbishment programmes. We will use new innovative approaches (such as variable line ratings) to increase asset utilisation.
Lifting system performance
We will improve the efficiency of the Grid by increasing the interaction between the energy market and the transmission network, to allow improved dispatch of generation. This will include increasing use of demand-side response.
Improving reliability and resilience
We will improve the reliability and resilience of the Grid by maintaining key strategic spares and resources to ensure we can restore security after a major event. Improved asset monitoring technologies will be used to prevent instability.
Enabling Platforms
Our ability to implement our strategies and respond to future needs will depend on the skills and resources we have available. Recognising this, Transmission Tomorrow identifies new technology platforms and capabilities required to underpin our strategies.
Networking: to deliver a secure digital data network linking our assets, control centres, offices and the wider electricity system.
Asset Information: to deliver a step change in the way that we manage assets on the Grid.
Skills and Competency: to ensure we have access to the skilled and experienced people required to operate and maintain the Grid and to operate the electricity system.
Corridor Management: to secure appropriate long-term access to transmission line assets.
3.2. OUR OPERATING ENVIRONMENT
3.2.1. ELECTRICITY TRANSMISSION IN NEW ZEALAND
New Zealand is a long, narrow country with much of its electricity generation located far from the main demand centres. Much of this is hydro-generated in the South Island while most of the demand is in the North Island, particularly in the Auckland region. The high-voltage direct current (HVDC) link between the islands is, therefore, a vital feature of our network that does not exist in many overseas networks. The Grid is also long and ‘stringy’ without the level of interconnection more typically found in transmission systems.
BUSINESS AND OPERATING ENVIRONMENT
16 MP01 – Main Proposal
Coupled with its geography, New Zealand’s low population density means our network has a relatively low energy density. Low energy density, together with our continuing ownership of a number of sub-transmission voltage assets, means that we operate a large number (178) of substations. Maps of the Grid can be found in AM09 - Annual Planning Report (APR) and on our website.
Changes in Demand and Generation
We have seen a flattening in aggregate demand in recent years due to a variety of factors, including the recent economic downturn and reduced manufacturing. However, the growing population in Auckland is increasing demand in the upper North Island relative to the rest of the country.
Even with this flattened demand, the location of generation resources is changing. Older uneconomic generation is being retired as new generation is developed closer to resources, such as geothermal, wind, gas or hydro. In particular, we have seen a shift towards geothermal generation in the central North Island.18
These changes to demand and generation are altering the geographic balance between load and generation across the Grid. This would increase further were the Tiwai Point aluminium smelter to close or significantly reduce its power consumption.
We are innovating and optimising investments in the existing Grid to recognise these planning uncertainties and to prudently defer the need for Capex. In addition, we are selectively applying variable line ratings and promoting the use of demand-response to maximise asset utilisation.
Distribution
To supply end-consumers, we directly connect with 29 distribution companies. These distributors vary considerably in scale. This, together with historic investment decisions, has resulted in us owning and operating connection equipment at multiple voltages – 11 kV, 22 kV, 33 kV, 50 kV, 66 kV, and 110 kV. In addition, we operate the main backbone links on the Grid at 220 kV and 350 kV (HVDC). Such a wide range of voltages is atypical for international transmission companies.
Financial Transmission Rights and Outage Management
The availability of our key transmission lines is important to electricity market participants as it affects generator access to the market. Reduced availability due to outages can lead to constraints that impact the dispatch of generation and may lead to locational price risk.
Financial Transmission Rights (FTR) are financial products used to hedge against locational price risk in wholesale electricity markets. These products provide electricity companies with a tool to manage the risk of large, unpredictable price movements. They were introduced to the New Zealand electricity market in 2013.
Most of our Capex and maintenance works need network outages. Outages are currently forecast 12 months in advance though there has been historic volatility in this plan due to several factors.19 To effectively manage locational price risk the FTR market requires a long-term (up to 24 months), stable outage plan.
To support the introduction of FTR, we are developing longer-range maintenance and Capex delivery plans to facilitate a 24-month outage plan. In addition, we have set circuit availability targets with financial incentives as part of our service performance measures (see Chapter 10).
18
Recently commissioned geothermal plants include Ngatamariki (82 MW), Kawerau (24 MW), and Te Mihi (160 MW). 19
Changes to the outage plan occur because of adverse weather, access constraints, and availability of resources.
BUSINESS AND OPERATING ENVIRONMENT
MP01 – Main Proposal 17
3.2.2. OPERATING CONDITIONS
Geography
Many of our assets are located in regions remote from population centres. This means our field workers often face considerable travelling time, which can increase the average duration of outages.
It also means that driver behaviour and vehicle operation are significant elements in our efforts to improve workforce and public safety.
Skills Base
The skills needed to maintain the network are difficult to source. There is a limited pool of skilled workers, and because of a worldwide demand for engineers we face competition from overseas employers.
Climate
The New Zealand climate varies greatly by region, but most areas exhibit a temperate, moist, maritime climate. There are frequent strong winds, often from the sea, leading to salt deposition and the relatively rapid onset of corrosion. Compared to networks in drier climates, this leads to higher maintenance and asset replacement costs, coupled with additional performance issues.
Over 50% of our lines are located in coastal or geothermal areas where they are exposed to corrosive conditions. This environment poses particular challenges for our steel lattice towers and conductors. During RCP2 we plan to paint a large number of towers to manage corrosion, and to undertake significant re-conductoring work.
Land Access
Apart from a few isolated cases, there are no legal easements for transmission lines in New Zealand. In practice, access over private property to work on assets relies on landowner consent. We incur costs in liaising with landowners that would not arise to the same extent if legal easements were in place.
Restrictions on access to accommodate the needs and requests of landowners can also impact on maintenance and project scheduling.
Vegetation Management
Vegetation management beneath transmission lines is a significant cost. Our climate contributes to rapid vegetation growth in some areas, compared with cooler or drier environments.
To achieve landowner consent and maintain goodwill, vegetation often needs to be trimmed repeatedly rather than being permanently removed. This leads to increased costs compared with the alternative of complete clearance.
3.3. OUR ASSET BASE
3.3.1. OUR GRID ASSETS
As discussed above, the Grid is atypical of modern transmission systems. Our asset base includes an extensive network of assets located throughout New Zealand. As at 30 June 2013, it included 178 substations, 11,627 km (route length) of transmission lines, and three submarine HVDC cables.
BUSINESS AND OPERATING ENVIRONMENT
18 MP01 – Main Proposal
Our asset base is also atypical in terms of the boundary between the Grid and our customers’ assets. For example, we own a large number of local supply transformers. This means that there is a relatively large number of 11 kV to 33 kV assets on the Grid, which would more typically be owned by distributors. The position is gradually changing as we continue a programme of divestment, transferring sub-transmission assets to local distributors.
Asset Population
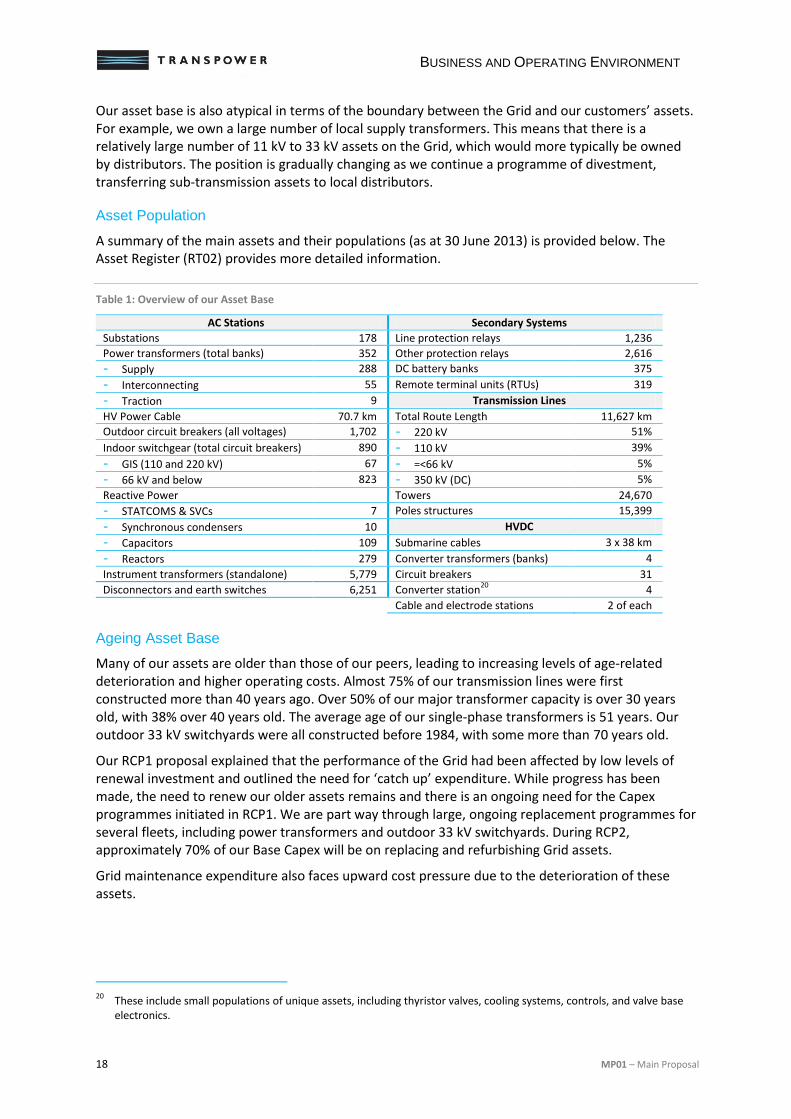
A summary of the main assets and their populations (as at 30 June 2013) is provided below. The Asset Register (RT02) provides more detailed information.
Table 1: Overview of our Asset Base
AC Stations Secondary Systems
Substations 178 Line protection relays 1,236
Power transformers (total banks) 352 Other protection relays 2,616
- Supply 288 DC battery banks 375
- Interconnecting 55 Remote terminal units (RTUs) 319
- Traction 9 Transmission Lines
HV Power Cable 70.7 km Total Route Length 11,627 km
Outdoor circuit breakers (all voltages) 1,702 - 220 kV 51%
Indoor switchgear (total circuit breakers) 890 - 110 kV 39%
- GIS (110 and 220 kV) 67 - =<66 kV 5%
- 66 kV and below 823 - 350 kV (DC) 5%
Reactive Power Towers 24,670
- STATCOMS & SVCs 7 Poles structures 15,399
- Synchronous condensers 10 HVDC
- Capacitors 109 Submarine cables 3 x 38 km
- Reactors 279 Converter transformers (banks) 4
Instrument transformers (standalone) 5,779 Circuit breakers 31
Disconnectors and earth switches 6,251 Converter station20
4
Cable and electrode stations 2 of each
Ageing Asset Base
Many of our assets are older than those of our peers, leading to increasing levels of age-related deterioration and higher operating costs. Almost 75% of our transmission lines were first constructed more than 40 years ago. Over 50% of our major transformer capacity is over 30 years old, with 38% over 40 years old. The average age of our single-phase transformers is 51 years. Our outdoor 33 kV switchyards were all constructed before 1984, with some more than 70 years old.
Our RCP1 proposal explained that the performance of the Grid had been affected by low levels of renewal investment and outlined the need for ‘catch up’ expenditure. While progress has been made, the need to renew our older assets remains and there is an ongoing need for the Capex programmes initiated in RCP1. We are part way through large, ongoing replacement programmes for several fleets, including power transformers and outdoor 33 kV switchyards. During RCP2, approximately 70% of our Base Capex will be on replacing and refurbishing Grid assets.
Grid maintenance expenditure also faces upward cost pressure due to the deterioration of these assets.
20
These include small populations of unique assets, including thyristor valves, cooling systems, controls, and valve base electronics.
BUSINESS AND OPERATING ENVIRONMENT
MP01 – Main Proposal 19
3.3.2. REVIEW OF MAJOR CAPEX PROJECTS UNDERTAKEN DURING RCP1
During RCP1 we will deliver a number of Major Capex Projects. The four largest projects are summarised below.
The North Island Grid Upgrade (NIGUP)
We have constructed 186 km of new transmission line (supported by 426 new structures) and 10 km of underground cable between Whakamaru and Pakuranga. This work, together with new substations, was needed to address the changing load and generation balance in the upper North Island due to generator closures and population growth.
The new line and cables have increased transmission capacity into the upper North Island. This provides a secure supply of electricity to Auckland and Northland and supports the development of renewable energy. The assets were commissioned in October 2012
The expected final cost of the project will be $894m. This is approximately $70m greater than the maximum Capex allowance. We consider that the overall cost was reasonable and efficiently incurred in the circumstances in which the project was planned and delivered.
HVDC Upgrade
We have constructed and installed new AC/DC converter equipment at Benmore (South Island) and Haywards (North Island) substations to increase capacity of the HVDC inter-island link. The new converter equipment, known as Pole 3, replaces the Pole 1 equipment at both substations with modern thyristor valve units. Pole 3 was commissioned in May 2013.
Stage 2 of the project involves the commissioning of new dynamic reactive compensation and a new control system for Pole 2. Stage 2 will increase bi-pole capacity to 1,200 MW and will be commissioned in December 2013.
North Auckland and Northland (NAaN)
We are installing a new underground high-voltage cable link between Pakuranga and Albany, and have built new substations at Hobson Street and Wairau Road. The new substations and cable link will help meet the long-term electricity needs of the Auckland and Northland regions. A total of 37 km of cabling will be installed.
The project will be completed in early 2014.
Wairakei to Whakamaru replacement transmission line project
We are removing an existing single circuit transmission line between Wairakei and Whakamaru and replacing it with a double-circuit line, to provide greater capacity in the area. The project involves the removal of 110 transmission towers and the construction of 106 new towers along with associated substation works. The new double-circuit 220 kV line will help connect generation being built in the area.
The project will be completed by March 2014.
RCP1 PROGRESS
20 MP01 – Main Proposal
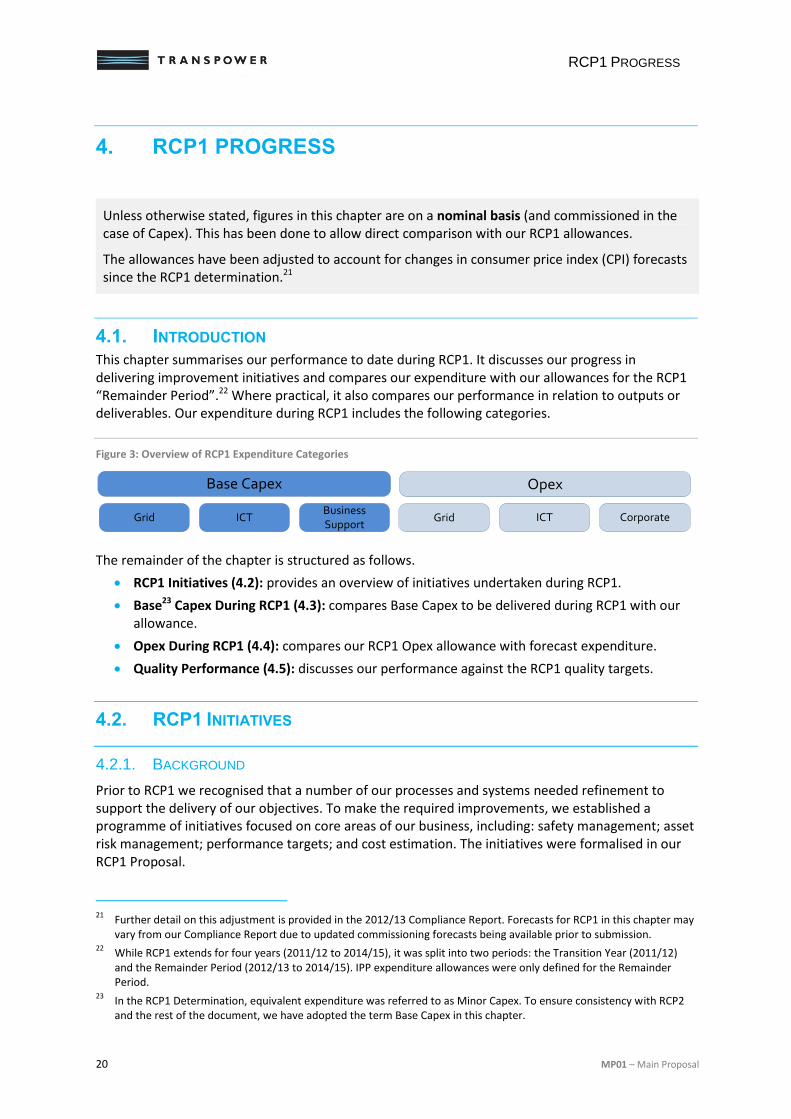
4. RCP1 PROGRESS
Unless otherwise stated, figures in this chapter are on a nominal basis (and commissioned in the case of Capex). This has been done to allow direct comparison with our RCP1 allowances.
The allowances have been adjusted to account for changes in consumer price index (CPI) forecasts since the RCP1 determination.21
4.1. INTRODUCTION This chapter summarises our performance to date during RCP1. It discusses our progress in delivering improvement initiatives and compares our expenditure with our allowances for the RCP1 “Remainder Period”.22 Where practical, it also compares our performance in relation to outputs or deliverables. Our expenditure during RCP1 includes the following categories.
Figure 3: Overview of RCP1 Expenditure Categories
The remainder of the chapter is structured as follows.
RCP1 Initiatives (4.2): provides an overview of initiatives undertaken during RCP1.
Base23 Capex During RCP1 (4.3): compares Base Capex to be delivered during RCP1 with our allowance.
Opex During RCP1 (4.4): compares our RCP1 Opex allowance with forecast expenditure.
Quality Performance (4.5): discusses our performance against the RCP1 quality targets.
4.2. RCP1 INITIATIVES
4.2.1. BACKGROUND
Prior to RCP1 we recognised that a number of our processes and systems needed refinement to support the delivery of our objectives. To make the required improvements, we established a programme of initiatives focused on core areas of our business, including: safety management; asset risk management; performance targets; and cost estimation. The initiatives were formalised in our RCP1 Proposal.
21
Further detail on this adjustment is provided in the 2012/13 Compliance Report. Forecasts for RCP1 in this chapter may vary from our Compliance Report due to updated commissioning forecasts being available prior to submission.
22 While RCP1 extends for four years (2011/12 to 2014/15), it was split into two periods: the Transition Year (2011/12)
and the Remainder Period (2012/13 to 2014/15). IPP expenditure allowances were only defined for the Remainder Period.
23 In the RCP1 Determination, equivalent expenditure was referred to as Minor Capex. To ensure consistency with RCP2
and the rest of the document, we have adopted the term Base Capex in this chapter.
ICT GridBusiness Support
ICTGrid Corporate
Base Capex Opex
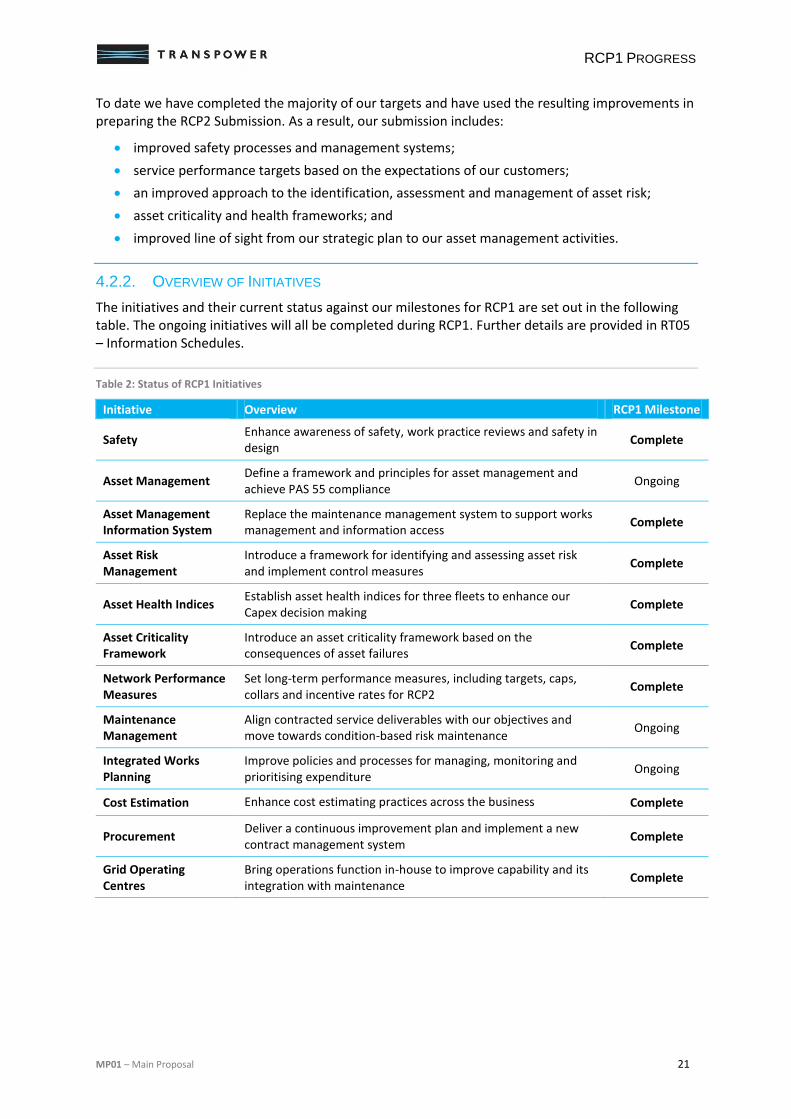
RCP1 PROGRESS
MP01 – Main Proposal 21
To date we have completed the majority of our targets and have used the resulting improvements in preparing the RCP2 Submission. As a result, our submission includes:
improved safety processes and management systems;
service performance targets based on the expectations of our customers;
an improved approach to the identification, assessment and management of asset risk;
asset criticality and health frameworks; and
improved line of sight from our strategic plan to our asset management activities.
4.2.2. OVERVIEW OF INITIATIVES
The initiatives and their current status against our milestones for RCP1 are set out in the following table. The ongoing initiatives will all be completed during RCP1. Further details are provided in RT05 – Information Schedules.
Table 2: Status of RCP1 Initiatives
Initiative Overview RCP1 Milestone
Safety Enhance awareness of safety, work practice reviews and safety in design
Complete
Asset Management Define a framework and principles for asset management and achieve PAS 55 compliance
Ongoing
Asset Management Information System
Replace the maintenance management system to support works management and information access
Complete
Asset Risk Management
Introduce a framework for identifying and assessing asset risk and implement control measures
Complete
Asset Health Indices Establish asset health indices for three fleets to enhance our Capex decision making
Complete
Asset Criticality Framework
Introduce an asset criticality framework based on the consequences of asset failures
Complete
Network Performance Measures
Set long-term performance measures, including targets, caps, collars and incentive rates for RCP2
Complete
Maintenance Management
Align contracted service deliverables with our objectives and move towards condition-based risk maintenance
Ongoing
Integrated Works Planning
Improve policies and processes for managing, monitoring and prioritising expenditure
Ongoing
Cost Estimation Enhance cost estimating practices across the business Complete
Procurement Deliver a continuous improvement plan and implement a new contract management system
Complete
Grid Operating Centres
Bring operations function in-house to improve capability and its integration with maintenance
Complete
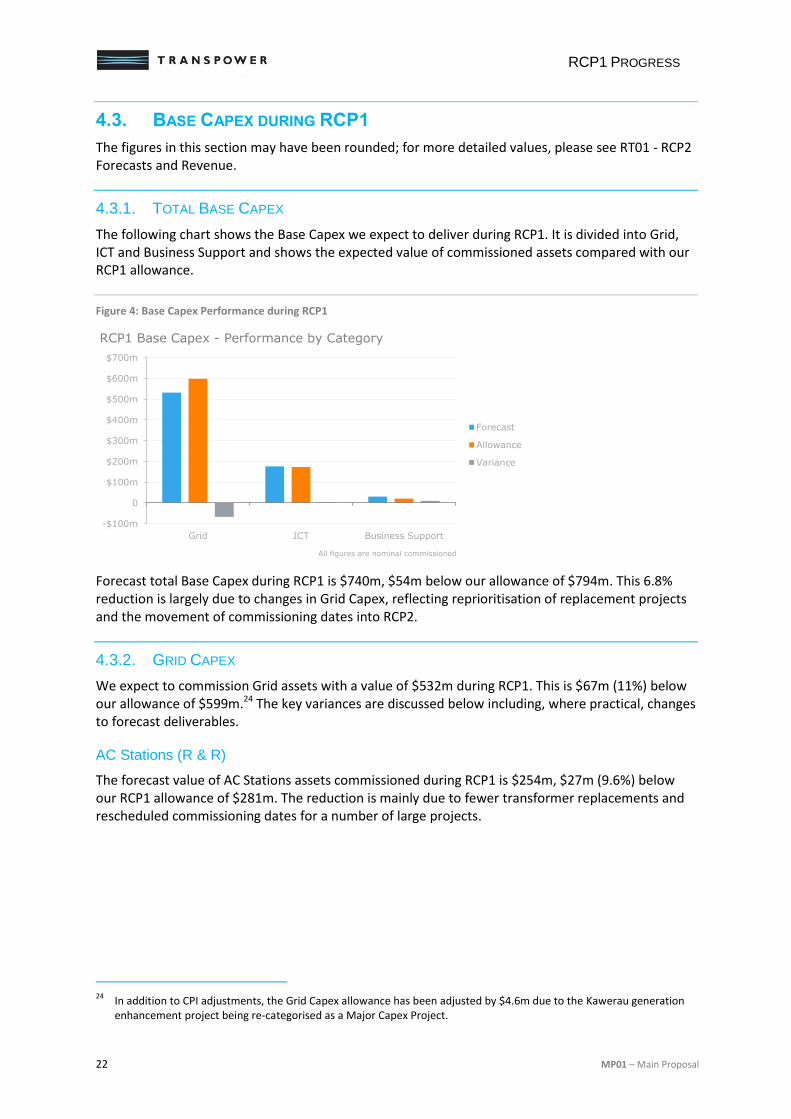
RCP1 PROGRESS
22 MP01 – Main Proposal
4.3. BASE CAPEX DURING RCP1
The figures in this section may have been rounded; for more detailed values, please see RT01 - RCP2 Forecasts and Revenue.
4.3.1. TOTAL BASE CAPEX
The following chart shows the Base Capex we expect to deliver during RCP1. It is divided into Grid, ICT and Business Support and shows the expected value of commissioned assets compared with our RCP1 allowance.
Figure 4: Base Capex Performance during RCP1
Forecast total Base Capex during RCP1 is $740m, $54m below our allowance of $794m. This 6.8% reduction is largely due to changes in Grid Capex, reflecting reprioritisation of replacement projects and the movement of commissioning dates into RCP2.
4.3.2. GRID CAPEX
We expect to commission Grid assets with a value of $532m during RCP1. This is $67m (11%) below our allowance of $599m.24 The key variances are discussed below including, where practical, changes to forecast deliverables.
AC Stations (R & R)
The forecast value of AC Stations assets commissioned during RCP1 is $254m, $27m (9.6%) below our RCP1 allowance of $281m. The reduction is mainly due to fewer transformer replacements and rescheduled commissioning dates for a number of large projects.
24
In addition to CPI adjustments, the Grid Capex allowance has been adjusted by $4.6m due to the Kawerau generation enhancement project being re-categorised as a Major Capex Project.
-$100m
0
$100m
$200m
$300m
$400m
$500m
$600m
$700m
Grid ICT Business Support
Forecast
Allowance
Variance
RCP1 Base Capex - Performance by Category
All figures are nominal commissioned
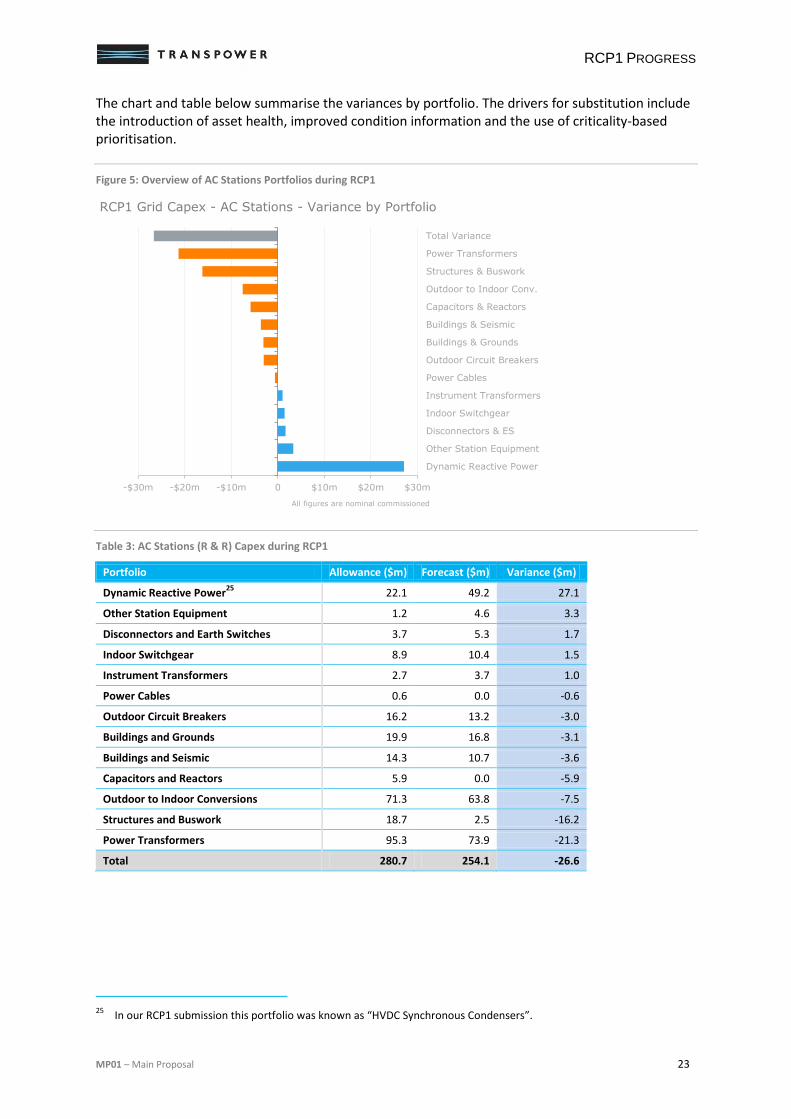
RCP1 PROGRESS
MP01 – Main Proposal 23
The chart and table below summarise the variances by portfolio. The drivers for substitution include the introduction of asset health, improved condition information and the use of criticality-based prioritisation.
Figure 5: Overview of AC Stations Portfolios during RCP1
Table 3: AC Stations (R & R) Capex during RCP1
Portfolio Allowance ($m) Forecast ($m) Variance ($m)
Dynamic Reactive Power25
22.1 49.2 27.1
Other Station Equipment 1.2 4.6 3.3
Disconnectors and Earth Switches 3.7 5.3 1.7
Indoor Switchgear 8.9 10.4 1.5
Instrument Transformers 2.7 3.7 1.0
Power Cables 0.6 0.0 -0.6
Outdoor Circuit Breakers 16.2 13.2 -3.0
Buildings and Grounds 19.9 16.8 -3.1
Buildings and Seismic 14.3 10.7 -3.6
Capacitors and Reactors 5.9 0.0 -5.9
Outdoor to Indoor Conversions 71.3 63.8 -7.5
Structures and Buswork 18.7 2.5 -16.2
Power Transformers 95.3 73.9 -21.3
Total 280.7 254.1 -26.6
25
In our RCP1 submission this portfolio was known as “HVDC Synchronous Condensers”.
-$30m -$20m -$10m 0 $10m $20m $30m
Dynamic Reactive Power
Other Station Equipment
Disconnectors & ES
Indoor Switchgear
Instrument Transformers
Power Cables
Outdoor Circuit Breakers
Buildings & Grounds
Buildings & Seismic
Capacitors & Reactors
Outdoor to Indoor Conv.
Structures & Buswork
Power Transformers
Total Variance
RCP1 Grid Capex - AC Stations - Variance by Portfolio
All figures are nominal commissioned
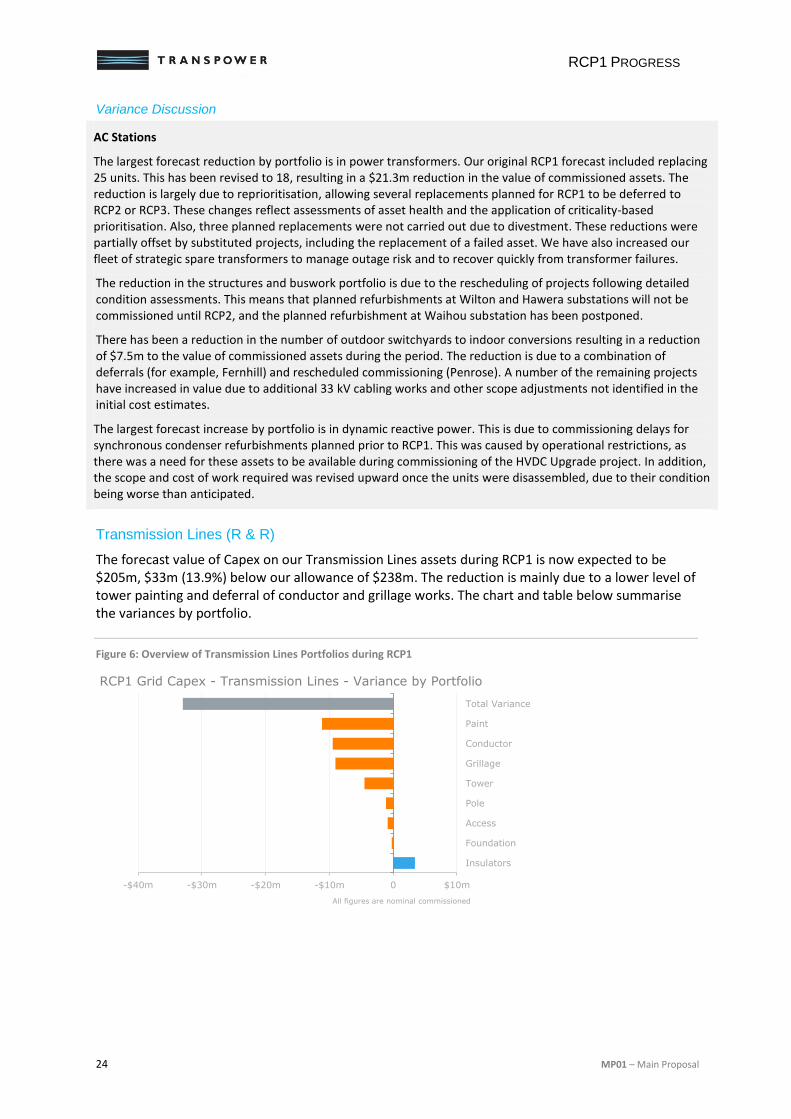
RCP1 PROGRESS
24 MP01 – Main Proposal
Variance Discussion
AC Stations
The largest forecast reduction by portfolio is in power transformers. Our original RCP1 forecast included replacing 25 units. This has been revised to 18, resulting in a $21.3m reduction in the value of commissioned assets. The reduction is largely due to reprioritisation, allowing several replacements planned for RCP1 to be deferred to RCP2 or RCP3. These changes reflect assessments of asset health and the application of criticality-based prioritisation. Also, three planned replacements were not carried out due to divestment. These reductions were partially offset by substituted projects, including the replacement of a failed asset. We have also increased our fleet of strategic spare transformers to manage outage risk and to recover quickly from transformer failures.
The reduction in the structures and buswork portfolio is due to the rescheduling of projects following detailed condition assessments. This means that planned refurbishments at Wilton and Hawera substations will not be commissioned until RCP2, and the planned refurbishment at Waihou substation has been postponed.
There has been a reduction in the number of outdoor switchyards to indoor conversions resulting in a reduction of $7.5m to the value of commissioned assets during the period. The reduction is due to a combination of deferrals (for example, Fernhill) and rescheduled commissioning (Penrose). A number of the remaining projects have increased in value due to additional 33 kV cabling works and other scope adjustments not identified in the initial cost estimates.
The largest forecast increase by portfolio is in dynamic reactive power. This is due to commissioning delays for synchronous condenser refurbishments planned prior to RCP1. This was caused by operational restrictions, as there was a need for these assets to be available during commissioning of the HVDC Upgrade project. In addition, the scope and cost of work required was revised upward once the units were disassembled, due to their condition being worse than anticipated.
Transmission Lines (R & R)
The forecast value of Capex on our Transmission Lines assets during RCP1 is now expected to be $205m, $33m (13.9%) below our allowance of $238m. The reduction is mainly due to a lower level of tower painting and deferral of conductor and grillage works. The chart and table below summarise the variances by portfolio.
Figure 6: Overview of Transmission Lines Portfolios during RCP1
-$40m -$30m -$20m -$10m 0 $10m
Insulators
Foundation
Access
Pole
Tower
Grillage
Conductor
Paint
Total Variance
RCP1 Grid Capex - Transmission Lines - Variance by Portfolio
All figures are nominal commissioned
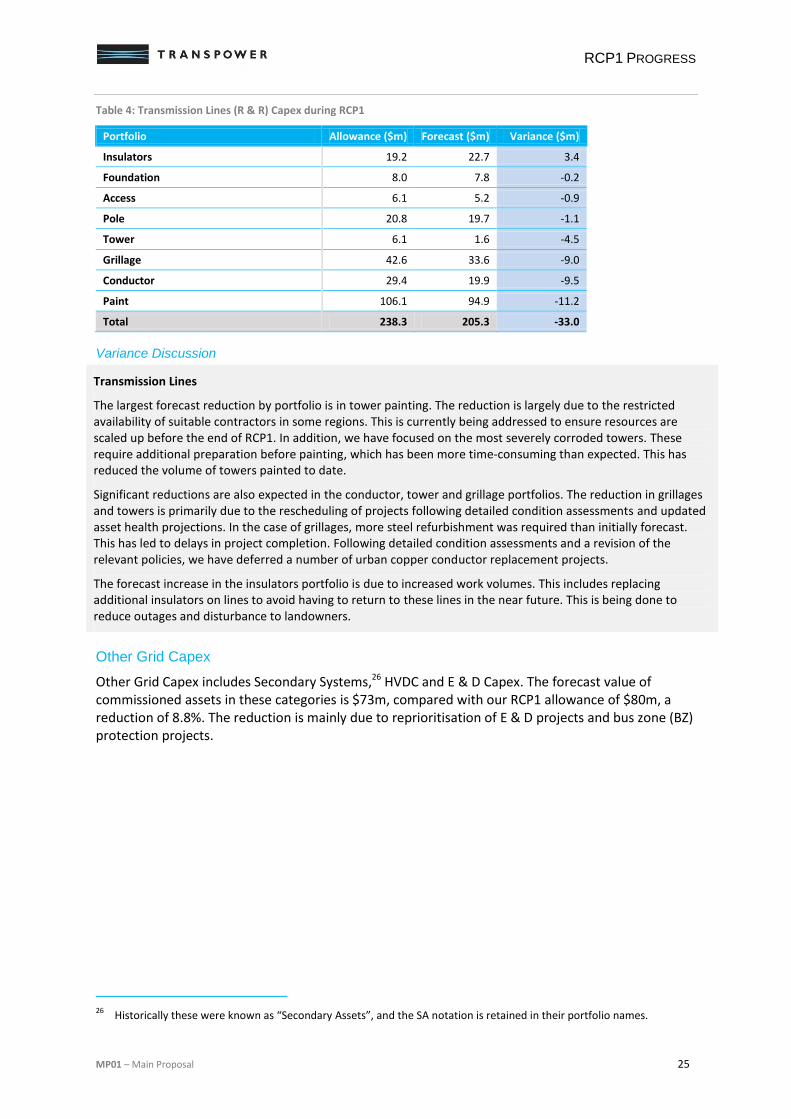
RCP1 PROGRESS
MP01 – Main Proposal 25
Table 4: Transmission Lines (R & R) Capex during RCP1
Portfolio Allowance ($m) Forecast ($m) Variance ($m)
Insulators 19.2 22.7 3.4
Foundation 8.0 7.8 -0.2
Access 6.1 5.2 -0.9
Pole 20.8 19.7 -1.1
Tower 6.1 1.6 -4.5
Grillage 42.6 33.6 -9.0
Conductor 29.4 19.9 -9.5
Paint 106.1 94.9 -11.2
Total 238.3 205.3 -33.0
Variance Discussion
Transmission Lines
The largest forecast reduction by portfolio is in tower painting. The reduction is largely due to the restricted availability of suitable contractors in some regions. This is currently being addressed to ensure resources are scaled up before the end of RCP1. In addition, we have focused on the most severely corroded towers. These require additional preparation before painting, which has been more time-consuming than expected. This has reduced the volume of towers painted to date.
Significant reductions are also expected in the conductor, tower and grillage portfolios. The reduction in grillages and towers is primarily due to the rescheduling of projects following detailed condition assessments and updated asset health projections. In the case of grillages, more steel refurbishment was required than initially forecast. This has led to delays in project completion. Following detailed condition assessments and a revision of the relevant policies, we have deferred a number of urban copper conductor replacement projects.
The forecast increase in the insulators portfolio is due to increased work volumes. This includes replacing additional insulators on lines to avoid having to return to these lines in the near future. This is being done to reduce outages and disturbance to landowners.
Other Grid Capex
Other Grid Capex includes Secondary Systems,26 HVDC and E & D Capex. The forecast value of commissioned assets in these categories is $73m, compared with our RCP1 allowance of $80m, a reduction of 8.8%. The reduction is mainly due to reprioritisation of E & D projects and bus zone (BZ) protection projects.
26
Historically these were known as “Secondary Assets”, and the SA notation is retained in their portfolio names.
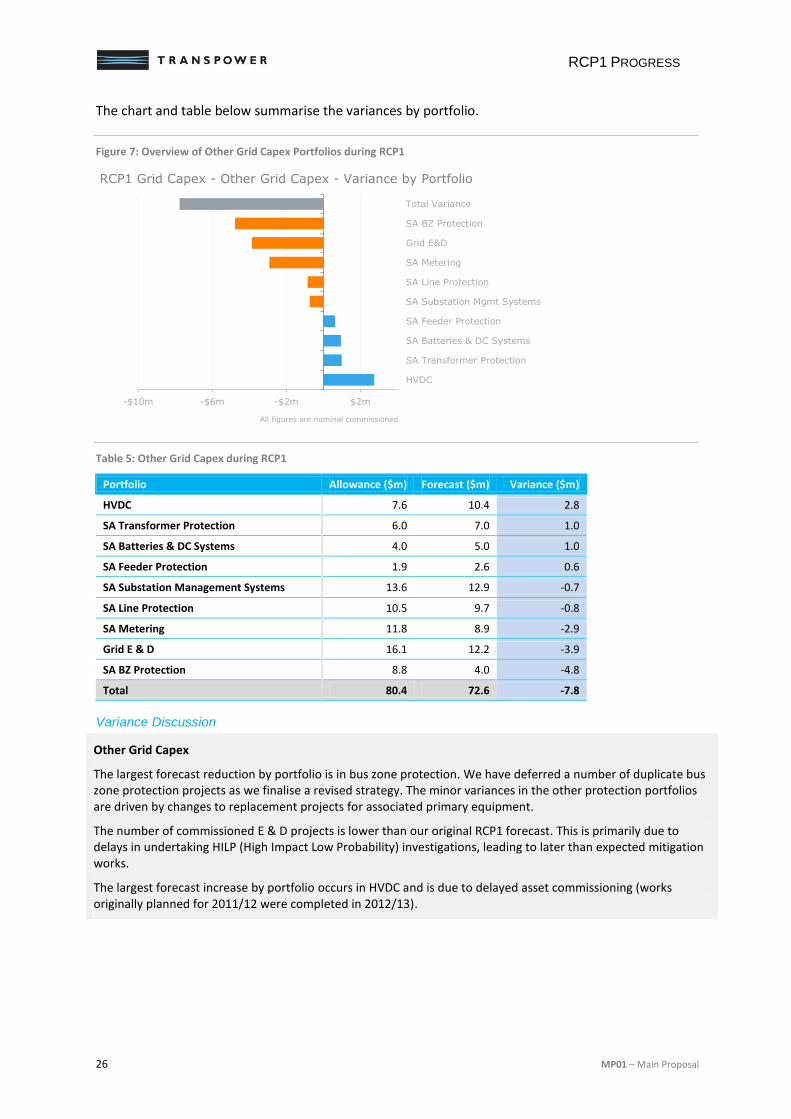
RCP1 PROGRESS
26 MP01 – Main Proposal
The chart and table below summarise the variances by portfolio.
Figure 7: Overview of Other Grid Capex Portfolios during RCP1
Table 5: Other Grid Capex during RCP1
Portfolio Allowance ($m) Forecast ($m) Variance ($m)
HVDC 7.6 10.4 2.8
SA Transformer Protection 6.0 7.0 1.0
SA Batteries & DC Systems 4.0 5.0 1.0
SA Feeder Protection 1.9 2.6 0.6
SA Substation Management Systems 13.6 12.9 -0.7
SA Line Protection 10.5 9.7 -0.8
SA Metering 11.8 8.9 -2.9
Grid E & D 16.1 12.2 -3.9
SA BZ Protection 8.8 4.0 -4.8
Total 80.4 72.6 -7.8
Variance Discussion
Other Grid Capex
The largest forecast reduction by portfolio is in bus zone protection. We have deferred a number of duplicate bus zone protection projects as we finalise a revised strategy. The minor variances in the other protection portfolios are driven by changes to replacement projects for associated primary equipment.
The number of commissioned E & D projects is lower than our original RCP1 forecast. This is primarily due to delays in undertaking HILP (High Impact Low Probability) investigations, leading to later than expected mitigation works.
The largest forecast increase by portfolio occurs in HVDC and is due to delayed asset commissioning (works originally planned for 2011/12 were completed in 2012/13).
-$10m -$6m -$2m $2m
HVDC
SA Transformer Protection
SA Batteries & DC Systems
SA Feeder Protection
SA Substation Mgmt Systems
SA Line Protection
SA Metering
Grid E&D
SA BZ Protection
Total Variance
RCP1 Grid Capex - Other Grid Capex - Variance by Portfolio
All figures are nominal commissioned
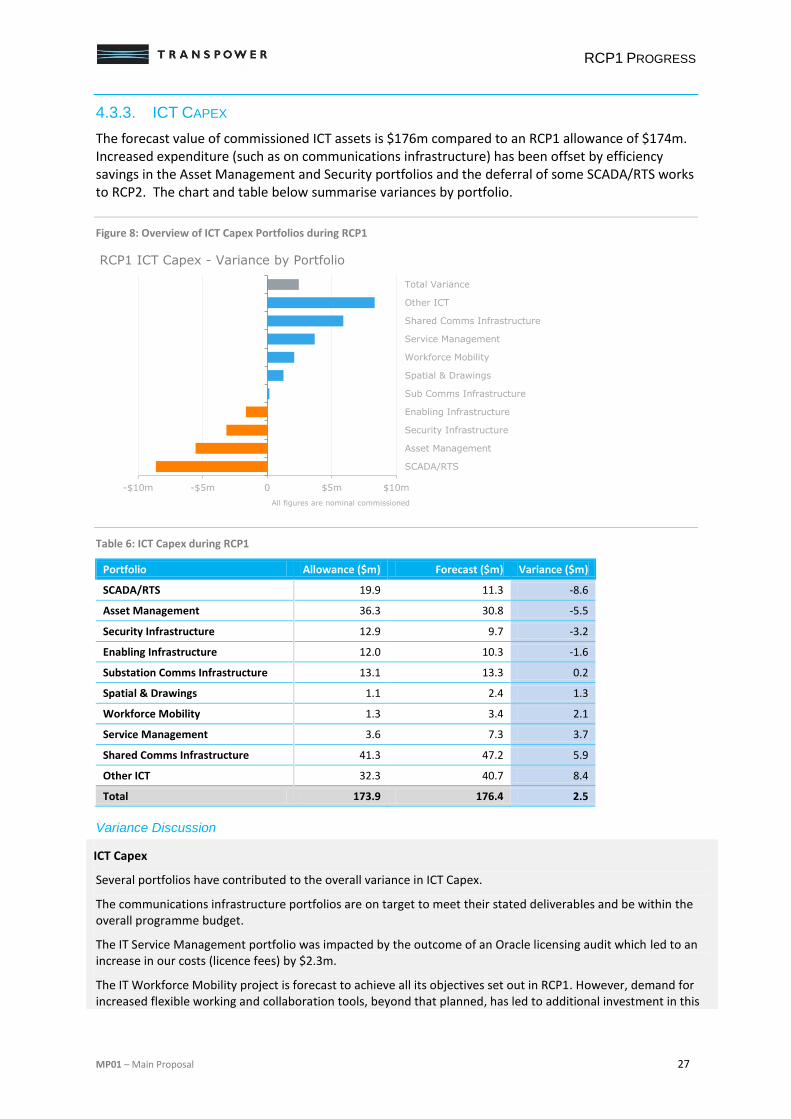
RCP1 PROGRESS
MP01 – Main Proposal 27
4.3.3. ICT CAPEX
The forecast value of commissioned ICT assets is $176m compared to an RCP1 allowance of $174m. Increased expenditure (such as on communications infrastructure) has been offset by efficiency savings in the Asset Management and Security portfolios and the deferral of some SCADA/RTS works to RCP2. The chart and table below summarise variances by portfolio.
Figure 8: Overview of ICT Capex Portfolios during RCP1
Table 6: ICT Capex during RCP1
Portfolio Allowance ($m) Forecast ($m) Variance ($m)
SCADA/RTS 19.9 11.3 -8.6
Asset Management 36.3 30.8 -5.5
Security Infrastructure 12.9 9.7 -3.2
Enabling Infrastructure 12.0 10.3 -1.6
Substation Comms Infrastructure 13.1 13.3 0.2
Spatial & Drawings 1.1 2.4 1.3
Workforce Mobility 1.3 3.4 2.1
Service Management 3.6 7.3 3.7
Shared Comms Infrastructure 41.3 47.2 5.9
Other ICT 32.3 40.7 8.4
Total 173.9 176.4 2.5
Variance Discussion
ICT Capex
Several portfolios have contributed to the overall variance in ICT Capex.
The communications infrastructure portfolios are on target to meet their stated deliverables and be within the overall programme budget.
The IT Service Management portfolio was impacted by the outcome of an Oracle licensing audit which led to an increase in our costs (licence fees) by $2.3m.
The IT Workforce Mobility project is forecast to achieve all its objectives set out in RCP1. However, demand for increased flexible working and collaboration tools, beyond that planned, has led to additional investment in this
-$10m -$5m 0 $5m $10m
SCADA/RTS
Asset Management
Security Infrastructure
Enabling Infrastructure
Sub Comms Infrastructure
Spatial & Drawings
Workforce Mobility
Service Management
Shared Comms Infrastructure
Other ICT
Total Variance
RCP1 ICT Capex - Variance by Portfolio
All figures are nominal commissioned
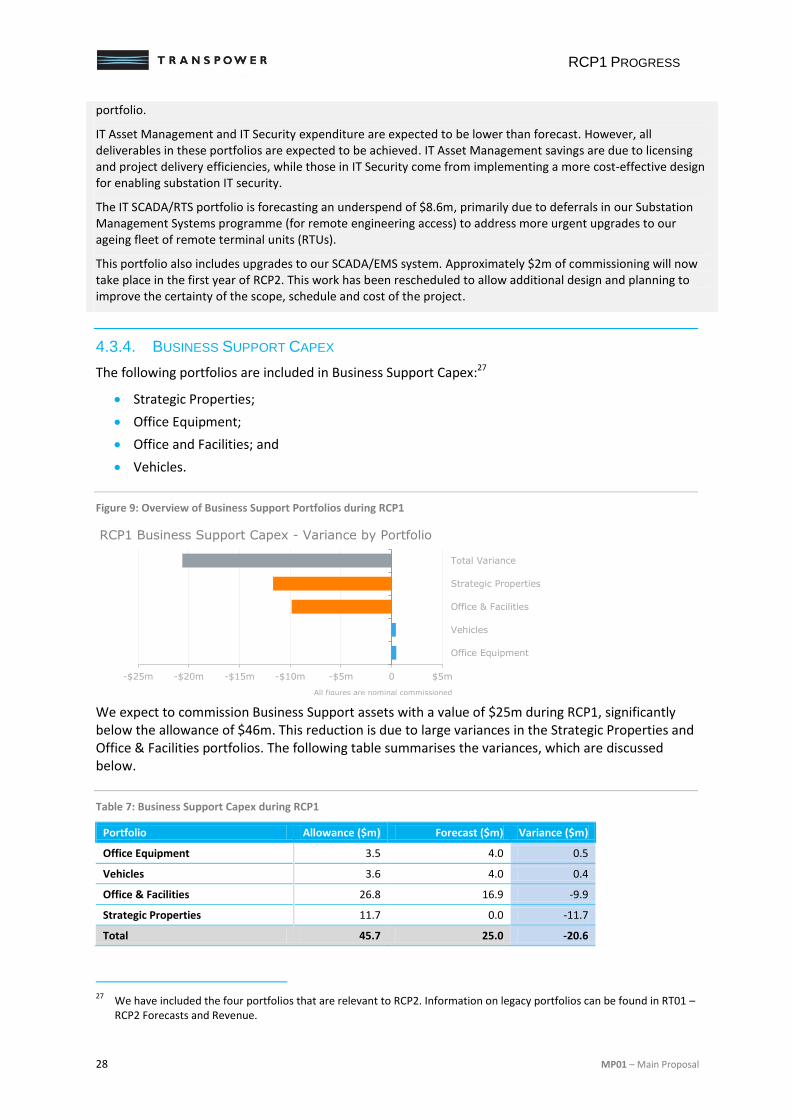
RCP1 PROGRESS
28 MP01 – Main Proposal
portfolio.
IT Asset Management and IT Security expenditure are expected to be lower than forecast. However, all deliverables in these portfolios are expected to be achieved. IT Asset Management savings are due to licensing and project delivery efficiencies, while those in IT Security come from implementing a more cost-effective design for enabling substation IT security.
The IT SCADA/RTS portfolio is forecasting an underspend of $8.6m, primarily due to deferrals in our Substation Management Systems programme (for remote engineering access) to address more urgent upgrades to our ageing fleet of remote terminal units (RTUs).
This portfolio also includes upgrades to our SCADA/EMS system. Approximately $2m of commissioning will now take place in the first year of RCP2. This work has been rescheduled to allow additional design and planning to improve the certainty of the scope, schedule and cost of the project.
4.3.4. BUSINESS SUPPORT CAPEX
The following portfolios are included in Business Support Capex:27
Strategic Properties;
Office Equipment;
Office and Facilities; and
Vehicles.
Figure 9: Overview of Business Support Portfolios during RCP1
We expect to commission Business Support assets with a value of $25m during RCP1, significantly below the allowance of $46m. This reduction is due to large variances in the Strategic Properties and Office & Facilities portfolios. The following table summarises the variances, which are discussed below.
Table 7: Business Support Capex during RCP1
Portfolio Allowance ($m) Forecast ($m) Variance ($m)
Office Equipment 3.5 4.0 0.5
Vehicles 3.6 4.0 0.4
Office & Facilities 26.8 16.9 -9.9
Strategic Properties 11.7 0.0 -11.7
Total 45.7 25.0 -20.6
27
We have included the four portfolios that are relevant to RCP2. Information on legacy portfolios can be found in RT01 – RCP2 Forecasts and Revenue.
-$25m -$20m -$15m -$10m -$5m 0 $5m
Office Equipment
Vehicles
Office & Facilities
Strategic Properties
Total Variance
RCP1 Business Support Capex - Variance by Portfolio
All figures are nominal commissioned
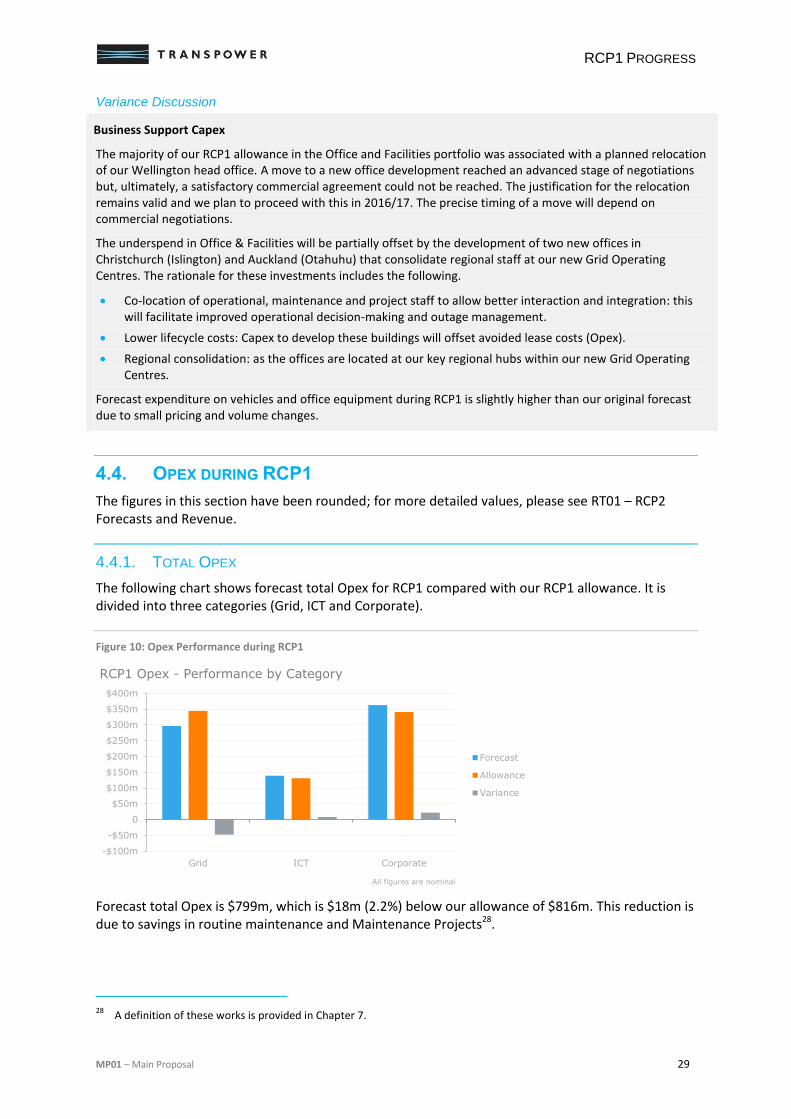
RCP1 PROGRESS
MP01 – Main Proposal 29
Variance Discussion
Business Support Capex
The majority of our RCP1 allowance in the Office and Facilities portfolio was associated with a planned relocation of our Wellington head office. A move to a new office development reached an advanced stage of negotiations but, ultimately, a satisfactory commercial agreement could not be reached. The justification for the relocation remains valid and we plan to proceed with this in 2016/17. The precise timing of a move will depend on commercial negotiations.
The underspend in Office & Facilities will be partially offset by the development of two new offices in Christchurch (Islington) and Auckland (Otahuhu) that consolidate regional staff at our new Grid Operating Centres. The rationale for these investments includes the following.
Co-location of operational, maintenance and project staff to allow better interaction and integration: this will facilitate improved operational decision-making and outage management.
Lower lifecycle costs: Capex to develop these buildings will offset avoided lease costs (Opex).
Regional consolidation: as the offices are located at our key regional hubs within our new Grid Operating Centres.
Forecast expenditure on vehicles and office equipment during RCP1 is slightly higher than our original forecast due to small pricing and volume changes.
4.4. OPEX DURING RCP1
The figures in this section have been rounded; for more detailed values, please see RT01 – RCP2 Forecasts and Revenue.
4.4.1. TOTAL OPEX
The following chart shows forecast total Opex for RCP1 compared with our RCP1 allowance. It is divided into three categories (Grid, ICT and Corporate).
Figure 10: Opex Performance during RCP1
Forecast total Opex is $799m, which is $18m (2.2%) below our allowance of $816m. This reduction is due to savings in routine maintenance and Maintenance Projects28.
28
A definition of these works is provided in Chapter 7.
-$100m
-$50m
0
$50m
$100m
$150m
$200m
$250m
$300m
$350m
$400m
Grid ICT Corporate
Forecast
Allowance
Variance
RCP1 Opex - Performance by Category
All figures are nominal
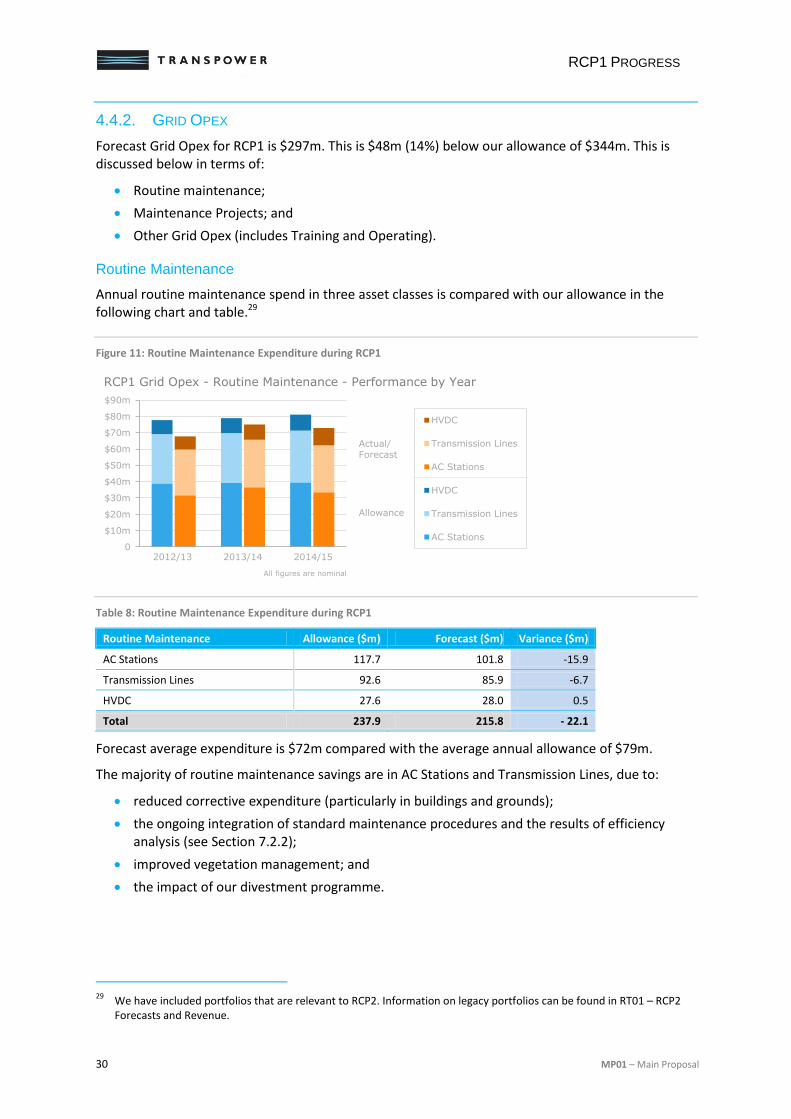
RCP1 PROGRESS
30 MP01 – Main Proposal
4.4.2. GRID OPEX
Forecast Grid Opex for RCP1 is $297m. This is $48m (14%) below our allowance of $344m. This is discussed below in terms of:
Routine maintenance;
Maintenance Projects; and
Other Grid Opex (includes Training and Operating).
Routine Maintenance
Annual routine maintenance spend in three asset classes is compared with our allowance in the following chart and table.29
Figure 11: Routine Maintenance Expenditure during RCP1
Table 8: Routine Maintenance Expenditure during RCP1
Routine Maintenance Allowance ($m) Forecast ($m) Variance ($m)
AC Stations 117.7 101.8 -15.9
Transmission Lines 92.6 85.9 -6.7
HVDC 27.6 28.0 0.5
Total 237.9 215.8 - 22.1
Forecast average expenditure is $72m compared with the average annual allowance of $79m.
The majority of routine maintenance savings are in AC Stations and Transmission Lines, due to:
reduced corrective expenditure (particularly in buildings and grounds);
the ongoing integration of standard maintenance procedures and the results of efficiency analysis (see Section 7.2.2);
improved vegetation management; and
the impact of our divestment programme.
29
We have included portfolios that are relevant to RCP2. Information on legacy portfolios can be found in RT01 – RCP2 Forecasts and Revenue.
0
$10m
$20m
$30m
$40m
$50m
$60m
$70m
$80m
$90m
HVDC
Transmission Lines
AC Stations
HVDC
Transmission Lines
AC Stations
2012/13 2013/14 2014/15
Actual/Forecast
Allowance
All figures are nominal
RCP1 Grid Opex - Routine Maintenance - Performance by Year
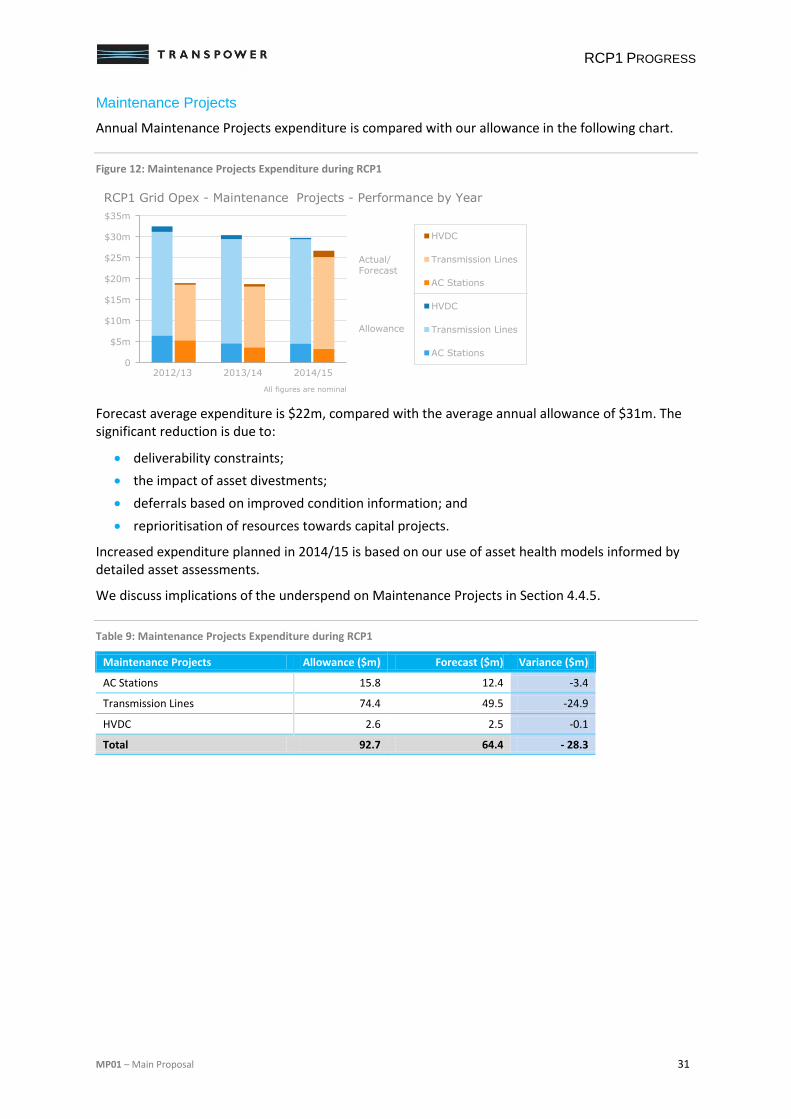
RCP1 PROGRESS
MP01 – Main Proposal 31
Maintenance Projects
Annual Maintenance Projects expenditure is compared with our allowance in the following chart.
Figure 12: Maintenance Projects Expenditure during RCP1
Forecast average expenditure is $22m, compared with the average annual allowance of $31m. The significant reduction is due to:
deliverability constraints;
the impact of asset divestments;
deferrals based on improved condition information; and
reprioritisation of resources towards capital projects.
Increased expenditure planned in 2014/15 is based on our use of asset health models informed by detailed asset assessments.
We discuss implications of the underspend on Maintenance Projects in Section 4.4.5.
Table 9: Maintenance Projects Expenditure during RCP1
Maintenance Projects Allowance ($m) Forecast ($m) Variance ($m)
AC Stations 15.8 12.4 -3.4
Transmission Lines 74.4 49.5 -24.9
HVDC 2.6 2.5 -0.1
Total 92.7 64.4 - 28.3
0
$5m
$10m
$15m
$20m
$25m
$30m
$35m
HVDC
Transmission Lines
AC Stations
HVDC
Transmission Lines
AC Stations
Actual/Forecast
Allowance
All figures are nominal
2012/13 2013/14 2014/15
RCP1 Grid Opex - Maintenance Projects - Performance by Year
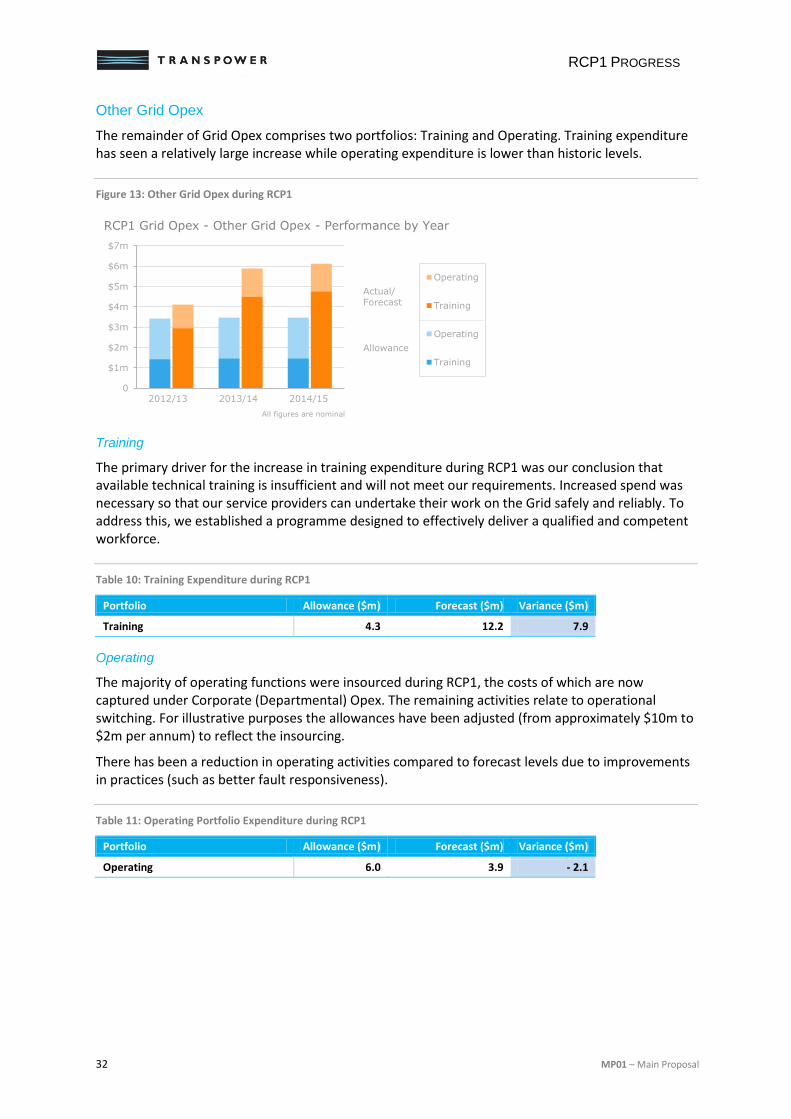
RCP1 PROGRESS
32 MP01 – Main Proposal
Other Grid Opex
The remainder of Grid Opex comprises two portfolios: Training and Operating. Training expenditure has seen a relatively large increase while operating expenditure is lower than historic levels.
Figure 13: Other Grid Opex during RCP1
Training
The primary driver for the increase in training expenditure during RCP1 was our conclusion that available technical training is insufficient and will not meet our requirements. Increased spend was necessary so that our service providers can undertake their work on the Grid safely and reliably. To address this, we established a programme designed to effectively deliver a qualified and competent workforce.
Table 10: Training Expenditure during RCP1
Portfolio Allowance ($m) Forecast ($m) Variance ($m)
Training 4.3 12.2 7.9
Operating
The majority of operating functions were insourced during RCP1, the costs of which are now captured under Corporate (Departmental) Opex. The remaining activities relate to operational switching. For illustrative purposes the allowances have been adjusted (from approximately $10m to $2m per annum) to reflect the insourcing.
There has been a reduction in operating activities compared to forecast levels due to improvements in practices (such as better fault responsiveness).
Table 11: Operating Portfolio Expenditure during RCP1
Portfolio Allowance ($m) Forecast ($m) Variance ($m)
Operating 6.0 3.9 - 2.1
0
$1m
$2m
$3m
$4m
$5m
$6m
$7m
Operating
Training
Operating
Training
2012/13 2013/14 2014/15
Actual/Forecast
Allowance
All figures are nominal
RCP1 Grid Opex - Other Grid Opex - Performance by Year
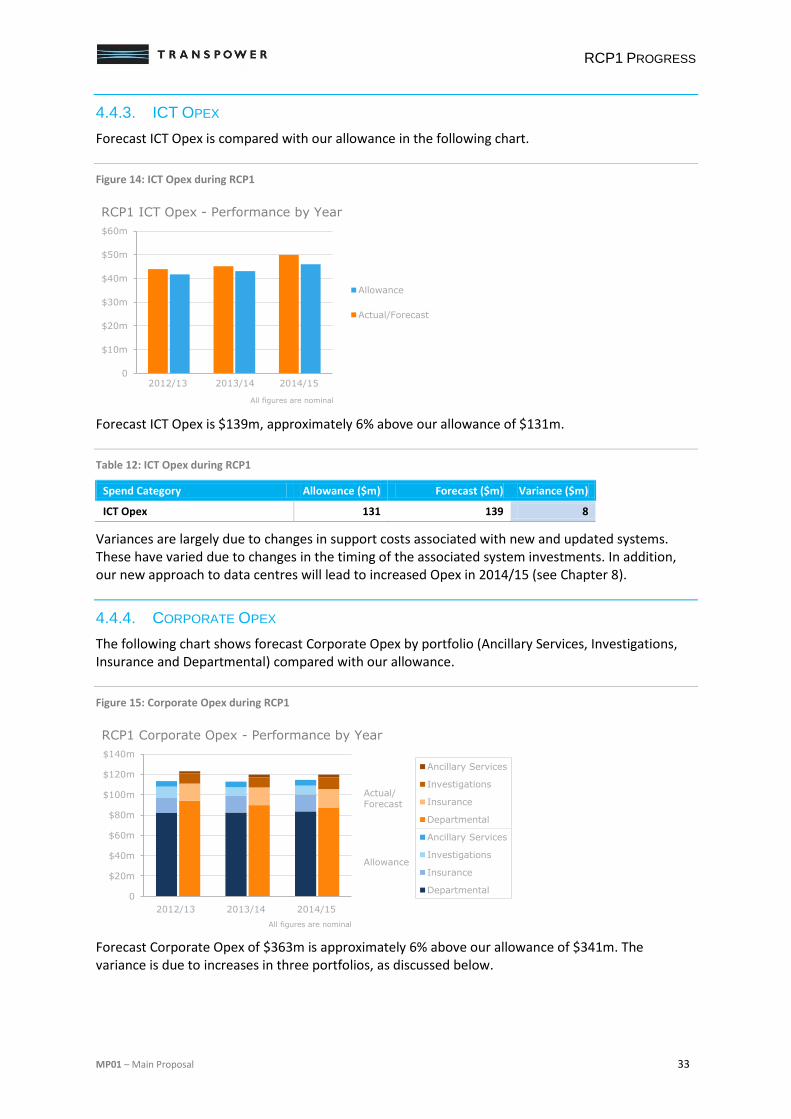
RCP1 PROGRESS
MP01 – Main Proposal 33
4.4.3. ICT OPEX
Forecast ICT Opex is compared with our allowance in the following chart.
Figure 14: ICT Opex during RCP1
Forecast ICT Opex is $139m, approximately 6% above our allowance of $131m.
Table 12: ICT Opex during RCP1
Spend Category Allowance ($m) Forecast ($m) Variance ($m)
ICT Opex 131 139 8
Variances are largely due to changes in support costs associated with new and updated systems. These have varied due to changes in the timing of the associated system investments. In addition, our new approach to data centres will lead to increased Opex in 2014/15 (see Chapter 8).
4.4.4. CORPORATE OPEX
The following chart shows forecast Corporate Opex by portfolio (Ancillary Services, Investigations, Insurance and Departmental) compared with our allowance.
Figure 15: Corporate Opex during RCP1
Forecast Corporate Opex of $363m is approximately 6% above our allowance of $341m. The variance is due to increases in three portfolios, as discussed below.
0
$10m
$20m
$30m
$40m
$50m
$60m
RCP1 ICT Opex - Performance by Year
Allowance
Actual/Forecast
2012/13 2013/14 2014/15
All figures are nominal
0
$20m
$40m
$60m
$80m
$100m
$120m
$140m
RCP1 Corporate Opex - Performance by Year
Ancillary Services
Investigations
Insurance
Departmental
Ancillary Services
Investigations
Insurance
Departmental
2012/13 2013/14 2014/15
Actual/Forecast
Allowance
All figures are nominal
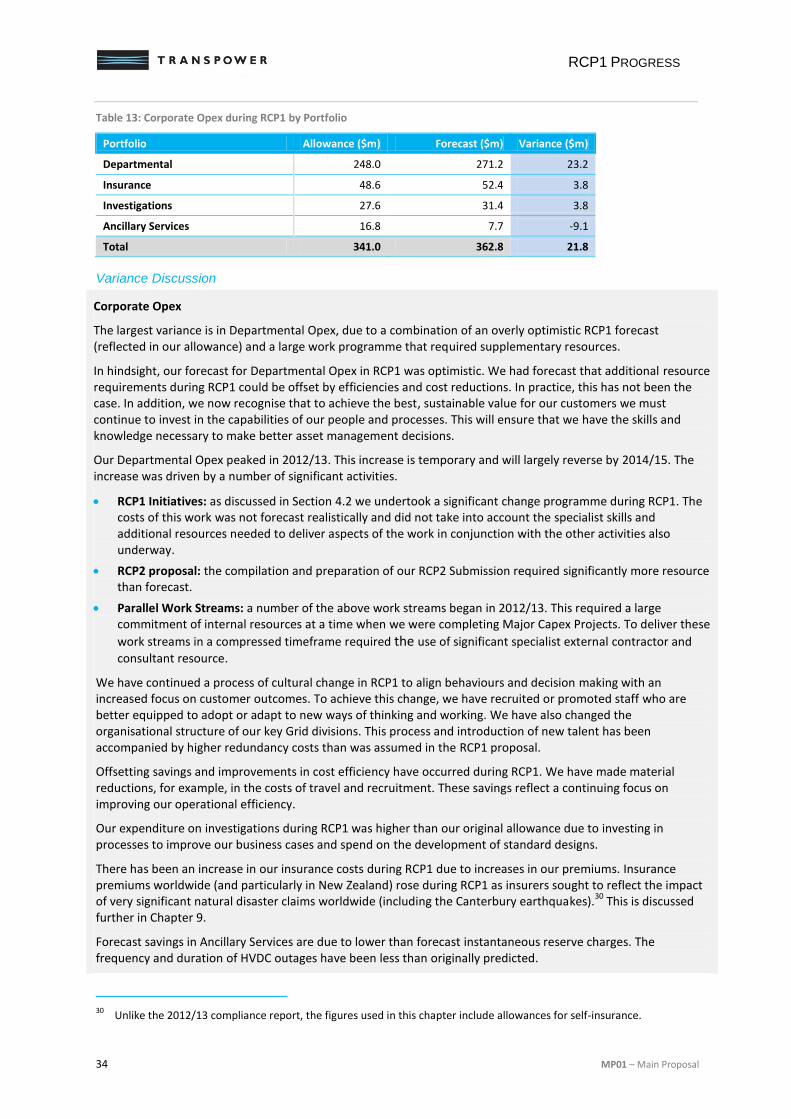
RCP1 PROGRESS
34 MP01 – Main Proposal
Table 13: Corporate Opex during RCP1 by Portfolio
Portfolio Allowance ($m) Forecast ($m) Variance ($m)
Departmental 248.0 271.2 23.2
Insurance 48.6 52.4 3.8
Investigations 27.6 31.4 3.8
Ancillary Services 16.8 7.7 -9.1
Total 341.0 362.8 21.8
Variance Discussion
Corporate Opex
The largest variance is in Departmental Opex, due to a combination of an overly optimistic RCP1 forecast (reflected in our allowance) and a large work programme that required supplementary resources.
In hindsight, our forecast for Departmental Opex in RCP1 was optimistic. We had forecast that additional resource requirements during RCP1 could be offset by efficiencies and cost reductions. In practice, this has not been the case. In addition, we now recognise that to achieve the best, sustainable value for our customers we must continue to invest in the capabilities of our people and processes. This will ensure that we have the skills and knowledge necessary to make better asset management decisions.
Our Departmental Opex peaked in 2012/13. This increase is temporary and will largely reverse by 2014/15. The increase was driven by a number of significant activities.
RCP1 Initiatives: as discussed in Section 4.2 we undertook a significant change programme during RCP1. The costs of this work was not forecast realistically and did not take into account the specialist skills and additional resources needed to deliver aspects of the work in conjunction with the other activities also underway.
RCP2 proposal: the compilation and preparation of our RCP2 Submission required significantly more resource than forecast.
Parallel Work Streams: a number of the above work streams began in 2012/13. This required a large commitment of internal resources at a time when we were completing Major Capex Projects. To deliver these
work streams in a compressed timeframe required the use of significant specialist external contractor and
consultant resource.
We have continued a process of cultural change in RCP1 to align behaviours and decision making with an increased focus on customer outcomes. To achieve this change, we have recruited or promoted staff who are better equipped to adopt or adapt to new ways of thinking and working. We have also changed the organisational structure of our key Grid divisions. This process and introduction of new talent has been accompanied by higher redundancy costs than was assumed in the RCP1 proposal.
Offsetting savings and improvements in cost efficiency have occurred during RCP1. We have made material reductions, for example, in the costs of travel and recruitment. These savings reflect a continuing focus on improving our operational efficiency.
Our expenditure on investigations during RCP1 was higher than our original allowance due to investing in processes to improve our business cases and spend on the development of standard designs.
There has been an increase in our insurance costs during RCP1 due to increases in our premiums. Insurance premiums worldwide (and particularly in New Zealand) rose during RCP1 as insurers sought to reflect the impact of very significant natural disaster claims worldwide (including the Canterbury earthquakes).
30 This is discussed
further in Chapter 9.
Forecast savings in Ancillary Services are due to lower than forecast instantaneous reserve charges. The frequency and duration of HVDC outages have been less than originally predicted.
30
Unlike the 2012/13 compliance report, the figures used in this chapter include allowances for self-insurance.
RCP1 PROGRESS
MP01 – Main Proposal 35
4.4.5. OPEX INCENTIVES
As discussed above, in aggregate, we expect to underspend against our RCP1 Opex allowance. Under the IPP Opex efficiency mechanism (or IRIS) underspends may lead to the retention of savings for up to five years.
IRIS applies to the Remainder Period, during which time we will have underspent by $29m on a nominal basis. Applying the IRIS methodology, and based on expected spend for the remainder of the period, we estimate this underspend would lead to a retained benefit of $46m across RCP1 and RCP2.
Significant portions of this underspend occurred in maintenance projects (see Section 4.4.2). In our view, the IRIS mechanism should reward genuine efficiency gains and not scope reductions. The savings partly relate to justified deferrals. However, a portion of the reduction was due to scope reductions caused by delays and resource constraints. We have sought to identify the portion of underspend on maintenance projects caused by scope reduction. We propose to forego the benefit due to scope reduction and, as a result, reduce the economic benefit obtained under IRIS by $19m. We propose to implement this through voluntary revenue reductions during RCP2.
4.5. QUALITY PERFORMANCE
This section sets out a brief overview of our network performance compared to RCP1 quality measures.31 For RCP2 we have developed new quality measures that differ materially from those used during RCP1. The RCP2 measures are discussed in Chapter 10.
4.5.1. RCP1 QUALITY MEASURES
The following quality measures apply to our network performance during RCP1.
Loss of Supply Event Frequency: measures the number, or frequency, of unplanned interruption events.
High voltage alternating current (HVAC) Unplanned Unavailability: is the average percentage of time that transmission circuits are unavailable as a result of unplanned outages.
HVDC Bi-pole Unavailability: is a measure of the energy which could not be transmitted due to unplanned outages.
Impact of Interruptions: measured in ‘System Minutes’, reflects the aggregate impact on end-consumers of supply interruptions.32
These measures apply until 2015, and we will continue reporting performance against them until then.
31
“Quality Performance Measures” was the term used for these measures during RCP1. 32
System Minutes is a normalised measure of un-served energy and includes both planned and unplanned interruptions.
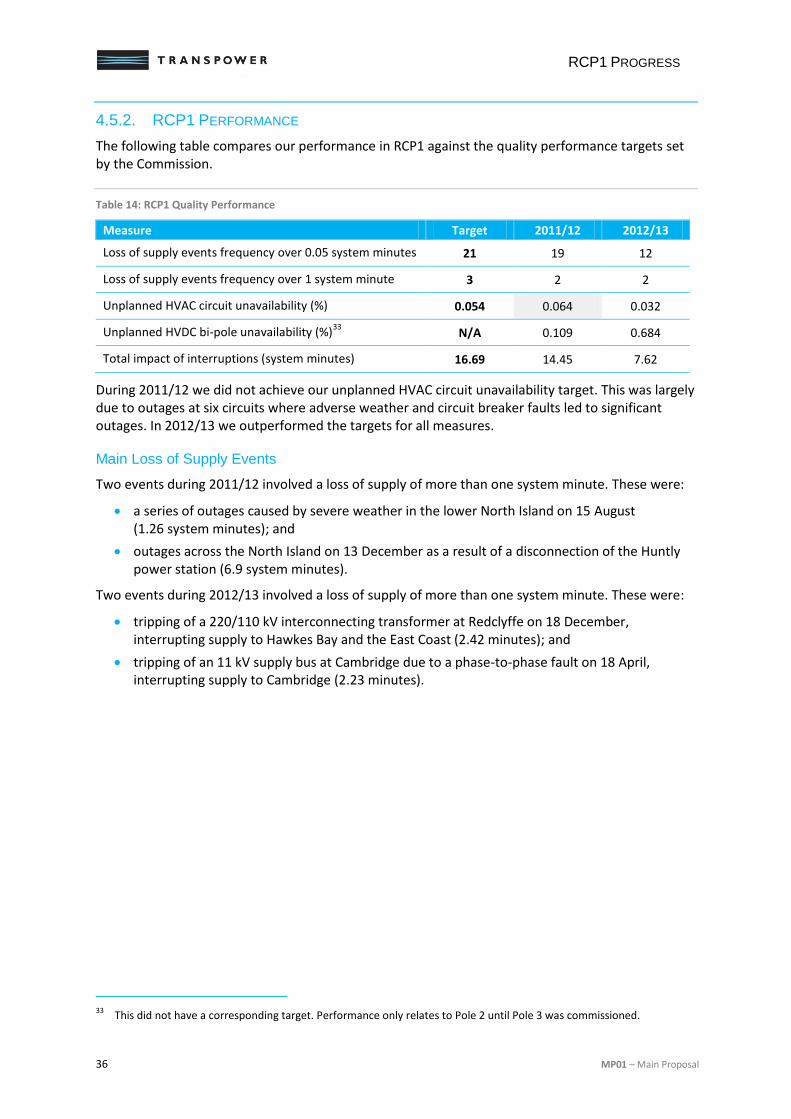
RCP1 PROGRESS
36 MP01 – Main Proposal
4.5.2. RCP1 PERFORMANCE
The following table compares our performance in RCP1 against the quality performance targets set by the Commission.
Table 14: RCP1 Quality Performance
Measure Target 2011/12 2012/13
Loss of supply events frequency over 0.05 system minutes 21 19 12
Loss of supply events frequency over 1 system minute 3 2 2
Unplanned HVAC circuit unavailability (%) 0.054 0.064 0.032
Unplanned HVDC bi-pole unavailability (%)33
N/A 0.109 0.684
Total impact of interruptions (system minutes) 16.69 14.45 7.62
During 2011/12 we did not achieve our unplanned HVAC circuit unavailability target. This was largely due to outages at six circuits where adverse weather and circuit breaker faults led to significant outages. In 2012/13 we outperformed the targets for all measures.
Main Loss of Supply Events
Two events during 2011/12 involved a loss of supply of more than one system minute. These were:
a series of outages caused by severe weather in the lower North Island on 15 August (1.26 system minutes); and
outages across the North Island on 13 December as a result of a disconnection of the Huntly power station (6.9 system minutes).
Two events during 2012/13 involved a loss of supply of more than one system minute. These were:
tripping of a 220/110 kV interconnecting transformer at Redclyffe on 18 December, interrupting supply to Hawkes Bay and the East Coast (2.42 minutes); and
tripping of an 11 kV supply bus at Cambridge due to a phase-to-phase fault on 18 April, interrupting supply to Cambridge (2.23 minutes).
33
This did not have a corresponding target. Performance only relates to Pole 2 until Pole 3 was commissioned.
OVERVIEW OF RCP2 PROPOSAL
MP01 – Main Proposal 37
5. OVERVIEW OF RCP2 PROPOSAL
This chapter provides an overview of our forecast expenditure and performance targets for RCP2. It describes the forecasting and approval approaches used. The chapter is structured as follows.
RCP2 Service Performance (5.1): summarises our service performance measures and targets.
Expenditure Categories (5.2): identifies the expenditure categories used in this proposal.
Base Capex and Opex (5.3): presents our total forecast expenditure for RCP2.
Forecasting Methodology and Inputs (5.4): provides an overview of our forecasting approach and key input assumptions.
Deliverability (5.5): discusses a deliverability review of works proposed for RCP2.
Base Capex Exception (5.6): discusses the proposed removal of large conductor projects from Base Capex.
RCP2 Approvals (5.7): discusses the internal challenge and approval rounds applied to our forecasts.
Proposed Allowances (5.8): summarises the revenue requirements that result from our forecast expenditure.
5.1. RCP2 SERVICE PERFORMANCE
Our Base Capex and Opex forecasts have been developed to deliver a cost-effective service for our customers. This is reflected in our service performance targets and planned improvements to asset health. We summarise these improvements in this section, with additional detail provided in Chapter 10 and the relevant fleet strategies.
5.1.1. OVERVIEW OF SERVICE PERFORMANCE MEASURES
Our proposed service performance measures are divided into ‘Grid Performance Measures’, ‘Asset Performance Measures’ and ‘Other Measures’.
Grid Performance Measures
We have developed Grid Performance Measures that monitor the:
number of interruptions per year;
average duration of an interruption; and
upper bound of interruption duration (90th percentile).
Asset Performance Measures
We have developed Asset Performance Measures that monitor the:
energy availability of the HVDC link; and
availability of key HVAC circuits.34
34
We have used circuits that account for the most significant electricity market impacts.
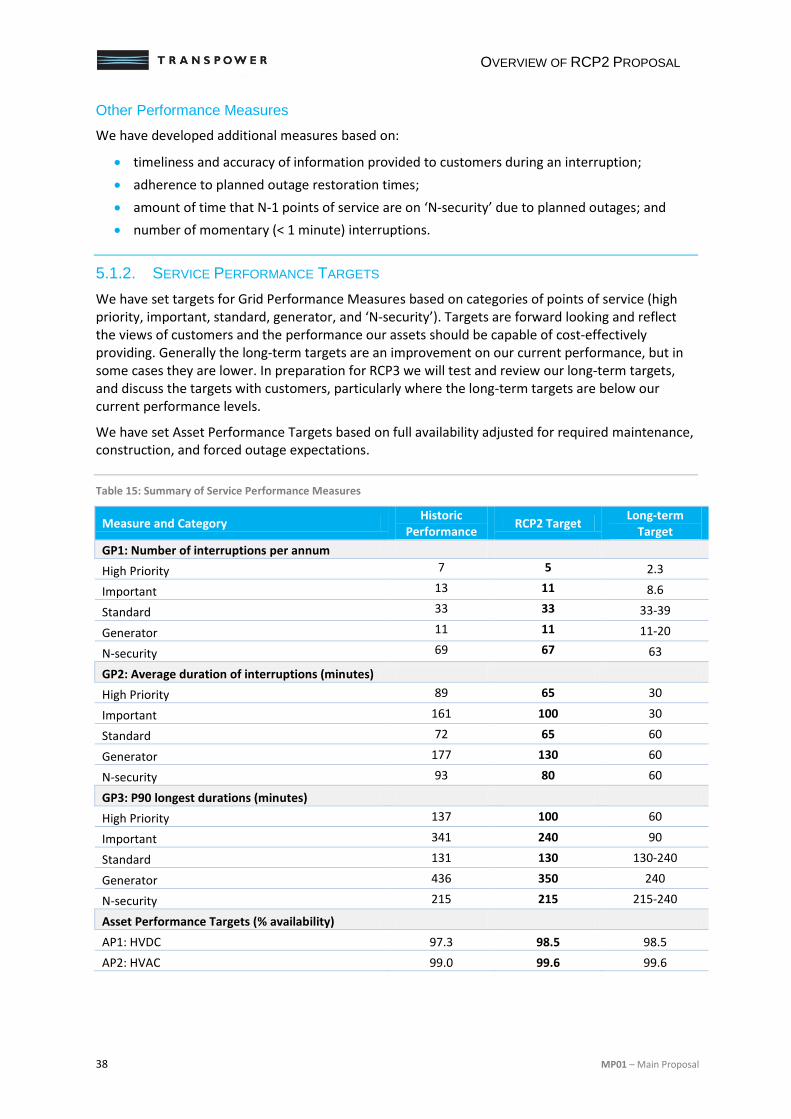
OVERVIEW OF RCP2 PROPOSAL
38 MP01 – Main Proposal
Other Performance Measures
We have developed additional measures based on:
timeliness and accuracy of information provided to customers during an interruption;
adherence to planned outage restoration times;
amount of time that N-1 points of service are on ‘N-security’ due to planned outages; and
number of momentary (< 1 minute) interruptions.
5.1.2. SERVICE PERFORMANCE TARGETS
We have set targets for Grid Performance Measures based on categories of points of service (high priority, important, standard, generator, and ‘N-security’). Targets are forward looking and reflect the views of customers and the performance our assets should be capable of cost-effectively providing. Generally the long-term targets are an improvement on our current performance, but in some cases they are lower. In preparation for RCP3 we will test and review our long-term targets, and discuss the targets with customers, particularly where the long-term targets are below our current performance levels.
We have set Asset Performance Targets based on full availability adjusted for required maintenance, construction, and forced outage expectations.
Table 15: Summary of Service Performance Measures
Measure and Category Historic
Performance RCP2 Target
Long-term Target
GP1: Number of interruptions per annum
High Priority 7 5 2.3
Important 13 11 8.6
Standard 33 33 33-39
Generator 11 11 11-20
N-security 69 67 63
GP2: Average duration of interruptions (minutes)
High Priority 89 65 30
Important 161 100 30
Standard 72 65 60
Generator 177 130 60
N-security 93 80 60
GP3: P90 longest durations (minutes)
High Priority 137 100 60
Important 341 240 90
Standard 131 130 130-240
Generator 436 350 240
N-security 215 215 215-240
Asset Performance Targets (% availability)
AP1: HVDC 97.3 98.5 98.5
AP2: HVAC 99.0 99.6 99.6
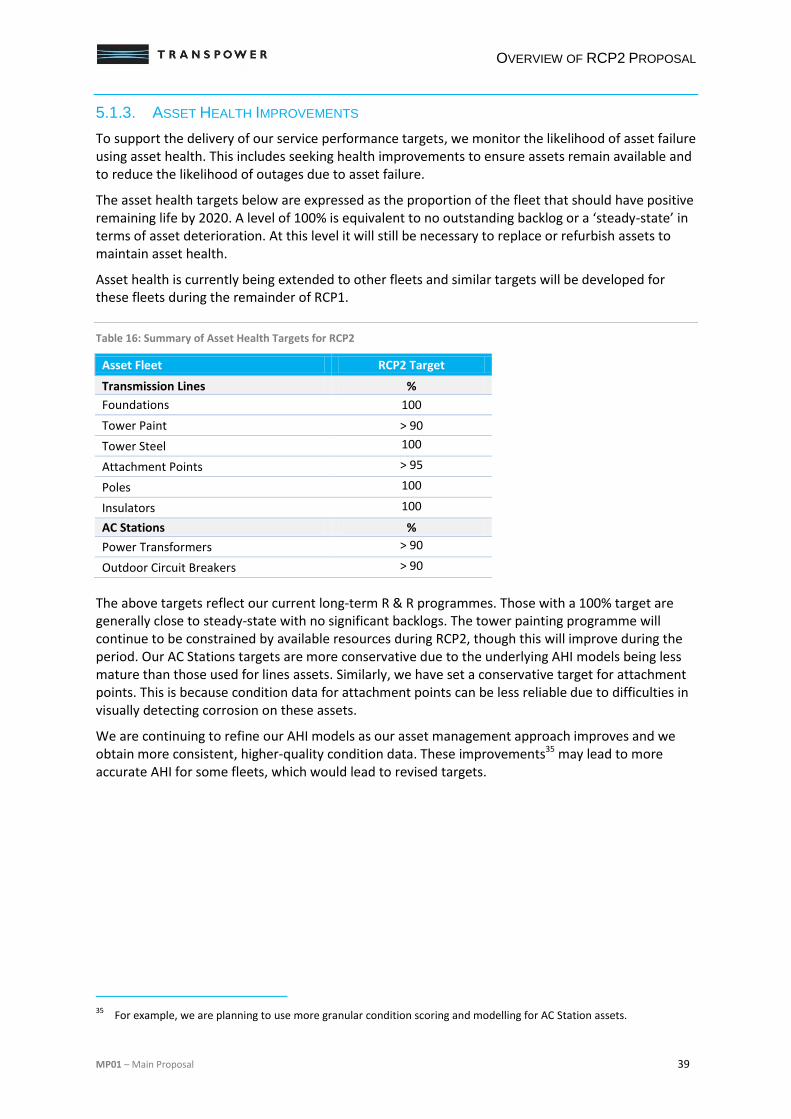
OVERVIEW OF RCP2 PROPOSAL
MP01 – Main Proposal 39
5.1.3. ASSET HEALTH IMPROVEMENTS
To support the delivery of our service performance targets, we monitor the likelihood of asset failure using asset health. This includes seeking health improvements to ensure assets remain available and to reduce the likelihood of outages due to asset failure.
The asset health targets below are expressed as the proportion of the fleet that should have positive remaining life by 2020. A level of 100% is equivalent to no outstanding backlog or a ‘steady-state’ in terms of asset deterioration. At this level it will still be necessary to replace or refurbish assets to maintain asset health.
Asset health is currently being extended to other fleets and similar targets will be developed for these fleets during the remainder of RCP1.
Table 16: Summary of Asset Health Targets for RCP2
Asset Fleet RCP2 Target
Transmission Lines %
Foundations 100
Tower Paint > 90
Tower Steel 100
Attachment Points > 95
Poles 100
Insulators 100
AC Stations %
Power Transformers > 90
Outdoor Circuit Breakers > 90
The above targets reflect our current long-term R & R programmes. Those with a 100% target are generally close to steady-state with no significant backlogs. The tower painting programme will continue to be constrained by available resources during RCP2, though this will improve during the period. Our AC Stations targets are more conservative due to the underlying AHI models being less mature than those used for lines assets. Similarly, we have set a conservative target for attachment points. This is because condition data for attachment points can be less reliable due to difficulties in visually detecting corrosion on these assets.
We are continuing to refine our AHI models as our asset management approach improves and we obtain more consistent, higher-quality condition data. These improvements35 may lead to more accurate AHI for some fleets, which would lead to revised targets.
35
For example, we are planning to use more granular condition scoring and modelling for AC Station assets.
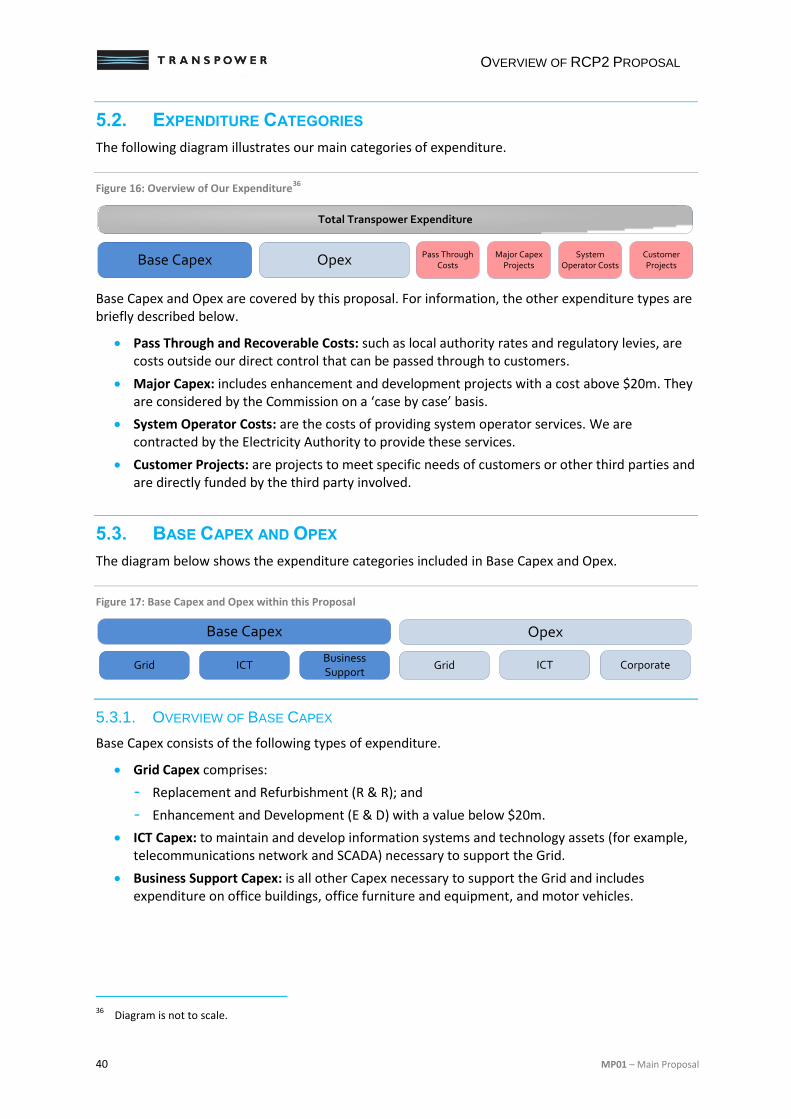
OVERVIEW OF RCP2 PROPOSAL
40 MP01 – Main Proposal
5.2. EXPENDITURE CATEGORIES
The following diagram illustrates our main categories of expenditure.
Figure 16: Overview of Our Expenditure36
Base Capex and Opex are covered by this proposal. For information, the other expenditure types are briefly described below.
Pass Through and Recoverable Costs: such as local authority rates and regulatory levies, are costs outside our direct control that can be passed through to customers.
Major Capex: includes enhancement and development projects with a cost above $20m. They are considered by the Commission on a ‘case by case’ basis.
System Operator Costs: are the costs of providing system operator services. We are contracted by the Electricity Authority to provide these services.
Customer Projects: are projects to meet specific needs of customers or other third parties and are directly funded by the third party involved.
5.3. BASE CAPEX AND OPEX
The diagram below shows the expenditure categories included in Base Capex and Opex.
Figure 17: Base Capex and Opex within this Proposal
5.3.1. OVERVIEW OF BASE CAPEX
Base Capex consists of the following types of expenditure.
Grid Capex comprises:
- Replacement and Refurbishment (R & R); and
- Enhancement and Development (E & D) with a value below $20m.
ICT Capex: to maintain and develop information systems and technology assets (for example, telecommunications network and SCADA) necessary to support the Grid.
Business Support Capex: is all other Capex necessary to support the Grid and includes expenditure on office buildings, office furniture and equipment, and motor vehicles.
36
Diagram is not to scale.
Pass Through Costs
Total Transpower Expenditure
Major Capex Projects
System Operator Costs
Customer ProjectsBase Capex Opex
ICT GridBusiness Support
ICTGrid Corporate
Base Capex Opex
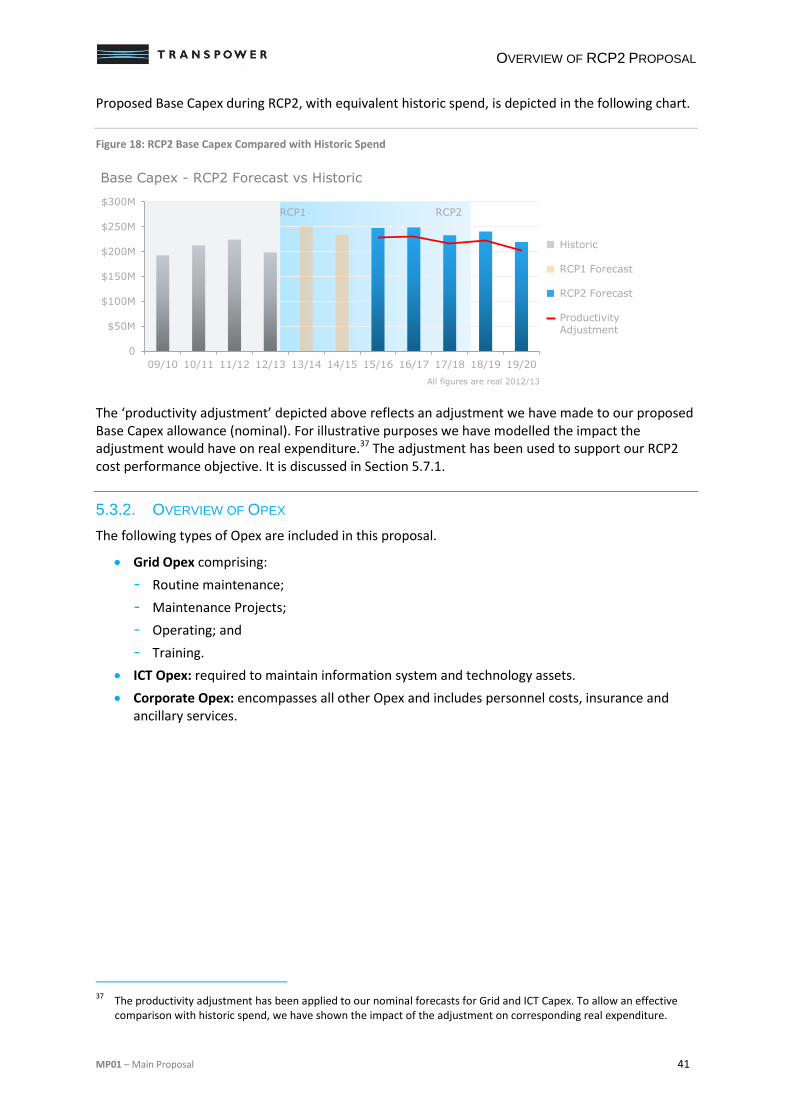
OVERVIEW OF RCP2 PROPOSAL
MP01 – Main Proposal 41
Proposed Base Capex during RCP2, with equivalent historic spend, is depicted in the following chart.
Figure 18: RCP2 Base Capex Compared with Historic Spend
The ‘productivity adjustment’ depicted above reflects an adjustment we have made to our proposed Base Capex allowance (nominal). For illustrative purposes we have modelled the impact the adjustment would have on real expenditure.37 The adjustment has been used to support our RCP2 cost performance objective. It is discussed in Section 5.7.1.
5.3.2. OVERVIEW OF OPEX
The following types of Opex are included in this proposal.
Grid Opex comprising:
- Routine maintenance;
- Maintenance Projects;
- Operating; and
- Training.
ICT Opex: required to maintain information system and technology assets.
Corporate Opex: encompasses all other Opex and includes personnel costs, insurance and ancillary services.
37
The productivity adjustment has been applied to our nominal forecasts for Grid and ICT Capex. To allow an effective comparison with historic spend, we have shown the impact of the adjustment on corresponding real expenditure.
0
$50M
$100M
$150M
$200M
$250M
$300M
09/10 10/11 11/12 12/13 13/14 14/15 15/16 16/17 17/18 18/19 19/20
Base Capex - RCP2 Forecast vs Historic
All figures are real 2012/13
RCP1 RCP2
Historic
RCP1 Forecast
RCP2 Forecast
ProductivityAdjustment
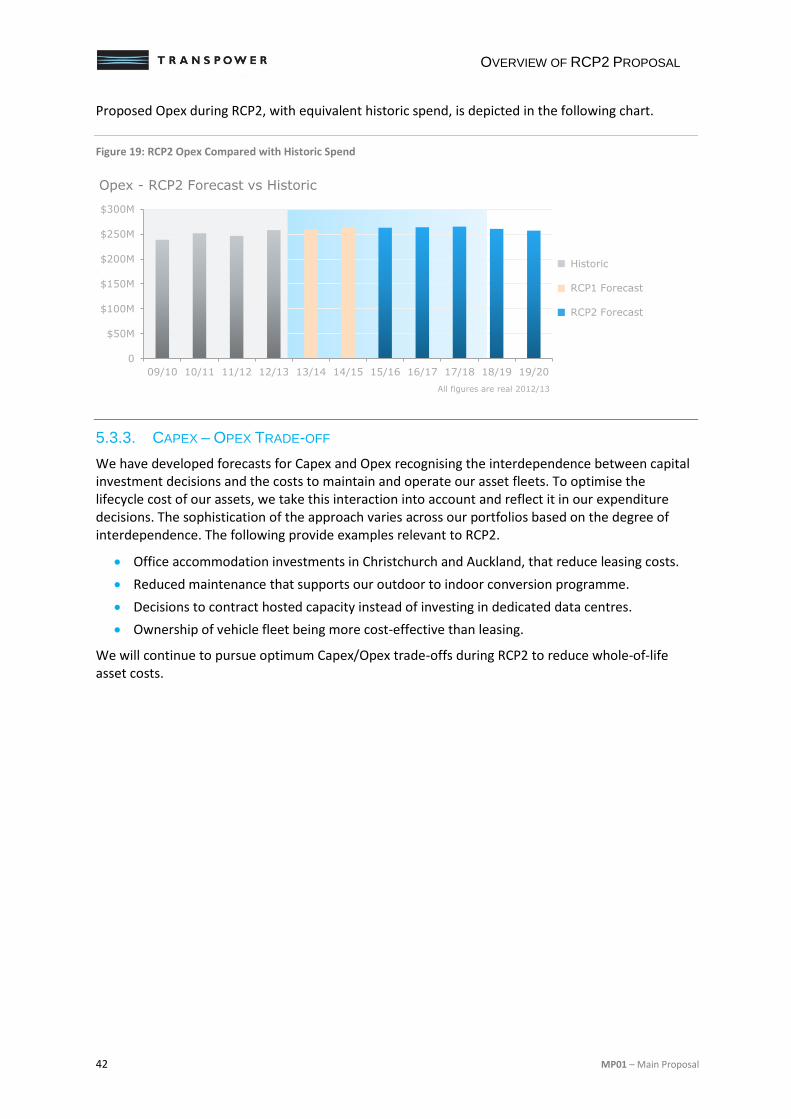
OVERVIEW OF RCP2 PROPOSAL
42 MP01 – Main Proposal
Proposed Opex during RCP2, with equivalent historic spend, is depicted in the following chart.
Figure 19: RCP2 Opex Compared with Historic Spend
5.3.3. CAPEX – OPEX TRADE-OFF
We have developed forecasts for Capex and Opex recognising the interdependence between capital investment decisions and the costs to maintain and operate our asset fleets. To optimise the lifecycle cost of our assets, we take this interaction into account and reflect it in our expenditure decisions. The sophistication of the approach varies across our portfolios based on the degree of interdependence. The following provide examples relevant to RCP2.
Office accommodation investments in Christchurch and Auckland, that reduce leasing costs.
Reduced maintenance that supports our outdoor to indoor conversion programme.
Decisions to contract hosted capacity instead of investing in dedicated data centres.
Ownership of vehicle fleet being more cost-effective than leasing.
We will continue to pursue optimum Capex/Opex trade-offs during RCP2 to reduce whole-of-life asset costs.
0
$50M
$100M
$150M
$200M
$250M
$300M
09/10 10/11 11/12 12/13 13/14 14/15 15/16 16/17 17/18 18/19 19/20
Opex - RCP2 Forecast vs Historic
All figures are real 2012/13
Historic
RCP1 Forecast
RCP2 Forecast
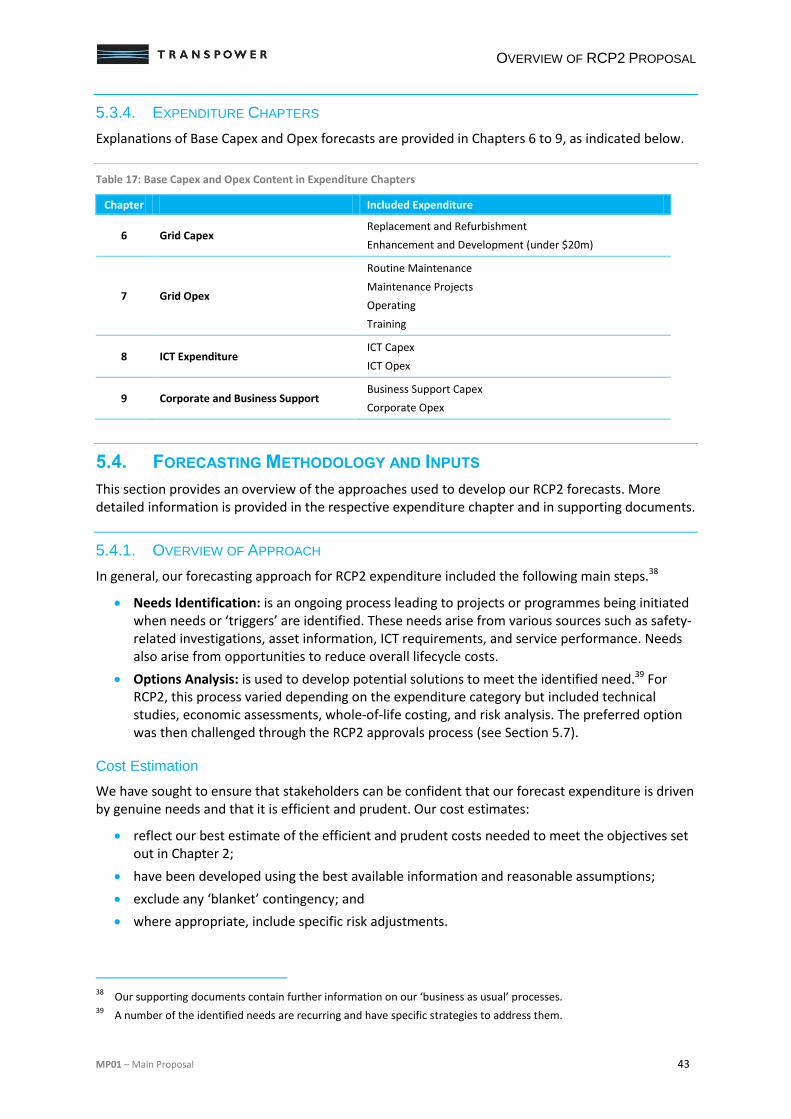
OVERVIEW OF RCP2 PROPOSAL
MP01 – Main Proposal 43
5.3.4. EXPENDITURE CHAPTERS
Explanations of Base Capex and Opex forecasts are provided in Chapters 6 to 9, as indicated below.
Table 17: Base Capex and Opex Content in Expenditure Chapters
Chapter Included Expenditure
6 Grid Capex Replacement and Refurbishment
Enhancement and Development (under $20m)
7 Grid Opex
Routine Maintenance
Maintenance Projects
Operating
Training
8 ICT Expenditure ICT Capex
ICT Opex
9 Corporate and Business Support Business Support Capex
Corporate Opex
5.4. FORECASTING METHODOLOGY AND INPUTS
This section provides an overview of the approaches used to develop our RCP2 forecasts. More detailed information is provided in the respective expenditure chapter and in supporting documents.
5.4.1. OVERVIEW OF APPROACH
In general, our forecasting approach for RCP2 expenditure included the following main steps.38
Needs Identification: is an ongoing process leading to projects or programmes being initiated when needs or ‘triggers’ are identified. These needs arise from various sources such as safety-related investigations, asset information, ICT requirements, and service performance. Needs also arise from opportunities to reduce overall lifecycle costs.
Options Analysis: is used to develop potential solutions to meet the identified need.39 For RCP2, this process varied depending on the expenditure category but included technical studies, economic assessments, whole-of-life costing, and risk analysis. The preferred option was then challenged through the RCP2 approvals process (see Section 5.7).
Cost Estimation
We have sought to ensure that stakeholders can be confident that our forecast expenditure is driven by genuine needs and that it is efficient and prudent. Our cost estimates:
reflect our best estimate of the efficient and prudent costs needed to meet the objectives set out in Chapter 2;
have been developed using the best available information and reasonable assumptions;
exclude any ‘blanket’ contingency; and
where appropriate, include specific risk adjustments.
38
Our supporting documents contain further information on our ‘business as usual’ processes. 39
A number of the identified needs are recurring and have specific strategies to address them.
OVERVIEW OF RCP2 PROPOSAL
44 MP01 – Main Proposal
Grid Capex cost estimation is built around the Transpower Enterprise Estimating Tool (TEES).40 Using this tool, both staff and service providers can develop robust cost estimates using a centrally managed dataset. TEES provides a number of benefits including consistent and traceable pricing, automated rate updates and centralised management of foreign exchange risk.
Our Grid Capex for RCP2 is based on P5041 cost estimates. The estimation approaches for Grid Capex, Grid Opex, ICT and Business Support are discussed in Chapters 6, 7, 8 and 9 respectively.
5.4.2. FORECAST INPUTS AND ASSUMPTIONS
Financial information in this proposal is presented in real terms using 2012/13 prices.
A number of inputs and assumptions have been used in developing our forecasts. These include:
exchange rates;
interest during construction (IDC);
inflation adjustments;
commissioning; and
cost allocation.
Exchange Rates
Exchange rates have been used to translate forecast costs in foreign currencies to NZ dollars.42 The exchange rates used are the average forecast exchange rates over RCP2, based on forecasts from the four main New Zealand banks.
Interest during Construction
Interest during construction (IDC) reflects the costs of funding Capex before it is recognised in the regulatory asset base (RAB), after which assets earn a return based on an estimate of our cost of capital. IDC for each project is determined based on the forecast average cost of debt, project cost, spend profile and commissioning date.43
Inflation Adjustment
Our proposal is presented in real terms, while our allowance is approved on a nominal basis. We have converted real to nominal expenditure using the Consumer Price Index (CPI) and Real Price Effects (RPE) adjustments.44
CPI represents a basket of consumer goods and reflects general movements in prices in the New Zealand economy. The CPI rate used is the “Headline CPI” rate from the Reserve Bank of New Zealand monetary policy statement.45
RPE represents changes in specific cost inputs (such as steel and copper) that are influenced by factors other than domestic CPI. RPE rates are based on forecast escalation and the portion of each
40
The tool is developed by a company called US Cost and is often referred to as “US Cost”. 41
P50 refers to a probability of exceedance where the likelihood of an estimate being exceeded is 50%. The use of P50 is discussed further in AM03 - Planning Lifecycle Strategy.
42 It is worth noting that the IPP mechanism adjusts for differences between actual and forecast exchange rates on an ex-
post basis. 43
The use of forecast average cost of debt as the basis for determining the cost of funding expenditure is consistent with the Capex IM.
44 Further detail is provided in Section 5.8.
45 Use of this rate is required by the Capex IM.
OVERVIEW OF RCP2 PROPOSAL
MP01 – Main Proposal 45
cost input used. The escalation rates of input costs were derived by an external specialist consultancy.46
Commissioning
Capex is approved on a nominal, commissioned basis. It includes IDC and inflation (see above) and is recognised when the asset is commissioned and included in the RAB. Commissioning dates are forecast for each Capex project and include any partial commissioning to reflect phased investments.
Cost Allocation
In addition to providing the transmission service, in our role as System Operator, we manage the operation of the wider power system. Expenditure relating to this service is not regulated under the IPP. However, in providing these services we use shared assets and resources (for example, a head office). In accordance with our avoidable cost allocation methodology (ACAM), costs that are identifiable as relating solely to a particular part of the business are allocated accordingly. Other costs are allocated to activities regulated under the IPP on an avoidable cost basis. This cost allocation methodology applied is consistent with our IM requirements.
5.5. DELIVERABILITY
Our RCP2 forecasts were challenged by our project delivery group to test the aggregate resource required. The review focused on critical resources (identified by our experience and service provider information), which included linesmen, tower painters, and substation construction and maintenance personnel.
The review concluded that our overall resource requirements are similar to what has been managed in the recent past. While there are specific areas where present capacity is insufficient (including tower painting), these are being addressed. In addition, we monitor and address emerging delivery risks through regular workshops as part of our risk management process. Accordingly, we are confident that the proposed levels of Base Capex and Opex can be delivered during RCP2.
5.6. BASE CAPEX EXCEPTION
The timing of our submission and the five year regulatory period requires the estimation of projects that may not begin for up to seven years and may not be commissioned for up to 10 years. This introduces the potential for significant estimation and forecasting risk.
As part of our forecasting process, we have assessed the cost and scope uncertainty associated with certain large projects. Large transmission line re-conductoring projects have significantly higher cost uncertainty than other Base Capex projects driven by large uncertainties in the required scope of tower and foundation works and the large-scale complex nature of the projects.
Moreover, detailed technical studies are yet to be completed to determine whether or not it is economic to enhance capacity. For these reasons, particularly the potential for an enhancement component, we propose that five large re-conductoring projects be excluded from Base Capex and submitted separately to the Commission for separate approval.47 Accordingly, we have removed expenditure associated with these projects from our Base Capex forecasts.
46
Forecast by the New Zealand Institute of Economic Research (NZIER) (refer CR02). 47
Further details on the projects is provided in the Conductors and Insulators Fleet Strategy.
OVERVIEW OF RCP2 PROPOSAL
46 MP01 – Main Proposal
5.7. RCP2 APPROVALS
This section describes the internal challenge and review processes used to approve our RCP2 forecasts.
5.7.1. CHALLENGE ROUNDS
In developing our expenditure forecasts we undertook a comprehensive ‘bottom-up’ analysis of the need case. We then ‘stress-tested’ this via successive challenge rounds.
Business Owner Review: forecasts were reviewed and challenged by the relevant business owner. These senior managers have specialist knowledge and expertise in the relevant areas.
RCP2 Advisory Team: a group of subject matter experts and general managers responsible for the expenditure areas was established to challenge the RCP2 proposal in detail.
CEO Review: forecasts were also reviewed and challenged by the CEO, including using the Capital Governance Team to further challenge Capex.
Board Review: each component of the RCP2 expenditure forecasts was submitted to the Transpower Board for review.
Top-Down Capex Review
A further top-down review tested forecast Grid and ICT Capex. This review took into account our output targets and our longer-term vision for the Grid. It assessed how various factors48 might impact our overall expenditure requirements. These included the following.
Alternative Solutions: the potential for alternative project solutions (options) to address the identified needs. Historically there have been situations where more cost-effective solutions were developed following the completion of investigations or detailed design.
Prioritisation: the potential for risk-based prioritisation to achieve larger improvements in performance and asset health relative to the associated expenditure.
Asset divestment: which may increase beyond the levels assumed for RCP2.
Efficiencies: potential improvements in our procurement and delivery processes.
The expenditure chapters set out Base Capex based on our bottom-up view of the scope required to meet our RCP2 objectives. However, taking into account the above factors, we believe that it is reasonable for us to target meeting our RCP2 objectives with reduced expenditure. To account for anticipated productivity improvements we have applied a top-down reduction of 7.5% to our total Grid and ICT Capex forecasts. The impact of this ‘productivity adjustment’ is set out in Section 5.8.
It should be noted that:
the identified factors are most relevant to Grid Capex and ICT and are not expected to have a material impact on Business Support Capex;
there has been no associated adjustment to RCP2 objectives or outputs, including the performance reliability targets in Chapter 10; and
the 7.5% adjustment has been applied to the aggregate nominal forecasts for Grid Capex and ICT Capex and not to the individual portfolios or project estimates set out in Chapters 6 and 8.
48
These were chosen based on historic precedent and a perception that they could lead to substitution and programme revision during RCP2.
OVERVIEW OF RCP2 PROPOSAL
MP01 – Main Proposal 47
5.7.2. FINALISED FORECAST
Following the challenge rounds and application of the productivity adjustment, we consider that the resulting forecasts represent the minimum prudent level of expenditure required to achieve our RCP2 objectives. A further reduction to the proposed expenditure would undermine our ability to deliver our performance targets and our longer-term vision for the Grid.
5.8. PROPOSED ALLOWANCES
To align with the Commission’s approvals process we have converted our Opex forecast to nominal dollars, and Base Capex to nominal commissioned dollars.
5.8.1. PROPOSED OPEX ALLOWANCE
The table below sets out our Opex forecast in real terms and the proposed RCP2 Opex allowance in nominal terms (i.e., inflated by CPI and RPE).
Table 18: Proposed RCP2 Opex Allowance
Opex ($m) 2015/16 2016/17 2017/18 2018/19 2019/20 Total
Opex (Real) 263.0 263.9 265.0 260.6 256.9 1,309.3
Proposed Opex Allowance (Nominal)
282.8 290.0 297.3 298.8 300.9 1,469.8
5.8.2. PROPOSED BASE CAPEX ALLOWANCE
The table below sets out:
1. our forecast Base Capex in real terms;
2. nominal Base Capex following inflation adjustment (for example, inflated by CPI and RPE);
3. nominal Base Capex on a commissioned basis;
4. top-down productivity adjustment of 7.5% (see Section 5.7.1); and
5. proposed RCP2 Base Capex allowance.
Table 19: Proposed RCP2 Base Capex Allowance
Base Capex ($m) 2015/16 2016/17 2017/18 2018/19 2019/20 Total
Base Capex (Real) 247.3 248.6 232.8 240.5 219.4 1,188.6
Base Capex (Nominal) 271.3 279.6 268.7 283.7 264.1 1,367.4
Base Capex (Nominal, Commissioned)
268.2 282.2 262.0 268.4 268.3 1,349.0
Productivity Adjustment (Nominal, Commissioned)
19.9 19.6 19.1 19.9 19.9 98.4
Proposed Base Capex Allowance (Nominal, Commissioned)
248.3 262.5 242.9 248.5 248.4 1,250.6

OVERVIEW OF RCP2 PROPOSAL
48 MP01 – Main Proposal
5.8.3. FORECAST MAR
The expenditure proposals drive the calculation of our MAR. The MAR is determined using a ‘building block’ approach that includes the following components:
the return on capital invested;
return of capital invested (depreciation);
Opex allowance; and
tax costs.
Our Base Capex allowance is an input into the capital invested terms above. Further details on our MAR calculation is set out in RT01 – RCP2 Forecasts and Revenue.
GRID CAPITAL EXPENDITURE
MP01 – Main Proposal 49
6. GRID CAPITAL EXPENDITURE
This chapter provides an overview of proposed Grid Capex.49
Figure 20: Expenditure included in Chapter 6
The chapter is structured as follows.
Overview (6.1): provides a summary of Grid Capex, including a comparison with RCP1 expenditure.
Capex Forecasting (6.2): describes our forecasting methodology and governance processes.
Replacement and Refurbishment Forecasts (6.3): sets out our proposed R & R Capex.
Enhancement and Development Forecasts (6.4): sets out our proposed E & D Capex.
Additional information is included throughout our RCP2 Submission, particularly in our lifecycle strategies, APR, fleet strategies and PODs.50
6.1. OVERVIEW
Our recent focus has been on the delivery of new infrastructure. Much of this work is now complete and our focus has turned to optimising our asset renewal programme to deliver a safer, more cost-effective service.
6.1.1. GRID CAPEX CATEGORIES
Replacement and Refurbishment
Replacement and Refurbishment (R & R) is Capex that seeks to ensure assets deliver a required level of service over their life at an efficient cost. R & R Capex includes the replacement of assets and refurbishments that extend an asset’s useful life. These works are generally managed as a series of programmes within a portfolio, focused on a particular asset fleet (such as power transformers). Grid portfolios are grouped into four main classes (Transmission Lines, AC Stations, Secondary Systems, and HVDC).
49
Figures in this chapter may have been rounded; for more detailed forecasts, please see RT01 – RCP2 Forecasts and Revenue.
50 See: AM03 – Planning Lifecycle Strategy, AM04 – Delivery Lifecycle Strategy and AM09 – Annual Planning Report, 2013.
ICT GridBusiness Support
ICTGrid Corporate
Base Capex Opex
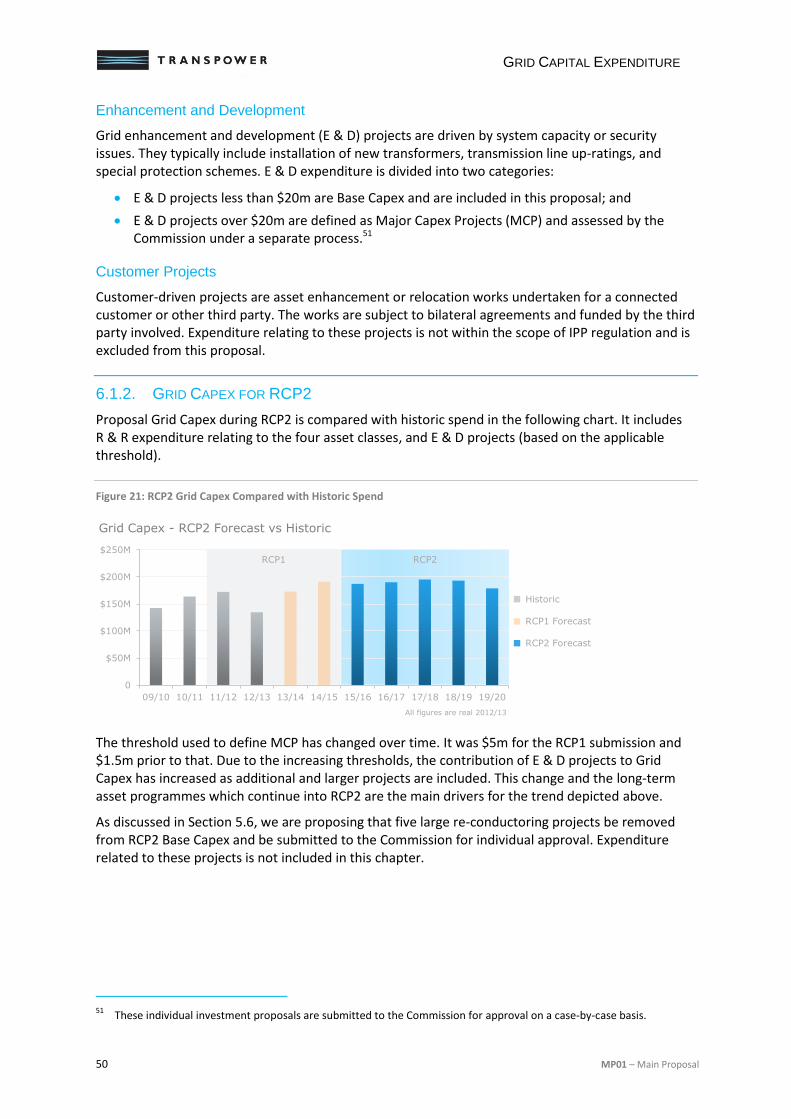
GRID CAPITAL EXPENDITURE
50 MP01 – Main Proposal
Enhancement and Development
Grid enhancement and development (E & D) projects are driven by system capacity or security issues. They typically include installation of new transformers, transmission line up-ratings, and special protection schemes. E & D expenditure is divided into two categories:
E & D projects less than $20m are Base Capex and are included in this proposal; and
E & D projects over $20m are defined as Major Capex Projects (MCP) and assessed by the Commission under a separate process.51
Customer Projects
Customer-driven projects are asset enhancement or relocation works undertaken for a connected customer or other third party. The works are subject to bilateral agreements and funded by the third party involved. Expenditure relating to these projects is not within the scope of IPP regulation and is excluded from this proposal.
6.1.2. GRID CAPEX FOR RCP2
Proposal Grid Capex during RCP2 is compared with historic spend in the following chart. It includes R & R expenditure relating to the four asset classes, and E & D projects (based on the applicable threshold).
Figure 21: RCP2 Grid Capex Compared with Historic Spend
The threshold used to define MCP has changed over time. It was $5m for the RCP1 submission and $1.5m prior to that. Due to the increasing thresholds, the contribution of E & D projects to Grid Capex has increased as additional and larger projects are included. This change and the long-term asset programmes which continue into RCP2 are the main drivers for the trend depicted above.
As discussed in Section 5.6, we are proposing that five large re-conductoring projects be removed from RCP2 Base Capex and be submitted to the Commission for individual approval. Expenditure related to these projects is not included in this chapter.
51
These individual investment proposals are submitted to the Commission for approval on a case-by-case basis.
RCP1 RCP2
0
$50M
$100M
$150M
$200M
$250M
09/10 10/11 11/12 12/13 13/14 14/15 15/16 16/17 17/18 18/19 19/20
Grid Capex - RCP2 Forecast vs Historic
All figures are real 2012/13
Historic
RCP1 Forecast
RCP2 Forecast
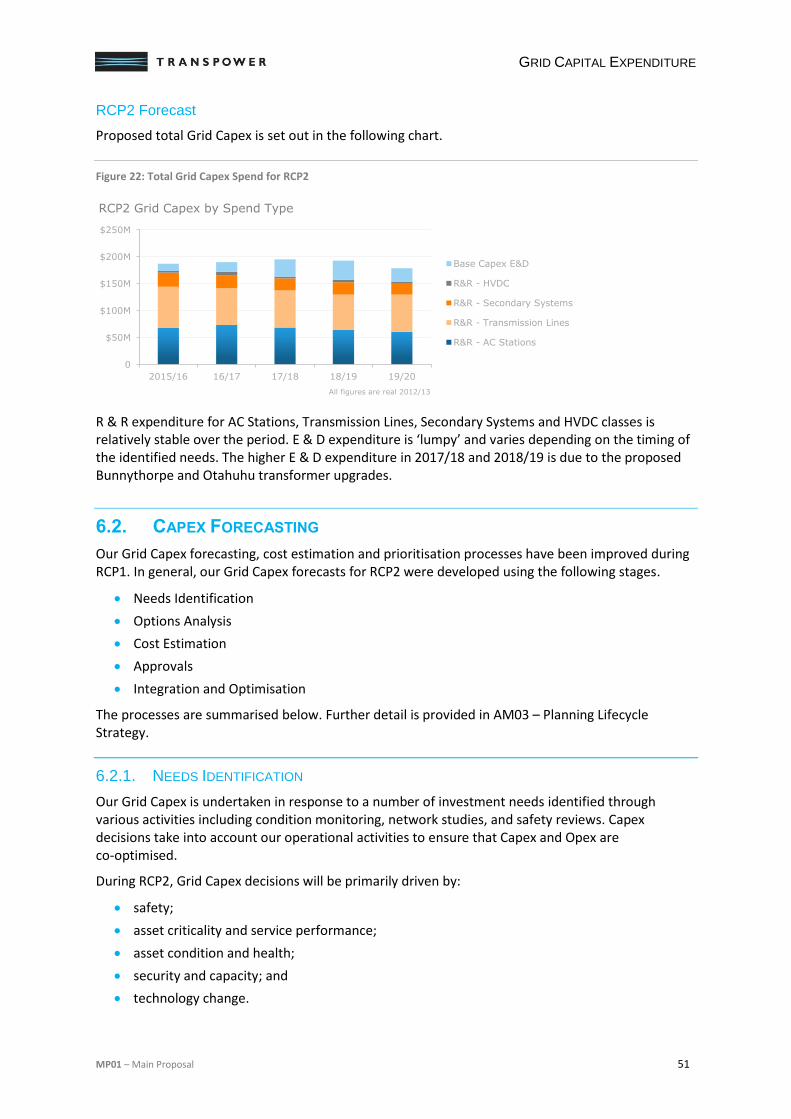
GRID CAPITAL EXPENDITURE
MP01 – Main Proposal 51
RCP2 Forecast
Proposed total Grid Capex is set out in the following chart.
Figure 22: Total Grid Capex Spend for RCP2
R & R expenditure for AC Stations, Transmission Lines, Secondary Systems and HVDC classes is relatively stable over the period. E & D expenditure is ‘lumpy’ and varies depending on the timing of the identified needs. The higher E & D expenditure in 2017/18 and 2018/19 is due to the proposed Bunnythorpe and Otahuhu transformer upgrades.
6.2. CAPEX FORECASTING
Our Grid Capex forecasting, cost estimation and prioritisation processes have been improved during RCP1. In general, our Grid Capex forecasts for RCP2 were developed using the following stages.
Needs Identification
Options Analysis
Cost Estimation
Approvals
Integration and Optimisation
The processes are summarised below. Further detail is provided in AM03 – Planning Lifecycle Strategy.
6.2.1. NEEDS IDENTIFICATION
Our Grid Capex is undertaken in response to a number of investment needs identified through various activities including condition monitoring, network studies, and safety reviews. Capex decisions take into account our operational activities to ensure that Capex and Opex are co-optimised.
During RCP2, Grid Capex decisions will be primarily driven by:
safety;
asset criticality and service performance;
asset condition and health;
security and capacity; and
technology change.
0
$50M
$100M
$150M
$200M
$250M
2015/16 16/17 17/18 18/19 19/20
Base Capex E&D
R&R - HVDC
R&R - Secondary Systems
R&R - Transmission Lines
R&R - AC Stations
RCP2 Grid Capex by Spend Type
All figures are real 2012/13
GRID CAPITAL EXPENDITURE
52 MP01 – Main Proposal
The investment drivers are discussed below.
Safety
Investments are sometimes required to ensure that Grid assets do not pose safety risks to staff, service providers or the general public. Where risks are unavoidable, they must be isolated or mitigated to the extent possible. This is accounted for both in the timing of investments and the design of assets. Safety risks also arise from degrading asset condition or changes to acceptable operating or maintenance practices.
We identify potential safety-related investments using various information sources, including field inspections, review of health and safety incidents, and from the experiences of peer utilities.
A key example of safety-driven Grid Capex is the ongoing conversion of 33 kV outdoor switchyards to indoor switchrooms. The restricted working space in these switchyards poses a significant safety hazard to maintenance personnel.
Asset Criticality and Service Performance
Our approach to asset management has been refined to recognise differing levels of asset criticality. Asset criticality recognises that assets have differing importance in terms of the service provided. A criticality level has been assigned to each point of service based on an assessment of the impacts of an outage, with reference to:
the load carried;
the level of reliability required by the connected customer(s);
constraints that would be placed on the rest of the grid in the event of an outage; and
the level of redundancy.
A preliminary approach has been developed to translate the criticality of the point of service to criticality of the network branches and associated assets that supply the point of service. It categorises assets as high, medium or low impact. When considering Grid Capex investments, we have targeted higher-impact assets.
As discussed in Chapter 10, we have specified performance targets for points of service based on criticality. Using historic failure data, we have prioritised assets that have been identified as contributing to poor performance (for example assets at a point of service with poor reliability relative to its performance target). This process, which is still being developed, includes analysis of failure modes to determine the root cause of performance issues and the development of suitable mitigations. This helps to align investments with our performance targets.
To support our service performance objectives, R & R work programmes have taken into account historic forced outage rates caused by equipment failure. Some AC Station fleets show strong linkages between outage frequency and condition-related failure modes; for example, leak-prone SF6 circuit breakers and some tap changer models on single-phase transformers. We have developed specific programmes and prioritisation techniques52 to address these issues.
Asset Condition and Health
Asset health indices (AHI) and condition information are used to optimise the timing of asset interventions based on assets’ expected remaining life. Remaining life represents the estimated time before an intervention may be required in response to increasing asset risk. We use AHI to estimate remaining life on a consistent basis across fleets.
52
Our transformer AHI model includes adjustments based on the presence of problematic tap changers.
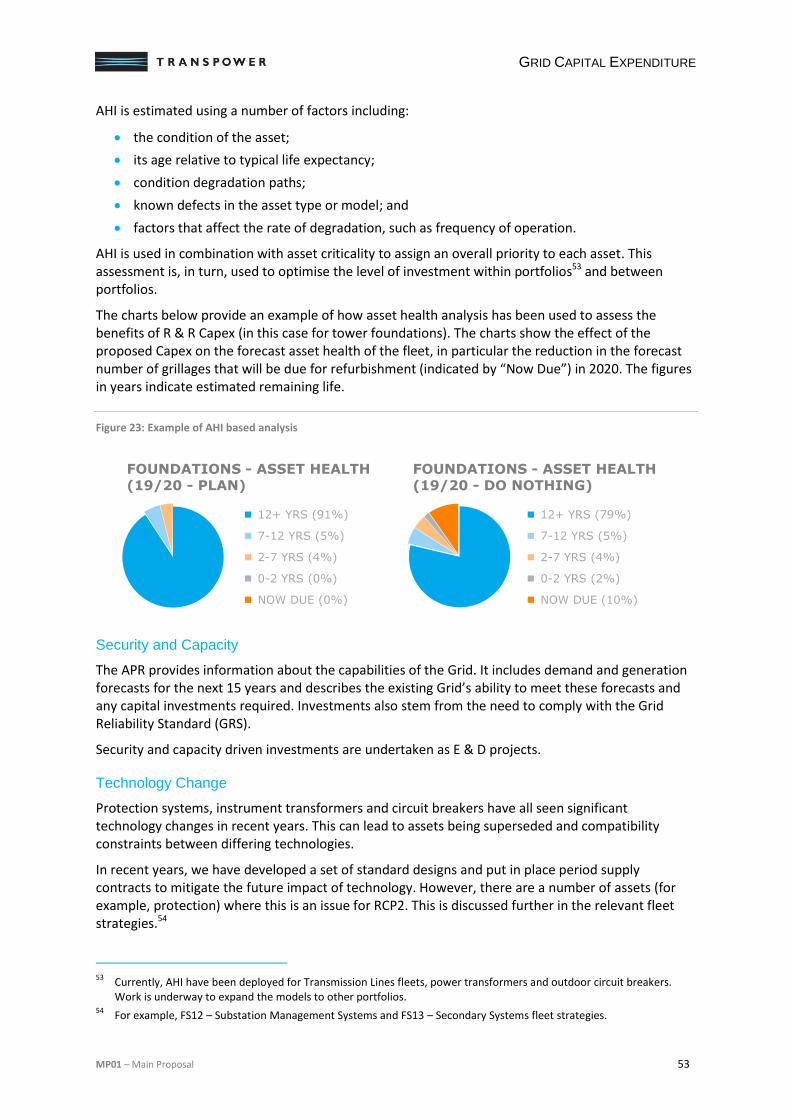
GRID CAPITAL EXPENDITURE
MP01 – Main Proposal 53
AHI is estimated using a number of factors including:
the condition of the asset;
its age relative to typical life expectancy;
condition degradation paths;
known defects in the asset type or model; and
factors that affect the rate of degradation, such as frequency of operation.
AHI is used in combination with asset criticality to assign an overall priority to each asset. This assessment is, in turn, used to optimise the level of investment within portfolios53 and between portfolios.
The charts below provide an example of how asset health analysis has been used to assess the benefits of R & R Capex (in this case for tower foundations). The charts show the effect of the proposed Capex on the forecast asset health of the fleet, in particular the reduction in the forecast number of grillages that will be due for refurbishment (indicated by “Now Due”) in 2020. The figures in years indicate estimated remaining life.
Figure 23: Example of AHI based analysis
Security and Capacity
The APR provides information about the capabilities of the Grid. It includes demand and generation forecasts for the next 15 years and describes the existing Grid’s ability to meet these forecasts and any capital investments required. Investments also stem from the need to comply with the Grid Reliability Standard (GRS).
Security and capacity driven investments are undertaken as E & D projects.
Technology Change
Protection systems, instrument transformers and circuit breakers have all seen significant technology changes in recent years. This can lead to assets being superseded and compatibility constraints between differing technologies.
In recent years, we have developed a set of standard designs and put in place period supply contracts to mitigate the future impact of technology. However, there are a number of assets (for example, protection) where this is an issue for RCP2. This is discussed further in the relevant fleet strategies.54
53
Currently, AHI have been deployed for Transmission Lines fleets, power transformers and outdoor circuit breakers. Work is underway to expand the models to other portfolios.
54 For example, FS12 – Substation Management Systems and FS13 – Secondary Systems fleet strategies.
12+ YRS (91%)
7-12 YRS (5%)
2-7 YRS (4%)
0-2 YRS (0%)
NOW DUE (0%)
FOUNDATIONS - ASSET HEALTH (19/20 - PLAN)
12+ YRS (79%)
7-12 YRS (5%)
2-7 YRS (4%)
0-2 YRS (2%)
NOW DUE (10%)
FOUNDATIONS - ASSET HEALTH (19/20 - DO NOTHING)
GRID CAPITAL EXPENDITURE
54 MP01 – Main Proposal
6.2.2. OPTIONS ANALYSIS
Once Grid Capex needs are identified, we can consider potential solutions. The number and type of solutions (or options) varies depending on the type, value and complexity of the investment. Our options analysis is also tailored based on whether the Capex is related to E & D or R & R. Both approaches are briefly discussed below, with further details provided in AM03 – Planning Lifecycle Strategy.
Replacement and Refurbishment
Condition-related issues are mainly addressed through two intervention options: to replace or refurbish the asset, or continue maintaining the asset.
We assess both the costs and benefits (such as reduced failure risk) of each intervention option including the status quo or ‘do nothing’55 option. The optimum time for the intervention is also determined in this process.
Together with safety, whole-of-life costing is a key consideration when choosing between competing investment options. When considering the capital cost of replacement or refurbishment investments, we also assess the cost of maintenance, disposal and other costs incurred over the life of the asset. In many cases, the longer-term maintenance and operation costs are a significant proportion of the whole-of-life cost.
Enhancement and Development
The APR identifies potential transmission investment needs based on the capabilities of the existing Grid and the requirements of the GRS. Typical options to address the identified needs include:
non-transmission solutions such as demand response;
enhancements to existing assets;
creation of new assets; and
operational solutions such as special protection schemes.
Options are narrowed down to form a ‘credible options list’ that are commercially and technically feasible, including meeting legislative requirements; and that can be implemented in sufficient time to meet the need.
Detailed analysis of the credible options, including consideration of non-network solutions and a ‘do nothing’ option, determines whether there is a case for investment. High-level scope and cost estimates are used to compare options, alongside estimated benefits such as the reduction in transmission losses or avoidance of un-served energy.
For MCPs we apply the Regulated Investment Test (RIT) as prescribed in the Capex IM. For Base Capex E & D projects we apply the RIT principles, but modify the level of analysis commensurate with the size of the investment.
55
While described as ‘do nothing’ this approach will include routine maintenance.
GRID CAPITAL EXPENDITURE
MP01 – Main Proposal 55
6.2.3. COST ESTIMATION
For Grid Capex forecasts, we developed two forms of cost estimate:
Customised Estimates: for large single projects (>$1m) that require individual, tailored investigation; and
Volumetric Estimates: for smaller, high-volume projects that are reasonably routine and uniform.
Estimates were produced using our TEES estimation system.
We have not included a ‘blanket’ contingency in our estimates to account for uncertainty during RCP2. However, long-term cost estimates do carry estimation risk which we have addressed using the approaches described below.
Customised Estimates
For customised estimates a detailed scope of work, including design layout drawings, is developed.56 The likely location of the new assets is determined from a desktop review of aerial photographs, site layout drawings, underground services drawings, and available cable ducts. These assessments provide reasonably accurate estimates for materials and work quantities; for example, building extensions, new bay(s), cabling, and fire walls. These project scopes are included in our BC1+ documentation (described in Section 6.2.4).
The component costs for material and work quantities are managed using TEES. Material and plant costs are determined with reference to current period supply contracts and historic installation costs respectively. Civil and earthworks costs are extrapolated from historic costs. Installation costs are informed by similar historic projects and/or quotes from service providers.
Given the risks associated with estimating the scope of projects up to seven years in advance, we have applied specific risk adjustments to some cost items, as explained below. Other costs, such as primary plant costs, have not been adjusted as the estimation risk is low and likely to be symmetric.57
Risk estimation
We have developed a risk assessment approach to determine the need for, and the magnitude of, risk adjustments for individual cost items. The items subject to material estimation risk vary by project but, in general, include:
site location (such as site remoteness and likely impact on construction costs);
cable or conductor lengths;
building and grounds requirements;
geotechnical/ground condition and the potential need for ground improvements; and
excavation requirements and the potential for contaminated soil to be present.
Three scenarios (high, medium and low cost risk) were developed for each cost category. Each scenario had an associated three-point estimate range (i.e., minimum, most likely and maximum).
56
The approach used for re-conductoring differs from this generalised description. Further detail on the methodology used can be found in FS03 – Conductors and Insulators.
57 Symmetric cost risks across a portfolio will tend to balance out over time as overruns and underruns begin to net off as
the number of projects increases.
GRID CAPITAL EXPENDITURE
56 MP01 – Main Proposal
Based on the particular characteristics of the project, we derived a P5058 estimate based on a PERT59 distribution using the most appropriate scenario and point estimate for each cost item.
Volumetric Estimates
Programmes with relatively large volumes of similar works are categorised as volumetric works for estimation purposes. The key determinant of accurate cost estimates for volumetric projects is the feedback of historic costs from completed, equivalent projects. This feedback is used to derive average unit costs for materials and activities. These unit costs are then combined to form ‘building blocks’ that include the main components of typical works. Using these building blocks, we consider that our volumetric costs methodology will produce a P50 estimate based on the following assumptions.
Project scope is reasonably consistent and well defined.
The volume of historic works is sufficiently large to provide a representative ‘average’ cost.
‘Building blocks’ based on historic out-turn costs effectively capture the impact of past risks.
The aggregate future impact of those risks is likely to be consistent.
To maintain a ‘portfolio effect’60 a large number of future projects are likely to be undertaken.
6.2.4. GRID CAPEX APPROVALS
Our Grid Capex proposals for RCP2 have been built-up using a ‘bottom-up’ approach. Individual projects have been developed to meet our RCP2 objectives, including our overall asset management objectives and strategy. Our challenge and approvals process has then been used to ensure that forecasts have been derived in a systematic and rigorous manner, and have undergone appropriate scrutiny.
Below we describe the challenge process used to develop the RCP2 Grid Capex forecast.
Business Case Documentation
The Business Case (BC) documents used to develop the RCP2 expenditure proposal are as follows.
BC1: authorises the entry of works into the approvals system. Portfolio owners approve these documents which include confirmation that the project is aligned to overall asset management objectives and strategy. For large projects we prepare a more detailed BC1+ document with a detailed scope for cost estimation.
BC2: gives approval for a detailed investigation to begin. This is generally only necessary for large, complex projects that require detailed design to finalise the solution.
BC3: finalises the budget and, subject to the relevant management sign-off, gives authority for the work to proceed.
A large majority of RCP2 Grid Capex projects are at the BC1 stage. Given the timeframes involved, few have advanced to BC2 or BC3 stages.
58
The P50 cost value is an estimate of the project cost based on a 50% probability that the cost will not be exceeded. 59
PERT refers to Program and Evaluation Review Technique. 60
The net impact of cost variances will tend to diminish in a portfolio containing a large number of P50 estimates.
GRID CAPITAL EXPENDITURE
MP01 – Main Proposal 57
Challenge and Approvals
To formulate and substantiate our RCP2 expenditure a robust, dedicated challenge and approval process was applied.
Cost Estimation Advice: our estimation and risk analysis approaches were supported by an external engineering firm, which specialises in network and utility project estimation.
Portfolio Approvals: the proposed set of preferred project options and asset interventions were reviewed, challenged and approved by portfolio owners. These senior managers have specific asset management knowledge and expertise in each portfolio.
RCP2 Advisory Team: a cross-functional advisory team was established to challenge the RCP2 proposal in detail. This group included general managers responsible for RCP2 expenditure and other subject matter experts from within the business. This group undertook the key role of prioritising expenditure across portfolios (discussed further below).
Capital Governance Team (CGT): this group of general managers led by the CEO performed a further challenge round on the proposed RCP2 expenditure. This group approved expenditure in and across portfolios, including setting priorities.
Board Review: the RCP2 expenditure forecasts were submitted to the Transpower Board for review.
As discussed in Section 5.7.1, we undertook a top-down review as a further challenge process and to ensure that our proposals took into account scope for further productivity improvements.
Further details on our Capex governance approach are provided in AM03 – Planning Lifecycle Strategy.
6.2.5. INTEGRATION AND OPTIMISATION
Base Capex projects are continuously prioritised and integrated (by timing and location) with other work programmes, including Opex and MCPs, to realise benefits from synergies between programmes. These benefits include reduced outages and lower costs through improved resource allocation.
Planning – Integration and Optimisation
As discussed above, a cross-functional advisory team was set up to challenge the RCP2 proposal in detail. The responsibilities of this group included looking at the scope for integration of expenditure across asset portfolios and prioritisation of the asset fleets. The methods used included:
Future Asset Health: for those fleets with AHI, sensitivity analysis was used to compare the future health of fleets based on alternative investment scenarios. This allowed us to measure the impact of expenditure across portfolios.
Deliverability: as discussed in Section 5.5, where necessary, activity levels were adjusted to account for potential deliverability constraints (for example, tower painting was constrained downwards). This has allowed us to allocate resources more effectively across our asset fleets.
Service Performance Measures and Criticality: were used to target expenditure across portfolios. While not a direct comparison between portfolios, this process targeted and prioritised assets and points of service based on relative criticality and associated performance targets.
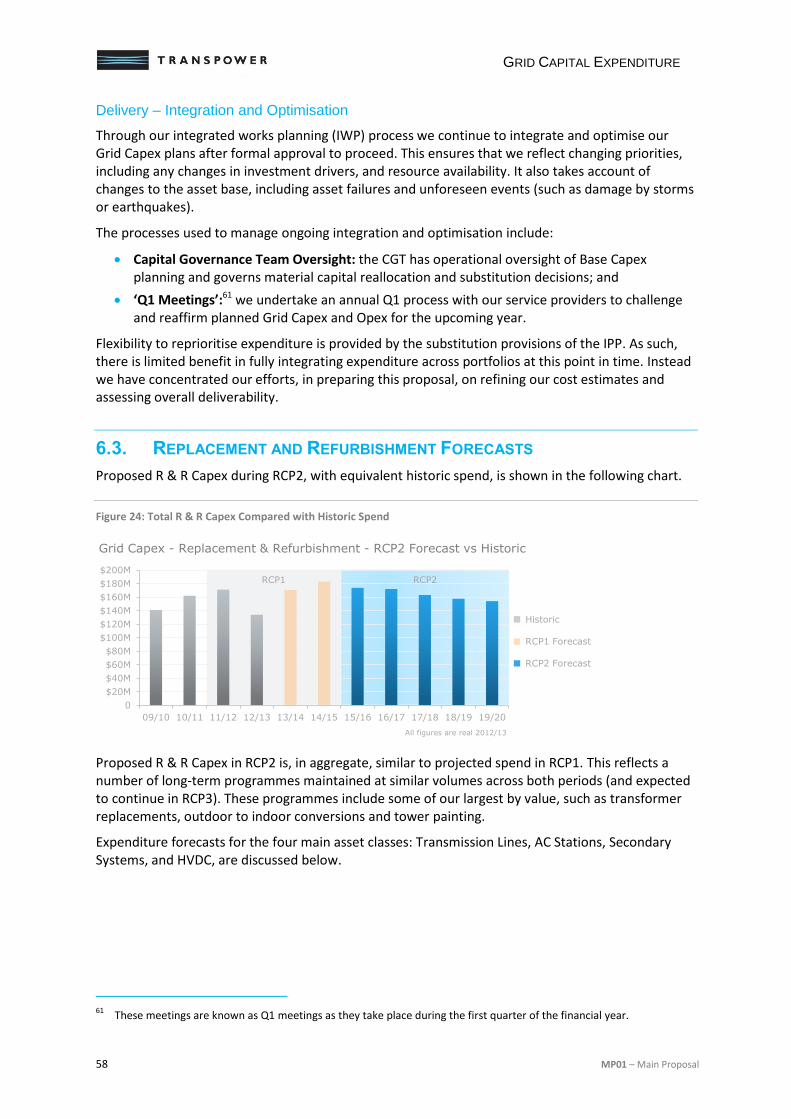
GRID CAPITAL EXPENDITURE
58 MP01 – Main Proposal
Delivery – Integration and Optimisation
Through our integrated works planning (IWP) process we continue to integrate and optimise our Grid Capex plans after formal approval to proceed. This ensures that we reflect changing priorities, including any changes in investment drivers, and resource availability. It also takes account of changes to the asset base, including asset failures and unforeseen events (such as damage by storms or earthquakes).
The processes used to manage ongoing integration and optimisation include:
Capital Governance Team Oversight: the CGT has operational oversight of Base Capex planning and governs material capital reallocation and substitution decisions; and
‘Q1 Meetings’:61 we undertake an annual Q1 process with our service providers to challenge and reaffirm planned Grid Capex and Opex for the upcoming year.
Flexibility to reprioritise expenditure is provided by the substitution provisions of the IPP. As such, there is limited benefit in fully integrating expenditure across portfolios at this point in time. Instead we have concentrated our efforts, in preparing this proposal, on refining our cost estimates and assessing overall deliverability.
6.3. REPLACEMENT AND REFURBISHMENT FORECASTS
Proposed R & R Capex during RCP2, with equivalent historic spend, is shown in the following chart.
Figure 24: Total R & R Capex Compared with Historic Spend
Proposed R & R Capex in RCP2 is, in aggregate, similar to projected spend in RCP1. This reflects a number of long-term programmes maintained at similar volumes across both periods (and expected to continue in RCP3). These programmes include some of our largest by value, such as transformer replacements, outdoor to indoor conversions and tower painting.
Expenditure forecasts for the four main asset classes: Transmission Lines, AC Stations, Secondary Systems, and HVDC, are discussed below.
61
These meetings are known as Q1 meetings as they take place during the first quarter of the financial year.
RCP1 RCP2
0
$20M
$40M
$60M
$80M
$100M
$120M
$140M
$160M
$180M
$200M
09/10 10/11 11/12 12/13 13/14 14/15 15/16 16/17 17/18 18/19 19/20
Grid Capex - Replacement & Refurbishment - RCP2 Forecast vs Historic
All figures are real 2012/13
Historic
RCP1 Forecast
RCP2 Forecast
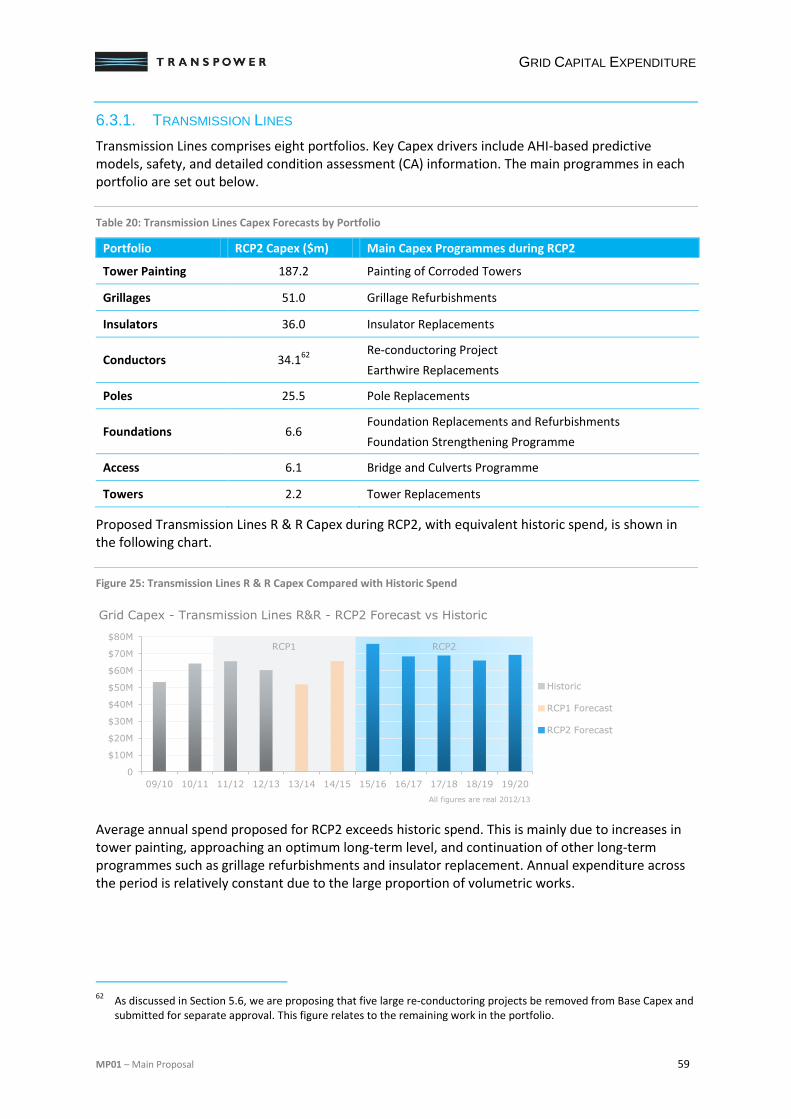
GRID CAPITAL EXPENDITURE
MP01 – Main Proposal 59
6.3.1. TRANSMISSION LINES
Transmission Lines comprises eight portfolios. Key Capex drivers include AHI-based predictive models, safety, and detailed condition assessment (CA) information. The main programmes in each portfolio are set out below.
Table 20: Transmission Lines Capex Forecasts by Portfolio
Portfolio RCP2 Capex ($m) Main Capex Programmes during RCP2
Tower Painting 187.2 Painting of Corroded Towers
Grillages 51.0 Grillage Refurbishments
Insulators 36.0 Insulator Replacements
Conductors 34.162
Re-conductoring Project
Earthwire Replacements
Poles 25.5 Pole Replacements
Foundations 6.6 Foundation Replacements and Refurbishments
Foundation Strengthening Programme
Access 6.1 Bridge and Culverts Programme
Towers 2.2 Tower Replacements
Proposed Transmission Lines R & R Capex during RCP2, with equivalent historic spend, is shown in the following chart.
Figure 25: Transmission Lines R & R Capex Compared with Historic Spend
Average annual spend proposed for RCP2 exceeds historic spend. This is mainly due to increases in tower painting, approaching an optimum long-term level, and continuation of other long-term programmes such as grillage refurbishments and insulator replacement. Annual expenditure across the period is relatively constant due to the large proportion of volumetric works.
62
As discussed in Section 5.6, we are proposing that five large re-conductoring projects be removed from Base Capex and submitted for separate approval. This figure relates to the remaining work in the portfolio.
RCP1 RCP2
0
$10M
$20M
$30M
$40M
$50M
$60M
$70M
$80M
09/10 10/11 11/12 12/13 13/14 14/15 15/16 16/17 17/18 18/19 19/20
Grid Capex - Transmission Lines R&R - RCP2 Forecast vs Historic
All figures are real 2012/13
Historic
RCP1 Forecast
RCP2 Forecast
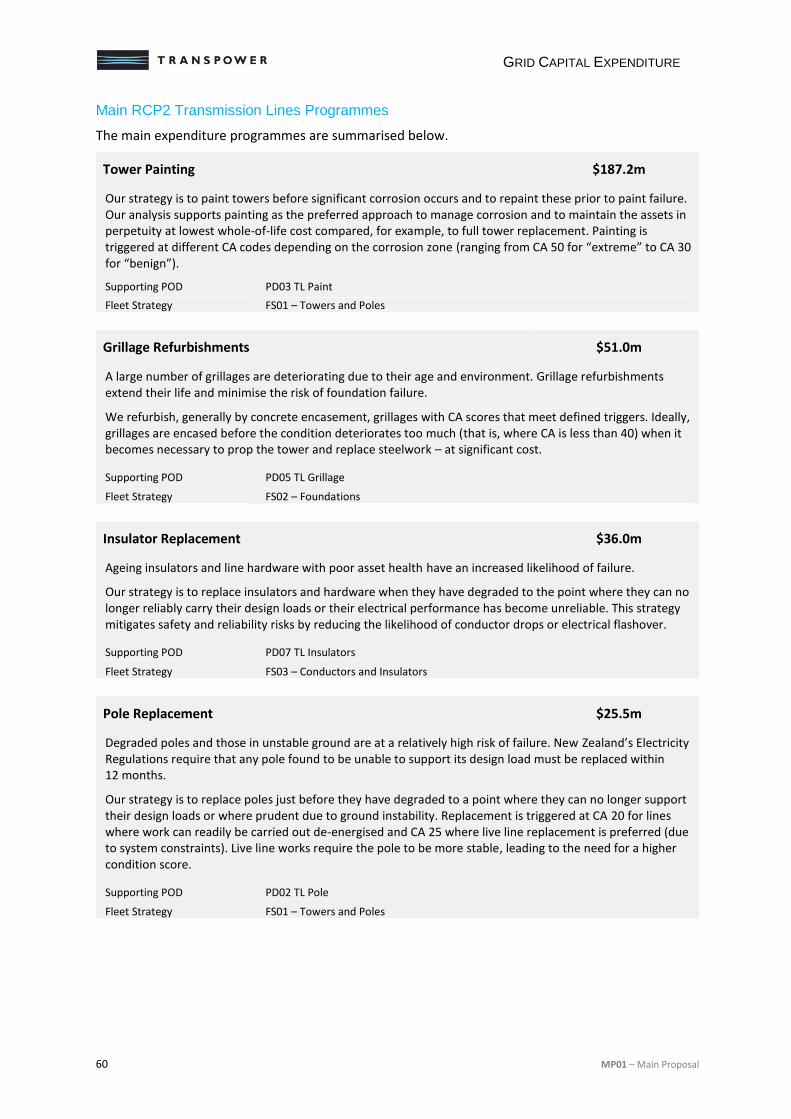
GRID CAPITAL EXPENDITURE
60 MP01 – Main Proposal
Main RCP2 Transmission Lines Programmes
The main expenditure programmes are summarised below.
Tower Painting $187.2m
Our strategy is to paint towers before significant corrosion occurs and to repaint these prior to paint failure. Our analysis supports painting as the preferred approach to manage corrosion and to maintain the assets in perpetuity at lowest whole-of-life cost compared, for example, to full tower replacement. Painting is triggered at different CA codes depending on the corrosion zone (ranging from CA 50 for “extreme” to CA 30 for “benign”).
Supporting POD PD03 TL Paint
Fleet Strategy FS01 – Towers and Poles
Grillage Refurbishments $51.0m
A large number of grillages are deteriorating due to their age and environment. Grillage refurbishments extend their life and minimise the risk of foundation failure.
We refurbish, generally by concrete encasement, grillages with CA scores that meet defined triggers. Ideally, grillages are encased before the condition deteriorates too much (that is, where CA is less than 40) when it becomes necessary to prop the tower and replace steelwork – at significant cost.
Supporting POD PD05 TL Grillage
Fleet Strategy FS02 – Foundations
Insulator Replacement $36.0m
Ageing insulators and line hardware with poor asset health have an increased likelihood of failure.
Our strategy is to replace insulators and hardware when they have degraded to the point where they can no longer reliably carry their design loads or their electrical performance has become unreliable. This strategy mitigates safety and reliability risks by reducing the likelihood of conductor drops or electrical flashover.
Supporting POD PD07 TL Insulators
Fleet Strategy FS03 – Conductors and Insulators
Pole Replacement $25.5m
Degraded poles and those in unstable ground are at a relatively high risk of failure. New Zealand’s Electricity Regulations require that any pole found to be unable to support its design load must be replaced within 12 months.
Our strategy is to replace poles just before they have degraded to a point where they can no longer support their design loads or where prudent due to ground instability. Replacement is triggered at CA 20 for lines where work can readily be carried out de-energised and CA 25 where live line replacement is preferred (due to system constraints). Live line works require the pole to be more stable, leading to the need for a higher condition score.
Supporting POD PD02 TL Pole
Fleet Strategy FS01 – Towers and Poles
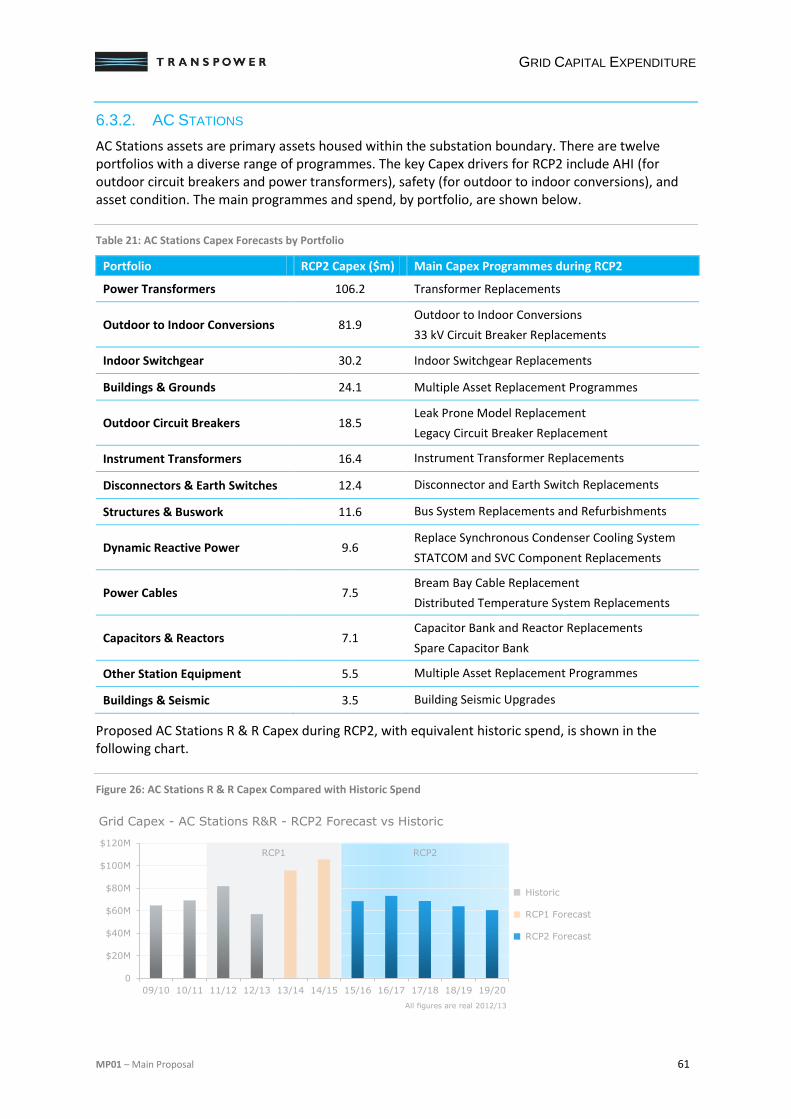
GRID CAPITAL EXPENDITURE
MP01 – Main Proposal 61
6.3.2. AC STATIONS
AC Stations assets are primary assets housed within the substation boundary. There are twelve portfolios with a diverse range of programmes. The key Capex drivers for RCP2 include AHI (for outdoor circuit breakers and power transformers), safety (for outdoor to indoor conversions), and asset condition. The main programmes and spend, by portfolio, are shown below.
Table 21: AC Stations Capex Forecasts by Portfolio
Portfolio RCP2 Capex ($m) Main Capex Programmes during RCP2
Power Transformers 106.2 Transformer Replacements
Outdoor to Indoor Conversions 81.9 Outdoor to Indoor Conversions
33 kV Circuit Breaker Replacements
Indoor Switchgear 30.2 Indoor Switchgear Replacements
Buildings & Grounds 24.1 Multiple Asset Replacement Programmes
Outdoor Circuit Breakers 18.5 Leak Prone Model Replacement
Legacy Circuit Breaker Replacement
Instrument Transformers 16.4 Instrument Transformer Replacements
Disconnectors & Earth Switches 12.4 Disconnector and Earth Switch Replacements
Structures & Buswork 11.6 Bus System Replacements and Refurbishments
Dynamic Reactive Power 9.6 Replace Synchronous Condenser Cooling System
STATCOM and SVC Component Replacements
Power Cables 7.5 Bream Bay Cable Replacement
Distributed Temperature System Replacements
Capacitors & Reactors 7.1 Capacitor Bank and Reactor Replacements
Spare Capacitor Bank
Other Station Equipment 5.5 Multiple Asset Replacement Programmes
Buildings & Seismic 3.5 Building Seismic Upgrades
Proposed AC Stations R & R Capex during RCP2, with equivalent historic spend, is shown in the following chart.
Figure 26: AC Stations R & R Capex Compared with Historic Spend
RCP1 RCP2
0
$20M
$40M
$60M
$80M
$100M
$120M
09/10 10/11 11/12 12/13 13/14 14/15 15/16 16/17 17/18 18/19 19/20
Grid Capex - AC Stations R&R - RCP2 Forecast vs Historic
All figures are real 2012/13
Historic
RCP1 Forecast
RCP2 Forecast
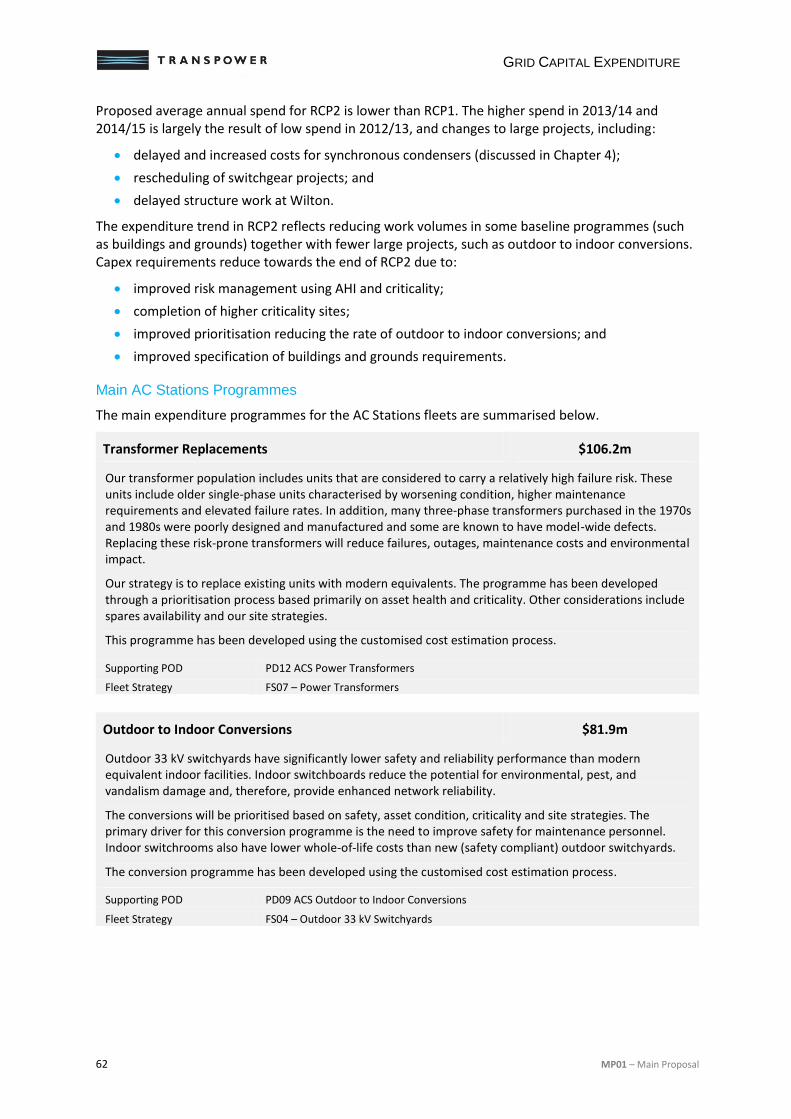
GRID CAPITAL EXPENDITURE
62 MP01 – Main Proposal
Proposed average annual spend for RCP2 is lower than RCP1. The higher spend in 2013/14 and 2014/15 is largely the result of low spend in 2012/13, and changes to large projects, including:
delayed and increased costs for synchronous condensers (discussed in Chapter 4);
rescheduling of switchgear projects; and
delayed structure work at Wilton.
The expenditure trend in RCP2 reflects reducing work volumes in some baseline programmes (such as buildings and grounds) together with fewer large projects, such as outdoor to indoor conversions. Capex requirements reduce towards the end of RCP2 due to:
improved risk management using AHI and criticality;
completion of higher criticality sites;
improved prioritisation reducing the rate of outdoor to indoor conversions; and
improved specification of buildings and grounds requirements.
Main AC Stations Programmes
The main expenditure programmes for the AC Stations fleets are summarised below.
Transformer Replacements $106.2m
Our transformer population includes units that are considered to carry a relatively high failure risk. These units include older single-phase units characterised by worsening condition, higher maintenance requirements and elevated failure rates. In addition, many three-phase transformers purchased in the 1970s and 1980s were poorly designed and manufactured and some are known to have model-wide defects. Replacing these risk-prone transformers will reduce failures, outages, maintenance costs and environmental impact.
Our strategy is to replace existing units with modern equivalents. The programme has been developed through a prioritisation process based primarily on asset health and criticality. Other considerations include spares availability and our site strategies.
This programme has been developed using the customised cost estimation process.
Supporting POD PD12 ACS Power Transformers
Fleet Strategy FS07 – Power Transformers
Outdoor to Indoor Conversions $81.9m
Outdoor 33 kV switchyards have significantly lower safety and reliability performance than modern equivalent indoor facilities. Indoor switchboards reduce the potential for environmental, pest, and vandalism damage and, therefore, provide enhanced network reliability.
The conversions will be prioritised based on safety, asset condition, criticality and site strategies. The primary driver for this conversion programme is the need to improve safety for maintenance personnel. Indoor switchrooms also have lower whole-of-life costs than new (safety compliant) outdoor switchyards.
The conversion programme has been developed using the customised cost estimation process.
Supporting POD PD09 ACS Outdoor to Indoor Conversions
Fleet Strategy FS04 – Outdoor 33 kV Switchyards
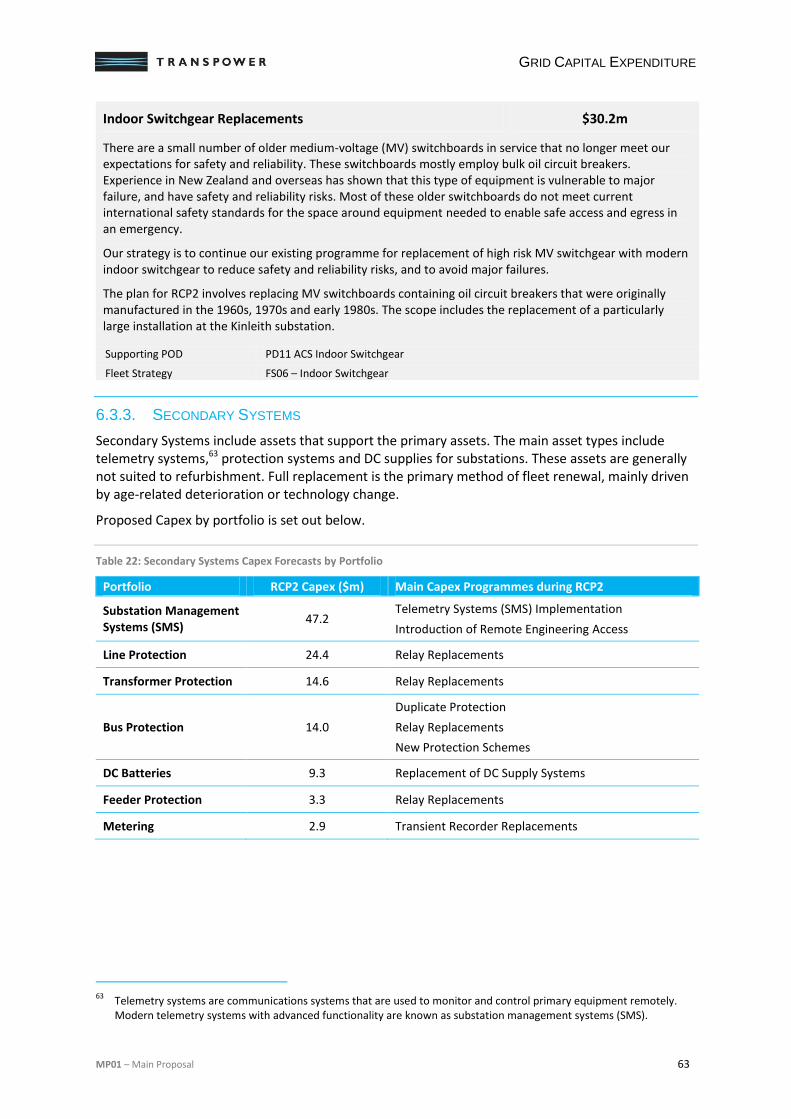
GRID CAPITAL EXPENDITURE
MP01 – Main Proposal 63
Indoor Switchgear Replacements $30.2m
There are a small number of older medium-voltage (MV) switchboards in service that no longer meet our expectations for safety and reliability. These switchboards mostly employ bulk oil circuit breakers. Experience in New Zealand and overseas has shown that this type of equipment is vulnerable to major failure, and have safety and reliability risks. Most of these older switchboards do not meet current international safety standards for the space around equipment needed to enable safe access and egress in an emergency.
Our strategy is to continue our existing programme for replacement of high risk MV switchgear with modern indoor switchgear to reduce safety and reliability risks, and to avoid major failures.
The plan for RCP2 involves replacing MV switchboards containing oil circuit breakers that were originally manufactured in the 1960s, 1970s and early 1980s. The scope includes the replacement of a particularly large installation at the Kinleith substation.
Supporting POD PD11 ACS Indoor Switchgear
Fleet Strategy FS06 – Indoor Switchgear
6.3.3. SECONDARY SYSTEMS
Secondary Systems include assets that support the primary assets. The main asset types include telemetry systems,63 protection systems and DC supplies for substations. These assets are generally not suited to refurbishment. Full replacement is the primary method of fleet renewal, mainly driven by age-related deterioration or technology change.
Proposed Capex by portfolio is set out below.
Table 22: Secondary Systems Capex Forecasts by Portfolio
Portfolio RCP2 Capex ($m) Main Capex Programmes during RCP2
Substation Management Systems (SMS)
47.2 Telemetry Systems (SMS) Implementation
Introduction of Remote Engineering Access
Line Protection 24.4 Relay Replacements
Transformer Protection 14.6 Relay Replacements
Bus Protection 14.0
Duplicate Protection
Relay Replacements
New Protection Schemes
DC Batteries 9.3 Replacement of DC Supply Systems
Feeder Protection 3.3 Relay Replacements
Metering 2.9 Transient Recorder Replacements
63
Telemetry systems are communications systems that are used to monitor and control primary equipment remotely. Modern telemetry systems with advanced functionality are known as substation management systems (SMS).
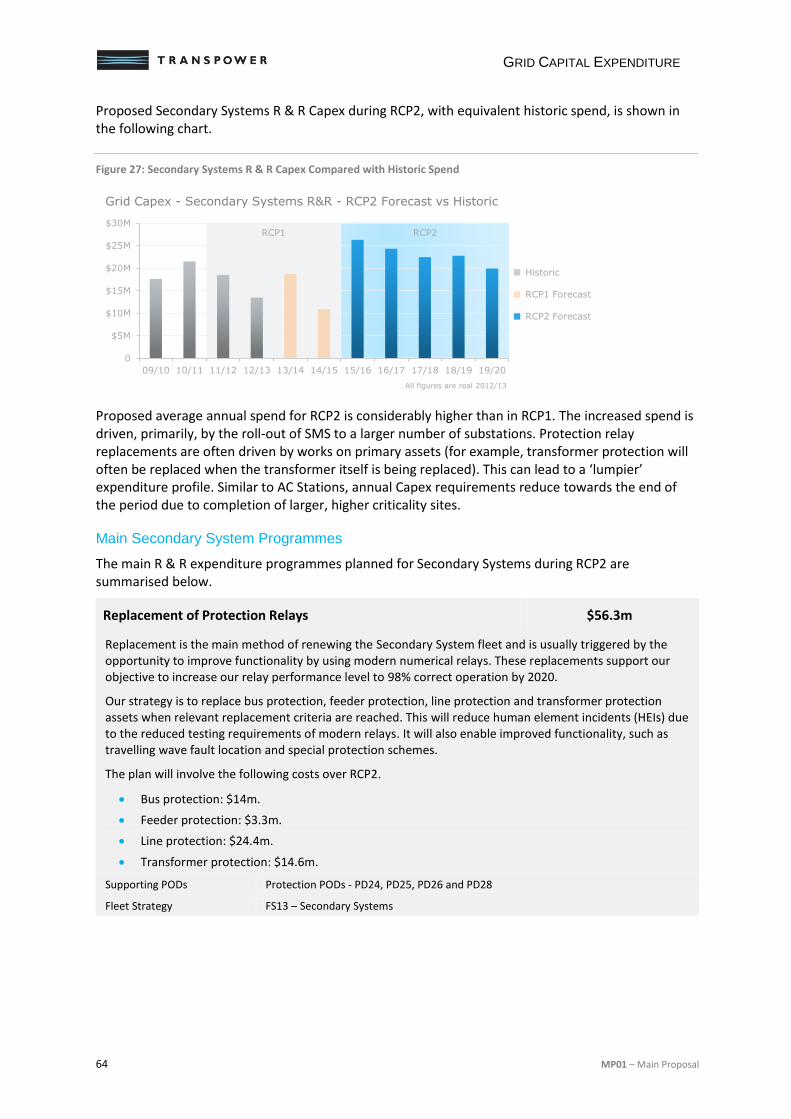
GRID CAPITAL EXPENDITURE
64 MP01 – Main Proposal
Proposed Secondary Systems R & R Capex during RCP2, with equivalent historic spend, is shown in the following chart.
Figure 27: Secondary Systems R & R Capex Compared with Historic Spend
Proposed average annual spend for RCP2 is considerably higher than in RCP1. The increased spend is driven, primarily, by the roll-out of SMS to a larger number of substations. Protection relay replacements are often driven by works on primary assets (for example, transformer protection will often be replaced when the transformer itself is being replaced). This can lead to a ‘lumpier’ expenditure profile. Similar to AC Stations, annual Capex requirements reduce towards the end of the period due to completion of larger, higher criticality sites.
Main Secondary System Programmes
The main R & R expenditure programmes planned for Secondary Systems during RCP2 are summarised below.
Replacement of Protection Relays $56.3m
Replacement is the main method of renewing the Secondary System fleet and is usually triggered by the opportunity to improve functionality by using modern numerical relays. These replacements support our objective to increase our relay performance level to 98% correct operation by 2020.
Our strategy is to replace bus protection, feeder protection, line protection and transformer protection assets when relevant replacement criteria are reached. This will reduce human element incidents (HEIs) due to the reduced testing requirements of modern relays. It will also enable improved functionality, such as travelling wave fault location and special protection schemes.
The plan will involve the following costs over RCP2.
Bus protection: $14m.
Feeder protection: $3.3m.
Line protection: $24.4m.
Transformer protection: $14.6m.
Supporting PODs Protection PODs - PD24, PD25, PD26 and PD28
Fleet Strategy FS13 – Secondary Systems
RCP1 RCP2
0
$5M
$10M
$15M
$20M
$25M
$30M
09/10 10/11 11/12 12/13 13/14 14/15 15/16 16/17 17/18 18/19 19/20
Grid Capex - Secondary Systems R&R - RCP2 Forecast vs Historic
All figures are real 2012/13
Historic
RCP1 Forecast
RCP2 Forecast
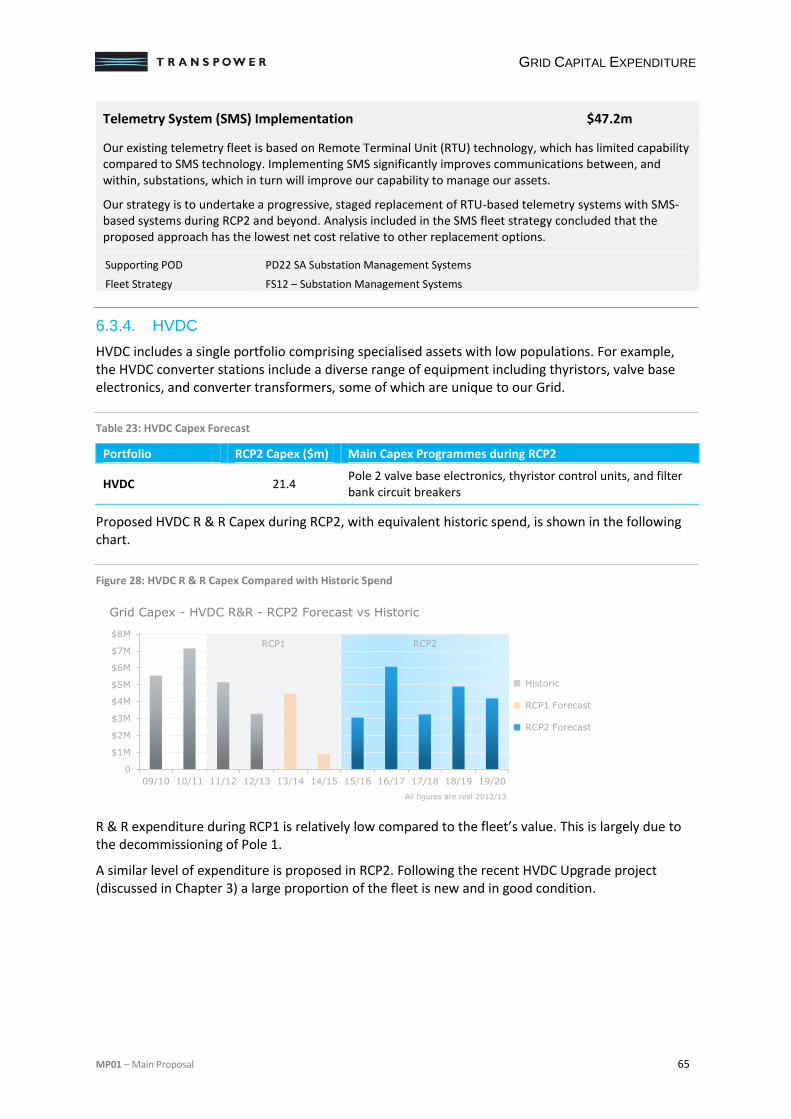
GRID CAPITAL EXPENDITURE
MP01 – Main Proposal 65
Telemetry System (SMS) Implementation $47.2m
Our existing telemetry fleet is based on Remote Terminal Unit (RTU) technology, which has limited capability compared to SMS technology. Implementing SMS significantly improves communications between, and within, substations, which in turn will improve our capability to manage our assets.
Our strategy is to undertake a progressive, staged replacement of RTU-based telemetry systems with SMS-based systems during RCP2 and beyond. Analysis included in the SMS fleet strategy concluded that the proposed approach has the lowest net cost relative to other replacement options.
Supporting POD PD22 SA Substation Management Systems
Fleet Strategy FS12 – Substation Management Systems
6.3.4. HVDC
HVDC includes a single portfolio comprising specialised assets with low populations. For example, the HVDC converter stations include a diverse range of equipment including thyristors, valve base electronics, and converter transformers, some of which are unique to our Grid.
Table 23: HVDC Capex Forecast
Portfolio RCP2 Capex ($m) Main Capex Programmes during RCP2
HVDC 21.4 Pole 2 valve base electronics, thyristor control units, and filter bank circuit breakers
Proposed HVDC R & R Capex during RCP2, with equivalent historic spend, is shown in the following chart.
Figure 28: HVDC R & R Capex Compared with Historic Spend
R & R expenditure during RCP1 is relatively low compared to the fleet’s value. This is largely due to the decommissioning of Pole 1.
A similar level of expenditure is proposed in RCP2. Following the recent HVDC Upgrade project (discussed in Chapter 3) a large proportion of the fleet is new and in good condition.
RCP1 RCP2
0
$1M
$2M
$3M
$4M
$5M
$6M
$7M
$8M
09/10 10/11 11/12 12/13 13/14 14/15 15/16 16/17 17/18 18/19 19/20
Grid Capex - HVDC R&R - RCP2 Forecast vs Historic
All figures are real 2012/13
Historic
RCP1 Forecast
RCP2 Forecast
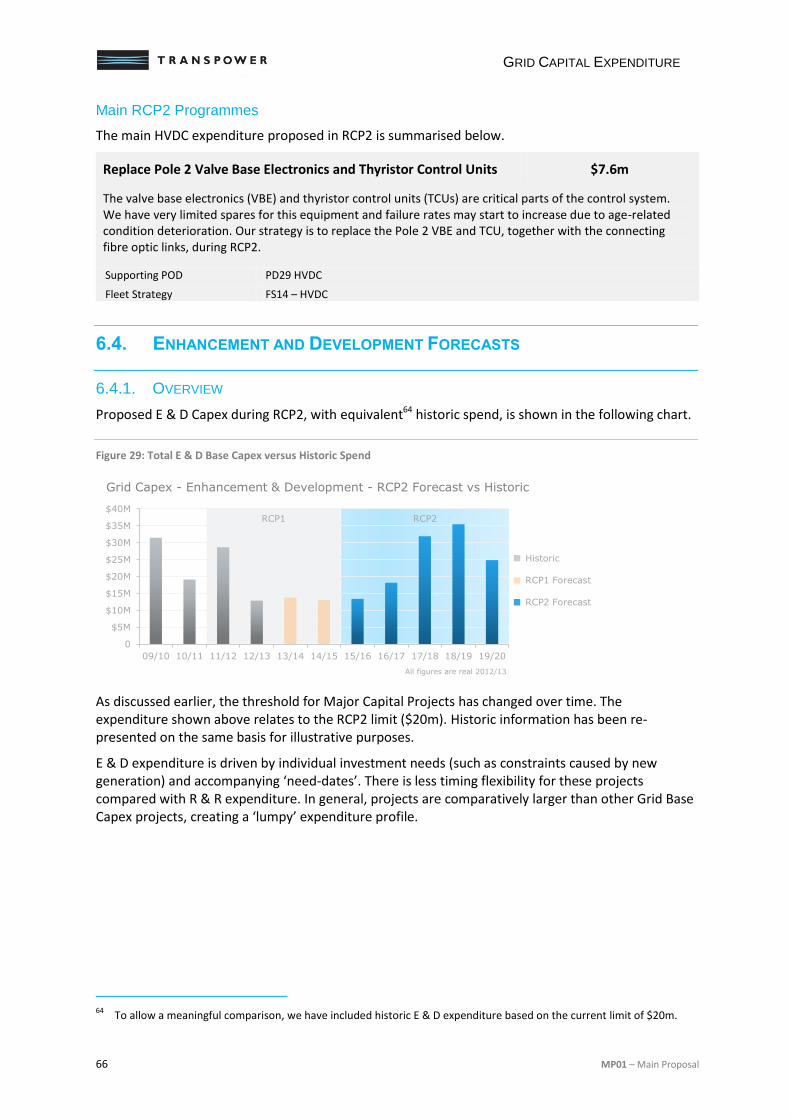
GRID CAPITAL EXPENDITURE
66 MP01 – Main Proposal
Main RCP2 Programmes
The main HVDC expenditure proposed in RCP2 is summarised below.
Replace Pole 2 Valve Base Electronics and Thyristor Control Units $7.6m
The valve base electronics (VBE) and thyristor control units (TCUs) are critical parts of the control system. We have very limited spares for this equipment and failure rates may start to increase due to age-related condition deterioration. Our strategy is to replace the Pole 2 VBE and TCU, together with the connecting fibre optic links, during RCP2.
Supporting POD PD29 HVDC
Fleet Strategy FS14 – HVDC
6.4. ENHANCEMENT AND DEVELOPMENT FORECASTS
6.4.1. OVERVIEW
Proposed E & D Capex during RCP2, with equivalent64 historic spend, is shown in the following chart.
Figure 29: Total E & D Base Capex versus Historic Spend
As discussed earlier, the threshold for Major Capital Projects has changed over time. The expenditure shown above relates to the RCP2 limit ($20m). Historic information has been re-presented on the same basis for illustrative purposes.
E & D expenditure is driven by individual investment needs (such as constraints caused by new generation) and accompanying ‘need-dates’. There is less timing flexibility for these projects compared with R & R expenditure. In general, projects are comparatively larger than other Grid Base Capex projects, creating a ‘lumpy’ expenditure profile.
64
To allow a meaningful comparison, we have included historic E & D expenditure based on the current limit of $20m.
RCP1 RCP2
0
$5M
$10M
$15M
$20M
$25M
$30M
$35M
$40M
09/10 10/11 11/12 12/13 13/14 14/15 15/16 16/17 17/18 18/19 19/20
Grid Capex - Enhancement & Development - RCP2 Forecast vs Historic
All figures are real 2012/13
Historic
RCP1 Forecast
RCP2 Forecast
GRID CAPITAL EXPENDITURE
MP01 – Main Proposal 67
6.4.2. MAIN E & D PROJECTS
The main E & D projects proposed in RCP2 are summarised below.
Otahuhu-Wiri Transmission Capacity $18.5m
This project will increase the transmission capacity of the 110 kV Otahuhu–Wiri circuits. An outage of either Bombay–Wiri–Otahuhu circuit removes one Wiri supply transformer from service and may overload the Otahuhu–Wiri section of the remaining in-service circuit.
The currently preferred solution is to install a 220/110 kV 150 MVA transformer at Bombay with a tee connection onto one of the Huntly–Otahuhu circuits. The Bombay 110 kV bus would be reconfigured, with Bombay load being supplied entirely from Hamilton and the new Bombay interconnecting transformer supplying the Wiri load. The project also involves construction of a 110 kV bus at Wiri.
Supporting POD PD30 Otahuhu-Wiri Transmission Capacity
Main Driver Grid Reliability Standards
Relieve Generation Constraints $16.7m
A number of issues can arise from generation connections that have the potential to impact on transmission capacity and the operation of other Grid equipment. Transmission constraints may arise from existing generation, new generation connections and equipment short-circuit ratings. This project addresses N-1 transmission capacity issues in the short to medium term.
In general, we address generation constraints using either a Special Protection Scheme (SPS) or an upgrade to the interconnecting transformer capacity. A SPS is usually an interim solution to temporarily relieve the constraint and defer significant investment in a transformer upgrade.
It is difficult to predict with certainty the location, timing and size of new generators that may connect to the Grid. There are a number of possible new generation connections during RCP2 for which we have developed project plans. It will only be possible to finalise solutions once the potential generation is committed and the impact of the connection can be fully investigated. Proposed solutions include SPS, series reactor, and upgraded equipment.
Supporting POD PD31 Relieve Generation Constraints
Main Driver Grid Reliability Standards
Otahuhu and Penrose Interconnecting Transformer $16.6m
The 220/110 kV interconnection at Otahuhu and Penrose comprises core Grid assets. Core Grid assets must be of sufficient capacity and/or operated in a manner that satisfies the GRS.
This project increases Otahuhu and Penrose 220/110 kV interconnecting transformer capacity. The Otahuhu and Penrose substation configurations, and the transmission between the substations, are such that four interconnecting transformers, two at Otahuhu (T2 and T4) and two at Penrose (T6 and T10), operate in parallel. The rating and impedance of each transformer is different. The ratings and difference in impedance could result in Otahuhu T2 overloading if the other transformer fails.
Otahuhu T2 and T4, and Penrose T10 will be upgraded to larger 250 MVA, 15% impedance transformers to meet the load demand in the Auckland region and correct power sharing with the Penrose T6 interconnecting transformer.
Supporting POD PD35 Otahuhu and Penrose Interconnection Capacity
Main Driver Grid Reliability Standards
GRID CAPITAL EXPENDITURE
68 MP01 – Main Proposal
Bus Section Fault Reliability $13.9m
There are a small number of core Grid sites that would not currently meet the GRS during the failure or removal from service of a single bus section. These core Grid buses normally have no bus section breaker (no N-1 bus security) and bus outages will disconnect more than one power system component (for example other circuits, transformers or generators). Although the risk of a bus fault is low, being less common than a circuit or transformer outage, the consequences are more severe. This project will deliver solutions to improve reliability at the affected sites.
Supporting POD PD33 Bus Section Fault Reliability
Main Driver Grid Reliability Standards
Wellington Supply Security $11.4m
Central Park substation provides a 33 kV point of supply to the Wellington distribution network, including the central business district. Peak demand in 2013 was around 180 MW. The substation is supplied from Wilton substation via three 110 kV transformer feeders. The Central Park–Wilton circuits are defined as core Grid.
The N-1 capacity of the Central Park 110/33 kV transformers will not be able to meet the load from 2016. Also there are a number of planned works affecting Central Park, including re-conductoring the double-circuit 110 kV Central Park–Wilton line and replacing two of the Central Park 110/33 kV transformers.
Outages for the planned work at Central Park will require load management with the existing system configuration. The proposed investment work will enable future demand increases to be met and avoid the need for load management during outages in the longer term.
Supporting POD PD34 Wellington Supply Security
Main Driver Grid Reliability Standards
Other E & D Projects
Other E & D projects planned for RCP2 are set out below.
Table 24: Additional Base Capex E & D projects during RCP2
Project Capex ($m)
High Impact Low Probability Event Mitigation 9.2
Bunnythorpe Interconnection Capacity 8.8
Upper North Island Reactive Support 8.0
Southland Reactive Support 6.0
Hororata and Kimberley Voltage Quality 3.4
North Taranaki Transmission Capacity and Low Voltage 3.0
Timaru 220/110 kV Interconnecting Transformer 2.5
Islington 220/66 kV Spare Transformer Switchgear 2.4
Haywards Local Service Third Incomer 1.8
E & D Other 1.7
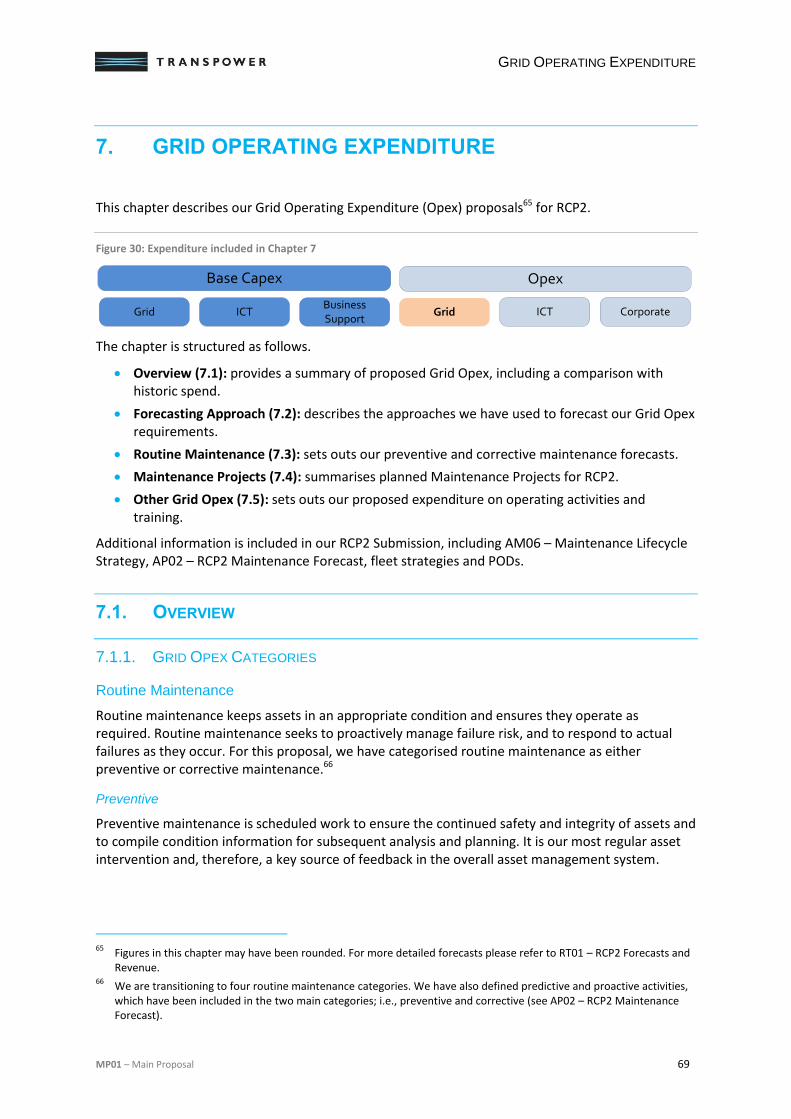
GRID OPERATING EXPENDITURE
MP01 – Main Proposal 69
7. GRID OPERATING EXPENDITURE
This chapter describes our Grid Operating Expenditure (Opex) proposals65 for RCP2.
Figure 30: Expenditure included in Chapter 7
The chapter is structured as follows.
Overview (7.1): provides a summary of proposed Grid Opex, including a comparison with historic spend.
Forecasting Approach (7.2): describes the approaches we have used to forecast our Grid Opex requirements.
Routine Maintenance (7.3): sets outs our preventive and corrective maintenance forecasts.
Maintenance Projects (7.4): summarises planned Maintenance Projects for RCP2.
Other Grid Opex (7.5): sets outs our proposed expenditure on operating activities and training.
Additional information is included in our RCP2 Submission, including AM06 – Maintenance Lifecycle Strategy, AP02 – RCP2 Maintenance Forecast, fleet strategies and PODs.
7.1. OVERVIEW
7.1.1. GRID OPEX CATEGORIES
Routine Maintenance
Routine maintenance keeps assets in an appropriate condition and ensures they operate as required. Routine maintenance seeks to proactively manage failure risk, and to respond to actual failures as they occur. For this proposal, we have categorised routine maintenance as either preventive or corrective maintenance.66
Preventive
Preventive maintenance is scheduled work to ensure the continued safety and integrity of assets and to compile condition information for subsequent analysis and planning. It is our most regular asset intervention and, therefore, a key source of feedback in the overall asset management system.
65
Figures in this chapter may have been rounded. For more detailed forecasts please refer to RT01 – RCP2 Forecasts and Revenue.
66 We are transitioning to four routine maintenance categories. We have also defined predictive and proactive activities,
which have been included in the two main categories; i.e., preventive and corrective (see AP02 – RCP2 Maintenance Forecast).
ICT GridBusiness Support
ICTGrid Corporate
Base Capex Opex
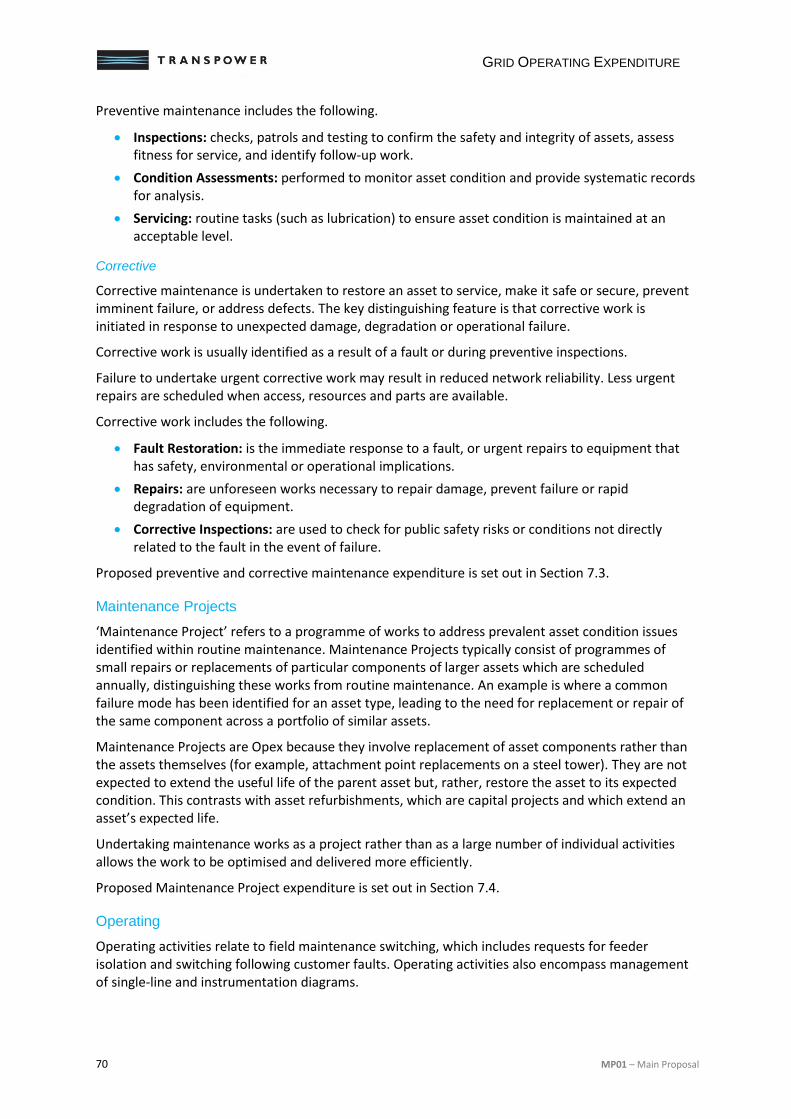
GRID OPERATING EXPENDITURE
70 MP01 – Main Proposal
Preventive maintenance includes the following.
Inspections: checks, patrols and testing to confirm the safety and integrity of assets, assess fitness for service, and identify follow-up work.
Condition Assessments: performed to monitor asset condition and provide systematic records for analysis.
Servicing: routine tasks (such as lubrication) to ensure asset condition is maintained at an acceptable level.
Corrective
Corrective maintenance is undertaken to restore an asset to service, make it safe or secure, prevent imminent failure, or address defects. The key distinguishing feature is that corrective work is initiated in response to unexpected damage, degradation or operational failure.
Corrective work is usually identified as a result of a fault or during preventive inspections.
Failure to undertake urgent corrective work may result in reduced network reliability. Less urgent repairs are scheduled when access, resources and parts are available.
Corrective work includes the following.
Fault Restoration: is the immediate response to a fault, or urgent repairs to equipment that has safety, environmental or operational implications.
Repairs: are unforeseen works necessary to repair damage, prevent failure or rapid degradation of equipment.
Corrective Inspections: are used to check for public safety risks or conditions not directly related to the fault in the event of failure.
Proposed preventive and corrective maintenance expenditure is set out in Section 7.3.
Maintenance Projects
‘Maintenance Project’ refers to a programme of works to address prevalent asset condition issues identified within routine maintenance. Maintenance Projects typically consist of programmes of small repairs or replacements of particular components of larger assets which are scheduled annually, distinguishing these works from routine maintenance. An example is where a common failure mode has been identified for an asset type, leading to the need for replacement or repair of the same component across a portfolio of similar assets.
Maintenance Projects are Opex because they involve replacement of asset components rather than the assets themselves (for example, attachment point replacements on a steel tower). They are not expected to extend the useful life of the parent asset but, rather, restore the asset to its expected condition. This contrasts with asset refurbishments, which are capital projects and which extend an asset’s expected life.
Undertaking maintenance works as a project rather than as a large number of individual activities allows the work to be optimised and delivered more efficiently.
Proposed Maintenance Project expenditure is set out in Section 7.4.
Operating
Operating activities relate to field maintenance switching, which includes requests for feeder isolation and switching following customer faults. Operating activities also encompass management of single-line and instrumentation diagrams.
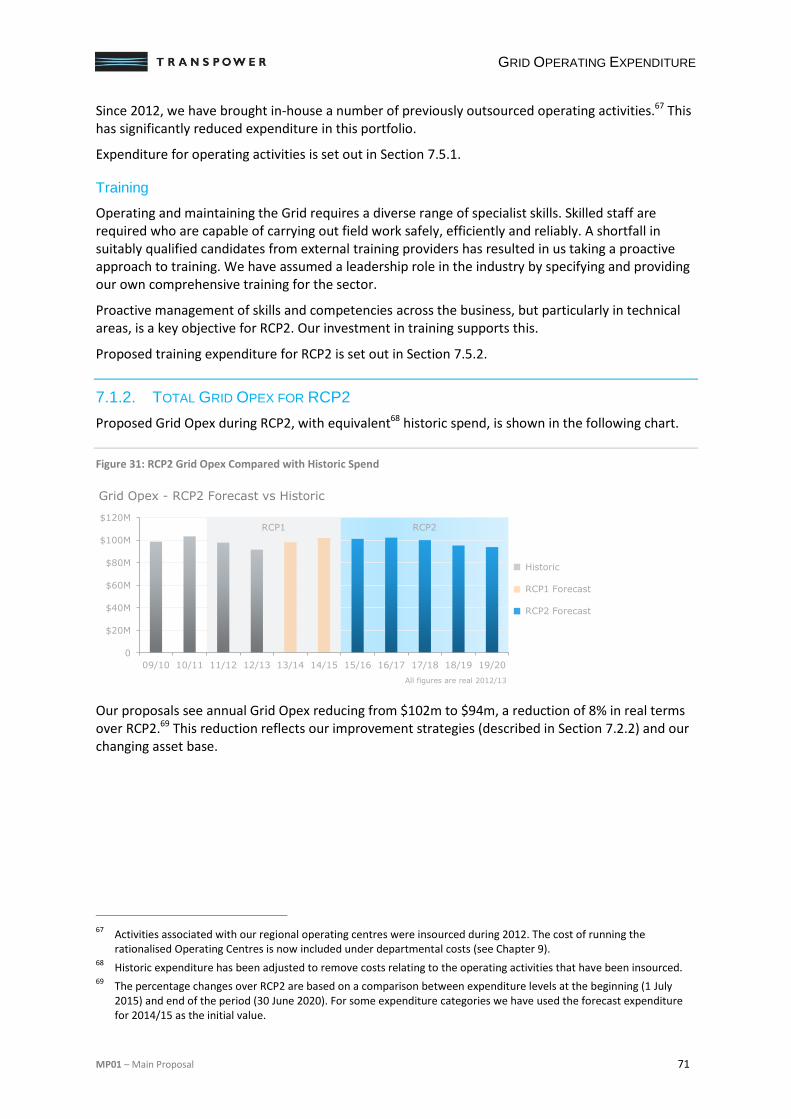
GRID OPERATING EXPENDITURE
MP01 – Main Proposal 71
Since 2012, we have brought in-house a number of previously outsourced operating activities.67 This has significantly reduced expenditure in this portfolio.
Expenditure for operating activities is set out in Section 7.5.1.
Training
Operating and maintaining the Grid requires a diverse range of specialist skills. Skilled staff are required who are capable of carrying out field work safely, efficiently and reliably. A shortfall in suitably qualified candidates from external training providers has resulted in us taking a proactive approach to training. We have assumed a leadership role in the industry by specifying and providing our own comprehensive training for the sector.
Proactive management of skills and competencies across the business, but particularly in technical areas, is a key objective for RCP2. Our investment in training supports this.
Proposed training expenditure for RCP2 is set out in Section 7.5.2.
7.1.2. TOTAL GRID OPEX FOR RCP2
Proposed Grid Opex during RCP2, with equivalent68 historic spend, is shown in the following chart.
Figure 31: RCP2 Grid Opex Compared with Historic Spend
Our proposals see annual Grid Opex reducing from $102m to $94m, a reduction of 8% in real terms over RCP2.69 This reduction reflects our improvement strategies (described in Section 7.2.2) and our changing asset base.
67
Activities associated with our regional operating centres were insourced during 2012. The cost of running the rationalised Operating Centres is now included under departmental costs (see Chapter 9).
68 Historic expenditure has been adjusted to remove costs relating to the operating activities that have been insourced.
69 The percentage changes over RCP2 are based on a comparison between expenditure levels at the beginning (1 July
2015) and end of the period (30 June 2020). For some expenditure categories we have used the forecast expenditure for 2014/15 as the initial value.
RCP1 RCP2
0
$20M
$40M
$60M
$80M
$100M
$120M
09/10 10/11 11/12 12/13 13/14 14/15 15/16 16/17 17/18 18/19 19/20
Grid Opex - RCP2 Forecast vs Historic
All figures are real 2012/13
Historic
RCP1 Forecast
RCP2 Forecast
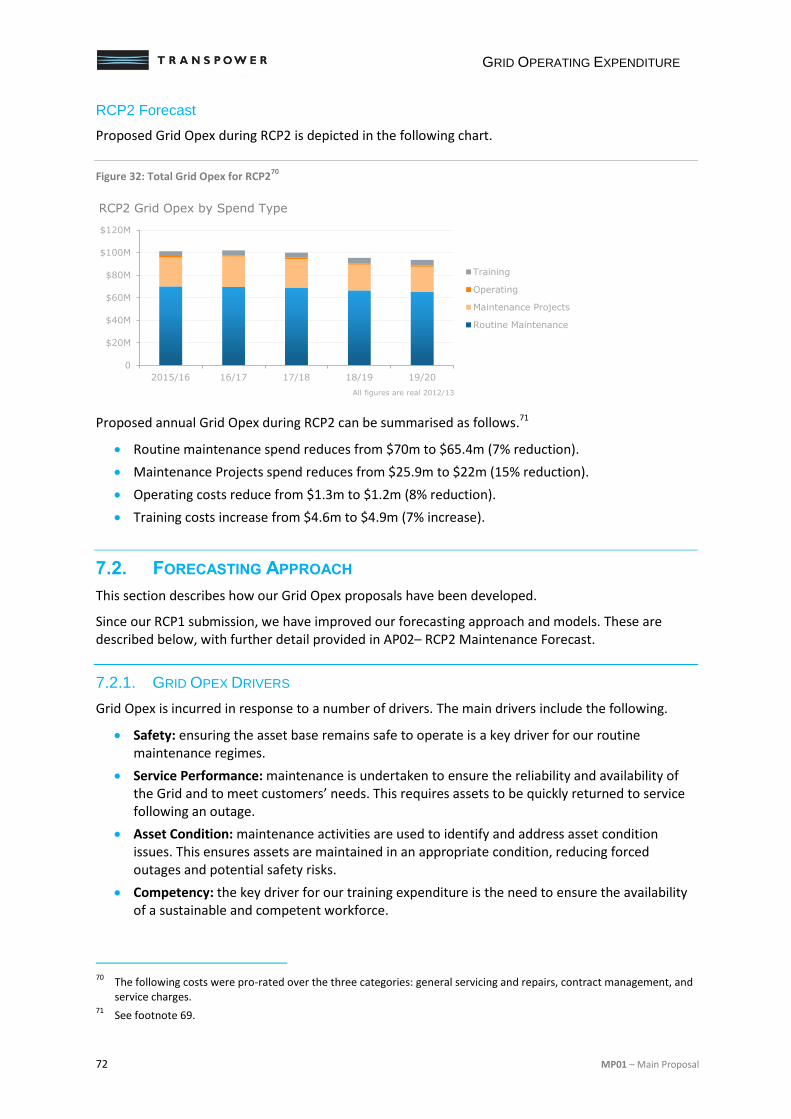
GRID OPERATING EXPENDITURE
72 MP01 – Main Proposal
RCP2 Forecast
Proposed Grid Opex during RCP2 is depicted in the following chart.
Figure 32: Total Grid Opex for RCP270
Proposed annual Grid Opex during RCP2 can be summarised as follows.71
Routine maintenance spend reduces from $70m to $65.4m (7% reduction).
Maintenance Projects spend reduces from $25.9m to $22m (15% reduction).
Operating costs reduce from $1.3m to $1.2m (8% reduction).
Training costs increase from $4.6m to $4.9m (7% increase).
7.2. FORECASTING APPROACH
This section describes how our Grid Opex proposals have been developed.
Since our RCP1 submission, we have improved our forecasting approach and models. These are described below, with further detail provided in AP02– RCP2 Maintenance Forecast.
7.2.1. GRID OPEX DRIVERS
Grid Opex is incurred in response to a number of drivers. The main drivers include the following.
Safety: ensuring the asset base remains safe to operate is a key driver for our routine maintenance regimes.
Service Performance: maintenance is undertaken to ensure the reliability and availability of the Grid and to meet customers’ needs. This requires assets to be quickly returned to service following an outage.
Asset Condition: maintenance activities are used to identify and address asset condition issues. This ensures assets are maintained in an appropriate condition, reducing forced outages and potential safety risks.
Competency: the key driver for our training expenditure is the need to ensure the availability of a sustainable and competent workforce.
70
The following costs were pro-rated over the three categories: general servicing and repairs, contract management, and service charges.
71 See footnote 69.
0
$20M
$40M
$60M
$80M
$100M
$120M
2015/16 16/17 17/18 18/19 19/20
Training
Operating
Maintenance Projects
Routine Maintenance
RCP2 Grid Opex by Spend Type
All figures are real 2012/13
GRID OPERATING EXPENDITURE
MP01 – Main Proposal 73
7.2.2. GRID OPEX IMPROVEMENTS
Our Grid Opex proposal takes into account a number of ongoing improvements in maintenance processes and other RCP1 initiatives, which have led to reductions in forecast routine maintenance and operating costs.
Routine Maintenance Improvements
During RCP1 we have undertaken a number of initiatives to further improve our routine maintenance, including:
implementing the Maximo asset management information system to ensure the availability of accurate data to support maintenance forecasting and decision making;
rolling out improved contracts to service providers that better define responsibilities and accountabilities;
taking the lead on maintenance competencies management;
establishing a dedicated reliability management function to enhance and optimise our maintenance approach and techniques;
rolling out improved Standard Maintenance Procedures (SMPs) across our service providers and regions to increase the standardisation of work practices and associated competencies;
developing a new forecasting model, the Maintenance Activity and Cost Model (MACM); which allows improved, more granular and robust forecasting; and
undertaking detailed statistical analysis to improve our work management and identify improvement and efficiency opportunities.
These improvements will continue to be built on during the remainder of RCP1 and are incorporated into our ongoing maintenance improvement strategies for RCP2 and beyond.
Maintenance Efficiency Study
A third-party consultancy undertook a ‘data-mining’ exercise on historic maintenance transactions to identify potential savings opportunities.72
The analysis compared maintenance activity and cost on individual assets with the average activity and cost across the asset portfolio to identify potential efficiency improvements. This analysis included removing outliers and applied a conservative approach when identifying potential efficiencies.73 The analysis provided saving targets for corrective spend, which have been applied to our proposals.
Maintenance Projects
Our Maintenance Project forecasts also take into account a number of ongoing improvements across the wider business. While not specific to maintenance, these initiatives have allowed us to prioritise and optimise our Maintenance Projects. Asset Criticality has been used to prioritise the assets included within Maintenance Projects, while Asset Health has been used to optimise their timing.
72
Further detail is included in AP02 – RCP2 Maintenance Forecast. 73
For example, small facilities were excluded and a cap was placed on the maximum amount of expected savings that could be considered for particular facilities or assets.
GRID OPERATING EXPENDITURE
74 MP01 – Main Proposal
Operating
In 2012, we concluded that the regional operating centres and associated personnel, previously outsourced, should be brought in-house. Key targeted improvements included the following.
Increased in-house capability: process improvements, including better alignment between maintenance and operating activities.
Consolidation: the three previous regional operating centres have been merged into two national operating centres with improved scheduling and operational processes.
The majority of costs relating to the previously outsourced functions are now included under Corporate Opex (see Chapter 9).
7.2.3. ACTIVITY AND COST FORECASTS
This section summarises the development of our activity and cost forecasts for Grid Opex in RCP2. Further details can be found in AP02 – RCP2 Maintenance Forecast.
Routine Maintenance
Our routine maintenance forecast was developed using a new dedicated forecasting model. The Maintenance Activity and Cost Model (MACM), which:
allows improved optimisation between Capex and Opex;
accounts for asset base changes including divestments;
improves transparency and accuracy;
captures the outputs of work history analysis and similar initiatives; and
can incorporate ongoing improvements to our maintenance regime.
Overview of our approach
The forecasting process included the following steps.
Work History and Asset Database: we built a new database including each routine maintenance activity for the last 10 years. This included information for each asset, including location, type, installation date and forecast decommissioning or replacement date.
Base Case Forecast: a base case forecast for corrective and preventive activities was developed using the 2012/2013 asset base to provide a baseline forecast.74 This allowed scenario and sensitivity analysis to be conducted based on changes in the asset base or maintenance approach.
Refinement: to adjust for known Capex works and planned asset divestments.
Targeted Savings: from applying efficiency targets, including those identified by the maintenance efficiency study (discussed earlier).
A detailed description of the forecasting model is included in AP02 – RCP2 Maintenance Forecast.
74
Routine maintenance costs include forecast service charges (primarily lease costs for station sites).
GRID OPERATING EXPENDITURE
MP01 – Main Proposal 75
Governance arrangements
The following governance process was used to refine and challenge our Grid Opex proposals.
Forecasting Team: a dedicated cross-functional project team was established.
Specialist Advice: database and model auditing expertise was provided by an external consultancy firm. An external specialist also assisted with data analysis and provided advice on the forecasting methodology.
Quality Assurance: a quality assurance process was used to manage version control, and model reconciliation and documentation.
Deliverability Assurance: forecasts were tested against potential delivery risks, including, availability of network outages and field resources.
Forecast Approvals: forecasts were subjected to three challenge and approval rounds: General Manager and RCP2 Advisory Team (28 May 2013); CEO and Capital Governance Team (6 June 2013); and the Transpower Board (12 September 2013).
Maintenance Projects
As previously noted, maintenance projects are fleet-specific works and are forecast and approved for a specific asset portfolio. Assets are generally included within the scope of a maintenance project based on defined triggers, including:
asset health and condition;
asset criticality;
safety risks; and
model or type issues.
Maintenance Projects are forecast and approved under the same Integrated Works Planning process used for capital projects and are subject to individual business case approval. Due to their repetitive nature, costs are typically forecast using the ‘volumetric’ approach discussed in Section 6.2.3.
Detailed descriptions of Maintenance Projects proposed in RCP2 are included in relevant fleet strategies and PODs.
Operating
Our proposals for field switching activities during RCP2 are based on historic activity levels, which are expected to remain stable, using applicable contract rates.
Training
Training expenditure proposals have been developed based on the following cost drivers:
numbers requiring training during RCP2;
number of days that training will take to deliver;
average cost per trainee day; and
fixed costs, including administration and upkeep of training facilities.
We have assumed that the number of trainees will increase through RCP2 based on the demographic profile of the current workforce and a growing number of retirements, current attrition rates, and the introduction of new technology requiring staff to retrain. These upward pressures are offset by new training methods (such as e-learning) and increased use of regional, rather than national, programmes to reduce travel and accommodation costs.
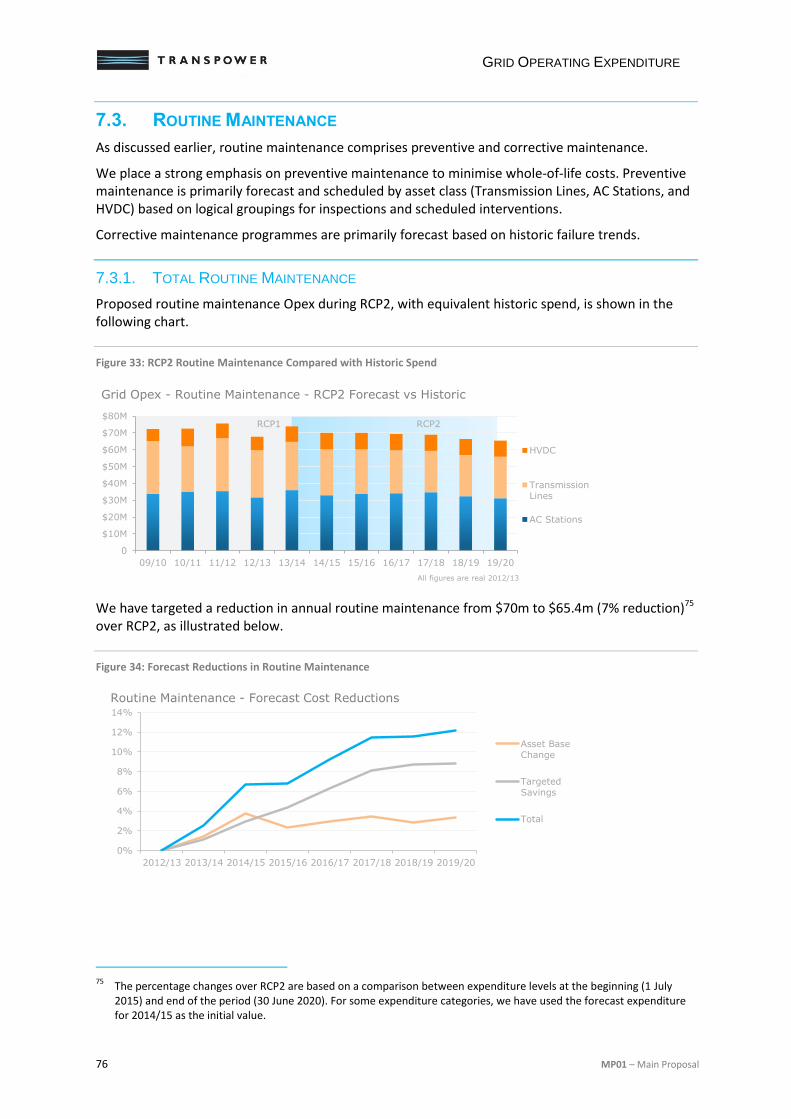
GRID OPERATING EXPENDITURE
76 MP01 – Main Proposal
7.3. ROUTINE MAINTENANCE
As discussed earlier, routine maintenance comprises preventive and corrective maintenance.
We place a strong emphasis on preventive maintenance to minimise whole-of-life costs. Preventive maintenance is primarily forecast and scheduled by asset class (Transmission Lines, AC Stations, and HVDC) based on logical groupings for inspections and scheduled interventions.
Corrective maintenance programmes are primarily forecast based on historic failure trends.
7.3.1. TOTAL ROUTINE MAINTENANCE
Proposed routine maintenance Opex during RCP2, with equivalent historic spend, is shown in the following chart.
Figure 33: RCP2 Routine Maintenance Compared with Historic Spend
We have targeted a reduction in annual routine maintenance from $70m to $65.4m (7% reduction)75 over RCP2, as illustrated below.
Figure 34: Forecast Reductions in Routine Maintenance
75
The percentage changes over RCP2 are based on a comparison between expenditure levels at the beginning (1 July 2015) and end of the period (30 June 2020). For some expenditure categories, we have used the forecast expenditure for 2014/15 as the initial value.
0
$10M
$20M
$30M
$40M
$50M
$60M
$70M
$80M
09/10 10/11 11/12 12/13 13/14 14/15 15/16 16/17 17/18 18/19 19/20
HVDC
TransmissionLines
AC Stations
Grid Opex - Routine Maintenance - RCP2 Forecast vs Historic
All figures are real 2012/13
RCP1 RCP2
0%
2%
4%
6%
8%
10%
12%
14%
2012/13 2013/14 2014/15 2015/16 2016/17 2017/18 2018/19 2019/20
Routine Maintenance - Forecast Cost Reductions
Asset BaseChange
TargetedSavings
Total
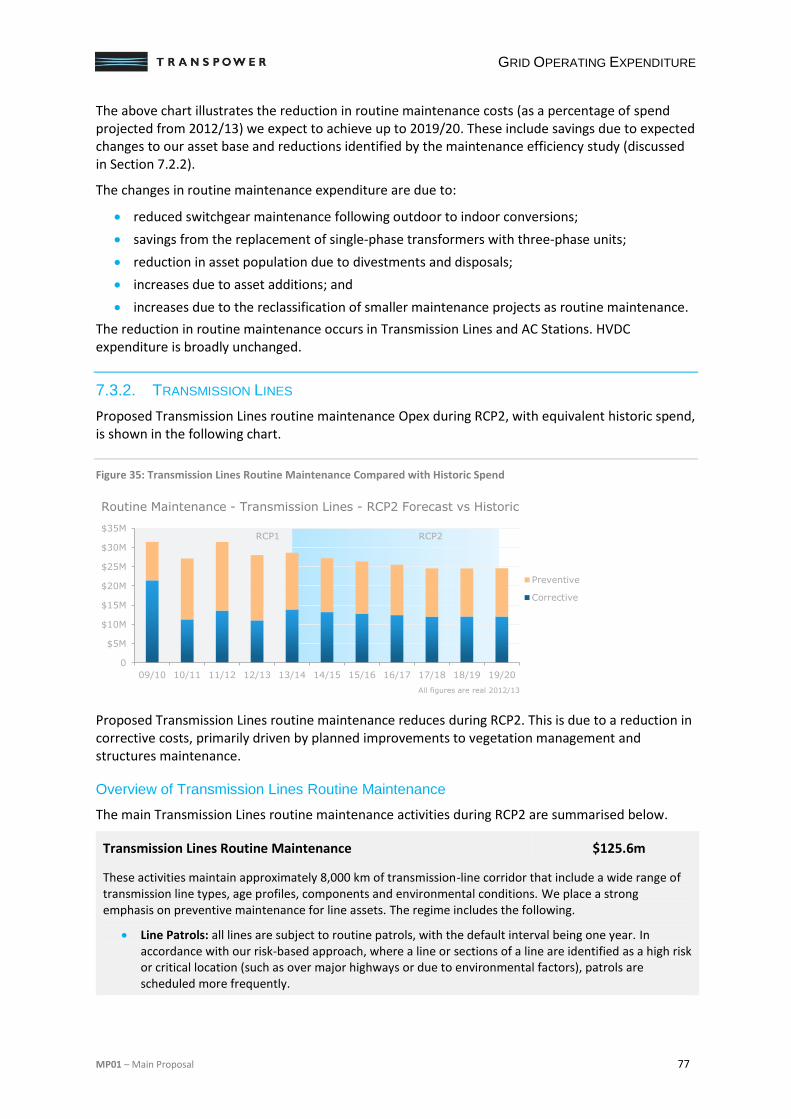
GRID OPERATING EXPENDITURE
MP01 – Main Proposal 77
The above chart illustrates the reduction in routine maintenance costs (as a percentage of spend projected from 2012/13) we expect to achieve up to 2019/20. These include savings due to expected changes to our asset base and reductions identified by the maintenance efficiency study (discussed in Section 7.2.2).
The changes in routine maintenance expenditure are due to:
reduced switchgear maintenance following outdoor to indoor conversions;
savings from the replacement of single-phase transformers with three-phase units;
reduction in asset population due to divestments and disposals;
increases due to asset additions; and
increases due to the reclassification of smaller maintenance projects as routine maintenance.
The reduction in routine maintenance occurs in Transmission Lines and AC Stations. HVDC expenditure is broadly unchanged.
7.3.2. TRANSMISSION LINES
Proposed Transmission Lines routine maintenance Opex during RCP2, with equivalent historic spend, is shown in the following chart.
Figure 35: Transmission Lines Routine Maintenance Compared with Historic Spend
Proposed Transmission Lines routine maintenance reduces during RCP2. This is due to a reduction in corrective costs, primarily driven by planned improvements to vegetation management and structures maintenance.
Overview of Transmission Lines Routine Maintenance
The main Transmission Lines routine maintenance activities during RCP2 are summarised below.
Transmission Lines Routine Maintenance $125.6m
These activities maintain approximately 8,000 km of transmission-line corridor that include a wide range of transmission line types, age profiles, components and environmental conditions. We place a strong emphasis on preventive maintenance for line assets. The regime includes the following.
Line Patrols: all lines are subject to routine patrols, with the default interval being one year. In accordance with our risk-based approach, where a line or sections of a line are identified as a high risk or critical location (such as over major highways or due to environmental factors), patrols are scheduled more frequently.
0
$5M
$10M
$15M
$20M
$25M
$30M
$35M
09/10 10/11 11/12 12/13 13/14 14/15 15/16 16/17 17/18 18/19 19/20
Preventive
Corrective
Routine Maintenance - Transmission Lines - RCP2 Forecast vs Historic
All figures are real 2012/13
RCP1 RCP2
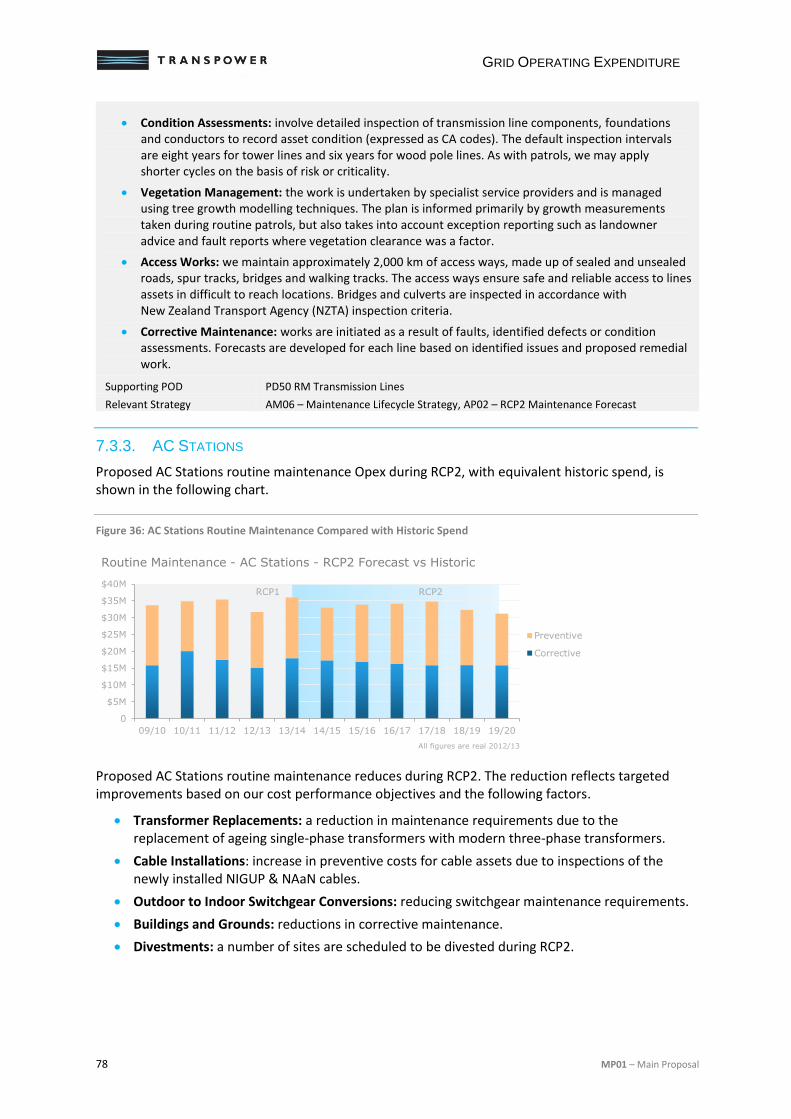
GRID OPERATING EXPENDITURE
78 MP01 – Main Proposal
Condition Assessments: involve detailed inspection of transmission line components, foundations and conductors to record asset condition (expressed as CA codes). The default inspection intervals are eight years for tower lines and six years for wood pole lines. As with patrols, we may apply shorter cycles on the basis of risk or criticality.
Vegetation Management: the work is undertaken by specialist service providers and is managed using tree growth modelling techniques. The plan is informed primarily by growth measurements taken during routine patrols, but also takes into account exception reporting such as landowner advice and fault reports where vegetation clearance was a factor.
Access Works: we maintain approximately 2,000 km of access ways, made up of sealed and unsealed roads, spur tracks, bridges and walking tracks. The access ways ensure safe and reliable access to lines assets in difficult to reach locations. Bridges and culverts are inspected in accordance with New Zealand Transport Agency (NZTA) inspection criteria.
Corrective Maintenance: works are initiated as a result of faults, identified defects or condition assessments. Forecasts are developed for each line based on identified issues and proposed remedial work.
Supporting POD PD50 RM Transmission Lines
Relevant Strategy AM06 – Maintenance Lifecycle Strategy, AP02 – RCP2 Maintenance Forecast
7.3.3. AC STATIONS
Proposed AC Stations routine maintenance Opex during RCP2, with equivalent historic spend, is shown in the following chart.
Figure 36: AC Stations Routine Maintenance Compared with Historic Spend
Proposed AC Stations routine maintenance reduces during RCP2. The reduction reflects targeted improvements based on our cost performance objectives and the following factors.
Transformer Replacements: a reduction in maintenance requirements due to the replacement of ageing single-phase transformers with modern three-phase transformers.
Cable Installations: increase in preventive costs for cable assets due to inspections of the newly installed NIGUP & NAaN cables.
Outdoor to Indoor Switchgear Conversions: reducing switchgear maintenance requirements.
Buildings and Grounds: reductions in corrective maintenance.
Divestments: a number of sites are scheduled to be divested during RCP2.
0
$5M
$10M
$15M
$20M
$25M
$30M
$35M
$40M
09/10 10/11 11/12 12/13 13/14 14/15 15/16 16/17 17/18 18/19 19/20
Preventive
Corrective
Routine Maintenance - AC Stations - RCP2 Forecast vs Historic
All figures are real 2012/13
RCP1 RCP2
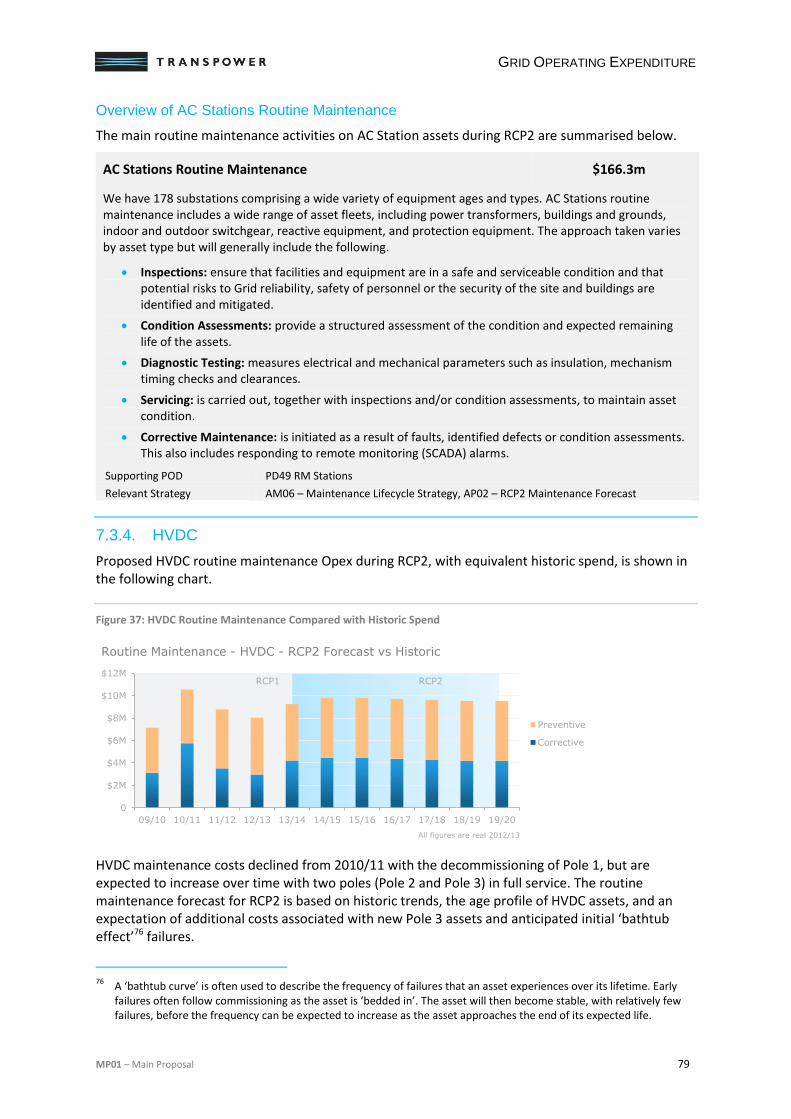
GRID OPERATING EXPENDITURE
MP01 – Main Proposal 79
Overview of AC Stations Routine Maintenance
The main routine maintenance activities on AC Station assets during RCP2 are summarised below.
AC Stations Routine Maintenance $166.3m
We have 178 substations comprising a wide variety of equipment ages and types. AC Stations routine maintenance includes a wide range of asset fleets, including power transformers, buildings and grounds, indoor and outdoor switchgear, reactive equipment, and protection equipment. The approach taken varies by asset type but will generally include the following.
Inspections: ensure that facilities and equipment are in a safe and serviceable condition and that potential risks to Grid reliability, safety of personnel or the security of the site and buildings are identified and mitigated.
Condition Assessments: provide a structured assessment of the condition and expected remaining life of the assets.
Diagnostic Testing: measures electrical and mechanical parameters such as insulation, mechanism timing checks and clearances.
Servicing: is carried out, together with inspections and/or condition assessments, to maintain asset condition.
Corrective Maintenance: is initiated as a result of faults, identified defects or condition assessments. This also includes responding to remote monitoring (SCADA) alarms.
Supporting POD PD49 RM Stations
Relevant Strategy AM06 – Maintenance Lifecycle Strategy, AP02 – RCP2 Maintenance Forecast
7.3.4. HVDC
Proposed HVDC routine maintenance Opex during RCP2, with equivalent historic spend, is shown in the following chart.
Figure 37: HVDC Routine Maintenance Compared with Historic Spend
HVDC maintenance costs declined from 2010/11 with the decommissioning of Pole 1, but are expected to increase over time with two poles (Pole 2 and Pole 3) in full service. The routine maintenance forecast for RCP2 is based on historic trends, the age profile of HVDC assets, and an expectation of additional costs associated with new Pole 3 assets and anticipated initial ‘bathtub effect’76 failures.
76
A ‘bathtub curve’ is often used to describe the frequency of failures that an asset experiences over its lifetime. Early failures often follow commissioning as the asset is ‘bedded in’. The asset will then become stable, with relatively few failures, before the frequency can be expected to increase as the asset approaches the end of its expected life.
0
$2M
$4M
$6M
$8M
$10M
$12M
09/10 10/11 11/12 12/13 13/14 14/15 15/16 16/17 17/18 18/19 19/20
Preventive
Corrective
Routine Maintenance - HVDC - RCP2 Forecast vs Historic
All figures are real 2012/13
RCP1 RCP2
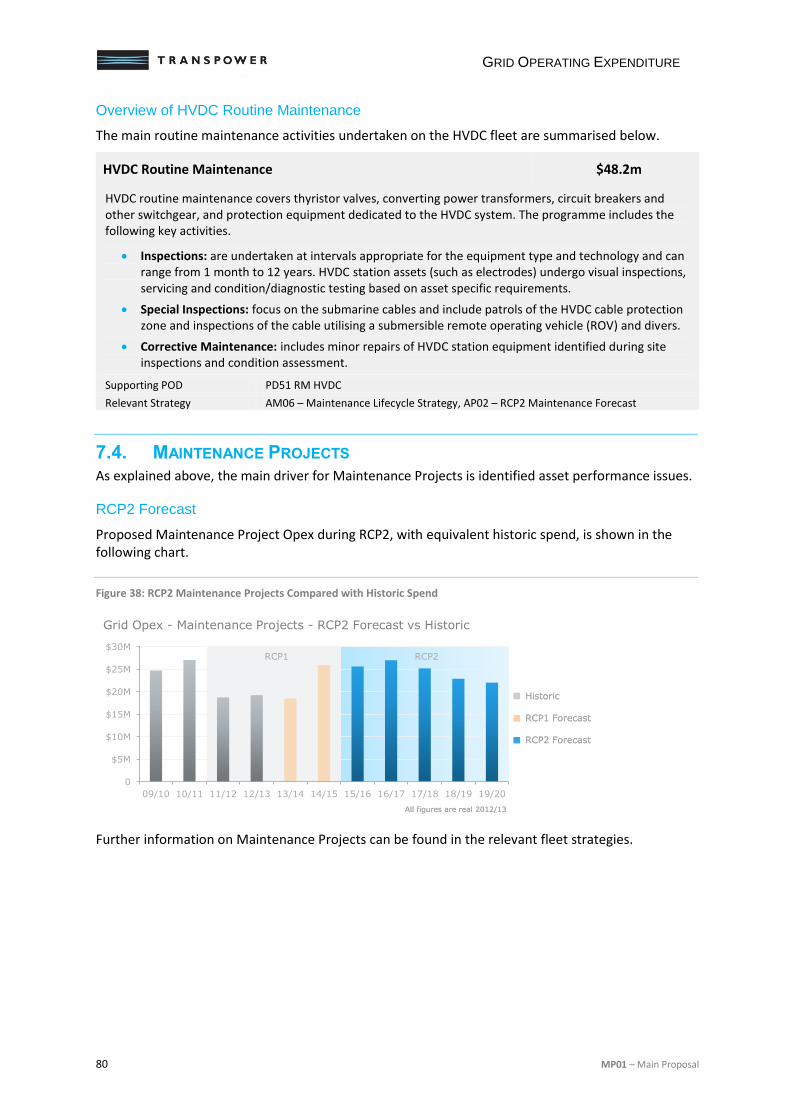
GRID OPERATING EXPENDITURE
80 MP01 – Main Proposal
Overview of HVDC Routine Maintenance
The main routine maintenance activities undertaken on the HVDC fleet are summarised below.
HVDC Routine Maintenance $48.2m
HVDC routine maintenance covers thyristor valves, converting power transformers, circuit breakers and other switchgear, and protection equipment dedicated to the HVDC system. The programme includes the following key activities.
Inspections: are undertaken at intervals appropriate for the equipment type and technology and can range from 1 month to 12 years. HVDC station assets (such as electrodes) undergo visual inspections, servicing and condition/diagnostic testing based on asset specific requirements.
Special Inspections: focus on the submarine cables and include patrols of the HVDC cable protection zone and inspections of the cable utilising a submersible remote operating vehicle (ROV) and divers.
Corrective Maintenance: includes minor repairs of HVDC station equipment identified during site inspections and condition assessment.
Supporting POD PD51 RM HVDC
Relevant Strategy AM06 – Maintenance Lifecycle Strategy, AP02 – RCP2 Maintenance Forecast
7.4. MAINTENANCE PROJECTS As explained above, the main driver for Maintenance Projects is identified asset performance issues.
RCP2 Forecast
Proposed Maintenance Project Opex during RCP2, with equivalent historic spend, is shown in the following chart.
Figure 38: RCP2 Maintenance Projects Compared with Historic Spend
Further information on Maintenance Projects can be found in the relevant fleet strategies.
0
$5M
$10M
$15M
$20M
$25M
$30M
09/10 10/11 11/12 12/13 13/14 14/15 15/16 16/17 17/18 18/19 19/20
Grid Opex - Maintenance Projects - RCP2 Forecast vs Historic
All figures are real 2012/13
Historic
RCP1 Forecast
RCP2 Forecast
All figures are real 2012/13
Historic
RCP1 Forecast
RCP2 Forecast
RCP1 RCP2
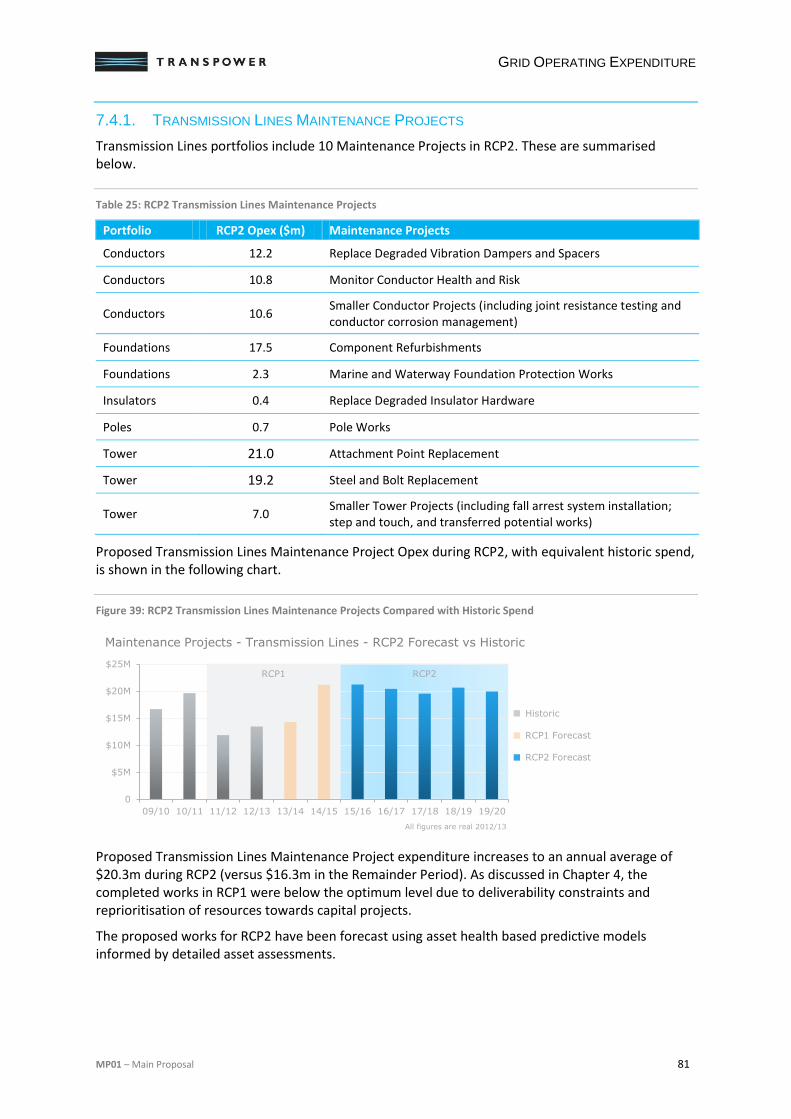
GRID OPERATING EXPENDITURE
MP01 – Main Proposal 81
7.4.1. TRANSMISSION LINES MAINTENANCE PROJECTS
Transmission Lines portfolios include 10 Maintenance Projects in RCP2. These are summarised below.
Table 25: RCP2 Transmission Lines Maintenance Projects
Portfolio RCP2 Opex ($m) Maintenance Projects
Conductors 12.2 Replace Degraded Vibration Dampers and Spacers
Conductors 10.8 Monitor Conductor Health and Risk
Conductors 10.6 Smaller Conductor Projects (including joint resistance testing and conductor corrosion management)
Foundations 17.5 Component Refurbishments
Foundations 2.3 Marine and Waterway Foundation Protection Works
Insulators 0.4 Replace Degraded Insulator Hardware
Poles 0.7 Pole Works
Tower 21.0 Attachment Point Replacement
Tower 19.2 Steel and Bolt Replacement
Tower 7.0 Smaller Tower Projects (including fall arrest system installation; step and touch, and transferred potential works)
Proposed Transmission Lines Maintenance Project Opex during RCP2, with equivalent historic spend, is shown in the following chart.
Figure 39: RCP2 Transmission Lines Maintenance Projects Compared with Historic Spend
Proposed Transmission Lines Maintenance Project expenditure increases to an annual average of $20.3m during RCP2 (versus $16.3m in the Remainder Period). As discussed in Chapter 4, the completed works in RCP1 were below the optimum level due to deliverability constraints and reprioritisation of resources towards capital projects.
The proposed works for RCP2 have been forecast using asset health based predictive models informed by detailed asset assessments.
RCP1 RCP2
0
$5M
$10M
$15M
$20M
$25M
09/10 10/11 11/12 12/13 13/14 14/15 15/16 16/17 17/18 18/19 19/20
Maintenance Projects - Transmission Lines - RCP2 Forecast vs Historic
All figures are real 2012/13
Historic
RCP1 Forecast
RCP2 Forecast
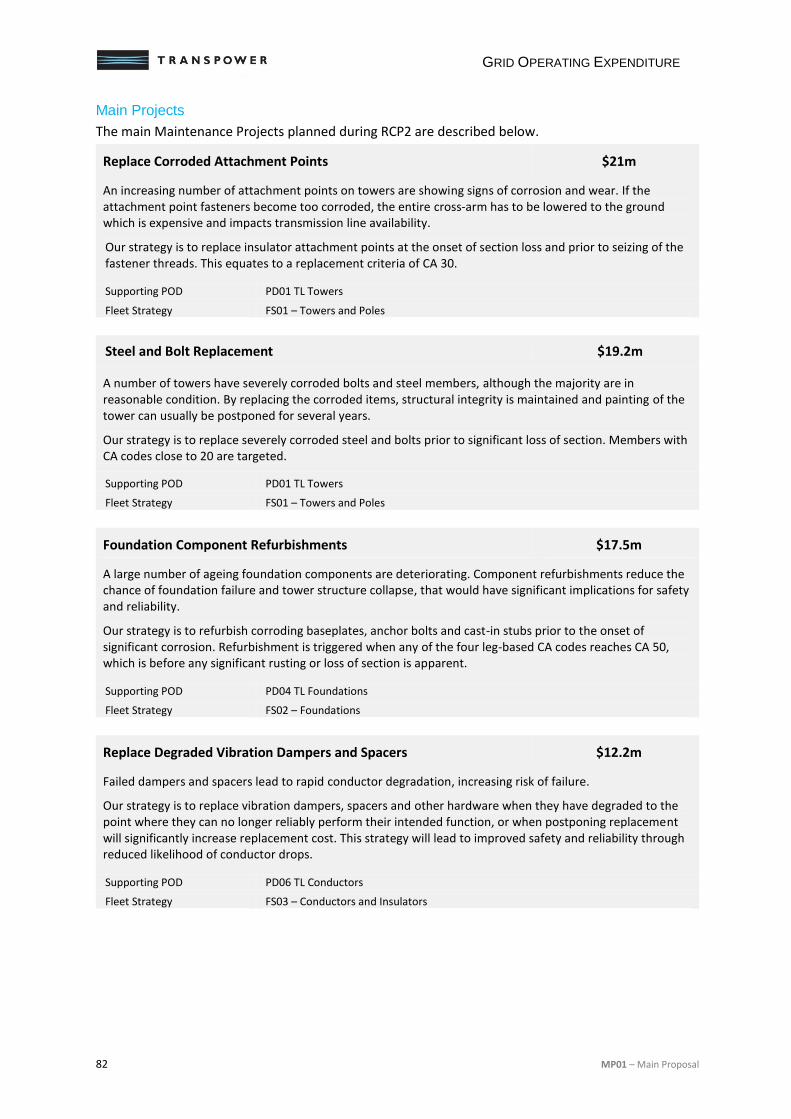
GRID OPERATING EXPENDITURE
82 MP01 – Main Proposal
Main Projects
The main Maintenance Projects planned during RCP2 are described below.
Replace Corroded Attachment Points $21m
An increasing number of attachment points on towers are showing signs of corrosion and wear. If the attachment point fasteners become too corroded, the entire cross-arm has to be lowered to the ground which is expensive and impacts transmission line availability.
Our strategy is to replace insulator attachment points at the onset of section loss and prior to seizing of the fastener threads. This equates to a replacement criteria of CA 30.
Supporting POD PD01 TL Towers
Fleet Strategy FS01 – Towers and Poles
Steel and Bolt Replacement $19.2m
A number of towers have severely corroded bolts and steel members, although the majority are in reasonable condition. By replacing the corroded items, structural integrity is maintained and painting of the tower can usually be postponed for several years.
Our strategy is to replace severely corroded steel and bolts prior to significant loss of section. Members with CA codes close to 20 are targeted.
Supporting POD PD01 TL Towers
Fleet Strategy FS01 – Towers and Poles
Foundation Component Refurbishments $17.5m
A large number of ageing foundation components are deteriorating. Component refurbishments reduce the chance of foundation failure and tower structure collapse, that would have significant implications for safety and reliability.
Our strategy is to refurbish corroding baseplates, anchor bolts and cast-in stubs prior to the onset of significant corrosion. Refurbishment is triggered when any of the four leg-based CA codes reaches CA 50, which is before any significant rusting or loss of section is apparent.
Supporting POD PD04 TL Foundations
Fleet Strategy FS02 – Foundations
Replace Degraded Vibration Dampers and Spacers $12.2m
Failed dampers and spacers lead to rapid conductor degradation, increasing risk of failure.
Our strategy is to replace vibration dampers, spacers and other hardware when they have degraded to the point where they can no longer reliably perform their intended function, or when postponing replacement will significantly increase replacement cost. This strategy will lead to improved safety and reliability through reduced likelihood of conductor drops.
Supporting POD PD06 TL Conductors
Fleet Strategy FS03 – Conductors and Insulators
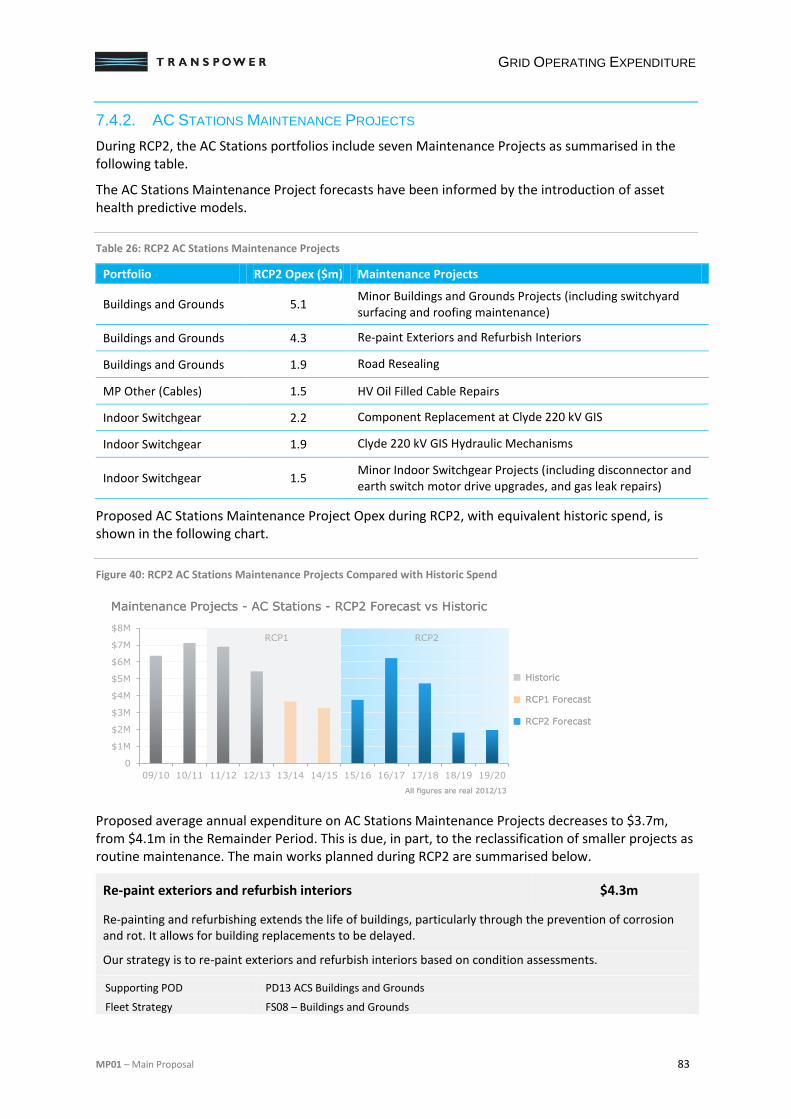
GRID OPERATING EXPENDITURE
MP01 – Main Proposal 83
7.4.2. AC STATIONS MAINTENANCE PROJECTS
During RCP2, the AC Stations portfolios include seven Maintenance Projects as summarised in the following table.
The AC Stations Maintenance Project forecasts have been informed by the introduction of asset health predictive models.
Table 26: RCP2 AC Stations Maintenance Projects
Portfolio RCP2 Opex ($m) Maintenance Projects
Buildings and Grounds 5.1 Minor Buildings and Grounds Projects (including switchyard surfacing and roofing maintenance)
Buildings and Grounds 4.3 Re-paint Exteriors and Refurbish Interiors
Buildings and Grounds 1.9 Road Resealing
MP Other (Cables) 1.5 HV Oil Filled Cable Repairs
Indoor Switchgear 2.2 Component Replacement at Clyde 220 kV GIS
Indoor Switchgear 1.9 Clyde 220 kV GIS Hydraulic Mechanisms
Indoor Switchgear 1.5 Minor Indoor Switchgear Projects (including disconnector and earth switch motor drive upgrades, and gas leak repairs)
Proposed AC Stations Maintenance Project Opex during RCP2, with equivalent historic spend, is shown in the following chart.
Figure 40: RCP2 AC Stations Maintenance Projects Compared with Historic Spend
Proposed average annual expenditure on AC Stations Maintenance Projects decreases to $3.7m, from $4.1m in the Remainder Period. This is due, in part, to the reclassification of smaller projects as routine maintenance. The main works planned during RCP2 are summarised below.
Re-paint exteriors and refurbish interiors $4.3m
Re-painting and refurbishing extends the life of buildings, particularly through the prevention of corrosion and rot. It allows for building replacements to be delayed.
Our strategy is to re-paint exteriors and refurbish interiors based on condition assessments.
Supporting POD PD13 ACS Buildings and Grounds
Fleet Strategy FS08 – Buildings and Grounds
0
$1M
$2M
$3M
$4M
$5M
$6M
$7M
$8M
09/10 10/11 11/12 12/13 13/14 14/15 15/16 16/17 17/18 18/19 19/20
Maintenance Projects - AC Stations - RCP2 Forecast vs Historic
All figures are real 2012/13
Historic
RCP1 Forecast
RCP2 Forecast
Maintenance Projects - AC Stations - RCP2 Forecast vs Historic
All figures are real 2012/13
Historic
RCP1 Forecast
RCP2 Forecast
RCP1 RCP2
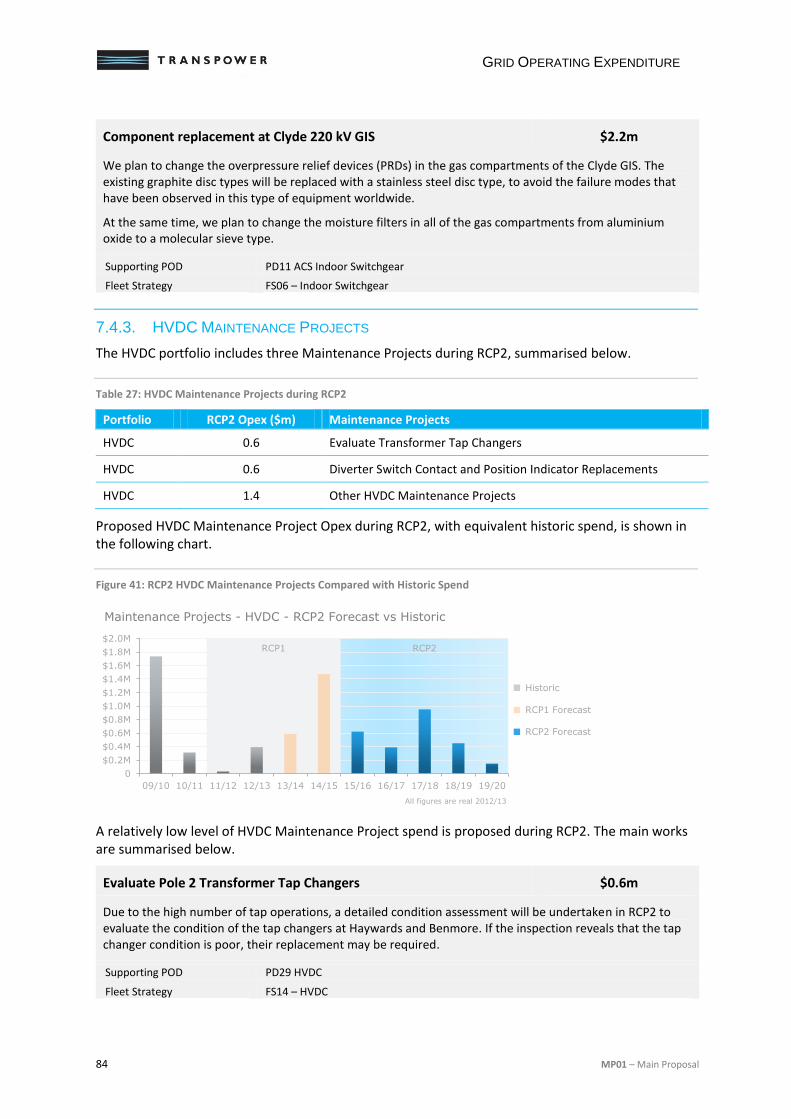
GRID OPERATING EXPENDITURE
84 MP01 – Main Proposal
Component replacement at Clyde 220 kV GIS $2.2m
We plan to change the overpressure relief devices (PRDs) in the gas compartments of the Clyde GIS. The existing graphite disc types will be replaced with a stainless steel disc type, to avoid the failure modes that have been observed in this type of equipment worldwide.
At the same time, we plan to change the moisture filters in all of the gas compartments from aluminium oxide to a molecular sieve type.
Supporting POD PD11 ACS Indoor Switchgear
Fleet Strategy FS06 – Indoor Switchgear
7.4.3. HVDC MAINTENANCE PROJECTS
The HVDC portfolio includes three Maintenance Projects during RCP2, summarised below.
Table 27: HVDC Maintenance Projects during RCP2
Portfolio RCP2 Opex ($m) Maintenance Projects
HVDC 0.6 Evaluate Transformer Tap Changers
HVDC 0.6 Diverter Switch Contact and Position Indicator Replacements
HVDC 1.4 Other HVDC Maintenance Projects
Proposed HVDC Maintenance Project Opex during RCP2, with equivalent historic spend, is shown in the following chart.
Figure 41: RCP2 HVDC Maintenance Projects Compared with Historic Spend
A relatively low level of HVDC Maintenance Project spend is proposed during RCP2. The main works are summarised below.
Evaluate Pole 2 Transformer Tap Changers $0.6m
Due to the high number of tap operations, a detailed condition assessment will be undertaken in RCP2 to evaluate the condition of the tap changers at Haywards and Benmore. If the inspection reveals that the tap changer condition is poor, their replacement may be required.
Supporting POD PD29 HVDC
Fleet Strategy FS14 – HVDC
RCP1 RCP2
0
$0.2M
$0.4M
$0.6M
$0.8M
$1.0M
$1.2M
$1.4M
$1.6M
$1.8M
$2.0M
09/10 10/11 11/12 12/13 13/14 14/15 15/16 16/17 17/18 18/19 19/20
Maintenance Projects - HVDC - RCP2 Forecast vs Historic
All figures are real 2012/13
Historic
RCP1 Forecast
RCP2 Forecast
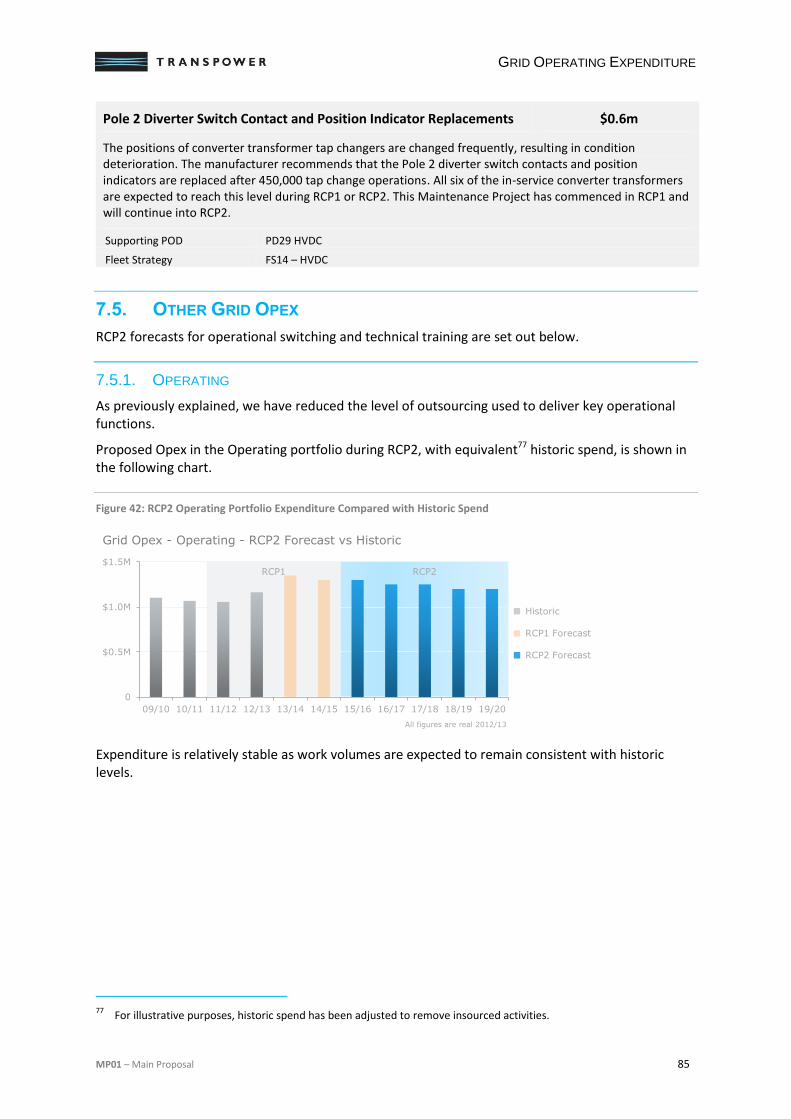
GRID OPERATING EXPENDITURE
MP01 – Main Proposal 85
Pole 2 Diverter Switch Contact and Position Indicator Replacements $0.6m
The positions of converter transformer tap changers are changed frequently, resulting in condition deterioration. The manufacturer recommends that the Pole 2 diverter switch contacts and position indicators are replaced after 450,000 tap change operations. All six of the in-service converter transformers are expected to reach this level during RCP1 or RCP2. This Maintenance Project has commenced in RCP1 and will continue into RCP2.
Supporting POD PD29 HVDC
Fleet Strategy FS14 – HVDC
7.5. OTHER GRID OPEX
RCP2 forecasts for operational switching and technical training are set out below.
7.5.1. OPERATING
As previously explained, we have reduced the level of outsourcing used to deliver key operational functions.
Proposed Opex in the Operating portfolio during RCP2, with equivalent77 historic spend, is shown in the following chart.
Figure 42: RCP2 Operating Portfolio Expenditure Compared with Historic Spend
Expenditure is relatively stable as work volumes are expected to remain consistent with historic levels.
77
For illustrative purposes, historic spend has been adjusted to remove insourced activities.
RCP1 RCP2
0
$0.5M
$1.0M
$1.5M
09/10 10/11 11/12 12/13 13/14 14/15 15/16 16/17 17/18 18/19 19/20
Grid Opex - Operating - RCP2 Forecast vs Historic
All figures are real 2012/13
Historic
RCP1 Forecast
RCP2 Forecast
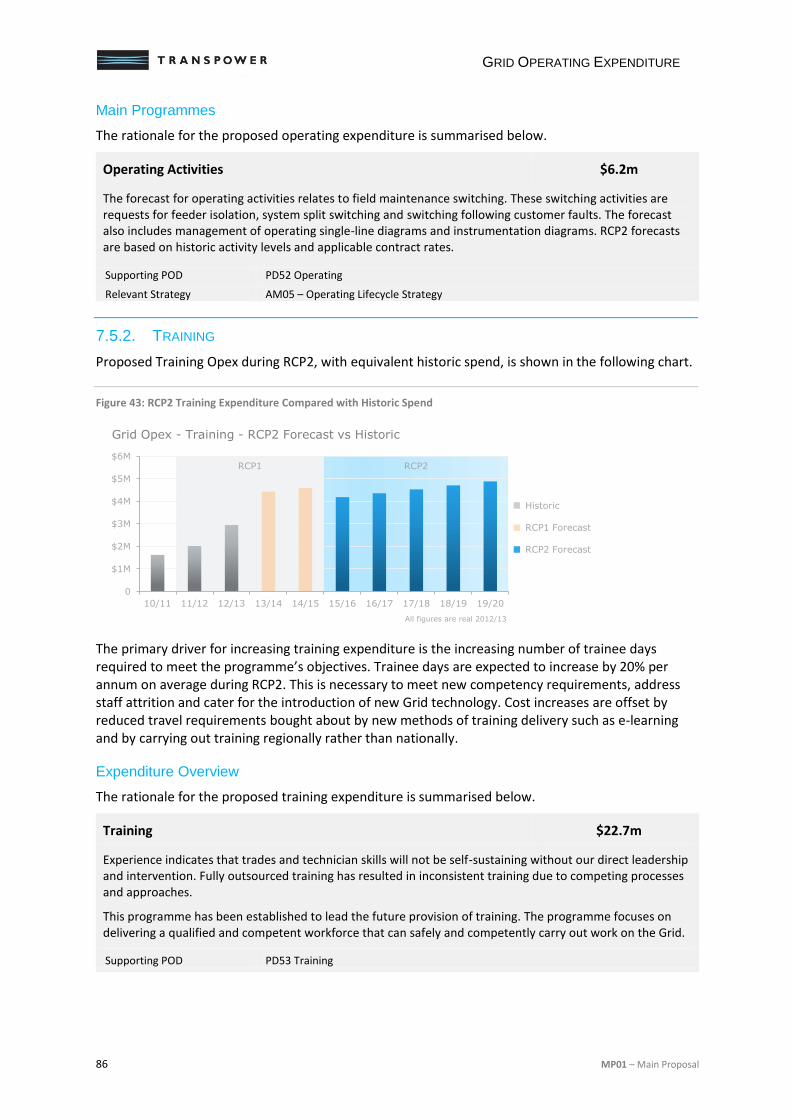
GRID OPERATING EXPENDITURE
86 MP01 – Main Proposal
Main Programmes
The rationale for the proposed operating expenditure is summarised below.
Operating Activities $6.2m
The forecast for operating activities relates to field maintenance switching. These switching activities are requests for feeder isolation, system split switching and switching following customer faults. The forecast also includes management of operating single-line diagrams and instrumentation diagrams. RCP2 forecasts are based on historic activity levels and applicable contract rates.
Supporting POD PD52 Operating
Relevant Strategy AM05 – Operating Lifecycle Strategy
7.5.2. TRAINING
Proposed Training Opex during RCP2, with equivalent historic spend, is shown in the following chart.
Figure 43: RCP2 Training Expenditure Compared with Historic Spend
The primary driver for increasing training expenditure is the increasing number of trainee days required to meet the programme’s objectives. Trainee days are expected to increase by 20% per annum on average during RCP2. This is necessary to meet new competency requirements, address staff attrition and cater for the introduction of new Grid technology. Cost increases are offset by reduced travel requirements bought about by new methods of training delivery such as e-learning and by carrying out training regionally rather than nationally.
Expenditure Overview
The rationale for the proposed training expenditure is summarised below.
Training $22.7m
Experience indicates that trades and technician skills will not be self-sustaining without our direct leadership and intervention. Fully outsourced training has resulted in inconsistent training due to competing processes and approaches.
This programme has been established to lead the future provision of training. The programme focuses on delivering a qualified and competent workforce that can safely and competently carry out work on the Grid.
Supporting POD PD53 Training
RCP1 RCP2
0
$1M
$2M
$3M
$4M
$5M
$6M
10/11 11/12 12/13 13/14 14/15 15/16 16/17 17/18 18/19 19/20
Grid Opex - Training - RCP2 Forecast vs Historic
All figures are real 2012/13
Historic
RCP1 Forecast
RCP2 Forecast
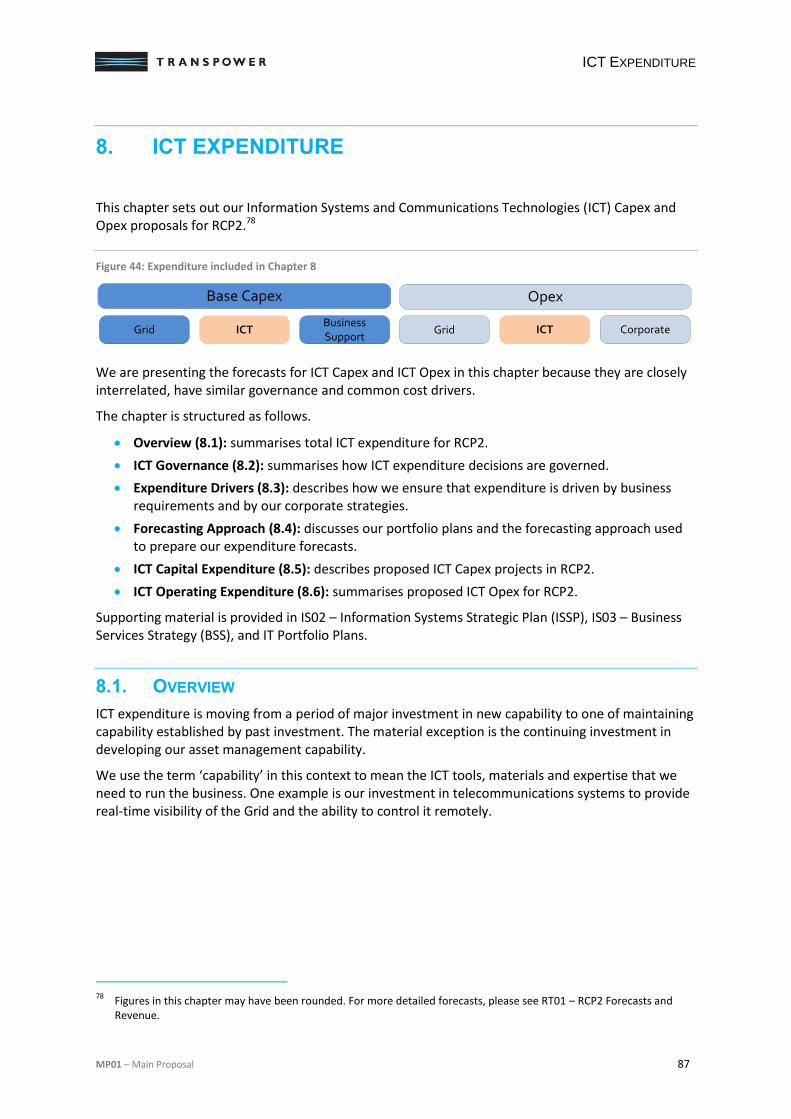
ICT EXPENDITURE
MP01 – Main Proposal 87
8. ICT EXPENDITURE
This chapter sets out our Information Systems and Communications Technologies (ICT) Capex and Opex proposals for RCP2.78
Figure 44: Expenditure included in Chapter 8
We are presenting the forecasts for ICT Capex and ICT Opex in this chapter because they are closely interrelated, have similar governance and common cost drivers.
The chapter is structured as follows.
Overview (8.1): summarises total ICT expenditure for RCP2.
ICT Governance (8.2): summarises how ICT expenditure decisions are governed.
Expenditure Drivers (8.3): describes how we ensure that expenditure is driven by business requirements and by our corporate strategies.
Forecasting Approach (8.4): discusses our portfolio plans and the forecasting approach used to prepare our expenditure forecasts.
ICT Capital Expenditure (8.5): describes proposed ICT Capex projects in RCP2.
ICT Operating Expenditure (8.6): summarises proposed ICT Opex for RCP2.
Supporting material is provided in IS02 – Information Systems Strategic Plan (ISSP), IS03 – Business Services Strategy (BSS), and IT Portfolio Plans.
8.1. OVERVIEW
ICT expenditure is moving from a period of major investment in new capability to one of maintaining capability established by past investment. The material exception is the continuing investment in developing our asset management capability.
We use the term ‘capability’ in this context to mean the ICT tools, materials and expertise that we need to run the business. One example is our investment in telecommunications systems to provide real-time visibility of the Grid and the ability to control it remotely.
78
Figures in this chapter may have been rounded. For more detailed forecasts, please see RT01 – RCP2 Forecasts and Revenue.
ICT GridBusiness Support
ICTGrid Corporate
Base Capex Opex
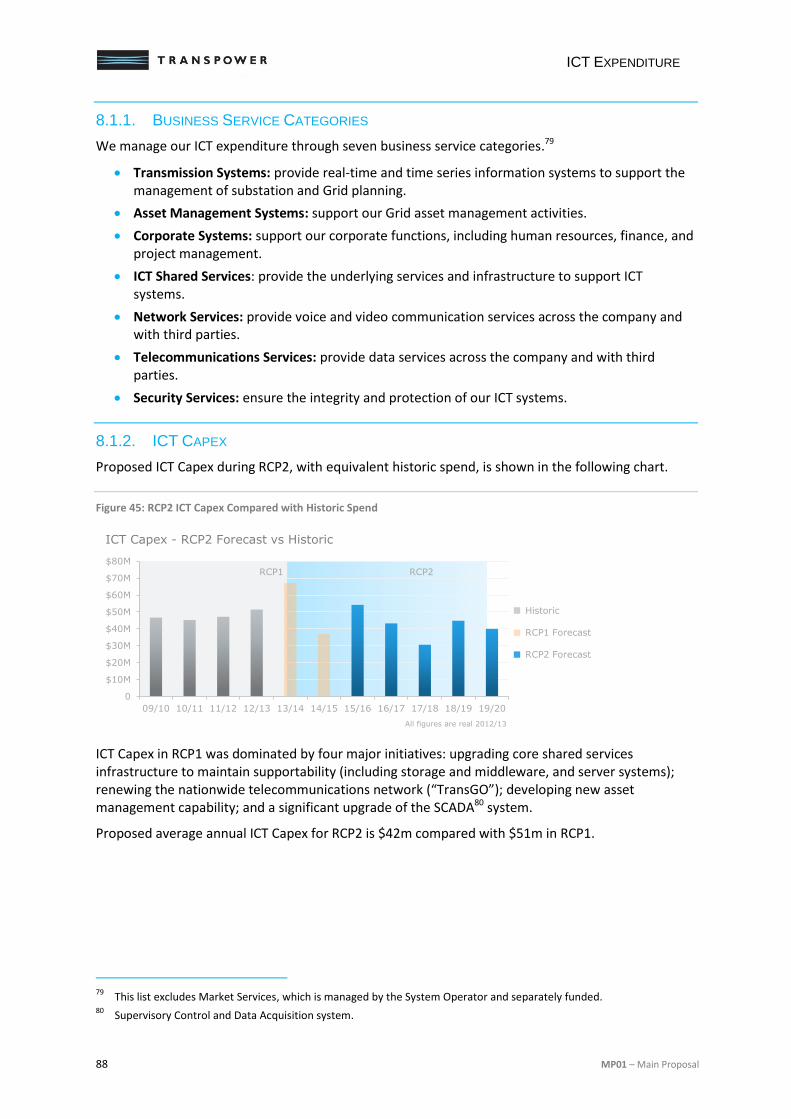
ICT EXPENDITURE
88 MP01 – Main Proposal
8.1.1. BUSINESS SERVICE CATEGORIES
We manage our ICT expenditure through seven business service categories.79
Transmission Systems: provide real-time and time series information systems to support the management of substation and Grid planning.
Asset Management Systems: support our Grid asset management activities.
Corporate Systems: support our corporate functions, including human resources, finance, and project management.
ICT Shared Services: provide the underlying services and infrastructure to support ICT systems.
Network Services: provide voice and video communication services across the company and with third parties.
Telecommunications Services: provide data services across the company and with third parties.
Security Services: ensure the integrity and protection of our ICT systems.
8.1.2. ICT CAPEX
Proposed ICT Capex during RCP2, with equivalent historic spend, is shown in the following chart.
Figure 45: RCP2 ICT Capex Compared with Historic Spend
ICT Capex in RCP1 was dominated by four major initiatives: upgrading core shared services infrastructure to maintain supportability (including storage and middleware, and server systems); renewing the nationwide telecommunications network (“TransGO”); developing new asset management capability; and a significant upgrade of the SCADA80 system.
Proposed average annual ICT Capex for RCP2 is $42m compared with $51m in RCP1.
79
This list excludes Market Services, which is managed by the System Operator and separately funded. 80
Supervisory Control and Data Acquisition system.
0
$10M
$20M
$30M
$40M
$50M
$60M
$70M
$80M
09/10 10/11 11/12 12/13 13/14 14/15 15/16 16/17 17/18 18/19 19/20
ICT Capex - RCP2 Forecast vs Historic
All figures are real 2012/13
Historic
RCP1 Forecast
RCP2 Forecast
RCP1 RCP2
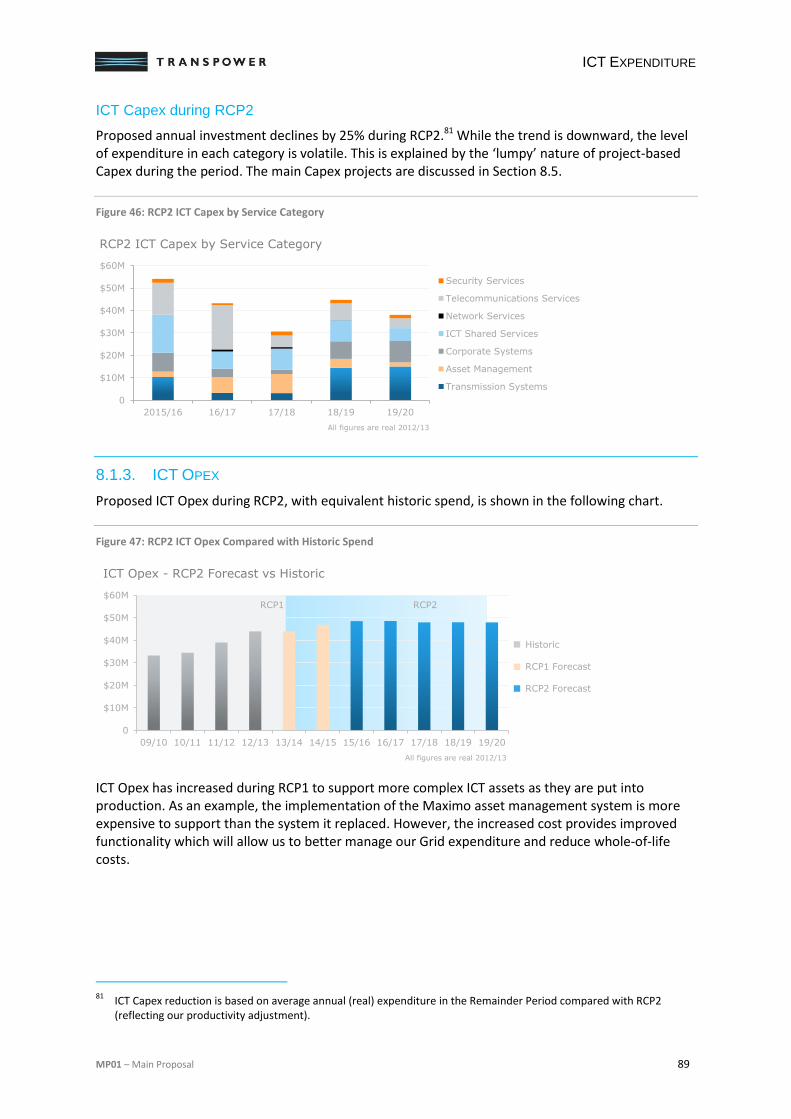
ICT EXPENDITURE
MP01 – Main Proposal 89
ICT Capex during RCP2
Proposed annual investment declines by 25% during RCP2.81 While the trend is downward, the level of expenditure in each category is volatile. This is explained by the ‘lumpy’ nature of project-based Capex during the period. The main Capex projects are discussed in Section 8.5.
Figure 46: RCP2 ICT Capex by Service Category
8.1.3. ICT OPEX
Proposed ICT Opex during RCP2, with equivalent historic spend, is shown in the following chart.
Figure 47: RCP2 ICT Opex Compared with Historic Spend
ICT Opex has increased during RCP1 to support more complex ICT assets as they are put into production. As an example, the implementation of the Maximo asset management system is more expensive to support than the system it replaced. However, the increased cost provides improved functionality which will allow us to better manage our Grid expenditure and reduce whole-of-life costs.
81
ICT Capex reduction is based on average annual (real) expenditure in the Remainder Period compared with RCP2 (reflecting our productivity adjustment).
0
$10M
$20M
$30M
$40M
$50M
$60M
2015/16 16/17 17/18 18/19 19/20
Security Services
Telecommunications Services
Network Services
ICT Shared Services
Corporate Systems
Asset Management
Transmission Systems
RCP2 ICT Capex by Service Category
All figures are real 2012/13
0
$10M
$20M
$30M
$40M
$50M
$60M
09/10 10/11 11/12 12/13 13/14 14/15 15/16 16/17 17/18 18/19 19/20
ICT Opex - RCP2 Forecast vs Historic
All figures are real 2012/13
Historic
RCP1 Forecast
RCP2 Forecast
RCP1 RCP2
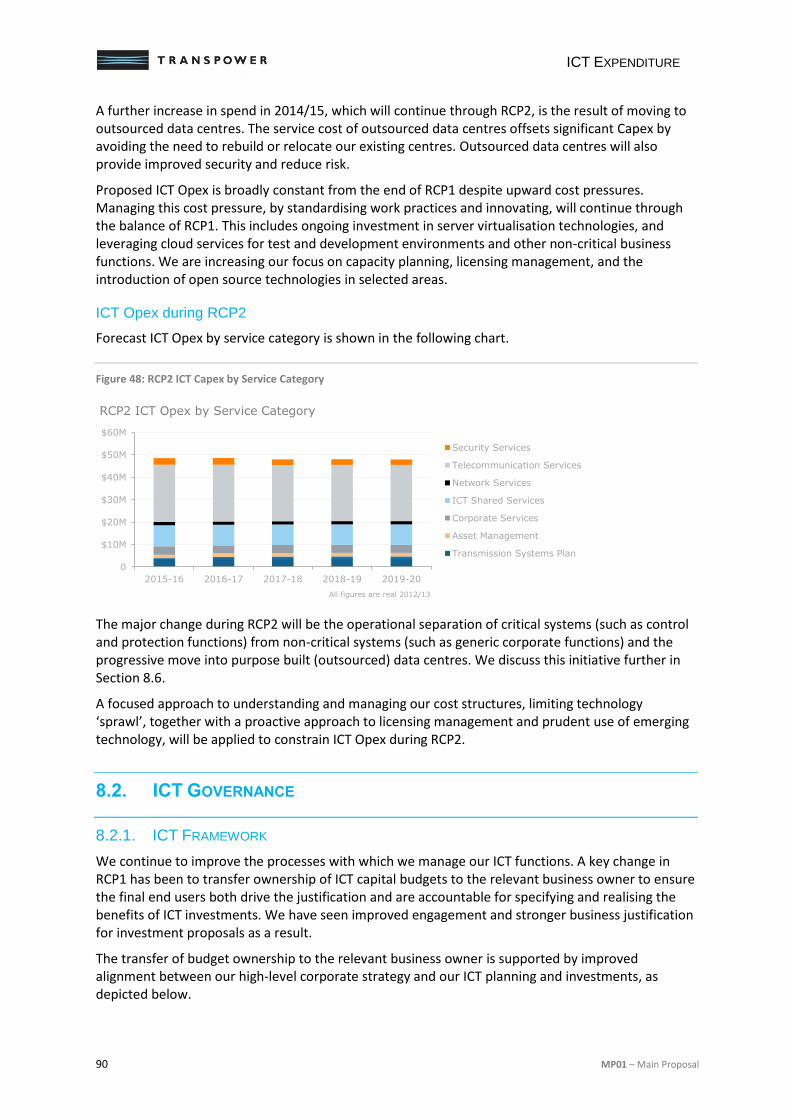
ICT EXPENDITURE
90 MP01 – Main Proposal
A further increase in spend in 2014/15, which will continue through RCP2, is the result of moving to outsourced data centres. The service cost of outsourced data centres offsets significant Capex by avoiding the need to rebuild or relocate our existing centres. Outsourced data centres will also provide improved security and reduce risk.
Proposed ICT Opex is broadly constant from the end of RCP1 despite upward cost pressures. Managing this cost pressure, by standardising work practices and innovating, will continue through the balance of RCP1. This includes ongoing investment in server virtualisation technologies, and leveraging cloud services for test and development environments and other non-critical business functions. We are increasing our focus on capacity planning, licensing management, and the introduction of open source technologies in selected areas.
ICT Opex during RCP2
Forecast ICT Opex by service category is shown in the following chart.
Figure 48: RCP2 ICT Capex by Service Category
The major change during RCP2 will be the operational separation of critical systems (such as control and protection functions) from non-critical systems (such as generic corporate functions) and the progressive move into purpose built (outsourced) data centres. We discuss this initiative further in Section 8.6.
A focused approach to understanding and managing our cost structures, limiting technology ‘sprawl’, together with a proactive approach to licensing management and prudent use of emerging technology, will be applied to constrain ICT Opex during RCP2.
8.2. ICT GOVERNANCE
8.2.1. ICT FRAMEWORK
We continue to improve the processes with which we manage our ICT functions. A key change in RCP1 has been to transfer ownership of ICT capital budgets to the relevant business owner to ensure the final end users both drive the justification and are accountable for specifying and realising the benefits of ICT investments. We have seen improved engagement and stronger business justification for investment proposals as a result.
The transfer of budget ownership to the relevant business owner is supported by improved alignment between our high-level corporate strategy and our ICT planning and investments, as depicted below.
0
$10M
$20M
$30M
$40M
$50M
$60M
2015-16 2016-17 2017-18 2018-19 2019-20
Security Services
Telecommunication Services
Network Services
ICT Shared Services
Corporate Services
Asset Management
Transmission Systems Plan
RCP2 ICT Opex by Service Category
All figures are real 2012/13
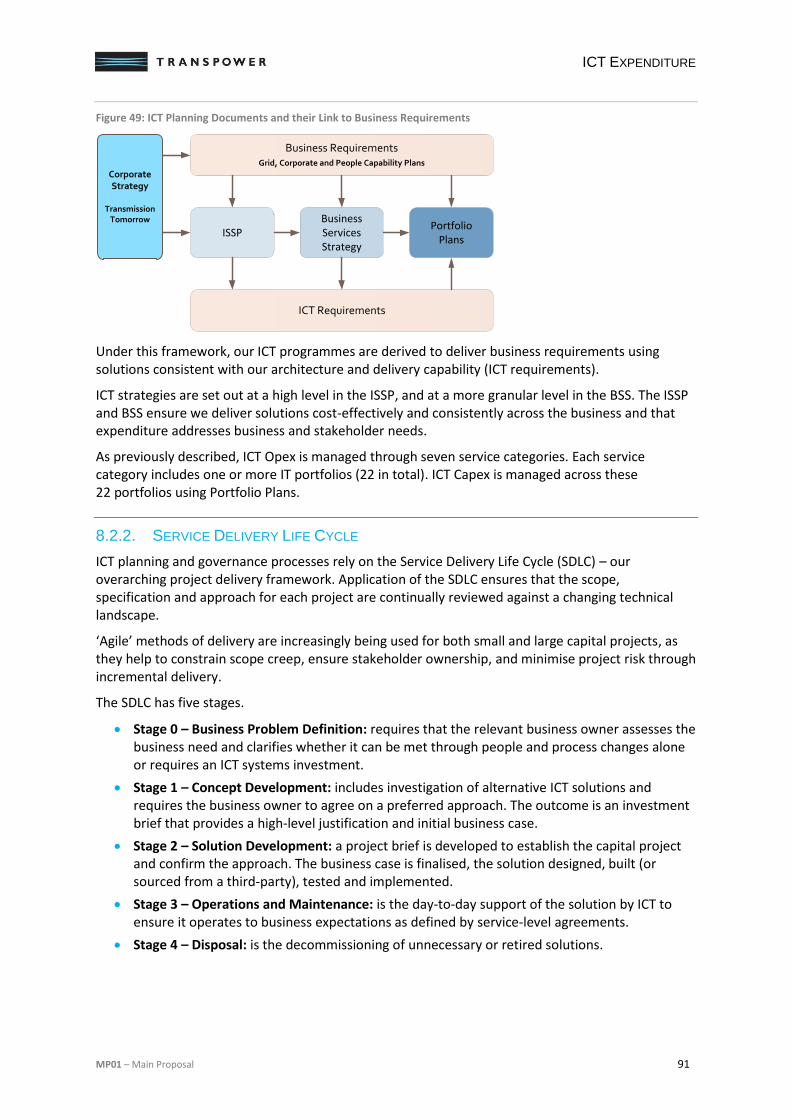
ICT EXPENDITURE
MP01 – Main Proposal 91
Figure 49: ICT Planning Documents and their Link to Business Requirements
Under this framework, our ICT programmes are derived to deliver business requirements using solutions consistent with our architecture and delivery capability (ICT requirements).
ICT strategies are set out at a high level in the ISSP, and at a more granular level in the BSS. The ISSP and BSS ensure we deliver solutions cost-effectively and consistently across the business and that expenditure addresses business and stakeholder needs.
As previously described, ICT Opex is managed through seven service categories. Each service category includes one or more IT portfolios (22 in total). ICT Capex is managed across these 22 portfolios using Portfolio Plans.
8.2.2. SERVICE DELIVERY LIFE CYCLE
ICT planning and governance processes rely on the Service Delivery Life Cycle (SDLC) – our overarching project delivery framework. Application of the SDLC ensures that the scope, specification and approach for each project are continually reviewed against a changing technical landscape.
‘Agile’ methods of delivery are increasingly being used for both small and large capital projects, as they help to constrain scope creep, ensure stakeholder ownership, and minimise project risk through incremental delivery.
The SDLC has five stages.
Stage 0 – Business Problem Definition: requires that the relevant business owner assesses the business need and clarifies whether it can be met through people and process changes alone or requires an ICT systems investment.
Stage 1 – Concept Development: includes investigation of alternative ICT solutions and requires the business owner to agree on a preferred approach. The outcome is an investment brief that provides a high-level justification and initial business case.
Stage 2 – Solution Development: a project brief is developed to establish the capital project and confirm the approach. The business case is finalised, the solution designed, built (or sourced from a third-party), tested and implemented.
Stage 3 – Operations and Maintenance: is the day-to-day support of the solution by ICT to ensure it operates to business expectations as defined by service-level agreements.
Stage 4 – Disposal: is the decommissioning of unnecessary or retired solutions.
Business RequirementsGrid, Corporate and People Capability Plans
ISSPPortfolio
Plans
Business Services Strategy
ICT Requirements
Corporate Strategy
Transmission
Tomorrow
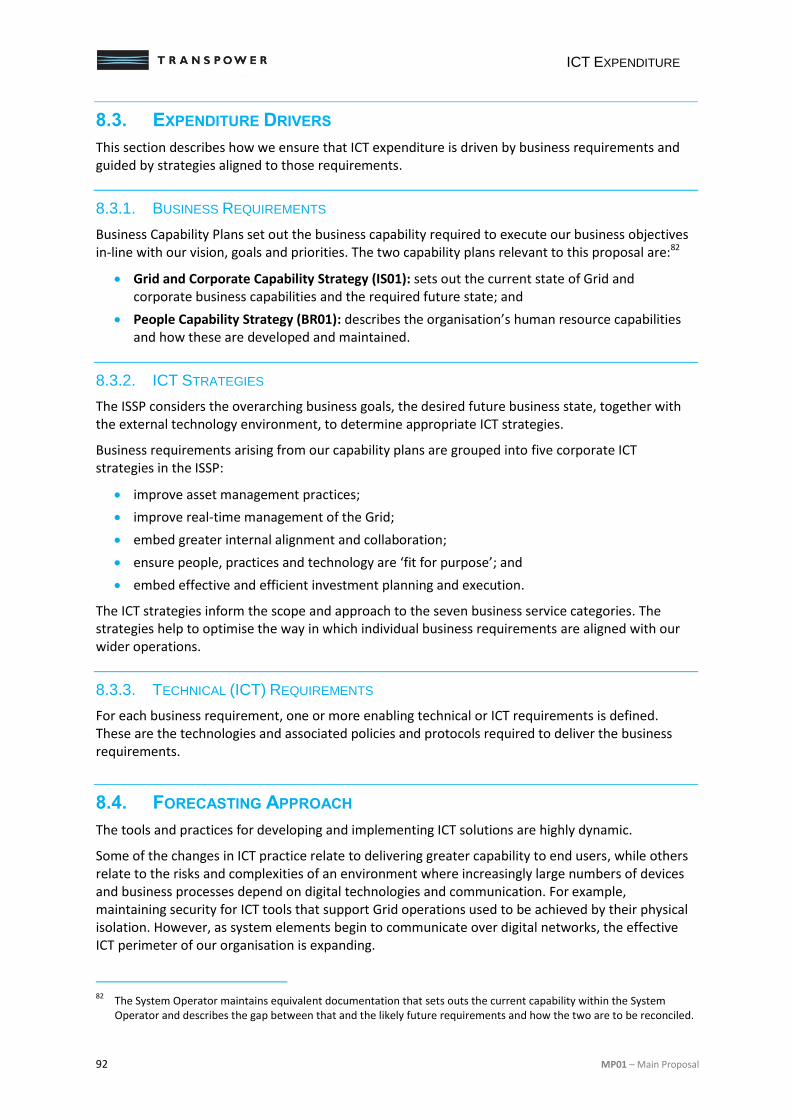
ICT EXPENDITURE
92 MP01 – Main Proposal
8.3. EXPENDITURE DRIVERS
This section describes how we ensure that ICT expenditure is driven by business requirements and guided by strategies aligned to those requirements.
8.3.1. BUSINESS REQUIREMENTS
Business Capability Plans set out the business capability required to execute our business objectives in-line with our vision, goals and priorities. The two capability plans relevant to this proposal are:82
Grid and Corporate Capability Strategy (IS01): sets out the current state of Grid and corporate business capabilities and the required future state; and
People Capability Strategy (BR01): describes the organisation’s human resource capabilities and how these are developed and maintained.
8.3.2. ICT STRATEGIES
The ISSP considers the overarching business goals, the desired future business state, together with the external technology environment, to determine appropriate ICT strategies.
Business requirements arising from our capability plans are grouped into five corporate ICT strategies in the ISSP:
improve asset management practices;
improve real-time management of the Grid;
embed greater internal alignment and collaboration;
ensure people, practices and technology are ‘fit for purpose’; and
embed effective and efficient investment planning and execution.
The ICT strategies inform the scope and approach to the seven business service categories. The strategies help to optimise the way in which individual business requirements are aligned with our wider operations.
8.3.3. TECHNICAL (ICT) REQUIREMENTS
For each business requirement, one or more enabling technical or ICT requirements is defined. These are the technologies and associated policies and protocols required to deliver the business requirements.
8.4. FORECASTING APPROACH
The tools and practices for developing and implementing ICT solutions are highly dynamic.
Some of the changes in ICT practice relate to delivering greater capability to end users, while others relate to the risks and complexities of an environment where increasingly large numbers of devices and business processes depend on digital technologies and communication. For example, maintaining security for ICT tools that support Grid operations used to be achieved by their physical isolation. However, as system elements begin to communicate over digital networks, the effective ICT perimeter of our organisation is expanding.
82
The System Operator maintains equivalent documentation that sets outs the current capability within the System Operator and describes the gap between that and the likely future requirements and how the two are to be reconciled.
ICT EXPENDITURE
MP01 – Main Proposal 93
The management of new risks and vulnerabilities means that ICT costs face continuous upward pressure even to deliver constant levels of service.
8.4.1. CAPITAL EXPENDITURE
Cost forecasts have been developed by considering: historic costs for previous investments; original implementation costs; and current market pricing for hardware, software and design services. Scoping workshops and industry analysis are used to further refine the cost estimates. The workshops and analysis involve internal subject matter experts, relevant consultants, and industry analysts. This blended approach is appropriate, as we cannot predict with certainty what technologies we will be commissioning in 3–5 years or the exact techniques that we will use to deliver them.
Cost estimates are continually refined through stages 1 and 2 of the SDLC. In this way, detailed estimates for projects can be refined up until the start of work. This has the advantage of allowing us to consider emerging, cost-effective technologies and to adopt them if they are sufficiently mature.
8.4.2. OPERATING EXPENDITURE
For ICT Opex forecasts, we rely on top-down projections to estimate cost trends by service category. These are based on: extrapolation of historic cost trends in light of anticipated changes to our operating environments; planned ICT Capex; new service requirements; and emerging tools and practices from the wider ICT industry.
During RCP1, we commissioned a number of major capital programmes including new telecommunications assets and a new asset management system. These programmes have delivered new capability to the business, but are more expensive to support.
In parallel with delivering new capability, we have standardised and simplified the way we deliver common ICT services using IT Service Management techniques. Under this approach, ICT Opex is more predictable and stable than under a reactive model. This is reflected in our forecasts for RCP2.
8.5. ICT CAPITAL EXPENDITURE
ICT Capex for each of the seven business service categories is set out in the following sections.
8.5.1. TRANSMISSION SYSTEMS
Transmission Systems support the transmission service through the provision of Grid information systems and management of substation information.
The largest initiative for RCP2 is to bring our SCADA and Real-Time Systems up to date. The timing of this investment is driven by our strategy of updating third-party software at the same time as our vendors, to avoid having immature solutions or being unable to access support. Other investments focus on enhancing existing tools, making them easier to access and to analyse information held across diverse systems. The capabilities provided by the systems and tools in these portfolios are key enablers for our planned Grid asset management improvements.
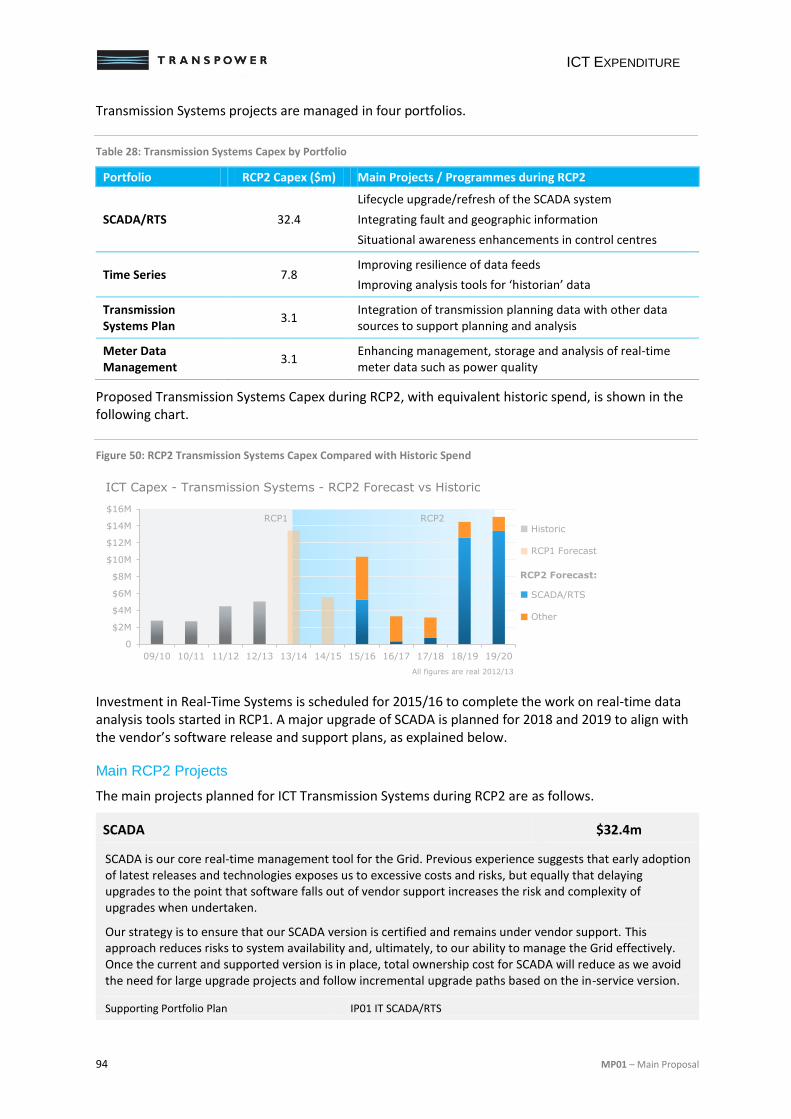
ICT EXPENDITURE
94 MP01 – Main Proposal
Transmission Systems projects are managed in four portfolios.
Table 28: Transmission Systems Capex by Portfolio
Portfolio RCP2 Capex ($m) Main Projects / Programmes during RCP2
SCADA/RTS 32.4
Lifecycle upgrade/refresh of the SCADA system
Integrating fault and geographic information
Situational awareness enhancements in control centres
Time Series 7.8 Improving resilience of data feeds
Improving analysis tools for ‘historian’ data
Transmission Systems Plan
3.1 Integration of transmission planning data with other data sources to support planning and analysis
Meter Data Management
3.1 Enhancing management, storage and analysis of real-time meter data such as power quality
Proposed Transmission Systems Capex during RCP2, with equivalent historic spend, is shown in the following chart.
Figure 50: RCP2 Transmission Systems Capex Compared with Historic Spend
Investment in Real-Time Systems is scheduled for 2015/16 to complete the work on real-time data analysis tools started in RCP1. A major upgrade of SCADA is planned for 2018 and 2019 to align with the vendor’s software release and support plans, as explained below.
Main RCP2 Projects
The main projects planned for ICT Transmission Systems during RCP2 are as follows.
SCADA $32.4m
SCADA is our core real-time management tool for the Grid. Previous experience suggests that early adoption of latest releases and technologies exposes us to excessive costs and risks, but equally that delaying upgrades to the point that software falls out of vendor support increases the risk and complexity of upgrades when undertaken.
Our strategy is to ensure that our SCADA version is certified and remains under vendor support. This approach reduces risks to system availability and, ultimately, to our ability to manage the Grid effectively. Once the current and supported version is in place, total ownership cost for SCADA will reduce as we avoid the need for large upgrade projects and follow incremental upgrade paths based on the in-service version.
Supporting Portfolio Plan IP01 IT SCADA/RTS
0
$2M
$4M
$6M
$8M
$10M
$12M
$14M
$16M
09/10 10/11 11/12 12/13 13/14 14/15 15/16 16/17 17/18 18/19 19/20
ICT Capex - Transmission Systems - RCP2 Forecast vs Historic
All figures are real 2012/13
RCP1 RCP2Historic
RCP1 Forecast
SCADA/RTS
Other
RCP2 Forecast:
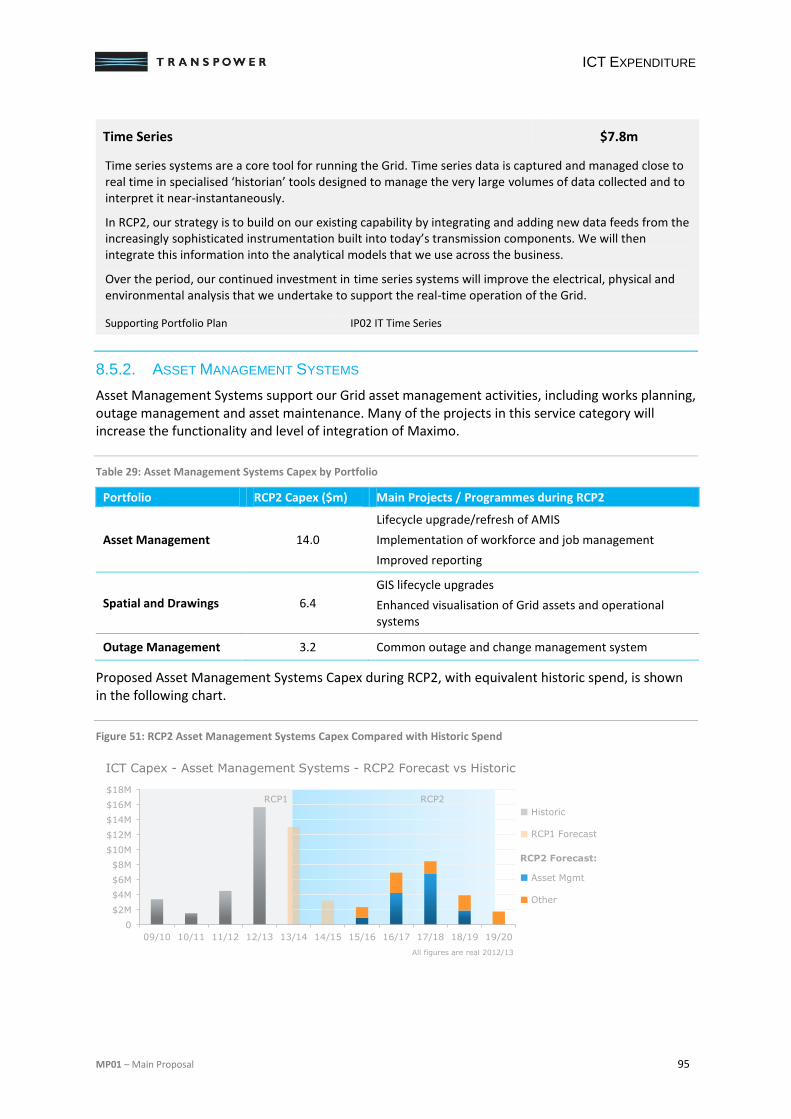
ICT EXPENDITURE
MP01 – Main Proposal 95
Time Series $7.8m
Time series systems are a core tool for running the Grid. Time series data is captured and managed close to real time in specialised ‘historian’ tools designed to manage the very large volumes of data collected and to interpret it near-instantaneously.
In RCP2, our strategy is to build on our existing capability by integrating and adding new data feeds from the increasingly sophisticated instrumentation built into today’s transmission components. We will then integrate this information into the analytical models that we use across the business.
Over the period, our continued investment in time series systems will improve the electrical, physical and environmental analysis that we undertake to support the real-time operation of the Grid.
Supporting Portfolio Plan IP02 IT Time Series
8.5.2. ASSET MANAGEMENT SYSTEMS
Asset Management Systems support our Grid asset management activities, including works planning, outage management and asset maintenance. Many of the projects in this service category will increase the functionality and level of integration of Maximo.
Table 29: Asset Management Systems Capex by Portfolio
Portfolio RCP2 Capex ($m) Main Projects / Programmes during RCP2
Asset Management 14.0
Lifecycle upgrade/refresh of AMIS
Implementation of workforce and job management
Improved reporting
Spatial and Drawings 6.4
GIS lifecycle upgrades
Enhanced visualisation of Grid assets and operational systems
Outage Management 3.2 Common outage and change management system
Proposed Asset Management Systems Capex during RCP2, with equivalent historic spend, is shown in the following chart.
Figure 51: RCP2 Asset Management Systems Capex Compared with Historic Spend
0
$2M
$4M
$6M
$8M
$10M
$12M
$14M
$16M
$18M
09/10 10/11 11/12 12/13 13/14 14/15 15/16 16/17 17/18 18/19 19/20
ICT Capex - Asset Management Systems - RCP2 Forecast vs Historic
All figures are real 2012/13
RCP1 RCP2
Historic
RCP1 Forecast
Asset Mgmt
Other
RCP2 Forecast:
ICT EXPENDITURE
96 MP01 – Main Proposal
The peak in 2012/13 and 2013/14 relates to the commissioning and extension of Maximo. Implementation of Maximo was a large business change, initially focused on ensuring a successful transition from our outdated, legacy system (MMS).
We will enhance Maximo’s functionality in RCP2. The main investments are scheduled for 2016/17 and 2017/18, when we will optimise job and workforce management using data from a variety of sources and introduce new analytic capabilities.
Capex in Outage Management and Spatial and Drawings (‘Other’ in the chart) is relatively stable across the period.
Main RCP2 Projects
The main projects planned for RCP2 are summarised below.
Asset Management Information System Enhancements and Refresh $14.0m
The replacement of our legacy maintenance management system was a major ICT initiative in RCP1. Maximo has broader scope and has catalysed change across the business.
Secondment of additional staff resource and improved change management, including across our service providers, has allowed an earlier implementation than originally envisaged.
Now that the core system has been commissioned, our strategy is to ensure it remains supported and continues to meet the requirements of the business as our sophistication in asset management increases and with it our demand for enabling technology.
As with the SCADA refresh, our strategy is to ensure that the asset management system remains current and supported by the software vendor at all times.
Supporting Portfolio Plan IP05 IT Asset Management
Spatial and Drawing Systems Enhancements $6.4m
Our planning processes are hampered by difficulty integrating information from our many asset data repositories. The use of visualisation technologies provides a highly productive interface for engineers to integrate this data and, thereby, optimise their planning decisions.
Upgrading our Geographic Information System (GIS) and integrating it with the wider suite of information systems that support asset management planning across the company will deliver new capability to visualise alternative operational scenarios.
Such capability will improve the timeliness of Grid planning decision making and ultimately improve the asset management strategies that we deploy.
Supporting Portfolio Plan IP06 IT Spatial and Drawings
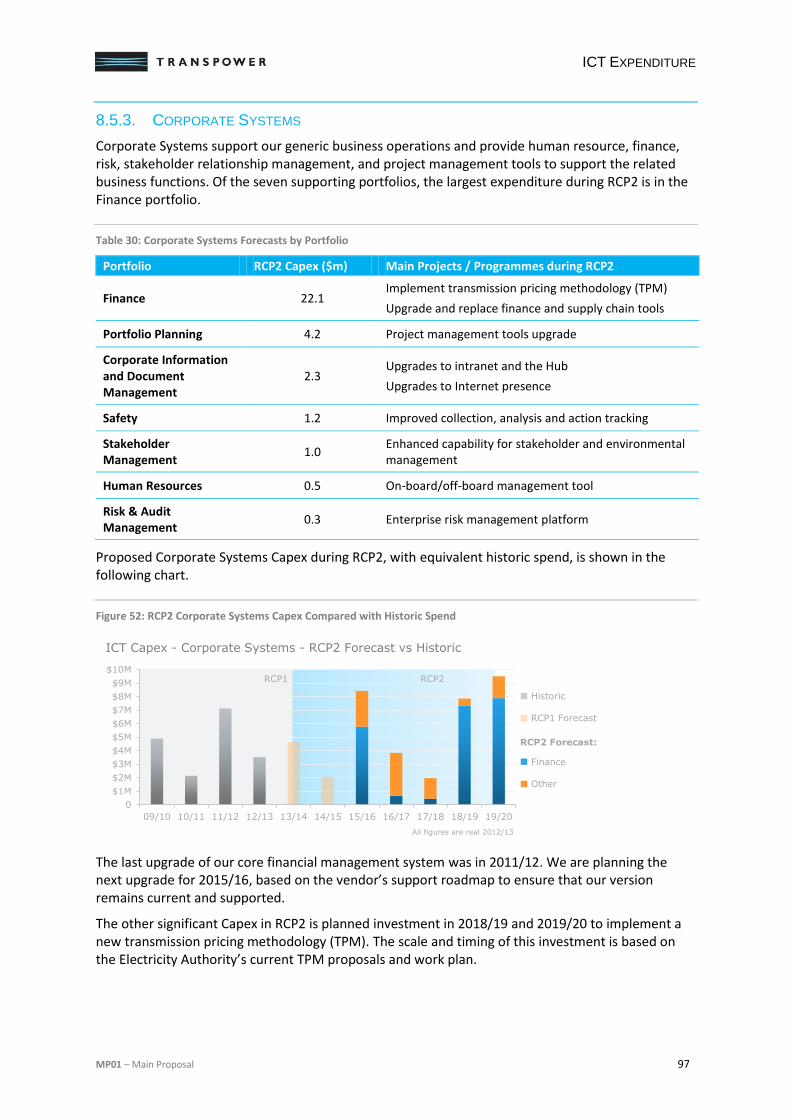
ICT EXPENDITURE
MP01 – Main Proposal 97
8.5.3. CORPORATE SYSTEMS
Corporate Systems support our generic business operations and provide human resource, finance, risk, stakeholder relationship management, and project management tools to support the related business functions. Of the seven supporting portfolios, the largest expenditure during RCP2 is in the Finance portfolio.
Table 30: Corporate Systems Forecasts by Portfolio
Portfolio RCP2 Capex ($m) Main Projects / Programmes during RCP2
Finance 22.1 Implement transmission pricing methodology (TPM)
Upgrade and replace finance and supply chain tools
Portfolio Planning 4.2 Project management tools upgrade
Corporate Information and Document Management
2.3 Upgrades to intranet and the Hub
Upgrades to Internet presence
Safety 1.2 Improved collection, analysis and action tracking
Stakeholder Management
1.0 Enhanced capability for stakeholder and environmental management
Human Resources 0.5 On-board/off-board management tool
Risk & Audit Management
0.3 Enterprise risk management platform
Proposed Corporate Systems Capex during RCP2, with equivalent historic spend, is shown in the following chart.
Figure 52: RCP2 Corporate Systems Capex Compared with Historic Spend
The last upgrade of our core financial management system was in 2011/12. We are planning the next upgrade for 2015/16, based on the vendor’s support roadmap to ensure that our version remains current and supported.
The other significant Capex in RCP2 is planned investment in 2018/19 and 2019/20 to implement a new transmission pricing methodology (TPM). The scale and timing of this investment is based on the Electricity Authority’s current TPM proposals and work plan.
0
$1M
$2M
$3M
$4M
$5M
$6M
$7M
$8M
$9M
$10M
09/10 10/11 11/12 12/13 13/14 14/15 15/16 16/17 17/18 18/19 19/20
ICT Capex - Corporate Systems - RCP2 Forecast vs Historic
All figures are real 2012/13
RCP1 RCP2
Historic
RCP1 Forecast
Finance
Other
RCP2 Forecast:
ICT EXPENDITURE
98 MP01 – Main Proposal
Main RCP2 Projects
The main Corporate Systems projects during RCP2 are summarised below.
Transmission Pricing Methodology (TPM) Update $15.1m
The Electricity Authority’s continuing review of the transmission pricing methodology is planned to conclude in 2015 and the Authority’s preferred approach would appear to be to move to a cost allocation approach that is considerably more complex than the current approach. The implementation of a new methodology will likely require that the current enabling business processes and supporting technologies undergo significant revision and replacement. The current pricing engine is, in any event, overdue for replacement, which has been deferred for the last two years pending a decision from the Authority on a revised TPM.
Consistent with our strategy to align the way we provision ICT resources with business risk and needs, implementation of the pricing methodology will explore how common IT services for finance can be used to underpin the transmission pricing model. By using third-party software to deliver generic financial management capability, we will minimise the scope of the bespoke solution that we will need to develop to support what will be a unique cost allocation formula. This will reduce the support and maintenance costs of what would otherwise be a very complex application.
Supporting Portfolio Plan IP15 IT Finance
Financial Management Information Systems Upgrade $6.2m
Our existing Financial Management Information System (FMIS) is a standard version of third-party software from a large, international vendor. Our current software version is old and vendor support will expire during RCP2. Consistent with our policy to maintain software at current versions, the upgrade project will maintain the integrity of our core FMIS and data into RCP3.
Supporting Portfolio Plan IP15 IT Finance
8.5.4. ICT SHARED SERVICES
ICT Shared Services provides the platform for operation of our information systems, including servers, storage and the devices with which our people interact.
Table 31: ICT Shared Services Forecasts by Portfolio
Portfolio RCP2 Capex ($m) Main Projects / Programmes during RCP2
Enabling Infrastructure
25.8 Upgrade and refresh core ICT infrastructure components (servers, storage, etc.)
Service Management 16.5 Lifecycle upgrades to tools and systems used in monitoring and managing our computer and telecommunications networks
Workforce Mobility 3.7 Lifecycle upgrades to systems that allow field and remote access to our systems
Data Centre 3.1 Migration to hosted (third-party) facilities
Incremental infrastructure to transition critical systems
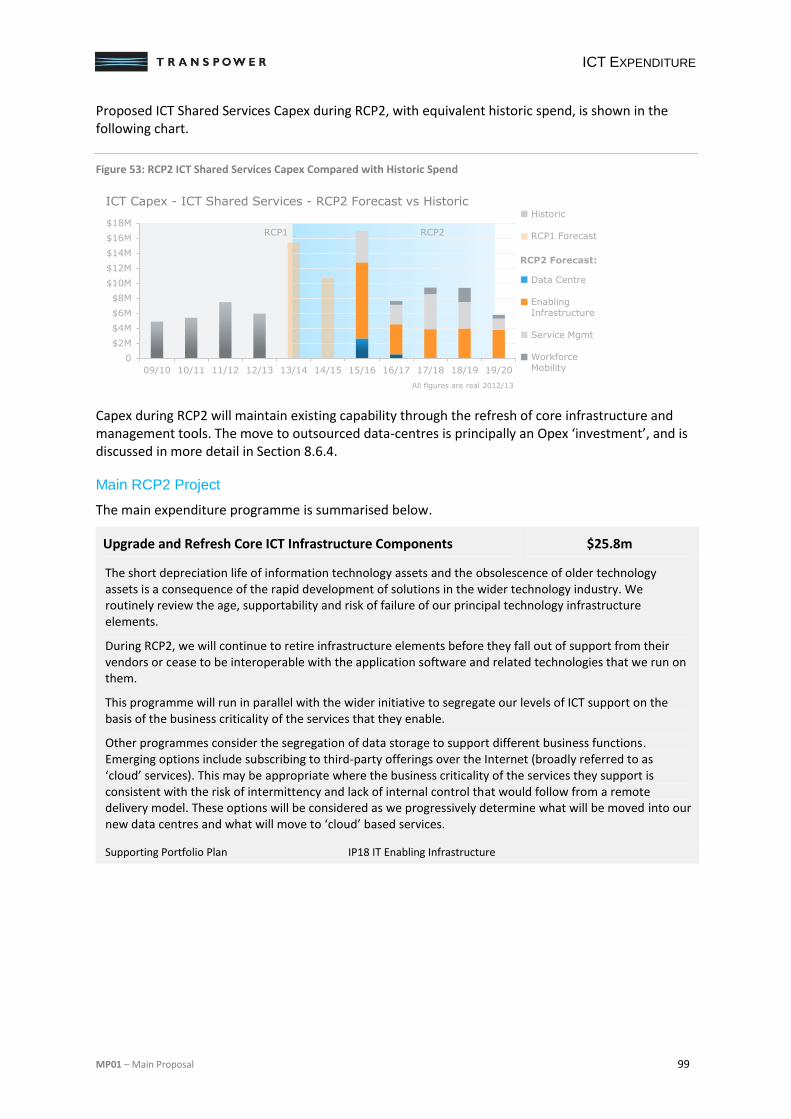
ICT EXPENDITURE
MP01 – Main Proposal 99
Proposed ICT Shared Services Capex during RCP2, with equivalent historic spend, is shown in the following chart.
Figure 53: RCP2 ICT Shared Services Capex Compared with Historic Spend
Capex during RCP2 will maintain existing capability through the refresh of core infrastructure and management tools. The move to outsourced data-centres is principally an Opex ‘investment’, and is discussed in more detail in Section 8.6.4.
Main RCP2 Project
The main expenditure programme is summarised below.
Upgrade and Refresh Core ICT Infrastructure Components $25.8m
The short depreciation life of information technology assets and the obsolescence of older technology assets is a consequence of the rapid development of solutions in the wider technology industry. We routinely review the age, supportability and risk of failure of our principal technology infrastructure elements.
During RCP2, we will continue to retire infrastructure elements before they fall out of support from their vendors or cease to be interoperable with the application software and related technologies that we run on them.
This programme will run in parallel with the wider initiative to segregate our levels of ICT support on the basis of the business criticality of the services that they enable.
Other programmes consider the segregation of data storage to support different business functions. Emerging options include subscribing to third-party offerings over the Internet (broadly referred to as ‘cloud’ services). This may be appropriate where the business criticality of the services they support is consistent with the risk of intermittency and lack of internal control that would follow from a remote delivery model. These options will be considered as we progressively determine what will be moved into our new data centres and what will move to ‘cloud’ based services.
Supporting Portfolio Plan IP18 IT Enabling Infrastructure
0
$2M
$4M
$6M
$8M
$10M
$12M
$14M
$16M
$18M
09/10 10/11 11/12 12/13 13/14 14/15 15/16 16/17 17/18 18/19 19/20
ICT Capex - ICT Shared Services - RCP2 Forecast vs Historic
All figures are real 2012/13
RCP1 RCP2
Historic
RCP1 Forecast
Data Centre
Enabling Infrastructure
Service Mgmt
Workforce Mobility
RCP2 Forecast:
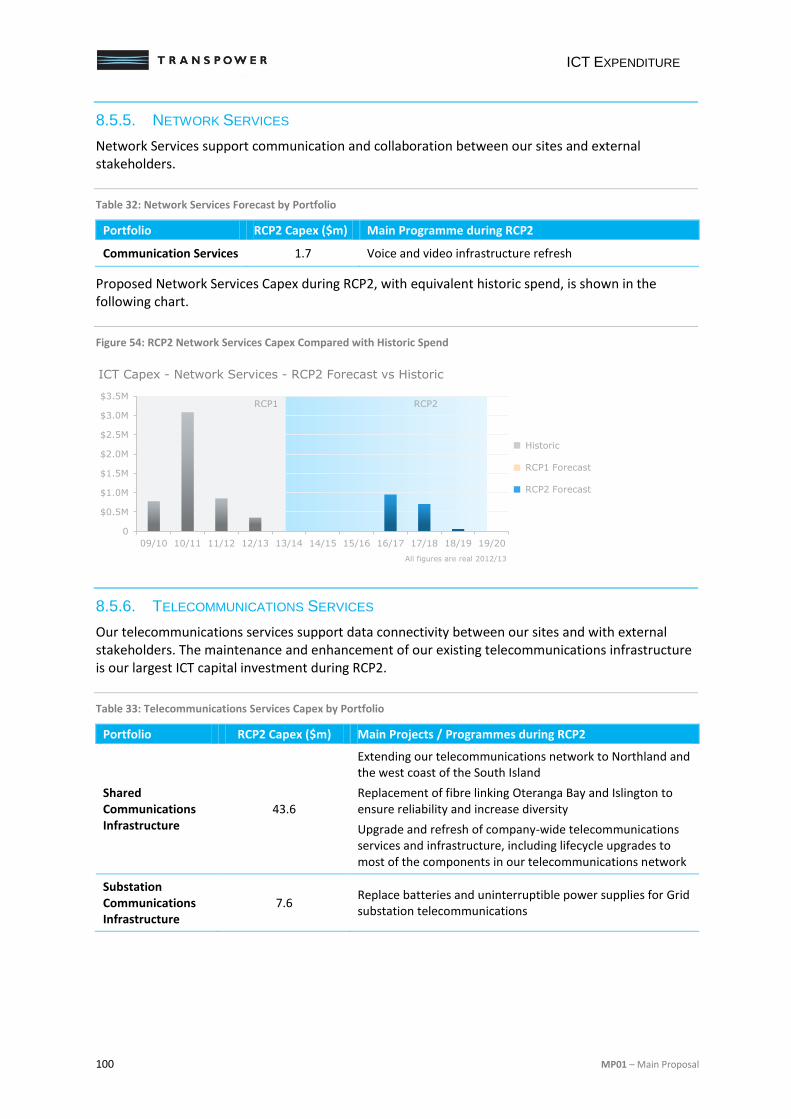
ICT EXPENDITURE
100 MP01 – Main Proposal
8.5.5. NETWORK SERVICES
Network Services support communication and collaboration between our sites and external stakeholders.
Table 32: Network Services Forecast by Portfolio
Portfolio RCP2 Capex ($m) Main Programme during RCP2
Communication Services 1.7 Voice and video infrastructure refresh
Proposed Network Services Capex during RCP2, with equivalent historic spend, is shown in the following chart.
Figure 54: RCP2 Network Services Capex Compared with Historic Spend
8.5.6. TELECOMMUNICATIONS SERVICES
Our telecommunications services support data connectivity between our sites and with external stakeholders. The maintenance and enhancement of our existing telecommunications infrastructure is our largest ICT capital investment during RCP2.
Table 33: Telecommunications Services Capex by Portfolio
Portfolio RCP2 Capex ($m) Main Projects / Programmes during RCP2
Shared Communications Infrastructure
43.6
Extending our telecommunications network to Northland and the west coast of the South Island
Replacement of fibre linking Oteranga Bay and Islington to ensure reliability and increase diversity
Upgrade and refresh of company-wide telecommunications services and infrastructure, including lifecycle upgrades to most of the components in our telecommunications network
Substation Communications Infrastructure
7.6 Replace batteries and uninterruptible power supplies for Grid substation telecommunications
0
$0.5M
$1.0M
$1.5M
$2.0M
$2.5M
$3.0M
$3.5M
09/10 10/11 11/12 12/13 13/14 14/15 15/16 16/17 17/18 18/19 19/20
ICT Capex - Network Services - RCP2 Forecast vs Historic
All figures are real 2012/13
Historic
RCP1 Forecast
RCP2 Forecast
RCP1 RCP2
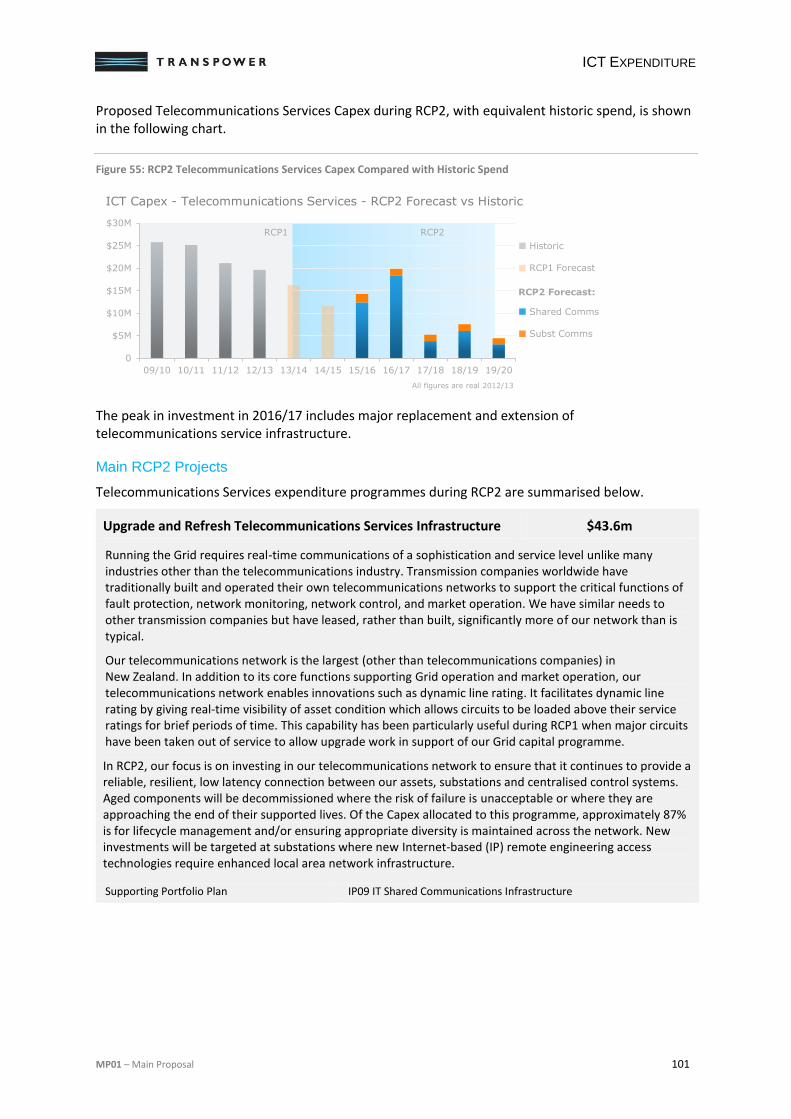
ICT EXPENDITURE
MP01 – Main Proposal 101
Proposed Telecommunications Services Capex during RCP2, with equivalent historic spend, is shown in the following chart.
Figure 55: RCP2 Telecommunications Services Capex Compared with Historic Spend
The peak in investment in 2016/17 includes major replacement and extension of telecommunications service infrastructure.
Main RCP2 Projects
Telecommunications Services expenditure programmes during RCP2 are summarised below.
Upgrade and Refresh Telecommunications Services Infrastructure $43.6m
Running the Grid requires real-time communications of a sophistication and service level unlike many industries other than the telecommunications industry. Transmission companies worldwide have traditionally built and operated their own telecommunications networks to support the critical functions of fault protection, network monitoring, network control, and market operation. We have similar needs to other transmission companies but have leased, rather than built, significantly more of our network than is typical.
Our telecommunications network is the largest (other than telecommunications companies) in New Zealand. In addition to its core functions supporting Grid operation and market operation, our telecommunications network enables innovations such as dynamic line rating. It facilitates dynamic line rating by giving real-time visibility of asset condition which allows circuits to be loaded above their service ratings for brief periods of time. This capability has been particularly useful during RCP1 when major circuits have been taken out of service to allow upgrade work in support of our Grid capital programme.
In RCP2, our focus is on investing in our telecommunications network to ensure that it continues to provide a reliable, resilient, low latency connection between our assets, substations and centralised control systems. Aged components will be decommissioned where the risk of failure is unacceptable or where they are approaching the end of their supported lives. Of the Capex allocated to this programme, approximately 87% is for lifecycle management and/or ensuring appropriate diversity is maintained across the network. New investments will be targeted at substations where new Internet-based (IP) remote engineering access technologies require enhanced local area network infrastructure.
Supporting Portfolio Plan IP09 IT Shared Communications Infrastructure
0
$5M
$10M
$15M
$20M
$25M
$30M
09/10 10/11 11/12 12/13 13/14 14/15 15/16 16/17 17/18 18/19 19/20
ICT Capex - Telecommunications Services - RCP2 Forecast vs Historic
All figures are real 2012/13
RCP1 RCP2
Historic
RCP1 Forecast
Shared Comms
Subst Comms
RCP2 Forecast:
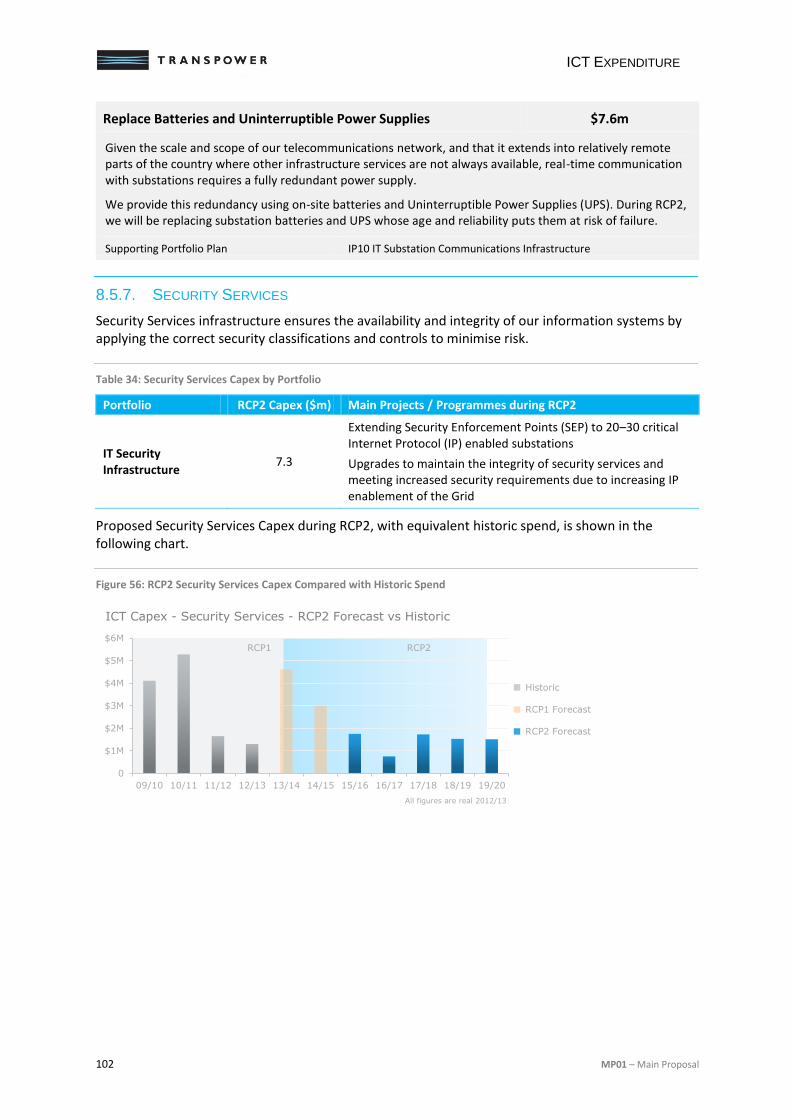
ICT EXPENDITURE
102 MP01 – Main Proposal
Replace Batteries and Uninterruptible Power Supplies $7.6m
Given the scale and scope of our telecommunications network, and that it extends into relatively remote parts of the country where other infrastructure services are not always available, real-time communication with substations requires a fully redundant power supply.
We provide this redundancy using on-site batteries and Uninterruptible Power Supplies (UPS). During RCP2, we will be replacing substation batteries and UPS whose age and reliability puts them at risk of failure.
Supporting Portfolio Plan IP10 IT Substation Communications Infrastructure
8.5.7. SECURITY SERVICES
Security Services infrastructure ensures the availability and integrity of our information systems by applying the correct security classifications and controls to minimise risk.
Table 34: Security Services Capex by Portfolio
Portfolio RCP2 Capex ($m) Main Projects / Programmes during RCP2
IT Security Infrastructure
7.3
Extending Security Enforcement Points (SEP) to 20–30 critical Internet Protocol (IP) enabled substations
Upgrades to maintain the integrity of security services and meeting increased security requirements due to increasing IP enablement of the Grid
Proposed Security Services Capex during RCP2, with equivalent historic spend, is shown in the following chart.
Figure 56: RCP2 Security Services Capex Compared with Historic Spend
0
$1M
$2M
$3M
$4M
$5M
$6M
09/10 10/11 11/12 12/13 13/14 14/15 15/16 16/17 17/18 18/19 19/20
ICT Capex - Security Services - RCP2 Forecast vs Historic
All figures are real 2012/13
Historic
RCP1 Forecast
RCP2 Forecast
RCP1 RCP2
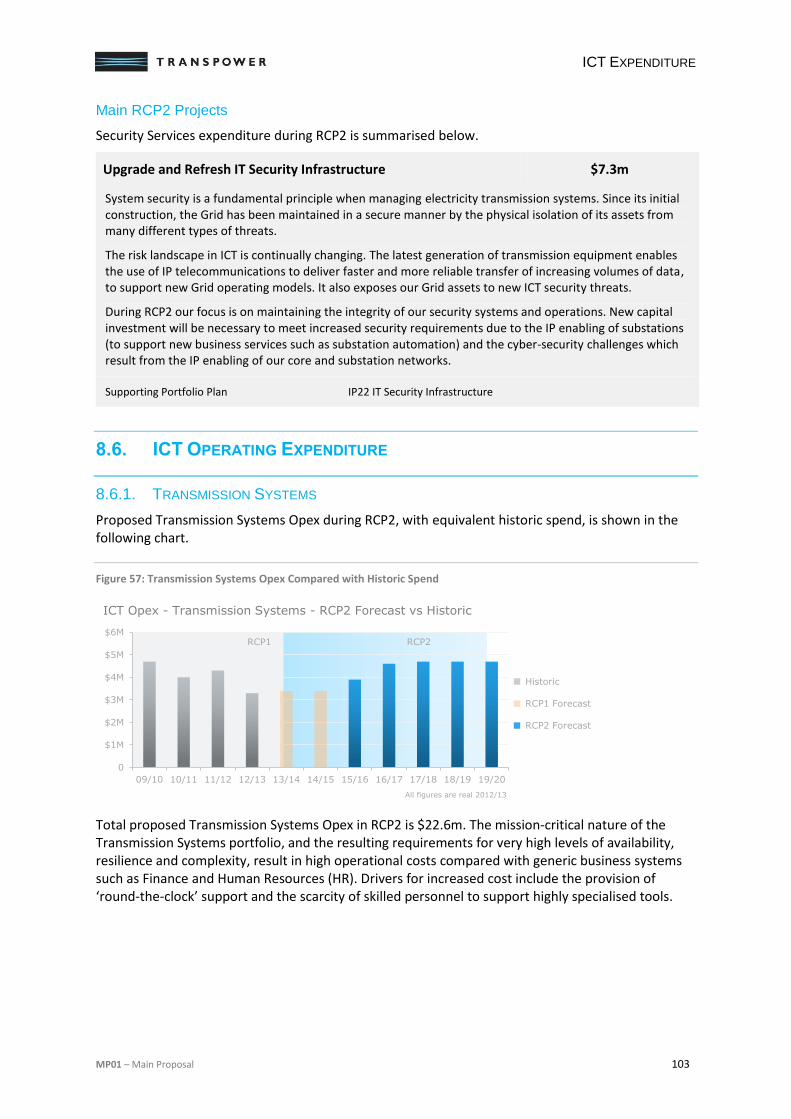
ICT EXPENDITURE
MP01 – Main Proposal 103
Main RCP2 Projects
Security Services expenditure during RCP2 is summarised below.
Upgrade and Refresh IT Security Infrastructure $7.3m
System security is a fundamental principle when managing electricity transmission systems. Since its initial construction, the Grid has been maintained in a secure manner by the physical isolation of its assets from many different types of threats.
The risk landscape in ICT is continually changing. The latest generation of transmission equipment enables the use of IP telecommunications to deliver faster and more reliable transfer of increasing volumes of data, to support new Grid operating models. It also exposes our Grid assets to new ICT security threats.
During RCP2 our focus is on maintaining the integrity of our security systems and operations. New capital investment will be necessary to meet increased security requirements due to the IP enabling of substations (to support new business services such as substation automation) and the cyber-security challenges which result from the IP enabling of our core and substation networks.
Supporting Portfolio Plan IP22 IT Security Infrastructure
8.6. ICT OPERATING EXPENDITURE
8.6.1. TRANSMISSION SYSTEMS
Proposed Transmission Systems Opex during RCP2, with equivalent historic spend, is shown in the following chart.
Figure 57: Transmission Systems Opex Compared with Historic Spend
Total proposed Transmission Systems Opex in RCP2 is $22.6m. The mission-critical nature of the Transmission Systems portfolio, and the resulting requirements for very high levels of availability, resilience and complexity, result in high operational costs compared with generic business systems such as Finance and Human Resources (HR). Drivers for increased cost include the provision of ‘round-the-clock’ support and the scarcity of skilled personnel to support highly specialised tools.
0
$1M
$2M
$3M
$4M
$5M
$6M
09/10 10/11 11/12 12/13 13/14 14/15 15/16 16/17 17/18 18/19 19/20
ICT Opex - Transmission Systems - RCP2 Forecast vs Historic
All figures are real 2012/13
Historic
RCP1 Forecast
RCP2 Forecast
RCP1 RCP2
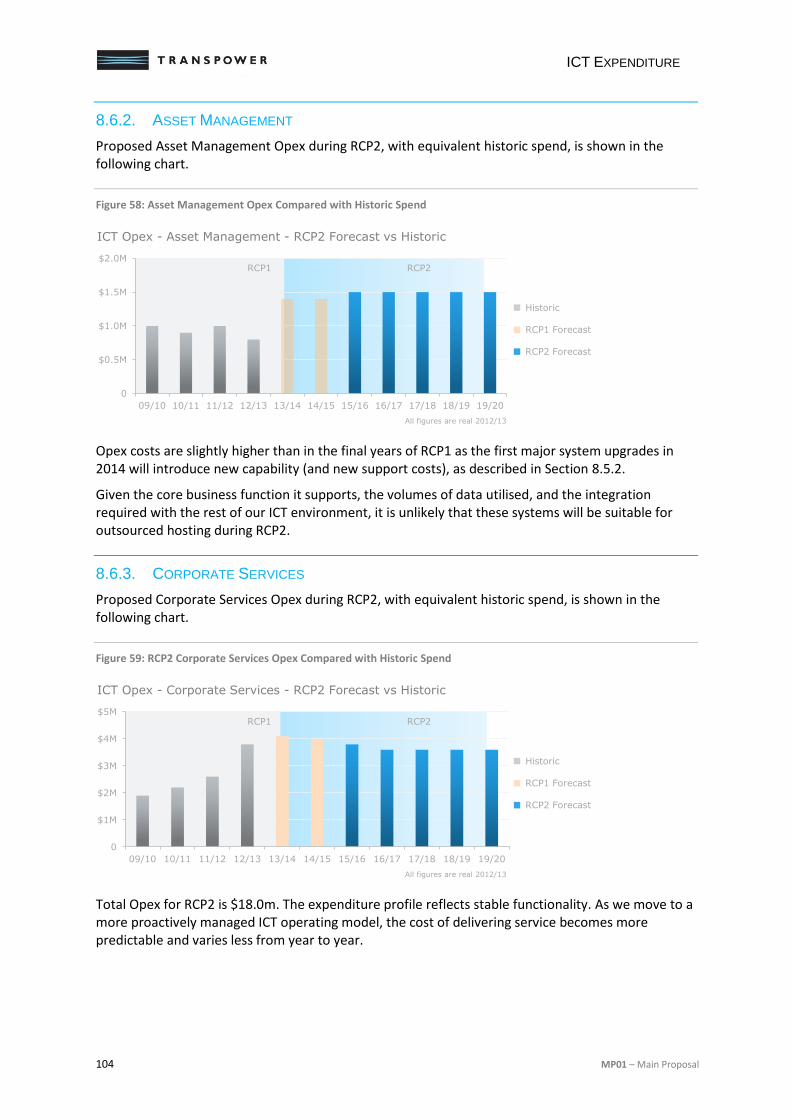
ICT EXPENDITURE
104 MP01 – Main Proposal
8.6.2. ASSET MANAGEMENT
Proposed Asset Management Opex during RCP2, with equivalent historic spend, is shown in the following chart.
Figure 58: Asset Management Opex Compared with Historic Spend
Opex costs are slightly higher than in the final years of RCP1 as the first major system upgrades in 2014 will introduce new capability (and new support costs), as described in Section 8.5.2.
Given the core business function it supports, the volumes of data utilised, and the integration required with the rest of our ICT environment, it is unlikely that these systems will be suitable for outsourced hosting during RCP2.
8.6.3. CORPORATE SERVICES
Proposed Corporate Services Opex during RCP2, with equivalent historic spend, is shown in the following chart.
Figure 59: RCP2 Corporate Services Opex Compared with Historic Spend
Total Opex for RCP2 is $18.0m. The expenditure profile reflects stable functionality. As we move to a more proactively managed ICT operating model, the cost of delivering service becomes more predictable and varies less from year to year.
0
$0.5M
$1.0M
$1.5M
$2.0M
09/10 10/11 11/12 12/13 13/14 14/15 15/16 16/17 17/18 18/19 19/20
ICT Opex - Asset Management - RCP2 Forecast vs Historic
All figures are real 2012/13
Historic
RCP1 Forecast
RCP2 Forecast
RCP1 RCP2
0
$1M
$2M
$3M
$4M
$5M
09/10 10/11 11/12 12/13 13/14 14/15 15/16 16/17 17/18 18/19 19/20
ICT Opex - Corporate Services - RCP2 Forecast vs Historic
All figures are real 2012/13
Historic
RCP1 Forecast
RCP2 Forecast
RCP1 RCP2
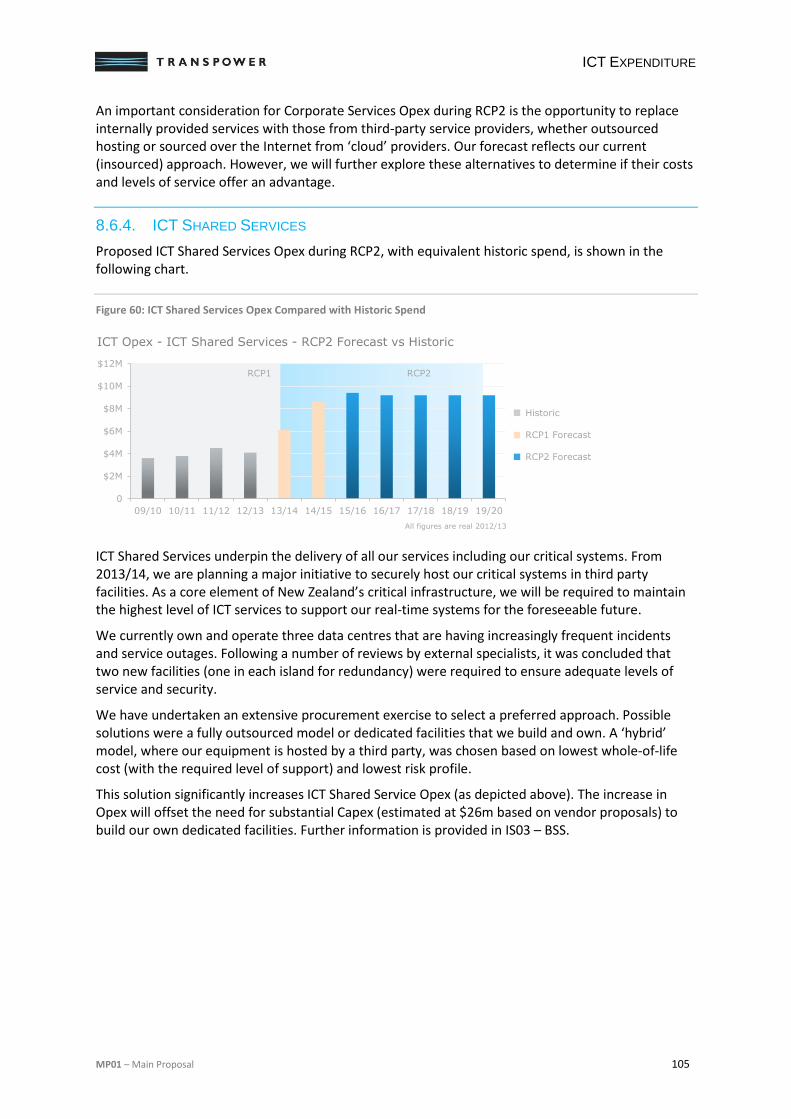
ICT EXPENDITURE
MP01 – Main Proposal 105
An important consideration for Corporate Services Opex during RCP2 is the opportunity to replace internally provided services with those from third-party service providers, whether outsourced hosting or sourced over the Internet from ‘cloud’ providers. Our forecast reflects our current (insourced) approach. However, we will further explore these alternatives to determine if their costs and levels of service offer an advantage.
8.6.4. ICT SHARED SERVICES
Proposed ICT Shared Services Opex during RCP2, with equivalent historic spend, is shown in the following chart.
Figure 60: ICT Shared Services Opex Compared with Historic Spend
ICT Shared Services underpin the delivery of all our services including our critical systems. From 2013/14, we are planning a major initiative to securely host our critical systems in third party facilities. As a core element of New Zealand’s critical infrastructure, we will be required to maintain the highest level of ICT services to support our real-time systems for the foreseeable future.
We currently own and operate three data centres that are having increasingly frequent incidents and service outages. Following a number of reviews by external specialists, it was concluded that two new facilities (one in each island for redundancy) were required to ensure adequate levels of service and security.
We have undertaken an extensive procurement exercise to select a preferred approach. Possible solutions were a fully outsourced model or dedicated facilities that we build and own. A ‘hybrid’ model, where our equipment is hosted by a third party, was chosen based on lowest whole-of-life cost (with the required level of support) and lowest risk profile.
This solution significantly increases ICT Shared Service Opex (as depicted above). The increase in Opex will offset the need for substantial Capex (estimated at $26m based on vendor proposals) to build our own dedicated facilities. Further information is provided in IS03 – BSS.
0
$2M
$4M
$6M
$8M
$10M
$12M
09/10 10/11 11/12 12/13 13/14 14/15 15/16 16/17 17/18 18/19 19/20
ICT Opex - ICT Shared Services - RCP2 Forecast vs Historic
All figures are real 2012/13
Historic
RCP1 Forecast
RCP2 Forecast
RCP1 RCP2
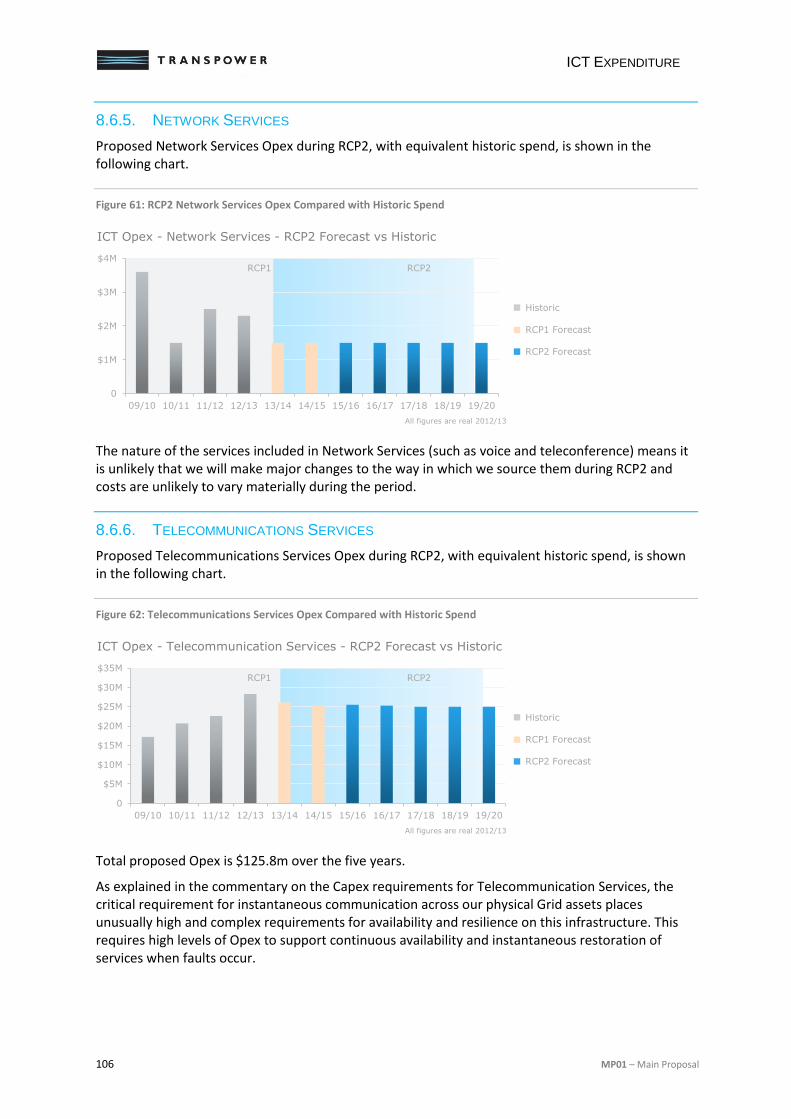
ICT EXPENDITURE
106 MP01 – Main Proposal
8.6.5. NETWORK SERVICES
Proposed Network Services Opex during RCP2, with equivalent historic spend, is shown in the following chart.
Figure 61: RCP2 Network Services Opex Compared with Historic Spend
The nature of the services included in Network Services (such as voice and teleconference) means it is unlikely that we will make major changes to the way in which we source them during RCP2 and costs are unlikely to vary materially during the period.
8.6.6. TELECOMMUNICATIONS SERVICES
Proposed Telecommunications Services Opex during RCP2, with equivalent historic spend, is shown in the following chart.
Figure 62: Telecommunications Services Opex Compared with Historic Spend
Total proposed Opex is $125.8m over the five years.
As explained in the commentary on the Capex requirements for Telecommunication Services, the critical requirement for instantaneous communication across our physical Grid assets places unusually high and complex requirements for availability and resilience on this infrastructure. This requires high levels of Opex to support continuous availability and instantaneous restoration of services when faults occur.
0
$1M
$2M
$3M
$4M
09/10 10/11 11/12 12/13 13/14 14/15 15/16 16/17 17/18 18/19 19/20
ICT Opex - Network Services - RCP2 Forecast vs Historic
All figures are real 2012/13
Historic
RCP1 Forecast
RCP2 Forecast
RCP1 RCP2
0
$5M
$10M
$15M
$20M
$25M
$30M
$35M
09/10 10/11 11/12 12/13 13/14 14/15 15/16 16/17 17/18 18/19 19/20
ICT Opex - Telecommunication Services - RCP2 Forecast vs Historic
All figures are real 2012/13
Historic
RCP1 Forecast
RCP2 Forecast
RCP1 RCP2
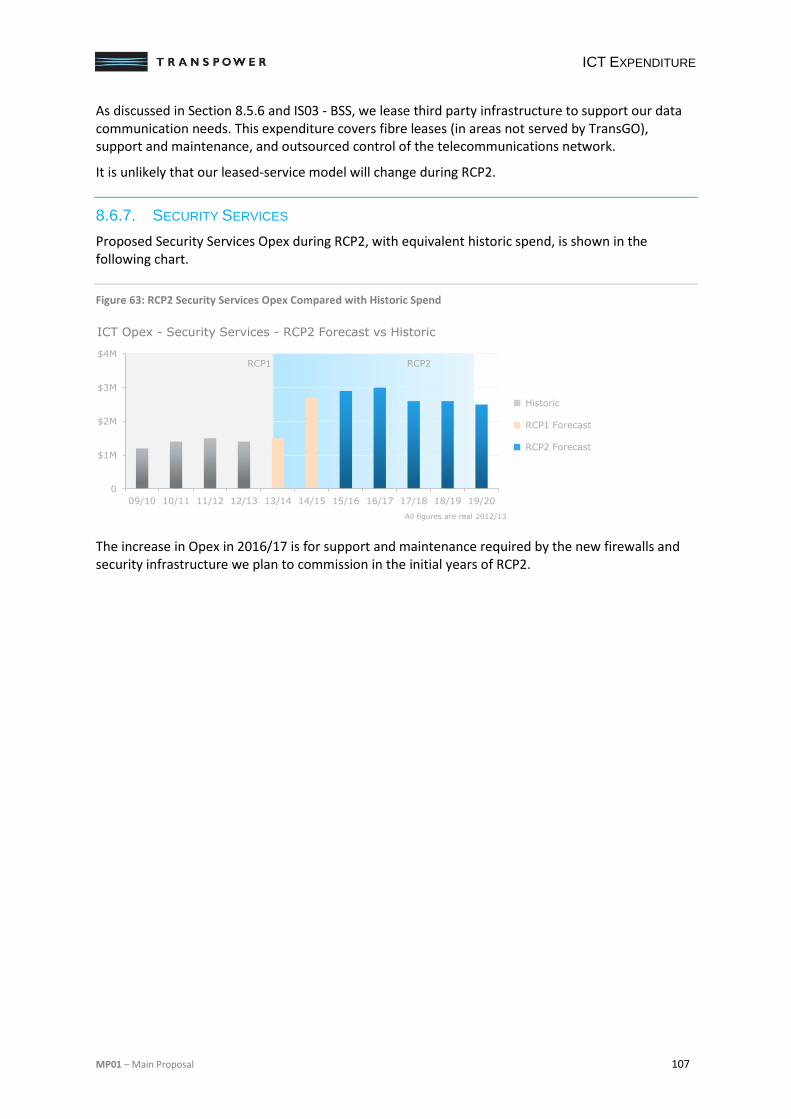
ICT EXPENDITURE
MP01 – Main Proposal 107
As discussed in Section 8.5.6 and IS03 - BSS, we lease third party infrastructure to support our data communication needs. This expenditure covers fibre leases (in areas not served by TransGO), support and maintenance, and outsourced control of the telecommunications network.
It is unlikely that our leased-service model will change during RCP2.
8.6.7. SECURITY SERVICES
Proposed Security Services Opex during RCP2, with equivalent historic spend, is shown in the following chart.
Figure 63: RCP2 Security Services Opex Compared with Historic Spend
The increase in Opex in 2016/17 is for support and maintenance required by the new firewalls and security infrastructure we plan to commission in the initial years of RCP2.
0
$1M
$2M
$3M
$4M
09/10 10/11 11/12 12/13 13/14 14/15 15/16 16/17 17/18 18/19 19/20
ICT Opex - Security Services - RCP2 Forecast vs Historic
All figures are real 2012/13
Historic
RCP1 Forecast
RCP2 Forecast
RCP1 RCP2
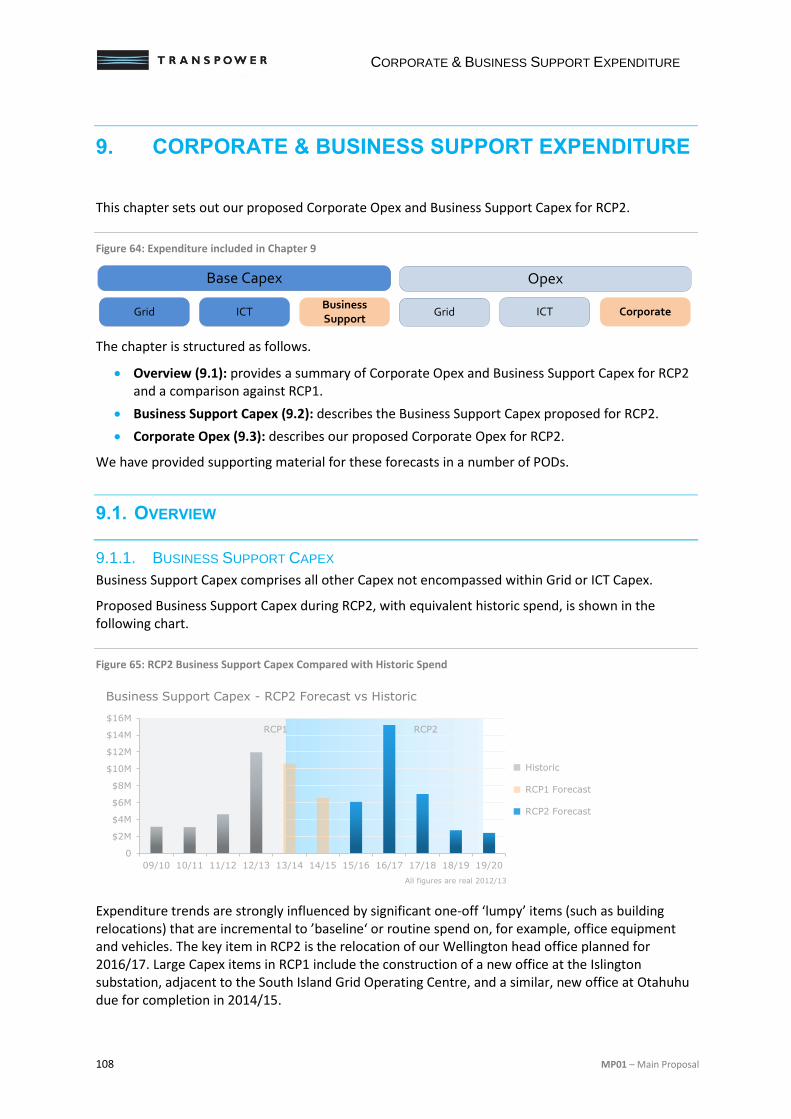
CORPORATE & BUSINESS SUPPORT EXPENDITURE
108 MP01 – Main Proposal
9. CORPORATE & BUSINESS SUPPORT EXPENDITURE
This chapter sets out our proposed Corporate Opex and Business Support Capex for RCP2.
Figure 64: Expenditure included in Chapter 9
The chapter is structured as follows.
Overview (9.1): provides a summary of Corporate Opex and Business Support Capex for RCP2 and a comparison against RCP1.
Business Support Capex (9.2): describes the Business Support Capex proposed for RCP2.
Corporate Opex (9.3): describes our proposed Corporate Opex for RCP2.
We have provided supporting material for these forecasts in a number of PODs.
9.1. OVERVIEW
9.1.1. BUSINESS SUPPORT CAPEX
Business Support Capex comprises all other Capex not encompassed within Grid or ICT Capex.
Proposed Business Support Capex during RCP2, with equivalent historic spend, is shown in the following chart.
Figure 65: RCP2 Business Support Capex Compared with Historic Spend
Expenditure trends are strongly influenced by significant one-off ‘lumpy’ items (such as building relocations) that are incremental to ’baseline‘ or routine spend on, for example, office equipment and vehicles. The key item in RCP2 is the relocation of our Wellington head office planned for 2016/17. Large Capex items in RCP1 include the construction of a new office at the Islington substation, adjacent to the South Island Grid Operating Centre, and a similar, new office at Otahuhu due for completion in 2014/15.
ICT GridBusiness Support
ICTGrid Corporate
Base Capex Opex
0
$2M
$4M
$6M
$8M
$10M
$12M
$14M
$16M
09/10 10/11 11/12 12/13 13/14 14/15 15/16 16/17 17/18 18/19 19/20
Business Support Capex - RCP2 Forecast vs Historic
All figures are real 2012/13
Historic
RCP1 Forecast
RCP2 Forecast
RCP1 RCP2
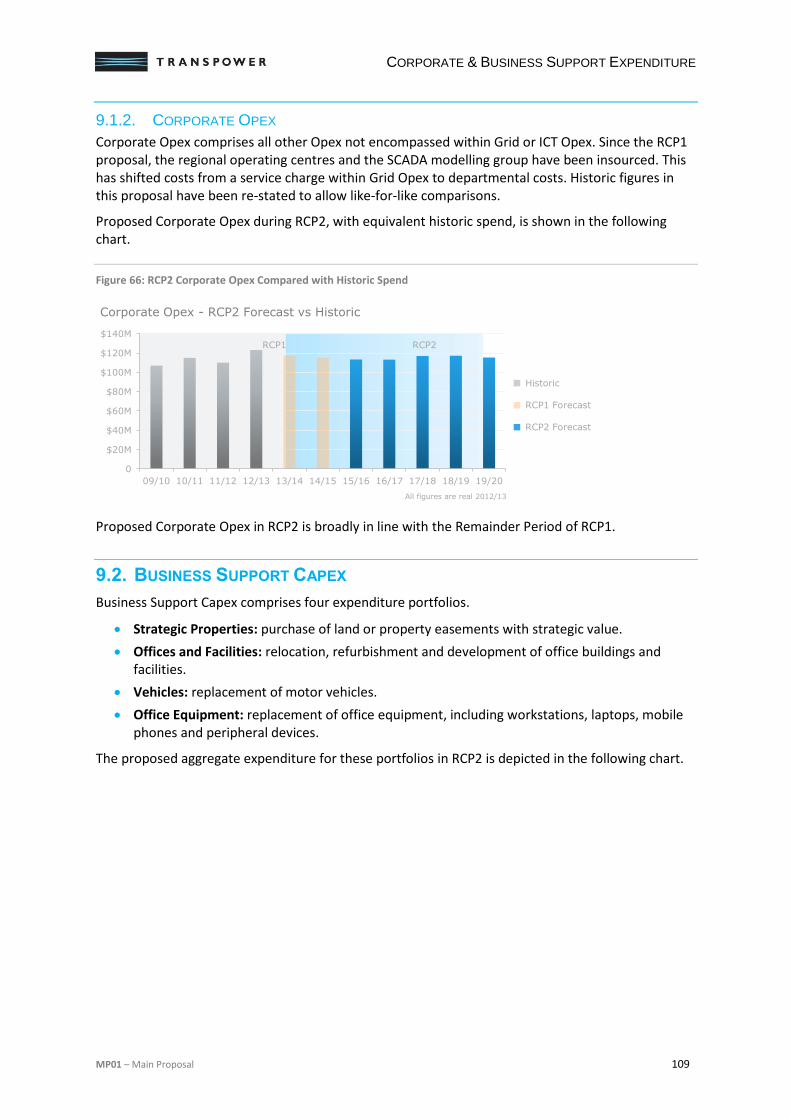
CORPORATE & BUSINESS SUPPORT EXPENDITURE
MP01 – Main Proposal 109
9.1.2. CORPORATE OPEX
Corporate Opex comprises all other Opex not encompassed within Grid or ICT Opex. Since the RCP1 proposal, the regional operating centres and the SCADA modelling group have been insourced. This has shifted costs from a service charge within Grid Opex to departmental costs. Historic figures in this proposal have been re-stated to allow like-for-like comparisons.
Proposed Corporate Opex during RCP2, with equivalent historic spend, is shown in the following chart.
Figure 66: RCP2 Corporate Opex Compared with Historic Spend
Proposed Corporate Opex in RCP2 is broadly in line with the Remainder Period of RCP1.
9.2. BUSINESS SUPPORT CAPEX
Business Support Capex comprises four expenditure portfolios.
Strategic Properties: purchase of land or property easements with strategic value.
Offices and Facilities: relocation, refurbishment and development of office buildings and facilities.
Vehicles: replacement of motor vehicles.
Office Equipment: replacement of office equipment, including workstations, laptops, mobile phones and peripheral devices.
The proposed aggregate expenditure for these portfolios in RCP2 is depicted in the following chart.
0
$20M
$40M
$60M
$80M
$100M
$120M
$140M
09/10 10/11 11/12 12/13 13/14 14/15 15/16 16/17 17/18 18/19 19/20
Corporate Opex - RCP2 Forecast vs Historic
All figures are real 2012/13
Historic
RCP1 Forecast
RCP2 Forecast
RCP1 RCP2
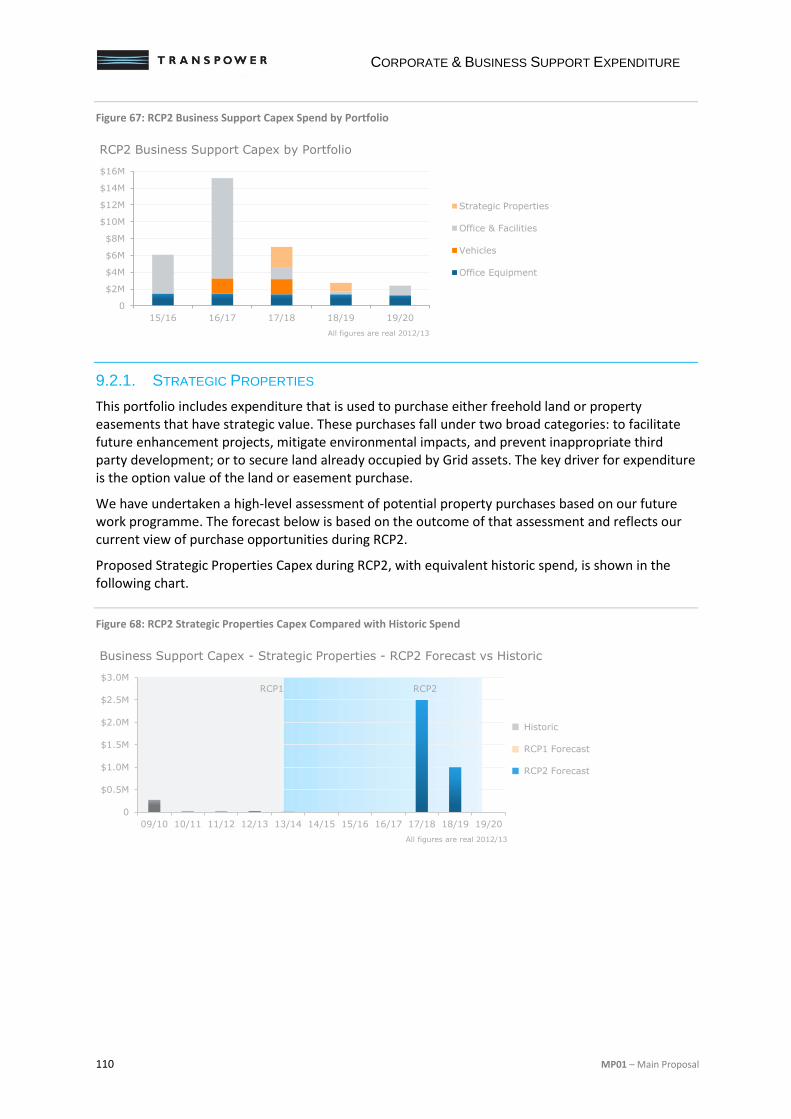
CORPORATE & BUSINESS SUPPORT EXPENDITURE
110 MP01 – Main Proposal
Figure 67: RCP2 Business Support Capex Spend by Portfolio
9.2.1. STRATEGIC PROPERTIES
This portfolio includes expenditure that is used to purchase either freehold land or property easements that have strategic value. These purchases fall under two broad categories: to facilitate future enhancement projects, mitigate environmental impacts, and prevent inappropriate third party development; or to secure land already occupied by Grid assets. The key driver for expenditure is the option value of the land or easement purchase.
We have undertaken a high-level assessment of potential property purchases based on our future work programme. The forecast below is based on the outcome of that assessment and reflects our current view of purchase opportunities during RCP2.
Proposed Strategic Properties Capex during RCP2, with equivalent historic spend, is shown in the following chart.
Figure 68: RCP2 Strategic Properties Capex Compared with Historic Spend
0
$2M
$4M
$6M
$8M
$10M
$12M
$14M
$16M
15/16 16/17 17/18 18/19 19/20
Strategic Properties
Office & Facilities
Vehicles
Office Equipment
RCP2 Business Support Capex by Portfolio
All figures are real 2012/13
0
$0.5M
$1.0M
$1.5M
$2.0M
$2.5M
$3.0M
09/10 10/11 11/12 12/13 13/14 14/15 15/16 16/17 17/18 18/19 19/20
Business Support Capex - Strategic Properties - RCP2 Forecast vs Historic
All figures are real 2012/13
RCP1 RCP2
Historic
RCP1 Forecast
RCP2 Forecast
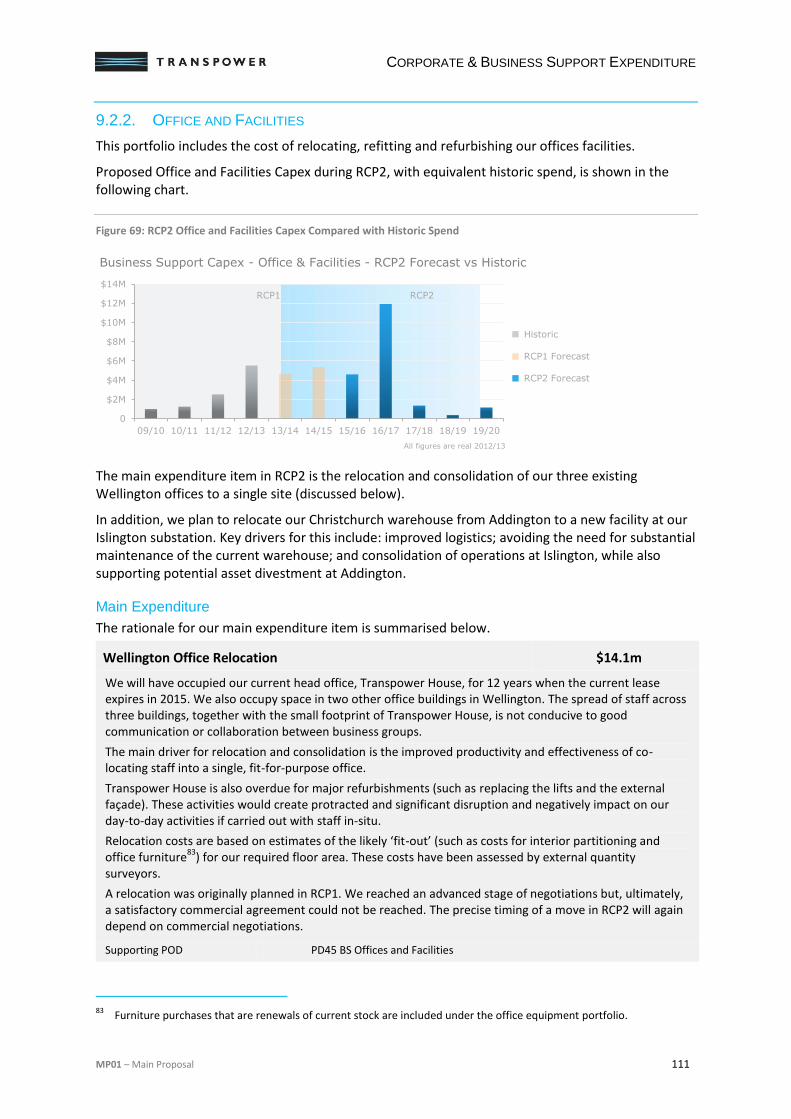
CORPORATE & BUSINESS SUPPORT EXPENDITURE
MP01 – Main Proposal 111
9.2.2. OFFICE AND FACILITIES
This portfolio includes the cost of relocating, refitting and refurbishing our offices facilities.
Proposed Office and Facilities Capex during RCP2, with equivalent historic spend, is shown in the following chart.
Figure 69: RCP2 Office and Facilities Capex Compared with Historic Spend
The main expenditure item in RCP2 is the relocation and consolidation of our three existing Wellington offices to a single site (discussed below).
In addition, we plan to relocate our Christchurch warehouse from Addington to a new facility at our Islington substation. Key drivers for this include: improved logistics; avoiding the need for substantial maintenance of the current warehouse; and consolidation of operations at Islington, while also supporting potential asset divestment at Addington.
Main Expenditure
The rationale for our main expenditure item is summarised below.
Wellington Office Relocation $14.1m
We will have occupied our current head office, Transpower House, for 12 years when the current lease expires in 2015. We also occupy space in two other office buildings in Wellington. The spread of staff across three buildings, together with the small footprint of Transpower House, is not conducive to good communication or collaboration between business groups.
The main driver for relocation and consolidation is the improved productivity and effectiveness of co-locating staff into a single, fit-for-purpose office.
Transpower House is also overdue for major refurbishments (such as replacing the lifts and the external façade). These activities would create protracted and significant disruption and negatively impact on our day-to-day activities if carried out with staff in-situ.
Relocation costs are based on estimates of the likely ‘fit-out’ (such as costs for interior partitioning and office furniture
83) for our required floor area. These costs have been assessed by external quantity
surveyors.
A relocation was originally planned in RCP1. We reached an advanced stage of negotiations but, ultimately, a satisfactory commercial agreement could not be reached. The precise timing of a move in RCP2 will again depend on commercial negotiations.
Supporting POD PD45 BS Offices and Facilities
83
Furniture purchases that are renewals of current stock are included under the office equipment portfolio.
0
$2M
$4M
$6M
$8M
$10M
$12M
$14M
09/10 10/11 11/12 12/13 13/14 14/15 15/16 16/17 17/18 18/19 19/20
Business Support Capex - Office & Facilities - RCP2 Forecast vs Historic
All figures are real 2012/13
RCP1 RCP2
Historic
RCP1 Forecast
RCP2 Forecast
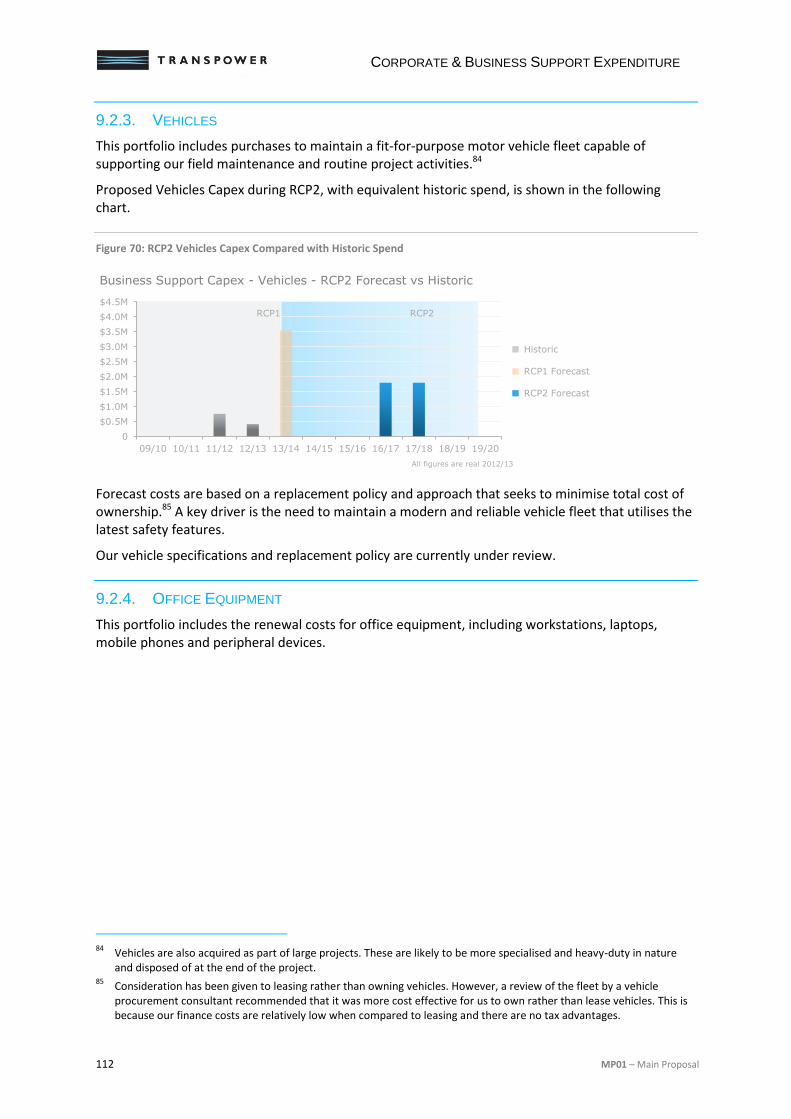
CORPORATE & BUSINESS SUPPORT EXPENDITURE
112 MP01 – Main Proposal
9.2.3. VEHICLES
This portfolio includes purchases to maintain a fit-for-purpose motor vehicle fleet capable of supporting our field maintenance and routine project activities.84
Proposed Vehicles Capex during RCP2, with equivalent historic spend, is shown in the following chart.
Figure 70: RCP2 Vehicles Capex Compared with Historic Spend
Forecast costs are based on a replacement policy and approach that seeks to minimise total cost of ownership.85 A key driver is the need to maintain a modern and reliable vehicle fleet that utilises the latest safety features.
Our vehicle specifications and replacement policy are currently under review.
9.2.4. OFFICE EQUIPMENT
This portfolio includes the renewal costs for office equipment, including workstations, laptops, mobile phones and peripheral devices.
84
Vehicles are also acquired as part of large projects. These are likely to be more specialised and heavy-duty in nature and disposed of at the end of the project.
85 Consideration has been given to leasing rather than owning vehicles. However, a review of the fleet by a vehicle
procurement consultant recommended that it was more cost effective for us to own rather than lease vehicles. This is because our finance costs are relatively low when compared to leasing and there are no tax advantages.
0
$0.5M
$1.0M
$1.5M
$2.0M
$2.5M
$3.0M
$3.5M
$4.0M
$4.5M
09/10 10/11 11/12 12/13 13/14 14/15 15/16 16/17 17/18 18/19 19/20
Business Support Capex - Vehicles - RCP2 Forecast vs Historic
All figures are real 2012/13
RCP1 RCP2
Historic
RCP1 Forecast
RCP2 Forecast
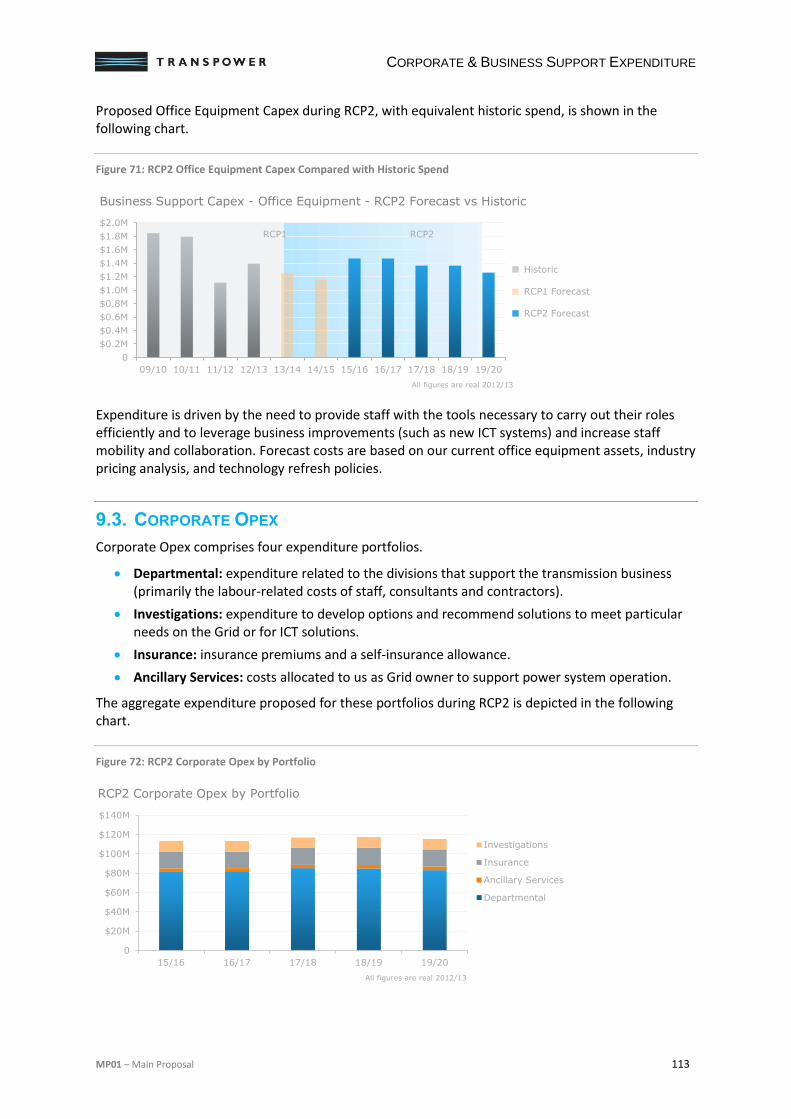
CORPORATE & BUSINESS SUPPORT EXPENDITURE
MP01 – Main Proposal 113
Proposed Office Equipment Capex during RCP2, with equivalent historic spend, is shown in the following chart.
Figure 71: RCP2 Office Equipment Capex Compared with Historic Spend
Expenditure is driven by the need to provide staff with the tools necessary to carry out their roles efficiently and to leverage business improvements (such as new ICT systems) and increase staff mobility and collaboration. Forecast costs are based on our current office equipment assets, industry pricing analysis, and technology refresh policies.
9.3. CORPORATE OPEX
Corporate Opex comprises four expenditure portfolios.
Departmental: expenditure related to the divisions that support the transmission business (primarily the labour-related costs of staff, consultants and contractors).
Investigations: expenditure to develop options and recommend solutions to meet particular needs on the Grid or for ICT solutions.
Insurance: insurance premiums and a self-insurance allowance.
Ancillary Services: costs allocated to us as Grid owner to support power system operation.
The aggregate expenditure proposed for these portfolios during RCP2 is depicted in the following chart.
Figure 72: RCP2 Corporate Opex by Portfolio
0
$0.2M
$0.4M
$0.6M
$0.8M
$1.0M
$1.2M
$1.4M
$1.6M
$1.8M
$2.0M
09/10 10/11 11/12 12/13 13/14 14/15 15/16 16/17 17/18 18/19 19/20
Business Support Capex - Office Equipment - RCP2 Forecast vs Historic
All figures are real 2012/13
RCP1 RCP2
Historic
RCP1 Forecast
RCP2 Forecast
0
$20M
$40M
$60M
$80M
$100M
$120M
$140M
15/16 16/17 17/18 18/19 19/20
Investigations
Insurance
Ancillary Services
Departmental
RCP2 Corporate Opex by Portfolio
All figures are real 2012/13
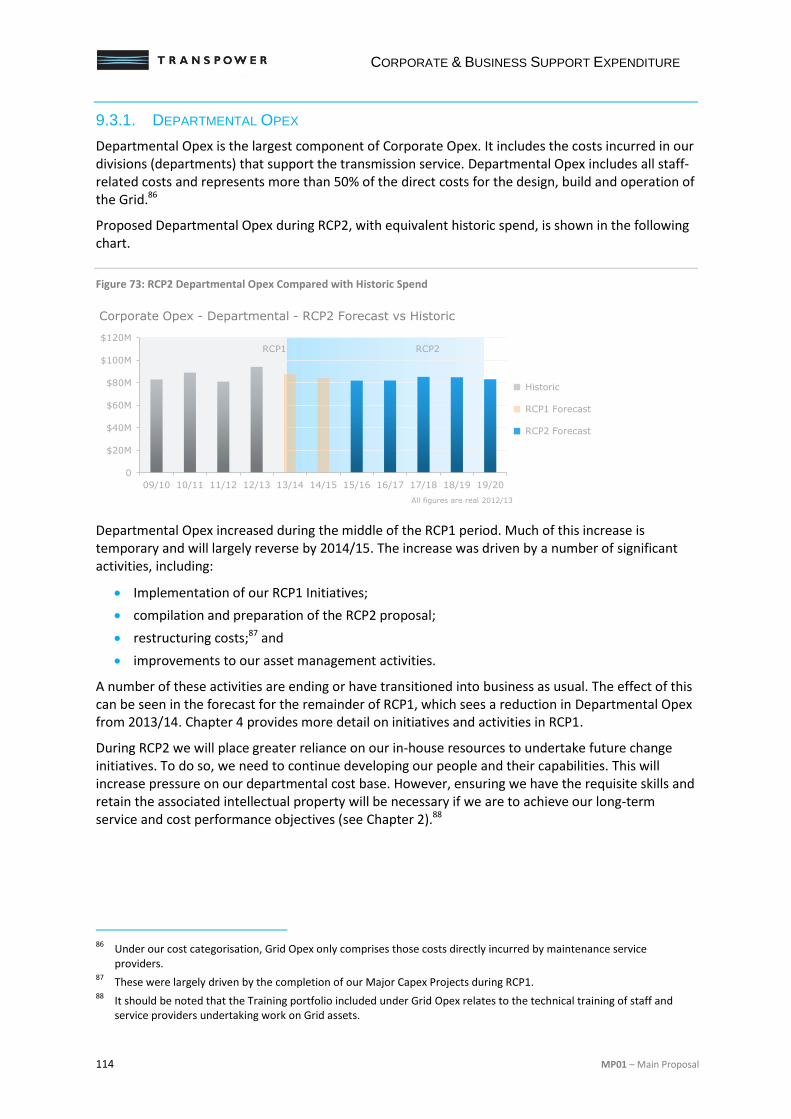
CORPORATE & BUSINESS SUPPORT EXPENDITURE
114 MP01 – Main Proposal
9.3.1. DEPARTMENTAL OPEX
Departmental Opex is the largest component of Corporate Opex. It includes the costs incurred in our divisions (departments) that support the transmission service. Departmental Opex includes all staff-related costs and represents more than 50% of the direct costs for the design, build and operation of the Grid.86
Proposed Departmental Opex during RCP2, with equivalent historic spend, is shown in the following chart.
Figure 73: RCP2 Departmental Opex Compared with Historic Spend
Departmental Opex increased during the middle of the RCP1 period. Much of this increase is temporary and will largely reverse by 2014/15. The increase was driven by a number of significant activities, including:
Implementation of our RCP1 Initiatives;
compilation and preparation of the RCP2 proposal;
restructuring costs;87 and
improvements to our asset management activities.
A number of these activities are ending or have transitioned into business as usual. The effect of this can be seen in the forecast for the remainder of RCP1, which sees a reduction in Departmental Opex from 2013/14. Chapter 4 provides more detail on initiatives and activities in RCP1.
During RCP2 we will place greater reliance on our in-house resources to undertake future change initiatives. To do so, we need to continue developing our people and their capabilities. This will increase pressure on our departmental cost base. However, ensuring we have the requisite skills and retain the associated intellectual property will be necessary if we are to achieve our long-term service and cost performance objectives (see Chapter 2).88
86
Under our cost categorisation, Grid Opex only comprises those costs directly incurred by maintenance service providers.
87 These were largely driven by the completion of our Major Capex Projects during RCP1.
88 It should be noted that the Training portfolio included under Grid Opex relates to the technical training of staff and
service providers undertaking work on Grid assets.
0
$20M
$40M
$60M
$80M
$100M
$120M
09/10 10/11 11/12 12/13 13/14 14/15 15/16 16/17 17/18 18/19 19/20
Corporate Opex - Departmental - RCP2 Forecast vs Historic
All figures are real 2012/13
Historic
RCP1 Forecast
RCP2 Forecast
RCP1 RCP2
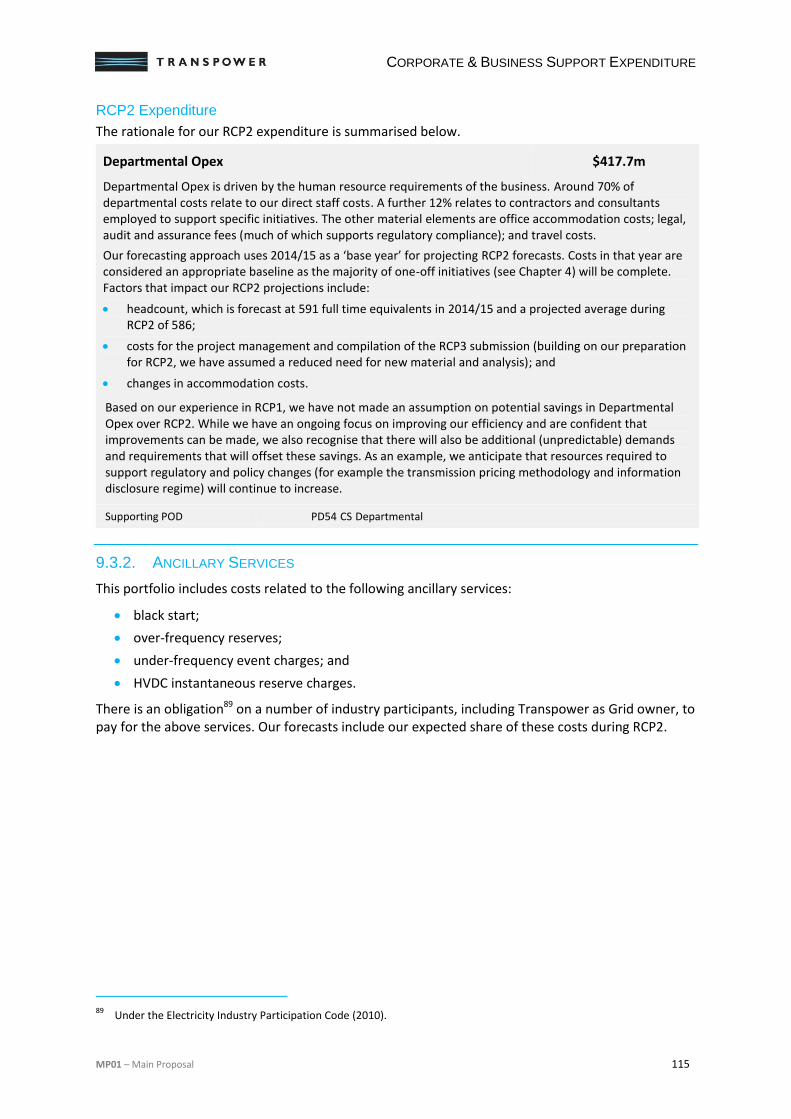
CORPORATE & BUSINESS SUPPORT EXPENDITURE
MP01 – Main Proposal 115
RCP2 Expenditure
The rationale for our RCP2 expenditure is summarised below.
Departmental Opex $417.7m
Departmental Opex is driven by the human resource requirements of the business. Around 70% of departmental costs relate to our direct staff costs. A further 12% relates to contractors and consultants employed to support specific initiatives. The other material elements are office accommodation costs; legal, audit and assurance fees (much of which supports regulatory compliance); and travel costs.
Our forecasting approach uses 2014/15 as a ‘base year’ for projecting RCP2 forecasts. Costs in that year are considered an appropriate baseline as the majority of one-off initiatives (see Chapter 4) will be complete. Factors that impact our RCP2 projections include:
headcount, which is forecast at 591 full time equivalents in 2014/15 and a projected average during RCP2 of 586;
costs for the project management and compilation of the RCP3 submission (building on our preparation for RCP2, we have assumed a reduced need for new material and analysis); and
changes in accommodation costs.
Based on our experience in RCP1, we have not made an assumption on potential savings in Departmental Opex over RCP2. While we have an ongoing focus on improving our efficiency and are confident that improvements can be made, we also recognise that there will also be additional (unpredictable) demands and requirements that will offset these savings. As an example, we anticipate that resources required to support regulatory and policy changes (for example the transmission pricing methodology and information disclosure regime) will continue to increase.
Supporting POD PD54 CS Departmental
9.3.2. ANCILLARY SERVICES
This portfolio includes costs related to the following ancillary services:
black start;
over-frequency reserves;
under-frequency event charges; and
HVDC instantaneous reserve charges.
There is an obligation89 on a number of industry participants, including Transpower as Grid owner, to pay for the above services. Our forecasts include our expected share of these costs during RCP2.
89
Under the Electricity Industry Participation Code (2010).
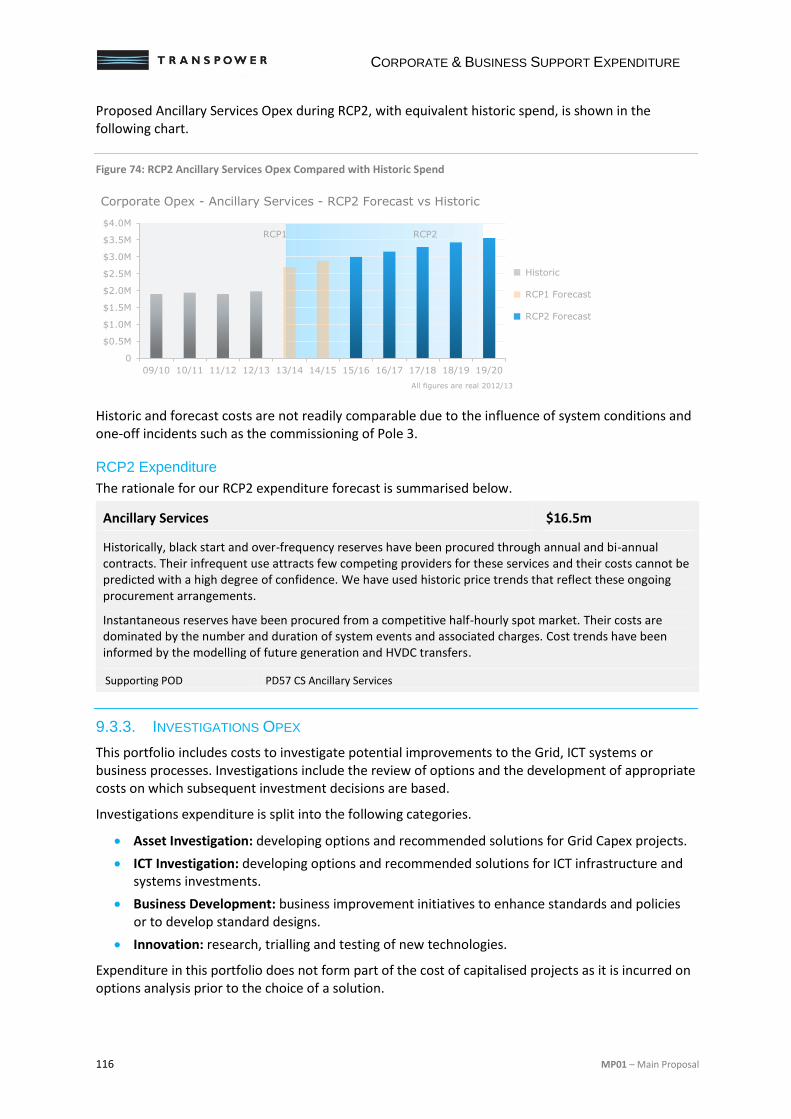
CORPORATE & BUSINESS SUPPORT EXPENDITURE
116 MP01 – Main Proposal
Proposed Ancillary Services Opex during RCP2, with equivalent historic spend, is shown in the following chart.
Figure 74: RCP2 Ancillary Services Opex Compared with Historic Spend
Historic and forecast costs are not readily comparable due to the influence of system conditions and one-off incidents such as the commissioning of Pole 3.
RCP2 Expenditure
The rationale for our RCP2 expenditure forecast is summarised below.
Ancillary Services $16.5m
Historically, black start and over-frequency reserves have been procured through annual and bi-annual contracts. Their infrequent use attracts few competing providers for these services and their costs cannot be predicted with a high degree of confidence. We have used historic price trends that reflect these ongoing procurement arrangements.
Instantaneous reserves have been procured from a competitive half-hourly spot market. Their costs are dominated by the number and duration of system events and associated charges. Cost trends have been informed by the modelling of future generation and HVDC transfers.
Supporting POD PD57 CS Ancillary Services
9.3.3. INVESTIGATIONS OPEX
This portfolio includes costs to investigate potential improvements to the Grid, ICT systems or business processes. Investigations include the review of options and the development of appropriate costs on which subsequent investment decisions are based.
Investigations expenditure is split into the following categories.
Asset Investigation: developing options and recommended solutions for Grid Capex projects.
ICT Investigation: developing options and recommended solutions for ICT infrastructure and systems investments.
Business Development: business improvement initiatives to enhance standards and policies or to develop standard designs.
Innovation: research, trialling and testing of new technologies.
Expenditure in this portfolio does not form part of the cost of capitalised projects as it is incurred on options analysis prior to the choice of a solution.
0
$0.5M
$1.0M
$1.5M
$2.0M
$2.5M
$3.0M
$3.5M
$4.0M
09/10 10/11 11/12 12/13 13/14 14/15 15/16 16/17 17/18 18/19 19/20
Corporate Opex - Ancillary Services - RCP2 Forecast vs Historic
All figures are real 2012/13
Historic
RCP1 Forecast
RCP2 Forecast
RCP1 RCP2
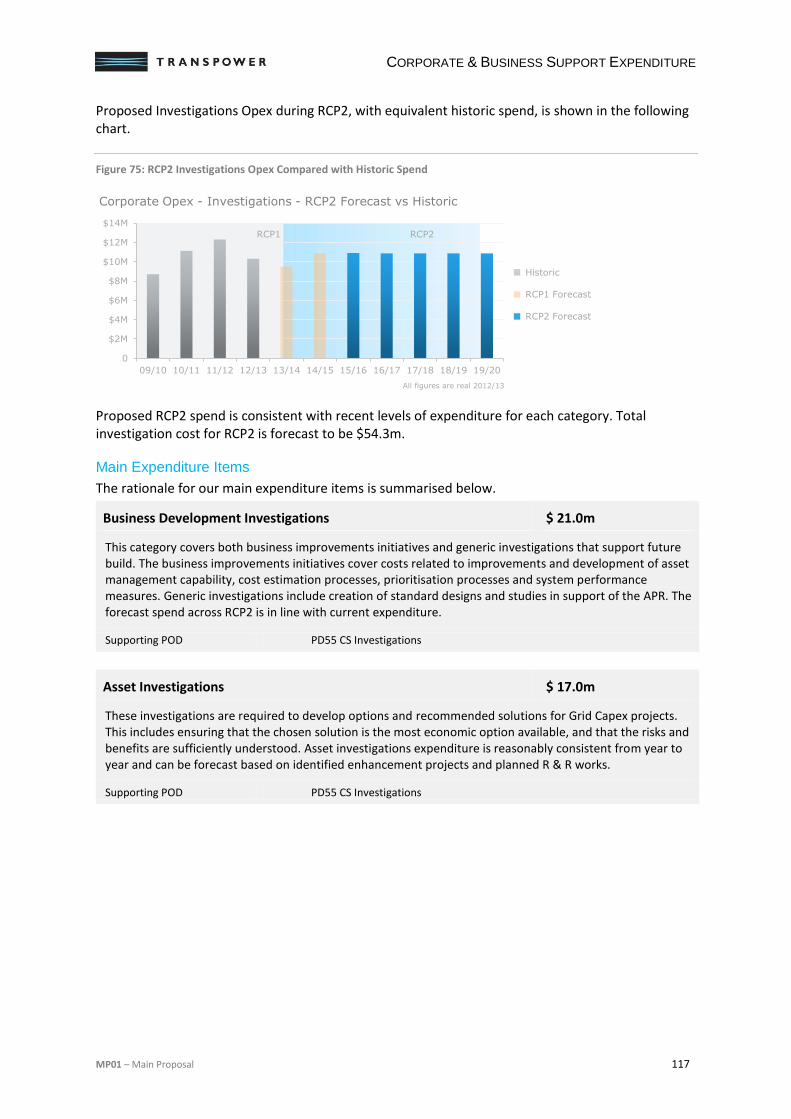
CORPORATE & BUSINESS SUPPORT EXPENDITURE
MP01 – Main Proposal 117
Proposed Investigations Opex during RCP2, with equivalent historic spend, is shown in the following chart.
Figure 75: RCP2 Investigations Opex Compared with Historic Spend
Proposed RCP2 spend is consistent with recent levels of expenditure for each category. Total investigation cost for RCP2 is forecast to be $54.3m.
Main Expenditure Items
The rationale for our main expenditure items is summarised below.
Business Development Investigations $ 21.0m
This category covers both business improvements initiatives and generic investigations that support future build. The business improvements initiatives cover costs related to improvements and development of asset management capability, cost estimation processes, prioritisation processes and system performance measures. Generic investigations include creation of standard designs and studies in support of the APR. The forecast spend across RCP2 is in line with current expenditure.
Supporting POD PD55 CS Investigations
Asset Investigations $ 17.0m
These investigations are required to develop options and recommended solutions for Grid Capex projects. This includes ensuring that the chosen solution is the most economic option available, and that the risks and benefits are sufficiently understood. Asset investigations expenditure is reasonably consistent from year to year and can be forecast based on identified enhancement projects and planned R & R works.
Supporting POD PD55 CS Investigations
0
$2M
$4M
$6M
$8M
$10M
$12M
$14M
09/10 10/11 11/12 12/13 13/14 14/15 15/16 16/17 17/18 18/19 19/20
Corporate Opex - Investigations - RCP2 Forecast vs Historic
All figures are real 2012/13
Historic
RCP1 Forecast
RCP2 Forecast
RCP1 RCP2
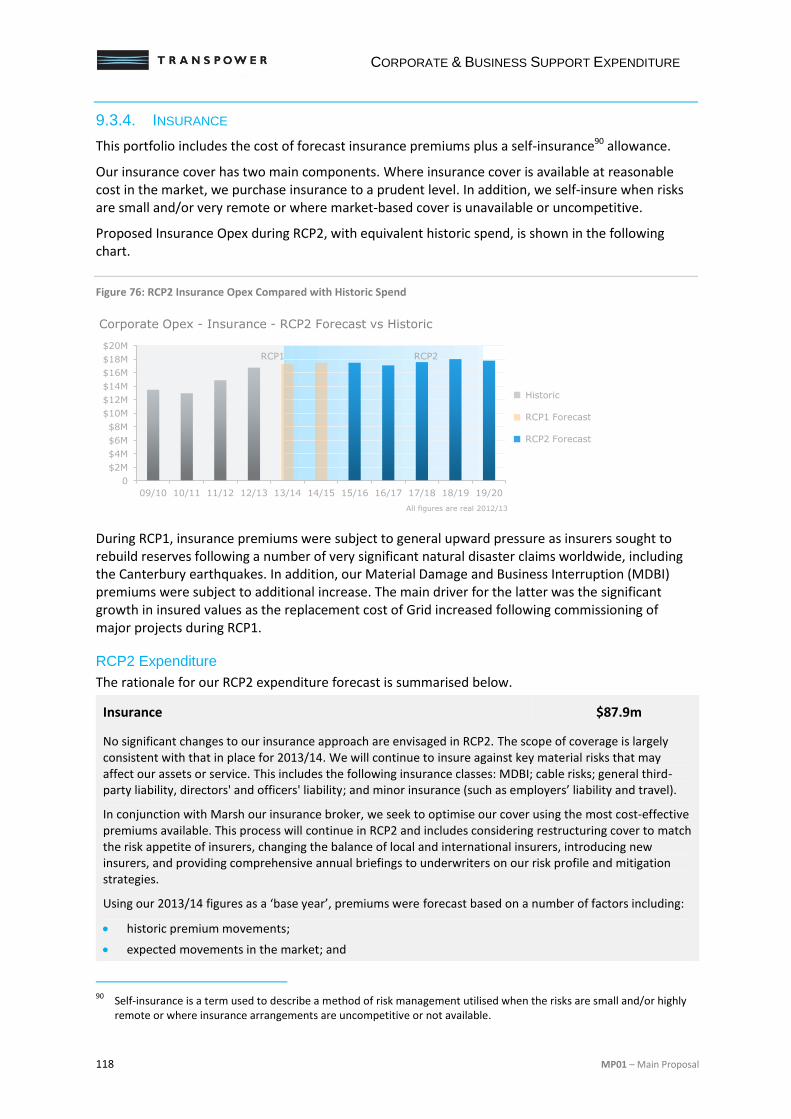
CORPORATE & BUSINESS SUPPORT EXPENDITURE
118 MP01 – Main Proposal
9.3.4. INSURANCE
This portfolio includes the cost of forecast insurance premiums plus a self-insurance90 allowance.
Our insurance cover has two main components. Where insurance cover is available at reasonable cost in the market, we purchase insurance to a prudent level. In addition, we self-insure when risks are small and/or very remote or where market-based cover is unavailable or uncompetitive.
Proposed Insurance Opex during RCP2, with equivalent historic spend, is shown in the following chart.
Figure 76: RCP2 Insurance Opex Compared with Historic Spend
During RCP1, insurance premiums were subject to general upward pressure as insurers sought to rebuild reserves following a number of very significant natural disaster claims worldwide, including the Canterbury earthquakes. In addition, our Material Damage and Business Interruption (MDBI) premiums were subject to additional increase. The main driver for the latter was the significant growth in insured values as the replacement cost of Grid increased following commissioning of major projects during RCP1.
RCP2 Expenditure
The rationale for our RCP2 expenditure forecast is summarised below.
Insurance $87.9m
No significant changes to our insurance approach are envisaged in RCP2. The scope of coverage is largely consistent with that in place for 2013/14. We will continue to insure against key material risks that may affect our assets or service. This includes the following insurance classes: MDBI; cable risks; general third-party liability, directors' and officers' liability; and minor insurance (such as employers’ liability and travel).
In conjunction with Marsh our insurance broker, we seek to optimise our cover using the most cost-effective premiums available. This process will continue in RCP2 and includes considering restructuring cover to match the risk appetite of insurers, changing the balance of local and international insurers, introducing new insurers, and providing comprehensive annual briefings to underwriters on our risk profile and mitigation strategies.
Using our 2013/14 figures as a ‘base year’, premiums were forecast based on a number of factors including:
historic premium movements;
expected movements in the market; and
90
Self-insurance is a term used to describe a method of risk management utilised when the risks are small and/or highly remote or where insurance arrangements are uncompetitive or not available.
0
$2M
$4M
$6M
$8M
$10M
$12M
$14M
$16M
$18M
$20M
09/10 10/11 11/12 12/13 13/14 14/15 15/16 16/17 17/18 18/19 19/20
Corporate Opex - Insurance - RCP2 Forecast vs Historic
All figures are real 2012/13
Historic
RCP1 Forecast
RCP2 Forecast
RCP1 RCP2

CORPORATE & BUSINESS SUPPORT EXPENDITURE
MP01 – Main Proposal 119
forecast value of commissioned assets.
To determine a self-insurance allowance, consideration was given to the extent to which potential losses would be reduced by other funding sources including external insurance cover, IPP provisions (see below) and our operational funding. Our self-insurance premium was estimated to address two potential loss exposures (that is, below applicable deductibles and uninsured risks).
An important input into our self-insurance estimate is the operation of the IPP reopening trigger, which we have assumed would operate where losses are above prudent insurance limits. In our view, the current wording of the IPP is open to interpretation. As a result, we have used a number of assumptions to model the effect of a reopening (refer to the supporting POD). If these assumptions are not supported by the Commission, we may need to review the proposed self-insurance estimate for RCP2.
Supporting POD PD56 CS Insurance
SERVICE PERFORMANCE MEASURES
120 MP01 – Main Proposal
10. SERVICE PERFORMANCE MEASURES
This chapter describes our proposed service performance measures and targets for RCP2. The chapter also describes how the incentive regime will link a portion of our revenue to our performance against these targets.
The proposed framework reflects our RCP2 objective (see Chapter 2) to improve service performance with a focus on high priority and important points of service.
The chapter is structured as follows.
Defining the Measures (10.1): provides an overview of our performance measures.
Background (10.2): explains the rationale for the measures and our consultation approach.
Grid Performance Measures (10.3): describes the measures and targets that reflect how well we deliver an uninterrupted service.
Asset Performance Measures (10.4): describes the measures and targets that reflect how well we maintain the availability of circuits.
Other Measures (10.5): describes additional performance measures relating to other aspects of our service valued by customers.
Incentive Regime (10.6): provides an overview of how we propose our revenue will be affected by our performance.
Further detail on our performance measures and targets is available in BR04 – Service Performance Measures.
10.1. DEFINING THE MEASURES
We use the term ‘Service Performance Measures’91 to refer to the set of measures and targets included in our RCP2 Submission. Reflecting the views of stakeholders, our proposed measures focus on how well we deliver observable outputs that are important to our customers. Our measures are divided into three broad groups:
Grid Performance Measures;
Asset Performance Measures; and
Other Measures.
Grid Performance Measures
Our Grid Performance Measures are based on the number and duration of interruptions, and measure our ability to provide an uninterrupted service to our customers. The measures encompass all unplanned interruptions longer than one minute, including events caused by extreme weather or environmental factors.92
91
The associated term in the Capex IM is ‘Grid Output Measures’. 92
The full definitions of included interruptions, and associated rationale are included in BR04 – Service Performance Measures.
SERVICE PERFORMANCE MEASURES
MP01 – Main Proposal 121
There are three Grid Performance (GP) measures. They are:
number of unplanned interruptions, GP1;
average duration of unplanned interruptions, GP2; and
P9093 interruption duration, GP3.
The targets for each measure differ for each point of service category.
Asset Performance Measures
Our Asset Performance Measures are based on the availability of selected circuits that have the largest potential impact on the electricity market. Circuit availability affects generators’ ability to supply the market and potentially wholesale electricity prices.
There are two Asset Performance (AP) measures. They are:
energy availability of HVDC circuits, AP1; and
availability of selected HVAC circuits, AP2.
Other Measures
Our ‘Other Measures’ reflect additional aspects of our service that are important to customers. There are six Other Measures (OM). They are:
time taken to provide initial information following an unplanned interruption, OM1;
time taken to update information following an unplanned interruption, OM2;
accuracy of notified restoration times for unplanned interruptions, OM3;
extent of overruns to planned outage restoration times, OM4;
extent to which we place customers on ‘N-security’,94 OM5; and
number of momentary interruptions experienced by customers, OM6.
10.2. BACKGROUND
10.2.1. RATIONALE
We recognise that our performance measures should reflect the aspects of our service which are important to customers. Measuring our performance against appropriate targets will allow our stakeholders, and particularly our direct customers, to assess how well we are performing. We have selected performance measures:
that reflect the service received by our customers;
are tailored, based on the criticality of points of service; and
contain targets that are forward-looking and based on customer’s expectations, rather than on historic performance.
93
GP3 reflects our performance in terms of longer interruptions. We will monitor, and set targets, for the length of our longer interruptions (those with durations that exceed 90% of all interruptions).
94 ’N-security’ refers to a level of security that means a single outage, such as a power transformer failure, would lead to a
supply interruption. In contrast, N-1 security refers to a level of security where there is sufficient system redundancy to experience a single outage without, necessarily, interrupting supply.
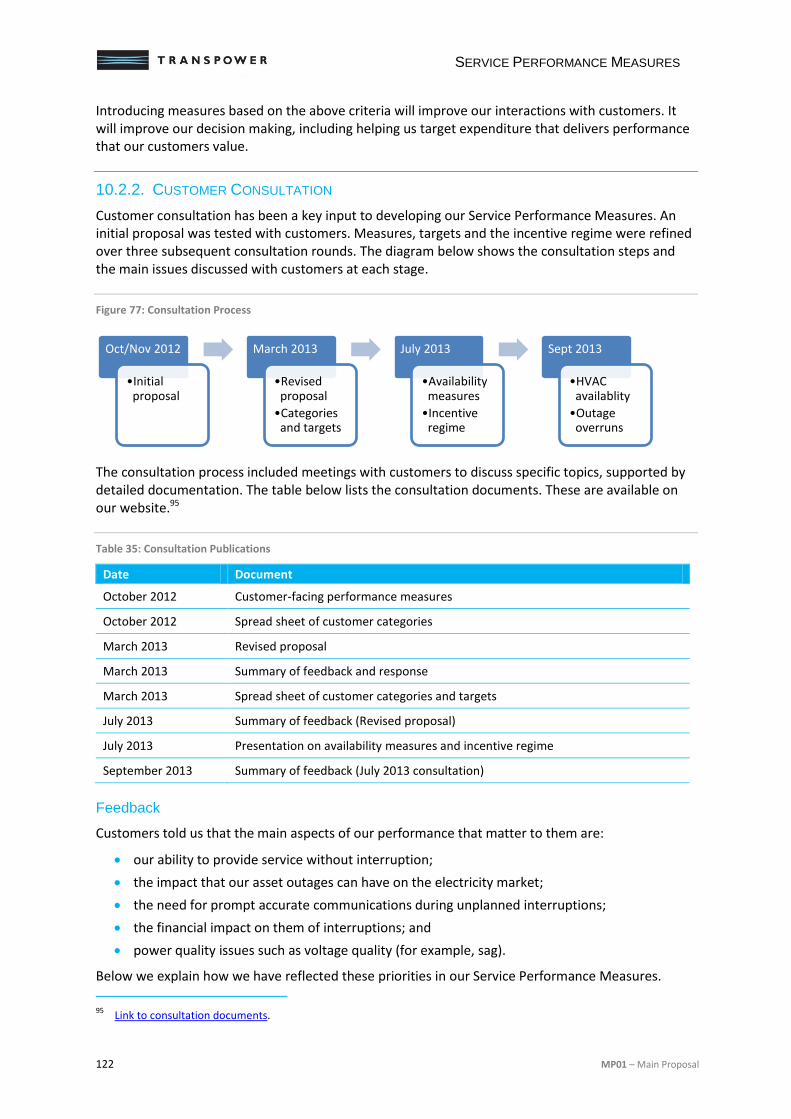
SERVICE PERFORMANCE MEASURES
122 MP01 – Main Proposal
Introducing measures based on the above criteria will improve our interactions with customers. It will improve our decision making, including helping us target expenditure that delivers performance that our customers value.
10.2.2. CUSTOMER CONSULTATION
Customer consultation has been a key input to developing our Service Performance Measures. An initial proposal was tested with customers. Measures, targets and the incentive regime were refined over three subsequent consultation rounds. The diagram below shows the consultation steps and the main issues discussed with customers at each stage.
Figure 77: Consultation Process
The consultation process included meetings with customers to discuss specific topics, supported by detailed documentation. The table below lists the consultation documents. These are available on our website.95
Table 35: Consultation Publications
Date Document
October 2012 Customer-facing performance measures
October 2012 Spread sheet of customer categories
March 2013 Revised proposal
March 2013 Summary of feedback and response
March 2013 Spread sheet of customer categories and targets
July 2013 Summary of feedback (Revised proposal)
July 2013 Presentation on availability measures and incentive regime
September 2013 Summary of feedback (July 2013 consultation)
Feedback
Customers told us that the main aspects of our performance that matter to them are:
our ability to provide service without interruption;
the impact that our asset outages can have on the electricity market;
the need for prompt accurate communications during unplanned interruptions;
the financial impact on them of interruptions; and
power quality issues such as voltage quality (for example, sag).
Below we explain how we have reflected these priorities in our Service Performance Measures.
95
Link to consultation documents.
Oct/Nov 2012
•Initial proposal
March 2013
•Revised proposal
•Categories and targets
July 2013
•Availability measures
•Incentive regime
Sept 2013
•HVAC availablity
•Outage overruns
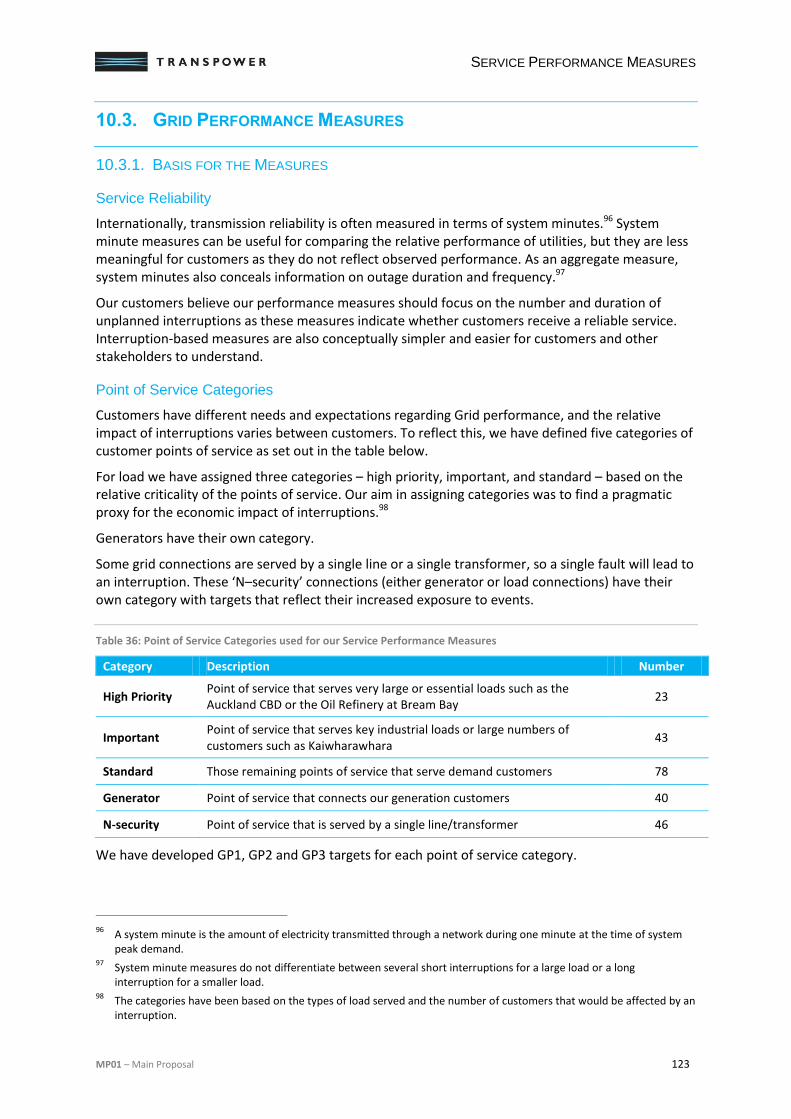
SERVICE PERFORMANCE MEASURES
MP01 – Main Proposal 123
10.3. GRID PERFORMANCE MEASURES
10.3.1. BASIS FOR THE MEASURES
Service Reliability
Internationally, transmission reliability is often measured in terms of system minutes.96 System minute measures can be useful for comparing the relative performance of utilities, but they are less meaningful for customers as they do not reflect observed performance. As an aggregate measure, system minutes also conceals information on outage duration and frequency.97
Our customers believe our performance measures should focus on the number and duration of unplanned interruptions as these measures indicate whether customers receive a reliable service. Interruption-based measures are also conceptually simpler and easier for customers and other stakeholders to understand.
Point of Service Categories
Customers have different needs and expectations regarding Grid performance, and the relative impact of interruptions varies between customers. To reflect this, we have defined five categories of customer points of service as set out in the table below.
For load we have assigned three categories – high priority, important, and standard – based on the relative criticality of the points of service. Our aim in assigning categories was to find a pragmatic proxy for the economic impact of interruptions.98
Generators have their own category.
Some grid connections are served by a single line or a single transformer, so a single fault will lead to an interruption. These ‘N–security’ connections (either generator or load connections) have their own category with targets that reflect their increased exposure to events.
Table 36: Point of Service Categories used for our Service Performance Measures
Category Description Number
High Priority Point of service that serves very large or essential loads such as the Auckland CBD or the Oil Refinery at Bream Bay
23
Important Point of service that serves key industrial loads or large numbers of customers such as Kaiwharawhara
43
Standard Those remaining points of service that serve demand customers 78
Generator Point of service that connects our generation customers 40
N-security Point of service that is served by a single line/transformer 46
We have developed GP1, GP2 and GP3 targets for each point of service category.
96
A system minute is the amount of electricity transmitted through a network during one minute at the time of system peak demand.
97 System minute measures do not differentiate between several short interruptions for a large load or a long
interruption for a smaller load. 98
The categories have been based on the types of load served and the number of customers that would be affected by an interruption.
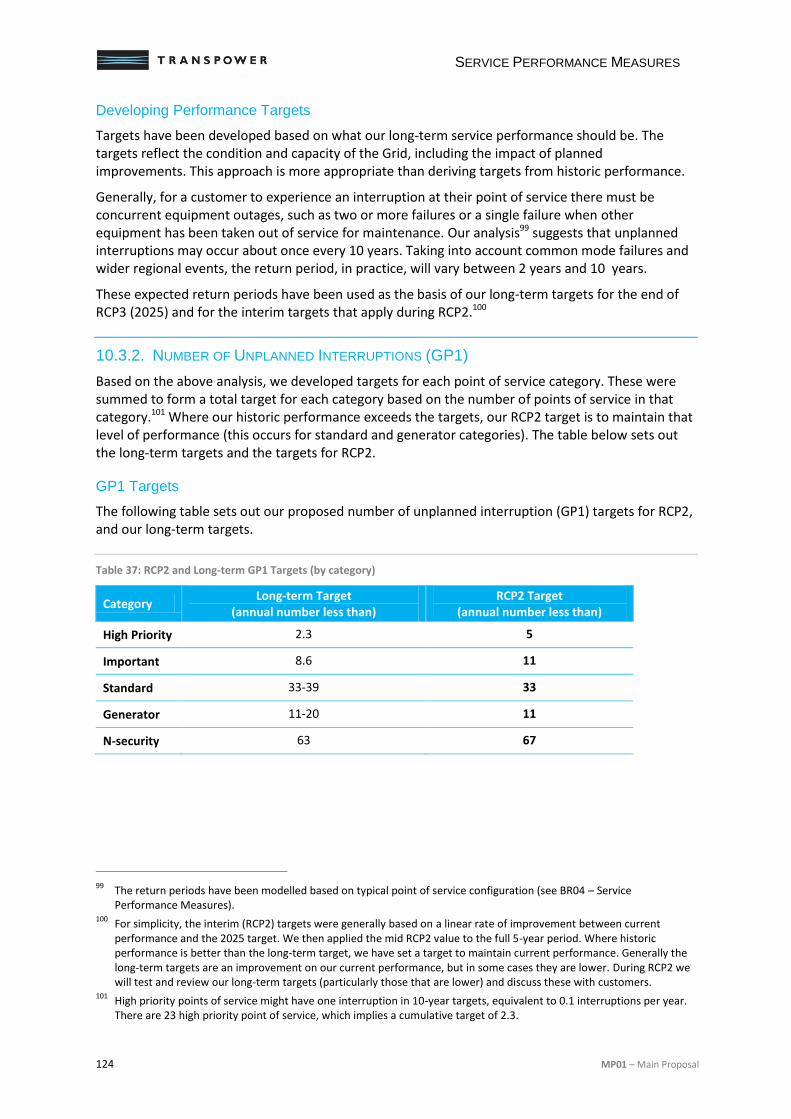
SERVICE PERFORMANCE MEASURES
124 MP01 – Main Proposal
Developing Performance Targets
Targets have been developed based on what our long-term service performance should be. The targets reflect the condition and capacity of the Grid, including the impact of planned improvements. This approach is more appropriate than deriving targets from historic performance.
Generally, for a customer to experience an interruption at their point of service there must be concurrent equipment outages, such as two or more failures or a single failure when other equipment has been taken out of service for maintenance. Our analysis99 suggests that unplanned interruptions may occur about once every 10 years. Taking into account common mode failures and wider regional events, the return period, in practice, will vary between 2 years and 10 years.
These expected return periods have been used as the basis of our long-term targets for the end of RCP3 (2025) and for the interim targets that apply during RCP2.100
10.3.2. NUMBER OF UNPLANNED INTERRUPTIONS (GP1)
Based on the above analysis, we developed targets for each point of service category. These were summed to form a total target for each category based on the number of points of service in that category.101 Where our historic performance exceeds the targets, our RCP2 target is to maintain that level of performance (this occurs for standard and generator categories). The table below sets out the long-term targets and the targets for RCP2.
GP1 Targets
The following table sets out our proposed number of unplanned interruption (GP1) targets for RCP2, and our long-term targets.
Table 37: RCP2 and Long-term GP1 Targets (by category)
Category Long-term Target
(annual number less than) RCP2 Target
(annual number less than)
High Priority 2.3 5
Important 8.6 11
Standard 33-39 33
Generator 11-20 11
N-security 63 67
99
The return periods have been modelled based on typical point of service configuration (see BR04 – Service Performance Measures).
100 For simplicity, the interim (RCP2) targets were generally based on a linear rate of improvement between current
performance and the 2025 target. We then applied the mid RCP2 value to the full 5-year period. Where historic performance is better than the long-term target, we have set a target to maintain current performance. Generally the long-term targets are an improvement on our current performance, but in some cases they are lower. During RCP2 we will test and review our long-term targets (particularly those that are lower) and discuss these with customers.
101 High priority points of service might have one interruption in 10-year targets, equivalent to 0.1 interruptions per year.
There are 23 high priority point of service, which implies a cumulative target of 2.3.
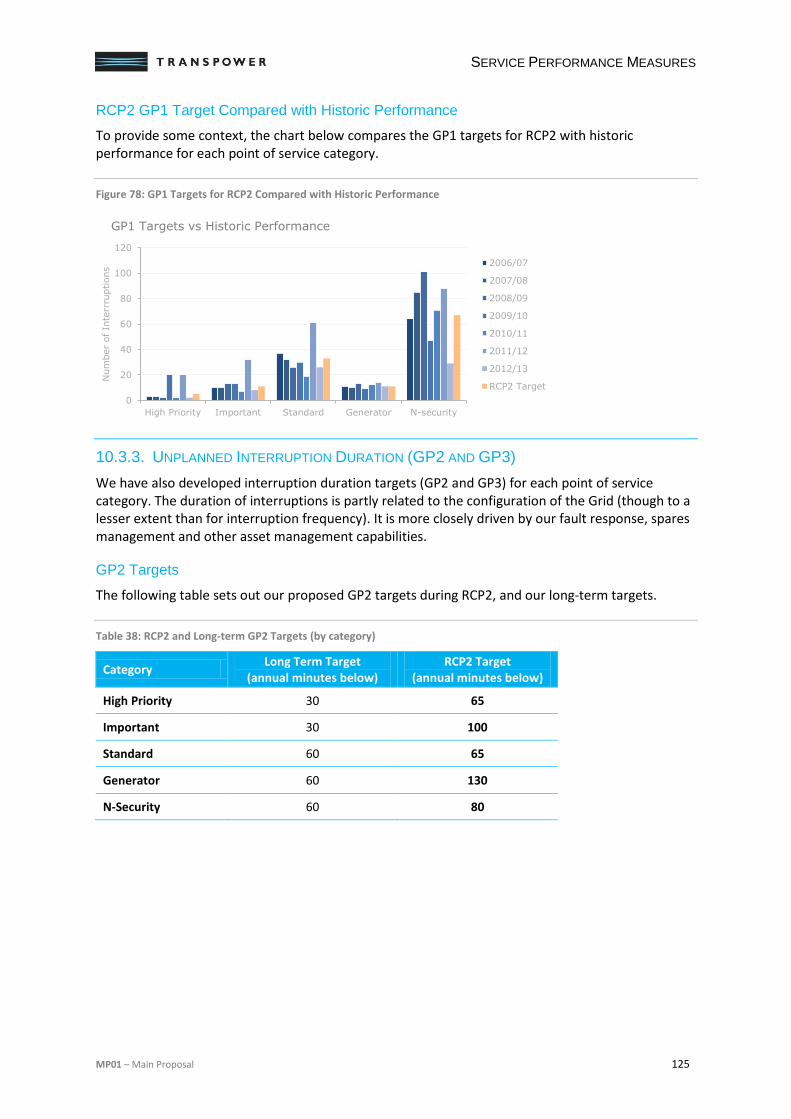
SERVICE PERFORMANCE MEASURES
MP01 – Main Proposal 125
RCP2 GP1 Target Compared with Historic Performance
To provide some context, the chart below compares the GP1 targets for RCP2 with historic performance for each point of service category.
Figure 78: GP1 Targets for RCP2 Compared with Historic Performance
10.3.3. UNPLANNED INTERRUPTION DURATION (GP2 AND GP3)
We have also developed interruption duration targets (GP2 and GP3) for each point of service category. The duration of interruptions is partly related to the configuration of the Grid (though to a lesser extent than for interruption frequency). It is more closely driven by our fault response, spares management and other asset management capabilities.
GP2 Targets
The following table sets out our proposed GP2 targets during RCP2, and our long-term targets.
Table 38: RCP2 and Long-term GP2 Targets (by category)
Category Long Term Target
(annual minutes below) RCP2 Target
(annual minutes below)
High Priority 30 65
Important 30 100
Standard 60 65
Generator 60 130
N-Security 60 80
0
20
40
60
80
100
120
High Priority Important Standard Generator N-security
Num
ber
of In
terr
ruptions
2006/07
2007/08
2008/09
2009/10
2010/11
2011/12
2012/13
RCP2 Target
GP1 Targets vs Historic Performance
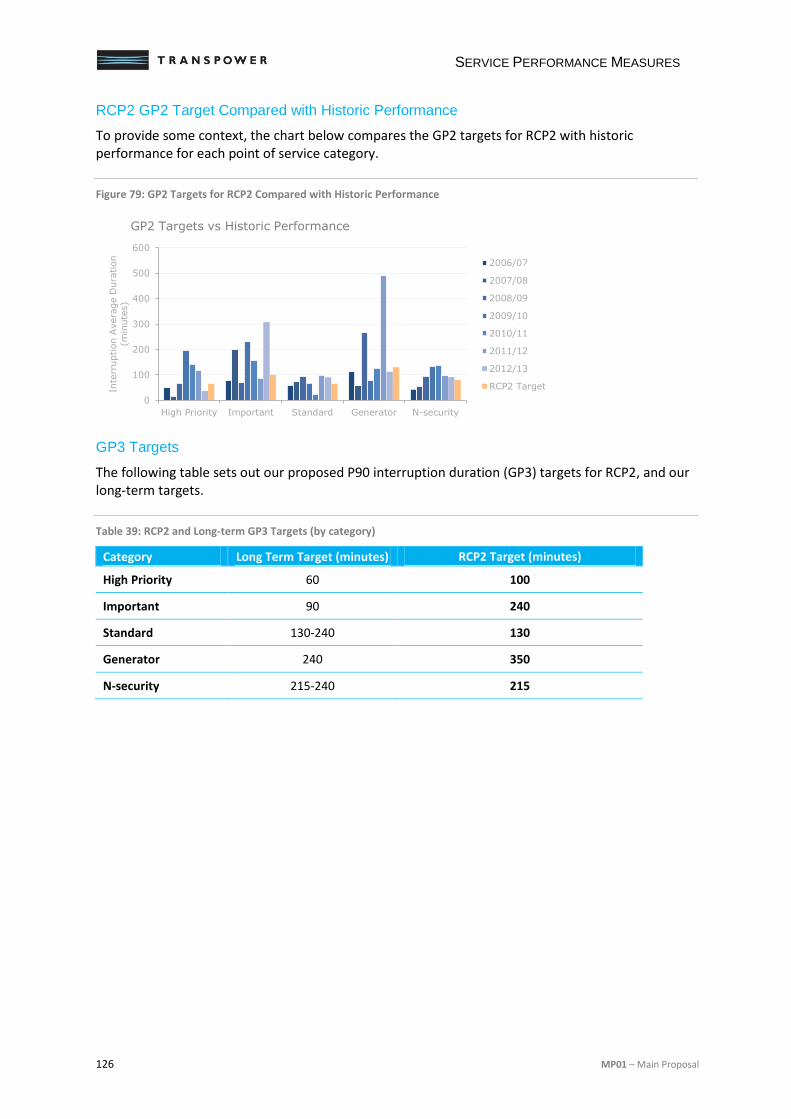
SERVICE PERFORMANCE MEASURES
126 MP01 – Main Proposal
RCP2 GP2 Target Compared with Historic Performance
To provide some context, the chart below compares the GP2 targets for RCP2 with historic performance for each point of service category.
Figure 79: GP2 Targets for RCP2 Compared with Historic Performance
GP3 Targets
The following table sets out our proposed P90 interruption duration (GP3) targets for RCP2, and our long-term targets.
Table 39: RCP2 and Long-term GP3 Targets (by category)
Category Long Term Target (minutes) RCP2 Target (minutes)
High Priority 60 100
Important 90 240
Standard 130-240 130
Generator 240 350
N-security 215-240 215
0
100
200
300
400
500
600
High Priority Important Standard Generator N-security
Inte
rruption A
vera
ge D
ura
tion
(min
ute
s)
2006/07
2007/08
2008/09
2009/10
2010/11
2011/12
2012/13
RCP2 Target
GP2 Targets vs Historic Performance
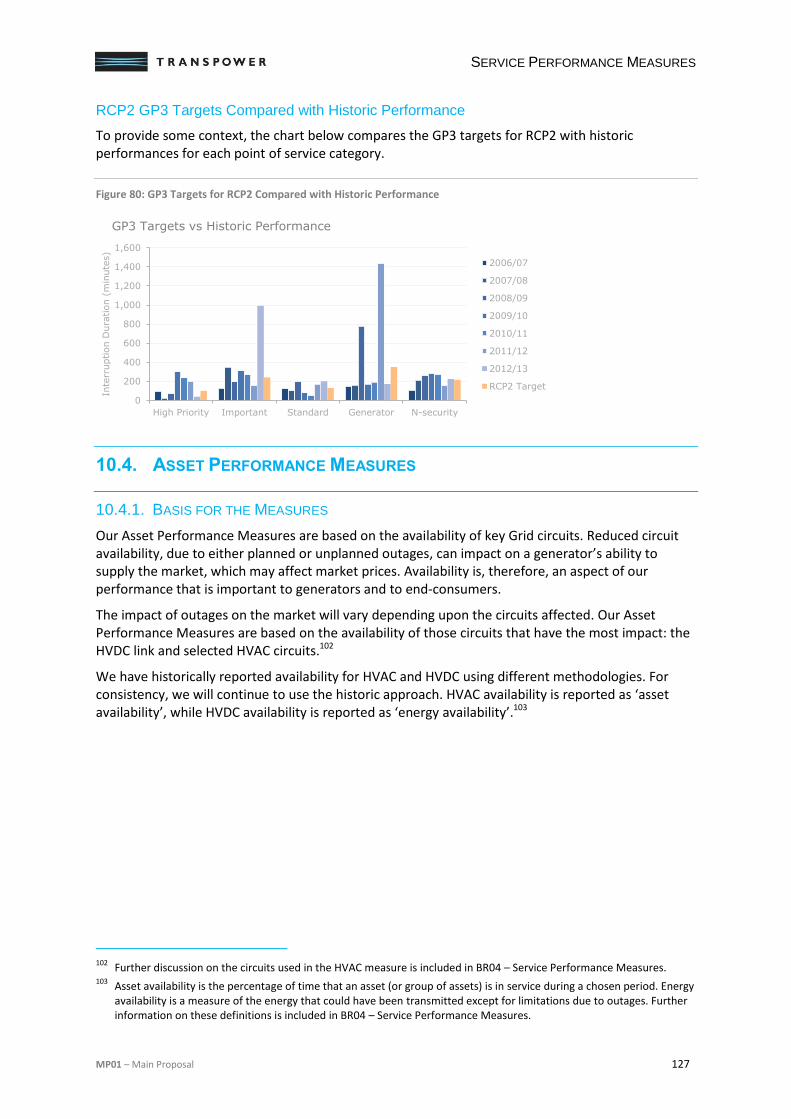
SERVICE PERFORMANCE MEASURES
MP01 – Main Proposal 127
RCP2 GP3 Targets Compared with Historic Performance
To provide some context, the chart below compares the GP3 targets for RCP2 with historic performances for each point of service category.
Figure 80: GP3 Targets for RCP2 Compared with Historic Performance
10.4. ASSET PERFORMANCE MEASURES
10.4.1. BASIS FOR THE MEASURES
Our Asset Performance Measures are based on the availability of key Grid circuits. Reduced circuit availability, due to either planned or unplanned outages, can impact on a generator’s ability to supply the market, which may affect market prices. Availability is, therefore, an aspect of our performance that is important to generators and to end-consumers.
The impact of outages on the market will vary depending upon the circuits affected. Our Asset Performance Measures are based on the availability of those circuits that have the most impact: the HVDC link and selected HVAC circuits.102
We have historically reported availability for HVAC and HVDC using different methodologies. For consistency, we will continue to use the historic approach. HVAC availability is reported as ‘asset availability’, while HVDC availability is reported as ‘energy availability’.103
102
Further discussion on the circuits used in the HVAC measure is included in BR04 – Service Performance Measures. 103
Asset availability is the percentage of time that an asset (or group of assets) is in service during a chosen period. Energy availability is a measure of the energy that could have been transmitted except for limitations due to outages. Further information on these definitions is included in BR04 – Service Performance Measures.
0
200
400
600
800
1,000
1,200
1,400
1,600
High Priority Important Standard Generator N-security
Inte
rruption D
ura
tion (
min
ute
s)
2006/07
2007/08
2008/09
2009/10
2010/11
2011/12
2012/13
RCP2 Target
GP3 Targets vs Historic Performance
SERVICE PERFORMANCE MEASURES
128 MP01 – Main Proposal
10.4.2. HVDC AVAILABILITY (AP1)
The HVDC availability measure is the average energy availability of Poles 2 and 3.
AP1 Target
The proposed target for AP1 is 98.5% during RCP2. This is based on reductions below 100% energy availability to account for:
approved construction outages during the period;104
preventive maintenance outages required to meet service specifications; and
forced outages based on service level agreements for Pole 3.
There is no historic performance associated with Pole 3 (commissioned May 2013), so historic comparison of HVDC performance against the RCP2 target is not meaningful.
10.4.3. HVAC AVAILABILITY (AP2)
The HVAC availability measure is the average annual availability of a set of selected 220 kV circuits. The circuits have been selected based on the potential effect their outages might have on the energy market.
AP2 Target
The proposed target for HVAC availability is 99.6% during RCP2. This is based on reductions below 100% availability taking into account:
approved construction outages during the period;105
preventive maintenance outages required to meet service specifications;
an allowance for corrective maintenance; and
an allowance for forced outage unavailability.
104
No construction outages are currently planned during RCP2. This could change if Stage 3 of the HVDC Upgrade is approved and the construction outages fall within RCP2.
105 The decision to undertake the work and the costs of reduced availability during construction outages are considered
under our Capex governance processes.
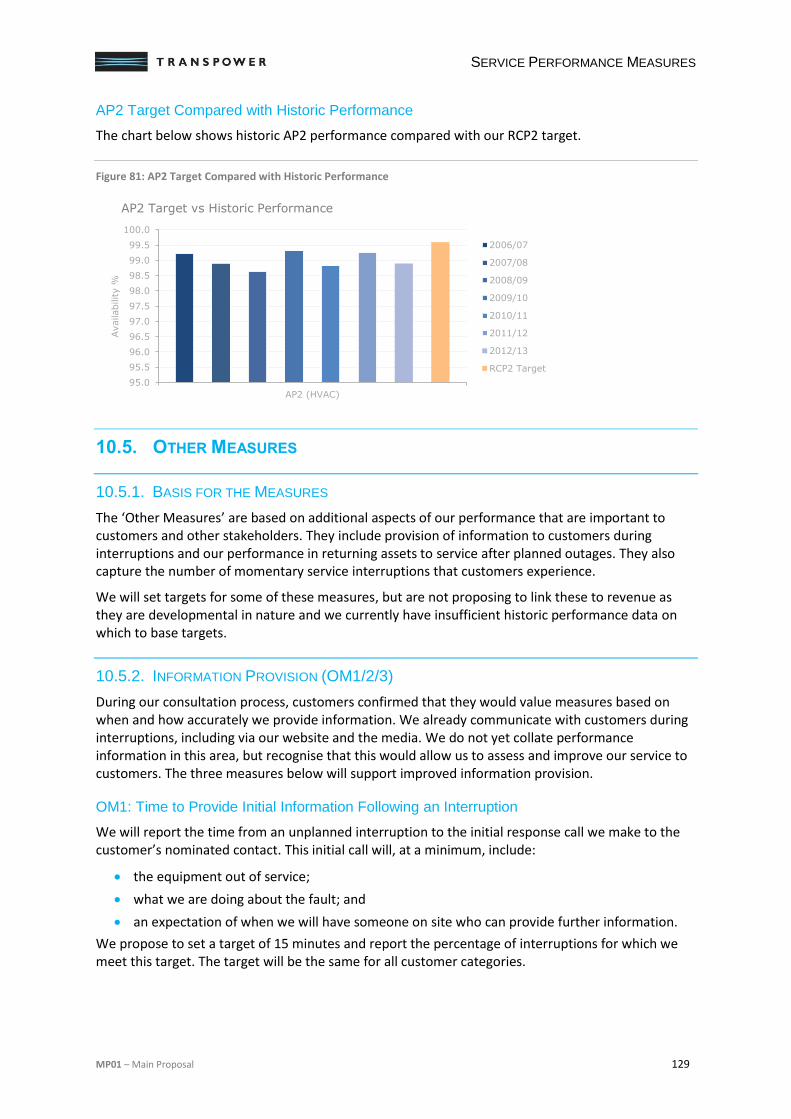
SERVICE PERFORMANCE MEASURES
MP01 – Main Proposal 129
AP2 Target Compared with Historic Performance
The chart below shows historic AP2 performance compared with our RCP2 target.
Figure 81: AP2 Target Compared with Historic Performance
10.5. OTHER MEASURES
10.5.1. BASIS FOR THE MEASURES
The ‘Other Measures’ are based on additional aspects of our performance that are important to customers and other stakeholders. They include provision of information to customers during interruptions and our performance in returning assets to service after planned outages. They also capture the number of momentary service interruptions that customers experience.
We will set targets for some of these measures, but are not proposing to link these to revenue as they are developmental in nature and we currently have insufficient historic performance data on which to base targets.
10.5.2. INFORMATION PROVISION (OM1/2/3)
During our consultation process, customers confirmed that they would value measures based on when and how accurately we provide information. We already communicate with customers during interruptions, including via our website and the media. We do not yet collate performance information in this area, but recognise that this would allow us to assess and improve our service to customers. The three measures below will support improved information provision.
OM1: Time to Provide Initial Information Following an Interruption
We will report the time from an unplanned interruption to the initial response call we make to the customer’s nominated contact. This initial call will, at a minimum, include:
the equipment out of service;
what we are doing about the fault; and
an expectation of when we will have someone on site who can provide further information.
We propose to set a target of 15 minutes and report the percentage of interruptions for which we meet this target. The target will be the same for all customer categories.
95.0
95.5
96.0
96.5
97.0
97.5
98.0
98.5
99.0
99.5
100.0
AP2 (HVAC)
Availability %
2006/07
2007/08
2008/09
2009/10
2010/11
2011/12
2012/13
RCP2 Target
AP2 Target vs Historic Performance
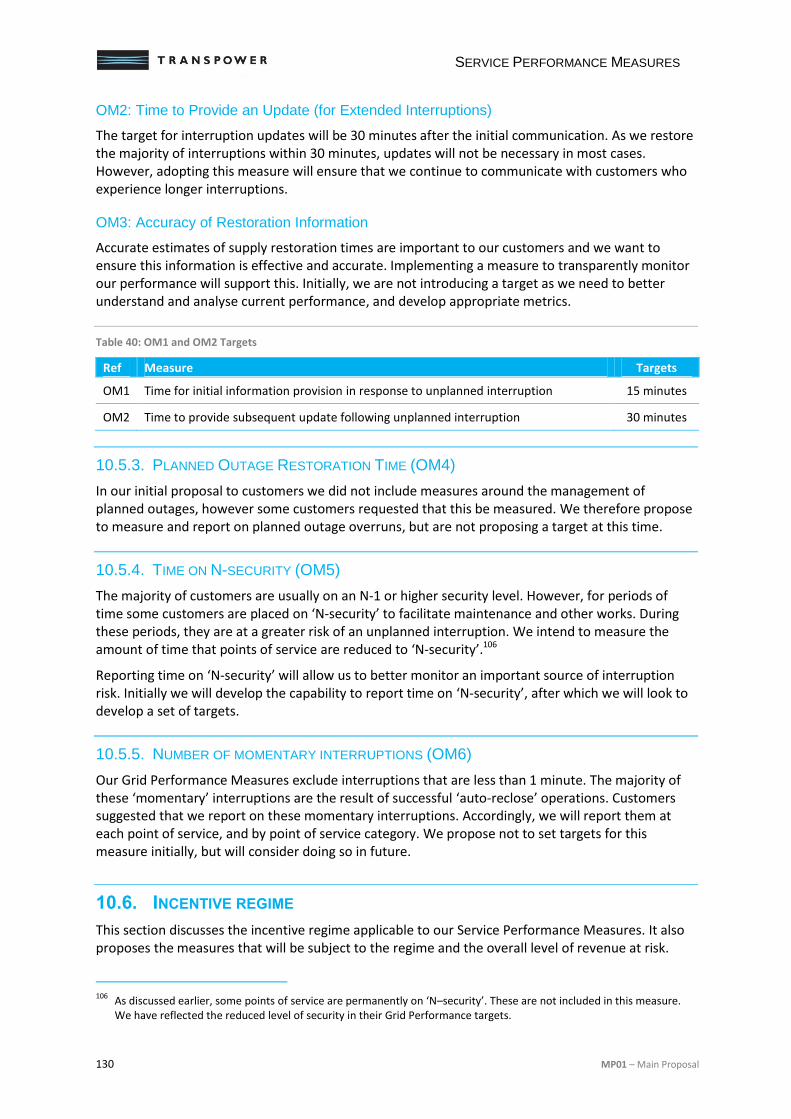
SERVICE PERFORMANCE MEASURES
130 MP01 – Main Proposal
OM2: Time to Provide an Update (for Extended Interruptions)
The target for interruption updates will be 30 minutes after the initial communication. As we restore the majority of interruptions within 30 minutes, updates will not be necessary in most cases. However, adopting this measure will ensure that we continue to communicate with customers who experience longer interruptions.
OM3: Accuracy of Restoration Information
Accurate estimates of supply restoration times are important to our customers and we want to ensure this information is effective and accurate. Implementing a measure to transparently monitor our performance will support this. Initially, we are not introducing a target as we need to better understand and analyse current performance, and develop appropriate metrics.
Table 40: OM1 and OM2 Targets
Ref Measure Targets
OM1 Time for initial information provision in response to unplanned interruption 15 minutes
OM2 Time to provide subsequent update following unplanned interruption 30 minutes
10.5.3. PLANNED OUTAGE RESTORATION TIME (OM4)
In our initial proposal to customers we did not include measures around the management of planned outages, however some customers requested that this be measured. We therefore propose to measure and report on planned outage overruns, but are not proposing a target at this time.
10.5.4. TIME ON N-SECURITY (OM5)
The majority of customers are usually on an N-1 or higher security level. However, for periods of time some customers are placed on ‘N-security’ to facilitate maintenance and other works. During these periods, they are at a greater risk of an unplanned interruption. We intend to measure the amount of time that points of service are reduced to ‘N-security’.106
Reporting time on ‘N-security’ will allow us to better monitor an important source of interruption risk. Initially we will develop the capability to report time on ‘N-security’, after which we will look to develop a set of targets.
10.5.5. NUMBER OF MOMENTARY INTERRUPTIONS (OM6)
Our Grid Performance Measures exclude interruptions that are less than 1 minute. The majority of these ‘momentary’ interruptions are the result of successful ‘auto-reclose’ operations. Customers suggested that we report on these momentary interruptions. Accordingly, we will report them at each point of service, and by point of service category. We propose not to set targets for this measure initially, but will consider doing so in future.
10.6. INCENTIVE REGIME
This section discusses the incentive regime applicable to our Service Performance Measures. It also proposes the measures that will be subject to the regime and the overall level of revenue at risk.
106
As discussed earlier, some points of service are permanently on ‘N–security’. These are not included in this measure. We have reflected the reduced level of security in their Grid Performance targets.
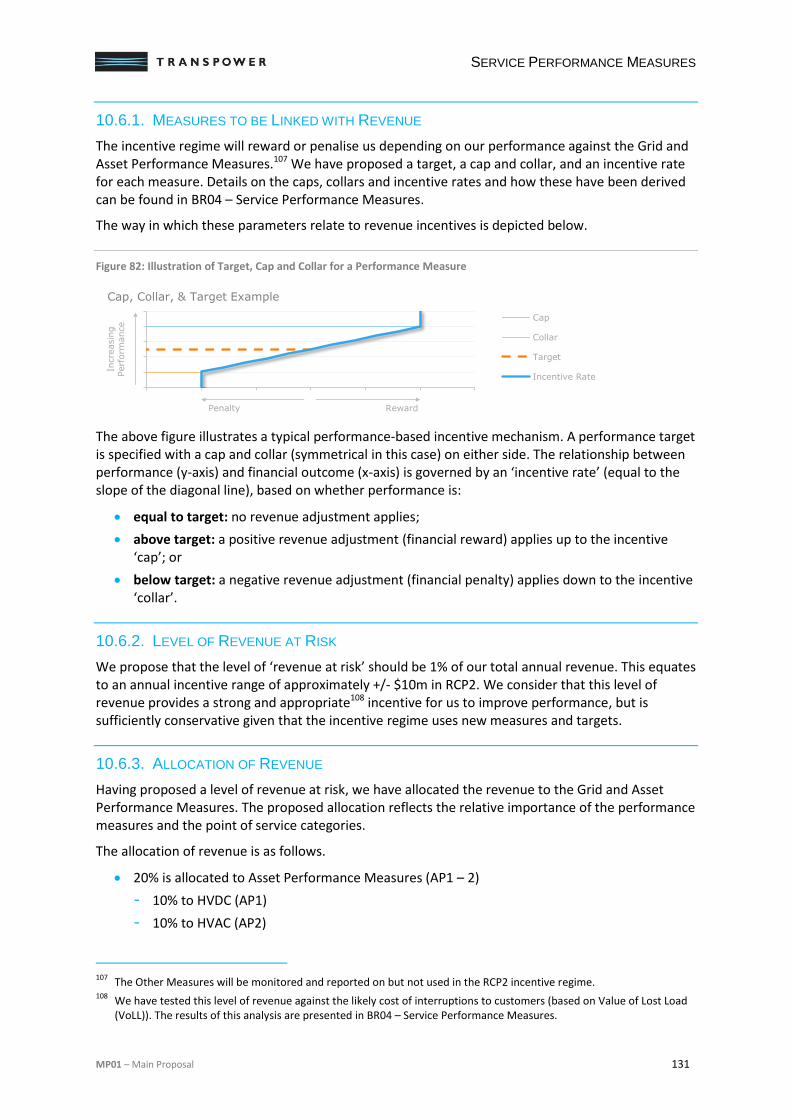
SERVICE PERFORMANCE MEASURES
MP01 – Main Proposal 131
10.6.1. MEASURES TO BE LINKED WITH REVENUE
The incentive regime will reward or penalise us depending on our performance against the Grid and Asset Performance Measures.107 We have proposed a target, a cap and collar, and an incentive rate for each measure. Details on the caps, collars and incentive rates and how these have been derived can be found in BR04 – Service Performance Measures.
The way in which these parameters relate to revenue incentives is depicted below.
Figure 82: Illustration of Target, Cap and Collar for a Performance Measure
The above figure illustrates a typical performance-based incentive mechanism. A performance target is specified with a cap and collar (symmetrical in this case) on either side. The relationship between performance (y-axis) and financial outcome (x-axis) is governed by an ‘incentive rate’ (equal to the slope of the diagonal line), based on whether performance is:
equal to target: no revenue adjustment applies;
above target: a positive revenue adjustment (financial reward) applies up to the incentive ‘cap’; or
below target: a negative revenue adjustment (financial penalty) applies down to the incentive ‘collar’.
10.6.2. LEVEL OF REVENUE AT RISK
We propose that the level of ‘revenue at risk’ should be 1% of our total annual revenue. This equates to an annual incentive range of approximately +/- $10m in RCP2. We consider that this level of revenue provides a strong and appropriate108 incentive for us to improve performance, but is sufficiently conservative given that the incentive regime uses new measures and targets.
10.6.3. ALLOCATION OF REVENUE
Having proposed a level of revenue at risk, we have allocated the revenue to the Grid and Asset Performance Measures. The proposed allocation reflects the relative importance of the performance measures and the point of service categories.
The allocation of revenue is as follows.
20% is allocated to Asset Performance Measures (AP1 – 2)
- 10% to HVDC (AP1)
- 10% to HVAC (AP2)
107
The Other Measures will be monitored and reported on but not used in the RCP2 incentive regime. 108
We have tested this level of revenue against the likely cost of interruptions to customers (based on Value of Lost Load (VoLL)). The results of this analysis are presented in BR04 – Service Performance Measures.
Incre
asin
g
Perf
orm
ance
Cap, Collar, & Target Example
Cap
Collar
Target
Incentive Rate
Penalty Reward
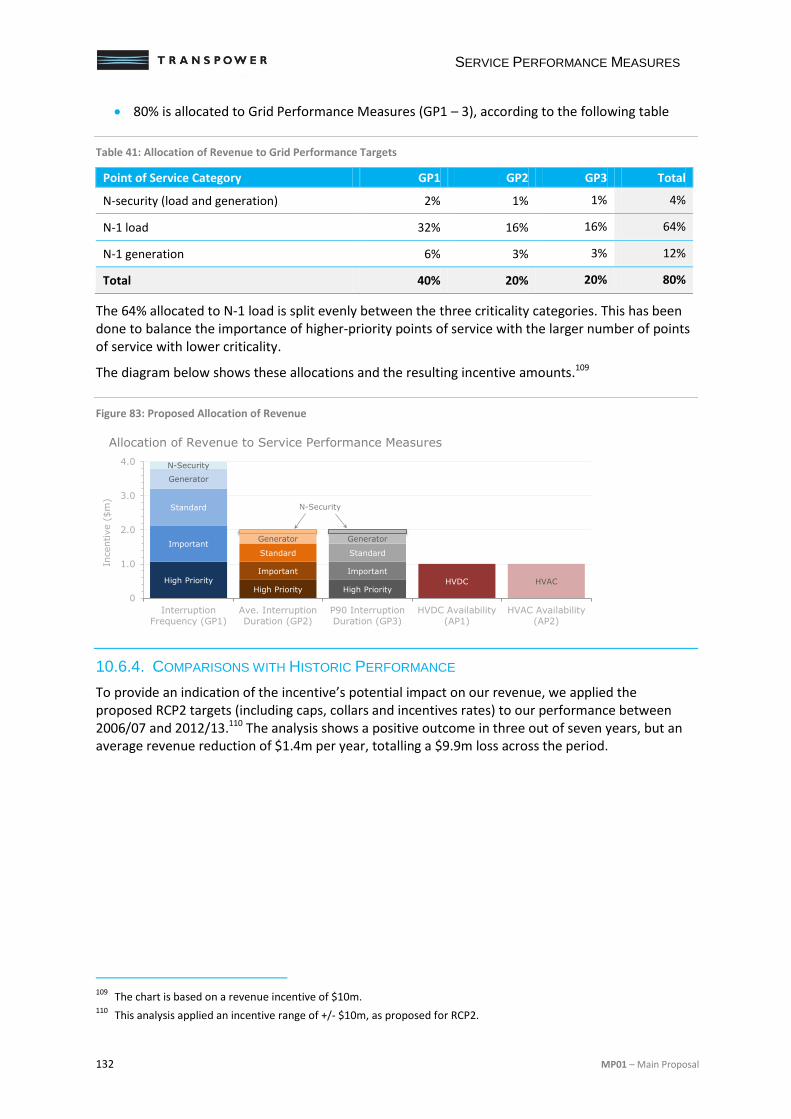
SERVICE PERFORMANCE MEASURES
132 MP01 – Main Proposal
80% is allocated to Grid Performance Measures (GP1 – 3), according to the following table
Table 41: Allocation of Revenue to Grid Performance Targets
Point of Service Category GP1 GP2 GP3 Total
N-security (load and generation) 2% 1% 1% 4%
N-1 load 32% 16% 16% 64%
N-1 generation 6% 3% 3% 12%
Total 40% 20% 20% 80%
The 64% allocated to N-1 load is split evenly between the three criticality categories. This has been done to balance the importance of higher-priority points of service with the larger number of points of service with lower criticality.
The diagram below shows these allocations and the resulting incentive amounts.109
Figure 83: Proposed Allocation of Revenue
10.6.4. COMPARISONS WITH HISTORIC PERFORMANCE
To provide an indication of the incentive’s potential impact on our revenue, we applied the proposed RCP2 targets (including caps, collars and incentives rates) to our performance between 2006/07 and 2012/13.110 The analysis shows a positive outcome in three out of seven years, but an average revenue reduction of $1.4m per year, totalling a $9.9m loss across the period.
109
The chart is based on a revenue incentive of $10m. 110
This analysis applied an incentive range of +/- $10m, as proposed for RCP2.
High Priority
Important
Standard
Generator
High Priority
Important
Standard
Generator
High Priority
Important
Standard
Generator
HVDC HVAC
N-Security
0
1.0
2.0
3.0
4.0
InterruptionFrequency (GP1)
Ave. InterruptionDuration (GP2)
P90 InterruptionDuration (GP3)
HVDC Availability(AP1)
HVAC Availability(AP2)
Incentive (
$m
)
Allocation of Revenue to Service Performance Measures
N-Security
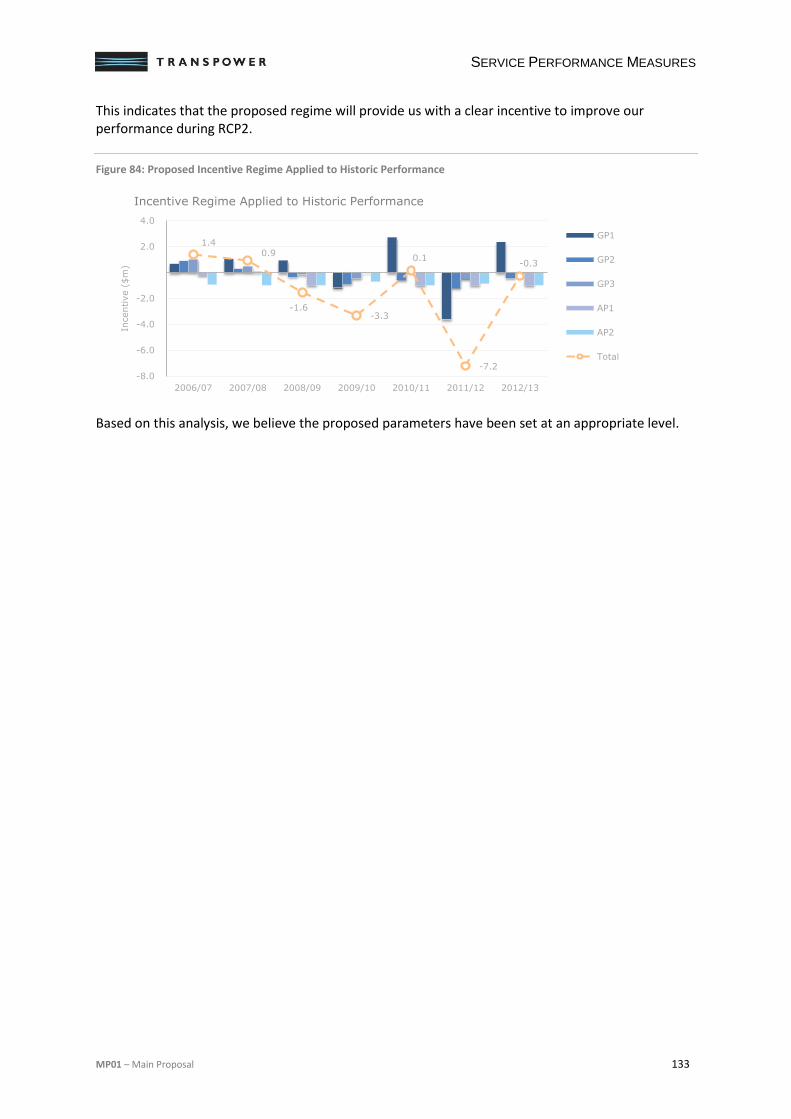
SERVICE PERFORMANCE MEASURES
MP01 – Main Proposal 133
This indicates that the proposed regime will provide us with a clear incentive to improve our performance during RCP2.
Figure 84: Proposed Incentive Regime Applied to Historic Performance
Based on this analysis, we believe the proposed parameters have been set at an appropriate level.
1.4 0.9
-1.6 -3.3
0.1
-7.2
-0.3
-8.0
-6.0
-4.0
-2.0
2.0
4.0
2006/07 2007/08 2008/09 2009/10 2010/11 2011/12 2012/13
Incentive (
$m
)
GP1
GP2
GP3
AP1
AP2
Total
Incentive Regime Applied to Historic Performance
APPENDIX A – ITP COMPLIANCE
134 MP01 – Main Proposal
APPENDIX A – ITP COMPLIANCE
The purpose of this appendix is to set out how the RCP2 Submission meets the Integrated Transmission Plan (ITP) requirements.
ITP Requirements
The Commission states that the purpose of the ITP is to explain Transpower's view of the long-term operation and development of the Grid.
An ITP is to be provided to the Commission on the first working day of December, 16 months prior to the start of each regulatory control period, and updated and reissued each September of the regulatory period except for the last year.
This equates to providing the Commission an ITP on 2 December 2013 and updating and reissuing the ITP in September 2015 - 2018 inclusive.
The ITP must contain an “ITP narrative” and supporting documentation. The narrative consists of an overview of expenditure, outputs, key assumptions, risks and synergies, along with expenditure and output schedules for the next two regulatory periods. The supporting documents consist of an asset management plan that sets out asset management strategies and objectives, a planning report that sets out the Grid’s ability to meet future demand and generation needs, and an output and performance objectives report.
Meeting the ITP Requirements
In discussions with the Commission it was recognised that there was substantial overlap between the content of the RCP2 Submission and the ITP. To avoid undue repetition, we have met the ITP requirements within the RCP2 Submission documents. The specific ITP requirements with RCP2 Submission references are set out in the sections below.
With respect to subsequent ITPs, we are currently assessing the content and relationship of the external documents that we produce each year. At this point we are looking to produce a separate document at the end of the 2014/15 financial year that meets the requirements of the ITP. We will engage with the Commission to determine the structure and timing of this document.
RCP2 Submission References
The sections below set out the specific ITP requirements followed by where these have been met in the RCP2 Submission. Unless stated otherwise, all chapter references refer to MP01 – Main Proposal.
ITP Narrative
Overview of expenditure and outputs
ITP Clause E2(1)(a)
Provide a high level overview of the expenditure and outputs for RCP2 and RCP3.
Chapter 2 sets out the commitment we have made to our customers and the priorities we will focus on to deliver that commitment. Chapter 5 provides an overview of our forecast expenditure and service performance targets.
APPENDIX A – ITP COMPLIANCE
MP01 – Main Proposal 135
More detailed explanations of our Base Capex and Opex forecasts for RCP2 are provided in Chapters 6 to 9, while a more detailed explanation of the service performance measures is provided in Chapter 10.
Expenditure forecasts for RCP2 and RCP3 are set out in RT06 - Integrated Transmission Plan Information.
Key assumptions, uncertainties and risks
ITP Clause E2(1)(b)–(f)
Provide a high level:-
overview of the key assumptions and scenarios used to determine forecast expenditure and grid outputs;
assessment of the key uncertainties in the key assumptions, and forecast expenditure and grid outputs;
assessment of the key risks affecting forecast expenditure;
assessment of how the key uncertainties and key risks will affect Transpower's ability to deliver the forecast grid outputs; and
description of the proposed measures to manage and mitigate the key uncertainties and key risks.
Chapter 5 includes an overview of the forecasting methodology and inputs, deliverability, areas of high uncertainty, and the internal challenge and approval rounds applied to our forecasts.
Chapter 2 provides an overview of asset management, including our approach to asset risk management.
Further detail on the forecasting approach, risk assessment, and expenditure into RCP3 for specific portfolios, is set out in Chapters 6 to 9. Chapter 10 provides background information on our service performance measures, including the consultation process applied in developing the measures, and the basis for, and development of, performance targets.
Excerpts from our Risk Register that are relevant to those risks affecting our forecast expenditure and outputs are provided in RT05 – Information Schedules.
Synergies and trade-offs across projects, programmes and outputs
ITP Clause E2(1)(g)
Provide a high level description of the key relationships, including any synergies or trade-offs, within and between the following:-
projects and programmes assumed for the purpose of determining the forecast expenditure; and
the forecast grid outputs.
Chapter 5 steps through the service performance targets for RCP2 and RCP3 and the asset health improvements and proposed expenditure for the RCP2 Period. This includes a high-level description of the relationship between performance; asset health and expenditure; Capex and Opex trade-off; forecasting methodology and inputs used; and the challenge rounds applied.
Further detail on prioritisation and the optimisation between Grid Capex, major capital projects and Opex is set out in Chapter 6.
APPENDIX A – ITP COMPLIANCE
136 MP01 – Main Proposal
ITP Schedules
Expenditure
ITP Clause E2(2)(a-c)
Forecast expenditure in the form of a schedule in respect of each disclosure year for:-
operating expenditure (disaggregated by major areas of expenditure);
Base Capex (disaggregated by major areas of expenditure); and
approved Major Capex (disaggregated by project).
Schedules of Opex, Base Capex and major capital expenditure approved and under development for the 2009/10 to 2024/25 years are contained in RT06 – Integrated Transmission Plan Information.
The disaggregation of the expenditure contained in these schedules matches that agreed with the Commission.
Service performance
ITP Clause E2(3)(a and b)
Forecast grid outputs in the form of a schedule in respect of each disclosure year for:-
each revenue-linked grid output measure described in the Base Capex proposal relating to the first regulatory period to which the ITP narrative relates; and
all proposed grid output measures other than those referred to in (a) above described in that Base Capex proposal relating to the first regulatory period.
A schedule of proposed Grid output measures are contained in RT03 – Performance Measures Model.
Major Capex
ITP Clause E2(3)(c) and E2(4)(a-c)
Forecast grid outputs in the form of a schedule in respect of each disclosure year for:-
Major Capex project outputs assumed to be delivered by each approved major capex project.
A summary of Major Capex projects under development, including:-
a summary of the key issues being addressed with reference to the planning report which is an ITP supporting document;
estimates of likely capital expenditure; and
estimates of project timings, including those relating to consultation periods, submissions for approval, construction, and commissioning.
A schedule of Major Capex Projects, outputs, issues being addressed and project timings are contained in RT06 – Integrated Transmission Plan Information.
APPENDIX A – ITP COMPLIANCE
MP01 – Main Proposal 137
ITP Supporting Documents
ITP Clause E3(a-c)
The following documents, prepared or updated no more than two years before the submission date:-
an asset management plan that includes the information specified in clause E4;
a planning report that includes the information specified in clause E5; and
a report setting out Transpower's output and performance objectives that includes the information specified in clause E6.
The asset management plan requirements are contained in the asset management document suite:-
AM01 – Grid Asset Management Policy;
AM02 – Asset Management Strategy;
AM03-AM07 – Lifecycle Strategies for planning, delivery, operating, maintenance, and disposal and divestments; and
FS01-14 – Fleet Strategies by asset type.
The planning report requirements are contained in AM09 – Annual Planning Report 2013.
The output and performance objectives requirements are contained in BR04 – Service Performance Measures.


EXPENDITURE PROPOSALREGULATORY CONTROL PERIOD 2
DECEMBER 2013
EXP
EN
DITU
RE
PR
OP
OS
AL R
EG
ULATO
RY C
ON
TRO
L PE
RIO
D 2
D
EC
EM
BE
R 2
01
3
EXPENDITURE PROPOSAL REGULATORY CONTROL PERIOD 2
DECEMBER 2013
www.transpower.co.nz