Embed Size (px)
Citation preview
Income Distribution, Public Expenditure and Equality
Luigi Campiglio
Absfruct. The increased role of public expenditure in industrialised countries involves new theoretical and empirical problems: general equilibrium models must be fully accom- modated with the structural presence of the public sector and at the same time we need a better understanding of the redistributive impact of non-market rules. Therefore we sug- gest looking at our economies as a resource allocation mechanism. in which a Walrasian mechanism (without auctioneer) interacts with a political mechanism: we suggest that ex post resource equality is the driving force behind the increasing role of the public sector, and therefore i t is also the crucial test against which to evaluate the impact of public expenditure. A stylised way to look at our economies therefore can be as follows: ex anfe equality is the domain of market, whilst erpost equality is the domain of the public sec- tor. This approach is compared with cross-section data of 16 countries and more detailed data, both cross-section and time-series, for the case of Italy: empirical results suggest that ex post equality is not a clearcut target, but rather i t arises as the net outcome of contrasting forcas.
1. Economies as Resource Allocation Mechanisms
A major branch of economic analysis emphasises the role of the mar- ket system as an information economiser and the role of prices as com- plete summary statistics of all relevant information. More precisely it can be shown that the Walrasian mechanism is informationally efficient, in the sense that the message space required for its viability with Pareto- efficient equilibria is the smallest one. Moreover, the Walrasian mechan- ism elicits individual behaviour which is both sincere and competitive. The literature on market failures is still an assertion of the Walrasian mechanism: given the appropriate amendments, such as completing the
Luigi Campiglio, Universith Cattolica, Milan. A preliminary version of this paper was presented at the 1989 Conference of the Con-
federation of European Economic Associations in Barcelona, May 25-26, 1989 and at the 6th Convegno Nazionale della Associazione Italiana degli Econom ;ti del Lavoro, AIEL held in Ban on October 5-7, 1989.
Received on November 13, 1989, and approved by the Editoiia Board on February 13, 1990.
Labour 4 (1): 97-124 (1990) J.E.L. 910
97
Luigi Campiglio 98
missing markets or defining the property rights, the market system can continue to work properly.
Keynes notwithstanding, we still lack a framework where the public sector plays a structural role. In a Keynesian mood we must consider imperfect competition as the norm for real economies: but this implies that the message space is certainly bigger than the Walrasian one. Fur- ther, the notion of message space helps to make clear how we can dis- pense with the artifact of the auctioneer in a private market. In the case of a competitive equilibrium, the messages reduce to prices and quanti- ties demanded and supplied: if we modify the model to accommodate for imperfect competition and then we extend it to encompass a struc- tural role for the public sector, the message space becomes much more complex. We have then an economy which is made up of two interact- ing mechanisms, that is, two different institutional arrangements: the imperfect competitive market and the public sector. The exact working of this kind of economy is still to be explored (among the few see the recent contributions in Groves, Radner and Reiter, 1987) but it is the essential foundation for a correct understanding of the role of the pub- lic sector. We will use this framework in the following analysis: here it is worth specifying the building blocks of the corresponding theoreti- cal model.
First, the majority of public expenditure is made up of private goods provided by the public sector, both at central and local levels. In other words the message space is the same for the private and the public sec- tor: a specific institutional arrangement specifies a simultaneous equilibri- um for demand and supply in both the private and the public sector for a given good or service, such as health or education.
Second, the main impact of public expenditure is on individual bud- get constraints. Income transfers relax the budget constraint for all the goods and leave the consumer his freedom of choice; government con- sumption is a form of transfer, made ‘in-kind’, more precisely a good consumed at zero market price but with a positive subjective price. In- dividual constraints are perceived as particularly severe when one can- not afford to buy priority goods that the market can instead efficiently deliver. As a consequence private messages of supply influence messages of demand for goods provided by the public sector.
Third, we have a political game in which voters and politicians ex- change messages with each other. Politicians try, at a cost, to discover the message of the voters: what we might call their ‘voice’. Voters send messages which relax their constraints: they ask for income and in-kind
Income Dbtribution, Public Expenditure and Equality 99
redistribution. With an institutional time lag, voters give their vote to the politicians which best replied to their ‘voice’. Votes can be thought of as a (small) fee paid in a principal-agent relationship, where the principal, that is the voter, can observe only partially the behaviour of the agent - the politician. This kind of political game is characterised by an intrinsic uncertainty, as recognising messages is costly, and by a structural dise- quilibrium as there is a time lag during which no one knows if politicians are acting in accordance with the message. Further, in the voting game any equilibrium concept must be temporary; in fact the essence of the vot- ing game is to fight and to beat the political opponent. As a consequence, in modern democracies, the economy can never be at rest in a self- perpetuating equilibrium. The presence of the public sector implies more than possible manipulation of private information (and incentive compati- bility): even if all messages are true they are difficult to collect.
Fourth the income redistribution game is not one of perfect and com- plete information. The individual can observe the gross benefit but not the tax related to it, also because a direct and strict connection between specific taxes and specific expenditures does not usually exist. In other words, the individual can only guess the expected value of tax in order to obtain the expected net benefit as a difference. Again, to compute the net benefit is costly and the individual can easily under or overesti- mate the net benefit (this point is overlooked by the otherwise impor- tant contributions by Aumann and Kurz (1977, 1987)).
Finally, the distribution of total taxes between central and local levels has a major impact on fiscal policy and deficit. A politician, usually elected at a local level, can inflate the net benefits simply by shifting the expected cost at central level. If this indeed happens, then in general the central budget will be greater than the local one. As a consequence total deficit depends also on the system of tax collection: a true binding constraint at local level can reduce the global deficit while leaving the management of the fiscal policy, and if necessary a deficit, to the cen- tral government.
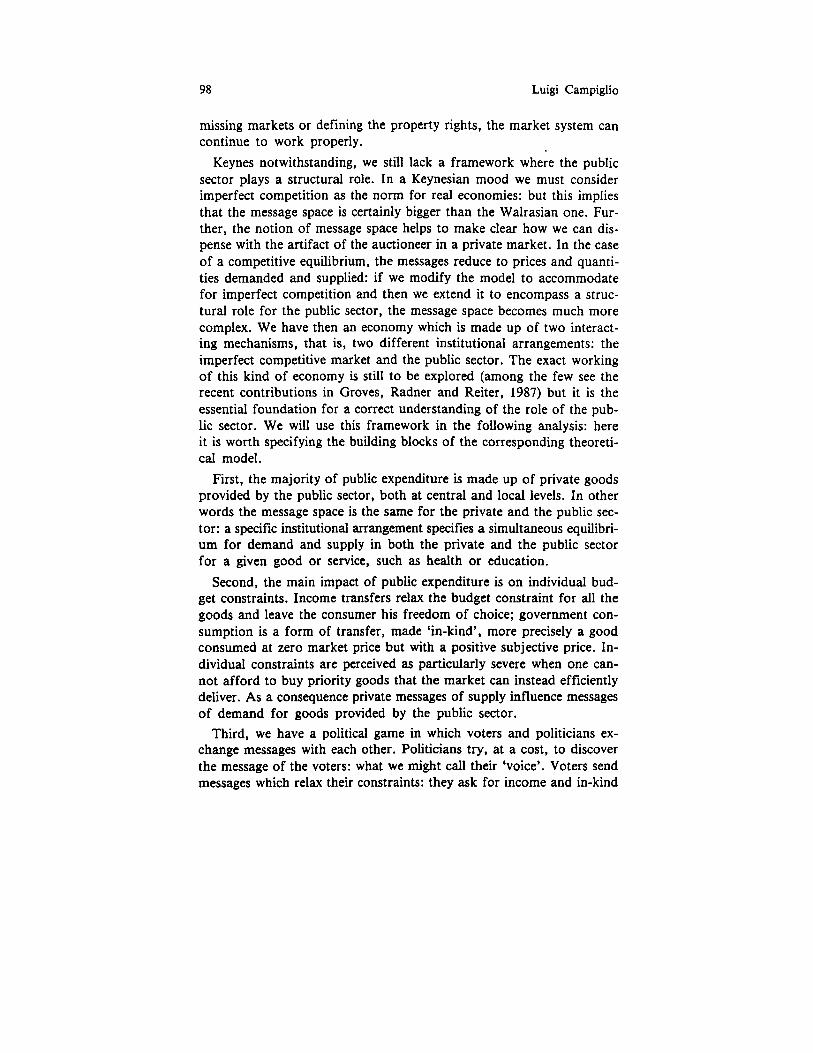
These five points, which form the outline of a work in progress, can be better viewed with the help of a commutative diagram:
Implementable plan INFORMATION ALLOCATIONS
response function function Outcome \ MESSAGE SPACE /
100 Luigi Campiglio
This diagram, thought of in terms of public sector allocations, allows us to derive some testable implications from it. Firstly, the allocations are better implemented if they are related to information which cannot be manipulated, as in the case of age or sex. Secondly, voting is a cru- cial statistic of message space: as a consequence we expect resource d o - cations (and public expenditure) to be functions of voting results. Thirdly, we can expect that in the political game people’s behaviour transmits a variety of quantity signals (like queueing or unemployment): in fact, as the message space includes the private sector, then also market prices can become an important message for the public sector (for example to subsidise home-rents or food). In the following pages we will test these and some more specific predictions: here we want only to suggest that the driving force behind the messages transmitted by people is a deep-felt demand for ex post equality.
2. The Demand for Ex post Equality
We argue that the quest for expost resource equality is the main fac- tor to explain the growing quota of public expenditure: we now give reasons for this argument and derive some implications.
As suggested beforehand we can consider the public sector as an in- stitutional arrangement that together with the private market represents the design of our economies. Market efficiency seems to be achieved in a world of ex ante equality: serious inefficiencies arise from asym- metric information or imperfect capital markets, just to mention a couple of cases. Ex ante equality, mainly in the form of equal opportunities in the market game, lies at the heart of modern capitalism and therefore ex post inequalities are a necessary and desirable result of ex ante equal- ity. The market game has the characteristic of not having upper and lower bounds on expost outcomes: the upper bound could be total wealth in the hands of only one man, but the lower bound is zero income and wealth, below the survival income. It is reasonable to suppose that if there is a majority of risk-adverse people, no one wants to end the mar- ket game at zero level because of their poor talent or simply bad luck: zero income and wealth means that a number of people are bound to die of starvation and as a consequence only the promise of a given posi- tive level of income and wealth at the end of the game can convince them to begin it. In a democratic society the public provision of a mini- mum level becomes then a condition for the viability of the market sys- tem.
Income Distribution, Public Expenditure and Equality 101
The same point can be reasserted from another perspective. General equilibrium models take as an assumption what instead should be proved as a result, that is, the survival of the persons pertaining to that econo- my. The survival assumption can be replaced, as pointed out by McKenzie (1981), by the assumption that the economy is irreducible, that is, every- one has a positive income. Put more simply, any consumer can decide to live without trade, using only his original endowment. This is clearly at variance with what we observe in the underdeveloped countries and also in developed countries. Again a minimum level of income is needed to ensure the efficiency of the market system. Therefore, even if equity is ignored we need the presence of a public sector to make the redistri- bution necessary for the working of the market system: by definition, expost income distribution will be more equally distributed. Income redis- tribution regards persons who are still playing the market game (unem- ployment benefits) or, above all, persons for whom the game is over (old age pensioners).
A similar argument applies to some types of ‘in-kind’ transfers such as health care: the country with the most articulated private insurance market system, the USA, is also that which spends the biggest share of GDP on health care. No wonder then, that some businessmen are thinking seriously of a form of public health provision as a matter of pure efficiency and reducing costs. This in turn simply reaffirms what is known at the theoretical level: public provision has a clear advantage because it solves the problems of adverse selection. In the case of public provision the State acts as a social insurer for all citizens; given the state of the world, the government warrants a status of ex post equality.
We want to stress that until now the case for expost equality provid- ed by the public sector rests only on efficiency grounds, in other words, if we want an efficient market system we also need structural govern- ment intervention. This is also the case for the education system. In 1985, the average cost per pupil until high school was about 2 million liras per year in Italy, which would account for almost 10 percent of the average net disposable annual income. If households had to pay the full cost in a private system, a substantial number simply could not af- ford it. From the point of view of the pupils, we still have a ‘nature game’ where the states of the world are the income of the different house- holds: children do not choose in which family to grow up and much less have the opportunity to play the ex ante game. Therefore, public provision of education surely is, for them, a form of expost equality. For the society as a whole ex ante and ex pusf equality are intrinsically
102 Luigi Campiglio
intertwined, in fact equality of education is the hallmark of equality of (ex ante) opportunities in the market game.
An ex post equality public policy can therefore be advocated purely in terms of efficiency, but as is well known, ex ante allocations will normally differ from corresponding ex post allocations. The conflict be- tween the two types of allocations can disappear only in very special cases: as a consequence, if we want to obtain some notion of ex ante efficiency, this will appear as an ex post inefficiency, so commonly ascribed to the public sector. This point can be put in a different way: let us suppose that we want to redistribute income to get rid of poverty. We know in advance that message manipulation can cause someone not in a state of poverty to receive the benefit, in this case we can decide what kind of inefficiency to avoid but we cannot avoid the (ex post) inefficiency itself. One may want to avoid the risk of not giving when the recipient is really poor, or to avoid the risk of giving to a person who is not poor, but of course allocations will be different in the two cases, and an expost equality approach will support the former. In fact the behaviour of governments in industrialised countries seems to con- firm the preference for ex post equality, in the form of a steady in- crease of social coverage, that is the proportion of the relevant popula- tion which can benefit from a given programme (OECD, 1985).
The notion of expost equality, in a sense, completes the traditional notion of horizontal equity, i.e. the idea of treating equally those who are equal before they are taxed. We now need to distinguish between horizontal tax equity and horizontal expenditure equity, because this last notion implies treating equals equally when they consume public resources or receive money.
But if we speak of equality in public expenditure we need to further distinguish between input equality and output equality: for the Utilitari- an case in particular, Arrow (1971) has shown that output equality is not an easy result to achieve. Some authors (Giarda, 1986) explicitly acknowledge these difficulties, and conclude that input equality would be a more feasible target, producing a net improvement of the status quo. In the short term the argument is quite reasonable, but it would be a mistake to overlook that government ‘failure’ arises just because of output inequalities between the public and the private sector, and within the public sector itself. We conclude that the driving force be- hind the growth of public expenditure is a demand for expost output equality in those events where the individual’s margin of choice is se- verely constrained. Politicians have the role of satisfying the recognized message demand within the public sector budget constraint.
Income Distribution, Public Expenditure and Equality 103
3. The Growing Public Sector: An International Comparison
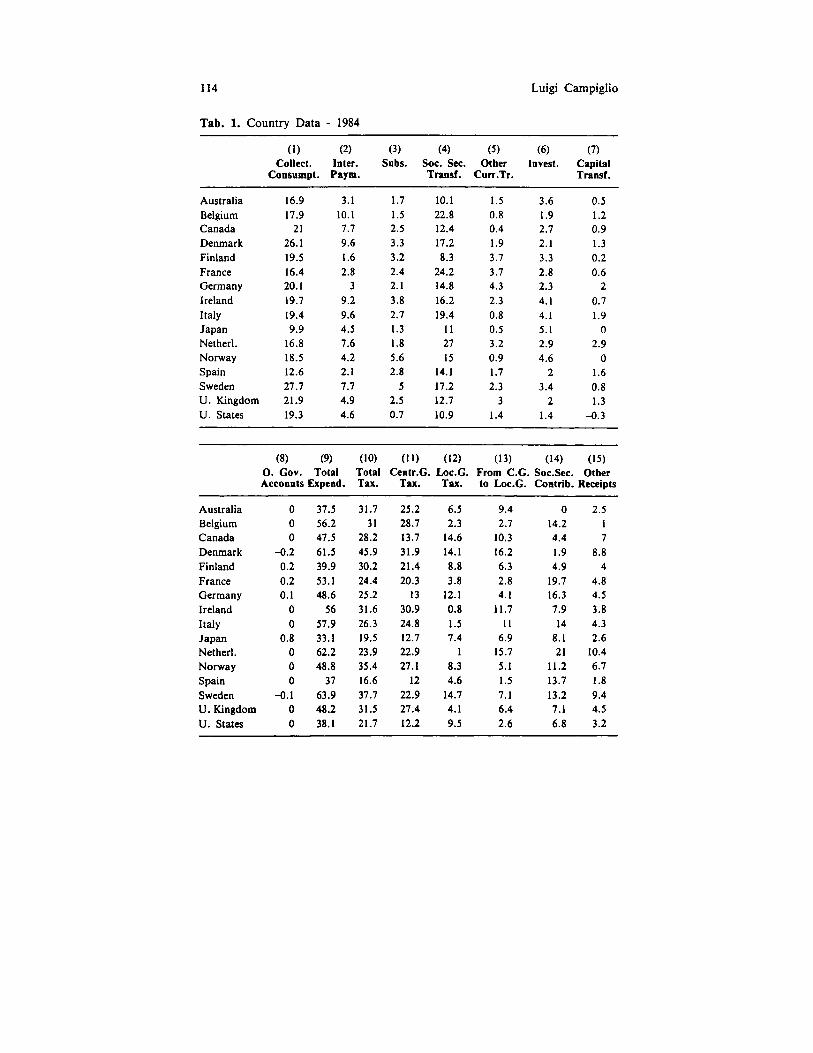
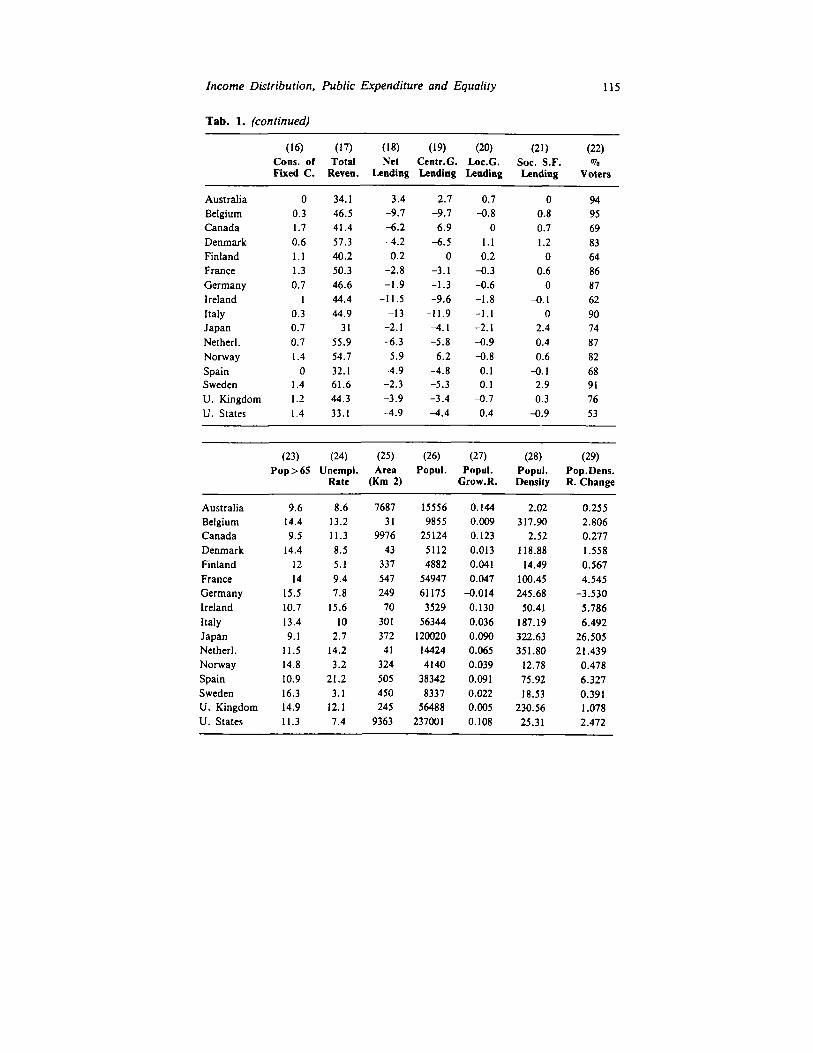
In this section we undertake a cross-section analysis of public expend- iture for 16 countries: their highly different institutional frameworks should clarify the role of structural factors in shaping public expendi- ture. The basic data used come from a specific and detailed analysis accomplished by the OECD (1987). These data, together with others of different sources, are collected in the appendix (all national account data are expressed as a percentage share of the corresponding GDP). The number of observations available for each variable is statistically limit- ed, therefore the results can only be judged in conjunction with the previ- ous theoretical analysis. It is hence to that analysis that we now explicit- ly refer in presenting the results.
3.1 . The Political Game
Some recent results have stressed the role of political variables in ex- plaining budget deficit. Roubini and Sachs, (1988) use an index of polit- ical cohesion to show that during the period 1975-1985, the largest deficits are associated with multiparty coalition governments of short tenure. Here we ask a more fundamental question, namely if within the politi- cal game we can assign a positive money value to the vote, in other words if the demand for income redistribution materialises in the public expenditure structure. The political variable we use is the simplest possi- ble: the percentage of people who vote in each country (VOT), a crude but reasonable proxy of the democratic ‘voice’. We find, as expected, a significant relationship between vote and a measure of income redis- tribution, the transfer payments (TRA). The equation estimated is (OSL, and t-values in parenthesis):
TRA= - 2.145 + 0.228 *VOT R2 = 0.293 (- 0.285) (2.414) R2 adj. = 0.243
We want to stress that given the limited number of observations, other statistical methods, in particular cograduation analysis, would be more appropriate. On the other hand as the substantial results obtained are the same, we chose to show regression results because they are more familiar to economists.
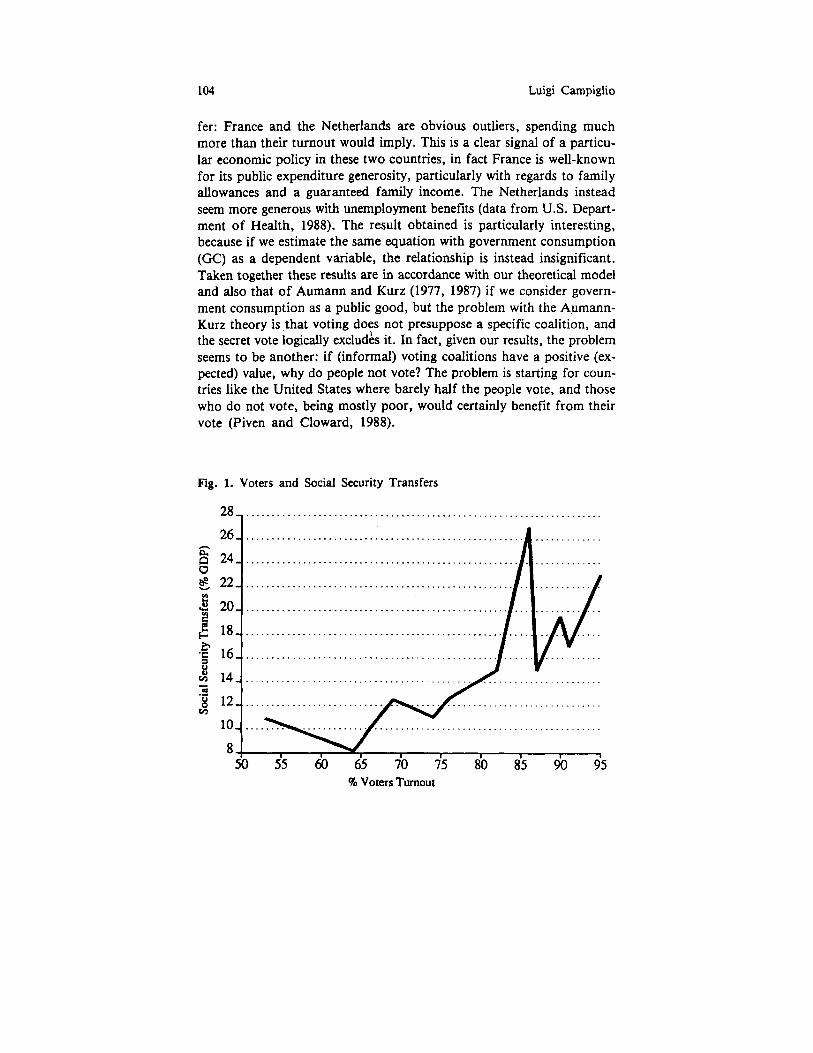
Figure 1 clearly shows the positive pattern existing between the per- centage of voter turnout and the share (of GDP) of social security trans-
104 Luigi Campiglio
fer: France and the Netherlands are obvious outliers, spending much more than their turnout would imply. This is a clear signal of a particu- lar economic policy in these two countries, in fact France is well-known for its public expenditure generosity, particularly with regards to family allowances and a guaranteed family income. The Netherlands instead seem more generous with unemployment benefits (data from U.S. Depart- ment of Health, 1988). The result obtained is particularly interesting, because if we estimate the same equation with government consumption (GC) as a dependent variable, the relationship is instead insignificant. Taken together these results are in accordance with our theoretical model and also that of Aumann and Kurz (1977, 1987) if we consider govern- ment consumption as a public good, but the problem with the Aumann- Kurz theory is that voting does not presuppose a specific coalition, and the secret vote logically excludks it. In fact, given our results, the problem seems to be another: if (informal) voting coalitions have a positive (ex- pected) value, why do people not vote? The problem is starting for coun- tries like the United States where barely half the people vote, and those who do not vote, being mostly poor, would certainly benefit from their vote (Piven and Cloward, 1988).
Fig. 1. Voters and Social Security Transfers
28, ................................................................
. . . . . . . . . . . .
> LL -I . . . . . . . . . . . . . . . . . . . . . . . . . . . . . . . . . . . . . . . . . . . . . . . . . . . . I . . I . .
-5 'U -I .................................................I......II..........
. . . . . . . . . . . . . . . . . . . . . . . . . . . . . . . . . . . . . . . . . . . . . . . . . .
% Voters Turnout
Income Distribution, Public Expenditure and Equality 105
3.2. The Message Space
We consider here these messages which are less manipulable, such as age or sex. Taking into account the increasing concern about the ageing population in industrialised countries (OECD, 1988) we considered the quota of old people (OLD), that is over 65, as a non manipulable mes- sage for the government which has to choose from amongst implement- able plans. The elderly can benefit from public expenditure both through transfer payments (TRA) and government consumption (GCO), typical- ly in the form of health care expenditures. In the latter case we obtain the following result:
GCO= 4.828 + 1.119 *OLD R2 = 0.363 (0.951) (2.830) R2 adj. =0.318
This result seems to support the argument of Wilensky (1976) who attempts to show that in the United States, the increase of the elderly as a fraction of the population is the most powerful source of welfare spending: in this case cross-section results would also agree with time- series data. A further interesting result comes from Usui (1987) who models the timing of adopting social insurance policies in 63 countries in the period 1880-1976. OLD is a significant variable in explaining the first adoption of social insurance policies in a country, and it is a very significant variable in explaining the adoption of an unemployment programme. It may seem strange that OLD does not explain Old Age programmes, but Usui’s results show that this programme is mainly de- termined by the fact that some other programme has already been adopt- ed, and in this case OLD seems to explain Old Age programmes via the influence of the first adoption.
Aged people are also a message; although weaker, on transfer pay- ments, for which the simple correlation coefficient is r = 0.366. Unem- ployment is also a natural message, in fact, there is a weak correlation with transfer payments (r = 0.314) but also a stronger and interesting correlation with capital transfer (r = 0.548). This seems to suggest that the main response to high unemployment is to stimulate investments made by firms: whereas with regard to the relationship between unemploy- ment and public investment, there is no sign of a positive relation, but rather we observe a negative sign (r = - 0.441) which is worth explaining in another paper.
106 Luigi Campiglio
3.3. Budget Deficit and Tax Levels
Our results seem to suggest the following chain of relationships: a) across the countries a clear positive relationship for the following
account items arises: total government consumption and taxes (r = 0.79); social security transfers and social security contributions (r = 0.768). These results may seem obvious, but we think they are not. It is in fact the signal of an implicit accounting behaviour which prevails in the indus- trialised countries;
b) total deficit (more precisely net lending) is explained almost entire- ly by the central government deficit (CDE) and in turn central deficit is mainly explained by interest payments: the inclusion of the unemploy- ment rate is also significant, and this seems to imply a reasonable cycli- cal sensitivity. The equation estimated is:
CDE= 4.058 - 0.965 *INT- 0.320 *UNE R2 = 0.675 (2.226) (- 4.195) (- 2.351) R2 adj. = 0.625
(Note that the central deficit data - CDE - enter with their negative or positive sign). Without putting too much weight on this estimate for the reasons already stressed, we note that the intercept is positive and significant, which means a budget surplus. As it should be clear we are using a Domar perspective, interest payments are the burden of the debt for which a tax should be imposed;
c) local deficits seem much easier to control and a greater fiscal au- tonomy at the local level helps to control expenditures and to reduce the deficit. If we consider local taxes (LTX) in the private sector (i.e. net of government transfers) we obtain a measure of local tax autono- my. On this basis we made the following estimate:
LDE= - 1.234 + 0.082 *LTX+ 0.206 *GLTX R2 = 0.437 (- 4.31 1) (2.358) (1.733) R2 adj. = 0.396
(where LDE = local deficit, LTX = local taxes and GLTX is the variation in local taxes share on GDP between 1974 and 1984). It is worth noting the cases of Italy, Netherlands and Ireland which have the lowest local tax level, an almost complete transfer from The central to local govern- ment and at the same time rank highest in the total budget deficit. To obtain a more precise measure of the relation between fiscal autonomy and level of public expenditure, we considered a very detailed variable,
Income Distribution, Public Expenditure and Equality 107
i.e. the volume of money transfer from the central government to local governments (TCL), we regressed this particular measure on the level of total public expenditure (TPE) and the result obtained is:
TCL= - 3.850 + 0.229 *TPE R2 = 0.252 (- 0.725) (2.174) R2 adj. =0.198
This result lends support to those economists who ask for greater fis- cal autonomy at the local level as one of the instruments to regain a lost balance between the power to spend and the responsibility to tax (Mazzocchi-Pastori, 1972).
4. The Growing Public Sector: the Case of Italy
A number of recent and articulated studies have tried to understand the dynamics of public expenditure in each European country (Lybeck and Henrekson, 1988). Brosio and Marchese (1988) have proposed a model for the case of Italy which is built on the idea of competing in- terest groups, but they find this theoretical notion difficult to translate in their econometric estimates. For this reason we decided to test our model considering the dynamics of two specific types of expenditure: hospitals and pensions. The model for the hospital sector in Italy has been already published (Campiglio, 1982) and it has the characteristics of the theoretical model here proposed (the period covered is 1959-1980). The message space is made up of the bed-days demanded from the pub- lic sector, and the number of people insured: the first message can be considered non manipulable, while the second reflects the demand for ex post equality. Government perceives this demand and adjusts its bed supply with a given lag, which in turn influences the bed supply in the private sector. Further, bed-days demanded affect the offer of new doc- tors (physicians), i.e. the enrollment at University. The basic structural model is so described:
BEDSPU: = a + b.BDDPU, + c.INS, PI
BEDSPU,-BEDSPU,_, = CX*(BEDSPU:-BEDSPU,-, ) + U, (21
BEDSPR: = a + b.BDDPR, + d-BDSPU,-, PI
BEDSPR,-BEDSPR,-, = CX*(BEDSPR:-BEDSPR,-, ) + U, PI
108 Luigi Campiglio
PHYPU: = a + b-BEDSPU, + c.DEGREE,-,
PHYPU:-PHYPU,-, = (Y*(PHYPU:-PHYPU,-,) + U, [51
(61
PHYPR: = a + bSBEDSPR, + c.DEGREE,-, 171
ENROL, = a + b-ENROL,-, +ENROL,-, + d-BEDSTO, [81
ADMPU = A(PRCARE, PRTIME, BEDSPU) [91
ADMPR = A(PRCARE, PRTIME) no1
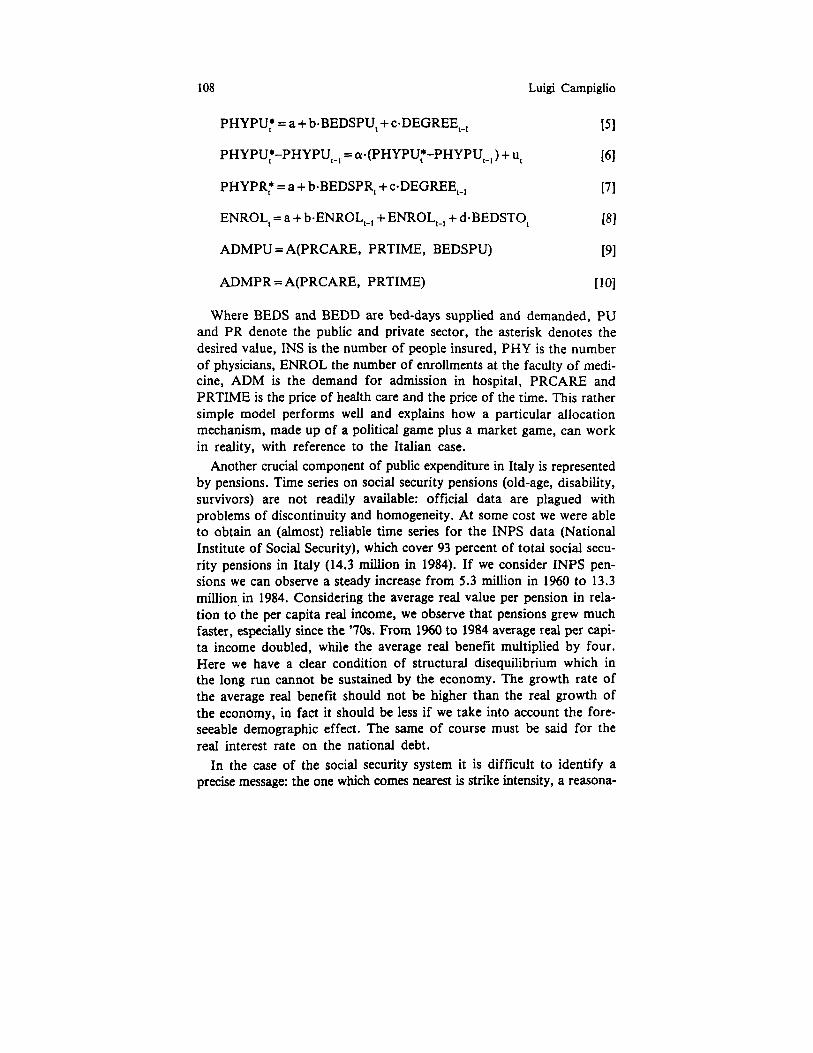
Where BEDS and BEDD are bed-days supplied and demanded, PU and PR denote the public and private sector, the asterisk denotes the desired value, INS is the number of people insured, PHY is the number of physicians, ENROL the number of enrollments at the faculty of medi- cine, ADM is the demand for admission in hospital, PRCARE and PRTIME is the price of health care and the price of the time. This rather simple model performs well and explains how a particular allocation mechanism, made up of a political game plus a market game, can work in reality, with reference to the Italian case.
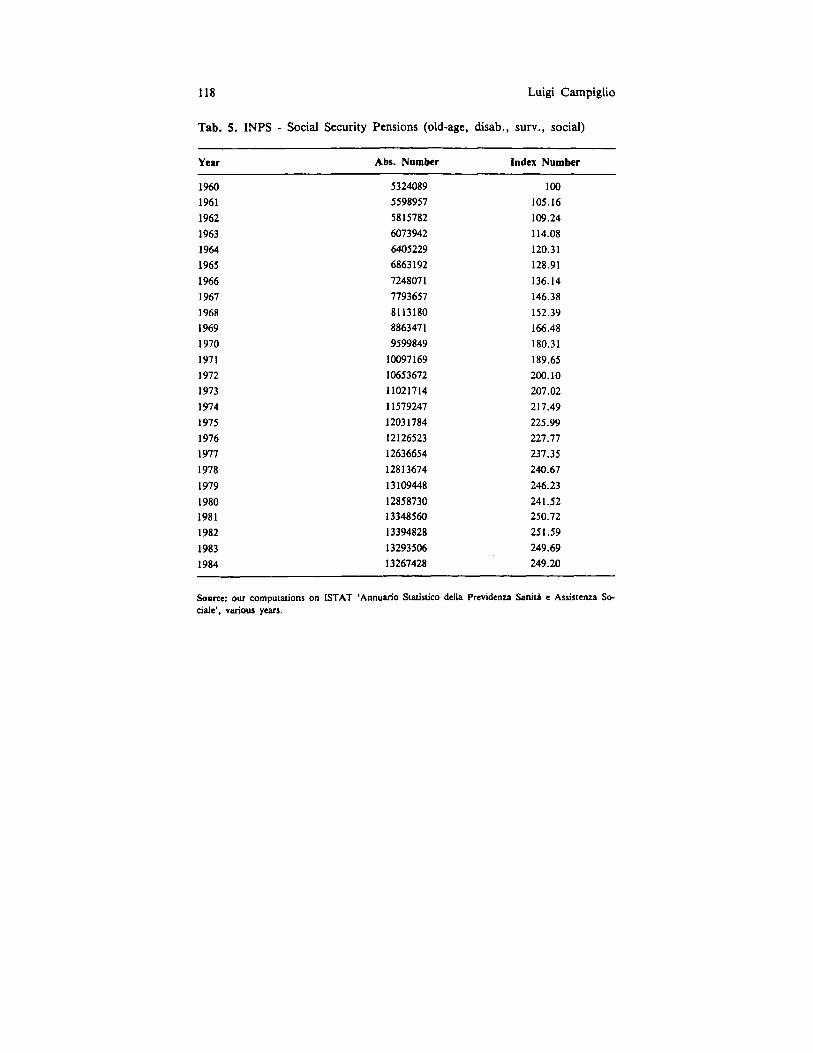
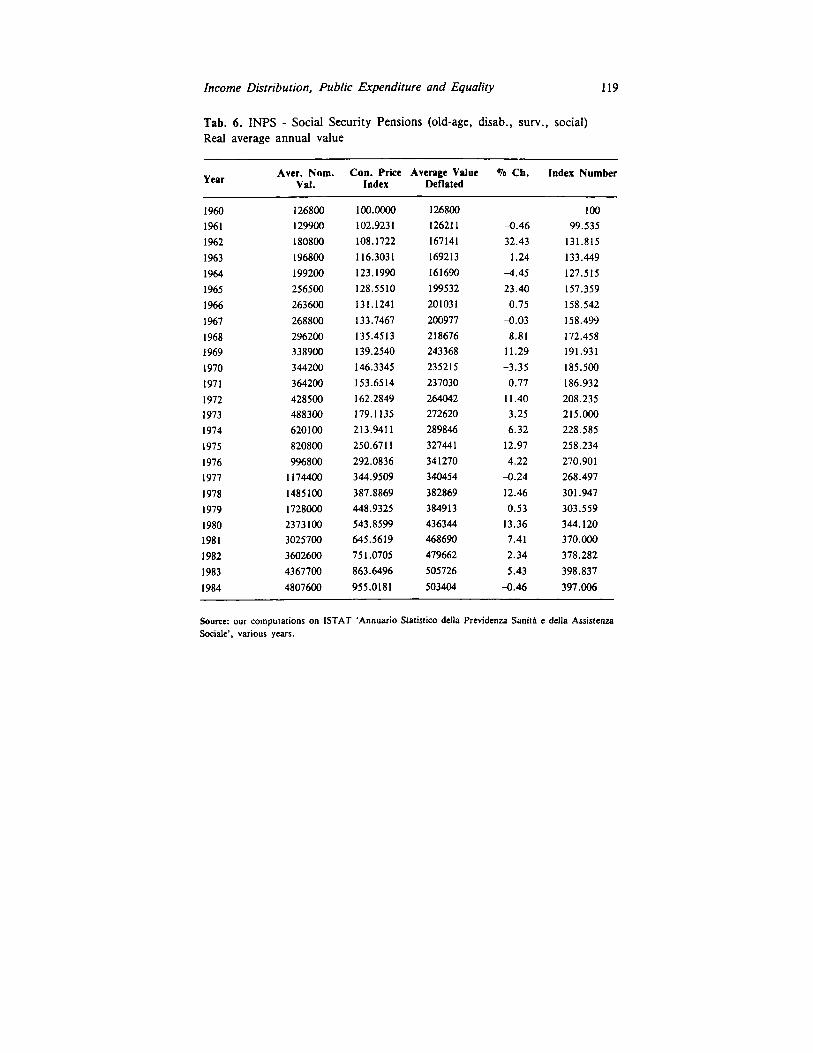
Another crucial component of public expenditure in Italy is represented by pensions. Time series on social security pensions (old-age, disability, survivors) are not readily available: official data are plagued with problems of discontinuity and homogeneity. At some cost we were able to obtain an (almost) reliable time series for the INPS data (National Institute of Social Security), which cover 93 percent of total social secu- rity pensions in Italy (14.3 million in 1984). If we consider INPS pen- sions we can observe a steady increase from 5.3 million in 1960 to 13.3 million in 1984. Considering the average real value per pension in rela- tion to'the per capita real income, we observe that pensions grew much faster, especially since the '70s. From 1960 to 1984 average real per capi- ta income doubled, while the average real benefit multiplied by four. Here we have a clear condition of structural disequilibrium which in the long run cannot be sustained by the economy. The growth rate of the average real benefit should not be higher than the real growth of the economy, in fact it should be less if we take into account the fore- seeable demographic effect. The same of course must be said for the real interest rate on the national debt.
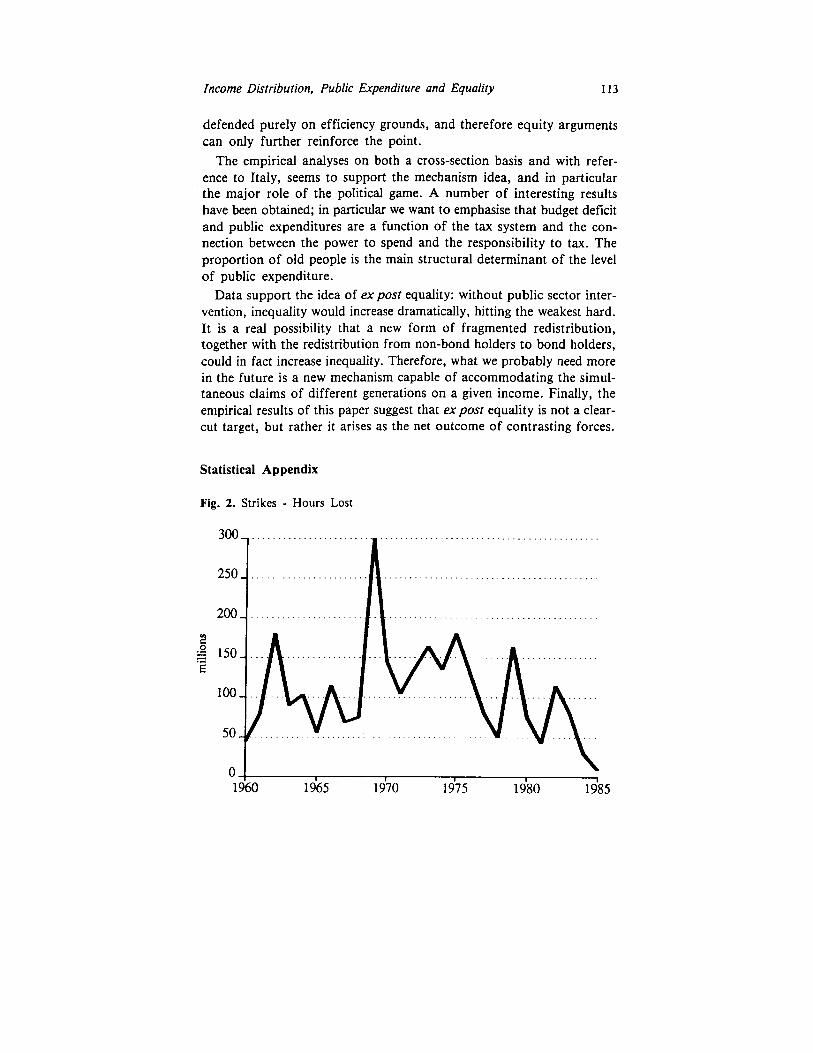
In the case of the social security system it is difficult to identify a precise message: the one which comes nearest is strike intensity, a reasona-
Income Distribution, Public Expenditure and Equality 109
ble measure for a specific ‘voice’ of the people. In fact if we plot the hours lost for strikes some peaks can be observed which we can associ- ate to some important laws passed by the Parliament, with the purpose of improving the economic condition of the elderly. This is in particular the case in the years 1969 and 1975 with the introduction of Social Pen- sions, the linking of pensions to the last five years of work and the cost of living indexation.
This observation can be added to Usui’s results for a better explana- tion of Old Age programmes. Given the nature of the Italian political system, we think that the most appropriate way to model the political game is through utilising a power index (Shapley value). Preliminary results seem to show that in the case of Italy the political business cycle takes the specific form of politicians more willing to spend in the months preceding election day.
5. The Ex post Equality: Some Evidence
In this sector we ask the question whether public expenditure does in fact redistribute in the direction of expost equality in the Italian case. The precise answer to this question would imply a comparison of the same economic system with and without public expenditure, simulated through a general equilibrium model. Available statistical data do not allow us to perform this exercise: nevertheless we can put together some specific evidence on income distribution, monetary and in-kind trans- fers.
5.1. Income Distribution and Monetary Transfers
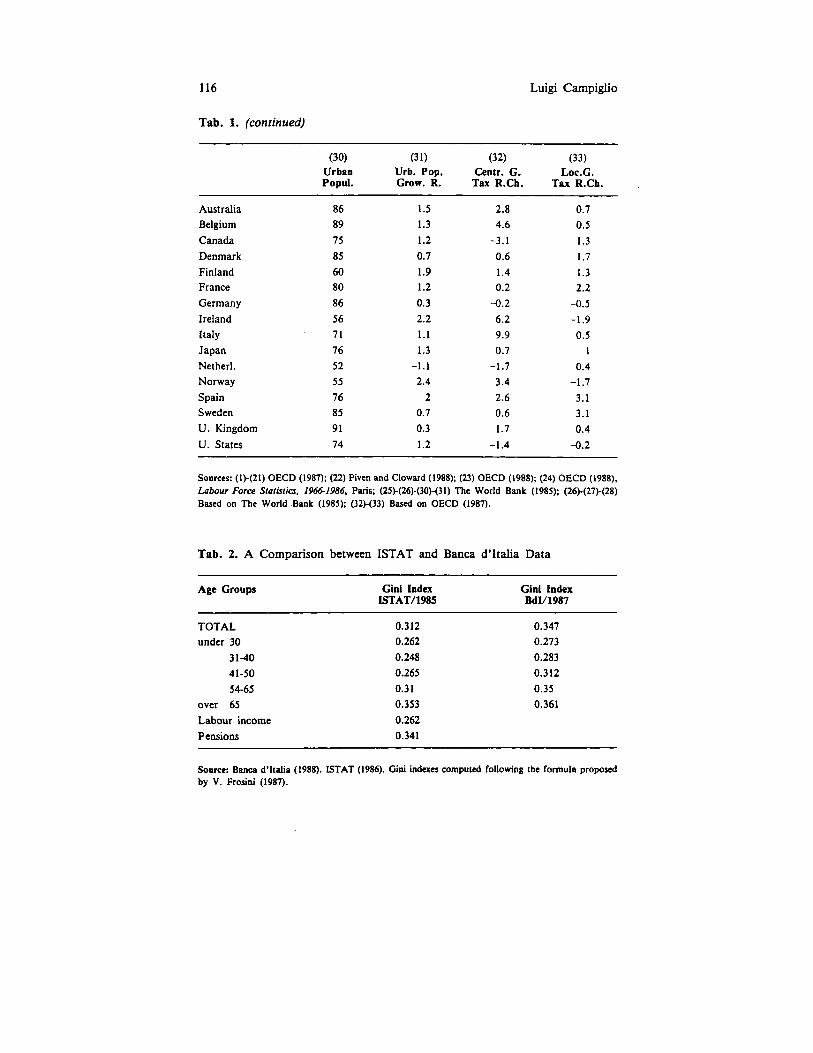
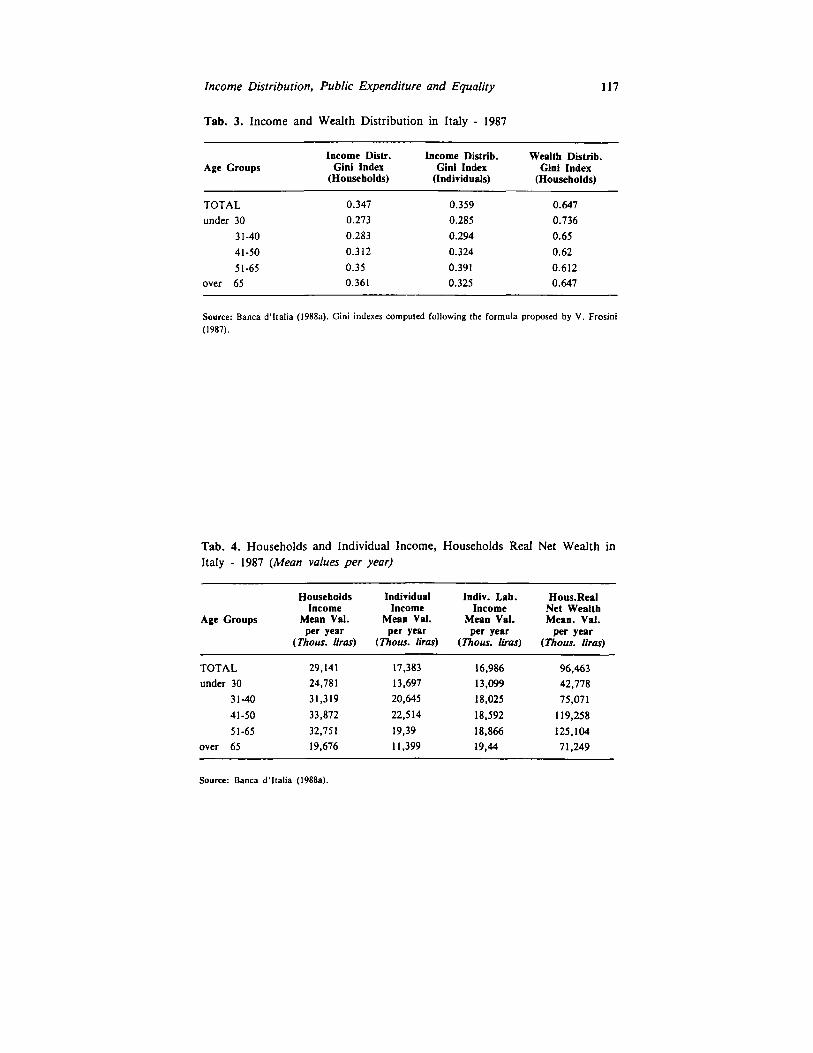
Income distribution data come from two sources: the Bank of Italy and ISTAT (Central Institute of Statistics). We will use the Bank of Italy data, but together with a homogeneous comparison of the two sources. We need first to examine the Gini index by age groups and from this analysis we can derive some interesting results:
a) for individuals, income inequality increases with age, it declines for the group over 65 and this supports the intuition that income trans- fer decreases overall inequality. On the other hand, for households the Gini index increases steadily with age, including the group over 65; moreover income inequality declines, shifting from individuals to house- holds for each age group, with the notable exception of the over 65
110 Luigi Campiglio
age group. In other words the aggregation of individual incomes in each household decreases inequality, except for the older households where the family behaviour (or perhaps the impossibility to behave in the labour market) seems to widen rather than to reduce the inequality. Wealth inequality is, as usual, much higher than income inequality: it is highest under 30 and over 65. Using ISTAT data for household incomes, the same kind of pattern arises: income inequality increases steadily with age, but in comparison with the Bank of Italy data, the level of the Gini index is systematically lower. These data, taken together with the age-income profile, seem to suggest that a significant part of average net wealth comes from inheritance and not saving.
We can conclude that the State seems to be pointing in the right direc- tion for ex post equality in the case of individuals, but not in the case of households. This seems to suggest that, in addition, expost family equality should be the focus of income redistribution;
b) to understand the relevance of income transfers on income distri- bution we performed the following exercise: the over 65 age group has 14 percent of total income, and about 60 percent of its income comes from income transfers. On this basis we computed what the income dis- tribution would be without the transfers, making the hypothesis of a proportional reduction in the four lower deciles and a symmetric increase of 10 percent of the upper deciles. The result of the exercise is that be- fore income transfers the Gini index is 0.46, and after the transfers it decreases by 10 points to 0.36. In other words the redistributive impact seems substantial and underlines what is going to be the real problem of the future, that is, the possible generational conflict between people in the working force and people outside the working force.
5.2. Distribution of Pensions
The volume of resources transferred from working to non-working people is not equally distributed; it seems that expost equality regards the relation between different generations at a given date, but that in- come inequality remains substantial within the oldest age group. The previous data suggest the existence of considerable inequality over 65 households, while inequality decreases for individuals. As suggested this is a clear signal that households, rather than individuals, should be the target of income transfers. To grasp the origin of income inequality amongst the aged we must consider these data in more detail, in partic- ular by type of insurance.
Income Distribution, Public Expenditure and Equality 111
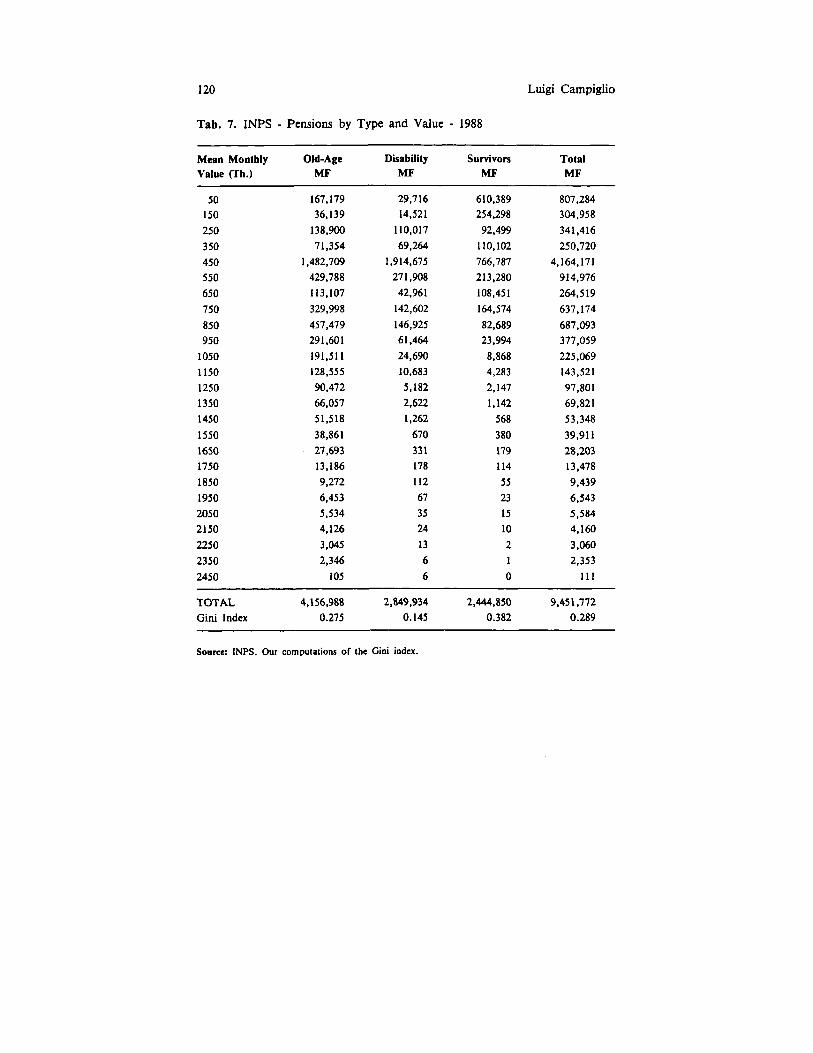
If we analyse the INPS data for the normal type of insurance - pri- vate sector employees - we find a Gini index of 0.289 for the total, which is made up of 0.275 for old-age pensions, 0.145 for disability pen- sions, and 0.382 for veterans’ pensions. In general the normal type of insurance seems to be rather expost equalizing (there is a small bias in these data because they do not take account of the people who receive two pensions, but the number and the average benefit are small and so is the bias). But if we compare these Gini indexes with that comput- ed for all pensions, we obtain the higher value of 0.341 (on ISTAT data) and of 0.325 on individuals aged over 65 (on Bank of Italy data). It therefore seems that other types of insurance increase inequality.
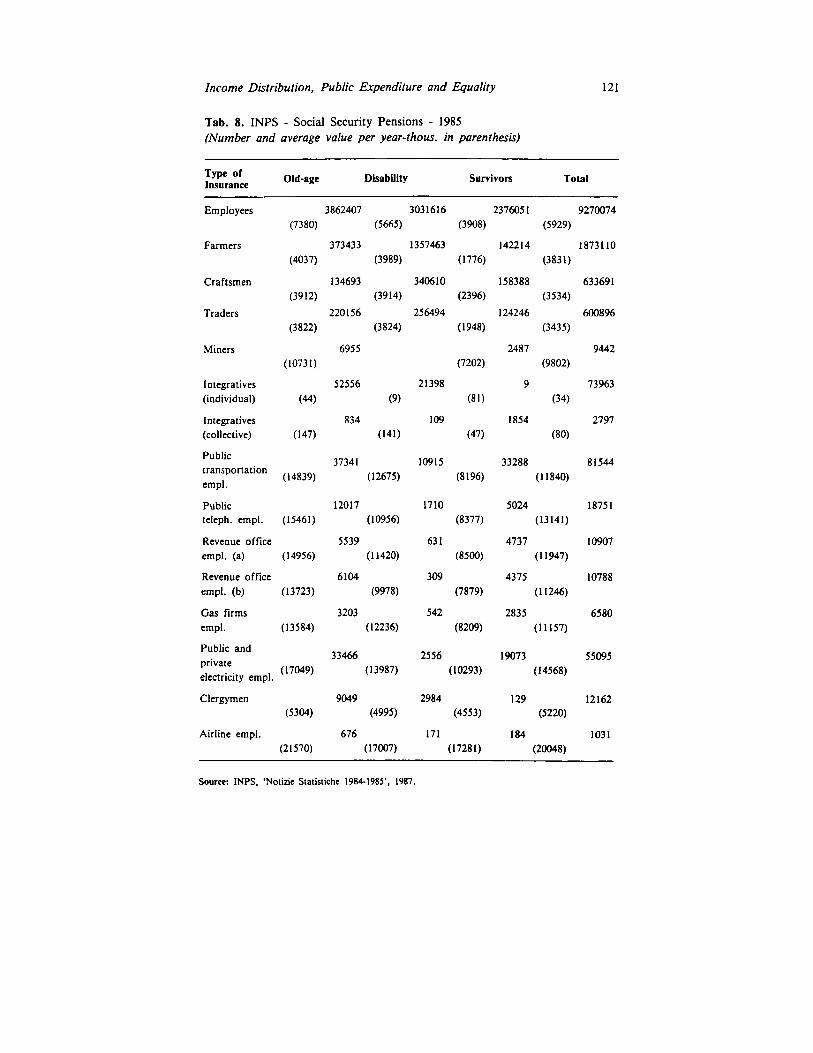
It is here that the framework of competing groups adopted by Brosio and Marchese (1988) seems to fit better, because alongside the normal insurance we have special insurances for particular groups like farmers or craftsmen (with lower average benefit) or like employees in public utilities (transportation, telephones etc.) who instead generally receive benefits much higher than the average. Furthermore it is common to find private arrangements which provide for a supplementary benefit on top of that stated by the law. No doubt these are good examples of the fragmented redistribution to which Lindbeck (1985) ascribes a major role in recent years; we can add that this kind of redistribution seems to increase inequality, going in the opposite direction of ex post equality. To the fragmented redistribution suggested by Lindbeck, we must these days add the redistribution of interest from non-bond holders to bond holders, which, we think, contributes to further increasing ine- quality.
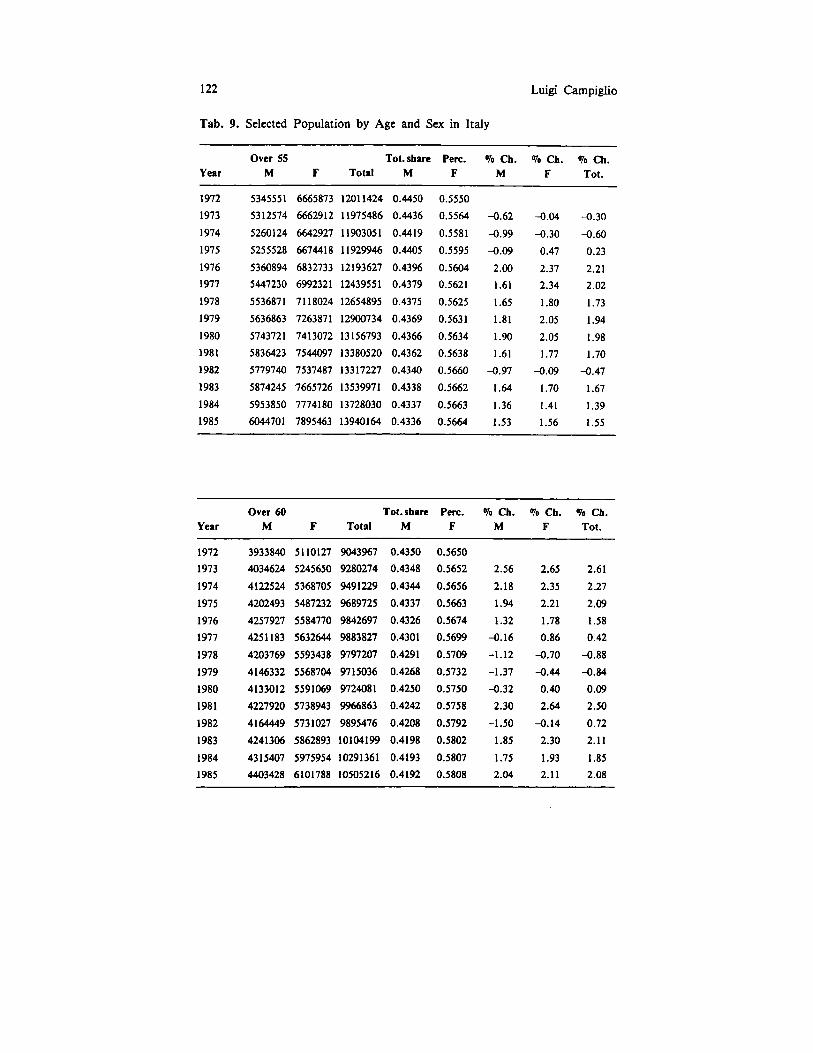
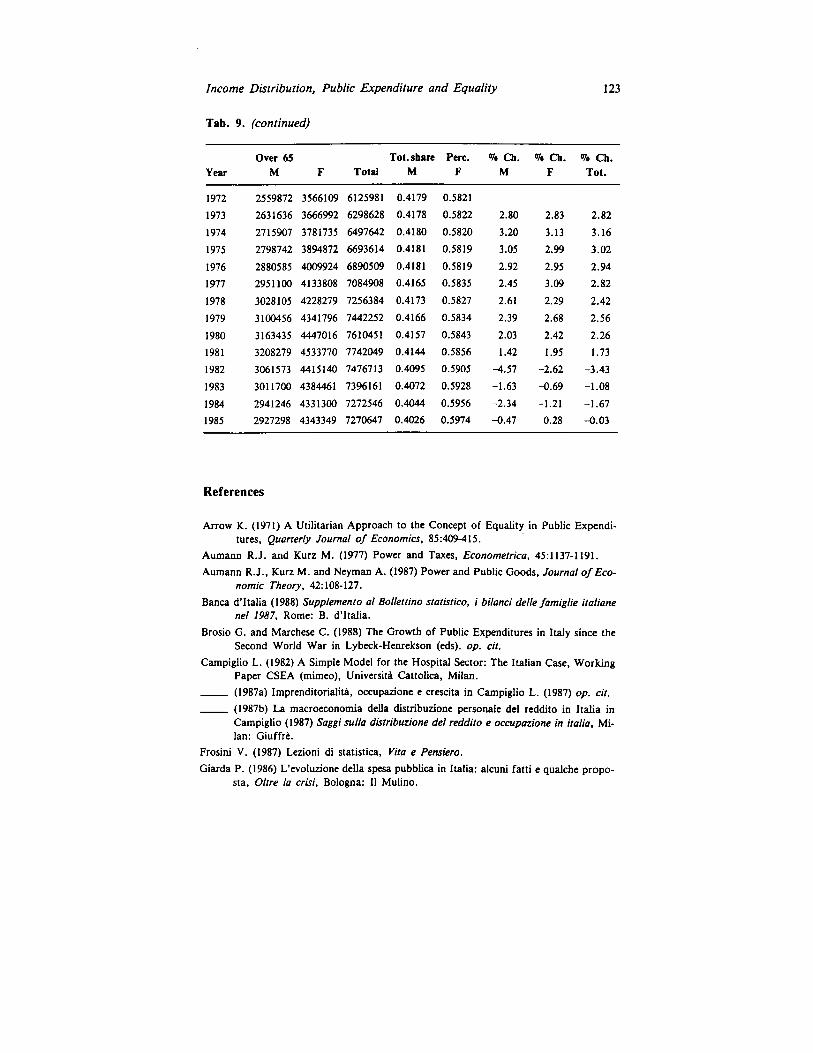
A final point on pensions is worth considering: we know that the demo- graphic effects are going to become more and more important. What is overlooked in the demography of pensions is the fact that in the near future the problem of redistribution concerns more and more widows or women alone.
5.3. Income Distribution and Transfers In-kind
Transfers in-kind have a major role in reducing inequality between the elderly, especially in the case of health care. There is, however, a clear problem in measuring the impact of these transfers on income dis- tribution. An interesting effort has been made by the U.S. Bureau of Census (1984) in trying to evaluate the impact of in-kind transfers on poverty levels. The most impressive change regards the aged (65 years
112 Luigi Campiglio
and over) which in 1983 had an official poverty rate of 14.1 percent; counting in-kind transfers, the poverty rate drops to 3.3 percent, and this difference results almost entirely from counting the market value of Medicare and Medicaid as income. We have reason to believe that something similar holds in the case of Italy: we know in fact that per- sons over 60 years account for 42% of total bed-days in hospitals, and a number of studies suggest that the health care cost of old people is much higher than the average. We have some indications for the United States from expenditure statistics, that the per capita expenditure on per- sonal health care for the over 65s is almost three times the average amount: no wonder then that two thirds of the amount for the elderly is paid by the public sector (US. Department of Health, 1983). To un- derstand the relevance of public health care on income redistribution in Italy one has only to consider that the average length of stay in hospital for a person of more than 60 years is about 30 days: each day should cost about 200 thousand lira, and total cost is therefore about 6 million, more than half the average annual income for this age group. We can reasonably conclude that health care is a crucial instance of ex post equal- ity: in a modern economy the consequences of cancelling public provi- sion would be dramatic both in terms of welfare and income distribution.
Finally, public expenditure acts as an income equaliser also in those cases where the State plays the role of a last resort employer. About 70% of government consumption is made up of labour income of em- ployees, and therefore the State can directly influence the income distri- bution of a given region. We proved elsewhere (1987a) that this is in- deed the case for the regions in the South of Italy where the State also acts as a last resort employer. This type of action surely underlies the strong negative relationship between income inequality and per capita income that we found in a companion paper (1987b).
Conclusions
We suggested that we still need to fully incorporate the public sector in our general equilibrium models. In this paper we propose considering our economies as a resource allocation mechanism, composed of a po- litical game and a market game, whose interaction produces specific so- lutions and allocations. While markets are the domain of ex ante equal- ity, the public sector has the domain of expost equality. Therefore we argue that the driving force behind the growth of public expenditure is a demand for an ex post equality of outcomes: this hypothesis is
Income Distribution, Public Expenditure and Equality 113
defended purely on efficiency grounds, and therefore equity arguments can only further reinforce the point.
The empirical analyses on both a cross-section basis and with refer- ence to Italy, seems to support the mechanism idea, and in particular the major role of the political game. A number of interesting results have been obtained; in particular we want to emphasise that budget deficit and public expenditures are a function of the tax system and the con- nection between the power to spend and the responsibility to tax. The proportion of old people is the main structural determinant of the level of public expenditure.
Data support the idea of expost equality: without public sector inter- vention, inequality would increase dramatically, hitting the weakest hard. It is a real possibility that a new form of fragmented redistribution, together with the redistribution from non-bond holders to bond holders, could in fact increase inequality. Therefore, what we probably need more in the future is a new mechanism capable of accommodating the simul- taneous claims of different generations on a given income. Finally, the empirical results of this paper suggest that expost equality is not a clear- cut target, but rather it arises as the net outcome of contrasting forces.
Statistical Appendix
Fig. 2. Strikes - Hours Lost
300 ~ . . . . . . . . . . . . . . . . . . . . . . . . . . . . . . . . . . . . . . . . . . . . . . . . . . . . . . .
. L . . . . . . . . . . . .
250 - ....................... . . . . . . . . . . . . . . . . . . . . . . . . . . . . .
200 - . . . . . . . . . . . . . . . . . . . . . . .
A V '
I I I 1 1
1960 1965 1970 1975 1980 1985
114 Luigi Campiglio
Tab. 1. Country Data - 1984
(1) (2) (3) (4) (5) (6) (7) Collect. Inter. Subs. SOC. Sec. Other Invest. Capital
Consumpt. Pam. Transf. Curr.Tr. Trnnsf.
Australia Belgium Canada Denmark Finland France Germany Ireland Italy Japan Netherl. Norway Spain Sweden U. Kingdom U. States
16.9 3.1 1.7 10.1 1.5 3.6 0.5 17.9 10.1 1.5 22.8 0.8 1.9 I .2
21 7.7 2.5 12.4 0.4 2.7 0.9 26.1 9.6 3.3 17.2 1.9 2.1 1.3 19.5 I .6 3.2 8.3 3.7 3.3 0.2 16.4 2.8 2.4 24.2 3.7 2.8 0.6 20. I 3 2.1 14.8 4.3 2.3 2 19.7 9.2 3.8 16.2 2.3 4. I 0.7 19.4 9.6 2.7 19.4 0.8 4.1 I .9 9.9 4.5 1.3 11 0.5 5.1 0
16.8 7.6 1.8 27 3.2 2.9 2.9 18.5 4.2 5.6 15 0.9 4.6 0 12.6 2.1 2.8 14.1 1.7 2 1.6 27.7 7.7 5 17.2 2.3 3.4 0.8 21.9 4.9 2.5 12.7 3 2 1.3 19.3 4.6 0.7 10.9 1.4 1.4 -0.3
(8) (9) (10) (11) (12) (13) (14) (15) 0. Cov. Total Total Centr.G. L0c.C. From C.G. Soc.Sec. Other Accounts Expend. Tax. Tax. Tax. to L0c.C. Contrib. Receipts
Australia Belgium Canada Denmark Finland France Germany Ireland Italy Japan Netherl. Norway Spain Sweden U. Kingdom U. States
0 37.5 31.7 25.2 6.5 9.4 0 2.5 0 56.2 31 28.7 2.3 2.7 14.2 I 0 47.5 28.2 13.7 14.6 10.3 4.4 7
-0.2 61.5 45.9 31.9 14.1 16.2 1.9 8.8 0.2 39.9 30.2 21.4 8.8 6.3 4.9 4 0.2 53.1 24.4 20.3 3.8 2.8 19.7 4.8 0.1 48.6 25.2 13 12.1 4.1 16.3 4.5
0 56 31.6 30.9 0.8 11.7 7.9 3.8 0 57.9 26.3 24.8 1.5 11 14 4.3
0.8 33.1 19.5 12.7 1.4 6.9 8.1 2.6 0 62.2 23.9 22.9 1 15.7 21 10.4 0 48.8 35.4 27.1 8.3 5.1 11.2 6.7 0 31 16.6 12 4.6 1.5 13.7 1.8
-0.1 63.9 37.7 22.9 14.7 7.1 13.2 9.4 0 48.2 31.5 27.4 4.1 6.4 7.1 4.5 0 38.1 21.7 12.2 9.5 2.6 6.8 3.2
Income Distribution, Public Expenditure and Equality 115
Tab. 1. (continued)
(16) (17) (18) (19) (20) (21) (22) Cons. of Total Net Centr.C. L0c.G. SOC. S.F. VO Fixed C. Reven. Lending Lending Lending Lending Voters
Australia Belgium Canada Denmark Finland France Germany Ireland Italy Japan Netherl. Norway Spain Sweden U. Kingdom U. States
0 34.1 3.4 0.3 46.5 -9.7 1.7 41.4 -6.2 0.6 57.3 -4.2 1.1 40.2 0.2 1.3 50.3 -2.8 0.7 46.6 -1.9
1 44.4 -11.5 0.3 44.9 -13 0.7 31 -2.1 0.7 55.9 -6.3 1.4 54.7 5.9
0 32.1 -4.9 1.4 61.6 -2.3 1.2 44.3 -3.9 1.4 33.1 -4.9
2.7 0.7 0 94 -9.7 -0.8 0.8 95 4 . 9 0 0.7 69 4.5 1.1 1.2 83
0 0.2 0 64 -3.1 -0.3 0.6 86 -1.3 4 . 6 0 87 -9.6 -1.8 -0. I 62
-11.9 -1.1 0 90 -4 .1 -2.1 2.4 74 -5.8 -0.9 0.4 87
6.2 -0.8 0.6 82 -4.8 0.1 -0.1 68 -5.3 0.1 2.9 91 -3.4 4 . 7 0.3 76 -4.4 0.4 -0.9 53
(23) (24) (25) (26) (27) (28) (29) Pop>65 Unempl. Area Popul. Popul. Popul. Pop.Dens.
Rafe (Km 2) Gr0w.R. Densify R. Change
Australia Belgium Canada Denmark Finland France Germany Ireland Italy Japan Netherl. Norway Spain Sweden U. Kingdom U. States
9.6 8.6 14.4 13.2 9.5 11.3
14.4 8.5 12 5.1 14 9.4
15.5 7.8 10.7 15.6 13.4 10 9.1 2.7
11.5 14.2 14.8 3.2 10.9 21.2 16.3 3.1 14.9 12.1 11.3 7.4
7687 31
9976 43
337 547 249 70
301 372 41
324 505 450 245
9363
15556 9855
25124 5112 4882
54947 61175 3529
56344 120020 14424 4140
38342 8337
56488 237001
0.144 0.009 0.123 0.013 0.041 0.047
-0.014 0.130 0.036 0.090 0.065 0.039 0.091 0.022 0.005 0.108
2.02 317.90
2.52 118.88
14.49 100.45 245.68
50.41 187.19 322.63 351.80
12.78 75.92 18.53
230.56 25.31
0.255 2.806 0.277 1.558 0.567 4.545
-3.530 5.786 6.492
26.505 21.439 0.478 6.327 0.391 1.078 2.472
116 Luigi Campiglio
Tab. 1. (continued)
(30) (31) (32) (33) Urban Urb. Pop. Centr. G . L0c.G. Popul. Grow. R. Tax R.Ch. Tax R.Ch.
~~~
Australia 86 1.5 2.8 0.7 Belgium 89 1.3 4.6 0.5 Canada 75 1.2 -3.1 1.3 Denmark 85 0.7 0.6 1.7 Finland 60 1.9 I .4 1.3 France 80 1.2 0.2 2.2 Germany 86 0.3 -0.2 -0.5 Ireland 56 2.2 6.2 -1.9 Italy 71 1.1 9.9 0.5 Japan 76 1.3 0.7 1 Netherl. 52 -1.1 -1.7 0.4 Norway 55 2.4 3.4 -1.7 Spain 76 2 2.6 3.1 Sweden 85 0.7 0.6 3.1 U. Kingdom 91 0.3 1.7 0.4 U. States 14 1.2 -1.4 -0.2
Sources: (1)-(21) OECD (1987); (22) Piven and Cloward (1988); (23) OECD (1988); (24) OECD (1988). Labour Force Statistics, 19661986, Paris; (25)-(26)-(30)-(31) The World Bank (1985); (26)-(27)-(28) Based on The World Bank (1985): (32)-(33) Based on OECD (1987).
Tab. 2. A Comparison between ISTAT and Banca d’Italia Data
Age Groups Gini Index ISTAT/1985
Gini Index Bd1/1987
TOTAL 0.312 0.347 under 30 0.262 0.273
3 1-40 0.248 0.283 41-50 0.265 0.312 54-65 0.3 1 0.35
over 65 0.353 0.361 Labour income 0.262 Pensions 0.341
Source: Banca d’Italia (1988). ISTAT (1986). Gini indexes computed following the formula proposed by V. Frosini (1987).
Income Distribution, Public Expenditure and Equality 117
Tab. 3. Income and Wealth Distribution in Italy - 1987
Income Distr. Income Distrib. Wealth Distrib.
(Housebolds) (Individuals) (Households) Gini Index Gini Index Age Groups Gini Index
TOTAL under 30
3 1-40 41-50 51-65
over 65
0.347 0.359 0.647 0.273 0.285 0.736 0.283 0.294 0.65 0.3 12 0.324 0.62 0.35 0.391 0.612 0.361 0.325 0.647
Source: Banca d’ltalia (1988a). Gini indexes computed following the formula proposed by V. Frosini (1987).
Tab. 4. Households and Individual Income, Households Real Net Wealth in Italy - 1987 (Mean values per year)
Age Groups
Households Income
Mean Val. per year
(Thous. liras)
Individual Income
Mean Val. per year
(Thous. liras)
TOTAL under 30
31-40 41-50 51-65
over 65
29.141 24,781 31,319 33,872 32.751 19,676
~
17,383 13,697 20,645 22,514 19,39 1 1,399
Indiv. Lab. Income
Mean Val. per year
(Thous. liras)
16,986 13,099 18,025 18,592 18,866 19,44
Hous.Real Net Wealth Mean. Val.
per year (Thous. liras)
96,463 42,778 75,071
119,258 125,104 7 1,249
~ ~~ ~ ~~
Source: Banca d’ltalia (1988a).
118 Luigi Campiglio
Tab. 5. INPS - Social Security Pensions (old-age. disab., sun., social)
Year Abs. Number Index Number
1960 1961 1962 1963 1964 1965 1966 1967 1968 I969 1970 1971 1972 1973 1974 1975 1976 1977 1978 1979 1980 1981 1982 1983 1984
5324089 5598957 5815782 6073942 6405229 6863 192 724807 1 7793657 8113180 8863471 9599849 10097169 10653672 11021714 11579247 1203 I784 12126523 12636654 12813674 13109448 12858730 13348560 13394828 13293506 I3267428
100 105.16 109.24 114.08 120.31 128.91 136.14 146.38 152.39 166.48 180.31 189.65 200.10 207.02 217.49 225.99 227.77 237.35 240.67 246.23 241.52 250.72 251.59 249.69 249.20
Soum: our computations on ISTAT ‘Annuho Statistic0 della Previdenza Sanitl e Assistenza So- cialc’, various years.
Income Distribution, Public Expenditure and Equality 119
Tab. 6 . INPS - Social Security Pensions (old-age, disab., surv., social) Real average annual value
Aver. Nom. Con. Price Average Value 'TO Cb. Index Number Val. Index Deflated Year
1960 1961 1962 1963 1964 1965 1966 1967 1968 1969 1970 1971 1972 1973 1974 1975 1976 1977 1978 1979 1980 1981 1982 1983 1984
126800 129900 180800 196800 199200 256500 263600 268800 296200 338900 344200 364200 428500 488300 620 100 820800 996800
1174400 1485100 1728000 2373100 3025700 3602600 4367700 4807600
100.oooo 102.9231 108.1722 116.3031 123.1990 128.5510 131 .I241 133.7467 135.4513 139.2540 146.3345 153.65 14 162.2849 179.1135 213.9411 250.671 I 292.0836 344.9509 387.8869 448.9325 543.8599 645.5619 75 1.0705 863.64% 955.01 8 1
126800 12621 1 4 . 4 6 167141 32.43 169213 1.24 161690 -4.45 199532 23.40 201031 0.75 200977 4 . 0 3 2 18676 8.81 243368 11.29 235215 -3.35 237030 0.77 264042 11.40 272620 3.25 289846 6.32 327441 12.97 341270 4.22 340454 -0.24 382869 12.46 384913 0.53 436344 13.36 468690 7.41 479662 2.34 505726 5.43 503404 -0.46
100 99.535
131.815 133.449 127.515 157.359 158.542 1 58.499 172.458 191.931 185.500 186.932 208.235 215.000 228.585 258.234 270.901 268.497 301.947 303.559 344.120 370.000 378.282 398.837 397.006
Source: our computations on ISTAT 'Annuario Statistico della Previdenza Smith e della Assistenza Sociale', various years.
120 Luigi Campiglio
Tab. 7. INPS - Pensions by Type and Value - 1988 ~~~~
Mean Monthly Old-Age Disability Survivors Total Value (Th.) MF MF MF MF
50 150 250 3 50 450 550 650 750 850 950
1050 1150 1250 1350 1450 1550 1650 1750 1850 1950 2050 2150 2250 2350 2450
167,179 36,139
138,900 71,354
1,482,709 429,788 113,107 329,998 457,479 29 1,60 1 191,511 128,555 90.472 66,057 51,518 38,861 27,693 13,186 9,272 6.453 5,534 4,126 3,045 2,346
105
29,716 14,521
110.017 69,264
1,914,675 271,908 42,961
142,602 146,925 6 1.464 24,690 10.683 5,182 2,622 1,262
670 331 178 112 67 35 24 13 6 6
610,389 254,298 92,499
110,102 766,787 2 13,280 108,451 164,574 82,689 23,994 8,868 4,283 2,147 1,142
568 380 179 114 55 23 I5 10 2 1 0
807,284 304,958 341,416 250,720
4,164.171 914,976 264,519 637,174 687,093 377,059 225,069 143,521 97,801 69,821 53,348 39.91 1 28,203 13,478 9,439 6,543 5,584 4,160 3,060 2,353
111
TOTAL 4,156,988 2,849,934 2,444,850 9,451,772 Gini Index 0.275 0.145 0.382 0.289
~
Source: INPS. Our computations of the Gini index.
Income Distribution, Public Expenditure and Equality 121
Tab. 8. INPS - Social Security Pensions - 1985 (Number and average value per year-thou. in parenthais)
Type of Insurance Old-age Disability Survivors Total
9270074 2376051 Employees 3862407 3031616 (7380) (5665) (3908) (5929)
Farmers 373433 1357463 142214 1873110 (4037) (3989) (1776) (3831)
Craftsmen 134693 340610 158388 633691
Traders 220156 256494 124246 600896
(3912) (3914) (2396) (3534)
(3822) (3824) (1948) (3435)
Miners 6955 (1073 1)
2487 9442 (7202) (9802)
Integratives 52556 21398 9 73963 (individual) (44) (9) (81) (34)
Integratives 834 109 1854 2797 (collective) ( 147) (141) (47) (80)
37341 10915 33288 81544 Public transportation empl.
(14839) (12675) (8196) (1 1840)
Public 12017 1710 5024 18751 teleph. empl. (15461) ( 10956) (8377) (13141)
Revenue office 5539 63 1 4737 10907 empl. (a) (14956) ( 1 1420) (8500) ( 1 1947)
Revenue office 6104 309 4375 10788 empl. (b) (1 3723) (9978) (7879) (1 1246)
Gas firms 3203 542 2835 6580 empl. ( 1 3 5 84) ( 1 2236) (8209) ( 1 1157)
33466 2556 19073 55095 Public and private
(1 3987) (10293) (14568)
Clergymen 9049 2984 129 12162 (5304) (4995) (4553) (5220)
Airline empl. 676 171 184 1031 (21570) ( 17007) (17281) (20048)
Source: INPS, ‘Notizie Statistiche 1984-1985’. 1987.
122 Luigi Campiglio
Tab. 9. Selected Population by Age and Sex in Italy
Over 55 To1.share Pere. 070 Ch. % Ch. VO Ch. Year M F Total M F M F Tot.
1972 5345551 6665873 1201 1424 0.4450 0.5550
1973 5312574 6662912 11975486 0.4436 0.5564 -0.62 4.04 -0.30
1974 5260124 6642927 11903051 0.4419 0.5581 -0.99 -0.30 -0.60 1975 5255528 6674418 11929946 0.4405 0.5595 -0.09 0.47 0.23
1976 5360894 6832733 12193627 0.43% 0.5604 2.00 2.37 2.21 1977 5447230 6992321 12439551 0.4379 0.5621 1.61 2.34 2.02
1978 5536871 7118024 12654895 0.4375 0.5625 1.65 1.80 1.73
1979 5636863 7263871 12900734 0.4369 0.5631 1.81 2.05 1.94
1980 5743721 7413072 13156793 0.4366 0.5634 1.90 2.05 1.98
1981 5836423 7544097 13380520 0.4362 0.5638 1.61 1.77 1.70
1982 5779740 7537487 13317227 0.4340 0.5660 -0.97 -0.09 -0.47
1983 5874245 7665726 13539971 0.4338 0.5662 1.64 1.70 1.67
1984 5953850 7774180 13728030 0.4337 0.5663 1.36 1.41 1.39
1985 6044701 7895463 13940164 0.4336 0.5664 1.53 1.56 1.55
Year
1972 1973
1974
1975
1976 1977
1978
1979
1980 1981
1982
1983
1984 1985
Over 60 Tot. share Pew. M F Total M F
3933840 5110127 9043967 0.4350 0.5650 4034624 5245650 9280274 0.4348 0.5652
4122524 5368705 9491229 0.4344 0.5656
4202493 5487232 9689725 0.4337 0.5663 4257927 5584770 9842697 0.4326 0.5674
4251183 5632644 9883827 0.4301 0.5699
4203769 5593438 9797207 0.4291 0.5709
4146332 5568704 9715036 0.4268 0.5732
4133012 5591069 9724081 0.4250 0.5750
4227920 5738943 9966863 0.4242 0.5758
4164449 5731027 9895476 0.4208 0.5792
4241306 5862893 10104199 0.4198 0.5802
4315407 5975954 10291361 0.4193 0.5807
4403428 6101788 10505216 0.4192 0.5808
% Ch. M
2.56
2.18
1.94
1.32
-0.16
-1.12
-1.37
-0.32
2.30
-1.50 1.85
1.75
2.04
% Cb. F
2.65
2.35
2.21
1.78 0.86
-0.70
-0.44
0.40
2.64
-0.14
2.30
1.93 2.11
To Ch. Tot.
2.61
2.27
2.09
1.58 0.42
4.88
-0.84
0.09 2.50
0.72
2.11
1.85 2.08
Income Distribution, Public Expenditure and Equality 123
Tab. 9. (continued)
Over 65 Tot.shon Pere. Vo Ch. % Ch. Vo Ch. Year M F Total M F M F Tot.
1972 1973 1974 1975 1976 1977 1978 1979 1980 1981 1982 1983 1984 1985
2559872 3566109 6125981 0.4179 2631636 3666992 6298628 0.4178 2715907 3781735 6497642 0.4180 2798742 3894872 6693614 0.4181 2880585 4009924 6890509 0.4181 2951100 4133808 7084908 0.4165 3028105 4228279 7256384 0.4173 3100456 4341796 7442252 0.4166 3163435 4447016 7610451 0.4157 3208279 4533770 7742049 0.4144 3061573 4415140 7476713 0.4095
3011700 4384461 7396161 0.4072 2941246 4331300 7272546 0.4044 2927298 4343349 7270647 0.4026
0.5821 0.5822 0.5820 0.5819 0.5819 0.5835 0.5827 0.5834 0.5843 0.5856 0.5905 0.5928 0.5956 0.5974
2.80 2.83 3.20 3.13 3.05 2.99 2.92 2.95 2.45 3.09 2.61 2.29 2.39 2.68 2.03 2.42 1.42 1.95
-4.57 -2.62 -1.63 -0.69 -2.34 -1.21 -0.47 0.28
2.82 3.16 3.02 2.94 2.82 2.42 2.56 2.26 1.73
-3.43 -1.08 -1.67 -0.03
References
Arrow K. (1971) A
Aumann R.J. and Kurz M. (1977) Power and Taxes, Econometrica, 45:1137-1191. Aumann R.J., Kurz M. and Neyman A. (1987) Power and Public Goods, Journal of Eco-
Banca d’Italia (1 988) Supplemento al Bolleltino stutktico. i bilanci delle fumiglie ituliane
Brosio G . and Marchese C. (1988) The Growth of Public Expenditures in Italy since the
Campiglio L. (1982) A Simple Model for the Hospital Sector: The Italian Case, Working
- (1987a) Imprenditorialiti, occupazione e crescita in Campiglio L. (1987) op. cit. - (1987b) La macroeconomia della distribuzione personale del reddito in Italia in
Campiglio (1987) Saggi sullu distribuzione del reddito e occupaione in italiu, Mi- lan: Giuffre.
ilitarian Approach to the Concept of Equality in Public Expendi- tures, Quurterly Journul of Economics, 85:409-415.
nomic Theory, 42:108-127.
nel 1987, Rome: B. d’Italia.
Second World War in Lybeck-Henrekson (eds). op. cit.
Paper CSEA (mimeo), Universiti Cattolica, Milan.
Frosini V. (1987) Lezioni di statistica, Vita e Pensiero. Giarda P. (1986) L’evoluzione della spesa pubblica in Italia: alcuni fatti e qualche propo-
sta. OIrre 10 crki, Bologna: I1 Mulino.
124 Luigi Campiglio
Groves T., Radner R. and Reiter S. (1987) (eds.) Information, Incentives and Economic Mechanism, London: Basil Blackwell.
ISTAT (1986) La distribuzione quantitativa del reddito in Italia nelle indagini mi bilanci delle famiglie 1985, Roma: ISTAT.
Lybeck J.A. and Henrekson M. (1988) (eds.) Explaining the Growth of Government, Am- sterdam: North Holland.
Lindbeck A. (1985) Redistribution Policy and the Expansion of the Public Sector, Journal of Public Economics, 28:309-328.
Mauocchi G. and Pastori G. (1972) Lime per una riforma della legge comunale e provin- ciale. Aspctti economici e aspetti giuridici. Rivista Internazionale di Scienze Socia- li, No. l-2:61-81.
McKenzie L.W. (1981) The Classic Theorem on Existence of Competitive Equilibrium, Econometrica, 49:819-841.
OECD (1985) Social Expenditure, 1960-1990, Paris: OECD. - (1987) The Control and Management of Government Expenditure, Paris: OECD. - (1988) The Ageing Population, Paris: OECD. OECD (1988a) Labour Force Statbtics 19661986, Paris: OECD. Piven F.F. and Cloward R.A. (1988) Why Americans Don’t Vote, New York: Pantheon
Books. Roubini N. and Sachs J. (1988) Political and Economic Determinants of Budget Deficits
in the Industrial Democracies, NBER Working Paper, N. 2682 U.S. Department of Health and Human SeMcs (1983) Health. The United States, Washing-
ton: U.S. Government Printing Office. U.S. Department of Health and Human Services (1988) social Securiry Programs Throughout
the World - 1987, Research Report NO. 64. U S . Bureau of the Census (1984) Including Estimates Poverty the Value of Non-cash
Benefits: 1983, Technical Paper 52, Washington: U.S. Government Printing Office. Usui C. (1987) The Origin and the Development of Modern Welfare States: A Study of
Societal Forces and World Influences on the Adoption of Social Insurance Policies among 63 Countries, 1880-1976, Ph.D. Stanford University, unpublished.
Wilensky H.L. (1976) The New Corporatism, Centralization and Werjare State, Beverly Hills CA: Sage Books.
The World Bank (1985) World Development Report 1985, Washington D.C.: World Bank.