Embed Size (px)
Citation preview
MAKUENI COUNTY
Public Expenditure and Financial
Accountability Assessment 2018
Final version
November 2018
Kenya - Makueni county Public Expenditure and Financial Accountability Assessment of Makueni County,
Kenya - Based on PEFA methodology 2016 July 2018
The quality assurance process followed in the production of this report satisfies all
the requirements of the PEFA Secretariat and hence receives the ‘PEFA CHECK’.
PEFA Secretariat,
November 15, 2018

Currency and indicative exchange rates
Local currency unit = Kenyan Shilling (Ksh)
EUR 1 = Ksh 118.7000 (December 2017)
US$1 = Ksh 100.7520
Fiscal Year
July 1 to June 30
Table of Contents
Executive Summary ..................................................................................................................................... iii
1. Introduction ......................................................................................................................................... 1
1.1 Rationale and Purpose .................................................................................................................. 1
1.2 Assessment management and quality assurance ......................................................................... 2
1.3 Assessment methodology ............................................................................................................. 4
Coverage of the assessment ................................................................................................................ 4
Sources of information ........................................................................................................................ 4
2. Makueni County Background Information .......................................................................................... 5
2.1 Economic context .......................................................................................................................... 5
An overview of the Kenyan economy .................................................................................................. 5
Overview of Makueni County economy .............................................................................................. 5
2.2 Fiscal and budgetary trends .......................................................................................................... 6
2.3 Legal and regulatory arrangements for PFM ................................................................................ 8
2.4 Institutional arrangements for PFM ........................................................................................... 10
3. Assessment of PFM Performance ...................................................................................................... 13
3.1 Subnational Government profile ................................................................................................ 13
HLG-1.1. Outturn of transfers from higher-level government .......................................................... 13
HLG-1.2. Earmarked grants outturn ................................................................................................... 14
HLG-1.3. Timeliness of transfers from higher-level government ...................................................... 14
3.2 Pillar I. Budget reliability ............................................................................................................. 15
PI-1. Aggregate expenditure outturn ................................................................................................. 15
PI-2. Expenditure composition outturn ............................................................................................. 16
PI-3. Revenue outturn ........................................................................................................................ 19
3.3 Pillar II. Transparency of public finances .................................................................................... 21
PI-4. Budget classification .................................................................................................................. 21
PI-5. Budget documentation .............................................................................................................. 23
PI-6. County government operations outside financial reports ........................................................ 24
PI-7. Transfers to sub-county governments ....................................................................................... 25
PI-8. Performance information for service delivery .......................................................................... 26
PI-9. Public access to fiscal information ............................................................................................. 27
3.4 Pillar III. Management of assets and liabilities ........................................................................... 29
PI-10. Fiscal risk reporting .................................................................................................................. 29
PI-11. Public investment management .............................................................................................. 30
PI-12. Public asset management ........................................................................................................ 33
PI-13. Debt management ................................................................................................................... 35
3.5 Pillar IV. Policy-based fiscal strategy and budgeting................................................................... 36
PI-14. Macroeconomic and fiscal forecasting .................................................................................... 36
PI-15. Fiscal strategy .......................................................................................................................... 38
PI-16. Medium-term perspective in expenditure budgeting ............................................................. 39
PI-17. Budget preparation process .................................................................................................... 40
PI-18. Legislative scrutiny of budgets ................................................................................................ 43
3.6 Pillar V. Predictability and control in budget execution ............................................................. 44
PI-19. Revenue administration .......................................................................................................... 45
PI-20. Accounting for revenue ........................................................................................................... 48
PI-21. Predictability of in-year resource allocation ............................................................................ 49
PI-22. Expenditure arrears ................................................................................................................. 50
PI-23. Payroll control .......................................................................................................................... 51
PI-24. Procurement ............................................................................................................................ 54
PI-25. Internal controls on non-salary expenditure ........................................................................... 58
PI-26. Internal audit ........................................................................................................................... 59
3.7 Pillar VI. Accounting and reporting ............................................................................................. 60
PI-27. Financial data integrity ............................................................................................................ 61
PI-28. In-year budget reports ............................................................................................................. 63
PI-29. Annual financial reports .......................................................................................................... 65
3.8 Pillar VII. External scrutiny and audit .......................................................................................... 66
PI-30. External audit ........................................................................................................................... 66
PI-31. Legislative scrutiny of audit reports ........................................................................................ 68
4. Conclusions of the Analysis of PFM Systems ..................................................................................... 72
4.1 Integrated assessment of PFM performance ............................................................................. 72
4.2 Effectiveness of the internal control framework ........................................................................ 74
4.3 PFM strengths and weaknesses .................................................................................................. 77
5. Government PFM reform process ..................................................................................................... 79
5.1 Approach to PFM reforms........................................................................................................... 79
5.2 Recent and ongoing reform actions ............................................................................................ 80
5.3 Institutional considerations ........................................................................................................ 80
Annex 1. Performance Indicator Summary ................................................................................................ 81
Annex 2. Summary of Observations on the Internal Control Framework .................................................. 89
Annex 3. Sources of information ................................................................................................................ 92
Annex 3A: Calculation Sheet for PFM Performance Indicators PI-1 and PI-2 (i) .................................... 92
Annex 3B: Lists of persons who have been interviewed and provided information for the PFM Performance Report ............................................................................................................................... 97
Annex 3C: Sources of information used to extract evidence for scoring each indicator ....................... 98
Annex 3D: County government entities audited for the last three FYs ............................................... 118
List of Tables
Table 2.1: Basic economic data and indicators for Makueni County ............................................................ 6
Table 2.2: Aggregate fiscal performance data for the last three FYs (percentage of total revenues) ......... 7
Table 2.3: Budget allocations by sectors (as a percentage of total expenditures) ....................................... 8
Table 2.4: Budget allocations by economic classification (as a percentage of total expenditures) ............. 8
Table 2.5: Structure of the public sector (Ksh, millions) - FY2015/16 ........................................................ 11
Table 2.6: Financial structure of county government (Ksh, millions) - FY2015/16 ..................................... 11
Table 3.1: Parameters used to share revenue for the last three FYs ......................................................... 13
Table 3.2: Estimate and actual revenue for the last three FYs (Ksh, millions and in percentage) ............. 13
Table 3.3: Source of revenue for the last three FYs (Ksh, millions and in percentage) .............................. 14
Table 3.4: Aggregate expenditure outturn (Ksh, millions and percentage) ............................................... 15
Table 3.5: Expenditure composition outturn by administrative/function classification (Ksh, millions and
percentage) ................................................................................................................................................. 16
Table 3.6: Expenditure composition outturn by economic type (Ksh, millions and percentage ) ............. 17
Table 3.7: List of contingency items for FY2015/16 (Ksh, millions) ............................................................ 18
Table 3.8: Updated contingency items for FY2015/16 (Ksh, millions) ........................................................ 19
Table 3.9: Aggregate revenue outturn (%) ................................................................................................. 20
Table 3.10: Revenue composition outturn for the last three FYs (Ksh, millions) ....................................... 21
Table 3.11: Compliance of elements contained in the budget documentation with basic elements of the
PEFA methodology ...................................................................................................................................... 23
Table 3.12: .................................................................................................................................................. 28
Table 3.13: Categories of nonfinancial assets - FY2014/15 and 2015/16 (Ksh, millions) ........................... 34
Table 3.14: Forecasting for total revenue and expenditure for the budget year and the two following years
.................................................................................................................................................................... 37
Table 3.15: Budget calendar 2015/16 ......................................................................................................... 40
Table 3.16: Deadlines of the budget calendar and compliance for FY2015/16 and 2016/17 .................... 42
Table 3.17. Sources of revenue for FY2014/15 (Ksh) .................................................................................. 45
Table 3.18: Payroll adjustments in FY2015/16 (Ksh, millions and percentage) ......................................... 52
Table 3.19: ................................................................................................................................................... 53
Table 3.20: Key procurement information to be made available to the public ......................................... 56
Table 3.21: Fees for review by the PPARB according to amount of tender (Ksh) ...................................... 57
Table 3.22: Procurement complaints management ................................................................................... 57

Table 3.23: Different stages of control of budget execution ...................................................................... 58
Table 3.24: County imprests and clearance accounts (Ksh, millions) ......................................................... 62
Table 3.25: Submission of audit reports to the legislature ......................................................................... 67
Table 3.26: Timing of audit reports ............................................................................................................ 69
i
Acronyms
ADP Annual Development Plan
ADS Authorized Data Sheet
AFROSAI-E African Organisation of English-speaking Supreme Audit Institutions
AFS Annual Financial Statement
AIA Appropriations in Aid
BIRR Budget Implementation Review Report
CBEC County Budget and Economic Forum
CBROP County Budget and Review Outlook Paper
CEC County Executive Committee
CFSP County Fiscal Strategy Paper
CIDP County Integrated Development Plan
CO Chief Officer
COB Controller of the Budget
COFOG Classification of the Functions of Government
CRA Commission on Revenue Allocation
CRF County Revenue Fund
ECD Early Childhood Development
GDP Gross Domestic Product
GFS Government Financial Statistics
GHRIS Government Human Resource Information System
IBEC Intergovernmental Budget and Economic Council
ICT Information and Communication Technology
IFMIS Integrated Financial Management Information System
IPPD Integrated Payroll Personnel Data
IDRC International Development Research Centre
ISSAI International Standards on Supreme Audit Institution
IPSAS International Public Sector Accounting Standards
KADP Kenya Accountable Devolution Program
KDSP Kenya Devolution Support Programme
KENAO Kenya National Audit Office
KIPPRA Kenya Institute for Public Policy Research and Analysis
KNBS Kenya National Bureau of Statistics
KSG Kenya School of Government
LGU Local Government Unit
M&E Monitoring and Evaluation
MTEF Medium-Term Expenditure Framework
MCAs Members of the County Assembly
MDAs Ministries, Departments, and Agencies
OAG Office of the Auditor General
OCOB Office of the Controller of Budget
PAC Public Accounts Committee
ii
PBB Program-Based Budget
PEFA Public Expenditure and Financial Accountability
PFM Public Financial Management
PFMR Public Financial Management Reforms
PPAB Public Procurement Advisory Board
PPARB Public Procurement and Administrative Review Board
PPOA Public Procurement Oversight Authority
PPP Public-Private Partnership
PSASB Public Sector Accounting Standards Board
SCOA Standard Chart of Accounts
Sida Swedish International Development Cooperation Agency
TSA Treasury Single Account
iii
Executive Summary
Background
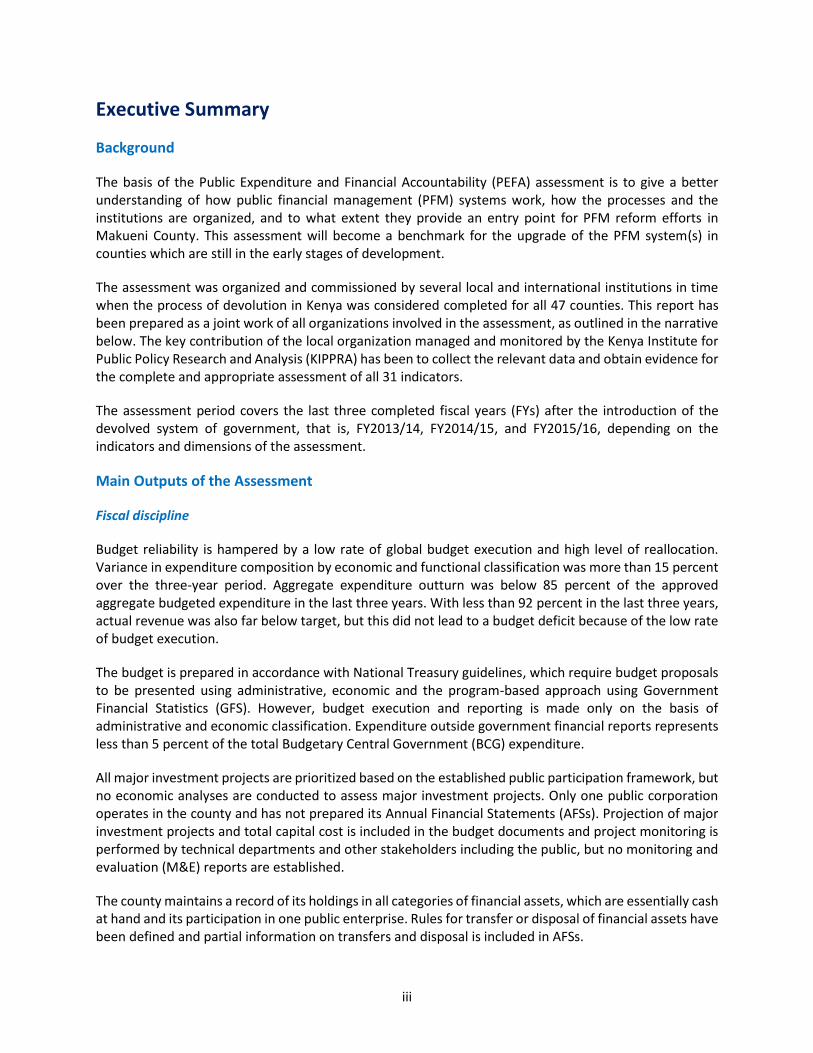
The basis of the Public Expenditure and Financial Accountability (PEFA) assessment is to give a better understanding of how public financial management (PFM) systems work, how the processes and the institutions are organized, and to what extent they provide an entry point for PFM reform efforts in Makueni County. This assessment will become a benchmark for the upgrade of the PFM system(s) in counties which are still in the early stages of development.
The assessment was organized and commissioned by several local and international institutions in time when the process of devolution in Kenya was considered completed for all 47 counties. This report has been prepared as a joint work of all organizations involved in the assessment, as outlined in the narrative below. The key contribution of the local organization managed and monitored by the Kenya Institute for Public Policy Research and Analysis (KIPPRA) has been to collect the relevant data and obtain evidence for the complete and appropriate assessment of all 31 indicators.
The assessment period covers the last three completed fiscal years (FYs) after the introduction of the devolved system of government, that is, FY2013/14, FY2014/15, and FY2015/16, depending on the indicators and dimensions of the assessment.
Main Outputs of the Assessment
Fiscal discipline
Budget reliability is hampered by a low rate of global budget execution and high level of reallocation. Variance in expenditure composition by economic and functional classification was more than 15 percent over the three-year period. Aggregate expenditure outturn was below 85 percent of the approved aggregate budgeted expenditure in the last three years. With less than 92 percent in the last three years, actual revenue was also far below target, but this did not lead to a budget deficit because of the low rate of budget execution.
The budget is prepared in accordance with National Treasury guidelines, which require budget proposals to be presented using administrative, economic and the program-based approach using Government Financial Statistics (GFS). However, budget execution and reporting is made only on the basis of administrative and economic classification. Expenditure outside government financial reports represents less than 5 percent of the total Budgetary Central Government (BCG) expenditure.
All major investment projects are prioritized based on the established public participation framework, but no economic analyses are conducted to assess major investment projects. Only one public corporation operates in the county and has not prepared its Annual Financial Statements (AFSs). Projection of major investment projects and total capital cost is included in the budget documents and project monitoring is performed by technical departments and other stakeholders including the public, but no monitoring and evaluation (M&E) reports are established.
The county maintains a record of its holdings in all categories of financial assets, which are essentially cash at hand and its participation in one public enterprise. Rules for transfer or disposal of financial assets have been defined and partial information on transfers and disposal is included in AFSs.
iv
The county maintains a register of its holdings of fixed assets and updates of records upon acquisition of new assets but does not report information on their usage and age. Information on contingent liabilities is not provided in AFSs. The county has not acquired any debt and has not developed a debt management strategy and does not report the debt inherited from the defunct authority. The Office of the Auditor General (OAG) recommends that the county should expedite taking over of the assets and liabilities of the defunct local authorities in liaison with the Transition Authority.
Strategic resource allocation
Budget elaboration is based on a clear annual budget calendar. The County Fiscal Strategy Paper (CFSP) reflects ministry ceilings, but they are not approved by the government before the first budget circular is issued. Medium-term fiscal forecasts are established, but the county does not prepare any fiscal policy scenarios. A report that describes progress made against its fiscal strategy is proposed to the legislature, but the reasons for any deviation from the objectives are not explained.
Legislature’s review of strategic resource allocation and other elements of the budget proposal is based on organizational arrangements including specialized review committees, technical support, negotiation procedures, and public consultation. The annual budget presents an estimate of expenditure for the budget year and the two following fiscal years, but these estimates are not supported by macroeconomic forecasts. Further, no explanation of changes to expenditure estimates between the second year of the last medium-term budget and the first year of the current medium-term budget is provided. The county only assesses proposed changes in revenue policies in the finance bill.
Efficient service delivery
No survey estimates of the resources received by service delivery units have been performed. Performance indicators for measuring the outputs or outcomes of the different ministries have not yet been put in place, but evaluations for services delivered have been performed by independent units, albeit not being published. Consequently, no information related to performance achieved for service delivery is being published. However, the Auditor’s report is available on the website of the OAG, as well as on the website of the county government.
Information on revenues is consolidated into a report and revenue collections are transferred weekly to the Treasury. However, payers do not have sufficient access to information on their rights and obligations. Further, there are no systematic approaches for assessing and prioritizing compliance risks for revenue streams. Finally, no audit of revenue from any of the sources has been undertaken while the stock of revenue arrears is above 40 percent of the total revenue collection.
Appropriate segregation of duties is clearly laid down and comprehensive expenditure commitment controls are in place. Budgetary units are provided with reliable information on commitment ceilings a quarter in advance and limit commitments to projected cash availability and approved budget allocations. However, significant in-year adjustments to budget allocations are done once a year.
Changes to personnel and payroll records result in an audit trail. Reconciliation of the payroll with personnel records takes place at least every six months through a payroll audit. Required changes to the personnel records and payroll are updated in time and retroactive adjustments are rare, but there is no evidence that staff hiring is controlled by a list of approved staff positions. Payroll audits are periodically conducted.
v
With regard to public procurement, legal, and regulatory frameworks, bidding opportunities and data on resolution of procurement complaints are available to the public. However, no database is maintained to provide information for contracts, value of procurement, or who has been awarded contracts while open tendering was used for less than 40 percent of the total procurement. The procurement complaint system is nevertheless compliant with good practices, except for charging fees that may prohibit access by concerned parties.
In theory, internal audits are focused on evaluation of the adequacy and effectiveness of internal controls, but no quality assurance process has been put in place to show adherence to professional standards. Practically, internal audit remains focused on financial compliance, with an indication that most payments are compliant with regular payment procedures.
Access and changes to records during the budget implementation is restricted and recorded, but no operational body, unit, or team has been established to verify financial data integrity.
Monthly reporting on budget execution with production of quarterly budget implementation reports enables a partial follow-up of service delivery. These reports, which are produced on a cash basis, provide a comparison between actual and budgeted expenditure with partial aggregation. Commitment expenditure is presented in a separate report.
AFSs are generally completed and available for audit, respectively, three and four months after the end of the year. They contain information on revenue, expenditure, financial assets, financial liabilities, and guarantees but not on long-term obligations.
External audits of the county are still performed at the national level by the OAG. No independent constitutional body has been put in place at the county level. Material weaknesses are highlighted in the management letters that are issued to the county. For FY2013/14, which was the first year of operation, the OAG stated that the County Executive and County Assembly had challenges in adhering to the existing PFM Regulation and Procedures; the Public Procurement and Asset Disposal Act, 2015; and Regulations 2016 and to general human resources management policies and procedures. Consequently, the OAG did not give a positive opinion on the accounts. The OAG expressed a non-qualified opinion in its audit report for FY2014/15 but a positive opinion on the accounts for FY2015/16, which underlines a general improvement in the budget management and follow-up by the County Administration.
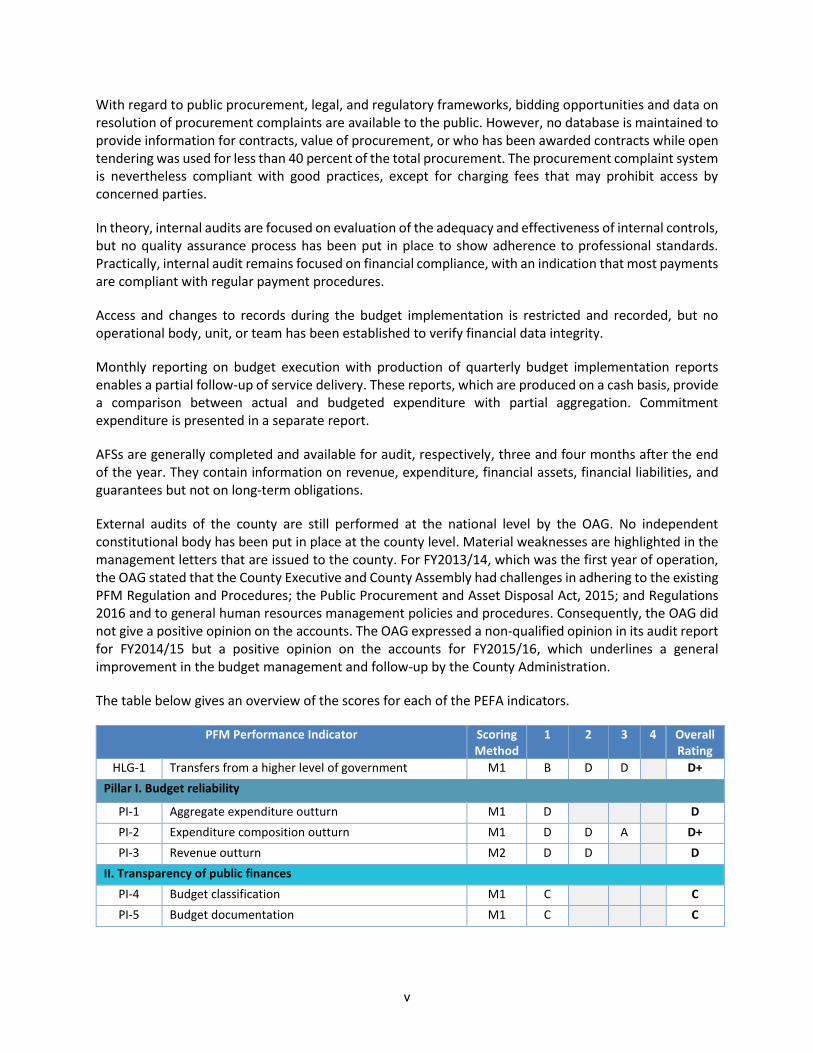
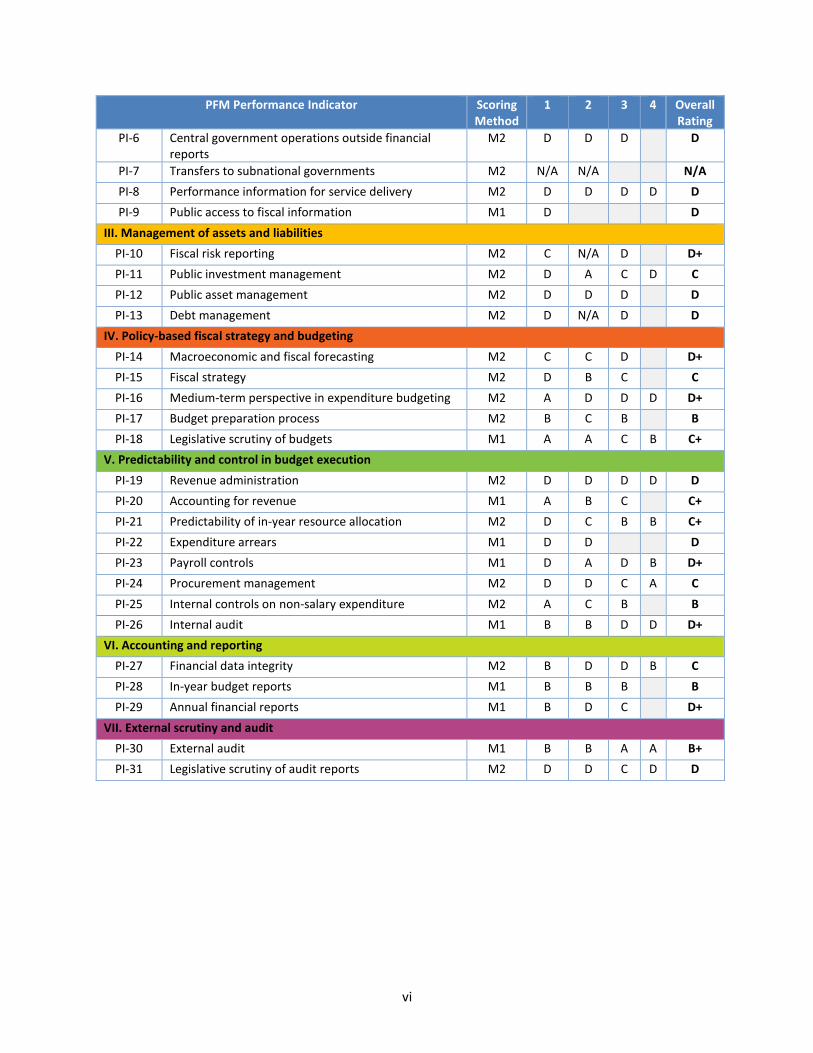
The table below gives an overview of the scores for each of the PEFA indicators.
PFM Performance Indicator Scoring Method
1 2 3 4 Overall Rating
HLG-1 Transfers from a higher level of government M1 B D D
D+
Pillar I. Budget reliability
PI-1 Aggregate expenditure outturn M1 D
D
PI-2 Expenditure composition outturn M1 D D A
D+
PI-3 Revenue outturn M2 D D
D
II. Transparency of public finances
PI-4 Budget classification M1 C
C
PI-5 Budget documentation M1 C
C
vi
PFM Performance Indicator Scoring Method
1 2 3 4 Overall Rating
PI-6 Central government operations outside financial reports
M2 D D D
D
PI-7 Transfers to subnational governments M2 N/A N/A
N/A
PI-8 Performance information for service delivery M2 D D D D D
PI-9 Public access to fiscal information M1 D
D
III. Management of assets and liabilities
PI-10 Fiscal risk reporting M2 C N/A D
D+
PI-11 Public investment management M2 D A C D C
PI-12 Public asset management M2 D D D
D
PI-13 Debt management M2 D N/A D
D
IV. Policy-based fiscal strategy and budgeting
PI-14 Macroeconomic and fiscal forecasting M2 C C D
D+
PI-15 Fiscal strategy M2 D B C
C
PI-16 Medium-term perspective in expenditure budgeting M2 A D D D D+
PI-17 Budget preparation process M2 B C B
B
PI-18 Legislative scrutiny of budgets M1 A A C B C+
V. Predictability and control in budget execution
PI-19 Revenue administration M2 D D D D D
PI-20 Accounting for revenue M1 A B C
C+
PI-21 Predictability of in-year resource allocation M2 D C B B C+
PI-22 Expenditure arrears M1 D D
D
PI-23 Payroll controls M1 D A D B D+
PI-24 Procurement management M2 D D C A C
PI-25 Internal controls on non-salary expenditure M2 A C B
B
PI-26 Internal audit M1 B B D D D+
VI. Accounting and reporting
PI-27 Financial data integrity M2 B D D B C
PI-28 In-year budget reports M1 B B B
B
PI-29 Annual financial reports M1 B D C
D+
VII. External scrutiny and audit
PI-30 External audit M1 B B A A B+
PI-31 Legislative scrutiny of audit reports M2 D D C D D
1
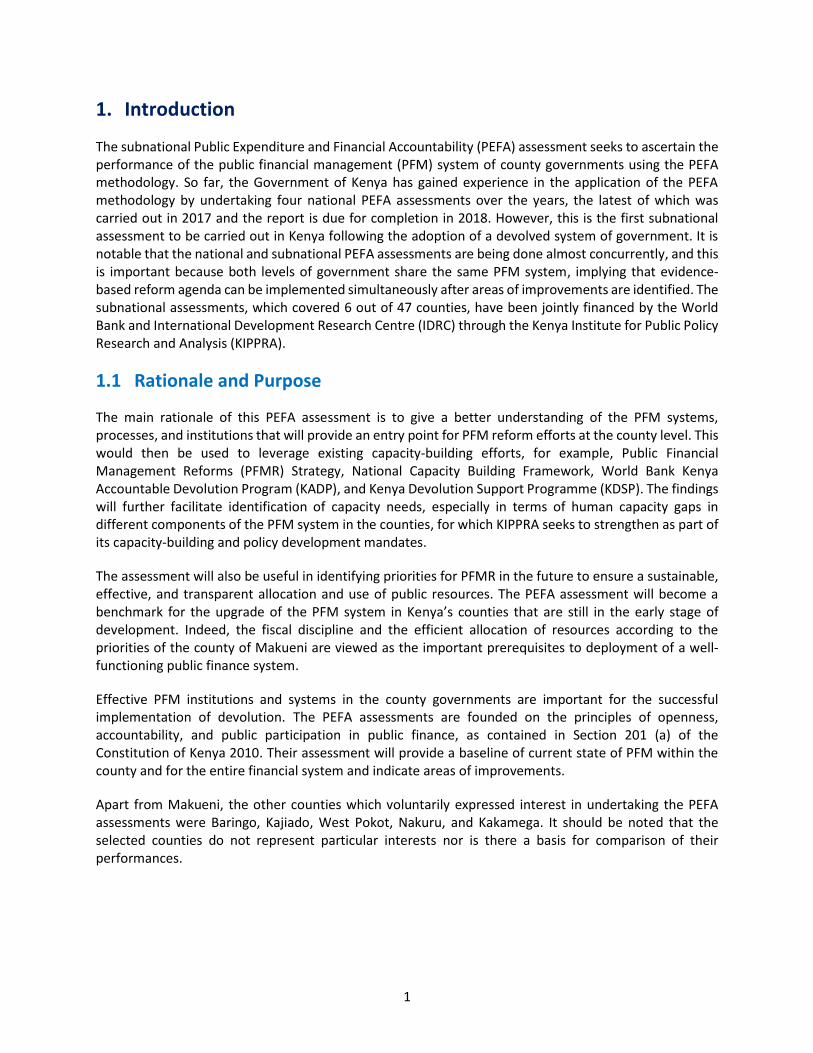
1. Introduction
The subnational Public Expenditure and Financial Accountability (PEFA) assessment seeks to ascertain the performance of the public financial management (PFM) system of county governments using the PEFA methodology. So far, the Government of Kenya has gained experience in the application of the PEFA methodology by undertaking four national PEFA assessments over the years, the latest of which was carried out in 2017 and the report is due for completion in 2018. However, this is the first subnational assessment to be carried out in Kenya following the adoption of a devolved system of government. It is notable that the national and subnational PEFA assessments are being done almost concurrently, and this is important because both levels of government share the same PFM system, implying that evidence-based reform agenda can be implemented simultaneously after areas of improvements are identified. The subnational assessments, which covered 6 out of 47 counties, have been jointly financed by the World Bank and International Development Research Centre (IDRC) through the Kenya Institute for Public Policy Research and Analysis (KIPPRA).
1.1 Rationale and Purpose
The main rationale of this PEFA assessment is to give a better understanding of the PFM systems, processes, and institutions that will provide an entry point for PFM reform efforts at the county level. This would then be used to leverage existing capacity-building efforts, for example, Public Financial Management Reforms (PFMR) Strategy, National Capacity Building Framework, World Bank Kenya Accountable Devolution Program (KADP), and Kenya Devolution Support Programme (KDSP). The findings will further facilitate identification of capacity needs, especially in terms of human capacity gaps in different components of the PFM system in the counties, for which KIPPRA seeks to strengthen as part of its capacity-building and policy development mandates.
The assessment will also be useful in identifying priorities for PFMR in the future to ensure a sustainable, effective, and transparent allocation and use of public resources. The PEFA assessment will become a benchmark for the upgrade of the PFM system in Kenya’s counties that are still in the early stage of development. Indeed, the fiscal discipline and the efficient allocation of resources according to the priorities of the county of Makueni are viewed as the important prerequisites to deployment of a well-functioning public finance system.
Effective PFM institutions and systems in the county governments are important for the successful implementation of devolution. The PEFA assessments are founded on the principles of openness, accountability, and public participation in public finance, as contained in Section 201 (a) of the Constitution of Kenya 2010. Their assessment will provide a baseline of current state of PFM within the county and for the entire financial system and indicate areas of improvements.
Apart from Makueni, the other counties which voluntarily expressed interest in undertaking the PEFA assessments were Baringo, Kajiado, West Pokot, Nakuru, and Kakamega. It should be noted that the selected counties do not represent particular interests nor is there a basis for comparison of their performances.
2
Objectives of the PEFA Assessments
The specific objectives of the PEFA assessment in Makueni include the following:
(a) Assess the state of financial management capacities in the county
(b) Identify gaps in terms of capacity, systems, policies and, processes in PFM
(c) Provide a basis for informing entry points for PFM reform engagements in the county that will be used to leverage existing capacity-building efforts
(d) Facilitate and develop self-assessment capacity at the county level and build capacities of key staff to carry out assessments in the future
1.2 Assessment management and quality assurance
This PEFA Report has been prepared as a collaboration of various persons and organisations who played various roles as part of the assessment: (a) The Oversight Team (members who are listed in Box 1.1)- who provided strategic guidance and the authorizing environment to facilitate the assessments to be undertaken; (b) the Assessment Teams (members who are listed in Box 1.1) who were technical staff involved in the actual data collection and scoring across the indicators; and (c) reviewers (as listed in Box 1.1) who provided a quality assurance/peer review role of both the concept note and versions of the draft reports. County governments formed part of each team, through representation from the Council of Governors Secretariat.
KIPPRA and the World Bank led the assessment process. KIPPRA provided technical staff and the financial resources (to mobilize and facilitate the assessment teams to collect data in the counties) as well as procured venues to host workshops to write the draft reports. The World Bank then contracted the four consultants that provided the technical expertise for the process (this included facilitating the costs of their movement to and from the counties), as well as supported various sensitization/validation workshops with stakeholders. Development partners played a key role in the process as peer reviewers and as the source of funds used by the World Bank under the Kenya Accountable Devolution Program (KADP) Multi-Donor Trust Fund (contributing partners include Sweden, Finland, the European Union, the U.K. Department for International Development, Danish International Development Agency, and U.S. Agency for International Development).
The assessment teams collected the relevant data to obtain evidence for the complete and appropriate assessment of all 31 indicators. The data gathering stage of the assignment was carried out as a field work in all six counties (Baringo, Kajiado, Makueni, Kakamega, West Pokot, and Nakuru) through meetings and interviews with local government officials. A detailed list of people is presented by their respective organizations in Annex 3B.
3
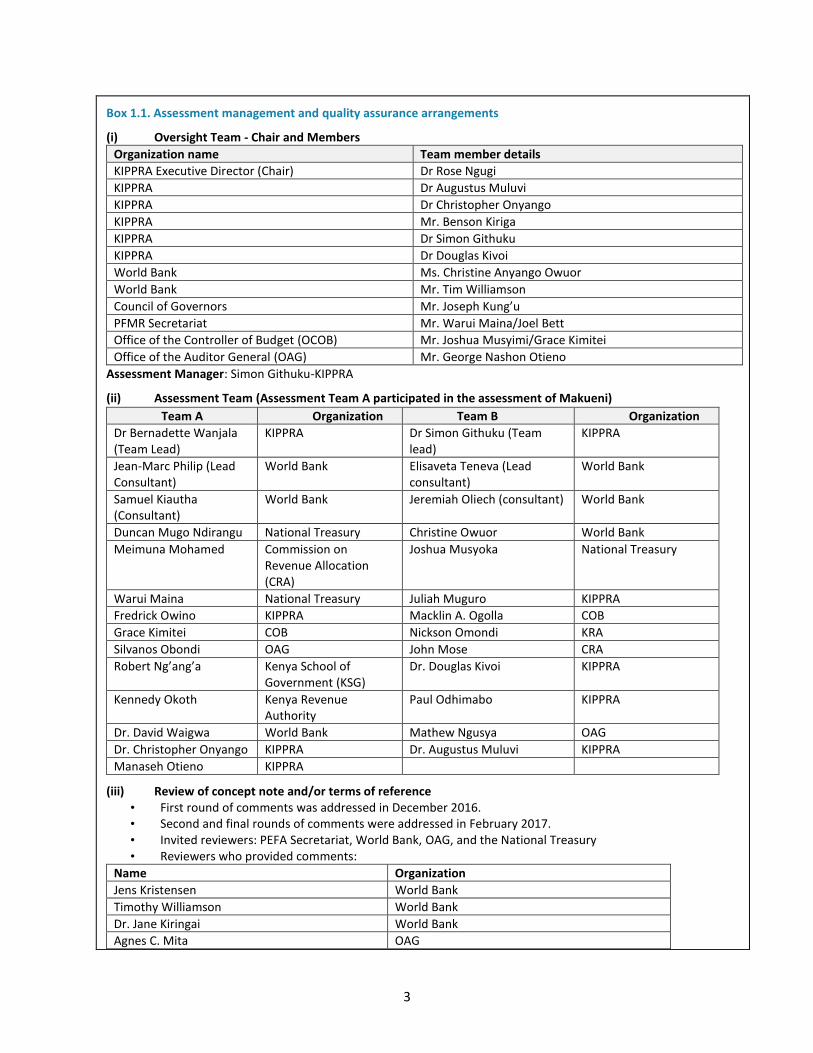
Box 1.1. Assessment management and quality assurance arrangements
(i) Oversight Team - Chair and Members
Organization name Team member details
KIPPRA Executive Director (Chair) Dr Rose Ngugi
KIPPRA Dr Augustus Muluvi
KIPPRA Dr Christopher Onyango
KIPPRA Mr. Benson Kiriga
KIPPRA Dr Simon Githuku
KIPPRA Dr Douglas Kivoi
World Bank Ms. Christine Anyango Owuor
World Bank Mr. Tim Williamson
Council of Governors Mr. Joseph Kung’u
PFMR Secretariat Mr. Warui Maina/Joel Bett
Office of the Controller of Budget (OCOB) Mr. Joshua Musyimi/Grace Kimitei
Office of the Auditor General (OAG) Mr. George Nashon Otieno
Assessment Manager: Simon Githuku-KIPPRA
(ii) Assessment Team (Assessment Team A participated in the assessment of Makueni)
Team A Organization Team B Organization
Dr Bernadette Wanjala (Team Lead)
KIPPRA Dr Simon Githuku (Team lead)
KIPPRA
Jean-Marc Philip (Lead Consultant)
World Bank Elisaveta Teneva (Lead consultant)
World Bank
Samuel Kiautha (Consultant)
World Bank Jeremiah Oliech (consultant) World Bank
Duncan Mugo Ndirangu National Treasury Christine Owuor World Bank
Meimuna Mohamed Commission on Revenue Allocation (CRA)
Joshua Musyoka National Treasury
Warui Maina National Treasury Juliah Muguro KIPPRA
Fredrick Owino KIPPRA Macklin A. Ogolla COB
Grace Kimitei COB Nickson Omondi KRA
Silvanos Obondi OAG John Mose CRA
Robert Ng’ang’a Kenya School of Government (KSG)
Dr. Douglas Kivoi KIPPRA
Kennedy Okoth Kenya Revenue Authority
Paul Odhimabo KIPPRA
Dr. David Waigwa World Bank Mathew Ngusya OAG
Dr. Christopher Onyango KIPPRA Dr. Augustus Muluvi KIPPRA
Manaseh Otieno KIPPRA
(iii) Review of concept note and/or terms of reference • First round of comments was addressed in December 2016. • Second and final rounds of comments were addressed in February 2017. • Invited reviewers: PEFA Secretariat, World Bank, OAG, and the National Treasury • Reviewers who provided comments:
Name Organization
Jens Kristensen World Bank
Timothy Williamson World Bank
Dr. Jane Kiringai World Bank
Agnes C. Mita OAG
4
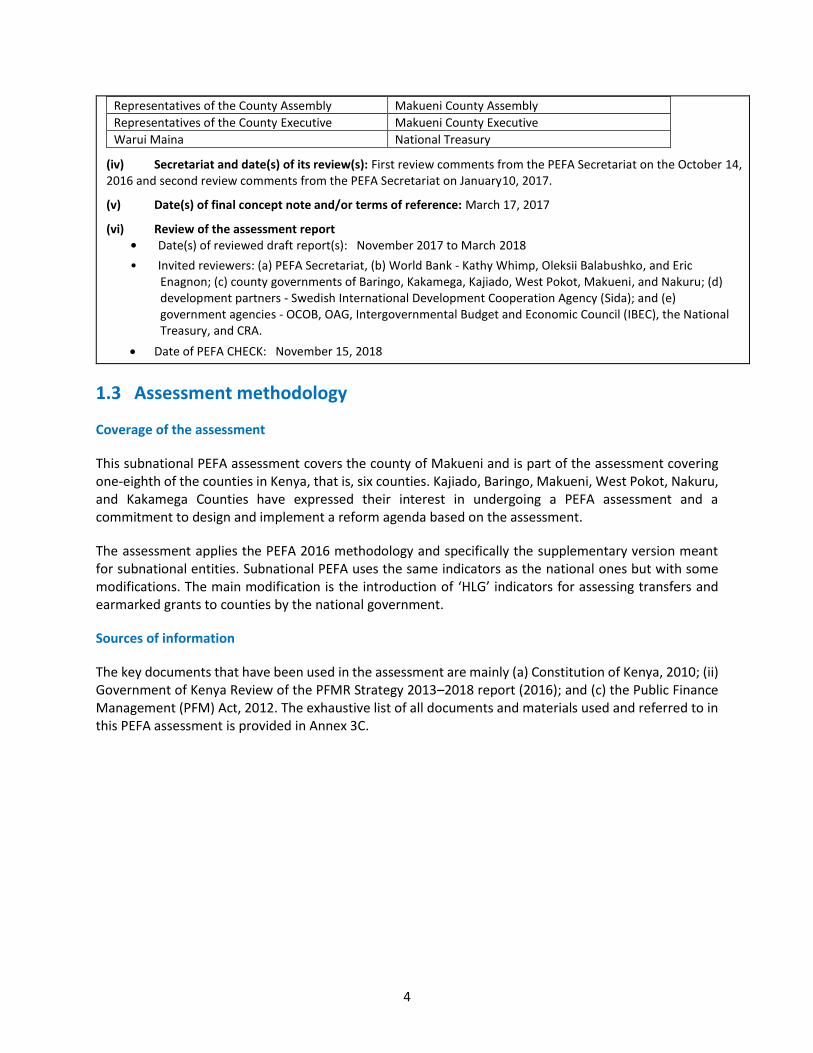
Representatives of the County Assembly Makueni County Assembly
Representatives of the County Executive Makueni County Executive
Warui Maina National Treasury
(iv) Secretariat and date(s) of its review(s): First review comments from the PEFA Secretariat on the October 14, 2016 and second review comments from the PEFA Secretariat on January10, 2017.
(v) Date(s) of final concept note and/or terms of reference: March 17, 2017
(vi) Review of the assessment report • Date(s) of reviewed draft report(s): November 2017 to March 2018
• Invited reviewers: (a) PEFA Secretariat, (b) World Bank - Kathy Whimp, Oleksii Balabushko, and Eric Enagnon; (c) county governments of Baringo, Kakamega, Kajiado, West Pokot, Makueni, and Nakuru; (d) development partners - Swedish International Development Cooperation Agency (Sida); and (e) government agencies - OCOB, OAG, Intergovernmental Budget and Economic Council (IBEC), the National Treasury, and CRA.
• Date of PEFA CHECK: November 15, 2018
1.3 Assessment methodology
Coverage of the assessment
This subnational PEFA assessment covers the county of Makueni and is part of the assessment covering one-eighth of the counties in Kenya, that is, six counties. Kajiado, Baringo, Makueni, West Pokot, Nakuru, and Kakamega Counties have expressed their interest in undergoing a PEFA assessment and a commitment to design and implement a reform agenda based on the assessment.
The assessment applies the PEFA 2016 methodology and specifically the supplementary version meant for subnational entities. Subnational PEFA uses the same indicators as the national ones but with some modifications. The main modification is the introduction of ‘HLG’ indicators for assessing transfers and earmarked grants to counties by the national government.
Sources of information
The key documents that have been used in the assessment are mainly (a) Constitution of Kenya, 2010; (ii) Government of Kenya Review of the PFMR Strategy 2013–2018 report (2016); and (c) the Public Finance Management (PFM) Act, 2012. The exhaustive list of all documents and materials used and referred to in this PEFA assessment is provided in Annex 3C.
5
2. Makueni County Background Information
2.1 Economic context
An overview of the Kenyan economy
Kenya has a unitary but devolved system of government consisting of the national and 47 county governments, as provided in the Constitution. All counties do not have detailed economic data such as gross domestic product (GDP) growth, inflation rates, and so on. However, the Kenya National Bureau of Statistics (KNBS) has developed county-specific statistical abstracts. The National Treasury together with the World Bank is set to undertake compilation of county-specific GDPs.
The Kenyan economy has sustained its robust growth in the past decade, supported by significant structural and economic reforms. The economy grew by 5.7 percent, 5.9 percent, and 4.9 percent in 2015, 2016, and 2017, respectively. The leading sectors in growth during 2017 included tourism, building and construction, transport, and information and communication technology (ICT). On the other hand, the agriculture sector declined tremendously to 1.6 percent from 5.1 percent the previous year due to drought coupled with pests and diseases.
Inflation rate in 2017 was 8.0 percent, a rise from 6.3 percent recorded in 2016. The inflationary pressure was mainly attributed to significant increases in oil and high food prices.
Economic growth is expected to be accelerated during 2018 due to improved political stability and favorable macroeconomic environment. In addition, the ongoing investments in infrastructure, improved business confidence, and strong private consumption are likely to support a strong growth. Besides, the favorable climatic conditions are likely to boost agriculture production and electricity and water sectors, and hence support manufacturing growth. On the other hand, rising oil prices and depressed growth of credit to the private sector which started in 2016 are likely to undermine the growth prospects. However, the adverse effects are likely to be offset by the strong favorable factors and result in better growth in 2018.
Overview of Makueni County economy
Makueni County is one of the 47 counties in Kenya. It is situated in the southeastern part of the country. It borders Machakos County to the north, Kitui County to the east, Kajiado County to the west, and Taita Taveta County to the south. The county lies in the arid and semi-arid zones of the eastern region of the country. The major physical features in Makueni County include the volcanic Chyulu hills which lie along the southwest border of the county in Kibwezi West constituency, Mbooni Hills in Mbooni constituency, and Kilungu Hills in Kaiti constituency, which rise to 1,900 m above sea level. The county terrain is generally low-lying, from 600 m above sea level in Tsavo at the southern end of the county.
The county is currently divided into nine sub counties and 25 divisions. The sub counties are Makueni, Kilungu, Mukaa, Kibwezi, Kathonzweni, Makindu, Mbooni East, Mbooni West, and Nzaui. There are six parliamentary constituencies: Kaiti, Makueni, Kibwezi East, Kibwezi West, Mbooni, and Kilome. There are 30 county assembly wards. The main economic activities are subsistence agriculture, beekeeping, small-scale trade, dairy farming and limited coffee growing, ecotourism, and commercial businesses. In 2014, the projected population in the county was 939,879, consisting of 461,688 males and 478,191 females. The 2015 projected population in the county was 961,738, consisting of 468,298 males and 493,440
6
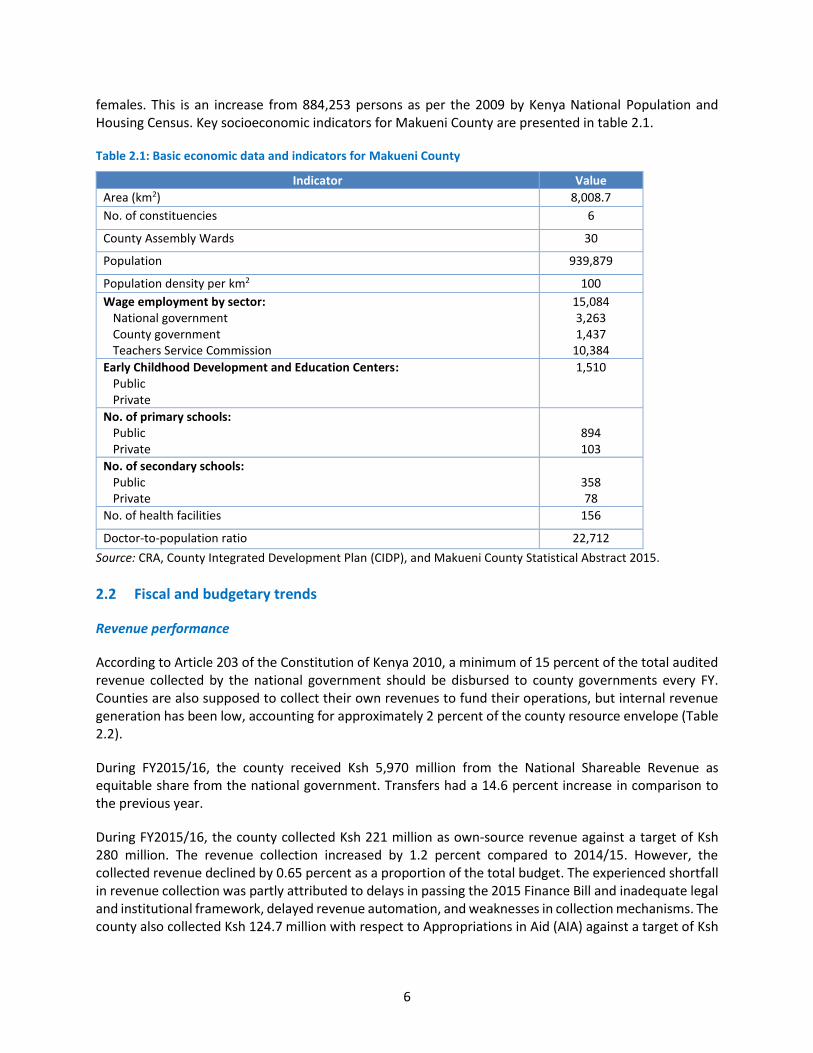
females. This is an increase from 884,253 persons as per the 2009 by Kenya National Population and Housing Census. Key socioeconomic indicators for Makueni County are presented in table 2.1.
Table 2.1: Basic economic data and indicators for Makueni County
Indicator Value
Area (km2) 8,008.7
No. of constituencies 6
County Assembly Wards 30
Population 939,879
Population density per km2 100
Wage employment by sector: National government County government Teachers Service Commission
15,084 3,263 1,437
10,384
Early Childhood Development and Education Centers: Public Private
1,510
No. of primary schools: Public Private
894 103
No. of secondary schools: Public Private
358 78
No. of health facilities 156
Doctor-to-population ratio 22,712
Source: CRA, County Integrated Development Plan (CIDP), and Makueni County Statistical Abstract 2015.
2.2 Fiscal and budgetary trends
Revenue performance
According to Article 203 of the Constitution of Kenya 2010, a minimum of 15 percent of the total audited revenue collected by the national government should be disbursed to county governments every FY. Counties are also supposed to collect their own revenues to fund their operations, but internal revenue generation has been low, accounting for approximately 2 percent of the county resource envelope (Table 2.2).
During FY2015/16, the county received Ksh 5,970 million from the National Shareable Revenue as equitable share from the national government. Transfers had a 14.6 percent increase in comparison to the previous year.
During FY2015/16, the county collected Ksh 221 million as own-source revenue against a target of Ksh 280 million. The revenue collection increased by 1.2 percent compared to 2014/15. However, the collected revenue declined by 0.65 percent as a proportion of the total budget. The experienced shortfall in revenue collection was partly attributed to delays in passing the 2015 Finance Bill and inadequate legal and institutional framework, delayed revenue automation, and weaknesses in collection mechanisms. The county also collected Ksh 124.7 million with respect to Appropriations in Aid (AIA) against a target of Ksh
7
89 million, which was a 40 percent increase above the target. The six constituencies’ allocations saw an upward trend from total allocations of Ksh 508.5 million in FY2013/14 to Ksh 779.431 million in FY2015/16.
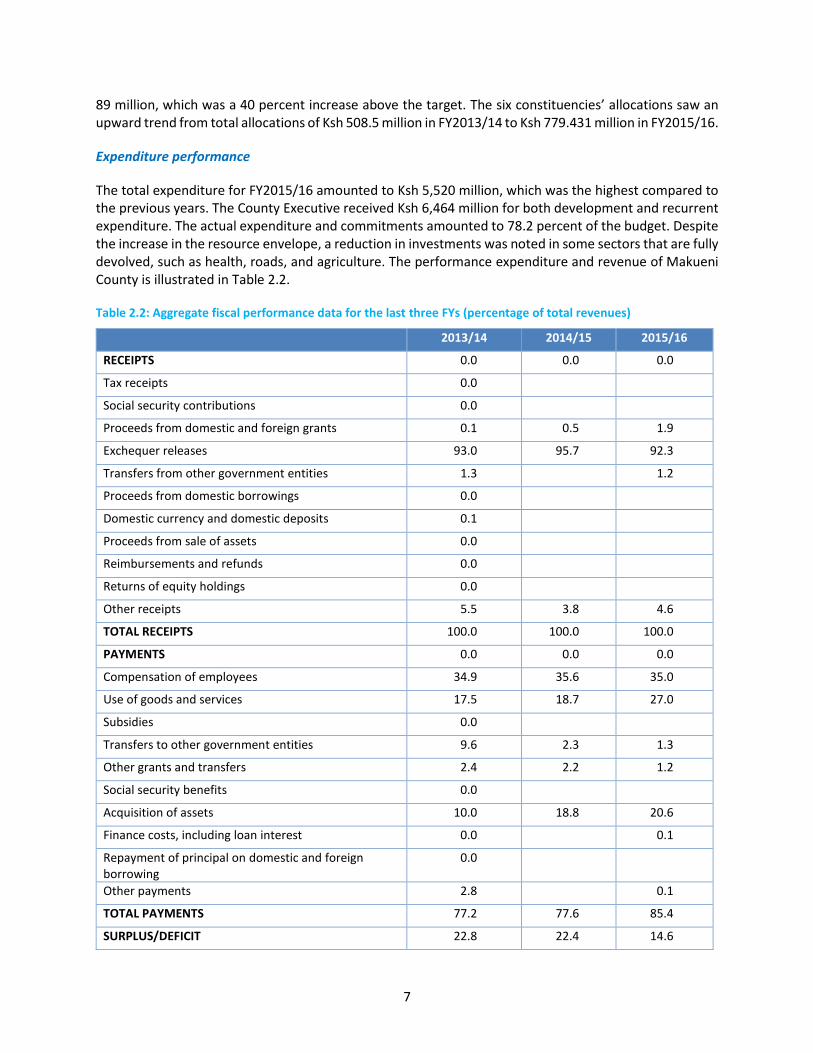
Expenditure performance
The total expenditure for FY2015/16 amounted to Ksh 5,520 million, which was the highest compared to the previous years. The County Executive received Ksh 6,464 million for both development and recurrent expenditure. The actual expenditure and commitments amounted to 78.2 percent of the budget. Despite the increase in the resource envelope, a reduction in investments was noted in some sectors that are fully devolved, such as health, roads, and agriculture. The performance expenditure and revenue of Makueni County is illustrated in Table 2.2.
Table 2.2: Aggregate fiscal performance data for the last three FYs (percentage of total revenues)
2013/14 2014/15 2015/16
RECEIPTS 0.0 0.0 0.0
Tax receipts 0.0
Social security contributions 0.0
Proceeds from domestic and foreign grants 0.1 0.5 1.9
Exchequer releases 93.0 95.7 92.3
Transfers from other government entities 1.3
1.2
Proceeds from domestic borrowings 0.0
Domestic currency and domestic deposits 0.1
Proceeds from sale of assets 0.0
Reimbursements and refunds 0.0
Returns of equity holdings 0.0
Other receipts 5.5 3.8 4.6
TOTAL RECEIPTS 100.0 100.0 100.0
PAYMENTS 0.0 0.0 0.0
Compensation of employees 34.9 35.6 35.0
Use of goods and services 17.5 18.7 27.0
Subsidies 0.0
Transfers to other government entities 9.6 2.3 1.3
Other grants and transfers 2.4 2.2 1.2
Social security benefits 0.0
Acquisition of assets 10.0 18.8 20.6
Finance costs, including loan interest 0.0
0.1
Repayment of principal on domestic and foreign borrowing
0.0
Other payments 2.8
0.1
TOTAL PAYMENTS 77.2 77.6 85.4
SURPLUS/DEFICIT 22.8 22.4 14.6
8
Source: Annual Financial Statements (AFSs).
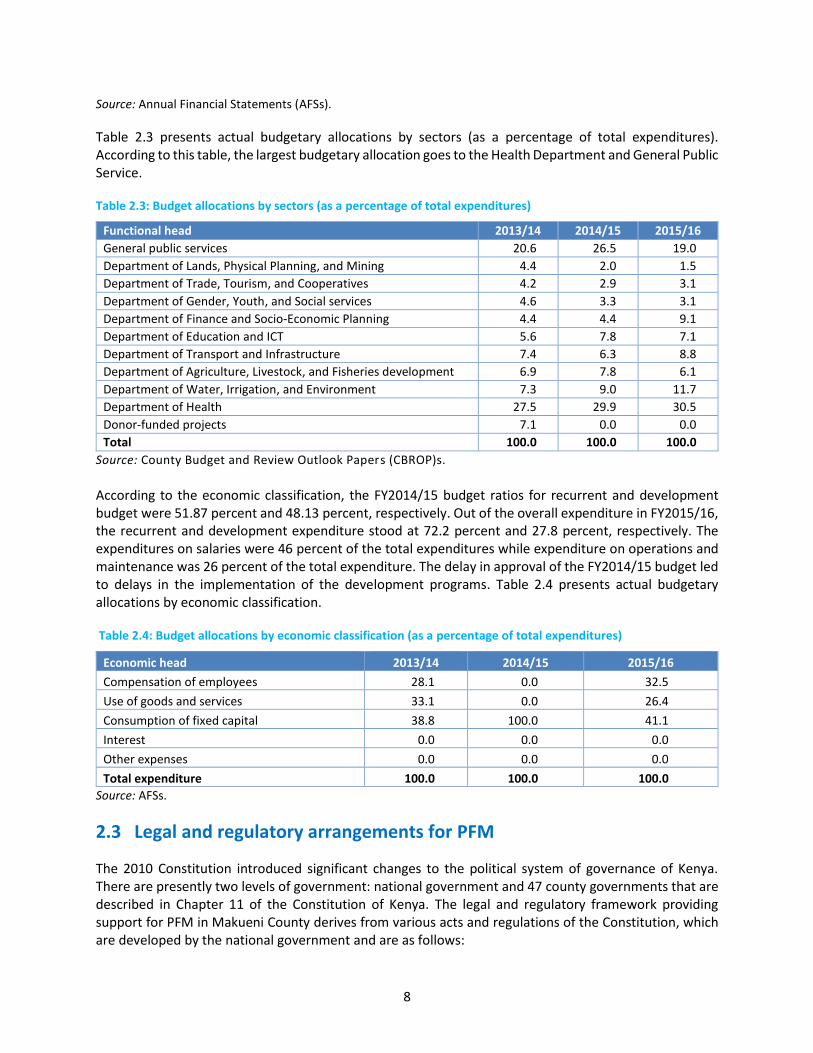
Table 2.3 presents actual budgetary allocations by sectors (as a percentage of total expenditures). According to this table, the largest budgetary allocation goes to the Health Department and General Public Service.
Table 2.3: Budget allocations by sectors (as a percentage of total expenditures)
Functional head 2013/14 2014/15 2015/16
General public services 20.6 26.5 19.0
Department of Lands, Physical Planning, and Mining 4.4 2.0 1.5
Department of Trade, Tourism, and Cooperatives 4.2 2.9 3.1
Department of Gender, Youth, and Social services 4.6 3.3 3.1
Department of Finance and Socio-Economic Planning 4.4 4.4 9.1
Department of Education and ICT 5.6 7.8 7.1
Department of Transport and Infrastructure 7.4 6.3 8.8
Department of Agriculture, Livestock, and Fisheries development 6.9 7.8 6.1
Department of Water, Irrigation, and Environment 7.3 9.0 11.7
Department of Health 27.5 29.9 30.5
Donor-funded projects 7.1 0.0 0.0
Total 100.0 100.0 100.0
Source: County Budget and Review Outlook Papers (CBROP)s.
According to the economic classification, the FY2014/15 budget ratios for recurrent and development budget were 51.87 percent and 48.13 percent, respectively. Out of the overall expenditure in FY2015/16, the recurrent and development expenditure stood at 72.2 percent and 27.8 percent, respectively. The expenditures on salaries were 46 percent of the total expenditures while expenditure on operations and maintenance was 26 percent of the total expenditure. The delay in approval of the FY2014/15 budget led to delays in the implementation of the development programs. Table 2.4 presents actual budgetary allocations by economic classification.
Table 2.4: Budget allocations by economic classification (as a percentage of total expenditures)
Economic head 2013/14 2014/15 2015/16
Compensation of employees 28.1 0.0 32.5
Use of goods and services 33.1 0.0 26.4
Consumption of fixed capital 38.8 100.0 41.1
Interest 0.0 0.0 0.0
Other expenses 0.0 0.0 0.0
Total expenditure 100.0 100.0 100.0
Source: AFSs.
2.3 Legal and regulatory arrangements for PFM
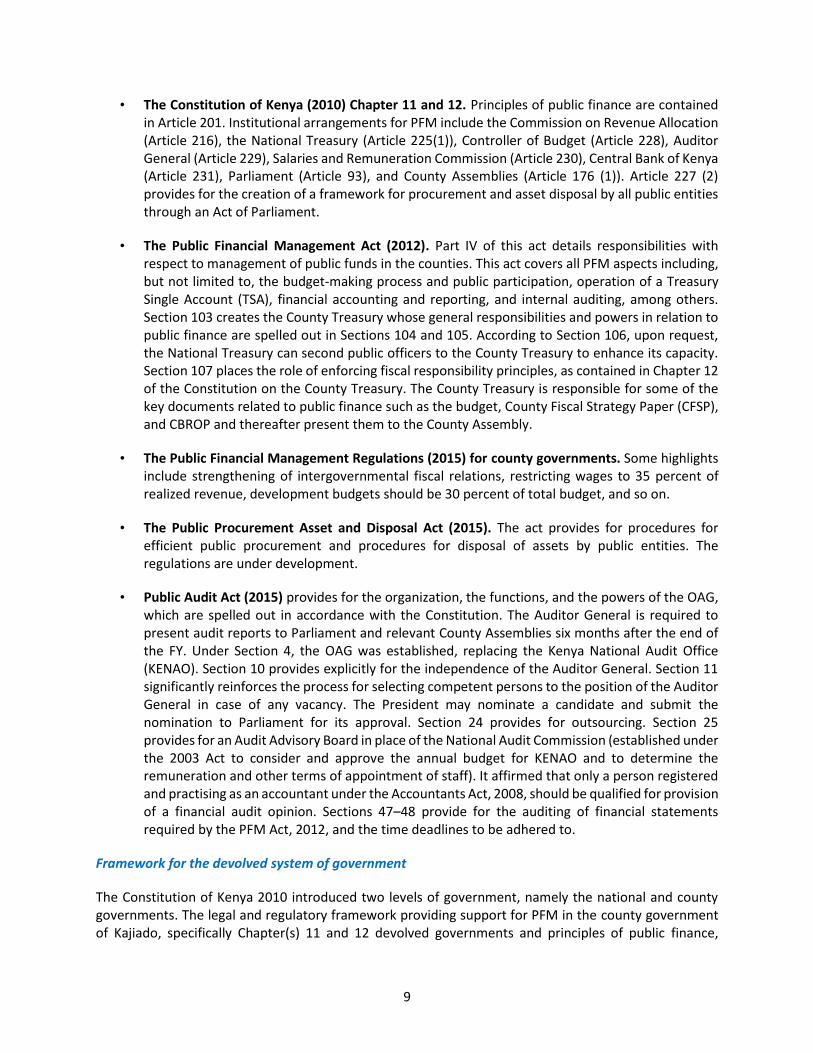
The 2010 Constitution introduced significant changes to the political system of governance of Kenya. There are presently two levels of government: national government and 47 county governments that are described in Chapter 11 of the Constitution of Kenya. The legal and regulatory framework providing support for PFM in Makueni County derives from various acts and regulations of the Constitution, which are developed by the national government and are as follows:
9
• The Constitution of Kenya (2010) Chapter 11 and 12. Principles of public finance are contained in Article 201. Institutional arrangements for PFM include the Commission on Revenue Allocation (Article 216), the National Treasury (Article 225(1)), Controller of Budget (Article 228), Auditor General (Article 229), Salaries and Remuneration Commission (Article 230), Central Bank of Kenya (Article 231), Parliament (Article 93), and County Assemblies (Article 176 (1)). Article 227 (2) provides for the creation of a framework for procurement and asset disposal by all public entities through an Act of Parliament.
• The Public Financial Management Act (2012). Part IV of this act details responsibilities with respect to management of public funds in the counties. This act covers all PFM aspects including, but not limited to, the budget-making process and public participation, operation of a Treasury Single Account (TSA), financial accounting and reporting, and internal auditing, among others. Section 103 creates the County Treasury whose general responsibilities and powers in relation to public finance are spelled out in Sections 104 and 105. According to Section 106, upon request, the National Treasury can second public officers to the County Treasury to enhance its capacity. Section 107 places the role of enforcing fiscal responsibility principles, as contained in Chapter 12 of the Constitution on the County Treasury. The County Treasury is responsible for some of the key documents related to public finance such as the budget, County Fiscal Strategy Paper (CFSP), and CBROP and thereafter present them to the County Assembly.
• The Public Financial Management Regulations (2015) for county governments. Some highlights include strengthening of intergovernmental fiscal relations, restricting wages to 35 percent of realized revenue, development budgets should be 30 percent of total budget, and so on.
• The Public Procurement Asset and Disposal Act (2015). The act provides for procedures for efficient public procurement and procedures for disposal of assets by public entities. The regulations are under development.
• Public Audit Act (2015) provides for the organization, the functions, and the powers of the OAG, which are spelled out in accordance with the Constitution. The Auditor General is required to present audit reports to Parliament and relevant County Assemblies six months after the end of the FY. Under Section 4, the OAG was established, replacing the Kenya National Audit Office (KENAO). Section 10 provides explicitly for the independence of the Auditor General. Section 11 significantly reinforces the process for selecting competent persons to the position of the Auditor General in case of any vacancy. The President may nominate a candidate and submit the nomination to Parliament for its approval. Section 24 provides for outsourcing. Section 25 provides for an Audit Advisory Board in place of the National Audit Commission (established under the 2003 Act to consider and approve the annual budget for KENAO and to determine the remuneration and other terms of appointment of staff). It affirmed that only a person registered and practising as an accountant under the Accountants Act, 2008, should be qualified for provision of a financial audit opinion. Sections 47–48 provide for the auditing of financial statements required by the PFM Act, 2012, and the time deadlines to be adhered to.
Framework for the devolved system of government
The Constitution of Kenya 2010 introduced two levels of government, namely the national and county governments. The legal and regulatory framework providing support for PFM in the county government of Kajiado, specifically Chapter(s) 11 and 12 devolved governments and principles of public finance,
10
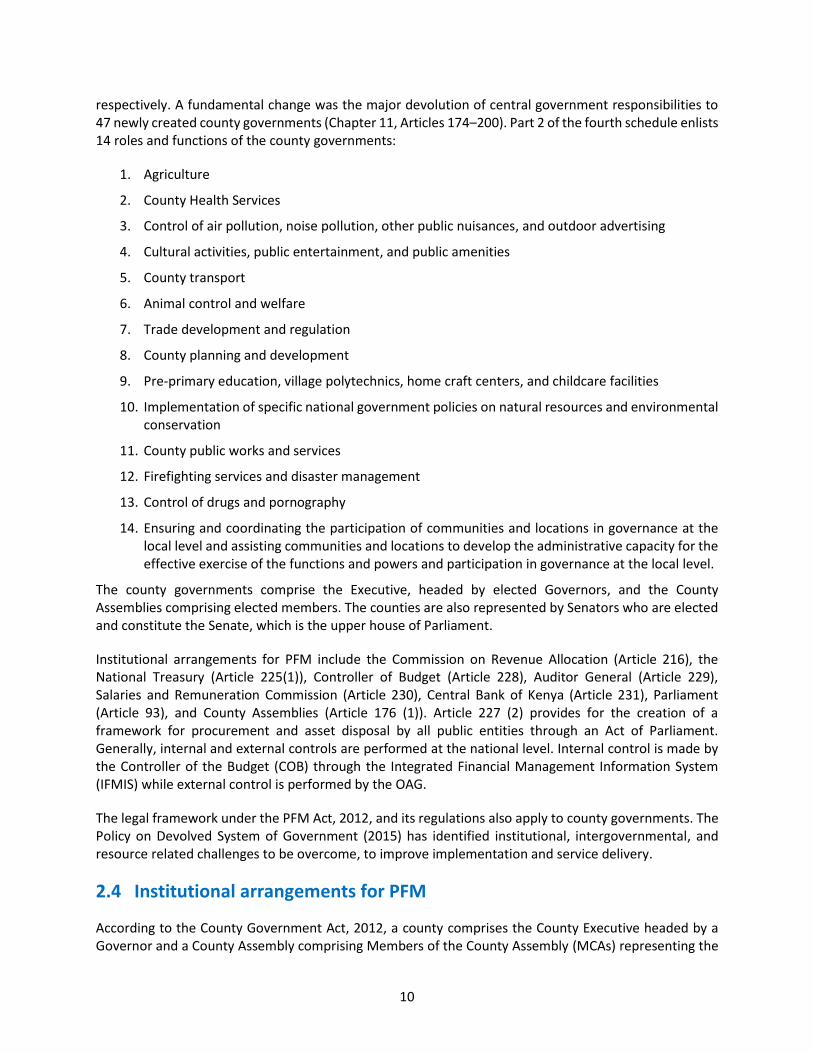
respectively. A fundamental change was the major devolution of central government responsibilities to 47 newly created county governments (Chapter 11, Articles 174–200). Part 2 of the fourth schedule enlists 14 roles and functions of the county governments:
1. Agriculture
2. County Health Services
3. Control of air pollution, noise pollution, other public nuisances, and outdoor advertising
4. Cultural activities, public entertainment, and public amenities
5. County transport
6. Animal control and welfare
7. Trade development and regulation
8. County planning and development
9. Pre-primary education, village polytechnics, home craft centers, and childcare facilities
10. Implementation of specific national government policies on natural resources and environmental conservation
11. County public works and services
12. Firefighting services and disaster management
13. Control of drugs and pornography
14. Ensuring and coordinating the participation of communities and locations in governance at the local level and assisting communities and locations to develop the administrative capacity for the effective exercise of the functions and powers and participation in governance at the local level.
The county governments comprise the Executive, headed by elected Governors, and the County Assemblies comprising elected members. The counties are also represented by Senators who are elected and constitute the Senate, which is the upper house of Parliament.
Institutional arrangements for PFM include the Commission on Revenue Allocation (Article 216), the National Treasury (Article 225(1)), Controller of Budget (Article 228), Auditor General (Article 229), Salaries and Remuneration Commission (Article 230), Central Bank of Kenya (Article 231), Parliament (Article 93), and County Assemblies (Article 176 (1)). Article 227 (2) provides for the creation of a framework for procurement and asset disposal by all public entities through an Act of Parliament. Generally, internal and external controls are performed at the national level. Internal control is made by the Controller of the Budget (COB) through the Integrated Financial Management Information System (IFMIS) while external control is performed by the OAG.
The legal framework under the PFM Act, 2012, and its regulations also apply to county governments. The Policy on Devolved System of Government (2015) has identified institutional, intergovernmental, and resource related challenges to be overcome, to improve implementation and service delivery.
2.4 Institutional arrangements for PFM
According to the County Government Act, 2012, a county comprises the County Executive headed by a Governor and a County Assembly comprising Members of the County Assembly (MCAs) representing the
11
wards. The County Governor is responsible for the general policy and strategic direction of the county. The Constitution transferred various powers and functions (including limited fiscal authority) to the counties. This is in recognition of fiscal decentralization as a mechanism for enhancing delivery of social services at the grassroots and promoting enhanced accountability. Moreover, a central objective of the Constitution was to promote good governance in PFM through the establishment of sound institutional and regulatory environment at both national and county levels.
Members of the County Executive are nominated by the Governor but their appointment has to be approved by the County Assembly. Part IV of the PFM Act, 2012, gives the county government the responsibility of managing public finances in the county. Section 103 of the PFM Act, 2012, establishes the County Treasury comprising the County Executive Committee (CEC) member in charge of finance, the Chief Officer (CO), and department(s) of the County Treasury responsible for financial and fiscal matters. According to Section 103 (3), the CEC member for finance shall be the head of the County Treasury. The COs are the chief accounting officers in their respective departments.
In addition to its primary function of passing legislation, the County Assembly also approves nominees to other county public service offices. Most of the MCAs are elected during a General Election but some are also nominated by political parties. The County Assembly has the oversight role over the County Executive in terms of use of public finances. Key public finance documents such as the budgets, CFSP, and CBROPs have to be presented by the County Executive for approval. All funds including the emergency funds and any other by County Executive must be approved by the County Assembly.
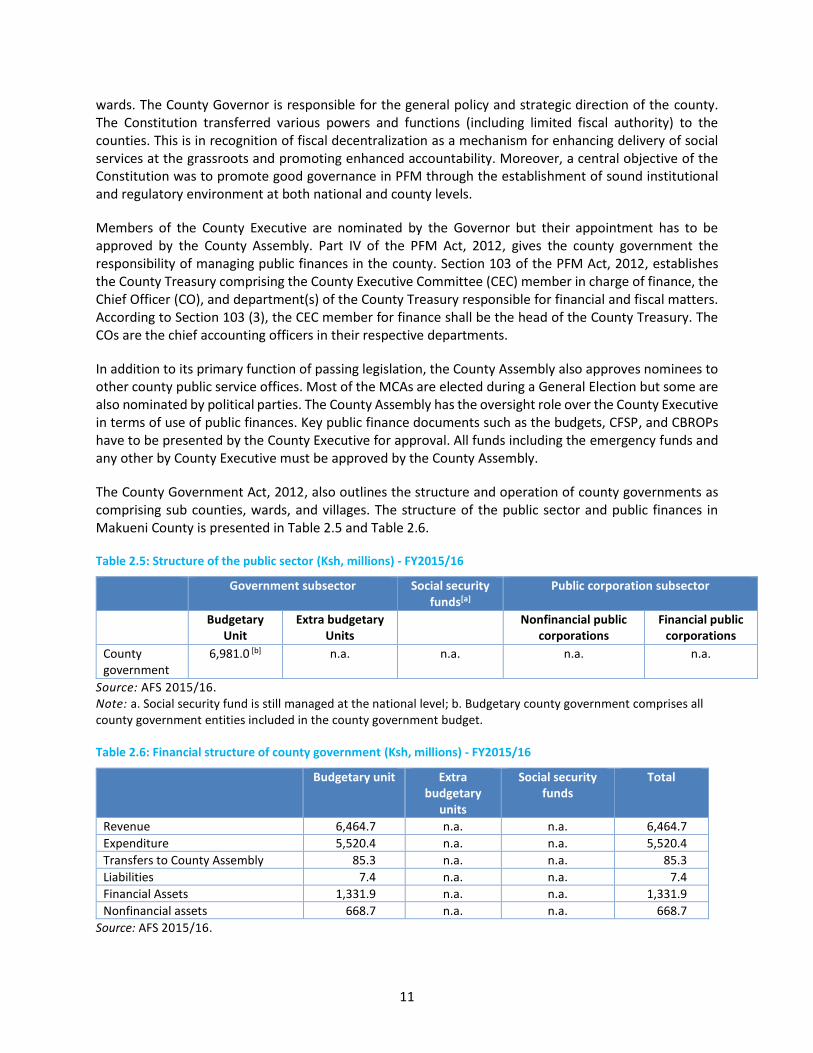
The County Government Act, 2012, also outlines the structure and operation of county governments as comprising sub counties, wards, and villages. The structure of the public sector and public finances in Makueni County is presented in Table 2.5 and Table 2.6.
Table 2.5: Structure of the public sector (Ksh, millions) - FY2015/16
Government subsector Social security funds[a]
Public corporation subsector
Budgetary Unit
Extra budgetary Units
Nonfinancial public corporations
Financial public corporations
County government
6,981.0 [b]
n.a. n.a. n.a. n.a.
Source: AFS 2015/16. Note: a. Social security fund is still managed at the national level; b. Budgetary county government comprises all county government entities included in the county government budget.
Table 2.6: Financial structure of county government (Ksh, millions) - FY2015/16
Budgetary unit Extra budgetary
units
Social security funds
Total
Revenue 6,464.7 n.a. n.a. 6,464.7
Expenditure 5,520.4 n.a. n.a. 5,520.4
Transfers to County Assembly 85.3 n.a. n.a. 85.3
Liabilities 7.4 n.a. n.a. 7.4
Financial Assets 1,331.9 n.a. n.a. 1,331.9
Nonfinancial assets 668.7 n.a. n.a. 668.7
Source: AFS 2015/16.

12
Public participation is part of the Constitution of Kenya and is stipulated as a function of Makueni County Government. Sections 87 to 92 and 115 of the County Governments Act, 2012, outline the principles of public participation and the imperative for facilitating public participation in the work of the county government.
13
3. Assessment of PFM Performance
3.1 Subnational Government profile
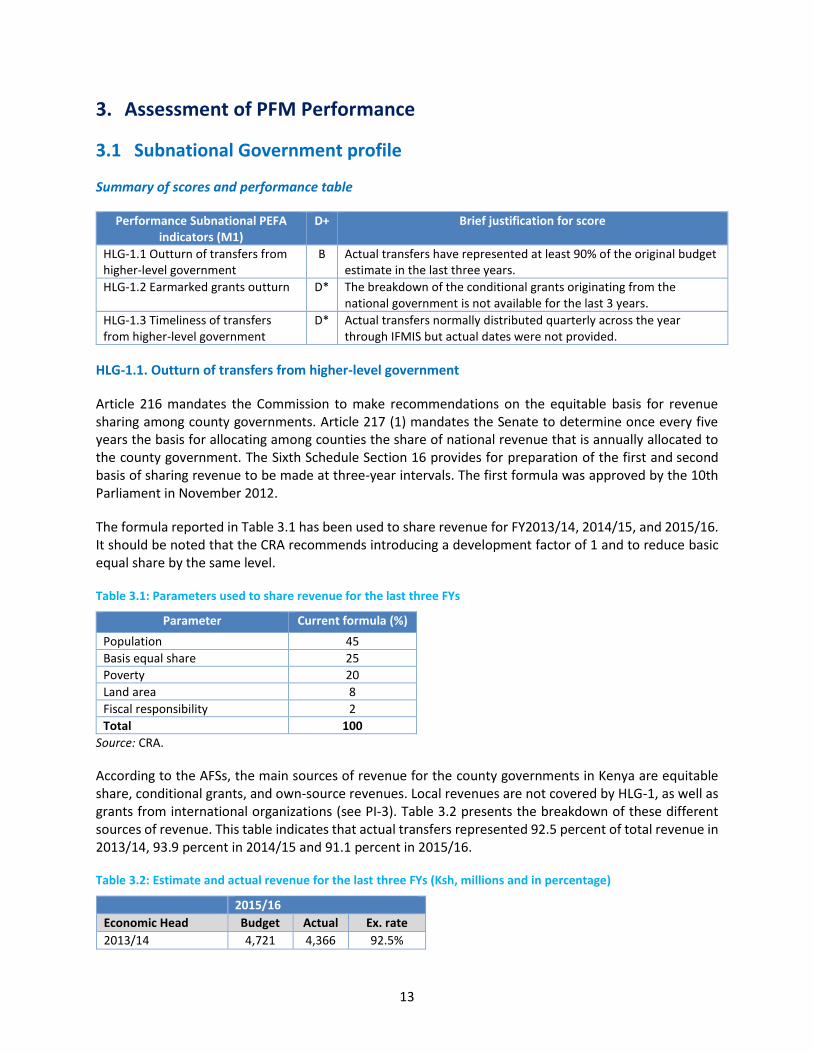
Summary of scores and performance table
Performance Subnational PEFA indicators (M1)
D+ Brief justification for score
HLG-1.1 Outturn of transfers from higher-level government
B Actual transfers have represented at least 90% of the original budget estimate in the last three years.
HLG-1.2 Earmarked grants outturn D* The breakdown of the conditional grants originating from the national government is not available for the last 3 years.
HLG-1.3 Timeliness of transfers from higher-level government
D* Actual transfers normally distributed quarterly across the year through IFMIS but actual dates were not provided.
HLG-1.1. Outturn of transfers from higher-level government
Article 216 mandates the Commission to make recommendations on the equitable basis for revenue sharing among county governments. Article 217 (1) mandates the Senate to determine once every five years the basis for allocating among counties the share of national revenue that is annually allocated to the county government. The Sixth Schedule Section 16 provides for preparation of the first and second basis of sharing revenue to be made at three-year intervals. The first formula was approved by the 10th Parliament in November 2012.
The formula reported in Table 3.1 has been used to share revenue for FY2013/14, 2014/15, and 2015/16. It should be noted that the CRA recommends introducing a development factor of 1 and to reduce basic equal share by the same level.
Table 3.1: Parameters used to share revenue for the last three FYs
Parameter Current formula (%)
Population 45
Basis equal share 25
Poverty 20
Land area 8
Fiscal responsibility 2
Total 100
Source: CRA.
According to the AFSs, the main sources of revenue for the county governments in Kenya are equitable share, conditional grants, and own-source revenues. Local revenues are not covered by HLG-1, as well as grants from international organizations (see PI-3). Table 3.2 presents the breakdown of these different sources of revenue. This table indicates that actual transfers represented 92.5 percent of total revenue in 2013/14, 93.9 percent in 2014/15 and 91.1 percent in 2015/16.
Table 3.2: Estimate and actual revenue for the last three FYs (Ksh, millions and in percentage)
2015/16
Economic Head Budget Actual Ex. rate
2013/14 4,721 4,366 92.5%
14
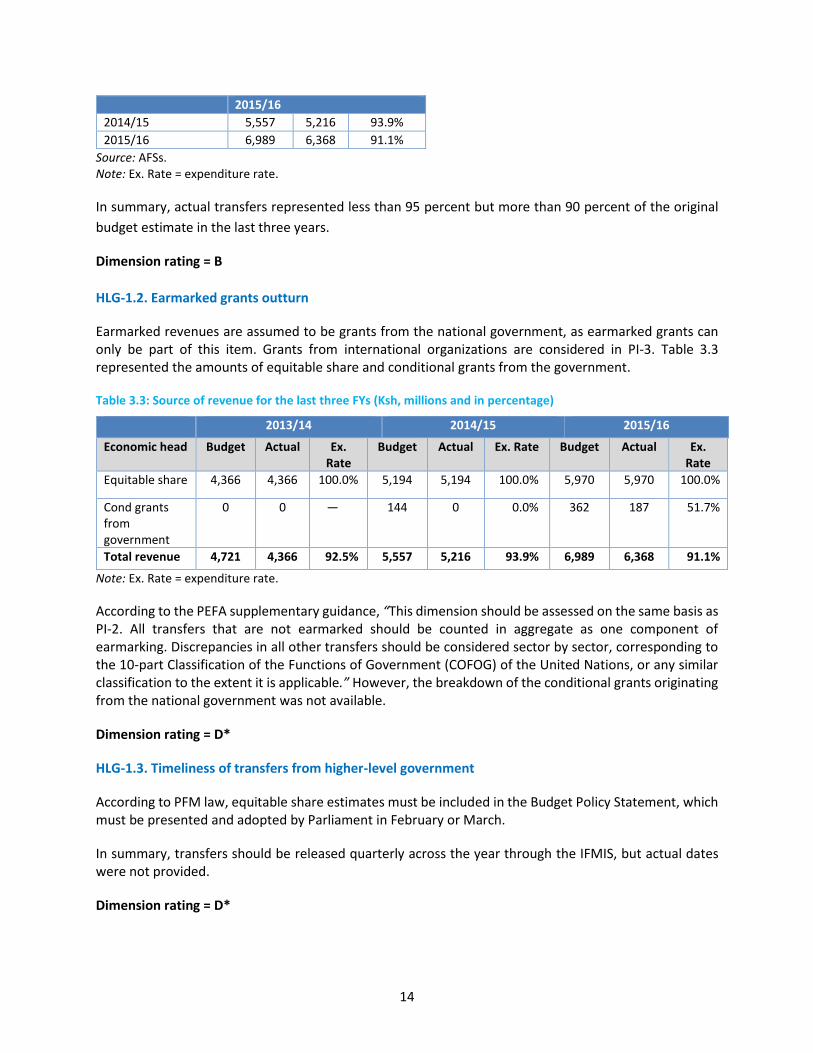
2015/16
2014/15 5,557 5,216 93.9%
2015/16 6,989 6,368 91.1%
Source: AFSs. Note: Ex. Rate = expenditure rate.
In summary, actual transfers represented less than 95 percent but more than 90 percent of the original
budget estimate in the last three years.
Dimension rating = B
HLG-1.2. Earmarked grants outturn
Earmarked revenues are assumed to be grants from the national government, as earmarked grants can only be part of this item. Grants from international organizations are considered in PI-3. Table 3.3 represented the amounts of equitable share and conditional grants from the government.
Table 3.3: Source of revenue for the last three FYs (Ksh, millions and in percentage)
2013/14 2014/15 2015/16
Economic head Budget Actual Ex. Rate
Budget Actual Ex. Rate Budget Actual Ex. Rate
Equitable share 4,366 4,366 100.0% 5,194 5,194 100.0% 5,970 5,970 100.0%
Cond grants from government
0 0 — 144 0 0.0% 362 187 51.7%
Total revenue 4,721 4,366 92.5% 5,557 5,216 93.9% 6,989 6,368 91.1%
Note: Ex. Rate = expenditure rate.
According to the PEFA supplementary guidance, “This dimension should be assessed on the same basis as PI-2. All transfers that are not earmarked should be counted in aggregate as one component of earmarking. Discrepancies in all other transfers should be considered sector by sector, corresponding to the 10-part Classification of the Functions of Government (COFOG) of the United Nations, or any similar classification to the extent it is applicable.” However, the breakdown of the conditional grants originating from the national government was not available.
Dimension rating = D*
HLG-1.3. Timeliness of transfers from higher-level government
According to PFM law, equitable share estimates must be included in the Budget Policy Statement, which must be presented and adopted by Parliament in February or March.
In summary, transfers should be released quarterly across the year through the IFMIS, but actual dates were not provided.
Dimension rating = D*
15
3.2 Pillar I. Budget reliability
A budget is reliable if it is implemented in accordance with the approved estimates before the beginning of the FY. To determine the extent to which this is the case, three indicators—aggregate expenditure outturn, expenditure composition outturn, and revenue outturn—were examined for FY2013/14, 2014/15, and 2015/16.
PI-1. Aggregate expenditure outturn
Summary of scores and performance table
PI-1. Aggregate expenditure outturn (M1)
D Brief justification for score
1.1 Aggregate expenditure outturn
D Aggregate expenditure outturn was below 85% of the approved aggregate budgeted expenditure in the last three years.
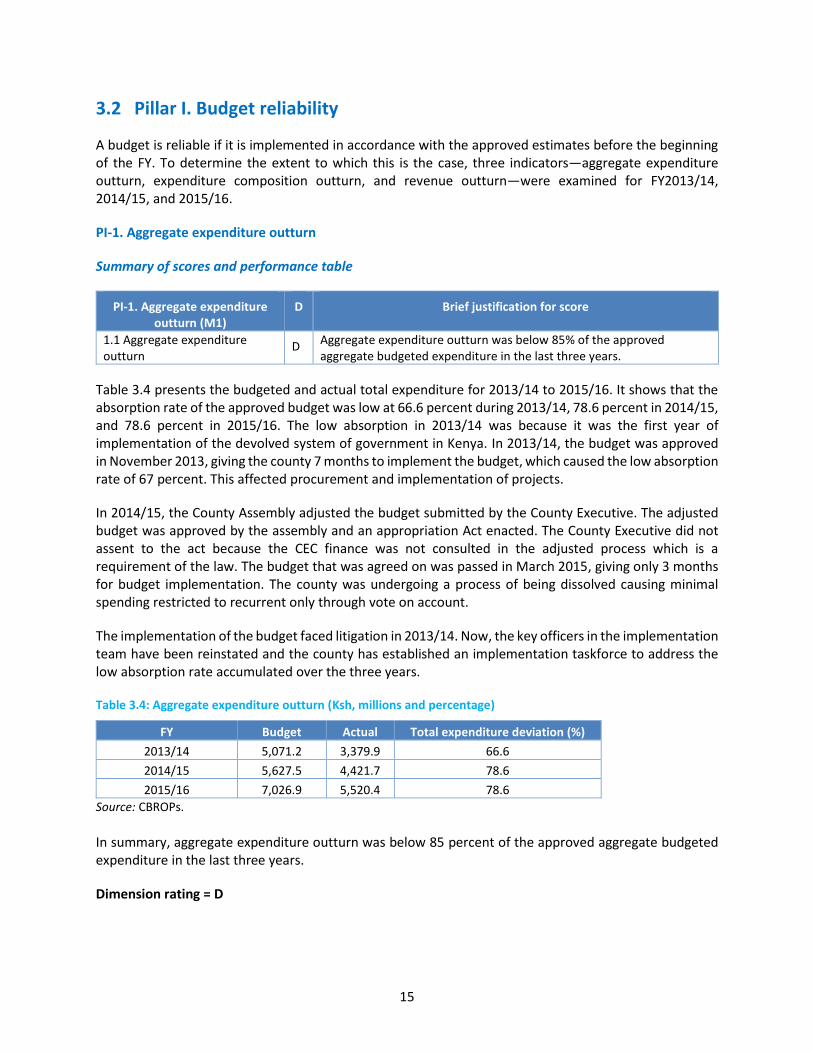
Table 3.4 presents the budgeted and actual total expenditure for 2013/14 to 2015/16. It shows that the absorption rate of the approved budget was low at 66.6 percent during 2013/14, 78.6 percent in 2014/15, and 78.6 percent in 2015/16. The low absorption in 2013/14 was because it was the first year of implementation of the devolved system of government in Kenya. In 2013/14, the budget was approved in November 2013, giving the county 7 months to implement the budget, which caused the low absorption rate of 67 percent. This affected procurement and implementation of projects.
In 2014/15, the County Assembly adjusted the budget submitted by the County Executive. The adjusted budget was approved by the assembly and an appropriation Act enacted. The County Executive did not assent to the act because the CEC finance was not consulted in the adjusted process which is a requirement of the law. The budget that was agreed on was passed in March 2015, giving only 3 months for budget implementation. The county was undergoing a process of being dissolved causing minimal spending restricted to recurrent only through vote on account.
The implementation of the budget faced litigation in 2013/14. Now, the key officers in the implementation team have been reinstated and the county has established an implementation taskforce to address the low absorption rate accumulated over the three years.
Table 3.4: Aggregate expenditure outturn (Ksh, millions and percentage)
FY Budget Actual Total expenditure deviation (%)
2013/14 5,071.2 3,379.9 66.6
2014/15 5,627.5 4,421.7 78.6
2015/16 7,026.9 5,520.4 78.6
Source: CBROPs.
In summary, aggregate expenditure outturn was below 85 percent of the approved aggregate budgeted expenditure in the last three years.
Dimension rating = D
16
PI-2. Expenditure composition outturn
Summary of scores and performance table
PI-2. Expenditure composition outturn (M1) D+ Brief justification for score
2.1 Expenditure composition outturn by function
D Variance in expenditure composition by administrative/functional classification was more than 15% in the last three years.
2.2 Expenditure composition outturn by economic type
D Variance in expenditure composition by economic classification was more than 15% in the last three years.
2.3 Expenditure for contingency reserve A The actual expenditure charged to contingency was on average less than 3% of the original budget.
PI-2.1. Expenditure composition outturn by function
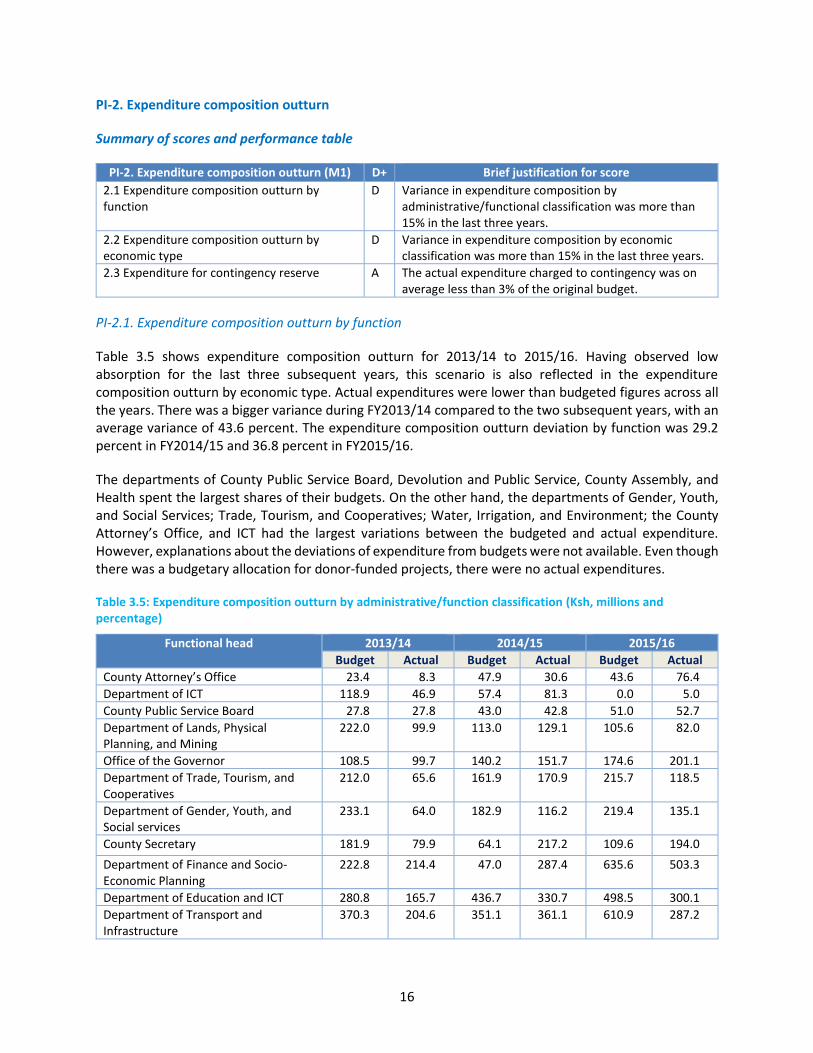
Table 3.5 shows expenditure composition outturn for 2013/14 to 2015/16. Having observed low absorption for the last three subsequent years, this scenario is also reflected in the expenditure composition outturn by economic type. Actual expenditures were lower than budgeted figures across all the years. There was a bigger variance during FY2013/14 compared to the two subsequent years, with an average variance of 43.6 percent. The expenditure composition outturn deviation by function was 29.2 percent in FY2014/15 and 36.8 percent in FY2015/16.
The departments of County Public Service Board, Devolution and Public Service, County Assembly, and Health spent the largest shares of their budgets. On the other hand, the departments of Gender, Youth, and Social Services; Trade, Tourism, and Cooperatives; Water, Irrigation, and Environment; the County Attorney’s Office, and ICT had the largest variations between the budgeted and actual expenditure. However, explanations about the deviations of expenditure from budgets were not available. Even though there was a budgetary allocation for donor-funded projects, there were no actual expenditures.
Table 3.5: Expenditure composition outturn by administrative/function classification (Ksh, millions and percentage)
Functional head 2013/14 2014/15 2015/16
Budget Actual Budget Actual Budget Actual
County Attorney’s Office 23.4 8.3 47.9 30.6 43.6 76.4
Department of ICT 118.9 46.9 57.4 81.3 0.0 5.0
County Public Service Board 27.8 27.8 43.0 42.8 51.0 52.7
Department of Lands, Physical Planning, and Mining
222.0 99.9 113.0 129.1 105.6 82.0
Office of the Governor 108.5 99.7 140.2 151.7 174.6 201.1
Department of Trade, Tourism, and Cooperatives
212.0 65.6 161.9 170.9 215.7 118.5
Department of Gender, Youth, and Social services
233.1 64.0 182.9 116.2 219.4 135.1
County Secretary 181.9 79.9 64.1 217.2 109.6 194.0
Department of Finance and Socio-Economic Planning
222.8 214.4 47.0 287.4 635.6 503.3
Department of Education and ICT 280.8 165.7 436.7 330.7 498.5 300.1
Department of Transport and Infrastructure
370.3 204.6 351.1 361.1 610.9 287.2
17
Functional head 2013/14 2014/15 2015/16
Budget Actual Budget Actual Budget Actual
Department of Agriculture, Livestock, and Fisheries Development
345.3 221.2 434.6 252.2 423.3 321.8
Department of Water, Irrigation, and Environment
366.7 120.5 502.8 314.3 820 525.6
Department of Health 1,385.3 1,373.7 1,664.7 1,333.7 2,128.8 1,780.3
County Assembly 577.5 566.0 913.8 517.1 664.7 237.2
Donor-funded projects 354.9 0.0 0.0 670.8
Department of Devolution and Public Service
11.4 49.7 279.7 0.0
Contingency 40.0 21.8 55.1 35.7 45.9 28.9
Total 5,071.2 3,379.9 5,627.5 4,421.7 7,026.9 5,520.4
Composition variance (%) 43.6 29.2 36.8
Source: annual original budget and program implementation report for Makueni County
Variance in expenditure composition by administrative/functional classification was more than 15 percent in the last three years.
Dimension rating = D
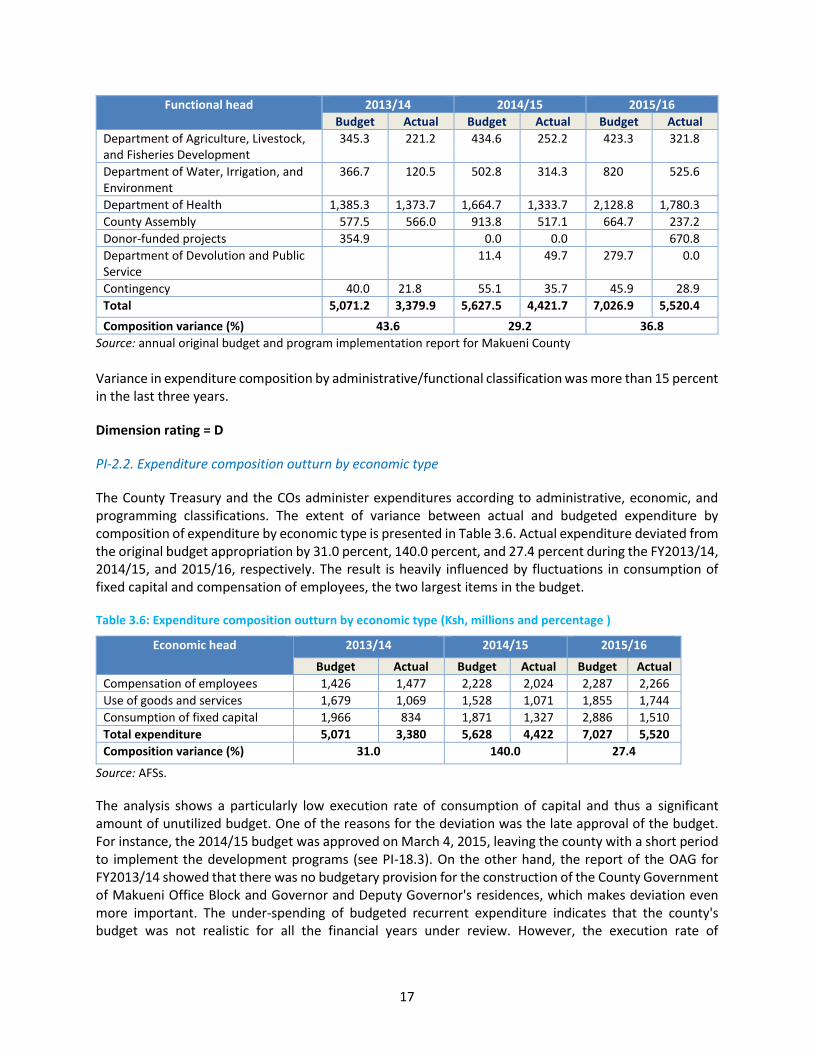
PI-2.2. Expenditure composition outturn by economic type
The County Treasury and the COs administer expenditures according to administrative, economic, and programming classifications. The extent of variance between actual and budgeted expenditure by composition of expenditure by economic type is presented in Table 3.6. Actual expenditure deviated from the original budget appropriation by 31.0 percent, 140.0 percent, and 27.4 percent during the FY2013/14, 2014/15, and 2015/16, respectively. The result is heavily influenced by fluctuations in consumption of fixed capital and compensation of employees, the two largest items in the budget.
Table 3.6: Expenditure composition outturn by economic type (Ksh, millions and percentage )
Economic head 2013/14 2014/15 2015/16
Budget Actual Budget Actual Budget Actual
Compensation of employees 1,426 1,477 2,228 2,024 2,287 2,266
Use of goods and services 1,679 1,069 1,528 1,071 1,855 1,744
Consumption of fixed capital 1,966 834 1,871 1,327 2,886 1,510
Total expenditure 5,071 3,380 5,628 4,422 7,027 5,520
Composition variance (%) 31.0 140.0 27.4
Source: AFSs.
The analysis shows a particularly low execution rate of consumption of capital and thus a significant amount of unutilized budget. One of the reasons for the deviation was the late approval of the budget. For instance, the 2014/15 budget was approved on March 4, 2015, leaving the county with a short period to implement the development programs (see PI-18.3). On the other hand, the report of the OAG for FY2013/14 showed that there was no budgetary provision for the construction of the County Government of Makueni Office Block and Governor and Deputy Governor's residences, which makes deviation even more important. The under-spending of budgeted recurrent expenditure indicates that the county's budget was not realistic for all the financial years under review. However, the execution rate of
18
compensation of employees was the highest of all categories and even exceeded 100 percent in FY2013/14.
In summary, variance in expenditure composition by economic classification was more than 15 percent in the last three years.
Dimension rating = D
PI-2.3 Expenditure for Contingency Reserve
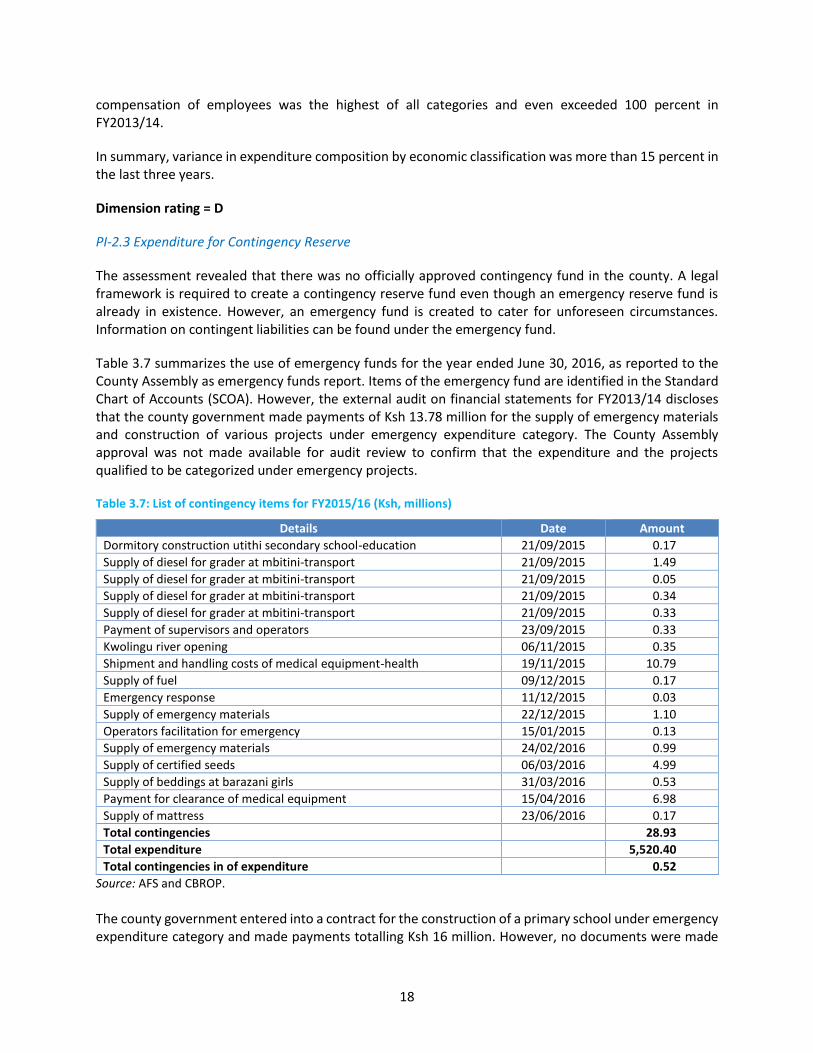
The assessment revealed that there was no officially approved contingency fund in the county. A legal framework is required to create a contingency reserve fund even though an emergency reserve fund is already in existence. However, an emergency fund is created to cater for unforeseen circumstances. Information on contingent liabilities can be found under the emergency fund.
Table 3.7 summarizes the use of emergency funds for the year ended June 30, 2016, as reported to the County Assembly as emergency funds report. Items of the emergency fund are identified in the Standard Chart of Accounts (SCOA). However, the external audit on financial statements for FY2013/14 discloses that the county government made payments of Ksh 13.78 million for the supply of emergency materials and construction of various projects under emergency expenditure category. The County Assembly approval was not made available for audit review to confirm that the expenditure and the projects qualified to be categorized under emergency projects.
Table 3.7: List of contingency items for FY2015/16 (Ksh, millions)
Details Date Amount
Dormitory construction utithi secondary school-education 21/09/2015 0.17
Supply of diesel for grader at mbitini-transport 21/09/2015 1.49
Supply of diesel for grader at mbitini-transport 21/09/2015 0.05
Supply of diesel for grader at mbitini-transport 21/09/2015 0.34
Supply of diesel for grader at mbitini-transport 21/09/2015 0.33
Payment of supervisors and operators 23/09/2015 0.33
Kwolingu river opening 06/11/2015 0.35
Shipment and handling costs of medical equipment-health 19/11/2015 10.79
Supply of fuel 09/12/2015 0.17
Emergency response 11/12/2015 0.03
Supply of emergency materials 22/12/2015 1.10
Operators facilitation for emergency 15/01/2015 0.13
Supply of emergency materials 24/02/2016 0.99
Supply of certified seeds 06/03/2016 4.99
Supply of beddings at barazani girls 31/03/2016 0.53
Payment for clearance of medical equipment 15/04/2016 6.98
Supply of mattress 23/06/2016 0.17
Total contingencies 28.93
Total expenditure 5,520.40
Total contingencies in of expenditure 0.52
Source: AFS and CBROP.
The county government entered into a contract for the construction of a primary school under emergency expenditure category and made payments totalling Ksh 16 million. However, no documents were made
19
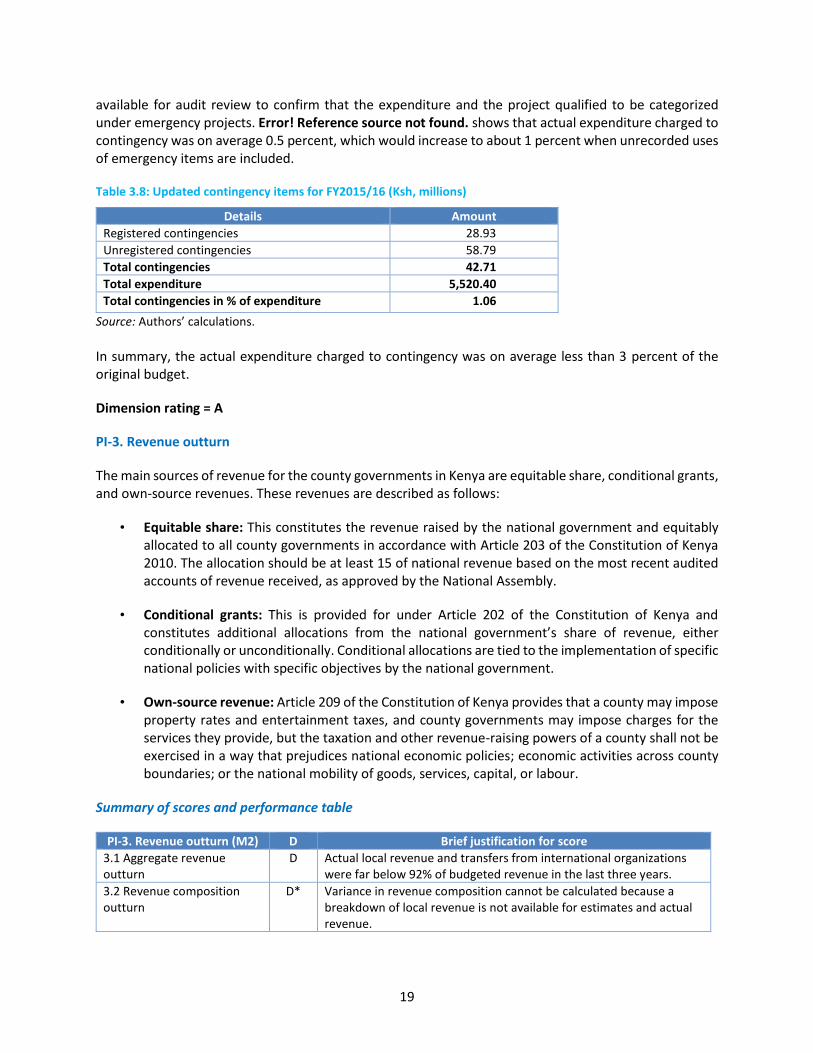
available for audit review to confirm that the expenditure and the project qualified to be categorized under emergency projects. Error! Reference source not found. shows that actual expenditure charged to contingency was on average 0.5 percent, which would increase to about 1 percent when unrecorded uses of emergency items are included.
Table 3.8: Updated contingency items for FY2015/16 (Ksh, millions)
Details Amount
Registered contingencies 28.93
Unregistered contingencies 58.79
Total contingencies 42.71
Total expenditure 5,520.40
Total contingencies in % of expenditure 1.06
Source: Authors’ calculations.
In summary, the actual expenditure charged to contingency was on average less than 3 percent of the original budget.
Dimension rating = A
PI-3. Revenue outturn
The main sources of revenue for the county governments in Kenya are equitable share, conditional grants, and own-source revenues. These revenues are described as follows:
• Equitable share: This constitutes the revenue raised by the national government and equitably allocated to all county governments in accordance with Article 203 of the Constitution of Kenya 2010. The allocation should be at least 15 of national revenue based on the most recent audited accounts of revenue received, as approved by the National Assembly.
• Conditional grants: This is provided for under Article 202 of the Constitution of Kenya and constitutes additional allocations from the national government’s share of revenue, either conditionally or unconditionally. Conditional allocations are tied to the implementation of specific national policies with specific objectives by the national government.
• Own-source revenue: Article 209 of the Constitution of Kenya provides that a county may impose property rates and entertainment taxes, and county governments may impose charges for the services they provide, but the taxation and other revenue-raising powers of a county shall not be exercised in a way that prejudices national economic policies; economic activities across county boundaries; or the national mobility of goods, services, capital, or labour.
Summary of scores and performance table
PI-3. Revenue outturn (M2) D Brief justification for score
3.1 Aggregate revenue outturn
D Actual local revenue and transfers from international organizations were far below 92% of budgeted revenue in the last three years.
3.2 Revenue composition outturn
D* Variance in revenue composition cannot be calculated because a breakdown of local revenue is not available for estimates and actual revenue.
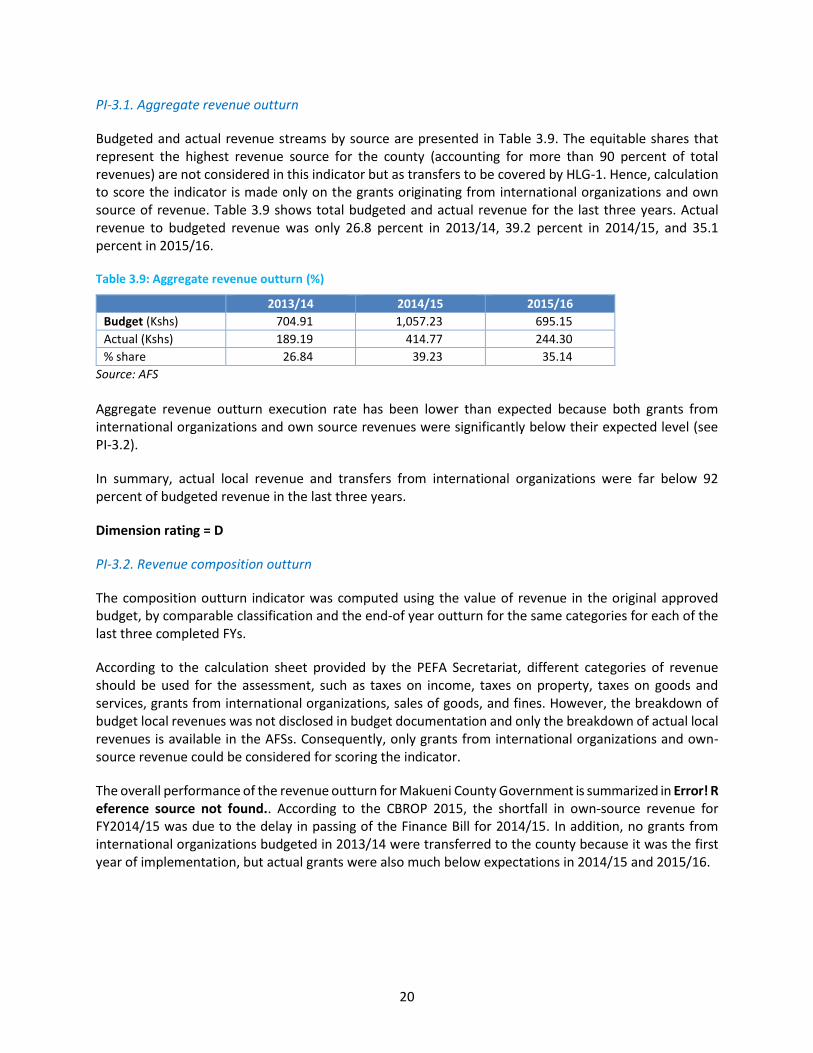
20
PI-3.1. Aggregate revenue outturn
Budgeted and actual revenue streams by source are presented in Table 3.9. The equitable shares that represent the highest revenue source for the county (accounting for more than 90 percent of total revenues) are not considered in this indicator but as transfers to be covered by HLG-1. Hence, calculation to score the indicator is made only on the grants originating from international organizations and own source of revenue. Table 3.9 shows total budgeted and actual revenue for the last three years. Actual revenue to budgeted revenue was only 26.8 percent in 2013/14, 39.2 percent in 2014/15, and 35.1 percent in 2015/16.
Table 3.9: Aggregate revenue outturn (%)
2013/14 2014/15 2015/16
Budget (Kshs) 704.91 1,057.23 695.15
Actual (Kshs) 189.19 414.77 244.30
% share 26.84 39.23 35.14
Source: AFS
Aggregate revenue outturn execution rate has been lower than expected because both grants from international organizations and own source revenues were significantly below their expected level (see PI-3.2).
In summary, actual local revenue and transfers from international organizations were far below 92 percent of budgeted revenue in the last three years.
Dimension rating = D
PI-3.2. Revenue composition outturn
The composition outturn indicator was computed using the value of revenue in the original approved budget, by comparable classification and the end-of year outturn for the same categories for each of the last three completed FYs.
According to the calculation sheet provided by the PEFA Secretariat, different categories of revenue should be used for the assessment, such as taxes on income, taxes on property, taxes on goods and services, grants from international organizations, sales of goods, and fines. However, the breakdown of budget local revenues was not disclosed in budget documentation and only the breakdown of actual local revenues is available in the AFSs. Consequently, only grants from international organizations and own-source revenue could be considered for scoring the indicator.
The overall performance of the revenue outturn for Makueni County Government is summarized in Error! Reference source not found.. According to the CBROP 2015, the shortfall in own-source revenue for FY2014/15 was due to the delay in passing of the Finance Bill for 2014/15. In addition, no grants from international organizations budgeted in 2013/14 were transferred to the county because it was the first year of implementation, but actual grants were also much below expectations in 2014/15 and 2015/16.
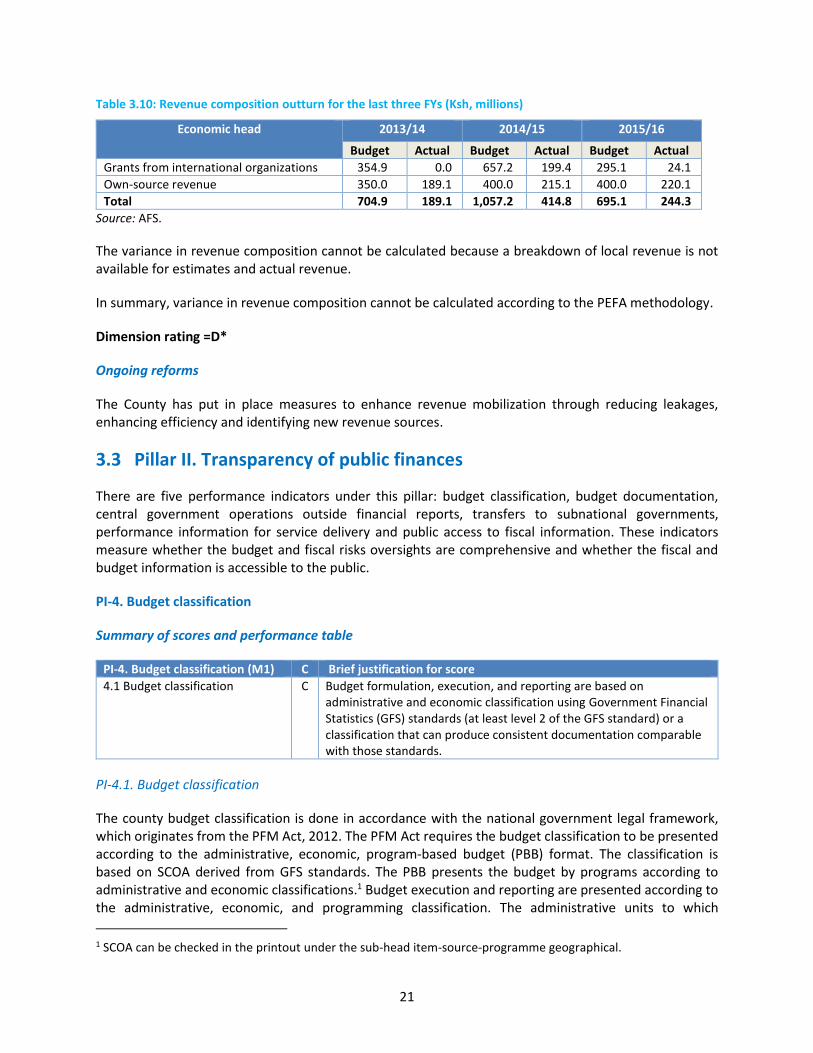
21
Table 3.10: Revenue composition outturn for the last three FYs (Ksh, millions)
Economic head 2013/14 2014/15 2015/16
Budget Actual Budget Actual Budget Actual
Grants from international organizations 354.9 0.0 657.2 199.4 295.1 24.1
Own-source revenue 350.0 189.1 400.0 215.1 400.0 220.1
Total 704.9 189.1 1,057.2 414.8 695.1 244.3
Source: AFS.
The variance in revenue composition cannot be calculated because a breakdown of local revenue is not available for estimates and actual revenue.
In summary, variance in revenue composition cannot be calculated according to the PEFA methodology.
Dimension rating =D*
Ongoing reforms
The County has put in place measures to enhance revenue mobilization through reducing leakages, enhancing efficiency and identifying new revenue sources.
3.3 Pillar II. Transparency of public finances
There are five performance indicators under this pillar: budget classification, budget documentation, central government operations outside financial reports, transfers to subnational governments, performance information for service delivery and public access to fiscal information. These indicators measure whether the budget and fiscal risks oversights are comprehensive and whether the fiscal and budget information is accessible to the public.
PI-4. Budget classification
Summary of scores and performance table
PI-4. Budget classification (M1) C Brief justification for score
4.1 Budget classification C Budget formulation, execution, and reporting are based on administrative and economic classification using Government Financial Statistics (GFS) standards (at least level 2 of the GFS standard) or a classification that can produce consistent documentation comparable with those standards.
PI-4.1. Budget classification
The county budget classification is done in accordance with the national government legal framework, which originates from the PFM Act, 2012. The PFM Act requires the budget classification to be presented according to the administrative, economic, program-based budget (PBB) format. The classification is based on SCOA derived from GFS standards. The PBB presents the budget by programs according to administrative and economic classifications.1 Budget execution and reporting are presented according to the administrative, economic, and programming classification. The administrative units to which
1 SCOA can be checked in the printout under the sub-head item-source-programme geographical.
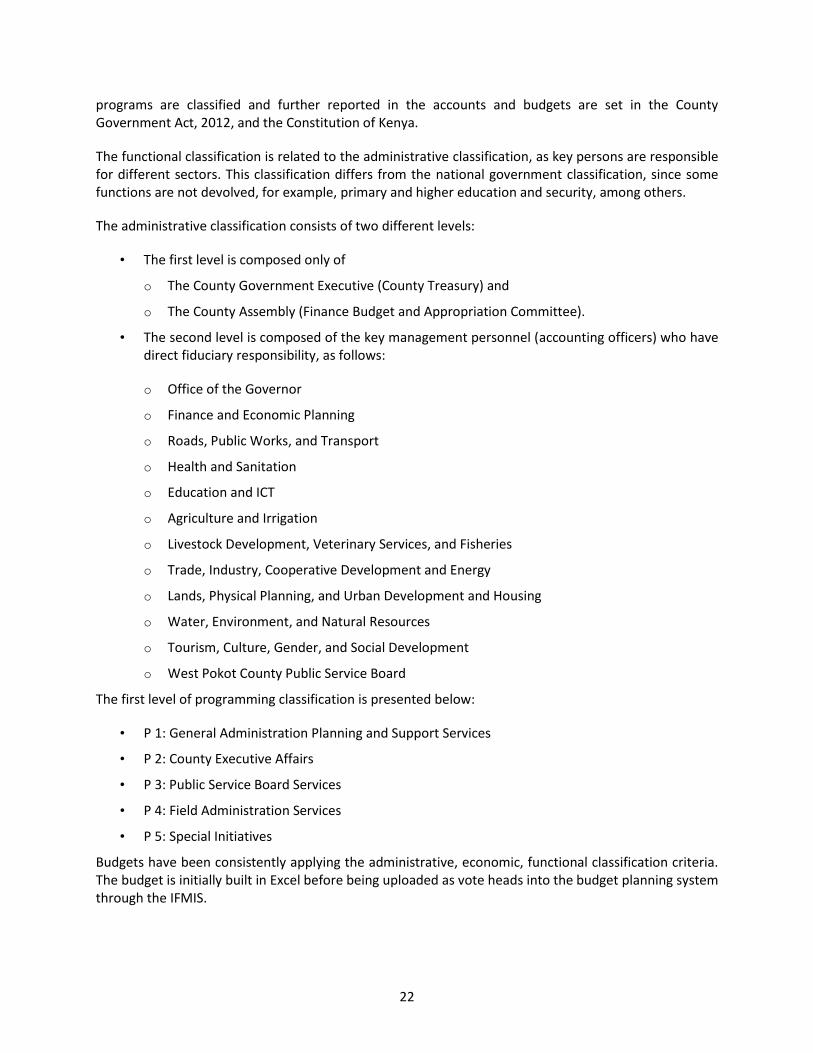
22
programs are classified and further reported in the accounts and budgets are set in the County Government Act, 2012, and the Constitution of Kenya.
The functional classification is related to the administrative classification, as key persons are responsible for different sectors. This classification differs from the national government classification, since some functions are not devolved, for example, primary and higher education and security, among others.
The administrative classification consists of two different levels:
• The first level is composed only of
o The County Government Executive (County Treasury) and
o The County Assembly (Finance Budget and Appropriation Committee).
• The second level is composed of the key management personnel (accounting officers) who have direct fiduciary responsibility, as follows:
o Office of the Governor
o Finance and Economic Planning
o Roads, Public Works, and Transport
o Health and Sanitation
o Education and ICT
o Agriculture and Irrigation
o Livestock Development, Veterinary Services, and Fisheries
o Trade, Industry, Cooperative Development and Energy
o Lands, Physical Planning, and Urban Development and Housing
o Water, Environment, and Natural Resources
o Tourism, Culture, Gender, and Social Development
o West Pokot County Public Service Board
The first level of programming classification is presented below:
• P 1: General Administration Planning and Support Services
• P 2: County Executive Affairs
• P 3: Public Service Board Services
• P 4: Field Administration Services
• P 5: Special Initiatives
Budgets have been consistently applying the administrative, economic, functional classification criteria. The budget is initially built in Excel before being uploaded as vote heads into the budget planning system through the IFMIS.
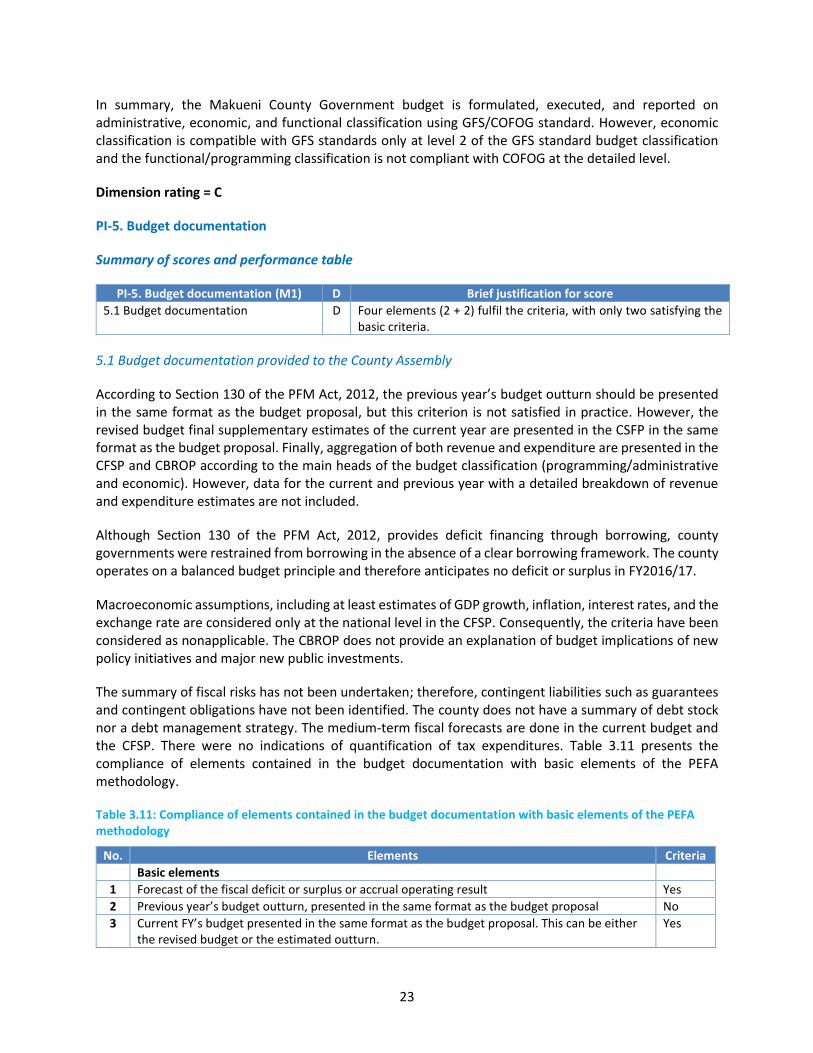
23
In summary, the Makueni County Government budget is formulated, executed, and reported on administrative, economic, and functional classification using GFS/COFOG standard. However, economic classification is compatible with GFS standards only at level 2 of the GFS standard budget classification and the functional/programming classification is not compliant with COFOG at the detailed level.
Dimension rating = C
PI-5. Budget documentation
Summary of scores and performance table
PI-5. Budget documentation (M1) D Brief justification for score
5.1 Budget documentation D Four elements (2 + 2) fulfil the criteria, with only two satisfying the basic criteria.
5.1 Budget documentation provided to the County Assembly
According to Section 130 of the PFM Act, 2012, the previous year’s budget outturn should be presented in the same format as the budget proposal, but this criterion is not satisfied in practice. However, the revised budget final supplementary estimates of the current year are presented in the CSFP in the same format as the budget proposal. Finally, aggregation of both revenue and expenditure are presented in the CFSP and CBROP according to the main heads of the budget classification (programming/administrative and economic). However, data for the current and previous year with a detailed breakdown of revenue and expenditure estimates are not included.
Although Section 130 of the PFM Act, 2012, provides deficit financing through borrowing, county governments were restrained from borrowing in the absence of a clear borrowing framework. The county operates on a balanced budget principle and therefore anticipates no deficit or surplus in FY2016/17.
Macroeconomic assumptions, including at least estimates of GDP growth, inflation, interest rates, and the exchange rate are considered only at the national level in the CFSP. Consequently, the criteria have been considered as nonapplicable. The CBROP does not provide an explanation of budget implications of new policy initiatives and major new public investments.
The summary of fiscal risks has not been undertaken; therefore, contingent liabilities such as guarantees and contingent obligations have not been identified. The county does not have a summary of debt stock nor a debt management strategy. The medium-term fiscal forecasts are done in the current budget and the CFSP. There were no indications of quantification of tax expenditures. Table 3.11 presents the compliance of elements contained in the budget documentation with basic elements of the PEFA methodology.
Table 3.11: Compliance of elements contained in the budget documentation with basic elements of the PEFA methodology
No. Elements Criteria Basic elements
1 Forecast of the fiscal deficit or surplus or accrual operating result Yes
2 Previous year’s budget outturn, presented in the same format as the budget proposal No
3 Current FY’s budget presented in the same format as the budget proposal. This can be either the revised budget or the estimated outturn.
Yes
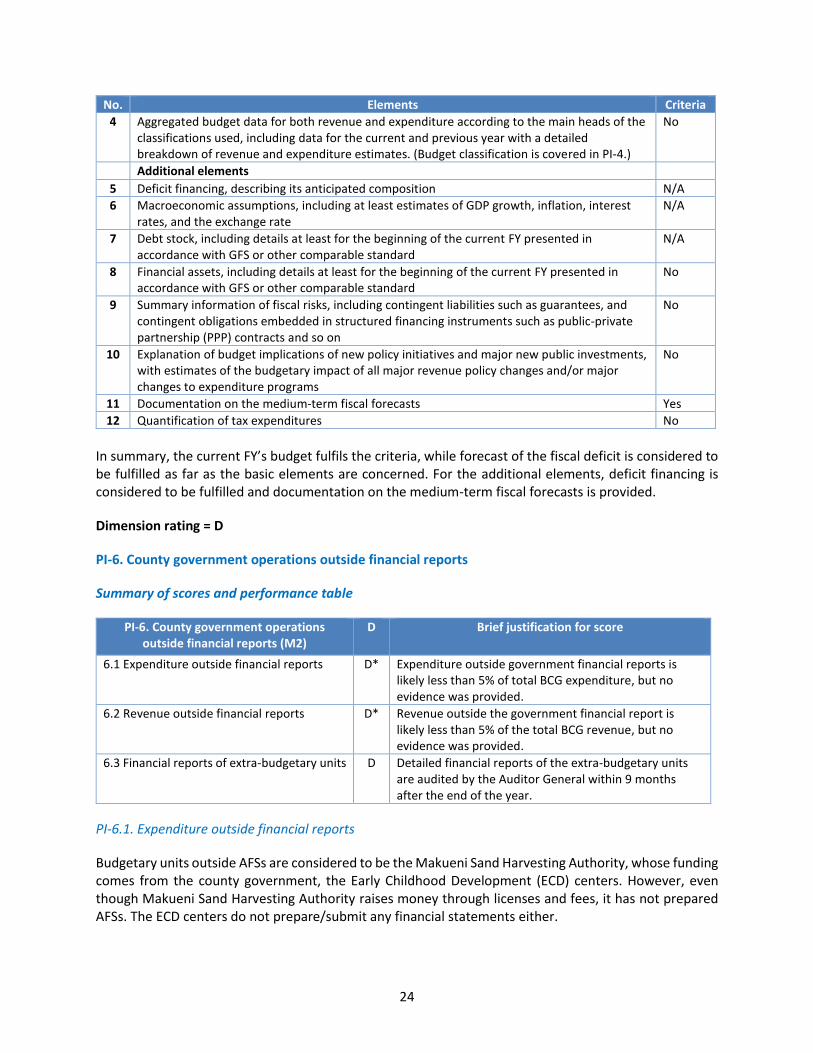
24
No. Elements Criteria
4 Aggregated budget data for both revenue and expenditure according to the main heads of the classifications used, including data for the current and previous year with a detailed breakdown of revenue and expenditure estimates. (Budget classification is covered in PI-4.)
No
Additional elements
5 Deficit financing, describing its anticipated composition N/A
6 Macroeconomic assumptions, including at least estimates of GDP growth, inflation, interest rates, and the exchange rate
N/A
7 Debt stock, including details at least for the beginning of the current FY presented in accordance with GFS or other comparable standard
N/A
8 Financial assets, including details at least for the beginning of the current FY presented in accordance with GFS or other comparable standard
No
9 Summary information of fiscal risks, including contingent liabilities such as guarantees, and contingent obligations embedded in structured financing instruments such as public-private partnership (PPP) contracts and so on
No
10 Explanation of budget implications of new policy initiatives and major new public investments, with estimates of the budgetary impact of all major revenue policy changes and/or major changes to expenditure programs
No
11 Documentation on the medium-term fiscal forecasts Yes
12 Quantification of tax expenditures No
In summary, the current FY’s budget fulfils the criteria, while forecast of the fiscal deficit is considered to be fulfilled as far as the basic elements are concerned. For the additional elements, deficit financing is considered to be fulfilled and documentation on the medium-term fiscal forecasts is provided.
Dimension rating = D
PI-6. County government operations outside financial reports
Summary of scores and performance table
PI-6. County government operations outside financial reports (M2)
D Brief justification for score
6.1 Expenditure outside financial reports D* Expenditure outside government financial reports is likely less than 5% of total BCG expenditure, but no evidence was provided.
6.2 Revenue outside financial reports D* Revenue outside the government financial report is likely less than 5% of the total BCG revenue, but no evidence was provided.
6.3 Financial reports of extra-budgetary units D Detailed financial reports of the extra-budgetary units are audited by the Auditor General within 9 months after the end of the year.
PI-6.1. Expenditure outside financial reports
Budgetary units outside AFSs are considered to be the Makueni Sand Harvesting Authority, whose funding comes from the county government, the Early Childhood Development (ECD) centers. However, even though Makueni Sand Harvesting Authority raises money through licenses and fees, it has not prepared AFSs. The ECD centers do not prepare/submit any financial statements either.
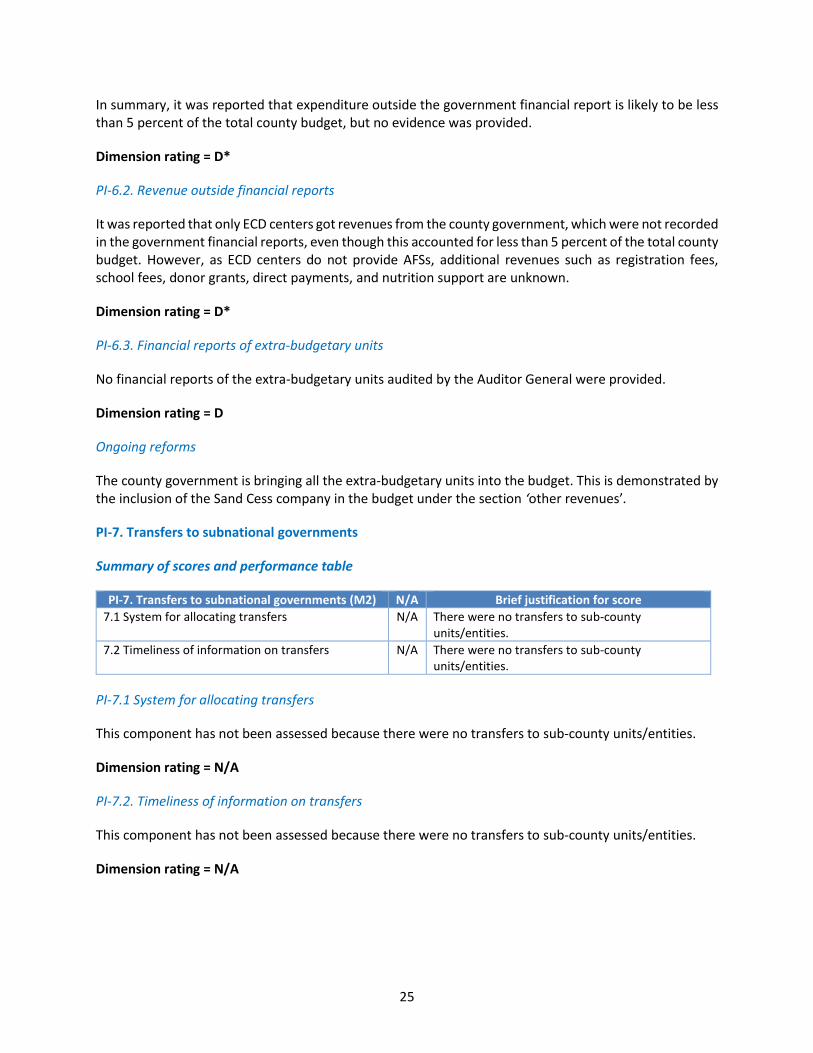
25
In summary, it was reported that expenditure outside the government financial report is likely to be less than 5 percent of the total county budget, but no evidence was provided.
Dimension rating = D*
PI-6.2. Revenue outside financial reports
It was reported that only ECD centers got revenues from the county government, which were not recorded in the government financial reports, even though this accounted for less than 5 percent of the total county budget. However, as ECD centers do not provide AFSs, additional revenues such as registration fees, school fees, donor grants, direct payments, and nutrition support are unknown.
Dimension rating = D*
PI-6.3. Financial reports of extra-budgetary units
No financial reports of the extra-budgetary units audited by the Auditor General were provided.
Dimension rating = D
Ongoing reforms
The county government is bringing all the extra-budgetary units into the budget. This is demonstrated by the inclusion of the Sand Cess company in the budget under the section ‘other revenues’.
PI-7. Transfers to subnational governments
Summary of scores and performance table
PI-7. Transfers to subnational governments (M2) N/A Brief justification for score
7.1 System for allocating transfers N/A There were no transfers to sub-county units/entities.
7.2 Timeliness of information on transfers N/A There were no transfers to sub-county units/entities.
PI-7.1 System for allocating transfers
This component has not been assessed because there were no transfers to sub-county units/entities.
Dimension rating = N/A
PI-7.2. Timeliness of information on transfers
This component has not been assessed because there were no transfers to sub-county units/entities.
Dimension rating = N/A
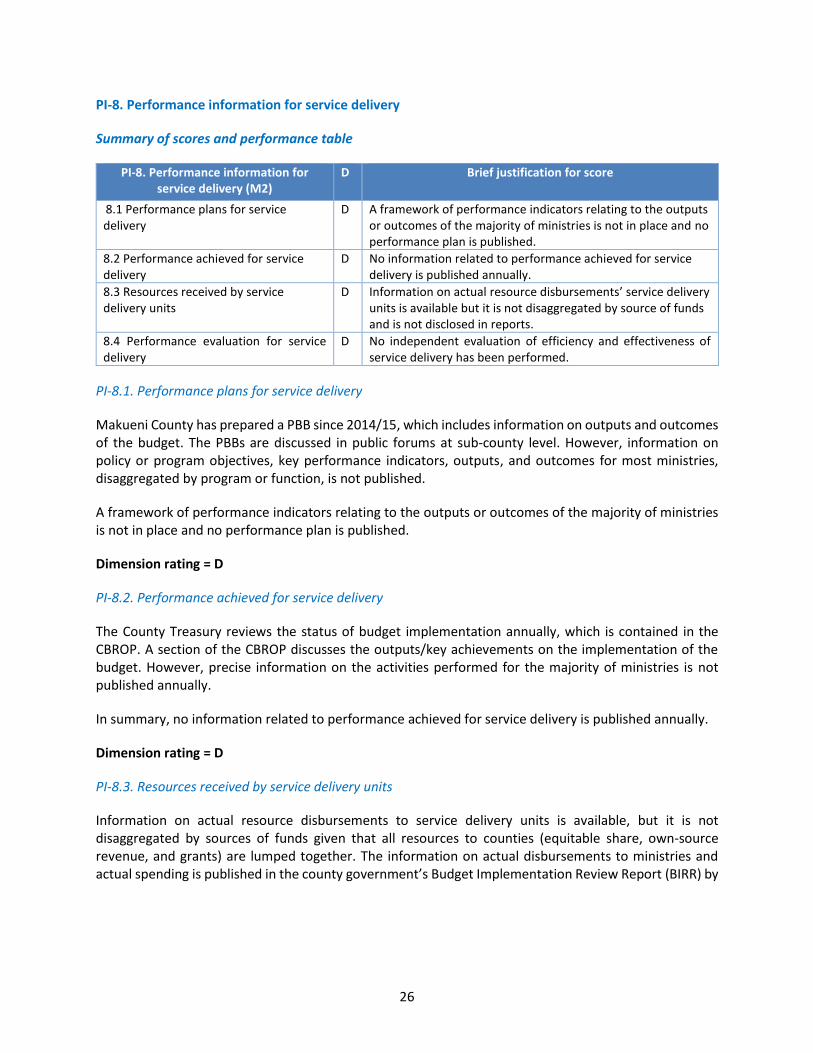
26
PI-8. Performance information for service delivery
Summary of scores and performance table
PI-8. Performance information for service delivery (M2)
D
Brief justification for score
8.1 Performance plans for service delivery
D A framework of performance indicators relating to the outputs or outcomes of the majority of ministries is not in place and no performance plan is published.
8.2 Performance achieved for service delivery
D No information related to performance achieved for service delivery is published annually.
8.3 Resources received by service delivery units
D Information on actual resource disbursements’ service delivery units is available but it is not disaggregated by source of funds and is not disclosed in reports.
8.4 Performance evaluation for service delivery
D No independent evaluation of efficiency and effectiveness of service delivery has been performed.
PI-8.1. Performance plans for service delivery
Makueni County has prepared a PBB since 2014/15, which includes information on outputs and outcomes of the budget. The PBBs are discussed in public forums at sub-county level. However, information on policy or program objectives, key performance indicators, outputs, and outcomes for most ministries, disaggregated by program or function, is not published.
A framework of performance indicators relating to the outputs or outcomes of the majority of ministries is not in place and no performance plan is published.
Dimension rating = D
PI-8.2. Performance achieved for service delivery
The County Treasury reviews the status of budget implementation annually, which is contained in the CBROP. A section of the CBROP discusses the outputs/key achievements on the implementation of the budget. However, precise information on the activities performed for the majority of ministries is not published annually.
In summary, no information related to performance achieved for service delivery is published annually.
Dimension rating = D
PI-8.3. Resources received by service delivery units
Information on actual resource disbursements to service delivery units is available, but it is not disaggregated by sources of funds given that all resources to counties (equitable share, own-source revenue, and grants) are lumped together. The information on actual disbursements to ministries and actual spending is published in the county government’s Budget Implementation Review Report (BIRR) by
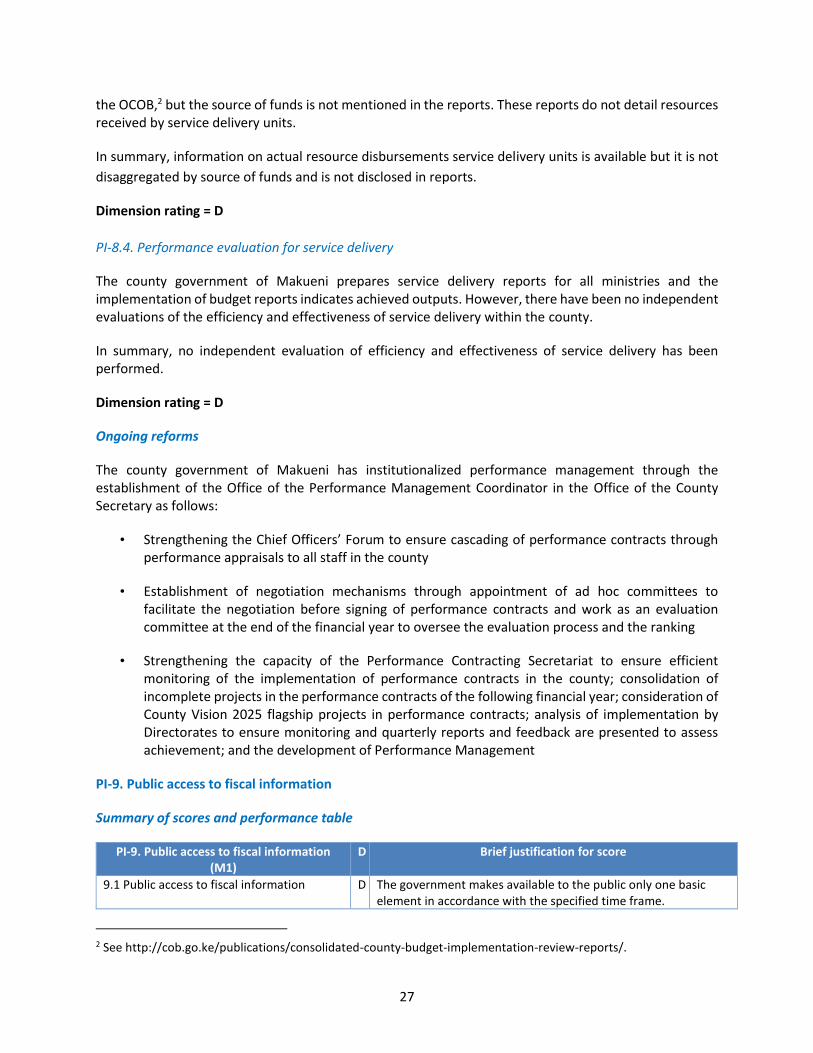
27
the OCOB,2 but the source of funds is not mentioned in the reports. These reports do not detail resources received by service delivery units.
In summary, information on actual resource disbursements service delivery units is available but it is not
disaggregated by source of funds and is not disclosed in reports.
Dimension rating = D
PI-8.4. Performance evaluation for service delivery
The county government of Makueni prepares service delivery reports for all ministries and the implementation of budget reports indicates achieved outputs. However, there have been no independent evaluations of the efficiency and effectiveness of service delivery within the county.
In summary, no independent evaluation of efficiency and effectiveness of service delivery has been performed.
Dimension rating = D
Ongoing reforms
The county government of Makueni has institutionalized performance management through the establishment of the Office of the Performance Management Coordinator in the Office of the County Secretary as follows:
• Strengthening the Chief Officers’ Forum to ensure cascading of performance contracts through performance appraisals to all staff in the county
• Establishment of negotiation mechanisms through appointment of ad hoc committees to facilitate the negotiation before signing of performance contracts and work as an evaluation committee at the end of the financial year to oversee the evaluation process and the ranking
• Strengthening the capacity of the Performance Contracting Secretariat to ensure efficient monitoring of the implementation of performance contracts in the county; consolidation of incomplete projects in the performance contracts of the following financial year; consideration of County Vision 2025 flagship projects in performance contracts; analysis of implementation by Directorates to ensure monitoring and quarterly reports and feedback are presented to assess achievement; and the development of Performance Management
PI-9. Public access to fiscal information
Summary of scores and performance table
PI-9. Public access to fiscal information (M1)
D Brief justification for score
9.1 Public access to fiscal information D The government makes available to the public only one basic element in accordance with the specified time frame.
2 See http://cob.go.ke/publications/consolidated-county-budget-implementation-review-reports/.
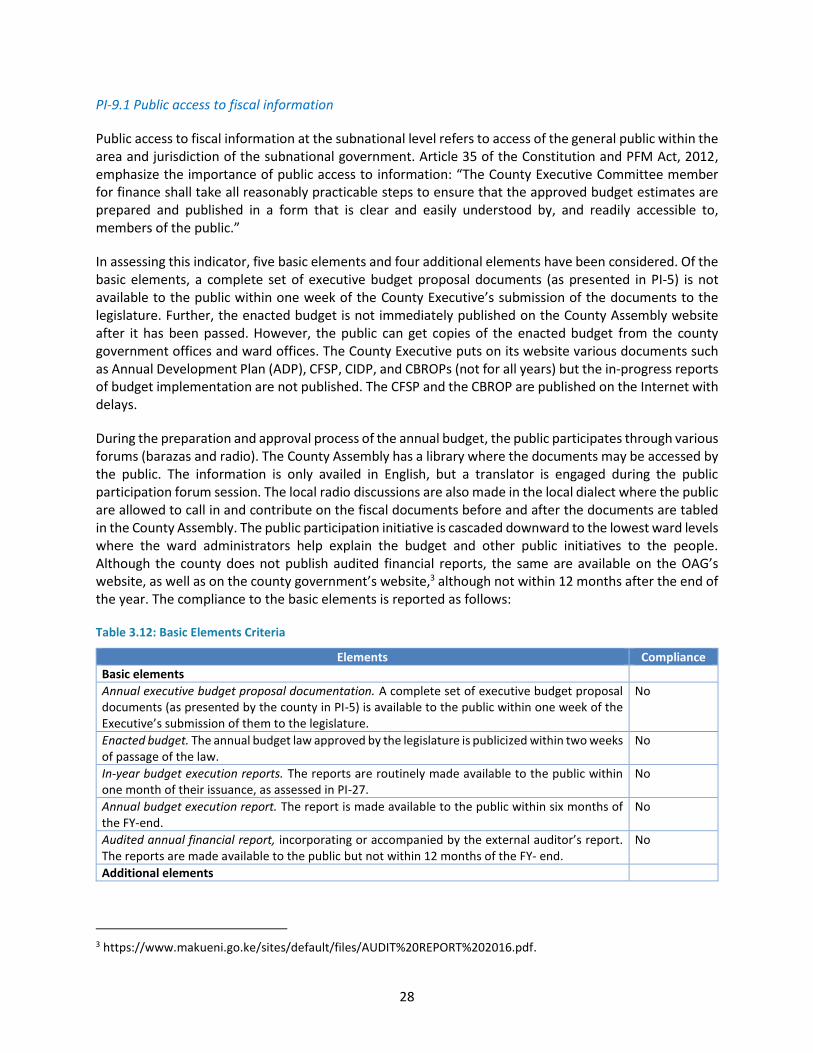
28
PI-9.1 Public access to fiscal information
Public access to fiscal information at the subnational level refers to access of the general public within the area and jurisdiction of the subnational government. Article 35 of the Constitution and PFM Act, 2012, emphasize the importance of public access to information: “The County Executive Committee member for finance shall take all reasonably practicable steps to ensure that the approved budget estimates are prepared and published in a form that is clear and easily understood by, and readily accessible to, members of the public.”
In assessing this indicator, five basic elements and four additional elements have been considered. Of the basic elements, a complete set of executive budget proposal documents (as presented in PI-5) is not available to the public within one week of the County Executive’s submission of the documents to the legislature. Further, the enacted budget is not immediately published on the County Assembly website after it has been passed. However, the public can get copies of the enacted budget from the county government offices and ward offices. The County Executive puts on its website various documents such as Annual Development Plan (ADP), CFSP, CIDP, and CBROPs (not for all years) but the in-progress reports of budget implementation are not published. The CFSP and the CBROP are published on the Internet with delays.
During the preparation and approval process of the annual budget, the public participates through various forums (barazas and radio). The County Assembly has a library where the documents may be accessed by the public. The information is only availed in English, but a translator is engaged during the public participation forum session. The local radio discussions are also made in the local dialect where the public are allowed to call in and contribute on the fiscal documents before and after the documents are tabled in the County Assembly. The public participation initiative is cascaded downward to the lowest ward levels where the ward administrators help explain the budget and other public initiatives to the people. Although the county does not publish audited financial reports, the same are available on the OAG’s website, as well as on the county government’s website,3 although not within 12 months after the end of the year. The compliance to the basic elements is reported as follows:
Table 3.12: Basic Elements Criteria
Elements Compliance
Basic elements
Annual executive budget proposal documentation. A complete set of executive budget proposal documents (as presented by the county in PI-5) is available to the public within one week of the Executive’s submission of them to the legislature.
No
Enacted budget. The annual budget law approved by the legislature is publicized within two weeks of passage of the law.
No
In-year budget execution reports. The reports are routinely made available to the public within one month of their issuance, as assessed in PI-27.
No
Annual budget execution report. The report is made available to the public within six months of the FY-end.
No
Audited annual financial report, incorporating or accompanied by the external auditor’s report. The reports are made available to the public but not within 12 months of the FY- end.
No
Additional elements
3 https://www.makueni.go.ke/sites/default/files/AUDIT%20REPORT%202016.pdf.
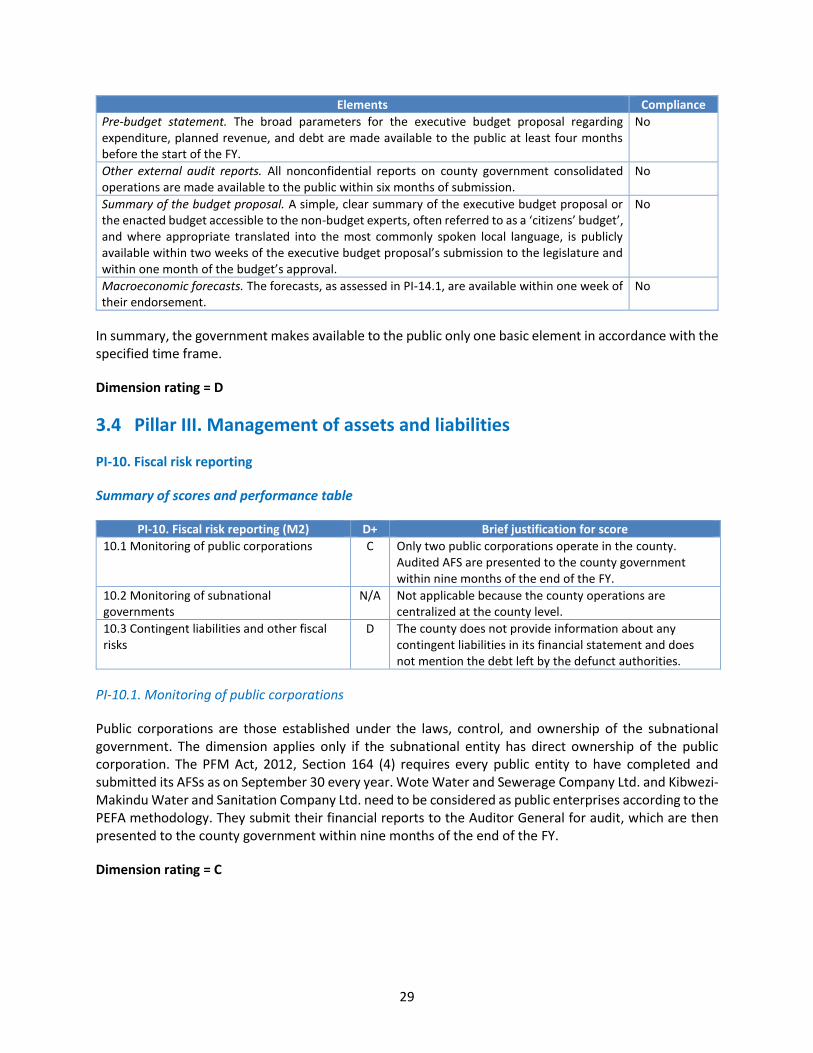
29
Elements Compliance
Pre-budget statement. The broad parameters for the executive budget proposal regarding expenditure, planned revenue, and debt are made available to the public at least four months before the start of the FY.
No
Other external audit reports. All nonconfidential reports on county government consolidated operations are made available to the public within six months of submission.
No
Summary of the budget proposal. A simple, clear summary of the executive budget proposal or the enacted budget accessible to the non-budget experts, often referred to as a ‘citizens’ budget’, and where appropriate translated into the most commonly spoken local language, is publicly available within two weeks of the executive budget proposal’s submission to the legislature and within one month of the budget’s approval.
No
Macroeconomic forecasts. The forecasts, as assessed in PI-14.1, are available within one week of their endorsement.
No
In summary, the government makes available to the public only one basic element in accordance with the specified time frame.
Dimension rating = D
3.4 Pillar III. Management of assets and liabilities
PI-10. Fiscal risk reporting
Summary of scores and performance table
PI-10. Fiscal risk reporting (M2) D+ Brief justification for score
10.1 Monitoring of public corporations C Only two public corporations operate in the county. Audited AFS are presented to the county government within nine months of the end of the FY.
10.2 Monitoring of subnational governments
N/A Not applicable because the county operations are centralized at the county level.
10.3 Contingent liabilities and other fiscal risks
D The county does not provide information about any contingent liabilities in its financial statement and does not mention the debt left by the defunct authorities.
PI-10.1. Monitoring of public corporations
Public corporations are those established under the laws, control, and ownership of the subnational government. The dimension applies only if the subnational entity has direct ownership of the public corporation. The PFM Act, 2012, Section 164 (4) requires every public entity to have completed and submitted its AFSs as on September 30 every year. Wote Water and Sewerage Company Ltd. and Kibwezi-Makindu Water and Sanitation Company Ltd. need to be considered as public enterprises according to the PEFA methodology. They submit their financial reports to the Auditor General for audit, which are then presented to the county government within nine months of the end of the FY.
Dimension rating = C
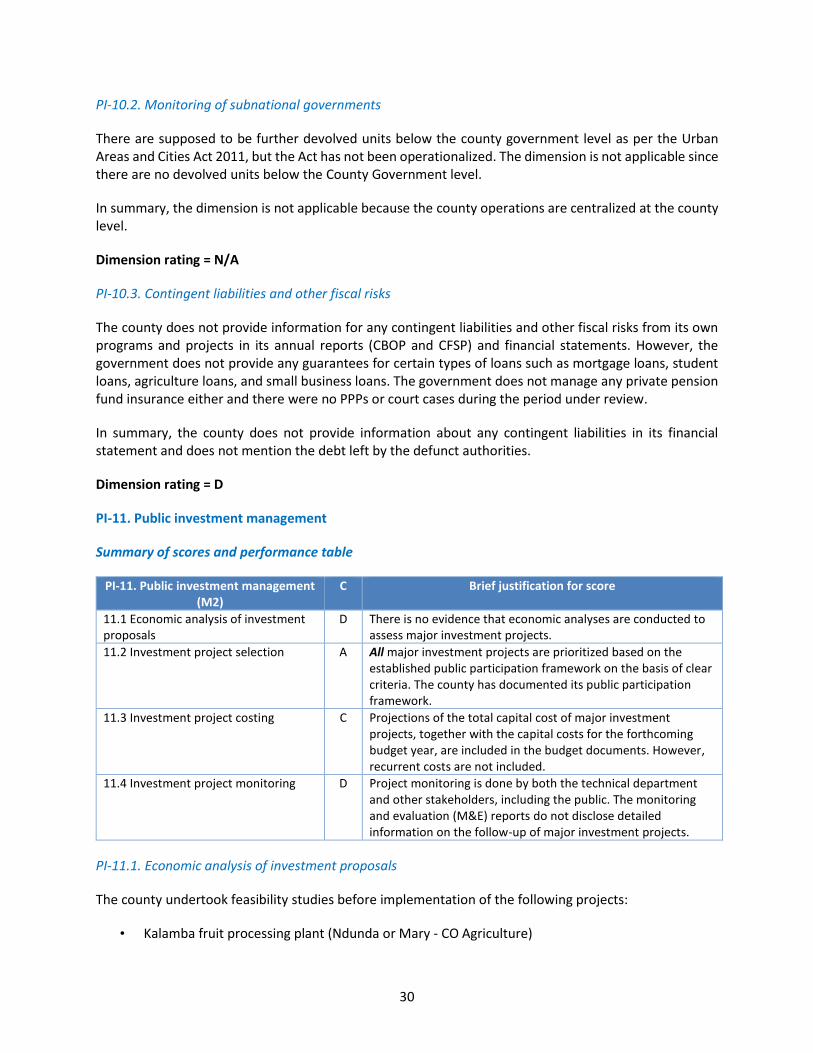
30
PI-10.2. Monitoring of subnational governments
There are supposed to be further devolved units below the county government level as per the Urban Areas and Cities Act 2011, but the Act has not been operationalized. The dimension is not applicable since there are no devolved units below the County Government level.
In summary, the dimension is not applicable because the county operations are centralized at the county level.
Dimension rating = N/A
PI-10.3. Contingent liabilities and other fiscal risks
The county does not provide information for any contingent liabilities and other fiscal risks from its own programs and projects in its annual reports (CBOP and CFSP) and financial statements. However, the government does not provide any guarantees for certain types of loans such as mortgage loans, student loans, agriculture loans, and small business loans. The government does not manage any private pension fund insurance either and there were no PPPs or court cases during the period under review.
In summary, the county does not provide information about any contingent liabilities in its financial statement and does not mention the debt left by the defunct authorities.
Dimension rating = D
PI-11. Public investment management
Summary of scores and performance table
PI-11. Public investment management (M2)
C Brief justification for score
11.1 Economic analysis of investment proposals
D There is no evidence that economic analyses are conducted to assess major investment projects.
11.2 Investment project selection A All major investment projects are prioritized based on the established public participation framework on the basis of clear criteria. The county has documented its public participation framework.
11.3 Investment project costing C Projections of the total capital cost of major investment projects, together with the capital costs for the forthcoming budget year, are included in the budget documents. However, recurrent costs are not included.
11.4 Investment project monitoring D Project monitoring is done by both the technical department and other stakeholders, including the public. The monitoring and evaluation (M&E) reports do not disclose detailed information on the follow-up of major investment projects.
PI-11.1. Economic analysis of investment proposals
The county undertook feasibility studies before implementation of the following projects:
• Kalamba fruit processing plant (Ndunda or Mary - CO Agriculture)
31
• Kambu abattoir (Esther C.O Trade)
• Thwake bridge (Kingola - C.O transport)
• ENE Microfinance bank (Esther C.O Trade)
• The universal health care (the business case and the guidelines) - Director Kiuluku
• The business case and guidelines for Tetheka fund - C.O Gender
• Emali Bus Park
The County Budget and Economic Forum assists the county in reviewing the economic analyses of the projects.4 All projections are included in the budget documents. However, no evidence of economic analysis or rigorous analytical techniques to appraise their viability was provided.
There is no evidence showing that economic analyses are conducted to assess major investment projects.
Dimension rating = D
PI-11.2. Investment project selection
Selection of the projects to be implemented during the financial year in Makueni County is through the established public participation model. The participation involves identification and prioritization of projects from the 3,455 villages up to the ward level. Project selection entails a consultative approach that is done according to the County Government Act.
The criterion for selecting projects is guided by Treasury circulars. The circulars give guidance on the way the community will identify and prioritize projects on the basis of either earlier funded projects, completion of existing projects, or strategic objectives of the government, among others. The county has documented its public participation framework, which is available on the County Executive’s website.5 A Public Participation Matrix is provided and available on the County Executive’s website. After each project is funded in the budget, each department is required to prepare a cabinet paper for the projects. The cabinet paper details the project background, justification of the project, project bill of quantities, risks inherent in project implementation, and stakeholders to be involved. After approval of the cabinet paper by the cabinet, the department starts the process of procurement and implementation. The public participation framework is clearly empowering the public by placing the selection process and final decision-making authority in the hands of the 55 representatives of their development committees.
In summary, all major investment projects are prioritized based on the established public participation framework and clear selection criteria.
Dimension rating = A
4 The list of all the projects is available from http://makueni.go.ke/projects/public/projects.php. 5 https://www.makueni.go.ke/public-participation-framework.
32
PI-11.3. Investment project costing
The county prepares PBBs, with reference to key county/national government policy documents, particularly the Makueni County Integrated Development Plan (2013–2017), the Second Medium Term Plan (2013–2017) of Vision 2030 and the draft Makueni County Strategic Plan (2013–2018). All these documents were provided and published. The total cost of projects is consolidated in the PBB documents but expenditure is categorized into three broad categories: compensation to employees, recurrent expenditures, and development expenditures. The costs of each program present both the recurrent and development costs. The recurrent costs include Project Management Committee costs and M&E. A policy has been developed to give guidelines on the payments of the recurrent costs.
In summary, the county does program-based budgeting. Costs of each program/subprogram include development and recurrent costs. There is a distinction of projections between capital and recurrent costs of approved investment projects in the budget documents. Evidence is included in the budget documents.
Dimension rating = C
PI-11.4. Investment project monitoring
The project monitoring is done jointly by the technical departments, community members, and host departments. The visits are periodical depending on the status and nature of each project. Information regarding the project is prepared by each department and is contained in the budget.
The status of the project is published online at https://www.makueni.go.ke/projects/public/projects.php. The status mentions only whether the project is new, has been completed, or is still ongoing. In addition, the follow-up shows a lot of inconsistencies, such as amount of expenditure being the same as the amount of budget while the project is still ongoing, ‘complete’ mentioned instead of the amount of the budget, no expenditure shown while the project is ‘on going’, and so on. This ‘online’ follow-up does not appear to be very reliable and no official report is produced.
Independent M&E is also done by the OAG. For instance, according to the report by the OAG for FY2014/15, the county government entered into a contract for the extension of the Kiboko Twaandu Water project at a contract sum of Ksh 5.2 million. Although the contractor had been paid 93 percent of the total cost of the project at the time of audit inspection, it was established that the project was half complete. Further, the outstanding works were not done, due to wayleave complications. The same report points out that the county government entered into a contract for the supply and installation of a geographical information system phase 1 at a cost of Ksh 5.6 million. The project was to be done in two phases, but no funds had been put aside for phase 2, which meant that value for money spent in phase 1 may not be realized without implementation of phase 2.
For the construction of Kalamba fruit processing plant, the county government paid Ksh 31 million to contractors for various preliminary works and services, including a payment of Ksh 6.3 million for consultancy services. However, the management did not provide the relevant procurement documents for audit review. For the construction of county technical training institutes, ECD centers, and rural electrification projects in various wards in the county at a total cost of Ksh 58 million, the county government did not give full contracts to the contractors but instead split the contracts into two portions. The first portion was for the supply of the required materials and the second part was for supply of labour. The result was poor workmanship of the projects, and some delivery of materials could not be verified.
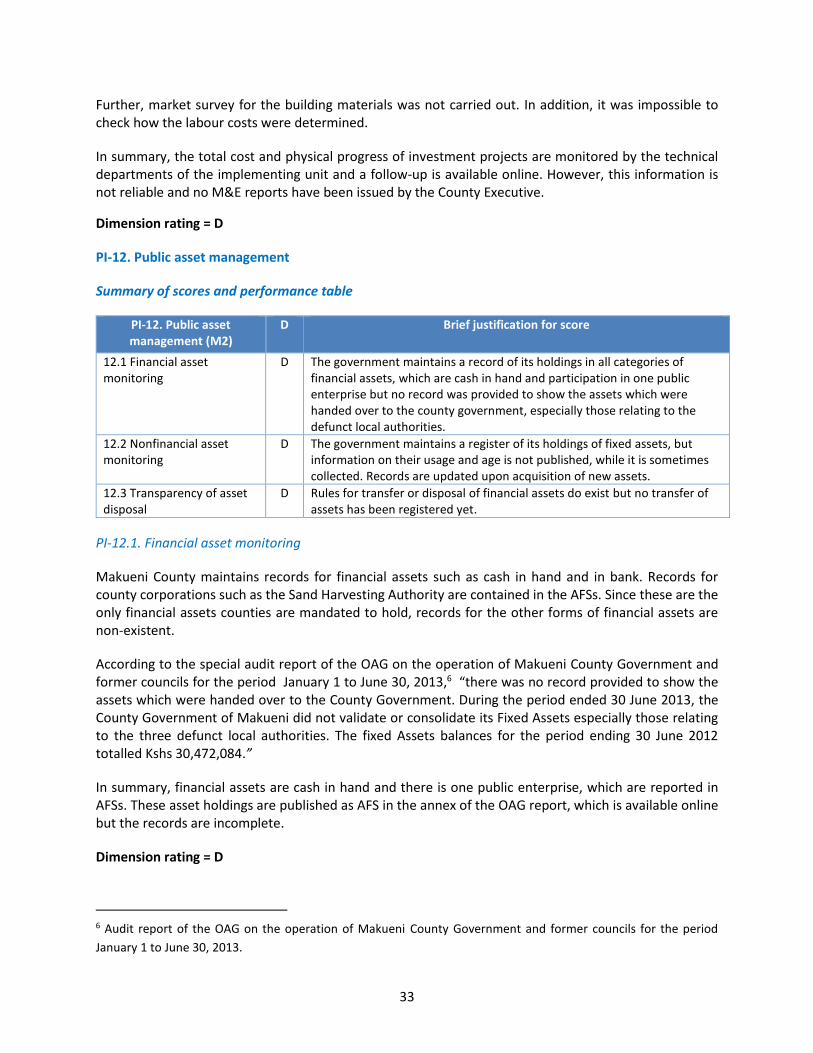
33
Further, market survey for the building materials was not carried out. In addition, it was impossible to check how the labour costs were determined.
In summary, the total cost and physical progress of investment projects are monitored by the technical departments of the implementing unit and a follow-up is available online. However, this information is not reliable and no M&E reports have been issued by the County Executive.
Dimension rating = D
PI-12. Public asset management
Summary of scores and performance table
PI-12. Public asset management (M2)
D Brief justification for score
12.1 Financial asset monitoring
D The government maintains a record of its holdings in all categories of financial assets, which are cash in hand and participation in one public enterprise but no record was provided to show the assets which were handed over to the county government, especially those relating to the defunct local authorities.
12.2 Nonfinancial asset monitoring
D The government maintains a register of its holdings of fixed assets, but information on their usage and age is not published, while it is sometimes collected. Records are updated upon acquisition of new assets.
12.3 Transparency of asset disposal
D Rules for transfer or disposal of financial assets do exist but no transfer of assets has been registered yet.
PI-12.1. Financial asset monitoring
Makueni County maintains records for financial assets such as cash in hand and in bank. Records for county corporations such as the Sand Harvesting Authority are contained in the AFSs. Since these are the only financial assets counties are mandated to hold, records for the other forms of financial assets are non-existent.
According to the special audit report of the OAG on the operation of Makueni County Government and former councils for the period January 1 to June 30, 2013,6 “there was no record provided to show the assets which were handed over to the County Government. During the period ended 30 June 2013, the County Government of Makueni did not validate or consolidate its Fixed Assets especially those relating to the three defunct local authorities. The fixed Assets balances for the period ending 30 June 2012 totalled Kshs 30,472,084.”
In summary, financial assets are cash in hand and there is one public enterprise, which are reported in AFSs. These asset holdings are published as AFS in the annex of the OAG report, which is available online but the records are incomplete.
Dimension rating = D
6 Audit report of the OAG on the operation of Makueni County Government and former councils for the period
January 1 to June 30, 2013.
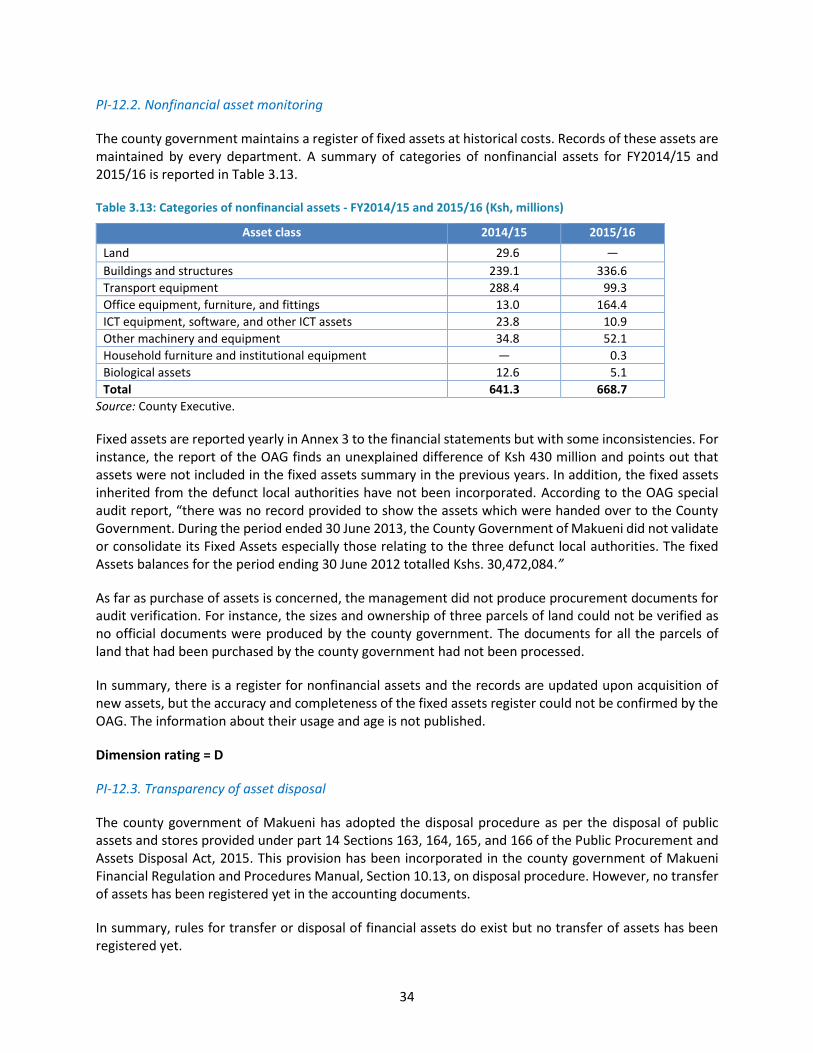
34
PI-12.2. Nonfinancial asset monitoring
The county government maintains a register of fixed assets at historical costs. Records of these assets are maintained by every department. A summary of categories of nonfinancial assets for FY2014/15 and 2015/16 is reported in Table 3.13.
Table 3.13: Categories of nonfinancial assets - FY2014/15 and 2015/16 (Ksh, millions)
Asset class 2014/15 2015/16
Land 29.6 —
Buildings and structures 239.1 336.6
Transport equipment 288.4 99.3
Office equipment, furniture, and fittings 13.0 164.4
ICT equipment, software, and other ICT assets 23.8 10.9
Other machinery and equipment 34.8 52.1
Household furniture and institutional equipment — 0.3
Biological assets 12.6 5.1
Total 641.3 668.7
Source: County Executive.
Fixed assets are reported yearly in Annex 3 to the financial statements but with some inconsistencies. For instance, the report of the OAG finds an unexplained difference of Ksh 430 million and points out that assets were not included in the fixed assets summary in the previous years. In addition, the fixed assets inherited from the defunct local authorities have not been incorporated. According to the OAG special audit report, “there was no record provided to show the assets which were handed over to the County Government. During the period ended 30 June 2013, the County Government of Makueni did not validate or consolidate its Fixed Assets especially those relating to the three defunct local authorities. The fixed Assets balances for the period ending 30 June 2012 totalled Kshs. 30,472,084.”
As far as purchase of assets is concerned, the management did not produce procurement documents for audit verification. For instance, the sizes and ownership of three parcels of land could not be verified as no official documents were produced by the county government. The documents for all the parcels of land that had been purchased by the county government had not been processed.
In summary, there is a register for nonfinancial assets and the records are updated upon acquisition of new assets, but the accuracy and completeness of the fixed assets register could not be confirmed by the OAG. The information about their usage and age is not published.
Dimension rating = D
PI-12.3. Transparency of asset disposal
The county government of Makueni has adopted the disposal procedure as per the disposal of public assets and stores provided under part 14 Sections 163, 164, 165, and 166 of the Public Procurement and Assets Disposal Act, 2015. This provision has been incorporated in the county government of Makueni Financial Regulation and Procedures Manual, Section 10.13, on disposal procedure. However, no transfer of assets has been registered yet in the accounting documents.
In summary, rules for transfer or disposal of financial assets do exist but no transfer of assets has been registered yet.
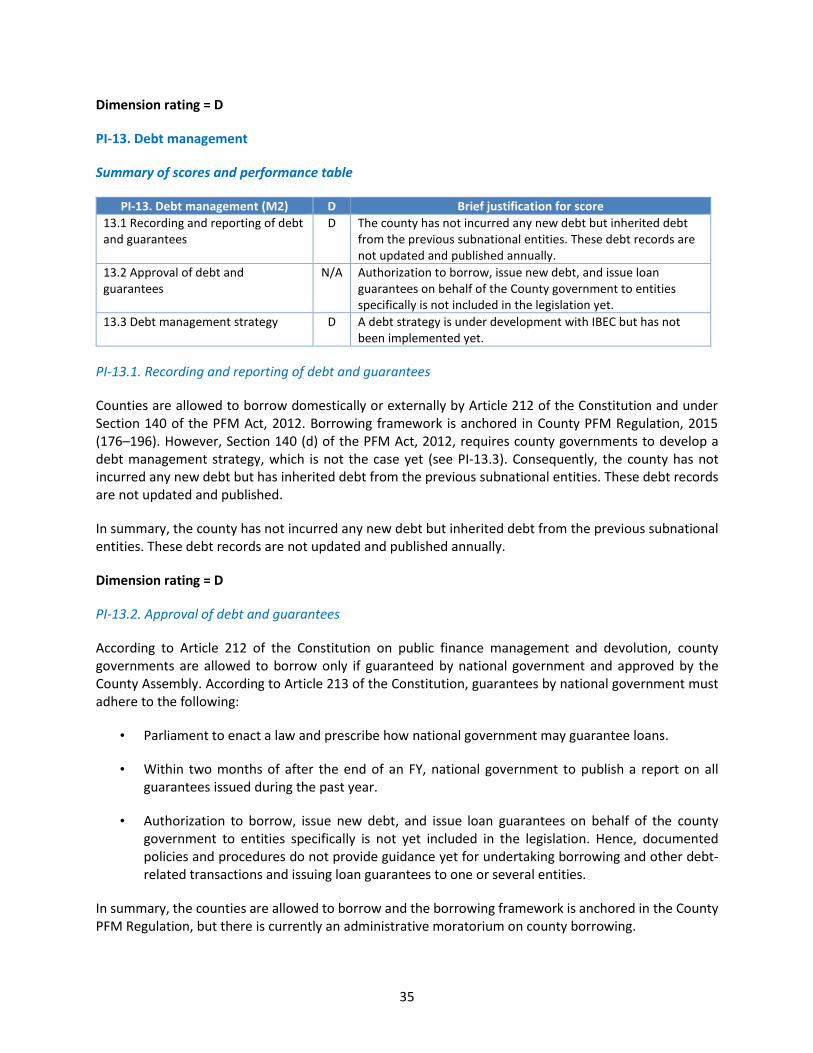
35
Dimension rating = D
PI-13. Debt management
Summary of scores and performance table
PI-13. Debt management (M2) D Brief justification for score
13.1 Recording and reporting of debt and guarantees
D The county has not incurred any new debt but inherited debt from the previous subnational entities. These debt records are not updated and published annually.
13.2 Approval of debt and guarantees
N/A Authorization to borrow, issue new debt, and issue loan guarantees on behalf of the County government to entities specifically is not included in the legislation yet.
13.3 Debt management strategy D A debt strategy is under development with IBEC but has not been implemented yet.
PI-13.1. Recording and reporting of debt and guarantees
Counties are allowed to borrow domestically or externally by Article 212 of the Constitution and under Section 140 of the PFM Act, 2012. Borrowing framework is anchored in County PFM Regulation, 2015 (176–196). However, Section 140 (d) of the PFM Act, 2012, requires county governments to develop a debt management strategy, which is not the case yet (see PI-13.3). Consequently, the county has not incurred any new debt but has inherited debt from the previous subnational entities. These debt records are not updated and published.
In summary, the county has not incurred any new debt but inherited debt from the previous subnational entities. These debt records are not updated and published annually.
Dimension rating = D
PI-13.2. Approval of debt and guarantees
According to Article 212 of the Constitution on public finance management and devolution, county governments are allowed to borrow only if guaranteed by national government and approved by the County Assembly. According to Article 213 of the Constitution, guarantees by national government must adhere to the following:
• Parliament to enact a law and prescribe how national government may guarantee loans.
• Within two months of after the end of an FY, national government to publish a report on all guarantees issued during the past year.
• Authorization to borrow, issue new debt, and issue loan guarantees on behalf of the county government to entities specifically is not yet included in the legislation. Hence, documented policies and procedures do not provide guidance yet for undertaking borrowing and other debt-related transactions and issuing loan guarantees to one or several entities.
In summary, the counties are allowed to borrow and the borrowing framework is anchored in the County PFM Regulation, but there is currently an administrative moratorium on county borrowing.
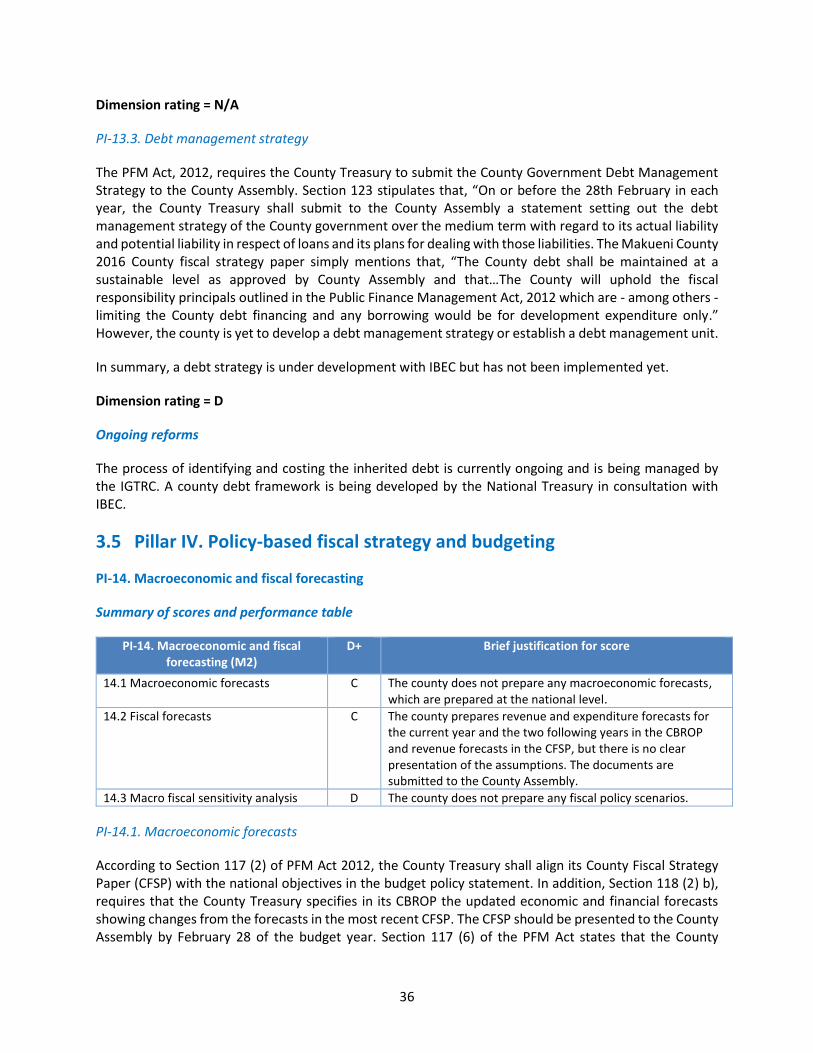
36
Dimension rating = N/A
PI-13.3. Debt management strategy
The PFM Act, 2012, requires the County Treasury to submit the County Government Debt Management Strategy to the County Assembly. Section 123 stipulates that, “On or before the 28th February in each year, the County Treasury shall submit to the County Assembly a statement setting out the debt management strategy of the County government over the medium term with regard to its actual liability and potential liability in respect of loans and its plans for dealing with those liabilities. The Makueni County 2016 County fiscal strategy paper simply mentions that, “The County debt shall be maintained at a sustainable level as approved by County Assembly and that…The County will uphold the fiscal responsibility principals outlined in the Public Finance Management Act, 2012 which are - among others - limiting the County debt financing and any borrowing would be for development expenditure only.” However, the county is yet to develop a debt management strategy or establish a debt management unit.
In summary, a debt strategy is under development with IBEC but has not been implemented yet.
Dimension rating = D
Ongoing reforms
The process of identifying and costing the inherited debt is currently ongoing and is being managed by the IGTRC. A county debt framework is being developed by the National Treasury in consultation with IBEC.
3.5 Pillar IV. Policy-based fiscal strategy and budgeting
PI-14. Macroeconomic and fiscal forecasting
Summary of scores and performance table
PI-14. Macroeconomic and fiscal forecasting (M2)
D+ Brief justification for score
14.1 Macroeconomic forecasts C The county does not prepare any macroeconomic forecasts, which are prepared at the national level.
14.2 Fiscal forecasts C The county prepares revenue and expenditure forecasts for the current year and the two following years in the CBROP and revenue forecasts in the CFSP, but there is no clear presentation of the assumptions. The documents are submitted to the County Assembly.
14.3 Macro fiscal sensitivity analysis D The county does not prepare any fiscal policy scenarios.
PI-14.1. Macroeconomic forecasts
According to Section 117 (2) of PFM Act 2012, the County Treasury shall align its County Fiscal Strategy Paper (CFSP) with the national objectives in the budget policy statement. In addition, Section 118 (2) b), requires that the County Treasury specifies in its CBROP the updated economic and financial forecasts showing changes from the forecasts in the most recent CFSP. The CFSP should be presented to the County Assembly by February 28 of the budget year. Section 117 (6) of the PFM Act states that the County
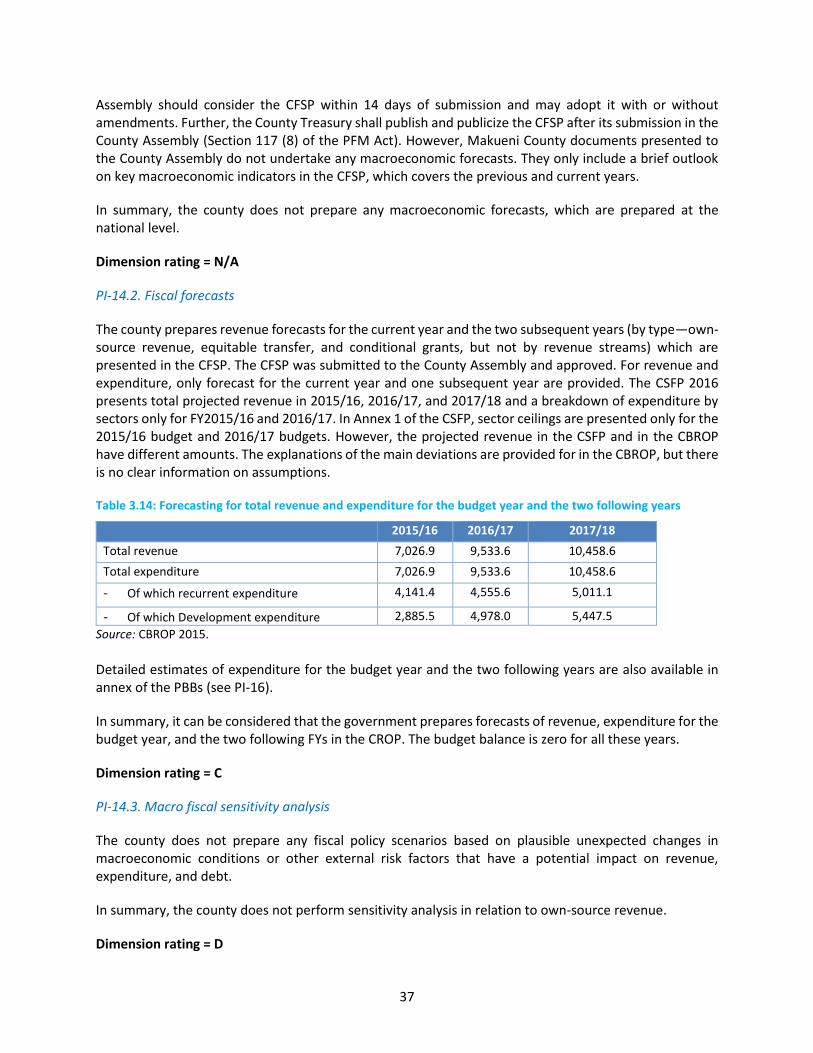
37
Assembly should consider the CFSP within 14 days of submission and may adopt it with or without amendments. Further, the County Treasury shall publish and publicize the CFSP after its submission in the County Assembly (Section 117 (8) of the PFM Act). However, Makueni County documents presented to the County Assembly do not undertake any macroeconomic forecasts. They only include a brief outlook on key macroeconomic indicators in the CFSP, which covers the previous and current years.
In summary, the county does not prepare any macroeconomic forecasts, which are prepared at the national level.
Dimension rating = N/A
PI-14.2. Fiscal forecasts
The county prepares revenue forecasts for the current year and the two subsequent years (by type—own-source revenue, equitable transfer, and conditional grants, but not by revenue streams) which are presented in the CFSP. The CFSP was submitted to the County Assembly and approved. For revenue and expenditure, only forecast for the current year and one subsequent year are provided. The CSFP 2016 presents total projected revenue in 2015/16, 2016/17, and 2017/18 and a breakdown of expenditure by sectors only for FY2015/16 and 2016/17. In Annex 1 of the CSFP, sector ceilings are presented only for the 2015/16 budget and 2016/17 budgets. However, the projected revenue in the CSFP and in the CBROP have different amounts. The explanations of the main deviations are provided for in the CBROP, but there is no clear information on assumptions.
Table 3.14: Forecasting for total revenue and expenditure for the budget year and the two following years
2015/16 2016/17 2017/18
Total revenue 7,026.9 9,533.6 10,458.6
Total expenditure 7,026.9 9,533.6 10,458.6
- Of which recurrent expenditure 4,141.4 4,555.6 5,011.1
- Of which Development expenditure 2,885.5 4,978.0 5,447.5
Source: CBROP 2015.
Detailed estimates of expenditure for the budget year and the two following years are also available in annex of the PBBs (see PI-16).
In summary, it can be considered that the government prepares forecasts of revenue, expenditure for the budget year, and the two following FYs in the CROP. The budget balance is zero for all these years.
Dimension rating = C
PI-14.3. Macro fiscal sensitivity analysis
The county does not prepare any fiscal policy scenarios based on plausible unexpected changes in macroeconomic conditions or other external risk factors that have a potential impact on revenue, expenditure, and debt.
In summary, the county does not perform sensitivity analysis in relation to own-source revenue.
Dimension rating = D
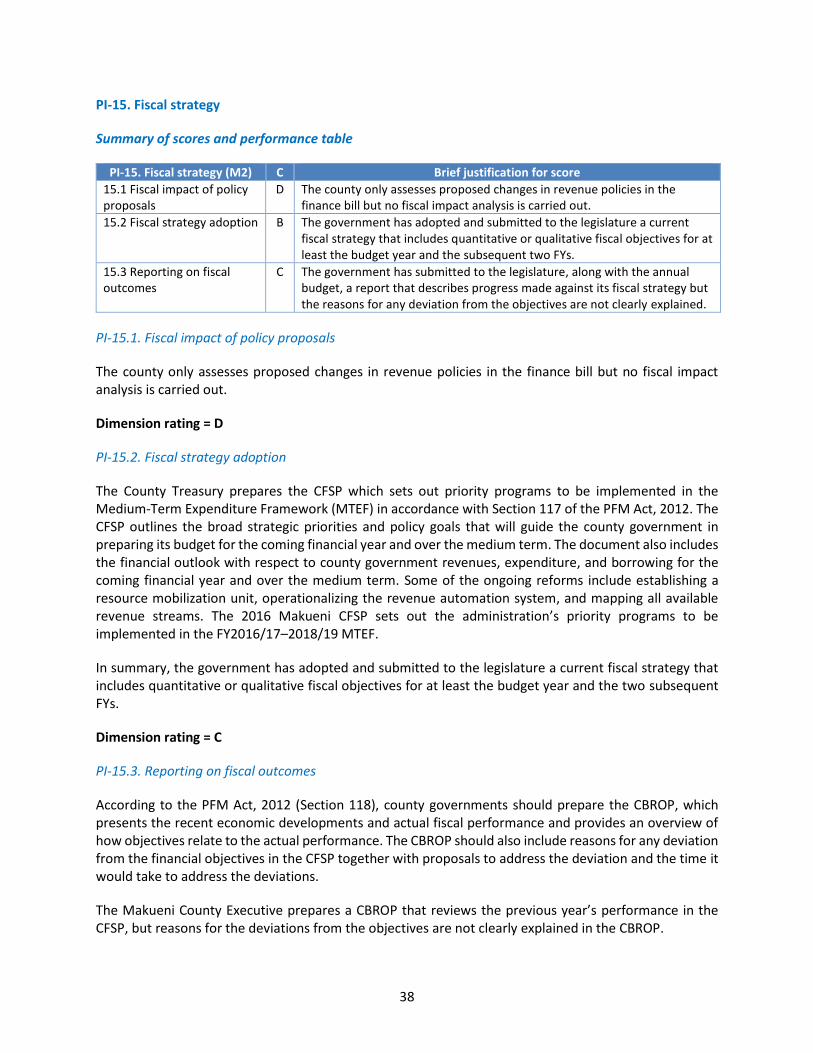
38
PI-15. Fiscal strategy
Summary of scores and performance table
PI-15. Fiscal strategy (M2) C Brief justification for score
15.1 Fiscal impact of policy proposals
D The county only assesses proposed changes in revenue policies in the finance bill but no fiscal impact analysis is carried out.
15.2 Fiscal strategy adoption B The government has adopted and submitted to the legislature a current fiscal strategy that includes quantitative or qualitative fiscal objectives for at least the budget year and the subsequent two FYs.
15.3 Reporting on fiscal outcomes
C The government has submitted to the legislature, along with the annual budget, a report that describes progress made against its fiscal strategy but the reasons for any deviation from the objectives are not clearly explained.
PI-15.1. Fiscal impact of policy proposals
The county only assesses proposed changes in revenue policies in the finance bill but no fiscal impact analysis is carried out.
Dimension rating = D
PI-15.2. Fiscal strategy adoption
The County Treasury prepares the CFSP which sets out priority programs to be implemented in the Medium-Term Expenditure Framework (MTEF) in accordance with Section 117 of the PFM Act, 2012. The CFSP outlines the broad strategic priorities and policy goals that will guide the county government in preparing its budget for the coming financial year and over the medium term. The document also includes the financial outlook with respect to county government revenues, expenditure, and borrowing for the coming financial year and over the medium term. Some of the ongoing reforms include establishing a resource mobilization unit, operationalizing the revenue automation system, and mapping all available revenue streams. The 2016 Makueni CFSP sets out the administration’s priority programs to be implemented in the FY2016/17–2018/19 MTEF.
In summary, the government has adopted and submitted to the legislature a current fiscal strategy that includes quantitative or qualitative fiscal objectives for at least the budget year and the two subsequent FYs.
Dimension rating = C
PI-15.3. Reporting on fiscal outcomes
According to the PFM Act, 2012 (Section 118), county governments should prepare the CBROP, which presents the recent economic developments and actual fiscal performance and provides an overview of how objectives relate to the actual performance. The CBROP should also include reasons for any deviation from the financial objectives in the CFSP together with proposals to address the deviation and the time it would take to address the deviations.
The Makueni County Executive prepares a CBROP that reviews the previous year’s performance in the CFSP, but reasons for the deviations from the objectives are not clearly explained in the CBROP.
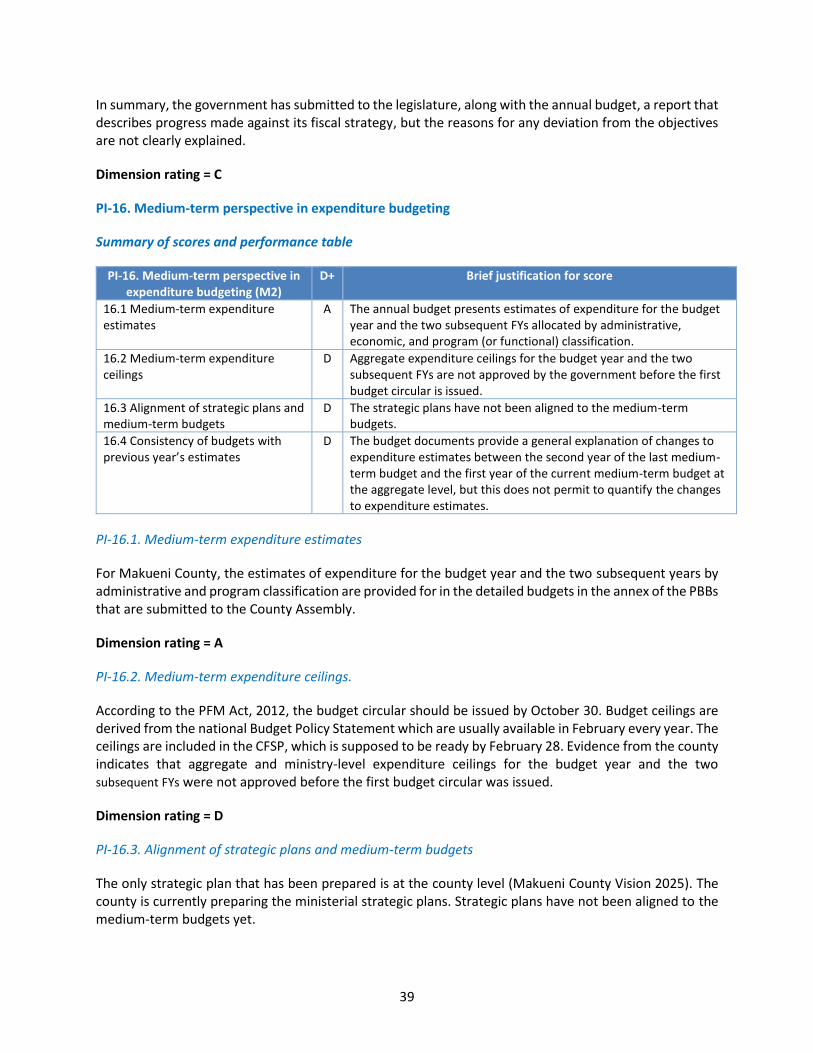
39
In summary, the government has submitted to the legislature, along with the annual budget, a report that describes progress made against its fiscal strategy, but the reasons for any deviation from the objectives are not clearly explained.
Dimension rating = C
PI-16. Medium-term perspective in expenditure budgeting
Summary of scores and performance table
PI-16. Medium-term perspective in expenditure budgeting (M2)
D+ Brief justification for score
16.1 Medium-term expenditure estimates
A The annual budget presents estimates of expenditure for the budget year and the two subsequent FYs allocated by administrative, economic, and program (or functional) classification.
16.2 Medium-term expenditure ceilings
D Aggregate expenditure ceilings for the budget year and the two subsequent FYs are not approved by the government before the first budget circular is issued.
16.3 Alignment of strategic plans and medium-term budgets
D The strategic plans have not been aligned to the medium-term budgets.
16.4 Consistency of budgets with previous year’s estimates
D The budget documents provide a general explanation of changes to expenditure estimates between the second year of the last medium-term budget and the first year of the current medium-term budget at the aggregate level, but this does not permit to quantify the changes to expenditure estimates.
PI-16.1. Medium-term expenditure estimates
For Makueni County, the estimates of expenditure for the budget year and the two subsequent years by administrative and program classification are provided for in the detailed budgets in the annex of the PBBs that are submitted to the County Assembly.
Dimension rating = A
PI-16.2. Medium-term expenditure ceilings.
According to the PFM Act, 2012, the budget circular should be issued by October 30. Budget ceilings are derived from the national Budget Policy Statement which are usually available in February every year. The ceilings are included in the CFSP, which is supposed to be ready by February 28. Evidence from the county indicates that aggregate and ministry-level expenditure ceilings for the budget year and the two subsequent FYs were not approved before the first budget circular was issued.
Dimension rating = D
PI-16.3. Alignment of strategic plans and medium-term budgets
The only strategic plan that has been prepared is at the county level (Makueni County Vision 2025). The county is currently preparing the ministerial strategic plans. Strategic plans have not been aligned to the medium-term budgets yet.
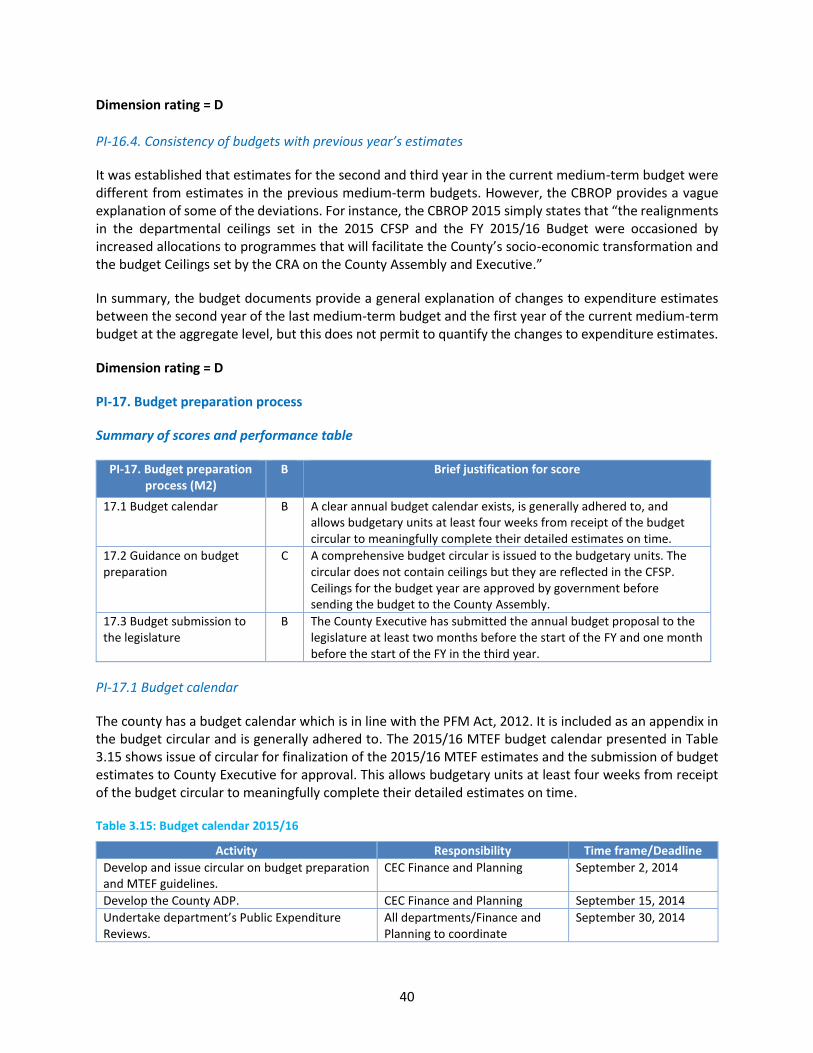
40
Dimension rating = D
PI-16.4. Consistency of budgets with previous year’s estimates
It was established that estimates for the second and third year in the current medium-term budget were different from estimates in the previous medium-term budgets. However, the CBROP provides a vague explanation of some of the deviations. For instance, the CBROP 2015 simply states that “the realignments in the departmental ceilings set in the 2015 CFSP and the FY 2015/16 Budget were occasioned by increased allocations to programmes that will facilitate the County’s socio-economic transformation and the budget Ceilings set by the CRA on the County Assembly and Executive.”
In summary, the budget documents provide a general explanation of changes to expenditure estimates between the second year of the last medium-term budget and the first year of the current medium-term budget at the aggregate level, but this does not permit to quantify the changes to expenditure estimates.
Dimension rating = D
PI-17. Budget preparation process
Summary of scores and performance table
PI-17. Budget preparation process (M2)
B Brief justification for score
17.1 Budget calendar B A clear annual budget calendar exists, is generally adhered to, and allows budgetary units at least four weeks from receipt of the budget circular to meaningfully complete their detailed estimates on time.
17.2 Guidance on budget preparation
C A comprehensive budget circular is issued to the budgetary units. The circular does not contain ceilings but they are reflected in the CFSP. Ceilings for the budget year are approved by government before sending the budget to the County Assembly.
17.3 Budget submission to the legislature
B The County Executive has submitted the annual budget proposal to the legislature at least two months before the start of the FY and one month before the start of the FY in the third year.
PI-17.1 Budget calendar
The county has a budget calendar which is in line with the PFM Act, 2012. It is included as an appendix in the budget circular and is generally adhered to. The 2015/16 MTEF budget calendar presented in Table 3.15 shows issue of circular for finalization of the 2015/16 MTEF estimates and the submission of budget estimates to County Executive for approval. This allows budgetary units at least four weeks from receipt of the budget circular to meaningfully complete their detailed estimates on time.
Table 3.15: Budget calendar 2015/16
Activity Responsibility Time frame/Deadline
Develop and issue circular on budget preparation and MTEF guidelines.
CEC Finance and Planning September 2, 2014
Develop the County ADP. CEC Finance and Planning September 15, 2014
Undertake department’s Public Expenditure Reviews.
All departments/Finance and Planning to coordinate
September 30, 2014
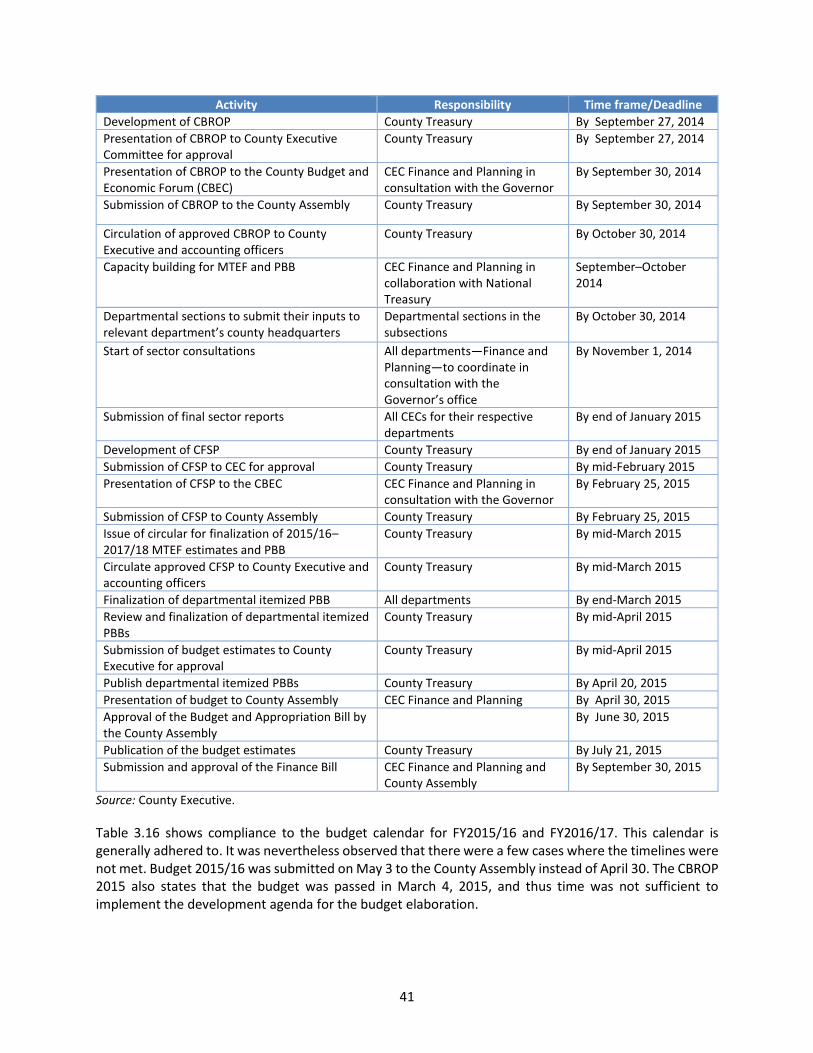
41
Activity Responsibility Time frame/Deadline
Development of CBROP County Treasury By September 27, 2014
Presentation of CBROP to County Executive Committee for approval
County Treasury By September 27, 2014
Presentation of CBROP to the County Budget and Economic Forum (CBEC)
CEC Finance and Planning in consultation with the Governor
By September 30, 2014
Submission of CBROP to the County Assembly County Treasury By September 30, 2014
Circulation of approved CBROP to County Executive and accounting officers
County Treasury By October 30, 2014
Capacity building for MTEF and PBB CEC Finance and Planning in collaboration with National Treasury
September–October 2014
Departmental sections to submit their inputs to relevant department’s county headquarters
Departmental sections in the subsections
By October 30, 2014
Start of sector consultations All departments—Finance and Planning—to coordinate in consultation with the Governor’s office
By November 1, 2014
Submission of final sector reports All CECs for their respective departments
By end of January 2015
Development of CFSP County Treasury By end of January 2015
Submission of CFSP to CEC for approval County Treasury By mid-February 2015
Presentation of CFSP to the CBEC CEC Finance and Planning in consultation with the Governor
By February 25, 2015
Submission of CFSP to County Assembly County Treasury By February 25, 2015
Issue of circular for finalization of 2015/16–2017/18 MTEF estimates and PBB
County Treasury By mid-March 2015
Circulate approved CFSP to County Executive and accounting officers
County Treasury By mid-March 2015
Finalization of departmental itemized PBB All departments By end-March 2015
Review and finalization of departmental itemized PBBs
County Treasury By mid-April 2015
Submission of budget estimates to County Executive for approval
County Treasury By mid-April 2015
Publish departmental itemized PBBs County Treasury By April 20, 2015
Presentation of budget to County Assembly CEC Finance and Planning By April 30, 2015
Approval of the Budget and Appropriation Bill by the County Assembly
By June 30, 2015
Publication of the budget estimates County Treasury By July 21, 2015
Submission and approval of the Finance Bill CEC Finance and Planning and County Assembly
By September 30, 2015
Source: County Executive.
Table 3.16 shows compliance to the budget calendar for FY2015/16 and FY2016/17. This calendar is generally adhered to. It was nevertheless observed that there were a few cases where the timelines were not met. Budget 2015/16 was submitted on May 3 to the County Assembly instead of April 30. The CBROP 2015 also states that the budget was passed in March 4, 2015, and thus time was not sufficient to implement the development agenda for the budget elaboration.
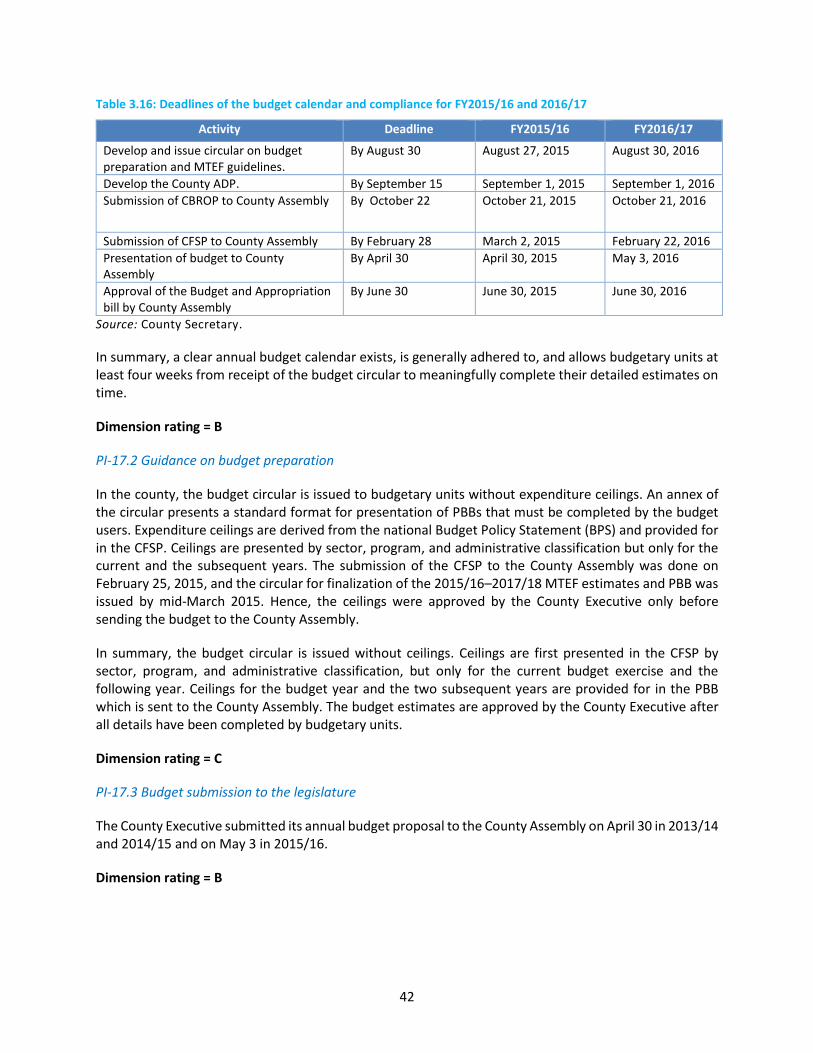
42
Table 3.16: Deadlines of the budget calendar and compliance for FY2015/16 and 2016/17
Activity Deadline FY2015/16 FY2016/17
Develop and issue circular on budget preparation and MTEF guidelines.
By August 30 August 27, 2015 August 30, 2016
Develop the County ADP. By September 15 September 1, 2015 September 1, 2016
Submission of CBROP to County Assembly By October 22 October 21, 2015 October 21, 2016
Submission of CFSP to County Assembly By February 28 March 2, 2015 February 22, 2016
Presentation of budget to County Assembly
By April 30 April 30, 2015 May 3, 2016
Approval of the Budget and Appropriation bill by County Assembly
By June 30 June 30, 2015 June 30, 2016
Source: County Secretary.
In summary, a clear annual budget calendar exists, is generally adhered to, and allows budgetary units at least four weeks from receipt of the budget circular to meaningfully complete their detailed estimates on time.
Dimension rating = B
PI-17.2 Guidance on budget preparation
In the county, the budget circular is issued to budgetary units without expenditure ceilings. An annex of the circular presents a standard format for presentation of PBBs that must be completed by the budget users. Expenditure ceilings are derived from the national Budget Policy Statement (BPS) and provided for in the CFSP. Ceilings are presented by sector, program, and administrative classification but only for the current and the subsequent years. The submission of the CFSP to the County Assembly was done on February 25, 2015, and the circular for finalization of the 2015/16–2017/18 MTEF estimates and PBB was issued by mid-March 2015. Hence, the ceilings were approved by the County Executive only before sending the budget to the County Assembly.
In summary, the budget circular is issued without ceilings. Ceilings are first presented in the CFSP by sector, program, and administrative classification, but only for the current budget exercise and the following year. Ceilings for the budget year and the two subsequent years are provided for in the PBB which is sent to the County Assembly. The budget estimates are approved by the County Executive after all details have been completed by budgetary units.
Dimension rating = C
PI-17.3 Budget submission to the legislature
The County Executive submitted its annual budget proposal to the County Assembly on April 30 in 2013/14 and 2014/15 and on May 3 in 2015/16.
Dimension rating = B
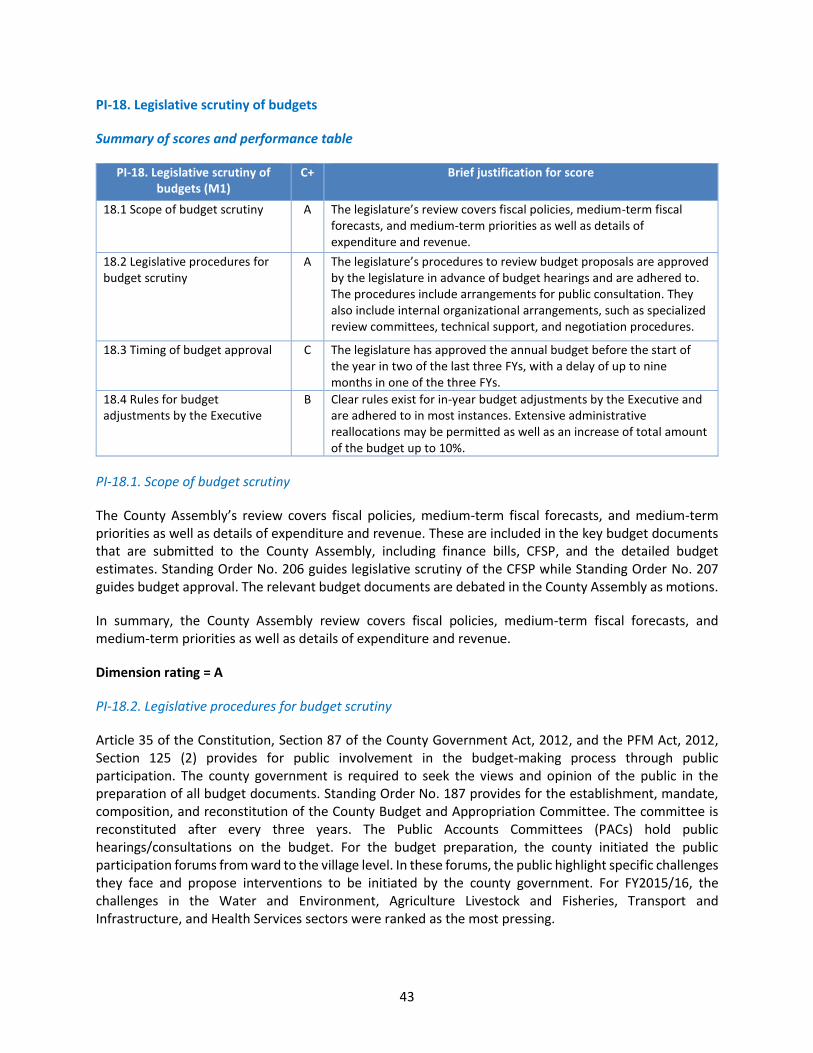
43
PI-18. Legislative scrutiny of budgets
Summary of scores and performance table
PI-18. Legislative scrutiny of budgets (M1)
C+ Brief justification for score
18.1 Scope of budget scrutiny A The legislature’s review covers fiscal policies, medium-term fiscal forecasts, and medium-term priorities as well as details of expenditure and revenue.
18.2 Legislative procedures for budget scrutiny
A The legislature’s procedures to review budget proposals are approved by the legislature in advance of budget hearings and are adhered to. The procedures include arrangements for public consultation. They also include internal organizational arrangements, such as specialized review committees, technical support, and negotiation procedures.
18.3 Timing of budget approval C The legislature has approved the annual budget before the start of the year in two of the last three FYs, with a delay of up to nine months in one of the three FYs.
18.4 Rules for budget adjustments by the Executive
B Clear rules exist for in-year budget adjustments by the Executive and are adhered to in most instances. Extensive administrative reallocations may be permitted as well as an increase of total amount of the budget up to 10%.
PI-18.1. Scope of budget scrutiny
The County Assembly’s review covers fiscal policies, medium-term fiscal forecasts, and medium-term priorities as well as details of expenditure and revenue. These are included in the key budget documents that are submitted to the County Assembly, including finance bills, CFSP, and the detailed budget estimates. Standing Order No. 206 guides legislative scrutiny of the CFSP while Standing Order No. 207 guides budget approval. The relevant budget documents are debated in the County Assembly as motions.
In summary, the County Assembly review covers fiscal policies, medium-term fiscal forecasts, and medium-term priorities as well as details of expenditure and revenue.
Dimension rating = A
PI-18.2. Legislative procedures for budget scrutiny
Article 35 of the Constitution, Section 87 of the County Government Act, 2012, and the PFM Act, 2012, Section 125 (2) provides for public involvement in the budget-making process through public participation. The county government is required to seek the views and opinion of the public in the preparation of all budget documents. Standing Order No. 187 provides for the establishment, mandate, composition, and reconstitution of the County Budget and Appropriation Committee. The committee is reconstituted after every three years. The Public Accounts Committees (PACs) hold public hearings/consultations on the budget. For the budget preparation, the county initiated the public participation forums from ward to the village level. In these forums, the public highlight specific challenges they face and propose interventions to be initiated by the county government. For FY2015/16, the challenges in the Water and Environment, Agriculture Livestock and Fisheries, Transport and Infrastructure, and Health Services sectors were ranked as the most pressing.
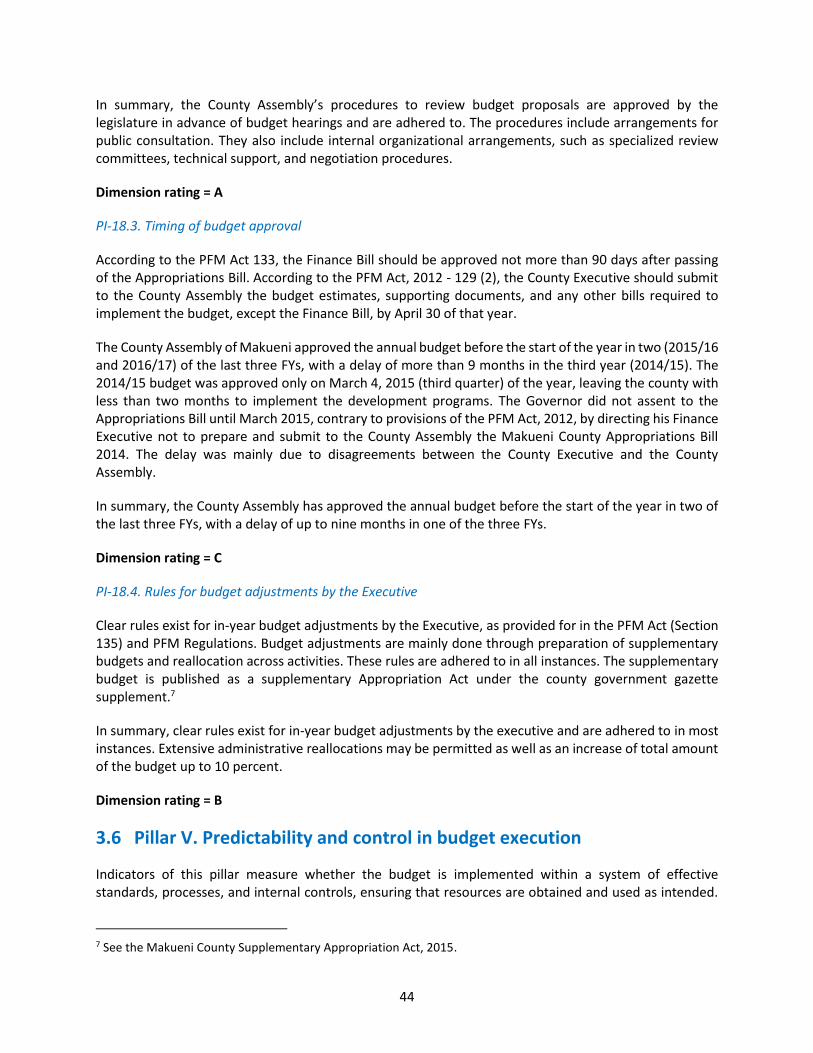
44
In summary, the County Assembly’s procedures to review budget proposals are approved by the legislature in advance of budget hearings and are adhered to. The procedures include arrangements for public consultation. They also include internal organizational arrangements, such as specialized review committees, technical support, and negotiation procedures.
Dimension rating = A
PI-18.3. Timing of budget approval
According to the PFM Act 133, the Finance Bill should be approved not more than 90 days after passing of the Appropriations Bill. According to the PFM Act, 2012 - 129 (2), the County Executive should submit to the County Assembly the budget estimates, supporting documents, and any other bills required to implement the budget, except the Finance Bill, by April 30 of that year.
The County Assembly of Makueni approved the annual budget before the start of the year in two (2015/16 and 2016/17) of the last three FYs, with a delay of more than 9 months in the third year (2014/15). The 2014/15 budget was approved only on March 4, 2015 (third quarter) of the year, leaving the county with less than two months to implement the development programs. The Governor did not assent to the Appropriations Bill until March 2015, contrary to provisions of the PFM Act, 2012, by directing his Finance Executive not to prepare and submit to the County Assembly the Makueni County Appropriations Bill 2014. The delay was mainly due to disagreements between the County Executive and the County Assembly.
In summary, the County Assembly has approved the annual budget before the start of the year in two of the last three FYs, with a delay of up to nine months in one of the three FYs.
Dimension rating = C
PI-18.4. Rules for budget adjustments by the Executive
Clear rules exist for in-year budget adjustments by the Executive, as provided for in the PFM Act (Section 135) and PFM Regulations. Budget adjustments are mainly done through preparation of supplementary budgets and reallocation across activities. These rules are adhered to in all instances. The supplementary budget is published as a supplementary Appropriation Act under the county government gazette supplement.7
In summary, clear rules exist for in-year budget adjustments by the executive and are adhered to in most instances. Extensive administrative reallocations may be permitted as well as an increase of total amount of the budget up to 10 percent.
Dimension rating = B
3.6 Pillar V. Predictability and control in budget execution
Indicators of this pillar measure whether the budget is implemented within a system of effective standards, processes, and internal controls, ensuring that resources are obtained and used as intended.
7 See the Makueni County Supplementary Appropriation Act, 2015.
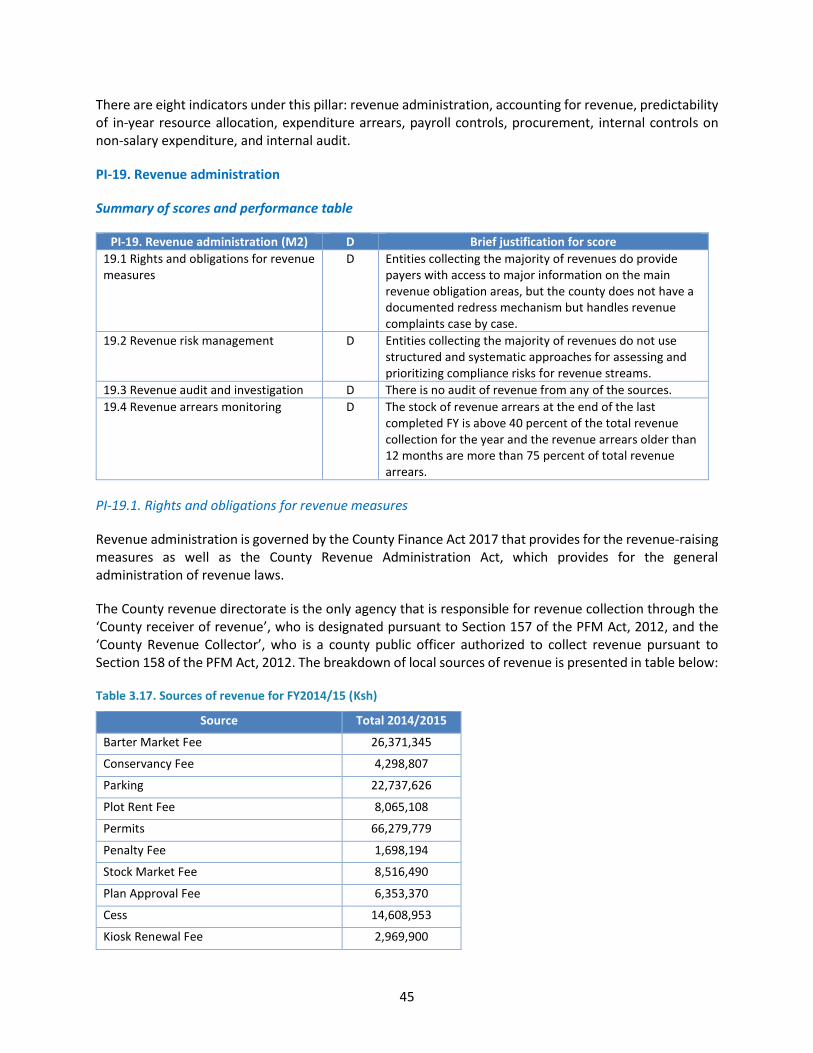
45
There are eight indicators under this pillar: revenue administration, accounting for revenue, predictability of in-year resource allocation, expenditure arrears, payroll controls, procurement, internal controls on non-salary expenditure, and internal audit.
PI-19. Revenue administration
Summary of scores and performance table
PI-19. Revenue administration (M2) D Brief justification for score
19.1 Rights and obligations for revenue measures
D Entities collecting the majority of revenues do provide payers with access to major information on the main revenue obligation areas, but the county does not have a documented redress mechanism but handles revenue complaints case by case.
19.2 Revenue risk management D Entities collecting the majority of revenues do not use structured and systematic approaches for assessing and prioritizing compliance risks for revenue streams.
19.3 Revenue audit and investigation D There is no audit of revenue from any of the sources.
19.4 Revenue arrears monitoring D The stock of revenue arrears at the end of the last completed FY is above 40 percent of the total revenue collection for the year and the revenue arrears older than 12 months are more than 75 percent of total revenue arrears.
PI-19.1. Rights and obligations for revenue measures
Revenue administration is governed by the County Finance Act 2017 that provides for the revenue-raising measures as well as the County Revenue Administration Act, which provides for the general administration of revenue laws.
The County revenue directorate is the only agency that is responsible for revenue collection through the ‘County receiver of revenue’, who is designated pursuant to Section 157 of the PFM Act, 2012, and the ‘County Revenue Collector’, who is a county public officer authorized to collect revenue pursuant to Section 158 of the PFM Act, 2012. The breakdown of local sources of revenue is presented in table below:
Table 3.17. Sources of revenue for FY2014/15 (Ksh)
Source Total 2014/2015
Barter Market Fee 26,371,345
Conservancy Fee 4,298,807
Parking 22,737,626
Plot Rent Fee 8,065,108
Permits 66,279,779
Penalty Fee 1,698,194
Stock Market Fee 8,516,490
Plan Approval Fee 6,353,370
Cess 14,608,953
Kiosk Renewal Fee 2,969,900
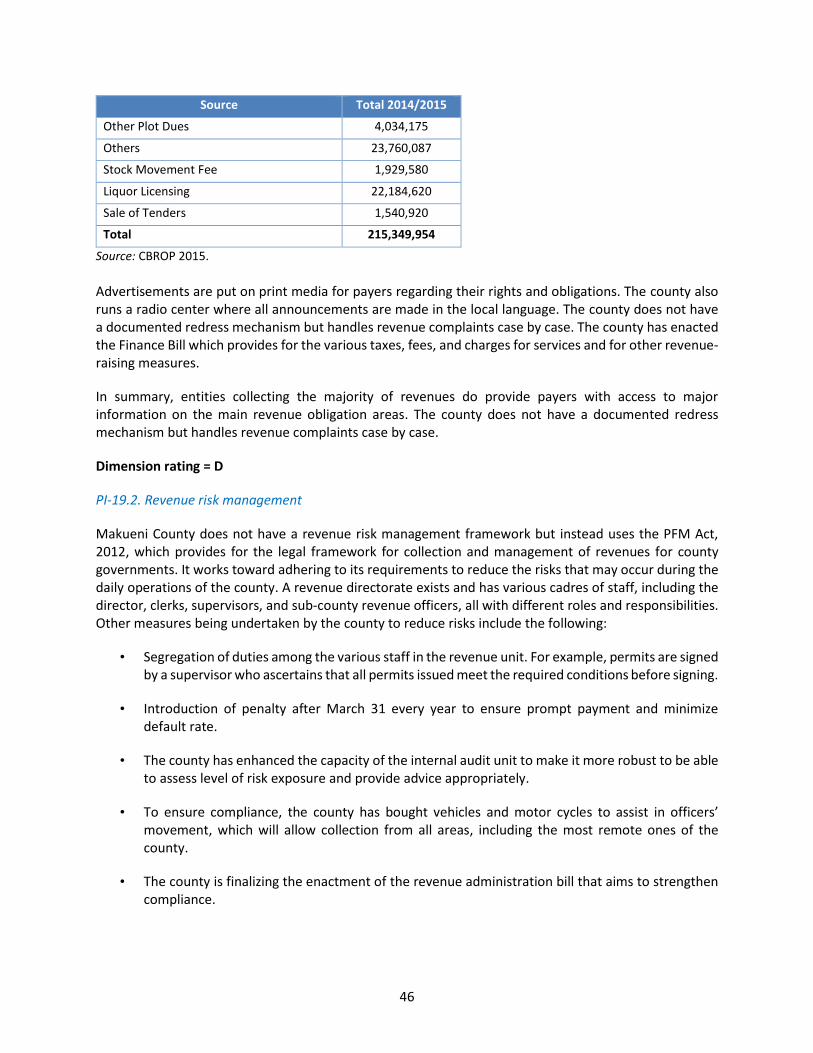
46
Source Total 2014/2015
Other Plot Dues 4,034,175
Others 23,760,087
Stock Movement Fee 1,929,580
Liquor Licensing 22,184,620
Sale of Tenders 1,540,920
Total 215,349,954
Source: CBROP 2015.
Advertisements are put on print media for payers regarding their rights and obligations. The county also runs a radio center where all announcements are made in the local language. The county does not have a documented redress mechanism but handles revenue complaints case by case. The county has enacted the Finance Bill which provides for the various taxes, fees, and charges for services and for other revenue-raising measures.
In summary, entities collecting the majority of revenues do provide payers with access to major information on the main revenue obligation areas. The county does not have a documented redress mechanism but handles revenue complaints case by case.
Dimension rating = D
PI-19.2. Revenue risk management
Makueni County does not have a revenue risk management framework but instead uses the PFM Act, 2012, which provides for the legal framework for collection and management of revenues for county governments. It works toward adhering to its requirements to reduce the risks that may occur during the daily operations of the county. A revenue directorate exists and has various cadres of staff, including the director, clerks, supervisors, and sub-county revenue officers, all with different roles and responsibilities. Other measures being undertaken by the county to reduce risks include the following:
• Segregation of duties among the various staff in the revenue unit. For example, permits are signed by a supervisor who ascertains that all permits issued meet the required conditions before signing.
• Introduction of penalty after March 31 every year to ensure prompt payment and minimize default rate.
• The county has enhanced the capacity of the internal audit unit to make it more robust to be able to assess level of risk exposure and provide advice appropriately.
• To ensure compliance, the county has bought vehicles and motor cycles to assist in officers’ movement, which will allow collection from all areas, including the most remote ones of the county.
• The county is finalizing the enactment of the revenue administration bill that aims to strengthen compliance.
47
• The county is in the process of implementing an automated revenue management system that will go a long way in minimizing revenue leakages and associated risks.
In summary, entities collecting the majority of revenues do not use structured and systematic approaches for assessing and prioritizing compliance risks for revenue streams.
Dimension rating = D
PI-19.3. Revenue audit and investigation
Revenue audit is governed by PFM Regulation No. 153, 2015, but a revenue audit department is not operational yet. Only one fraud investigation report, originating from the revenue department, dated June 30, 2015, was provided. No audit of revenue from any of the sources has been provided.
Audit and investigation is performed mainly by the OAG. The external audit report on the Makueni County Executive for FY2015/16 pointed out an unbanked revenue of Ksh 309,050, because three officers, whose names are reported, did not transfer this amount of collected revenue on the Central Bank of Kenya.
In summary, there is no audit of revenue from any of the sources.
Dimension rating = D
PI-19.4. Revenue arrears monitoring
According to the PFM Act, 2012, article 82 (1), at the end of each financial year, a receiver of revenue for the national government shall prepare an account with respect to the revenue received and collected by the receiver during that financial year. An account prepared under subsection (1) shall include (a) a statement of receipts and disbursements in such form as the National Treasury may direct and (b) a statement of arrears of revenue.
According to data provided by the Revenue Administration, the stock of arrears at the end of FY2015/16 amounted to Ksh 148,868,671, with 7 arrears less than 12 months and 93 older than 12 months, against the total revenue collection of Ksh 220,171,649. Arrears appear to represent 68 of the actual revenue collection and most of these arrears are more than one year old.
The county is in the process of instituting requisite procedures for undertaking revenue audits and investigations. A legal framework on revenue administration is at the County Assembly for debate. A draft valuation and rating bill is to be presented to the public for input.
In summary, the stock of revenue arrears at the end of the last completed FY is above 40 percent of the total revenue collection for the year and the revenue arrears older than 12 months are more than 75 percent of total revenue arrears.
Dimension rating = D
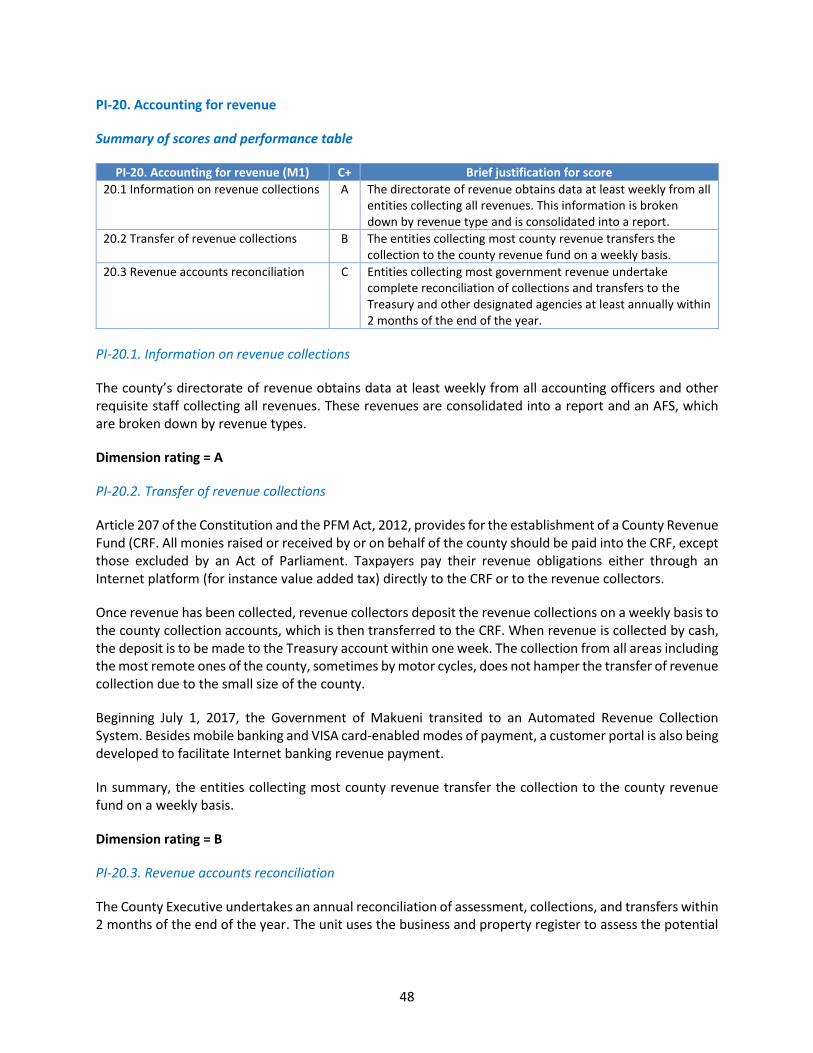
48
PI-20. Accounting for revenue
Summary of scores and performance table
PI-20. Accounting for revenue (M1) C+ Brief justification for score
20.1 Information on revenue collections A The directorate of revenue obtains data at least weekly from all entities collecting all revenues. This information is broken down by revenue type and is consolidated into a report.
20.2 Transfer of revenue collections B The entities collecting most county revenue transfers the collection to the county revenue fund on a weekly basis.
20.3 Revenue accounts reconciliation C Entities collecting most government revenue undertake complete reconciliation of collections and transfers to the Treasury and other designated agencies at least annually within 2 months of the end of the year.
PI-20.1. Information on revenue collections
The county’s directorate of revenue obtains data at least weekly from all accounting officers and other requisite staff collecting all revenues. These revenues are consolidated into a report and an AFS, which are broken down by revenue types.
Dimension rating = A
PI-20.2. Transfer of revenue collections
Article 207 of the Constitution and the PFM Act, 2012, provides for the establishment of a County Revenue Fund (CRF. All monies raised or received by or on behalf of the county should be paid into the CRF, except those excluded by an Act of Parliament. Taxpayers pay their revenue obligations either through an Internet platform (for instance value added tax) directly to the CRF or to the revenue collectors.
Once revenue has been collected, revenue collectors deposit the revenue collections on a weekly basis to the county collection accounts, which is then transferred to the CRF. When revenue is collected by cash, the deposit is to be made to the Treasury account within one week. The collection from all areas including the most remote ones of the county, sometimes by motor cycles, does not hamper the transfer of revenue collection due to the small size of the county.
Beginning July 1, 2017, the Government of Makueni transited to an Automated Revenue Collection System. Besides mobile banking and VISA card-enabled modes of payment, a customer portal is also being developed to facilitate Internet banking revenue payment.
In summary, the entities collecting most county revenue transfer the collection to the county revenue fund on a weekly basis.
Dimension rating = B
PI-20.3. Revenue accounts reconciliation
The County Executive undertakes an annual reconciliation of assessment, collections, and transfers within 2 months of the end of the year. The unit uses the business and property register to assess the potential
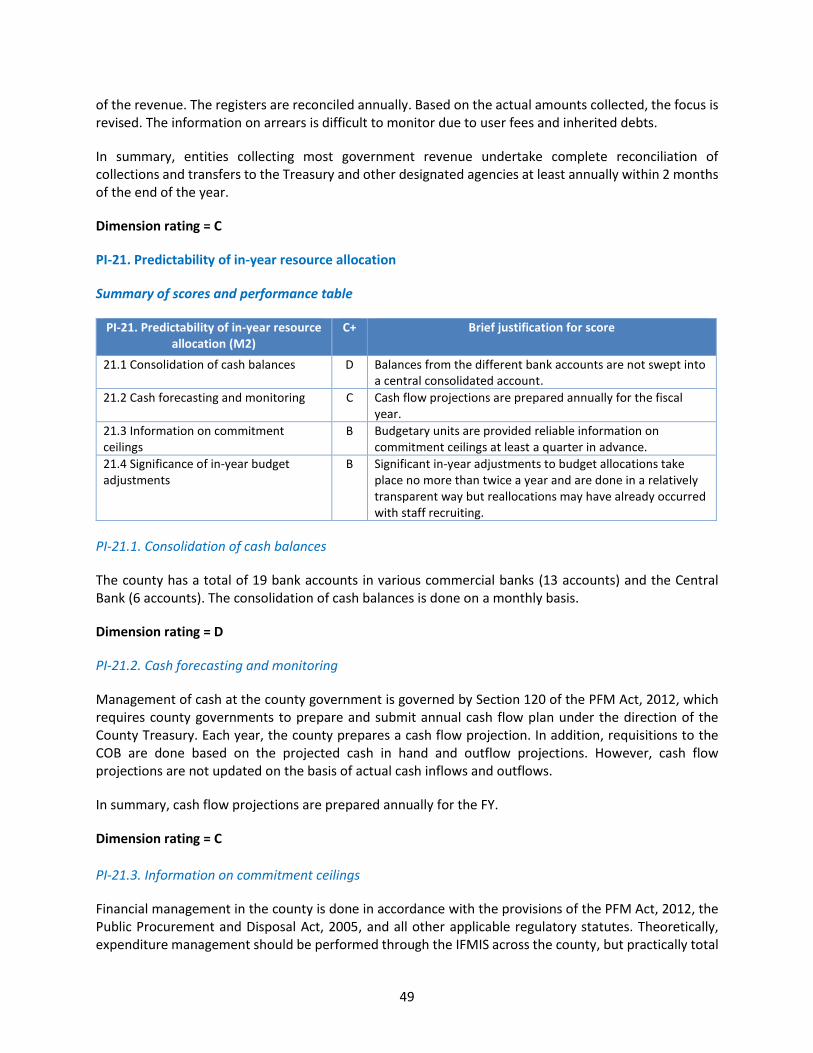
49
of the revenue. The registers are reconciled annually. Based on the actual amounts collected, the focus is revised. The information on arrears is difficult to monitor due to user fees and inherited debts.
In summary, entities collecting most government revenue undertake complete reconciliation of collections and transfers to the Treasury and other designated agencies at least annually within 2 months of the end of the year.
Dimension rating = C
PI-21. Predictability of in-year resource allocation
Summary of scores and performance table
PI-21. Predictability of in-year resource allocation (M2)
C+ Brief justification for score
21.1 Consolidation of cash balances D Balances from the different bank accounts are not swept into a central consolidated account.
21.2 Cash forecasting and monitoring C Cash flow projections are prepared annually for the fiscal year.
21.3 Information on commitment ceilings
B Budgetary units are provided reliable information on commitment ceilings at least a quarter in advance.
21.4 Significance of in-year budget adjustments
B Significant in-year adjustments to budget allocations take place no more than twice a year and are done in a relatively transparent way but reallocations may have already occurred with staff recruiting.
PI-21.1. Consolidation of cash balances
The county has a total of 19 bank accounts in various commercial banks (13 accounts) and the Central Bank (6 accounts). The consolidation of cash balances is done on a monthly basis.
Dimension rating = D
PI-21.2. Cash forecasting and monitoring
Management of cash at the county government is governed by Section 120 of the PFM Act, 2012, which requires county governments to prepare and submit annual cash flow plan under the direction of the County Treasury. Each year, the county prepares a cash flow projection. In addition, requisitions to the COB are done based on the projected cash in hand and outflow projections. However, cash flow projections are not updated on the basis of actual cash inflows and outflows.
In summary, cash flow projections are prepared annually for the FY.
Dimension rating = C
PI-21.3. Information on commitment ceilings
Financial management in the county is done in accordance with the provisions of the PFM Act, 2012, the Public Procurement and Disposal Act, 2005, and all other applicable regulatory statutes. Theoretically, expenditure management should be performed through the IFMIS across the county, but practically total
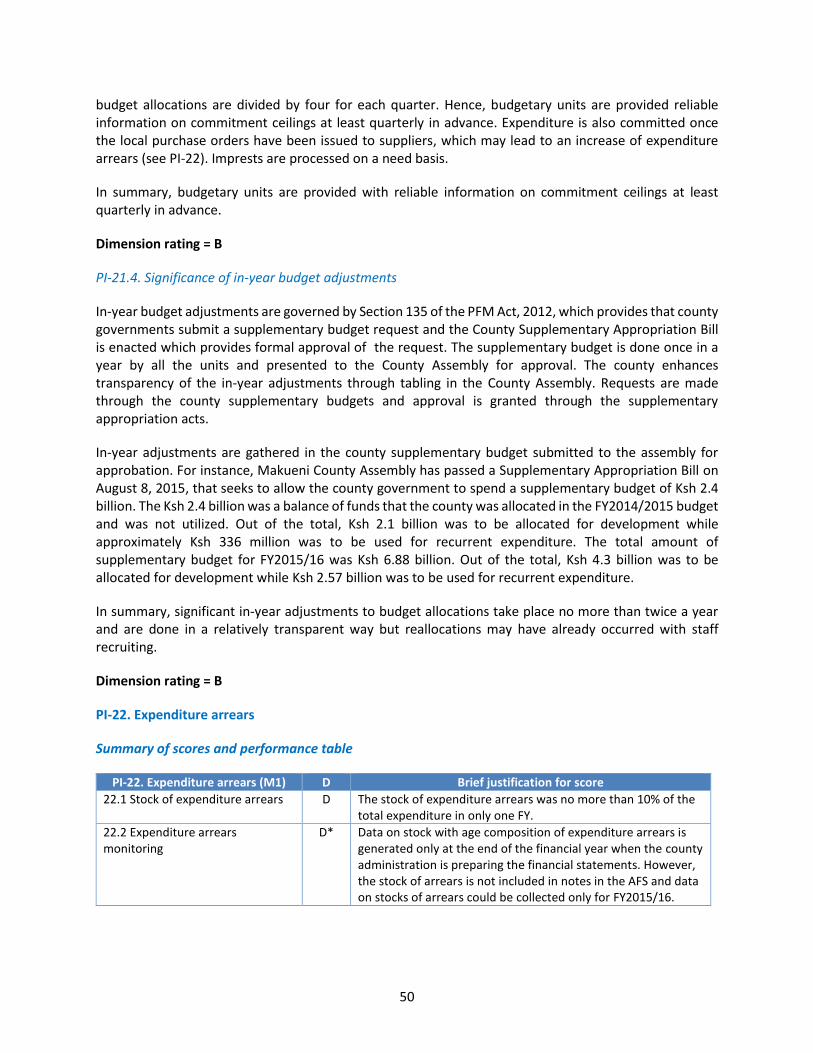
50
budget allocations are divided by four for each quarter. Hence, budgetary units are provided reliable information on commitment ceilings at least quarterly in advance. Expenditure is also committed once the local purchase orders have been issued to suppliers, which may lead to an increase of expenditure arrears (see PI-22). Imprests are processed on a need basis.
In summary, budgetary units are provided with reliable information on commitment ceilings at least quarterly in advance.
Dimension rating = B
PI-21.4. Significance of in-year budget adjustments
In-year budget adjustments are governed by Section 135 of the PFM Act, 2012, which provides that county governments submit a supplementary budget request and the County Supplementary Appropriation Bill is enacted which provides formal approval of the request. The supplementary budget is done once in a year by all the units and presented to the County Assembly for approval. The county enhances transparency of the in-year adjustments through tabling in the County Assembly. Requests are made through the county supplementary budgets and approval is granted through the supplementary appropriation acts.
In-year adjustments are gathered in the county supplementary budget submitted to the assembly for approbation. For instance, Makueni County Assembly has passed a Supplementary Appropriation Bill on August 8, 2015, that seeks to allow the county government to spend a supplementary budget of Ksh 2.4 billion. The Ksh 2.4 billion was a balance of funds that the county was allocated in the FY2014/2015 budget and was not utilized. Out of the total, Ksh 2.1 billion was to be allocated for development while approximately Ksh 336 million was to be used for recurrent expenditure. The total amount of supplementary budget for FY2015/16 was Ksh 6.88 billion. Out of the total, Ksh 4.3 billion was to be allocated for development while Ksh 2.57 billion was to be used for recurrent expenditure.
In summary, significant in-year adjustments to budget allocations take place no more than twice a year and are done in a relatively transparent way but reallocations may have already occurred with staff recruiting.
Dimension rating = B
PI-22. Expenditure arrears
Summary of scores and performance table
PI-22. Expenditure arrears (M1) D Brief justification for score
22.1 Stock of expenditure arrears D The stock of expenditure arrears was no more than 10% of the total expenditure in only one FY.
22.2 Expenditure arrears monitoring
D* Data on stock with age composition of expenditure arrears is generated only at the end of the financial year when the county administration is preparing the financial statements. However, the stock of arrears is not included in notes in the AFS and data on stocks of arrears could be collected only for FY2015/16.
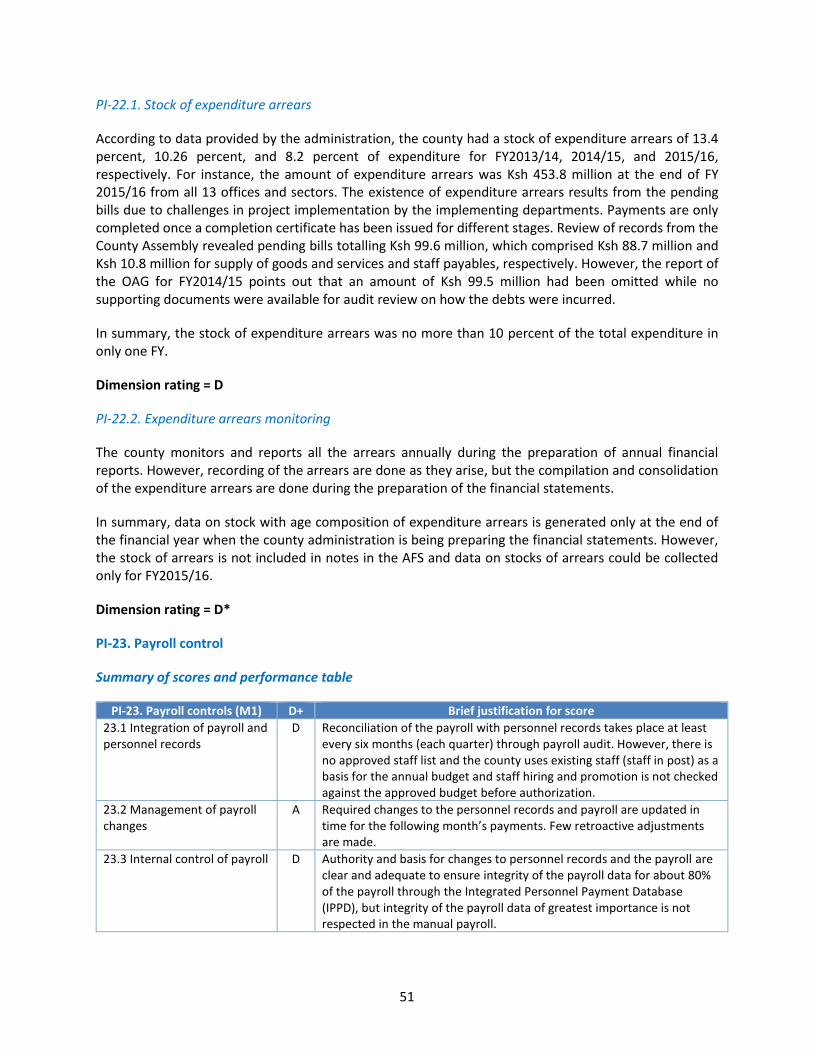
51
PI-22.1. Stock of expenditure arrears
According to data provided by the administration, the county had a stock of expenditure arrears of 13.4 percent, 10.26 percent, and 8.2 percent of expenditure for FY2013/14, 2014/15, and 2015/16, respectively. For instance, the amount of expenditure arrears was Ksh 453.8 million at the end of FY 2015/16 from all 13 offices and sectors. The existence of expenditure arrears results from the pending bills due to challenges in project implementation by the implementing departments. Payments are only completed once a completion certificate has been issued for different stages. Review of records from the County Assembly revealed pending bills totalling Ksh 99.6 million, which comprised Ksh 88.7 million and Ksh 10.8 million for supply of goods and services and staff payables, respectively. However, the report of the OAG for FY2014/15 points out that an amount of Ksh 99.5 million had been omitted while no supporting documents were available for audit review on how the debts were incurred.
In summary, the stock of expenditure arrears was no more than 10 percent of the total expenditure in only one FY.
Dimension rating = D
PI-22.2. Expenditure arrears monitoring
The county monitors and reports all the arrears annually during the preparation of annual financial reports. However, recording of the arrears are done as they arise, but the compilation and consolidation of the expenditure arrears are done during the preparation of the financial statements.
In summary, data on stock with age composition of expenditure arrears is generated only at the end of the financial year when the county administration is being preparing the financial statements. However, the stock of arrears is not included in notes in the AFS and data on stocks of arrears could be collected only for FY2015/16.
Dimension rating = D*
PI-23. Payroll control
Summary of scores and performance table
PI-23. Payroll controls (M1) D+ Brief justification for score
23.1 Integration of payroll and personnel records
D Reconciliation of the payroll with personnel records takes place at least every six months (each quarter) through payroll audit. However, there is no approved staff list and the county uses existing staff (staff in post) as a basis for the annual budget and staff hiring and promotion is not checked against the approved budget before authorization.
23.2 Management of payroll changes
A Required changes to the personnel records and payroll are updated in time for the following month’s payments. Few retroactive adjustments are made.
23.3 Internal control of payroll
D Authority and basis for changes to personnel records and the payroll are clear and adequate to ensure integrity of the payroll data for about 80% of the payroll through the Integrated Personnel Payment Database (IPPD), but integrity of the payroll data of greatest importance is not respected in the manual payroll.
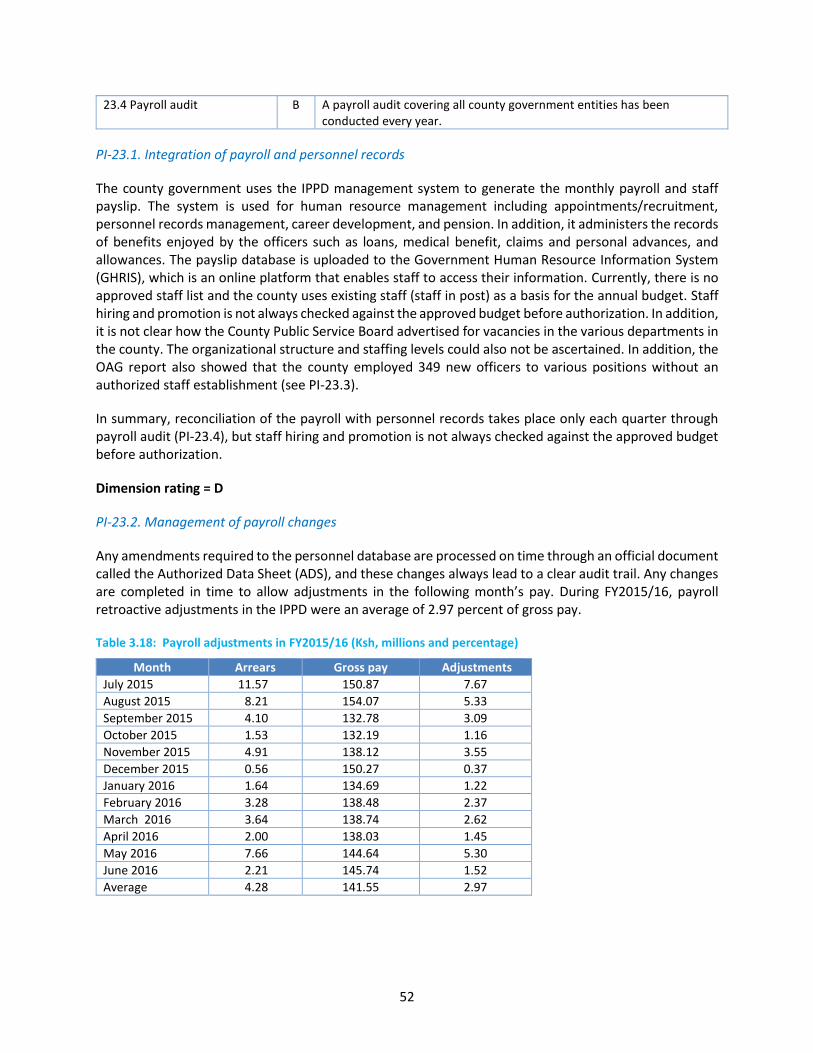
52
23.4 Payroll audit B A payroll audit covering all county government entities has been conducted every year.
PI-23.1. Integration of payroll and personnel records
The county government uses the IPPD management system to generate the monthly payroll and staff payslip. The system is used for human resource management including appointments/recruitment, personnel records management, career development, and pension. In addition, it administers the records of benefits enjoyed by the officers such as loans, medical benefit, claims and personal advances, and allowances. The payslip database is uploaded to the Government Human Resource Information System (GHRIS), which is an online platform that enables staff to access their information. Currently, there is no approved staff list and the county uses existing staff (staff in post) as a basis for the annual budget. Staff hiring and promotion is not always checked against the approved budget before authorization. In addition, it is not clear how the County Public Service Board advertised for vacancies in the various departments in the county. The organizational structure and staffing levels could also not be ascertained. In addition, the OAG report also showed that the county employed 349 new officers to various positions without an authorized staff establishment (see PI-23.3).
In summary, reconciliation of the payroll with personnel records takes place only each quarter through payroll audit (PI-23.4), but staff hiring and promotion is not always checked against the approved budget before authorization.
Dimension rating = D
PI-23.2. Management of payroll changes
Any amendments required to the personnel database are processed on time through an official document called the Authorized Data Sheet (ADS), and these changes always lead to a clear audit trail. Any changes are completed in time to allow adjustments in the following month’s pay. During FY2015/16, payroll retroactive adjustments in the IPPD were an average of 2.97 percent of gross pay.
Table 3.18: Payroll adjustments in FY2015/16 (Ksh, millions and percentage)
Month Arrears Gross pay Adjustments
July 2015 11.57 150.87 7.67
August 2015 8.21 154.07 5.33
September 2015 4.10 132.78 3.09
October 2015 1.53 132.19 1.16
November 2015 4.91 138.12 3.55
December 2015 0.56 150.27 0.37
January 2016 1.64 134.69 1.22
February 2016 3.28 138.48 2.37
March 2016 3.64 138.74 2.62
April 2016 2.00 138.03 1.45
May 2016 7.66 144.64 5.30
June 2016 2.21 145.74 1.52
Average 4.28 141.55 2.97
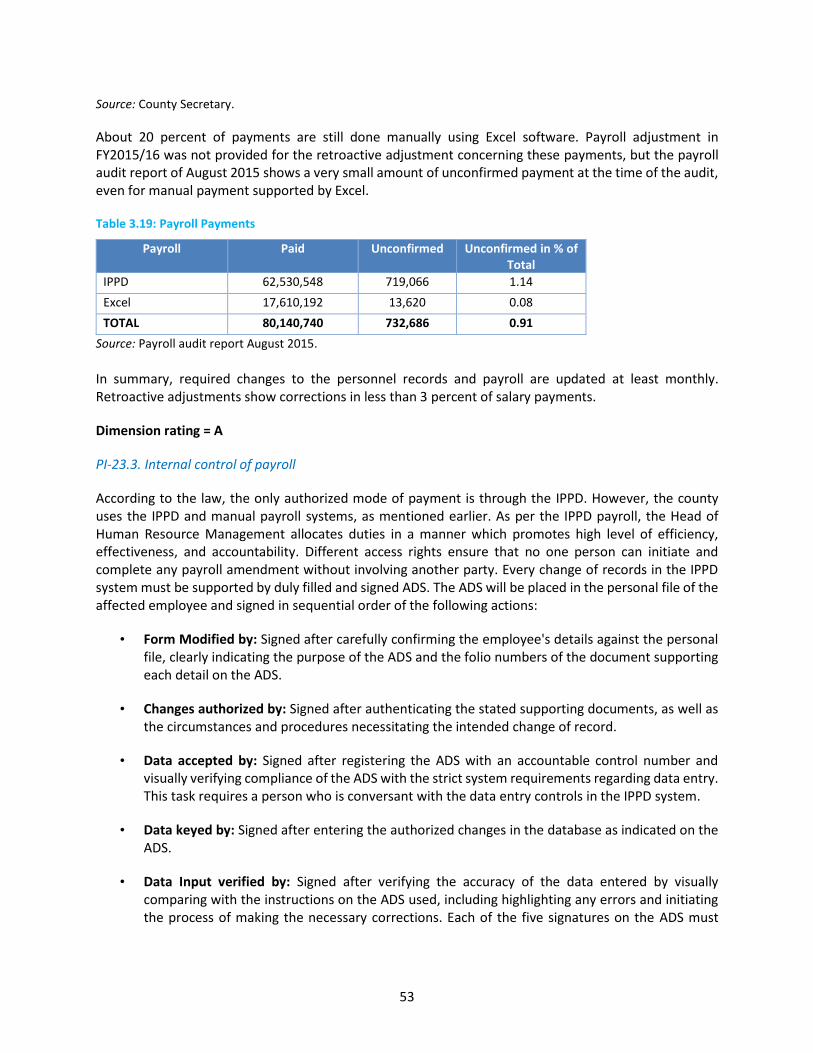
53
Source: County Secretary.
About 20 percent of payments are still done manually using Excel software. Payroll adjustment in FY2015/16 was not provided for the retroactive adjustment concerning these payments, but the payroll audit report of August 2015 shows a very small amount of unconfirmed payment at the time of the audit, even for manual payment supported by Excel.
Table 3.19: Payroll Payments
Payroll Paid Unconfirmed Unconfirmed in % of Total
IPPD 62,530,548 719,066 1.14
Excel 17,610,192 13,620 0.08
TOTAL 80,140,740 732,686 0.91
Source: Payroll audit report August 2015.
In summary, required changes to the personnel records and payroll are updated at least monthly. Retroactive adjustments show corrections in less than 3 percent of salary payments.
Dimension rating = A
PI-23.3. Internal control of payroll
According to the law, the only authorized mode of payment is through the IPPD. However, the county uses the IPPD and manual payroll systems, as mentioned earlier. As per the IPPD payroll, the Head of Human Resource Management allocates duties in a manner which promotes high level of efficiency, effectiveness, and accountability. Different access rights ensure that no one person can initiate and complete any payroll amendment without involving another party. Every change of records in the IPPD system must be supported by duly filled and signed ADS. The ADS will be placed in the personal file of the affected employee and signed in sequential order of the following actions:
• Form Modified by: Signed after carefully confirming the employee's details against the personal file, clearly indicating the purpose of the ADS and the folio numbers of the document supporting each detail on the ADS.
• Changes authorized by: Signed after authenticating the stated supporting documents, as well as the circumstances and procedures necessitating the intended change of record.
• Data accepted by: Signed after registering the ADS with an accountable control number and visually verifying compliance of the ADS with the strict system requirements regarding data entry. This task requires a person who is conversant with the data entry controls in the IPPD system.
• Data keyed by: Signed after entering the authorized changes in the database as indicated on the ADS.
• Data Input verified by: Signed after verifying the accuracy of the data entered by visually comparing with the instructions on the ADS used, including highlighting any errors and initiating the process of making the necessary corrections. Each of the five signatures on the ADS must
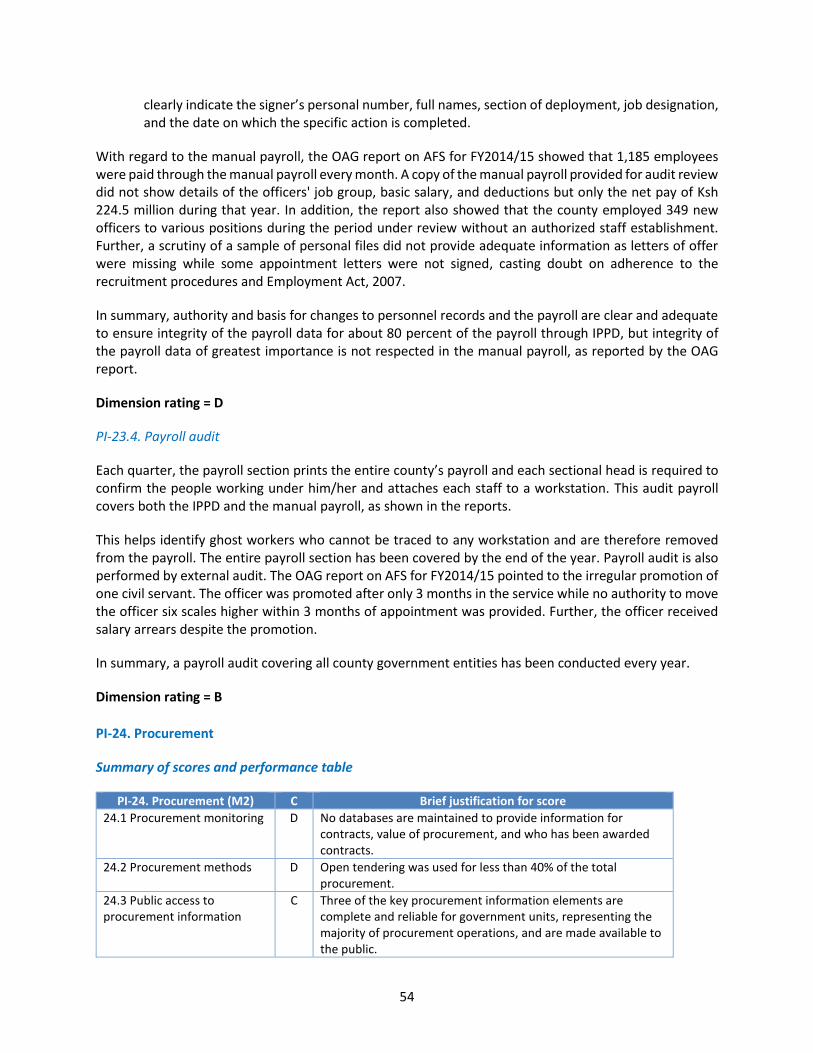
54
clearly indicate the signer’s personal number, full names, section of deployment, job designation, and the date on which the specific action is completed.
With regard to the manual payroll, the OAG report on AFS for FY2014/15 showed that 1,185 employees were paid through the manual payroll every month. A copy of the manual payroll provided for audit review did not show details of the officers' job group, basic salary, and deductions but only the net pay of Ksh 224.5 million during that year. In addition, the report also showed that the county employed 349 new officers to various positions during the period under review without an authorized staff establishment. Further, a scrutiny of a sample of personal files did not provide adequate information as letters of offer were missing while some appointment letters were not signed, casting doubt on adherence to the recruitment procedures and Employment Act, 2007.
In summary, authority and basis for changes to personnel records and the payroll are clear and adequate to ensure integrity of the payroll data for about 80 percent of the payroll through IPPD, but integrity of the payroll data of greatest importance is not respected in the manual payroll, as reported by the OAG report.
Dimension rating = D
PI-23.4. Payroll audit
Each quarter, the payroll section prints the entire county’s payroll and each sectional head is required to confirm the people working under him/her and attaches each staff to a workstation. This audit payroll covers both the IPPD and the manual payroll, as shown in the reports.
This helps identify ghost workers who cannot be traced to any workstation and are therefore removed from the payroll. The entire payroll section has been covered by the end of the year. Payroll audit is also performed by external audit. The OAG report on AFS for FY2014/15 pointed to the irregular promotion of one civil servant. The officer was promoted after only 3 months in the service while no authority to move the officer six scales higher within 3 months of appointment was provided. Further, the officer received salary arrears despite the promotion.
In summary, a payroll audit covering all county government entities has been conducted every year.
Dimension rating = B
PI-24. Procurement
Summary of scores and performance table
PI-24. Procurement (M2) C Brief justification for score
24.1 Procurement monitoring D No databases are maintained to provide information for contracts, value of procurement, and who has been awarded contracts.
24.2 Procurement methods D Open tendering was used for less than 40% of the total procurement.
24.3 Public access to procurement information
C Three of the key procurement information elements are complete and reliable for government units, representing the majority of procurement operations, and are made available to the public.
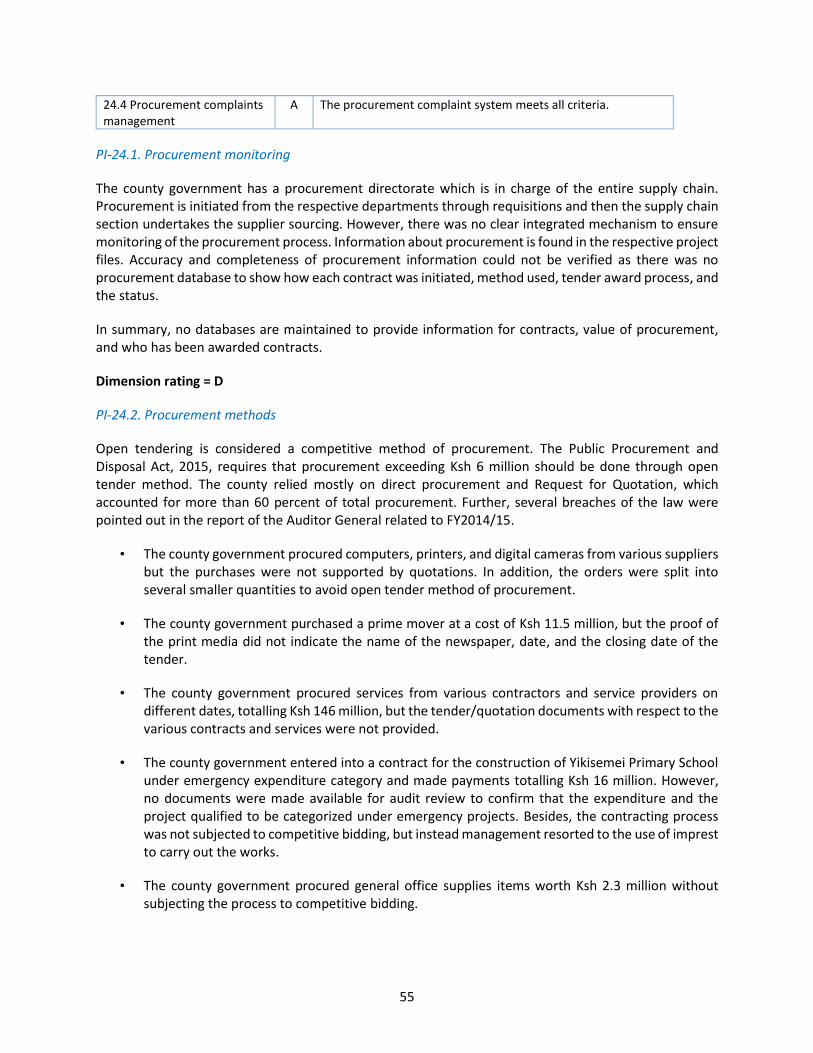
55
24.4 Procurement complaints management
A The procurement complaint system meets all criteria.
PI-24.1. Procurement monitoring
The county government has a procurement directorate which is in charge of the entire supply chain. Procurement is initiated from the respective departments through requisitions and then the supply chain section undertakes the supplier sourcing. However, there was no clear integrated mechanism to ensure monitoring of the procurement process. Information about procurement is found in the respective project files. Accuracy and completeness of procurement information could not be verified as there was no procurement database to show how each contract was initiated, method used, tender award process, and the status.
In summary, no databases are maintained to provide information for contracts, value of procurement, and who has been awarded contracts.
Dimension rating = D
PI-24.2. Procurement methods
Open tendering is considered a competitive method of procurement. The Public Procurement and Disposal Act, 2015, requires that procurement exceeding Ksh 6 million should be done through open tender method. The county relied mostly on direct procurement and Request for Quotation, which accounted for more than 60 percent of total procurement. Further, several breaches of the law were pointed out in the report of the Auditor General related to FY2014/15.
• The county government procured computers, printers, and digital cameras from various suppliers but the purchases were not supported by quotations. In addition, the orders were split into several smaller quantities to avoid open tender method of procurement.
• The county government purchased a prime mover at a cost of Ksh 11.5 million, but the proof of the print media did not indicate the name of the newspaper, date, and the closing date of the tender.
• The county government procured services from various contractors and service providers on different dates, totalling Ksh 146 million, but the tender/quotation documents with respect to the various contracts and services were not provided.
• The county government entered into a contract for the construction of Yikisemei Primary School under emergency expenditure category and made payments totalling Ksh 16 million. However, no documents were made available for audit review to confirm that the expenditure and the project qualified to be categorized under emergency projects. Besides, the contracting process was not subjected to competitive bidding, but instead management resorted to the use of imprest to carry out the works.
• The county government procured general office supplies items worth Ksh 2.3 million without subjecting the process to competitive bidding.
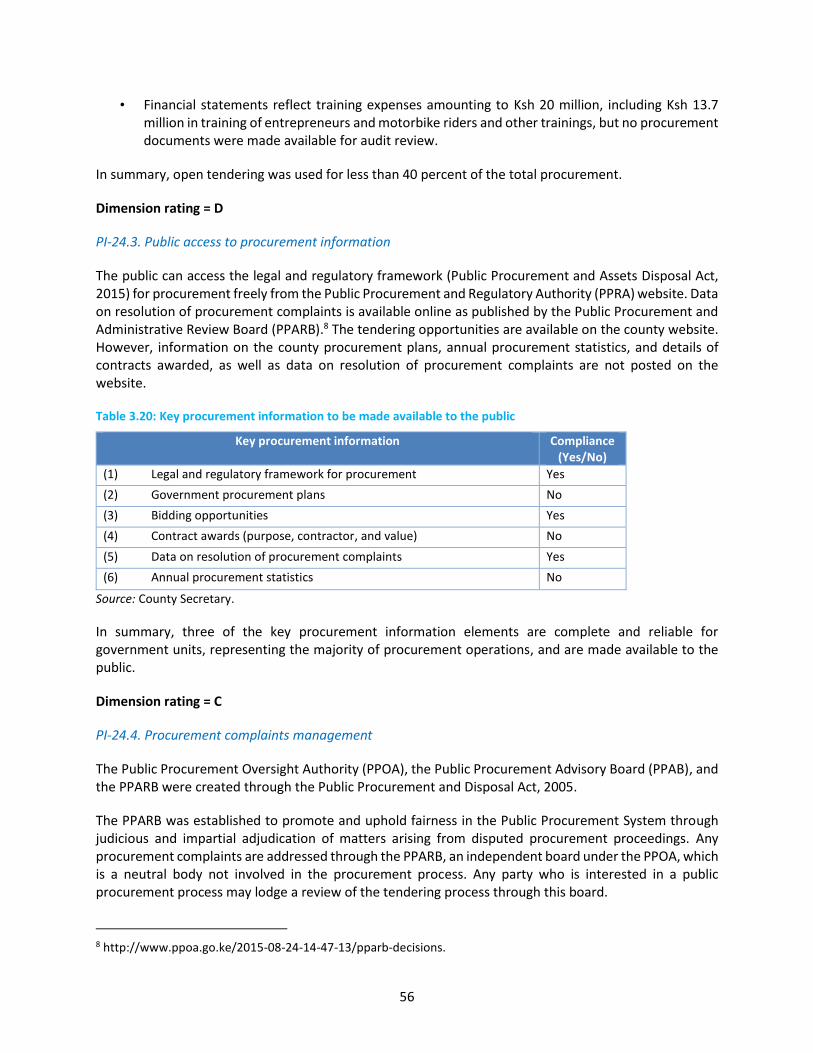
56
• Financial statements reflect training expenses amounting to Ksh 20 million, including Ksh 13.7 million in training of entrepreneurs and motorbike riders and other trainings, but no procurement documents were made available for audit review.
In summary, open tendering was used for less than 40 percent of the total procurement.
Dimension rating = D
PI-24.3. Public access to procurement information
The public can access the legal and regulatory framework (Public Procurement and Assets Disposal Act, 2015) for procurement freely from the Public Procurement and Regulatory Authority (PPRA) website. Data on resolution of procurement complaints is available online as published by the Public Procurement and Administrative Review Board (PPARB).8 The tendering opportunities are available on the county website. However, information on the county procurement plans, annual procurement statistics, and details of contracts awarded, as well as data on resolution of procurement complaints are not posted on the website.
Table 3.20: Key procurement information to be made available to the public
Key procurement information Compliance (Yes/No)
(1) Legal and regulatory framework for procurement Yes
(2) Government procurement plans No
(3) Bidding opportunities Yes
(4) Contract awards (purpose, contractor, and value) No
(5) Data on resolution of procurement complaints Yes
(6) Annual procurement statistics No
Source: County Secretary.
In summary, three of the key procurement information elements are complete and reliable for government units, representing the majority of procurement operations, and are made available to the public.
Dimension rating = C
PI-24.4. Procurement complaints management
The Public Procurement Oversight Authority (PPOA), the Public Procurement Advisory Board (PPAB), and the PPARB were created through the Public Procurement and Disposal Act, 2005.
The PPARB was established to promote and uphold fairness in the Public Procurement System through judicious and impartial adjudication of matters arising from disputed procurement proceedings. Any procurement complaints are addressed through the PPARB, an independent board under the PPOA, which is a neutral body not involved in the procurement process. Any party who is interested in a public procurement process may lodge a review of the tendering process through this board.
8 http://www.ppoa.go.ke/2015-08-24-14-47-13/pparb-decisions.
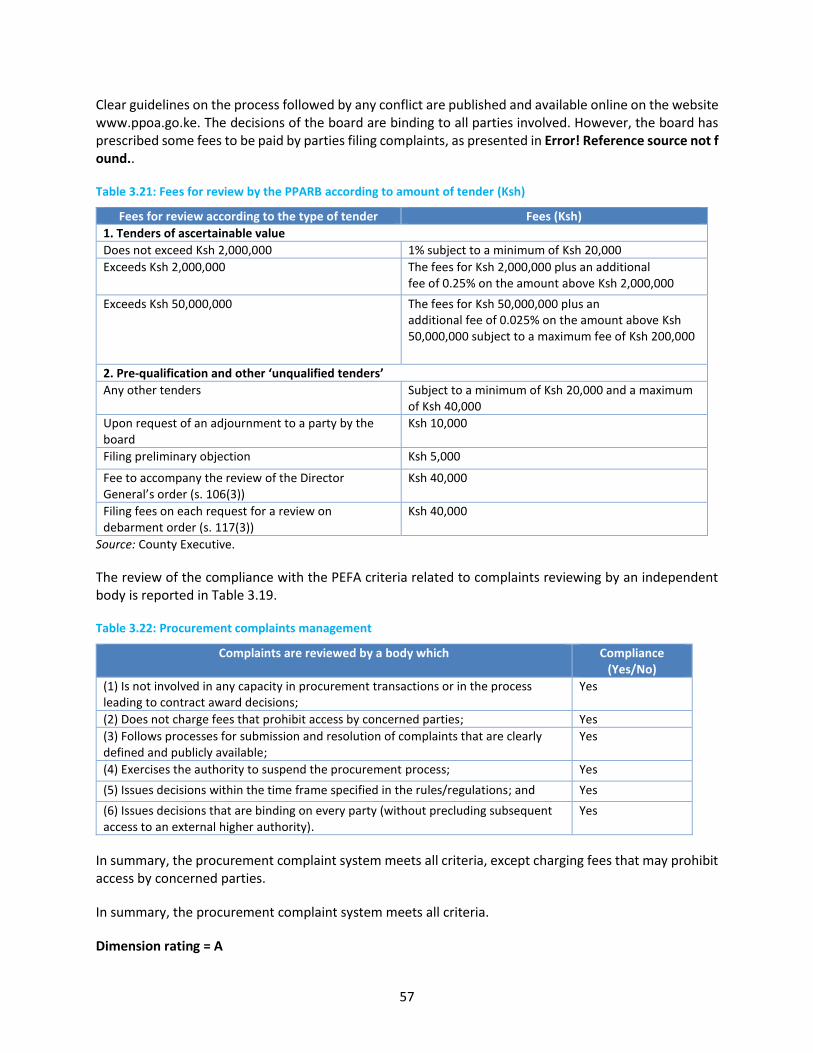
57
Clear guidelines on the process followed by any conflict are published and available online on the website www.ppoa.go.ke. The decisions of the board are binding to all parties involved. However, the board has prescribed some fees to be paid by parties filing complaints, as presented in Error! Reference source not found..
Table 3.21: Fees for review by the PPARB according to amount of tender (Ksh)
Fees for review according to the type of tender Fees (Ksh)
1. Tenders of ascertainable value
Does not exceed Ksh 2,000,000 1% subject to a minimum of Ksh 20,000
Exceeds Ksh 2,000,000 The fees for Ksh 2,000,000 plus an additional fee of 0.25% on the amount above Ksh 2,000,000
Exceeds Ksh 50,000,000 The fees for Ksh 50,000,000 plus an additional fee of 0.025% on the amount above Ksh 50,000,000 subject to a maximum fee of Ksh 200,000
2. Pre-qualification and other ‘unqualified tenders’
Any other tenders Subject to a minimum of Ksh 20,000 and a maximum of Ksh 40,000
Upon request of an adjournment to a party by the board
Ksh 10,000
Filing preliminary objection Ksh 5,000
Fee to accompany the review of the Director General’s order (s. 106(3))
Ksh 40,000
Filing fees on each request for a review on debarment order (s. 117(3))
Ksh 40,000
Source: County Executive.
The review of the compliance with the PEFA criteria related to complaints reviewing by an independent body is reported in Table 3.19.
Table 3.22: Procurement complaints management
Complaints are reviewed by a body which Compliance (Yes/No)
(1) Is not involved in any capacity in procurement transactions or in the process leading to contract award decisions;
Yes
(2) Does not charge fees that prohibit access by concerned parties; Yes
(3) Follows processes for submission and resolution of complaints that are clearly defined and publicly available;
Yes
(4) Exercises the authority to suspend the procurement process; Yes
(5) Issues decisions within the time frame specified in the rules/regulations; and Yes
(6) Issues decisions that are binding on every party (without precluding subsequent access to an external higher authority).
Yes
In summary, the procurement complaint system meets all criteria, except charging fees that may prohibit access by concerned parties.
In summary, the procurement complaint system meets all criteria.
Dimension rating = A
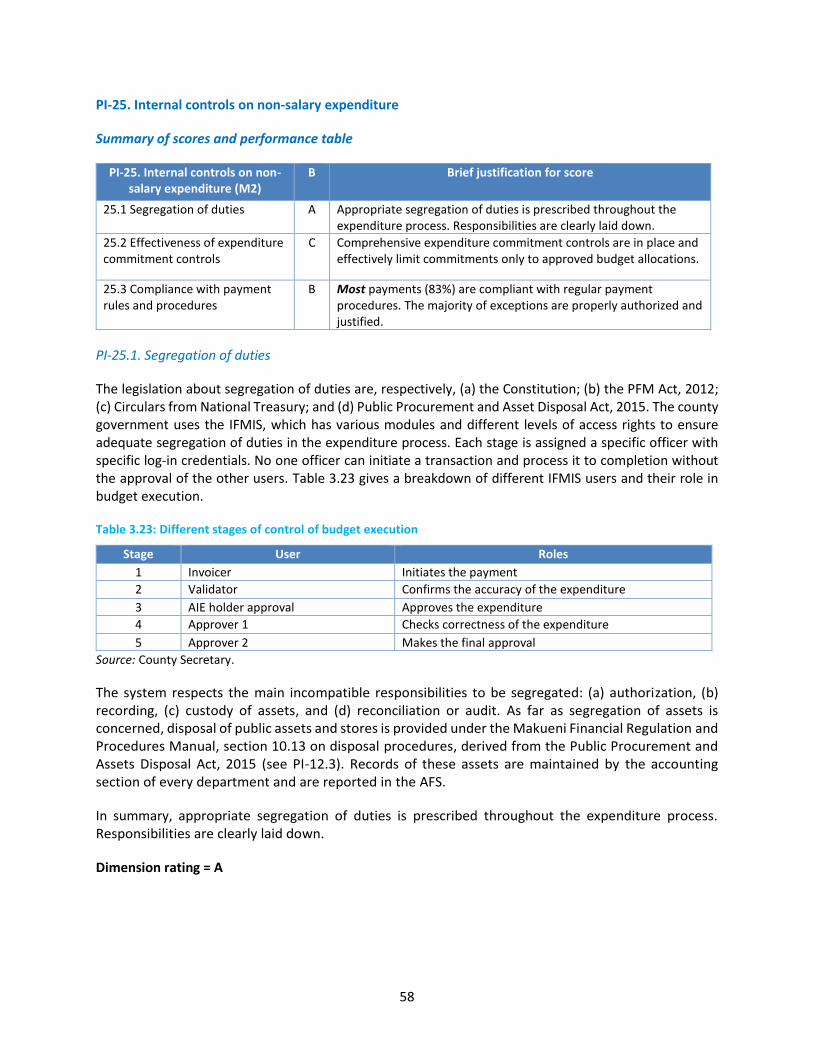
58
PI-25. Internal controls on non-salary expenditure
Summary of scores and performance table
PI-25. Internal controls on non-salary expenditure (M2)
B Brief justification for score
25.1 Segregation of duties A Appropriate segregation of duties is prescribed throughout the expenditure process. Responsibilities are clearly laid down.
25.2 Effectiveness of expenditure commitment controls
C Comprehensive expenditure commitment controls are in place and effectively limit commitments only to approved budget allocations.
25.3 Compliance with payment rules and procedures
B Most payments (83%) are compliant with regular payment procedures. The majority of exceptions are properly authorized and justified.
PI-25.1. Segregation of duties
The legislation about segregation of duties are, respectively, (a) the Constitution; (b) the PFM Act, 2012; (c) Circulars from National Treasury; and (d) Public Procurement and Asset Disposal Act, 2015. The county government uses the IFMIS, which has various modules and different levels of access rights to ensure adequate segregation of duties in the expenditure process. Each stage is assigned a specific officer with specific log-in credentials. No one officer can initiate a transaction and process it to completion without the approval of the other users. Table 3.23 gives a breakdown of different IFMIS users and their role in budget execution.
Table 3.23: Different stages of control of budget execution
Stage User Roles
1 Invoicer Initiates the payment
2 Validator Confirms the accuracy of the expenditure
3 AIE holder approval Approves the expenditure
4 Approver 1 Checks correctness of the expenditure
5 Approver 2 Makes the final approval
Source: County Secretary.
The system respects the main incompatible responsibilities to be segregated: (a) authorization, (b) recording, (c) custody of assets, and (d) reconciliation or audit. As far as segregation of assets is concerned, disposal of public assets and stores is provided under the Makueni Financial Regulation and Procedures Manual, section 10.13 on disposal procedures, derived from the Public Procurement and Assets Disposal Act, 2015 (see PI-12.3). Records of these assets are maintained by the accounting section of every department and are reported in the AFS.
In summary, appropriate segregation of duties is prescribed throughout the expenditure process. Responsibilities are clearly laid down.
Dimension rating = A
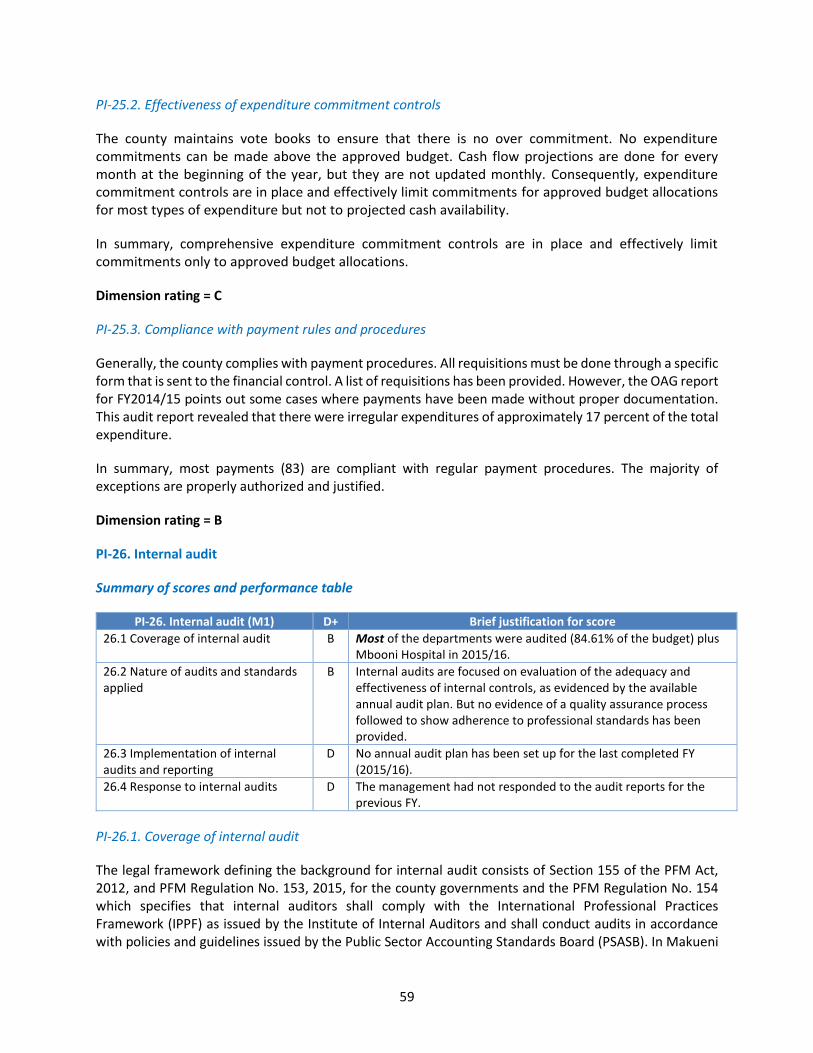
59
PI-25.2. Effectiveness of expenditure commitment controls
The county maintains vote books to ensure that there is no over commitment. No expenditure commitments can be made above the approved budget. Cash flow projections are done for every month at the beginning of the year, but they are not updated monthly. Consequently, expenditure commitment controls are in place and effectively limit commitments for approved budget allocations for most types of expenditure but not to projected cash availability.
In summary, comprehensive expenditure commitment controls are in place and effectively limit commitments only to approved budget allocations.
Dimension rating = C
PI-25.3. Compliance with payment rules and procedures
Generally, the county complies with payment procedures. All requisitions must be done through a specific form that is sent to the financial control. A list of requisitions has been provided. However, the OAG report for FY2014/15 points out some cases where payments have been made without proper documentation. This audit report revealed that there were irregular expenditures of approximately 17 percent of the total expenditure.
In summary, most payments (83) are compliant with regular payment procedures. The majority of exceptions are properly authorized and justified.
Dimension rating = B
PI-26. Internal audit
Summary of scores and performance table
PI-26. Internal audit (M1) D+ Brief justification for score
26.1 Coverage of internal audit B Most of the departments were audited (84.61% of the budget) plus Mbooni Hospital in 2015/16.
26.2 Nature of audits and standards applied
B Internal audits are focused on evaluation of the adequacy and effectiveness of internal controls, as evidenced by the available annual audit plan. But no evidence of a quality assurance process followed to show adherence to professional standards has been provided.
26.3 Implementation of internal audits and reporting
D No annual audit plan has been set up for the last completed FY (2015/16).
26.4 Response to internal audits D The management had not responded to the audit reports for the previous FY.
PI-26.1. Coverage of internal audit
The legal framework defining the background for internal audit consists of Section 155 of the PFM Act, 2012, and PFM Regulation No. 153, 2015, for the county governments and the PFM Regulation No. 154 which specifies that internal auditors shall comply with the International Professional Practices Framework (IPPF) as issued by the Institute of Internal Auditors and shall conduct audits in accordance with policies and guidelines issued by the Public Sector Accounting Standards Board (PSASB). In Makueni
60
County, the internal audit unit was established only in FY2015/16 and became functional in January 2017. Thus, no report was provided for the previous three FYs. Before establishment of the unit, there was only one officer in charge of internal audit. The internal audit unit conducted audits only in FY2015/16. According to data provided, most of departments were audited (84.61 of the budget) plus Mbooni Hospital and Makueni Hospital. The County Assembly has also established an internal audit unit, but no data was provided.
In summary, internal audit is operational for central government entities representing total budgeted expenditures and for central government entities collecting budgeted government revenue.
Dimension rating =B
PI-26.2. Nature of audits and standards applied
The internal audit function in Makueni County Government became operational in FY2016/17. Internal audits focused on evaluation of the adequacy and effectiveness of internal controls, as evidenced by the available annual audit plan. On February 23, 2017, an Audit Committee was inaugurated to support the management in risk control and governance and also provide associated assurance. However, there was no evidence of a quality assurance process followed to show adherence to professional standards.
In summary, internal audits are focused on evaluation of the adequacy and effectiveness of internal controls, as evidenced by the available annual audit plan. But there was no evidence of a quality assurance process followed to show adherence to professional standards has been provided.
Dimension rating = B
PI-26.3. Implementation of internal audits and reporting
There was no annual audit plan for the last completed FY (2015/16). The audit plan provided was for FY 2016/17. However, a list of completed internal audits for that FY together with the respective reports was provided.
Dimension rating = D
PI-26.4. Response to internal audits
The first internal reports that the audit team released were for FY2015/16 and are still awaiting responses from the management (accounting officers).
Dimension rating = D
3.7 Pillar VI. Accounting and reporting
Indicators under this pillar measure whether accurate and reliable records are maintained, and information is produced and disseminated at appropriate times to meet decision-making, management, and reporting needs. There are three indicators under this pillar: financial data integrity, in-year budget reports, and annual financial reports.
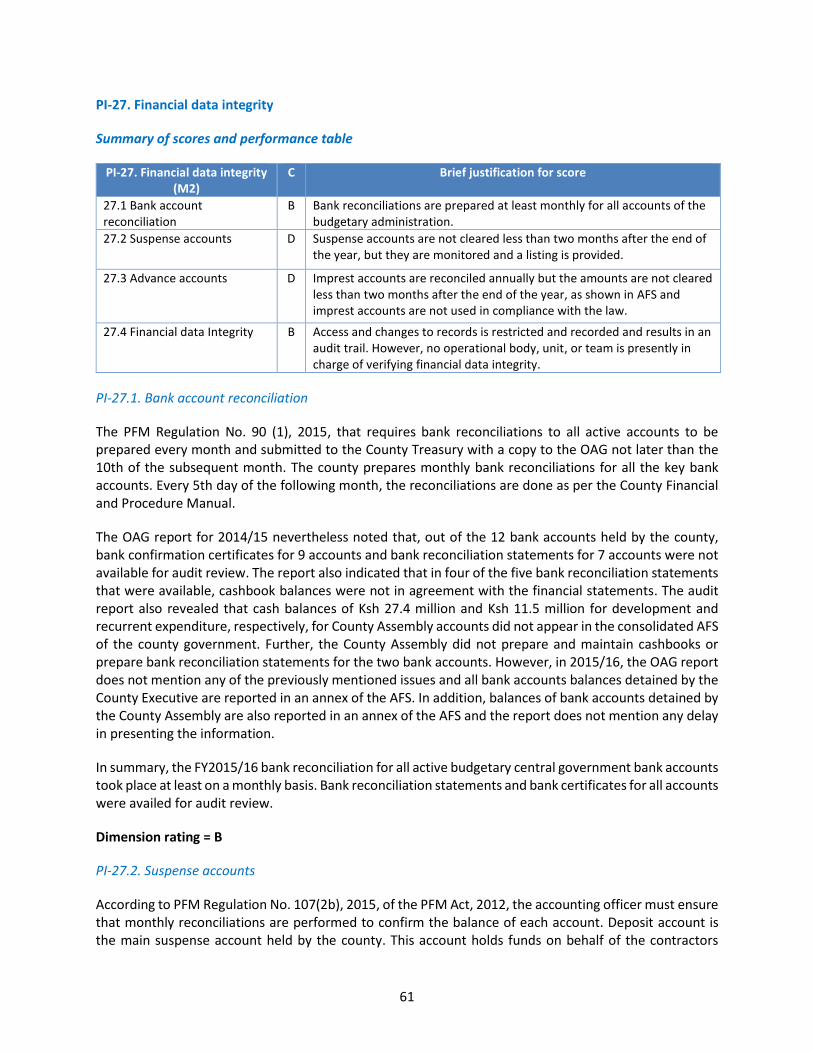
61
PI-27. Financial data integrity
Summary of scores and performance table
PI-27. Financial data integrity (M2)
C Brief justification for score
27.1 Bank account reconciliation
B Bank reconciliations are prepared at least monthly for all accounts of the budgetary administration.
27.2 Suspense accounts D Suspense accounts are not cleared less than two months after the end of the year, but they are monitored and a listing is provided.
27.3 Advance accounts D Imprest accounts are reconciled annually but the amounts are not cleared less than two months after the end of the year, as shown in AFS and imprest accounts are not used in compliance with the law.
27.4 Financial data Integrity B Access and changes to records is restricted and recorded and results in an audit trail. However, no operational body, unit, or team is presently in charge of verifying financial data integrity.
PI-27.1. Bank account reconciliation
The PFM Regulation No. 90 (1), 2015, that requires bank reconciliations to all active accounts to be prepared every month and submitted to the County Treasury with a copy to the OAG not later than the 10th of the subsequent month. The county prepares monthly bank reconciliations for all the key bank accounts. Every 5th day of the following month, the reconciliations are done as per the County Financial and Procedure Manual.
The OAG report for 2014/15 nevertheless noted that, out of the 12 bank accounts held by the county, bank confirmation certificates for 9 accounts and bank reconciliation statements for 7 accounts were not available for audit review. The report also indicated that in four of the five bank reconciliation statements that were available, cashbook balances were not in agreement with the financial statements. The audit report also revealed that cash balances of Ksh 27.4 million and Ksh 11.5 million for development and recurrent expenditure, respectively, for County Assembly accounts did not appear in the consolidated AFS of the county government. Further, the County Assembly did not prepare and maintain cashbooks or prepare bank reconciliation statements for the two bank accounts. However, in 2015/16, the OAG report does not mention any of the previously mentioned issues and all bank accounts balances detained by the County Executive are reported in an annex of the AFS. In addition, balances of bank accounts detained by the County Assembly are also reported in an annex of the AFS and the report does not mention any delay in presenting the information.
In summary, the FY2015/16 bank reconciliation for all active budgetary central government bank accounts took place at least on a monthly basis. Bank reconciliation statements and bank certificates for all accounts were availed for audit review.
Dimension rating = B
PI-27.2. Suspense accounts
According to PFM Regulation No. 107(2b), 2015, of the PFM Act, 2012, the accounting officer must ensure that monthly reconciliations are performed to confirm the balance of each account. Deposit account is the main suspense account held by the county. This account holds funds on behalf of the contractors
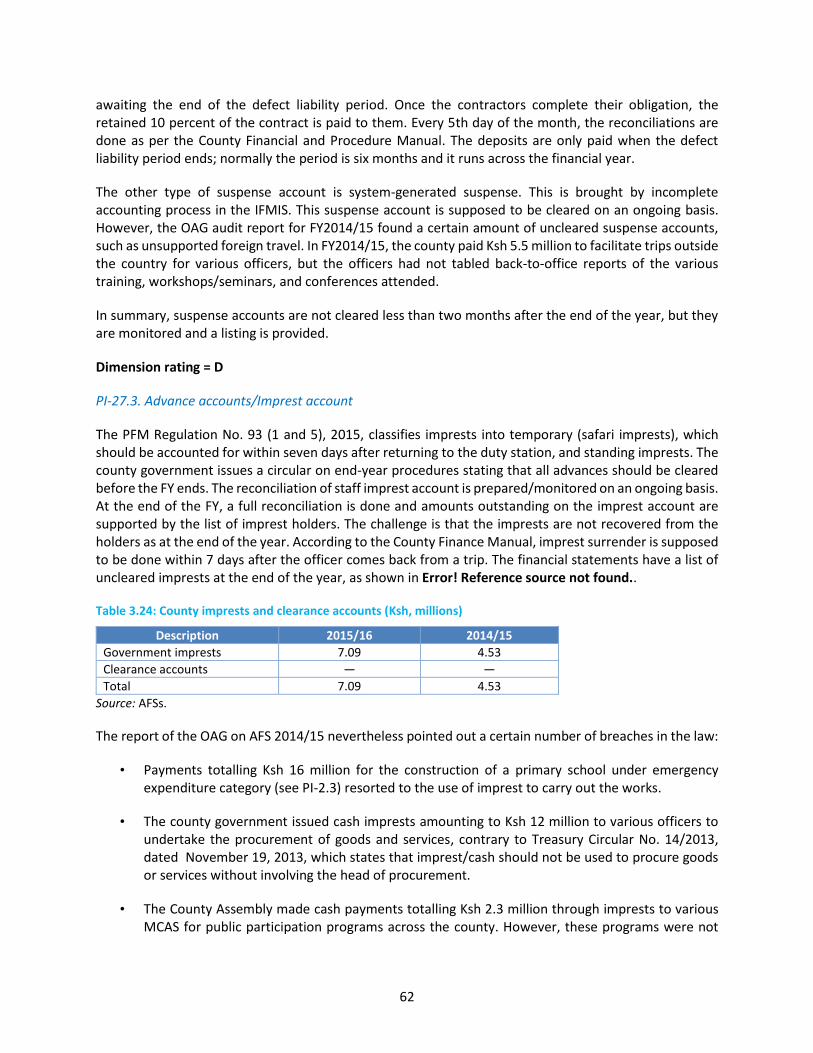
62
awaiting the end of the defect liability period. Once the contractors complete their obligation, the retained 10 percent of the contract is paid to them. Every 5th day of the month, the reconciliations are done as per the County Financial and Procedure Manual. The deposits are only paid when the defect liability period ends; normally the period is six months and it runs across the financial year.
The other type of suspense account is system-generated suspense. This is brought by incomplete accounting process in the IFMIS. This suspense account is supposed to be cleared on an ongoing basis. However, the OAG audit report for FY2014/15 found a certain amount of uncleared suspense accounts, such as unsupported foreign travel. In FY2014/15, the county paid Ksh 5.5 million to facilitate trips outside the country for various officers, but the officers had not tabled back-to-office reports of the various training, workshops/seminars, and conferences attended.
In summary, suspense accounts are not cleared less than two months after the end of the year, but they are monitored and a listing is provided.
Dimension rating = D
PI-27.3. Advance accounts/Imprest account
The PFM Regulation No. 93 (1 and 5), 2015, classifies imprests into temporary (safari imprests), which should be accounted for within seven days after returning to the duty station, and standing imprests. The county government issues a circular on end-year procedures stating that all advances should be cleared before the FY ends. The reconciliation of staff imprest account is prepared/monitored on an ongoing basis. At the end of the FY, a full reconciliation is done and amounts outstanding on the imprest account are supported by the list of imprest holders. The challenge is that the imprests are not recovered from the holders as at the end of the year. According to the County Finance Manual, imprest surrender is supposed to be done within 7 days after the officer comes back from a trip. The financial statements have a list of uncleared imprests at the end of the year, as shown in Error! Reference source not found..
Table 3.24: County imprests and clearance accounts (Ksh, millions)
Description 2015/16 2014/15
Government imprests 7.09 4.53
Clearance accounts — —
Total 7.09 4.53
Source: AFSs.
The report of the OAG on AFS 2014/15 nevertheless pointed out a certain number of breaches in the law:
• Payments totalling Ksh 16 million for the construction of a primary school under emergency expenditure category (see PI-2.3) resorted to the use of imprest to carry out the works.
• The county government issued cash imprests amounting to Ksh 12 million to various officers to undertake the procurement of goods and services, contrary to Treasury Circular No. 14/2013, dated November 19, 2013, which states that imprest/cash should not be used to procure goods or services without involving the head of procurement.
• The County Assembly made cash payments totalling Ksh 2.3 million through imprests to various MCAS for public participation programs across the county. However, these programs were not
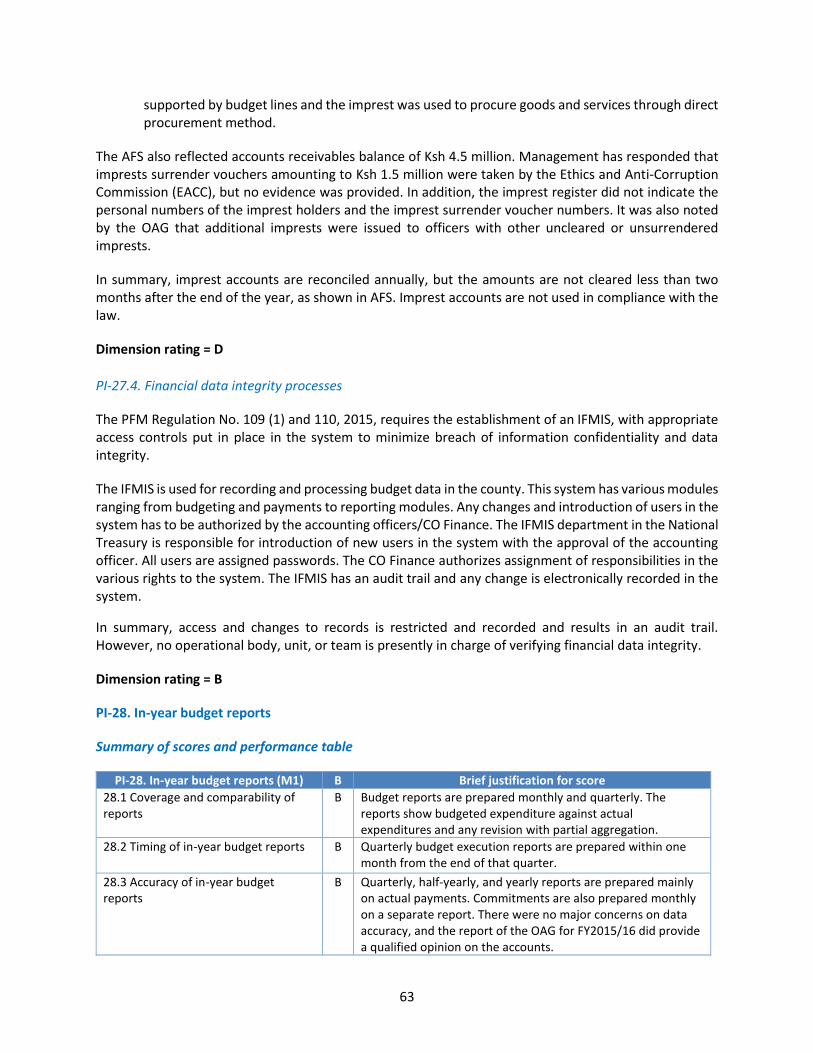
63
supported by budget lines and the imprest was used to procure goods and services through direct procurement method.
The AFS also reflected accounts receivables balance of Ksh 4.5 million. Management has responded that imprests surrender vouchers amounting to Ksh 1.5 million were taken by the Ethics and Anti-Corruption Commission (EACC), but no evidence was provided. In addition, the imprest register did not indicate the personal numbers of the imprest holders and the imprest surrender voucher numbers. It was also noted by the OAG that additional imprests were issued to officers with other uncleared or unsurrendered imprests.
In summary, imprest accounts are reconciled annually, but the amounts are not cleared less than two months after the end of the year, as shown in AFS. Imprest accounts are not used in compliance with the law.
Dimension rating = D
PI-27.4. Financial data integrity processes
The PFM Regulation No. 109 (1) and 110, 2015, requires the establishment of an IFMIS, with appropriate access controls put in place in the system to minimize breach of information confidentiality and data integrity.
The IFMIS is used for recording and processing budget data in the county. This system has various modules ranging from budgeting and payments to reporting modules. Any changes and introduction of users in the system has to be authorized by the accounting officers/CO Finance. The IFMIS department in the National Treasury is responsible for introduction of new users in the system with the approval of the accounting officer. All users are assigned passwords. The CO Finance authorizes assignment of responsibilities in the various rights to the system. The IFMIS has an audit trail and any change is electronically recorded in the system.
In summary, access and changes to records is restricted and recorded and results in an audit trail. However, no operational body, unit, or team is presently in charge of verifying financial data integrity.
Dimension rating = B
PI-28. In-year budget reports
Summary of scores and performance table
PI-28. In-year budget reports (M1) B Brief justification for score
28.1 Coverage and comparability of reports
B Budget reports are prepared monthly and quarterly. The reports show budgeted expenditure against actual expenditures and any revision with partial aggregation.
28.2 Timing of in-year budget reports B Quarterly budget execution reports are prepared within one month from the end of that quarter.
28.3 Accuracy of in-year budget reports
B Quarterly, half-yearly, and yearly reports are prepared mainly on actual payments. Commitments are also prepared monthly on a separate report. There were no major concerns on data accuracy, and the report of the OAG for FY2015/16 did provide a qualified opinion on the accounts.
64
PI-28.1. Coverage and comparability of reports
Makueni County prepares monthly and quarterly budget reports. The reports show budgeted expenditure against actual expenditure and any revision in the same line items. Coverage and classification of data allow direct comparison to the original budget with a certain level of aggregation. Economic classification is the same as in the budget; there is no separate economic classification provided. Only the three main items of this classification (for example, compensation of employees, use of goods and services, and consumption of fixed capital) are provided in the reports. No transfers exist to deconcentrated units.
In summary, budget reports are prepared monthly and quarterly. The reports show budgeted expenditure against actual expenditures and any revision with partial aggregation.
Dimension rating = B
PI-28.2. Timing of in-year budget reports
Budget execution reports are prepared quarterly and the reports disclose monthly data. They are produced within one month from the end of the relevant period. For example, the fourth quarter report for the period ended June 30, 2016, was completed on July 20, 2016.
In summary, quarterly budget execution reports are prepared within one month from the end of the quarter.
Dimension rating = B
PI-28.3. Accuracy of in-year budget reports
In-year quarterly and monthly reports by the county are prepared mainly on actual payments. Commitments are also monthly prepared on a separate report. However, there are concerns regarding data accuracy, as the OAG audit report for FY2014/15 does not give a positive opinion on the accounts.
Management letter by the OAG identifies some areas of concern. For example, the recurrent expenditure for FY2015/16 presented a total amount of Ksh 3.527 billion and development expenditure a total of Ksh 1.335 billion. These figures differed with the IFMIS vote book, which presented accumulated expenditure figures of Ksh 4.117 billion and Ksh 1.402 billion for both recurrent and development expenditures, respectively. Some concerns were also noted about revenue collection and preparation of cashbook.
The situation improved for FY2015/16, as the OAG was able to provide a qualified opinion, not seeing major discrepancies between the IFMIS reports and AFS and stating that the financial statements presented fairly the financial position of the County Executive.
In summary, quarterly, half-yearly, and yearly reports are prepared mainly on actual payments. Commitments are also prepared monthly on a separate report. There were no major concerns on data accuracy, and the report of the OAG for FY2015/16 did provide a qualified opinion on the accounts.
Dimension rating = B
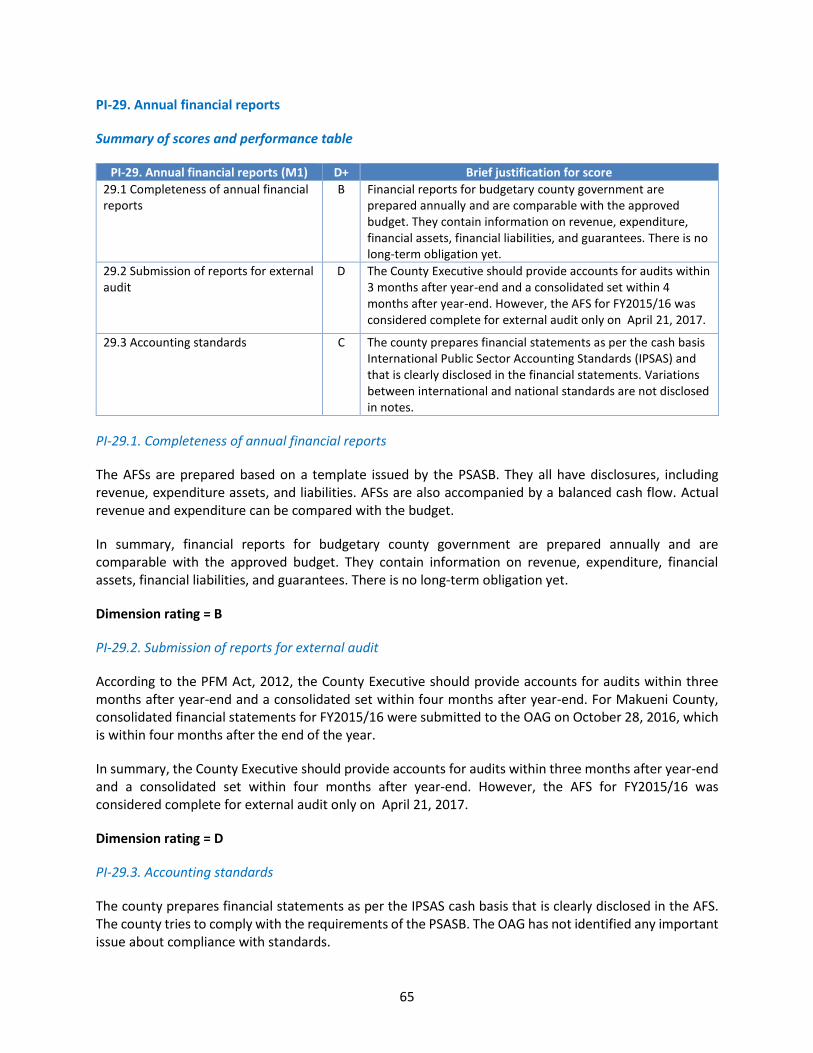
65
PI-29. Annual financial reports
Summary of scores and performance table
PI-29. Annual financial reports (M1) D+ Brief justification for score
29.1 Completeness of annual financial reports
B Financial reports for budgetary county government are prepared annually and are comparable with the approved budget. They contain information on revenue, expenditure, financial assets, financial liabilities, and guarantees. There is no long-term obligation yet.
29.2 Submission of reports for external audit
D The County Executive should provide accounts for audits within 3 months after year-end and a consolidated set within 4 months after year-end. However, the AFS for FY2015/16 was considered complete for external audit only on April 21, 2017.
29.3 Accounting standards C The county prepares financial statements as per the cash basis International Public Sector Accounting Standards (IPSAS) and that is clearly disclosed in the financial statements. Variations between international and national standards are not disclosed in notes.
PI-29.1. Completeness of annual financial reports
The AFSs are prepared based on a template issued by the PSASB. They all have disclosures, including revenue, expenditure assets, and liabilities. AFSs are also accompanied by a balanced cash flow. Actual revenue and expenditure can be compared with the budget.
In summary, financial reports for budgetary county government are prepared annually and are comparable with the approved budget. They contain information on revenue, expenditure, financial assets, financial liabilities, and guarantees. There is no long-term obligation yet.
Dimension rating = B
PI-29.2. Submission of reports for external audit
According to the PFM Act, 2012, the County Executive should provide accounts for audits within three months after year-end and a consolidated set within four months after year-end. For Makueni County, consolidated financial statements for FY2015/16 were submitted to the OAG on October 28, 2016, which is within four months after the end of the year.
In summary, the County Executive should provide accounts for audits within three months after year-end and a consolidated set within four months after year-end. However, the AFS for FY2015/16 was considered complete for external audit only on April 21, 2017.
Dimension rating = D
PI-29.3. Accounting standards
The county prepares financial statements as per the IPSAS cash basis that is clearly disclosed in the AFS. The county tries to comply with the requirements of the PSASB. The OAG has not identified any important issue about compliance with standards.
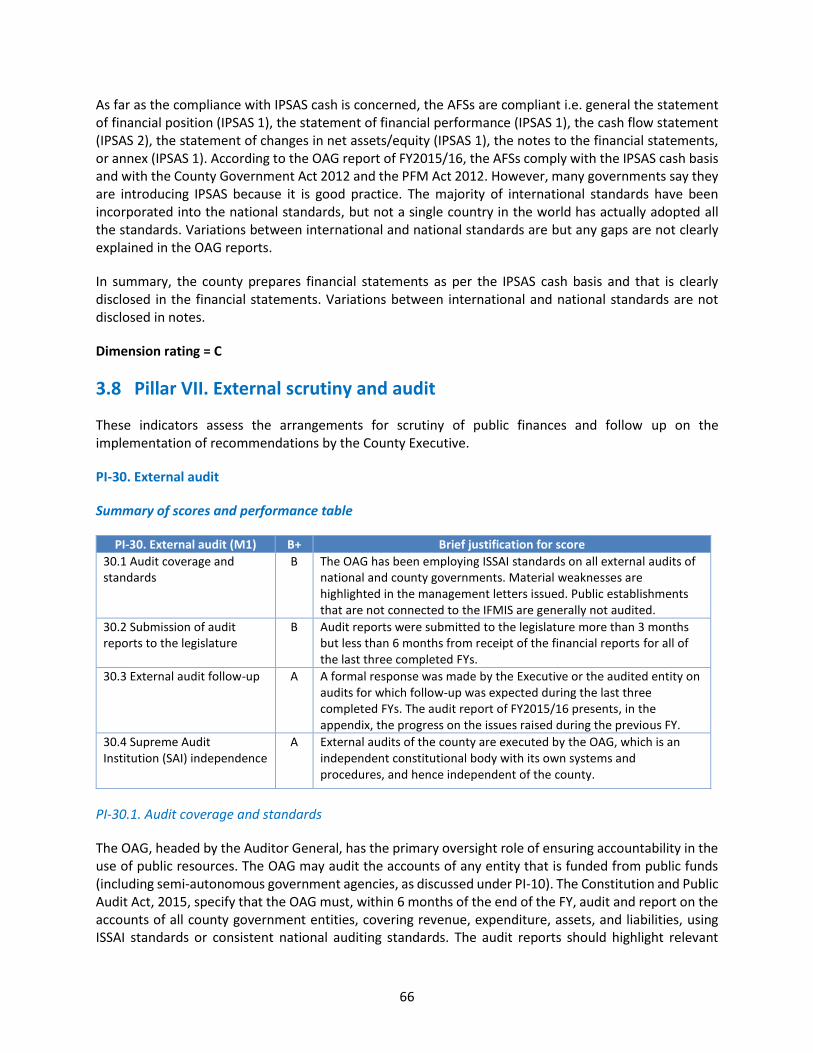
66
As far as the compliance with IPSAS cash is concerned, the AFSs are compliant i.e. general the statement of financial position (IPSAS 1), the statement of financial performance (IPSAS 1), the cash flow statement (IPSAS 2), the statement of changes in net assets/equity (IPSAS 1), the notes to the financial statements, or annex (IPSAS 1). According to the OAG report of FY2015/16, the AFSs comply with the IPSAS cash basis and with the County Government Act 2012 and the PFM Act 2012. However, many governments say they are introducing IPSAS because it is good practice. The majority of international standards have been incorporated into the national standards, but not a single country in the world has actually adopted all the standards. Variations between international and national standards are but any gaps are not clearly explained in the OAG reports.
In summary, the county prepares financial statements as per the IPSAS cash basis and that is clearly disclosed in the financial statements. Variations between international and national standards are not disclosed in notes.
Dimension rating = C
3.8 Pillar VII. External scrutiny and audit
These indicators assess the arrangements for scrutiny of public finances and follow up on the implementation of recommendations by the County Executive.
PI-30. External audit
Summary of scores and performance table
PI-30. External audit (M1) B+ Brief justification for score
30.1 Audit coverage and standards
B The OAG has been employing ISSAI standards on all external audits of national and county governments. Material weaknesses are highlighted in the management letters issued. Public establishments that are not connected to the IFMIS are generally not audited.
30.2 Submission of audit reports to the legislature
B Audit reports were submitted to the legislature more than 3 months but less than 6 months from receipt of the financial reports for all of the last three completed FYs.
30.3 External audit follow-up A A formal response was made by the Executive or the audited entity on audits for which follow-up was expected during the last three completed FYs. The audit report of FY2015/16 presents, in the appendix, the progress on the issues raised during the previous FY.
30.4 Supreme Audit Institution (SAI) independence
A External audits of the county are executed by the OAG, which is an independent constitutional body with its own systems and procedures, and hence independent of the county.
PI-30.1. Audit coverage and standards
The OAG, headed by the Auditor General, has the primary oversight role of ensuring accountability in the use of public resources. The OAG may audit the accounts of any entity that is funded from public funds (including semi-autonomous government agencies, as discussed under PI-10). The Constitution and Public Audit Act, 2015, specify that the OAG must, within 6 months of the end of the FY, audit and report on the accounts of all county government entities, covering revenue, expenditure, assets, and liabilities, using ISSAI standards or consistent national auditing standards. The audit reports should highlight relevant
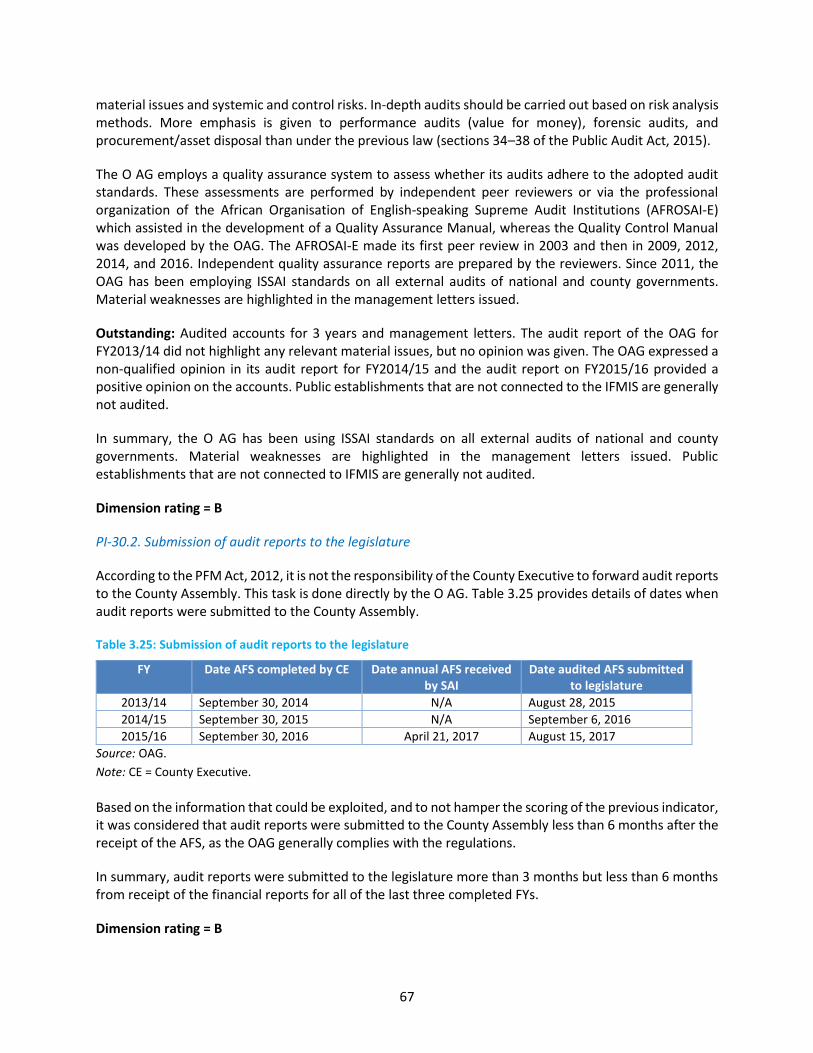
67
material issues and systemic and control risks. In-depth audits should be carried out based on risk analysis methods. More emphasis is given to performance audits (value for money), forensic audits, and procurement/asset disposal than under the previous law (sections 34–38 of the Public Audit Act, 2015).
The O AG employs a quality assurance system to assess whether its audits adhere to the adopted audit standards. These assessments are performed by independent peer reviewers or via the professional organization of the African Organisation of English-speaking Supreme Audit Institutions (AFROSAI-E) which assisted in the development of a Quality Assurance Manual, whereas the Quality Control Manual was developed by the OAG. The AFROSAI-E made its first peer review in 2003 and then in 2009, 2012, 2014, and 2016. Independent quality assurance reports are prepared by the reviewers. Since 2011, the OAG has been employing ISSAI standards on all external audits of national and county governments. Material weaknesses are highlighted in the management letters issued.
Outstanding: Audited accounts for 3 years and management letters. The audit report of the OAG for FY2013/14 did not highlight any relevant material issues, but no opinion was given. The OAG expressed a non-qualified opinion in its audit report for FY2014/15 and the audit report on FY2015/16 provided a positive opinion on the accounts. Public establishments that are not connected to the IFMIS are generally not audited.
In summary, the O AG has been using ISSAI standards on all external audits of national and county governments. Material weaknesses are highlighted in the management letters issued. Public establishments that are not connected to IFMIS are generally not audited.
Dimension rating = B
PI-30.2. Submission of audit reports to the legislature
According to the PFM Act, 2012, it is not the responsibility of the County Executive to forward audit reports to the County Assembly. This task is done directly by the O AG. Table 3.25 provides details of dates when audit reports were submitted to the County Assembly.
Table 3.25: Submission of audit reports to the legislature
FY Date AFS completed by CE Date annual AFS received by SAI
Date audited AFS submitted to legislature
2013/14 September 30, 2014 N/A August 28, 2015
2014/15 September 30, 2015 N/A September 6, 2016
2015/16 September 30, 2016 April 21, 2017 August 15, 2017
Source: OAG.
Note: CE = County Executive.
Based on the information that could be exploited, and to not hamper the scoring of the previous indicator, it was considered that audit reports were submitted to the County Assembly less than 6 months after the receipt of the AFS, as the OAG generally complies with the regulations.
In summary, audit reports were submitted to the legislature more than 3 months but less than 6 months from receipt of the financial reports for all of the last three completed FYs.
Dimension rating = B
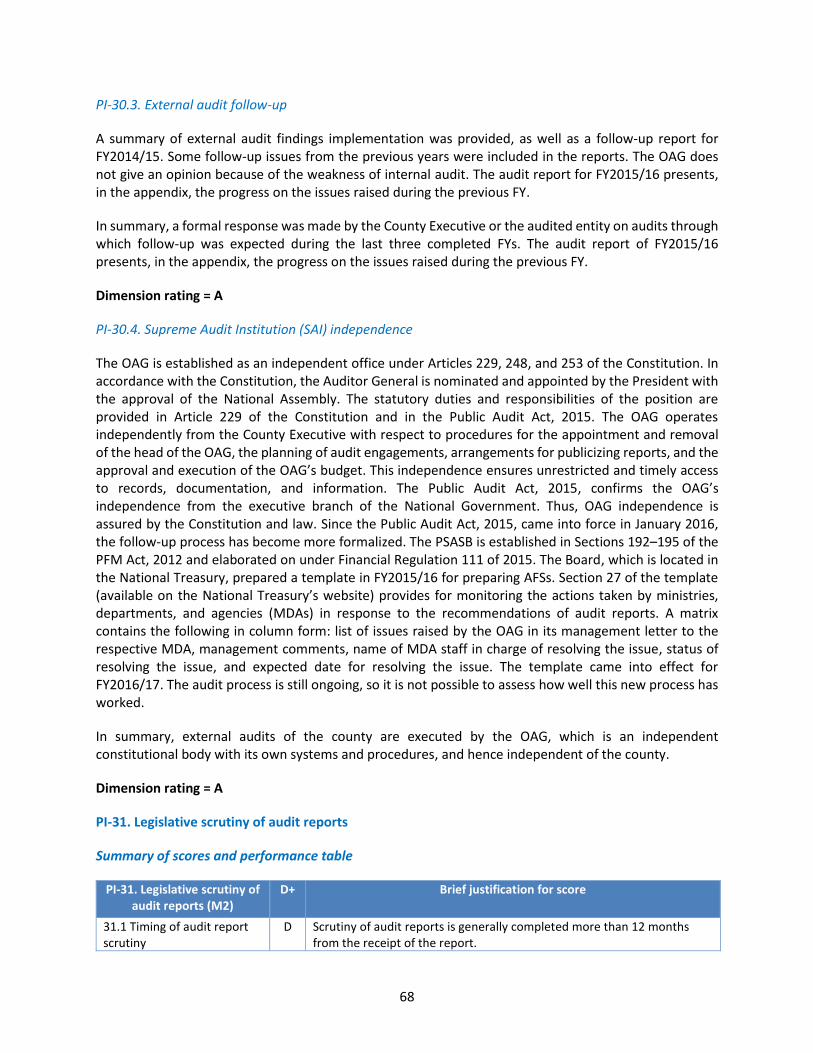
68
PI-30.3. External audit follow-up
A summary of external audit findings implementation was provided, as well as a follow-up report for FY2014/15. Some follow-up issues from the previous years were included in the reports. The OAG does not give an opinion because of the weakness of internal audit. The audit report for FY2015/16 presents, in the appendix, the progress on the issues raised during the previous FY.
In summary, a formal response was made by the County Executive or the audited entity on audits through which follow-up was expected during the last three completed FYs. The audit report of FY2015/16 presents, in the appendix, the progress on the issues raised during the previous FY.
Dimension rating = A
PI-30.4. Supreme Audit Institution (SAI) independence
The OAG is established as an independent office under Articles 229, 248, and 253 of the Constitution. In accordance with the Constitution, the Auditor General is nominated and appointed by the President with the approval of the National Assembly. The statutory duties and responsibilities of the position are provided in Article 229 of the Constitution and in the Public Audit Act, 2015. The OAG operates independently from the County Executive with respect to procedures for the appointment and removal of the head of the OAG, the planning of audit engagements, arrangements for publicizing reports, and the approval and execution of the OAG’s budget. This independence ensures unrestricted and timely access to records, documentation, and information. The Public Audit Act, 2015, confirms the OAG’s independence from the executive branch of the National Government. Thus, OAG independence is assured by the Constitution and law. Since the Public Audit Act, 2015, came into force in January 2016, the follow-up process has become more formalized. The PSASB is established in Sections 192–195 of the PFM Act, 2012 and elaborated on under Financial Regulation 111 of 2015. The Board, which is located in the National Treasury, prepared a template in FY2015/16 for preparing AFSs. Section 27 of the template (available on the National Treasury’s website) provides for monitoring the actions taken by ministries, departments, and agencies (MDAs) in response to the recommendations of audit reports. A matrix contains the following in column form: list of issues raised by the OAG in its management letter to the respective MDA, management comments, name of MDA staff in charge of resolving the issue, status of resolving the issue, and expected date for resolving the issue. The template came into effect for FY2016/17. The audit process is still ongoing, so it is not possible to assess how well this new process has worked.
In summary, external audits of the county are executed by the OAG, which is an independent constitutional body with its own systems and procedures, and hence independent of the county.
Dimension rating = A
PI-31. Legislative scrutiny of audit reports
Summary of scores and performance table
PI-31. Legislative scrutiny of audit reports (M2)
D+ Brief justification for score
31.1 Timing of audit report scrutiny
D Scrutiny of audit reports is generally completed more than 12 months from the receipt of the report.
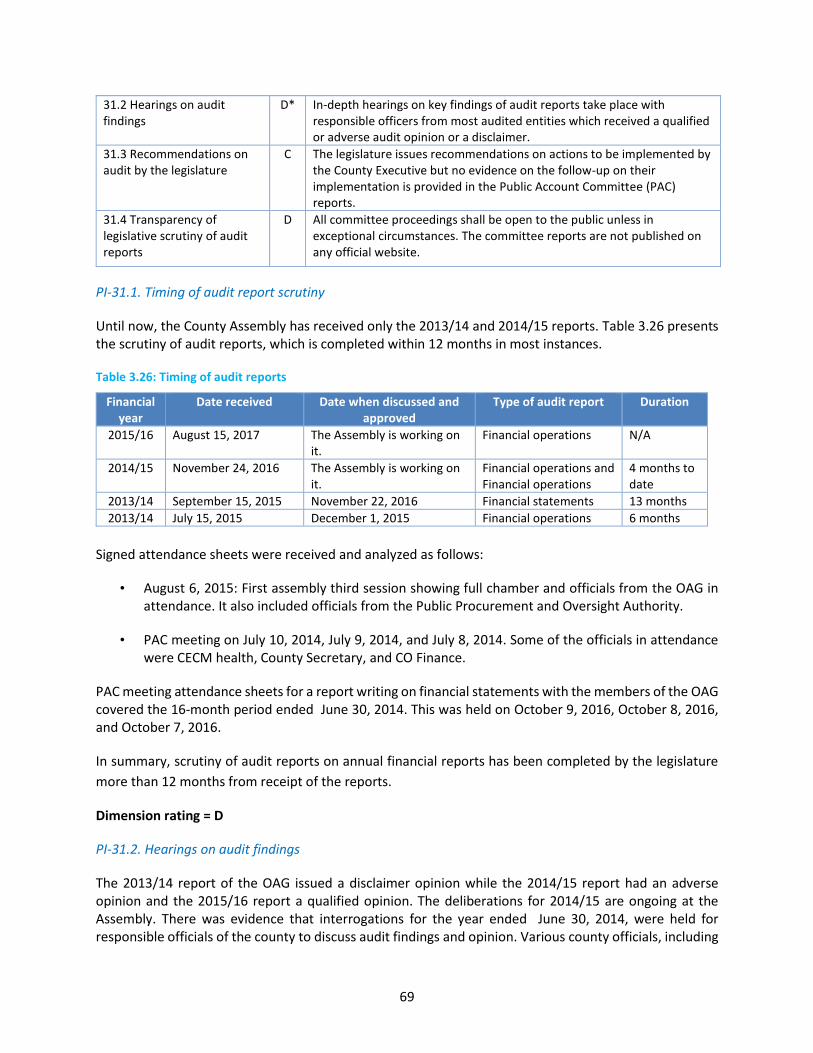
69
31.2 Hearings on audit findings
D* In-depth hearings on key findings of audit reports take place with responsible officers from most audited entities which received a qualified or adverse audit opinion or a disclaimer.
31.3 Recommendations on audit by the legislature
C The legislature issues recommendations on actions to be implemented by the County Executive but no evidence on the follow-up on their implementation is provided in the Public Account Committee (PAC) reports.
31.4 Transparency of legislative scrutiny of audit reports
D All committee proceedings shall be open to the public unless in exceptional circumstances. The committee reports are not published on any official website.
PI-31.1. Timing of audit report scrutiny
Until now, the County Assembly has received only the 2013/14 and 2014/15 reports. Table 3.26 presents the scrutiny of audit reports, which is completed within 12 months in most instances.
Table 3.26: Timing of audit reports
Financial year
Date received Date when discussed and approved
Type of audit report Duration
2015/16 August 15, 2017 The Assembly is working on it.
Financial operations N/A
2014/15 November 24, 2016 The Assembly is working on it.
Financial operations and Financial operations
4 months to date
2013/14 September 15, 2015 November 22, 2016 Financial statements 13 months
2013/14 July 15, 2015 December 1, 2015 Financial operations 6 months
Signed attendance sheets were received and analyzed as follows:
• August 6, 2015: First assembly third session showing full chamber and officials from the OAG in attendance. It also included officials from the Public Procurement and Oversight Authority.
• PAC meeting on July 10, 2014, July 9, 2014, and July 8, 2014. Some of the officials in attendance were CECM health, County Secretary, and CO Finance.
PAC meeting attendance sheets for a report writing on financial statements with the members of the OAG covered the 16-month period ended June 30, 2014. This was held on October 9, 2016, October 8, 2016, and October 7, 2016.
In summary, scrutiny of audit reports on annual financial reports has been completed by the legislature
more than 12 months from receipt of the reports.
Dimension rating = D
PI-31.2. Hearings on audit findings
The 2013/14 report of the OAG issued a disclaimer opinion while the 2014/15 report had an adverse opinion and the 2015/16 report a qualified opinion. The deliberations for 2014/15 are ongoing at the Assembly. There was evidence that interrogations for the year ended June 30, 2014, were held for responsible officials of the county to discuss audit findings and opinion. Various county officials, including
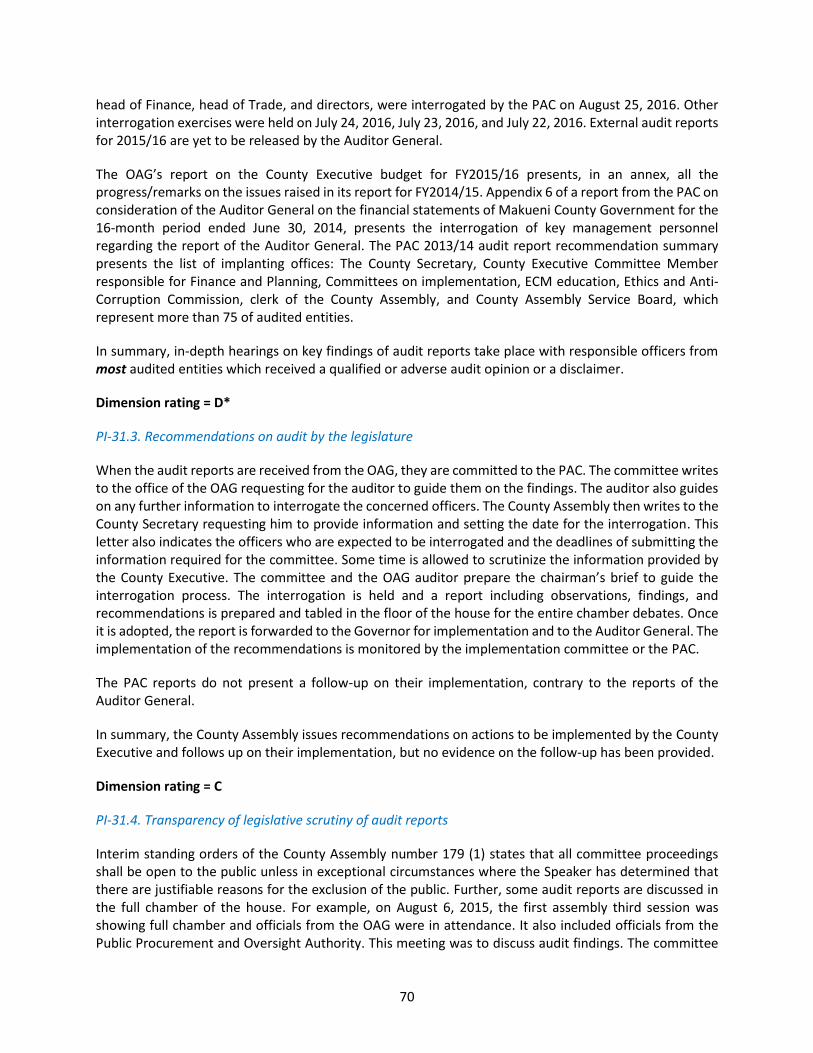
70
head of Finance, head of Trade, and directors, were interrogated by the PAC on August 25, 2016. Other interrogation exercises were held on July 24, 2016, July 23, 2016, and July 22, 2016. External audit reports for 2015/16 are yet to be released by the Auditor General.
The OAG’s report on the County Executive budget for FY2015/16 presents, in an annex, all the progress/remarks on the issues raised in its report for FY2014/15. Appendix 6 of a report from the PAC on consideration of the Auditor General on the financial statements of Makueni County Government for the 16-month period ended June 30, 2014, presents the interrogation of key management personnel regarding the report of the Auditor General. The PAC 2013/14 audit report recommendation summary presents the list of implanting offices: The County Secretary, County Executive Committee Member responsible for Finance and Planning, Committees on implementation, ECM education, Ethics and Anti-Corruption Commission, clerk of the County Assembly, and County Assembly Service Board, which represent more than 75 of audited entities.
In summary, in-depth hearings on key findings of audit reports take place with responsible officers from most audited entities which received a qualified or adverse audit opinion or a disclaimer.
Dimension rating = D*
PI-31.3. Recommendations on audit by the legislature
When the audit reports are received from the OAG, they are committed to the PAC. The committee writes to the office of the OAG requesting for the auditor to guide them on the findings. The auditor also guides on any further information to interrogate the concerned officers. The County Assembly then writes to the County Secretary requesting him to provide information and setting the date for the interrogation. This letter also indicates the officers who are expected to be interrogated and the deadlines of submitting the information required for the committee. Some time is allowed to scrutinize the information provided by the County Executive. The committee and the OAG auditor prepare the chairman’s brief to guide the interrogation process. The interrogation is held and a report including observations, findings, and recommendations is prepared and tabled in the floor of the house for the entire chamber debates. Once it is adopted, the report is forwarded to the Governor for implementation and to the Auditor General. The implementation of the recommendations is monitored by the implementation committee or the PAC.
The PAC reports do not present a follow-up on their implementation, contrary to the reports of the Auditor General.
In summary, the County Assembly issues recommendations on actions to be implemented by the County Executive and follows up on their implementation, but no evidence on the follow-up has been provided.
Dimension rating = C
PI-31.4. Transparency of legislative scrutiny of audit reports
Interim standing orders of the County Assembly number 179 (1) states that all committee proceedings shall be open to the public unless in exceptional circumstances where the Speaker has determined that there are justifiable reasons for the exclusion of the public. Further, some audit reports are discussed in the full chamber of the house. For example, on August 6, 2015, the first assembly third session was showing full chamber and officials from the OAG were in attendance. It also included officials from the Public Procurement and Oversight Authority. This meeting was to discuss audit findings. The committee

71
reports are not published on the official website, but the Makueni County Assembly Official Reports are published on the web and the County Assembly has a library where some of the reports are available to the public.
In summary, all committee proceedings shall be open to the public unless in exceptional circumstances. The committee reports are not published on any official website, even if the County Assembly Official Reports are published on the web and the County Assembly has a library where some of the reports are available to the public.
Dimension rating = D
72
4. Conclusions of the Analysis of PFM Systems
4.1 Integrated assessment of PFM performance
Budget reliability
Budget reliability is hampered by a low rate of budget execution and high level of reallocation. Variance in expenditure composition by economic functional classification was more than 15 percent over the three-year period. Aggregate expenditure outturn was below 85 percent of the approved aggregate budgeted expenditure in the last three years. With less than 92 percent in the last three years, actual revenue was also far below target, but this did not lead to a budget deficit because of the low rate of budget execution.
Transparency of public finances
Budget formulation, execution, and reporting are based on administrative and economic classification using GFS standards. Budget documentation that is transferred to the County Assembly contains forecast of the fiscal deficit/surplus, previous and revised budget in the same format as the budget proposal in the budget estimates, and aggregated budget data for both revenue and expenditure. Expenditure outside government financial reports are also reported and they represent less than 5 percent of total BCG expenditure.
Medium-term fiscal forecasts are established, but there are no survey estimates of the resources received by service delivery units. Performance indicators for measuring the outputs or outcomes of the different ministries have not been put in place, but evaluations for services delivered have been performed by independent units, albeit not being published. Consequently, no information related to performance achieved for service delivery is published annually. The audited AFS report and the external auditor’s report are made available to the public (on the OAG website).
Management of assets and liabilities
All major investment projects are prioritized based on the established public participation framework, but no economic analyses are conducted to assess major investment projects. Only one public corporation operates in the county and has not prepared its AFS. Projection total capital cost of major investment projects are included in the budget documents and project monitoring is performed by technical departments and other stakeholders including the public, but no M&E reports are established.
The county maintains a record of its holdings in all categories of financial assets, which are essentially cash at hand and its participation in one public enterprise. Information on the performance of these assets is published in line with international accounting standards in the AFS. Rules for transfer or disposal of financial assets do exist and partial information on transfers and disposal is included in the budget documents the county.
The county maintains a register of its holdings of fixed assets and updates records upon acquisition of new assets but does not report information on their usage and age. Information on contingent liabilities is not provided in AFSs. The county has not acquired any debt and has not developed a debt management strategy. Authorization to borrow, issue new debt, and issue loan guarantees on behalf of the county to entities is not included in the legislation. Records on debt inherited from the defunct local authorities are
73
not updated. The OAG audit report for FY2013/14 recommended that the county should expedite taking over of the assets and liabilities of the defunct local authorities in liaison with the Transition Authority.
Policy-based fiscal strategy and budgeting
Budget elaboration is based on a clear annual budget calendar. The CFSP reflects ministry ceilings allocated by administrative, economic, and program (or functional) classification, but they are not approved by the government before the first budget circular is issued. Further, the county does not prepare any fiscal policy scenarios and medium-term aggregate expenditure and ceilings. A report that describes progress made against its fiscal strategy is proposed to the legislature, but the reasons for any deviation from the objectives are not explained.
Legislature’s review covers fiscal policies, medium-term fiscal forecasts, and medium-term priorities as well as details of expenditure and revenue, which is based on organizational arrangements including specialized review committees, technical support, negotiation procedures, and public consultation. The annual budget presents an estimate of expenditure for the budget year and the two subsequent FYs, but they do not rely on any macroeconomic forecasts. Further, no explanation of changes to expenditure estimates between the second year of the last medium-term budget and the first year of the current medium-term budget is provided. The county only assesses proposed changes in revenue policies in the finance bill.
Predictability and control in budget execution
The directorate of revenue obtains data at least weekly from all entities collecting all revenues. This information is consolidated into a report and revenue collections are transferred weekly to the Treasury. However, payers do not have sufficient access to information on their rights and obligations. Further, there are no systematic approaches for assessing and prioritizing compliance risks for revenue streams. Also, no audit of revenue from any of the sources has been undertaken. The stock of revenue arrears is above 40 percent of the total revenue collection, while the stock of expenditure arrears varies between 8 percent and 13 percent of the total expenditure.
Appropriate segregation of duties is clearly laid down and comprehensive expenditure commitment controls are in place. Budgetary units are provided with reliable information on commitment ceilings a quarter in advance and limit commitments to projected cash availability and approved budget allocations. However, significant in-year adjustments to budget allocations are done once a year according to the law and presented to the County Assembly.
Changes to personnel and payroll records result in an audit trail. Reconciliation of the payroll with personnel records takes place at least every six months through a payroll audit. Required changes to the personnel records and payroll are updated in time and retroactive adjustments are rare, but there is no evidence that staff hiring is controlled by a list of approved staff positions. Payroll audits are periodically conducted at least once in the last three completed FYs.
Bank reconciliations and all cash balances are prepared and consolidated on a monthly basis. On the other hand, data on stock with age composition of expenditure arrears is generated only at the end of the financial year, when financial statements are prepared. Reconciliation of revenue collections and transfers to Treasury is also done only at the end of the year.
74
With regard to public procurement, legal, and regulatory frameworks, bidding opportunities and data on resolution of procurement complaints are available to the public. However, no database is maintained to provide information for contracts, value of procurement, or who has been awarded contracts. Open tendering was used for less than 40 percent of the total procurement. The procurement complaint system is compliant with good practices, except for charging fees that may prohibit access by concerned parties.
Internal audits are focused on evaluation of the adequacy and effectiveness of internal controls, but no quality assurance process has been put in place to show adherence to professional standards. Practically, internal audit remains focused on financial compliance, with an indication that most payments are compliant with regular payment procedures.
Accounting and reporting
Access and changes to records during budget implementation are restricted and recorded, but no operational body, unit, or team is in charge of verifying financial data integrity. There is monthly reporting on budget execution with production of quarterly budget implementation reports. These reports provide a comparison between actual expenditure and budgeted expenditure with partial aggregation on a cash basis. Commitment expenditures are presented in a separate report. On the expenditure side, payroll audits are periodically conducted at least once in the last three completed FYs.
AFSs are generally completed and available for audit, respectively, three and four months after the end of the year. They contain information on revenue, expenditure, financial assets, financial liabilities, and guarantees but not on long-term obligations. Imprest accounts are reconciled annually, but the amounts are not cleared timely, as shown in the AFS.
External scrutiny and audit
External audits of the county are still performed at the national level by the OAG. No independent constitutional body has been put in place at the county level. Material weaknesses are highlighted in the management letters that are issued to the county. In-depth hearings on key findings of audit reports take place with responsible officers. The County Executive provides responses to the audited entity with delays, which also cause delays in audit completion. However, scrutiny of audit reports is generally completed within 12 months in most instances. For FY2013/14, which was the first year of operation, the OAG report states that the County Executive and Assembly had challenges with regard to adhering to the existing PFM Regulation and Procedures, the Public Procurement and Asset Disposal Act, 2015 and Regulations 2016, and general human resources management policies and procedures and did not give a positive opinion on the accounts. For FY2014/15, the OAG report states that the audit evidence obtained is sufficient and appropriate to provide a basis for adverse opinion on the accounts of the County Executive. The legislature issues recommendations on actions to be implemented by the County Executive and follows up on their implementation.
4.2 Effectiveness of the internal control framework
Control environment
Based on the available information provided by the county, the internal control practice in place is not sufficient to contribute to the achievement of the four control objectives. The national-level internal control framework is indicative to a large extent for the county operation because the subnational
75
functions and operations mirror the establishment at the national level in regulation and practice. The following is an overview of the internal control activities collected from the preceding sections of the report. It builds on the description of the design of internal controls and the individual assessment of specific control activities as covered by the performance indicators (Chapter 3).
Risk assessment
The county decisions do not appear to be driven by risk assessment and management activities. Risks are not evaluated by their significance or the degree of likelihood of occurring almost at all budget processes. Having no risk profile of the county functions, no risk responses are to be made to reduce the likelihood or downside outcomes for key operations. Thus, potential future events that create uncertainty are not covered. The following risks, which are not provided for, exist in all stages of PFM:
• Pillar 2: The county is not able to capture expenditure and revenue outside financial reports (PI-6), which creates the risk of having a noncomprehensive and incomplete budget, potential misuse of funds, and poor service to the public.
• Pillar 3: With no economic analysis of investment proposals (PI-11), no costing of investment, and no written procedures for monitoring of the investment performance, there is a huge risk of abuse and loss of funds in investment. There is also no reconciliation of inherited debt with creditors (PI-13).
• Pillar 4: There is a weak link between policy formulation, programmed activities, and the budget estimates, which is mainly due to the inability to provide for uncertain economic events and the lack of a sensitivity analysis. This leads to the risk of having a noncomprehensive budget that is prone to amendments.
• Pillar 5: The revenue administration unit does not have an integrated revenue management system to detect and arrest potential revenue risks and also manage arrears (PI-19). The county does not keep proper accounting records of expenditure arrears, which presents a risk of accumulation (PI-22). Approved staff establishment is not linked to the IPPD, which is also not linked to the IFMIS (PI-23). This creates a potential risk of having ghost workers. Procurement practice reveals that non-competitive selection methods are mostly applied, which creates the risk of discrimination, reduced control on the quality of procured services or works, misuse of funds, and hence poor public service delivery (PI-24). There is clear segregation of duties with regard to non-salary expenditure which are electronically set up in the IFMIS with various authorization levels and roles assigned to different functions and operational staff. This arrangement provides for all phases of budget implementation to be executed in the IFMIS (PI-25) but many operations remain executed outside the IFMIS.
Control activities
The lack of risk profile of the county and the failure to define responses to the risk lead to inadequate and insufficient control activities that can treat, share, avoid, or intercept the risk. The risk-related activities for both the budget process and the service delivery exist for the functions related to budget implementation, which are executed in the IFMIS with clear segregation of duties. There are risks that are not covered by appropriate control activities, especially in the area of transparency of public finances with regard to non-captured expenditure and revenue outside financial reports (PI-6). With regard to management of assets and liabilities, there are no controls for the selection of investment activities (PI-
76
11) and aging of nonfinancial assets (PI-12). There are controls for budget execution with clear control of payment rules for all operations captured by the IFMIS except for those outside the IFMIS. However, the control is not sufficient for the record of actual staff in the IPPD and HR personnel records. Some staff are paid through a manual system that is outside the IPPD. The weak internal control systems eventually lead to unreliable financial records, which result in loss of organizational integrity. This may affect budget execution and the implementation of projects and county priorities, both of development and recurrent nature.
Information and communication
This internal control element deals with the methods and records used to register, maintain, and report on facts and events of the entity, as well as to maintain accountability for the related assets, liabilities, and initiatives of the county. The channels of information and communication of the county are through all budget-related documents that are produced and disseminated to other budget users and the public. Despite the legal requirement for all documents related to use of public funds to be made easily available, they do not all reach the public. The channels of internal information and communication are the orders and management letters that are issued by the respective function management units and the County Assembly. None of the basic elements of fiscal information to be made public and published are complied with, with the exception of the external audit report, which is issued with significant delay (PI-9). The county is adopting legislation on public participation, which will set the rules for interaction with the public at all stages of budget formulation and service delivery.
Monitoring
Monitoring entails the process of assessing the quality of internal control performance over time. In the context of the county government, this aspect can be expanded to encompass the monitoring practices of the PFM process in general. Performance monitoring at the county is weak, with the main tool of budget utilization monitoring being the quarterly reports and the budget execution reports. The CBROP is a kind of economic assessment paper. There are no specific reports elaborating on consistency of performance planned outputs and achieved outcomes and explaining any deviation. The internal control framework of the county, described as having in place only isolated control activities, is not efficient to ensure against irregularities and errors. It also highlights areas that are insufficiently addressed such as (a) performance information for service delivery, (b) public access to fiscal information, (c) monitoring of fiscal risk, (d) no monitoring on public investment, and (e) poor public asset management information.
In terms of assessment of the quality of the internal control system, the county has established an Internal Audit Department even though it is still in the process of establishing its practice. The focus of the internal audit is mainly on compliance and regulatory issues and is not yet developed to provide full oversight (of all budget users) of the effectiveness of the internal control system. The practice of the external audit, which is far more advanced, is focused on financial audit with elements of internal control. Apart from their usual financial reporting mandate, the external auditors check the processes related to the accounting function, salary and payroll, and procurement practice. The interaction between the external and the internal audit as far as the oversight of the internal control system is concerned has not been evidenced during the field work and the respective indicators’ assessment.
Apart from the OAG, external oversight mechanisms which are supposed to contribute to monitoring and effectiveness of the internal control system are the review of audits by the legislature, the follow-up systems for the Executive’s implementation of remedial measures, and provision of public access to
77
relevant reports and debates (PI-31). The oversight activities of the County Assembly (PI-31) have been shown to be ineffective. The County Assembly’s contribution to building a sound internal control system has been found to be weak due to the lack of hearings of the external audit findings, no evidence of recommendations to the county executive, and no transparency of the external audit scrutiny. Therefore, the legislative scrutiny cannot serve as reinforcing mechanisms to the effectiveness of the internal control system of the county.
Lack of properly instituted county-specific systems of internal control (internal procedures) affects the financial reporting process and may ultimately lead to production of unreliable reports, which in turn negatively affects the accountability role of management. Detailed findings concerning the main elements of the five internal control components are summarized in a table (Annex 2). Weak internal controls encourage fraud, mismanagement of assets (Pillar 3), loss of revenue, and embezzlement of public funds (Pillar 4). The county maintains minimum internal control over external factors such as unexpected economic, social, and natural disaster events. As far as the national legislative framework is concerned the internal control system of the county is largely sound. However, the specific control environment with its inherent risk assessment, relevant control activities, and related monitoring is not sufficiently established to contribute to the county’s main fiscal and budgetary outcomes. With existing and adequate internal control systems in place at the county, the resources will be safeguarded and directed in an optimal manner to the priority activities and projects, as planned.
4.3 PFM strengths and weaknesses
Aggregate fiscal discipline
On fiscal discipline, the county government experienced a shortfall in own generated revenue, inadequate capacity to use e-procurement, and delays in approval of county bills necessary to operationalize some budget items. Budget execution reports are produced quarterly on a cash basis, with a classification that is comparable with the original budget. There is a need to adjust the voted budget because inadequate time is given to implement the development agenda in the budget. This leads to unfinished and unimplemented development projects and extensive reallocations between recurrent and development expenditure. To mitigate these risks, the government has introduced performance contracting in all departments and a specific program for implementing development projects to increase the pace at which projects are being implemented in-county. However, the Internal Audit Department is not fully operational given that it has only one officer even though a strong internal audit is necessary. This is because the county oversees numerous transactions and development projects.
Strategic allocation of resources
Strategic allocation of resources is defined in the CFSP, to be compliant with the strategic activities defined in the CIDP. The weakness lies in the way the proposed programs/projects are addressing the strategic interventions identified in the county’s vision, as reflected in the CIDP.
Efficient use of resources for service delivery
Strategic plans are not aligned to the medium-term budgets because the county is still in the process of preparing the ministerial strategic plans. Consequently, equity in distribution of resources in all areas of the county is not ensured and projects contained in the CIDP and/or that have been prioritized by the

78
community are not fully implemented. Consequently, the efficient use of resources for service delivery is not ensured.
79
5. Government PFM reform process
5.1 Approach to PFM reforms
The MTEF for 2017/18–2019/20 ensures that resources are allocated to priority program, as envisaged in the CIDP, ADP, County Vision 2025, and other county policy documents. The broad focus is on wealth creation for socioeconomic transformation. The county has anchored its development on the basis of three pillars and sector approach as outlined in Vision 2025: the economic, social, and political pillars.
As far as the economic and social pillars are concerned, the county has proposed to set up a social transformation fund targeting fund development and poverty reduction initiatives in all marginalized areas and analysis of how the proposed programs are addressing the strategic interventions identified in the county’s Vision 2025, the CIDP, community budget hearing proposals, and ADPs. The county also intends to improve equity in distribution of resources and monitoring of sector budget performance for the previous year. The fiscal plan (2016/17) contained in the CFSP 2016 entails a deliberate effort to continue exercising prudence in public expenditure management with the principal goal of containing fiscal risks, gradually lowering the fiscal deficit, and containing growth of recurrent expenditures in favor of productive capital spending. Under the FY2017/18 budget, the detailed priorities to be funded are as follows:
• Enhancing county legal systems through legislating on all devolved functions and developing the relevant policy to guide full implementation of devolved functions necessary for county development. Departments and the public will also be trained on the necessary legal requirements.
• Strengthening public administration and service delivery. The county will undertake a survey to determine the location of the establishment of service delivery centers and the magnitude of operations as a basis for construction and operationalization;
• Strengthening county M&E systems. The government will strengthen the M&E systems and undertake capacity development of the M&E Unit as well as county departments on result-based management and tracking of service delivery.
• Strengthening county planning, budgeting, and statistics systems. The county will enhance the development of an integrated county project management system which will link planning, budgeting, and outcomes.
• Improving PFM systems. The county will enhance prudent financial management and sustainable utilization of public funds through strengthening sub-county treasury services, internal audit, and the county Audit Committee.
• Strengthening of county human resources and performance management system. The county will develop a scheme of service for all cadres, which will guide career progression and development through the County Public Service Commission.
80
5.2 Recent and ongoing reform actions
To address the above-mentioned weaknesses, the county instituted a number of measures: timely execution of budgets, recruitment of competent staff, staff capacity building, county rapid results initiatives, acquisition of equipment for roads construction, drilling of boreholes and agricultural mechanization, automation of revenue collection, and internal restructuring of service delivery. The county is also bringing all the extra-budgetary units into the budget; as demonstrated by the inclusion of the sand cess in the budget under the section on other revenues, this percentage will reduce further in FY2017/18. All staff in the county are subject to performance contracts through performance appraisals and monitored by the Performance Management Coordinator and the Officers’ Forum. Ad hoc committees have been established to facilitate the negotiation before signing of performance contracts and an evaluation committee is in charge of overseeing the evaluation process and the ranking at the end of the financial year. The ministry is currently in the process of rolling out a GHRIS, which is an online system that addresses all HR-related needs of the government. This system is expected to interface with other existing systems like the IFMIS, G-PAY, and IPPD. Users of the GHRIS are government ministries, county governments, departments, agencies, and government employees.
Key officers in the implementation team have been reinstated and the county has established an implementation taskforce to address the low absorption rate accumulated over the three years. Consolidation of incomplete projects in the performance contracts of the following financial year are followed by the Performance Contracting Secretariat.
Guidelines have been established and a unit has been put in place to operationalize the revenue automation system and improve the mapping of all available revenue streams. Guidelines have also been established for reducing payment delays. A County Debt Framework is being developed by the National Treasury in consultation with IBEC to improve debt management. An Audit Committee was established at the beginning of 2017 to support the management of risk control and governance and also provide associated assurance. An audit charter is under development. Finally, the county has developed an in-house financial reporting manual, which is constantly being updated with best practices, but no Business Intelligence system has been put in place yet to improve budget and financial reporting.
5.3 Institutional considerations
The Kenyan devolution process is still young and the county still needs to improve the efficiency of public expenditures while improving domestic resource mobilization. The county relies heavily on equitable transfers and grants. However, improving expenditure efficiency would bring more gain than new aid given that the county cannot be sure of a predictable flow of aid and subsidies. In addition, budget surplus could be used to reduce the county’s inherited debt. Given that strong institutions are the ones where individual agents are accountable, county leadership and ownership of the devolution process are subject to the reinforcement of the processes that have been implemented at the national level.
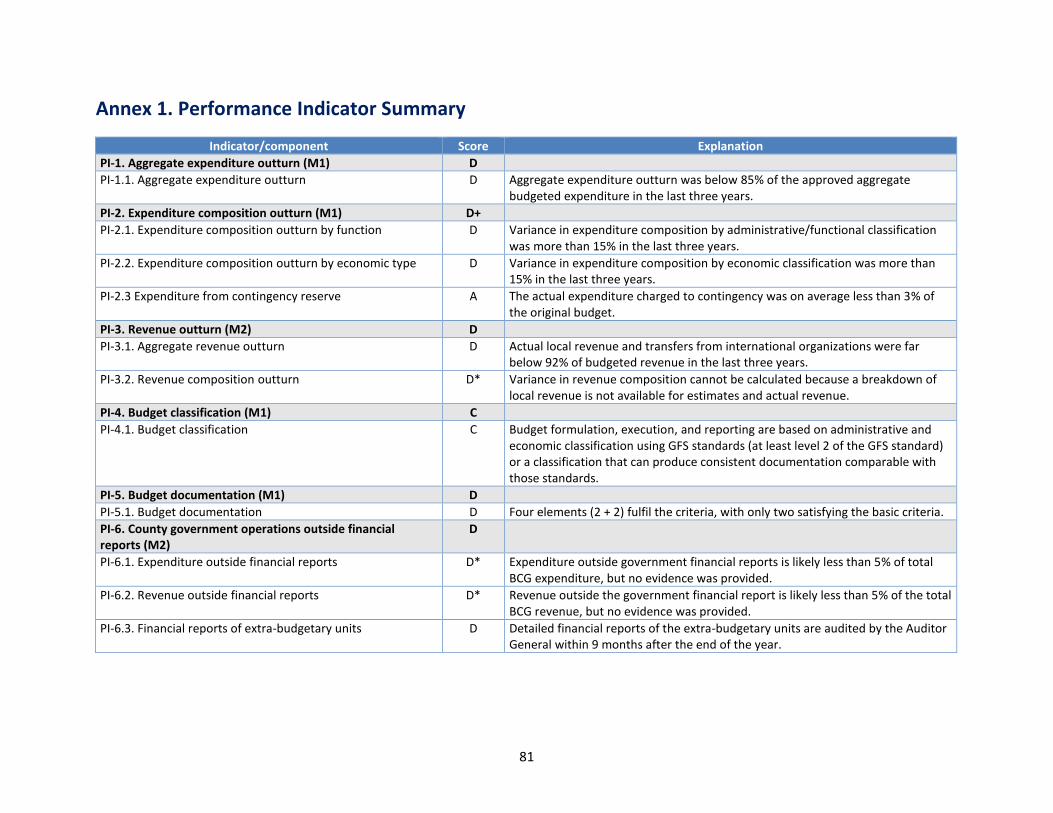
81
Annex 1. Performance Indicator Summary
Indicator/component Score Explanation
PI-1. Aggregate expenditure outturn (M1) D
PI-1.1. Aggregate expenditure outturn D Aggregate expenditure outturn was below 85% of the approved aggregate budgeted expenditure in the last three years.
PI-2. Expenditure composition outturn (M1) D+
PI-2.1. Expenditure composition outturn by function D Variance in expenditure composition by administrative/functional classification was more than 15% in the last three years.
PI-2.2. Expenditure composition outturn by economic type D Variance in expenditure composition by economic classification was more than 15% in the last three years.
PI-2.3 Expenditure from contingency reserve A The actual expenditure charged to contingency was on average less than 3% of the original budget.
PI-3. Revenue outturn (M2) D
PI-3.1. Aggregate revenue outturn D Actual local revenue and transfers from international organizations were far below 92% of budgeted revenue in the last three years.
PI-3.2. Revenue composition outturn D* Variance in revenue composition cannot be calculated because a breakdown of local revenue is not available for estimates and actual revenue.
PI-4. Budget classification (M1) C
PI-4.1. Budget classification C Budget formulation, execution, and reporting are based on administrative and economic classification using GFS standards (at least level 2 of the GFS standard) or a classification that can produce consistent documentation comparable with those standards.
PI-5. Budget documentation (M1) D
PI-5.1. Budget documentation D Four elements (2 + 2) fulfil the criteria, with only two satisfying the basic criteria.
PI-6. County government operations outside financial reports (M2)
D
PI-6.1. Expenditure outside financial reports D* Expenditure outside government financial reports is likely less than 5% of total BCG expenditure, but no evidence was provided.
PI-6.2. Revenue outside financial reports D* Revenue outside the government financial report is likely less than 5% of the total BCG revenue, but no evidence was provided.
PI-6.3. Financial reports of extra-budgetary units D Detailed financial reports of the extra-budgetary units are audited by the Auditor General within 9 months after the end of the year.
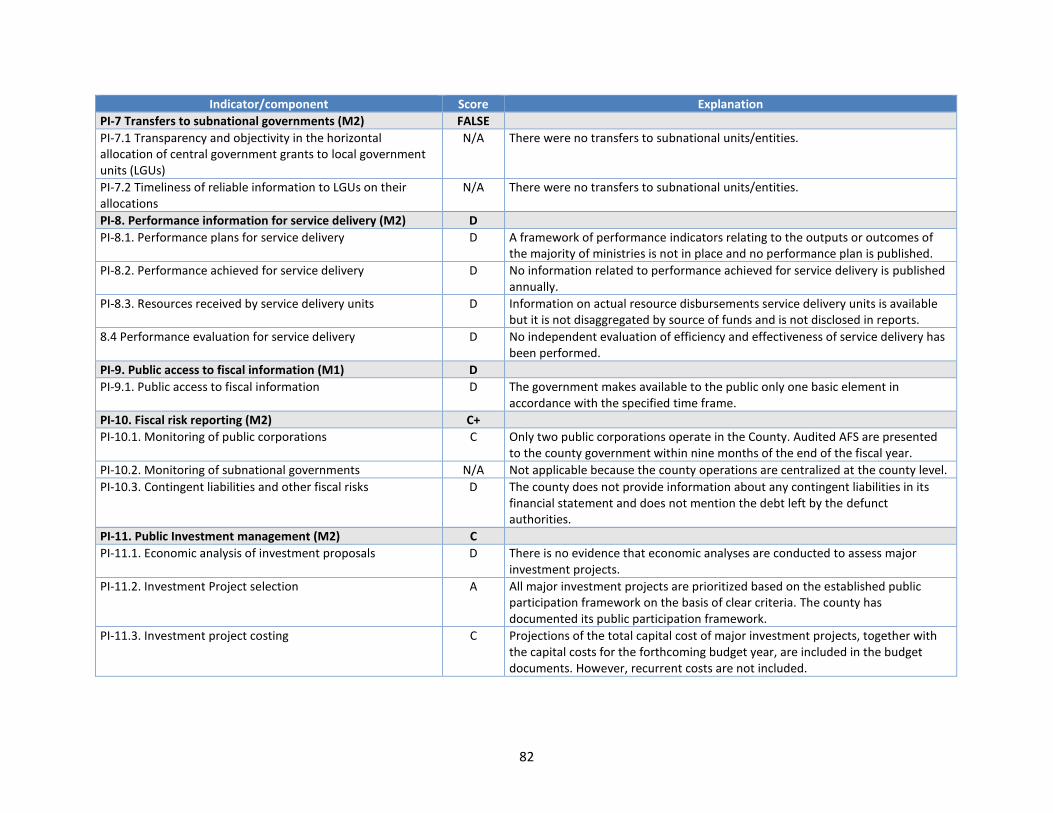
82
Indicator/component Score Explanation
PI-7 Transfers to subnational governments (M2) FALSE
PI-7.1 Transparency and objectivity in the horizontal allocation of central government grants to local government units (LGUs)
N/A There were no transfers to subnational units/entities.
PI-7.2 Timeliness of reliable information to LGUs on their allocations
N/A There were no transfers to subnational units/entities.
PI-8. Performance information for service delivery (M2) D
PI-8.1. Performance plans for service delivery D A framework of performance indicators relating to the outputs or outcomes of the majority of ministries is not in place and no performance plan is published.
PI-8.2. Performance achieved for service delivery D No information related to performance achieved for service delivery is published annually.
PI-8.3. Resources received by service delivery units D Information on actual resource disbursements service delivery units is available but it is not disaggregated by source of funds and is not disclosed in reports.
8.4 Performance evaluation for service delivery D No independent evaluation of efficiency and effectiveness of service delivery has been performed.
PI-9. Public access to fiscal information (M1) D
PI-9.1. Public access to fiscal information D The government makes available to the public only one basic element in accordance with the specified time frame.
PI-10. Fiscal risk reporting (M2) C+
PI-10.1. Monitoring of public corporations C Only two public corporations operate in the County. Audited AFS are presented to the county government within nine months of the end of the fiscal year.
PI-10.2. Monitoring of subnational governments N/A Not applicable because the county operations are centralized at the county level.
PI-10.3. Contingent liabilities and other fiscal risks D The county does not provide information about any contingent liabilities in its financial statement and does not mention the debt left by the defunct authorities.
PI-11. Public Investment management (M2) C
PI-11.1. Economic analysis of investment proposals D There is no evidence that economic analyses are conducted to assess major investment projects.
PI-11.2. Investment Project selection A All major investment projects are prioritized based on the established public participation framework on the basis of clear criteria. The county has documented its public participation framework.
PI-11.3. Investment project costing C Projections of the total capital cost of major investment projects, together with the capital costs for the forthcoming budget year, are included in the budget documents. However, recurrent costs are not included.
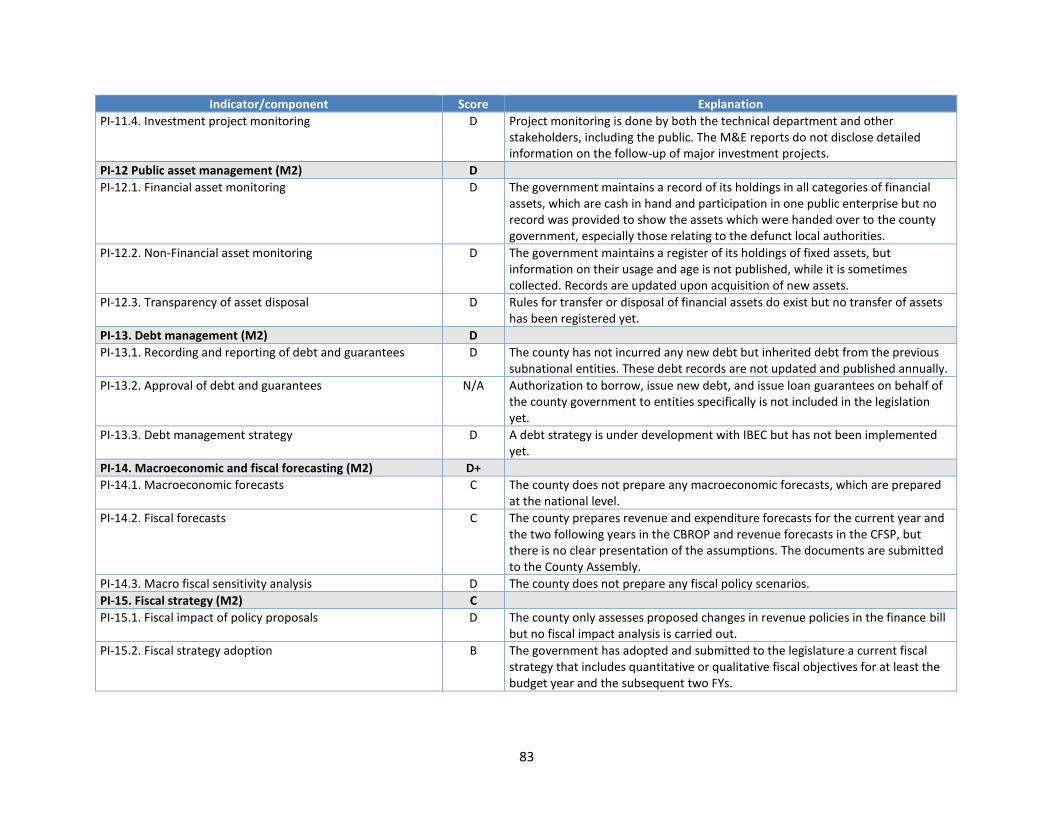
83
Indicator/component Score Explanation
PI-11.4. Investment project monitoring D Project monitoring is done by both the technical department and other stakeholders, including the public. The M&E reports do not disclose detailed information on the follow-up of major investment projects.
PI-12 Public asset management (M2) D
PI-12.1. Financial asset monitoring D The government maintains a record of its holdings in all categories of financial assets, which are cash in hand and participation in one public enterprise but no record was provided to show the assets which were handed over to the county government, especially those relating to the defunct local authorities.
PI-12.2. Non-Financial asset monitoring D The government maintains a register of its holdings of fixed assets, but information on their usage and age is not published, while it is sometimes collected. Records are updated upon acquisition of new assets.
PI-12.3. Transparency of asset disposal D Rules for transfer or disposal of financial assets do exist but no transfer of assets has been registered yet.
PI-13. Debt management (M2) D
PI-13.1. Recording and reporting of debt and guarantees D The county has not incurred any new debt but inherited debt from the previous subnational entities. These debt records are not updated and published annually.
PI-13.2. Approval of debt and guarantees N/A Authorization to borrow, issue new debt, and issue loan guarantees on behalf of the county government to entities specifically is not included in the legislation yet.
PI-13.3. Debt management strategy D A debt strategy is under development with IBEC but has not been implemented yet.
PI-14. Macroeconomic and fiscal forecasting (M2) D+
PI-14.1. Macroeconomic forecasts C The county does not prepare any macroeconomic forecasts, which are prepared at the national level.
PI-14.2. Fiscal forecasts C The county prepares revenue and expenditure forecasts for the current year and the two following years in the CBROP and revenue forecasts in the CFSP, but there is no clear presentation of the assumptions. The documents are submitted to the County Assembly.
PI-14.3. Macro fiscal sensitivity analysis D The county does not prepare any fiscal policy scenarios.
PI-15. Fiscal strategy (M2) C
PI-15.1. Fiscal impact of policy proposals D The county only assesses proposed changes in revenue policies in the finance bill but no fiscal impact analysis is carried out.
PI-15.2. Fiscal strategy adoption B The government has adopted and submitted to the legislature a current fiscal strategy that includes quantitative or qualitative fiscal objectives for at least the budget year and the subsequent two FYs.
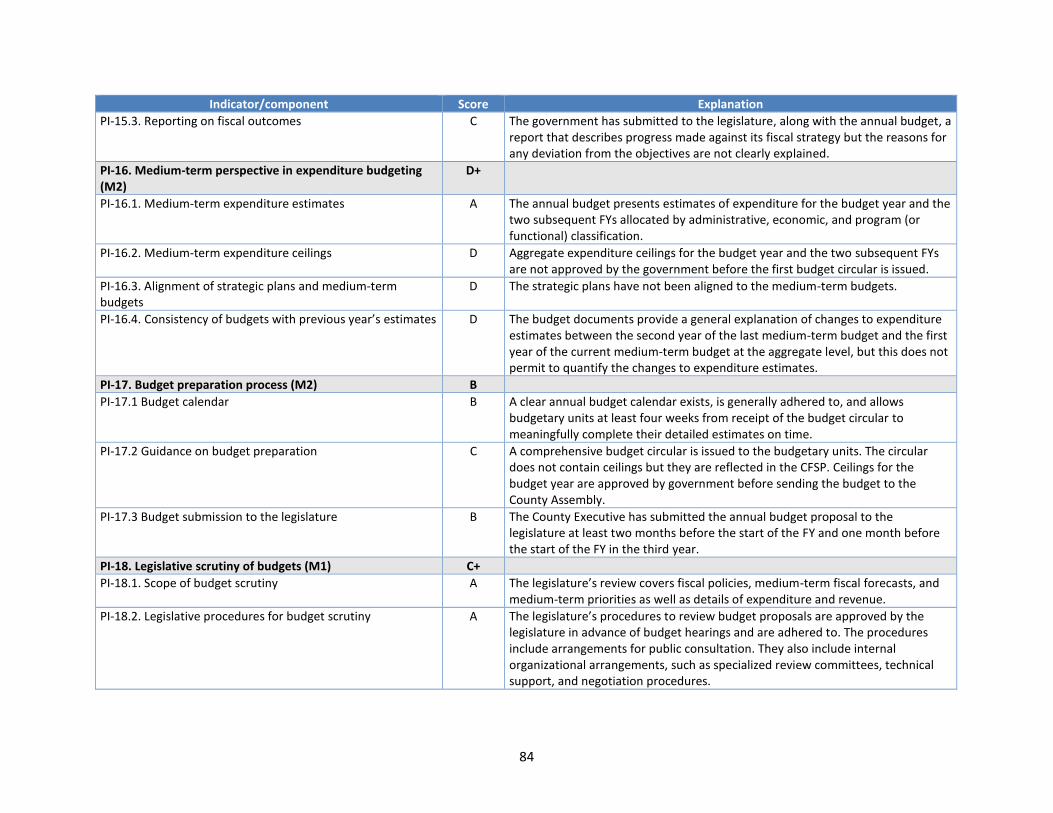
84
Indicator/component Score Explanation
PI-15.3. Reporting on fiscal outcomes C The government has submitted to the legislature, along with the annual budget, a report that describes progress made against its fiscal strategy but the reasons for any deviation from the objectives are not clearly explained.
PI-16. Medium-term perspective in expenditure budgeting (M2)
D+
PI-16.1. Medium-term expenditure estimates A The annual budget presents estimates of expenditure for the budget year and the two subsequent FYs allocated by administrative, economic, and program (or functional) classification.
PI-16.2. Medium-term expenditure ceilings D Aggregate expenditure ceilings for the budget year and the two subsequent FYs are not approved by the government before the first budget circular is issued.
PI-16.3. Alignment of strategic plans and medium-term budgets
D The strategic plans have not been aligned to the medium-term budgets.
PI-16.4. Consistency of budgets with previous year’s estimates D The budget documents provide a general explanation of changes to expenditure estimates between the second year of the last medium-term budget and the first year of the current medium-term budget at the aggregate level, but this does not permit to quantify the changes to expenditure estimates.
PI-17. Budget preparation process (M2) B
PI-17.1 Budget calendar B A clear annual budget calendar exists, is generally adhered to, and allows budgetary units at least four weeks from receipt of the budget circular to meaningfully complete their detailed estimates on time.
PI-17.2 Guidance on budget preparation C A comprehensive budget circular is issued to the budgetary units. The circular does not contain ceilings but they are reflected in the CFSP. Ceilings for the budget year are approved by government before sending the budget to the County Assembly.
PI-17.3 Budget submission to the legislature B The County Executive has submitted the annual budget proposal to the legislature at least two months before the start of the FY and one month before the start of the FY in the third year.
PI-18. Legislative scrutiny of budgets (M1) C+
PI-18.1. Scope of budget scrutiny A The legislature’s review covers fiscal policies, medium-term fiscal forecasts, and medium-term priorities as well as details of expenditure and revenue.
PI-18.2. Legislative procedures for budget scrutiny A The legislature’s procedures to review budget proposals are approved by the legislature in advance of budget hearings and are adhered to. The procedures include arrangements for public consultation. They also include internal organizational arrangements, such as specialized review committees, technical support, and negotiation procedures.
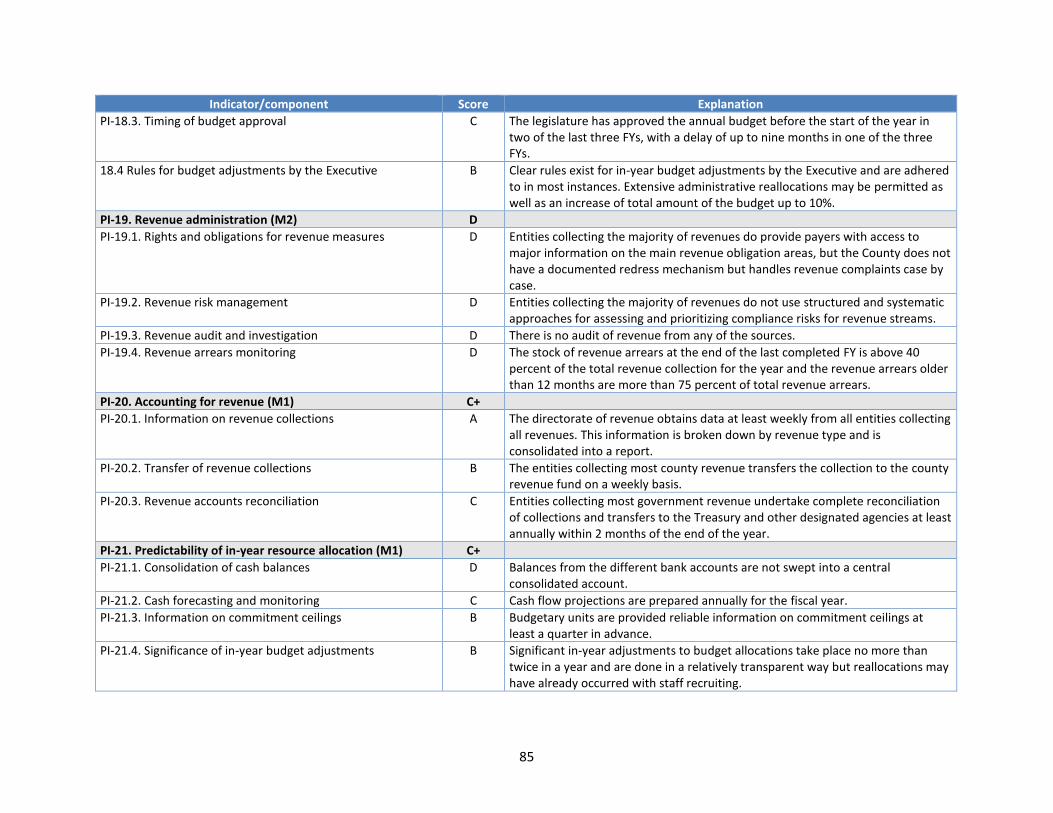
85
Indicator/component Score Explanation
PI-18.3. Timing of budget approval C The legislature has approved the annual budget before the start of the year in two of the last three FYs, with a delay of up to nine months in one of the three FYs.
18.4 Rules for budget adjustments by the Executive B Clear rules exist for in-year budget adjustments by the Executive and are adhered to in most instances. Extensive administrative reallocations may be permitted as well as an increase of total amount of the budget up to 10%.
PI-19. Revenue administration (M2) D
PI-19.1. Rights and obligations for revenue measures D Entities collecting the majority of revenues do provide payers with access to major information on the main revenue obligation areas, but the County does not have a documented redress mechanism but handles revenue complaints case by case.
PI-19.2. Revenue risk management D Entities collecting the majority of revenues do not use structured and systematic approaches for assessing and prioritizing compliance risks for revenue streams.
PI-19.3. Revenue audit and investigation D There is no audit of revenue from any of the sources.
PI-19.4. Revenue arrears monitoring D The stock of revenue arrears at the end of the last completed FY is above 40 percent of the total revenue collection for the year and the revenue arrears older than 12 months are more than 75 percent of total revenue arrears.
PI-20. Accounting for revenue (M1) C+
PI-20.1. Information on revenue collections A The directorate of revenue obtains data at least weekly from all entities collecting all revenues. This information is broken down by revenue type and is consolidated into a report.
PI-20.2. Transfer of revenue collections B The entities collecting most county revenue transfers the collection to the county revenue fund on a weekly basis.
PI-20.3. Revenue accounts reconciliation C Entities collecting most government revenue undertake complete reconciliation of collections and transfers to the Treasury and other designated agencies at least annually within 2 months of the end of the year.
PI-21. Predictability of in-year resource allocation (M1) C+
PI-21.1. Consolidation of cash balances D Balances from the different bank accounts are not swept into a central consolidated account.
PI-21.2. Cash forecasting and monitoring C Cash flow projections are prepared annually for the fiscal year.
PI-21.3. Information on commitment ceilings B Budgetary units are provided reliable information on commitment ceilings at least a quarter in advance.
PI-21.4. Significance of in-year budget adjustments B Significant in-year adjustments to budget allocations take place no more than twice in a year and are done in a relatively transparent way but reallocations may have already occurred with staff recruiting.
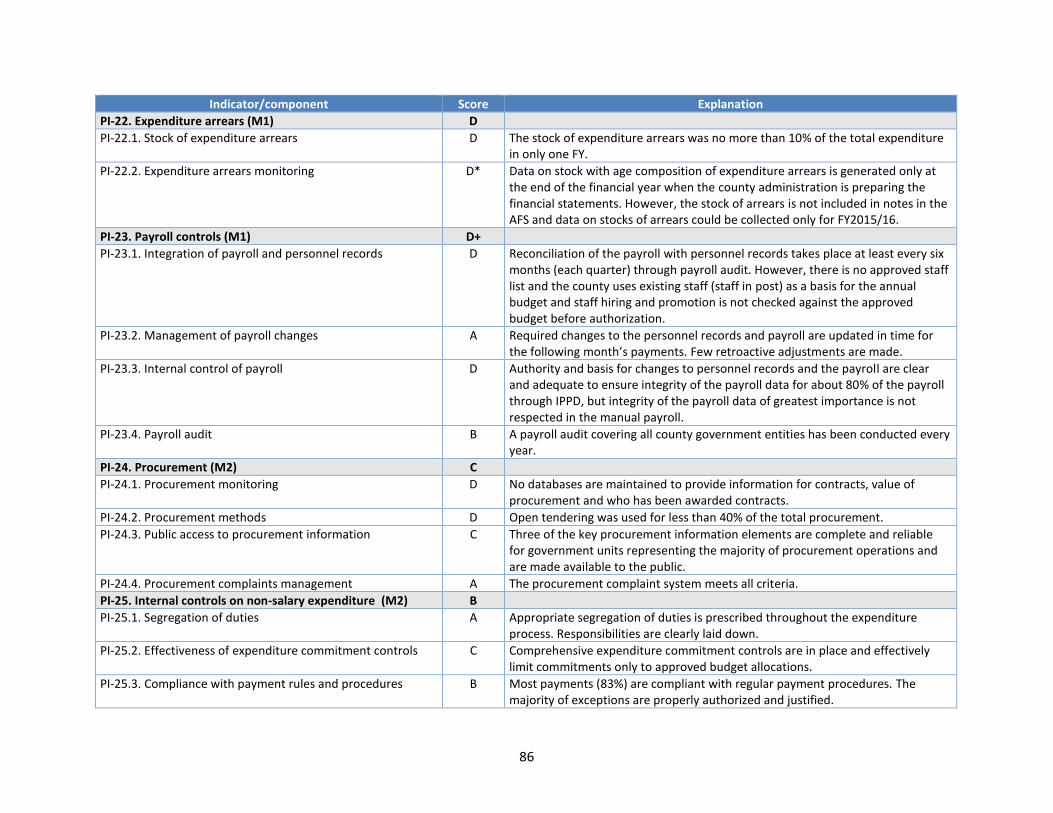
86
Indicator/component Score Explanation
PI-22. Expenditure arrears (M1) D
PI-22.1. Stock of expenditure arrears D The stock of expenditure arrears was no more than 10% of the total expenditure in only one FY.
PI-22.2. Expenditure arrears monitoring D* Data on stock with age composition of expenditure arrears is generated only at the end of the financial year when the county administration is preparing the financial statements. However, the stock of arrears is not included in notes in the AFS and data on stocks of arrears could be collected only for FY2015/16.
PI-23. Payroll controls (M1) D+
PI-23.1. Integration of payroll and personnel records D Reconciliation of the payroll with personnel records takes place at least every six months (each quarter) through payroll audit. However, there is no approved staff list and the county uses existing staff (staff in post) as a basis for the annual budget and staff hiring and promotion is not checked against the approved budget before authorization.
PI-23.2. Management of payroll changes A Required changes to the personnel records and payroll are updated in time for the following month’s payments. Few retroactive adjustments are made.
PI-23.3. Internal control of payroll D Authority and basis for changes to personnel records and the payroll are clear and adequate to ensure integrity of the payroll data for about 80% of the payroll through IPPD, but integrity of the payroll data of greatest importance is not respected in the manual payroll.
PI-23.4. Payroll audit B A payroll audit covering all county government entities has been conducted every year.
PI-24. Procurement (M2) C
PI-24.1. Procurement monitoring D No databases are maintained to provide information for contracts, value of procurement and who has been awarded contracts.
PI-24.2. Procurement methods D Open tendering was used for less than 40% of the total procurement.
PI-24.3. Public access to procurement information C Three of the key procurement information elements are complete and reliable for government units representing the majority of procurement operations and are made available to the public.
PI-24.4. Procurement complaints management A The procurement complaint system meets all criteria.
PI-25. Internal controls on non-salary expenditure (M2) B
PI-25.1. Segregation of duties A Appropriate segregation of duties is prescribed throughout the expenditure process. Responsibilities are clearly laid down.
PI-25.2. Effectiveness of expenditure commitment controls C Comprehensive expenditure commitment controls are in place and effectively limit commitments only to approved budget allocations.
PI-25.3. Compliance with payment rules and procedures B Most payments (83%) are compliant with regular payment procedures. The majority of exceptions are properly authorized and justified.
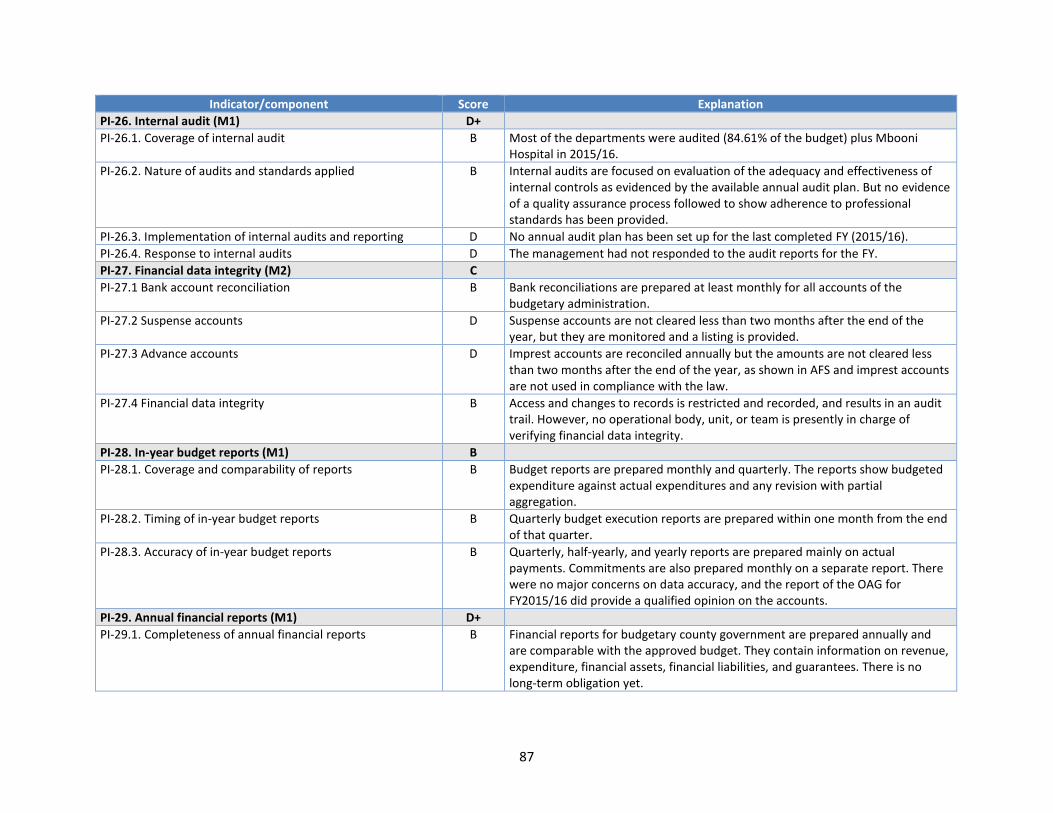
87
Indicator/component Score Explanation
PI-26. Internal audit (M1) D+
PI-26.1. Coverage of internal audit B Most of the departments were audited (84.61% of the budget) plus Mbooni Hospital in 2015/16.
PI-26.2. Nature of audits and standards applied B Internal audits are focused on evaluation of the adequacy and effectiveness of internal controls as evidenced by the available annual audit plan. But no evidence of a quality assurance process followed to show adherence to professional standards has been provided.
PI-26.3. Implementation of internal audits and reporting D No annual audit plan has been set up for the last completed FY (2015/16).
PI-26.4. Response to internal audits D The management had not responded to the audit reports for the FY.
PI-27. Financial data integrity (M2) C
PI-27.1 Bank account reconciliation B Bank reconciliations are prepared at least monthly for all accounts of the budgetary administration.
PI-27.2 Suspense accounts D Suspense accounts are not cleared less than two months after the end of the year, but they are monitored and a listing is provided.
PI-27.3 Advance accounts D Imprest accounts are reconciled annually but the amounts are not cleared less than two months after the end of the year, as shown in AFS and imprest accounts are not used in compliance with the law.
PI-27.4 Financial data integrity B Access and changes to records is restricted and recorded, and results in an audit trail. However, no operational body, unit, or team is presently in charge of verifying financial data integrity.
PI-28. In-year budget reports (M1) B
PI-28.1. Coverage and comparability of reports B Budget reports are prepared monthly and quarterly. The reports show budgeted expenditure against actual expenditures and any revision with partial aggregation.
PI-28.2. Timing of in-year budget reports B Quarterly budget execution reports are prepared within one month from the end of that quarter.
PI-28.3. Accuracy of in-year budget reports B Quarterly, half-yearly, and yearly reports are prepared mainly on actual payments. Commitments are also prepared monthly on a separate report. There were no major concerns on data accuracy, and the report of the OAG for FY2015/16 did provide a qualified opinion on the accounts.
PI-29. Annual financial reports (M1) D+
PI-29.1. Completeness of annual financial reports B Financial reports for budgetary county government are prepared annually and are comparable with the approved budget. They contain information on revenue, expenditure, financial assets, financial liabilities, and guarantees. There is no long-term obligation yet.
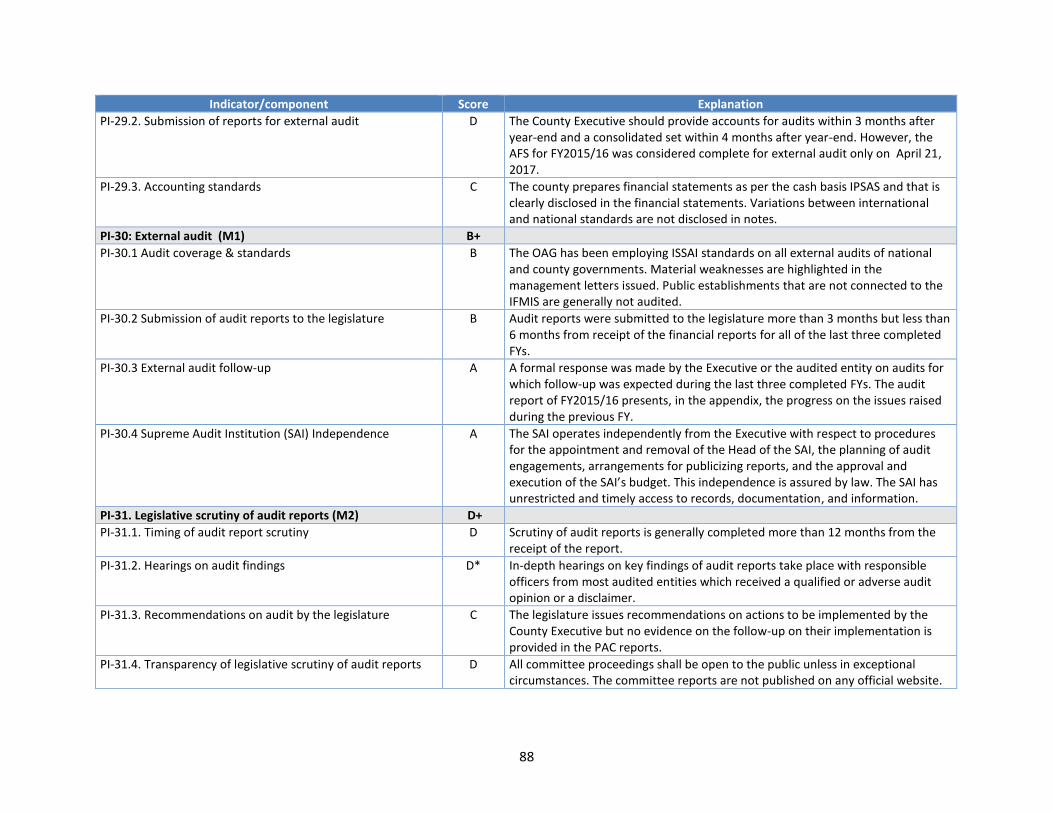
88
Indicator/component Score Explanation
PI-29.2. Submission of reports for external audit D The County Executive should provide accounts for audits within 3 months after year-end and a consolidated set within 4 months after year-end. However, the AFS for FY2015/16 was considered complete for external audit only on April 21, 2017.
PI-29.3. Accounting standards C The county prepares financial statements as per the cash basis IPSAS and that is clearly disclosed in the financial statements. Variations between international and national standards are not disclosed in notes.
PI-30: External audit (M1) B+
PI-30.1 Audit coverage & standards B The OAG has been employing ISSAI standards on all external audits of national and county governments. Material weaknesses are highlighted in the management letters issued. Public establishments that are not connected to the IFMIS are generally not audited.
PI-30.2 Submission of audit reports to the legislature B Audit reports were submitted to the legislature more than 3 months but less than 6 months from receipt of the financial reports for all of the last three completed FYs.
PI-30.3 External audit follow-up A A formal response was made by the Executive or the audited entity on audits for which follow-up was expected during the last three completed FYs. The audit report of FY2015/16 presents, in the appendix, the progress on the issues raised during the previous FY.
PI-30.4 Supreme Audit Institution (SAI) Independence A The SAI operates independently from the Executive with respect to procedures for the appointment and removal of the Head of the SAI, the planning of audit engagements, arrangements for publicizing reports, and the approval and execution of the SAI’s budget. This independence is assured by law. The SAI has unrestricted and timely access to records, documentation, and information.
PI-31. Legislative scrutiny of audit reports (M2) D+
PI-31.1. Timing of audit report scrutiny D Scrutiny of audit reports is generally completed more than 12 months from the receipt of the report.
PI-31.2. Hearings on audit findings D* In-depth hearings on key findings of audit reports take place with responsible officers from most audited entities which received a qualified or adverse audit opinion or a disclaimer.
PI-31.3. Recommendations on audit by the legislature C The legislature issues recommendations on actions to be implemented by the County Executive but no evidence on the follow-up on their implementation is provided in the PAC reports.
PI-31.4. Transparency of legislative scrutiny of audit reports D All committee proceedings shall be open to the public unless in exceptional circumstances. The committee reports are not published on any official website.
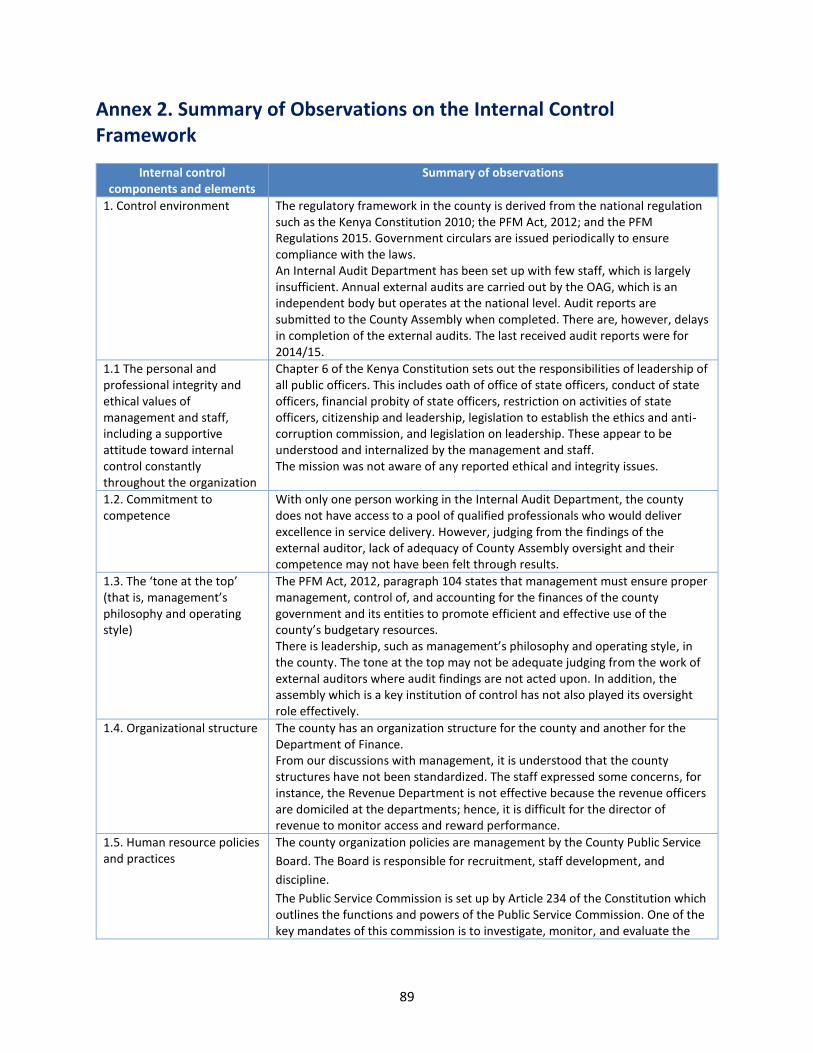
89
Annex 2. Summary of Observations on the Internal Control Framework
Internal control components and elements
Summary of observations
1. Control environment The regulatory framework in the county is derived from the national regulation such as the Kenya Constitution 2010; the PFM Act, 2012; and the PFM Regulations 2015. Government circulars are issued periodically to ensure compliance with the laws. An Internal Audit Department has been set up with few staff, which is largely insufficient. Annual external audits are carried out by the OAG, which is an independent body but operates at the national level. Audit reports are submitted to the County Assembly when completed. There are, however, delays in completion of the external audits. The last received audit reports were for 2014/15.
1.1 The personal and professional integrity and ethical values of management and staff, including a supportive attitude toward internal control constantly throughout the organization
Chapter 6 of the Kenya Constitution sets out the responsibilities of leadership of all public officers. This includes oath of office of state officers, conduct of state officers, financial probity of state officers, restriction on activities of state officers, citizenship and leadership, legislation to establish the ethics and anti-corruption commission, and legislation on leadership. These appear to be understood and internalized by the management and staff. The mission was not aware of any reported ethical and integrity issues.
1.2. Commitment to competence
With only one person working in the Internal Audit Department, the county does not have access to a pool of qualified professionals who would deliver excellence in service delivery. However, judging from the findings of the external auditor, lack of adequacy of County Assembly oversight and their competence may not have been felt through results.
1.3. The ‘tone at the top’ (that is, management’s philosophy and operating style)
The PFM Act, 2012, paragraph 104 states that management must ensure proper management, control of, and accounting for the finances of the county government and its entities to promote efficient and effective use of the county’s budgetary resources. There is leadership, such as management’s philosophy and operating style, in the county. The tone at the top may not be adequate judging from the work of external auditors where audit findings are not acted upon. In addition, the assembly which is a key institution of control has not also played its oversight role effectively.
1.4. Organizational structure The county has an organization structure for the county and another for the Department of Finance. From our discussions with management, it is understood that the county structures have not been standardized. The staff expressed some concerns, for instance, the Revenue Department is not effective because the revenue officers are domiciled at the departments; hence, it is difficult for the director of revenue to monitor access and reward performance.
1.5. Human resource policies and practices
The county organization policies are management by the County Public Service
Board. The Board is responsible for recruitment, staff development, and
discipline.
The Public Service Commission is set up by Article 234 of the Constitution which outlines the functions and powers of the Public Service Commission. One of the key mandates of this commission is to investigate, monitor, and evaluate the
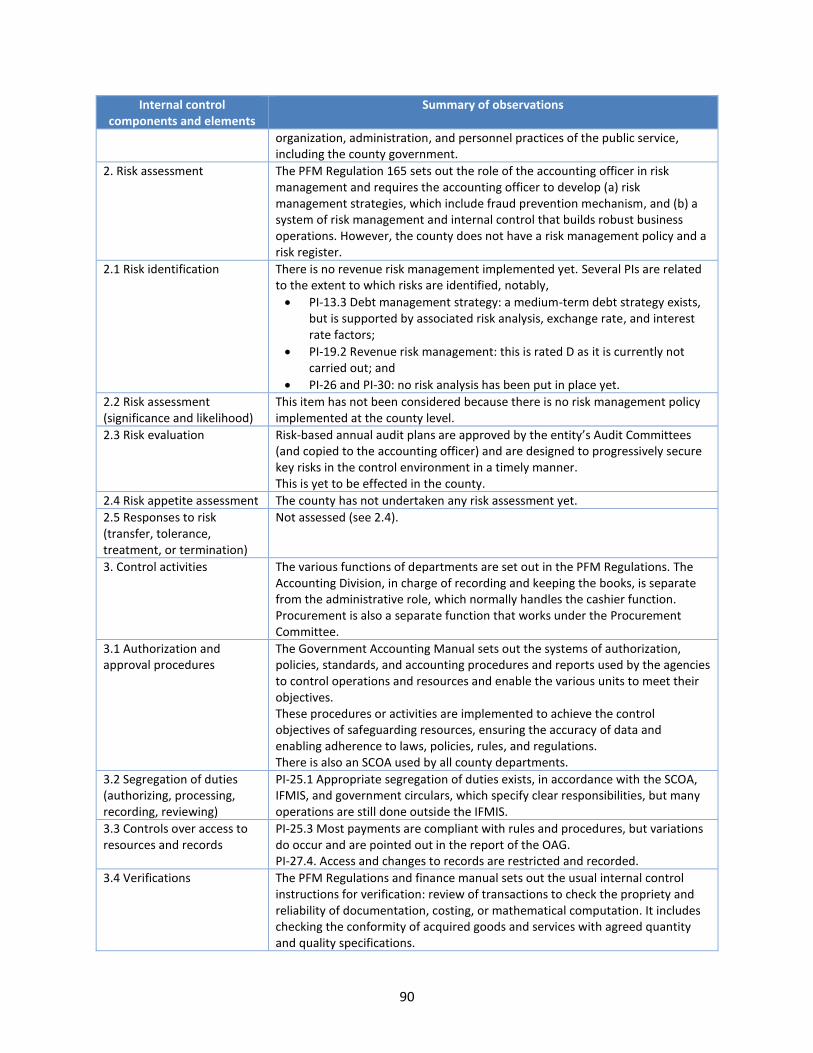
90
Internal control components and elements
Summary of observations
organization, administration, and personnel practices of the public service, including the county government.
2. Risk assessment The PFM Regulation 165 sets out the role of the accounting officer in risk management and requires the accounting officer to develop (a) risk management strategies, which include fraud prevention mechanism, and (b) a system of risk management and internal control that builds robust business operations. However, the county does not have a risk management policy and a risk register.
2.1 Risk identification There is no revenue risk management implemented yet. Several PIs are related to the extent to which risks are identified, notably,
• PI-13.3 Debt management strategy: a medium-term debt strategy exists, but is supported by associated risk analysis, exchange rate, and interest rate factors;
• PI-19.2 Revenue risk management: this is rated D as it is currently not carried out; and
• PI-26 and PI-30: no risk analysis has been put in place yet.
2.2 Risk assessment (significance and likelihood)
This item has not been considered because there is no risk management policy implemented at the county level.
2.3 Risk evaluation Risk-based annual audit plans are approved by the entity’s Audit Committees (and copied to the accounting officer) and are designed to progressively secure key risks in the control environment in a timely manner. This is yet to be effected in the county.
2.4 Risk appetite assessment The county has not undertaken any risk assessment yet.
2.5 Responses to risk (transfer, tolerance, treatment, or termination)
Not assessed (see 2.4).
3. Control activities The various functions of departments are set out in the PFM Regulations. The Accounting Division, in charge of recording and keeping the books, is separate from the administrative role, which normally handles the cashier function. Procurement is also a separate function that works under the Procurement Committee.
3.1 Authorization and approval procedures
The Government Accounting Manual sets out the systems of authorization, policies, standards, and accounting procedures and reports used by the agencies to control operations and resources and enable the various units to meet their objectives. These procedures or activities are implemented to achieve the control objectives of safeguarding resources, ensuring the accuracy of data and enabling adherence to laws, policies, rules, and regulations. There is also an SCOA used by all county departments.
3.2 Segregation of duties (authorizing, processing, recording, reviewing)
PI-25.1 Appropriate segregation of duties exists, in accordance with the SCOA, IFMIS, and government circulars, which specify clear responsibilities, but many operations are still done outside the IFMIS.
3.3 Controls over access to resources and records
PI-25.3 Most payments are compliant with rules and procedures, but variations do occur and are pointed out in the report of the OAG. PI-27.4. Access and changes to records are restricted and recorded.
3.4 Verifications The PFM Regulations and finance manual sets out the usual internal control instructions for verification: review of transactions to check the propriety and reliability of documentation, costing, or mathematical computation. It includes checking the conformity of acquired goods and services with agreed quantity and quality specifications.
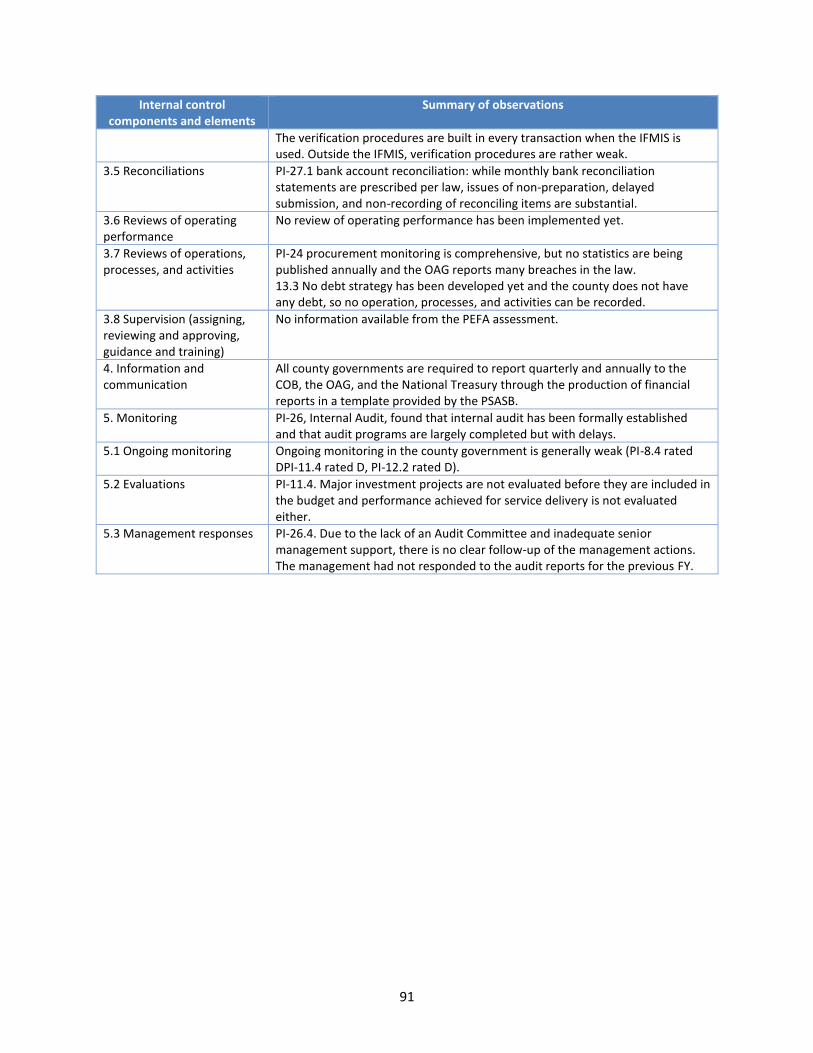
91
Internal control components and elements
Summary of observations
The verification procedures are built in every transaction when the IFMIS is used. Outside the IFMIS, verification procedures are rather weak.
3.5 Reconciliations PI-27.1 bank account reconciliation: while monthly bank reconciliation statements are prescribed per law, issues of non-preparation, delayed submission, and non-recording of reconciling items are substantial.
3.6 Reviews of operating performance
No review of operating performance has been implemented yet.
3.7 Reviews of operations, processes, and activities
PI-24 procurement monitoring is comprehensive, but no statistics are being published annually and the OAG reports many breaches in the law. 13.3 No debt strategy has been developed yet and the county does not have any debt, so no operation, processes, and activities can be recorded.
3.8 Supervision (assigning, reviewing and approving, guidance and training)
No information available from the PEFA assessment.
4. Information and communication
All county governments are required to report quarterly and annually to the COB, the OAG, and the National Treasury through the production of financial reports in a template provided by the PSASB.
5. Monitoring PI-26, Internal Audit, found that internal audit has been formally established and that audit programs are largely completed but with delays.
5.1 Ongoing monitoring Ongoing monitoring in the county government is generally weak (PI-8.4 rated DPI-11.4 rated D, PI-12.2 rated D).
5.2 Evaluations PI-11.4. Major investment projects are not evaluated before they are included in the budget and performance achieved for service delivery is not evaluated either.
5.3 Management responses PI-26.4. Due to the lack of an Audit Committee and inadequate senior management support, there is no clear follow-up of the management actions. The management had not responded to the audit reports for the previous FY.
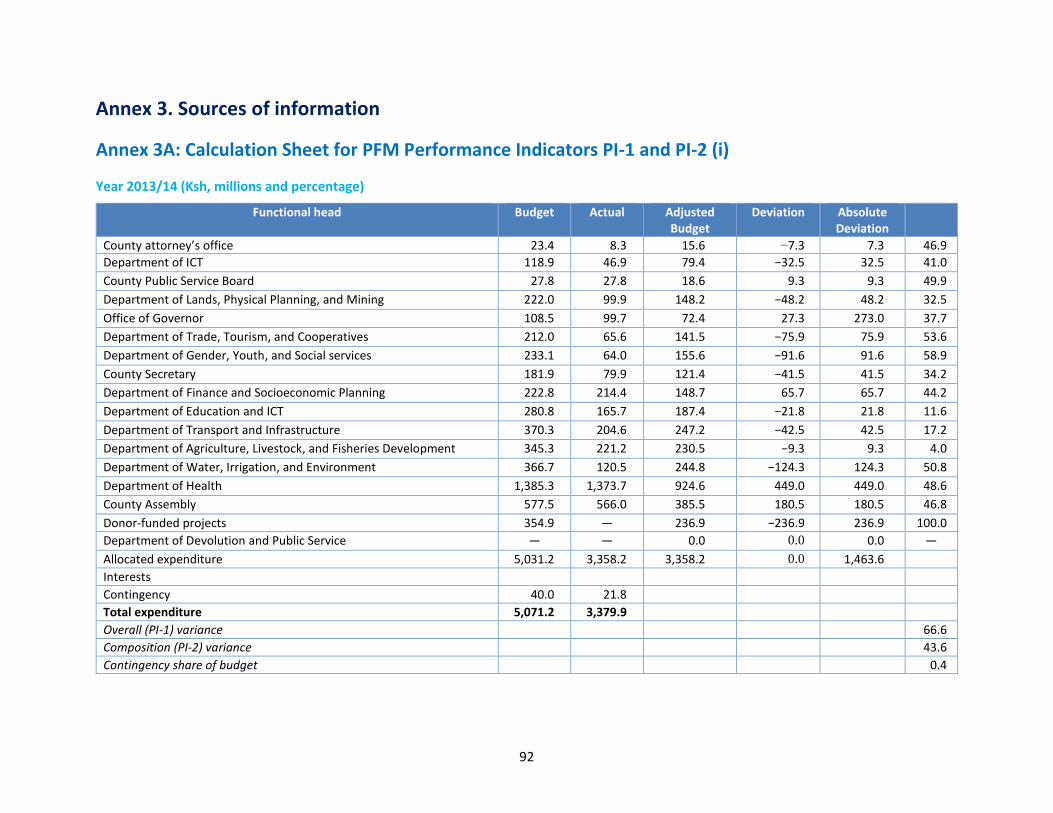
92
Annex 3. Sources of information
Annex 3A: Calculation Sheet for PFM Performance Indicators PI-1 and PI-2 (i)
Year 2013/14 (Ksh, millions and percentage)
Functional head Budget Actual Adjusted Budget
Deviation Absolute Deviation
County attorney’s office 23.4 8.3 15.6 −7.3 7.3 46.9
Department of ICT 118.9 46.9 79.4 −32.5 32.5 41.0
County Public Service Board 27.8 27.8 18.6 9.3 9.3 49.9
Department of Lands, Physical Planning, and Mining 222.0 99.9 148.2 −48.2 48.2 32.5
Office of Governor 108.5 99.7 72.4 27.3 273.0 37.7
Department of Trade, Tourism, and Cooperatives 212.0 65.6 141.5 −75.9 75.9 53.6
Department of Gender, Youth, and Social services 233.1 64.0 155.6 −91.6 91.6 58.9
County Secretary 181.9 79.9 121.4 −41.5 41.5 34.2
Department of Finance and Socioeconomic Planning 222.8 214.4 148.7 65.7 65.7 44.2
Department of Education and ICT 280.8 165.7 187.4 −21.8 21.8 11.6
Department of Transport and Infrastructure 370.3 204.6 247.2 −42.5 42.5 17.2
Department of Agriculture, Livestock, and Fisheries Development 345.3 221.2 230.5 −9.3 9.3 4.0
Department of Water, Irrigation, and Environment 366.7 120.5 244.8 −124.3 124.3 50.8
Department of Health 1,385.3 1,373.7 924.6 449.0 449.0 48.6
County Assembly 577.5 566.0 385.5 180.5 180.5 46.8
Donor-funded projects 354.9 — 236.9 −236.9 236.9 100.0
Department of Devolution and Public Service — — 0.0 0.0 0.0 —
Allocated expenditure 5,031.2 3,358.2 3,358.2 0.0 1,463.6
Interests
Contingency 40.0 21.8
Total expenditure 5,071.2 3,379.9
Overall (PI-1) variance
66.6
Composition (PI-2) variance
43.6
Contingency share of budget
0.4
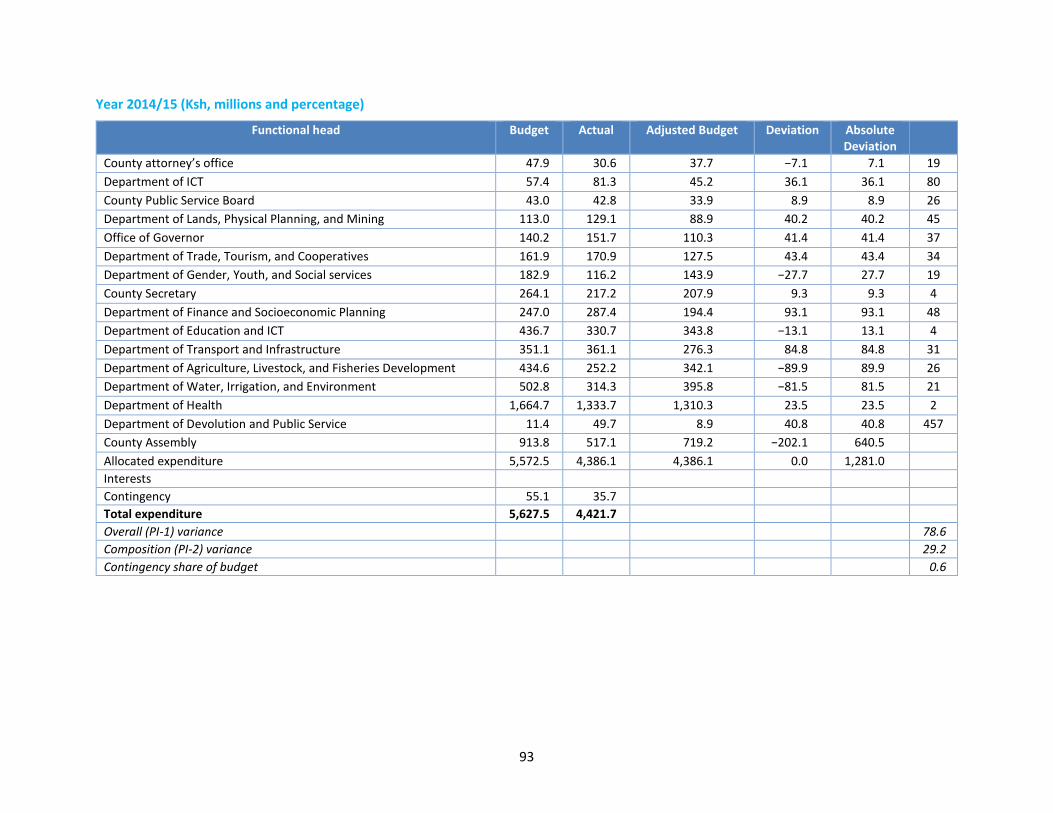
93
Year 2014/15 (Ksh, millions and percentage)
Functional head Budget Actual Adjusted Budget Deviation Absolute Deviation
County attorney’s office 47.9 30.6 37.7 −7.1 7.1 19
Department of ICT 57.4 81.3 45.2 36.1 36.1 80
County Public Service Board 43.0 42.8 33.9 8.9 8.9 26
Department of Lands, Physical Planning, and Mining 113.0 129.1 88.9 40.2 40.2 45
Office of Governor 140.2 151.7 110.3 41.4 41.4 37
Department of Trade, Tourism, and Cooperatives 161.9 170.9 127.5 43.4 43.4 34
Department of Gender, Youth, and Social services 182.9 116.2 143.9 −27.7 27.7 19
County Secretary 264.1 217.2 207.9 9.3 9.3 4
Department of Finance and Socioeconomic Planning 247.0 287.4 194.4 93.1 93.1 48
Department of Education and ICT 436.7 330.7 343.8 −13.1 13.1 4
Department of Transport and Infrastructure 351.1 361.1 276.3 84.8 84.8 31
Department of Agriculture, Livestock, and Fisheries Development 434.6 252.2 342.1 −89.9 89.9 26
Department of Water, Irrigation, and Environment 502.8 314.3 395.8 −81.5 81.5 21
Department of Health 1,664.7 1,333.7 1,310.3 23.5 23.5 2
Department of Devolution and Public Service 11.4 49.7 8.9 40.8 40.8 457
County Assembly 913.8 517.1 719.2 −202.1 640.5
Allocated expenditure 5,572.5 4,386.1 4,386.1 0.0 1,281.0
Interests
Contingency 55.1 35.7
Total expenditure 5,627.5 4,421.7
Overall (PI-1) variance
78.6
Composition (PI-2) variance
29.2
Contingency share of budget
0.6
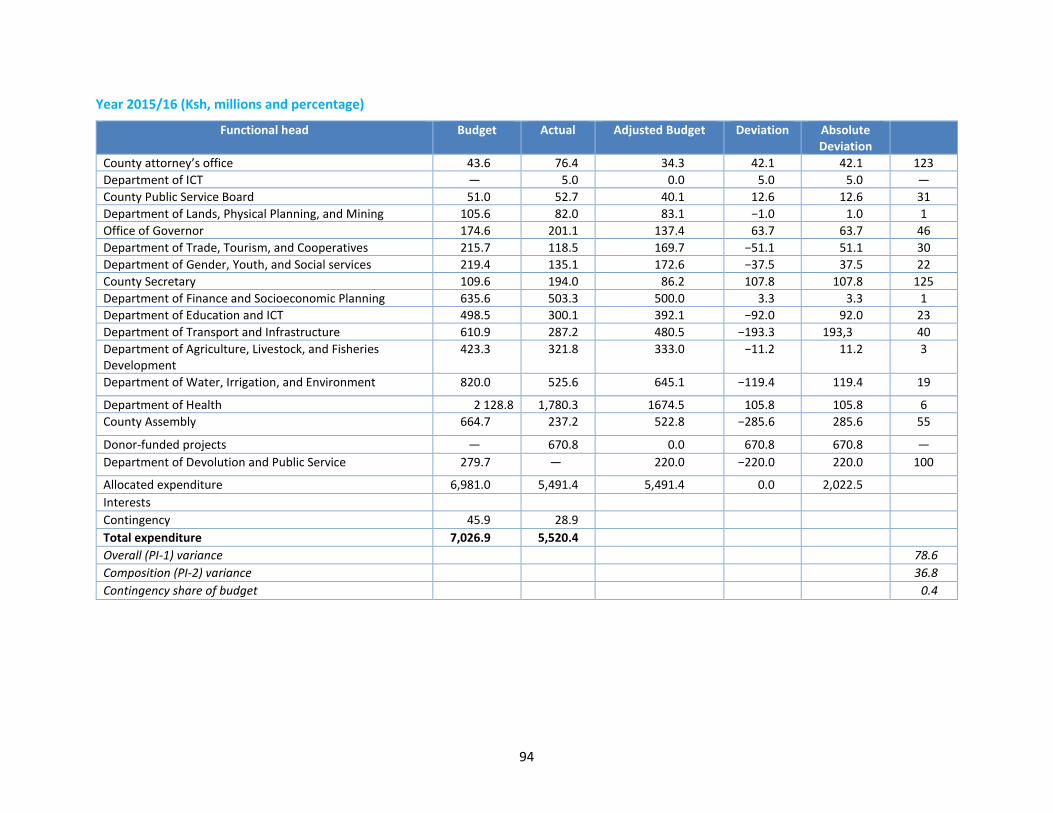
94
Year 2015/16 (Ksh, millions and percentage)
Functional head Budget Actual Adjusted Budget Deviation Absolute Deviation
County attorney’s office 43.6 76.4 34.3 42.1 42.1 123
Department of ICT — 5.0 0.0 5.0 5.0 —
County Public Service Board 51.0 52.7 40.1 12.6 12.6 31
Department of Lands, Physical Planning, and Mining 105.6 82.0 83.1 −1.0 1.0 1
Office of Governor 174.6 201.1 137.4 63.7 63.7 46
Department of Trade, Tourism, and Cooperatives 215.7 118.5 169.7 −51.1 51.1 30
Department of Gender, Youth, and Social services 219.4 135.1 172.6 −37.5 37.5 22
County Secretary 109.6 194.0 86.2 107.8 107.8 125
Department of Finance and Socioeconomic Planning 635.6 503.3 500.0 3.3 3.3 1
Department of Education and ICT 498.5 300.1 392.1 −92.0 92.0 23
Department of Transport and Infrastructure 610.9 287.2 480.5 −193.3 193,3 40
Department of Agriculture, Livestock, and Fisheries Development
423.3 321.8 333.0 −11.2 11.2 3
Department of Water, Irrigation, and Environment 820.0 525.6 645.1 −119.4 119.4 19
Department of Health 2 128.8 1,780.3 1674.5 105.8 105.8 6
County Assembly 664.7 237.2 522.8 −285.6 285.6 55
Donor-funded projects — 670.8 0.0 670.8 670.8 —
Department of Devolution and Public Service 279.7 — 220.0 −220.0 220.0 100
Allocated expenditure 6,981.0 5,491.4 5,491.4 0.0 2,022.5
Interests
Contingency 45.9 28.9
Total expenditure 7,026.9 5,520.4
Overall (PI-1) variance
78.6
Composition (PI-2) variance
36.8
Contingency share of budget
0.4
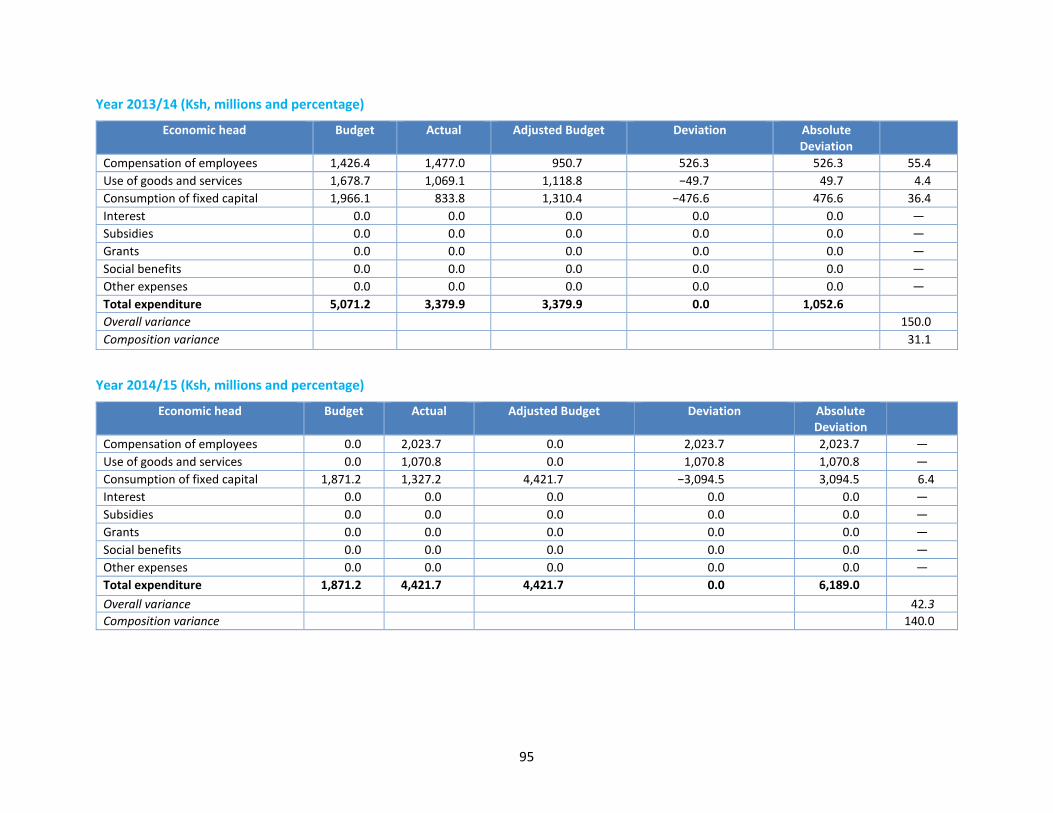
95
Year 2013/14 (Ksh, millions and percentage)
Economic head Budget Actual Adjusted Budget Deviation Absolute Deviation
Compensation of employees 1,426.4 1,477.0 950.7 526.3 526.3 55.4
Use of goods and services 1,678.7 1,069.1 1,118.8 −49.7 49.7 4.4
Consumption of fixed capital 1,966.1 833.8 1,310.4 −476.6 476.6 36.4
Interest 0.0 0.0 0.0 0.0 0.0 —
Subsidies 0.0 0.0 0.0 0.0 0.0 —
Grants 0.0 0.0 0.0 0.0 0.0 —
Social benefits 0.0 0.0 0.0 0.0 0.0 —
Other expenses 0.0 0.0 0.0 0.0 0.0 —
Total expenditure 5,071.2 3,379.9 3,379.9 0.0 1,052.6
Overall variance
150.0
Composition variance
31.1
Year 2014/15 (Ksh, millions and percentage)
Economic head Budget Actual Adjusted Budget Deviation Absolute Deviation
Compensation of employees 0.0 2,023.7 0.0 2,023.7 2,023.7 —
Use of goods and services 0.0 1,070.8 0.0 1,070.8 1,070.8 —
Consumption of fixed capital 1,871.2 1,327.2 4,421.7 −3,094.5 3,094.5 6.4
Interest 0.0 0.0 0.0 0.0 0.0 —
Subsidies 0.0 0.0 0.0 0.0 0.0 —
Grants 0.0 0.0 0.0 0.0 0.0 —
Social benefits 0.0 0.0 0.0 0.0 0.0 —
Other expenses 0.0 0.0 0.0 0.0 0.0 —
Total expenditure 1,871.2 4,421.7 4,421.7 0.0 6,189.0
Overall variance
42.3
Composition variance
140.0
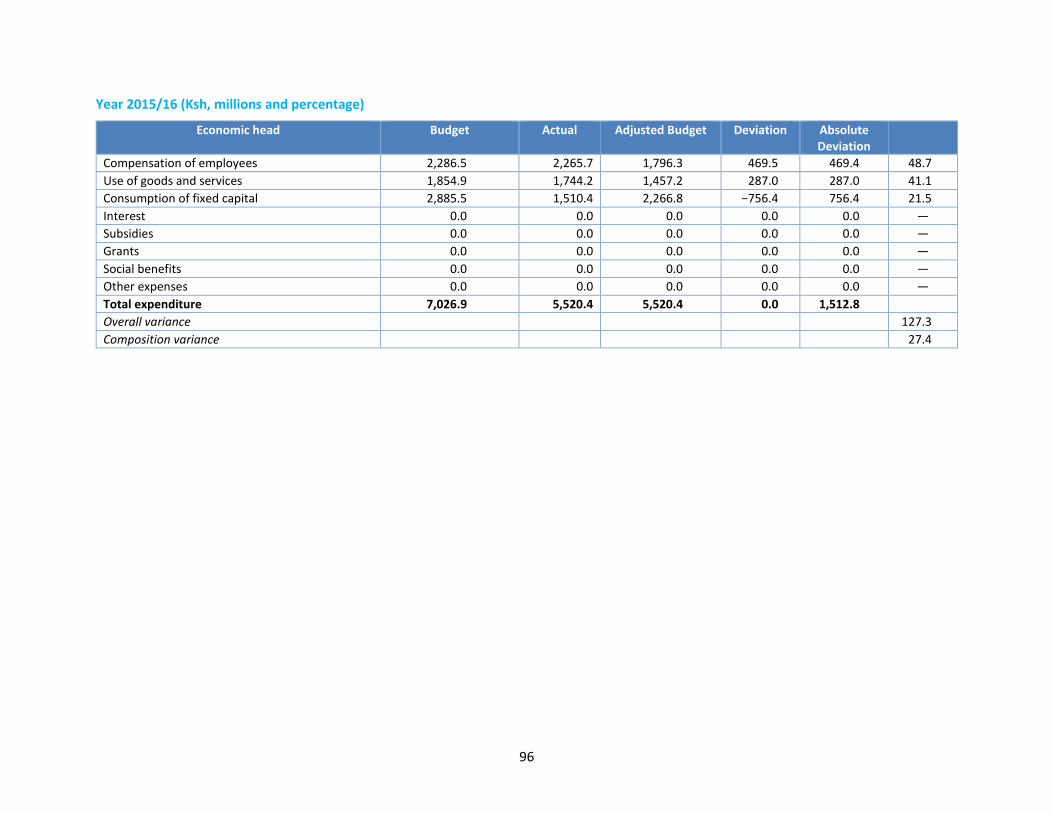
96
Year 2015/16 (Ksh, millions and percentage)
Economic head Budget Actual Adjusted Budget Deviation Absolute Deviation
Compensation of employees 2,286.5 2,265.7 1,796.3 469.5 469.4 48.7
Use of goods and services 1,854.9 1,744.2 1,457.2 287.0 287.0 41.1
Consumption of fixed capital 2,885.5 1,510.4 2,266.8 −756.4 756.4 21.5
Interest 0.0 0.0 0.0 0.0 0.0 —
Subsidies 0.0 0.0 0.0 0.0 0.0 —
Grants 0.0 0.0 0.0 0.0 0.0 —
Social benefits 0.0 0.0 0.0 0.0 0.0 —
Other expenses 0.0 0.0 0.0 0.0 0.0 —
Total expenditure 7,026.9 5,520.4 5,520.4 0.0 1,512.8
Overall variance
127.3
Composition variance
27.4
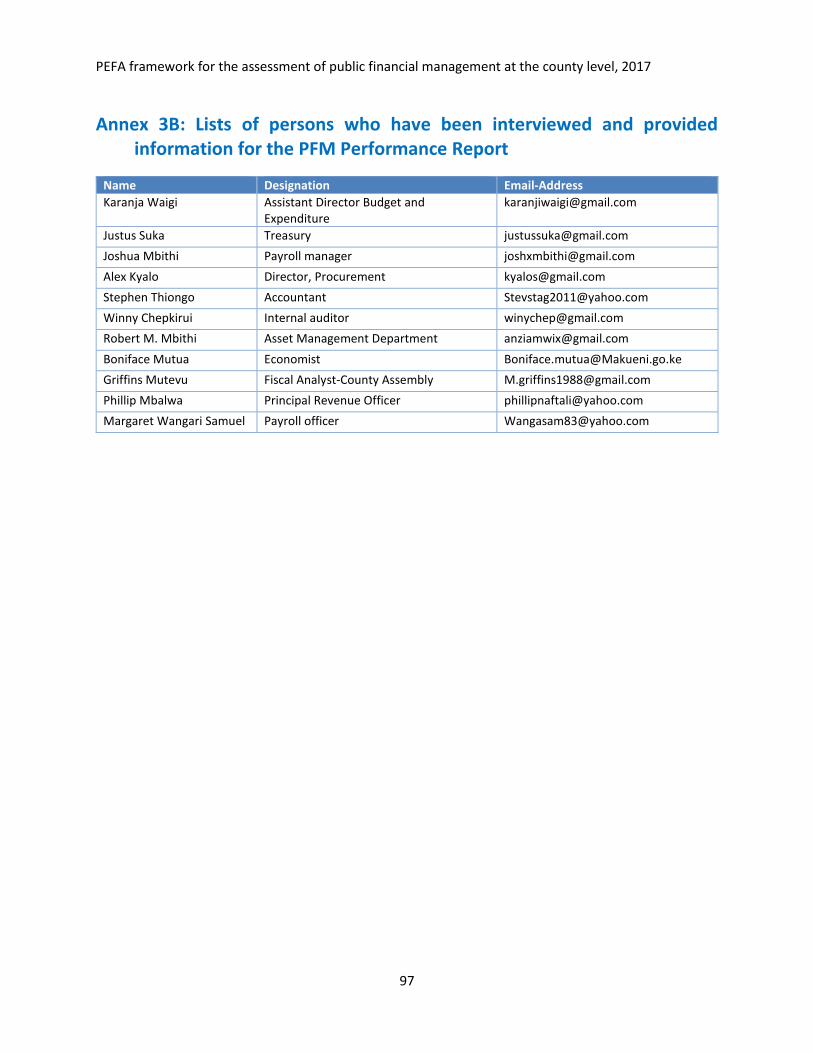
PEFA framework for the assessment of public financial management at the county level, 2017
97
Annex 3B: Lists of persons who have been interviewed and provided information for the PFM Performance Report
Name Designation Email-Address
Karanja Waigi Assistant Director Budget and Expenditure
Justus Suka Treasury [email protected]
Joshua Mbithi Payroll manager [email protected]
Alex Kyalo Director, Procurement [email protected]
Stephen Thiongo Accountant [email protected]
Winny Chepkirui Internal auditor [email protected]
Robert M. Mbithi Asset Management Department [email protected]
Boniface Mutua Economist [email protected]
Griffins Mutevu Fiscal Analyst-County Assembly [email protected]
Phillip Mbalwa Principal Revenue Officer [email protected]
Margaret Wangari Samuel Payroll officer [email protected]
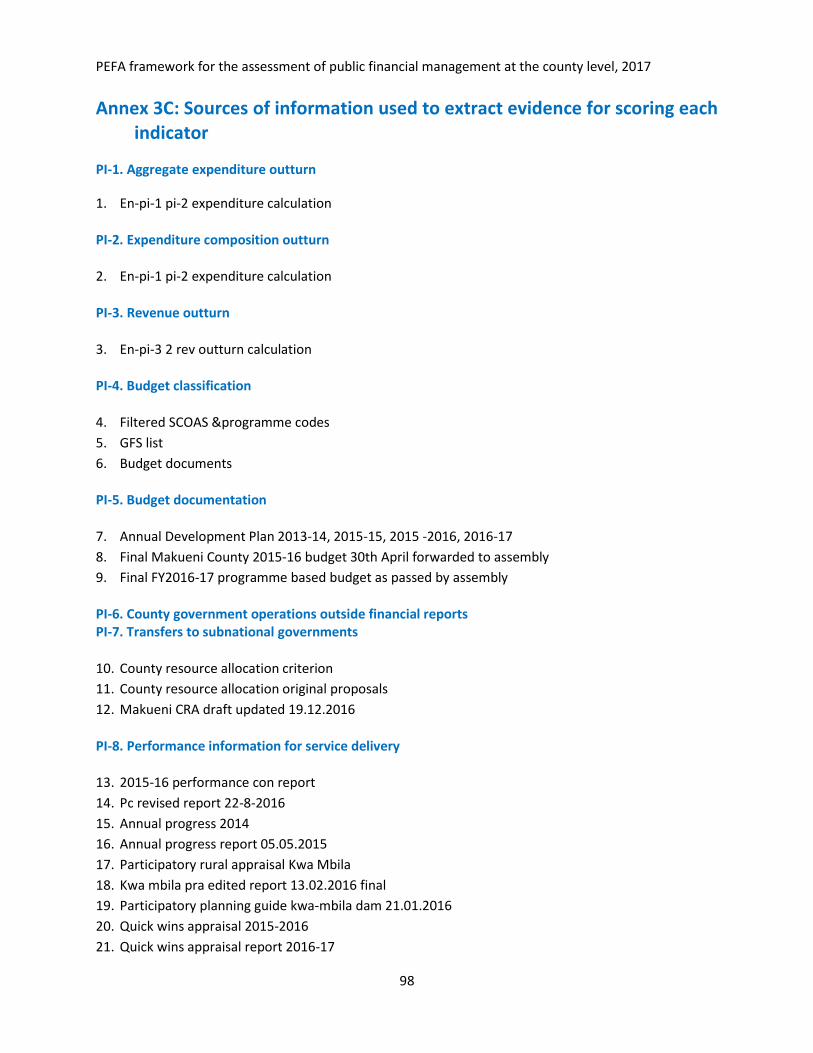
PEFA framework for the assessment of public financial management at the county level, 2017
98
Annex 3C: Sources of information used to extract evidence for scoring each indicator
PI-1. Aggregate expenditure outturn
1. En-pi-1 pi-2 expenditure calculation
PI-2. Expenditure composition outturn
2. En-pi-1 pi-2 expenditure calculation
PI-3. Revenue outturn
3. En-pi-3 2 rev outturn calculation
PI-4. Budget classification
4. Filtered SCOAS &programme codes
5. GFS list
6. Budget documents
PI-5. Budget documentation
7. Annual Development Plan 2013-14, 2015-15, 2015 -2016, 2016-17
8. Final Makueni County 2015-16 budget 30th April forwarded to assembly
9. Final FY2016-17 programme based budget as passed by assembly
PI-6. County government operations outside financial reports PI-7. Transfers to subnational governments
10. County resource allocation criterion
11. County resource allocation original proposals
12. Makueni CRA draft updated 19.12.2016
PI-8. Performance information for service delivery
13. 2015-16 performance con report
14. Pc revised report 22-8-2016
15. Annual progress 2014
16. Annual progress report 05.05.2015
17. Participatory rural appraisal Kwa Mbila
18. Kwa mbila pra edited report 13.02.2016 final
19. Participatory planning guide kwa-mbila dam 21.01.2016
20. Quick wins appraisal 2015-2016
21. Quick wins appraisal report 2016-17
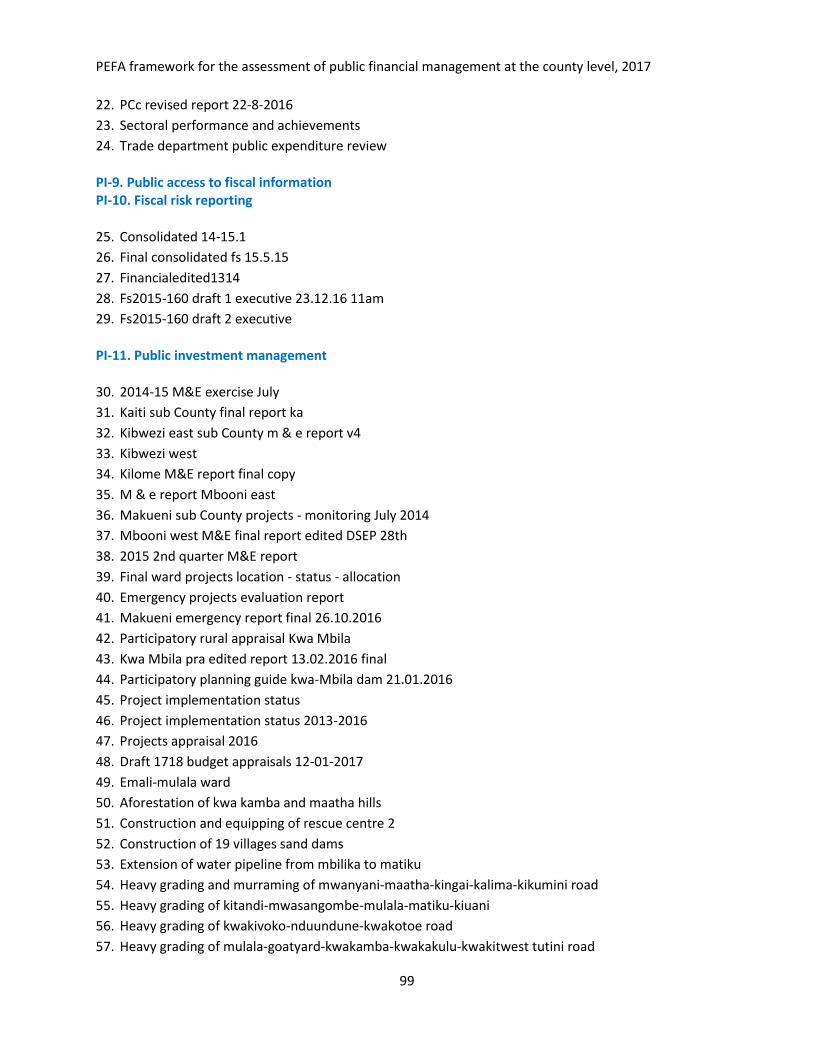
PEFA framework for the assessment of public financial management at the county level, 2017
99
22. PCc revised report 22-8-2016
23. Sectoral performance and achievements
24. Trade department public expenditure review
PI-9. Public access to fiscal information PI-10. Fiscal risk reporting
25. Consolidated 14-15.1
26. Final consolidated fs 15.5.15
27. Financialedited1314
28. Fs2015-160 draft 1 executive 23.12.16 11am
29. Fs2015-160 draft 2 executive
PI-11. Public investment management
30. 2014-15 M&E exercise July
31. Kaiti sub County final report ka
32. Kibwezi east sub County m & e report v4
33. Kibwezi west
34. Kilome M&E report final copy
35. M & e report Mbooni east
36. Makueni sub County projects - monitoring July 2014
37. Mbooni west M&E final report edited DSEP 28th
38. 2015 2nd quarter M&E report
39. Final ward projects location - status - allocation
40. Emergency projects evaluation report
41. Makueni emergency report final 26.10.2016
42. Participatory rural appraisal Kwa Mbila
43. Kwa Mbila pra edited report 13.02.2016 final
44. Participatory planning guide kwa-Mbila dam 21.01.2016
45. Project implementation status
46. Project implementation status 2013-2016
47. Projects appraisal 2016
48. Draft 1718 budget appraisals 12-01-2017
49. Emali-mulala ward
50. Aforestation of kwa kamba and maatha hills
51. Construction and equipping of rescue centre 2
52. Construction of 19 villages sand dams
53. Extension of water pipeline from mbilika to matiku
54. Heavy grading and murraming of mwanyani-maatha-kingai-kalima-kikumini road
55. Heavy grading of kitandi-mwasangombe-mulala-matiku-kiuani
56. Heavy grading of kwakivoko-nduundune-kwakotoe road
57. Heavy grading of mulala-goatyard-kwakamba-kwakakulu-kwakitwest tutini road
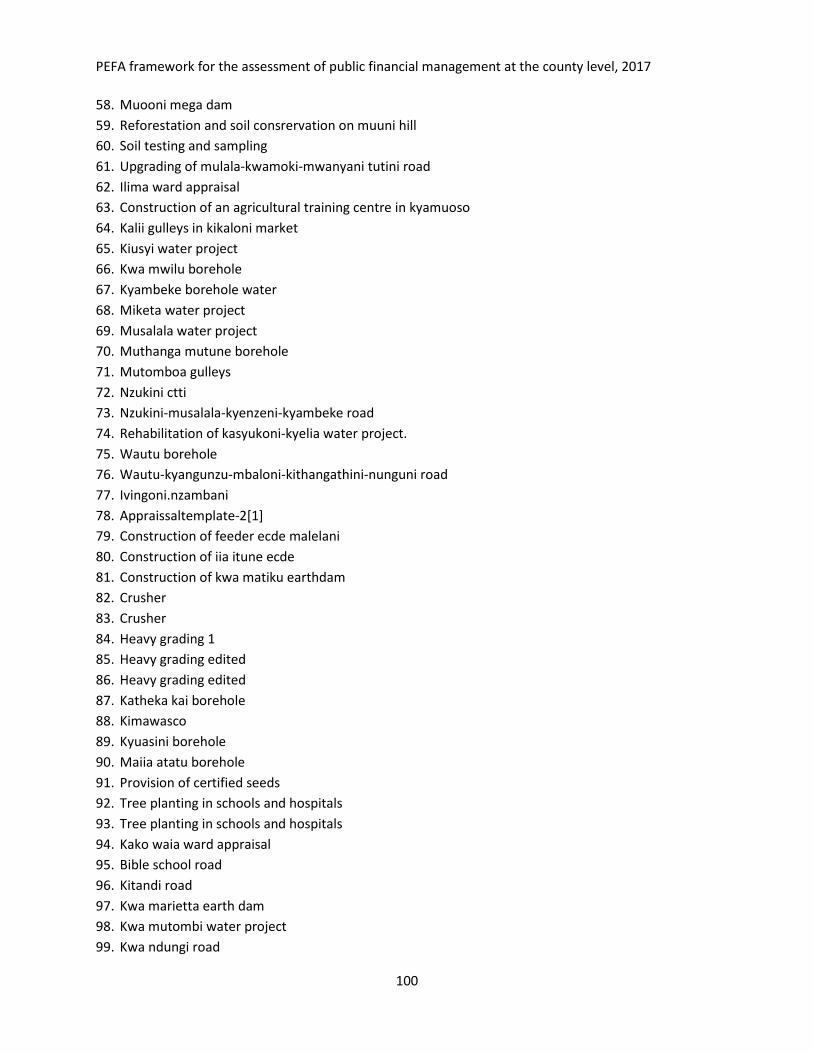
PEFA framework for the assessment of public financial management at the county level, 2017
100
58. Muooni mega dam
59. Reforestation and soil consrervation on muuni hill
60. Soil testing and sampling
61. Upgrading of mulala-kwamoki-mwanyani tutini road
62. Ilima ward appraisal
63. Construction of an agricultural training centre in kyamuoso
64. Kalii gulleys in kikaloni market
65. Kiusyi water project
66. Kwa mwilu borehole
67. Kyambeke borehole water
68. Miketa water project
69. Musalala water project
70. Muthanga mutune borehole
71. Mutomboa gulleys
72. Nzukini ctti
73. Nzukini-musalala-kyenzeni-kyambeke road
74. Rehabilitation of kasyukoni-kyelia water project.
75. Wautu borehole
76. Wautu-kyangunzu-mbaloni-kithangathini-nunguni road
77. Ivingoni.nzambani
78. Appraissaltemplate-2[1]
79. Construction of feeder ecde malelani
80. Construction of iia itune ecde
81. Construction of kwa matiku earthdam
82. Crusher
83. Crusher
84. Heavy grading 1
85. Heavy grading edited
86. Heavy grading edited
87. Katheka kai borehole
88. Kimawasco
89. Kyuasini borehole
90. Maiia atatu borehole
91. Provision of certified seeds
92. Tree planting in schools and hospitals
93. Tree planting in schools and hospitals
94. Kako waia ward appraisal
95. Bible school road
96. Kitandi road
97. Kwa marietta earth dam
98. Kwa mutombi water project
99. Kwa ndungi road
PEFA framework for the assessment of public financial management at the county level, 2017
101
100. Kwa nzwili sand dam
101. Malatani road
102. Nzou nthei gully
103. Savani drift
104. Sofia road
105. Uviluni road
106. Waia earth dam
107. Kalawa ward appraisal
108. Kathulumbi dispensary
109. Katukulu earth dam
110. Kinyau road
111. Kwa muia gulley
112. Kwa philiph road
113. Maana eli earth dam
114. Musingini road
115. Muusini earthdam
116. Syotuvali dispensary
117. Syotuvali water project
118. Kasikeu
119. Enguli river sand dams-climate change
120. Kawese ecde classroom
121. Kiembeni borehole
122. Kima river sand dams
123. Kisuki road-fuel levy
124. Kithina borehole
125. Kwa loki earth dam-flagship
126. Kwa susu borehole
127. Landu sand dam-climate change
128. Lumu borehole
129. Mbiini dispensary
130. Ndiling road-fuel levy
131. Sultan hamud open air market
132. Tractor for kasikeu subward-flagship
133. Kathonzweni appraisal
134. Grading of road- mbuvo
135. Grading of road-kathonzweni
136. Kikuu water project- mbuvo
137. Kikuu water project
138. Kwa katoo gulley
139. Kwa kavisi water project
140. Kwa kilai earth dam
141. Kwa mathembo kithuka earth dam
PEFA framework for the assessment of public financial management at the county level, 2017
102
142. Kwa mbila water project
143. Londokwe earth dam
144. Modern abattoir
145. Soil and water conservation kathos
146. Soil and water conservation
147. Woolile earth dam
148. Yoani ecde centre
149. Kee ward appraisal
150. Construction of kyamuthyoi earth dam
151. Construction of nthonzweni ecde class
152. Drilling of kitandi borehole
153. Kavandini-mutulani-nguluni-kasunguni-salama road.
154. Kee ctti docx
155. Kiianzou mega dam
156. Kwa kithyoma earth dam
157. Kwa kivinda gulley
158. Kwa ntheketha-kituuti earth dam
159. Kweluu-earth dam
160. Kyambai gulleys-
161. Kyambai- ngiitini-kee road
162. Kyandumbi borehole water project
163. Support to farmers with subsidized farm inputs.
164. Kiima kiu
165. Itumbule dispensary-flagship
166. Ivununi borehole
167. Kaluku earth dam
168. Kasalama borehole
169. Kima open air market
170. Kwa ivia earth dam
171. Kwa kimonde borehole
172. Kwa kingee roads-fuel levy
173. Kwa mulela earth dam-climate change
174. Kwa tuva-yaitha road
175. Makulani earth dam-climate change
176. Malili open air market-flagship
177. Malili -uiini road-fuel levy
178. Silanga mbuu earth dam
179. Kikumbulyu north ward appraisal
180. Construction of mukononi earth dam
181. Construction of kitulani ecde
182. Construction of kwa matha sand dam
183. Construction of kwa mutua earth dam
PEFA framework for the assessment of public financial management at the county level, 2017
103
184. Construction of kwa ngano sand dam
185. Construction of mikauni ecde
186. Equipping of ndetani ctti
187. Planting of trees in institutions and markets
188. Rehabilitation and fencing of malebwa earth dam
189. Kikumbulyu south ward appraisal
190. Construction of a ecde class room at kibwezi township primary
191. Construction of a social hall at mukamba cultural centre
192. Construction of kalungu ecde
193. Construction of kawala drift
194. Construction of matinga ecde
195. Piping of kimwasco water project from mikameni to nthunguni
196. Planting of trees in mbunzau hill,and kilui water catchment
197. Provision of drought resistant seeds in kikumbulyu
198. Kikumini-muvau ward appraisal
199. Kikumini
200. Kilungu ward appraisal
201. Ikuma road
202. Inyonywe water project
203. Itambani rd
204. Ithemboni road
205. Kikuyuni road
206. Kisyani road
207. Kithangathini seedbeds
208. Kyanzinzi water project
209. Kyetuli earthdam
210. Kyumani water project
211. Makutano road
212. Mwitikio river
213. Ndiani road
214. Nthunguni gulley
215. Kisau kiteta
216. Construction of a dumping site at mbumbuni market
217. Construction of gabions at kyome primary school
218. Grading of mwana - kwa masaku - kavutini road
219. Grading of ndiang’u - kanyenyoni - mbulutoni - syunguni road
220. Kavuvoni ecde
221. Kyome ecde
222. Maintenance and grading of mbumbuni - mbiani road
223. Mukundi water project
224. Ndituni water project
225. Rehabilitation of kinze dam
PEFA framework for the assessment of public financial management at the county level, 2017
104
226. Supply of subsidized farm inputs - kisau
227. Supply of subsidized farm inputs - kiteta
228. Tawa market floodlights installation
229. Uvaa water project
230. Kithungo appraisals
231. Appraissaltemplate-2[1]
232. Kalala kavatini road
233. Kaliani dispensary
234. Kaliavati gabions
235. Kaseki itulandoo rd
236. Kilyungi playfield
237. Kilyungi-utangwa road
238. Kinyongo spring
239. Kithungo cold storage
240. Mwenyeani water project
241. Utangwa ctti dorm
242. Utangwa sand dams
243. Kithungo ward appraisals
244. vide
245. Kitise kithuki
246. Kitise
247. Makindu ward appraisal
248. Construction of kiu ecde
249. Gabbions
250. Gnca ecde
251. -kiboko-twaandu
252. Kisingo borehole
253. Kiu catchment
254. Kwa kasimu bh
255. Ngaaka dispensary
256. Ngomano earth dam
257. Ngomano water project
258. Nthia-mbiuni road
259. Poultry &goat keeping
260. Masongaleni ward appraisal
261. Athi river water pumping scheme 2
262. Athi river water pumping
263. Elengole dam expansion
264. Ititi rock catchment
265. Kimawasco pipeline from kalulu to nzembete a. B
266. Kimawasco
267. Kwa majee e.dam
PEFA framework for the assessment of public financial management at the county level, 2017
105
268. Kwa mbandi e. Dam
269. Masaku ndogo bh
270. Ngovani e.dam
271. Rehab machinery-kavatini-kativani
272. Rehabilitation of major gulleys
273. Syathi e.dam
274. Wandei mwaani thange river drift
275. Mavindini ward
276. Athi water project (kamuithi water project)
277. Community water tanks to all public institutions- water tracking points
278. Construction of kwa ndungulu drift (landi - nzeveni road)
279. Construction of kwa david mutunga and mutisya mainga . Earth dam
280. Construction of nguthunu earth dam
281. Equiping a maternity and construction of staff quarters at iiani dispensary
282. Expansion and fencing of enzio earth dam
283. Ngolovoi drift (kanthuni - kyase road)
284. Rehabilitation of athi - ivinganzia (kasayani water project)
285. Mbitini ward appraissal
286. Kiisini springs
287. Kivani-kwa ngiti-kavuthu road
288. Mutyambua bh
289. Ngesu river sanddams
290. Nolturesh water project
291. Reafforestation of kyemundu, kalumbi and mwambwani forests
292. Supply of certified seeds and fertilizers
293. Supply of fertilizers and certified seeds
294. Upgrading masokani ctti
295. Upgrading of manooni play ground
296. Upgrading of mungyani-kithumani-kwa mutula-ngoto-kitulani road
297. Mbooni appraisals
298. Appraissaltemplate-2[1]
299. Gabions at nzeveni
300. Ikokani water project
301. Ililu dam
302. Katilini dispensary
303. Kivandini nzaini road
304. Makuu ecde
305. Mbooni agric flagship
306. Mukaatini ctti
307. Mulima water project
308. Mutulanguu ecde
309. Muumoni dispensary
PEFA framework for the assessment of public financial management at the county level, 2017
106
310. Sensitizaton on climate change
311. Wathi water project
312. Mtito andei ward appraisal
313. Agricultural activities
314. Appraissaltemplate-2[1]
315. Athi kamuyu drift
316. Athi river w.p
317. Construction of gabions
318. Construction of ilikoni ecde
319. Construction of kwa musenya kwa kavyu earthdam
320. Construction of nguumo ecde
321. Heavy grading edited
322. Heavy grading k
323. Improved agricultural practices
324. Kwa mulandi gabions
325. Kwa mwelu drift
326. Masai earthdam
327. Nzalani ecde
328. Slaughter road drift
329. Title deeds
330. Tree planting
331. Yindundu ecde
332. Mukaa ward appraisal
333. Drilling of kwa kasila borehole
334. Ianduini borehole
335. Kateseimbya -kivani road
336. Kima -kitaingo road
337. Kitonguni borehole
338. Kwa kala earth dam
339. Kwa musaa borehole
340. Kwa musuu borehole
341. Kyandue borehole
342. Mutiluni borehole
343. Mwanyani borehole
344. Tree nursuries in all clusters
345. Tree planting in schools and churches
346. Nguu-masumba ward
347. Itiani ecde
348. Kikumini playground
349. Kikuu sand dams construction.
350. Kwa matilu earthdam
351. Livestock improvement
PEFA framework for the assessment of public financial management at the county level, 2017
107
352. Matutu dispensary
353. Mbukani primary borehole
354. Mithumoni dispensary
355. Tree nurseries 2
356. Utini ecde
357. Yikivumbu market shed
358. Nguumo ward appraisal
359. Borehole soto
360. Farm ponds
361. Goats and poutry
362. Ilaatu stadium
363. Ilatu dispensary
364. Kalakalya borehole
365. Kaunguni dispensary
366. Kaunguni forest
367. Kwa kala borehole
368. Makusu syumile
369. Market shed at kibarani
370. Mbui nzau hill
371. Nguumo playground
372. Sanddam at mukononi river
373. Tuaga & kwa singi bridge
374. Uvileni ctti
375. Wakiamba ecde
376. Nzaui ward appraissal
377. Construction of katulani ed
378. Iangini ed
379. Katulye maternity wing
380. Kikuu river catchment protection
381. Kithatu-mathanguni-kalaani road
382. Kwa masaa-kalumoni road
383. Kwa mbiti-kithumba-makutano-kalamba
384. Kwa moto samp tank
385. Kyuasini ecde
386. Manyenyoni drift
387. Muuani-kalivia road
388. Ngyau earth dam
389. Soil conservation
390. Yanthooko sanddam
391. Thange ward appraisal
392. Exp kikunduku e.dam
393. Kilungu bh
PEFA framework for the assessment of public financial management at the county level, 2017
108
394. Kilungu pri.nzavoni.masonga road
395. Kinyambu s.h
396. Kituneni kwa munguti bh
397. Kiumoni ctti
398. Kwa nzomba e.dam
399. Kyaani e.dam
400. Machinery.masonga.nzavoni.kinyambu disp road
401. Machinery.moki.ngomano.mutusye w.pipeline
402. Masonga ctti
403. Musikiti- nzavoni pri road
404. Muthungue disp bh
405. Utithi.kasasule road
406. Tulimani ward appraisal
407. Dam at ngwani river
408. Iiani dispensary
409. Ikokani water project
410. Itetani dispensary
411. Kalawani market public toilet
412. Kalii earthdam
413. Katunda- kyamithenge - ngunini - uvaani - kooi road
414. Kiatineni borehole
415. Kwa ndifatha borehole
416. Kyamithenge ecde
417. Kyanguma ecde
418. Maintainance of kalawani - kwa mutisya road
419. Mavindu dispensary
420. Muketani ecde
421. Nthangathini ecde
422. Rehabilitation of gullies
423. Tree planting at kakima hill
424. Tulimani dispensary (tututha)
425. Wanzauni ecde
426. Yandue dispensary
427. Ukia ward appraisal
428. Grading and maintanance of road
429. Improvement of dairy farming
430. Itithini dispensary
431. Kaumoni earth dam
432. Kilala model health centre
433. Kyambalasi mega earth dam
434. Mbaani water project
435. Ndiuni water project
PEFA framework for the assessment of public financial management at the county level, 2017
109
436. Planting of trees
437. Tree planting
438. Ukia dispensary
439. Water weir at ikangaani spring
440. Hq projects appraisal
441. Project prioritization worksheet 29.11.2016
442. Public participation
443. 1617 participation
444. Budgeting at sub ward level guide FY2016-17
445. Makueni County public participation
446. Public participation framework final
447. Public participation hand book 13th Feb 2017 master copy
448. Makueni County projects monitoring system
449. Quick wins appraisal report 2016-17
450. PI-12 public asset management
451. Final asset register-Makueni County
452. Agriculture assets updated 24.3.2017
453. Asset reg water
454. Asset register devolution
455. Asset register-education
456. Asset tracking register - health department - March 2017
457. Cs asset register
458. Finance & planning
459. Lands dept asset register 24032017
460. Trade
461. Transport& infrastructure assets final
462. Consolidated 14-15.1
463. Final consolidated fs 15.5.15
464. Financial edited 2013-14
465. Fs2015-160 draft 1 executive 23.12.16 11am
466. Fs2015-160 draft 2 executive
467. Gfs list
PI-13. Debt management PI-14. Macroeconomic and fiscal forecasting
468. CBROP 13-14
469. Makueni BROP 2013
470. CBROP 14-15
471. Final Makueni BROP 2014
472. CBROP 15-16
473. Makueni CBROP 2015 19th October final version
PEFA framework for the assessment of public financial management at the county level, 2017
110
474. CFSP 14-15
475. Final printed Makueni fiscal strategy paper 2014
476. CFSP 15-16
477. Final Makueni CountyCFSP2015 3rd March 2015
478. CFSP 16-17
479. Final Makueni CountyCFSP2016 25th February 2016 (submitted to c.a)
480. CFSP 2017-18
481. Makueni County 2017 CFSP12.01.2017 submitted to County assembly
482. 2016 CBROP
PI-15. Fiscal strategy
483. CBROP 13-14
484. Makueni BROP 2013
485. CBROP 14-15
486. Final Makueni BROP 2014
487. CBROP 15-16
488. Makueni CBROP 2015 19th October final version
489. CFSP 2017-18
490. Makueni County 2017 CFSP12.01.2017 submitted to County assembly
491. CFSP submission 2015
492. CFSP submission 2016
493. Final Makueni CountyCFSP2015 3rd March 2015
494. Final Makueni CountyCFSP2016 25th February 2016 (submitted to c.a)
495. Final printed Makueni fiscal strategy paper 2014
PI-16. Medium-term perspective in expenditure budgeting
496. Annual development plan 2013-14
497. Annual development plan 2014-15
498. Annual development plan 2015-16
499. Annual development plan 2016-17
500. County integrated development plan (CIDP) 2013-17
501. Edited Makueni CIDP November 2013 Makau
502. CFSP 15-16
503. Final Makueni CountyCFSP2015 3rd March 2015
504. CFSP 16-17
505. Final Makueni CountyCFSP2016 25th February 2016 (submitted to C.A.)
506. CFSP 2017-18
507. Makueni County 2017 CFSP submitted to County assembly
508. CIDP 2013-17
509. Edited Makueni CIDP November 2013
510. Final Makueni CountyCFSP2015 3rd March 2015
PEFA framework for the assessment of public financial management at the county level, 2017
111
511. Final Makueni CountyCFSP2016 25th February 2016 (submitted to C.A.)
512. County fiscal strategic Paper 2014-15
513. Final printed Makueni fiscal strategy paper 2014
514. County strategic plan - vision 2025
515. Makueni County vision 2025 final document
516. Departmental strategic plans
517. Agri strategic plan zero draft
518. Finance & socio-economic planning strategic plan draft edited 21.11.14
519. Gender & youth strategic plan
520. Health sectoral strategic plan
521. ICT strategic plan
522. Office of the governor strategic plan
523. Strategic plan education
524. Strategic plan roads transport infrastructure& energy 001 new
525. Water strategic plan draft
526. Analysis of dates
527. Final printed Makueni fiscal strategy paper 2014
PI-17. Budget preparation process
528. 1415 advert public hearings - Makueni County
529. 2013 budget circular
530. 2014 budget circular
531. 2016 CBROP
532. 2015-16 budget hearings
533. Budget calendar & actual dates
534. Budget circular 26th august
535. Budget circular 2014
536. Budget circular 2015
537. Budget circular 2016
538. Budget submission 2014
539. Final Makueni BROP 2014
540. Finalization circular
541. Makueni BROP 2013
542. Makueni County 1st half FY2014-15 budget implementation report - 1st draft
543. Makueni CountyBROP 2015 19th October final version
544. Makueni County development projects all financial years
545. Makueni County public participation
546. Public participation framework final
547. Sub ward participation tool- final 29.11.2016
PEFA framework for the assessment of public financial management at the county level, 2017
112
PI-18. Legislative scrutiny of budgets
548. County Assembly budget estimates2016
549. County Assembly resolution 2015
550. Interim County assembly standing orders final
551. Appropriation bill 2014-15 26th February
552. Final Makueni County CFSP2016 25th February 2016 (submitted to c.a)
553. Final Makueni County supplementary budget FY2015/16
554. Makueni County final appropriation bill 2015-16 30th June
555. Makueni County appropriation bill 2013
PI-19. Revenue administration
P1-19.1 556. County finance bill 2014 final version
P1-19.2 557. Revenue administration bill
P1-19.3 558. Fraud investigation report
P1-19.4 559. Revenue arrears as at 30 June 2014
560. Revenue arrears as at 30 June 2015
561. Revenue arrears as at 30 June 2016
562. Revenue arrears less than 12 months old
563. Revenue arrears older than 12 years
564. Revenue arrears older than 12 months old
565. Stock of revenue arrears 2015-2016
566. Total revenue collection for 3 FYs
PI-20. Accounting for revenue
P1-20.1 567. Information on daily revenue collection
568. Monthly summary for revenue collection for 2015-2016
569. Weekly summary for revenue collection returns June 2016
570. Weekly summary for revenue collection returns 14-5-16 to 20-5-2016
P1-20.2 571. Sweeping of own revenues at commercial banks to CRF (weekly)
PEFA framework for the assessment of public financial management at the county level, 2017
113
PI-21. Predictability of in-year resource allocation
P1-21.1 572. 2015-16 cash-flow
573. Bank reconciliation February 2017
574. Bank reconciliation January 2017
575. Bank reconciliation-retention
576. CBK revenue
577. Development account 2016-2017
578. KCB development final 2016 17
579. List of County bank accounts
580. Transfer of cash balances to County exchequer account
P1-21.2 581. 2015-16 cash flow
P1-21.3 582. 2016-17 requisitions
583. Form a-car loan sep 2016 assembly
584. Form a-dev 9th sep ca 2016
585. Form a-dev 22nd aug ca 2016
586. Form a-dev aug ca 2016
587. Form a- requisition 4th august 2016 assembly 5th august
588. Form a- requisition 9th sep 2016 assembly
589. Form a- requisition 22nd august 2016 assembly
590. 2016-17 requisition dev ce not subb
591. 2016-17 requisition emergency ce not subb
592. Copy of FY 1617 recurrent requisition
593. Form a-dev aug 15th executive not subb
594. Form a-dev aug 29th reallocation
595. Form a-dev aug 31st executive
596. Form a-dev oct 24th
597. Form a-rec 24th oct 2016
598. Form a-rec july executive 5th august 2016
599. Fy 1617 recurrent requisition 3 amended
600. Fy 1617 recurrent requisition 3
601. Fy 1617 recurrent requisition 4
602. Fy 1617 recurrent requisition
603. Reallocation requisitions-dev
604. Reallocation, main bgt requisitions-dev 2nd req
605. Reallocation, main bgt requisitions-dev
606. Copy of august requisition- ca
607. Form a-ce aug 22nd emergency
PEFA framework for the assessment of public financial management at the county level, 2017
114
608. Form a-dev 9th sep ca 2016
609. Form a-dev aug 15th executive
610. Form a-rec9th sep 2016 assembly
611. Form a-recc 5th jan 2017
612. Form a-recc 9th sept executive car loan
613. Form a-recc 9th sept executive
614. Makueni County government FY2016-17 budget analysis assembly 29th
615. Requirements for release of funds 2016-17
616. Appropriation bill 2014-15 26th February
617. Final Makueni County CFSP 2016 25th February 2016 (submitted to c.a)
618. Final Makueni County government FY2015-16 budget
619. Makueni County 2014-15 budget as passed by assembly
620. Makueni County final appropriation bill 2015-16 30th June
621. MakueniCountyappropriationbill2013
P1-21.4 622. Final FY2015/16 reallocation budget 12th July
623. Final FY2015/16 reallocation budget 13th July 2016 as forwarded to the County assembly
explanations
624. Final FY2015/16 reallocation budget as passed by assembly final version 5th august
625. FY2015/16 revised budget
PI-22. Expenditure arrears
P1-22.1 626. Pending bills 20152016-kenao.zip
627. Stock of expenditure
P1-22.2 628. Pending bills 20152016-kenao
629. Stock of expenditure
PI-23. Payroll controls
630. Authorised data sheet - ads for payroll changes
631. Carps - capacity assessment and rationalization
632. IPPD payroll management guidelines
633. Kiprra payroll Makueni County executive
634. Payroll audit report 1
635. Payroll audit report 2
636. Payroll audit report 3
637. Proposed bench marking on HR matters
638. Retroactive adjustments
PEFA framework for the assessment of public financial management at the county level, 2017
115
PI-24. Procurement management
639. Departmental procurement plans
640. Agriculture
641. Consolidated annual proc. Plan
642. Copy of final 2014-15 budget by departments and directorates
643. Education-procurement plan
644. Gender
645. Health
646. ICT-procurement plan
647. Lands-procurement plan
648. Trade
649. Transport-procurement plan
650. Water-procurement plan
651. Details of contracts awarded per department
652. Agriculture
653. County public service board
654. Department of youth doc
655. Education world bank 2013-2015
656. Education world bank report 2015-2016
657. Finance report
658. Lands
659. Roads, transport& infrastructure world bank report
660. Trade world bank report
661. Water world bank doc
662. Fees for review
663. Hearing notice
664. Notification for review
665. Public procurement and administrative review board
666. Public procurement and asset disposal act 2015
667. Public procurement and disposal manual
668. Publicprocurementanddisposalact2005
669. Request for review
670. Requirements for review
PI-25. Internal controls on non-salary expenditure
671. IFMIS modules and segregation of duties
672. General ledger and reporting
673. Management of accounts receivables
674. Management of fixed assets
675. Procure to pay process
676. Revenue and cash management process
PEFA framework for the assessment of public financial management at the county level, 2017
116
677. Assessing compliance of payment procedures
678. External audit report for the year ended 30 June 2015
679. Makueni County financial regulations & procedure manual
680. Monthly cash flow projections for 2015-2016
681. Public finance management act 2012
PI-26. Internal audit
682. Annual audit plan 2016-2017
683. Appointment as chairman audit committee
684. Audit committee induction program
685. Audits conducted in the last 3 financial years
686. Inauguration of internal audit committee
687. Planned audits for the next three years
688. Publicfinancemanagementact2012
689. Reminder to management for action of audit reports
PI-27. Financial data integrity
690. Development account 2016-2017; February 2017, January 2017
691. KCB development reconciliation final 2016-20 17
692. Bank reconciliation-retention; Development account 2016-2017; February 2017, January 2017
693. KCB development reconciliation final 2016-2017
694. Retention account suspense
PI-28. In-year budget reports
695. 2016-17 quarterly report
696. Consolidated quarterly report-16.1.2017
697. Emergency report: Emergency 2015-16 FY, Emergency 2013-14 FY, Emergency 2014-15 FY
698. Quarterly expenditure reports: 3rd quarter report April 2016 final, 2014-15 report
699. Executive fs 2015
700. First quarter report 2015
701. First quarter report
702. Fourth quarter report 2015
703. Half year report
704. Monthly expenditure reports feb fy2016-17
705. Second quarter report Jan. 2105
706. Third quarter report Inc. & exp. April 16
707. Third quarter report 2015
708. 2015-2016 q1 budget implementation report
709. M&E report 2nd quarter report final
710. Makueni CBROP 13-14
PEFA framework for the assessment of public financial management at the county level, 2017
117
711. CBROP 14-15
712. Final Makueni BROP 2014
713. CBROP 15-16
PI-29. Annual financial reports
714. Makueni CBROP 2015 19th October final version
715. Financial statements16 months fs for 2013-14-audited
716. 2013-14 financial statement-audited
717. 2014-15 financial statement-audited
718. 2015-16 financial statement-audited
719. Management letter responses 2016
720. Management letter responses June 2015
PI-30. External audit
721. External audit report Makueni County assembly-2014-15
722. External audit report Makueni County assembly 2013- 14
723. External audit report Makueni County executive 2014-15
724. External audit report Makueni County executive-2013-14
725. PAC report recommendations summary
726. Progress report -on audit
PI-31. Legislative scrutiny of audit reports
727. Adopted PAC2013-2014 audit report
728. Interim County assembly standing orders final
729. Letter no 1 to County secretary Makueni-7th April 2016
730. Pac report recommendations summary
731. Pac's report on fs for 16 months ended 30th June 2014
732. Response from County secretary Makueni 25th April 2016
733. Special audit report Jan-June 2013
734. Submission and approval of audit reports
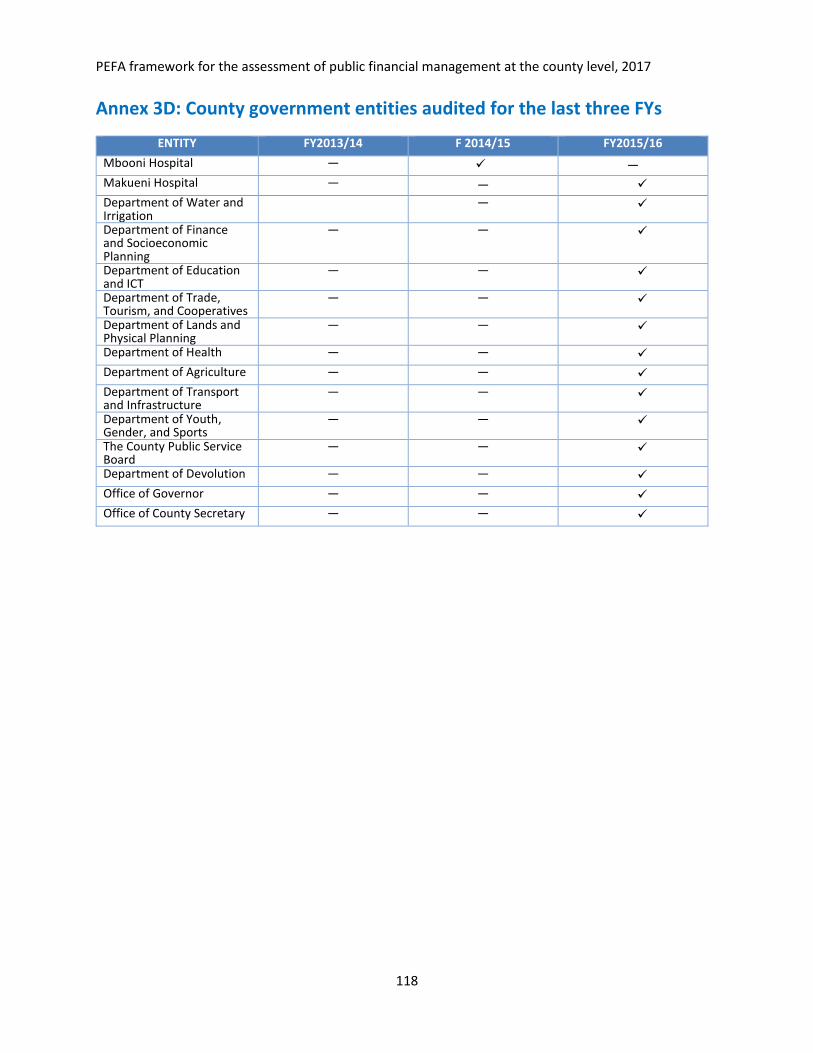
PEFA framework for the assessment of public financial management at the county level, 2017
118
Annex 3D: County government entities audited for the last three FYs
ENTITY FY2013/14 F 2014/15 FY2015/16
Mbooni Hospital — ✓ —
Makueni Hospital — — ✓
Department of Water and Irrigation
— — ✓
Department of Finance and Socioeconomic Planning
— — ✓
Department of Education and ICT
— — ✓
Department of Trade, Tourism, and Cooperatives
— — ✓
Department of Lands and Physical Planning
— — ✓
Department of Health — — ✓
Department of Agriculture — — ✓
Department of Transport and Infrastructure
— — ✓
Department of Youth, Gender, and Sports
— — ✓
The County Public Service Board
— — ✓
Department of Devolution — — ✓
Office of Governor — — ✓
Office of County Secretary — — ✓