Embed Size (px)
Citation preview
IEEE TRANSACTIONS ON SIGNAL PROCESSING, VOL. 57, NO. 12, DECEMBER 2009 4823
Correlation Matching Approach for SpectrumSensing in Open Spectrum Communications
Ana I. Pérez-Neira, Senior Member, IEEE, Miguel Angel Lagunas, Fellow, IEEE, Miguel Angel Rojas, andPetre Stoica, Fellow, IEEE
Abstract—In the new paradigm of open spectrum access, the en-visioned radio agility calls for fast and accurate spectrum sensing,this challenges traditional spectral estimation. In this study, wepropose three new procedures that are able to sense the knownspectrum of the candidate or primary user, fulfilling the require-ments of open spectrum scenarios. These procedures are developedby following the framework of correlation matching, changing thetraditional single frequency scan to a spectral scan with a par-ticular shape and generalizing filter-bank designs. The proposedtechniques are called Candidate methods, because their goal is toreact only when the candidate’s spectral shape is present. First,Candidate-F is proposed as a spectral detection method, wherethis is based on minimizing the Frobenius distance between cor-relation matrices, and can be viewed as an extended version of theweighted overlapped spectrum averaging estimate. Next, Candi-date-G is presented, which is a new procedure that is based on ageodesic distance, and that presents the lowest complexity. Lastly, athird procedure is studied, Candidate-M, which provides the mostcompliant performance with the demanding open spectrum sce-nario by generalizing the Capon-spectral estimator. By means ofthe analytical results, simulations of receiver operating character-istics, and estimation variance, this study shows the advantages ofCandidate-M over the existing filter bank or cyclostationary de-tector methods.
Index Terms—Applications involving signal processing forcommunications, applications of statistical signal processing tech-niques, cognitive radio and dynamic spectrum access, spectralanalysis and spectral estimation.
I. INTRODUCTION
T HE scarce use of the radio spectrum, together withthe continuous advance of physical layer technologies
has motivated new concepts for communication systems [1],in which different users share the available spectrum; thus,
Manuscript received September 29, 2008; accepted June 10, 2009. First pub-lished July 28, 2009; current version published November 18, 2009. The as-sociate editor coordinating the review of this manuscript and approving it forpublication was Prof. Qing Zhao. This work has been supported in part by theSpanish Government under Grant TEC2008-06327-C03, the Swedish ResearchCouncil (VR) and the European Research Council (ERC), Newcom++, and theACCESS/Signal Processing Lab, KTH, Stockholm.
A. I. Pérez-Neira and M. A. Lagunas are with the Department of SignalTheory and Communications, Technical University of Catalonia (UPC),08034 Barcelona, Spain, and also with the Centre Tecnològic de Teleco-municacions de Catalunya (CTTC), 08860-Castelldefels, Spain (e-mail:[email protected]; [email protected]; [email protected]).
M. A. Rojas is with the Centre Tecnològic de Telecomunicacions deCatalunya (CTTC), 08860-Castelldefels, Spain (e-mail: [email protected]).
P. Stoica is with the Information Technology Department, Division of Sys-tems and Control, Uppsala University, SE-751 05 Uppsala, Sweden (e-mail:[email protected]).
Digital Object Identifier 10.1109/TSP.2009.2027778
moving beyond the borders that the current strict regulationpermits (see, e.g., [2] for an interesting survey of the topic).Instead of a free spectrum, the concept of an open spectrummeans that the owner of a license may open his spectrum foruse to secondary parties when and where it is not used by theircustomers. To protect the primary systems from the adverseeffects of secondary users’ interference, unused spaces acrossfrequency, time, and space should be reliably identified. Onepossible approach consists of considering low-complexity sec-ondary transceivers, and charging the primary systems with thetask of providing secondary users with current spectrum-usageinformation. The IEEE 802.22 standard for Cognitive WirelessRegional Area Network [3], [4], follows this model, where apotential market would be the deployment of existing or newoperators of spectral monitoring equipment. Regardless ofwhether or not this model is accepted, there is no way to avoidproperly monitoring of the spectrum of the primary users incognitive radios. Open spectrum scenarios usually have impli-cations in terms of the required detection sensitivity, they posepractical challenges in reliable identification of unused primaryfrequency bands, and demand advanced signal processing [5],as discussed here.
The detection sensitivity is defined as the minimum signal-to-noise ratio (SNR) at which the primary signal may still be accu-rately detected. Spectrum sensing in cognitive radio networksis challenged by several sources of uncertainty ranging fromchannel randomness to device- and network-level uncertainties;thus, higher detection sensitivity is required [6]. For instance,in the IEEE 802.22 standard, the required sensing receiver SNRdetection level ranges from 1–21 dB. This means that some ofthe licensed signals (e.g., digital TV) must be sensed at a verylow SNR. High detection sensitivity is one of the challenges inspectrum sensing, and impacts the receiver operating charac-teristics (ROC), which is a plot of the probability of detectionversus the probability of false alarm.
A second constraint is the required detection time [7].Sensing performance may be improved by observing the bandfor a longer time, thereby increasing signal processing gain.However, regulatory constraints imposed on sensing time limitsuch improvements. To precisely define the available timeslots that are free from a primary user’s activity, the detectorshould work with record lengths below the frame of the desireduser (e.g., 256 symbols at 4 samples/symbol represents 1000samples). Third, note that a primary user’s activity must bemonitored, both in cases where no interference from secondaryusers is present, as well as in the open spectrum scenario, wherelow-regulated transmissions from secondary users are present.
1053-587X/$26.00 © 2009 IEEE
4824 IEEE TRANSACTIONS ON SIGNAL PROCESSING, VOL. 57, NO. 12, DECEMBER 2009
If the primary user’s activity is detected, however weak it mightbe,1 then the spectrum of the primary user may be closed tothe secondary users. These demanding conditions in terms ofsignal-to-noise-plus-interference ratio (SNIR) for a primaryuser’s spectrum identification pose a difficult problem to besolved by traditional spectral estimation techniques. Finally,a fourth desirable feature is that the primary user’s activitydetector has to provide an accurate power level for the primaryuser. This reveals information on the distance at which theprimary user is located from the open spectrum area, and alsothe level of collision that secondary users represent.
The simplest alternative for detecting a primary signal innoise is to employ energy detection. However, the energy detec-tors are unable to discriminate between the sources of receivedenergy, which makes them susceptible to uncertainties at lowSNR or in the presence of interference. If the full structureof the primary signal is known, together with time and evencarrier synchronization, the optimal detector is a matched filterfollowed by a threshold test. The matched filter detector canbe further modified to cope with interference. As an example,a radar target signal is detected and classified by incorporatingthe structure of the interference (i.e., jammer) either in theadaptive coherent estimator or in the generalized-likelihoodratio test (GLRT) [8]. This is an alternative approach to re-solving the problem put forth in this study. Nevertheless,instead of the whole signal structure, only some features of theprimary signal such as its carrier frequency or modulation typeare known. Therefore, the so-called feature detectors are moresuitable for addressing the problem. In an open spectrum, sincethe spectral correlation properties of different communicationsignals are usually unique, feature detection allows a cognitiveradio to differentiate between a specific primary signal-to-noiseplus interference. A survey of the spectrum sensing techniquesthat are included in the draft IEEE 802.22 standard, in bothnon-feature- and feature-based detectors, has been published[3]. The aim of this study is to approach the primary userdetection problem from the feature-based detector perspective,and more specifically, tuning the detector to the spectral shapeof the primary user.
In summary, the aforementioned requirements for the spec-tral estimation procedures are as follows: i) the detector mustbe tuned to the spectral shape of the desired user; ii) the ROCcurve of the resulting detector must cover low-SNR scenarios;iii) the detector should work with record lengths below the frameof the desired user; iv) the procedure must provide an accurateestimate of the primary user’s power level and frequency loca-tion; finally, v) the detector should be robust toward secondaryuser’s interference.
Next, with these constraints in mind, we consider themost prominent spectral estimation procedures for cogni-tive radio and comment on their suitability for the appli-cation that has been defined. First, we consider data-inde-pendent filter-bank analysis, such as weighted overlappedsegment averaging (WOSA) [9] or Thomson’s multitapermethod (MTM) [10]. In [11], the author provides clear insight
1Under channel fading or shadowing, low received signal strength does notnecessarily imply that the primary system is located out of the secondary user’sinterference range.
into the pros and cons of cognitive radio. A filter bank withWOSA offers an integrated tool for data communication withfewer complications, since the filter bank that is used fordemodulation is also used for signal analysis. The MTM isregarded as an excellent procedure, but it has a greater compu-tational cost. The MTM is a very powerful spectrum-analysistechnique and is the best technique for managing the large dy-namic ranges that are required for detecting spectrum holes incognitive radio scenarios. However, its high computational costmay limit its application in cognitive radio. Another aspect tonote is that neither WOSA nor MTM are flexible for feature de-tection because the tuning to a specific feature, when needed, isperformed in a pattern recognition framework, and the requireddata record length is much larger than 1000 samples to achieveproper performance. This fact imposes prohibitive detectiondelays or latencies for the application targeted in this study.Also, both procedures are not robust to interference, especiallyWOSA, where the leakage from in - band interference explainsits poor ROC curves, and why it has to be combined with offsetquadrature amplitude modulation (OQAM) to ease the leakageproblem.
The second alternative is the cylostationary detector reportedby Gardner [12], [13]; a complete and comprehensive review,together with a significant scientific contribution has also beenprovided [14]. This method can be considered to be a featuredetector, which is highly suitable to be tuned to a given spectralshape, and more specifically, to a predefined baud rate. Since itcan be listed as a potential solution to the problem listed herein,it is compared with the method that is proposed hereafter. Nev-ertheless, cyclostationarity is only formulated in nonparametricterms, and in consequence, resolution and robustness might bedifficult to obtain for low data record lengths.
In this study, we develop a novel correlation matching frame-work [15] that allows us to obtain different methods for de-tecting a predefined spectral shape with high sensitivity and ro-bustness. We refer to any method that is tuned to a given spectralshape as a Candidate method.
• Section II revisits classical spectral analysis to generalizeit and migrate from spectral line search to the general spec-tral shape search. We refer to any method that is tuned to agiven spectral shape as a Candidate method and the candi-date autocorrelation matrix is defined.
• Section III states the candidate power level estimationproblem to be solved in this paper and presents three newprocedures that potentially fit the design demands listedpreviously for open spectrum (i.e., detection of primaryuser, power level range, frequency location and robustnessto presence of secondary users). Based on theoreticalconsiderations and single record analysis, Candidate-Mpresents the lowest leakage and is the most compliant ina demanding scenario. Uncertainty in the knowledge ofthe primary and secondary user spectral properties is outof the scope of this study and can motivate further workbased on the original approach described previously [16].
• Section IV studies the performance of the proposed proce-dures in terms of resolution, ROC, and variance.
• Finally, in Section V, we provide some concludingremarks.
PÉREZ-NEIRA et al.: CORRELATION MATCHING APPROACH FOR SPECTRUM SENSING 4825
Notation: Vectors are denoted by boldface lowercase letters,and matrices are denoted by boldface uppercase letters. We use
to denote the transpose, and for the conjugate trans-pose. The Frobenius norm is denoted as .
II. POWER LEVEL ESTIMATION
Let be a random process with power spectral den-sity and . The objective of spectral estima-tion techniques is to obtain, from a data record of N samples,
, an estimate of thepower spectral density in terms of power versus frequency usingsignal processing algorithms. Basically, the interest in spectralestimation lies in providing accurate power level densities at agiven frequency, as well as the highest resolution in terms ofthe lowest leakage from other frequency zones. Accurate powerdensities provide proper power level estimates by directly in-tegrating the estimated power density over the correspondingfrequency range. In most cases, the power level is the final ob-jective of the procedure, and power density estimates are just anintermediate step. Power level and density estimates are some-times confused in a single framework of spectral estimates thatentail frequency detectors. Our interest is to directly estimate thepower level, since the density can be derived from the quotientof the estimated power level and the analysis bandwidth. More-over, in open spectrum, knowledge of the primary user’s powerlevel provides ranging information (i.e., information regardingthe distance between the primary user and the open spectrumarea).
Let denote the correlations of and be the-by- correlation matrix (i.e., ). A general
framework for a power level estimate at frequency , definedas , is to design an appropriate quality measure that de-termines how much power, coming from a single line or purefrequency, is contained within a given data auto-correlation ma-trix . We assume that the pure frequency contribution to thedata autocorrelation function (acf) is
(1)
where is the frequency steering vector, and, to clarify the notation,
the dependency on has been removed to clarify notation.Based on this assumption, an estimate of the power level canbe formulated as
with (2)
where is a similarity function between the two matrices.Note that the estimate will clearly be a function of the steeringfrequency, and pure frequency scanning can be viewed as a base-band acf matrix modulated at frequency . More specifically,for the purpose of the present work on communication signals,which are introduced in Section III, we generalize the so-calledcandidate matrix as
(3)
where denotes the elementwise product of two matrices andis a baseband matrix. This matrix is the autocorrelation
of the impulse response of the basic baseband filter that isused by the spectral analyzer. This fact is evidence that fre-quency scanning in power level spectral estimation impliesthat a given baseband pattern is modulated. For instance,
, when the spectral shape of thisautocorrelation is a spectral line in the baseband or a continuouscomponent. Thus, (3) becomes , which is the casefor all classical spectral analysis techniques. It is importantto remark that, from this viewpoint, traditional power levelestimation is reduced to determining some similarity function
that describes how much pure frequency spectrum poweris contained in the given acf correlation matrix. In general,nonparametric spectral estimation methods [17], [18], mainlythose based on filter-bank analysis, can be encompassed inthis framework. The different estimates result from the properchoice of the aforementioned similarity function, which can bedivided in two groups: the first group selects the similarity func-tion in terms of distance between the two matrices, that is, thedata acf matrix , and , and the second group relies onthe positive definite character of the difference .Next, we provide a brief summary of the use of this correlationmatching framework to present two well-known power levelestimates.
Within the group of estimates derived by using distance cri-teria as similarity functions, the most popular is obtained whenselecting the Frobenius distance as an objective. In this case, thepower level estimate is formulated as
(4)
The solution to this problem with the resulting minimum dis-tance is given by
(5)
Note that this power level estimate is the WOSA estimate re-ported by Welch [9]. This estimator shows low resolution be-cause of the considerable existing leakage, which leads to falsealarms or detection losses. In summary, the performance of thedetector in (5) is severely degraded by the presence of contri-butions other than those of the candidate data. Thus, it has beenadded for completeness, rather than as a suitable procedure forspectrum labeling.
Within the second group of estimates, the most popular is
s.t. (6)
That is, the maximum power level that guarantees the differ-ence between the data acf and candidate acf remains positivedefinite. The solution to (6) when is the minimumvariance, or Capon’s estimate [19], which is given by
(7)
Some remarks concerning this well-known estimate areuseful to introduce the Candidate procedures for spectrum la-beling or identification of desired users presented in Section III.
4826 IEEE TRANSACTIONS ON SIGNAL PROCESSING, VOL. 57, NO. 12, DECEMBER 2009
The first is that the formulation (6) was not widely used inCapon’s estimate because of the filter-bank formulation [20];at each scanning frequency, a filter was designed to minimizeleakage and to provide 0-dB gain. Amazingly, for a powerlevel measurement, the filter constraint must be set in terms ofmagnitude and phase. When the phase constraint is removed,(6) and the filter-bank problem are identical. The second remarkconcerns resolution. When the scenario consists of a pure linelocated at in white noise, it is easy to check that
for (8a)
for (8b)
(this latter is achieved by means of the Cauchy–Schwartz in-equality). This proves that the resolution of (7) is always betterthan the resolution of (5). The third and final remark is that theformulation of (6) can be considered a special case of a generalformulation, where a minimum value greater than zero is setfor the minimum eigenvalue of the difference matrix. In otherwords, note that by selecting the minimum eigenvalue equal tozero in
(9)
and , we obtain (6). Also, it is clear that the noisepower cannot be less than zero, and should be lower than theminimum eigenvalue of the data acf matrix. We comment that aclosed-form solution to the problem formulated in (9) is givenby
(10)
where is the order of the approximate solution. In practice,close to 5 provides solutions that stay very close to the exact
one. The Appendix shows how to obtain this result. The estimatein (10) presents the resolution of a frequency detector whilepreserving perfect calibration of the power level. For(10) tends to zero at those frequencies where there is only back-ground noise. This means that the dynamic range of (10) is for-mally unbound. However, as increases, the variance of thesample covariance estimates also increase; thus, the choice of
is supported in this study.Section III first extends these fundamentals to the case where
scanning is not performed in terms of a pure frequency line buta predefined spectral shape, which is labeled as the candidatespectrum. The candidate spectrum corresponds to the spectralsignature of the primary user that we aim to label or identifyin the open spectrum scenario for cognitive radio applications.Second, the specific problem to solve is stated.
III. CANDIDATE POWER LEVEL ESTIMATION
A. The Candidate Spectrum and Autocorrelation Matrix
A digital communication signal that is a process with a pe-riodic mean and autocorrelation function is called a cyclosta-tionary process, and its power density spectrum is computedby averaging over a cyclic period. In the specific case of lin-early modulated signals,2 the associated spectral shape depends
2Without loss of generality for the results of the article, linearly modulatedsignals are considered to simplify notation
mainly on the energy spectrum of the modulation pulse ,that is , multiplied by the baud rate . As a re-sult, the average power spectral density of the analytic signal ofthe primary user, , for positive frequencies in a distor-tionless channel is
with
(11)
where is the actual power level measured at the sensing sta-tion, is the carrier frequency, and is the number of sam-ples per pulse. As stated in the introduction of this study, weare interested in estimating the power level and the carrier fre-quency when (11) appears in the presence of interference and/orlow SNR. In this section, we show how to address this problemthrough the use of the same framework as that described inSection II, but instead of using pure frequency scanning, we usethe acf matrix that is associated with (11), which was presentedas in (3). More specifically, the discrete inverse Fouriertransform of gives each of the elements of ,where the order of this Toeptliz matrix depends on the orderof the spectral estimation procedure. Note that to obtain a per-fect calibration in this study, the candidate matrix is nor-malized to have a unit diagonal, and thus,
(12)
At baseband, reduces to , and it depends only on thebaud rate, and on the modulation pulse. Depending on the ap-plication, is either available analytically or it has to beestimated from noise free data. For instance, if the transmit-ting pulse is a root-cosine pulse, the first row of consistsof the first samples of the cosine pulse3 , i.e.,
for . We note that the major featureof the proposed power level estimates versus cyclostationary-based estimates, lies in the fact that the Candidate proceduresnot only use the baud rate but also the pulse shape of the pri-mary user to be detected.
B. Problem Statement
Given a data autocorrelation matrix , the specific problem tosolve in this study is estimating the power and central frequencyof the candidate matrix of the primary user that contains.The general formulation of this problem can be found in (2) with
as modeled in (3). A suitable similarity functionis needed in order to obtain estimates i) in scenarios with lowSNR; ii) that are robust to the presence of the strong interferencethat secondary users may cause; iii) with a low number of datarecords , which is required due to regulatory constraints onsensing time. As discussed in Section V, is estimated from
independent data records. The sample correlation is
(13)
3Note that the root-cosine pulse � ���, whose Fourier Transform is � ���,relates to the cosine pulse � ���, whose Fourier Transform is � ���, as�� ���� � � ���. Therefore, � ��� � � ��� � � ���.
PÉREZ-NEIRA et al.: CORRELATION MATCHING APPROACH FOR SPECTRUM SENSING 4827
Concerning the order or dimension of both matrices, it isexpected that accurate results are obtained when the order se-lected is above the number of samples per pulse .
The model for the data acf matrix is given by
(14)
where is the noise plus interference acf matrix. The noiseis white Gaussian distributed with zero mean and unit vari-ance. The interference is independent of the noise and candidatesignal, and its spectral shape is different from that of the candi-date. For simplicity and as a baseline, we assume that the inter-ference is a pure tone. This assumption is also supported by thefollowing statement: in practice, the interference signal is dueto the presence of a secondary user, which is rarely going to usethe same modulation or physical support as the primary user.Even more, the secondary user is liable to transmit at a muchlower rate than the primary one, to guarantee the primary user’sQuality of Service (QoS) among other reasons. Both noise andinterference are uncorrelated with the primary user’s signal.
C. Candidate-F: Candidate Spectrum Detector Based on theFrobenius Norm, a Generalization of WOSA
Let us consider the Frobenius distance, then the formulationfor the corresponding power level estimate is given by
(15)
This power level estimate can be viewed as the extended, orthe candidate version of the WOSA estimate of (5). The majorcriticism to this estimate is that does not preserve the positivedefinite character of the difference acf matrix. In other words,in a linear space, the Euclidean distance between two matricesis given by the length of the line formulated in
(16)
The Euclidean distance is the Frobenius norm of the dif-ference between matrices. However, this linear space doesnot guarantee that matrices along the line are positive definitebecause it corresponds to acf matrices. A more proper distanceis based on the geodesic distance, which is introduced inSection III-D.
D. Candidate-G: Candidate Spectrum DetectorBased on the Geodesic Distance
The geodesic distance [21] is the length of the geodesic lineor segment described as
with
and (17)
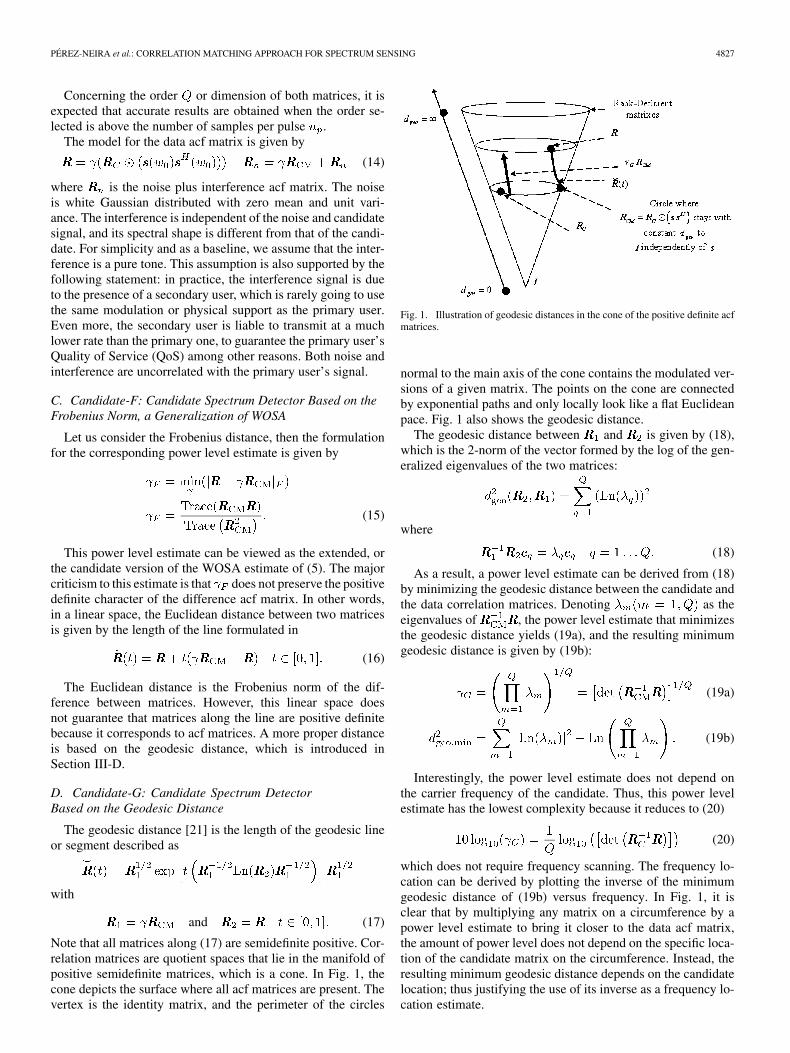
Note that all matrices along (17) are semidefinite positive. Cor-relation matrices are quotient spaces that lie in the manifold ofpositive semidefinite matrices, which is a cone. In Fig. 1, thecone depicts the surface where all acf matrices are present. Thevertex is the identity matrix, and the perimeter of the circles
Fig. 1. Illustration of geodesic distances in the cone of the positive definite acfmatrices.
normal to the main axis of the cone contains the modulated ver-sions of a given matrix. The points on the cone are connectedby exponential paths and only locally look like a flat Euclideanpace. Fig. 1 also shows the geodesic distance.
The geodesic distance between and is given by (18),which is the 2-norm of the vector formed by the log of the gen-eralized eigenvalues of the two matrices:
where
(18)
As a result, a power level estimate can be derived from (18)by minimizing the geodesic distance between the candidate andthe data correlation matrices. Denoting as theeigenvalues of , the power level estimate that minimizesthe geodesic distance yields (19a), and the resulting minimumgeodesic distance is given by (19b):
(19a)
(19b)
Interestingly, the power level estimate does not depend onthe carrier frequency of the candidate. Thus, this power levelestimate has the lowest complexity because it reduces to (20)
(20)
which does not require frequency scanning. The frequency lo-cation can be derived by plotting the inverse of the minimumgeodesic distance of (19b) versus frequency. In Fig. 1, it isclear that by multiplying any matrix on a circumference by apower level estimate to bring it closer to the data acf matrix,the amount of power level does not depend on the specific loca-tion of the candidate matrix on the circumference. Instead, theresulting minimum geodesic distance depends on the candidatelocation; thus justifying the use of its inverse as a frequency lo-cation estimate.
4828 IEEE TRANSACTIONS ON SIGNAL PROCESSING, VOL. 57, NO. 12, DECEMBER 2009
E. Candidate-M: Candidate Spectrum Detector Based on theMinimum Eigenvalue, a Generalization of Capon’s Method
Finally, a new power level estimate can be derived by forcinga positive definite difference between the data acf matrix andthe candidate matrix. The general formulation is given by (21a).Nevertheless, we concentrate on the zero-order approximation,in other words, on the case where the minimum eigenvalue isset to zero (i.e., ) as in (21b):
(21a)
(21b)
The solution to (21b) is
(22)
where we note the frequency scanning that is implicit in(i.e., ). The estimate (22) provides a lower overestima-tion of the actual power level than and , as concludedfrom
(23)
In addition to presenting accurate power levels, Section IVshows the remarkable capabilities of in terms of resolutionand robustness to interference when compared with and .Concerning the complexity of the Candidate-M procedure, thefollowing computations are involved: 1) should be esti-mated from the data, whenever it is not available off-line; 2) thesample correlation matrix should be estimated; 3) the min-imum general eigenvalue has to be computed. Additionally, ifthe central frequency is not known a 1-D scanning has to bedone for the minimum eigenvalue. Finally, Section IV showsthat the estimations are done with a few symbols, because quickdetection is a key aspect in cognitive radio.
The novelty in this work is the study of (22) under a corre-lation matching framework, and its new application to candi-date spectral estimates in cognitive radios. This new applica-tion raises new problems, including those originally presented in[22], which are further studied in Section IV. Before describingthe simulations, we show how the power level estimates pre-sented in this section relate to the minimum mean-square esti-mation (MMSE) approach.
Let us assume that the data vector is modeled as
(24)
where contains the samples of the candidate signal, andis the noise plus interference vector, which is statistically
independent from . We can then obtain the MMSE filterthat minimizes
(25)
where has been taken as a reference and is the errormatrix. By substituting the MMSE solution
(26)
into , we obtain
(27)
Note that the trace of is bounded below by
(28)
therefore, to preserve the semidefinite positive character of
(29)
We remark that (29) coincides with , this fact further sup-ports this estimate. However, if instead of (28) we use the lowerbound
(30)
then,(31)
sets the lower bound (30) to zero. Note that even though (31)seems at first glance to be the generalization of the Capon’sestimate that is given by (7), if (31) is substituted in (27), theresulting matrix is not necessarily semidefinite positive.
IV. SIMULATIONS
This section is divided into three parts. The first part con-centrates on the general performance of the power level esti-mates reported in Section III. From this performance evaluationwe conclude that i) the power level estimate is disregardedin favor of ; ii) the Candidate-G estimate presents a goodtrade-off performance versus complexity; and iii) the superiorperformance and robustness of to interference becomes evi-dent. This first part uses scenarios with high SNR for the sake offigure clarity. The second part gives the ROC results and vari-ance for low SNR scenarios that are compliant with the con-straint set, which was presented in Section I to characterize theopen spectrum scenario. Finally, the third part compares Can-didate-M power level detector with the cyclostationary detectorto prove analytically and by means of simulations that the Can-didate detector presents better ROC curves.
A. High SNR Scenario
To test the ability of the Candidate procedures to properlylabel a desired user in the presence of white noise and inter-ference, the following scenario is used in the simulations: thedesired user is assumed to be an I-Q (in-phase and quadraturecomponents), binary phase shift keying (BPSK) signal with arectangular pulse shape, and samples per symbol. TheSNR of the desired user is 10 dB and the normalized carrier fre-quency is . Therefore, (11) becomes
Note that these values describe the normal operation ofBPSK systems, allowing synchronism acquisition and BER
PÉREZ-NEIRA et al.: CORRELATION MATCHING APPROACH FOR SPECTRUM SENSING 4829
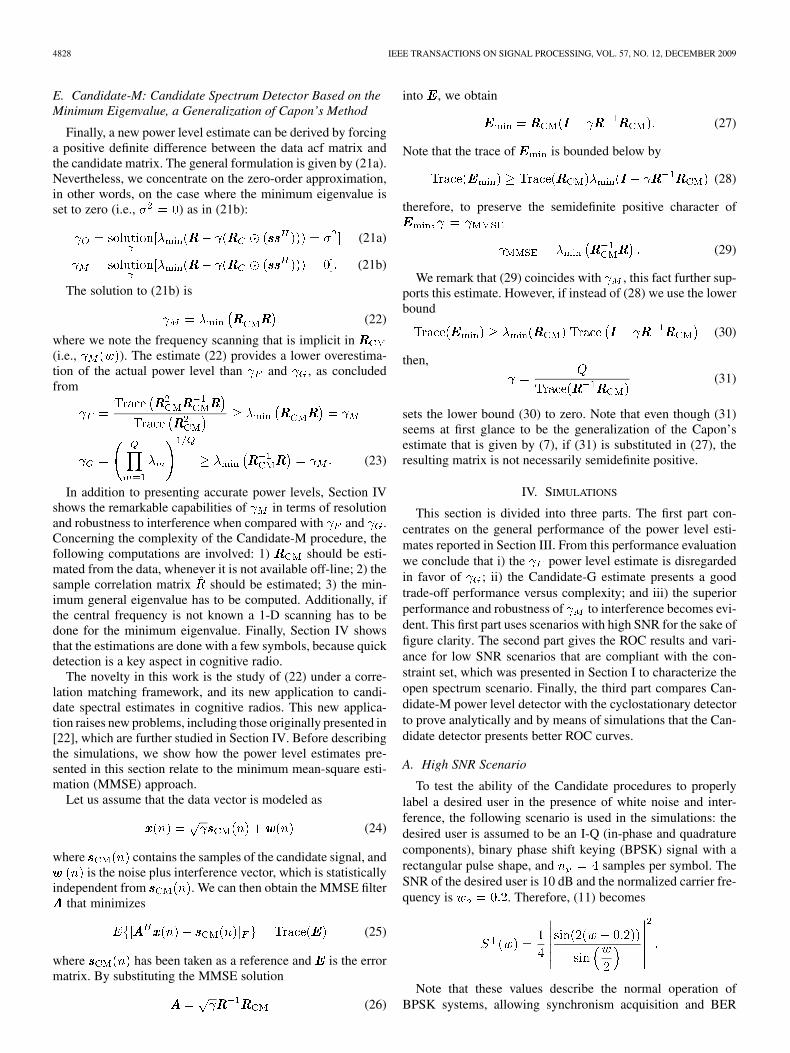
Fig. 2. (a). Performance of classical filter-bank approaches. The candidatehas the following parameters: BPSK signal with four samples per symbol, and��� � �� dB at frequency 0.2. The interference is a pure sinusoid located atfrequency 0.3 and with ��� � �� dB. The sample record consists of 1000samples and the analysis order is � � ��. (a) Performance of three classicalfilter-bank approaches, from top to bottom: Periodogram, Capon (MLM), andNormalized Capon by the noise bandwidth (NMLM) [20]; (b) Performance ofMTM.
below . For those plots containing interference, a 10-dBcarrier is included at normalized frequency equal to 0.3. Thedata record for the following plots is samples,which is equivalent to 250 symbols in the primary user signal.The analysis order should be above the four samples persymbol rate of the desired user. Unless otherwise specified,order has been selected for all the experiments sinceit is above the minimum, yet preserves the computational loadof the procedure below that of other potential alternatives. Theplots are given as a function of the digital frequency .
Fig. 2(a) shows three major filter-bank spectral estimates forthe scenario with interference at frequency 0.3. Note that theyare not robust to the strong interference, and present low reso-lution. Fig. 2(b) displays the spectral estimate that is obtained
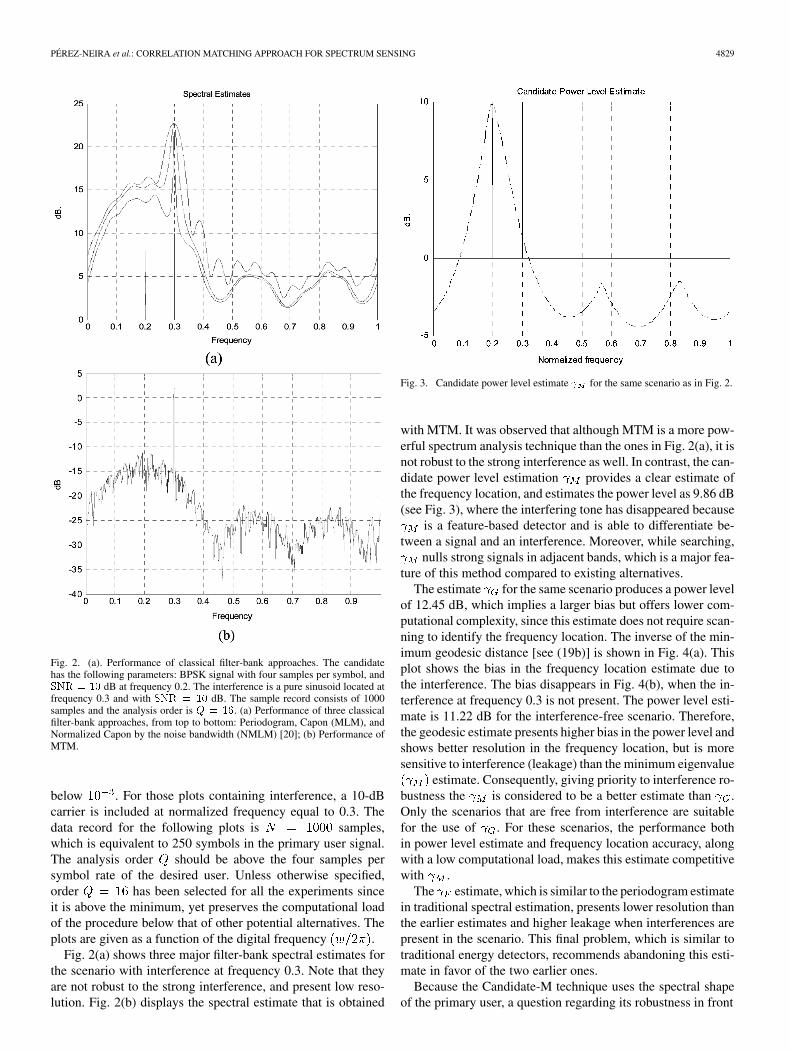
Fig. 3. Candidate power level estimate � for the same scenario as in Fig. 2.
with MTM. It was observed that although MTM is a more pow-erful spectrum analysis technique than the ones in Fig. 2(a), it isnot robust to the strong interference as well. In contrast, the can-didate power level estimation provides a clear estimate ofthe frequency location, and estimates the power level as 9.86 dB(see Fig. 3), where the interfering tone has disappeared because
is a feature-based detector and is able to differentiate be-tween a signal and an interference. Moreover, while searching,
nulls strong signals in adjacent bands, which is a major fea-ture of this method compared to existing alternatives.
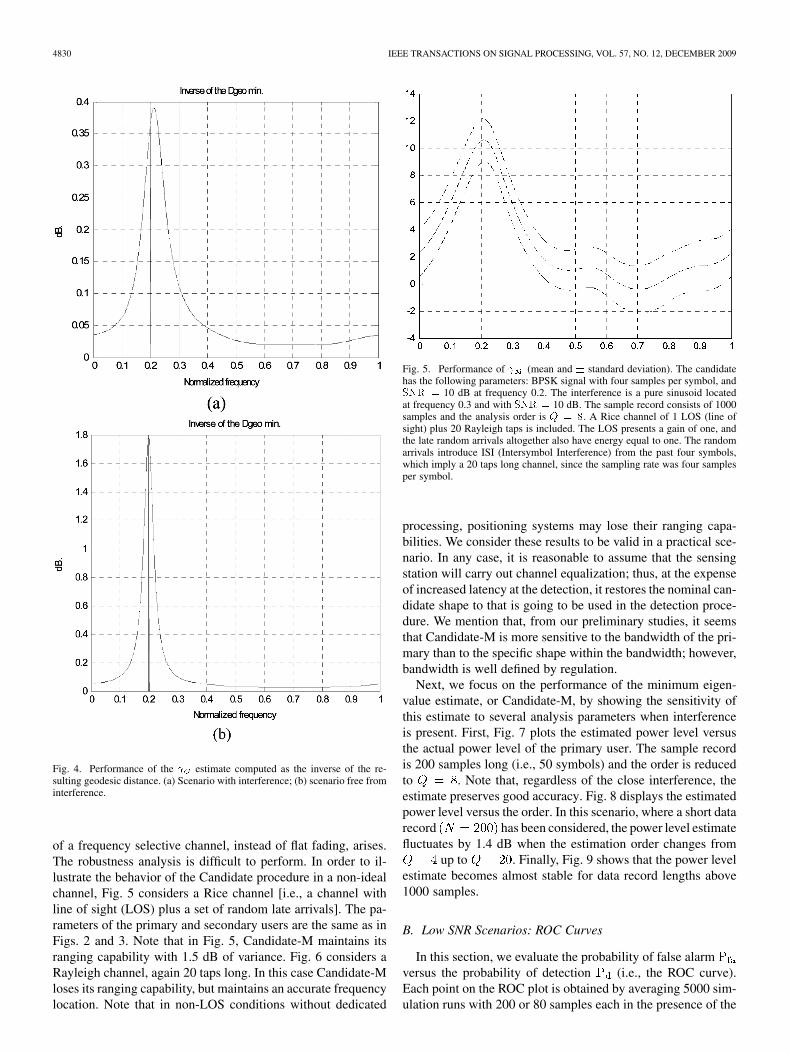
The estimate for the same scenario produces a power levelof 12.45 dB, which implies a larger bias but offers lower com-putational complexity, since this estimate does not require scan-ning to identify the frequency location. The inverse of the min-imum geodesic distance [see (19b)] is shown in Fig. 4(a). Thisplot shows the bias in the frequency location estimate due tothe interference. The bias disappears in Fig. 4(b), when the in-terference at frequency 0.3 is not present. The power level esti-mate is 11.22 dB for the interference-free scenario. Therefore,the geodesic estimate presents higher bias in the power level andshows better resolution in the frequency location, but is moresensitive to interference (leakage) than the minimum eigenvalue
estimate. Consequently, giving priority to interference ro-bustness the is considered to be a better estimate than .Only the scenarios that are free from interference are suitablefor the use of . For these scenarios, the performance bothin power level estimate and frequency location accuracy, alongwith a low computational load, makes this estimate competitivewith .
The estimate, which is similar to the periodogram estimatein traditional spectral estimation, presents lower resolution thanthe earlier estimates and higher leakage when interferences arepresent in the scenario. This final problem, which is similar totraditional energy detectors, recommends abandoning this esti-mate in favor of the two earlier ones.
Because the Candidate-M technique uses the spectral shapeof the primary user, a question regarding its robustness in front
4830 IEEE TRANSACTIONS ON SIGNAL PROCESSING, VOL. 57, NO. 12, DECEMBER 2009
Fig. 4. Performance of the � estimate computed as the inverse of the re-sulting geodesic distance. (a) Scenario with interference; (b) scenario free frominterference.
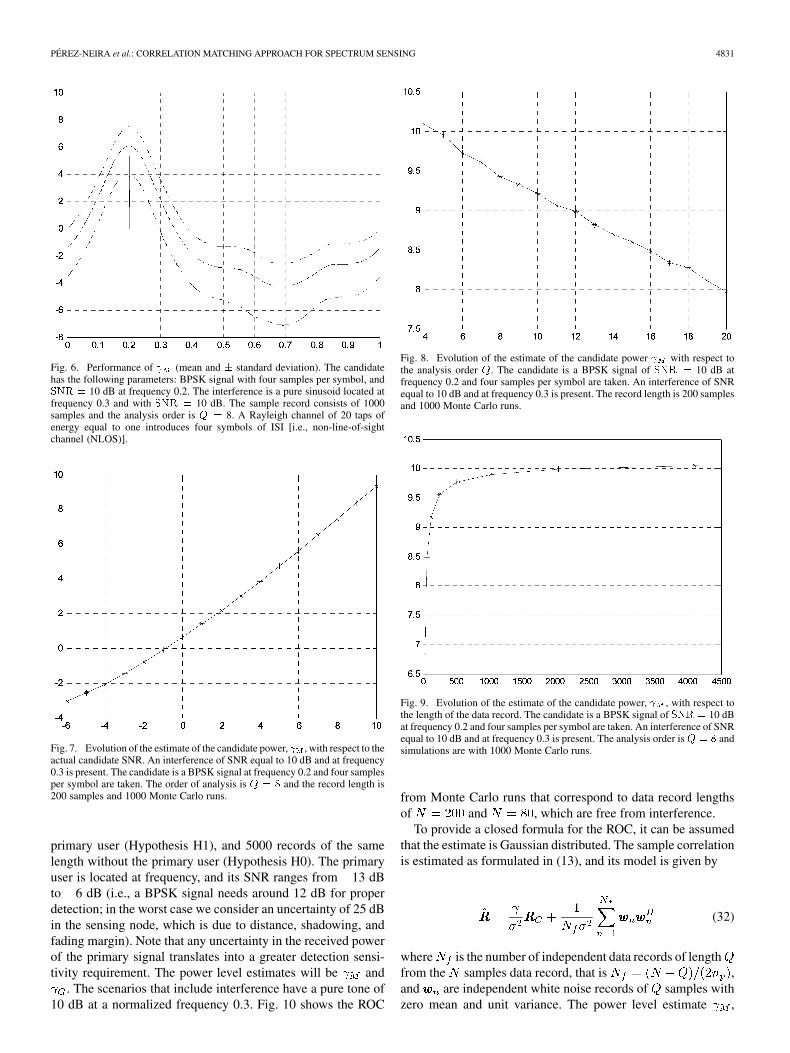
of a frequency selective channel, instead of flat fading, arises.The robustness analysis is difficult to perform. In order to il-lustrate the behavior of the Candidate procedure in a non-idealchannel, Fig. 5 considers a Rice channel [i.e., a channel withline of sight (LOS) plus a set of random late arrivals]. The pa-rameters of the primary and secondary users are the same as inFigs. 2 and 3. Note that in Fig. 5, Candidate-M maintains itsranging capability with 1.5 dB of variance. Fig. 6 considers aRayleigh channel, again 20 taps long. In this case Candidate-Mloses its ranging capability, but maintains an accurate frequencylocation. Note that in non-LOS conditions without dedicated
Fig. 5. Performance of � (mean and � standard deviation). The candidatehas the following parameters: BPSK signal with four samples per symbol, and��� � 10 dB at frequency 0.2. The interference is a pure sinusoid locatedat frequency 0.3 and with ��� � 10 dB. The sample record consists of 1000samples and the analysis order is � � �. A Rice channel of 1 LOS (line ofsight) plus 20 Rayleigh taps is included. The LOS presents a gain of one, andthe late random arrivals altogether also have energy equal to one. The randomarrivals introduce ISI (Intersymbol Interference) from the past four symbols,which imply a 20 taps long channel, since the sampling rate was four samplesper symbol.
processing, positioning systems may lose their ranging capa-bilities. We consider these results to be valid in a practical sce-nario. In any case, it is reasonable to assume that the sensingstation will carry out channel equalization; thus, at the expenseof increased latency at the detection, it restores the nominal can-didate shape to that is going to be used in the detection proce-dure. We mention that, from our preliminary studies, it seemsthat Candidate-M is more sensitive to the bandwidth of the pri-mary than to the specific shape within the bandwidth; however,bandwidth is well defined by regulation.
Next, we focus on the performance of the minimum eigen-value estimate, or Candidate-M, by showing the sensitivity ofthis estimate to several analysis parameters when interferenceis present. First, Fig. 7 plots the estimated power level versusthe actual power level of the primary user. The sample recordis 200 samples long (i.e., 50 symbols) and the order is reducedto . Note that, regardless of the close interference, theestimate preserves good accuracy. Fig. 8 displays the estimatedpower level versus the order. In this scenario, where a short datarecord has been considered, the power level estimatefluctuates by 1.4 dB when the estimation order changes from
up to . Finally, Fig. 9 shows that the power levelestimate becomes almost stable for data record lengths above1000 samples.
B. Low SNR Scenarios: ROC Curves
In this section, we evaluate the probability of false alarmversus the probability of detection (i.e., the ROC curve).Each point on the ROC plot is obtained by averaging 5000 sim-ulation runs with 200 or 80 samples each in the presence of the
PÉREZ-NEIRA et al.: CORRELATION MATCHING APPROACH FOR SPECTRUM SENSING 4831
Fig. 6. Performance of � (mean and � standard deviation). The candidatehas the following parameters: BPSK signal with four samples per symbol, and��� � 10 dB at frequency 0.2. The interference is a pure sinusoid located atfrequency 0.3 and with ��� � 10 dB. The sample record consists of 1000samples and the analysis order is � � 8. A Rayleigh channel of 20 taps ofenergy equal to one introduces four symbols of ISI [i.e., non-line-of-sightchannel (NLOS)].
Fig. 7. Evolution of the estimate of the candidate power, � , with respect to theactual candidate SNR. An interference of SNR equal to 10 dB and at frequency0.3 is present. The candidate is a BPSK signal at frequency 0.2 and four samplesper symbol are taken. The order of analysis is � � � and the record length is200 samples and 1000 Monte Carlo runs.
primary user (Hypothesis H1), and 5000 records of the samelength without the primary user (Hypothesis H0). The primaryuser is located at frequency, and its SNR ranges from 13 dBto 6 dB (i.e., a BPSK signal needs around 12 dB for properdetection; in the worst case we consider an uncertainty of 25 dBin the sensing node, which is due to distance, shadowing, andfading margin). Note that any uncertainty in the received powerof the primary signal translates into a greater detection sensi-tivity requirement. The power level estimates will be and
. The scenarios that include interference have a pure tone of10 dB at a normalized frequency 0.3. Fig. 10 shows the ROC
Fig. 8. Evolution of the estimate of the candidate power � with respect tothe analysis order �. The candidate is a BPSK signal of ��� � 10 dB atfrequency 0.2 and four samples per symbol are taken. An interference of SNRequal to 10 dB and at frequency 0.3 is present. The record length is 200 samplesand 1000 Monte Carlo runs.
Fig. 9. Evolution of the estimate of the candidate power, � , with respect tothe length of the data record. The candidate is a BPSK signal of ��� � 10 dBat frequency 0.2 and four samples per symbol are taken. An interference of SNRequal to 10 dB and at frequency 0.3 is present. The analysis order is� � � andsimulations are with 1000 Monte Carlo runs.
from Monte Carlo runs that correspond to data record lengthsof and , which are free from interference.
To provide a closed formula for the ROC, it can be assumedthat the estimate is Gaussian distributed. The sample correlationis estimated as formulated in (13), and its model is given by
(32)
where is the number of independent data records of lengthfrom the samples data record, that is ,and are independent white noise records of samples withzero mean and unit variance. The power level estimate ,
4832 IEEE TRANSACTIONS ON SIGNAL PROCESSING, VOL. 57, NO. 12, DECEMBER 2009
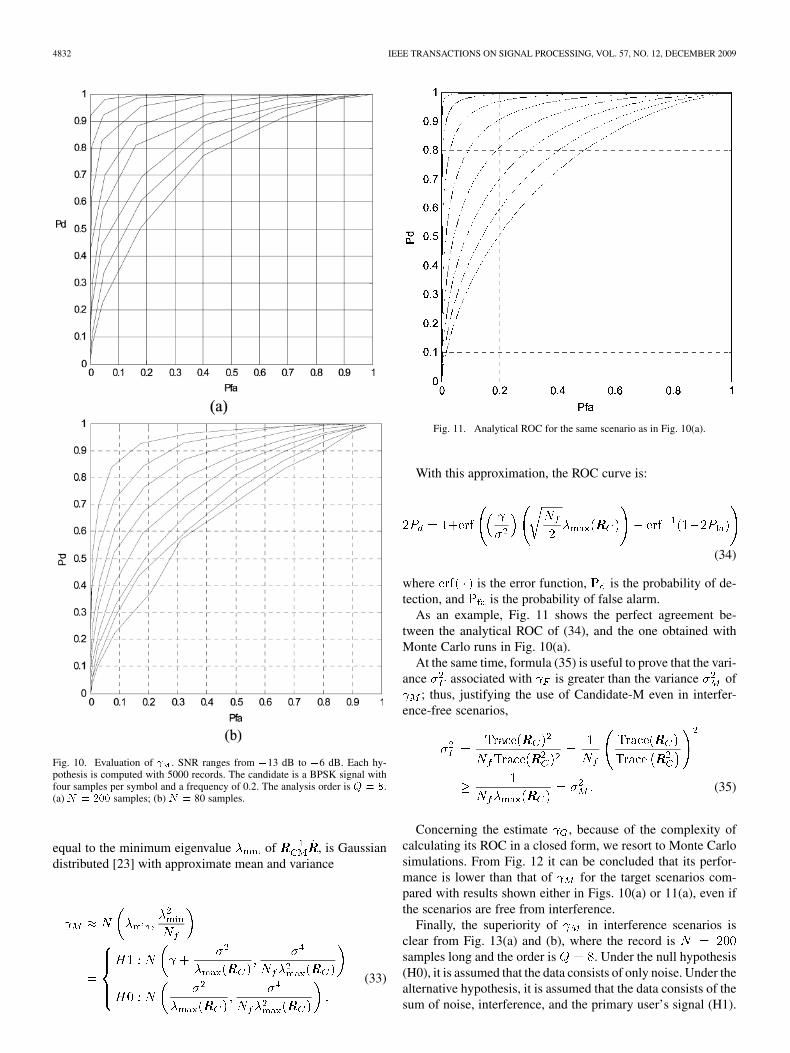
Fig. 10. Evaluation of � . SNR ranges from �13 dB to �6 dB. Each hy-pothesis is computed with 5000 records. The candidate is a BPSK signal withfour samples per symbol and a frequency of 0.2. The analysis order is � � �.(a) � � ��� samples; (b) � � 80 samples.
equal to the minimum eigenvalue of , is Gaussiandistributed [23] with approximate mean and variance
(33)
Fig. 11. Analytical ROC for the same scenario as in Fig. 10(a).
With this approximation, the ROC curve is:
(34)
where is the error function, is the probability of de-tection, and is the probability of false alarm.
As an example, Fig. 11 shows the perfect agreement be-tween the analytical ROC of (34), and the one obtained withMonte Carlo runs in Fig. 10(a).
At the same time, formula (35) is useful to prove that the vari-ance associated with is greater than the variance of
; thus, justifying the use of Candidate-M even in interfer-ence-free scenarios,
(35)
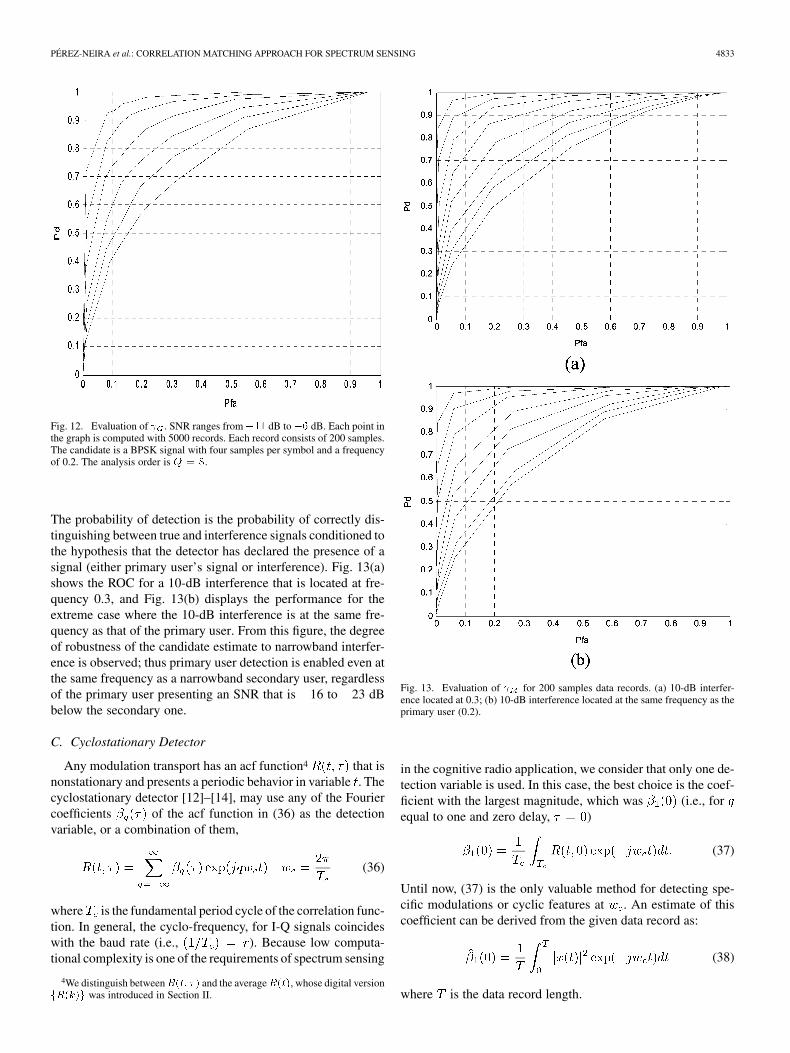
Concerning the estimate , because of the complexity ofcalculating its ROC in a closed form, we resort to Monte Carlosimulations. From Fig. 12 it can be concluded that its perfor-mance is lower than that of for the target scenarios com-pared with results shown either in Figs. 10(a) or 11(a), even ifthe scenarios are free from interference.
Finally, the superiority of in interference scenarios isclear from Fig. 13(a) and (b), where the record issamples long and the order is . Under the null hypothesis(H0), it is assumed that the data consists of only noise. Under thealternative hypothesis, it is assumed that the data consists of thesum of noise, interference, and the primary user’s signal (H1).
PÉREZ-NEIRA et al.: CORRELATION MATCHING APPROACH FOR SPECTRUM SENSING 4833
Fig. 12. Evaluation of � . SNR ranges from��� dB to�� dB. Each point inthe graph is computed with 5000 records. Each record consists of 200 samples.The candidate is a BPSK signal with four samples per symbol and a frequencyof 0.2. The analysis order is � � �.
The probability of detection is the probability of correctly dis-tinguishing between true and interference signals conditioned tothe hypothesis that the detector has declared the presence of asignal (either primary user’s signal or interference). Fig. 13(a)shows the ROC for a 10-dB interference that is located at fre-quency 0.3, and Fig. 13(b) displays the performance for theextreme case where the 10-dB interference is at the same fre-quency as that of the primary user. From this figure, the degreeof robustness of the candidate estimate to narrowband interfer-ence is observed; thus primary user detection is enabled even atthe same frequency as a narrowband secondary user, regardlessof the primary user presenting an SNR that is 16 to 23 dBbelow the secondary one.
C. Cyclostationary Detector
Any modulation transport has an acf function4 that isnonstationary and presents a periodic behavior in variable . Thecyclostationary detector [12]–[14], may use any of the Fouriercoefficients of the acf function in (36) as the detectionvariable, or a combination of them,
(36)
where is the fundamental period cycle of the correlation func-tion. In general, the cyclo-frequency, for I-Q signals coincideswith the baud rate (i.e., ). Because low computa-tional complexity is one of the requirements of spectrum sensing
4We distinguish between���� �� and the average����, whose digital version������ was introduced in Section II.
Fig. 13. Evaluation of � for 200 samples data records. (a) 10-dB interfer-ence located at 0.3; (b) 10-dB interference located at the same frequency as theprimary user (0.2).
in the cognitive radio application, we consider that only one de-tection variable is used. In this case, the best choice is the coef-ficient with the largest magnitude, which was (i.e., forequal to one and zero delay, )
(37)
Until now, (37) is the only valuable method for detecting spe-cific modulations or cyclic features at . An estimate of thiscoefficient can be derived from the given data record as:
(38)
where is the data record length.
4834 IEEE TRANSACTIONS ON SIGNAL PROCESSING, VOL. 57, NO. 12, DECEMBER 2009
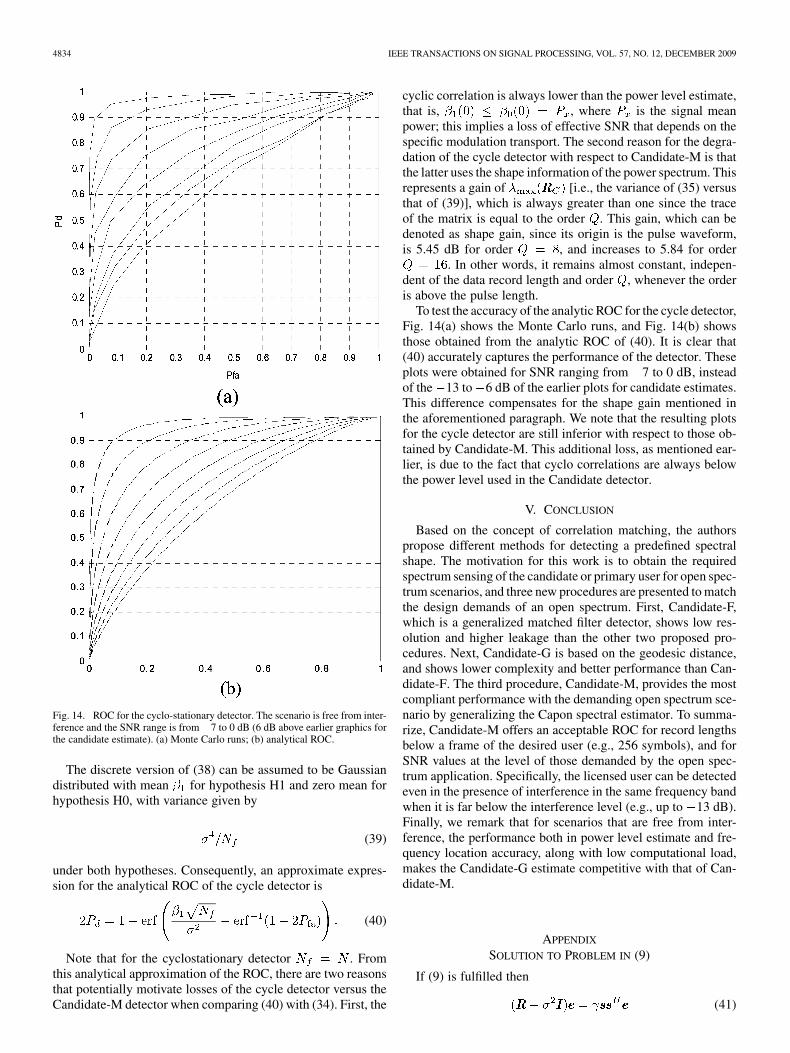
Fig. 14. ROC for the cyclo-stationary detector. The scenario is free from inter-ference and the SNR range is from�7 to 0 dB (6 dB above earlier graphics forthe candidate estimate). (a) Monte Carlo runs; (b) analytical ROC.
The discrete version of (38) can be assumed to be Gaussiandistributed with mean for hypothesis H1 and zero mean forhypothesis H0, with variance given by
(39)
under both hypotheses. Consequently, an approximate expres-sion for the analytical ROC of the cycle detector is
(40)
Note that for the cyclostationary detector . Fromthis analytical approximation of the ROC, there are two reasonsthat potentially motivate losses of the cycle detector versus theCandidate-M detector when comparing (40) with (34). First, the
cyclic correlation is always lower than the power level estimate,that is, , where is the signal meanpower; this implies a loss of effective SNR that depends on thespecific modulation transport. The second reason for the degra-dation of the cycle detector with respect to Candidate-M is thatthe latter uses the shape information of the power spectrum. Thisrepresents a gain of [i.e., the variance of (35) versusthat of (39)], which is always greater than one since the traceof the matrix is equal to the order . This gain, which can bedenoted as shape gain, since its origin is the pulse waveform,is 5.45 dB for order , and increases to 5.84 for order
. In other words, it remains almost constant, indepen-dent of the data record length and order , whenever the orderis above the pulse length.
To test the accuracy of the analytic ROC for the cycle detector,Fig. 14(a) shows the Monte Carlo runs, and Fig. 14(b) showsthose obtained from the analytic ROC of (40). It is clear that(40) accurately captures the performance of the detector. Theseplots were obtained for SNR ranging from 7 to 0 dB, insteadof the 13 to 6 dB of the earlier plots for candidate estimates.This difference compensates for the shape gain mentioned inthe aforementioned paragraph. We note that the resulting plotsfor the cycle detector are still inferior with respect to those ob-tained by Candidate-M. This additional loss, as mentioned ear-lier, is due to the fact that cyclo correlations are always belowthe power level used in the Candidate detector.
V. CONCLUSION
Based on the concept of correlation matching, the authorspropose different methods for detecting a predefined spectralshape. The motivation for this work is to obtain the requiredspectrum sensing of the candidate or primary user for open spec-trum scenarios, and three new procedures are presented to matchthe design demands of an open spectrum. First, Candidate-F,which is a generalized matched filter detector, shows low res-olution and higher leakage than the other two proposed pro-cedures. Next, Candidate-G is based on the geodesic distance,and shows lower complexity and better performance than Can-didate-F. The third procedure, Candidate-M, provides the mostcompliant performance with the demanding open spectrum sce-nario by generalizing the Capon spectral estimator. To summa-rize, Candidate-M offers an acceptable ROC for record lengthsbelow a frame of the desired user (e.g., 256 symbols), and forSNR values at the level of those demanded by the open spec-trum application. Specifically, the licensed user can be detectedeven in the presence of interference in the same frequency bandwhen it is far below the interference level (e.g., up to 13 dB).Finally, we remark that for scenarios that are free from inter-ference, the performance both in power level estimate and fre-quency location accuracy, along with low computational load,makes the Candidate-G estimate competitive with that of Can-didate-M.
APPENDIX
SOLUTION TO PROBLEM IN (9)
If (9) is fulfilled then
(41)
PÉREZ-NEIRA et al.: CORRELATION MATCHING APPROACH FOR SPECTRUM SENSING 4835
where is the eigenvector associated with the minimum eigen-value, , of [i.e., equivalently, associated withthe maximum general eigenvalue in (41)]. From (41) we canobtain
(42)
Therefore,
such that (43)
If we denote as the eigenvalues of , then theeigenvalues of are
(44)
Finally, by substituting (44) in (43) we conclude
which proves (10).
REFERENCES
[1] J. Mitola, III, “Cognitive Radio: An Integrated Agent Architecturefor Software Defined Radio,” Ph.D. dissertation, Computer Commun.Syst. Lab., Teleinformatics Dept., Royal Instit. Technology (KTH),Stockholm, Sweden, 2000.
[2] T. Renk, C. Kloeck, and F. J. Jondral, “A cognitive approach to thedetection of spectrum holes in wireless networks,” in Proc. ConsumerCommunications Networking Conf., Jan. 2007, pp. 1118–1122.
[3] S. J. Shellhammer, “Spectrum sensing in IEEE 802.22,” in Proc. CIP2008, Santorini, Greece, Jun. 2008, pp. 1–6.
[4] IEEE 802.22 Working Group, , Sep. 2008 [Online]. Available: http://grouper.ieee.org/groups/802/22/
[5] I. F. Akyildiz, W. Lee, M. C. Vuran, and S. Mohanty, “Next generation/dynamic spectrum access/cognitive radio wireless networks: A survey,”Comput. Netw., vol. 50, pp. 2127–2159, 2006.
[6] A. Ghasemi and E. S. Sousa, “Spectrum sensing in cognitive radionetworks: Requirements, challenges and design trade-offs,” IEEECommun. Mag., pp. 32–39, Apr. 2008.
[7] Z. Tian and G. B. Giannakis, “Compressed sensing for wideband cog-nitive radios,” in Proc. Int. Conf. Acoustics, Speech, Signal Process.(ICASSP), Las Vegas, NV, May 2008, pp. IV-1357–1360.
[8] M. Greco, F. Gini, and A. Farina, “Radar detection and classificationof jamming signals belonging to a cone class,” IEEE Trans. SignalProcess., vol. 56, no. 5, pp. 1984–1993, May 2008.
[9] P. D. Welch, “The use of FFT for the estimation of power spectra: Amethod based on time averaging over short modified periodograms,”IEEE Trans. Audio Electroacoust., vol. AU-15, no. 2, pp. 70–73, Jun.1967.
[10] D. J. Thomson, “Spectrum estimation and harmonic analysis,” Proc.IEEE, vol. 70, no. 9, pp. 1055–1096, Sep. 1982.
[11] B. Farhang-Boroujeny, “Filter bank spectrum sensing for cognitive ra-dios,” IEEE Trans. Signal Process., vol. 56, no. 5, pp. 1801–1811, May2008.
[12] W. Gardner, “Signal interception: A unifying theoretical framework forfeature detection,” IEEE Trans. Commun., vol. 36, pp. 897–906, Aug.1988.
[13] W. A. Gardner, A. Napolitano, and L. Paura, “Cyclostationary: Halfa century of research,” Signal Process., vol. 86, pp. 639–697, Apr.2006.
[14] J. Lunden, V. Koivunen, A. Huttunen, and H. V. Poor, “Spectrumsensing in cognitive radios based on multiple cyclic frequencies,” inProc. Cognitive Radio Oriented Wireless Network and Communica-tions (CrownCom), Aug. 1–3, 2007, pp. 37–43.
[15] A. B. Gershman, C. F. Mecklenbräuker, and J. F. Böhme, “Matrix fit-ting approach to direction of arrival estimation with imperfect spatialcoherence of wavefronts,” IEEE Trans. Signal Process., vol. 45, no. 7,pp. 1894–1899, Jul. 1997.
[16] S. Shahbazpanahi, A. B. Gershman, Z. Luo, and K. M. Wong, “Robustadaptive beamforming for general-rank signal models,” IEEE Trans.Signal Process., vol. 51, no. 9, pp. 2257–2269, Sep. 2003.
[17] P. Stoica and R. Moses, Introduction to Spectral Analysis. Engle-wood Cliffs, NJ: Prentice-Hall, 1997.
[18] V. J. Mathews, D. H. Youn, and N. Ahmed, “A unified approach tononparametric spectrum estimation algorithms,” IEEE Trans. Acoust.,Speech, Signal Process., vol. ASSP-35, no. 3, pp. 338–349, Mar.1987.
[19] J. Capon, “High resolution frequency-wavenumber spectrum analysis,”Proc. IEEE, vol. 57, pp. 1408–1418, 1969.
[20] M. A. Lagunas, M. E. Santamaria, A. Gasull, and A. Moreno, “Max-imum likelihood filters in spectral estimation problems,” EURASIPSignal Process. (Special Issue on Major Trends in Spectral Analysis),vol. 10, no. 1, pp. 19–34, Jan. 1986.
[21] J. J. Boutros, F. Kharrat, and H. Randriambololona, “A classificationof multiple antenna channels,” in Proc. Int. Zurich Seminar Communi-cations (IZS), Feb. 2006, pp. 14–17.
[22] M. A. Lagunas, M. A. Rojas, and P. Stoica, “New espectral estimationbased on filter bank for spectrum sensing,” in Proc. Int. Conf. Acous-tics, Speech, Signal Process. (ICASSP), Las Vegas, NV, May 2008, pp.3509–3512.
[23] T. W. Anderson, An Introduction to Multivariate Statistical Anal-ysis.. New York: Wiley, 1984, pp. 468–469.
Ana I. Pérez-Neira (S’92–M’95–SM’09) receivedthe Telecommunication Engineering degree and thePh.D. degree from the Technical University of Cat-alonia (UPC), Barcelona, Spain, in 1991 and 1995,respectively.
In 1991, she joined the Department of SignalTheory and Communication of the UPC, where shecarried on research activities in the field of higherorder statistics and statistical array processing. In1992, she became Lecturer, in 1996, AssociateProfessor, and in 2004 she got the Habilitación to
become Professor in Spain. Since 2006 she has been Full Professor for signaltheory and communication at UPC. From 2000 to 2003, she was a memberof the Board of Directors of the Telecommunications School of Barcelona,ETSETB, and since 2002 she has been Research Associate at the CTTC(Centre Tecnologic de Telecomunicacions de Catalunya Castelldefels), whereshe is currently member of the Board of Directors. She teaches and coordinatesgraduate and undergraduate courses in statistical signal processing, array andMIMO processing, analog and digital communications, mathematical methodsfor communications, and nonlinear signal processing. She is the author of onebook, three book chapters, three patents, 25 journal papers, and more than 200conference papers (20 invited) in the area of statistical signal processing andfuzzy processing, with applications to mobile/satellite communication systems,physical, and access layers.
Dr. Pérez-Neira is the Editor of the Journal on Applied Signal Pro-cessing—Hindawi and co-editor of three special issues for EURASIP SignalProcessing. She has participated in the organization of two conferences (ESAconference 1996 and SAM 2004) and chaired IWCLD 2009. She has coordi-nated national public and private founded projects (INTAS, RACE, ACTS, IST,and Eureka and ESA European projects): 15 European competitive projects,nine National competitive projects, and four industry noncompetitive projects.She is member of EURASIP Adcom.
4836 IEEE TRANSACTIONS ON SIGNAL PROCESSING, VOL. 57, NO. 12, DECEMBER 2009
Miguel Angel Lagunas (S’73–M’78–SM’89–F’97)was born in Madrid, Spain, in 1951. He received theTelecommunications Engineer degree from UPM,Madrid, Spain, in 1973 and the Ph.D. degree intelecommunications from UPB, Barcelona, Spain, in1976.
From 1971 to 1973, he was a Research Assistantat the Semiconductor Lab ETSIT, Madrid. Hejoined UPC as Teacher’s Assistant in Circuit Theoryand Semiconductor Electronics (1973–1979); andAssociate Professor of Digital Signal Processing
for Communications (1979–1982). Since 1983, he has been a Full Professorat UPC, teaching courses in signal processing, array processing, and digitalcommunications. He was Project Leader of high-speed SCMA (1987–1989)and ATM (1994–1995) cable network. was Vice-President for Research ofUPC from 1986–1989 and Vice-Secretary General for Research, CICYT, Spainfrom 1995–1996. Member of the NATO scientific committee (1997–2001).Currently, he is Director of the Telecommunications Technological Center ofCatalonia (CTTC) in the Barcelona Private Research Center on low layerstechnologies for communications systems. He is also Co-Director of thefirst projects for the European Spatial Agency and the European Union,providing engineering demonstration models on smart antennas for satellitecommunications using DS and FH systems (1986) and antenna arrays formobile communications GSM (1997). His research activity is devoted tospectral estimation, DSP and spatial diversity processing in communications.His technical activities are in advanced front-ends for digital communicationscombining spatial with frequency-time and coding diversity.
Prof. Lagunas is an elected member of the Academy of Engineers of Spainand of the Academy of Science and Art of Barcelona and a correspondentMember of the Northern Wesfalia Academy for Sciences and Arts, Dusseldorf,Germany. He was a Fulbright scholar at the University of Boulder, CO, from1981 to 1982.
Miguel Angel Rojas was born in Veracruz, Mexico.He graduated in electronic and communications en-gineering from Veracruzana University in 1990. Hereceived the Master’s degree in telecommunicationengineering from the National Polytechnic Institutein 2001. In 2005 he was awarded a grant by theMexican Government within its Ph.D. fellowshipprogram. He is currently working towards thePh.D. degree at the Communications and SignalTheory Department of the University Polytechnic ofCatalunya. He is doing his Ph.D. dissertation at the
Centre Tecnològic de Telecomunicacions de Catalunya under the collaborationand the supervision of Dr. M. A. Lagunas Hernández.
From 1990 to 1995, he worked as Researcher at the Nuclear Energy Depart-ment of the Electrical Research Institute, Morelos, Mexico, where he was in-volved in a project of the Control Systems of Laguna Verde’s Nuclear PowerPlant. From 1995 to 2005, he worked as Professor at the Veracruzana Univer-sity. His research interest areas are filter bank, spectral analysis for cognitiveradio, and multicarrier communications techniques.
Petre Stoica (F’94) received the D.Sc. degree inautomatic control from the Polytechnic Institute ofBucharest (BPI), Bucharest, Romania, in 1979 andan honorary Ph.D. degree in science from UppsalaUniversity (UU), Uppsala, Sweden, in 1993.
He is a Professor of systems modeling with theDivision of Systems and Control, the Departmentof Information Technology, UU. Previously, hewas a Professor of system identification and signalprocessing with the Faculty of Automatic Controland Computers, BPI. He held longer visiting posi-
tions with Eindhoven University of Technology, Eindhoven, The Netherlands;Chalmers University of Technology, Gothenburg, Sweden (where he held aJubilee Visiting Professorship); UU; The University of Florida, Gainesville;and Stanford University, Stanford, CA. His main scientific interests are in theareas of system identification, time series analysis and prediction, statisticalsignal and array processing, spectral analysis, wireless communications, andradar signal processing. He has published nine books, ten book chapters, andapproximately 500 papers in archival journals and conference records. Themost recent book he coauthored, with R. Moses, is Spectral Analysis of Signals(Englewood Cliffs, NJ: Prentice-Hall, 2005).
Dr. Stoica is on the editorial boards of six journals: the Journal of Fore-casting; Signal Processing; Circuits, Signals, and Signal Processing; DigitalSignal Processing-CA Review Journal; Signal Processing Magazine; and Mul-tidimensional Systems and Signal Processing. He was a Co-Guest Editor forseveral special issues on system identification, signal processing, spectral anal-ysis, and radar for some of the aforementioned journals, as well as for the IEEProceedings. He was corecipient of the IEEE ASSP Senior Award for a paperon statistical aspects of array signal processing. He was also recipient of theTechnical Achievement Award of the IEEE Signal Processing Society. In 1998,he was the recipient of a Senior Individual Grant Award of the Swedish Founda-tion for Strategic Research. He was also corecipient of the 1998 EURASIP BestPaper Award for Signal Processing for a work on parameter estimation of ex-ponential signals with time-varying amplitude, a 1999 IEEE Signal ProcessingSociety Best Paper Award for a paper on parameter and rank estimation of re-duced-rank regression, a 2000 IEEE Third Millennium Medal, and the 2000 W.R. G. Baker Prize Paper Award for a paper on maximum-likelihood methodsfor radar. He was a member of the international program committees of manytopical conferences. From 1981 to 1986, he was a Director of the InternationalTime-Series Analysis and Forecasting Society, and he was also a member of theIFAC Technical Committee on Modeling, Identification, and Signal Processing.He is also a member of the Royal Swedish Academy of Engineering Sciences,an honorary member of the Romanian Academy, and a fellow of the Royal Sta-tistical Society.