Embed Size (px)
Citation preview

HUGHES Communications, Inc.
2 0 0 8 A N N U A L R E P O R T

H U G H E S C O M M U N I C AT I O N S, I N C.
Innovation is why we lead.
EnterpriseAn ever-expanding range of broadband solutions and managed services unlocks a wealth of benefi ts tocompanies of all sizes, from worldwide blue chips tomedium and small businesses with global potential.
enterprise.hughes.com
GovernmentFrom emergency preparedness, to highly secure private networks, to telework and distance learning, Hughes delivers the most advanced technologies and highest standard of communications solutions to support the many missionsof government.
government.hughes.com
ConsumerRead more about the highest speed satellite Internet access plans available in North America—up to 5 Mbps. Always-on, affordable, convenient—HughesNet® at home means you can download fi les in seconds, check e-mail instantly and surf faster than you ever imagined.
go.gethughesnet.com
and services for all marketHughes creates new technologies that

1
Hughes is named the fastest growing technology company by Deloitte and Touche LLP, one of 11 awards won bythe company in 2008.
Check out more awards atawards.hughes.com
Diversity is what keeps us strong.
Congratulations to Pradman Kaul on being named 2008 Satellite Executive of the Year by Via Satellite magazine.
viasatellite.hughes.com
AWAR D S WE RECE IVED
Defense and IntelligenceWhether the requirement is tactical or strategic—in the air, on the sea, or on the ground—your communications network can’t be less than the best. When it comes to Defense and Intelligence Systems, count on Hughes to deliver broadband solutions which meet the grade, utilizing the best in satellite and terrestrial technologies.
defense.hughes.com
Small BusinessHughesNet business class services are tailored to the needs of small businesses, from high-performance Internet access, to private networks and broadband backup, whether for afew sites or many.
business.hughesnet.com
sectors around the globe.enable breakthrough broadband products
2 0 0 8 A N N U A L R E P O R T

H U G H E S C O M M U N I C AT I O N S, I N C.
Dear Fellow Shareholder,
2008 was a year of signifi cant change, with the global fi nancial meltdown negatively impacting many companies. At Hughes,our business model has fortunately withstood the turmoil, and we continued to deliver on our promises with four more quarters of results which met or exceeded all fi nancial metrics. The Total Revenue and Adjusted EBITDA charts on the right tell the story: we have now achieved positive results for 10 successive quarters since going public in 2006, and we have shown positive growth and earnings for the past four years. This validates our successful strategy—namely, to expand our broadband service business worldwide by leveraging our technology and product innovations. Recurring service revenue from an ever-growing base of repeat customers in North America, Europe, India and Brazil now exceeds our technology and product revenues. It is growing at a faster rate, giving us the diversity that sets us apart from our competition and keeps us strong.
At Hughes, our mission has always been to innovate and create positive change. Nothing could demonstrate that better than launching commercial service on SPACEWAY® 3 in April 2008, which turned Hughes overnight into a fully integrated satellite service provider. At 10 Gbps throughput, SPACEWAY 3 is the world’s fi rst commercial satellite system with on board switching and routing. Combined with numerous other advances, it represents a dramatic change in satellite technology. These advances have already been translated into HughesNet service offerings across all of our market sectors in North America. We have introduced the highest speed satellite Internet access plans available for consumers and small businesses, up to 5 Mbps; bandwidth-on-demand services; and the deployment of any combination of star or mesh private network topologies. This unique capability is ideal for enterprise and government Continuity of Operations (COOP) and emergency preparedness applications.
We have now shipped more than 1.9 million VSATs to consumer, small business, enterprise and government customers in more than 100 countries, solidifying our market leadership. Last year alone, we shipped over 300,000 units and grew our successful broadband satellite service revenues by 13% over 2007. Our consumer business continued to show strength, despite the economic downturn, with gross subscriber adds growing by a record 170,000, or 14% over 2007; average revenue per unit increased by 5% to $65; and total subscriber count climbed
LE TTER TO SHAREHOLDERS
H U G H E S C O M M U N I C AT I O N S, I N C.2
to 432,800. Notable enterprise wins included Wyndham Worldwide; ConocoPhillips; Barrett/Xplore in Canada, our fi rst SPACEWAY service provider outside the U.S.; GTECH, which entrusted Hughes to manage its nationwide lottery network of over 70,000 sites; and our successful build-out of over 28,000 sites for Camelot Lotteries (U.K.). These wins have raised our total managed service sites globally to over 200,000. Considering our high renewal rate for enterprise customers, this substantial base ensures a healthy and predictable recurring revenue fl ow.
In the emerging government segment, our selection on the U.S. General Services Administration’s SATCOM-II and Networx contract vehicles unleashed the possibility for government agencies to realize the many benefi ts of broadband satellite solutions, now signifi cantly enhanced with the capabilities of SPACEWAY 3. For example, the Government Education and Training Network (GETN) selected Hughes to provide Federal agencies with an interoperable network which enables them to share distance learning programs. Another example is at the Social Security Administration (SSA), which selected Hughes for its Interactive Video Tele-training Network. IVT will reach out to more than 1,650 SSA offi ces and be fully managed by Hughes, including delivery of video and video-related applications.
Internationally, Hughes is helping to close the “digital divide” and bring broadband to rural communities on every continent. For example, a public-private partnership in India is bringing distance learning and a range of e-governance applications to thousands of rural locations. In Brazil, PRODAM—the data processing company of the State of Amazonas—is utilizing our HughesNet service to deliver broadband to government agencies and the public at large throughout the State, which covers a huge area of 1.5 million square kilometers (930,000 square miles), about 30 percent larger than Alaska. The unique Hughes solution combining WiMAX base stations with broadband satellite backhaul will soon solve the enormous challenge of connecting this resource-rich region to the world.
Closer to home, Florida-based America’s Emergency Network (AEN) has been successfully streaming real-time news briefi ngs from numerous state and local operations centers since the onset of the 2008 hurricane season, powered by our HughesNet service operating over SPACEWAY 3. AEN also

2 0 0 8 A N N U A L R E P O R T
provides convenient, free public access to video streams from major Florida newspapers. The unique AEN solution clearly demonstrates how satellite communications is the key path to diversity for all COOP applications, offering a true alternate path when terrestrial networks are out of service.
In closing, the world of Hughes is all about broadband—from technologies, to products and services, the benefi ts of which are only beginning to be realized in virtually all market sectors globally. We have a proven business strategy, and as our results have demonstrated in both good times and bad, continued success is rooted in executing that strategy. I have the highest confi dence that we will succeed because of the best group of shareholders, employees, and customers in the industry.I would like to thank them all for their confi dence and support.
Sincerely,
Pradman P. KaulPresident and CEO,Hughes Communications, Inc.
2 0 0 8 A N N U A L R E P O R T 3
Back row: T. Paul Gaske, Adrian MorrisFront row: Bahram Pourmand, Pradman P. Kaul, Grant A. Barber
Service Revenue %
$0
$200
$400
$600
$800
$1,000
$1,200
Total Revenue ($M)
$0
$20
$40
$60
$80
$100
$120
Adjusted EBITDA ($M)
$140$160
2007
2006
2005
$115
$140$126
2008
$155
53% 51% 55% 58%
2006
2005
$807$970
$1,060
$858
2008
2007
Hughes Networks Systems, LLC*
*Hughes Network Systems, LLC is the Company’s primary operating subsidiary.See reconciliation of non-GAAP fi nancial measures on the following page.

Hughes Communications, Inc. operates its business primarily through Hughes Network Systems, LLC,its wholly owned subsidiary. The following table presents fi nancial highlights for Hughes Network Systems, LLC.
(Dollars in thousands)
Revenue by Segments
North America VSATInternational VSATTelecom Systems
Total Revenues
Reconciliation of Non-GAAP to GAAP Financial Measures
Net IncomeAdd:
Equity incentive planInterest expenseIncome tax expenseDepreciation and amortizationLong-term incentive/retention cash planRestructuring chargeInventory provision for shift to Broadband focusHughesNet branding costsFacilities costsTransaction costs for the April 2005 AcquisitionElimination of payroll and benefi ts refl ective of headcount reductionsAssumed net reduction of SPACEWAY operating costsBenefi ts/insurance programs sponsored by DIRECTVLegal expenses related to non-acquired businessesLegal settlement and related fees pre-2005 AcquisitionManagement fee to Hughes Communications Inc.
Less:Interest income
Adjusted EBITDA
2005
$535,385202,93568,589
$806,909
HUGHES, HughesNet, SPACEWAY, Connect to the future and Broadband Unbound are trademarks of Hughes Network Systems, LLC.All other trademarks are the property of their respective owners.© 2009 Hughes Communications, Inc. All rights reserved.
2008
$ 12,096
5,22151,3277,588
68,93713,219
(2,978)
$ 155,410
2005
$ 24,048
11524,375
87340,943
3,068
2,3631,4685,4184,5427,5972,178
690
(2,915)
$114,763
2006
$ 19,102
31246,0413,276
48,459
11,8791,454
2,385
5861,000
(8,875)
$125,619
2007
$ 49,801
3,02043,7725,316
45,860
1,211
(8,972)
$140,008
Hughes Network Systems, LLCYear Ended December 31,
F INANC IAL H IGHL IGHTS
4
2006
$573,867193,37090,988
$858,225
2007
$615,716214,833139,526
$970,075
2008
$ 667,665237,188155,038
$1,059,891
Hughes Network Systems, LLCYear Ended December 31,
H U G H E S C O M M U N I C AT I O N S, I N C.

APPENDIX
Hughes Communications, Inc. Annual Report on Form 10-K.

[THIS PAGE INTENTIONALLY LEFT BLANK]

UNITED STATESSECURITIES AND EXCHANGE COMMISSION
WASHINGTON, DC 20549
FORM 10-K(Mark One)
È ANNUAL REPORT PURSUANT TO SECTION 13 OR 15(d) OF THESECURITIES EXCHANGE ACT OF 1934
For the Fiscal Year Ended December 31, 2008or
‘ TRANSITION REPORT PURSUANT TO SECTION 13 OR 15(d) OF THESECURITIES EXCHANGE ACT OF 1934 FOR THE TRANSITION PERIODFROM TO
Commission file number: 001-33040
HUGHES COMMUNICATIONS, INC.(Exact Name of Registrant as Specified in Its Charter)
Delaware 13-3871202(State or Other Jurisdiction ofIncorporation or Organization)
(I.R.S. EmployerIdentification No.)
11717 Exploration Lane, Germantown, Maryland 20876(Address of Principal Executive Offices and Zip Code)
(301) 428-5500(Registrant’s Telephone Number, Including Area Code)
Securities registered pursuant to Section 12(b) of the Act:Common Stock: $0.001 par value The NASDAQ Stock Market LLC (NASDAQ Global
Select Market)(Title of Each Class) (Name Of Each Exchange On Which Registered)
Securities registered pursuant to Section 12(g) of the Act:None
Indicate by check mark if the registrant is a well-known seasoned issuer, as defined in Rule 405 of theSecurities Act. Yes‘ NoÈ
Indicate by check mark if the registrant is not required to file reports pursuant to Section 13 or Section 15(d) of theExchange Act. Yes‘ NoÈ
Indicate by check mark whether the registrant (1) has filed all reports required to be filed by Section 13 or 15(d) of the SecuritiesExchange Act of 1934 during the preceding 12 months (or for such shorter period that the registrant was required to file such reports)and (2) has been subject to such filing requirements for the past 90 days. YesÈ No‘
Indicate by check mark if disclosure of delinquent filers pursuant to Item 405 of Regulation S-K is not contained herein, and willnot be contained, to the best of registrant’s knowledge, in definitive proxy or information statements incorporated by reference in PartIII of this Form 10-K or any amendment to this Form 10-K. È
Indicate by check mark if the registrant is a large accelerated filer, an accelerated filer, a non-accelerated filer, or a smallerreporting company. See definition of “large accelerated filer,” “accelerated filer” and “smaller reporting company” in Rule 12b-2 ofthe Exchange Act.
Large accelerated filer ‘ Accelerated filer ÈNon-accelerated filer ‘ (Do not check if a smaller reporting company) Smaller reporting company ‘
Indicate by check mark whether the company is a shell company (as defined in Rule 12b-2 of the Exchange Act). Yes‘ NoÈThe aggregate market value of voting and non-voting common equity held by non-affiliates as of June 30, 2008 was
$432,174,369.The number of shares of the registrant’s common stock outstanding as of February 27, 2009 was 21,514,520.
DOCUMENTS INCORPORATED BY REFERENCEPortions of the registrant’s definitive Proxy Statement to be filed with the Securities and Exchange Commission in connection
with the registrant’s 2009 annual meeting of stockholders are incorporated by reference into Part III of this Annual Report on Form10-K. Such Proxy Statement will be filed with the Securities and Exchange Commission not later than 120 days after the registrant’sfiscal year ended December 31, 2008.

[THIS PAGE INTENTIONALLY LEFT BLANK]

TABLE OF CONTENTS
Page
PART I . . . . . . . . . . . . . . . . . . . . . . . . . . . . . . . . . . . . . . . . . . . . . . . . . . . . . . . . . . . . . . . . . . . . . . . . . . . . . 1Item 1. Business . . . . . . . . . . . . . . . . . . . . . . . . . . . . . . . . . . . . . . . . . . . . . . . . . . . . . . . . . . . . . . . . . . . . 2Item 1A. Risk Factors . . . . . . . . . . . . . . . . . . . . . . . . . . . . . . . . . . . . . . . . . . . . . . . . . . . . . . . . . . . . . . . . . 18Item 1B. Unresolved Staff Comments . . . . . . . . . . . . . . . . . . . . . . . . . . . . . . . . . . . . . . . . . . . . . . . . . . . . . 31Item 2. Properties . . . . . . . . . . . . . . . . . . . . . . . . . . . . . . . . . . . . . . . . . . . . . . . . . . . . . . . . . . . . . . . . . . . 32Item 3. Legal Proceedings . . . . . . . . . . . . . . . . . . . . . . . . . . . . . . . . . . . . . . . . . . . . . . . . . . . . . . . . . . . . . 33Item 4. Submission of Matters to a Vote of Security Holders . . . . . . . . . . . . . . . . . . . . . . . . . . . . . . . . . 33PART II . . . . . . . . . . . . . . . . . . . . . . . . . . . . . . . . . . . . . . . . . . . . . . . . . . . . . . . . . . . . . . . . . . . . . . . . . . . . . 34Item 5. Market for Registrant’s Common Equity, Related Stockholder Matters and Issuer Purchases of
Equity Securities . . . . . . . . . . . . . . . . . . . . . . . . . . . . . . . . . . . . . . . . . . . . . . . . . . . . . . . . . . . . . . 34Item 6. Selected Financial Data . . . . . . . . . . . . . . . . . . . . . . . . . . . . . . . . . . . . . . . . . . . . . . . . . . . . . . . . 36Item 7. Management’s Discussion and Analysis of Financial Condition and Results of Operations . . . 37Item 7A. Quantitative and Qualitative Disclosures about Market Risk . . . . . . . . . . . . . . . . . . . . . . . . . . . . 62Item 8. Financial Statements and Supplementary Data . . . . . . . . . . . . . . . . . . . . . . . . . . . . . . . . . . . . . . 64Item 9. Changes in and Disagreements with Accountants on Accounting and Financial Disclosure . . . 121Item 9A. Controls and Procedures . . . . . . . . . . . . . . . . . . . . . . . . . . . . . . . . . . . . . . . . . . . . . . . . . . . . . . . . 121Item 9B. Other Information . . . . . . . . . . . . . . . . . . . . . . . . . . . . . . . . . . . . . . . . . . . . . . . . . . . . . . . . . . . . . 122PART III . . . . . . . . . . . . . . . . . . . . . . . . . . . . . . . . . . . . . . . . . . . . . . . . . . . . . . . . . . . . . . . . . . . . . . . . . . . . 123Item 10. Directors, Executive Officers and Corporate Governance . . . . . . . . . . . . . . . . . . . . . . . . . . . . . . 123Item 11. Executive Compensation . . . . . . . . . . . . . . . . . . . . . . . . . . . . . . . . . . . . . . . . . . . . . . . . . . . . . . . 126Item 12. Security Ownership of Certain Beneficial Owners and Management and Related Stockholder
Matters . . . . . . . . . . . . . . . . . . . . . . . . . . . . . . . . . . . . . . . . . . . . . . . . . . . . . . . . . . . . . . . . . . . . . 126Item 13. Certain Relationships and Related Transactions, and Director Independence . . . . . . . . . . . . . . . 127Item 14. Principal Accountant Fees and Services . . . . . . . . . . . . . . . . . . . . . . . . . . . . . . . . . . . . . . . . . . . . 127PART IV . . . . . . . . . . . . . . . . . . . . . . . . . . . . . . . . . . . . . . . . . . . . . . . . . . . . . . . . . . . . . . . . . . . . . . . . . . . . 128Item 15. Exhibits and Financial Statement Schedules . . . . . . . . . . . . . . . . . . . . . . . . . . . . . . . . . . . . . . . . 128SIGNATURES . . . . . . . . . . . . . . . . . . . . . . . . . . . . . . . . . . . . . . . . . . . . . . . . . . . . . . . . . . . . . . . . . . . . . . . 132
i

[THIS PAGE INTENTIONALLY LEFT BLANK]

PART I
SPECIAL NOTE REGARDING FORWARD-LOOKING STATEMENTS
This Annual Report on Form 10-K contains “forward-looking statements” that involve risks anduncertainties within the meaning of various provisions of the Securities Act of 1933 and of the SecuritiesExchange Act of 1934. Forward-looking statements include statements concerning our plans, objectives, goals,strategies, future events, future revenues or performance, capital expenditures, financing needs and otherinformation that is not historical information and, in particular, appear in the sections entitled “Risk Factors,”“Management’s Discussion and Analysis of Financial Condition and Results of Operations” and elsewhere in thisreport. When used in this report, the words “estimates,” “expects,” “anticipates,” “forecasts,” “plans,” “intends,”“believes,” “seeks,” “may,” “will,” “should” and variations of these words or similar expressions (or the negativeversions of any these words) are intended to identify forward-looking statements. All forward-lookingstatements, including, without limitation, management’s examination of historical operating trends, are basedupon our current expectations and various assumptions. Our expectations, beliefs and projections are expressedin good faith and we believe there is a reasonable basis for them. However, we can give no assurance thatmanagement’s expectations, beliefs and projections will be achieved.
There are a number of risks and uncertainties that could cause our actual results to differ materially from theresults referred to in the forward-looking statements contained in this report. Important factors that could causeour actual results to differ materially from the results referred to in the forward-looking statements we make inthis report are set forth elsewhere in this report, including under the heading “Item 1A. Risk Factors.”
1

Item 1. Business
Unless otherwise indicated or the context requires otherwise, the terms “HCI,” the “Company,” “we,”“us” and “our” refer to Hughes Communications, Inc. and its subsidiaries, including Hughes Network Systems,LLC (“HNS”).
Overview
We were formed as a Delaware corporation, then a wholly-owned subsidiary of SkyTerra Communications,Inc. (“SkyTerra”), on June 23, 2005. As of February 21, 2006, we became a publicly traded company, see“—Significant Transactions” for detailed discussion. We operate our business primarily through our wholly-owned subsidiary, HNS, a telecommunications company. We are the world’s leading provider of broadbandsatellite network services and systems to the enterprise market. We are also the largest satellite Internet accessprovider to North American consumers and small and medium sized businesses, such as small office and homeoffice users, which we refer to as the Consumer market. In addition, we provide managed services to largeenterprises that combine the use of satellite and terrestrial alternatives, thus offering solutions that are tailoredand cost optimized to the specific customer requirements.
Since HNS’ deployment of the first very small aperture terminal (“VSAT”) network in 1983, we have beena leader in commercial digital satellite communications and have achieved extensive depth and experience in thedevelopment, manufacturing and operation of satellite-based data, voice and video networks. Leveraging thisexpertise, we provide highly reliable, end-to-end communications with guaranteed quality of service to ourenterprise customers regardless of the number of fixed or mobile sites or their geographic location. HNS startedin this business as an equipment and system supplier. During 1988, HNS became a service provider to mediumand large enterprises, including Fortune 1000 companies. In the early part of this decade, HNS leveraged itsexperience with its enterprise customers to expand its business into other growing market areas such as providingbroadband Internet service to the Consumer market. In addition, we have strategically used our technology baseand expertise in satellite communication to provide turnkey satellite ground systems and user terminal equipmentto mobile system operators as well as expand our business to the automotive telematics market, which we believeoffers us the potential for growth not only in our system design services, but also in the design and manufacturingof user terminal equipment.
In August 2007, we launched our SPACEWAYTM 3 satellite (“SPACEWAY 3”) to support the marketgrowth in our North American enterprise and consumer businesses, and in April 2008, we introduced service inNorth America on the SPACEWAY system. The commencement of service on the SPACEWAY system enablesus to expand our business by increasing our addressable markets in North America.
Significant Transactions
Through a series of transactions from 2005 to 2008, we acquired the businesses that we owned as ofDecember 31, 2008. An overview of those transactions is as follows:
• On April 22, 2005, SkyTerra acquired 50% of HNS’ voting, or Class A membership interests (the “April2005 Transaction”) from DTV Network Systems, Inc. (“DTV Networks”), a wholly-owned subsidiaryof The DIRECTV Group, Inc. (“DIRECTV”).
• On October 12, 2005, we acquired Series A preferred shares of Hughes Systique Corporation (“HughesSystique”) for $3.0 million. On January 9, 2008, the Company invested an additional $1.5 million in thecommon equity of Hughes Systique. As a result, the Company owns approximately 31.8% of theoutstanding shares of Hughes Systique, on an undiluted basis, at December 31, 2008.
• On December 31, 2005, pursuant to a separation agreement between us and SkyTerra (the “SeparationAgreement”), SkyTerra contributed to us the following:
- its 50% ownership of HNS’ Class A membership interests;
2

- its interests in: i) AfriHUB LLC, a discontinued business; ii) Electronic System Products, Inc.(“ESP”); and iii) certain minority investments; and
- other investments, cash and short-term investments.
• On January 1, 2006, we completed our purchase of the remaining 50% of HNS’ Class A membershipinterests for $100.0 million in cash (the “January 2006 Transaction”). To finance the January 2006Transaction, we borrowed $100.0 million from certain of SkyTerra’s controlling stockholders, variousinvestment vehicles that are affiliated with Apollo Management, L.P. (together with its affiliates,“Apollo”). The loan was repaid in March 2006 following the completion of a rights offering conductedby us. As a result of the January 2006 Transaction, we own 100% of HNS’ Class A membershipinterests, and our consolidated financial statements for periods beginning on or after January 1, 2006include the results of HNS and its controlled, majority-owned subsidiaries.
• On February 21, 2006, SkyTerra distributed all of our outstanding shares of common stock toSkyTerra’s common, non-voting common and preferred stockholders and its Series 1-A and 2-A warrantholders (the “Distribution”). The Distribution separated SkyTerra into two publicly traded companies.Accordingly, SkyTerra no longer owns any of our capital stock; and Apollo, SkyTerra’s controllingstockholder at the time of the Distribution, became our controlling stockholder.
Notwithstanding the legal form of the Distribution, we are treated as the “accounting successor” toSkyTerra for financial reporting purposes. This accounting is required because, among other things, (i) thebusinesses transferred to us generated all of SkyTerra’s historical consolidated revenues and constituted amajority of the book value of SkyTerra’s assets immediately preceding the Distribution, and (ii) thebusinesses transferred to us included SkyTerra’s discontinued operating subsidiaries and all of the assetsand liabilities relating to such subsidiaries. Accordingly, the Company’s historical results throughDecember 31, 2005 are derived from SkyTerra’s audited financial statements, including the results of thebusiness and assets retained by SkyTerra in accordance with Emerging Issues Task Force Issue No. 02-11,“Accounting for Reverse Spin-offs.” The Company’s results for periods beginning on and after January 1,2006, the date on which the Company completed the January 2006 Transaction, include the results of thebusiness and assets retained by SkyTerra through the date of the Distribution and reflect HNS’ results ofoperations.
• On March 27, 2006, we completed a rights offering, pursuant to which we issued 7,843,141 shares ofour common stock to our stockholders at a subscription price of $12.75 per share. In connection with therights offering, we received proceeds of $100.0 million, of which $68.4 million was received fromApollo.
Industry Overview
The emergence of VSATs in the 1980s marked the beginning of a new era in satellite communication. Theuse of smaller antennas meant that the benefits of satellite-based communication could be made commerciallyviable in a wide range of applications, whereas previous uses were generally limited to government and largecommercial installations. A VSAT network operates by connecting multiple, geographically-dispersedcommunication sites through a satellite to a single point (the network hub) and from there to the customer’s datacenter. VSAT operators typically lease transponder capacity from a third-party fixed satellite service provider.VSAT networks can operate independently or as a complete overlay to terrestrial networks and can, therefore,provide a single source solution for a particular customer’s communication requirements. Other benefits includea highly secure and reliable network and service availability across a single or multiple regions. In addition, dueto the shared nature of the satellite communications resource, VSATs provide attractive economics for multi-siteapplications that have various levels of traffic requirements at any one site. VSAT networks can support a fullspectrum of capabilities and customer applications including email, Internet-based virtual private networks,video/voice, Internet access, Internet telephony, distance learning, content distribution and financial transactions.
3

VSAT networks allow every site in a network to have access to consistent service levels, sometimes with aguaranteed minimum level of quality, compared with terrestrial networks in which service levels across areasmay differ both within a single network and across different networks. In addition, VSAT networks havemultiple layers of redundancy, including multiple network operation centers and arrangements to shift loads tobackup satellites or transponders in the event of a particular satellite and/or transponder’s failure. Anotheradvantage of VSAT satellite solutions is that due to their wireless nature, they are able to be deployed morerapidly than terrestrial services. The VSAT solution provides users with the ability to multicast and broadcastunder the same economic model that has enabled the rapid growth in direct-to-home satellite television. As aresult, tasks such as the distribution of training videos are achieved efficiently and economically via a VSATsatellite solution.
Business Segments
We currently operate in four business segments—the North America VSAT segment, the InternationalVSAT segment, the Telecom Systems segment and the Corporate and Other segment. The North America VSATsegment consists of the Consumer group and the Enterprise group. The International VSAT segment consists ofthe Enterprise group, which includes our international service companies. The Telecom Systems segmentconsists of the Mobile Satellite Systems group, the Telematics group, and the Terrestrial Microwave group. TheCorporate and Other segment consists of various minority investments held by the Company, our corporateoffices and assets not specifically related to another business segment. Due to the complementary nature andcommon architecture of our services and products across our business lines, we are able to leverage our expertiseand resources within our various operating units to yield significant cost efficiencies.
See Note 22—Segment Data and Geographic Data to the Company’s audited consolidated financialstatements included in Item 8 of this report for financial information by operating segment and by geographiclocation.
4

The following chart summarizes the key elements of our markets comprising our business segments, excludingour Corporate and Other segment, each of which is discussed in further detail below:
North AmericaVSAT Segment
InternationalVSAT Segment
Telecom SystemsSegment
Consumer Enterprise EnterpriseMobile Satellite
Systems Telematics Terrestrial Microwave
Customer Base • Subscriptionservices
• Enterprises,government andlocal governmentagencies in NorthAmerica
• EnterprisesTelecomcarriers andgovernmentagencies locatedoutside of NorthAmerica
• Mobile satellite-basedvoice and dataservice operators
• Telematicsserviceproviders
• Cellular mobileoperators and localexchange carriers
2008 Revenues(in millions)
• $376 • $292 • $237 • $106 • $31 • $18
Products/ServiceApplication(s)
• Internet access • VSAT equipment • VSAT equipment • Turnkey mobilenetwork solutionsincluding gateways/terminals
• Telematicsdevelopmentandequipment
• Microwave-basednetworkingequipment
• ISP servicesincludinge-mail
• Intranet/Internetaccess
• Intranet/Internetaccess
• Wireless backhaul forcellular serviceproviders
• IP VPN • IP VPNMulticast filedelivery/videostreaming
• Customized businesssolutions
• Turnkey managednetwork services- Program andInstallation
- Management- Maintenance- Customer care
• Inventorymanagement
• Content distribution• Online Learning• Satellite andTerrestrial transport
• IP VPN• Multicast filedelivery/videostreaming
• Customizedbusinesssolutions
• Turnkeymanagednetwork services- Program andInstallation
- Management- Maintenance- Customer care
• Inventorymanagement
• Contentdistribution
• Online Learning• VoIP
RepresentativeCustomers
• Wal-Mart Stores,Inc., ExxonMobilCorporation,Blockbuster, Inc.,GTECHCorporation,Lowe’s, Wendy’sInternational, BP,WyndhamWorldwideCorporation,ChevronCorporation, Shell,Walgreen Co., RiteAid, YUM Brands,Social SecurityAdministration
• Volkswagen AG,Tesco, Telefonos deMexico, VISAInternational ServiceAssociation, TelkomSouth Africa,TelstraAustralia,the Ministry ofForeign Affairs ofSaudi Arabia, StateBank of India,Camelot Group plc
• Globalstar, Inc., ICOGlobalCommunicationsLtd., Inmarsat Ltd.,SkyTerraCommunications,Inc., TerreStarNetworks, Inc.,ThurayaTelecommunicationsCompany
• HughesTelematics,Inc.
• Nokia SiemensNetworks, VodafoneItaly/Portugal/Greece,Wind Italy/Greece,Vodacom SouthAfrica, PTC Poland,BTC Bulgaria, T-Mobile Czech,Crowley Poland,Covad USA, GTSCentral Europe
5

North America VSAT Segment
Business Overview
Consumer Group
Our Consumer group was launched in 2001. Utilizing our VSAT data networking capabilities, we havedeveloped a consumer service that reaches all 50 states, Puerto Rico and parts of Canada. With the advent ofcompeting low-cost cable modem and Digital Subscriber Line (“DSL”) services, we have focused our marketingand sales efforts on the underserved markets that would be less likely to receive terrestrial broadband service.These markets include rural and suburban areas. We deliver broadband internet service with an accompanying setof internet service provider (“ISP”) services such as e-mail and web hosting and offer various service plans toappeal to particular market segments.
The user terminal for our consumer customers consists of a 0.74m or 0.98m antenna and radio transceiverlocated on the roof or side of a home and a satellite modem located indoors near the user’s computer or router.Our third-party contractors install the user terminals for our customers and have developed an extensive set ofbusiness processes and systems to maintain the quality and timeliness of our installations. We use the hubs inGermantown, Maryland and Las Vegas, Nevada to communicate with the consumer terminals. From theselocations, we connect directly to the public internet and host our ISP services. Our network operations center inGermantown, Maryland, manages the delivery of our service and maintains our quality and performance. Thenetwork operations center also provides advanced engineering support to our customer call centers.
Our service package consists of a hardware purchase, as well as a non-cancelable long-term service planwith a monthly service fee that varies depending on the level of service selected and includes the following:
• satellite-based Internet access;
• live technical support that is available 24 hours per day, seven days per week;
• multiple e-mail accounts;
• professional standard installation; and
• a commercial-grade antenna.
We modify our service offerings from time to time to increase our sales and to provide packages that areattractive to our customers. We also offer a deferred hardware purchase plan that allows our customers to deferthe cost of the equipment and installation over a period of up to two years.
Enterprise Group
A VSAT system uses satellite data communication technology to provide broadband connectivity to one ormore fixed locations on the ground. We provide or enable a variety of network equipment and services for usessuch as private networking, intranet and Internet access, voice services, connectivity to suppliers, franchisees andcustomers, credit authorization, inventory management, content delivery and video distribution to enterprises.Our Enterprise group offers complete turnkey solutions to enterprises, including program management,installation, training and support services. We currently serve more than 200 companies, including Fortune 1000companies, which have numerous widely dispersed operating units. Our enterprise customer base includesindustry leaders in the automotive, energy, hospitality, retail and services industries.
We maintain our market leadership position by offering global large enterprises customizable and completeturnkey solutions. Enterprise customers typically enter into non-cancelable contracts with an average duration oftwo to five years. These contracts typically include commitments for specific levels of service and bandwidth, aswell as bundled packages consisting of hardware, services and capacity across our network that are tailored
6

specifically to their needs. In some markets, most notably in North America, we deliver services using not onlysatellite transport platforms, but also using terrestrial transport platforms such as DSL and frame relay.
Our networking capabilities have attracted a strong franchisee customer base that includes large nationalchains. We provide these customers with a complete solution to enhance internal sales activities, develop brand-specific IP credit solutions, build secure branded websites and launch successful sales campaigns.
SPACEWAY
We launched SPACEWAY 3 in August 2007 and introduced service in North America on the SPACEWAYnetwork in April 2008. SPACEWAY 3 was designed and developed as the next generation Ka-band broadbandsatellite system with a unique architecture for broadband data communications. Designed for operationalflexibility, the system greatly enhances data communication and efficiencies for enterprise and consumercustomers with the following capabilities:
• An on-board fast packet switch and processor which enables direct user-to-user communication atbroadband speeds;
• A technologically advanced antenna providing significant frequency re-use with up to 112 uplink spotbeams and 784 downlink spot beams;
• An IP based architecture giving it the capability to integrate seamlessly with terrestrial networks;
• Up to 10 gigabits per second of gross transmission capacity reducing data transport costs relative totoday’s systems; and
• Operation in the Ka-band, a relatively new band open to satellites, is particularly suited for spot beam,frequency reutilization;
We believe that SPACEWAY 3 allows us to offer our North American enterprise and consumer customersfaster communication rates, reduce our operating costs in the future, substantially through the reduction of third-party transponder capacity expenses as we utilize the additional capacity of SPACEWAY 3, and significantlyimprove our margins. However, we have incurred fixed costs associated with the operation of SPACEWAY 3that has reduced and will continue to reduce our earnings until we acquire a sufficient number of customers tooffset those costs.
Our approach to the market for SPACEWAY 3 services can be characterized as follows:
• Significant Expansion in Business from Small and Medium Business (“SMB”) Customers—SPACEWAY 3 delivers a range of cost effective and high quality services, from Internet access tosmall private networks for these customers, many of whom are in locations underserved by terrestrialbroadband technology.
• Expansion of Consumer Customer Base—Since April 2008, when SPACEWAY 3 was placed inservice, the majority of our new consumer customers have been operating over the SPACEWAYnetwork.
• Expansion of Business Offerings with Large Enterprises—Because SPACEWAY supports higher datarates and offers direct user-to-user network connectivity, we are able to offer faster speeds andspecialized services aimed at expanding our offerings to large enterprises, allowing us to compete moreeffectively in the enterprise wide area networking market.
Sales, Marketing and Distribution
Our distribution strategy is designed around a core sales team that has developed an extensive knowledge ofour customers’ needs. For our Equipment and Services group, the market coverage by our direct sales force issupplemented by additional distribution channels, including resellers, retail, and direct marketing, in order to
7

maximize our potential customer base. For our Consumer group, we have an extensive independent nationwideretail distribution network consisting of distributors, dealers, sales agents and major retailers, such as Best Buyand Walmart. Our distribution channels reach across North America. Our distributors recruit and support dealersthroughout the territory in their efforts to sell our services and also coordinate installation of the equipment forall our customers. Our sales and marketing operations are based at our corporate headquarters in Germantown,Maryland. We also maintain other regional sales offices in North America. We will continue to grow our directand indirect marketing and distribution channels through direct mail, television advertising, dealers, sales agentsand value added resellers.
Installation and Technical Support
We rely extensively on a third-party installation network covering all 50 U.S. states, Canada and PuertoRico. Our network of installation teams are trained and certified by us and are required to meet installationguidelines that we monitor. The installation services are managed and tracked on a web-based work ordermanagement system that provides the visibility and accountability to manage a customer’s installation andtrouble resolution. Our installers and service contractors must complete a certification program and their work issubject to quality control audits.
We provide our customers with comprehensive support services, which may include a sales team thatconsists of a program manager, engineers and account team members. We also provide our customers with acustomer care web portal, which allows them to open trouble tickets and track problems or failures from start toresolution. Our maintenance support services are provided by a third-party that has many service sites throughoutthe U.S., including Alaska and Hawaii, Puerto Rico and Canada. These sites are staffed with technicians trainedin accordance with standards that we establish. Additionally, our help desk and network operations centerprovide 24-hour technical support. The customer service representatives at these call centers are also trained inaccordance with standards that we establish. Our call center operations currently utilize both in-house andoutsourced support.
We have engaged several companies to provide call center support for our customers. Such companies areorganized to handle calls from our retail customers regarding service, billing and installation support, and theyprovide deep support to our wholesale customers. These centers are supervised by our customer serviceorganization, and they process most customer calls. We have a staff of technical support personnel that assistthese centers with difficult or unusual problems.
International VSAT Segment
Business Overview
Enterprise Group
We provide satellite communication networks and services to customers worldwide. Our products andservices are particularly well-suited to many of our international markets because of the geographic dispersion ofour customers as well as the lack of local infrastructure. We have also shifted our international focus fromproviding only hardware to also providing shared-hub services, modeled in part on our North Americanenterprise business. Shared-hub services are now available both via our own hubs covering Europe, Brazil,Northern Africa, India and the Middle East and through third-party and joint venture operations.
We lease transponder capacity on satellites from multiple providers for our Enterprise customers. We alsomaintain three hub facilities, located in Griesheim, Germany, New Delhi, India and Sao Paulo, Brazil thatprovide ground support to our international enterprise customers.
8

Our international customers span a wide variety of industries and include state-owned operators as well asprivate businesses. Our service and product offerings in our International Enterprise group are substantiallysimilar to those in our North American Enterprise group. In addition, we have been successful in providingapplication solutions that are especially well-suited to emerging markets. Examples include satellite baseddistance learning and education services in Mexico and India, Internet access centers available to populations inremote areas in India for e-governance and delivery of digitized cinema to movie theaters.
Sales, Marketing and Distribution
Our equipment sales and marketing activities are performed directly through our sales offices in the UnitedStates and other parts of the world. We currently have sales offices in Germantown, Maryland; Miami, Florida;Milton Keynes, United Kingdom; Griesheim, Germany; Rome, Italy; Sao Paulo, Brazil; Mexico City, Mexico;New Delhi, Mumbai and Bangalore in India; Dubai, United Arab Emirates; Moscow, Russia; and Jakarta,Indonesia. In addition, depending on the need, we appoint sales representatives in various countries who arecompensated on a commission basis. In other areas, notably Africa, the Middle East, China, Japan, the RussianFederation, Australia, Indonesia and Malaysia, we provide our infrastructure equipment to independent serviceproviders that in turn provide the satellite communications services to enterprise customers using our equipment.We also pursue dedicated systems sales using a combination of our own sales staff and our sales representativechannels.
We have established subsidiaries in Europe, India and Brazil that provide end-to-end communicationservices to customers in those regions. These subsidiaries are fully staffed with local sales, marketing, support,administrative and management staff. Periodic training is provided to our sales staff and channels throughregional seminars and training sessions at our Germantown, Maryland headquarters.
Installation and Technical Support
Our European, Indian and Brazilian operations provide VSAT installation services for our customersthrough a network of third-party installers, similar to our North American installation operations. In certainlimited circumstances, we provide installation services ourselves. In regions that are not covered by our services,our customers provide their own installation services. In all instances, hub equipment installation services areprovided by our Germantown, Maryland or India installation teams.
We provide hardware and software maintenance services through annual customer assistance centermaintenance agreements. On-site repair of VSATs and maintenance services are provided in Europe, India andBrazil through subcontractors. In other areas, our customers provide their own repair services to the end-users.Our customer assistance center maintenance offerings include a customer assistance center that is operated 24hours per day, 365 days per year, and is available to our customers worldwide, as well as assistance throughregional support centers in India, Europe and Brazil. In addition, an on-line trouble reporting and trackingsystem, functionally similar to our North American counterpart, is made available to our customers around theworld.
Telecom Systems Segment
Business Overview
The Telecom Systems segment consists of the Mobile Satellite Systems group, the Telematics group, andthe Terrestrial Microwave group. We believe our Mobile Satellite Systems, Telematics and TerrestrialMicrowave groups address strategic markets that have significant advantages. None of these groups requiresubstantial operating cash or working capital and all are low fixed-cost operations.
9

Mobile Satellite Systems Group
Our Mobile Satellite Systems group provides turnkey satellite ground segment systems to mobile systemoperators that include Globalstar, Inc. (“Globalstar”), ICO Global Communications Ltd. (“ICO”), Inmarsat plc,SkyTerra, TerreStar Networks, Inc. (“TerreStar”), and Thuraya Satellite Telecommunications Company. As apart of these system solutions, we provide design and development engineering, terminals, Ground Based BeamForming (“GBBF”) equipment, Base Station solutions, Radio Access Networks (“RAN”) and other subsystemsas may be required. These systems provide voice, data and fax services to handheld or transportable terminals.The Mobile Satellite Systems group generally has large, multi-year contracts with its customers.
We will continue to develop and leverage our satellite communication expertise in the Mobile SatelliteSystems group on an opportunistic basis. We also have been actively pursuing a number of opportunities in thearea of hybrid satellite/terrestrial mobile networks. For example, we are currently under contract with SpaceSystems/Loral for development and deployment of GBBF equipment for two different satellite systems and withSkyTerra, TerreStar and ICO for development of satellite base stations. We are also under contract with ICO fordevelopment of a vehicular terminal that offers entertainment and emergency communication services and undercontract with TerreStar for development of a satellite chipset and platform to enable the utilization of handheldterminals. In addition, we have entered into a contract with Globalstar to provide next generation RANs and userterminal chipset. We believe that the Ancillary Terrestrial Component operator business is a growth area of themobile satellite industry as it allows sharing of bandwidth between terrestrial and satellite applications.
The Mobile Satellite Systems group has been and will continue to be a complementary part of our coreVSAT business. Our VSAT technology and engineering teams support our mobile satellite efforts, which in turncontribute to advancing our technology in the VSAT arena with customer funded programs.
Telematics Group
We have expanded our reach into the automotive telematics market, which we believe offers us the potentialfor growth not only in our system design services, but also in the design and manufacturing of user terminalequipment. As part of our telematics business, we entered into an agreement with Hughes Telematics, Inc.(“HTI”), pursuant to which we are developing an overall automotive telematics system for HTI, comprising thetelematics system hub and the Telematics Control Unit (“TCU”), which will serve as the user appliance in thetelematics system. The agreement also provides that, subject to certain specified performance conditions, we willserve as the exclusive supplier of TCUs for some of HTI’s customers.
Terrestrial Microwave Group
We have developed a family of broadband products for point-to-multipoint (“PMP”) microwave radionetwork systems that enable mobile operators to connect their cell sites and fixed operators to provide wirelessbroadband services quickly, cost-effectively and competitively. Our broadband PMP microwave systems havegained a reputation for technical excellence and have been deployed in North America, South America, Europe,Africa, and Asia by well known operators.
Our current contracts require us to either supply equipment along with support services on a turnkey basis,or simply supply equipment to the end customers or our distributors. Typically, contracts range from one to fiveyears for the supply of equipment with corresponding periods for maintenance services. We do not anticipatesignificant expansion in the Terrestrial Microwave group; however, we will continue to assess customeropportunities on a project-by-project basis.
10

Corporate and Other Segment
The Corporate and Other segment consists of ESP, certain minority interest investments held by theCompany, including portfolio investments in Hughes Systique Corporation, Data Synapse, Inc. EdmundsHoldings, Inc., and Mainstream Data, Inc., as well as our corporate offices and assets not related to anotherbusiness segment.
Our Strengths
Our strengths include the following:
Leading Satellite Internet Access Provider to Underserved Rural Consumer Markets in North America—Wefocus our marketing and sales efforts on underserved markets that are less likely to receive terrestrial broadbandservice. We believe that the existing or contemplated terrestrial broadband solutions are not likely to provideaccess to these customers and SMBs in the foreseeable future given the high costs associated with developing aterrestrial network and the lack of population density in some of these markets. Since we are one of the fewsatellite broadband service providers to this market, it represents a significant growth opportunity for us.
Leading Provider of Broadband Satellite Network Services and Systems to the Enterprise Market—Over thelast 20 years, we have shipped more than 1.9 million VSAT terminals to customers in more than 100 countries.We have maintained our leadership position in this market, which has allowed us to leverage our scale andexpertise to offer a broader suite of enhanced managed services to our customers. Our Enterprise customersinclude blue chip companies and leaders in the retail, energy, financial, hospitality, automotive and servicesindustries. Our customers typically have widely dispersed branches spread over a large geographic area, such asgas service stations (Shell International, ExxonMobil Corporation, BP and Chevron Corporation) and retailers(Wal-Mart Stores, Inc., Lowe’s Companies, Inc. and Sears). Service contracts with these enterprises generallyrange from two to five years in duration and historically, we have experienced a high rate of renewals. We alsohave many long term relationships with our customers, some of which exceed 20 years, which have contributedto a significant revenue backlog.
SPACEWAY 3 Provides Significant Additional Capacity and Operating Leverage—SPACEWAY 3 satelliteis one of the most technologically advanced satellite broadband services platforms in our industry, optimized fordata and designed to provide 10 gigabits per second of capacity and subscriber speeds comparable to DSL.SPACEWAY 3 enables us to more effectively offer bandwidth on demand through its dynamic capacityallocation and on board routing capabilities. In addition, SPACEWAY 3 provides us with significant cost savingsby decreasing transponder leasing expenses. We began service on SPACEWAY 3 in April 2008.
Market Leader in Technology and Innovation—We have been a leader in pioneering major advances insatellite data communication technology since we developed the first Ku band VSAT network more than 20years ago. Through our focused research and development efforts, we have developed industry-leading hardwareand software technology that has proven critical to the development of VSAT industry standards. We havedesigned a common platform for all of our existing VSAT products which reduces costs for research anddevelopment, manufacturing, maintenance, customer support and network operations. The common platform alsoallows us to develop solutions for new and different end markets.
Diversified Revenue Stream—We benefit from a geographically diverse revenue stream that consists of amix of services and hardware sales. In 2008, we derived approximately 58% of our global revenues fromproviding services and 42% from hardware sales and leases. We expect service revenues to continue to exceedhardware revenues in the foreseeable future. Within the North America and International VSAT segments, ourrevenues are well diversified across our customer base and not concentrated in a few large customers.
Experienced Senior Management Team and Strong Controlling Private Equity Stockholder—Our seniormanagement team has extensive experience in the satellite communications industry, with an average industry
11

experience of 30 years. We are majority-owned by various investment vehicles that are affiliated with Apollo,which is a leading private equity investment firm with significant expertise in the satellite sector.
Our Business Strategy
Our business strategy is to continue growing our revenue and cash flow generation capability by capitalizingon the increasing demand for consumer satellite broadband and enterprise solutions, while lowering our costs andutilizing our industry expertise and technology leadership. Our strategy includes the following initiatives:
• Continue our focus on being the technology leader and the low cost provider to facilitate our growth;
• Continue to provide high levels of reliable and quality services with a stable enterprise marketcharacterized by long-term contracts that have a high renewal rate providing the base for us to grow;
• Continue to expand our VSAT growth through our Consumer group in the North America VSATsegment and our service companies in the International VSAT segment;
• Expand on the opportunities for growth in the Telecom System segment by extending our reach withour mobile satellite and telematics projects; and
• Lower our transponder leasing costs substantially and significantly improve our margins through theutilization of SPACEWAY 3.
Consistent with this strategy to grow the Company and improve our financial position, we also review ourcompetitive position on an ongoing basis and, from time to time, consider various acquisitions, strategicalliances, and divestitures, which we believe would be beneficial to our business.
Competition
The network communications industry is highly competitive. As a provider of data network products andservices in the United States and internationally, we compete with a large number of telecommunications serviceproviders. This increasingly competitive environment has put pressure on prices and margins. To competeeffectively, we emphasize our network quality, our customization capability, our offering of networks as aturnkey managed service rather than as an equipment sale, our position as a single point of contact for productsand services and our competitive prices.
We have encountered competition in our Enterprise groups from major established carriers such as AT&TCorp., Verizon, Sprint Corporation, British Telecommunications plc, France Télécom, Deutsche Telekom AGand the global consortia of telecom operators and other major carriers, which provide international telephone,private line and private network services using their national telephone networks and those of other carriers.
Our VSAT networks generally have an advantage over terrestrial networks where the network must reachmany locations over large distances, where the customer has a “last mile” or congestion problem that cannot besolved easily with terrestrial facilities and where there is a need for transmission to remote locations or emergingmarkets. By comparison, ground-based facilities (e.g., fiber optic cables) often have an advantage for carryinglarge amounts of bulk traffic between a small numbers of fixed locations. However, because of a customer’sparticular circumstances, the pricing offered by suppliers and the effectiveness of the marketing efforts of thecompeting suppliers also play a key role in this competitive environment.
Our principal competitors in our Enterprise groups for the supply of VSAT satellite networks are GilatSatellite Networks Ltd. (“Gilat”), ViaSat, Inc. (“ViaSat”) and iDirect Technologies (“iDirect”). Unlike Gilat,which offers a full line of VSAT products and services, ViaSat and iDirect only offer VSAT products. Incompeting with Gilat, ViaSat and iDirect, we emphasize particular technological features of our products andservices, our ability to customize networks and perform desired development work, the quality of our customerservice and our willingness to be flexible in structuring arrangements for the customer. We are aware of other
12

emerging competitors that supply networks, equipment and services. We also face competition from resellers andnumerous local companies who purchase equipment and sell services to local customers.
The satellite market currently has two open technology standards for VSAT equipment: (i) Internet Protocolover Satellite (“IPoS”), which is our own standard and is recognized by the European TelecommunicationsStandards Institute (“ETSI”), in Europe, the Telecommunications Industry Association in the United States andthe International Telecommunication Union (“ITU”) and (ii) Digital Video Broadcast-Return Channel bySatellite (“DVB-RCS”), which is also recognized by the ETSI and the ITU. There are several manufacturersproviding and supporting DVB-RCS and some manufacturers are considering providing and supporting IPoS.
We face competition in our Consumer group primarily from telecommunications and other DSL and cableinternet service providers. In addition, other satellite broadband companies, such as WildBlue Communications,Inc. and StarBand Communications Inc., have launched consumer satellite Internet access services that competewith us in North America.
Government Regulation
The provision of telecommunications is highly regulated. We are required to comply with the laws andregulations of, and often obtain approvals from, national and local authorities in connection with most of theservices that we provide. As a provider of communications services in the United States, we are subject to theregulatory authority of the United States, primarily the Federal Communications Commission (“FCC”). We arealso subject to the export control laws and regulations and trade and economic sanctions laws and regulations ofthe United States with respect to the export of telecommunications equipment and services. Certain aspects ofour business are subject to state and local regulation. The FCC has preempted many state and local regulationsthat impair the installation and use of VSATs. However, our business nonetheless may be adversely affected bystate and local regulation, including zoning regulations that impair the ability to install VSATs. In addition, weare subject to regulation by the national communications regulatory authorities of other countries in which we,and under certain circumstances our resellers and distributors, provide service.
Regulation by the FCC
All commercial entities that use radio frequencies to provide communications services in the United Statesare subject to the jurisdiction of the FCC under the Communications Act of 1934, as amended. TheCommunications Act prohibits the operation of certain satellite earth station facilities, such as those operated byus and certain of our customers, except under licenses issued by the FCC. Changes in our FCC-licensed earthstation operations require license modifications that generally must be approved by the FCC in advance. Theearth station licenses we hold are granted for ten to fifteen year terms. The FCC also has granted periodicrequests by us for special temporary authorizations and experimental authorizations to operate new or modifiedfacilities on a temporary basis. The FCC generally renews satellite earth station licenses routinely.
As a provider of telecommunications in the United States, we are presently required to contribute apercentage of our revenues from telecommunications services to universal service support mechanisms thatsubsidize the provision of services to low-income consumers, high-cost areas, schools, libraries and rural healthcare providers. This percentage is set each calendar quarter by the FCC. Current FCC rules permit us to pass thisuniversal service contribution through to our customers.
The FCC also requires broadband Internet access and Internet telephony service providers to comply withthe requirements of the Federal Communications Assistance for Law Enforcement Act (“CALEA”). CALEArequires telecommunications carriers, including satellite-based carriers, to ensure that law enforcement agenciesare able to conduct lawfully-authorized surveillance of users of their services.
13

FCC Licensing of SPACEWAY 3
We currently hold a license issued by the FCC to operate SPACEWAY 3 at 95° West Longitude. We alsohold authorizations through the Office of Communications in the United Kingdom to operate satellites at certainlocations on the geostationary arc, which we may use for SPACEWAY 3 or any future satellite we acquire.
Our spacecraft operations are subject to the licensing jurisdiction of, and conditions imposed by, the FCCand any other government whose ITU filing we use to operate the satellite. Such conditions may include, forexample, that we implement the satellite system in a manner consistent with certain milestones (such as for thesatellite design and construction, ground segment procurement, and launch and implementation of service), thatthe satellite control center be located in national territory, that a license be obtained prior to launching oroperating the satellite or that a license be obtained before interconnecting with the local switched telephonenetwork.
ITU Frequency Registration
The orbital location and frequencies for SPACEWAY 3 and any additional satellites we may acquire in thefuture are subject to the frequency registration and coordination process of the ITU. The ITU Radio Regulationsdefine the international rules and rights for a satellite to use specific radio frequencies at a specific orbitallocation. We have made filings with the ITU for SPACEWAY 3 and other potential satellites.
International Regulation
We must comply with the applicable laws and regulations and, where required, obtain the approval of theregulatory authority of each country in which we, or under certain circumstances our resellers, provide servicesor operate earth stations. The laws and regulatory requirements regulating access to satellite systems vary fromcountry to country. In certain countries, a license is required to provide our services and to operate satellite earthstations. The application procedure can be time-consuming and costly in some countries, and the terms oflicenses vary for different countries. In some countries, there may be restrictions on our ability to interconnectwith the local switched telephone network. In addition, in certain countries, there are limitations on the fees thatcan be charged for the services we provide.
Many countries permit competition in the provision of voice, data or video services, the ownership of theequipment needed to provide telecommunications services and the provision of transponder capacity to thatcountry. We believe that this trend should continue due to commitments by many countries to open their satellitemarkets to competition. In other countries, however, a single entity, often the government-ownedtelecommunications authority, may hold a monopoly on the ownership and operation of telecommunicationsfacilities or on the provision of telecommunications to, from or within the country. In those cases, we may berequired to negotiate for access to service or equipment provided by that monopoly entity, and we may not beable to obtain favorable rates or other terms.
Export Control Requirements and Sanctions Regulations
In the operation of our business, we must comply with all applicable export control and economic sanctionslaws and regulations of the United States and other countries. Applicable United States laws and regulationsinclude the Arms Export Control Act, the International Traffic in Arms Regulations (“ITAR”), the ExportAdministration Regulations and the trade sanctions laws and regulations administered by the United StatesDepartment of the Treasury’s Office of Foreign Assets Control (“OFAC”).
The export of certain hardware, technical data and services relating to satellites to non-United States personsis regulated by the United States Department of State’s Directorate of Defense Trade Controls, under the ITAR.Other items are controlled for export by the United States Department of Commerce’s Bureau of Industry and
14

Security (“BIS”), under the Export Administration Regulations. For example, BIS regulates our export ofequipment for earth stations in ground networks located outside of the United States. In addition, we cannotprovide certain equipment or services to certain countries subject to United States trade sanctions unless we firstobtain the necessary authorizations from OFAC. We are also subject to the Foreign Corrupt Practices Act, thatprohibits payment of bribes or giving anything of value to foreign government officials for the purpose ofobtaining or retaining business or gaining a competitive advantage.
Following a voluntary disclosure by DIRECTV and DTV Networks in June 2004, DIRECTV and DTVNetworks entered into a consent agreement (the “Consent Agreement”) with the U.S. Department of State inJanuary 2005 regarding alleged violations of ITAR relating to exports by us of VSAT technology, primarily toChina. As part of the Consent Agreement, which applies to us, one of our subsidiaries was debarred fromconducting certain international business, although we may seek reinstatement in the future. In addition, we wererequired to enhance our export compliance program to avoid future infractions.
Intellectual Property
We currently rely on a combination of patent, trade secret, copyright and trademark law, together withlicenses, non-disclosure and confidentiality agreements and technical measures, to establish and protectproprietary rights in our products. We hold United States patents covering various aspects of our products andservices, including patents covering technologies that we believe will enable the production of lower cost satelliteterminals and provide for significant acceleration of communication speeds and enhancement of throughput. Byfederal statute, the duration of each of our patents is 20 years from the earliest filing date. In connection with theApril 2005 Transaction, DIRECTV assigned to us a large number of patents and patent applications subject to aroyalty-free, perpetual license-back to DIRECTV and previous licenses or other rights granted in the course ofbusiness or in connection with prior divestitures by DIRECTV. DIRECTV also licensed to us, on a royalty free,perpetual basis, many of the patents originating from DTV Networks that it retained as a result of the April 2005Transaction, and covenanted not to assert or bring claims against us based on any intellectual property owned orcontrolled by DIRECTV and related to our business as of the closing date of the April 2005 Transaction. Inaddition, we have granted licenses to use our trademarks and service-marks to resellers worldwide, and wetypically retain the right to monitor the use of those marks and impose significant restrictions on their use inefforts to ensure a consistent brand identity. We protect our proprietary rights in our software through softwarelicenses that, among other things, require that the software source code be maintained as confidential informationand prohibit any reverse-engineering of that code.
We believe that our patents are important to our business. We also believe that, in some areas, theimprovement of existing products and the development of new products, as well as reliance upon trade secretsand unpatented proprietary know-how, are important in establishing and maintaining a competitive advantage.We believe, to a certain extent, that the value of our products and services are dependent upon our proprietarysoftware, hardware and other technology, remaining “trade secrets” or subject to copyright protection. Generally,we enter into non-disclosure and invention assignment agreements with our employees, subcontractors andcertain customers and other business partners.
Research and Development, Engineering and Manufacturing
We have a skilled and multi-disciplined engineering organization that develops our products and services.Our in-house technological capability includes the complete set of skills required to develop the hardware,software and firmware required in our products and services. In addition to our product development skills, overthe past 30 years, we have pioneered numerous advances in the area of wireless communication techniques andmethodologies. This 30-year history has resulted in the grant of over 500 patents to HNS and its predecessors,and the adoption of HNS’ techniques in numerous communication standards in both satellite and terrestrialsystems. Of these patents, HNS currently owns over 230 patents. The remaining patents are subject to either aroyalty-free perpetual license or a covenant not to assert from DIRECTV.
15

With respect to hardware development, our skill-set includes complex digital designs, radio frequency andintermediate frequency analog designs, advanced application-specific integrated circuit designs and sophisticatedconsumer and system level packaging designs. We also have extensive experience in developing products forhigh-volume, low-cost manufacturing for the consumer industry, including satellite TV set-top receivers and dualmode satellite and cellular handsets.
As a complement to our hardware development, we have developed extensive experience in designingreliable software systems as part of our telecommunication systems and services offerings. For example, ourVSAT product line for the enterprise market supports an extensive range of protocols for data communications.Our software engineers have also developed many large turnkey systems for our customers by designing theoverall solution, implementing the various subsystems, deploying the entire network and user terminals,integrating and verifying the operational system and ultimately training the customers’ technicians and operators.
Our products are designed, manufactured and tested primarily at our facilities in Maryland; however, weoutsource a significant portion of the manufacturing of our products to third-parties. Our manufacturing facilities,together with our third-party arrangements, have sufficient capacity to handle current demand. We continuouslyadjust our capacity based on our production requirements. We also work with third-party vendors for thedevelopment and manufacture of components that are integrated into our products. We develop dual sourcingcapabilities for critical parts when practical and we evaluate outsourced subcontract vendors on a periodic basis.We have implemented a multifaceted strategy focused on meeting customer demand for our products andreducing production costs. Our operations group, together with our research and development group, work withour vendors and subcontractors to reduce development costs and to increase production efficiency in order toobtain components at lower prices.
Subsidiaries
We own a number of subsidiaries and have entered into certain joint ventures, one of which providesmarketing and sales support to sell our VSAT products or to provide related services. A complete list of oursubsidiaries is filed as Exhibit 21.1 to this report.
Environmental
We are subject to various federal, state and local laws relating to the protection of the environment, mostsignificantly the Resource Conservation and Recovery Act (“RCRA”) and the Emergency Planning andCommunity Right-to-Know Act (“EPCRA”). Our Safety, Health and Environmental Affairs department managesour compliance with all applicable federal and state environmental laws and regulations.
Under the RCRA, the Company is considered a small quantity generator. As such, we perform weeklyinspections of any waste storage areas to ensure that their integrity has not been breached and to ensure that thewaste receptacles are intact. We also label all hazardous waste containers with appropriate signage identifyingboth the contents and the date the waste was generated, and we use a third-party waste hauler to transport anddispose of such waste. Hazardous and other waste is manifested and shipped in accordance with EnvironmentalProtection Agency, Department of Transportation and relevant state regulations.
As required by the EPCRA, we file periodic reports with regulators covering four areas: EmergencyPlanning, Emergency Release, Hazardous Chemical Storage and Toxic Chemical Release. We maintain smallquantities of hazardous materials on our premises and, therefore, have relatively modest reporting requirementsunder the EPCRA.
Our environmental compliance costs to date have not been material, and we currently have no reason tobelieve that such costs will become material in the foreseeable future.
16

Employees and Labor Relations
As of December 31, 2008, we had 1,958 employees. Other than 51 of our employees located in Italy andBrazil, none are represented by a union. We believe that our relations with our employees are good.
Generally, our employees are retained on an at-will basis. However, we have entered into employment andnon-competition agreements with our Chief Executive Officer, Chief Financial Officer and each of our ExecutiveVice Presidents. We require all at-will employees to sign at-will employee agreements which contain aconfidentiality agreement and an agreement not to compete with the Company during their employment with usand for a period of two years following the termination of their employment.
Additional Information
The Securities and Exchange Commission (the “SEC”) maintains an internet site (http://www.sec.gov) thatcontains periodic and other reports such as annual, quarterly and current reports on Forms 10-K, 10-Q and 8-K,respectively, as well as proxy and information statements regarding the Company, Hughes Network Systems,LLC and other companies that file electronically with the SEC. Copies of our SEC filings, including our annualreports on Form 10-K, quarterly reports on Form 10-Q, current reports on Form 8-K, and amendments to thosereports filed or furnished pursuant to Section 13(a) or 15(d) of the Exchange Act, are available on our website assoon as reasonably practicable after we electronically file such reports with the SEC. Investors and otherinterested parties can also access these reports at www.hughes.com and follow the link to Investor Relations.
17

Item 1A. Risk Factors
This section should be read carefully considering the risks described below as well as other information anddata included in this report. Any of the following risks could materially and adversely affect our business, resultsof operations and financial condition.
Risks Related to the Nature and Operation of Our Business
The enterprise network communications industry is highly competitive. We may be unsuccessful in competingeffectively against other terrestrial and satellite-based network providers in our Enterprise groups.
We operate in a highly competitive enterprise network communications industry in the sale and lease of ourproducts and services. Our industry is characterized by competitive pressures to provide enhanced functionality forthe same or lower price with each new generation of technology. As the prices of our products decrease, we willneed to sell more products and/or reduce the per-unit costs to improve or maintain our results of operations. OurEnterprise groups face competition from providers of terrestrial-based networks, such as Digital Subscriber Line(“DSL”), cable modem service, Multiprotocol Label Switching and Internet protocol-based virtual private networks,which may have advantages over satellite networks for certain customer applications. Terrestrial-based networks areoffered by telecommunications carriers and other large companies, many of which have substantially greaterfinancial resources and greater name recognition than us.
The costs of a satellite network may exceed those of a terrestrial-based network, especially in areas that haveexperienced significant DSL and cable internet build-out. It may become more difficult for us to compete withterrestrial providers as the number of these areas increase and the cost of their network and hardware servicesdeclines. In addition, government agencies are increasingly considering and implementing subsidies for deploymentof broadband access in underserved areas. Depending on how the particular programs are structured, these subsidiesmay favor, or in some cases be limited to, terrestrial-based services. We also compete for enterprise clients withother satellite network providers, satellite providers that are targeting small and medium businesses and smallerindependent systems integrators on procurement projects. In Asia and Latin America, the build-out of terrestrialnetworks has adversely impacted demand for very small aperture terminal (“VSAT”) services and regulation andinequitable access remain barriers to new business.
The consumer network communications market is highly competitive. We may be unsuccessful in competingeffectively against DSL and cable service providers and other satellite broadband providers in our Consumergroup.
We face competition in our Consumer group primarily from DSL and cable internet service providers. Also,other satellite and wireless broadband companies have launched or are planning the launch of consumer satelliteinternet access services in competition with us in North America. Some of these competitors offer consumerservices and hardware at lower prices than ours. In addition, terrestrial alternatives do not require our externaldish which may limit customer acceptance of our products.
We also may face competition from Hughes Network Systems, LLC’s (“HNS”) former parent, TheDIRECTV Group, Inc. (“DIRECTV”). For a description of this risk, see “—DIRECTV may compete with us incertain sectors and subject to certain conditions.”
18

If we are unable to develop, introduce and market new products, applications and services on a cost effectiveand timely basis, or if we are unable to sell our new products and services to existing and new customers, ourbusiness could be adversely affected.
The network communications market is characterized by rapid technological changes, frequent new productintroductions and evolving industry standards. If we fail to develop new technology or keep pace with significantindustry technological changes, our existing products and technology could be rendered obsolete. Even if wekeep up with technological innovation, we may not meet the demands of the network communications market.For example, our large enterprise customers may only choose to renew services with us at substantially lowerprices or for a decreased level of service. Many of our large enterprise customers have existing networksavailable to them and may opt to find alternatives to our VSAT services or may renew with us solely as a backupnetwork. If we are unable to respond to technological advances on a cost effective and timely basis, or if ourproducts or applications are not accepted by the market, then our business, financial condition and results ofoperations would be adversely affected.
Economic factors may result in reduced demand and pricing pressure on our products and services.
To a certain extent, our business depends on the economic health and willingness of our customers andpotential customers to make and adhere to capital and financial commitments to purchase our products andservices. The U.S. and world economic markets are undergoing a period of slowdown or recession, and the futureeconomic environment may continue to be less favorable than that of recent years. In addition, thetelecommunications industry has been facing significant challenges resulting from excess capacity, newtechnologies and intense price competition. If the conditions in the U.S. and world economic markets continue tobe volatile or deteriorate further or if the telecommunications industry experiences future weaknesses, we couldexperience reduced demand for, and pricing pressure on, our products and services, which could lead to areduction in our revenues and adversely affect our business, financial condition and results of operations.
We face risks associated with our SPACEWAYTM 3 satellite.
If we are unable to continue to operate SPACEWAY 3 as a result of any of the following risks, we will beunable to realize the anticipated benefits from SPACEWAY 3, and our business, financial condition and resultsof operations could be adversely affected:
• Business plan—Our SPACEWAY business plan may be unsuccessful, and we may not be able toachieve the cost savings that we expect from SPACEWAY 3. A failure to attract a sufficient number ofcustomers would result in our inability to realize the cost savings that we expect to achieve from theanticipated lower costs of bandwidth associated with the capacity of SPACEWAY 3. In addition, wewill continue to incur start-up losses associated with the launch and operation of SPACEWAY 3 untilwe acquire a sufficient number of customers.
• Regulatory license risk—SPACEWAY 3 is primarily intended to provide services to North America.The SPACEWAY 3 spacecraft operations are subject to compliance with the licensing conditions ofthe United States Federal Communications Commission (“FCC”) and those of any other governmentwhose International Telecommunication Union filing we may use to operate SPACEWAY 3 in thefuture. Satellite authorizations granted by the FCC or foreign regulatory agencies are typically subjectto conditions imposed by such regulatory agency in addition to such agency’s general authority tomodify, cancel or revoke those authorization. Failure to comply with such requirements, or comply in atimely manner could lead to the loss of authorizations and could have an adverse effect on ourbusiness, financial condition and results of operations.
• In-orbit risks—SPACEWAY 3 is subject to similar potential satellite failures or performancedegradations as other satellites. In-orbit risks similar to those described below under “—Satellitefailures or degradations in satellite performance could affect our business, financial condition andresults of operations” apply to SPACEWAY 3. To the extent there is an anomaly or other in-orbit
19

failure with respect to SPACEWAY 3, we do not currently have a replacement satellite or backuptransponder capacity and would have to identify and lease alternative transponder capacity that may notbe available on economic terms or at all. Additionally, we could be required to reposition the antennasof our customers, which would entail significant cost and could require new or modified licenses fromregulatory authorities.
• Insurance—The price, terms and availability of satellite insurance can fluctuate significantly. Thesepolicies may not continue to be available on commercially reasonable terms or at all. In addition tohigher premiums, insurance policies may provide for higher deductibles, shorter coverage periods andpolicy exclusions related to satellite health.
• Novel design—SPACEWAY 3 employs a complex and novel design intended for higher-speed datarates and greater bandwidth per network site. If the enhanced features of the satellite design do notfunction to their specifications, we may not be able to offer the functionality or throughput oftransmission service that we expect for SPACEWAY 3.
Satellite failures or degradations in satellite performance could affect our business, financial condition andresults of operations.
For most of our customers, we lease satellite transponder capacity from fixed satellite service (“FSS”)providers in order to send and receive data communications to and from our VSAT networks. Beginning onApril 3, 2008, we also began providing capacity on our SPACEWAY 3 satellite. Satellites are subject to in-orbitrisks including malfunctions, commonly referred to as anomalies, and collisions with meteoroids,decommissioned spacecraft or other space debris. Anomalies occur as a result of various factors, such as satellitemanufacturing errors, problems with the power systems or control systems of the satellites and general failuresresulting from operating satellites in the harsh space environment.
For risks associated with anomalies affecting SPACEWAY 3, see “—We face risks associated with ourSPACEWAY 3 satellite.” Any single anomaly or series of anomalies affecting the satellites on which we leasetransponder capacity could materially adversely affect our operations and revenues and our relationships withcurrent customers, as well as our ability to attract new customers for our satellite services. Anomalies may alsoreduce the expected useful life of a satellite, thereby creating additional expenses due to the need to providereplacement or backup capacity and potentially reduce revenues if service is interrupted on the satellites weutilize. We may not be able to obtain backup capacity at similar prices, or at all. In addition, an increasedfrequency of anomalies could impact market acceptance of our services.
Any failure on our part to perform our VSAT service contracts or provide satellite broadband access as aresult of satellite failures could result in: (i) a loss of revenue despite continued obligations under our leasingarrangements; (ii) possible cancellation of our long-term contracts; (iii) inability to continue with oursubscription-based customers; (iv) incurring additional expenses to reposition customer antennas to alternativesatellites; and (v) damaging our reputation, which could negatively affect our ability to retain existing customersor to gain new business. The cancellation of long-term contracts due to service disruptions is an exception to thegenerally non-cancelable nature of our contracts, and such cancellation would reduce our revenue backlogdescribed in this report. See “—The failure to adequately anticipate the need for transponder capacity or theinability to obtain transponder capacity could harm our results of operations.”
Our networks and those of our third-party service providers may be vulnerable to security risks.
We expect the secure transmission of confidential information over public networks to continue to be acritical element of our operations. Our networks and those of our third-party service providers and our customersmay be vulnerable to unauthorized access, computer viruses and other security problems. Persons whocircumvent security measures could wrongfully obtain or use information on the network or cause interruptions,delays or malfunctions in our operations, any of which could have a material adverse effect on our business,
20

financial condition and results of operations. We may be required to expend significant resources to protectagainst the threat of security breaches or to alleviate problems, including reputational harm and litigation, causedby any breaches. In addition, our customer contracts, in general, do not contain provisions which would protectus against liability to third-parties with whom our customers conduct business. Although we have implementedand intend to continue to implement industry-standard security measures, these measures may prove to beinadequate and result in system failures and delays that could lower network operations center availability andhave a material adverse effect on our business, financial condition and results of operations.
DIRECTV may compete with HNS in certain sectors and subject to certain conditions.
While HNS has entered into a non-competition agreement with DIRECTV in connection with its separationfrom DIRECTV in 2005, DIRECTV has retained the right to compete with HNS in selling data services toconsumers at all times and may compete with HNS in all areas after the five-year term of the non-competitionagreement which commenced on April 22, 2005. In addition, while the non-competition agreement restrictsDIRECTV from using the advanced on-board processing capabilities of its two SPACEWAY satellites for dataservice offerings that would directly compete with HNS, DIRECTV is not limited in such use if the videocapability of its SPACEWAY satellites does not remain capable of commercial operations. Moreover, DIRECTVis not restricted from competing with HNS’ business if such data services are incidental to DIRECTV’s provisionof a video service to an enterprise customer and are an integral part of such video service or are available as anoptional add-on to such video service. In any event, DIRECTV may compete with HNS after thenon-competition agreement expires on April 22, 2010.
We are dependent upon suppliers of components, manufacturing outsourcing, installation, and customerservice, and our results of operations may be materially affected if any of these third-party providers fail toappropriately deliver the contracted goods or services.
We are dependent upon third-party services and products provided to us, including the following:
• Components—A limited number of suppliers manufacture some of the key components required tobuild our VSATs. These key components may not be continually available and we may not be able toforecast our component requirements sufficiently in advance, which may have a detrimental effect onsupply. If we are required to change suppliers for any reason, we would experience a delay inmanufacturing our products if another supplier is not able to meet our requirements on a timely basis.In addition, if we are unable to obtain the necessary volumes of components on favorable terms orprices on a timely basis, we may be unable to produce our products at competitive prices and we maybe unable to satisfy demand from our customers. All of our products contain components whose baseraw materials have undergone dramatic cost fluctuations in the last 24 months. Fluctuations in pricingof raw materials have the ability to affect our product costs. Although we have been successful inoffsetting or mitigating our exposure to these fluctuations, such changes could have an adverse impacton our product costs.
• Manufacturing outsourcing—While we develop and manufacture prototypes for our products, we usecontract manufacturers to produce a significant portion of our hardware. If these contractmanufacturers fail to provide products that meet our specifications in a timely manner, then ourcustomer relationships may be harmed.
• Installation and customer support service—Each of our North American and international operationsutilize a network of third-party installers to deploy our hardware. In addition, a portion of our customersupport and management is provided by offshore call centers. Since we provide customized services forour customers that are essential to their operations, a decline in levels of service or attention to theneeds of our customers or the occurrence of negligent and careless acts could adversely affect ourreputation, renewal rates and ability to win new business.
21

The failure to adequately anticipate the need for transponder capacity or the inability to obtain transpondercapacity could harm our results of operations.
We have made substantial contractual commitments for transponder capacity based on our existingcustomer contracts and backlog, as well as anticipated future business, to the extent our existing customers arenot expected to utilize our SPACEWAY 3 satellite. If future demand does not meet our expectations, we will becommitted to maintain excess transponder capacity for which we will have no or insufficient revenues to coverour costs, which would have a negative impact on our margins and results of operations. Our transponder leasesare generally for two to five years, and different leases cover satellites with coverage of different geographicalareas or support different applications and features, so we may not be able to quickly or easily adjust our capacityto changes in demand. If we only purchase transponder capacity based on existing contracts and bookings,capacity for certain types of coverage in the future that cannot be readily served by SPACEWAY 3 may beunavailable to us and we may not be able to satisfy certain needs of our customers, which could result in a loss ofpossible new business and could negatively impact the margins earned for those services. At present, until thelaunch and operation of additional satellites, there is limited availability of capacity on the Ku-band frequenciesin North America. In addition, the FSS industry has seen consolidation in the past decade, and today, the threemain FSS providers in North America and a number of smaller regional providers own and operate the currentsatellites that are available for our capacity needs. The failure of any of these FSS providers or a downturn intheir industry as a whole could reduce or interrupt the Ku-band capacity available to us. If we are not able torenew our capacity leases at economically viable rates, or if capacity is not available due to any problems of theFSS providers, our business and results of operations would be adversely affected, to the extent SPACEWAY isunable to satisfy the associated demand.
If our products contain defects, we could be subject to significant costs to correct such defects and our productand network service contracts could be delayed or cancelled, which could expose us to significant liability andadversely affect our revenues.
The products and the networks we deploy are highly complex, and some may contain defects when firstintroduced or when new versions or enhancements are released, despite extensive testing and our quality controlprocedures. In addition, many of our products and network services are designed to interface with our customers’existing networks, each of which has different specifications and utilize multiple protocol standards. Ourproducts and services must interoperate with the other products and services within our customers’ networks, aswell as with future products and services that might be added to these networks, to meet our customers’requirements. Further, in the consumer market, our products are usually installed in residential and otherlocations where there might be a higher likelihood of product liability claims relating to improper or unsafeproducts or installations. The occurrence of any defects, errors or failures in our products or network servicescould result in: (i) additional costs to correct such defects; (ii) cancellation of orders; (iii) a reduction in revenuebacklog; (iv) product returns or recalls; (v) diversion of our resources; (vi) legal actions by our customers or ourcustomers’ end users, including for damages caused by a defective product; and (vii) the issuance of credits tocustomers and other losses to us, our customers or end users. Any of these occurrences could also result in theloss of or delay in market acceptance of our products and services and loss of sales, which would harm ourreputation and our business and adversely affect our revenues and profitability. In addition, our insurance wouldnot cover the cost of correcting significant errors, defects, or security problems.
Our failure to develop, obtain or protect our intellectual property rights could adversely affect our futureperformance and growth.
We rely on a combination of United States and foreign patent, trademark, copyright and trade secret laws aswell as licenses, nondisclosure, confidentiality and other contractual agreements or restrictions to protect ourproprietary rights to the technologies and inventions used in our services and products, including proprietaryVSAT technology and related services and products. We have registered trademarks and patents and havepending trademark and patent applications in the United States and a number of foreign countries. However, our
22

patent and trademark applications may not be allowed by the applicable governmental authorities to issue aspatents or register as trademarks at all, or in a form that will be advantageous to us. In addition, in someinstances, we may not have registered important patent and trademark rights in these and other countries. If wefail to timely file a patent application in any such country, we may be precluded from doing so at a later date. Inaddition, the laws of some countries do not protect and do not allow us to enforce our proprietary rights to thesame extent as do the laws of the United States. Accordingly, we might not be able to protect our proprietaryproducts and technologies against unauthorized third-party copying or use, which could negatively affect ourcompetitive position.
Furthermore, our intellectual property may prove inadequate to protect our proprietary rights, may beinfringed or misappropriated by others, or may diminish in value over time. Our competitors may be able tofreely make use of our patented technology after our patents expire, or may challenge the validity, enforceabilityor scope of our patents, trademarks or trade secrets. Competitors also may independently develop products orservices that are substantially equivalent or superior to our technology. In addition, it may be possible for third-parties to reverse-engineer, otherwise obtain, copy and use information that we regard as proprietary. If we areunable to protect our services and products through the enforcement of our intellectual property rights, our abilityto compete based on our current market advantages may be harmed.
We also rely on unpatented proprietary technology. To protect our trade secrets and other proprietaryinformation, we require employees, consultants, advisors and collaborators to enter into confidentialityagreements. These agreements may not provide meaningful protection for our trade secrets, know-how or otherproprietary information in the event of any unauthorized use, misappropriation or disclosure of such tradesecrets, know-how or other proprietary information. If we fail to prevent substantial unauthorized access to ourtrade secrets, we risk the loss of those intellectual property rights and whatever competitive advantage theyprovide us.
Claims that our services and products infringe the intellectual property rights of others could increase ourcosts and reduce our sales, which would adversely affect our revenue.
We have received, and may in the future receive, communications from third-parties claiming that we or ourproducts infringe upon the intellectual property rights of third-parties. In addition, we may be named in the futureas a defendant in lawsuits claiming that our services or products infringe upon the intellectual property rights ofthird-parties. Litigation may be necessary to determine the validity and scope of third-party rights or to defendagainst claims of infringement. Litigation may also be necessary to enforce our intellectual property rights or todefend against claims that our intellectual property rights are invalid or unenforceable. Such litigation, regardlessof the outcome, could result in substantial costs and diversion of resources, including time and attention ofmanagement and other key personnel, and could have a material adverse effect on our business, financialcondition and results of operations. We expect to be increasingly subject to such claims as the number ofproducts and competitors in our industry grows.
We may not be aware of all intellectual property rights that our services or products may potentiallyinfringe. Further, without lengthy litigation, it may not be possible to determine definitively whether a claim ofinfringement is valid. We cannot estimate the extent to which we may be required in the future to obtainintellectual property licenses or the availability and cost of any such licenses. Those costs, and their impact onour earnings, could be material. Damages in patent infringement cases may also include treble damages in certaincircumstances. If a third-party holds intellectual property rights, it may not allow us to use our intellectualproperty at any price, or on terms acceptable to us, which could materially adversely affect our competitiveposition. To the extent that we are required to pay royalties to third-parties to whom we are not currently makingpayments, these increased costs of doing business could materially adversely affect our results of operations. Inaddition, under some of our agreements with customers, we are not permitted to use all or some of theintellectual property developed for that customer for other customers, and in other cases, we have agreed not toprovide similar services to such customers’ competitors. Further, our service agreements with our customers
23

generally provide that we will defend and indemnify them for claims against them relating to our allegedinfringement of third-party intellectual property rights with respect to services and products we provide. Third-parties may assert infringement claims against our customers. These claims may require us to initiate or defendprotracted and costly litigation on behalf of our customers, regardless of the merits of these claims. If any ofthese claims succeed, we may be forced to pay damages on behalf of our customers or may be required to obtainlicenses for the products they use. If we cannot obtain all necessary licenses on commercially reasonably terms,our customers may be forced to stop using our products.
In addition, our patents, trademarks and other proprietary rights may be subject to various attacks claimingthey are invalid or unenforceable. These attacks might invalidate, render unenforceable or otherwise limit thescope of the protection that our patents, trademarks and other rights afford us. If we lose the use of a productname or brand name, our efforts spent on building that brand may be lost, and we will have to rebuild a brand forthat product, which we may or may not be able to do, and which would cause us to incur new costs in connectionwith building such brand name. If we are involved in a patent infringement suit, even if we prevail, there is noassurance that third-parties will not be able to design around our patents, which could harm our competitiveposition.
If we are unable to license technology from third-parties on satisfactory terms, our developmental costs couldincrease and we may not be able to deploy our services and products in a timely manner.
We depend, in part, on technology that we license from third-parties on a non-exclusive basis and integrateinto our products and service offerings. Licenses for third-party technology that we use in our current productsmay be terminated or not renewed, and we may be unable to license third-party technology necessary for suchproducts in the future. Furthermore, we may be unable to renegotiate acceptable third-party license terms toreflect changes in our pricing models. Changes to or the loss of a third-party license could lead to an increase inthe costs of licensing or inoperability of products or network services. In addition, technology licensed fromthird-parties may have undetected errors that impair the functionality or prevent the successful integration of ourproducts or services. As a result of any such changes or loss, we may need to incur additional development coststo ensure continued performance of our products or suffer delays until replacement technology, if available, canbe obtained and integrated.
We are majority-owned by various investment vehicles affiliated with Apollo Management, L.P. (together withits affiliates, “Apollo”) and Apollo’s interests as an equity holder may conflict with those of the holders ofHNS’ 91⁄2% senior notes (the “Senior Notes”) or with the other equity holders of the Company.
At December 31, 2008, Apollo owned in the aggregate 12,408,611 shares, or approximately 57.7%, of ourissued and outstanding common stock. Therefore, Apollo has control over our management and policies, such asthe election of our directors, the appointment of new management and the approval of any other action requiringthe approval of our stockholders, including any amendments to our certificate of incorporation and mergers orsales of all or substantially all of our assets. The interests of Apollo may not in all cases be aligned with those ofthe holders of the Senior Notes or those of the other holders of our common stock. In addition, the level ofApollo’s ownership of our common stock could have the effect of discouraging or impeding an unsolicitedacquisition proposal. Furthermore, Apollo may, in the future, own businesses that directly or indirectly competewith us. Apollo may also pursue acquisition opportunities that may be complementary to our business, and as aresult, those acquisition opportunities may not be available to us. Subject to limitations contained in HNS’limited liability company agreement, the indenture governing the Senior Notes, HNS’ $50.0 million revolvingcredit facility (the “Revolving Credit Facility”) and HNS’ $115.0 million term loan facility (the “Term LoanFacility”) regarding affiliate transactions, Apollo may cause the Company or HNS to enter into transactions withtheir affiliates to buy or sell assets.
24

We are a holding company and the inability of our subsidiaries to pay distributions or dividends or transferfunds or other assets to us would harm our ability to pay future dividends.
We are a holding company and our principal assets are membership interests of HNS and cash. Although wedo not currently intend to pay dividends on our shares of common stock for the foreseeable future (See “—RisksRelating to our Common Stock”), in the event that we choose to pay dividends, we would be primarily reliant ondistributions or dividends from our subsidiaries to pay such dividends. The ability of HNS to pay us distributionsor transfer funds or other assets is subject to the terms of HNS’ debt agreements which contain covenants which,among other things, limit the ability of HNS and certain of its subsidiaries to pay dividends or distributions orredeem or repurchase capital stock. Such limitations could harm our ability to pay future dividends, if any.
Our future success depends on our ability to retain our key employees.
We are dependent on the services of HNS’ and our senior management team to remain competitive in ourindustry. The loss of one or more members of HNS’ or our senior management team could have an adverse effecton us until qualified replacements are found. We may not be able to quickly replace these individuals withpersons of equal experience and capabilities. In addition, technological innovation depends, to a significantextent, on the work of technically skilled employees. Competition for executive, managerial and skilledpersonnel in our industry is intense. We expect to face continued increases in compensation costs in order toattract and retain senior executives, managers and skilled employees, especially if the current job economyimproves. We may not be able to retain our existing senior management, fill new positions or vacancies createdby expansion or turnover or attract or retain the management and personnel necessary to develop and market ourproducts. We do not maintain key man life insurance on any of these individuals.
Risks Related to the Regulation of Our Business
We may face difficulties in obtaining regulatory approvals for our provision of telecommunications services,and we may face changes in regulation, each of which could adversely affect our operations.
In a number of countries where we operate, the provision of telecommunications services is highlyregulated. In such countries, we are required to obtain approvals from national and local authorities in connectionwith most of the services that we provide. In many jurisdictions, we must maintain such approvals throughcompliance with license conditions or payment of annual regulatory fees.
While the governmental authorizations for our current business generally have not been difficult to obtain ina timely manner, the need to obtain particular authorizations in the future may delay our provision of current andnew services. Moreover, the imposition by a governmental entity of conditions on our authorizations, or thefailure to obtain authorizations necessary to launch and operate satellites or provide satellite service, could have amaterial adverse effect on our ability to generate revenue and conduct our business as currently planned.Violations of laws or regulations may result in various sanctions including fines, loss of authorizations and thedenial of applications for new authorizations or for the renewal of existing authorizations.
Future changes to the regulations under which we operate could make it difficult for us to obtain or maintainauthorizations, increase our costs or make it easier or less expensive for our competitors to compete with us.
We may face difficulties in accurately assessing and collecting contributions towards the Universal ServiceFund.
As a provider of telecommunications in the United States, we are presently required to contribute apercentage of our revenues from telecommunications services to universal service support mechanisms thatsubsidize the provision of services to low-income consumers, high-cost areas, schools, libraries and rural healthcare providers. This percentage is set each calendar quarter by the FCC. Current FCC rules permit us to pass thisuniversal service contribution onto our customers.
25

Because our customer contracts often include both telecommunications services, which create such supportobligations, and other goods and services, which do not, it can be difficult to determine which portion of ourrevenues forms the basis for this contribution and the amount that we can recover from our customers. If theFCC, which oversees the support mechanisms, or a court or other governmental entity were to determine that wecomputed our contribution obligation incorrectly or passed the wrong amount onto our customers, we couldbecome subject to additional assessments, liabilities, or other financial penalties. In addition, the FCC isconsidering substantial changes to its universal service contribution rules, and these changes could impact ourfuture contribution obligations and those of third-parties that provide communication services to our business.Any such change to the universal service contribution rules could adversely affect our costs of providing serviceto our customers.
Our international sales and operations are subject to applicable laws relating to trade, export controls andforeign corrupt practices, the violation of which could adversely affect our operations.
We must comply with all applicable export control laws and regulations of the United States and othercountries. United States laws and regulations applicable to us include the Arms Export Control Act, theInternational Traffic in Arms Regulations (“ITAR”), the Export Administration Regulations (“EAR”) and thetrade sanctions laws and regulations administered by the United States Department of the Treasury’s Office ofForeign Assets Control (“OFAC”). The export of certain satellite hardware, services and technical data relating tosatellites is regulated by the United States Department of State’s Directorate of Defense Trade Controls underITAR. Other items are controlled for export by the United States Department of Commerce’s Bureau of Industryand Security under the EAR. We cannot provide services to certain countries subject to United States tradesanctions unless we first obtain the necessary authorizations from OFAC. In addition, we are subject to theForeign Corrupt Practices Act, that, generally, bars bribes or unreasonable gifts to foreign governments orofficials. See “Item 1. Business—Government Regulation.”
Following a voluntary disclosure by DIRECTV and DTV Network Systems, Inc. (“DTV Networks”) in June2004, DIRECTV and DTV Networks entered into a consent agreement with the U.S. Department of State inJanuary 2005 regarding alleged violations of the ITAR relating to exports by HNS of VSAT technology,primarily to China. Under the consent agreement, which applies to HNS, DIRECTV agreed to pay a $4.0 millionfine over a period of three years and HNS was required to establish and maintain an external special complianceofficial for a period of three years. The external special compliance official was an independent contractor withauthority to oversee matters relating to compliance with the ITAR. Pursuant to the consent agreement, the three-year term of the external special compliance official ended in January 2008 whereupon we appointed an internalspecial compliance official who has the authority to oversee matters relating to compliance with ITAR for aperiod of two years from January 2008 to January 2010. HNS has satisfied the requirement in the consentagreement that it spend $1.0 million over a period of three years for certain enhanced remedial compliancemeasures. As part of the consent agreement, one of HNS’ subsidiaries in China was debarred from conductingcertain international business, although HNS may seek reinstatement in the future. The January 2005 consentagreement supplemented another consent agreement of DIRECTV in March 2003, which applies to HNS andarose out of separate violations of ITAR in which HNS was a named party.
Violations of these laws or regulations could result in significant additional sanctions including fines, moreonerous compliance requirements, more extensive debarments from export privileges or loss of authorizationsneeded to conduct aspects of our international business. A future violation of ITAR or the other regulationsenumerated above could materially adversely affect our business, financial condition and results of operations.
Our foreign operations expose us to regulatory risks and restrictions not present in our domestic operations.
Our operations outside the United States accounted for approximately 25.9% of our revenues for the yearended December 31, 2008, and we expect our foreign operations to continue to represent a significant portion ofour business. We have operations in Brazil, Germany, India, Indonesia, Italy, Mexico, the Russian Federation,
26

South Africa, the United Arab Emirates and the United Kingdom, among other nations. Over the last 20 years,we have sold products in over 100 countries. Our foreign operations involve varying degrees of risks anduncertainties inherent in doing business abroad. Such risks include:
• Complications in complying with restrictions on foreign ownership and investment and limitations onrepatriation—We may not be permitted to own our operations in some countries and may have to enterinto partnership or joint venture relationships. Many foreign legal regimes restrict our repatriation ofearnings to the United States from our subsidiaries and joint venture entities. We may also be limited inour ability to distribute or access our assets by the governing documents pertaining to such entities. Insuch event, we will not have access to the cash flow and assets of our joint ventures.
• Difficulties in following a variety of foreign laws and regulations, such as those relating to datacontent retention, privacy and employee welfare—Our international operations are subject to the lawsof many different jurisdictions that may differ significantly from United States law. For example, localpolitical or intellectual property law may hold us responsible for the data that is transmitted over ournetwork by our clients. Also, other nations have more stringent employee welfare laws that guaranteeperquisites that we must offer. Compliance with these laws may lead to increased operations costs, lossof business opportunities or violations that result in fines or other penalties.
• We face significant competition in our international markets—Outside North America, we havetraditionally competed for VSAT hardware and services sales primarily in Europe, Brazil and India andfocused only on hardware sales in other regions. In Europe, we face intense competition which is notexpected to abate in the near future.
• Changes in exchange rates between foreign currencies and the United States dollar—We conduct ourbusiness and incur costs in the local currency of a number of the countries in which we operate.Accordingly, our results of operations are reported in the relevant local currency and then translated toUnited States dollars at the applicable currency exchange rate for inclusion in our financial statements.Because our foreign subsidiaries and joint ventures operate in foreign currencies, fluctuations incurrency exchange rates have affected, and may in the future affect, the value of profits earned oninternational sales. In addition, we sell our products and services and acquire supplies and componentsfrom countries that historically have been, and may continue to be, susceptible to recessions orcurrency devaluation.
• Greater exposure to the possibility of economic instability, the disruption of operations from labor andpolitical disturbances, expropriation or war—As we conduct operations throughout the world, wecould be subject to regional or national economic downturns or instability, labor or politicaldisturbances or conflicts of various sizes. Any of these disruptions could detrimentally affect our salesin the affected region or country or lead to damage to, or expropriation of, its property or danger to ourpersonnel.
• Competition with large or state-owned enterprises and/or regulations that effectively limit ouroperations and favor local competitors—Many of the countries in which we conduct business havetraditionally had state owned or state granted monopolies on telecommunications services that favor anincumbent service provider. We face competition from these favored and entrenched companies incountries that have not deregulated. The slower pace of deregulation in these countries, particularly inAsia and Latin America, has adversely affected the growth of our business in these regions.
• Customer credit risks—Customer credit risks are exacerbated in foreign operations because there isoften little information available about the credit histories of customers in the foreign countries inwhich we operate.
27

Risks Related to HNS’ Indebtedness
HNS’ high level of indebtedness could adversely affect its ability to raise additional capital to fund HNS’operations and could limit its ability to react to changes in the economy or its industry and prevent HNS frommeeting its obligations.
HNS is significantly leveraged. The following table shows HNS’ level of indebtedness as of December 31,2008 (in thousands):
December 31,2008
Senior notes . . . . . . . . . . . . . . . . . . . . . . . . . . . . . . . . . . . . . . . . . . . . . . . . . . . . . . . . . $ 450,000Term loans . . . . . . . . . . . . . . . . . . . . . . . . . . . . . . . . . . . . . . . . . . . . . . . . . . . . . . . . . . 115,206VSAT hardware financing . . . . . . . . . . . . . . . . . . . . . . . . . . . . . . . . . . . . . . . . . . . . . . 12,902Revolving bank borrowings . . . . . . . . . . . . . . . . . . . . . . . . . . . . . . . . . . . . . . . . . . . . . 2,432Capital lease . . . . . . . . . . . . . . . . . . . . . . . . . . . . . . . . . . . . . . . . . . . . . . . . . . . . . . . . . 6,010
Total debt . . . . . . . . . . . . . . . . . . . . . . . . . . . . . . . . . . . . . . . . . . . . . . . . . . . . . . . $ 586,550
HNS’ substantial degree of leverage could have important consequences, including the following:
• it may limit HNS’ ability to obtain additional debt or equity financing for working capital, capitalexpenditures, debt service requirements, acquisitions and general corporate or other purposes;
• a substantial portion of HNS’ cash flows from operations will be dedicated to the payment of principaland interest on its indebtedness and will not be available for other purposes, including its operations,capital expenditures, investments in new technologies and future business opportunities;
• HNS’ Term Loan Facility, its Revolving Credit Facility and certain of its unsecured term loans are at avariable rate of interest, exposing HNS to the risk of increased interest rates, except for instances whereHNS has entered into interest rate swap agreements;
• it may limit HNS’ ability to adjust to changing market conditions and place HNS at a competitivedisadvantage compared to its competitors that have less debt or more financial resources; and
• HNS may be vulnerable in a downturn in general economic condition or in its business, or HNS may beunable to carry out capital spending that is important to its growth.
HNS may not be able to generate cash to meet its debt service needs.
HNS’ ability to make payments on or to refinance its indebtedness will depend on HNS’ ability to generatecash in the future, which is subject in part to general economic, financial, competitive, legislative, regulatory andother factors that are beyond its control. If HNS does not generate sufficient cash flow from operations or futureborrowings are not available to HNS, HNS may not be able to service its indebtedness.
If HNS cannot make scheduled payments on its debt, HNS will be in default and, as a result:
• its debt holders could declare all outstanding principal and interest to be due and payable;
• the lenders under its Revolving Credit Facility could terminate their commitments to loan HNS moneyand foreclose against the assets securing their borrowings; and
• we could lose our equity investment in HNS, which equity interests have been pledged by us to thelenders under HNS’ Revolving Credit Facility.
28

Covenants in HNS’ debt agreements restrict our business in many ways.
The indenture governing the Senior Notes and the credit agreement governing the Term Loan Facilitycontain various covenants that limit HNS’ ability and/or its restricted subsidiaries’ ability to, among other things:
• incur, assume or guarantee additional indebtedness;
• issue redeemable stock and preferred stock;
• incur liens;
• pay dividends or distributions or redeem or repurchase capital stock;
• prepay, redeem or repurchase debt;
• make loans and investments;
• enter into agreements that restrict distributions from its subsidiaries;
• sell assets and capital stock of its subsidiaries;
• enter into certain transactions with its affiliates;
• consolidate or merge with or into, or sell substantially all of its assets to, another person; and
• enter into new lines of business.
In addition, HNS’ Revolving Credit Facility contains restrictive covenants. A breach of any of the covenantsunder the indenture, the Revolving Credit Facility or the Term Loan Facility could result in a default under HNS’Revolving Credit Facility and/or the Senior Notes and/or the Term Loan Facility. Upon an event of default underHNS’ Revolving Credit Facility, the lenders could elect to declare all amounts outstanding under its RevolvingCredit Facility to be immediately due and payable and terminate all commitments to extend further credit. IfHNS is unable to repay those amounts, the lenders under HNS’ Revolving Credit Facility could proceed againstthe collateral that secures that indebtedness. HNS has pledged a significant portion of its assets as collateralunder its Revolving Credit Facility.
Risks Related to the Distribution and Separation from SkyTerra Communications, Inc.
We may incur significant liability to SkyTerra Communications, Inc. (“SkyTerra”) pursuant to theindemnification provisions of the separation agreement.
We and SkyTerra have entered into a separation agreement (the “Separation Agreement”) that affected thetransfer, by way of contribution from SkyTerra to us, of the assets related to our business, and the assumption byus of certain liabilities. The Separation Agreement and certain related agreements govern, among other things,certain of the ongoing relations between us and SkyTerra following the distribution by SkyTerra of all of ourcommon stock to SkyTerra’s common stockholders (the “Distribution”). The Separation Agreement provides thatwe will indemnify SkyTerra and its affiliates against potential losses based on, arising out of or resulting from,among other things:
• the ownership or the operation of the assets or properties transferred to us under the SeparationAgreement, and the operation or conduct of the business of, including contracts entered into and anyactivities engaged in by, us, whether in the past or future;
• any other activities we engage in;
• any guaranty or keep well of or by SkyTerra provided to any parties with respect to any of our actual orcontingent obligations;
• any breach by us of the Separation Agreement or any other agreement between us and SkyTerra; or
• any failure by us to honor any of the liabilities assumed by us under the Separation Agreement.
29

We may incur significant liability to SkyTerra pursuant to the provisions of the tax sharing agreement.
The tax sharing agreement governs the allocation between us and SkyTerra of tax liabilities and related taxmatters, such as the preparation and filing of tax returns and tax contests, for all taxable periods. We willgenerally be responsible for, and indemnify SkyTerra and its subsidiaries against, all tax liabilities imposed on orattributable to:
• the Company and any of its subsidiaries relating to all taxable periods; and
• SkyTerra and any of its subsidiaries for all taxable periods or portions thereof ending on or prior to achange of control of SkyTerra.
Risks Relating to Our Common Stock
There may be a limited public market for our common stock and our stock price may experience volatility.
The stock market from time to time experiences extreme price and volume fluctuations that are oftenunrelated to the operating performance of particular companies. Changes in earnings estimates by analysts, ifany, and economic and other external factors may have a significant effect on the market price of our commonstock. Fluctuations or decreases in the trading price of our common stock may adversely affect the liquidity ofthe trading market for our common stock.
Fluctuations in our results of operations could adversely affect the trading price of our common stock.
Our results of operations may fluctuate as a result of a variety of factors, many of which are outside of ourcontrol, including:
• risks and uncertainties affecting the current and proposed business of HNS and the broadband satelliteindustry;
• increased competition in the broadband satellite industry;
• competition in the North America and International VSAT segments and the Telecom Systemssegment; and
• general economic conditions.
As a result of these possible fluctuations, period-to-period comparisons of our financial results may not bereliable indicators of future performance.
Future sales of our shares could depress the market price of our common stock.
We may, in the future, sell additional shares of our common stock to raise capital, which could result insubstantial dilution and a decrease in the market price of our common stock. These sales, or the possibility thatthese sales may occur, also might make it more difficult for us to sell equity securities in the future at a time andat a price that we deem appropriate.
At December 31, 2008, we had 21,514,963 shares of our common stock outstanding, all of which are freelytradable without restriction under the Securities Act except for any such shares held at any time by any of our“affiliates,” as such term is defined under Rule 144 promulgated under the Securities Act. In addition, all of theshares of common stock issued or reserved for issuance or issuable upon the exercise of stock options under our2006 Equity and Incentive Plan will be available for sale in the open market, unless such shares of common stockare subject to vesting restrictions. We may have to issue additional shares of our common stock to satisfy theClass B Units and bonus units of HNS, which may, to the extent vested, be exchanged for our common stock.
30

We do not plan to pay dividends on our common stock and consequently, the only opportunity to achieve areturn on an investment in our common stock is if the price of our common stock appreciates.
We do not plan to declare dividends on our common stock for the foreseeable future and do not plan to paydividends on our common stock. In addition, the agreements governing HNS’ outstanding indebtedness limit ourability to pay dividends on our common stock. The only opportunity to achieve a positive return on an investmentin our common stock for the foreseeable future may be if the market price of our common stock appreciates.
Provisions in our charter documents and Delaware law may delay or prevent our acquisition by a third-party.
Our certificate of incorporation and by-laws contain several provisions that may make it more difficult for athird-party to acquire control of us without the approval of our board of directors. These provisions include,among other things, advance notice for raising business or making nominations at meetings of stockholders and“blank check” preferred stock. Blank check preferred stock enables our board of directors, without stockholderapproval, to designate and issue additional series of preferred stock with such special dividend, liquidation,conversion, voting or other rights, including the right to issue convertible securities with no limitations onconversion, as our board of directors may determine, including rights to dividends and proceeds in a liquidationthat are senior to the common stock. In addition, our board may issue additional shares of common stock withoutany further vote or action by our common stockholders, which would have the effect of diluting commonstockholders. These provisions may make it more difficult or expensive for a third-party to acquire a majority ofour outstanding voting common stock. In addition, the Delaware General Corporation Law contains provisionsthat could make it more difficult for a third-party to acquire control of us.
Item 1B. Unresolved Staff Comments
The Company has no unresolved comments from the Securities and Exchange Commission.
31

Item 2. Properties
Our principal executive offices are located at 11717 Exploration Lane, Germantown, Maryland 20876. Ourproperties consist of design centers, service facilities and sales and marketing offices and are located in theUnited States, Latin America, Europe, Asia and Africa. Substantially all of our properties are used to support ourNorth America and International VSAT segments. The following table sets forth our owned and leased propertiesas of December 31, 2008.
LocationOwned/Leased
SquareFootage Function
Germantown, Maryland* . . . . . . . . . Owned 311,000 Corporate headquarters—office and engineering lab,network operations, shared hubs
Gaithersburg, Maryland . . . . . . . . . . Leased 107,500 Manufacturing, testGaithersburg, Maryland . . . . . . . . . . Leased 77,800 Engineering, office spaceGurgaon, India* . . . . . . . . . . . . . . . . Leased 52,300 Corporate headquarters (India), shared hub,
operations, warehouseLas Vegas, Nevada* . . . . . . . . . . . . . Leased 37,100 Shared hub, backup network operation and control
center SPACEWAYGriesheim, Germany* . . . . . . . . . . . . Leased 29,200 Office space, shared hub, operations, warehouseSan Diego, California . . . . . . . . . . . . Leased 20,900 Engineering, salesMilton Keynes, United Kingdom . . . Leased 18,000 Corporate headquarters and operations (Europe)Barueri, Brazil* . . . . . . . . . . . . . . . . . Leased 16,400 Warehouse, shared hubSouthfield, Michigan* . . . . . . . . . . . Leased 15,000 Shared hubKolkata, India . . . . . . . . . . . . . . . . . . Leased 9,300 WarehouseDelhi, India . . . . . . . . . . . . . . . . . . . . Leased 8,500 Warehouse, office spaceSao Paulo, Brazil . . . . . . . . . . . . . . . . Leased 6,700 Office spaceAlexandria, Virginia . . . . . . . . . . . . . Leased 6,500 WarehouseMumbai, India . . . . . . . . . . . . . . . . . . Leased 5,600 Warehouse, office spaceBangalore, India . . . . . . . . . . . . . . . . Leased 4,300 WarehouseGaithersburg, Maryland . . . . . . . . . . Leased 3,800 Warehouse, garageRome, Italy . . . . . . . . . . . . . . . . . . . . Leased 2,700 Sales, marketingChicago, Illinois . . . . . . . . . . . . . . . . Leased 2,700 Sales, marketingJakarta, Indonesia . . . . . . . . . . . . . . . Leased 1,100 Sales, marketing, operationsMoscow, Russia . . . . . . . . . . . . . . . . Leased 1,100 Sales, marketingDubai, United Arab Emirates . . . . . . Leased 500 SalesLomas de Chaputepec, Mexico . . . . . Leased 450 Sales, marketing, operationsSpokane, Washington . . . . . . . . . . . . Leased 280 GatewayEnglewood, Colorado . . . . . . . . . . . . Leased 250 GatewayAlbuquerque, New Mexico . . . . . . . . Leased 250 GatewaySeattle, Washington . . . . . . . . . . . . . Leased 250 GatewaySalt Lake City, Utah . . . . . . . . . . . . . Leased 200 GatewayBoise, Idaho . . . . . . . . . . . . . . . . . . . Leased 160 GatewayFort Lauderdale, Florida . . . . . . . . . . Leased 160 SalesMiami, Florida . . . . . . . . . . . . . . . . . Leased 110 Sales
* We perform network services and customer support functions 24 hours a day, 7 days a week, 365 days a year at these locations.
32

Item 3. Legal Proceedings
The Company is periodically involved in litigation in the ordinary course of its business alleging intellectualproperty infringement claims, product liability claims, property damage claims, personal injury claims, contractclaims, employment related claims and worker’s compensation claims. We do not believe that there are any suchpending or threatened legal proceedings, including ordinary litigation incidental to the conduct of our businessand the ownership of our properties that, if adversely determined, would have a material adverse effect on ourbusiness, financial condition, results of operations or liquidity.
Following a voluntary disclosure by The DIRECTV Group, Inc. (“DIRECTV”) and DTV Network Systems,Inc. (“DTV Networks”) in June 2004, DIRECTV and DTV Networks entered into a consent agreement with theU.S. Department of State in January 2005 regarding alleged violations of the International Traffic in ArmsRegulations. This consent agreement addresses exports of technology related to the International VSAT segmentprimarily to China. As part of the consent agreement, which applies to us, one of our subsidiaries was debarredfrom conducting certain international business, although we may seek reinstatement in the future. In addition, wewere required to enhance our export compliance program to avoid future infractions.
On June 28, 2007, Hughes Network Systems, LLC (“HNS”) initiated an arbitration proceeding against SeaLaunch Limited Partnership and Sea Launch Company, LLC (collectively, “Sea Launch”) with the AmericanArbitration Association seeking a refund of $44.4 million in payments made to Sea Launch under a LaunchServices Agreement (“LSA”). This dispute stems from the material failure of a Sea Launch rocket that occurredon January 30, 2007. Sea Launch was scheduled to launch HNS’ SPACEWAYTM 3 satellite (“SPACEWAY 3”)in May 2007; however, following the January 30, 2007 rocket failure, there was substantial uncertainty aboutwhen Sea Launch would return to flight. As a result, HNS made alternative arrangements with another launchservices provider to launch SPACEWAY 3 in August 2007. In accordance with the LSA, HNS sent a notice oftermination to Sea Launch and was entitled to a refund of the $44.4 million in payments made to Sea Launch inanticipation of the SPACEWAY 3 launch. Sea Launch refused to refund HNS’ payments and alleged that HNSbreached the LSA by entering into a contract with another launch services provider and that the January 30, 2007explosion of a Sea Launch rocket constituted an “excusable delay” under the LSA. HNS’ arbitration filing isbased on breach of contract. HNS believes that Sea Launch’s purported justifications for refusing to refund the$44.4 million are without merit and that HNS is contractually entitled to a full refund of its payments under theexpress terms of the LSA. As a result, HNS has vigorously pursued the recovery of the $44.4 million in paymentsas well as any other relief to which it may be entitled as a consequence of Sea Launch’s wrongful refusal torefund HNS’ payments. HNS has recorded a deposit, included in Other assets in the accompanying auditedConsolidated Balance Sheets, in anticipation of a full refund from Sea Launch. As of December 31, 2008, thearbitration hearings have been completed and the Company is awaiting the decision of the arbitration tribunal.The Company expects the result of the arbitration will be available in 2009.
On September 29, 2008, the Company received notice of a complaint in a putative class action filed in theUnited States District Court for the Eastern District of Pennsylvania. The case, captioned Scasta v. HughesNet,et. al. was filed by David Scasta, a former customer of the Company’s consumer broadband internet service. Thecomplaint sought damages of $75 million and alleges, among other things, that the Company failed to deliver thespeeds of consumer internet service that it advertises and that the Company filters and blocks Internet contentresulting in slower service speeds. On December 29, 2008, Mr. Scasta filed a motion for a voluntary dismissalwith the court and the case was dismissed without prejudice.
No other material legal proceedings have commenced or been terminated during the period covered by thisreport.
Item 4. Submission of Matters to a Vote of Security Holders
None.
33

PART II
Item 5. Market for Registrant’s Common Equity, Related Stockholder Matters and Issuer Purchases ofEquity Securities
During 2008, our common stock was traded on the NASDAQ Global Select Market under the symbol“HUGH.” During 2007, our common stock was traded on the NASDAQ Global Market. The following tableshows the high and low sale prices per share of our common stock as reported by the NASDAQ:
High Low
Year Ended December 31,2007:First quarter . . . . . . . . . . . . . . . . . . . . . . . . . . . . . . . . . . . . . . . . . . . . . . . . . . . . . $ 49.33 $ 40.35Second quarter . . . . . . . . . . . . . . . . . . . . . . . . . . . . . . . . . . . . . . . . . . . . . . . . . . $ 54.36 $ 45.99Third quarter . . . . . . . . . . . . . . . . . . . . . . . . . . . . . . . . . . . . . . . . . . . . . . . . . . . . $ 55.99 $ 42.83Fourth quarter . . . . . . . . . . . . . . . . . . . . . . . . . . . . . . . . . . . . . . . . . . . . . . . . . . . $ 61.00 $ 47.48
2008:First quarter . . . . . . . . . . . . . . . . . . . . . . . . . . . . . . . . . . . . . . . . . . . . . . . . . . . . . $ 55.52 $ 42.00Second quarter . . . . . . . . . . . . . . . . . . . . . . . . . . . . . . . . . . . . . . . . . . . . . . . . . . $ 55.99 $ 44.71Third quarter . . . . . . . . . . . . . . . . . . . . . . . . . . . . . . . . . . . . . . . . . . . . . . . . . . . . $ 49.20 $ 30.01Fourth quarter . . . . . . . . . . . . . . . . . . . . . . . . . . . . . . . . . . . . . . . . . . . . . . . . . . . $ 36.93 $ 10.00
The closing sale price of our common stock as reported on the NASDAQ on February 27, 2009 was $10.46per share. At that date, there were 842 holders of record of our common stock.
Dividends
We have not paid any dividends on our common stock, and we do not anticipate or intend to pay cashdividends on our common stock for the foreseeable future. We are a holding company and our principal assetsare membership interests of Hughes Network Systems, LLC (“HNS”) and cash. In the event that we choose topay dividends, we would be primarily reliant on distributions or dividends from our subsidiaries to pay suchdividends. The ability of HNS to pay us distributions or transfer funds or other assets is subject to the terms ofHNS’ debt agreements which, among other things, limit the ability of HNS and certain of its subsidiaries to paydividends or distributions or transfer funds or other assets to us. Our board of directors will determine anychanges in our dividend policy based upon its analysis of factors it deems relevant. We expect that these factorswill include our financial condition, earnings, cash requirements and legal requirements.
34

Performance Graph
The following performance graph shows the cumulative total return to a holder of our common stockcompared with the cumulative total return of the NASDAQ Composite Index and the NASDAQTelecommunications Index for the period from February 23, 2006 (the date our common stock began trading on anational market) through December 31, 2008. The comparison assumes the investment of $100 on February 23,2006 in our common stock and each of the foregoing indices and reinvestment of all dividends.
Cumulative Total Returns$100 Invested at February 23, 2006
$0.00
$25.00
$50.00
$75.00
$100.00
$125.00
$150.00
$175.00
$200.00
$225.00
$250.00
12/31/200712/31/20062/23/2006 12/31/2008
Dol
lars
Hughes Communications, Inc. ("HUGH")
NASDAQ Composite Index ("^IXIC")
NASDAQ Telecommunications Index ("^IXUT")
February 23,2006
December 31,
2006 2007 2008
Hughes Communications, Inc. . . . . . . . . . $ 100.00 $ 186.48 $ 218.44 $ 63.76NASDAQ Composite Index . . . . . . . . . . . . $ 100.00 $ 105.97 $ 116.36 $ 69.19NASDAQ Telecommunications Index . . . $ 100.00 $ 115.13 $ 125.69 $ 71.67
35

Item 6. Selected Financial Data
Set forth below is our selected consolidated financial data. The Company’s historical consolidated financialdata for the years ended or as of December 31, 2005 and 2004 are derived from audited financial statements ofSkyTerra Communications, Inc. (“SkyTerra”). Our consolidated balance sheet data and statement of operationsdata for the years ended or as of December 31, 2008, 2007 and 2006 are derived from our audited consolidatedfinancial statements included in this report. The selected consolidated financial data presented below should beread in conjunction with our consolidated financial statements, the notes to our consolidated financial statementsincluded in “Item 8. Financial Statements and Supplementary Data”, and “Item 7. Management’s Discussion andAnalysis of Financial Condition and Results of Operations” of this report.
Notwithstanding the legal form of the Distribution, the Distribution was accounted for as a reverse spin-offin accordance with Emerging Issues Task Force Issue No. 02-11, “Accounting for Reverse Spin-offs.”Accordingly, we were considered the divesting entity and treated as the “accounting successor” to SkyTerra forfinancial reporting purposes. This accounting is required because, among other things; (i) the businessestransferred to us generated all of SkyTerra’s historical consolidated revenues and constitute a majority of thebook value of SkyTerra’s assets immediately preceding the Distribution and (ii) the businesses transferred to usinclude SkyTerra’s discontinued operating subsidiaries and all of the assets and liabilities relating to suchsubsidiaries.
Our historical results through December 31, 2005 are those previously reported by SkyTerra, including theresults attributable to the businesses and assets retained by SkyTerra, in accordance with Emerging Issues TaskForce Issue No. 02-11. Accordingly, future reports will continue to reflect Hughes Network Systems, LLC’shistorical results (through December 31, 2005) under the equity method and will also reflect the historical resultsthrough the date of the Distribution attributable to Mobile Satellite Ventures LP and other assets and liabilitiesretained by SkyTerra.
As of or For the Year Ended December 31,
2008 2007 2006 2005 2004
(Dollars in thousands, except per share amounts)Consolidated statements of operations data:Revenues . . . . . . . . . . . . . . . . . . . . . . . . . . . . . . . . . . $ 1,060,353 $ 970,648 $ 858,699 $ 615 $ 2,117Income tax expense (benefit) . . . . . . . . . . . . . . . . . . . $ 7,593 $ 5,337 $ 54,110 $ (50,334) $ -Income (loss) from continuing operations . . . . . . . . . $ 9,018 $ 43,540 $ (39,310) $ 59,220 $ 19,126Net income (loss) attributable to commonstockholders . . . . . . . . . . . . . . . . . . . . . . . . . . . . . . $ 9,018 $ 43,540 $ (40,567) $ 49,356 $ 7,248
Basic net earnings (loss) per common share:Continuing operations . . . . . . . . . . . . . . . . . . . . . . . . $ 0.44 $ 2.31 $ (2.44) $ 5.59 $ 1.22Discontinued operations . . . . . . . . . . . . . . . . . . . . . . . - - 0.01 0.01 (0.26)
Basic net earnings (loss) per common share . . . . . $ 0.44 $ 2.31 $ (2.43) $ 5.60 $ 0.96
Diluted net earnings (loss) per common share:Continuing operations . . . . . . . . . . . . . . . . . . . . . . . . $ 0.44 $ 2.26 $ (2.44) $ 5.33 $ 1.16Discontinued operations . . . . . . . . . . . . . . . . . . . . . . . - - 0.01 0.01 (0.24)
Diluted net earnings (loss) per common share . . . . $ 0.44 $ 2.26 $ (2.43) $ 5.34 $ 0.92
Consolidated balance sheet data:Total assets . . . . . . . . . . . . . . . . . . . . . . . . . . . . . . . . . $ 1,190,393 $ 1,129,837 $ 931,644 $ 205,337 $ 154,570Long-term obligations . . . . . . . . . . . . . . . . . . . . . . . . $ 596,303 $ 584,287 $ 487,269 $ - $ -Series A redeemable convertible preferred stock,net . . . . . . . . . . . . . . . . . . . . . . . . . . . . . . . . . . . . . . $ - $ - $ - $ 93,100 $ 88,706
Stockholders’ equity . . . . . . . . . . . . . . . . . . . . . . . . . . $ 338,147 $ 262,361 $ 215,389 $ 98,385 $ 45,378
Ratio of earnings to fixed charges . . . . . . . . . . . . . . . . . 1.2x 1.6x 1.3x * 507.6xDeficiency of earnings to fixed charges . . . . . . . . . . . . . $ (6,986)
* Ratio not provided due to deficiency in the period.
36

Item 7. Management’s Discussion and Analysis of Financial Condition and Results of Operations
The following discussion and analysis of the Company’s financial condition and results of operations arebased upon financial statements which have been prepared in accordance with accounting principles generallyaccepted in the United States of America and should each be read together with our consolidated financialstatements and the notes to those consolidated financial statements included elsewhere in this report. This reportcontains forward-looking statements that involve risks and uncertainties, including statements regarding ourcapital needs, business strategy, expectations and intentions within the meaning of Section 27A of the SecuritiesAct of 1933, as amended, and Section 21E of the Securities Exchange Act of 1934, as amended, which representour expectations or beliefs concerning future events. We urge you to consider statements that use the terms“believe,” “do not believe,” “anticipate,” “expect,” “plan,” “estimate,” “strive,” “intend” and similarexpressions are intended to identify forward-looking statements. These statements reflect our current views withrespect to future events and because our business is subject to numerous risks, uncertainties and risk factors, ouractual results could differ materially from those anticipated in the forward-looking statements, including thoseset forth below under this “Item 7. Management’s Discussion and Analysis of Financial Condition and Results ofOperations,” “Special Note Regarding Forward-Looking Statements” and elsewhere in this report. All forward-looking statements speak only as of the date of this report. Actual results will most likely differ from thosereflected in these forward-looking statements and the differences could be substantial. We disclaim anyobligation to update these forward-looking statements or disclose any difference, except as may be required bysecurities laws; between our actual results and those reflected in these statements. Although we believe that ourplans, intentions and expectations reflected in or suggested by the forward-looking statements we make in thisreport are reasonable, we can give no assurance that such plans, intentions or expectations will be achieved.
As a result of the January 2006 Transaction, as described below, our business has changed materially. Forthe periods following the January 2006 Transaction, we include the financial position and operating results ofHughes Network Systems, LLC (“HNS”), our wholly-owned subsidiary, in our consolidated financial statements.
Overview
Hughes Communications, Inc. (“HCI,” “the Company,” “we,” “us,” and “our”) operates its businessprimarily through HNS, our wholly-owned subsidiary, a telecommunications company. We are the world’sleading provider of broadband satellite network services and systems to the enterprise market. We are also thelargest satellite Internet access provider to North American consumers and small and medium sized businesses,such as small office and home office users, which we refer to as the Consumer market. In addition, we providemanaged services to large enterprises that combine the use of satellite and terrestrial alternatives, thus offeringsolutions that are tailored and cost optimized to the specific customer requirements.
We operate in four business segments: (i) the North America VSAT segment; (ii) the International VSATsegment; (iii) the Telecom Systems segment; and (iv) the Corporate and Other segment. The North AmericaVSAT segment consists of the Consumer group, which delivers broadband Internet service to consumercustomers, and the Enterprise group, which provides satellite communication networks and services toenterprises. The International VSAT segment consists of the Enterprise group, which includes our internationalservice companies. The international Enterprise group provides satellite communication networks and services toenterprise customers worldwide. The Telecom Systems segment consists of the Mobile Satellite Systems group,the Telematics group, and the Terrestrial Microwave group. The Mobile Satellite Systems group providesturnkey satellite ground segment systems to mobile system operators. The Telematics group providesdevelopment services and equipment to Hughes Telematics, Inc. (“HTI”) and certain of its customers. TheTerrestrial Microwave group provides point-to-multipoint microwave radio network systems that enable mobileoperators to connect their cell sites and fixed operators to provide wireless broadband services. The Corporateand Other segment consists of various minority investments held by the Company, our corporate offices andassets not specifically related to another business segment. Due to the complementary nature and commonarchitecture of our services and products across our business groups, we are able to leverage our expertise andresources within our various operating units to yield significant cost efficiencies.
37

Significant Transactions
Through a series of transactions from 2005 to 2008, we acquired the businesses that we owned as ofDecember 31, 2008. An overview of those transactions is as follows:
• On April 22, 2005, SkyTerra acquired 50% of HNS’ voting, or Class A membership interests (the“April 2005 Transaction”) from DTV Network Systems, Inc., a wholly-owned subsidiary of TheDIRECTV Group, Inc. (“DIRECTV”).
• On October 12, 2005, we acquired Series A preferred shares of Hughes Systique Corporation (“HughesSystique”) for $3.0 million. On January 9, 2008, the Company invested an additional $1.5 million inthe common equity of Hughes Systique. As a result, the Company owns approximately 31.8% of theoutstanding shares of Hughes Systique, on an undiluted basis, at December 31, 2008.
• On December 31, 2005, pursuant to separation agreement between us and SkyTerra (the “SeparationAgreement”), SkyTerra contributed to us the following:
- its 50% ownership of HNS’ voting, or Class A, membership interests;
- its interests in: i) AfriHUB LLC, a discontinued business; ii) Electronic System Products, Inc.(“ESP”); and iii) certain minority investments; and
- cash and short-term investments.
• On January 1, 2006, we completed our purchase of the remaining 50% of HNS’ Class A membershipinterests for $100.0 million in cash (the “January 2006 Transaction”) pursuant to a membership interestpurchase agreement we entered into with DIRECTV on November 10, 2005. To finance the purchase,we borrowed $100.0 million from certain of SkyTerra’s controlling stockholders, various investmentvehicles that are affiliated with Apollo Management, L.P. (together with its affiliates, “Apollo”). Theloan was repaid in March 2006 following the completion of the rights offering conducted by us. As aresult of the January 2006 Transaction, we own 100% of HNS’ Class A membership interests, and ourconsolidated financial statements for periods beginning on or after January 1, 2006 include the resultsof HNS and its controlled, majority-owned subsidiaries.
• On February 21, 2006, SkyTerra distributed all of our outstanding shares of common stock toSkyTerra’s common, non-voting common and preferred stockholders and its Series 1-A and 2-Awarrant holders (the “Distribution”). The Distribution separated SkyTerra into two publicly tradedcompanies: SkyTerra and HCI. Accordingly, SkyTerra no longer owns any of our capital stock, andApollo, SkyTerra’s controlling stockholder at the time of the Distribution, became our controllingstockholder. Following the Distribution, SkyTerra retained its interest in its other assets, including cashand investments.
Notwithstanding the legal form of the Distribution, we are treated as the “accounting successor” toSkyTerra for financial reporting purposes . This accounting was required because, among other things;(i) the businesses transferred to the Company generated all of SkyTerra’s historical consolidatedrevenues and constituted a majority of the book value of SkyTerra’s assets immediately preceding theDistribution and (ii) the businesses transferred to the Company included SkyTerra’s discontinuedoperating subsidiaries and all of the assets and liabilities relating to such subsidiaries. The Company’sresults for periods beginning on or after January 1, 2006, the date on which the Company completedthe January 2006 Transaction, included the results of the business and assets retained by SkyTerrathrough the Distribution date and reflected HNS’ results of operations.
• On March 27, 2006, we completed a rights offering, pursuant to which we issued 7,843,141 shares ofour common stock to our stockholders at a subscription price of $12.75 per share. In connection withthe rights offering, we received proceeds of $100.0 million, of which $68.4 million was received fromApollo.
38

Distribution
On February 21, 2006, SkyTerra completed the Distribution and separated into two publicly tradedcompanies: (i) Hughes Communications, Inc., which consists of, among other things, the assets, liabilities andoperations associated with HNS and ESP and certain minority investments in entities including Data Synapse,Inc., Edmunds Holdings, Inc., Mainstream Data, Inc., and Hughes Systique, along with all of SkyTerra’s cash,cash equivalents and marketable securities, excluding $12.5 million, and certain other liabilities expresslyallocated from SkyTerra and (ii) SkyTerra, which consists of the assets and liabilities associated with SkyTerra’sinterest in Mobile Satellite Ventures LP (“MSV”) and SkyTerra’s stake in TerreStar Networks, Inc.(“TerreStar”), $12.5 million in cash, cash equivalents and marketable securities and the obligations pursuant toSkyTerra’s Series A Preferred Stock.
To effect the Distribution, SkyTerra distributed to each of its stockholders one-half of one share of ourcommon stock for each share of SkyTerra common stock (or, in the case of holders of SkyTerra preferred stockand Series 1-A and 2-A warrants, in accordance with their terms, one-half of one share of our common stock foreach share of SkyTerra common stock issuable upon conversion or exercise of such preferred stock andwarrants).
Pursuant to SkyTerra’s 1998 Long Term Incentive Plan, the compensation committee of SkyTerra’s board ofdirectors is required to make an equitable adjustment to the terms of options issued under that plan in the event aspecial, large and nonrecurring dividend or distribution affects SkyTerra’s common stock such that an adjustment isappropriate in order to prevent dilution or enlargement of the rights of the participants under such plan. SkyTerra’scompensation committee has discretion to make such an adjustment to any option issued under the plan by adjustingthe number and kind of shares that may be issued in respect of outstanding options or the exercise price relating tosuch options. Pursuant to this provision, SkyTerra’s compensation committee determined that holders of stockoptions issued under the plan who were current members of SkyTerra’s management and Board of Directors, aswell as a consultant and former directors who were involved with the acquisition of HNS, should receive an optionto purchase one share of our common stock for each option to purchase two shares of SkyTerra’s common stockthat they held as of the date of the Distribution. The issuance of such options to purchase our common stock was inlieu of a larger adjustment to the exercise price of SkyTerra’s options that such holders would have been otherwiseentitled had they not received options to purchase our common stock. A reduction in the exercise price (or in somecases, an increase in the number of shares) was the manner in which all of SkyTerra’s other options outstandingunder the plan were adjusted. On February 24, 2006, options to purchase 435,836 shares of our common stock wereissued to holders of SkyTerra options.
Separation Agreement
We entered into the Separation Agreement with SkyTerra effective December 31, 2005, which affected thetransfer, by way of contribution from SkyTerra to us, of the assets related to our business, and the assumption byus of certain liabilities. The Separation Agreement and certain related agreements govern, among other things,certain of the ongoing relations between us and SkyTerra following the Distribution.
In general, pursuant to the terms of the Separation Agreement, all of SkyTerra’s assets and liabilities, otherthan those specifically relating to MSV and TerreStar, $12.5 million in cash, cash equivalents and marketablesecurities and the obligations pursuant to SkyTerra’s Series A Preferred Stock, became our assets and liabilities.The Separation Agreement also provides for assumptions of liabilities and cross-indemnities designed to allocategenerally, effective as of the date of the Separation Agreement, financial responsibility for all liabilities arisingout of or in connection with our businesses to us and all liabilities arising out of or in connection with SkyTerra’sinterest in MSV and TerreStar to SkyTerra. In addition, we will indemnify SkyTerra for liabilities relating tocertain litigation in which SkyTerra or SkyTerra’s subsidiaries were involved. Furthermore, the Company has atax sharing agreement with SkyTerra that governs the allocation of tax liabilities and related tax matters, such asthe preparation and filing of tax returns and tax contests, between the Company and SkyTerra for all taxableperiods ended on or before the Distribution date.
39

Strategic Initiatives and Their Impact on Our Results of Operations
For the years ended December 31, 2008, 2007 and 2006, we generated net income of $9.0 million, $43.5million and a net loss of $40.6 million, respectively. Net income for the year ended December 31, 2008 wasadversely impacted by two initiatives related to our operations that did not exist in the comparable periods in2007 and 2006. These initiatives, which support our future growth in services and the retention of employees,were: i) the recognition of depreciation expense of $19.6 million related to the commencement of SPACEWAYservices in April 2008 and ii) the accrual of compensation expense of $13.2 million related to a one-timeretention program as described in Note 19—Long-Term Cash Incentive Retention Program included in Item 8 ofthis report. We expect our long-term results of operations to improve over time as we add subscribers on theSPACEWAY network.
Consumer Group—We have made significant investments in our Consumer group as we believe there is alarge segment of this market that is underserved by terrestrial alternatives such as Digital Subscriber Line(“DSL”) and cable. We continue to review and adjust pricing policies relative to other competitive offerings inthe marketplace in connection with our Consumer hardware and service offerings. In September 2008, we beganoffering customers the option to rent the equipment with a 24 month service contract. We believe that theconsumer rental program will expand our customer base while providing customers with an economicalalternative to purchasing the equipment. We have incurred and expect to continue to incur significant costs,including subscriber acquisition costs, related to hardware and associated marketing costs. At December 31,2008, we had a consumer customer base of approximately 432,800 subscribers that generated revenues of $376.1million.
Satellite Related Assets—As part of our focus on less costly and more efficient technological solutions, wehave constructed and developed the SPACEWAYTM 3 satellite (“SPACEWAY 3”) as well as related networkoperations center facilities, certain other ground facilities and equipment. The SPACEWAY system was designedand developed as the next generation Ka-band broadband satellite system with a unique architecture forbroadband data communications. Designed for maximum operational flexibility, the system greatly enhancesdata communication capabilities and efficiencies for enterprise and consumer customers. In August 2007, welaunched SPACEWAY 3 and introduced service in North America on the SPACEWAY network in April 2008.We believe that the SPACEWAY system enables us to offer our North American enterprise and consumercustomers faster communication rates, reduce our operating costs in the future, primarily through the reduction ofthird-party transponder capacity expenses as we utilize the additional capacity of SPACEWAY 3, and expand ourbusiness significantly by increasing our addressable market in the enterprise and consumer markets. However,we have incurred fixed costs associated with the launch and operation of SPACEWAY 3 that has reduced andwill continue to reduce our earnings until we acquire a sufficient number of customers to offset those costs.
The Company continues to evaluate the requirements for additional space segment capacity, including theacquisition of another satellite. The Company is considering various alternatives related to the ownershipstructure of a new satellite, capacity features and other factors that would promote long term growth whilemeeting the needs of its customers.
Technology—We have incorporated advances in semiconductor technology to increase the functionality andreliability of our VSATs and reduce manufacturing costs. In addition, through the usage of advanced spectrallyefficient modulation and coding methodologies, such as DVB-S2, and proprietary software web acceleration andcompression techniques, we continue to improve the efficiency of our transponder capacity and invest in ourresearch and development efforts to maintain our position as a leader in VSAT technology.
Acquisitions, Strategic Alliances and Divestitures—We continue to focus on expanding the identifiedmarkets for our products, services and network solutions in our North America VSAT, International VSAT andTelecom Systems segments. Consistent with this strategy to grow and improve our financial position, we alsoreview our competitive position on an ongoing basis and, from time to time, consider various acquisitions,strategic alliances and divestitures which we believe would be beneficial to our business.
40

In February 2008, we acquired Helius, Inc., which was subsequently converted to a limited liabilitycompany, Helius, LLC (“Helius”), and transferred our ownership of Helius to HNS. Helius operates within ourNorth America VSAT segment due to the nature of its business activities, its customer base and similarities withthe North America enterprise business. We believe that the combination of Helius’ internet protocol televisionsolutions and our extensive broadband networking experience and customer base will create synergies thatfacilitate long-term sales growth. For further discussion of this acquisition, see Note 5—Acquisition of Helius,Inc. to the Company’s audited consolidated financial statements included in Item 8 of this report.
Broadband Market Focus—In 2006, our results of operations were negatively impacted by our decision toshift our primary focus exclusively to the broadband market. Accordingly, we evaluated the narrowband productsin our inventory and recorded a charge in the second quarter of 2006 of $11.9 million for excess or obsoleteinventories to reduce net book value of the narrowband products to their net realizable value, and substantially allof these products were disposed of during 2006. This charge was included in cost of hardware products sold andprimarily related to the North America VSAT segment.
Key Business Metrics
Business Segments—We divide our operations into four distinct segments—the North America VSATsegment, the International VSAT segment, the Telecom Systems segment and the Corporate and Other segment.Within the North America VSAT segment, sales can be attributed to the Consumer group and the Enterprisegroup. Within the International VSAT segment, sales can be attributed to the Enterprise group, which includesour international service companies. Sales from our Telecom Systems segment can be attributed to the MobileSatellite Systems group, the Telematics group, and the Terrestrial Microwave group. The Corporate and Othersegment consists of various minority investments held by the Company, our corporate offices and assets notspecifically related to another business segment. Due to the complementary nature and common architecture ofour services and products across our business lines, we are able to leverage our expertise and resources withinour various operating units to yield significant cost efficiencies.
Revenues—We generate revenues from the sale and financing of hardware and the provision of services. Inour North America and International VSAT segments, we generate revenues from services and hardware, whilein our Telecom Systems segment, we generate revenues primarily from the development and sale of hardware.Some of our large enterprise VSAT customers, who purchase equipment separately, operate their own networks.These customers include large enterprises, incumbent local exchange carriers, governmental agencies andresellers. Contracts for our VSAT services vary in length depending on the customer’s requirements.
41

Services—Our services revenue is varied in nature and includes total turnkey communications services,terminal relocation, maintenance and changes, transponder capacity and multicast or broadcast services. Ourservices are offered on a contractual basis, which vary in length based on the particular end market. Typically,our large enterprise customers enter into a service contract with a three- to five-year duration and our consumercustomers enter into a 24-month contract. We bill and recognize service revenues on a monthly per site basis. Forenterprise customers who receive services from our network operation, our services include the following:
Service Type Description
Broadbandconnectivity
• Provides basic transport, intranet connectivity services and internet serviceprovider services
• Applications include high-speed internet access, IP VPN, multicast file deliveryand streaming, point-of-sale credit transactions, enterprise back-officecommunications, and satellite backup for frame relay service and other terrestrialnetworks
Managed networkservices
• Provides one-stop turnkey suite of bundled services that include terrestrial andsatellite networks
• Includes network design program management, installation management, networkand application engineering services, proactive network management, networkoperations, field maintenance and customer care
ISP services andhosted application
• Provides internet connectivity and hosted customer-owned and managedapplications on our network facilities
• Provides the customer application services developed by us or in conjunction withour service partners
• Includes internet access, e-mail services, web hosting and online payments
Digital media services • Digital content management and delivery including video, online learning anddigital signage applications
Customized businesssolutions
• Provides customized, industry-specific enterprise solutions that can be applied tomultiple businesses in a given industry
Our services to enterprise customers are negotiated on a contract-by-contract basis with price varying basedon numerous factors, including number of sites, complexity of system and scope of services provided. We havethe ability to integrate these service offerings to provide comprehensive solutions for our customers. We alsoprovide managed services to our customers who operate their own dedicated network facilities and charge them amanagement fee for the operation and support of their networks.
Hardware—We offer our enterprise customers the option to purchase their equipment up front or as part oftheir service agreement under which payments are made over a fixed term. Our consumer customers have theoption to purchase the equipment up front or, beginning in September 2008, to rent the equipment with a24-month service contract. Prior to September 2008, we offered our consumer customers the option to pay for thepurchased equipment over a 24-month period. Hardware revenues of the North American and InternationalEnterprise groups are derived from network operating centers, radio frequency terminals (earth stations), VSATcomponents including indoor units, outdoor units, antennas, voice, video, serial data appliances, and systemintegration services to integrate all of the above into a system.
We also provide specialized equipment to our Mobile Satellite Systems, Telematics, and TerrestrialMicrowave customers. Through large multi-year contracts, we develop and supply turnkey networking andterminal systems for various operators who offer mobile satellite-based or telematics voice and data services. Wealso supply microwave-based networking equipment to mobile operators for back-hauling their data from cellular
42

telephone sites to their switching centers. In addition, local exchange carriers use our equipment for broadbandaccess traffic from corporations bypassing local phone companies. The size and scope of these projects vary fromyear to year and do not follow a pattern that can be reasonably predicted.
Market trends impacting our revenues—The following table presents our revenues by end market for theyears ended December 31, 2008, 2007 and 2006 (in thousands):
Variance
Year Ended December 31, 2008 vs. 2007 2007 vs. 2006
2008 2007 2006 Amount % Amount %
Revenues:Services . . . . . . . . . . . . . . . . . . . . . . . . . $ 611,247 $537,688 $440,450 $73,559 13.7 % $ 97,238 22.1 %Hardware sales . . . . . . . . . . . . . . . . . . . . 449,106 432,960 418,249 16,146 3.7 % 14,711 3.5 %
Total revenues . . . . . . . . . . . . . . . . $1,060,353 $970,648 $858,699 $89,705 9.2 % $111,949 13.0 %
Revenues by end market:North America VSAT:Consumer . . . . . . . . . . . . . . . . . . . . . . $ 376,055 $331,129 $292,336 $44,926 13.6 % $ 38,793 13.3 %Enterprise . . . . . . . . . . . . . . . . . . . . . . 291,610 284,587 281,531 7,023 2.5 % 3,056 1.1 %
Total North America VSAT . . . . . . 667,665 615,716 573,867 51,949 8.4 % 41,849 7.3 %
International VSAT:Enterprise . . . . . . . . . . . . . . . . . . . . . . 237,188 214,833 193,370 22,355 10.4 % 21,463 11.1 %
Telecom Systems:Mobile Satellite Systems . . . . . . . . . . 105,725 103,991 69,772 1,734 1.7 % 34,219 49.0 %Telematics . . . . . . . . . . . . . . . . . . . . . 31,065 22,301 1,611 8,764 39.3 % 20,690 *Terrestrial Microwave . . . . . . . . . . . . 18,248 13,234 19,605 5,014 37.9 % (6,371)(32.5)%
Total Telecom Systems . . . . . . . . . 155,038 139,526 90,988 15,512 11.1 % 48,538 53.3 %
Corporate and Other . . . . . . . . . . . . . . . . 462 573 474 (111)(19.4)% 99 20.9 %
Total revenues . . . . . . . . . . . . . . . . $1,060,353 $970,648 $858,699 $89,705 9.2 % $111,949 13.0 %
* Percentage not meaningful.
The following table presents our subscribers, churn rate, average revenue per unit (“ARPU”), and averagegross customer additions for the years ended December 31, 2008, 2007 and 2006:
Variance
December 31, 2008 vs. 2007 2007 vs. 2006
2008 2007 2006 Amount % Amount %
Subscribers . . . . . . . . . . . . . . . . . . . . . . 432,800 379,900 327,500 52,900 13.9 % 52,400 16.0 %
Variance
Year Ended December 31, 2008 vs. 2007 2007 vs. 2006
2008 2007 2006 Amount % Amount %
Churn rate . . . . . . . . . . . . . . . . . . . . . . 2.36% 2.26% 2.32% 0.10% 4.4 % (0.06)% (2.6)%ARPU . . . . . . . . . . . . . . . . . . . . . . . . . . $ 65 $ 62 $ 60 $ 3 4.8 % $ 2 3.3 %Average gross customer addition . . . . 14,000 12,000 11,000 2,000 16.7 % 1,000 9.1 %
43

North America VSAT Segment
The growth in our Consumer group has been driven primarily by two factors: (i) the substantial growth inthe number of subscribers arising from increased consumer awareness in geographic areas that have historicallybeen underserved by DSL and cable and (ii) targeted service plans, with higher prices coincident with higherbroadband capacity to meet the consumer customer’s broadband access requirements, as well as value-addedservices, resulting in an increase in average monthly revenue per subscriber.
Revenue from our North American Enterprise group for the year ended December 31, 2008 increasedslightly by 2.5% to $291.6 million compared to the same period in 2007. The increase was primarily due to anincrease in our managed services business. Enterprise hardware revenue can be impacted by the timing ofrenewals and upgrades of existing contracts, as well as award and delivery of new contracts. Enterprise servicerevenue is generally characterized by long term contracts, and our enterprise backlog continues to increase as aresult of new orders for enterprise services.
International VSAT Segment
Revenue from our International Enterprise group for the year ended December 31, 2008 increased by 10.4%to $237.2 million compared to the same period in 2007, primarily due to the growth of our Brazil and Europeoperations as we continue to offer an expanding array of solutions and services to enterprises and governmentorganizations across emerging markets. Additionally, we continue to offer terrestrial and satellite access in ourmanaged network service offerings.
Telecom Systems Segment
Revenue from our Telematics group for the year ended December 31, 2008 increased by 39.3% to$31.1 million compared to the same period in 2007. Contributing to the growth was increased engineering effortson new projects involving automotive telematics solutions and for the design, development and supply of userterminals and chipset related development. We continue to actively pursue a number of opportunities in the areaof hybrid satellite/terrestrial mobile networks and automotive telematics solutions. Revenue from our TerrestrialMicrowave group for the year ended December 31, 2008 increased by 37.9% to $18.2 million compared to thesame period in 2007, due to orders from new customers in Europe and Africa. In this group, we pursue revenueopportunities through sales of point-to-multipoint equipment to international mobile and fixed wireless operatorsfor backhauling their base station traffic to their switching centers.
Revenue Backlog—At December 31, 2008, 2007 and 2006, our total revenue backlog, which we define asour expected future revenue under customer contracts that are non-cancelable and excluding consumercustomers, was $840.9 million, $751.8 million and $604.8 million, respectively. We expect to realize our revenuebacklog as follows: $331.3 million in 2009, $247.3 million in 2010, $141.2 million in 2011, $35.2 million in2012 and $85.9 million thereafter. See “Item 1A. Risk Factors” and “Special Note Regarding Forward-LookingStatements” for a discussion of the potential risks to our revenue and backlog. Although we have signed contractswith our consumer customers for 24 months, we do not include these contractual commitments in our backlog.
Cost of Services—Our cost of services relates to the costs associated with the provision of managed networkservices, which primarily consist of transponder capacity leases, hub infrastructure, customer care, terrestrialcapacity, depreciation expense related to network infrastructure and capitalized hardware under the consumerrental program, which we began offering to consumer customers in September 2008, and the salaries and relatedemployment costs for those employees who manage our network operations and other project areas. These costsare dependent on the number of customers served and have increased relative to our growth. We continue toexecute a number of cost containment and efficiency initiatives that were implemented during 2008, 2007, and2006. In addition, the migration to a single upgraded platform for our North America VSAT segment has enabled
44

us to leverage our satellite bandwidth and network operation facilities to achieve further cost efficiencies. Thecosts associated with transponder capacity leases for the Consumer group are expected to decline as morecustomers are added to the SPACEWAY network.
In recent years, transponder capacity has not been a limiting factor in growing the VSAT service business.Transponder capacity is typically sold under long-term contracts by fixed satellite service providers, and we arecontinually evaluating the need to secure additional capacity with sufficient lead time to permit us to providereliable service to our customers.
Cost of Hardware Products Sold—We outsource a significant portion of the manufacturing of our hardwarefor our North America and International VSAT and Telecom Systems segments to third-party contractmanufacturers. Our cost of hardware products sold relates primarily to direct materials and subsystems (e.g.,antennas), salaries and related employment costs for those employees who are directly associated with theprocurement and manufacture of our products and other items of indirect overhead incurred in the procurementand production process. Cost of hardware products sold also includes certain engineering and hardware costsrelated to the design of a particular product for specific customer programs. In addition, certain softwaredevelopment costs are capitalized in accordance with Statement of Financial Accounting Standards (“SFAS”)No. 86, “Accounting for the Costs of Computer Software to Be Sold, Leased, or Otherwise Marketed” andamortized to cost of hardware products sold over their estimated useful lives, not to exceed five years. As wehave developed new product offerings, we have reduced product costs due to higher levels of componentintegration, design improvements and volume increases.
Subscriber acquisition costs (“SAC”) are associated with our Consumer group and are comprised of threeelements: (i) the subsidy for the cost of hardware and related installation; (ii) sales and marketing expense; and(iii) dealer and customer service representative commissions on new installations/activations. The subsidy forcost of hardware and related cost of installation is deferred and amortized over the initial contract period or theuseful life of the hardware as a component of cost of hardware products sold for hardware related sales or cost ofservices for activities related to the consumer rental program. The portion of SAC related to sales and marketingis expensed as incurred. Dealer and customer service representative commissions are deferred and amortizedover the initial contract period as a component of sales and marketing expense.
Selling, General and Administrative—Selling expenses primarily consist of the salaries, commissions,related benefit costs of our direct sales force and marketing staff, advertising, channel compensations on newactivations which are deferred and amortized over the initial consumer contract period, travel, allocation offacilities, and other directly related overhead costs for our domestic and international businesses. General andadministrative expenses include bad debt expense and salaries and related employee benefits for employeesassociated with common supporting functions, such as accounting and finance, risk management, legal,information technology, administration, human resources, and senior management. Selling, general, andadministrative costs also include facilities costs, third-party service providers’ costs (such as outside tax and legalcounsel, and insurance providers), bank fees related to credit card processing charges and depreciation of fixedassets.
Research and Development (“R&D”)—R&D expenses primarily consist of the salaries of certain membersof our engineering staff plus an applied overhead charge. R&D expenses also include engineering support forexisting platforms and development efforts to build new products and software applications, subcontractors,material purchases and other direct costs in support of product development.
45

Selected Segment Data
Our operations are comprised of four segments: (i) the North America VSAT segment, which consists of theConsumer group and the Enterprise group; (ii) the International VSAT segment, which consists of the Enterprisegroup; (iii) the Telecom Systems segment, which consists of the Mobile Satellite Systems group, the Telematicsgroup, and the Terrestrial Microwave group; and (iv) the Corporate and Other segment which consists of ESP’sbusiness, various minority investments held by the Company as well as our corporate offices and assets notspecifically related to another business segment. The following tables set forth our revenues and operatingincome for our primary segments (in thousands):
Variance
Year Ended December 31, 2008 vs. 2007 2007 vs. 2006
2008 2007 2006 Amount % Amount %
Revenues by end market:North America VSAT . . . . . $ 667,665 $615,716 $573,867 $ 51,949 8.4 % $ 41,849 7.3 %International VSAT . . . . . . 237,188 214,833 193,370 22,355 10.4 % 21,463 11.1 %Telecom Systems . . . . . . . . 155,038 139,526 90,988 15,512 11.1 % 48,538 53.3 %Corporate and Other . . . . . . 462 573 474 (111) (19.4)% 99 20.9 %
Total revenues . . . . . . . . $1,060,353 $970,648 $858,699 $ 89,705 9.2 % $111,949 13.0 %
Operating income by endmarket:North America VSAT . . . . . $ 21,339 $ 44,259 $ 35,625 $(22,920) (51.8)% $ 8,634 24.2 %International VSAT . . . . . . 21,679 19,637 3,178 2,042 10.4 % 16,459 *Telecom Systems . . . . . . . . 25,116 25,911 18,871 (795) (3.1)% 7,040 37.3 %Corporate and Other . . . . . . (3,842) (6,171) (5,032) 2,329 37.7 % (1,139) (22.6)%
Total operating income . . $ 64,292 $ 83,636 $ 52,642 $(19,344) (23.1)% $ 30,994 58.9 %
* Percentage not meaningful.
Results of Operations
Year Ended December 31, 2008 Compared to Year Ended December 31, 2007
Revenues
Year Ended December 31, Variance
(Dollars in thousands) 2008 2007 Amount %
Services . . . . . . . . . . . . . . . . . . . . . . . . . . . . . . . . . . . . . . . . . . $ 611,247 $ 537,688 $73,559 13.7 %Hardware sales . . . . . . . . . . . . . . . . . . . . . . . . . . . . . . . . . . . . 449,106 432,960 16,146 3.7 %
Total revenues . . . . . . . . . . . . . . . . . . . . . . . . . . . . . . . . . $1,060,353 $ 970,648 $89,705 9.2 %
% of revenue to total revenues:Services . . . . . . . . . . . . . . . . . . . . . . . . . . . . . . . . . . . . . . 57.6% 55.4%Hardware sales . . . . . . . . . . . . . . . . . . . . . . . . . . . . . . . . 42.4% 44.6%
Services Revenues
The largest contributor to the increase in services revenues was revenue growth from the Consumer group of$55.8 million, or 20.9%, to $322.9 million for the year ended December 31, 2008 compared to $267.1 million forthe same period in 2007. The increase was primarily due to an increase in the subscriber base of approximately
46

52,900 subscribers to approximately 432,800 subscribers at December 31, 2008 and an increase in ARPU of4.8% to $65 for 2008. Also contributing to the increase in services revenues was revenue growth from our NorthAmerica Equipment and Services group of $16.2 million to $153.4 million for the year ended December 31, 2008compared to $137.2 million for the same period in 2007, mainly due to increase in our managed services businessas well as new contracts awarded in 2007 and 2008 that provided incremental service revenue in 2008.
The increase in services revenue was also driven by an increase in revenue from our Telecom Systemssegment of $9.0 million to $32.0 million for the year ended December 31, 2008 compared to $23.0 million forthe same period in 2007, which primarily resulted from an increase in design and development engineeringservices provided by our Telematics group.
Services revenue from our International VSAT segment decreased by $7.3 million to $102.5 million for theyear ended December 31, 2008 from $109.8 million for the same period in 2007, mainly resulting from areduction in revenue from our European operations as a result of the completion of legacy service contracts.
Hardware Sales
Hardware sales increased mainly due to revenue growth from our International VSAT segment of $29.7million, or 28.3%, to $134.7 million for the year ended December 31, 2008 compared to $105.0 million for thesame period in 2007. The increase was primarily due to the continued rollout of terminal shipments on a new,multi-year contract for a large lottery operator in the United Kingdom, partially offset by delays in U.S. sourcednew orders from enterprise customers.
Hardware sales from our Telecom Systems segment for the year ended December 31, 2008 increased $6.5million to $123.0 million compared to $116.5 million for the same period in 2007. The increase resulted fromhigher hardware sales from the Terrestrial Microwave group, primarily due to orders from new and existingcustomers in Europe and Africa.
Partially offsetting the increase in hardware sales was a reduction in revenue from our North AmericaVSAT segment of $20.0 million to $191.4 million for the year ended December 31, 2008 compared to $211.4million for the same period in 2007. The decrease was primarily due to a revenue reduction of $9.2 million in ourNorth America Enterprise group as a result of a change in the product mix where the emphasis on managedservices has led to lower upfront hardware revenue and an increase in recurring service revenues. In addition,despite the growth in the subscriber base, hardware sales in the Consumer group decreased by $10.8 million to$53.2 million in 2008, resulting from increasing popularity of the equipment rental program, as well as changesin pricing plans in response to competitive pressures.
Costs of Revenues
Year Ended December 31, Variance
(Dollars in thousands) 2008 2007 Amount %
Cost of services . . . . . . . . . . . . . . . . . . . . . . . . . . . . . . . . $ 406,697 $ 356,306 $ 50,391 14.1%Cost of hardware products sold . . . . . . . . . . . . . . . . . . . . 378,264 355,475 22,789 6.4%
Total cost of revenues . . . . . . . . . . . . . . . . . . . . . . . $ 784,961 $ 711,781 $ 73,180 10.3%
Services cost as a % of services revenues . . . . . . . . . . . . 66.5% 66.3%Hardware cost as a % of hardware revenues . . . . . . . . . . 84.2% 82.1%
Cost of Services
Cost of services increased mainly as a result of revenue growth from our North American Enterprise group.The increase was partly due to $24.7 million of fixed expenses related to the commencement of SPACEWAY
47

services, which primarily consisted of SPACEWAY related depreciation, as well as related network operationscenter and support, operation of Traffic Off-load Gateways, and in-orbit insurance. These costs are generallyfixed in nature and are expected to be absorbed in the coming quarters as additional consumer customers areadded to the SPACEWAY network. The increase in cost of services was also due to higher transponder capacitylease expense of $4.7 million in 2008 compared to 2007, mainly resulting from additional space capacityacquired to support the growth in the enterprise service business from the North America Equipment andServices group. The increase in additional space capacity for the enterprise services business was partially offsetby a reduction in transponder capacity lease expense for the Consumer group as new consumer customers wereadded to the SPACEWAY network. We expect transponder capacity lease expense for the Consumer group tocontinue to decrease as more customers are placed on the SPACEWAY network. In addition, other support costsincluding customer service, network operations, field services and backhaul costs and depreciation expenseincreased by $12.6 million.
Cost of Hardware Products Sold
Cost of hardware products sold increased in conjunction with the growth in hardware sales. The increasewas mainly attributable to higher cost of hardware products sold from our International VSAT segment of $16.9million to $86.3 million for the year ended December 31, 2008 compared to $69.4 million for the same period in2007. The increase was primarily due to the continued rollout of terminal shipments on a new, multi-yearcontract for a large lottery operator in the United Kingdom, partially offset by a decrease in U.S. sourcedshipments to our international enterprise customers.
In addition, cost of hardware products sold from the Telecom System segment increased by $6.3 million to$94.0 million for the year ended December 31, 2008 compared to $87.7 million for the same period in 2007. Theincrease was due to engineering and manufacturing costs related to the design and manufacturing of userterminals and chipset related development, as well as, product costs associated with the sale ofpoint-to-multipoint equipment from the Terrestrial Microwave group.
Cost of hardware products sold from the North America VSAT segment remained flat for 2008 compared to2007. As a result of the commencement of SPACEWAY services and changes in consumer pricing plansimplemented in 2007, cost of hardware products sold from the Consumer group increased slightly. However, theincrease in cost of hardware product sold in the Consumer group was offset by the reduction in cost of hardwareproducts sold in the North America Network Equipment and Service group due to lower hardware revenues.
Selling, General and Administrative (“SG&A”) Expense
Year Ended December 31, Variance
(Dollars in thousands) 2008 2007 Amount %
Selling, general and administrative expense . . . . . . . . $ 177,848 $ 152,051 $ 25,797 17.0%% of revenue . . . . . . . . . . . . . . . . . . . . . . . . . . . . . . . . 16.8% 15.7%
SG&A expense increased primarily due to higher costs of $13.2 million related to a one-time retentionprogram (the “Retention Program”) in connection with the April 22, 2005 transaction between DIRECTV andSkyTerra. Further contributing to the increase in SG&A expense was additional domestic selling, advertising andcustomer service costs of $8.0 million as well as additional SG&A expense from Helius, which we acquired inFebruary 2008. For further discussion of the Retention Program, see Note 19—Long-Term Cash IncentiveRetention Program to the Company’s consolidated financial statements included in Item 8 of this report.
48

Research and Development
Year Ended December 31, Variance
(Dollars in thousands) 2008 2007 Amount %
Research and development . . . . . . . . . . . . . . . . . . . . . . . . $ 26,833 $ 17,036 $ 9,797 57.5%% of revenue . . . . . . . . . . . . . . . . . . . . . . . . . . . . . . . . . . . 2.5% 1.8%
The increase in research and development was primarily due to continued development in our NorthAmerica VSAT segment in connection with our HughesNet and SPACEWAY platforms and from our Heliussubsidiary that we acquired in February 2008.
Amortization of Intangibles
Year Ended December 31, Variance
(Dollars in thousands) 2008 2007 Amount %
Amortization of intangibles . . . . . . . . . . . . . . . . . . . . . . . . $ 6,419 $ 6,144 $ 275 4.5%% of revenue . . . . . . . . . . . . . . . . . . . . . . . . . . . . . . . . . . . . 0.6% 0.6%
Amortization of intangible assets increased due to additional amortization related to the acquisition ofHelius. The increase was partially offset by adjustments to our intangible assets to reflect the reversal ofvaluation allowances associated with our United Kingdom and German subsidiaries. See Note 11—IntangibleAssets, Net to the Company’s consolidated financial statements included in Item 8 of this report.
Operating Income
Year Ended December 31, Variance
(Dollars in thousands) 2008 2007 Amount %
Operating income . . . . . . . . . . . . . . . . . . . . . . . . . . . . . . . $ 64,292 $ 83,636 $ (19,344) (23.1)%% of revenue . . . . . . . . . . . . . . . . . . . . . . . . . . . . . . . . . . . 6.1% 8.6%
The decrease in operating income was attributable to the increase in operating costs associated with theincrease in revenues. In 2008, there were two initiatives related to our operations that did not exist in 2007, whichwere the recognition of $19.6 million of depreciation expense associated with the commencement ofSPACEWAY services in April 2008 and $13.2 million of compensation expense related to the RetentionProgram. Further contributing to higher operating costs was the increase in SG&A and R&D as described above.
Interest Expense
Year Ended December 31, Variance
(Dollars in thousands) 2008 2007 Amount %
Interest expense . . . . . . . . . . . . . . . . . . . . . . . . . . . . . . . . . $ 51,327 $ 43,775 $ 7,552 17.3%
Interest expense primarily relates to interest paid on the $450.0 million unsecured senior notes (the “SeniorNotes”) and the $115.0 million term loan facility (the “Term Loan Facility”) less the capitalized interestassociated with the construction and launch of SPACEWAY 3. The increase in interest expense was due to theinterest capitalization associated with SPACEWAY 3 which was discontinued after the satellite was placed intoservice in April 2008. In addition, interest expense on the Term Loan Facility for 2008 was incurred over a12-month period compared to a 10-month period in 2007. Partially offsetting the increase in interest expense is adecrease in lease interest due to the expiration of leases associated with our North American Equipment andServices Group in 2008.
49

Interest and Other Income, Net
Year Ended December 31, Variance
(Dollars in thousands) 2008 2007 Amount %
Interest income . . . . . . . . . . . . . . . . . . . . . . . . . . . . . . . . . . $ 4,377 $ 9,527 $ (5,150) (54.1)%Other income, net . . . . . . . . . . . . . . . . . . . . . . . . . . . . . . . . 178 242 (64) (26.4)%
Total interest and other income, net . . . . . . . . . . . . . . $ 4,555 $ 9,769 $ (5,214) (53.4)%
The decrease in total interest and other income, net was primarily due to lower average cash balances andlower rates of return for 2008 compared to 2007.
Income Tax Expense
Year Ended December 31, Variance
(Dollars in thousands) 2008 2007 Amount %
Income tax expense . . . . . . . . . . . . . . . . . . . . . . . . . . . . . . . $ 7,593 $ 5,337 $ 2,256 42.3 %
The increase in income tax expense was primarily attributable to increases in income earned from ourforeign subsidiaries and in state income taxes.
Year Ended December 31, 2007 Compared to Year Ended December 31, 2006
Revenues
Year Ended December 31, Variance
(Dollars in thousands) 2007 2006 Amount %
Services . . . . . . . . . . . . . . . . . . . . . . . . . . . . . . . . . . . . . . . . $ 537,688 $ 440,450 $ 97,238 22.1%Hardware sales . . . . . . . . . . . . . . . . . . . . . . . . . . . . . . . . . . 432,960 418,249 14,711 3.5%
Total revenues . . . . . . . . . . . . . . . . . . . . . . . . . . . . . . . $ 970,648 $ 858,699 $ 111,949 13.0%
% of revenue to total revenues:Services . . . . . . . . . . . . . . . . . . . . . . . . . . . . . . . . . . . . 55.4% 51.3%Hardware sales . . . . . . . . . . . . . . . . . . . . . . . . . . . . . . 44.6% 48.7%
Services Revenues
Our services revenue is primarily generated by our North America VSAT segment. The growth in servicesrevenues was attributable to a revenue increase in the Consumer group of $48.8 million to $267.1 million in 2007compared to $218.3 million in 2006, primarily as a result of increases in the subscriber base. At December 31,2007, the total subscriber base increased by approximately 52,400 subscribers to approximately 379,900subscribers compared to 327,500 at December 31, 2006. ARPU increased by 3.3% to $62 for the year endedDecember 31, 2007 from $60 for the year ended December 31, 2006. In addition, services revenue from ourInternational VSAT segment increased by $28.7 million to $109.8 million in 2007 from $81.1 million in 2006,mainly resulting from higher revenues of: (i) $7.9 million from our Brazil operations as the number of sites underservice increased to approximately 7,000 as of December 31, 2007 from approximately 4,700 as of December 31,2006; (ii) $5.3 million from enterprise customers in India; and (iii) $17.3 million from our European operationsas a result of the launch of HUGHESNET® Managed Network Services in late 2006 and the commencement ofservices on a new, multi-year contract for a large lottery operator in the United Kingdom. Partially offsetting theincrease in services revenue from our International VSAT segment was a $1.5 million reduction in U.S. sourceservices provided directly to our international customers. The increase in services revenue was also driven by anincrease in revenue from our Telecom Systems segment of $20.7 million to $23.0 million in 2007 compared to$2.3 million in 2006, which primarily resulted from an increase in design and development engineering servicesprovided by our Telematics group.
50

Hardware Sales
The increase in hardware sales was mainly driven by an increase in hardware sales from our TelecomSystems segment of $27.8 million to $116.5 million in 2007 compared to $88.7 million in 2006. The increaseresulted from higher hardware sales in the Mobile Satellite System group of: (i) $16.2 million in engineeringactivities related to the design and development of a secondary gateway and high-speed packet data network for alarge mobile satellite operator in the United Arab Emirates; (ii) $12.8 million in connection with contracts for thedesign, development and supply of satellite base stations and the integration of ground based beam formingprojects; and (iii) $5.2 million in engineering activities related to a new contract with a mobile satellite operatorfor the design of a terrestrial baseband chipset. Offsetting the increase in hardware sales was a reduction of $6.4million from the Terrestrial Microwave group, primarily due to the completion of a development contract for amajor telecommunications company in 2006.
Offsetting the increase in hardware sales was a reduction in revenue from our North America VSATsegment of $5.8 million to $211.4 million in 2007 compared to $217.2 million in 2006. Despite the growth in thesubscriber base, hardware sales in the Consumer group decreased by $10.0 million to $64.0 million in 2007compared to $74.0 million in 2006, resulting from changes in pricing plans in response to competitive pressures.The decrease in hardware sales was offset by a revenue increase of $4.2 million related to enterprise andgovernment contracts from our North American Enterprise group as a result of successful efforts to develop thismarket.
Further offsetting the increase was a decrease in hardware sales from our International VSAT segment of$7.3 million to $105.0 million in 2007 compared to $112.3 million in 2006. The decrease was primarily due to areduction of $12.4 million in sales to the Latin America region as a result of the completion of terminal deliverieson a large, e-education program in Mexico, offset by a $5.1 million increase in shipments to enterprise andHughesNet Fusion customers in India.
Costs of Revenues
Year Ended December 31, Variance
(Dollars in thousands) 2007 2006 Amount %
Cost of services . . . . . . . . . . . . . . . . . . . . . . . . . . . . . . . . . . . . $ 356,306 $ 309,698 $ 46,608 15.0%Cost of hardware products sold . . . . . . . . . . . . . . . . . . . . . . . . 355,475 327,708 27,767 8.5%
Total cost of revenues . . . . . . . . . . . . . . . . . . . . . . . . . . . $ 711,781 $ 637,406 $ 74,375 11.7%
Services cost as a % of services revenues . . . . . . . . . . . . . . . . 66.3% 70.3%Hardware cost as a % of hardware revenues . . . . . . . . . . . . . . 82.1% 78.4%
Cost of Services
The increase in cost of services resulted from higher costs associated with the growth of the subscriber basein the Consumer group and an increase in bandwidth usage per customer which increased transponder capacitylease expense by $23.8 million in 2007 compared to 2006. In addition, our costs of services increased by:(i) $11.5 million across our international service businesses in Europe, India, and Brazil due to an increase in thenumber of sites under service; (ii) $12.6 million in engineering service costs to support development activitiesprovided to HTI; and (iii) $2.1 million in higher depreciation and amortization expense. Offsetting the increase incost of services was a reduction of $4.0 million associated with the wind-down and completion of theSPACEWAY services agreement with DIRECTV.
51

Cost of Hardware Products Sold
The increase in cost of hardware products sold was mainly due to an increase in costs incurred from ourTelecom Systems segment of $28.1 million to $87.7 million in 2007 compared to $59.6 million in 2006,corresponding with the increase in hardware products sold in 2007. The increase was primarily due to higherengineering and production costs of $30.8 million related to contracts in the Mobile Satellite Systems group,which was offset by a decrease in cost of hardware products sold of $1.9 million in our Terrestrial Microwavegroup.
Offsetting the increase in cost of hardware products sold was a small net reduction of $0.3 million in 2007from our North America and International VSAT segments to $267.8 million in 2007 compared to $268.1 millionin 2006. Total terminals shipped at December 31, 2007 increased by approximately 12,000 terminals toapproximately 295,000 compared to approximately 283,000 terminals at December 31, 2006, resulting in highercost of sales for hardware and higher installation activity and installation support of $3.1 million. Shipments ofour broadband satellite systems in 2007 also increased as the launch of the HUGHES® HX System in late 2006resulted in an increase of 25 Network Operations Centers shipped to small-to-medium-size enterprises in ourInternational Enterprise group. In addition, SFAS No. 86 software amortization costs increased by $1.4 milliondue to additional amortization for software projects previously completed. The increase in cost of hardwareproducts sold were offset by a charge of $10.5 million recorded in June 2006 to reduce the net book value of ournarrowband products to their net realizable value in connection with our decision to shift our primary focusexclusively to the broadband market and a decrease in hardware revenue.
Selling, General and Administrative Expense
Year Ended December 31, Variance
(Dollars in thousands) 2007 2006 Amount %
Selling, general and administrative expense . . . . . . . . . . . . . $ 152,051 $ 139,449 $ 12,602 9.0 %% of revenue . . . . . . . . . . . . . . . . . . . . . . . . . . . . . . . . . . . . . 15.7% 16.2%
SG&A expense increased primarily due to higher costs of $3.8 million related to marketing expense and$3.5 million related to our international subsidiaries. In addition, the increase was also attributable to a $2.8million cost reduction related to the settlement of a purchase commitment for external software services in 2006.
Research and Development
Year Ended December 31, Variance
(Dollars in thousands) 2007 2006 Amount %
Research and development . . . . . . . . . . . . . . . . . . . . . . . . . . $ 17,036 $ 23,058 $ (6,022) (26.1)%% of revenue . . . . . . . . . . . . . . . . . . . . . . . . . . . . . . . . . . . . . 1.8% 2.7%
The decrease in R&D was due to the assignment of engineers to non-R&D activities such as customerfunded programs and to other software projects, which costs are capitalized under SFAS No. 86 or as internallydeveloped software.
Operating Income
Year Ended December 31, Variance
(Dollars in thousands) 2007 2006 Amount %
Operating income . . . . . . . . . . . . . . . . . . . . . . . . . . . . . . . . . $ 83,636 $ 52,642 $ 30,994 58.9 %% of revenue . . . . . . . . . . . . . . . . . . . . . . . . . . . . . . . . . . . . . 8.6% 6.1%
52

Operating income improved as a result of an increase in 2007 revenues of $111.9 million, with gainsprimarily in the Consumer group and the Mobile Satellite Systems group. The increase in revenues was partiallyoffset by higher operating costs of $81.0 million in 2007, primarily attributable to an increase in costs of sales tocorrespond with increase in revenues.
Interest Expense
Year Ended December 31, Variance
(Dollars in thousands) 2007 2006 Amount %
Interest expense . . . . . . . . . . . . . . . . . . . . . . . . . . . . . . . . . . . . $ 43,775 $ 47,791 $ (4,016) (8.4)%
Interest expense primarily relates to the Senior Notes, VSAT hardware financing and various borrowings byour foreign subsidiaries. The decrease in interest expense was attributable to increased capitalization of interestrelated to the increased construction in process associated with the SPACEWAY program in 2007, a prepaymentpenalty associated with the April 2006 refinancing, lower lease interest expense associated with our NorthAmerican Equipment and Services group in 2007 and a loan from Apollo in 2006. Partially offsetting thedecrease in interest expense was higher interest expense due to the incurrence of a full year of interest on theSenior Notes in 2007, the interest on the Term Loan Facility and higher interest costs associated with our foreignsubsidiaries in 2007 compared to the same period in 2006.
Interest and Other Income, Net
Year Ended December 31, Variance
(Dollars in thousands) 2007 2006 Amount %
Interest income . . . . . . . . . . . . . . . . . . . . . . . . . . . . . . . . . . . . . $ 9,527 $ 9,640 $ (113) (1.2)%Other income, net . . . . . . . . . . . . . . . . . . . . . . . . . . . . . . . . . . . 242 2,323 (2,081) (89.6)%
Total interest and other income, net . . . . . . . . . . . . . . . . . $ 9,769 $ 11,963 $ (2,194) (18.3)%
The decrease in total interest and other income, net was primarily due to a reduction in other income, net of$2.1 million, primarily related to a gain in connection with a non-operating settlement of an exchange of equityrelated to an Indian subsidiary in 2006.
Income Tax Expense
Year Ended December 31, Variance
(Dollars in thousands) 2007 2006 Amount %
Income tax expense . . . . . . . . . . . . . . . . . . . . . . . . . . . . . . . $ 5,337 $ 54,110 $ (48,773) (90.1)%
Income tax expense decreased primarily due to the gain on the Distribution and the utilization of thedeferred tax asset recorded as of December 31, 2005. In 2007, our income tax expense was primarily related toincome earned by our international subsidiaries in Brazil, India and Europe and domestic state income taxes.
Liquidity and Capital Resources
Year Ended December 31, 2008 Compared to Year Ended December 31, 2007
Year Ended December 31, Variance
(Dollars in thousands) 2008 2007 Amount %
Net cash provided by (used in):Operating activities . . . . . . . . . . . . . . . . . . . . . . . . . . . . . $ 71,703 $ 93,515 $ (21,812) (23.3)%Investing activities . . . . . . . . . . . . . . . . . . . . . . . . . . . . . $ (88,552) $ (156,670) $ (68,118) (43.5)%Financing activities . . . . . . . . . . . . . . . . . . . . . . . . . . . . . $ 83,201 $ 93,324 $ (10,123) (10.8)%
53

Net Cash Flows from Operating Activities
The decrease in net cash provided by operating activities for the year ended December 31, 2008 wasprimarily due to the decrease in net income of $34.5 million for the year ended December 31, 2008 compared tothe same period in 2007. In addition, changes of $12.1 million in operating assets and liabilities furthercontributed to the decrease in net cash provided by operating activities, primarily related to a one-time retentionprogram. The decrease in net cash provided by operating activities was partially offset by a $23.6 millionincrease in depreciation and amortization expense.
Net Cash Flows from Investing Activities
The decrease in net cash used in investing activities for the year ended December 31, 2008 was primarilydue to a decrease of $151.9 million in capital expenditures, as set forth in the table below. The decrease waspartially offset by the reduction of $72.7 million in investment activities in 2008 and the acquisition of Helius inFebruary 2008.
Capital expenditures for the years ended December 31, 2008 and 2007 are shown as follows (in thousands):
Year Ended December 31,
2008 2007 Variance
Capital expenditures:Other capital expenditures—VSAT . . . . . . . . . . . . . . . . . . . . . . . . . . $ 41,314 $ 30,330 $ 10,984SPACEWAY program . . . . . . . . . . . . . . . . . . . . . . . . . . . . . . . . . . . . 27,211 190,056 (162,845)Capitalized software . . . . . . . . . . . . . . . . . . . . . . . . . . . . . . . . . . . . . 14,564 14,228 336Capital expenditures—other . . . . . . . . . . . . . . . . . . . . . . . . . . . . . . . 11,318 13,566 (2,248)VSAT operating lease hardware . . . . . . . . . . . . . . . . . . . . . . . . . . . . 1,826 - 1,826
Total capital expenditures . . . . . . . . . . . . . . . . . . . . . . . . . . . . . . . $ 96,233 $ 248,180 $ (151,947)
Net Cash Flows from Financing Activities
The decrease in net cash provided by financing activities for the year ended December 31, 2008 was due toa reduction in the level of borrowing activities, mainly related to the borrowing of $115 million under the TermLoan Facility in February 2007. The decrease was partially offset by lower debt repayments of $11.1 million andthe proceeds from our equity offering of $93.0 million.
Year Ended December 31, 2007 Compared to Year Ended December 31, 2006
Year EndedDecember 31, Variance
(Dollars in thousands) 2007 2006 Amount %
Net cash provided by (used in):Operating activities . . . . . . . . . . . . . . . . . . . . . . . . . . . $ 93,515 $ 90,173 $ 3,342 3.7 %Investing activities . . . . . . . . . . . . . . . . . . . . . . . . . . . $ (156,670) $ (173,328) $ (16,658) (9.6)%Financing activities . . . . . . . . . . . . . . . . . . . . . . . . . . . $ 93,324 $ 168,679 $ (75,355) (44.7)%
Net Cash Flows from Operating Activities
The increase in net cash provided by operating activities for the year ended December 31, 2007 wasprimarily due to the increase in net income of $82.7 million for 2007 compared to 2006. The improvement in netcash provided by operating activities was offset by a $2.7 million reduction in depreciation and amortization, a$1.5 million reduction in equity losses from unconsolidated affiliates and a decrease of $78.2 million resultingfrom changes in operating assets and liabilities and deferred income taxes. Additionally, there was a $1.8 millionincrease due to a gain on receipt of investment by a subsidiary in 2006.
54

Net Cash Flows from Investing Activities
The decrease in net cash used in investing activities for the year ended December 31, 2007 was primarilydue to an increase in net sales of marketable securities of $179.9 million, offset by increases in capitalexpenditures, as set forth in the table below, and $12.8 million of cash received, primarily in connection with theJanuary 2006 Transaction.
Capital expenditures for the years ended December 31, 2007 and 2006 are shown as follows (in thousands):
Year Ended December 31,
2007 2006 Variance
Capital expenditures:SPACEWAY program . . . . . . . . . . . . . . . . . . . . . . . . . . . . . . . . . . . . $ 190,056 $ 46,773 $ 143,283Other capital expenditures—VSAT . . . . . . . . . . . . . . . . . . . . . . . . . . 30,330 22,932 7,398Capitalized software . . . . . . . . . . . . . . . . . . . . . . . . . . . . . . . . . . . . . 14,228 16,416 (2,188)Capital expenditures—other . . . . . . . . . . . . . . . . . . . . . . . . . . . . . . . 13,566 7,486 6,080
Total capital expenditures . . . . . . . . . . . . . . . . . . . . . . . . . . . . . $ 248,180 $ 93,607 $ 154,573
Net Cash Flows from Financing Activities
Net cash provided by financing activities for the year ended December 31, 2007 decreased by $75.4 millionprimarily due to a decrease in the level of borrowing activities. For the year ended December 31, 2007, cashprovided from financing activities of $93.3 million was comprised primarily of $115 million under the TermLoan Facility in February 2007 partially offset by debt repayments of $24.8 million. For the year endedDecember 31, 2006 the cash provided from financing activities of $168.7 million was primarily comprised of theproceeds from the issuance of the $450 million Senior Notes and $100 million from the rights offering. Theproceeds were partially offset by debt repayments of $364.9 million primarily related to the repayment of debt onthe $325 million first and second lien loans and payments related to the VSAT hardware financing.
Future Liquidity Requirements
As of December 31, 2008, our Cash and cash equivalents totaled $203.8 million and our total debt was$586.6 million. We are significantly leveraged as a result of debt incurred by HNS and its subsidiaries.
HNS completed an offering in April 2006 of $450 million of 91⁄2% senior notes maturing on April 15, 2014(the “Senior Notes”). The Senior Notes are guaranteed on a senior unsecured basis by each of HNS’ current andfuture domestic subsidiaries that guarantee any of HNS’ indebtedness or indebtedness of HNS’ other subsidiaryguarantors, including the indebtedness under HNS’ secured $50 million revolving credit facility (the “RevolvingCredit Facility”). Interest on the Senior Notes is paid semi-annually in arrears on April 15 and October 15. Theinterest payments on the Senior Notes are estimated to be $42.8 million for each of the years ended December 31,2009 through 2013 and $21.4 million for the year ended December 31, 2014. The Senior Notes are currentlyrated B1 and B by Moody’s and Standard &Poor’s (“S&P”), respectively.
The Revolving Credit Facility matures on April 22, 2011. The Revolving Credit Facility is available forborrowings and for issuance of letters of credit. The interest rate on borrowings under the Revolving CreditFacility, if any, is based on, at HNS’ option, the ABR rate plus 1.50% or LIBOR plus 2.50%. During 2008 and2007, there were no borrowings under the Revolving Credit Facility. The Revolving Credit Facility is guaranteedby, subject to certain exceptions, HNS’ direct and indirect wholly-owned domestic subsidiaries and is secured bysubstantially all of its domestic tangible and intangible assets. For outstanding letters of credit issued under theRevolving Credit Facility, HNS pays a participation fee of 2.50% per annum and an issuance fee of 0.25% perannum. In addition, HNS is charged a commitment fee of 0.50% per annum for any unused portion of the
55

Revolving Credit Facility. At December 31, 2008, HNS has issued letters of credit totaling $10.3 million underthe Revolving Credit Facility. As a result, the available borrowing capacity under the Revolving Credit Facilityas of December 31, 2008 was $39.7 million. The Revolving Credit Facility is currently rated Ba1 and BB- byMoody’s and S&P, respectively.
In February 2007, HNS borrowed $115 million from a syndicate of banks pursuant to a senior unsecuredcredit agreement (the “Term Loan Facility”). The Term Loan Facility is guaranteed, on a senior unsecured basis,by all of HNS’ existing and future subsidiaries that guarantee its existing Senior Notes and Revolving CreditFacility. The interest on the Term Loan Facility is paid quarterly at Adjusted LIBOR (as defined in the TermLoan Facility and the existing Revolving Credit Facility) plus 2.50% per annum. To mitigate the variable interestrate risk associated with the Term Loan Facility, HNS entered into an agreement to swap the Adjusted LIBORfor a fixed rate of 5.12% per annum (the “Swap Agreement”). As a result, the interest rate for the Term LoanFacility at December 31, 2008 was 7.62%. The Term Loan Facility is subject to certain mandatory and optionalprepayment provisions and contains negative covenants and events of default, in each case, substantially similarto those provisions contained in the indenture governing the Senior Notes. The maturity date of the Term LoanFacility is April 15, 2014. The net interest payments based on the Swap Agreement and the Term Loan Facilityare estimated to be approximately $8.8 million for each of the years ended December 31, 2009 through 2013 and$3.3 million for the year ended December 31, 2014. The Term Loan Facility is currently rated B1 and B byMoody’s and S&P, respectively.
The indenture governing the Senior Notes, the agreement governing the amended Revolving Credit Facilityand the agreement governing the Term Loan Facility require HNS to comply with certain covenants: (i) in thecase of the indenture, for so long as any Senior Notes are outstanding; (ii) in the case of the amended RevolvingCredit Facility, so long as the amended Revolving Credit Facility is in effect, and (iii) in the case of the TermLoan Facility, for so long as the Term Loan Facility remains outstanding. Negative covenants contained in theseagreements include limitations on the ability of HNS and/or certain of its subsidiaries to incur additionalindebtedness; issue redeemable stock and subsidiary preferred stock; incur liens; pay dividends or distributions orredeem or repurchase capital stock; prepay, redeem or repurchase debt; make loans and investments; enter intoagreements that restrict distributions from HNS’ subsidiaries; sell assets and capital stock of our subsidiaries;enter into certain transactions with affiliates; consolidate or merge with or into, or sell substantially all of ourassets to, another person; and enter into new lines of business. In addition to these negative covenants, theamended Revolving Credit Facility, the indenture governing the Senior Notes and/or the agreement governing theTerm Loan Facility contain affirmative covenants that require us to: (i) preserve our businesses and properties;(ii) maintain insurance over our assets; (iii) pay and discharge all material taxes when due; and (iv) furnish thelenders’ administrative agent our financial statements for each fiscal quarter and fiscal year, certificates from afinancial officer certifying that no Event of Default or Default has occurred during the fiscal period beingreported, litigation and other notices, compliance with laws, maintenance of records and other such customarycovenants. HNS and its subsidiaries comprise a substantial portion of the Company’s net assets and results ofoperations since January 1, 2006. Because of the negative covenants above, there are certain restrictions on thenet assets of HNS, the consolidated net assets of HNS at December 31, 2008 and 2007 were $229.8 million and$247.5 million, respectively. Management believes that HNS was in compliance with all of its debt covenants atDecember 31, 2008.
HNS’ subsidiaries primarily meet their working capital requirements through their respective operations orlocal credit facilities. Occasionally, the subsidiaries utilize temporary advances to/from HNS to meet temporarycash requirements. HNS’ Indian subsidiary, HCIL, maintains various revolving and term loans funded by localbanks in Indian Rupees. The balances outstanding at December 31, 2008 and 2007 were $2.6 million and $4.2million, respectively. HCIL may be restricted from paying dividends to HNS under the terms of these loans.
The Company and its subsidiaries are separate and distinct legal entities and, except for our existing andfuture subsidiaries that are or will be guarantors of the Senior Notes, the Term Loan Facility and the RevolvingCredit Facility, they will have no obligation, contingent or otherwise, to pay amounts due under the Senior Notesor to make any funds available to pay those amounts, whether by dividend, distribution, loan or other payment.
56

In February 2008, the Company completed the acquisition of Helius, Inc. in connection with the mergeragreement that the Company entered into on December 21, 2007 (the “Merger Agreement”) with Helius, Inc.,Utah Acquisition Corp., a wholly-owned subsidiary of the Company and The Canopy Group, Inc., and CanopyVentures I, L.P., the primary shareholders of Helius, Inc. Pursuant to the Merger Agreement, the Company paid$10.5 million, after certain adjustments, at the closing of the acquisition. Immediately after the acquisition,Helius, Inc. was converted to a limited liability company, Helius, LLC (“Helius”). The Company has a remainingcontractual obligation for contingent consideration of up to $20.0 million (“Contingent Payment”). If Heliusachieves the performance goals as set forth in the Merger Agreement, we are obligated to pay the ContingentPayment in April 2010 as additional purchase price.
On January 9, 2008, we invested an additional $1.5 million in the common equity of Hughes Systique. As aresult, we now own approximately 32% of the outstanding shares of Hughes Systique on an undiluted basis. OnFebruary 8, 2008, the Company and another significant shareholder of Hughes Systique agreed to make availableto Hughes Systique a term loan facility of up to $3.0 million. Under that facility Hughes Systique may makeborrowing requests of at least $1.0 million to be funded equally by the Company and the other shareholder. Theloan bears interest at 6%, payable annually, and is convertible into shares of Hughes Systique upon non-paymentor an event of default. On February 11, 2008, Hughes Systique made a request for an initial draw of $1.0 million,and we funded $0.5 million for our share of the initial draw
On August 8, 2007, we filed a shelf registration statement on Form S-3, as amended on November 15, 2007,to register shares of our common stock, preferred stock, and warrants and debt securities and non-convertibledebt securities of HNS and HNS Finance Corp., as co issuers. In the event HNS issues debt securities pursuant tothe shelf registration statement, we will, and one or more of our other subsidiaries may, on a joint and severalbasis, offer full and unconditional guarantees of HNS’ and HNS Finance Corp.’s obligations under the debtsecurities. On May 21, 2008, the Company made an equity offering to sell 2,000,000 shares of the Company’scommon stock, par value $0.001 per share for a purchase price of $50.00 per share, prior to deducting theunderwriting discounts and commissions. The equity offering closed on May 28, 2008 and as a result, theCompany raised $93.0 million, net of the underwriting discounts, commissions and offering expenses, which willbe used for the acquisition of a satellite or general corporate purposes.
In July 2006, the Company entered into an agreement with 95 West Co., Inc. (“95 West Co.”) and its parent,Miraxis License Holdings, LLC (“MLH”), pursuant to which 95 West Co. and MLH agreed to provide a series ofcoordination agreements allowing the Company to operate SPACEWAY 3 at the 95° West Longitude orbital slotwhere 95 West Co. and MLH have higher priority rights. Our remaining obligations with 95 West Co. atDecember 31, 2008 are subject to conditions in the agreement including our ability to operate SPACEWAY 3,and are as follows: $0.75 million for each of the years ending December 31, 2009 through 2010 and $1.0 millionfor each of the years ending December 31, 2011 through 2016.
Based on our current and anticipated levels of operations and conditions in our markets and industry, webelieve that our cash on hand, cash flow from operations and availability under our Revolving Credit Facility willenable us to meet our requirements for working capital, capital expenditures, debt service, research anddevelopment, remaining ground infrastructure expenditures for SPACEWAY3, new acquisitions, initialmilestone payments for development of a potential new satellite and, to a lesser extent, other on-going capitaland operating expenditures. However, our ability to fund these needs and to comply with the financial covenantsunder our debt agreements depends on our future operating performance and cash flow, which are subject toprevailing economic conditions, the level of spending by our customers and other factors, many of which arebeyond our control. Any future acquisitions, joint ventures, acquisition of a satellite, or other similar transactionswill likely require additional capital and there can be no assurance that any such capital will be available to us onacceptable terms, if at all.
57

Contractual Obligations
The following table summarizes our contractual obligations at December 31, 2008 and the effect suchobligations are expected to have on our liquidity and cash flow in future periods (in thousands):
Due in
2009 2010 2011 2012 2013 Thereafter Total
Senior notes . . . . . . . . . . . . . . . . . $ - $ - $ - $ - $ - $ 450,000 $ 450,000Term loans . . . . . . . . . . . . . . . . . . 206 - - - - 115,000 115,206VSAT hardware financingobligations (1) . . . . . . . . . . . . . . 4,864 3,190 2,667 1,866 315 - 12,902
Orbital slot commitment (2) . . . . . . 750 750 1,000 1,000 1,000 3,000 7,500Revolving loans . . . . . . . . . . . . . . 2,432 - - - - - 2,432Estimated interest payments (3) . . . 52,643 52,221 51,953 51,777 51,651 24,734 284,979Transponder lease obligations . . . 125,050 73,953 30,700 10,569 9,821 24,296 274,389Leases and other commitment . . . 10,729 7,370 5,717 4,618 983 226 29,643Retention Program (4) . . . . . . . . . . 14,100 - - - - - 14,100Due to affiliates . . . . . . . . . . . . . . 1,507 - - - - - 1,507
Total . . . . . . . . . . . . . . . . . . . . . $212,281 $137,484 $92,037 $69,830 $63,770 $ 617,256 $1,192,658
(1) Amount represents our VSAT hardware financing obligations that were funded by third-party financial institutions.(2) Amount represents a commitment to a related party for certain rights in connection with a satellite orbital slot for SPACEWAY 3.(3) Amount includes interest calculated on the Senior Notes, VSAT hardware financing obligations, and the Term Loans Facility.(4) Relates to the Long-Term Cash Incentive Retention Program.
Commitments and Contingencies
For a discussion of commitments and contingencies, see Note 24—Commitments and Contingencies to theCompany’s audited consolidated financial statements included in Item 8 of this report.
Off-Balance Sheet Arrangements
The Company is required to issue standby letters of credit and bonds primarily to support certain sales of itsequipment to international government customers. These letters of credit are either bid bonds to support contractbids, or to support advance payments made by customers upon contract execution and prior to equipment beingshipped, or guarantees of performance issued in support of its warranty obligations. Bid bonds typically expireupon the issue of the award by the customer. Advance payment bonds expire upon receipt by the customer ofequipment, and performance bonds typically expire when the warranty expires, generally one year after theinstallation of the equipment.
As of December 31, 2008, we had $26.4 million of contractual obligations to customers and other statutory/governmental agencies, which were secured by letters of credit issued through us and our subsidiaries’ creditfacilities. Of this amount, $10.3 million were issued under the Revolving Credit Facility; $1.6 million wassecured by restricted cash; $0.9 million related to an insurance bond; and $13.6 million were secured by letters ofcredit issued under credit arrangements available to our Indian and Brazilian subsidiaries. Certain of the letters ofcredit issued by our Indian subsidiaries are secured by those entities’ assets.
58

Seasonality
Like many communications infrastructure equipment vendors, a significant amount of our hardware salesoccur in the second half of the year due to our customers’ annual procurement and budget cycles. Largeenterprises and operators usually allocate their capital expenditure budgets at the beginning of their fiscal year(which often coincides with the calendar year). The typical sales cycle for large complex system procurements is6 to 12 months, which often results in the customer expenditure occurring towards the end of the year. Customersoften seek to expend the budgeted funds prior to the end of the year and the next budget cycle. As a result,interim results are not indicative of the results to be expected for the full year.
Inflation
Historically, inflation has not had a material effect on our results of operations.
Certain Relationships and Related Transactions
For a discussion of related-party transactions, see Note 23—Transactions with Related Parties to theCompany’s audited consolidated financial statements included in Item 8 of this report.
Critical Accounting Policies
Our discussion and analysis of our financial condition and results of operations are based upon ourconsolidated financial statements, which have been prepared in accordance with generally accepted accountingprinciples in the United States. The preparation of these financial statements requires us to make estimates andassumptions that affect the reported amounts of assets and liabilities and the disclosure of contingencies at thedate of the financial statements as well as the reported amounts of revenues and expenses during the reportingperiod. We evaluate these estimates and assumptions on an ongoing basis. The results of these estimates form thebasis for making judgments about the carrying values of assets and liabilities that are not readily apparent fromother sources. Actual results could differ from these estimates under different assumptions and conditions.
Revenue Recognition
Service revenues and hardware sales, excluding lease revenues described below, are recognized whenservices are rendered or products are installed or shipped to third-party installers and as title passes to thosecustomers. In situations where customer offerings represent a bundled arrangement for both services andhardware, revenue elements are separated into their relevant components (services or hardware) for revenuerecognition purposes. The Company offers a rebate to qualifying new consumer subscribers and records areduction in revenue in the same period the related sale occurs based on an estimate of the number of rebates thatwill be redeemed. This estimate is based on historical experience and actual sales during the promotion.
In addition to providing standard product and service offerings, the Company also enters into contracts todesign, develop and deliver telecommunication networks to customers. These contracts for telecommunicationnetworks require significant effort to develop and construct the network, over an extended time period. Revenuesare also earned from long-term contracts for the sale of mobile satellite communications systems. Sales underthese long-term contracts are recognized using the percentage-of-completion (cost-to-cost) method of accounting.Under this method, sales are recorded equivalent to costs incurred plus a portion of the profit expected to berealized, determined based on the ratio of costs incurred to estimated total costs at completion. Profits expectedto be realized on long-term contracts are based on estimates of total sales value and costs at completion. Theseestimates are reviewed and revised periodically throughout the lives of the contracts, and adjustments to profitsresulting from such revisions are recorded in the accounting period in which the revisions are made. Estimatedlosses on contracts are recorded in the period in which they are identified.
59

Business Combinations and Intangible Assets
The Company has participated in several significant transactions since April 2005 which have impacted theCompany’s financial statements. The Company accounts for business combinations in accordance SFASNo. 141, “Business Combinations.” The acquisition of businesses is an element of the Company’s strategy.Under the purchase method, the Company is required to record the net assets acquired at the estimated fair valueat the date of acquisition. The determination of the fair value of the assets acquired and liabilities assumedrequires the Company to make estimates and assumptions that affect the Company’s financial statements.Intangible assets acquired in connection with business combinations which have definite lives are amortized overtheir estimated useful lives. The estimated useful lives are based on estimates of the period during which theassets are expected to generate revenue. Intangible assets with definite lives are tested for impairment wheneverevents or changes in circumstances indicate that the carrying amount of the assets may no longer be recoverable.
Income Taxes
We must make certain estimates and judgments in determining provisions for income taxes. These estimatesand judgments occur in the calculation of tax credits, tax benefits and deductions, and in the calculation of certaintax assets and liabilities, which arise from differences in the timing of recognition of revenue and expense for taxand financial statement purposes.
We assess the recoverability of deferred tax assets at each reporting date and where applicable, record avaluation allowance to reduce the total deferred tax assets to amounts that will, more-likely-than-not, be realizedin the future. Our assessment includes an analysis of whether deferred tax assets will be realized in the ordinarycourse of operations based on the available positive and negative evidence, including the scheduling of deferredtax liabilities and forecasted taxable income from operating activities. The underlying assumptions we use inforecasting future taxable income require significant judgment. In the event that actual taxable income fromoperating activities differs from forecasted amounts, or if we change our estimates of forecasted taxable incomefrom operating activities, we could record additional charges in order to adjust the carrying value of deferred taxassets to their realizable amounts. Such charges could be material to our consolidated results of operations andfinancial position.
We also review our positions taken or that will be taken on the income tax returns for unrecognized taxbenefits, assess whether such unrecognized tax benefits meet the more-likely-than-not threshold, and determinethe need to record a liability in accordance with Financial Accounting Standards Board (“FASB”) InterpretationNo. 48, “Accounting for Uncertainty in Income Taxes,” along with any penalty and interest.
In addition, the calculation of our tax liabilities involves dealing with uncertainties in the application ofcomplex tax regulations, domestically and internationally. We recognize liabilities for anticipated tax audit issuesin the United States and other tax jurisdictions based on our determination of whether, and the extent to which,additional tax assessments are probable and estimable. If we ultimately determine that payment of these amountsis less than we originally expected, we reverse the liability and recognize a tax benefit during the period in whichwe determine that the liability is no longer necessary.
Subscriber Acquisition Costs (“SAC”)
The Company’s Consumer group, included in the North America VSAT segment, offers internet and datanetworking services to consumers and small-medium businesses in North America. The products and services aresold to customers using a variety of competitive service packages, through an extensive independent nationwidenetwork of distributors, dealers, sales agents and retail companies. SAC is an important component of our cost toacquire new consumer subscribers. SAC consists of dealer and customer service representative commissions onnew installations and, in certain cases, the cost of hardware and installation provided to customers at theinception of service or cost of services for activities related to the consumer rental program. SAC is deferred
60

when a customer commits to a service agreement, and the deferred SAC is amortized over the commitmentperiod as the related service revenue is earned. Prior to 2007, service agreements were 12 to 15 months induration. In May 2007, the Company began to offer only 24-month service agreements. Customers who receivehardware and installation under these service agreements have a higher monthly service rate than is charged tocustomers who purchase their equipment outright at the inception of service. The Company monitors therecoverability of subscriber acquisition costs and is entitled to an early termination fee (secured by customercredit card information) if the subscriber cancels service prior to the end of the commitment period. Therecoverability of deferred subscriber acquisition costs is reasonably assured through the increased monthlyservice fee charged to customers, the ability to recover the equipment, and/or the ability to charge an earlytermination fee.
Accounting for the Distribution
The Distribution by SkyTerra was accounted for as a reverse spin-off in accordance with Emerging IssuesTask Force Issue No. 02-11, “Accounting for Reverse Spin-offs”, which provides guidance in situations in whicha transferred business generated substantially all of the transferor’s historical consolidated revenues andconstituted a majority of the book value of the transferor’s assets immediately prior to the spin-off. Further, weaccounted for the Distribution as a non-monetary transaction in accordance with Accounting PronouncementBulletin No. 29, “Accounting for Non-Monetary Transactions” resulting in transfer of the net assets at theirhistorical basis as of the date of the transfer.
New Accounting Pronouncements
For a discussion of new accounting pronouncements, see Note 3—Basis of Presentation and Summary ofSignificant Accounting Policies to the Company’s audited consolidated financial statements included in Item 8 ofthis report.
61

Item 7A. Quantitative and Qualitative Disclosures about Market Risk
The following discussion and the estimated amounts generated from the sensitivity analyses referred tobelow include forward-looking statements of market risk which assume for analytical purposes that certainadverse market conditions may occur. Actual future market conditions may differ materially from suchassumptions because the amounts noted below are the result of analyses used for the purpose of assessingpossible risks and the mitigation thereof. Accordingly, you should not consider the forward-looking statements asprojections by us of future events or losses.
General
The Company’s cash flows and earnings are subject to fluctuations resulting from changes in foreigncurrency exchange rates, interest rates and changes in the market value of its equity investments. The Companymanages its exposure to those market risks through internally established policies and procedures and, whendeemed appropriate, through the use of derivative financial instruments. The Company enters into derivativeinstruments only to the extent considered necessary to meet its risk management objectives and does not enterinto derivative contracts for speculative purposes.
Foreign Currency Risk
The Company generally conducts its business in United States dollars. However, as its internationalbusiness is conducted in a variety of foreign currencies, it is exposed to fluctuations in foreign currency exchangerates. The Company’s objective in managing its exposure to foreign currency changes is to reduce earnings andcash flow volatility associated with foreign exchange rate fluctuations. Accordingly, we may enter into foreignexchange contracts to mitigate risks associated with foreign currency denominated assets, liabilities,commitments and anticipated foreign currency transactions. At December 31, 2008, the Company and its foreignsubsidiaries had an estimated $18.5 million of foreign currency denominated receivables and payablesoutstanding, of which $9.0 million had hedge contracts in place to partially mitigate foreign currency risk. Of the$18.5 million, $3.0 million is denominated in Euros, $15.0 million is in U.S. dollars and $0.5 million is in DanishKroner. The differences between the face amount of the foreign exchange contracts and their estimated fairvalues were not material at December 31, 2008. The impact of a hypothetical 10% adverse change in exchangerates on the fair value of foreign currency denominated assets and liabilities would be an estimated loss of $6.8million as of December 31, 2008.
Marketable Securities Risk
We have established an investment policy which governs our investment strategy and stipulates that wediversify investments among United States Treasury securities and other high credit quality debt instruments thatwe believe to be low risk. The Company is averse to principal loss and seeks to preserve its invested funds bylimiting default risk and market risk. As a result of the current adverse market conditions, we preserve our cashvalue by holding it in money market funds invested in the U.S. Government Treasury and Agency Securities. AtDecember 31, 2008, we did not have any investment in marketable securities.
Interest Rate Risk
The Senior Notes issued on April 13, 2006 and outstanding borrowings related to very small apertureterminal hardware financing arrangements are not subject to interest rate fluctuations because the interest rate isfixed for the term of the instrument. The Company is subject to variable interest rates on certain other debtincluding the secured $50 million revolving credit facility (the “Revolving Credit Facility”). To the extent thatthe Company draws against the credit facility, increases in interest rates would have an adverse impact on theCompany’s results of operations. Additionally, the Company is subject to variable interest rates on the $115.0million term loan facility (the “Term Loan Facility”), which closed in February 2007. The interest on the TermLoan Facility was at Adjusted LIBOR (as defined in the Term Loan Facility and existing Revolving CreditFacility) plus 2.50% per annum.
62

To mitigate the variable interest rate risk associated with the Term Loan Facility, the Company entered intothe Swap Agreement with Bear Stearns Capital Markets, Inc. (“Bear Stearns”), which was acquired byJ.P.Morgan Chase & Co. (“JPM”) in May 2008, to swap the Adjusted LIBOR for a fixed interest rate of5.12% per annum. The Swap Agreement is effective February 28, 2007 and has a termination date of April 15,2014, which is the maturity date of the Term Loan Facility. As a result, the interest rate for the Term LoanFacility at December 31, 2008 was 7.62%. The net interest payments based on the Swap Agreement and theTerm Loan Facility are paid quarterly and are estimated to be approximately $8.8 million for each of the yearsended December 31, 2009 through 2013 and $3.3 million for the year ended December 31, 2014. The security forour interest obligation to JPM under the Swap Agreement is the same as the security for the Revolving CreditFacility described in Note 14 to the Company’s audited consolidated financial statements included in Item 8 inthis report.
Market Concentration and Credit Risk
The Company provides services and extends credit to a number of communications equipment customers,service providers, and a large number of consumers, both in the United States and around the world. TheCompany monitors its exposure to credit losses and maintains, as necessary, allowances for anticipated losses.No single customer accounted for more than 5% of total annual revenues in any of the periods presented.Financial instruments which potentially subject the Company to a concentration of credit risk consist of cash,cash equivalents and marketable investments. Although the Company maintains cash balances at financialinstitutions that exceed federally insured limits, these balances are placed with high credit quality financialinstitutions.
Commodity Price Risk
All of our products contain components whose base raw materials have undergone dramatic costfluctuations in the last 24 months. Fluctuations in pricing of raw materials have the ability to affect our productcosts. Although we have been successful in offsetting or mitigating our exposure to these fluctuations, suchchanges could have an adverse impact on our product costs. We are unable to predict the possible impact ofchanges in commodity prices.
63

Item 8. Financial Statements and Supplementary Data
REPORT OF INDEPENDENT REGISTERED PUBLIC ACCOUNTING FIRM
To the Board of Directors and Stockholders ofHughes Communications, Inc.Germantown, Maryland
We have audited the accompanying consolidated balance sheets of Hughes Communications, Inc. andsubsidiaries (the “Company”) as of December 31, 2008 and 2007, and the related consolidated statements ofoperations, changes in stockholders’ equity, and cash flows for each of the three years in the period endedDecember 31, 2008. Our audits also included Schedule II listed in the Index at Item 15. We also have audited theCompany’s internal control over financial reporting as of December 31, 2008, based on criteria established inInternal Control—Integrated Framework issued by the Committee of Sponsoring Organizations of the TreadwayCommission. The Company’s management is responsible for these financial statements and financial statementschedules, for maintaining effective internal control over financial reporting, and for its assessment of theeffectiveness of internal control over financial reporting, included in the accompanying Management Report onInternal Control Over Financial Reporting. Our responsibility is to express an opinion on these financialstatements and financial statement schedules and an opinion on the Company’s internal control over financialreporting based on our audits.
We conducted our audits in accordance with the standards of the Public Company Accounting OversightBoard (United States). Those standards require that we plan and perform the audit to obtain reasonable assuranceabout whether the financial statements are free of material misstatement and whether effective internal controlover financial reporting was maintained in all material respects. Our audits of the financial statements includedexamining, on a test basis, evidence supporting the amounts and disclosures in the financial statements, assessingthe accounting principles used and significant estimates made by management, and evaluating the overallfinancial statement presentation. Our audit of internal control over financial reporting included obtaining anunderstanding of internal control over financial reporting, assessing the risk that a material weakness exists,testing and evaluating the design and operating effectiveness of internal control based on the assessed risk. Ouraudits also included performing such other procedures as we considered necessary in the circumstances. Webelieve that our audits provide a reasonable basis for our opinions.
A company’s internal control over financial reporting is a process designed by, or under the supervision of,the company’s principal executive and principal financial officers, or persons performing similar functions, andeffected by the company’s board of directors, management, and other personnel to provide reasonable assuranceregarding the reliability of financial reporting and the preparation of financial statements for external purposes inaccordance with generally accepted accounting principles. A company’s internal control over financial reportingincludes those policies and procedures that (1) pertain to the maintenance of records that, in reasonable detail,accurately and fairly reflect the transactions and dispositions of the assets of the company; (2) provide reasonableassurance that transactions are recorded as necessary to permit preparation of financial statements in accordancewith generally accepted accounting principles and that receipts and expenditures of the company are being madeonly in accordance with authorizations of management and directors of the company; and (3) provide reasonableassurance regarding prevention or timely detection of unauthorized acquisition, use, or disposition of thecompany’s assets that could have a material effect on the financial statements.
Because of the inherent limitations of internal control over financial reporting, including the possibility ofcollusion or improper management override of controls, material misstatements due to error or fraud may not beprevented or detected on a timely basis. Also, projections of any evaluation of the effectiveness of the internalcontrol over financial reporting to future periods are subject to the risk that the controls may become inadequatebecause of changes in conditions, or that the degree of compliance with the policies or procedures maydeteriorate.
64

In our opinion, the consolidated financial statements referred to above present fairly, in all material respects,the financial position of Hughes Communications, Inc. and subsidiaries as of December 31, 2008 and 2007, andthe results of their operations and their cash flows for each of the three years in the period ended December 31,2008, in conformity with accounting principles generally accepted in the United States of America. Also, in ouropinion, such financial statement schedules, when considered in relation to the basic consolidated financialstatements taken as a whole, present fairly, in all material respects, the information set forth therein. Also, in ouropinion, the Company maintained, in all material respects, effective internal control over financial reporting as ofDecember 31, 2008, based on the criteria established in Internal Control—Integrated Framework issued by theCommittee of Sponsoring Organizations of the Treadway Commission.
/s/ Deloitte & Touche LLP
Baltimore, MarylandMarch 4, 2009
65

HUGHES COMMUNICATIONS, INC.
CONSOLIDATED BALANCE SHEETS(Dollars in thousands, except per share amounts)
December 31,
2008 2007
ASSETSCurrent assets:Cash and cash equivalents . . . . . . . . . . . . . . . . . . . . . . . . . . . . . . . . . . . . . . . . . . . . . . $ 203,816 $ 134,092Marketable securities . . . . . . . . . . . . . . . . . . . . . . . . . . . . . . . . . . . . . . . . . . . . . . . . . - 17,307Receivables, net . . . . . . . . . . . . . . . . . . . . . . . . . . . . . . . . . . . . . . . . . . . . . . . . . . . . . . 200,373 209,943Inventories . . . . . . . . . . . . . . . . . . . . . . . . . . . . . . . . . . . . . . . . . . . . . . . . . . . . . . . . . . 65,485 65,754Prepaid expenses and other . . . . . . . . . . . . . . . . . . . . . . . . . . . . . . . . . . . . . . . . . . . . . 20,926 43,720
Total current assets . . . . . . . . . . . . . . . . . . . . . . . . . . . . . . . . . . . . . . . . . . . . . . . 490,600 470,816Property, net . . . . . . . . . . . . . . . . . . . . . . . . . . . . . . . . . . . . . . . . . . . . . . . . . . . . . . . . . . 507,270 479,976Capitalized software costs, net . . . . . . . . . . . . . . . . . . . . . . . . . . . . . . . . . . . . . . . . . . . . 51,454 47,582Intangible assets, net . . . . . . . . . . . . . . . . . . . . . . . . . . . . . . . . . . . . . . . . . . . . . . . . . . . . 19,780 22,513Goodwill . . . . . . . . . . . . . . . . . . . . . . . . . . . . . . . . . . . . . . . . . . . . . . . . . . . . . . . . . . . . . 2,661 -Other assets . . . . . . . . . . . . . . . . . . . . . . . . . . . . . . . . . . . . . . . . . . . . . . . . . . . . . . . . . . . 118,628 108,950
Total assets . . . . . . . . . . . . . . . . . . . . . . . . . . . . . . . . . . . . . . . . . . . . . . . . . . . . . $1,190,393 $1,129,837
LIABILITIES AND STOCKHOLDERS’ EQUITYCurrent liabilities:Accounts payable . . . . . . . . . . . . . . . . . . . . . . . . . . . . . . . . . . . . . . . . . . . . . . . . . . . . $ 82,939 $ 72,440Short-term debt . . . . . . . . . . . . . . . . . . . . . . . . . . . . . . . . . . . . . . . . . . . . . . . . . . . . . . 8,252 14,795Accrued liabilities . . . . . . . . . . . . . . . . . . . . . . . . . . . . . . . . . . . . . . . . . . . . . . . . . . . . 157,534 177,932Due to affiliates . . . . . . . . . . . . . . . . . . . . . . . . . . . . . . . . . . . . . . . . . . . . . . . . . . . . . . 1,507 12,621
Total current liabilities . . . . . . . . . . . . . . . . . . . . . . . . . . . . . . . . . . . . . . . . . . . . 250,232 277,788Long-term debt . . . . . . . . . . . . . . . . . . . . . . . . . . . . . . . . . . . . . . . . . . . . . . . . . . . . . . . . 578,298 577,761Other long-term liabilities . . . . . . . . . . . . . . . . . . . . . . . . . . . . . . . . . . . . . . . . . . . . . . . . 18,005 6,526
Total liabilities . . . . . . . . . . . . . . . . . . . . . . . . . . . . . . . . . . . . . . . . . . . . . . . . . . 846,535 862,075
Commitments and contingencies
Minority interests . . . . . . . . . . . . . . . . . . . . . . . . . . . . . . . . . . . . . . . . . . . . . . . . . . . . . . 5,711 5,401
Stockholders’ Equity:Preferred stock, $0.001 par value; 1,000,000 shares authorized and no shares issuedand outstanding as of December 31, 2008 and 2007 . . . . . . . . . . . . . . . . . . . . . . . . - -
Common stock, $0.001 par value; 64,000,000 shares authorized; 21,514,963 sharesand 19,195,972 shares issued and outstanding as of December 31, 2008 and2007, respectively . . . . . . . . . . . . . . . . . . . . . . . . . . . . . . . . . . . . . . . . . . . . . . . . . . 22 19
Additional paid in capital . . . . . . . . . . . . . . . . . . . . . . . . . . . . . . . . . . . . . . . . . . . . . . 724,558 631,300Accumulated deficit . . . . . . . . . . . . . . . . . . . . . . . . . . . . . . . . . . . . . . . . . . . . . . . . . . (357,850) (366,868)Accumulated other comprehensive gain (loss):Foreign currency translation adjustments . . . . . . . . . . . . . . . . . . . . . . . . . . . . . . . . (11,212) 3,305Unrealized loss on hedging instruments . . . . . . . . . . . . . . . . . . . . . . . . . . . . . . . . . (17,403) (5,482)Unrealized gain on securities . . . . . . . . . . . . . . . . . . . . . . . . . . . . . . . . . . . . . . . . . 32 87
Total stockholders’ equity . . . . . . . . . . . . . . . . . . . . . . . . . . . . . . . . . . . . . . . . . . 338,147 262,361
Total liabilities and stockholders’ equity . . . . . . . . . . . . . . . . . . . . . . . . . . . . . . $1,190,393 $1,129,837
See accompanying Notes to the Consolidated Financial Statements.
66

HUGHES COMMUNICATIONS, INC.
CONSOLIDATED STATEMENTS OF OPERATIONS(Dollars in thousands, except per share amounts)
Year Ended December 31,
2008 2007 2006
Revenues:Services . . . . . . . . . . . . . . . . . . . . . . . . . . . . . . . . . . . . . . . . . . . . . . $ 611,247 $ 537,688 $ 440,450Hardware sales . . . . . . . . . . . . . . . . . . . . . . . . . . . . . . . . . . . . . . . . 449,106 432,960 418,249
Total revenues . . . . . . . . . . . . . . . . . . . . . . . . . . . . . . . . . . . . . . . 1,060,353 970,648 858,699
Operating costs and expenses:Cost of services . . . . . . . . . . . . . . . . . . . . . . . . . . . . . . . . . . . . . . . . 406,697 356,306 309,698Cost of hardware products sold . . . . . . . . . . . . . . . . . . . . . . . . . . . . 378,264 355,475 327,708Selling, general and administrative . . . . . . . . . . . . . . . . . . . . . . . . . 177,848 152,051 139,449Research and development . . . . . . . . . . . . . . . . . . . . . . . . . . . . . . . 26,833 17,036 23,058Amortization of intangibles . . . . . . . . . . . . . . . . . . . . . . . . . . . . . . . 6,419 6,144 6,144
Total operating costs and expenses . . . . . . . . . . . . . . . . . . . . . . . 996,061 887,012 806,057
Operating income . . . . . . . . . . . . . . . . . . . . . . . . . . . . . . . . . . . . . . . . 64,292 83,636 52,642Other income (expense):Interest expense . . . . . . . . . . . . . . . . . . . . . . . . . . . . . . . . . . . . . . . . (51,327) (43,775) (47,791)Interest income . . . . . . . . . . . . . . . . . . . . . . . . . . . . . . . . . . . . . . . . 4,377 9,527 9,640Other income, net . . . . . . . . . . . . . . . . . . . . . . . . . . . . . . . . . . . . . . 178 242 2,323
Income before income tax expense; equity in losses ofunconsolidated affiliates; minority interests in net (earnings)losses of subsidiaries; and discontinued operations . . . . . . . . 17,520 49,630 16,814
Income tax expense . . . . . . . . . . . . . . . . . . . . . . . . . . . . . . . . . . . . . . . (7,593) (5,337) (54,110)Equity in losses of unconsolidated affiliates . . . . . . . . . . . . . . . . . . . . (599) (640) (2,132)Minority interests in net (earnings) losses of subsidiaries . . . . . . . . . (310) (113) 118
Income (loss) from continuing operations . . . . . . . . . . . . . . . . . . . . . 9,018 43,540 (39,310)Discontinued operations:Loss from discontinued operations . . . . . . . . . . . . . . . . . . . . . . . . . - - (43)Gain on sale of discontinued operations . . . . . . . . . . . . . . . . . . . . . - - 240
Net income (loss) . . . . . . . . . . . . . . . . . . . . . . . . . . . . . . . . . . . . . . . . 9,018 43,540 (39,113)Cumulative dividends and accretion of convertible preferred stockto liquidation value . . . . . . . . . . . . . . . . . . . . . . . . . . . . . . . . . . . . . - - (1,454)
Net income (loss) attributable to common stockholders . . . . . . . . . $ 9,018 $ 43,540 $ (40,567)
Basic net earnings (loss) per common share:Continuing operations . . . . . . . . . . . . . . . . . . . . . . . . . . . . . . . . . . . $ 0.44 $ 2.31 $ (2.44)Discontinued operations . . . . . . . . . . . . . . . . . . . . . . . . . . . . . . . . . - - 0.01
Basic net earnings (loss) per common share . . . . . . . . . . . . . . . . $ 0.44 $ 2.31 $ (2.43)
Diluted net earnings (loss) per common share:Continuing operations . . . . . . . . . . . . . . . . . . . . . . . . . . . . . . . . . . . $ 0.44 $ 2.26 $ (2.44)Discontinued operations . . . . . . . . . . . . . . . . . . . . . . . . . . . . . . . . . - - 0.01
Diluted net earnings (loss) per common share . . . . . . . . . . . . . . $ 0.44 $ 2.26 $ (2.43)
Basic weighted average common shares outstanding . . . . . . . . . . . . . 20,317,155 18,860,517 16,668,591Diluted weighted average common shares outstanding . . . . . . . . . . . 20,633,833 19,227,919 16,668,591
See accompanying Notes to the Consolidated Financial Statements.
67

HUGHESCOMMUNIC
ATIO
NS,
INC.
CONSO
LID
ATEDST
ATEMENTSOFCHANGESIN
STOCKHOLDERS’
EQUIT
Y(D
ollars
inthou
sand
s,except
pershaream
ounts)
VotingCom
mon
Stock
($.001
parvalue)
Non
-Voting
Com
mon
Stock
($.01pa
rvalue)
Add
itiona
lPaid-In
Cap
ital
Accum
ulated
Other
Com
prehensive
Income(Loss)
Accum
ulated
Deficit
Total
Stockh
olders’
(Deficit)
Equ
ity
Com
prehensive
Income(Loss)
Balan
ceat
Janu
ary1,2006
..........
..$
4$
45$
473,737
$(4,106)$
(371,295)$
98,385
Netloss
.............................
(39,113)
(39,113)
$(39,113)
Issuance
ofcommon
stockin
connectio
nwith
theDistribution.................
11-
(11)
--
Issuance
ofcommon
stockin
connectio
nwith
therightsoffering
...............
8-
99,992
-100,000
Issuance
ofcommon
stockthroughexercise
ofstockoptio
ns.....................
--
909
-909
Issuance
ofSk
yTerra
Com
munications,Inc.
common
stockpriorto
Distribution.....
--
1,300
-1,300
SkyT
erra
stock-basedcompensation
......
--
76-
76Mobile
SatelliteVenturesLPstock-based
compensation
......................
--
633
-633
Stock-basedcompensation..............
--
3,011
-3,011
Spin-offfrom
SkyT
erra
................
(4)
(45)
48,737
106
-48,794
Dividends
onandaccretionof
convertib
lepreferredstock
.....................
--
(1,454)
--
(1,454)
Repurchaseof
minority
interestin
acompany
subsidiary
.................
--
(3)
--
(3)
Other
comprehensive
income:
Foreigncurrency
translation
adjustments
......................
2,833
2,833
2,833
Unrealized
gain
onsecurities..........
1818
18
Balan
ceat
Decem
ber31,2006........
..$
19$
-$
626,927
$(1,149)$
(410,408)$
215,389
$(36,262)
SeeaccompanyingNotes
totheConsolid
ated
FinancialS
tatements
68

HUGHESCOMMUNIC
ATIO
NS,
INC.
CONSO
LID
ATEDST
ATEMENTSOFCHANGESIN
STOCKHOLDERS’
EQUIT
Y(C
ontinu
ed)
(Dollars
inthou
sand
s,except
pershaream
ounts)
VotingCom
mon
Stock
($.001
parvalue)
Non
-Voting
Com
mon
Stock
($.01pa
rvalue)
Add
itiona
lPaid-In
Cap
ital
Accum
ulated
Other
Com
prehensive
Income(Loss)
Accum
ulated
Deficit
Total
Stockh
olders’
(Deficit)
Equ
ity
Com
prehensive
Income(Loss)
Balan
ceat
Decem
ber31,2006........
...$
19$
-$
626,927$
(1,149)$
(410,408)$
215,389
Netincome...........................
43,540
43,540
$43,540
Issuance
ofcommon
stockthroughexercise
ofstockoptio
ns.....................
--
113
-113
Stock-basedcompensation...............
--
4,260
-4,260
Other
comprehensive
income(loss):
Foreigncurrency
translation
adjustments.......................
4,452
4,452
4,452
Reclassificationof
hedginginstruments
..(252)
(252)
(252)
Unrealized
loss
onhedginginstruments
..(5,230)
(5,230)
(5,230)
Unrealized
gain
onsecurities...........
8989
89
Balan
ceat
Decem
ber31,2007........
...$
19$
-$
631,300$
(2,090)$
(366,868)$
262,361$
42,599
Netincome........................
...
9,018
9,018$
9,018
Issuance
ofcommon
stockin
connectio
nwith
equity
offering
..................
2-
93,044
-93,046
Issuance
ofcommon
stockthroughexercise
ofstockoptio
ns.....................
--
75-
75Issuance
ofrestricted
stockaw
ards
........
1-
--
1Retirem
ento
frestricted
stock
............
--
(6,032)
-(6,032)
Shared-based
compensation..............
--
5,724
-5,724
Other
................................
--
447
-447
Other
comprehensive
income(loss):
Foreigncurrency
translation
adjustments.......................
(14,517)
(14,517)
(14,517)
Reclassificationof
hedginginstruments
..2,010
2,010
2,010
Unrealized
loss
onhedginginstruments
..(13,931)
(13,931)
(13,931)
Unrealized
gain
onsecurities...........
(55)
(55)
(55)
Balan
ceat
Decem
ber31,2008........
...$
22$
-$
724,558$
(28,583)
$(357,850)$
338,147$
(17,475)
SeeaccompanyingNotes
totheConsolid
ated
FinancialS
tatements
69

HUGHES COMMUNICATIONS, INC.
CONSOLIDATED STATEMENTS OF CASH FLOWS(In thousands)
Year Ended December 31,
2008 2007 2006
Cash flows from operating activities:Net income (loss) . . . . . . . . . . . . . . . . . . . . . . . . . . . . . . . . . . . . . . . . . . . . . $ 9,018 $ 43,540 $ (39,113)Adjustments to reconcile net income (loss) to cash flows from operatingactivities:Loss on discontinued operations . . . . . . . . . . . . . . . . . . . . . . . . . . . . . . . - - 43Depreciation and amortization . . . . . . . . . . . . . . . . . . . . . . . . . . . . . . . . . 68,937 45,860 48,459Amortization of debt issuance costs . . . . . . . . . . . . . . . . . . . . . . . . . . . . . 1,424 906 1,056Equity plan compensation expense . . . . . . . . . . . . . . . . . . . . . . . . . . . . . 5,724 4,260 3,720Minority interests . . . . . . . . . . . . . . . . . . . . . . . . . . . . . . . . . . . . . . . . . . . 310 113 (118)Equity in losses from unconsolidated affiliates . . . . . . . . . . . . . . . . . . . . 599 640 2,132Gain on receipt of investment by subsidiary . . . . . . . . . . . . . . . . . . . . . . - - (1,788)Other . . . . . . . . . . . . . . . . . . . . . . . . . . . . . . . . . . . . . . . . . . . . . . . . . . . . . (97) 340 (222)
Change in other operating assets and liabilities, net of acquisition:Receivables, net . . . . . . . . . . . . . . . . . . . . . . . . . . . . . . . . . . . . . . . . . . . . (2,540) (23,270) 24,599Inventories . . . . . . . . . . . . . . . . . . . . . . . . . . . . . . . . . . . . . . . . . . . . . . . . (2,710) (3,708) 11,894Prepaid expenses and other . . . . . . . . . . . . . . . . . . . . . . . . . . . . . . . . . . . (9,319) (10,442) 56,609Accounts payable . . . . . . . . . . . . . . . . . . . . . . . . . . . . . . . . . . . . . . . . . . . 6,314 14,100 (11,675)Accrued liabilities and other . . . . . . . . . . . . . . . . . . . . . . . . . . . . . . . . . . (5,957) 21,176 (5,413)
Net cash provided by continuing operations . . . . . . . . . . . . . . . . . . . . . . . . . . 71,703 93,515 90,183Net cash used in discontinued operations . . . . . . . . . . . . . . . . . . . . . . . . . . . . - - (10)
Net cash provided by operating activities . . . . . . . . . . . . . . . . . . . . . . . . . . . . 71,703 93,515 90,173
Cash flows from investing activities:Acquisition of Hughes Network Systems, LLC, net of cash received . . . . . - - 12,753Change in restricted cash . . . . . . . . . . . . . . . . . . . . . . . . . . . . . . . . . . . . . . . 3,104 1,168 (2,883)Purchases of marketable securities . . . . . . . . . . . . . . . . . . . . . . . . . . . . . . . . (2,070) (32,864) (90,112)Proceeds from sales of marketable securities . . . . . . . . . . . . . . . . . . . . . . . . 19,190 122,690 -Expenditures for property . . . . . . . . . . . . . . . . . . . . . . . . . . . . . . . . . . . . . . (81,669) (233,952) (77,191)Expenditures for capitalized software . . . . . . . . . . . . . . . . . . . . . . . . . . . . . (14,564) (14,228) (16,416)Proceeds from sale of property . . . . . . . . . . . . . . . . . . . . . . . . . . . . . . . . . . - 516 521Acquisition of Helius, Inc., net of cash received . . . . . . . . . . . . . . . . . . . . . (10,543) - -Additional equity investment in Hughes Systique Corporation . . . . . . . . . . (1,500) - -Hughes Systique Corporation note receivables . . . . . . . . . . . . . . . . . . . . . . (500) - -
Net cash used in investing activities . . . . . . . . . . . . . . . . . . . . . . . . . . . . . . . . $(88,552) $(156,670) $(173,328)
See accompanying Notes to the Consolidated Financial Statements.
70

HUGHES COMMUNICATIONS, INC.
CONSOLIDATED STATEMENTS OF CASH FLOWS (Continued)(In thousands)
Year Ended December 31,
2008 2007 2006
Cash flows from financing activities:Net increase (decrease) in notes and loans payable . . . . . . . . . . . . . . $ 223 $ 376 $ (1,609)Debt borrowings from Apollo . . . . . . . . . . . . . . . . . . . . . . . . . . . . . . - - 100,000Debt repayments to Apollo . . . . . . . . . . . . . . . . . . . . . . . . . . . . . . . . - - (100,000)Proceeds from rights offering . . . . . . . . . . . . . . . . . . . . . . . . . . . . . . . - - 100,000Distribution to SkyTerra Communications, Inc. . . . . . . . . . . . . . . . . - - (9,314)Payment of dividends on preferred stock . . . . . . . . . . . . . . . . . . . . . . - - (1,394)Proceeds from equity offering . . . . . . . . . . . . . . . . . . . . . . . . . . . . . . 94,500 - -Equity offering related costs . . . . . . . . . . . . . . . . . . . . . . . . . . . . . . . (1,454) - -Proceeds from exercise of stock options . . . . . . . . . . . . . . . . . . . . . . 75 113 2,206Long-term debt borrowings . . . . . . . . . . . . . . . . . . . . . . . . . . . . . . . . 3,606 119,731 455,330Repayment of long-term debt . . . . . . . . . . . . . . . . . . . . . . . . . . . . . . . (13,749) (24,843) (364,872)Debt issuance costs . . . . . . . . . . . . . . . . . . . . . . . . . . . . . . . . . . . . . . . - (2,053) (11,668)
Net cash provided by financing activities . . . . . . . . . . . . . . . . . . . . . . . 83,201 93,324 168,679
Effect of exchange rate changes on cash and cash equivalents . . . . . . . 3,372 (3,010) (555)
Net increase in cash and cash equivalents . . . . . . . . . . . . . . . . . . . . . . . 69,724 27,159 84,969Cash and cash equivalents at beginning of the period . . . . . . . . . . . . . . 134,092 106,933 21,964
Cash and cash equivalents at end of the period . . . . . . . . . . . . . . . . . . . $ 203,816 $ 134,092 $ 106,933
Supplemental cash flow information:Cash paid for interest . . . . . . . . . . . . . . . . . . . . . . . . . . . . . . . . . . . . . $ 54,138 $ 53,594 $ 41,464Cash paid for income taxes . . . . . . . . . . . . . . . . . . . . . . . . . . . . . . . . $ 3,622 $ 3,567 $ 6,578
Supplemental non-cash disclosures related to:95 West capital lease . . . . . . . . . . . . . . . . . . . . . . . . . . . . . . . . . . . . . $ 5,751Acquisition by Hughes Communications, Inc.: . . . . . . . . . . . . . . . . .Increase in assets . . . . . . . . . . . . . . . . . . . . . . . . . . . . . . . . . . . . . . $ 51,471Increase in liabilities . . . . . . . . . . . . . . . . . . . . . . . . . . . . . . . . . . . 40,118
Increase in net assets . . . . . . . . . . . . . . . . . . . . . . . . . . . . . . . $ 11,353
See accompanying Notes to the Consolidated Financial Statements.
71

HUGHES COMMUNICATIONS, INC.
NOTES TO THE CONSOLIDATED FINANCIAL STATEMENTS
Note 1: Organization
Hughes Communications, Inc. (“HCI” and, together with its consolidated subsidiaries, the “Company” or“we”) was formed as a Delaware corporation, then a wholly-owned subsidiary of SkyTerra Communications, Inc.(“SkyTerra”), on June 23, 2005. The Company is a publicly-traded company, and its stock trades on the NationalAssociation of Securities Dealers Automated Quotations System—Global Selected Market (“NASDAQ”) underthe symbol “HUGH.” The Company operates its business primarily through its wholly-owned subsidiary, HughesNetwork Systems, LLC (“HNS”), a telecommunications company. Through a series of transactions from 2005 to2008, we acquired the businesses that we owned as of December 31, 2008. An overview of those transactions isas follows:
• On April 22, 2005, SkyTerra acquired 50% of HNS’ voting, or Class A membership interests (the“April 2005 Transaction”) from DTV Network Systems, Inc. (“DTV Networks”), a wholly-ownedsubsidiary of The DIRECTV Group, Inc. (“DIRECTV”).
• On October 12, 2005, the Company acquired Series A Preferred Shares from Hughes SystiqueCorporation (“Hughes Systique”). On January 9, 2008, the Company invested an additional $1.5million in the common equity of Hughes Systique. As a result, the Company owns approximately31.8% of the outstanding shares of Hughes Systique, on an undiluted basis, at December 31, 2008.
• On December 31, 2005, pursuant to a separation agreement between the Company and SkyTerra (the“Separation Agreement”), SkyTerra contributed to the Company the following:
- its 50% ownership of HNS’ voting, or Class A, membership interests;
- its interests in: i) AfriHUB LLC (“AfriHUB”), a discontinued business; ii) Electronic SystemProducts, Inc. (“ESP”); and iii) certain minority investments; and
- cash and short-term investments.
• On January 1, 2006, the Company completed the purchase of the remaining 50% of HNS’ Class Amembership interests for $100.0 million (the “January 2006 Transaction”).To finance the January2006 Transaction, we borrowed $100.0 million from certain of SkyTerra’s controlling stockholders,various investment vehicles that are affiliated with Apollo Management, L.P. (together with itsaffiliates, “Apollo”). The loan was repaid in March 2006 following the completion of a rightsoffering conducted by us. As a result of the January 2006 Transaction, we own 100% of HNS’Class A membership interests, and our consolidated financial statements for periods beginning on orafter January 1, 2006 include the results of HNS and its controlled, majority-owned subsidiaries.
• On February 21, 2006, SkyTerra distributed all of our outstanding common stock to SkyTerra’scommon, non-voting common and preferred stockholders and its Series 1-A and 2-A warrant holders(the “Distribution”). As the result, SkyTerra was separated into two publicly traded companies:SkyTerra and HCI. Accordingly, SkyTerra no longer owns any of our capital stock, and Apollo,SkyTerra’s controlling stockholder at the time of the Distribution, became our controlling stockholder.
Notwithstanding the legal form of the Distribution, we are treated as the “accounting successor” toSkyTerra for financial reporting purposes. This accounting is required because, among other things,(i) the businesses transferred to us generated all of SkyTerra’s historical consolidated revenues andconstituted a majority of the book value of SkyTerra’s assets immediately preceding the Distribution,and (ii) the businesses transferred to us included SkyTerra’s discontinued operating subsidiaries andall of the assets and liabilities relating to such subsidiaries. The Company’s results for periodsbeginning on and after January 1, 2006, the date on which the Company completed the January 2006Transaction, include the results of the business and assets retained by SkyTerra through the date ofthe Distribution and reflect HNS’ results of operations.
72

HUGHES COMMUNICATIONS, INC.
NOTES TO THE CONSOLIDATED FINANCIAL STATEMENTS (Continued)
• On March 27, 2006, we completed our rights offering, pursuant to which we issued 7,843,141 sharesof our common stock to our stockholders at a subscription price of $12.75 per share. In connectionwith the rights offering, we received proceeds of $100.0 million, of which $68.4 million was receivedfrom Apollo.
Note 2: Description of Business
We are a telecommunications company that primarily provides satellite based communications services andequipment that utilize very small aperture terminals (“VSAT”) to distribute signals via satellite as a means ofconnecting participants in private and shared data networks. VSAT networks are typically used by enterpriseswith a large number of geographically dispersed locations to provide reliable, scalable, and cost-effectiveapplications, such as credit card verification, inventory tracking and control, and broadcast video. Our broadbandsatellite network services and systems are provided to the international and domestic enterprise markets, and oursatellite Internet access is provided to North American consumers, which we refer to as the Consumer market.We also provide managed services to enterprises that combine the use of satellite and terrestrial alternatives, thusoffering solutions that are tailored and cost optimized to the specific customer requirements.
In addition, we provide networking systems solutions to customers for mobile satellite, telematics andwireless backhaul systems. These services are generally provided on a contract or project basis and may involvethe use of proprietary products engineered by us.
Note 3: Basis of Presentation and Summary of Significant Accounting Policies
Basis of Presentation
The accompanying financial statements have been prepared in accordance with generally acceptedaccounting principles in the United States of America (“GAAP”) and include the assets, liabilities, results ofoperations and cash flows of the Company, including its domestic and foreign subsidiaries that are more than50% owned or for which the Company is deemed to be the primary beneficiary as defined by FinancialAccounting Standards Board (“FASB”) Interpretation No. (“FIN”) 46R, “Consolidation of Variable InterestEntities”. Entities in which the Company holds at least 20% ownership or in which there are other indicators ofsignificant influence are generally accounted for by the equity method, whereby the Company records itsproportionate share of the subsidiary’s results of operations. Entities in which the Company holds less than 20%ownership and does not have the ability to exercise significant influence are generally carried at cost.
All intercompany balances and transactions with subsidiaries and other consolidated entities have beeneliminated.
Use of Estimates in the Preparation of the Consolidated Financial Statements
The preparation of the consolidated financial statements in accordance with GAAP requires management tomake estimates and assumptions that affect reported amounts of assets and liabilities, disclosure of contingentassets and liabilities, and the reported amounts of revenues and expenses. Management bases its estimates andassumptions on historical experience and on various other factors that are believed to be reasonable under thecircumstances. Due to the inherent uncertainty involved in making estimates, actual results reported in futureperiods may be affected by changes in those estimates.
73

HUGHES COMMUNICATIONS, INC.
NOTES TO THE CONSOLIDATED FINANCIAL STATEMENTS (Continued)
Market Concentrations and Credit Risk
The Company provides services and extends credit to a number of communications equipment customers,service providers, and a large number of consumers, both in the United States and around the world. TheCompany monitors its exposure to credit losses and maintains, as necessary, allowances for anticipated losses.No single customer accounted for more than 5% of total annual revenues in any of the periods presented in thisreport. Financial instruments which potentially subject the Company to a concentration of credit risk consist ofcash, cash equivalents, and short-term investments. Although the Company maintains cash balances at financialinstitutions that exceed federally insured limits, these balances are placed with high credit quality financialinstitutions.
Revenue Recognition
Service revenues and hardware sales, excluding lease revenues described below, are recognized whenservices are rendered or products are installed or shipped to third-party installers and as title passes to thosecustomers. In situations where customer offerings represent a bundled arrangement for both services andhardware, revenue elements are separated into their relevant components (services or hardware) for revenuerecognition purposes. The Company offers a rebate to qualifying new consumer subscribers and records areduction in revenue in the same period in which the related sale occurs based on an estimate of the number ofrebates that will be redeemed. This estimate is based on historical experience and actual sales during thepromotion. In September 2008, the Company began to offer our consumer customers the option to rent theequipment with a 24-month service contract. Once the initial contract ends, it becomes a month-to-monthcontract. Revenue on the rental equipment is recognized on a monthly basis until the customers terminates theircontracts with us.
Revenue is also earned from long-term contracts for the sale of mobile satellite communications systems.Sales under these long-term contracts are recognized using the percentage-of-completion (cost-to-cost) method ofaccounting. Under this method, sales are recorded equivalent to costs incurred plus a portion of the profitexpected to be realized, based on the ratio of costs incurred to estimated total costs at completion. Profitsexpected to be realized on long-term contracts are based on estimates of total sale values and costs at completion.These estimates are reviewed and revised periodically throughout the lives of the contracts, and adjustments toprofits resulting from such revisions are recorded in the accounting period in which the revisions are made.Estimated losses on contracts are recorded in the period in which they are identified.
Income Taxes
Deferred tax assets and liabilities are recognized for the future tax consequences attributable to differencesbetween the financial statement carrying amounts of existing assets and liabilities and their respective tax basesand for operating loss and tax credit carryforwards. Deferred tax assets and liabilities are measured using enactedtax rates expected to be applied to taxable income in the years in which those temporary differences are expectedto be recovered or settled. The effect on deferred tax assets and liabilities of a change in tax rates is recognized inincome in the period that includes the enactment date. Under the terms of the agreement entered into inconnection with the April 2005 Transaction, DIRECTV retains the tax benefits from the net operating lossesgenerated by DTV Networks and has responsibility for all of the pre-closing domestic and international incometax liabilities of DTV Networks. We have recorded a liability in the balance sheet for the estimated amount wemay be required to pay to DIRECTV resulting from prepaid taxes exceeding tax liabilities as of April 22, 2005.
We record net deferred tax assets to the extent we believe these assets will more-likely-than-not be realized.In making such determination, we consider all available positive and negative evidence, including scheduled
74

HUGHES COMMUNICATIONS, INC.
NOTES TO THE CONSOLIDATED FINANCIAL STATEMENTS (Continued)
reversals of deferred tax liabilities, projected future taxable income, tax planning strategies and recent financialoperations. In the event we were to determine that we would be able to realize our deferred income tax assets inthe future in excess of their net recorded amount, we would make an adjustment to the valuation allowance whichmay reduce the provision for income taxes.
In July 2006, the FASB issued FIN 48, “Accounting for Uncertainty in Income Taxes,” which clarifies theaccounting for uncertainty in income taxes recognized in the financial statements in accordance with Statementof Financial Accounting Standards (“SFAS”) No. 109, “Accounting for Income Taxes.” FIN 48 provides that atax benefit from an uncertain tax position may be recognized when it is more-likely-than-not that the positionwill be sustained upon examination, including resolutions of any related appeals or litigation processes, based onthe technical merits.
Income tax positions must meet a more-likely-than-not recognition threshold at the effective date to berecognized upon the adoption of FIN 48 and in subsequent periods. This interpretation also provides guidance onmeasurement, derecognition, classification, interest and penalties, accounting in interim periods, disclosure andtransition. FIN 48 is effective for fiscal years beginning after December 15, 2006. The Company adopted theprovisions of FIN 48 on January 1, 2007. As a result of the implementation of FIN 48, the Company identified an$8.7 million unrecognized tax benefits related to tax positions in prior periods. The Company recognizes interestaccrued related to unrecognized tax benefits in operating expenses and penalties in income tax expense in theconsolidated statements of operations.
On January 1, 2009, the Company implemented SFAS No. 141(R), which amends the requirements of SFASNo. 109. As a result, the Company may have adjustments to tax expense in lieu of recording an adjustment forvaluation allowance to intangible assets recognized in connection with earlier business combinations.
Cash and Cash Equivalents
The Company considers all highly liquid investments with original maturities of ninety days or less at thedate of investment to be cash equivalents.
Restricted Cash
Cash subject to restrictions expiring within one year is included in Prepaid expenses and other in theaccompanying Consolidated Balance Sheets. Cash subject to restrictions expiring beyond one year is included inOther assets in the accompanying Consolidated Balance Sheets. At December 31, 2008 and 2007, the Companyhad $1.7 million and $4.8 million of restricted cash, respectively, which secures certain letters of credit at HNS.Restrictions on the cash relating to letters of credit will be released as the letters of credit expire through July2015.
Marketable Securities
The Company classifies all debt securities with original maturities exceeding ninety days asavailable-for-sale investments in accordance with SFAS No. 115, “Accounting for Certain Investments in Debtand Equity Securities.” Securities classified as available-for-sale securities are carried at fair value with therelated unrealized gains and losses reported as a component of accumulated other comprehensive income (loss).Fair value is based on quoted market prices as of the reporting date. The book value of these securities is adjustedfor amortization or accretion of premium and discounts method over the contractual lives of the securities, whichis included in Interest income in the accompanying Consolidated Statements of Operations.
75

HUGHES COMMUNICATIONS, INC.
NOTES TO THE CONSOLIDATED FINANCIAL STATEMENTS (Continued)
The Company had no investments classified as trading or held-to-maturity at December 31, 2007 and noinvestments at December 31, 2008.
Property and Depreciation
Property and equipment are carried at cost and depreciated or amortized on a straight-line basis over theirestimated useful lives, generally three to thirty years. In conjunction with the January 2006 Transaction, theCompany revalued all of its assets held at January 1, 2006 in accordance with SFAS No. 141 “BusinessCombinations”, and the historical bases of those assets were adjusted to their estimated fair market value.Depreciation is generally computed using the straight-line method over the estimated useful lives of the assets.Land is carried at cost, and land improvements are depreciated over ten years. Buildings are depreciated overthirty years. Leasehold improvements are amortized over the lesser of their estimated useful lives or lease term.
A significant component of our property and equipment is the capitalized costs associated with theSPACEWAY program, which includes costs associated with the construction of the satellite, launch services,insurance premiums for the satellite launch and the in-orbit testing period, capitalized interest incurred during theconstruction of the satellite, and other costs directly related to the satellite. Capitalized satellite costs aredepreciated on a straight-line basis over the estimated useful life of 15 years. The Company periodically reviews,at least annually, the remaining estimated useful life of the satellite to determine if revisions to the estimated lifeare necessary.
Capitalized Software Costs
Software development costs are capitalized in accordance with SFAS No. 86, “Accounting for the Costs ofComputer Software to be Sold, Leased, or Otherwise Marketed.” Capitalized software development costs areamortized using the straight-line method over their estimated useful lives, not in excess of five years. Softwareprogram reviews are conducted at least annually, or as events and circumstances warrant such a review, to ensurethat capitalized software development costs are not impaired and that costs associated with programs that are nolonger generating revenue are expensed. Amortization of software development costs was $11.3 million, $8.3million and $6.2 million for the years ended December 31, 2008, 2007 and 2006, respectively.
Intangible Assets
Intangible assets acquired in connection with business combinations which have definite lives are amortizedover their estimated useful lives. Intangible assets include backlog, customer relationships, patented technology,and trademarks. Intangible assets are amortized on a straight-line basis over their estimated useful lives that areas follows:
Life (Years)
Backlog . . . . . . . . . . . . . . . . . . . . . . . . . . . . . . . . . . . . . . . . . . . . . . 4Customer relationships . . . . . . . . . . . . . . . . . . . . . . . . . . . . . . . . . . 8Patented technology . . . . . . . . . . . . . . . . . . . . . . . . . . . . . . . . . . . . 8Trademarks . . . . . . . . . . . . . . . . . . . . . . . . . . . . . . . . . . . . . . . . . . . 2 - 10
Goodwill
Goodwill is the excess of purchase price over the fair value of identified net assets of businesses acquired.Goodwill is accounted for under SFAS No. 142, “Goodwill and Other Intangible Assets.” Under the provisions
76

HUGHES COMMUNICATIONS, INC.
NOTES TO THE CONSOLIDATED FINANCIAL STATEMENTS (Continued)
of this statement, the Company’s goodwill is tested for impairment on an annual basis during the fourth quarter,or earlier if events and circumstances occur indicating that goodwill might be impaired. During the year endedDecember 31, 2008, the Company did not recognize any impairment charges.
Debt Issuance Costs
Debt issuance costs are amortized based upon the lives of the associated debt obligations using the effectiveinterest method with such amortization included in Interest expense in the accompanying ConsolidatedStatements of Operations. For the years ended December 31, 2008, 2007 and 2006, we amortized $1.4 million,$0.9 million and $1.1 million, respectively, of debt issuance costs related to the senior notes and term loans. AtDecember 31, 2008 and 2007, the Company had $10.3 million and $11.7 million, respectively, of unamortizeddebt issuance costs included in Other assets in the accompanying Consolidated Balance Sheets.
Subscriber Acquisition Costs (“SAC”)
SAC is an important component of our costs to acquire new consumer subscribers. SAC consists of costspaid to third-party dealers and customer service representative commissions on new installations and, in certaincases, the cost of hardware and installation provided to customers at the inception of service or cost of servicesfor activities related to the consumer rental program, which we began to offer to our consumer customers inSeptember 2008. SAC is deferred when a customer commits to a service agreement, and the deferred SAC isamortized over the commitment period as the related service revenue is earned. Prior to 2007, service agreementswere 12 to 15 months in duration. In May 2007, the Company began to offer only 24 month service agreements.Customers who receive hardware and installation under these service agreements have a higher monthly servicerate than is charged to customers who purchase their equipment outright at the inception of service. TheCompany monitors the recoverability of subscriber acquisition costs and is entitled to an early termination fee(secured by customer credit card information) if the subscriber cancels service prior to the end of thecommitment period. The recoverability of deferred subscriber acquisition costs is reasonably assured through theincreased monthly service fee charged to customers, the ability to recover the equipment, and/or the ability tocharge an early termination fee. At December 31, 2008 and 2007, the Company had $43.4 million and $28.6million of deferred SAC, respectively, included in Other assets in the accompanying Consolidated BalanceSheets.
Valuation of Long-Lived Assets
The Company evaluates the carrying value of long-lived assets to be held and used annually or when eventsand circumstances warrant such a review. The carrying value of a long-lived asset is considered impaired whenthe carrying value of the asset exceeds the aggregate amount of its separately identifiable undiscounted futurecash flows. In that event, a loss is recognized based on the amount by which the carrying value exceeds the fairvalue of the long-lived asset. Changes in estimates of future cash flows could result in a write-down of long-livedassets in a future period.
Foreign Currency
Certain foreign operations have determined the local currency to be their functional currency. Accordingly,these foreign entities translate assets and liabilities from their local currencies to U.S. dollars using period-endexchange rates while income and expense accounts are translated at the average rates in effect during the period.The resulting translation adjustment is recorded in accumulated other comprehensive income (loss) (“OCI”), aseparate component of equity. Translation adjustments for foreign currency denominated equity investments arenot material and are recorded as part of OCI.
77

HUGHES COMMUNICATIONS, INC.
NOTES TO THE CONSOLIDATED FINANCIAL STATEMENTS (Continued)
The Company also has foreign operations where the U.S. dollar has been determined as the functionalcurrency. Gains and losses resulting from remeasurement of the foreign currency denominated assets, liabilitiesand transactions into the U.S. dollar are recognized currently in the statements of operations and were notmaterial in each of the periods presented herein.
Investments and Financial Instruments
The Company maintains investments in equity securities of unaffiliated companies, and such investmentsare included in Other assets in the accompanying Consolidated Balance Sheets. Non-marketable equity securitiesare carried at cost. Marketable equity securities are considered available-for-sale and carried at fair value basedon quoted market prices with unrealized gains or losses (excluding other-than-temporary losses), reported as partof OCI. The Company continually reviews its investments to determine whether a decline in fair value below thecost basis is “other-than-temporary.” The Company considers, among other factors: the magnitude and durationof the decline; the financial health and business outlook of the investee, including industry and sectorperformance, changes in technology, and operational and financing cash flow factors; and the Company’s intentand ability to hold the investment. If the decline in fair value is judged to be other-than-temporary, the cost basisof the security is written down to fair value, and the amount is recognized in the statements of operations in otherincome (expense) and recorded as a reclassification adjustment from OCI.
Investments in which the Company owns at least 20% of the voting securities or has significant influenceare accounted for under the equity method of accounting. Equity method investments are recorded at cost andadjusted for the appropriate share of the net earnings or losses of the investee. The carrying value of investmentsmay include a component of goodwill if the cost of our investment exceeds the fair value of the investment, andany such goodwill is subject to an evaluation for impairment pursuant to Accounting Pronouncement BulletinNo. 18—”The Equity Method of Accounting for Investments in Common Stock.” Investee losses are recorded upto the amount of the investment plus advances and loans made to the investee, and financial guarantees made onbehalf of the investee. In certain instances, this can result in the Company recognizing investee earnings or lossesin excess of its ownership percentage.
At December 31, 2008 and 2007, we have equity investments of $10.8 million and $9.9 million,respectively, which include Escort Motors Ltd. and Hughes Systique. At December 31, 2008 and 2007, we havecost basis investments of $2.6 million and $2.9 million, respectively, which include Data Synapse, Inc., EdmundsHoldings, Inc., Mainstream Data, Inc., and Comat Technologies Ltd.
We recognized a net loss of $0.6 million for each of the years ended December 31, 2008, 2007 and 2006 forour proportionate share of Hughes Systique’s results of operations.
The carrying value of cash and cash equivalents; receivables, net; other assets; accounts payable; andamounts included in accrued liabilities and other liabilities meeting the definition of a financial instrument anddebt approximate fair value at December 31, 2008 and 2007.
The Company carries all derivative financial instruments in the balance sheets at fair value based on quotedmarket prices. The Company uses derivative contracts to minimize the financial impact of changes in the fairvalue of recognized assets, liabilities, and unrecognized firm commitments, or the variability of cash flowsassociated with forecasted transactions in accordance with internal risk management policies. Changes in fairvalue of designated, qualified, and effective fair value hedges are recognized in earnings as offsets to the changesin fair value of the related hedged items. Changes in fair value of designated, qualified, and effective cash flowhedges are deferred and recorded as a component of OCI until the hedged transactions occur and are recognized
78

HUGHES COMMUNICATIONS, INC.
NOTES TO THE CONSOLIDATED FINANCIAL STATEMENTS (Continued)
in earnings. Changes related to amounts excluded from the effectiveness assessment of a hedging derivative’schange in fair value and the ineffective portion of a hedge is immediately recognized in the statements ofoperations. Both at the inception of the hedge and on an on-going basis, we assess whether the derivatives arehighly effective. Hedge accounting is prospectively discontinued when hedge instruments are no longer highlyeffective. During each of the periods presented herein there were no material hedge transactions.
The Company enters into interest rate swaps from time to time to manage its interest rate exposure. Thesederivatives may be designated as cash flow hedges or fair value hedges depending on the nature of the risk beinghedged. Derivatives used to hedge risk associated with changes in the fair value of certain fixed rate debtobligations are designated as fair value hedges. Consequently, changes in the fair value of the hedged debtobligations that are attributable to the hedged risk are recognized in the current period earnings.
The Company’s cash flows and earnings are subject to fluctuations resulting from changes in foreigncurrency exchange rates, interest rates, and changes in the market value of its equity investments. We manage ourexposure to these market risks through internally established policies and procedures and, when deemedappropriate, through the use of derivative financial instruments. We enter into derivative instruments only to theextent considered necessary to meet our risk management objectives and do not enter into derivative contracts forspeculative purposes.
The Company generally conducts its business in U.S. dollars with some business conducted in a variety offoreign currencies and, therefore, is exposed to fluctuations in foreign currency exchange rates. Our objective inmanaging our exposure to foreign currency changes is to reduce earnings and cash flow volatility associated withforeign exchange rate fluctuations. Accordingly, we enter into foreign exchange contracts to mitigate risksassociated with foreign currency denominated assets, liabilities, commitments and anticipated foreign currencytransactions. The gains and losses on derivative foreign exchange contracts offset changes in the value of therelated exposures. As of December 31, 2008 and 2007, we had purchased foreign exchange contracts totaling$9.0 million and $3.7 million, respectively, to mitigate foreign currency fluctuation risks associated with short-term U.S. dollar denominated obligations. The differences between the face amount of the foreign exchangecontracts and their estimated fair values were not material at December 31, 2008. All of the forward exchangecontracts outstanding at December 31, 2008 expire in 2009.
The Company is exposed to credit risk in the event of non-performance by the counterparties to itsderivative financial instrument contracts. While the Company believes this risk is remote, credit risk is managedthrough the periodic monitoring and approval of financially sound counterparties.
Net Earnings (Loss) Per Common Share
Basic net earnings (loss) per common share is computed by dividing net income (loss) attributable to thecommon stockholders by the weighted average number of common shares outstanding. Diluted net earnings(loss) per common share reflects the potential dilution from the exercise or conversion of securities into theCompany’s common stock. However, in accordance with SFAS 128, “Earnings per Share,” potential commonshares have been excluded from the computation of any diluted per share amount in periods when a loss fromcontinuing operations exists. The potential dilutive effect of outstanding stock options and warrants is calculatedusing the “treasury stock” method. The Company excluded 547,400 stock options that were granted in 2008 fromthe computation of diluted net earnings (loss) per common share, as the effect would have been anti-dilutive.
For the purpose of computing weighted average common shares outstanding, SkyTerra’s outstanding sharesthrough the date of the Distribution were converted into equivalent shares of the Company stock by multiplyingSkyTerra’s outstanding shares by the exchange ratio used in the Distribution, which was one-half share ofCompany stock for each share of SkyTerra stock.
79

HUGHES COMMUNICATIONS, INC.
NOTES TO THE CONSOLIDATED FINANCIAL STATEMENTS (Continued)
The following table provides a reconciliation of the shares used in calculating earnings (loss) per commonshare:
Year Ended December 31,
2008 2007 2006
Basic weighted average common shares outstanding . . . . . . . . . . . . . . . . 20,317,155 18,860,517 16,668,591Effect of dilutive securities:Restricted stock units . . . . . . . . . . . . . . . . . . . . . . . . . . . . . . . . . . . . . . 51,070 121,344 -Restricted stock awards . . . . . . . . . . . . . . . . . . . . . . . . . . . . . . . . . . . . . 201,829 178,936 -Options to purchase common stock . . . . . . . . . . . . . . . . . . . . . . . . . . . 63,779 67,122 -
Diluted weighted average common shares outstanding . . . . . . . . . . 20,633,833 19,227,919 16,668,591
New Accounting Pronouncements
In December 2008, the FASB issued FASB Staff Position (“FSP”) No. FAS 140-4 and FIN 46(R)-8 (“FSPNo. FAS 140-4 and FIN 46R-8”), “Disclosures by Public Entities (Enterprises) about Transfers of FinancialAssets and Interests in Variable Interest Entities.” FAS 140-4 and FIN 46R-8 amends SFAS No. 140,“Accounting for Transfers and Servicing of Financial Assets and Extinguishment of Liabilities” and FINNo. 46(R) to require public entities to provide additional disclosures about transfers of financial assets and theirinvolvement with variable interest entities. This FSP is effective for the first reporting period ending afterDecember 15, 2008. The Company adopted this FSP and provided additional required disclosure relating to ourinvolvement with variable interest entities in Note 23—Transactions with Related Parties.
In October 2008, the FASB issued FSP 157-3, “Determining the Fair Value of a Financial Asset When theMarket for That Asset Is Not Active.” FSP 157-3 clarifies the application of SFAS No. 157 in a market that is notactive and addresses application issues such as the use of internal assumptions when relevant observable datadoes not exist, the use of observable market information when the market is not active and the use of marketquotes when assessing the relevance of observable and unobservable data. FSP 157-3 is effective for all periodspresented in accordance with SFAS No. 157. The guidance in FSP 157-3 is effective immediately and did nothave an impact on the Company’s disclosure. See Note 16—Fair Value for information and related disclosuresregarding our fair value measurements.
In March 2008, the FASB issued SFAS No. 161, “Disclosures about Derivative Instruments and HedgingActivities—an amendment of SFAS No. 133.” This Statement, among other things, requires entities to providemore transparent disclosure for derivative instruments and for hedging activities. SFAS No. 161 is effective forfinancial statements issued for fiscal years and interim periods beginning after November 15, 2008. TheCompany has not yet adopted SFAS No. 161 but does not expect it to have a material impact on its disclosuresabout derivative instruments and hedging activities.
In February 2008, the FASB issued FSP No. 157-2, “Effective Date of FASB Statement No. 157,” whichdelays the effective date of SFAS No. 157, “Fair Value Measurements,” for non-financial assets and liabilities tofiscal years beginning after November 15, 2008. With this deferral, the Company has not applied the provisionsof SFAS No. 157 to goodwill and intangible assets. The Company does not expect the adoption of SFAS No. 157for non-financial assets and liabilities to have a material impact on our consolidated results of operations,financial position, or cash flow.
In December 2007, the FASB issued SFAS No. 141(R), “Business Combinations, a revision of SFASNo. 141”. SFAS No. 141(R) establishes principles and requirements for how the acquirer of a business
80

HUGHES COMMUNICATIONS, INC.
NOTES TO THE CONSOLIDATED FINANCIAL STATEMENTS (Continued)
recognizes and measures in its financial statements the identifiable assets acquired, the liabilities assumed, andany noncontrolling interest in the acquiree. The statement also provides guidance for recognizing and measuringthe goodwill acquired in the business combination and determines what information to disclose to enable users ofthe financial statements to evaluate the nature and financial effects of the business combination. SFASNo. 141(R) is effective for financial statements issued for fiscal years beginning after December 15, 2008.Accordingly, any business combinations we engaged in prior to January 1, 2009 have been completed inaccordance with SFAS No. 141.
In December 2007, the FASB issued SFAS No. 160, “Noncontrolling Interests in Consolidated FinancialStatements—an amendment of Accounting Research Bulletin No. 51.” The objective of SFAS No. 160 is toimprove the relevance, comparability, and transparency of the financial information that a reporting entityprovides in its consolidated financial statements. This Statement applies to all entities that prepare consolidatedfinancial statements, except not-for-profit organizations, but will affect only those entities that have anoutstanding noncontrolling interest in one or more subsidiaries or that deconsolidate a subsidiary. The Companydoes not expect the adoption of SFAS No. 160 to have a material impact on its consolidated results of operations,financial position, or cash flow.
Note 4: Acquisition of Hughes Network Systems, LLC
In April 2005, SkyTerra completed its acquisition of 50% of the Class A membership interests of HNS fromDTV Networks, a wholly-owned subsidiary of DIRECTV, for $50.0 million in cash and 300,000 shares ofSkyTerra’s common stock. The acquisition occurred pursuant to an agreement among SkyTerra, DIRECTV,DTV Networks and HNS, dated December 3, 2004, as amended. Immediately prior to the acquisition, DTVNetworks contributed substantially all of the assets and certain liabilities of its very small aperture terminal,mobile satellite and terrestrial microwave businesses, as well as certain portions of its SPACEWAY Ka-bandsatellite communications platform, to HNS, which at the time was a wholly-owned subsidiary of DTV Networks.In consideration for the contribution of assets by DTV Networks, HNS paid DTV Networks approximately$200.7 million of cash. On December 31, 2005, SkyTerra contributed to the Company its 50% Class Amembership interest in HNS.
Concurrent with the April 2005 Transaction, HNS incurred $325.0 million of term indebtedness andobtained a $50.0 million revolving credit facility. The Company and DTV Networks each pledged theirrespective membership interests of HNS to secure the obligations of HNS under the term indebtedness. Theindebtedness was otherwise non-recourse to the Company or DTV Networks. On April 13, 2006, the termindebtedness was repaid with a portion of the proceeds of HNS’ offering of $450.0 million of 91⁄2% senior notesdue in 2014. See Note 14—Short-term and Long-term Debt for further discussion.
Through December 31, 2005, the Company accounted for its interest in HNS under the equity method inaccordance with FIN 46R, as HNS was a variable interest entity as defined in FIN 46R and the Company was notthe primary beneficiary as defined in FIN 46R. Accordingly, the Company recorded its proportionate share of thenet income of HNS, subject to certain adjustments. These adjustments related primarily to the amortization of theexcess of the Company’s proportionate share of HNS’ net assets over the Company’s carrying amount on thedate of transaction. This excess was being amortized over the remaining useful life of certain HNS long-livedassets on a straight line basis.
Management determined the fair value considering a number of factors. The excess of the fair value of thenet assets acquired over the amount paid of approximately $369.0 million has been reflected as a reduction of fairvalue, on a pro rata basis, of long lived assets in accordance with SFAS No. 141.
81

HUGHES COMMUNICATIONS, INC.
NOTES TO THE CONSOLIDATED FINANCIAL STATEMENTS (Continued)
The Company’s basis that was allocated to HNS’ net assets was determined as follows (in thousands):
Amount
Cash consideration ($50,000 paid in April 2005, $100,000 paid in January 2006) . . . . . . . . . . . . . . . $ 150,000Equity consideration (300,000 shares of SkyTerra at $17.20 per share) . . . . . . . . . . . . . . . . . . . . . . . 5,160Direct acquisition costs . . . . . . . . . . . . . . . . . . . . . . . . . . . . . . . . . . . . . . . . . . . . . . . . . . . . . . . . . . . . 663HCI equity in earnings of HNS following the April 2005 Transaction throughDecember 31, 2005 . . . . . . . . . . . . . . . . . . . . . . . . . . . . . . . . . . . . . . . . . . . . . . . . . . . . . . . . . . . . . 20,122
Total . . . . . . . . . . . . . . . . . . . . . . . . . . . . . . . . . . . . . . . . . . . . . . . . . . . . . . . . . . . . . . . . . . . . . . . . . $ 175,945
The fair values of the assets acquired, less the excess of fair value over acquisition cost, and liabilitiesassumed as of January 1, 2006, are summarized as follows (in thousands):
Fair MarketValue of Net
Assets
Allocation ofNegativeGoodwill
AdjustedNet Assets
Current assets . . . . . . . . . . . . . . . . . . . . . . . . . . . . . . . . . . . . . . . . . . $ 448,710 $ - $ 448,710Property, net . . . . . . . . . . . . . . . . . . . . . . . . . . . . . . . . . . . . . . . . . . . 565,762 (295,080) 270,682Other assets . . . . . . . . . . . . . . . . . . . . . . . . . . . . . . . . . . . . . . . . . . . 162,566 (73,963) 88,603
Total assets . . . . . . . . . . . . . . . . . . . . . . . . . . . . . . . . . . . . . . . . . . 1,177,038 (369,043) 807,995
Current liabilities . . . . . . . . . . . . . . . . . . . . . . . . . . . . . . . . . . . . . . . (245,940) - (245,940)Long-term debt and other liabilities . . . . . . . . . . . . . . . . . . . . . . . . . (379,292) - (379,292)Minority interests . . . . . . . . . . . . . . . . . . . . . . . . . . . . . . . . . . . . . . . (6,818) - (6,818)
Total liabilities . . . . . . . . . . . . . . . . . . . . . . . . . . . . . . . . . . . . . . . . . (632,050) - (632,050)
Net assets acquired . . . . . . . . . . . . . . . . . . . . . . . . . . . . . . . . . . . . $ 544,988 $(369,043) $ 175,945
The fair value of intangible assets was based, in part, on a valuation using an income approach. Intangibleassets, after reduction for the pro-rata allocation of negative goodwill are as follows (in thousands):
Amount
Backlog . . . . . . . . . . . . . . . . . . . . . . . . . . . . . . . . . . . . . . . . . . . . . . . . . . . . . . . . . . . . . . . . . . . . . . . . . $ 13,385Patented technology . . . . . . . . . . . . . . . . . . . . . . . . . . . . . . . . . . . . . . . . . . . . . . . . . . . . . . . . . . . . . . . 10,994Customer relationships . . . . . . . . . . . . . . . . . . . . . . . . . . . . . . . . . . . . . . . . . . . . . . . . . . . . . . . . . . . . . 7,170Trademarks . . . . . . . . . . . . . . . . . . . . . . . . . . . . . . . . . . . . . . . . . . . . . . . . . . . . . . . . . . . . . . . . . . . . . . 5,258
Total . . . . . . . . . . . . . . . . . . . . . . . . . . . . . . . . . . . . . . . . . . . . . . . . . . . . . . . . . . . . . . . . . . . . . . . . . $ 36,807
The weighted average amortization period for the intangibles is approximately 6.8 years.
Note 5: Acquisition of Helius, Inc.
In February 2008, we completed the acquisition of Helius, Inc. pursuant to the merger agreement we enteredinto on December 21, 2007 (the “Merger Agreement”). Pursuant to the Merger Agreement, we paid $10.5million, after certain adjustments, at the closing of the acquisition. Immediately after the acquisition, Helius, Inc.was converted to a limited liability company, Helius, LLC (“Helius”). We have a remaining contractualobligation for contingent consideration of up to $20.0 million (the “Contingent Payment”). If Helius achievescertain post-closing performance goals (the “Performance Goals”) as set forth in the Merger Agreement, we are
82

HUGHES COMMUNICATIONS, INC.
NOTES TO THE CONSOLIDATED FINANCIAL STATEMENTS (Continued)
obligated to pay the Contingent Payment in April 2010 as additional purchase price. Since it is not certain thatHelius will achieve the Performance Goals, we have not recognized the liability on the Contingent Paymentaccording to SFAS No. 141, “Business Combinations.” However, if it becomes probable that Helius will achievethe Performance Goals pursuant to the Merger Agreement, we will recognize the Contingent Payment asadditional goodwill.
We believe that the goodwill resulting from the Helius acquisition reflects the expected synergies that willgenerate long-term revenue growth, expansion of customer services and improvement of customer retention ratesas we combine Helius’ customer base and skills as a recognized leader in the internet protocol televisionsolutions business with our extensive broadband networking experience and customer base. Due to the nature ofHelius’ business activities, its customer base and other similarities with our North America Enterprise business,Helius operates within our North America VSAT segment. Helius’ results of operations have been included inour consolidated statement of operations since February 2008. The excess of the total acquisition costs of $10.8million over the estimated fair value of the net assets acquired has been reflected as goodwill in accordance withSFAS No. 141.
Based on the valuation of Helius’s net assets, the purchase price has been computed as follows (inthousands):
Amount
Cash consideration . . . . . . . . . . . . . . . . . . . . . . . . . . . . . . . . . . . . . . . . . . . . . . . . . . . . . . . . . . . . . . . $ 10,500Direct acquisition costs . . . . . . . . . . . . . . . . . . . . . . . . . . . . . . . . . . . . . . . . . . . . . . . . . . . . . . . . . . . 305
Total acquisition costs . . . . . . . . . . . . . . . . . . . . . . . . . . . . . . . . . . . . . . . . . . . . . . . . . . . . . . . . . . $ 10,805
The following table summarizes the fair values of the assets acquired and liabilities assumed at theacquisition date (in thousands):
Amount
Current assets . . . . . . . . . . . . . . . . . . . . . . . . . . . . . . . . . . . . . . . . . . . . . . . . . . . . . . . . . . . . . . . . . . . $ 1,054Property, net . . . . . . . . . . . . . . . . . . . . . . . . . . . . . . . . . . . . . . . . . . . . . . . . . . . . . . . . . . . . . . . . . . . . 658Intangible assets . . . . . . . . . . . . . . . . . . . . . . . . . . . . . . . . . . . . . . . . . . . . . . . . . . . . . . . . . . . . . . . . . 7,600Goodwill . . . . . . . . . . . . . . . . . . . . . . . . . . . . . . . . . . . . . . . . . . . . . . . . . . . . . . . . . . . . . . . . . . . . . . . 2,661
Total assets . . . . . . . . . . . . . . . . . . . . . . . . . . . . . . . . . . . . . . . . . . . . . . . . . . . . . . . . . . . . . . . . . . . 11,973
Current liabilities . . . . . . . . . . . . . . . . . . . . . . . . . . . . . . . . . . . . . . . . . . . . . . . . . . . . . . . . . . . . . . . . (1,168)
Total liabilities . . . . . . . . . . . . . . . . . . . . . . . . . . . . . . . . . . . . . . . . . . . . . . . . . . . . . . . . . . . . . . . . . . (1,168)
Net assets acquired . . . . . . . . . . . . . . . . . . . . . . . . . . . . . . . . . . . . . . . . . . . . . . . . . . . . . . . . . . . . . $ 10,805
Based on the valuation of Helius’ intangible assets, using an income approach, the fair values of theintangible assets are as follows (in thousands):
Amount
Customer relationships . . . . . . . . . . . . . . . . . . . . . . . . . . . . . . . . . . . . . . . . . . . . . . . . . . . . . . . . . . . . $ 4,260Patented technology . . . . . . . . . . . . . . . . . . . . . . . . . . . . . . . . . . . . . . . . . . . . . . . . . . . . . . . . . . . . . . 2,870Trademarks . . . . . . . . . . . . . . . . . . . . . . . . . . . . . . . . . . . . . . . . . . . . . . . . . . . . . . . . . . . . . . . . . . . . . 470
Total . . . . . . . . . . . . . . . . . . . . . . . . . . . . . . . . . . . . . . . . . . . . . . . . . . . . . . . . . . . . . . . . . . . . . . . . $ 7,600
83

HUGHES COMMUNICATIONS, INC.
NOTES TO THE CONSOLIDATED FINANCIAL STATEMENTS (Continued)
The weighted average amortization period for the intangible assets is approximately 7.6 years. The totalamount of goodwill is expected to be deductible for tax purposes.
Other than intangible assets and goodwill, the assets, liabilities and results of operations were not significantto the Company’s consolidated financial statements; therefore, pro forma information is not presented.
Note 6: Discontinued Operations
Pursuant to the Separation Agreement, SkyTerra contributed its interests in AfriHUB to the Company inDecember 2005. Immediately thereafter, the Company decided to discontinue operating AfriHUB and signed aletter of intent to sell its interest in AfriHUB. Effective February 20, 2006, the Company sold its equity and debtinterests in AfriHUB and recorded a gain on the sale of $0.2 million in 2006.
Note 7: Marketable Securities
There were no available-for-sale marketable securities at December 31, 2008. The amortized cost basis andestimated fair values of available-for-sale marketable securities at December 31, 2007 are summarized as follows(in thousands):
CostBasis
Gross Unrealized EstimatedFair ValuesGains Losses
Corporate bonds . . . . . . . . . . . . . . . . . . . . . . . . . . . . . . . $ 10,153 $ 59 $ - $ 10,212Municipal bonds . . . . . . . . . . . . . . . . . . . . . . . . . . . . . . . 5,076 4 - 5,080Government agencies . . . . . . . . . . . . . . . . . . . . . . . . . . . 2,016 - (1) 2,015
Total available-for-sale securities . . . . . . . . . . . . . . . . $ 17,245 $ 63 $ (1) $ 17,307
Note 8: Receivables, Net
Receivables, net consisted of the following (in thousands):
December 31,
2008 2007
Trade receivables . . . . . . . . . . . . . . . . . . . . . . . . . . . . . . . . . . . . . . . . . . . . . . . . . . . . . $ 177,798 $ 177,047Contracts in process . . . . . . . . . . . . . . . . . . . . . . . . . . . . . . . . . . . . . . . . . . . . . . . . . . . 30,412 39,656Other receivables . . . . . . . . . . . . . . . . . . . . . . . . . . . . . . . . . . . . . . . . . . . . . . . . . . . . . 1,714 2,300
Total receivables . . . . . . . . . . . . . . . . . . . . . . . . . . . . . . . . . . . . . . . . . . . . . . . . . 209,924 219,003Allowance for doubtful accounts . . . . . . . . . . . . . . . . . . . . . . . . . . . . . . . . . . . . . . . . . (9,551) (9,060)
Total receivables, net . . . . . . . . . . . . . . . . . . . . . . . . . . . . . . . . . . . . . . . . . . . . . . $ 200,373 $ 209,943
Trade receivables included $6.8 million and $2.7 million of amounts due from affiliates at December 31,2008 and 2007, respectively. Advances and progress billings offset against contracts in process amounted to$13.9 million and $27.0 million at December 31, 2008 and 2007, respectively.
84

HUGHES COMMUNICATIONS, INC.
NOTES TO THE CONSOLIDATED FINANCIAL STATEMENTS (Continued)
Note 9: Inventories
Inventories consisted of the following (in thousands):
December 31,
2008 2007
Production materials and supplies . . . . . . . . . . . . . . . . . . . . . . . . . . . . . . . . . . . . . . . . $ 10,268 $ 10,926Work in process . . . . . . . . . . . . . . . . . . . . . . . . . . . . . . . . . . . . . . . . . . . . . . . . . . . . . . 12,445 15,147Finished goods . . . . . . . . . . . . . . . . . . . . . . . . . . . . . . . . . . . . . . . . . . . . . . . . . . . . . . . 42,772 39,681
Total inventories . . . . . . . . . . . . . . . . . . . . . . . . . . . . . . . . . . . . . . . . . . . . . . . . . . . $ 65,485 $ 65,754
Inventories are carried at the lower of cost or market, principally using standard costs adjusted to reflectactual based on variance analyses performed throughout the year. Inventories are adjusted to net realizable valueusing management’s best estimates of future use. In making its assessment of future use or recovery,management considers the aging and composition of inventory balances, the effects of technological and/ordesign changes, forecasted future product demand based on firm or near-firm customer orders and alternativemeans of disposition of excess or obsolete items.
Note 10: Property, Net
Property, net consisted of the following (dollars in thousands):
EstimatedUseful Lives
(years)
December 31,
2008 2007
Land and improvements . . . . . . . . . . . . . . . . . . . . . . . . . . . . . . . . . . . . 10 $ 5,871 $ 5,909Buildings and leasehold improvements . . . . . . . . . . . . . . . . . . . . . . . . 2 - 30 28,090 23,450Satellite related assets . . . . . . . . . . . . . . . . . . . . . . . . . . . . . . . . . . . . . . 15 380,394 -Machinery and equipment . . . . . . . . . . . . . . . . . . . . . . . . . . . . . . . . . . . 1 - 7 134,544 85,807VSAT operating lease hardware . . . . . . . . . . . . . . . . . . . . . . . . . . . . . . 2 - 5 42,741 43,029Furniture and fixtures . . . . . . . . . . . . . . . . . . . . . . . . . . . . . . . . . . . . . . 7 1,092 812Construction in progress - SPACEWAY . . . . . . . . . . . . . . . . . . . . . . . - 360,777
- Other . . . . . . . . . . . . . . . . . . . . . . . . . . . . . . 25,180 19,270
Total property . . . . . . . . . . . . . . . . . . . . . . . . . . . . . . . . . . . . . . . . . . 617,912 539,054Accumulated depreciation . . . . . . . . . . . . . . . . . . . . . . . . . . . . . . . . . . (110,642) (59,078)
Total property, net . . . . . . . . . . . . . . . . . . . . . . . . . . . . . . . . . . . . . . . $ 507,270 $ 479,976
Satellite related assets consist primarily of the SPACEWAYTM 3 satellite (“SPACEWAY 3”), a nextgeneration broadband satellite system with a unique architecture for broadband data communications. In April2008, we placed SPACEWAY 3 into service and began to depreciate its related costs on a straight-line basis overthe estimated useful life of 15 years. Satellite related assets include the costs associated with the construction andlaunch of the satellite, insurance premiums for the satellite launch and the in-orbit testing period, interestincurred during the construction of the satellite, and other costs directly related to the satellite.
We capitalized interest related to the construction of SPACEWAY 3 of $4.8 million and $12.1 million forthe years ended December 31, 2008 and 2007, respectively.
VSAT operating lease hardware represents VSAT equipment installed at customer facilities that are subjectto an operating lease with the customer and against which we have borrowed funds from third-party financial
85

HUGHES COMMUNICATIONS, INC.
NOTES TO THE CONSOLIDATED FINANCIAL STATEMENTS (Continued)
institutions. Title to the equipment has passed to the financial institutions and they will own the equipment at theend of the term of the customer contract; however, for certain contracts, HNS retains certain ongoing obligationsrelating to the equipment. For those contracts, depreciation is recorded in cost of hardware products sold over theterm of the operating lease.
During 2008, 2007 and 2006, depreciation expense for property was $51.2 million, $31.5 million and $36.1million, respectively.
Note 11: Intangible Assets, Net
Intangible assets, net consisted of the following (dollars in thousands):
Estimated UsefulLives (years) Cost Basis
AccumulatedAmortization Net Basis
December 31,2008:Backlog and customer relationships . . . . . . . . . . 4-8 $ 22,092 $ (12,694) $ 9,398Patented technology and trademarks . . . . . . . . . . 2-10 16,393 (6,011) 10,382
Total intangible assets, net . . . . . . . . . . . . . . . . $ 38,485 $ (18,705) $ 19,780
December 31,2007:Backlog and customer relationships . . . . . . . . . . 4-8 $ 19,567 $ (8,488) $ 11,079Patented technology and trademarks . . . . . . . . . . 8-10 15,234 (3,800) 11,434
Total intangible assets, net . . . . . . . . . . . . . . . . $ 34,801 $ (12,288) $ 22,513
We amortize the recorded values of our intangible assets over their estimated useful lives. As a result of theapplication of SFAS No. 109, “Accounting for Income Taxes,” we reduced the cost basis of our intangible assetsfor the year ended December 31, 2008 and 2007 by approximately $3.9 million and $2.0 million, respectively, ona pro-rata basis. This reduction related to the reversal of valuation allowances associated with the deferred taxassets of our United Kingdom (“U.K.”) and German subsidiaries acquired in our acquisition of HNS. Upon theCompany’s adoption of SFAS No. 141(R) on January 1, 2009, any benefit realized from the utilization of theU.K. and German net operating loss (“NOL”) carryforwards will be recorded as a reduction to income taxexpense. See Note 17—Income Taxes for further discussion.
In addition, the cost basis of our intangible assets at December 31, 2008 included $7.6 million resultingfrom the acquisition of Helius. See Note 5—Acquisition of Helius, Inc. for further discussion.
We recorded $6.4 million, $6.1 million and $6.1 million for the years ended December 31, 2008, 2007 and2006, respectively, of amortization expense related to intangible assets. Estimated future amortization expense atDecember 31, 2008 was as follows (in thousands):
Amount
Year ending December 31,2009 . . . . . . . . . . . . . . . . . . . . . . . . . . . . . . . . . . . . . . . . . . . . . . . . . . . . . . . . . . . . . . . . . . . . . . . . . . $ 5,5412010 . . . . . . . . . . . . . . . . . . . . . . . . . . . . . . . . . . . . . . . . . . . . . . . . . . . . . . . . . . . . . . . . . . . . . . . . . . 2,9202011 . . . . . . . . . . . . . . . . . . . . . . . . . . . . . . . . . . . . . . . . . . . . . . . . . . . . . . . . . . . . . . . . . . . . . . . . . . 2,9022012 . . . . . . . . . . . . . . . . . . . . . . . . . . . . . . . . . . . . . . . . . . . . . . . . . . . . . . . . . . . . . . . . . . . . . . . . . . 2,9022013 . . . . . . . . . . . . . . . . . . . . . . . . . . . . . . . . . . . . . . . . . . . . . . . . . . . . . . . . . . . . . . . . . . . . . . . . . . 2,902Thereafter . . . . . . . . . . . . . . . . . . . . . . . . . . . . . . . . . . . . . . . . . . . . . . . . . . . . . . . . . . . . . . . . . . . . . 2,613
Total estimated future amortization expense . . . . . . . . . . . . . . . . . . . . . . . . . . . . . . . . . . . . . . . . $ 19,780
86

HUGHES COMMUNICATIONS, INC.
NOTES TO THE CONSOLIDATED FINANCIAL STATEMENTS (Continued)
Note 12: Other Assets
Other assets consisted of the following (in thousands):
December 31,
2008 2007
Sea Launch deposit . . . . . . . . . . . . . . . . . . . . . . . . . . . . . . . . . . . . . . . . . . . . . . . . $ 44,400 $ 44,400Subscriber acquisition costs . . . . . . . . . . . . . . . . . . . . . . . . . . . . . . . . . . . . . . . . . 43,361 28,569Debt issuance costs . . . . . . . . . . . . . . . . . . . . . . . . . . . . . . . . . . . . . . . . . . . . . . . . 10,312 11,736Other . . . . . . . . . . . . . . . . . . . . . . . . . . . . . . . . . . . . . . . . . . . . . . . . . . . . . . . . . . . 20,555 24,245
Total other assets . . . . . . . . . . . . . . . . . . . . . . . . . . . . . . . . . . . . . . . . . . . . . . $ 118,628 $ 108,950
Note 13: Accrued Liabilities
Accrued liabilities consisted of the following (in thousands):
December 31,
2008 2007
Accrued and other liabilities . . . . . . . . . . . . . . . . . . . . . . . . . . . . . . . . . . . . . . . . . $ 55,428 $ 62,517Progress billings to customers . . . . . . . . . . . . . . . . . . . . . . . . . . . . . . . . . . . . . . . . 51,019 53,610Payroll and other compensation . . . . . . . . . . . . . . . . . . . . . . . . . . . . . . . . . . . . . . 41,283 31,764Amount due to DIRECTV . . . . . . . . . . . . . . . . . . . . . . . . . . . . . . . . . . . . . . . . . . . - 20,230Accrued interest expense . . . . . . . . . . . . . . . . . . . . . . . . . . . . . . . . . . . . . . . . . . . . 9,804 9,811
Total accrued liabilities . . . . . . . . . . . . . . . . . . . . . . . . . . . . . . . . . . . . . . . . . $ 157,534 $ 177,932
Note 14: Short-Term and Long-Term Debt
Short-term and current portion of long-term debt consisted of the following (dollars in thousands):
December 31,
Interest Rates 2008 2007
VSAT hardware financing . . . . . . . . . . . . . . . . . . . . . . . . . . . 8.00% - 12.00% $ 4,864 $ 10,883Revolving bank borrowings . . . . . . . . . . . . . . . . . . . . . . . . . . 8.25% - 18.00% 2,432 2,897Term loans . . . . . . . . . . . . . . . . . . . . . . . . . . . . . . . . . . . . . . . . 12.25% - 13.75% 206 1,015Capital lease . . . . . . . . . . . . . . . . . . . . . . . . . . . . . . . . . . . . . . 6.00% 750 -
Total short term borrowings and current portion oflong-term debt . . . . . . . . . . . . . . . . . . . . . . . . . . . . . . . $ 8,252 $ 14,795
At December 31, 2008, HNS had outstanding revolving bank borrowings of $2.4 million, which had aweighted average variable interest rate of 14.68% and a fixed rate of 8.25%. These borrowings were obtained byHNS’ subsidiaries in India and Europe under revolving lines of credit with several local banks. There is norequirement for compensating balances for these borrowings. The total amount available for borrowing by theIndian and European subsidiaries under the revolving lines of credit was $1.0 million at December 31, 2008.
87

HUGHES COMMUNICATIONS, INC.
NOTES TO THE CONSOLIDATED FINANCIAL STATEMENTS (Continued)
Long-term debt consisted of the following (dollars in thousands):
December 31,
Interest Rates 2008 2007
Senior notes . . . . . . . . . . . . . . . . . . . . . . . . . . . . . . . . . . . . . . . . . . . 9.50% $ 450,000 $ 450,000Term loans . . . . . . . . . . . . . . . . . . . . . . . . . . . . . . . . . . . . . . . . . . . . 7.62% - 12.25% 115,000 115,254VSAT hardware financing . . . . . . . . . . . . . . . . . . . . . . . . . . . . . . . 8.00% - 12.00% 8,038 12,507Capital lease . . . . . . . . . . . . . . . . . . . . . . . . . . . . . . . . . . . . . . . . . . 6.00% 5,260 -
Total long-term debt . . . . . . . . . . . . . . . . . . . . . . . . . . . . . . . . $ 578,298 $ 577,761
On April 13, 2006, HNS completed an offering of $450 million of 91⁄2% senior notes maturing on April 15,2014 (the “Senior Notes”). Interest on the Senior Notes is paid semi-annually in arrears on April 15 andOctober 15. HNS used a portion of the proceeds of the Senior Notes to repay the outstanding borrowings of theexisting first and second lien term loans in full. At December 31, 2008 and 2007, interest accrued on the SeniorNotes was $9.0 million for each period.
HNS has a secured $50 million revolving credit facility (the “Revolving Credit Facility”) with Bank ofAmerica, which matures on April 22, 2011. The interest rate associated with the Revolving Credit Facility, ifany, is based on, at the Company’s option, the ABR rate plus 1.50% or LIBOR plus 2.50%. The RevolvingCredit Facility is guaranteed by, subject to certain exceptions, HNS’ direct and indirect wholly-owned domesticsubsidiaries and is secured by substantially all of its domestic tangible and intangible assets. For outstandingletters of credit issued under the Revolving Credit Facility, we pay a participation fee of 2.50% per annum and anissuance fee of 0.25% per annum. In addition, the Company is charged a commitment fee of 0.50% per annumfor any unused portion of the Revolving Credit Facility.
As of December 31, 2008, we have issued $10.3 million letters of credit, and we had no borrowings underthe Revolving Credit Facility during 2008 and 2007. As a result, the available borrowing capacity under theRevolving Credit Facility as of December 31, 2008 was $39.7 million.
In February 2007, HNS borrowed $115 million from a syndicate of banks (the “Term Loan Facility”). TheTerm Loan Facility is guaranteed, on a senior unsecured basis, by all of its existing and future subsidiaries thatguarantee its existing Senior Notes and existing Revolving Credit Facility. HNS Finance Corp., a wholly-ownedsubsidiary of HNS and co-issuer of the Senior Notes, is a co-borrower under the Term Loan Facility. The intereston the Term Loan Facility is paid quarterly, starting on May 29, 2007, at Adjusted LIBOR (as defined in theTerm Loan Facility and existing Revolving Credit Facility) plus 2.50%. The Term Loan Facility is subject tocertain mandatory and optional prepayment provisions and contains negative covenants and events of defaultprovisions, in each case, substantially similar to those provisions contained in the indenture governing the SeniorNotes. The maturity date of the Term Loan Facility is April 15, 2014.
To mitigate the variable interest rate risk associated with the Term Loan Facility, HNS entered into anagreement with Bear Stearns Capital Markets, Inc. (“Bear Stearns”), which was acquired by J.P.Morgan Chase &Co. (“JPM”) in May 2008, to swap the Adjusted LIBOR for a fixed interest rate of 5.12% per annum (the “SwapAgreement”). The Swap Agreement is effective February 28, 2007 and has a termination date of April 15, 2014,which is the maturity date of the Term Loan Facility. As a result, the interest rate for the Term Loan Facility atDecember 31, 2008 was 7.62%. The security for HNS’ interest obligation to JPM, as successor Bear Stearnsunder the Swap Agreement is the same as the security for the Revolving Credit Facility. Interest expense basedon the Term Loan Facility and the Swap Agreement was $8.9 million and $7.6 million for the years endedDecember 31, 2008 and 2007, respectively.
88

HUGHES COMMUNICATIONS, INC.
NOTES TO THE CONSOLIDATED FINANCIAL STATEMENTS (Continued)
The indenture governing the Senior Notes, the agreement governing the amended Revolving Credit Facilityand the agreement governing the Term Loan Facility require HNS to comply with certain covenants: (i) in thecase of the indenture, for so long as any Senior Notes are outstanding; (ii) in the case of the amended RevolvingCredit Facility, so long as the amended revolving credit agreement is in effect, and (iii) in the case of the TermLoan Facility, for so long as the Term Loan Facility remains outstanding. Negative covenants contained in theseagreements include limitations on the ability of HNS and/or certain of its subsidiaries to incur additionalindebtedness; issue redeemable stock and subsidiary preferred stock; incur liens; pay dividends or distributions orredeem or repurchase capital stock; prepay, redeem or repurchase debt; make loans and investments; enter intoagreements that restrict distributions from HNS’ subsidiaries; sell assets and capital stock of HNS’ subsidiaries;enter into certain transactions with affiliates; consolidate or merge with or into, or sell substantially all of HNS’assets to, another person; and enter into new lines of business. In addition to these negative covenants, theamended Revolving Credit Facility, the indenture governing the Senior Notes and/or the agreement governing theTerm Loan Facility contain affirmative covenants that require HNS to: (i) preserve its businesses and properties;(ii) maintain insurance over its assets; (iii) pay and discharge all material taxes when due; and (iv) furnish thelenders’ administrative agent its financial statements for each fiscal quarter and fiscal year, certificates from afinancial officer certifying that no Event of Default or Default has occurred during the fiscal period beingreported, litigation and other notices, compliance with laws, maintenance of records and other such customarycovenants. HNS and its subsidiaries comprise a substantial portion of the Company’s net assets and results ofoperations since January 1, 2006. There are certain restrictions on the net assets of HNS, the consolidated netassets of HNS at December 31, 2008 and 2007 were $229.8 million and $247.5 million, respectively.Management believes that HNS was in compliance with all of its debt covenants at December 31, 2008.
Prior to September 2005, HNS leased certain VSAT hardware under an operating lease with customerswhich were funded by two financial institutions at the inception of the operating lease for the future operatinglease revenues. As part of the agreement, the financial institution received title to the equipment and obtained theresidual rights to the equipment after the operating lease with the customer expires and assumed the credit riskassociated with non-payment by the customers. However, HNS retained a continuing obligation to the financinginstitution to indemnify it from losses it may incur (up to the original value of the hardware) fromnon-performance of the HNS system (a “Non-Performance Event”). Accordingly, HSN recognized a liability tothe financial institution for the funded amount, HNS has not provided a reserve for a Non-Performance Eventbecause it believes that the possibility of an occurrence of a Non-Performance Event due to a service outage isremote, given the ability to quickly re-establish customer service at relatively nominal costs.
We entered in a capital lease with 95 West Co., Inc. (“95 West Co.”) and its parent, Miraxis LicenseHoldings, LLC (“MLH”), which are our related parties as discussed in Note 23—Transactions with RelatedParties. Pursuant to the capital lease agreement, 95 West Co. and MLH agreed to provide a series of coordinationagreements allowing HNS to operate its SPACEWAY 3 at the 95° west longitude orbital slot where 95 West Co.and MLH have higher priority rights. As of December 31, 2008, the net present value of the remaining debtbalance under the capital lease was $6.0 million, included in Capital lease in the short-term and long-term debttables above. The remaining payments under the capital lease are subject to conditions in the agreementincluding our ability to operate SPACEWAY 3, and are as follows: $0.75 million for each of the years endingDecember 31, 2009 through 2010 and $1.0 million for each of the years ending December 31, 2011 through2016.
89

HUGHES COMMUNICATIONS, INC.
NOTES TO THE CONSOLIDATED FINANCIAL STATEMENTS (Continued)
Principal payments of our debt at December 31, 2008 are as follows (in thousands):
Amount
Year ending December 31,2009 . . . . . . . . . . . . . . . . . . . . . . . . . . . . . . . . . . . . . . . . . . . . . . . . . . . . . . . . . . . . . . . . . . . . . . . . $ 8,2522010 . . . . . . . . . . . . . . . . . . . . . . . . . . . . . . . . . . . . . . . . . . . . . . . . . . . . . . . . . . . . . . . . . . . . . . . . 3,9402011 . . . . . . . . . . . . . . . . . . . . . . . . . . . . . . . . . . . . . . . . . . . . . . . . . . . . . . . . . . . . . . . . . . . . . . . . 3,4172012 . . . . . . . . . . . . . . . . . . . . . . . . . . . . . . . . . . . . . . . . . . . . . . . . . . . . . . . . . . . . . . . . . . . . . . . . 2,6162013 . . . . . . . . . . . . . . . . . . . . . . . . . . . . . . . . . . . . . . . . . . . . . . . . . . . . . . . . . . . . . . . . . . . . . . . . 1,065Thereafter . . . . . . . . . . . . . . . . . . . . . . . . . . . . . . . . . . . . . . . . . . . . . . . . . . . . . . . . . . . . . . . . . . . . 567,260
Total debt . . . . . . . . . . . . . . . . . . . . . . . . . . . . . . . . . . . . . . . . . . . . . . . . . . . . . . . . . . . . . . . . . . $ 586,550
Note 15: Financial Instruments
Interest Rate Swap
The interest on the Term Loan Facility was at Adjusted LIBOR plus 2.50% per annum. To mitigate thevariable interest rate risk associated with the Term Loan Facility, the Company entered into the Swap Agreementwith Bear Stearns, which was acquired by JPM in May 2008, to swap the Adjusted LIBOR for a fixed interestrate of 5.12% per annum. The Swap Agreement is effective February 28, 2007 and has a termination date ofApril 15, 2014, which is the maturity date of the Term Loan Facility. As a result, the interest rate for the TermLoan Facility at December 31, 2008 was 7.62%. For the years ended December 31, 2008 and 2007, the Companyrecorded an unrealized loss of $11.9 million and $5.5 million, respectively, in other comprehensive lossassociated with the fair market valuation of the interest rate swap. The net interest payments based on the SwapAgreement and the Term Loan Facility are paid quarterly starting on May 29, 2007 and are estimated to beapproximately $8.8 million for each of the years ended December 31, 2009 through 2013 and $3.3 million for theyear ended December 31, 2014. For the years ended December 31, 2008 and 2007, we recorded $8.9 million and$7.6 million interest expense on the Term Loan Facility.
Note 16: Fair Value
In September 2006, the FASB issued SFAS No. 157, “Fair Value Measurements,” which defines fair value,establishes a framework for measuring fair value and expands disclosures about fair value measurements. SFASNo. 157 applies to other accounting pronouncements that require or permit fair value measurements, but does notrequire any new fair value measurements.
SFAS No. 157 defines fair value as the price that would be received to sell an asset or paid to transfer aliability (exit price) in an orderly transaction between market participants at the measurement date. The principalmarket, as prescribed by SFAS No. 157, is the market in which the reporting entity would sell the asset ortransfer the liability with the greatest volume and level of activity for the asset or liability. If there is no principalmarket, the most advantageous market is used. This is the market in which the reporting entity would sell theasset or transfer the liability with the price that maximizes the amount that would be received for the asset orminimizes the amount that would be paid to transfer the liability. SFAS No. 157 clarifies that fair value should bebased on assumptions market participants would make in pricing the asset or liability. Where available, fair valueis based on observable quoted market prices or derived from observable market data. Where observable prices orinputs are not available, valuation models are used (i.e. Black-Scholes or a binomial model).
90

HUGHES COMMUNICATIONS, INC.
NOTES TO THE CONSOLIDATED FINANCIAL STATEMENTS (Continued)
Effective January 1, 2008, financial assets and financial liabilities recorded at fair value on our consolidatedbalance sheet were categorized based on the priority of the inputs used in the valuation technique to measure fairvalue. SFAS No. 157 established a three level fair value hierarchy to classify the inputs used in measuring fairvalue as follows:
Level 1-Inputs are unadjusted quoted prices in active markets for identical assets or liabilities available atthe measurement date.
Level 2-Inputs are unadjusted quoted prices for similar assets and liabilities in active markets, quoted pricesfor identical or similar assets and liabilities in markets that are not active, inputs other than quoted prices that areobservable, and inputs derived from or corroborated by observable market data.
Level 3-Inputs are unobservable inputs which reflect the reporting entity’s own assumptions on whatassumptions the market participants would use in pricing the asset or liability based on the best availableinformation.
As of December 31, 2008, the carrying values of cash and cash equivalents, marketable securities,receivables, net, other assets, accounts payable, and debt, except for the Senior Notes and the interest rate swapas described below, approximate fair values. The carrying value and the fair value of our Senior Notes were$450.0 million and $360.0 million, respectively, at December 31, 2008.
Our Term Loan Facility originally had a variable interest rate based on observable interest rates plus2.50% per annum; however, we entered into the Swap Agreement to swap only the Adjusted LIBOR basedinterest for a fixed interest rate of 5.12% per annum. The Company adjusts the value of the interest rate swap ona quarterly basis. At December 31, 2008, the fair value of the interest rate swap was a $17.4 million liability andwas within Level 2 of the fair value hierarchy.
In February 2008, the FASB issued FASB Staff Position No. 157-2, which delays the effective date of SFASNo. 157 for non-financial assets and liabilities to fiscal years beginning after November 15, 2008. With thisdeferral, we have not applied the provisions of SFAS No. 157 to goodwill and intangible assets. We do notexpect the adoption of SFAS No. 157 for non-financial assets and liabilities to have a material impact on ourconsolidated results of operations, financial position, or cash flow statements.
Note 17: Income Taxes
For U.S. Federal income tax purposes, the Company’s results through the date of the Distribution wereincluded in the consolidated returns filed by SkyTerra. Prior to the Distribution, SkyTerra had unused NOLcarryforwards of approximately $227.2 million expiring in 2008 through 2025 and capital loss carryforwards ofapproximately $93.3 million expiring in 2006 through 2010. Following the issuance of a private letter ruling bythe Internal Revenue Service with respect to whether an “ownership change” as defined by Section 382 of theInternal Revenue Code occurred during a period from 1999 through 2004, SkyTerra expects that itscarryforwards will not be subject to such limitation and, therefore, will be available to offset future taxableincome unless subject to other limitation. Following the Distribution, a portion of the SkyTerra NOL and capitalloss carryforwards belong to the Company. The Company estimates that its share of the NOL carryforwards areapproximately $128.5 million and its share of the capital loss carryforwards are approximately $3.3 million at theDistribution date.
For the year ended December 31, 2008, the Company estimates that its Federal and state NOLcarryforwards are approximately $170.7 million which will expire, if unused, between the years 2012 and 2028.The capital loss carryforward of approximately $13.0 million will expire, if unused, between 2010 and 2012.
91

HUGHES COMMUNICATIONS, INC.
NOTES TO THE CONSOLIDATED FINANCIAL STATEMENTS (Continued)
Prior to the year ended December 31, 2005, due to SkyTerra’s operating losses and the uncertaintysurrounding the ability of SkyTerra to realize its deferred tax assets, a full valuation allowance had beenestablished related to the NOLs and capital loss carryforwards. As the Distribution did not qualify as a tax-freespin-off, SkyTerra generated significant taxable income in 2006 for federal and state income tax purposes. As theCompany is the accounting successor to SkyTerra, as described in Note 1, the taxes associated with theDistribution are included in the Company’s results. In addition, due to the tax sharing agreement betweenSkyTerra and the Company (the “Tax Sharing Agreement”), the Company is responsible for all tax liabilitiesassociated with the Distribution. According to SkyTerra’s 2006 income tax returns, the existing NOL and capitalloss carry-forwards were sufficient to offset any income taxes payable on the gain from the Distribution, otherthan alternative minimum taxes (“AMT”) of $1.1 million.
The Company’s consolidated temporary differences that give rise to the net deferred tax assets atDecember 31, 2008 and 2007 are as follows (in thousands):
December 31,
2008 2007
Deferred tax assets:Net operating loss carryforwards . . . . . . . . . . . . . . . . . . . . . . . . . . . . . . . . . . . . . . $ 71,830 $ 57,879Capital loss carryforwards . . . . . . . . . . . . . . . . . . . . . . . . . . . . . . . . . . . . . . . . . . . . 4,554 1,148Compensation expense on restricted stock . . . . . . . . . . . . . . . . . . . . . . . . . . . . . . . 54 946Alternative minimum tax credit . . . . . . . . . . . . . . . . . . . . . . . . . . . . . . . . . . . . . . . 491 500Research and development credit . . . . . . . . . . . . . . . . . . . . . . . . . . . . . . . . . . . . . . 4,150 -Other assets . . . . . . . . . . . . . . . . . . . . . . . . . . . . . . . . . . . . . . . . . . . . . . . . . . . . . . . 6,534 3,366
Total gross deferred tax assets . . . . . . . . . . . . . . . . . . . . . . . . . . . . . . . . . . . . . . 87,613 63,839
Deferred tax liability:Investment in Hughes Network Systems, LLC . . . . . . . . . . . . . . . . . . . . . . . . . . . . 40,541 28,965Other deferred tax liability . . . . . . . . . . . . . . . . . . . . . . . . . . . . . . . . . . . . . . . . . . . 645 626
Total gross deferred tax liability . . . . . . . . . . . . . . . . . . . . . . . . . . . . . . . . . . . . . 41,186 29,591
Net deferred tax assets before valuation allowance . . . . . . . . . . . . . . . . . . . . 46,427 34,248Valuation allowance . . . . . . . . . . . . . . . . . . . . . . . . . . . . . . . . . . . . . . . . . . . . . . . . (43,080) (30,040)
Net deferred tax assets . . . . . . . . . . . . . . . . . . . . . . . . . . . . . . . . . . . . . . . . . . . . . . . . . $ 3,347 $ 4,208
As the Company has not met the more-likely-than-not criteria of SFAS No. 109, “Accounting for IncomeTaxes”, the Company maintained a full valuation allowance on its deferred tax assets as of December 31, 2008with the exception of deferred tax assets of $0.5 million associated with our AMT credit and $2.9 millionassociated with our foreign subsidiaries. The ultimate realization of deferred tax assets is dependent upon thegeneration of future taxable income during the periods in which those temporary differences become deductible.The Company considered the scheduled reversal of deferred tax liabilities, projected future taxable income andtax planning in making these assessments.
The Company’s German and U.K. subsidiaries have approximately $36.9 million and $39.6 million of NOLcarryforwards, respectively. As the U.K. subsidiary is treated as a disregarded entity for U.S. income taxpurposes, its net income or loss is reported on HNS’ partnership income tax return and subsequently allocated tothe Company. The NOL carryforwards are available to reduce future U.K. taxable income and do not expire. TheNOL carryforwards of the German subsidiary are available to reduce future German taxable income and do notexpire. The ultimate realization of deferred tax assets is dependent upon the generation of future taxable income
92

HUGHES COMMUNICATIONS, INC.
NOTES TO THE CONSOLIDATED FINANCIAL STATEMENTS (Continued)
during the periods in which those temporary differences become deductible. The Company considered thescheduled reversal of deferred tax liabilities, projected future taxable income and tax planning in making theseassessments.
As the German and U.K. subsidiaries have not met the more-likely–than-not criteria of SFAS No. 109, theCompany maintained a full valuation allowance on the German and U.K. NOL carryforwards as of December 31,2008. During 2008, the German and U.K. subsidiaries utilized $3.6 million and $8.2 million, respectively, oftheir NOL carryforwards to offset taxable income. Furthermore, the U.K. NOL carryforwards were increased by$47.1 million reflecting additional NOL carryforwards available from years prior to April 22, 2005. The Germanand U.K. NOL carryforwards were translated into U.S. dollars at the year-end exchange rate.
As required by SFAS No. 109, the reversal of the U.K. and German valuation allowance associated withtheir deferred tax assets reduced the basis of our intangible assets by approximately $3.9 million and $2.0million, on a pro-rata basis, in 2008 and 2007, respectively. Upon the Company’s adoption of SFAS No. 141(R),a revision of SFAS No. 141, on January 1, 2009, any benefit realized from the utilization of the German and U.K.deferred tax assets will be recorded as a reduction to income tax expense.
The U.K. income tax rate was reduced to 28% from 30% during the year and is effective starting April2008. The U.K. income tax expense and DTA net of valuation allowance is calculated at this new rate.
The components of income before income tax expense, equity in losses of unconsolidated affiliates,minority interests in net (earnings) losses of subsidiaries and the corresponding income tax expense reflected onthe consolidated statements of operations for the years ended December 31, 2008, 2007 and 2006 consisted of thefollowing (in thousands):
Year Ended December 31,
2008 2007 2006
Components of income before income tax expense, equity in lossesof unconsolidated affiliates, and minority interests in net (earnings)losses of subsidiaries:Domestic income . . . . . . . . . . . . . . . . . . . . . . . . . . . . . . . . . . . . . . . . . . . $ 9,093 $ 39,703 $ 7,927Foreign income . . . . . . . . . . . . . . . . . . . . . . . . . . . . . . . . . . . . . . . . . . . . . 8,427 9,927 8,887
Total . . . . . . . . . . . . . . . . . . . . . . . . . . . . . . . . . . . . . . . . . . . . . . . . . . . $ 17,520 $ 49,630 $ 16,814
Components of income tax expense:Current income tax expense:Foreign . . . . . . . . . . . . . . . . . . . . . . . . . . . . . . . . . . . . . . . . . . . . . . . . . $ 2,373 $ 2,850 $ 3,276State . . . . . . . . . . . . . . . . . . . . . . . . . . . . . . . . . . . . . . . . . . . . . . . . . . . 803 21 500
Total current income tax expense . . . . . . . . . . . . . . . . . . . . . . . . . . 3,176 2,871 3,776
Deferred income tax expense:Foreign . . . . . . . . . . . . . . . . . . . . . . . . . . . . . . . . . . . . . . . . . . . . . . . . . 4,417 2,466 -Federal . . . . . . . . . . . . . . . . . . . . . . . . . . . . . . . . . . . . . . . . . . . . . . . . . - - 50,334
Total deferred income tax expense . . . . . . . . . . . . . . . . . . . . . . . . . 4,417 2,466 50,334
Total income tax expense . . . . . . . . . . . . . . . . . . . . . . . . . . . . . . . $ 7,593 $ 5,337 $ 54,110
For the year ended December 31, 2006, the Company recorded income tax expense of $54.1 million. Thisamount relates primarily to the gain on the Distribution, and includes the utilization of the deferred tax assetrecorded as of December 31, 2005. In addition, income tax expense includes taxes on income earned by the
93

HUGHES COMMUNICATIONS, INC.
NOTES TO THE CONSOLIDATED FINANCIAL STATEMENTS (Continued)
Company’s subsidiaries in India and Brazil and estimated domestic state income taxes. For the years endedDecember 31, 2007 and 2008, the Company recorded income tax expense of $5.3 million and $7.6 million,respectively. These amounts related primarily to the income taxes on income earned by the Company’s foreignsubsidiaries and domestic state income taxes.
For the tax year ended December 31, 2007, the Company has recorded an alternative minimum tax liabilityin the amount of $0.5 million. Since current alternative minimum tax liability results in alternative minimum taxcredit for future years when the taxpayer is subject to regular tax liability, a corresponding deferred tax asset wasrecorded for the alternative minimum tax credit.
As a result of the gain from the Distribution, the Company paid SkyTerra $1.1 million of alternativeminimum tax. In accordance with the Tax Sharing Agreement, the Company is entitled to a reimbursement of$1.1 million from SkyTerra at such time SkyTerra realizes the benefit of the alternative minimum tax credit. Thisreimbursement has been reflected on the Company’s books as a non-current receivable from SkyTerra.
For the years ended December 31, 2008, 2007 and 2006, income tax expense differs from the amountscomputed by applying the statutory rates to the Company’s income from continuing operations before incometaxes as follows (in thousands):
Year Ended December 31,
2008 2007 2006
Income before income tax expense, equity in losses of unconsolidatedaffiliates, and minority interests in net (earnings) losses ofsubsidiaries . . . . . . . . . . . . . . . . . . . . . . . . . . . . . . . . . . . . . . . . . . . . . . . $ 17,520 $ 49,630 $ 16,814
Federal income tax @ 35% . . . . . . . . . . . . . . . . . . . . . . . . . . . . . . . . . . . . . $ 6,132 $ 17,371 $ 5,885Net permanent differences . . . . . . . . . . . . . . . . . . . . . . . . . . . . . . . . . . . . . . 512 (189) -Change in valuation allowance . . . . . . . . . . . . . . . . . . . . . . . . . . . . . . . . . . 896 (13,596) -State taxes, net of federal benefit . . . . . . . . . . . . . . . . . . . . . . . . . . . . . . . . . 803 21 325Foreign taxes above federal tax rate . . . . . . . . . . . . . . . . . . . . . . . . . . . . . . (750) 1,730 223Distribution gain net of valuation allowance . . . . . . . . . . . . . . . . . . . . . . . . - - 47,677
Total income tax expense . . . . . . . . . . . . . . . . . . . . . . . . . . . . . . . . . . . . $ 7,593 $ 5,337 $ 54,110
The difference between the statutory Federal income tax rate and the Company’s effective tax rate for theyear ended December 31, 2008 is due to the increase in valuation allowance and state taxes as well as thedecrease in foreign taxes.
The difference between the statutory Federal income tax rate and the Company’s effective tax rate for theyear ended December 31, 2007 is principally due to the decrease in valuation allowance as a result of theutilization of NOL carryforwards to offset current year income.
The difference between the statutory Federal income tax rate and the Company’s effective tax rate for theyear ended December 31, 2006 is principally due to the reversal of deferred tax assets related to losscarryforwards expected to be utilized to offset the taxable income generated as a result of the Distribution.Following the Distribution, the Company, as accounting successor to Skyterra, distributed to Skyterra their shareof net deferred tax assets and associated valuation allowance, which did not impact the 2006 ConsolidatedStatement of Operations.
94

HUGHES COMMUNICATIONS, INC.
NOTES TO THE CONSOLIDATED FINANCIAL STATEMENTS (Continued)
We have not provided for U.S. deferred income taxes or foreign withholding taxes on $14.8 million of ourundistributed earnings for certain non-U.S. subsidiaries earnings because these earnings are intended to bepermanently reinvested in operations outside the United States.
In July 2006, the FASB issued FIN 48, “Accounting for Uncertainty in Income Taxes—an interpretation ofSFAS 109, Accounting for Income Taxes.” The interpretation addresses the determination of whether taxbenefits claimed or expected to be claimed on a tax return should be recorded in the financial statements. UnderFIN 48, the Company may recognize the tax benefit from an uncertain tax position only if it is more-likely-than-not that the tax position will be sustained on examination by the taxing authorities, based on the technicalmerits of the position. The tax benefits recognized in the financial statements from such a position should bemeasured based on the largest benefit that has a greater than fifty percent likelihood of being realized uponultimate settlement with a taxing authority that has full knowledge of all relevant information. FIN 48 requiresincreased disclosures and also provides guidance on de-recognition, classification, interest and penalties onincome taxes and accounting in interim periods. FIN 48 is effective as of the beginning of an entity’s first fiscalyear that starts after December 15, 2006.
A tabular reconciliation of a change in unrecognized tax benefits for the twelve months ended December 31,2008 and 2007 is as follows (in thousands):
December 31,
2008 2007
Beginning balance of unrecognized tax benefits . . . . . . . . . . . . . . . . . . . . . . . . . . . . . . . $ 8,708 $ 8,708Gross increases—tax positions in prior periods . . . . . . . . . . . . . . . . . . . . . . . . . . . . . . . . 989 -Gross decrease—tax positions in prior periods . . . . . . . . . . . . . . . . . . . . . . . . . . . . . . . . . - -Gross increases—tax positions in current period . . . . . . . . . . . . . . . . . . . . . . . . . . . . . . . 525 -Gross decrease—tax positions in current period . . . . . . . . . . . . . . . . . . . . . . . . . . . . . . . . - -Decrease in unrecognized tax benefits related to tax settlements . . . . . . . . . . . . . . . . . . . - -Reduction to unrecognized tax benefits due to lapse of statute of limitations . . . . . . . . . - -
Ending balance of unrecognized tax benefits . . . . . . . . . . . . . . . . . . . . . . . . . . . . . . . . $ 10,222 $ 8,708
At the adoption of FIN 48 on January 1, 2007, the Company identified an $8.7 million unrecognized taxbenefit related to tax positions in prior periods. If recognized, the total unrecognized tax benefits at December 31,2007 would impact the Company’s effective tax rate. We anticipate that uncertain tax positions will increasewithin the next twelve months as follows:
1. Nature of Uncertainty— tax credit
2. Nature of the Event Causing the Change—external study to compute the tax credit
3. Estimate of the Range—$0.5 million to $1.0 million
95

HUGHES COMMUNICATIONS, INC.
NOTES TO THE CONSOLIDATED FINANCIAL STATEMENTS (Continued)
The Company recognizes interest accrued related to unrecognized tax benefits in operating expenses andpenalties in income tax expense in the consolidated statements of operations. As of December 31, 2008, theCompany has not recorded any liability for the payment of interest or penalties associated with uncertain taxpositions. Following is a description of the tax years that remain subject to examination by major taxjurisdictions:
United States - Federal . . . . . . . . . . . . . . . . . . . . . . . . . . . . . . . . . . . . . . . . . . . . . . . . . . . . . . . . 1994 and forwardUnited States - Various States . . . . . . . . . . . . . . . . . . . . . . . . . . . . . . . . . . . . . . . . . . . . . . . . . . 1994 and forwardUnited Kingdom . . . . . . . . . . . . . . . . . . . . . . . . . . . . . . . . . . . . . . . . . . . . . . . . . . . . . . . . . . . . . 2005 and forwardGermany . . . . . . . . . . . . . . . . . . . . . . . . . . . . . . . . . . . . . . . . . . . . . . . . . . . . . . . . . . . . . . . . . . . 2004 and forwardItaly . . . . . . . . . . . . . . . . . . . . . . . . . . . . . . . . . . . . . . . . . . . . . . . . . . . . . . . . . . . . . . . . . . . . . . . 2004 and forwardIndia . . . . . . . . . . . . . . . . . . . . . . . . . . . . . . . . . . . . . . . . . . . . . . . . . . . . . . . . . . . . . . . . . . . . . . 1995 and forwardBrazil . . . . . . . . . . . . . . . . . . . . . . . . . . . . . . . . . . . . . . . . . . . . . . . . . . . . . . . . . . . . . . . . . . . . . . 2003 and forward
In January 2009, the Internal Revenue Service (“IRS”) contacted the Company to schedule an audit of HNS’2006 U.S. Income Tax Return.
Note 18: Employee Share-Based Payments
2006 Equity and Incentive Plan
In January 2006, we adopted and our Board of Directors approved the 2006 Equity and Incentive Plan (the“Plan”). The Plan provides for the grant of equity-based awards, including restricted common stock, restrictedstock units, stock options, stock appreciation rights and other equity-based awards, as well as cash bonuses andlong-term cash awards to directors, officers, other employees, advisors and consultants of the Company and itssubsidiaries who are selected by our Compensation Committee for participation in the Plan. Unless earlierterminated by the Company’s Board of Directors, the Plan will expire on the tenth anniversary of the date of itsadoption. Termination of the Plan is not intended to adversely affect any award that is then outstanding withoutthe award holder’s consent. The Company’s Board of Directors may amend the Plan at any time. Planamendments are not intended to adversely affect any award that is then outstanding without the award holder’sconsent, and the Company must obtain stockholder approval of a plan amendment if stockholder approval isrequired to comply with any applicable law, regulation or stock exchange rule.
The Plan provides for the issuance of up to 2,700,000 shares of our common stock which may be issued inthe form of restricted stock, stock options or stock appreciation rights; provided that the maximum number ofshares that may be issued pursuant to the exercise of incentive stock options may not exceed 1,350,000 shares. Inaccordance with the terms of the Plan, in August 2006, the board delegated to the CEO the authority to award, atthe CEO’s discretion, up to 250,000 shares in the aggregate of restricted stock to employees (other thanSection 16 reporting persons) up to a maximum award of 4,000 shares per employee. The CEO has issuedRestricted Stock Awards and Restricted Stock Units to employees, for which 50% of the shares vest on thesecond anniversary of the issuance date, and an additional 25% of the shares vest on each of the third and fourthanniversaries of the issuance date. The fair value of the shares is calculated based on the market price on thegrant date.
The Company also issues shares under the Plan to its directors, officers and key employees and contractorsof the Company and its wholly-owned subsidiaries. These awards are issued at their fair market value on the dateof grant. In March 2006, the Company issued Restricted Stock Award of 14,000 shares each to four of its officersand a contractor. These restricted shares vest within two years of the date of issuance. The Company issued anaggregate of 60,000 shares of restricted stock, which vest over a three year period, to members of our Board ofDirectors during the period from February through May 2006.
96

HUGHES COMMUNICATIONS, INC.
NOTES TO THE CONSOLIDATED FINANCIAL STATEMENTS (Continued)
The Company and HNS account for shares issued in accordance with the provisions of SFAS No. 123(R),“Share-Based Payments, a revision of SFAS No. 123.” The Company records compensation expense forrestricted stock awards and restricted stock units on a straight-line basis over their vesting period. For the yearsended December 31, 2008, 2007 and 2006, the Company recorded compensation expense related to the restrictedstock awards, issued to members of our Board of Directors, our executives, a former HNS executive and HNS’employees, and restricted stock units, issued only to our international employees, after adjustment for forfeitures,of $3.2 million, $4.0 million and $1.9 million, respectively. As of December 31, 2008, the Company had$5.8 million of unrecognized compensation expense related to the restricted stock awards and restricted stockunits, which will be recognized over a weighted average life of 2.18 years. The Company recognized a taxbenefit of $2.6 million and $0.3 million related to restricted stock awards and restricted stock units for the yearended December 31, 2008 and 2006, respectively. The Company did not recognize any tax benefit in 2007.
Summaries of non-vested restricted stock awards and restricted stock units are as follows:
Restricted Stock Awards
Shares
Weighted-AverageGrant-DateFair Value
Non-vested at December 31, 2007 . . . . . . . . . . . . . . . . . . . . . . . . . . . . . . . . . . . . . 347,850 $ 41.30Issued . . . . . . . . . . . . . . . . . . . . . . . . . . . . . . . . . . . . . . . . . . . . . . . . . . . . . . . . . . . 12,500 $ 47.95Forfeited . . . . . . . . . . . . . . . . . . . . . . . . . . . . . . . . . . . . . . . . . . . . . . . . . . . . . . . . . (16,858) $ 44.58Vested . . . . . . . . . . . . . . . . . . . . . . . . . . . . . . . . . . . . . . . . . . . . . . . . . . . . . . . . . . (182,727) $ 37.76
Non-vested at December 31, 2008 . . . . . . . . . . . . . . . . . . . . . . . . . . . . . . . . . 160,765 $ 45.51
The weighted average grant-date fair value of restricted stock awards granted for the year endedDecember 31, 2008, 2007 and 2006 were $47.95, $49.86 and $39.38, respectively. The total fair value of sharesvested during the year ended December 31, 2008 was $6.9 million. None of the restricted stock awards issued toemployees vested during 2007 and 2006.
Restricted Stock Units
Shares
Weighted-AverageGrant-DateFair Value
Non-vested at December 31, 2007 . . . . . . . . . . . . . . . . . . . . . . . . . . . . . . . . . . . . . 10,700 $ 45.83Issued . . . . . . . . . . . . . . . . . . . . . . . . . . . . . . . . . . . . . . . . . . . . . . . . . . . . . . . . . . . 1,500 $ 43.27Vested . . . . . . . . . . . . . . . . . . . . . . . . . . . . . . . . . . . . . . . . . . . . . . . . . . . . . . . . . . (3,850) $ 44.20
Non-vested at December 31, 2008 . . . . . . . . . . . . . . . . . . . . . . . . . . . . . . . . . 8,350 $ 46.12
The weighted average grant-date fair value of restricted stock units granted for the year ended December 31,2008, 2007 and 2006 were $43.27, $50.00 and $44.20, respectively. The total fair value of units vested during theyear ended December 31, 2008 was $0.2 million. None of the restricted stock units were vested during 2007 and2006.
97

HUGHES COMMUNICATIONS, INC.
NOTES TO THE CONSOLIDATED FINANCIAL STATEMENTS (Continued)
Stock Option Program
On April 24, 2008, the Company’s Compensation Committee made stock options awards under the 2006Equity and Incentive Plan (the “Stock Option Program”), which consisted of the issuance of non-qualified stockoptions to employees of HCI and its subsidiaries. A total of 700,000 options (the “Option Pool”) have beenauthorized under the Stock Option Program for option awards during the period of April 24, 2008 toDecember 31, 2009. The grant and exercise price of the stock options is the closing price of the Company’scommon stock on the date of the grant. Any forfeited or cancelled options before exercise will be deposited backinto the Option Pool and will become available for award under the Stock Option Program. In accordance withthe terms of the Stock Option Program, the Compensation Committee delegated to the Chief Executive Officer(“CEO”) and President of the Company the authority to award options, at his discretion, to the current and futureemployees of the Company and its subsidiaries. Each grant has a 10 year life and vests 50% on the secondanniversary of the grant date and 25% on each of the third and fourth anniversaries of the grant date. The fairvalue of each option award was estimated on the date of grant using a Black-Scholes option valuation modelbased on the assumptions noted in the table below.
Since the Company recently became a public registrant in February 2006 and does not have sufficienthistory to measure expected volatility using its own stock price history and does not have the history to computeexpected term, the Company utilized an average volatility based on a group of companies identified as its peersuntil such time that the Company has adequate stock history of its own. The Company estimated the expectedterm of the stock, which is closely aligned with the identified peer group, based upon the current anticipatedcorporate growth, the currently identified market value of the stock price at issuance and the vesting schedule ofthe stock options. The risk-free interest rate is based on the published U.S. Treasury Yield Curve as of the grantdate for the period of 5 years which most closely correlates to the expected term of the option award. Dividendyield is zero as the Company has not, nor does it currently plan to, issue dividends to our shareholders.
The key assumptions for the option awards are as follows:
Year EndedDecember 31, 2008
Volatility range . . . . . . . . . . . . . . . . . . . . . . . . . . . . . . . . . . . . . . . . . . . . . . . . . . . 47.60% - 55.0%Weighted-average volatility . . . . . . . . . . . . . . . . . . . . . . . . . . . . . . . . . . . . . . . . . . 47.67%Expected term . . . . . . . . . . . . . . . . . . . . . . . . . . . . . . . . . . . . . . . . . . . . . . . . . . . . 5 yearsRisk-free interest rate range . . . . . . . . . . . . . . . . . . . . . . . . . . . . . . . . . . . . . . . . . . 3.15% - 1.50%Weighted-average risk-free interest rate . . . . . . . . . . . . . . . . . . . . . . . . . . . . . . . . 3.14%
OptionShares
Weighted-AverageExercisePrice
WeightedAverage
RemainingContractual
Life
AggregateIntrinsicValue
Outstanding at January 1, 2008 . . . . . . . . . . . . . . . . . . . . . . - $ -Granted . . . . . . . . . . . . . . . . . . . . . . . . . . . . . . . . . . . . . . . . 562,400 $ 53.67Forfeited or expired . . . . . . . . . . . . . . . . . . . . . . . . . . . . . . . (10,000) $ 54.00
Outstanding at December 31, 2008 . . . . . . . . . . . . . . . . . . . 552,400 $ 53.67 9.32 $ -
Vested and expected to vest at December 31, 2008 . . . . . . 497,160 $ 53.67 9.32 $ -
Exercisable at December 31, 2008 . . . . . . . . . . . . . . . . . . . - $ -
98

HUGHES COMMUNICATIONS, INC.
NOTES TO THE CONSOLIDATED FINANCIAL STATEMENTS (Continued)
The compensation expense related to these awards is recognized on a straight-line basis over the four-yearvesting period beginning in the second quarter of 2008. The Company recorded $2.0 million compensationexpense for the year ended December 31, 2008 and $10.2 million remained unrecognized at December 31, 2008for non-vested stock options, which is expected to be recognized over a weighted average period of 3.32 years.None of the stock options vested during 2008.
HNS’ Bonus Unit Plan
In July 2005, HNS adopted an incentive bonus unit plan (the “Bonus Unit Plan”) pursuant to which4.4 million bonus units representing approximately 4% of the increase in the value of HNS, as defined in theBonus Unit Plan, were granted to certain of its employees. The bonus units provide for time vesting over fiveyears and are subject to a participant’s continued employment with HNS. Pursuant to the Bonus Unit Plan, ifparticipants are employed by HNS on the predetermined exchange dates, they are entitled to exchange theirvested bonus units for shares of our common stock. The first exchange occurred on July 15, 2008, whenapproximately 1.9 million bonus units were exchanged for 192,399 shares of our common stock. The number ofour common stock shares to be issued upon each exchange is calculated based upon the fair market value of thevested bonus unit divided by the closing trading price of our common stock for the 20 business days immediatelypreceding the date of the exchange. The fair value of the bonus units on the grant date was approximately$1.2 million, after adjustment for a 13% estimated forfeiture rate, based on the estimated increase in the fairmarket value of HNS’ net equity at the time of the grant which reflected the pending purchase price in connectionwith the January 2006 Transaction.
On September 19, 2008, HNS issued 310,000 bonus units to certain of its employees pursuant to the termsof the Bonus Unit Plan. The fair value of the new issuance of bonus units was determined using a forward pricingmodel. The total estimated compensation expense for the new issuance of bonus units is $1.7 million, afteradjustment for a 10% estimated forfeiture rate.
Pursuant to SFAS No. 123(R), the Company amortizes the compensation expense of the Bonus Unit Planover the vesting period beginning on the date of grant. HNS recognized compensation expense of $0.4 million,$0.2 million and $0.2 million for years ended December 31, 2008, 2007 and 2006, respectively.
The following table summarizes changes in bonus units under the Bonus Unit Plan:
Year Ended December 31,
2008 2007
Non-vested beginning balance . . . . . . . . . . . . . . . . . . . . . . . . . . . . . . . . . . . . . . . . . 4,175,000 4,255,000Converted to HCI common shares . . . . . . . . . . . . . . . . . . . . . . . . . . . . . . . . . . . . . . (1,865,250) -Forfeited . . . . . . . . . . . . . . . . . . . . . . . . . . . . . . . . . . . . . . . . . . . . . . . . . . . . . . . . . . (119,750) (80,000)Re-issuance of forfeited bonus units . . . . . . . . . . . . . . . . . . . . . . . . . . . . . . . . . . . . . 310,000 -
Non-vested ending balance . . . . . . . . . . . . . . . . . . . . . . . . . . . . . . . . . . . . . . . . . . 2,500,000 4,175,000
HNS Class B Membership Interests
Class B membership interests in HNS were issued to certain members of HNS’ senior management, two ofHNS’ former senior management and a member of our Board of Directors. The holders of the Class Bmembership interests are entitled to receive their pro-rata share of any distributions made by HNS after theholders of Class A equity interests have received distributions equaling their capital contributions. However,holders of the Class B membership interests are not entitled to distributions resulting from appreciation of HNS’assets or income earned by HNS prior to the issuance of the Class B membership interests.
99

HUGHES COMMUNICATIONS, INC.
NOTES TO THE CONSOLIDATED FINANCIAL STATEMENTS (Continued)
In May 2008, certain members of the Company’s senior management exchanged a portion of their vestedClass B membership interests for the Company’s common stock. The number of shares of the Company’scommon stock issued upon the exchange was based upon the fair market value of the vested Class B membershipinterests tendered for exchange divided by the average closing trading price of the Company’s common stock forthe 20 business days immediately preceding the date of the exchange. A total of 170,081 shares of our commonstock were issued in connection with the exchange, of which 169,600 shares were sold in connection with theoffering. See Note 20—Stockholders’ Equity for further discussion.
As of December 31, 2008, there were 3,656 Class B membership interests outstanding, representingapproximately 3.7% of the combined outstanding Class A and Class B membership interests. These Class Bmembership interests are subject to certain vesting requirements, with 50% of the Class B membership interestssubject to time vesting over five years and the other 50% vesting based upon certain performance milestones.One-half of the Class B membership interests subject to performance milestones will vest if, following the earlierof April 22, 2010 (January 24, 2011 with respect to 250 Class B membership interests) or a change of control ofHNS, and the Company has received a cumulative total return of at least 3.0 times on its investment in HNS. AllClass B membership interests subject to performance milestones will vest if, following the earlier of April 22,2010 (January 24, 2011 with respect to 250 Class B membership interests) or a change of control of HNS, andthe Company has received a cumulative total return of at least 5.0 times on its investment in HNS. In each suchcase, vesting of Class B membership interests subject to performance milestones requires continued employmentof the Class B membership holder through the earlier of April 22, 2010 (January 24, 2011 with respect to 250Class B membership interests) or a change in control of HNS. At the holders’ election, vested Class Bmembership interests may be exchanged for our common stock. The number of shares of our common stock to beissued upon such exchange will be based upon the fair market value of such vested Class B membership interesttendered for exchange divided by the average closing trading price of our common stock for the 20 business daysimmediately preceding the date of such exchange. Pursuant to SFAS No. 123, HNS determined that the Class Bmembership interests had nominal value at the date of grant, and, accordingly, compensation expensed of $0.1million was recorded for each of the years ended December 31, 2008, 2007 and 2006.
Summary of Class B membership interests activities is as follows:
Year EndedDecember 31,
2008 2007
Outstanding beginning balance . . . . . . . . . . . . . . . . . . . . . . . . . . . . . . . . . . . . . . . . . . . . . . . . . 4,650 4,650Converted to HCI common shares . . . . . . . . . . . . . . . . . . . . . . . . . . . . . . . . . . . . . . . . . . . . . . . (994) -
Outstanding ending balance . . . . . . . . . . . . . . . . . . . . . . . . . . . . . . . . . . . . . . . . . . . . . . . . . . 3,656 4,650
SkyTerra’s 1998 Long Term Incentive Plan
Pursuant to SkyTerra’s 1998 Long Term Incentive Plan (the “SkyTerra Plan”), the compensation committeeof the Board of Directors of SkyTerra was required to make an equitable adjustment to the terms of optionsissued under the SkyTerra Plan in the event a special, large and nonrecurring dividend or distribution affectsSkyTerra’s common stock such that an adjustment is appropriate in order to prevent dilution or enlargement ofthe rights of the participants under the SkyTerra Plan. SkyTerra’s compensation committee has discretion tomake such an adjustment to any option issued under the SkyTerra Plan by adjusting the number and kind ofshares that may be issued in respect of outstanding options or the exercise price relating to such options. Pursuantto this provision, SkyTerra’s compensation committee determined that holders of stock options issued under theSkyTerra Plan who were members of SkyTerra’s management and Board of Directors as of the date of theDistribution, as well as a consultant and former directors who were involved with SkyTerra’s acquisition of
100

HUGHES COMMUNICATIONS, INC.
NOTES TO THE CONSOLIDATED FINANCIAL STATEMENTS (Continued)
HNS, would receive an option to purchase one share of our common stock for each option to purchase two sharesof SkyTerra common stock that they held as of the date of the Distribution. The issuance of such options topurchase our common stock was in lieu of a larger adjustment to the exercise price of the SkyTerra options thatsuch holders would have been otherwise entitled had they not received options to purchase our common stock. Areduction in the exercise price (or in some cases, an increase in the number of shares) was the manner in whichall other SkyTerra options outstanding under the plan were adjusted. In February 2006, the Company issuedoptions to purchase 435,836 shares of our common stock to holders of SkyTerra options under the Plan.
The exercise price of such options to purchase shares of our common stock that were issued to certainholders of options to purchase SkyTerra common stock was determined by multiplying the exercise price of suchSkyTerra option by a fraction, the numerator of which was the closing price of a share of our common stock onthe first trading day after the Distribution date multiplied by the exchange ratio of 0.5 and the denominator ofwhich was that price multiplied by the exchange ratio plus the closing price of a share of SkyTerra common stockon the first trading day after the Distribution date and further dividing such result by the exchange ratio.
The fair value of each share or option, as applicable, was determined on the date of grant, except for sharesof restricted stock issued to a consultant. In accordance with EITF Issue No. 96-18, “Accounting for EquityInstruments That Are Issued to Other Than Employees for Acquiring, or in Conjunction with Selling, Goods orServices”, the fair value of such shares is adjusted at the end of the reporting period, and accordingly, the fairvalue as of December 31, 2008 was used for determining compensation expense attributable to such shares.
The following table summarizes stock option activity and related information for the SkyTerra Plan for theyears ended December 31, 2008, 2007 and 2006:
Number ofShares
WeightedAverageExercisePrice
AggregateIntrinsicValue*
Options outstanding at January 1, 2006 . . . . . . . . . . . . . . . . . . . . . . . . - $ - $ -Issued:
Issued to holders of SkyTerra options . . . . . . . . . . . . . . . . . . . . . 435,836 $ 4.39 $ -Issued to an HCI officer and a former HNS officer . . . . . . . . . . . 40,000 $ 10.35 $ -
Exercised:Exercised by holders of SkyTerra options . . . . . . . . . . . . . . . . . . (365,002) $ 1.36 $ 16,150Exercised by an HCI officer and a former HNS officer . . . . . . . . (40,000) $ 10.35 $ 1,451
Options outstanding & exercisable at December 31, 2006 . . . . . . . . . 70,834 $ 19.99 $ 1,886Exercised by holders of SkyTerra options . . . . . . . . . . . . . . . . . . (5,000) $ 22.53 $ 160
Options outstanding & exercisable at December 31, 2007 . . . . . . . . . 65,834 $ 19.80 $ 2,292Exercised by holders of SkyTerra options . . . . . . . . . . . . . . . . . . (3,334) $ 22.53 $ -
Options outstanding & exercisable at December 31, 2008 . . . . . . . . . 62,500 $ 19.65 $ -
* In thousands.
101

HUGHES COMMUNICATIONS, INC.
NOTES TO THE CONSOLIDATED FINANCIAL STATEMENTS (Continued)
The following table summarizes information about stock options that are outstanding and exercisable as ofDecember 31, 2008:
Stock Options Outstanding and Exercisable
Range of Exercise PricesNumber ofShares
WeightedAverageExercisePrice
WeightedAverage
RemainingLife (Years)
$1.48 . . . . . . . . . . . . . . . . . . . . . . . . . . . . . . . . . . . . . . . . . . . . . . . . . . . 5,000 $ 1.48 5.13$20.23 - $22.53 . . . . . . . . . . . . . . . . . . . . . . . . . . . . . . . . . . . . . . . . . . . 57,500 $ 21.23 6.28
62,500 $ 19.65 6.19
On March 24, 2006, the Company issued fully vested options to acquire 40,000 shares of our common stockat an exercise price of $10.35/share to two of our executives. The options expired by December 31, 2006 if notexercised. All of these options were exercised in 2006 and are no longer outstanding. The Company recognized$0.8 million of compensation expense in 2006 related to these awards.
Note 19: Other Benefits
401(k) Plan
The Company has a 401(k) salary deferral program for eligible employees in the United States who havemet certain service requirements. Eligible employees may contribute up to 25% (16% for highly compensatedemployees) of their eligible compensation into the plan on a pre-tax basis each payroll period, subject to a limitof $15,500 in 2008 per the IRS. Employee contributions are immediately vested. The Company will match 100%of employee contributions up to 3% of eligible compensation and 50% of employee contributions on up to anadditional 6% of eligible compensation. Matching contributions are 100% vested after eligible employees havecompleted three years of service. During 2008, 2007 and 2006, the Company matching contributions were $6.9million, $6.6 million and $6.2 million, respectively.
In addition, set by the IRS, participants who are age 50 or older may make additional contributions(“catch-up contributions”), up to $5,000 in 2008, into the plan. The Company does not match the catch-upcontributions. The plan also permits participants to make contributions on an after-tax basis.
Long-Term Cash Incentive Retention Program
In connection with the April 22, 2005 transaction between The DIRECTV Group, Inc. (“DIRECTV”) andSkyTerra, HNS established the Long-Term Cash Incentive Retention Program (the “Retention Program”), aone-time employee retention program, which was designed to retain a select group of employees chosen by HNS’senior management. The Retention Program provides that participants will receive a cash payout equal to eachparticipant’s individual target bonus amount if (i) the individual remains employed by HNS on the vesting dateof April 22, 2009 and (ii) HNS successfully attains its earnings goal for 2008.
In accordance with the Retention Program, HNS established the earnings goal in March 2008, which isequivalent to its planned 2008 Adjusted EBITDA, defined as earnings before interest, tax, depreciation andamortization further adjusted to exclude certain adjustments consistent with the definition used in calculatingHNS’ covenant compliance under its credit agreements and the indenture governing the Senior Notes. As ofDecember 31, 2008, HNS successfully attained 100% of its Adjusted EBITDA goal for 2008. During 2008, theCompany recorded an accrued liability of $13.2 million of a maximum payout (if all participants remainemployed through the vesting date) of approximately $14.1 million.
102

HUGHES COMMUNICATIONS, INC.
NOTES TO THE CONSOLIDATED FINANCIAL STATEMENTS (Continued)
Note 20: Stockholders’ Equity
HCI’s common stock is traded on the NASDAQ Global Select Market under the symbol “HUGH.” TheCompany is authorized to issue 64,000,000 shares of common stock, par value $0.001 per share, of which21,514,963 shares were issued and outstanding at December 31, 2008. Additionally the Company is authorized toissue 1,000,000 shares of preferred stock, par value $0.001 per share, of which none were outstanding atDecember 31, 2008. The preferred stock can be issued in one or more classes or series, and the Board ofDirectors has the authority to establish voting rights, preferences, and other rights related to dividends,convertibility, redemptions and other limitations as may be permitted by the General Corporation Law of theState of Delaware. As of December 31, 2008, no class or series of preferred stock had been established by theCompany’s Board of Directors.
On May 21, 2008, the Company completed an underwritten equity offering in which it sold 2,000,000shares of the Company’s common stock, par value $0.001 per share (“Common Stock”). The equity offeringclosed on May 28, 2008, and as a result, the Company raised $93.0 million in net proceeds, after deductingrelated offering costs. The Company did not receive any proceeds from the sale of 169,600 shares of theCommon Stock received by certain stockholders of the Company in connection with the exchange of their ClassB membership interests, as discussed in Note 18—Employee Share-Based Payments.
Note 21: Redeemable Convertible Preferred Stock
On June 4, 1999, SkyTerra issued and sold Series A and B preferred stock and warrants to Apollo for anaggregate purchase price of $87.0 million. As approved at SkyTerra’s 1999 annual meeting of stockholders, allSeries B securities were converted to Series A securities. As part of the Distribution, all outstanding Series Apreferred stock and warrants were distributed to SkyTerra.
At the time of issuance, the Company ascribed value to the Series A securities based on their relative fairvalue. As such, $29.9 million was allocated to Series A preferred stock and the remaining $57.1 million wasallocated to the related Series 1-A and Series 2-A warrants. This transaction was accounted for in accordancewith EITF Issue No. 98-5 “Accounting for Convertible Securities with Beneficial Conversion Features.”Dividends have been recorded representing the accrual of the quarterly paid-in-kind dividends, and the accretionof the carrying value up to the face redemption over 13 years. For the year ended December 31, 2006, theaccretion through the date of the Distribution was $0.6 million, respectively.
In accordance with Accounting Pronouncement Bulletin No. 29, the distribution of the Series A redeemableconvertible preferred stock on the date of the Distribution was accounted for as a distribution to SkyTerra at itshistorical basis. As a result of and subsequent to the Distribution, SkyTerra Series A and B securities are not anauthorized class of securities for the Company.
Note 22: Segment Data and Geographic Data
We have four reportable segments, which we operate and manage as strategic business units and organize byproducts and services. We measure and evaluate our reportable segments based on operating earnings of therespective segments. Our business segments include: (i) the North America VSAT segment; (ii) the InternationalVSAT segment; (iii) the Telecom Systems segment; and (iv) the Corporate and Other segment. The NorthAmerica VSAT segment consists of the Consumer group, which delivers broadband internet service to consumercustomers, and the Enterprise group, which provides satellite communication networks and services toenterprises. The International VSAT segment consists of the Enterprise group, which includes our international
103

HUGHES COMMUNICATIONS, INC.
NOTES TO THE CONSOLIDATED FINANCIAL STATEMENTS (Continued)
service companies. The international Enterprise group provides satellite communication networks and services toenterprise customers worldwide. The Telecom Systems segment consists of the Mobile Satellite Systems group,the Telematics group, and the Terrestrial Microwave group. The Mobile Satellite Systems group providesturnkey satellite ground segment systems to mobile system operators. The Telematics group providesdevelopment services and equipment to Hughes Telematics, Inc. (“HTI”) and certain of its customers. TheTerrestrial Microwave group provides point-to-multipoint microwave radio network systems that enable mobileoperators to connect their cell sites and fixed operators to provide wireless broadband services. The Corporateand Other segment includes various minority investments held by the Company, our corporate offices and assetsnot specifically related to another business segment.
There are no intersegment transactions. Selected financial information for our operating segments is asfollows (in thousands):
NorthAmericaVSAT
InternationalVSAT
TelecomSystems
Corporateand Other Eliminations(1) Consolidated
As of and For the Year EndedDecember 31, 2008
Revenues . . . . . . . . . . . . . . . . . . . . $ 667,665 $ 237,188 $ 155,038 $ 462 $ - $ 1,060,353Operating income (loss) . . . . . . . . $ 21,339 $ 21,679 $ 25,116 $ (3,842) $ - $ 64,292Depreciation and amortization . . . $ 55,868 $ 9,233 $ 3,836 $ - $ - $ 68,937Assets . . . . . . . . . . . . . . . . . . . . . . . $ 648,603 $ 197,087 $ 64,727 $ 279,976 $ - $ 1,190,393Capital expenditures . . . . . . . . . . . $ 71,696 $ 11,188 $ 2,223 $ 11,126 $ - $ 96,233
As of and For the Year EndedDecember 31, 2007
Revenues . . . . . . . . . . . . . . . . . . . . $ 615,716 $ 214,833 $ 139,526 $ 573 $ - $ 970,648Operating income (loss) . . . . . . . . $ 44,259 $ 19,637 $ 25,911 $ (6,171) $ - $ 83,636Depreciation and amortization . . . $ 34,970 $ 7,947 $ 2,943 $ - $ - $ 45,860Assets . . . . . . . . . . . . . . . . . . . . . . . $ 610,950 $ 214,231 $ 66,215 $ 238,441 $ - $ 1,129,837Capital expenditures . . . . . . . . . . . $ 216,943 $ 14,357 $ 4,093 $ 12,787 $ - $ 248,180
As of and For the Year EndedDecember 31, 2006
Revenues . . . . . . . . . . . . . . . . . . . . $ 573,867 $ 193,370 $ 90,988 $ 8,616 $ (8,142) $ 858,699Operating income (loss) . . . . . . . . $ 35,625 $ 3,178 $ 18,871 $ (17,277) $ 12,245 $ 52,642Depreciation and amortization . . . $ 39,224 $ 6,861 $ 2,374 $ - $ - $ 48,459Assets . . . . . . . . . . . . . . . . . . . . . . . $ 450,671 $ 185,926 $ 44,774 $ 250,273 $ - $ 931,644Capital expenditures . . . . . . . . . . . $ 75,786 $ 8,109 $ 3,075 $ 6,637 $ - $ 93,607
(1) To Eliminate the Company’s 23% share of the MSV Joint Venture as it is included in the Corporate and Other columns.
For the years ended December 31, 2008, 2007 and 2006, no single customer accounted for more than 5% oftotal revenues. Revenues by geographic area are summarized by customers’ location as follows (in thousands):
Year Ended December 31,
2008 2007 2006
North America . . . . . . . . . . . . . . . . . . . . . . . . . . . . . . . . . . . . . . . . . . . . . . $ 803,496 $ 726,246 $ 665,778Europe . . . . . . . . . . . . . . . . . . . . . . . . . . . . . . . . . . . . . . . . . . . . . . . . . . . . 115,495 88,366 66,694Africa, Asia and the Middle East . . . . . . . . . . . . . . . . . . . . . . . . . . . . . . . 106,627 125,043 104,873South America and the Caribbean . . . . . . . . . . . . . . . . . . . . . . . . . . . . . . . 34,735 30,993 21,354
Total revenues . . . . . . . . . . . . . . . . . . . . . . . . . . . . . . . . . . . . . . . . . . $ 1,060,353 $ 970,648 $ 858,699
104

HUGHES COMMUNICATIONS, INC.
NOTES TO THE CONSOLIDATED FINANCIAL STATEMENTS (Continued)
Individual countries with significant revenues for the three years ended December 31, 2008 are as follows(in thousands):
Year Ended December 31,
2008 2007 2006
United States . . . . . . . . . . . . . . . . . . . . . . . . . . . . . . . . . . . . . . . . . . . . . . . . $ 785,349 $ 717,824 $ 639,401United Kingdom . . . . . . . . . . . . . . . . . . . . . . . . . . . . . . . . . . . . . . . . . . . . . . $ 66,555 $ 30,568 $ 20,062
Total property, net by geographic area is summarized by customers’ location as follows (in thousands):
December 31,
2008 2007
North America:United States . . . . . . . . . . . . . . . . . . . . . . . . . . . . . . . . . . . . . . . . . . . . $ 489,284 $ 461,920Mexico . . . . . . . . . . . . . . . . . . . . . . . . . . . . . . . . . . . . . . . . . . . . . . . . . 2 5
Total North America . . . . . . . . . . . . . . . . . . . . . . . . . . . . . . . . . . . . . . . . . . 489,286 461,925Africa, Asia and the Middle East . . . . . . . . . . . . . . . . . . . . . . . . . . . . . . . . . 8,300 8,260South America and the Caribbean . . . . . . . . . . . . . . . . . . . . . . . . . . . . . . . . 5,344 4,655Europe . . . . . . . . . . . . . . . . . . . . . . . . . . . . . . . . . . . . . . . . . . . . . . . . . . . . . 4,340 5,136
Total property, net . . . . . . . . . . . . . . . . . . . . . . . . . . . . . . . . . . . . . . . . $ 507,270 $ 479,976
Note 23: Transactions with Related Parties
In the ordinary course of our operations, we enter into transactions with related parties to purchase and/orsell telecommunications services, equipment and inventory. Related parties include Apollo Management, L.P.and its affiliates (collectively “Apollo”), which includes other satellite related companies.
Separation Agreement
On December 30, 2005, in preparation for the Distribution, SkyTerra and the Company entered into aSeparation Agreement pursuant to which SkyTerra contributed to the Company, effective December 31, 2005, allof its assets, liabilities and operations other than those associated with Mobile Satellite Ventures LP (“MSV”)and TerreStar Networks, Inc. (“TerreStar”) and $12.5 million of cash, cash equivalents and short-terminvestments. SkyTerra retained its interest in each of MSV and TerreStar, $12.5 million of cash, cash equivalentsand short-term investments and the obligations pursuant to the Series A Preferred Stock. Upon a change ofcontrol of SkyTerra, the remaining balance of the $12.5 million of cash, cash equivalents and short-terminvestments at such time, if any, would have been transferred to the Company from SkyTerra. SkyTerra hasindicated that there are no remaining funds to be transferred to the Company as a result of qualified expendituresas defined in the agreement. The Separation Agreement also provides that the Company was responsible forpaying all fees, costs and expenses directly related to the Distribution, except to the extent such fees were paid bySkyTerra. In addition, the Separation Agreement provides for certain indemnifications, tax sharing, consultingservices and access to facilities.
Indemnification—The Separation Agreement provides that the Company will indemnify SkyTerra againstlosses based on, arising out of, or resulting from (i) the ownership or the operation of the assets or propertiestransferred to the Company under the Separation Agreement, and the operation or conduct of the business of,
105

HUGHES COMMUNICATIONS, INC.
NOTES TO THE CONSOLIDATED FINANCIAL STATEMENTS (Continued)
including contracts entered into and any activities engaged in by, the Company, whether in the past or future;(ii) any other activities the Company engages in; (iii) any guaranty or keep well of or by SkyTerra provided toany parties with respect to any of the Company’s actual or contingent obligations; and (iv) certain other mattersdescribed in the Separation Agreement. The Separation Agreement provides that SkyTerra will indemnify theCompany against losses based on, arising out of, or resulting from the ownership or operation of the assets orproperties of MSV or TerreStar, or the operation or conduct of their businesses, including the contracts enteredinto by them, and certain other matters described in the Separation Agreement.
Tax sharing agreement—The tax sharing agreement governs the allocation between the Company andSkyTerra of tax liabilities and related tax matters, such as the preparation and filing of tax returns and taxcontests, for all taxable periods ended on or before February 21, 2006. The Company will generally beresponsible for, and indemnify SkyTerra and its subsidiaries against, all tax liabilities imposed on or attributableto (i) the Company and any of its subsidiaries relating to all taxable periods and (ii) SkyTerra and any of itssubsidiaries for all taxable periods or portions thereof ending on or prior to a change of control of SkyTerra, ineach case, after taking into account any tax attributes of SkyTerra or any of its subsidiaries that are available tooffset such tax liabilities. Notwithstanding the foregoing, the Company is not responsible for any taxes relating toMSV, TerreStar or a change of control of SkyTerra. Additionally, under the tax sharing agreement, SkyTerra isresponsible for, and indemnifies the Company and its subsidiaries against, all tax liabilities imposed on orattributable to MSV and TerreStar relating to all taxable periods, SkyTerra and any of its subsidiaries relating toall taxable periods or portions thereof beginning and ending after a change of control, and any change of controlof SkyTerra.
Smart & Final, Inc. (“Smart & Final”)
As of December 31, 2008, Apollo owned, directly or indirectly, 95% of Smart & Final. We provide VSATproducts and services to Smart & Final.
Hughes Systique Corporation
On October 12, 2005, the Company acquired Series A Preferred Shares from Hughes Systique for $3.0million. HNS has contracted with Hughes Systique for software development services. The founders of HughesSystique include Pradman Kaul, our CEO and President and HNS’ CEO and President and certain formeremployees of the Company, including Pradeep Kaul, who is the CEO and President of Hughes Systique, ourformer Executive Vice President and the brother of our CEO and President.
On January 9, 2008, the Company purchased additional Series A Preferred Shares from Hughes Systique.On February 8, 2008, the Company and another significant shareholder of Hughes Systique agreed to makeavailable to Hughes Systique a term loan facility of up to $3.0 million. Under that facility, Hughes Systique maymake borrowing requests of at least $1.0 million to be funded equally by the Company and the other shareholder.The loan bears interest at 6%, payable annually, and is convertible into shares of Hughes Systique uponnon-payment or an event of default. On February 11, 2008, Hughes Systique made a request for an initial draw of$1.0 million, and we funded $0.5 million for our share of the initial draw.
At December 31, 2008, on an undiluted basis, the Company owned approximately 31.8% of the outstandingshares of Hughes Systique, and our CEO and President and his brother owned an aggregate of approximately17.3% of the outstanding shares of Hughes Systique. In addition, our CEO and President and Jeffrey A. Leddy, amember of our Board of Directors and HNS’ Board of Managers, serve on the board of directors of HughesSystique.
106

HUGHES COMMUNICATIONS, INC.
NOTES TO THE CONSOLIDATED FINANCIAL STATEMENTS (Continued)
At December 31, 2008, the Company’s maximum loss exposure on its investment in Hughes Systique was$3.1 million which includes the carrying value of the Company’s investment in Hughes Systique of $2.6 millionand the term loan of $0.5 million that was funded in February 2008 as part of the Company’s share of the initialdraw.
Intelsat Holdings Limited
The Company and its subsidiaries lease satellite transponder capacity from Intelsat. In addition, our Italiansubsidiary, Hughes Network Systems, S.r.L., entered into a cooperation agreement with Intelsat, Telespazio andTelecom Italia. Under this agreement, the parties are cooperating to provide broadband satellite services forItalian businesses operating in Eastern Europe and North Africa. Effective February 4, 2008, Apollo divested itsentire ownership interest in Intelsat; therefore, Intelsat is no longer a related party to us as of that date.
Agreement with 95 West Co., Inc.
In July 2006, HNS entered into an agreement with 95 West Co. and its parent, MLH, pursuant to which 95West Co. and MLH agreed to provide a series of coordination agreements which allow HNS to operate itsSPACEWAY 3 at an orbital position where such parties have higher-priority rights. Jeffrey A. Leddy, a memberof our Board of Directors and HNS’ Board of Managers, is the managing director of 95 West Co. and MLH andalso owns a small interest in each. Andrew Africk, another member of our Board of Directors and HNS’ Board ofManagers, is also a director of MLH. As part of the agreement, HNS agreed to pay $9.3 million, in annualinstallments of $0.3 million in 2006, $0.75 million in each year between 2007 and 2010 and $1.0 million in eachyear between 2011 and 2016 for the use of the orbital position, subject to conditions in the agreement includingHNS’ ability to operate SPACEWAY 3. During 2008, we paid $0.75 million to 95 West Co. pursuant to theagreement.
Agreement with Hughes Telematics, Inc.
In July 2006, HNS granted a limited license to HTI allowing HTI to use the HUGHES trademark. Thelicense is limited in that HTI may use the HUGHES trademark only in connection with its business of automotivetelematics and only in combination with the TELEMATICS name. As partial consideration for the license, theagreement provides that HNS will be HTI’s preferred engineering services provider. The license is royalty-free,except that HTI has agreed to pay a royalty to HNS in the event HTI no longer has a commercial or affiliatedrelationship with HNS. As contemplated by the license terms, HNS has commenced providing developmentservices and equipment to HTI.
In October 2007, HNS entered into an agreement with HTI and a customer of HTI, whereby HNS agreed toassume the rights and performance obligations of HTI in the event that HTI fails to perform its obligations due toa fundamental cause such as bankruptcy or the cessation of its telematics business. In connection with thatagreement, HNS and HTI have entered into a letter agreement pursuant to which HTI has agreed to take certainactions to enable HNS to assume HTI’s obligations in the event that such action is required. HNS’ managementdoes not believe that this agreement with HTI and HTI’s customer, together with the letter agreement with HTI,will have a significant negative impact, if any, on HNS and its financial position, results of operations or cashflows.
In January 2008, HNS entered into an agreement with HTI, pursuant to which HNS is developing an overallautomotive telematics system for HTI, comprising the telematics system hub and the Telematics Control Unit(“TCU”), which will serve as the user appliance in the telematics system. The agreement also provides that,subject to certain specified performance conditions, HNS will serve as the exclusive manufacturer and supplier ofTCUs for HTI.
107

HUGHES COMMUNICATIONS, INC.
NOTES TO THE CONSOLIDATED FINANCIAL STATEMENTS (Continued)
HTI is controlled by an affiliate of Apollo. Apollo is our controlling stockholder. A member of HNS’ Boardof Managers and our Board of Directors, Jeffrey A. Leddy, is the CEO and a director of HTI and ownsapproximately 1.0% of HTI’ s equity as of December 31, 2008. In addition, another member of HNS’ Board ofManagers and our Board of Directors, Andrew Africk, is a director of HTI and a senior partner of Apollo.
Other
Certain members of our Board of Directors and officers serve on the board of directors of some of ouraffiliates, including Hughes Systique. In some cases, such directors and officers have received stock-basedcompensation from such affiliates for their service. In those cases, the amount of stock-based compensationreceived by the directors and officers is comparable to stock-based compensation awarded to other non-executivemembers of the affiliates’ board of directors.
Related Party Transactions
Sales and purchase transactions with related parties are as follows (in thousands):
Year Ended December 31,
2008 2007 2006
Sales:HTI . . . . . . . . . . . . . . . . . . . . . . . . . . . . . . . . . . . . . . . . . . . . . . . . . . $ 31,065 $ 22,301 $ 1,611Apollo and affiliates . . . . . . . . . . . . . . . . . . . . . . . . . . . . . . . . . . . . . 897 11,512 20,381
Total sales . . . . . . . . . . . . . . . . . . . . . . . . . . . . . . . . . . . . . . . . . $ 31,962 $ 33,813 $ 21,992
Purchases:Intelsat* . . . . . . . . . . . . . . . . . . . . . . . . . . . . . . . . . . . . . . . . . . . . . . $ 10,074 $ 119,961 $ 59,402Hughes Systique . . . . . . . . . . . . . . . . . . . . . . . . . . . . . . . . . . . . . . . . 9,419 5,609 84795 West Co. . . . . . . . . . . . . . . . . . . . . . . . . . . . . . . . . . . . . . . . . . . . 750 - -Apollo and affiliates . . . . . . . . . . . . . . . . . . . . . . . . . . . . . . . . . . . . . - - 15,617
Total purchases . . . . . . . . . . . . . . . . . . . . . . . . . . . . . . . . . . . . . $ 20,243 $ 125,570 $ 75,866
* Subsequent to February 4, 2008, Intelsat is no longer a related party.
Assets and liabilities resulting from transactions with related parties are as follows (in thousands):
December 31,
2008 2007
Due from related parties:HTI . . . . . . . . . . . . . . . . . . . . . . . . . . . . . . . . . . . . . . . . . . . . . . . . . . . . . . . . . . . . $ 6,734 $ 2,380Apollo and affiliates . . . . . . . . . . . . . . . . . . . . . . . . . . . . . . . . . . . . . . . . . . . . . . . 30 299
Total due from related party . . . . . . . . . . . . . . . . . . . . . . . . . . . . . . . . . . . . . $ 6,764 $ 2,679
Due to related parties:Hughes Systique . . . . . . . . . . . . . . . . . . . . . . . . . . . . . . . . . . . . . . . . . . . . . . . . . . $ 1,507 $ 310Intelsat* . . . . . . . . . . . . . . . . . . . . . . . . . . . . . . . . . . . . . . . . . . . . . . . . . . . . . . . . . - 12,311
Total due to related party . . . . . . . . . . . . . . . . . . . . . . . . . . . . . . . . . . . . . . . $ 1,507 $ 12,621
* Subsequent to February 4, 2008, Intelsat is no longer a related party.
108

HUGHES COMMUNICATIONS, INC.
NOTES TO THE CONSOLIDATED FINANCIAL STATEMENTS (Continued)
Note 24: Commitments and Contingencies
Litigation
The Company is periodically involved in litigation in the ordinary course of its business involving claimsregarding intellectual property infringement, product liability, property damage, personal injury, contracts,employment and worker’s compensation. We do not believe that there are any such pending or threatened legalproceedings, including ordinary litigation incidental to the conduct of our business and the ownership of ourproperties that, if adversely determined, would have a material adverse effect on our business, financialcondition, results of operations or liquidity.
On June 28, 2007, HNS initiated an arbitration proceeding against Sea Launch Limited Partnership and SeaLaunch Company, LLC (collectively, “Sea Launch”) with the American Arbitration Association seeking a refundof $44.4 million in payments made to Sea Launch under a Launch Services Agreement (“LSA”). This disputestems from the material failure of a Sea Launch rocket that occurred on January 30, 2007. Sea Launch wasscheduled to launch HNS’ SPACEWAY 3 in May 2007; however, following the January 30, 2007 rocket failure,there was substantial uncertainty about when Sea Launch would return to flight. As a result, HNS madealternative arrangements with another launch services provider to launch SPACEWAY 3 in August 2007. Inaccordance with the LSA, HNS sent a notice of termination to Sea Launch and was entitled to a refund of the$44.4 million in payments made to Sea Launch in anticipation of the SPACEWAY 3 launch. Sea Launch refusedto refund HNS’ payments and alleged that HNS breached the LSA by entering into a contract with anotherlaunch services provider and that the January 30, 2007 explosion of a Sea Launch rocket constituted an“excusable delay” under the LSA. HNS’ arbitration filing is based on breach of contract. HNS believes that SeaLaunch’s purported justifications for refusing to refund the $44.4 million are without merit and that HNS iscontractually entitled to a full refund of its payments under the express terms of the LSA. As a result, HNS hasvigorously pursued the recovery of the $44.4 million in payments as well as any other relief to which it may beentitled as a consequence of Sea Launch’s wrongful refusal to refund HNS’ payments. HNS has recorded adeposit, included in Other assets in the accompanying audited Consolidated Balance Sheets, in anticipation of afull refund from Sea Launch. As of December 31, 2008, the arbitration hearings have been completed and theCompany is awaiting the decision of the arbitration tribunal. The Company expects the result of the arbitrationwill be available in 2009.
On September 29, 2008, the Company received notice of a complaint in a putative class action filed in theUnited States District Court for the Eastern District of Pennsylvania. The case, captioned Scasta v. HughesNet,et. al. was filed by David Scasta, a former customer of the Company’s consumer broadband internet service. Thecomplaint sought damages of $75 million and alleges, among other things, that the Company failed to deliver thespeeds of consumer internet service that it advertises and that the Company filters and blocks Internet contentresulting in slower service speeds. On December 29, 2008, Mr. Scasta filed a motion for a voluntary dismissalwith the court and the case was dismissed without prejudice.
In October 2008, Hughes Telecommunicacoes do Brasil Ltda. (“HTB”), a wholly owned subsidiary of HNS,received a tax assessment of approximately $4.4 million from the State of Sao Paulo Treasury Department. Thetax assessment alleges HTB failed to pay certain import taxes to the State of São Paulo. The Company disputesthe State of Sao Paulo’s claims and it intends to vigorously defend itself against these allegations. As such, theCompany does not believe the assessment is valid and has not recorded a liability.
It is the opinion of management that such litigation is not expected to have a material adverse effect on theCompany’s financial position, results of operations or cash flows.
109

HUGHES COMMUNICATIONS, INC.
NOTES TO THE CONSOLIDATED FINANCIAL STATEMENTS (Continued)
Product Warranties
The Company warrants its hardware products over 12 to 24 months, depending on the products sold,following the date of installation. A large portion of its enterprise customers enter into maintenance agreementsunder which the Company recognizes revenue for providing maintenance services that prolong the life andeffectiveness of the installed hardware, thus minimizing the potential for warranty claims or repairs. Warrantyreserves are determined based on historical warranty repair experience and an assessment of the number of unitsremaining under warranty coverage. Long-term contracts for the sale of wireless communications systems mayinclude contractual provisions relating to warranty coverage for fixed terms generally not exceeding five years.Warranty provisions for these contracts are included in the determination of overall contract costs and earnings,based on management’s estimates of the cost of the related coverage. Accrued contract warranty costs arereviewed and adjusted, as appropriate, over the term of the contractual warranty period.
Changes in accrued warranty costs were as follows (in thousands):
December 31,
2008 2007
Balance beginning of period . . . . . . . . . . . . . . . . . . . . . . . . . . . . . . . . . . . . . . . . . . . . . . . . $ 3,579 $ 2,827Warranty costs accrual . . . . . . . . . . . . . . . . . . . . . . . . . . . . . . . . . . . . . . . . . . . . . . . . . . . . 3,267 3,881Warranty costs incurred . . . . . . . . . . . . . . . . . . . . . . . . . . . . . . . . . . . . . . . . . . . . . . . . . . . (2,937) (3,129)
Balance at end of period . . . . . . . . . . . . . . . . . . . . . . . . . . . . . . . . . . . . . . . . . . . . . . . $ 3,909 $ 3,579
Leases
The Company has non-cancelable operating leases having lease terms in excess of one year, primarily forreal property. Future minimum payments under such leases at December 31, 2008 are as follows (in thousands):
Amount
Year ending December 31,2009 . . . . . . . . . . . . . . . . . . . . . . . . . . . . . . . . . . . . . . . . . . . . . . . . . . . . . . . . . . . . . . . . . . . . . . . . . . $ 10,1282010 . . . . . . . . . . . . . . . . . . . . . . . . . . . . . . . . . . . . . . . . . . . . . . . . . . . . . . . . . . . . . . . . . . . . . . . . . . 7,3702011 . . . . . . . . . . . . . . . . . . . . . . . . . . . . . . . . . . . . . . . . . . . . . . . . . . . . . . . . . . . . . . . . . . . . . . . . . . 5,7172012 . . . . . . . . . . . . . . . . . . . . . . . . . . . . . . . . . . . . . . . . . . . . . . . . . . . . . . . . . . . . . . . . . . . . . . . . . . 4,6182013 . . . . . . . . . . . . . . . . . . . . . . . . . . . . . . . . . . . . . . . . . . . . . . . . . . . . . . . . . . . . . . . . . . . . . . . . . . 983Thereafter . . . . . . . . . . . . . . . . . . . . . . . . . . . . . . . . . . . . . . . . . . . . . . . . . . . . . . . . . . . . . . . . . . . . . . 226
Total minimum lease payments . . . . . . . . . . . . . . . . . . . . . . . . . . . . . . . . . . . . . . . . . . . . . . . . . . . $ 29,042
Rental expenses under operating leases, net of sublease income, were $12.8 million, $12.6 million and $11.1million for the years ended December 31, 2008, 2007 and 2006, respectively.
110

HUGHES COMMUNICATIONS, INC.
NOTES TO THE CONSOLIDATED FINANCIAL STATEMENTS (Continued)
The Company has non-cancelable vendor obligations for acquisition of transponder capacity. Futureminimum payments under such obligations at December 31, 2008 are as follows (in thousands):
Amount
Year ending December 31,2009 . . . . . . . . . . . . . . . . . . . . . . . . . . . . . . . . . . . . . . . . . . . . . . . . . . . . . . . . . . . . . . . . . . . . . . . . . $ 125,0502010 . . . . . . . . . . . . . . . . . . . . . . . . . . . . . . . . . . . . . . . . . . . . . . . . . . . . . . . . . . . . . . . . . . . . . . . . . 73,9532011 . . . . . . . . . . . . . . . . . . . . . . . . . . . . . . . . . . . . . . . . . . . . . . . . . . . . . . . . . . . . . . . . . . . . . . . . . 30,7002012 . . . . . . . . . . . . . . . . . . . . . . . . . . . . . . . . . . . . . . . . . . . . . . . . . . . . . . . . . . . . . . . . . . . . . . . . . 10,5692013 . . . . . . . . . . . . . . . . . . . . . . . . . . . . . . . . . . . . . . . . . . . . . . . . . . . . . . . . . . . . . . . . . . . . . . . . . 9,821Thereafter . . . . . . . . . . . . . . . . . . . . . . . . . . . . . . . . . . . . . . . . . . . . . . . . . . . . . . . . . . . . . . . . . . . . . 24,296
Total minimum lease payments . . . . . . . . . . . . . . . . . . . . . . . . . . . . . . . . . . . . . . . . . . . . . . . . . . $ 274,389
Rental expenses under operating leases for transponder capacity were $193.3 million, $188.5 million and$167.9 million for the years ended December 31, 2008, 2007 and 2006, respectively.
Other
The Company is contingently liable under standby letters of credit and bonds in the aggregate amount of$26.4 million that were undrawn at December 31, 2008. Of this amount, $10.3 million were issued under theRevolving Credit Facility; $1.6 million was secured by restricted cash; $0.9 million related to an insurance bond;and $13.6 million were secured by letters of credit issued under credit arrangements available to our Indian andBrazilian subsidiaries. Certain of the letters of credit issued by our Indian subsidiaries are secured by thoseentities’ assets. As of December 31, 2008, these obligations were scheduled to expire as follows: $21.1 million in2009; $1.4 million in 2010; $0.5 million in 2011; and $3.4 million in 2012 and thereafter.
In connection with the acquisition of Helius on February 4, 2008 as described in Note 5, pursuant to theagreement, the Company has a contractual obligation for contingent consideration of up to $20.0 million asadditional purchase price, if any, to be payable in April 2010 by us or Helius, as the surviving corporation,subject to Helius achieving the Performance Goal as set forth in the Merger Agreement.
Note 25: Supplemental Guarantor and Non-Guarantor Financial Information
On August 8, 2007, the Company filed a shelf registration statement on Form S-3, as amended onNovember 15, 2007, to register shares of our common stock, preferred stock, and warrants and debt securitiesand non-convertible debt securities of HNS and HNS Finance Corp., a finance subsidiary which is HNS’swholly-owned subsidiary (the “Co-Issuer”), as co issuers. In connection with any future issuance of debtsecurities of HNS and the Co-Issuer, we will, and one or more of our other subsidiaries may, on a joint andseveral basis, offer full and unconditional guarantees of the obligations of HNS and the Co-Issuer, under suchdebt securities. The registration statement was declared effective by the Securities and Exchange Commission onNovember 19, 2007.
In lieu of providing separate audited financial statements of HNS, the Co-Issuer and HNS’ guarantorsubsidiaries, condensed financial statements prepared in accordance with Rule 3-10 and Rule 5-04 of RegulationS-X are presented below. The column marked “Parent” represents the Company’s results. The column marked“Subsidiary Issuer” represents the results of HNS. The column marked “Guarantor Subsidiaries” includes theresults of HNS’ guarantor subsidiaries and the Co-Issuer, which is a co-issuer of HNS’ Senior Notes and which
111

HUGHES COMMUNICATIONS, INC.
NOTES TO THE CONSOLIDATED FINANCIAL STATEMENTS (Continued)
had no assets, operations, revenues or cash flows for the periods presented. The column marked “Non-GuarantorSubsidiaries” includes the results of non-guarantor subsidiaries of the Company and HNS. Eliminationsnecessary to arrive at the information for the Company on a consolidated basis for the periods presented areincluded in the column so labeled. Separate financial statements and other disclosures concerning the Co-Issuerand HNS’ Guarantor Subsidiaries are not presented because management has determined that they are notmaterial to investors.
The following represents the supplemental condensed financial statements of the Company, HNS, theGuarantor Subsidiaries and the Non-guarantor Subsidiaries. These condensed financial statements should be readin conjunction with our consolidated financial statements and notes thereto.
Condensed Consolidated Balance Sheet as of December 31, 2008(In thousands)
ParentSubsidiaryIssuer
GuarantorSubsidiaries
Non-GuarantorSubsidiaries Eliminations Total
Assets
Cash and cash equivalents . . $ 103,281 $ 75,956 $ 2,013 $ 22,566 $ - $ 203,816Receivables, net . . . . . . . . . . 6,326 147,424 2,007 66,197 (21,581) 200,373Inventories . . . . . . . . . . . . . . - 57,453 666 7,366 - 65,485Prepaid expenses andother . . . . . . . . . . . . . . . . . 479 8,030 284 12,133 - 20,926
Total current assets . . . . . . 110,086 288,863 4,970 108,262 (21,581) 490,600Property, net . . . . . . . . . . . . . - 459,855 29,600 17,815 - 507,270Investment in subsidiaries . . 229,373 91,060 - - (320,433) -Other assets . . . . . . . . . . . . . 717 173,531 10,614 7,661 - 192,523
Total assets . . . . . . . . . . . . $ 340,176 $ 1,013,309 $ 45,184 $ 133,738 $ (342,014)$ 1,190,393
Liabilities and equity
Accounts payable . . . . . . . . . $ 1,228 $ 57,488 $ 3,133 $ 41,559 $ (20,469)$ 82,939Short-term debt . . . . . . . . . . - 4,391 - 3,861 - 8,252Accrued liabilities and due toaffiliates . . . . . . . . . . . . . . 719 128,813 761 29,860 (1,112) 159,041
Total current liabilities . . . 1,947 190,692 3,894 75,280 (21,581) 250,232Long-term debt . . . . . . . . . . . - 574,771 - 3,527 - 578,298Other long-term liabilities . . - 18,005 - - - 18,005Minority interests . . . . . . . . . 82 - 5,629 - - 5,711Total equity . . . . . . . . . . . . . 338,147 229,841 35,661 54,931 (320,433) 338,147
Total liabilities andequity . . . . . . . . . . . . . . $ 340,176 $ 1,013,309 $ 45,184 $ 133,738 $ (342,014)$ 1,190,393
112

HUGHES COMMUNICATIONS, INC.
NOTES TO THE CONSOLIDATED FINANCIAL STATEMENTS (Continued)
Condensed Consolidated Balance Sheet as of December 31, 2007(In thousands)
ParentSubsidiaryIssuer
GuarantorSubsidiaries
Non-GuarantorSubsidiaries Eliminations Total
Assets
Cash and cash equivalents . . . . . $ 4,790 $ 113,530 $ 150 $ 15,622 $ - $ 134,092Marketable securities . . . . . . . . . 6,083 11,224 - - - 17,307Receivables, net . . . . . . . . . . . . . 964 158,540 15 69,019 (18,595) 209,943Inventories . . . . . . . . . . . . . . . . . - 59,164 - 6,590 - 65,754Prepaid expenses and other . . . . 1,589 26,638 83 15,410 - 43,720
Total current assets . . . . . . . . . 13,426 369,096 248 106,641 (18,595) 470,816Property, net . . . . . . . . . . . . . . . . - 436,116 25,941 17,919 - 479,976Investment in subsidiaries . . . . . 246,568 76,557 - - (323,125) -Other assets . . . . . . . . . . . . . . . . 5,080 168,084 5,881 - - 179,045
Total assets . . . . . . . . . . . . . . . $ 265,074 $ 1,049,853 $ 32,070 $ 124,560 $ (341,720)$ 1,129,837
Liabilities and equity
Accounts payable . . . . . . . . . . . . $ 1,899 $ 56,638 $ 11 $ 31,635 $ (17,743)$ 72,440Short-term debt . . . . . . . . . . . . . - 9,636 - 5,159 - 14,795Accrued liabilities and dueto affiliates . . . . . . . . . . . . . . . 763 156,460 - 34,182 (852) 190,553
Total current liabilities . . . . . . 2,662 222,734 11 70,976 (18,595) 277,788Long-term debt . . . . . . . . . . . . . . - 573,836 - 3,925 - 577,761Other long-term liabilities . . . . . - 5,813 - 713 - 6,526Minority interests . . . . . . . . . . . . 51 - 5,350 - - 5,401Total equity . . . . . . . . . . . . . . . . 262,361 247,470 26,709 48,946 (323,125) 262,361
Total liabilities and equity . . . $ 265,074 $ 1,049,853 $ 32,070 $ 124,560 $ (341,720)$ 1,129,837
113

HUGHES COMMUNICATIONS, INC.
NOTES TO THE CONSOLIDATED FINANCIAL STATEMENTS (Continued)
Condensed Consolidated Statement of Operations for the Year Ended December 31, 2008(In thousands)
ParentSubsidiaryIssuer
GuarantorSubsidiaries
Non-GuarantorSubsidiaries Eliminations Total
Revenues . . . . . . . . . . . . . . . . . . . . . $ - $ 894,885 $ 13,873 $ 187,190 $ (35,595) $ 1,060,353
Operating costs and expenses:Costs of revenues . . . . . . . . . . . . - 676,339 5,878 134,500 (31,756) 784,961Selling, general andadministrative . . . . . . . . . . . . . 4,265 140,747 5,533 31,142 (3,839) 177,848
Research and development . . . . . - 23,931 2,902 - - 26,833Amortization of intangibles . . . . - 5,387 1,032 - - 6,419
Total operating costs andexpenses . . . . . . . . . . . . . . . 4,265 846,404 15,345 165,642 (35,595) 996,061
Operating income (loss) . . . . . . . . . (4,265) 48,481 (1,472) 21,548 - 64,292Other income (expense):Interest expense . . . . . . . . . . . . . - (49,898) - (1,431) 2 (51,327)Interest and other income(expense), net . . . . . . . . . . . . . 770 2,448 (381) 811 (2) 3,646
Equity in earnings ofsubsidiaries . . . . . . . . . . . . . . . 12,530 11,988 - - (24,518) -
Income (loss) before income taxexpense . . . . . . . . . . . . . . . . . . . . 9,035 13,019 (1,853) 20,928 (24,518) 16,611
Income tax expense . . . . . . . . . . . . (17) (923) - (6,653) - (7,593)
Net income (loss) . . . . . . . . . . . . . . $ 9,018 $ 12,096 $ (1,853) $ 14,275 $ (24,518) $ 9,018
114

HUGHES COMMUNICATIONS, INC.
NOTES TO THE CONSOLIDATED FINANCIAL STATEMENTS (Continued)
Condensed Consolidated Statement of Operations for the Year Ended December 31, 2007(In thousands)
ParentSubsidiaryIssuer
GuarantorSubsidiaries
Non-GuarantorSubsidiaries Eliminations Total
Revenues . . . . . . . . . . . . . . . . . . . . . $ - $ 845,501 $ 1,140 $ 148,701 $ (24,694) $ 970,648
Operating costs and expenses:Costs of revenues . . . . . . . . . . . . . - 627,684 - 104,700 (20,603) 711,781Selling, general andadministrative . . . . . . . . . . . . . 6,609 116,134 3,295 30,104 (4,091) 152,051
Research and development . . . . . - 17,036 - - - 17,036Amortization of intangibles . . . . . - 6,144 - - - 6,144
Total operating costs andexpenses . . . . . . . . . . . . . . . . 6,609 766,998 3,295 134,804 (24,694) 887,012
Operating income (loss) . . . . . . . . . . (6,609) 78,503 (2,155) 13,897 - 83,636Other income (expense):Interest expense . . . . . . . . . . . . . . (3) (41,962) - (1,810) - (43,775)Interest and other income(expense), net . . . . . . . . . . . . . . (52) 8,690 (286) 664 - 9,016
Equity in earnings ofsubsidiaries . . . . . . . . . . . . . . . 50,204 4,670 - - (54,874) -
Income (loss) before income taxexpense . . . . . . . . . . . . . . . . . . . . 43,540 49,901 (2,441) 12,751 (54,874) 48,877
Income tax expense . . . . . . . . . . . . . - (100) - (5,237) - (5,337)
Net income (loss) . . . . . . . . . . . . . . . $ 43,540 $ 49,801 $ (2,441) $ 7,514 $ (54,874) $ 43,540
115

HUGHES COMMUNICATIONS, INC.
NOTES TO THE CONSOLIDATED FINANCIAL STATEMENTS (Continued)
Condensed Consolidated Statement of Operations for the Year Ended December 31, 2006(In thousands)
ParentSubsidiaryIssuer
GuarantorSubsidiaries
Non-GuarantorSubsidiaries Eliminations Total
Revenues . . . . . . . . . . . . . . . . . . . . . $ - $ 763,675 $ 969 $ 115,188 $ (21,133)$ 858,699
Operating costs and expenses:Costs of revenues . . . . . . . . . . . . - 568,040 - 87,656 (18,290) 637,406Selling, general andadministrative . . . . . . . . . . . . . 5,008 108,621 2,157 27,496 (3,833) 139,449
Research and development . . . . . - 23,058 - - - 23,058Amortization of intangibles . . . . - 6,144 - - - 6,144
Total operating costs andexpenses . . . . . . . . . . . . . . . 5,008 705,863 2,157 115,152 (22,123) 806,057
Operating income (loss) . . . . . . . . . (5,008) 57,812 (1,188) 36 990 52,642Other income (expense):Interest expense . . . . . . . . . . . . . (1,709) (44,973) - (1,265) 156 (47,791)Interest and other income(expense), net . . . . . . . . . . . . . 1,037 8,561 (334) 1,841 (1,156) 9,949
Equity in earnings ofsubsidiaries . . . . . . . . . . . . . . . 17,204 (2,298) - - (14,906) -
Income (loss) from continuingoperations before income taxexpense . . . . . . . . . . . . . . . . . . . . 11,524 19,102 (1,522) 612 (14,916) 14,800
Income tax expense . . . . . . . . . . . . . (50,834) - - (3,276) - (54,110)
Income (loss) from continuingoperations . . . . . . . . . . . . . . . . . . (39,310) 19,102 (1,522) (2,664) (14,916) (39,310)
Income from discontinuedoperations . . . . . . . . . . . . . . . . . . 197 - - - - 197
Net income (loss) . . . . . . . . . . . . . . $ (39,113)$ 19,102 $ (1,522)$ (2,664)$ (14,916)$ (39,113)
116

HUGHES COMMUNICATIONS, INC.
NOTES TO THE CONSOLIDATED FINANCIAL STATEMENTS (Continued)
Condensed Consolidated Statement of Cash Flows for the Year Ended December 31, 2008(In thousands)
ParentSubsidiaryIssuer
GuarantorSubsidiaries
Non-GuarantorSubsidiaries Eliminations Total
Cash flows from operating activities:Net income (loss) . . . . . . . . . . . . . . . $ 9,018 $ 12,096 $ (1,853)$ 14,275 $ (24,518)$ 9,018Adjustments to reconcile net income(loss) to net cash flows fromoperating activities . . . . . . . . . . . . (7,678) 40,452 8,555 (3,162) 24,518 62,685
Net cash provided by operatingactivities . . . . . . . . . . . . . . . . . . 1,340 52,548 6,702 11,113 - 71,703
Cash flows from investing activities:Change in restricted cash . . . . . . . . . - 3,577 - (473) - 3,104Purchases of marketablesecurities . . . . . . . . . . . . . . . . . . . . (2,070) - - - - (2,070)
Proceeds from sales of marketablesecurities . . . . . . . . . . . . . . . . . . . . 8,100 11,090 - - - 19,190
Expenditures for property . . . . . . . . . - (69,535) (4,839) (7,295) - (81,669)Expenditures for capitalizedsoftware . . . . . . . . . . . . . . . . . . . . . - (14,564) - - - (14,564)
Acquisition of Helius, net of cashreceived . . . . . . . . . . . . . . . . . . . . . - (10,543) - - - (10,543)
Additional equity investment in . . . .Hughes Systique . . . . . . . . . . . . . . . . (1,500) - - - - (1,500)Hughes Systique note receivables . . . (500) - - - - (500)
Net cash provided by (used in)investing activities . . . . . . . . . . 4,030 (79,975) (4,839) (7,768) - (88,552)
Cash flows from financing activities:Net increase in notes and loanspayable . . . . . . . . . . . . . . . . . . . . . - - - 223 - 223
Proceeds from equity offering . . . . . 94,500 - - - - 94,500Equity offering costs . . . . . . . . . . . . . (1,454) - - - - (1,454)Proceeds from exercise of stockoptions . . . . . . . . . . . . . . . . . . . . . . 75 - - - - 75
Long-term debt borrowings . . . . . . . - 173 - 3,433 - 3,606Repayment of long-term debt . . . . . . - (10,320) - (3,429) - (13,749)Net cash provided by (used in)financing activities . . . . . . . . . . 93,121 (10,147) - 227 - 83,201
Effect of exchange rate changes oncash and cash equivalents . . . . . . . . . - - - 3,372 - 3,372
Net increase (decrease) in cash andcash equivalents . . . . . . . . . . . . . . . . 98,491 (37,574) 1,863 6,944 - 69,724
Cash and cash equivalents at beginningof period . . . . . . . . . . . . . . . . . . . . . . 4,790 113,530 150 15,622 - 134,092
Cash and cash equivalents at end ofperiod . . . . . . . . . . . . . . . . . . . . . . . . $ 103,281 $ 75,956 $ 2,013 $ 22,566 $ - $ 203,816
117

HUGHES COMMUNICATIONS, INC.
NOTES TO THE CONSOLIDATED FINANCIAL STATEMENTS (Continued)
Condensed Consolidated Statement of Cash Flows for the Year Ended December 31, 2007(In thousands)
ParentSubsidiaryIssuer
GuarantorSubsidiaries
Non-GuarantorSubsidiaries Eliminations Total
Cash flows from operating activities:Net income (loss) . . . . . . . . . . . . . . $ 43,540 $ 49,801 $ (2,441)$ 7,514 $ (54,874)$ 43,540Adjustments to reconcile netincome (loss) to net cash flowsfrom operating activities . . . . . . . (45,211) 21,375 3,706 15,231 54,874 49,975
Net cash provided by (used in)operating activities . . . . . . . . . (1,671) 71,176 1,265 22,745 - 93,515
Cash flows from investing activities:Change in restricted cash . . . . . . . . 789 284 - 95 - 1,168Purchases of marketablesecurities . . . . . . . . . . . . . . . . . . . (10,768) (22,096) - - - (32,864)
Proceeds from sales of marketablesecurities . . . . . . . . . . . . . . . . . . . 8,585 114,105 - - - 122,690
Expenditures for property . . . . . . . . - (220,451) (1,195) (12,306) - (233,952)Expenditures for capitalizedsoftware . . . . . . . . . . . . . . . . . . . - (14,228) - - - (14,228)
Proceeds from sale of property . . . . - 382 - 134 - 516
Net cash used in investingactivities . . . . . . . . . . . . . . . . . (1,394) (142,004) (1,195) (12,077) - (156,670)
Cash flows from financing activities:Net increase in notes and loanspayable . . . . . . . . . . . . . . . . . . . . - - - 376 - 376
Proceeds from exercise of stockoptions . . . . . . . . . . . . . . . . . . . . 113 - - - - 113
Long-term debt borrowings . . . . . . - 115,000 - 4,731 - 119,731Repayment of long-term debt . . . . . - (21,577) - (3,266) - (24,843)Debt issuance cost . . . . . . . . . . . . . - (2,053) - - - (2,053)
Net cash provided by financingactivities . . . . . . . . . . . . . . . . . 113 91,370 - 1,841 - 93,324
Effect of exchange rate changes oncash and cash equivalents . . . . . . . . - - - (3,010) - (3,010)
Net increase (decrease) in cash andcash equivalents . . . . . . . . . . . . . . . (2,952) 20,542 70 9,499 - 27,159
Cash and cash equivalents atbeginning of period . . . . . . . . . . . . 7,742 92,988 80 6,123 - 106,933
Cash and cash equivalents at end ofperiod . . . . . . . . . . . . . . . . . . . . . . . $ 4,790 $ 113,530 $ 150 $ 15,622 $ - $ 134,092
118

HUGHES COMMUNICATIONS, INC.
NOTES TO THE CONSOLIDATED FINANCIAL STATEMENTS (Continued)
Condensed Consolidated Statement of Cash Flows for the Year Ended December 31, 2006(In thousands)
ParentSubsidiaryIssuer
SubsidiaryGuarantor
SubsidiaryNon-Guarantor Eliminations Total
Cash flows from operating activities:Net income (loss) . . . . . . . . . . . . . . . . $ (39,113)$ 19,102 $ (1,522) $ (2,663) $ (14,917)$ (39,113)Adjustments to reconcile net income(loss) to net cash flows fromoperating activities . . . . . . . . . . . . . 37,571 71,568 2,077 3,163 14,917 129,296
Net cash provided by (used in)continuing operations . . . . . . . . . . (1,542) 90,670 555 500 - 90,183
Net cash used in discontinuedoperations . . . . . . . . . . . . . . . . . . . . - - - (10) - (10)
Net cash provided by (used in)operating activities . . . . . . . . . . . (1,542) 90,670 555 490 - 90,173
Cash flows from investing activities:Change in restricted cash . . . . . . . . . . (2,737) (124) - (22) - (2,883)Purchases of marketable securities . . (858) (89,254) - - - (90,112)Expenditures for property . . . . . . . . . - (71,844) (552) (4,795) - (77,191)Expenditures for capitalizedsoftware . . . . . . . . . . . . . . . . . . . . . - (16,416) - - - (16,416)
Proceeds from sale of property . . . . . - - - 521 - 521Acquisition of HNS, net . . . . . . . . . . (100,514) - - - 113,267 12,753
Net cash used in investingactivities . . . . . . . . . . . . . . . . . . . (104,109) (177,638) (552) (4,296) 113,267 (173,328)
Cash flows from financing activities:Net decrease in notes and loanspayable . . . . . . . . . . . . . . . . . . . . . . - - - (1,609) - (1,609)
Debt borrowing from Apollo . . . . . . . 100,000 - - - - 100,000Debt repayment to Apollo . . . . . . . . . (100,000) - - - - (100,000)Proceeds from rights offering . . . . . . 100,000 - - - - 100,000Distribution to SkyTerra . . . . . . . . . . (9,314) - - - - (9,314)Payment of dividends on preferredstock . . . . . . . . . . . . . . . . . . . . . . . . (1,394) - - - - (1,394)
Proceeds from exercise of stockoptions . . . . . . . . . . . . . . . . . . . . . . 2,206 - - - - 2,206
Long-term debt borrowings . . . . . . . . - 450,000 - 5,330 - 455,330Repayment of long-term debt . . . . . . - (360,924) - (3,948) - (364,872)Debt issuance cost . . . . . . . . . . . . . . . - (11,668) - - - (11,668)
Net cash provided by (used in)financing activities . . . . . . . . . . . 91,498 77,408 - (227) - 168,679
Effect of exchange rate changes on cashand cash equivalents . . . . . . . . . . . . . - - - (555) - (555)
Net increase (decrease) in cash and cashequivalents . . . . . . . . . . . . . . . . . . . . . (14,153) (9,560) 3 (4,588) 113,267 84,969
Cash and cash equivalents at beginningof period . . . . . . . . . . . . . . . . . . . . . . . 21,895 102,548 77 10,711 (113,267) 21,964
Cash and cash equivalents at end ofperiod . . . . . . . . . . . . . . . . . . . . . . . . . $ 7,742 $ 92,988 $ 80 $ 6,123 $ - $ 106,933
119

HUGHES COMMUNICATIONS, INC.
NOTES TO THE CONSOLIDATED FINANCIAL STATEMENTS (Continued)
Note 26: Supplementary Unaudited Quarterly Financial Information
The following table sets forth selected unaudited quarterly financial data, which included all adjustmentsthat are necessary, in the opinion of our management, for a fair presentation of its results of operations for theinterim periods (in thousands, except per share data):
1st Quarter 2nd Quarter 3rd Quarter 4th Quarter
2008:Revenues . . . . . . . . . . . . . . . . . . . . . . . . . . . . . . . . . . . $ 237,160 $ 265,642 $ 271,779 $ 285,772Gross margin . . . . . . . . . . . . . . . . . . . . . . . . . . . . . . . . $ 66,145 $ 66,407 $ 68,910 $ 73,930Net income attributable to common stockholders . . . $ 656 $ 1,827 $ 3,184 $ 3,351Basic earnings per share . . . . . . . . . . . . . . . . . . . . . . . $ 0.03 $ 0.09 $ 0.15 $ 0.17Diluted earnings per share . . . . . . . . . . . . . . . . . . . . . $ 0.03 $ 0.09 $ 0.15 $ 0.17
2007:Revenues . . . . . . . . . . . . . . . . . . . . . . . . . . . . . . . . . . . $ 222,882 $ 234,358 $ 233,703 $ 279,705Gross margin . . . . . . . . . . . . . . . . . . . . . . . . . . . . . . . . $ 55,482 $ 62,066 $ 60,906 $ 80,413Net income . . . . . . . . . . . . . . . . . . . . . . . . . . . . . . . . . $ 2,940 $ 9,632 $ 11,037 $ 19,931Net income attributable to common stockholders . . . $ 2,940 $ 9,632 $ 11,037 $ 19,931Basic earnings per share . . . . . . . . . . . . . . . . . . . . . . . $ 0.16 $ 0.51 $ 0.58 $ 1.06Diluted earnings per share . . . . . . . . . . . . . . . . . . . . . $ 0.15 $ 0.50 $ 0.57 $ 1.04
120

Item 9. Changes in and Disagreements with Accountants on Accounting and Financial Disclosure
None.
Item 9A. Controls and Procedures
Disclosure Controls and Procedures
As required by Rules 13a-15 and 15d-15 of the Securities Exchange Act of 1934, the Company hasevaluated, with the participation of management, including the Chief Executive Officer and the Chief FinancialOfficer, the effectiveness of its disclosure controls and procedures (as defined in such rules) as of the end of theperiod covered by this annual report. Based on such evaluation, the Chief Executive Officer and Chief FinancialOfficer concluded that the Company’s disclosure controls and procedures are effective to ensure that informationrequired to be disclosed by the Company in reports prepared in accordance with the rules and regulations of theSecurities and Exchange Commission (the “SEC”) is recorded, processed, summarized and reported within thetime periods specified by the SEC’s rules and forms.
Our management, including the Company’s Chief Executive Officer and Chief Financial Officer, does notexpect that the Company’s disclosure controls and procedures will prevent all errors and all fraud. A controlsystem, no matter how well conceived and operated, can provide only reasonable, not absolute, assurance that theobjectives of the control system are met. Further, the design of a control system must reflect the fact that thereare resource constraints, and the benefits of controls must be considered relative to their costs. Because of theinherent limitations in all control systems, no evaluation of controls can provide absolute assurance that allcontrol issues and instances of fraud, if any, within the Company have been detected. These inherent limitationsinclude the realities that judgments in decision-making can be faulty, and that breakdowns can occur because ofsimple error or mistake.
Additionally, controls can be circumvented by the individual acts of some persons, by collusion of two ormore people, or by management override of the control. The design of any system of controls also is based inpart upon certain assumptions about the likelihood of future events, and there can be no assurance that any designwill succeed in achieving its stated goals under all potential future conditions; over time, controls may becomeinadequate because of changes in conditions, or the degree of compliance with the policies or procedures maydeteriorate. Because of the inherent limitations in a cost-effective control system, misstatements due to error orfraud may occur and not be detected.
Changes in Internal Control Over Financial Reporting
There have been no changes in the Company’s internal control over financial reporting that occurred duringthe fourth quarter of the year ended December 31, 2008 that have materially affected, or are reasonably likely tomaterially affect, the Company’s internal control over financial reporting. The Company continues to review itsdisclosure controls and procedures, including its internal controls over financial reporting, and may from time totime make changes aimed at enhancing their effectiveness and to ensure that the Company’s systems evolve withits business.
Management Report on Internal Control Over Financial Reporting
Our management is responsible for establishing and maintaining adequate internal control over financialreporting. Our internal control system is designed to provide reasonable assurance regarding the reliability offinancial reporting and the preparation of financial statements for external purposes in accordance with generallyaccepted accounting principles in the United States (“GAAP”) and includes those policies and procedures that:
• pertain to the maintenance of records that in reasonable detail accurately and fairly reflect thetransactions and dispositions of the assets of the company;
121

• provide reasonable assurance that transactions are recorded as necessary to permit preparation offinancial statements in accordance with GAAP, and that receipts and expenditures of the company arebeing made only in accordance with authorizations of management and directors of the company; and
• provide reasonable assurance regarding prevention or timely detection of unauthorized acquisition, useor disposition of the company’s assets that could have a material effect on its financial statements.
Because of its inherent limitations, a system of internal control over financial reporting can provide onlyreasonable assurance and may not prevent or detect misstatements. Further, because of changes in conditions,effectiveness of internal controls over financial reporting may vary over time. Our system contains self-monitoring mechanisms, and actions are taken to correct deficiencies as they are identified.
Our management conducted an evaluation of the effectiveness of the system of internal control overfinancial reporting based on the framework in Internal Control—Integrated Framework issued by the Committeeof Sponsoring Organizations of the Treadway Commission. Based on this evaluation, our management concludedthat our system of internal control over financial reporting was effective as of December 31, 2008. Theeffectiveness of our internal controls over financial reporting has been audited by Deloitte & Touche LLP, anindependent registered public accounting firm, as stated in their report, which is included herein.
Item 9B. Other Information
None.
122

PART III
Item 10. Directors, Executive Officers and Corporate Governance
Set forth below is certain information concerning our executive officers and members of our Board ofDirectors. Our Board of Directors is composed of eight members. Each director is elected for a one-year term oruntil such person’s successor is duly elected or qualified.
Name Age Position
Pradman P. Kaul . . . . . . . . . . . . . . 62 Chief Executive Officer, President and DirectorGrant A. Barber . . . . . . . . . . . . . . . 49 Executive Vice President and Chief Financial OfficerT. Paul Gaske . . . . . . . . . . . . . . . . 55 Executive Vice PresidentAdrian Morris . . . . . . . . . . . . . . . . 54 Executive Vice PresidentBahram Pourmand . . . . . . . . . . . . 62 Executive Vice PresidentThomas J. McElroy . . . . . . . . . . . . 53 Chief Accounting OfficerDean A. Manson . . . . . . . . . . . . . . 42 Senior Vice President, General Counsel and SecretaryDeepak V. Dutt . . . . . . . . . . . . . . . 64 Vice President, Treasurer and Investor Relations officerCleo V. Belmonte . . . . . . . . . . . . . 31 Assistant SecretaryAndrew D. Africk . . . . . . . . . . . . . 42 DirectorO. Gene Gabbard . . . . . . . . . . . . . 68 DirectorJeffrey A. Leddy . . . . . . . . . . . . . . 53 DirectorLawrence J. Ruisi . . . . . . . . . . . . . 60 DirectorAaron J. Stone . . . . . . . . . . . . . . . . 36 DirectorMichael D. Weiner . . . . . . . . . . . . 56 Director
Pradman P. Kaul—Chief Executive Officer, President and Director. Mr. Kaul has been our Chief ExecutiveOfficer and President as well as a member of our Board of Directors since February 2006, and has been HNS’Chief Executive Officer and President since 2000. Mr. Kaul was appointed to, and has served as Chairman of,HNS’ Board of Managers since April 22, 2005. Previously, Mr. Kaul served as the Chief Operating Officer,Executive Vice President and Director of Engineering of HNS. Before joining HNS in 1973, Mr. Kaul worked atCOMSAT Laboratories in Clarksburg, Maryland. Mr. Kaul received a Bachelor of Science degree in ElectricalEngineering from The George Washington University and a Master of Science degree in Electrical Engineeringfrom the University of California at Berkeley. He holds numerous patents and has published articles and paperson a variety of technical topics concerning satellite communications. Mr. Kaul is a member of the NationalAcademy of Engineering and serves on the Board of Directors of Primus Telecom in the United States.
Grant A. Barber—Executive Vice President and Chief Financial Officer. Mr. Barber has been our ExecutiveVice President and Chief Financial Officer since February 2006 and has served as the Executive Vice Presidentand Chief Financial Officer of HNS since January 2006. From 2003 to 2006, Mr. Barber served first asController and then Executive Vice President and Chief Financial Officer for Acterna, Inc., a globalmanufacturer of test and measurement equipment for the Telco and Cable markets located in Germantown,Maryland. From 1984 through 2002, Mr. Barber served in various senior financial positions with NortelNetworks in the United States, Canada, France and England. Mr. Barber received his Bachelor degree inBusiness Administration from Wilfrid Laurier University and is a Canadian chartered accountant.
T. Paul Gaske— Executive Vice President. Mr. Gaske has been our Executive Vice President since February2006 and has also served as HNS’ Executive Vice President, North American division since 1999. Mr. Gaskejoined HNS in 1977. Mr. Gaske has held a variety of engineering, marketing, and business management positionsthroughout his career. Mr. Gaske holds a Bachelor of Science degree in Electrical Engineering from theUniversity of Maryland and a Master of Science degree in Computer Science from Johns Hopkins University inBaltimore, Maryland. He is a member of the Institute of Electrical and Electronics Engineering (IEEE), apublished author on satellite networking technologies and markets and the holder of numerous patents in satellitecommunications and broadband networking.
123

Adrian Morris—Executive Vice President. Mr. Morris has been our Executive Vice President and HNS’Executive Vice President, Engineering since February 2006. Prior to that, Mr. Morris had been Senior VicePresident of Engineering since 1996. His career began with HNS in 1982 as a hardware design engineer and hehas held a variety of technical and management positions throughout his career. Mr. Morris received a Bachelorof Science degree from Trinity College Dublin and a Master of Science degree in Digital Techniques from HeriotWatt University, Edinburgh. Prior to joining HNS, he worked for Ferranti Electronics and Electro OpticsDivision. Mr. Morris is a co-inventor for a number of patents in digital communications and has authored severalpublished papers. He is also a member of the IEEE.
Bahram Pourmand—Executive Vice President. Mr. Pourmand has been our Executive Vice President sinceFebruary 2006 and has also served as HNS’ Executive Vice President, International Division since 1993.Mr. Pourmand joined HNS in 1979 and is currently responsible for all aspects of HNS’ international operations,including oversight of profit and loss, marketing, product development and strategic direction for HNS’ globalactivities. Prior to joining HNS, Mr. Pourmand was a director with Rockwell International in Dallas, Texas.Mr. Pourmand has a Bachelor of Science degree in Electrical Engineering from Texas Tech University and aMaster of Science degree in Electrical Engineering from Southern Methodist University.
Thomas J. McElroy—Chief Accounting Officer. Mr. McElroy has been our Chief Accounting Officer sinceFebruary 2006. In August 2007, he was appointed Senior Vice President and Controller of HNS and isresponsible for all financial accounting and reporting matters for HNS and its global consolidated operations.From June 2006 to September 2007, he was HNS’ Vice President and Controller. Prior to joining HNS in January1988 as a Director of Finance, Mr. McElroy was a Senior Manager in the audit group for Price Waterhouse &Co. in Washington, DC from 1977 to 1988. He received his Bachelor of Science degree in Accounting from St.Francis University.
Dean A. Manson—Senior Vice President, General Counsel and Secretary. Mr. Manson has been our andHNS’ Senior Vice President, General Counsel and Secretary since August 2007, prior to which he was our VicePresident, General Counsel and Secretary since February 2006 and HNS’ Vice President, General Counsel andSecretary since November 2004. Mr. Manson also serves as a director or officer for several of our subsidiaries.Before joining HNS in June 2000 as Assistant Vice President, Legal, Mr. Manson was associated with the lawfirm of Milbank, Tweed, Hadley & McCloy LLP. Mr. Manson earned a Bachelor of Science degree inEngineering from Princeton University and a Juris Doctorate degree from Columbia University School of Law.
Deepak V. Dutt—Vice President, Treasurer and Investor Relations Officer. Mr. Dutt has been our VicePresident, Treasurer and Investor Relations Officer since March 2007. Mr. Dutt has served as Vice President andTreasurer of HNS since January 2001 and as Investor Relations Officer since February 2008. Mr. Dutt joinedHNS in July 1993 and has held various positions in finance since then, including corporate planning,international finance, treasury and an international assignment as Chief Financial Officer of a subsidiary of theCompany where he played a lead role in its start-up and in taking it public. Prior to joining our Company,Mr. Dutt served in various positions in the U.S. and overseas at IBM Corporation in sales, marketing and finance.He received a Bachelor of Science degree in Engineering from the University of Poona, India.
Cleo V. Belmonte—Assistant Secretary. Ms. Belmonte has been our Assistant Secretary since March 2007and Senior Counsel, Securities of HNS since joining the Company in January 2007. Prior to joining HNS, from2002 to 2006, Ms. Belmonte was an associate with the law firms of Pillsbury Winthrop Shaw Pittman LLP andPatton Boggs LLP where she practiced securities and general corporate law. Ms. Belmonte received Bachelor ofScience degrees in Multinational Business Operations, Marketing and Business Management from Florida StateUniversity. Ms. Belmonte received a Juris Doctorate degree from the Georgetown University Law Center.
Andrew D. Africk—Director. Mr. Africk has been a director since December 2005. Mr. Africk is a seniorpartner of Apollo Advisors, L.P., which, together with its affiliates, acts as managing general partner of theApollo Investment Funds, a series of private securities investment funds, where he has worked since 1992.
124

Mr. Africk also serves on the Board of Directors of Hughes Telematics and SOURCECORP, Incorporated.Mr. Africk also serves on HNS’ Board of Managers. Mr. Africk also serves as the chairman of our Nominatingand Corporate Governance Committee and our Compensation Committee.
O. Gene Gabbard—Director. Mr. Gabbard has been a director since June 2006. He is a private investor whohas more than 25 years of general management experience in the telecommunications and technology sectors.Mr. Gabbard is a member of the board of directors of COLT Telecom, SA, Luxembourg, a pan-Europeanprovider of business communications services. He is also a member of the Board of Directors of Knology, Inc.,West Point, Georgia, Trillion Partners, Austin, Texas and NetCracker, Inc., Waltham, Massachusetts. FromAugust 1990 to January 1993, Mr. Gabbard was Executive Vice President and Chief Financial Officer of MCICommunications Corporation. Mr. Gabbard serves on our Audit Committee.
Jeffrey A. Leddy—Director. Mr. Leddy has been a director since our formation in June 2005. Mr. Leddywas our President from our formation in June 2005 until February 2006 and our Chief Executive Officer fromNovember 2005 until February 2006. Mr. Leddy is currently the Chief Executive Officer of Hughes Telematics.He previously served as SkyTerra’s Chief Executive Officer and President from April 2003 through December2006, having served as its President and Chief Operating Officer since October 2002 and its Senior VicePresident of Operations since June 2002. From September 1980 to December 2001, Mr. Leddy worked for EMSTechnologies, most recently as a Vice President. Mr. Leddy also serves on the Board of Directors of HughesTelematics and Hughes Systique Corporation. Mr. Leddy also serves on HNS’ Board of Managers. Mr. Leddyserves on our Compensation Committee.
Lawrence J. Ruisi—Director. Mr. Ruisi has been a director since June 2006. He is a private investor/consultant and also serves on the Board of Governors of Sound Shore Medical Center where he was Chairmanfrom 2002 to 2006. He also serves on the boards of directors of Innkeepers USA, a privately held hotel real estateinvestment trust and Adaptec, Inc., a data storage provider to OEMs. Mr. Ruisi has over twenty years ofexperience in the entertainment industry in which he held various senior executive positions. He was ChiefExecutive Officer and President of Loews Cineplex Entertainment from 1998 to 2002, Executive Vice Presidentof Sony Pictures Entertainment from 1991 to 1998, Senior Vice President of Columbia Pictures Entertainmentfrom 1987 to 1990 and Senior Vice President Finance and Vice President and Controller of Tri-Star Picturesfrom 1983 to 1987. Mr. Ruisi started his career in public accounting and worked for Price Waterhouse & Co.from 1970 to 1983. Mr. Ruisi serves as the chairman of our Audit Committee.
Aaron J. Stone—Director. Mr. Stone has been a director since December 2005. Mr. Stone is a seniorpartner of Apollo Advisors, L.P., which, together with its affiliates, acts as managing general partner of theApollo Investment Funds, a series of private securities investment funds, where he has worked since 1997.Mr. Stone also serves on the Board of Directors of AMC Entertainment Inc. and Connections Academy, LLC.Mr. Stone also serves on HNS’ Board of Managers. Mr. Stone serves on our Compensation Committee andNominating and Corporate Governance Committee.
Michael D. Weiner—Director. Mr. Weiner has been a director since December 2005. Mr. Weiner has beenChief Legal Officer and General Counsel of Ares Management since September 2006. Previously, Mr. Weinerwas employed with Apollo Advisors, L.P. and Apollo Real Estate Advisors and served as general counsel of theApollo organization from 1992 to September 2006. Prior to joining Apollo, Mr. Weiner was a partner in the lawfirm of Morgan, Lewis & Bockius specializing in securities law, public and private financings, and corporate andcommercial transactions. Mr. Weiner serves on our Audit Committee.
125

Code of Ethics
We have adopted a written code of ethics, the “Amended and Restated Code of Ethics” for our ChiefExecutive and Senior Financial Officers, which is applicable to our principal executive officer, principal financialofficer, principal accounting officer or controller and other executive officers who perform similar functions(collectively, the “Selected Officers”). Our Code of Ethics is available on our website at www.hughes.com oryou may request a free copy of our Code of Ethics from:
Hughes Communications, Inc.11717 Exploration LaneGermantown, MD 20876Attn: Sandi Kerentoff
Certain information required by this item is incorporated by reference to the Company’s definitive ProxyStatement to be filed with the Securities and Exchange Commission in connection with the Company’s 2009annual meeting stockholders.
Item 11. Executive Compensation
The information required by this item is incorporated by reference to the Company’s definitive ProxyStatement to be filed with the Securities and Exchange Commission in connection with the Company’s 2009annual meeting of stockholders.
Item 12. Security Ownership of Certain Beneficial Owners and Management and Related StockholderMatters
Certain information required by this item is incorporated by reference to the Company’s definitive ProxyStatement to be filed with the Securities and Exchange Commission in connection with the Company’s 2009annual meeting of stockholders.
Securities Authorized for Issuance under the Equity Compensation Plans
On January 30, 2006, we adopted the 2006 Equity and Incentive Plan (the “Plan”), which provides for thegrant of equity-based awards, including restricted common stock, restricted stock units, stock options, stockappreciation rights and other equity-based awards, as well as cash bonuses and long-term cash awards to ourdirectors, officers and other employees, advisors and consultants who are selected by its compensation committeefor participation in the Plan. Unless earlier terminated by our Board of Directors, the Plan will expire onJanuary 30, 2016. Termination of the Plan is not intended to adversely affect any award that is then outstandingwithout the award holder’s consent. Our Board of Directors may amend the Plan at any time. Plan amendmentsare not intended to adversely affect any award that is then outstanding without the award holder’s consent, andwe must obtain stockholder approval of a plan amendment if stockholder approval is required to comply with anyapplicable law, regulation or stock exchange rule.
126

The following table provides information regarding our equity compensation plans as of December 31,2008:
Plan category
Securities tobe Issued
upon Exerciseof Outstanding
Options,Warrantsand Rights
( a )
Weighted AverageExercise Priceof Outstanding
Options, Warrantsand Rights
( b )
SecuritiesRemaining
Available for FutureIssuance Under
EquityCompensationPlans (excluding
Securities Reflectedin Column (a))
( c )
Equity compensation plans approved by security holders:The Plan(1) . . . . . . . . . . . . . . . . . . . . . . . . . . . . . . . . . . . . . . . . . . . . . . 552,400 $ 53.67 147,600Hughes Network Systems LLC Bonus Unit Plan (“HNS Bonus UnitPlan”)(2) . . . . . . . . . . . . . . . . . . . . . . . . . . . . . . . . . . . . . . . . . . . . . .
Equity compensation plans not approved by security holders:SkyTerra 1998 Long Term Incentive Plan (“SkyTerra Plan”)(3) . . . . . 62,500 $ 19.65 -
Total . . . . . . . . . . . . . . . . . . . . . . . . . . . . . . . . . . . . . . . . . . . . . . . . . 614,900 $ 50.21 147,600
(1) The Plan provides for this issuance of equity based awards in various forms including restricted common stock, restricted stock units,stock options, stock appreciation rights and other equity based awards. As of December 31, 2008, 8,350 restricted stock units, which aresubject to time vesting, granted to our international employees were outstanding. Upon vesting, each restricted stock unit is convertibleinto one share of common stock.
(2) In July 2005, HNS adopted an incentive plan (the “HNS Bonus Unit Plan”) pursuant to which 4.4 million bonus units were granted tocertain employees. The bonus units provide for time vesting and are subject to a participant’s continued employment with HNS at thetime of predetermined exchange dates. The number of our common stock shares to be issued upon each exchange would be based uponthe fair market value of the vested bonus units divided by the closing trading price of our common stock for the 20 business daysimmediately preceding the date of the exchange.
(3) In February 2006, the stock options granted under the SkyTerra Plan were converted into options to purchase shares of our commonstock.
Item 13. Certain Relationships and Related Transactions, and Director Independence
The information required by this item is incorporated by reference to the Company’s definitive ProxyStatement to be filed with the Securities and Exchange Commission in connection with the Company’s 2009annual meeting of stockholders.
Item 14. Principal Accountant Fees and Services
The information required by this item is incorporated by reference to the Company’s definitive ProxyStatement to be filed with the Securities and Exchange Commission in connection with the Company’s 2009annual meeting of stockholders.
127

PART IV
Item 15. Exhibits and Financial Statement Schedules
PageNumber
(a) 1. All Consolidated Financial Statements Item 82. Financial Statement Schedule I—Condensed Financial Information of the Registrant 111
Financial Statement Schedule II—Valuation and Qualifying Accounts for the YearsEnded December 31, 2008, 2007 and 2006 131
3. Exhibits See below
ExhibitNumber Description
2.1 Agreement and Plan of Merger by and among Hughes Communications, Inc., Utah AcquisitionCorp., Helius, Inc., Canopy Ventures I, L.P., and Canopy Group, in its capacity as ShareholderRepresentative dated as of December 21, 2007 (incorporated by reference to Exhibit 2.1 to theAnnual Report on Form 10-K of Hughes Communications, Inc. filed March 10, 2008).
3.1 Amended and Restated Certificate of Incorporation of Hughes Communications, Inc., dated asof December 2, 2005 (incorporated by reference to Exhibit 3.1 to the Registration Statement onForm S-1 of Hughes Communications, Inc. filed December 5, 2005).
3.2 Amended and Restated By-Laws of Hughes Communications, Inc., dated as of December 2,2005 (incorporated by reference to Exhibit 3.2 to the Registration Statement on Form S-1 ofHughes Communications, Inc. filed December 5, 2005).
3.3 Certificate of Amendment to the Amended and Restated Certificate of Incorporation of HughesCommunications, Inc., dated February 16, 2006 (incorporated by reference to Exhibit 3.1 to theCurrent Report on Form 8-K of Hughes Communications, Inc. filed February 24, 2006).
4.1 Specimen Common Stock Certificate (incorporated by reference to Exhibit 4.1 to AmendmentNo. 3 to the Registration Statement on Form S-1 of Hughes Communications, Inc. filedFebruary 6, 2006).
4.2 Form of Subscription Rights Certificate (incorporated by reference to Exhibit 4.2 toAmendment No. 3 to the Registration Statement on Form S-1 of Hughes Communications, Inc.filed February 6, 2006).
4.3 Indenture dated as of April 13, 2006 between Hughes Network Systems, LLC, HNS FinanceCorp., the guarantors party thereto and Wells Fargo Bank, National Association, as trustee(incorporated by reference to Exhibit 4.1 to the Current Report on Form 8-K of HughesCommunications, Inc. filed April 17, 2006).
4.4 Supplemental Indenture No. dated as of May 6, 2008 among Helius, LLC, Helius Acquisition,LLC and Advanced Satellite Research, LLC, Hughes Network Systems, LLC, HNS FinanceCorp., the other Guarantors (as defined in the Indenture) and Wells Fargo Bank, NationalAssociation (incorporated by reference to Exhibit 4 to the Quarterly Report on Form 10-Q ofHughes communications, Inc. filed on August 7, 2008).
4.5 Registration Rights Agreement, dated as of April 13, 2006, by and among Hughes NetworkSystems, LLC, HNS Finance Corp., the guarantor subsidiaries of Hughes Network Systems,LLC party thereto and Bear, Stearns & Co. Inc., Morgan Stanley & Co. Incorporated and Bancof America Securities LLC (incorporated by reference to Exhibit 10.1 to the Current Report onForm 8-K of Hughes Communications, Inc. filed April 17, 2006).
10.1 Separation Agreement, dated as of December 30, 2005, by and between HughesCommunications, Inc. and SkyTerra Communications, Inc. (incorporated by reference toExhibit 10.1 to the Current Report on Form 8-K of SkyTerra Communications, Inc. filedJanuary 3, 2006 (File No. 000-13865)).
128

ExhibitNumber Description
10.2 First Amendment to Separation Agreement, dated as of February 3, 2006, by and betweenHughes Communications, Inc. and SkyTerra Communications, Inc. (incorporated by referenceto Exhibit 10.2 to Amendment No. 3 to the Registration Statement on Form S-1 of HughesCommunications, Inc. filed February 6, 2006).
10.3 Tax Sharing Agreement, dated as of December 30, 2005, by and between HughesCommunications, Inc. and SkyTerra Communications, Inc. (incorporated by reference toExhibit 10.2 to the Current Report on Form 8-K of SkyTerra Communications, Inc. filedJanuary 3, 2006 (File No. 000-13865)).
10.4 Employment Agreement, dated as of April 23, 2005, by and between Hughes Network Systems,LLC and Pradman Kaul (incorporated by reference to Exhibit 10.3 to the RegistrationStatement on Form S-1 of Hughes Communications, Inc. filed December 5, 2005).
10.5 Restricted Unit Purchase Agreement, dated as of June 20, 2005, between Hughes NetworkSystems, LLC and Jeffrey A. Leddy (incorporated by reference to Exhibit 10.4 to theRegistration Statement on Form S-1 of Hughes Communications, Inc. filed December 5, 2005).
10.6 2006 Equity and Incentive Plan (incorporated by reference to Exhibit 10.6 to Amendment No. 3 tothe Registration Statement on Form S-1 of Hughes Communications, Inc. filed February 6, 2006).
10.7 Amended and Restated Limited Liability Company Agreement, dated as of April 22, 2005, byand between Hughes Network Systems, Inc. and SkyTerra Communications, Inc. (incorporatedby reference to Exhibit 99.3 to the Current Report on Form 8-K of SkyTerra Communications,Inc. filed April 26, 2005 (File No. 000-13865)).
10.8 Investor Rights Agreement, dated as of April 22, 2005, by and among Hughes NetworkSystems, LLC, Hughes Network Systems, Inc. and SkyTerra Communications, Inc.(incorporated by reference to Exhibit 99.5 to the Current Report on Form 8-K of SkyTerraCommunications, Inc. filed April 26, 2005 (File No. 000-13865)).
10.9 First Lien Credit Agreement, dated as of April 22, 2005, as Amended and Restated as ofJune 24, 2005, among Hughes Network Systems, LLC, as borrower, the lenders party thereto,JPMorgan Chase Bank, N.A., as Administrative Agent, Bear Stearns Corporate Lending Inc., asSyndication Agent, and J.P. Morgan Securities Inc. and Bear, Stearns & Co. Inc., as joint leadarrangers and joint bookrunners (incorporated by reference to Exhibit 10.8 to the RegistrationStatement on Form S-1 of Hughes Communications, Inc. filed December 5, 2005).
10.10 Credit Agreement dated as of April 22, 2005, as amended and restated as of June 27, 2005 andas further amended and restated as of April 13, 2006, among Hughes Network Systems, LLC,the lenders party thereto from time to time, Bear Stearns Corporate Lending Inc., asadministrative agent, Morgan Stanley Senior Funding, Inc., as syndication agent, and Bear,Stearns & Co. Inc. and Morgan Stanley Senior Funding, Inc., as joint lead arrangers and jointbook managers (incorporated by reference to Exhibit 10.2 to the Current Report on Form 8-K ofHughes Communications, Inc. filed April 17, 2006).
10.11 Contribution and Membership Interest Purchase Agreement, dated December 3, 2004, by andamong The DIRECTV Group, Inc., Hughes Network Systems, Inc., SkyTerra Communications,Inc. and Hughes Network Systems, LLC (incorporated by reference to the Current Report onForm 8-K of SkyTerra Communications, Inc. filed December 9, 2004 (File No. 000-13865)).
10.12 Membership Interest Purchase Agreement, dated as of November 10, 2005, by and amongSkyTerra Communications, Inc., SkyTerra Holdings, Inc., DIRECTV Group, Inc., DTVNetwork Systems, Inc. and Hughes Network Systems, LLC (incorporated by reference toExhibit 10.1 to the Current Report on Form 8-K of SkyTerra Communications, Inc. filedNovember 14, 2005 (File No. 000-13865)).
10.13 Registration Rights Agreement, dated as of January 1, 2006, by and among HughesCommunications, Inc., Apollo Investment Fund IV, L.P., Apollo Overseas Partners IV, L.P.,AIF IV/RRRR LLC, AP/RM Acquisition LLC and ST/RRRR LLC (incorporated by referenceto Exhibit 10.5 to the Current Report on Form 8-K of SkyTerra Communications, Inc. filedJanuary 3, 2006 (File No. 000-13865)).
129

ExhibitNumber Description
10.14 Hughes Network Systems, LLC Bonus Unit Plan (incorporated by reference to Exhibit 10.1 tothe quarterly report on Form 10-Q of SkyTerra Communications, Inc. filed August 15, 2005(File No. 000-13865)).
10.15 Employment Agreement, dated as of April 23, 2005, by and between Hughes Network Systems,LLC and Paul Gaske (incorporated by reference to Exhibit 10.19 to Amendment No. 2 to theRegistration Statement on Form S-1 of Hughes Communications, Inc. filed January 26, 2006).
10.16 Employment Agreement, dated as of April 23, 2005, by and between Hughes Network Systems,LLC and Bahram Pourmand (incorporated by reference to Exhibit 10.20 to Amendment No. 2to the Registration Statement on Form S-1 of Hughes Communications, Inc. filed January 26,2006).
10.17 Employment Agreement, dated as of April 23, 2005, by and between Hughes Network Systems,LLC and Adrian Morris (incorporated by reference to Exhibit 10.21 to Amendment No. 2 to theRegistration Statement on Form S-1 of Hughes Communications, Inc. filed January 26, 2006).
10.18 Second Amended and Restated Limited Liability Company Agreement of Hughes NetworkSystems, LLC, dated as of February 28, 2006, by and among Hughes Communications, Inc., theClass B Members and the other signatories thereto (incorporated by reference to Exhibit 10.1 tothe Current Report on Form 8-K of Hughes Communications, Inc. filed March 3, 2006).
10.19 Employment Agreement, dated February 23, 2006, between Hughes Communications, Inc.,Hughes Network Systems, LLC and Grant A. Barber (incorporated by reference to Exhibit 10.1to the Current Report on Form 8-K of Hughes Communications, Inc. filed February 27, 2006).
10.20 Management and Advisory Services Agreement dated March 27, 2006 between HughesCommunications, Inc. and Hughes Network Systems, LLC (incorporated by reference toExhibit 10.1 to the Current Report on Form 8-K of Hughes Communications, Inc. filed March29, 2006).
10.21 Form of Indemnification Agreement (incorporated by reference to Exhibit 10.1 to the CurrentReport on Form 8-K of Hughes Communications, Inc. filed June 22, 2006).
10.22 Credit Agreement, dated as of February 23, 2007, among Hughes Network Systems, LLC andHNS Finance Corp. as co-borrowers, Bear Stearns Corporate Lending Inc. (“BSCL”) as theinitial lender, Bear Stearns & Co. Inc. as lead arranger and bookrunning manager, and BSCL asadministrative agent (incorporated by reference to Exhibit 10.1 to the Current Report on Form8-K of Hughes Network Systems, LLC filed February 27, 2007 (File No. 333-138009).
10.23 First Amendment to Amended and Restated Credit Agreement and First Lien Guarantee andCollateral Agreement, dated as of April 06, 2007, by and among Hughes Network System,LLC, as the Borrower, and Bear Stearns Corporate Lending Inc., as administrative agent(incorporated by reference to Exhibit 10.1 to the Current Report on Form 8-K of HughesNetwork System, LLC filed April 12, 2007) (File No. 333-138009).
10.24 Hughes Network systems, LLC Long Term Cash Incentive Retention Program (Incorporated byreference to Exhibit 4 to the Form 10-Q of Hughes Communications, Inc. filed on May 7,2008).
11* Statement regarding computation of earnings per shares.12* Statement of computation of ratio of earnings to fixed charges.21.1* List of Subsidiaries of Hughes Communications, Inc.23.1* Consent of Independent Registered Public Accounting Firm—Deloitte & Touche LLP31.1* Certification of Chief Executive Officer of Hughes Communications, Inc. pursuant to Section
302 of the Sarbanes-Oxley Act of 2002.31.2* Certification of Chief Financial Officer of Hughes Communications, Inc. pursuant to Section
302 of the Sarbanes-Oxley Act of 2002.32* Certification of Chief Executive Officer and Chief Financial Officer of Hughes
Communications, Inc. pursuant to Section 906 of the Sarbanes-Oxley Act of 2002.* Filed herewith.
130

Financial Statements Schedules
Schedule I—Condensed Financial Information of the Registrant
The condensed financial information required by this schedule is included in Note 24 and Note 25 to theCompany’s audited consolidated financial statements included in Item 8 of this report.
Schedule II—Valuation and Qualifying Accounts for the Years Ended December 31, 2008, 2007 and 2006
Additional to
Deductions - DescriptionsBeginningBalance
Costs andExpenses
OtherAccounts Deductions
EndingBalance
(in thousands)Reserves and allowances deducted from asset accounts:Allowances for uncollectible accounts receivable:Year ended December 31, 2008 . . . . . . . . . . . . . . . $ 9,060 $ 15,198 $ - $ (14,707) $ 9,551Year ended December 31, 2007 . . . . . . . . . . . . . . . $ 10,158 $ 11,405 $ - $ (12,503) $ 9,060Year ended December 31, 2006 . . . . . . . . . . . . . . . $ 78 $ 23,908 $ - $ (13,828) $ 10,158
Deferred tax valuation allowance:Year ended December 31, 2008 . . . . . . . . . . . . . . . $ 30,040 $ 13,040 $ - $ - $ 43,080Year ended December 31, 2007 . . . . . . . . . . . . . . . $ 41,629 $ - $ - $ (11,589) $ 30,040Year ended December 31, 2006 . . . . . . . . . . . . . . . $ 70,009 $ - $ - $ (28,380) $ 41,629
131

SIGNATURES
Pursuant to the requirements of the Securities Exchange Act of 1934, the registrant has duly caused thisreport to be signed on its behalf by the undersigned thereunto duly authorized.
Date: March 5, 2009 HUGHES COMMUNICATIONS, INC.(Registrant)
/s/ GRANT A. BARBER
Name: Grant A. BarberTitle: Executive Vice President and Chief Financial Officer
(Principal Financial Officer)
Pursuant to the requirements of the Securities Exchange Act of 1934, this Annual Report on Form 10-K hasbeen signed below by the following persons on behalf of the registrant and in the capacities indicated.
Signature Title Date
/s/ PRADMAN P. KAUL
Pradman P. Kaul
Chief Executive Officer, Presidentand Director(Principal Executive Officer)
March 5, 2009
/s/ GRANT A. BARBER
Grant A. Barber
Executive Vice President andChief Financial Officer(Principal Financial Officer)
March 5, 2009
/s/ THOMAS J. MCELROYThomas J. McElroy
Chief Accounting Officer(Principal Accounting Officer)
March 5, 2009
/s/ O. GENE GABBARD
O. Gene Gabbard
Director March 5, 2009
/s/ LAWRENCE J. RUISI
Lawrence J. Ruisi
Director March 5, 2009
/s/ MICHAEL D. WEINER
Michael D. Weiner
Director March 5, 2009
/s/ JEFFREY A. LEDDYJeffrey A. Leddy
Director March 5, 2009
/s/ ANDREW D. AFRICK
Andrew D. Africk
Director March 5, 2009
/s/ AARON J. STONEAaron J. Stone
Director March 5, 2009
132

Exhibit 11
HUGHES COMMUNICATIONS, INC.STATEMENT REGARDING COMPUTATION OF EARNINGS PER SHARE
In accordance with Statement of Financial Accounting Standards No. 128, “Earnings per Share,” thecomputations of per share amounts included in the accompanying financial statements exclude the effects ofdilutive securities in periods when a loss from continuing operations exists or when their inclusion would be anti-dilutive. The tables below are prepared in accordance with Rule 601(b)(11) of Regulation S-K of the Securitiesand Exchange Act of 1934, as amended.
The following table is a reconciliation of basic and diluted earnings per share (dollars in thousands, exceptper share amounts):
Year Ended December 31,
2008 2007 2006
Income (loss):Income (loss) from continuing operations . . . . . . . . . . . . . . . . . $ 9,018 $ 43,540 $ (39,310)Loss from discontinued operations . . . . . . . . . . . . . . . . . . . . . . . - - (43)Gain on sale of discontinued operations . . . . . . . . . . . . . . . . . . . - - 240
Net income (loss) . . . . . . . . . . . . . . . . . . . . . . . . . . . . . . . . . . 9,018 43,540 (39,113)Cumulative dividends and accretion of convertible preferredstock to liquidation value . . . . . . . . . . . . . . . . . . . . . . . . . . . . - - (1,454)
Net income (loss) attributable to common stockholders . . . . . $ 9,018 $ 43,540 $ (40,567)
Shares:Basic weighted average common shares outstanding . . . . . . . . . 20,317,155 18,860,517 16,668,591Effect of dilutive securities: . . . . . . . . . . . . . . . . . . . . . . . . . . . .Restricted stock units . . . . . . . . . . . . . . . . . . . . . . . . . . . . . . . 51,070 121,344 -Restricted stock awards . . . . . . . . . . . . . . . . . . . . . . . . . . . . . . 201,829 178,936 -Options to purchase common stock . . . . . . . . . . . . . . . . . . . . 63,779 67,122 -
Diluted weighted average common shares outstanding . . . 20,633,833 19,227,919 16,668,591
Per shares:Basic earnings (loss) per common share:Continuing operations . . . . . . . . . . . . . . . . . . . . . . . . . . . . . . . $ 0.44 $ 2.31 $ (2.44)Discontinued operations . . . . . . . . . . . . . . . . . . . . . . . . . . . . . - - 0.01
Basic net earnings (loss) per share . . . . . . . . . . . . . . . . . . . $ 0.44 $ 2.31 $ (2.43)
Diluted earnings (loss) per common share:Continuing operations . . . . . . . . . . . . . . . . . . . . . . . . . . . . . . . $ 0.44 $ 2.26 $ (2.44)Discontinued operations . . . . . . . . . . . . . . . . . . . . . . . . . . . . . - - 0.01
Net diluted earnings (loss) per share . . . . . . . . . . . . . . . . . . $ 0.44 $ 2.26 $ (2.43)
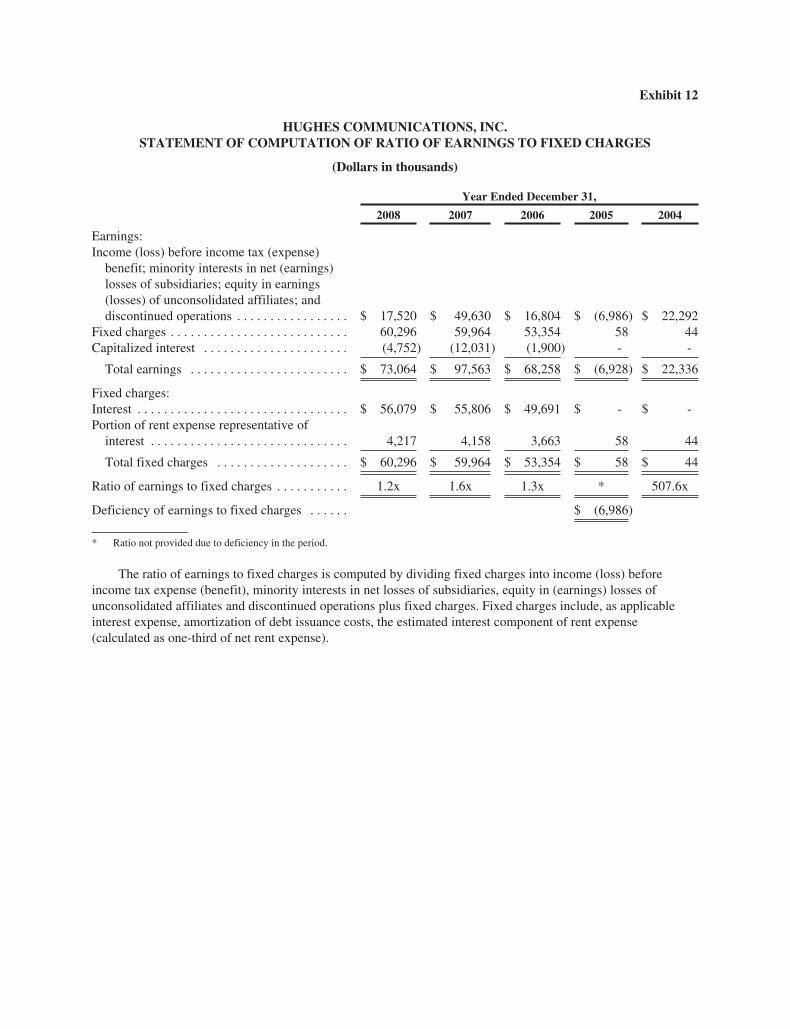
Exhibit 12
HUGHES COMMUNICATIONS, INC.STATEMENT OF COMPUTATION OF RATIO OF EARNINGS TO FIXED CHARGES
(Dollars in thousands)
Year Ended December 31,
2008 2007 2006 2005 2004
Earnings:Income (loss) before income tax (expense)benefit; minority interests in net (earnings)losses of subsidiaries; equity in earnings(losses) of unconsolidated affiliates; anddiscontinued operations . . . . . . . . . . . . . . . . . $ 17,520 $ 49,630 $ 16,804 $ (6,986) $ 22,292
Fixed charges . . . . . . . . . . . . . . . . . . . . . . . . . . . 60,296 59,964 53,354 58 44Capitalized interest . . . . . . . . . . . . . . . . . . . . . . (4,752) (12,031) (1,900) - -
Total earnings . . . . . . . . . . . . . . . . . . . . . . . . $ 73,064 $ 97,563 $ 68,258 $ (6,928) $ 22,336
Fixed charges:Interest . . . . . . . . . . . . . . . . . . . . . . . . . . . . . . . . $ 56,079 $ 55,806 $ 49,691 $ - $ -Portion of rent expense representative ofinterest . . . . . . . . . . . . . . . . . . . . . . . . . . . . . . 4,217 4,158 3,663 58 44
Total fixed charges . . . . . . . . . . . . . . . . . . . . $ 60,296 $ 59,964 $ 53,354 $ 58 $ 44
Ratio of earnings to fixed charges . . . . . . . . . . . 1.2x 1.6x 1.3x * 507.6x
Deficiency of earnings to fixed charges . . . . . . $ (6,986)
* Ratio not provided due to deficiency in the period.
The ratio of earnings to fixed charges is computed by dividing fixed charges into income (loss) beforeincome tax expense (benefit), minority interests in net losses of subsidiaries, equity in (earnings) losses ofunconsolidated affiliates and discontinued operations plus fixed charges. Fixed charges include, as applicableinterest expense, amortization of debt issuance costs, the estimated interest component of rent expense(calculated as one-third of net rent expense).

Exhibit 21.1
HUGHES COMMUNICATIONS, INC.SUBSIDIARIES
The following table sets forth our subsidiaries as of December 31, 2008:
Company(1)Place of
IncorporationOwnershipInterest
Subsidiaries of Hughes Communications, Inc.:Hughes Network Systems, LLC . . . . . . . . . . . . . . . . . . . . . . . . . . . . . . . . . . . . Delaware 100%Electronic Systems Products, Inc. . . . . . . . . . . . . . . . . . . . . . . . . . . . . . . . . . . . Illinois 93.4%
Subsidiaries of Hughes Network Systems, LLC:Advance Satellite Research, LLC . . . . . . . . . . . . . . . . . . . . . . . . . . . . . . . . . . . Delaware 100%Helius, LLC . . . . . . . . . . . . . . . . . . . . . . . . . . . . . . . . . . . . . . . . . . . . . . . . . . . . Utah 100%Helius Acquisition, LLC . . . . . . . . . . . . . . . . . . . . . . . . . . . . . . . . . . . . . . . . . . Utah 100%HNS Participações e Empreendimentos Ltda. . . . . . . . . . . . . . . . . . . . . . . . . . Brazil 100%HNS Américas Comunicações Ltda. . . . . . . . . . . . . . . . . . . . . . . . . . . . . . . . . . Brazil 100%Hughes Telecomunicações do Brasil Ltda. . . . . . . . . . . . . . . . . . . . . . . . . . . . . Brazil 99.99%Hughes Network Systems (Beijing) Co., Ltd. . . . . . . . . . . . . . . . . . . . . . . . . . . China 100%HNS Finance Corp. . . . . . . . . . . . . . . . . . . . . . . . . . . . . . . . . . . . . . . . . . . . . . . Delaware 100%Hughes Network Systems International Service Company . . . . . . . . . . . . . . . Delaware 100%HNS-India VSAT, Inc. . . . . . . . . . . . . . . . . . . . . . . . . . . . . . . . . . . . . . . . . . . . Delaware 100%HNS-Shanghai, Inc. . . . . . . . . . . . . . . . . . . . . . . . . . . . . . . . . . . . . . . . . . . . . . . Delaware 100%HNS License Sub, LLC . . . . . . . . . . . . . . . . . . . . . . . . . . . . . . . . . . . . . . . . . . . Delaware 100%HNS Real Estate, LLC . . . . . . . . . . . . . . . . . . . . . . . . . . . . . . . . . . . . . . . . . . . Delaware 100%Hughes Network Systems GmbH . . . . . . . . . . . . . . . . . . . . . . . . . . . . . . . . . . . Germany 100%Hughes Communications India Limited(2) . . . . . . . . . . . . . . . . . . . . . . . . . . . . India 69.24%Hughes Network Systems India Limited . . . . . . . . . . . . . . . . . . . . . . . . . . . . . India 99.99%HCIL Comtel Limited . . . . . . . . . . . . . . . . . . . . . . . . . . . . . . . . . . . . . . . . . . . . India 98.98%P.T. Hughes Network Systems Indonesia . . . . . . . . . . . . . . . . . . . . . . . . . . . . . Indonesia 100%Hughes Network Systems S.r.L. . . . . . . . . . . . . . . . . . . . . . . . . . . . . . . . . . . . . Italy 100%HNS Mauritius Ltd. . . . . . . . . . . . . . . . . . . . . . . . . . . . . . . . . . . . . . . . . . . . . . . Mauritius 100%HNS de México S.A. de C.V. . . . . . . . . . . . . . . . . . . . . . . . . . . . . . . . . . . . . . . México 100%Hughes Network Systems Europe Limited . . . . . . . . . . . . . . . . . . . . . . . . . . . . United Kingdom 100%Hughes Network Systems Limited . . . . . . . . . . . . . . . . . . . . . . . . . . . . . . . . . . United Kingdom 100%HNS License Sub Limited . . . . . . . . . . . . . . . . . . . . . . . . . . . . . . . . . . . . . . . . . United Kingdom 100%
(1) Excludes certain inactive subsidiaries which, in the aggregate as a single subsidiary, would not constitute a significant subsidiary as ofDecember 31, 2008.
(2) Our ownership interest in Hughes Communications India Limited of 69.24% consists of 47.42% owned indirectly through our whollyowned subsidiary, HNS- India VSAT, Inc.; 10.91% owned indirectly through our subsidiary, Hughes Network Systems India Limited;and 10.91% owned indirectly through Escorts Motors Limited, in which we indirectly own 49%.
Exhibit 23.1
CONSENT OF INDEPENDENT REGISTERED PUBLIC ACCOUNTING FIRM
We consent to the incorporation by reference in Registration Statements No. 333-145251 on Form S-3 andNo. 333-131900 on Form S-8 of our report dated March 4, 2009, relating to the consolidated financial statementsand financial statement schedule of Hughes Communications, Inc. and subsidiaries, and the effectiveness ofHughes Communications, Inc. and subsidiaries’ internal control over financial reporting, appearing in thisAnnual Report on Form 10-K of Hughes Communications, Inc. for the year ended December 31, 2008.
/s/ Deloitte & Touche LLP
Baltimore, MarylandMarch 4, 2009

Exhibit 31.1
CERTIFICATION OF CHIEF EXECUTIVE OFFICERPURSUANT TO SECTION 302 OF THE SARBANES-OXLEY ACT OF 2002 (15 U.S.C. § 7241)
I, Pradman P. Kaul, certify that:
1. I have reviewed this annual report on Form 10-K of Hughes Communications, Inc.;
2. Based on my knowledge, this report does not contain any untrue statement of a material fact or omit to statea material fact necessary to make the statements made, in light of the circumstances under which suchstatements were made, not misleading with respect to the period covered by this report;
3. Based on my knowledge, the financial statements, and other financial information included in this report,fairly present in all material respects the financial condition, results of operations and cash flows of theregistrant as of, and for, the periods presented in this report;
4. The registrant’s other certifying officer(s) and I are responsible for establishing and maintaining disclosurecontrols and procedures (as defined in Exchange Act Rules 13a-15(e) and 15d-15(e)) and internal control overfinancial reporting (as defined in Exchange Act Rules 13a-15(f) and 15d-15(f)) for the registrant and have:
a) designed such disclosure controls and procedures, or caused such disclosure controls and procedures tobe designed under our supervision, to ensure that material information relating to the registrant,including its consolidated subsidiaries, is made known to us by others within those entities, particularlyduring the period in which this report is being prepared;
b) designed such internal control over financial reporting, or caused such internal control over financialreporting to be designed under our supervision, to provide reasonable assurance regarding thereliability of financial reporting and the preparation of financial statements for external purposes inaccordance with generally accepted accounting principles;
c) evaluated the effectiveness of the registrant’s disclosure controls and procedures and presented in thisreport our conclusions about the effectiveness of the disclosure controls and procedures, as of the endof the period covered by this report based on such evaluation;
d) disclosed in this report any change in the registrant’s internal control over financial reporting thatoccurred during the registrant’s most recent fiscal quarter (the registrant’s fourth fiscal quarter in thecase of an annual report) that has materially affected, or is reasonably likely to materially affect, theregistrant’s internal control over financial reporting; and
5. The registrant’s other certifying officers and I have disclosed, based on our most recent evaluation ofinternal control over financial reporting, to the registrant’s auditors and the audit committee of registrant’sBoard of Directors (or persons performing the equivalent functions):
a) all significant deficiencies in the design or operation of internal controls which are reasonably likely toadversely affect the registrant’s ability to record, process, summarize and report financial information;and
b) any fraud, whether or not material, that involves management or other employees who have asignificant role in the registrant’s internal control over financial reporting.
Date: March 5, 2009 HUGHES COMMUNICATIONS, INC.(Registrant)
/s/ PRADMAN P. KAUL
Name: Pradman P. KaulTitle: President and Chief Executive Officer
(Principal Executive Officer)

Exhibit 31.2
CERTIFICATION OF PRINCIPAL FINANCIAL OFFICERPURSUANT TO SECTION 302 OF THE SARBANES-OXLEY ACT OF 2002 (15 U.S.C. § 7241)
I, Grant A. Barber, certify that:
1. I have reviewed this annual report on Form 10-K of Hughes Communications, Inc.;
2. Based on my knowledge, this report does not contain any untrue statement of a material fact or omit to statea material fact necessary to make the statements made, in light of the circumstances under which suchstatements were made, not misleading with respect to the period covered by this report;
3. Based on my knowledge, the financial statements, and other financial information included in this report,fairly present in all material respects the financial condition, results of operations and cash flows of theregistrant as of, and for, the periods presented in this report;
4. The registrant’s other certifying officer(s) and I are responsible for establishing and maintaining disclosurecontrols and procedures (as defined in Exchange Act Rules 13a-15(e) and 15d-15(e)) and internal control overfinancial reporting (as defined in Exchange Act Rules 13a-15(f) and 15d-15(f)) for the registrant and have:
a) designed such disclosure controls and procedures, or caused such disclosure controls and procedures tobe designed under our supervision, to ensure that material information relating to the registrant,including its consolidated subsidiaries, is made known to us by others within those entities, particularlyduring the period in which this report is being prepared;
b) designed such internal control over financial reporting, or caused such internal control over financialreporting to be designed under our supervision, to provide reasonable assurance regarding thereliability of financial reporting and the preparation of financial statements for external purposes inaccordance with generally accepted accounting principles;
c) evaluated the effectiveness of the registrant’s disclosure controls and procedures and presented in thisreport our conclusions about the effectiveness of the disclosure controls and procedures, as of the endof the period covered by this report based on such evaluation;
d) disclosed in this report any change in the registrant’s internal control over financial reporting thatoccurred during the registrant’s most recent fiscal quarter (the registrant’s fourth fiscal quarter in thecase of an annual report) that has materially affected, or is reasonably likely to materially affect, theregistrant’s internal control over financial reporting; and
5. The registrant’s other certifying officers and I have disclosed, based on our most recent evaluation ofinternal control over financial reporting, to the registrant’s auditors and the audit committee of registrant’sBoard of Directors (or persons performing the equivalent functions):
a) all significant deficiencies in the design or operation of internal controls which are reasonably likely toadversely affect the registrant’s ability to record, process, summarize and report financial information;and
b) any fraud, whether or not material, that involves management or other employees who have asignificant role in the registrant’s internal control over financial reporting.
Date: March 5, 2009 HUGHES COMMUNICATIONS, INC.(Registrant)
/s/ GRANT A. BARBER
Name: Grant A. BarberTitle: Executive Vice President and Chief Financial Officer
(Principal Financial Officer)

Exhibit 32
CERTIFICATION PURSUANT TO 18 U.S.C. SECTION 1350,AS ADOPTED PURSUANT TO SECTION 906 OF THE SARBANES-OXLEY ACT OF 2002
In connection with the annual report for the year ended December 31, 2008 on Form 10-K (the “AnnualReport”), of Hughes Communications, Inc (“the Company”) as filed with the Securities and ExchangeCommission on the date hereof, we, Pradman P. Kaul and Grant A. Barber, Chief Executive Officer and ChiefFinancial Officer, respectively, of the Company, certify, pursuant to 18 U.S.C. Section 1350, as adopted pursuantsection 906 of the Sarbanes-Oxley Act of 2002, that to the best of our knowledge:
(i) the Annual Report fully complies with the requirements of Section 13(a) or Section 15(d) of theSecurities Exchange Act of 1934; and
(ii) the information contained in this Annual Report fairly presents, in all material respects, the financialcondition and result of operations of the Company.
Date: March 5, 2009 HUGHES COMMUNICATIONS, INC.(Registrant)
/s/ PRADMAN P. KAUL
Name: Pradman P. KaulTitle: President and Chief Executive Officer
(Principal Executive Officer)
/s/ GRANT A. BARBER
Name: Grant A. BarberTitle: Executive Vice President and Chief Financial Officer
(Principal Financial Officer)
A SIGNED ORIGINAL OF THIS WRITTEN STATEMENT REQUIRED BY SECTION 906 HAS BEENPROVIDED TO THE COMPANY ANDWILL BE RETAINED BY THE COMPANY AND FURNISHED TOTHE SECURITIES AND EXCHANGE COMMISSION OR ITS STAFF UPON REQUEST.

[THIS PAGE INTENTIONALLY LEFT BLANK]

[THIS PAGE INTENTIONALLY LEFT BLANK]

[THIS PAGE INTENTIONALLY LEFT BLANK]
Corporate Information
Hughes Communications, Inc. Corporate Headquarters11717 Exploration LaneGermantown, MD 20876 USATel: 301-428-5500Fax: 301-428-1868Twx: 710-828-0541
InternetHughes maintains a corporate website on the Internetat www.hughes.com.
Common StockStock Symbol: HUGHListed: NASDAQ Global Select
Directors and Executive Officers
Pradman P. Kaul President and Chief Executive Officer
Grant A. Barber Executive Vice President and Chief Financial Officer
T. Paul Gaske Executive Vice President
Bahram Pourmand Executive Vice President
Adrian Morris Executive Vice President
Dean A. Manson Senior Vice President, General Counsel and Secretary
Thomas J. McElroy Senior Vice President, Chief Accounting Officer
Deepak V. Dutt Vice President, Treasurer and Investor Relations Officer
Cleo V. Belmonte Assistant Secretary
Andrew D. Africk Director
O. Gene Gabbard Director
Jeffrey A. Leddy Director
Lawrence J. Ruisi Director
Aaron J. Stone Director
Michael D. Weiner Director
Independent Registered Public Accounting FirmDeloitte & Touche, LLPBaltimore, Maryland
Annual MeetingThe annual meeting of shareholders will be held on Wednesday, April 15, 2009 at 10:00 A.M. Eastern Time, at the Company’s headquarters located at 11717 Exploration Lane, Germantown, Maryland 20876.
Transfer AgentAmerican Stock Transfer & Trust Company59 Maiden LaneNew York, NY 10038
EmploymentHughes is an equal opportunity employer.
Disclosure of Non-GAAP Financial MeasuresFor definitions of Adjusted EBITDA, see “Reconciliation of Non-GAAP to GAAP Financial Measures” included inthis report.
CertificationsHughes Communications, Inc. filed the Chief Executive Officer and Chief Financial Officer certifications required by Section 302 of the Sarbanes-Oxley Act of 2002 as exhibits to Hughes Communications Inc.’s Annual Report on Form 10-K for the fiscal year ended December 31, 2008.
Safe Harbor StatementSome of the statements in this report contain “forward-lookingstatements” which involve risks and uncertainties within the meaning of various provisions of the Securities Act of 1933 and of the Securities Exchange Act of 1934. Forward-looking statements include statements concerning the Company’s plans, objectives, goals, strategies, future events, future revenues or performance, capital expenditures, financing needs and other information that is not historical information. When used in this report, the words “estimates,” “expects,” “anticipates,” “forecasts,” “plans,” “intends,” “believes,” “seeks,” “may,” “will,” “should” and variations of these words or similar expressions (or the negative versions of any of these words) are intended to identify forward-looking statements. All forward-looking statements, including, without limitation, management’s examination of historical operating trends, are based upon our current expectations and various assumptions. The Company’s expectations, beliefs and projections are expressed in good faith, and the Company believes that there is a reasonable basis for them. However, we can give no assurance that management’s expectations, beliefs and projections will be achieved. There are a number of risks and uncertainties that could cause our actual results to differ materially from the results referred to in the forward-looking statements contained in this report. Important factors that could cause our actual results to differ materially from the results referred to in the forward-looking statements that we make in this report are described in detail in the Company’s SEC filings, including its Annual Report on Form 10-K. Hughes Communications, Inc. assumes no obligation to update any such forward-looking information.
2 0 0 8 A N N U A L R E P O R T

Worldwide Headquarters11717 Exploration LaneGermantown, MD 20876 USATel: 301-428-5500www.hughes.com
For additional information, contact:Deepak V. DuttVice President, Treasurer and Investor Relations OfficerE-mail: [email protected]
CORP 705 MAR 09