Embed Size (px)
Citation preview
“A STUDY ON CONSUMER BRAND PREFERENCE
TOWARDS SELECTED HOME APPLIANCES”
Project Report submitted to
UNIVERSITY OF CALICUT
In partial fulfillment of the requirement for the award of the degree of
BACHELOR OF COMMERCE
Submitted by
CHRISTEEN JOHNSON
(CCASBCM147)
Under the supervision of
Ms. TEENA THOMAS
DEPARTMENT OF COMMERCE
CHRIST COLLEGE (AUTONOMOUS), IRINJALAKUDA
MARCH 2021
CHRIST COLLEGE (AUTONOMOUS), IRINJALAKUDA
CALICUT UNIVERSITY
DEPARTMENT OF COMMERCE
CERTIFICATE
This is to certify that the project report entitled “A STUDY ON CONSUMER
BRAND PREFRENCE TOWARD SELECTED HOME APPLIANCES” is
a bonafide record of project done by CHRISTEEN JOHNSON, Reg. No.
CCASBCM147, under my guidance and supervision in partial fulfillment of
the requirement for the award of the degree of BACHELOR OF COMMERCE
and it has not previously formed the basis for any Degree, Diploma and
Associateship or Fellowship.
Prof. K.J.JOSEPH Ms. TEENA THOMAS
Co-ordinator Project Guide
DECLARATION
I, CHRISTEEN JOHNSON, hereby declare that the project work
entitled “A STUDY ON CONSUMER BRAND PREFERENCES TOWARD
SELECTED HOME APPLIANCES” is a record of independent and bonafide
project work carried out by me under the supervision and guidance of Ms.
Teena Thomas, Assistant Professor, Department of Commerce, Christ College,
Irinjalakuda.
The information and data given in the report is authentic to the best of my
knowledge. The report has not been previously submitted for the award of any
Degree, Diploma, Associateship or other similar title of any other university or
institute.
Place: Irinjalakuda CHRISTEEN JOHNSON
Date: CCASBCM147

ACKNOWLEDGEMENT
I would like to take the opportunity to express my sincere gratitude to all people who have helped me with sound advice and able guidance.
Above all, I express my eternal gratitude to the Lord Almighty under whose
divine guidance; I have been able to complete this work successfully.
I would like to express my sincere obligation to Rev.Dr. Jolly Andrews,
Principal-in-Charge, Christ college Irinjalakuda for providing various facilities.
I am thankful to Prof. K.J.Joseph, Co-ordinator of B.Com (Finance), for
providing proper help and encouragement in the preparation of this report.
I am thankful to Ms. Smitha Antony, Class teacher for her cordial support,
valuable information and guidance, which helped me in completing this task through various stages.
I express my sincere gratitude to Ms. Teena Thomas, Assistant Professor,
whose guidance and support throughout the training period helped me to complete this work successfully.
I would like to express my gratitude to all the faculties of the Department for their interest and cooperation in this regard.
I extend my hearty gratitude to the librarian and other library staffs of my
college for their wholehearted cooperation.
I express my sincere thanks to my friends and family for their support in
completing this report successfully.
TABLES OF CONTENTS
CHAPTER NO. CONTENTS PAGE NO:
LIST OF TABLES
LIST OF FIGURES
CHAPTER 1 INTRODUCTION 1 – 3
CHAPTER 2 REVIEW OF LITERATURE 4 – 5
CHAPTER 3 THEORETICAL
FRAMEWORK 6 – 9
CHAPTER 4 DATA ANALYSIS AND
INTERPRETATION 10 – 29
CHAPTER 5 FINDINGS, SUGGESTIONS
& CONCLUSION 30 – 32
BIBLIOGRAPHY
APPENDIX
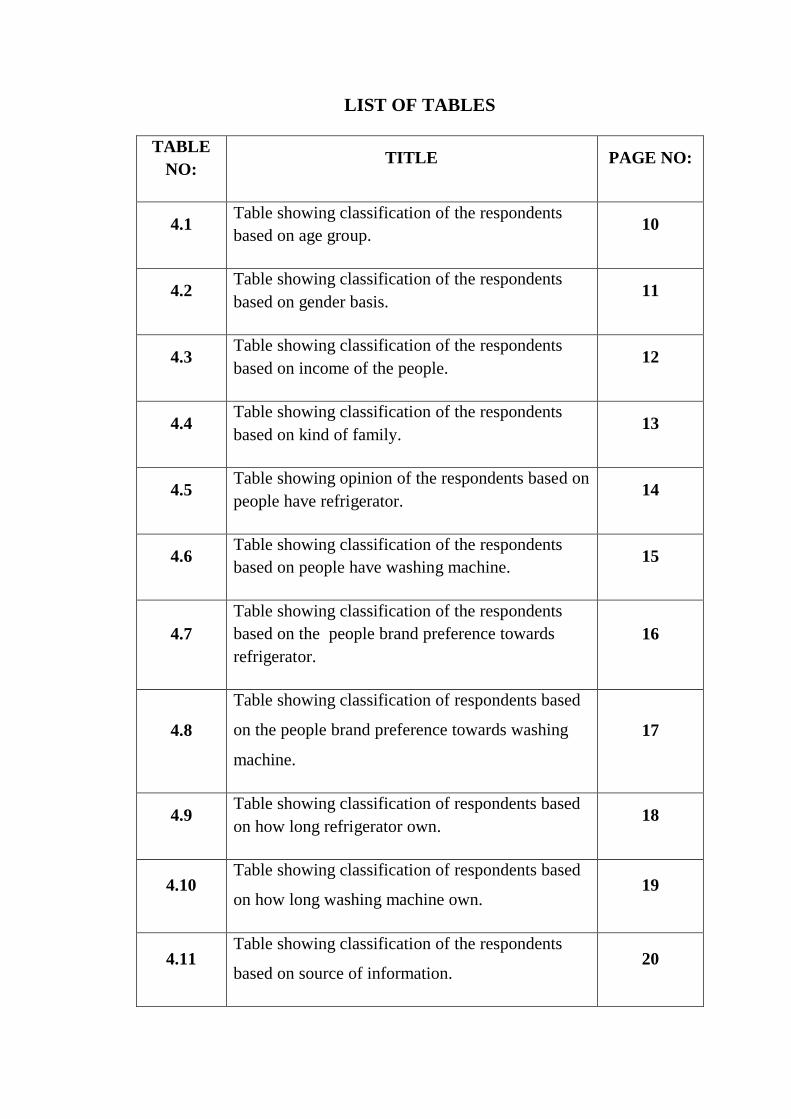
LIST OF TABLES
TABLE
NO: TITLE PAGE NO:
4.1 Table showing classification of the respondents
based on age group. 10
4.2 Table showing classification of the respondents
based on gender basis. 11
4.3 Table showing classification of the respondents
based on income of the people. 12
4.4 Table showing classification of the respondents
based on kind of family. 13
4.5 Table showing opinion of the respondents based on
people have refrigerator. 14
4.6 Table showing classification of the respondents
based on people have washing machine. 15
4.7
Table showing classification of the respondents
based on the people brand preference towards
refrigerator.
16
4.8
Table showing classification of respondents based
on the people brand preference towards washing
machine.
17
4.9 Table showing classification of respondents based
on how long refrigerator own. 18
4.10 Table showing classification of respondents based
on how long washing machine own. 19
4.11 Table showing classification of the respondents
based on source of information. 20
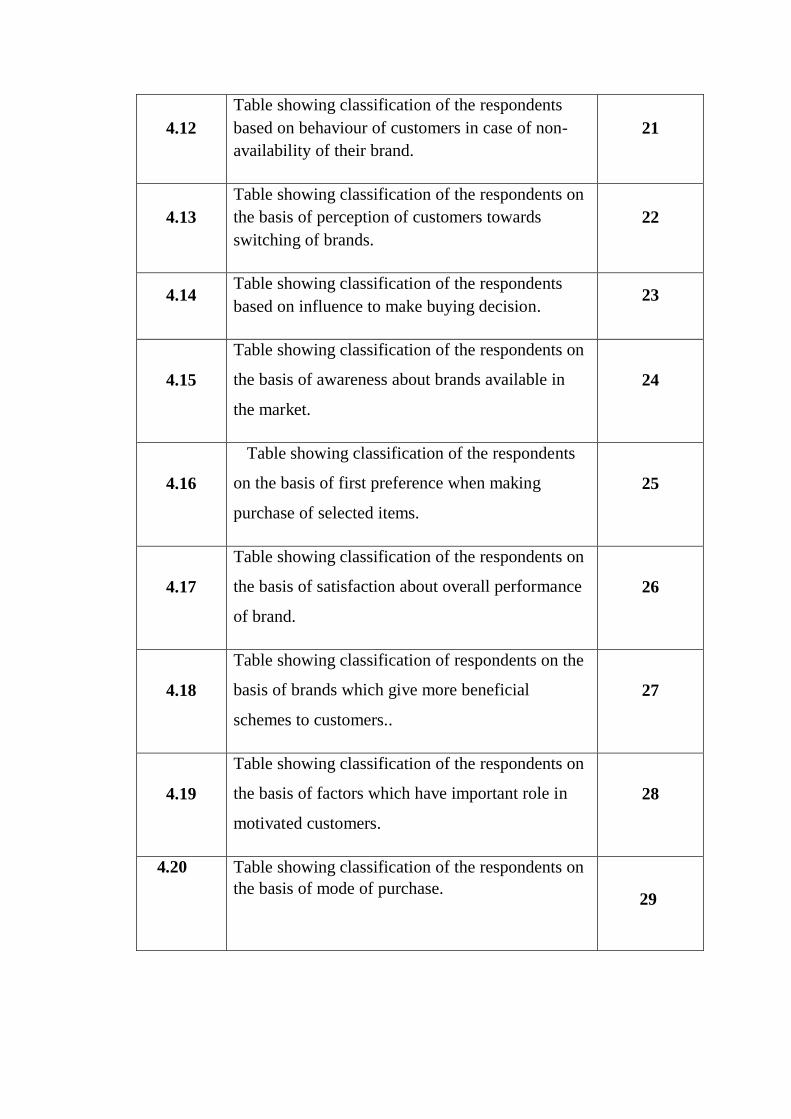
4.12
Table showing classification of the respondents
based on behaviour of customers in case of non-
availability of their brand.
21
4.13
Table showing classification of the respondents on
the basis of perception of customers towards
switching of brands.
22
4.14 Table showing classification of the respondents
based on influence to make buying decision. 23
4.15
Table showing classification of the respondents on
the basis of awareness about brands available in
the market.
24
4.16
Table showing classification of the respondents
on the basis of first preference when making
purchase of selected items.
25
4.17
Table showing classification of the respondents on
the basis of satisfaction about overall performance
of brand.
26
4.18
Table showing classification of respondents on the
basis of brands which give more beneficial
schemes to customers..
27
4.19
Table showing classification of the respondents on
the basis of factors which have important role in
motivated customers.
28
4.20 Table showing classification of the respondents on
the basis of mode of purchase.
29
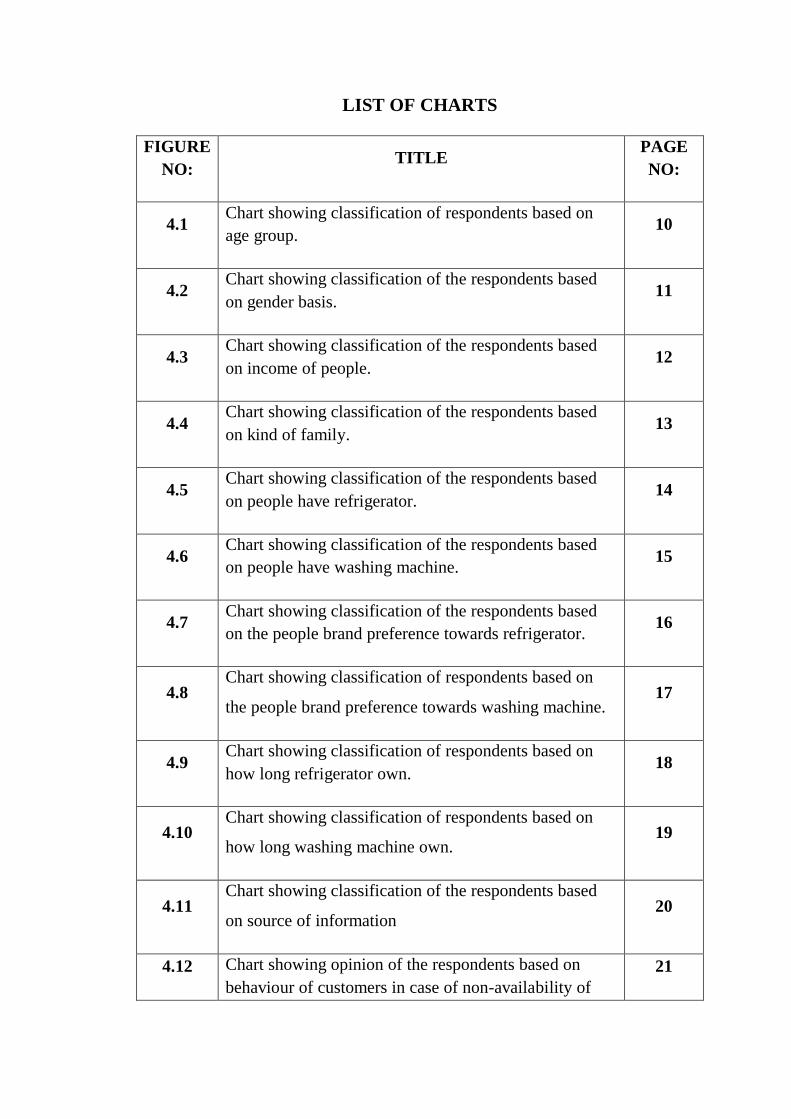
LIST OF CHARTS
FIGURE
NO: TITLE
PAGE
NO:
4.1 Chart showing classification of respondents based on
age group. 10
4.2 Chart showing classification of the respondents based
on gender basis. 11
4.3 Chart showing classification of the respondents based
on income of people. 12
4.4 Chart showing classification of the respondents based
on kind of family. 13
4.5 Chart showing classification of the respondents based
on people have refrigerator. 14
4.6 Chart showing classification of the respondents based
on people have washing machine. 15
4.7 Chart showing classification of the respondents based
on the people brand preference towards refrigerator. 16
4.8 Chart showing classification of respondents based on
the people brand preference towards washing machine. 17
4.9 Chart showing classification of respondents based on
how long refrigerator own. 18
4.10 Chart showing classification of respondents based on
how long washing machine own. 19
4.11 Chart showing classification of the respondents based
on source of information 20
4.12 Chart showing opinion of the respondents based on
behaviour of customers in case of non-availability of
21
their brand.
4.13 Chart showing opinion of the respondents on the basis
of perception of customers towards switching of brands. 22
4.14 Chart showing classification of the respondents based
on influence to make buy decision. 23
4.15 Chart showing classification of respondents on the basis
of awareness about brands available in the market. 24
4.16
Chart showing classification of respondents on the basis
first preference when making purchase of selected home
appliances.
25
4.17 Chart showing classification of respondents on the basis of satisfaction about overall performance of brand. 26
4.18 Chart showing classification of respondents on the basis
of brands which give more beneficial schemes to
customers.
27
4.19 Chart showing classification of the respondents on the
basis of factors which have important role in motivated
customers.
28
4.20 Table showing classification of the respondents on the
basis of mode of purchase. 29

CHAPTER 1
INTRODUCTION
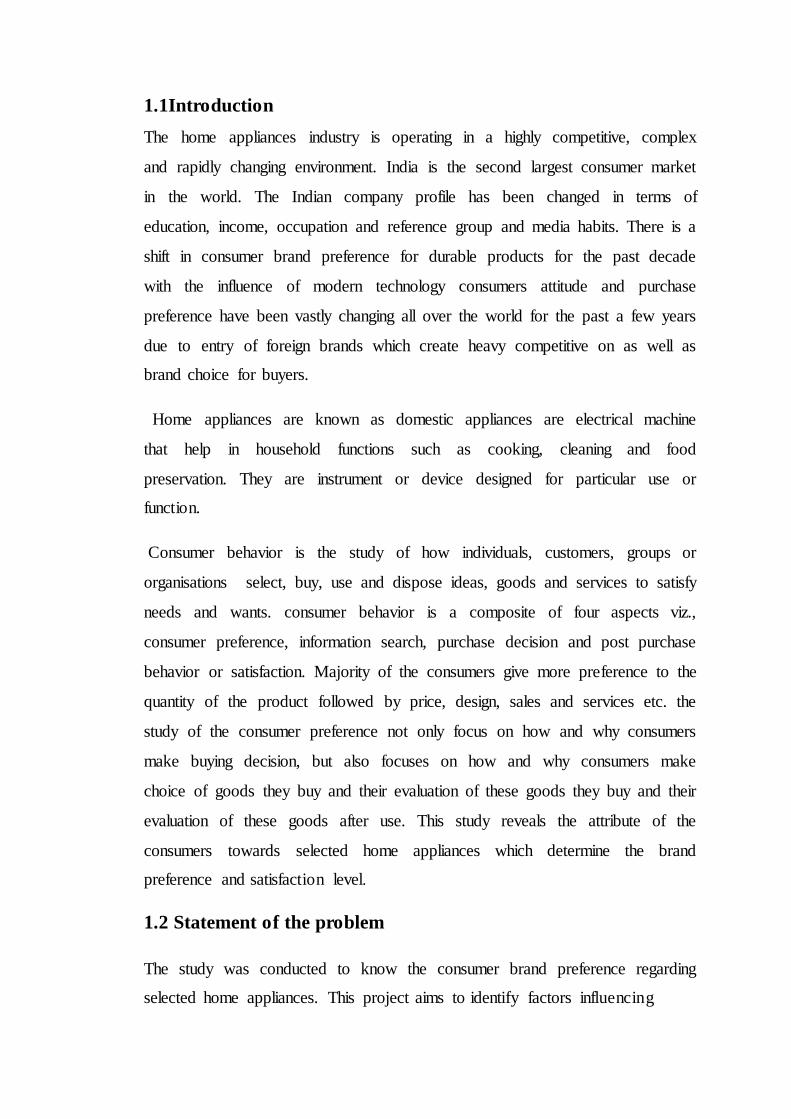
1.1Introduction
The home appliances industry is operating in a highly competitive, complex
and rapidly changing environment. India is the second largest consumer market
in the world. The Indian company profile has been changed in terms of
education, income, occupation and reference group and media habits. There is a
shift in consumer brand preference for durable products for the past decade
with the influence of modern technology consumers attitude and purchase
preference have been vastly changing all over the world for the past a few years
due to entry of foreign brands which create heavy competitive on as well as
brand choice for buyers.
Home appliances are known as domestic appliances are electrical machine
that help in household functions such as cooking, cleaning and food
preservation. They are instrument or device designed for particular use or
function.
Consumer behavior is the study of how individuals, customers, groups or
organisations select, buy, use and dispose ideas, goods and services to satisfy
needs and wants. consumer behavior is a composite of four aspects viz.,
consumer preference, information search, purchase decision and post purchase
behavior or satisfaction. Majority of the consumers give more preference to the
quantity of the product followed by price, design, sales and services etc. the
study of the consumer preference not only focus on how and why consumers
make buying decision, but also focuses on how and why consumers make
choice of goods they buy and their evaluation of these goods they buy and their
evaluation of these goods after use. This study reveals the attribute of the
consumers towards selected home appliances which determine the brand
preference and satisfaction level.
1.2 Statement of the problem
The study was conducted to know the consumer brand preference regarding
selected home appliances. This project aims to identify factors influencing
2
customers while purchasing. The consumer has certain expectation from
branded products in term of its quality, price and others. The appliances
selected for the project are refrigerator are Samsung, LG, whirlpool, Godrej,
Haier, and Videocon etc. the popular brands of washing machine are LG,
whirlpool, Godrej, Haier, Panasonic etc.
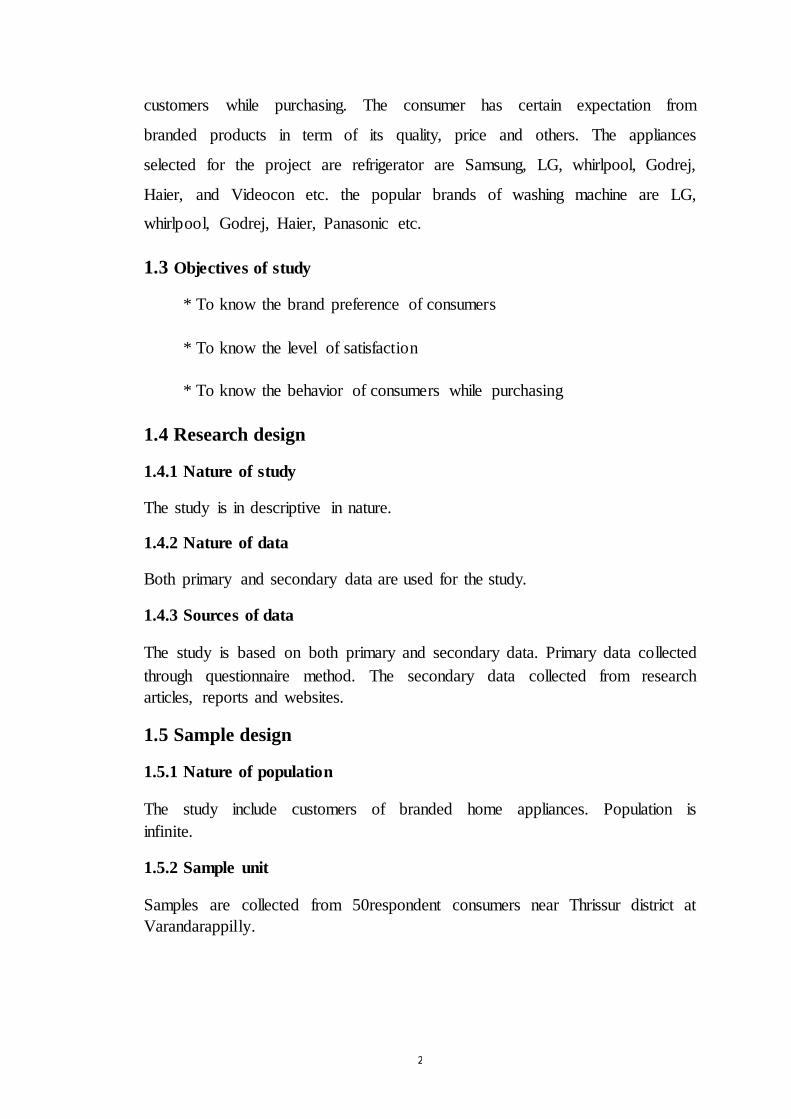
1.3 Objectives of study
* To know the brand preference of consumers
* To know the level of satisfaction
* To know the behavior of consumers while purchasing
1.4 Research design
1.4.1 Nature of study
The study is in descriptive in nature.
1.4.2 Nature of data
Both primary and secondary data are used for the study.
1.4.3 Sources of data
The study is based on both primary and secondary data. Primary data collected
through questionnaire method. The secondary data collected from research
articles, reports and websites.
1.5 Sample design
1.5.1 Nature of population
The study include customers of branded home appliances. Population is
infinite.
1.5.2 Sample unit
Samples are collected from 50respondent consumers near Thrissur district at
Varandarappilly.
3
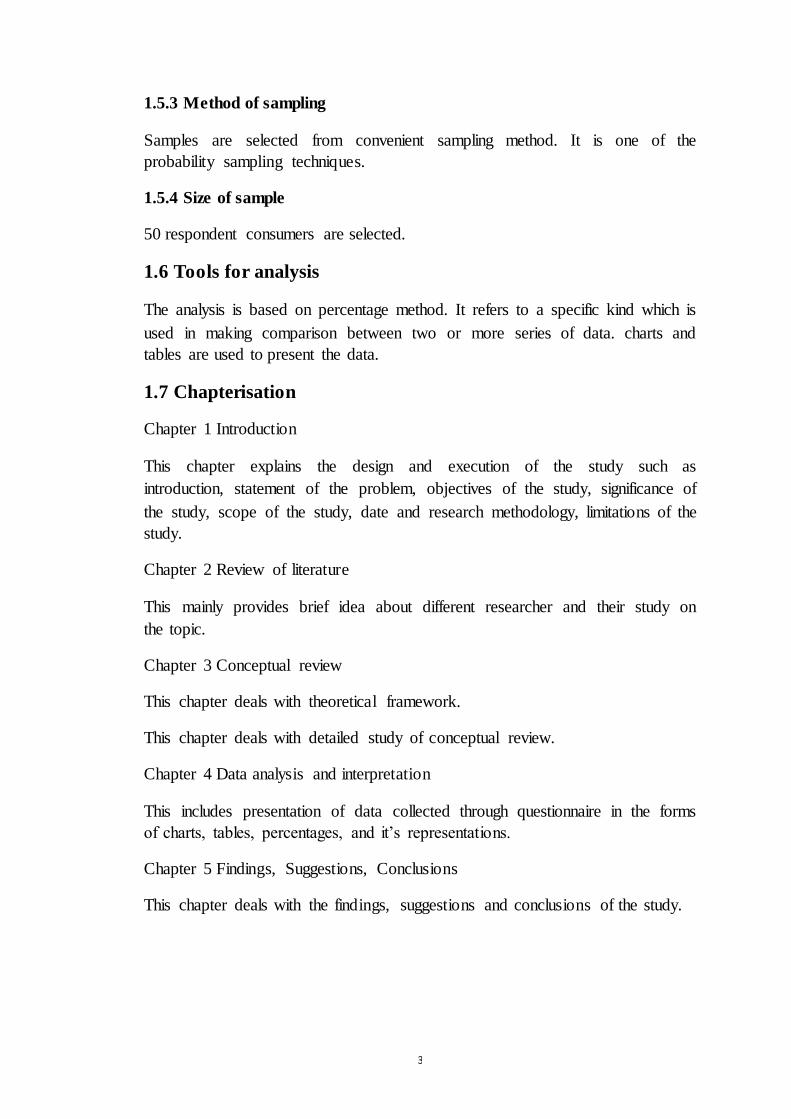
1.5.3 Method of sampling
Samples are selected from convenient sampling method. It is one of the
probability sampling techniques.
1.5.4 Size of sample
50 respondent consumers are selected.
1.6 Tools for analysis
The analysis is based on percentage method. It refers to a specific kind which is
used in making comparison between two or more series of data. charts and
tables are used to present the data.
1.7 Chapterisation
Chapter 1 Introduction
This chapter explains the design and execution of the study such as
introduction, statement of the problem, objectives of the study, significance of
the study, scope of the study, date and research methodology, limitations of the
study.
Chapter 2 Review of literature
This mainly provides brief idea about different researcher and their study on
the topic.
Chapter 3 Conceptual review
This chapter deals with theoretical framework.
This chapter deals with detailed study of conceptual review.
Chapter 4 Data analysis and interpretation
This includes presentation of data collected through questionnaire in the forms
of charts, tables, percentages, and it’s representations.
Chapter 5 Findings, Suggestions, Conclusions
This chapter deals with the findings, suggestions and conclusions of the study.

4
CHAPTER 2
REVIEW OF LITERATURE
4
2.1 Literature Review
Anil Kumar and Jelsey Joseph(2012) analysed the consumer behaviour of
urban and rural working women consumers towards durables and optioned that
the urban and rural markets significantly different from each other in
considering general and product specific factors while making their purchase
decision for durables
Mumtaz Ali, Jing Fengie and Naveed Akthar Qureshi(2010) provided a
detailed view of consumers way of thinking and investigated the degree of
association of six country of origin age, culture and advertising on buying
behaviour of goods and services
Minakshi Thamman and Priya Ahuja(2010) analysed the consumer behaviour
of television, refrigerator and food processor with reference to income level,
buying motives different in various income categories
Anand Thakur and Hundai(2008) suggested that both rural and urban
consumers different in their perception about washing machine compared to
rural and preferred to put them in necessity category
Kavaldeep Dixit(2008) says that consumer durables industry in india is at a
take off stage. It has emerged as one of the most dynamics and fast moving
sectors with several reputed players entering the market. That is growing day to
day.
Madona Mohan(2007) says that man has been continuously trying to improve
the surroundings to make him more and more comfortable
Rathod M Raju(2007) found that many have refrigerator, washing machine,
microwave ovens, dish washes etc. today the consumers demand more value
for money and they are health and quality conscious. Companies today have
streamlined their business according to customers needs and preferences
5
Harish R(2007) had reviewed the studies on ‘Emerging trends in the marketing
of consumers durables in india’. He has concluded that about 60% of the
domestic demand for durables is met by local manufacturing, while the rest is
archived be buying more of imported durables in the years to come
Jayasree Krishnan(2006) reviewed the life style and its influence on brand
choice behaviour. She concluded that life style has a significant influence on
the purchase behaviour of the refrigerator users. Customers more interested in
the well known and established brands in the market
Sakthrivel Murugan(2006) concluded that in modern society, people select the
set of products , services and activities that define themselves and in turn create
a social identity that is communicated to others

CHAPTER 3
THEORETICAL FRAMEWORK
6
3.1 Introduction
This chapter deals with conceptual review and empirical literature. Conceptual
review deals with different concept used in the study. Empirical literature deals
with studies conducted by the previous authors. Empirical literature is arranged
in chronological order.
3.1.1 Meaning of consumer behaviour
Consumer behaviour is the study of individuals, groups or organization and all
the activities associated with purchase, use and disposal of goods and services,
how the consumer behaviour.
3.1.2 Definition of consumer behaviour
In accordance with Solomon 2006 “consumer behaviour is defined as the
process decision making and physical activity involved in acquiring disposing
goods and services to satisfy needs and wants.
3.1.3 Factors influencing consumer behaviour
There are four major factors influencing on buying behaviour of consumer
(a)Cultural factors
Consumer behaviour culture can be defined as sum total of learned belief,
values that serve to guide and direct the consumer behaviour of all member of
that society. Cultural factor is learned through the following three ways: formal
learning, informal learning, technical learning.
(b)Social factors
Consumer behaviour is also influenced by such social factors as reference
group, family and, social role and status.
7
(c)Personal factors
Buyers decision are also influenced by personnel characteristics, the buyers age
life cycle stages, occupation, economics circumstances life style and
personality and self concept.
(d)Psychological factors
Abraham Mallows need can be ranked in order of importance from the low
biological needs to higher level of psychological needs. Maslow’s hierarchy of
human needs make us understand consumer motivation. It is useful for the
marketer who can identify what generic level needs this brand is capable of
fulfilling and according position his brand up with relevant marketing input.
3.1.4 Advantages of consumer behaviour
(a) Saves from disaster
The failure rate of new product is surprisingly high not only in highly
competitive economies of USA, Europe and japan etc. but even in India for
instance, roohafza of hamdard succeeded well but when other companies tried
like Dabur to produce similar product they could not succeed. Dabur had to
sleep production of sharbat, because consumers did not like its taste. There are
many more such examples. If one tests the market before launching a new
product this type of disaster can be minimized or avoided.
(b) Segmentation of market is helped
The study of consumer behaviour suggested that everyone does not buy on
price consideration or utility consideration. Only for high income groups high
priced cloth, cars etc have been produced.in certain cases prices of such cloth is
three to eight times of normal suiting price but some section still buy it for
prestige or show
(c) Helps in product orientation
8
The study of consumer behaviour helps to find out why consumer are drifting
away from a product or why they are not liking it. for instance, some of indian
toothpaste are being produced for long like neem but it could not capture the
market. There are many other instances when a new product has been
developed or reoriented to again capture its old glorious position.
(d) Helps the consumer to study their behaviour
The consumers often are guided by their income, emotions, opinion of others
and they do not undertake study of their behaviour whether it is scientific or
not. The science, however, can help them to study cost benefit of their buying
decision. The study can reveal them whether buying an expensive item it’s
rational or not.
3.1.5 Disadvantages of consumer behaviour
The marketers study the behaviour of consumers to mold it in favour of their
product and sometimes make fancy claims and use objectionable techniques.
They also take the help to produce and market such product which have utility.
In many cases consumers are exploited by sexy or otherwise attractive
advertisements through the media.
They take full advantage of weakness of consumers to mold it in their favour
whether it is scheme of exchange, gift, lotteries or otherwise. All over the
world consumers have been exploited by sales promotion schemes and
campaigns. For instance, certain producers claim that use of their tooth paste
will guard against germs and cavity.
Producers of medicine claim cure of certain deceases. Producers of hair oils
claim that it will stop falling of hairs and or new hairs will start growing. Slim
centers claims reduce weight in magic speedy manner. Someone claims that
boldness can be cured by replanting of new hairs in short period. Someone
claims regeneration of vitality even in old person.
9
Any number of examples can be given but such claims sometimes even by big
companies are only partially true. High priced products are introduced to take
advantage of consumers weakness just by changing shapes, packing etc.
customers are attracted by gifts, lotteries, exchange scheme etc.
In such cases often claims are exaggerated and benefits in the form of sales
promotion scheme is only to seller and not to buyer. The government in most
of the countries has found though consumer is the he is exploited. Hence most
of the countries have framed and enacted many acts and regulations to
safeguard the interest of consumers.
CHAPTER 4
DATA ANALYSIS & INTERPRETATION
10
4.1 Introduction
Data analysis and interpretation is the process of assigning meaning to the
collected information and determining the conclusions, significance and
implication of the findings.
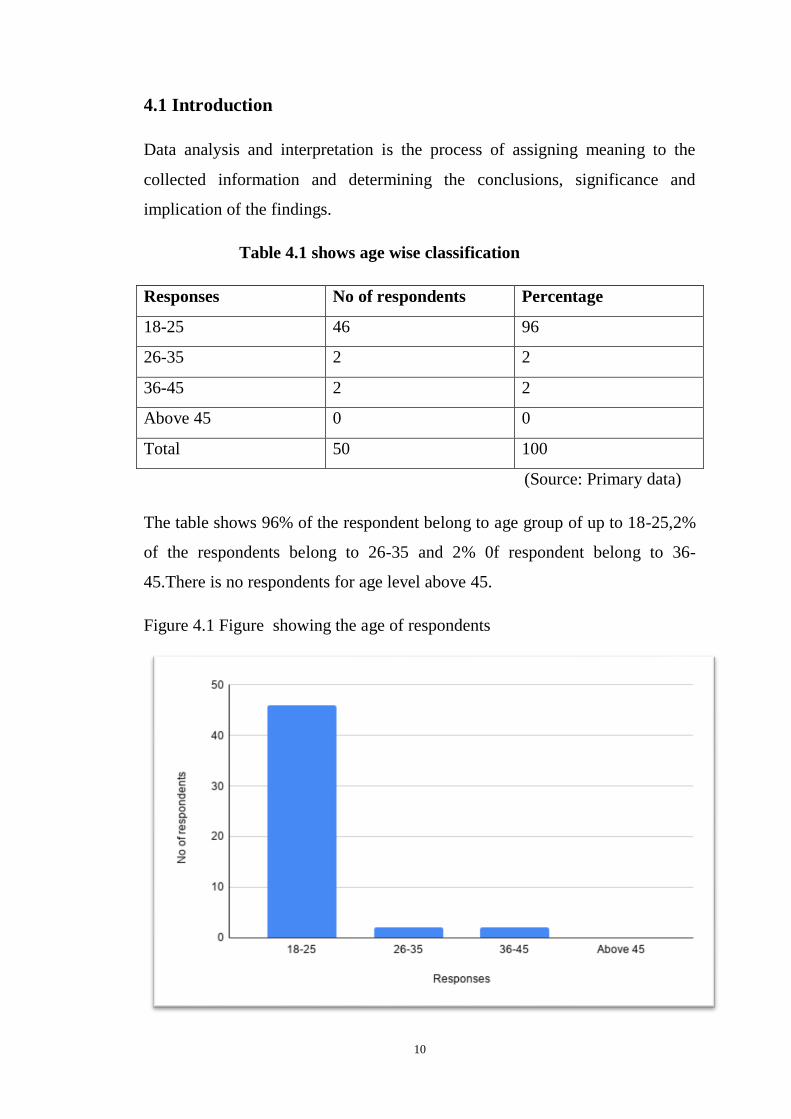
Table 4.1 shows age wise classification
Responses No of respondents Percentage
18-25 46 96
26-35 2 2
36-45 2 2
Above 45 0 0
Total 50 100
(Source: Primary data)
The table shows 96% of the respondent belong to age group of up to 18-25,2%
of the respondents belong to 26-35 and 2% 0f respondent belong to 36-
45.There is no respondents for age level above 45.
Figure 4.1 Figure showing the age of respondents
11
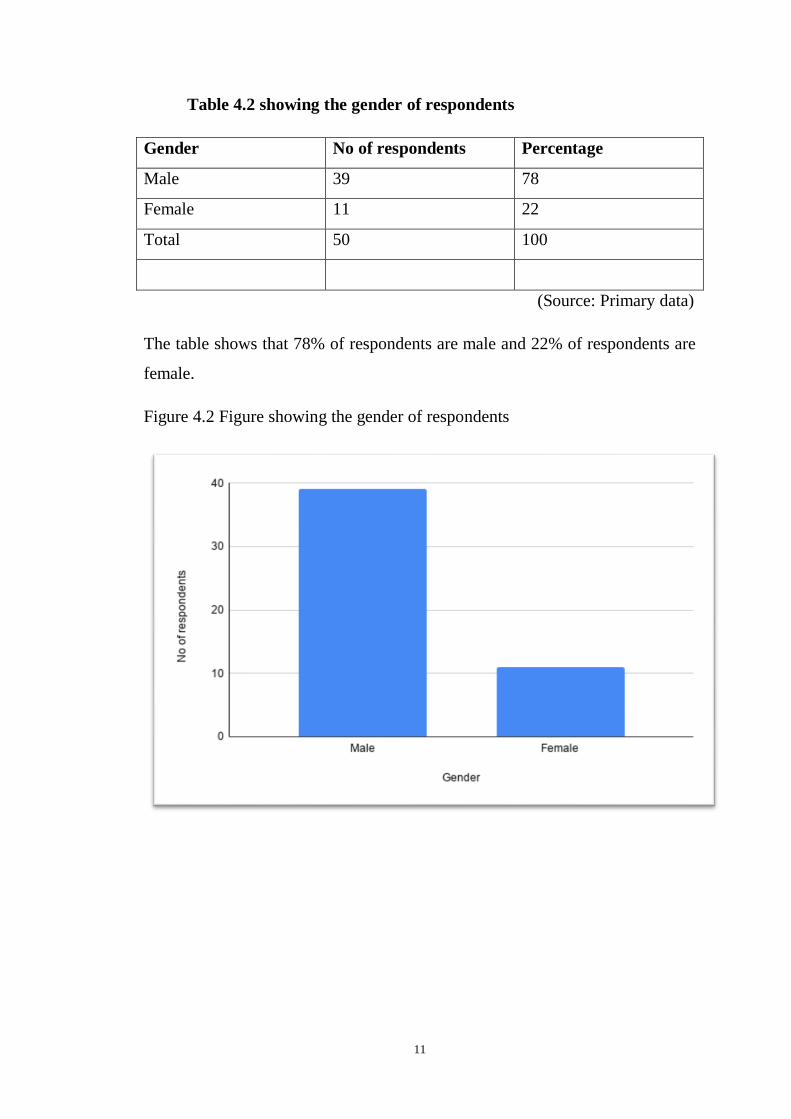
Table 4.2 showing the gender of respondents
Gender No of respondents Percentage
Male 39 78
Female 11 22
Total 50 100
(Source: Primary data)
The table shows that 78% of respondents are male and 22% of respondents are
female.
Figure 4.2 Figure showing the gender of respondents
12
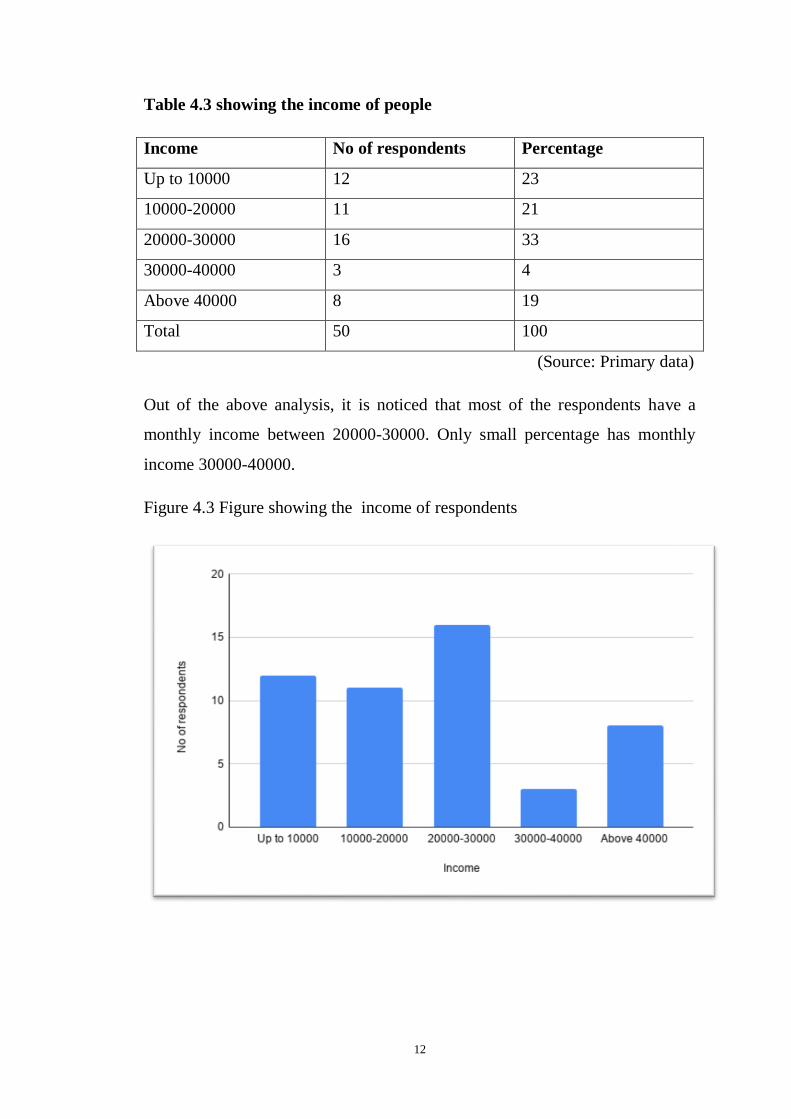
Table 4.3 showing the income of people
Income No of respondents Percentage
Up to 10000 12 23
10000-20000 11 21
20000-30000 16 33
30000-40000 3 4
Above 40000 8 19
Total 50 100
(Source: Primary data)
Out of the above analysis, it is noticed that most of the respondents have a
monthly income between 20000-30000. Only small percentage has monthly
income 30000-40000.
Figure 4.3 Figure showing the income of respondents
13
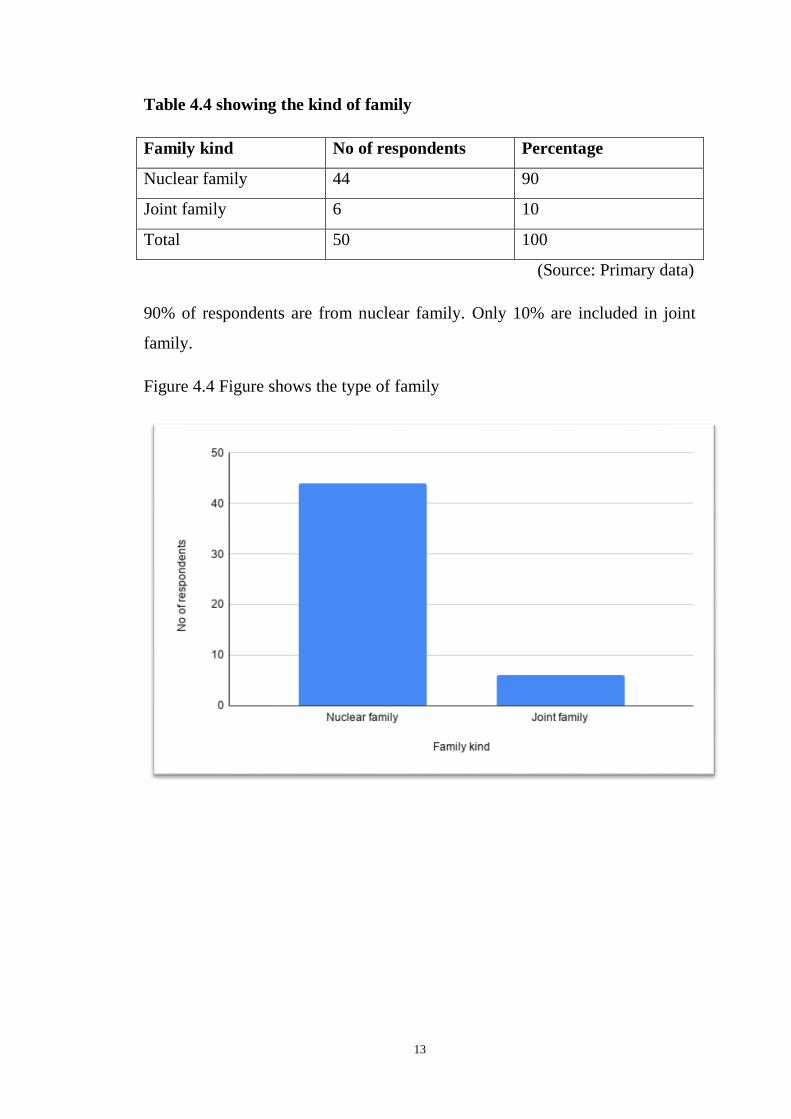
Table 4.4 showing the kind of family
Family kind No of respondents Percentage
Nuclear family 44 90
Joint family 6 10
Total 50 100
(Source: Primary data)
90% of respondents are from nuclear family. Only 10% are included in joint
family.
Figure 4.4 Figure shows the type of family
14
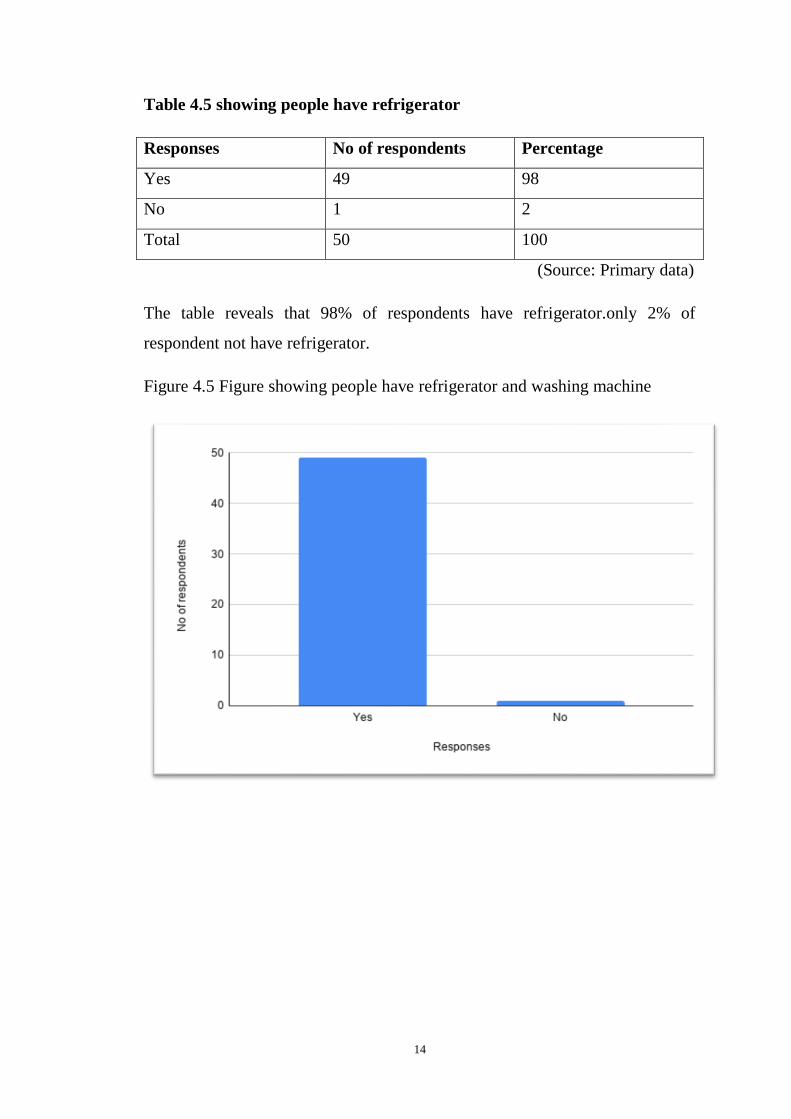
Table 4.5 showing people have refrigerator
Responses No of respondents Percentage
Yes 49 98
No 1 2
Total 50 100
(Source: Primary data)
The table reveals that 98% of respondents have refrigerator.only 2% of
respondent not have refrigerator.
Figure 4.5 Figure showing people have refrigerator and washing machine
15
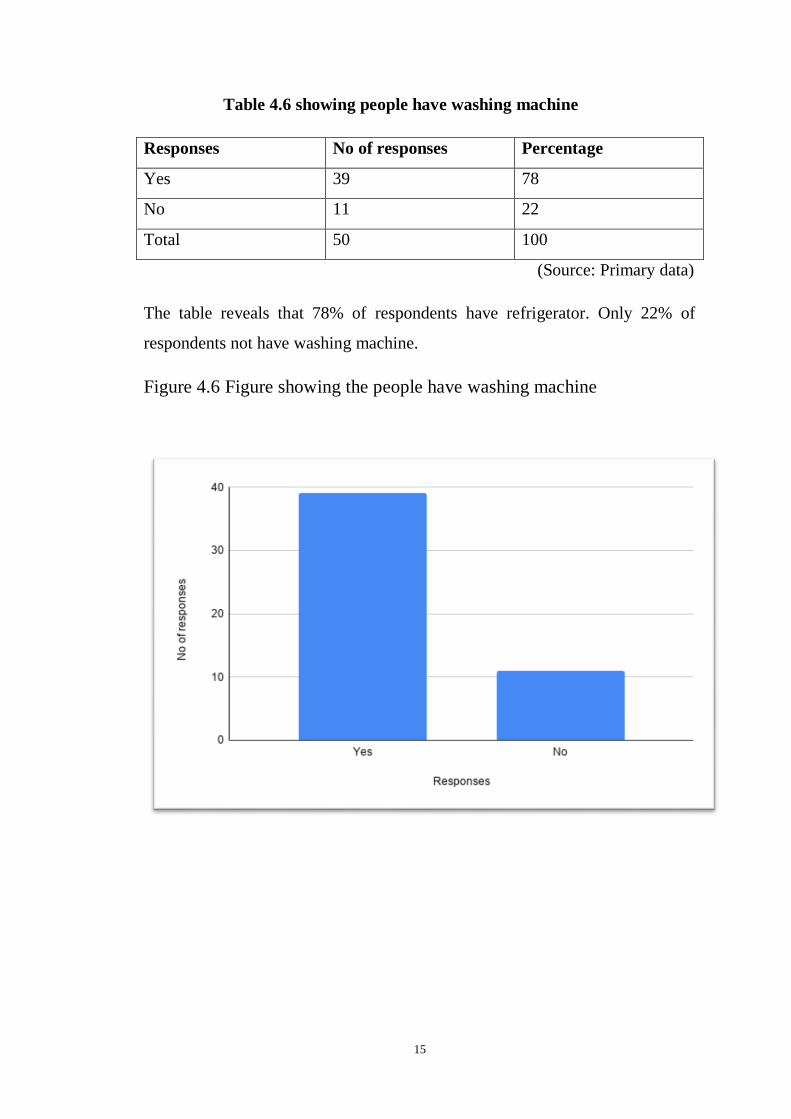
Table 4.6 showing people have washing machine
Responses No of responses Percentage
Yes 39 78
No 11 22
Total 50 100
(Source: Primary data)
The table reveals that 78% of respondents have refrigerator. Only 22% of
respondents not have washing machine.
Figure 4.6 Figure showing the people have washing machine
16
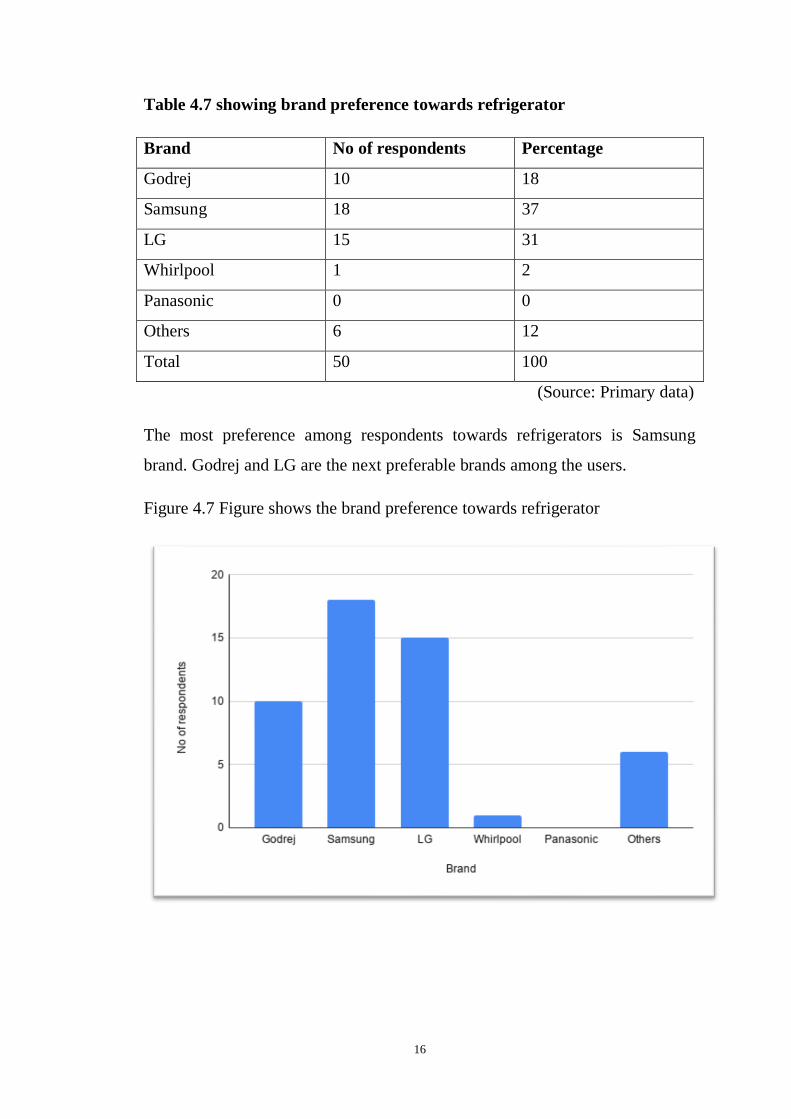
Table 4.7 showing brand preference towards refrigerator
Brand No of respondents Percentage
Godrej 10 18
Samsung 18 37
LG 15 31
Whirlpool 1 2
Panasonic 0 0
Others 6 12
Total 50 100
(Source: Primary data)
The most preference among respondents towards refrigerators is Samsung
brand. Godrej and LG are the next preferable brands among the users.
Figure 4.7 Figure shows the brand preference towards refrigerator
17
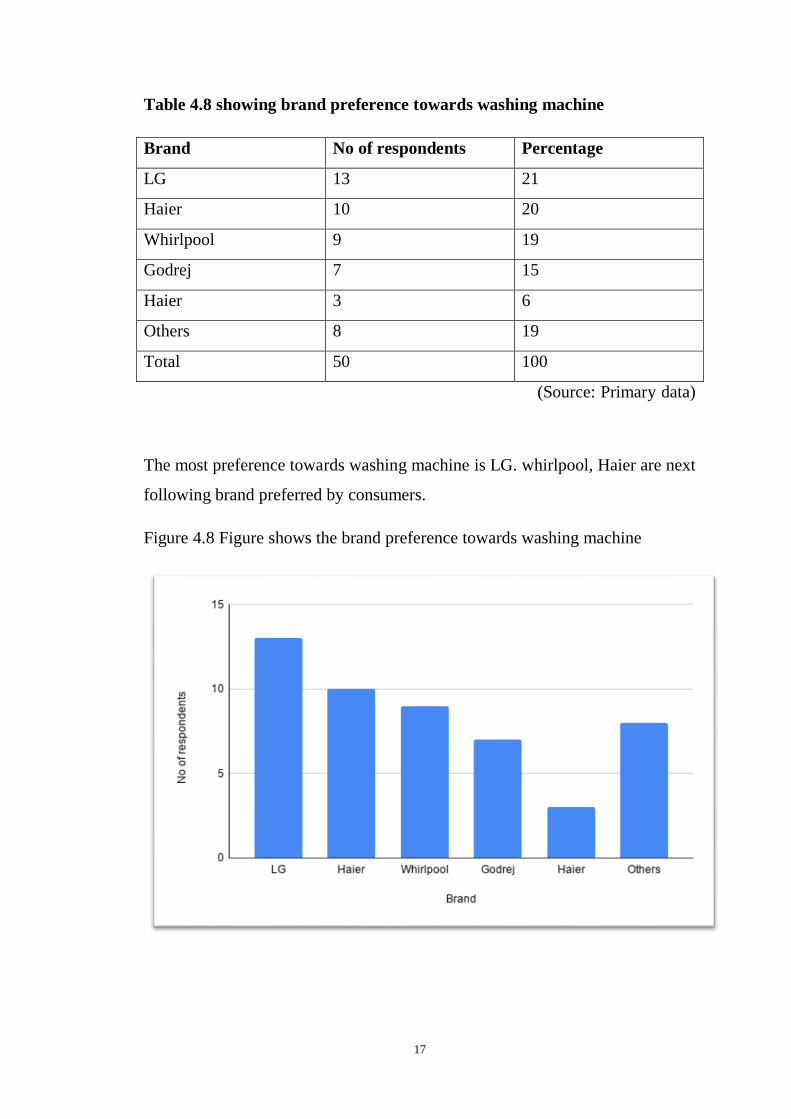
Table 4.8 showing brand preference towards washing machine
Brand No of respondents Percentage
LG 13 21
Haier 10 20
Whirlpool 9 19
Godrej 7 15
Haier 3 6
Others 8 19
Total 50 100
(Source: Primary data)
The most preference towards washing machine is LG. whirlpool, Haier are next
following brand preferred by consumers.
Figure 4.8 Figure shows the brand preference towards washing machine
18
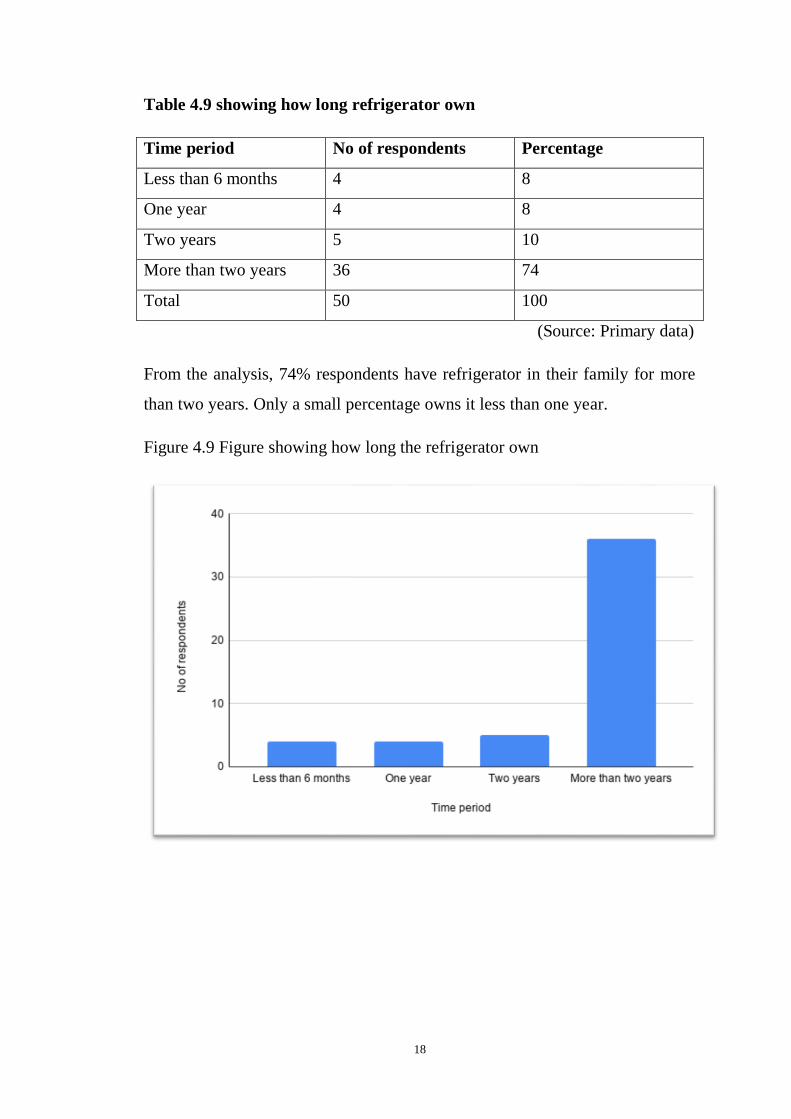
Table 4.9 showing how long refrigerator own
Time period No of respondents Percentage
Less than 6 months 4 8
One year 4 8
Two years 5 10
More than two years 36 74
Total 50 100
(Source: Primary data)
From the analysis, 74% respondents have refrigerator in their family for more
than two years. Only a small percentage owns it less than one year.
Figure 4.9 Figure showing how long the refrigerator own
19
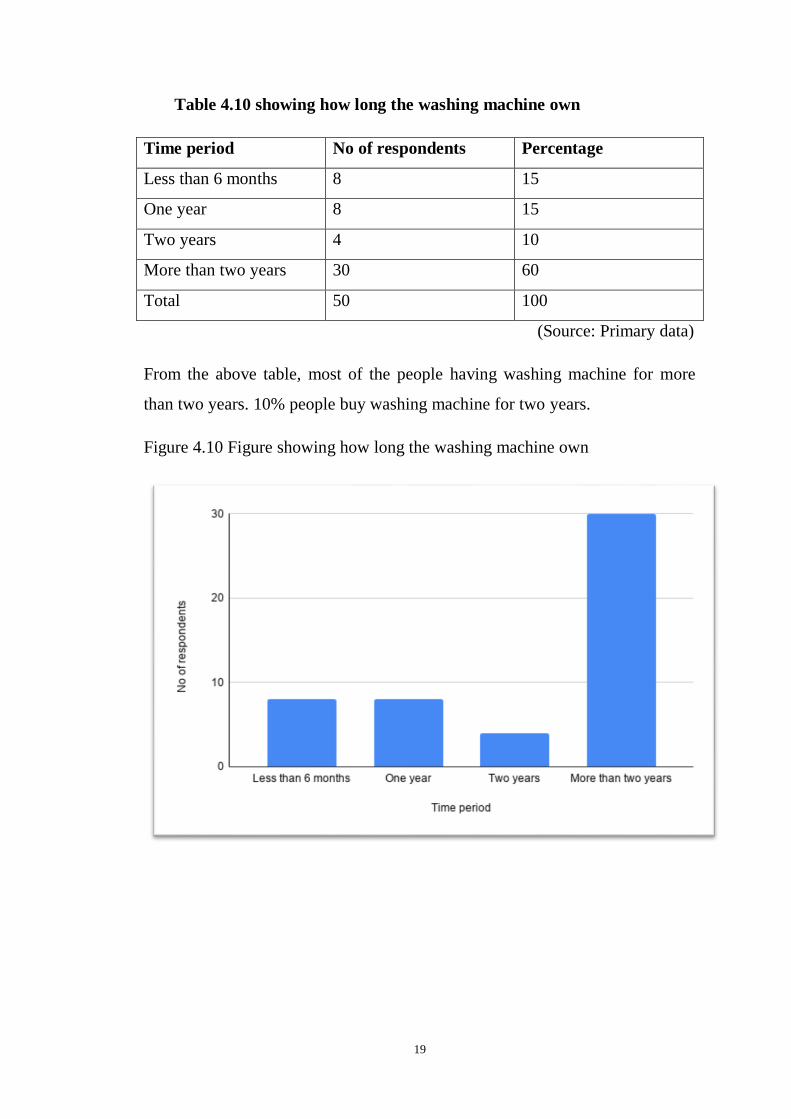
Table 4.10 showing how long the washing machine own
Time period No of respondents Percentage
Less than 6 months 8 15
One year 8 15
Two years 4 10
More than two years 30 60
Total 50 100
(Source: Primary data)
From the above table, most of the people having washing machine for more
than two years. 10% people buy washing machine for two years.
Figure 4.10 Figure showing how long the washing machine own
20
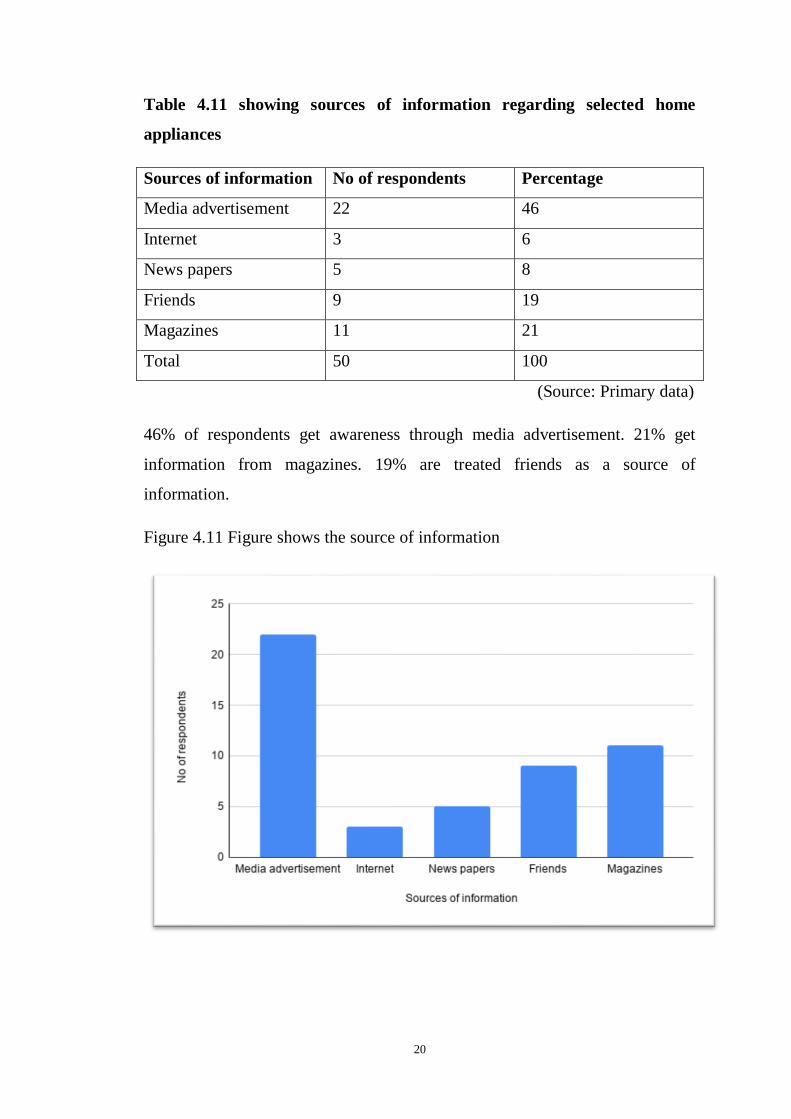
Table 4.11 showing sources of information regarding selected home
appliances
Sources of information No of respondents Percentage
Media advertisement 22 46
Internet 3 6
News papers 5 8
Friends 9 19
Magazines 11 21
Total 50 100
(Source: Primary data)
46% of respondents get awareness through media advertisement. 21% get
information from magazines. 19% are treated friends as a source of
information.
Figure 4.11 Figure shows the source of information
21
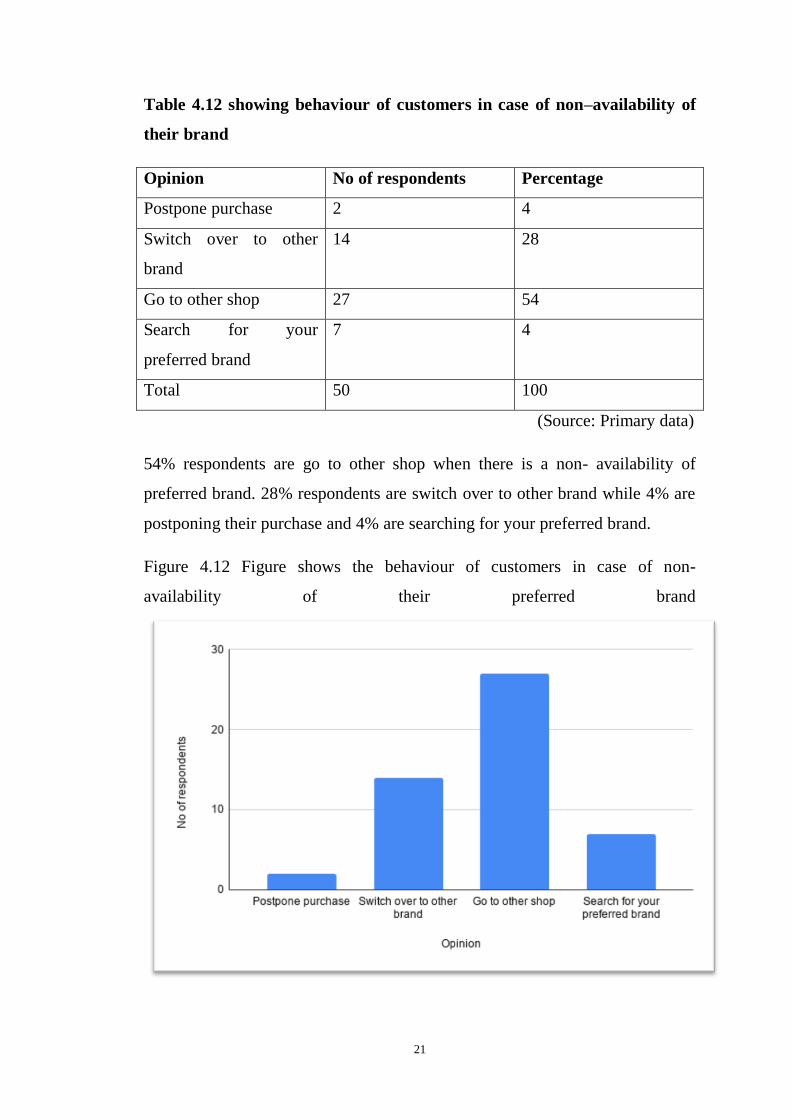
Table 4.12 showing behaviour of customers in case of non–availability of
their brand
Opinion No of respondents Percentage
Postpone purchase 2 4
Switch over to other
brand
14 28
Go to other shop 27 54
Search for your
preferred brand
7 4
Total 50 100
(Source: Primary data)
54% respondents are go to other shop when there is a non- availability of
preferred brand. 28% respondents are switch over to other brand while 4% are
postponing their purchase and 4% are searching for your preferred brand.
Figure 4.12 Figure shows the behaviour of customers in case of non-
availability of their preferred brand
22
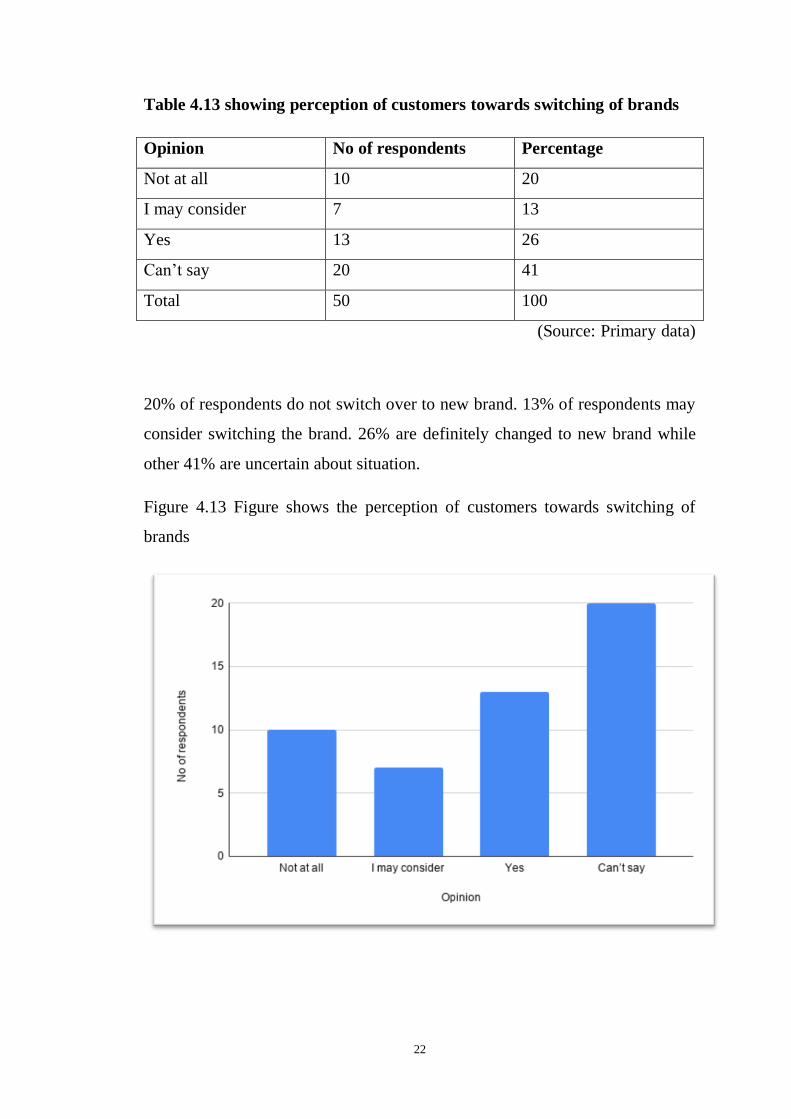
Table 4.13 showing perception of customers towards switching of brands
Opinion No of respondents Percentage
Not at all 10 20
I may consider 7 13
Yes 13 26
Can’t say 20 41
Total 50 100
(Source: Primary data)
20% of respondents do not switch over to new brand. 13% of respondents may
consider switching the brand. 26% are definitely changed to new brand while
other 41% are uncertain about situation.
Figure 4.13 Figure shows the perception of customers towards switching of
brands
23
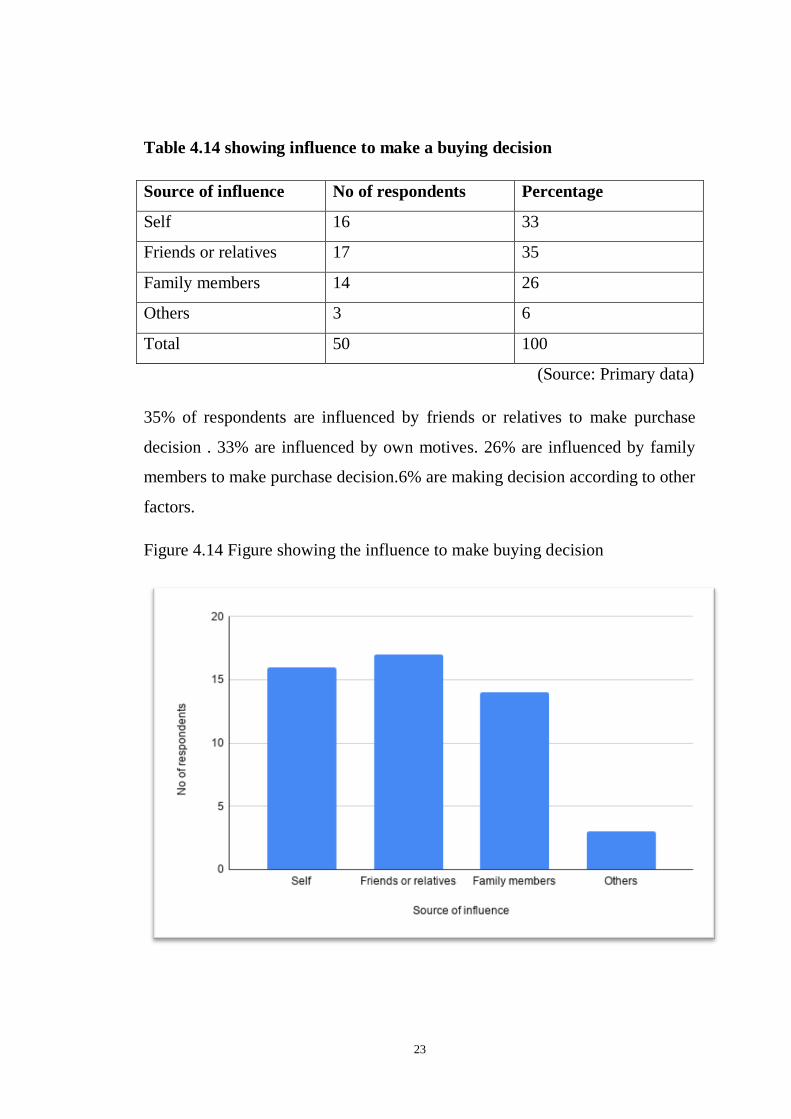
Table 4.14 showing influence to make a buying decision
Source of influence No of respondents Percentage
Self 16 33
Friends or relatives 17 35
Family members 14 26
Others 3 6
Total 50 100
(Source: Primary data)
35% of respondents are influenced by friends or relatives to make purchase
decision . 33% are influenced by own motives. 26% are influenced by family
members to make purchase decision.6% are making decision according to other
factors.
Figure 4.14 Figure showing the influence to make buying decision
24
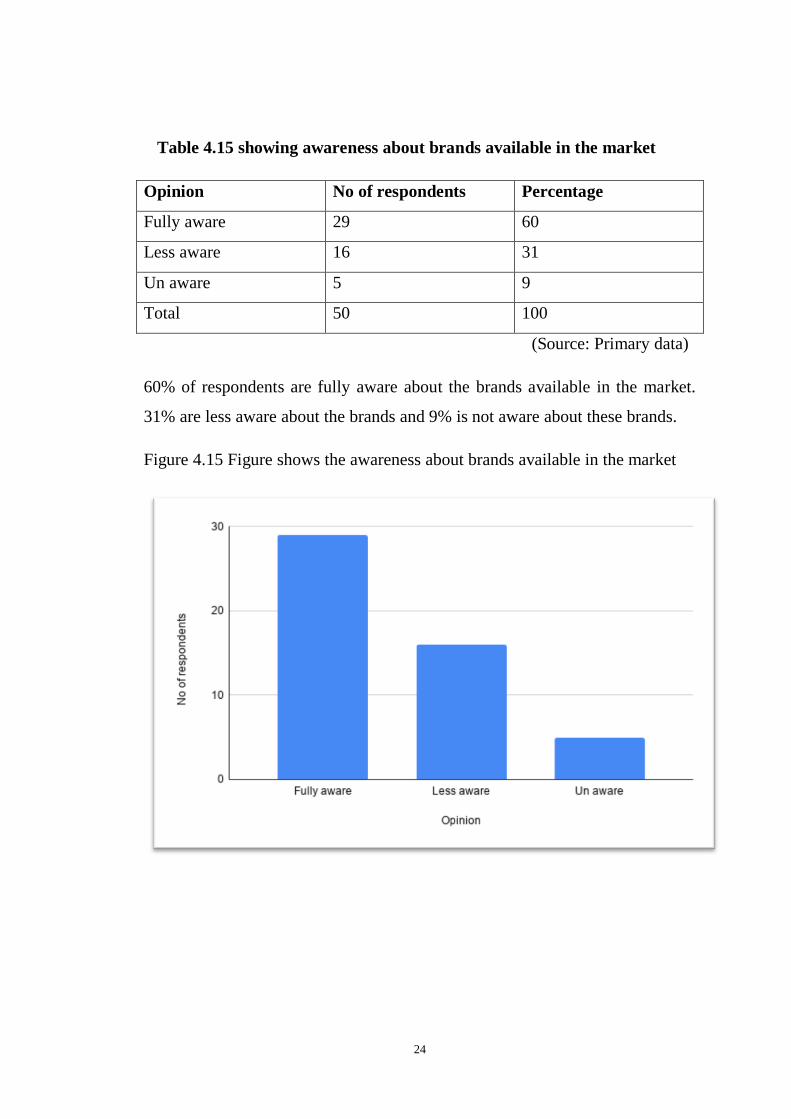
Table 4.15 showing awareness about brands available in the market
Opinion No of respondents Percentage
Fully aware 29 60
Less aware 16 31
Un aware 5 9
Total 50 100
(Source: Primary data)
60% of respondents are fully aware about the brands available in the market.
31% are less aware about the brands and 9% is not aware about these brands.
Figure 4.15 Figure shows the awareness about brands available in the market
25
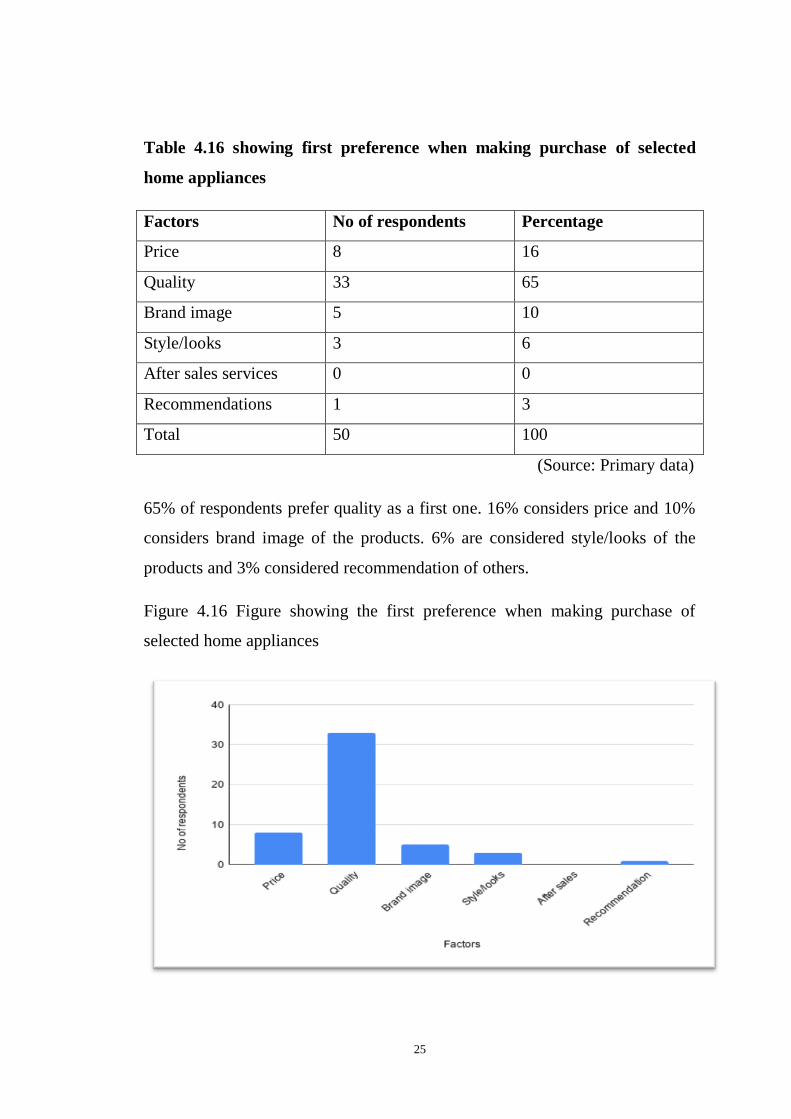
Table 4.16 showing first preference when making purchase of selected
home appliances
Factors No of respondents Percentage
Price 8 16
Quality 33 65
Brand image 5 10
Style/looks 3 6
After sales services 0 0
Recommendations 1 3
Total 50 100
(Source: Primary data)
65% of respondents prefer quality as a first one. 16% considers price and 10%
considers brand image of the products. 6% are considered style/looks of the
products and 3% considered recommendation of others.
Figure 4.16 Figure showing the first preference when making purchase of
selected home appliances
26
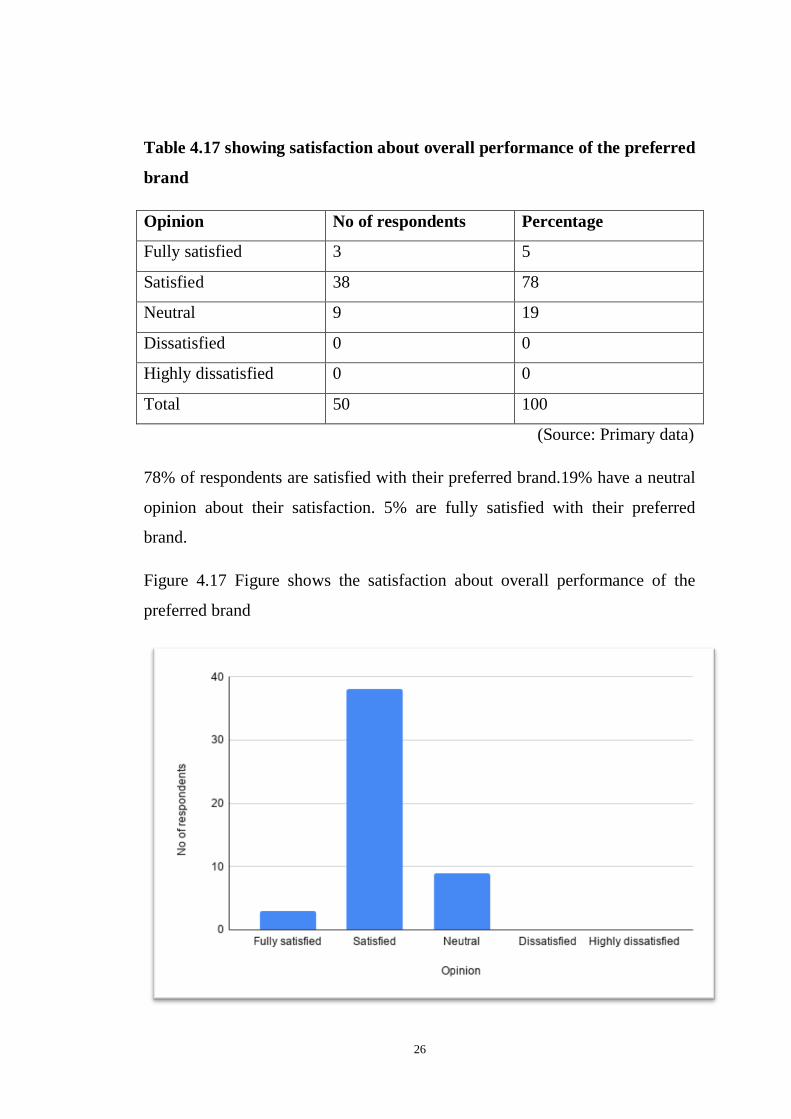
Table 4.17 showing satisfaction about overall performance of the preferred
brand
Opinion No of respondents Percentage
Fully satisfied 3 5
Satisfied 38 78
Neutral 9 19
Dissatisfied 0 0
Highly dissatisfied 0 0
Total 50 100
(Source: Primary data)
78% of respondents are satisfied with their preferred brand.19% have a neutral
opinion about their satisfaction. 5% are fully satisfied with their preferred
brand.
Figure 4.17 Figure shows the satisfaction about overall performance of the
preferred brand
27
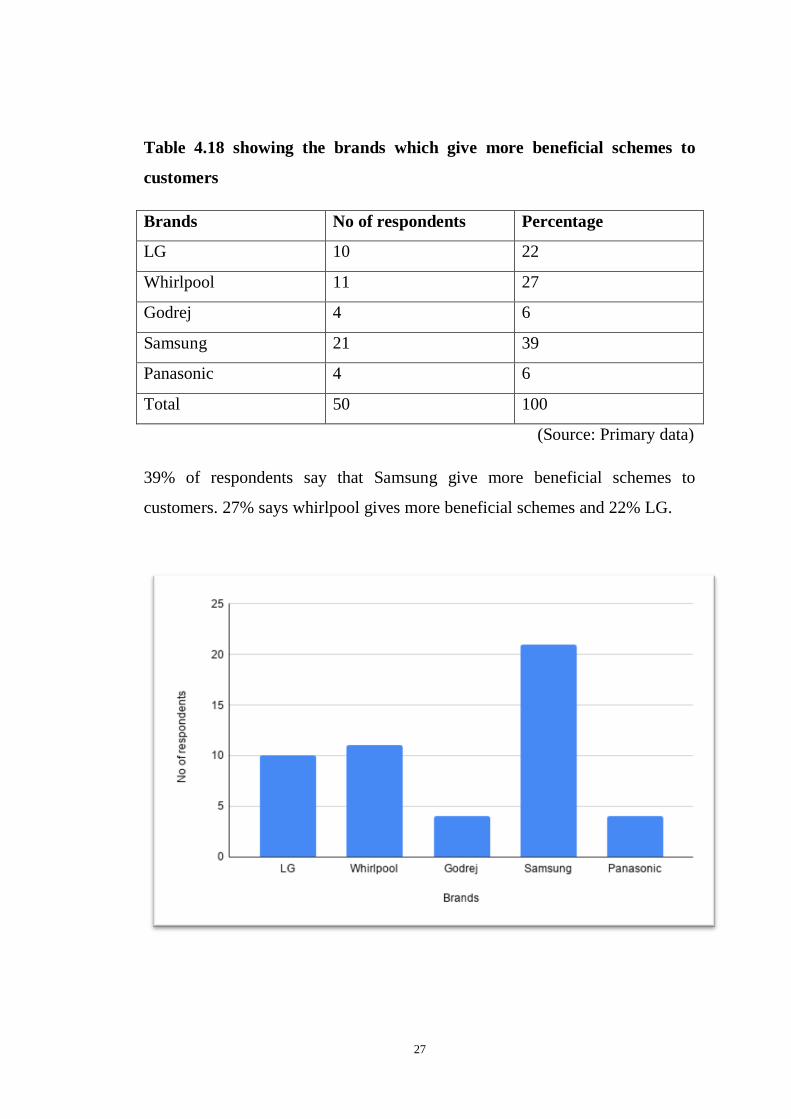
Table 4.18 showing the brands which give more beneficial schemes to
customers
Brands No of respondents Percentage
LG 10 22
Whirlpool 11 27
Godrej 4 6
Samsung 21 39
Panasonic 4 6
Total 50 100
(Source: Primary data)
39% of respondents say that Samsung give more beneficial schemes to
customers. 27% says whirlpool gives more beneficial schemes and 22% LG.
28
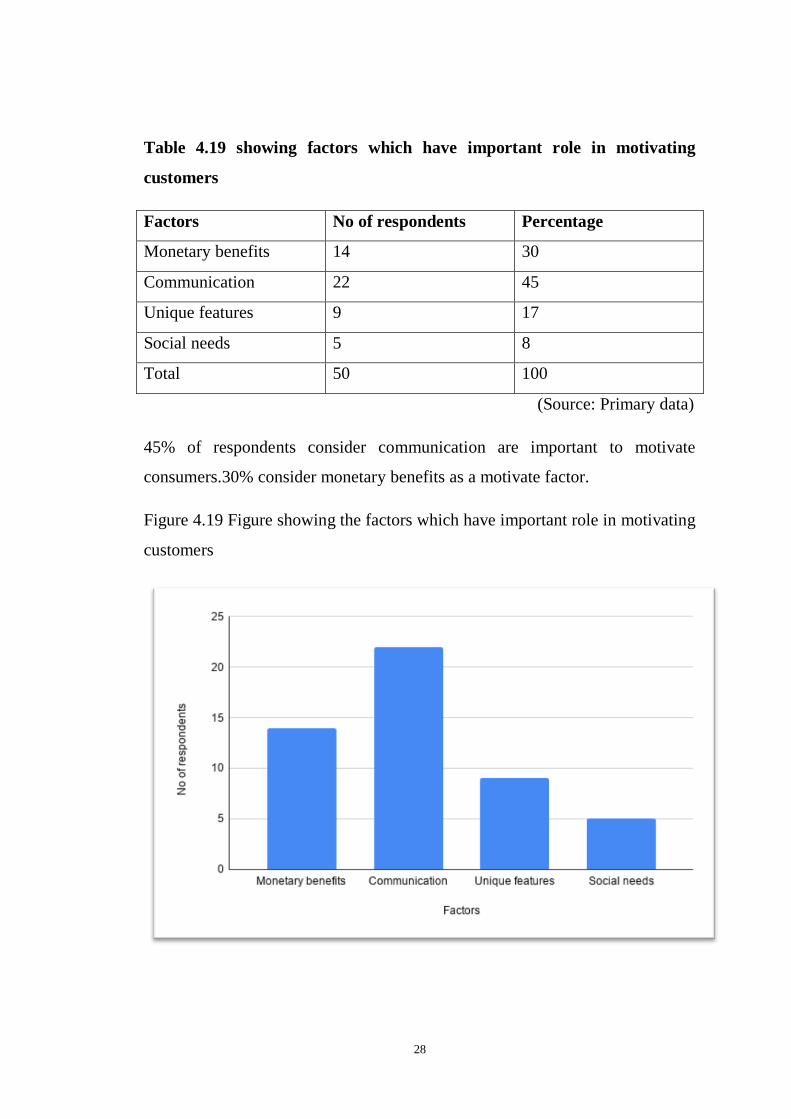
Table 4.19 showing factors which have important role in motivating
customers
Factors No of respondents Percentage
Monetary benefits 14 30
Communication 22 45
Unique features 9 17
Social needs 5 8
Total 50 100
(Source: Primary data)
45% of respondents consider communication are important to motivate
consumers.30% consider monetary benefits as a motivate factor.
Figure 4.19 Figure showing the factors which have important role in motivating
customers
29
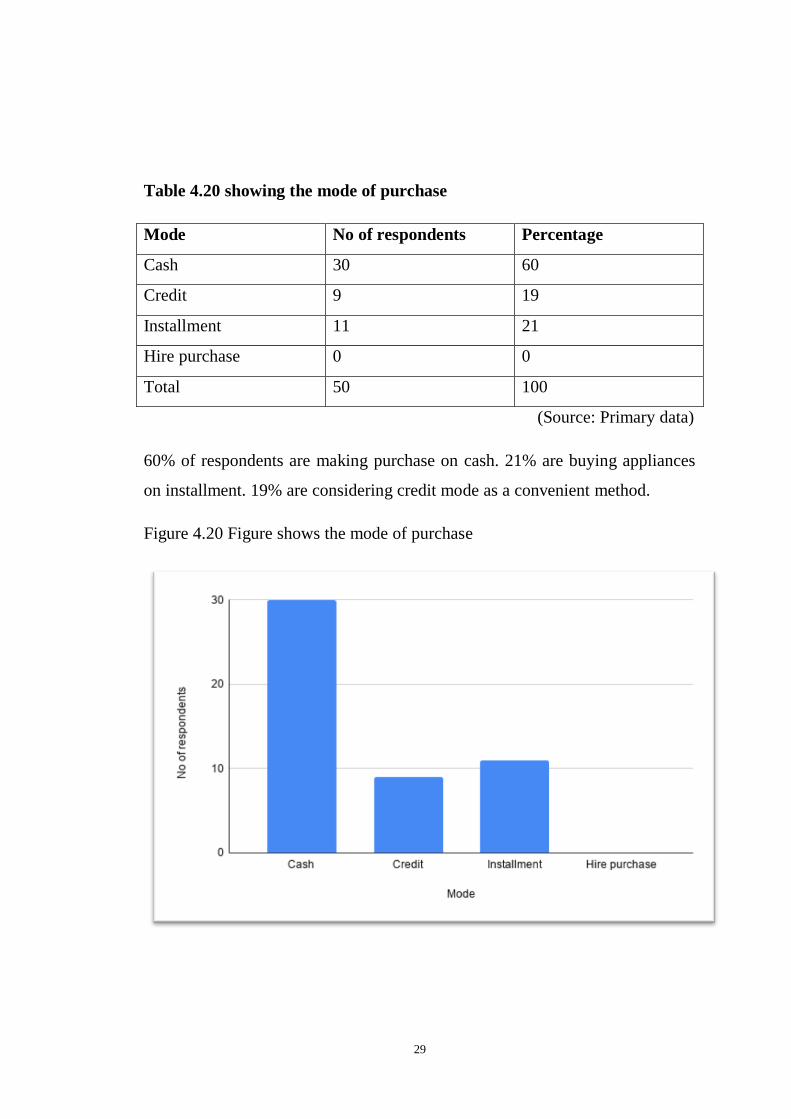
Table 4.20 showing the mode of purchase
Mode No of respondents Percentage
Cash 30 60
Credit 9 19
Installment 11 21
Hire purchase 0 0
Total 50 100
(Source: Primary data)
60% of respondents are making purchase on cash. 21% are buying appliances
on installment. 19% are considering credit mode as a convenient method.
Figure 4.20 Figure shows the mode of purchase

CHAPTER 5
FINDINGS, SUGGESTIONS &
CONCLUSION
30
5.1 Findings
The project titled ‘consumer brand preference towards selected home
appliances with special reference to Varandarapilly area in Thrissur district’
has been arrived following findings.
The study has shown that majority of the respondents are males.
96% of the respondents are between 18-25 year age group.
Most of the respondents have monthly income between 30000-40000.
90% are from nuclear family
Majority of the respondents have both washing machine and
refrigerator.
74% respondents have refrigerator for more than two years.
Most of the respondents have washing machine for more than two years.
46% of the respondents get information from media advertisement
related to selected home appliances.
54% are going to other shop when in case of non-available of preferred
brand.
35% are influenced by friends/relatives in making in making buying
decision.
60% are fully aware about the brands available in the markets.
65% are given first preference to quality while making purchase.
78% are satisfied with preferred brand.
39% of respondent says Samsung give more beneficial schemes to
customer.
45% say communication facility have an important role in motivate
customers.
60% prefer cash purchase of products.
31
5.2 Suggestions
Consumers prefer high valued consumer goods of well established
brands. So the manufacturers must follow brand loyalty in their
products.
Some of the respondent suggests improvement in the quality of
products.
Company should offer attractive price discounts during festival seasons
and off seasons to attract consumers in order to increase sales
Company should make sure that there products are available with almost
all the dealers so that customer will not face any difficulty in finding
them.
5.3 Conclusion
The market for consumer goods is becoming more competitive now days. From
the study, majority of the respondents are satisfied with their preferred brand.
According to their priority, major factors leads to purchase are quality, price,
brand image, advertising and recommendations. The findings help to identify
the strong and weak points of various brands and suggestion have been framed
with a view to higher degree of brand awareness, satisfaction towards selected
home appliances.
To survive in the competitive market, the producer of the goods should
understand the consumer interest. Marketers communicate with consumers and
try to convince through every possible media. Consumer is the king of the
market, so the marketer should understand the behaviour of consumers and
plan his strategies to suit the needs and aspirations of the target market will
definitely have an advantage over his competitors. Thus the manufacture
through suitable advertising and promotional strategies create awareness , make
customer to feel that his product is essential to him, influence him to buy and

32
experience the product in wholesome and create repetitive need for the same,
upgrade the product simultaneously and try to retain the customer forever.

BIBLIOGRAPHY
JOURNALS
• Jayasree Krishnan, life style and it’s influence on brand choice
behaviour. The lefian journal of management research 2006-5(7): 30-32.
• Sakthrivel Murugan, influence of bramd choice behaviour. The lefian
journal of management research 2007-5(8): 20-25.
• Madana Mohan- customer’s perception on consumer durables with
special reference to shop keepers M-infinity. Journal of management
2007; 2(1) 66-68.
• Rathod M Raju- Nitty Grittty multi-brand versus exclusive retailing,
marketing mastermind, 2007-09.
• Harish R- emerging trends in marketing of consumers durables in india-
the lefian journal of management 2007(6); 46-55.
• Kavaldeep Dixit- retail marketing in india, markrting mastermind, 2008,
8-2.
• Anil kumar and jelsey joseph:Family purchase decision making and the
process of adjustment,JMR, Journal of Marketing Research (pre-1986);
May 2012; 12, 000002; ABI/INFORM Global pg. 189.
• Minakshi Thammana and Priya Ahuja: A model of male consumer
behaviour inbuying skin care products in Thailand, 29(1):39-52.
• Mumtaz Ali, Jing Fengie : Teenagers involvement in family decision
making, Journal of Consumer Marketing,24(3):160–170.
• Anand Takur and Hundai:Purchase decision making and the increasing
significance of family types, Journal of Consumer Marketing,25(1):45-
56.
WEBSITES
• http://ebuyguru.com
• http://indiahousing.com

• http://financial express.com

APPENDIX
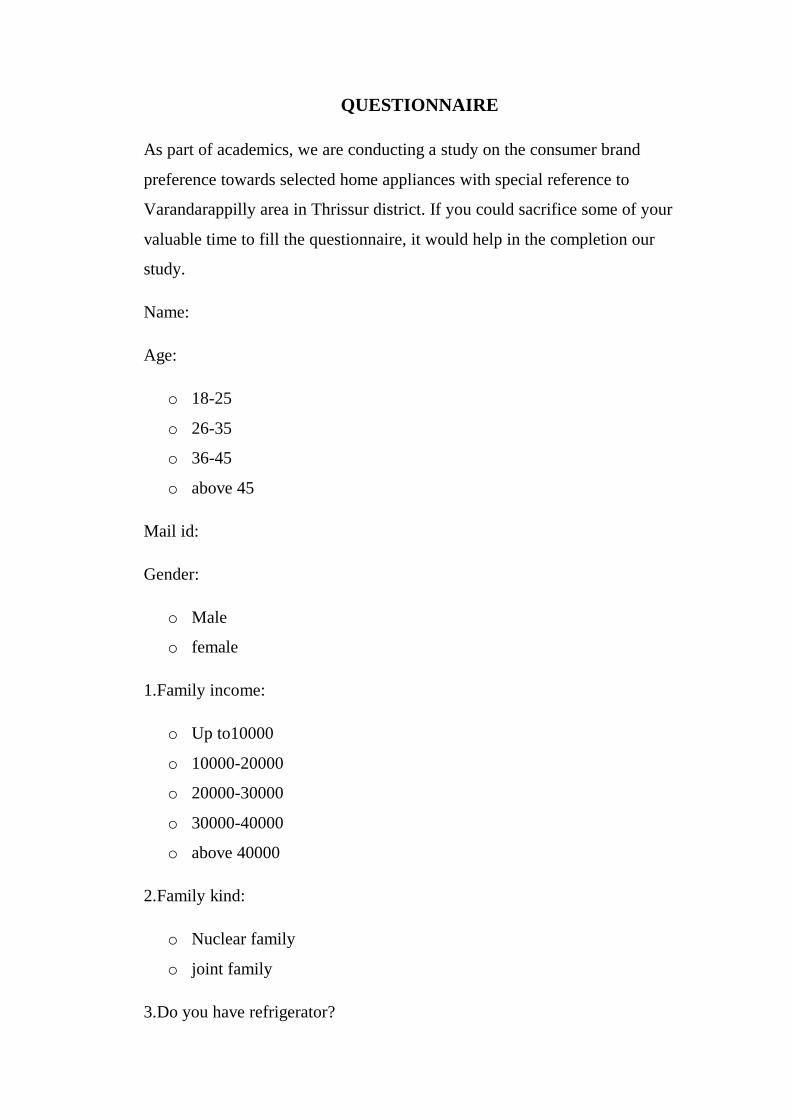
QUESTIONNAIRE
As part of academics, we are conducting a study on the consumer brand
preference towards selected home appliances with special reference to
Varandarappilly area in Thrissur district. If you could sacrifice some of your
valuable time to fill the questionnaire, it would help in the completion our
study.
Name:
Age:
o 18-25
o 26-35
o 36-45
o above 45
Mail id:
Gender:
o Male
o female
1.Family income:
o Up to10000
o 10000-20000
o 20000-30000
o 30000-40000
o above 40000
2.Family kind:
o Nuclear family
o joint family
3.Do you have refrigerator?
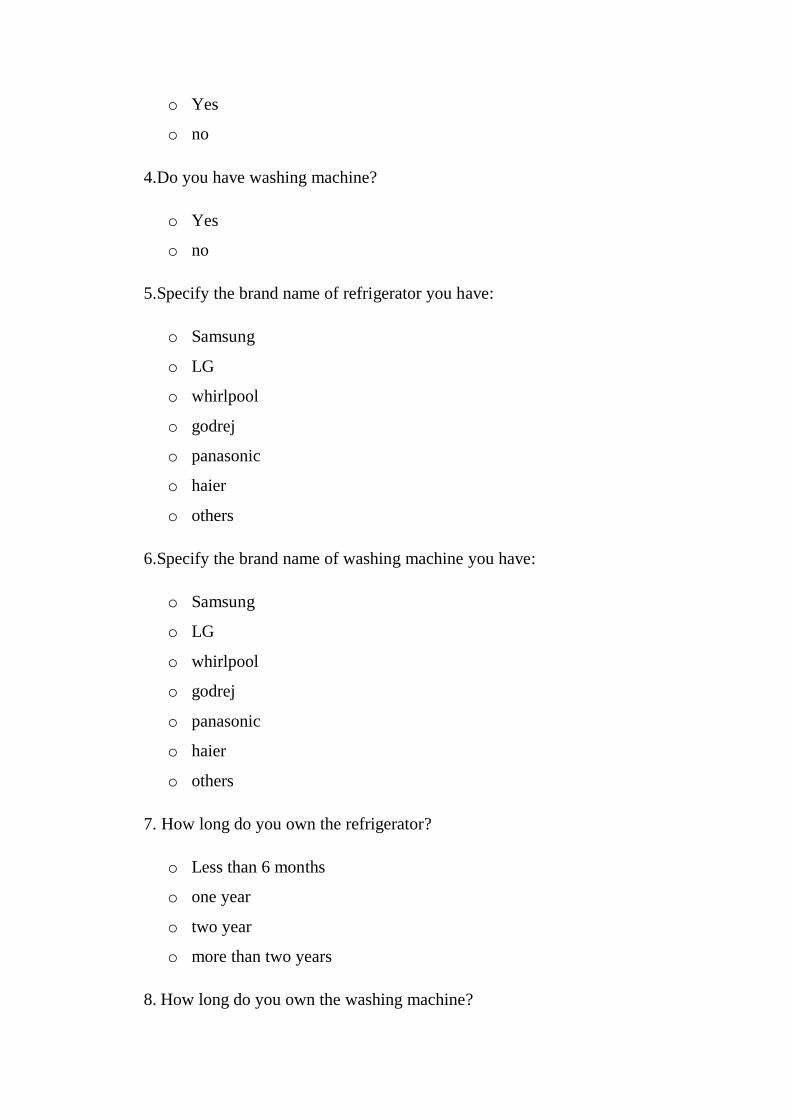
o Yes
o no
4.Do you have washing machine?
o Yes
o no
5.Specify the brand name of refrigerator you have:
o Samsung
o LG
o whirlpool
o godrej
o panasonic
o haier
o others
6.Specify the brand name of washing machine you have:
o Samsung
o LG
o whirlpool
o godrej
o panasonic
o haier
o others
7. How long do you own the refrigerator?
o Less than 6 months
o one year
o two year
o more than two years
8. How long do you own the washing machine?
o Less than 6 months
o one year
o two year
o more than two years
9.How did you know brand model of these products?
o Media advertisement
o magazines
o newspapers
o friends
o internet
10.Do you change the brand in case of non availability of preferred brand?
o Yes
o No
11.If your preferred brand is not available, what will you do?
o Postpone purchase
o switch over to other brand
o go to other shop
o search for our brand
12.what is your perception towards switching towards other brands?
o Not at all
o yes
o can’t say
o i may consider
13.Who influenced you in more in buying decision?
o Self
o friends/relatives
o family members
o Other
14.Awareness about brands available in the markets:
o Fully aware
o less aware
o unaware
15.What is your first preference while purchase of selected home appliances?
o Price
o quality
o brand image
o style/looks
o after sales services
o recommendation
16.Are you satisfied with overall performance of branded products?
o Highly satisfied
o satisfied
o neutral
o dissatisfied
o highly dissatisfied
17. According to you which company gives more beneficial schemes to
customers?
o Samsung
o LG
o whirlpool
o godrej
o panasonic
o haier
o others
18.According to you, what is the important factor considered to motivate
customers?
o Monitory benefits
o communication
o unique features
o social need
19.Which mode of purchase is considered as comfortable to you?
o Cash
o credit
o installments
o hire purchase
20.Which is the time suitable to make purchase?
o New year
o onam
o festival season
o whenever needed