Embed Size (px)
Citation preview
EFFECT OF BRAND PERCEPTION ON CONSUMER LOYALTY TO
PACKAGED MILK PRODUCTS IN KENYA
SCHOLASTICA A. AGUTU
A RESEARCH PROJECT PRESENTED IN PARTIAL FULFILLMENT OF THE
REQUIREMENTS FOR THE AWARD OF THE DEGREE OF MASTER OF
BUSINESS ADMINISTRATION, SCHOOL OF BUSINESS, UNIVERSITY OF
NAIROBI
2019
ii
DECLARATION
This research project is my original work and has not been submitted for examination in
any other university
Signature _______________________Date_______________________
SCHOLASTICA A AGUTU
REG NO: D61/P/8425/99
Supervisors’ Approval
This research project has been submitted for examination with my approval as the
University Supervisor.
Signature _______________________Date_______________________

iii
ACKNOWLEDGEMENTS
I would like to acknowledge my supervisor Dr. Catherine Ngahu for her guidance and wise counsel during the development of this study.

iv
DEDICATION
This project is dedicated to my late father, who encouraged me to pursue these studies and, additionally, my husband and entire family for their support and encouragement as I worked on this project.
v
TABLE OF CONTENTS
DECLARATION ............................................................................................................... ii
ACKNOWLEDGEMENTS ............................................................................................ iii
DEDICATION .................................................................................................................. iv
TABLE OF CONTENTS ................................................................................................. v
LIST OF TABLES ......................................................................................................... viii
ABBREVIATIONS AND ACRONYMS ........................................................................ ix
ABSTRACT ....................................................................................................................... x
CHAPTER ONE: INTRODUCTION ............................................................................. 1
1.1 Background to the Study ........................................................................................... 1
1.1.1 Brand concept .................................................................................................. 3
1.1.2 Brand perception ................................................................................................. 3
1.1.3 Customer Loyalty ............................................................................................... 4
1.1.4 Packaged Milk Brands ........................................................................................ 5
1.2 Research Problem ...................................................................................................... 6
1.3 Research Objective .................................................................................................... 8
1.4 Value Of The Study ................................................................................................... 8
CHAPTER TWO: LITERATURE REVIEW .............................................................. 10
2.1 Introduction ............................................................................................................. 10
2.2 Theoretical framework ............................................................................................ 10
2.2.1 Theory of reasoned action ................................................................................ 10
2.2.2 Self-Concept Theory ......................................................................................... 11
2.2.3 Social Identity Theory ...................................................................................... 11
2.3 Factors that Influence Consumer Perception ......................................................... 12
2.3.1 Price Perception ................................................................................................ 12
2.3.2 Quality .............................................................................................................. 12
2.3.3 Packaging and Branding ................................................................................... 13
2.3.4 Promotion ......................................................................................................... 13
2.4 Factors Influencing Customer Loyalty .................................................................... 14
vi
2.4.1 Customer Satisfaction ....................................................................................... 14
2.4.2 Brand Trust ....................................................................................................... 15
2.4.3 Price Fairness .................................................................................................... 15
2.4.4 Brand Value ...................................................................................................... 16
2.5 Empirical Review .................................................................................................... 16
CHAPTER THREE: RESEARCH METHODOLOGY ............................................. 18
3.1 Research design ...................................................................................................... 18
3.2 Population of the study ........................................................................................... 18
3.3 Sample Size ............................................................................................................ 18
3.4 Data Collection ........................................................................................................ 19
3.5 Data Analysis .......................................................................................................... 19
CHAPTER FOUR: RESULTS AND FINDINGS ........................................................ 20
4.1 Introduction ............................................................................................................. 20
4.2 General Information ................................................................................................ 20
4.2.1 Gender of the Respondents ............................................................................... 20
4.2.2 Age groups of the respondents ......................................................................... 21
4.2.3 Highest Level of Education .............................................................................. 21
4.2.4 Duration of Use of Packaged Milk Brands ....................................................... 22
4.2.5 Milk Brand Consumed ...................................................................................... 23
4.3 Effect of Quality Perception on Consumer Loyalty ................................................ 24
4.4 The Effect of Price Perception on Consumer loyalty .............................................. 24
4.5 Influence of Packaging Perception on Consumer Loyalty ...................................... 25
4.6 Effect of Advertising Perception on Consumer loyalty .......................................... 26
4.7 Consumer Loyalty ................................................................................................... 27
4.8 Inferential Statistics ................................................................................................. 28
4.8.1 Model Summary ............................................................................................... 28
4.8.2 ANOVA ............................................................................................................ 29
4.8.3 Regression Coefficients .................................................................................... 29
CHAPTER FIVE: SUMMARY, DISCUSSION, CONCLUSION AND
RECOMMENDATIONS ................................................................................................ 32
vii
5.1 Introduction ............................................................................................................. 32
5.2 Summary ................................................................................................................. 32
5.2 Discussion ............................................................................................................... 33
5.3 Conclusion of the Study .......................................................................................... 35
5.4 Recommendations ................................................................................................... 36
5.5 Areas Suggested for Further Research .................................................................... 36
REFERENCES ................................................................................................................ 37
Appendix I: Questionnaire for Consumers of Packaged Milk Products in Kenya ... 39
viii
LIST OF TABLES
Table 4.1: Gender distribution summary...........................................................................20
Table 4.2 Age distribution.................................................................................................21
Table 4.3 Education Level.................................................................................................21
Table 4.4 Duration of usage..............................................................................................22
Table 4.5 Milk Brand Consumed......................................................................................23
Table 4.6 Quality Perception on Consumer Loyalty........................................................ 24
Table 4.7 Price Perception on Consumer loyalty..............................................................25
Table 4.8: Packaging Perception.......................................................................................25
Table 4.9: Advertising Perception....................................................................................26
Table 4.10: Consumer Loyalty.........................................................................................27
Table 4.11: Model Summary............................................................................................28
Table 4.12: ANOVA.........................................................................................................29
Table 4.13: Regression coefficients.................................................................................30
ix
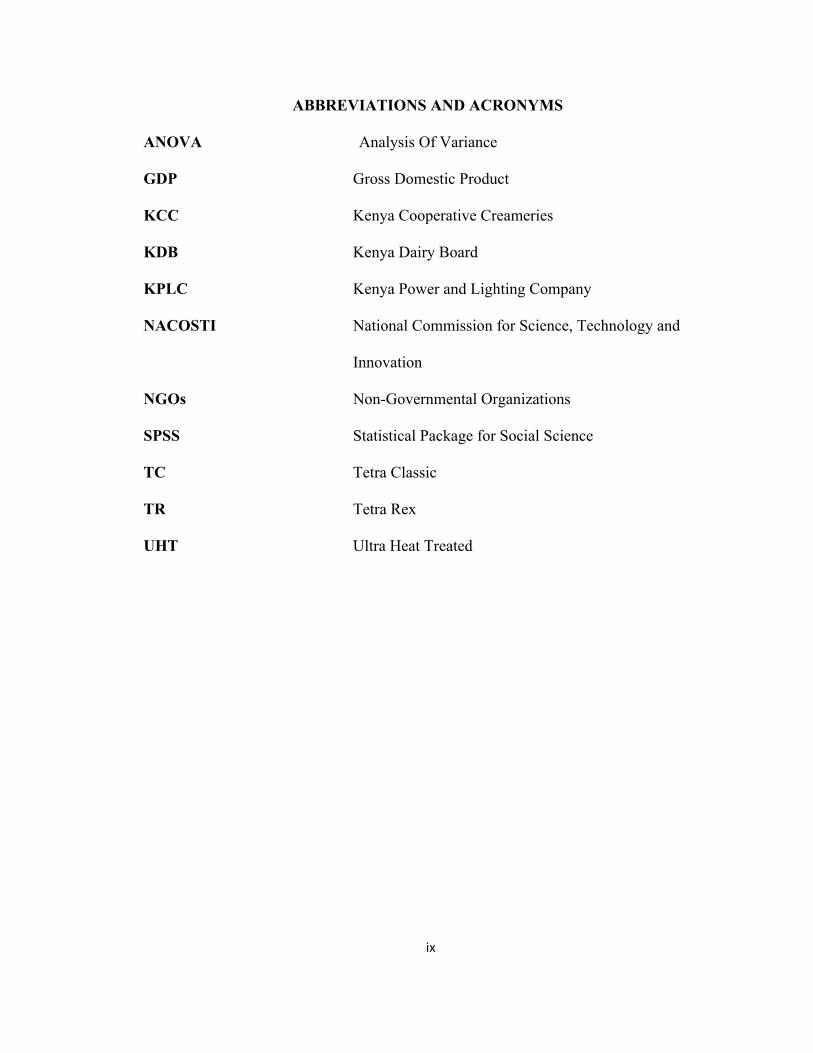
ABBREVIATIONS AND ACRONYMS
ANOVA Analysis Of Variance
GDP Gross Domestic Product
KCC Kenya Cooperative Creameries
KDB Kenya Dairy Board
KPLC Kenya Power and Lighting Company
NACOSTI National Commission for Science, Technology and
Innovation
NGOs Non-Governmental Organizations
SPSS Statistical Package for Social Science
TC Tetra Classic
TR Tetra Rex
UHT Ultra Heat Treated
x
ABSTRACT
This study set out to determine the effect of brand perception on consumer loyalty to packaged milk brands in Kenya. This was done using a descriptive research design. The study identified and interviewed adult shoppers at the milk buying sections in supermarkets who stock a large variety of milk brands in Nairobi County. A total of 385 customers were chosen randomly from large supermarkets in Nairobi. Primary data was gathered through questionnaires. Analysis of the data was done using SPSS (Statistical Package for Social Science) using percentages, frequencies, means and standard deviation in form of tables. The study showed that consumers considered the price of a brand to be a key indicator of its quality. Consumers often seemed to believe that price was an indicator of value and that the higher the price, the higher the value and hence that high priced brands were less susceptible to competitive price cuts than lower priced ones. The study findings established that increased levels of promotion were an indicator of higher brand quality. Promotion played a central part in building brand image. Promotion created brand awareness and enhanced the chances of being selected by a consumer. Further, from the findings consumers also benefited from information on the milk packages. The survey showed that most consumers bought their favorite milk brand because of the brand name. The study concludes that whereas all the determinants of perception, such as quality, price, packaging and promotion have an effect on the perception of packaged milk products, quality and price have the highest impact. To remain competitive, milk processors need to ensure the maintenance of consistent quality and affordable pricing.
1
CHAPTER ONE: INTRODUCTION
1.1 Background to the Study
Building customer loyalty towards organizations’ goods or services is considered a key
marketing activity (Dick and Basu 1994). Increased customer loyalty typically means a
higher market share and being able to demand higher prices compared to those of
competitors (Chaudhri and Holbrook2001). Customer loyalty implies being strongly
attracted to a brand and having a strong commitment to buy it repeatedly despite
competitor activities. Further, it can be demonstrated by other behaviors such as not
easily shifting to other brands, being less sensitive to price changes and giving positive
referrals of their preferred brand (Kotler, 1991). Customer loyalty comprises of both an
attitudinal and behavioral inclination, whereby consumers prefer a given brand, due to
satisfaction experienced with the brand its convenience, performance, or simply due to
how familiar and comfortable they are with the brand. Studies by Cunningham (1967),
Day (1969) and Jacoby (1971), states that attitudinal components of consumer loyalty
have equal weight with the behavioral aspects.
Customers maintain loyalty to organizations and brands that are responsive to their wants
and needs. Loyalty encourages consumers to shop more consistently for their preferred
brands, and spend more on them. They also recommend these brands actively, and
generally feel positive about them. Consequently consumer loyalty results in gains such
as lower marketing and advertising expenses (Chaudhuri & Holbrook, 2001Chaudhuri,
A. & Holbrook, M. B. (2001). Factors that impact a customer’s loyalty to a brand include
trust, customer satisfaction experienced, price and its brand value.
Brand perception on the other hand, is determined by the aggregate of all experiences that
consumers encounter with the brand. Brand owners are therefore required to build
positive experiences regarding their brands. This enables customers develop, positive
feelings, beliefs, opinions and perceptions about a brand. According to Kotler (2005)
brand perception refers to the manner in which individuals receive, select, organize and
interpret information. Brand perception is determined by factors such as quality, which,
2
based on studies by Uggla (2001), is a core component of brand identity. Pricing is
another component which McDonald and Sharp (2000) state is important for brand
selection as consumers can select lower priced brands for those seeking affordability or
make a choice of brands with the highest price so as to achieve product quality. Also
included is packaging, which as per Kotler et al (2000), plays an important role in being
able to attract consumers and to help in describing the product. The other factor is
advertising, whose aim is to create awareness about a brand. According to Aaker (2000),
in order to strengthen a brand, there is need for advertising and promotion. Some forms
of advertising include television, cinema, radio, billboard etc. Ultimately consumers buy
products whose value they believe in. The perception a consumer holds regarding a brand
affects decisions they make about the selection of products and ultimately leads to
loyalty. Consumer loyalty therefore occurs when a customer’s perceived view about a
product has been fulfilled by what the brand offers. This fulfilled consumer perception
then leads to repeat purchase and also leads to consumer loyalty.
The years between 2008 and 2018 have been years of rapid growth and competition in
the dairy industry. Currently four dairies, namely Brookside Dairy Ltd, New KCC,
Githunguri Dairies and Sameer Industries lead the market. Brookside Dairy has acquired
a number of brands such as Tuzo, Molo, Delamare and Ilara making it the largest milk
processor. However, with the entrance of new small to medium size dairy firms such as
Kinangop, Afro Dane, Bio, Happy Cow and others, the top giants have been slowly
conceding their market share to smaller firms. All the players thus need to protect their
market share from erosion by ensuring that they create loyal customers and that their
marketing efforts go beyond price promotions.
Milk processors have the twin task of creating a positive perception of packaged milk
considering the wide availability of unpacked milk and also to convince customers to
select their brands given a very competitive and crowded market. In this market
therefore, one of the keys to business success is in knowing what influences customer
loyalty. This facilitates recognizing and understanding the factors that influence customer
loyalty. Several studies have been conducted in the milk market, but very few have
3
focused on how perception affects consumer loyalty especially in the dairy industry. With
the rapid growth of the milk market in Kenya and the attendant proliferation of brands,
market players need clear understanding of the extent to which investment in brand
perception can impact customer loyalty. The objective of the study therefore is to
determine the effect of brand perception on consumer loyalty to packed milk in Kenya.
1.1.1 Brand concept Branding is about how to distinguish goods and services in a manner that makes them
unique. “A brand is therefore a distinguishing mark, for example, a brand name, a term,
a unique design, a symbol, or other marks that identify a brand as distinct from those of
other sellers” (American Marketing Association). Branding is a strategy used by
marketers to make it easier for consumers to identify their brands, and as such, provide a
basis for choosing their brands over the competitors, the objective being, to acquire and
maintain loyal customers, by availing brands that deliver what it promises. Today
branding includes much more than just differentiating a product. A brand is used to
create an emotional appeal for brands (Dolak, 2003; Kotler & Armstrong, 2004). The
role of a successful brand is to generate a feeling of non-tangible benefits that emanate
from the brand name, mark, or symbol (Aaker, 1991;Dolak, 2003). Brands are deemed
to be successful when they can generate a perception amongst consumers about their
uniqueness. A strong brand is one that consistently meets consumer expectations thereby
provides trust and reliability therefore fulfilling the promises made by a brand
(Srinvasan, Park & Chang, 2005).Marketers utilize various concepts to create positive
brand perceptions. These includehow a brand is positioned, the different ways a brand is
identified, the type of advertising, promotion, sponsorships and communication in
general that a brand is involved in.
1.1.2 Brand perception
When consumers purchase a brand and use it over a period of time, they develop
feelings for it based on their experiences. The manner in which they interpret the brand
is termed as brand perception.Brand perception comprises a consumer’s impression/
4
awareness regarding goods or services. Customer perception is impacted by personal
experiences as well as all forms of communication that a brand utilizes, including social
media. Kotler (2005) defines perception as a means of acquiring, choosing, sorting out
and deciphering information. Brand perception is important as it drives consumer’s
choice in the marketplace. Marketers therefore need to identify the things that appeal to
different market segments and to use it to attract them. For example in order to attract
high-end consumers one must consider issues such as quality, cleanliness and hygiene,
lighting, packaging, and general details in the product presentation. When consumers
perceive a brand positively, they are more inclined to select a given brand over
competitors. They are further inclined to talk positively of the brand to the people they
interact with. Conversely, when consumers perceive a brand negatively, then they are
more inclined to buy a competitors brand and pass this information about their choice to
others. Positive engagement with brands leads to long-term loyalty.
1.1.3 Customer Loyalty Customer loyalty develops when a consumer has a long-term liking or commitment to
specific brands as reflected in repeat purchases. Kotler and Keller (2009) define loyalty
as a deep obligation to continually purchase a brand despite competing influences. This
means that a brand with strong loyalty will be purchased consistently over its rivals.
Customer loyalty entails holding a strong allegiance towards a product. Some brands are
continuously purchased not only by individuals but also by generations. Customer
loyalty occurs when one feels that a brand fulfills their expectations better than others
and hence decides to make a repeat purchase. Additionally, it occurs when the customer
are satisfied with the brand.
Milk processors therefore need to recognize this principle and put in place marketing
strategies that maintain this status for their brands. Consumer loyalty results in benefits
such as, reduction in the cost of customer acquisition, increased profitability, positive
customer testimony and building barriers to competitor activities. Bowen and
Shoemaker (1998) posit that even minimal increases in customer loyalty could result in
large increases in profits. Additionally, longer serving customers imply more
5
profitability to a firm. (Kim and Cha, 2002). All successful brands are anchored on a
firm and loyal customer base. Brands without a loyal customer base gradually suffer
market share decline.
Loyalty is described through attitudinal indexes of trust, enthusiasm and tendency to re-
buy a brand as the first choice. Customer loyalty however begins with customer
satisfaction and a positive brand perception. Only then can a company develop long-
term customer loyalty. Studies by researchers have found that customer loyalty is
developed from attitudes and behaviors. Customer attitude leads to brand purchase of
both the same product as well as others from the same organization. It also spurs them to
recommend the company to others. Additionally they are less responsive to competitive
activities. (Cronin & Taylor, 1992; Narayandas, 1996; Prus & Brandt, 1995), and are
committed to paying higher prices (Zeithaml, Berry, & Parasuraman, 1996). Customer
loyalty is best demonstrated by overt customer behavior. This is aptly proved by the
frequency of their repurchasing of given brands. When brands create the perception of
their brands as being of high quality, and fairly priced, and that their services are
responsive they will gain more customers and enjoy great customer loyalty. Therefore
comprehension about how consumers perceive and process information is an important
consideration in today’s business environment.
1.1.4 Packaged Milk Brands About 84% of Kenya’s milk production is sold in lower priced unprocessed form by
farmers. This not only poses a health risk to consumers, but also reduces the market
share for established processors. However, the silver lining is that as the economy
improves resulting in more consumers who can afford processed milk, there is growth
opportunity for processors to convert raw milk consumers to become users of packed
milk. Nevertheless, Kenya’s dairy industry is relatively more advanced than others in in
sub-Sahara Africa, and has a vibrant and expanding processing industry. In 1992, the
monopoly of Kenya Co-operatives Creameries as the only organization authorized to
process and market dairy products was abolished with the liberalization of the dairy
industry. As a result, there were major dynamic shifts in milk marketing and the
6
emergence of new processors. As in many economies, the Kenyan dairy industry is
tiered into large, medium and small-scale processors. The first tier comprises of the four
dominant ones, which are Brookside Dairies Ltd, New Kenya Co-operative Creameries,
Sameer industries and Githunguri Dairy Co-operative Society. The second tier dairies
include processors such as Kinangop, Meru Dairy Cooperative Society, and Kabianga
Dairy. The third tier processors include Bio Food Products, Razco Ltd, Raka Cheese,
Brown's Cheese and Alpha Dairy.
Dairy products fall into the following two broad categories: a) Liquid milk (fresh, long
life), Value added products which includes Butter, Ghee, Cheese, Yogurt, Cream and
Powder. In order to provide access to a broader customer base, processors have
developed innovative packaging and delivery solutions such as polythene and
Automated Milk Dispensers. Examples of this trend is New KCC which markets milk in
plastic bottles under the Gold Crown brand name, Tetra Pack and polythene solutions in
both KCC fresh milk and Gold Crown and Safariland powder milk in tins. Brookside
dairy limited also provides a similar range of products except for powder milk supplied
only by KCC. Additionally processors are addressing the affordability challenge by
reducing pack sizes. In a market where the use of dairy products as a refreshment is on
the rise, processors have developed products to meet this need by introducing yogurt
flavored long life milk, flavored fermented milk and milk in convenient easy to open
and close packaging.
1.2 Research Problem
Kenya’s dairy industry has gone through a revolution, from a monopoly government
protected KCC, to a period of liberalization that has seen several milk processors enter
the industry; resulting in cutthroat competition, with every player trying to acquire a
share of the market. This growth has been driven by rapid urbanization, increased
population and income growth, especially amongst the middle class. Additionally many
Kenyans drink milk as a snack and also as a necessary component of preparing tea,
which is a popular drink everywhere in Kenya. This positive perception of milk provides
tremendous growth opportunities for the Kenyan dairy industry. Milk processors are
7
therefore offering a wide choice of products in different variations, packaging, flavors,
quality and overall product presentation. Consumers now have a wide selection, and are
able to access their choice of brand more easily and conveniently than before (KDB,
2004), and are therefore spoilt for choice. Loyalty generation (customer stickiness) for
milk brands hence becomes a key marketing strategy for sustainability.
Fierce industry competition, has threatened all processors market shares and indeed
some have closed down operations (KDB, 2004). Out of the 40 processors originally
licensed after liberalization in 1992, only 25 remain operational in 2019. In order to
ensure that players acquire and maintain loyal customers, there is the need to ensure that
their brands command a positive brand perception. The following groups of studies
delineate both the ways of measuring customer loyalty and the study limitations. The
first of these studies discusses loyalty as a result of repeat purchasing (Liljander and
Strandvik, 2003), and its attitudinal component (Dick and Basu, 2004). The attitudinal
approach treats loyalty as purchase behavior driven by the attitude held. However this
approach has met with much criticism as leading to limited loyalty (Day, 2000). The
behavioral approach on the other hand lacks theoretical background (Jacoby, Robert and
William, 2008). Consumer’s faithfulness could be attributed to the difficulties involved
in switching brands or may lack viable alternatives.
Research undertaken by Karanja and Gakure (2012) about the significance of customer
loyalty on retail products in the era of global trade, based on Unilever Nairobi Kenya
found that, 57% percent of the respondents felt that customer loyalty played a significant
role in generating commitment to their brands. Findings showed that customer retention
and repeat purchase was significantly driven by the loyalty of customers. A Kenyan
Telecommunication Industry study by (Kihara & Ngugi 2014 on Safaricom in response
to fierce competition in the mobile phone market in Kenya was conducted. It showed
that many firms were struggling to maintain existing customers and were consequently
paying more attention to recruiting new ones instead of retaining existing ones. The case
study involved 70 postpaid customers in Nairobi. 69% of those interviewed said that
service delivery affected their loyalty to Safaricom, Additionally 75% of them indicated
8
that switching barriers by Safaricom barred them from migrating to the competitors,
while 75% of those interviewed viewed Safaricom as customer focused. In this study
therefore an increase in switching barriers, positive brand image, good service quality
and value added services were found to influence customer loyalty. Based on a study by
Adede and Kinoti, (2016), regarding the elements that determine a consumers’ selection
of dairy products in designated housing units belonging to the Nairobi City County, the
most important driver of customer loyalty was product quality, and that promotional
activities could only serve to reinforce a positive customer experience.
In light of increased competition, more resources should be invested in improving brand
perception of packed milk, so as to acquire new users into the category as it hygienically
packed and healthier to consume, and will additionally contribute towards growing the
market. Studies carried out in the Kenyan dairy industry have tended to focus on milk
production with few of them directly focusing on the link between brand perception and
consumer loyalty. Our research seeks to fill this gap and answer the question: Does
brand perception affect consumer loyalty to packed milk brands in Kenya?
1.3 Research Objective
The following research objective will guide the study:
To establish the effect of brand perception on consumer loyalty to packaged milk brands
in Kenya.
1.4 Value Of The Study
This study is intended to benefit milk processors in Kenya, in order to enable them focus
on issues of concern, and on how to implement useful results from the research to
improve their strategies on both brand perception and consumer loyalty. Further it will
benefit sales and marketing staff by providing them with insights on how to improve
brand perception as well as consumer loyalty. It may also serve as a future reference for
other studies. Background information resulting from this research may benefit other
researchers and scholars interested in carrying out further research. Academicians keen

9
to study a similar area can use this study to arrive at comprehensive conclusions and
reasoning on consumer loyalty and brand perception.
10
CHAPTER TWO: LITERATURE REVIEW
2.1 Introduction
This section reviews the theoretical framework, and empirical literature pertinent to the
study. The first sub-section in this chapter discusses three theories; theory of reasoned
action, self-concept theory and social identity theory. The study explains the
implications of each theory to the study topic. Under the second sub-section the concept
of brand perception and consumer loyalty is discussed. I also review past relevant
researches to collate complementary information.
2.2 Theoretical framework
2.2.1 Theory of reasoned action According to the above theory two components are expected to influence behavioral
intention. These are attitude and behavior. There are two schools of thought on what
drives purchasers to act the manner in that they do, which is the attitudinal approach and
the behavioral approach. Behavioral loyalty refers to consistency and regularity in
purchase behavior, for instance, a customer who whether by circumstance or choice
purchases goods out of habit from the same outlet is behaviorally loyal. There are
circumstances where one may shop at a store because of the absence of choice or where
the costs of switching are inordinately high. Behavioral loyalty is very important and
must be sustained, because it means that there are predictable revenue flows. Attitudinal
loyalty refers to loyalty that derives from a deep cognitive conviction driven by trust and
satisfaction. This conviction leads to positive testimony.
Attitudinal loyalty supports a brand’s strength and marketing efforts, as such customers
play a promotional by attracting others. Attitudinal loyalty is often measured on several
parameters such as repeat buying plans, willingness to offer positive testimony,
unwillingness to switch to other brands, and willingness to pay premium prices for their
favorite brands. Consequently attitudinal loyalty is a key building block for consumer
loyalty. Obviously it is best for an organization to have a substantial number of customers
who are both attitudinally and behaviorally loyal.
11
2.2.2 Self-Concept Theory This theory refers to the entirety of views, preferences and attitudes that individuals
develop for their personal existence, or in other words how individuals think of
themselves and how they act their various life roles. Marketers try to develop product
attributes that are aligned to the target markets’ self-concept. Sirgy (1982, 1986), in his
research states that the theory is key to marketing practitioners as it explains that
consumers whose self-perception is aligned to that of the brand have a greater
inclination to buy such products and hence become loyal users. The same thinking
applies to marketing communication, where consumers are more likely to identify with
and buy products whose core message is aligned to their own self-image. Marketers
therefore need to identify how consumers see themselves i.e in terms of their ideal self,
private self and their Public self. This enables marketers position their company and
brands in a way that supports the consumers’ self-concept so that they connect with
brands emotionally and develop loyalty.
2.2.3 Social Identity Theory
This theory postulates that individuals tend to define themselves on the basis of their
membership to certain established social groups such as religions, workplaces, social
clubs, and age cohorts etc., each with its own distinct identities. Social identities define
and control people’s behavior. This is a very important attribute for marketers because it
brings a certain degree of predictability to their consumption patterns. As an example
people in the same professional occupation may most likely buy similar goods and
services. Social identity is a powerful determinant of the choices that consumers make.
Marketing strategists therefore attempt to develop products that reflect the values of the
social group and the brand attributes, thereby increasing the chances of creating loyal
customers.
12
2.3 Factors that Influence Consumer Perception
2.3.1 Price Perception Price is in several instances perceived as an indicator of product value. It therefore plays
a significant role in determining how a brand is perceived. A highly priced product often
creates a perception of quality. It is therefore incumbent upon product manufacturers
and indeed milk processors to ensure that there is alignment of quality and price. Price is
a therefore significant driver of consumer perception. Whereas consumers seek bargains
where possible, they perceive low priced products as being low in quality. Price
perception refers to how consumers perceive pricing levels as this has a significant
impact on purchase behavior. Assael (2004) states that consumers’ price perceptions are
linked to expectations regarding general price levels, which in turn are based on past
prices and those of competing products.
2.3.2 Quality The way consumers perceive the quality of a brand, is closely linked to how much it
repeatedly satisfies their expectations (Harrell and Frazier, 1999). Arnould, Price and
Zinkhan (2004) states that quality rates higher than price, therefore efforts should be
focused on enhancing quality as a vital building block to sustained competitiveness. This
is because perceived quality derives judgment by comparing performance perceptions
against expectations. If consumers feel that a brand ranks higher than others, they will
select the brand when making a purchase decision from the product category. Keller
(2008) introduces the aspect of brand comparison, and states that the manner in which
the quality of a brand is perceived depends on the customers’ ranking of brands with
their alternatives. The same view is expressed by Chi, Yeh and Yang, (2009) when they
state that the perception of quality makes customers subjective in their quality
assessment, thus giving products noticeable differentiation. Perceived quality is
comprised of both intrinsic and extrinsic attributes. The former is made up of the
physical appearance of products, while the latter relates to all non-physical attributes
such as product name, pricing, location, and packaging. Marketers can therefore
segment the market through various cues relating to quality as people vary in their use of
13
cues (Arnould, Price and Zinkhan, 2004). The quality of a brand is therefore relative
and is dependent on a consumer’s own characteristics.
Perception created about the quality of a brand, is often different from the actual quality.
Whereas the way that customers perceive a brand relates to a customer’s own
assessment of products superior attributes, the latter refers to measurable attributes.
(Fayrene and Lee, 2011) Statt (1997), observe that objectivity varies from one consumer
to the other, as different consumer perceives their environment differently and has
constructed their own reality out of it. Fayrene and Lee (2011) thus conclude that
perception of quality plays an important role in how judgment of the overall quality is
formed. Since quality is directly influenced by consumer perceptions, it is the quality
judgment formed by consumers that they use to compare the quality of unfamiliar
products. When consumers have formed certain judgments about products, they will use
it as a benchmark to make decisions about any unfamiliar products.
2.3.3 Packaging and Branding Packaging is the first level of consumer engagement and opinion formation it is
therefore important to get it right. Packaging plays an important role on how a customer
perceives a brand and can therefore be considered a selling point in itself. All aspects of
the pack design including color, design, text, eco-friendliness, and sturdiness will impact
consumer brand perception. Packaging and branding therefore have a significant impact
on brand perceptions, particularly when making first time purchase decisions. Packaging
and branding communication is typically tailored to the tastes and preferences of a given
market.
2.3.4 Promotion According to Fayrene and Lee (2011) creating awareness of a brand is the process of
instilling brand attributes into a consumer’s memory resulting in recall of the brand,
under diverse situations.Promotions are one way of having a positive impact in how
consumers select the milk brands purchased. In addition advertising has an impact on
milk purchase decisions (Fuller, 2006). Further, promotion is linked consumers’ ability
14
to differentiate preferred brands from others on the basis of positive attributes already
entrenched in their minds. The depth of brand awareness determines the likelihood and
simplicity with which the attributes of a brand are recalled. (Haglofs, 2014). A brand,
whose level of brand awareness is deep, is relatively easier to recall, compared to a
brand that only comes to the customers’ mind when they see it.
Brand awareness increases the consumer’s recall about a brands benefits and
uniqueness. This in turn diminishes the consumer’s perceived risk when making a
purchase decision. The probability of purchasing and being positive towards a brand is
higher amongst consumers who are familiar with a brand than those who are not.
Marketers therefore need to determine where their brands sit in the customers’ selection
set and the level of awareness about the brand as this affects customers’ perceptions
about a brand and may influence their tastes and purchase decisions (Haglofs, 2014).
2.4 Factors Influencing Customer Loyalty
2.4.1 Customer Satisfaction Oliver’s 1997 study outlined satisfaction as a consumer’s response to fulfillment. The
judgment delivered by consumers is that product consumption provides fulfillment of
varying degrees. The satisfaction derived from a brand is the aggregation of the
experiences a customer undergoes during the purchase and consumption of a brand
(Fornell, Johnson, Anderson, Cha & Bryant 1996). Repeat purchase of a brand is more
likely amongst satisfied customers. Additionally they are less likely to be price sensitive,
are more likely to be engaged in favorable brand testimonials, and hence have a higher
probability of becoming a loyal customer (Chen & Wang 2009.) When customers are
satisfied with a brand, it often leads to increased benefits to an organization such as
customer loyalty and customer satisfaction. Business growth can be severely stunted
and compromised if the needs of customers remain unmet. (Tao 2014.)
Oliver (1980) developed a model to gauge customer satisfaction where customers
measure their product and service experience with their expectations; and that with the
increase of satisfaction, repeat purchases also increases. According to Da Silva and Alwi
15
(2006), customers show satisfaction to brands that meets their expectations. Several
customer satisfaction studies have shown a link between satisfaction and loyalty and the
switch to new brands by customers who are dissatisfied (Omenye, 2013).
2.4.2 Brand Trust Based on the commitment-trust theory, consumers’ commitment is enhanced with a
decline in uncertainty (Morgan & Hunt, 1994). Consumers therefore purchase brands
they trust in order to circumvent any discontent (Chen-Yu et al., 2016). Brand trust
develops when a customer depends on a brand due to the expectation of a favorable
outcome. When trust in a brand, has been achieved, consumer loyalty increases. (Jang,
2007; Lee et al., 2011; Loureiro et al., 2012. McKnight and Chervany (2002), define
trust as a foundation in forming a long-term association. Trust, according to them, refers
to the profundity and statement of feelings grounded on decisive evidence. According to
Chiou (2004) trust precedes loyalty, as it can help in customer recruitment and retention.
A study by So and Scull (2002) among e-business customers revealed the strong
relationship between customer satisfaction and trust.
2.4.3 Price Fairness Cadogan and Foster, in their 2000 study, define price as the key driver of purchasing
decisions among consumers. It was however stated by Keller (2003), that highly loyal
consumers can purchase their favorite brand at a higher price. De Ruyter et al., 2009
argues that customers become more tolerant to prices if they have a relationship with the
brand. This is because loyalty keeps customers from shopping around and comparing the
price of the favorite brand with those of other products. Price is a key factor when it
comes to consumers’ judgments of the value on offer, and their overall appraisal of their
preferred brand. According to Yoon & Kim, 2000, shopper satisfaction can also be
created when customers compare a product’s price with the anticipated costs and gains.
Should the anticipated value of the specific product override the cost, then consumers
can be expected to buy it. The price of a brand not only influences its demand but also
the amount purchased and utilized. Income levels impacts the pricing and consumption
of milk. Families from low-income groups typically select their milk of choice either
16
from the lower priced processed packed or unpacked milk, or raw milk. Consumers
higher up the income ladder on the other hand, typically buy milk sold in more
sophisticated packaging such as milk in bottles. They also tend to buy high value milk
products such as yogurt, cheese and butter, which are marketed by reputable
organizations, who sell leading brands (Hartili, 2004; Fuller, 2006; Bai, 2008; Smith,
2009 and Miftari, 2009). Price thus significantly influences the purchase decisions and
the variety of dairy products preferred (Kumar, 2014)
2.4.4 Brand Value Value can be defined as a conscious decision by consumers to select one product over
another (Gan et al., 2005). The concept of equity is the analysis of what customers deem
to be fair for the consideration that is paid (Bolton & Lemon, 2003). Costs of the
perceived value comprise financial and non-financial payments such as energy and time
consumption. Cost in this case also includes the stress that customers experience. This
leads to the value results customer anticipate and an analysis of the parallel or alternative
rewards and sacrifices that are associated with the offering.
Customer value is largely considered foundational for marketing (Oliver & DeSarbo,
2008). According to them, customers will feel fairly treated should they notice that the
comparison between their inputs versus their outputs could be fairly equated to the
company’s offers. In addition customers make comparisons between the firm they are
loyal to and competitor’s products.
2.5 Empirical Review
Adel Pourdehghan (2015) in his study “The impact of marketing mix on consumer
loyalty, - a case study of the mobile phone industry” states that the intense competition
experienced in contemporary markets creates a major challenge for keeping clients and
holding their loyalty. Hence organizations and retailers need creative strategies for
customer retention. Neupane (2015) in his research looked at the impact to customer
loyalty and satisfaction of brand perception with the conclusion that it has a significant
impact. Other studies include Nasab and Alroaya (2013), who similarly evaluated the
17
effect of brand perception based on a study of electronic companies, Sony and LG. The
research population was clients of these two products, and was randomly selected
amongst 437 persons. Results indicated that customer loyalty was directly impacted by
satisfaction as well as values, emotions, resistance to change, trust and brand equity.
Tanui (2007) undertook a study of petrol stations’ customer loyalty programmes. The
study, which was held in Nairobi, concluded that customer loyalty was driven by
perceived value and uniqueness of the brand. Kamau (2008) studied customer loyalty
and the factors behind it at Mombasa port. The study’s conclusion was that it is
perceived quality that influences consumer loyalty. Kwena (2001) undertook a study on
the extent to which consumer preferences are impacted by branding and concluded that
branding of sugar products did enhance the perceived quality of sugar.
18
CHAPTER THREE: RESEARCH METHODOLOGY
3.1 Research design
A descriptive research design was used in the study. Such studies aim to describe
something usually market characteristic or function (Malhotra, 2007). It allows us to
take a picture of a situation in its natural setting at a particular point in time as relates to
what, where, how, who and when of a research topic (Cooper and Schindler, 2005). The
research outcome can then be used to generalize to the whole population.
3.2 Population of the study
This study covered customers of packaged milk products in Nairobi City County. This
choice took into account the population density, its diversity and high demand for
packaged milk.
3.3 Sample Size
The study sampled 385 supermarket customers within Nairobi County who are
purchasers of packaged milk. This is because supermarkets are the largest retailers of
packaged milk. There are large numbers of customers visiting these outlets on a daily
basis and are exposed to a wide selection of brands. Since milk is consumed across all
population demographics, I selected outlets spread across the different parts of Nairobi
as follows; supermarkets in Lavington to access populations in the upper class areas of
Lavington Muthangari and Loresho areas and low income groups living in Kawangware;
supermarkets in Westlands for middle to upper income groups living in the Westlands,
Spring Valley and Kyuna areas and the low income population living in Kangemi.
Additionally supermarkets in the middle-income group areas of Buru Buru, Tassia and
Embakasi were also included. The selection of respondents at the entrance of every store
was random. A random selection of 385 customers was picked from large supermarkets
in Nairobi as they purchased milk daily.
19
3.4 Data Collection
Using research assistants we administered structured questionnaires for data collection.
These questionnaires consisted of closed and open-ended questions for purposes of
gathering data for further analysis. The questionnaire comprised of three parts. The
purpose of the first section was designed to gather general data about the respondents.
The second part sought information relating to perception and consumer loyalty amongst
supermarket customers and the third part was on consumer loyalty
3.5 Data Analysis
According (Mugenda & Mugenda, 2009 researchers can make sense of the data
collected through data analysis. Data analysis entails editing, coding and analyzing data
so as to make conclusions that are easy to interpret. Upon completion of the data
collection, the questionnaires were checked to confirm their accuracy and completeness
in readiness for analysis. The quantitative data was analyzed using the SPSS (Statistical
Package for Social Science), through the use of percentages, frequencies, means and
standard deviation in form of tables. In order to determine the mean score and standard
deviation, Likert scale data was used. Multiple regression was used to determine the
relationship between independent variables and dependent variables. The following
formula was used:
Y = C+a1X1+a2 X2+a3 X3+a4X4 + e
Where Y is the dependent variable (consumer loyalty)
a1 are the coefficients
C is model intercept
X1 is quality perception
X2 is price perception
X3 is packaging perception
X4 is advertising perception
e is the error margin
20
CHAPTER FOUR: RESULTS AND FINDINGS
4.1 Introduction
Chapter four summarizes the results and findings of the research question derived from
data collected from the respondents. This is guided by what the study set out to determine
namely, the effect of brand perception on consumer loyalty to packaged milk brands in
Kenya. During the study, we distributed a total of 385 questionnaires. Of this, a total of
324 were dully completed and passed for analysis. The response rate was therefore
84.2%.
4.2 General Information
The study gathered general respondent data such as gender, age and education levels
attained. This would provide data as to who buys milk products. Additionally I sought to
know the duration of use of dairy products and type of dairy product used to determine
loyalty and the type of product involved.
4.2.1 Gender of the Respondents Table 4.1 below is a summary of the number of male and female respondents
interviewed:
Table 4.2: Gender distribution summary
Gender Number Percent (%) Female 170 52.5% Male 154 47.5% Total 324 100% Source: Research Data, 2019
While 52.5% of those interviewed were male 47.5% were Male. This shows that both
genders are involved in the purchase of milk due to its wide usage.
21
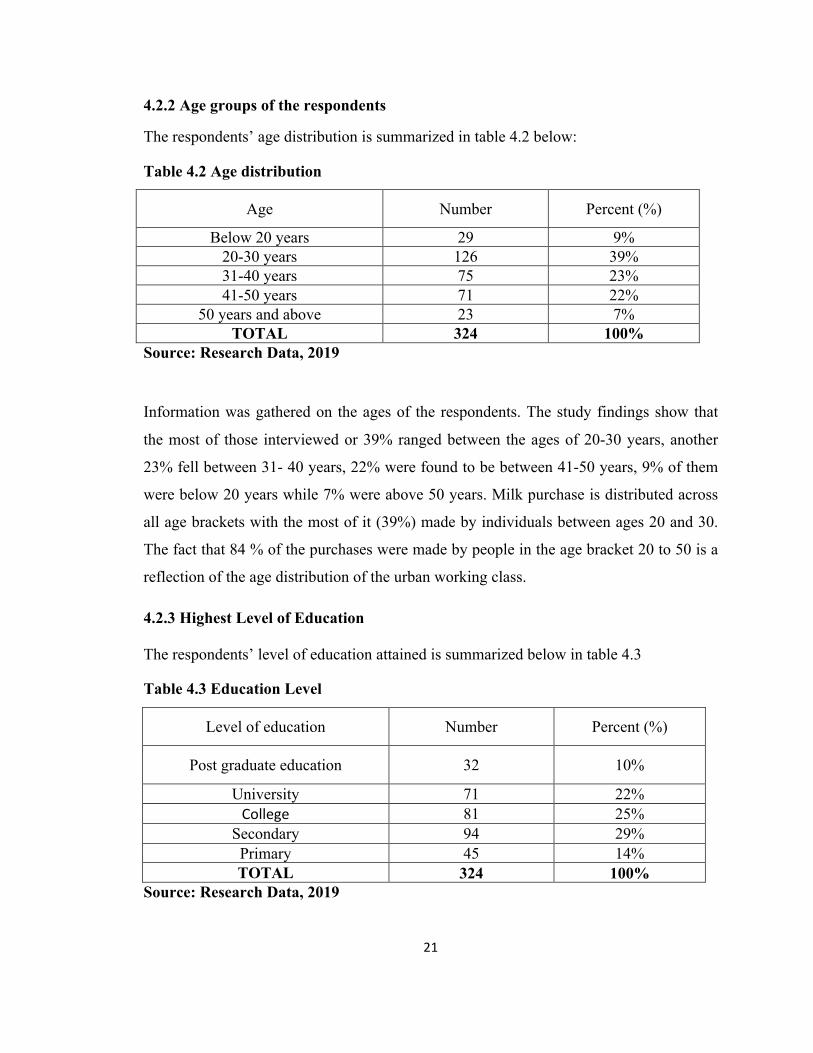
4.2.2 Age groups of the respondents
The respondents’ age distribution is summarized in table 4.2 below:
Table 4.2 Age distribution
Age Number Percent (%)
Below 20 years 29 9% 20-30 years 126 39% 31-40 years 75 23% 41-50 years 71 22%
50 years and above 23 7% TOTAL 324 100%
Source: Research Data, 2019
Information was gathered on the ages of the respondents. The study findings show that
the most of those interviewed or 39% ranged between the ages of 20-30 years, another
23% fell between 31- 40 years, 22% were found to be between 41-50 years, 9% of them
were below 20 years while 7% were above 50 years. Milk purchase is distributed across
all age brackets with the most of it (39%) made by individuals between ages 20 and 30.
The fact that 84 % of the purchases were made by people in the age bracket 20 to 50 is a
reflection of the age distribution of the urban working class.
4.2.3 Highest Level of Education The respondents’ level of education attained is summarized below in table 4.3
Table 4.3 Education Level
Level of education Number Percent (%)
Post graduate education 32 10%
University 71 22% College 81 25%
Secondary 94 29% Primary 45 14% TOTAL 324 100%
Source: Research Data, 2019
22
Data on education level attained by the respondents was collected. The findings showed
that, the highest number of those interviewed i.e. 29% had secondary level education.
25% were college graduates; 22% of the respondents were University graduates; 14% had
had primary level education whilst 10% had postgraduate education. This implies that
milk is widely consumed and that the customers for packaged milk brands come from a
cross section of education backgrounds.
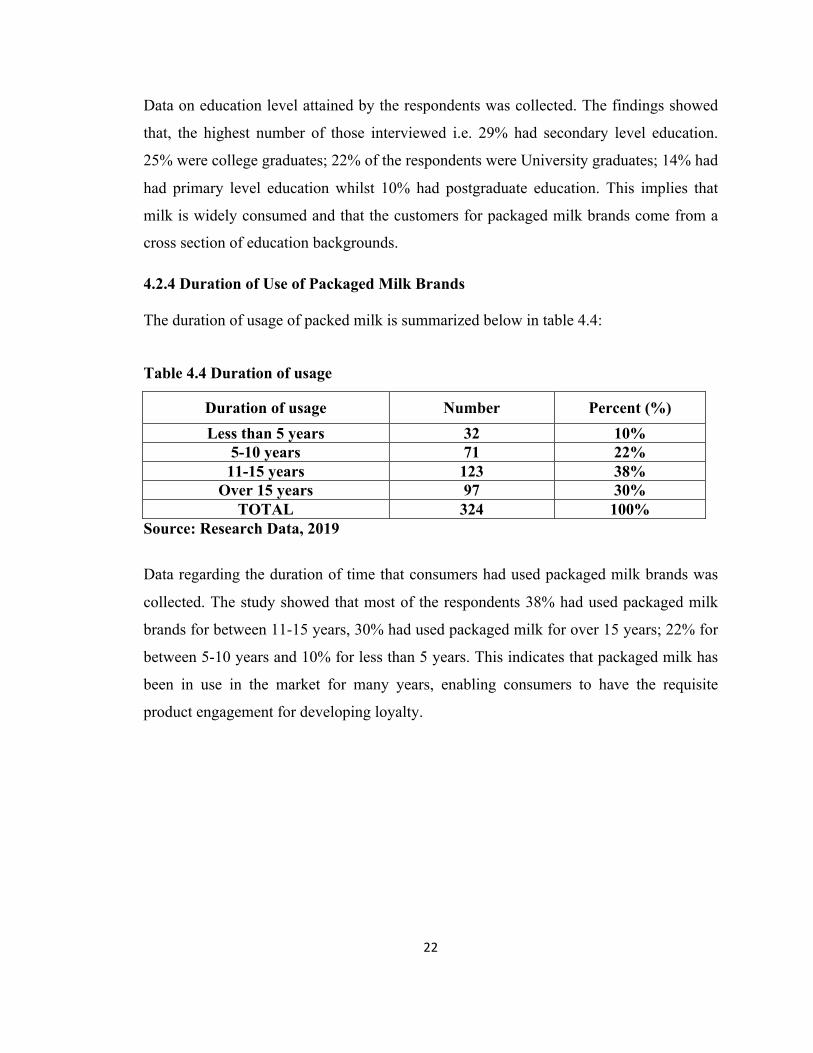
4.2.4 Duration of Use of Packaged Milk Brands The duration of usage of packed milk is summarized below in table 4.4:
Table 4.4 Duration of usage
Duration of usage Number Percent (%) Less than 5 years 32 10%
5-10 years 71 22% 11-15 years 123 38%
Over 15 years 97 30% TOTAL 324 100%
Source: Research Data, 2019
Data regarding the duration of time that consumers had used packaged milk brands was
collected. The study showed that most of the respondents 38% had used packaged milk
brands for between 11-15 years, 30% had used packaged milk for over 15 years; 22% for
between 5-10 years and 10% for less than 5 years. This indicates that packaged milk has
been in use in the market for many years, enabling consumers to have the requisite
product engagement for developing loyalty.
23
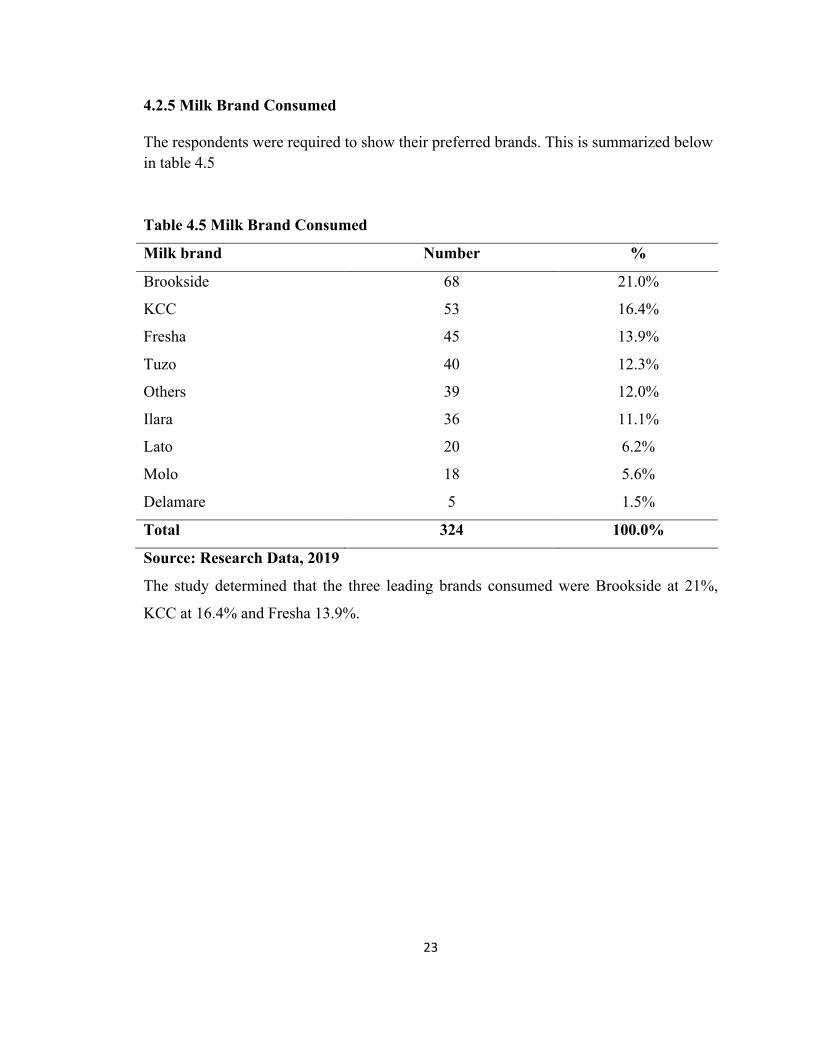
4.2.5 Milk Brand Consumed The respondents were required to show their preferred brands. This is summarized below in table 4.5
Table 4.5 Milk Brand Consumed
Milk brand Number %
Brookside 68 21.0%
KCC 53 16.4%
Fresha 45 13.9%
Tuzo 40 12.3%
Others 39 12.0%
Ilara 36 11.1%
Lato 20 6.2%
Molo 18 5.6%
Delamare 5 1.5%
Total 324 100.0%
Source: Research Data, 2019
The study determined that the three leading brands consumed were Brookside at 21%,
KCC at 16.4% and Fresha 13.9%.
24
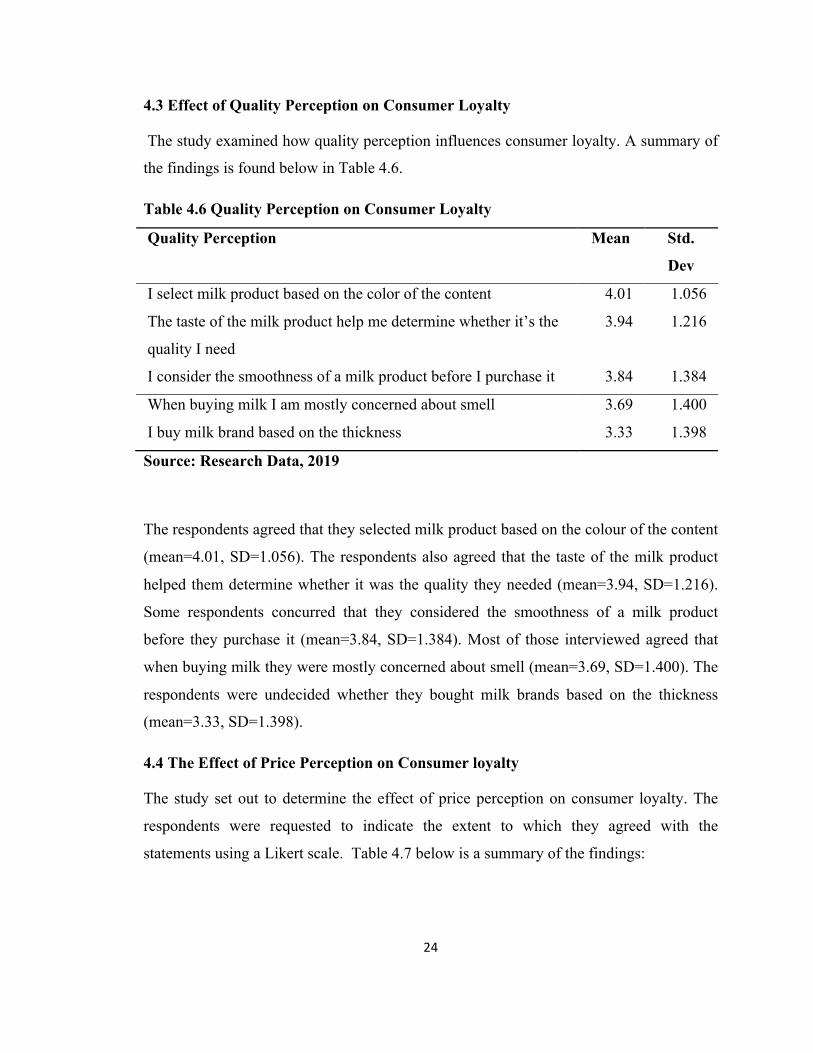
4.3 Effect of Quality Perception on Consumer Loyalty
The study examined how quality perception influences consumer loyalty. A summary of
the findings is found below in Table 4.6.
Table 4.6 Quality Perception on Consumer Loyalty
Quality Perception Mean Std.
Dev
I select milk product based on the color of the content 4.01 1.056
The taste of the milk product help me determine whether it’s the
quality I need
3.94 1.216
I consider the smoothness of a milk product before I purchase it 3.84 1.384
When buying milk I am mostly concerned about smell 3.69 1.400
I buy milk brand based on the thickness 3.33 1.398
Source: Research Data, 2019
The respondents agreed that they selected milk product based on the colour of the content
(mean=4.01, SD=1.056). The respondents also agreed that the taste of the milk product
helped them determine whether it was the quality they needed (mean=3.94, SD=1.216).
Some respondents concurred that they considered the smoothness of a milk product
before they purchase it (mean=3.84, SD=1.384). Most of those interviewed agreed that
when buying milk they were mostly concerned about smell (mean=3.69, SD=1.400). The
respondents were undecided whether they bought milk brands based on the thickness
(mean=3.33, SD=1.398).
4.4 The Effect of Price Perception on Consumer loyalty
The study set out to determine the effect of price perception on consumer loyalty. The
respondents were requested to indicate the extent to which they agreed with the
statements using a Likert scale. Table 4.7 below is a summary of the findings:
25
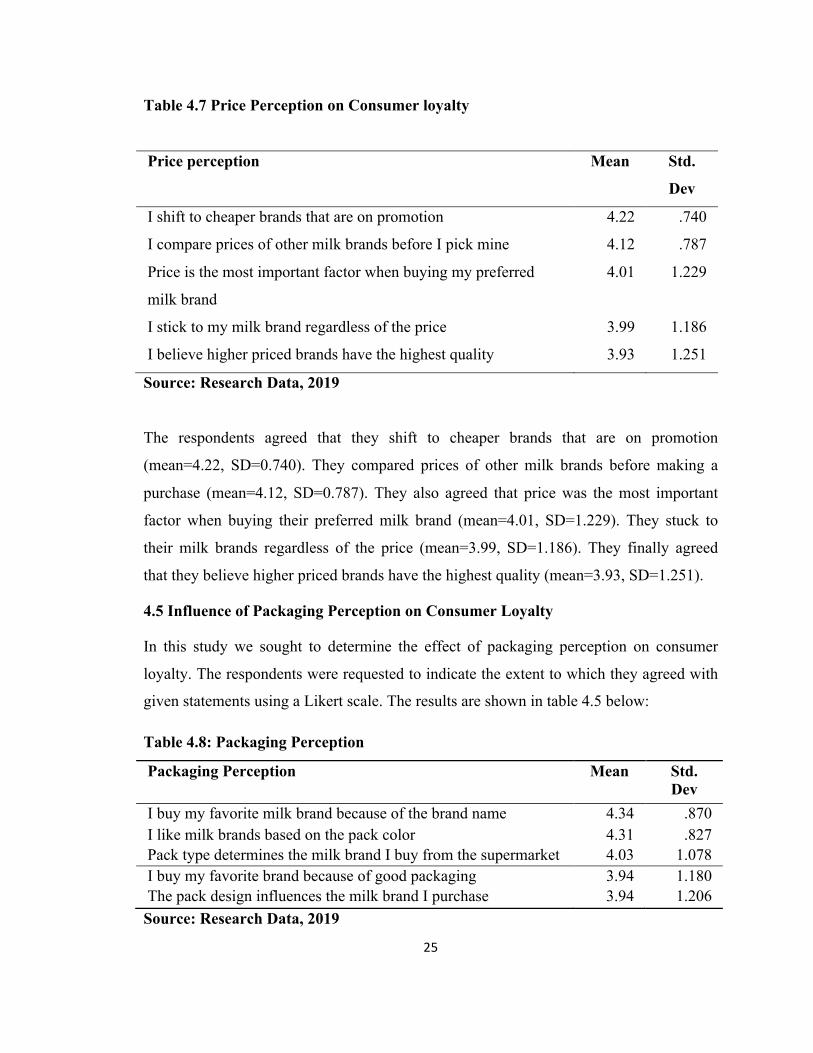
Table 4.7 Price Perception on Consumer loyalty
Price perception Mean Std.
Dev
I shift to cheaper brands that are on promotion 4.22 .740
I compare prices of other milk brands before I pick mine 4.12 .787
Price is the most important factor when buying my preferred
milk brand
4.01 1.229
I stick to my milk brand regardless of the price 3.99 1.186
I believe higher priced brands have the highest quality 3.93 1.251
Source: Research Data, 2019
The respondents agreed that they shift to cheaper brands that are on promotion
(mean=4.22, SD=0.740). They compared prices of other milk brands before making a
purchase (mean=4.12, SD=0.787). They also agreed that price was the most important
factor when buying their preferred milk brand (mean=4.01, SD=1.229). They stuck to
their milk brands regardless of the price (mean=3.99, SD=1.186). They finally agreed
that they believe higher priced brands have the highest quality (mean=3.93, SD=1.251).
4.5 Influence of Packaging Perception on Consumer Loyalty
In this study we sought to determine the effect of packaging perception on consumer
loyalty. The respondents were requested to indicate the extent to which they agreed with
given statements using a Likert scale. The results are shown in table 4.5 below:
Table 4.8: Packaging Perception
Packaging Perception Mean Std. Dev
I buy my favorite milk brand because of the brand name 4.34 .870 I like milk brands based on the pack color 4.31 .827 Pack type determines the milk brand I buy from the supermarket 4.03 1.078 I buy my favorite brand because of good packaging 3.94 1.180 The pack design influences the milk brand I purchase 3.94 1.206 Source: Research Data, 2019
26
The respondents agreed that they bought their favorite milk brand because of the brand
name (mean=4.34, SD=0.870). They liked milk brands based on the pack color
(mean=4.31, SD=0. 827). They also agreed that pack type determined the milk brand they
bought from the supermarket (mean=4.03, SD=1.078) and they bought their favorite
brand because of good packaging (mean=3.94, SD=1.180). They further agreed that pack
design influences the milk brand they purchased (mean=3.94, SD=1.206).
4.6 Effect of Advertising Perception on Consumer loyalty
The study also wanted to determine the effect of advertising perception on consumer
loyalty. The respondents were requested to indicate the extent to which they agreed with
given statements using a Likert scale. The results are shown in table 4.6 below:
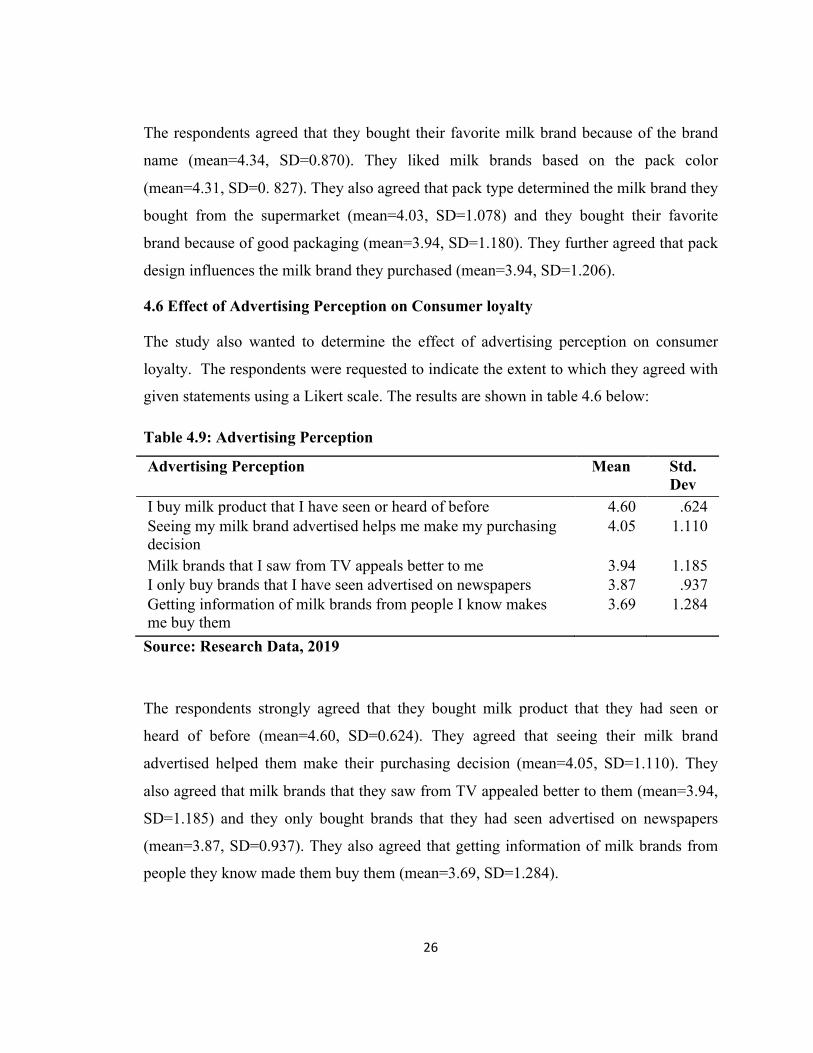
Table 4.9: Advertising Perception
Advertising Perception Mean Std. Dev
I buy milk product that I have seen or heard of before 4.60 .624 Seeing my milk brand advertised helps me make my purchasing decision
4.05 1.110
Milk brands that I saw from TV appeals better to me 3.94 1.185 I only buy brands that I have seen advertised on newspapers 3.87 .937 Getting information of milk brands from people I know makes me buy them
3.69 1.284
Source: Research Data, 2019
The respondents strongly agreed that they bought milk product that they had seen or
heard of before (mean=4.60, SD=0.624). They agreed that seeing their milk brand
advertised helped them make their purchasing decision (mean=4.05, SD=1.110). They
also agreed that milk brands that they saw from TV appealed better to them (mean=3.94,
SD=1.185) and they only bought brands that they had seen advertised on newspapers
(mean=3.87, SD=0.937). They also agreed that getting information of milk brands from
people they know made them buy them (mean=3.69, SD=1.284).
27
4.7 Consumer Loyalty
The study also asked the respondents to specify the extent to which they agreed or
disagreed with the statements provided on consumer loyalty. Table 4.7 below is a
summary of these findings:
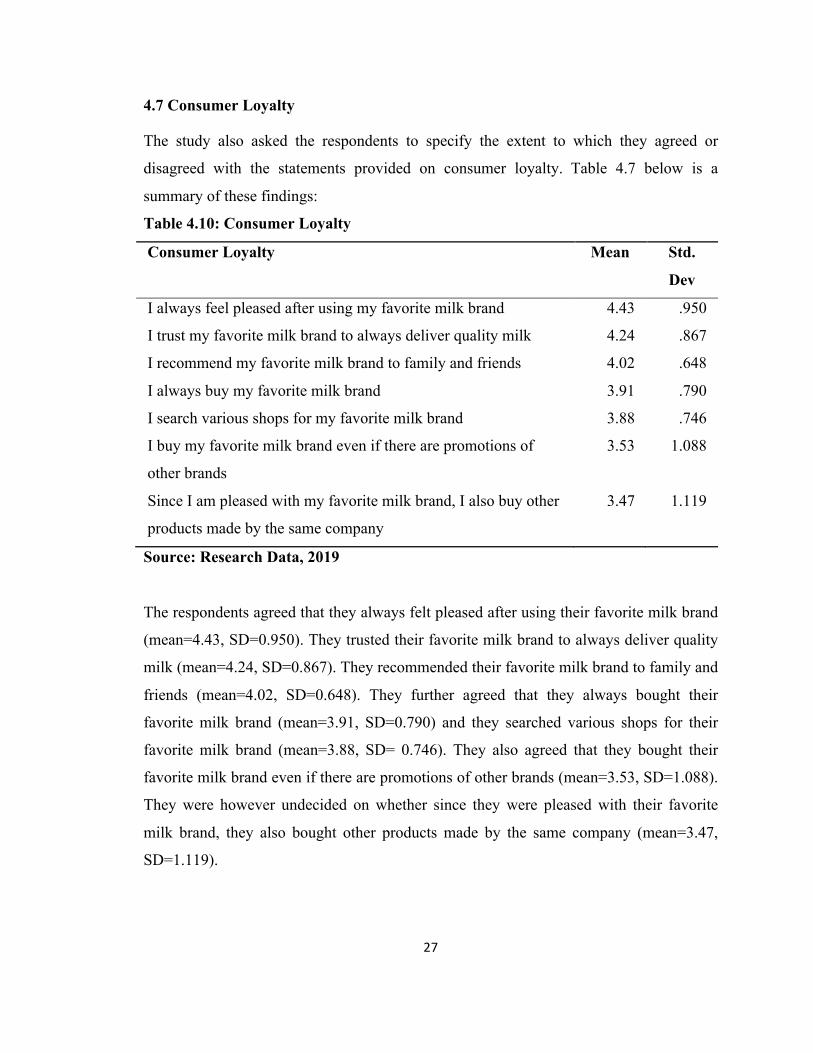
Table 4.10: Consumer Loyalty
Consumer Loyalty Mean Std.
Dev
I always feel pleased after using my favorite milk brand 4.43 .950
I trust my favorite milk brand to always deliver quality milk 4.24 .867
I recommend my favorite milk brand to family and friends 4.02 .648
I always buy my favorite milk brand 3.91 .790
I search various shops for my favorite milk brand 3.88 .746
I buy my favorite milk brand even if there are promotions of
other brands
3.53 1.088
Since I am pleased with my favorite milk brand, I also buy other
products made by the same company
3.47 1.119
Source: Research Data, 2019
The respondents agreed that they always felt pleased after using their favorite milk brand
(mean=4.43, SD=0.950). They trusted their favorite milk brand to always deliver quality
milk (mean=4.24, SD=0.867). They recommended their favorite milk brand to family and
friends (mean=4.02, SD=0.648). They further agreed that they always bought their
favorite milk brand (mean=3.91, SD=0.790) and they searched various shops for their
favorite milk brand (mean=3.88, SD= 0.746). They also agreed that they bought their
favorite milk brand even if there are promotions of other brands (mean=3.53, SD=1.088).
They were however undecided on whether since they were pleased with their favorite
milk brand, they also bought other products made by the same company (mean=3.47,
SD=1.119).
28
4.8 Inferential Statistics
A multiple regression model was applied to determine the relative significance of each of
the independent variables with respect to the consumer loyalty to packaged milk brands.
The regression model was as follows:
Y= B0 +B1X1+B2X2+B3X3+B4 X4 +e
Where
Y is the consumer loyalty,
B0 is the constant
X1 = Quality perception
X2 = Price perception
X3 = Packaging perception
X4 = Advertising perception
ε = Error term
B1, B2, B3 B4 and B5 are coefficients
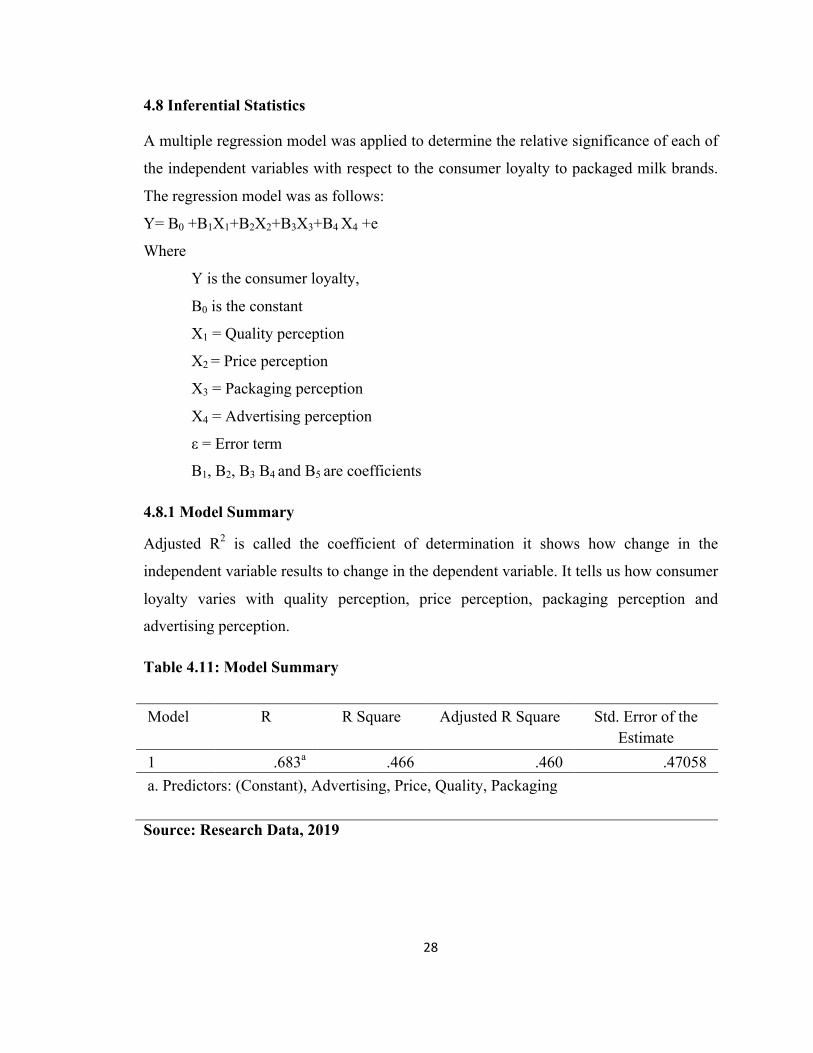
4.8.1 Model Summary
Adjusted R2 is called the coefficient of determination it shows how change in the
independent variable results to change in the dependent variable. It tells us how consumer
loyalty varies with quality perception, price perception, packaging perception and
advertising perception.
Table 4.11: Model Summary
Model R R Square Adjusted R Square Std. Error of the
Estimate 1 .683a .466 .460 .47058 a. Predictors: (Constant), Advertising, Price, Quality, Packaging
Source: Research Data, 2019
29
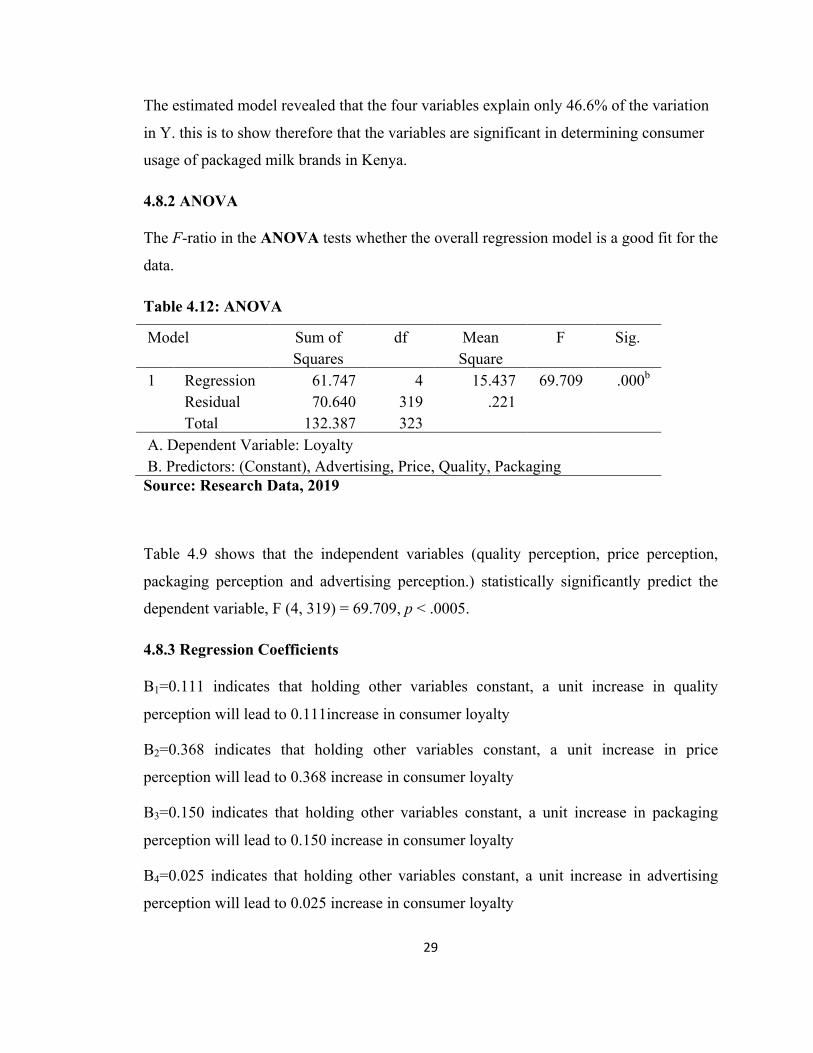
The estimated model revealed that the four variables explain only 46.6% of the variation
in Y. this is to show therefore that the variables are significant in determining consumer
usage of packaged milk brands in Kenya.
4.8.2 ANOVA The F-ratio in the ANOVA tests whether the overall regression model is a good fit for the
data.
Table 4.12: ANOVA
Model Sum of Squares
df Mean Square
F Sig.
1 Regression 61.747 4 15.437 69.709 .000b Residual 70.640 319 .221 Total 132.387 323
A. Dependent Variable: Loyalty B. Predictors: (Constant), Advertising, Price, Quality, Packaging Source: Research Data, 2019
Table 4.9 shows that the independent variables (quality perception, price perception,
packaging perception and advertising perception.) statistically significantly predict the
dependent variable, F (4, 319) = 69.709, p < .0005.
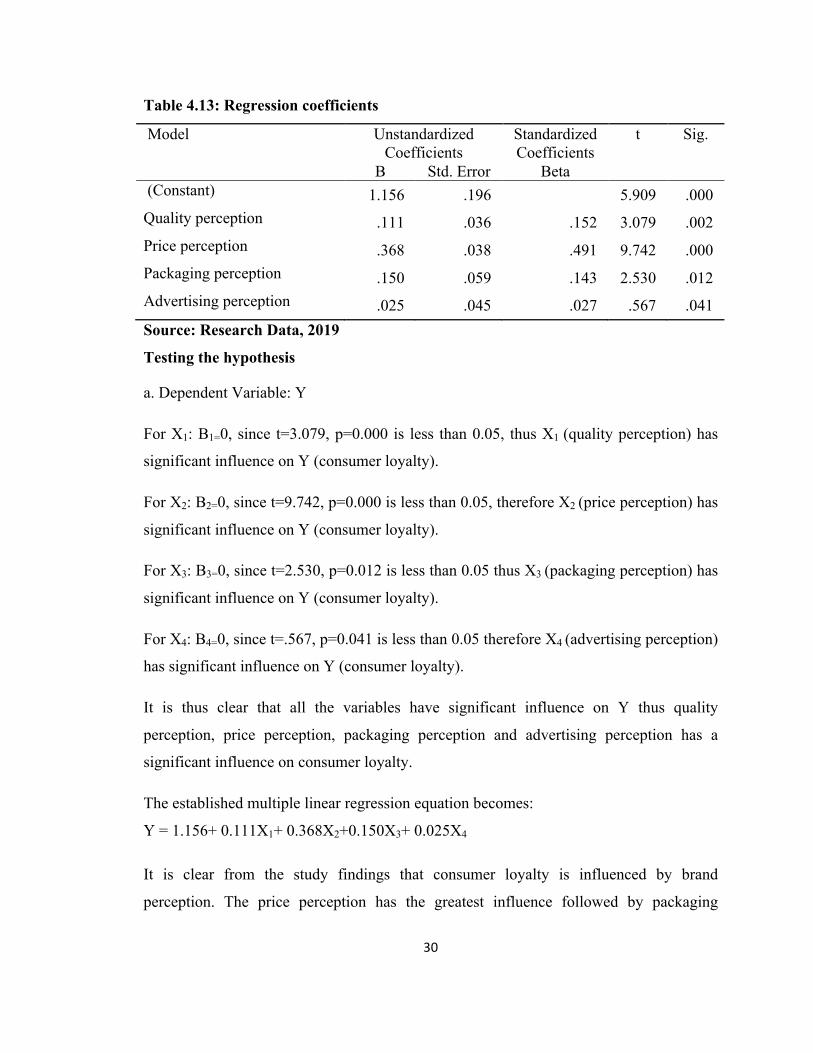
4.8.3 Regression Coefficients B1=0.111 indicates that holding other variables constant, a unit increase in quality
perception will lead to 0.111increase in consumer loyalty
B2=0.368 indicates that holding other variables constant, a unit increase in price
perception will lead to 0.368 increase in consumer loyalty
B3=0.150 indicates that holding other variables constant, a unit increase in packaging
perception will lead to 0.150 increase in consumer loyalty
B4=0.025 indicates that holding other variables constant, a unit increase in advertising
perception will lead to 0.025 increase in consumer loyalty
30
Table 4.13: Regression coefficients
Model Unstandardized Coefficients
Standardized Coefficients
t Sig.
B Std. Error Beta (Constant) 1.156 .196 5.909 .000 Quality perception .111 .036 .152 3.079 .002 Price perception .368 .038 .491 9.742 .000 Packaging perception .150 .059 .143 2.530 .012 Advertising perception .025 .045 .027 .567 .041 Source: Research Data, 2019
Testing the hypothesis
a. Dependent Variable: Y
For X1: B1=0, since t=3.079, p=0.000 is less than 0.05, thus X1 (quality perception) has
significant influence on Y (consumer loyalty).
For X2: B2=0, since t=9.742, p=0.000 is less than 0.05, therefore X2 (price perception) has
significant influence on Y (consumer loyalty).
For X3: B3=0, since t=2.530, p=0.012 is less than 0.05 thus X3 (packaging perception) has
significant influence on Y (consumer loyalty).
For X4: B4=0, since t=.567, p=0.041 is less than 0.05 therefore X4 (advertising perception)
has significant influence on Y (consumer loyalty).
It is thus clear that all the variables have significant influence on Y thus quality
perception, price perception, packaging perception and advertising perception has a
significant influence on consumer loyalty.
The established multiple linear regression equation becomes:
Y = 1.156+ 0.111X1+ 0.368X2+0.150X3+ 0.025X4
It is clear from the study findings that consumer loyalty is influenced by brand
perception. The price perception has the greatest influence followed by packaging
31
perception and quality perception. Advertising perception has the least influence on
consumer loyalty towards packaged milk products. In this study quality and price have
the greatest impact on brand perception of packaged milk brands. Product quality has a
significant effect on brand perception and should reflect the brand. Therefore the quality
of the brand should match the pricing, branding, packaging and type of advertising.
Quality must however meet customer expectations.
32
CHAPTER FIVE: SUMMARY, DISCUSSION, CONCLUSION AND
RECOMMENDATIONS
5.1 Introduction
In this chapter I cover the summary, discussions, conclusion, and recommendations of
this study.
5.2 Summary
The findings show that consumers selected milk product based on the color of the
content. The taste of the milk product helped them determine whether it was the quality
they needed. Consumers considered the smoothness of a milk product before they
purchase it. When buying milk consumers were mostly concerned about smell it.
Further from the findings consumers shifted to cheaper milk brands that were on
promotion and they compared prices of other milk brands before they picked theirs. Price
was the most important factor when buying their preferred milk brand. Consumers stuck
to their milk brands regardless of the price and they believe higher priced brands had the
highest quality.
The study also established that consumers bought their favorite milk brand because of the
brand name. They liked milk brands based on the pack color. Pack type determined the
milk brand consumers bought from the supermarket. Consumers bought their favorite
brand because of good packaging. The pack design influenced the milk brand consumers
purchased.
The findings further established that consumers bought milk product that they had seen or
heard of before. Seeing their milk brand advertised helped them make consumers
purchasing decision. Milk brands that they saw from TV appealed better to consumers
they only bought brands that they had seen advertised on newspapers. Getting
information of milk brands from people they know made consumers buy them.
33
The study finally established that consumers always feel pleased after using their favorite
milk brand. Consumers trust their favorite milk brand to always deliver quality milk.
Consumers recommend their favorite milk brand to family and friends. Further,
consumers always buy their favorite milk brand and they search various shops for their
favorite milk brand. The study shows that consumers buy their favorite milk brand even
if there are promotions of other brands.
5.2 Discussion
According to Aaker (1991), perceived quality is determined by the customer’s perception
of the overall quality of the brand given its intended purpose, considering other
alternatives. The findings show that perception of quality was very important as all the
attributes of quality had a standard deviation of above 1.000. Leading amongst the
attributes was smell at 1.400 followed by thickness at 1.398 smoothness at 1.384, taste at
1.216 and color at 1.956.Consumers perception of quality was therefore largely driven by
smell thickness and smoothness. The findings correspond to Ravindran et al. (2013)
study, which shows that excellent quality can often overshadow a negative experience
with the product itself. The research showed that the most highly consumed milk product
is fresh milk marketed by Brookside Dairies, followed by KCC and Fresh from
Githunguri dairies.
On price the findings showed that consumers shifted to cheaper brands that were on
promotion. They however switched back to their usual brand once the promotion ended.
Price being important, they compared prices of other milk brands before they picked
theirs. The study concludes that the most important factor when buying their preferred
milk brand is price. This is in agreement with arguments by Hatirli (2004) and Golias
(2002) which states that price influences who buys a product, the quantity bought and the
location from where it is purchased. Also according to Kotler and Keller (2012), the price
of a brand is the one element of the marketing mix that generates income, since the other
components generate expenses and it is a deciding factor in purchase decision of
customers (Grabowski & Vernon, 2017).
34
The study established that during price offers by milk companies, consumers switch
brands to lower priced ones. They then revert back to their usual milk brands when the
promotion ends. Consumers typically stay loyal to their preferred milk brand regardless
of the price, and believe that higher priced brands are of higher quality. Findings are in
line with Azevedo and Farhangmehr, (2005) that some companies use premium pricing th
to create a higher perceived value of their brands. Brookside milk is priced higher than
other milk brand and is perceived to be of higher quality and was the leading brand in this
study.
The study also established that as regards packaging, brand names played a key role in
determining consumers’ perception regarding milk brands. Further, they liked milk
brands based on the pack color and also the pack type. The options available included
plastic bags, plastic bottles and triangular packs from Tetra Pak. Consumers however
bought their favorite brand because of good packaging with no risk of spillage or
spoilage. As there are many brands to select from, pack design influenced the milk brand
purchased with the highest standard deviation of 1.208.
The findings further established that consumers bought milk brands that they had seen or
heard of before. Seeing their milk brand advertised helped them make consumers
purchasing decision. Milk brands that they saw from TV appealed better to consumers
they only bought brands that they had seen advertised on newspapers. Getting
information of milk brands from people they know made consumers buy them.
Products or services with positive brand perceptions can expect to enjoy certain benefits.
These typically comprise increased consumer loyalty and being less susceptible to
competitor activities, enjoying larger margins and more inelastic reactions by consumers
to price increases. Coner and Gungor (2002) stated that the level of customer loyalty was
determined by factors such as quality, retailer image, price and promotion. They further
stated that the quality [of product and service] is directly related to a customer’s
satisfaction with the brand, and that this ultimately leads to customer loyalty (Coner and
Gungor, 2002).
35
5.3 Conclusion of the Study
Customer perception is the culmination of a number of factors. It is therefore the result of
all the activities a brand is involved in, and is experienced by a consumer. Whether it is
an attractive packaging design, consistent product quality price fairness or advertising,
absolutely everything the brand does affects customer perception. Some factors however
have a greater effect than others. In this study quality and price have the greatest impact
on brand perception of packaged milk brands. Although other factors such as packaging
have a smaller impact they too matter especially when combined with the rest.
Product quality plays an important part in influencing brand perception and should thus
reflect the brand. Therefore the quality of the brand should match the pricing, branding,
packaging and type of advertising. That quality should match customer expectations. For
example a luxury brand must have high quality whereas a budget brand may work well
but have fewer features. Milk packed in bottles therefore sells for more money than that
which is sold in polythene bags. The buyers of milk in polythene bags expect to pay less
for the compromise in packaging quality. Brand perception therefore has a significant
impact on buying decisions.
Price has a huge influence on how others see a brand. High prices convey luxury, quality,
and excellent customer experience. Conversely, lower priced goods may appeal to
customers seeking bargains, or repel customers concerned about quality. Packaging on
the other hand is usually the first contact many customers have with a brand and therefore
significant in influencing perception of the brand. This is aligned to the arguments
presented by Kotler (2000) and Kennedy (2004) who stated that the manner in which a
brand is presented influences who it may attract. This is because the typical consumer
considers the appearance of a product as a vital cue, when evaluating it for indicators
such as freshness, healthiness and value for money. Another finding is that consumers are
more comfortable buying milk products that they have seen or heard of before. Seeing or
hearing their milk brand advertised helps them make consumers purchasing decisions.
Milk brands that they saw on TV, radio and newspapers appealed better to consumers.
36
A positive consumer perception of a milk brand is vital for increased sales turnover, as
consumers consistently repurchase these brands, despite competitive activities, and are
more likely to recommend such brands to others. They thus contribute to lowering
expenditure on product marketing. Additionally profit margins can be increased by use
of premium pricing on quality brands.
5.4 Recommendations
i. Dairy companies should focus more on maintaining consistent quality of their
products as opposed to price reduction as a strategy for customer acquisition.
Many consumers do not mind buying a product at a slightly higher price as long
as their perception of the brand is that it will deliver good quality.
ii. Advertising is another important factor that dairy companies should consider
improving. The type of promotion done as well as the type of media used has a
great impact on the consumers’ readiness to purchase such a product. This should
match the needs and lifestyle of the market segment being targeted.
iii. The product packaging influences consumers’ loyalty towards a certain dairy
product. The dairy companies should therefore work on improving their brand in
order to be more distinct. Many pack designs tend to have similar colors of either
green or blue. They should however have more distinct designs.
5.5 Areas Suggested for Further Research
I would therefore like to suggest that additional research be undertaken on consumer
loyalty towards other brands such as washing detergents, cooking fats among other
households’ goods to determine whether the same factors .A similar study on milk brands
should be conducted in other parts of the country especially major towns such as Kisumu,
Eldoret and Mombasa. This will help validate the findings of this study.
37
REFERENCES
Abdulvand, M. and Abdoli, K. (2006), "evaluating the effective factors on customer
loyalty of Tejarat Bank depositors", Marketing Management Journal, Vol, 5, pp.
1-20.
Aberdeen., N. Syamsun., M. Najib M. (2016). The Effect of Brand Awareness and Image
on Consumer Perceived Quality and Purchase Intension –A Study Case of
Carbonated Drink Brand at Bogor City. International Journal of Scientific and
Research Publications; 6(8), 441-446
Adede O and Kinoti M. (2016). Determinants of Consumers’ Choice of Milk Brands in
Selected Residential Estates Owned By Nairobi City County, Kenya.
International Journal of Business and Social Science. 7(4), 211-222
Agumba, G., Kirui C., & Gudda, P. (2017). Effect of Brand Awareness on Customer
Retention in the Mobile Telecommunication Industry in Kenya: A Case of Airtel
Kenya. International Journal of Management and Commerce Innovations, 5(1),
601-604
Allameh, M. ; Noktedan, A. (2006), "The effect of service quality on customer loyalty.",
Business Administration Journal, vol. 5, pp. 109-24.
Amboko, A. K. & Namusonge, G. (2015). Effects of strategic brand awareness and
customer loyalty on performance of Kenya Power and Lighting Company
Limited. International Academic Journal of Human Resource and Business
Administration, 1 (5), 13-35
Brakus, J.J, Schmitt, B.H., and Zarantonello, L. (2009). Brand Experience: What is it?
How is it Measured? Does It Affect Loyalty? Journal of Marketing, 73, 52-68
Iglesias, O., Singh, J., and Foguet, J. (2010) The Role of Brand Experience and Affective
Commitment in Determining Consumer loyalty. Journal of Brand Management.
18, 570–582.
Karam A. & Saydam S. (2015). An Analysis Study of Improving Brand Awareness and
Its Impact on Consumer Behavior Via Media in North Cyprus (A Case Study of
Fast Food Restaurants). International Journal of Business and Social Science.
7(4), 66-80
38
KenduiwaA.,MwonyaR.andKinuthiaL.(2016).InfluenceofSmallholderDairyFarmers
Participation inMicrofinance on Breed Improvement in Dairy farming in Longisa Sub
County,BometCounty,Kenya.JournalofAgricultureandVeterinaryScience,9(7):66-7
KenyaNationalDairyMasterPlan(2010).NationalDairyMasterPlan.MinistryofLivestock
Development. Retrieved from http://kdb.co.ke/press/publications/reports/5-kenya-
national-dairy-masterplan/file.
MachiraG.(2014).StatusoftheKenyanDairyIndustry.PresentedduringESADAsBreakfast
Meeting, on 13th August 2014. Retrieved February 23, 2019, from
www.slideshare.net/mobile/dairyesada/status-of-the-kenyan-dairy-industry
MugambiD.,MainaM.,KairuSandGitunuA.(2015).Assessmentofperformanceof
smallholder dairy farms in Kenya: an econometric approach. Journal of Applied
Biosciences,85:7891–7899.
Nasab M. & Alroaya Y. (2013). The Study of the Effect of Brand on Customer Loyalty
of Electronic products. International J. Soc. Sci. & Education. 3(4), 1047-1058
Neupane R. (2015). The effects of brand image on customer satisfaction and loyalty
intention in retail super market chain UK. International Journal of Social
Sciences and Management, 2(1), 9-26
Ramaseshen, B., and Stein, A. (2014) Connecting the Dots Between Brand Experience
and Consumer loyalty: The Mediating Role of Brand Personality and Brand
Relationships. 669-670.
Ravindran R., Senith, S., John F. (2013). Branding is the solution for product
differentiation in Indian Dairy Industry. IOSR Journal of Business and
Management 14(3), 93-99
Seyed Javadin et al. (2010) "evaluating the effect of brand on loyalty of industrial
customers", Business Administration Prospect, vol. 3, pp. 57-73.
Sherry, J.F. (2005) Brand meaning. In: A.M. Tybout and T. Calkins (eds.) Kellog on
Branding. Hoboken: John Wiley and Sons, pp. 40–69.
Warutere M. (2015). The extent to which consumer promotions builds awareness of dairy
products: a case of consumers in Nairobi. European Journal of Business and
Social Sciences, 4(8), 246-259
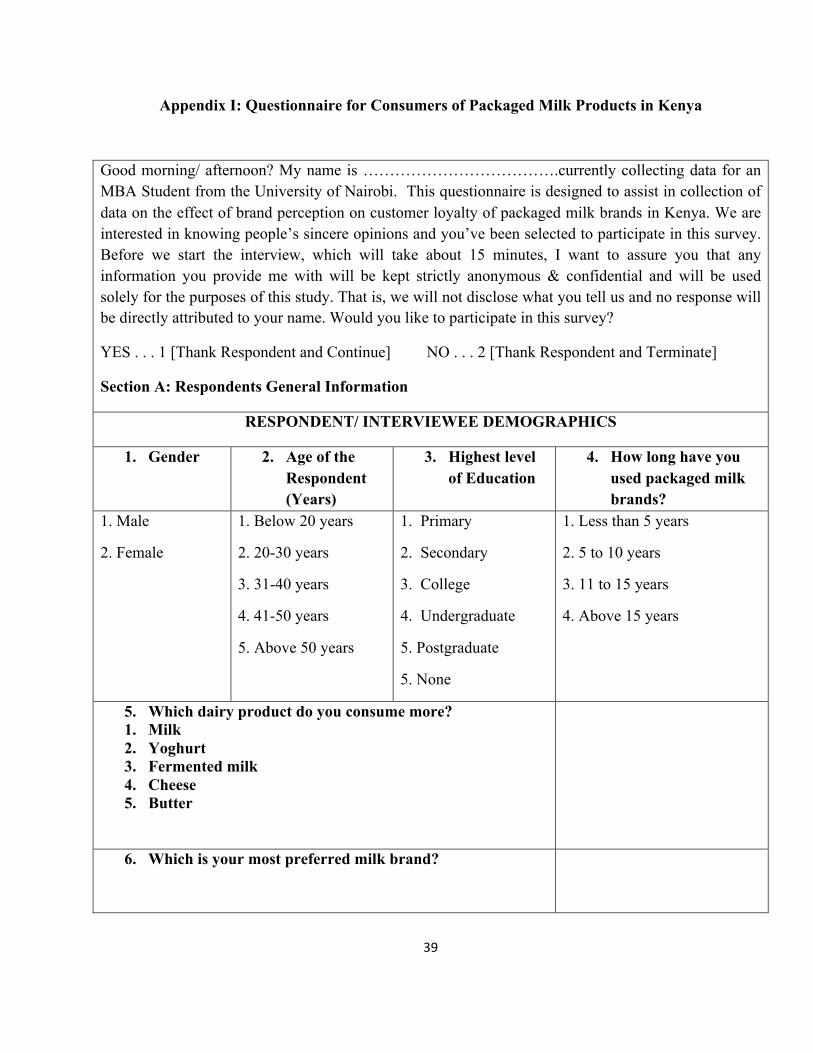
39
Appendix I: Questionnaire for Consumers of Packaged Milk Products in Kenya
Good morning/ afternoon? My name is ……………………………….currently collecting data for an MBA Student from the University of Nairobi. This questionnaire is designed to assist in collection of data on the effect of brand perception on customer loyalty of packaged milk brands in Kenya. We are interested in knowing people’s sincere opinions and you’ve been selected to participate in this survey. Before we start the interview, which will take about 15 minutes, I want to assure you that any information you provide me with will be kept strictly anonymous & confidential and will be used solely for the purposes of this study. That is, we will not disclose what you tell us and no response will be directly attributed to your name. Would you like to participate in this survey?
YES . . . 1 [Thank Respondent and Continue] NO . . . 2 [Thank Respondent and Terminate]
Section A: Respondents General Information
RESPONDENT/ INTERVIEWEE DEMOGRAPHICS
1. Gender 2. Age of the Respondent (Years)
3. Highest level of Education
4. How long have you used packaged milk brands?
1. Male
2. Female
1. Below 20 years
2. 20-30 years
3. 31-40 years
4. 41-50 years
5. Above 50 years
1. Primary
2. Secondary
3. College
4. Undergraduate
5. Postgraduate
5. None
1. Less than 5 years
2. 5 to 10 years
3. 11 to 15 years
4. Above 15 years
5. Which dairy product do you consume more? 1. Milk 2. Yoghurt 3. Fermented milk 4. Cheese 5. Butter
6. Which is your most preferred milk brand?
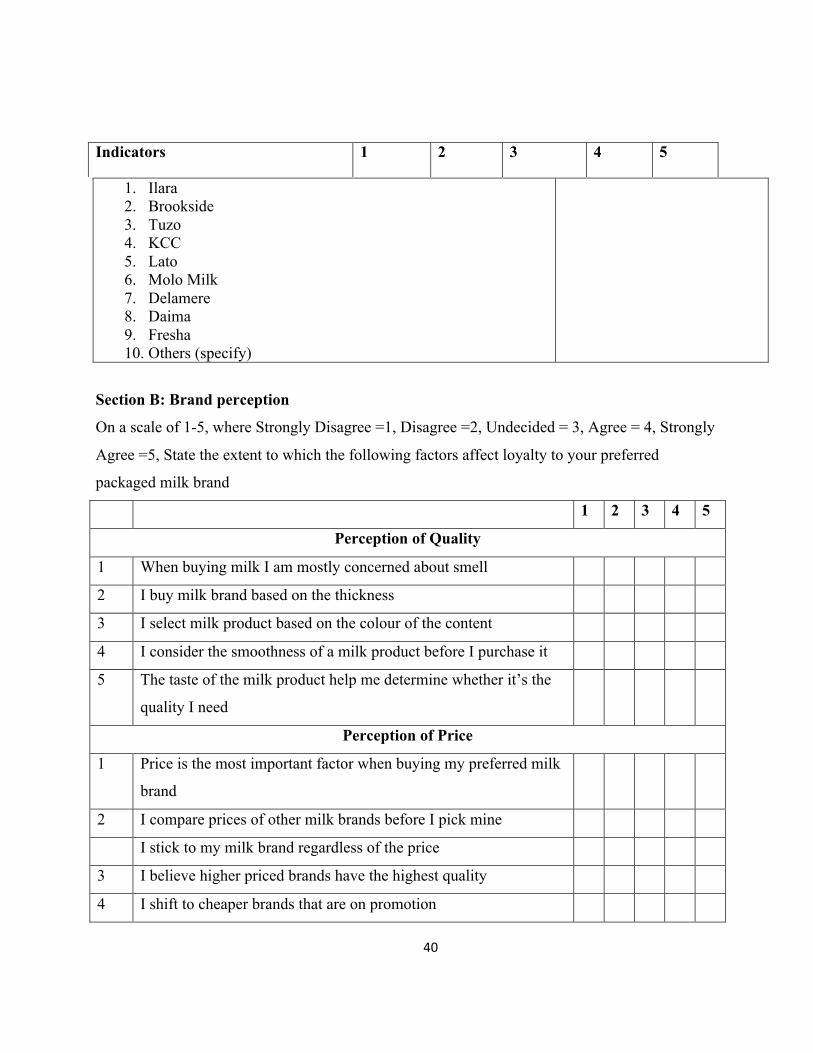
40
1. Ilara 2. Brookside 3. Tuzo 4. KCC 5. Lato 6. Molo Milk 7. Delamere 8. Daima 9. Fresha 10. Others (specify)
Section B: Brand perception
On a scale of 1-5, where Strongly Disagree =1, Disagree =2, Undecided = 3, Agree = 4, Strongly
Agree =5, State the extent to which the following factors affect loyalty to your preferred
packaged milk brand
1 2 3 4 5
Perception of Quality
1 When buying milk I am mostly concerned about smell
2 I buy milk brand based on the thickness
3 I select milk product based on the colour of the content
4 I consider the smoothness of a milk product before I purchase it
5 The taste of the milk product help me determine whether it’s the
quality I need
Perception of Price
1 Price is the most important factor when buying my preferred milk
brand
2 I compare prices of other milk brands before I pick mine
I stick to my milk brand regardless of the price
3 I believe higher priced brands have the highest quality
4 I shift to cheaper brands that are on promotion
Indicators 1 2 3 4 5
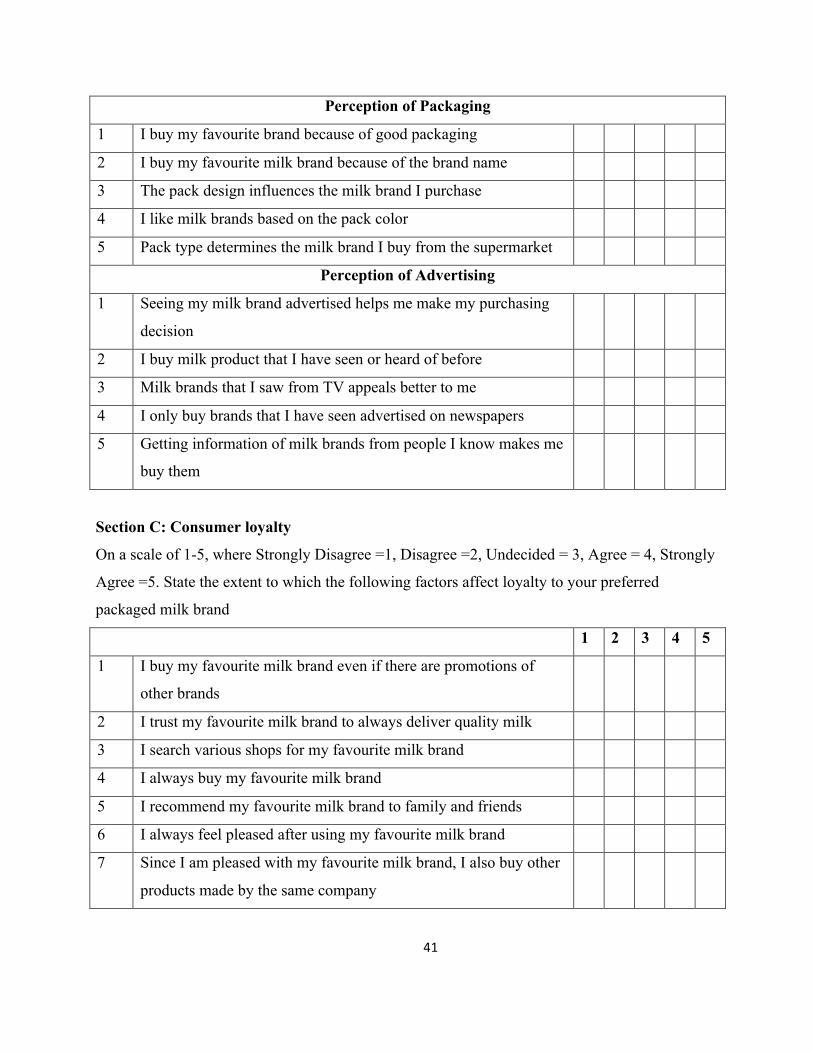
41
Perception of Packaging
1 I buy my favourite brand because of good packaging
2 I buy my favourite milk brand because of the brand name
3 The pack design influences the milk brand I purchase
4 I like milk brands based on the pack color
5 Pack type determines the milk brand I buy from the supermarket
Perception of Advertising
1 Seeing my milk brand advertised helps me make my purchasing
decision
2 I buy milk product that I have seen or heard of before
3 Milk brands that I saw from TV appeals better to me
4 I only buy brands that I have seen advertised on newspapers
5 Getting information of milk brands from people I know makes me
buy them
Section C: Consumer loyalty
On a scale of 1-5, where Strongly Disagree =1, Disagree =2, Undecided = 3, Agree = 4, Strongly
Agree =5. State the extent to which the following factors affect loyalty to your preferred
packaged milk brand
1 2 3 4 5
1 I buy my favourite milk brand even if there are promotions of
other brands
2 I trust my favourite milk brand to always deliver quality milk
3 I search various shops for my favourite milk brand
4 I always buy my favourite milk brand
5 I recommend my favourite milk brand to family and friends
6 I always feel pleased after using my favourite milk brand
7 Since I am pleased with my favourite milk brand, I also buy other
products made by the same company