Embed Size (px)
Citation preview

Indonesia’s Millennial Consumer Insight on Brand Equity:
Effects of Brand Association, Brand Loyalty, Brand
Awareness, and Brand Image
UNDERGRADUATE THESIS
To Fulfill the Partial Requirement to Obtain Bachelor Degree
Management Department
Bachelor Thesis Supervisor:
Prof. Dr. Basu Swasta Dharmmesta, M.B.A.
Proposed by:
Ajeng Ghina Farhani
11/311427/EK/18232
FACULTY OF ECONOMICS AND BUSINESS
UNIVERSITAS GADJAH MADA
2015

EA THESIS
TNDONESIA'S MILLENNIAL CONSUMER II{SIGHT ON BRAND EQUITY:EFFECTS OF BRAND ASSOCIATION, BRAND LOYALTY, BRAND
AWAREI{ESS, AND BRAND IMAGE
By:
AJENG GHINA FARHANI
ty3tt427|EKA8232
Defended and examined before the Board of Examiners
on February 26,2016
Presented and declared acceptable as the partial fulfillment of the requirements
to obtain the Sarjana Ekonomi Degree
in Faculty of Economics and Business Universitas Gad.jah Mada
Board of Examiners
Supervisor Members of Board of Examinersand Member of Board of Examiner
NBasu Swastha Dharmmesta, Prof. Dr., M.B.A. Teguh Budiarto, Drs., M.I.M.
Faculty of Economics and Business Universitas Gad.iah Mada
Rr Tur Nastiti, M.Si.
Date February 26,,2016
of Management Study Program

UNIVERSITAS GADJAH MADAFACULTY OF ECONOMICS AND BUSINESS
Here I state that the thesis titled:
INDONESIA'S MILLENNIAL CONSUMER INSIGHT ON BRAND EQUTTY:EFFECTS OF BRAND ASSOCIATION, BRAND LOYALTY, BRANT)
AWAREI{ESS, AND BRAND IMAGE
By:
AJENG GHINA FARHANI
ty3tt427tBKlt8232
Has been read carefully and its covering and quality have been fulfilling the requirements ofscientific standard as a thesis for undergraduate degree.
Supervisort\
Basu Swastha Dharmmesta, Prof. Dr., M.B.A.
The thesis has been submitted to the Undergraduate Program of Faculty of Economics andBusiness Universitas Gadjah Mada and has been accepted as the parlial requirements to obtainthe Sarjana Degree (S1)
Yogyakarta, February 26, 201 6
Head of Management Study Program
Wayan Nuka Lantara, M.Si., Ph.D.NrP. 1975033 1200801 1003

UNIVERSITAS GADJAH MADAFACULTY OF ECONOMICS AND BUSINESS
STATEMENTS OF WORK'S ORIGINALITY
Here I state that the thesis titled:
INDONESIA'S MILLENNIAL CONSUMER II\SIGHT ON BRAND EQUITY:EFFECTS OF BRAND ASSOCIATION, BRAND LOYALTY, BRAND
AWARENESS, AND BRAND IMAGE
Which was defended and examined on February 26,2016 is my original work.
I honestly declare that the thesis I wrote does not contain the works or part of works of otherpeople by copying in the form of sentences or symbols which show other writers' idea or opinionor thought, except cited in the quotations and bibliography, as a scientific paper should.
I will willingly withdraw this thesis as my original work if in the future I was founded out doingplagiarism either or not in coincidence. Here I also state that I will accept the consequences oflosing the degree I had from Universitas Gadjah Mada.
Yogyakarla, February 26, 201 6
Stated by,
AJENG GHINA FARHANI
Witness
Supervisor Members of Board of Examiners\And Member of Bo4qd of Examiner
Basu Swastha Dhaimmesta, Prof. Dr., M.B.A. Teguh Budiarto, Drs., M.I.M.
Nr Tur Nastiti, M.Si.

iv
PREFACE
Alhamdulillah, all praises and thanks to Allah SWT for the blessing so the
author can finish this thesis entitled: “Indonesia’s Millennial Consumer Insight on
Brand Equity: Effects of Brand Association, Brand, Loyalty, Brand Awareness, and
Brand Image”.
The author would like to offer her sincere gratitude to some parties who, either
directly or indirectly have provided prayer, support and encouragement and guidance
to the author, in particular to:
1. Prof. Dr. Basu Swastha Dharmmesta, M.B.A., as Supervisor who has
patiently given his time for guidance and invaluable advice in writing this
research paper.
2. Prof. Wihana Kirana Jaya, M.Soc.Sc., Ph.D., as Dean of Faculty of
Economics and Business Universitas Gadjah Mada.
3. Finally, all the lecturers at FEB UGM and all the staff at FEB UGM for
their kindness and patience in helping me through my study.
Yogyakarta, January 2016
Ajeng Ghina Farhani
v
DEDICATION
This thesis is dedicated to:
1. Allah SWT, for the love, help, guidance and blessing given to me.
2. My beloved parents, Wali Sabana and Farida Mariana. I’m forever thankful to
have such a supportive parents.Thank you for everything.
3. My little sister Putri Ghassani Ramadhina, and My sister in law Diana A.
Prasetyo .Although we do not see each other that often, thank you so much for
the support and become my chatting partner. I love you to infinity and beyond.
4. My grandma, Djamraana. Mami, thank you for always being there for me.
5. My best friends: Pricil,Vinda, and Flori. Thanks girls for your support.
Although you’re miles away, you always become a great support system.
6. My best friends in university: Dini, Cakti, Amel, Nadkar and Ririe. They are
wonderful individuals that make my university days seems brighter and makes
Jogja feels like my second home
7. IUP FEB UGM 2011. Thanks for a great university life.
8. My heroines, the greatest people I met on the internet. I haven’t meet any of
you yet, but it feels like I’ve long distance family somewhere. Thank you for
all the support, I’m happy to be a part of the group.
9. My fur babies. My four legs family who can’t talk back but always cheer me
up since the day one of them come.

ABSTRAK
Millennial merupakan salah satu generasi terbesar serta konsumen terbesar.
Millennial juga yang paling mungkin generasi menjadi produktif dan menghabiskan
uang di seluruh dunia, yang berarti mereka harus menjadi fokus utama dalam strategi
pemasaran. ekuitas merek menggambarkan nilai merek dan bagaimana merek dapat
menghasilkan keuntungan dari nama merek, sebagai nama merek terkemuka akan
memberikan keuntungan yang lebih baik bagi perusahaan. Penelitian ini bertujuan
untuk menyelidiki faktor apa ekuitas merek efek.
Penelitian ini dilakukan dengan menggunakan pendekatan kuantitatif dengan
menggunakan kuesioner sebagai instrumen penelitian. Data itu diperoleh dari 219
responden yang harus pergi ke sebuah kedai kopi setidaknya sekali dalam jangka waktu
satu bulan.
analisis regresi berganda digunakan untuk melakukan penelitian ini. Temuan
menunjukkan bahwa asosiasi merek, loyalitas merek, kesadaran merek, dan citra merek
positif mempengaruhi ekuitas merek.
Kata kunci: merek, ekuitas merek, asosiasi merek, loyalitas merek, kesadaran
merek, citra merek, konsumen millennial.

vii
ABSTRACT
Millennial is one of the largest amount generation, as well as the largest
customer. Millennial are also the most likely generation to be earning and spending
money across the globe, which means they need to become a primary focus in
marketing strategies. Brand equity describes the value of brand name and how the
brand can generate profit from the brand name, as a reputable brand name will give
better profit to the company. This study aims to investigate what factor effect brand
equity.
This research was conducted using quantitative approach using questionnaire
as research instrument. The data was obtained from 219 respondents who must have
went to a coffee shop at least once within a period of a month.
Multiple regression analysis was used to conduct this research. The findings
show that brand association, brand loyalty, brand awareness, and brand image
positively affect brand equity.
Keywords: brand, brand equity, brand association, brand loyalty, brand awareness,
brand image, millennial consumer.
viii
TABLE OF CONTENTS
TITLE PAGE…………………………………………………………………………..
STATEMENT OF EXAMINERS……………………………………………………...i
STATEMENT OF SUPERVISORS…………………………………………………..ii
STATEMENT OF WORK’S ORIGINALITY……………………………………….iii
PREFACE…………………………………………………………………………… iv
DEDICATION………………………………………………………………………...v
ABSTRACT…………………………………………………………………………vii
TABLE OF CONTENT……………………………………………………………..viii
LIST OF TABLES…………………………………………………………………....xi
LIST OF FIGURES…………………………………………………………………...xi
CHAPTER I: INTRODUCTION
1.1 Background……………………………………………………………….…..1
1.2 Research Questions…………………………………………………………...3
1.3 Research Problems……………………………………………………………3
1.4 Research Purpose……………………………………………………………..4
1.5 Research Scope…………………………………………………………….....5
1.6 Research Contribution ………………………………………………………..5
1.7 Writing Framework…………………………………………………………...6
CHAPTER II: THEORITICAL FRAMEWORK AND HYPOTHESIS
DEVELOPMENT
2.1 Millennial……………………………………………………………………..8
2.2 Brand Equity………………………………………………………………….9
2.3 Brand Association…………………………………………………………...12
2.4 Brand Loyalty………………………………………………………………..12
2.5 Brand Awareness……………………………………………………………14

ix
2.6 Brand Image…………………………………………………………………14
2.7 Hypothesis Development……………………………………………………15
CHAPTER III: RESEARCH METHOD
3.1 Research Design……………………………………………………………..19
3.2 Operational Definition and Measurement…………………………………...20
3.2.1 Brand Associations……………………………………………………..20
3.2.2 Brand Loyalty…………………………………………………………..21
3.2.3 Brand Awareness……………………………………………………….21
3.2.4 Brand Image……………………………………………………………21
3.2.5 Brand Equity…………………………………………………………...22
3.3 Sampling Design…………………………………………………………….22
3.3.1 Population……………………………………………………………...22
3.3.2 Sample………………………………………………………………….22
3.3.3 Sampling Method………………………………………………………23
3.3.4 Sampling Size…………………………………………………………..23
3.4 Research Object……………………………………………………………..24
3.5 Data Collection Method……………………………………………………..25
3.6 Research Instrument…………………………………………………………25
3.6.1 Questionnaire…………………………………………………………..25
3.6.2 Pre-test…………………………………………………………………26
3.7 Instrument Test……………………………………………………………....27
3.7.1 Validity Test……………………………………………………………27
3.7.2 Reliability Test…………………………………………………………29
3.8 Data Analysis Method and Hypothesis Testing……………………………...30
3.8.1 Data Analysis Method………………………………………………….30
3.8.2 Hypothesis Testing Method…………………………………………….30
3.8.3 Goodness of Fit Testing………………………………………………...31

x
3.8.4 Hypothesis Testing……………………………………………………..32
CHAPTER IV: DATA ANALYSIS
4.1 Respondents Characteristics………………………………………………...33
4.1.1 Gender………………………………………………………………….33
4.1.2 Age……………………………………………………………………..34
4.1.3 Occupation……………………………………………………………..34
4.1.4 Monthly Expenditure…………………………………………………...35
4.1.5 Favorite Coffee Shop…………………………………………………...36
4.1.6 Frequency of Visit……………………………………………………...36
4.1.7 Monthly Spending in Coffee Shop……………………………………..37
4.2 Instrument Test of Primary Data…………………………………………….38
4.2.1 Validity Test……………………………………………………………38
4.2.2 Reliability Test…………………………………………………………39
4.3 Descriptive Statistics………………………………………………………...40
4.4 Hypothesis Testing…………………………………………………………..41
4.4.1 Hypothesis Testing……………………………………………………..44
4.4.2 Summary of Hypothesis Testing……………………………………….45
4.5 Discussion…………………………………………………………………...46
CHAPTER V: CONCLUSSIONS AND SUGGESTIONS
5.1 Conclusions………………………………………………………………….49
5.2 Research Limitation…………………………………………………………50
5.3 Suggestion for Future Research……………………………………………..51
5.4 Managerial Implication……………………………………………………...51
REFERENCES………………………………………………………………………53
APPENDICIES………………………………………………………………………58

xi
LIST OF TABLES
Table 3.1 KMO and Bartlett’s Test…………………………………………………...27
Table 3.2 Rotated Component Matrix………………………………………………..28
Table 3.3 Reliability Test of Pre-Test………………………………………………..29
Table 4.1 Gender……………………………………………………………………..33
Table 4.2 Age………………………………………………………………………...34
Table 4.3 Occupation………………………………………………………………...34
Table 4.4 Monthly Expenditure………………………………………………………35
Table 4.5 Favorite Coffee Shop ……………………………………………………...36
Table 4.6 Frequency of Visit…………………………………………………………37
Table 4.7 Monthly Spending in Coffee Shop………………………………………...37
Table 4.8 KMO and Bartlett’s Test of Big Sample…………………………………...38
Table 4.9 Rotated Component Matrix of Big Sample………………………………..39
Table 4.10 Reliability Test of Big Sample……………………………………………39
Table 4.11 Descriptive Statistics……………………………………………………..40
Table 4.12 R2 Test……………………………………………………………………42
Table 4.13 F Test……………………………………………………………………..42
Table 4.14 Multiple Regression Test…………………………………………………43
Table 4.15 Summary of Hypothesis Testing…………………………………………45
Table 5.1 Comparison between the Findings of Previous Study and This Study……49
LIST OF FIGURES
Figure 2.1 Aaker Brand Equity Model………………………………………………11
Figure 2.2Research Model…………………………………………………………...18
Figure 4.1 Research Model after Hypothesis Testing………………………………...46
1
CHAPTER I
INTRODUCTION
1.1 Background
Indonesia is one of the world's top coffee producing and exporting countries.
According to Coffee Organization, Indonesia is the third coffee producer in the world
as well as the third coffee exporter. About 80% of Indonesia’s coffee production is
Robusta coffee followed by Arabica and Liberica.
According to Bloomberg, coffee consumption in Indonesia will probably
increase 17 percent in 2015 alongside with rising income and middle class population.
As the consumption of coffee increase, Cafés and coffee shops continues to expand
with the opening of more outlets, not only throughout major cities such as Jakarta,
Bandung and Surabaya, but also in smaller cities as the companies present in the
channel expand their focus. PT. Mitra Adi Perkasa’s Starbucks chain, for example,
opened its first outlet in Cirebon during the review period. In addition, Excelso
Multirasa's Excelso Café expanded its outlet network to include Jogja City. Outlet
volume grew at a faster rate in 2014, reaching a total number of 4,310 outlets.
Cafés/bars have gained popularity among various different consumers of all age
groups. These types of establishments serve as suitable gathering places for business
meetings and for students to do their group assignments as well as for casual gatherings

2
and hanging out, which drove growth in terms of volume and value sales throughout
2014.
Millennial, also known as Generation Y, are those born roughly between 1980
and 2000. According to report from HK Strategies (2014), aside from the intrinsic
knowledge of the internet, millennial is the most educated generation in the history. A
study conducted by Viacom in 2012 stated that, there are 2.5 billion Millennial
worldwide, about a third of the global population. These numbers represent a
tremendous amount of buying power, and will make Generation Y the largest consumer
group in history.
Based on the census conducted by Badan Pusat Staistik (BPS) in 2010,
Indonesia’s population accounted to be more than 234 million people. Sixty percent of
the population below 30 years old. The population is expanding 2.9 million a year.
Indonesia is 16th largest economy in the world and produce 33% of ASEAN GDP. The
top ten cities in Indonesia are contributing 55% of GDP.
Indonesia’s population is young, growing and urbanizing, making it the fastest
growing consumer market in the world. In 2013, McKinsey found that urban
consuming class accounted for about 20 million Indonesians.
In Indonesia, millennial make up the biggest part of the population, makes it
the most potential consumer in the market (Asril and Hudraysah, 2013). According to
Jakarta Globe (2013), the yearly income of millennial of Indonesia add up to $38.2

3
billion. Regardless of the potential of the market, not all marketer understand the power
of millennial consumer. Deeper understanding about millienial consumer become
important. Despite the large potential, the research about millennial in developing
countries is still a uncommon, most of the research about millennial consumer behavior
are located in developing countries such as United States, Canada, and Germany. The
research is replicating research of brand equity from Sasmita and Suki (2015) located
in Malaysia, with the subject of young consumers. That is why researcher interested to
do research about millennia’s consumer insight on brand equity adopting research
model by Sasmita and Suki (2015).
Based on the previous research, the researcher wants to explain factors affecting
brand equity of millennial consumer in Indonesia. Factors that will be analyzed in this
research including brand association, brand loyalty, brand awareness and brand image.
1.2 Research Questions
The following questions are proposed on this research:
1. Does brand association have a positive relationship with brand equity?
2. Does brand loyalty have a positive relationship with brand equity?
3. Does brand awareness have a positive relationship with brand equity?
4. Does brand image have a positive relationship with brand equity?
1.3 Research Problem

4
In Indonesia, millennial make up the biggest part of the population, makes it the
most potential consumer in the market (Asril and Hudraysah, 2013). According to
Jakarta Globe (2013), the yearly income of millennial of Indonesia add up to $38.2
billion. Regardless of the potential of the market, not all marketer understand the power
of millennial consumer. Deeper understanding about millennial consumer become
important. Despite the large potential, the research about millennial in developing
countries is still a uncommon, most of the research about millennial consumer behavior
The research is replicating research of brand equity from Sasmita and Suki (2015)
located in Malaysia, with the subject of young consumers. Research about brand equity
is a popular topic for Indonesian researcher, but none of the research specifically target
millennial consumer. That is why researcher interested to investigate about factor
affecting brand equity of Indonesian millennial consumer by adapting research model
from Sasmita and Suki (2015).
1.4 Research Purpose
The purpose if this research is to analyze the effect of brand association, brand
loyalty, brand awareness and brand image towards brand equity. This research
conducted by replicating previous research conducted by Sasmita and Suki (2015)
under the title “Young Consumers’ Insight on Brand Equity: Effects of Brand
Associations, Brand Loyalty, Brand Awareness and Brand Image.” The researcher
decided to replicate this particular research because the researcher finds the topic

5
interesting and as the previous research use Malaysia which is have similarities with
Indonesia, the researcher want to apply the existing theory to new conditions to know
whether the researcher will get the same results with previous research or not.
1.5 Research Scope
The respondents of this research are Indonesians in the age between 15 to 33
years old who go to coffee shop at least once in the time scope of a month. The research
takes place in Indonesia. The time scope of this research is in the period between
October and November 2015.
1.6 Research Contribution
The findings of this research are expected to enlarge the knowledge of
academician and for practitioner especially insights on brand equity.
a. For Academician
The finding of this study will expected to give understanding about factors affecting
brand equity among millennial consumer as well as give positive contribution
complement previous research. This research is expected to become reference for
further research in the different location and characteristics.
b. For Practitioner
6
The findings will help marketers and practitioners to formulate strategies to
enhance their brand equity in order to obtain competitive advantages among
millennial consumers.
1.7 Writing Framework
The writing framework summarizes the sequence of this study, so the content
of the study can be simply understood by readers.
Chapter I. Introduction
This chapter describes the background of research, problem statement, research
question, purpose of the research, scope of research, contribution of the research, and
the writing framework of the research.
Chapter II. Theoretical Framework and Hypotheses Development
This chapter describes related fundamental theory as the base of the research.
This chapter also explain the hypotheses that will be tested in this research as well as
the research model.
Chapter III. Research Method
This chapter describe sthe samples that use in the research strategy, samples, source
of data, and method of analysis to test the hypotheses that already explain in the
previous chapter.
Chapter IV. Result of Research and Discussion

7
This chapter explains the characteristics of respondents, result of model testing as well
as the measurement that contains validity and reliability testing to test the hypotheses
and discussion of result.
Chapter V. Conclusion and Suggestions
Chapter V is the last chapter in this research that contains conclusion and suggestion
related to the result of research, research limitation, managerial implication and
suggestion for the next research.

8
CHAPTER II
THEORITICAL FRAMEWORK AND HYPOTHESIS DEVELOPMENT
2.1 Millennial
Millennial is one of the largest generation in history. Millennial-born between
1980 and 2000 are both the 20th century’s last generation and the first digital generation
(Donnelly and Scaff, 2013) Millennials have come of age during a time of
technological change, globalization and economic disruption. That’s given them a
different set of behaviors and experiences than their parents. They have been slower to
marry and move out on their own, and have shown different attitudes to ownership that
have helped spawn what’s being called a “sharing economy.” (Goldman Sachs, 2015).
Developed countries such as U.S, France, and Japan drooping along with 1-2
percent annual growth rate. The population pyramid of developed countries are towards
older generation. According to The Economist Online (2010), Japan is ageing faster
than any country in the history. The working-age population will shrink so quickly that
by 2050 it will be smaller than it was in 1950, and four out of ten Japanese will be over
65. Unless Japan's productivity rises faster than its workforce declines, which seems
unlikely, its economy will shrink.
Meanwhile, Latin America, parts of Africa and Southeast Asia are
experiencing their first period of prolonged stable growth in quite some time (Dover

9
and Salkowitz, 2011). These countries have something else in common. They are
among the youngest in the world, with median population ages under thirty, compared
to those of working age. In 2007, Harvard demographer David Bloom identifies this
condition as a “demographic dividend,” and has shown correlations between youthful
workforces and economic growth in the Tiger economies of Southeast Asia, China, and
parts of Europe. Young people in emerging nations are growing up as their horizons,
buying power, and future prospects continue to brighten.
2.2 Brand Equity
American Marketing Associations defines brand as a name, term, sign, symbol
or design, or combination of them, intended to identify the goods or services of one
seller and to differentiate the competitors. Brand identify the source or maker of a
product and allow consumers to assign responsibility for its performance to a particular
manufacturer or distributor (Kotler and Keller, 2012, p.263).
Brand equity is added value endowed on products and services (Kotler and
Keller 2012, p.265). Brand equity is related to costumers place greater confidence in a
particular brand than competitor’s brand which enhances consumer loyalty and
willingness to pay a premium price for the brand (Lassar et al., 1995). Brand equity is
an inseparable part of marketing and essentials to the companies to create core
competencies and build strong brand experience that will impact consumer decision
process (Yasin and Zahari, 2011). The firm with high brand equity gain more
10
competitive advantage and enjoy the opportunity for successful extensions, flexibility
against competitors promotional pressure and creations of barriers to competitive entry
(Severi and Ling, 2013).
Brand equity has been studied from two different perspective by academicians:
financial perspective and consumer perspective.Financial data analysis use to assess
the success of a range of brand management activities including strategies designed to
build market share (Isberg and Pitta, 2013; Ward and Ryals, 2001; Simon and Sullivan,
1993). If a company has publicly traded equity, brand equity value will be reflected in
the price of its shares, it provides a good basis for evaluating the effectiveness of a
brand management strategy in general (Isberg and Pitta, 2013)
Consumer perspective of brand equity is refers to how consumers perceive
brand value from anchor marketing decision making (Kim et al., 2003). A brand has a
positive customer-based brand equity when customers react more favorably to a
product and the way it is marketed when the brand is identified, that when it’s not
identified. A brand has negative customer-based brand equity of consumers react less
favorably to marketing activity for a brand under the same circumstances (Kotler and
Keller, 2012, p.266).
Aaker (1991, p.37) identifies fives brand equity components: brand loyalty,
brand awareness, perceived quality, brand associations, and other proprietary assets.
Aaker (1991) stated that brand equity as the set of brand assets and liabilities linked to

11
the brad its name and symbols, the add value to or subtract value from, a product or
service. These assets include brand loyalty, brand awareness perceived quality and
associations.
Figure 2.1 Aaker brand Equity Model
Source: Aaker (1991)
This model can be used to get insight of relation between the different brand
equity components and future performance of the brand.

12
2.3 Brand Association
Brand association is related to information on what is in the customer mind
about the brand either positive or negative, connected to the node of the brain memory
(Sasmita and Suki, 2015; Emari et al., 2012). Brand awareness, familiarity, popularity,
organizational associations, and brand image consistency are brand associations that
are viewed as related to the core sides in several brand equity frameworks (Aaker,
1996; Blackston, 1995; Farquhar, 1989; Keller, 1993). Keller (1993) also theorizes that
brand associations are at different levels of abstraction where brand attributes, benefits,
and an overall affective brand attitude represent the levels hierarchically. Brand
associations formed from direct experience tend to be stronger and are more quickly
retrieved from memory than those formed via other means (Netemeyer et al.2004;
Fazio and Zanna, 1981).
2.4 Brand Loyalty
Jagdish and Sheth (1974) in Sasmita and Suki (2015) stated that brand loyalty
is related to users repetitive buying behavior overtime with positively biased emotional,
evaluative and/or be behavioral tendency towards a branded, labelled or graded
alternative of products and services. This statement is similar to definition of brand
loyalty by Oliver 1999 in Luarn and Lin (2003) that argues that brand loyalty is
connected to consumer rebuying or a preferred product consistently has initiated
repetitive purchasing of the same brand or same brand set.

13
Meanwhile, Aaker (1991) defines brand loyalty as symbolize a constructive
mindset toward brand that leading to constant purchasing of the brand over time. Aaker
(1991, p.41) stated that loyal consumer expressed brand loyalty in following factors:
reduce marketing tools, trade leverage, attracting new customers, and time to respond
to competitive threats.
The brand that have high customer loyalty will reduce marketing cost because
it is cheaper to hanging on loyal customers than attract potential new customers. Trade
leverage means that loyal customer is a stable source of revenue. If the company
already have a lot of loyal customer, the company don not have to worry about the
revenue especially when they have new product or conduct different strategy. For
example, Apple have a huge amount of loyal customer so called “Apple fan boy”, they
will buy the products every time Apple launch new product. Attracting new customer
means that loyal consumer be a free marketing agent to the company. As the new
customer will believe the real life experience from previous users, new customer will
more likely to buy the product if they already get a grip of the product from personal
experience of others. Time to respond to competitive threats, loyal customers are not
likely to switch brands. In the case of Apple, even though other brand like Samsung is
one step ahead when it comes to technology, the fan boy will not switch brand. And if
Apple already catch up with the technology, a fan boy will still perceive that Apple do
something revolutionary.
14
2.5 Brand Awareness
Brand awareness is how customer associate the brand with particular product
that they aim to own (Sasmita and Suki, 2015). Brand awareness is viewed as the
degree to which consumers automatically think of a brand when a given product
category is mentioned (Netemeyer et al., 2004).Brand awareness will be created by
ingoing visibility, enhancing familiarity and powerful associations with related
offerings and buying experiences (Severi and Ling, 2013; Keller, 1993).
Brand awareness is viewed as the degree to which consumers automatically
think of a brand when a given product category is mentioned (Netemeyer et al., 2004).
Brand awareness foster the consumers’ ability to recognize or recall the brand within
category, in sufficient detail to make purchase (Kotler and Keller, 2012.p. 482). Brand
awareness reflects salience of the brand in customers mind (Aaker, 1991. p.114)
2.6 Brand Image
Brand image is a set of associations which is significant to the customer (Aaker
1991). Brand image is the reasoned or emotional perceptions consumers attach to a
specific brand.
Keller (1993) defined brand image as “perceptions about a brand as reflected
by the brand association held in consumer memory”. These associations refer to any
brand aspect within the consumer’s memory. In other words, brand image is the overall
mental image that consumers have of a brand, and its uniqueness in comparison to the
other brands (Faircloth, 2005). Brand image comprises a consumer’s knowledge and
15
beliefs about the brand’s diverse products and its non-product attribute. Brand image
represents the personal symbolism that consumers associate with the brand, which
comprises of all the descriptive and evaluative brand-related information (Iversen and
Hem, 2008). When consumers have a favorable brand image, the brand’s messages
have a stronger influence in comparison to competitor brand messages (Hsieh and Li,
2008). A favorable brand image would have a positive influence on consumer behavior
towards the brand in terms of increasing loyalty, commanding a price premium and
generating positive word-of-mouth (Martenson, 2007).
2.7 Hypothesis Development
Keller (1993) affirmed that brand associations could be classified into three
major categories of increasing scope: attributes, benefits, and attitudes. Attributes are
descriptive features that characterize a product or service, what a customer thinks the
product or service is or has and what is involved with its purchase or consumption.
Attributes can be categorized into product related attributes and non-product related
attributes such as price, user and brand personality. Benefits are the personal values
consumer attach to product or services attributes. Brand attitudes identifies as
consumers’ overall evaluations of a brand Aaker (1991) believes that brand association
and brand equity are strongly interrelated to each other because brand associations
enhances the memorable of a particular brand. Meanwhile. Chen (2001.p.439) stated
that brand association is the core assets of brand equity, perceive quality id one kind of
brand association. The concept of brand knowledge also focus on association network.
16
Brand equity is supported in a great part by the associations that consumers make with
a brand.
From the research conducted by Pouromid and Iranzadeh (2012) shows that the
relationship between brand association and brand equity is positive and significant.
This research is supported by research conducted by Sasmita and Suki (2015), the result
stated that brand association have positive impact on brand equity. The higher the brand
association in the product, the more it will be remembered by the consumer and be
loyal towards the brand. Based on the argument, the research therefore proposes that:
H1: Brand association has a positive relationship with brand equity
Brand loyalty is desired by firms because retaining existing customers is less
costly than obtaining new ones, and firms profit from having loyal customers
(Lazarevic, 2012; Oliver, 1999; Sheth and Parvatiyar, 1995). Profit over time is
increased because firms do not have to spend as much per customer for maintaining the
relationship or marketing to them, and loyal long-term customers spend more money
with the firm (Lazarevic 2012; Sheth and Parvatiyar, 1995).
A popular brand not only attracts more customers, but those consumers also
have greater loyalty to the brand (Ehrenberg et al., 1990). Brand popularity occurs due
to factors such as a superior brand image, word of-mouth and imitation (Kim and
Chung, 1997).
H2: Brand loyalty has a positive relationship with brand equity

17
Aaker (1991) defines brand awareness as the extent to which a brand is known
among public. It can be measured by the associations of attachment, familiarity and
liking, commitment to the brand, and if the brand is considered in purchasing process.
Brand awareness reflects the strength of a brand’s presence in a consumer’s mind
(Pappu, Quester, and Cooksey, 2005). Positive associations about the brand may be
formed as a result of increased familiarity with the brand. Brand awareness
significantly impacts consumer decision making where consumer generally use it as an
experimental decision which benefits the management of customer-based equity
(Norazah, 2013). Pitta and Katsanis (1995) argue there is an inter-relationship between
brand awareness and brand association by asserting that the brand awareness of a
product can be produced in the consumer’s mind prior to brand association of the
product is built and embedded in the consumer’s memory. This research also proved
by Pouromid and Iranzadeh (2012) and Sasmita and Suki (2015) that discovered that
brand awareness has direct effects on brand equity.
H3: Brand awareness has a positive relationship with brand equity
Jacoby et al. (1971) discovered that consumer’s perception of quality and
valueare significantly affect by brand image. A favorable brand image would have a
positive influence on consumer behavior towards the brand in terms of increasing
loyalty, commanding a price premium and generating positive word-of-mouth
(Martenson, 2007).

18
A brand image can be an association set and is usually organized in some
meaningful way (Aaker, 1991). Keller (1993) has argued that if a brand’s image is
related to association (e.g. attribute and attitude), the brand’s association gains,
favorable strength and uniqueness in the mind of the consumer. Faircloth et al. (2001)
found that the more positive the brand image, the more consumers are willing to pay
and thus the greater the brand equity. Faircloth et al. (2001) also found that the more
positive the brand image, the more consumers are willing to pay and thus the greater
the brand equity. Rubio et al. (2014) and Sasmita and Suki (2015) achieved similar
result that stated that brand image has positive effect on brand equity. Based on the
argument, the research therefor proposes that
H4: Brand image has positive relationship with brand equity
2.8 Research Model
Figure 2.2 Research Model
Source: Sasmita and Suki (2015)

19
CHAPTER III
RESEARCH METHOD
3.1 Research Design
This research is using quantitative data analysis to observe the effect of brand
association, brand loyalty, brand awareness and brand image to brand equity.
Quantitative research is a research that use with formal standard and the answer is
prepared in the questionnaire or survey that given to respondents (Hair et al., 2006) A
quantitative approach is one in which the investigator primarily use post positivist
claims for developing knowledge (i.e., cause and effect thinking, reduction to specific
variables and hypotheses, questions, use of measurement and observation, and the test
of theories), employs strategies of inquiry such as experiments, and surveys and collect
data on predetermined instruments that yield statistical data (Creswell, 2002 ). In
quantitative research, the researcher able to test theory and research model to explain
consumer behavior or relationships of the variables within the model.
This research use survey method to obtain primary data by filling the
questionnaire by respondents. Survey method is a research procedure intended to
collect large number of data using question and answer format (Hair et al., 2006 p.
221).Survey method focus on gathering primer data which enable researcher to
understand and solve the research questions. The advantage of this method is that it can
be used to collect a large number of quantitative data which is suitable for this research.

20
3.2 Operational Definition and Measurement
In this research, researcher use five variables that consist of brand awareness,
brand association, brand loyalty, brand awareness, brand image and brand equity that
measured by five-point Likert Scale. The measurement as follows:
1. Point 1: Strongly Disagree
2. Point 2: Disagree
3. Point 3: Neutral
4. Point 4: Agree
5. Point 5: Strongly Agree
The operational variable of this research as follows:
3.2.1 Brand Associations
Brand associations formed from direct experience tend to be stronger and are
more quickly retrieved from memory than those formed via other means (Netemeyer,
2004; Fazio and Zanna, 1981). Keller (1993) theorizes that brand associations are at
different levels of abstraction where brand attributes, benefits, and an overall affective
brand attitude represent the levels hierarchically. The scale measurement for this
variable are measured using five items based on Sasmita and Suki (2015) which are
personality, comparison with competitors, trust, familiarity, and reasons to buy.

21
3.2.2Brand Loyalty
Aaker (1991) defines brand loyalty as symbolize a constructive mind set toward
brand that leading to constant purchasing of the brand over time. A popular brand not
only attracts more customers, but those consumers also have greater loyalty to the brand
(Ehrenberg et al., 1990). Brand popularity occurs due to factors such as a superior
brand image, word-of-mouth and imitation (Kim and Chung, 1997). The scale
measurement for this variable is measured using five items based on Sasmita and Suki
(2015) which are referral, choice of using, willingness to recommend, brand switching,
and satisfaction.
3.2.3 Brand Awareness
Brand awareness is viewed as the degree to which consumers automatically
think of a brand when a given product category is mentioned (Netemeyer, 2004). Brand
awareness foster the consumers’ ability to recognize or recall the brand within
category, in sufficient detail to make purchase (Kotler and Keller, 2012,p.507). The
scale measurement for this variable are measured using five items based on Sasmita
and Suki (2015) which are awareness, recognizable, product knowledge, characteristic
of the product and symbol recall of the brand.
3.2.4 Brand Image
Keller (1993) defined brand image as perceptions about a brand as reflected by
the brand association held in consumer memory. These associations refer to any brand
aspect within the consumer’s memory. Faircloth et al. (2001) also found that the more
22
positive the brand image, the more consumers are willing to pay and thus the greater
the brand equity. The scale measurement for this variable are measured using three
items based on Sasmita and Suki (2015) which are differentiation, brand image, and
image comparison with competitors.
3.2.5 Brand Equity
Brand equity is added value endowed on products and services (Kotler and
Keller 2012). Brand equity is related to costumers place greater confidence in a
particular brand than competitor’s brand which enhances consumer loyalty and
willingness to pay a premium price for the brand (Lassar et al .1995).The scale
measurement for this variable are measured using two items based on Sasmita and Suki
(2015) which are willingness to purchase and brand preference.
3.3 Sampling Design
3.3.1 Population
Population is refers to whole individuals, events, or objects that being
investigated by the researcher (Sekaran and Bougie 2009, p. 262). By analyzing
samples, a researcher can draw conclusion of what happened with the whole
population. The population that used in this research is Indonesian millennial consumer
age from 15 to 33 years old who frequently go to the coffee shop.
3.3.2 Sample
A sample is a subset of the population. By studying the sample, research should
be able to draw conclusions that are generalizable to the population of interest (Sekaran

23
and Bougie, 2009, p.263). Sampling unit in this research is Indonesian millennial
consumer that frequently visit coffee shop at least once a month.
3.3.3 Sampling Method
In this research, the researcher chooses to use non probability sampling. Non
probability sampling method is a method where every respondent in the population
does not have the same opportunity to be selected as sample (Sekaran and Bougie 2009,
p. 276). In the other words, the finding cannot be generalized by the population.
This research used purposive sampling, which falls into nonprobability
sampling category. According to Sekaran and Bougie (2009, p. 278). Purposive
sampling confined specific types of people who can provide information either because
they are the only ones who have it, or conform the criteria set by researcher.
3.3.4 Sampling Size
In this research, the researcher used 219 respondents as the sample. The amount
of respondents refer to the rules of Hair et al. (2006, p. 317) that stated that the amount
of ideal samples are using 5 to 10 times of the amount of items in the questionnaire is
considered as ideal. Roscoe (1975) in Sekaran and Bougie (2009, p. 296) support the
usage of samples in this research, he proposes the following rules of thumb for
determining sample size:
a. Sample size larger than 30 and less than 500 are appropriate for most
research.
24
b. Where sample size are to be broken into subsamples; (males/females, juniors/
seniors, etc.), a minimum sample size of 30 for each category is necessary.
c. In multivariate research (including multiple regression analyses), the sample
size. Should be several times (preferably ten times or more) as large as the
number of variables in the study.
d. For simple experimental research with tight experimental controls (matched
pairs, etc.). Successful research is possible with sample as small as 10 to 20 in
size.
From the rules that the amount of samples needed are more than 30 and less than
500 are the ideal measurement for most research. Therefore, in this research, the
researcher use 219 respondents. The sample size used I this research is bigger than
sample size used in the previous research by Sasmita and Suki (2015) that used 200
respondents.
3.4 Research Object
Research object in this research is coffee shop in Indonesia that sells coffee
based beverages, food and other beverages. In the questionnaire respondents can
choose coffee shop that they visit such as Starbucks Coffee, Coffee Bean & Tea Leaf,
J.CO Donuts &Coffee, Excelso Coffee, Dunkin’ Donuts and others. Determination of
the coffee shop is based on the major player in Indonesia.
25
3.5 Data Collection Method
The researcher uses primary data in this research. Primary data refers to the
information retrieved first-hand by the researcher on the variables of interest for the
specific purpose of the study (Sekaran and Bougie, 2009, p.37). The data collected by
distributing questionnaire online that will be filled by respondents. Based on rule of
thumb Roscoe (1975) in Sekaran and Bougie (2009), 240 questionnaires was
distributed. The questionnaire are distributed through Google Docs, and the link will
be spread through social media such as Facebook, Path, and Twitter as well as through
online chatting applications like WhatsApp and Line. Researcher used online
questionnaires to simplify the questionnaire filling process.
3.6 Research Instrument
3.6.1 Questionnaire
Questionnaire is a tool to collect data through set of questions and respondents
give the response (Sekaran and Bougie, 2009, p.197).This research is using close ended
question. In the questionnaire, researcher use five-point Likert Scale.
The questionnaire consists of five parts, as follows:
a. Introduction
This part consist of preface from researcher that contain identity of researcher,
research purpose and request to be respondent.
b. Identity of respondent

26
This part contain information about respondent that consist of gender, age,
occupation and monthly spending per month.
c. Questions about personal experience
This part is consist of questions about personal experience on coffee shop.
d. Questions about variables of the research
This part is the keynote of the questionnaire. This part is consist of questions
related to the variables tested and must be answered by the respondents
e. Closing
This is the last part of the questionnaire that say thank you greeting for the
respondents to participate in the research.
3.6.2 Pre- test
Pre-test is a trial for research instrument to know the quality of research
instrument that can be determined from level of validity and reliability. If there are
some errors, it can be resolved. Researcher tested the questionnaire to 60 respondents.
During the pre-test, the researcher spread link address of the questionnaire to target
respondents that match sampling criteria through personal message and social media.
After collecting pre-test data, the researcher tests reliability and validity of the
questionnaire. If the data are valid and reliable, the questionnaire can be used for the
research.

27
3.7 Instrument Test
3.7.1 Validity Test
Validity refers to the degree to which evidence and theory support the
interpretations of test scores entailed by proposed uses of tests. To measure the validity
of instruments, researcher employed construct validity. Construct validity make sure
the test adequately assesses the theoretical concept. Confirmatory Factor Analysis
(CFA) was used to validate the scales. In CFA method, the criteria used are the value
of factor loading. Researcher also used Kaiser Meyer Olkin Measure (KMO) to
determine validity of the questionnaire. If the value of KMO is ≥ 0.5, it means the
questionnaire is valid. From pre-test, the validity test result as follows.
Table 3.1 KMO and Bartlett’s Test
Source: Appendix 3
Based on Table 3.1 it is shown that the result of KMO is 0.868, the value
is above 0.5 which means that it already fulfil the requirement. The result of
Bartlett’s Test of Sphericity shows the significant value in 0.000. It can be
concluded that the factor analysis can be continue. To interpret result of the
research, researcher use varimax as shown in Table 3.2.
Description Value
Respondents 60
Kaiser-Meyer Olkin Measure of Sampling 0.868
Sig.Value 0.000

28
Table 3.2 Rotated Component Matrix
Source: From Appendix 4
From Table 3.2, there are rotation matrix that show maximum variation value
and grouped to be one factor. If the item in each variables have maximum variation
value more than 0.5 and form one rotation matrix with other item in one variable, the
item is valid.
1 2 3 4 5
BAS1 .577
BAS2 .754
BAS3 .800
BAS4 .533
BAS5 .744
BLO1 .811
BLO2 .765
BLO3 .826
BLO4 .840
BLO5 .773
BAW1 .718
BAW2 .754
BAW3 .789
BAW4 .714
BAW5 .735
BIM1 .755
BIM2 .807
BIM3 .654
BEQ1 .796
BEQ2 .717
Rotated Component Matrixa
Component
Extraction Method: Principal Component Analysis.
Rotation Method: Varimax with Kaiser Normalization.a. Rotation converged in 7 iterations.

29
3.7.2 Reliability Test
Reliability of a measure indicates the extent to which it is without error and
ensures consistent measurement across time and across various items in the instrument
(Sekaran and Bougie, 2009). In addition, reliability measures the indication of stability
and consistency which instrument measures to help assess the goodness of a measure.
The research use internal consistency to measure reliability of instrument.
Cronbach’s coefficient alpha will be used in the reliability test. According to Sekaran
and Bougie (2009, p.325), criteria of reliability test is that Cronbach’s coefficient alpha
must exceed 0.70. The bigger the value of Cronbach Alpha or the closer to one, the
better consistency of research instrument.
This is the result of reliability test from pre-test that use 60 respondents.
Table 3.3 Reliability Test of Pre-test
Source: From Appendix 5
Based on figure 3.3 all the variables in the research are reliable. It is shown by
the value of Cronbach’s Alpha in all variables that value below 0.7.
Variable Cronbach Alpha N Description
Brand Association 0.935 5 Reliable
Brand Loyalty 0.943 5 Reliable
Brand Awareness 0.917 5 Reliable
Brand Image 0.909 3 Reliable
Brand Equity 0.853 2 Reliable

30
3.8 Data Analysis Method and Hypothesis Testing
3.8.1 Data Analysis Method
Analysis that used in this research is multiple regression analysis. Multiple
regression analysis is a multivariate technique that commonly used in business
research. There are more than one independent variables in this analysis that use to
explain variance in the dependent variable (Sekaran and Bougie, 2009).
Result of multiple regression analysis is in the form of coefficient that
calculated to describe relationship between independent and dependent variables. The
coefficient is used to measure the effect of every independent variables toward
dependent variable. Large coefficient is a good predictor, and small coefficient is a
weak predictor (Hair et al., 2006).In this research, multiple regression analysis is used
to measure relationship between brand association, brand loyalty, brand awareness, and
brand awareness towards brand loyalty.
3.8.2 Hypothesis Testing Method
From the research model, the basic mathematical formulation that used in this research
is multiple regression model as follows.
Y= β1. X1 + β2.X2 + β3.X3+ β4.X.4 + e
Y = Brand Equity
X1 = Brand Association
X2 = Brand Loyalty
31
X3 = Brand Awareness
X4 = Brand Image
3.8.3 Goodness of Fit Testing
1. R2 Test
R2 test is used to measure how independent variable explain dependent variable
in a model. R2 value is about 0 < R2< 1. Independent variable explain dependent
variable if the value of R2 close to 1 or 100%.
2. F Test
F test is used to measure effect of independent variable as simultaneously to
independent variable. It is most often used when comparing statistical models that have
been fitted to a data set, in order to identify the model that best fits the population from
which the data were sampled. In this research, the significance use is α = 5%, which
commonly use in the social research.
3. T Test
T Test is used to measure whether independent variable individually affect
dependent variable. It is most commonly applied when the test statistic would follow
a normal distribution if the value of a scaling term in the test statistic. The t-test
assesses whether the means of two groups are statistically different from each other.
This analysis is appropriate whenever you want to compare the means of two group.

32
3.8.4 Hypothesis Testing
Process of hypothesis testing in this research is started from determining null
hypothesis (Ho) that shaped to be rejected to support alternative hypotheses. Statement
of Ho explain that there is no relationship between variables (Sekaran and Bougie,
2009). Hypothesis testing continued by observing value of beta and significance value
from multiple regression result. If the value of beta is positive independent variable
have positive effect towards dependent variable. If the probability below value of
significance that been determined (p < 5% or 0. 05) independent variable have
significance effect toward dependent variable. If both of the case are fulfilled, Ho is
rejected and Ha is accepted.

33
CHAPTER IV
DATA ANALYSIS
This chapter is explaining the analysis of the research. The analysis started with
explanation about respondents’ characteristics, validity test using Confirmatory Factor
Analysis, Reliability test with Cronbach’s Alpha, goodness of fit test and hypothesis
testing with multiple regression. Online questionnaire were distributed since November
2015 through Facebook groups, personal chatting applications (WhatsApp and LINE)
and social media (Facebook and Path). From 230 received responses, there were 219
eligible questionnaire that could be processed further.
4.1 Respondent Characteristics
4.1.1 Gender
Table 4.1 Gender
Gender Frequency Percentage (%)
Male 71 32.4
Female 148 67.6
Total 219 100.0
Source: Appendix 10
From Table 4.1, it can be shown that most of the respondents are female. There
are 148 respondents or 67.6%, which make up more than a half of respondent. While
male respondent accounted for 71 respondents or 32.4% from the total respondents

34
4.1.2 Age
Table 4.2 Age
Age Group Frequency Percentage (%)
(years old)
15-17 40 18.3
18-20 69 31.5
21-25 92 42.0
26-33 18 8.2
Total 219 100.0
Source: Appendix 10
Table 4.2 shows that majority of respondents are from 21-25 age group which
is accounted for 42% followed by 18-20 age group for 31.5%, 15-17 age group for
18.3% and the least amount of respondents are from 26 – 33 age group.
4.1.3 Occupation
Table 4.3 Occupation
Occupation Frequency Percentage (%)
Student 153 69.9
Employee 33 15.0
Civil Servant 17 7.8
Entrepreneur 5 2.3
Other 11 5.0
Total 219 100.0
Source: Appendix 10
35
Table 4.3 explain characteristics of respondents based on occupations
of respondents. Majority of respondents are students whether high school
students of college students. Students accounted for almost 70% of respondents,
followed by employee for 15%, civil servant for 7.8%, other for 5% and the last
are entrepreneur for 2.3%.
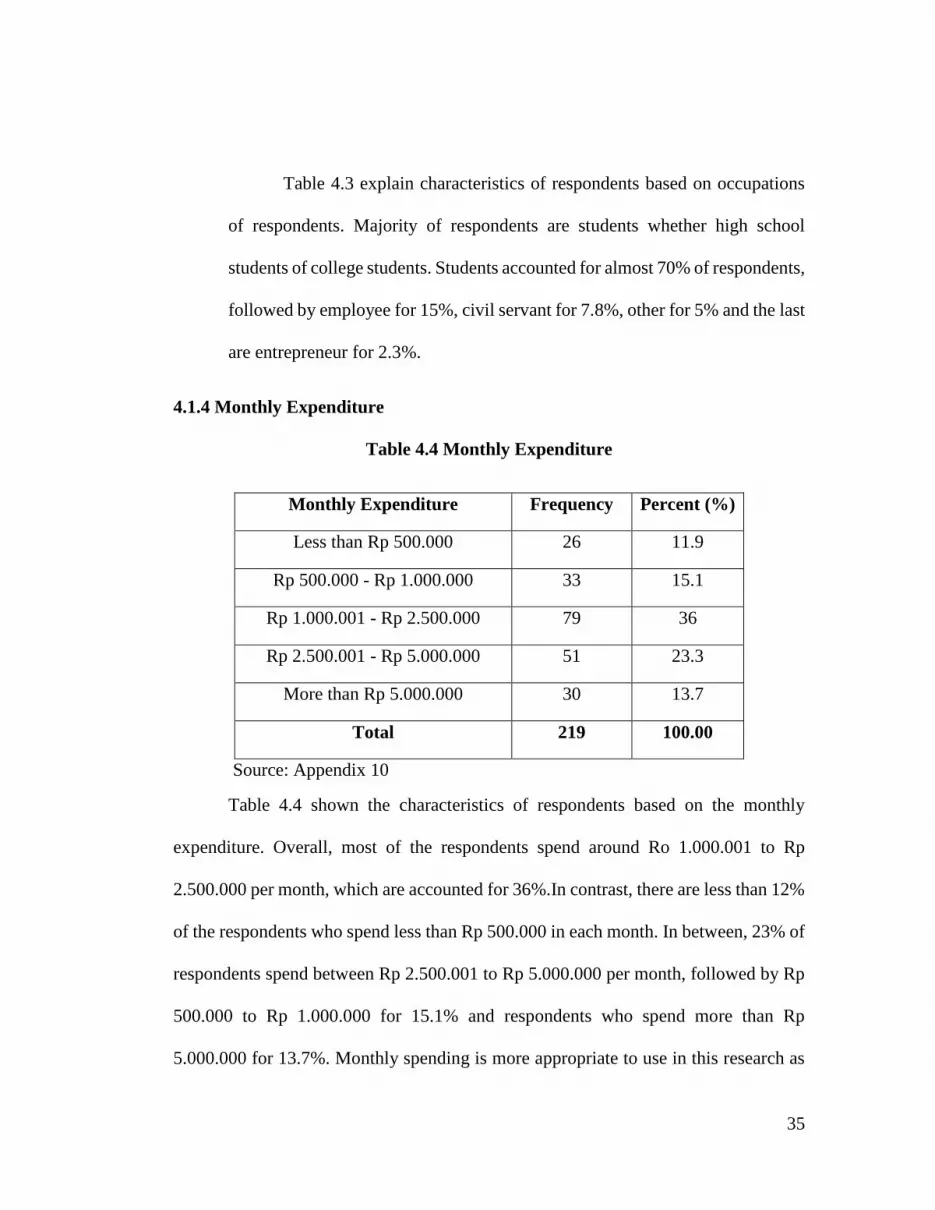
4.1.4 Monthly Expenditure
Table 4.4 Monthly Expenditure
Monthly Expenditure Frequency Percent (%)
Less than Rp 500.000 26 11.9
Rp 500.000 - Rp 1.000.000 33 15.1
Rp 1.000.001 - Rp 2.500.000 79 36
Rp 2.500.001 - Rp 5.000.000 51 23.3
More than Rp 5.000.000 30 13.7
Total 219 100.00
Source: Appendix 10
Table 4.4 shown the characteristics of respondents based on the monthly
expenditure. Overall, most of the respondents spend around Ro 1.000.001 to Rp
2.500.000 per month, which are accounted for 36%.In contrast, there are less than 12%
of the respondents who spend less than Rp 500.000 in each month. In between, 23% of
respondents spend between Rp 2.500.001 to Rp 5.000.000 per month, followed by Rp
500.000 to Rp 1.000.000 for 15.1% and respondents who spend more than Rp
5.000.000 for 13.7%. Monthly spending is more appropriate to use in this research as
36
majority of the respondents are students who do not have income and still receive
money from parents.
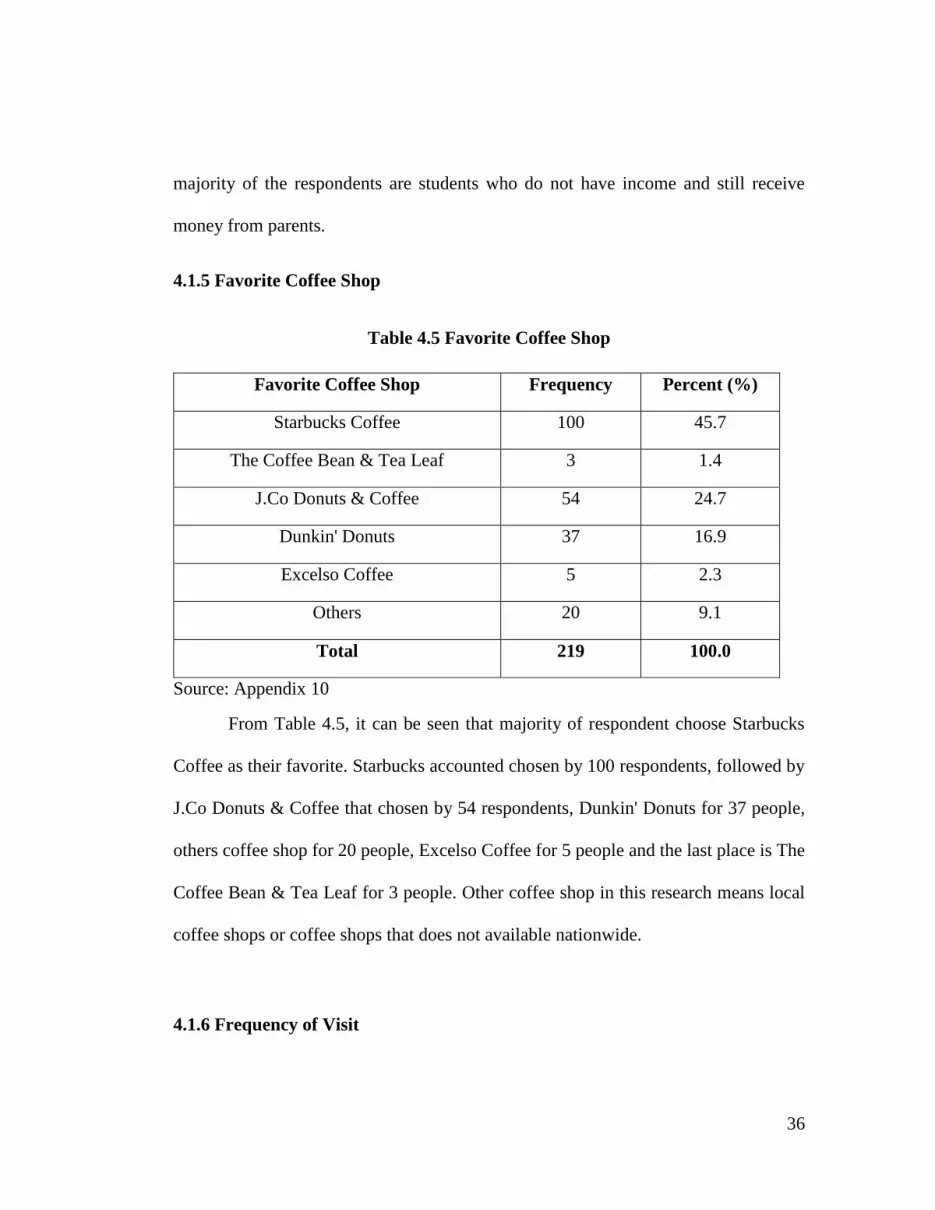
4.1.5 Favorite Coffee Shop
Table 4.5 Favorite Coffee Shop
Source: Appendix 10
From Table 4.5, it can be seen that majority of respondent choose Starbucks
Coffee as their favorite. Starbucks accounted chosen by 100 respondents, followed by
J.Co Donuts & Coffee that chosen by 54 respondents, Dunkin' Donuts for 37 people,
others coffee shop for 20 people, Excelso Coffee for 5 people and the last place is The
Coffee Bean & Tea Leaf for 3 people. Other coffee shop in this research means local
coffee shops or coffee shops that does not available nationwide.
4.1.6 Frequency of Visit
Favorite Coffee Shop Frequency Percent (%)
Starbucks Coffee 100 45.7
The Coffee Bean & Tea Leaf 3 1.4
J.Co Donuts & Coffee 54 24.7
Dunkin' Donuts 37 16.9
Excelso Coffee 5 2.3
Others 20 9.1
Total 219 100.0
37
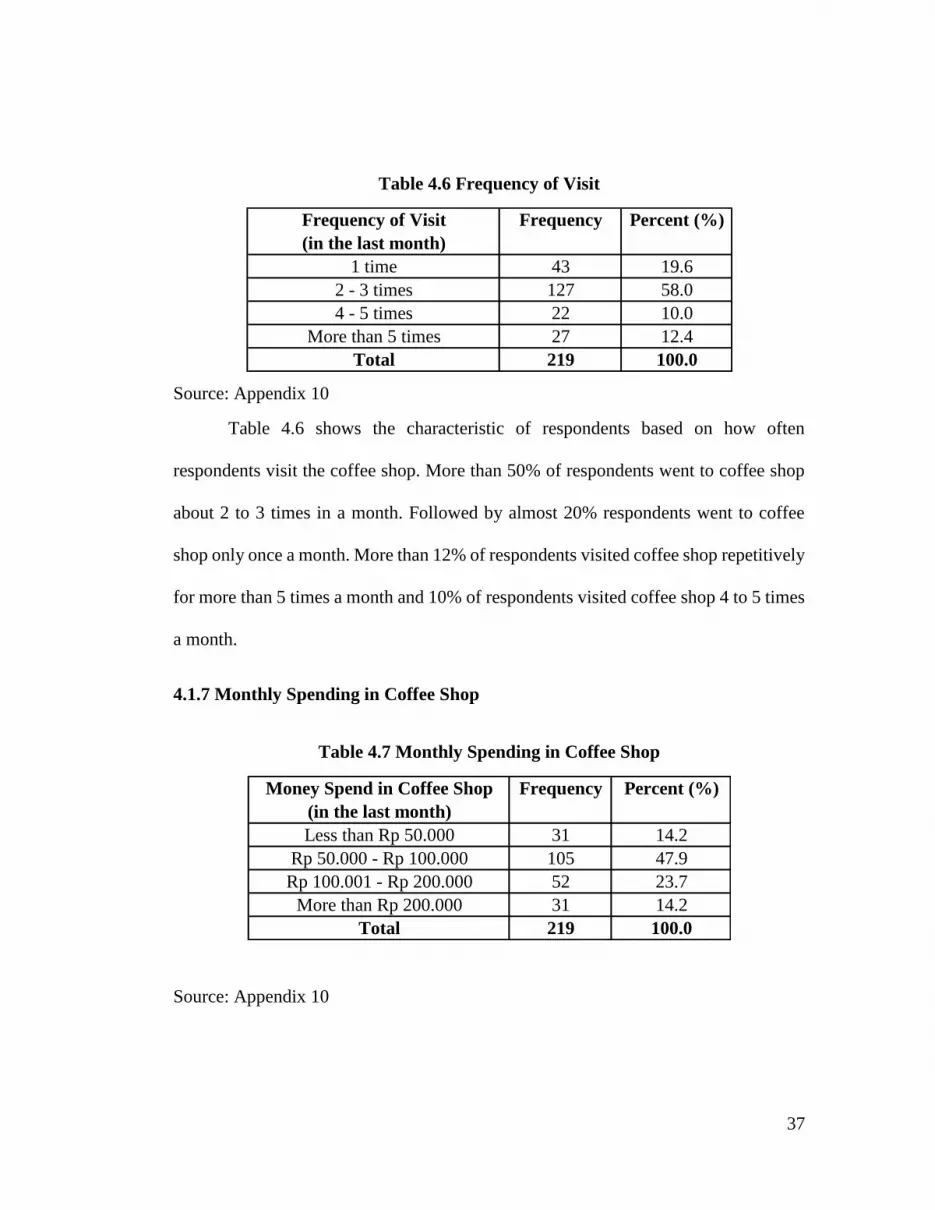
Table 4.6 Frequency of Visit
Source: Appendix 10
Table 4.6 shows the characteristic of respondents based on how often
respondents visit the coffee shop. More than 50% of respondents went to coffee shop
about 2 to 3 times in a month. Followed by almost 20% respondents went to coffee
shop only once a month. More than 12% of respondents visited coffee shop repetitively
for more than 5 times a month and 10% of respondents visited coffee shop 4 to 5 times
a month.
4.1.7 Monthly Spending in Coffee Shop
Table 4.7 Monthly Spending in Coffee Shop
Source: Appendix 10
Money Spend in Coffee Shop Frequency Percent (%)
(in the last month)
Less than Rp 50.000 31 14.2
Rp 50.000 - Rp 100.000 105 47.9
Rp 100.001 - Rp 200.000 52 23.7
More than Rp 200.000 31 14.2
Total 219 100.0
Frequency of Visit Frequency Percent (%)
(in the last month)
1 time 43 19.6
2 - 3 times 127 58.0
4 - 5 times 22 10.0
More than 5 times 27 12.4
Total 219 100.0
38
Table 4.7 described how much respondents spend money in coffee shop in a
time frame of one month. Majority of respondents, which are accounted for 105
respondents spend between Rp 50.000 to Rp 100.000 in coffee shop. The second
highest number are 52 respondents spend about Rp 100.001 to Rp 200.000 every month
in coffee shop. The last places are respondents who spend more than Rp 200.000 and
less than Rp 50.000 accounted for 31 respondents.
4.2 Instrument Test of Primary Data
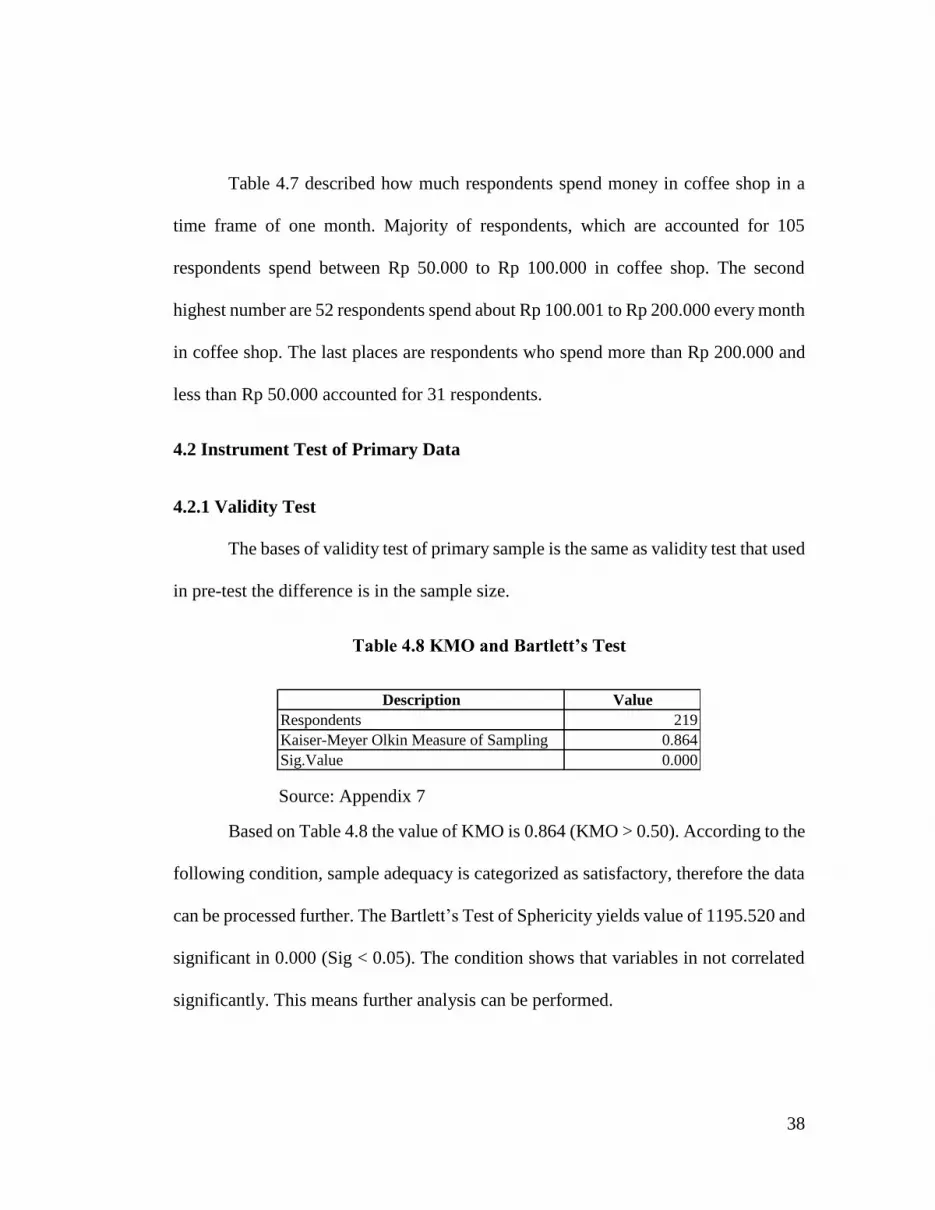
4.2.1 Validity Test
The bases of validity test of primary sample is the same as validity test that used
in pre-test the difference is in the sample size.
Table 4.8 KMO and Bartlett’s Test
Source: Appendix 7
Based on Table 4.8 the value of KMO is 0.864 (KMO > 0.50). According to the
following condition, sample adequacy is categorized as satisfactory, therefore the data
can be processed further. The Bartlett’s Test of Sphericity yields value of 1195.520 and
significant in 0.000 (Sig < 0.05). The condition shows that variables in not correlated
significantly. This means further analysis can be performed.
Description Value
Respondents 219
Kaiser-Meyer Olkin Measure of Sampling 0.864
Sig.Value 0.000
39
Table 4.9 Rotated Component Matrix
Source: Appendix 8
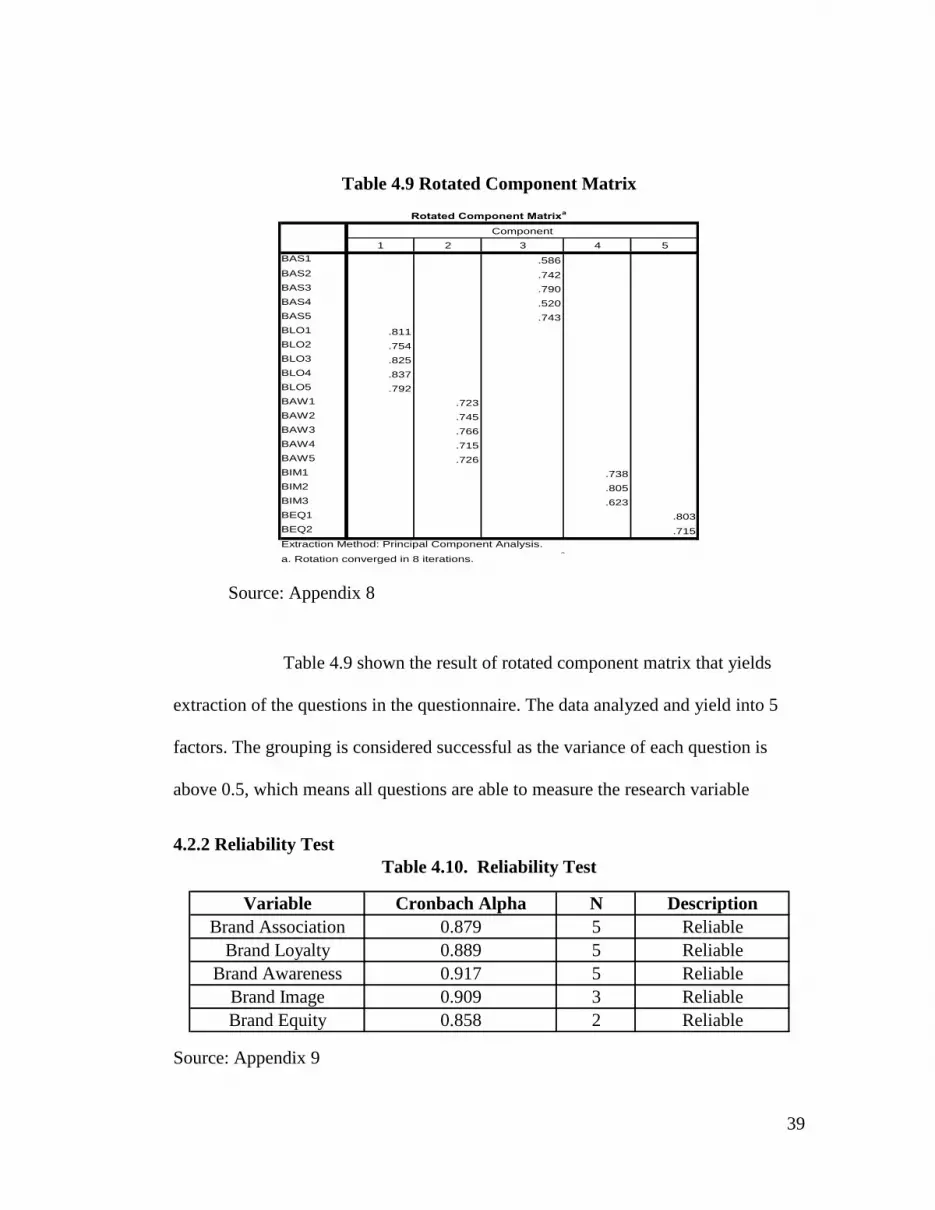
Table 4.9 shown the result of rotated component matrix that yields
extraction of the questions in the questionnaire. The data analyzed and yield into 5
factors. The grouping is considered successful as the variance of each question is
above 0.5, which means all questions are able to measure the research variable
4.2.2 Reliability Test
Table 4.10. Reliability Test
Source: Appendix 9
1 2 3 4 5
BAS1 .586
BAS2 .742
BAS3 .790
BAS4 .520
BAS5 .743
BLO1 .811
BLO2 .754
BLO3 .825
BLO4 .837
BLO5 .792
BAW1 .723
BAW2 .745
BAW3 .766
BAW4 .715
BAW5 .726
BIM1 .738
BIM2 .805
BIM3 .623
BEQ1 .803
BEQ2 .715
Rotated Component Matrixa
Component
Extraction Method: Principal Component Analysis.
Rotation Method: Varimax with Kaiser Normalization.a
a. Rotation converged in 8 iterations.
Variable Cronbach Alpha N Description
Brand Association 0.879 5 Reliable
Brand Loyalty 0.889 5 Reliable
Brand Awareness 0.917 5 Reliable
Brand Image 0.909 3 Reliable
Brand Equity 0.858 2 Reliable

40
Reliability test in this research is using statistical test of Cronbach Alpha. The
Table 4.10 is shows value of Cronbach’s Alpha in each variable in this research. It
can be seen that each variable valued above 0.70, which means that every items in
this research are reliable.
4.3 Descriptive Statistics
Descriptive statistics is use to explain the mean and standard deviation of each
variables that are used in this research. Descriptive statistics also conducted to describe
the character of each variable within the research. The variables in this research consist
of brand awareness (BAS), brand loyalty (BLO), brand awareness (BAW), brand
image (BIM), and brand equity (BEQ).
Table 4.11 Descriptive Statistics
Source: Appendix 14
Table 4.11, shows that the amount of respondents (N) in this research are 219
respondents. There are five variables in this research. The variables are Brand
associations, brand loyalty, brand awareness, brand image and brand equity.
Variables N Minimum Maximum Mean Std. Deviation
Brand Association 219 1 5 3.84 0.866
Brand Loyalty 219 1 5 3.65 0.916
Brand Awareness 219 2 5 4.11 0.819
Brand Image 219 2 5 3.87 0.782
Brand Equity 219 2 5 3.99 0.779
Valid N (listwise) 219

41
Brand association and brand loyalty have minimum value of 2 (two), brand
awareness, brand image and brand equity have minimum value of 1 (one). All of the
variables have maximum value 5 (five).
The mean of brand association is 3.84 and standard deviation accounted for
0.866. The mean of brand loyalty is 3.65 and standard deviation accounted for 0.916.
The mean of awareness is 4.11 and standard deviation accounted for 0.819. The mean
of brand image is 3.87 and standard deviation accounted for 0.782. The mean of brand
equity is 3.99 and standard deviation accounted for 0.799.
In this research, the mean values are greater than 3, which implies that
respondents agree with the statements provided by researcher. The mean is ranged from
3.65 to 4.11. Strong agreement can be seen from brand awareness variable with mean
value of 4.11.
4.4 Hypothesis Testing
Hypothesis testing is used to discover the effect of independent variable to
dependent variable. Four hypotheses in this research are tested using multiple
regression method. The analysis conducted using SPSS software. Multiple regression
analysis is used because there are more than one independent variable in the research.
The independent variable in this research are brand association (BAS), brand loyalty
(BLO), brand awareness (BAS) and brand image (BIM). The dependent variable is
brand equity (BEQ).
42
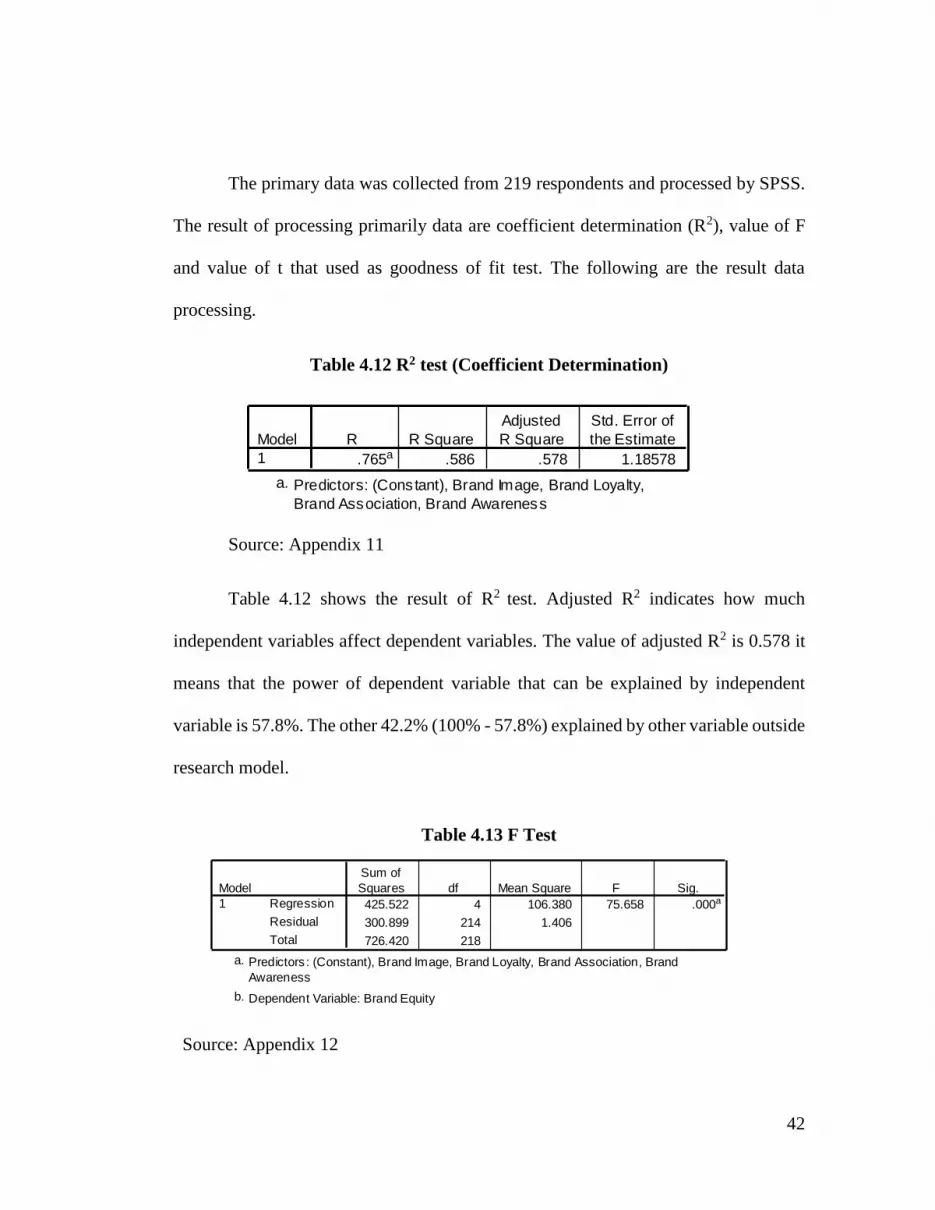
The primary data was collected from 219 respondents and processed by SPSS.
The result of processing primarily data are coefficient determination (R2), value of F
and value of t that used as goodness of fit test. The following are the result data
processing.
Table 4.12 R2 test (Coefficient Determination)
Source: Appendix 11
Table 4.12 shows the result of R2 test. Adjusted R2 indicates how much
independent variables affect dependent variables. The value of adjusted R2 is 0.578 it
means that the power of dependent variable that can be explained by independent
variable is 57.8%. The other 42.2% (100% - 57.8%) explained by other variable outside
research model.
Table 4.13 F Test
Source: Appendix 12
Model Summary
.765a .586 .578 1.18578
Model
1
R R Square
Adjusted
R Square
Std. Error of
the Estimate
Predictors: (Constant), Brand Image, Brand Loyalty,
Brand Association, Brand Awareness
a.
ANOVAb
425.522 4 106.380 75.658 .000a
300.899 214 1.406
726.420 218
Regression
Residual
Total
Model
1
Sum of
Squares df Mean Square F Sig.
Predictors : (Constant), Brand Image, Brand Loyalty, Brand Association, Brand
Awareness
a.
Dependent Variable: Brand Equityb.

43
In the F test, independent variables can affect dependent variable when the
value of F is bigger than F table and have significant value below the significance level
that determined before (p < 5%). From Table 4.13, the value of F is 75,658 with
significance level of 0.000, which is below 0.05. This means that all independent
variables (brand association, brand loyalty, brand awareness and brand image in the
model are affecting brand equity as dependent variable. The result of F test is
significant, so the model can be processed further.
Table 4.14 Multiple Regression Test
Source: Appendix 13
Based on Table 4.14, all four independent variables show significant result. IT
can be seen based on result of t test, the significance value of each variable is less
than 0.05. It means that each independent variables (Brand Association, Brand
Loyalty, Brand awareness and Brand Image) affect the dependent variable (Brand
Equity).
The result of the test from Table 4.14 can be computed as follows:
Y= 0.245X1+ 0.248X2 + 0.189X3+ 0.185X4
Independent Variable Standard Beta Coefficients t Sig.
Constant 1.312 0.191
Brand Association 0.245 3.061 0.002
Brand Loyalty 0.248 3.748 0.000
Brand Awareness 0.189 2.328 0.021
Brand Image 0.185 2.606 0.10

44
Y: Brand equity
X1: Brand association
X2: Brand loyalty
X3: Brand awareness
X4: Brand image
4.4.1 Hypothesis testing
a. Hypothesis 1 (H1):
Ho1. Brand association do not have positive impact on brand equity.
Ha1: Brand association have positive impact on brand equity.
Based on Table 4.14, the value of beta for brand association is 0.103 and
significance value of 0.245 (p<0.05). The value proofed that Ho1 is rejected and Ha1
is accepted. It can be concluded that brand association positively affect brand equity.
b. Hypothesis 2 (H2):
Ho2: Brand loyalty do not have positive impact on brand equity
Ha2: Brand loyalty have positive impact on brand equity
Based on Table 4.14, the value of beta for brand loyalty is 0.248 and
significance value of 0.000 (p<0.05). The value proofed that Ho2 is rejected and Ha2
is accepted. In conclusion, brand loyalty positively affect brand equity.
c. Hypothesis 3 (H3):
Ho3: Brand awareness do not have positive impact on brand equity
45
Ha3: Brand awareness have positive impact on brand equity
Based on Table 4.14, the value of beta for brand awareness is 0.189 and
significance value of 0.021 (p<0.05). The value proofed that Ho1 is rejected and Ha1
is accepted. It can be concluded that brand awareness positively affect brand equity.
d. Hypothesis 4 (H4):
Ho4: Brand image do not have positive impact on brand equity
Ha4: Brand image have positive impact on brand equity
Based on Table 4.14, the value of beta for brand image is 0.144 and significance
value of 0.185 (p<0.05). The value proofed that Ho1 is rejected and Ha1 is accepted.
In conclusion, brand image positively affect brand equity.
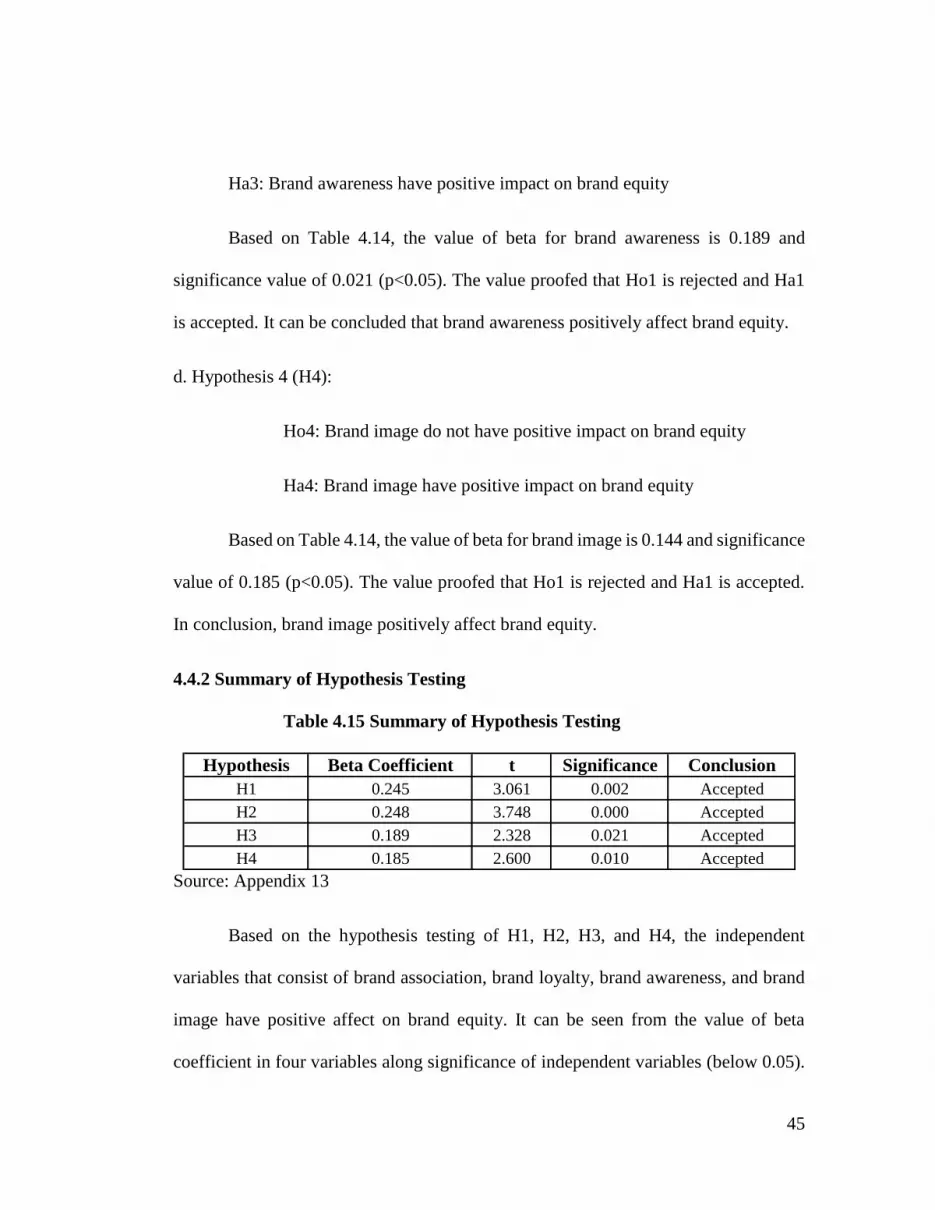
4.4.2 Summary of Hypothesis Testing
Table 4.15 Summary of Hypothesis Testing
Source: Appendix 13
Based on the hypothesis testing of H1, H2, H3, and H4, the independent
variables that consist of brand association, brand loyalty, brand awareness, and brand
image have positive affect on brand equity. It can be seen from the value of beta
coefficient in four variables along significance of independent variables (below 0.05).
Hypothesis Beta Coefficient t Significance Conclusion
H1 0.245 3.061 0.002 Accepted
H2 0.248 3.748 0.000 Accepted
H3 0.189 2.328 0.021 Accepted
H4 0.185 2.600 0.010 Accepted
46
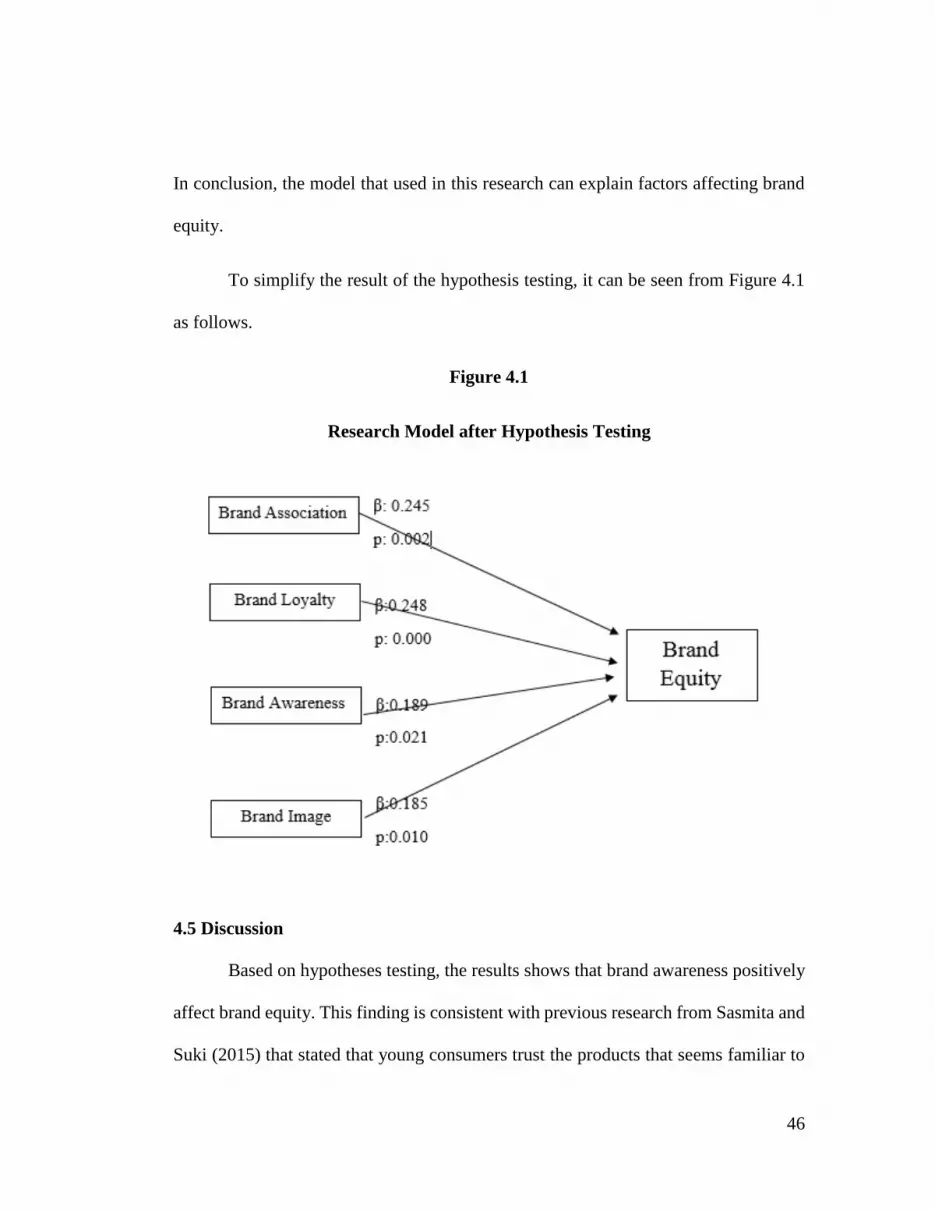
In conclusion, the model that used in this research can explain factors affecting brand
equity.
To simplify the result of the hypothesis testing, it can be seen from Figure 4.1
as follows.
Figure 4.1
Research Model after Hypothesis Testing
4.5 Discussion
Based on hypotheses testing, the results shows that brand awareness positively
affect brand equity. This finding is consistent with previous research from Sasmita and
Suki (2015) that stated that young consumers trust the products that seems familiar to

47
them. Brand awareness of a brand or product can be seen from brand personality,
familiarity and how the brand differs stand out among competitors.
Brand loyalty proved have positive effect to brand equity. The finding is
supported by previous research from Sasmita and Suki (2015) that proved that young
consumer usually put the familiar products as their first choice of evaluation and
selection to minimize the perceived risk. This finding also supported by research
conducted by Binninger (2008), the research confirms that improvement of consumer
satisfaction will lead loyalty towards the brand. From this research it can be seen that
brand loyalty have the highest affect in brand equity. It can be shown from that the
value of Beta (βBLO: 3.748) which is higher than other variables. Therefore, loyal
consumer will affect significantly towards brand equity.
Brand awareness proved to be influential towards brand equity. The result is
consistent with previous research conducted by Sasmita and Suki (2015), the research
stated that brand awareness affect brand equity in the sense that consumer decision to
buy a product depends on their awareness of the product. Indeed, they can recall the
symbol or logo of the brand. Chung et al. (2013) also find similar result. In the research
it is stated that the brand is likely chosen based on the awareness of consumer.
Based on the finding, brand image is positively affect brand equity. The items
in this variable that consist of reputation and image proved to have positive Affect
towards brand equity. The result is consistent with finding of Sasmita and Suki (2015
) and Rubio et al. (2014) who proved that brand image has positive image on brand
48
equity. When a brand has a great brand image, consumer will perceive it have good
quality, unique and different with competitors in the market. As a result, it will increase
intention to buy the product.
In conclusion, the result of this research shows that factors affecting brand
equity including brand association, brand loyalty, brand awareness, brand loyalty, and
brand image proved to have positive impact towards brand equity. The result is similar
with research conducted by Sasmita and Suki (2015) who stated that brand association,
brand awareness, brand loyalty, and brand image have positive impact towards brand
equity.

49
CHAPTER V
CONCLUSSIONS AND SUGGESTIONS
5.1 Conclusions
The previous study conducted by Sasmita and Suki in 2015 in Malaysia
revealed that brand association, brand loyalty, brand awareness and brand image have
direct positive relationship with brand equity. This study which is conducted in
Indonesia found the similar result, all independent variables have positive relationship
with brand equity.
Table 5.1 Comparison between the Findings of Previous Study and This
Study
The research question proposed earlier in this research will be addressed briefly
in this section. Based in the result of hypothesis, statistical output interpretation and
data analysis, it can be concluded that brand equity does not stand alone, but is affected
by 4 four distinct variables which will be described below.
Brand association which was measured by trust, familiarity, reasons to buy,
brand personality and how the brand differs to other competitors was proven to have
positive relationship towards brand equity. The associations of a well-established brand
Independent Variable Beta (Sasmita and Suki ,2015) Beta (this study)
Brand Association 0.240 0.245
Brand Loyalty 0.231 0.248
Brand Awareness 0.424 0.189
Brand Image 0.369 0.185

50
name will influence purchase behavior as well as user satisfaction that will lead to
affect brand equity.
Secondly, brand loyalty was proven to significantly influence brand equity.
Customers who satisfied with a brand will tend to be more loyal and will recommend
the particular brand to other customers and convince as many as possible about the
brand.
Thirdly, brand awareness was proven to have positive relationship with brand
equity. Brand awareness was measured by symbol familiarity, characteristics of a
brand, awareness of product, and product knowledge. However, it was the least
convincing construct to take into account after the other independent variables.
Lastly, brand image was the strongest predictor of brand equity. Brand image
is an intangible resource of a brand. A brand with great brand image will become the
influence of choice for customer, create loyalty, and enable price premium because of
the strong brand image. Thus, they are the most important asset for company aiming to
create brand equity.
5.2 Research Limitation
This research is limited to coffee shop consumer, so this finding of this research
are unable to be generalized for different product category. The respondent’s
characteristics and response from different product category may report different result.
The next limitation is that with online distributions, it enables respondents who do not
51
fit the criteria as valid respondents can fill the questionnaire regardless the filtering
questions that researcher addressed in the first place. Despite the advantages of quick
responses and convenience, online surveys increase risk of bias responses as input to
process the data using statistical software package.
The questionnaire that use to measure items in this research are originally in
English. The questionnaire translated into Indonesian to make the questionnaire more
understandable to respondents. The intended meaning of the original meaning and
translated version may have slight abnormality.
5.3 Suggestion for Future Research
The sample used in this research can be enlarged to gain better understanding
about investigated phenomena. Further research also can use different products as
subject to compare how brand associations, brand loyalty, brand awareness and brand
image effecting brand equity on different products. It is also interesting to investigate
different generations such as baby boomers and generation such as baby boomers,
generation X and generation Z (post millennial).
5.4 Managerial Implication
a. For Marketers
This result of this research can be a consideration for marketers to their
millennial consumers. Marketer need to run strategy that will improve the brand

52
association, brand loyalty a, brand awareness and brand image to increase overall brand
equity as well as maintain and gain new customers especially millennial customers.
b. For Academician
This research can give an insight about millennial consumer as the effects of
brand association, brand loyalty a, brand awareness and brand image to brand equity.
Researcher hope that this research can give useful knowledge and insight for further
research.

53
REFERENCES
Aaker, D.A. (1991), Managing Brand Equity: Capitalizing on the Value of Brand
Name, The Free Press:New York,NY.
Aaker,D.A.(1996),”Measuring Brand Equity across Products and
Markets,”International Journal of Marketing Studies, Vol. 38, No.3, pp.102-120.
Asril, A. and H. Hudraysah (2013),”Media Indonesia Marketing Strategy to Increase
Their Gen Y Readers,”The Indonesian Journal of Business Administration.Vol.2,
No.8, pp.890-898.
Binninger, A.S. (2008), “Exploring the relationships between retail brands and
consumer store loyalty”, International Journal of Retail and Distribution
Management, Vol. 36 No. 2, pp. 94-110
Blackston, M. (1995), "The Qualitative Dimension of Brand Equity," Journal of
Advertising Research, Vol.35, No.4, pp. 2-7.
Chen, A.C.H. (2001),”Using Free Association to Examine the Relationship Between
the Characteristics of Brand Associations and Brand equity “Journal of product
& brand management, Vol. 10, No. 7, pp. 439-451.
Chung, Y.J; J. Lee and L.R. Heath, L.R. (2013), “Public relations aspects of brand
attitudes and customer activity”, Public Relations Review, Vol. 39, No. 5, pp.
432-439.
Creswell, J. (2002). Educational Research: Planning, Conducting, and Evaluating
Quantitative and Qualitative Research. Upper Saddle River, NJ: Prentice Hall
Publisher.
Donnely, C. and R. Scaff (2013),”Who are Millennial Shoppers? And what do They
Want,” Accenture. Retrived from https://www.accenture.com/id-en/insight-
outlook-who-are-millennial-shoppers-what-do-they-really-want-retail.Accesed
on October 12, 2015.
Dover,M. and R.Salkowitz (2011),” Co-Creating Young Brand with Young World
Consumer- Entrepreneurs,”Ivey Business Journal. Retrieved from http : //
www.economist.com/ blogs/dailychart/2010/japans_population Accessed on
October 11,2015.
Ehrenberg, A.S.C.; G.J. Goodhardt; and T.P. Barwise (1990),”Double Jeopardy
Revisited,” Journal of Marketing,Vol. 54, No. 3, pp. 82-91.
54
Emari, H.; A. Jafari and M. Mogddam (2012),” Factors Influencing Consumer
Behavior towards Store Brands: Evidence from the French Market,”
International Journal of Retail Distribution, Vol. 41, No.6, pp. 422-441.
Faircloth, J.B. (2005), “Factors Influencing Nonprofit Resource Provider Support
Decision: Applying the Brand Equity Concept to Nonprofit”, Journal of
Marketing Practice and Theory, Vol. 1, No. 3, pp. 1-15.
Faircloth, J.B.; L.M. Capella, L.M. and B.L. Ahord (2001), “The effect of brand
attitude and brand image on brand equity”, Journal of Marketing Theory and
Practice, Vol. 9 No. 3, pp. 61-75.
Farquhar, P.H. (1989), “Managing brand equity,” Marketing Research, Vol. 1, pp. 24-
33.
Fazio R.H. and M.P. Zanna, (1981), “Direct Experiences and Attitude–Behavior
Consistency,” Advances in Experimental Social Psychology,Vol. 14. pp. 161–
202.
Global Business Guide Indonesia. (2014). Indonesia’s Coffee Industry Needs Growth
Capital. Retrieved July 14, 2015, from Global Business Guide Indonesia:
http://www.gbgindonesia.com/en/agriculture/article/2014/indonesia_s_coffee_i
ndustry_needs_growth_capital.php
Goldman Sachs (2015),” Millennia’s Coming of Age,” Goldman Sachs. Retrieved from
http://www.goldmansachs.com/our-thinking/pages/millennials/. Accessed on
October 11, 2015.
Hair, J. F.; W. C. Black; B. J. Babin; R.E. Anderson and R.L. Tatham (2006),
Multivariate Data Analysis, 6ed. Upper Saddle River, NJ: Pearson Prentice Hall.
Hsieh, A. T. and C. K. Li (2008),” The moderating effect of brand image on public
relations perception and customer loyalty ,”Marketing Intelligence and Planning,
Vol. 26,No.1,pp. 26-42.
International Coffee Organization. (2014). Domestic Consumption of Exporting
Countries. International Coffee Organization.
Isberg, S. and D. Pitta (2013),”Using Financial Analysis to Assess Brand
Equity,”Journal of Product and Brand Management, Vol. 22, No.1, pp. 65-78.
Iversen, N. M. and L. E. Hem (2008), Provenance Associations as Core Values of Place
Umbrella Brands: A Framework of Characteristics,” European Journal of
Marketing, Vol.42 No.5/6.pp. 603-626.
Jacoby, J.; J. C. Olson and R.A. Haddock (1971),”Price, Brand Name, and Product
Composition Characteristics as Determinants of Perceived Quality,” Journal of
Applied Psychology, Vol. 55, pp. 570-579.

55
Jagdish,N and Sheth,C.W. (1974) ,” A Theory of Multidimensional Brand Loyalty,”
Advances in Consumer Research, Vol.1,No.1, pp. 449-459.
Keller, K.L. (1993),” Conceptualizing Measuring, and Managing Customer Based
Brand Equity,” Journal of Marketing, Vol. 57, No.1, pp. 1-22.
Kim, C. K. and J. Y. Chung (1997),”Brand Popularity, Country Image and Market
Share: an Empirical Study,” Journal of International Business Studies, Vol. 28,
Kim, H. B.; W.G. Kim and J. A. An (2003),”The Effect of Consumer Based Brand
Equity on Firms' Financial performance, “Journal of Consumer Marketing, Vol.
20, No. 4, pp. 335-351.
Kotler, P. and K. L. Keller (2012). Marketing Management, 14ed .Upper Saddle River,
N.J: Pearson Prentice Hall Publisher.
Lassar,W.; B. Mital.;and S. Arun .(1995),” Measuring Consumer Based Brand Equity,”
Journal of Consumer Marketing, Vol. 12,No. 4, pp. 11-19.
Lazarevic,V. (2012), “ Encouraging Brand Loyalty in Fickle Generation Y
Consumers,” Journal of Young Consumer, Vol. 13, No. 1, pp. 45- 61.
Luarn, P. and H.H. Lin. (2003),” A Customer Loyalty Model for E-Service Context,”
Journal of Electronic Commerce Research, Vol. 4, No. 4, pp. 157-167
Martenson, R. (2007), “Corporate Brand Image, Satisfaction, and Store Loyalty: A
Study of the Store as a Brand, Store Brands, and Manufacturer Brands,”
International Journal of Retail and Distribution Management, Vol. 35, No 7,
pp.544-555.
Mckinsey. (2012). The Archipelago economy: Unleashing Indonesia’s Potential
Mckinsey global institute, Jakarta: Mckinsey.
Mike Dover and R. Salkowitz (2011),” Co-creating youth brand with young world
consumer entrepreneur Ivey Business Journal. Retrieved from
http://iveybusinessjournal.com/publication. Accessed on October 11, 2015
Netemeyer,R.G,; B. Krishan; P.Chris;G.Wang;M.Yagci;D. Dean; J. Ricks;and F.
Wirdh (2004),” Developing and Validating Measure of Facets of Consumer
Based Brand Equity,” Journal of Business Research, Vol. 57, No.1, pp 209-224.
Norazah,M.S. (2013),” Green Awareness Effects on Consumer’s Purchasing Decision:
Some Insights from Malaysia,” International Journal of Asia Pacific
Studies,Vol. 9,No.2,pp. 49-63.
Oliver, R.L. (1999), “Whence Consumer Loyalty,” Journal of Marketing, Vol. 63, pp.
33-44,

56
Pappu, R.; P. G. Quester and R.W. Cooksey (2005),”Consumer-Based Brand Equity:
Improving the Measurement-Empirical Evidence,” Journal of Product and
Brand Management, Vol.14, No.3.pp. 143-154.
Pitta, D. A. and L. P. Katsanis (1995),”Understanding Brand Equity for Successful
Brand Extension,” Journal of Consumer Marketing, Vol.12, No.4, pp. 51-64.
Pouromid B. and S. Iranzadeh (2012),”The Evaluation of the Factors Effects on the
Brad Equity of Pars Khazar Household Appliances Based on the Vision of
Female Consumer,” Middle-East Journal of Scientific Research, Vol.12, No.8,
pp.1050-1055.
Roscoe, J. T. (1975). Fundamental research statistics for the behavioral sciences, 2ed.
New York: Holt, Rinehart and Winston,
Rubio,N.; J. Oubina and N. Villasenor (2014), “ Brand Awareness – Brand Quality
Interference and Consumer’s Risk Perception in Store Brands of Food Products,
“Food Quality and Preference, Vol. 32, pp. 289-298
Sasmita, J. and N. M. Suki (2015),” Young Consumers’ Insights on Brand Equity:
Effects of Brand Association, Brand Loyalty, Brand Awareness, and Brand
Image,” International Journal of Retail & Distribution Management, Vol.43,
No.3, pp. 276-292.
Sekaran, U. and R. Bougie (2009), Research Method for Business, a Skill Building
Approach, 5th ed West Sussex: John Wiley & Sons Ltd
Severi, E. and K.C. Ling (2013),”The Mediating Effects of Brand Association, Brand
Loyalty, Brand Image and Perceived Quality on Brand Equity,” Asian Social
Science, Vol.9, No.3, pp. 125-137.
Sheth, J.N. and A. Parvatiyar (1995), ‘‘Relationship in Consumer Markets:
Antecedents and Consequences’’, Journal of the Academy of Marketing
Science, Vol. 23 No. 4, pp. 255-71
Simon, C. and M. Sullivan (1993), “The measurement and Determinants of Brand
Equity: a Financial Approach,” Marketing Science, Vol. 12, No. 1, pp. 28-52.
The Economist Online (2010),” Japan’s Population: The Old and the Older,” The
Economist. Retrieved from
http://www.economist.com/blogs/dailychart/2010/11/japans_population.
Accessed on October 11, 2015.
Ward, K. and L. Ryals (2001),”Latest Thinking on Attaching a Financial Value to
Marketing Strategy: Through Brands to Valuing Relationships,” Journal of
Targeting, Measurement and Analysis for Marketing, Vol.9, No.4, pp. 327-340.

57
Yasin, N. M. and A.R. Zahari, (2011),”Does Family and Viral Marketing Have Any
Effect on Brand Equity,” Journal of Contemporary Marketing
Review, Vol.1,No.9,pp/. 19-31.
Zanna, M. P.; J.M. Olson, J. M. and R.H.Fazio (1981),”Self-Perception and Attitude
Behavior Consistency,”Personality and Social Psychology Bulletin, Vol.7, No.2,
pp.252-256
http://blog.viacom.com/2012/11/the-next-normal-an-unprecedented-look-at-
millennials-worldwide/ accessed on October 11, 2015
http://jakartaglobe.beritasatu.com/archive/indonesias-financially-savvy-millennials-
live-within-means/ accessed on October 11, 2015.
http://www.bloomberg.com/news/articles/2015-03-25/coffee-consumption-in-
indonesia-seen-climbing-as-incomes-expand accessed on October 11, 2015
accessed on October 11, 2015
http://www.euromonitor.com/cafes-bars-in-indonesia/report accessed on October 11,
2015
http://www.forbes.com/sites/micahsolomon/2014/12/29/5-traits-that-define-the-80-
million-millennial-customers-coming-your-way/ accessed on October 11, 2015
http://www.goldmansachs.com/our-thinking/pages/millennials/
http://www.hkstrategies.com/news/millennial-market accessed on October 11, 2015
http://www.indonesiainvestments.com/business/commodities/coffee/item18652-256.
Accessed on October 11, 2015

58
APPENDICES
Appendix 1: Research Questionnaire
Research Questionnaire
Dengan hormat,
Saya Ajeng Ghina Farhani, mahasiswi S1 jurusan Manajemen Fakultas Ekonomika dan
Bisnis Universitas Gadjah Mada, memohon kesediaan saudara/i responden untu
menggidi kuisioner ini. Penelitian ini dilakukan dalam rangka penyusunan tugas akhir
dan sebagai salah satu persyaratan untuk menyelesaikan studi saya. Penelitian ini
bertujuan untuk mengetahui wawasan konsumer muda Indonesia tentang ekuitas
merek.
Untuk itu, saya mohon bantuan kesediaan Saudara/i untuk terlibat dalam penelitian ini
dengan mengisi kuisioner terlampir. Saya berharap Saudara/I dapat memberikan
jawaban yang akurat serta sesuai dengan pengalaman dalam kuisioner ini. Dalam
penelitian ini tidak ada jawaban benar atau salah. Saya akan menjamin kerahasiaan data
yang Anda berikan, karena jawaban tersebut hanya sebagai bahan penelitian bukan
untuk dipublikasikan. Atas perhatian dan waktu yang diberikan untuk memberikan
jawaban,saya ucapkan terima kasih.
Peneliti,
Ajeng Ghina Farhani
Part 1

59
1. Jenis Kelamin
a. Laki-laki
b. Perempuan
2. Usia
a. 15 -17 tahun
b. 17 - 20 tahun
c. 21 – 25 tahun
d. 26 – 33 tahun
3. Profesi
a. Pelajar/Mahasiswa
b. Pegawai Swasta
c. Pegawai Negeri
d. Wiraswasta
e. Lainnya
4. Pengeluaran Perbulan
a. Kurang dari Rp 500.000
b. Rp 500.001-Rp.1.000.000
c. Rp 1.000.001- Rp 2.500.000
d. Rp 2.500.001- Rp 5.000.000
e. Lebih dari Rp 5.000.000

60
Part 2
5. Apakah Anda mengunjungi coffee shop dalam satu bulan terakhir?
Ya. (Silahkan melanjutkan pengisian kuisioner ini)
Tidak. (Partisipasi Anda selesai. Terima kasih)
6. Apa coffee shop favorit Anda?
a. Starbucks Coffee
b. The Coffee Bean & Tea Leaf
c. J.CO Donuts & Coffee
d. Dunkin’ Donuts
e. Excelso
f. Lainnya
7. Frekuensi mengunjungi coffee shop dalam satu bulan terakhir?
a. 1 kali
b. 2-3 kali
c. 4 -5 kali
d. Lebih dari 5 kali
8. Uang yang dihabiskan dalam sebulan untuk membeli dari coffee shop?
a. Kurang dari Rp 50.000
b. Rp 50.000 – Rp 100.000
c. Rp 100.001 – Rp 200.000
61
d. Lebih dari Rp 200.000
Part 3
Petunjuk pengisian:Berilah tanda () pada kolom jawaban yang menurut Anda paling
sesuai.
Keterangan: 1: Sangat Tidak
2: Tidak Setuju
3: Netral
4: Setuju

62
5: Sangat Setuju
Terima kasih atas partisipasi Anda.
Appendix 2: Pre-test data
No. Pernyataan 1 2 3 4 5
BAS1 Coffee shop ini mempunyai kepribadian sendiri.
BAS2 Coffee shop ini berbeda dengan pesaing lain.
BAS3 Saya percaya dengan perusahaan yang memiliki coffee shop tersebut.
BAS4 Saya familiar dengan coffee shop ini.
BAS5 Saya mempunyai alasan memilih coffee shop ini dibanding pesaing lain.
BLO1 Saya secara teratur merekomendasikan coffee shop tersebut .
BLO2 Biasanya saya memilih coffee shop tersebut sebagai pilihan utama
dibanding kompetitor lain.
BLO3 Saya merekomendasikan coffee shop tersebut kepada orang lain
BLO4 Saya tidak akan berganti ke coffee shop lain
BLO5 Saya puas dengan coffee shop ini.
BAW1Saya dapat mengingat dengan baik logo coffee shop ini.
BAW2Beberapa karaterisktik coffee shop tersebut terlintas dengan cepat di dalam pikiran saya
BAW3Saya sadar dengan kehadiran coffee shop ini.
BAW4Saya dapat mengenali coffee shop ini dibandingkan dengan kompetitor lain.
BAW5Saya mengetahui rasa produk dari coffee shop tersebut.
BIM1 Coffee shop ini didirikan dengan baik
BIM2 Coffee shop ini mempunyai reputasi yang bagus
BIM3 Coffee shop ini mempunyai image yang berbeda dibanding kompetitor lain
BEQ1 Masuk akal untuk memilih coffee shop ini dibanding kompetitor lain
BEQ2 Bila kompetitor lain mempunyai fitur yang sama, saya tetap akan memilih coffee shop ini.
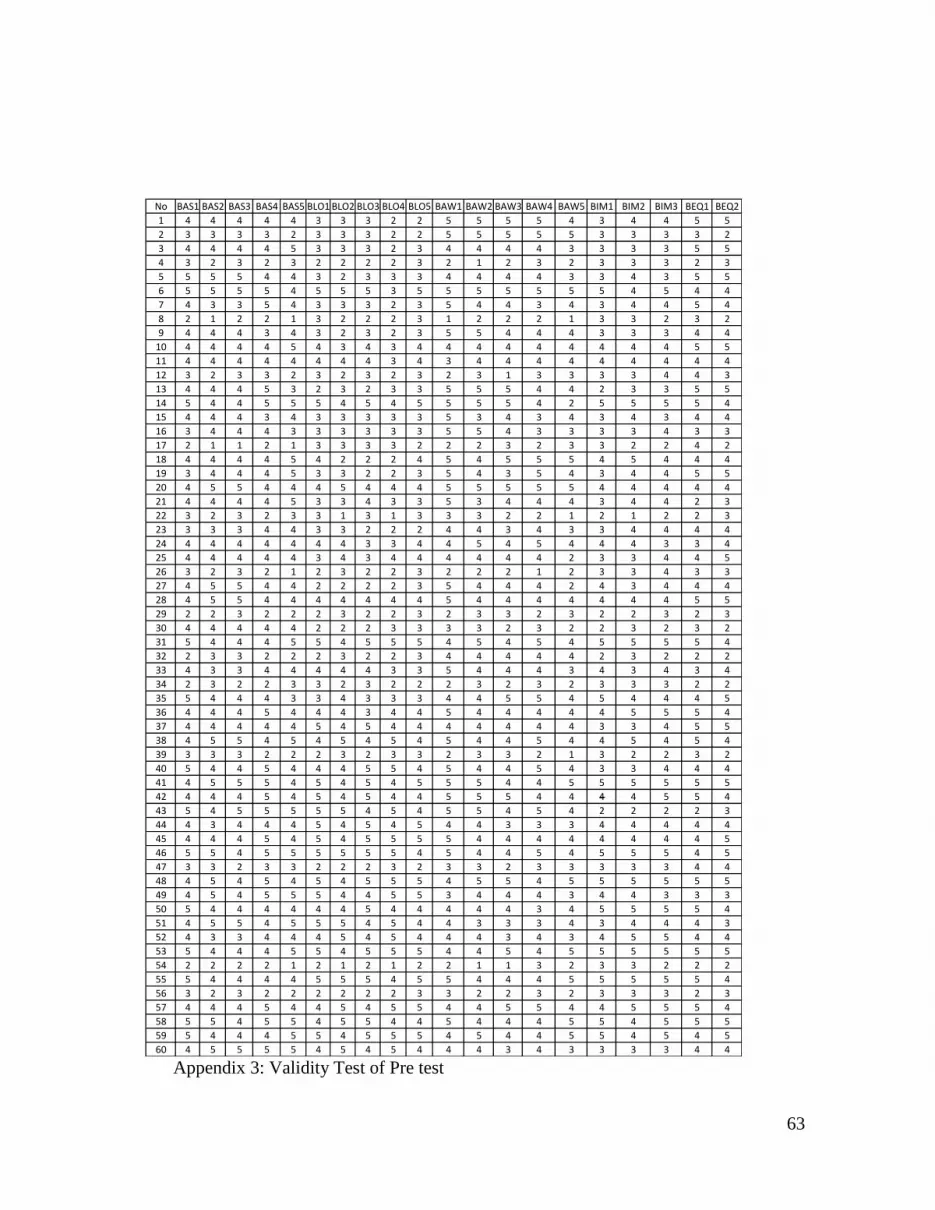
63
Appendix 3: Validity Test of Pre test
No BAS1 BAS2 BAS3 BAS4 BAS5 BLO1 BLO2 BLO3 BLO4 BLO5 BAW1 BAW2 BAW3 BAW4 BAW5 BIM1 BIM2 BIM3 BEQ1 BEQ2
1 4 4 4 4 4 3 3 3 2 2 5 5 5 5 4 3 4 4 5 5
2 3 3 3 3 2 3 3 3 2 2 5 5 5 5 5 3 3 3 3 2
3 4 4 4 4 5 3 3 3 2 3 4 4 4 4 3 3 3 3 5 5
4 3 2 3 2 3 2 2 2 2 3 2 1 2 3 2 3 3 3 2 3
5 5 5 5 4 4 3 2 3 3 3 4 4 4 4 3 3 4 3 5 5
6 5 5 5 5 4 5 5 5 3 5 5 5 5 5 5 5 4 5 4 4
7 4 3 3 5 4 3 3 3 2 3 5 4 4 3 4 3 4 4 5 4
8 2 1 2 2 1 3 2 2 2 3 1 2 2 2 1 3 3 2 3 2
9 4 4 4 3 4 3 2 3 2 3 5 5 4 4 4 3 3 3 4 4
10 4 4 4 4 5 4 3 4 3 4 4 4 4 4 4 4 4 4 5 5
11 4 4 4 4 4 4 4 4 3 4 3 4 4 4 4 4 4 4 4 4
12 3 2 3 3 2 3 2 3 2 3 2 3 1 3 3 3 3 4 4 3
13 4 4 4 5 3 2 3 2 3 3 5 5 5 4 4 2 3 3 5 5
14 5 4 4 5 5 5 4 5 4 5 5 5 5 4 2 5 5 5 5 4
15 4 4 4 3 4 3 3 3 3 3 5 3 4 3 4 3 4 3 4 4
16 3 4 4 4 3 3 3 3 3 3 5 5 4 3 3 3 3 4 3 3
17 2 1 1 2 1 3 3 3 3 2 2 2 3 2 3 3 2 2 4 2
18 4 4 4 4 5 4 2 2 2 4 5 4 5 5 5 4 5 4 4 4
19 3 4 4 4 5 3 3 2 2 3 5 4 3 5 4 3 4 4 5 5
20 4 5 5 4 4 4 5 4 4 4 5 5 5 5 5 4 4 4 4 4
21 4 4 4 4 5 3 3 4 3 3 5 3 4 4 4 3 4 4 2 3
22 3 2 3 2 3 3 1 3 1 3 3 3 2 2 1 2 1 2 2 3
23 3 3 3 4 4 3 3 2 2 2 4 4 3 4 3 3 4 4 4 4
24 4 4 4 4 4 4 4 3 3 4 4 5 4 5 4 4 4 3 3 4
25 4 4 4 4 4 3 4 3 4 4 4 4 4 4 2 3 3 4 4 5
26 3 2 3 2 1 2 3 2 2 3 2 2 2 1 2 3 3 4 3 3
27 4 5 5 4 4 2 2 2 2 3 5 4 4 4 2 4 3 4 4 4
28 4 5 5 4 4 4 4 4 4 4 5 4 4 4 4 4 4 4 5 5
29 2 2 3 2 2 2 3 2 2 3 2 3 3 2 3 2 2 3 2 3
30 4 4 4 4 4 2 2 2 3 3 3 3 2 3 2 2 3 2 3 2
31 5 4 4 4 5 5 4 5 5 5 4 5 4 5 4 5 5 5 5 4
32 2 3 3 2 2 2 3 2 2 3 4 4 4 4 4 2 3 2 2 2
33 4 3 3 4 4 4 4 4 3 3 5 4 4 4 3 4 3 4 3 4
34 2 3 2 2 3 3 2 3 2 2 2 3 2 3 2 3 3 3 2 2
35 5 4 4 4 3 3 4 3 3 3 4 4 5 5 4 5 4 4 4 5
36 4 4 4 5 4 4 4 3 4 4 5 4 4 4 4 4 5 5 5 4
37 4 4 4 4 4 5 4 5 4 4 4 4 4 4 4 3 3 4 5 5
38 4 5 5 4 5 4 5 4 5 4 5 4 4 5 4 4 5 4 5 4
39 3 3 3 2 2 2 3 2 3 3 2 3 3 2 1 3 2 2 3 2
40 5 4 4 5 4 4 4 5 5 4 5 4 4 5 4 3 3 4 4 4
41 4 5 5 5 4 5 4 5 4 5 5 5 4 4 5 5 5 5 5 5
42 4 4 4 5 4 5 4 5 4 4 5 5 5 4 4 4 4 5 5 4
43 5 4 5 5 5 5 5 4 5 4 5 5 4 5 4 2 2 2 2 3
44 4 3 4 4 4 5 4 5 4 5 4 4 3 3 3 4 4 4 4 4
45 4 4 4 5 4 5 4 5 5 5 5 4 4 4 4 4 4 4 4 5
46 5 5 4 5 5 5 5 5 5 4 5 4 4 5 4 5 5 5 4 5
47 3 3 2 3 3 2 2 2 3 2 3 3 2 3 3 3 3 3 4 4
48 4 5 4 5 4 5 4 5 5 5 4 5 5 4 5 5 5 5 5 5
49 4 5 4 5 5 5 4 4 5 5 3 4 4 4 3 4 4 3 3 3
50 5 4 4 4 4 4 4 5 4 4 4 4 4 3 4 5 5 5 5 4
51 4 5 5 4 5 5 5 4 5 4 4 3 3 3 4 3 4 4 4 3
52 4 3 3 4 4 4 5 4 5 4 4 4 3 4 3 4 5 5 4 4
53 5 4 4 4 5 5 4 5 5 5 4 4 5 4 5 5 5 5 5 5
54 2 2 2 2 1 2 1 2 1 2 2 1 1 3 2 3 3 2 2 2
55 5 4 4 4 4 5 5 5 4 5 5 4 4 4 5 5 5 5 5 4
56 3 2 3 2 2 2 2 2 2 3 3 2 2 3 2 3 3 3 2 3
57 4 4 4 5 4 4 5 4 5 5 4 4 5 5 4 4 5 5 5 4
58 5 5 4 5 5 4 5 5 4 4 5 4 4 4 5 5 4 5 5 5
59 5 4 4 4 5 5 4 5 5 5 4 5 4 4 5 5 4 5 4 5
60 4 5 5 5 5 4 5 4 5 4 4 4 3 4 3 3 3 3 4 4
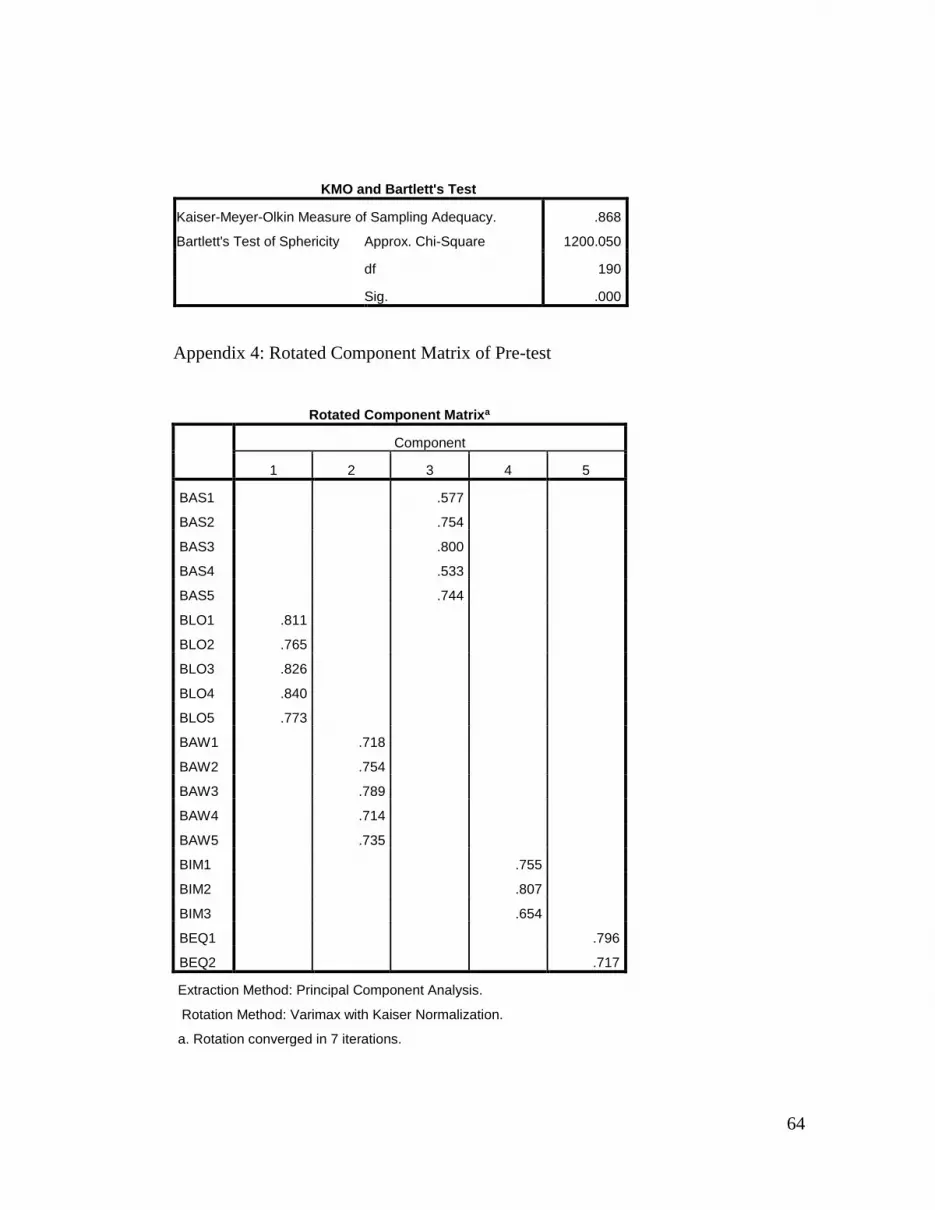
64
KMO and Bartlett's Test
Kaiser-Meyer-Olkin Measure of Sampling Adequacy. .868
Bartlett's Test of Sphericity Approx. Chi-Square 1200.050
df 190
Sig. .000
Appendix 4: Rotated Component Matrix of Pre-test
Rotated Component Matrixa
Component
1 2 3 4 5
BAS1 .577
BAS2 .754
BAS3 .800
BAS4 .533
BAS5 .744
BLO1 .811
BLO2 .765
BLO3 .826
BLO4 .840
BLO5 .773
BAW1 .718
BAW2 .754
BAW3 .789
BAW4 .714
BAW5 .735
BIM1 .755
BIM2 .807
BIM3 .654
BEQ1 .796
BEQ2 .717
Extraction Method: Principal Component Analysis.
Rotation Method: Varimax with Kaiser Normalization.
a. Rotation converged in 7 iterations.

65
Appendix 5: Reliability test of Pre test
Case Processing Summary
N %
Cases Valid 60 100.0
Excludeda 0 .0
Total 60 100.0
a. Listwise deletion based on all variables in the
procedure.
Brand Associations Variable
Reliability Statistics
Cronbach's Alpha N of Items
.935 5
Item-Total Statistics
Scale Mean if
Item Deleted
Scale Variance if
Item Deleted
Corrected Item-
Total Correlation
Cronbach's
Alpha if Item
Deleted
BAS1 15.05 13.879 .814 .924
BAS2 15.17 12.480 .878 .911
BAS3 15.12 13.901 .828 .922
BAS4 15.07 12.877 .822 .922
BAS5 15.13 12.016 .831 .923

66
Brand Loyalty Variable
Reliability Statistics
Cronbach's Alpha N of Items
.943 5
Item-Total Statistics
Scale Mean if
Item Deleted
Scale Variance if
Item Deleted
Corrected Item-
Total Correlation
Cronbach's
Alpha if Item
Deleted
BLO1 13.87 15.812 .886 .923
BLO2 14.03 16.338 .809 .937
BLO3 13.97 15.456 .868 .926
BLO4 14.15 15.045 .853 .930
BLO5 13.85 17.045 .833 .934
Brand Awareness Variable
Reliability Statistics
Cronbach's Alpha N of Items
.917 5
Item-Total Statistics
Scale Mean if
Item Deleted
Scale Variance if
Item Deleted
Corrected Item-
Total Correlation
Cronbach's
Alpha if Item
Deleted
BAW1 14.88 12.817 .814 .893
BAW2 15.03 13.592 .806 .895
BAW3 15.18 13.068 .828 .890
BAW4 15.10 14.092 .773 .902

67
BAW5 15.40 13.498 .723 .912
Brand Image Variable
Reliability Statistics
Cronbach's Alpha N of Items
.909 3
Item-Total Statistics
Scale Mean if
Item Deleted
Scale Variance if
Item Deleted
Corrected Item-
Total Correlation
Cronbach's
Alpha if Item
Deleted
BIM1 7.47 3.270 .820 .868
BIM2 7.35 3.214 .815 .872
BIM3 7.25 3.106 .820 .868
Brand Equity Variable
Reliability Statistics
Cronbach's Alpha N of Items
.853 2
Item-Total Statistics
Scale Mean if
Item Deleted
Scale Variance if
Item Deleted
Corrected Item-
Total Correlation
Cronbach's
Alpha if Item
Deleted
BEQ1 3.83 .989 .745 .
BEQ2 3.90 1.108 .745 .

68
Appendix 6: Primary Research Data
No BAS1 BAS2 BAS3 BAS4 BAS5 BLO1 BLO2 BLO3 BLO4 BLO5 BAW1 BAW2 BAW3 BAW4 BAW5 BIM1 BIM2 BIM3 BEQ1 BEQ2
1 4 4 4 4 4 3 3 3 2 2 5 5 5 5 4 3 4 4 5 5
2 3 3 3 3 2 3 3 3 2 2 5 5 5 5 5 3 3 4 3 2
3 4 4 4 4 5 3 3 3 2 3 4 4 4 4 3 3 3 3 5 5
4 3 2 3 2 3 2 2 2 2 3 2 1 2 3 2 3 3 3 2 3
5 5 5 5 4 4 3 2 3 3 3 4 4 4 4 3 3 4 3 5 5
6 5 5 5 5 4 5 5 5 3 5 5 5 5 5 5 5 4 5 4 4
7 4 3 3 5 4 3 3 3 2 3 5 4 4 3 4 3 4 4 5 4
8 2 1 2 2 1 3 2 2 2 3 1 2 2 2 1 3 3 2 3 2
9 4 4 4 3 4 3 2 3 2 3 5 5 4 4 4 3 3 3 4 4
10 4 4 4 4 5 4 3 4 3 4 4 4 4 4 4 4 4 4 5 5
11 4 4 4 4 4 4 4 4 3 4 3 4 4 4 4 4 4 4 4 4
12 3 2 3 3 2 3 2 3 2 3 2 3 1 3 3 3 3 4 4 3
13 4 4 4 5 3 2 3 2 3 3 5 5 5 4 4 2 3 3 5 5
14 5 4 4 5 5 5 4 5 4 5 5 5 5 4 2 5 5 5 5 4
15 4 4 4 3 4 3 3 3 3 3 5 3 4 3 4 3 4 3 4 4
16 3 4 4 4 3 3 3 3 3 3 5 5 4 3 3 3 3 4 3 3
17 2 1 1 2 1 3 3 3 3 2 2 2 3 2 3 3 2 2 4 2
18 4 4 4 4 5 4 2 2 2 4 5 4 5 5 5 4 5 4 4 4
19 3 4 4 4 5 3 3 2 2 3 5 4 3 5 4 3 4 4 5 5
20 4 5 5 4 4 4 5 4 4 4 5 5 5 5 5 4 4 4 4 4
21 4 4 4 4 5 3 3 4 3 3 5 3 4 4 4 3 4 4 2 3
22 3 2 3 2 3 3 1 3 1 3 3 3 2 2 1 2 1 2 2 3
23 3 3 3 4 4 3 3 2 2 2 4 4 3 4 3 3 4 4 4 4
24 4 4 4 4 4 4 4 3 3 4 4 5 4 5 4 4 4 3 3 4
25 4 4 4 4 4 3 4 3 4 4 4 4 4 4 2 3 3 4 4 5
26 3 2 3 2 1 2 3 2 2 3 2 2 2 1 2 3 3 4 3 3
27 4 5 5 4 4 2 2 2 2 3 5 4 4 4 2 4 3 4 4 4
28 4 5 5 4 4 4 4 4 4 4 5 4 4 4 4 4 4 4 5 5
29 2 2 3 2 2 2 3 2 2 3 2 3 3 2 3 2 2 3 2 3
30 4 4 4 4 4 2 2 2 3 3 3 3 2 3 2 2 3 2 3 2
31 5 4 4 4 5 5 4 5 5 5 4 5 4 5 4 5 5 5 5 4
32 2 3 3 2 2 2 3 2 2 3 4 4 4 4 4 2 3 2 2 2
33 4 3 3 4 4 4 4 4 3 3 5 4 4 4 3 4 3 4 3 4
34 2 3 2 2 3 3 2 3 2 2 2 3 2 3 2 3 3 3 2 2
35 5 4 4 4 3 3 4 3 3 3 4 4 5 5 4 5 4 4 4 5
36 4 4 4 5 4 4 4 3 4 4 5 4 4 4 4 4 5 5 5 4
37 4 4 4 4 4 5 4 5 4 4 4 4 4 4 4 3 3 4 5 5
38 4 5 5 4 5 4 5 4 5 4 5 4 4 5 4 4 5 4 5 4
39 3 3 3 2 2 2 3 2 3 3 2 3 3 2 1 3 2 2 3 2
40 5 4 4 5 4 4 4 5 5 4 5 4 4 5 4 3 3 4 4 4
41 4 5 5 5 4 5 4 5 4 5 5 5 4 4 5 5 5 5 5 5
42 4 4 4 5 4 5 4 5 4 4 5 5 5 4 4 4 4 5 5 4
43 5 4 5 5 5 5 5 4 5 4 5 5 4 5 4 2 2 2 2 3
44 4 3 4 4 4 5 4 5 4 5 4 4 3 3 3 4 4 4 4 4
45 4 4 4 5 4 5 4 5 5 5 5 4 4 4 4 4 4 4 4 5
46 5 5 4 5 5 5 5 5 5 4 5 4 4 5 4 5 5 5 4 5
47 3 3 2 3 3 2 2 2 3 2 3 3 2 3 3 3 3 3 4 4
48 4 5 4 5 4 5 4 5 5 5 4 5 5 4 5 5 5 5 5 5
49 4 5 4 5 5 5 4 4 5 5 3 4 4 4 3 4 4 3 3 3
50 5 4 4 4 4 4 4 5 4 4 4 4 4 3 4 5 5 5 5 4

69
No BAS1 BAS2 BAS3 BAS4 BAS5 BLO1 BLO2 BLO3 BLO4 BLO5 BAW1 BAW2 BAW3 BAW4 BAW5 BIM1 BIM2 BIM3 BEQ1 BEQ2
51 4 5 5 4 5 5 5 4 5 4 4 3 3 3 4 3 4 4 4 3
52 4 3 3 4 4 4 5 4 5 4 4 4 3 4 3 4 5 5 4 4
53 5 4 4 4 5 5 4 5 5 5 4 4 5 4 5 5 5 5 5 5
54 2 2 2 2 1 2 1 2 1 2 2 1 1 3 2 3 3 2 2 2
55 5 4 4 4 4 5 5 5 4 5 5 4 4 4 5 5 5 5 5 4
56 3 2 3 2 2 2 2 2 2 3 3 2 2 3 2 3 3 3 2 3
57 4 4 4 5 4 4 5 4 5 5 4 4 5 5 4 4 5 5 5 4
58 5 5 4 5 5 4 5 5 4 4 5 4 4 4 5 5 4 5 5 5
59 5 4 4 4 5 5 4 5 5 5 4 5 4 4 5 5 4 5 4 5
60 4 5 5 5 5 4 4 4 5 5 4 5 5 4 3 3 3 4 4 4
61 3 3 4 4 4 4 4 4 5 4 4 5 3 3 4 5 4 5 4 4
62 4 4 5 3 3 4 4 2 3 5 4 5 4 4 5 5 4 3 3 3
63 5 4 5 5 3 2 3 2 3 5 5 5 5 5 5 5 4 3 2 2
64 4 3 3 4 3 4 3 2 3 4 5 5 4 3 3 4 4 4 2 2
65 4 3 5 2 3 2 3 3 2 5 4 5 5 3 3 4 5 3 3 3
66 4 5 4 4 3 4 3 3 4 4 5 5 5 5 4 5 5 4 5 5
67 4 3 4 5 1 2 1 2 2 4 5 4 5 3 4 5 5 2 2 2
68 3 5 5 5 5 4 5 3 3 5 4 5 5 5 5 5 4 5 5 5
69 2 2 4 2 1 2 1 1 2 4 4 4 5 1 4 5 5 2 1 1
70 1 2 3 2 1 2 2 3 3 3 3 3 2 2 1 2 3 2 3 3
71 3 3 4 4 3 3 4 2 3 5 4 5 5 4 3 4 4 3 3 3
72 3 3 4 4 4 4 4 4 5 4 5 4 5 4 4 4 3 4 3 3
73 1 2 1 2 3 2 3 4 3 2 1 2 3 2 1 1 2 2 2 2
74 4 4 5 3 3 4 3 2 3 5 5 5 4 4 4 4 5 3 4 4
75 3 4 4 4 4 3 4 3 3 4 5 5 4 4 4 4 5 4 4 4
76 3 4 5 4 4 5 4 3 5 3 4 5 5 4 4 4 4 4 4 4
77 5 4 5 5 3 5 4 2 4 5 4 5 5 4 4 5 5 4 3 3
78 4 5 5 3 2 4 3 3 4 5 5 4 4 4 4 5 4 5 4 4
79 4 4 4 5 5 5 5 4 4 5 5 5 4 5 4 4 5 4 4 4
80 3 3 4 3 3 3 3 3 3 5 3 4 3 4 3 3 4 3 3 3
81 2 3 4 4 3 4 4 3 4 5 5 4 5 4 3 4 5 3 3 3
82 4 4 4 4 4 3 4 3 4 4 4 4 3 4 4 4 5 4 4 4
83 4 5 5 5 4 4 4 2 3 5 4 5 4 5 4 5 5 4 4 4
84 2 3 5 5 3 3 4 2 4 5 4 4 5 4 3 5 5 4 5 5
85 5 5 5 5 4 5 4 4 4 5 5 5 4 5 5 5 4 4 5 5
86 2 3 4 4 2 4 4 2 4 5 5 4 4 4 5 4 5 4 3 3
87 4 3 5 4 3 4 3 1 2 5 4 4 5 3 4 4 5 4 3 3
88 4 3 3 4 3 3 4 2 3 4 4 3 4 3 4 4 5 4 3 3
89 4 4 5 4 4 4 3 3 4 2 3 4 3 4 4 4 4 4 4 4
90 2 1 2 3 2 2 1 2 2 2 2 3 3 2 3 2 3 1 2 2
91 4 4 4 4 3 4 4 4 3 4 3 4 3 2 5 4 5 4 4 4
92 2 4 4 2 2 3 2 2 3 4 2 4 3 2 4 4 5 2 4 4
93 4 4 4 4 2 3 2 2 3 5 4 5 5 5 5 5 4 5 5 5
94 4 4 4 4 4 5 4 4 5 5 4 5 4 4 5 5 4 4 5 5
95 4 5 4 2 2 3 4 2 2 5 5 4 5 4 4 5 4 5 5 5
96 2 4 4 2 2 3 2 3 3 4 4 5 5 4 5 5 5 5 5 5
97 5 5 4 5 5 4 5 5 4 4 5 5 5 4 4 5 5 5 5 5
98 4 2 5 2 2 3 2 2 3 4 5 5 4 4 5 4 4 4 2 2
99 2 4 4 4 4 3 4 3 4 5 4 5 4 5 4 5 5 4 2 2
100 2 4 4 2 4 4 4 4 3 5 5 5 4 4 4 5 5 5 5 5

70
No BAS1 BAS2 BAS3 BAS4 BAS5 BLO1 BLO2 BLO3 BLO4 BLO5 BAW1 BAW2 BAW3 BAW4 BAW5 BIM1 BIM2 BIM3 BEQ1 BEQ2
101 2 5 5 5 5 4 4 3 3 4 4 5 5 4 4 5 4 5 5 5
102 2 5 4 5 4 5 5 2 3 5 4 5 4 4 4 5 5 4 5 5
103 2 4 4 4 2 4 2 4 3 4 4 4 5 4 4 4 4 5 5 5
104 4 4 5 4 4 5 4 5 5 5 5 4 5 4 4 5 5 4 4 4
105 2 4 4 2 2 3 2 4 3 5 4 5 4 4 4 4 5 4 4 4
106 3 3 4 3 3 4 4 3 3 4 4 3 4 4 4 4 4 3 3 3
107 3 4 5 4 5 3 5 4 4 4 4 5 4 5 4 4 5 5 3 3
108 4 4 5 5 2 3 4 4 5 5 5 4 5 3 4 4 4 3 4 4
109 4 5 5 5 4 3 4 3 4 5 5 5 5 5 4 4 5 4 4 4
110 5 5 5 5 3 4 5 4 3 5 4 5 4 4 5 5 4 5 5 5
111 5 4 5 5 5 4 5 3 5 5 4 5 4 5 4 4 5 5 5 5
112 5 5 5 5 4 3 4 5 4 5 4 5 5 4 5 5 4 5 5 5
113 4 4 3 4 4 4 4 1 3 5 4 5 5 4 4 5 4 3 2 2
114 4 4 4 4 4 4 4 4 5 4 5 4 5 4 4 4 5 4 4 4
115 5 5 5 5 2 3 2 2 3 5 5 4 5 5 5 5 4 5 5 5
116 4 4 4 4 2 3 3 3 3 3 4 4 4 3 4 4 5 3 4 4
117 5 5 5 5 3 4 3 2 3 5 4 5 4 3 5 5 4 4 3 3
118 1 4 5 4 1 3 5 3 3 5 4 5 5 5 5 5 5 4 3 3
119 3 3 3 3 4 2 3 1 2 5 4 5 4 5 4 4 5 3 2 2
120 4 3 4 3 4 4 4 4 4 4 5 5 4 5 5 4 5 4 3 3
121 3 2 3 3 4 3 3 2 3 5 4 5 5 4 4 4 4 4 4 4
122 2 1 1 2 2 1 1 2 2 2 3 2 3 2 3 3 4 2 2 2
123 2 2 1 2 2 2 2 2 1 3 3 3 2 3 2 3 3 2 2 2
124 4 4 5 4 3 4 4 3 4 3 5 3 4 4 4 4 5 4 5 5
125 4 4 5 5 5 5 5 5 4 5 5 4 5 4 5 4 5 5 4 4
126 4 4 3 4 3 4 4 3 3 4 5 4 5 4 4 3 4 4 3 3
127 3 4 5 4 4 5 5 4 5 4 4 5 5 4 5 4 5 4 3 3
128 4 5 4 4 3 4 3 4 4 4 5 4 5 3 4 5 4 4 5 5
129 4 3 4 3 3 4 4 3 4 5 5 4 5 4 5 5 4 5 5 5
130 4 3 4 3 4 3 4 3 4 4 4 5 4 3 5 4 5 3 4 4
131 3 4 4 3 3 4 4 4 4 5 4 5 5 5 5 4 4 5 4 4
132 2 3 2 3 2 2 2 2 1 2 3 2 3 2 3 3 4 2 3 3
133 4 3 4 4 3 4 3 4 4 4 5 5 5 4 5 4 4 4 5 5
134 2 1 2 1 2 2 2 1 2 1 2 3 1 2 1 2 2 2 2 2
135 3 4 3 4 4 3 4 4 3 5 5 4 5 5 5 4 4 4 5 5
136 4 4 5 4 5 4 5 4 5 4 4 5 5 5 5 5 4 5 5 5
137 5 5 4 5 5 5 4 5 5 5 5 4 5 4 4 5 4 5 5 5
138 3 4 5 4 3 5 4 5 4 4 5 5 4 5 5 4 4 4 5 5
139 4 5 5 4 4 4 4 3 4 4 5 4 4 5 5 5 5 5 5 5
140 4 4 4 4 3 3 2 3 3 3 5 4 4 4 4 3 4 4 3 3
141 4 5 5 5 4 4 4 5 4 4 5 5 4 5 5 3 4 4 3 3
142 5 5 5 4 3 5 4 4 3 5 4 4 5 5 5 4 5 5 4 4
143 3 4 4 5 5 4 5 5 4 5 3 5 5 3 3 5 4 4 5 5
144 1 2 1 1 2 3 2 2 2 3 2 3 3 3 3 2 3 3 2 2
145 4 5 5 4 4 3 5 5 3 4 5 5 4 4 5 4 5 4 3 3
146 4 5 4 4 5 4 3 4 5 5 4 4 5 5 4 5 5 4 5 5
147 5 5 5 4 4 5 5 4 4 5 5 4 5 5 3 4 3 4 3 3
148 3 4 4 3 5 4 4 3 3 5 4 5 5 4 5 4 5 4 5 5
149 4 4 5 5 4 5 5 4 4 5 4 5 5 5 4 5 5 5 3 3

71
No BAS1 BAS2 BAS3 BAS4 BAS5 BLO1 BLO2 BLO3 BLO4 BLO5 BAW1 BAW2 BAW3 BAW4 BAW5 BIM1 BIM2 BIM3 BEQ1 BEQ2
150 4 5 4 4 5 4 5 4 5 5 5 4 5 3 5 4 5 4 4 4
151 4 5 5 5 5 4 3 4 3 4 5 5 4 5 4 5 4 4 3 3
152 5 3 4 4 3 3 4 5 5 5 4 5 5 4 5 4 4 4 5 5
153 3 4 5 5 5 4 5 5 5 5 4 3 4 5 4 5 5 5 5 5
154 5 4 5 3 4 5 4 3 3 4 3 3 5 4 4 5 4 4 5 5
155 4 5 5 5 4 5 5 5 4 5 5 5 4 5 5 4 5 4 5 5
156 3 4 3 3 4 4 3 4 3 4 5 4 5 4 4 3 4 4 3 3
157 5 5 4 5 5 4 5 5 4 5 5 5 4 5 5 4 5 4 5 5
158 4 4 3 4 5 3 4 4 3 4 5 4 5 4 4 5 5 5 5 5
159 4 3 3 4 5 4 4 4 5 5 5 4 5 5 4 5 4 5 5 5
160 2 2 3 3 3 2 3 2 2 1 2 3 3 3 3 2 3 2 3 3
161 4 5 4 5 4 4 3 4 4 4 5 4 4 3 4 5 4 4 4 4
162 5 4 5 5 5 5 5 4 4 5 5 4 4 5 5 4 5 5 5 5
163 4 5 4 5 5 4 5 5 4 5 5 4 5 5 4 5 5 4 5 5
164 4 4 5 4 4 5 5 4 4 5 5 4 4 5 5 4 3 4 4 4
165 4 3 3 4 5 4 4 4 5 4 3 4 4 3 4 4 5 5 4 4
166 5 4 5 5 4 5 5 5 4 5 4 5 4 4 5 5 5 4 5 5
167 4 4 4 5 4 5 4 4 5 5 5 4 5 4 4 4 5 5 4 4
168 3 4 5 4 5 4 5 5 4 4 5 4 4 5 4 5 4 4 4 4
169 3 3 4 4 5 4 5 5 5 5 5 5 5 5 5 4 5 5 5 5
170 4 4 5 4 4 5 5 5 4 4 4 5 5 5 4 5 5 4 5 5
171 5 5 5 4 5 5 5 5 4 5 5 4 5 4 5 4 4 5 5 5
172 3 4 4 4 5 5 4 5 5 5 5 5 4 4 4 5 5 4 5 5
173 3 1 2 2 3 2 1 2 3 3 2 1 2 3 3 2 3 3 2 2
174 2 3 2 2 3 2 1 2 2 1 2 2 1 2 2 3 2 2 3 3
175 5 5 5 5 4 5 4 5 5 5 4 5 4 5 5 4 5 4 5 5
176 4 5 5 4 5 4 5 4 5 4 5 4 5 4 5 5 5 5 4 4
177 4 5 5 4 5 5 4 5 4 5 4 5 4 5 5 4 5 5 5 5
178 4 5 4 5 4 5 4 5 5 5 5 4 5 5 4 5 5 4 5 5
179 3 3 4 5 5 4 4 5 4 4 5 4 5 3 4 4 4 3 4 4
180 5 5 5 5 5 5 4 4 5 4 4 5 5 5 5 5 4 4 5 5
181 4 4 3 3 4 4 5 3 4 5 5 5 4 5 4 5 5 5 4 4
182 5 5 5 5 4 5 5 5 4 5 4 5 5 5 4 5 4 5 5 5
183 3 4 3 3 4 4 3 3 4 4 4 5 4 4 4 4 3 4 4 4
184 5 5 5 4 5 4 5 5 4 5 4 5 5 5 5 4 5 4 5 5
185 1 2 2 2 1 3 2 2 1 3 3 2 3 2 3 2 3 3 2 2
186 4 4 3 4 4 2 4 4 2 4 3 4 4 4 4 4 3 4 3 3
187 3 4 4 4 5 4 5 4 5 5 4 5 5 5 5 4 5 5 5 5
188 4 5 5 3 4 5 4 5 5 5 5 4 5 5 5 5 5 4 5 5
189 5 4 4 5 5 4 5 4 4 5 4 5 5 4 4 5 5 5 5 5
190 4 3 4 5 4 5 4 4 5 5 3 4 5 4 5 4 5 4 5 5
191 5 4 4 4 4 5 4 5 5 4 5 5 5 5 5 5 5 5 5 5
192 3 4 4 3 3 3 3 4 4 5 4 4 3 4 3 4 4 4 3 3
193 1 2 1 2 3 2 3 3 2 2 1 2 2 1 2 1 2 2 2 2
194 4 4 3 4 4 4 5 3 5 4 5 4 5 5 5 4 5 4 4 4
195 5 5 4 4 5 5 5 4 4 5 4 5 5 5 5 5 5 4 5 5
196 5 4 5 5 4 4 5 5 4 4 5 5 4 5 4 5 4 5 4 4
197 4 3 3 4 3 5 4 4 5 5 4 4 5 5 5 5 4 4 5 5
198 5 4 4 5 4 4 5 5 5 5 4 5 5 4 4 5 4 4 4 4
199 4 5 4 5 4 4 4 5 4 5 5 5 4 5 5 5 4 4 5 5
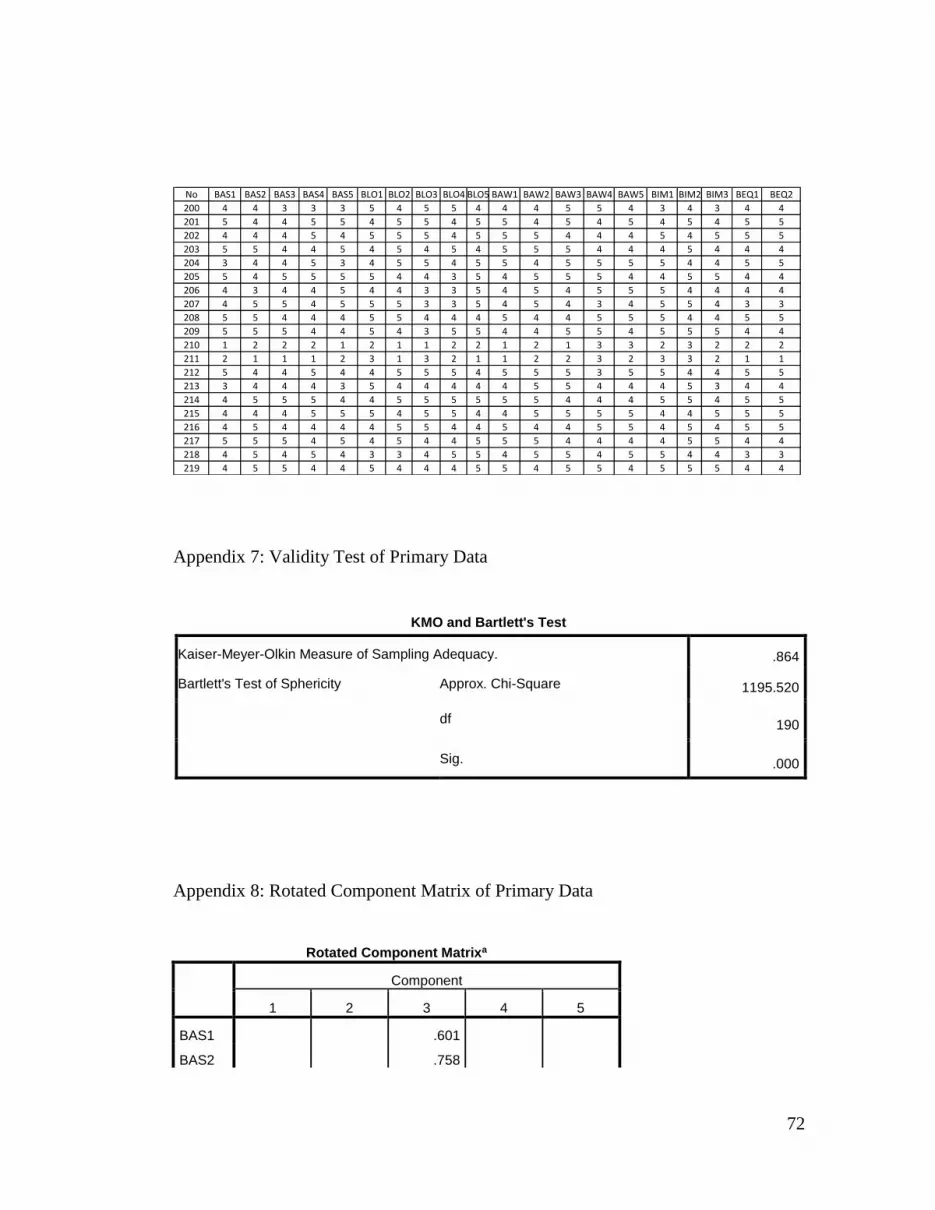
72
Appendix 7: Validity Test of Primary Data
KMO and Bartlett's Test
Kaiser-Meyer-Olkin Measure of Sampling Adequacy. .864
Bartlett's Test of Sphericity Approx. Chi-Square 1195.520
df 190
Sig. .000
Appendix 8: Rotated Component Matrix of Primary Data
Rotated Component Matrixa
Component
1 2 3 4 5
BAS1 .601
BAS2 .758
No BAS1 BAS2 BAS3 BAS4 BAS5 BLO1 BLO2 BLO3 BLO4 BLO5 BAW1 BAW2 BAW3 BAW4 BAW5 BIM1 BIM2 BIM3 BEQ1 BEQ2
200 4 4 3 3 3 5 4 5 5 4 4 4 5 5 4 3 4 3 4 4
201 5 4 4 5 5 4 5 5 4 5 5 4 5 4 5 4 5 4 5 5
202 4 4 4 5 4 5 5 5 4 5 5 5 4 4 4 5 4 5 5 5
203 5 5 4 4 5 4 5 4 5 4 5 5 5 4 4 4 5 4 4 4
204 3 4 4 5 3 4 5 5 4 5 5 4 5 5 5 5 4 4 5 5
205 5 4 5 5 5 5 4 4 3 5 4 5 5 5 4 4 5 5 4 4
206 4 3 4 4 5 4 4 3 3 5 4 5 4 5 5 5 4 4 4 4
207 4 5 5 4 5 5 5 3 3 5 4 5 4 3 4 5 5 4 3 3
208 5 5 4 4 4 5 5 4 4 4 5 4 4 5 5 5 4 4 5 5
209 5 5 5 4 4 5 4 3 5 5 4 4 5 5 4 5 5 5 4 4
210 1 2 2 2 1 2 1 1 2 2 1 2 1 3 3 2 3 2 2 2
211 2 1 1 1 2 3 1 3 2 1 1 2 2 3 2 3 3 2 1 1
212 5 4 4 5 4 4 5 5 5 4 5 5 5 3 5 5 4 4 5 5
213 3 4 4 4 3 5 4 4 4 4 4 5 5 4 4 4 5 3 4 4
214 4 5 5 5 4 4 5 5 5 5 5 5 4 4 4 5 5 4 5 5
215 4 4 4 5 5 5 4 5 5 4 4 5 5 5 5 4 4 5 5 5
216 4 5 4 4 4 4 5 5 4 4 5 4 4 5 5 4 5 4 5 5
217 5 5 5 4 5 4 5 4 4 5 5 5 4 4 4 4 5 5 4 4
218 4 5 4 5 4 3 3 4 5 5 4 5 5 4 5 5 4 4 3 3
219 4 5 5 4 4 5 4 4 4 5 5 4 5 5 4 5 5 5 4 4

73
BAS3 .651
BAS4 .557
BAS5 .659
BLO1 .783
BLO2 .651
BLO3 .749
BLO4 .803
BLO5 .736
BAW1 .729
BAW2 .689
BAW3 .729
BAW4 .688
BAW5 .649
BIM1 .685
BIM2 .650
BIM3 .777
BEQ1 .696
BEQ2 .741
Extraction Method: Principal Component Analysis.
Rotation Method: Varimax with Kaiser Normalization.a
a. Rotation converged in 7 iterations.
Appendix 9: Reliability Test of Primary Data
Case Processing Summary
N %
Cases Valid 219 100.0
Excludeda 0 .0
Total 219 100.0
a. Listwise deletion based on all variables in the
procedure.

74
Brand Association Variable
Reliability Statistics
Cronbach's Alpha N of Items
.879 5
Item Statistics
Mean Std. Deviation N
BAS1 3.84 1.023 219
BAS2 3.67 1.072 219
BAS3 3.86 .978 219
BAS4 3.99 1.018 219
BAS5 3.86 1.062 219
Item-Total Statistics
Scale Mean if
Item Deleted
Scale Variance if
Item Deleted
Corrected Item-
Total Correlation
Cronbach's
Alpha if Item
Deleted
BAS1 15.39 11.974 .702 .856
BAS2 15.25 11.599 .779 .837
BAS3 15.11 12.322 .699 .857
BAS4 15.21 11.726 .756 .843
BAS5 15.40 11.994 .631 .874
Brand Loyalty Variable

75
Reliability Statistics
Cronbach's Alpha N of Items
.889 5
Item Statistics
Mean Std. Deviation N
BLO1 3.65 1.088 219
BLO2 3.72 1.009 219
BLO3 3.73 1.124 219
BLO4 3.49 1.171 219
BLO5 3.68 .990 219
Item-Total Statistics
Scale Mean if
Item Deleted
Scale Variance if
Item Deleted
Corrected Item-
Total Correlation
Cronbach's
Alpha if Item
Deleted
BLO1 14.98 13.142 .777 .856
BLO2 15.04 12.467 .772 .855
BLO3 15.20 12.684 .706 .872
BLO4 15.15 12.657 .776 .854
BLO5 14.62 14.036 .630 .887
Brand Awareness Variable
Reliability Statistics
Cronbach's Alpha N of Items
.917 5
Item Statistics

76
Mean Std. Deviation N
BAW1 4.24 1.004 219
BAW2 4.11 .971 219
BAW3 4.15 .953 219
BAW4 4.16 .939 219
BAW5 3.91 1.019 219
Item-Total Statistics
Scale Mean if
Item Deleted
Scale Variance if
Item Deleted
Corrected Item-
Total Correlation
Cronbach's
Alpha if Item
Deleted
BAW1 14.88 12.817 .814 .893
BAW2 15.03 13.592 .806 .895
BAW3 15.18 13.068 .828 .890
BAW4 15.10 14.092 .773 .902
BAW5 15.40 13.498 .723 .912
Brand Image Variable
Reliability Statistics
Cronbach's Alpha N of Items
.909 3
Item Statistics
Mean Std. Deviation N
BIM1 4.00 .914 219
BIM2 4.08 .930 219
BIM3 4.20 .853 219
Item-Total Statistics
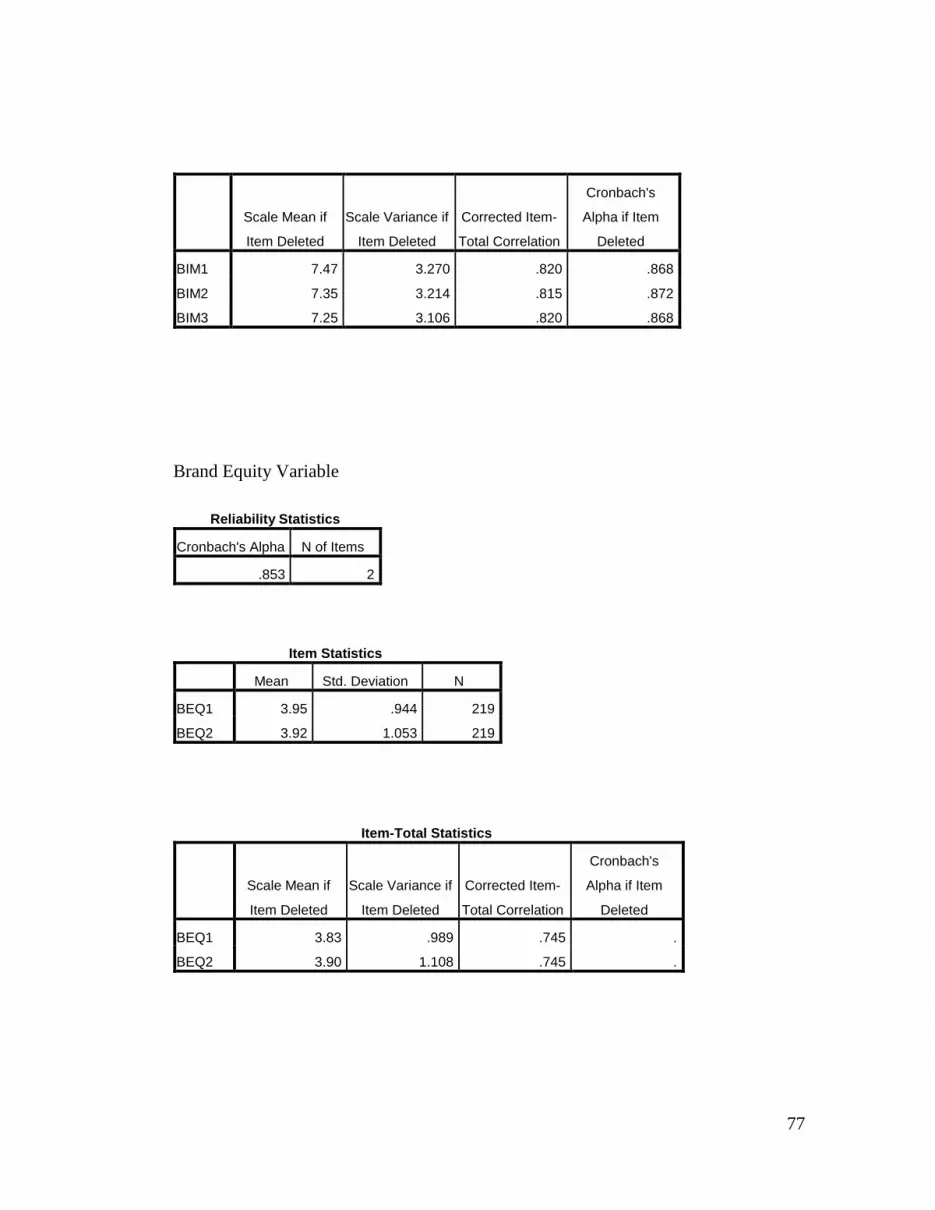
77
Scale Mean if
Item Deleted
Scale Variance if
Item Deleted
Corrected Item-
Total Correlation
Cronbach's
Alpha if Item
Deleted
BIM1 7.47 3.270 .820 .868
BIM2 7.35 3.214 .815 .872
BIM3 7.25 3.106 .820 .868
Brand Equity Variable
Reliability Statistics
Cronbach's Alpha N of Items
.853 2
Item Statistics
Mean Std. Deviation N
BEQ1 3.95 .944 219
BEQ2 3.92 1.053 219
Item-Total Statistics
Scale Mean if
Item Deleted
Scale Variance if
Item Deleted
Corrected Item-
Total Correlation
Cronbach's
Alpha if Item
Deleted
BEQ1 3.83 .989 .745 .
BEQ2 3.90 1.108 .745 .
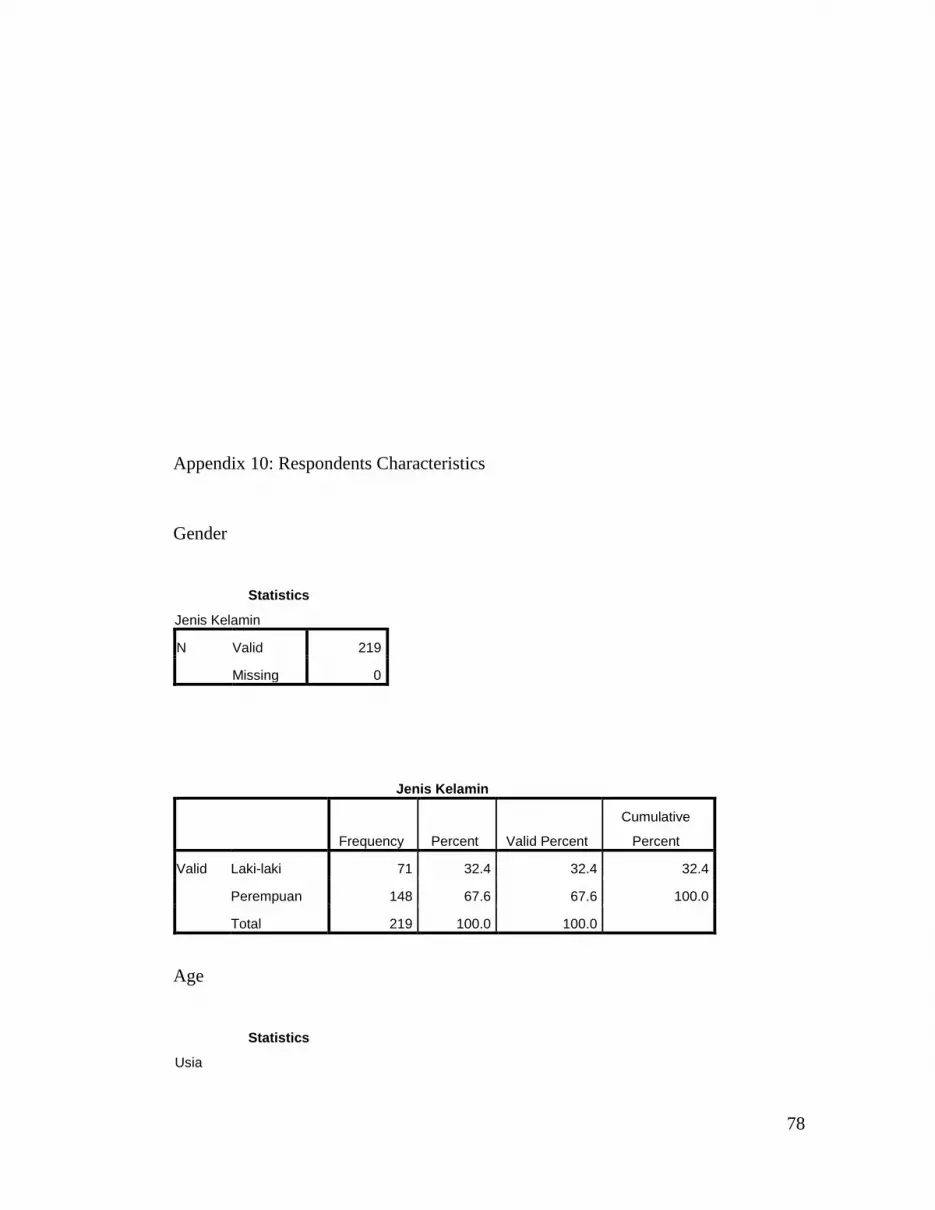
78
Appendix 10: Respondents Characteristics
Gender
Statistics
Jenis Kelamin
N Valid 219
Missing 0
Jenis Kelamin
Frequency Percent Valid Percent
Cumulative
Percent
Valid Laki-laki 71 32.4 32.4 32.4
Perempuan 148 67.6 67.6 100.0
Total 219 100.0 100.0
Age
Statistics
Usia

79
N Valid 219
Missing 0
Usia
Frequency Percent Valid Percent
Cumulative
Percent
Valid 15 - 17 tahun 40 18.3 18.3 18.3
18 - 20 tahun 69 31.5 31.5 49.8
21 - 25 tahun 92 42.0 42.0 91.8
26 – 33 tahun 18 8.2 8.2 100.0
Total 219 100.0 100.0
Occupation
Statistics
Profesi
N Valid 219
Missing 0
Profesi
Frequency Percent Valid Percent
Cumulative
Percent
Valid Pelajar/Mahasiswa 153 69.9 69.9 69.9
Pegawai Swasta 33 15.0 15.0 84.9
Pegawai Negeri 17 7.8 7.8 92.7
Wiraswasta 5 2.3 2.3 95.0
Lainnya 11 5.0 5.0 100.0
Total 219 100.0 100.0

80
Monthly Expenditure
Statistics
Pengeluaran Perbulan
N Valid 219
Missing 0
Pengeluaran Perbulan
Frequency Percent Valid Percent
Cumulative
Percent
Valid Kurang dari Rp 500.000 26 11.9 11.9 11.9
Rp 500.000 - Rp 1.000.000 33 15.1 15.1 26.9
Rp 1.000.001 - Rp 2.500.000 79 36 36 63.0
Rp 2.500.001- Rp 5.000.000 51 23.3 23.3 86.3
Lebih dari Rp 5.000.000 30 13.7 13.7 100.0
Total 219 100.0 100.0
Favorite Coffee Shop
Statistics
Coffee Shop Favorite
N Valid 219
Missing 0
Coffee Shop Favorit
Frequency Percent Valid Percent
Cumulative
Percent
Valid Starbucks Coffee 100 45.7 45.7 45.7
Coffee Bean and Tea Leafs 3 1.4 1.4 47.0
J.CO Donuts & Coffee 54 24.7 24.7 71.7

81
Dunkin' Donuts 37 16.9 16.9 88.6
Excelso 5 2.3 2.3 90.9
Lainnya 20 9.1 9.1 100.0
Total 219 100.0 100.0
Frequency to go to Coffee Shop per Month
Statistics
Frekuensi ke coffee shop perbulan
N Valid 219
Missing 0
Frekuensi ke coffee shop perbulan
Frequency Percent Valid Percent
Cumulative
Percent
Valid 1 kali 43 19.6 19.6 19.6
2 - 3 kali 127 58.0 58.0 77.6
4 - 5 kali 22 10.0 10.0 87.7
Lebih dari 5 kali 27 12.4 12.3 100.0
Total 219 100.0 100.0
Monthly Spending in Coffee Shop
Statistics
Uang yang dihabiskan di coffee
shop perbulan
N Valid 219
Missing 0
Uang yang dihabiskan di coffee shop perbulan

82
Frequency Percent Valid Percent
Cumulative
Percent
Valid Kurang dari Rp 50.000 31 14.2 14.2 14.2
Rp 50.000 - Rp 100.000 105 47.9 47.9 62.1
Rp 100.001 - Rp 200.000 52 23.7 23.7 85.8
Lebih dari Rp 200.000 31 14.2 14.2 100.0
Total 219 100.0 100.0
Appendix 11: Model Summary
Appendix 12: ANOVA
Appendix 13: Coefficients
Model Summaryb
.765a .586 .578 1.18578 1.973
Model
1
R R Square
Adjusted
R Square
Std. Error of
the Estimate
Durbin-
Watson
Predictors: (Constant), Brand Image, Brand Loyalty, Brand Association,
Brand Awareness
a.
Dependent Variable: Brand Equityb.
ANOVAb
425.522 4 106.380 75.658 .000a
300.899 214 1.406
726.420 218
Regression
Residual
Total
Model
1
Sum of
Squares df Mean Square F Sig.
Predictors : (Constant), Brand Image, Brand Loyalty, Brand Association, Brand
Awareness
a.
Dependent Variable: Brand Equityb.
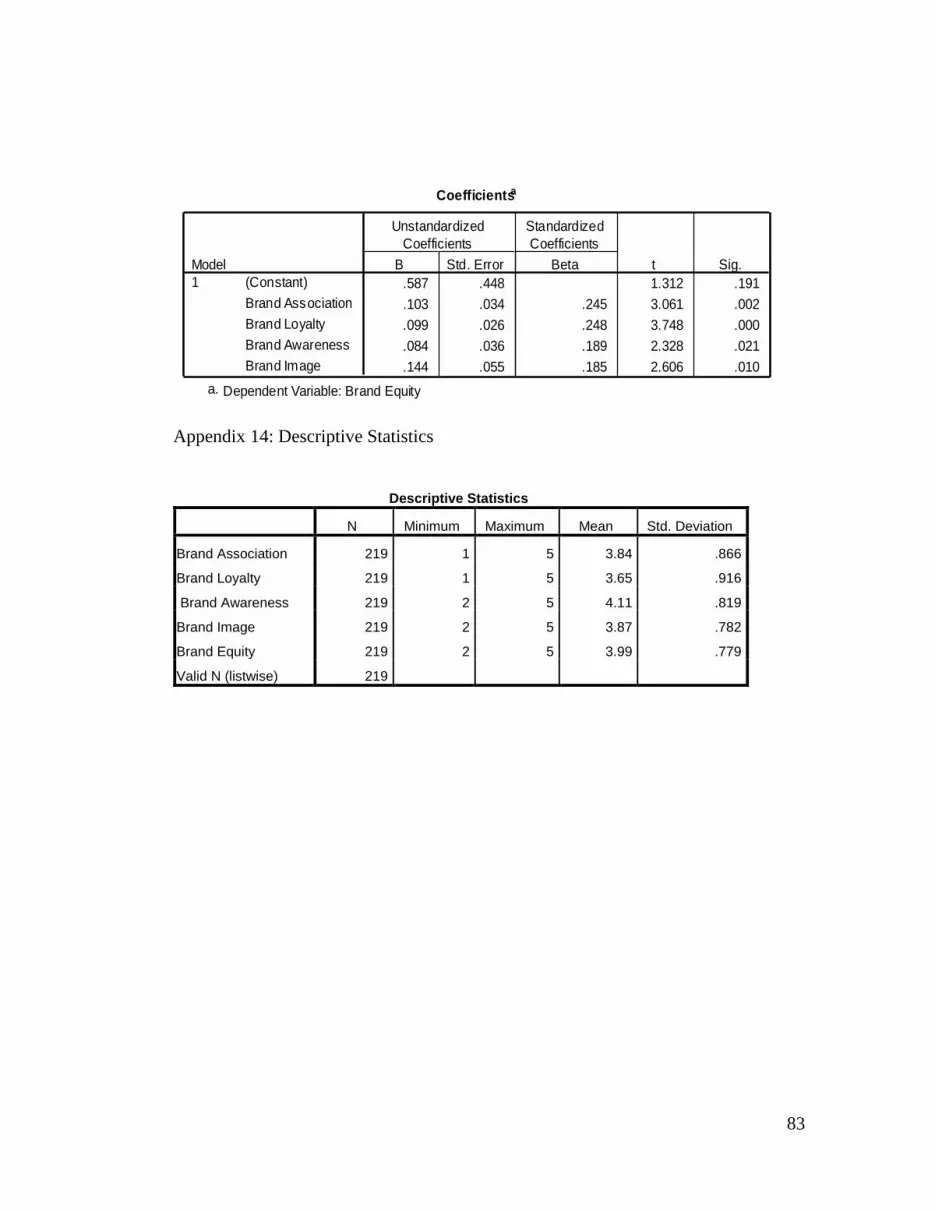
83
Appendix 14: Descriptive Statistics
Descriptive Statistics
N Minimum Maximum Mean Std. Deviation
Brand Association 219 1 5 3.84 .866
Brand Loyalty 219 1 5 3.65 .916
Brand Awareness 219 2 5 4.11 .819
Brand Image 219 2 5 3.87 .782
Brand Equity 219 2 5 3.99 .779
Valid N (listwise) 219
Coefficientsa
.587 .448 1.312 .191
.103 .034 .245 3.061 .002
.099 .026 .248 3.748 .000
.084 .036 .189 2.328 .021
.144 .055 .185 2.606 .010
(Constant)
Brand Association
Brand Loyalty
Brand Awareness
Brand Image
Model
1
B Std. Error
Unstandardized
Coefficients
Beta
Standardized
Coefficients
t Sig.
Dependent Variable: Brand Equitya.


