Embed Size (px)
Citation preview

BUSINESS EDUCATION & ACCREDITATION ♦ Volume 1 ♦ Number 1 ♦ 2009
THE IMPACT OF BRAND PERSONALITY ON BRAND PREFERENCE AND LOYALTY: EMPIRICAL
EVIDENCE FROM MALAYSIA Bamini KPD.Balakrishnan, Universiti Malaysia Sabah, Malaysia
Samuel Lee, Universiti Malaysia Sabah, Malaysia Azlinda Shazneem Md.Shuaib, University Malaysia Sabah, Malaysia
Najihah Hanisah Marmaya, Universiti Teknologi Mara, Malaysia
ABSTRACT This article examines the roles of the perception of brand personality in consumers’ brand preference and loyalty. This research conducts a survey of 300 adults in Malaysia with regard to brand personality, brand preference and loyalty in investigating two foreign brand coffee outlets, Starbucks and Coffee Bean. A questionnaire was used to gather data from respondents in various cities in Malaysia using purposive and convenience sampling methods. Statistical tests including factor analysis, reliability analysis and multiple regressions were utilized. The results of the analysis revealed that there are differences in consumer’s perception on brand personality attributed to foreign coffee outlet brands. The results indicate that Starbucks is a better brand than Coffee bean. The result shows that brand personality has a strong effect and influence on brand preference and consumer loyalty. This study suggests that intangible attributes contribute to brand perceptions, consumer preference and loyalty. The research findings provide useful insights for practitioners, brand managers and academicians. JEL: M3, M31 KEYWORD: Brand personality, Starbucks, Coffee Bean, Personality Inventory, Malaysia INTRODUCTION
rands constitute the basis by which organizations position themselves in a competitive surrounding. They serve as a vital distinction element in what any given organization offers relative to its competitors. Thus, purchasing a particular brand may enable individuals not only to
achieve maximum benefit by way of the brand’s implemental meaning, but also to express their personalities through the product’s symbolic meaning (Slaughter, 2004).
It is a well-known fact that consumer brands have significance that goes far beyond their utilitarian, functional, and commercial value (Ericksen, 1996; Leigh and Gabel, 1992; Czikszentmihalyi and Rochberg-Halton, 1981; Mick, 1986; Levy, 1959) Consumers do not "consume brands for their material utilities but consume the symbolic meaning of those brands as portrayed in their images" (Elliot, 1997). Thus, the brands that are consumed are not only "bundles of attributes that yield particular benefits" (Holt, 1995) but they are capable of signifying symbolic meaning to consumers. This was confirmed by a recent study by Bhat and Reddy (1998) who reported that brands have both functional as well as symbolic significance for consumers. Marketing scholars have become increasingly interested in understanding and measuring the symbolic meaning consumers attribute to brands. It is expected the more a consumer perceives a brand to have personality dimensions the better they can generate preference. This article examines the role of the perception of brand personality in consumers' brand preference and loyalty. The remainder of the paper is organized as follows. In Section 2 there will be literature review, section 3 describes the theoretical framework, section 4 explains the research methodologies used in the study
B
109

B. KPD. Balakrishnan, S. Lee, A. S. Md. Shuaib, N. H. Marmaya BEA ♦ Vol. 1 ♦ No. 1 ♦ 2009
followed by presentation of result and analysis. Finally, the paper is concluded with a discussion, limitations of the study and description of future work in Section 5.
LITERATURE REVIEW In recent years there has been a considerable amount of literature published on brand personality. Amidst the existing researcher regarding brand equity, a central fundamental is concerned with the image of a brand. The work of Kapferer and Theoning (1994) anticipated that brand image is the determinant of mental representations, emotional and/or cognitive, an individual attribute to a brand or to an organization. Brand personality is one of the indispensable constituent of brand image. Plummer (1985) delineates brand personality as being perceptions of a consumer about a brand. The brand has a peculiar personality profile. David Aaker (1991) in fact points out that any brand has an identity and nature, i.e a brand personality. This view is supported by Keller (1993) concluding that it tends to serve a symbolic or self-expressive function. Some researchers define brand personality from its expressions. Upshaw (1995) argues that brand personality is the same as brand image or brand reputation. In fact, the visual aspect of a brand is the extraneous personality depicted by the brand, like that of a person. An external personality is something that is given to the characteristic of a brand, and functions as the causal connection between the brand and the consumer either now or in the future. The more riveting and engrossing a brand, the more emotional the consumer communication will be. Hence, like the idea of Macrcac (1996), communication with consumers has the feature of variance dependant on brand personality profiles. Furthermore, some researchers define brand personality from its construction. Rajeev Batra (1999) claim that brand personality is the internal link of the whole brand image. It includes, but is not bounded to, all of the relationships among the brand specialty, the brand identity, and the lifestyle and characteristics of a consumer. All such relationships create the entire image of a brand. Langmeyer (1994) concludes a brand personality is built by its characteristics and the fascinating response process of consumers in the market surrounding; precisely like that the personality of a person is based on his or her genetic endowment and his or her environment. Their researches show that the image of a product or service can be measured independently, and it is not related to the target consumers.
Aaker (1997) considered that brand personality represents the set of human characteristics associated with a brand. For example, Absolut Vodka was described as a cool, hip, contemporary 25-year old man. The personality traits associated with a brand, such as those associated with an individual, tend to be relatively enduring and distinct. Among all brand research, little has been done based on the Chinese market, and far less is founded in the perceptions of consumers about their preference, attitude, loyalty, and buying intent. Aaker (1997) insisted that brand personality, used as a heuristic cue, might influence consumer attitudes. The brand personality framework and scale developed by Aaker have important applications for researchers examining the perceptions of brand personality across cultures. Nonetheless, the scale might not be appropriate for measuring brand personality in different cultural contexts.
Aaker (1997) developed a 42-item Brand Personality Scale (BPS) to structure and measure the brand personality of any brand across five key dimensions. The research focuses on dimensions in examining the salience of brand personality for each brand as perceived by consumers. Although brand personality dimensions and framework create by Aaker (1997) were tested across many product categories (such as shoes, clothing, cars, fragrance, soft drink, credit card and so on) in different countries, the theories have only been tested by Bamini, A.Saufi and Amran (2008) in the car market of Malaysia. It was found that only when consumers perceive a brand to have descriptive personality does it influence the preferences. The idea here is that consumers become “attached” to a brand on the personality and intangible level whereby feelings influence brand preference and loyalty. Bamini et al (2008) suggest that further investigation is needed in different brands and product levels for further confirmation and
110

BUSINESS EDUCATION & ACCREDITATION ♦ Volume 1 ♦ Number 1 ♦ 2009
understanding. Therefore, this study provides a significant contribution on determining the effectiveness of Aaker’s dimension in a Malaysian context in a different market setting. CONCEPTUAL FRAMEWORK Figure 1: Proposed Theoretical Model Framework the Relationship between Brand Personality Perception with Brand Preference and Loyalty
The theoretical framework in Figure 1 shows the important elements of this research. Consumers perception on brand personality serves as an independent factor influencing the brand preference and loyalty as the dependent factors.
Figure 1 shows the proposed theoretical model. Extensive literature on personality in psychology and other behavioral sciences has persuaded marketing researchers to theorize that brand personality characteristics should predict brand preference and other types of buyer activity (Bamini et.al 2005, Engel, J., Blackwell, R. & Miniard, 1995). Therefore, within such a framework the direct effect of personality attributes on consumers perception about a brand create brand preference and loyalty. Brand personality is different among different brands. Thus, it is important to distinguish brand differences, since brand personality influences the perceptions of consumers. RESEARCH HYPOTHESES AND METHODS Brand personality is different among brands. It is important to distinguish brand differences, because brand personality influences the perceptions of consumers. The perception of a brand personality is considered an expressive valuation of a brand in the mind of consumers. Based on brand personality valuation, a hypothesis is set up as follows: The perception of brand personality influences directly the consumer’s preference and loyalty. A non-student sample representing the population in Malaysia was collected. Fifty percent of the sample was female respondents aged between 20 and 50. A sample of various working respondents from the government and private sectors were surveyed. To enhance generalizability, according to Nunnaly (1978), a sample of 300 respondents is sufficient to test measurement scales in a research study. Thus, a sample (n = 300) that represented the Malaysian population with respect of working adults with purchasing power in making decision on selecting a particular brand were selected. The subjects in the two brand surveys were selected from the same sample base. Using an intercept survey method, these respondents were approached conveniently, and were delivered a questionnaire by hand. The survey was conducted with the assistant from the researcher if required. The surveys were conducted in Malaysia including the main cities of Penang, Ipoh, Kuala Lumpur, Kuantan, Johor Bharu, Kota Kinabalu and Kuching . Approximately 70 questionnaires were distributed at each research location. This approach was taken to provide equal ratio of sample for each area. Usable responses of 261 out of 280 collected which translate to 87% of response rate. For the purpose of brand personality testing, two mega-foreign coffee brands in Malaysia were chosen: Starbucks and Coffee Bean & Tea Leaf. All respondents who participated in the study were supposed to
BRAND PREFERNCE (Dependent Variable)
BRAND LOYALTY (Dependent Variable)
BRAND PERSONALITY PERCEPTION
(Independent Variable
111
B. KPD. Balakrishnan, S. Lee, A. S. Md. Shuaib, N. H. Marmaya BEA ♦ Vol. 1 ♦ No. 1 ♦ 2009
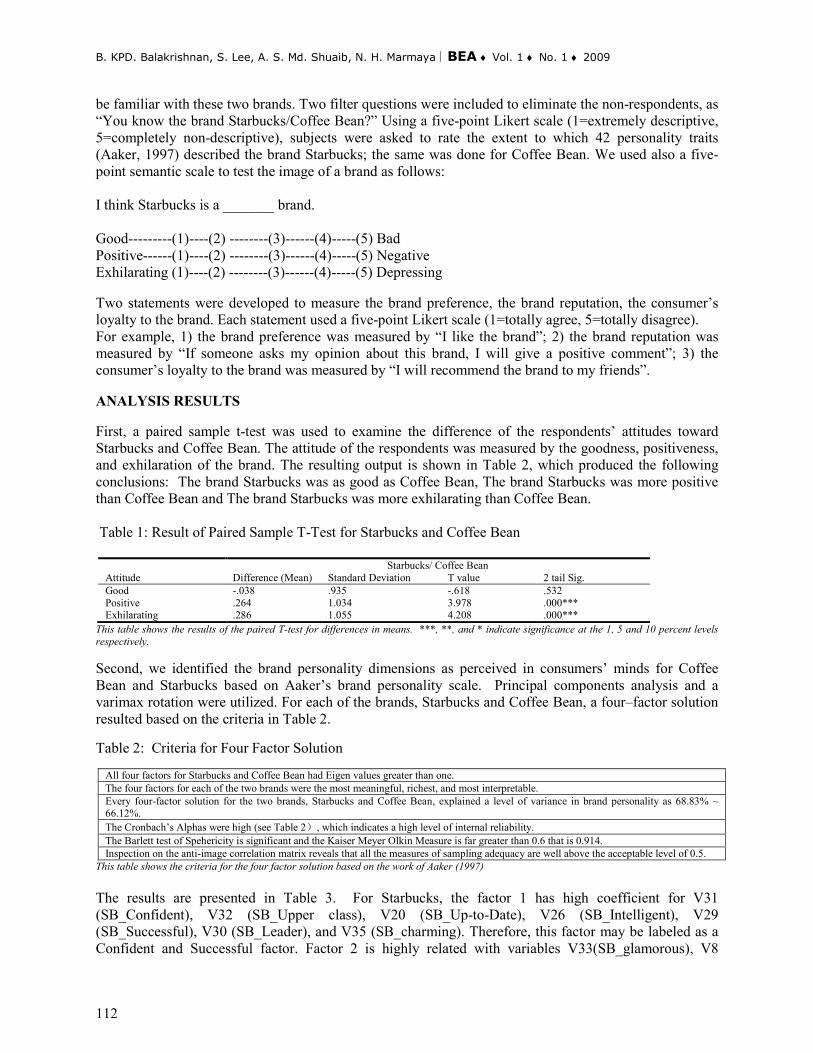
be familiar with these two brands. Two filter questions were included to eliminate the non-respondents, as “You know the brand Starbucks/Coffee Bean?” Using a five-point Likert scale (1=extremely descriptive, 5=completely non-descriptive), subjects were asked to rate the extent to which 42 personality traits (Aaker, 1997) described the brand Starbucks; the same was done for Coffee Bean. We used also a five-point semantic scale to test the image of a brand as follows: I think Starbucks is a _______ brand. Good---------(1)----(2) --------(3)------(4)-----(5) Bad Positive------(1)----(2) --------(3)------(4)-----(5) Negative Exhilarating (1)----(2) --------(3)------(4)-----(5) Depressing Two statements were developed to measure the brand preference, the brand reputation, the consumer’s loyalty to the brand. Each statement used a five-point Likert scale (1=totally agree, 5=totally disagree). For example, 1) the brand preference was measured by “I like the brand”; 2) the brand reputation was measured by “If someone asks my opinion about this brand, I will give a positive comment”; 3) the consumer’s loyalty to the brand was measured by “I will recommend the brand to my friends”. ANALYSIS RESULTS First, a paired sample t-test was used to examine the difference of the respondents’ attitudes toward Starbucks and Coffee Bean. The attitude of the respondents was measured by the goodness, positiveness, and exhilaration of the brand. The resulting output is shown in Table 2, which produced the following conclusions: The brand Starbucks was as good as Coffee Bean, The brand Starbucks was more positive than Coffee Bean and The brand Starbucks was more exhilarating than Coffee Bean. Table 1: Result of Paired Sample T-Test for Starbucks and Coffee Bean
Attitude
Starbucks/ Coffee Bean Difference (Mean) Standard Deviation T value 2 tail Sig.
Good -.038 .935 -.618 .532 Positive .264 1.034 3.978 .000*** Exhilarating .286 1.055 4.208 .000***
This table shows the results of the paired T-test for differences in means. ***, **, and * indicate significance at the 1, 5 and 10 percent levels respectively. Second, we identified the brand personality dimensions as perceived in consumers’ minds for Coffee Bean and Starbucks based on Aaker’s brand personality scale. Principal components analysis and a varimax rotation were utilized. For each of the brands, Starbucks and Coffee Bean, a four–factor solution resulted based on the criteria in Table 2. Table 2: Criteria for Four Factor Solution
All four factors for Starbucks and Coffee Bean had Eigen values greater than one. The four factors for each of the two brands were the most meaningful, richest, and most interpretable. Every four-factor solution for the two brands, Starbucks and Coffee Bean, explained a level of variance in brand personality as 68.83% ~ 66.12%. The Cronbach’s Alphas were high (see Table 2), which indicates a high level of internal reliability. The Barlett test of Spehericity is significant and the Kaiser Meyer Olkin Measure is far greater than 0.6 that is 0.914. Inspection on the anti-image correlation matrix reveals that all the measures of sampling adequacy are well above the acceptable level of 0.5.
This table shows the criteria for the four factor solution based on the work of Aaker (1997) The results are presented in Table 3. For Starbucks, the factor 1 has high coefficient for V31 (SB_Confident), V32 (SB_Upper class), V20 (SB_Up-to-Date), V26 (SB_Intelligent), V29 (SB_Successful), V30 (SB_Leader), and V35 (SB_charming). Therefore, this factor may be labeled as a Confident and Successful factor. Factor 2 is highly related with variables V33(SB_glamorous), V8
112

BUSINESS EDUCATION & ACCREDITATION ♦ Volume 1 ♦ Number 1 ♦ 2009
(SB_original), V18 (SB_imaginative), V9 (SB_cheerful), V15 (SB_spirited). This factor may be labeled as a Glamorous and Spirited factor. Factor 3 is highly related with variables V13 (SB_trendy), V19 (SB_unique), V11 (SB_friendly), V16 (SB_Cool), so this factor may be labeled cool and trendy. The last factor may be labeled as one of the original dimensions of brand personality, Ruggedness with a high coefficient for V42 (SB_rugged) and V39 (SB_Masculine). A propose of the brand Coffee Bean, factor 1 has high a coefficient for V84 (CB_rugged), V62 (CB_independent), V72 (CB_confident), V60 (CB_unique), V65 (CB_hardworking), V69 (CB_contemporary) and V54 (CB_trendy) so this factor may be labeled as a modern and unique factor. The factor 2 is highly related with variable V67 (CB_intelligent), V50 (CB_cheerful), V77 (CB_charming), V61 (CB_up-to-date), V65 (CB_upperclass) and V53 (CB_daring). Thus, this factor may be labeled as Charm of Intelligence. Factor 3 is highly related with V79 (CB_smooth), V47 (CB_sincere) and V57 (CB_cool). It may be labeled as a cool and smooth factor. The last factor’s brand personality trait, which is highly related with variable V55 (CB_exciting), V52 (CB_masculine) and V52 (CB_friendly) is labeled Friendly and Exciting. As a result, the data can be summarized by stating that the Malaysia consumer appeared to perceive four major kinds of brand personality for each coffee outlet brand respectively from Starbucks: Confident and Successful, Glamorous and spirited, cool and trendy, Rugged and Coffee Bean: Modern and Unique, Charm of Intelligence, Cool and Smooth, Friendly and Exciting. This resulted that Malaysians’ perceive the personality of both foreign coffee brands distinctly and are able to distinguish each with different traits. One of the major objectives of this research is to test the impact of brand personality on Malaysian consumers’ brand preference and loyalty. Here, a series of multiple regression analyses were used to examine the relationship among the dependent variable, consumers’ brand preference and loyalty and independent variables related to the four factors of brand personalities of Starbucks and Coffee Bean. For example, the four major kinds of brand personality traits from Starbucks are Confident and Successful, Glamorous and spirited, Cool and trendy and Rugged. The four major kinds of brand personality traits from Coffee Bean: Modern and Unique, Charm of Intelligence, Cool and Smooth and Friendly and Exciting. For Starbucks (SB) a 2 multiple regression model is estimated as follows: Vd = β0i +β1i F1SB + β1i F2SB + β1i F3SB + β1i F4SB + E, d = brand preference and loyalty The regression coefficients were presented in Table 4. Accordingly the F-test of the null hypothesis βij=0 (j=1,2,3,4, i=preference (V85) and loyalty(V86) or R square = 0 were rejected. Thus, both βij and R square were statistically different from zero at α = 0.001. Since all variance inflation factor (VIF) scores of explanatory variables were less than or equal to 1 within the accepted threshold values, the regression outcomes were unlikely to be effected by potential multicollinerity problems. In addition, the hetereoscedasticity tests performed for all regression equations showed that, that regression were free from hetereoscedasticity. Model 1: V(85)preferenceSB = 0.335a F1SB + 0.415a F2SB + 0.331aF3SB – 0.093c F4SB + 1.942a shows that the regression was positively related with F1 Confident and Successful, F2 Glamorous and Spirited and F3 Cool and Trendy. However, it was negatively related with F4 Rugged. The same results are found from Model 2 V Loyalty. In other words, the consumers’ loyalty was positively related with F1 Confident and Successful, F2 Glamorous and Spirited and F3 Cool and Trendy but the influence of F4 Rugged was vague.
113

B. KPD. Balakrishnan, S. Lee, A. S. Md. Shuaib, N. H. Marmaya BEA ♦ Vol. 1 ♦ No. 1 ♦ 2009
Thus, some brand personality traits such as F1 Confident and Successful, F2 Glamorous and Spirited and F3 Cool and Trendy of Starbucks have a good contribution to the brand perception value, but traits like F4 Ruggedness should be transformed because it had a negative effect on consumers’ brand preference and vague impact on brand loyalty. Table 3: Factors Affecting Starbuck’s / Cofee Bean’s Personalities Inventory Brand (% variance explained) Factors Variables included in the factor loading Cronbach’s Alpha Starbucks (68.83%)
F1: Confident and Successful V31 SB_confident .909 V32 SB_uspperclass .808 V20 SB_up to date .740 V26 SB_intelligent .717 V29 SB_successful .675 V30 SB_leader .636 V35 SB_charming .612
.897
F2: Glamour and Spirited V33 SB_glamorous .853 V08 SB_original .814 V18 SB_imaginative .732 V09 SB_cheerful .592 V15 SB_spirited .575
.847
F3: Cool & trendy V13 SB_trendy .806 V19 SB_unique .693 V11 SB_friendly .572 V16 SB_cool .552
.725
F4: Rugged V42 SB_rugged .842 V39 SB_masculine .695
.604
Coffee Bean (66.12%)
F1: Modern & Unique V84 CB_rugged .810 V62 CB_independent .789 V72 CB_confident .757 V60 CB_unique .725 V65 CB_hardworking .698 V69 CB_contemporary .683 V54 CB_trendy .613
.885
F2: Charm of Intelligence V67 CB_intelligent .768 V50 CB_cheerful .743 V77 CB_charming .727 V61 CB_up-to-date .676 V65 CB_upperclass .659 V53 CB_daring .643
.863
F3: Cool and Smooth V79 CB_smooth .731 V47 CB_sincere .580 V57 CB_cool .536
.663
Friendly and Exciting V55 CB_exciting .876 V81 CB_masculine .644 V52 CB_friendly .617
.722
Table 3 shows the factor of brand personality trait derived for both Starbucks and Coffee Beans and the internal reliability of the traits.
114

BUSINESS EDUCATION & ACCREDITATION ♦ Volume 1 ♦ Number 1 ♦ 2009
Table 4: Regression Model on Preference and Loyalty for Starbucks
Model 1 Model 2 Explanatory Variable B (V85 )
preference B (V86) Loyalty
(Constant) 1.933*
(46.478) 2.254*
(43.668) Starbucks F1 .335*
(7.959) .192*
(3.704) Starbucks F2 .415*
(9.781) .447*
(8.455) Starbucks F3 .331*
(5.514) .328*
(6.378) Starbucks F4 -.093*
(-2.242) .132***
(1.849) R Square .667 .553
F-Statistics 49.126 46.288 Sig. .000 .000
Number of Observations 261 261 All regressions are estimated by ordinary least square (OLS). Dependent variable is preference or loyalty. Figures within parentheses are t-test results *, **, *** denote significance at 0.001, 0.01 and 0.1 levels, respectively. The Collinearity Statistics indicates that all models do not have a collinearity problem with VIF=1.
For Coffee Bean (CB), as with Starbucks, two multiple regression models were estimatedas follows: Vd = β0i +β1i F1CB + β1i F2CB + β1i F3CB + β1i F4CB + E, d = brand preference and loyalty The regression coefficients are presented in Table 5. Based on an F-test, the null hypothesis βij=0 (j=1,2,3,4, i=preference (V87) and loyalty(V88) or R square = 0 were rejected. Thus, both βij and R square were statistically different from zero at α = 0.001. Since all variance inflation factor (VIF) scores of explanatory variables were less than or equal to 1, within the accepted threshold values, the regression outcomes were unlikely to be effected by multicollinerity problems. In addition, the hetereoscedasticity tests performed for all regression equations showed that, that regression were free from hetereoscedasticity. Table 5: Regression Model on Preference and Loyalty for Coffee Bean
Model 1 Model 2 Explanatory Variable B (V87 )
preference B (V88) Loyalty
(Constant) 2.214* (46.478)
2.218* (43.668)
Coffee Bean F1 .396* (11.538)
.431* (8.508)
Coffee Bean F2 .424* (8.681)
.386*
(7.566) Coffee Bean F3 .342*
(5.514) .320*
(5.378) Coffee Bean F4 .225*
(3.634) .185*
(3.630) R Square .633 .557
F-Statistics 63.959 47.680 Sig. .000 .000
Number of Observations 261 261 All regressions are estimated by ordinary least square (OLS). Dependent variable is preference or loyalty. Figures within parentheses are t-test results *, **, *** denote significance at 0.001, 0.01 and 0.1 levels, respectively. The Collinearity Statistics indicates that all models do not have a collinearity problem with VIF=1. Model 1: V87preferenceCB = 0.396a F1CB + 0.424a F2CB + 0.342a F3CB + 0.225a F4CB + 2.214a shows that the regression was positively related with F1 Modern and Unique, F2 Charm of Intelligence and F3 Cool and Smooth and also F4 Friendly and Exciting. The same result can be found from Model 2 V88 Loyalty.
115

B. KPD. Balakrishnan, S. Lee, A. S. Md. Shuaib, N. H. Marmaya BEA ♦ Vol. 1 ♦ No. 1 ♦ 2009
In other words, the consumers’ brand preference and loyalty for Coffee Bean was positively related with F1 Modern and Unique, F2 Charm of Intelligence and F3 Cool and Smooth and also F4 Friendly and Exciting. Thus, all brand personality traits as perceived by consumer for Coffee Bean have a good contribution to the brand perception value with statistically significant impact. CONCLUSIONS AND CONTRIBUTIONS This paper examines the brand characteristics of Starbucks and Coffee Bean. The results indicate that the perceptions of consumers are different for the two brands. The results indicate that, the characteristics of foreign coffee outlet brand Starbucks by consumer are F1 Confident and Successful, F2 Glamorous and spirited, F3 Cool and Trendy and F4 Rugged. However, the characteristics of the foreign coffee outlet brand Coffee Bean are F1 Modern and Unique, F2 Charm of Intelligence, F3 Cool and Smooth and F4 Excitement. It is interesting that there are no common combinations of traits for these two brands even though they are both well known foreign brand coffee outlets. In the global and international sights, the first impression is the most crucial in the brand personality characteristics. The first characteristic of Starbucks regarded by consumers is Confident and Successful, and the second is Glamorous and spirited. For Coffee Bean, Modern, Unique, and Charm of Intelligence are more distinctive. This leads to a number of interesting questions for further research. Most interesting might be the question of: Is there a gap between the brand personality strategy set by the organization and the one expected and perceived by the consumers? Second, we found that Starbucks and Coffee Bean are really two good brands for consumers, but Starbucks was more positive and exhilarating than Coffee Bean with regard to brand image. To unveil the exact reason behind such a difference, more research will be necessary. Third, the results show that brand personality has a strong effect and influence over consumer brand preference and brand loyalty. The sense of brand for Malaysian consumers is very strong. Hence, international firms should pay attention to the building of their brands when expanding into the Malaysian market. Marketers must get under the skin of the brand and to consider the non-functional personality elements of the brand. An excellent brand with good perception from consumers will offer higher value attributes to the products under the brand umbrella. Finally, this research also reaffirms the validity of Aaker’s brand personality framework in Malaysia markets thus contributing further on the pioneering work done in Malaysia on the impact of brand personality by Bamini et.al (2008). The perception of brand personality varies in different cultural backgrounds. Since cultural background influences the perception of brand personality to consumers, reorganizing cultural influences in brand personality is a strategy conducive to the value proposition of products.
This study is limited because it addresses only one market, foreign coffee brand outlets. Future research should examine other markets. The study of the impact of brand personality might also be examine consumer’s attitude and intentions to purchase.
116

BUSINESS EDUCATION & ACCREDITATION ♦ Volume 1 ♦ Number 1 ♦ 2009
APPENDIX SECTION B: BRAND PERSONALITY Instruction: To answer the questions in this section respondent is required to look at the coffee brands as if it is carrying human personality traits (e.g. down-to-earth, honest, intelligent, etc.)
1. Please indicate your agreement to which extent that the brand personality attributes below describe each brand. Scale (1) = Extremely non-descriptive (2) = Non-descriptive (3) = Neutral (4) = Descriptve (5) = Extremely descrptive
Statement
This personality attribute below describes the brand’s personality: PERSONALITY ATTRIBUTES/ BRANDS Starbucks Coffee Bean AND TEA LEAF DOWN-TO-EARTH 1 2 3 4 5 1 2 3 4 5 FAMILY ORIENTED 1 2 3 4 5 1 2 3 4 5 SMALL TOWN 1 2 3 4 5 1 2 3 4 5 HONEST 1 2 3 4 5 1 2 3 4 5 SINCERE 1 2 3 4 5 1 2 3 4 5 REAL 1 2 3 4 5 1 2 3 4 5 WHOLESOME 1 2 3 4 5 1 2 3 4 5 ORIGINAL 1 2 3 4 5 1 2 3 4 5 CHEERFUL 1 2 3 4 5 1 2 3 4 5 FRIENDLY 1 2 3 4 5 1 2 3 4 5 SENTIMENTAL 1 2 3 4 5 1 2 3 4 5 DARING/ 1 2 3 4 5 1 2 3 4 5 TRENDY 1 2 3 4 5 1 2 3 4 5 EXCITING 1 2 3 4 5 1 2 3 4 5 SPIRITED 1 2 3 4 5 1 2 3 4 5 COOL 1 2 3 4 5 1 2 3 4 5 YOUNG 1 2 3 4 5 1 2 3 4 5 IMAGINATIVE 1 2 3 4 5 1 2 3 4 5 UNIQUE 1 2 3 4 5 1 2 3 4 5 UP-TO-DATE 1 2 3 4 5 1 2 3 4 5 INDEPENDENT 1 2 3 4 5 1 2 3 4 5 CONTEMPORARY 1 2 3 4 5 1 2 3 4 5 RELIABLE 1 2 3 4 5 1 2 3 4 5 HARDWORKING 1 2 3 4 5 1 2 3 4 5 SECURE 1 2 3 4 5 1 2 3 4 5 INTELLIGENT 1 2 3 4 5 1 2 3 4 5 CORPORATE. 1 2 3 4 5 1 2 3 4 5 SUCCESSFUL 1 2 3 4 5 1 2 3 4 5 LEADER 1 2 3 4 5 1 2 3 4 5 CONFIDENT 1 2 3 4 5 1 2 3 4 5 UPPERCLASS 1 2 3 4 5 1 2 3 4 5 GLAMOROUS 1 2 3 4 5 1 2 3 4 5 SOPHISTICATED 1 2 3 4 5 1 2 3 4 5 GOOD-LOOKING 1 2 3 4 5 1 2 3 4 5 CHARMING 1 2 3 4 5 1 2 3 4 5 FEMININE 1 2 3 4 5 1 2 3 4 5 SMOOTH 1 2 3 4 5 1 2 3 4 5 TOUGH 1 2 3 4 5 1 2 3 4 5 MASCULINE 1 2 3 4 5 1 2 3 4 5 WESTERN 1 2 3 4 5 1 2 3 4 5 RUGGED 1 2 3 4 5 1 2 3 4 5
117

B. KPD. Balakrishnan, S. Lee, A. S. Md. Shuaib, N. H. Marmaya BEA ♦ Vol. 1 ♦ No. 1 ♦ 2009
REFERENCES
Aaker, D. (1991). Managing brand equity, New York: The Free Press. Aaker, J., & Aaker, L., Benet-Martinez , V., & Garolera, J. (2001). Consumption symbols as carriers Aaker, Jennifer & Aaker, L. (1997). Dimensions of brand personality. Journal of Marketing Research, vol.xxxiv, 347-356. Bamini, Roselina Ahmad Saufi, Amran Hj. Harun, (2005) The Role of Brand Personality in Consumers’ Relationship with Brand, Asian Applied Business Conference Proceeding, University Malaysia Sabah Press, vol.3. Bamini, Roselina Ahmad Saufi, Amran Hj. Harun, (2008) The Impact of Brand Personality on Brand Preference: A Study on Malaysian’s Perception towards Domestic and Asian Car Brands, 15th Annual South Dakota International Business Conference Proceeding, Northern State University, Rapid City, ISBN: 1-883120-02-0 ISBN 13: 978-1-883120-02-3 Published by: NSU Press pg.50-66. Batra,Rajeev, Myersl J. G., & Aaker, D.A. (1999). Advertisement management 5th. ed., Chinese edition, Tsinghua University Press, Prentice Hall. Inc., 218. Bhat, S. & Reddy, S. K. 1998. Symbolic and functional positioning of brands. Journal of Consumer Marketing, 15(1), 32-43. Czikszentmihalyi, M. & Rochberg-Halton, E. 1981. The Meaning of Things: Domestic Symbols and the Self, Cambridge University Press: Cambridge. Elliott, R. 1997. Existential consumption and irrational desire. European Journal of Marketing, 31(3/4), 285-96. Engel, James F., David T. Kollat, and Roger D. Blackwell (1995), "Personality Measures and Market Segmentation," Business Horizons, 12 (3), 61-70. Ericksen, M.K. 1996. Using self-congruity and ideal congruity to predict purchase intention: A European perspective. Journal of Euro-Marketing, 6(1), 41-56. Holt, D.B. 1995. How consumers consume: a typology of consumption practices. Journal of Consumer Research, 22(June), 1-15. Jennifer L. Aaker, J.L. (1997). Dimensions of brand personality. Journal of Marketing Research, vol.xxxiv, pp.347-356. Kapferer, J.N. (1994). Kapferer and J.C. Thoening, La Marque, Ediscience. Keller, K. L. (1993). Conceptualizing, measuring, and managing customer-based brand equity. Journal of Marketing, 57. Jan.1-22. Langmeyer, S. (1994). Does personality influence brand image? The Journal of Psychology, 128 (2): 157.
118

BUSINESS EDUCATION & ACCREDITATION ♦ Volume 1 ♦ Number 1 ♦ 2009
Leigh, J.H. & Gabel, T.G. 1992. Symbolic interactionism: its effects on consumer behavior and implications for marketing strategy. The Journal of Services Marketing, 6(3), 5-16. Levy, S.J. 1959. Symbols for sale. Harvard Business Review, 37(July-August), 117-24. Macrcac, C. (1996). The brand chartering handbook. New York: Addison–Wesley Publishing Company. Mick, D.G. 1986. Consumer research and semiotics: exploring the morphology of signs, symbols, and significance. Journal of Consumer Research, 13(2), 196-213. Nunnally, J. C. (1978) Psychometric theory (2nd ed.). New York: McGraw-Hill. of culture: a study of Japanese and Spanish brand personality constructs. Journal of Personality and Social Psychology, vol. 81, 3, 492-508. Plummer,J.T. (1985). How personality makes a difference. Journal of Advertising Research, 40, 6, 79-83. Rajeev Batra et al, (1999). Chinese version by Zhao Ping et al. Advertising Management. Tsinghua University Press, p. 218. Shank, L. (1994). Does personality influence brand image? The Journal of Psychology, 128(2): 157. Slaughter, J. L., Zickar, J. M., Highhouse, S. and Mohr, D. C. (2004), “Personality trait inferences about organizations: Development of a measure and assessment of construct validity,” Journal of Applied Psychology, Vol.89, No.1, pp. 85-103. Upsliaw, (1995). Building brand identity. New York: John Wiley& Sona, Inc. BIOGRAPHY
Ms.Bamini KPD. Balakrishnan is an academician in Marketing Programme at the School of Business and Economics, UMS rendering her expertise in field of Strategic Marketing, Marketing Management, International Marketing Management and Business Research Methodologies. Her current area of research is in the niche area Brand Personality and Consumer Brand Preference. Ms. Azlinda Shazneem Md. Shuaib is currently a lecturer in Universiti Malaysia Sabah, International Campus. Obtained her MBA with Universiti Malaysia Sabah. Her are of expertise are business management and international business. Mrs. Najihah Hanisah Marmaya is lecturer in Universiti Teknologi MARA since 2007 where she obtained her Diploma in 1999 and Professional degree in Chartered Institute of Logistic and Transport in 2003. In 2005 she graduated with Master in Business Administration (MBA) form Universiti Malaysia Sabah. Whilst lecturing Universiti Teknologi MARA (UiTM) she is pursuing her PhD with Universiti Malaysia Sabah. Her research area is on expatriate adjustment in Malaysia. Mr. Samuel Lee is a final year student of Bachelor in Business Studies at the School of Business and Economics, Univerisiti Malaysia Sabah.
119