Embed Size (px)
Citation preview
Juni Khyat ISSN: 2278-4632
(UGC Care Group I Listed Journal) Vol-10 Issue-5 No. 7 May 2020
Page | 292 www.junikhyat.com Copyright ⓒ 2020 Authors
BRAND PREFERENCE OF DIRECT TO HOME (DTH) –
A COMPARATIVE STUDY ON RURAL AND
URBAN CONSUMERS IN KOLLAM DISTRICT
*Chandanraj S.M. **Bindu. V ***Treesa Antony ****Annie K.T
*Assistant Professor, Post Graduate Department of Commerce, Siena College of
Professional Studies, Edakochi – 682010
**Assistant Professor, Nirmala College of Arts and Science, Meloor
***Assistant Professor, Nirmala College of Arts and Science, Meloor
****Assistant Professor, Nirmala College of Arts and Science, Meloor
Abstract
Telecommunication is one of the most important sector used by the peoples all over
the world. DTH is a digital satellite service that provides television viewing services directly to
subscribers through satellite transmission anylocation in the country. For a dish is placed outside a
home which helps in receiving the signals and broadcasting the transmission onto a television .So the
study focused on the brand preference on DTH in Kollam district. 400 samples were taken
from 5 taluks of Kollam district and Garrett’s ranking method was applied for data analysis.
I. INTRODUCTION
India Direct-To-Home (DTH) market is projected to exhibit a CAGR of around 10% during
through 2023, on the back of increasing government efforts towards encouraging the adoption of set-
top box services across the country. Moreover, ease of bill payment through online payment systems,
growing penetration of DTH across the rural parts of the country and increasing emergence of
technologically advanced televisions are expected to positively influence the Direct-To-Home (DTH)
market in India over the coming years. Market growth is also anticipated to be driven by increasing
number of partnerships between DTH operators and OTT providers over the course of next five
years.
Customers prefer a particular brand of DTH depends upon its price, Picture quality,
brand name, etc. So the study focused on comparative study of rural and urban consumers
regarding the bran preference of DTH in Kollam district of Kerala.
Juni Khyat ISSN: 2278-4632
(UGC Care Group I Listed Journal) Vol-10 Issue-5 No. 7 May 2020
Page | 293 www.junikhyat.com Copyright ⓒ 2020 Authors
II. STATEMENT OF THE PROBLEM
Telecommunication is one of the most important sector for the peoples all over the
world. In India, the direct-to-home (DTH) technology was started in 2003 and since then, it has grown
phenomenally. According to a TRAI report, the number of active subscribers has increased from 41
million users in September 2015 to 65.31 million in June 2017. At present, in the distribution industry,
DTH holds 33 per cent market share, and digital cable constitutes 29 per cent and about 38 per cent is
dominated by analogue cable.
Brand preference of DTH in urban and rural peoples may differ. Some buyers are totally
brand loyal, buying only one brand in a product group. Most of the buyers switch over to
other brands.
These reasons made the researches to take up the research study entitled “Brand
Preference of Direct to Home –A Comparative Study of Rural and Urban Customers in
Kollam District in Kerala”.
III. OBJECTIVES OF THE STUDY
The main objectives of the present study is as follows.
To analyze the Socio-Economic status of Rural and Urban respondents in Kollam
District of Kerala.
To study the factors influencing the brand preference of Direct To Home (DTH)
operator among rural and urban respondents in Kollam district of Kerala.
IV. METHODOLOGY
The study is based on both primary and secondary data. For the collection of primary
data Questionnaire cum interview schedule method were used. Secondary data were collected
from books, journals, articles, newspapers and websites.
V. SAMPLE DESIGN
The Kollam District consisted of 5 taluks. From these 5taluks total of 400 samples
were taken. 200 respondents from rural areas and 200 respondents from urban areas.
Convenient method of sampling were used to choose samples. For the present study the
researcher select five popular DTH operators in Kollam District of Kerala. The famous DTH

Juni Khyat ISSN: 2278-4632
(UGC Care Group I Listed Journal) Vol-10 Issue-5 No. 7 May 2020
Page | 294 www.junikhyat.com Copyright ⓒ 2020 Authors
operators Which are currently operating in Kollam district are Tata Sky, Sun Direct , Airtel
Digital TV, Videocon d2H and Doordarshan DTH.
VI. FRAMEWORK OF ANALYSIS
The collected data were processed with the help of appropriate statistical tools in
order to fulfil the objectives of the study. For the present study simple percentage analysis
and Garrett’s Ranking Technique were adopted.
VII. ANALYSIS INTERPRETATION
This part analyses the socio-economic profile, brand preference, reasons for the
selection of particular brand of milk among rural and urban consumers in Kollam District of
Kerala in various aspects.
1. GENDER OF THE RESPONDENTS
The following table shows the gender wise distribution of respondents.
Table 1 :Gender of the respondents
Gender Rural Urban Total
No. of
Respondents Percent
No. of
Respondents Percent
No. of
Respondents
Per
cost
Male 130 65.00 140 70.00 270 67.50
Female 70 35.00 60 30.00 130 32.50
Total 200 100 200 100 400 100
Source: Primary data
It is clear from the table that out of 200 rural consumers 130 (65.00%) are male and 70
(35.00%) c are female. Thus majority of the consumers are male in rural area.
Among the 200 urban consumers 140 (70.00%) consumers are male and 60 (30.00%)
consumers are female. Thus majority of the consumers are male in urban area.
Among the total 400 respondents 270 (67.50%) consumers are male and 130 (32.5%)
consumers are female. Thus majority of the consumers are male.
2. AGE OF THE RESPONDENTS
The following table shows the age wise distribution of respondents.
Juni Khyat ISSN: 2278-4632
(UGC Care Group I Listed Journal) Vol-10 Issue-5 No. 7 May 2020
Page | 295 www.junikhyat.com Copyright ⓒ 2020 Authors
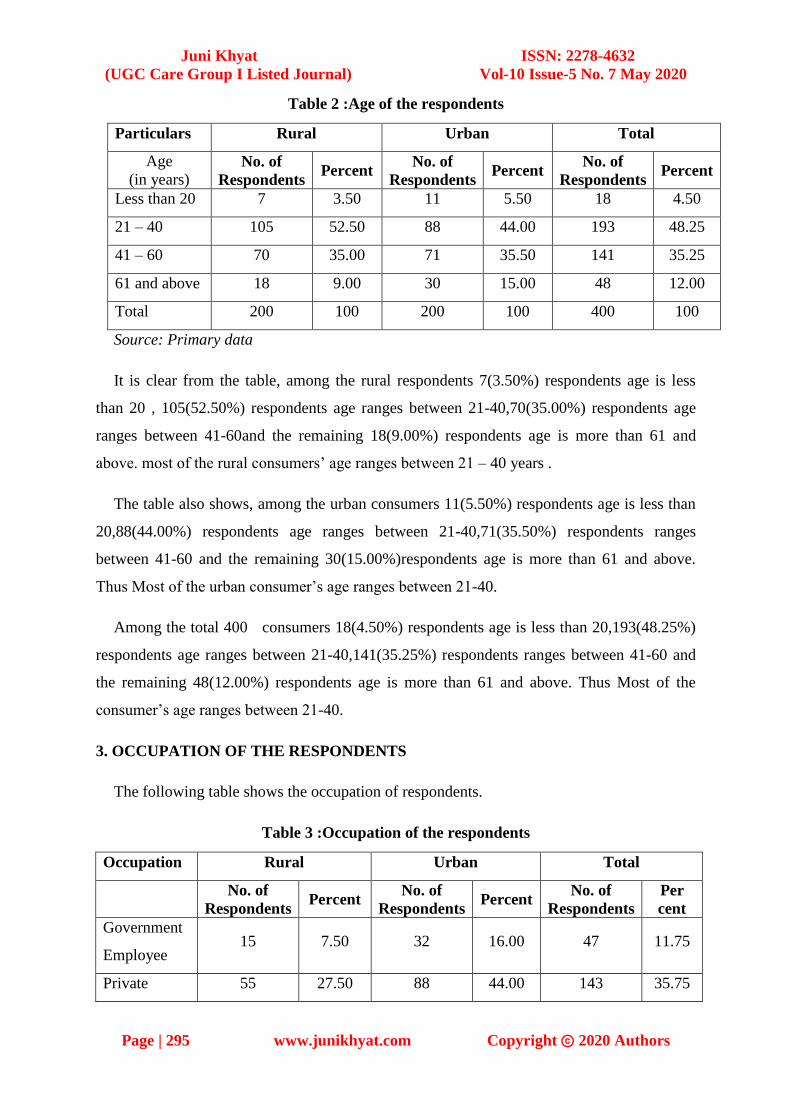
Table 2 :Age of the respondents
Particulars Rural Urban Total
Age
(in years) No. of
Respondents Percent
No. of
Respondents Percent
No. of
Respondents Percent
Less than 20 7 3.50 11 5.50 18 4.50
21 – 40 105 52.50 88 44.00 193 48.25
41 – 60 70 35.00 71 35.50 141 35.25
61 and above 18 9.00 30 15.00 48 12.00
Total 200 100 200 100 400 100
Source: Primary data
It is clear from the table, among the rural respondents 7(3.50%) respondents age is less
than 20 , 105(52.50%) respondents age ranges between 21-40,70(35.00%) respondents age
ranges between 41-60and the remaining 18(9.00%) respondents age is more than 61 and
above. most of the rural consumers’ age ranges between 21 – 40 years .
The table also shows, among the urban consumers 11(5.50%) respondents age is less than
20,88(44.00%) respondents age ranges between 21-40,71(35.50%) respondents ranges
between 41-60 and the remaining 30(15.00%)respondents age is more than 61 and above.
Thus Most of the urban consumer’s age ranges between 21-40.
Among the total 400 consumers 18(4.50%) respondents age is less than 20,193(48.25%)
respondents age ranges between 21-40,141(35.25%) respondents ranges between 41-60 and
the remaining 48(12.00%) respondents age is more than 61 and above. Thus Most of the
consumer’s age ranges between 21-40.
3. OCCUPATION OF THE RESPONDENTS
The following table shows the occupation of respondents.
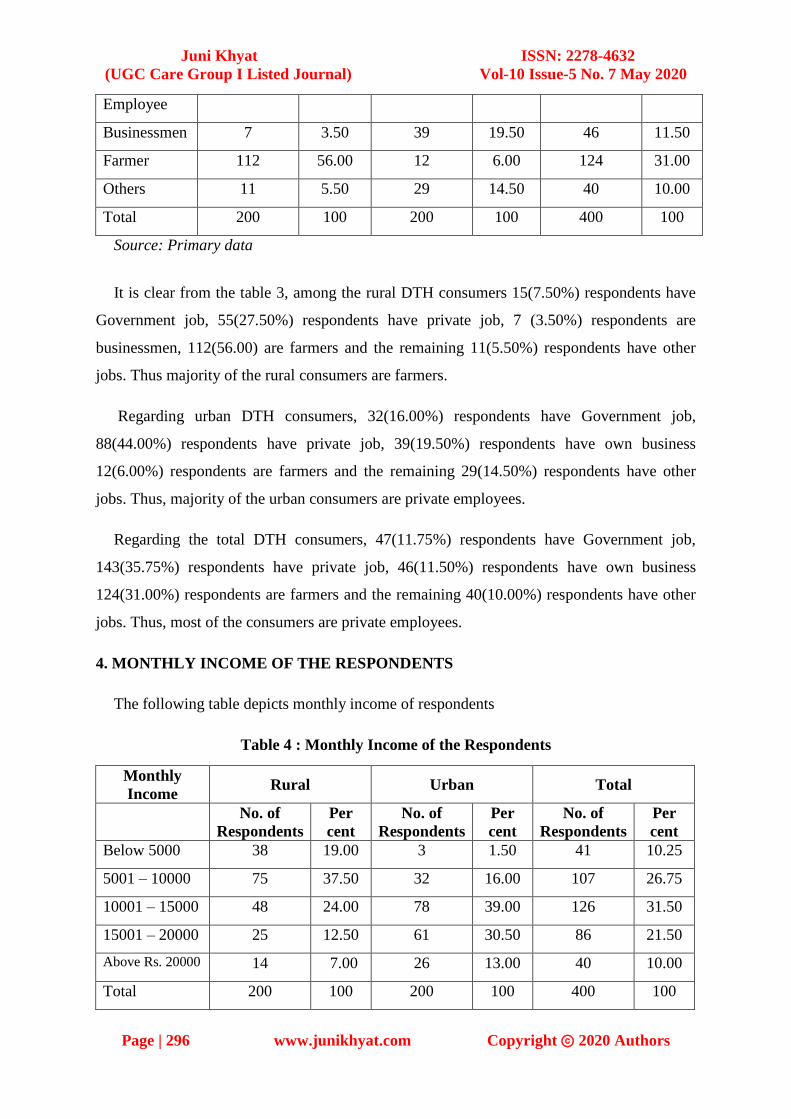
Table 3 :Occupation of the respondents
Occupation Rural Urban Total
No. of
Respondents Percent
No. of
Respondents Percent
No. of
Respondents
Per
cent
Government
Employee 15 7.50 32 16.00 47 11.75
Private 55 27.50 88 44.00 143 35.75
Juni Khyat ISSN: 2278-4632
(UGC Care Group I Listed Journal) Vol-10 Issue-5 No. 7 May 2020
Page | 296 www.junikhyat.com Copyright ⓒ 2020 Authors
Employee
Businessmen 7 3.50 39 19.50 46 11.50
Farmer 112 56.00 12 6.00 124 31.00
Others 11 5.50 29 14.50 40 10.00
Total 200 100 200 100 400 100
Source: Primary data
It is clear from the table 3, among the rural DTH consumers 15(7.50%) respondents have
Government job, 55(27.50%) respondents have private job, 7 (3.50%) respondents are
businessmen, 112(56.00) are farmers and the remaining 11(5.50%) respondents have other
jobs. Thus majority of the rural consumers are farmers.
Regarding urban DTH consumers, 32(16.00%) respondents have Government job,
88(44.00%) respondents have private job, 39(19.50%) respondents have own business
12(6.00%) respondents are farmers and the remaining 29(14.50%) respondents have other
jobs. Thus, majority of the urban consumers are private employees.
Regarding the total DTH consumers, 47(11.75%) respondents have Government job,
143(35.75%) respondents have private job, 46(11.50%) respondents have own business
124(31.00%) respondents are farmers and the remaining 40(10.00%) respondents have other
jobs. Thus, most of the consumers are private employees.
4. MONTHLY INCOME OF THE RESPONDENTS
The following table depicts monthly income of respondents
Table 4 : Monthly Income of the Respondents
Monthly
Income Rural Urban Total
No. of
Respondents
Per
cent
No. of
Respondents
Per
cent
No. of
Respondents
Per
cent
Below 5000 38 19.00 3 1.50 41 10.25
5001 – 10000 75 37.50 32 16.00 107 26.75
10001 – 15000 48 24.00 78 39.00 126 31.50
15001 – 20000 25 12.50 61 30.50 86 21.50
Above Rs. 20000 14 7.00 26 13.00 40 10.00
Total 200 100 200 100 400 100
Juni Khyat ISSN: 2278-4632
(UGC Care Group I Listed Journal) Vol-10 Issue-5 No. 7 May 2020
Page | 297 www.junikhyat.com Copyright ⓒ 2020 Authors
Source: Primary data
It is clear from table 4 that, among the rural DTH consumer’s 38(19.00%) respondents
have monthly income less than Rs.5000, 75(37.50%) respondents’ income ranges between
Rs.5001-10000, 48(24.00%) respondents have income ranges between10001-15000,
30(15.00%) respondents have income betweenRs.15001-20000 and the remaining 14(7.00%)
respondents have income more than Rs.20000 per month.
Among the urban DTH consumers 3(1.50%) respondents have monthly income less than
Rs.5000, 32(16.00%) respondents’ income ranges between Rs. 5001-10000, 78(39.00%)
respondents have income ranges between Rs.10001-15000, 61(30.50%) respondents have
income between Rs.15001-20000 and the remaining 26(13.00%) respondents have income
more
Among the total DTH consumers 41(10.25%) respondents have monthly income less than
Rs.5000, 107(26.75%) respondents’ income ranges between Rs. 5001-10000, 126(31.50%)
respondents have income ranges between Rs.10001-15000, 86(21.50%) respondents have
income between Rs.15001-20000 and the remaining 40(10.00%) respondents have income
more than Rs.20000 per month.
5. DTH CHOICE OF RESPONDENTS
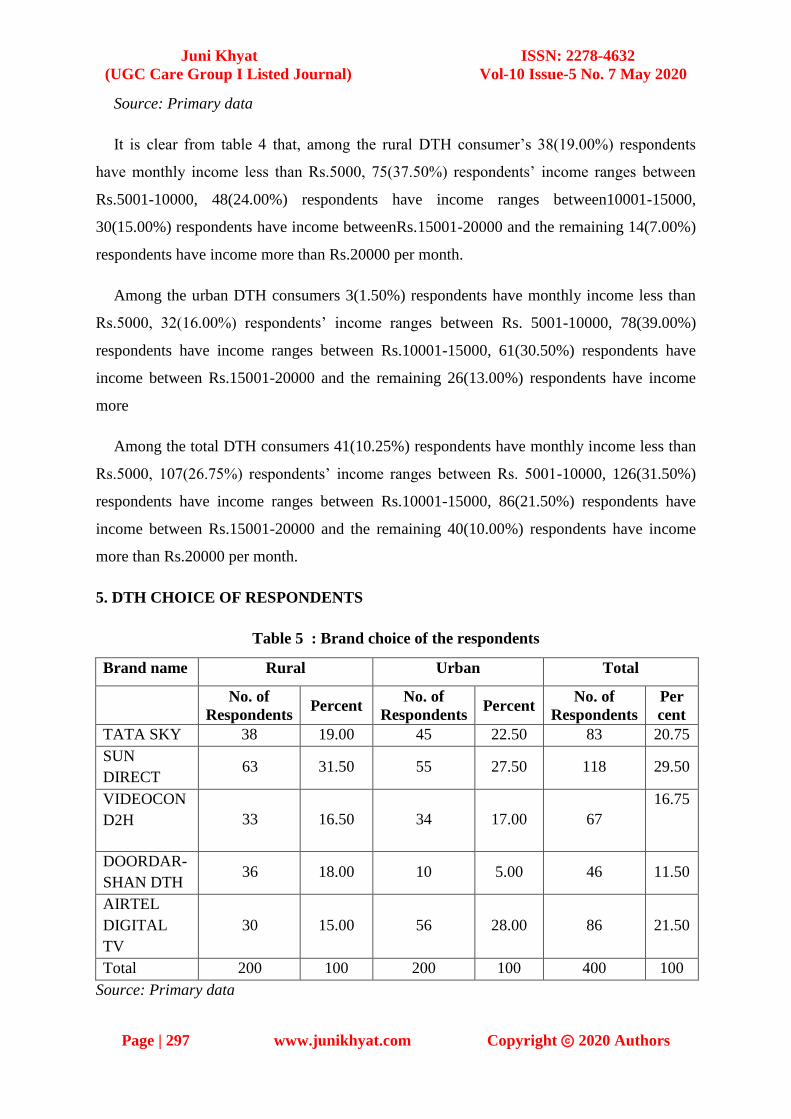
Table 5 : Brand choice of the respondents
Brand name Rural Urban Total
No. of
Respondents Percent
No. of
Respondents Percent
No. of
Respondents
Per
cent
TATA SKY 38 19.00 45 22.50 83 20.75
SUN
DIRECT 63 31.50 55 27.50 118 29.50
VIDEOCON
D2H 33 16.50 34 17.00 67
16.75
DOORDAR-
SHAN DTH 36 18.00 10 5.00 46 11.50
AIRTEL
DIGITAL
TV
30 15.00 56 28.00 86 21.50
Total 200 100 200 100 400 100
Source: Primary data
Juni Khyat ISSN: 2278-4632
(UGC Care Group I Listed Journal) Vol-10 Issue-5 No. 7 May 2020
Page | 298 www.junikhyat.com Copyright ⓒ 2020 Authors
It is clear from the Table No. 5, among the rural DTH consumers thirty eight
(19.00%) respondents are choose Tata Sky DTH, 63(31.50%) respondents choose Sun
Direct,33 (16.50%) respondents choose Videocon D2H ,36(18.00%) respondents choose
Doordarshan DTH and the remaining 30(15.00%) respondents prefer Airtel Digital TV. Thus,
majority of the rural consumers are selected Sun Direct DTH.
Among the urban consumers 45 (22.50%) respondents choose Tata Sky, 55(27.50%)
respondents choose Sun Direct, 34 (17.00%) respondents choose Videocon D2H, 10(5.00%)
respondents choose Doordarshan DTH and the remaining 56(28.00%) respondents choose
Airtel Digital TV. Thus, majority of the urban consumers are preferring Airtel Digital TV.
Among the total 400 consumers 83 (20.75%) respondents choose Tata Sky,
118(29.50%) respondents choose Sun Direct, 67 (16.75%) respondents choose Videocon
D2H, 46(11.50%) respondents choose Doordarshan DTH and the remaining 86(21.50%)
respondents choose Airtel Digital TV. Thus, majority of the DTH consumers are preferring
Sun Direct DTH.
6. REASON FOR CHOOSING PARTICULAR BRAND OF DTH AMONG
RURAL CUSTOMERS
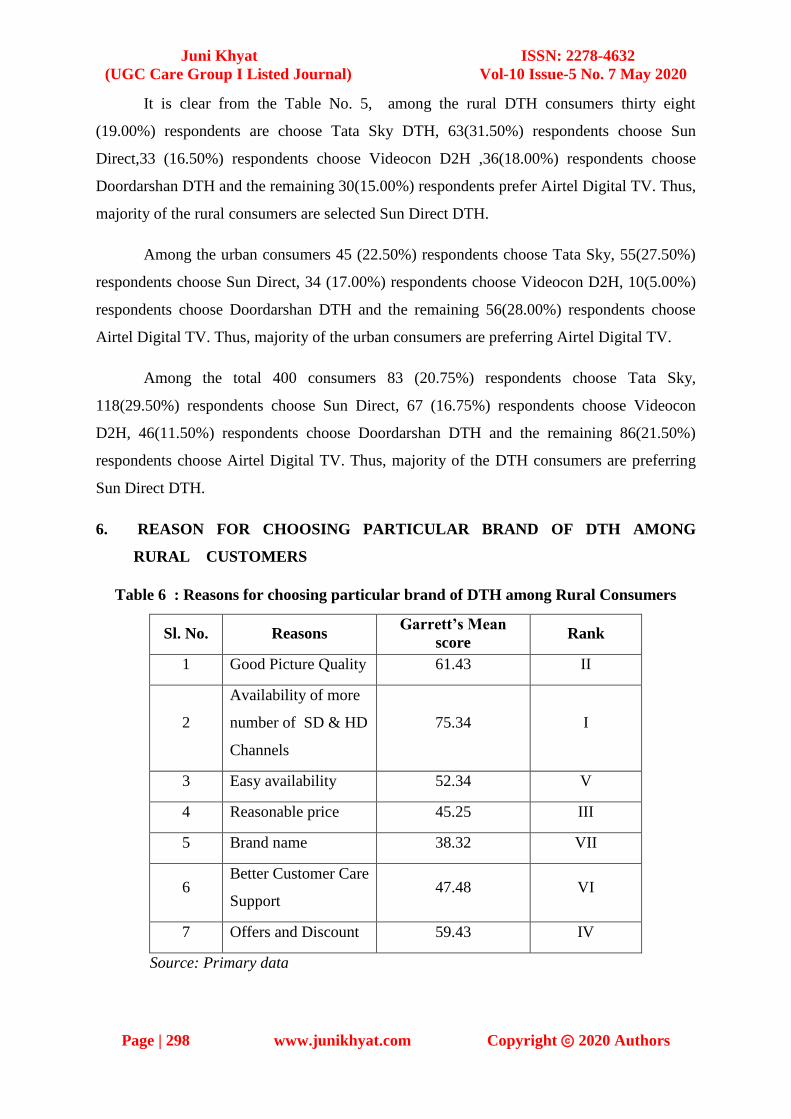
Table 6 : Reasons for choosing particular brand of DTH among Rural Consumers
Sl. No. Reasons Garrett’s Mean
score Rank
1 Good Picture Quality 61.43 II
2
Availability of more
number of SD & HD
Channels
75.34 I
3 Easy availability 52.34 V
4 Reasonable price 45.25 III
5 Brand name 38.32 VII
6 Better Customer Care
Support 47.48 VI
7 Offers and Discount 59.43 IV
Source: Primary data
Juni Khyat ISSN: 2278-4632
(UGC Care Group I Listed Journal) Vol-10 Issue-5 No. 7 May 2020
Page | 299 www.junikhyat.com Copyright ⓒ 2020 Authors
It is clear from the table number 6, that majority of rural consumers prefer the
particular brand of DTH because of Availability of more number of SD & HD channels with
mean score 75.34 (ranked first),followed by Good Picture Quality with mean score
61.43(ranked 2nd),Reasonable Price with mean score 45.25 (ranked 3rd
),Offers and Discount
with mean score 59.43 (ranked 4th
),Easy Availability with mean score 52.34 (ranked 5 th),
Better Customer Support with mean score 47.48 (ranked 6th
)and Brand Name with mean
score of 38.32 (ranked 7 th).
Thus, majority of the rural consumers prefer particular brand of DTH because of
Availability of more number SD and HD channels, Good Picture Quality and Reasonable
Price.
7. REASONS FOR CHOOSING PARTICULAR BRAND OF DTH AMONG
URBAN CUSTOMERS
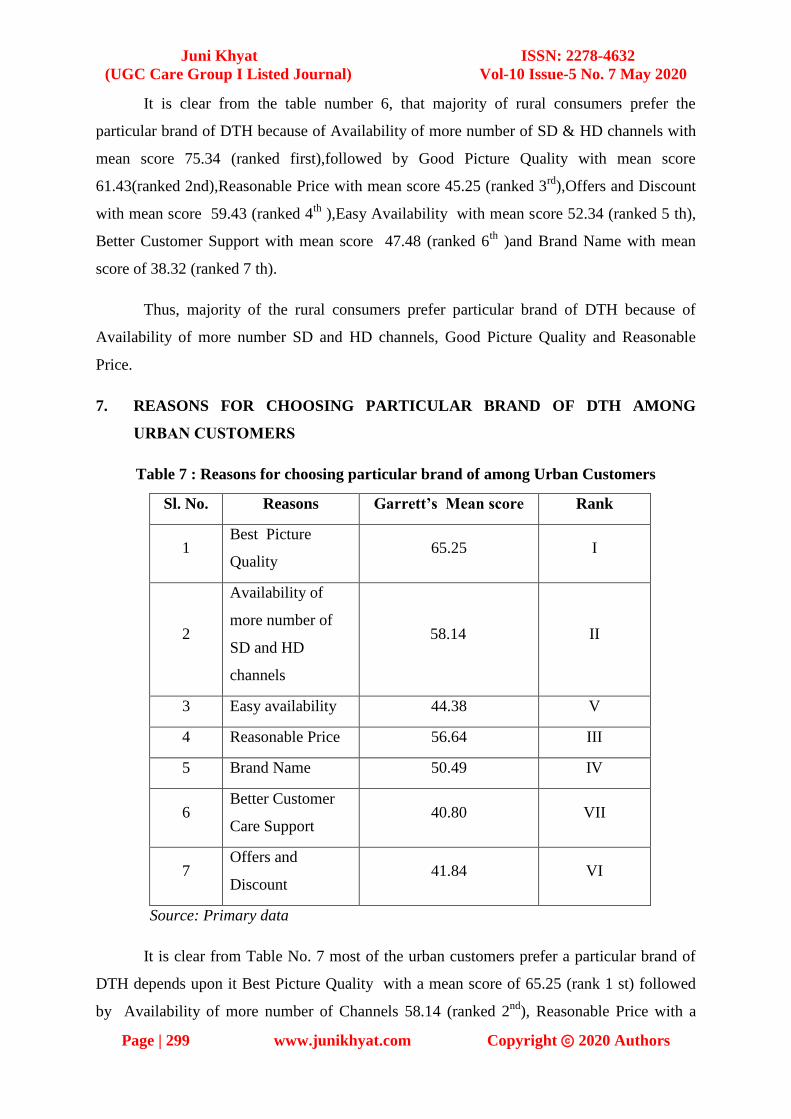
Table 7 : Reasons for choosing particular brand of among Urban Customers
Sl. No. Reasons Garrett’s Mean score Rank
1 Best Picture
Quality 65.25 I
2
Availability of
more number of
SD and HD
channels
58.14 II
3 Easy availability 44.38 V
4 Reasonable Price 56.64 III
5 Brand Name 50.49 IV
6 Better Customer
Care Support 40.80 VII
7 Offers and
Discount 41.84 VI
Source: Primary data
It is clear from Table No. 7 most of the urban customers prefer a particular brand of
DTH depends upon it Best Picture Quality with a mean score of 65.25 (rank 1 st) followed
by Availability of more number of Channels 58.14 (ranked 2nd
), Reasonable Price with a
Juni Khyat ISSN: 2278-4632
(UGC Care Group I Listed Journal) Vol-10 Issue-5 No. 7 May 2020
Page | 300 www.junikhyat.com Copyright ⓒ 2020 Authors
mean score 56.64(ranked 3 rd ), Brand name with mean score 50.49(ranked 4 th ),Easy
Availability with a mean score 40.80 (ranked 5 th ) Offers and Discount with a mean score
41.84 (ranked 6 th) and Better Customer Care Support with a mean score 40.80 (ranked 7 th)
Thus, majority of the urban consumers prefer particular brand of DTH because of its
Best Picture Quality, Availability of more number of SD and HD channels, Reasonable
Price....
VIII. FINDINGS
Following are the results of the study.
1. Thus majority of the consumers are male.
2. Most of the consumer’s age ranges between 21 – 40 years.
3. Most of the consumers are private employees.
4. Most of the consumers earns between 10,001 – 15,000
5. Majority of the DTH consumers are preferring Sun Direct DTH.
6. Majority of the rural consumers prefer particular brand of DTH because of
Availability of more number SD and HD channels, Good Picture Quality and
Reasonable Price.
7. Majority of the urban consumers prefer particular brand of DTH because of its
Best Picture Quality, Availability of more number of SD and HD channels,
Reasonable Price.
IX. SUGGESTIONS
Following are the suggestions.
1. The DTH operators try to build good customer relationship with its agent and
customers.
2. The companies should create awareness among their brands through various sales
promotion techniques and advertisements.
3. Each company should be fix the price comparatively moderate with other brands.
X. CONCLUSION
The study “Brand Preference of Direct to Home – A comparative study in Rural and
Urban Consumers of Kollam district in Kerala” determines how far the customers prefer a
particular brand over other brand. In order to sustain in the market company should consider
Juni Khyat ISSN: 2278-4632
(UGC Care Group I Listed Journal) Vol-10 Issue-5 No. 7 May 2020
Page | 301 www.junikhyat.com Copyright ⓒ 2020 Authors
better picture quality, maintain reasonable price for channels and easy availability in the
markets and it will ensure satisfaction of consumers.
XI. REFERENCES
Journals
International Journal of Marketing, Financial Services & Management Research (Vol.
1 No. 3, March 2012, ISSN 22773622)
Radix International Journal of Research in Marketing, Volume 1, Issue 9th
September
2012.
IOSR Journal of Business and Management (p-ISSN: 2319-7668)
Websites
www.dth.com
www.sundirect.com
www.bigtv.com