Embed Size (px)
Citation preview

58
International Academic Research Journal of Business and Technology 1(2) 2015 Page 58-70
Bridging the gap between brand experience and customer loyalty: The mediating role of emotional-based trust
Chuan Huat Ong1, Salniza Md. Salleh
2 and Rushami Zien Yusoff
3
1,2,3, School of Business Management, Universiti Utara Malaysia, Kedah, Malaysia.
Corresponding email: [email protected]
Article Information
Abstract
Keywords Brand Experience, emotional-based trust, attitudinal loyalty, behavioural loyalty, SMEs brand
In the business arena, every manager hopes to prolong their business
lifespan through customer loyalty. Therefore, it is important to understand
the predictor and influence of customer trust in order to strengthen the
customer-brand relationship. Customer trust is formed from rational and
emotional perspective. However, the latter trust is less studied despite being
argued to be more stable as compared to rational-based trust. This study
aims to investigate how emotional-based trust can influence customer
loyalty in the customer-brand relationship context. Loyalty is examined
separately as attitudinal and behavioural in order to provide clearer insight
on customer-brand relationship. This study seeks to examine three research
issues: (1) Does emotional based trust influence both attitudinal and
behavioural loyalty? (2) Does brand experience influence emotional based
trust? and (3) Does emotional-based trust mediate the relationship between
brand experience and both dimensions of loyalty? 220 surveys were
obtained from intercept survey from customer on Small and Medium
Enterprise (SME) brand in the restaurant industry. Result shows that there is
a positive relationship between brand experience and on emotional-based
trust, on emotional-based trust and both attitudinal and behavioural loyalty,
and on emotional-based trust mediates the linkage between brand experience
and loyalty.
INTRODUCTION
In the Malaysia foodservice industry, both global and local brand are competing each other to sustain in the
marketplace. Global brand tend to have advantages to sustain and eliminate weaker competitors due to larger
economies of scale and higher customer base resulting from strong brand. Such circumstances leave the Small
and Medium Enterprises (SMEs) brand to strive for survival. Former Senior Director of Exporters Development
Division of Malaysi External Trade Development Corporation (MATRADE), Datuk Dzulkifli Mahmud argued
the importance of SME to practice solid branding in order to gain competitive edge against large organizations
in the industry (Bernama, 2013). However, such encouraging statement is insufficient to provide a clear
guidance for SMEs brand. Studies argued that many local brands fail to create brand equity among their
customers due to unclear direction for branding strategy (Tan, Deviniaga, and Hishamuddin, 2013). In addition,
more than 50% of the market shares are dominated by foreign brands (Euromonitor, 2014). High market share
signifies high customer loyalty and trust for global brand (Chaudhuri & Holbrook, 2001; Rauyruen, Miller, &
International Academic Research Journal of Business and Technology 1(2) 2015, Page 58-70
59
Groth, 2009; Readers Digest Asia, 2013). This situation possess threat for SME brands which do not practice
solid branding because most of them rely on domestic market for survival (SME Corp. 2012).
In addition, review of SMEs studies shows that nothing much has been studied on brand management in the
foodservice industry for SME brand. Only studies on internal branding for SMEs are heavily studied (Agostini,
Filippini, & Nosella, 2014; Asamoah, 2014; Reijonen et al., 2012; Berthon et al., 2008; Krake, 2005). Therefore,
this paper aims to shed light on how SMEs can practice branding strategy successfully. Specifically, the current
study will investigate the relationships between brand experience, emotional-based trust, and brand loyalty in
the context of successful SMEs brand. The model builds upon the study of Delgado-Ballester and Munuera
Aleman (2005) as well as Giantari, Zain, Rahayu, and Solimun (2013). Social exchange theory serves as the
underpinning theory for this model because complicated branding theory such as brand equity is incompatible
for SMEs related studies (Hogarth-Scott, Watson, & Wilson, 1996). Besides, this theory helps to explain better
the relationship marketing practice by SMEs (Reijonen & Laukkanen, 2010).The empirical evidence from this
study will contribute to the SME branding literature in two ways. First, the result will provide empirical
evidence of the relationships between the constructs in the SME context. In support, emotional-based trust
construct is less studied in the literature compared to rational-based trust (Schoorman, Mayer, and Davis, 2007;
Williams, 2001). Second, this model will provide insight on the role of emotional-based trust in the exchange
process between customer-brand relationships as highlighted by Bagozzi (1975). From practical view, the
findings will provide clearer picture for other SMEs to learn from the branding strategy practiced by successful
SMEs brand. Second, emotional-based trust is focused given that it is more lasting as compared to rational-
based trust (McAllister, 1995; Williams, 2001). Hence, the result will provide knowledge for SMEs to execute
their branding strategy to gain the more stable emotional-based trust from customers.
LITERATURE REVIEW
Brand Loyalty
Brand loyalty helps SME brand to sustain in the market with positive performance through cost reduction and
higher profits. Loyal customer usually tends to pay more as well as spreading positive word of mouth among
friends and family (Chaudhuri & Holbrook, 2001; Ismail & Spinelli, 2000; Lau & Lee, 1999; Zhang & Bloemer,
2008). This is beneficial for business performance of SME given they highly rely on customer recommendations
to get new customers (Hogarth-Scott, Watson, and Wilson, 1996). Besides, loyal customer needs little
influencing effort to make purchase decision too (Blattberg and Deighton, 1996). In other word, the
effectiveness of positive word of mouth will help reduce cost of SME business strategy from investment in
advertisement in order to gain awareness until the purchase is made. Furthermore, such advertising investment
has high risk of no success guarantee Reichheld & Sasser, 1990; Zeithaml et al., 1996). Apart from that, SME
brands with already limited financial resources will face higher probability of being eliminated out of the market
when customers did not return to make repeated purchase given the high number of SMEs business
establishment in the foodservice industry mentioned above. Therefore, it is vital for SME brands to capture loyal
customers to ensure ongoing revenues and profits (Chaudhuri & Holbrook, 2001; Lau & Lee, 1999; Rauyruen,
Miller, & Groth, 2009; Zhang & Bloemer, 2008). Literature had agreed that brand loyalty consisted of
attitudinal and behavioral loyalty (Day, 1969; De Chernatony, 1999; Chaudhuri & Holbrook, 2001). Studies had
argued that attitudinal loyalty leads to premium price while behavioral loyalty leads to higher market share
(Chaudhuri & Holbrook, 2001; Rauyruen, Miller, & Groth, 2009). Following this, brand loyalty will be studied
as separate attitudinal and behavioral loyalty to provide valuable findings. The following section discusses on
the relationships between the constructs of the proposed model (Figure 1) and derivation of research hypotheses.
Brand Experience
Brand Experience is defined as subjective, inner responses of a consumer that can be categorized into sensory,
affective, intellectual, and behavioral response evoked by restaurant brand related stimuli (Brakus et al., 2009).
In the foodservice sector, customer experience with the particular food brand outlet is crucial to determine
whether they will return for future visit (Mohamed et al., 2011). In fact, businesses should acknowledge that
customers today are looking for benefits from both utility and emotional perspective (Walter, Cleff, & Chu,
2013). Therefore, brand experience is an important success factor in order to create differentiation for a
particular brand in competitive industry (e.g. foodservice industry) to retain loyal diners (Brakus, Schmitt, &
Zarantonello, 2009; Iglesias, Singh, & Batista-Foguet, 2011). Besides, trust is formed from prior experience
(Kantsperger & Kunz, 2010). Following this, experience is studied as predictor of trust in the model.
The relationship between brand experience and trust has been empirically test and inconsistent findings
have been reported. Some studies (Giantari et al., 2013; Lau & Lee, 1999; Sahin, Zehir, and Kitapci, 2011)
reported positive relationships between brand experience and brand trust while other studies reported
insignificant positive relationships (Lee & Kang, 2012; Ramasehan & Stein, 2014; Taleghani, Largani, and

International Academic Research Journal of Business and Technology 1(2) 2015, Page 58-70
60
Mousavian, 2011). Despite that, the impact of brand experience on emotional-based trust has not been
investigated in any empirical research from the perspective of SME brands. Separate studies by Delgado-
Ballester and Munuera-Aleman (2005) reported that satisfaction has a positive impact on emotional-based trust.
Similarly, the research finding of Kantsperger and Kunz (2010) also support the positive relationships between
satisfaction on emotional-based trust. Brand experience had been reported to exert positive influence on
satisfaction (Brakus et al., 2009; Chinomona, 2013; Taleghani et al., 2011; Walter et al., 2013). Following this,
the following hypotheses are proposed:
H1: Brand experience exerts positive influence on emotional-based trust.
Emotional-based trust
Literature has defined brand trust as consisting of both emotional-based trust and rational-based trust (Delgado
et al., 2003). Rational-based trust relates to the trustworthiness of a particular brand to consistently deliver what
they promise to the customers. Meanwhile, emotional-based trust relates to the trustworthiness formed as a
result of a brand behaving in good way to protect their customer welfare when uncertain situation arise. Trust is
an important focus in the study related to SMEs. Reijonen (2010) argued SME rely on close relationship with its
small customers base to ensure ongoing revenues and profits. This study focuses on emotional-based trust as
compared to rational-based trust because there has been lack of studies investigating this construct (Schoorman,
Mayer, and Davis, 2007; Williams, 2001). In addition, emotional-based trust is argued to be more lasting and
unique as compared to the common rational-based trust (McAllister, 1995; Williams, 2001). Next, loyalty is
developed when consumer trust toward a particular brand (Forgas, Moliner, Sanchez, & Palau, 2010; Lee &
Back, 2010; Sahin et al., 2011; Zehir et al., 2011).
Despite the importance of brand trust on SME survival has been acknowledged in the marketing
literature, this study would like investigate whether emotional-based trust exerts a positive influence on
customer loyalty namely attitudinal and behavioral loyalty. In addition, there is also conflicting result of trust
dimensions on customer loyalty. Some studies have found positive effect of brand trust on customer loyalty
(Han & Jeong, 2013; Lee & Back, 2010; Lee & Kang, 2012; Sahin et al., 2011; Ueacharoenkit, 2012).
Meanwhile, other studies fail to discover significance positive influence of brand trust on customer loyalty
(Anabila et al., 2012; Haghihi et al., 2012). This sparks our interest to investigate whether emotional-based trust
influences customer loyalty positively. In addition, emotional-based trust had been reported to exert positive
influence on customer loyalty (Delgado-Ballester & Munuera-Aleman, 2005; Kantsperger & Kunz, 2010).
Following the argument above, the current study proposes that emotional-based trust will have positive
influence on customer loyalty.
H2: Emotional-based trust exerts positive influence on attitudinal loyalty.
H3: Emotional-based trust exerts positive influence on behavioral loyalty.
Relationship between brand experience, emotional-based trust, and brand loyalty
Customer trust is formed from past experience with a particular brand (Delgado-Ballester & Munuera-Aleman,
2005; Kantsperger & Kunz, 2010). Therefore, a positive experience will ensure higher trust in customers.
Besides, Morrison and Crane (2007) claim that when loyalty is the outcome when a deep emotional bond
between customer and brand relationships is formed. Hence, customers who trust a brand emotionally will tend
to exhibit attitudinal and behavioral loyalty (Ramasehan & Stein, 2014). In addition, study also found that trust
mediate the relationship between brand experience and purchase intentions (Giantari, Zain, Rahayu, & Solimun,
2013). Following the argument above, the current study proposes that emotional-based trust will mediate the
relationship between brand experience and customer loyalty.
H4: Emotional-based trust mediates the relationship between brand experience and attitudinal loyalty.
H5: Emotional-based trust mediates the relationship between brand experience and behavioral loyalty.
Figure 1:
Proposed model
Brand Experience Emotional-based
Trust
Attitudinal Loyalty
Behavioral Loyalty
International Academic Research Journal of Business and Technology 1(2) 2015, Page 58-70
61
METHODOLOGY
Research settings and subjects
Two brands are chosen from the list of companies given at SME Corp. Malaysia (SME Corp., 2014) for the
purpose of this study. These brands have sustained for more than 10 years in Malaysia. The selection of SME
brand for this study follows the method of prior studies in selecting brand for loyalty studies where the brand are
mainly established brands of at least 10 years in the industry (Brakus et al., 2009; Lee et al., 2009; Lin, 2010;
Lin & Huang, 2012; Mengxia, 2007; Nam et al., 2011; Yoo & Donthu, 2000). Meanwhile, the survey was
carried in a one month period from early November to early December 2014 in Klang Valley, Malaysia.
Intercept survey was carried out with 220 customers who had dined in the particular local established SME
brands restaurants.
This study deployed multistage area probability sampling as suggested by Sudman (1980). There are two cluster
stage involved before selecting the particular branch as venue for data collection. In the first stage clustering,
Peninsular Malaysia is clustered into four region namely Central, East Coast, Northern, and Southern region
(Ministry of Tourism and Culture, 2014). The common goal of a research is to manually collect data that are
representative of a population to be studied (Bartlett, Kotrlik, & Higgins, 2001; Cavana et al., 2001; Hau &
Marsh, 2004; Krejcie & Morgan, 1970). Therefore, central region is chosen due to highest number of population
which is 7,209,175 (Department of Statistics Malaysia, 2011). In the second stage clustering, the central region
is clustered into ten districts according to its local authorities namely Kuala Lumpur City Hall, Putrajaya
Corporation, Selayang Municipal Council, Ampang Jaya Municipal Council, Kajang Municipal Council, Klang
Municipal Council, Petaling Jaya City Council, Subang Jaya City Council, Shah Alam City Council, and
Sepang Municipal Council. These ten districts consisting majority of the population within central region and is
also known as Greater Kuala Lumpur or Klang Valley. Klang Valley is the largest metropolitan in Malaysia
with approximately 6 million populations and contributed RM263 billion to Gross National Incomes (GNI) in
year 2010 (Economic Transformation Programme, 2012; Department of Statistics Malaysia, 2011). Next, each
SME brands were allocated equally and randomly among the ten district areas. One restaurant branch were
selected randomly on each districts based on business volume as suggested by outlet manager. This research
used systematic sampling to select the respondents in which every first of fifth diners were approached upon
exiting the restaurant after paying their bill. The questionnaires were distributed on random weekdays and
weekends during lunch (12pm-3pm) and dinner time (6pm-9pm).
Partial least squares structural equation modeling (PLS-SEM) is used to analyze data. Meanwhile, minimum
sample size for PLS-SEM depends on the desired 80 percent statistical power in social science studies (Cohen,
1988; Gefen, Rigdon, and Straub, 2011). Therefore, power analysis with G*Power software suggested by Hair,
Hult, Ringle, and Sarstedt (2014) recommend that at least 68 respondents needed to achieved significance level
of 0.05 and statistical power of 80 percent for hypothesis testing. Despite scholars argues that SME required
large sample size, PLS-SEM work well with smaller sample size even for a complex model as compared to CB-
SEM which required at least 200 observations to avoid non-convergence and improper solutions (Boomsma &
Hoogland, 2001, p. 8; Hair, Sarstedt, Hopkins, & Kuppelwiesier, 2014, p. 108). The final sample size is
expanded to 200 respondents due to the higher non-response rate associated with intercept survey method used
in this study (Gates & Solomon, 1982; p 46; Hornik & Ellis, 1988, p. 539; Zikmund et al., 2009, p.213).
Measurement
This study adapted existing scales for all constructs. Brand experience scales were measured using the 12 items
developed by Brakus, Schmitt, and Zarantonello (2009). Brakus et al. (2009) identified brand experience in
terms of four dimensions: sensory (3 items), affective (3 items), intellectual (3 items), and behavioral (3 items).
Emotional-based trust scales was adapted from items developed by (Delgado-Ballester et al., 2003). Brand
loyalty scales were adapted from items developed by Chaudhuri & Holbrook (2001), Ismail & Spinelli (2000),
Lau & Lee (1999), Zhang & Bloemer (2008). All the statements were measured with six-point Likert scale
(1=strongly disagree and 6=strongly agree). An even number response will encourage respondent to answer
based on content of the questions and reduce bias in answering the middle or neutral point (Garland, 1991).
Besides, Asian respondents have higher tendency to answer the middle point than the Western (Mitchell, 1999;
Si & Cullen, 1998). There is also report that even number response scale has higher validity and reliability as
compared to uneven number of response scale (Birkett, 1986; Coelho & Esteves, 2007). Therefore, the use of
six-point Likert scale is justified. In order to minimize translation issues, the translation of questionnaire were
conducted as recommended by Brislin (1970). The final survey questionnaire were in both English and Malay
version to suit the respondent understanding. Pilot study was conducted among 30 respondents of the particular
SME brand in Penang. The amount of respondents for pilot study follows the recommendation of Malhotra et al.

International Academic Research Journal of Business and Technology 1(2) 2015, Page 58-70
62
(2002). Pilot study result suggest that the survey questionnaires are highly reliable with all the Cronbach’s alpha
value were greater than 0.90 (Nunnally, 1978).
Data analysis technique
This study used the Partial Least Squares (PLS) version 2.0 (Ringle, Wende, & Will, 2005) as a technique to
analyze the data for hypothesis testing. In addition, we used the bootsrapping method of 500 resamples to
determine the significance level for loadings and path coefficients (Chin, 1998).
ANALYSIS
Profile of respondents
A total of 220 questionnaires were received at the end of data collection process. The number of final survey is
sufficient for data analysis provided it exceeds the minimum of 68 observations to achieve significance level of
0.05 and statistical power of 80 percent for hypothesis testing. Therefore, the number of questionnaire is
sufficient to proceed for data analysis given it has achieved the minimum sample observations required for this
study to achieved significance level of 0.05 and statistical power of 80 percent for hypothesis testing. The
profiles of respondents are analyzed according to gender, age, education, and occupation as summarized in
Table 1. All the respondents were Malaysian. From the total of 220 respondents, a total of 160 (73 percent) were
female while 60 (27 percent) were male. This result is also consistent with other restaurant survey studies
(Chang, 2013; Kim et al., 2012; Lee et al., 2009). One plausible reason for female dominant responses is due to
the higher likelihood of female to answer survey as compared to men (Gannon et al., 1971; Green, 1996). The
age group of 21-30 (36 percent) and 31-40 (36 percent) accounted for the biggest portion for the sample
meanwhile age group less than 21 years (4 percent) are the smallest portion of the sample. Most of the
respondents are bachelor degree holder (41 percent) and working employees (71 percent).
Non response bias
Non-response bias was tested with extrapolation method which assumes late respondents are similar to non-
respondents (Armstrong & Overton, 1977). Therefore, an independent t-test will be used to test whether mean
score differ between early and late respondents. The early 100 responses were compared with the last 100
responses for mean difference. The number and equal size of responses for comparison is meet the minimum 30
responses and to avoid issues on statistical power reduction (Lindner, Murphy, and Briers, 2001). The result of
shows the mean for every variable exceed the 0.05 significance level for both group indicating there is no mean
difference for both groups (Pallant, 2010). Therefore, the issue of non-response bias did not occur in this study.
Measurement model
A two-step approach was used in this study for data analysis (Anderson and Gerbing, 1988). Firstly, convergent
validity and reliability were evaluated as shown in Table 2. In order to achieve convergent validity, loadings
must be greater than 0.5 (Bagozzi & Yi, 1988), composite reliability must be greater than 0.7 (Gefen et al.,
2000), and the average variance extracted (AVE) must be greater than 0.5 (Fornell & Lacker, 1981). As shown
in Table 2, the measures achieve sufficient convergent validity and reliability because it achieves the criterion
stated above.
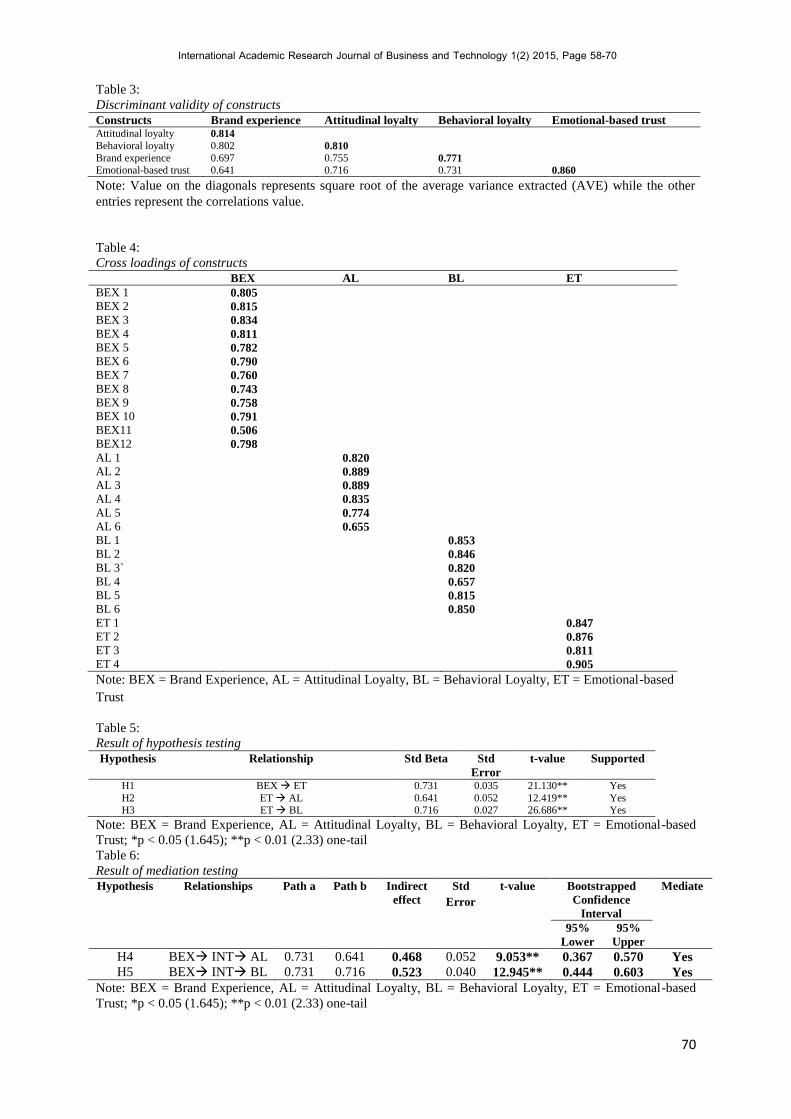
Next, discriminant validity is evaluated as shown in Table 3. In order to achieve discriminant validity, the
average variance shared between each construct and its measures should be greater than the variance shared
between the construct and other constructs (Fornell & Cha, 1994; Fornell & Lacker, 1981). As shown in Table
3, the measures achieve sufficient discriminant validity because the correlation values for each constructs
(included row and column) is lower than the square root of the average variance extracted (AVE) by the
indicators measuring that construct which is displayed on the diagonal. Hair et al. (2014) suggest that the
loadings of measurement items should be higher than the cross loadings to achieve sufficient discriminant
validity. As shown in Table 4, the loadings of all constructs satisfy this criterion. Thus, we can conclude that
discriminant validity is achieved.
Structural Model
The results of hypothesis testing for this study are shown in Table 5 and Table 6. Firstly, brand experience (β =
0.731, p < 0.01) is found to exert positive influence on emotional-based trust. Therefore, H1 is supported.
Secondly, the result also showed that emotional-based trust (β = 0.641, p < 0.01) is positively influence
attitudinal loyalty. Therefore, H2 is supported. Next, emotional-based trust (β = 0.716, p < 0.01) is a significant
predictor of behavioral loyalty. Hence, H3 is accepted. Next, this study test the mediating effect of emotional-

International Academic Research Journal of Business and Technology 1(2) 2015, Page 58-70
63
based trust using percentile bootstrap confidence interval as suggested by Hayes (2013). The bootstrapping
result for H4 display an indirect effect β = 0.468 (0.731*0.641) was significant with a t-value of .9.053. The
indirect effect 0.468, 95% Boot CI: [LL = 0.367, UL = 0.570] does not straddle in a between zero indicating
there is mediation. Hence, we can conclude that emotional-based trust act as mediator between brand experience
and attitudinal loyalty. Therefore, H4 is supported. Next, the bootstrapping result for H5 display an indirect
effect β = 0.523 (0.731*0.716) was significant with a t-value of 12.945. The indirect effect 0.523, 95% Boot CI:
[LL = 0.444, UL = 0.603] does not straddle in a between zero indicating there is mediation. Hence, we can
conclude that emotional-based trust act as mediator between brand experience and attitudinal loyalty. Therefore,
H5 is supported. In sum, all the hypotheses were supported.
Figure 2 exhibited both Q2 values and R
2 values for the respective endogenous variables. The R
2 values
are 0.410, 0.513, and 0.534 respectively which suggest that the modeled variables can explain 41.0 percent on
attitudinal loyalty, 51.3 percent on behavioral loyalty, and 53.4 percent on emotional-based trust. In addition, the
Q2 values for attitudinal loyalty (Q
2 = 0.261), behavioral loyalty (Q
2 = 0.330), and emotional-based trust (Q
2 =
0.391) are both greater than value of 0 suggesting that the model has predictive relevance (Fornell & Cha,
1994).
Figure 2:
Results of the structural model analysis
DISCUSSION
The aim of this study was to test the relationships between brand experience, emotional-based trust, and brand
loyalty in the context of successful SMEs brand. Result of this study found that brand experience have direct
positive relationship on emotional-based trust. This result is supported by prior studies (Giantari et al., 2013;
Lau & Lee, 1999; Sahin, Zehir, and Kitapci, 2011) which found positive relationship between brand experience
and trust. Brand experience prove to be an important construct (R2 = 0.534) in explaining customer emotional-
based trust. Next, emotional-based trust was found to exert positive influence on attitudinal and behavioral
loyalty. In addition, emotional-based trust shows a stronger influence on behavioral loyalty as compared to
attitudinal loyalty. The result is supported by prior studies (Delgado-Ballester & Munuera-Aleman, 2005;
Kantsperger & Kunz, 2010) which found positive relationship between emotional-based trust and customer
loyalty. Consequently, emotional-based trust mediates the relationship between brand experience and both
attitudinal and behavioral loyalty. This result support the study of Kantsperger and Kunz (2010) which found
emotional-based trust have higher mediating effect between satisfaction and loyalty as compared to rational-
based trust.
IMPLICATIONS
From a theoretical view, the findings contribute to the literature by providing empirical evidence of the
relationships between brand experience, emotional-based trust, attitudinal loyalty, and behavioral loyalty. The
empirical finding suggests that emotional-based trust does mediate the relationship between brand experience
and customer loyalty. This finding is further supported by theory of social exchange on the specific trust
mediating effect. The result answer issue highlight by Bagozzi (1975) whom had urge studies to look into
specific social and psychological processes (i.e. emotional-based trust) that assist in the creation of marketing
exchanges. Besides, emotional trust has received little attention in the literature (Das et al., 2014). Apart from
that, literature had argued emotional based trust tends to be lasting as compared to common rational based trust
(Kantsperger & Kunz, 2010; McAllister, 1995; Williams, 2001). Hence from a practical view, the finding
suggests that owner-manager of SME brands should emphasize to earn customer emotional-based trust give it
does influence both attitudinal and behavioral loyalty as well as having advantage to be a more stable form of
trust compared to rational-based trust. This study had shows that managers can focus on brand experience as
Brand Experience Emotional-based
Trust
Q2 = 0.391
R2 = 0.534
Attitudinal Loyalty
Q2 = 0.261
R2 = 0.410
Behavioral Loyalty
Q2 = 0.330
R2 = 0.513
0.731
0.716
0.641
International Academic Research Journal of Business and Technology 1(2) 2015, Page 58-70
64
their branding strategy to form customer trust from emotional perspective. By doing so, customer will exhibit
both attitudinal and behavioral loyalty which helps to ensure ongoing revenue for SME business.
LIMITATIONS AND FUTURE RESEARCH
Although the current study provides interesting findings on the relationships between brand experience,
emotional-based trust, attitudinal loyalty, and behavioral loyalty, it has several limitations. Firstly, results of this
study are obtained from data of only two successful Malaysian SME brand in the casual dining chain. Therefore,
the result should be generalized with caveat because finding may be different if data were collected from other
successful SME brand from different industry such Flipper and Coveithci in the footwear industry (The
BrandLaureate, 2014). This study strongly urges more researches to be undertake on other SME brands to
further validate our findings. Moreover, literatures had indicated there is dearth of branding studies in the
context of SME brand in comparison to global/ big brand (Agostini et al., 2014; Asamoah, 2014; Reijonen,
Laukkanen, Komppula, & Tuominen, 2012; Spence & Essousi, 2010). Secondly, this study did not include any
moderator in the model. Despite, emotional-based trust serves as mediation in this model; the existence of
moderator such as sales promotion might yield different result as shown in studies of Luk and Yip (2008).
Therefore, it would be interesting to enhance the current model with inclusion of moderator such as sales
promotion or antecedents such brand reputation or brand image to further enhance the validity of this finding.
REFERENCES
Agostini, L., Filippini, R., & Nosella, A. (2014). Corporate and product brands: Do they improve SMEs'
performance? Measuring Business Excellence, 18(1), 78-91.
Armstrong, J. C., & Overton, T. S. (1977). Estimating nonresponse bias in mail surveys. Journal of Marketing,
14(3), 396-402.
Asamoah, E. S. (2014). Customer based brand equity (CBBE) and the competitive performance of SMEs in
Ghana. Journal of Small Business and Enterprise Development, 21(1), 117-131.
Assael, H. (1998). Consumer behavior and marketing action. Cincinnati, OH: South-Western.
Bagozzi, R. P. (1975). Marketing as exchange. Journal of Marketing, 39, 32-39.
Bagozzi, R.P. & Yi, T. (1988). On the evaluation of structural equation models. Journal of Academy of
Marketing Science, 16(1), 74-94.
Bernama. (2013). “SMEs can win in the market with good branding, says MATRADE.” Retrieved from
http://www.bernama.com/
Berthon, P., Ewing, M. T., & Napoli, J. (2008). Brand management in small and medium-sized enterprises.
Journal of Small Business Management, 46(1), 27-45.
Birkett, N. J. (1986). Selecting the number of response categories for a likert-type scale. Retrieved August 20,
2014, from http://www.amstat.org/sections/srms/Proceedings/papers/1986_091.pdf
Blattberg, R. C., & Deighton, J. (1996). Manage marketing by the customer equity nest. Harvard Busienss
Review, 74(4), 136-144.
Boomsma, A., & Hoogland, J. J. (2001). The robustness of LISREL modeling revisited. In R. Cudek and S. du
Toit and D. Sorbom. (Ed.). Structural equation models: Present and future. Chicago: Scientific
Software Internatinal.
Brakus, J. J., Schmitt, B. H., Zarantonello, L. (2009). Brand experience: What is it? How is it measured? Does it
affect loyalty? Journal of Marketing, 73, 52-68.
Chang, K-C. (2013). How reputation creates loyalty in the restaurant sector. International Journal of
Contemporary Hospitality Management, 25(4), 536-557.
Chaudhuri, A., & Holbrook, M. B. (2001). The chain of effect from brand trust and brand affect to brand
performance: The role of brand loyalty. Journal of Marketing, 65, 81-93.
Chin, W.W. (1998). Issues and opinion on structural equation modeling. MIS Quarterly, 22(1), 5-16.
Chinomona, R. (2013). The influence of brand experience on brand satisfaction, trust, and attachment in South
Africa. International Business and Economics Research Journal, 12 (10), 1303-1316.
Coelho, P. S., Esteves, S. P. 2007. The choice between a 5-point and a 10-point scale in the framework of
customer satisfaction measurement. International Journal of Market Research, 49(3), 313-345.
Cohen, J. B. 1988. Statistical Power Analysis for the Behavioral Sciences (2nd
Ed.). Hillsdale, NJ: Lawrence
Erlbaum Associates.
Day, G. S. (1969). A two-dimensional concept of brand loyalty. Journal of Advertising Research, 9(3), 29-35.
De Chernatony, L. (1999). Brand management through narrowing the gap between brand identitiy and brand
reputation. Journal of Marketing Management, 15, 157-169.
Delgado-Ballester, E., & Munuera-Aleman, J. L. (2005). Does brand trust matter to brand equity? Journal of
Product and Brand Management, 14(3), 187-196.

International Academic Research Journal of Business and Technology 1(2) 2015, Page 58-70
65
Delgado-Ballester, E., Munuera-Aleman, J. L., & Yague-Guillen, M. J. (2003). Development and validation of a
brand trust scale. International Journal of Market Research, 45(1), 35-53.
Department of Statistics Malaysia. (2011). Population distribution and basic demographic characteristics in
2010. Retrieved from http://www.statistics.gov.my
Eggers, F., O’Dwyer, M., Kraus, S., Vallaster, C., & Guldenberg, S. (2013). The impact of brand authenticity on
brand trust and SME growth: A CEO perspective. Journal of World Business, 48, 340-348.
Eisend, M., & Stokburger-Sauer, N. E. (2013). Brand personality: A meta-analytic review of antecedents and
consequences. Mark Lett, 24, 205-216.
Euromonitor International. (2014). Consumer foodservice in Malaysia. Retrieved from
www.portal.euromonitor.com
Forgas, S., Moliner, M. A., Sanchez, J., & Palau, R. (2010). Antecedents of airline passenger loyalty: Low-cost
versus traditional airlines. Journal of Air Transport Management, 16, 229-233.
Fornell, C., & Cha, J. (1994). Partial Least Squares. In R. P. Bagozzi (Ed.), Advanced Methods of Marketing
Research (pp.52-78). Cambridge, MA: Blackwell Business.
Fornell, C. & Lacker, D. F. (1981). Evaluation structural equation models with unobserved variables and
measurement error. Journal of Marketing Research, 18(1), 39-50.
Frank, Bjorn (2012). The formation of consumer attitudes and intentions towards fast food restaurants: How do
teenagers differ from adults? Managing service quality, 22(3), 260-280.
Freling, T. H., & Forbes, L. K. (2005). An empirical analysis of the brand personality effect. Journal of Product
and Brand Management, 14(7), 404-413.
Gannon, M. J., Nothern, J. C., Carroll Jr., S. J. (1971). Characteristics of nonrespondents among workers.
Journal of Applied Psychology, 55(6), 586-588.
Garland, R. (1991). The mid-point on a rating scale: Is it desirable? Marketing Bulletin, 2, 66-70.
Gates, R., & Solomon, P. J. (1982). Research using the mall intercept: State of the art. Journal of Advertising
Research, 22(4), 43-49.
Gefen, D., Rigdon, E. E., & Straub, D. (2011). An update and extension to SEM guidelines for administrative
and social science research. MIS Quarterly, 35(2), A1-A7.
Gefen, D., Straub, D.W. & Boudreau, M.-C. (2000). Structural equation modeling and regression: Guidelines
for research practice. Communications of the Association for Information Systems, 4, 1-79.
Giantari, I. G. A. K., Zain, D., Rahayu, M., & Solimun. (2013). The role of perceived behavioral control and
trust as mediator of experience on online purchasing intentions relationships : A study on youth in
denpasar city (Indonesia). International Journal of Business and Management Invention, 2(1), 30-38.
Gordon, G. L., Calantone, R. J., & Di Benedetto, C. A. (1993). Brand equity in the business-to-business sector.
Journal of Product and Brand Management, 2(3), 4-16.
Govers, P. C. M., & Schoormans, J. P. L. (2005). Product personality and its influence on consumer preference.
Journal of Consumer Marketing, 22(4), 189-197.
Green, K. E. (1996). Sociodemographic factors and mail survey response. Psychology and Marketing, 13(2),
171-184.
Haghihi, M., Dorosti, A., Rahnama, A., & Hoseinpor, A. (2012). Evaluation of factors affecting customer
loyalty in the restaurant industry. African Journal of Business Management, 6(14), 5039-5046.
Hair Jr, J. F., Black, W. C., Babin, B. J., Andersen, R. E., & Tatham, R. L. (2006). Multivariate data analysis
(6th
ed.). Upper Saddle River, NJ: Pearson Prentice Hall.
Han, H., Back, K-J., & Barrett, B. (2009). Influencing factors on restaurant customers’ revisit intention: The
roles of emotions and switching barriers. International Journal of Hospitality Management, 28, 563-
572.
Hair Jr, J. F. Jr., Hult, G. T. M., Ringle, C. M., & Sarstedt, M. (2014). A primer on partial least squares
structural equation modeling (PLS-SEM). United States of America: SAGE Publications, Inc.
Hair Jr, J. F., Sarstedt, M., Hopkins, L., & Kuppelwieser, V. G. (2014). Partial least squares structural equation
modeling (PLS-SEM): An emerging tool in business research. European Business Review, 26(2), 106-
121.
Han, H., & Jeong, C. (2013). Multi dimensions of patrons’ emotional experiences in upscale restaurants and
their role in loyalty formation: Emotion scale improvement. International Journal of Hospitality
Management, 32, 59-70.
Han, L., & Li, B. (2012). The effects of brand experience on customer brand loyalty. International Conference
on Information Management, Innovation Management and Industrial Engineering, 377-380.
Henseler, J. (2010). On the convergence of partial least squares path modeling algorithm. Comput Stat, 25, 107-
120.
Hornik, J., & Ellis, S. (1988). Strategies to secure compliance for a mall intercept interview. Public Opinion
Quarterly, 52, 539-551.

International Academic Research Journal of Business and Technology 1(2) 2015, Page 58-70
66
Iglesias, O., Singh, J. J., & Batista-Foguet, J. M. (2011). The role of brand experience and affective commitment
in determining brand loyalty. Journal of Brand Management, 18(8), 570-582.
Ismail, A. R., & Spinelli, G. (2012). Effects of brand love, personality, and image on word of mouth: The case
of fashion brands among young consumers. Journal of Fashion Marketing and Management, 16(4),
386-398.
Jacoby, J., & Kyner, D. B. (1973). Brand loyalty versus repeat purchasing behavior. Journal of Marketing
Research, 10(1), 1-9.
Kantsperger, R., & Kunz, W. H. (2010). Consumer trust in service companies: A multiple mediating analysis.
Managing Service Quality, 20(1), 4-25.
Keller, K. L. (2013). Strategic brand management: Building, measuring, and managing brand equity, 4th
edition. United States of America: Pearson Education Limited.
Kelloway, E. K. (1998). Using LISREL for structural equation modeling. California: Sage Publications.
Kim, W. G., & Kim, H-B. (2004). Measuring Customer-Based Restaurant Brand Equity. Cornell Hotel and
Restaurant Administration Quarterly, 45(2), 115-131.
Kim, D., Magnini, V. P., & Singal, M. (2011). The effects of customers’ perceptions of brand personality in
casual theme restaurants. International Journal of Hospitality Management, 30, 448-458.
Kim, T., Yoo, J. J-E., & Lee, G. (2012). Post-recovery customer relationships and customer partnerships in a
restaurant setting. International Journal of Contemporary Hospitality Management, 24(3), 381-401.
Kline, R. B. (2011). Principles and practice of structural equation modeling (3rd
Ed.). New York: The Guilford
Press.
Krake, F. B. G. J. M. (2005). Successful brand management in SMEs: A new theory and practical hints. Journal
of Product and Brand Management, 14(4), 228-238.
Kuikka, A., & Laukkanen, T. (2012). Brand loyalty and the role of hedonic value. Journal of Product and Brand
Management, 21(7), 529-537.
Lau, G. T., & Lee, S. H. (1999). Consumers’ trust in a band and the link to brand loyalty. Journal of Market
Focused Management, 4(4), 341-370.
Lee, J., & Back, K. (2010). Examining antecedents and consequences of brand personality in the upper-upscale
business hotel segment. Journal of Travel and Tourism Marketing, 27, 132-145.
Lee, H. J., & Kang, M, S. (2012). The effect of brand experience on brand relationship quality. Academy of
Marketing Studies Journal, 16(1), 87-98.
Lee, Y-K., Back, K-J., & Kim, J-Y. (2009). Family restaurant brand personality and its impact on customer’s
emotion, satisfaction, and brand loyalty. Journal of Hospitality and Tourism Research, 33(3), 305-328.
Lin, L. (2010). The relationship of consumer personality trait, brand personality and brand loyalty: An empirical
study of toys and video games buyers. Journal of Product and Brand Management, 19(1), 4-17.
Lin, Y., & Huang, P. (2012). Effects of big five brand personality dimensions on repurchase intentions: Using
branded coffee chain as examples. Journal of Foodservice Business Research, 15, 1-8.
Luk, S. T. K., & Yip, L. S. C. (2008). The moderator effect of monetary sales promotion on the relationship
between brand trust and purchase behavior. Journal of Brand Management, 15(6), 452-464.
Lindner, J. R., Murphy, T. H., & Briers, G. E. (2001). Handling nonresponse in social science research. Journal
of Agricultural Education, 42(4), 43-53.
Magnini, V. P., & Thelen, S. T. (2008). The influence of music on perceptions of brand personality, décor, and
service quality: The case of classical music in a fine dining restaurant. Journal of Hospitality and
Leisure Marketing, 16(3), 286-300.
Mascarenhas, O. A., Kesavan, R., & Bernacchi, M. (2006). Lasting customer loyalty: A total customer
experience approach. Journal of Consumer Marketing, 23(7), 397-405.
Mattila, A. S. (2001). Emotional bonding and restaurant loyalty. Cornell Hotel and Restaurant Administration
Quarterly, 42, 73-79.
McAllister, D.J. (1995). Affect- and cognition-based trust as foundations for interpersonal cooperation in
organizations. Academy of Management Journal, 38(1), 24-59.
Mengxia, Z. (2007). Impact of brand personality on PALI: A comparative research between two different
brands. International Management Review, 3(3), 36-44.
Merrilees, B., Rundle-Thiele, S., & Lye, A. (2011). Marketing capabilities: Antecedents and implications for
B2B SME performance. Industrial Marketing Management, 40, 368-375.
Ministry of Tourism and Culture (2014). Cuti-cuti Malaysia 1001 packages central region. Retrieved from
www.tourismmalaysia.com
Mitchell, J. (1999). Reaching across borders: Identifying, addressing issues globally. Marketing News, 33,
American Marketing Association, Chicago, IL.
Mohamed, R. N., & Musa, R. (2012). Disentangle the effects of brand experience trust, commitment, and
resonance: Evidence from popular fast food chain restaurants in Malaysia: Using structural equation
modeling approach. Cambridge Business and Economic Conference, 1-22.

International Academic Research Journal of Business and Technology 1(2) 2015, Page 58-70
67
Morgan, R. M., & Hunt, S. D. (1994). The commitment-trust theory of relationship marketing. Journal of
Marketing, 58(3), 20-38.
Morrison, S., & Crane, F. G. (2007). Building the service brand by creating and managing an emotional brand
experience. Journal of Brand Management, 14(5), 410-421.
Muhammad, M. Z., Char, A. K., Mohd Rushdan Yasao, & Hassan, Z. (2010). Small and Medium Enterprises
(SMEs) competing in the global business environment: A case of Malaysia. International Business
Research, 3(1), 66-75.
Murad, M. H., Omar, M. W., & Fadzil,, M. I. (2011). The effectiveness of face-to-face interaction in
establishment of SME Brand personality. Elixir Marketing Management, 36, 3114-3118.
Murase, H., & Bojanic, D. (2004). An Examination of the differences in restaurant brand personality across
cultures. Journal of Hospitality and Leisure Marketing, 11(2/3), 97-113.
Musante, M. D., Bojanic, D. C., & Zhang, J. J. (2008). A modified brand personality scale for the restaurant
industry. Journal of Hospitality and Leisure Marketing, 16(4), 303-323.
Nam, J., Ekinci, Y., & Whyatt, G. (2011). Brand equity, brand loyalty and consumer satisfaction. Annals of
Tourism Research, 38(3), 1009-1030.
Nguyen, N., Leclerc, A., & LeBlanc, G. (2013). The mediating role of customer trust on customer loyalty.
Journal of Service Science and Management, 6, 96-109.
Nysveen, H., Pedersen, P. E., & Skard, S. (2013). Brand experiences in service organizations: Exploring the
individual effects of brand experience dimensions. Journal of Brand Management 20(5), 404-423.
Oliver, R. L. (1999). Whence consumer loyalty? Journal of Marketing, 63, 33-44.
Opoku, R. A., Abratt, R., Bendixen, M., & Pitt, L. (2007). Communicating brand personality: Are the websites
doing the talking for food SMEs? Qualitative Market Research: An International Journal, 10(4), 362-
374.
Othman, M., & Goodazirad, B. (2013). Restaurant color’s as stimuli to enhance pleasure feeling and its effect on
diner’s behavioral intentions in the family chain restaurants. Journal of Tourism, Hospitality, and
Culinary Arts, 5(1), 75-101.
Othman, C., & Rahman, M. S. (2014). Investigation of the relationship of brand personality, subjective norm,
and perceived control on consumers’ purchase intention of organic fast food. Modern Applied Science,
8(3), 92-106.
Pallant, J. (2010). SPSS survival manual: A step by step guide to data analysis using SPSS (4th
Ed.). Allen &
Unwin.
Parijat, U., Saeed, J., & Pranab, K. D. (2011). Factors influencing ERP implementation in Indian manufacturing
organizations: A study of micro, small, and medium scaled enterprises. Journal of Enterprise
Information Management, 24(2), 130-145.
Pine, J. B. II., & Gilmore, J. H. (1998). Welcome to the experience economy. Harvard Business Review, 76(4),
97-106.
Polyorat, K. (2011). The influence of brand personality dimensions on brand identification and word of mouth:
The case study of a university brand in Thailand. Asian Journal of Business Research, 1(1), 54-69.
Rauyruen, P., Miller, K. E., & Groth, M. (2009). B2B services: Linking service loyalty and brand equity.
Journal of Service Marketing, 23(3), 175-186.
Readers Digest Asia. (2013). 2013 winners of the reader’s digest trusted brand award in Asia: Malaysia.
Retrieved from http://www.rdasia.com
Reichheld, F. F., & Sasser, W. E. Jr. (1990). Zero defections: Quality comes to services. Harvard Business
Review, 68, 105-111.
Reijonen, H. (2010). Do all SMEs practice same kind of marketing? Journal of Small Business and Enterprise
Development, 17(2), 279-293.
Reijonen, H., & Laukkanen, T. (2010). Customer relationship oriented marketing practices in SMEs. Marketing
Intelligence and Planning, 28(2), 115-136.
Reijonen, H., Laukkanen, T., Komppula, R., & Tuominen, S. (2012). Are growing SMEs more market-oriented
and brand-oriented? Journal of Small Business Management, 50(4), 699-716.
Reinartz, W. J., Haenlein, M., & Henseler, J. (2009). An empirical comparison of the efficiency of covariance-
based and variance-based SEM. INSEAD Working Paper No. 2009/44/MKT.
Ringle, C.M., Wende, S. and Will, A. (2005), ‘‘SmartPLS 2.0 (beta)’’, SmartPLS, Hamburg, available at:
www.smartpls.de
Ryu, K., Han, H., & Kim, T-H. (2008). The relationships among overall quick-casual restaurant image,
perceived value, customer satisfaction, and behavioral intentions. International Journal of Hospitality
Management, 27, 459-469.
Sahin, A., Zehir, C., & Kitapci, H. (2011). The effects of brand experiences, trust, and satisfaction on building
brand loyalty: An empirical research on global brands. Procedia Social and Behavioral Sciences, 24,
1288-1301.

International Academic Research Journal of Business and Technology 1(2) 2015, Page 58-70
68
Saleh, A. S., & Ndubisi, N. O. (2006). An evaluation of SME development in Malaysia. International Review
of Business Research Papers, 2(1), 1-14.
Schoorman, F. D., Mayer, R. C., and Davis, J. H. (2007). An integrative model of organizational trust: Past,
present, and future. Academy of Management Review, 32(2), 344-354.
Sethuraman, R., & Gielens, K. (2014). Determinants of store brand share. Journal of Retailing, 90(2), 141-153.
Shashank, S. Siddhartha, N., & Subhas, C. M. (2014). Identifying success factors for implementations of ERP at
Indian SMEs: A comparative study with Indian large organizations and the global trend. Journal of
Modelling in Management, 8(1), 103-122.
Si, S. X. & Cullen, J. B. (1998). Response categories and potential cultural bias: Effects of an explicit middle
point in cross cultural surveys. The International Journal of Organizational Analysis, 6(3), 218-230.
Siguaw, J. A., Mattila, A., & Austin, J. R. (1999). The brand personality scale: An application for restaurants.
Cornell Hotel and Restaurant Administration Quarterly, 40, 48-55.
SME Corp. (2012). SME Annual Report 2011/12: Redefining the future. Retrieved from
http://www.smecorp.gov.my
SME Corp. (2014). SME Corporation Malaysia: List of companies. Retrieved from http://www.smecorp.gov.my
Sophonsiri, S., & Polyorat, K. (2009). The impact of brand personality dimensions on brand association and
brand attractiveness: The case study of KFC in Thailand. Journal of Global Business and Technology,
5(2), 51-62.
Spence, M. & Essoussi, L. H. (2010). SME brand building and management: An exploratory study. European
Journal of Marketing, 44 (7/8), 1037-1054.
Sudman, S. (1980). Improving the quality of shopping center sampling. Journal of Marketing Research, 423-
431.
Sung, Y., & Kim, J. (2010). Effects of brand personality on brand trust and brand affect. Psychology and
Marketing, 27(7), 639-661.
Taleghani, M., Largani, M. S., & Mousavian, S. J. (2011). The investigation and analysis impact of brand
dimensions on services quality and customers satisfaction in new enterprises of Iran. Contemporary
Marketing Review, 1(6), 1-13.
Tan, T. M., Deviniaga, R., & Hishamuddin, I. (2013). The common challenges of brand equity creation among
local fast food brands in Malaysia. International Journal of Business and Management, 8(2), 96-106.
The BrandLaureate. (2014). The BrandLaureate: SMEs bestbrands awards. Retrieved from
http://www.thebrandlaureate.com
Tucker, W. T. (1964). The development of brand loyalty. Journal of Marketing Research, 1(3), 32-35.
Ueacharoenkit, S. (2012). Investigating the relationship between brand experience and loyalty: The study of
luxury cosmetic brand in Thailand. Brunel Business School Doctoral Symposium, 1-12.
Ueacharoenkit, S., & Cohen, G. (2013). An investigation of the relationship between brand experience and
loyalty within the context of the luxury cosmetics sector in Thailand. PhD Theses of Brunel Business
School, Brunel University.
Vila-Lopez, N., & Rodriguez-Molina, M. (2013). Event-brand transfer in an entertainment service: Experiential
marketing. Industrial Management and Data Systems, 113(5), 712-731.
Walter, N., Cleff, T., & Chu, G. (2013). Brand experience’s influence on customer satisfaction and loyalty: A
mirage in marketing research? International Journal or Management Research and Business Strategy,
2(1), 130-144.
Williams, M. (2001). In whom we trust: Group membership as an affective context for trust development.
Academy of Management Review, 26(3), 377-396.
Yoo, M., & Bai, B. (2013). Customer loyalty marketing research: A comparative approach between hospitality
and business journal. International Journal of Hospitality Management, 33, 166-177.
Yoo, B., Donthu, N., & Lee, S. (2000). An examination of selected marketing mix elements and brand equity.
Journal of the Academy of Marketing Science, 28(2), 195-211.
Zehir, C., Sahin, A., Kitapci, H., & Ozsahin, M. (2011). The effects of brand communication and service quality
in building brand loyalty through brand trust: The empirical research on global brands. Procedia Social
and Behavioral Sciences, 24, 1218-1231.
Zhang, J., & Bloemer, J. M. M. (2008). The impact of value congruence on consumer-service brand
relationships. Journal of Service Research, 11(2), 161-178.
Zikmund, W. G., Babin, B. J., Carr, J. C., & Griffin, M. (2009). Business research methods (8th
ed.). South-
Western College Publication.
Zeithaml, V. A., Berry, L. L., & Parasuraman, A. (1996). The behavioral consequences of service quality.
Journal of Marketing, 60(2), 31-46.

International Academic Research Journal of Business and Technology 1(2) 2015, Page 58-70
69
APPENDICES
Table1:
Respondent profile Demographic characteristics Frequency % Gender
Male 60 27 Female 160 73
Age < 21 9 4
21-30 79 36
31-40 78 36 41-50 32 14
>50 22 10
Education
Primary school 7 3 Secondary school 38 17
College (Certificate/ Diploma/ Advanced Diploma) 73 33
Bachelor degree 90 41 Postgraduate degree 12 6
Occupation Student 18 9
Employee 156 71
Self-employed 23 10 Unemployed/ Housewife 23 10
Table 2:
Result of measurement model
Model construct Measurement item Loading CRa AVEb
Brand experience BEX 1 0.805 0.945 0.594
BEX 2 0.815
BEX 3 0.834 BEX 4 0.811
BEX 5 0.782
BEX 6 0.790 BEX 7 0.760
BEX 8 0.743
BEX 9 0.758 BEX 10 0.791
BEX11 0.506 BEX 12 0.798
Attitudinal loyalty AL 1 0.820 0.921 0.663
AL 2 0.889 AL 3 0.889
AL 4 0.835
AL 5 0.774 AL 6 0.655
Behavioral loyalty BL 1 0.853 0.919 0.656
BL 2 0.846
BL 3` 0.820
BL 4 0.657
BL 5 0.815 BL 6 0.850
Emotional-based trust ET 1 0.847 0.919 0.740
ET 2 0.876 ET 3 0.811
ET 4 0.905
Note: aComposite Reliability (CR) = (square of the summation of the factor loadings)/{(square of the summation
of the factor loadings) + (square of the summation of the error variances)}; bAverage Variance Extracted (AVE)
= (summation of the square of the factor loadings)/{(summation of the square of the factor loadings) +
(summation of the error variances)}
International Academic Research Journal of Business and Technology 1(2) 2015, Page 58-70
70
Table 3:
Discriminant validity of constructs
Constructs Brand experience Attitudinal loyalty Behavioral loyalty Emotional-based trust Attitudinal loyalty 0.814
Behavioral loyalty 0.802 0.810
Brand experience 0.697 0.755 0.771 Emotional-based trust 0.641 0.716 0.731 0.860
Note: Value on the diagonals represents square root of the average variance extracted (AVE) while the other
entries represent the correlations value.
Table 4:
Cross loadings of constructs
BEX AL BL ET
BEX 1 0.805
BEX 2 0.815
BEX 3 0.834
BEX 4 0.811
BEX 5 0.782
BEX 6 0.790
BEX 7 0.760
BEX 8 0.743
BEX 9 0.758
BEX 10 0.791
BEX11 0.506
BEX12 0.798
AL 1 0.820
AL 2 0.889
AL 3 0.889
AL 4 0.835
AL 5 0.774
AL 6 0.655
BL 1 0.853
BL 2 0.846
BL 3` 0.820
BL 4 0.657
BL 5 0.815
BL 6 0.850
ET 1 0.847
ET 2 0.876
ET 3 0.811
ET 4 0.905
Note: BEX = Brand Experience, AL = Attitudinal Loyalty, BL = Behavioral Loyalty, ET = Emotional-based
Trust
Table 5:
Result of hypothesis testing
Hypothesis Relationship Std Beta Std
Error
t-value Supported
H1 BEX ET 0.731 0.035 21.130** Yes
H2 ET AL 0.641 0.052 12.419** Yes H3 ET BL 0.716 0.027 26.686** Yes
Note: BEX = Brand Experience, AL = Attitudinal Loyalty, BL = Behavioral Loyalty, ET = Emotional-based
Trust; *p < 0.05 (1.645); **p < 0.01 (2.33) one-tail
Table 6:
Result of mediation testing
Hypothesis Relationships Path a Path b Indirect
effect
Std
Error
t-value Bootstrapped
Confidence
Interval
Mediate
95%
Lower
95%
Upper
H4 BEX INT AL 0.731 0.641 0.468 0.052 9.053** 0.367 0.570 Yes
H5 BEX INT BL 0.731 0.716 0.523 0.040 12.945** 0.444 0.603 Yes
Note: BEX = Brand Experience, AL = Attitudinal Loyalty, BL = Behavioral Loyalty, ET = Emotional-based
Trust; *p < 0.05 (1.645); **p < 0.01 (2.33) one-tail