Embed Size (px)
Citation preview
sustainability
Article
Examining the Moderating Role of Brand Loyaltyamong Consumers of Technology Products
Sunder Ramachandran 1,* and Sreejith Balasubramanian 2
1 Abu Dhabi School of Management, P.O.Box 6844, Abu Dhabi, UAE2 Business School, Middlesex University Dubai, P.O.Box 500697, Dubai, UAE; [email protected]* Correspondence: [email protected]
Received: 14 October 2020; Accepted: 25 November 2020; Published: 28 November 2020 �����������������
Abstract: The long-term survival of a company depends on its economic sustainability. It costs severaltimes more to acquire new customers than retain current ones, and loyal customers spend morethan new ones. Unfortunately, consumers are increasingly becoming less loyal to brands/productsthan before. Unearthing the underlying reasons for this diminishing consumer loyalty is critical.This forms the motivation of this study, which aims to examine the moderating role of loyalty amongconsumers of technology products. Specifically, the study explores the heterogeneity in the factors(antecedents) influencing brand-loyal attitudes and behavior among consumers of different loyaltylevels. A total of 355 survey responses were obtained from an administrated survey across threeloyalty groups (high loyalty—155; medium loyalty—99; low loyalty—90) in the United Arab Emirates.Structural equation modeling and multi-group moderation tests were used to test the hypothesizeddifferences in the relationships between antecedents (trust, self-image, quality, and perceived easeof use) and customer attitude, and between customer attitude and repurchase intentions amongthe different loyalty groups. The results show that the different levels of loyalty have a moderatingimpact on the relationships. The findings are useful for marketers to better understand and managecustomer attitudes, and subsequent purchase/repurchase intention depending on the levels of loyaltythey may be in, as well as maneuver their customers through the different levels of loyalty to achievebusiness sustainability.
Keywords: business sustainability; brand loyalty; consumer behavior; repurchase intention;technology products; structural equation modeling
1. Introduction
As the saying goes, the business of business is to stay in business [1]. In today’s highly competitiveglobal market, one of the main challenges for organizations is to ensure business sustainability orthe preservation of a business through time. Sustainability in marketing literature covering differentaspects, such as sustainable reputation [2], sustainable brand management [3], sustainable onlinecustomers [4], and sustainable brand loyalty [5], has witnessed significant interest in recent years.Among these interrelated aspects, brand loyalty has emerged as a critical factor for sustainable businessgrowth as it directly contributes to increased market share and profitability [6,7]. This is because,sustainable business, at a basic level, is to make sure that customers are satisfied and become loyalto the brand. In other words, maintaining a loyal customer base is critical for business sustainability.The importance of sustainability has never been more pronounced than in these pandemic times.The pandemic continues to ensnare almost every possible area, leaving a deleterious effect in its wake.As the world struggles to come to grips with this seemingly unending menace, one of the foremostthoughts in the minds of business owners is not just immediate survival but also continued sustenance.Businesses are vying more aggressively to grab a share of the customers’ wallet and exert their best
Sustainability 2020, 12, 9967; doi:10.3390/su12239967 www.mdpi.com/journal/sustainability
Sustainability 2020, 12, 9967 2 of 16
efforts to bring back the lost customers into their fold. This emphasizes the critical role played bybrand loyalty in the survival and sustainability of businesses. Brand-loyal behavior is the overt act ofselective repeat purchasing based on evaluative psychological decision processes, while brand-loyalattitudes are underlying predispositions to behave in such a selective fashion [8,9]. A loyal customer iscommitted to their product/firm and is less price-sensitive and less prone to other enticements [10,11].In other words, loyal customers are like the proverbial “bird in hand”, that costs less to retain than toattract a new one [12]. Moreover, they are willing advocates of the product/firm, and thereby, provideone of the most effective and inexpensive forms of advertisements.
However, recent studies have shown that firms are losing loyal customers faster today tocompetition than before, given the highly crowded marketplace seeking to grab the attention of thepromiscuous consumer with myriad and less differentiated product offerings [13]. A more recentindustry study on consumer loyalty has shown that nearly two-fifths of consumers feel less loyal tobrands and companies than a year ago [14]. Yet, this feeling is belied by our continued support forthe brands we know and trust. Brand-loyal attitudes and behavior is, therefore, an increasingly morecomplicated problem than before, and it is important that we consider it as a dynamic and non-linearprocess rather than viewing it as simple, straightforward, or even linear as it may lead to erroneousconclusions [9].
Though brand loyalty has been extensively studied over many decades, the focus of the studies hasbeen mostly on understanding its direct and mediating role in consumer behavior. Despite increasingcalls in the literature, the moderating impact of brand loyalty on the consumer acceptance of aproduct/service has witnessed very limited empirical investigation [9,15,16]. For instance, it isimportant to understand the heterogeneity in the antecedents (e.g., trust, quality) in forming/modifyingcustomer attitudes and subsequent purchase/repurchase intention as consumers move through thedifferent levels of loyalty, i.e., from no/low loyalty to high loyalty [16]. This understanding wouldenable firms to assess how much time, money, and effort they should invest and where to invest toachieve the desired attitudes towards the product/brand of customers belonging to different loyaltysegments. Further, it also helps in understanding whether the loyal customer base is still a holy grail intoday’s fast-changing, competitive, technology-driven world, and if so, whether brands can take theirloyal customer base for granted and even exploit them?
The relevance of such understanding is even greater for technology products such as smartphonesand tablets, which are having increasingly shorter life-cycles. Recent evidence has shown that firmswith a loyal customer base are exploiting the trust of their customers. For example, consider the caseof Apple, which was accused of deliberately slowing down their old iPhones in an attempt to makecustomers buy new ones. This scandalous practice of “throttling”, which came to be known as “batterygate”, led to customers feeling cheated and angry and resulted in more than 60 lawsuits being filedagainst Apple [17]. Similarly, the Volkswagen Group, one of the leading car manufacturers in theworld, has openly admitted that they broke the trust of their customers and the general public in theemission scandal, where they used illegal software to cheat on emissions tests [18]. Similarly, Facebookhas publicly apologized for the “breach of trust” with consumer data in the Cambridge Analyticascandal. Yet, these brands emerged stronger from these scandals and retained their position or becameleaders in their respective categories.
From a product quality perspective, Samsung, another brand with a loyal customer base,experienced a considerable quality setback with its Note7 smartphone. Within weeks of its launch,Samsung’s South Korean customers complained about its battery exploding and catching fire, causinga colossal loss of USD 26 billion in the stock market and an estimated USD 16 billion in sales [19].Like Apple, Samsung also managed to emerge stronger, and became a leader in the smartphone market.
Similarly, in terms of ease of use, Instagram has undergone several updates and layout changes inrecent years, which did not fare well with their users, with many active users openly expressing theirbrand hate against these new updates and changes [20]. Yet, Instagram users have grown significantly,with many users even switching from other social media platforms such as Facebook to Instagram [21].
Sustainability 2020, 12, 9967 3 of 16
Finally, recent studies have shown that brands are missing out on billions of dollars by failing to takea balanced approach to marketing campaigns that supports, rather than undermines, the self-image ofall demographic groups [22]. For instance, H&M has been accused of racially insensitive advertisements,such as the “monkey sweatshirt”, that hurt the self-image of a particular demographic group [23].Unlike technology brands, this scandal, which H&M publicly apologized for, had led to a significantdecline in their sales [24,25]. However, it is unknown whether this self-image congruence on brandpreference is similar across different loyalty groups of technology brands? This understanding iscritical for technology brands in their effort to develop or maintain self-image to attract new customersor retain existing customers.
In short, the above examples raise the following question: Had these episodes that affected trust,quality, ease of use, and self-image occurred with a recent entrant (in low customer loyalty segment) inthe technology product category, would that have affected their customer attitude and subsequentpurchase intention more adversely than for customer segments in medium and high loyalty?
This formed the motivation of this study, which aims to understand the impact of antecedents,namely, trust, quality, perceived ease of use, and self-image on attitude towards the brand andsubsequent repurchase intention across different customer loyalty (high, medium, and low loyalty)groups. The findings have great significance for marketers in understanding and in devising strategiesfor converting low loyalty groups to high loyalty groups.
The rest of the paper is structured as follows. In Section 2, the relevant literature on brandloyalty is discussed, and the study framework and related hypotheses are introduced. The researchmethodology adopted in this study is discussed in Section 3. The analysis and findings are detailedin Section 4, while the results are discussed in Section 5. The study concludes in Section 6 with theimplications, limitations, and suggestions for future research.
2. Literature Review and Hypotheses Development
The Technology Acceptance Model (TAM) and its adaptation is the widely used model inunderstanding the impact of antecedents in consumer attitudes and subsequent purchase/repurchaseintentions in a technology-driven environment [26–28]. The proposed hypotheses in this study areadapted primarily from the Consumers’ Acceptance Model of Chen and Tan [29] (which in turn wasdeveloped by expanding TAM) and from Singh [30], who incorporated the self-image variable in TAM.These are discussed in the following sections.
2.1. Moderating Impact of Brand Loyalty on the Relationship between Trust and Attitude
Trust has long been regarded as a catalyst for buyer–seller transactions that can provide consumerswith high expectations of satisfying exchange relationships [26]. It is defined as the willingness of aparty to be vulnerable to the actions of another party based on the expectation that the latter one willperform particular actions, which are important to the former one [31]. In other words, when firms actresponsibly, customers are assured, and the “perceived risk with the firm is likely reduced”, thereforeenhancing the possibility of a positive attitude and behavior by the customer [32].
Attitude, on the other hand, is a psychological tendency that is expressed by evaluating a particularentity with some degree of favor or disfavor [33]. In a marketing context, it is the feeling of an individual(positive or negative) towards the product or brand [28].
A meta-analysis of 128 studies by Wu et al. [31] that employed TAM showed a positive relationshipbetween trust and attitude. However, the moderating impact of brand loyalty on this relationshipis unclear, though its impact on attitude is expected to vary with the different levels of loyalty.Social psychology studies have shown an asymmetry between difficulty in creating trust and the easeof its destruction. In other words, establishing trust may be slow and challenging, while losing it maybe fast and easy. Conversely, studies on perseverance bias have shown that once people have adopteda belief system, events or happenings that should affect the belief system often result in little or nochange in their attitude [34]. It seems the latter is true, as customers who are highly loyal repose greater
Sustainability 2020, 12, 9967 4 of 16
trust, making them impervious to not just inducements but even from clear “breach of trust”, as seenfrom the various scandals, such as the battery gate and Cambridge Analytica. It appears that oncetrust is established, learning about negative events might be dismissed away as one-off incidents withlittle or no change in their attitude towards the brand [35]. In line with this argument, we proposethe following:
Hypothesis 1a (H1a). The impact of trust on attitude will be significantly greater for high loyal customers asopposed to medium loyal customers.
Hypothesis 1b (H1b). The impact of trust on attitude will be significantly greater for medium loyal customersas opposed to low loyal customers.
Hypothesis 1c (H1c). The impact of trust on will be significantly greater for high loyal customers as opposedto low loyal customers.
2.2. Moderating Impact of Brand Loyalty on the Relationship between Self-Image and Attitude
Self-image is defined as measurable aspects of what one does, how one appears, and what materialthings one has [36]. The “image” of “self” includes attitudes, perceptions, feelings, and appropriatebehavior befitting the situation [37]. Consumers are more likely to buy a brand if they perceive that thebrand matches with their self-image. The related self-congruity theory has been tested and retestedand continues to be a dominant theory in the realm of consumer behavior and an important predictorof consumer attitudes and purchase intentions [38]. Past studies have demonstrated the impact ofself-image congruity on attitude [39,40]. While the studies affirm the influence of self-image overbrand loyalty, these studies have examined the relationships between the two concepts singularlyand as a linear process. In line with Dolich’s [41] study, which reveals greater similarity betweenself-concept congruence and most preferred brands, it is assumed that self-image impact on attitudewill be significantly greater for customers with high loyalty levels than medium or low loyalty levels.We, therefore, propose the following hypotheses:
Hypothesis 2a (H2a). Self-image impact on attitude will be significantly greater for high loyal customers asopposed to medium loyal customers.
Hypothesis 2b (H2b). Self-image impact on attitude will be significantly greater for medium loyal customersas opposed to low loyal customers.
Hypothesis 2c (H2c). Self-image impact on attitude will be significantly greater for high loyal customers asopposed to low loyal customers.
2.3. Moderating Impact of Brand Loyalty on the Relationship between Quality and Attitude
In the product literature, quality is a factor for which consumers are willing to pay a higher price,facilitates increased profitability, and is a cause for repeat purchase [42,43]. Zeithaml et al. [44] foundthat when service quality is high, the customers’ behavioral intentions become favorable, and therelationship strengthens. When the service quality is low, the behavioral intentions become low,leading to defection. However, the moderating impact of brand loyalty on the relationship betweenquality and attitude has not been explicitly studied. However, based on the evidence from studies suchas Obermiller and Wheatley [45], which show that the consumer has a greater attitudinal preference forbrands with strong prior beliefs in quality than brands with weak prior beliefs in quality, we proposethe following:
Sustainability 2020, 12, 9967 5 of 16
Hypothesis 3a (H3a). Quality impact on attitude will be significantly greater for high loyal customers asopposed to medium loyal customers.
Hypothesis 3b (H3b). Quality impact on attitude will be significantly greater for medium loyal customers asopposed to low loyal customers.
Hypothesis 3c (H3c). Quality impact on attitude will be significantly greater for high loyal customers asopposed to low loyal customers.
2.4. Moderating Impact of Brand Loyalty on the Relationship between Perceived Ease of Use and Attitude
Perceived ease of use refers to the degree to which a person believes that using a particularsystem would be effortless [46]. One of the primary determinants of consumer attitude in TAM is theperceived ease of use. This relationship has been investigated in many contexts, and researchers haveinvariably found a positive association between the two. However, the moderating impact of loyaltyon the relationship between perceived ease of use and attitude is unclear. Similar to other studies,which have shown that the link between loyalty and other variables, such as satisfaction, are not simple,straightforward, or even linear [47,48]. It could be assumed that the impact of perceived ease of use onattitude may vary depending upon the strength of loyalty. Going by a similar logic for H3, we positthe following hypotheses:
Hypothesis 4a (H4a). Perceived ease of use impact on attitude will be significantly greater for high loyalcustomers as opposed to medium loyal customers.
Hypothesis 4b (H4b). Perceived ease of use impact on attitude will be significantly greater for medium loyalcustomers as opposed to low loyal customers.
Hypothesis 4c (H4c). Perceived ease of use impact on attitude will be significantly greater for high loyalcustomers as opposed to low loyal customers.
2.5. Moderating Impact of Brand Loyalty on the Relationship between Attitude and Repurchase Intention
Repurchase intentions are defined as the customer’s self-reported likelihood of engaging in futurerepurchase behavior [49]. Zeithaml et al. [44] call it as behavioral intentions whose favorability orunfavourability determines the continuance or defection of a customer with the firm. Again, one ofthe key relationships in the TAM model is the relationship between attitude and behavioral intentionto purchase/repurchase, and studies have invariably found a positive association between the two.However, explicit evidence on the moderating impact of brand loyalty on this relationship is unclear.A seminal, experimental study by Cohen and Houston [50] examined how brand loyal and non-loyalconsumers perceived the product attributes of different toothpaste brands, namely Colgate and Crest.Specifically, the study looked at differences in perception between consumers who are loyal (purchasedthat brand and no other brand) to either of these two leading toothpaste brands and a control group ofconsumers who have loyalty to some other brand. The results showed only trivial differences in theperception of Colgate and Crest by the control group, while the brand loyalists showed substantialdifferences, always in the direction of their preferred brand, demonstrating that loyalty moderatesthe perception of product attributes. In line with Cohen and Houston [50], this study assumes thatcustomers with high loyalty will have a more favorable attitude towards the brand leading to purchasevis-à-vis customers with medium or low loyalty. We, therefore, propose the following hypotheses:
Hypothesis 5a (H5a). Attitude impact on repurchase intention will be significantly greater for high loyalcustomers as opposed to medium loyal customers.
Sustainability 2020, 12, 9967 6 of 16
Hypothesis 5b (H5b). Attitude impact on repurchase intention will be significantly greater for medium loyalcustomers as opposed to low loyal customers.
Hypothesis 5c (H5c). Attitude impact on repurchase intention will be significantly greater for high loyalcustomers as opposed to low loyal customers.
3. Proposed Conceptual Model
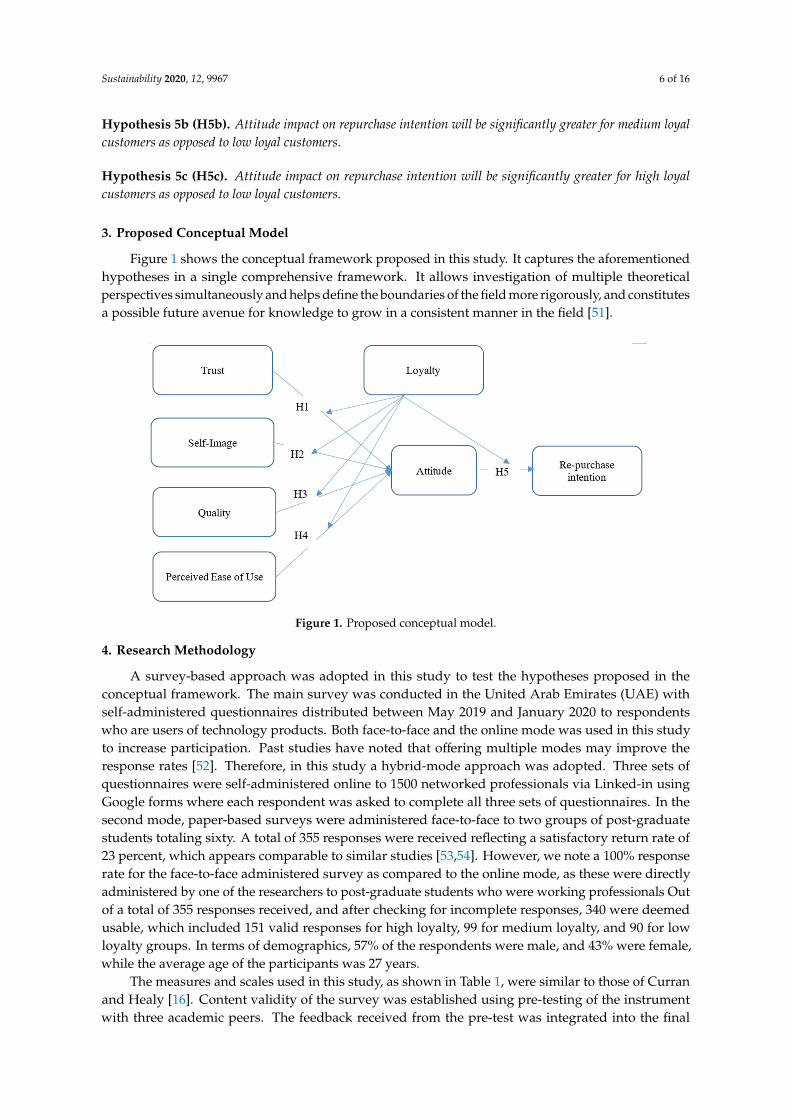
Figure 1 shows the conceptual framework proposed in this study. It captures the aforementionedhypotheses in a single comprehensive framework. It allows investigation of multiple theoreticalperspectives simultaneously and helps define the boundaries of the field more rigorously, and constitutesa possible future avenue for knowledge to grow in a consistent manner in the field [51].
Sustainability 2020, 12, x 6 of 16
3. Proposed Conceptual Model
Figure 1 shows the conceptual framework proposed in this study. It captures the aforementioned hypotheses in a single comprehensive framework. It allows investigation of multiple theoretical perspectives simultaneously and helps define the boundaries of the field more rigorously, and constitutes a possible future avenue for knowledge to grow in a consistent manner in the field [51].
Figure 1. Proposed conceptual model.
4. Research Methodology
A survey-based approach was adopted in this study to test the hypotheses proposed in the conceptual framework. The main survey was conducted in the United Arab Emirates (UAE) with self-administered questionnaires distributed between May 2019 and January 2020 to respondents who are users of technology products. Both face-to-face and the online mode was used in this study to increase participation. Past studies have noted that offering multiple modes may improve the response rates [52]. Therefore, in this study a hybrid-mode approach was adopted. Three sets of questionnaires were self-administered online to 1500 networked professionals via Linked-in using Google forms where each respondent was asked to complete all three sets of questionnaires. In the second mode, paper-based surveys were administered face-to-face to two groups of post-graduate students totaling sixty. A total of 355 responses were received reflecting a satisfactory return rate of 23 percent, which appears comparable to similar studies [53,54]. However, we note a 100% response rate for the face-to-face administered survey as compared to the online mode, as these were directly administered by one of the researchers to post-graduate students who were working professionals Out of a total of 355 responses received, and after checking for incomplete responses, 340 were deemed usable, which included 151 valid responses for high loyalty, 99 for medium loyalty, and 90 for low loyalty groups. In terms of demographics, 57% of the respondents were male, and 43% were female, while the average age of the participants was 27 years.
The measures and scales used in this study, as shown in Table 1, were similar to those of Curran and Healy [16]. Content validity of the survey was established using pre-testing of the instrument with three academic peers. The feedback received from the pre-test was integrated into the final questionnaire. A pilot-test was carried out prior to the main survey. This pilot-test helped us to evaluate the ease of respondents’ understanding of each item and their interpretation in addition to other aspects such as the average completion time.
Figure 1. Proposed conceptual model.
4. Research Methodology
A survey-based approach was adopted in this study to test the hypotheses proposed in theconceptual framework. The main survey was conducted in the United Arab Emirates (UAE) withself-administered questionnaires distributed between May 2019 and January 2020 to respondentswho are users of technology products. Both face-to-face and the online mode was used in this studyto increase participation. Past studies have noted that offering multiple modes may improve theresponse rates [52]. Therefore, in this study a hybrid-mode approach was adopted. Three sets ofquestionnaires were self-administered online to 1500 networked professionals via Linked-in usingGoogle forms where each respondent was asked to complete all three sets of questionnaires. In thesecond mode, paper-based surveys were administered face-to-face to two groups of post-graduatestudents totaling sixty. A total of 355 responses were received reflecting a satisfactory return rate of23 percent, which appears comparable to similar studies [53,54]. However, we note a 100% responserate for the face-to-face administered survey as compared to the online mode, as these were directlyadministered by one of the researchers to post-graduate students who were working professionals Outof a total of 355 responses received, and after checking for incomplete responses, 340 were deemedusable, which included 151 valid responses for high loyalty, 99 for medium loyalty, and 90 for lowloyalty groups. In terms of demographics, 57% of the respondents were male, and 43% were female,while the average age of the participants was 27 years.
The measures and scales used in this study, as shown in Table 1, were similar to those of Curranand Healy [16]. Content validity of the survey was established using pre-testing of the instrumentwith three academic peers. The feedback received from the pre-test was integrated into the final
Sustainability 2020, 12, 9967 7 of 16
questionnaire. A pilot-test was carried out prior to the main survey. This pilot-test helped us toevaluate the ease of respondents’ understanding of each item and their interpretation in addition toother aspects such as the average completion time.
Table 1. Survey variables and measures.
Variable Measure
Loyalty Highly Loyalty, Medium Loyalty, Low LoyaltyAttitude (1) I like the product that I have chosenAttitude (2) I feel good using the product that I have chosenAttitude (3) It is pleasant to use the product that I have chosen
Repurchase intentions I am likely to repurchase the product that I have chosenTrust I trust the product I have chosen
Self-image The product I have chosen expresses my personalityQuality The product I have chosen is of superior quality
Perceived ease of use The product I have chosen is easy to use/access
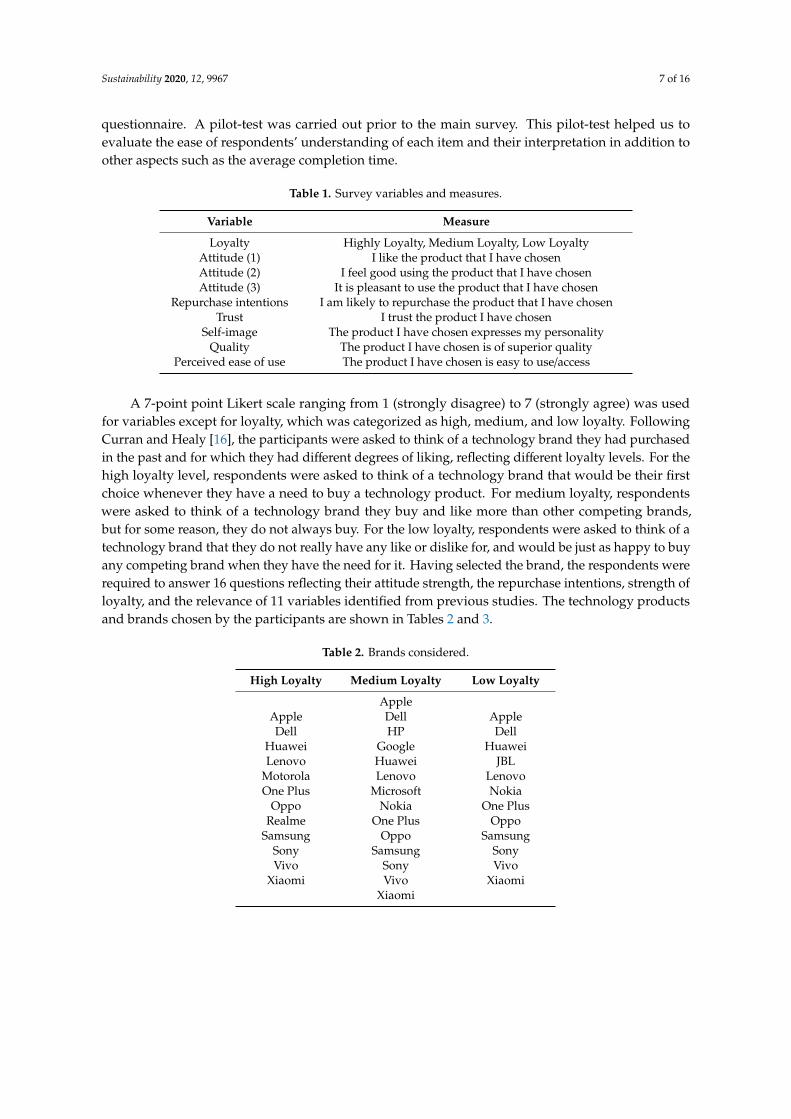
A 7-point point Likert scale ranging from 1 (strongly disagree) to 7 (strongly agree) was usedfor variables except for loyalty, which was categorized as high, medium, and low loyalty. FollowingCurran and Healy [16], the participants were asked to think of a technology brand they had purchasedin the past and for which they had different degrees of liking, reflecting different loyalty levels. For thehigh loyalty level, respondents were asked to think of a technology brand that would be their firstchoice whenever they have a need to buy a technology product. For medium loyalty, respondentswere asked to think of a technology brand they buy and like more than other competing brands,but for some reason, they do not always buy. For the low loyalty, respondents were asked to think of atechnology brand that they do not really have any like or dislike for, and would be just as happy to buyany competing brand when they have the need for it. Having selected the brand, the respondents wererequired to answer 16 questions reflecting their attitude strength, the repurchase intentions, strength ofloyalty, and the relevance of 11 variables identified from previous studies. The technology productsand brands chosen by the participants are shown in Tables 2 and 3.
Table 2. Brands considered.
High Loyalty Medium Loyalty Low Loyalty
AppleApple Dell AppleDell HP Dell
Huawei Google HuaweiLenovo Huawei JBL
Motorola Lenovo LenovoOne Plus Microsoft Nokia
Oppo Nokia One PlusRealme One Plus Oppo
Samsung Oppo SamsungSony Samsung SonyVivo Sony Vivo
Xiaomi Vivo XiaomiXiaomi
Sustainability 2020, 12, 9967 8 of 16
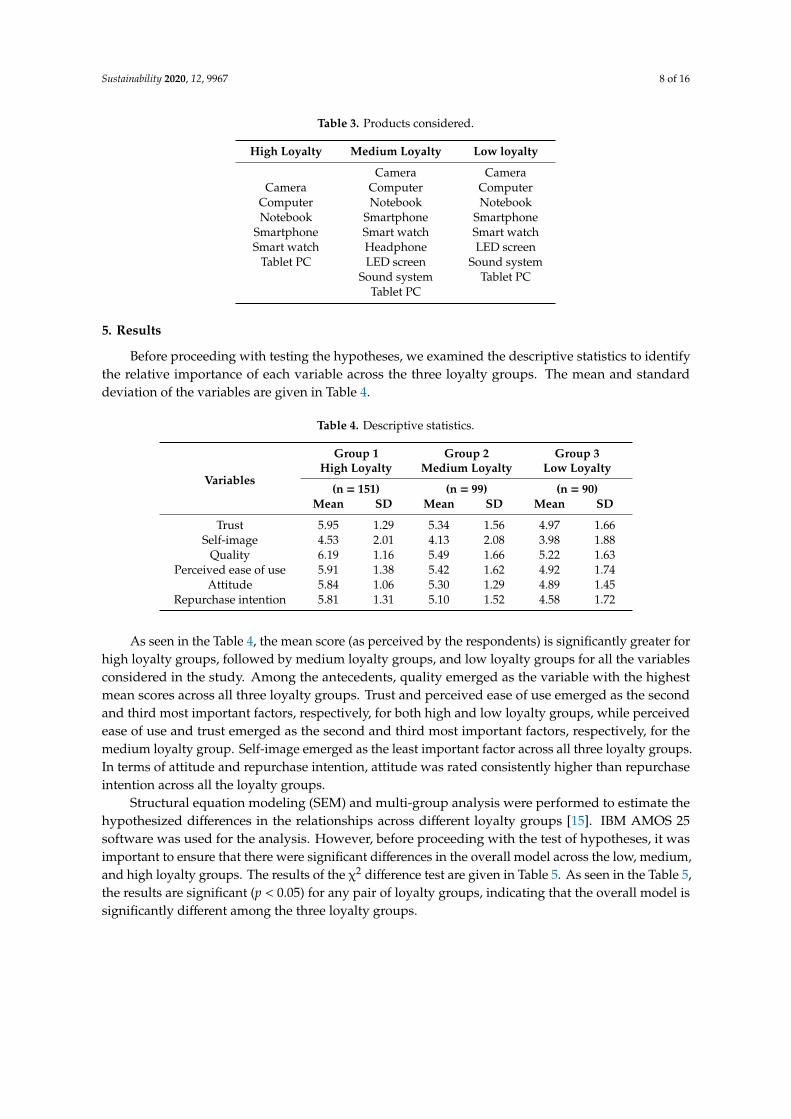
Table 3. Products considered.
High Loyalty Medium Loyalty Low loyalty
Camera CameraCamera Computer Computer
Computer Notebook NotebookNotebook Smartphone Smartphone
Smartphone Smart watch Smart watchSmart watch Headphone LED screen
Tablet PC LED screen Sound systemSound system Tablet PC
Tablet PC
5. Results
Before proceeding with testing the hypotheses, we examined the descriptive statistics to identifythe relative importance of each variable across the three loyalty groups. The mean and standarddeviation of the variables are given in Table 4.
Table 4. Descriptive statistics.
Variables
Group 1High Loyalty
Group 2Medium Loyalty
Group 3Low Loyalty
(n = 151) (n = 99) (n = 90)Mean SD Mean SD Mean SD
Trust 5.95 1.29 5.34 1.56 4.97 1.66Self-image 4.53 2.01 4.13 2.08 3.98 1.88
Quality 6.19 1.16 5.49 1.66 5.22 1.63Perceived ease of use 5.91 1.38 5.42 1.62 4.92 1.74
Attitude 5.84 1.06 5.30 1.29 4.89 1.45Repurchase intention 5.81 1.31 5.10 1.52 4.58 1.72
As seen in the Table 4, the mean score (as perceived by the respondents) is significantly greater forhigh loyalty groups, followed by medium loyalty groups, and low loyalty groups for all the variablesconsidered in the study. Among the antecedents, quality emerged as the variable with the highestmean scores across all three loyalty groups. Trust and perceived ease of use emerged as the secondand third most important factors, respectively, for both high and low loyalty groups, while perceivedease of use and trust emerged as the second and third most important factors, respectively, for themedium loyalty group. Self-image emerged as the least important factor across all three loyalty groups.In terms of attitude and repurchase intention, attitude was rated consistently higher than repurchaseintention across all the loyalty groups.
Structural equation modeling (SEM) and multi-group analysis were performed to estimate thehypothesized differences in the relationships across different loyalty groups [15]. IBM AMOS 25software was used for the analysis. However, before proceeding with the test of hypotheses, it wasimportant to ensure that there were significant differences in the overall model across the low, medium,and high loyalty groups. The results of the χ2 difference test are given in Table 5. As seen in the Table 5,the results are significant (p < 0.05) for any pair of loyalty groups, indicating that the overall model issignificantly different among the three loyalty groups.
Sustainability 2020, 12, 9967 9 of 16
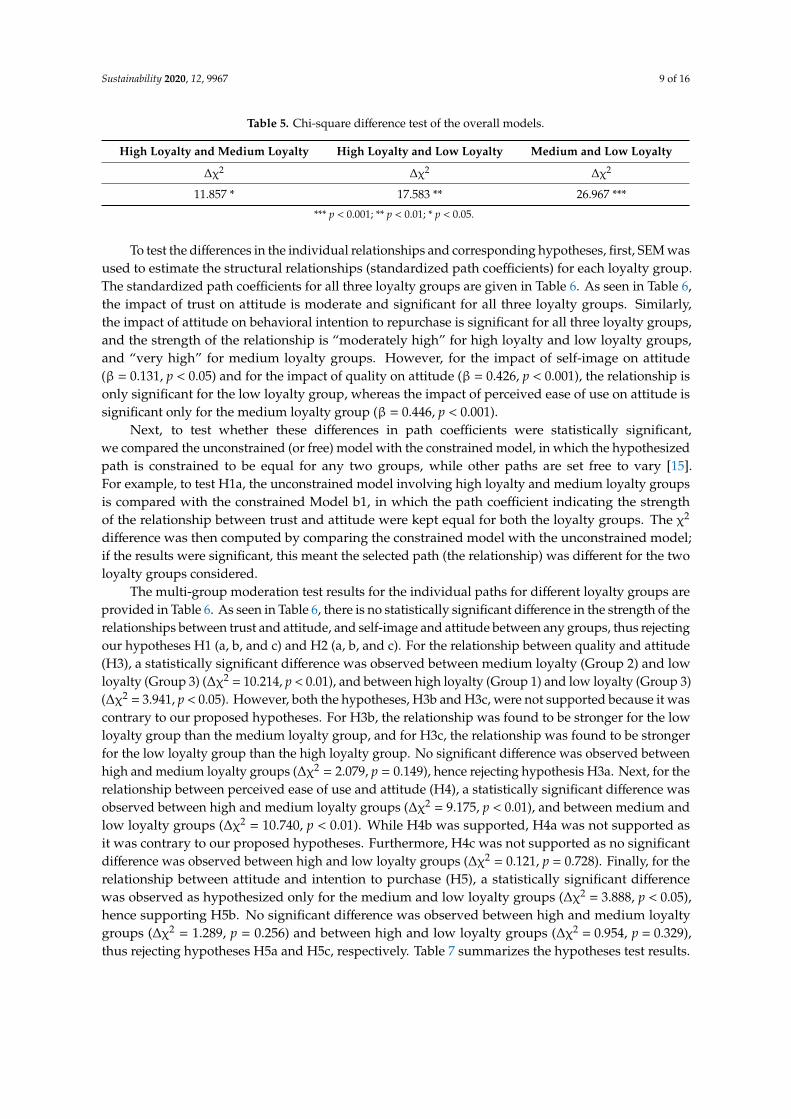
Table 5. Chi-square difference test of the overall models.
High Loyalty and Medium Loyalty High Loyalty and Low Loyalty Medium and Low Loyalty
∆χ2 ∆χ2 ∆χ2
11.857 * 17.583 ** 26.967 ***
*** p < 0.001; ** p < 0.01; * p < 0.05.
To test the differences in the individual relationships and corresponding hypotheses, first, SEM wasused to estimate the structural relationships (standardized path coefficients) for each loyalty group.The standardized path coefficients for all three loyalty groups are given in Table 6. As seen in Table 6,the impact of trust on attitude is moderate and significant for all three loyalty groups. Similarly,the impact of attitude on behavioral intention to repurchase is significant for all three loyalty groups,and the strength of the relationship is “moderately high” for high loyalty and low loyalty groups,and “very high” for medium loyalty groups. However, for the impact of self-image on attitude(β = 0.131, p < 0.05) and for the impact of quality on attitude (β = 0.426, p < 0.001), the relationship isonly significant for the low loyalty group, whereas the impact of perceived ease of use on attitude issignificant only for the medium loyalty group (β = 0.446, p < 0.001).
Next, to test whether these differences in path coefficients were statistically significant,we compared the unconstrained (or free) model with the constrained model, in which the hypothesizedpath is constrained to be equal for any two groups, while other paths are set free to vary [15].For example, to test H1a, the unconstrained model involving high loyalty and medium loyalty groupsis compared with the constrained Model b1, in which the path coefficient indicating the strengthof the relationship between trust and attitude were kept equal for both the loyalty groups. The χ2
difference was then computed by comparing the constrained model with the unconstrained model;if the results were significant, this meant the selected path (the relationship) was different for the twoloyalty groups considered.
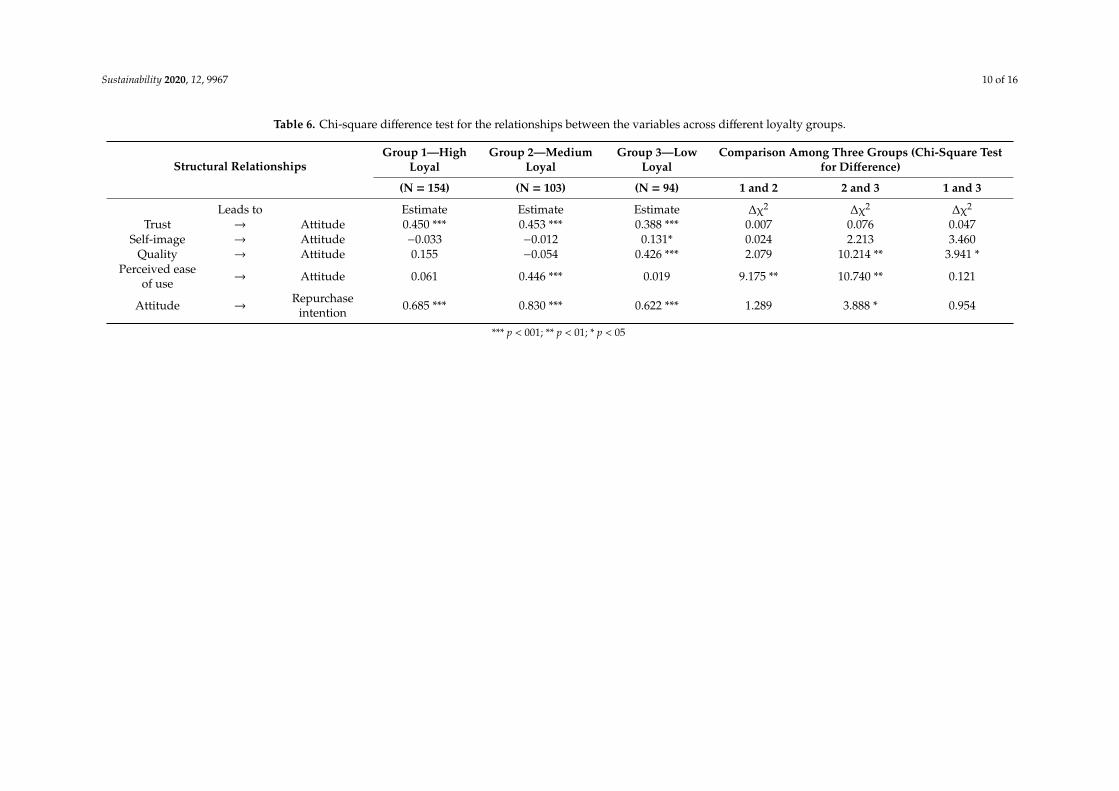
The multi-group moderation test results for the individual paths for different loyalty groups areprovided in Table 6. As seen in Table 6, there is no statistically significant difference in the strength of therelationships between trust and attitude, and self-image and attitude between any groups, thus rejectingour hypotheses H1 (a, b, and c) and H2 (a, b, and c). For the relationship between quality and attitude(H3), a statistically significant difference was observed between medium loyalty (Group 2) and lowloyalty (Group 3) (∆χ2 = 10.214, p < 0.01), and between high loyalty (Group 1) and low loyalty (Group 3)(∆χ2 = 3.941, p < 0.05). However, both the hypotheses, H3b and H3c, were not supported because it wascontrary to our proposed hypotheses. For H3b, the relationship was found to be stronger for the lowloyalty group than the medium loyalty group, and for H3c, the relationship was found to be strongerfor the low loyalty group than the high loyalty group. No significant difference was observed betweenhigh and medium loyalty groups (∆χ2 = 2.079, p = 0.149), hence rejecting hypothesis H3a. Next, for therelationship between perceived ease of use and attitude (H4), a statistically significant difference wasobserved between high and medium loyalty groups (∆χ2 = 9.175, p < 0.01), and between medium andlow loyalty groups (∆χ2 = 10.740, p < 0.01). While H4b was supported, H4a was not supported asit was contrary to our proposed hypotheses. Furthermore, H4c was not supported as no significantdifference was observed between high and low loyalty groups (∆χ2 = 0.121, p = 0.728). Finally, for therelationship between attitude and intention to purchase (H5), a statistically significant differencewas observed as hypothesized only for the medium and low loyalty groups (∆χ2 = 3.888, p < 0.05),hence supporting H5b. No significant difference was observed between high and medium loyaltygroups (∆χ2 = 1.289, p = 0.256) and between high and low loyalty groups (∆χ2 = 0.954, p = 0.329),thus rejecting hypotheses H5a and H5c, respectively. Table 7 summarizes the hypotheses test results.
Sustainability 2020, 12, 9967 10 of 16
Table 6. Chi-square difference test for the relationships between the variables across different loyalty groups.
Structural RelationshipsGroup 1—High
LoyalGroup 2—Medium
LoyalGroup 3—Low
LoyalComparison Among Three Groups (Chi-Square Test
for Difference)
(N = 154) (N = 103) (N = 94) 1 and 2 2 and 3 1 and 3
Leads to Estimate Estimate Estimate ∆χ2 ∆χ2 ∆χ2
Trust → Attitude 0.450 *** 0.453 *** 0.388 *** 0.007 0.076 0.047Self-image → Attitude −0.033 −0.012 0.131* 0.024 2.213 3.460
Quality → Attitude 0.155 −0.054 0.426 *** 2.079 10.214 ** 3.941 *Perceived ease
of use → Attitude 0.061 0.446 *** 0.019 9.175 ** 10.740 ** 0.121
Attitude →Repurchase
intention 0.685 *** 0.830 *** 0.622 *** 1.289 3.888 * 0.954
*** p < 001; ** p < 01; * p < 05
Sustainability 2020, 12, 9967 11 of 16
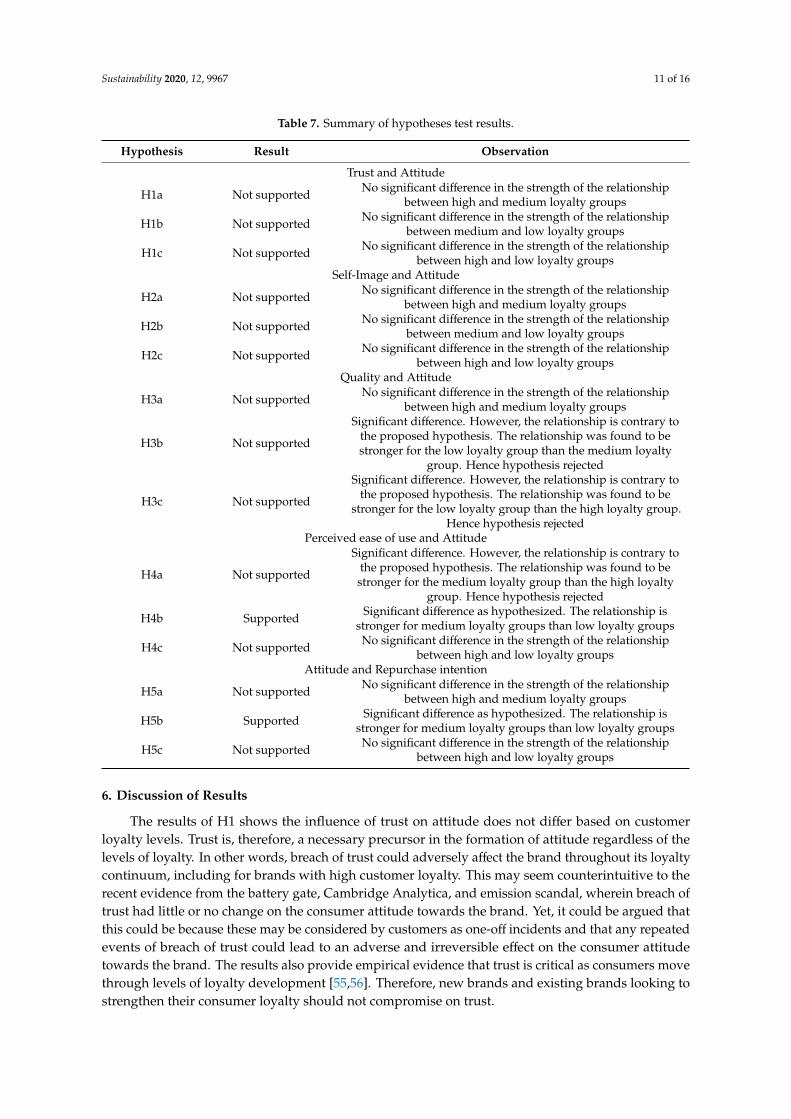
Table 7. Summary of hypotheses test results.
Hypothesis Result Observation
Trust and Attitude
H1a Not supported No significant difference in the strength of the relationshipbetween high and medium loyalty groups
H1b Not supported No significant difference in the strength of the relationshipbetween medium and low loyalty groups
H1c Not supported No significant difference in the strength of the relationshipbetween high and low loyalty groups
Self-Image and Attitude
H2a Not supported No significant difference in the strength of the relationshipbetween high and medium loyalty groups
H2b Not supported No significant difference in the strength of the relationshipbetween medium and low loyalty groups
H2c Not supported No significant difference in the strength of the relationshipbetween high and low loyalty groups
Quality and Attitude
H3a Not supported No significant difference in the strength of the relationshipbetween high and medium loyalty groups
H3b Not supported
Significant difference. However, the relationship is contrary tothe proposed hypothesis. The relationship was found to bestronger for the low loyalty group than the medium loyalty
group. Hence hypothesis rejected
H3c Not supported
Significant difference. However, the relationship is contrary tothe proposed hypothesis. The relationship was found to be
stronger for the low loyalty group than the high loyalty group.Hence hypothesis rejected
Perceived ease of use and Attitude
H4a Not supported
Significant difference. However, the relationship is contrary tothe proposed hypothesis. The relationship was found to bestronger for the medium loyalty group than the high loyalty
group. Hence hypothesis rejected
H4b Supported Significant difference as hypothesized. The relationship isstronger for medium loyalty groups than low loyalty groups
H4c Not supported No significant difference in the strength of the relationshipbetween high and low loyalty groups
Attitude and Repurchase intention
H5a Not supported No significant difference in the strength of the relationshipbetween high and medium loyalty groups
H5b Supported Significant difference as hypothesized. The relationship isstronger for medium loyalty groups than low loyalty groups
H5c Not supported No significant difference in the strength of the relationshipbetween high and low loyalty groups
6. Discussion of Results
The results of H1 shows the influence of trust on attitude does not differ based on customerloyalty levels. Trust is, therefore, a necessary precursor in the formation of attitude regardless of thelevels of loyalty. In other words, breach of trust could adversely affect the brand throughout its loyaltycontinuum, including for brands with high customer loyalty. This may seem counterintuitive to therecent evidence from the battery gate, Cambridge Analytica, and emission scandal, wherein breach oftrust had little or no change on the consumer attitude towards the brand. Yet, it could be argued thatthis could be because these may be considered by customers as one-off incidents and that any repeatedevents of breach of trust could lead to an adverse and irreversible effect on the consumer attitudetowards the brand. The results also provide empirical evidence that trust is critical as consumers movethrough levels of loyalty development [55,56]. Therefore, new brands and existing brands looking tostrengthen their consumer loyalty should not compromise on trust.
Sustainability 2020, 12, 9967 12 of 16
Similarly, to H1, the results of H2 show that the influence of self-image on attitude also does notdiffer across the three different levels of loyalty. Moreover, a very low (strength) and non-significantrelationship (except for low loyalty groups) show that customers appear not to lay much emphasis oncongruence of their self-image with the technology brands. The low but significant relationship forlow loyal customers may be because they indulge in purchases of products from superior brands togratify their self-image feelings. Overall, still, the lack of any meaningful influence of self-image onattitude across different loyalty groups could be because of the lack of novelty or symbolic benefit inthe technological products, which does not provide them with the motivation to express themselvesthrough the possession or adoption of technology products. This is not surprising given that technologybrands are increasingly offering less differentiated product offerings. Further, technological productsare replete with utilitarian benefits, which makes them be considered more as day-to-day productivitytools than something which allows one to express themselves. Moreover, in the context of this study,UAE is a country that enjoys high per capita income and where consumers have the opportunityto acquire the latest, best, and most luxurious products and/or services, which are construed moreas strong symbols for self-image congruence than technology products. For instance, possessing aLamborghini or a Mercedes G-class SUV with a unique number plate may be more of a status symbolthan an iPhone. Perhaps in the context of a different country, the results may be different and could bea part of future studies.
Unlike H1 and H2, the results of H3 show that the importance of quality for creating a positiveattitude towards the brand is more critical for brands with consumers in the lower levels of the loyaltyspectrum. For medium and high loyalty customer groups, quality was found to have no impact ontheir attitude towards the brand. This could be explained from the premises of perseverance bias,a tendency to cling to one’s initial belief even after receiving new information that contradicts ordisconfirms the basis of that belief [34]. This could well explain why a brand such as Samsung wasable to bounce back stronger even after a major quality setback with its Note7 smartphone becauseNote7 users had been Samsung’s most loyal users [19]. It also explains the actions of Netflix amid anincrease in demand during COVID-19 to lower the streaming quality of its content to its service inEurope to reduce the strain on internet service providers [57]. In sum, the findings show that variationin quality may not affect the attitude of their loyal customer base and that loyal customers provide asafety net in the case of any quality issue that arises.
The results of H4 also provide critical insights on the role of perceived ease of use on customerattitude towards the product or brand. The heterogeneity in the influence of perceived ease of use onconsumer attitudes across different loyalty levels shows that the result is not systemic as conceived inTAM. Contrary to our hypotheses, perceived ease of use was found to have a lower and non-significantinfluence on the attitude of high loyal customer segments and for low loyal customer segments.For brands looking to attract one time or impulsive buyers, perceived ease of use may not be a concern.For high loyal customer groups, perceived ease of use no longer influences their attitude because,by default, they expect it to be there. Like quality, this shows that even if the perceived ease of usegoes down for brands with a loyal customer base, for example, with the addition of new featuresor application or drastic change in form factor or layout in technology products/services, it may notaffect customer attitude that adversely. This could well explain why Instagram managed to keep andgrow its active users despite having undergone several updates and layout changes in recent years,which did not go well with their users. However, an interesting finding is a significant relationshipbetween perceived ease of use and attitude for medium loyalty customer groups. In other words,ease of use is critical for brands looking to strengthen their customer brand loyalty and maneuver theirmedium loyal customers towards greater loyalty. Such brands should invest more in making theirproducts more convenient and easier to use.
Finally, in the case of H5, while there was no surprise in the fact that consumer attitude positivelyimpacts repurchase intention in line with TAM, the interesting finding is that the strength of this
Sustainability 2020, 12, 9967 13 of 16
relationship is greater for medium loyal groups. In other words, brands with medium loyal customersare poised to gain more from a unit increase in attitude.
7. Implications and Conclusions
Business sustainability is adversely impacted by the dwindling number of customers due to theshifts in the spending behaviors, preferences, and new market dynamics in these pandemic times.Many established businesses have gone bankrupt and many more are teetering on the edge of theprecipice. Business sustainability resonates globally across all types of businesses, be it a multinationalcorporation or a small business, a private or public enterprise, it is the same everywhere and thesurvival of any business is inextricably linked to its customers and their loyalty to the brand.
The study examined the heterogeneity in the relationship between consumer attitudes,its antecedents, and repurchase intention across three different levels of loyalty (high, medium, and low)and found the levels of loyalty have a moderating impact on the relationships. The contributions of thisstudy are manifold. First, the study supports the increasing calls in the literature to empirically examinethe moderating impact of loyalty as opposed to its direct or mediating impact in consumer attitudeformation and subsequent repurchase intention [9,15,16] (. Given that none of the previous studieshave explored the moderating role of loyalty across these three different loyalty groups, the findings ofthis study are both novel and significant. It also complements other studies in the domain, such ascustomer loyalty and brand switching intention [5]. Further, given the fact that the brands consideredby the respondents are global brands, we believe the findings have generalizability beyond UAE.
Practitioners in the UAE and elsewhere could use the findings to better understand and managecustomer attitudes, and subsequent purchase/repurchase intention depending on the levels of loyaltydevelopment they may be in. The findings have great significance for marketers in devising strategiesfor converting low loyalty groups to high loyalty groups. For instance, trust is having a positiveimpact on attitude across all three loyalty groups and shows that firms should not compromise on trust.Marketers are, therefore, strongly advised to engage in trust-building measures both at a product andcompany level to reduce the likelihood of customers changing their strong trust beliefs into distrustand defection to other brands.
The results also shed insights for practitioners on the strategy that firms must take to maneuvertheir customers through the different levels of loyalty. For instance, with the exception of ease of use,all other antecedents (trust, self-image, and quality) are critical in developing a positive consumerattitude towards the product/brand among low loyalty groups. In the case of medium loyalty customersegments, the critical antecedents of attitude are trust and ease of use, whereas, in the case of highloyalty customer segments, trust is the main antecedent of attitude. Breach of trust of loyal customersas evidenced from the increasing number of scandals could be the reason why consumers are feelingless loyal to brands today, and why firms are losing loyal customers faster today to competition [13,14].
Firms could accordingly invest their time, money, and effort to change the levers (trust, quality,self-image, and ease of use) to achieve the desired attitudes towards the product/brand belongingto different customer loyalty segments. The study also shows that having a loyal customer base isstill a holy grail in today’s fast-changing, competitive, technology-driven world as it makes themimpervious to quality issues as well as issues related to ease of use. However, this also means thatbrands can exploit their high loyal customers, given their perseverance bias. For instance, loweringquality attributes, such as the speed of the product or service (e.g., Apple, Netflix), may not lowerconsumer attitude because loyal customer segments are likely to have developed a belief system (in linewith perseverance bias) that any events or happenings (positive or negative) that should affect thebelief system often result in little or no change in their attitude.
The study has some limitations. First, the data for this study was collected from both online andface-to-face participants. The difference in the mode of data collection could have an impact on theresults. Second, the data for this study was mostly gathered from UAE, a country that enjoys highper capita income and where consumers have the opportunity to acquire the latest, best, and most
Sustainability 2020, 12, 9967 14 of 16
luxurious products and/or services. A similar study conducted in a low-income country may haveyielded different results. Third, the sample size was relatively small, especially for medium andlow loyalty groups, again a concern for generalizability. Fourth, only four antecedents of customerattitude were considered in this study. Finally, the study was conducted for technology products andnot services. Future studies could, therefore, expand the framework to include more antecedents ofconsumer attitude. Furthermore, future studies could use the study framework and design to test themoderating effects of loyalty using a large-scale study in other countries as well for non-technologyproducts. Further, future studies could adapt and apply the framework to understand the moderatingimpact of brand loyalty on technology services such as internet services, mobile applications, etc.
Despite the limitations, we believe our approach and findings can encourage additional researchinto understanding consumer perceptions, attitudes, and behavioral intention across different loyaltygroups and contribute towards the theoretical advancement of brand loyalty literature.
Author Contributions: Conceptualization, S.R.; methodology, S.R.; software, Sreejith Balasubramanian; validation,S.B.; formal analysis, S.B.; writing-original draft preparation, S.R.; writing-review & editing, S.R., S.B.; All authorshave read and agreed to the published version of the manuscript.
Funding: This research received no external funding.
Acknowledgments: Grateful acknowledgement is made to Professor Abdullah Abonamah, Abu Dhabi School ofManagement, for his valuable suggestions, and to Dr. Muhammad U. Tariq, Abu Dhabi School of Management forhis support to this project.
Conflicts of Interest: The authors declare no conflict of interest.
References
1. Financial Times. Sustainable Businesses Should Be ‘Long-Term Greedy’. 2018. Available online: https://www.ft.com/content/bd30c5ec-20a9--11e9-a46f-08f9738d6b2b (accessed on 28 July 2020).
2. Kiatkawsin, K.; Sutherland, I. Examining Luxury Restaurant Dining Experience Towards SustainableReputation of the Michelin Restaurant Guide. Sustainability 2020, 12, 2134. [CrossRef]
3. Majerova, J.; Sroka, W.; Krizanova, A.; Gajanova, L.; Lazaroiu, G.; Nadanyiova, M. Sustainable BrandManagement of Alimentary Goods. Sustainability 2020, 12, 556. [CrossRef]
4. Wang, Y.; Chowdhury Ahmed, S.; Deng, S.; Wang, H. Success of Social Media Marketing Efforts in RetainingSustainable Online Consumers: An Empirical Analysis on the Online Fashion Retail Market. Sustainability2019, 11, 3596. [CrossRef]
5. Zhang, X.; Ding, X.; Ma, L.; Wang, G. Identifying Factors Preventing Sustainable Brand Loyalty amongConsumers: A Mixed Methods Approach. Sustainability 2018, 10, 4685. [CrossRef]
6. Kandampully, J.; Duddy, R. Competitive Advantage Through Anticipation, Innovation and Relationships.Manag. Decis. 1999, 37, 51–56. [CrossRef]
7. Arslan, I.K. The Importance of Creating Customer Loyalty in Achieving Sustainable Competitive Advantage.Eurasian J. Bus. Manag. 2020, 8, 11–20. [CrossRef]
8. Jacoby, J. Brand Loyalty: A Conceptual Definition. In Proceedings of the American Psychological Association,Montreal, QC, Canada, 3–7 September 1971; Volume 6, pp. 655–656.
9. Kim, D.; Lee, S.Y.; Bu, K.; Lee, S. Do VIP Programs Always Work Well? The Moderating Role of Loyalty.Psychol. Mark. 2009, 26, 590–609. [CrossRef]
10. Krishnamurthi, L.; Raj, S.P. An Empirical Analysis of the Relationship between Brand Loyalty and ConsumerPrice Elasticity. Mark. Sci. 1991, 10, 172–183. [CrossRef]
11. Reicheld, F.F. Loyalty and the Renaissance of Marketing. Mark. Manag. 1994, 2, 10–21.12. Reicheld, F.F.; Markey, R.G.; Hopton, C. The Loyalty Effect—The Relationship between Loyalty and Profits.
Eur. Bus. J. 2000, 12, 134–139.13. Kumar, V.; Bhagwat, Y. Regaining Lost Customers: The Predictive Power of First-Lifetime Behavior,
the Reason for Defection, and the Nature of the Win-Back Offer. J. Mark. 2015, 79, 34–55. [CrossRef]14. DMA. How to Win Trust and Loyalty. Data and Marketing Association. 2018. Available online: https:
//dma.org.uk/uploads/misc/customer-engagment---loyalty-report-26.pdf (accessed on 13 August 2020).
Sustainability 2020, 12, 9967 15 of 16
15. Lee, J.S.; Back, K.J. An Examination of Attendee Brand Loyalty: Understanding the Moderator of BehavioralBrand Loyalty. J. Hosp. Tour. Res. 2009, 33, 30–50. [CrossRef]
16. Curran, J.M.; Healy, B.C. The Loyalty Continuum: Differentiating between Stages of Loyalty Development.J. Mark. Theory Pract. 2014, 22, 367–384. [CrossRef]
17. Business Insider. Apple Will Pay Up to $500 Million to End a Lawsuit Claiming It Intentionally SlowedDown iPhones. 2020. Available online: https://www.businessinsider.com/apple-batterygate-500m-lawsuit-settlement-2017-iphone-intentional-slowdown-2020--3 (accessed on 13 August 2020).
18. BBC. Volkswagen: The Scandal Explained. 2015. Available online: https://www.bbc.com/news/business-34324772 (accessed on 13 August 2020).
19. The Washington Post. How Samsung Moved Beyond Its Exploding Phones. 2018. Available online:https://www.washingtonpost.com/business/how-samsung-moved-beyond-its-exploding-phones/2018/02/
23/5675632c-182f-11e8-b681--2d4d462a1921_story.html (accessed on 20 August 2020).20. Digital Information World. Again Another Layout Change: Instagram Users Are Not in the Favor of New
Update. 2019. Available online: https://www.digitalinformationworld.com/2019/06/instagram-new-layout-users-reaction.html (accessed on 18 August 2020).
21. Statista. Number of Monthly Active Instagram Users from January 2013 to June 2018. 2019. Available online:https://www.statista.com/statistics/253577/number-of-monthly-active-instagram-users/ (accessed on26 July 2020).
22. Marketing Week. Brands Are Losing Out on £774bn by Failing to Bridge the ‘Self-Esteem Gap’. 2018.Available online: https://www.marketingweek.com/brands-losing-out-failing-to-bridge-self-esteem-gap/
(accessed on 28 July 2020).23. Forbes. A Racially Insensitive Product Photo Just Cost H&M a Major Celebrity Partner. 2018. Available online:
https://www.forbes.com/sites/nicolafumo/2018/01/08/a-racially-insensitive-product-photo-just-cost-hm-a-major-celebrity-partner/#22c30d607fb3 (accessed on 20 August 2020).
24. EurWeb. H&M’s Profits Plunge Following Racist ‘Coolest Monkey’ Hoodie Ad. 2018. Available online: https://eurweb.com/2018/04/01/hms-profits-plunge-following-racist-coolest-monkey-hoodie-ad/ (accessed on30 July 2020).
25. Statista. Sales of the H&M Group Worldwide from 2007 to 2019 (in Million U.S. Dollars). 2020.Available online: https://www.statista.com/statistics/252190/gross-sales-of-the-h-und-m-group-worldwide/
(accessed on 26 July 2020).26. Pavlou, P.A. Consumer Acceptance of Electronic Commerce: Integrating Trust and Risk with the Technology
Acceptance Model. Int. J. Electron. Commer. 2003, 7, 101–134.27. Johar, M.G.M.; Awalluddin, J.A.A. The Role of Technology Acceptance Model in Explaining Effect on
e-Commerce Application System. Int. J. Manag. Inf. Technol. 2011, 3, 1–14. [CrossRef]28. Shukla, A.; Sharma, S.K. Evaluating Consumers’ Adoption of Mobile Technology for Grocery Shopping:
An Application of Technology Acceptance Model. Vision 2018, 22, 185–198. [CrossRef]29. Chen, L.D.; Tan, J. Technology Adaptation in e-Commerce: Key Determinants of Virtual Stores Acceptance.
Eur. Manag. J. 2004, 22, 74–86. [CrossRef]30. Singh, D.P. Integration of TAM, TPB, and Self-Image to Study Online Purchase Intentions in an Emerging
Economy. Int. J. Online Mark. 2015, 5, 20–37. [CrossRef]31. Wu, K.; Zhao, Y.; Zhu, Q.; Tan, X.; Zheng, H. A Meta-Analysis of the Impact of Trust on Technology
Acceptance Model: Investigation of Moderating Influence of Subject and Context Type. Int. J. Inf. Manag.2011, 31, 572–581. [CrossRef]
32. Sirdeshmukh, D.; Singh, J.; Sabol, B. Consumer Trust, Value, and Loyalty in Relational Exchanges. J. Mark.2002, 66, 15–37. [CrossRef]
33. Albarracin, D.; Johnson, B.T.; Zanna, M.P. (Eds.) The Handbook of Attitudes; Lawrence Erlbaum Associates:Mahwah, NJ, USA; London, UK, 2005.
34. Anderson, C.A.; New, B.L.; Speer, J.R. Argument Availability as a Mediator of Social Theory Perseverance.Soc. Cogn. 1985, 3, 235–249. [CrossRef]
35. Cvetkovich, G.; Siegrist, M.; Murray, R.; Tragesser, S. New Information and Social Trust: Asymmetry andPerseverance of Attributions About Hazard Managers. Risk Anal. 2002, 22, 359–367. [CrossRef] [PubMed]
36. Bailey, J.A. Self-Image, Self-Concept and Self-Identity Revisited. J. Natl. Med Assoc. 2003, 95, 383–386.[PubMed]
Sustainability 2020, 12, 9967 16 of 16
37. Schenk, C.T.; Holman, R.H. A Sociological Approach to Brand Choice: The Concept of Situational Self Image.Adv. Consum. Res. 1980, 7, 610–614.
38. Kressmann, F.; Sirgy, M.J.; Herrmann, A.; Huber, F.; Huber, S.; Lee, D.J. Direct and Indirect Effects ofSelf-Image Congruence on Brand Loyalty. J. Bus. Res. 2006, 59, 955–964. [CrossRef]
39. Liu, F.; Li, J.; Mizerski, D.; Soh, H. Self-Congruity, Brand Attitude, and Brand Loyalty: A Study on LuxuryBrands. Eur. J. Mark. 2012, 46, 922–937. [CrossRef]
40. Premayani, W.W.; Ayu, I.G.; Giantari, K.; Kerti, N.N. The Effect of Self Image Congruity and FunctionalCongruity to Attitudes and Repurchase Intention. IOSR J. Bus. Manag. 2018, 20, 8–11.
41. Dolich, I.J. Congruence Relationships between Self Images and Product Brands. J. Mark. Res. 1969, 6, 80–84.[CrossRef]
42. Abdul-Rahman, M.; Kamarulzaman, Y. The Influence of Relationship Quality and Switching Costs onCustomer Loyalty in the Malaysian Hotel Industry. Procedia Soc. Behav. Sci. 2012, 62, 1023–1027. [CrossRef]
43. Jacobson, R.; Aaker, D.A. The Strategic Role of Product Quality. J. Mark. 1987, 51, 31–44. [CrossRef]44. Zeithaml, V.A.; Berry, L.L.; Parasuraman, A. The Behavioral Consequences of Service Quality. J. Mark. 1996,
60, 31–46. [CrossRef]45. Obermiller, C.; Wheatley, J.J. Price Effects on Choice and Perceptions Under Varying Conditions of Experience,
Information, and Beliefs in Quality. Adv. Consum. Res. 1984, 11, 453–458.46. Karahanna, E.; Straub, D.W. The Psychological Origins of Perceived Usefulness and Ease-of-Use. Inf. Manag.
1999, 35, 237–250. [CrossRef]47. Bloemer, J.M.M.; De Ruyter, K. Customer Loyalty in High and Low Involvement Service Settings:
The Moderating Impact of Positive Emotions. J. Mark. Manag. 1999, 15, 315–330. [CrossRef]48. Oliva, T.A.; Oliver, R.L.; Bearden, W.O. The Relationships among Consumer Satisfaction, Involvement,
and Product Performance: A Catastrophe Theory Application. Behav. Sci. 1995, 40, 104–132. [CrossRef]49. Seiders, K.; Voss, G.B.; Grewal, D.; Godfrey, A.L. Do Satisfied Customers Buy More? Examining Moderating
Influences in a Retailing Context. J. Mark. 2005, 69, 26–43. [CrossRef]50. Cohen, J.B.; Houston, M.J. Cognitive Consequences of Brand Loyalty. J. Mark. Res. 1972, 9, 97–99. [CrossRef]51. Balasubramanian, S.; Shukla, V. Green Supply Chain Management: An Empirical Investigation on the
Construction Sector. Supply Chain Manag. Int. J. 2017, 22, 58–81. [CrossRef]52. Medway, R.L.; Fulton, J. When More Gets You Less: A Meta-Analysis of the Effect of Concurrent Web Options
on Mail Survey Response Rates. Public Opin. Q. 2012, 76, 733–746. [CrossRef]53. Hunt, S.D.; Chonko, L.B. Advertising Education and Successful Advertising Careers: Are They Related?
J. Advert. Res. 1987, 27, 43–51.54. Powers, T.L.; Bendall Valentine, D. Response Quality in Consumer Satisfaction Research. J. Consum. Mark.
2009, 26, 232–240. [CrossRef]55. Dick, A.S.; Basu, K. Customer Loyalty: Toward an Integrated Conceptual Framework. J. Acad. Mark. Sci.
1994, 22, 99–113. [CrossRef]56. Oliver, R.L. Whence Consumer Loyalty? J. Mark. 1999, 63, 33–44. [CrossRef]57. BBC. Netflix to Cut Streaming Quality in Europe for 30 Days. 2020. Available online: https://www.bbc.com/
news/technology-51968302 (accessed on 16 August 2020).
Publisher’s Note: MDPI stays neutral with regard to jurisdictional claims in published maps and institutionalaffiliations.
© 2020 by the authors. Licensee MDPI, Basel, Switzerland. This article is an open accessarticle distributed under the terms and conditions of the Creative Commons Attribution(CC BY) license (http://creativecommons.org/licenses/by/4.0/).