Embed Size (px)
Citation preview
The role of Loyalty in Private label Consumer based Brand Equity
João Tavares Fernando
Dissertation submitted as partial requirement for the conferral of
Master’s in Marketing
Supervisor:
Prof. Mónica Mendes Ferreira, ISCTE Business School,
Marketing, Operations and General Management Department
September 2019
The
role
of
Loya
lty
in P
riva
te la
bel
Co
nsu
mer
bas
ed B
ran
d E
qu
ity
João
Tav
are
s Fe
rnan
do
The role of Loyalty in Private label Consumer based Brand Equity
II
Abstract
Private label products have become so appealing that not even big retail chains can dismiss them.
Initially seen as cheap alternatives, they now compete with premium national brand products, since
consumers perceive them as legitimate and trustworthy brands. It’s imperative that brand equity
dimensions are seen through the light of private labels. The main focus of this thesis is to better
understand the relationship between private label loyalty and consumer based brand equity,
improving and applying previous scales and frameworks to a new universe. This framework relates
the different dimensions of brand equity with brand equity itself, also looking at the hierarchical
relationship between them. It takes into account the brand equity dimensions derived from private
label brand research and their influence on the brand equity based dimensions. Regarding
conclusions, in order to increase brand awareness, retailers should invest in strategies such as store
taste tests, comparisons with other brands, samples or coupons, or invest in extrinsic cues like
package design, labeling and branding strategies. Low product risk is essential to foster product
quality, reliability and consistency. Only a risk-free product will be able to grow, allowing it to
become a familiar item in the consumer’s basket. The most relevant factors in influencing the
purchase of private label goods are brand familiarity, perceived value and perceived risk of goods.
In the end, it’s seen the influence that perceived value has on the whole process, impacting private
label antecedents, CBBE antecedents and brand loyalty itself.
Keywords: retail, private labels, brand equity, brand loyalty.
JEL Classification System:
M30: General Marketing
M31: Marketing
The role of Loyalty in Private label Consumer based Brand Equity
III
Resumo
Produtos de marca branca tornaram-se tão apelativos que nem mesmo as grandes cadeias de
retalhistas os podem ignorar. Inicialmente vistos como alternativas baratas, agora competem com
produtos de marca de fabricante, dado que são vistos pelo consumidor como marcas legítimas e
de confiança. É imperativo que as dimensões de brand equity sejam vistas através da posição das
marcas brancas. O principal foco desta tese é compreender melhor a relação entre produtos de
marca branca e brand equity, melhorando e aplicando as escalas e frameworks existentes a um
novo universo. Este framework relaciona as diferentes dimensões de brand equity consigo mesma,
olhando também para a sua relação hierárquica. Tem em conta as dimensões de brand equity de
produtos de marca branca e a sua influência em dimensões de brand equity. Relativamente a
conclusões, para aumentar brand awareness, os retalhistas devem investirr em estratégias como
provas em loja, comparação com outras marcas, amostras e cupões, ou investiver em sinais
extrinsicos como embalagem, rótulo, estratégias de gestão de marca. Produtos de baixo risco são
essenciais para fomentar qualidade, confiança e consistência. Apenas um produto de baixo risco
poderá crescer e tornar-se familiar para o consumidor. Os factores mais relevantes para influenciar
a compra de produtos de marca branca são a familiaridade da marca, o “valor” e o risco desses
produtos. No final, é vista a influência que o “valor” do produto tem em todo o processo, tendo
impacto nos antecedentes de marca branca, nos antecedentes de brand equity e na lealdade em si.
Palavras-chave: retalho, marcas brancas, brand equity, lealdade.
Classificação JEL:
M30: Marketing Geral
M31: Marketing

The role of Loyalty in Private label Consumer based Brand Equity
IV
Acknowledgements
First of all, I would like to extend my gratitute to my thesis supervisor, Professor Mónica Ferreira,
for always being at my side through this challenging journey. Always helpful and ready to lend a
hand, armed with a very pratical mindset that made discussion and thesis construction a much
easier endeavour. Without your advice and encouragement, this uphill battle would have taken a
much bigger toll on my mindset and stamina, and the final product, which owes much to your
knowledge, would have been way, way inferior in terms of quality.
To my family, for putting up with me for the whole time, for trying to understand and help on the
topic at hands, for pulling me up from my worse days, and for being there and believing in me and
in my skills every single day.
To my colleagues and superiors at Unilever, for being extremely understanding of my situation
and extremely flexible when it came to any of my thesis related issues.
To Pedro, for being my “thesis buddy”, and for playing a pivotal role in its development, always
ready to discuss the intricacies of both my topic and the general requirements of the dissertation.
To all my masters colleagues and friends, who made this journey bearable, and were always ready
to share insight on their works and methods.
To Duarte, for literally saving my thesis, and for the best two months of my life.
To every single other friend, be it the Magic people, the bachelors people, the high school people
and everyone else in between, for being there the whole time, and making my life more colorful,
every single day.
Last but not least, I’m thankful to every person who answered my questionnaire, as well as those
who shared and helped spread this work. This theses, wouldn’t have, literally, been possible
without their time and effort
The role of Loyalty in Private label Consumer based Brand Equity
I
Table of contents
1. Introduction .............................................................................................................................................. 1
1.1. Theme ................................................................................................................................................ 1
1.2. Research problematic ........................................................................................................................ 2
1.3. Objectives........................................................................................................................................... 3
1.4. Structure ............................................................................................................................................ 3
2. Inside the brand and the store ................................................................................................................. 5
2.1. The brand ........................................................................................................................................... 5
2.2. The private label ................................................................................................................................ 6
2.3. Standard private label, Economy private label and Premium private label ...................................... 8
2.4. Retail ................................................................................................................................................ 12
2.5. Hard discount ................................................................................................................................... 15
2.6. Pricing strategies .............................................................................................................................. 16
2.7. The buyer decision process .............................................................................................................. 19
3.Private label relationships........................................................................................................................ 21
3.1. PL and loyalty ................................................................................................................................... 21
3.2. PL against HD ................................................................................................................................... 26
4. Consumer based brand equity ................................................................................................................ 33
4.1 Antecedents of CBBE......................................................................................................................... 35
4.2. CBBE scales and loyalty .................................................................................................................... 36
5. Framework .............................................................................................................................................. 39
6. Hypothesis ............................................................................................................................................... 41
7. Methodology ........................................................................................................................................... 44
8. Statistical analysis ................................................................................................................................... 46
8.1. Demographics and descriptives ....................................................................................................... 46
8.2. Reliability and Validity ...................................................................................................................... 48
8.3. Hypothesis testing ............................................................................................................................ 50
8.3.1. H1. CBBE based dimensions positively influence brand loyalty. .............................................. 52
8.3.2. H2. Private label based CBBE positively influence CBBE based dimensions. ............................ 53
8.3.3. H3. Private label based CBBE positively influence brand loyalty. ............................................. 56
8.4. Summary .......................................................................................................................................... 57
The role of Loyalty in Private label Consumer based Brand Equity
II
9. Conclusion ............................................................................................................................................... 58
9.1. Brand equity antecedents and loyalty ............................................................................................. 59
9.2. Private label antecedents and Brand equity antecedents ............................................................... 61
9.3. Private label antecedents and loyalty .............................................................................................. 62
9.4. Academic and managerial implications ........................................................................................... 65
9.5. Limitations and future research ....................................................................................................... 66
10. Bibliography .......................................................................................................................................... 68
11. Appendixes ............................................................................................................................................ 74
Appendix 1. Original questionnaire ........................................................................................................ 74
Appendix 2. Portuguese questionnaire .................................................................................................. 75
Appendix 3. Education*Age crosstabulation .......................................................................................... 77
Appendix 4. Education*Gender crosstabulation .................................................................................... 78
Appendix 5. Retailer*Family crosstabulation ......................................................................................... 79
Appendix 6. Retailer*Wage crosstabulation .......................................................................................... 80
Appendix 7. Descriptive statistics ........................................................................................................... 81
Appendix 8. Frequency tables ................................................................................................................. 81
Appendix 9. Cronbach’s Alpha ................................................................................................................ 84
Appendix 10. KMO and Bartlett’s test .................................................................................................... 85
Appendix 11. PCA Total variance explained ........................................................................................... 87
Appendix 12. Perceived risk rotated component matrix ........................................................................ 90
Appendix 13. Component matrix ............................................................................................................ 91
Appendix 14. H1 Brand loyalty regression .............................................................................................. 96
Appendix 15. H2 Brand associations regression ..................................................................................... 97
Appendix 16. H2 Brand awareness regression ....................................................................................... 98
Appendix 17. H2 Perceived quality regression ....................................................................................... 99
Appendix 18. H3 Brand loyalty regression ............................................................................................ 100

The role of Loyalty in Private label Consumer based Brand Equity
III
List of tables
Table 1. Brand equity definitions ................................................................................................................ 34
Table 2. Hypothesis outcomes .................................................................................................................... 58

The role of Loyalty in Private label Consumer based Brand Equity
IV
List of figures
Figure 1. Antecedents of Brand Equity ....................................................................................................... 41
Figure 2. Proposed Hypothesis ................................................................................................................... 43

The role of Loyalty in Private label Consumer based Brand Equity
1
1. Introduction
The main focus of this thesis will be to better understand the relationship between loyalty and
consumer based brand equity (CBBE). Special attention will be given to private label products,
picking up where previous studies left, and applying, as well as improving, previous scales and
materials to a new and different universe.
1.1. Theme
The modern day consumer is constantly bombarded with an avalanche of products, options and
alternatives. While having a vast portfolio from where to shop from might appeal to some, there
is an increasing wave of consumers that want the exact opposite, a reduced portfolio focused on
the most essential of products (Vroegrijk, Gijsbrechts & Campo, 2016). Enter the hard discounters;
retail outlets with a vastly reduced portfolio, which offer mostly private label products and are,
generally, cheaper than the competition.
While initially one might think that these outlets are merely inferior alternatives to normal
supermarkets, being associated with cheaper knock offs of branded products, the truth is that
consumers are adapting and warming up to this type of store, trusting more and more in these
entities and the private label products they offer, as seen by the superior growth of private label
brands (Grande Consumo, 2019).
Private label products became so appealing that not even big retail chains could dismiss them.
What initially started as cheap alternatives and basic copies, now competes with premium national
brand products. While previously, regular supermarkets competed against each other mostly on a
price level, including daily and weekly sales and promotions, and competed against hard
discounters by taunting higher quality products; they now compete on a product differentiation
and quality level against both normal competitors and hard discounters, based on the portfolio of
private label delivered (Hipersuper, 2019).
The role of Loyalty in Private label Consumer based Brand Equity
2
1.2. Research problematic
Supermarkets have been around for almost 100 years now, and are an integral part of day to day
modern life. While initially focused around brands and national label, the playing field would show
itself as not being welcoming to different types of products. It would take until late 80s for private
labels to ditch their “not so appealing” past, changing from nasty cheap items, to solid cheap
alternatives (Kumar & Steenkamp, 2007). A new type of private label product also saw an increase
in sales, this new product would still be affordable, but instead of positioning itself as the “poor
man’s alternative” it positioned itself as a standard equivalent to the regular national brands.
Recently, another new type of private label product has been having success, the premium private
label. This type of product no longer competes at a price level, instead focusing on defining
characteristic and differentiation (Kumar & Steenkamp, 2007).
When talking about private label products one mustn’t miss to speak about the giant sized elephant
in the room: hard discounters like Aldi and Lidl. These retail giants compete on a different category
of their own, since they are different enough from regular super and hypermarkets. The main
difference comes in the limited variety of products they carry, 1,000 to 1,500 stock keeping units
(SKU) (a U.S. supermarket sells 30,000, on average), and the fact that most of these products are
private label. The combination of below average prices, as well as mostly offering “unknown”
brands, may lead to the consumers associating these retail players with cheap and poor quality
products and services (Baltas & Argouslidis, 2007).
However, when asking shoppers why they haven’t tried hard discounters yet, the main reasons
received where mostly unawareness and lack of presence (Knudson & Vu, 2017).
It’s foolish to assume and relegate private label products as mere cheap knockoffs of popular
known brands, bought only by cash constrained customers. On average, shoppers of all types have
a favorable perception of private labels. It was found that 85% of all shoppers are open to private-
label products—with more than half of them saying private labels are as good as, or have even
better quality than, national brands (Knudson & Vu, 2017). Customers these days aren’t “won” on
price positioning alone, with many often citing quality as a major moving force.

The role of Loyalty in Private label Consumer based Brand Equity
3
The combination of these topics and with private label on the rise, with more and more robust and
dynamic product portfolios, sets the stage and opens discussion for the analysis of the relationship
between private brands and loyalty, seeing as the latter is a major component of brand equity. The
answers to this question pose a great advantage when competing with other retailers, seeing as
they allow for better customization to customer needs.
1.3. Objectives
The main objective of this dissertation is to delve further into how private label products are able
to create consumer based brand equity, particularly, into how loyalty, both to the product itself and
to the retailer that sells it, affects the creation of said brand equity. While there is ample literature
focused on how brands create brand equity, as well as their antecedents and their role both as
influencers and mediators, seeing as this is already a hot discussion topic of much interest, of
relevance to both companies and researchers alike, there is still much to unveil when it comes to
dealing with private labels specifically.
Following recent breakthroughs in academia, namely the proposal and consequential discovery
that not all of CBBE antecedents have the same weight and influence, as well as the creation and
application of a new set of antecedents rooted specifically in private label brand theory, paired
with the recent growth in attention and relevancy of private label products, and the retailers that
sell them, sets the stage for an in-depth dive into the world of private label goods, where they
started and where they are headed, and into how different antecedents and components influence
them.
1.4. Structure
This work starts with a general introduction on the topics that will be covered, providing some
explanations on where the latest research developed stands, as well as shedding some light into the
theme at hand, private label and brand equity, and how it will be approached.
The following chapters, Inside the brand and the store, Private label relationships and Consumer
based brand equity, together form the literature review section, which focuses on providing a basis
for theory to be built upon. These sections are essential to the current work, seeing as they provide
crucial information necessary for familiarization with the topic at hands. They will cover all of the

The role of Loyalty in Private label Consumer based Brand Equity
4
concepts related to loyalty, private labels and brand equity; starting with some nuances over the
concept of brand and its evolution, different types of private labels and how retail and physical
spaces have changed and adapted over the years. Greater focus is then spent on private label and
its relationships, with a section on consumer based brand equity and how it unfolds itself over its
different antecedents and product labels.
Having explored the world of retail and private labels, the Framework section further develops the
topics previously touched upon, developing the mechanical structure on which this investigation
will be based on, and which will allow for hypothesis testing.
The Hypothesis section states and explains the questions this dissertation will try to answer,
providing evidence of both their relevancy and the role they fulfill.
In the Methodology section the survey and the questionnaire are detailed and given a thorough
look. Here, in preparation for the analytical section, the characteristics of the study to be applied
are discussed, starting with the data collection techniques, the origin and validity of the
questionnaire items and new additions to the survey.
The analytical part of this work is found on the Statistical analysis section, which encompasses all
of the statistical and numerical tests and approaches required. This section covers all of the tests
employed to check the validity of the previously presented hypothesis, while also guaranteeing
their validity and usefulness. An in-depth analysis is delivered of the demographics and
descriptives collected.
The final section, the Conclusion, wraps up this dissertation and presents the major findings by
reporting on the major, academic and managerial, implications. The limitations of the study are
also developed, along with suggestions for further research.
The role of Loyalty in Private label Consumer based Brand Equity
5
2. Inside the brand and the store
2.1. The brand
While initially used to differentiate cow breeders and clay pots, the core concept of brand is still
the same today as it was in the beginning of civilization, to create a unique difference and to stand
out among the competition, hopefully leading to increased satisfaction value, credibility and
loyalty. The brand is a complex symbol that represents various attributes and ideas, often being
associated with certain causes and emotional feelings. These attributes are fairly important, seeing
as sometimes, the functional characteristics of the product aren’t enough to surpass the
competition. Through his works, Aaker (1991) claims that brands aren’t simply used to identify
different companies, they are also fundamental in transmitting information regarding the technical
components of the product or service, and differentiating them even further, by creating functional
relationships and building connections, either practical and emotive, or even self or social based
expressions.
According to Clifton and Simmons (2003), the brand’s name is its most important element, based
on the fact that it’s the most memorable of elements, guaranteeing a universal point of reference.
It’s also, according to these authors, the only element that must not be changed, with other elements
being allowed to permutate to better fit current trends and tastes. In his work, Keller (2013) stated
that companies use brand names as an easy and practical way to share and transmit product quality.
Following a brand equity perspective, brand names are a very powerful extrinsic suggestion, often
causing positive and favorable reactions on consumers, thus leading to increased sales. Strong
brand names are essential in creating truly positive associations, being one the main influencers of
both brand image and motivating purchase decisions, as well as, store selection and brand loyalty.
A catchy name alone is nowhere near enough for a unique, distinct place in the market and the
consumer’s head. It is though, a major part of the brand positioning strategy. Positioning is directly
related to concepts of image and association, and requires that there is an “adversary” reference
point, a competitor that allows for relative positioning. Positioning is useful, not only to see how
the brand is perceived by consumers, but also, to reflect how a brand wants to be perceived
(Aaker,1991).
The role of Loyalty in Private label Consumer based Brand Equity
6
2.2. The private label
Retailers own and selectively distribute private labels or store brands (referred to as PLs or SBs)
in their stores (Kumar & Steenkamp, 2007).
Currently, there are two main brand types sold at most of the retailers: national brand (NB), which
is a brand that is sponsored or owned by a company whose primary business is production; and a
private label (PL) sponsored or owned by retailers, wholesalers, or distributors that is sold
exclusively in their stores (Schutte, 1969, Bushman, 1993 in Nenycz-Thiel & Romaniuk, 2016).
Private labels currently account for up to 40% of grocery sales at specific retailers and most
predictions expect continual, global growth (Gielens, 2012 in Schnittka, 2015). Almost every
household purchases some private label products nowadays, which means private labels are now
present in almost every category in grocery stores, be it in the U.S. or Europe.
PL brands are present in more than 90% of consumer packaged goods categories. Market shares
across Europe have reached 23%, on average, with shares being higher in countries such as the
United Kingdom (46%), Switzerland (45%), Germany (37%), and Spain (33%) (Europanel 2009).
Moreover, their growth significantly exceeds that experienced by manufacturer brands (18% vs.
4.5%, respectively) (Cuneo, Milberg, Benavente & Palacios-Fenech, 2015).
Store brands are products that are owned or licensed exclusively by retailers and wholesalers, for
distribution in their respective segments of the marketplace. Unlike national brands, which may be
found and purchased at practically any supermarket store, private-label brands are owned by the
supermarket chains themselves. Although just about every supermarket chain offers a private-label
line of products, the image and brand associations pertaining to a private-label line are unique and
cannot be substituted by another competitor. Their brand names are also owned by specific
organizations, and cannot be duplicated by competitors (Pepe, Abratt & Dion, 2012). According
to Brazauskaitė, Auruškevičienė and Gerbutavičienė (2014), national brands and store brands
differ substantially in terms of management, strategy and tactics. Both of these brands differentiate
strongly from each other in many of the central elements of the marketing mix, including branding
and extrinsic cues like packaging, price, distribution networks and how they are publicized, with
The role of Loyalty in Private label Consumer based Brand Equity
7
national brands being present on a lot of different media platforms and store brands mostly
operating at a store level.
The development and main objective of private label brands is quite straightforward, being mostly
focused on increasing retailer’s profits, by increasing marginal revenue as well as a more
competitive positioning, often due to being a more attractive option (K. L. Ailawadi & Keller,
2004).
For both Ailawadi and Keller (2004) and Amrouche and Yan (2012), store brands bring numerous
advantages and possibilities, allowing for more negotiation power with suppliers and
manufacturers, more products and more store activity, which may lead to higher store loyalty.
Following Brazauskaitė et al. (2014) work the major outcomes that come from investing in private
labels are: strategical benefits like the improvement of store image, store differentiation and store
support; strengthening of positioning values, making it so the company stands out from its
competitors; bigger negotiation power with suppliers and manufacturers, which leads to higher
margins when compared to national brands; more agility to answer price changes and promotions
from national brands; more freedom to foster or kill certain product categories, by investing in
newer products or deleting those who are performing worse. At the same time, the retailer’s
capacity to increase their own equity, by creating powerful and influential brands, may isolate
them above their competitors, turning the store into a desirable destiny, thus increasing their sales
values, which in conjunction with better supplier relationships, and lower costs, leads to an
increase in profitability (K. L. Ailawadi & Keller, 2004).
This investment in private label brands is not without its flaws though; as seen in Pepe et al (2012)
and Ipek, Aşkin and Ilter (2016) who both advocate and show that consumers who are very loyal
to private labels are, in fact, more loyal to cheap alternatives than to the brand or the retailer
themselves; often prowling different chains in search for the cheapest price. One can’t expect
suppliers and manufacturers to just sit and watch as they lose market share to private labels. These
are perceived as a very serious threat, seeing as they occupy prime spots in the supermarket shelves
and mimic national brand appearance and characteristics, fostering impulse buying and pushing
national brands out of the product category space (Brazauskaitė et al., 2014).
The role of Loyalty in Private label Consumer based Brand Equity
8
According to Pepe et al. (2012), retailers publicize national brands as a way to pull people to visit
their store and, once there, try to win them over with their private label product offerings, which
appeal to customers due to their lower prices, while allowing for greater margins for the retailer.
This way, retailers’ strategy has mostly focused on investing and developing new brands, so as to
further evolve their offers portfolio, by curating and creating new product categories as well as
increasing the width of products offered on said new and existing categories (Amrouche et al.,
2012).
2.3. Standard private label, Economy private label and Premium private label
In the beginning, private labels were not as successful as national brands because of their
poorer product qualities; however nowadays, the situation has changed and transformed the
private labels into proper challenging competitors by strengthening both their quality and
performance sides, while still hanging on to their price advantage. These days, private label
products are available in almost all retail stores, offering enormous product varieties, less
expensive prices, and medium to high quality standards (Chakraborty, 2013 in Ipek, Aşkin
& Ilter, 2016). In the recent decade, research on private label has received an increased
attention among scholars all around the world, due to their curious set of characteristics, and
over the years PLs’ offer developed across the price-quality spectrum – economy (initially
referred to as generics),standard(initially referred to as “copycat”) and premium. This would
then be called the three tier pricing system (good, better, best).
Generics, especially in the US, were cheap and grossly inferior versions of manufacturer owned
brands (Fitzell, 1982 in Nenycz-Thiel & Romaniuk, 2016). They were white labelled product
ranges with significantly lower prices, very poor packaging and no marketing support, which did
not typically carry the name of the store. These inferior products occupied categories associated
with low risk (dog food, toilet tissue, plastic bags etc.) and were introduced only when the
production process and technology were very uncomplicated and efficient. Later on, economy PLs
lost some of their generics past, and were primarily re-introduced to fight hard discounters,
offering no-frills, bottom-of-the-market, lowest possible cost PLs (Dekimpe et al., 2011 in Ter
Braak, Geyskens & Dekimpe, 2014).
The role of Loyalty in Private label Consumer based Brand Equity
9
In the late 1980s generics started to lose their share to PLs that carried the name of the retailer.
These new, completely different, PLs were simply “copycats” of leading NBs (Kumar &
Steenkamp, 2007), to the point that the packaging of a leading NB and a PL “copycat” was so
similar that many manufacturers had to sue retailers for unfair competition. The “copycats”
benefited from the quality assurance held by NBs, and delivered decent margins to the retailers.
Their prices were well below those of NBs. The risk of introducing a “copycat” was very low, as
the retailers simply imitated the NB leaders and mostly followed the biggest trends. The main
reason for selling “copycats” was to compete directly with NBs, by advertising similar quality for
a lower price. Within such a strategy, the original SPL (standard private label) is typically marketed
as “quality similar to national brands at a lower price”, geared toward competition with these
national brands and other traditional supermarkets (Kumar & Steenkamp 2007; Corstjens & Lal
2000 in Vroegrijk, Gijsbrechts & Campo, 2016).
As of the late 1990s, every major grocery retailer had developed a credible private-label offering.
Western Europe is the most developed PL region, with PL goods accounting for up to 43% of total
consumer packaged goods consumption in the United Kingdom, 39% in Germany, and 34% in
France. In the United States, consumers allocate upwards of 20% in their total spending to PLs
(Planet Retail 2008 in Geyskens, Gielens & Gijsbrechts, 2010). These three-tiered PL programs
follow a "good, better, best" approach and by 1999, private label products accounted for over 20
percent of supermarket unit sales and 15.7 percent of dollar sales in the US (Williams 2000 in
Chan Choi & Coughlan, 2006).
These PLs are now a major competitor for national brands, particularly at the medium and value
end of the spectrum. This growth and competition is particularly evident in the grocery sector,
where packaged goods are at the forefront of PL innovation.
Even though the majority of packaged goods PLs are the traditional ‘value’ type, the fastest
growing PL type is actually the premium PL (referred to as PPL), such as Sam's Choice (US),
Tesco Finest (UK) and LIDL Deluxe. PPLs are classified as top tier in quality and other attributes,
rather than value products, seeing as they differ from value PLs across several dimensions that can
impact consumers' perceptions of these brands; using a variety of features like exotic or high-end
The role of Loyalty in Private label Consumer based Brand Equity
10
materials and components (Geyskens et al., 2010; Martos Partal & Gonzalez- Benito, 2011 in
Nenycz-Thiel & Romaniuk, 2016).
While the role of “copycats” was to increase the competition between NBs and PLs, PPLs were ,
instead, invented in the late 90’s to differentiate stores from each other (Corstjens & Lal, 2000 in
Nenycz-Thiel & Romaniuk, 2016). A common rationale for PPL introduction is to create point of
differentiation from other retailers.
PPLs are exclusive to the particular retailers that produce/sell them, and are not intended to
substitute NBs; but rather to complement and widen the store offering. Under PPLs, retailers offer
unique versions of products that can be found selectively in their particular chain.
Premium PLs are positioned at the top end of the market, and their unique features in terms of
taste, origin, and ingredients enable retailers to compete with the highest-quality national brands,
something not possible with both economy PL and standard PL. In their work, Kumar and
Steenkamp (2007) describe retailers' move to PPLs as “escaping commoditization”, to overcome
the equivalence of EPLs offered by every retailer. Premium private labels offer the retailer the
opportunity for responding to the national brand's ability to cater to heterogeneous preferences.
This appears more likely in categories where private labels already offer high quality products,
comparable to the national brands’ (Dhar & Hoch, 1997).
Premium PLs should now also take their standard PLs offering in that category into account. While
standard PLs were introduced first (and were most successful) in high-penetration categories and
premium PLs are more likely to be found in low purchase-frequency categories, companies should
still take cannibalization into account (Ter Braak et al., 2014).
However, private labels, especially premium private labels, differ from other brands in the core
elements of the marketing mix (Kumar & Steenkamp, 2007). Research shows that private labels’
in-store communication, its distribution (availability in number of stores) and the perceived price
are essential in building and fostering private label brand equity. There is a focus on in-store
communication, seeing as advertising had very little impact on the PL equity. When retailers
enhance private labels exposure in the store, which they control, it is possible that the effect of this
tactics and exposure is stronger in consumers than the exposure of a normal advertising
The role of Loyalty in Private label Consumer based Brand Equity
11
commercial. Retailers also tend to invest less on advertising in general, instead leveraging the
advertising efforts of lead manufacturers to grow their private labels (Abril & Rodriguez-Cánovas,
2016). Research has found that the presence of an in-store event does have an impact on store
choice decisions; however, findings from further analysis suggested that this is only the case for
specialist stores. Thus, the results suggest that specialist retailers have more to gain from hosting
these discrete and temporary in-store events (Sands, Oppewal & Beverland, 2009).
In this context, price is an important tool to offer a value proposal to the market and an alternative
to manufacturer brand positioning (Nenycz-Thiel & Romaniuk, 2012). These premium private
labels engage in more advertising, have higher prices and more attractive packaging when
compared to other alternative private labels. This additional investment in the marketing mix
means that premium private labels, almost as a necessity due to higher costs, also compete less on
price differentials, and more on other attributes, such as quality and novelty. These private labels
rely less on value-for money perception, and more on other qualities, coming from advertising and
the sub-brand name. Therefore, when encountering premium private labels, consumers would be
more likely to think of product qualities and new experiences other than value-for-money.
Not all store brands are the same though, and the distinction between high-quality and low-quality
store brands is vital for understanding their contribution to a retailer’s strategy. It is the high-
quality store brand that paves the way for differentiation, store loyalty, and profitability. In
contrast, low-quality store brands tend to lead towards price wars by emphasizing and intensifying
consumer price sensitivity. There has been provided evidence from empirical analyses at both the
retail and household level that demonstrates the significant, positive impact of store brand
penetration on store profitability as measured by market share (Corstjens & Lal, 2000). Some of
the advantages referred to explain this phenomenon is that private labels offer retailers a way
to differentiate in the consumers’ market by providing a set of distinctive products to its
customers thus helping retailers strengthen consumer loyalty (Sayman et al., 2002 in do
Vale, Verga Matos & Caiado, 2016).
Co-branding can also be used as a strategy to increase penetration in foreign markets. The
marketing literature points out an increasing popularity of co-branding in the introduction of new
consumer products in new markets in recent years. In particular, according to Choi and Jeon
The role of Loyalty in Private label Consumer based Brand Equity
12
(2007), this perspective is useful to understand the role that brands of multinational firms play in
the era of globalization, and to measure their impact. As the study illustrates, one can distinguish
two types of leverage when reputation leverage occurs through co-branding between a global brand
and a local one. Either the co-branding leverages the latter’s reputation to the former (if the local
brand enjoys high recognition and the global brand is relatively unknown in the local context) and
thereby helps the global brand, to penetrate local markets; or it leverages the latter’s reputation to
the former. Through the second type of leverage, globalization can bring important benefit to a
local economy which is poor in reputation, since it will be seen at a larger scale. However, a
multinational would be reluctant to leverage its reputation to a local firm if it has an ambition to
be a global player; in this case, it might prefer outsourcing to co-branding.
2.4. Retail
While initially focused on fulfilling basic needs like hunger, thirst or warmth, production and
consumption steadily evolved into two different concepts. Production stopped focusing on just
fulfilling these essential self needs and instead turned to fulfilling the needs of others, thus giving
birth to the concept of strategic production and economic specialization, paving the way for a
market economy and trade based society.
Retail revolutions are a common sight in literature pertaining to evolution of the concepts of buying
and selling. Originally the term referred to the transformation of retailing from traditionally
organized, local and primitive, to large-scale, nationally integrated and modern systems. However,
these revolutions have been identified all across history, in a vast array of different years and
locations, from medieval shops and their narrow offerings, passing by the advent of the
supermarket and their broader array of shiny new products, to the infinite possibilities of modern
internet shopping.
According to Stobart (2010) and following Jefferys (1954), revolutions are seen as comprising a
range of new retail formats and practices, with multiple outlets and department stores pioneering
the use of advertising, fixed prices, window displays and other innovative strategies. Retail
modernity was a variable phenomenon. In the early modern period of the eighteenth century, a
time of consumer revolution, much of the changing demand was met through innovative modes of
The role of Loyalty in Private label Consumer based Brand Equity
13
selling. By looking at the literature, many examples can be found, of a close relationship between
the advent of new goods and new modes of selling (Stobart, 2010).
Following Miotto and Parente (2015), who based their work on Reynolds et al. (2007), the
diversification and variety in the different retail formats is due to the ever changing business
models developed by retailers, who constantly adapt to the never ceasing changes in the
competitive environment. Innovation is mandatory in order to attract more customers, serve their
needs better, overcome the competition, and take advantage of the newest technology.
The strategy designed by the retailer is implemented via the configuration of different variables
which determine the end result store format. These following six controllable variables of the
retailing marketing mix have been identified to characterize and define store format: product, price,
presentation, promotion, personnel/service and location (Miotto & Parente, 2015). The product
variable strategy can be moved according to decisions on width, the quantity of categories of
products offered, and depth, the variety of products in the same category. Pricing decisions are
also extremely important and very sensitive, as they directly affect not only the store image, but
also sales and profitability, as well as influence the store strategy and positioning (Miotto &
Parente, 2015). To better understand the forces behind these retail revolutions, and how the retail
formats change and develop, attention must be paid to the four major theories of retailer structural
change.
The wheel of retailing, developed by Malcolm P. McNair in 1958, is a theory that states that new
retail entrants start out as low status, low level of services, low margin, and low price stores. Once
established, they gradually acquire more elaborate establishments and facilities and begin to trade
up by increasing their service quality. These higher investments and higher operating costs
ultimately lead to higher prices, with stores maturing into high cost, high price merchants. The
previous positioning, low status and low price, is now ripe for taking, and an increase in
competitors focused on lower quality and prices is to be expected. The new competitors will end
up following the same path, leading to a closed circle (Levy, Grewal, Peterson & Connolly, 2005;
Oren, 2007; Miotto & Parente, 2015).
The retail accordion theory, initially developed by Hollander in 1966, uses only one variable as a
basis of analyzing retail changes, product category width and depth. This theory claims that

The role of Loyalty in Private label Consumer based Brand Equity
14
product assortment is the key driver of format innovation, stating that it follows a continuum of
expansion and contraction phases, thus leading to a cyclical conclusion. The expansion phase is
characterized by a growth in category width with an accompanying decline in category depth; the
opposite holds true in the contraction phases, with a decrease in width and an increase in depth.
American history is useful as a practical example. In the early days small general stores were the
norm, as they offered a variety of mostly essential products (expansion). As cities grew, so did the
number of retail specialist stores, which focused on a narrower, but more developed, array of
categories (contraction). The next expansion lead to the rise of giant general stores, which saw
massively increased the array of categories offered, as well as a tangible growth in category depth
(Levy, Grewal, Peterson & Connolly, 2005; Oren, 2007; Miotto & Parente, 2015).
The dialectic process, researched by Maronick and Walker in 1974, offers another explanation for
the evolution of retail institutions, one sustained on the process of thesis, antithesis and synthesis.
This theory proposes that two opposing and drastically different competitors, like established
department stores and newcomer discount stores (the thesis and antithesis), face against each other,
culminating in a new format, a blend (the synthesis) of the former’s strongest characteristics (Levy,
Grewal, Peterson & Connolly, 2005; Miotto & Parente, 2015).
The “Environmental Theory” or natural selection theory, developed by Dreesmann in 1968 and
Forester, in 1995, is based on the concept of the survival of the fittest in Darwin’s theory.
Organisms evolve and change on the basis of adapting to new environments. In retailing, those
institutions best able to adapt to changes in their customers, technology, competition, and legal
environments have the greatest chance of success (Levy et al., 2005; Miotto & Parente, 2015).
For the most part, existing hypotheses regarding the structure and evolution of retailing institutions
are lacking, in that they fail to offer comprehensive explanations of how and why retail institutions
develop. It would take until the new century, for a more thorough and in depth theory to be created.
The Big Middle model, developed by Levy et al. (2005), is a theory that aims to describe and
explain how the retailing formats and institutions develop and evolve. The concept of the Big
Middle is defined as the market space where the bulk of retailers compete to serve the mass market
segments, with a focus on the long run, since it’s where the largest number of potential customers
reside, often requiring an expansion into both broader and deeper product lines.
The role of Loyalty in Private label Consumer based Brand Equity
15
Retailers typically exist in one of four segments: innovative, Big Middle, low price, and in trouble.
Retailers that occupy the innovative segment direct their strategies towards quality-conscious
markets who seek premium offerings; low-price retailers appeal to price-conscious markets, Big
Middle retailers thrive because of their competitive advantage and high value offerings, and in
trouble retailers are unable to deliver high levels of value relative to their competitors. According
to the concept of the Big Middle, retail institutions tend to originate as either innovative or low-
price retailers, and the successful ones eventually transition or migrate to the Big Middle, a hybrid
of the two that appeals to a much larger customer base and provides great value for a broader array
of merchandise, both in width and depth, leveraging their respective strengths and thereby
transforming their niche appeal into mass market or large segment appeal.
However, after they move into the Big Middle positioning, retailers cannot expect to simply rest
on their golden throne, seeing as merely being in the Big Middle is not sufficient for long-term
viability. Even though the Big Middle is desirable because of its revenue and profit potentials, it
is also the most dangerous and competitive marketspace. To maintain their leadership positions,
Big Middle retailers must continue to focus their efforts on maintaining and sustaining their value
proposition, if they are to remain viable. Big Middle retailers that fail to maintain their value
proposition will transition to the in trouble segment (Levy et al., 2005; Miotto & Parente, 2015).
2.5. Hard discount
Hard-discounters (HDs) like Aldi and Lidl, are minimally decorated outlets that sell a small
assortment of food products and household goods, typically 1,000 to 1,500 stock keeping units
(SKU), and mostly focus on PL (Kumar & Steenkamp, 2009). For reference sake, a U.S.
supermarket sells 30,000 SKU on average, which helps to put in perspective just how different
these two concepts are. Hard-discounters have seen a dramatic increase on the number of retail
sales, about 60 billion dollars each, with both giants having acquired a top spot in the Western
European grocery market. Market share levels have reached 35 percent in some countries, and are
expected to further increase in the following years (Vroegrijk et al., 2016).
Being a HD isn’t just a trendy way of running the show, it takes specific behaviors like streamlining
their operations and economizing on assortment size and in-store service. This way, HD chains
can offer grocery merchandise at rock-bottom prices and gain advantage over their standard retail
The role of Loyalty in Private label Consumer based Brand Equity
16
alternatives (Kumar & Steenkamp, 2009). While their low price levels were initially associated
with subpar product quality, the perceived quality of their products has vastly improved over the
last decade, to the point that consumers are no longer apprehensive about them, with some even
preferring them over the national brand (Nauwelaers, Renders & Vandenbroucke 2012; Van
Rompaey 2014 in Vroegrijk, Gijsbrechts & Campo, 2016).
Hard discounters are not only for the poor. In fact, brand manufacturers and traditional retailers
often believe that hard discounters attract only the bottom percent of the market. And while that
assumption isn’t necessarily wrong, it’s important to reemphasize that the low-income segment
constitutes an important part of the market, and that the relationship between hard discount buying
and income is weaker than one might think. In proper terms, in Germany, for example, hard
discounters own 43% of the market in the lowest income quartile and 34% in the highest. These
wealthy consumers shop at hard-discount stores not because they have to, but because they want
to (Baltas & Argouslidis, 2007; Steenkamp & Kumar, 2009).
While some consumers prefer private label and hard discounters in many categories, they still love
store brand products in other categories. Hard discounters now understand that an overwhelmingly
private-label format can win only so much market share.
As seen in Kumar and Steenkamp (2007), Lidl's managing director for the UK explains: "Own-
brands are Lidl's future, but we believe branded products complement our range. If a customer
comes to us for the first time, they will be more comfortable seeing some brands they know. At
some point…customers will swap to our own-brands."
2.6. Pricing strategies
Private label brands have traditionally acted as a low cost alternative to national brands. While
national brand managers tend to invest significant marketing resources to develop brand equity
and brand familiarity, private label brands instead, rely on lowered investment costs to provide
goods at lower final prices, and on store familiarity to foster interest. The strategy of many retailers,
traditional and hard discounters alike, has been to keep costs of production, packaging, and
manufacturing as low as possible, so as to maintain a significant price gap between the private
The role of Loyalty in Private label Consumer based Brand Equity
17
label and national brand offerings. Such a strategy allows retailers to offer value to customers
through the private label product offerings (Hoskins, 2016).
According to Jacoby, Olson and Haddock (1971), and Fisher, Burton and Garretson (2002), price
applies an effect upon the perception of product quality when it is the only antecedent permitted
to vary. At the same time, price does not operate as an antecedent of product quality when a part
of a multiple variable setting.
If a consumer believes a supermarket to offer value for money, they will also be more likely to
realize that a private label within the supermarket offers value for money. This difficult to achieve
positioning is essential, seeing as how the perception that private labels offer value for money is
one of the strongest links in consumer memory about private labels and their relationship (Nenycz-
Thiel & Romaniuk, 2012).
According to Richardson, Jain and Dick (1996), framework, it was found that promotional
strategies and activities focusing on value for money may have a positive and significant effect on
private brand consumption proneness. However, results clearly show that such a promotional
strategy may not be very effective if consumers perceive there being quality variation or risk
associated with store brand purchases. This is consistent with the findings of Hoch and Banerji
(1993), who found that high quality and consistency are much more important than price in
claiming and maintaining market share for private label products (Richardson et al., 1996).
Perceived product quality and relative price have a significant positive relationships with perceived
product value, while perceived risk has a significant negative correlation with perceived product
value (Beneke, Flynn, Greig & Mukaiwa, 2013). Price differentiation between national and private
label brands needs to be significant, so as to justify the savings and risk in opting for a “lesser”
brand.
It would be advisable for retailers to make it clear to consumers that the lower prices of their brands
are not due to inferior quality but instead, a result from great cost savings in marketing activities
and publicity, as well as logistical and production advantages (Mieres, Martín & Gutiérrez, 2006).
While traditional views state that private labels fare better in price sensitive markets, Jagmohan,
Sethuraman and Sanjay (1995), bring attention to the importance of distinguishing between two
The role of Loyalty in Private label Consumer based Brand Equity
18
types of price competition: price competition among national brands and price competition
between national brands and the store brand. Higher price competition among national brands
makes private label introduction less appealing and decreases store brand share. On the other hand,
higher price competition between national brands and the store brand favors private label
introduction and increases store brand share. Retailers may want to take both factors into account
when deciding on their private label programs.
This proliferation of private labels invokes strong price competition. A retailer has two major price
positioning strategies to choose. The retailer that adopts a high-low (HiLo) promotion strategy
tries to stimulate customer demand and attention through time limited price promotions. Price
based special offers aim to attract consumers to the store while also signaling price competency
for the assortment. The other strategy, has a retailer employ an everyday low price (EDLP)
strategy, which largely eliminates price promotions and offers products for a consistently low,
non-varying price (Pechtl, 2004 in Olbrich, Jansen & Hundt, 2017). This type of positioning
strategy benefits the store brand but, only in lower quality categories where the value positioning
of the store may be better aligned with the price advantage of the store brand (Dhar & Hoch, 1997).
It was found, by Van Heerde, Gijsbrechts and Pauwels (2008), that a price war induced consumers
to shop around more, leading to a temporary increase in store visits. However, although the price
war initially created a windfall effect, spending levels fell in the long run, with consumers having
redistributed their purchases across the stores they visit, meaning the price war enhanced
consumers' price sensitivity. One should avoid the price cutting trap that originates from fiery price
based wars. Several retailers have shown a renewed interest in price competition as a primary tool
to increase market share and cement positioning, and have started to introduce budget store brands
at significantly reduced prices. Findings from Steenkamp and Dekimpe (1997) indicate that the
price discount variable is not a major driving factor of market power, which further corroborates
the importance of quality. Vicious price competition between budget PL brands and national
brands may not benefit either party. In the end, if a store must engage in a price war, it’s desirable
to make the first move, seeing as there is evidence of a first mover advantage between stores (van
Heerde et al., 2008).
The role of Loyalty in Private label Consumer based Brand Equity
19
A retailer’s price strategy, which can fluctuate between Every Day Low Price (EDLP) and High-
Low Promotional Pricing (HILO), also influences consumers’ store choice and shopping behavior.
A study from Bell and Lattin (1998), in K. L. Ailawadi and Keller (2004), shows that “large basket
shoppers” prefer EDLP stores whereas “small basket shoppers” prefer HILO stores. The intuition
behind this logic is that large basket shoppers are more time constrained and prefer to satisfy all
their shopping needs in the minimum number of different stores possible; as such, they interact
with a large set of product categories at a time, without the flexibility to take advantage of
occasional price deals on individual products, but still end up having a lower expected basket price.
Small basket shoppers, who can take advantage of variations in prices of individual products and
visit an increased number of stores, by taking advantage of different deals, can lower their basket
price, even if average prices in the store are higher (K. L. Ailawadi & Keller, 2004).
2.7. The buyer decision process
While the consumer is seen as a rational decision maker in the literature, at the same time,
consumption experience is ignored and regarded as not important by previous research. The notion
and concept of experience, marketing related, in the buyer decision process was firstly presented
by Holbrook and Hirschman (1982), in Andajani (2015). Both state that elements of pleasure,
beauty, symbolic meaning, creativity and emotion can enrich and broaden the understanding of
consumer behavior, which contrasts with the simplistic view of yore. In present times, this concept
of customer experience plays an important role in understanding said behavior, paying special
attention to emotion, and how different ones play a role in product and brand selection. It’s now
believed there is a strong relation between emotion and experience, seeing as an experience is
unique to each individual and remembered by each in different ways. It involves emotional,
physical and intellectual aspects of the self and the individual. Good experiences reduce customer
uncertainty and lead to an increase in trust, often leading to an increase in loyalty. Accepting the
existence of consumption experience leads to the idea that it’s not limited to a before or after
purchase. In fact, consumption is divided into four stages: pre-consumption experience, purchase
experience, core consumption experience and remembered consumption experience (Andajani,
2015).
According to Kotler and Armstrong (2018) buying behavior is affected by four different types of
factors: cultural, social, personal and psychological. Cultural factors are the most important ones

The role of Loyalty in Private label Consumer based Brand Equity
20
and the most impactful. Country of origin is responsible for the different tastes and quirks of the
individual, with narrower groupings like subculture (religion or geography) or social class (wealth
or academic background) affecting more precise characteristics. Social factors encompass mostly
the consumer’s bonds, be them family bonds or work related bonds, which have an impact on
attitudes and behaviors, as well as self-perception. Personal factors are related to the characteristics
of each specific consumer, and mostly focus on age, life style, and personality; all of which affect
product segmentation. Lastly, psychological factors are related to different areas of the consumer’s
mind, like motivations, past experiences and personal beliefs.
While emotional and intangible factors have a big impact on the buying process, one mustn’t forget
about the tangible role of different players who are responsible for, and an influence to the final
purchasing decisions. These can be, the initiator, who first presents the buying opportunity, the
influencer, who sells and recommends the product, the decision maker, who decides what and how
to buy, and finally the user, the one who will enjoy the product or service (Kotler & Armstrong
2018).
The biggest issue though, is not in how you analyze and extract tangible progress from these
processes and factors, but instead on actually getting in touch with them. According to Kotler and
Armstrong (2018) there is a big difference between saying and doing something, in particular, the
consumer might not even be aware of his motivations or to how he reacts to different influences,
which can lead to indecision and proneness to change his mind.
Even though the buyer decision process may look like a gigantic beast to tame, it’s still possible
to take a more operational approach to its analysis. According to Kotler and Armstrong (2018) this
process is divided into different steps and stages. It starts with need recognition, where the
consumer first faces a problem or need, then comes information search, where the consumer will
look into different possibilities to solve said problem or need. Before actually buying something,
the consumer will first evaluate the different alternatives collected in the previous step, rationally
judging each one of them according to his personal standards. After the purchase decision, the
consumer now moves into the post purchase behavior phase, which is where he will feel either
satisfaction or dissatisfaction, depending on whether the performance of said purchase is in line
with his expectations or not.
The role of Loyalty in Private label Consumer based Brand Equity
21
3.Private label relationships
3.1. PL and loyalty
Due to the recent increased competition in retailing industry, retailers are required to develop
new strategies and be at the top of their game, in order to keep existing customers and gain
new customers, further cementing their position. Creating loyal customers generates the main
aim of most of the retailers.
Even though it’s a fairly hot research topic, there is still no agreement on the definition of
store loyalty, with customer loyalty also remaining a topic of great interest for both companies
and scholars alike. While some authors propose it can be measured by focusing on consumers‘
intentions to keep purchasing (Sirohi et al., 1998; Meyer-Waarden, 2015 in do Vale, Verga
Matos & Caiado, 2016), others suggest it can also be measured focusing on consumers’
behavioral characteristics, such as frequency of store visits or relative volume spent
(Ailawadi et al., 2008; Bustos-Reyes & González-Benito, 2008; Seenivasan et al., 2015 in do
Vale et al., 2016). Moreover, loyalty is also often defined as a pattern of repeated purchase
behavior of a specific brand that can lead to the development of a relationship with it,
generating purchase routines (Blut et al., 2007 in do Vale et al., 2016). These results are
aligned with findings from previous research which indicated store convenience, the level of
service offered, and pricing policies adopted, as critical loyalty factors (Pan & Zinkhan, 2006;
Maruyama & Wu, 2014 in do Vale et al., 2016).
Based on the loyalty definition of Oliver (1999), in Ipek et al. (2016), store loyalty can be
defined as the commitment that is held deeply to a particular retailer. In order to purchase
these private brands, consumers may be willing to go to that specific store regularly, which
thus transforms into store loyalty. Also, many scholars have reported that consumers who
prefer to buy private label brands are more loyal to the specific retail stores and usage of
private labels directly increases the store loyalty and sales of the retailers (Baltas et al., 1997;
Cotterill & Putsis, 2000; Liu & Wang, 2008; do Vale et al., 2016 in Ipek et al., 2016).
Even though the market share of private label products has increased, consumers may still perceive
private label products to be of lower quality than other well-known brands, with respect to private

The role of Loyalty in Private label Consumer based Brand Equity
22
label positioning strategies of store chains leading to worse the loyalty towards the store (Ipek et
al., 2016).
The most important element for a private label brand in establishing loyalty is the brand’s capacity
to fulfill promises to its consumer base. The continued fulfillment of promises eventually leads to
a long-term profitable relationship between the retailer and consumer and is related to the
utilitarian benefits offered by the brand (Carpenter, 2003 in Pepe, Abratt & Dion, 2011; Pepe,
Abratt & Dion, 2011).
According to Sethuraman and Gielens (2014), consumers will purchase PLs if they perceive the
quality is higher and quality variation is lower, if they have a positive image of PLs, and if they
think PLs are not risky. Price, perceived quality and value for money all interact to influence the
degree of perceived shopping risk (Omar, 1996).
A thorough look at the importance of different factors influencing private brand proneness reveals
that familiarity with retailer’s private label brands is essential. The large relative importance of
familiarity suggests that consumers who are familiar with private label products are prone to view
them as high quality, low risk products that generate good value for money. Lack of familiarity
may lead to increased reliance on extrinsic parameters such as brand name, packaging, and price,
areas in which retailers’ private brands are rated lower when compared to their national brand
counterparts. Familiarity with retailers’ private label brands could be increased through different
strategies, such as store taste tests, blind comparisons with national brands, distribution of free
samples, or issuing store brand coupons (Richardson et al., 1996).
During blind testing, in which consumers weren’t aware of brand names, results indicated better
taste and higher purchase intentions for private labels. At the same time though, the opposite held
true when the tests weren’t blind. This study suggests that the “quality gap” that once existed
between premium private labels and national brands is fading, but retailers must still deal with the
“brand gap” (Rossi, Borges & Bakpayev, 2015).
Consumers by and large seem to be more interested in quality than value for the money, even for
store brands. They tend to rely more on extrinsic, rather than intrinsic, cues to judge a brand’s
The role of Loyalty in Private label Consumer based Brand Equity
23
quality. Prior literature focuses on three common tangible extrinsic cues: package design, price
and brand name (Bao, Bao & Sheng, 2011).
National brand producers, understand that success depends on not only maintaining a high level
of tangible product quality, but also developing a strong brand image. National brands that are not
backed by an effective communication strategy may have little to no advantages when compared
to store brands. In essence, development of a strong brand image without delivering a
correspondingly high level of tangible product quality may lead to a disagreement between these
two realities, diminishing the perceived quality of said brand (Richardson, Dick & Jain, 1994).
These findings indicate that the future of PLs and NBs will continue to depend on how retailers
and NB marketers manage brand and product perceptions, potentially signaling the growing role
of PL advertising in coming years (Sethuraman & Gielens, 2014). Consistency in quality over time
will lead to lower levels of perceived risk and lower uncertainty. At the same time, consistent
quality levels and positioning, as well as a reduction of the gap between the perceived quality
levels of national and store brands, would go a long way in helping store brands (Valenzuela, Zhao
& Erdem, 2004).
Findings suggest that consumers’ loyalty towards private labels is mostly driven by its quality,
in line with recent results. This discovery is interesting because the initial positioning strategy
of private labels was based on low price, while results provide empirical evidence that the
adoption of private labels is no longer attributed to its initial pricing strategy, but has turned
towards quality, as suggested by Kumar and Steenkamp (2007) and Richardson et al. (1994).
Taking into consideration the results from Steenkamp and Dekimpe (1997) study, it can be
seen that quality improvement is the key to success. In particular, focusing on Albert Heijn as a
retailer, perceived quality emerged as a prime factor underlying their growing power. The higher
the perceived quality of their store brand, both absolute and relative to its competitors, the greater
its conquesting power. Further, Albert growth was found to be strongly correlated with its market
share. Hence, the implication that improving product quality is a prime way to build market share.
According to Hansen and Singh (2008), households’ natural inclinations to buy store brands are
driven by some underlying value trait that is not captured in its entirety by a simple measure of
their price sensitivity, with previous studies showing that store brand buyers are still more price
The role of Loyalty in Private label Consumer based Brand Equity
24
sensitive than their national brand counterpart. This finding could make them more vulnerable to
competitors’ moves and less store loyal overall, even when taking into account that store brands
have the ability to foster store loyalty. The logic behind this argument is that since store brands are
available exclusively at the retailer, they create a point of differentiation, and foster a strong
preference for store brands, which in turn can translate into store loyalty. Their results show that
store brand buying behavior is driven by households’ underlying value trait over and beyond what
is captured by price sensitivity alone, and that these value-oriented households are more
susceptible to new competitors.
Results indicate that store image perceptions, PL price-image, value consciousness, and PL attitude
have significant and positive influence on PL purchase behavior. None of the socio-demographic
variables (age, gender, household income and family size) included as control variables in the tests
ran by Fall Diallo, Chandon, Cliquet and Philippe (2013), had an effect on SB choice. Socio-
demographic variables are undoubtedly the most studied variables in relation to SB purchase
influences. This study evaluated a partial mediation model including four socio-demographic
variables (age, gender, household income, and family size) as influencers, or antecedent of SB
choice. The results showed that none of these socio-demographic variables had an effect on SB
choice. However, previous results dealing with the effects of socio-demographics on SB store
purchase behavior have been rather inconsistent, and as such, must be taken with extra care.
Previous research has identified factors that have a positive influence on the acceptance of private
labels, such as private label quality and the introduction of premium private labels (Dhar & Hoch,
1997; Geyskens et al., 2010; Koschate-Fischer, Cramer & Hoyer, 2014; De & Singh, 2017).
Research from González-Benito and Martos-Partal (2012), proposes that the relationship between
a customer’s private label share and the customer’s store loyalty differs between product categories
in terms of perceived risk. The study of Koschate-Fischer et al. (2014), extends this work by
delving into two important product category characteristics that influence the private label share–
store loyalty link: degree of commoditization and product involvement. Private label share is
defined as being the value share of private labels in the shopping basket of a customer (Koschate-
Fischer et al., 2014).
The role of Loyalty in Private label Consumer based Brand Equity
25
Regarding degree of commoditization, it was found that the variable has a negative moderating
impact, which implies the lower the degree of commoditization, the stronger the link between
private label share and store loyalty. Customers risk more when switching to other brands if
commoditization is low, since there are more perceived differences between brands. Consistent
with this notion, the data indicates that customers are more likely to be store loyal in this situation.
In contrast, when commoditization is high, there is little risk of switching to different brands,
seeing as they are fairly similar, and therefore private label share should play a lesser role in
developing store loyalty.
A positive moderating effect was found, in the case of product category involvement, meaning the
private label share–store loyalty link was stronger in relatively high involvement product
categories. Findings suggest that driving store loyalty through private label brand share is more
likely to be successful in relatively higher-involvement product categories. In categories where
involvement is lower, consumers are less likely to develop strong attitudes toward private labels,
and switching costs are lower (Koschate-Fischer et al., 2014).
It was found that private labels have better results in product categories that are less commoditized
and with relatively high in involvement. Examples would include coffee, chocolate, ice cream,
facial lotion, and deodorant. As such it’s best to invest in these categories if retailers want to
increase customers’ loyalty toward the store through the use of private label brands.
Private labels in categories with lower purchase frequency, with a larger price ratio relative to
national brands, and with lower levels of NB marketing activities and promotions, tend to have
higher potential to differentiate the store from competitors. It was found, by Hoch and Banerji
(1993), that private labels tend to perform better in larger categories, with high gross margins, and
where quality levels are high. Private labels tend to have a worse performance in categories with
higher competition and where more intense branding activity is present (national brand
advertising).
Following this logic, retailers who want to use PLs as a way to increase their store loyalty should
invest in good quality, higher priced PLs, in less frequently bought categories, like laundry
detergent or shampoo (Dawes & Nenycz-Thiel, 2013).
The role of Loyalty in Private label Consumer based Brand Equity
26
Note that following this strategy represents a significant challenge for the companies, seeing as
these categories are the very ones in which customers are more willing to pay higher prices for
national brands to avoid the “riskiness” of buying private labels (Steenkamp, Van Heerde &
Geyskens 2010). However, the payoff in terms of greater store loyalty would suggest that this
strategy is worth the investment. This is an essential implication because many retailers tend to
focus their private label activities on highly commoditized, low-involvement product categories,
leading to worse results. This study would suggest that retailers are less effective in developing
store loyalty under this previous strategy. PLs that are much cheaper than NBs, especially in
frequently bought categories, tend to attract value-driven consumers who will buy a cheap PL
anywhere they can find it, and that aren’t likely to become store loyal (Dawes & Nenycz-Thiel,
2013).
Another study shows PL buying increases as the possibility of purchasing a poorer product
declines. In practical terms, the national brand should find every legitimate way to create fear,
uncertainty and doubt in the consumer’s mind regarding the quality equivalence between the
national brand and the PL, in the hope that the resulting anxiety pushes the consumer to prefer the
traditional national brand that he his familiarized with, over the cheaper PLB (Batra, 2000).
3.2. PL against HD
The ever increasing rise of the discounter format is a key driver of structural change within the
consumer goods sector. Their market shares range from about 10% to an astonishing 43% in
Germany (Global Retail Mag, 2014 in Hökelekli, Lamey & Verboven, 2017) and they are
estimated to grow by 82.2% until 2020 (Food Manufacture UK, 2015 in Hökelekli et al., 2017).
This retail approach competes mainly on price, quality, consistency and simplicity. Discounters
apply their no-frills strategy: products are often presented on the floor on retail ready pallets, with
half-sized pallets being used to further optimize floor space. Their sales rely primarily on private
labels (PLs) and, recently, they started to offer a limited number of select national brands (NBs),
leading to an overall improved shopping experience.
The role of Loyalty in Private label Consumer based Brand Equity
27
Discounters not only affect traditional retailers’ market share, they also put pressure on them to
increase operational efficiency and decrease prices, turning the retail battlefield into a way more
competitive market.
The study of Geyskens et al. (2010), in Hökelekli et al. (2017), shows that, based on a brand-
choice model, the introduction of an economy PL cannibalizes the store’s standard PL but benefits
the more popular NBs. Similarly, an introduction of a premium PL cannibalizes the store’s PLs
(i.e. economy and standard) and sometimes benefits premium-quality NBs.
Another conclusion is that since PLs compete more intensely between each other than with NBs,
in some categories, PL growth may sometimes hinder other PLs more so than NBs. This result
highlights the importance of stores to start looking at competition between the two types of store
brands across stores, and seeing PLs from other retail outlets as close competitors.
Following the same steps, for the manager of a NB worried about the growth of a competitor PL,
the results indicate those category characteristics of other PLs that could deal with the particular
PL's growth, rather than NBs. A further implication for NB owners concerns the finding that many
consumers limit their purchases to PL brands in categories where there are frequent NB
promotions. As such, frequent promotions may not be a good way for NBs to recover market share
from PLs (Dawes & Nenycz-Thiel, 2013).
According to Sayman and Raju (2004),retailers are more prone to offer store brands in categories
where the price sensitivity between the national brands is low, and price sensitivity between the
store brand and national brands is high. Analysis suggests that retailers are more prone to offer
two different store brand alternatives in categories where the national brands are similar in strength
and the price disparity between the national brands is low. Introducing multiple store brands that
are positioned to fight different national brands is a very legitimate strategic path for retailers. This
positioning strategy may benefit the retailer in two ways. First, when store brands target different
national brands, it is more likely to extend the demand for store brands, which is required for
profitable multiple store brands. Secondly, targeting may exert pressure on to the national brand
manufacturers to offer better trade terms.
The role of Loyalty in Private label Consumer based Brand Equity
28
In most cases, it can be seen that retailers earn higher percentage gross margins on private labels
than on national brands. This is mostly due to the fact that private label suppliers have little market
power, in contrast with national brands. These suppliers operate in a cutthroat competitive market
with little to no product differentiation and thus sell to retailers at a price that is close to their
marginal cost. These retailers have somewhat of a local monopoly on their store brand, seeing as
competing retailers can’t carry the same store brand, even if they carry the same national brands.
On average, it is found that percentage margins on store brands are significantly higher than on
national brands; as such, all else being equal, individual category percentage margins increase with
store-brand share (K. L. Ailawadi & Harlam, 2004). National brand manufacturers build their
power through customer loyalty. Loyal consumers are the ones most likely to pay full price for
their favorite brands, instead of waiting for price discounts. They look for them in any store they
shop and, if not found, may simply shop elsewhere. If enough consumers threaten to act in this
manner, retailers will be compelled to carry the national brands and be vulnerable to worse
negotiation terms. At the same time though, retailers may employ their private labels strategically
to decrease the space available for competing national brands. They may also use private labels to
pressure manufacturers into competing more aggressively on price (Fisher et al., 2002). For
retailers, selling private labels, besides the increase in category and overall profits, store
differentiation, access to higher product margins and stronger negotiation power with national
brand manufacturers, private label brands also provide a positive impact of private label share on
store loyalty (Pepe et al., 2012).
Most studies in this area have spent the most of their focus on the direct relationship between
private label share and store loyalty. The key finding of this research is that the relationship
between these two variables has an inverted U shape; meaning private label share increases store
loyalty up to a point, after which there is an incremental negative effect (Ailawadi, Pauwels &
Steenkamp 2008 and González-Benito & Martos-Partal 2012 in Koschate-Fischer, Cramer &
Hoyer, 2014).
Studies suggest that pushing private labels could increase the share of wallet that consumers devote
to a specific store. Share of wallet, at the beginning, increases strongly with PL share, but after a
PL share of about 40%, it begins to fall (Ailawadi, 2008). The inverted-U effect of PL share on
share of wallet can be explained by the concept that consumers who buy moderate amounts of PL
The role of Loyalty in Private label Consumer based Brand Equity
29
from a chain are likely to build chain loyalty, those who don’t buy PL at all have no loyalty, and
those who buy a lot of PL are drawn more towards savings and lower prices than to a particular
PL, prowling different shops for the best prices and deals (Ipek et al., 2016).
Following the previous logic, high store brand purchase rates point towards customers not
differentiating or selecting store brands in specific categories; instead, choosing solely on the basis
of price. These customers may not differentiate across retailers, because they pursue the best price,
regardless of who sells it.
This theory is further cemented by Ailawadi, Pauwels and Steenkamp (2008) suggesting that
increased private-label share in risky categories (e.g., desserts, beauty products) is more critical
than the share in other, less risky, categories (e.g., dry goods, household paper products); thus
predicting that perceived risk creates a more favorable relationship between private-label share
and store loyalty.
With a price oriented positioning, instead of a quality focused one, the relationship between store
brand consumption and store loyalty is more favorable, to such a degree that the store brand share
at which the relationship begins to be negative occurs later, instead of at the previously mentioned
40%, and the negative relationship is weaker.
At the same time however, studies have concluded that when a brand’s positioning prioritizes
quality rather than price (i.e., copycat), it has a more favorable effect on store loyalty, compared
to when the positioning prioritizes price over quality (generic store brands). Specifically, the store
brand loyalty level at which the store brand loyalty effect begins to have a negative influence on
store loyalty occurs earlier when the store brand positioning stresses price instead of quality
(Martos-Partal & González-Benito, 2011).
These findings are not exactly conclusive, seeing as some studies find direct relationships, others
find inverse relationships, and still others do not find any relationship whatsoever (González-
Benito & Martos-Partal, 2012).
Additionally, significant differences are found across categories in this relationship between in
store private label consumption and store loyalty. It appears more favorable for categories related
to personal care products than for household products and for household products relative to food
The role of Loyalty in Private label Consumer based Brand Equity
30
products. More favorable still means that the negative relationship occurs, only that it will be later
and less significant. As such, it’s concluded that the relationship between store brand share and
store loyalty is more favorable for risky product categories. In any case, retailers should combine
the role of quality oriented store brands to differentiate the store and the role of price-oriented store
brands to attract price-conscious consumers, since this complicated balance will yield more
positive results.
In line with previous reasoning, it was found that when the share of the PLs in the product
assortment increases, consumers tend to switch from the national brand to the store brand
alternatives (Ngobo, 2011). This switch occurs mainly among the consumers who are currently
spending a smaller share of their grocery expenditures on store brands. Consumers who are already
making a substantial proportion of their purchases on store brands tend not to buy more private
label products. Instead, they tend to move to competing stores, thus reducing their share of wallet
to the focal store.
However, when the relative share of PLs increases above a certain limit, all the consumers increase
the size of their consideration set, and this reduces their loyalty and expenditure to the focal store.
The most likely to switch to other stores are consumers who spend a smaller proportion of their
grocery expenditures to store brands, reflecting the fact they are relatively more sensitive to
product quality than the other customer groups.
The results indicate that there is a significant non-monotonic negative relationship between
department private label sales penetration and overall department sales, which corroborates the
previous “40% theory” (Pepe et al., 2011).
The results of this research indicate that as private label sales penetration increased for the grocery
department, overall department sales decreased. These results indicate that national brands are still
key for enhancing overall sales, by taking into account and focusing on the fact that increasing
private label sales beyond a certain level may result in less overall sales.
The finding that there is a positive relationship between private label share and store loyalty is an
important one. There is a stronger relationship between private label share and store loyalty for
customers who display a more price oriented behavior. Thus, when retailers have a large, price-
The role of Loyalty in Private label Consumer based Brand Equity
31
oriented customer base, it is crucial that these segments are targeted with private label brands.
Product characteristics also moderate this important relationship; as concluded earlier, the private
label share and store loyalty link is stronger in product categories where there is a low degree of
commoditization and high product category involvement. It was also found that the private label
brand share drives store loyalty more for retailers with a low price positioning (Koschate-Fischer
et al., 2014).
It was found that premium PLs do not seem an effective strategy in the fight between traditional
retailers and hard discounters, seeing as they mainly cannibalize the traditional retailers’ standard
PLs and steal market share from their NBs in both categories. At the same time, even if economy
PLs manage to steal some market share from discounters, they mainly cannibalize standard Pls.
Standard PLs seem the most effective strategy to fight discounters since they are the ones who
steal most market share from discounters.
Looking at real world scenarios, in the oats category, it was found that national brand preferences
do not change, but consumers become more price sensitive after the launch of the PL. In fact, after
the retailer introduces the PL, the national brand manufacturer behaves in a more
“accommodating” fashion towards the retailer in terms of the its pricing decisions.(Chintagunta,
Bonfrer & Song, 2002) If traditional retailers want to mitigate the loss that is incurred due to
discounter entry, they should mostly focus on their standard PL portfolio and its pricing strategies
(Hökelekli et al., 2017) .
Private label strategy has begun to transform from simply selling on a cost advantage/ price based
strategy, to actually establishing the private label as a brand itself (Kumar & Steenkamp, 2007).
Many retailers have determined that simply positioning the private label brand as cheap may be a
suboptimal strategy that sells short the true potential of the private label brand for overall retail
business, which follows the proof that promoting product quality is the superior way of raising
store loyalty (Hoskins, 2016).
The work of Richardson et al. (1996) suggests that simple improvements in the extrinsic cues
associated with store brands may be a powerful, yet obvious way to increasing consumer
acceptance of private label brands. European retailers are aware of this and have been successful
in increasing store brand market share by investing in dramatic improvements in package design,
The role of Loyalty in Private label Consumer based Brand Equity
32
labeling, advertising, and branding strategies. Despite these strategies, it may not be enough to
have good quality; what may be needed is comparable quality which matches or even exceeds that
of leading national brands.
Results from Hansen, Singh and Chintagunta (2006) regarding 10 studied product categories,
points to households displaying similarities in their preference for store brands and marketing mix
activities across categories. This study suggests that store brands are better positioned in certain
categories, seeing as they attract buyers primarily due to their preferences rather than price
concerns. In such scenarios, retailers could consider narrowing the price difference with national
brands.
Moreover, different PL positioning strategies can often be seen across product categories in the
same store. For example, one supermarket can offer a PL jam as the most expensive item in the
category, but position its PL beef jerky as a cheaper brand than leading national brands. Other
categories can have PLs priced higher than some NBs but lower than top-tier NBs, a strategy
observed in multiple retailers. All of these point to the conclusion that there is no “one-size-fits-
all” PL positioning strategy that is optimal in all situations. Instead, it’s concluded that the relative
proportions of quality conscious consumers and price sensitive consumers have a major influence
on optimal SB positioning strategy (Chung & Lee, 2017).
Findings from the analysis conducted by Rao (2006) suggest that in certain segments of the private
brand market, consumers are likely to differentiate less between different store brands of the same
product. A curious aspect of this analysis is that, unlike what is seen in national brands, the success
of one private brand seems to be positively related with the success of other stores' private brands.
In fact, one of the major objectives of EPLs is to offer a viable alternative to the HDs’ bottom
priced private brands, and allow traditional retailers to compete with HD retailers in these
segments.
However, findings corroborate that EPLs are not a good way to combat the hard discounter threat
(Vroegrijk et al., 2016).Offering an EPL does not heighten the traditional retailer’s category sales
when faced against a HD; if anything, the budget line falls and leads to even bigger category losses
following HD entry. A likely explanation is that PL products increase price sensitivity and thus,

The role of Loyalty in Private label Consumer based Brand Equity
33
rather than binding consumers to the traditional retailer, drives them toward the low-priced HD,
which is in accordance to previously stated findings (Chintagunta, Bonfrer & Song 2002; Hansen
& Singh 2008 in Vroegrijk et al., 2016).
Managers of premium quality NBs should focus on making the most out of the attraction effect by
emphasizing their quality superiority. In these highly price volatile environments, managers must
resist the temptation to cut prices or offer promotions to combat premium PL introductions,
possibly injuring their quality perception. Instead, they should invest in product innovations and
in communicating to consumers that their brands are superior option, by sustaining a high level of
advertising and investment in the marketing mix (Geyskens et al., 2010).
4. Consumer based brand equity
Brand equity can be regarded as a managerial concept, as a financial intangible asset, as a
relationship concept or as a customer-based concept from the perspective of the individual
consumer. There is, currently, no consensus in the marketing literature on what exactly brand
equity means or encompasses, though most researchers agree that, at its most basic level, brand
equity is the value given by the brand name to a particular product (Yoo & Donthu, 2001; Abril &
Rodriguez-Cánovas, 2016; Girard, Trapp, Pinar, Gulsoy & Boyt, 2017).
It can be deduced that, if consumers perceive a particular brand favorably, then the firm may have
a competitive advantage over its competitors, possibly leading to greater profits and long term
cash-flows. As such, it’s vital that brand managers have access to valid and reliable consumer-
based brand equity instruments. Some definitions are based on the financial-perspective and stress
the monetary value of a brand to the firm; while others are based on the consumer-perspective,
which defines brand equity as the value of a brand to the consumer (Pappu, Quester & Cooksey,
2009).
The following table presents some of the different brand equity definitions adopted over the years
by different authors.

The role of Loyalty in Private label Consumer based Brand Equity
34
Farquhar (1990) The added value that a brand endows a product with.
Aaker, (1991) The added value endowed to a product or a service as a result of past
investments in the marketing for the brand.
Rangaswamy (1993) The different response between a branded and an unbranded product when
both have the same level of marketing stimuli and product attributes.
Barwise (1993) A utility not explained by measured attributes.
Keller (1993) The differential effect that brand knowledge has on consumer response to the
marketing of that brand.
Moore (1993) The combination of brand awareness, liking and perceptions.
Broniarczyk and
Alba (1994) The value a brand name adds to a product.
Park and Srinivasan
(1994)
The added value endowed by the brand to the product as perceived by a
consumer.
Keegan, Moriarty
and Duncan (1995)
The incremental price that a customer will pay for a brand versus the price for
a comparable product without a brand name on it.
Moriarty and
Duncan (1998)
A product of the total brand support of customers and other stakeholders that
is determined by all interactions with the company.
Pappu, Quester and
Cooksey (2009)
The value attached to a brand because of the powerful relationship that has
been developed between the brand and customers.
Abril and
Rodriguez-Cánovas
(2016)
Incremental utility or value added to a product by its brand name.
Girard, Trapp, Pinar,
Gulsoy & Boyt
(2017)
A set of brand assets and liabilities linked to a brand, its name and symbol that
add to or subtract from the value provided by a product to a firm and to that
firm’s customer. Source: Author’s elaboration
Table 1: Brand equity definitions
At its core, customer-based brand equity is defined as the power of a brand that lies in the minds
of consumers and what they have experienced and learned about over time (Tuominen, 1999).
The work of Aaker (1991), provides the most comprehensive definition of brand equity from a
customer perspective available in the literature, defining brand equity as a set of brand assets and
liabilities linked to a brand, that impact and alter the value provided by a product or service to a
firm and to that firm’s customers. Brand equity is defined by Keller (1993) from a different view,
The role of Loyalty in Private label Consumer based Brand Equity
35
stating it to be the differential effect of brand knowledge on consumer response to the marketing
of the brand, which differs slightly from Aaker’s definition (Çifci et al., 2016; Girard, Trapp, Pinar,
Gulsoy & Boyt, 2017).
To hold a strong brand equity requires that consumers recognize brands, have favorable brand
identification, and show increased degrees of brand loyalty.
In summary, high brand equity implies that customers have a lot of positive and strong associations
related to the brand, perceive the brand is of high quality, and are loyal to the brand (Boonghee,
Naveen & Sungho, 2000).
4.1 Antecedents of CBBE
When laying the first bricks of consumer based brand equity, Aaker (1991), and later Keller (1993)
initially theorized it as a multidimensional concept, with its antecedents consisting of brand
awareness, brand association, perceived quality, and brand loyalty, all of which are essential, from
a customer perspective.
Perceived quality is described as the consumer's judgment about a product's overall quality or
superiority. Personal product experiences, unique needs, and consumption situations may
influence the consumer's subjective judgement of quality. A principal positioning characteristic
of a brand is its location within the dimension of perceived quality. High perceived quality means
that, through the long-term experience related to the brand, consumers recognize the differentiation
and superiority of the brand. Such a perceived quality advantage provides the option of charging
a premium price for these products (Tuominen, 1999).
Brand awareness refers to the consumer's ability to recall brands or recognize a brand as a member
of a specific category (Aaker, 1991). Recognition provides the brand with a sense of familiarity,
which Brand awareness encompasses. Brand awareness also plays an important role in consumer
decision making, seeing as it is very important that consumers think of a specific brand when they
think about the product category it is part of. As such, it’s deduced that it can affect decisions about
a brand in the consideration set. Brand awareness affects consumer decision making by influencing
the formation and strength of brand associations and brand image (Keller 1993; Tuominen, 1999;
Choi & Huddleston, 2014).
The role of Loyalty in Private label Consumer based Brand Equity
36
Brand association is the brand knowledge stored in the consumer's mind, any meaning that is
linked to a brand in the consumer’s memory, and anything linked in memory to a brand and brand
image; with the latter being described as a set of brand associations, usually in some meaningful
way. Brand associations are complicated and connected to one another, and consist of multiple
ideas, episodes, instances, and facts that establish a solid network of brand knowledge.
Brand loyalty, as seen previously, has been a difficult concept to narrow and define, with different
authors each claiming it to be seen by alternative viewpoints. Initially, Aaker (1991) defined brand
loyalty as simply being the attachment that a customer has to a brand. Later on, Yoo and Donthu
(2001) instead, defined brand loyalty as being demonstrated by the intention to buy the brand as a
primary choice. Looking at the loyalty definition of Oliver (1999), in Ipek et al. (2016), loyalty
can be defined as the commitment that is held deeply to a particular retailer or brand and the
wish to patronize a preferred product in the future, which is also in line with Arnett, Laverie
and Meiers (2003). Sometimes seen as consistent purchasing of one brand over time, as an
indication of brand loyalty, or by the sequence and the proportion of purchases, repeated
purchasing is assumed to reflect loyalty, but this behavior may lack commitment to the brand and
reflect repeat buying based on inertia. Loyalty implies a commitment to a brand that may not be
reflected by just measuring continuous behavior, with loyal consumers showing more favorable
responses to a brand than non-loyal or switching consumers. The findings of prior studies
concerning the relationship between private-label share and store loyalty are not conclusive, thus
suggesting the complexity of the relationship and the nonexistence of a simple unidirectional
relationship.
4.2. CBBE scales and loyalty
Much of the initial study of CBBE scales is due to Yoo and Donthu (2001), who were among the
first researchers to come up with a rigorous and precise scale to measure consumer based brand
equity, making use of the antecedents and findings present in Aaker (1991) and Keller (1993). A
questionnaire was run, presenting three different product categories and being delivered to three
different market segments. These results were then processed and perfected, dropping items with
poor correlations and relationships. Brand awareness, brand association, perceived quality and
brand loyalty were the subjects of this in-depth research, pooling together different items to define
and measure them. Though Yoo and Donthu (2001) wrote brand awareness and brand association
The role of Loyalty in Private label Consumer based Brand Equity
37
as being effectively the same, following the concept of brand knowledge, which is made of both
brand awareness and brand association, and was coined by Keller (1993), this is not an unanimous
decision, since Aaker (1991) defined them as being conceptually different. This claim was further
investigated by Arnett et al. (2003), with results cementing the idea that awareness and association
are, in fact, distinct dimensions of retailer equity.
The study of Pappu and Quester (2006) extends Aaker’s (1991) initial framework of brand equity
and Yoo and Donthu’s (2001) framework of consumer-based brand equity to the domain of retailer
equity; successfully being able to prove that the structure of retailer equity mirrors that of brand
equity. The definition of retailer equity follows Aaker (1991) initial definition of brand equity and
can be interpreted as the value associated by the consumer with the name of a retailer. As with
brand equity, it’s measured by the following dimensions, retailer awareness, retailer associations,
retailer perceived quality and retailer loyalty. For this study, Pappu and Quester (2006), in order
to create a valid scale to measure retailer equity, based most of its items on the works of Aaker
(1991), Keller (1993), Boonghee et al. (2000)and Yoo and Donthu (2001).
While the four dimensions of consumer based brand equity and retailer equity are often seen as
parallel and equally related in terms of weight, some researchers, namely Choi and Huddleston
(2014) and Jinfeng and Zhilong (2009), argue that, instead, retailer loyalty can be seen as the
dependent variable.
The study of Jinfeng and Zhilong (2009) focuses on the impact of different store image dimensions
on retailer equity, and provides some very relevant results, both confirming previous hypothesis
and presenting new conclusions. As a basis to build upon, the results from Pappu and Quester
(2006) are utilized, meaning, it’s accepted that retailer equity mirrors brand equity and is also a
multidimensional concept made up of retailer awareness, retailer associations, retailer perceived
quality and retailer loyalty, with Arnet et al (2003) providing similar results. The work of Jinfeng
and Zhilong (2009) follows the proposal that the dimensions of brand equity affect brand equity
by influencing brand loyalty first, since they found loyalty to be a more holistic construct that is
closer to brand equity.
Their framework model of brand equity is also based on Boonghee et al. (2000) model, extended
and adapted with a few twists. Both brand equity and its dimensions were replaced with retailer
The role of Loyalty in Private label Consumer based Brand Equity
38
equity and dimensions of retailer equity. Retailer equity dimensions were then divided into two
constructs, retailer loyalty and other dimensions of retailer equity, as a means to see how these
constructs are related. Lastly, marketing mix elements were added to the store image dimensions,
since store image attributes are equated to different elements of the marketing mix. Research also
suggests that store image and its attributes have an effect on store buying behavior, with both of
these elements influencing store loyalty. The relationships between store image dimensions and
retailer equity dimensions were investigated; with results showing retailer awareness, retailer
association and retailer perceived quality as being positively related to retailer loyalty. In fact,
these results prove that there is a hierarchy among retailer equity dimensions, further confirming
that the proposal of loyalty being a more holistic construct that is closer to brand equity is true.
The other three retailer equity dimensions are also affected by the store image dimensions, which
positively influence retailer equity thanks to the mediating effect of these three retailer equity
dimensions.
While Choi and Huddleston (2014) work is a bit more specific, focusing on the effect of retailer
owned private brands on retailer equity, and narrowing down to comparing how retailer named or
non-named brands fare; it still provides conclusions in line with Jinfeng and Zhilong (2009) work,
by proving that retailer loyalty is a direct core dimension of retailer equity, and it has a positive
relationship with retailer awareness, retailer association, and perceived quality, which corroborates
the idea that there is a hierarchical structure between the retailer equity dimensions, with retailer
loyalty being more holistic and closer to brand equity.
According to Girard, Trapp, Pinar, Gulsoy and Boyt (2017), and taking into account the objective
changes happening both inside, and outside, the retail sphere, researching and developing brand
equity measures for private-label brands is a fundamental issue to be addressed, seeing as private-
label brands have been building brand equity and an actual place in consumer’s minds, as they no
longer represent just a price alternative to consumers.
While being among the first to tackle private label consumer based brand equity, Girard, Trapp,
Pinar, Gulsoy and Boyt (2017) based some of their work on the previous findings of Richardson,
Jain and Dick (1996), who, despite not being directly related to brand equity, present a framework
of factors that might influence private label proneness. Their results show that the most relevant
The role of Loyalty in Private label Consumer based Brand Equity
39
factors found to influence the purchase of private label goods are familiarity with the brand,
perceived value and perceived risk of the goods, and also extrinsic cues. This same study also
showed that familiarity/ awareness with private-label brands is critical for influencing private-label
brand proneness.
Based on existing brand equity research and private-label brand knowledge, private-label brand
equity is conceptualized as multiple constructs and measured with eight different brand equity
dimensions. The four brand-equity dimensions compiled from CBBE theory are brand awareness,
perceived quality, brand association, and brand loyalty. Based on existing research on private-label
brands the four other brand equity dimensions are perceived value, perceived risk, retailer/store
brand loyalty, and private label brand equity.
Consumers who are familiar with private-label products are likely to view them as having
perceived high quality and, as being low risk products that represent good value for money.
Higher levels of brand awareness, perceived quality, perceived value, brand association, brand
loyalty for store, and lower levels of perceived risks contribute to higher levels of loyalty for the
private-label brand and ultimately to the increase of the brand’s overall brand equity.
Their results thus showed that store loyalty increased brand loyalty for Private Label, and
ultimately the brand loyalty for Private Label increased the brand equity for the Private Label
brand.
5. Framework
The main purpose of this study is to investigate the relationships between brand loyalty and brand
equity. As was previously stated, and according to Girard, Trapp, Pinar, Gulsoy and Boyt (2017),
private labels are no longer only a price alternative to consumers who currently perceive them,
instead, as legitimate and trustworthy brands. As such, it’s imperative that brand equity measures
are seen through the light of these said private labels, researching and developing brand equity
measures just like for their national brand counterparts.
The role of Loyalty in Private label Consumer based Brand Equity
40
To sum up the concepts and findings presented in the literature review a conceptual framework
will be developed. Based on the work of Jinfeng and Zhilong (2009), who built their model aligned
with Boonghee et al. (2000) proposed framework and theory, this model relates the different
dimensions of brand equity with brand equity itself, while also looking at the hierarchical
relationship between themselves. It also takes into account the brand equity dimensions derived
from private label brand research and their influence on the CBBE based dimensions, as well as
their influence on brand equity.
As with both Boonghee et al. (2000) and Jinfeng and Zhilong (2009) models, this proposed
framework takes into account original propositions from Aaker (1991), namely the idea that brand
equity creates value for the costumer and the firm, and that this same brand equity consists of
multiple dimensions. Setting brand equity as a separate construct allows for a better understanding
on how the different dimensions influence brand equity. Antecedents are also added, to further
examine their influence role on both brand equity dimensions and brand equity itself.
Since this framework will be based on the study of Jinfeng and Zhilong (2009) it makes sense to
delve deeper on how their work was structured. Also based on Boonghee et al. (2000), it’s
proposed that brand equity dimensions contribute to brand equity and that, perceived quality, brand
associations and brand awareness might affect brand equity by influencing brand loyalty first.
Cemented on the study of Pappu and Quester (2006), that states that brand management principles
can be applied to retail bands, the original model is extended by replacing the dimensions of brand
equity with dimensions of retailer equity and brand equity with retailer equity, respectively.
Further, in order to show how retailer loyalty is related to the rest of retailer equity dimensions,
these are divided into two constructs, that is, retailer loyalty and other dimensions of retailer equity.
Having stated the logical inspirations of this adapted model, the dimensions of retailer equity, and
retailer equity itself are thus reverted back to their original state of brand equity, including retailer
loyalty. Store image dimensions, the antecedents, are also adapted into Private label based CBBE
dimensions, following the findings of Girard, Trapp, Pinar, Gulsoy and Boyt (2017).
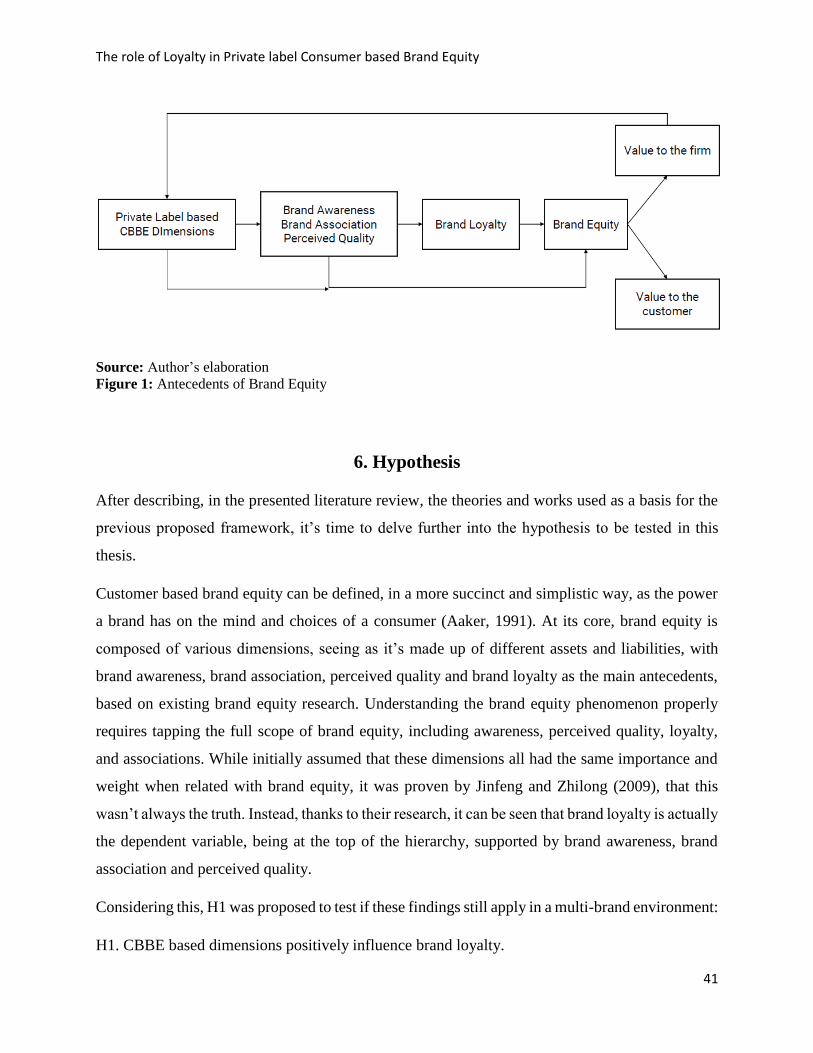
The role of Loyalty in Private label Consumer based Brand Equity
41
Source: Author’s elaboration
Figure 1: Antecedents of Brand Equity
6. Hypothesis
After describing, in the presented literature review, the theories and works used as a basis for the
previous proposed framework, it’s time to delve further into the hypothesis to be tested in this
thesis.
Customer based brand equity can be defined, in a more succinct and simplistic way, as the power
a brand has on the mind and choices of a consumer (Aaker, 1991). At its core, brand equity is
composed of various dimensions, seeing as it’s made up of different assets and liabilities, with
brand awareness, brand association, perceived quality and brand loyalty as the main antecedents,
based on existing brand equity research. Understanding the brand equity phenomenon properly
requires tapping the full scope of brand equity, including awareness, perceived quality, loyalty,
and associations. While initially assumed that these dimensions all had the same importance and
weight when related with brand equity, it was proven by Jinfeng and Zhilong (2009), that this
wasn’t always the truth. Instead, thanks to their research, it can be seen that brand loyalty is actually
the dependent variable, being at the top of the hierarchy, supported by brand awareness, brand
association and perceived quality.
Considering this, H1 was proposed to test if these findings still apply in a multi-brand environment:
H1. CBBE based dimensions positively influence brand loyalty.
The role of Loyalty in Private label Consumer based Brand Equity
42
H1a. Brand association positively influences brand loyalty.
H1b. Brand awareness positively influences brand loyalty.
H1c. Perceived quality positively influences brand loyalty.
When starting to look at brand equity and its dimensions through different prisms, it can be seen
that it’s a more complex topic than initially thought, with brand equity dimensions unfolding into
different layers and aspects. In particular, when focusing on private label based brand equity and
taking into account existing research on the topic, a new array of dimensions can be found. Thanks
to the work of Girard, Trapp, Pinar, Gulsoy and Boyt (2017) it can be seen that brand equity is
also influenced by perceived value, perceived risk, store brand loyalty and private label brand
equity, which are all based on existing research on private label brands. The other three brand
equity based brand equity dimensions are also affected by the private label dimensions, which
influence brand equity thanks to the mediating effect of these three brand equity dimensions.
To better understand how private label based CBBE affect CBBE dimensions in a multi brand
environment, H2 is proposed:
H2. Private label based CBBE positively influence CBBE based dimensions.
H2a. Perceived value positively influences brand association.
H2b. Perceived value positively influences brand awareness.
H2c. Perceived value positively influences perceived quality.
H2d. Perceived risk positively influences brand association.
H2e. Perceived risk positively influences brand awareness.
H2f. Perceived risk positively influences perceived quality.
H2g. Store brand loyalty positively influences brand association.
H2h. Store brand loyalty positively influences brand awareness.
H2i. Store brand loyalty positively influences perceived quality.
H2j. Private label brand equity positively influences brand association.

The role of Loyalty in Private label Consumer based Brand Equity
43
H2l. Private label brand equity positively influences brand awareness.
H2m. Private label brand equity positively influences perceived quality.
Taking into account the two previously proposed hypothesis, and with the goal of better
understanding private label CBBE impact on brand equity, the role of these dimensions is further
scrutinized. In particular, to see if private label based CBBE have an impact on brand loyalty, and
consequently brand equity, without requiring the mediating effect of the consumer based CBBE
dimensions. As such, it follows that H3 asks:
H3. Private label based CBBE positively influence brand loyalty.
H3a. Perceived value positively influences brand loyalty.
H3b. Perceived risk positively influences brand loyalty.
H3c. Store brand loyalty positively influences brand loyalty.
H3d. Private label brand equity positively influences brand loyalty.
The following image delineates and helps visualize the proposed hypothesis.
Source: Author’s elaboration
Figure 2: Proposed Hypothesis
The role of Loyalty in Private label Consumer based Brand Equity
44
7. Methodology
Having stated this thesis’ main objective, the role of loyalty in creating brand equity, with a special
focus on private label brand equity, and presented the hypothesis to be tested, it’s now time to
further expand on how these will be proven as true or false.
Via Qualtrics, an online survey tool, an online questionnaire was run. This type of data gathering
technique was seen as the best option to provide factual and precise conclusions, and can be
described as a quantitative research method. Quantitative research focuses on gathering numerical
data and generalizing it across groups of people or to explain a particular phenomenon, by using
methods that emphasize objective measurements and the statistical, mathematical, or numerical
analysis of data collected.
While secondary data, as well as previous information and theory, will work as the pillar for this
study, strengthening its core goals and allowing for further questioning and theory crafting;
primary data will allow for the brunt of the work yet to be written, in the sense that only new and
fresh data, collected under new specifications and situations, will help sustain innovative points of
view, thus guaranteeing that all the conclusions will come from the analysis of data collected
through experimentation and observation.
The sampling method used, snowball sampling, is a non-random one, and was chosen mostly due
the difficulty of finding and gathering such a large mass of respondents. While this method may
be accused of producing biased results, given the fact that it relies on the researcher’s social circles,
its practicality and ease of use must not be underestimated. The biasing issue will be mostly null,
by sharing the questionnaire with fairly different social circles, be it in their occupation, age and
background, which will then branch into even more diverse circles.
The questionnaire (Appendix 1 & 2) used in this thesis is heavily influenced by the previous
literature review. Following Girard, Trapp, Pinar, Gulsoy and Boyt (2017) work, and focusing on
the limitations and suggestions for further research, a need to apply their model to a broader
experience can be seen; specifically, the wish to use their scale on more than one single retailer, a
multiple retail brand environment. This will serve as the path-setter of this research and, as such,
their presented scale will be used as the main tool in the survey.

The role of Loyalty in Private label Consumer based Brand Equity
45
This scale is among the first to tackle the topic of private label based brand equity, from the
perspective of the consumer. The survey includes a total of eight brand equity antecedents and
dimensions, with the initial four focusing on traditional CBBE theory, and the other four focused
on private label studies. The scales used to measure the traditional CBBE are fairly stock, and
don’t deviate much from what other researchers have been employing in their works, being mostly
based on the accepted and widely used works of Aaker and Yoo and Donthu. The private label
scales required a much deeper study, seeing as they are still fairly untrodden. Multiple
questionnaires were analyzed by Girard, Trapp, Pinar, Gulsoy and Boyt (2017), often requiring
adaptation and rearrangement to be usable in their survey. This innovative work was the subject
of heavy testing, constantly reshaped to better fit the goals of the researchers, who pushed it to
higher purity levels via numerous rigorous pretests. Several tests were conducted in order to fine
tune the scales, both in terms of meaning and clarity and relevance of the different items.
In this thesis, a set of demographic questions were added to the survey, which allows for the
creation of more detailed consumer profiles and trends. The survey was afterwards translated from
English to Portuguese, by both the author and other fluent colleagues, seeing as the population will
be composed of Portuguese speaking citizens, and the questionnaire will be focused on the
Portuguese reality and retail brand market structure. The different translations were compared and
utilized to prepare a more precise result, still loyal and with the same meaning as the original one.
The survey was also “translated backwards” from the final Portuguese version back into English,
with results showing that the end results were still very much aligned with the original’s goal and
meaning, with little to nothing having been lost in translation. Some pretests were also run before
releasing the survey into the wild, further confirming its original purpose had not been lost, and
reassuring that it was easily understood and answered by the population. The survey is composed
of three different sections: demographic questions, first batch of antecedents and second batch of
antecedents. Besides providing more detailed information on the person answering the survey, the
demographic section also filters respondents, by asking if they are the primary responsible for
buying household goods and foods, while at the same time sorting respondents by their most loyal
retailer, on which the following sections will focus on. The antecedents sections are made up of
the translated questionnaire of Girard, Trapp, Pinar, Gulsoy and Boyt (2017) divided in two
batches of four antecedents. This way, besides providing a more appealing and easier to answer
survey, the author is able to thematically separate the questions, which first focus on the familiarity
The role of Loyalty in Private label Consumer based Brand Equity
46
to the chosen retailer, and then on the loyalty the respondent feels. Both of these sections will be
measured with a seven point Likert scale, with 1 being equal to “Strongly disagree” and 7 being
equal to “Strongly agree”.
8. Statistical analysis
8.1. Demographics and descriptives
A total of 304 questionnaire responses were collected through the Qualtrics platform, and later
treated and analyzed via the SPSS software. Of these, only 202 were deemed valid and fit for
analysis, seeing as the ones left behind were severely incomplete.
The sample being studied, the 202 valid responses, is made up of 143 females and 77 males, thus
showing a 65% share of women versus a 35% share of men. Age groups show a fairly even
distribution of respondents, with all of them hovering around the 25% value mark. The 25-34 years
group comes out slightly ahead, boasting a respondent number of 63 and representing 28% of the
total sample.
The education levels of the respondents paint a picture of a generally educated individual, seeing
as 45% of the sample holds an undergraduate degree, closely followed by respondents with an
high school or master’s education level, showing values of 26% and 21% respectively. Looking at
the Education*Age cross tabulation table (Appendix 3) it can be seen that there is a fairly even
distribution of respondents across all education levels, with only the 25-34 group standing out from
among the other groups when analyzing those with Masters level education. The
Education*Gender table (Appendix 4) also presents values in line with the previous findings,
following the same distribution trend seen in the Gender analysis, with women having around
double the amount of respondents in each education category.
The percentage of respondents who live alone, or in other words, those with no extra family
members, meaning they have a family size of 0, represent only 11% of the total sample. The most
common composition is that of one respondent plus three other family members, which accounts
for 28%. The number of individuals who live with either one more, or two more family members
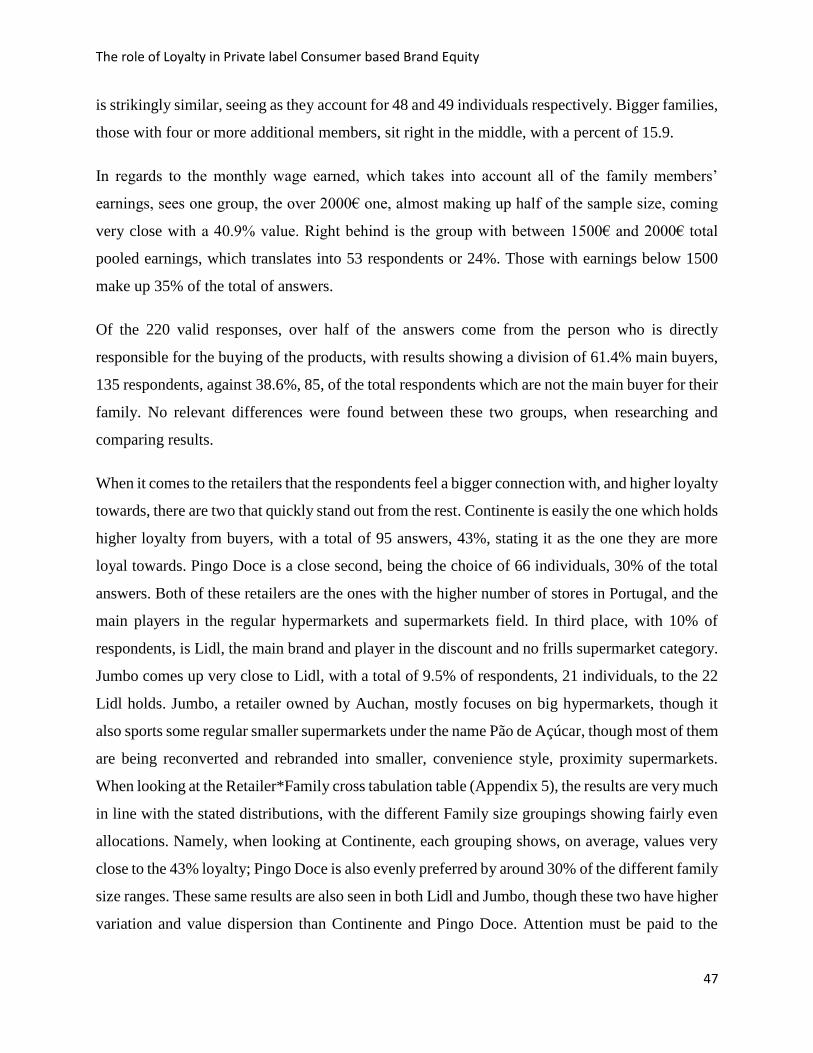
The role of Loyalty in Private label Consumer based Brand Equity
47
is strikingly similar, seeing as they account for 48 and 49 individuals respectively. Bigger families,
those with four or more additional members, sit right in the middle, with a percent of 15.9.
In regards to the monthly wage earned, which takes into account all of the family members’
earnings, sees one group, the over 2000€ one, almost making up half of the sample size, coming
very close with a 40.9% value. Right behind is the group with between 1500€ and 2000€ total
pooled earnings, which translates into 53 respondents or 24%. Those with earnings below 1500
make up 35% of the total of answers.
Of the 220 valid responses, over half of the answers come from the person who is directly
responsible for the buying of the products, with results showing a division of 61.4% main buyers,
135 respondents, against 38.6%, 85, of the total respondents which are not the main buyer for their
family. No relevant differences were found between these two groups, when researching and
comparing results.
When it comes to the retailers that the respondents feel a bigger connection with, and higher loyalty
towards, there are two that quickly stand out from the rest. Continente is easily the one which holds
higher loyalty from buyers, with a total of 95 answers, 43%, stating it as the one they are more
loyal towards. Pingo Doce is a close second, being the choice of 66 individuals, 30% of the total
answers. Both of these retailers are the ones with the higher number of stores in Portugal, and the
main players in the regular hypermarkets and supermarkets field. In third place, with 10% of
respondents, is Lidl, the main brand and player in the discount and no frills supermarket category.
Jumbo comes up very close to Lidl, with a total of 9.5% of respondents, 21 individuals, to the 22
Lidl holds. Jumbo, a retailer owned by Auchan, mostly focuses on big hypermarkets, though it
also sports some regular smaller supermarkets under the name Pão de Açúcar, though most of them
are being reconverted and rebranded into smaller, convenience style, proximity supermarkets.
When looking at the Retailer*Family cross tabulation table (Appendix 5), the results are very much
in line with the stated distributions, with the different Family size groupings showing fairly even
allocations. Namely, when looking at Continente, each grouping shows, on average, values very
close to the 43% loyalty; Pingo Doce is also evenly preferred by around 30% of the different family
size ranges. These same results are also seen in both Lidl and Jumbo, though these two have higher
variation and value dispersion than Continente and Pingo Doce. Attention must be paid to the
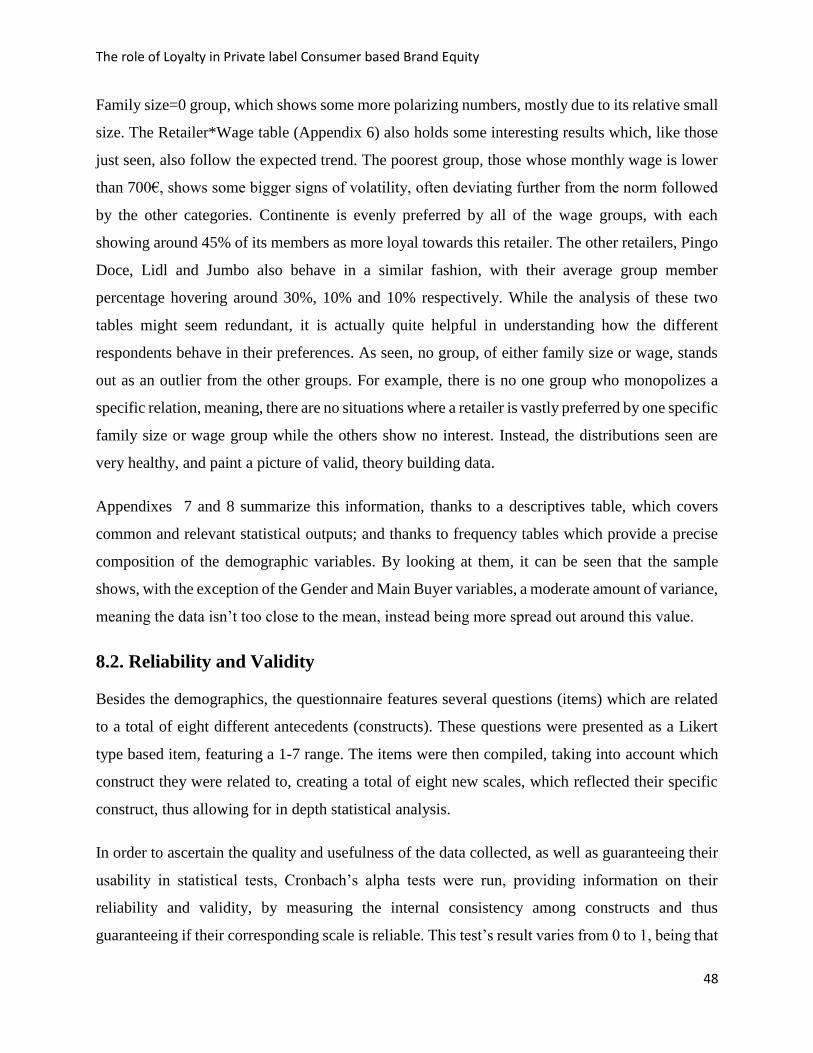
The role of Loyalty in Private label Consumer based Brand Equity
48
Family size=0 group, which shows some more polarizing numbers, mostly due to its relative small
size. The Retailer*Wage table (Appendix 6) also holds some interesting results which, like those
just seen, also follow the expected trend. The poorest group, those whose monthly wage is lower
than 700€, shows some bigger signs of volatility, often deviating further from the norm followed
by the other categories. Continente is evenly preferred by all of the wage groups, with each
showing around 45% of its members as more loyal towards this retailer. The other retailers, Pingo
Doce, Lidl and Jumbo also behave in a similar fashion, with their average group member
percentage hovering around 30%, 10% and 10% respectively. While the analysis of these two
tables might seem redundant, it is actually quite helpful in understanding how the different
respondents behave in their preferences. As seen, no group, of either family size or wage, stands
out as an outlier from the other groups. For example, there is no one group who monopolizes a
specific relation, meaning, there are no situations where a retailer is vastly preferred by one specific
family size or wage group while the others show no interest. Instead, the distributions seen are
very healthy, and paint a picture of valid, theory building data.
Appendixes 7 and 8 summarize this information, thanks to a descriptives table, which covers
common and relevant statistical outputs; and thanks to frequency tables which provide a precise
composition of the demographic variables. By looking at them, it can be seen that the sample
shows, with the exception of the Gender and Main Buyer variables, a moderate amount of variance,
meaning the data isn’t too close to the mean, instead being more spread out around this value.
8.2. Reliability and Validity
Besides the demographics, the questionnaire features several questions (items) which are related
to a total of eight different antecedents (constructs). These questions were presented as a Likert
type based item, featuring a 1-7 range. The items were then compiled, taking into account which
construct they were related to, creating a total of eight new scales, which reflected their specific
construct, thus allowing for in depth statistical analysis.
In order to ascertain the quality and usefulness of the data collected, as well as guaranteeing their
usability in statistical tests, Cronbach’s alpha tests were run, providing information on their
reliability and validity, by measuring the internal consistency among constructs and thus
guaranteeing if their corresponding scale is reliable. This test’s result varies from 0 to 1, being that

The role of Loyalty in Private label Consumer based Brand Equity
49
the generally accepted lower limit is 0,7. All of the constructs, with the exception of Perceived
quality, show values above 0,7 (Appendix 9), meaning that most of the item groupings are fairly
closely related.
It’s important to bear in mind that a Cronbach value bigger than 0,7 does not imply
unidimensionality of the measures. Unidimensionality is relevant for statistical exercises, seeing
as being unidimensional guarantees that a scale is measuring only one construct. As such, and in
order to prove unidimensionality, an explanatory factor analysis was performed, using principal
component analysis (PCA) to test the validity of the scales used.
In order to run a PCA analysis, the variables must pass two different tests. The first one, KMO
test, checks whether the sample under analysis is appropriate to perform PCA, requiring that the
test result values are higher than 0.6. The second test, Bartlett’s test, is an hypothesis test that
checks whether the variables show any signs of correlation. Thanks to the Appendix 10, it can be
seen that all constructs pass both tests, presenting both KMO values over 0.6 and rejecting
Bartlett’s null hypothesis.
With the exception of Perceived risk, and using Kaiser’s criterion, which checks for Eigen values
bigger than one, all constructs presented a single component result (Appendix 11). Though the end
result is a positive one, and further strengthens each construct’s claim of unidimensionality,
besides Perceived value and Overall brand equity, which boast 83% and 76% explained variance
respectively, all of the other constructs have very poor variance explained values, presenting very
contrasting criteria end results, when taking into account the variance explained criteria.
The only construct to suggest the use of two components, Perceived risk, ends up having a fairly
intuitive and easy to grasp conclusion. When looking at the rotated component matrix a very clear
division of the items can be seen: pr1, pr2 and pr3 are clearly more related with the physical and
monetary risk associated with a purchase, while pr4, pr5 and pr6 focuses on what type of image
the use of said product gives, and on how that product reflects on the consumer’s relations with
other individuals (Appendix 12).
Even with the contrasting results given by the different measurement criteria, and taking into
account that the Perceived risk construct could be divided into two different scales, when looking
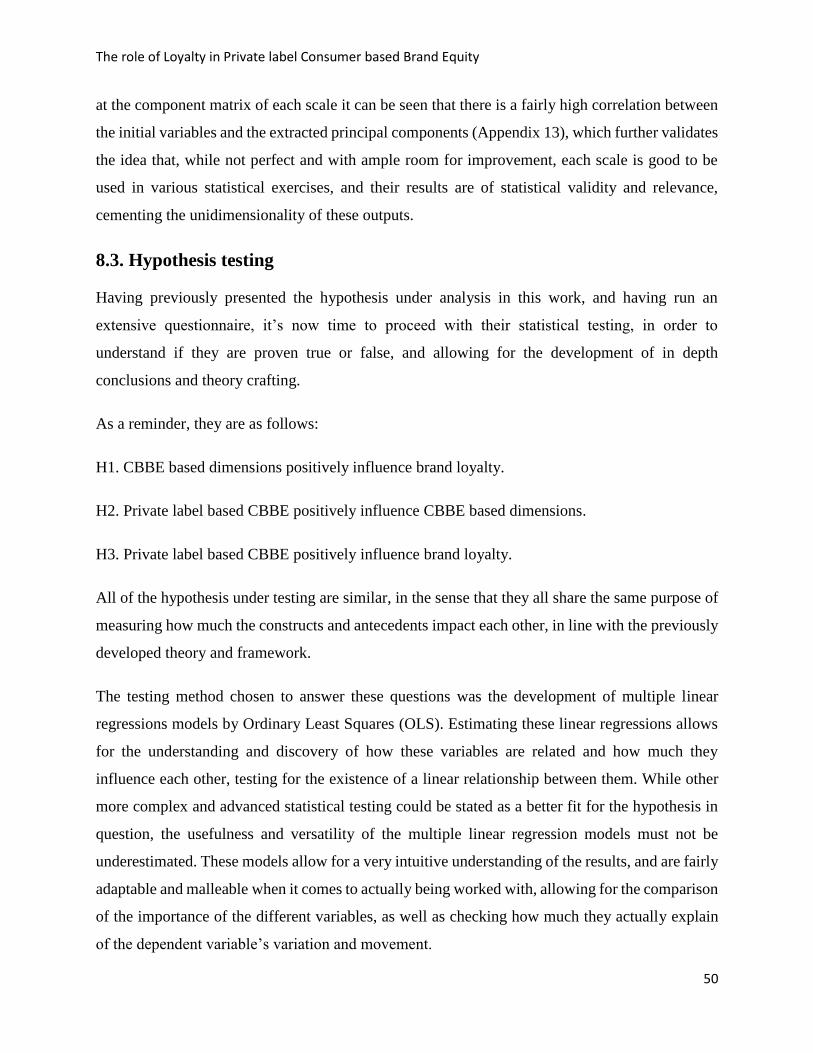
The role of Loyalty in Private label Consumer based Brand Equity
50
at the component matrix of each scale it can be seen that there is a fairly high correlation between
the initial variables and the extracted principal components (Appendix 13), which further validates
the idea that, while not perfect and with ample room for improvement, each scale is good to be
used in various statistical exercises, and their results are of statistical validity and relevance,
cementing the unidimensionality of these outputs.
8.3. Hypothesis testing
Having previously presented the hypothesis under analysis in this work, and having run an
extensive questionnaire, it’s now time to proceed with their statistical testing, in order to
understand if they are proven true or false, and allowing for the development of in depth
conclusions and theory crafting.
As a reminder, they are as follows:
H1. CBBE based dimensions positively influence brand loyalty.
H2. Private label based CBBE positively influence CBBE based dimensions.
H3. Private label based CBBE positively influence brand loyalty.
All of the hypothesis under testing are similar, in the sense that they all share the same purpose of
measuring how much the constructs and antecedents impact each other, in line with the previously
developed theory and framework.
The testing method chosen to answer these questions was the development of multiple linear
regressions models by Ordinary Least Squares (OLS). Estimating these linear regressions allows
for the understanding and discovery of how these variables are related and how much they
influence each other, testing for the existence of a linear relationship between them. While other
more complex and advanced statistical testing could be stated as a better fit for the hypothesis in
question, the usefulness and versatility of the multiple linear regression models must not be
underestimated. These models allow for a very intuitive understanding of the results, and are fairly
adaptable and malleable when it comes to actually being worked with, allowing for the comparison
of the importance of the different variables, as well as checking how much they actually explain
of the dependent variable’s variation and movement.
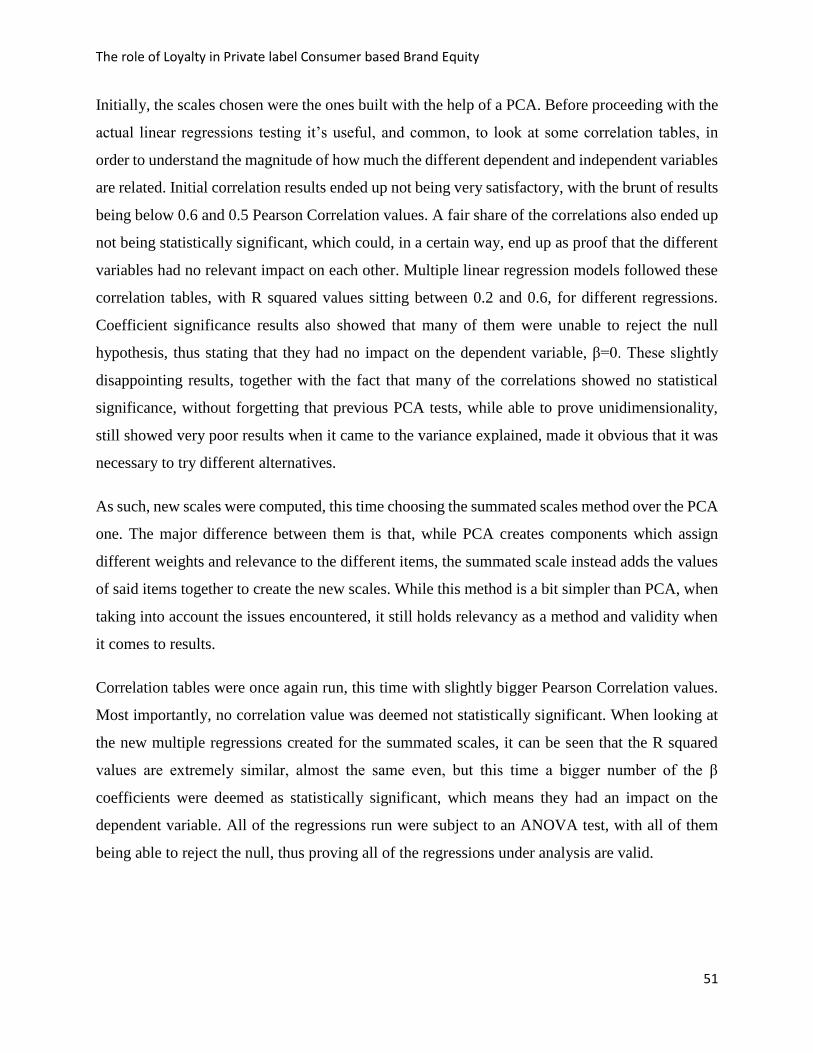
The role of Loyalty in Private label Consumer based Brand Equity
51
Initially, the scales chosen were the ones built with the help of a PCA. Before proceeding with the
actual linear regressions testing it’s useful, and common, to look at some correlation tables, in
order to understand the magnitude of how much the different dependent and independent variables
are related. Initial correlation results ended up not being very satisfactory, with the brunt of results
being below 0.6 and 0.5 Pearson Correlation values. A fair share of the correlations also ended up
not being statistically significant, which could, in a certain way, end up as proof that the different
variables had no relevant impact on each other. Multiple linear regression models followed these
correlation tables, with R squared values sitting between 0.2 and 0.6, for different regressions.
Coefficient significance results also showed that many of them were unable to reject the null
hypothesis, thus stating that they had no impact on the dependent variable, β=0. These slightly
disappointing results, together with the fact that many of the correlations showed no statistical
significance, without forgetting that previous PCA tests, while able to prove unidimensionality,
still showed very poor results when it came to the variance explained, made it obvious that it was
necessary to try different alternatives.
As such, new scales were computed, this time choosing the summated scales method over the PCA
one. The major difference between them is that, while PCA creates components which assign
different weights and relevance to the different items, the summated scale instead adds the values
of said items together to create the new scales. While this method is a bit simpler than PCA, when
taking into account the issues encountered, it still holds relevancy as a method and validity when
it comes to results.
Correlation tables were once again run, this time with slightly bigger Pearson Correlation values.
Most importantly, no correlation value was deemed not statistically significant. When looking at
the new multiple regressions created for the summated scales, it can be seen that the R squared
values are extremely similar, almost the same even, but this time a bigger number of the β
coefficients were deemed as statistically significant, which means they had an impact on the
dependent variable. All of the regressions run were subject to an ANOVA test, with all of them
being able to reject the null, thus proving all of the regressions under analysis are valid.
The role of Loyalty in Private label Consumer based Brand Equity
52
8.3.1. H1. CBBE based dimensions positively influence brand loyalty.
In line with what was developed in the literature review and hypothesis development parts, as well
as considering the limitations presented in Girard, Trapp, Pinar, Gulsoy and Boyt (2017) work, it
makes sense to test whether their findings, namely the fact that brand loyalty is supported by brand
awareness, brand association and perceived quality, its antecedents, still holds in a multi retailer
scenario.
The sub questions are:
H1a. Brand association positively influences brand loyalty.
H1b. Brand awareness positively influences brand loyalty.
H1c. Perceived quality positively influences brand loyalty.
When analyzing the correlation values (Appendix 14), it can be seen that all of the independent
variables have a positive correlation with the dependent variable, Brand loyalty. Though causality
can’t be implied from these values, they are still valuable and useful, in the sense that they show a
relevant relationship between the variables.
The multiple linear regression model computed (Appendix 14) shows an Adjusted R square value
of 0.42, meaning the independent variables, the antecedents, explain 42% of Brand loyalty’s
variation.
Looking at the coefficients’ values and significance, it can be seen that all of the antecedents have
statistical significance, meaning they are relevant and helpful in explaining Brand Loyalty.
Perceived quality is the variable with higher coefficient, 0.395, meaning it’s the most important in
explaining Brand loyalty. Brand awareness follows with a 0.25 coefficient, with Brand association
being the least important, with a coefficient of 0.168.
After this analysis, all of the three sub hypothesis are confirmed as true, thus H1 is also confirmed
true, meaning that even in a multi brand environment Brand loyalty, the hierarchically higher
variable, is still supported and influenced by its antecedents, Brand association, Brand Awareness
and Perceived quality.
The role of Loyalty in Private label Consumer based Brand Equity
53
8.3.2. H2. Private label based CBBE positively influence CBBE based
dimensions.
Following Girard, Trapp, Pinar, Gulsoy and Boyt (2017) work, as well as the developed and
explored literature review, it’s proposed that the private label based brand items have an impact
on Brand loyalty, and subsequently Brand equity, via the mediating effect of the original Brand
loyalty antecedents.
The sub hypothesis are thus divided by the relationship between each private label variable and
one of the three consumer based brand equity scales.
H2a. Perceived value positively influences brand association.
H2d. Perceived risk positively influences brand association.
H2g. Store brand loyalty positively influences brand association.
H2j. Private label brand equity positively influences brand association.
By looking at the correlation table (Appendix 15), Perceived risk jumps out from the others, due
to the fact that it has a negative correlation value of -0.212. With the exception of Perceived value,
which holds a correlation of 0.56, the other three variables hold significantly lower values, when
related with Brand association.
The regression ran shows an Adjusted R square value of 0.308, meaning the independent variables
explain 30.8% of the brand association variation (Appendix 15).
When looking at the coefficients, it’s quickly noted that of the four independent variables, only
Perceived value holds any relevance in explaining Brand association, also showing a coefficient
value of 0.509.
With this analysis in mind, only Perceived value, H2a, is considered true, meaning, it’s the only
private label based scale which affects Brand association. The other three variables, which fail to
reject the null hypothesis, Perceived risk, Store brand loyalty and Private label brand equity, H2d,
H2g and H2j respectively, are false, meaning they have no influence, positive or negative, on the
dependent variable Brand association.
The role of Loyalty in Private label Consumer based Brand Equity
54
H2b. Perceived value positively influences brand awareness.
H2e. Perceived risk positively influences brand awareness.
H2h. Store brand loyalty positively influences brand awareness.
H2l. Private label brand equity positively influences brand awareness.
Starting with the correlations (Appendix 16), Perceived risk, once again, shows a negative
correlation value of -0.302. When compared with Brand association, the relationships with Brand
Awareness are, on average, of a slightly higher numerical value.
The Adjusted R square of this new regression is equal to 0.255, thus showing that these
independent variables only explain 25.5% of Brand awareness variation.
This time, when analyzing the coefficient’s values and significance (Appendix 16), only Private
label brand equity fails to reject the null and, as such, has no impact on Brand awareness. Perceived
risk holds a negative value of -0.14, which means that a unitary increase in the perceived risk scale
will lead to a decrease in Brand awareness. The other two variables, Perceived value and Store
brand loyalty have positive coefficients, 0.371 and 0.158 respectively.
Taking these results into consideration, H2l is thus proven as false, with H2b and H2h being true,
cementing the idea that they both have an impact on Brand awareness. H2e, Perceived risk, is also
deemed false, though it’s important to note that this is not due to a lack of impact, but instead, a
negative impact, which contrasts with the results of the other variables.
H2c. Perceived value positively influences perceived quality.
H2f. Perceived risk positively influences perceived quality.
H2i. Store brand loyalty positively influences perceived quality.
H2m. Private label brand equity positively influences perceived quality.
As with the previous regressions and their specific correlations table (Appendix 17), Perceived
Risk shows a negative correlation value with Perceived quality, -0.412. Of all the H2 regressions,
The role of Loyalty in Private label Consumer based Brand Equity
55
this is the one in which the correlation values are strikingly higher, with Perceived value carrying
0.696.
In the same spirit, of all the H2 related regressions, this one holds the highest Adjusted R square
value (Appendix 17), sitting at the top with 0.515, meaning these independent variables explain
51.5% of Perceived quality variation.
Private label brand equity, as well as Store brand loyalty, both fail to have any impact on the
dependent variable. As expected, Perceived value holds the highest coefficient, impacting
Perceived quality with a value of 0.577; and Perceived risk once again holds a negative value of -
0.185.
Regarding this regression, both Store brand loyalty, H2i, and Private label brand equity, H2m, are
false, meaning that, and in line with the previous finding, they both have no impact on Perceived
quality. Perceived value, H2c, is seen as true, thus impacting positively Perceived quality. As with
the previous regression, Perceived risk, H2f, is false again. This variable holds no positive relation
with the dependent variable, but it is still relevant for the study, seeing as it has a quantifiable
negative impact.
Due to the fact that not all sub hypothesis are seen as true, H2 can’t be globally seen as a true
hypothesis, in contrast with H1. As a summary, and for simplicity’s sake, the findings are thus
shown, covering both the true sub hypothesis, as well as the ones which, albeit false, are still
relevant for analysis.
All of the following are true, meaning they have a positive impact on the specific CBBE
antecedent.
H2a. Perceived value positively influences brand association.
H2b. Perceived value positively influences brand awareness.
H2c. Perceived value positively influences perceived quality.
H2h. Store brand loyalty positively influences brand awareness.
The role of Loyalty in Private label Consumer based Brand Equity
56
The following, albeit false, still represent private label variables which impact the respective
CBBE antecedent, only with a negative impact.
H2e. Perceived risk positively influences brand awareness.
H2f. Perceived risk positively influences perceived quality.
8.3.3. H3. Private label based CBBE positively influence brand loyalty.
After testing whether the private label based variables were able to impact Brand loyalty through
the mediating effect of the CBBE variables, with results showing that that isn’t always the case. If
a private label dimension affects some of the three Brand equity dimensions, it’s expected to lead
to an impact on Brand loyalty. It was deemed relevant to test if those same private label variables
could, instead, impact Brand loyalty directly, this time without the need of the CBBE variables.
The sub hypothesis are as follows.
H3a. Perceived value positively influences brand loyalty.
H3b. Perceived risk positively influences brand loyalty.
H3c. Store brand loyalty positively influences brand loyalty.
H3d. Private label brand equity positively influences brand loyalty.
Initial findings from the correlation table (Appendix 18), show fairly promising results, given the
high correlation values of the independent variables to Brand loyalty, with Perceived value, Store
brand loyalty and Private label brand equity holding 0.696, 0.567 and 0.661 respectively.
Following previous trends, Perceived risk, once more, shows a relevant negative relation to the
dependent variable, -0.275, even if it’s a smaller impact than the other variables.
Looking at the regression model (Appendix 18), and in line with the positive correlation results,
the Adjusted R square value holds a value of 0.66, the biggest of all the regressions analyzed thus
far. This means that the private label variables are able to explain 66% of the Brand loyalty
variation.

The role of Loyalty in Private label Consumer based Brand Equity
57
Looking at the coefficient values and validity, Perceived risk stands out from among the other
variables, seeing as it is the only one that is deemed not relevant, meaning it has no impact on the
dependent variable. The other variables are all seen as relevant, with Perceived value being the
one with the biggest impact, at a coefficient value of 0.444.
In the end, only Perceived risk, H3b, is considered false, meaning it has no direct impact, positive
or negative, on Brand loyalty. The other three private label independent variables are thus true,
meaning they have a positive impact on Brand loyalty, and are able to impact it without the
mediation effects of the original CBBE variables.
8.4. Summary
As a conclusion of the hypothesis testing, the following table aims to illustrate and summarize the
outcomes of all tests that were performed for each hypothesis
H1a. Brand association positively influences brand loyalty. Validated
H1b. Brand awareness positively influences brand loyalty. Validated
H1c. Perceived quality positively influences brand loyalty. Validated
H2a. Perceived value positively influences brand association. Validated
H2b. Perceived value positively influences brand awareness. Validated
H2c. Perceived value positively influences perceived quality. Validated
H2d. Perceived risk positively influences brand association. Rejected
H2e. Perceived risk positively influences brand awareness. Rejected
H2f. Perceived risk positively influences perceived quality. Rejected
H2g. Store brand loyalty positively influences brand association. Rejected
H2h. Store brand loyalty positively influences brand awareness. Validated
H2i. Store brand loyalty positively influences perceived quality. Rejected
H2j. Private label brand equity positively influences brand association. Rejected
H2l. Private label brand equity positively influences brand awareness. Rejected
H2m. Private label brand equity positively influences perceived quality. Rejected
H3a. Perceived value positively influences brand loyalty. Validated
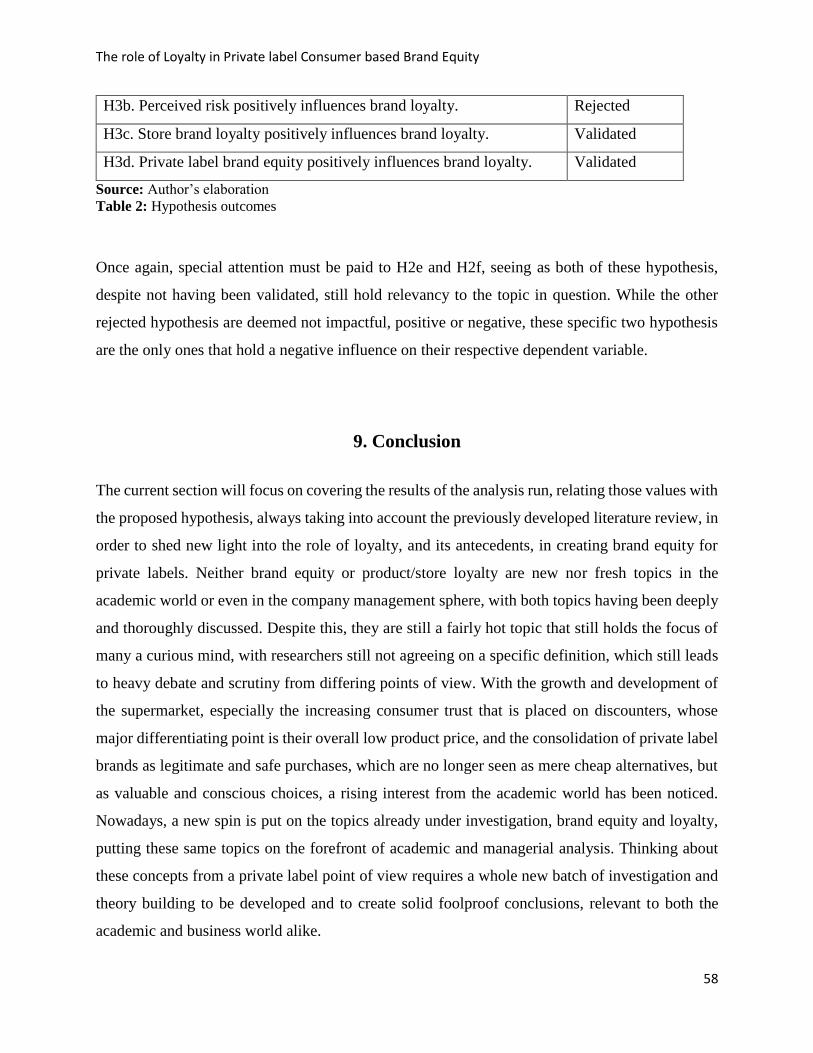
The role of Loyalty in Private label Consumer based Brand Equity
58
H3b. Perceived risk positively influences brand loyalty. Rejected
H3c. Store brand loyalty positively influences brand loyalty. Validated
H3d. Private label brand equity positively influences brand loyalty. Validated
Source: Author’s elaboration
Table 2: Hypothesis outcomes
Once again, special attention must be paid to H2e and H2f, seeing as both of these hypothesis,
despite not having been validated, still hold relevancy to the topic in question. While the other
rejected hypothesis are deemed not impactful, positive or negative, these specific two hypothesis
are the only ones that hold a negative influence on their respective dependent variable.
9. Conclusion
The current section will focus on covering the results of the analysis run, relating those values with
the proposed hypothesis, always taking into account the previously developed literature review, in
order to shed new light into the role of loyalty, and its antecedents, in creating brand equity for
private labels. Neither brand equity or product/store loyalty are new nor fresh topics in the
academic world or even in the company management sphere, with both topics having been deeply
and thoroughly discussed. Despite this, they are still a fairly hot topic that still holds the focus of
many a curious mind, with researchers still not agreeing on a specific definition, which still leads
to heavy debate and scrutiny from differing points of view. With the growth and development of
the supermarket, especially the increasing consumer trust that is placed on discounters, whose
major differentiating point is their overall low product price, and the consolidation of private label
brands as legitimate and safe purchases, which are no longer seen as mere cheap alternatives, but
as valuable and conscious choices, a rising interest from the academic world has been noticed.
Nowadays, a new spin is put on the topics already under investigation, brand equity and loyalty,
putting these same topics on the forefront of academic and managerial analysis. Thinking about
these concepts from a private label point of view requires a whole new batch of investigation and
theory building to be developed and to create solid foolproof conclusions, relevant to both the
academic and business world alike.
The role of Loyalty in Private label Consumer based Brand Equity
59
This work follows the research developed by Girard, Trapp, Pinar, Gulsoy and Boyt (2017), who
were among the first to relate and propose the analysis of brand equity and loyalty from a private
label point of view. The framework used follows the analysis developed by Boonghee et al. (2000),
that was further enhanced by Jinfeng and Zhilong (2009). This framework (Figure 1) will serve as
the guide for the conclusions reached, based on the previously tested hypothesis and previously
researched literature review.
9.1. Brand equity antecedents and loyalty
As was previously seen, brand equity as a concept is made out of different dimensions and
components. Most scholars agree that brand awareness, brand association, perceived quality and
brand loyalty are the most relevant antecedents, based on existing brand equity research. Initially,
it was believed that all of these four dimensions had the same weight and carried the same
importance in explaining brand equity; it was only after the advancements brought forth by Jinfeng
and Zhilong (2009) that the academic world started to question these previous assumptions as
dogmatic statements. In their research, it could be seen that brand loyalty was actually the
dependent variable and at the top of the dimension hierarchy, held in place thanks to the support
and influence of brand awareness, brand association and perceived quality. Brand loyalty was thus
found to be a more holistic construct, one that is closer to brand equity, thanks to the positive
relation of the other three dimensions with brand loyalty itself.
In the work of Girard, Trapp, Pinar, Gulsoy and Boyt (2017), the results defended by Jinfeng and
Zhilong (2009) are taken as true and are an essential part of the framework developed for analyzing
brand equity and private label. Following their studies and seeing as the scale used in this
dissertation is largely influenced by their work, it makes sense to look at their recommendations
for future research, namely, the wish to apply their research to other retailers and to run tests in a
multi-retailer environment. This extension of their study would serve as a means to provide
validation to the scale developed, further extending its reliability and validity and providing an
increase in overall usefulness, as well as solidifying the theory that there is a hierarchy among
brand equity antecedents.
A multiple linear regression was run, with brand loyalty in the place of the dependent variable,
and with the other dimensions, brand association, brand awareness and perceived quality as the
independent variables. The results, which can be checked in the Statistical Analysis section, show
The role of Loyalty in Private label Consumer based Brand Equity
60
that all of the dimensions are relevant and meaningful in regard to explaining the variation of brand
loyalty, with all of them also having a positive correlation. This result alone proves that the findings
of Jinfeng and Zhilong (2009), that there is a hierarchy between the antecedents and that loyalty is
a more holistic construct, still hold in a multi-retailer environment, further cementing the work of
Girard, Trapp, Pinar, Gulsoy and Boyt (2017). Perceived quality is the most important variable in
regard to explain brand loyalty, followed by brand awareness and brand association.
Besides confirming and validating previous theory, these results, namely the order in which the
different dimensions influence brand loyalty, lead to some new discussion and spark conversation
on how to most efficiently and smartly approach leverage of an increase in brand loyalty. As was
previously seen, and thanks to the work of Knudson and Vu (2017), quality is one of the major
reasons that lead to repeated purchasing behaviors. This finding bodes well for private labels,
which continue to see an increase in their popularity and public acceptance, thanks to increased
efforts in both diversifying their offer and increasing their quality and quality ranges, as seen by
the creation of economy and premium private label products; which has led to some consumer
actually preferring private label products over their national brand counterparts. This is consistent
with the findings of Hoch and Banerji (1993), who found that high quality and consistency are
much more important than price in claiming and maintaining market share for private label
products (Richardson et al., 1996). Brand awareness reflects the consumer’s ability to recognize a
specific product, as well as their familiarity with said product (Aaker, 1991). If there is a lack of
familiarity, not even high levels of product quality will be enough to foster customer consumption
of private label products, which usually leads to customers relying more on extrinsic cues.
According to the work of Bao, Bao and Sheng (2011), the most relevant extrinsic cues are price as
well as brand name and package design, areas in which private labels tend to be rated lower than
national brands. In order to increase familiarity, and consequently brand awareness, retailers
should look towards investing in strategies such as store taste test, comparisons with other brands
or even distributing samples or coupons. At the same time, a simple, yet obvious way of increasing
familiarity would be to invest in improving extrinsic cues like package design, labeling and
branding strategies (Richardson et al., 1996). Brand association, the more ethereal and less tangible
component out of the three, is seen as the one which has less impact on brand loyalty. This result
doesn’t really come as a big surprise, seeing as this dimension is made out of all the links in the
The role of Loyalty in Private label Consumer based Brand Equity
61
consumer’s memory, and is completely dependent on previously experienced episodes, instances
and ideas and the complicated connections between all of them.
9.2. Private label antecedents and Brand equity antecedents
The work of Girard, Trapp, Pinar, Gulsoy and Boyt (2017), stands out from the other works
focused on consumer-based brand equity, due to the fact that it chooses to analyze private label
products specifically. It makes use of the four previously studied brand equity dimensions, brand
loyalty, brand awareness, perceived quality and brand association, while at the same time adding
four new dimensions based on private label literature, perceived value, perceived risk, store brand
loyalty and private label brand equity. Following the logic and idea of the constructed framework,
the relationship between these new private label antecedents and brand equity was measured,
through the use of multiple linear regressions; though initially through the mediating role of the
already established brand equity antecedents. Each of the new antecedents will thus be analyzed
individually, checking whether they are relevant in explaining variations in brand loyalty, through
the mediation role of the brand equity dimensions.
Perceived value is positively related to brand loyalty through the mediating role of brand
association, brand awareness and perceived quality.
Perceived risk is negatively related to brand loyalty through the mediating role of brand awareness
and perceived quality.
Store brand loyalty is positively related to brand loyalty through the mediating role of brand
awareness.
Private label brand equity is not related to brand loyalty through the mediating role of the brand
equity antecedents.
As a construct, Private label brand equity ends up having no tangible impact on brand loyalty
through the mediating role of the brand equity antecedents. While initially this might seem like a
cause for alarm, it’s actually a fairly reasonable outcome; seeing as this private label antecedent
may initially be seen as more “broad” or “less focused” than the other three private label
antecedents, similar to how brand association may be seen as more “ethereal”, covering issues and
positioning itself more towards the end of the consumer buying journey. Instead, and despite its
The role of Loyalty in Private label Consumer based Brand Equity
62
“broader” appearance, this construct is directly focused and tied to the act of buying the private
label product itself, and as such, doesn’t really require any sort of mediation to be relevant, as will
be shown in the following section.
Brand association, which was already described as less tangible than the other CBBE antecedents,
is only relevant as a brand loyalty mediator for the perceived value antecedent. Perceived value
can also be described as the less tangible of the private label antecedents, ignoring private label
brand equity which has just been detailed, when comparing with perceived risk and store brand
loyalty, which are much more direct and practical, relying on a more “hands-on” approach, with
store brand loyalty being directly related to the retailer itself and not to the private label product.
Of the four private label antecedents, only perceived value is related to brand loyalty through the
mediating role of all three CBBE antecedents, which cements its role as an essential and crucial
component to measuring and increasing brand equity.
Perhaps the most expected, or obvious relationship, is perceived risk being mediated by both brand
awareness and perceived quality. Perceived risk directly covers expectations of both the tangible
attributes of the product, being highly related to product quality, as well as how it reflects outwards
and how the user of said products will be seen by the rest of society, both close and distant.
9.3. Private label antecedents and loyalty
While this dissertation is heavily grounded on Girard, Trapp, Pinar, Gulsoy and Boyt (2017) work,
it still took a big slice of inspiration from other works, most notably Jinfeng and Zhilong (2009).
In their work, which focused on retailer equity, they investigated if antecedents that were mediated
by CBBE antecedents influenced loyalty without the need for these mediators, seeing as brand
association, brand awareness and perceived quality all were related, positively, with brand equity.
A multiple linear regression was run, to check if the private label antecedents had any significant
impact on brand loyalty.
Private label brand equity, the construct which saw no influence in brand loyalty through the
mediating role of the CBBE antecedents, is now seen as a significant variable in explaining and
influencing brand loyalty. Overall brand equity, one of the names by which this construct has often
been referred to throughout the different studies, encapsulates perfectly what it sets out to do:
focusing on and measuring the essence of brand equity for different products; being composed by

The role of Loyalty in Private label Consumer based Brand Equity
63
different questionnaire items that are positioned right at the core of these essential situations.
Taking its focus into account, and following previously stated findings, it can be seen that this
antecedent has no need for any sort of mediation, being instead in a position where it influences
brand loyalty directly. Even though there is statistical proof of the relevancy of this construct, it
could still be argued that this is too narrow of a construct, or that the outputs obtained are so
focused that they end up not being that interesting or relevant. Instead, the better way to approach
this construct is to see it as a sort of “barometer” of the quality and health of private label brand
loyalty, alongside its role as an antecedent.
Of all the private label antecedents, only perceived risk ends up showing no significant impact on
brand loyalty. While one could rush to conclusions, therefore stating it has thus no importance for
the thesis at hands, this would be a grossly incorrect inference. It would make sense that, seeing
as perceived risk was mediated by brand awareness and perceived quality, it would also impact
brand loyalty, though it’s not such a case. This antecedent is still instrumental in helping explain
brand loyalty and equity though; what makes it unique is the fact that it is a private label
antecedent, not a CBBE antecedent, meaning perceived risk is related to, and heavily influences
both brand awareness and perceived quality. Taking into account the scales used to gather this
information, as well as the statistical analysis conducted, it can be seen that perceived risk focuses
on the quality and safety of the private label product, and on the way using said product will be
seen by others. Low product risk is an essential part of maintaining and guaranteeing product
quality, reliability and consistency. At the same time, only a risk free product will be able to grow
and expand, allowing it to become a familiar item in the consumer’s basket. This creates a sort of
three way relationship between perceived risk, perceived quality and brand awareness, in the sense
that all three are connected and related to each other, with perceived risk adopting a more “support
role” position, which heavily influences and dictates both brand awareness and perceived quality.
Brand awareness was also responsible for mediating perceived value and store brand loyalty, with
both of them directly impacting brand loyalty. As developed in the literature review section, it can
be seen that there is a two way relationship between store brand loyalty and private label product
consumption, in the sense that consuming higher amounts of private label products leads to an
increase in loyalty towards its specific store, while ate the same time, an increase in loyalty towards
the store will lead to higher levels of private label product consumption. The relationship between
The role of Loyalty in Private label Consumer based Brand Equity
64
brand awareness and store brand loyalty is an interesting one, mostly due to the fact that one is
focused on products and the other is focused on the store itself. There is though some overlap, in
the sense that they both care about the brand and how it influences them and their constructs. As
such, their relationship is justified and provides relevant insights. At the same time, statistical
analysis has proven that store brand loyalty is directly related to brand loyalty and does not need
the mediating effects of brand awareness. This situation is logically simple to understand, seeing
as the two-way relationship between product consumption and store loyalty already foreshadowed
the consequential impact on brand loyalty and brand equity.
Following the statistical analysis conducted, and thanks to the multiple linear regression created,
it can be seen that perceived value is the construct that has higher impact and influence on brand
loyalty. Considering that perceived value was also the only private label antecedent to be mediated
by all three CBBE antecedents, one can see just how important and relevant perceived value is.
The relationships based on, and around perceived value are complex and intertwined, whether they
are CBBE based or private label based. As a scale construct, in the questionnaire, perceived value
is centered on getting a good purchase or getting “more than the money’s worth”. When looking
into its relationship with the CBBE antecedents, one can quickly see why it has a positive relation
with each one of them, as it is a crucial requirement for producing familiarity while also expanding
the depth of perceived quality, tying it all together due to its influence on brand association and
the connections and experiences it contains. Perceived value may just be the most “multifaceted”
construct of all, being able to directly influence brand loyalty and the CBBE antecedents at the
same time, while also maintaining a close connection with the other private label constructs. Using
an example from the previously developed literature, it can be seen that believing a supermarket
to offer value for money leads to believing that its private label also offers value for money.
Consumers who are familiar with private-label products are likely to view them as having
perceived high quality and, as being low risk products that represent good value for money.
Currently, consumers actually want to buy private labels; they aren’t doing it just because they are
cash constrained. Thanks to the results of Richardson, Jain and Dick (1996), we know that the
most relevant factors found to influence the purchase of private label goods are familiarity with
the brand, perceived value and perceived risk of the goods. This example is great at showing the
influence perceived value has on the whole process, impacting private label antecedents, CBBE
antecedents and finally brand loyalty itself, by leading to an increase in the product purchase.
The role of Loyalty in Private label Consumer based Brand Equity
65
9.4. Academic and managerial implications
This section will cover the major takeaways that can be extracted from this thesis, being based on
the developed literature review, proposed framework and hypothesis, the questionnaire and
statistical analysis ran, as well as the conclusions reached in the previous section.
As far as academic impact goes, this dissertation is among the first to cover the topic of private
label-based brand equity creation. The works of Girard, Trapp, Pinar, Gulsoy and Boyt (2017) and
Jinfeng and Zhilong (2009) are of crucial importance to this dissertation, seeing as the antecedents
and questionnaire were heavily influenced by the first, with the framework and hypothesis creation
having drawn majorly from the second. Following Girard, Trapp, Pinar, Gulsoy and Boyt (2017)
suggestions for future research, this thesis analyzed how their scales fared in a multi retailer
environment, taking into consideration if the results collected were still valid and if assumptions
still held. While the demographic questions presented were similar to theirs, this study tried to go
a bit farther in terms of collected information by adding an item which asked the respondents to
which retailer they felt increased loyalty and asking to answer subsequent items based on the
retailer chosen. Though the limitations of this choice will be covered in the following section, it’s
still relevant to take this first step into account, seeing as it allows for better understanding of both
the consumers and the retailers, as well as creating more detailed consumer profiles, even if it can
only be used in multi retailer scenarios. While this dissertation didn’t wander too far off its initial
roots, it still provides valuable inputs on the topic at hands namely, an extensive literature review
focused on private label products, their past and their trends; that the previously developed
theoretical work still holds in more realistic and complex scenarios and that this more advanced
and robust framework is able to validate old assumptions while still allowing for new
experimentation.
Regarding managerial implications, the antecedents and their roles and position have already been
subject to a detailed analysis in this conclusion section. The major implications are as follows.
Investing into increasing store brand loyalty leads to an increase in private label product
consumption, which in turn leads to an increase in private label loyalty. It’s important to remember
the two way relationship present in these situations, in the sense that an increase in store brand
loyalty and private label product consumption both lead to an increase in its counterpart. The most
relevant factors found to influence the purchase of private label goods are familiarity with the
The role of Loyalty in Private label Consumer based Brand Equity
66
brand, perceived value and perceived risk of the goods. This three-way relationship, which has
been detailed before, shows that consumers who have high levels of brand awareness, see private-
label products as having high perceived quality and, as being low risk products that represent good
value for money. High quality is much more important than price in claiming and maintaining
market share for private label products, seeing as it also influences repeated purchasing behaviors.
The foundation for building and increasing private label brand loyalty and equity is brand
awareness and familiarity. If a lack of familiarity is present, not even high levels of product quality
will be enough to increase private label product consumption, which usually leads to customers
relying more on extrinsic cues. Thus, retailers must ensure that their private labels have engaging
packaging and prominent display in the store environment, increasing exposure and the probability
that customers will notice and inspect the products. In order to increase familiarity, and
consequently brand awareness, retailers should look towards investing in strategies such as store
taste test, comparisons with other brands or even distributing samples or coupons in the storefield.
9.5. Limitations and future research
Even though researchers tend to get very attached to their investigation works, seeing as they
require extensive work hours and a religious devotion, a critical mindset must be kept until the
very end, since being able to discuss the new milestones reached is as important as providing an
honest review and criticism of the work developed. The ones that stand out the most in this
dissertation are as follows.
First of all, the number of questionnaire respondents, while serviceable, is still lower than one
would like. The 202 valid responses, which ended up as the total population for this study, allowed
for a proper statistical analysis, but are just barely enough. A higher number of responses should
be assured in the future, in order to lower any possible bias and non-randomness the population
may show.
In the same vein, a total of 304 responses were collected. Truthfully though, the total amount of
non-valid answers is drastically higher than this, but is, unfortunately, impossible to determine.
This situation is caused by Qualtrics, the software used to create and measure the questionnaire,
which automatically deletes non valid answers after a short time frame. While it’s true that these
would still not increase the pool of valid answers, it would have still provided useful information,

The role of Loyalty in Private label Consumer based Brand Equity
67
in the sense that it would allow for more investigation on the creation of consumer profiles, as well
as, allowing for improvements in the questionnaire itself, since one would be able to see where
those respondents stopped answering the items.
Having run the questionnaire, and after interviewing some of the respondents, it can be said that
the questionnaire was mostly well received, though comments of some answers being too similar
were often received. It is thus relevant to investigate further on the scales, analyzing both the
possibility of taking some superfluous items out and the possibility of changing or adding some
more distinct items, which would broaden the questionnaires range.
Running the test on a multiple retailer scenario opens up the possibility of new demographic
questions, like the one proposed: asking which retailer the respondent is more loyal towards. While
in theory this would allow for the segmentation and possibility of more in-depth consumer profiles,
the reality is that this is a much more complex situation. Retailer loyalty is a very hard concept to
define, with many different legitimate points of view, however, in the questionnaire, and due to
logistical issues, it’s impossible to explain this concept in detail, which thus requires that this item
be oversimplified, possibly leading to some confusion. At the same time, concepts such as retailer,
wholesaler, private label and national brand are not completely known or understood by a large
part of the population, which requires either an explanation, or, once more, an oversimplified
approach.
The statistical analysis ran, while practical and able to deliver relevant results, is a bit too
simplified, in the sense that linear regressions are only able to report on fairly basic relationships.
Summated scales, the method used to create the questionnaire scales, are also a bit too basic of a
tool, and as such, the overall project would benefit from the application and use of more complex
statistical tools.
The role of Loyalty in Private label Consumer based Brand Equity
68
10. Bibliography
Aaker, D. A. (1991). Managing brand equity: Capitalizing on the value of a brand name. New
York: Free Press.
Abril, C., & Rodriguez-Cánovas, B. (2016). Marketing mix effects on private labels brand equity.
European Journal of Management and Business Economics, 25(3), 168–175.
https://doi.org/10.1016/j.redeen.2016.09.003
Ailawadi, K. (2008). Private Label Use and Store Loyalty. Journal of Marketing, 72, 19–30.
https://doi.org/10.1136/bcr-2015-213144 LK -
http://limo.libis.be/resolver?&sid=EMBASE&issn=1757790X&id=doi:10.1136%2Fbcr-
2015-
213144&atitle=Spontaneous+pulmonary+haemorrhage+into+an+existing+emphysematous
+bulla&stitle=BMJ+Case+Rep.&title=BMJ+Case+Reports&volume=2016&issue=&spage
=&epage=&aulast=Withey&aufirst=Samuel&auinit=S.&aufull=Withey+S.&coden=&isbn=
&pages=-&date=2016&auinit1=S&auinitm=
Ailawadi, K. L., & Harlam, B. (2004). An Empirical Analysis of the Determinants of Retail
Margins: The Role of Store-Brand Share. Journal of Marketing, 68(1), 147–165.
https://doi.org/10.1509/jmkg.68.1.147.24027
Ailawadi, K. L., & Keller, K. L. (2004). Understanding retail branding: Conceptual insights and
research priorities. Journal of Retailing, 80(4), 331–342.
https://doi.org/10.1016/j.jretai.2004.10.008
Amrouche, N., & Yan, R. (2012). Implementing online store for national brand competing against
private label. Journal of Business Research, 65(3), 325–332.
https://doi.org/10.1016/j.jbusres.2011.04.008
Andajani, E. (2015). Understanding Customer Experience Management in Retailing. Procedia -
Social and Behavioral Sciences, 211(September), 629–633.
https://doi.org/10.1016/j.sbspro.2015.11.082
Arnett, D. B., Laverie, D. A., & Meiers, A. (2003). Developing parsimonious retailer equity
indexes using partial least squares analysis: A method and applications. Journal of Retailing,
79(3), 161–170. https://doi.org/10.1016/S0022-4359(03)00036-8
AS CADEIAS DE LOJAS MAIS PRODUTIVOS DA EUROPA (2019, May,27) Retrieved May,
27, 2019 from http://www.hipersuper.pt/2019/05/27/as-cadeias-lojas-produtivos-da-europa/
Baltas, G., & Argouslidis, P. C. (2007). Consumer characteristics and demand for store brands.
International Journal of Retail & Distribution Management, 35(5), 328–341.
https://doi.org/10.1108/09590550710743708
Bao, Y., Bao, Y., & Sheng, S. (2011). Motivating purchase of private brands: Effects of store
image, product signatureness, and quality variation. Journal of Business Research, 64(2),
220–226. https://doi.org/10.1016/j.jbusres.2010.02.007
Batra, R. (2000). Consumer-Level Factors Moderating The Success. 76(2), 175–191.
Beneke, J., Flynn, R., Greig, T., & Mukaiwa, M. (2013). The influence of perceived product
quality, relative price and risk on customer value and willingness to buy: A study of private
label merchandise. Journal of Product and Brand Management, 22(3), 218–228.
The role of Loyalty in Private label Consumer based Brand Equity
69
https://doi.org/10.1108/JPBM-02-2013-0262
Boonghee, Y., Naveen, D., & Sungho, L. (2000). An Examination of Selected Marketing Mix
Elements and Brand Equity. Journal of the Academy of Marketing Science, 28(2), 195–211.
Retrieved from https://link.springer.com/content/pdf/10.1177/0092070300282002.pdf
Brazauskaitė, I., Auruškevičienė, V., & Gerbutavičienė, R. (2014). Private label management in
retail : the concept, consumer profiling and competition with national brands. Systematic
review of main findings. Management of Organizations: Systematic Research, 71(71), 53–
65. https://doi.org/10.7220/mosr.2335.8750.2014.71.4
Chan Choi, S., & Coughlan, A. T. (2006). Private label positioning: Quality versus feature
differentiation from the national brand. Journal of Retailing, 82(2), 79–93.
https://doi.org/10.1016/j.jretai.2006.02.005
Chintagunta, P. K., Bonfrer, A., & Song, I. (2002). Investigating the Effects of Store-Brand
Introduction on Retailer Demand and Pricing Behavior. Management Science, 48(10), 1242–
1267. https://doi.org/10.1287/mnsc.48.10.1242.274
Choi, J. P., & Jeon, D.-S. (2007). A Leverage Theory of Reputation Building with Co-Branding:
Complementarity in Reputation Building. Ssrn. https://doi.org/10.2139/ssrn.1002882
Choi, L., & Huddleston, P. (2014). The effect of retailer private brands on consumer-based retailer
equity: comparison of named private brands and generic private brands. International Review
of Retail, Distribution and Consumer Research, Vol. 24, pp. 59–78.
https://doi.org/10.1080/09593969.2013.821417
Chung, H., & Lee, E. (2017). Store Brand Quality and Retailer’s Product Line Design. Journal of
Retailing, 93(4), 527–540. https://doi.org/10.1016/j.jretai.2017.09.002
Çifci, S., Ekinci, Y., Whyatt, G., Japutra, A., Molinillo, S., & Siala, H. (2016). A cross validation
of Consumer-Based Brand Equity models: Driving customer equity in retail brands. Journal
of Business Research, 69(9), 3740–3747. https://doi.org/10.1139/b61-092
Clifton, R., & Simmons, J., (2003) Brands and branding. Great Britain: The Economist
Corstjens, M., & Lal, R. (2000). Building Store Loyalty Through Store Brands. Journal of
Marketing Research, 37(3), 281–291. https://doi.org/10.1509/jmkr.37.3.281.18781
Cuneo, A., Milberg, S. J., Benavente, J. M., & Palacios-Fenech, J. (2015). The Growth of Private
Label Brands: A Worldwide Phenomenon? Journal of International Marketing, 23(1), 72–
90. https://doi.org/10.1509/jim.14.0036
Dawes, J., & Nenycz-Thiel, M. (2013). Analyzing the intensity of private label competition across
retailers. Journal of Business Research, 66(1), 60–66.
https://doi.org/10.1016/j.jbusres.2011.07.023
De, D., & Singh, A. (2017). Consumer’s Perspective and Retailer’s Consideration Towards
Purchase of Private Label Brands. Procedia Computer Science, 122, 587–594.
https://doi.org/10.1016/j.procs.2017.11.410
Dhar, S. K., & Hoch, S. J. (1997). Why Store Brand Penetration Varies by Retailer. Marketing
Science, 16(3), 208–227. https://doi.org/10.1287/mksc.16.3.208
do Vale, R. C., Verga Matos, P., & Caiado, J. (2016). The impact of private labels on consumer
store loyalty: An integrative perspective. Journal of Retailing and Consumer Services, 28,
The role of Loyalty in Private label Consumer based Brand Equity
70
179–188. https://doi.org/10.1016/j.jretconser.2015.10.003
Fall Diallo, M., Chandon, J. L., Cliquet, G., & Philippe, J. (2013). Factors influencing consumer
behaviour towards store brands: Evidence from the French market. International Journal of
Retail & Distribution Management, 41(6), 422–441.
https://doi.org/10.1108/09590551311330816
Fisher, D., Burton, S., & Garretson, J. A. (2002). Antecedents of private label attitude and national
brand promotion attitude: similarities and differences. Journal of Retailing, 78(2), 91–99.
https://doi.org/10.1016/S0022-4359(02)00071-4
Getting Ready to Battle Grocery's Hard Discounters (Knudon,K. Vu,M.,2017, May, 31) Retrieved
May 27,2018 from https://www.bain.com/insights/getting-ready-to-battle-grocerys-hard-
discounters/
Geyskens, I., Gielens, K., & Gijsbrechts, E. (2010). Proliferating Private-Label Portfolios: How
Introducing Economy and Premium Private Labels Influences Brand Choice. Journal of
Marketing Research, 47(5), 791–807. https://doi.org/10.1509/jmkr.47.5.791
Girard, T., Trapp, P., Pinar, M., Gulsoy, T., & Boyt, T. E. (2017). Consumer-Based Brand Equity
of a Private-Label Brand: Measuring and Examining Determinants. Journal of Marketing
Theory and Practice, 25(1), 39–56. https://doi.org/10.1080/10696679.2016.1236662
Hansen, K., & Singh, V. (2008). Are Store-Brand Buyers Store Loyal? An Empirical Investigation.
Management Science, 54(10), 1828–1834. https://doi.org/10.1287/mnsc.1080.0861
Hansen, K., Singh, V., & Chintagunta, P. (2006). Understanding Store-Brand Purchase Behavior
Across Categories. Marketing Science, 25(1), 75–90.
https://doi.org/10.1287/mksc.1050.0151
Hoch, S. J., & Banerji, S. (1993). When Do Private Labels Succeed? | MIT Sloan Management
Review. Sloan Management Review, 34(4), 57–67. Retrieved from
http://sloanreview.mit.edu/article/when-do-private-labels-succeed/
Hökelekli, G., Lamey, L., & Verboven, F. (2017). The battle of traditional retailers versus
discounters: The role of PL tiers. Journal of Retailing and Consumer Services, 39(June), 11–
22. https://doi.org/10.1016/j.jretconser.2017.06.011
Hoskins, J. D. (2016). Offering value and capturing surplus: A strategy for private label sales in a
new customer loyalty building scenario. Journal of Retailing and Consumer Services, 28(July
2015), 274–280. https://doi.org/10.1016/j.jretconser.2015.06.006
Ipek, I., Aşkin, N., & Ilter, B. (2016). Private label usage and store loyalty: The moderating impact
of shopping value. Journal of Retailing and Consumer Services, 31, 72–79.
https://doi.org/10.1016/j.jretconser.2016.03.011
Jacoby, J., Olson, J. C., & Haddock, R. A. (1971). Price, brand name, and product composition
characteristics as determinants of perceived quality. Journal of Applied Psychology, 55(6),
570–579. https://doi.org/10.1037/h0032045
Jagmohan, S., Sethuraman, R., & Sanjay, K. (1995). The introduction and performance of store
brands. Management Science, 41(6), 957–978.
Jinfeng, W., & Zhilong, T. (2009). The impact of selected store image dimensions on retailer
equity: Evidence from 10 Chinese hypermarkets. Journal of Retailing and Consumer
The role of Loyalty in Private label Consumer based Brand Equity
71
Services, 16(6), 486–494. https://doi.org/10.1016/j.jretconser.2009.08.002
Keller, K.L. 2013. Strategic brand management: Building, measuring and managing brand
Equity. Pearson Education International, Upper Saddle River.
Koschate-Fischer, N., Cramer, J., & Hoyer, W. D. (2014). Moderating Effects of the Relationship
Between Private Label Share and Store Loyalty. Journal of Marketing, 78(2), 69–82.
https://doi.org/10.1509/jm.13.0075
Kotler, P. & Armstrong, G., (2018) Principles of Marketing. United Kingdom, Pearson
Kumar, N. & Steenkamp, J., (2007) Private Label Strategy: How to Meet the Store Brand
Challenge. Boston: Harvard Business School Press
Levy, M., Grewal, D., Peterson, R. A., & Connolly, B. (2005). The concept of the “Big Middle.”
Journal of Retailing, 81(2 SPEC. ISS.), 83–88. https://doi.org/10.1016/j.jretai.2005.04.001
Marcas da distribuição crescem acima das marcas de fabricante (2019, September, 11) Retrieved
September, 11, 2019 from https://grandeconsumo.com/marcas-da-distribuicao-crescem-acima-
das-marcas-de-fabricante
Martos-Partal, M., & González-Benito, Ó. (2011). Store brand and store loyalty: The moderating
role of store brand positioning. Marketing Letters, 22(3), 297–313.
https://doi.org/10.1007/s11002-010-9126-x
Mieres, C. G., Martín, A. M. D., & Gutiérrez, J. A. T. (2006). Antecedents of the difference in
perceived risk between store brands and national brands. European Journal of Marketing,
40(1–2), 61–82. https://doi.org/10.1108/03090560610637310
Morris B. Holbrook, & Elizabeth C. Hirschman. (n.d.). 1982_Holbrook. 1982.
Nenycz-Thiel, M., & Romaniuk, J. (2012). Value-for-money perceptions of supermarket and
private labels. Australasian Marketing Journal, 20(2), 171–177.
https://doi.org/10.1016/j.ausmj.2011.12.002
Nenycz-Thiel, M., & Romaniuk, J. (2016). Understanding premium private labels: A consumer
categorisation approach. Journal of Retailing and Consumer Services, 29, 22–30.
https://doi.org/10.1016/j.jretconser.2015.10.008
Ngobo, P. V. (2011). Private label share, branding strategy and store loyalty. Journal of Retailing
and Consumer Services, 18(4), 259–270. https://doi.org/10.1016/j.jretconser.2010.11.007
Olbrich, R., Jansen, H. C., & Hundt, M. (2017). Effects of pricing strategies and product quality
on private label and national brand performance. Journal of Retailing and Consumer Services,
34, 294–301. https://doi.org/10.1016/j.jretconser.2016.01.012
Oliver, R. L. (1999). Whence Consumer Loyalty. Journal of Marketing, 63, 33–44.
Omar, O. E. (1996). Grocery purchase behaviour for national and own-label brands. Service
Industries Journal, 16(1), 58–66. https://doi.org/10.1080/02642069600000006
Oren, C. (2007). The dialectic of the retail evolution. Journal of Direct Marketing, 3(1), 15–29.
https://doi.org/10.1002/dir.4000030105
ÓscarGonzález-Benito, & MercedesMartos-Partal. (2012). ROLE OF RETAILER
POSITIONING AND PRODUCT CATEGORY ON THE RELATIONSHIP BETWEEN
The role of Loyalty in Private label Consumer based Brand Equity
72
STORE BRAND CONSUMPTION AND STORE LOYALTY. Journal of Retailing, 88(2),
236–249.
Pappu, R., & Quester, P. (2006). A consumer-based method for retailer equity measurement:
Results of an empirical study. Journal of Retailing and Consumer Services, 13(5), 317–329.
https://doi.org/10.1016/j.jretconser.2005.10.002
Pappu, R., Quester, P. G., & Cooksey, R. W. (2009). Consumer‐based brand equity: improving
the measurement – empirical evidence. Journal of Product & Brand Management, Vol. 14,
pp. 143–154. https://doi.org/10.1108/10610420510601012
Paula, A., Juracy, M., Parente, G., Hristov, L., & Reynolds, J. (2015). International Journal of
Retail & Distribution Management Retail evolution model in emerging markets: apparel store
formats in Brazil"Retail evolution model in emerging markets: apparel store formats in.
International Journal of Retail & Distribution Management International Journal of Retail
& Distribution Management International Journal of Retail & Distribution
Management International Journal of Retail & Distribution Management, 43(2), 242–
260. Retrieved from http://dx.doi.org/10.1108/IJRDM-03-2012-
0025%5Cnhttp://%5Cnhttp://dx.doi.org/10.1108/%5Cnhttp://dx.doi.org/10.1108/IJRDM-
09-2012-0079
PEKKA TUOMINEN. (1999). Managing Brand Equity. 65–100. Retrieved from
https://pdfs.semanticscholar.org/5a49/dfc627a8ce55369687bc53c17b06c84e5252.pdf
Pepe, M. S., Abratt, R., & Dion, P. (2011). The impact of private label brands on customer loyalty
and product category profitability. Journal of Product and Brand Management, 20(1), 27–
36. https://doi.org/10.1108/10610421111107996
Pepe, M. S., Abratt, R., & Dion, P. (2012). Competitive advantage, private-label brands, and
category profitability. Journal of Marketing Management, 28(1–2), 154–172.
https://doi.org/10.1080/0267257X.2010.498145
Rao, T. R. (2006). Are Some Consumers More Prone to Purchase Private Brands? Journal of
Marketing Research, 6(4), 447. https://doi.org/10.2307/3150080
Richardson, P. S., Dick, A. S., & Jain, A. K. (1994). Extrinsic and Intrinsic Cue Effects on
Perceptions of Store Brand Quality. Journal of Marketing, 58(4), 28.
https://doi.org/10.2307/1251914
Richardson, P. S., Jain, A. K., & Dick, A. (1996). Household store brand proneness: A framework.
Journal of Retailing, 72(2), 159–185. https://doi.org/10.1016/S0022-4359(96)90012-3
Rossi, P., Borges, A., & Bakpayev, M. (2015). Journal of Retailing and Consumer Services Private
labels versus national brands : The effects of branding on sensory perceptions and purchase
intentions. Journal of Retailing and Consumer Services, 27, 74–79.
Sands, S., Oppewal, H., & Beverland, M. (2009). The effects of in-store themed events on
consumer store choice decisions. Journal of Retailing and Consumer Services, 16(5), 386–
395. https://doi.org/10.1016/j.jretconser.2009.05.001
Sayman, S., & Raju, J. S. (2004). How category characteristics affect the number of store brands
offered by the retailer: A model and empirical analysis. Journal of Retailing, 80(4), 279–287.
https://doi.org/10.1016/j.jretai.2004.10.004
Schnittka, O. (2015). Are they always promising? An empirical analysis of moderators influencing

The role of Loyalty in Private label Consumer based Brand Equity
73
consumer preferences for economy and premium private labels. Journal of Retailing and
Consumer Services, 24(C), 94–99. https://doi.org/10.1016/j.jretconser.2015.02.006
Sethuraman, R., & Gielens, K. (2014). Determinants of store brand share. Journal of Retailing,
90(2), 141–153. https://doi.org/10.1016/j.jretai.2014.04.002
Steenkamp, J.-B. E. M., & Kumar, N. (2009). Don ’ t Be Undersold ! Harvard Business Review,
87(12), 90–95.
Steenkamp, J. B. E. M., & Dekimpe, M. G. (1997). The Increasing Power of Store Brands:
Building Loyalty and Market Share. Long Range Planning, 30(6), 917–930.
https://doi.org/10.1016/S0024-6301(97)00077-0
Steenkamp, J. E. M., & Kumar, N. (2009). Don ’ t Be Undersold ! 90–95.
Stobart, J. (2010). Explorations & insights: A history of shopping: The missing link between retail
and consumer revolutions. Journal of Historical Research in Marketing, 2(3), 342–349.
https://doi.org/10.1108/17557501011067860
Ter Braak, A., Geyskens, I., & Dekimpe, M. G. (2014). Taking private labels upmarket: Empirical
generalizations on category drivers of premium private label introductions. Journal of
Retailing, 90(2), 125–140. https://doi.org/10.1016/j.jretai.2014.01.003
Valenzuela, A., Zhao, Y., & Erdem, T. (2004). Performance of Store Brands: A Cross-Country
Analysis of Consumer Store-Brand Preferences, Perceptions, and Risk. Journal of Marketing
Research, 41(1), 86–100.
van Heerde, H. J., Gijsbrechts, E., & Pauwels, K. (2008). Winners and Losers in a Major Price
War. Journal of Marketing Research, 45(5), 499–518. https://doi.org/10.1509/jmkr.45.5.499
Vroegrijk, M., Gijsbrechts, E., & Campo, K. (2016). Battling for the Household’s Category Buck:
Can Economy Private Labels Defend Supermarkets Against the Hard-Discounter Threat?
Journal of Retailing, 92(3), 300–318. https://doi.org/10.1016/j.jretai.2016.05.003
Yoo, B., & Donthu, N. (2001). Developing and validating a multidimensional consumer-based
brand equity scale. Journal of Business Research, 52(1), 1–14.
https://doi.org/10.1016/S0148-2963(99)00098-3
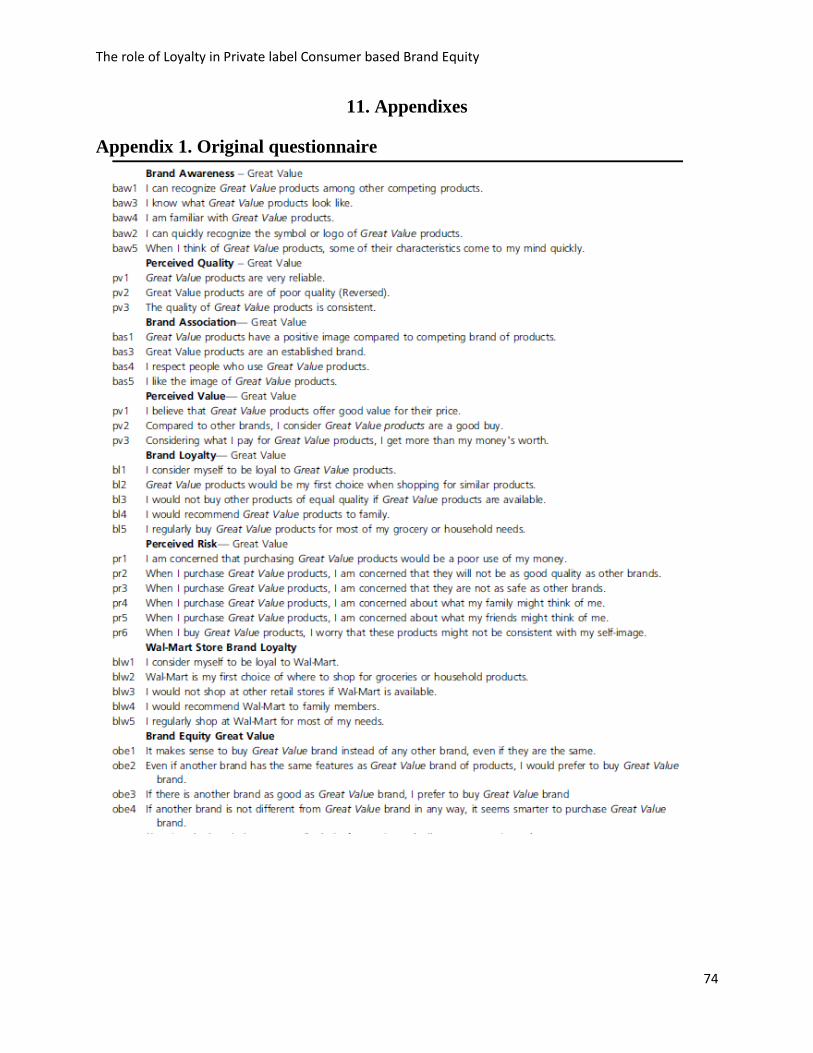
The role of Loyalty in Private label Consumer based Brand Equity
74
11. Appendixes
Appendix 1. Original questionnaire
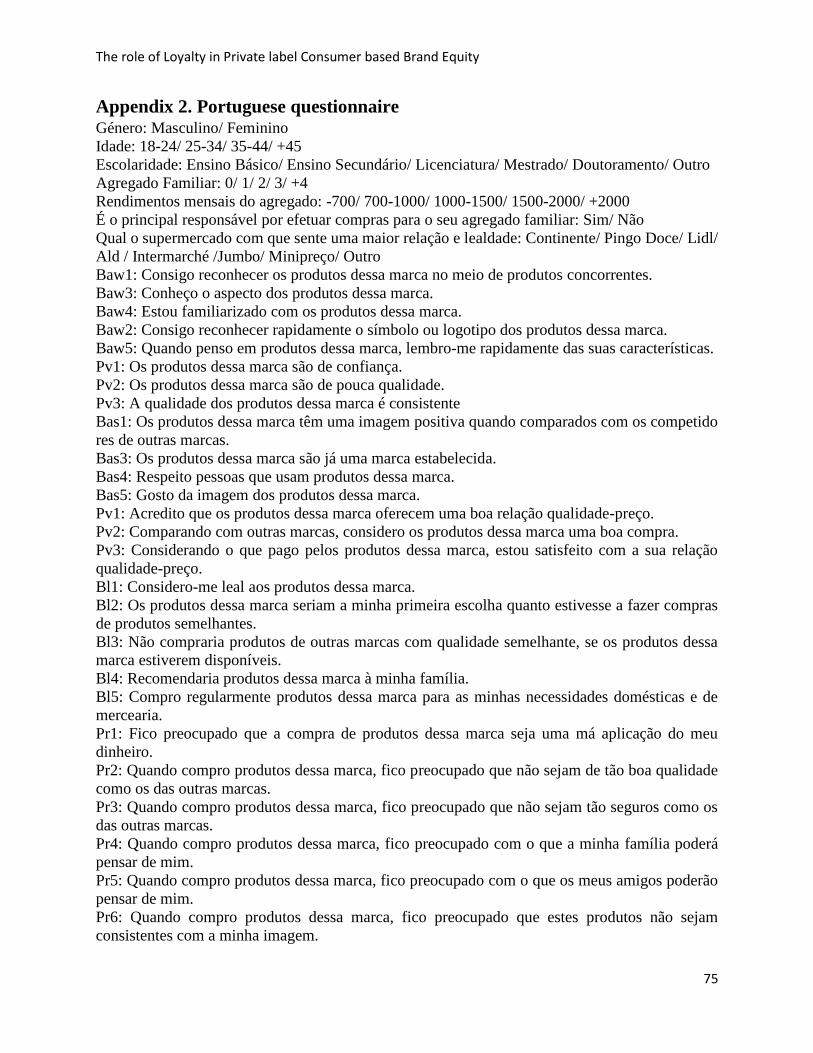
The role of Loyalty in Private label Consumer based Brand Equity
75
Appendix 2. Portuguese questionnaire Género: Masculino/ Feminino
Idade: 18-24/ 25-34/ 35-44/ +45
Escolaridade: Ensino Básico/ Ensino Secundário/ Licenciatura/ Mestrado/ Doutoramento/ Outro
Agregado Familiar: 0/ 1/ 2/ 3/ +4
Rendimentos mensais do agregado: -700/ 700-1000/ 1000-1500/ 1500-2000/ +2000
É o principal responsável por efetuar compras para o seu agregado familiar: Sim/ Não
Qual o supermercado com que sente uma maior relação e lealdade: Continente/ Pingo Doce/ Lidl/
Ald / Intermarché /Jumbo/ Minipreço/ Outro
Baw1: Consigo reconhecer os produtos dessa marca no meio de produtos concorrentes.
Baw3: Conheço o aspecto dos produtos dessa marca.
Baw4: Estou familiarizado com os produtos dessa marca.
Baw2: Consigo reconhecer rapidamente o símbolo ou logotipo dos produtos dessa marca.
Baw5: Quando penso em produtos dessa marca, lembro-me rapidamente das suas características.
Pv1: Os produtos dessa marca são de confiança.
Pv2: Os produtos dessa marca são de pouca qualidade.
Pv3: A qualidade dos produtos dessa marca é consistente
Bas1: Os produtos dessa marca têm uma imagem positiva quando comparados com os competido
res de outras marcas.
Bas3: Os produtos dessa marca são já uma marca estabelecida.
Bas4: Respeito pessoas que usam produtos dessa marca.
Bas5: Gosto da imagem dos produtos dessa marca.
Pv1: Acredito que os produtos dessa marca oferecem uma boa relação qualidade-preço.
Pv2: Comparando com outras marcas, considero os produtos dessa marca uma boa compra.
Pv3: Considerando o que pago pelos produtos dessa marca, estou satisfeito com a sua relação
qualidade-preço.
Bl1: Considero-me leal aos produtos dessa marca.
Bl2: Os produtos dessa marca seriam a minha primeira escolha quanto estivesse a fazer compras
de produtos semelhantes.
Bl3: Não compraria produtos de outras marcas com qualidade semelhante, se os produtos dessa
marca estiverem disponíveis.
Bl4: Recomendaria produtos dessa marca à minha família.
Bl5: Compro regularmente produtos dessa marca para as minhas necessidades domésticas e de
mercearia.
Pr1: Fico preocupado que a compra de produtos dessa marca seja uma má aplicação do meu
dinheiro.
Pr2: Quando compro produtos dessa marca, fico preocupado que não sejam de tão boa qualidade
como os das outras marcas.
Pr3: Quando compro produtos dessa marca, fico preocupado que não sejam tão seguros como os
das outras marcas.
Pr4: Quando compro produtos dessa marca, fico preocupado com o que a minha família poderá
pensar de mim.
Pr5: Quando compro produtos dessa marca, fico preocupado com o que os meus amigos poderão
pensar de mim.
Pr6: Quando compro produtos dessa marca, fico preocupado que estes produtos não sejam
consistentes com a minha imagem.
The role of Loyalty in Private label Consumer based Brand Equity
76
Blw1: Considero-me leal ao retalhista (supermercado) dessa marca.
Blw2: O retalhista (supermercado) dessa marca é a minha primeira escolha para compras
domésticas e de mercearia.
Blw3: Não faria compras noutras lojas se o retalhista (supermercado) dessa marca estivesse
disponível.
Blw4: Recomendaria o retalhista (supermercado) dessa marca aos meus familiares.
Blw5: Faço compras regularmente, para a maioria das minhas necessidades, no retalhista
(supermercado) dessa marca.
Obe1: Faz sentido comprar produtos dessa marca em vez de outras, mesmo que sejam idênticos.
Obe2: Mesmo que outro produto tenha as mesmas características que o dessa marca, prefiro
comprar produtos dessa marca.
Obe3: Mesmo que haja outra alternativa igualmente boa, prefiro comprar produtos dessa marca.
Obe4: Mesmo que outra alternativa não seja diferente dessa marca, faz mais sentido comprar
produtos dessa marca.
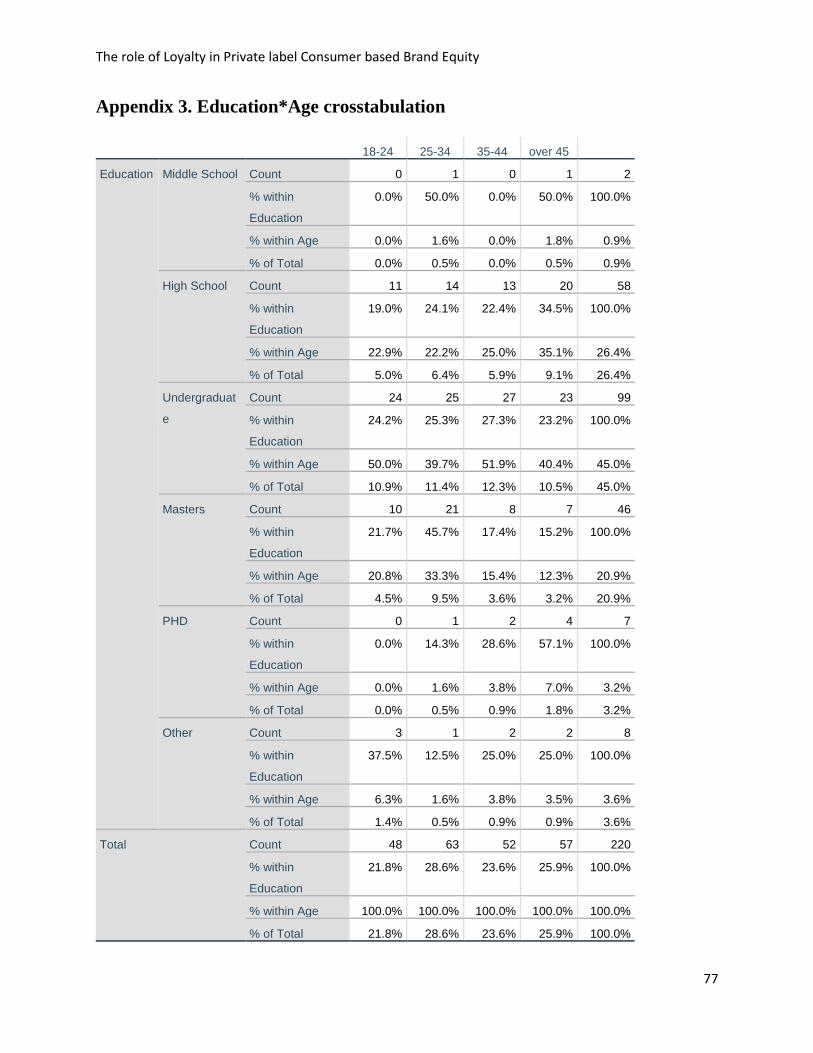
The role of Loyalty in Private label Consumer based Brand Equity
77
Appendix 3. Education*Age crosstabulation
18-24 25-34 35-44 over 45
Education Middle School Count 0 1 0 1 2
% within
Education
0.0% 50.0% 0.0% 50.0% 100.0%
% within Age 0.0% 1.6% 0.0% 1.8% 0.9%
% of Total 0.0% 0.5% 0.0% 0.5% 0.9%
High School Count 11 14 13 20 58
% within
Education
19.0% 24.1% 22.4% 34.5% 100.0%
% within Age 22.9% 22.2% 25.0% 35.1% 26.4%
% of Total 5.0% 6.4% 5.9% 9.1% 26.4%
Undergraduat
e
Count 24 25 27 23 99
% within
Education
24.2% 25.3% 27.3% 23.2% 100.0%
% within Age 50.0% 39.7% 51.9% 40.4% 45.0%
% of Total 10.9% 11.4% 12.3% 10.5% 45.0%
Masters Count 10 21 8 7 46
% within
Education
21.7% 45.7% 17.4% 15.2% 100.0%
% within Age 20.8% 33.3% 15.4% 12.3% 20.9%
% of Total 4.5% 9.5% 3.6% 3.2% 20.9%
PHD Count 0 1 2 4 7
% within
Education
0.0% 14.3% 28.6% 57.1% 100.0%
% within Age 0.0% 1.6% 3.8% 7.0% 3.2%
% of Total 0.0% 0.5% 0.9% 1.8% 3.2%
Other Count 3 1 2 2 8
% within
Education
37.5% 12.5% 25.0% 25.0% 100.0%
% within Age 6.3% 1.6% 3.8% 3.5% 3.6%
% of Total 1.4% 0.5% 0.9% 0.9% 3.6%
Total Count 48 63 52 57 220
% within
Education
21.8% 28.6% 23.6% 25.9% 100.0%
% within Age 100.0% 100.0% 100.0% 100.0% 100.0%
% of Total 21.8% 28.6% 23.6% 25.9% 100.0%
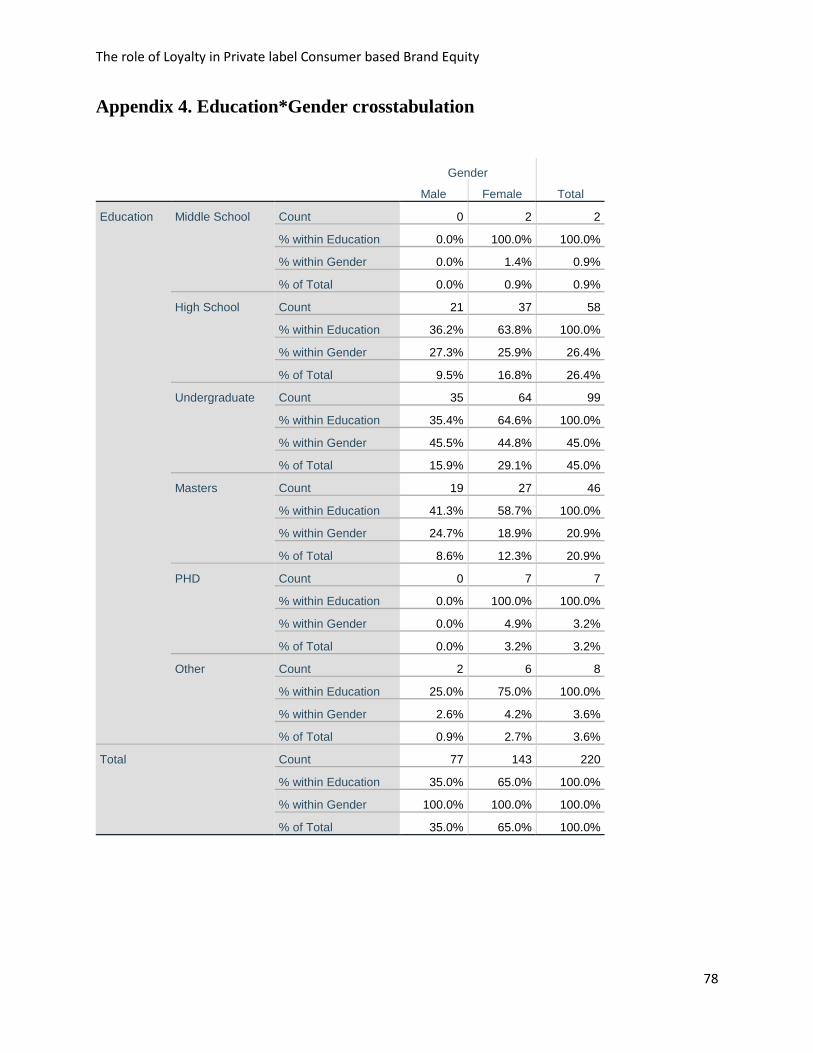
The role of Loyalty in Private label Consumer based Brand Equity
78
Appendix 4. Education*Gender crosstabulation
Gender
Total Male Female
Education Middle School Count 0 2 2
% within Education 0.0% 100.0% 100.0%
% within Gender 0.0% 1.4% 0.9%
% of Total 0.0% 0.9% 0.9%
High School Count 21 37 58
% within Education 36.2% 63.8% 100.0%
% within Gender 27.3% 25.9% 26.4%
% of Total 9.5% 16.8% 26.4%
Undergraduate Count 35 64 99
% within Education 35.4% 64.6% 100.0%
% within Gender 45.5% 44.8% 45.0%
% of Total 15.9% 29.1% 45.0%
Masters Count 19 27 46
% within Education 41.3% 58.7% 100.0%
% within Gender 24.7% 18.9% 20.9%
% of Total 8.6% 12.3% 20.9%
PHD Count 0 7 7
% within Education 0.0% 100.0% 100.0%
% within Gender 0.0% 4.9% 3.2%
% of Total 0.0% 3.2% 3.2%
Other Count 2 6 8
% within Education 25.0% 75.0% 100.0%
% within Gender 2.6% 4.2% 3.6%
% of Total 0.9% 2.7% 3.6%
Total Count 77 143 220
% within Education 35.0% 65.0% 100.0%
% within Gender 100.0% 100.0% 100.0%
% of Total 35.0% 65.0% 100.0%
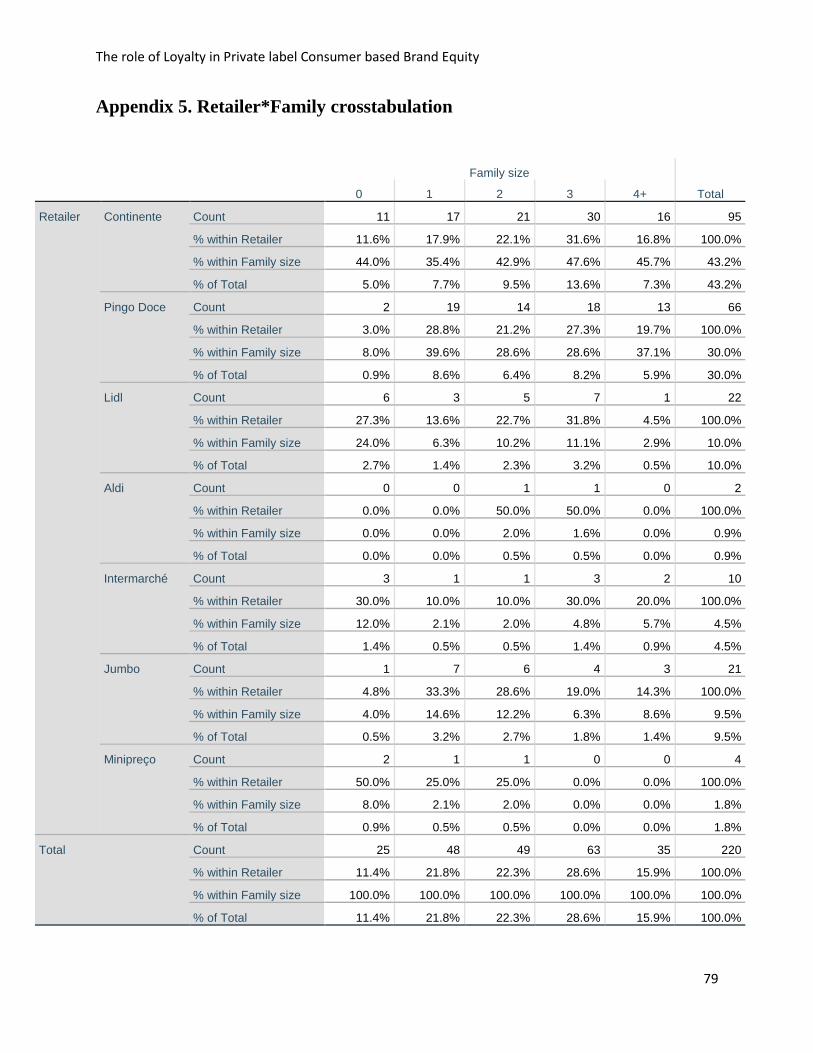
The role of Loyalty in Private label Consumer based Brand Equity
79
Appendix 5. Retailer*Family crosstabulation
Family size
Total 0 1 2 3 4+
Retailer Continente Count 11 17 21 30 16 95
% within Retailer 11.6% 17.9% 22.1% 31.6% 16.8% 100.0%
% within Family size 44.0% 35.4% 42.9% 47.6% 45.7% 43.2%
% of Total 5.0% 7.7% 9.5% 13.6% 7.3% 43.2%
Pingo Doce Count 2 19 14 18 13 66
% within Retailer 3.0% 28.8% 21.2% 27.3% 19.7% 100.0%
% within Family size 8.0% 39.6% 28.6% 28.6% 37.1% 30.0%
% of Total 0.9% 8.6% 6.4% 8.2% 5.9% 30.0%
Lidl Count 6 3 5 7 1 22
% within Retailer 27.3% 13.6% 22.7% 31.8% 4.5% 100.0%
% within Family size 24.0% 6.3% 10.2% 11.1% 2.9% 10.0%
% of Total 2.7% 1.4% 2.3% 3.2% 0.5% 10.0%
Aldi Count 0 0 1 1 0 2
% within Retailer 0.0% 0.0% 50.0% 50.0% 0.0% 100.0%
% within Family size 0.0% 0.0% 2.0% 1.6% 0.0% 0.9%
% of Total 0.0% 0.0% 0.5% 0.5% 0.0% 0.9%
Intermarché Count 3 1 1 3 2 10
% within Retailer 30.0% 10.0% 10.0% 30.0% 20.0% 100.0%
% within Family size 12.0% 2.1% 2.0% 4.8% 5.7% 4.5%
% of Total 1.4% 0.5% 0.5% 1.4% 0.9% 4.5%
Jumbo Count 1 7 6 4 3 21
% within Retailer 4.8% 33.3% 28.6% 19.0% 14.3% 100.0%
% within Family size 4.0% 14.6% 12.2% 6.3% 8.6% 9.5%
% of Total 0.5% 3.2% 2.7% 1.8% 1.4% 9.5%
Minipreço Count 2 1 1 0 0 4
% within Retailer 50.0% 25.0% 25.0% 0.0% 0.0% 100.0%
% within Family size 8.0% 2.1% 2.0% 0.0% 0.0% 1.8%
% of Total 0.9% 0.5% 0.5% 0.0% 0.0% 1.8%
Total Count 25 48 49 63 35 220
% within Retailer 11.4% 21.8% 22.3% 28.6% 15.9% 100.0%
% within Family size 100.0% 100.0% 100.0% 100.0% 100.0% 100.0%
% of Total 11.4% 21.8% 22.3% 28.6% 15.9% 100.0%
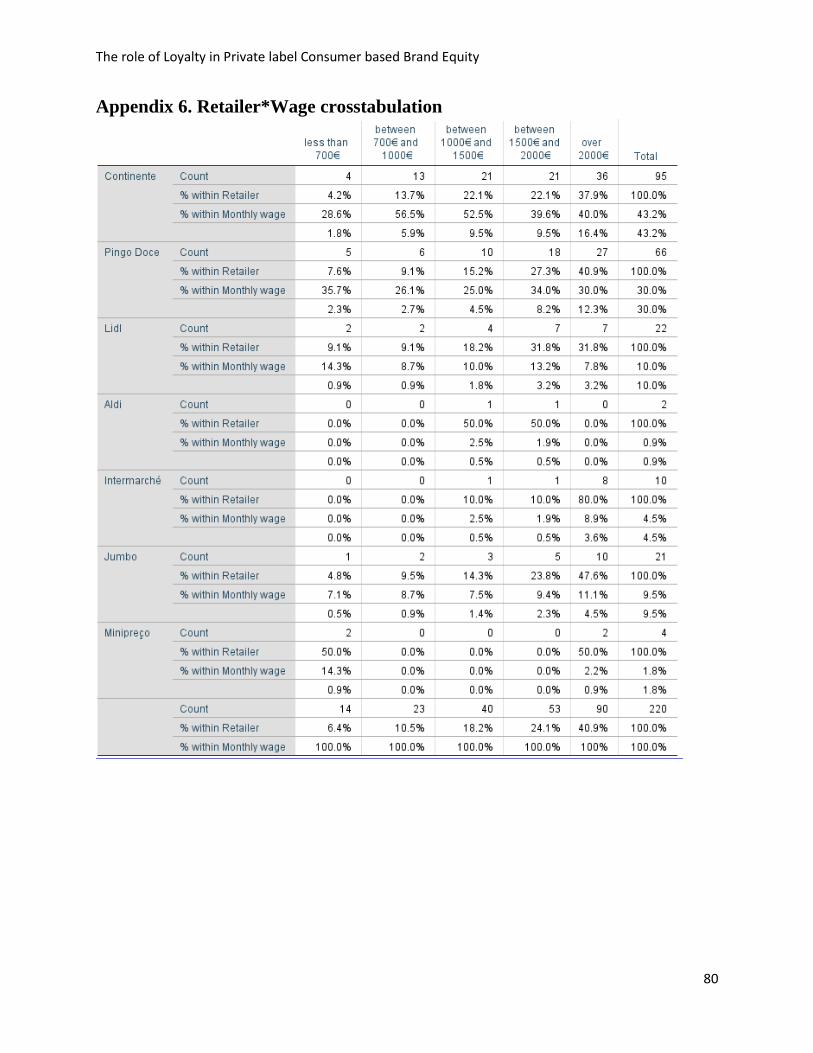
The role of Loyalty in Private label Consumer based Brand Equity
80
Appendix 6. Retailer*Wage crosstabulation

The role of Loyalty in Private label Consumer based Brand Equity
81
Appendix 7. Descriptive statistics
Descriptive Statistics
N Minimum Maximum Mean Std. Deviation Variance Skewness Kurtosis
Gender 220 1 2 1.65 .478 .229 -.633 -1.614
Age 220 1 4 2.54 1.099 1.209 .000 -1.318
Education 220 1 6 3.10 .979 .958 .889 1.106
Family size 220 1 5 3.16 1.256 1.577 -.165 -1.036
Monthly wage 220 1 5 3.83 1.249 1.559 -.790 -.454
Main buyer 220 1 2 1.39 .488 .238 .470 -1.796
Retailer 220 1 7 2.30 1.699 2.885 1.402 .759
Appendix 8. Frequency tables
Gender
Frequency Percent Valid Percent
Cumulative
Percent
Valid Male 77 35.0 35.0 35.0
Female 143 65.0 65.0 100.0
Total 220 100.0 100.0
Age
Frequency Percent Valid Percent
Cumulative
Percent
Valid 18-24 48 21.8 21.8 21.8
25-34 63 28.6 28.6 50.5
35-44 52 23.6 23.6 74.1
over 45 57 25.9 25.9 100.0
Total 220 100.0 100.0
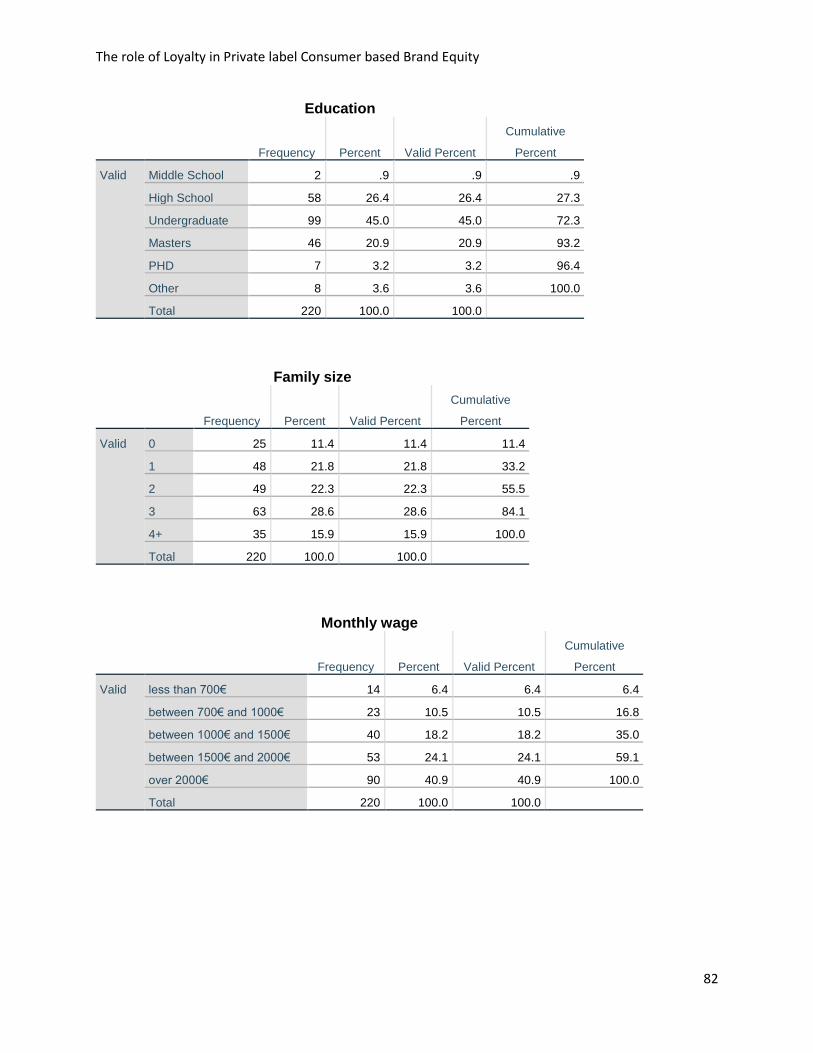
The role of Loyalty in Private label Consumer based Brand Equity
82
Education
Frequency Percent Valid Percent
Cumulative
Percent
Valid Middle School 2 .9 .9 .9
High School 58 26.4 26.4 27.3
Undergraduate 99 45.0 45.0 72.3
Masters 46 20.9 20.9 93.2
PHD 7 3.2 3.2 96.4
Other 8 3.6 3.6 100.0
Total 220 100.0 100.0
Family size
Frequency Percent Valid Percent
Cumulative
Percent
Valid 0 25 11.4 11.4 11.4
1 48 21.8 21.8 33.2
2 49 22.3 22.3 55.5
3 63 28.6 28.6 84.1
4+ 35 15.9 15.9 100.0
Total 220 100.0 100.0
Monthly wage
Frequency Percent Valid Percent
Cumulative
Percent
Valid less than 700€ 14 6.4 6.4 6.4
between 700€ and 1000€ 23 10.5 10.5 16.8
between 1000€ and 1500€ 40 18.2 18.2 35.0
between 1500€ and 2000€ 53 24.1 24.1 59.1
over 2000€ 90 40.9 40.9 100.0
Total 220 100.0 100.0
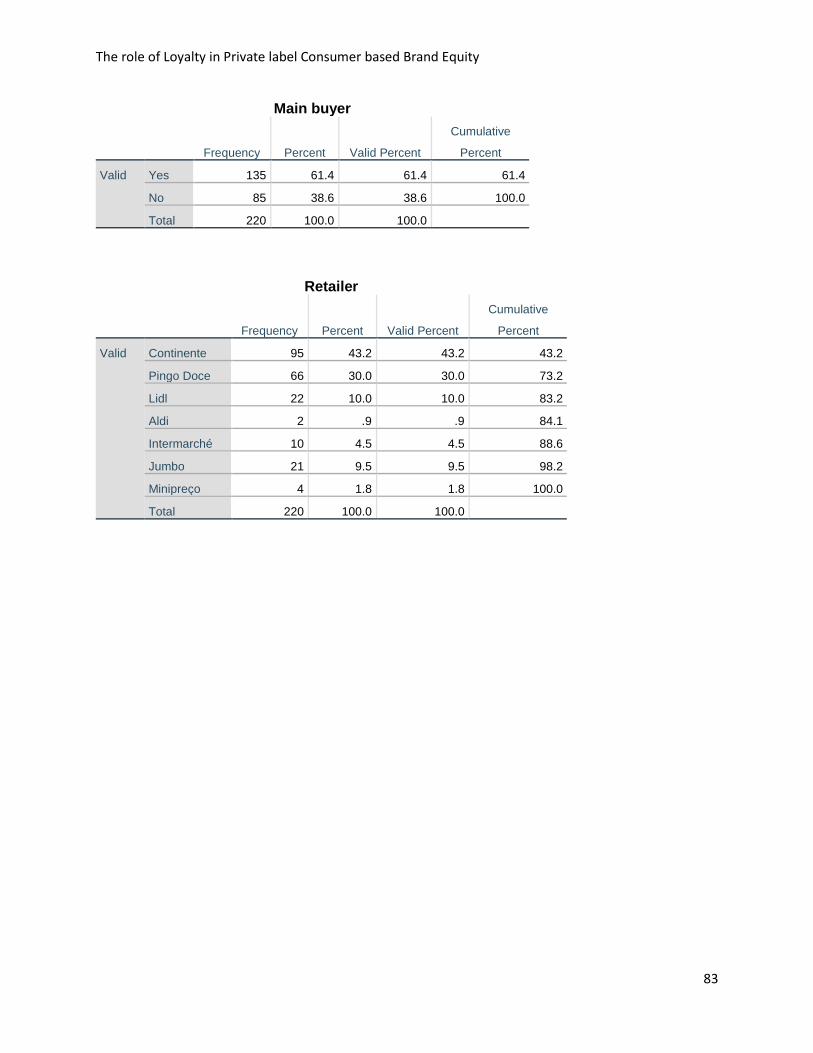
The role of Loyalty in Private label Consumer based Brand Equity
83
Main buyer
Frequency Percent Valid Percent
Cumulative
Percent
Valid Yes 135 61.4 61.4 61.4
No 85 38.6 38.6 100.0
Total 220 100.0 100.0
Retailer
Frequency Percent Valid Percent
Cumulative
Percent
Valid Continente 95 43.2 43.2 43.2
Pingo Doce 66 30.0 30.0 73.2
Lidl 22 10.0 10.0 83.2
Aldi 2 .9 .9 84.1
Intermarché 10 4.5 4.5 88.6
Jumbo 21 9.5 9.5 98.2
Minipreço 4 1.8 1.8 100.0
Total 220 100.0 100.0
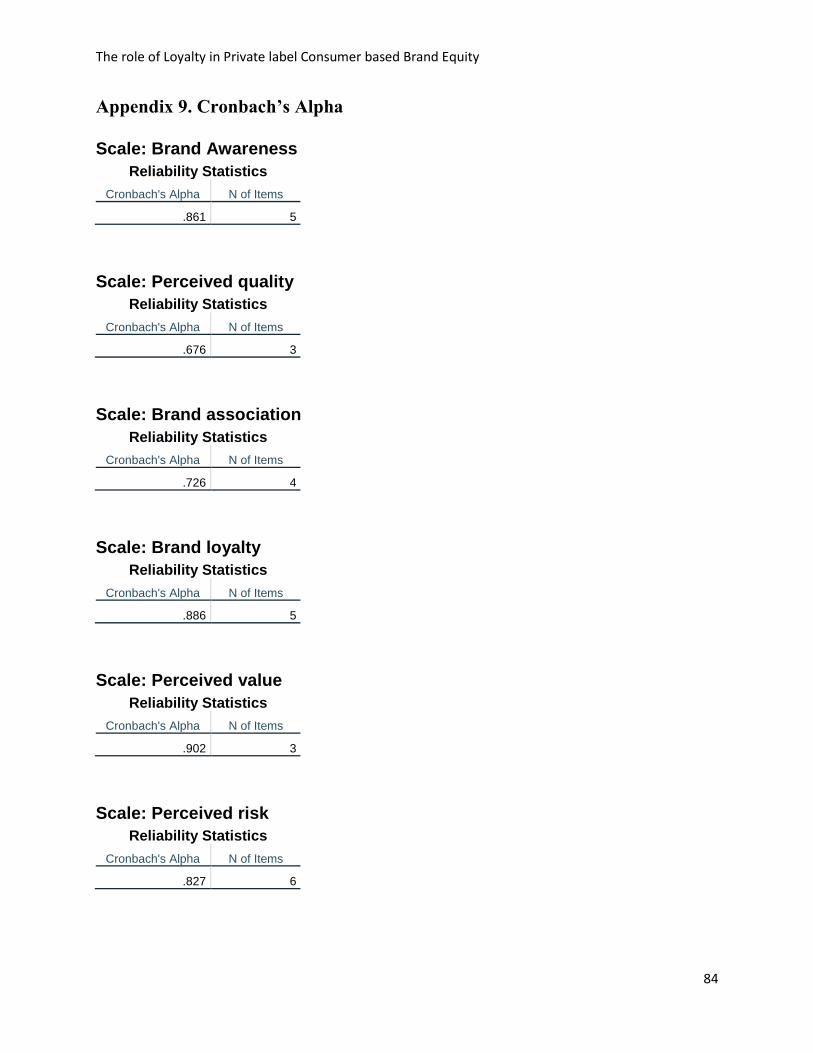
The role of Loyalty in Private label Consumer based Brand Equity
84
Appendix 9. Cronbach’s Alpha
Scale: Brand Awareness
Reliability Statistics
Cronbach's Alpha N of Items
.861 5
Scale: Perceived quality
Reliability Statistics
Cronbach's Alpha N of Items
.676 3
Scale: Brand association
Reliability Statistics
Cronbach's Alpha N of Items
.726 4
Scale: Brand loyalty
Reliability Statistics
Cronbach's Alpha N of Items
.886 5
Scale: Perceived value
Reliability Statistics
Cronbach's Alpha N of Items
.902 3
Scale: Perceived risk
Reliability Statistics
Cronbach's Alpha N of Items
.827 6
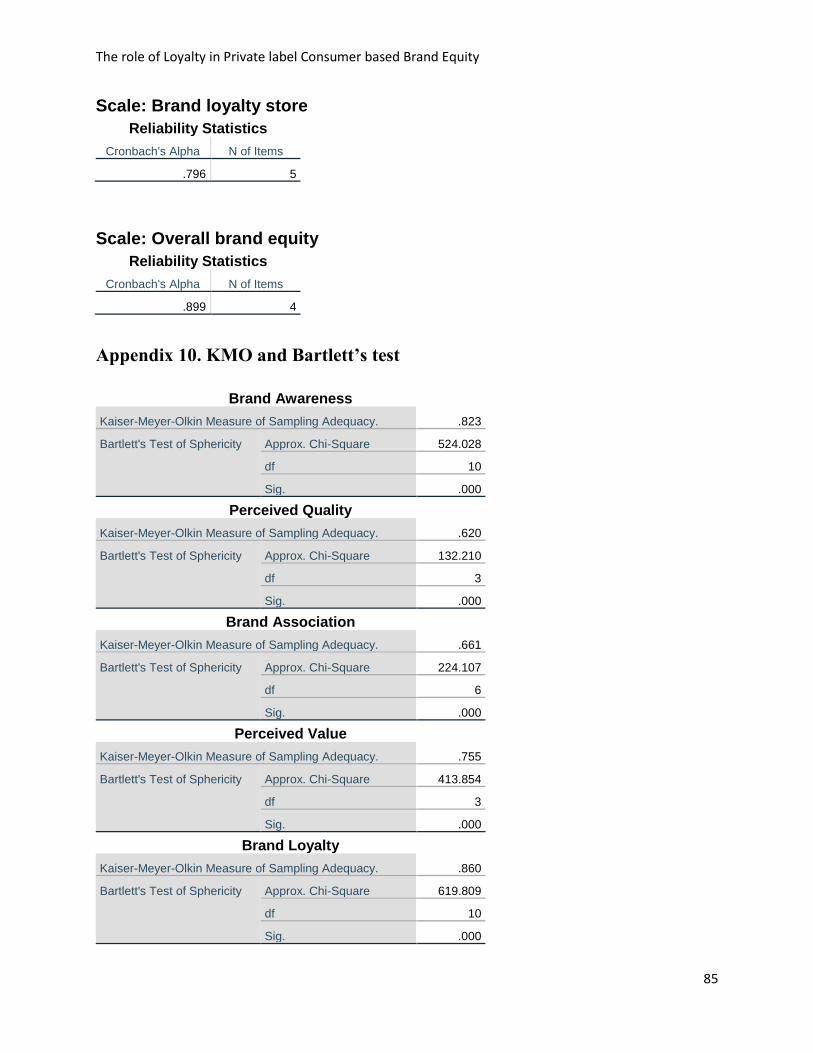
The role of Loyalty in Private label Consumer based Brand Equity
85
Scale: Brand loyalty store
Reliability Statistics
Cronbach's Alpha N of Items
.796 5
Scale: Overall brand equity
Reliability Statistics
Cronbach's Alpha N of Items
.899 4
Appendix 10. KMO and Bartlett’s test
Brand Awareness
Kaiser-Meyer-Olkin Measure of Sampling Adequacy. .823
Bartlett's Test of Sphericity Approx. Chi-Square 524.028
df 10
Sig. .000
Perceived Quality
Kaiser-Meyer-Olkin Measure of Sampling Adequacy. .620
Bartlett's Test of Sphericity Approx. Chi-Square 132.210
df 3
Sig. .000
Brand Association
Kaiser-Meyer-Olkin Measure of Sampling Adequacy. .661
Bartlett's Test of Sphericity Approx. Chi-Square 224.107
df 6
Sig. .000
Perceived Value
Kaiser-Meyer-Olkin Measure of Sampling Adequacy. .755
Bartlett's Test of Sphericity Approx. Chi-Square 413.854
df 3
Sig. .000
Brand Loyalty
Kaiser-Meyer-Olkin Measure of Sampling Adequacy. .860
Bartlett's Test of Sphericity Approx. Chi-Square 619.809
df 10
Sig. .000
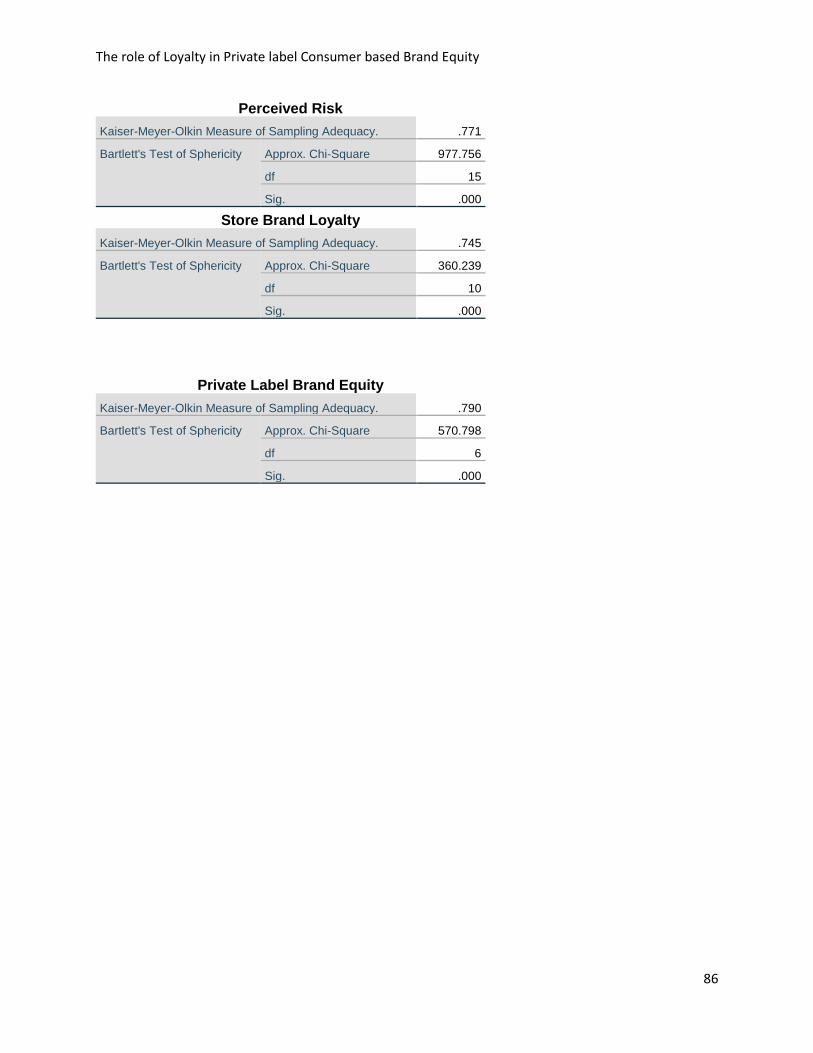
The role of Loyalty in Private label Consumer based Brand Equity
86
Perceived Risk
Kaiser-Meyer-Olkin Measure of Sampling Adequacy. .771
Bartlett's Test of Sphericity Approx. Chi-Square 977.756
df 15
Sig. .000
Store Brand Loyalty
Kaiser-Meyer-Olkin Measure of Sampling Adequacy. .745
Bartlett's Test of Sphericity Approx. Chi-Square 360.239
df 10
Sig. .000
Private Label Brand Equity
Kaiser-Meyer-Olkin Measure of Sampling Adequacy. .790
Bartlett's Test of Sphericity Approx. Chi-Square 570.798
df 6
Sig. .000

The role of Loyalty in Private label Consumer based Brand Equity
87
Appendix 11. PCA Total variance explained
Brand AwarenessTotal Variance Explained
Component
Initial Eigenvalues Extraction Sums of Squared Loadings
Total % of Variance Cumulative % Total % of Variance Cumulative %
1 3.256 65.119 65.119 3.256 65.119 65.119
2 .696 13.928 79.048
3 .463 9.263 88.311
4 .320 6.399 94.709
5 .265 5.291 100.000
Extraction Method: Principal Component Analysis.
Perceived Quality Total Variance Explained
Component
Initial Eigenvalues Extraction Sums of Squared Loadings
Total % of Variance Cumulative % Total % of Variance Cumulative %
1 1.883 62.783 62.783 1.883 62.783 62.783
2 .709 23.645 86.427
3 .407 13.573 100.000
Extraction Method: Principal Component Analysis.
Brand Association Total Variance Explained
Component
Initial Eigenvalues Extraction Sums of Squared Loadings
Total % of Variance Cumulative % Total % of Variance Cumulative %
1 2.247 56.177 56.177 2.247 56.177 56.177
2 .857 21.418 77.595
3 .575 14.364 91.960
4 .322 8.040 100.000
Extraction Method: Principal Component Analysis.

The role of Loyalty in Private label Consumer based Brand Equity
88
Perceived Value Total Variance Explained
Component
Initial Eigenvalues Extraction Sums of Squared Loadings
Total % of Variance Cumulative % Total % of Variance Cumulative %
1 2.513 83.777 83.777 2.513 83.777 83.777
2 .250 8.341 92.117
3 .236 7.883 100.000
Extraction Method: Principal Component Analysis.
Brand Loyalty Total Variance Explained
Component
Initial Eigenvalues Extraction Sums of Squared Loadings
Total % of Variance Cumulative % Total % of Variance Cumulative %
1 3.472 69.441 69.441 3.472 69.441 69.441
2 .573 11.455 80.896
3 .433 8.660 89.557
4 .304 6.081 95.638
5 .218 4.362 100.000
Extraction Method: Principal Component Analysis.
Perceived Risk Total Variance Explained
Component
Initial Eigenvalues Extraction Sums of Squared Loadings Rotation Sums of Squared Loadings
Total % of Variance Cumulative % Total % of Variance Cumulative % Total % of Variance Cumulative %
1 3.379 56.316 56.316 3.379 56.316 56.316 2.689 44.821 44.821
2 1.697 28.291 84.607 1.697 28.291 84.607 2.387 39.786 84.607
3 .374 6.238 90.845
4 .247 4.108 94.953
5 .201 3.342 98.295
6 .102 1.705 100.000
Extraction Method: Principal Component Analysis.
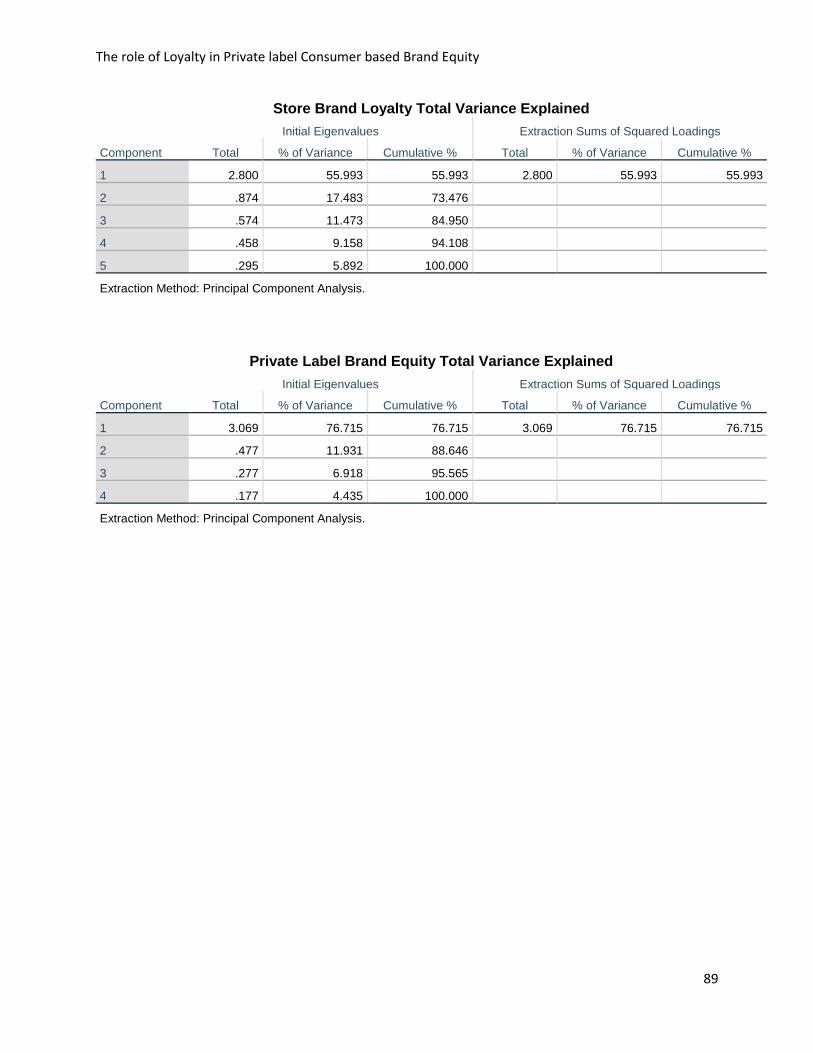
The role of Loyalty in Private label Consumer based Brand Equity
89
Store Brand Loyalty Total Variance Explained
Component
Initial Eigenvalues Extraction Sums of Squared Loadings
Total % of Variance Cumulative % Total % of Variance Cumulative %
1 2.800 55.993 55.993 2.800 55.993 55.993
2 .874 17.483 73.476
3 .574 11.473 84.950
4 .458 9.158 94.108
5 .295 5.892 100.000
Extraction Method: Principal Component Analysis.
Private Label Brand Equity Total Variance Explained
Component
Initial Eigenvalues Extraction Sums of Squared Loadings
Total % of Variance Cumulative % Total % of Variance Cumulative %
1 3.069 76.715 76.715 3.069 76.715 76.715
2 .477 11.931 88.646
3 .277 6.918 95.565
4 .177 4.435 100.000
Extraction Method: Principal Component Analysis.

The role of Loyalty in Private label Consumer based Brand Equity
90
Appendix 12. Perceived risk rotated component matrix
Rotated Component Matrixa
Component
1 2
pr1 I am concerned that
purchasing this retailer's
products would be a poor
use of my money.
.163 .848
pr2 When I purchase this
retailer's products, I am
concerned that they will not
be as good quality as other
brands.
.081 .900
pr3 When I purchase this
retailer's products, I am
concerned that they are not
as safe as other brands.
.203 .886
pr4 When I purchase this
retailer's products, I am
concerned about what my
family might think of me.
.914 .184
pr5 When I purchase this
retailer's products, I am
concerned about what my
friends might think of me.
.953 .149
pr6 When I buy this retailer's
products, I worry that these
products might not be
consistent with my self-
image.
.933 .135
Extraction Method: Principal Component Analysis.
Rotation Method: Varimax with Kaiser Normalization.a
a. Rotation converged in 3 iterations.
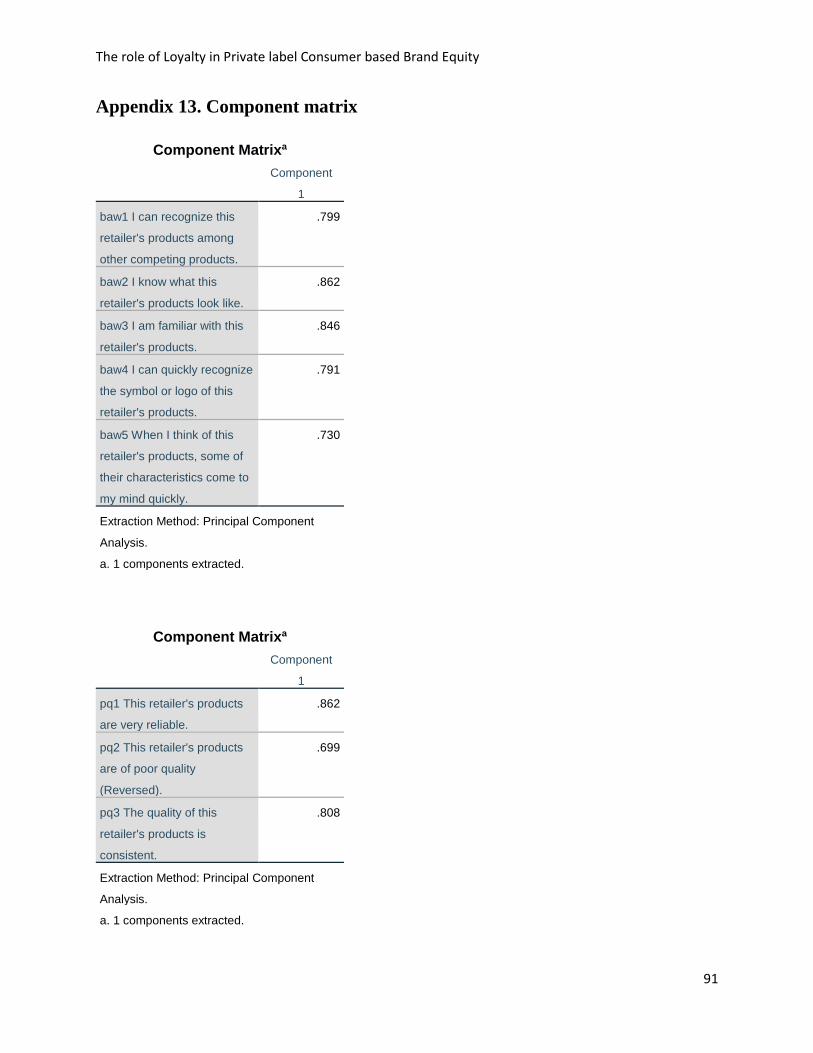
The role of Loyalty in Private label Consumer based Brand Equity
91
Appendix 13. Component matrix
Component Matrixa
Component
1
baw1 I can recognize this
retailer's products among
other competing products.
.799
baw2 I know what this
retailer's products look like.
.862
baw3 I am familiar with this
retailer's products.
.846
baw4 I can quickly recognize
the symbol or logo of this
retailer's products.
.791
baw5 When I think of this
retailer's products, some of
their characteristics come to
my mind quickly.
.730
Extraction Method: Principal Component
Analysis.
a. 1 components extracted.
Component Matrixa
Component
1
pq1 This retailer's products
are very reliable.
.862
pq2 This retailer's products
are of poor quality
(Reversed).
.699
pq3 The quality of this
retailer's products is
consistent.
.808
Extraction Method: Principal Component
Analysis.
a. 1 components extracted.
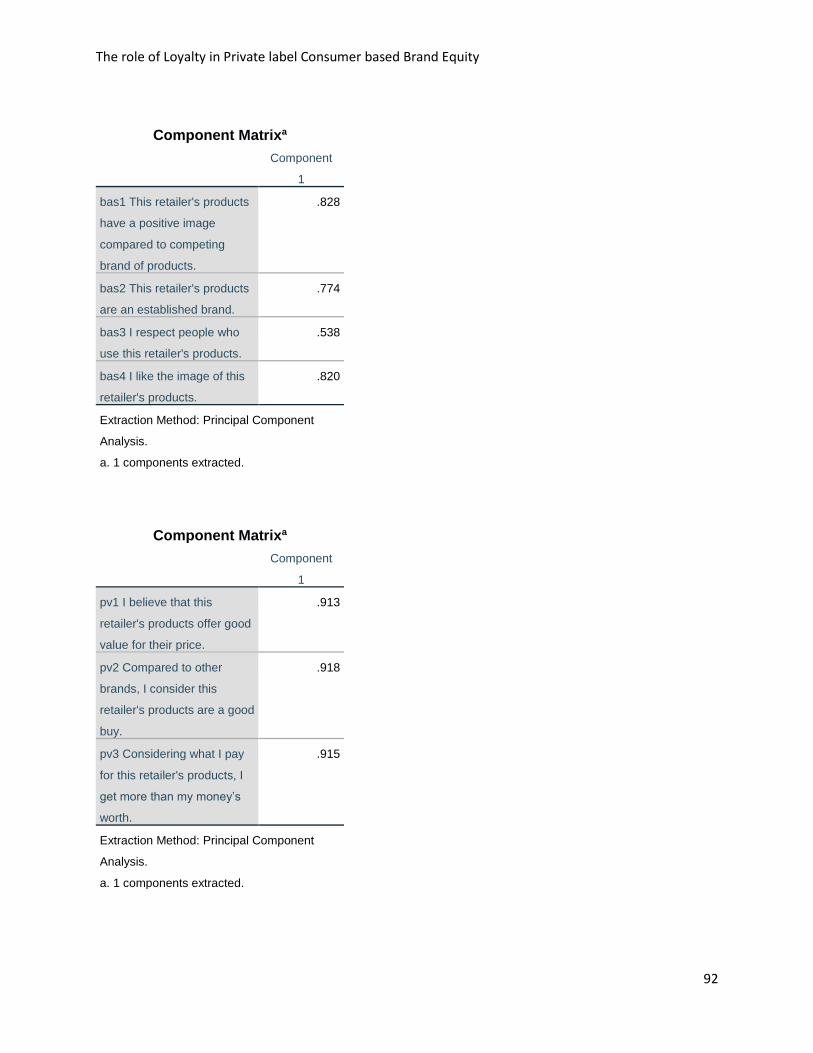
The role of Loyalty in Private label Consumer based Brand Equity
92
Component Matrixa
Component
1
bas1 This retailer's products
have a positive image
compared to competing
brand of products.
.828
bas2 This retailer's products
are an established brand.
.774
bas3 I respect people who
use this retailer's products.
.538
bas4 I like the image of this
retailer's products.
.820
Extraction Method: Principal Component
Analysis.
a. 1 components extracted.
Component Matrixa
Component
1
pv1 I believe that this
retailer's products offer good
value for their price.
.913
pv2 Compared to other
brands, I consider this
retailer's products are a good
buy.
.918
pv3 Considering what I pay
for this retailer's products, I
get more than my money’s
worth.
.915
Extraction Method: Principal Component
Analysis.
a. 1 components extracted.
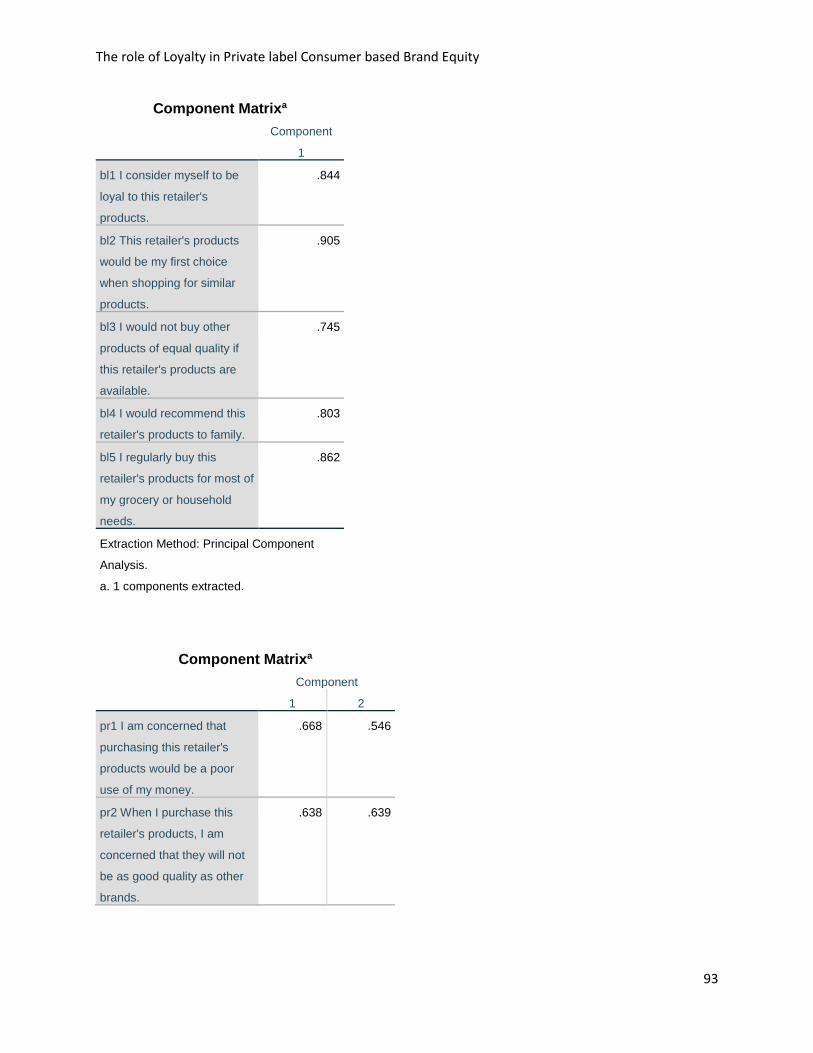
The role of Loyalty in Private label Consumer based Brand Equity
93
Component Matrixa
Component
1
bl1 I consider myself to be
loyal to this retailer's
products.
.844
bl2 This retailer's products
would be my first choice
when shopping for similar
products.
.905
bl3 I would not buy other
products of equal quality if
this retailer's products are
available.
.745
bl4 I would recommend this
retailer's products to family.
.803
bl5 I regularly buy this
retailer's products for most of
my grocery or household
needs.
.862
Extraction Method: Principal Component
Analysis.
a. 1 components extracted.
Component Matrixa
Component
1 2
pr1 I am concerned that
purchasing this retailer's
products would be a poor
use of my money.
.668 .546
pr2 When I purchase this
retailer's products, I am
concerned that they will not
be as good quality as other
brands.
.638 .639
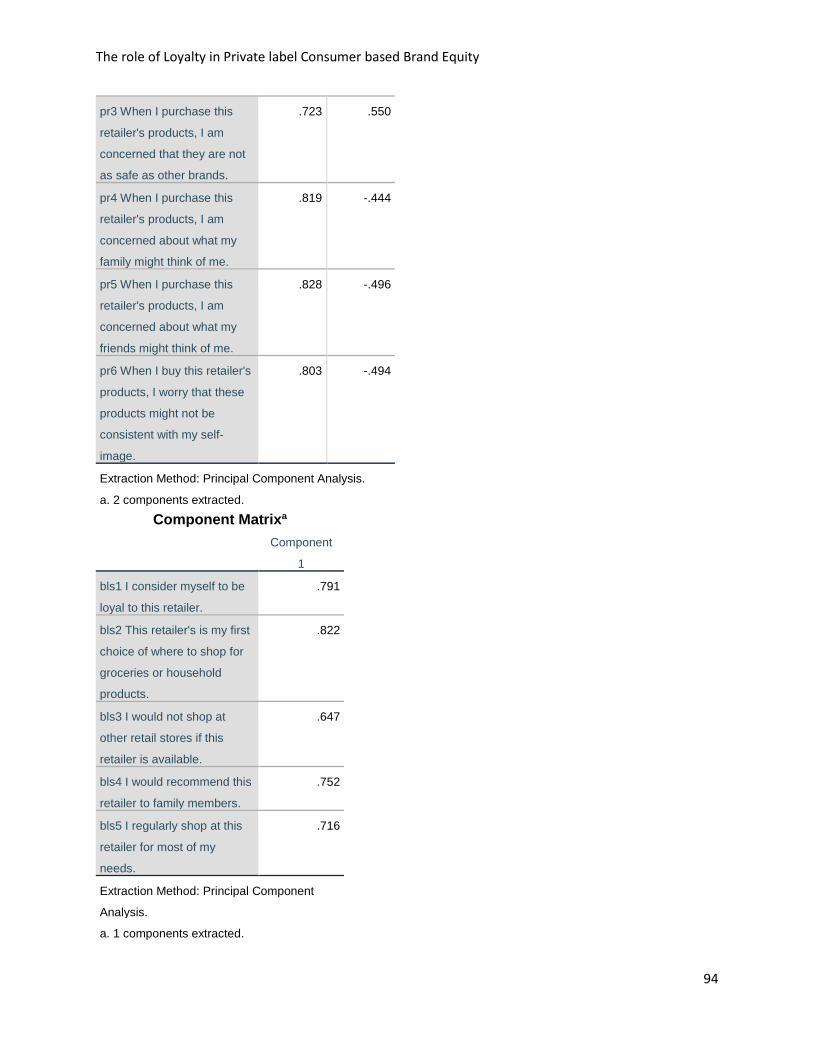
The role of Loyalty in Private label Consumer based Brand Equity
94
pr3 When I purchase this
retailer's products, I am
concerned that they are not
as safe as other brands.
.723 .550
pr4 When I purchase this
retailer's products, I am
concerned about what my
family might think of me.
.819 -.444
pr5 When I purchase this
retailer's products, I am
concerned about what my
friends might think of me.
.828 -.496
pr6 When I buy this retailer's
products, I worry that these
products might not be
consistent with my self-
image.
.803 -.494
Extraction Method: Principal Component Analysis.
a. 2 components extracted.
Component Matrixa
Component
1
bls1 I consider myself to be
loyal to this retailer.
.791
bls2 This retailer's is my first
choice of where to shop for
groceries or household
products.
.822
bls3 I would not shop at
other retail stores if this
retailer is available.
.647
bls4 I would recommend this
retailer to family members.
.752
bls5 I regularly shop at this
retailer for most of my
needs.
.716
Extraction Method: Principal Component
Analysis.
a. 1 components extracted.
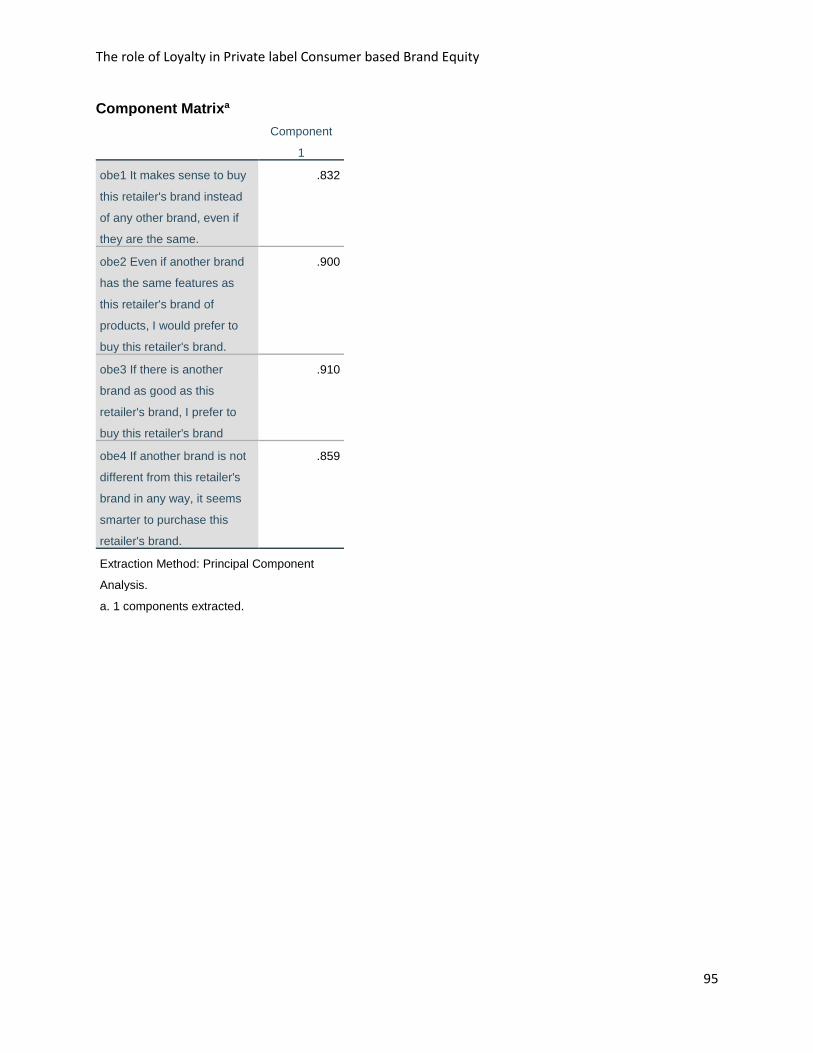
The role of Loyalty in Private label Consumer based Brand Equity
95
Component Matrixa
Component
1
obe1 It makes sense to buy
this retailer's brand instead
of any other brand, even if
they are the same.
.832
obe2 Even if another brand
has the same features as
this retailer's brand of
products, I would prefer to
buy this retailer's brand.
.900
obe3 If there is another
brand as good as this
retailer's brand, I prefer to
buy this retailer's brand
.910
obe4 If another brand is not
different from this retailer's
brand in any way, it seems
smarter to purchase this
retailer's brand.
.859
Extraction Method: Principal Component
Analysis.
a. 1 components extracted.
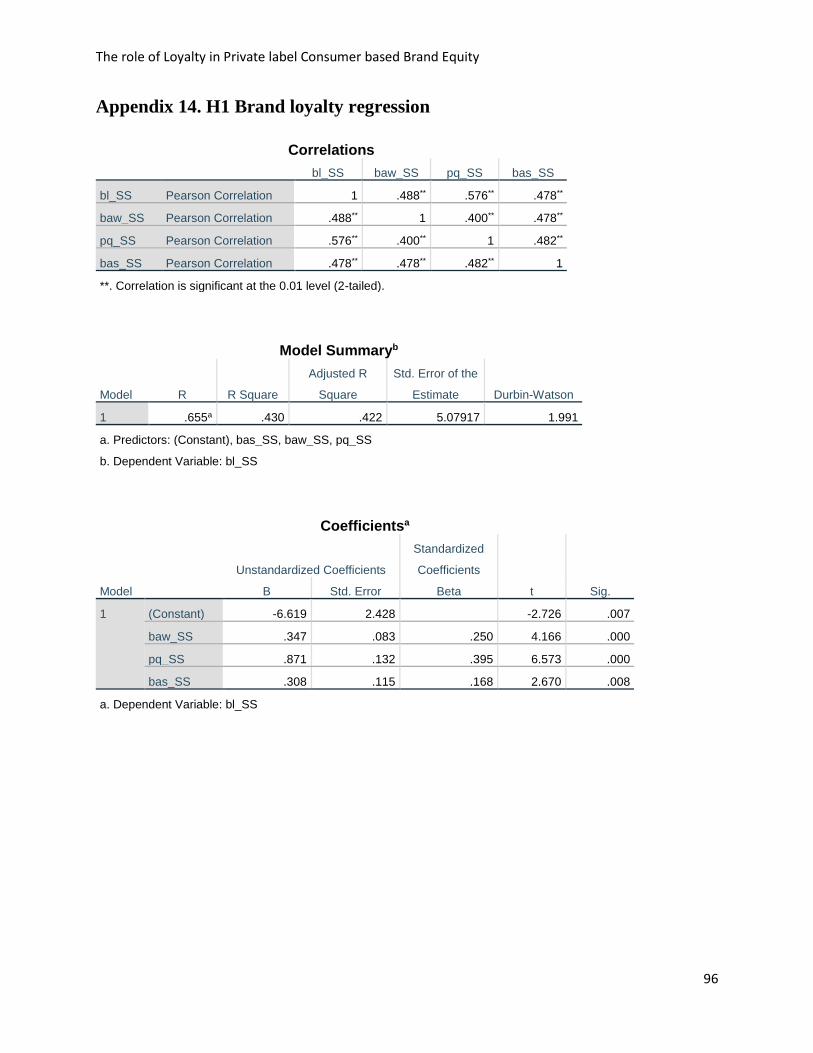
The role of Loyalty in Private label Consumer based Brand Equity
96
Appendix 14. H1 Brand loyalty regression
Correlations
bl_SS baw_SS pq_SS bas_SS
bl_SS Pearson Correlation 1 .488** .576** .478**
baw_SS Pearson Correlation .488** 1 .400** .478**
pq_SS Pearson Correlation .576** .400** 1 .482**
bas_SS Pearson Correlation .478** .478** .482** 1
**. Correlation is significant at the 0.01 level (2-tailed).
Model Summaryb
Model R R Square
Adjusted R
Square
Std. Error of the
Estimate Durbin-Watson
1 .655a .430 .422 5.07917 1.991
a. Predictors: (Constant), bas_SS, baw_SS, pq_SS
b. Dependent Variable: bl_SS
Coefficientsa
Model
Unstandardized Coefficients
Standardized
Coefficients
t Sig. B Std. Error Beta
1 (Constant) -6.619 2.428 -2.726 .007
baw_SS .347 .083 .250 4.166 .000
pq_SS .871 .132 .395 6.573 .000
bas_SS .308 .115 .168 2.670 .008
a. Dependent Variable: bl_SS

The role of Loyalty in Private label Consumer based Brand Equity
97
Appendix 15. H2 Brand associations regression
Correlations
bas_SS pv_SS pr_SS bls_SS obe_SS
bas_SS Pearson Correlation 1 .560** -.212** .260** .336**
pv_SS Pearson Correlation .560** 1 -.351** .375** .482**
pr_SS Pearson Correlation -.212** -.351** 1 -.212** -.198**
bls_SS Pearson Correlation .260** .375** -.212** 1 .475**
obe_SS Pearson Correlation .336** .482** -.198** .475** 1
**. Correlation is significant at the 0.01 level (2-tailed).
Model Summaryb
Model R R Square
Adjusted R
Square
Std. Error of the
Estimate Durbin-Watson
1 .566a .321 .308 3.02633 1.807
a. Predictors: (Constant), obe_SS, pr_SS, bls_SS, pv_SS
b. Dependent Variable: bas_SS
Coefficientsa
Model
Unstandardized Coefficients
Standardized
Coefficients
t Sig. B Std. Error Beta
1 (Constant) 10.144 1.439 7.049 .000
pv_SS .538 .072 .509 7.484 .000
pr_SS -.007 .034 -.011 -.189 .850
bls_SS .021 .043 .033 .503 .616
obe_SS .050 .048 .072 1.050 .295
a. Dependent Variable: bas_SS
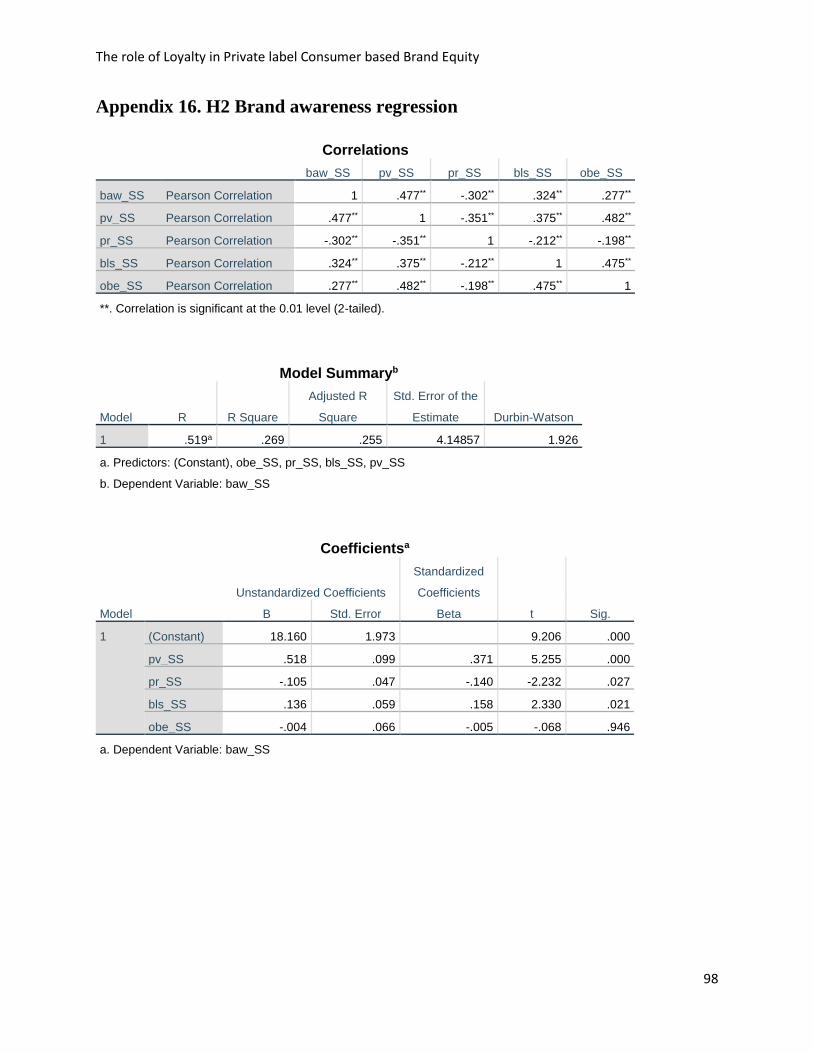
The role of Loyalty in Private label Consumer based Brand Equity
98
Appendix 16. H2 Brand awareness regression
Correlations
baw_SS pv_SS pr_SS bls_SS obe_SS
baw_SS Pearson Correlation 1 .477** -.302** .324** .277**
pv_SS Pearson Correlation .477** 1 -.351** .375** .482**
pr_SS Pearson Correlation -.302** -.351** 1 -.212** -.198**
bls_SS Pearson Correlation .324** .375** -.212** 1 .475**
obe_SS Pearson Correlation .277** .482** -.198** .475** 1
**. Correlation is significant at the 0.01 level (2-tailed).
Model Summaryb
Model R R Square
Adjusted R
Square
Std. Error of the
Estimate Durbin-Watson
1 .519a .269 .255 4.14857 1.926
a. Predictors: (Constant), obe_SS, pr_SS, bls_SS, pv_SS
b. Dependent Variable: baw_SS
Coefficientsa
Model
Unstandardized Coefficients
Standardized
Coefficients
t Sig. B Std. Error Beta
1 (Constant) 18.160 1.973 9.206 .000
pv_SS .518 .099 .371 5.255 .000
pr_SS -.105 .047 -.140 -2.232 .027
bls_SS .136 .059 .158 2.330 .021
obe_SS -.004 .066 -.005 -.068 .946
a. Dependent Variable: baw_SS
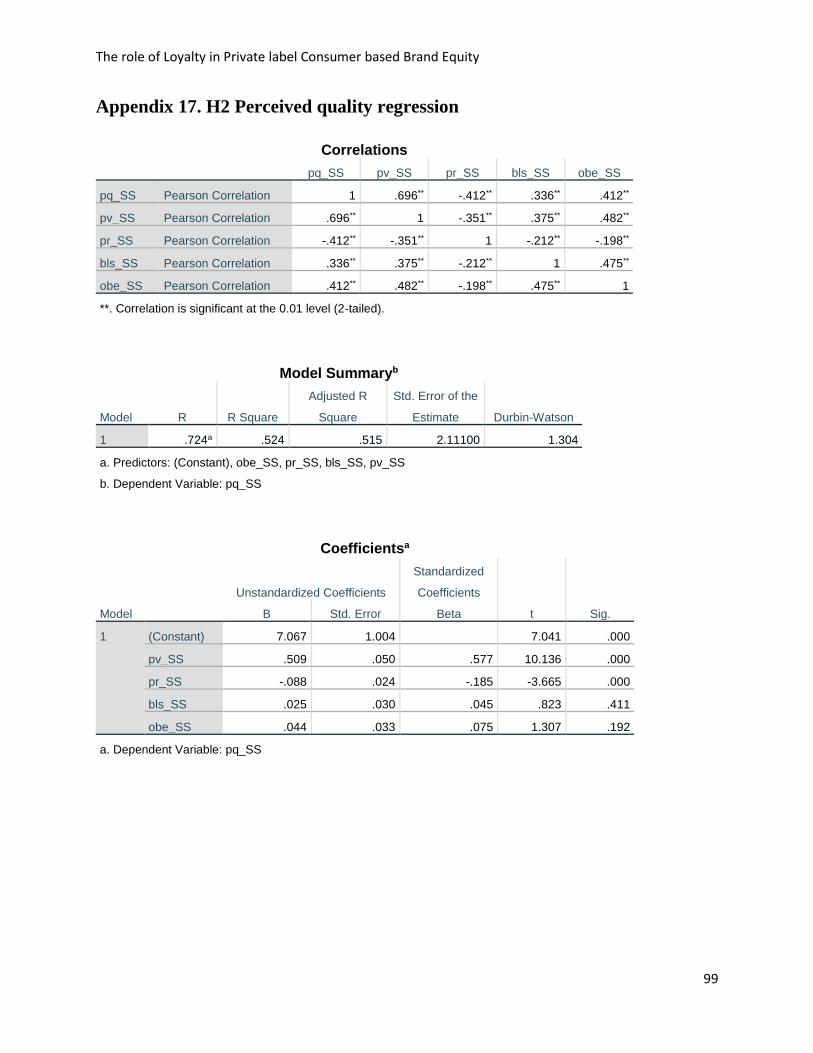
The role of Loyalty in Private label Consumer based Brand Equity
99
Appendix 17. H2 Perceived quality regression
Correlations
pq_SS pv_SS pr_SS bls_SS obe_SS
pq_SS Pearson Correlation 1 .696** -.412** .336** .412**
pv_SS Pearson Correlation .696** 1 -.351** .375** .482**
pr_SS Pearson Correlation -.412** -.351** 1 -.212** -.198**
bls_SS Pearson Correlation .336** .375** -.212** 1 .475**
obe_SS Pearson Correlation .412** .482** -.198** .475** 1
**. Correlation is significant at the 0.01 level (2-tailed).
Model Summaryb
Model R R Square
Adjusted R
Square
Std. Error of the
Estimate Durbin-Watson
1 .724a .524 .515 2.11100 1.304
a. Predictors: (Constant), obe_SS, pr_SS, bls_SS, pv_SS
b. Dependent Variable: pq_SS
Coefficientsa
Model
Unstandardized Coefficients
Standardized
Coefficients
t Sig. B Std. Error Beta
1 (Constant) 7.067 1.004 7.041 .000
pv_SS .509 .050 .577 10.136 .000
pr_SS -.088 .024 -.185 -3.665 .000
bls_SS .025 .030 .045 .823 .411
obe_SS .044 .033 .075 1.307 .192
a. Dependent Variable: pq_SS
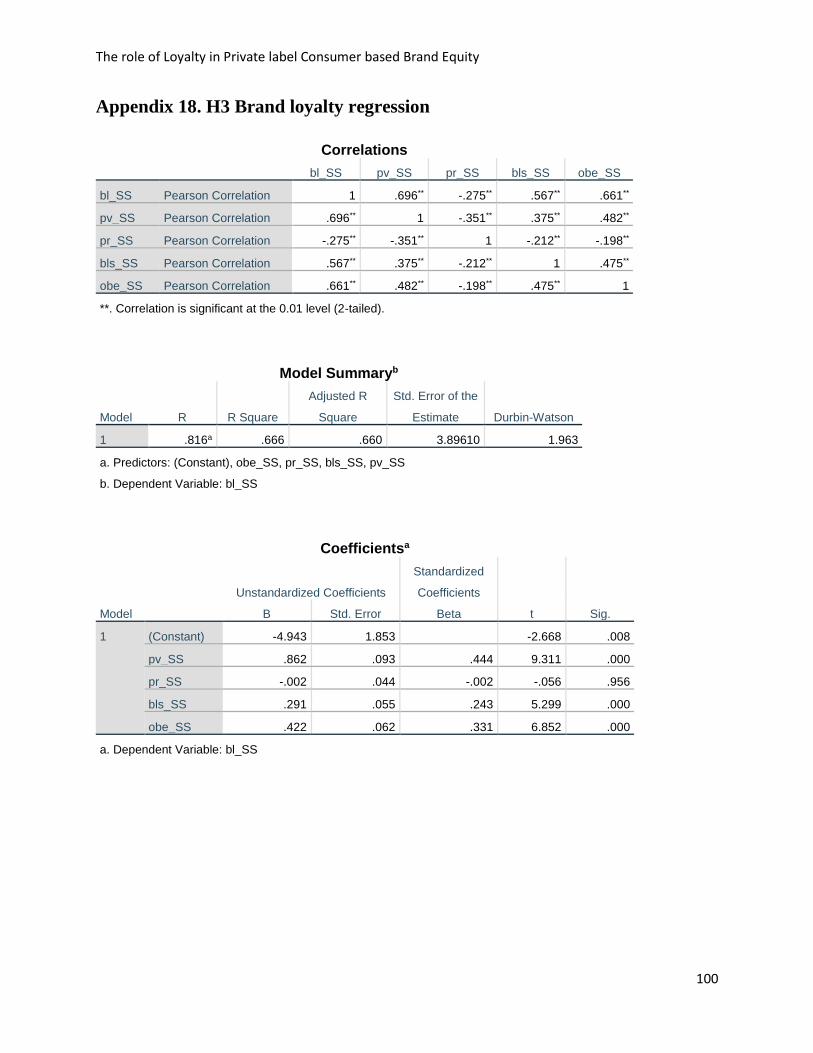
The role of Loyalty in Private label Consumer based Brand Equity
100
Appendix 18. H3 Brand loyalty regression
Correlations
bl_SS pv_SS pr_SS bls_SS obe_SS
bl_SS Pearson Correlation 1 .696** -.275** .567** .661**
pv_SS Pearson Correlation .696** 1 -.351** .375** .482**
pr_SS Pearson Correlation -.275** -.351** 1 -.212** -.198**
bls_SS Pearson Correlation .567** .375** -.212** 1 .475**
obe_SS Pearson Correlation .661** .482** -.198** .475** 1
**. Correlation is significant at the 0.01 level (2-tailed).
Model Summaryb
Model R R Square
Adjusted R
Square
Std. Error of the
Estimate Durbin-Watson
1 .816a .666 .660 3.89610 1.963
a. Predictors: (Constant), obe_SS, pr_SS, bls_SS, pv_SS
b. Dependent Variable: bl_SS
Coefficientsa
Model
Unstandardized Coefficients
Standardized
Coefficients
t Sig. B Std. Error Beta
1 (Constant) -4.943 1.853 -2.668 .008
pv_SS .862 .093 .444 9.311 .000
pr_SS -.002 .044 -.002 -.056 .956
bls_SS .291 .055 .243 5.299 .000
obe_SS .422 .062 .331 6.852 .000
a. Dependent Variable: bl_SS