Embed Size (px)
Citation preview
INFLUENCE OF BRAND EQUITY ON CONSUMER
PURCHASE DECISION OF ALCOHOLIC BEVERAGES IN
NAIROBI
BY
BARMASAI FELIX KIPRONO
UNITED STATES INTERNATIONAL UNIVERSITY -
AFRICA
SPRING 2019
INFLUENCE OF BRAND EQUITY ON CONSUMER
PURCHASE DECISION OF ALCOHOLIC BEVERAGES IN
NAIROBI
BY
BARMASAI FELIX KIPRONO
A Research Project Report Submitted to the Chandaria School
of Business in Partial Fulfillment of the Requirement for the
Degree of Masters in Business Administration (MBA)
UNITED STATES INTERNATIONAL UNIVERSITY -
AFRICA
SPRING 2019
ii
STUDENT’S DECLARATION
I, the undersigned, declare that this is my original work and has not been submitted to any
other college, institution or university other than the United States International
University in Nairobi for academic credit.
Signed: ________________________ Date: _____________________
Barmasai Felix Kiprono (ID 642058)
This research project report has been presented for examination with my approval as the
appointed supervisor.
Signed: ________________________ Date: _____________________
Dr. Peter Kiriri
Signed: _______________________ Date: _____________________
Dean, Chandaria School of Business

iii
COPYRIGHT
All rights reserved. No part of this research paper may be replicated, stored in a retrieval
system or transmitted in any form, without prior consent.
Copyright ©2019
iv
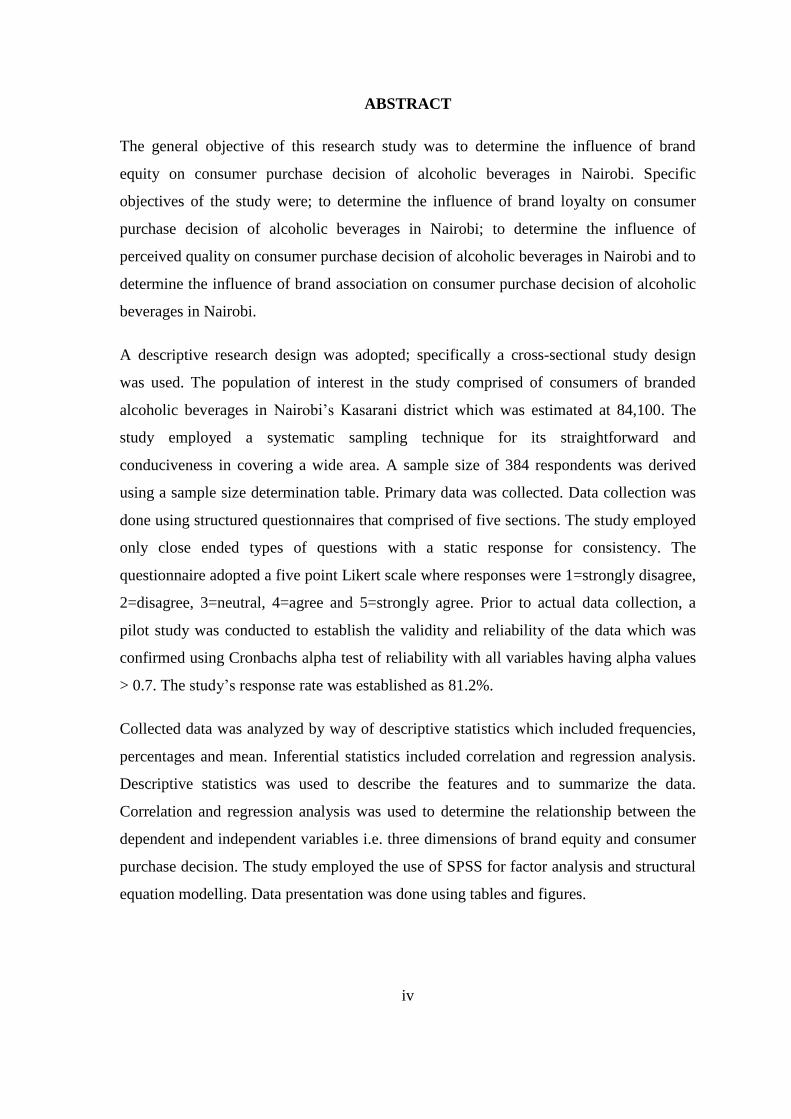
ABSTRACT
The general objective of this research study was to determine the influence of brand
equity on consumer purchase decision of alcoholic beverages in Nairobi. Specific
objectives of the study were; to determine the influence of brand loyalty on consumer
purchase decision of alcoholic beverages in Nairobi; to determine the influence of
perceived quality on consumer purchase decision of alcoholic beverages in Nairobi and to
determine the influence of brand association on consumer purchase decision of alcoholic
beverages in Nairobi.
A descriptive research design was adopted; specifically a cross-sectional study design
was used. The population of interest in the study comprised of consumers of branded
alcoholic beverages in Nairobi’s Kasarani district which was estimated at 84,100. The
study employed a systematic sampling technique for its straightforward and
conduciveness in covering a wide area. A sample size of 384 respondents was derived
using a sample size determination table. Primary data was collected. Data collection was
done using structured questionnaires that comprised of five sections. The study employed
only close ended types of questions with a static response for consistency. The
questionnaire adopted a five point Likert scale where responses were 1=strongly disagree,
2=disagree, 3=neutral, 4=agree and 5=strongly agree. Prior to actual data collection, a
pilot study was conducted to establish the validity and reliability of the data which was
confirmed using Cronbachs alpha test of reliability with all variables having alpha values
> 0.7. The study’s response rate was established as 81.2%.
Collected data was analyzed by way of descriptive statistics which included frequencies,
percentages and mean. Inferential statistics included correlation and regression analysis.
Descriptive statistics was used to describe the features and to summarize the data.
Correlation and regression analysis was used to determine the relationship between the
dependent and independent variables i.e. three dimensions of brand equity and consumer
purchase decision. The study employed the use of SPSS for factor analysis and structural
equation modelling. Data presentation was done using tables and figures.
v
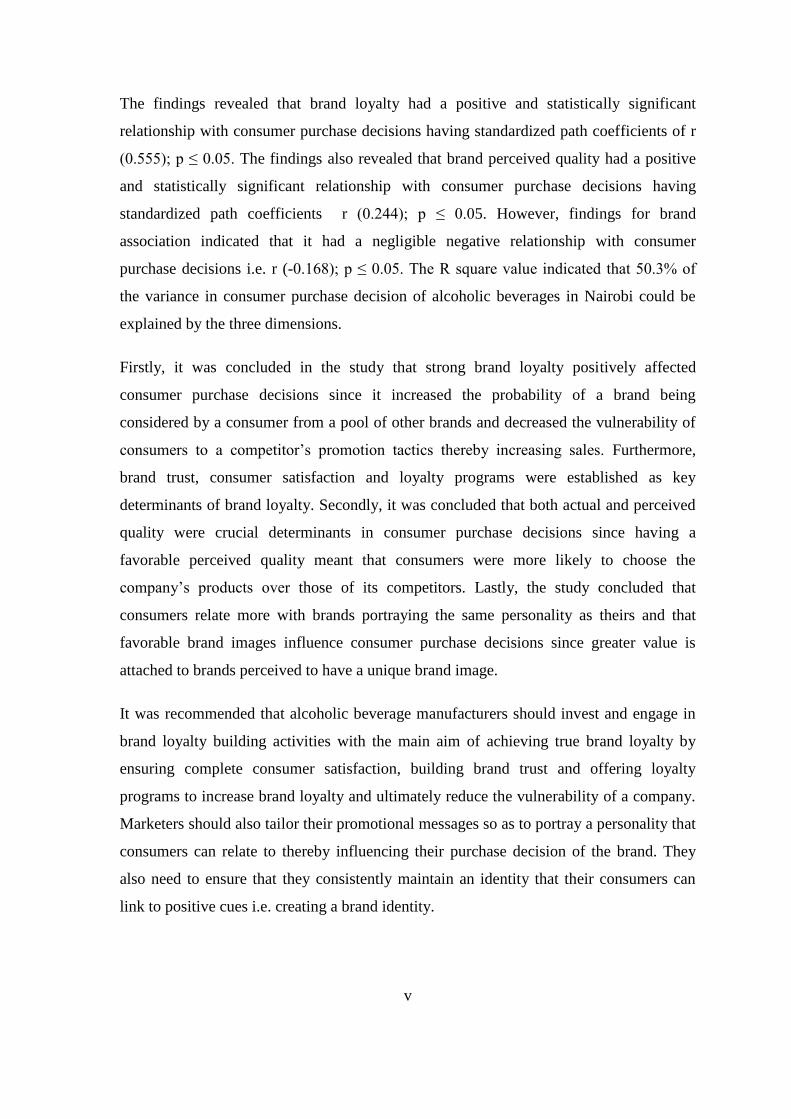
The findings revealed that brand loyalty had a positive and statistically significant
relationship with consumer purchase decisions having standardized path coefficients of r
(0.555); p ≤ 0.05. The findings also revealed that brand perceived quality had a positive
and statistically significant relationship with consumer purchase decisions having
standardized path coefficients r (0.244); p ≤ 0.05. However, findings for brand
association indicated that it had a negligible negative relationship with consumer
purchase decisions i.e. r (-0.168); p ≤ 0.05. The R square value indicated that 50.3% of
the variance in consumer purchase decision of alcoholic beverages in Nairobi could be
explained by the three dimensions.
Firstly, it was concluded in the study that strong brand loyalty positively affected
consumer purchase decisions since it increased the probability of a brand being
considered by a consumer from a pool of other brands and decreased the vulnerability of
consumers to a competitor’s promotion tactics thereby increasing sales. Furthermore,
brand trust, consumer satisfaction and loyalty programs were established as key
determinants of brand loyalty. Secondly, it was concluded that both actual and perceived
quality were crucial determinants in consumer purchase decisions since having a
favorable perceived quality meant that consumers were more likely to choose the
company’s products over those of its competitors. Lastly, the study concluded that
consumers relate more with brands portraying the same personality as theirs and that
favorable brand images influence consumer purchase decisions since greater value is
attached to brands perceived to have a unique brand image.
It was recommended that alcoholic beverage manufacturers should invest and engage in
brand loyalty building activities with the main aim of achieving true brand loyalty by
ensuring complete consumer satisfaction, building brand trust and offering loyalty
programs to increase brand loyalty and ultimately reduce the vulnerability of a company.
Marketers should also tailor their promotional messages so as to portray a personality that
consumers can relate to thereby influencing their purchase decision of the brand. They
also need to ensure that they consistently maintain an identity that their consumers can
link to positive cues i.e. creating a brand identity.

vi
ACKNOWLEDGMENT
My sincere and heartfelt gratitude goes to my supervisor, Dr. Peter Kiriri for his guidance
and support throughout this research project, my family and friends for the moral support
and for believing in me. I would also like to acknowledge my employer, for the financial
support to cover the costs of my studies and finally, a special thanks to all who were
involved in one way or another towards the completion of this research project.
vii
TABLE OF CONTENTS
STUDENT’S DECLARATION ............................................................................................. ii
COPYRIGHT ......................................................................................................................... iii
ABSTRACT ............................................................................................................................ iv
ACKNOWLEDGMENT ....................................................................................................... vi
TABLE OF CONTENTS ..................................................................................................... vii
LIST OF TABLES .................................................................................................................. x
LIST OF FIGURES ............................................................................................................... xi
ACRONYMS AND ABBREVIATIONS ............................................................................. xii
CHAPTER ONE ..................................................................................................................... 1
1.0 INTRODUCTION............................................................................................................. 1
1.1Background of the Study ..................................................................................................... 1
1.3 General Objective ............................................................................................................... 5
1.4 Specific Objectives ............................................................................................................. 5
1.5 Significance of the Study .................................................................................................... 6
1.6 Scope of the Study .............................................................................................................. 7
1.8 Definition of Terms............................................................................................................. 7
1.9 Chapter Summary ............................................................................................................... 8
CHAPTER TWO .................................................................................................................... 9
2.0 LITERATURE REVIEW ................................................................................................ 9
2.1 Introduction ....................................................................................................................... 9
2.2 Brand Loyalty and Consumer Purchase Decision .............................................................. 9
2.3 Perceived Quality and Consumer Purchase Decision ....................................................... 16
2.4 Brand Associations and Consumer Purchase Decisions ................................................... 21
2.5 Chapter Summary ............................................................................................................. 26
viii
CHAPTER THREE .............................................................................................................. 27
3.0 RESEARCH METHODOLOGY .................................................................................. 27
3.1 Introduction ....................................................................................................................... 27
3.2 Research Design................................................................................................................ 27
3.3 Population and Sampling Design ...................................................................................... 27
3.4 Data Collection Methods .................................................................................................. 29
3.5 Research Procedures ......................................................................................................... 29
3.6 Data Analysis Methods ..................................................................................................... 30
3.7 Chapter Summary ............................................................................................................. 30
CHAPTER FOUR ................................................................................................................. 31
4.0 RESULTS AND FINDINGS .......................................................................................... 31
4.1 Introduction ....................................................................................................................... 31
4.2 Response Rate ................................................................................................................... 31
4.3 Demographic Characteristics ............................................................................................ 31
4.4 Brand Loyalty ................................................................................................................... 36
4.5 Perceived Quality .............................................................................................................. 39
4.6 Brand Association ............................................................................................................. 42
4.7 Purchase Decision ............................................................................................................. 44
4.8 Measurement Model ......................................................................................................... 45
4.9 Structural Model ............................................................................................................... 52
4.10 Path Coefficients ............................................................................................................. 54
4.11 Predictive Relevance of the Model ................................................................................. 55
4.12 Summary ......................................................................................................................... 55
CHAPTER FIVE .................................................................................................................. 56
5.0 DISCUSSION, CONCLUSIONS AND RECOMMENDATIONS ............................. 56
5.1 Introduction ....................................................................................................................... 56
ix
5.2 Summary ........................................................................................................................... 56
5.3 Discussion ......................................................................................................................... 57
5.4 Conclusion ........................................................................................................................ 63
5.5 Recommendations ............................................................................................................. 64
REFERENCES ...................................................................................................................... 67
APPENDICES ....................................................................................................................... 79
APPENDIX I: LETTER OF INTRODUCTION ............................................................... 79
APPENDIX II: QUESTIONNAIRE ................................................................................... 80
x
LIST OF TABLES
Table 4.1 Response Rate ......................................................................................................... 31
Table 4.2 Respondents Occupation......................................................................................... 33
Table 4.3 Brand Preference..................................................................................................... 34
Table 4.4 Consumption ........................................................................................................... 36
Table 4.5 Descriptives for Consumer Satisfaction ................................................................. 37
Table 4.6 Descriptives for Brand Trust................................................................................... 38
Table 4.7 Descriptives for Loyalty Programs ......................................................................... 39
Table 4.8 Descriptives for Perceived Product Quality............................................................ 40
Table 4.9 Descriptives for Brand Value ................................................................................. 41
Table 4.10 Descriptives for Country of Origin ....................................................................... 42
Table 4.11 Descriptives for Brand Personality ....................................................................... 43
Table 4.12 Descriptives for Brand Image ............................................................................... 44
Table 4.13 Descriptives for Purchase Decision ...................................................................... 45
Table 4.14 KMO and Bartlett's Test ....................................................................................... 46
Table 4.15 Factor Loadings .................................................................................................... 48
Table 4.16 Measurement Model Fits ...................................................................................... 49
Table 4.17 Reliability of Constructs ....................................................................................... 51
Table 4.18 Component Correlation Matrix ............................................................................. 52
Table 4.19 Structural Model Fit .............................................................................................. 52
Table 4.20 Path Coefficients ................................................................................................... 54
xi
LIST OF FIGURES
Figure 4.1 Gender of Respondents.......................................................................................... 31
Figure 4.2 Age of Respondents ............................................................................................... 32
Figure 4.3 Education Levels ................................................................................................... 32
Figure 4.4 Average Monthly Income ...................................................................................... 33
Figure 4.5 Marital Status......................................................................................................... 34
Figure 4.6 Brand Origin .......................................................................................................... 35
Figure 4.7 Brand Manufacturer/Distributor ............................................................................ 35
Figure 4.8 Scree Plot ............................................................................................................... 46
Figure 4.9 Measurement Model .............................................................................................. 50
Figure 4.10 Structural Model .................................................................................................. 53
xii
ACRONYMS AND ABBREVIATIONS
AIB Africa Investment Bank
CFA Confirmatory Factor Analysis
EABL East African Breweries Limited
EFA Exploratory Factor Analysis
ICAP International Center for Alcohol Policies
KNBS Kenya National Bureau of Statistics
NACADA National Authority for the Campaign against Alcohol and Drug Abuse
PCA Principal Component Analysis
SEM Structural Equation Modelling
1
CHAPTER ONE
1.0 INTRODUCTION
1.1Background of the Study
According to Jernigan (2012), the alcoholic beverage industry included producers,
wholesalers and distributors, point-of-sale operator and hospitality providers such as
hotels or cafes that serve alcohol. With a one billion liter increase in the amount of
alcohol consumed in 2016 , the global alcoholic beverages market was valued at $1,439
billion in 2017, and is expected to reach $1,684 billion by 2025, registering a compound
annual growth rate of 2.0% from 2018 to 2025 (Allied Market Research, 2018).
According to ICAP (2015), branded alcoholic beverages accounted for approximately
38% of recorded alcohol consumption world-wide. Additionally, the top ten producers
accounted for 66% of the global market share for beer, 59% for spirits, and 16% for wine.
According to Caetano and Laranjeira (2006), economic growth in developing nations
expands the local alcohol industry and makes developing nations targets of market
expansion by the ever-growing transnational producers of alcoholic beverages. Jernigan
(2012) asserts that producers of these alcoholic beverages tend to be large multinational
corporations reliant on marketing for their survival. His study found that the globalized
segment of the alcohol industry is large and concentrated in the hands of a relatively
small number of companies, particularly in the case of beer and distilled spirits. Jernigan
and Babor (2015) suggest that much of the African region is experiencing a rapid rise in
consumption. Rising populations and income and the rapid pace of urbanization make
Africa very attractive to the global alcohol industry, and industry leaders have identified
Africa as a key area for growth.
Distilled spirits is the top investment pocket in the alcoholic beverages market, attributed
to the boom in premium/super premium whiskey consumption and the demand shift from
beer (Allied Market Research, 2018). According to Jernigan (2009), globalization in the
alcoholic beverage industry has led to greater concentration of ownership and greater
dependence on marketing. In recent years, Kenya has seen an influx of imported
international brands of beer, wines and spirits imported and sold either through acquiring
local industries or forming partnerships with distributors. The market also witnessed
growth in sales of international brands, with Budweiser beer and Officer’s Choice
2
Whisky setting up shop in Kenya in 2016 to meet demand from the growing middle class
(Euromonitor, 2018). All this while Kenyan owned alcoholic beverage manufacturers
struggle with dwindling sales and reduced profits as consumers prefer global brands.
According to Caetano and Larangeira (2006), the market expansion of alcohol beverages
in developing countries by international conglomerates is sometimes conducted by
acquiring at least partial ownership of local industry. Aaker (2010) asserts that as
industries turn increasingly hostile, it is clear that strong brand-building skills are needed
to survive and prosper. According to Alamgir, Nasir, Shamsuddoha and Nedelea (2011),
marketers have become extremely concerned about knowing how brand names influence
the customer purchase decision. Why customers purchase a particular brand also implies
how they decide what to buy. According to Laforet (2010), consumer’s dependence on
brands is obvious and non-debatable since we live brands; from the clothes we dress in to
the drinks we have, the food we eat and the cars we drive.
Cravens and Piercy (2013) assert that it is crucial for companies to find out their
customer’s decision making process and to identify the conditions which customers apply
while making purchase decisions. Chernatony and McDonald (2011) assert that
successful brand building helps a firm’s profitability by adding value that entices
customers to buy. A brand is therefore one of the most valuable assets of a company, so
much so that many companies try to acquire them (Laforet, 2010). Branding is endowing
products and services with the power of a brand (Kotler & Keller, 2016). Keller (2008)
asserts that one of the most popular and potentially important marketing concepts to arise
in the 1980’s was brand equity.
Aaker (1991) defined brand equity as a set of brand assets or liabilities that are linked to a
brand and includes its name and symbol which add to or subtract from the value provided
by a product or service to a firm and / or to that firm’s customers. He identified four
dimensions of brand experience that led to positive brand equity which included
perceived quality, brand loyalty, name awareness, and brand association. He asserts that
the challenge is not only building brand equity to increase brand loyalty, but to sustain it
while maintaining positive brand equity. According to Keller (2008), customer based
brand equity occurs when the consumer has a high level of awareness and familiarity with
a brand and holds some strong favorable and unique brand associations in memory.
3
Laforet (2010) asserts that brand equity is the appropriate measure for evaluating the long
run impact of marketing decisions.
There has emerged the need to carry out research on the importance of brand building and
hence brand equity to both the firm and its consumers and how it can be used as a
marketing tool and a point of differentiation among the overly crowded liquor industry.
The manufacturing sector in Kenya grew at 3.5% in 2016 and 3.2% in 2015, contributing
10.3% to gross domestic product (KNBS, 2017). Kenya’s manufacturing sector is one of
the strongest among the other east African countries. It is expected that Kenya will be
classified as a middle income country by 2020 up from its current status as a low income
country. In Kenya, alcohol manufacturing is a subsector under the larger food and
beverage industry, the fastest growing subsector in the manufacturing industry.
According to the KNBS (2017), the beverages sub-sector grew by 5.6 per cent in 2016
mainly driven by production of beer and spirits, which went up by 11.8 per cent and 3.8
per cent, respectively. The growth in beer production was attributed to a 90 per cent
remission of excise duty for beer made from domestically grown sorghum, millet or
cassava. However, exports of beer in 2016 reduced by half from 65,073.3 thousand liters
to 32,564.0 thousand liters, indicating that most of the beer produced was consumed
locally (EABL, 2017). Kenyan owned local alcoholic beverage manufacturers seem to
have a tough time making significant gains in market share as EABL dominates both the
premium and economy segments.
What the local industries seem to lack is positive brand equity and therefore alcohol
lovers prefer to purchase from the “well-known” brands offered by East Africa Breweries
Limited. Successful brand building helps profitability by adding value that entices
customers to buy (De Chernatony & McDonald, 1994). A brand is therefore one of the
most valuable assets of a company, so much so that many companies try to acquire them
(Laforet, 2010). Brands vary in the amount of power and value they have in the
marketplace. Brands are complex entities, but ultimately they reside in consumers’ minds
(Tuominen, 1999).
4
1.2 Statement of the Problem
Building brand equity in this competitive environment is a very challenging and difficult
task. According to Tanveer and Lodhi (2016), companies are now focused on meeting
customers’ imminent desires by providing appropriate experiences. Aaker (2010) asserts
that the brand building process is eroding, loyalty levels falling and price becoming more
important despite the obvious value of brands. Kenya’s alcoholic beverage industry is
worth billions of shillings. Not only does it contribute to the country’s gross domestic
product but it also provides employment directly to thousands of people across Kenya as
well as an important revenue source for government through taxes.
EABL was Kenya’s largest alcoholic beverage manufacturer and remained the leader in
alcoholic drinks in 2017, due to its ability to cater for different consumer tastes and
preferences and continued reinvention of its value chain to secure its bottom line
(Euromonitor, 2018). According to its 2017 financial reports, it reported an upward
movement of 9% in net sales from 64.32 billion shillings in 2016 to 70.25 billion shillings
in 2017. It is controlled by Diageo Plc., the majority shareholder and the largest alcoholic
beverage manufacturer in the world. According to Africa yield (2012), EABL had 80%
market share of Kenya’s alcohol market. The market domination of East Africa Breweries
Limited can be interpreted to mean that a majority of Kenyan alcohol consumers would
prefer its product over other locally available brands. Multinational brands have
dominated the Kenyan alcoholic beverage industry either by acquiring local established
firms like Diageo did, or by partnering with local distributors.
According to AIB (2016), there has been increased demand for more premium beers and
the shift in consumer sophistication towards the spirits portfolio. Thanks to an expanding
middle class and hence more disposable incomes and a growing young population,
Kenyan consumers of alcohol have become more demanding. This has resulted in
increased imports of foreign beer, wine and spirit brands that have gained popularity over
the years. Internationally, the topic of brand equity and its influence on consumer choice
has been researched on although minimally. Porral, Bourgault and Dopico (2013) in their
study aimed to analyze the sources and consequences of beverages’ Brand Equity, and
more specifically, the beer Brand Equity in a Southern European mature market. They
concluded that brand equity has received continuous attention from researchers and
5
marketing managers and there is great abundance of models and concepts related to brand
equity, however there are few studies based on empirical data on the brewery sector. Kim,
Yang and Chao (2016) also investigated the effect of brand equity and country origin on
Korean consumers’ choice for beer brands.
Torres, Augusto and Lisboa (2015) concluded that the study of brand equity is regarded
as one of the most critical issues in marketing research and the interrelations between
brand equity dimensions was identified as a research gap. Locally, several studies have
been conducted on the topic of brand equity and its influence on consumer purchase
decisions. For example, Njuguna (2014) addressed the influence of brand equity on
consumer choice in branded bottled water among supermarket customers in Nairobi
central business district, Kenya. Asuma and Ndambuki (2015) focused on the influence of
brand equity on the choice of marketing strategies by manufacturers of carbonated drinks
in Kenya. Andai (2016) focused on the influence of brand equity on consumer purchase
choices among pay TV subscribers in Nairobi, Kenya while Muigai (2017) focused on the
impact of brand equity on consumer buyer behavior of smartphones among millennials: a
case study of the United States international university.
Therefore even though there were several studies on the topic of brand equity, none of the
research done locally had touched on the local alcohol beverage industry and therefore
the need arose for research in this area. EABL managed to create positive brand equity by
focusing on all its dimensions. In turn customers identified more with its products and
hence the large market share in the beer and spirit segment. This study sought to uncover
the influence of brand loyalty, perceived quality and brand associations on consumer
purchase decision of alcoholic beverages in Nairobi. The findings were key in informing
local alcoholic beverage manufacturers of the importance of creating positive brand
equity.
1.3 General Objective
The objective of this research was to determine the influence of brand equity on consumer
purchase decision of alcoholic beverages in Nairobi.
1.4 Specific Objectives
1.4.1 To determine the influence of brand loyalty on consumer purchase decision of
alcoholic beverages in Nairobi.
6
1.4.3 To determine the influence of perceived quality on consumer purchase decision of
alcoholic beverages in Nairobi.
1.4.4 To determine the influence of brand associations on consumer purchase decision of
alcoholic beverages in Nairobi.
1.5 Significance of the Study
1.5.1 Alcoholic Beverage Manufacturers in Kenya
The findings of this research study were especially beneficial to the local alcohol
manufacturers in Kenya. The growing demand for premium brands by Kenyan consumers
thanks to an expanding middle class and an increase in disposable income means that
consumers are willing to pay a higher price for a product deemed to be superior. It is
becoming seemingly obvious that consumers of alcoholic beverages especially those in
the middle income group buy brands rather than product. This explains the recent trends
where global beer, wine and spirit brands are flooding the Kenyan market and getting a
positive market reception. This study shed light on the importance of creating positive
brand equity to the company and therefore how best it can achieve this through the four
dimensions of brand equity.
1.5.2 The Government and Policy Makers
This research study’s findings will also be of significant importance to the government of
Kenya. Food and beverages usually a domestically-oriented industry is the dominant
manufacturing sector accounting for 40% to 70% of gross value addition. It is therefore
imperative that the government should support the growth of the local alcohol
manufacturing sector. The findings of this research will also be helpful to government
bodies such as Brand Kenya Board which is tasked with identifying and refining the key
attributes of Kenya that contribute positively to the country’s image and reputation. Its
goal is to enhance these characteristics and create an authentic, credible brand for the
country that establishes its uniqueness in the global arena. There is a need to work with
Brand Kenya to better incorporate manufactured goods as a key part of the Kenyan brand.
1.5. 3 Researchers
Brand equity is a broad marketing topic that has not been fully researched on. This
research paper will therefore contribute to the existing literature on brand equity,
7
consumer behavior and knowledge on the alcoholic beverage industry. To researchers, the
findings of this study will be key in guiding them through sequential studies on the topic
of brand equity and its four dimensions into other sub-sectors or industries.
1.6 Scope of the Study
The study aimed to investigate the influence of brand equity on consumer purchase
decision of alcoholic beverages in Nairobi. The target population consisted of consumers
of branded alcoholic beverages in Nairobi’s Kasarani district. The study involved seven
days of data collection from 50 alcoholic beverage retail outlets and 400 respondents
between the dates of April 21st to April 28th of 2019.
The study challenges included some respondent reluctance to indicate their level of
income which was mitigated by assuring the respondents confidentiality and that the data
was to be used for academic purposes only. To maximize the response rate, the
participants were offered a free pen after completing the questionnaire. This study was
also limited in scope as it covered only Kasarani district in Nairobi. However, the
sampling technique ensured that the results were representative to the whole population of
alcoholic beverage consumers.
1.8 Definition of Terms
1.8.1Brand
Hammond (2011) defined a brand as the total emotional experience a customer has with a
company and its product.
1.8.2 Product
Trott and Sople (2016) defined a product as a set of attributes offered for the purpose of
the satisfaction to the consumer.
1.8.3 Brand Equity
According to Keller (1993), brand equity is the measurable totality of a brand's worth and
is validated by assessing the effectiveness of these branding components.
8
1.8.4 Brand Associations
According to Tuominen (1999), brand association is any mental linkage to the brand.
Brand associations may include, e.g. Product attributes, customer benefits, uses, life-
styles, product classes, competitors and countries of origins.
1.8.5 Perceived Quality
Aaker (1991) defined perceived quality as the customer’s perception of the overall quality
or superiority of a product or service with respect to its intended purpose, relative to
alternatives.
1.8.6 Brand Loyalty
Trott and Sople (2016) defined brand loyalty as the conscious and unconscious decision
expressed through intention or repurchase of the brand continuously.
1.9 Chapter Summary
This was the introductory chapter which aimed at getting the reader familiarized with the
intended research as well as the issues to be addressed and discussed. It talked about the
background of the study. That is, factors that led the researcher to pursue this particular
topic on brand equity and its importance in consumer decision making. Secondly, it
talked about the specific industry problem based on the concerns raised in the background
of the study. The main objective of the research as well as the specific objectives which
were to determine the influence of three dimensions of brand equity (brand loyalty,
perceived quality and brand associations) on consumer purchase of alcoholic beverages
within Nairobi.
The significance of this study to the different stakeholders was also discussed in this
chapter. And finally key terms were defined for easier understanding. Chapter two
entailed literature review of books, scholarly articles and relevant material regarding the
topic of brand equity while chapter three entailed the research methodology which
described the research methods and procedures that were adopted in the research. Chapter
four and five entailed the analysis and presentation of the collected data and a discussion
of the results respectively.
9
CHAPTER TWO
2.0 LITERATURE REVIEW
2.1 Introduction
This chapter presented a review of relevant literature in regard to the topic of brand equity
and consumer purchase decision of alcoholic beverages in Nairobi. Specifically, a critical
evaluation of three dimensions of brand equity as well as their antecedents based on
Aaker’s brand equity model that had been identified as the specific objectives mentioned
in the chapter one. They included; brand loyalty, perceived quality and brand association.
2.2 Brand Loyalty and Consumer Purchase Decision
According to Lovelock and Wirtz (2015), brand loyalty has been used in the business
context to describe a customer’s willingness to continue patronizing a firm over the
long term, preferably on an exclusive basis, and recommending the firm’s products
to friends and associates. Aaker (2010) viewed brand loyalty as a key consideration when
placing value on a brand because having a highly loyal consumer base generates
predictable sales and profit streams.
He asserts that a brand becomes vulnerable without a loyal customer base and only has
value if it has the potential to create loyal customers. According to Ravi (2014), Brand
loyalty is considered as one of the major element of building brand equity. He asserts that
it is the primary factor which creates customer based brand equity because the customers
are loyal to their brand only in the case of complete satisfaction and trust. On one hand,
Ayub (2012) defines Brand loyalty as the extension to which a consumer constantly buys
the same brand within a product category. Aaker (2010) on the other hand defines brand
loyalty as a measure of the attachment that a customer has to a brand. He goes on to state
that brand loyalty reflects how likely a customer will be to switch to another brand
especially when that brand makes a change either in price or in product features.
Maheshwari, Lodorfos and Jacobsen (2014) assert that marketing strategies for brands
have shifted its focus on relationships and value creation that directly links to brand
loyalty. According to Asuma (2015), a strong brand can only exist given that it has a
strong supply of brand loyal customers. Lee, Moon, Kim and Yi (2015) suggest that a
10
loyal user is committed to the idea of repurchasing the same brand or brand set despite
situational influences or marketing efforts that can cause switching behavior.
Malik et al. (2013) explored the effects of brand loyalty and brand awareness on
consumer purchase intention. The results of his study indicated that purchase intentions
had a strong positive association with brand awareness and brand loyalty and he
concluded that purchase intentions can be enhanced by brand awareness and brand
Loyalty as a result of their strong positive association. He asserted that managers all over
the world should thus strive to promote the brand awareness along with brand loyalty as
both of them contribute towards positive purchase intentions. Atilgan, Aksoy, Akinci and
Kaynak (2009) explored the practicality and application of a customer based brand equity
model based on Aaker’s brand equity model. Their study investigated the relationships
between dimensions of brand equity. They specifically measured the way in which
consumer perceptions of the dimensions of brand equity affected the overall brand equity
evaluations.
Atilgan et al. (2009) concluded that brand loyalty was the most influential dimension of
brand equity. Other than identifying that brand loyalty was the most influential dimension
of brand equity, there was need to find the factors involved brand awareness and
perceived quality order to strengthen their influence on brand equity. Taylor, Celuch and
Goodwin (2004) conducted a study on the importance of brand equity to customer loyalty
that involved a nationwide sample of industrial customers of heavy equipment
manufacturers. Their findings suggested that brand equity and trust were the most
important antecedents to both behavioral and attitudinal forms of customer loyalty. They
also evidenced that the models underlying the formation of behavioral versus attitudinal
forms of customer loyalty may vary across research settings.
Their results suggested that industrial equipment marketers may consider moving beyond
a focus on satisfaction in relationship marketing strategies toward integrated strategies
that foster brand equity and trust in their customer base as well. Hanzaee and Andervazh
(2012) also investigated the relationship between factors affecting brand loyalty and
purchase intention in the cosmetic industry in Iran. They investigated the antecedent
elements that lead to brand loyalty and purchase intentions. The research results showed
that there was a positive and significant relationship between factors of brand loyalty and
11
cosmetics purchase intention. Aaker (2010) asserts that the customer loyalty a firm
commands is what creates a brands value and that loyalty as an asset justifies and
encourages loyalty building programs which then help create and enhance brand equity.
2.2.1 Creating Brand Loyalty
According to Giddens (2002), brand loyalty means that consumers will tend to pay high
prices to a certain brand within the same product group and will advise that brand to the
people around them. However, the high number of brands that serve the same purpose can
make consumers change their brand easily and make the creation of brand loyalty
difficult (Wood, 2004). Since the creation of loyalty is getting more difficult, administers
and researchers began to attach more importance to this issue. The ever increasing
competition among brands has led marketers to utilizing various means to maintain
consumer brand loyalty (Kotler & Keller, 2016). Academicians have come up with
different antecedents to brand loyalty.
As a result of the widely acclaimed importance of brand loyalty, much scholarly interest
in the branding literature has centered on identifying the antecedents of brand loyalty in
the retailing industry (Agustin & Singh, 2005). Research focused on brand preference
have tried to investigate the reasons why consumers prefer certain brands over others
(Yee, Yeung & Cheng, 2008). According to Shankar, Azar and Fuller (2008), brand
satisfaction and brand trust are among the most important precursors of brand preference.
Customer satisfaction, Trust and loyalty programs have been identified as appropriate
antecedents of brand loyalty and have been discussed below.
2.2.2 Consumer Satisfaction and Consumer Purchase Decision
Cooil, Keiningham, Aksoy, and Hsu (2007) assert that because consumer satisfaction has
been regarded a fundamental determinant of long-term business success, much of the
research on consumer satisfaction investigates its impact on consumers post consumption
evaluations such as behavioral and attitudinal loyalty. According to Dimitriades (2006), it
is widely accepted that satisfied consumers are less price sensitive, less influenced by
competitors’ attack and loyal to the firm longer than dissatisfied customers. Ercis, Unal,
Candan and Yildirim (2012) assert that strong competition and rapid technological
developments in various sectors made the firms aiming to increase their market shares by
12
gaining more customers protect their market shares and that one of the ways to protect
their market shares is to create customer loyalty.
The firms with loyal customer portfolios protect their existence for a long time by making
their customers repeat purchases. Therefore, there are several studies in the literature
about the investigation of variables affecting brand loyalty. Fecikova (2004) asserts that
in the contemporary global and highly competitive economy, it is fatal for a business
organization to be non-customer oriented. Indeed, to survive organizations need to
produce products and services of very good quality that yield highly satisfied and loyal
customers. Loyalty of customers is considered to be a function of satisfaction. For many
years customer satisfaction has been a major goal of business organizations, since it has
been deemed to affect customer retention and companies’ market share (Hansemark &
Albinsson, 2004).
Nam, Ekinci and Whyatt (2011) assert that although previous research has examined the
relationship between consumer satisfaction and consumer loyalty, there has been only
limited investigation into the impact of consumer satisfaction on the relationship between
brand equity and brand loyalty. Several studies suggest that customer characteristics such
as gender, age and education condition the relationship between satisfaction and
behavioral outcomes such as loyalty (Cooil et al, 2007). Although satisfaction is
presumed to affect customer loyalty, it is important to consider other factors that possibly
also play a role in explaining differences in customer loyalty (Schirmer, Ringle, Gudergan
& Feistel, 2018).
2.2.3 Brand Trust
Agustin and Singh (2005) define trust as a consumer’s confident beliefs that he or she can
rely on the brand to deliver promised services or products. Marketers should therefore
take careful consideration of brand factors in the development of trust in a brand.
According to Alhaddad (2015), building and maintaining a trusting and long-lasting
relationship with customers are critical to a brand’s success in today’s highly competitive
global market. He asserts that because of its importance, Brand trust has drawn increasing
attention from both practitioners and researchers in recent years. To build trust, both the
supplier and the buyer have to keep their promises. A stable brand personality and
consistency in the characteristics of the goods or service attributes will reduce the
13
emotional risk that the buyers experience every time they purchase a brand and will
increase its credibility.
According to Blackston (1993), this process can result in the development of trust and
satisfaction, especially when customers believe that the brand supports their needs, and
eventually to the creation of a bond between the buyer and the brand. Rauyruen and
Miller (2007) argued that in order to gain loyalty of customers, one must first gain their
trust. Lau and Lee (1999) in their study proposed that trust in a brand is important and is a
key factor in the development of brand loyalty.
Their findings revealed that brand characteristics were relatively more important in their
effects on a consumer’s trust in a brand and that trust in a brand is positively related to
brand loyalty. Delgado-Ballester and Munuera-Aleman (2005) analyzed the importance
of brand trust in the development of brand equity. Their findings revealed that brand trust
is rooted in the result of past experience with the brand, and it is also positively associated
with brand loyalty, which in turn maintains a positive relationship with brand equity
2.2.4 Loyalty Programs
According to Dorotic, Bijmolt and Verhoef (2011), the boom in information technology
and the shifting of companies towards customer focus has prompted the development of
loyalty programmes to encourage customer loyalty. The American Marketing Association
refers to loyalty programs as continuity incentive programs offered by a retailer to reward
customers and encourage repeat business. Dorotic et al. (2011) suggest that this definition
also includes manufacturers as potential offerees. According to Yi and Jeon (2003), a
loyalty program is a marketing program that is designed to build customer loyalty by
providing incentives to profitable customers and is often based on several propositions.
Zhang and Breugelmans (2012) assert that marketing researchers have studied various
loyalty programs extensively and that their effectiveness still remains debatable. A large
variety of companies, including airlines, hotels, retailers, and car manufacturers
increasingly use loyalty programs to manage their customer bases (Mimouni-Chaabane &
Volle, 2010). Gaining customer loyalty is an important goal of marketing, and loyalty
programs are intended to help in reaching it (Evanschitzky et al, 2011). The goal of a
loyalty program is to establish a higher level of customer retention in profitable segments
14
by providing more satisfaction and value to certain customers (Bolton, Kannan, &
Bramlett, 2000). A review of previous research suggests that the benefits customer obtain
from joining loyalty programs consist of monetary savings, convenience, exploration,
entertainment, recognition and social benefits.
According to Yi and Jeon (2003), although loyalty programs were widely used, there was
little empirical research that investigated whether loyalty programs are indeed perceived
as valuable to customers and whether it actually contributed to building brand loyalty.
Zhang and Breugelmans (2012) therefore suggest that as marketers look for ways to
differentiate their loyalty programs from others, it becomes increasingly important to
examine new loyalty program designs.
2.2.5 Brand Loyalty Levels
Aaker (2012) asserts that there are several levels of loyalty. He put forth a loyalty
pyramid where each level represents a different marketing challenge and a different type
of asset to manage and exploit. As brand loyalty increases, the vulnerability of the
customer base to competitive action is reduced. According to Aaker (1991), the five
levels of brand loyalty provide a feeling for the variety of forms that loyalty can take and
how it impacts upon brand equity. Aaker asserts that at the bottom of the loyalty level is
the non-loyal buyer who is completely indifferent to the brand since each brand is
perceived to be adequate, and the brand name plays only a small role in the purchase
decision. He suggests that this buyer might be termed a switcher. According to Aaker
(1991), the second level consists of buyers who are satisfied with the product or at least
not dissatisfied and may be called habitual buyers.
The third level consists of switching cost loyal. These are customers who are satisfied and
in addition have switching costs for example in time or money associated with switching.
He calls this group switching-cost loyal. The fourth level consists of those that truly like
the brand. Hence, their preference may be based upon a symbol, a set of use experiences
or a perceived high quality. Consumers in this fourth level might be termed friends of the
brand because there is an emotional attachment to the brand. Finally at the top level are
the committed buyers who feel pride in being users of the brand. Therefore the brand
becomes important to them either functionally or as an expression of who they are. Hence
they would be willing to recommend the brand to others.
15
The brand loyalty of existing customers represents a strategic asset that, if properly
managed and exploited, has the potential to provide value in several ways. A loyal set of
customers can reduce marketing costs, since it is much less costly to keep a customer than
to gain and regain, and it provides trade leverage over others in the distribution channel.
Customers can create brand awareness and generate reassurance to new customers. Loyal
customers will also give a company time to respond to competitive threats (Aaker 1991).
Brand loyalty is a measure of the extent to which consumers are loyal to a particular
brand over a period of time, which emphasizes a consistent repurchase of the same brand
(Sheth & Mittal, 2004). Brand loyalty results in an emotional attachment to the brand,
which is driven primarily by commitment and affection (Hawkins, Best & Coney, 2001)
.The consumer develops affection for the brand in a manner similar to a friendship (Ball,
Coelho & Machas, 2004).
Brand loyalty can develop through identification: the consumer believes the brand reflects
and reinforces some aspects of the consumer’s self-concept (Petromilli, Morrison &
Million, 2002). Consumers exhibit behavioral brand loyalty when a consumer buys a
brand simply out of habit or convenience without thinking much about it (Sheth & Mittal,
2004). According to Keller (2008), if consumers primarily used products of a particular
company in preference to the products of competing companies, they were considered
absolutely brand loyal. However if consumers used a product most of the time but
occasionally used a competitors’ product, they are considered moderately brand loyal
(Allender & Richards, 2012). Therefore, low brand loyalty exists if brand or product
switching occurs regularly with products.
Sheth, Mittal and Newman (1999) asserted that there are three major contributors to brand
loyalty, namely perceived brand performance fit, social and emotional identification with
the brand and habit combined with a long history of using the brand. According to McKee
(2010), consumers will seek rewards through repeated purchase especially if they have a
have a positive brand performance experience. Zhang, Gangwar and Seetharaman (2008)
assert that brands will acquire some social images through marketing communications or
by real world observations by consumers. According to Cant, Brink and Brijball (2006),
marketers often design emotional communication so that it can create a positive affective
response on consumers. Melo and Galan (2011) infer that consumers will often enjoy
16
using certain brands in such a way that they psychologically begin to see those brands as
part of themselves.
Neslin (2002) asserts that Brand loyalty arises from habit and long history of brand usage.
For example, a consumer who used a particular brand five years ago and had a good
experience with it in terms of quality and performance is more likely to use the same
brand today and in the future (Briesch, Chintagunta & Fox, 2009). Furthermore, if
consumers saw a brand being used in their parental home as they were growing up, they
are likely to view this long history of use by parents as testimony to the brand’s goodness
and are likely to maintain its usage (Sheth & Mittal, 2004). Positive word-of-mouth
communications from a committed customer increases both the probability of the
recipient becoming a customer and of the recipient sharing the positive comment with a
third person (Hawkins et al, 2001). Therefore, brand loyalty is one of the ways with
which consumers express satisfaction with the performance of the product or service
received.
2.3 Perceived Quality and Consumer Purchase Decision
According to Aaker (2010), perceived quality is a perception by customers and therefore
differs from actual quality, product based quality and the manufacturing quality. He
asserts that perceived quality cannot be objectively determined since it is a perception and
hence judgments about what is important to a customer is involved. Keller (2013) asserts
that perceived quality is a core dimension in customer based brand equity since it relates
to the willingness to pay a premium price, brand choice and brand purchase intention.
Masika (2013) referred to perceived quality as the perception of superiority of a brand
when compared to alternative brands in a competitive set and it is therefore considered
the consumer’s subjective assessment of a product’s superiority or excellence. Perceived
quality provides consumers with value and gives them a reason to differentiate one brand
from the other.
Yee and San (2011) assert that consumers compare the quality of alternatives with regard
to price within a category. Perceived quality is therefore a critical element in consumer
decision making. Mohan (2014) asserts that perceived quality is directly related to the
reputation of the firm that manufactures it. It is therefore used as a key factor by firms
that seek to create competitive advantage in their relative industry. According to
17
Schiffman, Kanuk and Wisenblit (2010), perceived quality is the consumers’ judgment
about an entity’s overall excellence or superiority and not the actual quality of the brand
or product. According to Kotler and Armstrong (2014), perceived quality has a direct
impact on a consumers’ purchase decision and brand loyalty, especially when the
consumer has little or no information about the products that they are intending to
purchase, and is either not motivated or unable to conduct a detailed analysis.
Strizhakova, Coulter, and Price (2011) developed two models with two specific mediating
variables. They were; brand and self-identity brand signal to identify the brand
preferences of consumers. They found that consumers in both developed and developing
countries prefer global brands owing to higher quality. This is in the view of the fact that
if a brand is perceived as globally available, brand quality is thought to be internationally
accepted. Therefore, consumers perceive higher quality of global brands. Additionally,
global brands even appeal more so to local consumers owing to higher perceived quality
and prestige. Schiffman et al. (2010) assert that consumers will often judge the quality of
a product based on a variety of informational cues, intrinsic or extrinsic, that they
associate with the product.
They assert that intrinsic cues are those that concern the physical characteristics of the
product itself i.e. the product performance, its features, reliability, conformance,
durability, serviceability and aesthetics. On the other hand, extrinsic attributes are the
cues that are external to the product itself and include its price, brand name, brand image,
company reputation, manufacturer’s image, retail store image and the country of origin.
Therefore, the subjective judgment of quality may be affected by personal product
experiences, unique requests, and consumption situations, whereas the long-term
experience with a brand makes consumers recognize the advantages and differentiation of
the brand (Aure & Nervik, 2014). Masika (2013) points out that perceived quality cannot
necessarily be objectively determined, in part, because it is a perception and also because
judgments about what is important to customers is involved, and customers differ in their
personalities, needs and preferences.
Stojanov (2012) noted that researchers have distinguished between objective quality and
perceived quality, to better understand the various ways in which quality is perceived.
Objective quality is also known as mechanistic quality, where the features of a product on
18
the market are examined through objective criteria. However, in this sense, the expression
of ‘objective quality’ may be deceptive, as the appraising methods have shown to vary
greatly. Some researchers view this mechanistic quality being as an example of technical
superiority, or the total of specific product attributes. On the other hand, humanistic or
perceived quality is subjectively examined by different audiences, being extremely
dependent on issues such as extremely unsteady results. To better gain clarity and
objectively study quality, numerous industrial ratings have typically been used. However,
the accuracy of their measures have been strongly debated.
While many products may have been termed as technically superior in particular aspects,
they may not be valued as highly by the consumers, since in one way or another, quality
is ultimately perceived and experienced subjectively (Stojanov, 2012). He explained how
researchers have previously further broken down quality into affective and cognitive
quality an overall attitude. The former relates to the general experience that consumers
have of the product or service examined, whereas the latter is used more so for products
which can be measured relatively better before purchase. The study further elaborated
that non-durable consumer products as well as services are usually evaluated through
affective quality, or equally through the quality perceptive attitude towards the product.
Aaker (2010) asserts that competing on the basis of high perceived quality is an attractive
alternative.
2.3.1 Dimensions of Perceived Product Quality
Muigai (2017) asserts that in order to efficiently manage perceived quality, it is essential
to consider its dimensions. According to Aaker (2010), there are seven perceived quality
dimensions for products. Firstly performance which he describes as the primary operating
characteristics of a product. Secondly features which he describes as the secondary
components of products that supplement the product’s basic functioning. The third is
conformance with specifications, that is, the absence of defects. The fourth is reliability:
the consistency of performance from each purchase to the next. The fifth is durability: the
measure of product life in terms of how long will the product last. The sixth is
serviceability: it reflects the ability to service the product, or the speed, courtesy, and
competence of repair.
19
Finally, the seventh dimension of perceived quality according to Aaker (2010), is fit and
finish which he refers to as the look or feel of quality. He asserts that this dimension is
considered vital since it is a dimension that consumers can judge. Aaker points out that
the assumption is often that if the business is not capable of producing good fit and finish
products, the products will in turn probably not offer any other, more important attributes
of quality. Muigai (2017) concluded that perceived product quality can be significantly
different from the actual manufacturing product quality such that even though the actual
quality of a product is good, it is possible that consumer perceptions about the products
may be negative.
2.3.2 Brand Value and Perceived Quality
Aaker (2010) suggests that perceived quality provides value in several ways; first,
perceived quality provides customers with a reason to buy by influencing which brands
they will include or exclude from consideration as well as the brand they will select. He
asserts that if the perceived quality is high, then advertising and promotion becomes
effective and since perceived quality is linked to purchase decisions, it also makes
marketing program elements more effective. Second, perceived quality enables the firm
to differentiate its products or services from those of its competitors. Aaker (2010) asserts
that a brands position on the perceived quality dimension is extremely important since it
will determine whether the product is in the super premium, premium, and value or
economy entry. Third, having a perceived quality advantage provides the firm with the
option of charging a premium price on its products or services which can increase profits
and provide resources used to reinvest in the brand.
Aaker (2010) asserts that the firm can choose to offer superior value at a competitive
price which results in higher brand loyalty, a larger consumer base and more efficient and
effective marketing programs. Fourth, perceived quality aids channel members such as
retailers and distributors in gaining distribution. Aaker (2010) asserts that channel
members prefer to stock quality products since their image is affected by the products or
services they include in their line. Therefore perceived quality motivates channel
members to carry brands that are well regarded and that customers want. Finally,
perceived quality can be used to introduce brand extensions which involves using the
brand name to enter new product categories. Aaker (2010) asserts that a stronger brand
20
with positive perceived quality has a higher probability of success if it extends further
compared to a weaker brand.
2.3.3 Country of Origin and Perceived Quality
Country of origin effect can be defined as any influence that the country of manufacture
has on a consumer’s positive or negative perception of a product (Cateora & Graham,
1999). Roth and Romeo (1992) suggest that attention has been given in the marketing
literature as to why country of origin influences purchase decisions. They assert that
explanations have been offered including product category involvement, knowledge of a
particular country, and patriotism. According to Khan and Bamber (2008), research
suggests that country of origin serves as a cue from which consumers make inferences
about product and product attributes. Hu et al. (2008) noted that consumers in emerging
markets perceived imported products from developed markets to be of superior quality
and those from other emerging markets to be of similar or inferior quality to their
domestic products.
In contrast, consumers in developed markets perceive products from less developed
markets to be of inferior quality, and those from other developed markets to be of similar
or superior quality to their domestic products (Gurhan-Canli & Maheswaran, 2000).
Sharma (2010) notes that despite growing evidence about differences in the attitudes and
behaviors of consumers in emerging and developed markets, there is little research on the
differences in country of origin effects on their evaluation, behavioral intentions, and
actual purchase of imported products (Sharma, 2010). Prior research on the effects of
country of origin on product evaluations shows that consumers perceive products made in
developed countries to be of higher quality compared with products made in emerging
markets (Josiassen & Harzing, 2008).
Sharma (2010) in his study introduced a new conceptual framework incorporating
consumer ethnocentrism, materialism, and value consciousness to hypothesize several
differences in the influence of country of origin effects on consumers from developed and
emerging markets. According to Koschate-Fischer, Diamantopoulos and Oldenkotte
(2012), price-related consequences of the country-of-origin cue have received limited
attention in extant literature. In their study, they drew from equity theory and cue
utilization theory and investigated whether a brand’s country of origin affects a
consumer’s willingness to pay and the extent to which the consumer’s familiarity with the
21
brand moderates this relationship. The results of three complementary experimental
studies revealed that country of origin indeed has a positive impact on willingness to pay.
Country of origin is known to lead to associations in the minds of consumers (Aaker,
1991). Thakor and Kohli (2003) suggest that less concern should be given to the place
where brands manufacture their products, and more to the place where people perceive
the brand’s country of origin to be. While positive country associations may exist in
consumers’ minds and create pride for brand owners, evidence linking them to actual
purchase behavior and business benefits is limited. Lusk et al. (2006) argue that firms
provide country of origin cues to consumers when it is profitable for them to do so and
based on the assumption that consumers trust this signal of product quality.
Country associations have also been positioned as a potential source of competitive
advantage for manufacturers seeking to differentiate their product in domestic and export
markets (Baker & Ballington, 2002). In addition, it has been suggested that use of these
associations is typical of emerging brands and companies that lack sufficient awareness
and resources to develop highly differentiated and sophisticated brand images in export
markets (Niss, 1996). Piron (2000) argues that the importance of a product’s country of
origin is indirect due to the associations that develop between a brand and a particular
country.
2.4 Brand Associations and Consumer Purchase Decisions
Aaker (1996) defines a brand association as anything linked in memory to a brand. He
asserts that links to a brand are stronger when they are based on many experiences and
exposures to communications and that brand associations are the foundations of purchase
decisions. Keller (2013) defines brand associations as informational nodes linked to the
brand node in memory that contain the meaning of the brand for consumers. Therefore
brand associations are important to marketers and consumers. According to Low and
Lamb (2000), marketers use brand associations to differentiate, position, and extend
brands, to create positive attitudes and feelings toward brands, and to suggest attributes or
benefits of purchasing or using a specific brand.
A study they conducted purposed to test empirically a conceptualization of brand
associations which they suggest consist of three dimensions; brand image, perceived
22
quality and brand attitude. According to Aaker (1991), consumers use brand associations
to help process, organize, and retrieve information in memory and to aid them in making
purchase decisions. He asserts that brand associations are what represent the bases of
purchase decisions and brand loyalty. Cheng (2001) envisioned two types of brand
associations; product associations and organizational associations. He further divided
product associations into functional and non-functional attributes. Keller (2008) defines
functional attributes as tangible features of a product. Aaker (2000) asserts that non-
functional attributes include symbolic attributes which are intangible features.
According to Keller (2013), non-functional attributes meet consumer needs for personal
expression, self-esteem or social approval. Fayrene and Lee (2011) observed that
consumers linked social image of a brand, trustworthiness, perceived value,
differentiation and country of origin to a brand. Aaker (1991) identifies five ways in
which associations create value to both the firm and its customers. First he asserts that
brand associations summarize facts and specifications that the customer would otherwise
not be able to process or access or would be expensive for the firm to communicate.
Therefore associations influence interpretation of facts by consumers as well as influence
the recall of information during decision making. Secondly, associations provide a basis
for differentiation. Aaker (2010) gives an example of product classes such as wines,
clothes and perfumes which are hardly distinguishable by most customers. Therefore,
associations of brand names play a critical role in separating brands from one another.
Keller (2008) asserts that brand associations take different forms and that they can be
classified into three main categories which include attributes, benefits and attitudes.
Aaker (2010) on the other hand identified eleven types of associations including; product
attributes, intangibles, customer benefits, relative price, country/geographic area,
competitors, product class, lifestyle/personality, celebrity/person, user/customer and use/
application. According to Keller (2008), attributes are the descriptive features that
characterize a product or service and hence what a consumer thinks the product or service
is or has and what is involved with its purchase or consumption. He goes on to state that
attributes can further be distinguished according to how directly they relate to a product
or service performance.
23
According to Keller (2008), product related attributes are the ingredients necessary for
performing product or service functions that are sought by customers such as a products
physical composition or service requirements. However, non-product related attributes
are the external aspects of the product or service relating to its purchase or consumption
and include; packaging or product appearance information, usage and user imagery, and
price information. He asserts that benefits are the personal value that consumers have
attached to a product or service attributes which includes what the consumer thinks a
product or service can do for them. Benefits can be categorized into three; functional
benefits, experiential benefits and symbolic benefits.
Keller (2008) defines functional benefits as the intrinsic advantages of a product and
correspond to product related attributes. He also asserts that experiential benefits refers to
what it feels like to use a product or service since the benefits satisfy needs such as
variety, cognitive stimulation and pleasure. According to Keller (2008), symbolic benefits
are the extrinsic advantages of a product that correspond to non-product related attributes.
Symbolic benefits relate to underlying needs for personal expression and for social
approval. Aaker (1996) asserts that measurement of differentiation can be structured
around three perspectives on the brand and include the brand value, brand personality and
organizational associations.
2.4.1 Brand Personality
Aaker (1997) defines brand personality as the set of human characteristics associated with
a brand. He asserts that it is a multi-dimensional and multifaceted construct that enables
consumers to express themselves along several dimensions. A substantial literature
stream indicates that there are benefits to having a favorable brand personality, such as
enhanced brand attitudes and purchase intentions and higher levels of consumer trust and
loyalty (Freling, Crosno & Henard, 2010). Brand personality, defined as all personality
traits used to characterize a person and associated with a brand, is an important concept
within the field of relational marketing (Louis & Lombart, 2010). According to Sweeny
and Brandon (2006), consumers can easily view a brand as having a friendly or exciting
personality due to advertisers’ continuous attempts to humanize and anthropomorphize
the brand.
24
Understanding brand personality is necessary for creating and building meaningful
consumer–brand relationships. It explains how those relationships impact individual level
consumer behavior (Sung & Kim, 2010) as well as product level performance
measurements (Freling & Forbes, 2005). In addition, brand personality is an effective and
efficient way in product differentiation and helps influence brand performance. Keller
(1993) asserts that strong, unique, and favorable brand associations which include
perceptions of a brand’s personality, have the capacity to positively affect a brand’s
overall equity. According to Doyle (1990), distinct brand personality plays a key role in
the success of a brand. He asserts that it leads customers to perceive the brand personality
and develop a strong connection to the brand.
Kumar, Luthra and Datta (2006) suggests that a brand personality should be shaped to be
long lasting and consistent and it should also be different from other brands and meet
consumer’s demands. With specific brand personality, consumers of varying personality
traits will be attracted and their brand preference will then be further developed (Lin,
2010). Aaker, Fournier and Brasel (2004) suggest that each exchange partner’s
personality traits affect the relationship. Thus, brands that possess a desirable personality
will provide a greater opportunity for the consumer to develop a strong relationship with
the brand. The brand personality scale developed by Aaker (1996) consists of five generic
dimensions: sincerity, excitement, competence, sophistication and ruggedness. Since its
creation his study has been replicated using various consumer brands within different
product categories and across different cultures.
According to Ismail and Spinelli (2012), the main focus in the present study is on the
excitement dimension of brand personality. As suggested by many scholars, excitement
and sincerity are considered two fundamental dimensions that capture the majority of
variance in personality ratings for brands (Aaker et al, 2004). Aaker (1996) asserts that
the value proposition, which usually involves a functional benefit, is basic to brands in
most product classes since a brand that does not generate value will be vulnerable to
competitors. The value measure provides a summary indicator of the brands success at
creating that value proposition. Because the focus is on value rather than specific
functional benefits, a measure is created which can apply across product classes.
According to Aaker (1996), brand value can be measured by whether the brand provides
25
consumers good value for money and also whether it gives consumers reasons to buy this
brand over competitors.
2.4.2 Brand Image
According to Keller (1993), brand image can be defined as the perceptions about a brand
as reflected by the brand association held in a consumer’s memory. According to Aaker
(1996), these associations refer to any brand aspect within the consumer’s memory. Roy
and Banerjee (2008) assert that brand image describes the consumer’s thoughts and
feelings towards the brand. Many successful companies with an inferior brand image
merge and acquire companies with a superior brand image in order to increase their
market share (Nguyen & Kleiner, 2003). According to Rubio, Oubina and Villasenor
(2013), consumers ascribe high quality to esteemed brands. Therefore, brand image is the
overall mental image that consumers have of a brand, and its uniqueness in comparison to
the other brands (Faircloth, 2005).
According to Iversen and Hem (2008), brand image represents the personal symbolism
that consumers associate with the brand, which comprises of all the descriptive and
evaluative brand related information. When consumers have a favorable brand image, the
brand’s messages have a stronger influence in comparison to competitor brand messages
(Hsieh & Li, 2008). Therefore, brand image is an important determinant of a buyer’s
behavior (Burmann, Schaefer & Maloney, 2008). Brand image comprises a consumer’s
knowledge and beliefs about the brand’s diverse products and its non-product attribute.
Reza-Jalilvand and Samiei (2012) assert that the creation of a brand implies
communicating a certain brand image in such a way that all the firm’s target groups link
such a brand and thus the services sold using its name with a set of associations.
According to Bian and Moutinho (2011), communication of a brand image to a target
segment has been regarded as an important marketing activity since it was first introduced
formally into the marketing discipline by Gardner and Levy in (1955).They assert that the
trend has never faded ever since and that brand image has been assigned different
meanings from the day it was introduced into the marketing discipline. Oladepo and
Abimbola (2015) conducted a study to evaluate the influence of brand image and
promotional mix on consumer buying decision. Their findings revealed that brand image,
advertising, sales promotion and personal selling have significant influence on consumer
26
buying decision. They therefore concluded that the way a product is promoted coupled
with the brand integrity of such product encourages consumers to purchase it and make
repeat purchase of it, and as well enhances the referral of such product to other prospects.
Da Silva and Alwi (2008) discovered that brand image not only enhances consumer
buying decisions but also has a direct positive relationship with customer loyalty. Malik
et al. (2013) assert that brand image development is a long term process that can prove a
strong weapon to fight with competitors. Brand image and advertisement play a crucial
role to boost up any business performance as brand image is an implied tool which can
positively change people’s buying behaviors and advertisement is behaving as a driving
force for any business as it’s an effective source to convey your message and stay in
customer’s mind (Malik et al, 2013). According to Martenson (2007), a favorable brand
image would have a positive influence on consumer behavior towards the brand in terms
of increasing loyalty, commanding a price premium and generating positive word of
mouth.
2.5 Chapter Summary
This chapter explored scholarly articles, books and relevant literature on the topic of
brand equity. Each of the three dimensions of brand equity which include brand loyalty,
perceived quality and brand associations were discussed mostly based on scholarly work
by Aaker in his brand equity model as well as Keller’s customer based brand equity
concept. Consumer satisfaction, brand trust and loyalty programs were identified and
their influence on consumer purchase decision discussed as antecedents to brand loyalty
while brand value and country of origin were identified and discussed as antecedents of
perceived quality. Lastly brand personality and brand image were identified as
antecedents of brand association and their influence on consumer purchase decisions
discussed. Chapter three entailed the methodology section which described the research
methods and procedures adopted throughout the research while chapter four presented the
results and findings of analysis of the data collected based on the specific objectives of
the study.
27
CHAPTER THREE
3.0 RESEARCH METHODOLOGY
3.1 Introduction
This chapter described the research methodology that was used. It outlined and justified
the research design used, described the population and sampling design used, the data
collection type and methods as well as instruments used, research procedures as well as
the data analysis methods employed throughout the study.
3.2 Research Design
The study adopted a descriptive research design specifically a cross sectional study
design. According to Christensen, Johnson and Turner (2016), descriptive research
focuses on describing some phenomenon, event or situation. Descriptive research is
undertaken to obtain answers to questions of who, what, where, when and how (Burns,
Bush & Nash, 2008). Mitchell and Jolley (2012) asserted that we need descriptive
research in order to accurately describe and predict what people think, feel and do. A
cross-sectional study involves looking at people who differ on one key characteristic at
one specific point in time. In this regard, other than being flexible, cross sectional studies
were considered because they were inexpensive and fast and hence suitable for this study.
The independent variables were established as brand loyalty, perceived quality and brand
associations. The dependent variable was identified as consumer purchase decision.
3.3 Population and Sampling Design
3.3.1 Population
Saunders, Lewis and Thornhill (2016) assert that a population comprises a set of
individuals, objects or data from where a statistical sample is drawn. Population therefore
forms a basis from which the sample or subjects for the study is drawn. The population of
interest in this study were consumers of branded alcoholic beverages in Nairobi's
Kasarani district. This geographical area was chosen because of the high concentration of
alcoholic beverage outlets and the nature of the population characterized by middle class
earnings and hence higher disposable incomes. Using NACADA (2017) estimates that
15.7% of Nairobi’s population consumes alcoholic beverages and KNBS (2010) data
28
indicating Kasarani had an estimated population of 525624, the population of interest for
this study was calculated and estimated as 0.157 * 525624 = 84100.
3.3.2 Sampling Design
3.3.2.1 Sampling Frame
Saunders et al. (2016) define a sampling frame as a list comprising of all those within a
population who may be sampled and include individuals, households, organizations or
institutions. Based on the research population, the sampling frame for this study
comprised of consumers of branded alcoholic beverages in outlets that sell alcohol within
Kasarani District including bars and wine and spirit outlets. According to Omulo (2018),
Kasarani district had 989 registered liquor outlets licensed by the Nairobi County
Alcoholic Drinks Control and Licensing Board.
3.3.2.2 Sampling Technique
The study employed systematic sampling technique where 50 alcoholic beverage outlets
were identified and chosen out of the possible 989. Eight respondents were chosen at
random from these outlets to get a total of 400 respondents. Systematic sampling was
chosen because it was least expensive since only fifty out of at least nine hundred outlets
were visited and it was therefore least time consuming hence suitable for this study. Due
to the large size of Nairobi County, respondents were only drawn from Kasarani district.
This is because of the high number of alcoholic beverage retailers in the area and hence a
better concentration and representation of the target population for this study.
3.3.2.3 Sample Size
Lavrakas (2008) defines sample size as the number of units that were chosen from which
data were gathered. According to Phrasisombath (2009), sampling involves the selection
of a number of study units from a define study population. Researchers sample because of
time and budget constraints and therefore a sample of the population is used to make
inferences about the whole population. To collect data that is representative of the entire
population of interest and to simplify the process of determining the sample size for a
finite population, the study adopted Krejcie and Morgan’s (1970) sample size
determination table for finite population with 95% certainty. Therefore the sample size
for this population was determined as follows: For a population N > 75000 < 1,000,000
29
Sample Size S= 384. Hence for our population N= 84100 giving a sample Size for the
study = 384.
3.4 Data Collection Methods
A survey method was adopted as the suitable data collection method. Specifically, the
use of a structured questionnaire with close ended questions for collecting primary data.
Questionnaire was chosen because it is easy to administer, less costly and time saving
when getting feedback especially due to the nature of the study population. The constructs
in this study were developed by using measurement scales adopted from prior studies and
modifications were made to the scale to fit the purpose of the study. All constructs were
measured using a five point Likert scale with ranges from strongly disagree (= 1) to
strongly agree (= 5) and therefore respondents were able to state their level of agreement
or disagreement with the statements.
The questionnaire contained five sections. Section one consisted of general information
about the respondents and included age, gender and income levels. The remaining
sections contained statements developed from the literature on the three independent
variables which were the three dimensions of brand equity and included brand loyalty,
perceived quality and brand associations and consumer purchase decisions as the
dependent variable. Respondents were approached and their willingness and suitability to
take part in the study determined.
3.5 Research Procedures
Permission was sought from the University before data collection was embarked on. A
pilot study was conducted where 20 questionnaires were administered so as to establish
the validity and reliability of the variables and hence the data. Cronbachs Alpha was used
to validate the reliability of the data with results indicating that all the variables had
Alpha values > 0.7. Suitable respondents were approached during the actual data
collection and the purpose of the study explained to them as well as the voluntary nature
of the exercise. They were handed the questionnaires which took approximately ten
minutes to complete. They were also assured of the highest level of confidentiality and
that the data collected was to be used for academic purposes only.
30
3.6 Data Analysis Methods
To ensure accuracy of data, the questionnaires were reviewed carefully and checked for
completeness and consistencies. The collected data was coded, edited and analyzed with
the aid of the Statistical Package for Social Science (SPSS) computer software and
Microsoft Excel. Structural Equation modelling was performed. The purpose of SEM was
to investigate the set of relations between one or more independent variables and one or
more dependent variables. SEM is an extensive statistics approach utilized to test models,
in which there are causal and correlational relations together between observable and
latent variables (Hoyle, 2012). Descriptive statistics analyzed using frequencies,
percentages and mean. The results were presented using tables and figures. Inferential
statistical analysis for the study included correlations and regression. Regression was used
to determine the level of significance in relationship between brand equity dimensions
and consumer purchase decisions. Correlation was used to establish the existence,
strength and nature of the relationships between the research variables.
3.7 Chapter Summary
This chapter entailed the research methodology that described the methods and
procedures to be used in the study. This included the research design, population and
sampling design, data collection methods, research procedures and finally data analysis
methods. Descriptive research systematic sampling was adopted as the sampling
technique, the population identified and sample size described using Krejcie and
Morgan’s (1970) table. The questionnaire was adopted as the data collection tool for
primary data. SPSS and Microsoft Excel were chosen as the data analysis tools. Chapter
four presented the results and findings of analysis of the data that was collected based on
the specific objectives of the study.
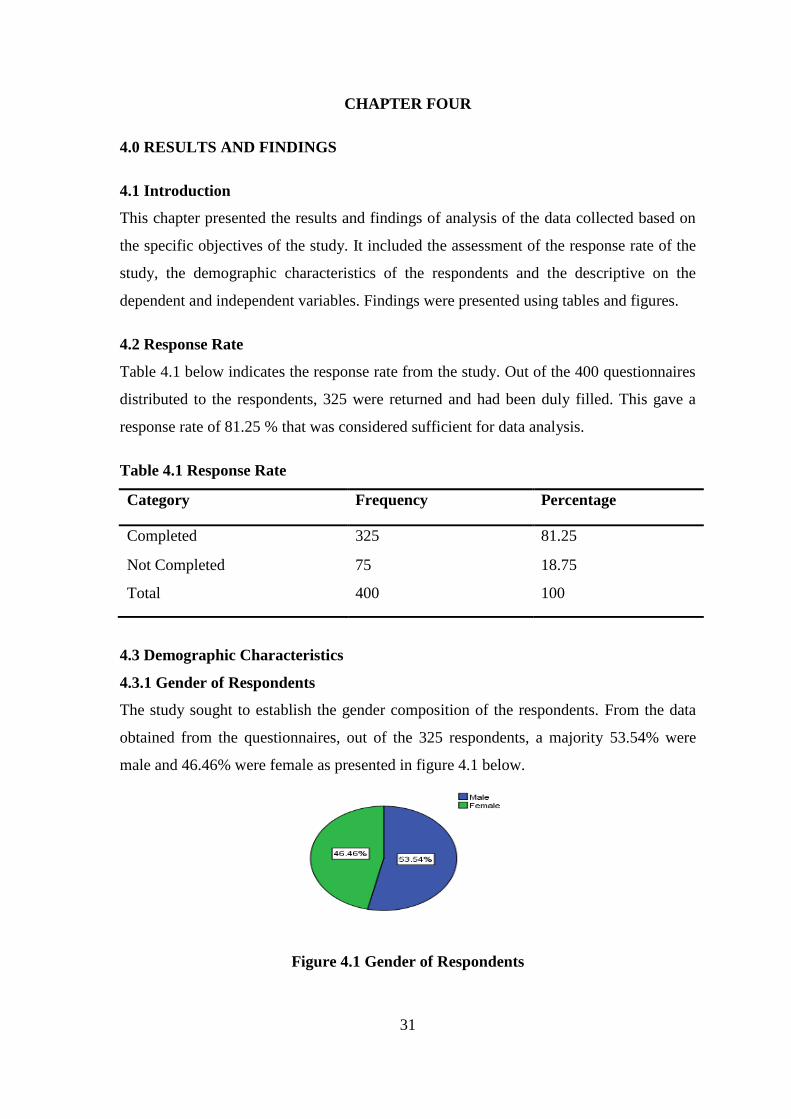
31
CHAPTER FOUR
4.0 RESULTS AND FINDINGS
4.1 Introduction
This chapter presented the results and findings of analysis of the data collected based on
the specific objectives of the study. It included the assessment of the response rate of the
study, the demographic characteristics of the respondents and the descriptive on the
dependent and independent variables. Findings were presented using tables and figures.
4.2 Response Rate
Table 4.1 below indicates the response rate from the study. Out of the 400 questionnaires
distributed to the respondents, 325 were returned and had been duly filled. This gave a
response rate of 81.25 % that was considered sufficient for data analysis.
Table 4.1 Response Rate
Category Frequency Percentage
Completed 325 81.25
Not Completed 75 18.75
Total 400 100
4.3 Demographic Characteristics
4.3.1 Gender of Respondents
The study sought to establish the gender composition of the respondents. From the data
obtained from the questionnaires, out of the 325 respondents, a majority 53.54% were
male and 46.46% were female as presented in figure 4.1 below.
Figure 4.1 Gender of Respondents
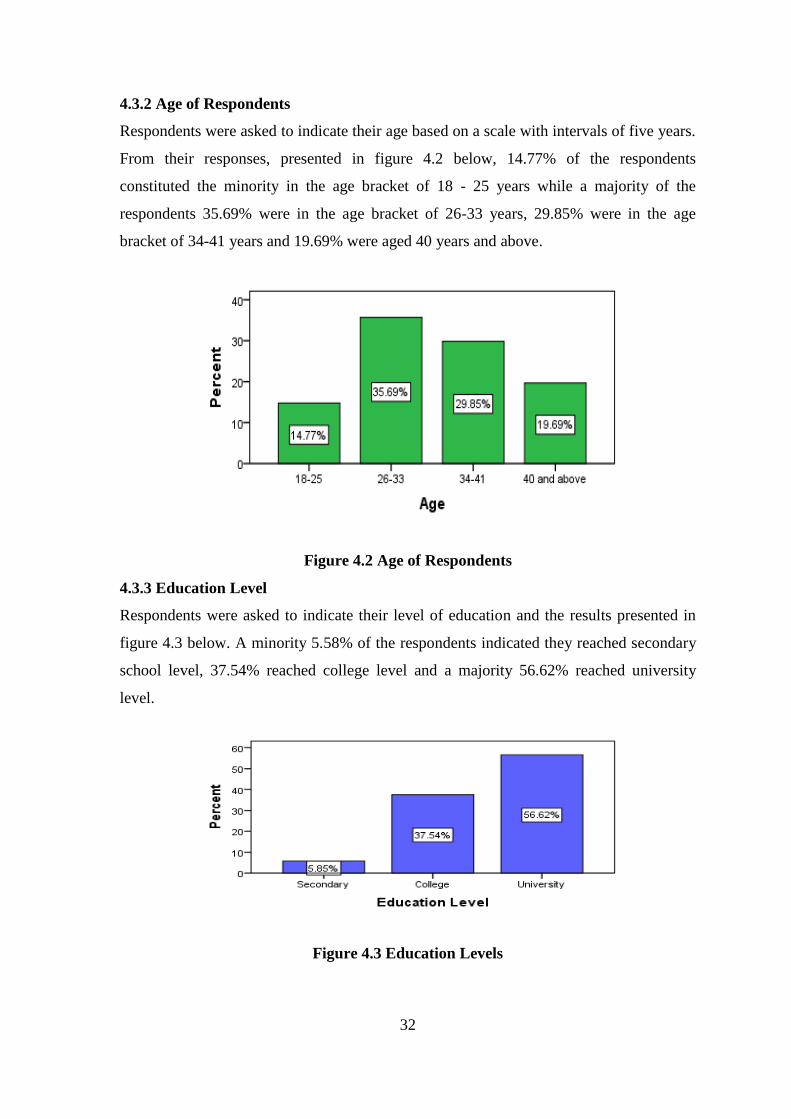
32
4.3.2 Age of Respondents
Respondents were asked to indicate their age based on a scale with intervals of five years.
From their responses, presented in figure 4.2 below, 14.77% of the respondents
constituted the minority in the age bracket of 18 - 25 years while a majority of the
respondents 35.69% were in the age bracket of 26-33 years, 29.85% were in the age
bracket of 34-41 years and 19.69% were aged 40 years and above.
Figure 4.2 Age of Respondents
4.3.3 Education Level
Respondents were asked to indicate their level of education and the results presented in
figure 4.3 below. A minority 5.58% of the respondents indicated they reached secondary
school level, 37.54% reached college level and a majority 56.62% reached university
level.
Figure 4.3 Education Levels
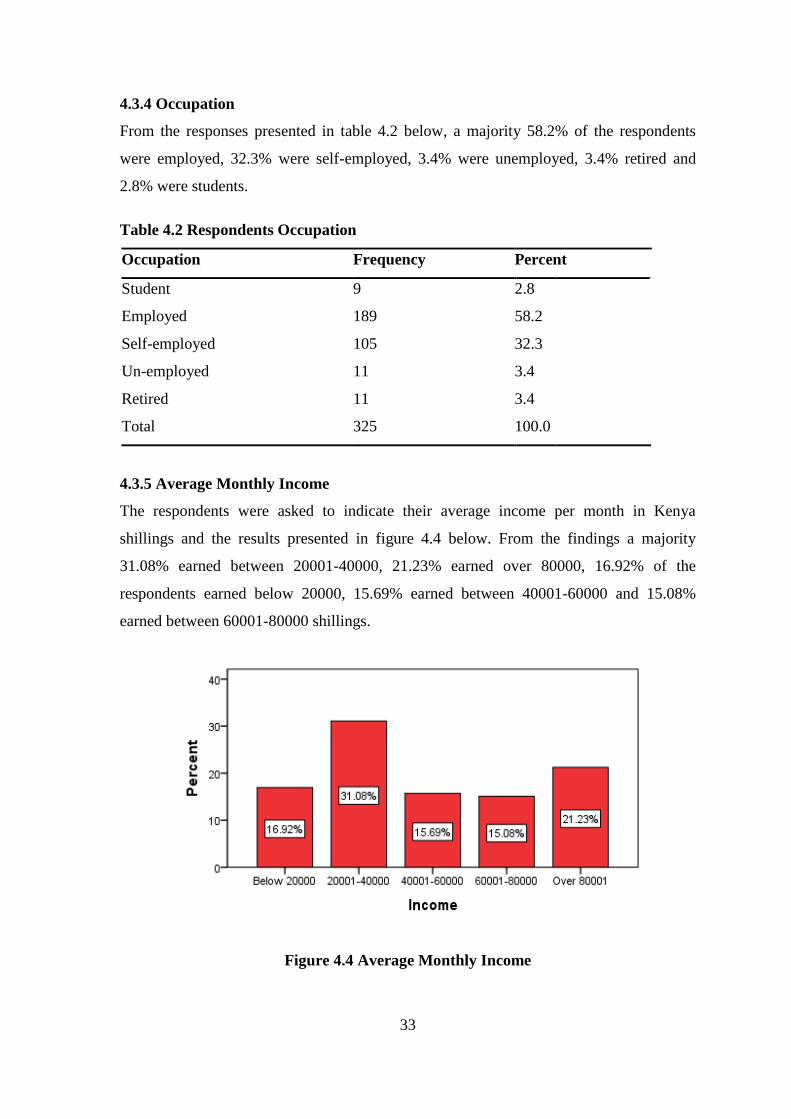
33
4.3.4 Occupation
From the responses presented in table 4.2 below, a majority 58.2% of the respondents
were employed, 32.3% were self-employed, 3.4% were unemployed, 3.4% retired and
2.8% were students.
Table 4.2 Respondents Occupation
Occupation Frequency Percent
Student 9 2.8
Employed 189 58.2
Self-employed 105 32.3
Un-employed 11 3.4
Retired 11 3.4
Total 325 100.0
4.3.5 Average Monthly Income
The respondents were asked to indicate their average income per month in Kenya
shillings and the results presented in figure 4.4 below. From the findings a majority
31.08% earned between 20001-40000, 21.23% earned over 80000, 16.92% of the
respondents earned below 20000, 15.69% earned between 40001-60000 and 15.08%
earned between 60001-80000 shillings.
Figure 4.4 Average Monthly Income
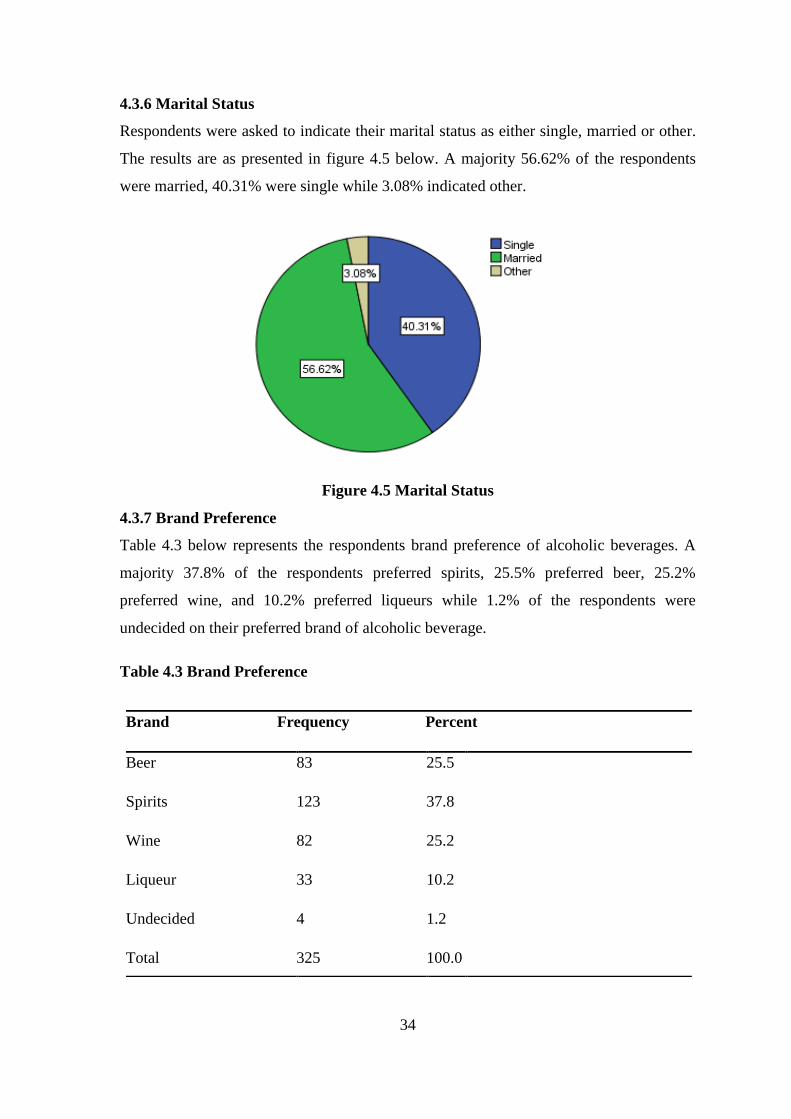
34
4.3.6 Marital Status
Respondents were asked to indicate their marital status as either single, married or other.
The results are as presented in figure 4.5 below. A majority 56.62% of the respondents
were married, 40.31% were single while 3.08% indicated other.
Figure 4.5 Marital Status
4.3.7 Brand Preference
Table 4.3 below represents the respondents brand preference of alcoholic beverages. A
majority 37.8% of the respondents preferred spirits, 25.5% preferred beer, 25.2%
preferred wine, and 10.2% preferred liqueurs while 1.2% of the respondents were
undecided on their preferred brand of alcoholic beverage.
Table 4.3 Brand Preference
Brand Frequency Percent
Beer 83 25.5
Spirits 123 37.8
Wine 82 25.2
Liqueur 33 10.2
Undecided 4 1.2
Total 325 100.0
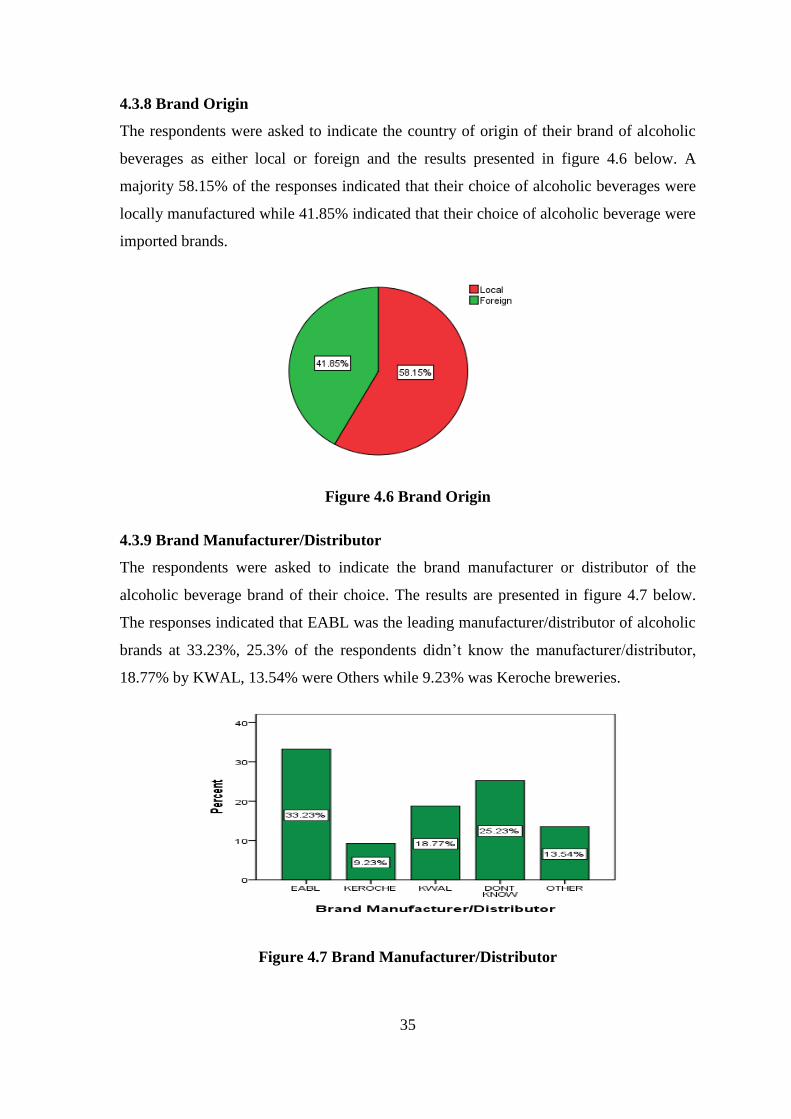
35
4.3.8 Brand Origin
The respondents were asked to indicate the country of origin of their brand of alcoholic
beverages as either local or foreign and the results presented in figure 4.6 below. A
majority 58.15% of the responses indicated that their choice of alcoholic beverages were
locally manufactured while 41.85% indicated that their choice of alcoholic beverage were
imported brands.
Figure 4.6 Brand Origin
4.3.9 Brand Manufacturer/Distributor
The respondents were asked to indicate the brand manufacturer or distributor of the
alcoholic beverage brand of their choice. The results are presented in figure 4.7 below.
The responses indicated that EABL was the leading manufacturer/distributor of alcoholic
brands at 33.23%, 25.3% of the respondents didn’t know the manufacturer/distributor,
18.77% by KWAL, 13.54% were Others while 9.23% was Keroche breweries.
Figure 4.7 Brand Manufacturer/Distributor
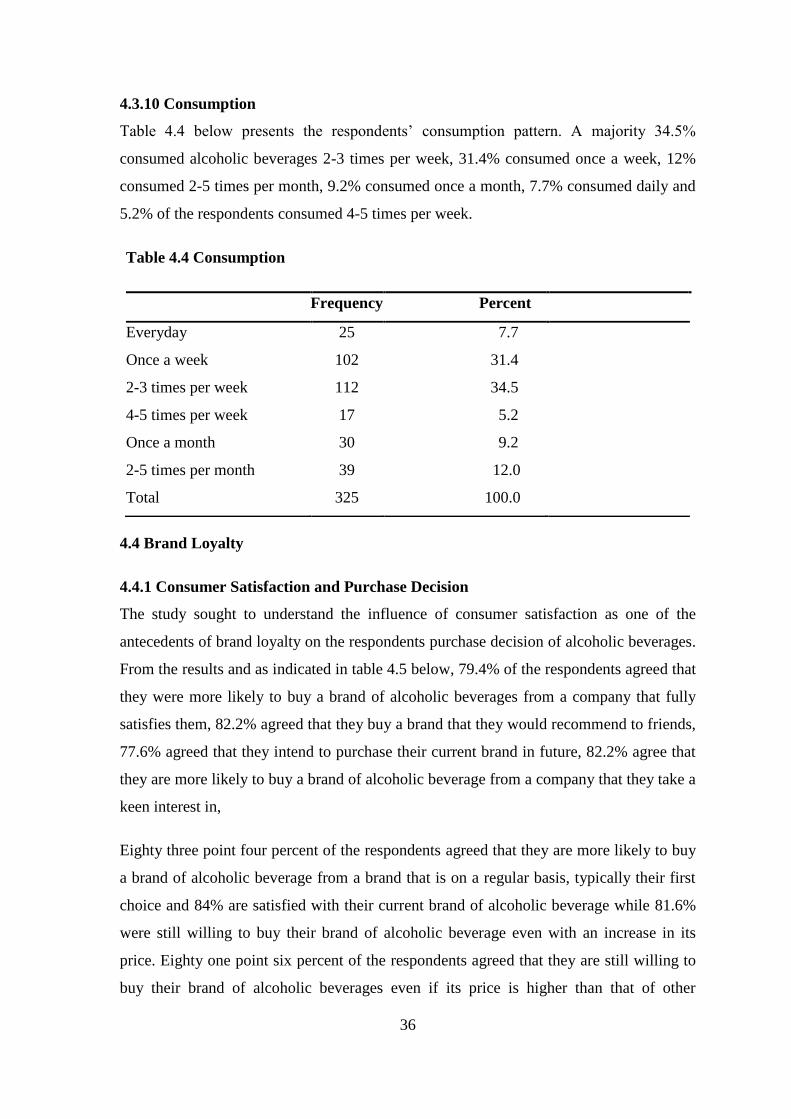
36
4.3.10 Consumption
Table 4.4 below presents the respondents’ consumption pattern. A majority 34.5%
consumed alcoholic beverages 2-3 times per week, 31.4% consumed once a week, 12%
consumed 2-5 times per month, 9.2% consumed once a month, 7.7% consumed daily and
5.2% of the respondents consumed 4-5 times per week.
4.4 Brand Loyalty
4.4.1 Consumer Satisfaction and Purchase Decision
The study sought to understand the influence of consumer satisfaction as one of the
antecedents of brand loyalty on the respondents purchase decision of alcoholic beverages.
From the results and as indicated in table 4.5 below, 79.4% of the respondents agreed that
they were more likely to buy a brand of alcoholic beverages from a company that fully
satisfies them, 82.2% agreed that they buy a brand that they would recommend to friends,
77.6% agreed that they intend to purchase their current brand in future, 82.2% agree that
they are more likely to buy a brand of alcoholic beverage from a company that they take a
keen interest in,
Eighty three point four percent of the respondents agreed that they are more likely to buy
a brand of alcoholic beverage from a brand that is on a regular basis, typically their first
choice and 84% are satisfied with their current brand of alcoholic beverage while 81.6%
were still willing to buy their brand of alcoholic beverage even with an increase in its
price. Eighty one point six percent of the respondents agreed that they are still willing to
buy their brand of alcoholic beverages even if its price is higher than that of other
Table 4.4 Consumption
Frequency Percent
Everyday 25 7.7
Once a week 102 31.4
2-3 times per week 112 34.5
4-5 times per week 17 5.2
Once a month 30 9.2
2-5 times per month 39 12.0
Total 325 100.0
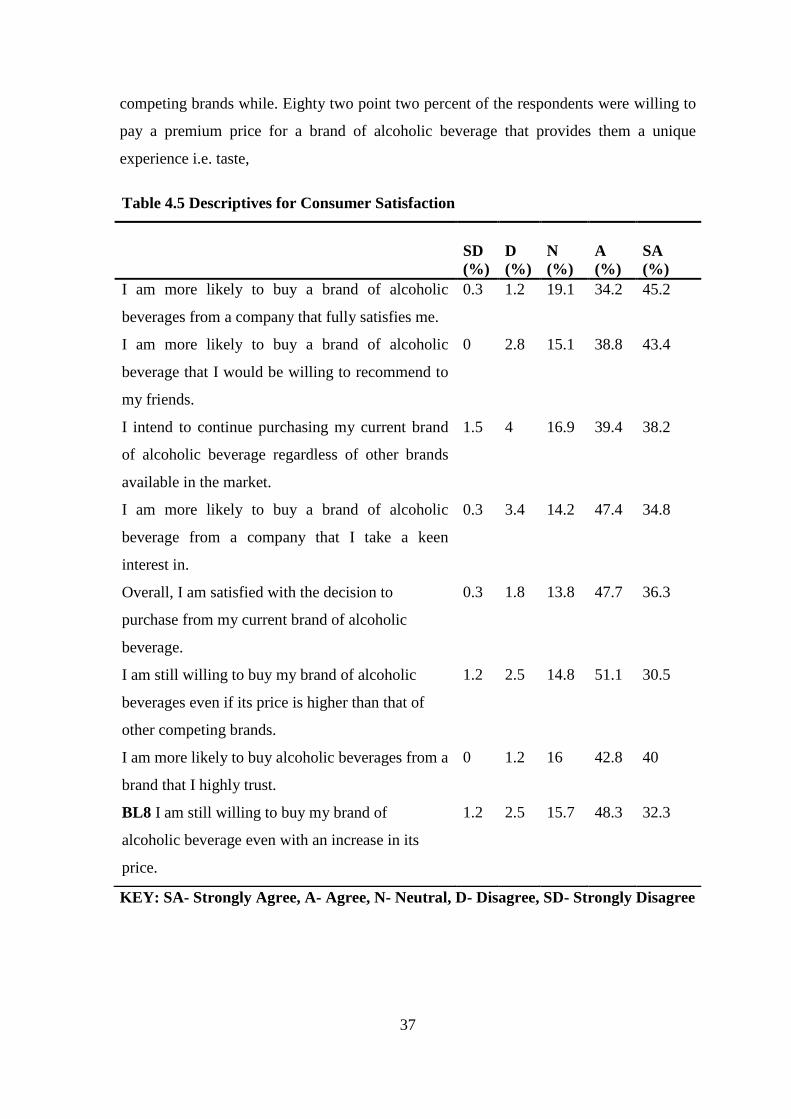
37
competing brands while. Eighty two point two percent of the respondents were willing to
pay a premium price for a brand of alcoholic beverage that provides them a unique
experience i.e. taste,
KEY: SA- Strongly Agree, A- Agree, N- Neutral, D- Disagree, SD- Strongly Disagree
Table 4.5 Descriptives for Consumer Satisfaction
SD
D
N
A
SA
(%) (%) (%) (%) (%)
I am more likely to buy a brand of alcoholic
beverages from a company that fully satisfies me.
0.3 1.2 19.1 34.2 45.2
I am more likely to buy a brand of alcoholic
beverage that I would be willing to recommend to
my friends.
0 2.8 15.1 38.8 43.4
I intend to continue purchasing my current brand
of alcoholic beverage regardless of other brands
available in the market.
1.5 4 16.9 39.4 38.2
I am more likely to buy a brand of alcoholic
beverage from a company that I take a keen
interest in.
0.3 3.4 14.2 47.4 34.8
Overall, I am satisfied with the decision to
purchase from my current brand of alcoholic
beverage.
0.3 1.8 13.8 47.7 36.3
I am still willing to buy my brand of alcoholic
beverages even if its price is higher than that of
other competing brands.
1.2 2.5 14.8 51.1 30.5
I am more likely to buy alcoholic beverages from a
brand that I highly trust.
0 1.2 16 42.8 40
BL8 I am still willing to buy my brand of
alcoholic beverage even with an increase in its
price.
1.2 2.5 15.7 48.3 32.3
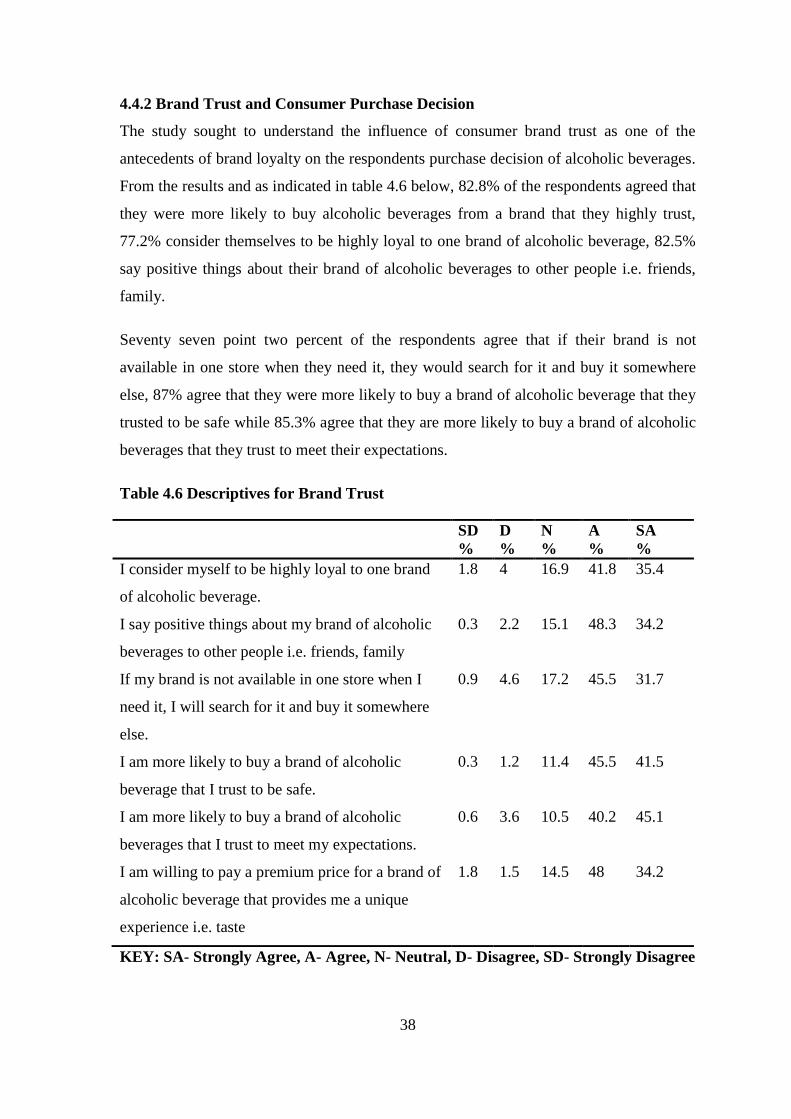
38
4.4.2 Brand Trust and Consumer Purchase Decision
The study sought to understand the influence of consumer brand trust as one of the
antecedents of brand loyalty on the respondents purchase decision of alcoholic beverages.
From the results and as indicated in table 4.6 below, 82.8% of the respondents agreed that
they were more likely to buy alcoholic beverages from a brand that they highly trust,
77.2% consider themselves to be highly loyal to one brand of alcoholic beverage, 82.5%
say positive things about their brand of alcoholic beverages to other people i.e. friends,
family.
Seventy seven point two percent of the respondents agree that if their brand is not
available in one store when they need it, they would search for it and buy it somewhere
else, 87% agree that they were more likely to buy a brand of alcoholic beverage that they
trusted to be safe while 85.3% agree that they are more likely to buy a brand of alcoholic
beverages that they trust to meet their expectations.
Table 4.6 Descriptives for Brand Trust
KEY: SA- Strongly Agree, A- Agree, N- Neutral, D- Disagree, SD- Strongly Disagree
SD
%
D
%
N
%
A
%
SA
%
I consider myself to be highly loyal to one brand
of alcoholic beverage.
1.8 4 16.9 41.8 35.4
I say positive things about my brand of alcoholic
beverages to other people i.e. friends, family
0.3 2.2 15.1 48.3 34.2
If my brand is not available in one store when I
need it, I will search for it and buy it somewhere
else.
0.9 4.6 17.2 45.5 31.7
I am more likely to buy a brand of alcoholic
beverage that I trust to be safe.
I am more likely to buy a brand of alcoholic
beverages that I trust to meet my expectations.
0.3
0.6
1.2
3.6
11.4
10.5
45.5
40.2
41.5
45.1
I am willing to pay a premium price for a brand of
alcoholic beverage that provides me a unique
experience i.e. taste
1.8 1.5 14.5 48 34.2
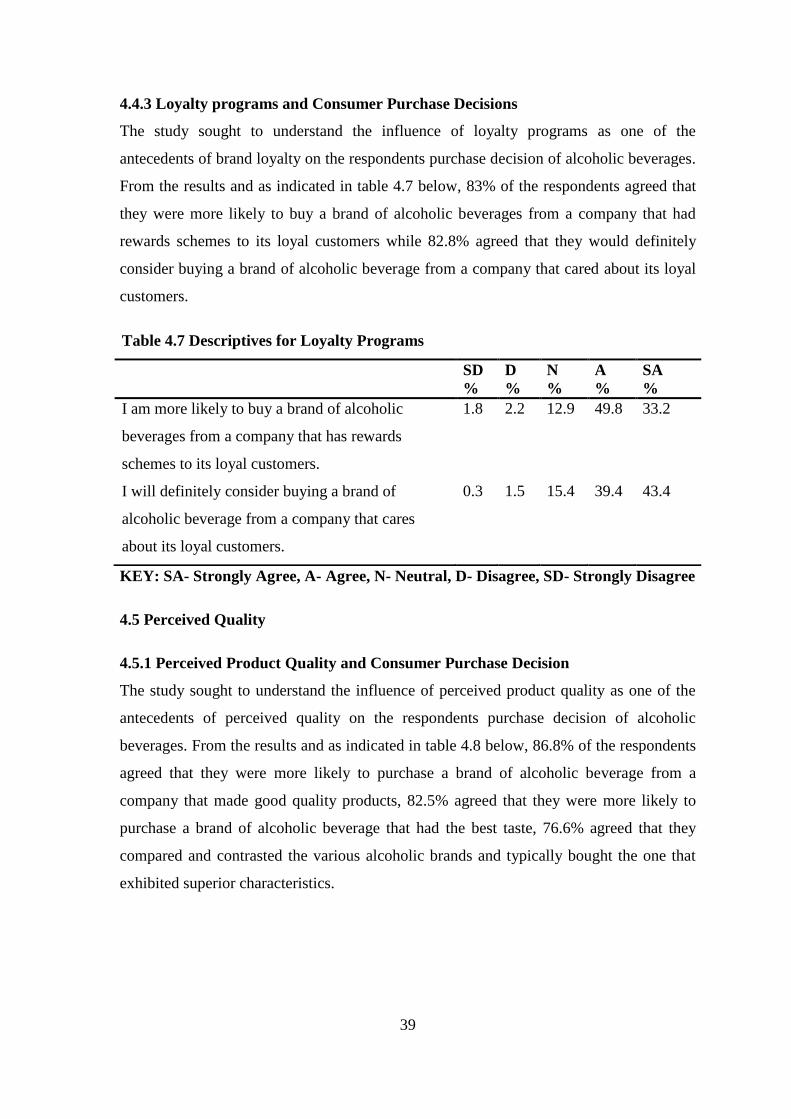
39
4.4.3 Loyalty programs and Consumer Purchase Decisions
The study sought to understand the influence of loyalty programs as one of the
antecedents of brand loyalty on the respondents purchase decision of alcoholic beverages.
From the results and as indicated in table 4.7 below, 83% of the respondents agreed that
they were more likely to buy a brand of alcoholic beverages from a company that had
rewards schemes to its loyal customers while 82.8% agreed that they would definitely
consider buying a brand of alcoholic beverage from a company that cared about its loyal
customers.
KEY: SA- Strongly Agree, A- Agree, N- Neutral, D- Disagree, SD- Strongly Disagree
4.5 Perceived Quality
4.5.1 Perceived Product Quality and Consumer Purchase Decision
The study sought to understand the influence of perceived product quality as one of the
antecedents of perceived quality on the respondents purchase decision of alcoholic
beverages. From the results and as indicated in table 4.8 below, 86.8% of the respondents
agreed that they were more likely to purchase a brand of alcoholic beverage from a
company that made good quality products, 82.5% agreed that they were more likely to
purchase a brand of alcoholic beverage that had the best taste, 76.6% agreed that they
compared and contrasted the various alcoholic brands and typically bought the one that
exhibited superior characteristics.
Table 4.7 Descriptives for Loyalty Programs
SD
%
D
%
N
%
A
%
SA
%
I am more likely to buy a brand of alcoholic
beverages from a company that has rewards
schemes to its loyal customers.
1.8 2.2 12.9 49.8 33.2
I will definitely consider buying a brand of
alcoholic beverage from a company that cares
about its loyal customers.
0.3 1.5 15.4 39.4 43.4
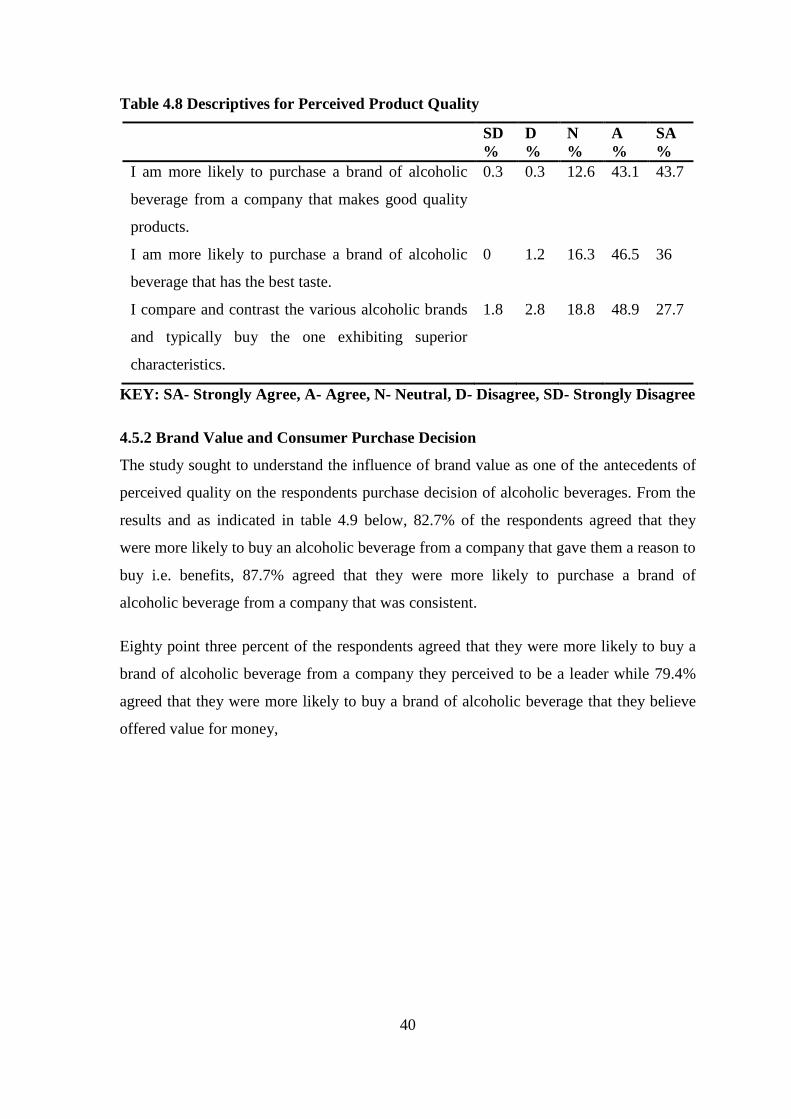
40
Table 4.8 Descriptives for Perceived Product Quality
SD
%
D
%
N
%
A
%
SA
%
I am more likely to purchase a brand of alcoholic
beverage from a company that makes good quality
products.
0.3 0.3 12.6 43.1 43.7
I am more likely to purchase a brand of alcoholic
beverage that has the best taste.
0 1.2 16.3 46.5 36
I compare and contrast the various alcoholic brands
and typically buy the one exhibiting superior
characteristics.
1.8 2.8 18.8 48.9 27.7
KEY: SA- Strongly Agree, A- Agree, N- Neutral, D- Disagree, SD- Strongly Disagree
4.5.2 Brand Value and Consumer Purchase Decision
The study sought to understand the influence of brand value as one of the antecedents of
perceived quality on the respondents purchase decision of alcoholic beverages. From the
results and as indicated in table 4.9 below, 82.7% of the respondents agreed that they
were more likely to buy an alcoholic beverage from a company that gave them a reason to
buy i.e. benefits, 87.7% agreed that they were more likely to purchase a brand of
alcoholic beverage from a company that was consistent.
Eighty point three percent of the respondents agreed that they were more likely to buy a
brand of alcoholic beverage from a company they perceived to be a leader while 79.4%
agreed that they were more likely to buy a brand of alcoholic beverage that they believe
offered value for money,
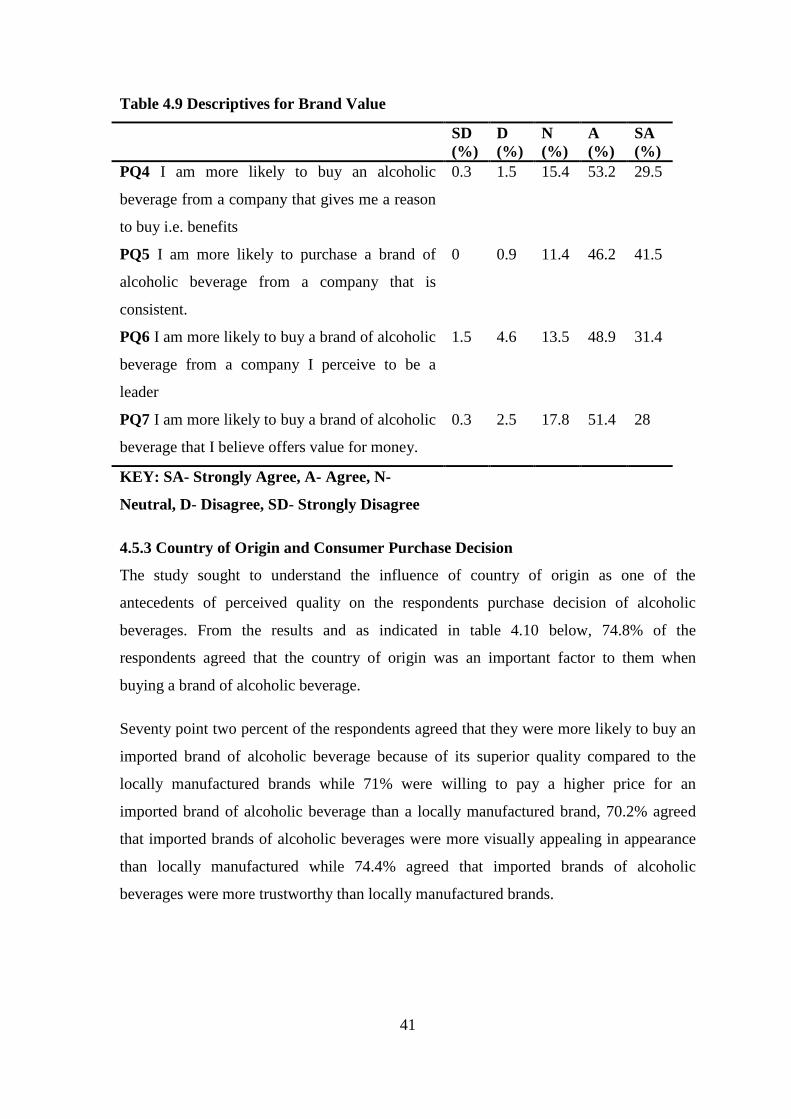
41
Table 4.9 Descriptives for Brand Value
SD
(%)
D
(%)
N
(%)
A
(%)
SA
(%)
PQ4 I am more likely to buy an alcoholic
beverage from a company that gives me a reason
to buy i.e. benefits
0.3 1.5 15.4 53.2 29.5
PQ5 I am more likely to purchase a brand of
alcoholic beverage from a company that is
consistent.
0 0.9 11.4 46.2 41.5
PQ6 I am more likely to buy a brand of alcoholic
beverage from a company I perceive to be a
leader
1.5 4.6 13.5 48.9 31.4
PQ7 I am more likely to buy a brand of alcoholic
beverage that I believe offers value for money.
0.3 2.5 17.8 51.4 28
KEY: SA- Strongly Agree, A- Agree, N-
Neutral, D- Disagree, SD- Strongly Disagree
4.5.3 Country of Origin and Consumer Purchase Decision
The study sought to understand the influence of country of origin as one of the
antecedents of perceived quality on the respondents purchase decision of alcoholic
beverages. From the results and as indicated in table 4.10 below, 74.8% of the
respondents agreed that the country of origin was an important factor to them when
buying a brand of alcoholic beverage.
Seventy point two percent of the respondents agreed that they were more likely to buy an
imported brand of alcoholic beverage because of its superior quality compared to the
locally manufactured brands while 71% were willing to pay a higher price for an
imported brand of alcoholic beverage than a locally manufactured brand, 70.2% agreed
that imported brands of alcoholic beverages were more visually appealing in appearance
than locally manufactured while 74.4% agreed that imported brands of alcoholic
beverages were more trustworthy than locally manufactured brands.
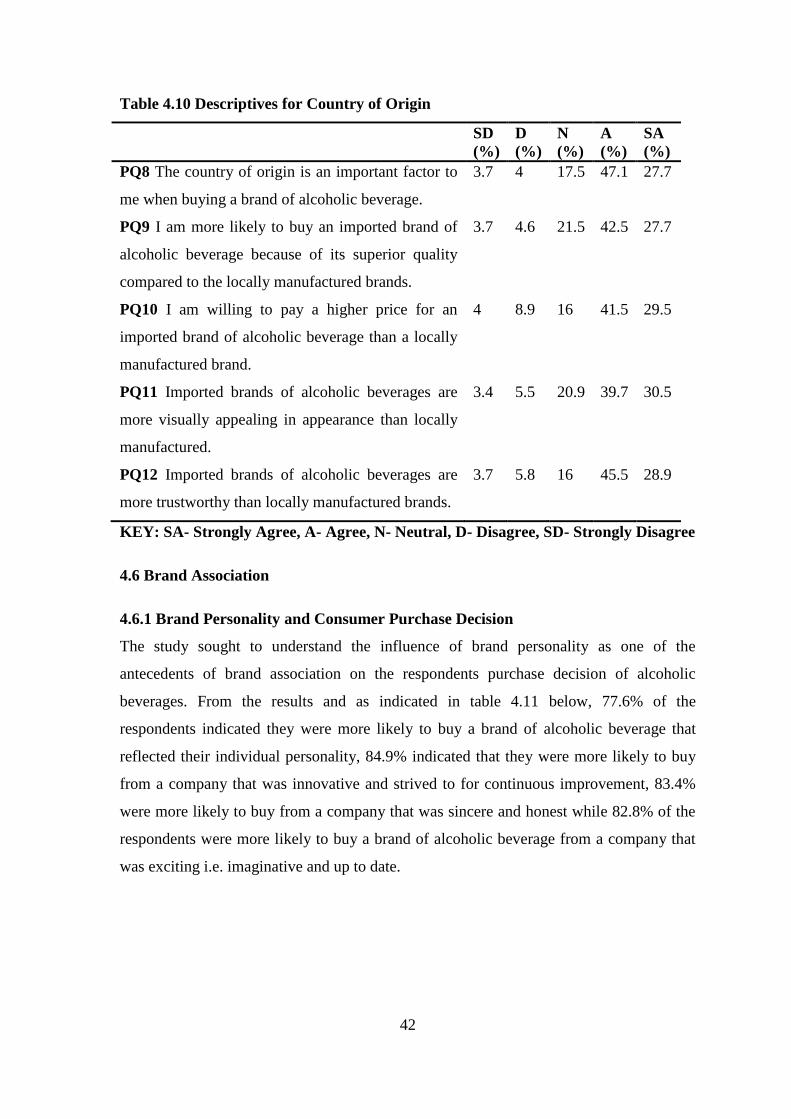
42
Table 4.10 Descriptives for Country of Origin
SD
(%)
D
(%)
N
(%)
A
(%)
SA
(%)
PQ8 The country of origin is an important factor to
me when buying a brand of alcoholic beverage.
3.7 4 17.5 47.1 27.7
PQ9 I am more likely to buy an imported brand of
alcoholic beverage because of its superior quality
compared to the locally manufactured brands.
3.7 4.6 21.5 42.5 27.7
PQ10 I am willing to pay a higher price for an
imported brand of alcoholic beverage than a locally
manufactured brand.
4 8.9 16 41.5 29.5
PQ11 Imported brands of alcoholic beverages are
more visually appealing in appearance than locally
manufactured.
3.4 5.5 20.9 39.7 30.5
PQ12 Imported brands of alcoholic beverages are
more trustworthy than locally manufactured brands.
3.7 5.8 16 45.5 28.9
KEY: SA- Strongly Agree, A- Agree, N- Neutral, D- Disagree, SD- Strongly Disagree
4.6 Brand Association
4.6.1 Brand Personality and Consumer Purchase Decision
The study sought to understand the influence of brand personality as one of the
antecedents of brand association on the respondents purchase decision of alcoholic
beverages. From the results and as indicated in table 4.11 below, 77.6% of the
respondents indicated they were more likely to buy a brand of alcoholic beverage that
reflected their individual personality, 84.9% indicated that they were more likely to buy
from a company that was innovative and strived to for continuous improvement, 83.4%
were more likely to buy from a company that was sincere and honest while 82.8% of the
respondents were more likely to buy a brand of alcoholic beverage from a company that
was exciting i.e. imaginative and up to date.
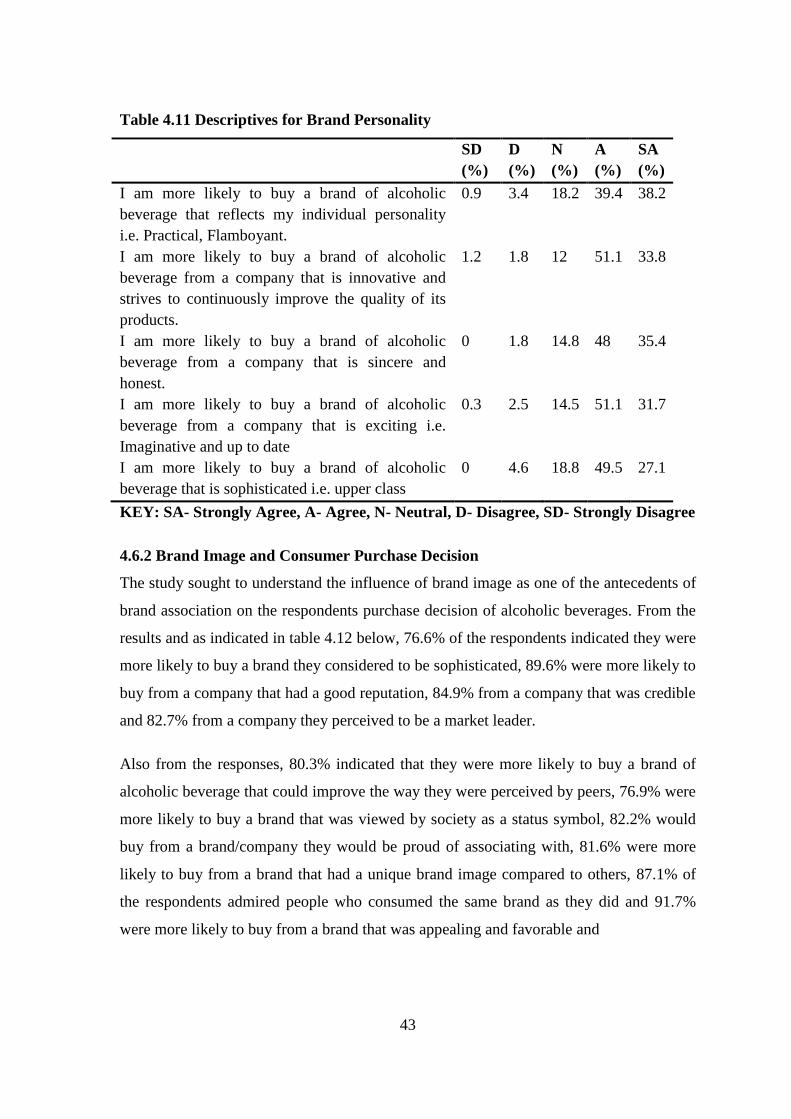
43
Table 4.11 Descriptives for Brand Personality
SD D N A SA
(%) (%) (%) (%) (%)
I am more likely to buy a brand of alcoholic
beverage that reflects my individual personality
i.e. Practical, Flamboyant.
0.9 3.4 18.2 39.4 38.2
I am more likely to buy a brand of alcoholic
beverage from a company that is innovative and
strives to continuously improve the quality of its
products.
1.2 1.8 12 51.1 33.8
I am more likely to buy a brand of alcoholic
beverage from a company that is sincere and
honest.
0 1.8 14.8 48 35.4
I am more likely to buy a brand of alcoholic
beverage from a company that is exciting i.e.
Imaginative and up to date
0.3 2.5 14.5 51.1 31.7
I am more likely to buy a brand of alcoholic
beverage that is sophisticated i.e. upper class
0 4.6 18.8 49.5 27.1
KEY: SA- Strongly Agree, A- Agree, N- Neutral, D- Disagree, SD- Strongly Disagree
4.6.2 Brand Image and Consumer Purchase Decision
The study sought to understand the influence of brand image as one of the antecedents of
brand association on the respondents purchase decision of alcoholic beverages. From the
results and as indicated in table 4.12 below, 76.6% of the respondents indicated they were
more likely to buy a brand they considered to be sophisticated, 89.6% were more likely to
buy from a company that had a good reputation, 84.9% from a company that was credible
and 82.7% from a company they perceived to be a market leader.
Also from the responses, 80.3% indicated that they were more likely to buy a brand of
alcoholic beverage that could improve the way they were perceived by peers, 76.9% were
more likely to buy a brand that was viewed by society as a status symbol, 82.2% would
buy from a brand/company they would be proud of associating with, 81.6% were more
likely to buy from a brand that had a unique brand image compared to others, 87.1% of
the respondents admired people who consumed the same brand as they did and 91.7%
were more likely to buy from a brand that was appealing and favorable and
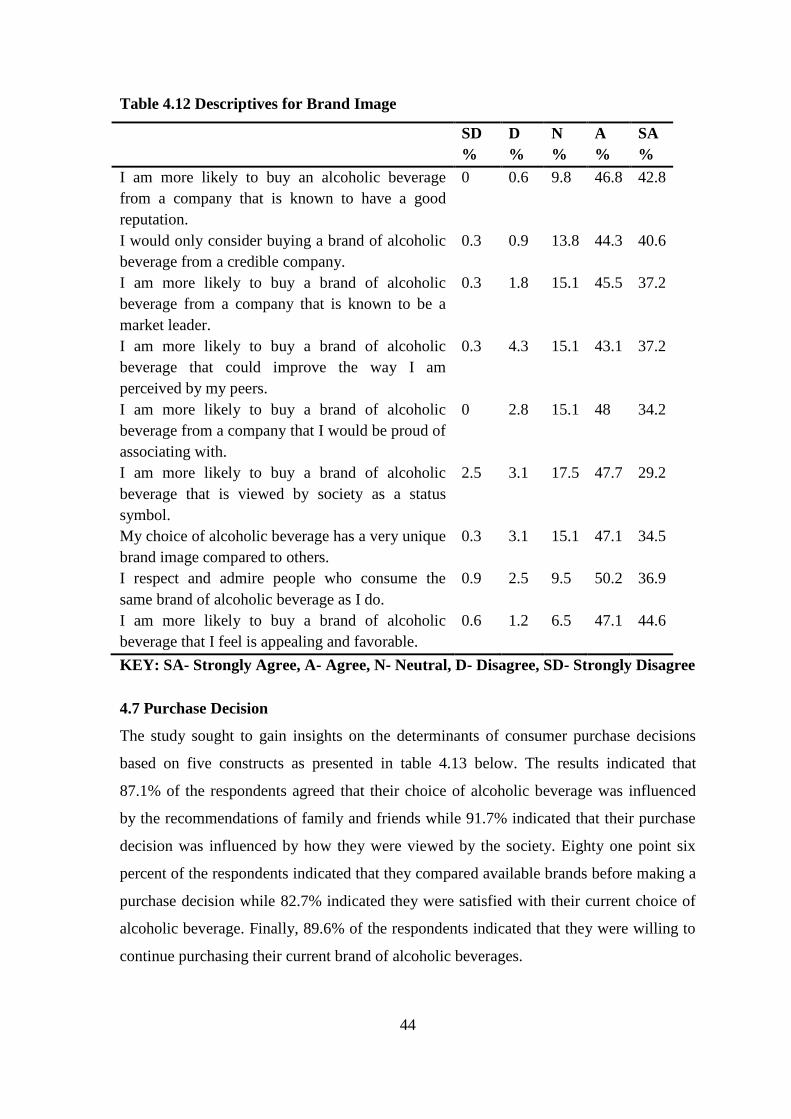
44
Table 4.12 Descriptives for Brand Image
SD
%
D
%
N
%
A
%
SA
%
I am more likely to buy an alcoholic beverage
from a company that is known to have a good
reputation.
0 0.6 9.8 46.8 42.8
I would only consider buying a brand of alcoholic
beverage from a credible company.
0.3 0.9 13.8 44.3 40.6
I am more likely to buy a brand of alcoholic
beverage from a company that is known to be a
market leader.
0.3 1.8 15.1 45.5 37.2
I am more likely to buy a brand of alcoholic
beverage that could improve the way I am
perceived by my peers.
0.3 4.3 15.1 43.1 37.2
I am more likely to buy a brand of alcoholic
beverage from a company that I would be proud of
associating with.
0 2.8 15.1 48 34.2
I am more likely to buy a brand of alcoholic
beverage that is viewed by society as a status
symbol.
2.5 3.1 17.5 47.7 29.2
My choice of alcoholic beverage has a very unique
brand image compared to others.
0.3 3.1 15.1 47.1 34.5
I respect and admire people who consume the
same brand of alcoholic beverage as I do.
0.9 2.5 9.5 50.2 36.9
I am more likely to buy a brand of alcoholic
beverage that I feel is appealing and favorable.
0.6 1.2 6.5 47.1 44.6
KEY: SA- Strongly Agree, A- Agree, N- Neutral, D- Disagree, SD- Strongly Disagree
4.7 Purchase Decision
The study sought to gain insights on the determinants of consumer purchase decisions
based on five constructs as presented in table 4.13 below. The results indicated that
87.1% of the respondents agreed that their choice of alcoholic beverage was influenced
by the recommendations of family and friends while 91.7% indicated that their purchase
decision was influenced by how they were viewed by the society. Eighty one point six
percent of the respondents indicated that they compared available brands before making a
purchase decision while 82.7% indicated they were satisfied with their current choice of
alcoholic beverage. Finally, 89.6% of the respondents indicated that they were willing to
continue purchasing their current brand of alcoholic beverages.
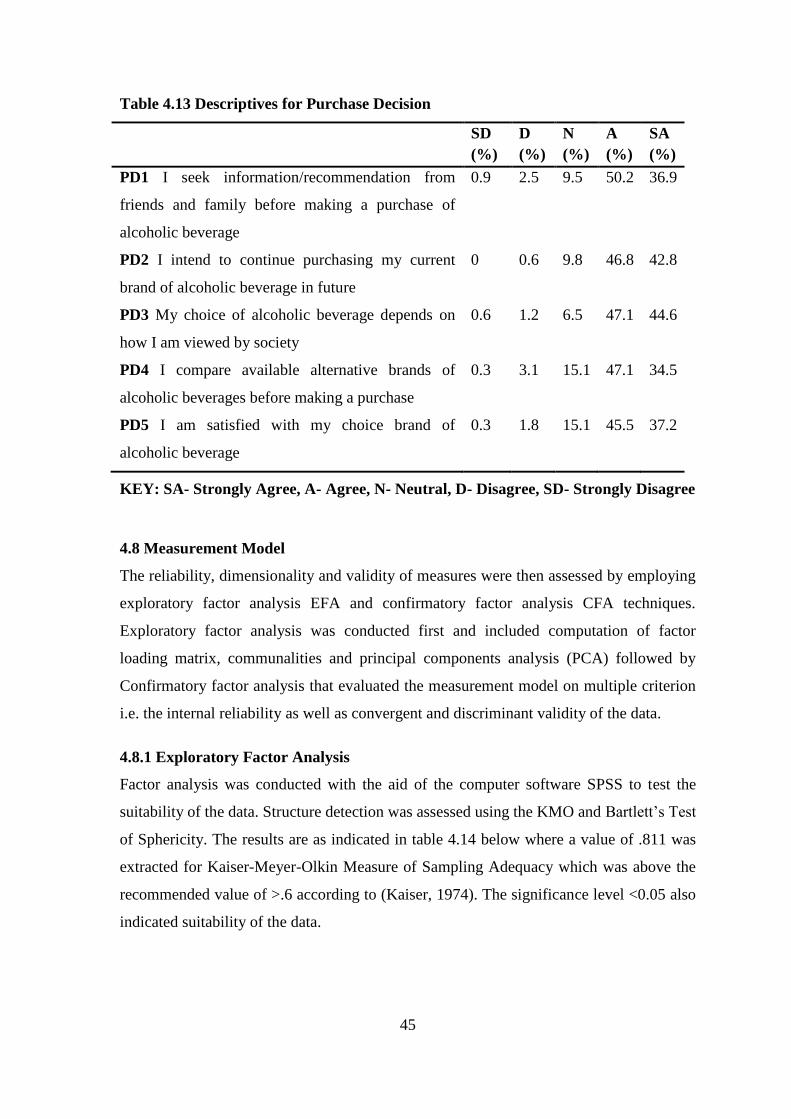
45
Table 4.13 Descriptives for Purchase Decision
SD D N A SA
(%) (%) (%) (%) (%)
PD1 I seek information/recommendation from
friends and family before making a purchase of
alcoholic beverage
0.9 2.5 9.5 50.2 36.9
PD2 I intend to continue purchasing my current
brand of alcoholic beverage in future
0 0.6 9.8 46.8 42.8
PD3 My choice of alcoholic beverage depends on
how I am viewed by society
0.6 1.2 6.5 47.1 44.6
PD4 I compare available alternative brands of
alcoholic beverages before making a purchase
0.3 3.1 15.1 47.1 34.5
PD5 I am satisfied with my choice brand of
alcoholic beverage
0.3 1.8 15.1 45.5 37.2
KEY: SA- Strongly Agree, A- Agree, N- Neutral, D- Disagree, SD- Strongly Disagree
4.8 Measurement Model
The reliability, dimensionality and validity of measures were then assessed by employing
exploratory factor analysis EFA and confirmatory factor analysis CFA techniques.
Exploratory factor analysis was conducted first and included computation of factor
loading matrix, communalities and principal components analysis (PCA) followed by
Confirmatory factor analysis that evaluated the measurement model on multiple criterion
i.e. the internal reliability as well as convergent and discriminant validity of the data.
4.8.1 Exploratory Factor Analysis
Factor analysis was conducted with the aid of the computer software SPSS to test the
suitability of the data. Structure detection was assessed using the KMO and Bartlett’s Test
of Sphericity. The results are as indicated in table 4.14 below where a value of .811 was
extracted for Kaiser-Meyer-Olkin Measure of Sampling Adequacy which was above the
recommended value of >.6 according to (Kaiser, 1974). The significance level <0.05 also
indicated suitability of the data.
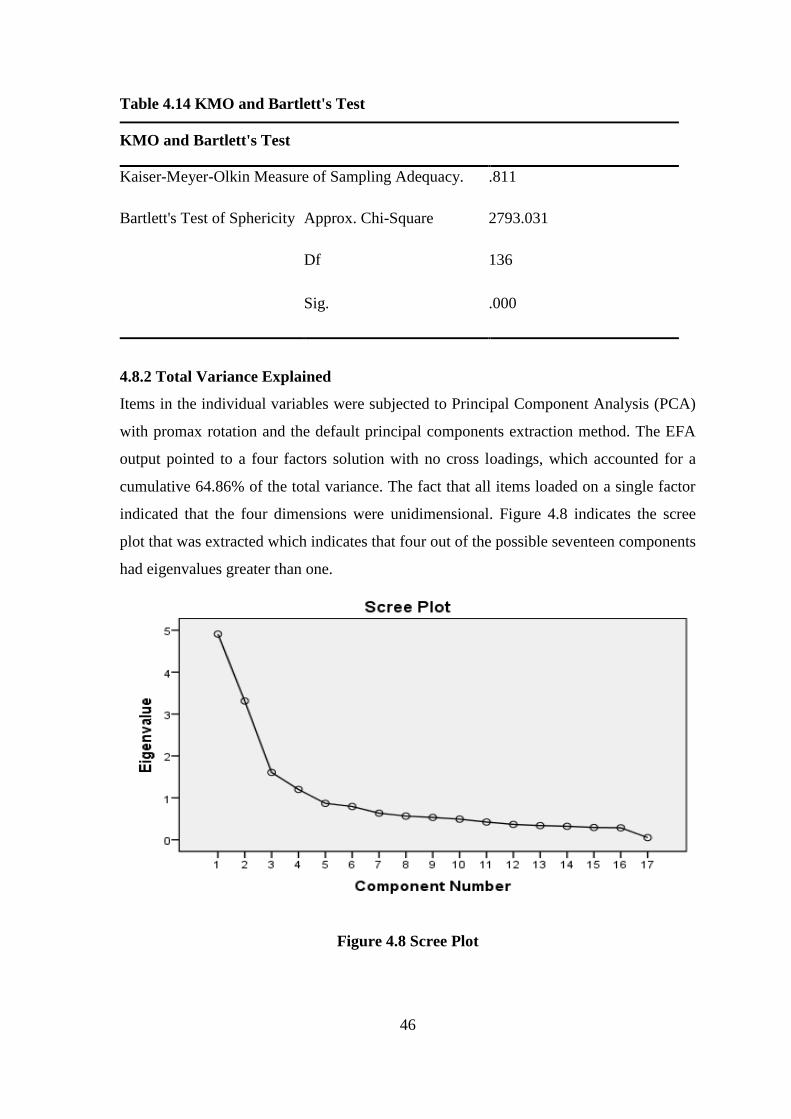
46
Table 4.14 KMO and Bartlett's Test
KMO and Bartlett's Test
Kaiser-Meyer-Olkin Measure of Sampling Adequacy. .811
Bartlett's Test of Sphericity Approx. Chi-Square 2793.031
Df 136
Sig. .000
4.8.2 Total Variance Explained
Items in the individual variables were subjected to Principal Component Analysis (PCA)
with promax rotation and the default principal components extraction method. The EFA
output pointed to a four factors solution with no cross loadings, which accounted for a
cumulative 64.86% of the total variance. The fact that all items loaded on a single factor
indicated that the four dimensions were unidimensional. Figure 4.8 indicates the scree
plot that was extracted which indicates that four out of the possible seventeen components
had eigenvalues greater than one.
Figure 4.8 Scree Plot
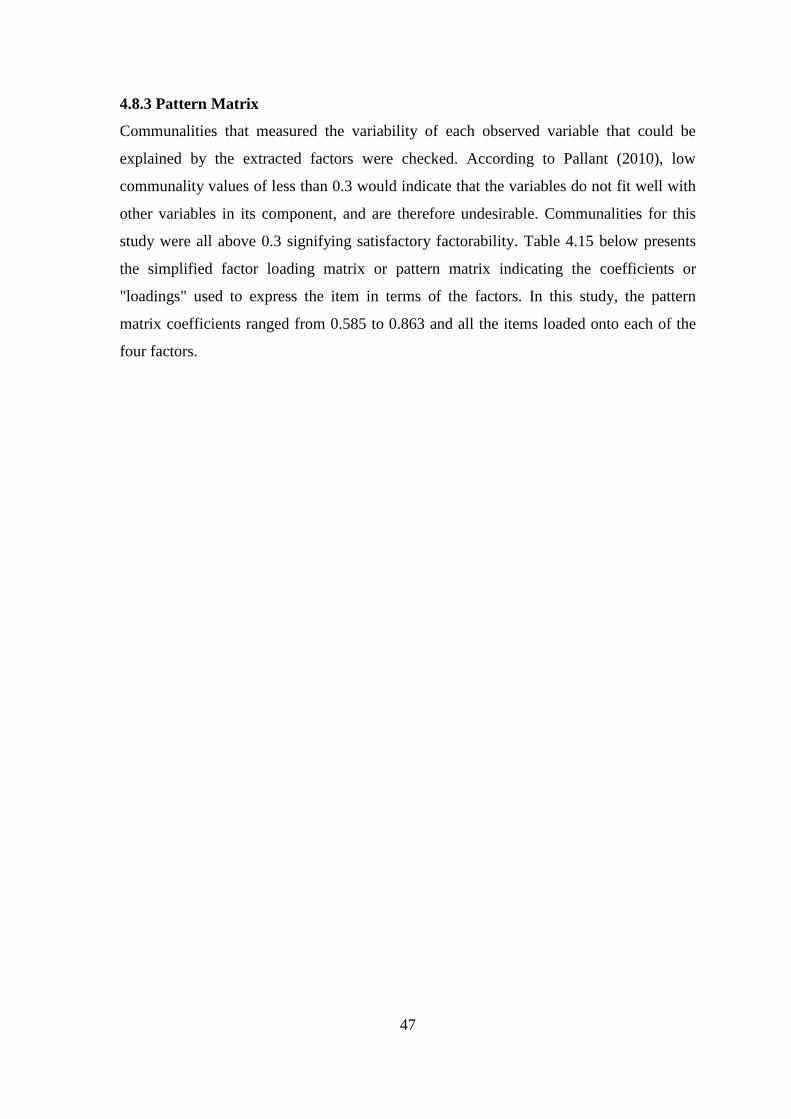
47
4.8.3 Pattern Matrix
Communalities that measured the variability of each observed variable that could be
explained by the extracted factors were checked. According to Pallant (2010), low
communality values of less than 0.3 would indicate that the variables do not fit well with
other variables in its component, and are therefore undesirable. Communalities for this
study were all above 0.3 signifying satisfactory factorability. Table 4.15 below presents
the simplified factor loading matrix or pattern matrix indicating the coefficients or
"loadings" used to express the item in terms of the factors. In this study, the pattern
matrix coefficients ranged from 0.585 to 0.863 and all the items loaded onto each of the
four factors.
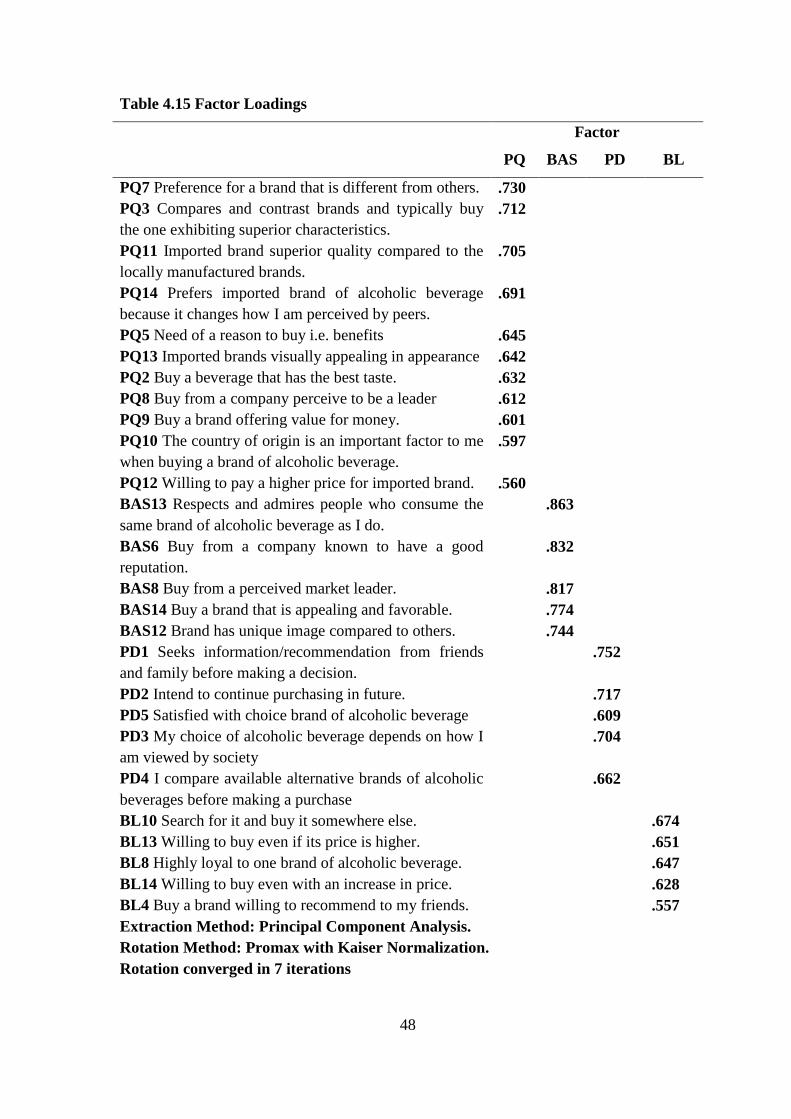
48
Table 4.15 Factor Loadings
Factor
PQ BAS PD BL
PQ7 Preference for a brand that is different from others. .730
PQ3 Compares and contrast brands and typically buy
the one exhibiting superior characteristics.
.712
PQ11 Imported brand superior quality compared to the
locally manufactured brands.
.705
PQ14 Prefers imported brand of alcoholic beverage
because it changes how I am perceived by peers.
.691
PQ5 Need of a reason to buy i.e. benefits .645
PQ13 Imported brands visually appealing in appearance .642
PQ2 Buy a beverage that has the best taste. .632
PQ8 Buy from a company perceive to be a leader .612
PQ9 Buy a brand offering value for money. .601
PQ10 The country of origin is an important factor to me
when buying a brand of alcoholic beverage.
.597
PQ12 Willing to pay a higher price for imported brand. .560
BAS13 Respects and admires people who consume the
same brand of alcoholic beverage as I do.
.863
BAS6 Buy from a company known to have a good
reputation.
.832
BAS8 Buy from a perceived market leader. .817
BAS14 Buy a brand that is appealing and favorable. .774
BAS12 Brand has unique image compared to others. .744
PD1 Seeks information/recommendation from friends
and family before making a decision.
.752
PD2 Intend to continue purchasing in future. .717
PD5 Satisfied with choice brand of alcoholic beverage .609
PD3 My choice of alcoholic beverage depends on how I
am viewed by society
.704
PD4 I compare available alternative brands of alcoholic
beverages before making a purchase
.662
BL10 Search for it and buy it somewhere else. .674
BL13 Willing to buy even if its price is higher. .651
BL8 Highly loyal to one brand of alcoholic beverage. .647
BL14 Willing to buy even with an increase in price. .628
BL4 Buy a brand willing to recommend to my friends. .557
Extraction Method: Principal Component Analysis.
Rotation Method: Promax with Kaiser Normalization.
Rotation converged in 7 iterations
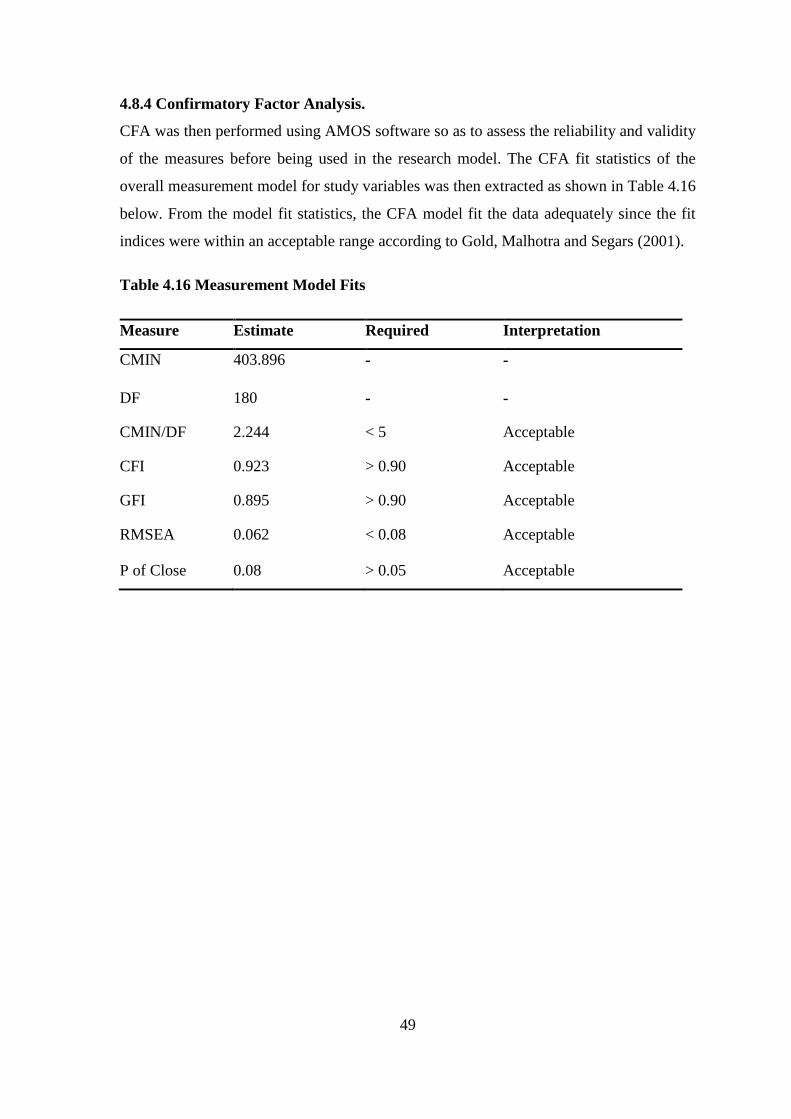
49
4.8.4 Confirmatory Factor Analysis.
CFA was then performed using AMOS software so as to assess the reliability and validity
of the measures before being used in the research model. The CFA fit statistics of the
overall measurement model for study variables was then extracted as shown in Table 4.16
below. From the model fit statistics, the CFA model fit the data adequately since the fit
indices were within an acceptable range according to Gold, Malhotra and Segars (2001).
Table 4.16 Measurement Model Fits
Measure Estimate Required Interpretation
CMIN 403.896 - -
DF 180 - -
CMIN/DF 2.244 < 5 Acceptable
CFI 0.923 > 0.90 Acceptable
GFI 0.895 > 0.90 Acceptable
RMSEA 0.062 < 0.08 Acceptable
P of Close 0.08 > 0.05 Acceptable
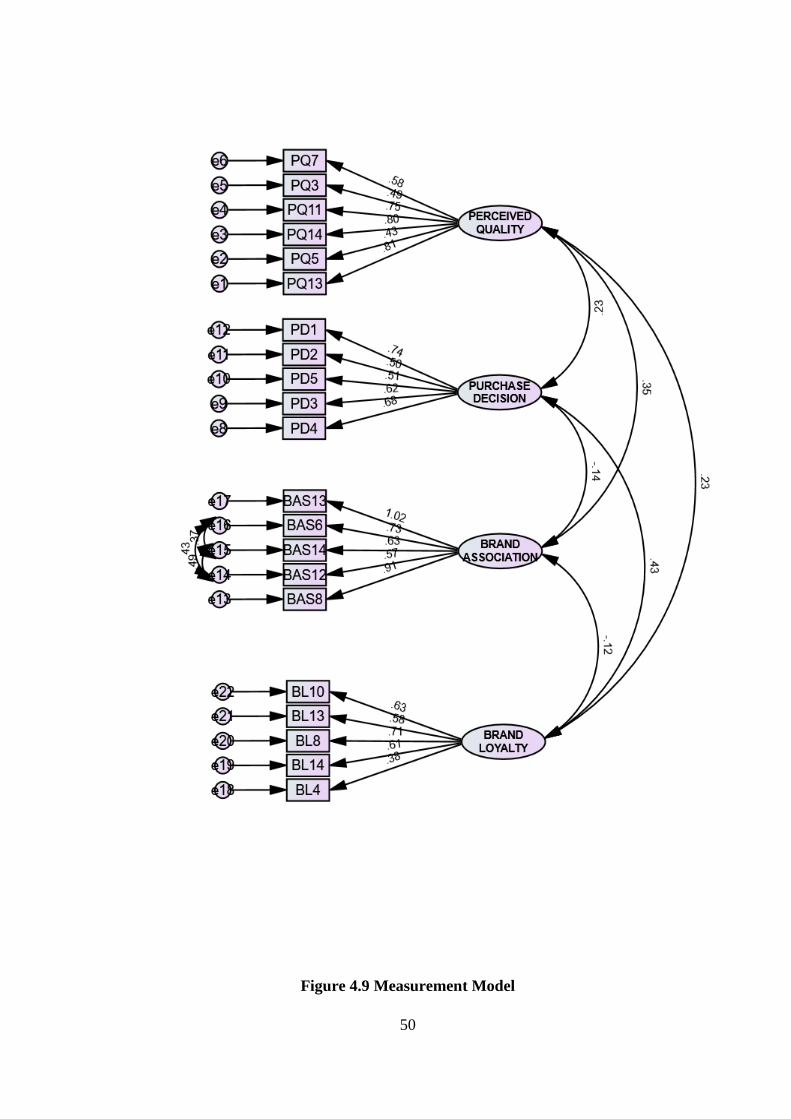
50
Figure 4.9 Measurement Model
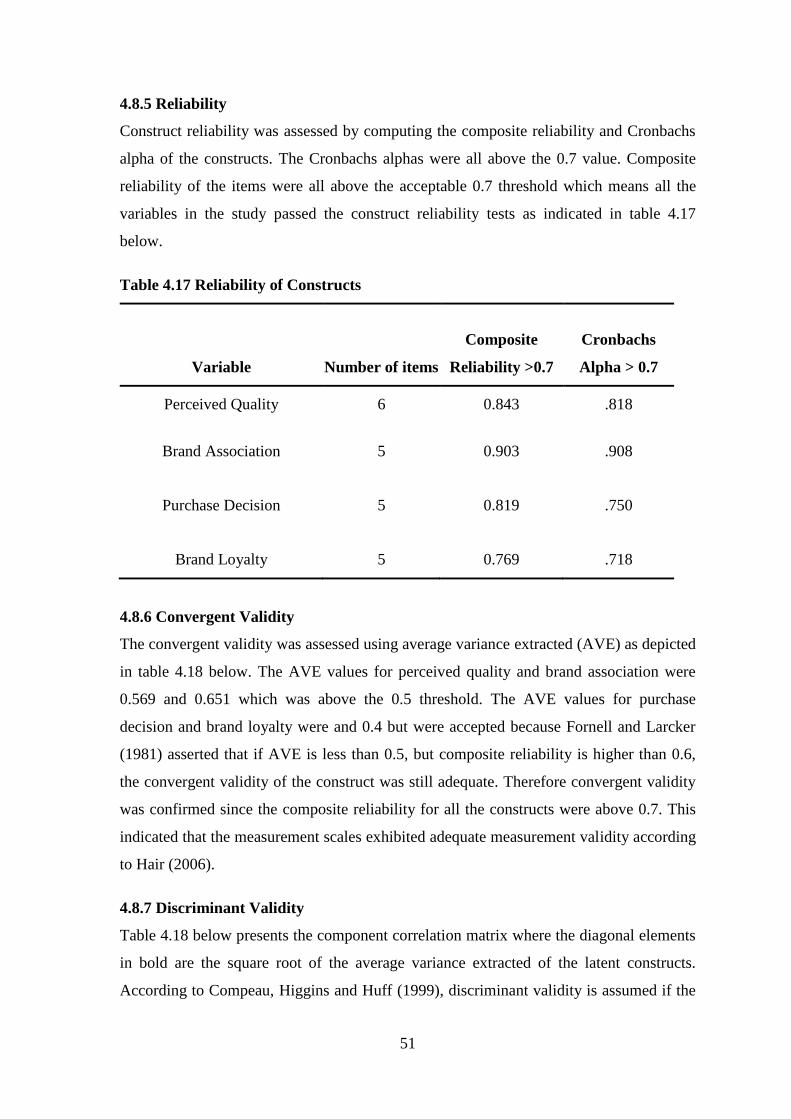
51
4.8.5 Reliability
Construct reliability was assessed by computing the composite reliability and Cronbachs
alpha of the constructs. The Cronbachs alphas were all above the 0.7 value. Composite
reliability of the items were all above the acceptable 0.7 threshold which means all the
variables in the study passed the construct reliability tests as indicated in table 4.17
below.
Table 4.17 Reliability of Constructs
Variable Number of items
Composite
Reliability >0.7
Cronbachs
Alpha > 0.7
Perceived Quality 6 0.843 .818
Brand Association 5 0.903 .908
Purchase Decision 5 0.819 .750
Brand Loyalty 5 0.769 .718
4.8.6 Convergent Validity
The convergent validity was assessed using average variance extracted (AVE) as depicted
in table 4.18 below. The AVE values for perceived quality and brand association were
0.569 and 0.651 which was above the 0.5 threshold. The AVE values for purchase
decision and brand loyalty were and 0.4 but were accepted because Fornell and Larcker
(1981) asserted that if AVE is less than 0.5, but composite reliability is higher than 0.6,
the convergent validity of the construct was still adequate. Therefore convergent validity
was confirmed since the composite reliability for all the constructs were above 0.7. This
indicated that the measurement scales exhibited adequate measurement validity according
to Hair (2006).
4.8.7 Discriminant Validity
Table 4.18 below presents the component correlation matrix where the diagonal elements
in bold are the square root of the average variance extracted of the latent constructs.
According to Compeau, Higgins and Huff (1999), discriminant validity is assumed if the
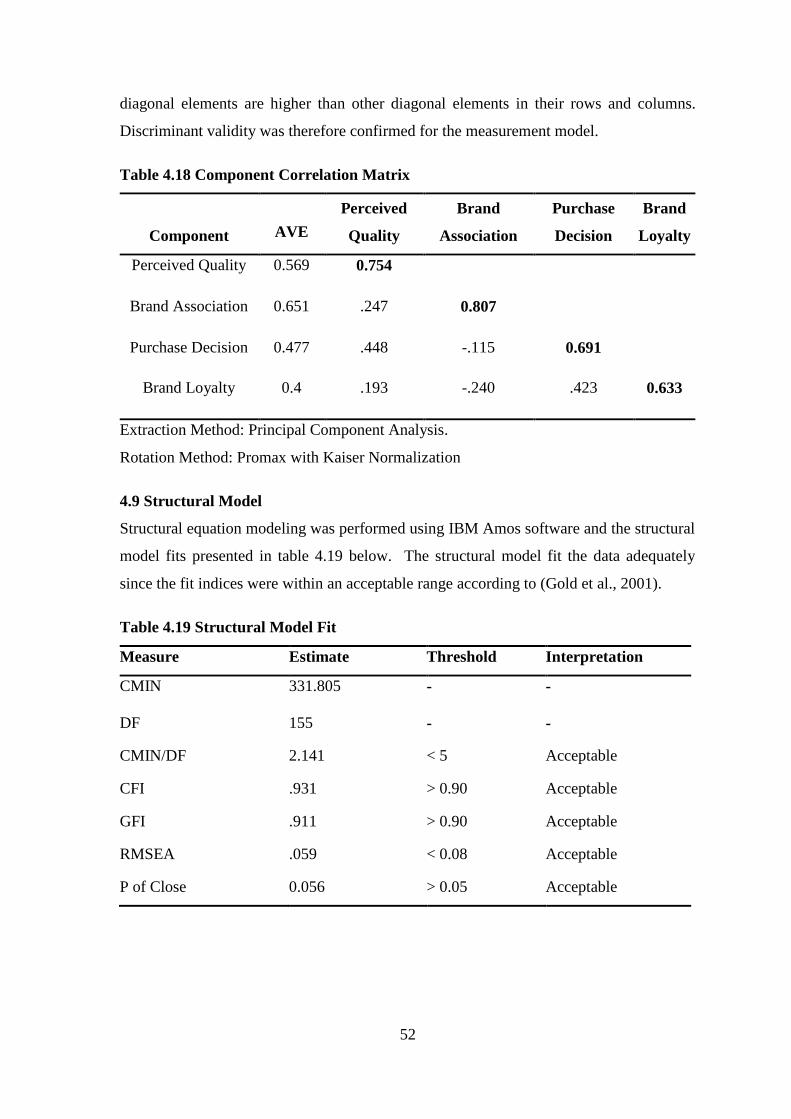
52
diagonal elements are higher than other diagonal elements in their rows and columns.
Discriminant validity was therefore confirmed for the measurement model.
Table 4.18 Component Correlation Matrix
Component
AVE
Perceived
Quality
Brand
Association
Purchase
Decision
Brand
Loyalty
Perceived Quality 0.569 0.754
Brand Association 0.651 .247 0.807
Purchase Decision 0.477 .448 -.115 0.691
Brand Loyalty 0.4 .193 -.240 .423 0.633
Extraction Method: Principal Component Analysis.
Rotation Method: Promax with Kaiser Normalization
4.9 Structural Model
Structural equation modeling was performed using IBM Amos software and the structural
model fits presented in table 4.19 below. The structural model fit the data adequately
since the fit indices were within an acceptable range according to (Gold et al., 2001).
Table 4.19 Structural Model Fit
Measure Estimate Threshold Interpretation
CMIN 331.805 - -
DF 155 - -
CMIN/DF 2.141 < 5 Acceptable
CFI .931 > 0.90 Acceptable
GFI .911 > 0.90 Acceptable
RMSEA .059 < 0.08 Acceptable
P of Close 0.056 > 0.05 Acceptable
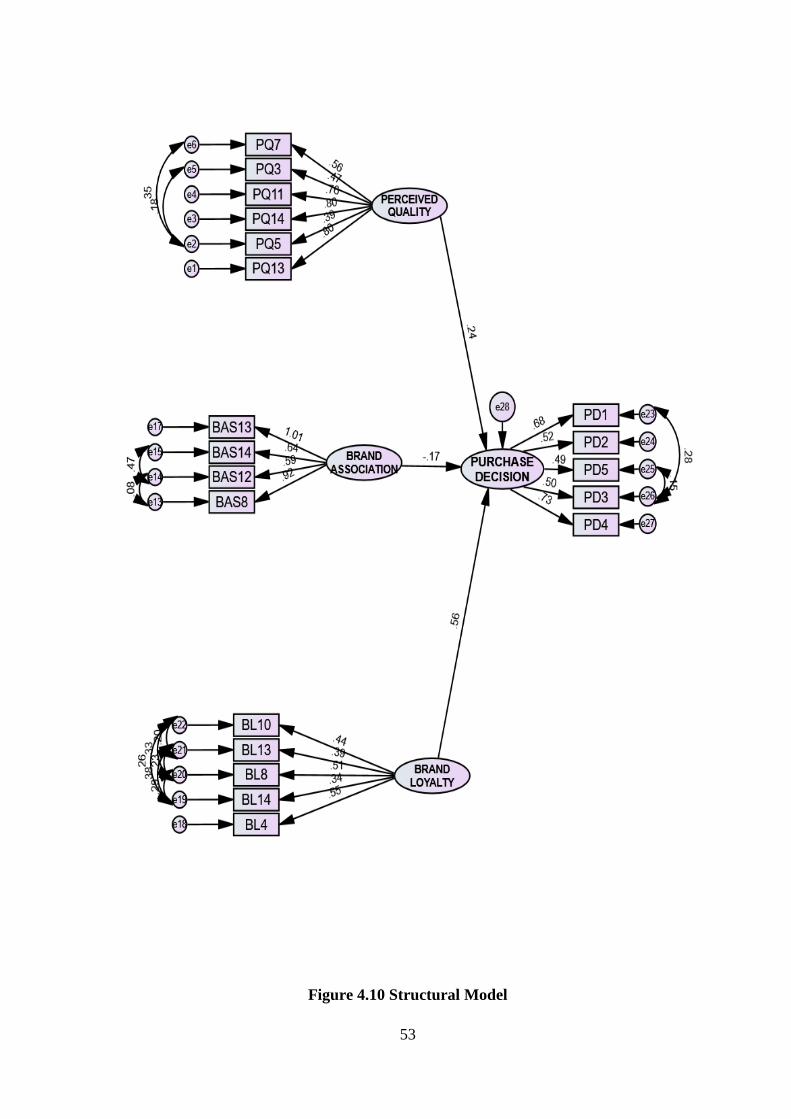
53
Figure 4.10 Structural Model
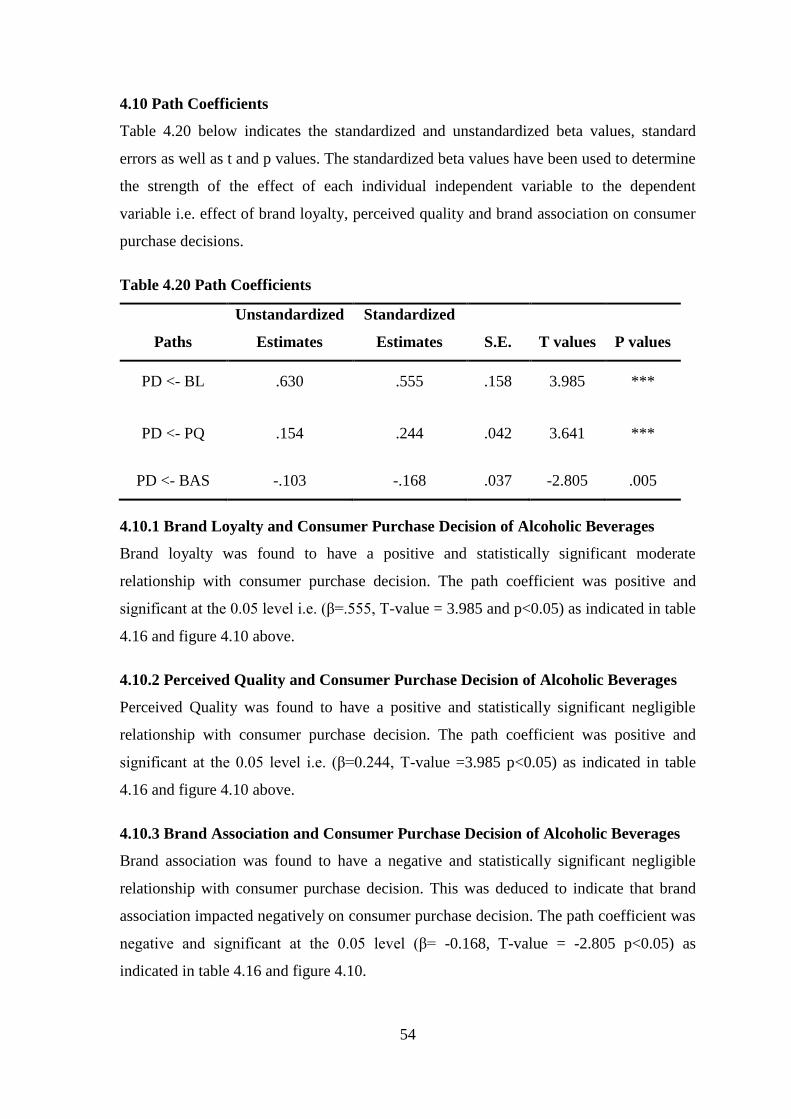
54
4.10 Path Coefficients
Table 4.20 below indicates the standardized and unstandardized beta values, standard
errors as well as t and p values. The standardized beta values have been used to determine
the strength of the effect of each individual independent variable to the dependent
variable i.e. effect of brand loyalty, perceived quality and brand association on consumer
purchase decisions.
Table 4.20 Path Coefficients
Paths
Unstandardized
Estimates
Standardized
Estimates S.E. T values P values
PD <- BL .630 .555 .158 3.985 ***
PD <- PQ .154 .244 .042 3.641 ***
PD <- BAS -.103 -.168 .037 -2.805 .005
4.10.1 Brand Loyalty and Consumer Purchase Decision of Alcoholic Beverages
Brand loyalty was found to have a positive and statistically significant moderate
relationship with consumer purchase decision. The path coefficient was positive and
significant at the 0.05 level i.e. (β=.555, T-value = 3.985 and p<0.05) as indicated in table
4.16 and figure 4.10 above.
4.10.2 Perceived Quality and Consumer Purchase Decision of Alcoholic Beverages
Perceived Quality was found to have a positive and statistically significant negligible
relationship with consumer purchase decision. The path coefficient was positive and
significant at the 0.05 level i.e. (β=0.244, T-value =3.985 p<0.05) as indicated in table
4.16 and figure 4.10 above.
4.10.3 Brand Association and Consumer Purchase Decision of Alcoholic Beverages
Brand association was found to have a negative and statistically significant negligible
relationship with consumer purchase decision. This was deduced to indicate that brand
association impacted negatively on consumer purchase decision. The path coefficient was
negative and significant at the 0.05 level (β= -0.168, T-value = -2.805 p<0.05) as
indicated in table 4.16 and figure 4.10.
55
4.11 Predictive Relevance of the Model
The quality of the structural model can be assessed by R2 that indicates the variance in the
endogenous variable that is explained by the exogenous variables. Based on the results
reported in figure 4.1, the R2 was found to be 0.503 indicating that brand loyalty,
perceived quality and brand association accounted for 50.3% of the variance in consumer
purchase decision.
4.12 Summary
This chapter highlighted the data analysis, results and findings. The study findings
regarding brand loyalty and consumer purchase decisions revealed that there exists a
positive and statistically significant relationship between them r (0.55); p ≤ 0.05. The
study findings regarding perceived quality and consumer purchase decision revealed a
positive and statistically significant relationship between them r (0.244); p≤ 0.05. The
study findings regarding brand association and consumer purchase decision revealed a
negligible negative relationship between them r (-0.168); p ≤ 0.05. Chapter five presented
the study summary, discussions, conclusions, and recommendations for improvement.
56
CHAPTER FIVE
5.0 DISCUSSION, CONCLUSIONS AND RECOMMENDATIONS
5.1 Introduction
This chapter involved the analysis and discussion of the findings in the previous chapter
with regards to the general and specific objectives of the study. Conclusions and
recommendations were also drawn in the chapter. It also provided a summary of the
objectives of the study, the results and findings of the specific research objectives and the
research methodology used.
5.2 Summary
The general objective of the study was to determine the influence of brand equity on
consumer purchase decisions of alcoholic beverages in Nairobi. Literature suggests that
brand equity components affect consumers differently across the different product
categories. Therefore the specific objectives were to determine the influence of brand
loyalty, perceived quality and brand associations on the purchase decision of alcoholic
beverage consumers in Nairobi. The study adopted a descriptive research design
specifically the cross sectional study design due to its flexibility and inexpensive nature
making it suitable for the study. The population for this study consisted of consumers of
branded alcoholic beverages in Nairobi’s Kasarani district comprising different age
groups, incomes, gender, taste and preferences.
Systematic sampling was used to gather responses from respondents in Kasarani district
which had over 989 licensed alcoholic drinks retail outlets. Krejcie and Morgan’s (1970)
sample size determination table was used to determine the study’s sample size of 384. A
structured questionnaire that adopted a likert scale of 1=SD to 5=SA was used to collect
primary data from 400 respondents prior to which a pilot study had been conducted to test
the reliability of the data and questionnaire items. The collected data was analyzed by
way of descriptive and inferential statistics with the aid of SPSS. Descriptive statistics
analyzed using frequencies, percentages and mean and the results were presented using
tables and figures. Inferential statistical analysis for the study included multiple
regression analysis used to determine the level of significance in relationship between
brand equity dimensions and consumer purchase decision.
57
From the analysis, brand loyalty was found to have a positive and moderately significant
relationship with consumer purchase decision. The path coefficient was positive and
significant at the 0.05 level i.e. (β=0.555, T-value =3.963 p<0.05). The positive
relationship was interpreted to mean that if brand loyalty increased by 1, consumer
purchase decision of the respondents would increase by 0.555.
Perceived quality on the other hand was found to have a positive and statistically
significant relationship with consumer purchase decision. The path coefficient was
positive and significant at the 0.05 level (β=0.244, T-value =3.641 p<0.05). It was
deduced to mean that an increase in perceived quality led to a positive increase in
consumer purchase decision. Brand association was found to have a negative and
statistically significant relationship with consumer purchase decision. It was deduced to
indicate that brand association impacted negatively on consumer purchase decision. The
path coefficient was negative and significant at the 0.05 level (β= -0.168, T-value = -
2.805 p<0.05).
In regression analysis, the R2 value indicated a 50.3% variance in consumer purchase
decision of alcoholic beverages in Nairobi is explained by the factors brand loyalty,
perceived quality and brand association. Therefore suggesting that unknown factors not
included in the study contributed to 49.7% of the variation in the consumer decision
making in alcoholic beverages in Nairobi.
5.3 Discussion
5.3.1 Brand Loyalty and Consumer Purchase Decision of Alcoholic Beverages in
Nairobi
The study findings on influence of brand loyalty on purchase decision revealed that there
exists a positive relationship between brand loyalty and consumer purchase decision i.e. r
(0.555); p ≤ 0.05. The study also revealed that the relationship was significant.
Descriptive results indicated a relationship between brand loyalty and consumer choice
much like previous study’s findings. Lovelock and Whyatt (2011) asserted that brand
loyalty has been used in the business context to describe a customer’s willingness to
continue patronizing a firm over the long term and preferably on an exclusive
basis, and recommending the firm’s products to friends and associates. From the study,
seventy seven point six percent of the respondents indicated that they intended to
58
continue purchasing their choice brand of alcoholic beverages regardless of other brands
available in the market while eighty two point two percent indicated their willingness to
recommend their choice brand to friends.
Giddens (2002) asserted that brand loyalty meant that consumers would tend to pay high
prices to a certain brand within the same product group and would advise that brand to the
people around them. The results of this study indicated that 81.6% of the respondents
were willing to purchase their choice brand of alcoholic beverage even if the price was
higher than competing brands. According the high number of brands that serve the same
purpose to change their brand easily and make the creation of brand loyalty difficult
(Wood, 2004).
According to Dimitriades (2006), it is widely accepted that satisfied consumers are less
price sensitive, less influenced by competitors’ attack and loyal to the firm longer than
dissatisfied customers. This theory has been confirmed with the study results indicating
that 79.4% of the respondents indicated that they were more likely to buy a brand that
fully satisfied them while 84% were indicated that they were satisfied with their current
brand choice of alcoholic beverage, 77.2% of the respondents considered themselves to
be highly loyal to one brand while 80.6% of the respondents were willing to continue
purchasing their brand of beverage even with an increase in its price. 82.2% of the
respondents indicated that they were willing. This confirms that loyal consumers were
less price sensitive.
Agustin and Singh (2005) define trust as a consumer’s confident beliefs that he or she can
rely on the brand to deliver promised services or products. From the study 82.8% of the
respondents are more likely to buy from a brand they highly trust while 87% were more
likely to buy a brand of alcoholic beverage that they trusted to be safe. 82.2% of the
respondents indicated that they were willing to pay a premium price for a brand that
offered them a unique experience. According to Hawkins, Best and Coney (2001), brand
loyalty results in an emotional attachment to the brand, which is driven primarily by
commitment and affection. The consumer develops affection for the brand in a manner
similar to a friendship (Ball, Coelho & Machas, 2004). This has been confirmed by the
study where 83.4% of the respondents indicated that their brand was typically their first
59
choice in mind while 82.5% of the respondents said positive things about their choice
brand.
If consumers primarily use the products of a particular company in preference to the
products of competing companies, they are absolutely brand loyal (Keller, 2008). 77.2%
of the respondents indicated that if their choice brand was not available in one store, they
would search for it somewhere else. Yi and Jeon (2003) defined loyalty programs as
marketing programs that are designed to build customer loyalty by providing incentives to
profitable customers and is often based on several propositions.
Evanschitzky et al. (2011) asserted that gaining customer loyalty was an important goal of
marketing, and loyalty programs are intended to help in reaching it. According to Bolton,
Kannan, and Bramlett (2000), the goal of a loyalty program is to establish a higher level
of customer retention in profitable segments by providing more satisfaction and value to
certain customers. From the study, 83% of the respondents revealed that they were more
likely to buy a brand of alcoholic beverages from a company that had reward scheme
programs for its loyal customers while 82.8% indicated that they were more likely to buy
a brand of alcoholic beverage from a company that cared about its customers.
5.3.2 Perceived Quality and Consumer Purchase Decision of Alcoholic Beverages in
Nairobi
The study findings on the influence of perceived quality on consumer purchase decision
revealed that there exists a positive relationship between perceived quality and consumer
purchase decision i.e. r (0.244); p ≤ 0.05. The study also revealed that the relationship
was significant. Perceived quality has been defined in different literature over the years
and one thing that stands out is the aspect of perception on the part of the consumer. For
example; Aaker (1991) defined perceived quality as the customer’s perception of the
overall quality or superiority of a product or service with respect to its intended purpose
and relative to alternatives, Masika (2013) defines it as the perception of superiority of a
brand when compared to alternative brands in a competitive set and it is therefore
considered the consumer’s subjective assessment of a product’s superiority or excellence.
Perceived quality provides consumers with value and gives them a reason to differentiate
one brand from the other. From the study 76.6% of the respondents agreed that they
compare and contrast the various alcoholic brands and typically buy the one exhibiting
60
superior characteristics. Yee and San (2011) asserted that consumers compare the quality
of alternatives with regard to price within a category. This can be supported with the fact
that 79.4% of the respondents in the study agreed that they are more likely to buy a brand
of alcoholic beverage that they believe offers value for money. Perceived quality is
therefore a critical element in consumer decision making. Mohan (2014) asserts that
perceived quality is directly related to the reputation of the firm that manufactures it. This
has been substantiated with the finding that 80.3% of the respondents agreed that they
were more likely to buy a brand of alcoholic beverage from a company they perceived to
be a leader.
It is therefore used as a key factor by firms that seek to create competitive advantage in
their relative industry. Muigai (2017) concluded that perceived product quality can be
significantly different from the actual manufacturing product quality such that even
though the actual quality of a product is good, it is possible that consumer perceptions
about the products may be negative. Aaker (2010) envisioned seven perceived quality
dimension which include; performance, features, conformance, reliability, durability,
serviceability and finally fit and finish.
From the study, 87.7% of the respondents indicated that they were more likely to buy an
alcoholic beverage from a company that is consistent while 70.2% agreed that imported
brands were more appealing than local brands of alcoholic beverages. According to
Koschate-Fischer, Diamantopoulos and Oldenkotte (2012) results of three complementary
experimental studies revealed that country of origin indeed had a positive impact on
willingness to pay. This has been substantiated by the fact that 71% of the respondents
agreed that they were willing to pay a higher price for an imported brand of alcoholic
beverage and also 74.4% perceived imported brands as being more trustworthy than local
brands. Khan and Bamber (2008) noted that country of origin served as a cue from which
consumers could make inferences about product and product attributes.
According to Wang and Yang (2008), consumers in emerging markets perceived
imported products from developed markets to be of superior quality, and products from
other emerging markets to be of similar or inferior quality to their domestic products.
From the study, 74.8% of the respondents indicated that the country of origin of the brand
of alcoholic beverage was important while 70.2% indicated that imported alcoholic
61
beverages are more superior in quality than local brands. Thakor and Kohli (2003)
suggested that less concern should be given to the place where brands manufacture their
products, and more to the place where people perceive the brand’s country of origin to be.
Aaker (2010) asserted that a stronger brand with positive perceived quality has a higher
probability of success if it extends further compared to a weaker brand.
5.3.3 Brand Association and Consumer Purchase Decision of Alcoholic Beverages in
Nairobi
The study findings on the influence of brand associations on consumer purchase decisions
revealed that there exists a negative relationship between brand association and consumer
purchase decision i.e. r (-0.168); p ≤ 0.05. The study also revealed that the relationship
was significant. Contrary to the numerous literature indicating a positive and significant
relationship between brand association and consumer decision making, the findings of the
study indicated a lack of positive and relationship between brand association and
purchase decision in as far as alcoholic brands are concerned. However the correlation is
negligible and could be taken to mean that brand association isn’t an important factor in
consumer decision making in as far as alcoholic beverages are concerned. Keller (2013)
defined brand associations as informational nodes linked to the brand in memory that
contains the meaning of the brand for consumers.
Therefore brand associations are important to marketers and consumers. According to
Sweeny and Brandon (2006), consumers can easily view a brand as having a friendly or
exciting personality due to advertisers’ continuous attempts to humanize and
anthropomorphize the brand. This has been confirmed by the study in that 77.6% of the
respondents would most likely buy a brand that reflects their individual personality in
terms of practicality and flamboyance.
The brand personality scale developed by Aaker (2000) consisted of five generic
dimensions namely sincerity, excitement, competence, sophistication and ruggedness.
The study sought to test Aaker’s scale and the results confirmed the scale with 83.4% of
the respondents indicating they would more likely buy from a sincere and honest firm,
82.8% would most likely buy from a brand that is exciting i.e. imaginative and up to date,
84.9% would more likely buy from a company that is innovative and strives to
continuously improve the quality of its products, Eighty nine point six percent of the
62
respondents indicated that they would most likely buy from a company that is known to
have a good reputation while 76.6% were more likely to buy from a brand that is
considered sophisticated and upper class.
Since the creation of Aaker’s scale, the study has been replicated using various consumer
brands within different product categories and across different cultures. Roy and Banerjee
(2008) asserted that brand image describe the consumer’s thoughts and feelings towards
the brand. According to Rubio, Oubiña and Villaseñor (2013), consumers ascribe high
quality to esteemed brands, 82.7% of respondents agreed that they were more likely to
purchase from a company that was perceived to be a market leader. Therefore, brand
image is the overall mental image that consumers have of a brand, and its uniqueness in
comparison to the other brands (Faircloth, 2005).
According to Iversen and Hem (2008), brand image represents the personal symbolism
that consumers associate with the brand, which comprises of all the descriptive and
evaluative brand related information. From the study, 80.3% of the respondents were
more likely to buy a brand that would improve their perception by peers, 76.9% bought a
brand that is viewed as a status symbol by society and finally 87.1% indicated that they
admired and respected consumers who consumed the same brand as they did.
Therefore, when consumers have a favorable brand image, the brand’s messages have a
stronger influence in comparison to competitor brand messages (Hsieh & Li, 2008). From
the results, 81.6% of the respondents agreed that their brand had a unique brand image
compared to others while 91.7% were more likely to purchase from a brand that was
appealing and favorable. In terms of organizational associations, one of the three
measures of brand associations or differentiation as described by Aaker, 82.2% of
respondents indicated that they would likely purchase from a brand they are proud of
associating with. The results acknowledge the assertions of Burmann, Schaefer and
Maloney (2008) that brand image is an important determinant of a buyer’s behavior.
63
5.4 Conclusion
5.4.1 Brand Loyalty and Consumer Purchase Decision of Alcoholic Beverages in
Nairobi
The study has established the existence of a moderate positive relationship between brand
loyalty and consumer purchase decisions which indicated that strong brand loyalty
positively affected consumer purchase decisions. Therefore, brand loyalty plays an
important role in consumer purchase decision since it increases the probability of a brand
being considered by consumers from a collection of brands to choose from. Furthermore,
it has also been determined that consumer satisfaction, brand trust and loyalty programs
are key determinants of brand loyalty.
Moreover, majority of consumers in their purchase decisions opted to buy familiar
brands. Hence higher levels of brand loyalty increase the probability of a successful
purchase decision among competing brands, produces greater consumer loyalty, and
decreases the vulnerability of consumers to competitors marketing actions thereby
ultimately increasing sales.
5.4.2 Perceived Quality and Consumer Purchase Decision of Alcoholic Beverages in
Nairobi
Perceived quality was established in both literature and in this study as an important
factor in consumer purchase decision. Its subjective nature as a perception by customers
means that alcoholic beverage companies should strive to create and maintain a favorable
and positive perceived as well as actual quality by; exceeding the expectations of
consumers; maintaining product consistency and fostering a favorable company
reputation. It was concluded from the study that both real and perceived product quality
were crucial determinants in consumer purchase decisions of alcoholic beverages since
having a favorable perceived product quality meant consumers were more likely to buy
your product over competitors’ offerings.
The country of origin was also established as an important factor in consumer purchase
decision of alcoholic beverages in Nairobi with a majority of the respondents indicating
their preference for imported alcoholic beverages as well as the willingness to pay a
premium price for foreign brands of alcoholic beverages. However, country of origin
could only be leveraged if the effects were favorable for the company.
64
5.4.3 Brand Associations and Consumer Purchase Decision of Alcoholic Beverages
in Nairobi
Brand association was identified to constitute brand personality and brand image.
Consumers can relate more with brands that portray the same personality as they do.
Attributes such as innovativeness, sincerity and honesty, sophistication, excitement,
credibility and leadership enhance positive brand association ultimately influencing
consumer purchase decisions. A favorable brand image positively influences consumer
purchase decisions as consumers attach greater value to brands perceived to have a
unique image. It also increases loyalty, commands a price premium and generates positive
word of mouth.
Although the results of the study indicated a negligible relationship between brand
association and consumer purchase decisions, descriptive results for the variable indicated
that favorable brand associations influence consumer choice. Literature has also shown
that maintaining positive brand associations is crucial for companies that want to boost
their performance.
5.5 Recommendations
5.5.1 Recommendations for Improvement
5.5.1.1 Brand Loyalty and consumer purchase decision of alcoholic beverages in
Nairobi
Alcoholic beverage manufacturers should invest and engage in brand loyalty building
activities with the main aim of achieving true brand loyalty. Complete satisfaction, brand
trust and loyalty programs have been found to increase brand loyalty and ultimately
reduces the vulnerability of a company. Therefore firms should strive to protect and
increase their market share and increase repeat purchases. Since there is stiff competition
in the alcoholic beverage industry because the product serves the same purpose,
companies should strive to; fully satisfy their customers since satisfied customers were
less price sensitive, less influenced by competitor offerings and remained loyal longer to
the firm; Build brand trust by keeping their promises of providing high quality and
consistent products with the aim of building a strong and long term relationship; Tailor a
differentiated loyalty program strategy that provides incentives and rewards loyal
customers of the company.
65
5.5.1.2 Perceived Quality and consumer purchase decision of alcoholic beverages in
Nairobi
Alcoholic beverage companies that are keen on creating favorable perceived quality
should capitalize on word of mouth marketing to improve their products perception since
consumers who create positive word of mouth about a product enable the firms products
to be perceived to be of good quality. Companies should also consider offering
differentiated brand categories to cater for the different market segments since different
consumers have different purchasing powers; some expect value for money while some
are looking for a reason to buy and are therefore willing to pay a premium price for a
differentiated or sophisticated product.
Therefore maintaining consistency is key to creating favorable perceived quality.
Manufacturers should also capitalize on country of origin marketing as a strategy if it is
favorable and to refrain from it if unfavorable. This is because some consumers perceive
brands for certain countries as superior and are willing to pay a premium price for them
while others perceive them as inferior and will avoid them.
5.5.1.3 Brand Association and consumer purchase decision of alcoholic beverages in
Nairobi
Alcoholic beverage manufacturers need to create and maintain positive brand associations
in consumer minds. Marketers should tailor their promotional messages of their brands to
portray a personality that consumers can relate to hence influencing on their purchase
decision towards the brand. They also need to ensure that they consistently maintain an
identity that their consumers can link to positive cues i.e. creating a brand identity.
Companies should also invest in creating and maintaining attributes which consumers
subscribe to such as their credibility, innovativeness, honesty and sincerity. Creating and
maintaining a positive brand image is also key in determining consumer purchase
decisions hence alcoholic beverage manufacturers should strive to do so.
5.5.2 Recommendations for Further Studies
The study focused on the alcoholic beverage industry alone. Therefore, future research
focus on other consumer product categories such as fast moving consumer goods so as to
investigate the contribution of brand equity factors towards consumer purchase decisions.

66
Future research can also be conducted to measure factors other than brand equity that may
influence consumer purchase decision of alcoholic beverages so as to gain a more holistic
understanding of the concept of brand equity. Finally, the study focused on one
geographical area of Nairobi, therefore the geographic area can be expanded to
accommodate a larger population.
67
REFERENCES
Aaker, D. A. (1991). Managing Brand Equity; Capitalizing on the value of a brand name.
New York: Free Press.
Aaker, J. L. (1997). Dimensions of brand personality. Journal of marketing
research, 34(3), 347-356.
Aaker, J., Fournier, S., & Brasel, S. A. (2004). When good brands do bad. Journal of
Consumer research, 31(1), 1-16.
Aaker, D. A. (1996). Building Strong Brands–The Free Press. A Division of Simon &
Schuster. Inc./D. Aaker.–NY.
Aaker, D. A. (1996). Measuring brand equity across products and markets. California
management review, 38(3).
Aaker, D. A. (2010). Brand relevance: Making competitors irrelevant. John Wiley &
Sons.
Aaker, D. A. & Joachimsthaler, E (2000). Brand Leadership. New York, NY: Free Press.
Africa Yield (2012). East African Breweries. Retrieved from
http://www.africayield.com/stock-research/kenya-stocks-table/east-africa-
breweries-ltd-eabl/
Agustin, C., & Singh, J. (2005). Curvilinear effects of consumer loyalty determinants in
relational exchanges. Journal of marketing research, 42(1), 96-108.
Ahn, J., & Ferle, C. L. (2008). Enhancing recall and recognition for brand names and body
copy: A mixed-language approach. Journal of Advertising, 37(3), 107-117.
AIB Capital (2016). East African Breweries Limited; Initiation coverage report.
Retrievedfrom;http://www.aibcapital.com/phocadownload/east%20african%20brew
eries%20limited%20initiation%20coverage%20report%20march%202016.pdf
Alamgir, M., Nasir, T., Shamsuddoha, M., & Nedelea, A. (2011). Influence of brand name
on consumer decision making process-an empirical study on car buyers. The USV
Annals of Economics and Public Administration, 10(2), 142-153.
Allender, W. J., & Richards, T. J. (2012). Brand loyalty and price promotion strategies: an
empirical analysis. Journal of Retailing, 88(3), 323-342.
Allied Market Research (2018). Global Alcoholic Beverages Market. Retrieved from
https://www.alliedmarketresearch.com/alcoholic-beverages-market
68
Alhaddad, A. (2015). A structural model of the relationships between brand image, brand
trust and brand loyalty. International Journal of Management Research and
Reviews, 5(3), 137.
Ali, M. J. (2014). Factors Influencing Marketing of Alcoholic Beverages In Kenya: A
Case Study of East African Breweries. European Journal of Business and Social
Sciences. Vol. 3 (2), 122 – 153.
Andai, J. (2016). Influence Of Brand Equity On Consumer Purchase Choices Among Pay
Tv Subscribers In Nairobi, Kenya. Nairobi: School Of Business University Of
Nairobi.
Asuma, C. M., & Ndambuki, M. V. (2015). the influence of brand equity on the choice of
marketing Strategies by manufacturers of carbonated drinks in Kenya (Doctoral
dissertation, University of Nairobi).
Atilgan, E., Akinci, S., Aksoy, S., & Kaynak, E. (2009). Customer-based brand equity for
global brands: A multinational approach. Journal of Euromarketing, 18(2), 115-132.
Aure, K.G., & Nervik, K.D. (2014). Building strong brands; A quantitative study of brand
equity. Unpublished MBA Project, Aalesund University College.
Ayub, J. M. (2012). Factors influencing brand loyalty in the oil industry: the case of the
Matatus on route 44 in Nairobi (Doctoral dissertation, University of Nairobi).
Baker, M. J., & Ballington, L. (2002). Country of origin as a source of competitive
advantage. Journal of Strategic Marketing, 10(2), 157-168.
Ball, D., Simões Coelho, P., & Machás, A. (2004). The role of communication and trust in
explaining customer loyalty: An extension to the ECSI model. European journal of
marketing, 38(9/10), 1272-1293.
Bian, X., & Moutinho, L. (2011). The role of brand image, product involvement, and
knowledge in explaining consumer purchase behaviour of counterfeits: Direct and
indirect effects. European Journal of Marketing, 45(1/2), 191-216.
Bilgili, B., & Ozkul, E. (2015). Brand awareness, brand personality, brand loyalty and
consumer satisfaction relations in brand positioning strategies (A Torku brand
sample). Journal of Global Strategic Management| Volume, 9(2).
Blackston, M. (1993). Beyond brand personality: building brand relationships. Brand
equity and advertising: Advertising's role in building strong brands, 113-124.
69
Bohrer, M. (2007), “Discriminant analysis of Aaker’s brand equity model on top-of-mind
awareness/brand preference congruence in prospective hospital patients”, DBA
dissertation, Falls School of Business, Anderson University, Anderson, IN.
Bolton, R. N., Kannan, P. K., &Bramlett, M. D. (2000). Implications of loyalty program
membership and service experiences for customer retention and value. Journal of
the academy of marketing science, 28(1), 95-108.
Brakus, J. J., Schmitt, B. H., &Zarantonello, L. (2009). Brand experience: What is it? How
is it measured? Does it affect loyalty?. Journal of Marketing, 73, 52–68.
Briesch, R. A., Chintagunta, P. K., & Fox, E. J. (2009). How does assortment affect
grocery store choice?.Journal of Marketing research, 46(2), 176-189.
Burmann, C., Schaefer, K., & Maloney, P. (2008). Industry image: Its impact on the brand
image of potential employees. Journal of Brand Management, 15(3), 157-176.
Buil, I., de Chernatony, L. and Martinez, E. (2008), “A cross-national validation of the
consumer-based brand equity scale”, Journal of Product & Brand Management, Vol.
17 No. 6, pp. 384-92.
Burns, A. C., Bush, R. F., & Nash, J. (2008). Basic marketing research: using Microsoft
Excel data analysis. Pearson Prentice Hall.
Cant, M. C., Brink, A., & Brijball, S. (Eds.). (2006). Consumer behaviour. Juta.
Caetano, R., & Laranjeira, R. (2006). A ‘perfect storm’in developing countries: economic
growth and the alcohol industry. Addiction, 101(2), 149-152.
Cateora, P., & Graham, J. L. (1999). International Marketing, Prentince Hall Inc.
International Edition.
Cheng-Hsui Chen, A. (2001). Using free association to examine the relationship between
the characteristics of brand associations and brand equity. Journal of product &
brand management, 10(7), 439-451.
Chen, M. F., & Wang, L. H. (2009). The moderating role of switching barriers on
customer loyalty in the life insurance industry. The Service Industries Journal,
29(8), 1105-1123.
Chernatony, L. D., McDonald, M., & Wallace, E (2011). Creating Powerful Brands
(4thed.). Oxford: Elsevier.
Christensen, L. B., Johnson, B., & Turner, L. A., (2016). Research methods, design, and
analysis.
70
Compeau, D., Higgins, C. A., & Huff, S. (1999). Social cognitive theory and individual
reactions to computing technology: A longitudinal study. MIS quarterly, 145-158
Cooil, B., Keiningham, T. L., Aksoy, L., & Hsu, M. (2007). A longitudinal analysis of
customer satisfaction and share of wallet: Investigating the moderating effect of
customer characteristics. Journal of Marketing, 71(1), 67–83.
Cravens, D. W., & Piercy, N.F. (2013). Strategic Marketing. New York, NY: McGraw-
Hill Irwin.
Da Silva, R. V., & Alwi, S. F. S. (2008). Online corporate brand image, satisfaction and
loyalty. Journal of Brand Management, 16(3), 119-144.
De Chernatony, L., & McDonald, M. (1994). Creating Powerful Brands,
ButterworthHeinemann.
Delgado-Ballester, E., & Luis Munuera-Alemán, J. (2005). Does brand trust matter to
brand equity?.Journal of product & brand management, 14(3), 187-196.
Dimitriades, Z. S. (2006). Customer satisfaction, loyalty and commitment in service
organizations: Some evidence from Greece. Management Research News, 29(12),
782-800.
Djakeli, K., &Tshumburidze, T. (2012). Brand Awareness Matrix in Political Marketing
Area. Journal of Business, 1(1), 25-28.
Dorotic, M., Bijmolt, T. H., & Verhoef, P. C. (2012). Loyalty programmes: Current
knowledge and research directions. International Journal of Management Reviews,
14(3), 217-237.
Dornyei, Z. (2007) Research methods in applied linguistics. New York: Oxford University
Press.
Doyle, P. (1990). Building successful brands: the strategic options. Journal of consumer
Marketing, 7(2), 5-20.
Delgado-Ballester, E., & Luis Munuera-Alemán, J. (2005). Does brand trust matter to
brand equity?. Journal of product & brand management, 14(3), 187-196.
EABL (2017). Integrated Report and Financial Statements. Retrieved from
https://www.google.com/url?sa=t&rct=j&q=&esrc=s&source=web&cd=1&cad=rja
&uact=8&ved=2ahUKEwjDkofj0PjiAhVKxYUKHbRED1IQFjAAegQIAhAC&url
=https%3A%2F%2Fwww.eabl.com%2Fsites%2Fdefault%2Ffiles%2Feabl-annual-
report-2017.pdf&usg=AOvVaw0-L091P03gYZf5-wRHpxQo
71
Ebrahim, R., Ghoneim, A., Irani, Z., & Fan, Y. (2016). A brand preference and repurchase
intention model: the role of consumer experience. Journal of Marketing
Management, 32(13-14), 1230-1259.
Erciş, A., Ünal, S., Candan, F. B., & Yıldırım, H. (2012). The effect of brand satisfaction,
trust and brand commitment on loyalty and repurchase intentions. Procedia-Social
and Behavioral Sciences, 58, 1395-1404.
Etikan, I., Musa, S. A., & Alkassim, R. S. (2016). Comparison of convenience sampling
and purposive sampling. American journal of theoretical and applied statistics,
5(1), 1-4.
Euromonitor (2018). Alcoholic Drinks in Kenya. Retrieved from
https://www.euromonitor.com/alcoholic-drinks-in-kenya/report
Evanschitzky, H., Ramaseshan, B., Woisetschläger, D. M., Richelsen, V., Blut, M., &
Backhaus, C. (2012). Consequences of customer loyalty to the loyalty program and
to the company. Journal of the Academy of Marketing Science, 40(5), 625-638.
Farris, P. W., Bendle, N., Pfeifer, P., & Reibstein, D. (2010). Marketing metrics: The
definitive guide to measuring marketing performance. Pearson Education.
Faircloth, J. B. (2005). Factors influencing nonprofit resource provider support decisions:
applying the brand equity concept to nonprofits. Journal of marketing theory and
practice, 13(3), 1-15.
Fayrene, C. Y., & Lee, G. C. (2011). Customer-based brand equity: A literature review.
Researchers World, 2(1), 33.
Fečiková, I. (2004). An index method for measurement of customer satisfaction. The TQM
magazine, 16(1), 57-66.
Fornell, C., & Larcker, D. F. (1981). Structural equation models with unobservable
variables and measurement error: Algebra and statistics.
Freling, T. H., Crosno, J. L., & Henard, D. H. (2011). Brand personality appeal:
conceptualization and empirical validation. Journal of the Academy of Marketing
Science, 39(3), 392-406.
Freling, T. H., & Forbes, L. P. (2005). An empirical analysis of the brand personality
effect. Journal of Product & Brand Management, 14(7), 404-413.
Gardner, B. B., & Levy, S. J. (1955). The product and the brand. Harvard business review,
33(2), 33-39.
72
Gıddens, N. (2002). Brand Loyalty. Ag Decision Maker. Iowa State University Extensions,
5(54), 1-2.
Gold, A. H., Malhotra, A., & Segars, A. H. (2001). Knowledge management: An
organizational capabilities perspective. Journal of management information systems,
18(1), 185-214.
Gürhan-Canli, Z., & Maheswaran, D. (2000). Cultural variations in country of origin
effects. Journal of Marketing Research, 37(3), 309-317.
Haig, M. (2011).Brand royalty: How the world’s top 100 brands thrive & survive. London:
Kogan Page.
Hair, J. F. (2006). Multivariate data analysis. Pearson Education India.
Hammond, J. (2011). Branding your business; Promote Your Business, Attract Customers
and Build Your Brand Through the Power of Emotion. Kogan Page.
Hansemark, O. C., & Albinsson, M. (2004). Customer satisfaction and retention: the
experiences of individual employees. Managing Service Quality: An International
Journal, 14(1), 40-57.
Hansen, J. D., Beitelspacher, L. S., & Deitz, G. D. (2013). Antecedents and consequences
of consumer’s comparative value assessments across the relationship life cycle.
Journal of Business Research,66(4), 473-479. doi:10.1016/j.jbusres.2011.11.006
Hanzaee, K., & Andervazh, L. (2012). The influence of Brand Loyalty on Cosmetics
purchase intention of Iranian Female Consumers. Journal of Basic and Applied
Scientific Research, 2(5), 5389-5398.
Hawkins, D.I., Best, R.J. & Coney, K.A., (2001), Consumer behavior, 9th edn. McGraw-
Hill, New York.
Hoyle, R. H. (Ed.). (2012). Handbook of structural equation modeling. Guilford press.
Hsieh, A. T., & Li, C. K. (2008). The moderating effect of brand image on public relations
perception and customer loyalty. Marketing Intelligence & Planning, 26(1), 26-42.
Hu, X., Li, L., Xie, C., & Zhou, J. (2008). The effects of country-of-origin on Chinese
consumers' wine purchasing behaviour. Journal of Technology Management in
China, 3(3), 292-306.
International Centre for Alcohol Policies (ICAP). Guidelines for industry contributions to
the WHO to reduce the harmful use of alcohol. 2012.
http://www.globalactions.org/LinkClick.aspx?fileticket:lRwMVFTNafk%3D&tabid
:463
73
Rageh Ismail, A., & Spinelli, G. (2012). Effects of brand love, personality and image on
word of mouth: The case of fashion brands among young consumers. Journal of
Fashion Marketing and Management: An International Journal, 16(4), 386-398.
Iversen, N. M., & Hem, L. E. (2008). Provenance associations as core values of place
umbrella brands: A framework of characteristics. European Journal of Marketing,
42(5/6), 603-626.
Jernigan, D. H. (2009). The global alcohol industry: an overview. Addiction, 104, 6-12.
Jernigan, D. H. (2012). Global alcohol producers, science, and policy: the case of the
International Center for Alcohol Policies. American journal of public health, 102(1),
80-89.
Jernigan, D. H., & Babor, T. F. (2015). The concentration of the global alcohol industry
and its penetration in the African region. Addiction, 110(4), 551-560.
Josiassen, A., &Harzing, A. W. (2008). Comment: Descending from the ivory tower:
reflections on the relevance and future of country‐ of‐ origin research. European
Management Review, 5(4), 264-270.
Kaiser, H. F. (1974). An index of factorial simplicity. Psychometrika, 39(1), 31-36.
Keller, K. L. (1993). Conceptualizing, measuring, and managing customer-based brand
equity. Journal of marketing, 57(1), 1-22.
Keller, K. L. (2013) Strategic Brand Management: Building, measuring and managing
brand equity. Boston: Pearson.
Keller, K. L. (2001). Building customer-based brand equity: A blueprint for creating
strong brands (pp. 3-27). Cambridge, MA: Marketing Science Institute.
Kenya National Bureau of Statistics. (2017) Economic Survey. Retrieved from;
https://www.knbs.or.ke/download/economic-survey-2017/
Kenya National Bureau of Statistics. (2009). Population and housing census statistics.
Retrieved from; https://www.knbs.or.ke/download/statistical-abstract-2009/
Khan, H., & Bamber, D. (2008). Country of origin effects, brand image, and social status
in an emerging market. Human Factors and Ergonomics in Manufacturing &
Service Industries, 18(5), 580-588.
Kim, R., Yang, H., & Chao, Y. (2016). Effect of brand equity& country origin on Korean
consumers' choice for beer brands. The Business & Management Review, 7(3), 398.
74
Koschate-Fischer, N., Diamantopoulos, A., & Oldenkotte, K. (2012). Are consumers really
willing to pay more for a favorable country image? A study of country-of-origin
effects on willingness to pay. Journal of International Marketing, 20(1), 19-41.
Kotler, P., & Keller, K.L. (2016). Marketing Management (13thed.). Upper Saddle River,
NJ: Pearson Prentice Hall.
Kotler, P., & Armstrong, G. (2014). Principles of marketing. New York, NY: Pearson.
Krejcie, R. V., & Morgan, D. W. (1970). Determining sample size for research activities.
Educational and psychological measurement, 30(3), 607-610.
Kumar, R., Luthra, A., & Datta, G. (2006). Linkages between brand personality and brand
loyalty: a qualitative study in an emerging market in the Indian context. South Asian
Journal of Management, 13(2), 11.
Laforet, S. (2010). Managing brands: A contemporary perspective. McGraw-Hill Higher
Education.
Lavrakas, P. J. (2008). Encyclopedia of survey research methods. Sage Publications.
Lee, D., Moon, J., Kim, Y. J., & Mun, Y. Y. (2015). Antecedents and consequences of
mobile phone usability: Linking simplicity and interactivity to satisfaction, trust,
and brand loyalty. Information & Management, 52(3), 295-304.
Leckie, C., Nyadzayo, M. W., & Johnson, L. W. (2016). Antecedents of consumer brand
engagement and brand loyalty. Journal of Marketing Management, 32(5-6), 558-
578.
Lin, L. Y. (2010). The relationship of consumer personality trait, brand personality and
brand loyalty: an empirical study of toys and video games buyers. Journal of
Product & Brand Management, 19(1), 4-17.
Louis, D., & Lombart, C. (2010). Impact of brand personality on three major relational
consequences (trust, attachment, and commitment to the brand). Journal of Product
& Brand Management, 19(2), 114-130.
Lovelock, C., &Wirtz, J. (2015). Services marketing: global edition. Pearson Higher Ed.
Low, G. S., & Lamb Jr, C. W. (2000). The measurement and dimensionality of brand
associations. Journal of Product & Brand Management, 9(6), 350-370.
Lusk, J. L., Brown, J., Mark, T., Proseku, I., Thompson, R., & Welsh, J. (2006). Consumer
behavior, public policy, and country-of-origin labeling. Review of agricultural
economics, 28(2), 284-292.
75
Maheshwari, V., Lodorfos, G., & Jacobsen, S. (2014). Determinants of brand loyalty: A
study of the experience-commitment-loyalty constructs.
Malik, M. E., Ghafoor, M. M., Iqbal, H. K., Ali, Q., Hunbal, H., Noman, M., & Ahmad, B.
(2013). Impact of brand image and advertisement on consumer buying behavior.
World Applied Sciences Journal, 23(1), 117-122.
Martenson, R. (2007). Corporate brand image, satisfaction and store loyalty: A study of
the store as a brand, store brands and manufacturer brands. International Journal of
Retail & Distribution Management, 35(7), 544-555.
Masika, C. (2013). The influence of mobile marketing on brand equity; A case study of
Safaricom Limited. Unpublished MBA Project, University of Nairobi.
McKee, S. (2010). Creative B2b branding (no, really): Building a creative brand in a
business world. Goodfellow.
Melo, T., & Galan, J. I. (2011). Effects of corporate social responsibility on brand value.
Journal of Brand Management, 18(6), 423-437.
Mimouni-Chaabane, A., &Volle, P. (2010). Perceived Benefits of Loyalty Programs
Measure.PsycTESTSDataset.JournalofBusinessResearch,Elsevier,2010,63(1),pp.32
37 doi:10.1037/t43686-000
Mittal, B., & Sheth, J. (2004). Customer Behavior: A managerial perspective. Natorp
Boulevard: Thompson South Western.
Mitchell, M. L., & Jolley, J. M. (2012). Research design explained. Cengage Learning.
Mohan, A. (2014). Consumer behavior toward smartphone industry in Indian market.
Unpublished MBA Project, Dublin Business School.
Muigai, C. N. (2017). Impact of Brand Equity on Consumer Buyer Behaviour of
Smartphones among Millennials: A Case Study of the United States International
University (Doctoral dissertation, United States International University-Africa).
Nam, J., Ekinci, Y., & Whyatt, G. (2011). Brand equity, brand loyalty and consumer
satisfaction. Annals of tourism Research, 38(3), 1009-1030.
Neslin, S.A., (2002), Sales promotion, Marketing Science Institute, Cambridge, MA.
Nguyen, H., & Kleiner, B. H. (2003). The effective management of mergers. Leadership &
Organization Development Journal, 24(8), 447-454.
Niss, H. (1996). Country of origin marketing over the product life cycle: A Danish case
study. European journal of marketing, 30(3), 6-22.
76
Njuguna, R. K. (2014). The influence of brand equity on consumer choice in branded
bottled water among supermarket customers in Nairobi central business district.
Kenya (Doctoral dissertation).
Oladepo, O. I., & Abimbola, O. S. (2015). The influence of brand image and promotional
mix on consumer buying decision-a study of beverage consumers in Lagos State,
Nigeria. British journal of marketing studies, 3(4), 97-109.
Omulo, C. (2018, September 25th). Nairobi halts issuing new licenses for bars. Business
Daily.
Pallant, J. (2010). SPSS Survival Manual, 4th edn, Maidenhead.
Phrasisombath, K. (2009). Sample size and sampling methods. Faculty of Postgraduate
Studies and Research University of Health Sciences: Vientiane.
Petromilli, M., Morrison, D., & Million, M. (2002). Brand architecture: Building brand
portfolio value. Strategy & leadership, 30(5), 22-28.
Piron, F. (2000). Consumers’ perceptions of the country-of-origin effect on purchasing
intentions of (in) conspicuous products. Journal of consumer marketing, 17(4), 308-
321.
Porral, C. C., Bourgault, N., &Dopico, D. C. (2013). Brewing the Recipe for Beer Brand
Equity. SSRN Electronic Journal,XVI (2), 82-97. doi:10.2139/ssrn.2243163
Radder, L., & Huang, W. (2008). High‐involvement and low‐involvement products.
Journal of Fashion Marketing and Management: An International Journal,12(2), 23
Rauyruen, P., & Miller, K. E. (2007). Relationship quality as a predictor of B2B customer
loyalty. Journal of business research, 60(1), 21-31.
Ravi, R. (2014). Brand Equity and Its Impact on Decision Making: A Study wrt Youth in
Selected Cities (Mumbai and Pune) and wrt FMCG Products.
Reza Jalilvand, M., & Samiei, N. (2012). The effect of electronic word of mouth on brand
image and purchase intention: An empirical study in the automobile industry in Iran.
Marketing Intelligence & Planning, 30(4), 460-476.
Roth, M. S., & Romeo, J. B. (1992). Matching product category and country image
perceptions: A framework for managing country-of-origin effects. Journal of
international business studies, 23(3), 477-497.
Roy, D., & Banerjee, S. (2008). CARE-ing strategy for integration of brand identity with
brand image. International journal of commerce and management, 17(1/2), 140-
148.
77
Rubio, N., Oubina, J., & Villasenor, N. (2014). Brand awareness–Brand quality inference
and consumer’s risk perception in store brands of food products. Food quality and
preference, 32, 289-298.
Saunders, M., Lewis, P. & Thornhill, A. (2016). Research Methods for Business Students
(7thedition). Harlow: Pearson.
Schiffman, L.G., Kanuk, L.L., & Wisenblit, J. (2010). Consumer buyer behavior (10th
ed.). Upper Saddle River, NJ: Pearson.
Schirmer, N., Ringle, C. M., Gudergan, S. P., &Feistel, M. S. (2018). The link between
customer satisfaction and loyalty: the moderating role of customer characteristics.
Journal of Strategic Marketing, 26(4), 298-317.
Shankar, V., Azar, P., & Fuller, M. (2008). Practice Prize Paper—BRAN* EQT: A
Multicategory Brand Equity Model and Its Application at Allstate. Marketing
Science, 27(4), 567-584.
Sharma, P. (2011). Country of origin effects in developed and emerging markets:
Exploring the contrasting roles of materialism and value consciousness. Journal of
International Business Studies, 42(2), 285-306.
Shehzad, U., Ahmad, S., Iqbal, K., Nawaz, M., & Usman, S. (2014). Influence of Brand
Name on Consumer Choice & Decision. IOSR Journal of Business and
Management (IOSR-JBM), 16(6), 72-76.
Sheth, J. N., Mittal, B., & Newman, B. I. (1999). Customer behavior: Consumer behavior
and beyond. South Western Educational Publishing.
Slattery, J., & Pitts, B. G. (2002). Corporate sponsorship and season ticket holder
attendees: An evaluation of changes in recall over the course of one American
collegiate football season. International Journal of Sports Marketing and
Sponsorship, 4(2), 56-79.
Strizhakova, Y., Coulter, R. A., & Price, L. L. (2011). Branding in a global marketplace:
The mediating effects of quality and self-identity brand signals. International
Journal of Research in Marketing, 28(4), 342-351.
Stojanov, L. (2012). Perceived quality – An empirical testing of marketing theories: A
case study on the imported baby foods market in Bulgaria. Unpublished MBA
Thesis, Aalto University.
Sung, Y., & Kim, J. (2010). Effects of brand personality on brand trust and brand affect.
Psychology & Marketing, 27(7), 639-661.
78
Sweeney, J., & Brandon, C. (2006). Brand personality: Exploring the potential to move
from factor analytical to circumplex models. Psychology and Marketing, 23(8),
639– 663.
Tanveer, Z., & Lodhi, R. N. (2016). The Effect of Brand Equity on Customer Satisfaction:
An Empirical Study Based on David Aaker's Brand Equity Model. IUP Journal Of
Brand Management, 13(3), 43-54.
Taylor, S. A., Celuch, K., & Goodwin, S. (2004). The importance of brand equity to
customer loyalty. Journal of product & brand management, 13(4), 217-227.
Thakor, M. V. (1996). Brand origin: conceptualization and review. Journal of consumer
marketing, 13(3), 27-42.
Torres, P. M., Augusto, M. G., &Lisboa, J. V. (2015). Determining the causal relationships
that affect consumer-based brand equity. Marketing Intelligence & Planning,33(6),
944-956.
Trott, S., &Sople, V. V. (2016). Brand Equity: An Indian Perspective. PHI Learning Pvt.
Ltd.
Tuominen, P. (1999). Managing brand equity. Lta, 1(99), 65-100.
Wood, L. (2004). Dimensions of brand purchasing behaviour: Consumers in the 18–24 age
group. Journal of Consumer Behaviour: An International Research Review, 4(1), 9-
24.
Yee, R. W., Yeung, A. C., & Cheng, T. E. (2008). The impact of employee satisfaction on
quality and profitability in high-contact service industries. Journal of operations
management, 26(5), 651-668.
Yee, C. J., & San, N. C. (2011). Consumers' perceived quality, perceived value and
perceived risk towards purchase decision on automobile. American Journal of
Economics and Business Administration, 3(1), 47.
Yi, Y., & Jeon, H. (2003). Effects of loyalty programs on value perception, program
loyalty, and brand loyalty. Journal of the academy of marketing science, 31(3), 229-
240.
Zhang, Q., Gangwar, M., & Seetharaman, P. B. (2008). Store loyalty as a category-
specific trait: What drives it. Working Paper, University of Iowa, Iowa City.
Zhang, J., & Breugelmans, E. (2012). The impact of an item-based loyalty program on
consumer purchase behavior. Journal of Marketing research, 49(1), 50-65.
79
APPENDICES
APPENDIX I: LETTER OF INTRODUCTION
P.O Box 56928-00200,
Nairobi.
Dear Sir/Madam,
RE: LETTER OF INTRODUCTION
I am a student at the United States International University (USIU-AFRICA) currently
pursuing a Master’s degree in Business Administration. In partial fulfillment of the
program, I am working on a research project entitled, Influence of Brand equity on
Consumer Purchase Decision of Alcoholic Beverages in Nairobi. The objectives of
this study will be to determine the extent in which brand loyalty, perceived quality and
brand associations affect consumer choice of alcoholic beverages in Nairobi County.
I hereby request for your permission and assistance towards the completion of the study
by allowing me to conduct the study within your premises. I declare to abide by the
University rules and guidelines concerning research undertaking and to observe utmost
ethical standards in the process of conducting the research.
The study will be beneficial to local alcoholic beverage manufacturers since the findings
will answer numerous questions regarding the consumer resulting in better product
offerings in terms of quality and variety.
Yours Sincerely
Barmasai Felix Kiprono
80
APPENDIX II: QUESTIONNAIRE
The purpose of this study is to determine the Influence of Brand Equity on
Consumer Choice of Alcoholic Beverages in Nairobi
The following questionnaire is divided into five sections for ease of administration. It will
require approximately 10 minutes to complete. Data collected from this questionnaire is
for academic purposes only. For confidentiality, kindly do not include your name.
Participation is strictly voluntary. If you choose to participate in this exercise, kindly
answer all questions as honestly as possible.
SECTION ONE: GENERAL INFORMATION
Please tick ONE appropriate box below
1. Gender: Male 1[ ] Female 2[ ]
1. Age: 18 – 25 1[ ] 26 – 33 2[ ] 34 – 41 3[ ] 40 and above 4[ ]
2. Education Level: Secondary1[ ] College 2[ ] University 3[ ]
3. Occupation: Student 1[ ] Employed 2[ ] Self- Employed 3[ ]
Unemployed 4[ ] Retired 5[ ]
4. Average Monthly Income in KSh: Below 20,000 1[ ] 20,001 – 40,000 2[ ]
40,001 – 60,000 3[ ] 60,001 – 80,000 4[ ] Over 80,001 5[ ]
5. Marital Status: Single 1[ ] Married 2[ ] Other……………………3
6. Which alcoholic beverages among the following do you prefer/consume:
Beer 1[ ] Spirits 2[ ] Wine 3[ ] Liqueur 4[ ] Undecided 5[ ]
7. Is the brand local or foreign in Origin Local 1[ ] Foreign 2[ ]
8. Kindly specify the Brand Manufacturer/Distributor: EABL 1[ ] KEROCHE2[ ]
KWAL 3[ ] I don’t know 4[ ] Others ……………………….....5
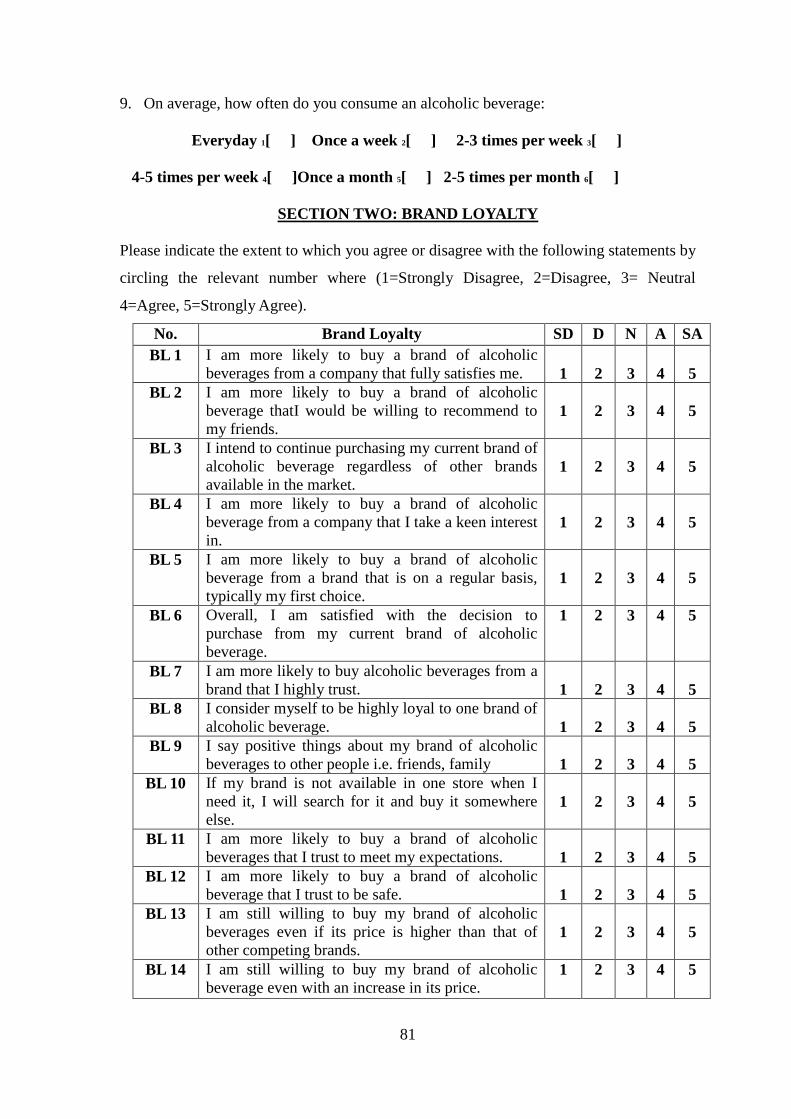
81
9. On average, how often do you consume an alcoholic beverage:
Everyday 1[ ] Once a week 2[ ] 2-3 times per week 3[ ]
4-5 times per week 4[ ]Once a month 5[ ] 2-5 times per month 6[ ]
SECTION TWO: BRAND LOYALTY
Please indicate the extent to which you agree or disagree with the following statements by
circling the relevant number where (1=Strongly Disagree, 2=Disagree, 3= Neutral
4=Agree, 5=Strongly Agree).
No. Brand Loyalty SD D N A SA
BL 1 I am more likely to buy a brand of alcoholic
beverages from a company that fully satisfies me.
1
2
3
4
5
BL 2 I am more likely to buy a brand of alcoholic
beverage thatI would be willing to recommend to
my friends.
1
2
3
4
5
BL 3 I intend to continue purchasing my current brand of
alcoholic beverage regardless of other brands
available in the market.
1
2
3
4
5
BL 4 I am more likely to buy a brand of alcoholic
beverage from a company that I take a keen interest
in.
1
2
3
4
5
BL 5 I am more likely to buy a brand of alcoholic
beverage from a brand that is on a regular basis,
typically my first choice.
1
2
3
4
5
BL 6 Overall, I am satisfied with the decision to
purchase from my current brand of alcoholic
beverage.
1 2 3 4 5
BL 7 I am more likely to buy alcoholic beverages from a
brand that I highly trust.
1
2
3
4
5
BL 8 I consider myself to be highly loyal to one brand of
alcoholic beverage.
1
2
3
4
5
BL 9 I say positive things about my brand of alcoholic
beverages to other people i.e. friends, family
1
2
3
4
5
BL 10 If my brand is not available in one store when I
need it, I will search for it and buy it somewhere
else.
1
2
3
4
5
BL 11 I am more likely to buy a brand of alcoholic
beverages that I trust to meet my expectations.
1
2
3
4
5
BL 12 I am more likely to buy a brand of alcoholic
beverage that I trust to be safe.
1
2
3
4
5
BL 13
I am still willing to buy my brand of alcoholic
beverages even if its price is higher than that of
other competing brands.
1
2
3
4
5
BL 14
I am still willing to buy my brand of alcoholic
beverage even with an increase in its price. 1 2 3 4 5
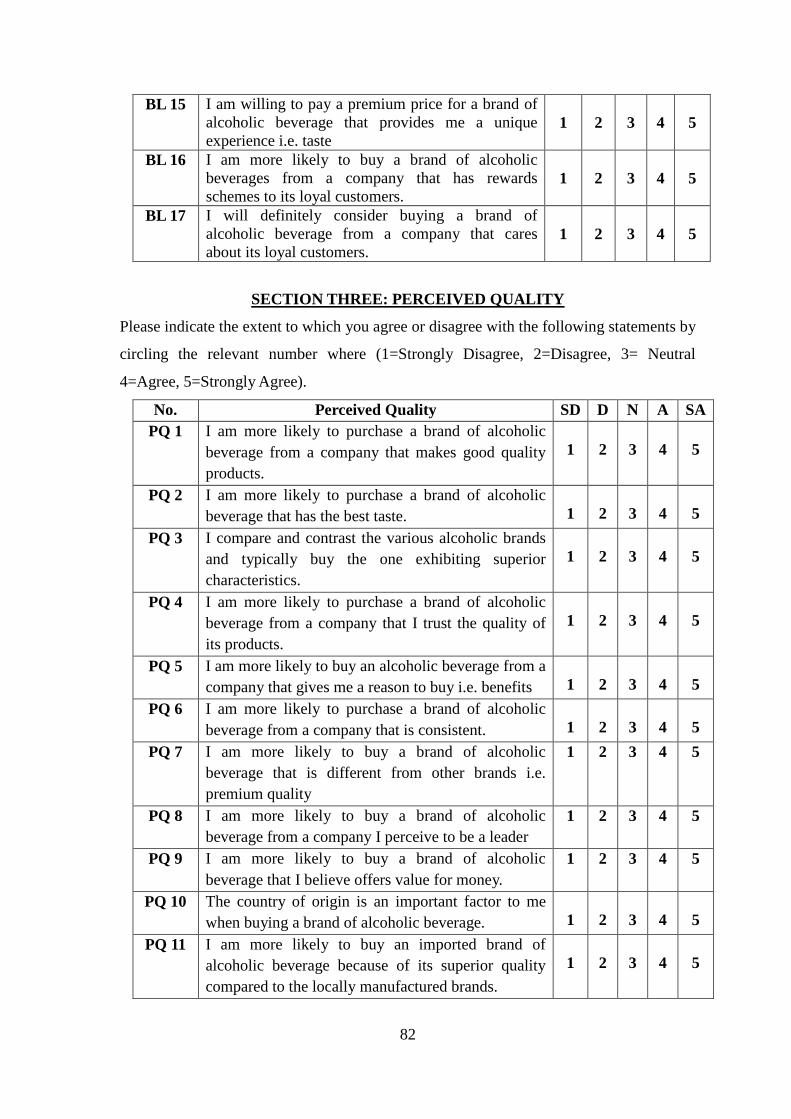
82
BL 15 I am willing to pay a premium price for a brand of
alcoholic beverage that provides me a unique
experience i.e. taste
1
2
3
4
5
BL 16 I am more likely to buy a brand of alcoholic
beverages from a company that has rewards
schemes to its loyal customers.
1
2
3
4
5
BL 17 I will definitely consider buying a brand of
alcoholic beverage from a company that cares
about its loyal customers.
1
2
3
4
5
SECTION THREE: PERCEIVED QUALITY
Please indicate the extent to which you agree or disagree with the following statements by
circling the relevant number where (1=Strongly Disagree, 2=Disagree, 3= Neutral
4=Agree, 5=Strongly Agree).
No. Perceived Quality SD D N A SA
PQ 1 I am more likely to purchase a brand of alcoholic
beverage from a company that makes good quality
products.
1
2
3
4
5
PQ 2 I am more likely to purchase a brand of alcoholic
beverage that has the best taste.
1
2
3
4
5
PQ 3 I compare and contrast the various alcoholic brands
and typically buy the one exhibiting superior
characteristics.
1
2
3
4
5
PQ 4 I am more likely to purchase a brand of alcoholic
beverage from a company that I trust the quality of
its products.
1
2
3
4
5
PQ 5 I am more likely to buy an alcoholic beverage from a
company that gives me a reason to buy i.e. benefits
1
2
3
4
5
PQ 6 I am more likely to purchase a brand of alcoholic
beverage from a company that is consistent.
1
2
3
4
5
PQ 7 I am more likely to buy a brand of alcoholic
beverage that is different from other brands i.e.
premium quality
1 2 3 4 5
PQ 8 I am more likely to buy a brand of alcoholic
beverage from a company I perceive to be a leader
1 2 3 4 5
PQ 9 I am more likely to buy a brand of alcoholic
beverage that I believe offers value for money.
1 2 3 4 5
PQ 10 The country of origin is an important factor to me
when buying a brand of alcoholic beverage.
1
2
3
4
5
PQ 11 I am more likely to buy an imported brand of
alcoholic beverage because of its superior quality
compared to the locally manufactured brands.
1
2
3
4
5
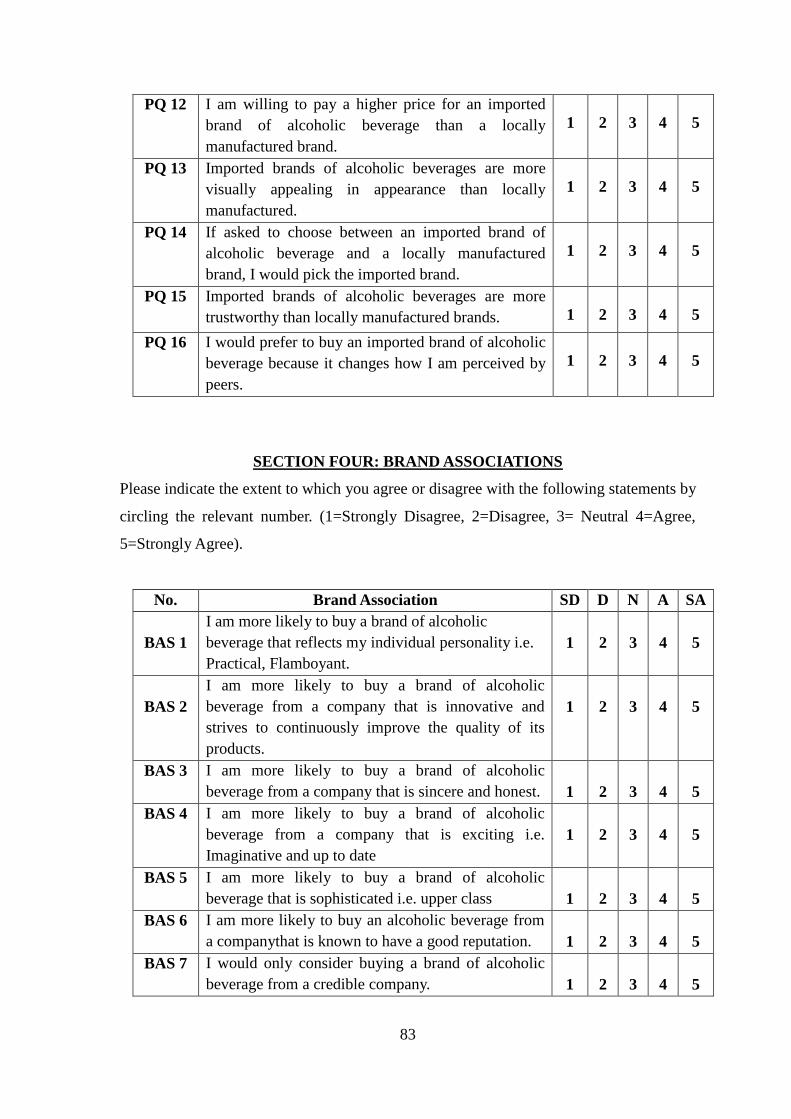
83
PQ 12 I am willing to pay a higher price for an imported
brand of alcoholic beverage than a locally
manufactured brand.
1
2
3
4
5
PQ 13 Imported brands of alcoholic beverages are more
visually appealing in appearance than locally
manufactured.
1
2
3
4
5
PQ 14 If asked to choose between an imported brand of
alcoholic beverage and a locally manufactured
brand, I would pick the imported brand.
1
2
3
4
5
PQ 15 Imported brands of alcoholic beverages are more
trustworthy than locally manufactured brands.
1
2
3
4
5
PQ 16 I would prefer to buy an imported brand of alcoholic
beverage because it changes how I am perceived by
peers.
1
2
3
4
5
SECTION FOUR: BRAND ASSOCIATIONS
Please indicate the extent to which you agree or disagree with the following statements by
circling the relevant number. (1=Strongly Disagree, 2=Disagree, 3= Neutral 4=Agree,
5=Strongly Agree).
No. Brand Association SD D N A SA
BAS 1
I am more likely to buy a brand of alcoholic
beverage that reflects my individual personality i.e.
Practical, Flamboyant.
1
2
3
4
5
BAS 2
I am more likely to buy a brand of alcoholic
beverage from a company that is innovative and
strives to continuously improve the quality of its
products.
1
2
3
4
5
BAS 3 I am more likely to buy a brand of alcoholic
beverage from a company that is sincere and honest.
1
2
3
4
5
BAS 4 I am more likely to buy a brand of alcoholic
beverage from a company that is exciting i.e.
Imaginative and up to date
1
2
3
4
5
BAS 5 I am more likely to buy a brand of alcoholic
beverage that is sophisticated i.e. upper class
1
2
3
4
5
BAS 6 I am more likely to buy an alcoholic beverage from
a companythat is known to have a good reputation.
1
2
3
4
5
BAS 7 I would only consider buying a brand of alcoholic
beverage from a credible company.
1
2
3
4
5
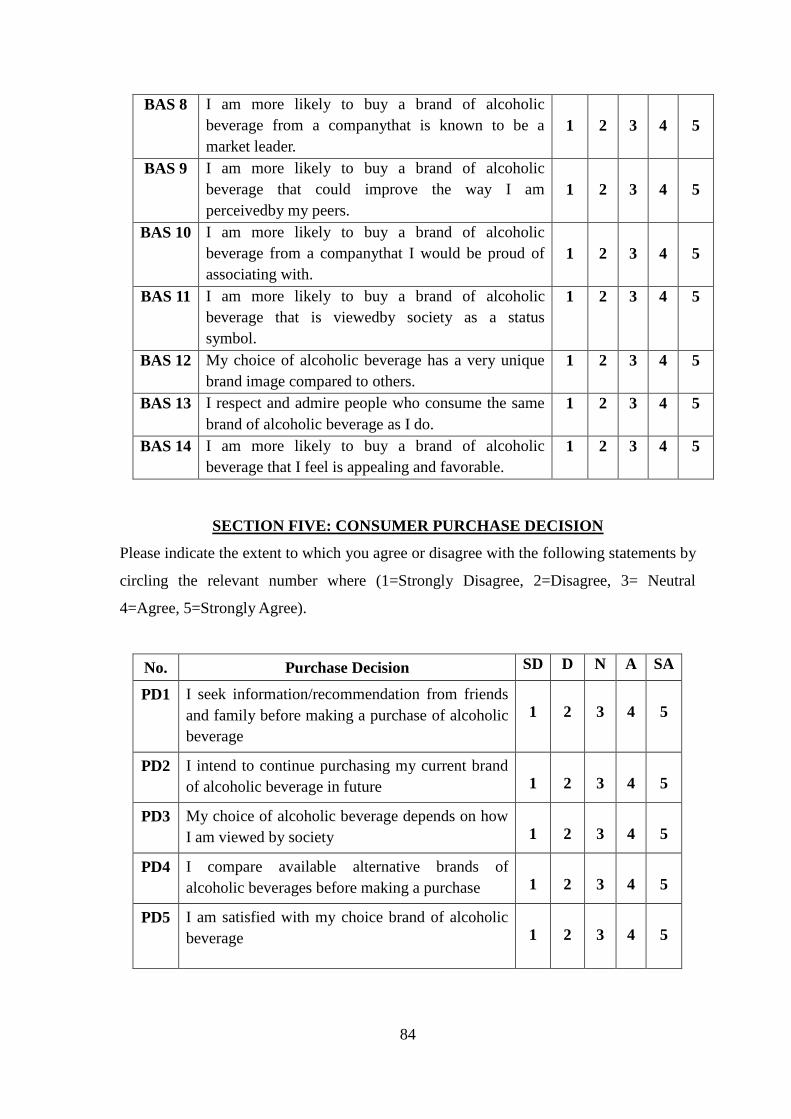
84
BAS 8 I am more likely to buy a brand of alcoholic
beverage from a companythat is known to be a
market leader.
1
2
3
4
5
BAS 9
I am more likely to buy a brand of alcoholic
beverage that could improve the way I am
perceivedby my peers.
1
2
3
4
5
BAS 10 I am more likely to buy a brand of alcoholic
beverage from a companythat I would be proud of
associating with.
1
2
3
4
5
BAS 11 I am more likely to buy a brand of alcoholic
beverage that is viewedby society as a status
symbol.
1 2 3 4 5
BAS 12 My choice of alcoholic beverage has a very unique
brand image compared to others.
1 2 3 4 5
BAS 13 I respect and admire people who consume the same
brand of alcoholic beverage as I do.
1 2 3 4 5
BAS 14 I am more likely to buy a brand of alcoholic
beverage that I feel is appealing and favorable.
1 2 3 4 5
SECTION FIVE: CONSUMER PURCHASE DECISION
Please indicate the extent to which you agree or disagree with the following statements by
circling the relevant number where (1=Strongly Disagree, 2=Disagree, 3= Neutral
4=Agree, 5=Strongly Agree).
No. Purchase Decision SD D N A SA
PD1 I seek information/recommendation from friends
and family before making a purchase of alcoholic
beverage
1
2
3
4
5
PD2 I intend to continue purchasing my current brand
of alcoholic beverage in future
1
2
3
4
5
PD3 My choice of alcoholic beverage depends on how
I am viewed by society
1
2
3
4
5
PD4 I compare available alternative brands of
alcoholic beverages before making a purchase
1
2
3
4
5
PD5 I am satisfied with my choice brand of alcoholic
beverage
1
2
3
4
5