Embed Size (px)
Citation preview

Electronic copy available at: http://ssrn.com/abstract=1935740
0
http://ssrn.com/abstract=1935740
THE RELATIONSHIP OF BRAND EQUITY TO PURCHASE INTENTION
Uthayakumar Tharmi
and
Samithamby Senthilnathan
Abstract: This study empirically examines the relationship between Brand Equity (BE) as the
independent variable and Purchase Intention (PI) as the dependent variable in relation to
branded baby soaps selectively. While both the variables individually have high level
attributes of the customers, the Pearson’s correlation analysis explores a positively
significant linear relationship between BE and PI. This implies that the PI of a customer for
purchasing branded baby soap can be predicted with the customer’s nature of BE. The
correlation coefficient between the BE and PI indicates that the BE of a customer is useful to
explain the variation in PI of a customer. Further analysis of regression model with intercept
indicates that it needs additional suitable variables to predict unexplained variation of 68%
of the PI. However, the model without intercept indicates that BE alone can predict the PI by
explaining its more than 99% variation.
Key words: brand equity, purchase intention, decision making process,
JEL code: M30, M31, M37, M39
U. Tharmi is attached to Discipline of Marketing, Department of Management in Eastern University, Sri Lanka. S. Senthilnathan is a Senior Lecturer in Management, Eastern University, Sri Lanka Your comments are welcome to improve this paper further, please e-mail: [email protected] or

Electronic copy available at: http://ssrn.com/abstract=1935740
1
http://ssrn.com/abstract=1935740
THE RELATIONSHIP OF BRAND EQUITY TO PURCHASE INTENTION
1. INTRODUCTION
Customers’ positive feelings on a product brand create purchase intention of the customers
(e.g., Aaker, 1991; Assael, 1998; and Wang and Kan, 2002). According to Farquhar (1989),
brand equity is meant for ‘an added value or asset to a brand and product’ and such a value
is made of ‘customers’ positive feelings, thinking, and acting towards purchasing a product’.
Since purchase intention is a result of brand equity, this study attempt to explore the positive
relationship between the Brand Equity (BE) and Purchase Intention (PI) in the Sri Lankan
context.
Sri Lanka was the first market to have open economic policy in South Asian developing
countries. To be specific, Bilkey and Nes (1982) indicate that consumers in developed
countries have preference for domestic products over foreign products, while consumers in
developing countries are more likely to prefer foreign products than domestic products.
Therefore, the market in Sri Lanka has been in intense competitive situation as the high
quality and international branded products are expected to do better than domestic products.
For a good product, there should be brand loyalty and BE. Any product with high BE can
capture the high market share in Sri Lanka. It is explicit that some of the best- known brands
can be found simply in retail firms, outlets and super markets in Sri Lanka.
Kotler and Keller (2006) define that brand can be ‘a name, term, sign, symbol or design, or a
combination of them’ that can be useful to identify the goods or services from suppliers in
view of differentiating those suppliers from their competitors. Therefore, they indicate ‘a
brand is a product or service that adds dimensions that differentiate it in some way from other
products or services designed to satisfy the same need’.
According to Ukpebor and Ipogah (2008), a powerful brand influences attitudes of customers
and makes a strong product association through the brand.1 As claimed by Vranesevic and
Stancec (2003), the importance of a brand basically highlighted through measuring the brand
impacts on choice and loyalty of consumers with the identification and differentiation of a
product’s quality, origin and additionally created values. Reardon et al. (2005) indicates that
when a brand captures attention and interest of customers as powerful as possible, the process
1 Powerful Brand = a brand of product that makes a household as being associated with a successful company.

2
http://ssrn.com/abstract=1935740
can be termed as an innovation strategy and indicatively, the consumers in developing
countries, in particular, rely on brand for their purchasing, since their expectations are met
with the brands they rely on.
Nowadays in general in Sri Lanka, attitudes of people have changed to have reasonably two
babies in a family. Most of the parents consider the child’s safety first. Therefore, all baby
products are formulated for a baby to have pure and gentle protection. Because of the rising
demand for baby soaps and opening up of the market for foreign companies, many of the
world's brands of baby soaps have entered into Sri Lankan markets. Another main reason is
that Sri Lanka mostly considers the social, health and safety issues, critically. Hence, this
study considers selected baby soaps for testing the role of brand equity (BE) in determining
the purchase intention (PI) of customers.
The results of this study indicate that the BE has positively related to the PI, where the BE
explains 32% variations of PI. Further analyses reveal that the BE and PI individually indicate
a high level attributes in the mind-set of customers.
The rest of this study is organized as literature and background of the study, conceptual
framework and hypothesis, method, results and conclusion.
2. LITERATURE AND BACKGROUND OF THE STUDY
Understanding PI is often used to analyze consumer behavior in related studies. Fishbein and
Ajzen (1975) indicate it as ‘a subjective inclination’ by consumers towards a certain product
or service and that can be the crucial element for predicting behavior of consumers.
Kotler (2000) indicates that consumer purchase behavior takes place with the customer
stimulation by internal and external factors (such as choosing a product, brand, a retailer,
timing, and quantity); and the consumers make a purchase decision based on their individual
qualities, personalities, characteristics and process of decision making. This implies that
consumers’ choice of product and brand have impacts on their purchasing behavior.
The model (see Figure 1) created by Engel, Kollat and Blackwell (1984) is a process that is
used to evaluate the way of decision making by consumers. The model (known as EKB
model) implies consumer behavior as a continuing process, which includes ‘recognition of a
problem, information gathering, evaluation of alternatives, decision making and post
purchase’.

3
http://ssrn.com/abstract=1935740
Figure 1: Consumer Decision-Making process of EKB model
(Source: Adapted from Hawkins, Best and Coney, 2001, p.475)
Though the EKB model facilitates the purchase decision-making process, the purchase
intention is the outcome of the objective of purchase (e.g., Ariely, 2000), recommendation
(e.g., Chen and Xie, 2008), convenience (e.g., Schaffer, 2000), and results and experience
(e.g., Holbrook and Hirschman, 1982) in using the product. Hence, the PI should be evaluated
through these measures as dimensions.
According to Kapferer (2005) and Keller (2003), BE is referred to a theme of various benefits
through pieces of legal property, influencing consumer behavior, being bought and sold, and
providing owner the security for sustained future revenues. These various benefits create
values to accrue, directly or indirectly.
Creating strong BE for a particular product often makes the brand itself with having a
successful market share. This will have an impact on other brands of similar products.
Because the retail industry is highly competitive with many businesses that look for acquiring
customers, it is important that a business comes up with a marketing strategy that creates BE.
A positive and memorable brand image of a company gives its business a competitive edge.
According to Aaker (1996)(a&b), the most important factors that contribute to create BE are
brand loyalty, brand awareness, brand association, and perceived quality (see Figure 2).
Problem Recognition
Information Search
Evaluation of Alternatives
Decision/Purchase
Post-Purchase
Motivation
Learning
Memory
Emotions
Perception
Attitudes
Personality
Lifestyle
Culture
Sub-culture
Demographics
Family norms
Opinion leaders
Reference groups
Social class
Marketing campaigns
Internal Influences External Influences

4
http://ssrn.com/abstract=1935740
Figure 2: Sources of Brand Equity
(Source: Adapted from Aaker, 1996(a&b), p.173)
According to Aaker (1991) and (1996)(b), the BE has a positive impact on PI of customers.
This specification has been supported by the empirical studies by Ashil and Sinha (2004) and
Chang and Liu (2009). The main objective of this study is to test whether Aaker’s (1991) and
(1996)(b) specification can be empirically confirmed in the baby soap market in one of the
main eastern cities in Sri Lanka.
In Sri Lanka, there are more baby soap brands walking down into the markets. According to
the report from Superbrands (2006 – 2008), Lanka Market Research Bureau Limited (LMRB)
indicates in its 2005 annual report that approximately more than 340,000 babies are born each
year in Sri Lanka. The report indicates that the toiletries market for newborn babies was
valued at Rs. 572 million. The baby soaps market was valued at Rs. 863 million in 2005
(LMRB, 2005) that includes the value for Pears holdings 49%, Baby Cheramy 34% and
Johnson’s Baby 3%.
According to different size of market shares for different soaps, it is obvious that all baby
soap brands have no same level and number of customers. As the BE is one of a company's
most important assets, marketers must create messages to keep consumers informed about that
their products or services are valuable and are something that persuade or influence the
customers to purchase the particular product or service at a particular moment and in the
future, thus creating the BE. Hence, this study attempt to explore the role of BE in influencing
the PI of branded baby soaps in Sri Lanka. Therefore in general, the research question of this
study is:
Whether the role of BE has positive relationship with PI of
branded baby soaps?
BRAND EQUITY
PERCEIVED
QUALITY
BRAND
AWARENESS
BRAND
ASSOCIATION
BRAND
LOYALTY

5
http://ssrn.com/abstract=1935740
3. CONCEPTUAL FRAMEWORK AND HYPOTHESIS
Considering EKB model of consumer decision-making process for PI (Figure 1), the Aaker’s
(1996)(a&b) source of brand equity (Figure 2), and the positive relationship between BE and PI
as suggected by Aaker (1991) and (1996)(b) and as per the findings by Ashil and Sinha (2004)
and Chang and Liu (2009), the conceptual model of this study is devised for this empirical
investigation (see Figure 3) and this conceptual framework was supported by the studies
Rahman and Rahaman (2008) and Hoyer and Maclnnis (2001).
Figure 3: Conceptual Framework
As Aaker (1991) and (1996)(b) indicates a positive relationship of BE to PI and this
relationship is empirically supported by other studies (e.g., Ashil and Sinha, 2004; Chang and
Liu, 2009), the hypothesis of this study (see Figure 3) is:
H1: Brand equity has a positive relationship with purchase intention.
BE is considered as its dimensions as the combination of brand awareness, brand loyalty,
brand association, and perceived quality. As the EKB model (Figure 1) facilitates the
purchase decision-making process, the purchase intention finally made with objective of
purchase (e.g., Ariely, 2000), recommendation (e.g., Chen and Xie 2008), convenience (e.g.,
Schaffer, 2000), and results and experience (e.g.,Holbrook and Hirschman, 1982) in using the
product. Hence, the PI is evaluated through these measures as dimensions.
4. METHOD
4.1 Data and Sampling
Primary data are collected through structured questionnaires with closed statements measured
with Likert’s scale (1-5 as strongly disagree, disagree, marginal, agree and strongly agree,
respectively), based on four branded baby soaps (namely Pears Baby, Johnson & Johnson,
Baby Cheramy, and Khomba Baby) in the Manmunai North Divisional Secretariate (MNDS)
Division in Batticaloa District in Sri Lanka. In the MNDS Division, there are 48 Grama
Niladhari Divisions and in which, the families (7830) with babies in (0-4) age group only
considered. All 48 Grama Niladhari Divisions are considered for this study. Among 7830
families in these Niladhari Divisions, about two hundred (200) families have been identified
as a mixture of initially stratified sampling and then convenient random sampling techniques.
(+) Purchase
Intention
Brand
Equity
6
http://ssrn.com/abstract=1935740
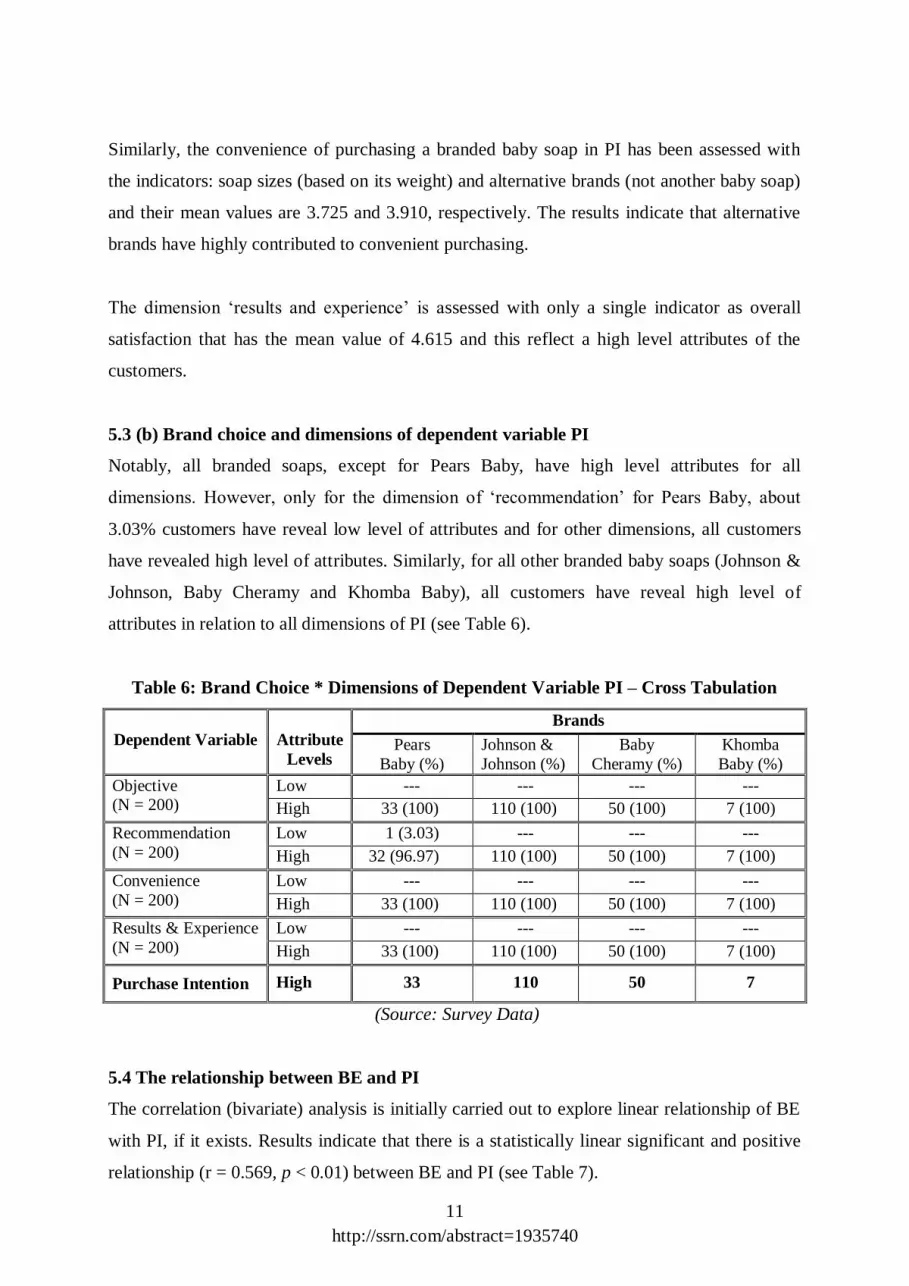
4.2 Method of Data Analysis and Evaluation
4.2.1 Univariate analysis
Univariate analysis is carried out for evaluating the attributes of dimensions and variables
individually based on the response in the questionnaires. For this purpose, mean values and
standard deviation of the dimensions and variables are taken into consideration. In this
context, the following assumptions have been made.
Assumption 1
This study basically assumes that a customer (respondent) is unbiased;
this unbiased nature forms a normal distribution for population with
mean value of Xi = 3 in Likert’s Scale; and its range was estimated at the
95% confidence limit with the standard deviation of the sample.
Assumption 2
Standard deviation of population is unknown and hence, that of sample
is considered as the population parameter.
Therefore, this study initially evaluates individual characteristics of dimensions and variables.
Assessing the levels of dimensions and variables individually is one of the secondary
objectives of this study with the following criteria.
Table 1: Decision Criteria for Univariate Analysis
Where Xi = mean value of a dimension/variable, = standard deviation,
Z = value of the 95% confidence limit and x = standard error of the mean
4.2.2 Bivariate analysis
The correlation analysis was used to measure the magnitude and the direction of the
relationship between the role of BE and PI of the branded baby soaps. The significance level
of the correlation coefficient is considered to explore the meaningful linear relationship
between the variables: BE and PI.
Range for Decision
Criteria
Decision
Criteria
Decision
Attribute
Xi < (3-Z σx) Xi < 3 Low Level
(3-Z σx) ≤ Xi ≤ (3+Z σx) Xi = 3 Moderate Level
Xi > (3+Z σx) Xi > 3 High Level

7
http://ssrn.com/abstract=1935740
5. RESULTS
5.1 Brand Choice
Though there are many baby soaps available in the market, only four baby soaps, namely
Pears Baby, Johnson & Johnson, Baby Cheramy, and Khomba Baby, are selected for this
study. Among the 200 consumers, about 55% of buyers are with Johnson & Johnson, 25% of
buyers with Baby Cheramy, 16.5% of buyers with Pears Baby and 3.5% of buyers with
Khomba Baby (see Table 2).
Table 2: Distribution of Brand Choice
Brand Choice Frequency Percent
Pears Baby 33 16.5
Johnson & Johnson 110 55.0
Baby Cheramy 50 25.0
Khomba Baby 7 3.5
Total 200 100
(Source: Survey Data)
5.2 Brand Equity and its Dimensions
5.2 (a) Levels of brand equity and its dimensions
BE is evaluated with four dimensions: Brand Loyalty, Brand Awareness, Brand Association,
and Perceived Quality as indicated by Aaker (1996)(a&b). BE as an independent variable has
high level attribute of the customers (Mean X5 = 4.126 and see Table 3). In addition, most of
the customers expressed generally a common opinion regarding the variable of BE (standard
deviation = 0.277). With individual analysis, it is also noted that about all customers in this
study have high level attribute for the BE.
Specifically, all dimensions of BE have high level attributes of customers in relation to their
mean values (mean values of brand loyalty X1 = 4.038, brand awareness X2 = 4.183, brand
association X3 = 4.013, and perceived quality X4 = 4.273). Among these dimensions,
perceived quality accounts high value of mean and brand association is with comparatively
lower than other dimensions in contribution to BE (see Table 3).
In evaluating brand loyalty, the behavioural loyalty and attitudinal loyalty are considered as
indicators of the brand loyalty. Though their mean values (3.870 and 4.205, respectively) are
of high level attribute of the customers, attitudinal loyalty has much contributed to brand
loyalty.

8
http://ssrn.com/abstract=1935740
Table 3: Overall Measures of Independent Variable BE and its Dimensions
Where HL = high level attribute
(Source: Survey Data)
In brand awareness as a dimension of BE, brand recall and recognition of the brand are
considered as its indicators (mean value of the indicators are 4.297 and 4.070, respectively).
Results indicate that the brand recall has made a high contribution to brand awareness.
Similarly, the brand association of BE has been evaluated with the indicators brand attribute,
brand image, and brand benefits (mean values of them are 4.400, 3.313 and 4.325,
respectively). The results indicate that brand attributes has highly contributed to brand
association.
The fourth dimension perceived quality is assessed with two indicators: intrinsic and extrinsic
attributes (mean values are 4.167 and 4.378, respectively). Notably, the extrinsic attributes
highly contributed to the perceived quality.
Overall, all the indicators have meaningfully contributed to determining the dimensions and
all dimensions have also highly contributed to the BE; and this is consistent with the
specifications by Aaker (1991) and (1996)(a&b) as given in Figure 2.
Description
Dimensions of BE
Brand
Equity
(X5)
Bra
nd
Lo
yalt
y
(X1)
Bra
nd
Aw
are
nes
s
(X2)
Bra
nd
Ass
oci
ati
on
(X3)
Per
ceiv
ed
Qu
ali
ty
(X4)
Mean 4.038 4.183 4.013 4.273 4.126
Standard Deviation (SD) 0.357 0.367 0.429 0.389 0.277
Maximum 4.667 4.833 4.833 5.0 4.630
Minimum 2.667 2.667 2.5 2.83 2.850
Number of data 200 200 200 200 200
Standard Error of Mean 0.025 0.026 0.030 0.028 0.020
Z – Value at 95% confidence 1.96 1.96 1.96 1.96 1.960
Lower Limit of Mean (3-1.96σx) 2.951 2.949 2.941 2.946 2.962
Upper Limit of Mean (3+1.96σx) 3.049 3.051 3.059 3.054 3.038
Decision Attribute HL HL HL HL HL

9
http://ssrn.com/abstract=1935740
5.2 (b) Brand choice and dimensions of independent variable BE
It is notable that for Pears Baby, about 6.06% of customers have perceived the low level,
3.03% of customers are with moderate level, and rest 90.91% of customers have perceived
high level of attributes for all dimensions of BE. The results indicate that for other brand of
baby soaps, all customers have highly perceived level of attributes in relation to all
dimensions of BE (see Table 4).
Table 4: Brand Choice * Dimensions of Independent Variable BE – Cross Tabulation
Independent
Variable
Attribute
Levels
Brands
Pears
Baby (%)
Johnson &
Johnson (%)
Baby
Cheramy (%)
Khomba
Baby (%)
Brand Loyalty
(N = 200)
Low 2 (6.06) --- --- ---
Moderate 1 (3.03) --- --- ---
High 30 (90.9) 110 (100) 50 (100) 7 (100)
Brand Awareness (N = 200)
Low 2 (6.06) --- --- ---
Moderate 1 (3.03) --- --- ---
High 30 (90.9) 110 (100) 50 (100) 7 (100)
Brand Association (N = 200)
Low 2 (6.06) --- --- ---
Moderate 1 (3.03) --- --- ---
High 30 (90.9) 110 (100) 50 (100) 7 (100)
Perceived Quality
(N = 200)
Low 2 (6.06) --- --- ---
Moderate 1 (3.03) --- --- ---
High 30 (90.9) 110 (100) 50 (100) 7 (100)
Brand Equity High 33 110 50 7
(Source: Survey Data)
5.3 Purchase Intension and its Dimensions
5.3 (a) Levels of purchase intension and its dimensions
The PI is assessed with four dimensions: objective of, recommendation for, convenience of,
and results and experience by, purchasing a branded baby soap as selectively combined from
EKB model of consumer decision-making process (see Figure 1). The dependent variable PI
has high level attribute of the customers (Mean X10 = 4.038 and see Table 5). Notably, most
of the customers expressed the common opinion regarding the variable of PI (standard
deviation = 0.397). With individual analysis, it is also noted that all customers have high level
attribute for the PI.
10
http://ssrn.com/abstract=1935740
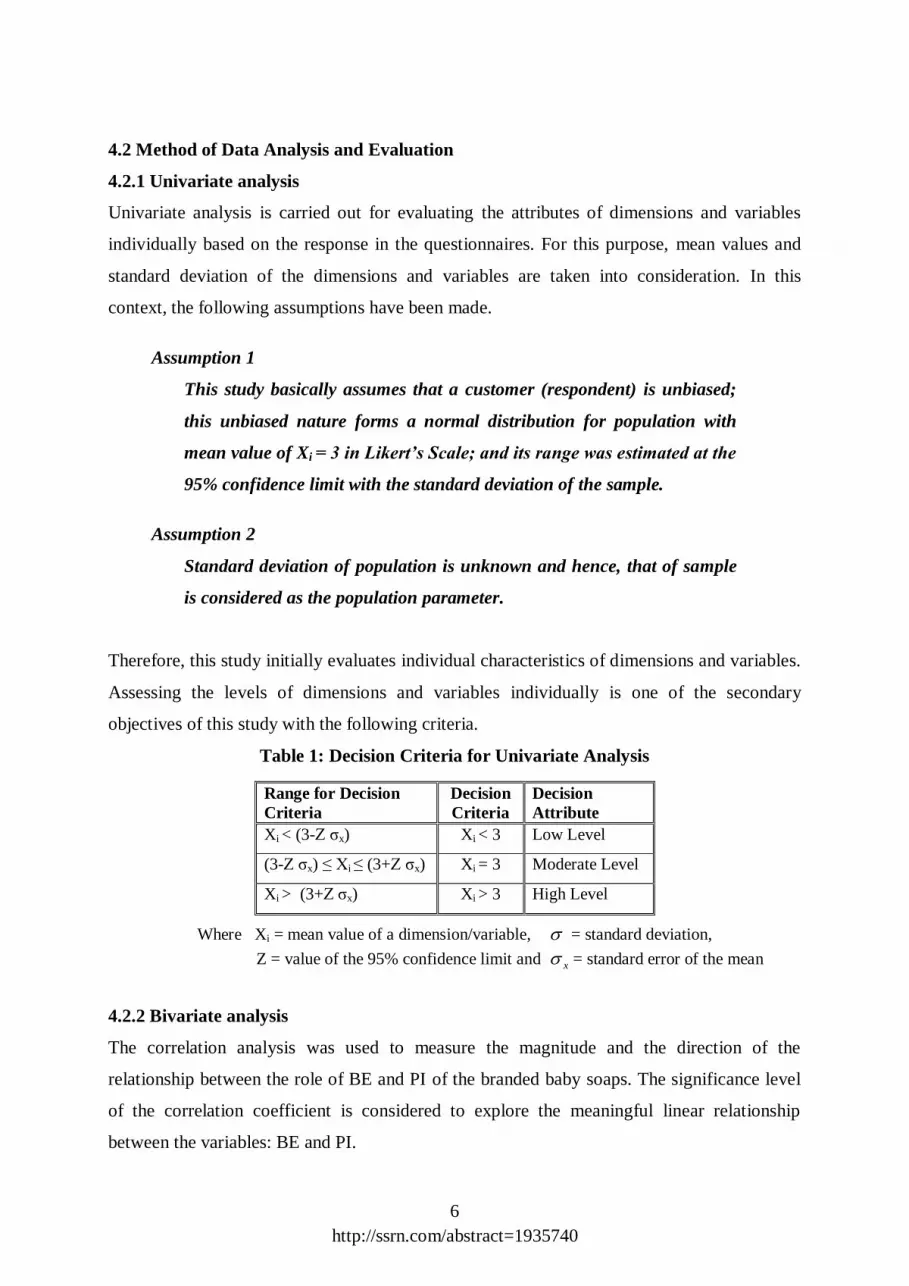
Indicatively, all dimensions of PI, except recommendation, have high level attributes of
customers in relation to their mean values (mean values of objective X6 = 4.658,
recommendation X7 = 3.062, convenience X8 = 3.818, and results and experience X9 = 4.615).
Among these dimensions, objective of purchasing a branded baby soap has high value of
mean; and recommendation is with comparatively lower than other dimensions in
contribution to PI (see Table 5).
Table 5: Overall Measures of Dependent Variable PI and its Dimensions
Where HL = high level attribute, ML = moderate level attribute
(Source: Survey Data)
In evaluating objective of purchasing, the health concern and the softness of skin are
considered as its indicators. Though their mean values (4.670 and 4.645, respectively) are of
high level attribute of the customers, health concern of the baby has marginally more
contribution than softness to objective of purchasing.
In recommendation for a branded baby soap as a dimension of PI, the recommendation from
doctors, friends and relations, and generation are considered as its indicators (mean value of
the indicators are 2.870, 3.340 and 2.975, respectively). Results indicate that the
recommendation from friends and relations has a high contribution to this dimension.
Description
Dimensions
Purchase
Intention
(X10)
Ob
ject
ive
(X
6)
Rec
om
men
da
tio
n
(X
7)
Co
nve
nie
nce
(X
8)
Res
ult
s &
Ex
per
ien
ce
(X9)
Mean 4.658 3.062 3.818 4.615 4.038
Standard Deviation (SD) 0.469 0.831 0.725 0.508 0.397
Maximum 5.0 5.0 5.0 5.0 4.792
Minimum 3.0 1.0 1.5 3.0 2.667
Number of data 200 200 200 200 200
Standard Error of Mean 0.033 0.059 0.051 0.036 0.028
Z – Value at 95% confidence 1.96 1.96 1.96 1.96 1.960
Lower Limit of Mean (3-1.96σx) 2.935 2.885 2.900 2.930 2.945
Upper Limit of Mean (3+1.96σx) 3.065 3.115 3.100 3.070 3.055
Decision Attribute HL ML HL HL HL
11
http://ssrn.com/abstract=1935740
Similarly, the convenience of purchasing a branded baby soap in PI has been assessed with
the indicators: soap sizes (based on its weight) and alternative brands (not another baby soap)
and their mean values are 3.725 and 3.910, respectively. The results indicate that alternative
brands have highly contributed to convenient purchasing.
The dimension ‘results and experience’ is assessed with only a single indicator as overall
satisfaction that has the mean value of 4.615 and this reflect a high level attributes of the
customers.
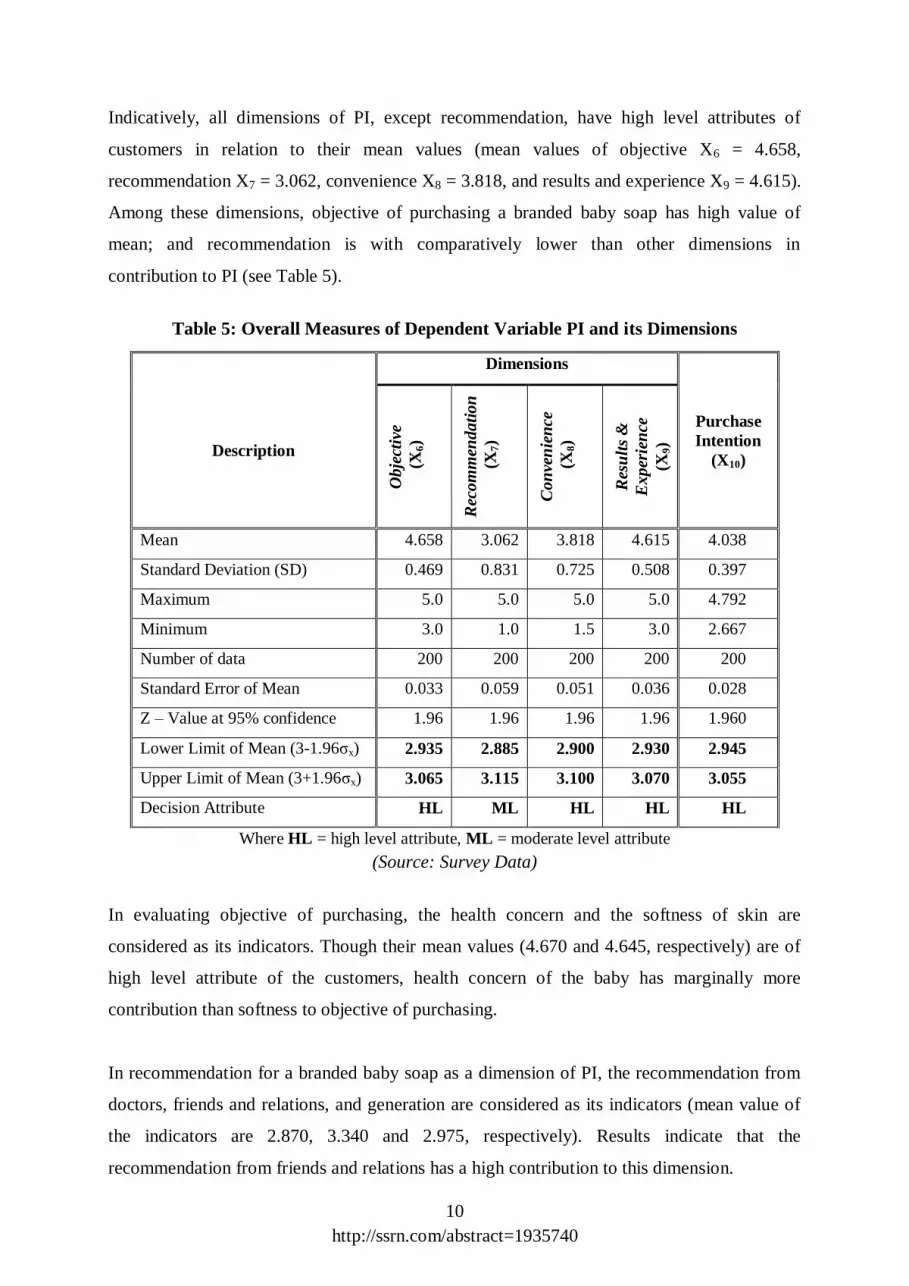
5.3 (b) Brand choice and dimensions of dependent variable PI
Notably, all branded soaps, except for Pears Baby, have high level attributes for all
dimensions. However, only for the dimension of ‘recommendation’ for Pears Baby, about
3.03% customers have reveal low level of attributes and for other dimensions, all customers
have revealed high level of attributes. Similarly, for all other branded baby soaps (Johnson &
Johnson, Baby Cheramy and Khomba Baby), all customers have reveal high level of
attributes in relation to all dimensions of PI (see Table 6).
Table 6: Brand Choice * Dimensions of Dependent Variable PI – Cross Tabulation
Dependent Variable
Attribute
Levels
Brands
Pears
Baby (%)
Johnson &
Johnson (%)
Baby
Cheramy (%)
Khomba
Baby (%)
Objective (N = 200)
Low --- --- --- ---
High 33 (100) 110 (100) 50 (100) 7 (100)
Recommendation
(N = 200)
Low 1 (3.03) --- --- ---
High 32 (96.97) 110 (100) 50 (100) 7 (100)
Convenience
(N = 200)
Low --- --- --- ---
High 33 (100) 110 (100) 50 (100) 7 (100)
Results & Experience
(N = 200)
Low --- --- --- ---
High 33 (100) 110 (100) 50 (100) 7 (100)
Purchase Intention High 33 110 50 7
(Source: Survey Data)
5.4 The relationship between BE and PI
The correlation (bivariate) analysis is initially carried out to explore linear relationship of BE
with PI, if it exists. Results indicate that there is a statistically linear significant and positive
relationship (r = 0.569, p < 0.01) between BE and PI (see Table 7).

12
http://ssrn.com/abstract=1935740
Table 7: Correlation between Brand Equity and Purchase Intention
Pearson Correlation: r 0.569**
Sig. (2-tailed) 0.000
** = significant at the 0.01 level.
(Source: Survey Data)
It is also noted that from a social science point of view, the BE has a reasonable strong
positive correlation. The association between the points of BE and PI is also very closely
observed and except a few combination of points, other points of coordinates between the
variables are very closely scattered (see Figure 4).
Figure 4: Scatter plots between Brand Equity and Purchase Intention
(Source: Survey Data)
Further analysis carried out to confirm how each dimension of variables has association with
each of them and the variable. According to the correlation matrix, it is obvious that most of
the correlations between dimensions are significant at the 5% level (see Table 8). The
dimension of brand loyalty in BE has no relationship with the objective, recommendation, and
results and experience of PI. These might have diluted the strong linear relationship of BE
with PI. Similarly, perceived quality of BE has no significant relationship with
recommendation and convenience of PI. Notably, these are not consistent with the theoretical
specifications. However, it is noted that all dimensions of a variable have significant
relationship with other variable, even at the 1% level (i.e., significant relationships of PI with
all dimensions of BE, and significant relationships of BE with all dimensions of PI).

13
http://ssrn.com/abstract=1935740
Table 8: Correlation between the dimensions of BE and PI
Variables & Dimensions
Ob
ject
ive
Rec
om
men
dat
ion
Co
nv
enie
nce
Res
ult
s &
Ex
per
ien
ce
Pu
rch
ase
Inte
nti
on
Brand Loyalty Correlation .082 .126 .225** .085 .220**
Sig. (2-tailed) .251 .075 .001 .233 .002
Brand Awareness Correlation .190** .156* .285** .203** .333**
Sig. (2-tailed) .007 .027 .000 .004 .000
Brand Association Correlation .213** .316** .289** .188** .420**
Sig. (2-tailed) .002 .000 .000 .008 .000
Perceived Quality Correlation .408** -.015 .023 .386** .246**
Sig. (2-tailed) .000 .835 .748 .000 .000
Brand Equity Correlation .498** .208** .366** .459** .569**
Sig. (2-tailed) .000 .003 .000 .000 .000
* = significant at the 0.05 level; ** = significant at the 0.01 level.
(Source: Survey Data)
In addition, the individual correlation analysis between the variables BE and PI for the brands
of this study reveal that except Khomba Baby, other three soaps (Pears Baby, Johnson &
Johnson, and Baby Cheramy) have significant correlation between BE and PI, even at the 1%
level (see Table 9). The insignificant relationship between the variable for Khomba Baby
might be due to small number (N = 7) and have diluted the overall significant relationship (r =
0.569, p < 0.01) between BE and PI.
Table 9: Correlation of Branded Baby Soaps
BR
AN
DE
D B
AB
Y S
OA
PS
Pears Baby
(N = 33)
Pearson Correlation: r 0.647**
Sig. (2-tailed) 0.000
Johnson & Johnson
(N = 110)
Pearson Correlation: r 0.492**
Sig. (2-tailed) 0.000
Baby Cheramy
(N = 50)
Pearson Correlation: r 0.628**
Sig. (2-tailed) 0.000
Khomba Baby
(N = 7)
Pearson Correlation: r 0.165
Sig. (2-tailed) 0.723
OVER VIEW
(N = 200)
Pearson Correlation: r 0.569**
Sig. (2-tailed) 0.000
** = significant at the 0.01 level
(Source: Survey Data)

14
http://ssrn.com/abstract=1935740
5.5 Regression of Purchase Intension (PI) on Brand Equity (BE)
As the correlation analysis reveals statistically significant linear relationship between BE and
PI, the following regression model has been used to determine how does 1 unit of BE result in
PI.
PIi = 0 + 1 BEi + ui --- (1)
Where i = 1, 2, 3, …….., 200,
PI = purchase intention,
BE = brand equity,
0 = intercept (constant) value,
1 = coefficient estimate of BE and
ui = error term
Regression results indicate that 1 unit of consumer’s BE is significantly (p < 0.05) converted
as (1 =) 0.817 times into PI. The constant value (0 = 0.666, p > 0.05) implies insignificant
estimate and that PI can be estimated with 0 = 0.666 as an additional provision beyond BE in
predicting PI, when BE is zero. The utility of this model is confirmed with significant F-
statistic (< 0.001) and the model indicates that about (Adjusted R2) 32% variation of PI can be
explained by BE. Further, for explaining the rest of 68% variation of PI, the model needs to
accommodate additional suitable variables/factors (see Table 10). However, since this mode1
(equation 1) explores the possibility of utilizing BE’s individual role significantly (1 = 0.817,
p < 0.05), and its additional provision (0) seem insignificant (0 = 0.666, p > 0.05) and can
possibly be zero (0 = 0), we are motivated to explore the possibility of predicting the PI with
BE alone. Hence, we consider the following model for the same (equation 2).
PIi = 1 BEi + ui --- (2)
Where i = 1, 2, 3, …….., 200,
PI = purchase intention,
BE = brand equity,
1 = coefficient estimate of BE and
ui = error term
The results indicate that using BE alone (equation 2) without having the additional provision
(no intercept) can be useful, when compared to the model with intercept (equation 1). Results
of regression analysis indicate that 1 unit of consumer’s BE is significantly (p < 0.05)

15
http://ssrn.com/abstract=1935740
converted as (1 =) 0.978 times into PI and this model becomes useful to have BE alone for
explaining the PI. The utility of this model is confirmed with significant F-statistic (< 0.001)
and the model indicates that about (Adjusted R2) 99.3% variation of PI can be explained by
BE alone, without the additional provision (0). For explaining the rest of (less than) 1%
variation of PI, the model needs to accommodate additional suitable variables/factors and
however, it can be negligible (see Table 10).
Table 10: Results of Regression Analyses
Model 0 1 Adjusted R2 p – value of
F – statistic N
PIi = 0 + 1 BEi + ui 0.665713 0.817215** 0.320851 < 0.001 200
1.91998 9.747492
PIi = 1 BEi + ui ----- 0.977824** 0.993405 < 0.001 200
----- 173.5652
In the table, i = 1, 2, 3, …….., 200, PI = purchase intention, BE = brand equity, 0 = intercept
(constant) value, 1 = coefficient estimate of BE, ui = error term, and ** = significant at the 1% level. Each column of estimates for a model consists of two measures: upper is the coefficient estimate and
the lower is its t-statistic value.
Overall, the results of correlation analysis on the relationship between BE and PI has been
statistically confirmed even at the 1% level. The results are consistent with Aaker (1991) and
(1996)(b), Ashil and Sinha (2004) and Chang and Liu (2009). The results confirm that the
purchase intention is the outcome of the objective of purchase, recommendation, convenience,
and results and experience in using the product as indicated by Ariely, (2000), Chen and Xie
(2008), Schaffer (2000), and Holbrook and Hirschman (1982), respectively. Further, the
results of regression indicate that BE positively contribute to predict consumers’ PI and
hence, sellers of the baby soaps in Manmunai North Divisional Secretariat should be aware
about consumers’ level of BE to explore the PI of customers in the region.
6. CONCLUSION
This study considers BE as the independent variable and PI as the dependent variable. While
both the variables individually have high level attributes of the customers, the Pearson’s
correlation analysis explores a positively significant linear relationship between BE and PI.
The correlation coefficient (r) was 0.569 at the 1% level. This implies that the PI of a
customer for purchasing branded baby soap can be predicted with the customer’s nature of
BE. Hence, we accept the hypothesis H1: Brand equity has a positive relationship with
purchase intention.
16
http://ssrn.com/abstract=1935740
The correlation coefficient between the BE and PI indicates that the BE of a customer is
useful to explain 32% of variation in a customer’s PI. If a soap manufacturer comes to know
the customer’s status of BE, the manufacturer can predict 32% of the customer’s PI and the
regression model with intercept indicates that it needs additional suitable variables to predict
unexplained variation of 68% of the PI. However, the model without intercept indicates that
BE alone can predict the PI by explaining its more than 99% variation.
According to Ashil and Sinha (2004), and Chang and Liu (2009), Brand Equity can have
positive effect on Purchase Intention and this is consistent with Aaker (1991) and (1996)(b).
Our study also has the same positive effect of Brand Equity on Purchase Intention.
This study focuses only one independent variable BE to explain the PI and to explore the
relationship between them. However, it is explicit that there may be other variable(s) to be
considered to explain the variation of PI. Future studies can be devised to identify those
additional variable(s) for explaining the PI.
Further, we would like to suggest that future research should include some other factors such
as reference group, price, place, or promotion of the products and other variables such as
attitudes, motivation and perception in the study as in the EKB model. In addition, the other
four stages of decision making: problem recognition, information search, evaluation of
alternatives and after purchase decision can also be investigated for further understanding of
target customers’ decision making behavior.

17
http://ssrn.com/abstract=1935740
References
Aaker, D.A. (1991). Managing Brand Equity: Capitalizing on the value of a brand name,
NewYork: The Free Press.
Aaker, D.A. (1996)(a). Building Strong Brands, New York: The Free Press.
Aaker, D.A. (1996)(b). Measuring brand equity across product and markets. California
Management Review, Vol. 38, No. 3 (spring), pp. 102-120.
Ariely, D. (2000). Controlling the information flow: effects on consumers` decision making
and preferences. Journal of Consumer Research, Vol. 27, pp. 233-248.
Ashil, N. J. & Sinha, A. (2004). An exploratory study into the impact of components of brand
equity and country of origin effects on purchase intention. Journal of Asia - Pacific
Business, Vol. 5, No. 3, pp. 27-43.
Assael, H. (1998). Consumer Behavior and Marketing Action, 6th ed., Cincinnati, Ohio:
South-Western.
Bilkey, W.J. & Nes, E. (1982). Country-of-origin effects on product evaluations. Journal of
International Business Studies, Vol. 13, Spring/Summer, pp. 89-99.
Chang, H. H. & Liu, Y. M. (2009). The impact of brand equity on brand preference and
purchase intentions in the service industries. The Service Industries Journal, Vol. 29,
No. 12, pp. 1687-1706.
Chen, Y. & Xie, J. (2008). Online consumer review: word-of-mouth as a new element of
marketing communication mix. Management Science, Vol. 54, No. 3, p. 477-491.
Engel, J. F., Kollat, D. T. & Blackwell, R. D. (1984). Consumer Behavior, 3rd
ed., New
Jersey: Prentice-Hall.
Farquhar, P.H. (1989). Managing brand equity. Marketing Research, Vol. 1, No. 3, pp. 24-33.
18
http://ssrn.com/abstract=1935740
Fishbein, M. & Ajzen, I. (1975). Belief, Attitude, Intention, and Behavior: An Introduction to
Theory and Research, MA: Addison-Wesley Publishing Company.
Hawkins, D., Best, R. & Coney, K. A. (2001). Consumer Behavior Building Marketing
Strategy, 8th ed., Boston: Irwin McGraw-Hill.
Holbrook, M. B. & Hirschman, E. C. (1982). The experiential aspects of consumption:
consumer fantasies, feelings and fun. Journal of Consumer Research, Vol. 9, pp. 132-
140.
Hoyer, W. & Maclnnis, D. (2001). Consumer Behavior, 2nd
ed., Boston: Houghton Mifflin
Company.
Kapferer, J. N. (2005). New Strategic Brand Management, 3rd
ed., London: Kogan Page.
Keller, K. L. (2003). Strategic Brand Management: Building, Measuring and Managing
Brand Equity, 2nd
ed., Upper Saddle River, NJ: Prentice Hall.
Kotler, P. (2000). Marketing Management, 10th ed., US: Prentice-Hall.
Kotler, P. & Keller, K. L. (2006). Marketing Management, 12th ed., India: Prentice-Hall.
Rahman, M. & Rahaman, M.A. (2008). To what extent the brand equity of high-involvement
products influence the consumers’ purchase decision: an empirical study in Umeå,
Sweden. Retrieved on May 1, 2011 from http://www.essays.se/essay/da9748135e/
Reardon, J., Miller, C., Vida, I., & Kim, I. (2005). The effects of ethnocentrism and economic
development on the formation of brand and ad attitudes in transitional economies.
European Journal of Marketing, Vol. 39 No.7/8, pp.737-754.
Schaffer, E. (2000). A better way for web design, InformationWeek, No. 784 (May 1), p. 194.
19
http://ssrn.com/abstract=1935740
Superbrands (2006 – 2008), Vol. 1, Retrieved on May 1, 2011 from
http://www.superbrands.com/lkc1/index.php?option=com_content&task=view&id=18&
Itemid=35 and http://www.superbrands.com/lkc1/pdf/07_consumerSB.pdf, pp. 12-13.
Ukpebor, P. & Ipogah, B. (2008). A study to indicate the importance of consumer based-
brand equity on consumer perception of brand (A case study of fast food restaurants).
Retrieved on May 1, 2011 from http://www.essays.se/essay/bc4f1fb6bf/
Vranesevic, T. & Stancec, R. (2003). The effect of the brand on perceived quality of food
products. British Food Journal, Vol. 105, No. 11, pp. 811-825.
Wang, Y. P. & Kan, W. H. (2002). The effects of quality image and country of origin on
consumers’ product evaluation. Proceedings in Management and Innovation Seminar of
National Taiwan University of Science and Technology.