Embed Size (px)
Citation preview
‘Watch Out’ for Wearables –
Factors that influence the purchase intention of
smartwatches in Germany
MASTER DEGREE PROJECT
THESIS WITHIN: Business Administration
NUMBER OF CREDITS: 15
PROGRAMME OF STUDY: International Marketing
AUTHOR: Mark M. Afrouz, Tobias Wahl
JÖNKÖPING May 2019
i
Master Thesis in Business Administration
Title: Wearable technologies: Factors that influence the purchase intention of
smartwatches in Germany
Authors: Mark M. Afrouz and Tobias Wahl
Tutor: Adele Berndt
Date: 2019-05-20
Key terms: Wearables, Smartwatches, TAM, TPB
Acknowledgements
The authors would like to thank everyone who supported them throughout the process of
writing this Master Thesis.
Most importantly, they wish to express their special appreciation and profound gratitude to their
supervisor Adele Berndt (Associate Professor in Business Administration) for her extensive and
valuable support as well as her constructive criticism on this thesis during the last five months.
Furthermore, the authors would like to thank the members of their seminar group (Laura
Grabowski, Maes Paauw, Henrik Svensson & Pontus Möller) who provided valuable and
constructive feedback in each of the sessions.
Lastly, the authors do not want to miss the chance to thank all of their numerous research
respondents for filling out the questionnaires as without them this study could not have been
conducted.
Mark M. Afrouz Tobias Wahl
______________ ______________
ii
Abstract
Background:
The rapid growth and increased competition in today’s technology industry leads to a growth
in consumers’ expectations on new presented products. One of the growing markets within the
technology sector are wearable devices – especially smartwatches. Almost all major IT and
electronic giants such as Apple, Samsung, Microsoft and Google offer smartwatches –
competition is increasingly growing. Consumers benefit from the wide variety of choices while
selecting a smartwatch – but what are the factors that influence them to purchase such a device?
Purpose:
This thesis investigates the intention of German consumers to purchase smartwatches and
examines the influencing factors.
Method:
In order to meet the purpose of this thesis, the authors conducted a quantitative study. The data
was collected by means of an online questionnaire among German consumers and was
distributed via the messenger application WhatsApp. To ensure the collection of enough
responses the authors chose to apply a non-probability snowball sampling approach. Beside
demographical questions and two introductory questions concerning the knowledge and the
usage of smartwatches, the questionnaire consisted of eight question blocks that have been
developed based on two well-established models to predict human behavior and technology
adoption: Theory of Planned Behavior (TPB) and Technology Acceptance Model (TAM).
Conclusion:
The results of this study provide empirical evidence that the attitude towards using was the
strongest predictor for the intention to purchase smartwatches.
The outcomes further show that the attitude is influenced by the two hedonic factors perceived
enjoyment and design aesthetics as well as by the utilitarian factor perceived usefulness. Out of
those three factors perceived enjoyment was found to exert the strongest influence on attitude.
Contrary to previous research, the results of this study could not reveal a significant influence
of subjective norms on purchase intention. However, beside the attitude, perceived behavioral
control was also found to influence purchase intention.
The findings of this research allowed to draw a variety of theoretical and managerial
implications as well as to develop possible research opportunities for future studies.
iii
FIGURES ................................................................................................................................ VI
TABLES .................................................................................................................................. VI
1 INTRODUCTION ................................................................................................................. 1
1.1 Background ................................................................................................................ 1
1.2 Problem Formulation .................................................................................................. 2
1.3 Purpose ....................................................................................................................... 4
1.4 Delimitations .............................................................................................................. 4
1.5 Contribution to Theory & Practice ............................................................................. 4
2 LITERATURE REVIEW ................................................................................................ 6
2.1 Approach to Literature review ................................................................................... 6
2.2 Overview of Wearable Technologies ......................................................................... 6
2.2.1 Benefits for Consumers ...................................................................................... 7
2.2.2 Benefits for Society ............................................................................................ 8
2.3 Smartwatches.............................................................................................................. 8
2.4 Smartwatches on the German Market ........................................................................ 9
2.5 Theoretical Background & Research Model ............................................................ 11
2.5.1 Introduction ...................................................................................................... 11
2.5.2 Technology Acceptance Model (TAM) ........................................................... 11
2.5.2.1 UTAUT & UTAUT2 .................................................................................... 12
2.5.2.2 TAM’s need for Extension – Hedonic Aspects ............................................ 13
2.5.3 Theory of Planned Behavior (TPB).................................................................. 14
2.5.4 Research Framework and Hypotheses Development ....................................... 16
2.5.4.1 Perceived Usefulness (PU) ........................................................................... 17
2.5.4.2 Perceived Ease of Use (PEU) ....................................................................... 18
2.5.4.3 Perceived Enjoyment (PE) ........................................................................... 18
2.5.4.4 Design Aesthetics (DA)................................................................................ 19
2.5.4.5 Attitude towards Using ................................................................................. 19
2.5.4.6 Subjective Norm (SN) .................................................................................. 20
2.5.4.7 Perceived Behavioral Control (PBC) ........................................................... 21
2.5.4.8 Behavioral / Purchase Intention ................................................................... 22
3 METHODOLOGY ......................................................................................................... 24
3.1 Research Philosophy ................................................................................................ 24
3.2 Research Approach................................................................................................... 25
3.3 Research Purpose ..................................................................................................... 26
3.4 Research Design and Research Strategy .................................................................. 26
3.5 Data Collection Method ........................................................................................... 27
iv
3.6 Survey Design .......................................................................................................... 28
3.7 Population and Sampling.......................................................................................... 31
3.8 Analyses of Data ...................................................................................................... 31
3.9 Limitations of Methodology ..................................................................................... 32
3.10 Reliability and Validity ............................................................................................ 33
3.10.1 Reliability ......................................................................................................... 33
3.10.2 Validity ............................................................................................................. 33
3.10.3 Pilot Testing ..................................................................................................... 33
3.11 Ethical Considerations .............................................................................................. 34
4 EMPIRICAL FINDINGS .............................................................................................. 35
4.1 Demographic Sample ............................................................................................... 35
4.2 Descriptive Statistics ................................................................................................ 36
4.3 Reliability Analysis .................................................................................................. 40
4.4 Factor Analysis ......................................................................................................... 40
4.5 Hypotheses Testing .................................................................................................. 43
4.5.1 Correlation Analysis ......................................................................................... 44
4.5.1.1 Hypothesis 1 ................................................................................................. 44
4.5.1.2 Hypotheses 2a & 2b ..................................................................................... 44
4.5.1.3 Hypotheses 3a & 3b ..................................................................................... 45
4.5.1.4 Hypotheses 4a & 4b ..................................................................................... 46
4.5.1.5 Hypothesis 5 ................................................................................................. 46
4.5.1.6 Hypothesis 6 ................................................................................................. 46
4.5.1.7 Hypothesis 7 ................................................................................................. 47
4.5.2 Multiple Regression Analysis .......................................................................... 47
4.5.2.1 Introduction .................................................................................................. 47
4.5.2.2 Hypotheses 1, 2b, 3b & 4b ........................................................................... 48
4.5.2.3 Hypotheses 2a & 3a ...................................................................................... 51
4.5.2.4 Hypothesis 4a ............................................................................................... 53
4.5.2.5 Hypotheses 5, 6 & 7 ..................................................................................... 54
5 DISCUSSION.................................................................................................................. 58
5.1 Attitude towards Using ............................................................................................. 58
5.1.1 Perceived Usefulness ........................................................................................ 59
5.1.2 Perceived Ease of Use ...................................................................................... 60
5.1.3 Perceived Enjoyment ........................................................................................ 60
5.1.4 Design Aesthetics ............................................................................................. 62
5.2 Purchase Intention .................................................................................................... 62
5.2.1 Attitude towards Using ..................................................................................... 63
v
5.2.2 Subjective Norm ............................................................................................... 63
5.2.3 Perceived Behavioral Control .......................................................................... 64
6 CONCLUSION ............................................................................................................... 66
6.1 Research Question .................................................................................................... 66
6.2 Theoretical Implications ........................................................................................... 66
6.3 Managerial Implications ........................................................................................... 67
6.4 Social and Ethical Issues of Smartwatches .............................................................. 68
6.5 Limitations................................................................................................................ 69
6.6 Future Research ........................................................................................................ 70
REFERENCES ....................................................................................................................... IV
APPENDIX .............................................................................................................................. X
Appendix 1: Article Search ........................................................................................ x
Appendix 2: Theory of Reasoned Action (TRA) ...................................................... xi
Appendix 3: UTAUT & UTAUT2 ........................................................................... xii
Appendix 4: Survey English.................................................................................... xiii
Appendix 5: Survey German .................................................................................. xxii
Appendix 6: Frequency Tables.............................................................................. xxxi
Appendix 7: Normal Probability Plots & Scatterplots ............................................. xii
vi
Figures
Figure 1: Technology Acceptance Model (TAM) .................................................................... 12
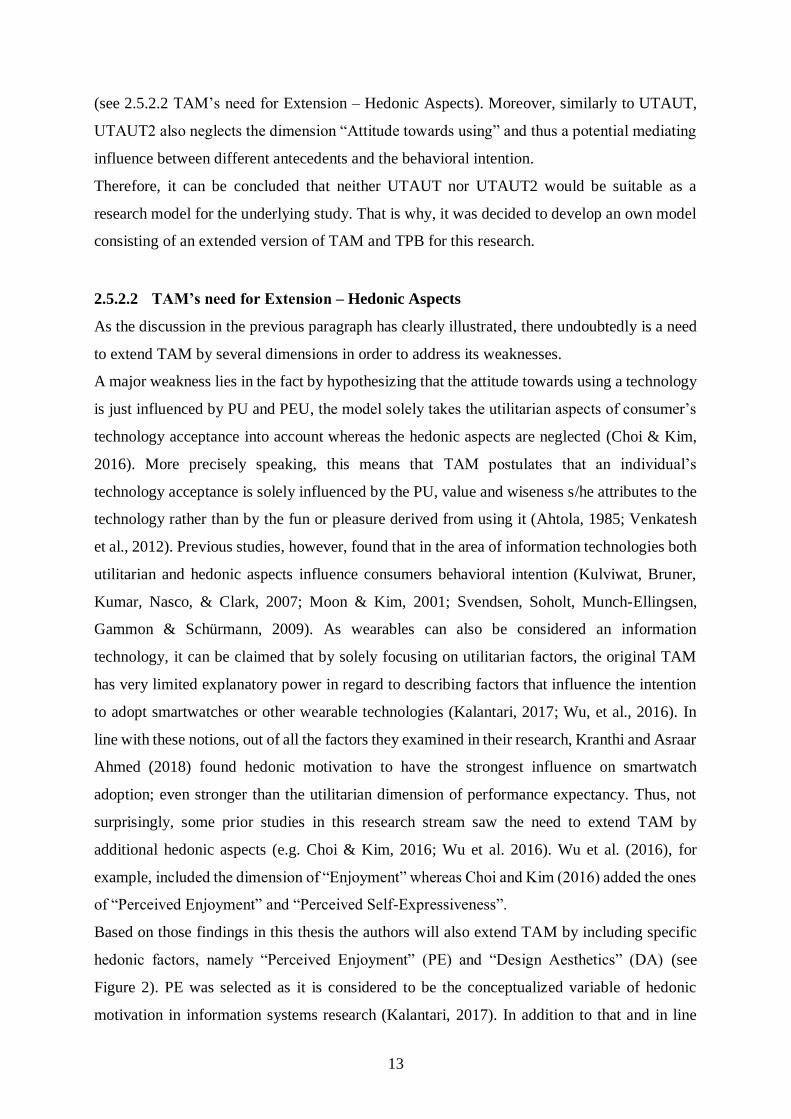
Figure 2: Extended TAM ......................................................................................................... 14
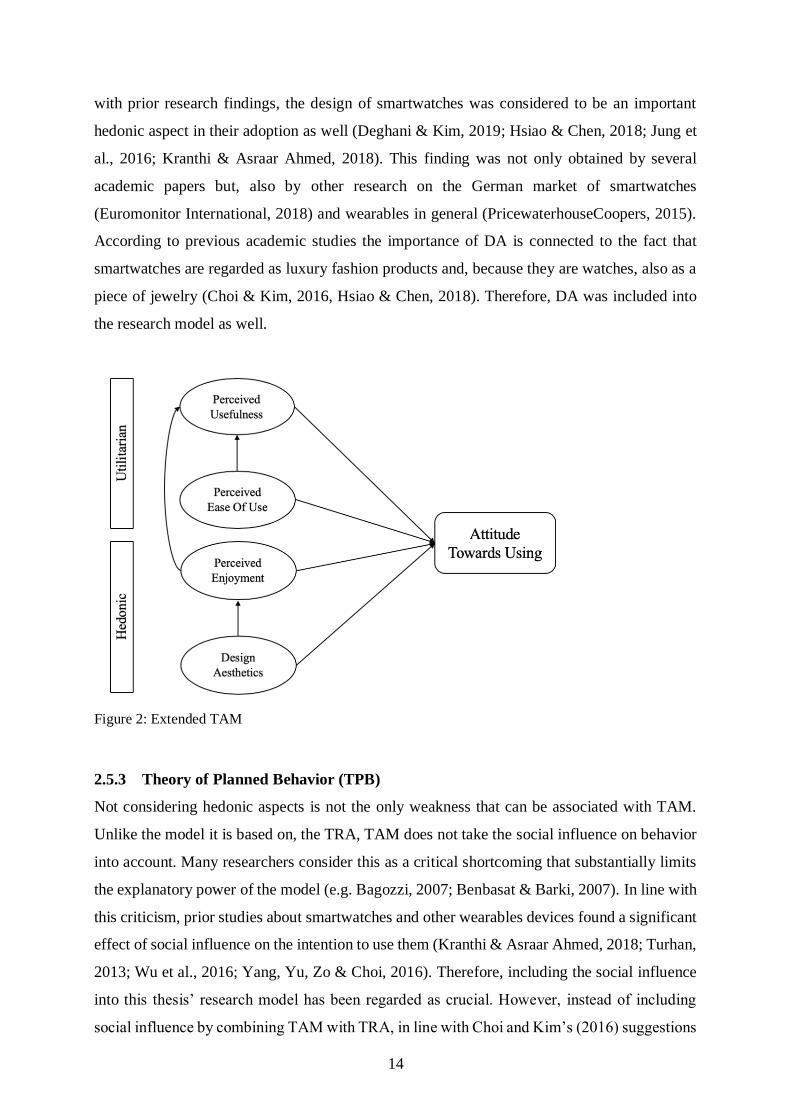
Figure 3: Theory of Planned Behavior (TPB) .......................................................................... 16
Figure 4: Research Framework ................................................................................................ 17
Figure 5: Research Framework Results.................................................................................... 57
Tables
Table 1: Summary of Hypotheses ............................................................................................ 22
Table 2: Measurement Items .................................................................................................... 29
Table 3: Frequency of Perceived Usefulness ........................................................................... 36
Table 4: Frequency of Perceived Ease of Use .......................................................................... 36
Table 5: Frequency of Perceived Enjoyment ........................................................................... 37
Table 6: Frequency of Design Aesthetics................................................................................. 37
Table 7: Frequency of Attitude towards Using ........................................................................ 38
Table 8: Frequency of Subjective Norm .................................................................................. 38
Table 9: Frequency Perceived Behavioral Control .................................................................. 39
Table 10: Frequency of Purchase Intention .............................................................................. 39
Table 11: Reliability of Constructs .......................................................................................... 40
Table 12: Rotated Component Matrix of Utilitarian Items ...................................................... 41
Table 13: Rotated Component Matrix of Hedonic Items ......................................................... 43
Table 14: Summary of Hypotheses .......................................................................................... 43
Table 15: Correlation Hypothesis 1.......................................................................................... 44
Table 16: Correlations Hypotheses 2a & 2b ............................................................................ 45
Table 17: Correlations Hypotheses 3a & 3b ............................................................................ 45
Table 18: Correlations Hypotheses 4a & 4b ............................................................................ 46
Table 19: Correlation Hypothesis 5.......................................................................................... 46
Table 20: Correlation Hypothesis 6.......................................................................................... 47
Table 21: Correlation Hypothesis 7.......................................................................................... 47
Table 22: Collinearity Statistics of Attitude towards Using .................................................... 49
Table 23: R square of Attitude towards Using ......................................................................... 50
Table 24: Beta Value and Significance Attitude towards Using .............................................. 50
vii
Table 25: Collinearity Statistics of Perceived Usefulness........................................................ 51
Table 26: R square of Perceived Usefulness ............................................................................ 52
Table 27: Beta Value and Significance Perceived Usefulness ................................................. 52
Table 28: R square of Perceived Enjoyment ............................................................................ 53
Table 29: Beta Value and Significance Perceived Enjoyment ................................................. 54
Table 30: Collinearity Statistics of Purchase Intention ............................................................ 54
Table 31: R square of Purchase Intention ................................................................................ 55
Table 32: Beta Value and Significance Purchase Intention ..................................................... 55
Table 33: Summary of Hypotheses .......................................................................................... 56
1
1 Introduction
The purpose of this section is to give background information on wearable technologies and to
introduce the reader to smartwatches in general. Furthermore, the problem of this thesis will
be formulated followed by the purpose and the research question as well as delimitations.
1.1 Background
Today’s technology industry is experiencing substantial growth and increased competition.
With that in mind, consumers’ expectations on newly presented products grow accordingly –
which is why it is more important than ever for companies to understand consumers’ purchase
intentions and ensure their ability to compete in such a competitive market.
One of the growing markets within the technology sector is the one of the wearable devices
(Pal, Funikul, & Vanija, 2018). Wearable devices are “electronic technologies or computers
that are incorporated into items of clothing and accessories which can comfortably be worn on
the body” (Wright & Keith, 2014).
According to the “Wearable Technology platform”, the wearable technology market has
established an ecosystem of more than 30.000 companies including market leaders and highly
innovative companies (Wearable Technologies, 2017). There are several kinds of wearables in
the latest evolution of information technology, such as smart glasses, contact lenses, fitness
wristband trackers, wireless headsets, clothing, as well as smart and fashionable jewellery items
like bracelets or necklaces (Wright & Keith, 2014).
However, one kind of wearable device gained particular momentum in the last three years: The
smartwatch (Ernst & Ernst, 2016a). Smartwatches are “wearable computers that can perform
various daily tasks to help users to deal with their daily work” (Hsiao & Chen, 2018, p. 104).
Since smartwatches are wrist mounted, they possess one strong advantage compared to other
devices: Their frequent connection to the skin (Rawassizadeh, Price, & Petre, 2015). This is
one reason why they are widely used in the fields of sports and health care (Hsiao & Chen,
2018).
In 2016 the International Data Corporation (IDC) predicted that smartwatch sales will increase
significantly by 2020, reaching $17.8 billion (Maddox, 2016). According to the IDC, the
worldwide wearables market shipped 124.9 million units by the end of 2018, which is an 8.2%
growth compared to the prior year (IDC, 2018). As smartwatches will grow in popularity and
2
are predicted to have a significant impact on the quality of people’s daily life, the market is
expected to increase to double-digit growth from 2019 until 2022 (IDC, 2018; Cecchinato, Cox,
& Bird, 2015). Currently, the smartwatch sector experiences a lot of competition as almost all
major IT and electronic giants such as Apple, Samsung, Microsoft and Google offer
smartwatches (Pal et al., 2018). Consumers benefit from that since they have a wide variety of
choices while selecting a smartwatch.
With the help of different models and theories like Rogers’ (1962) innovation diffusion theory
(IDT), Fishbein and Ajzen’s (1975) theory of reasoned action (TRA), Davis’ (1989) technology
acceptance model (TAM) and others, prior studies have already provided some insights into
consumers’ behavior towards smartwatches.
1.2 Problem Formulation
Until about three years ago the majority of the studies conducted about smartwatches - and
wearables in general - were focused on the new technical opportunities these devices entail -
such as the tracking of fitness and medical data (Chan, Esteve, Fourniols, Escriba, & Campo,
2012; Lymberis, 2003). Since then more scholars have drawn their attention to the consumer
perspective, i.e. researching how consumers perceive smartwatches and what drives them
towards using or purchasing them (e.g. Choi & Kim, 2016; Hong, Lin, & Hsieh, 2017; Hsiao
& Chen, 2018). However, almost all of the studies conducted in this field had taken place on
the Asian continent – especially in Korea and Taiwan - and thus used Asians as their target
populations. The reasons for the concentration of this research stream on those markets could
have to do with the fact that smartwatches quickly gained popularity in the developed Asia-
Pacific (APAC) region. According to Gfk (n.d.-a) in 2015 smartwatches already had a share of
81% to the total wearable’s sales in the developed APAC region whereas in Western Europe
(50%) and North America (47%) this share was substantially lower.
The global share of smartwatch sales on total wearable sales has more than doubled between
2015 and 2018 (GfK, n.d.-b). Additionally, the user penetration of wearables in high developed
European countries (c.f. Germany: 7.7%, Sweden: 7.4%, United Kingdom: 9.9%) as well as in
the United States (11.8%) and Canada (8.1%) in 2019 is considerably higher than the one in
Asia (6.1%, with South Korea: 5.5%) (Statista, 2019a, 2019b, 2019c, 2019d, 2019e, 2019f,
2019g). However, surprisingly, up to now there was only limited research conducted about the
consumer perspective of smartwatches on Western markets.
3
An explicit investigation of the factors that influence the intention to purchase, use or adapt
smartwatches in Western countries would, however, be desirable as due to the differences
between the East Asian and the Western culture (Hofstede, 2011) the influencing factors and
their respective strength uncovered in previous research based on Asian populations might not
apply to the same extent in the context of Western populations.
This thesis aims to fill this research gap by investigating the factors that influence the purchase
intention of smartwatches in Germany. The decision to draw attention specifically to Germany
was made for two reasons. First, although the country does not possess Europe’s highest user
penetration rate of wearable technologies in 2019 due to its high population, it still is the country
with the second-most users of wearable technologies (6.4 million) in Europe just closely behind
the United Kingdom (6.6 million) (Statista, 2019c; Statista, 2019f). So, Germany is one of the
most interesting European markets to study for this research stream as already small variations
in the user penetration rate result in high variations in total sales. Moreover, as the authors
themselves are from Germany they already possessed some knowledge about the German
market, making it an accessible research context.
In their research, the authors chose to solely focus on one Western country as they believe to
get more reliable results when all respondents share the same background opposed to a situation
where different people from various Western countries are surveyed.
It is recognized that Ernst and Ernst already conducted two studies about the consumer
perspectives of smartwatches on the German market (Ernst & Ernst, 2016a, 2016b). However,
by investigating the influence of past-product experience (Ernst & Ernst, 2016a) and perceived
privacy risk (Ernst & Ernst, 2016b) on the usage of smartwatches, their studies only provided
limited insight into the factors that drive Germans towards purchasing a smartwatch. This thesis
will examine other influencing factors and aims to provide a more detailed overview of the
factors that influence the purchase intention of smartwatches in Germany. To do so, similar to
previous studies in this research stream (e.g. Chua et al., 2016; Choi & Kim, 2016; Kim & Shin,
2015) the authors base their study on the TAM that they extend by two additional dimensions.
Moreover, as a first paper in the smartwatch research stream they combine the TAM with
another important theory in the area of purchase intention, namely the theory of planned
behavior (TPB), (Ajzen, 1985) in order to get further insights about the problem under
investigation.
4
1.3 Purpose
This thesis investigates German consumers’ intention to purchase smartwatches and examines
the influencing factors. Accordingly, this papers’ research question is as follows:
RQ: Which factors influence German consumers’ intention to purchase smartwatches?
As it can be derived from this purpose the authors apply a consumer perspective in this paper.
1.4 Delimitations
It is important to mention that the attention is specifically drawn to smartwatches. The authors
do not concern any other wearable technologies such as smart glasses or wristband trackers in
the empirical study for this paper. Furthermore, they specifically investigate the factors that
influence the purchase intention of smartwatches. So, they do neither concern the intention to
continue using smartwatches nor the actual purchase of smartwatches.
1.5 Contribution to Theory & Practice
Overall, the purpose of this thesis is descriptive in nature and, at the same time, aims at theory
refinement. This can be argued as, on the one hand, the authors aim to find out which factors
influence smartwatch purchase intention in Germany and thus want to describe some part of
reality. On the other hand, they also aim to contribute to the research stream in this field by
being one of the first papers to extend smartwatch purchase intention research to a Western
market. In addition to that, they aim to combine the in this context frequently-used TAM with
the not-yet-used TPB in order to develop a theoretical framework that enables them not only to
investigate how consumers’ attitudes towards smartwatches impact their decision to buy those
products but also which role subjective norms (SN) and perceived behavioral control (PBC)
play in this decision-making process. The results of this study can thus provide further insights
about the factors that drive purchase intention of smartwatches and can therefore make an
important contribution to the research stream in this field. In addition to that, the results may
specifically help to understand for which reasons German consumers purchase smartwatches.
Therefore, this research can be highly relevant for the various manufacturers of smartwatches
(e.g. Apple, Samsung, Microsoft, Google). It can help them to better understand which factors
are of high and which of low importance for Germans when they decide about purchasing a
smartwatch. Based on that knowledge the manufacturers can then either adjust some product
features or adapt their marketing communication strategy (or both) to be able to increase their

5
sales on the German market. So, to conclude, from its purpose it can be derived that this thesis
aims to make both important contributions to theory as well as to practice.
6
2 Literature review
This chapter encompasses an overview of wearable technologies with a deeper insight into the
world of smartwatches. Afterwards, there follows an in-depth theoretical background including
the development of a theory-based research framework and the formulation of hypotheses.
2.1 Approach to Literature review
To write a thorough literature review about the topic, the authors first needed to conduct a
sophisticated literature search. This search was carried out on three platforms (Primo, Scopus
and Google Scholar) by using different key words such as for example “smartwatches”,
“smartwatches influencing factors” and “smartwatches purchase intention” (for a detailed list
of keywords used for article search see Appendix 1). For each of those keywords on each
platform the first 50 articles resulting from the search were examined on their usefulness for
the underlying research. If an article was considered to be useful it was downloaded and
investigated further by the authors. More precisely speaking the authors reviewed these articles
specifically based on their research framework, on the theory applied, on the methodology used
– here in particular on where the study took place –, on the results obtained as well as on the
recommendations for further research that were given. From reading all the downloaded articles
the authors were able to identify a research gap which was addressed in this thesis.
2.2 Overview of Wearable Technologies
Technology can only be considered as ‘wearable technology’ if it has the capability of
incorporating information technology to be able to interact autonomously and process
information on the go (Park, Chung, & Jayaraman, 2014). This capability is what makes
technology ‘smart’.
Wearables include a variety of devices, such as smartwatches, smart glasses, fitness trackers,
contact lenses, smart garments, smart jewelries (e.g. smart rings), headbands or bracelets
(Wright & Keith, 2014). Examples of manufacturers are Google Glass, Microsoft HoloLens,
Apple Watch, Pebble Smartwatch, Fitbit fitness trackers, Oculus Rift and many more (Wright
& Keith, 2014).
There is a wide range of applications for both individuals and enterprises. Wearables usage
includes communication, information, entertainment, fitness and health tracking, education,
7
navigation and assisting services (Kalantari, 2017). On top of that, another important
application of wearables is in marketing. Wearables can be used to observe information about
consumers or users and their environment. With that, they can aggregate consumer’s purchase
behavior, activities and location. This information is highly valuable for companies since it
reveals consumer insights that can be used to improve customer experience (Kalantari, 2017).
Researchers and industry representatives have proposed different classifications for wearable
devices. In a market study published by Cognizant Solutions Corp they have been classified
into five different segments based on functionality: fitness, medical, lifestyle, gaming and
infotainment (Bhat & Reddi, 2014).
Wearable devices are closer to people’s bodies than mobile phones. These devices have
undergone experimentation and recently begun to be diffused (Jung, Kim, & Choi, 2016). They
are distinctive from conventional mobile phones or portable computers, work without
interruption and more inextricably intertwine with the body than other personal devices (Mann,
2014).
2.2.1 Benefits for Consumers
Wearable devices are supposed to assist consumers achieve a state of connected-self by using
both sensors and software that facilitate data-exchange, communication and information in real-
time (Kalantari, 2017). That is why, wearable devices are a big part of the internet of things
(Kalantari, 2017; Swan 2012; Wang, 2015). In comparison to mobile phones, smartphones and
computers, wearable devices are more convenient for consumers. This convenience can be
attributed to their accessibility, lightweight, possibility to use while the user is in motion and
the opportunity to make use of non-keyboard commands such as voice and hand gestures that
give the user control (Kalantari, 2017). Hein and Rauschnabel (2016) state that these devices
are generally not only perceived as “technology” but also as “fashion” and are therefore a
“fashionology”. Since wearables have the opportunity to surpass smartphones and computers
in performance, they can potentially also replace these technologies in the future. Accordingly,
there has been an increase in awareness as well as knowledge of consumers and developers are
also eager to release new wearable devices (Park et al., 2014).
8
2.2.2 Benefits for Society
Wearable technologies possess benefits that can change the landscape of societies and
businesses – they can improve people’s wellbeing and help them make better and more
informed decisions (Kalantari, 2017). They can support medical centers and hospitals by
enhancing the accuracy of health information acquired and thereby improve the treatment of
patients. Wearable devices’ ability to track health and fitness can thus lead to healthier behavior
and therefore decreases healthcare costs (Park et al., 2014).
Within sports, wearable devices can be linked with data analysis - which is called physiolotics.
By doing so, it is possible to monitor and improve performance by providing quantitative
feedback (Wilson, 2013).
Another great benefit wearable technology provides, are assistive services for disabled
individuals who have limited ability to use technological devices (Kalantari, 2017).
2.3 Smartwatches
Within academic literature, there is no clear definition of smartwatch technology and no clear
distinction of related technologies. For Kim and Shin (2015) for example, several wearables
including Fitbit Flex or Samsung Galaxy Gear are smartwatches. Although these devices are
wrist-worn there are differences that require a more detailed differentiation.
There often is a confusion between smart wristbands or fitness wristband trackers, which track
a user’s physical functions (e.g. pulse) and provide limited information on small displays, and
smartwatches (Chua, et al., 2016; Pal, Funikul, & Vanija, 2018). The primary purpose of the
wristbands further is collecting data which can be analyzed on a different device (e.g.
smartphone or computer). There is no possibility to install applications and the presentation of
information is very limited (e.g. time or pulse). Some examples of such devices are Nike
Fuelband or Fitbit Surge.
Smartwatches, on the contrary, are larger than smart wristbands or fitness wristband trackers.
Usually, the face of a smartwatch is a touchscreen and users are able to install various apps.
More than 10.000 apps are available for iOS (Apple) and more than 4.000 apps for Android
(Chua, et al., 2016).
Additionally, compared to smart wristbands or fitness wristband trackers, smartwatches provide
the most benefits when they are connected to the internet (Bluetooth, Wi-Fi or mobile internet).
For smart wristbands and fitness wristband trackers, the main purpose is to collect data. For
smartwatches on the other hand, a primary function is presenting relevant information (e.g.
emails).
9
After contemplating the uniqueness of smartwatches in comparison to smart wristbands and
fitness wristband trackers, the authors define a smartwatch following Cecchinato, Cox and
Brid’s (2015) notion who see them as “a wrist-worn device with advanced computational power
that allows the installation and use of applications, that can connect to other devices via short-
range wireless connectivity; provides alert notifications; collects personal data through a range
of sensors, stores them; and has an integrated clock” (p. 2134).
Smartwatches are computing devices that are also regarded as fashionable products or
accessories (Jung et al., 2016). Previous research has shown that in order to be recognized as
independent computing devices, display size and standalone communication functions are
important technological properties of smartwatches (Rawassizadeh et al., 2015).
Although there were computer-based wristwatches (e.g. Fossil wrist PDA, IBM/Citizen
WatchPad, Microsoft’s STOP Watch) in the early 2000’s, their functional limitations prevented
their success (Rawassizadeh at al., 2015). In 2012, the first widely adopted computer-based
watch was released: The Pebble watch. In 2014, Apple released their first Apple watch and
after that leading IT vendors – including Samsung, Google and Microsoft – did release their
new models of smartwatches.
The small display size can be a disadvantage of smartwatches compared to smartphones.
According to Cho, Jung and Im (2014), usability, including screen size, has a significant impact
on consumers’ satisfaction with mobile devices. Typing is possible on most smartwatches;
however, it is more convenient on smartphones. To mitigate this problem, some smartwatches
(e.g. Google Android Phone, Apple Watch) included voice recording systems.
Another important technological issue is the fact that most smartwatches models are indirectly
connected to smartphones by wireless networks. Short-distance communication systems like
Bluetooth are often used. With this technological characteristic, smartwatches work as
communication tools, nevertheless they also are dependent on smartphones. If there was a
possibility for smartwatches to be capable of standalone communication, they would get more
independent and maybe even replace smartphones (Quain, 2015).
2.4 Smartwatches on the German Market
According to Euromonitor International (2018), wearable technologies are popular on the
German market. The reason for this was found to lie in the consumption patterns of Germans.
More specifically it was found that in 2018, Germans’ consumption behavior was driven by
ongoing health and fitness trends as well as an increasing demand for more sophisticated
10
products (Euromonitor International, 2018). As described previously, wearable technologies
serve those demands, for example by providing people with the opportunity to track their health
and fitness data on the go. Therefore, those trends enabled wearable technologies, and also
smartwatches in particular, to strongly gain in sales volume as well as in current value terms on
the German market (Euromonitor International, 2018). More precisely, compared to 2017, the
revenue earned with wearables in Germany grew by 4.2 percent in 2018 (Statista, 2019c).
Furthermore, when it comes to the type of wearable devices Germans prefer wrist mounted
smartwatches and health monitors over devices which are built-in their clothes or eyewear
(Mordor Intelligence, 2017). Specifically, in regard to smartwatch sales, Apple occupied the
leading position in Germany in 2018 with their Apple Watch series (Euromonitor International,
2018).
A factor contributing to the sales growth of smartwatches in general was its design. According
to Euromonitor International (2018), their elegant, versatile and hybrid designs did convince
German consumers and let them buy those devices more frequently. In line with these findings
an older study by Pricewaterhouse Coopers (2015) uncovered design as one of the six most
important factors when purchasing a wearable device in Germany, the others being value for
money, data security, intuitive usability, compatibility with other devices and social media
access. In that regard, value for money has been indicated as the most important factor that
influences the purchase decision by Germans (Pricewaterhouse Coopers, 2015). Similar to that,
Euromonitor International (2018) found the average unit price of smartwatches to be an
impediment for further success in Germany.
Furthermore, in 2017 the majority of the users of wearable technologies in Germany could be
placed into the age group between 25-34 years (Statista Global Consumer Survey, 2018a)
indicating that specifically younger people adopt those technologies. However, at the same time
also new types of wearable devices that mainly target young children or elderly consumers (e.g.
specific health and wellness trackers) entered the German market (Euromonitor, 2018; Russey,
2018; Mojapelo, 2018).
Consequently, similar to the world market, the German market for wearable devices is also
growing which again underlines this thesis’ importance to focus on this market. Specifically,
smartwatches are increasingly more valued by Germans. Furthermore, especially factors such
as price, intuitive usability and design of smartwatches and other wearable devices play an
important role for Germans when they decide about adopting such devices. This perfectly fits
with this thesis’ research framework that is outlined in the following paragraphs.
11
2.5 Theoretical Background & Research Model
2.5.1 Introduction
In the next paragraphs follows a detailed discussion of TAM and TPB, the two models that are
used to construct this thesis’ research model. It is then explained how the underlying research
model was built based on those two theoretical models. Finally, hypotheses for each of the
dimensions are formulated.
2.5.2 Technology Acceptance Model (TAM)
In order to examine the factors that influence the purchase intention of smartwatches in
Germany, similar to previous studies (e.g. Choi & Kim, 2016; Chua et al., 2016; Kim & Shin,
2015) this thesis uses TAM as the basic underlying framework (see Figure 1). This decision
was made as, on the one hand, this model is one of the most used theoretical models to examine
people’s acceptance of information technology and is therefore highly relevant in this context
and, on the other hand, it is considered to be very robust (King & He, 2006; Venkatesh & Davis,
2000).
Originally, TAM is based on another psychological theory, the Theory of Reasoned Action
(TRA) (see Appendix 2) (Fishbein & Ajzen, 1975). TRA postulates that people’s behavior is
influenced by the behavioral intention which is again influenced by people’s attitude towards
that behavior as well as the SN regarding the behavior (Fishbein & Ajzen, 1975).
Based on this theory, Davis (1989) developed TAM to facilitate an understanding of
individual’s acceptance of new technologies. TAM hypothesizes that the attitude towards using
a specific technology is determined by the perceived usefulness (PU) as well as the perceived
ease of use (PEU) of that technology and finally leads to the intention to use as well as the
actual use of the technology (Davis, 1989). So, TAM’s structure is undoubtedly very simple.
However, despite its simplicity, empirical evidence underlined its robustness and relevance for
technology acceptance research (King & He, 2006; Venkatesh & Davis, 2000). Therefore,
TAM has been extensively and successfully used in previous studies about wearable
technologies (Choi & Kim, 2016; Chua et al, 2016; Kim & Shin, 2015; Rauschnabel & Ro,
2016).
Nevertheless, the original TAM also has several weaknesses. Those were primarily addressed
by Venkatesh, Morris, Davis and Davis (2003) as well as Venkatesh, Thong and Xu (2012) in
their development of the “Unified Theory of Acceptance and Use of Technology” (UTAUT)
and UTAUT2 respectively.
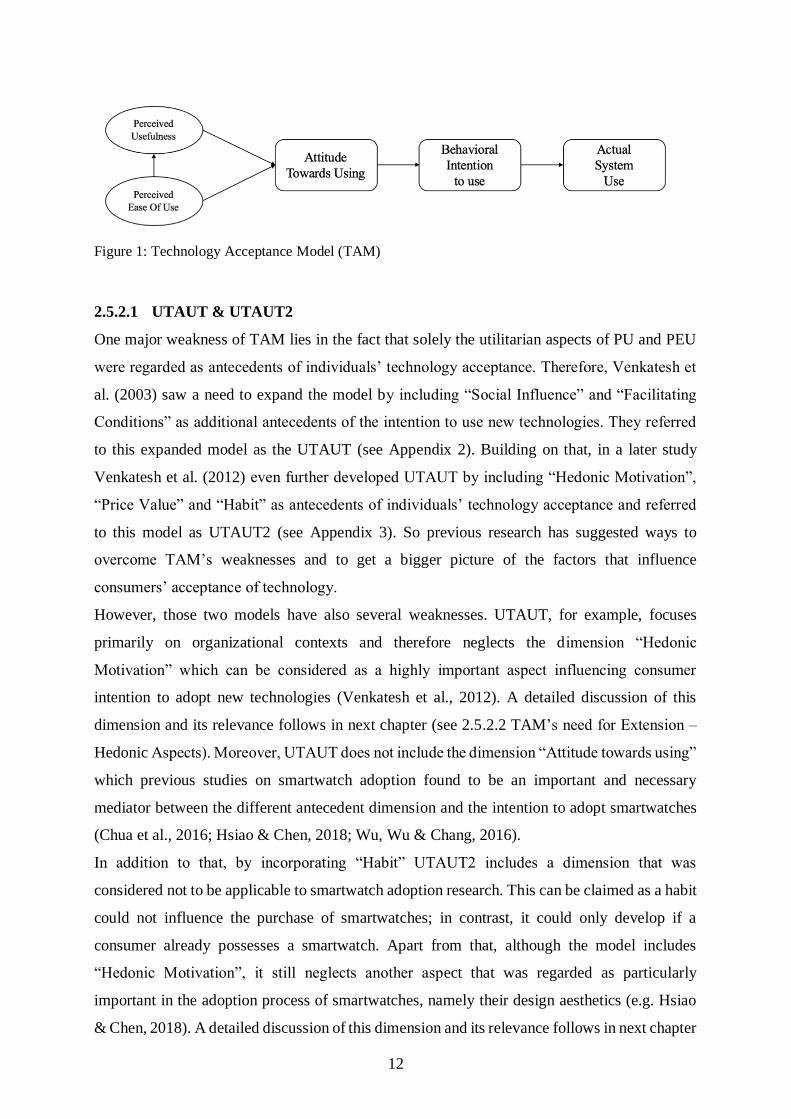
12
Figure 1: Technology Acceptance Model (TAM)
2.5.2.1 UTAUT & UTAUT2
One major weakness of TAM lies in the fact that solely the utilitarian aspects of PU and PEU
were regarded as antecedents of individuals’ technology acceptance. Therefore, Venkatesh et
al. (2003) saw a need to expand the model by including “Social Influence” and “Facilitating
Conditions” as additional antecedents of the intention to use new technologies. They referred
to this expanded model as the UTAUT (see Appendix 2). Building on that, in a later study
Venkatesh et al. (2012) even further developed UTAUT by including “Hedonic Motivation”,
“Price Value” and “Habit” as antecedents of individuals’ technology acceptance and referred
to this model as UTAUT2 (see Appendix 3). So previous research has suggested ways to
overcome TAM’s weaknesses and to get a bigger picture of the factors that influence
consumers’ acceptance of technology.
However, those two models have also several weaknesses. UTAUT, for example, focuses
primarily on organizational contexts and therefore neglects the dimension “Hedonic
Motivation” which can be considered as a highly important aspect influencing consumer
intention to adopt new technologies (Venkatesh et al., 2012). A detailed discussion of this
dimension and its relevance follows in next chapter (see 2.5.2.2 TAM’s need for Extension –
Hedonic Aspects). Moreover, UTAUT does not include the dimension “Attitude towards using”
which previous studies on smartwatch adoption found to be an important and necessary
mediator between the different antecedent dimension and the intention to adopt smartwatches
(Chua et al., 2016; Hsiao & Chen, 2018; Wu, Wu & Chang, 2016).
In addition to that, by incorporating “Habit” UTAUT2 includes a dimension that was
considered not to be applicable to smartwatch adoption research. This can be claimed as a habit
could not influence the purchase of smartwatches; in contrast, it could only develop if a
consumer already possesses a smartwatch. Apart from that, although the model includes
“Hedonic Motivation”, it still neglects another aspect that was regarded as particularly
important in the adoption process of smartwatches, namely their design aesthetics (e.g. Hsiao
& Chen, 2018). A detailed discussion of this dimension and its relevance follows in next chapter
13
(see 2.5.2.2 TAM’s need for Extension – Hedonic Aspects). Moreover, similarly to UTAUT,
UTAUT2 also neglects the dimension “Attitude towards using” and thus a potential mediating
influence between different antecedents and the behavioral intention.
Therefore, it can be concluded that neither UTAUT nor UTAUT2 would be suitable as a
research model for the underlying study. That is why, it was decided to develop an own model
consisting of an extended version of TAM and TPB for this research.
2.5.2.2 TAM’s need for Extension – Hedonic Aspects
As the discussion in the previous paragraph has clearly illustrated, there undoubtedly is a need
to extend TAM by several dimensions in order to address its weaknesses.
A major weakness lies in the fact by hypothesizing that the attitude towards using a technology
is just influenced by PU and PEU, the model solely takes the utilitarian aspects of consumer’s
technology acceptance into account whereas the hedonic aspects are neglected (Choi & Kim,
2016). More precisely speaking, this means that TAM postulates that an individual’s
technology acceptance is solely influenced by the PU, value and wiseness s/he attributes to the
technology rather than by the fun or pleasure derived from using it (Ahtola, 1985; Venkatesh
et al., 2012). Previous studies, however, found that in the area of information technologies both
utilitarian and hedonic aspects influence consumers behavioral intention (Kulviwat, Bruner,
Kumar, Nasco, & Clark, 2007; Moon & Kim, 2001; Svendsen, Soholt, Munch-Ellingsen,
Gammon & Schürmann, 2009). As wearables can also be considered an information
technology, it can be claimed that by solely focusing on utilitarian factors, the original TAM
has very limited explanatory power in regard to describing factors that influence the intention
to adopt smartwatches or other wearable technologies (Kalantari, 2017; Wu, et al., 2016). In
line with these notions, out of all the factors they examined in their research, Kranthi and Asraar
Ahmed (2018) found hedonic motivation to have the strongest influence on smartwatch
adoption; even stronger than the utilitarian dimension of performance expectancy. Thus, not
surprisingly, some prior studies in this research stream saw the need to extend TAM by
additional hedonic aspects (e.g. Choi & Kim, 2016; Wu et al. 2016). Wu et al. (2016), for
example, included the dimension of “Enjoyment” whereas Choi and Kim (2016) added the ones
of “Perceived Enjoyment” and “Perceived Self-Expressiveness”.
Based on those findings in this thesis the authors will also extend TAM by including specific
hedonic factors, namely “Perceived Enjoyment” (PE) and “Design Aesthetics” (DA) (see
Figure 2). PE was selected as it is considered to be the conceptualized variable of hedonic
motivation in information systems research (Kalantari, 2017). In addition to that and in line
14
with prior research findings, the design of smartwatches was considered to be an important
hedonic aspect in their adoption as well (Deghani & Kim, 2019; Hsiao & Chen, 2018; Jung et
al., 2016; Kranthi & Asraar Ahmed, 2018). This finding was not only obtained by several
academic papers but, also by other research on the German market of smartwatches
(Euromonitor International, 2018) and wearables in general (PricewaterhouseCoopers, 2015).
According to previous academic studies the importance of DA is connected to the fact that
smartwatches are regarded as luxury fashion products and, because they are watches, also as a
piece of jewelry (Choi & Kim, 2016, Hsiao & Chen, 2018). Therefore, DA was included into
the research model as well.
Figure 2: Extended TAM
2.5.3 Theory of Planned Behavior (TPB)
Not considering hedonic aspects is not the only weakness that can be associated with TAM.
Unlike the model it is based on, the TRA, TAM does not take the social influence on behavior
into account. Many researchers consider this as a critical shortcoming that substantially limits
the explanatory power of the model (e.g. Bagozzi, 2007; Benbasat & Barki, 2007). In line with
this criticism, prior studies about smartwatches and other wearables devices found a significant
effect of social influence on the intention to use them (Kranthi & Asraar Ahmed, 2018; Turhan,
2013; Wu et al., 2016; Yang, Yu, Zo & Choi, 2016). Therefore, including the social influence
into this thesis’ research model has been regarded as crucial. However, instead of including
social influence by combining TAM with TRA, in line with Choi and Kim’s (2016) suggestions
15
for further research, the authors decided to incorporate TAM with TPB in order to examine the
influencing factors of smartwatch purchase intention in Germany.
TPB (see Figure 3) is an extension of TRA that postulates that individual’s behavioral intention
is influenced by their attitude towards the behavior, by their subjective norm (SN) as well as by
their perceived behavioral control (PBC) (Ajzen, 1985). The attitude towards the behavior is
considered as a person’s positive or negative evaluation of the behavior (Ajzen, 1991). It is
determined by a person’s behavioral beliefs, i.e. its beliefs about the object in question (Ajzen,
1991). SN represents the social dimension of the model. It concerns the social pressure that
originates from referent groups or individuals and that forces a person to perform or refrain
from performing a given behavior (Ajzen, 1991). According to Fishbein and Ajzen’s (1975)
TRA those two dimensions influence the intention to perform a certain behavior. This
behavioral intention can be regarded as the motivational factors that ultimately influence a
behavior (Ajzen, 1991).
In contrast to TRA, TPB, however, includes a third antecedent dimension of behavioral
intention, namely PBC. This concept refers to “the perceived ease or difficulty of performing
the behavior” (Ajzen, 1991, p.188). It is dependent on an individual’s control beliefs, i.e. on
whether he/she believes that there are factors that facilitate or hinder the execution of the
behavior (Ajzen, 2002). Including PBC could be beneficial in this study as research about the
German market has found that especially the high cost of smartwatches represents an
impediment to their adoption (Euromonitor International, 2018; PricewaterhouseCoopers,
2015). Therefore, the price could, for example, be an important control belief in the underlying
case. Interestingly, so far none of the previous smartwatch adoption studies has examined the
influence of PBC on the intention to use smartwatches although, as described earlier,
smartwatches are often seen as luxury products and thus control beliefs such as the price might
play an important role when intentions about their purchase are developed.
As the underlying research just focuses on the intention to purchase smartwatches - not on their
actual purchase, the last part of the TPB, i.e. the influence of the behavioral intention on the
actual behavior, is neglected in this research.
Nevertheless, in line with all the considerations discussed above prior research has found that
integrating TAM with TPB leads to a higher explanatory power of technology acceptance in
business applications (Venkatesh et al., 2003; Yi, Jackson, Park & Probst, 2006). Therefore,
the theoretical approach carried out in this thesis is expected to fit well with the purpose of this
research.
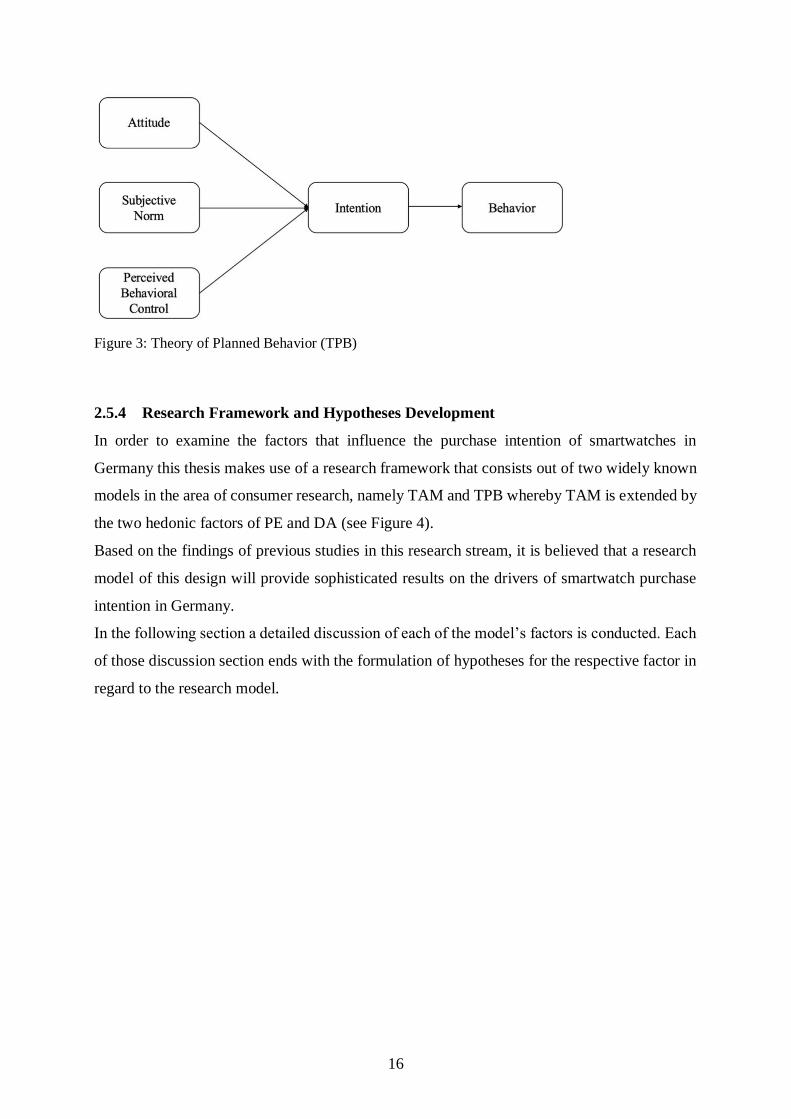
16
Figure 3: Theory of Planned Behavior (TPB)
2.5.4 Research Framework and Hypotheses Development
In order to examine the factors that influence the purchase intention of smartwatches in
Germany this thesis makes use of a research framework that consists out of two widely known
models in the area of consumer research, namely TAM and TPB whereby TAM is extended by
the two hedonic factors of PE and DA (see Figure 4).
Based on the findings of previous studies in this research stream, it is believed that a research
model of this design will provide sophisticated results on the drivers of smartwatch purchase
intention in Germany.
In the following section a detailed discussion of each of the model’s factors is conducted. Each
of those discussion section ends with the formulation of hypotheses for the respective factor in
regard to the research model.
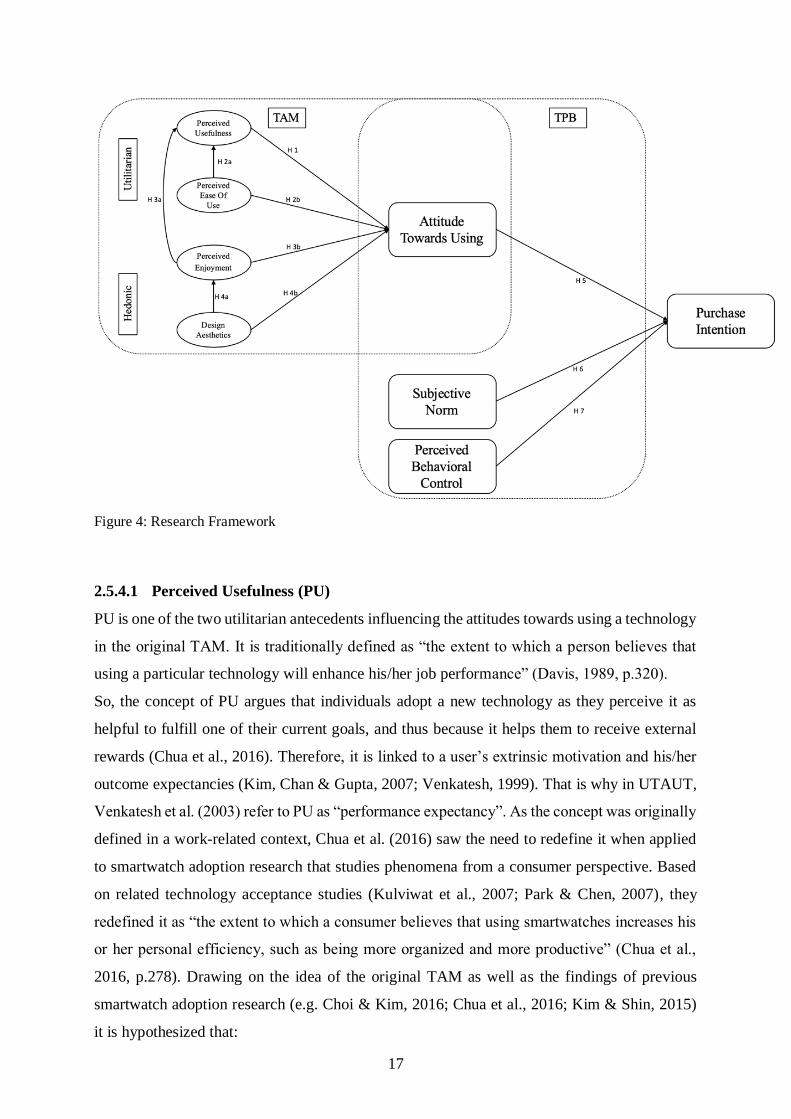
17
Figure 4: Research Framework
2.5.4.1 Perceived Usefulness (PU)
PU is one of the two utilitarian antecedents influencing the attitudes towards using a technology
in the original TAM. It is traditionally defined as “the extent to which a person believes that
using a particular technology will enhance his/her job performance” (Davis, 1989, p.320).
So, the concept of PU argues that individuals adopt a new technology as they perceive it as
helpful to fulfill one of their current goals, and thus because it helps them to receive external
rewards (Chua et al., 2016). Therefore, it is linked to a user’s extrinsic motivation and his/her
outcome expectancies (Kim, Chan & Gupta, 2007; Venkatesh, 1999). That is why in UTAUT,
Venkatesh et al. (2003) refer to PU as “performance expectancy”. As the concept was originally
defined in a work-related context, Chua et al. (2016) saw the need to redefine it when applied
to smartwatch adoption research that studies phenomena from a consumer perspective. Based
on related technology acceptance studies (Kulviwat et al., 2007; Park & Chen, 2007), they
redefined it as “the extent to which a consumer believes that using smartwatches increases his
or her personal efficiency, such as being more organized and more productive” (Chua et al.,
2016, p.278). Drawing on the idea of the original TAM as well as the findings of previous
smartwatch adoption research (e.g. Choi & Kim, 2016; Chua et al., 2016; Kim & Shin, 2015)
it is hypothesized that:
18
H1: PU positively influences the attitude towards using smartwatches.
2.5.4.2 Perceived Ease of Use (PEU)
PEU is the second utilitarian antecedent that influences the attitude towards using a technology
according to the original TAM. Davis (1989, p.320) defined it as “the degree to which a person
believes that using a particular system is free of effort”. PEU is thus driven by an individual’s
level of efficacy, so his/her self-assessment about his/her perceived competence in using the
technology (Venkatesh & Davis, 1996). It is therefore similar to the concept of “effort
expectancy” that Venkatesh et al. (2003) developed in UTAUT. In addition to that, it can be
also seen as similar to “intuitive usability” a factor that was shown to be valued highly by
Germans when deciding about purchasing a wearable device (Pricewaterhouse Coopers, 2015).
However, previous research on TAM has found out that PEU influences both directly and
indirectly the attitudes towards using a technology through PU (Venkatesh & Davis, 2000).
Those findings have also been replicated in several smartwatch adoption studies (e.g. Choe &
Noh, 2018; Kim & Shin, 2015). Therefore, following previous research on smartwatches that
was using TAM as well as German market research of wearables, it is hypothesized that:
H2a: PEU positively influences the German consumers’ PU of smartwatches.
H2b: PEU positively influences German consumers’ attitude of towards using smartwatches.
2.5.4.3 Perceived Enjoyment (PE)
PE is one of the additional hedonic aspects. It has already been previously defined as “the extent
to which the activity of using the computer is perceived to be enjoyable in its own right, apart
from any performance consequences that may be anticipated” (Bagozzi, Davis, & Warshaw,
1992, p. 659). PE is linked to intrinsic motivation as it focuses more on the process of
performing a behavior rather than on the behavior’s outcome (Choi & Kim, 2016). Previous
research has considered PE to be an important aspect in the adoption of information
technologies (Venkatesh, 2000). There are, for example, studies in this area that found a
positive effect of PE on the behavioral intention (Davis et al., 1992). More importantly,
however, especially in the adoption process of smartwatches, the dimension of PE has been
found to be highly relevant as those devices are to a great extent associated with fun and
entertainment (Kalantari, 2017). In line with those findings previous studies on smartwatch
adoption found a positive effect of PE on the attitude towards using (Choi & Kim, 2016; Wu et
al., 2016) as well as on the utilitarian dimension of PU (Ernst & Ernst, 2016b). In that regard
Sun and Zhang (2006) suggested that intrinsic motivations “increase the deliberation and
19
thoroughness of cognitive processing and lead to enhanced perceptions of ... extrinsic
motivation[s]” (p.629). Drawing on these findings for the dimension of PE it is hypothesized
that:
H3a: PE positively influences German consumers’ PU of smartwatches.
H3b: PE positively influences German consumers’ attitude towards using smartwatches.
2.5.4.4 Design Aesthetics (DA)
DA is the second hedonic aspect that has been added to the original TAM. In previous literature
about mobile commerce, it has been defined as “the balance, emotional appeal, or aesthetic of
a smartphone which may be expressed through color, shape, or animation” (Cyr, Head &
Ivanov, 2006, p.951). In line with Hsiao and Chen (2018) it is claimed here that this definition
holds true for smartwatches as well. As Choi and Kim (2016) found in their research,
smartwatches are considered not only as an IT but also as a fashion product. This again implies
that not only utilitarian but also hedonic aspects are important to consider in smartwatch
adoption studies. More specifically, however, being regarded as a fashion product entails that
the design of smartwatches is an important aspect for consumers in smartwatch adoption. This
is underlined by Jung et al. (2016), who found that shape and display size are important
influencing determinants for the evaluation of smartwatches. In addition to that, other academic
as well as German market research for wearable technologies in general (e.g. Hwang, Chung &
Sanders, 2016; Pricewaterhouse Coopers, 2015) and for smartwatches more specifically
(Deghani & Kim, 2019; Euromonitor International, 2018; Hsiao & Chen, 2018; Kranthi &
Asraar Ahmed, 2018) found that their design is an important influencing factor of their
adoption. In that regard Hsiao and Chen (2018) detected a positive effect of DA on the attitude
towards using smartwatches. Furthermore, Yang et al. (2016) found that wearable devices’
visual attractiveness also positively influences individual’s PE. Based on all those findings it is
hypothesized that:
H4a: DA positively influences German consumers’ PE of smartwatches.
H4b: DA positively influences German consumers’ attitude towards using smartwatches.
2.5.4.5 Attitude towards Using
The attitude towards using represents the dimension of the research model where TAM and
TPB overlap. So, in the underlying model TAM’s “attitude towards using” and TPB’s “attitude
20
towards behavior” depict the same dimension. In the context of technology acceptance, the
attitude towards using can be defined as the degree of people’s positive or negative valuations
on using technologies (Choi & Kim, 2016). Similar to that, according to TPB the attitudes
towards behavior are developed from behavioral beliefs that people hold about the behavior as
well as from the subjective evaluations of these beliefs (Ajzen, 1991). Those behavioral beliefs
are developed based on the beliefs about the object in question which are in turn formed by
associating this object with certain attributes (Ajzen, 1991). In the underlying case those
attributes are believed to be represented by the four dimensions PU, PEU, PE and DA. In line
with Ajzen’s (1991) notion it is believed that by evaluating smartwatches across those four
dimensions individuals link the behavior in question, i.e. the purchase of smartwatches, to a
positive and negative outcome and thus form a certain attitude towards that behavior. So, in the
research model of this thesis the attitude towards using is regarded as a consequence of the four
dimensions PU, PEU, PE and DA.
However, besides of being consequence of different factors, in line with the original versions
of TAM and TPB, several smartwatch adoption studies (e.g. Choi & Kim, 2016; Chua et al.,
2016; Hsiao & Chen, 2018; Wu et al., 2016) also found attitude to be an antecedent of the
intention to use or purchase those devices. More specifically, they revealed a positive
relationship between attitudes towards using and the intention to use or purchase smartwatches.
Therefore, for the empirical study of this thesis, it is hypothesized that:
H5: The attitude towards using smartwatches positively influences German consumers’
intention to purchase smartwatches.
However, as in this thesis’ research model TAM and TPB are combined, contrary to the
assumptions of the original TAM, the attitudes towards using are not considered as the only
antecedent of purchase intention but it is hypothesized that the latter is also influenced by the
SN and the PBC.
2.5.4.6 Subjective Norm (SN)
The SN is the second dimension of the TPB. It refers to “the perceived social pressure to
perform or not perform the behavior” (Ajzen, 1991, p.188). It originates from a person’s
normative beliefs, i.e. the beliefs on whether important referent groups or individuals approve
of performing a certain behavior or not (Ajzen, 1991). According to the original TPB
individuals score high on SN if their normative beliefs are strong and if they possess a strong
21
motivation to comply with these beliefs, i.e. if it is important for them to follow other
individuals or reference groups opinions. So according to Ajzen (1991) opinions of important
referent individuals or groups, such as family and friends, influence the intention to perform a
certain behavior. Previous studies on wearables devices (Turhan, 2015; Yang et al., 2016) and
on smartwatches in particular (Kranthi & Asraar Ahmed, 2018; Wu et al., 2016) have also
demonstrated the relevance of SN on the intention to adopt such technologies. Therefore, in
line with the assumption of the original TPB, in this thesis it is hypothesized that:
H6: SN positively influences German consumers’ intention to purchase smartwatches.
2.5.4.7 Perceived Behavioral Control (PBC)
PBC is the third dimension of the TPB. It is defined as the “perceived ease of difficulty of
performing the behavior” (Ajzen, 1991, p.188). PBC underlies the assumption that a desired or
planned behavior will be carried out only if the behavior is under volitional control (Ajzen,
1985, 1991). The concept is dependent on a person’s control beliefs which are beliefs on
whether there are factors that facilitate or impediment the execution of the behavior (Ajzen,
2002). According to Ajzen (1991), those control beliefs are formed based on a person’s own
past experience with the behavior but also based on second-hand information such as family
and friends experiences as well as by other factors that increase or reduce the person’s perceived
difficulty to carry out the respective behavior. So, control beliefs can be viewed as the beliefs
about an individual’s resources and opportunities to perform the behavior (Ajzen, 2002).
According to the original TPB individuals PBC is high if they possess strong control beliefs
and a high perceived power of the specific belief, i.e. a high power to facilitate the execution of
the behavior. Examples for factors that could hinder individuals in performing behavior of their
own free volition and that could thus decrease PBC would be limited ability, time,
environmental or organizational limits and unconscious habits (Bagozzi et al., 1992).
None of the previous smartwatch adoption studies has included the dimension of PBC in their
research. Based on the definition of that dimension, it is claimed here that for the specific case
of smartwatches people’s PBC could be especially dependent on the price and the ability to buy
smartwatches. This assumption is in line with Turhan (2013), who defined the dimension in a
similar way when he examined the influence of PBC on the acceptance of other wearable
technologies, namely smart bras and smart t-shirts. In addition to that, the hindering influence
of the high price of smartwatches on their adoption has also been revealed in previous research
on the German market (Euromonitor International 2018; PricewaterhouseCoopers, 2015).
22
Overall, previous research could identify a positive influence of PBC on the intention to adopt
or purchase wearable devices (Turhan, 2013; Wu et al., 2011). Therefore, in line with these
studies and with the assumptions of the original TAM in this thesis it is hypothesized that:
H7: PBC positively influences German consumers’ intention to purchase smartwatches.
2.5.4.8 Behavioral / Purchase Intention
The behavioral or purchase intention represents the second dimension of this thesis’ research
model where TAM and TPB overlap. According to the TPB, the behavioral intention is a
general indication of an individual’s readiness to perform a given behavior and it also refers to
the subjective probability of performing the behavior (Ajzen, 1991; Fishbein & Ajzen, 1975).
Behavioral intention is thus closely linked to people’s motivation to perform the behavior in
question (Ajzen, 1991). It is considered to be a meaningful predictor of actual behavior (Mao
& Palvia, 2006). Unlike in TAM, it is hypothesized here that the intention to purchase
smartwatches is not only solely dependent on people’s attitudes towards purchasing them but
also on the SN and the PBC. Therefore, in this aspect, this thesis’ research framework follows
the TPB and Ajzen’s (1991) general rule according to which the more favorable the attitude
and the SN and the greater the PBC, the stronger the individual’s intention to perform the
behavior of interest; which is in the underlying case the purchase of a smartwatch.
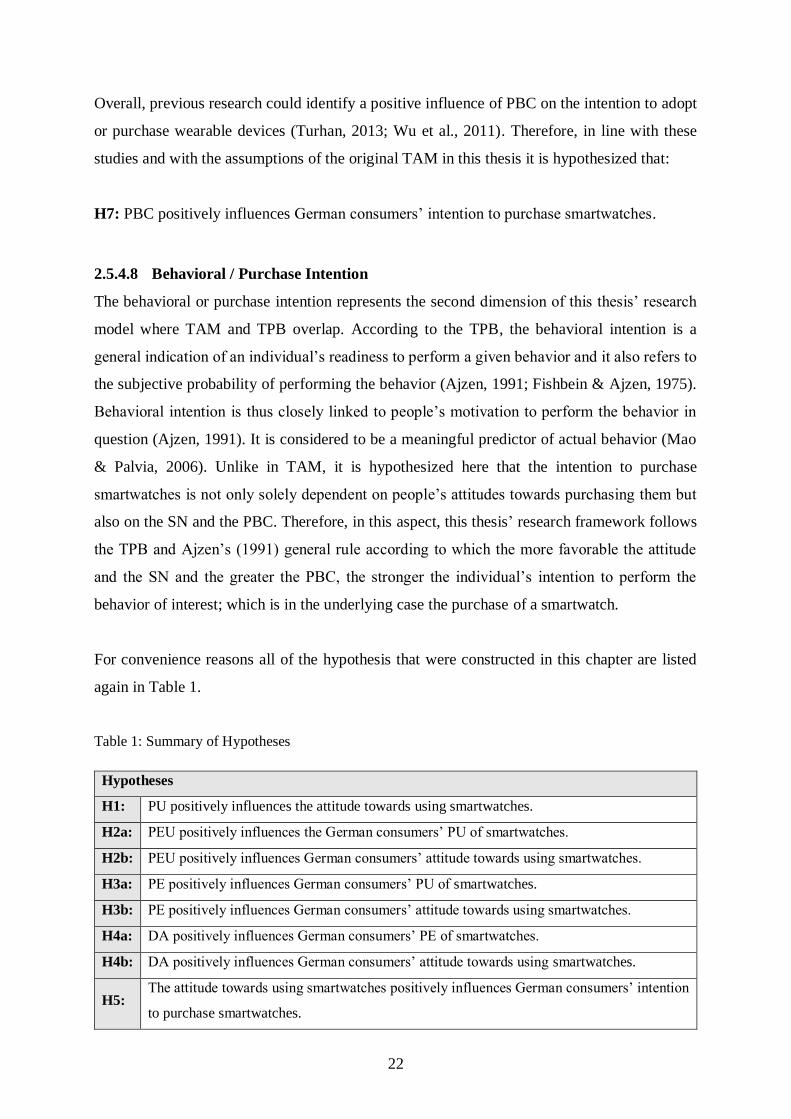
For convenience reasons all of the hypothesis that were constructed in this chapter are listed
again in Table 1.
Table 1: Summary of Hypotheses
Hypotheses
H1: PU positively influences the attitude towards using smartwatches.
H2a: PEU positively influences the German consumers’ PU of smartwatches.
H2b: PEU positively influences German consumers’ attitude towards using smartwatches.
H3a: PE positively influences German consumers’ PU of smartwatches.
H3b: PE positively influences German consumers’ attitude towards using smartwatches.
H4a: DA positively influences German consumers’ PE of smartwatches.
H4b: DA positively influences German consumers’ attitude towards using smartwatches.
H5: The attitude towards using smartwatches positively influences German consumers’ intention
to purchase smartwatches.

23
H6: SN positively influences German consumers’ intention to purchase smartwatches.
H7: PBC positively influences German consumers’ intention to purchase smartwatches.
24
3 Methodology
The purpose of this chapter is to identify the research philosophy, the research approach and
the research purpose and generally provide a structured guideline of how the research method
is approached in this social research.
A well-chosen research method and a good design will impact the reliability of the results
discussed later in this thesis (Saunders, Lewis & Thornhill, 2009). The research method is the
fundament of any academic study. If it is conducted critically and accurately, it decreases
inaccuracy, uncertainty and confusion and underlines the reliability of the results (Bryman,
2012).
3.1 Research Philosophy
The research philosophy contains important assumptions about how researchers interpret their
surroundings (Saunders et al., 2009). Additionally, these assumptions support the research
strategy and the methods chosen as part of that strategy (Saunders et al., 2009).
There are four different research philosophies: Positivism, realism, interpretivism and
pragmatism (Saunders et al., 2009). They differ in ontology, epistemology and axiology.
Ontology is about the nature of reality, epistemology concerns what constitutes acceptable
knowledge in a field of study and axiology is a branch of philosophy that studies judgements
about value (Babin & Zikmund, 2016).
Realism focuses on what people see and experience in terms of underlying structures or theories
(Saunders et al., 2009). Within interpretivism, humans are different from physical phenomena
as they create meanings within the social world and therefore cannot be examined the same
way as scientific topics (Saunders et al., 2009). Pragmatism states that research starts with a
problem and wants to find a practical solution to solve it for the future which indicates that a
pragmatist is more interested in practical outcomes rather than abstract distinctions (Babin &
Zikmund, 2016).
For this thesis, a positivist research philosophy is chosen. The researcher’s ontology is external,
objective and independent of all social actors (Saunders et al., 2009). Positivist researchers hold
the same view as natural scientists, which are convinced that reasonable data can only be
25
produced from observation - the focus is set on causality and law-like generalizations
(epistemology) (Saunders et al., 2009). Furthermore, the research is done value-free and the
researches are neutral and independent and maintain an objective attitude to not affect the
results in any way (axiology) (Saunders et al., 2009). In this thesis, two existing theoretical
frameworks are combined and extended to collect structured data to measure the hypotheses.
Those hypotheses were tested, and they were either supported or not supported in order to obtain
the research objectives. The entire research is highly structured and includes a large sample size
within a quantitative measurement – this also is a characteristic of a positivist research
philosophy.
3.2 Research Approach
In literature two main research approaches are used: Deduction and induction:
Induction avoids theory expressed in hypotheses as they say it would close off possible inquiry
areas (Malhotra, Birks & Wills, 2012). So, within induction only limited or even no theory is
used, and it is started with the mainly qualitative data collection in order to explain broader
phenomena and develop a model based on their findings (Malhotra et al., 2012).
This thesis aims to explore the reasons for consumers to purchase smartwatches and the
approach to identify these influencing factors has been deductive.
Deduction is the main approach in scientific research as well-developed theories are used to
move from theory to own gathered data (Saunders et al., 2009). It relies on the objective
collection and analysis of facts and data. After that, hypotheses are formulated which will be
investigated by gathering own quantitative data (Saunders et al., 2009). In the underlying thesis,
the authors first extensively scanned academic literature and build a framework in order to
collect their own primary data afterwards.
Another important aspect of deduction is to explain causal relationships by finding correlations
between variables. Therefore, the approach has to be highly structured and needs the application
of control to ensure the validity of the given data (Saunders et al., 2009).
Additionally, a deductive approach requires sample sizes of sufficient numerical size to be able
to generalize statistically about human social behavior (Saunders et al., 2009).
The authors formulated hypotheses on the basis of the researched theory. The existing theory
was extended with a framework which combines the TPB and the TAM and additionally adds
two factors (PE and DA). The authors tested the formulated hypotheses by looking for
correlations in an empirical study. With the help of a large sample size, generalizable results
26
were obtained. The results of the study showed, whether the formulated hypotheses were true
for consumers who purchase smartwatches.
3.3 Research Purpose
According to Saunders et al. (2009), there are three different research purposes: exploratory,
descriptive and explanatory. An exploratory study is particularly used if a research wants to
clarify an understanding of a problem. A descriptive study portrays profiles of persons, events
or situations (Robson, 2002). Explanatory studies establish causal relationships between
variables (Saunders et al., 2009).
The purpose of this thesis is to get insights on consumers’ purchase intention of smartwatches.
Therefore, the authors want to establish correlations between certain variables such as attitudes
or subjective norms onto purchase intention – thus, they want to detect phenomena about a
certain situation. Hence, this thesis is of a descriptive nature.
3.4 Research Design and Research Strategy
The research design can either be qualitative, quantitative or a mixture of both (Saunders et al.,
2009). As there already has been research conducted on the purchasing intention of
smartwatches on other markets, the authors decided to use a quantitative research design in
order to use the gathered data and knowledge of other researchers and to apply it onto German
consumers.
Quantitative approaches offer various advantages in comparison to qualitative ones: The
researchers have the opportunity to gather precise data and access a larger sample size. That
secures generalizability, objectivity and also reliability (Malhotra et al., 2012).
The quantitative research strategy in this thesis is an online survey (Appendix 4 & 5). Surveys
are usually associated within a deductive approach and it allows researchers to collect
quantitative data (Saunders et al., 2009). The gathered data are standardized and allow to be
easily compared (Saunders et al., 2009). In addition, the collected data can be used to suggest
possible reasons for certain relationships between variables (Saunders et al., 2009; Malhotra et
al., 2012).
Researchers have more control over the entire research process when using a survey and on top
of that they do not influence the respondents in their answers. The results are independent of
27
the general framework of the study because the researchers stay external during the research
process (Weinreich, 2010).
Nevertheless, there are also some disadvantages of quantitative research which are worth
mentioning here. Saunders et al. (2009) state that one is very dependent on others in order to
gather enough data to generalize. Therefore, progress can be delayed. Additionally, the number
of asked questions in a survey is limited which can make the survey method less detailed
(Saunders et al., 2009).
The authors were aware of these disadvantages, but still perceived a quantitative method to be
most suitable for this study.
3.5 Data Collection Method
To collect data, the authors decided to design a self-administrated questionnaire (Appendix 4
& 5). A self-administrated questionnaire is a survey “in which the respondent takes the
responsibility for reading and answering the questions without having them stated orally by an
interviewer” (Babin & Zikmund, 2016, p.187). So, this data collection method implies that the
respondents answer the questions autonomously and that the researcher is not present when the
survey is completed. The authors decided to administer the survey online on the platform
“Qualtrics” and distributed it via the messenger application WhatsApp (for more detailed
explanation on this see “3.7 Population Sampling”).
More in general, the decision for an internet survey was made as it offers various advantages,
most importantly the speed and cost-effectiveness as large samples from different parts of
Germany can be reached within a short time and, compared to a paper-based survey,
administrative costs such as those for printing and postage are eliminated (Babin & Zikmund,
2016). Moreover, internet-based surveys allow an accurate real-time capture as they allow
respondents to immediately record their answers into a data file and also offer the possibility to
prohibit improper data entries (Babin & Zikmund, 2016). Specifically, the further characteristic
was considered to be very helpful as it allowed the authors to save time compared to a situation
where they needed to manually input the data into the statistical software IBM SPSS 24
Statistics (SPSS) that was used for data analysis. Furthermore, it also reduces the risk of errors
that might occur when the data is put in manually. In addition to that, as the sample of this study
were smartphone users in Germany - and thus technology- and internet-literate people - working
with an internet survey was regarded to fit well. After all the data were collected digitally via
“Qualtrics” they were exported to SPSS and were analyzed there.
28
In this research the demographic variables gender, age, occupation, education and income as
well as the dimensions PEU, DA, SN and PBC were the independent variables which were
believed to directly or indirectly influence the dependent variable purchase intention. PU, PE
and attitude, in contrast, were both dependent and independent variables. That is the case as
attitude was hypothesized to be influenced by PU, PEU, PE and DA and at the same time was
believed to influence to purchase intention. Similarly, PU was perceived to be influenced by
PEU and PE and, in turn, possibly influences attitude. Lastly, PE was believed to be influenced
by DA and possibly influences PU and attitude. So, in this thesis the authors would like to find
out correlations between the independent and dependent variables - more specifically they
would like to test the relationships between dependent and independent variables on their
significance. In that way the authors were able uncover patterns in the data which helped them
get a picture of the factors that influenced the purchase intention of smartwatches in Germany.
3.6 Survey Design
A self-administered quantitative online survey was chosen in order to collect data from the
respondents. As the study concerned the German market beside the original English version,
due to convenience reasons, also a German variant of the questionnaire was provided so that
respondents could choose between one of those two languages when filling out the
questionnaire. It was clearly expected that the great majority of the respondents would fill out
the German translation of the survey, however, in order to provide them with some choice, it
was still decided to also make the original English version of the questionnaire available to
them.
In order to appeal to respondent’s responsibility to fill out the survey truthfully and honestly,
while distributing the questionnaire, they were told about the purpose of this research,
specifically that it is part of a master thesis at Jönköping International Business School.
Furthermore, the authors attempted to keep the questionnaire as short as possible as it was
recognized that - due to the fact that an extensive research framework needed to be tested -
there was risk that the survey finally consisted of too many questions if it was not paid specific
attention on that. A too long questionnaire could reduce the number of usable responses as
respondents may get bored while filling it out and would therefore not finish it. In addition to
that, it could also lead to a respondent error and therefore substantially impact the
meaningfulness of the results as people may just select any answer without thinking too much
about it in order to finish the survey. To avoid such situations the authors decided to test each
dimension with just three to four closed-ended questions that have already been validated by
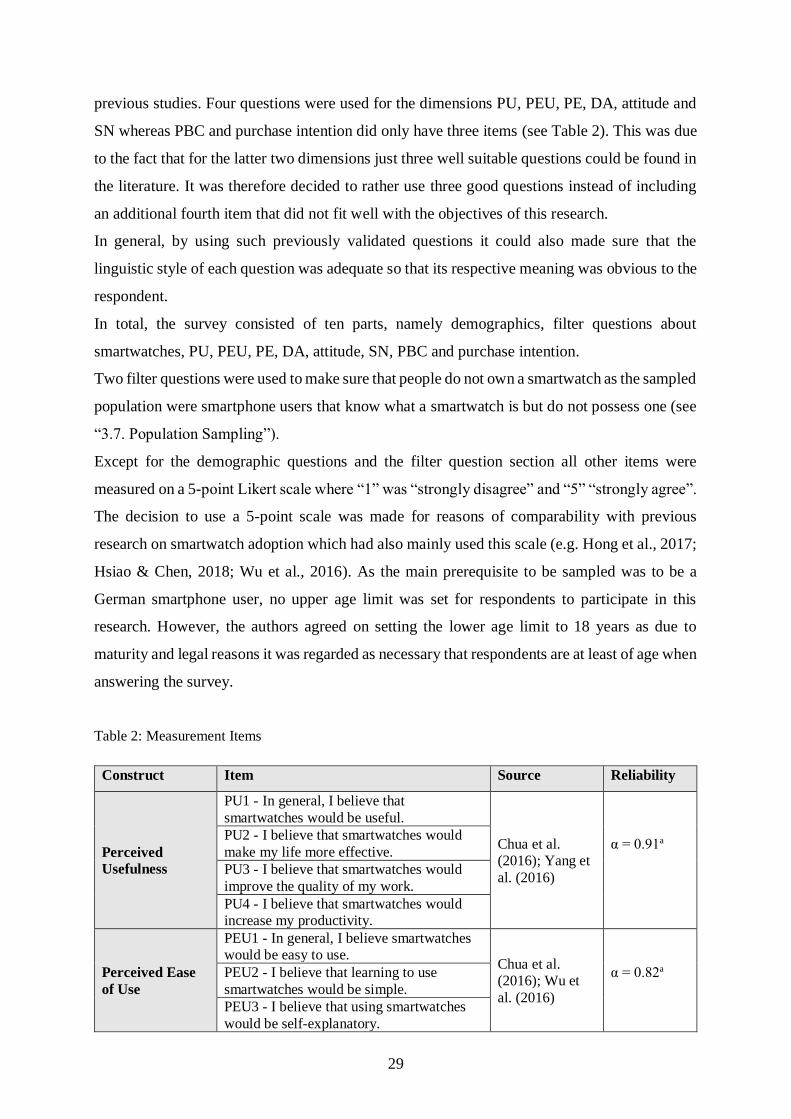
29
previous studies. Four questions were used for the dimensions PU, PEU, PE, DA, attitude and
SN whereas PBC and purchase intention did only have three items (see Table 2). This was due
to the fact that for the latter two dimensions just three well suitable questions could be found in
the literature. It was therefore decided to rather use three good questions instead of including
an additional fourth item that did not fit well with the objectives of this research.
In general, by using such previously validated questions it could also made sure that the
linguistic style of each question was adequate so that its respective meaning was obvious to the
respondent.
In total, the survey consisted of ten parts, namely demographics, filter questions about
smartwatches, PU, PEU, PE, DA, attitude, SN, PBC and purchase intention.
Two filter questions were used to make sure that people do not own a smartwatch as the sampled
population were smartphone users that know what a smartwatch is but do not possess one (see
“3.7. Population Sampling”).
Except for the demographic questions and the filter question section all other items were
measured on a 5-point Likert scale where “1” was “strongly disagree” and “5” “strongly agree”.
The decision to use a 5-point scale was made for reasons of comparability with previous
research on smartwatch adoption which had also mainly used this scale (e.g. Hong et al., 2017;
Hsiao & Chen, 2018; Wu et al., 2016). As the main prerequisite to be sampled was to be a
German smartphone user, no upper age limit was set for respondents to participate in this
research. However, the authors agreed on setting the lower age limit to 18 years as due to
maturity and legal reasons it was regarded as necessary that respondents are at least of age when
answering the survey.
Table 2: Measurement Items
Construct Item Source Reliability
Perceived
Usefulness
PU1 - In general, I believe that
smartwatches would be useful.
Chua et al.
(2016); Yang et
al. (2016)
α = 0.91a
PU2 - I believe that smartwatches would
make my life more effective.
PU3 - I believe that smartwatches would
improve the quality of my work.
PU4 - I believe that smartwatches would
increase my productivity.
Perceived Ease
of Use
PEU1 - In general, I believe smartwatches
would be easy to use. Chua et al.
(2016); Wu et
al. (2016)
α = 0.82a
PEU2 - I believe that learning to use
smartwatches would be simple.
PEU3 - I believe that using smartwatches
would be self-explanatory.
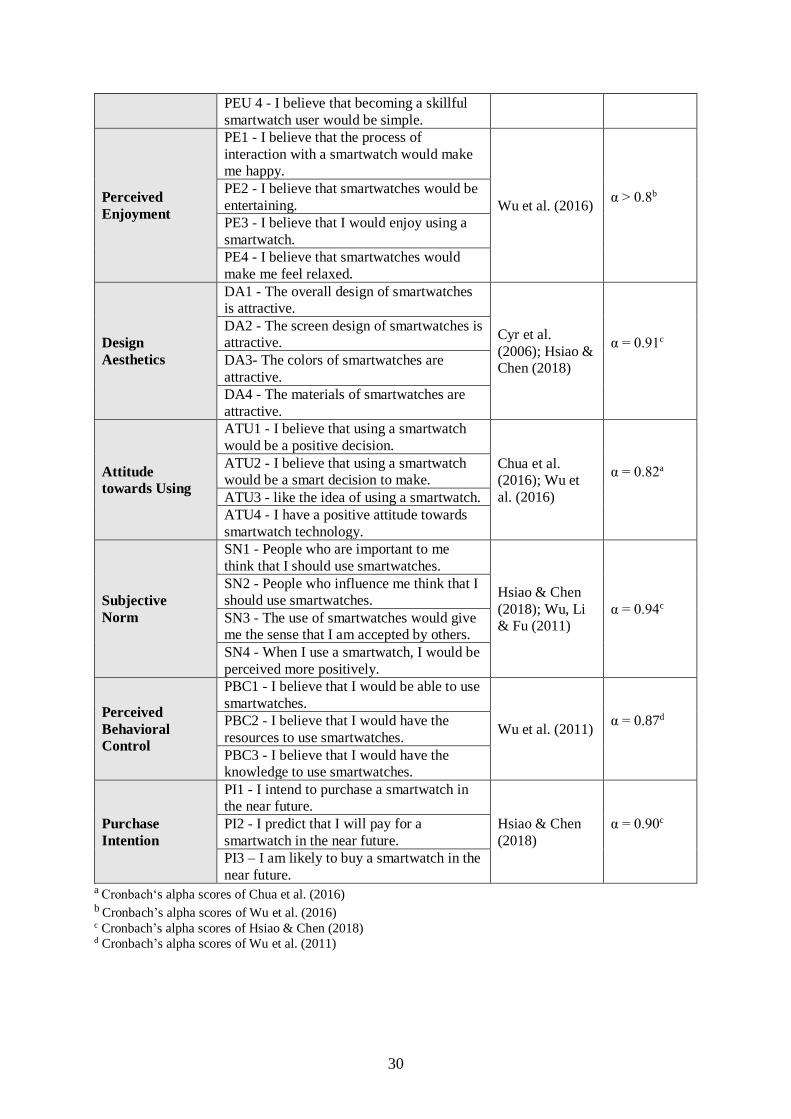
30
PEU 4 - I believe that becoming a skillful
smartwatch user would be simple.
Perceived
Enjoyment
PE1 - I believe that the process of
interaction with a smartwatch would make
me happy.
Wu et al. (2016) α > 0.8b
PE2 - I believe that smartwatches would be
entertaining.
PE3 - I believe that I would enjoy using a
smartwatch.
PE4 - I believe that smartwatches would
make me feel relaxed.
Design
Aesthetics
DA1 - The overall design of smartwatches
is attractive.
Cyr et al.
(2006); Hsiao &
Chen (2018)
α = 0.91c
DA2 - The screen design of smartwatches is
attractive.
DA3- The colors of smartwatches are
attractive.
DA4 - The materials of smartwatches are
attractive.
Attitude
towards Using
ATU1 - I believe that using a smartwatch
would be a positive decision.
Chua et al.
(2016); Wu et
al. (2016)
α = 0.82a
ATU2 - I believe that using a smartwatch
would be a smart decision to make.
ATU3 - like the idea of using a smartwatch.
ATU4 - I have a positive attitude towards
smartwatch technology.
Subjective
Norm
SN1 - People who are important to me
think that I should use smartwatches.
Hsiao & Chen
(2018); Wu, Li
& Fu (2011)
α = 0.94c
SN2 - People who influence me think that I
should use smartwatches.
SN3 - The use of smartwatches would give
me the sense that I am accepted by others.
SN4 - When I use a smartwatch, I would be
perceived more positively.
Perceived
Behavioral
Control
PBC1 - I believe that I would be able to use
smartwatches.
Wu et al. (2011) α = 0.87d
PBC2 - I believe that I would have the
resources to use smartwatches.
PBC3 - I believe that I would have the
knowledge to use smartwatches.
Purchase
Intention
PI1 - I intend to purchase a smartwatch in
the near future.
Hsiao & Chen
(2018)
α = 0.90c
PI2 - I predict that I will pay for a
smartwatch in the near future.
PI3 – I am likely to buy a smartwatch in the
near future. a Cronbach‘s alpha scores of Chua et al. (2016) b Cronbach’s alpha scores of Wu et al. (2016) c Cronbach’s alpha scores of Hsiao & Chen (2018) d Cronbach’s alpha scores of Wu et al. (2011)
31
3.7 Population and Sampling
As this research attempted to study the purchase intention of smartwatches, it made sense to
only survey people who do not own a smartwatch yet. More specifically, the authors decided
to survey potential adopters of smartwatches. In line with Hsiao and Chen (2018) smartphone
users were regarded as potential adopters of smartwatches as generally smartwatches need to
be paired with smartphones in order to develop most parts of their functionality – which means
that possessing a smartwatch without a smartphone does not make much sense.
For this research’s empirical study, it was thus necessary to sample individuals who fall into
that category. To do so and to make sure that enough responses were obtained the authors chose
to make use of a non-probability snowball sampling approach. This is a technique in which
initial respondents are selected by the authors using a non-probability sampling approach and
those respondents are then used to find additional respondents (Babin & Zikmund, 2016). More
specifically, in this case the authors first sent the link to the questionnaire via the messenger
application WhatsApp to their German family and friends and then asked them to further
distribute it via the same medium to their German relatives and acquaintances (Babin &
Zikmund, 2016). The distribution via WhatsApp was used as in that way it could be ensured
that all respondents owned a smartphone since this messenger application can only be used in
combination with a smartphone. Apart from that, with a market penetration rate of 83.4%
WhatsApp is by far the most popular messenger application in Germany and is used by the vast
majority of smartphone users in Germany (eMarketer, 2018). This indicates that most of the
German smartphone users could be reached when distributing a survey via WhatsApp. As in
order to be sampled for the underlying research, the respondents needed to be Germans who
are smartphone users and know what a smartwatch is but do not own one, it can be argued that
a judgement sampling approach was used to select the initial respondents for this study as those
respondents were selected based on the authors’ judgement (Babin & Zikmund, 2016). Whereas
the check whether respondents do not own a smartwatch but know what it is was carried out by
means of two filter questions at the beginning of the survey itself (see “3.6 Survey Design”),
their ownership of a smartphone was ensured during the data collection by only contacting
individuals via the messenger application WhatsApp.
3.8 Analyses of Data
All the data from the respondents was collected in an internet survey on the platform “Qualtrics”
which means that everything was stored digitally and could thus be easily exported to the
statistic software SPSS that was used to analyze the data.
32
The variables used in this research were dichotomous, nominal and ordinal (Saunders et al.,
2009). In total, five different tests had been conducted to analyze the data. As a first step, the
frequencies were analyzed. This helped the authors to identify important characteristics of each
of the applied items – such as their means, standard deviations and missing values. After that,
a reliability analysis by means of Cronbach’s alpha was carried out. This test was conducted to
ensure that all those items that measured the same construct provided consistently similar
results so that the scale of the construct was reliable (Pallant, 2005). Following on that, a factor
analysis was carried out to further check whether the items that were assigned to one of the two
utilitarian/ hedonic dimensions did exclusively load to this dimension and not the other
utilitarian/ hedonic dimension. Finally, in order to test the hypotheses, a Pearson correlation
analysis as well as a multiple regression analysis had been conducted. The Pearson correlation
was used to find out whether a significant correlation between two variables (i.e. dimensions)
under question existed and what the strength and direction of this relationship was. Following
on that, a multiple regression was performed in order obtain a more detailed result about the
interrelationships between the respective variables. With the multiple regression more than one
relationship between the variables could be tested at the same time and it could be determined
which variable of a set of independent variables made the strongest contribution to the
explanation of a dependent variable and whether this contribution was significant (Pallant,
2005).
3.9 Limitations of Methodology
It is important to mention that using quantitative methods does not only come with advantages.
In contrast, there are several limitations of this research methodology.
Most importantly, unlike qualitative studies, quantitative ones do not take into account
individual’s emotional reactions to the questions asked in the survey. These reactions could,
however, provide valuable information about individuals’ true inner meanings and feelings
about a specific question (Babin & Zikmund, 2016). Thus, not considering them and instead
just relying on what answer respondents selected in the survey could limit the meaningfulness
of the study. In addition to that, quantitative studies that make use of self-administered
questionnaires, such as the study carried out in this thesis, may be more prone to response errors
caused by unconscious misrepresentation due to the fact that respondents do not have the
possibility to ask an interviewer if they do not fully understand a question (Babin & Zikmund,
2016). It is important to take those limitations into account when conducting quantitative
research.
33
Furthermore, a specific limitation of the underlying study lies in the fact that by using snowball
sampling there might be a potential for bias as those respondents that are selected by the initial
respondents might be similar to themselves (Babin & Zikmund, 2016). In addition to that,
although the distribution medium WhatsApp has a very high market penetration in Germany,
there are still a few smartphone users that do not use this messenger application. Due to the
questionnaire distribution criteria they were neglected in this study.
3.10 Reliability and Validity
3.10.1 Reliability
Reliability is an indicator of a measure’s internal consistency (Babin & Zikmund, 2016). Should
different attempts to measure a dimension come to the same result then that measure is
considered to be reliable (Babin & Zikmund, 2016). To be able assess the reliability of each of
the dimensions tested in the survey for all of those dimensions three to four previously validated
questions that essentially ask similar things, were provided for each dimension (see Table 2).
Following on that, the internal consistency of the answers given on those questions was tested
by calculating Cronbach’s alpha scores (see chapter 4.3).
3.10.2 Validity
Validity is concerned with a measure’s accuracy or the degree to which a concept is truthfully
represented by the scores obtained (Babin & Zikmund, 2016). So, validity indicates whether a
measure truly measures what it intends to measure (Babin & Zikmund, 2016). In order to be
valid a measure needs to possess face validity (Babin & Zikmund, 2016). Face validity is
present if professionals agree that the scale which is applied reflects the concept that is
measured. It can be argued that the scales that were used in the underlying research possessed
face validity as they had all been used in previous studies on similar topics and had thus already
been validated.
3.10.3 Pilot Testing
Before the survey was distributed a pilot testing had taken place in order to make sure that the
questionnaire was logically constructed and easily understandable for the respondents. In total
five subjects that belong to the sampled population participated in this pilot test.
In general, all subjects were satisfied with the length of the questionnaire. They were able to
complete it in 5-7 minutes and did thus not perceive it as too long.
34
However, the authors received some remarks about the understandability of the questionnaire.
Some pilot study participants indicated that they had problems to understand the labelling of
the German version of the Likert scale. More specifically, they did not understand the difference
between the German labels for “agree/disagree” and for “strongly agree/strongly disagree”. In
addition to that, some pilot respondents did not completely understand the difference between
some of the adjectives used in the items that should test the dimensions in the German version
of the questionnaire. After showing them the original English version of those items, it became
apparent that it was the way those adjectives were translated into German that let to
misunderstandings. Therefore, together with the participants the authors adapted both the
labelling of the German version of the Likert Scale as well as the translation of some adjectives
towards more suitable ones.
3.11 Ethical Considerations
It can be ensured at this stage that all the data that were provided by this research’s respondents
was treated confidentially. The authors explicitly obliged themselves to not reveal any
information given by the respondents for the sake of this research. Respondents were ensured
that their data was solely collected for the research purpose. It was recognized that particularly
email and internet survey lack some anonymity as their responses could be theoretically traced
back to the respondents by means of their IP address. However, the authors specifically ensured
them this will not be done in the course of the underlying research.
35
4 Empirical Findings
The purpose of this chapter is to present the empirical findings of the study. First, the
demographic sample is described. Second, descriptive statistics are presented, followed by the
reliability testing and a factor analysis. After that, all the hypotheses are tested using
correlation analysis and linear regression.
4.1 Demographic Sample
In total, 354 responses were collected by the distribution of the online survey via the direct
messenger application WhatsApp.
Nevertheless, out of these 354 respondents only 245 could be used for further analysis. 12
respondents were under 18 years old and did not match the sample. Besides that, 20 did not
know what a smartwatch was and thus were excluded from further analysis. Another 66
respondents already owned a smartwatch. These respondents also did not meet the sampling
requirements, since their purchase already occurred (see chapter 3.7).
From the remaining 256 respondents, 11 had to be removed since their survey was not
completed. The result of 245 respondents was acceptable as the minimum size for problem-
solving research is 200 (Malhotra et al., 2012).
Out of these 245 respondents 51% (125) were female and 49% (120) were male. The most
represented age group within the 245 respondents were 18 – 24 years old (39.6%; 97
respondents), followed by the 25 – 34 years old respondents (31.4%; 77 respondents). An
explanation for this phenomenon could be the higher smartphone penetration among younger
generations as well as the fact that the sample consisted mostly out of acquaintances of the
authors who were of a similar age. Out of these, 31.8% (78 respondents) were holding a
bachelor’s degree.
A majority of the respondents were currently employed (46.9%; 115 respondents) or students
(43.4%; 106 respondents). Additionally, 40.4% (99 respondents) earned less than 1,000 € per
month which also supported the view that most of the respondents were students.
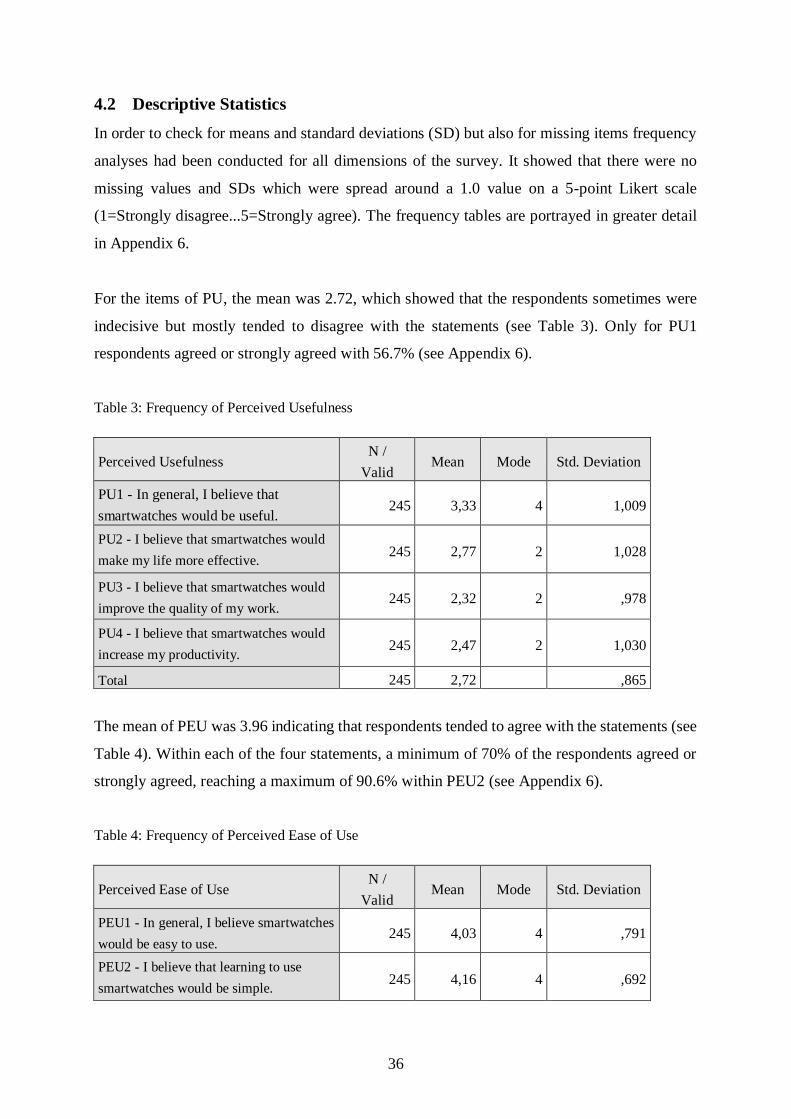
36
4.2 Descriptive Statistics
In order to check for means and standard deviations (SD) but also for missing items frequency
analyses had been conducted for all dimensions of the survey. It showed that there were no
missing values and SDs which were spread around a 1.0 value on a 5-point Likert scale
(1=Strongly disagree...5=Strongly agree). The frequency tables are portrayed in greater detail
in Appendix 6.
For the items of PU, the mean was 2.72, which showed that the respondents sometimes were
indecisive but mostly tended to disagree with the statements (see Table 3). Only for PU1
respondents agreed or strongly agreed with 56.7% (see Appendix 6).
Table 3: Frequency of Perceived Usefulness
Perceived Usefulness N /
Valid Mean Mode Std. Deviation
PU1 - In general, I believe that
smartwatches would be useful. 245 3,33 4 1,009
PU2 - I believe that smartwatches would
make my life more effective. 245 2,77 2 1,028
PU3 - I believe that smartwatches would
improve the quality of my work. 245 2,32 2 ,978
PU4 - I believe that smartwatches would
increase my productivity. 245 2,47 2 1,030
Total 245 2,72 ,865
The mean of PEU was 3.96 indicating that respondents tended to agree with the statements (see
Table 4). Within each of the four statements, a minimum of 70% of the respondents agreed or
strongly agreed, reaching a maximum of 90.6% within PEU2 (see Appendix 6).
Table 4: Frequency of Perceived Ease of Use
Perceived Ease of Use N /
Valid Mean Mode Std. Deviation
PEU1 - In general, I believe smartwatches
would be easy to use. 245 4,03 4 ,791
PEU2 - I believe that learning to use
smartwatches would be simple. 245 4,16 4 ,692
37
PEU3 - I believe that using smartwatches
would be self-explanatory. 245 3,82 4 ,884
PEU 4 - I believe that becoming a skillful
smartwatch user would be simple. 245 3,87 4 ,900
Total 245 3,96 ,705
The mean of PE was 2.75, demonstrating respondents sometimes were indecisive but mostly
tended to disagree with the statements (see Table 5). Only the PE2 (I believe that smartwatches
would be entertaining.) had 56.8% of the respondents agreeing or strongly agreeing. The rest
of the statements had more than 40% of the respondents disagreeing or strongly disagreeing
each, reaching a maximum of 62.8% at PEU4 (see Appendix 6).
Table 5: Frequency of Perceived Enjoyment
Perceived Enjoyment N /
Valid Mean Mode Std. Deviation
PE1 - I believe that the process of
interaction with a smartwatch would
make me happy.
245 2,60 2 1,168
PE2 - I believe that smartwatches would
be entertaining. 245 3,32 4 1,089
PE3 - I believe that I would enjoy using a
smartwatch. 245 2,81 4 1,158
PE4 - I believe that smartwatches would
make me feel relaxed. 245 2,28 2 ,952
Total 245 2,75 ,914
The mean of DA was 3.19, indicating that respondents tended to slightly agree with these
statements (see Table 6).
Table 6: Frequency of Design Aesthetics
Design Aesthetics N /
Valid Mean Mode Std. Deviation
DA1 - The overall design of
smartwatches is attractive. 245 3,13 4 1,072
DA2 - The screen design of smartwatches
is attractive. 245 3,08 4 1,060
DA3- The colors of smartwatches are
attractive. 245 3,30 4 ,913
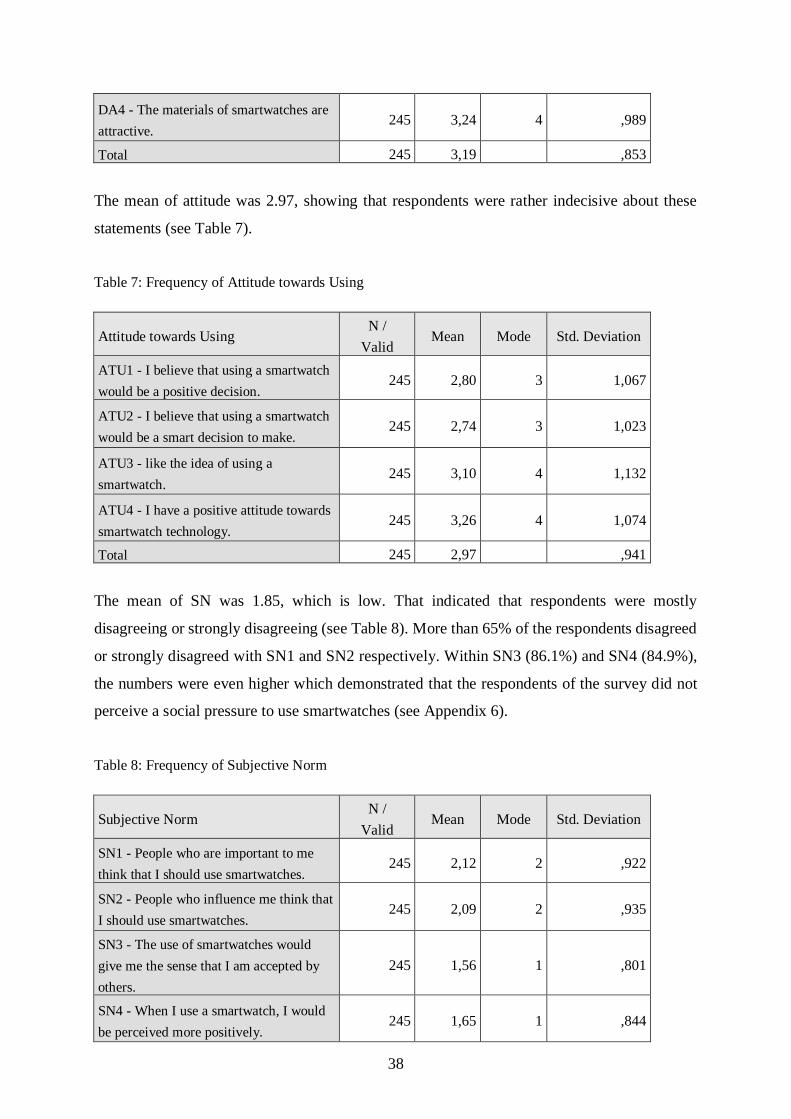
38
DA4 - The materials of smartwatches are
attractive. 245 3,24 4 ,989
Total 245 3,19 ,853
The mean of attitude was 2.97, showing that respondents were rather indecisive about these
statements (see Table 7).
Table 7: Frequency of Attitude towards Using
Attitude towards Using N /
Valid Mean Mode Std. Deviation
ATU1 - I believe that using a smartwatch
would be a positive decision. 245 2,80 3 1,067
ATU2 - I believe that using a smartwatch
would be a smart decision to make. 245 2,74 3 1,023
ATU3 - like the idea of using a
smartwatch. 245 3,10 4 1,132
ATU4 - I have a positive attitude towards
smartwatch technology. 245 3,26 4 1,074
Total 245 2,97 ,941
The mean of SN was 1.85, which is low. That indicated that respondents were mostly
disagreeing or strongly disagreeing (see Table 8). More than 65% of the respondents disagreed
or strongly disagreed with SN1 and SN2 respectively. Within SN3 (86.1%) and SN4 (84.9%),
the numbers were even higher which demonstrated that the respondents of the survey did not
perceive a social pressure to use smartwatches (see Appendix 6).
Table 8: Frequency of Subjective Norm
Subjective Norm N /
Valid Mean Mode Std. Deviation
SN1 - People who are important to me
think that I should use smartwatches. 245 2,12 2 ,922
SN2 - People who influence me think that
I should use smartwatches. 245 2,09 2 ,935
SN3 - The use of smartwatches would
give me the sense that I am accepted by
others.
245 1,56 1 ,801
SN4 - When I use a smartwatch, I would
be perceived more positively. 245 1,65 1 ,844
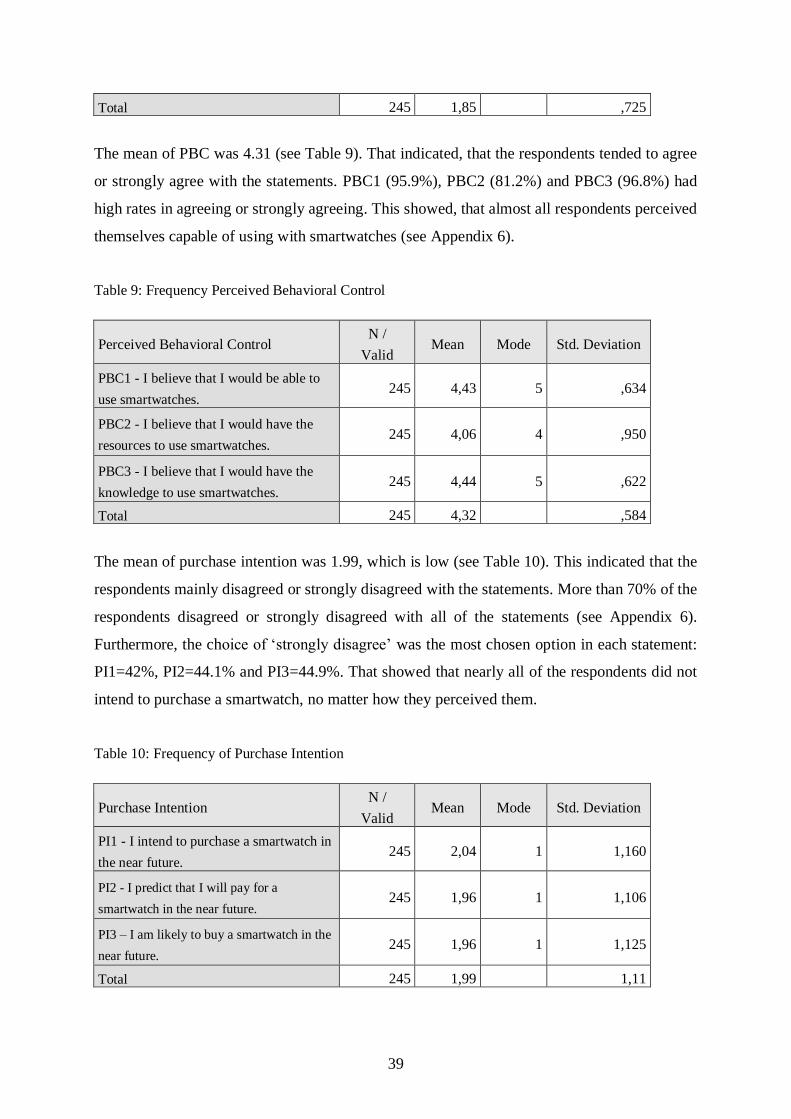
39
Total 245 1,85 ,725
The mean of PBC was 4.31 (see Table 9). That indicated, that the respondents tended to agree
or strongly agree with the statements. PBC1 (95.9%), PBC2 (81.2%) and PBC3 (96.8%) had
high rates in agreeing or strongly agreeing. This showed, that almost all respondents perceived
themselves capable of using with smartwatches (see Appendix 6).
Table 9: Frequency Perceived Behavioral Control
Perceived Behavioral Control N /
Valid Mean Mode Std. Deviation
PBC1 - I believe that I would be able to
use smartwatches. 245 4,43 5 ,634
PBC2 - I believe that I would have the
resources to use smartwatches. 245 4,06 4 ,950
PBC3 - I believe that I would have the
knowledge to use smartwatches. 245 4,44 5 ,622
Total 245 4,32 ,584
The mean of purchase intention was 1.99, which is low (see Table 10). This indicated that the
respondents mainly disagreed or strongly disagreed with the statements. More than 70% of the
respondents disagreed or strongly disagreed with all of the statements (see Appendix 6).
Furthermore, the choice of ‘strongly disagree’ was the most chosen option in each statement:
PI1=42%, PI2=44.1% and PI3=44.9%. That showed that nearly all of the respondents did not
intend to purchase a smartwatch, no matter how they perceived them.
Table 10: Frequency of Purchase Intention
Purchase Intention N /
Valid Mean Mode Std. Deviation
PI1 - I intend to purchase a smartwatch in
the near future. 245 2,04 1 1,160
PI2 - I predict that I will pay for a
smartwatch in the near future. 245 1,96 1 1,106
PI3 – I am likely to buy a smartwatch in the
near future. 245 1,96 1 1,125
Total 245 1,99 1,11
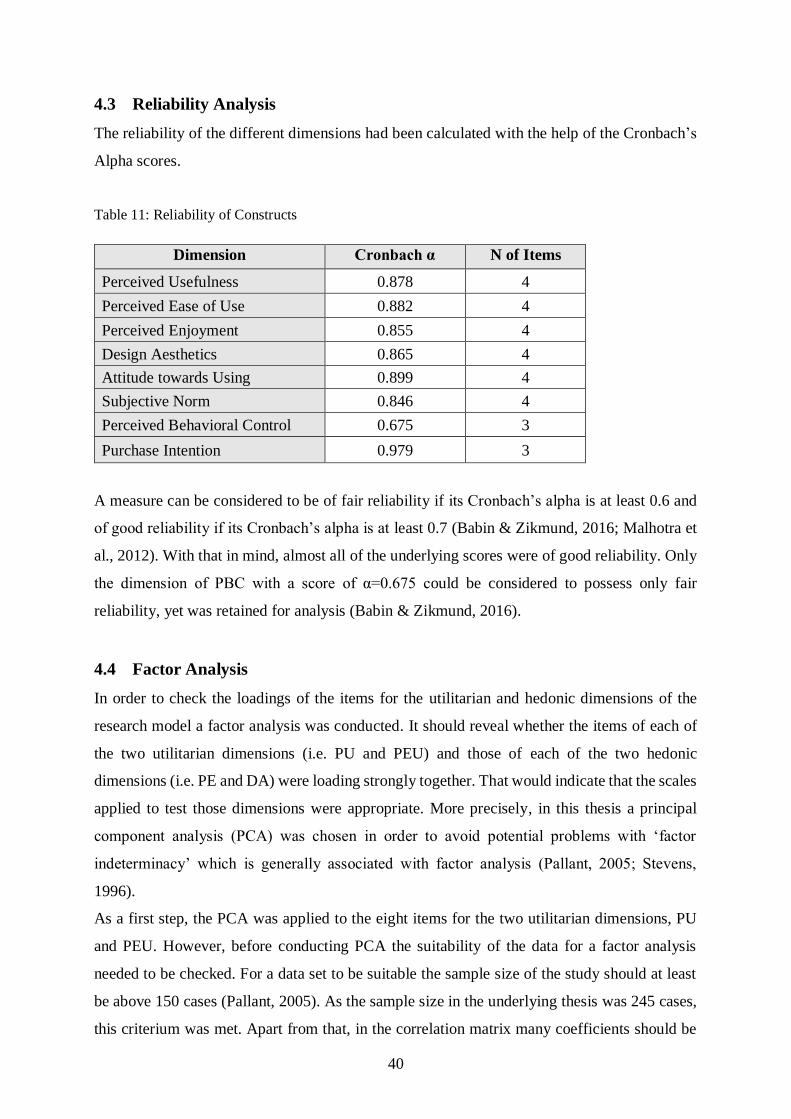
40
4.3 Reliability Analysis
The reliability of the different dimensions had been calculated with the help of the Cronbach’s
Alpha scores.
Table 11: Reliability of Constructs
Dimension Cronbach α N of Items
Perceived Usefulness 0.878 4
Perceived Ease of Use 0.882 4
Perceived Enjoyment 0.855 4
Design Aesthetics 0.865 4
Attitude towards Using 0.899 4
Subjective Norm 0.846 4
Perceived Behavioral Control 0.675 3
Purchase Intention 0.979 3
A measure can be considered to be of fair reliability if its Cronbach’s alpha is at least 0.6 and
of good reliability if its Cronbach’s alpha is at least 0.7 (Babin & Zikmund, 2016; Malhotra et
al., 2012). With that in mind, almost all of the underlying scores were of good reliability. Only
the dimension of PBC with a score of α=0.675 could be considered to possess only fair
reliability, yet was retained for analysis (Babin & Zikmund, 2016).
4.4 Factor Analysis
In order to check the loadings of the items for the utilitarian and hedonic dimensions of the
research model a factor analysis was conducted. It should reveal whether the items of each of
the two utilitarian dimensions (i.e. PU and PEU) and those of each of the two hedonic
dimensions (i.e. PE and DA) were loading strongly together. That would indicate that the scales
applied to test those dimensions were appropriate. More precisely, in this thesis a principal
component analysis (PCA) was chosen in order to avoid potential problems with ‘factor
indeterminacy’ which is generally associated with factor analysis (Pallant, 2005; Stevens,
1996).
As a first step, the PCA was applied to the eight items for the two utilitarian dimensions, PU
and PEU. However, before conducting PCA the suitability of the data for a factor analysis
needed to be checked. For a data set to be suitable the sample size of the study should at least
be above 150 cases (Pallant, 2005). As the sample size in the underlying thesis was 245 cases,
this criterium was met. Apart from that, in the correlation matrix many coefficients should be
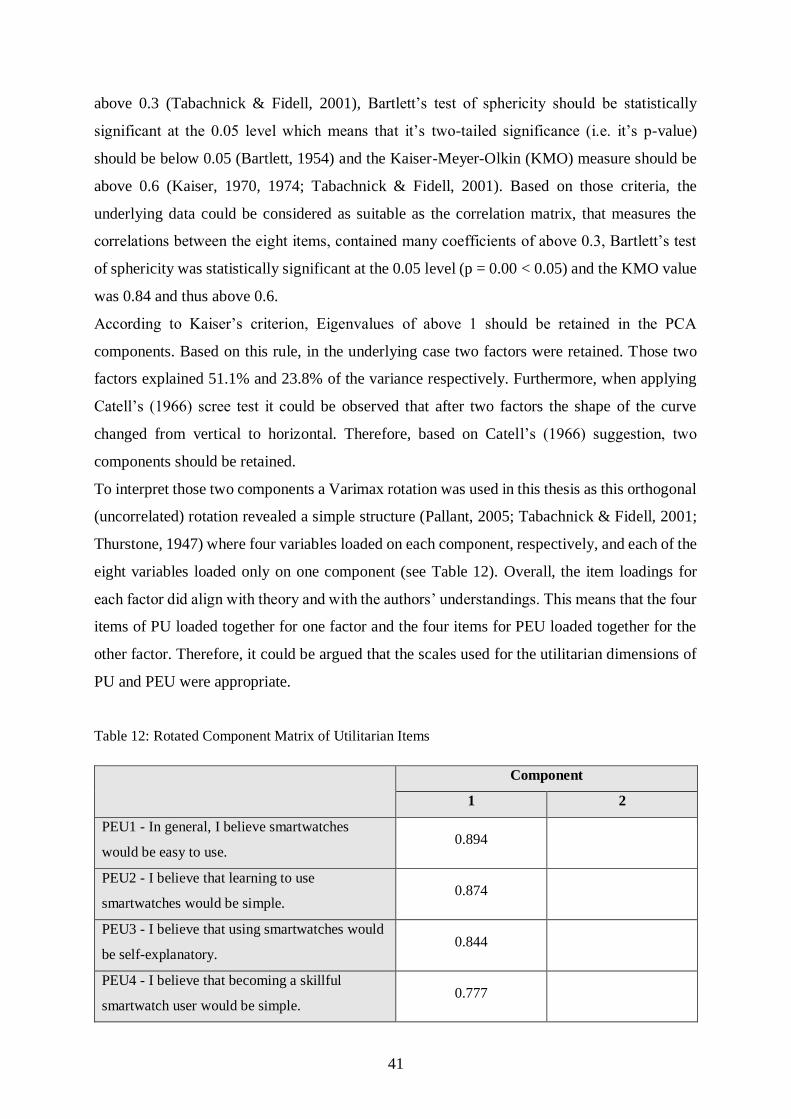
41
above 0.3 (Tabachnick & Fidell, 2001), Bartlett’s test of sphericity should be statistically
significant at the 0.05 level which means that it’s two-tailed significance (i.e. it’s p-value)
should be below 0.05 (Bartlett, 1954) and the Kaiser-Meyer-Olkin (KMO) measure should be
above 0.6 (Kaiser, 1970, 1974; Tabachnick & Fidell, 2001). Based on those criteria, the
underlying data could be considered as suitable as the correlation matrix, that measures the
correlations between the eight items, contained many coefficients of above 0.3, Bartlett’s test
of sphericity was statistically significant at the 0.05 level (p = 0.00 < 0.05) and the KMO value
was 0.84 and thus above 0.6.
According to Kaiser’s criterion, Eigenvalues of above 1 should be retained in the PCA
components. Based on this rule, in the underlying case two factors were retained. Those two
factors explained 51.1% and 23.8% of the variance respectively. Furthermore, when applying
Catell’s (1966) scree test it could be observed that after two factors the shape of the curve
changed from vertical to horizontal. Therefore, based on Catell’s (1966) suggestion, two
components should be retained.
To interpret those two components a Varimax rotation was used in this thesis as this orthogonal
(uncorrelated) rotation revealed a simple structure (Pallant, 2005; Tabachnick & Fidell, 2001;
Thurstone, 1947) where four variables loaded on each component, respectively, and each of the
eight variables loaded only on one component (see Table 12). Overall, the item loadings for
each factor did align with theory and with the authors’ understandings. This means that the four
items of PU loaded together for one factor and the four items for PEU loaded together for the
other factor. Therefore, it could be argued that the scales used for the utilitarian dimensions of
PU and PEU were appropriate.
Table 12: Rotated Component Matrix of Utilitarian Items
Component
1 2
PEU1 - In general, I believe smartwatches
would be easy to use. 0.894
PEU2 - I believe that learning to use
smartwatches would be simple. 0.874
PEU3 - I believe that using smartwatches would
be self-explanatory. 0.844
PEU4 - I believe that becoming a skillful
smartwatch user would be simple. 0.777
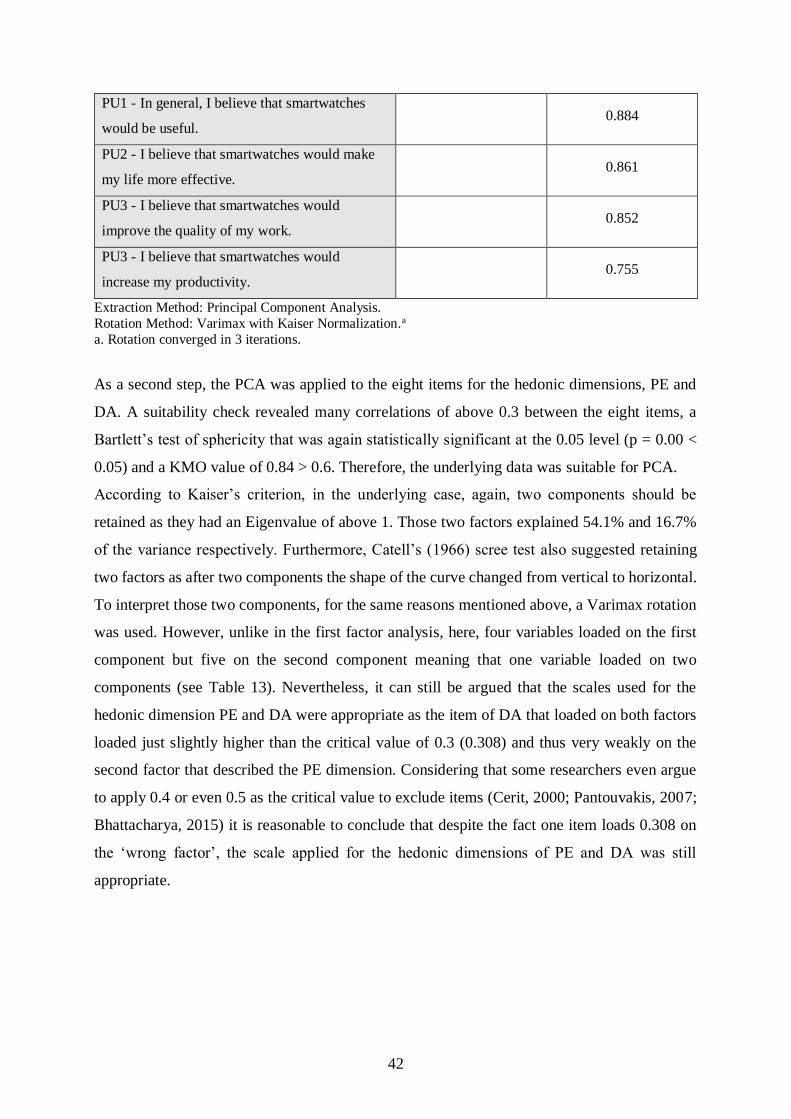
42
PU1 - In general, I believe that smartwatches
would be useful. 0.884
PU2 - I believe that smartwatches would make
my life more effective. 0.861
PU3 - I believe that smartwatches would
improve the quality of my work. 0.852
PU3 - I believe that smartwatches would
increase my productivity. 0.755
Extraction Method: Principal Component Analysis.
Rotation Method: Varimax with Kaiser Normalization.a
a. Rotation converged in 3 iterations.
As a second step, the PCA was applied to the eight items for the hedonic dimensions, PE and
DA. A suitability check revealed many correlations of above 0.3 between the eight items, a
Bartlett’s test of sphericity that was again statistically significant at the 0.05 level (p = 0.00 <
0.05) and a KMO value of 0.84 > 0.6. Therefore, the underlying data was suitable for PCA.
According to Kaiser’s criterion, in the underlying case, again, two components should be
retained as they had an Eigenvalue of above 1. Those two factors explained 54.1% and 16.7%
of the variance respectively. Furthermore, Catell’s (1966) scree test also suggested retaining
two factors as after two components the shape of the curve changed from vertical to horizontal.
To interpret those two components, for the same reasons mentioned above, a Varimax rotation
was used. However, unlike in the first factor analysis, here, four variables loaded on the first
component but five on the second component meaning that one variable loaded on two
components (see Table 13). Nevertheless, it can still be argued that the scales used for the
hedonic dimension PE and DA were appropriate as the item of DA that loaded on both factors
loaded just slightly higher than the critical value of 0.3 (0.308) and thus very weakly on the
second factor that described the PE dimension. Considering that some researchers even argue
to apply 0.4 or even 0.5 as the critical value to exclude items (Cerit, 2000; Pantouvakis, 2007;
Bhattacharya, 2015) it is reasonable to conclude that despite the fact one item loads 0.308 on
the ‘wrong factor’, the scale applied for the hedonic dimensions of PE and DA was still
appropriate.
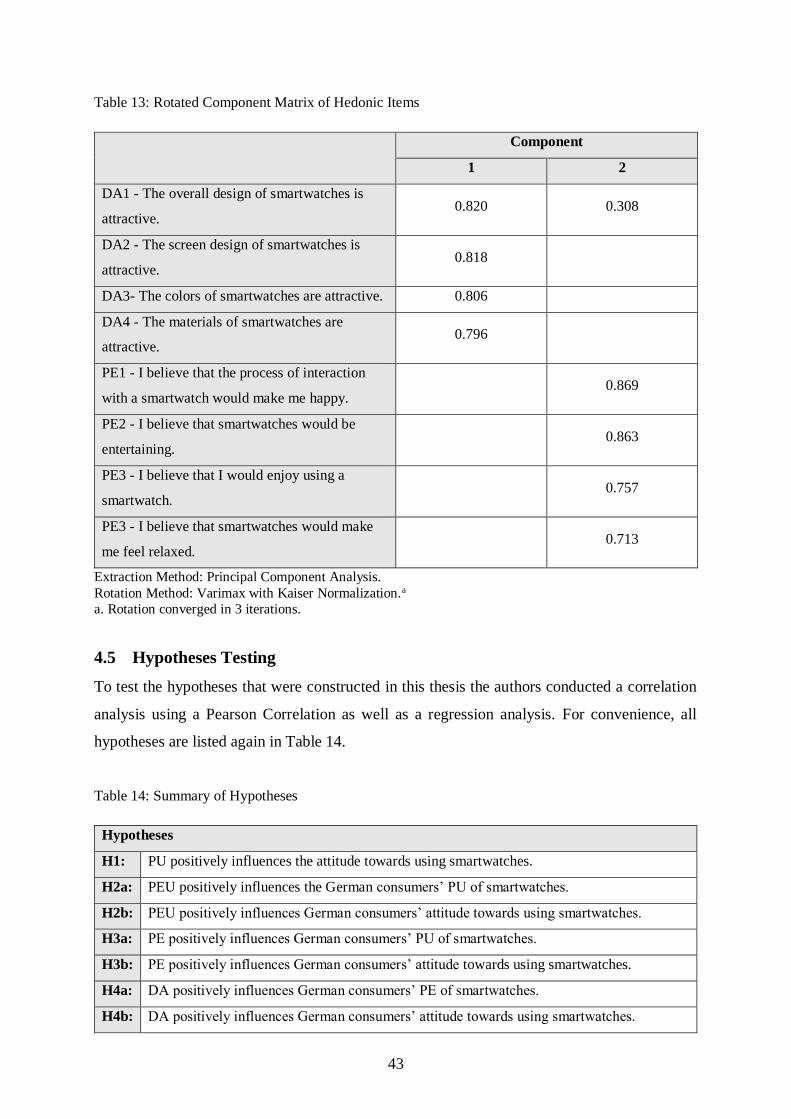
43
Table 13: Rotated Component Matrix of Hedonic Items
Component
1 2
DA1 - The overall design of smartwatches is
attractive. 0.820 0.308
DA2 - The screen design of smartwatches is
attractive. 0.818
DA3- The colors of smartwatches are attractive. 0.806
DA4 - The materials of smartwatches are
attractive. 0.796
PE1 - I believe that the process of interaction
with a smartwatch would make me happy. 0.869
PE2 - I believe that smartwatches would be
entertaining. 0.863
PE3 - I believe that I would enjoy using a
smartwatch. 0.757
PE3 - I believe that smartwatches would make
me feel relaxed. 0.713
Extraction Method: Principal Component Analysis.
Rotation Method: Varimax with Kaiser Normalization.a
a. Rotation converged in 3 iterations.
4.5 Hypotheses Testing
To test the hypotheses that were constructed in this thesis the authors conducted a correlation
analysis using a Pearson Correlation as well as a regression analysis. For convenience, all
hypotheses are listed again in Table 14.
Table 14: Summary of Hypotheses
Hypotheses
H1: PU positively influences the attitude towards using smartwatches.
H2a: PEU positively influences the German consumers’ PU of smartwatches.
H2b: PEU positively influences German consumers’ attitude towards using smartwatches.
H3a: PE positively influences German consumers’ PU of smartwatches.
H3b: PE positively influences German consumers’ attitude towards using smartwatches.
H4a: DA positively influences German consumers’ PE of smartwatches.
H4b: DA positively influences German consumers’ attitude towards using smartwatches.
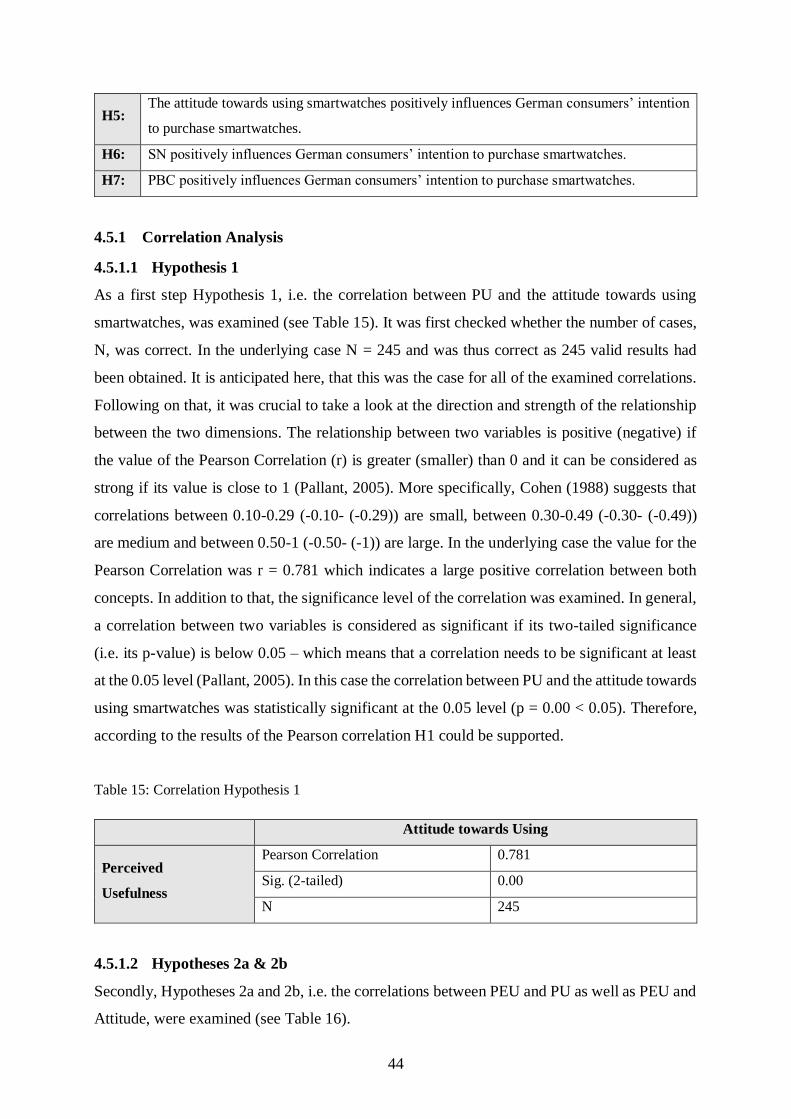
44
H5: The attitude towards using smartwatches positively influences German consumers’ intention
to purchase smartwatches.
H6: SN positively influences German consumers’ intention to purchase smartwatches.
H7: PBC positively influences German consumers’ intention to purchase smartwatches.
4.5.1 Correlation Analysis
4.5.1.1 Hypothesis 1
As a first step Hypothesis 1, i.e. the correlation between PU and the attitude towards using
smartwatches, was examined (see Table 15). It was first checked whether the number of cases,
N, was correct. In the underlying case N = 245 and was thus correct as 245 valid results had
been obtained. It is anticipated here, that this was the case for all of the examined correlations.
Following on that, it was crucial to take a look at the direction and strength of the relationship
between the two dimensions. The relationship between two variables is positive (negative) if
the value of the Pearson Correlation (r) is greater (smaller) than 0 and it can be considered as
strong if its value is close to 1 (Pallant, 2005). More specifically, Cohen (1988) suggests that
correlations between 0.10-0.29 (-0.10- (-0.29)) are small, between 0.30-0.49 (-0.30- (-0.49))
are medium and between 0.50-1 (-0.50- (-1)) are large. In the underlying case the value for the
Pearson Correlation was r = 0.781 which indicates a large positive correlation between both
concepts. In addition to that, the significance level of the correlation was examined. In general,
a correlation between two variables is considered as significant if its two-tailed significance
(i.e. its p-value) is below 0.05 – which means that a correlation needs to be significant at least
at the 0.05 level (Pallant, 2005). In this case the correlation between PU and the attitude towards
using smartwatches was statistically significant at the 0.05 level (p = 0.00 < 0.05). Therefore,
according to the results of the Pearson correlation H1 could be supported.
Table 15: Correlation Hypothesis 1
Attitude towards Using
Perceived
Usefulness
Pearson Correlation 0.781
Sig. (2-tailed) 0.00
N 245
4.5.1.2 Hypotheses 2a & 2b
Secondly, Hypotheses 2a and 2b, i.e. the correlations between PEU and PU as well as PEU and
Attitude, were examined (see Table 16).
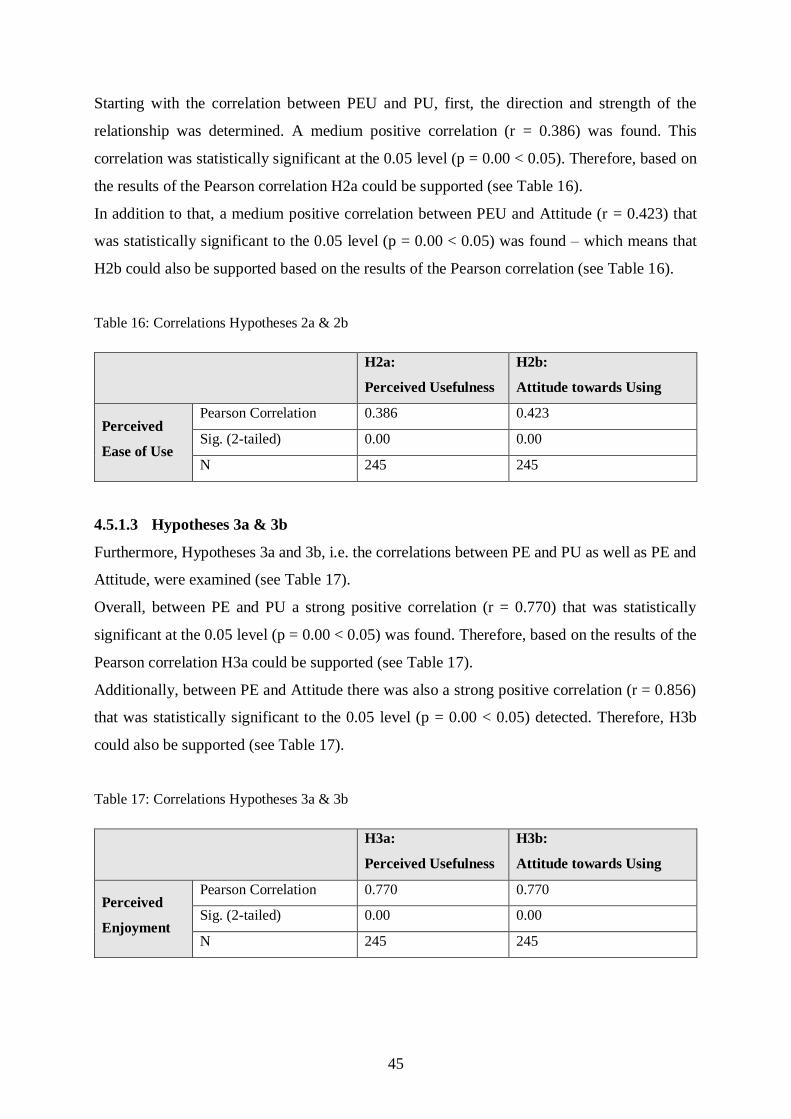
45
Starting with the correlation between PEU and PU, first, the direction and strength of the
relationship was determined. A medium positive correlation (r = 0.386) was found. This
correlation was statistically significant at the 0.05 level (p = 0.00 < 0.05). Therefore, based on
the results of the Pearson correlation H2a could be supported (see Table 16).
In addition to that, a medium positive correlation between PEU and Attitude (r = 0.423) that
was statistically significant to the 0.05 level (p = 0.00 < 0.05) was found – which means that
H2b could also be supported based on the results of the Pearson correlation (see Table 16).
Table 16: Correlations Hypotheses 2a & 2b
H2a:
Perceived Usefulness
H2b:
Attitude towards Using
Perceived
Ease of Use
Pearson Correlation 0.386 0.423
Sig. (2-tailed) 0.00 0.00
N 245 245
4.5.1.3 Hypotheses 3a & 3b
Furthermore, Hypotheses 3a and 3b, i.e. the correlations between PE and PU as well as PE and
Attitude, were examined (see Table 17).
Overall, between PE and PU a strong positive correlation (r = 0.770) that was statistically
significant at the 0.05 level (p = 0.00 < 0.05) was found. Therefore, based on the results of the
Pearson correlation H3a could be supported (see Table 17).
Additionally, between PE and Attitude there was also a strong positive correlation (r = 0.856)
that was statistically significant to the 0.05 level (p = 0.00 < 0.05) detected. Therefore, H3b
could also be supported (see Table 17).
Table 17: Correlations Hypotheses 3a & 3b
H3a:
Perceived Usefulness
H3b:
Attitude towards Using
Perceived
Enjoyment
Pearson Correlation 0.770 0.770
Sig. (2-tailed) 0.00 0.00
N 245 245
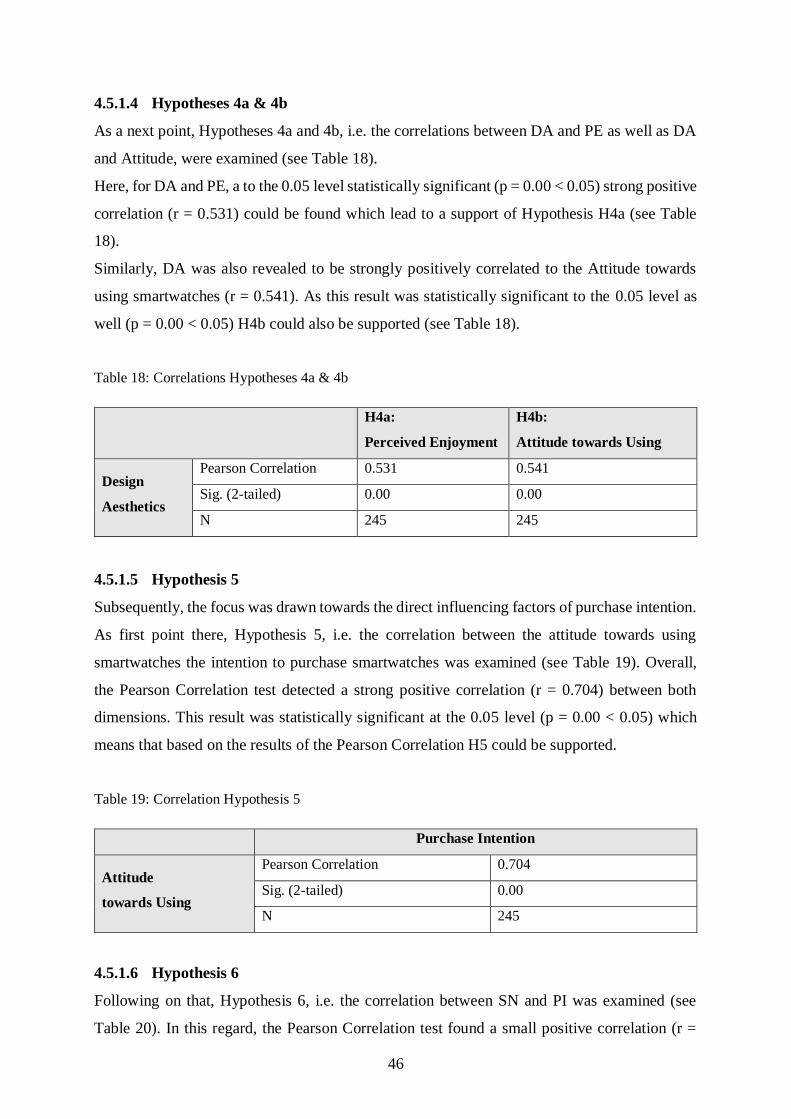
46
4.5.1.4 Hypotheses 4a & 4b
As a next point, Hypotheses 4a and 4b, i.e. the correlations between DA and PE as well as DA
and Attitude, were examined (see Table 18).
Here, for DA and PE, a to the 0.05 level statistically significant (p = 0.00 < 0.05) strong positive
correlation (r = 0.531) could be found which lead to a support of Hypothesis H4a (see Table
18).
Similarly, DA was also revealed to be strongly positively correlated to the Attitude towards
using smartwatches (r = 0.541). As this result was statistically significant to the 0.05 level as
well (p = 0.00 < 0.05) H4b could also be supported (see Table 18).
Table 18: Correlations Hypotheses 4a & 4b
H4a:
Perceived Enjoyment
H4b:
Attitude towards Using
Design
Aesthetics
Pearson Correlation 0.531 0.541
Sig. (2-tailed) 0.00 0.00
N 245 245
4.5.1.5 Hypothesis 5
Subsequently, the focus was drawn towards the direct influencing factors of purchase intention.
As first point there, Hypothesis 5, i.e. the correlation between the attitude towards using
smartwatches the intention to purchase smartwatches was examined (see Table 19). Overall,
the Pearson Correlation test detected a strong positive correlation (r = 0.704) between both
dimensions. This result was statistically significant at the 0.05 level (p = 0.00 < 0.05) which
means that based on the results of the Pearson Correlation H5 could be supported.
Table 19: Correlation Hypothesis 5
Purchase Intention
Attitude
towards Using
Pearson Correlation 0.704
Sig. (2-tailed) 0.00
N 245
4.5.1.6 Hypothesis 6
Following on that, Hypothesis 6, i.e. the correlation between SN and PI was examined (see
Table 20). In this regard, the Pearson Correlation test found a small positive correlation (r =
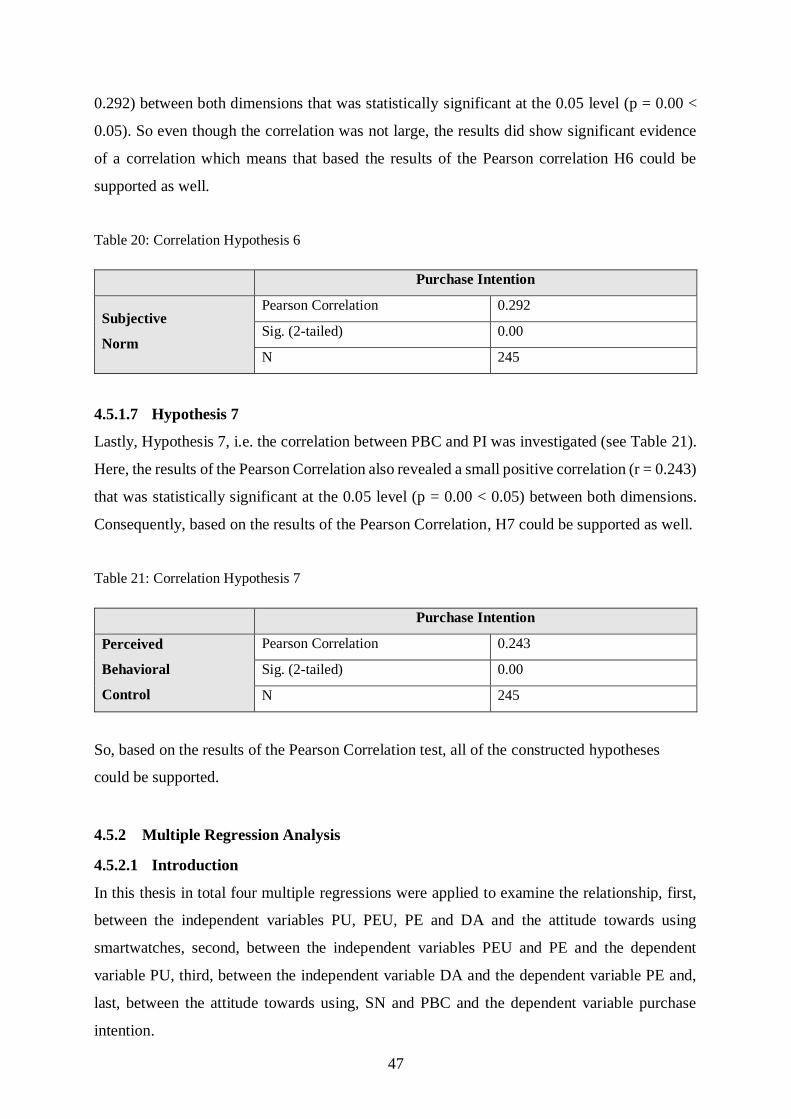
47
0.292) between both dimensions that was statistically significant at the 0.05 level (p = 0.00 <
0.05). So even though the correlation was not large, the results did show significant evidence
of a correlation which means that based the results of the Pearson correlation H6 could be
supported as well.
Table 20: Correlation Hypothesis 6
Purchase Intention
Subjective
Norm
Pearson Correlation 0.292
Sig. (2-tailed) 0.00
N 245
4.5.1.7 Hypothesis 7
Lastly, Hypothesis 7, i.e. the correlation between PBC and PI was investigated (see Table 21).
Here, the results of the Pearson Correlation also revealed a small positive correlation (r = 0.243)
that was statistically significant at the 0.05 level (p = 0.00 < 0.05) between both dimensions.
Consequently, based on the results of the Pearson Correlation, H7 could be supported as well.
Table 21: Correlation Hypothesis 7
Purchase Intention
Perceived
Behavioral
Control
Pearson Correlation 0.243
Sig. (2-tailed) 0.00
N 245
So, based on the results of the Pearson Correlation test, all of the constructed hypotheses
could be supported.
4.5.2 Multiple Regression Analysis
4.5.2.1 Introduction
In this thesis in total four multiple regressions were applied to examine the relationship, first,
between the independent variables PU, PEU, PE and DA and the attitude towards using
smartwatches, second, between the independent variables PEU and PE and the dependent
variable PU, third, between the independent variable DA and the dependent variable PE and,
last, between the attitude towards using, SN and PBC and the dependent variable purchase
intention.
48
4.5.2.2 Hypotheses 1, 2b, 3b & 4b
The first multiple linear regression examined the relationship between PU, PEU, PE, DA and
attitude towards using.
However, before it could be conducted, it was important to ensure that all its assumptions were
fulfilled. In that regard, it was, first, important to make sure that the sample size was large
enough for the multiple regression to lead to generalizable results (Pallant, 2005). According to
Tabachnik and Fidell (2001) this is the case if the following criteria is met: N > 50 + 8m (m =
number of independent variables). In this case four independent variables were tested on the
dependent variable attitude. Therefore, the sample size needed to be larger than 90 cases. As in
this paper in total 245 valid responses were obtained, the sample size criterium was met. Due
to the fact that for the other three multiple regressions only two, two and three dependent
variables were tested, respectively, it can be concluded that the sample size criterium was met
for all multiple regression applied in this thesis.
Secondly, it was important to make sure that no singularity between the variables existed. This
was not the case as none of the independent variables was a combination of other independent
variables (Pallant, 2005).
As the next point the multicollinearity between the independent variables needed to checked.
Multicollinearity occurs when the independent variables are strongly correlated (r ≥ 0.9)
(Pallant, 2005). In order to examine whether multicollinearity is present, it is, first, important
to check the correlations between the independent variables and the dependent variable. They
should be preferably above 0.3 (Pallant, 2005). In the underlying case this criterium was
fulfilled as all four independent variables correlated stronger than 0.3 to the dependent variable
attitude towards using (PU: 0.781; PEU: 0.423; PE: 0.856; DA: 0.541). Apart from that, the
bivariate correlations between the independent variables should be at least below 0.9 (Pallant,
2005). In this study no bivariate correlation between the independent variables exceeded 0.9
which means that this criterium was met as well. Therefore, all variables could be retained for
the multiple regression. Furthermore, the tolerance and the Variance Inflation Factor (VIF) that
were provided in the collinearity statistics needed to be checked as they could identify problems
with multicollinearity that were not obvious in the correlation matrix (Gujarati & Porter, 2009;
Pallant, 2005). The VIF indicates the overall estimate of the overlap of the variances between
the independent variables (Babin & Zikmund, 2016). Problems with multicollinearity would
exist if the value of the tolerance would be below 0.1 and that of the VIF would be above 10
(Gujarati & Porter, 2009; Pallant, 2005). In the underlying case the tolerance of each of the
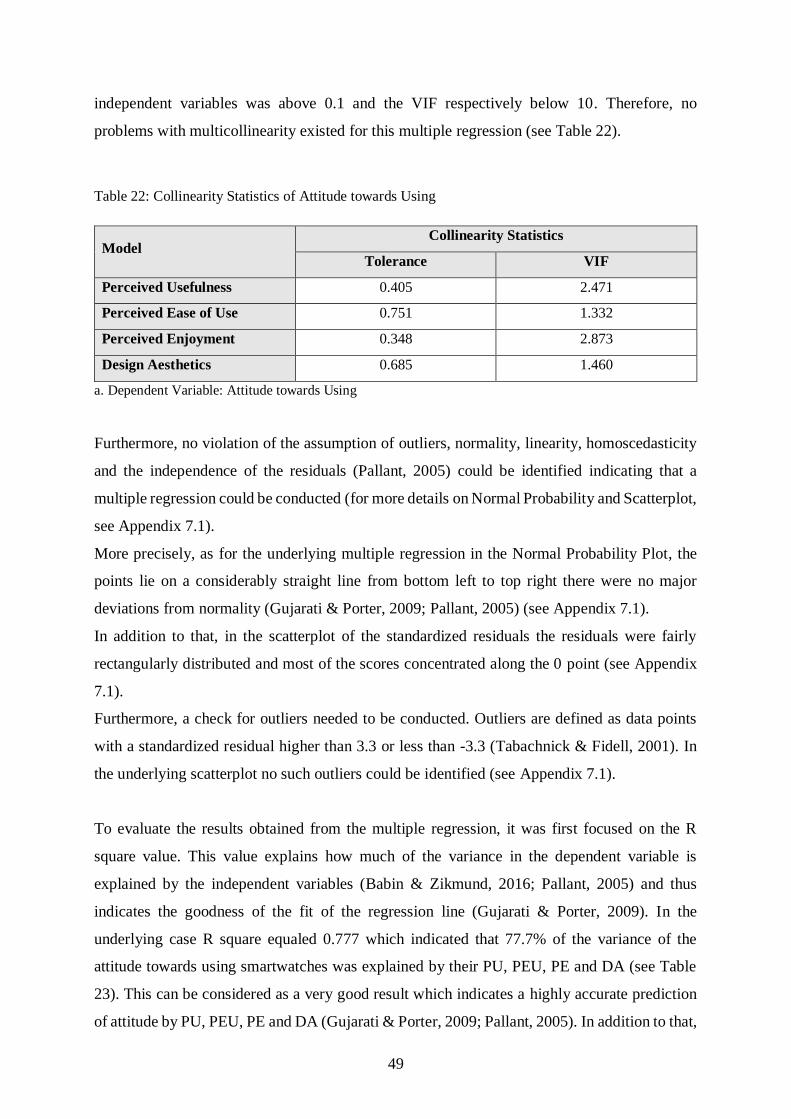
49
independent variables was above 0.1 and the VIF respectively below 10. Therefore, no
problems with multicollinearity existed for this multiple regression (see Table 22).
Table 22: Collinearity Statistics of Attitude towards Using
Model Collinearity Statistics
Tolerance VIF
Perceived Usefulness 0.405 2.471
Perceived Ease of Use 0.751 1.332
Perceived Enjoyment 0.348 2.873
Design Aesthetics 0.685 1.460
a. Dependent Variable: Attitude towards Using
Furthermore, no violation of the assumption of outliers, normality, linearity, homoscedasticity
and the independence of the residuals (Pallant, 2005) could be identified indicating that a
multiple regression could be conducted (for more details on Normal Probability and Scatterplot,
see Appendix 7.1).
More precisely, as for the underlying multiple regression in the Normal Probability Plot, the
points lie on a considerably straight line from bottom left to top right there were no major
deviations from normality (Gujarati & Porter, 2009; Pallant, 2005) (see Appendix 7.1).
In addition to that, in the scatterplot of the standardized residuals the residuals were fairly
rectangularly distributed and most of the scores concentrated along the 0 point (see Appendix
7.1).
Furthermore, a check for outliers needed to be conducted. Outliers are defined as data points
with a standardized residual higher than 3.3 or less than -3.3 (Tabachnick & Fidell, 2001). In
the underlying scatterplot no such outliers could be identified (see Appendix 7.1).
To evaluate the results obtained from the multiple regression, it was first focused on the R
square value. This value explains how much of the variance in the dependent variable is
explained by the independent variables (Babin & Zikmund, 2016; Pallant, 2005) and thus
indicates the goodness of the fit of the regression line (Gujarati & Porter, 2009). In the
underlying case R square equaled 0.777 which indicated that 77.7% of the variance of the
attitude towards using smartwatches was explained by their PU, PEU, PE and DA (see Table
23). This can be considered as a very good result which indicates a highly accurate prediction
of attitude by PU, PEU, PE and DA (Gujarati & Porter, 2009; Pallant, 2005). In addition to that,
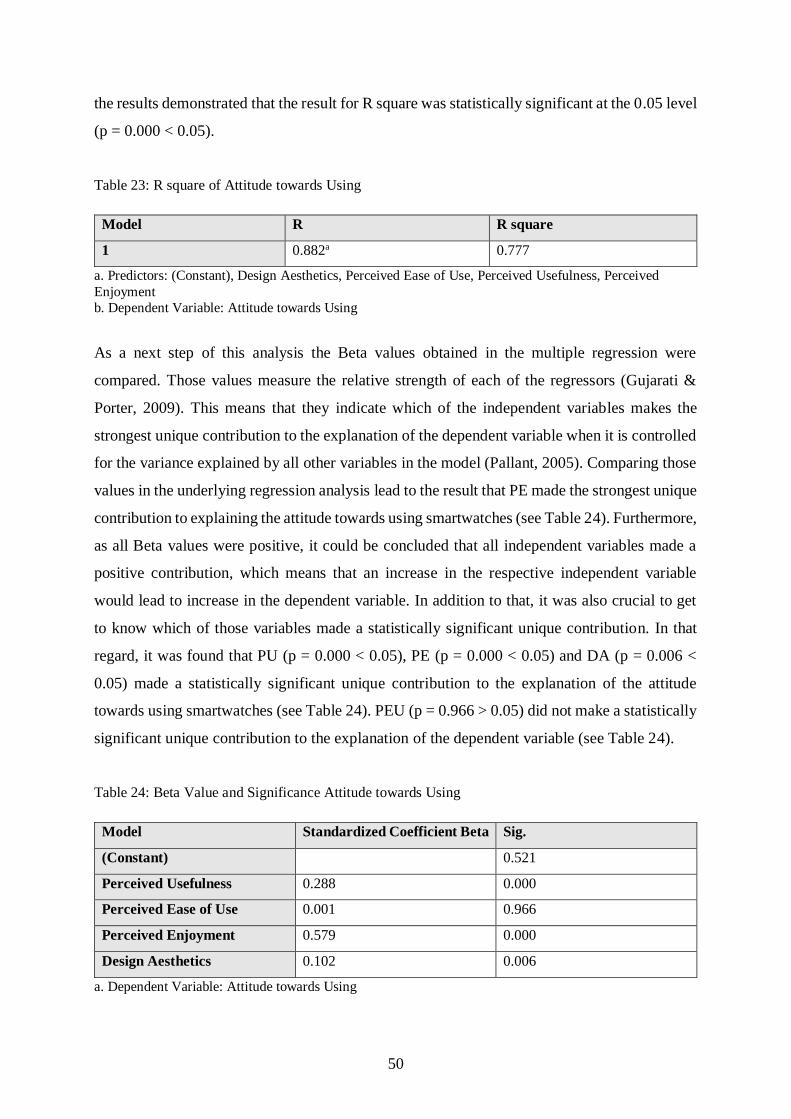
50
the results demonstrated that the result for R square was statistically significant at the 0.05 level
(p = 0.000 < 0.05).
Table 23: R square of Attitude towards Using
Model R R square
1 0.882a 0.777
a. Predictors: (Constant), Design Aesthetics, Perceived Ease of Use, Perceived Usefulness, Perceived
Enjoyment
b. Dependent Variable: Attitude towards Using
As a next step of this analysis the Beta values obtained in the multiple regression were
compared. Those values measure the relative strength of each of the regressors (Gujarati &
Porter, 2009). This means that they indicate which of the independent variables makes the
strongest unique contribution to the explanation of the dependent variable when it is controlled
for the variance explained by all other variables in the model (Pallant, 2005). Comparing those
values in the underlying regression analysis lead to the result that PE made the strongest unique
contribution to explaining the attitude towards using smartwatches (see Table 24). Furthermore,
as all Beta values were positive, it could be concluded that all independent variables made a
positive contribution, which means that an increase in the respective independent variable
would lead to increase in the dependent variable. In addition to that, it was also crucial to get
to know which of those variables made a statistically significant unique contribution. In that
regard, it was found that PU (p = 0.000 < 0.05), PE (p = 0.000 < 0.05) and DA (p = 0.006 <
0.05) made a statistically significant unique contribution to the explanation of the attitude
towards using smartwatches (see Table 24). PEU (p = 0.966 > 0.05) did not make a statistically
significant unique contribution to the explanation of the dependent variable (see Table 24).
Table 24: Beta Value and Significance Attitude towards Using
Model Standardized Coefficient Beta Sig.
(Constant) 0.521
Perceived Usefulness 0.288 0.000
Perceived Ease of Use 0.001 0.966
Perceived Enjoyment 0.579 0.000
Design Aesthetics 0.102 0.006
a. Dependent Variable: Attitude towards Using
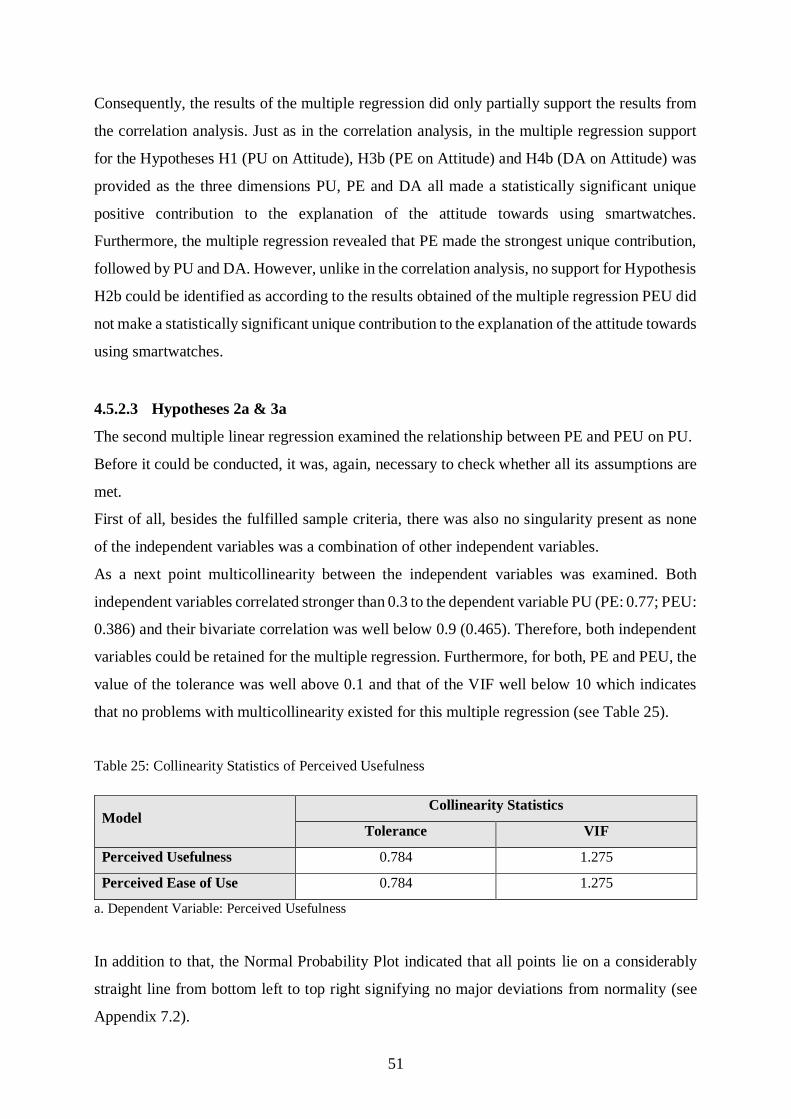
51
Consequently, the results of the multiple regression did only partially support the results from
the correlation analysis. Just as in the correlation analysis, in the multiple regression support
for the Hypotheses H1 (PU on Attitude), H3b (PE on Attitude) and H4b (DA on Attitude) was
provided as the three dimensions PU, PE and DA all made a statistically significant unique
positive contribution to the explanation of the attitude towards using smartwatches.
Furthermore, the multiple regression revealed that PE made the strongest unique contribution,
followed by PU and DA. However, unlike in the correlation analysis, no support for Hypothesis
H2b could be identified as according to the results obtained of the multiple regression PEU did
not make a statistically significant unique contribution to the explanation of the attitude towards
using smartwatches.
4.5.2.3 Hypotheses 2a & 3a
The second multiple linear regression examined the relationship between PE and PEU on PU.
Before it could be conducted, it was, again, necessary to check whether all its assumptions are
met.
First of all, besides the fulfilled sample criteria, there was also no singularity present as none
of the independent variables was a combination of other independent variables.
As a next point multicollinearity between the independent variables was examined. Both
independent variables correlated stronger than 0.3 to the dependent variable PU (PE: 0.77; PEU:
0.386) and their bivariate correlation was well below 0.9 (0.465). Therefore, both independent
variables could be retained for the multiple regression. Furthermore, for both, PE and PEU, the
value of the tolerance was well above 0.1 and that of the VIF well below 10 which indicates
that no problems with multicollinearity existed for this multiple regression (see Table 25).
Table 25: Collinearity Statistics of Perceived Usefulness
Model Collinearity Statistics
Tolerance VIF
Perceived Usefulness 0.784 1.275
Perceived Ease of Use 0.784 1.275
a. Dependent Variable: Perceived Usefulness
In addition to that, the Normal Probability Plot indicated that all points lie on a considerably
straight line from bottom left to top right signifying no major deviations from normality (see
Appendix 7.2).
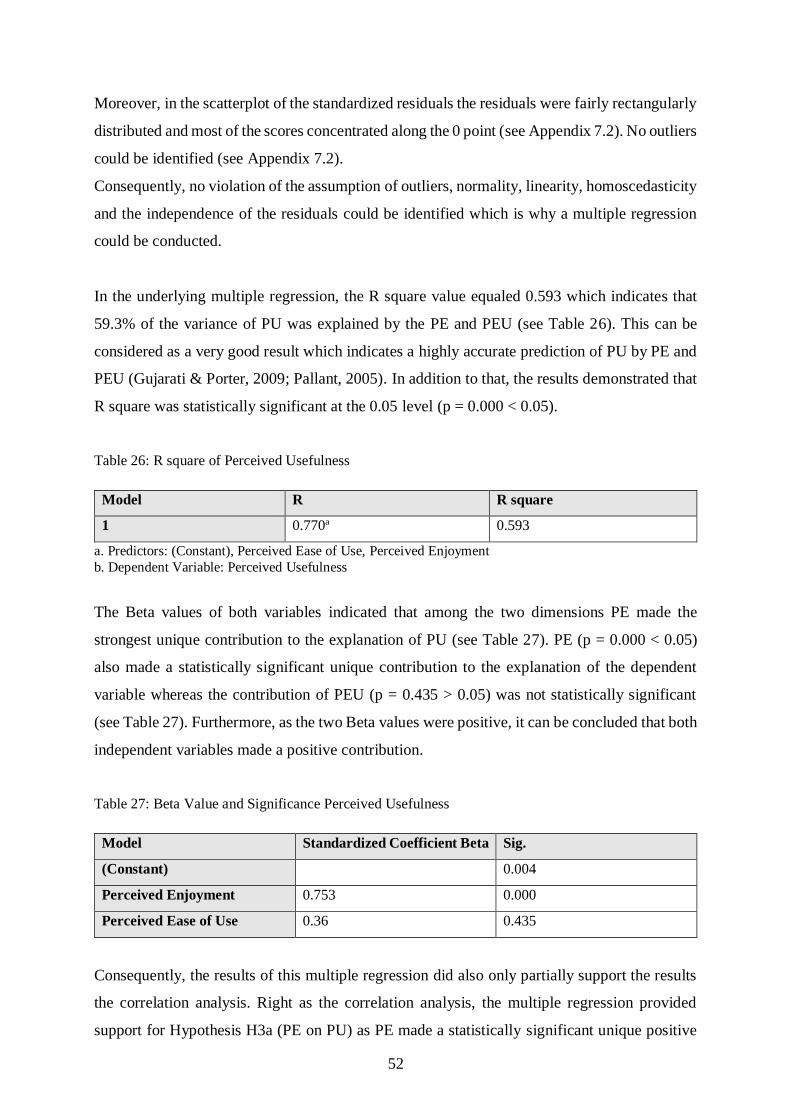
52
Moreover, in the scatterplot of the standardized residuals the residuals were fairly rectangularly
distributed and most of the scores concentrated along the 0 point (see Appendix 7.2). No outliers
could be identified (see Appendix 7.2).
Consequently, no violation of the assumption of outliers, normality, linearity, homoscedasticity
and the independence of the residuals could be identified which is why a multiple regression
could be conducted.
In the underlying multiple regression, the R square value equaled 0.593 which indicates that
59.3% of the variance of PU was explained by the PE and PEU (see Table 26). This can be
considered as a very good result which indicates a highly accurate prediction of PU by PE and
PEU (Gujarati & Porter, 2009; Pallant, 2005). In addition to that, the results demonstrated that
R square was statistically significant at the 0.05 level (p = 0.000 < 0.05).
Table 26: R square of Perceived Usefulness
Model R R square
1 0.770a 0.593
a. Predictors: (Constant), Perceived Ease of Use, Perceived Enjoyment
b. Dependent Variable: Perceived Usefulness
The Beta values of both variables indicated that among the two dimensions PE made the
strongest unique contribution to the explanation of PU (see Table 27). PE (p = 0.000 < 0.05)
also made a statistically significant unique contribution to the explanation of the dependent
variable whereas the contribution of PEU (p = 0.435 > 0.05) was not statistically significant
(see Table 27). Furthermore, as the two Beta values were positive, it can be concluded that both
independent variables made a positive contribution.
Table 27: Beta Value and Significance Perceived Usefulness
Model Standardized Coefficient Beta Sig.
(Constant) 0.004
Perceived Enjoyment 0.753 0.000
Perceived Ease of Use 0.36 0.435
Consequently, the results of this multiple regression did also only partially support the results
the correlation analysis. Right as the correlation analysis, the multiple regression provided
support for Hypothesis H3a (PE on PU) as PE made a statistically significant unique positive
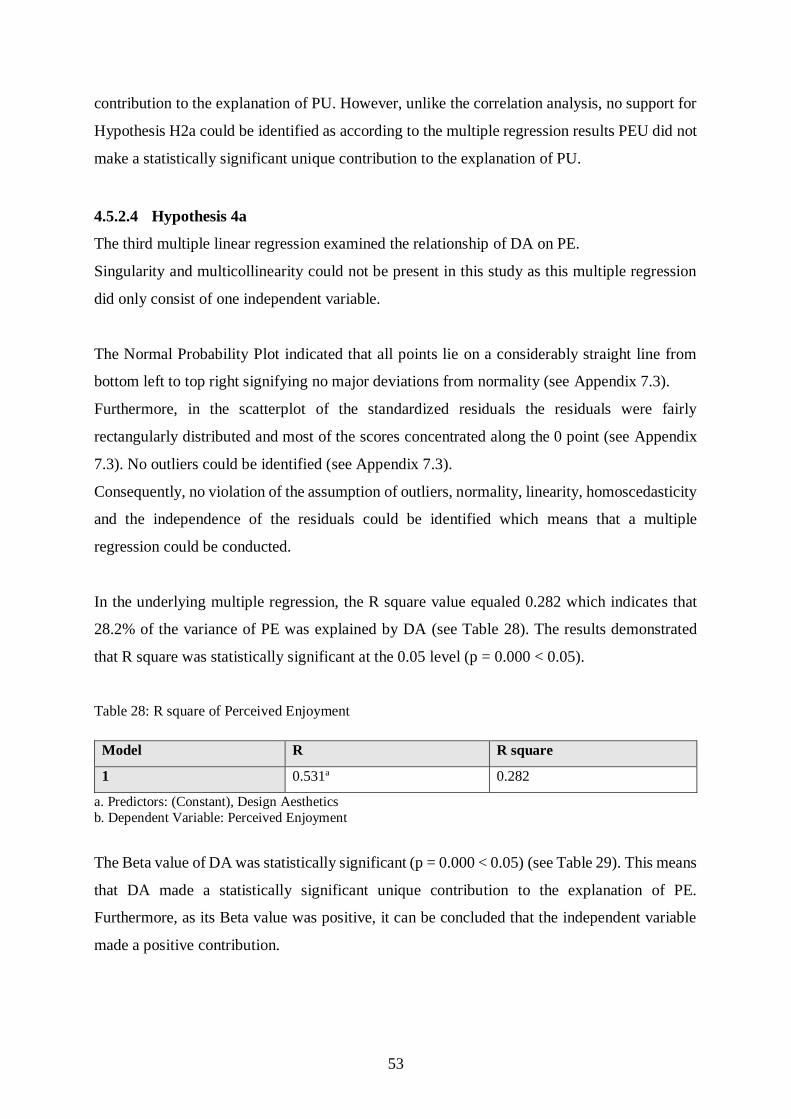
53
contribution to the explanation of PU. However, unlike the correlation analysis, no support for
Hypothesis H2a could be identified as according to the multiple regression results PEU did not
make a statistically significant unique contribution to the explanation of PU.
4.5.2.4 Hypothesis 4a
The third multiple linear regression examined the relationship of DA on PE.
Singularity and multicollinearity could not be present in this study as this multiple regression
did only consist of one independent variable.
The Normal Probability Plot indicated that all points lie on a considerably straight line from
bottom left to top right signifying no major deviations from normality (see Appendix 7.3).
Furthermore, in the scatterplot of the standardized residuals the residuals were fairly
rectangularly distributed and most of the scores concentrated along the 0 point (see Appendix
7.3). No outliers could be identified (see Appendix 7.3).
Consequently, no violation of the assumption of outliers, normality, linearity, homoscedasticity
and the independence of the residuals could be identified which means that a multiple
regression could be conducted.
In the underlying multiple regression, the R square value equaled 0.282 which indicates that
28.2% of the variance of PE was explained by DA (see Table 28). The results demonstrated
that R square was statistically significant at the 0.05 level (p = 0.000 < 0.05).
Table 28: R square of Perceived Enjoyment
Model R R square
1 0.531a 0.282
a. Predictors: (Constant), Design Aesthetics
b. Dependent Variable: Perceived Enjoyment
The Beta value of DA was statistically significant (p = 0.000 < 0.05) (see Table 29). This means
that DA made a statistically significant unique contribution to the explanation of PE.
Furthermore, as its Beta value was positive, it can be concluded that the independent variable
made a positive contribution.
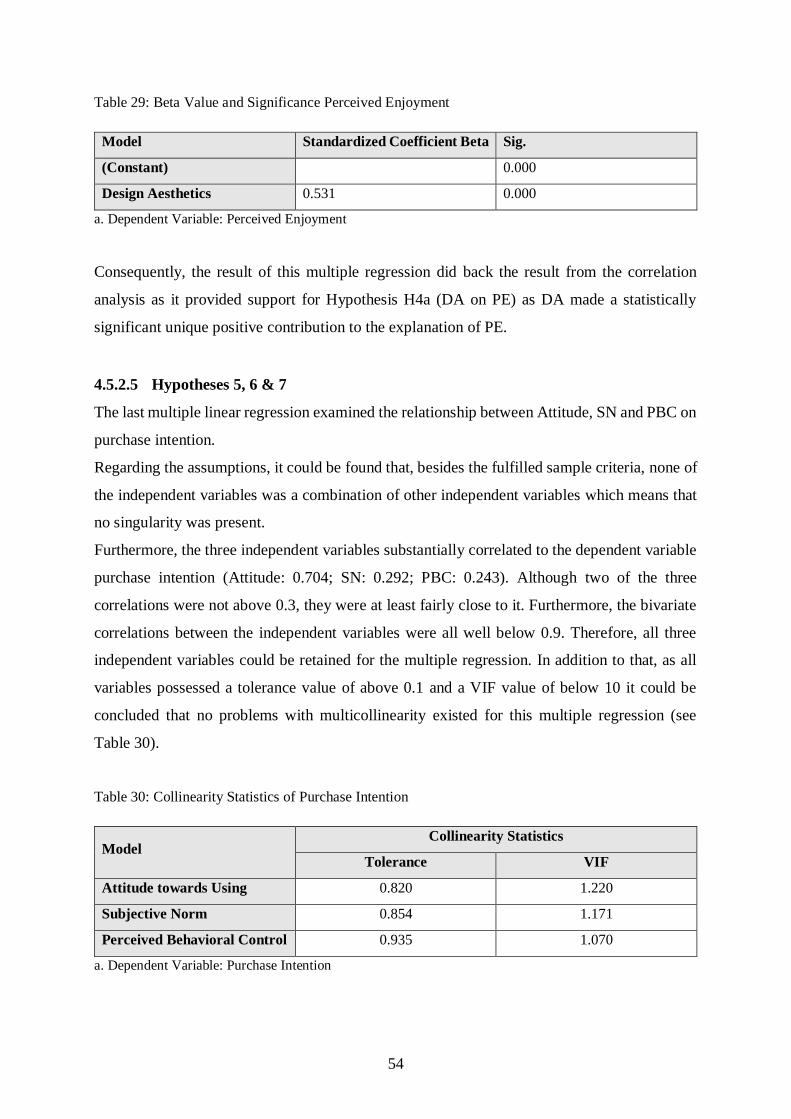
54
Table 29: Beta Value and Significance Perceived Enjoyment
Model Standardized Coefficient Beta Sig.
(Constant) 0.000
Design Aesthetics 0.531 0.000
a. Dependent Variable: Perceived Enjoyment
Consequently, the result of this multiple regression did back the result from the correlation
analysis as it provided support for Hypothesis H4a (DA on PE) as DA made a statistically
significant unique positive contribution to the explanation of PE.
4.5.2.5 Hypotheses 5, 6 & 7
The last multiple linear regression examined the relationship between Attitude, SN and PBC on
purchase intention.
Regarding the assumptions, it could be found that, besides the fulfilled sample criteria, none of
the independent variables was a combination of other independent variables which means that
no singularity was present.
Furthermore, the three independent variables substantially correlated to the dependent variable
purchase intention (Attitude: 0.704; SN: 0.292; PBC: 0.243). Although two of the three
correlations were not above 0.3, they were at least fairly close to it. Furthermore, the bivariate
correlations between the independent variables were all well below 0.9. Therefore, all three
independent variables could be retained for the multiple regression. In addition to that, as all
variables possessed a tolerance value of above 0.1 and a VIF value of below 10 it could be
concluded that no problems with multicollinearity existed for this multiple regression (see
Table 30).
Table 30: Collinearity Statistics of Purchase Intention
Model Collinearity Statistics
Tolerance VIF
Attitude towards Using 0.820 1.220
Subjective Norm 0.854 1.171
Perceived Behavioral Control 0.935 1.070
a. Dependent Variable: Purchase Intention
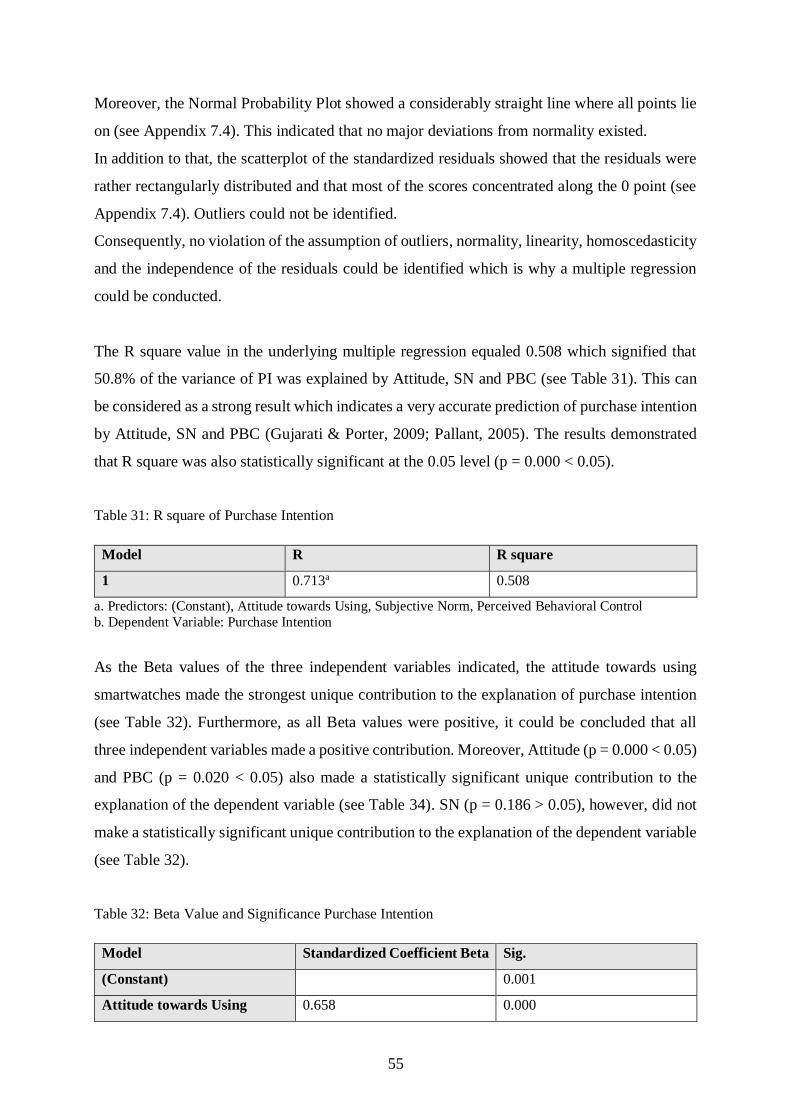
55
Moreover, the Normal Probability Plot showed a considerably straight line where all points lie
on (see Appendix 7.4). This indicated that no major deviations from normality existed.
In addition to that, the scatterplot of the standardized residuals showed that the residuals were
rather rectangularly distributed and that most of the scores concentrated along the 0 point (see
Appendix 7.4). Outliers could not be identified.
Consequently, no violation of the assumption of outliers, normality, linearity, homoscedasticity
and the independence of the residuals could be identified which is why a multiple regression
could be conducted.
The R square value in the underlying multiple regression equaled 0.508 which signified that
50.8% of the variance of PI was explained by Attitude, SN and PBC (see Table 31). This can
be considered as a strong result which indicates a very accurate prediction of purchase intention
by Attitude, SN and PBC (Gujarati & Porter, 2009; Pallant, 2005). The results demonstrated
that R square was also statistically significant at the 0.05 level (p = 0.000 < 0.05).
Table 31: R square of Purchase Intention
Model R R square
1 0.713a 0.508
a. Predictors: (Constant), Attitude towards Using, Subjective Norm, Perceived Behavioral Control
b. Dependent Variable: Purchase Intention
As the Beta values of the three independent variables indicated, the attitude towards using
smartwatches made the strongest unique contribution to the explanation of purchase intention
(see Table 32). Furthermore, as all Beta values were positive, it could be concluded that all
three independent variables made a positive contribution. Moreover, Attitude (p = 0.000 < 0.05)
and PBC (p = 0.020 < 0.05) also made a statistically significant unique contribution to the
explanation of the dependent variable (see Table 34). SN (p = 0.186 > 0.05), however, did not
make a statistically significant unique contribution to the explanation of the dependent variable
(see Table 32).
Table 32: Beta Value and Significance Purchase Intention
Model Standardized Coefficient Beta Sig.
(Constant) 0.001
Attitude towards Using 0.658 0.000
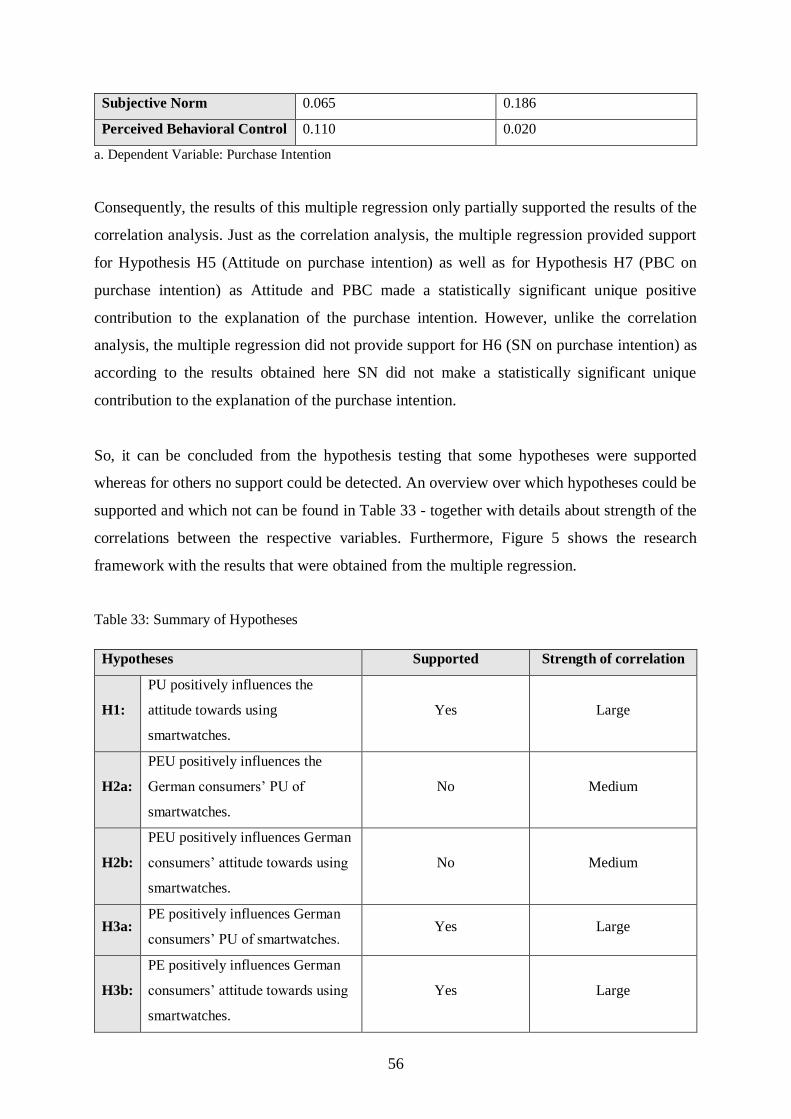
56
Subjective Norm 0.065 0.186
Perceived Behavioral Control 0.110 0.020
a. Dependent Variable: Purchase Intention
Consequently, the results of this multiple regression only partially supported the results of the
correlation analysis. Just as the correlation analysis, the multiple regression provided support
for Hypothesis H5 (Attitude on purchase intention) as well as for Hypothesis H7 (PBC on
purchase intention) as Attitude and PBC made a statistically significant unique positive
contribution to the explanation of the purchase intention. However, unlike the correlation
analysis, the multiple regression did not provide support for H6 (SN on purchase intention) as
according to the results obtained here SN did not make a statistically significant unique
contribution to the explanation of the purchase intention.
So, it can be concluded from the hypothesis testing that some hypotheses were supported
whereas for others no support could be detected. An overview over which hypotheses could be
supported and which not can be found in Table 33 - together with details about strength of the
correlations between the respective variables. Furthermore, Figure 5 shows the research
framework with the results that were obtained from the multiple regression.
Table 33: Summary of Hypotheses
Hypotheses Supported Strength of correlation
H1:
PU positively influences the
attitude towards using
smartwatches.
Yes Large
H2a:
PEU positively influences the
German consumers’ PU of
smartwatches.
No Medium
H2b:
PEU positively influences German
consumers’ attitude towards using
smartwatches.
No Medium
H3a: PE positively influences German
consumers’ PU of smartwatches. Yes Large
H3b:
PE positively influences German
consumers’ attitude towards using
smartwatches.
Yes Large
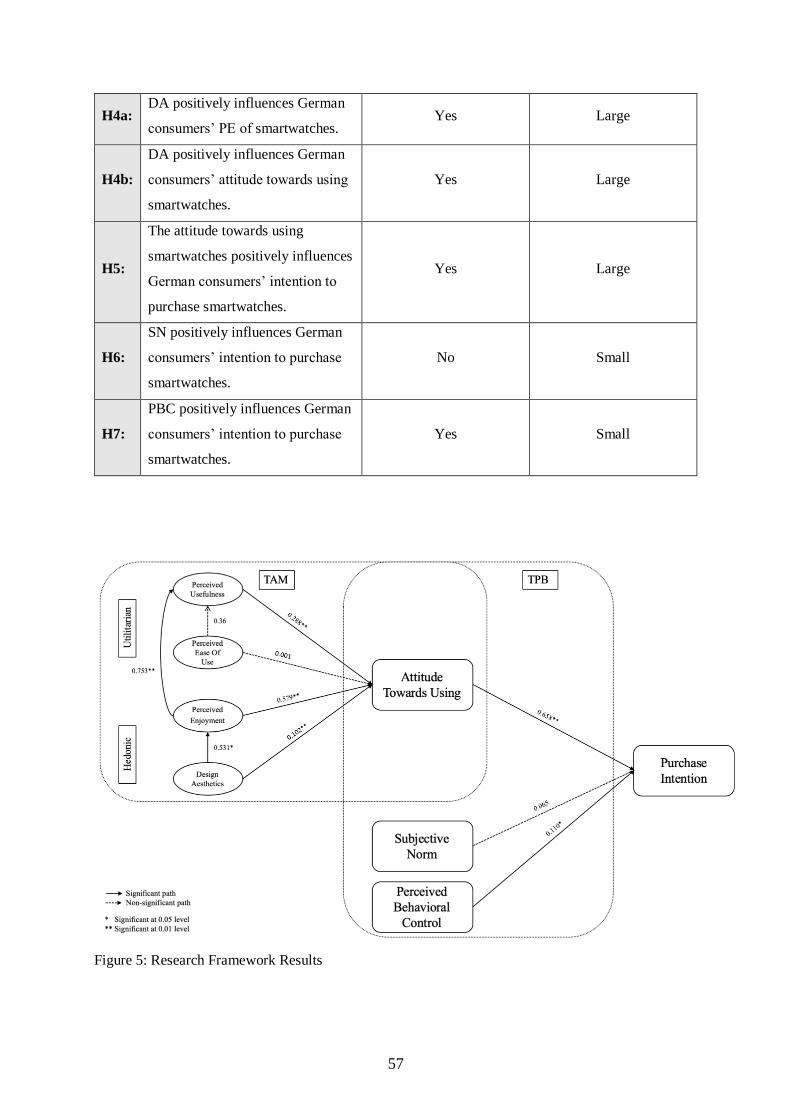
57
H4a: DA positively influences German
consumers’ PE of smartwatches. Yes Large
H4b:
DA positively influences German
consumers’ attitude towards using
smartwatches.
Yes Large
H5:
The attitude towards using
smartwatches positively influences
German consumers’ intention to
purchase smartwatches.
Yes Large
H6:
SN positively influences German
consumers’ intention to purchase
smartwatches.
No Small
H7:
PBC positively influences German
consumers’ intention to purchase
smartwatches.
Yes Small
Figure 5: Research Framework Results
58
5 Discussion
The following chapter discusses the findings of the present research study. The results are
compared to previous other studies.
5.1 Attitude towards Using
According to the empirical findings in this research German potential adopters of smartwatches
overall had a neutral attitude towards using smartwatches (total mean = 2.97; total SD = 0.941).
This indicates that there is an almost equal split between respondents who possessed negative
and those who possessed positive attitudes towards using smartwatches. In addition to that,
many respondents were indecisive about their attitude and therefore selected the no-choice
option. The latter could potentially be attributed to the fact, that smartwatches still are relatively
new on the market which might mean that not every German smartphone user has thought about
the benefits and drawbacks those devices would entail for him-/herself. Furthermore, the almost
equal split between the respondents that provided positive and those that provided negative
replies on the attitude questions demonstrates that smartwatches are a controversial issue in
Germany. So, although prior market research found that smartwatches are increasingly more
valued by Germans (Euromonitor International, 2018), the results of this study reveal that still
the majority of German potential adopters of smartwatches does not have a positive attitude
towards those devices. This means that although the smartwatch sales have strongly increased
in Germany (Euromonitor International, 2018) according to the results of this thesis’ study still
many Germans either do not like smartwatches or are indecisive about their attitudes towards
them. By receiving such low scores on the attitude dimension, the results obtained here differ
substantially from those of previous smartwatch adoption studies (e.g. Chua et al., 2016; Kim
& Shin, 2014; Wu et al., 2016) that obtained much more favorable total means for attitude.
These differences could have emerged due to a variety of reasons. The study of Chua et al.
(2016), for example, used only students rather than the total population as their sample. That
could explain some of the difference in the results as sampling only students, i.e. young people,
could result in more favorable total attitude scores because smartwatches and wearable
technologies in general are especially popular among the 25-34-year-old people (Statista Global
Consumer Survey, 2018b) whereas they are less popular in older demographic segments. In
addition to that, the study of Kim and Shin (2015) only surveyed current smartwatch users. It
59
is obvious that people that have already purchased such a device are likely to possess a more
positive attitude towards using smartwatches than non-users.
Furthermore, Wu et al.’s (2016) study, which focused on the consumer acceptance of
smartwatches, also detected a much more positive total attitude score than the underlying study.
Similar to the underlying research, this study also surveyed non-users of smartwatches and
made use of almost the same survey questions. So, there were no major differences in the
variables and demographics between both studies – which means that not so much possible
explanations for this substantial difference in respondents’ perception remain. It is argued here
that the discrepancy could have emerged due to the different methods of ensuring that
respondents know about smartwatches. Whereas in the underlying study consumers were solely
asked whether they know what a smartwatch is, Wu et al. (2016) showed their respondents a
video about those devices that presented a full definition and functionality of the smartwatch
and they also made sure that respondents had a showroom hands-on experience of those
devices. It could therefore be argued that when exposed to the different functionalities of
smartwatches, people might have more positive attitudes towards them as then they see all the
benefits that these devices offer.
In addition to that, an explanation for the discrepancies in the attitude scores between the three
previously mentioned and the underlying study could have also emerged due the cultural
difference between Asian and European consumers. This can be argued as the three previous
studies mentioned here all sampled Asian populations, indicating that the latter might have
more favorable attitudes towards using smartwatches than the further.
5.1.1 Perceived Usefulness
According to the findings of the underlying study, overall, Germans did not perceive
smartwatches as useful (total mean = 2.72; total SD: 0.865). This is, again, a substantial
difference compared to previous smartwatch adoption research (Chua et al., 2016; Kim & Shin,
2015; Wu et al., 2016) where, on average, smartwatches had been seen as useful among
respondents. Similar to the case of attitude, those findings could be attributed to three possible
explanations. First, that the underlying research was applied on a European rather than on an
Asian market (Chua et al., 2016; Kim & Shin, 2015; Wu et al., 2016), second, that the
knowledge about smartwatches was ensured in a different manner (Wu et al., 2016) as well as,
third, that those studies either sampled current smartwatch users (Kim & Shin, 2015) or students
and thus young non-users (Chua et al., 2016). As explained earlier sampling current users or
young non-user could have biased the results.
60
Apart from that, however, it has been found in this thesis that the utilitarian dimension of PU
positively influences the attitude towards using smartwatches with a significant beta-value of
0.228 (p = 0.00). Therefore, the first hypothesis that was constructed in this thesis (H1) could
be supported. This result was in line with the findings obtained by previous research on
smartwatch adoption that also revealed a positive influence of PU on attitude (e.g. Choi & Kim,
2016; Chua et al., 2016; Wu et al., 2016).
5.1.2 Perceived Ease of Use
In accordance with previous research (Chua et al., 2016; Kim & Shin, 2015; Wu et al, 2016)
the results of this study indicated that Germans perceive smartwatches as easy to use (total
mean = 3.96; total SD = 0.705).
Contrary to initial assumptions, however, the findings did not show a significant positive
influence of PEU on the attitude towards using those devices (Beta = 0.001; p = 0.966) –
meaning that hypothesis 2b could not be supported. In that way the results of this study could
not support Kim and Shin’s (2015) findings who detected a positive influence of PEU on
attitude and they could also not back Pricewaterhouse Coopers (2015) study according to which
the intuitive usability of a smartwatch is one of the most important influencing factors of their
purchase in Germany. Instead they were in line with other smartwatch adoption studies that
were also not able to find a significant direct relationship between the two concepts (Choi &
Kim, 2016; Chua et al., 2016; Wu et al., 2016). This could be attributed to the fact that
smartwatches are rather lightweight and do not intrude in daily life activities (Wu et al., 2016).
However, Choi & Kim (2016) as well as Chua et al. (2016) at least detected a significant indirect
influence of PEU on attitude via PU. Contrary to that, these results could also not find a
significant positive influence of PEU on PU indicating that also no indirect influence of PEU
on attitude via PU could be detected (Beta = 0.36; p = 0.435) and hypothesis 2a could not be
supported accordingly. Therefore, opposed to prior research findings this study suggests that
PU is the only relevant utilitarian factor that influences consumers’ attitudes and that PEU does
not play a role in the attitude formation. Consequently, it can be argued that the findings of the
underlying study are only partly in line with the assumptions of the original TAM.
5.1.3 Perceived Enjoyment
The underlying study indicated that, overall, Germans did not perceive smartwatches as
enjoyable (total mean = 2.75; total SD = 0.914). This is a noteworthy result as it is also not in
accordance with previous research findings (Wu et al., 2016). Similar to the above dimensions
61
the reasons for this discrepancy might be attributed to the fact that different methods were used
to ensure that people know what a smartwatch is and that it was worked with samples from
different cultures in both studies.
Apart from that, in accordance with the authors’ expectations, it was found that the hedonic
dimension PE has a positive influence on the attitudes towards using smartwatches (beta =
0.579; p = 0.00) leading to a support of hypothesis 3b. The results of this thesis’ study align
with prior research (Choi & Kim, 2016; Wu et al., 2016) that also found a positive influence of
PE on attitude. Furthermore, in line with Choi and Kim (2016) it was also found here that PE
has the strongest positive influence – i.e. stronger than perceived usefulness – on the attitude
towards using. Consequently, contrary to the assumptions of TAM the hedonic aspects that a
use of these devices would entail were found to be more important than the utilitarian aspects
for their attitude formation. In that way the findings of this study resemble those of Kranthi and
Asraar Ahmed (2018) who found hedonic motivations to have the strongest influence on
smartwatch adoption – stronger than the utilitarian dimension. At the same time, they seem to
contradict those of Yang et al. (2016) according to which potential users value the utilitarian
aspects of wearables devices more than the hedonic ones. A reason for this discrepancy could
lie in the fact that contrary to the underlying study, Yang et al. (2016) did not focus on one
specific type of wearable device – instead their study examined the acceptance of wearables in
general. Therefore, it is possible that respondents did more frequently thought of devices such
as fitness or health care trackers which undoubtedly mainly fulfill utilitarian purposes rather
than smartwatches when answering their survey. Consequently, this could have led to the result
that when asked about wearable devices in general, potential users value their utilitarian aspects
more than their hedonic ones – although, as the underlying study suggest, the reverse is true for
the specific case of smartwatches.
In addition to the direct influence of PE on the attitude towards using, in line with Ernst and
Ernst (2016b) this study also detected an indirect influence of PE on attitude via PU as PE was
found to positively influence PU (beta = 0.753; p = 0.00). This led to a support of hypothesis
3a and indicates that in a German market setting the hedonic aspects do not only directly
influence potential consumers attitude but they also influence the utilitarian aspects which
means that both aspects are not entirely independent of each other; instead there is a relationship
and thus also a connection between them.
62
5.1.4 Design Aesthetics
In the underlying study it became apparent that Germans perceive the overall design of
smartwatches as slightly appealing (total mean: 3.19; total SD: 0.853). It would have been
interesting to check whether these findings are in accordance with those of previous research.
However, as none of the studies that included DA into their research model (Deghani & Kim,
2019; Hsiao & Chen, 2018; Kranthi & Asraar Ahmed, 2018) had provided a mean score for
this dimension in their paper, this is not possible.
Furthermore, this research found that DA positively influences the attitude towards using
smartwatches (beta value = 0.102; p = 0.006) which leads to a support of hypothesis 4b. This
result for a German sample is in line with the findings of Hsiao and Chen (2018) who also
detected a positive influence of DA on attitude by sampling Taiwanese potential adopters of
smartwatches. Furthermore, it also resembles the findings of Deghani and Kim (2019) who
sampled non-users of smartwatches and found a positive influence of DA on the intention to
purchase those devices as well as those of Kranthi and Asraar Ahmed (2018) who received the
same results for the adoption intention among Indian IT professionals. However, unlike Hsiao
and Chen (2018) this study could only find evidence for a weak, yet still significant, effect of
DA on attitude. DA could not be regarded to have the strongest direct effect on attitude – instead
those of PU and PE were much stronger.
In addition to that, the findings show an indirect influence of DA on the attitude towards using
via PE as DA has been detected to positively influence PE (beta value = 0.531; p = 0.00). This
led to a support of hypothesis 4a. In that way these findings are in accordance with Yang et al.’s
(2016) results on potential users of wearable devices who also found a relationship between the
two hedonic dimensions with almost the exact same strength. This indicates that in a German
market setting DA positively influences PE in the case of smartwatches.
5.2 Purchase Intention
The results show, that Germans do not intend to purchase a smartwatch in the near future (total
mean = 1.99; total SD: 1.11). It is also worth mentioning that the most frequent answer for each
of the three questions of this dimension had been “strongly disagree”. So contrary to previous
market research that underlined a good potential for smartwatches on the German market
(Euromonitor International 2018), the results of this study suggest that the opportunities for the
German smartwatch market to further grow might be limited. There does not seem to be much
potential for smartwatches to be sold in Germany as the vast majority of the respondents did
not consider purchasing such a device in the near future. This might explain why, despite all
63
the positive sales trends in the last few years, the penetration rate of wearable devices in
Germany is projected to only grow marginally from 7.7% in 2019 to 8.0% in 2023 (Statista,
2019c).
The results differ substantially from previous research findings (Chua et al., 2016; Kim & Shin,
2014; Wu et al, 2016) as those studies all found that respondents intended to buy or use
smartwatches in the near future. As for the other dimensions, there are different possible
explanations for the emergence of those discrepancies. First, they could be attributed to the fact
that the underlying research was applied on a European rather than on an Asian market
indicating potential cultural differences between both regions with regard to smartwatch
purchase or use intention (Chua et al., 2016; Kim & Shin, 2015; Wu et al., 2016). Second, that
knowledge about smartwatches was ensured in a different manner (Wu et al., 2016) and, third,
some of those studies either sampled current smartwatch users who are obviously more likely
to use a smartwatch than potential adopters (Kim & Shin, 2015) or students and thus young
non-users which are from all age groups most likely to adopt smartwatches (Chua et al., 2016).
Therefore, the sample selection of some of the previous studies could have substantially biased
their results.
5.2.1 Attitude towards Using
Apart from that, it has been found that the attitude towards using smartwatches positively
influences Germans purchase intention (beta value = 0.704; p = 0.00) which led to a support of
hypothesis 5. This is in accordance with Hsiao & Chen (2018) who detected the exact same
relationship in their empirical study by sampling Taiwanese consumers. Furthermore, it also
resembles the results of other previous research who found a positive influence of the attitude
towards using on the intention to adopt or to use smartwatches (Choi & Kim, 2016; Chua et al.,
2016; Wu et al. 2016). In addition to that, attitude was even found to have the strongest impact
on purchase intention – i.e. stronger than SI and PBC. This result is also in line with Hsiao and
Chen’s (2018) findings.
5.2.2 Subjective Norm
Additionally, it was detected that respondents’ SN in regard to using smartwatches is very low
(total mean = 1.85; total SD = 0.725). This indicates that Germans do not feel a social pressure
to use smartwatches and even if this pressure would exist, it would not be important to them to
follow other individuals’ or reference groups’ opinions. Interestingly, these findings are also
not in accordance with those of Wu et al.’s (2016) study who found that Taiwanese non-users

64
of smartwatches feel that social pressure and care about their reference groups’ opinions. These
discrepancies can potentially be attributed to the cultural differences between Taiwan and
Germany. More specifically, being a highly collectivist culture Taiwanese value the group and
their opinions higher than themselves as an individual, whereas Germans are highly
individualistic and therefore value themselves and their own opinions higher than that of the
group (Hofstede, 2011; Hofstede Insights, n.d.).
Apart from that, contrary to initial expectations no positive influence of SN on the purchase
intention could be detected (beta value = 0.065; p = 0.186) which means that hypothesis 6 could
not be supported. In that way, the findings contradict with most of prior research on the adoption
of smartwatches and wearables in general that was conducted among non-users on the Asian
market (Kranthi & Asraar Ahmed, 2018; Wu et al., 2016; Yang et al., 2016). However, they
are in accordance with the results of Hsiao and Chen (2018) who also found no significant
influence of SN – or as they called it: ‘Social value’ – on the purchase intention of smartwatches
by sampling Taiwanese people. This means that the discrepancy between the results of the
underlying study and those of the majority of previous research could not only be explained by
cultural differences. Instead, it is possible that the fact that potential adopters often find it
difficult to evaluate the social value of not highly popular products (Hsiao, 2013) plays a role
here. Consequently, based on this reasoning, it can be argued that respondents’ inaccuracy of
evaluating the social value (i.e. in the underlying case the SN) of smartwatches might lead to
different results for the influence of this dimension on the behavioral intention in different
studies.
5.2.3 Perceived Behavioral Control
According to the findings of this research Germans have a high PBC in regard to using
smartwatches (total mean = 4.31; total SD = 0.584). This means that respondents thought that
they possess the ability as well the resources to use smartwatches. Consequently, the results of
this study could not support the findings from previous market research according to which the
average unit price of smartwatches is an impediment for their further success on the German
market (Euromonitor International, 2018). However, in line with this thesis’ results, previous
research on other types of wearable technologies has also obtained high mean scores for PBC
(Turhan, 2013; Wu et al., 2011).
In addition to that, in the underlying study a weak positive influence of PBC on the purchase
intention of smartwatches has been found (beta value = 0.110; p = 0.02) – which led to a support
of hypothesis 7. This result is in accordance with the previous study of Wu et al. (2011) who
65
also detected significant influence of PBC on the adoption intention for mobile healthcare
devices as well as partly in accordance with the study of Turhan (2013) who detected a
significant influence of PBC on the purchase intention of smart bras but not on that of smart t-
shirts. Consequently, based on the results, it can be argued that Germans ability to use those
devices as well as their resources to do so influence their intention to purchase smartwatches.
66
6 Conclusion
The following chapter presents conclusions about the research findings. The research question
is answered and theoretical as well as managerial implications presented. The chapter closes
with limitations of the study and recommendations for future research.
6.1 Research Question
The present research investigated which factors influence German consumers’ purchase
intention of smartwatches. Accordingly, the research question was as follows:
RQ: Which factors influence German consumers’ intention to purchase smartwatches?
The results of this study show that attitude was the strongest predictor for the intention to
purchase smartwatches followed by PBC. In contrast to the designed research framework that
also portrayed SN as a factor influencing purchase intention, the outcomes of this study could
not detect a positive relationship between those two dimensions.
Additionally, the results demonstrated that PU, PE and DA positively influence attitude as well
as that PE positively influences PU and DA positively influences PE. However, for the
dimension PEU no influence on attitude or PU could be found.
6.2 Theoretical Implications
Some research on the consumers’ intention to purchase, use or adopt smartwatches and other
wearables devices has already been conducted. However, most of this research has focused on
the Asian market – particularly on Korea and Taiwan (e.g. Choi & Kim, 2016; Hong et al.,
2017; Hsiao & Chen, 2018) and almost none has investigated a Western market. This clearly
was a research gap that the authors aimed to fill. Therefore, to the best of the authors’
knowledge, this thesis is one of the first studies to examine German consumers’ purchase
intentions of smartwatches. The authors researched the given topic by applying a new, self-
developed model consisting of TAM, TPB and two additional hedonic dimensions. Particularly,
this research introduces design aesthetics and perceived enjoyment as antecedents of the
attitude towards using smartwatches.
67
From a theoretical point of view, this thesis successfully integrated hedonic and utilitarian
factors into a research model for a purchase-intention context. The results show that hedonic
factors have a stronger influence on German consumers’ attitudes than utilitarian factors. More
specifically, PE was found to have the strongest influence on the attitude towards using
smartwatches. This means that consumers especially enjoy using smartwatches in their own
rights and that their performance consequences are not the most important factor influencing
their attitudes (Bagozzi et al., 1992). Nevertheless, the significant influence of PE on PU
indicates that the utilitarian and hedonic dimension are not fully independent of each other -
instead there is a relationship and thus a connection between them.
Furthermore, as a first study in this research stream, this thesis also investigated the influence
of PBC on the intention to purchase smartwatches. Here, the authors also detected a significant
relationship which indicates that people’s abilities to use smartwatches as well as their resources
influence their decision to buy those devices.
6.3 Managerial Implications
The results of this study provide several implications for smartwatch manufacturers as well as
marketing practitioners in the smartwatch industry.
First of all, they provide empirical evidence that hedonic values are a critical influencing factor
of German consumer attitudes towards using smartwatches - which eventually leads to their
intention to purchase one. More specifically, the influence of PE was found to be the strongest
factor influencing consumers attitudes. Therefore, marketers should put a strong emphasis on
advertising the hedonic value of smartwatches in their communication towards consumers. This
could be implemented by creating advertising campaigns that depict the smartwatch as a device
which is fun and enjoyable to use.
Furthermore, due to the influence of DA on PE and directly on attitude, the authors suggest
combining the fashion and technology component of smartwatches. At the moment, most
smartwatches offer to customize technical needs, like installing particular applications.
Nevertheless, the customization of design is limited, even though some manufacturers offer
different colors, wristbands or virtual backgrounds of the screen (Chua, et al., 2016; Yang et
al., 2016). Therefore, the authors suggest practitioners to mainly focus on well-differentiated
functionality and high compatibility and, at the same time, emphasize attractive designs.
Including fashion and communicating that to potential adopters can be a promising strategy by
focusing on the two dimensions: fashion and technology.
68
Additionally, the finding that PU also positively influences attitude should remind marketing
managers to also promote the usefulness of smartwatches in advertising campaigns. Although,
the enjoyment those devices entail should be in the center of such campaigns a hint towards
their usefulness in consumers’ daily life is also advisable to include. This could, for example,
be implemented by presenting the special features that only smartwatches possess and outline
how they could help make consumers’ lives more effective.
Moreover, marketing practitioners should also be aware of the positive influence of PBC. This
relationship demonstrates the importance to promote smartwatches as devices that are
conveniently usable at a fair cost so that consumers perceive their behavioral control, i.e. their
abilities and resources to use those devices as high.
6.4 Social and Ethical Issues of Smartwatches
Despite all the positive aspects of smartwatches that have been outlined in the course of this
thesis, it is crucial to mention, that the use of wearable technologies – and smartwatches in
particular – also involves some social and ethical issues.
In that regard, privacy issues are one major area of concern. Smartwatches gather a substantial
amount of intimate personal data about people’s everyday life including personal health data,
location or purchasing data (Eadicicco, 2014; Hamble, 2015; Spicer, 2014). This data is then
packaged and transmitted to specific datacenters for analytical purposes (Spicer, 2015).
Therefore, the risk arises that technology companies who get access to that data, sell it to third
parties such as insurance agencies, consumer goods companies or even employers who could
then create a detailed profile of each of their customers or employees (Hamble, 2015; Spicer,
2014). Such profiles would enable them to draw highly accurate conclusions about their
preferences or future behaviors (Hamblen, 2015). However, apart from the risk that technology
companies sell the consumer data, another danger might be that hackers gather the data and use
them for criminal purposes (Eadicicco, 2014). In any case, the rise of smartwatches might boost
the development towards more transparent human beings, and it might assist marketers and
employers to more easily see through their customers and employees. The ethical
reasonableness of such practices can be considered as highly controversial which makes this
topic a subject to ethical debates already today – and possibly even more frequently in the
future.
69
Apart from that, wearable devices forward the trend of consumers’ ‘getting addicted’ to
information and communication (Spicer, 2015). It was found that this development goes even
as far that frequent smartwatch users compulsively check their bare wrist to obtain information
updates even if there are not wearing the device (Spicer, 2014).
Furthermore, it can be argued that wearable technologies also increase people’s obsession with
their personal fitness as these devices continuously supply health and wellbeing information
(Alter, 2017; Spicer, 2014). This self-obsession with personal fitness can even lead to an
addiction in the sense of heavy exercising that is not in line with the body. This can be
dangerous for personal health and wellbeing (Alter, 2017; Spicer, 2015).
Lastly, after wearable technologies and specifically smartwatches hit the market, a public
debate about their possible cancer risk started to arise (e.g. Bilton, 2015; Feltman, 2015).
However, although some animal studies suggested that smartwatches might have the ability to
cause cancer in the long run, due to a lack of longitudinal studies on this topic, up to now, a
final answer on that question cannot be given (Biton, 2015; Whitehead, 2018). Hence, it can be
argued that the risk of smartwatches to cause cancer can at least not entirely be rejected today
- which might also be a possible issue that is attached to the use of those devices.
6.5 Limitations
As each academic study this research also comprises several limitations that need to be
discussed here.
Firstly, the study was conducted among German consumers which limits its scope as only one
country has been investigated. However, since a research gap was identified for the Western
markets this limitation was intentional. The outcomes of the present study can therefore only
be applied to Germany.
Additionally, the authors were facing time and financial constraints. That was the case as there
were only five months between the idea development and the hand-in date of this thesis and as
no additional funding for this research was provided. Therefore, the authors were forced to
make several decisions that limited the scope and representativeness of this study, such as
including only seven dimensions into the underlying research model as well as applying a non-
probability sampling method. It is argued here that by means of adding more factors to the
research model the study could have been more in-depth and accurate if the authors would have
had more time to carry out their research. Due to time constraints it was decided to only extend
70
TAM by PE and DA. However, examining the influence of additional factors such as
compatibility or trust on German consumers’ purchase intention of smartwatches could have
been interesting as well.
Furthermore, using of online questionnaires to gather the empirical data can also be considered
a limitation as such questionnaires’ response rates are usually very low (Bryman, 2012). This
is the case as the respondent is not actively encouraged to participate. In addition to that, this
method also entails the risk of bias, as it is possible that those people that respond substantially
differ from those that refuse to respond (Bryman, 2012). This means that only people that are
alike-thinking might respond and those who think differently refuse to respond. Consequently,
applying this method could have influenced the accuracy of this study (Bryman, 2012).
In addition to that, the TPB framework has been said to be not the best predictor for social
pressure (Mathieson, 1991) as consumers are often not aware of what influences them in their
decision-making process. Therefore, the validity of the SN construct and, thus, the explanatory
power of this study might be limited. This means that a social influence on the intention to
purchase smartwatches could exist although this study could not detect such a relationship.
Lastly, by asking respondents about their perceptions of smartwatches in general, the authors
aimed to make sure that they express their opinions without being biased by a certain product
from a specific brand. However, this led to the limitation that potential purchase intention
influencing factors such as attitudes or loyalty towards a specific brand were disregarded.
6.6 Future Research
The execution of the present study offers several possibilities for future research. Building on
the limitations of the study, future researchers could focus on conducting a similar study in
different settings, for example other western countries or cultures. That can lead to a
comparative study between countries and could thus provide further insights on whether the
geographical or cultural differences have an impact on the purchase intention.
Additionally, the present framework could be extended by more dimensions which could lead
to further valuable findings. Apart from that, a replication of this study by exchanging TPB
against a similar model might be advisable in order to better predict the influence of social
pressure on the behavioral intention. Another approach future research could take would be to
71
more specifically investigate the purchase intention for a specific smartwatch brand and then
include dimensions such as attitude or loyalty towards that brand. Furthermore, it might also be
advantageous to replicate this study by applying a probability sampling method and, at the same
time, avoiding the use of online questionnaires.
Apart from the future research suggestions that could be derived from this study’s limitations,
it is suggested here that future studies could also apply the framework introduced in this thesis
for studies on other types of wearable devices.
In addition to that, it would be advisable to focus more on the influence of different
demographics (i.e. gender, age or income groups) and how they differ in regard to the factors
influencing their purchase intentions.
Furthermore, it is important to underline the difficulty to accurately anticipate consumer
behavior. Therefore, it might be worth considering taking a longitudinal approach which would
enable to investigate the effect of intention on behavior. Furthermore, such a longitudinal
research would allow the examination of change in consumer behavior and its influencing
factors over time.
Finally, in order to get more detailed insights about the underlying motives for consumers’
intention to purchase smartwatches, future research could also execute a qualitative study.
Receiving in-depth insights about those motives from a qualitative study might be advantageous
as the perception of and the intention to adopt technological products is and will probably
always be a highly interesting topic for businesses, consumers and governments.
iv
References
Ahtola, O. (1985). Hedonic And Utilitarian Aspects Of Consumer Behavior: An Attitudinal
Perspective. NA - Advances In Consumer Research, 12, 7-10.
Ajzen, I. (1985). From Intentions To Actions: A Theory Of Planned Behavior. In J. Kuhl, & J.
Beckmann, Action-Control: From Cognition To Behavior. Heidelberg, Germany:
Springer.
Ajzen, I. (1991). The Theory Of Planned Behavior. Organizational Behavior And Human
Decision Processes, 50(2), 179-211.
Ajzen, I. (2002). Perceived Behavioral Control, Self-Efficacy, Locus Of Control, And The
Theory Of Planned Behavior. Journal of Applied Social Psychology, 32(4), 665-683.
Alter, A. (2017). Fitness Trackers Can Be Addictive - And Dangerous. Retrieved May 11th,
2019, from https://www.popsci.com/wearable-tech-exercise-addiction#page-2
Babin, B., & Zikmund, W. (2016). Exploring Marketing Research (Vol. 11th). Boston, MA:
Cengage Learning.
Bagozzi, R. (2007). The Legacy Of The Technology Acceptance Model And A Proposal For
A Paradigm Shift. Journal Of The Association For Information Systems, 8(4), 244-
254.
Bagozzi, R., Davis, F., & Warshaw, P. (1992). Development And Test Of A Theory Of
Technological Learning And Usage. Human Relations, 45(7), 659-686.
Bartlett, M. (1954). A Note On The Multiplying Factors For Various Chi Square
Approximations. Journal Of The Royal Statistical Society, 16(Series B), 296-298.
Benbasat, I., & Barki, H. (2007). Quo Vadis TAM? Journal Of The Association For
Information Systems, 8(4), 211-218.
Bhat, A., & Reddi, U. (2014). Wearable Devices: The Next Big Thing In CRM. Retrieved
February 28, 2019, from https://www.cognizant.com/services-resources/wearable-
devices-the-next-big-thing-in-crm-codex984.pdf
Bhattacharya, Y. (2015). Employee Engagement As A Predictor Of Seafarer Retention: A
Study Among Indian Officers. The Asian Journal Of Shipping And Logistics, 31(2),
295-318.
Bilton, N. (2015). The Health Concerns in Wearable Tech. Retrieved May 11th, 2019, from
https://www.nytimes.com/2015/03/19/style/could-wearable-computers-be-as-harmful-
as-cigarettes.html
Bryman, A. (2012). Social Research Methods (Vol. 4). New York, NY: Oxford University
Press.
Catell, R. (1966). The Scree Test For Number Of Factors. Multivariate Behavioral Research,
1, 245-276.
Cecchinato, M., Cox, A., & Bird, J. (2015). Smartwatches: The Good, The Bad And The
Ugly? In B. Begole, J. Kim, K. Inkpen, & W. Woo (Ed.), CHI EA '15: Proceedings of
the 33rd Annual ACM Conference Extended Abstracts on Human Factors in
Computing Systems (pp. 2133-2138). Association for Computing Machinery (ACM):
New York, NY, United States.
Cerit, A. (2000). Maritime Transport As An Area Of Competitive Advantage In International
Marketing. International Journal Of Maritime Economics, 2(1), 49-67.
Chan, M., Esteve, D., Fourniols, J., Escriba, C., & Campo, E. (2012). Smart Wearable
Systems: Current Status And Future Challenges. Artificial Intelligence in Medicine,
56(3), 137-156.
Cho, W., Jung, Y., & Im, J. (2014). Students’ Evaluation Of Learning Management Systems
In The Personal Computer And Smartphone Computing Environments. International
Journal Of Mobile Communications, 12, 142-159.
v
Choe, M.-J., & Noh, G.-Y. (2018). Combined Model Of Technology Acceptance And
Innovation Diffusion Theory For Adoption Of Smartwatches. International Journal Of
Contents, 14(3), 32-38.
Choi, J., & Kim, S. (2016). Is The Smartwatch An IT Product Or A Fashion Product? A Study
On Factors Affecting The Intention To Use Smartwatches. Computers in Human
Behavior(63), 777-786.
Chua, S.-W., Rauschnabel, P., Krey, N., Nguyen, B., Ramayah, T., & Lade, S. (2016).
Wearable Technologies: The Role Of Usefulness And Visibility In Smartwatch
Adoption. Computers in Human Behavior, 65, 276-284.
Cohen, J. (1988). Statistical Power Analysis For The Behavioral Sciences (Vol. 2). Hillsdale,
NJ: Lawrence Erlbaum Associates.
Cyr, D., Head, M., & Ivanov, A. (2006). Design Aesthetics Leading To Loyalty In Mobile
Commerce. Information And Management, 43, 950-963.
Davis, F. (1989). Perceived Usefulness, Perceived Ease Of Use, And User Acceptance Of
Information Technology. MIS Quarterly, 13(3), 319-3140.
Deghani, M., & Kim, K. (2019). The Effects Of Sesign, Size, And Uniqueness Of
Smartwatches: perspectives from current versus potential users. Behavior &
Information Technology, doi:10.1080/0144929X.2019.1571111 .
Eadicicco. (2014). A New Wave Of Gadgets Can Collect Your Personal Information Like
Never Before. Retrieved May 11th, 2019, from
https://www.businessinsider.com/privacy-fitness-trackers-smartwatches-2014-
10?r=US&IR=T
eMarketer. (2018). Top 5 Countries, Ranked By WhatsApp User Penetration, 2018 & 2019
(% Of Smartphone Users In Each Country). Retrieved April 20, 2019, from
https://www.emarketer.com/Chart/Top-5-Countries-Ranked-by-WhatsApp-User-
Penetration-2018-2019-of-smartphone-users-each-country/224233
Ernst, A., & Ernst, C.-P. (2016a). Success Comes To Those Who Are Successful: The
Influence Of Past Product Expectation Confirmation On Smartwatch Usage. In C.-P.-
H. Ernst, The Drivers of Wearable Device Usage (pp. 49-58). Cham, Switzerland:
Springer.
Ernst, C.-P., & Ernst, A. (2016b). The Influence Of Privacy Risk On Smartwatch Usage. 22nd
Americas Conference On information Systems, AMCIS (pp. 1303-1313). Red Hook,
NY: Curran Associates.
Euromonitor International. (2018). Country Report: Wearable Electronics In Germany.
Retrieved February 25, 2019, from https://www.euromonitor.com/wearable-
electronics-in-germany/report
Feltman, R. (2015). Smartwatches Might Cause Cancer, Says Article Based On ‘Expert’ Who
Pushes Holistic Breast Cancer Treatments. Retrieved May 11th, 2019, from
https://www.washingtonpost.com/news/speaking-of-
science/wp/2015/03/19/smartwatches-might-cause-cancer-says-article-based-on-
expert-who-pushes-holistic-breast-cancer-
treatments/?noredirect=on&utm_term=.fa49f4e11235
Fishbein, M., & Ajzen, I. (1975). Belief, Attitude, Intention, And Behavior: An Introduction
To Theory And Research. Reading, MA: Addison-Wesley.
GfK. (n.d.-a). Share Of Wearables Sales By Product Category And Region Worldwide In
2015. Retrieved February 22, 2019, from Statista - The Statistics Portal: https://www-
statista-com.proxy.library.ju.se/statistics/538185/wearable-sales-share-by-product-
and-region/
GfK. (n.d.-b). Wearables Unit Sales Share Worldwide From 2014 to 2018, By Category.
Retrieved February 22, 2019, from Statista - The Statistics Portal: https://www-
vi
statista-com.proxy.library.ju.se/statistics/538159/share-of-global-wearables-sales-by-
category/
Gujarati, D., & Porter, D. (2009). Basic Econometrics (Vol. 5). New York: McGraw-Hill /
Irvine.
Hamblen, M. (2015). As Smartwatches Gain Traction, Personal Data Privacy Worries
Mount. Retrieved May 11th, 2019, from
https://www.computerworld.com/article/2925311/as-smartwatches-gain-traction-
personal-data-privacy-worries-mount.html
Hein, D., & Rauschnabel, P. (2016). Augmented Reality Smart Glasses And Knowledge
Management: A Conceptual Framework For Enterprise Social Networks. Wiesbaden,
Germany: Springer.
Hofstede Insights. (n.d.). Compare Countries. Retrieved April 26, 2019, from
https://www.hofstede-insights.com/product/compare-countries/
Hofstede, G. (2011). Dimensionalizing Cultures: The Hofstede Model In Context. Online
Readings in Psychology And Culture, 2(1), doi: https://doi.org/10.9707/2307-
0919.1014 .
Hong, J.-C., Lin, P.-H., & Hsieh, P.-C. (2017). The Effect Of Consumer Innovativeness On
Perceived Value And Continuance Intention To Use Smartwatches. Computers in
Human Behavior, 67, 264-272.
Hsiao, K.-L. (2013). Android Smartphone Adoption And Intention To Pay For Mobile
Internet: Perspectives From Software, Hardware, Design, And Value. Library Hi
Tech, 31(2), 216-235.
Hsiao, K.-L., & Chen, C. (2018). What Drives Smartwatch Purchase Intention? Perspectives
From Hardware, Software, Design, And Value. 35, 103-113.
Hwang, C., Chung, T.-L., & Sanders, E. (2016). Attitudes And Purchase Intentions For Smart
Clothing: Examining U.S. Consumers’ Functional, Expressive, And Aesthetic Needs
For Solar-Powered Clothing. Clothing And Textiles Research Journal, 34(3), 207-222.
IDC. (2018). New Wearables Forecast from IDC Shows Smartwatches Continuing Their
Ascendance While Wristbands Face Flat Growth. Retrieved January 29, 2019, from
http://www.idc.com/getdoc.jsp?containerId=prUS44000018
Jung, Y., Kim, S., & Choi, B. (2016). Consumer Valuation Of The Wearables: The Case Of
Smartwatches. Computers In Human Behavior, 63, 899-905.
Kaiser, H. (1970). A Second Generation Little Jiffy. Psychometrika, 35(4), 401-415.
Kaiser, H. (1974). An Index Of Factoral Simplicity. Psychometrika, 39(1), 31-36.
Kalantari, M. (2017). Consumers' Adoption Of Wearable Technologies: Literature Review,
Synthesis, And Future Research Agenda. International Journal Of Technology
Marketing, 12(3), 274-307.
Kim, H., Chan, H., & Gupta, S. (2007). Value-Based Adoption Of Mobile Internet: An
Empirical Investigation. Decision Support Systems, 43(1), 111-126.
Kim, K., & Shin, D.-H. (2015). An Acceptance Model For Smartwatches: Implications For
The Adoption Of Future Wearable Technology. Internet Research, 25(4), 527-541.
King, W., & He, J. (2006). A Meta-Analysis Of The Technology Acceptance Model.
Information & Management, 43(6), 740-755.
Kranthi, A., & Asraar Ahmed, K. (2018). Determinants Of Smartwatch Adoption Among IT
Professionals – An Extended UTAUT2 Model For Smartwatch Enterprise.
International Journal Enterprise Network Management, 9(3/4), 294-316.
Kulviwat, S., Brunner, G., Kumar, A., Nasco, S., & Clark, T. (2007). Toward A Unified
Theory Of Consumer Acceptance Technology. Psychology & Marketing, 24(12),
1059-1084.
Lymberis, A. (2003). Smart Wearable Systems For Personalised Health Management: Current
R&D And Future Challenges. Proceedings of the 25th Annual International
vii
Conference of the IEEE Engineering in Medicine and Biology Society, 4, pp. 3716-
3719.
Maddox, T. (2016). Smartwatch Sales To Hit $17.8 Billion In 2020, But Business Use
Lagging. Retrieved January 29, 2019, from
http://www.techrepublic.com/article/smartwatch-sales-to-hit-17-8-billion-in-2010-but-
business-use-lagging/.
Malhotra, N., Birks, D., & Wills, P. (2012). Marketing Research: An Applied Approach (Vol.
4). Harlow, Essex, England: Pearson Education Limited.
Mann, S. (2014). Wearable Computing. In M. Soegaard, & R. Dam, The Encyclopedia Of
Human-Computer Intreraction (2. ed.). Aarhus, Denmark: The Interaction Design
Foundation.
Mao, E., & Palvia, P. (2006). Testing An Extended Model Of IT Acceptance In The Chinese
Cultural Context. The Database For Advances In Information Systems, 37.
Mathieson, K. (1991). Predicting User Intentions: Comparing The Technology Acceptance
Model With The Theory Of Planned Behaviour. Information System Research, 2(3),
173-191.
Mojapelo, T. (2018). Wearable Devices For Kids. Retrieved March 30, 2019, from
http://www.fluxtrends.com/wearable-devices-for-kids/
Moon, J., & Kim, Y. (2001). Extending The TAM For A World-Wide-Web Context.
Information & Management, 38(4), 217-230.
Mordor Intelligence. (2017). Germany Wearable Sensors Market. Retrieved February 25,
2019, from https://www.mordorintelligence.com/industry-reports/germany-wearable-
sensors-market-industry
Pal, D., Funikul, S., & Vanija, V. (2018). The Future Of Smartwatches: Assessing The End-
Users' Continous Usage Using An Extended Expectation-Confirmation Model. 1-21.
Pallant, J. (2005). SPSS Survival Manual: A Step By Step Guide To Using SPSS For Windows
(Vol. 12). New South Wales: Allen & Unwin.
Pantouvakis, A. (2007). Who Pays The Ferryman? An Analysis Of The Ferry passenger's
Selection Dilemma. Maritime Policy & Management, 34(6), 591-612.
Park, S., Chung, K., & Jayaraman, S. (2014). Wearables: Fundamentals, Advancements, And
A Roadmap For The Future. In E. Sazonov, & M. Neumann, Wearable Sensors:
Fundamentals, Implementation And Applications (pp. 1-23). AL, USA: Elsevier.
Park, Y., & Chen, J. (2007). Acceptance And Adoption Of The Innovative Use Of
Smartphones. Industrial Management & Data Systems, 107(9), 1349-1365.
Pricewaterhouse Coopers. (2015). Wearables: Die Tragbare Zukunft kommt näher
(Wearables: The wearable Future is approaching). Retrieved February 25, 2019, from
https://www.pwc.at/de/images/tmt-studie-3.pdf
Quain, J. (2015). Smartwatches: The Death Of The Smartphone? Retrieved March 7, 2019,
from https://www.foxnews.com/tech/smartwatches-the-death-of-the-smartphone
Rauschnabel, P., & Ro, Y. (2016). Augmented Reality Smart Glasses: An Investigation Of
Technology Acceptance Drivers. International Journal Of Technology Marketing,
11(2), 123-148.
Rawassizadeh, R., Price, B., & Petre, M. (2015). Wearables: Has The Age Of Smartwatches
Finally Arrived? 58(1), 45-47.
Robson, C. (2002). Real World Research (Vol. 2). Oxford: Blackwell.
Rogers, E. (1962). Diffusions Of Innovations. New York, NY: Free Press of Glencoe.
Russey, C. (2018). Wearables To Help The Elderly Stay Healthy And Safe At Home Or
Outside. Retrieved March 30, 2019, from https://www.wearable-
technologies.com/2018/09/wearables-to-help-the-elderly-stay-healthy-and-safe-at-
home-or-outside/
viii
Saunders, M., Lewis, P., & Townhill, A. (2009). Research Methods For Business Students
(Vol. 5). Harlow, Essex, England: Pearson Education Limited.
Spicer, A. (2014). Apple Delivers Smartwatch, But You Might Want To Think Twice About
Getting One. Retrieved May 11th, 2019, from http://theconversation.com/apple-
delivers-smart-watch-but-you-might-want-to-think-twice-about-getting-one-31526
Spicer, A. (2015). Apple Watch: Smartwatches Could Make Us Even More Self-Obsessed.
Retrieved May 11th, 2019, from https://edition.cnn.com/2015/03/10/opinions/apple-
watch-self-obsessed/index.html
Statista. (2019a). Wearables: Asia. Retrieved February 22, 2019, from https://www-statista-
com.proxy.library.ju.se/outlook/319/101/wearables/asia
Statista. (2019b). Wearables: Canada. Retrieved February 22, 2019, from https://www-
statista-com.proxy.library.ju.se/outlook/319/108/wearables/canada
Statista. (2019c). Wearables: Germany. Retrieved February 22, 2019, from https://www-
statista-com.proxy.library.ju.se/outlook/319/137/wearables/germany
Statista. (2019d). Wearables: South Korea. Retrieved February 22, 2019, from https://www-
statista-com.proxy.library.ju.se/outlook/319/125/wearables/south-korea
Statista. (2019e). Wearables: Sweden. Retrieved February 22, 2019, from https://www-
statista-com.proxy.library.ju.se/outlook/319/154/wearables/sweden
Statista. (2019f). Wearables: United Kingdom. Retrieved February 22, 2019, from
https://www-statista-com.proxy.library.ju.se/outlook/319/156/wearables/united-
kingdom
Statista. (2019g). Wearables: United States. Retrieved February 22, 2019, from https://www-
statista-com.proxy.library.ju.se/outlook/319/109/wearables/united-states
Statista Global Consumer Survey. (2018a). Wearable: Germany: User By Age. Retrieved
February 25, 2019, from
https://www.statista.com/outlook/319/137/wearables/germany#market-arpu
Statista Global Consumer Survey. (2018b). Wearables: Worldwide: User By Age. Retrieved
April 24, 2019, from
https://www.statista.com/outlook/319/100/wearables/worldwide#market-age
Stevens, J. (1996). Applied Multivariate Statistics For The Social Sciences (Vol. 3). Mahwah,
NJ: Lawrence Erlbaum.
Sun, H., & Zhang, P. (2006). Causal Relationships Between Perceived Enjoyment And
Perceived Ease Of Use: An Alternative Approach. Journal Of The Association For
Information Systems, 7(9), 618-645.
Svendsen, G., Soholt, Y., Munch-Ellingsen, A., Gammon, D., & Schürmann, A. (2009). The
Importance Of Being Useful And Fun: Factors Influencing Intention To Use A Mobile
System Motivating For Physical Activity. Proceedings Of The 42nd Annual Hawaii
International Conference On System Sciences, HICSS (pp. 1-10). Washington, DC:
IEEE Computer Society.
Swan, M. (2012). Sensor Mania! The Internet Of Things, Wearable Computing, Objective
Metrics, And The Quantified Self 2.0. Journal Of Sensor And Actuator Networks,
1(3), 217-253.
Tabachnik, B., & Fidell, L. (2001). Using Multivariate Statistics (Vol. 4). New York:
HarperCollins.
Thurstone, L. (1947). Multiple Factor Analysis. Chicago: University of Chicago Press.
Turhan, G. (2013). An Assessment Towards The Acceptance Of Wearable Technology To
Consumers In Turkey: The Application To Smart Bra And T-Shirt Products. Journal
Of The Textile Institute, 104(4), 375-395.
Venkatesh, V. (1999). Creation Of Favorable User Perceptions: Exploring The Role Of
Intrinsic Motivation. MIS Quarterly, 23(2), 239-260.
ix
Venkatesh, V., & Davis, F. (1996). A Model Of The Antecedents Of Perceived Ease Of Use:
Development And Test*. Decision Sciences, 27(3), 451-481.
Venkatesh, V., & Davis, F. (2000). A Theoretical Extension Of The Technology Acceptance
Model: Four Longitudinal Field Studies. Management Science, 46(2), 186-204.
Venkatesh, V., Morris, M., Davis, G., & Davis, F. (2003). User Acceptance Of Information
Technology: Toward A Unified View. MIS Quarterly, 7(3), 425-478.
Venkatesh, V., Thong, J., & Xu, X. (2012). Consumer Acceptance And Use Of Information
Technology: Extending The Unified Theory Of Acceptance And Use Of Technology.
MIS Quarterly, 36(1), 157-178.
Wang, X. (2015). The Architecture Design Of The Wearable Health Monitoring System
Based On Internet Of Things Technology. International Journal Of Grid And Utility
Computing, 6, 207-212.
Wearable Technologies. (2017). Information About Wearable Technologies. Retrieved
February 27, 2019, from https://www.wearable-technologies.com/about/
Weinreich, N. (2010). Hands-On Social Marketing: A Step-By-Step Guide To Designing
Change For Good. SAGE Publications.
Whitehead, J. (2018). Do You Need To Worry About Radiation From Your Smartwatch?
Retrieved May 11th, 2019, from https://digiswitch.org/smartwatch-radiation/
Wilson, H. (2013). Wearables In The Workplace. Harvard Business Review, 91(11), 27-37.
Wright, R., & Keith, L. (2014). Wearable Technology: If The Tech Fits, Wear It. 11(4), 204-
216.
Wu, I.-L., Li, J.-Y., & Fu, C.-Y. (2011). The Adoption Of Mobile Healthcare By Hospital's
Professionals: An Integrative Perspective. Decision Support Systems, 51(3), 587-596.
Wu, L.-H., Wu, L.-C., & Chang, S.-C. (2016). Exploring Consumers’ Intention To Accept
Smartwatch. Computers In Human Behavior, 64, 383-392.
Yang, H., Yu, J., Zo, H., & Choi, M. (2016). User Acceptance Of Wearable Devices: An
Extended Perspective Of Perceived Value. Telematics & Informatics, 33, 256-269.
Yi, M., Jackson, J., Park, J., & Probst, J. (2006). Understanding Information Technology
Acceptance By Individual Professionals: Toward An Integrative View. Information
Management, 43(3), 350-363.
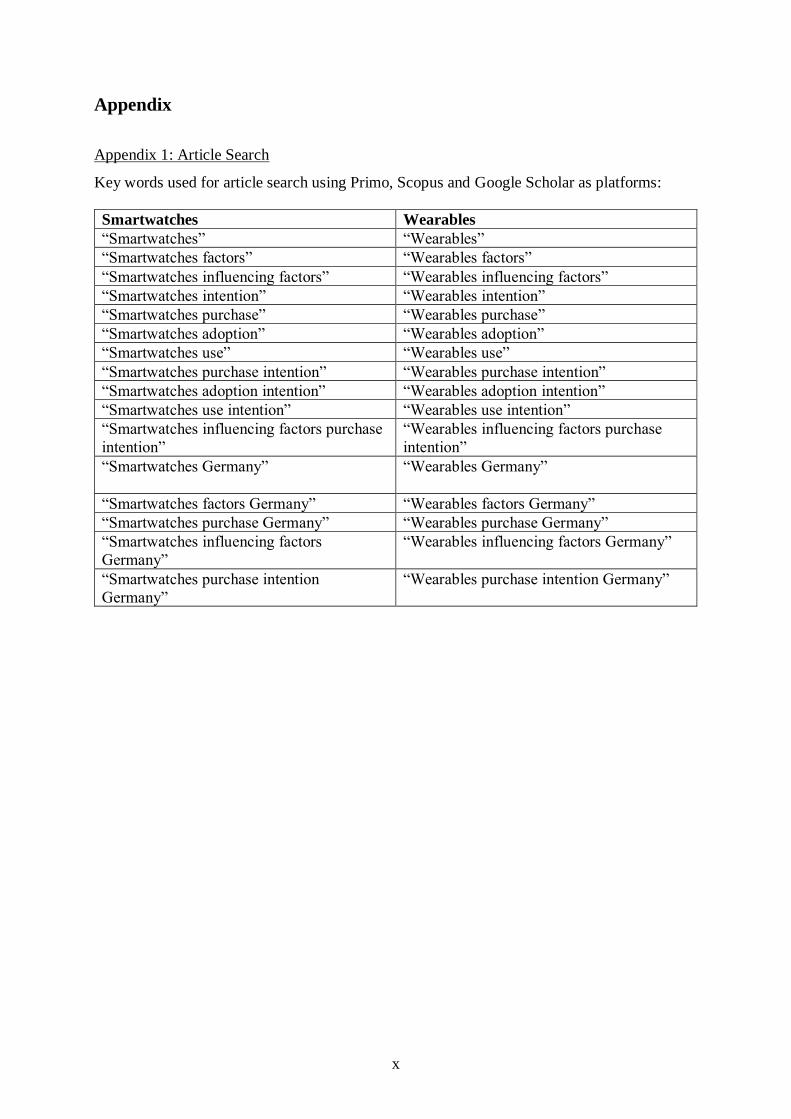
x
Appendix
Appendix 1: Article Search
Key words used for article search using Primo, Scopus and Google Scholar as platforms:
Smartwatches Wearables
“Smartwatches” “Wearables”
“Smartwatches factors” “Wearables factors”
“Smartwatches influencing factors” “Wearables influencing factors”
“Smartwatches intention” “Wearables intention”
“Smartwatches purchase” “Wearables purchase”
“Smartwatches adoption” “Wearables adoption”
“Smartwatches use” “Wearables use”
“Smartwatches purchase intention” “Wearables purchase intention”
“Smartwatches adoption intention” “Wearables adoption intention”
“Smartwatches use intention” “Wearables use intention”
“Smartwatches influencing factors purchase
intention”
“Wearables influencing factors purchase
intention”
“Smartwatches Germany” “Wearables Germany”
“Smartwatches factors Germany” “Wearables factors Germany”
“Smartwatches purchase Germany” “Wearables purchase Germany”
“Smartwatches influencing factors
Germany”
“Wearables influencing factors Germany”
“Smartwatches purchase intention
Germany”
“Wearables purchase intention Germany”
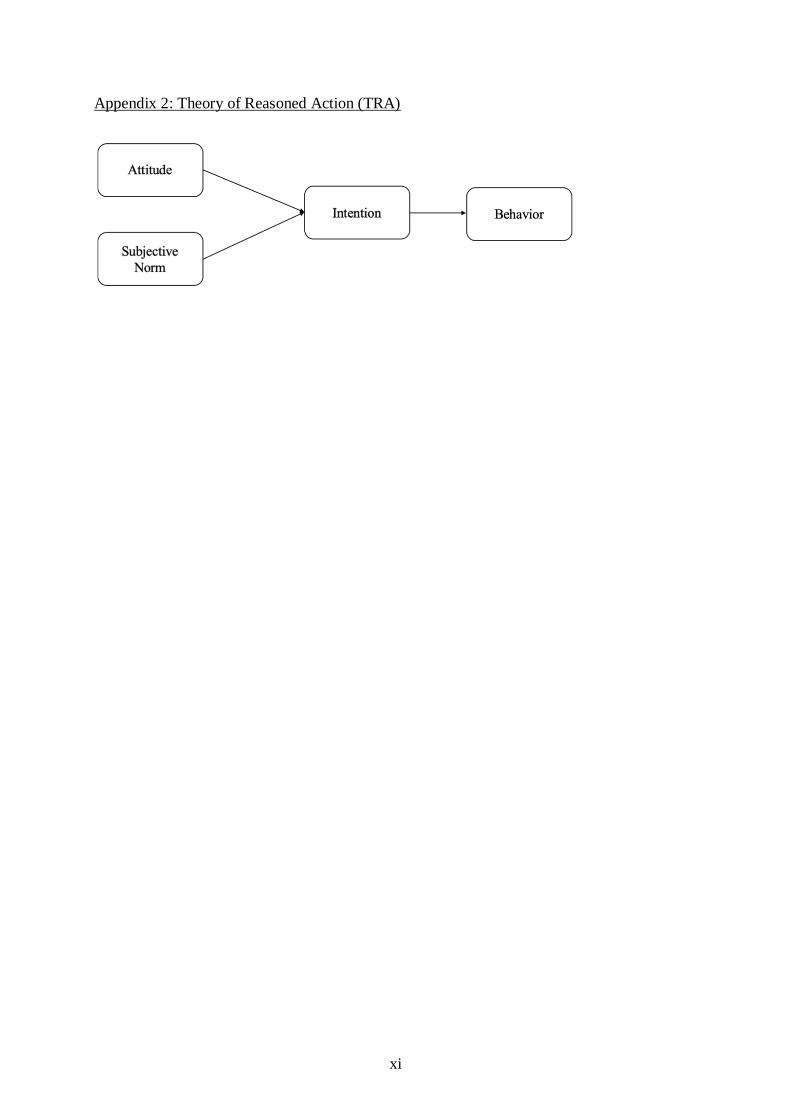
xi
Appendix 2: Theory of Reasoned Action (TRA)
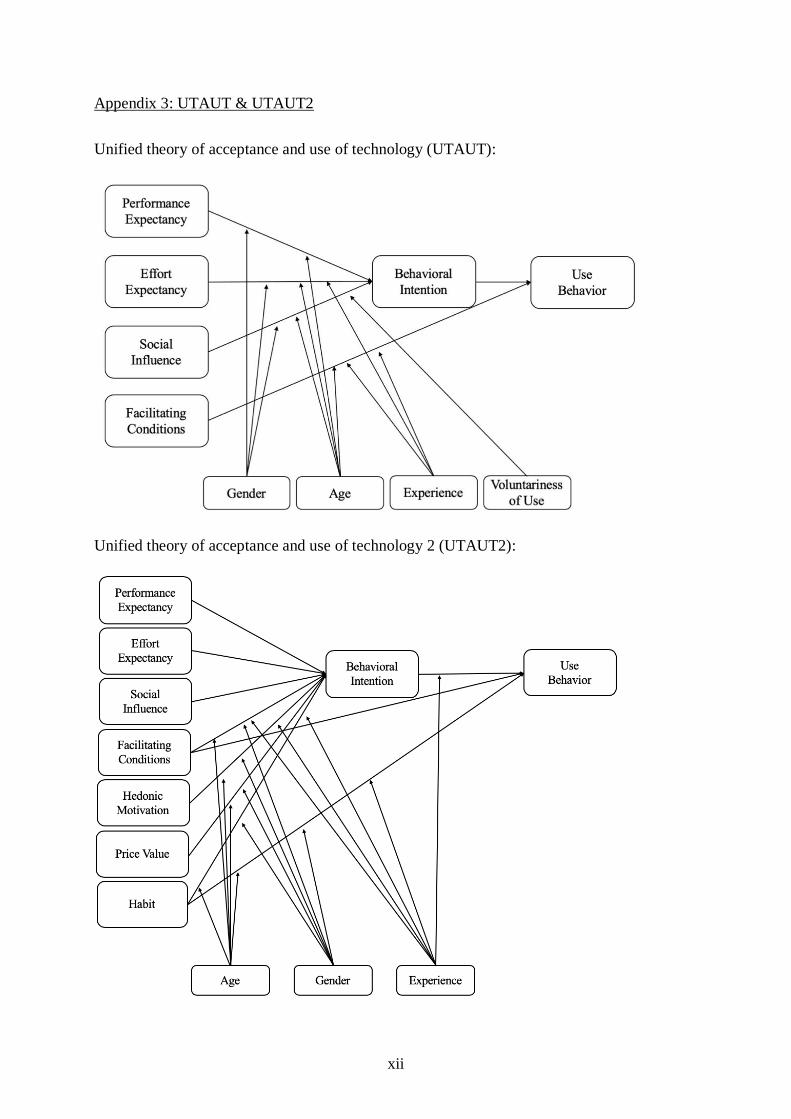
xii
Appendix 3: UTAUT & UTAUT2
Unified theory of acceptance and use of technology (UTAUT):
Unified theory of acceptance and use of technology 2 (UTAUT2):
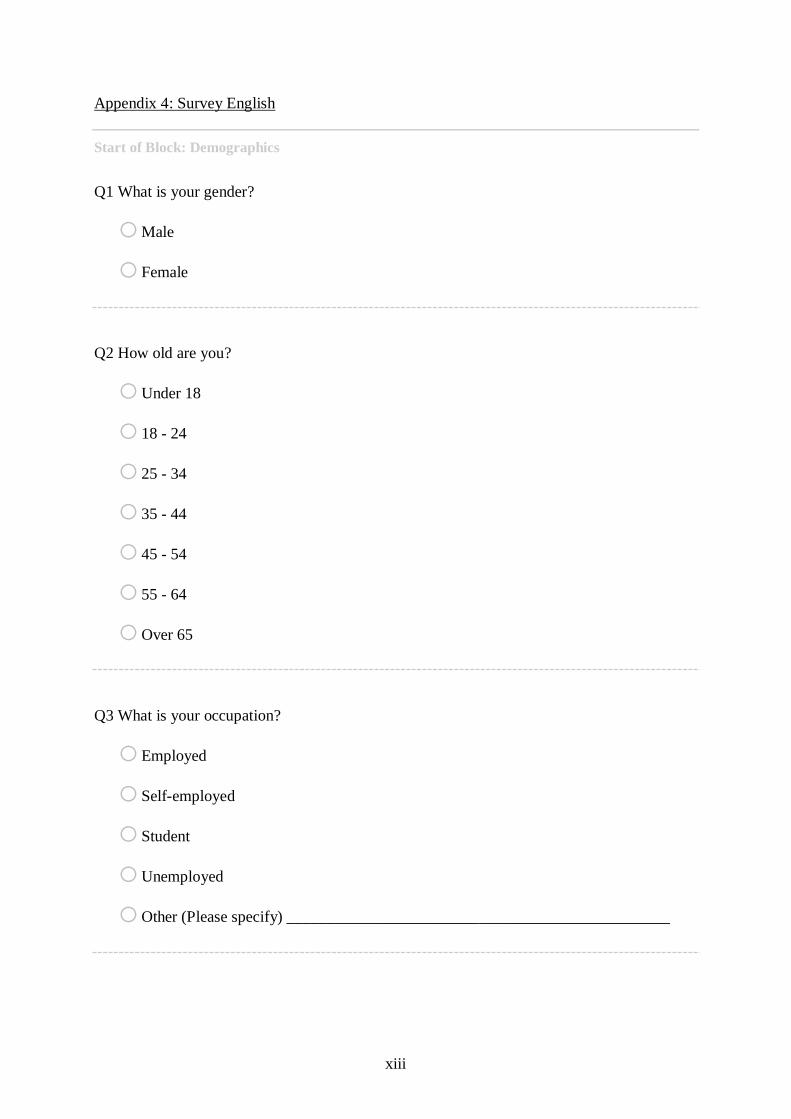
xiii
Appendix 4: Survey English
Start of Block: Demographics
Q1 What is your gender?
o Male
o Female
Q2 How old are you?
o Under 18
o 18 - 24
o 25 - 34
o 35 - 44
o 45 - 54
o 55 - 64
o Over 65
Q3 What is your occupation?
o Employed
o Self-employed
o Student
o Unemployed
o Other (Please specify) ________________________________________________
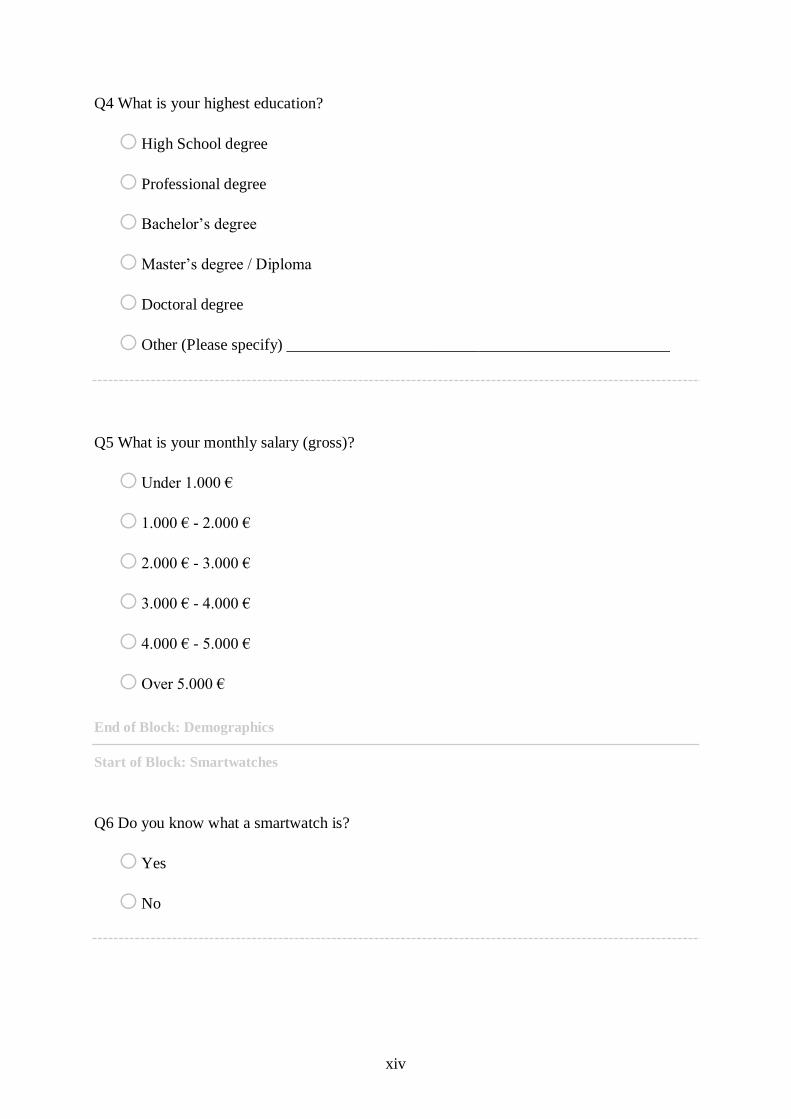
xiv
Q4 What is your highest education?
o High School degree
o Professional degree
o Bachelor’s degree
o Master’s degree / Diploma
o Doctoral degree
o Other (Please specify) ________________________________________________
Q5 What is your monthly salary (gross)?
o Under 1.000 €
o 1.000 € - 2.000 €
o 2.000 € - 3.000 €
o 3.000 € - 4.000 €
o 4.000 € - 5.000 €
o Over 5.000 €
End of Block: Demographics
Start of Block: Smartwatches
Q6 Do you know what a smartwatch is?
o Yes
o No
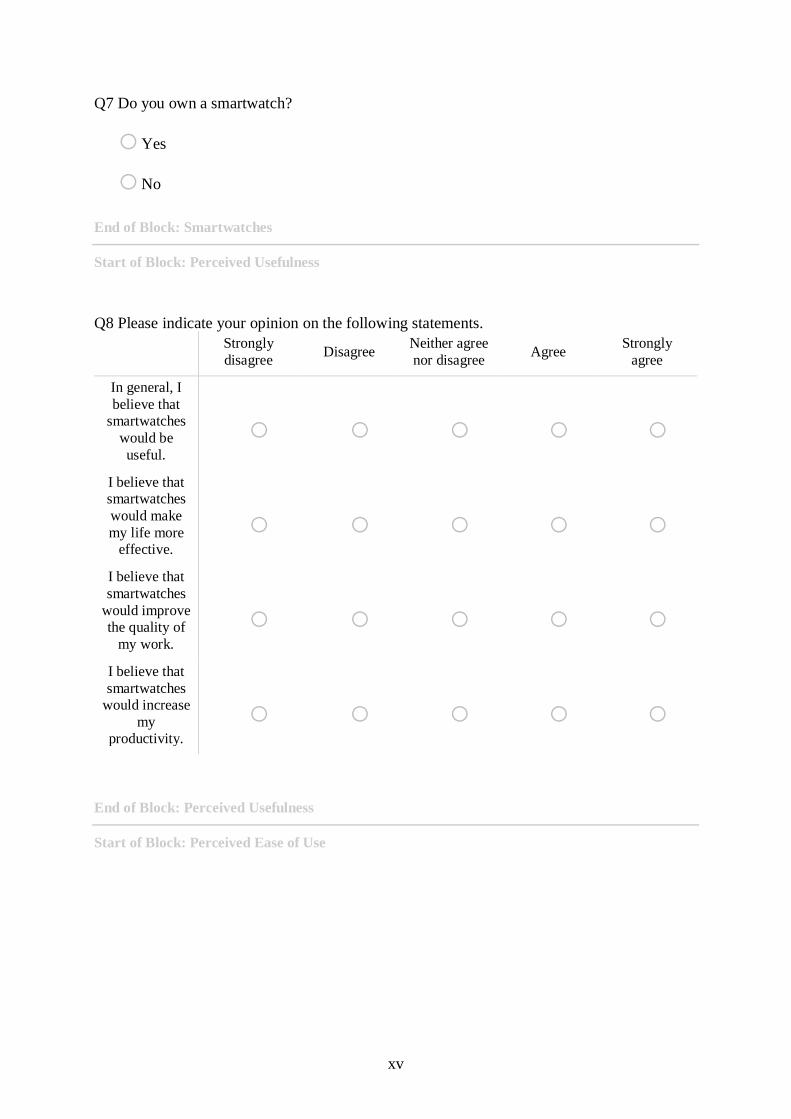
xv
Q7 Do you own a smartwatch?
o Yes
o No
End of Block: Smartwatches
Start of Block: Perceived Usefulness
Q8 Please indicate your opinion on the following statements.
Strongly
disagree Disagree
Neither agree
nor disagree Agree
Strongly
agree
In general, I
believe that
smartwatches
would be
useful.
o o o o o
I believe that
smartwatches
would make
my life more
effective.
o o o o o
I believe that
smartwatches
would improve
the quality of
my work.
o o o o o
I believe that
smartwatches
would increase
my
productivity.
o o o o o
End of Block: Perceived Usefulness
Start of Block: Perceived Ease of Use
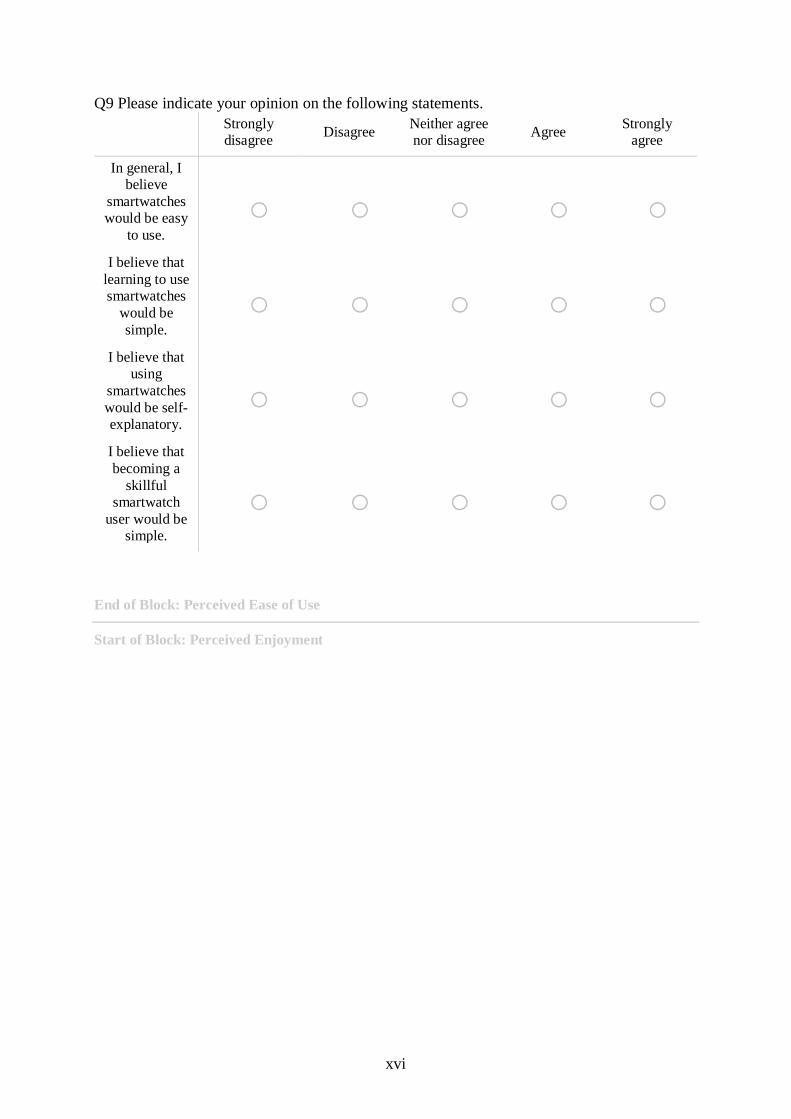
xvi
Q9 Please indicate your opinion on the following statements.
Strongly
disagree Disagree
Neither agree
nor disagree Agree
Strongly
agree
In general, I
believe
smartwatches
would be easy
to use.
o o o o o
I believe that
learning to use
smartwatches
would be
simple.
o o o o o
I believe that using
smartwatches
would be self-
explanatory.
o o o o o
I believe that
becoming a
skillful
smartwatch
user would be
simple.
o o o o o
End of Block: Perceived Ease of Use
Start of Block: Perceived Enjoyment
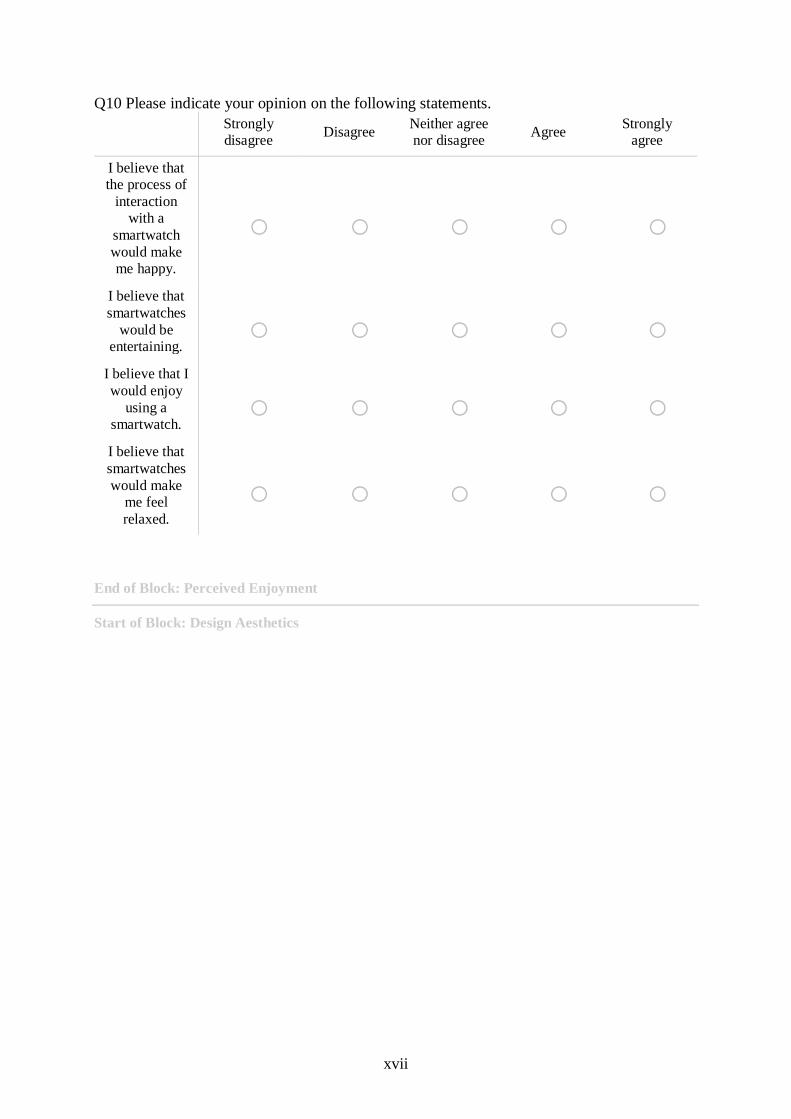
xvii
Q10 Please indicate your opinion on the following statements.
Strongly
disagree Disagree
Neither agree
nor disagree Agree
Strongly
agree
I believe that
the process of
interaction
with a
smartwatch
would make
me happy.
o o o o o
I believe that
smartwatches
would be
entertaining. o o o o o
I believe that I
would enjoy
using a
smartwatch. o o o o o
I believe that
smartwatches
would make
me feel
relaxed.
o o o o o
End of Block: Perceived Enjoyment
Start of Block: Design Aesthetics
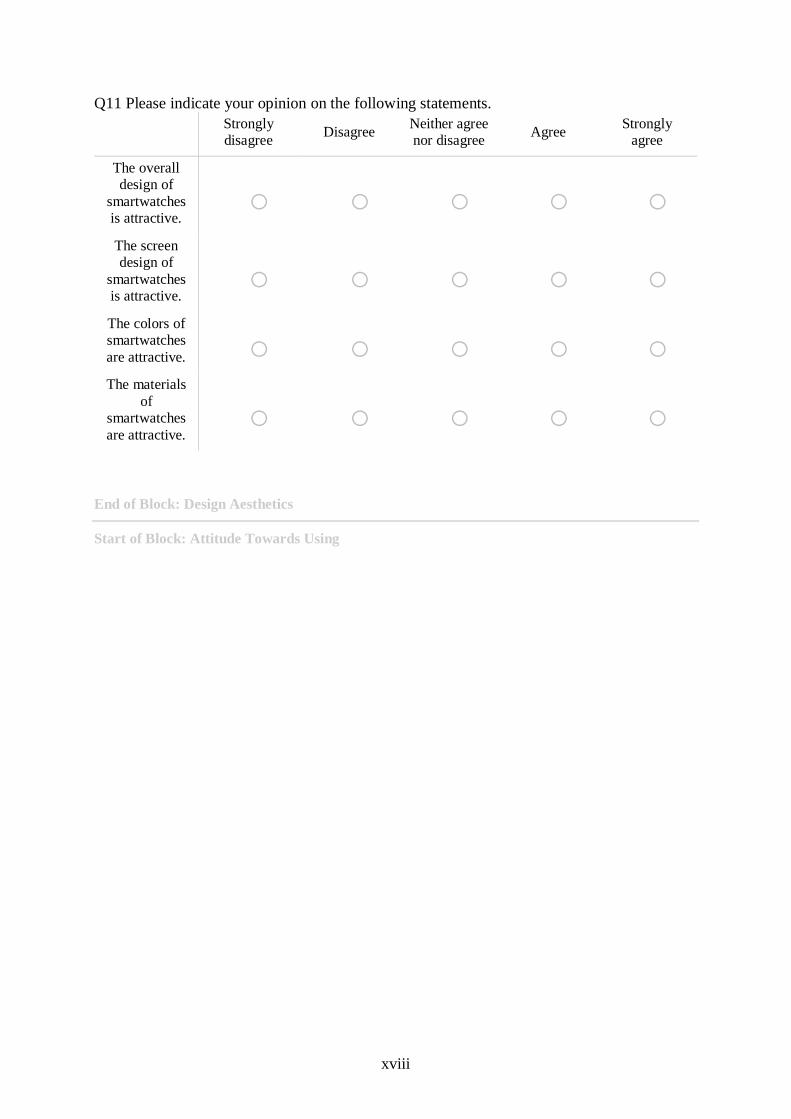
xviii
Q11 Please indicate your opinion on the following statements.
Strongly
disagree Disagree
Neither agree
nor disagree Agree
Strongly
agree
The overall
design of
smartwatches
is attractive. o o o o o
The screen
design of
smartwatches
is attractive. o o o o o
The colors of smartwatches
are attractive. o o o o o The materials
of
smartwatches
are attractive. o o o o o
End of Block: Design Aesthetics
Start of Block: Attitude Towards Using
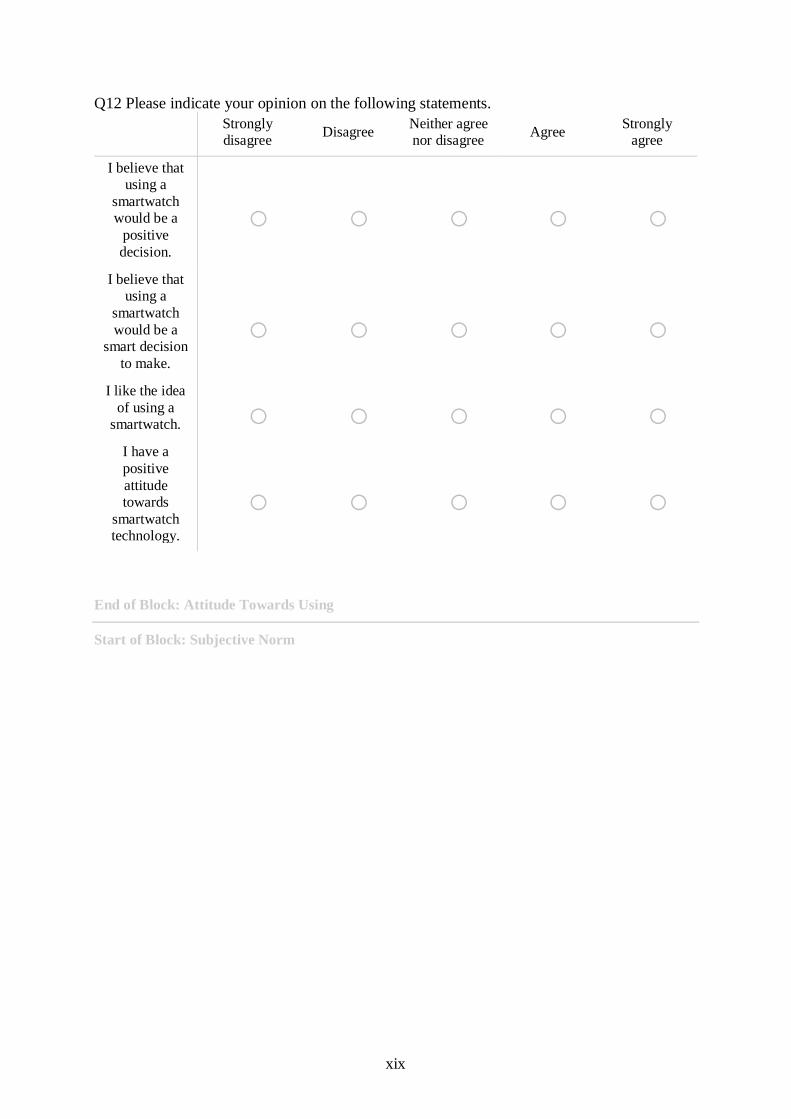
xix
Q12 Please indicate your opinion on the following statements.
Strongly
disagree Disagree
Neither agree
nor disagree Agree
Strongly
agree
I believe that
using a
smartwatch
would be a
positive
decision.
o o o o o
I believe that
using a
smartwatch
would be a
smart decision
to make.
o o o o o
I like the idea
of using a
smartwatch. o o o o o I have a
positive
attitude
towards
smartwatch
technology.
o o o o o
End of Block: Attitude Towards Using
Start of Block: Subjective Norm
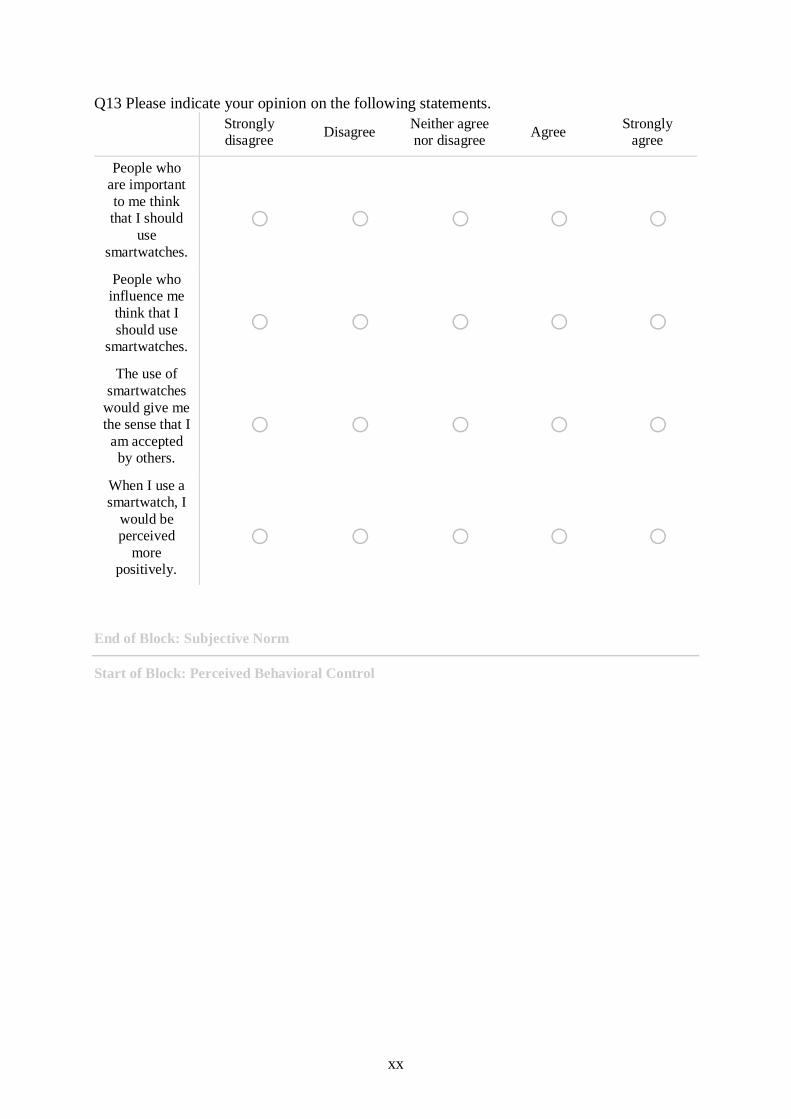
xx
Q13 Please indicate your opinion on the following statements.
Strongly
disagree Disagree
Neither agree
nor disagree Agree
Strongly
agree
People who
are important
to me think
that I should
use
smartwatches.
o o o o o
People who
influence me
think that I
should use
smartwatches.
o o o o o
The use of
smartwatches
would give me
the sense that I
am accepted
by others.
o o o o o
When I use a
smartwatch, I
would be
perceived
more
positively.
o o o o o
End of Block: Subjective Norm
Start of Block: Perceived Behavioral Control
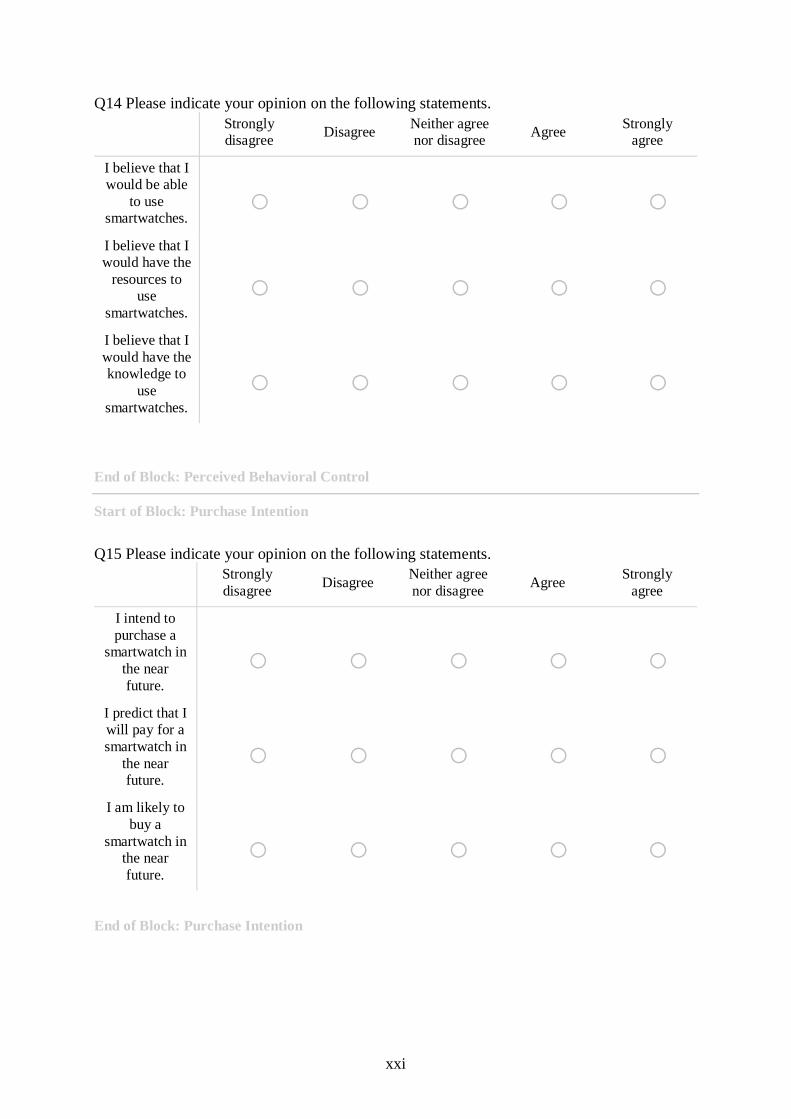
xxi
Q14 Please indicate your opinion on the following statements.
Strongly
disagree Disagree
Neither agree
nor disagree Agree
Strongly
agree
I believe that I
would be able
to use
smartwatches. o o o o o
I believe that I
would have the
resources to
use
smartwatches.
o o o o o
I believe that I
would have the knowledge to
use
smartwatches.
o o o o o
End of Block: Perceived Behavioral Control
Start of Block: Purchase Intention
Q15 Please indicate your opinion on the following statements.
Strongly
disagree Disagree
Neither agree
nor disagree Agree
Strongly
agree
I intend to
purchase a
smartwatch in
the near
future.
o o o o o
I predict that I
will pay for a
smartwatch in
the near future.
o o o o o
I am likely to
buy a
smartwatch in
the near
future.
o o o o o
End of Block: Purchase Intention
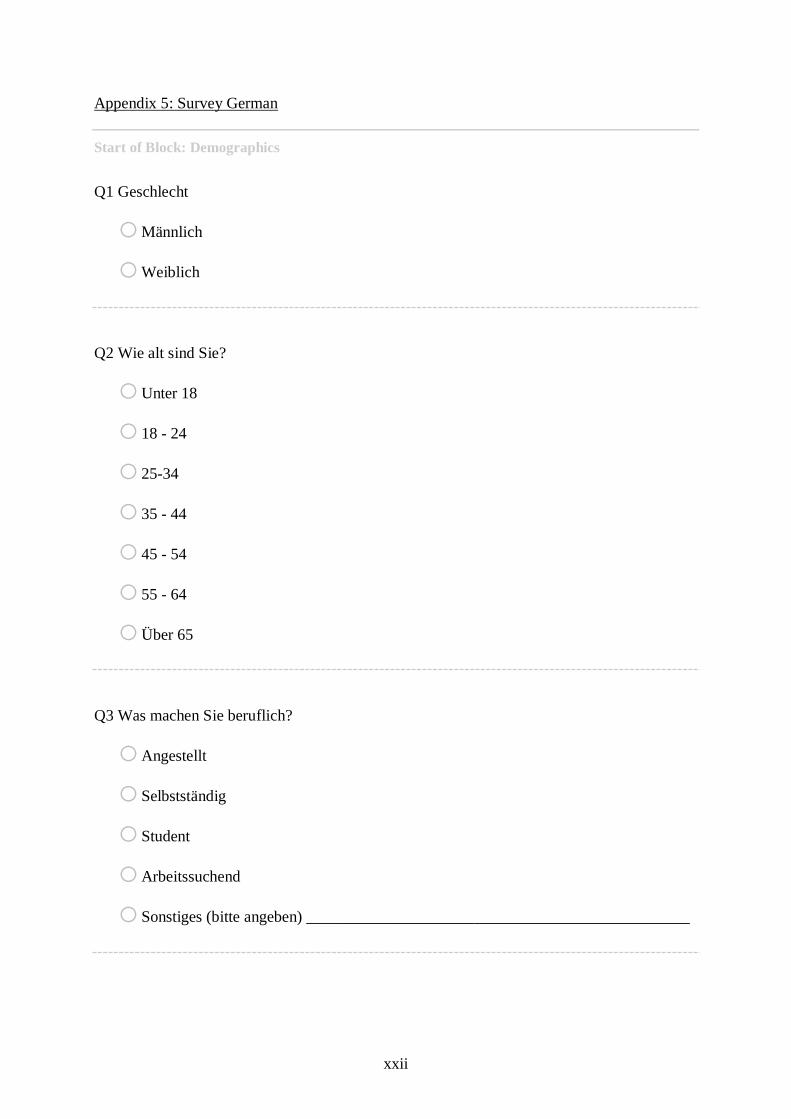
xxii
Appendix 5: Survey German
Start of Block: Demographics
Q1 Geschlecht
o Männlich
o Weiblich
Q2 Wie alt sind Sie?
o Unter 18
o 18 - 24
o 25-34
o 35 - 44
o 45 - 54
o 55 - 64
o Über 65
Q3 Was machen Sie beruflich?
o Angestellt
o Selbstständig
o Student
o Arbeitssuchend
o Sonstiges (bitte angeben) ________________________________________________
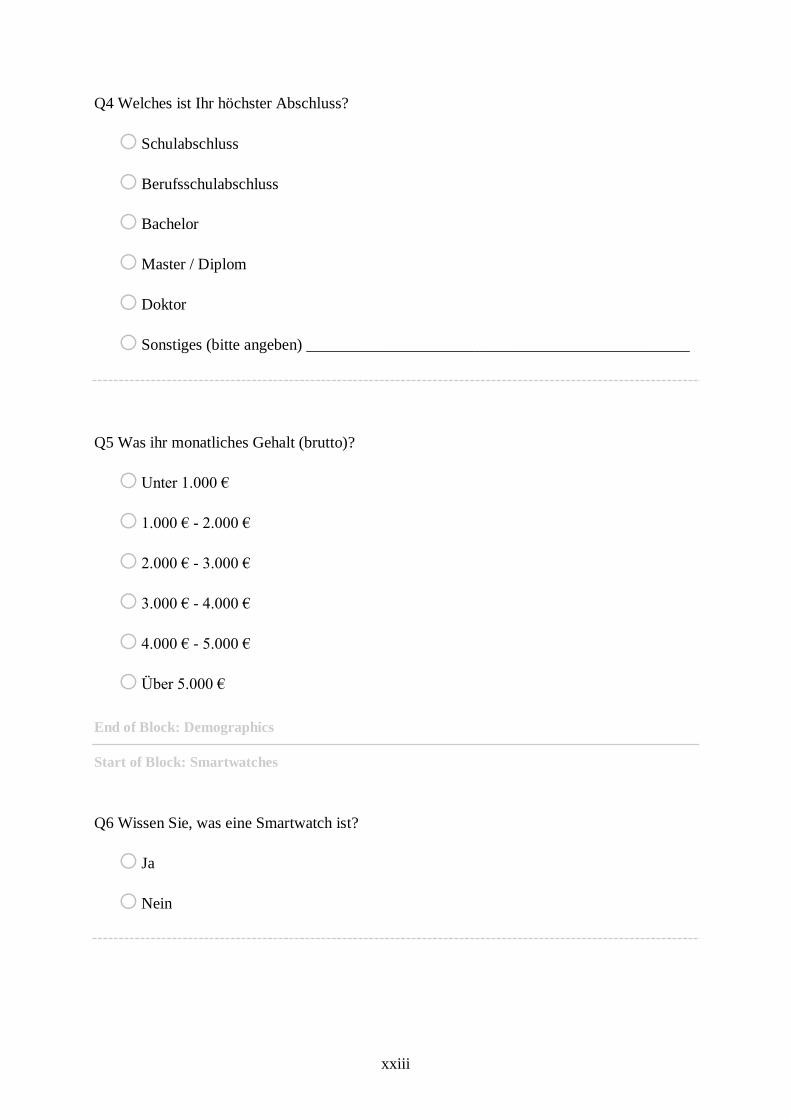
xxiii
Q4 Welches ist Ihr höchster Abschluss?
o Schulabschluss
o Berufsschulabschluss
o Bachelor
o Master / Diplom
o Doktor
o Sonstiges (bitte angeben) ________________________________________________
Q5 Was ihr monatliches Gehalt (brutto)?
o Unter 1.000 €
o 1.000 € - 2.000 €
o 2.000 € - 3.000 €
o 3.000 € - 4.000 €
o 4.000 € - 5.000 €
o Über 5.000 €
End of Block: Demographics
Start of Block: Smartwatches
Q6 Wissen Sie, was eine Smartwatch ist?
o Ja
o Nein
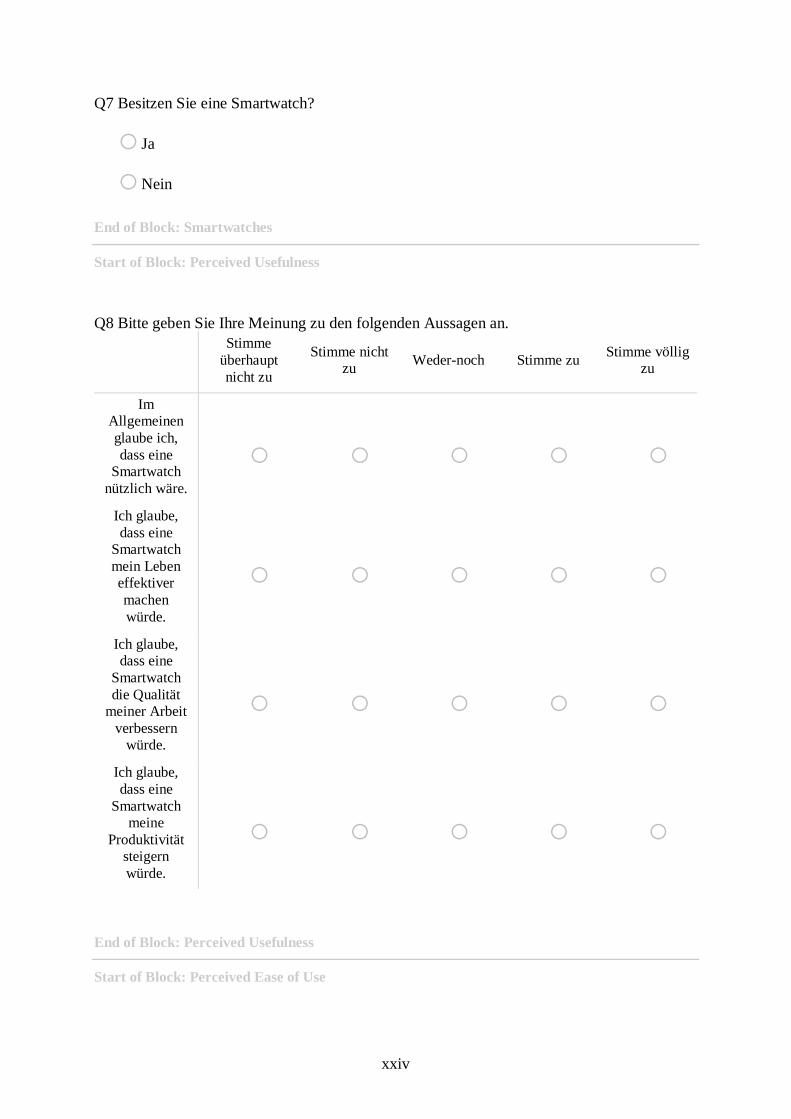
xxiv
Q7 Besitzen Sie eine Smartwatch?
o Ja
o Nein
End of Block: Smartwatches
Start of Block: Perceived Usefulness
Q8 Bitte geben Sie Ihre Meinung zu den folgenden Aussagen an.
Stimme
überhaupt
nicht zu
Stimme nicht
zu Weder-noch Stimme zu
Stimme völlig
zu
Im
Allgemeinen
glaube ich,
dass eine
Smartwatch
nützlich wäre.
o o o o o
Ich glaube,
dass eine
Smartwatch
mein Leben
effektiver
machen
würde.
o o o o o
Ich glaube,
dass eine
Smartwatch
die Qualität
meiner Arbeit
verbessern
würde.
o o o o o
Ich glaube,
dass eine
Smartwatch meine
Produktivität
steigern
würde.
o o o o o
End of Block: Perceived Usefulness
Start of Block: Perceived Ease of Use
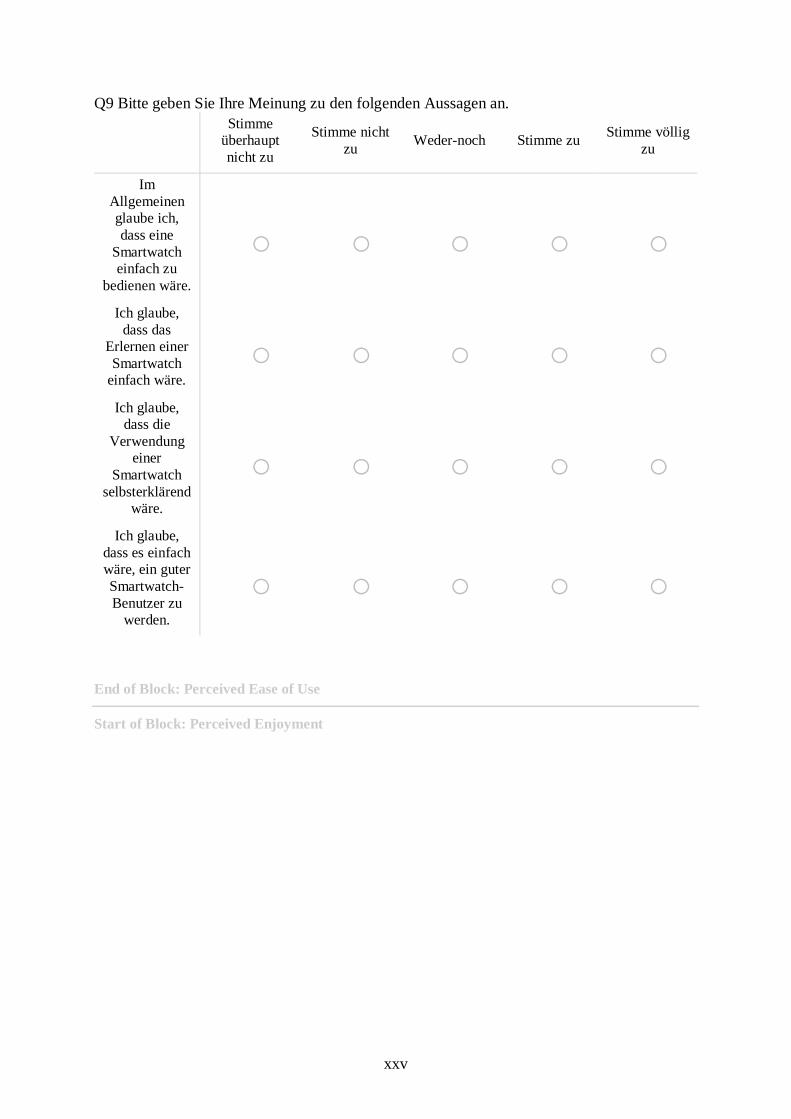
xxv
Q9 Bitte geben Sie Ihre Meinung zu den folgenden Aussagen an.
Stimme
überhaupt
nicht zu
Stimme nicht
zu Weder-noch Stimme zu
Stimme völlig
zu
Im
Allgemeinen
glaube ich,
dass eine
Smartwatch
einfach zu
bedienen wäre.
o o o o o
Ich glaube,
dass das
Erlernen einer
Smartwatch
einfach wäre.
o o o o o
Ich glaube,
dass die
Verwendung
einer
Smartwatch
selbsterklärend
wäre.
o o o o o
Ich glaube,
dass es einfach
wäre, ein guter
Smartwatch-
Benutzer zu
werden.
o o o o o
End of Block: Perceived Ease of Use
Start of Block: Perceived Enjoyment
xxvi
Q10 Bitte geben Sie Ihre Meinung zu den folgenden Aussagen an.
Stimme
überhaupt
nicht zu
Stimme nicht
zu Weder-noch Stimme zu
Stimme völlig
zu
Es würde mich
glücklich
machen, eine
Smartwatch zu
benutzen.
o o o o o
Ich glaube,
dass eine
Smartwatch
unterhaltsam
wäre.
o o o o o
Ich glaube, ich
würde es
genießen eine
Smartwatch zu
benutzen.
o o o o o
Die
Funktionen
einer
Smartwatch
würden mich
entspannen.
o o o o o
End of Block: Perceived Enjoyment
Start of Block: Design Aesthetics
xxvii
Q11 Bitte geben Sie Ihre Meinung zu den folgenden Aussagen an.
Stimme
überhaupt
nicht zu
Stimme nicht
zu Weder-noch Stimme zu
Stimme
völlig zu
Das gesamte
Design von
Smartwatches
spricht mich an. o o o o o
Das
Bildschirmdesign
(Form und
Größe) von
Smartwatches
spricht mich an.
o o o o o
Die Farben von
Smartwatches
sprechen mich
an. o o o o o
Die Materialien
von
Smartwatches
sprechen mich
an.
o o o o o
End of Block: Design Aesthetics
Start of Block: Attitude Towards Using
xxviii
Q12 Bitte geben Sie Ihre Meinung zu den folgenden Aussagen an.
Stimme
überhaupt
nicht zu
Stimme nicht
zu Weder-noch Stimme zu
Stimme völlig
zu
Ich glaube,
dass die
Nutzung einer
Smartwatch
eine positive
Entscheidung
wäre.
o o o o o
Ich glaube,
dass die
Nutzung einer
Smartwatch
eine kluge
Entscheidung
wäre.
o o o o o
Ich kann mich
mit der Idee
eine
Smartwatch zu
benutzen
anfreunden.
o o o o o
Ich habe eine
positive
Einstellung
gegenüber der
Smartwatch-
Technologie.
o o o o o
End of Block: Attitude Towards Using
Start of Block: Subjective Norm
xxix
Q13 Bitte geben Sie Ihre Meinung zu den folgenden Aussagen an.
Stimme
überhaupt
nicht zu
Stimme nicht
zu Weder-noch Stimme zu
Stimme
völlig zu
Personen, die
ich schätze,
denken, dass
ich eine
Smartwatch
benutzen sollte.
o o o o o
Personen, die
mich
beeinflussen,
denken, dass
ich eine
Smartwatch
benutzen sollte.
o o o o o
Die
Verwendung
einer
Smartwatch,
würde mir das
Gefühl geben,
dass ich von
anderen
akzeptiert
werde.
o o o o o
Wenn ich eine
Smartwatch
verwende,
würde ich
positiver
wahrgenommen
werden.
o o o o o
End of Block: Subjective Norm
Start of Block: Perceived Behavioral Control
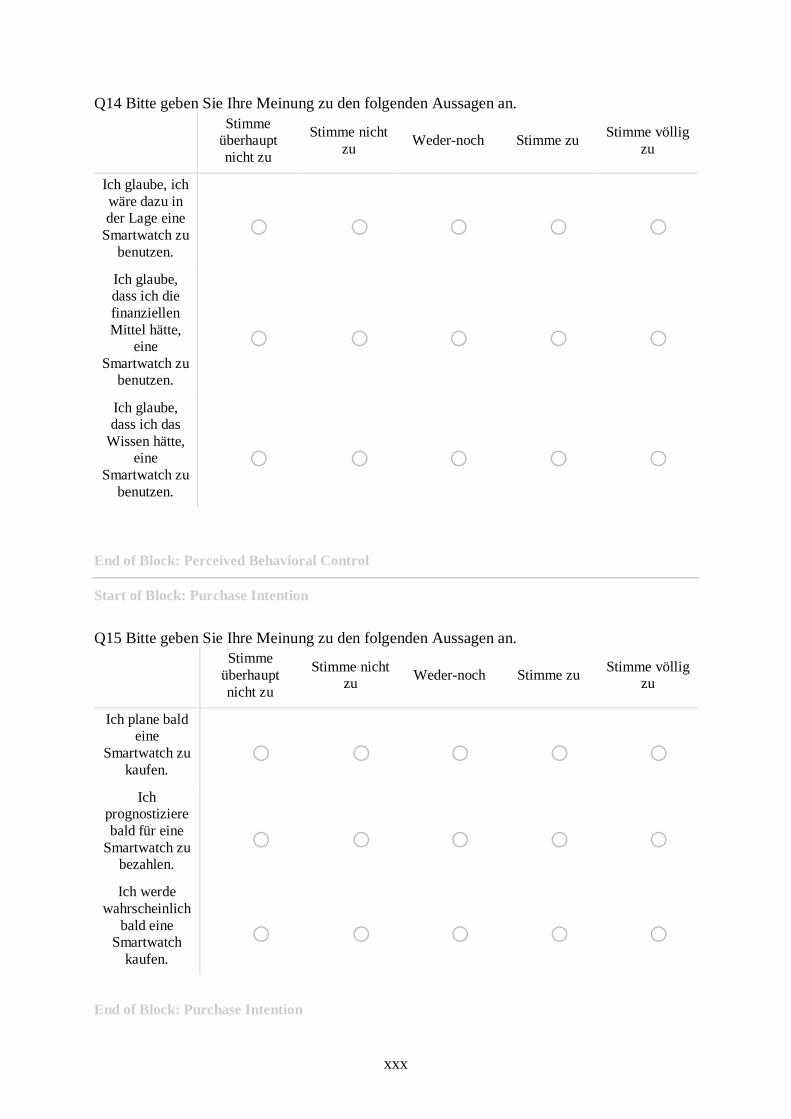
xxx
Q14 Bitte geben Sie Ihre Meinung zu den folgenden Aussagen an.
Stimme
überhaupt
nicht zu
Stimme nicht
zu Weder-noch Stimme zu
Stimme völlig
zu
Ich glaube, ich
wäre dazu in
der Lage eine
Smartwatch zu
benutzen.
o o o o o
Ich glaube,
dass ich die
finanziellen
Mittel hätte,
eine
Smartwatch zu
benutzen.
o o o o o
Ich glaube,
dass ich das
Wissen hätte,
eine
Smartwatch zu
benutzen.
o o o o o
End of Block: Perceived Behavioral Control
Start of Block: Purchase Intention
Q15 Bitte geben Sie Ihre Meinung zu den folgenden Aussagen an.
Stimme
überhaupt
nicht zu
Stimme nicht
zu Weder-noch Stimme zu
Stimme völlig
zu
Ich plane bald
eine
Smartwatch zu
kaufen. o o o o o
Ich prognostiziere
bald für eine
Smartwatch zu
bezahlen.
o o o o o
Ich werde
wahrscheinlich
bald eine
Smartwatch
kaufen.
o o o o o
End of Block: Purchase Intention
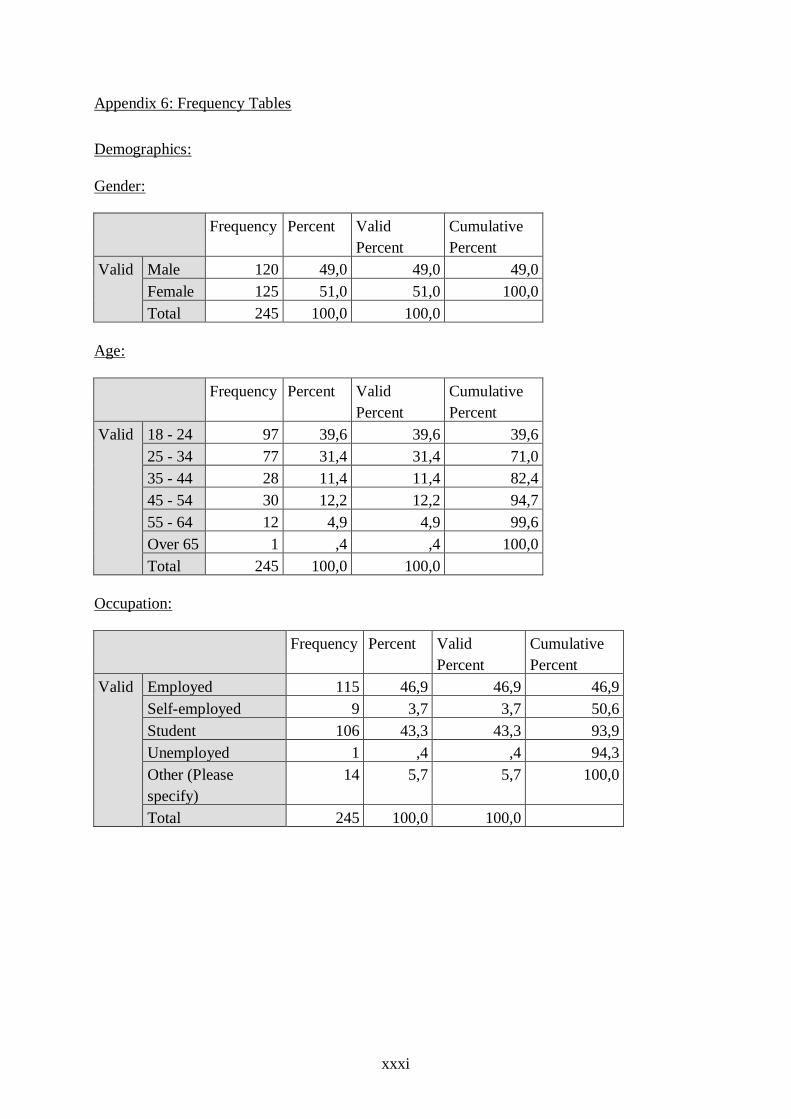
xxxi
Appendix 6: Frequency Tables
Demographics:
Gender:
Frequency Percent Valid
Percent
Cumulative
Percent
Valid Male 120 49,0 49,0 49,0
Female 125 51,0 51,0 100,0
Total 245 100,0 100,0
Age:
Frequency Percent Valid
Percent
Cumulative
Percent
Valid 18 - 24 97 39,6 39,6 39,6
25 - 34 77 31,4 31,4 71,0
35 - 44 28 11,4 11,4 82,4
45 - 54 30 12,2 12,2 94,7
55 - 64 12 4,9 4,9 99,6
Over 65 1 ,4 ,4 100,0
Total 245 100,0 100,0
Occupation:
Frequency Percent Valid
Percent
Cumulative
Percent
Valid Employed 115 46,9 46,9 46,9
Self-employed 9 3,7 3,7 50,6
Student 106 43,3 43,3 93,9
Unemployed 1 ,4 ,4 94,3
Other (Please
specify)
14 5,7 5,7 100,0
Total 245 100,0 100,0
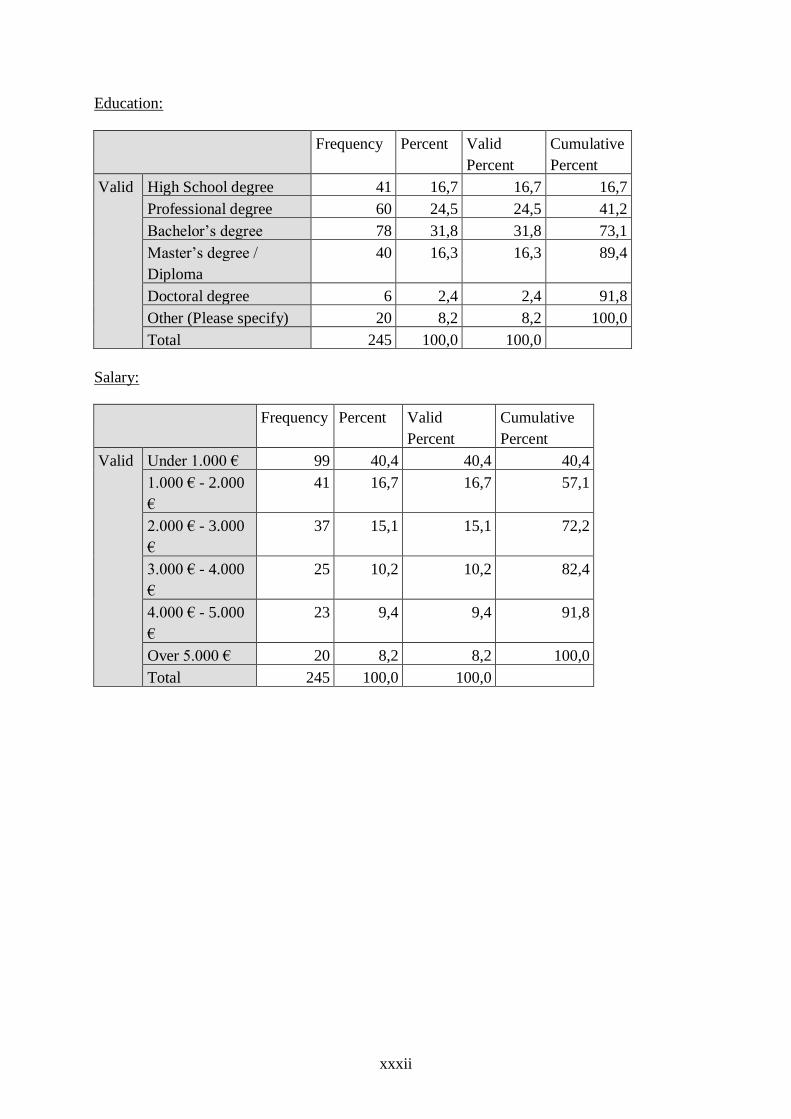
xxxii
Education:
Frequency Percent Valid
Percent
Cumulative
Percent
Valid High School degree 41 16,7 16,7 16,7
Professional degree 60 24,5 24,5 41,2
Bachelor’s degree 78 31,8 31,8 73,1
Master’s degree /
Diploma
40 16,3 16,3 89,4
Doctoral degree 6 2,4 2,4 91,8
Other (Please specify) 20 8,2 8,2 100,0
Total 245 100,0 100,0
Salary:
Frequency Percent Valid
Percent
Cumulative
Percent
Valid Under 1.000 € 99 40,4 40,4 40,4
1.000 € - 2.000
€
41 16,7 16,7 57,1
2.000 € - 3.000
€
37 15,1 15,1 72,2
3.000 € - 4.000
€
25 10,2 10,2 82,4
4.000 € - 5.000
€
23 9,4 9,4 91,8
Over 5.000 € 20 8,2 8,2 100,0
Total 245 100,0 100,0
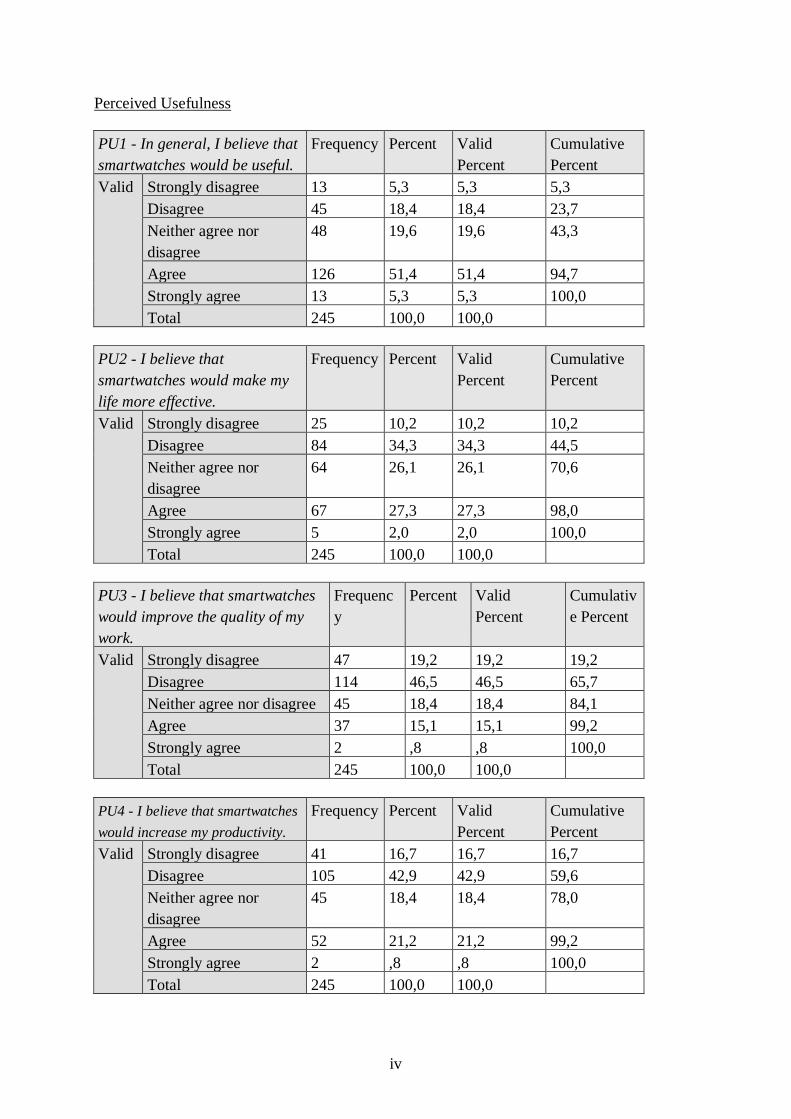
iv
Perceived Usefulness
PU1 - In general, I believe that
smartwatches would be useful.
Frequency Percent Valid
Percent
Cumulative
Percent
Valid Strongly disagree 13 5,3 5,3 5,3
Disagree 45 18,4 18,4 23,7
Neither agree nor
disagree
48 19,6 19,6 43,3
Agree 126 51,4 51,4 94,7
Strongly agree 13 5,3 5,3 100,0
Total 245 100,0 100,0
PU2 - I believe that
smartwatches would make my
life more effective.
Frequency Percent Valid
Percent
Cumulative
Percent
Valid Strongly disagree 25 10,2 10,2 10,2
Disagree 84 34,3 34,3 44,5
Neither agree nor
disagree
64 26,1 26,1 70,6
Agree 67 27,3 27,3 98,0
Strongly agree 5 2,0 2,0 100,0
Total 245 100,0 100,0
PU3 - I believe that smartwatches
would improve the quality of my
work.
Frequenc
y
Percent Valid
Percent
Cumulativ
e Percent
Valid Strongly disagree 47 19,2 19,2 19,2
Disagree 114 46,5 46,5 65,7
Neither agree nor disagree 45 18,4 18,4 84,1
Agree 37 15,1 15,1 99,2
Strongly agree 2 ,8 ,8 100,0
Total 245 100,0 100,0
PU4 - I believe that smartwatches
would increase my productivity.
Frequency Percent Valid
Percent
Cumulative
Percent
Valid Strongly disagree 41 16,7 16,7 16,7
Disagree 105 42,9 42,9 59,6
Neither agree nor
disagree
45 18,4 18,4 78,0
Agree 52 21,2 21,2 99,2
Strongly agree 2 ,8 ,8 100,0
Total 245 100,0 100,0
v
Perceived Ease of Use
PEU1 - In general, I believe
smartwatches would be easy to
use.
Frequenc
y
Percent Valid
Percent
Cumulative
Percent
Valid Strongly disagree 1 ,4 ,4 ,4
Disagree 13 5,3 5,3 5,7
Neither agree nor disagree 28 11,4 11,4 17,1
Agree 139 56,7 56,7 73,9
Strongly agree 64 26,1 26,1 100,0
Total 245 100,0 100,0
PEU2 - I believe that learning to
use smartwatches would be simple.
Frequency Percent Valid
Percent
Cumulative
Percent
Valid Strongly disagree 1 ,4 ,4 ,4
Disagree 7 2,9 2,9 3,3
Neither agree nor
disagree
15 6,1 6,1 9,4
Agree 151 61,6 61,6 71,0
Strongly agree 71 29,0 29,0 100,0
Total 245 100,0 100,0
PEU3 - I believe that using
smartwatches would be self-
explanatory.
Frequency Percent Valid
Percent
Cumulative
Percent
Valid Strongly disagree 2 ,8 ,8 ,8
Disagree 24 9,8 9,8 10,6
Neither agree nor
disagree
38 15,5 15,5 26,1
Agree 134 54,7 54,7 80,8
Strongly agree 47 19,2 19,2 100,0
Total 245 100,0 100,0
PEU 4 - I believe that becoming a
skillful smartwatch user would be
simple.
Frequency Percent Valid
Percent
Cumulative
Percent
Valid Strongly disagree 7 2,9 2,9 2,9
Disagree 14 5,7 5,7 8,6
Neither agree nor
disagree
33 13,5 13,5 22,0
Agree 141 57,6 57,6 79,6
Strongly agree 50 20,4 20,4 100,0
Total 245 100,0 100,0
vi
Perceived Enjoyment
PE1 - I believe that the process of
interaction with a smartwatch
would make me happy.
Frequency Percent Valid
Percent
Cumulative
Percent
Valid Strongly disagree 48 19,6 19,6 19,6
Disagree 77 31,4 31,4 51,0
Neither agree nor
disagree
59 24,1 24,1 75,1
Agree 47 19,2 19,2 94,3
Strongly agree 14 5,7 5,7 100,0
Total 245 100,0 100,0
PE2 - I believe that smartwatches
would be entertaining.
Frequency Percent Valid
Percent
Cumulative
Percent
Valid Strongly disagree 19 7,8 7,8 7,8
Disagree 42 17,1 17,1 24,9
Neither agree nor
disagree
45 18,4 18,4 43,3
Agree 120 49,0 49,0 92,2
Strongly agree 19 7,8 7,8 100,0
Total 245 100,0 100,0
PE3 - I believe that I would enjoy
using a smartwatch.
Frequency Percent Valid
Percent
Cumulative
Percent
Valid Strongly disagree 38 15,5 15,5 15,5
Disagree 65 26,5 26,5 42,0
Neither agree nor
disagree
59 24,1 24,1 66,1
Agree 71 29,0 29,0 95,1
Strongly agree 12 4,9 4,9 100,0
Total 245 100,0 100,0
PE4 - I believe that smartwatches
would make me feel relaxed.
Frequency Percent Valid
Percent
Cumulative
Percent
Valid Strongly disagree 53 21,6 21,6 21,6
Disagree 101 41,2 41,2 62,9
Neither agree nor
disagree
64 26,1 26,1 89,0
Agree 24 9,8 9,8 98,8
Strongly agree 3 1,2 1,2 100,0
Total 245 100,0 100,0
vii
Design Aesthetics
DA1 - The overall design of
smartwatches is attractive.
Frequency Percent Valid
Percent
Cumulative
Percent
Valid Strongly disagree 22 9,0 9,0 9,0
Disagree 53 21,6 21,6 30,6
Neither agree nor
disagree
47 19,2 19,2 49,8
Agree 116 47,3 47,3 97,1
Strongly agree 7 2,9 2,9 100,0
Total 245 100,0 100,0
DA2 - The screen design of
smartwatches is attractive.
Frequency Percent Valid
Percent
Cumulative
Percent
Valid Strongly disagree 21 8,6 8,6 8,6
Disagree 59 24,1 24,1 32,7
Neither agree nor
disagree
50 20,4 20,4 53,1
Agree 109 44,5 44,5 97,6
Strongly agree 6 2,4 2,4 100,0
Total 245 100,0 100,0
DA3- The colors of smartwatches
are attractive.
Frequency Percent Valid
Percent
Cumulative
Percent
Valid Strongly disagree 10 4,1 4,1 4,1
Disagree 36 14,7 14,7 18,8
Neither agree nor
disagree
80 32,7 32,7 51,4
Agree 109 44,5 44,5 95,9
Strongly agree 10 4,1 4,1 100,0
Total 245 100,0 100,0
DA4 - The materials of
smartwatches are attractive.
Frequency Percent Valid
Percent
Cumulative
Percent
Valid Strongly disagree 14 5,7 5,7 5,7
Disagree 40 16,3 16,3 22,0
Neither agree nor
disagree
79 32,2 32,2 54,3
Agree 97 39,6 39,6 93,9
Strongly agree 15 6,1 6,1 100,0
Total 245 100,0 100,0
viii
Attitude towards Using
ATU1 - I believe that using a
smartwatch would be a positive
decision.
Frequency Percent Valid
Percent
Cumulative
Percent
Valid Strongly disagree 31 12,7 12,7 12,7
Disagree 68 27,8 27,8 40,4
Neither agree nor
disagree
74 30,2 30,2 70,6
Agree 64 26,1 26,1 96,7
Strongly agree 8 3,3 3,3 100,0
Total 245 100,0 100,0
ATU2 - I believe that using a
smartwatch would be a smart
decision to make.
Frequency Percent Valid
Percent
Cumulative
Percent
Valid Strongly disagree 29 11,8 11,8 11,8
Disagree 75 30,6 30,6 42,4
Neither agree nor
disagree
78 31,8 31,8 74,3
Agree 57 23,3 23,3 97,6
Strongly agree 6 2,4 2,4 100,0
Total 245 100,0 100,0
ATU3 – I like the idea of using a
smartwatch.
Frequency Percent Valid
Percent
Cumulative
Percent
Valid Strongly disagree 25 10,2 10,2 10,2
Disagree 56 22,9 22,9 33,1
Neither agree nor
disagree
47 19,2 19,2 52,2
Agree 103 42,0 42,0 94,3
Strongly agree 14 5,7 5,7 100,0
Total 245 100,0 100,0
ATU4 - I have a positive attitude
towards smartwatch technology.
Frequency Percent Valid
Percent
Cumulative
Percent
Valid Strongly disagree 18 7,3 7,3 7,3
Disagree 42 17,1 17,1 24,5
Neither agree nor
disagree
64 26,1 26,1 50,6
Agree 100 40,8 40,8 91,4
Strongly agree 21 8,6 8,6 100,0
Total 245 100,0 100,0
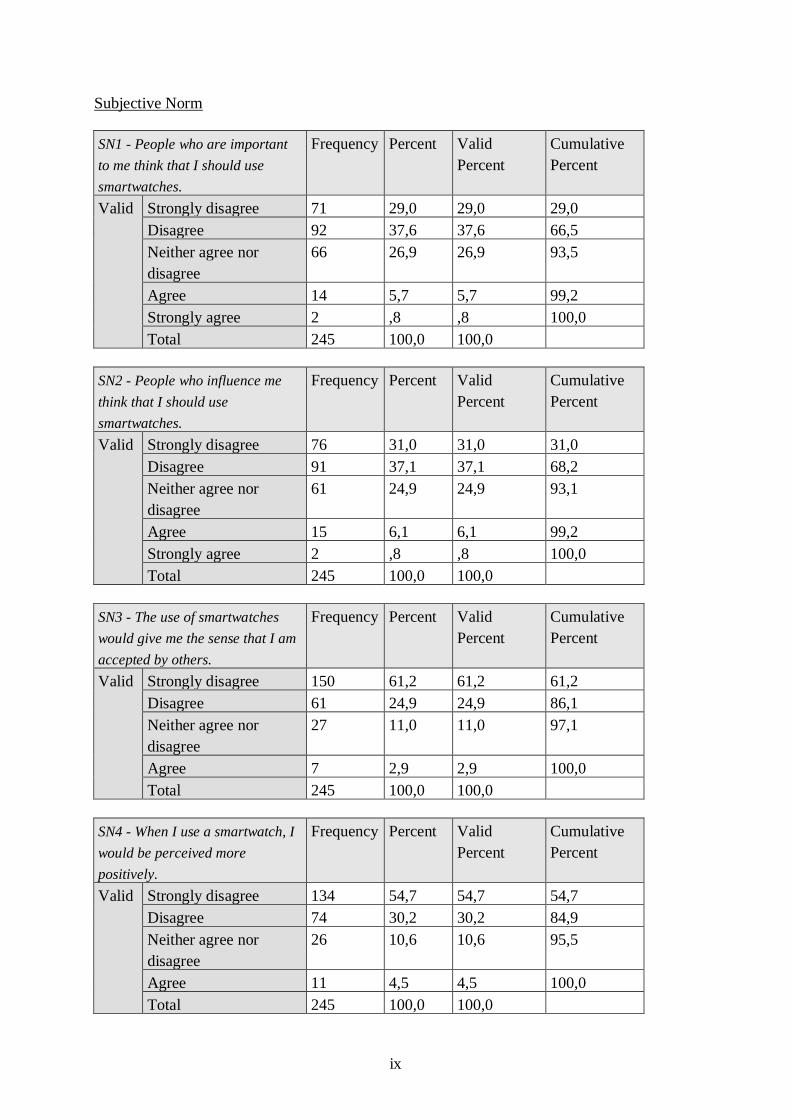
ix
Subjective Norm
SN1 - People who are important
to me think that I should use
smartwatches.
Frequency Percent Valid
Percent
Cumulative
Percent
Valid Strongly disagree 71 29,0 29,0 29,0
Disagree 92 37,6 37,6 66,5
Neither agree nor
disagree
66 26,9 26,9 93,5
Agree 14 5,7 5,7 99,2
Strongly agree 2 ,8 ,8 100,0
Total 245 100,0 100,0
SN2 - People who influence me
think that I should use
smartwatches.
Frequency Percent Valid
Percent
Cumulative
Percent
Valid Strongly disagree 76 31,0 31,0 31,0
Disagree 91 37,1 37,1 68,2
Neither agree nor
disagree
61 24,9 24,9 93,1
Agree 15 6,1 6,1 99,2
Strongly agree 2 ,8 ,8 100,0
Total 245 100,0 100,0
SN3 - The use of smartwatches
would give me the sense that I am
accepted by others.
Frequency Percent Valid
Percent
Cumulative
Percent
Valid Strongly disagree 150 61,2 61,2 61,2
Disagree 61 24,9 24,9 86,1
Neither agree nor
disagree
27 11,0 11,0 97,1
Agree 7 2,9 2,9 100,0
Total 245 100,0 100,0
SN4 - When I use a smartwatch, I
would be perceived more
positively.
Frequency Percent Valid
Percent
Cumulative
Percent
Valid Strongly disagree 134 54,7 54,7 54,7
Disagree 74 30,2 30,2 84,9
Neither agree nor
disagree
26 10,6 10,6 95,5
Agree 11 4,5 4,5 100,0
Total 245 100,0 100,0
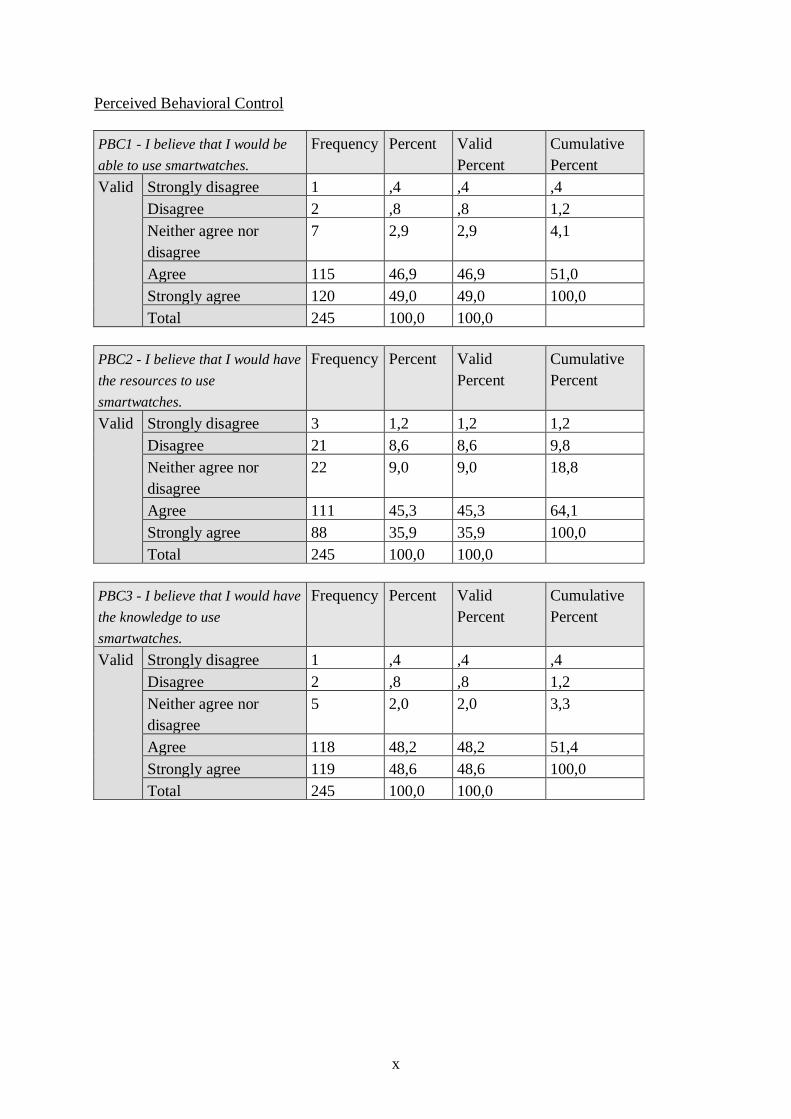
x
Perceived Behavioral Control
PBC1 - I believe that I would be
able to use smartwatches.
Frequency Percent Valid
Percent
Cumulative
Percent
Valid Strongly disagree 1 ,4 ,4 ,4
Disagree 2 ,8 ,8 1,2
Neither agree nor
disagree
7 2,9 2,9 4,1
Agree 115 46,9 46,9 51,0
Strongly agree 120 49,0 49,0 100,0
Total 245 100,0 100,0
PBC2 - I believe that I would have
the resources to use
smartwatches.
Frequency Percent Valid
Percent
Cumulative
Percent
Valid Strongly disagree 3 1,2 1,2 1,2
Disagree 21 8,6 8,6 9,8
Neither agree nor
disagree
22 9,0 9,0 18,8
Agree 111 45,3 45,3 64,1
Strongly agree 88 35,9 35,9 100,0
Total 245 100,0 100,0
PBC3 - I believe that I would have
the knowledge to use
smartwatches.
Frequency Percent Valid
Percent
Cumulative
Percent
Valid Strongly disagree 1 ,4 ,4 ,4
Disagree 2 ,8 ,8 1,2
Neither agree nor
disagree
5 2,0 2,0 3,3
Agree 118 48,2 48,2 51,4
Strongly agree 119 48,6 48,6 100,0
Total 245 100,0 100,0
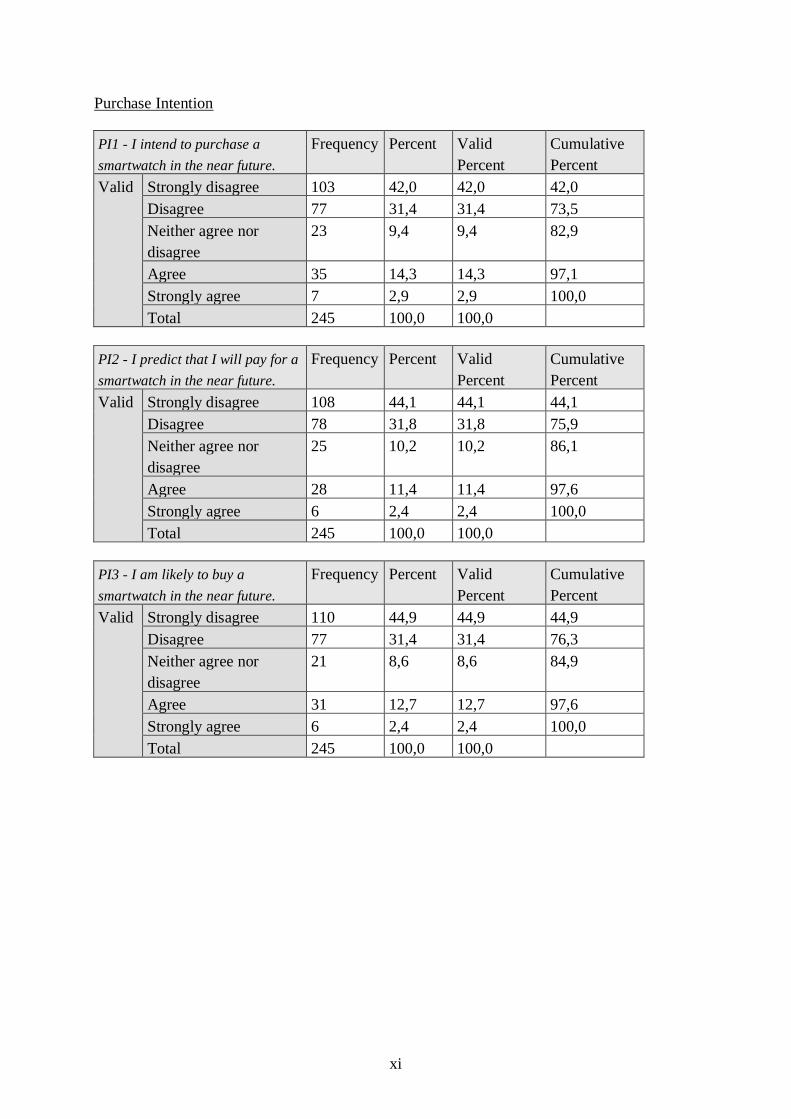
xi
Purchase Intention
PI1 - I intend to purchase a
smartwatch in the near future.
Frequency Percent Valid
Percent
Cumulative
Percent
Valid Strongly disagree 103 42,0 42,0 42,0
Disagree 77 31,4 31,4 73,5
Neither agree nor
disagree
23 9,4 9,4 82,9
Agree 35 14,3 14,3 97,1
Strongly agree 7 2,9 2,9 100,0
Total 245 100,0 100,0
PI2 - I predict that I will pay for a
smartwatch in the near future.
Frequency Percent Valid
Percent
Cumulative
Percent
Valid Strongly disagree 108 44,1 44,1 44,1
Disagree 78 31,8 31,8 75,9
Neither agree nor
disagree
25 10,2 10,2 86,1
Agree 28 11,4 11,4 97,6
Strongly agree 6 2,4 2,4 100,0
Total 245 100,0 100,0
PI3 - I am likely to buy a
smartwatch in the near future.
Frequency Percent Valid
Percent
Cumulative
Percent
Valid Strongly disagree 110 44,9 44,9 44,9
Disagree 77 31,4 31,4 76,3
Neither agree nor
disagree
21 8,6 8,6 84,9
Agree 31 12,7 12,7 97,6
Strongly agree 6 2,4 2,4 100,0
Total 245 100,0 100,0
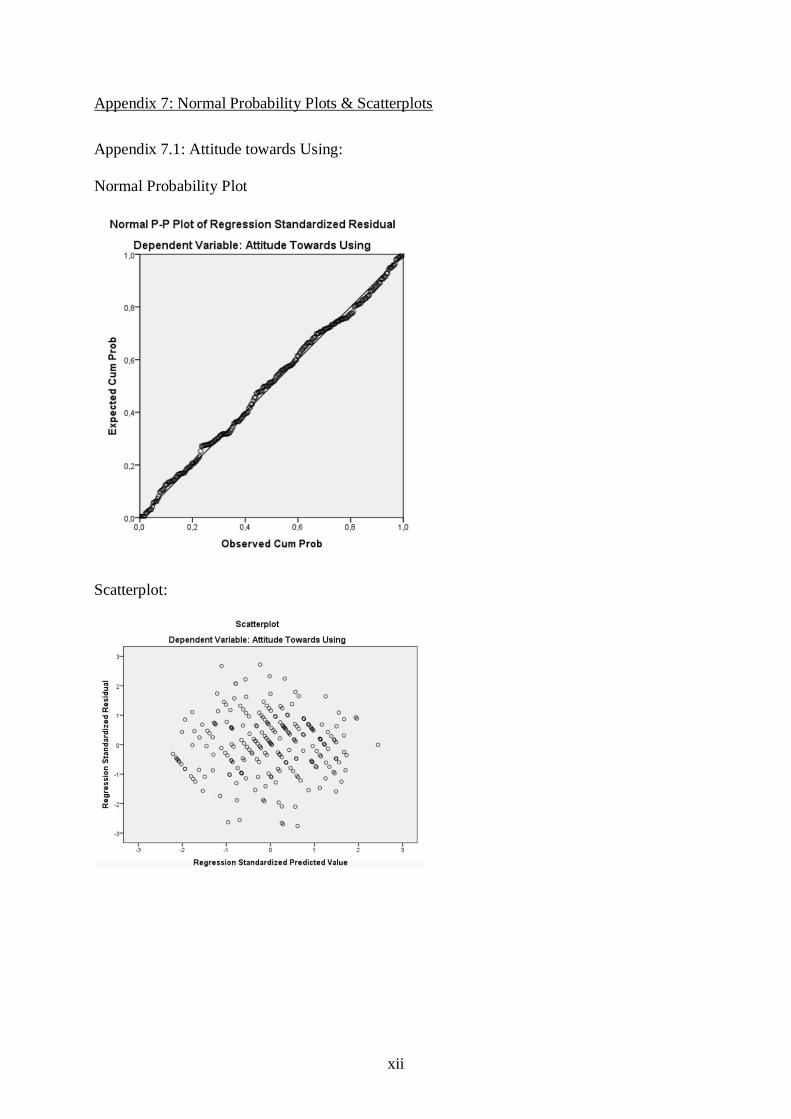
xii
Appendix 7: Normal Probability Plots & Scatterplots
Appendix 7.1: Attitude towards Using:
Normal Probability Plot
Scatterplot:
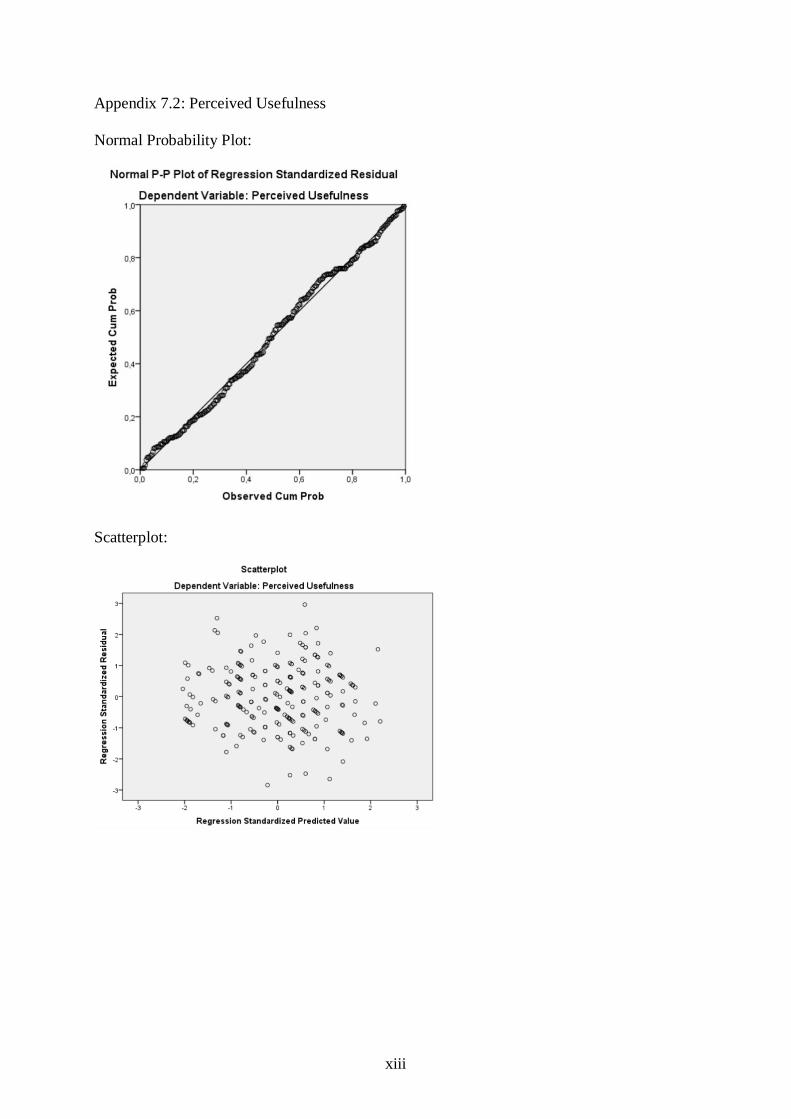
xiii
Appendix 7.2: Perceived Usefulness
Normal Probability Plot:
Scatterplot:
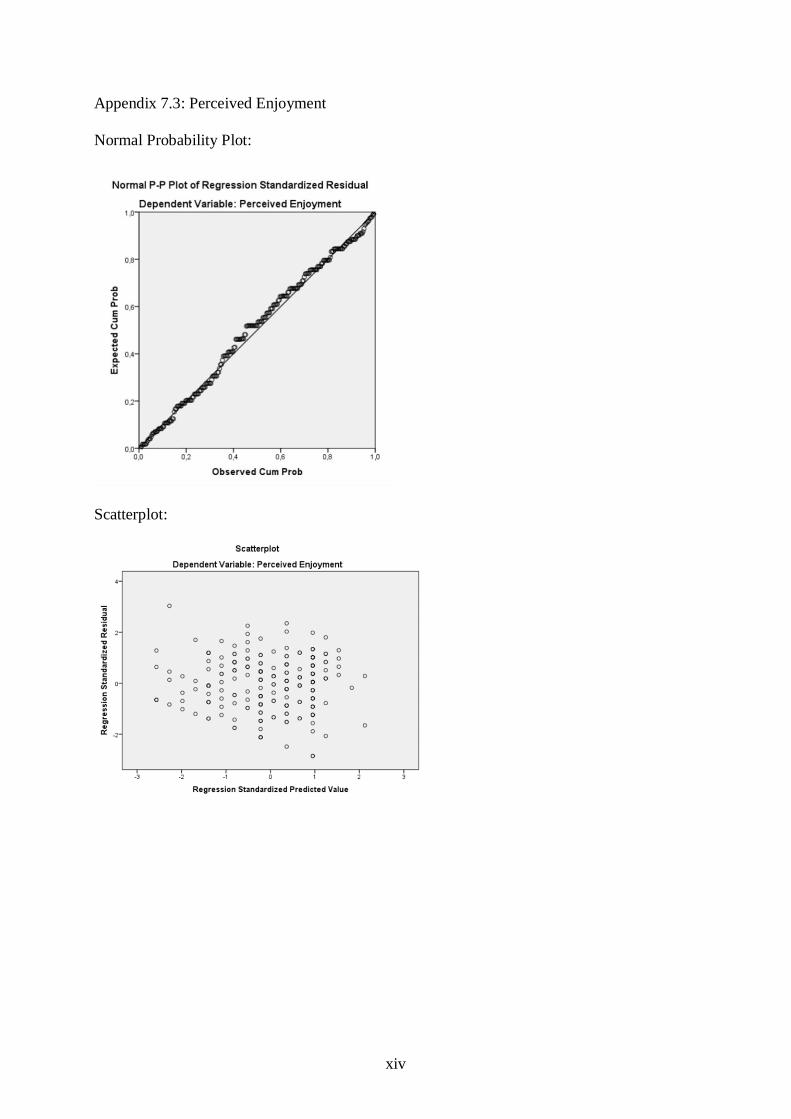
xiv
Appendix 7.3: Perceived Enjoyment
Normal Probability Plot:
Scatterplot:
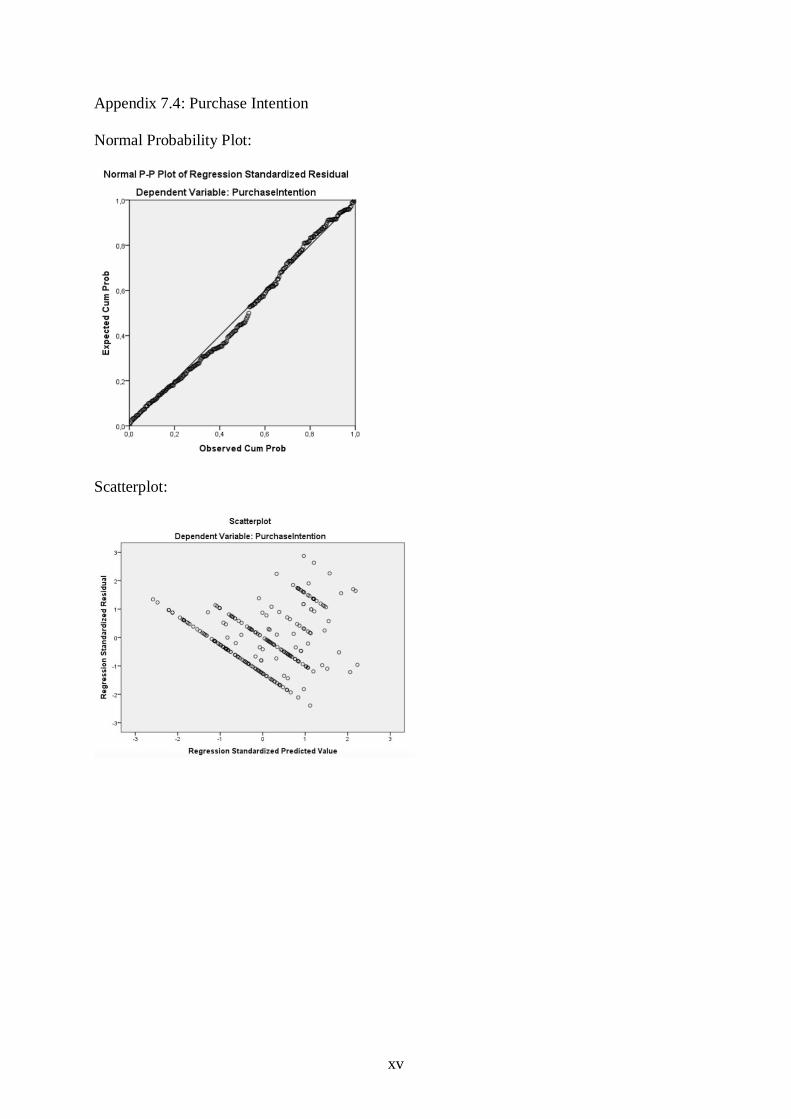
xv
Appendix 7.4: Purchase Intention
Normal Probability Plot:
Scatterplot: