Embed Size (px)
Citation preview

Wilmar International Limited Target Price: 3.45 SGD (27.8%)
23stSep 2015
Last Closed Price: 2.70 SGD 12M Target: 3.45 SGD “We invest, you yield”
Superiority of Integrated Business model Wilmar’s revenue is derived from seven segments of operation, and it continuously reinvests its profits to build a business model that includes the entire value chain In the agriculture business. With a wide distribution network globally and an extensive selling channel for consumer products, Wilmar serves over 50 countries. Its ability to successfully apply its business model to new segments such as the sugar market indicates a wide range of new markets for the company that will provide opportunities for future growth. Effective leadership & Management CEO Kuok Koon Hong has over 40 years of experience in the oil and grain industry. He had extensive successful experience in building an integrated model in the Southeast Asia that allowed Wilmar to become the dominant regional player. We believe in his sharp insight in choosing Africa as Wilmar’s next expansion target, and trust that his strong leadership and vast experience would allow Wilmar to stay competitive and generate good returns for shareholders. Tapping on African Market The African continent has been the second fastest growing economy with 4.5% per year in real terms between 1995 and 2013 according to the World Bank, and a projected 6% annual increase over the next decade. With more than 60% of the world’s unutilized arable land, low per capita consumption and young and rapidly growing population, we believe Africa has great potential for agricultural development that Wilmar could tap on. Wilmar already owns 59000 Ha of land in Africa and is set to invest more in manpower and finances in gestation projects such as manufacturing plants and plantations and also strengthening of the image of its branded consumer products. Key Investment Risks Due to the nature of its business, Wilmar’s profitability is directly related to commodity prices and given the recent fluctuations in the industry, this could pose a threat to Wilmar’s earnings. Furthermore, Wilmar has a relatively high value of debt which leads to a high interest rate risk. Valuation We used discounted cash flow (DCF) and relative valuation based on P/E to arrive at the target price of 3.45 SGD which represents a 27.8% upside potential from its current price.
Upside Potential: 27.8 % GICS Sector: Consumer Staples GICS Sub-Industry: Agricultural Products Bloomberg Ticker WIL :SW Equity 5Y Price v. Relative Index
Company Description Wilmar International Limited is founded in 1991 and currently headquartered in Singapore. It engages in agribusiness activities, including oil palm cultivation, oilseed crushing, sugar milling and refining, specialty fats among others. Wilmar has over 450 manufacturing plants and an extensive distribution network covering China, India, Indonesia and some 50 other countries
Key Financials Market Capitalization (mil) 16740 SGD Shares Outstanding (mil) 6403.4 Free Float (%) 29.4 52-Wk High 3.42 SGD 52-Wk Low 2.51 SGD P/E (ttm) 9.4
(USD mil) FY12A FY13A FY14A FY15E P/E (x) 13.90x 12.10x 13.9x 10.0x P/B (x) 1.20 1.20 1.00 - ROE (%) 9.07 8.79 7.98 10.4% Div Yield (%) 1.53 1.61 2.31 - Net D/E 0.31 0.45 0.46 - EBITDA (mil) 3368.4 3404.8 3007.2 3109.4 Key Executives Chairman/ CEO Kuok Koon Hong Executive Deputy Chairman Martua Sitorus Executive Director/ COO Teo Kim Yong
40.00
60.00
80.00
100.00
120.00
Wilmar STI

Figure 1. Revenue by Geographical Segment
Company Overview
Wilmar International Limited is founded in 1991 and is currently headquartered in Singapore. As Asia’s leading agribusiness group, Wilmar is ranked amongst the largest listed companies on the Singapore Exchange, with a market capitalization of 17.1 billion SGD. Wilmar engages in a wide range of agribusiness activities, including oil palm cultivation, oilseed crushing, sugar milling and refining specialty fats among others. As of Q2 2015, Wilmar operates over 450 manufacturing plants and has an extensive distribution network covering China, India, Indonesia and some 50 other countries. It is backed by a multinational workforce of about 92,000 people. Wilmar started operations in 1991 as a palm oil trading company. Through the years, Wilmar has achieved substantial growth and diversification though mergers and acquisitions, mainly in Malaysia and Indonesia in its early years. It has also expanded its increasingly diversified operations into foreign territories through multiple joint ventures. Notably, it formed a joint venture with Olam International and SIFCA group to develop a regional leadership position in agricultural plantation crops in Africa. Today it has more than 200 subsidiaries and associates internationally.
Business Model Wilmar’s revenue is derived from seven segments of operations. The key driver of revenue remains the palm and laurics segment, contributing 45.9%. This segment engages in merchandizing and a range of processing procedures which includes refining, fractionation and other down-stream operations. The processing plants are strategically located in major growing areas in Malaysia, Indonesia and Philippines as well as major consuming countries such as China and Vietnam. In FY2014, palm oil production reached 59.6 million metric tons. Wilmar has also established an extensive selling channel for its products. For palm oil and laurics, customers of Wilmar span a wide spectrum of international food producers. One of the largest customers is Unilever, the world’s third largest consumer goods company. Its palm oil-reliant products are margarine, oils, seasonings, shampoo and detergents among others. Other bulk purchasers include Nestle, Arnott Indonesia and China grains & oils group. Furthermore, Wilmar also produces and markets consumer products, such as edible oil, rice and flour under its own brand. Its best-selling oil brands, Arawana and Orchid under its Chinese subsidiary Yihai Kerry, holds a significant leadership position in the edible oil sector with market share of more than 30%. Key Strategy Building a resilient integrated agribusiness model Wilmar has been reinvesting its profits with a view to build a business model that encompasses the entire value chain of the agricultural commodity processing business, from origination and processing to branding to merchandising and distributing a wide range of agricultural products. This enables them to take control of the whole supply chain and gives Wilmar a competitive advantage in the market place. By having an integrated model, Wilmar experiences cost savings as it strategically places processing units close to refinery or consumer markets, thus lower transportation cost at each step of the value chain. It also benefits from internal economics of scale due to the control of its various processing facilities, hence allowing them to produce each unit at a lower cost, transferring cost savings to consumers by pricing its products more competitively. Furthermore, Wilmar is able to tap on market intelligence that its competitors do not have as they can tap on the
Source: Company Data Figure 2: Revenue by Company Divisions
Source: Company Data
23%
46%
3%
8%
4%5%
11%
Southeast Asia China
India Enrope
Aus & NZ Africa
Others
45.9%
25.6%
16.2%
7.2%
2.2%0.2% 2.7%
Palm and Laurics
Oilseeds and grains
Consumer products
Sugar Merchandising and Processing
Sugar Milling
Plantations and Palm Oils Mills
Others

Figure 3: Earnings per share and ROE
Source :Company Data
wide ground network and gather crucial information about the entire supply chain that could be used to best time their purchase of raw materials and take up various trading positions. In addition, Wilmar has its own fleet of vessels supporting an extensive distribution network of over 50 countries. The group’s integrated agribusiness model allows it to scale up its value chain, resulting in operational efficiency. Expansion through strategic acquisitions and joint ventures Wilmar has achieved significant growth through a series of strategic acquisitions and joint ventures. It is expecting to adopt the same proven formula for future growth. In January 2015, Wilmar announced the completion of phase two of its joint venture company in Myanmar with Great Wall Food Stuff Industry Company. Through this joint venture, Wilmar demonstrates its strategic commitment to the sugar industry and tap on the distribution networks in Myanmar hence presenting cost and time savings. With other Joint ventures in the Asian region such as in India and Indonesia, Wilmar has the ability to expand in the region and to strengthen its geographical position as a leading company in the commodity sector. Furthermore, joint ventures allows Wilmar to tap onto regions which may be difficult for foreign firms to invest in due to the vast red tapes present, for example Wilmar group made its inaugural entry into Zimbabwe through a joint venture with Surface Investments which operates the country’s largest multi-oilseed processing plant. These acquisitions allows Wilmar to generate revenue from various regions and hence diversifying its risk and making it less reliant on a specific area for its revenue. Despite some risks such as partners having different goals for joint ventures or lack of leadership and support, Wilmar has done well to mitigate these risks by setting clear goals and targets for its joint ventures and regularly updating its investors on the status of the projects, on top of that it has placed key individuals on the ground to supervise operations and work with the locals. Corporate Social Responsibility Though Wilmar has an unflattering history of ethical issues of deforestation and illegal sourcing, it has undertaken substantial efforts to resolve the issue. On 5th December 2013, Wilmar committed to a “No Deforestation, No Peat & No Exploitation” Policy for both its own operations and third party suppliers. In 2015, Wilmar won the Special Recognition Award at the Singapore Apex CSR Awards 2015. It was hailed as the first major palm oil player to step up to ensure its supply chain was de-linked from any forest destruction and human rights abuse. Management and Governance Wilmar’s executive management team has been a key driving force behind the company’s overall success. Its management team averages more than 20 years of experience in the industry and has shown good business acumen and foresight consistently. Its plan to build an integrated business model in the Southeast Asia over the past ten years has achieved phenomenal success, allowing Wilmar to become the regional leader in agribusiness. Since Mr Kuok Khoon Hong became CEO in 2006, he has steadily transformed Wilmar into one of the largest palm oil firms, achieving strong year-on-year top line growth. The management has identified Africa to be one of its major revenue driver in the medium to long term which we believe would be successful given their vast experience and sharp insight.
0
2
4
6
8
10
12
14
0
0.05
0.1
0.15
0.2
0.25
0.3
2010 2011 2012 2013 2014
Earnings per share (cents)
Return on Average Equity (%)

Figure 4: Forecast for Palm Oil Demand
Source: Grand View Research Inc. Figure 5: Porter’s 5 Forces
Figure 6: Geographic location of Wilmar’s Plantations
Source: Company Data
Industry Analysis Industry Profile The agricultural industry is facing strong head-winds due to slowing economic activities that have led to significant declines in commodity prices. With growing risks of a slowdown in commodities powerhouse China and an expectation of an interest rate hike in the United States, the medium-term outlook is unlikely to see any significant reversal in commodities prices. The agricultural industry remains competitive with a small number of large and mature companies competing for market share. Strong Growth in Palm Oil Demand Despite global uncertainties, global palm oil demand was 74.01 million tons in 2014 and is expected to reach 128.20 million tons by 2022, growing at a CAGR of 7.3% from 2014 to 2022. In addition to built-in demand growth expected, the Indonesian and Malaysian government have recently embarked on a greater push for palm oil to be used as an alternative form of biofuels to the more established corn and ethanol biofuels, which could be a catalyst for even stronger growth. Supply Concerns Remain Current market weaknesses due to a supply glut and poorer than expected demand have caused increased stockpiling of reserves in 2 largest palm oil producers. In July 2015, Malaysia’s stockpiles rose 5.3% to 2.27 million tonnes in July from a month earlier and 34% from a year ago. The oversupply of palm oil coupled with recent low prices, indicates that in the short to medium term, the outlook of prices of palm oil and its derivatives seems dull.
Porter’s 5 forces Competitive Rivalry Despite being one of the largest companies in Singapore by market capitalisation, Wilmar is a relatively young firm founded in 1991 up against more established and strong competitors. Over two decades of operations, Wilmar has proven the strength of its unique integrated business model, having grown both in revenue and earnings to match or even surpass its competitors in size. Wilmar faces strong competition from established local firms such as First Resources and Golden Agri-Resources, and international firms like Indofood Agri, Archer Daniels Midland Company and Cargill. Bargaining Power of Customers Wilmar’s final products are sold through wholesale distributors and end customers retail channels. As Wilmar’s products are sold through large-scale retailers and distributors, customers hold a certain degree of bargaining leverage as they could substitute Wilmar’s products with other competitors’ products or private offerings that are more attractively priced. Wilmar’s products are known for its high quality and consistency but its major productions are largely undifferentiated. The lack of strong branding, coupled with the presence of significant number of alternatives, indicates that customers could gravitate towards other brands swiftly, especially due to increased prices and the lack of advertising. Threat of New Entrants As new entrants would either need to build a large network of farmers or amass a large amount of land to get a business of similar operations going, the threat of new entrants is very low. These options require high capital costs and extensive lengths of time to achieve the necessary economies of scale, before the firm can be seen as a legitimate threat. Many firms are
0
50
100
1502
01
4
20
15
E
20
16
E
20
17
E
20
18
E
20
19
E
20
20
E
20
21
E
20
22
E
Palm Oil Demand (M tons)
CompetitiveRivalry
BargainingPower Of
Customers
Threat OfNew
Entrants
BargainingPower OfSuppliers
Threat OfSubstituteProducts
Porter's 5 Forces
70.00%
6.00%
24.00%
Indonesia Africa Malaysia

Figure 7: SWOT Analysis of Wilmar
Strengths -Strong leadership -Economies of Scale -Integrated Business Model
Weaknesses -High debt levels -lower palm oil yield in Africa
Opportunities -New markets (Africa) -Research & development
Threats -Intense competition -Fluctuation in commodity prices -Environment issues
already engaging in similar manufacturing and could enter particular downstream markets that Wilmar is already in, which may demonstrate low mobility barriers. However this risk is significantly mitigated by Wilmar’s integrated business model, such that the company has full control over the production at every stage of the process. Furthermore, it has the flexibility to tailor the use of its raw materials according to market conditions. Bargaining Power of Suppliers Wilmar is a vertically-integrated agricultural products conglomerate – it owns and manages the entire production chain from upstream raw material sourcing, to downstream refining, and to selling and distribution of products. Given that Wilmar’s raw materials are self-derived, it has few major suppliers, and hence supplier power would be low. Costs associated with production are thus highly stable, as its input costs are independent on commodity prices. In addition, Wilmar has geographically diverse business interests, having large interest in Malaysia, Indonesia, Australia (Sugar), Africa (13 countries), China (edible oil refiners, millers), India and Ukraine (edible oil refiners) that help to spread out potential cost risks. Threat of Substitute Products The threat of product substitutions away from core products is reduced through the company’s business interest in a wider range of alternative products through the refining and processing of a wide range of other commodities. (soybean, rapeseed, sunflower seed, cottonseed, canola, and peanut edible oils and meal; corn; wheat flour, rice, and bran) However, man-made substitutes (synthetic substitutes) for the divisions that create non-edible products could pose a threat with new developments that are more economical. SWOT Analysis Strengths The integrated business model of Wilmar is its greatest strength; this allows them to enjoy economies of scale, integration, logistical and distribution advantages. Through a large number of acquisitions and strategic investments, such as companies like Britain Palm Oil Limited (Europe) FFM Berhad (Malaysia), ProserineMill (Australia), Wilmar has increased its global presence, and added to a wide distribution network covering China, India, Indonesia and some 50 over countries. With ownership of 247,081Ha of land all around the world, and healthy plantation age profiles, Wilmar’s key strength also lies in its insulation from volatility of key raw material inputs for its manufacturing. This has allowed Wilmar to ensure comparative stability in its revenues and profits. With the strong leadership and far-sightedness of Kuok Koon Hong and over 90000 strong employees worldwide, this has given the company a strong foundation to penetrate the industry and become a global player in the commodity markets. Weaknesses Palm oil yield is much lower in Africa than in Southeast Asia for various reasons. It is still debatable whether comparable yields are achievable even with investment and improved growing techniques. The lower yield may be a potential obstacle to Wilmar’s expansion plan by lowering its margin, but it is partially offset by the higher prices in the continent, and Wilmar’s dedicated R&A efforts may provide solutions to that in the future. Wilmar witnessed an increase in its debt in FY2014. The company’s total long-term debt increased from 6803.9 million in 2013 to 7158.2 million USD in 2014. Increasing debt obligations requires more resources set aside to pay for principal and interests, and this limits the group’s flexibility in planning and reacting to changes in business and industry.

Figure 8 : Current and potential arable land in Africa
Source: Grid Arendal Figure 9: Malaysia palm oil futures
Source: indexmundi.com
Opportunities Wilmar’s growing presence in Africa provides a large potential in future earnings, as Africa is the second fastest growing economy in the world. 60% of the world’s unutilized agricultural land is in Africa. Wilmar is one of the first Asian commodity companies to venture into Africa. The company also intends to spend at least US$1 billion p.a. on new potential investments in the next few years, and to invest heavily into Research and Development to fully utilize resources and cut energy consumption. Growing demand for products such as oil seed products, palm, laurics, sugar, would boost potential earnings in the long run as consumer staples are essential necessities. Wilmar continues to strengthen its consumer product brands and build value. Furthermore, Wilmar has a huge potential for scalability and has duplicated its vertically integrated business model into its new sugar industry, and this is forecasted to increase revenues by 20% per annum in the next 5 years. Threats The commodity industry is volatile and hence Wilmar faces a risk when it comes to fluctuations in commodity prices, which may potentially lower its revenue and its margin. 45% of its revenue are in the palm oil and laurics segment, and commodity prices are subject to a wide range of factors such as weather, government policies and global demographic changes. Although Wilmar monitors and manage its open commodity position by forward physical contract and derivatives, we believe Wilmar is largely exposed to the risk in the long term, and its recent situation is worsened by the tumble in palm oil futures prices. Moreover, fluctuation in foreign exchange rates also impact its demand for imports and exports, hence affecting it reported earnings. Credit risk and interest rate risk are also notable though less serious threats. Wilmar hedges against foreign exchange risk and interest rate risk through financial instruments such as foreign currency forward and option contracts.
Investment Thesis
Dominant regional position across diversified sectors Despite being a relatively young firm, Wilmar has established a strong market position and has grown into a dominant regional player. It has seven segments, five of which are leaders in the respective market. Wilmar entered the sugar market in 2010 and is now one of the largest sugar producer and refines 75% Australia and New Zealand’s sugar requirements. In the consumer pack oil sector, it has a 45% market share in China, 35% in Indonesia, 20% in India and 55% in Vietnam. Given the relatively high barriers of entry and the vast potential for development in the region, Wilmar is bound to benefit from the rising population and increasing consumption in the developing markets. Unique vertically integrated agribusiness model promises lower cost Over the years Wilmar has invested substantial resources to develop a comprehensive chain of business, from origination, processing to branding, merchandising and distribution. It owns the entire supply chain upstream to downstream, with a huge complex operation that is rarely seen in Asia. This poses a challenge for the operations management but this also promises
400
450
500
550
600
650
700
Au
g-1
4
Oct
-14
Dec
-14
Feb
-15
Ap
r-1
5
Jun
-15
Au
g-1
5US
Do
llar
pe
r M
etr
ic T
on

Figure 10: Wilmar’s Integrated Business Model
Source: Company Data
tremendous opportunity for better control, higher efficiency and greater stability, all achieved at a lower cost and greater resilience. Wilmar has proven to overcome the challenge and successfully duplicated the vertically integrated model it uses for palm oil industry to the sugar industry. We believe that with further refinement and R&D efforts, Wilmar is bound to benefit from the model’s multiple advantages in the future. Commitment to research and development effort in China key to product differentiation Wilmar’s R&D efforts took place in China, Malaysia, Indonesia, India, Vietnam and Germany, and it is the key to providing sustainable solutions for optimization of resources and minimizing environmental impact. Its Shanghai R&D centre cooperated with China Nutritional Society to promote the 2014 Dietary Reference Intake guideline and subsequently designed a new formulation with balanced fatty acid composition for the group’s bestselling Arawana blended oils. The Arawana Food Nutrition and Safety Fund also supported three projects by the China National Centre for Food Safety Risk Assessment. This strengthens Wilmar’s already dominant presence and corporate reputation in China, and further differentiates its product as the healthy choice. Tapping on African market with huge potential revenue boost Africa has been the world’s second fastest growing economy over the last two decades with economic growth averaging 4.5% per year in real terms over the past twenty years, and expected annual GDP rise of 6%. The youth population of 1.11 billion is a key driver for growth, and is set to boost consumption and hasten urbanization. With more than 60% of the world’s unutilized arable land, of which only an estimated 14% is put to use, low per capita consumption and a young and rapidly growing population, Africa has great potential for agricultural development and consumer markets. Palm oil accounts for more than 70% of African edible oil consumption, and yet the continent is a net importer of palm oil. Wilmar has recognized the potential and seized through joint ventures 59,000 ha of oil palm planted area in West Africa and Uganda. The management has identified Africa as the key future revenue driver and would continue to invest in the continent. Management as key shareholders with extensive business ties and experience The CEO of Wilmar is Mr. Kuok Khoon Hong who is a Singaporean business magnate who shaped Wilmar to be “the world’s largest palm oil firm” in merely less than 20 years. Alongside him is Martua Sitorus, the Indonesian billionaire who co-founded Wilmar with Mr. Kuok. Two of them hold a 20% stake in the company. Coupled with the fact that Wilmar is a unique company that focuses on vertically integrating the entire business line, it goes to show that management has the capability to seek out high yielding stable business assets. With a strong balance sheet, we can expect that the company will continue to grow both organically and inorganically in the future.
Origination
Processing
7 Divisions:
- Bulk Edible Oils
- Consumer Pack Edible Oils
- Oilseeds Meal
- Specialty Fats
- Oleochemicals
- Raw & Refined Sugar
- Rice, Flour, Biodiesel
Merchandising, Shipping, Distribution
Customers
Financial Analysis
Figure 11: Revenue Forecast
Source: Own Estimates
Revenue/Profitability Wilmar has enjoyed relatively stable earnings for the past 10 years with no net losses incurred. Its strategic expansion into Indonesia, Malaysia, China and India has brought significant success and tremendous top line and bottom line growth over the past eight years. Revenue of FY2014 stands at 43 billion and 1.16 billion USD respectively, more than six times of that in 2006 before it became the regional leader. However, it’s slowing growth and stagnating revenue in the recent three years has shown its maturing position in the established Asian markets. Gross profit averaged a 1.2% drop over the period. However, we believe that Wilmar will see another boost to its top and bottom line if its expansion strategy to Africa would prove successful under the strict guidance of the management team who boasts an extensive record of success in the Asia market. Geographically, FY2014 revenue from Africa has already increased 35.5% over FY2013, accounting for 4.7% of its total revenue. GPM is relatively stable in the past three years, standing at 8.9% for FY2014, lower than the smaller Golden-Agri and First Resources as expected. However, compared to its American counterpart and competitor ADM, which aims to venture into the Asia market and has a much lower GPM of 4-6%, Wilmar still holds the advantage in terms of cheaper raw materials. Liquidity and Solvency At the end of FY2014, 70% of Wilmar’s liability is short-term, with 57% of total debt arising from trade financing, a tool to minimize credit risk with a cheap interest rate of less than 1% p.a. Current ratio remains healthy over the years and stands at 1.24 at end 2nd quarter in 2015. The cash ratio has also increased over the past three years to 0.18x. In addition, Wilmar has shown a consistent ability to generate interest income, which stands at 523 million USD for FY2014, depicting its exceptional ability to manage trade financing. In view of rising interest rates, the management has reduced the level of debt in its capital structure. Total debt ratio decreased by 3.6% from FY2013 to FY2014, while long-term debt decreased by more than 5%. Wilmar has also started re-financing its floating-rate loans, which has enjoyed low interest rates in the past, for preparation of a rate hike.
Figure 12: Discounted FCFF forecast
Source: Own Estimates
Valuation DCF with Gordon Growth Terminal Value Major Assumptions Revenue estimates: As Wilmar operates in the consumer staples industry, organic revenue growth are projected based on the population growth rate and are separated into different regions, namely China, Southeast Asia, India, Europe, Australia and New Zealand, Africa and others. In consideration of the market penetration rate, revenue from Africa is expected to grow at an additional 20% p.a. based on historical averages due on its tremendous expansion efforts, whereas growth in other mature markets are expected to remain stable. Cost estimates: Cost of revenue is assumed to be fixed at 91.6% of total revenue. As the gross margin for the past five years were stable, this projection relies on the average historical figures. For SG&A, projections are based on the weighted average inflation rate of the regions it operates in.
0
10000
20000
30000
40000
50000
60000
20
10
20
11
20
12
20
13
20
14
20
15
E
20
16
E
20
17
E
20
18
E
20
19
E
Revenue (S$M)
900
950
1000
1050
1100
Discounted FCFF
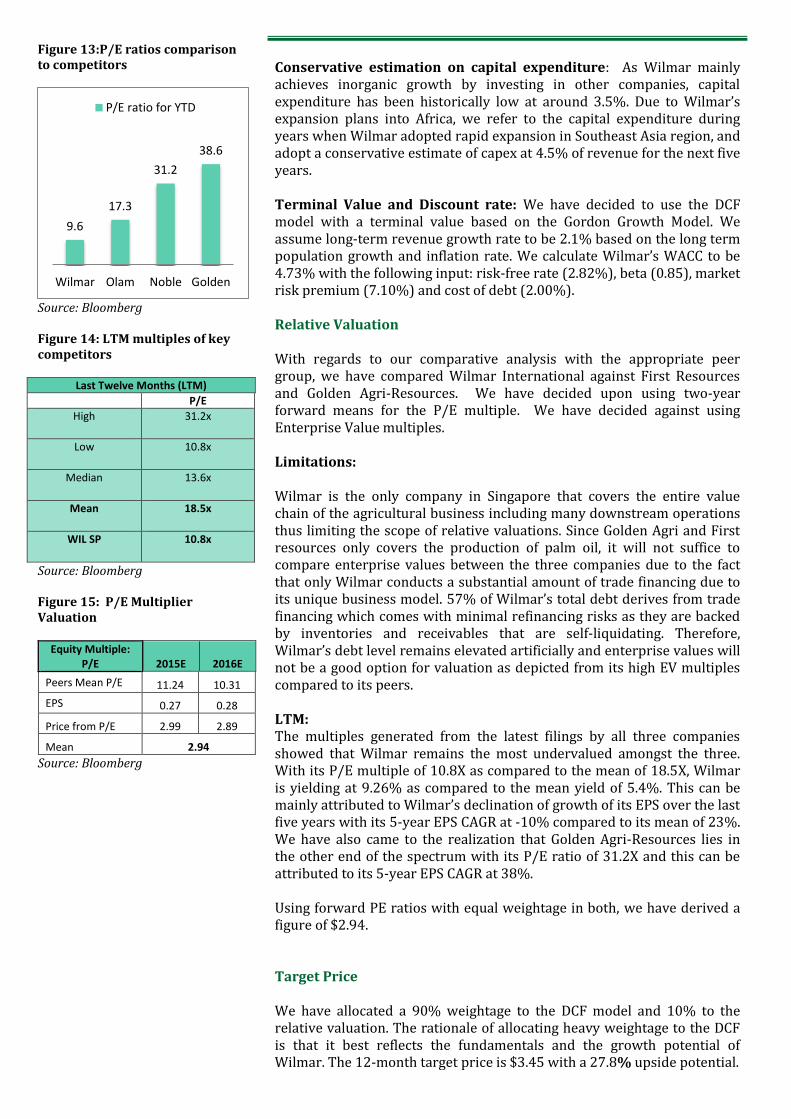
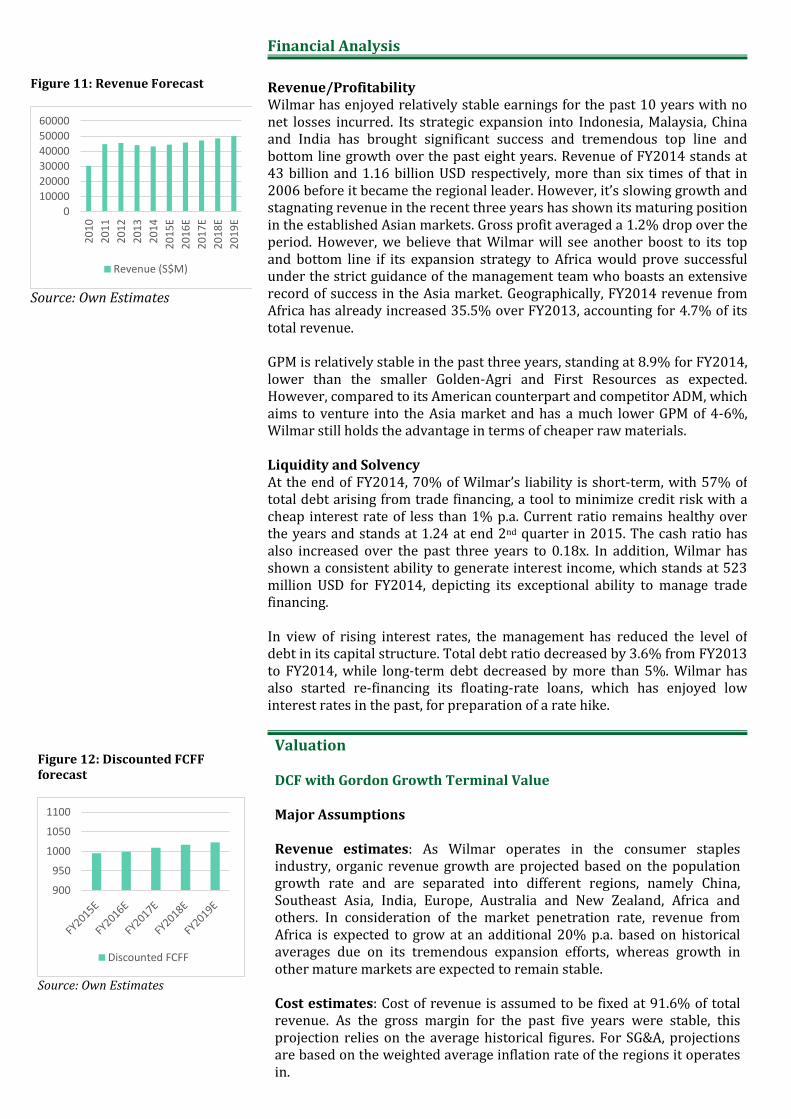
Figure 13:P/E ratios comparison to competitors
Source: Bloomberg Figure 14: LTM multiples of key competitors
Last Twelve Months (LTM)
P/E
High 31.2x
Low 10.8x
Median 13.6x
Mean 18.5x
WIL SP 10.8x
Source: Bloomberg Figure 15: P/E Multiplier Valuation
Equity Multiple: P/E 2015E 2016E
Peers Mean P/E 11.24 10.31
EPS 0.27 0.28
Price from P/E 2.99 2.89
Mean 2.94
Source: Bloomberg
Conservative estimation on capital expenditure: As Wilmar mainly achieves inorganic growth by investing in other companies, capital expenditure has been historically low at around 3.5%. Due to Wilmar’s expansion plans into Africa, we refer to the capital expenditure during years when Wilmar adopted rapid expansion in Southeast Asia region, and adopt a conservative estimate of capex at 4.5% of revenue for the next five years. Terminal Value and Discount rate: We have decided to use the DCF model with a terminal value based on the Gordon Growth Model. We assume long-term revenue growth rate to be 2.1% based on the long term population growth and inflation rate. We calculate Wilmar’s WACC to be 4.73% with the following input: risk-free rate (2.82%), beta (0.85), market risk premium (7.10%) and cost of debt (2.00%). Relative Valuation With regards to our comparative analysis with the appropriate peer group, we have compared Wilmar International against First Resources and Golden Agri-Resources. We have decided upon using two-year forward means for the P/E multiple. We have decided against using Enterprise Value multiples. Limitations: Wilmar is the only company in Singapore that covers the entire value chain of the agricultural business including many downstream operations thus limiting the scope of relative valuations. Since Golden Agri and First resources only covers the production of palm oil, it will not suffice to compare enterprise values between the three companies due to the fact that only Wilmar conducts a substantial amount of trade financing due to its unique business model. 57% of Wilmar’s total debt derives from trade financing which comes with minimal refinancing risks as they are backed by inventories and receivables that are self-liquidating. Therefore, Wilmar’s debt level remains elevated artificially and enterprise values will not be a good option for valuation as depicted from its high EV multiples compared to its peers. LTM: The multiples generated from the latest filings by all three companies showed that Wilmar remains the most undervalued amongst the three. With its P/E multiple of 10.8X as compared to the mean of 18.5X, Wilmar is yielding at 9.26% as compared to the mean yield of 5.4%. This can be mainly attributed to Wilmar’s declination of growth of its EPS over the last five years with its 5-year EPS CAGR at -10% compared to its mean of 23%. We have also came to the realization that Golden Agri-Resources lies in the other end of the spectrum with its P/E ratio of 31.2X and this can be attributed to its 5-year EPS CAGR at 38%. Using forward PE ratios with equal weightage in both, we have derived a figure of $2.94. Target Price We have allocated a 90% weightage to the DCF model and 10% to the relative valuation. The rationale of allocating heavy weightage to the DCF is that it best reflects the fundamentals and the growth potential of Wilmar. The 12-month target price is $3.45 with a 27.8% upside potential.
9.6
17.3
31.2
38.6
Wilmar Olam Noble Golden
P/E ratio for YTD

Key Investment Risks Commodity Risks With Wilmar unwilling to import raw materials in its manufacturing of agricultural products due to its integrated business model, demand for palm oil and other products by Wilmar will be related to the prices of substitutes and commodities such as oil. Given the recent economic slowdown, lower forecasted commodity prices will continue to threaten the profitability of Wilmar. Leverage and Debt Wilmar’s high financial leverage of 2.81 suggests that company performance is highly vulnerable to unfavourable changes in the global market.
Research Analysts:
Matthew Pay [email protected]
Du Haowei [email protected]
Hubert Yan [email protected]
Navin Prasad [email protected]
This research material has been prepared by NUS Invest. NUS Invest specifically prohibits the redistribution of this material in whole or in part
without the written permission of NUS Invest. The research officer(s) primarily responsible for the content of this research material, in whole or in
part, certifies that their views are accurately expressed and they will not receive direct or indirect compensation in exchange for expressing specific
recommendations or views in this research material. Whilst we have taken all reasonable care to ensure that the information contained in this
publication is not untrue or misleading at the time of publication, we cannot guarantee its accuracy or completeness, and you should not act on it
without first independently verifying its contents. Any opinion or estimate contained in this report is subject to change without notice. We have not
given any consideration to and we have not made any investigation of the investment objectives, financial situation or particular needs of the
recipient or any class of persons, and accordingly, no warranty whatsoever is given and no liability whatsoever is accepted for any loss arising
whether directly or indirectly as a result of the recipient or any class of persons acting on such information or opinion or estimate. You may wish to
seek advice from a financial adviser regarding the suitability of the securities mentioned herein, taking into consideration your investment objectives,
financial situation or particular needs, before making a commitment to invest in the securities. This report is published solely for information
purposes, it does not constitute an advertisement and is not to be construed as a solicitation or an offer to buy or sell any securities or related financial
instruments. No representation or warranty, either expressed or implied, is provided in relation to the accuracy, completeness or reliability of the
information contained herein. The research material should not be regarded by recipients as a substitute for the exercise of their own judgement. Any
opinions expressed in this research material are subject to change without notice.
©2015 NUS Invest