Embed Size (px)
Citation preview

Towards an Integrated Perceptual Sociolinguistics
Colin Sullivan
Senior Thesis, Haverford College
Department of Linguistics, Swarthmore College
Fall 2006
Abstract:
How is it possible that we can tell whether someone is from New
York City or Texas or Minnesota simply by listening to their speech? The
fact that ordinary people have no trouble with this task is a minor miracle!
Sociolinguists and dialectologists have ignored the ability of naïve
listeners to distinguish one dialect from another and to attach them to a
specific geographical region. Recent work done by Clopper (2004),
Preston (1999), and Thomas (2002), has begun to address the role of
perception in dialect recognition, synthesizing techniques from phonetics,
psychology, and even forensics. The New Integrated Perceptual
Sociolinguistics (IPS) research indicates that naïve listeners accumulate
knowledge about language variation and are able to apply this knowledge
to wide variety of tasks relating to dialect perception.
This paper reviews these studies and other previous research in
perceptual dialectology and sociophonetic work, and discusses their
experimental methodologies. Using this information as background, I
designed a pilot experiment involving dialect perception by naïve
listeners. The goal of this paper is to investigate naïve intuitive knowledge
of dialects from a perceptual perspective in the hopes of scrutinizing our
instinctive knowledge about language variation.*

2
I. Introduction
Intuitively, we all know that people throughout the United States do not speak the
same variety of English that we hear in our communities and at home. We know that
even though we are speaking the same language, elsewhere it sounds “different” on some
level. Language variation is not some new phenomenon that has sprung up, but has been
well documented by dialectologists and sociolinguists (e.g. Labov, 2001). It is no
surprise to us that the English language is not spoken identically everywhere.
While it seems obvious that people from different communities may distinctive
speech, the consequences of dialect contact affect our lives almost daily. Dialectal
differences are a part of our cultural awareness and allow us to make judgments about
people we encounter. It continually attracts our attention whenever we hear someone
from outside our community speak. Indeed, Joking remarks that someone from
Tennessee pronounces pen and pin the same way, that others say caught and cot
identically, and that some distinguish both these pairs are a common experience.
Anecdotes that Bostonians drop their r’s, yet Texans add them, or that New Yorkers say
cwuofee, and that people in Minnesota and North Dakota say their o’s funny are
examples of the types of expectations that normal Americans might have in their minds
when they listen to a foreign dialect. We do not simply say that people from different
parts of the country sound “strange”, but are attentive to the exact ways in which different
dialects sound distinct. As a result, colloquial vocabulary has developed to express ideas
such as Southern speech being “twangy”. This awareness is present in everyone and does

3
not require any special training in linguistics or the ability to speak more than one dialect.
Clopper (2004: 21) has summarized this phenomenon:
The body of research on the perception of dialect variation leads to one
overwhelming conclusion: naïve listeners can make reliable judgments about
where an unfamiliar talker is from without explicit instructions about what to
listen for. This perceptual ability suggests that listeners retain a memory of the
varieties of their native language and that these representations develop naturally
through a person’s experience with and exposure to his community and the world
at large.
The way in which we gain and apply this type of knowledge is still relatively unknown,
but is beginning to be unraveled by researchers.
The perception of dialects has been ignored until relatively recently, and
researching this behavior takes many different approaches. Sociolinguists and
dialectologists have devoted much attention to giving technical descriptions of dialects
phonetically, and exploring general questions about language attitude, stereotypes, and
how they may affect the workplace or classroom. However, variationist sociolinguistics
has overlooked the role perception plays and focused on the broad consequences of
language variation in society. This distinction is subtle, but crucial, because it neglects
how speech variations are processed by listeners in order to create these social biases
(Clopper, 2004). At the other end of the spectrum, speech scientists have traditionally
investigated the acoustic properties and parameters of the speech signal recognized by the
brain and have not devoted significant attention to the wider aspects of perception cross-
dialectally.
However, a new field comprised of techniques from dialectology, sociolinguistics,
psycholinguistics, phonetics, forensics, and applied linguistics is emerging with the goal
of investigating the nature of our knowledge about different dialects. A multitude of

4
questions can be raised about this knowledge, for example: How is this type of
knowledge acquired? What kind of knowledge about a dialect is utilized when listening
to an unfamiliar dialect? To what extent does the level of exposure to different dialects
affect perception? In what ways do expectations about the speaker’s regional dialect
affect perception? How well can listeners to distinguish among dialects and link them to
different geographical regions? What features of a dialect are noticed first? What kind
of information can be gleaned from parody imitations of different dialects by outsiders?
What role does speaker gender and ethnicity play in dialect perception? These questions
are broad in scope, yet already researchers have some notion of the answers.
The shift in focus within aspects sociolinguistics and traditional speech processing
has lead to the establishment of a new subfield of linguistics investigating dialect
perception. Since no formal name has been attributed to this type of research, I refer to
this subfield in this paper as Integrated Perceptual Sociolinguistics (IPS). Section 1 of
this paper begins by laying out the foundations of IPS and reviews the research
techniques used to examine these questions. The discussion IPS research will include an
analysis of the methodologies and assumptions contained within individual experimental
procedures. An analytical assessment of each technique is given along with an account of
the results.
Section 3 outlines the methodology and procedure of an original pilot experiment
and discusses the theoretical and pragmatic challenges encountered while carrying out
this experiment. Finally, Section 4, evaluates the results of this experiment situated in
the context of other IPS research. The aim of this paper is to give an account of

5
Integrated Perceptual Sociolinguistic research, its methodologies, and discuss possible
the new directions it may take with the addition of an original pilot experiment.
2.0 Foundations of IPS
2.1 Overview
While there is no acknowledged expert in Integrated Perceptual Sociolinguistics,
Clopper (2004) and Thomas (2002) have effectively laid out the scope of IPS and
established the following main objectives:
(1) Understanding how naïve listeners conceptualize and organize language
variation in the environment into mental representations of dialects.
(2) Assessing the ability of listeners to identify or correlate the dialects of a
speaker with a geographic region.
(3) Determining which features of a dialect are the most salient for naïve listeners
to be able to distinguish it.
(4) Evaluating the influence of expectations and stereotypes on the perception of
sounds within a dialect.
(5) Examining the ability of listeners to translate perceived linguistic variability
into knowledge about production of foreign sounds.
This burgeoning field has yet to codify the principles and goals of the discipline, and the
fact that researchers are approaching it from so many different backgrounds makes the
task rather complex. A review of the many research techniques incorporated in IPS
emphasizes the diversity of the methodologies and the necessity for careful experimental
design. Thomas (2001) points out that research investigating dialect perception tends to
be very demanding with respect to detail in experimental design, yet data analysis is less

6
intensive than in other fields of linguistics. Isolating the desired aspect of perception to
be investigated is one of the principle difficulties in IPS, which may explain the relative
deficiency of perceptual research in linguistics until now.
2.2 Conceptualization of Dialects
Research investigating how dialects are organized and conceptualized in the mind
fits within the branch of linguistics called Perceptual Dialectology or Folk Dialectology:
The word folk brings to mind a sense of class and the common tradition which invokes
inaccurate notions of the field. Researchers are interested in the accumulated mental set
of dialects and their features used by listeners to organize the linguistic variation into
separate categories. Experiments in this area usually incorporate map drawing tasks or
questions directed at dialect consciousness. Studies usually entail the demarcation of
dialect boundaries on a map and do not require that speech samples be presented to the
subjects, but instead rely only on their stored internal mental representations of dialects
and their distinctive features. It can be better described as perceptual dialectology.
In an experiment designed by Preston (1986) naïve subjects drew lines on a map
of the United States to indicate “where people speak differently”. Preston’s map drawing
experiment allowed the subjects to choose their own system of categorization and utilized
a “free classification” test, which was originally developed for research in cognitive
science. Free classification tests sometimes ask subjects to organize dialects into a set
number of categories in order to discern the most significant dimensions of classification.
Others allow subjects to be as specific or broad as they choose with no requirement for
the number of separate categories. The main goal of free classification tests is to gain
insight into the number and system of organization of mental representations, and

7
accomplishes this by not introducing criteria of categorization within the questions put to
the participants. An example of an experiment that violates free classification would ask
the participants to mark in which states people have ‘Southern’, ‘Midwestern’ and
‘Northern’ accents. This introduces a constraint on subjects to make their own internal
representations fit within the parameters laid down by the experimenters. Subjects may
internally have organized language variation into some other system that does not directly
distinguish ‘Southern’ and ‘Midwestern’. By giving as much freedom as possible to the
participants, researchers can glean information about the principles employed by naïve
participants to sort linguistic variation. Not surprisingly, Preston’s map drawing study
demonstrated that the maps created by naïve listeners did not match up with the
boundaries or categories sociolinguists had found in their research.
One of the patterns Preston noticed in his first set of experiments was that level of
detail was more granular and discriminating nearer to a subject’s hometown. He found
that there was a direct correlation between the distance away from the subject’s
hometown and number of distinctions in people’s speech. The closer to the speaker, the
finer the divisions. However overall, were consistent in their classifications of dialects for
regions far away from their community. The varied level of detail in the results merely
shows that people are more aware of the distinctions between the dialects to which they
are more often exposed (Preston, 1999). Participants in New Jersey made a distinction
between New England and Mid-Atlantic speech while those in Atlanta did not, because
participants in New Jersey had more experience and exposure to the local varieties
leading to finer category distinctions.

8
Experiments in dialect consciousness also using the free classification system
have been carried out primarily with rural Japanese Dialects. Clopper (2004) cited an
experiment done by Mase (1999), which asked participants to list specific characteristics
of other types of Japanese speech that was different from their own (Preston 1999). This
method elicited naïve descriptions of how dialects of Japanese differ, once again without
imposing any restrictions on the types of distinctions or the level of detail. Mase noted
that the descriptions provided by the participants generally related to a specific region or
dialect and did not relate to multiple dialects. Essentially, subjects were sensitive to
features characteristic of specific dialects and did not notice the absence of a distinctive
feature when listening to an unfamiliar dialect. For example, a subject asked in America
might list Southern speech as [+drawl], but would not have categorized Northern speech
as having the characteristic of [-drawl]. The hypothesis is that naïve subjects attune to
specific features of each dialect individually and do not generalize or compare
characteristics cross-dialectally to develop a system of categorization.
2.3 Correlating Dialects with Geography
The goal of studies correlating dialect with geography is to confirm that people
reliably and consistently attribute dialects to corresponding regions. The primary
difference between this type of research and the research presented in the previous
section is that subjects listen to actual speech samples of regional dialects and then asked
to geographically locate each sample individually. Preston (1993) and Clopper & Pisoni
(2004) have conducted dialect categorization experiments and found that people are, in
fact, able to match dialect with a region with some degree of proficiency.
9
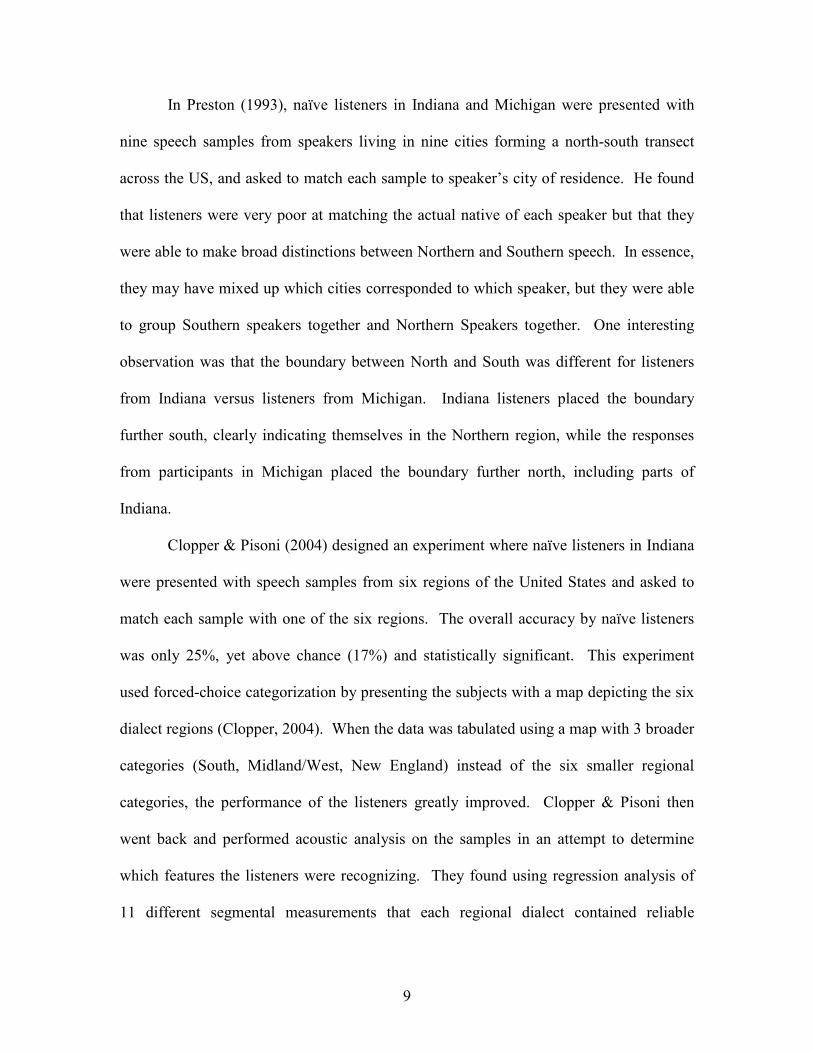
In Preston (1993), naïve listeners in Indiana and Michigan were presented with
nine speech samples from speakers living in nine cities forming a north-south transect
across the US, and asked to match each sample to speaker’s city of residence. He found
that listeners were very poor at matching the actual native of each speaker but that they
were able to make broad distinctions between Northern and Southern speech. In essence,
they may have mixed up which cities corresponded to which speaker, but they were able
to group Southern speakers together and Northern Speakers together. One interesting
observation was that the boundary between North and South was different for listeners
from Indiana versus listeners from Michigan. Indiana listeners placed the boundary
further south, clearly indicating themselves in the Northern region, while the responses
from participants in Michigan placed the boundary further north, including parts of
Indiana.
Clopper & Pisoni (2004) designed an experiment where naïve listeners in Indiana
were presented with speech samples from six regions of the United States and asked to
match each sample with one of the six regions. The overall accuracy by naïve listeners
was only 25%, yet above chance (17%) and statistically significant. This experiment
used forced-choice categorization by presenting the subjects with a map depicting the six
dialect regions (Clopper, 2004). When the data was tabulated using a map with 3 broader
categories (South, Midland/West, New England) instead of the six smaller regional
categories, the performance of the listeners greatly improved. Clopper & Pisoni then
went back and performed acoustic analysis on the samples in an attempt to determine
which features the listeners were recognizing. They found using regression analysis of
11 different segmental measurements that each regional dialect contained reliable

10
phonetic markers that were available to the naïve listeners. They found that[r]-lessness
was a strong predictor of New England speech as well as /æ/ backness. /ou/ offglides and
/aI/ monophthongization were strong predictors of Midland speech, while intervocalic
fricative voicing and /u/ fronting were connected to the typical Southern dialect. Based
on these results Clopper and Pisoni confirmed Preston’s previous work that naïve
listeners are able to match specific acoustic cues with broad geographic regions. The fact
that naïve listeners were able to correctly match speech samples with dialect regions to a
degree better than chance, seems to indicate that subjects were able to attune to some
phonetic cues. However, it may be that the speakers were not applying the cues found by
Clopper and Pisoni, and instead were basing their categorizations on intonation contours
or consonant articulations. Other researchers have slightly altered this procedure to test
which features specifically are helpful to naïve listeners.
2.4 Determining the Salient Features for Dialect Discrimination
IPS research investigating the salient features involved in dialect discrimination is
perhaps the most important for answering the question: How do we build the
conceptualizations of dialects in our mind for later use when matching a given speech
sample to our internal representations? Here researchers are interested in the phonetic
and phonological features picked up by naïve listeners during dialect conceptualization,
and the subsequent application of this knowledge when presented with new speech to
process.
Van Bezooijen & Gooskens (1999) tested naïve listeners of both British English
and Dutch and attempted to present different kinds of phonetic information to the
listeners to see which level was the most important for successful matching. Speech
11
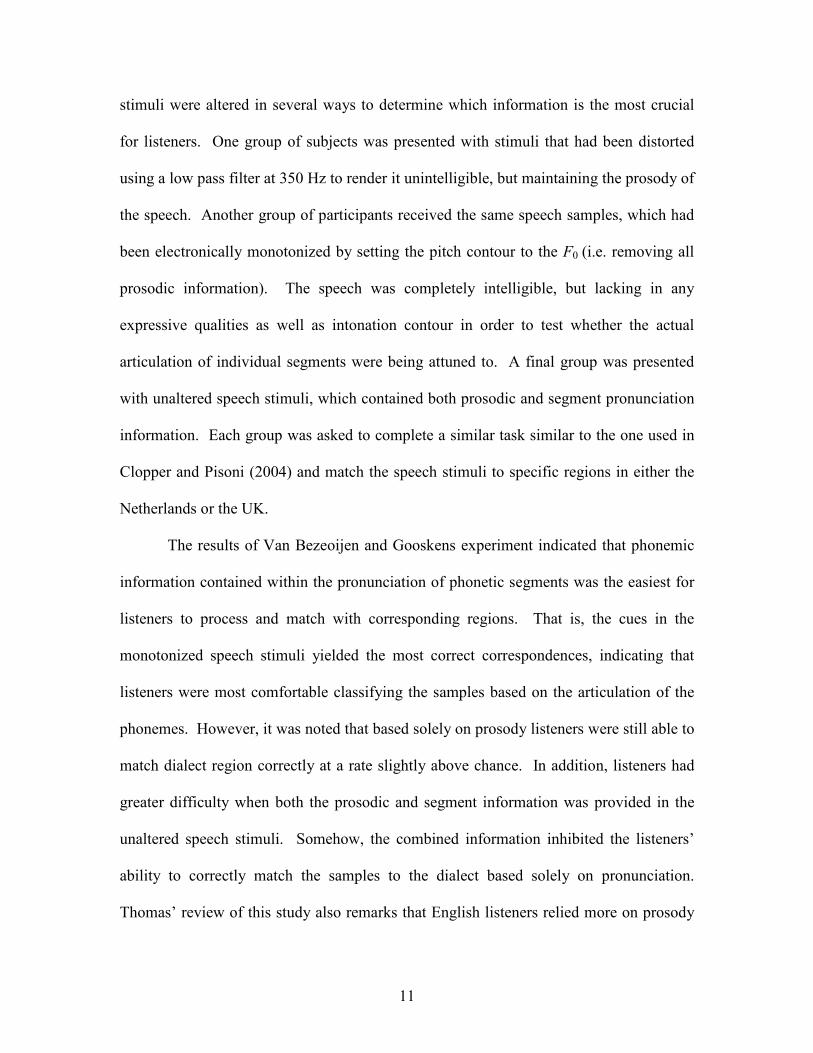
stimuli were altered in several ways to determine which information is the most crucial
for listeners. One group of subjects was presented with stimuli that had been distorted
using a low pass filter at 350 Hz to render it unintelligible, but maintaining the prosody of
the speech. Another group of participants received the same speech samples, which had
been electronically monotonized by setting the pitch contour to the F0 (i.e. removing all
prosodic information). The speech was completely intelligible, but lacking in any
expressive qualities as well as intonation contour in order to test whether the actual
articulation of individual segments were being attuned to. A final group was presented
with unaltered speech stimuli, which contained both prosodic and segment pronunciation
information. Each group was asked to complete a similar task similar to the one used in
Clopper and Pisoni (2004) and match the speech stimuli to specific regions in either the
Netherlands or the UK.
The results of Van Bezeoijen and Gooskens experiment indicated that phonemic
information contained within the pronunciation of phonetic segments was the easiest for
listeners to process and match with corresponding regions. That is, the cues in the
monotonized speech stimuli yielded the most correct correspondences, indicating that
listeners were most comfortable classifying the samples based on the articulation of the
phonemes. However, it was noted that based solely on prosody listeners were still able to
match dialect region correctly at a rate slightly above chance. In addition, listeners had
greater difficulty when both the prosodic and segment information was provided in the
unaltered speech stimuli. Somehow, the combined information inhibited the listeners’
ability to correctly match the samples to the dialect based solely on pronunciation.
Thomas’ review of this study also remarks that English listeners relied more on prosody

12
in their judgments of British dialects than did Dutch listeners for dialects of Dutch
(2002). This seems to point toward the idea that naïve listeners of different languages use
different means to make their judgment. This finding makes sense intuitively, since some
languages have more prosody than others and we would expect listeners to use those
features that are most prominent in their languages to distinguish dialects.
In similar experiment, Plichta and Preston (2003) tested whether listeners
differentiate dialects based solely vowel diphthongization as the targeted cue. Using the
same north-south transect from Saginaw, MI to Dotham, AL from Preston (1996), they
tested a continuum of the vowel sound /aI/ as in the word ice. Using a speech synthesizer
they created 9 different samples of the word ‘guide’ with varying degrees of
monophthongization to explore how it would be correlated along north-south continuum.
In this experiment, whether the participants matched the sample to correct city was not
and important factor, but instead investigated only whether the feature of vowel
diphthongization was involved in dialect processing. The goals were to determine
whether monophthongization is important to listeners for classifying variations along the
north-south dimension and to determine whether some categorical breakpoint exists at
which variants were classified as either north or south.
Plichta and Preston found that monophthongization operated as a gradient within
northern and southern regions, but that there was a breakpoint separating these two
classifications. In essence, subjects first classified the word ‘guide’ as belonging to either
Southern or Northern regions, and secondly attempted to represent the degree of
monophthongization in a gradient continuum within each category. This study confirms
the hypothesis that the degree of vowel monophthongization is a robust cue for dialect

13
categorization for naïve listeners. The synthesized /aI/ vowels may not match the actual
vowels produced by speakers from the 9 cities along the north-south transect, but naïve
listeners do associate a certain level of monophthongization with the southern variety.
Preston and Plichta’s experiment, overlaps to some degree with research investigating
stereotypes and expectations.
2.5 The Role of Expectations and Stereotypes
. Many studies have in the psycholinguistic arena show that our expectations
about a speaker will affect our perceptions of speech, and this type of methodology is
now being applied to research in IPS. This research investigates the ways in which our
perceptions might not match up directly with reality. Psycholinguistic research has
shown that expectations about speaker gender or ethnicity affect our judgments of speech
stimuli, but Niedzielski (1999) was the first to apply this to dialect perception.
Niedzielski presented speech samples of a Detroit native speaker to naïve listeners
from the Detroit area and asked them to match the vowels they heard in the samples with
synthesized vowel tokens. The listeners were divided into two groups. One group was
told they were listening to a Detroit native’s speech, while the other group was told the
speaker was from Canada. The goal was to see if the choices made by the listeners would
be affected by expectations about the speaker’s region. Niedzielski was able to conclude
from the results of the experiment that listeners do, in fact, use social information in
speech perception.
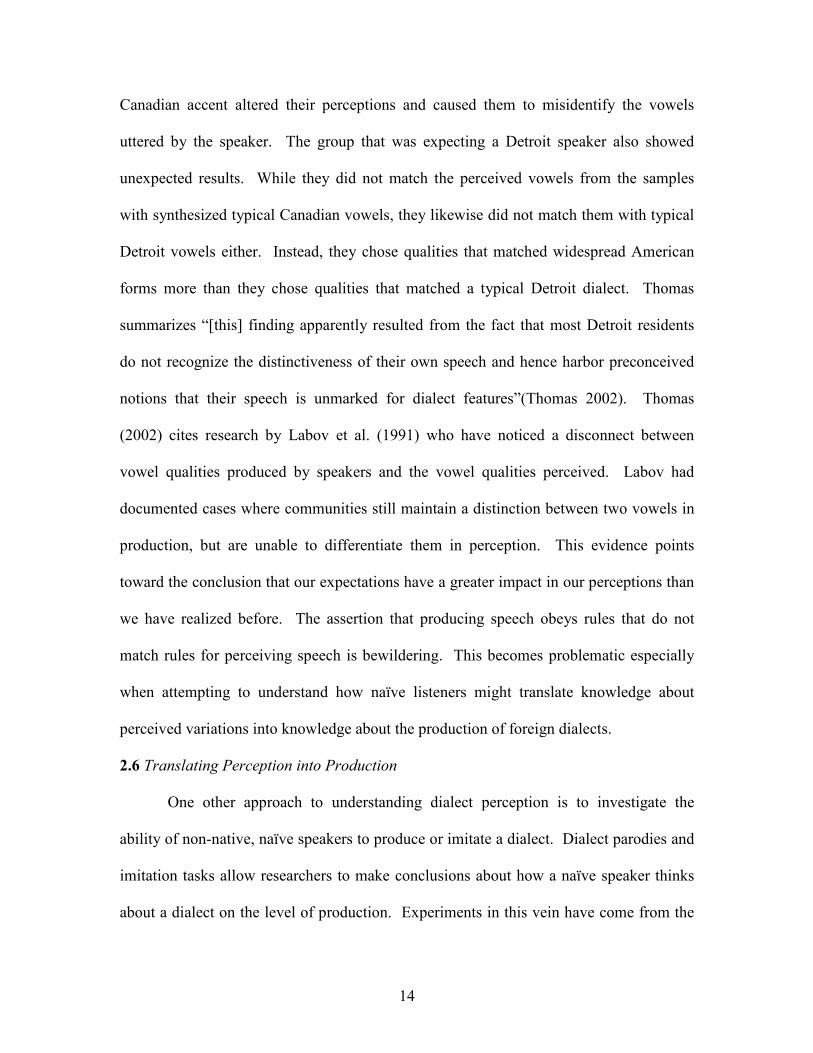
The group expecting to hear Canadian speech consistently matched the vowels
from the samples with raised segments like /aw/, typical of a Canadian dialect. Even
though they were presented with un-raised vowels in the stimuli, the expectation of a
14
Canadian accent altered their perceptions and caused them to misidentify the vowels
uttered by the speaker. The group that was expecting a Detroit speaker also showed
unexpected results. While they did not match the perceived vowels from the samples
with synthesized typical Canadian vowels, they likewise did not match them with typical
Detroit vowels either. Instead, they chose qualities that matched widespread American
forms more than they chose qualities that matched a typical Detroit dialect. Thomas
summarizes “[this] finding apparently resulted from the fact that most Detroit residents
do not recognize the distinctiveness of their own speech and hence harbor preconceived
notions that their speech is unmarked for dialect features”(Thomas 2002). Thomas
(2002) cites research by Labov et al. (1991) who have noticed a disconnect between
vowel qualities produced by speakers and the vowel qualities perceived. Labov had
documented cases where communities still maintain a distinction between two vowels in
production, but are unable to differentiate them in perception. This evidence points
toward the conclusion that our expectations have a greater impact in our perceptions than
we have realized before. The assertion that producing speech obeys rules that do not
match rules for perceiving speech is bewildering. This becomes problematic especially
when attempting to understand how naïve listeners might translate knowledge about
perceived variations into knowledge about the production of foreign dialects.
2.6 Translating Perception into Production
One other approach to understanding dialect perception is to investigate the
ability of non-native, naïve speakers to produce or imitate a dialect. Dialect parodies and
imitation tasks allow researchers to make conclusions about how a naïve speaker thinks
about a dialect on the level of production. Experiments in this vein have come from the

15
perspective of forensic linguistics with the intention of determining how well a non-
native speaker of a dialect may hide their identity though imitation. The results of these
experiments are easily transferable to the investigation of dialect perceptions.
Markham (1999) investigated ability of naïve dialect imitators to fool phonetically
trained listeners. The speakers were asked to perform imitations of certain dialects of
Swedish and the recordings were then presented to the trained listeners. The listeners
attempted to guess whether the speaker was imitating the dialect and if so to guess as to
the actual native dialect of the imitator. The results of the experiment demonstrated that
there is wide variation in the ability of naïve speakers to convincingly perform imitations
of dialects. Some speakers were able to deceive the listeners for one target dialect, but
failed for others. In addition, even though the listeners were trained phoneticians, they
mistakenly accepted some imitations that contained many errors by the imitator. Listeners
were more likely to judge the samples as imitations if the contained excessive use of
dialect markers rather than minor inconsistencies that would indicate more than one
dialectal influence. In other words, imitations that went over the top and over applied a
marker of the dialect were easily recognized as fake by the listeners. Markham
concluded that convincing imitations of a target dialect are possible though some
individuals were more successful than others and often were most successful (i.e. had a
talent) with one particular target dialect.
Another imitation experiment performed by Segerup (1999) focused more on the
attributes of the imitations in relation to the target dialect rather than on judgments of
their naturalness. Segerup did an acoustic analysis of the target dialect (West Swedish)
and identified characteristics that are robust in the dialect, and likely to be imitated by

16
naïve speakers. The elicited imitations were subjected to a similar acoustic analysis and
phonetic segments were quantitatively judged to belong to the target dialect, the native
dialect, or whether it did not belong to either. Like Markham, Segerup found that
imitators were able to produce approximate articulations for many phonetic features like
vowel quality, intonation pattern, and unique consonants. The acoustic analysis showed
that speakers were not able to completely shift to the target dialect and that measurable
traces of their native dialect were still present in many features. Segerup noted these
traces, which showed up in the acoustic analysis, were very difficult to hear by just
listening to the samples. Imitations judged as successful sounded much closer to the
target dialect than one would expect from the acoustic analysis. Segerup writes, “The
existing coloring [or acoustic traces] from the source dialect does not interfere with the
impression of successful imitation due to the native-like imitated features”(1999). This
was most apparent in vowel quality, as imitators were only able approach but not match
the formant frequencies of the target dialect, and what they actually produced fell
somewhere in the range between their native dialect and the target. Segerup concluded
that, for imitations of Swedish, vowel quality was the most important attribute for giving
the impression of a native speaker.
The results of these two experiments have clear implications for our knowledge of
dialect perception. In both cases imperfect imitations of a target dialect were able to
convince listeners that they were samples of native speech. It seems that the degree of
sensitivity listeners possess is rougher than expected. Remarkably, a native speaker of
the West Swedish dialect judged an imitation as native in Segerup’s experiment. The
acoustic analysis of the imitations shows that naïve imitators have correctly recognized

17
features of the target dialect and translated this into production in their imitations. While
their imitations are imperfect, as Segerup showed, likely these imitators have successfully
constructed mental representations about the articulation of features in a foreign dialect.
The imperfection may arise from difficulties in motor control, but further research is
needed to determine if this is the case or whether their perceptions of the target dialect are
imperfect.
2.7 IPS and New Directions
The results of all the experiments involved in IPS considered together show that
dialect perception involves many different multifaceted and imperfect processes. The
conclusions drawn from Integrated Perceptual Sociolinguistics research thus far implies
that dialect perception is an extremely complex behavior which depends upon many
factors which are difficult to isolate and test experimentally. IPS research remains a new
and relatively chaotic field, which, as the experimental techniques are perfected,
continues to pursue the nature of dialect perception.
3.0 An Original Experiment in IPS
3.1 The objective of a Pilot Experiment
A sound experiment in IPS, such as the examples reviewed above, exceeds the
resources of this paper; thus, the goal of my pilot study is to move towards an
experimental design that could lead to further conclusions and to gain further experience
in conducting linguistic studies. This section takes the form of an experimental journal or
lab notebook, which outlines the process of designing my experiment, the errors and
problems, and the revisions ultimately resulting in a design that will be useful on a larger
scale. I do not omit the parts of my experiment that fail and report only on my successes,

18
but instead I include all the steps taken in the experimental design and execution. The
final product of this process is not perfect in the sense that it will provide statistically
significant results, but the journey of modification and adjustment has its own inherent
educational value. I include all the materials involved in the experiments and notes about
the exact procedure with the goal that the reader will be able to replicate my experiment.
This endeavor may guide others interested in dialect perception research and I hope they
will gain from my experiences and mistakes to further develop the foundations of IPS.
3.2 Initial Experimental Designs
After reflecting on the IPS research reviewed above, I decided to perform an
experiment that would elicit results similar to the experiment done by Plichta & Preston
(2003) showing that degrees of monophthongization corresponding to different ratings of
Northern versus Southern Speech). My approach differed in that I planned to use an AxB
methodology similar to Niedzielski’s experiment (1999). This experiment would focus
on just the North South distinction since it is recognized as the most distinct. I planned to
individually test 2-3 distinct vowel features in northern and southern speech to determine
whether any particular feature was more salient in naïve listener’s classifications. With
this in mind I decided that single word speech stimuli would be most useful in isolating
the target feature in each case. The subjects would listen to the sample and be asked:
“Was the word uttered by someone from the North or the South?” This experiment
involved a forced classification, not allowing the listeners to choose and option in
between Northern or Southern speech. I predicted that listeners would show considerable
ability to distinguish between two dialects based on clear feature contrasts and that this
would strengthen the conclusion that people perceive dialectal differences and apply this
19
knowledge to formulate mental representations of dialects with respect to language
variation. I unfortunately had to abandon this experiment after learning that typically
AxB experiments require extensive acoustic leveling or manipulation of the sound
samples to make sure that listeners were relying solely on the target distinctive feature.
This would entail leveling the pitch, vowel duration, voice onset time, and other
parameters. The process would have been too complex for the short amount of time I had
to complete this experiment. It seams reasonable to expect that if this experiment was
conducted in the future that the results would agree with my predictions and support the
claims made by Plichta & Preston (2003) and Clopper & Pisoni (2004).
I then went about designing a series of mini of experiments that would get a
holistic picture of this naïve ability and would utilize spontaneous speech stimuli of a few
sentences in duration rather than single word. The rational behind this decision was that
people form their mental dialect representations from a variety of markers in the speech
and not just on from single features occurring in certain words. The experiment would
give listeners a speech sample containing many examples of the distinct markers of the
dialect. I had not yet decided what I wanted to elicit from my subjects after presenting
them with the speech stimuli, however I expected that my questionnaire would entail
several types of questions each with a separate purpose.
The speech samples I used come from two sources: the International Dialects of
English Archive (IDEA, 1997), which is intended as a resource for actors trying to learn a
dialect for a part in a play or film, and The Speech Accent Archive (2005), which is a
general database of speech samples reflecting different accents. The IDEA and Accent
Archive databases contain multiple examples of many dialects and have examples of

20
varying age, sex, and ethnicity. The samples provided by the IDEA are about 4 minutes
in length and contain a read passage as well as spontaneous speech, while the Accent
Archive is contains only 30 second segments of read speech from a passage. I selected
samples from the 3 major dialect regions of the United States as described by Labov et al.
(2001). They are: North East (or New England), South, and West/Midland. I took 4
samples from each region and edited them down to a portion of spontaneous speech of
about 2-3 sentences with a maximum length of 10 seconds. At the end I chose 12
samples with 4 examples each of the three major categories of American English, 9 of my
samples were from the IDEA database and 3 others were from the Speech Accent
Archive. Below is a map indicating the actual hometown of each speaker and the three
major dialects.
Figure 1
My next task was to find a way to use these samples to extract the information I
wanted in a series of mini-experiments. I had 3 goals, which I investigated in 3 separate
experiments. (1) Confirm that naïve listeners are able to recognize different dialects and
(2) correctly identify them as one of the 3 major dialects of American English. (3) Elicit
naïve descriptions of dialects and correlate them with attested dialect markers.

21
I intended to conduct a quasi map classification task in experiment (1) utilizing a
Free-classification framework. First, without presenting any speech samples, I gave the
subjects a map and asked them to mark it using colored pens into areas corresponding to
3 kinds of speech. This is restricts them to set number of dialects without putting the
categories of “northern, southern, and western” into their minds. I have found that people
are not always aware of a difference between western and northern speech and this
experiment was able to confirm that this was the case by comparison of the maps they
drew. In step (2) I asked them to listen to the speech samples and group each sample into
one of the 3 dialect groups. I predicted that this should be a fairly simple task and will
provide evidence that people are able to make consistent classifications of dialects within
these broad categories.
The goal of step 3 is to obtain a cogent set of naïve descriptions from the
participants and determine whether they correspond to attested markers of the dialect.
This was the most difficult phase of my pilot. If each individual subject gives unique
descriptions of dialects that are not easily grouped with descriptors from other subjects,
then making a convincing argument for a connection with attested dialect markers is
difficult. The second experiment requires significant modification and revision to elicit
the right level of detail and obtain their initial gut reaction. I did not want them to give
me lengthy descriptions of the dialect, but merely concise adjectives or phrases. In a
similar experiment, naïve descriptions of foreign languages were elicited from beginning
phonetics students1. The subjects did not speak any of the languages presented and,
therefore, were not distracted by semantic factors. I was concerned that English speakers
listening to English dialects will have difficulty describing familiar dialects. I was
1 David Harrison, Linguistics 044: Phonetics Fall, 2006

22
especially concerned that subjects will have difficulty describing Northern and Western
dialects because they would not be conscious of their dissimilarity as stated above. I
expected that these two would be closer to “Standard” American dialect in the minds of
the participants, and therefore their descriptions would be relatively bland.
After collecting the naïve descriptors I attempted sort them into groups that to
corresponded to one another and then made a conjecture as to what dialect marker they
might refer to. For example, southern speech in my initial trials is described as ‘twangy”,
“having a drawl’, or “rolling”. I predict that these descriptors are referring to the vowel
qualities in some way, possibly diphthongization or backing or some other parameter.
The final step would be to compile all the descriptors into a set and test my
hypotheses concerning the connection between naïve descriptors and actual dialect
markers. My attempts to design a way to test these predictions using naïve listeners has
been unsuccessful partially due to the difficulties I found with the descriptors themselves
and partially due to difficulties in experimental design. I had considered a final separate
experiment asking subjects to rate dialects according to each descriptor on a seven point
scale, but due to time constraints and experimental flaws I abandoned this final step.
However, if I had been able to successfully compile a set of naïve descriptors I would
expect that sample from the northern dialect would rate very low on ‘twangy’, but very
high on ‘unpronounced r’s’. These ratings, however, do not conclusively prove a
connection between the naïve descriptors and the attested dialect markers used by trained
dialectologists. This is a problem I am still pondering.
3.3 Procedure
Please Refer to the Questionnaire in Appendix A

23
I. Map Test
1. Explain that I am investigating dialects of American English and that I am
primarily interested in the nature of internal mental representations of dialects.
2. Present a blank map (which includes state lines) and the colored pens and ask
them think of the three main types of American speech and mark on the map where each
is spoken. I do NOT ask them to divide the map into 3 regions where people speak
differently. This allows the participant to have a single dialect spoken in multiple
regions. This, it turns out, had quite interesting results. My written directions on the
questionnaire were slightly vague, and I had to verbally instruct the subjects to include all
the territory in Continental United States into the 3 dialects they chose.
II. Sample Category Matching Test
1. While their map is still in front of them I presented the 12 samples one at a time
and after each I asked them to categorize it into one of their dialect regions by
announcing the color of the region associated with the sample. I recorded their response
on a separate sheet of paper, so that they would not see the number of samples to be
presented, nor would be influenced by their previous responses to even-out or level the
number of samples attributed to each group. This test was fairy simple and the
participants did not demonstrate difficulty with decision making.
2. While they read the instructions for the third part I compiled their responses into 3
groups according to color listing each sample under the corresponding color. For
example, according to their responses I might have samples 2, 4, 9, 7 listed under the
Green group and 1, 6, 11, 8 as the Red group and so on.
III. Descriptor Test

24
1. I play the samples from each group while they listen and write down their descriptors
at the same time. Initially I had asked them to wait to write down their descriptors until
after they had heard the samples played together, but they seemed to have greater
difficulty when this was the case, and that concurrent listening to the samples loosened
their imagination. I continued to play the samples as many times as required until they
felt they had adequately described the dialect before moving on to the next group.
Subjects showed a wide range in their responses with this test and there were several
participants that did not understand the kind of description I was asking for.
3.4 General Comments
In general, subjects felt as certain level of discomfort with only 3 categories of
English and expressed that 4 categories would have fit their mental representations better.
However, I think the addition of a category would alleviate the difficult decisions forced
upon the participants and would mask many of the implied results. Overall, subjects
found the tasks difficult but interesting and liked challenge presented by considering only
3 major categories of speech. After each trial the participants were always eager to
discuss their performance and asked to see the maps of other participants to compare with
their own. The following section lays out the results of each experiment individually and
discusses the methods of my analysis as well as the implications of the results.
4.0 Discussion of Experimental Results
4.1 The Map Test
The map test, itself, is not a new experiment in IPS, but when the test is combined
with the second category matching test, a new picture of dialect perception emerges from
the data which has not been shown by other research techniques. The free classification

25
map test has been done by others, most notably Clopper and Pisoni (2004) and Preston
(1986); however, my procedure and results are somewhat different from those described
above. Neither experiment limited participants to only 3 categories of English. Preston’s
procedure revealed the relationship between the degree of detail distinguishing speech
and proximity to the participant’s hometown. Clopper and Pisoni asked participants to
create regional categories based on speech samples, which demonstrated that while the
average number of dialects in peoples mind was 7, analysis of confusion matrices
indicated the 3 broad categories of West/Midland, South, and Northeast were the most
salient distinctions. My map drawing task is a hybrid of these two experiments with a
constraint on the number of dialect categories. I asked participants to create their dialect
categories based solely on their own internal representations without any exposure to
speech samples.
By constraining their choices I hoped to force deliberate choices in their maps and
to determine whether there were any common themes in the maps generated. The results
indicated that there were two common depictions of the 3 major dialects of American
English. I have created two sample maps that represent the overall picture portrayed in
each style and listed the percentage of participants that agree with each model.
Figure 2- Model 1 (55%) Model 2 (27 %)

26
These models show two competing conceptions of dialects in America, and
Model 1 confirms that people believe the West and the North East to be related dialects
as I predicted prior to carrying out the experiment. Model 2 shows a conceptualization
that is slightly closer to attested dialect boundaries for the general categories of South,
North East and West; however it is the minority and more participants want to group the
West together with the North East and show the Midland dialect as distinct. Had I
allowed the participants to break the country into 4 categories of English, I speculate that
the link between Western and North Eastern speech in the minds of participants would
not have been apparent. The restriction to 3 categories was therefore crucial to reveal this
relationship.
Furthermore, as you can see from the models above, participants showed very
little variation within the category of Southern Speech. In fact, 100% of the participants
listed the following states as southern: TX, AL, LA, MI, AR, GA, FL, TN, SC, KT, WV,
and VA. The only variations were concerning Okalahoma and Missouri, and were
identical everywhere else. States that were grouped as North East 100% of the time
were: ME, VT, NH, MA, CT, RI, NY, DE, and NJ. States that were in the Midland and
West alternated according to Model 1, Model 2, or some other model, but I did notice
certain groups of states in these categories that were always grouped together and never
separated. All the following states from the Midland were grouped together: MN, WI,
MI, IL, IN, KA, NA, IA, SD, and ND. The Western states were only consistently
grouped according to WA, OR, and CA, and all others were variable in the maps of
Model 1 and, thus, “fuzzy” in the minds of the participants.

27
Participants whose maps did not agree with Model 1 or Model 2 showed a few
intriguing properties. One participant had grouped the Western and Southern States
together extending all the way from Washington, through Texas to Maryland. The
Midland region went from the Dakotas south to Kansas and then east to Illinois and
Michigan. Another participant had a completely different and original interpretation of
the directions and grouped speech according to North, South, and Non-white Speech.
The map had a major dialect line dividing North and South running along Arizona, New
Mexico and then through Missouri and Kentucky. The Non-white speech dialect was
marked in urban areas in the South, as well as the Mid-Atlantic and Southern California.
The case of North, South, and Non-white categorization had interesting results in the
second phase of the experiment as I did not include any samples of Non-white speech,
leading to matching the samples with only 2 of the 3 categories.
4.2 Sample Category Matching Test
This test combined the results of the map drawing test with a category matching
task with speech samples presented to the subjects. While the first map drawing is a free
classification experiment with a constraint on the number of categories, the category
matching test becomes a forced choice experiment similar to the ones done by Clopper
and Pisoni (2004), but uses categories that were generated organically by the participant
before the samples are presented. I designed this experiment and planned out the
procedure before I really understood what is was testing, and only as the results of the
experiments were analyzed did I realize the significance of the results. The category
matching test, determines the degree to which naïve listeners are able to reliably match a
dialect with their internal conceptualizations of dialect regions. The test does not asses
28
the correctness of the dialect regions themselves, but determines only whether listeners
are able to associate a dialect with the correct region according to their internal
representation. Thus, a participant’s map may include the North East and the West
grouped together and category matching is considered successful if speech samples from
Los Angeles and Boston are grouped together under the schema designed by the
participant. This type of test has not been done before in IPS and may show very
interesting properties if expanded to a larger scale beyond this pilot experiment, yet
already the results seem to illustrate a new picture of dialect perception.
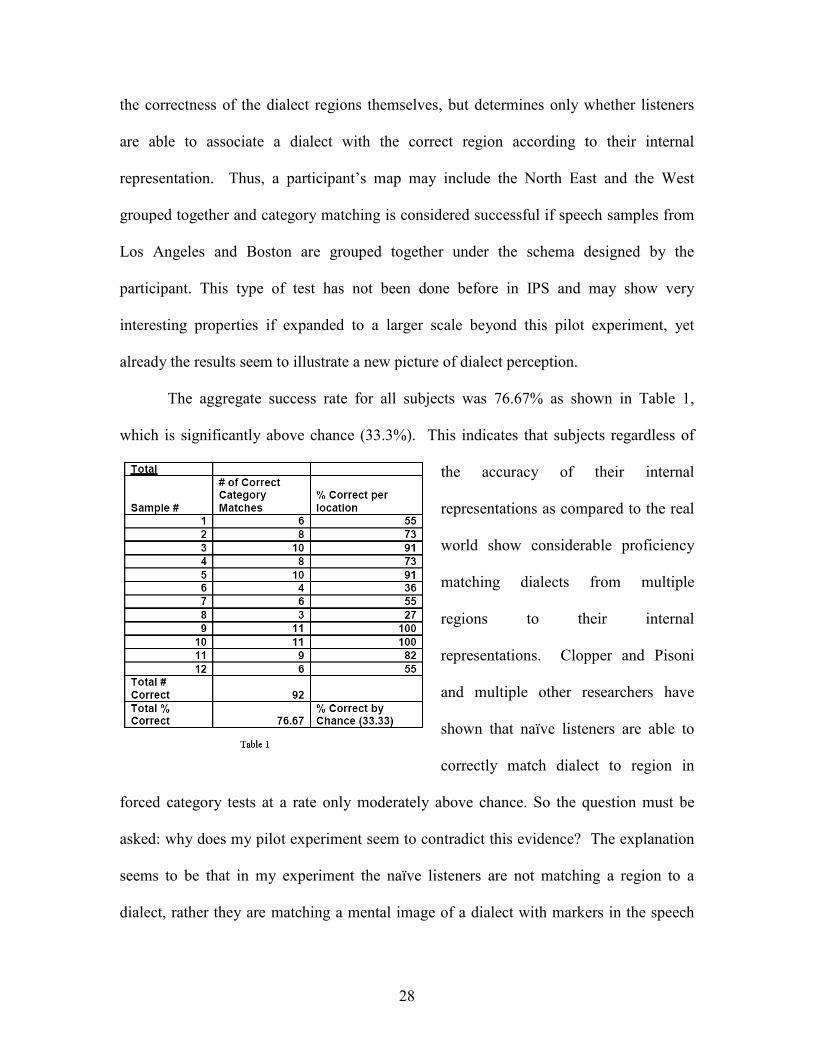
The aggregate success rate for all subjects was 76.67% as shown in Table 1,
which is significantly above chance (33.3%). This indicates that subjects regardless of
the accuracy of their internal
representations as compared to the real
world show considerable proficiency
matching dialects from multiple
regions to their internal
representations. Clopper and Pisoni
and multiple other researchers have
shown that naïve listeners are able to
correctly match dialect to region in
forced category tests at a rate only moderately above chance. So the question must be
asked: why does my pilot experiment seem to contradict this evidence? The explanation
seems to be that in my experiment the naïve listeners are not matching a region to a
dialect, rather they are matching a mental image of a dialect with markers in the speech
29
sample and ignoring region entirely. Part of the difficulty in matching a sample to region
for naïve listeners is tha,t in their minds, multiple regions may sound the same, and this
may explain the low results found in earlier category matching studies. I speculate that
naïve listeners in my experiment are using a different cognitive process to match the
samples.
To a participant who has a Map corresponding to Model 1 (equating the west with
the north east), a sample from Los Angeles may sound the same as a Connecticut accent.
If this is the case the participant recognizes it as a sample that belongs to the category of
North East and Western speakers without actually being aware whether the sample is
actually from, and achieves a successful matching of the sample to their mental
representation regardless of actual region. This process implies that listeners with
different mental representations will literally perceive samples differently provided that
success rates are approximately equal for all models (I will expand on this in a moment).
Therefore, to a subject with a Model 2 Map, the Los Angeles sample ought to be
perceived as identical to a Minnesota sample or an Ohio sample, which is not the case for
someone with a Model 1 Map.
While many more participants drew Model 1 over Model 2, it was still necessary
to compare the success rates of each group, though almost no conclusions can be drawn
from the comparison. Participants with Model 1 representations were on average
successful 77% of the time matching the sample to their category, while Model 2
participants had a success rate of 55%. Without having a larger testing pool it is nearly
impossible to tell whether this contrast would be perpetuated. A discrepancy in success
rates would imply that Model 2, as a collection of expectations about regional dialect

30
markers, did not coincide well with the actual perceived dialect markers, causing more
matching failures. This simply means that for less successful mental representations the
participants do not hear what they are expecting to hear. This opens up a whole new
avenue of research investigating which models, or mental representations, lead to the
highest success rate for matching samples to the category.
In terms of general statistics, Table 1 shows that Samples (6) and (8) were the
most problematic for listeners to correctly match and were successfully matched only
36% and 27% of the time respectively. Sample (6) was a New York Jewish accent,
surprisingly, while (8) was from Los Angeles and both were at or below chance success
rates. Samples (9) and (10) were successfully matched 100% of the time and were from
Texas and New Hampshire respectively. This was likely because these samples were
blatant examples and listeners had less trouble listening for cues. I made some
qualitative notes about how long it took people to match the sample to category and the
south was by far the fastest, as subjects blurted out their answer after only a couple of
seconds. The samples from the north and west were about equal in terms of difficulty. In
Table 2 the samples are organized into the attested dialect categories with the success rate
of each. It clearly indicates that southern speech was the easiest for the participants to
match to their mental representations while
samples from the west were most likely to be
confused. The range of successful matching
among individual participants went from a low at 41.33% up to the high at 91.33%. Both
indicate a success rate above chance. The overall indication is that naïve listeners are
significantly more proficient at matching dialect samples within their own conceptual

31
framework rather than trying to match samples with regions that are at odds with their
perceptions.
4.3 The Descriptor Test
The descriptor test ran into problems very early on with such a wide variety of
terms being used. Most participants could not resist the temptation to describe the speech
using a place name like “Boston-like” or “Southern”. I eliminated these descriptors as
well as all that referred to judgments of personality, like “proper”, “educated”, “honest”,
“emotional”, etc. Also, I realized halfway through that my usefulness of these naïve
descriptors for my intended purpose was reduced because of my experimental design. I
had planned to take the descriptors and conjecture as to what attested dialect marker they
might correspond, but my experimental design was not collecting descriptors of the
attested dialect markers, but instead descriptors of the markers that participants were
sensitive to in their own mental representations. I needed to revert to a design where
samples would be presented as a group representing the 3
attested dialects, according to sociolinguists, and not
according to the internal conceptual framework of each
participant. Essentially, since every participant had
different results in the category matching experiment, I
was getting descriptors of different dialects for each
subject. However, the descriptors that were given to me
were not particularly useful in their own right either. To
the left is table of all the unique descriptors I found and a
count of the number of appearances throughout the

32
experiment. It is clear that of the descriptors elicited, about 5 of them were used enough
times to be considered clear and salient descriptors to many speakers. The top five
descriptors in order were “enunciated”, “slow”, “long a’s”, “twangy”, and “drawl”.
These seemed like the best candidates for conjectures about what they might refer to.
However, the situation was complicated once again when I realized that descriptors were
being used multiple times by participants to describe different dialect categories. The
following table shows the top 5 descriptors and the number of occurrences where it was
used multiple times by single participants
describing multiple categories. Participants used
these descriptors sometimes to describe all 3 dialect
categories, thus rendering them virtually
meaningless to contrast features between dialect categories. In order to test which
descriptors are the most significant a much larger sample will be need and participants
must be restricted from using a descriptor more that once. In addition they should be
presented with a consistent set of samples that represent the attested dialect groups for,
rather than the groups of samples determined by their mental representations, especially
since no one was able to correctly match the samples within their framework 100%
accurately. Every participant was listening to samples that contained matching mistakes
and were not all representative of the major 3 dialects, West, North, and Southern. This
part of my experiment I determined to be a failure, though the descriptor terms were
interesting. I am hesitant to even make a conjecture about the significance of descriptors
like “twangy” and “drawl” because my data shows that these corresponded a few times to

33
non-southern categories and were attributed to both Midland and Western speech
samples.
5.0 Conclusions and The Future of IPS
The process of designing and carrying out this experiment has lead to many
surprising failures and results. The realization that my experimental design was yielding
results that were in stark contrast to the designs of Clopper and Pisoni (2004) forced me
to examine its methodology again, and I realized that it might be exposing aspects that
are much more significant than I had thought possible in my experiment. My experiment
was intended to culminate in the connection between naïve descriptors and dialect
markers, yet the real success was the realization that my category matching technique
may be pointing towards new and currently un-described behaviors.
This pilot experiment was only able to indicate that there is some unexplained
process behind the categorization of dialects, but created the possibility for numerous
variations to develop a deeper understanding of dialect perception. Were I to take this
type of experiment to the next level, I would recruit more subjects and investigate the
effect that increasing number of categories has on the map drawing as well as the success
rates of sample category matching. My hypothesis is that as the number of categories
increases that speakers will show a decrease in the success rate of matching samples to
categories. A wider variety of samples will need to be presented that fully demonstrate
all the variations of English. A second test could be to present the 2 most popular models
from the map experiment to naïve participants and then perform category matching tests
to determine whether a particular model of the mental representations results in a higher
success rate. A corollary to this would be to determine the most popular models for

34
dialects in the United States with differing constraints on the number of categories. I
speculate that Model 1 and Model 2 would be equally popular if the test was given to a
larger pool of subjects and with more diverse speech samples that both models would be
equally successful for category matching.
Within the larger context of IPS research, my experiment may be able to take a
new approach to understanding how people perceive language variation around them.
This study has proven to be something of a hybrid between free-classification and forced
choice structure that can explore the process of organizing external speech stimuli within
internal representations. Other researchers have been moving in this direction, but have
not yet synthesized studies eliciting the mental organization of dialects and testing that
system with real speech stimuli. The map drawing tasks from Preston (1986) and
geographic matching experiments from Clopper (2004) seem to be approaching the same
conclusions from different paths, but the combination of both techniques may have
revealed new information that was unattainable from either approach. The experimental
design clearly bears further exploration with input from both the fields of
psycholinguistics and cognitive science to maximize the information that may be drawn
out from the results.
The behaviors involved in dialect perception remain slippery and elusive to
researchers, yet with the improvement of experimental methods the field of IPS may
eventually have a set of concrete explanations and theories about the mental processes
behind dialect perception. The experiment outlined in this paper is yet another stepping
stone that I hope others may use on the path to understanding the cognitive processes
hidden within such a universal experience.

35
*Acknowledgments
I would like to thank my Faculty advisor David Harrison for all his guidance and
enthusiasm in my topic as well as for all his comments during the writing process. In
addition I thank my second faculty reader Donna Jo Napoli, my peer readers Nathaniel
Peters and Matt Singleton, and all my friends who showed such enthusiasm as
participants in my pilot study. I would also like to thank my parents for their assistance
as proof-readers and for their encouragement after reading my early drafts.
Appendix A: Sample Questionnaire with Responses
Colin Sullivan
Linguistics Thesis
Fall 2006
Pilot Experiment Questionnaire
Total Number of Subjects: 11
Subject Name: Joe Shmoe
I. The purpose of this study is to investigate the nature of internal mental
representations of American English dialects with respect to geography.
Please reflect on what you consider to be the 3 major dialects of English and
then indicate on the map, using the colored pens, where each dialect is
primarily spoken.

36
II. A series of short speech samples will be played. After listening to each
sample please announce to the experimenter which of the 3 major categories
of American English specified on the map above is the best fit for the sample.
You will hear the sample only once and you may indicate your choice by
referring the color corresponding to each dialect on the map.
II. Dialect Sample Matching (Recorded by the Experimenter, Not the Participant
Sample Grouping
1. Red Red Blue Green
1 3 4
2. Red 2 5 12
6 9
3. Blue 7 11
8
4. Green 10
5. Blue
6. Red
7. Red
8. Red
9. Blue
10. Red
11. Blue
12. Green
Notes/Comments:
•••• Green difficult to describe
•••• NE and West are together on the map
•••• Fast Reaction to samples listed as Blue (southern as indicated on the map)
•••• Expressed desire for 4 colored markers, instead of 3.

37
III. The experimenter will now play for you again all the samples you indicated
belong to each dialect. After listening to the group of samples from the
dialect please write down your impressions and descriptions of the qualities of
the speech. We are interested in only you initial gut feelings and reactions,
and we ask that you limit your responses to single word adjectives or short
descriptive phrases. You will perform this task for each dialect category.
Dialect 1 (Red)
•••• Hard /r/’s
•••• Enunciated
•••• Falling tone
•••• proper
Dialect 2 (Blue)
•••• Lolling
•••• Drawl
•••• Twangy
Dialect 3 (Green)
• Nasal
• Careful Pronunciation
• Slow
• Extended /a/’s
Bibliography
Clopper, C.G. (2004). Linguistic experience and the perceptual
classification of dialect variation. Doctoral dissertation, Indiana University,
Bloomington.
Clopper, C. G., & Pisoni, D. B. (2004). Some acoustic cues for the perceptual
categorization of American English regional dialects. Journal of Phonetics, 32,
111-1140.
Clopper, C. G., Conrey, B., Pisoni, D. B. (2005). The Effects of Talker Gender on Dialect
Categorization. Journal of Language and Social Psychology, 24, No. 2, 182-206.
Evans, B. G & Iverson, P. (2004). Vowel normalization for foreign accent: An
investigation of best exemplar locations in northern and southern British English
sentences. Journal of The Acoustical Society of America, 115, 352-361.
Hill, R. (2001). Production and Perception of authentic and feigned Spanish accent.
Journal of the Acoustical Society of America, 109, No. 5, 2475.

38
Krauss, Robert M. and Jennifer S. Pardo. To appear. Speaker perception and social
behavior: bridging social psychology and speech science. In Ed., Van Lange,
P.A.M., Bridging Social Psychology: Benefits of Transdisciplinary Approaches.
Mahwah, NJ: Lawrence Erlbaum Associates.
Labov, W., Ash, S., Boberg, C. (2001) Atlas of North American English. New York:
Mouton de Gruyter.
Labov, W., Karen, M., Miller, C. (1991). “Near Mergers and the Suspension of Phonemic
Contrast.” Language variation and change 3: 33-74.
Markham, D. (1997). Phonetic Imitation, Accent, and the Learner. Lund Univeristy
Press, Sweden.
Markham, D. (1999). Listeners and disguised voices: The imitation and perception of
dialectal accent. Forensic Linguistics, 6, 289-299.
Meier, Paul. The International Dialects of English Archive. University of Kansas,
Lawrence, Kansas 1997: http://web.ku.edu/idea
Niedzielski, N. (1999). The effect of social information on the perception of
sociolinguistic variables. Journal of the Acoustical Society of America, 19, No. 1,
62-85.
Plichta, B., & Preston, D. R. (2003) The /ay/s have it: Stereotype, perception, region.
Paper presented at New Ways of Analyzing Variation, 32, Philadelphia, PA.
October 9-12.
Preston, D. R., ed. (1999). Handbook of Perceptual Dialectology. J Benjamins:
Philadelphia.
Preston, D. R. (1989). Nonlinguists' views of areal linguistics. Topics in Sociolinguistics,
7, xviii, 141. Dordrecht & Providence: Fordence.
Preston, D.R (1986). Five visions of America. Language in Society, 15, 221-240.
Purnell, T., Isardi, W., & Baugh, J. (1999). Perceptual and phonetic experiments on
American English dialect identification. Journal of Language and Social
Psychology, 18, 10-30.
Segerup, M. (1999). Imitation of dialects: from South to West. Proceedings, FONETIK
99,121-124. Department of Linguistics, Goteborg University, Sweden.
Thomas, E. R. (2002). Sociophonetic applications of speech perception experiments.
American Speech, 77, No. 2, 115-147.

39
Traunmuller, H. (1998). Modulation and demodulation in production, perception, and
imitation of speech and bodily gestures. Proceedings, FONETIK 98, 40-43.
Department of Linguistics, Stockholm University.
Traunmüller, H. (2000) "Evidence for demodulation in speech perception" (Contribution
to a workshop on The Nature of Speech Percection and to ICSLP 2000).
Vaissiere, J., de Mareuil, P. B. (2004). Identifying a language or an accent: from
segments to prosody. Paper presented at the MIDL conference, Paris, November
29-30.
Van Bezooijen, R., & Gooskens, C. (1999) Identification of language varieties: The
contribution of different social levels. Journal of Language and Social
Psychology, 18, 31-48.
Weinberger, Steven. The Speech Accent Archive. George Mason University, Fairfax,
Virginia, 2005: http://accent.gmu.edu/