Embed Size (px)
Citation preview

The Effects of the 2010 Nobel Peace Prize
on Sino-Norwegian Trade Relations
An Empirical Study with the Gravity Model
Eric Blomfeldt Mathisrud
Master of Philosophy in Economics
Department of Economics
University of Oslo
May 2018

II

III
The Effects of the 2010 Nobel Peace Prize on
Sino-Norwegian Trade Relations
An Empirical Study with the Gravity Model
Eric Blomfeldt Mathisrud

IV
© Eric Blomfeldt Mathisrud
2018
The Effects of the 2010 Nobel Peace Prize on Sino-Norwegian Trade Relations
Eric Blomfeldt Mathisrud
http://www.duo.uio.no/
Publisher: Reprosentralen, University of Oslo

V
Summary
The aim of this thesis was to examine to what extent Norwegian export to China was affected by
the sanctions China imposed on Norway following the Nobel Peace Prize award to Chinese
dissident Liu Xiaobo in 2010. The thesis is divided into six chapters.
Chapter 1 is the introduction, which presents the research question and hypotheses and
asserts the importance of the topic of study.
Chapter 2 provides some background information. A short introduction is given to the
Nobel Peace Prize, which highlights its goal and the composition of the committee responsible for
selecting a candidate. China’s response to the 2010 Nobel Peace Prize is described, showing the
measures China imposed, which included a freeze in diplomatic relations and restrictions on the
import of Norwegian salmon. The chapter finishes by giving an account of the history of the
economic and political relationship between China and Norway after 1949 and shows that for most
of this time the two countries enjoyed very good relations.
Chapter 3 is devoted to theory and knowledge on economic sanctions. It starts by defining
what an economic sanction is, including what measures are counted as an economic sanction and
what the aims of economic sanctions are, as well as briefly presenting the current usage of
economic sanctions. Following is a discussion of whether or not economic sanctions actually work,
and if they do not, why countries are still using them. It is argued that economic sanctions which
are imposed rarely work, but that they might deter other countries from acting in way so that they
themselves will become a target of economic sanctions in the future. The thesis follows up on this
by examining some of the earlier literature that studied the effects of economic sanctions. Next,
China’s sanctions policy is analyzed, by investigating China’s attitude to and usage of economic
sanctions. It is shown in what situations China is employing economic sanctions and what kind of
sanctions China usually employ. Finally, ten cases of sanctions imposed by China are examined
in order to find their reason, aim, and magnitude.
Chapter 4 presents the model, data and methodology used to answer the research question.
The thesis bases its empirical method on the gravity model of international trade, and this chapter
begins by giving an overview of this model and its theoretical foundation. This is followed by a
presentation of the data used. The thesis uses data from CEPII, a French research center studying
the world economy and its development. The data section also shows the main export products

VI
from Norway to China before and after 2010. The chapter finishes with presenting the
methodology. The thesis considered three different regressions in order to analyze the effects of
the sanctions on Norwegian exports to China. The first is a simple OLS regression, the second is
a country-pair fixed effects regression, and the third is a country-pair, source-year, destination-
year fixed effects regression. The results were checked for robustness, including testing for yearly
effects for the whole period and testing with a control group. Additionally, the effects of the
sanctions on different Norwegian export products to China were analyzed to discover whether
some industries were hit more. Lastly, the effects of the sanctions on Norwegian import from China
was tested.
Chapter 5 shows the results. The sanctions are seen to have significantly affected
Norwegian export to China between 2011 and 2016, with the exports being 21 percent, or 5.5
billion USD, lower than they would have been without the sanctions. The robustness checks
support this conclusion. It was further found that fresh and chilled salmon was significantly
affected by the sanctions, with the results indicating that Norwegian export of fresh and chilled
salmon to China between 2011 and 2016 was 92 percent, or 3 billion USD, lower than it would
have been without the sanctions. This result is also supported by the robustness checks. No other
product or industry was found to be significantly affected by the sanctions. Norway’s import from
China between 2011 and 2016 was not found to be significantly affected. Next, some econometric
concerns are highlighted and it is discussed whether or not they could have affected the results.
Finally, the thesis discusses the main findings, based on the sanctions theory and analysis of
China’s sanctions policy presented earlier. It concludes that despite losing most of its market share
in China, the Norwegian salmon industry did not suffer noteworthy as a result of the sanctions,
however, Norwegian exporters lost opportunities to expand and grow in China. China’s aims were
to make Norway apologize for the Nobel Peace Prize award, declare it respects China’s political
system and promise it will not interfere in China’s internal affairs again, as well as to make Norway
pose as a warning to other countries. Based on the terms Norway had to agree to in December
2016 in order to normalize relations with China, China’s sanctions can be considered successful.
Chapter 6 concludes by presenting the main findings and the analysis in the discussion. It
finishes by offering some topics for future research.

VII
Acknowledgements
This thesis marks the end of my studies at the University of Oslo. First, I would like to thank my
supervisor, Professor Andreas Moxnes, for valuable guidance and inputs throughout the process.
Furthermore, I would like to thank Anita Blomfeldt, Nils Mathisrud and Stein Holden for
proofreading, valuable comments and support. Last but not least, I want to give special thanks to
Michaela Královičová for her constant support and guidance.
Any errors or inaccuracies are solely my responsibility.

VIII
Table of Contents
1 Introduction ................................................................................................................................1
2 Background ................................................................................................................................4
2.1 The Nobel Peace Prize ..........................................................................................................4
2.2 China’s Response to the 2010 Nobel Peace Prize .................................................................4
2.3 History of the Sino-Norwegian Economic and Political Relationship since 1949 ...............5
3 Current State of Research and Knowledge .............................................................................8
3.1 Sanctions Theory ...................................................................................................................8
3.2 Literature Review ................................................................................................................13
3.3 China’s Sanctions Policy .....................................................................................................14
4 The Model and Empirics .........................................................................................................19
4.1 The Gravity Model ..............................................................................................................19
4.2 Data .....................................................................................................................................21
4.3 Methodology .......................................................................................................................25
5 Empirical Findings...................................................................................................................31
5.1 Results and Robustness .......................................................................................................31
5.1.1 Effects on the Overall Norwegian Economy ................................................................31
5.1.2 Effects on Individual Industries or Products ................................................................35
5.1.3 Effects on China’s Export to Norway ..........................................................................42
5.1.4 Econometric Concerns..................................................................................................43
5.2 Discussion of Findings ........................................................................................................46
6 Conclusion ................................................................................................................................52
References .....................................................................................................................................54
IX
List of Figures
Figure 1: Sino-Norwegian Trade 2003-2016 ...................................................................................2
Figure 2: Sino-Norwegian Trade 2003-2016 ...................................................................................2
Figure 3: Sanctions Regimes in 2016 ..............................................................................................9
Figure 4: Norwegian Chemicals Export to China ..........................................................................35
Figure 5: Norwegian Machinery Export to China .........................................................................36
Figure 6: Norwegian Oil Export to China......................................................................................37
Figure 7: Norwegian Seafood Export to China..............................................................................38
Figure 8: Value of the Norwegian Krone ......................................................................................44
Figure 9: China’s Import of Fresh/Chilled Salmon .......................................................................47
Figure 10: Exports of Fresh/Chilled Salmon .................................................................................48
Figure 11: Norwegian Fresh/Chilled Salmon Export ....................................................................49
List of Tables Table 1: Norwegian Export Goods to China, 2003-2010 ..............................................................23
Table 2: Norwegian Export Goods to China, 2011-2016 ..............................................................24
Table 3: Descriptive Statistics of Main Variables .........................................................................25
Table 4: Effects of Sanctions on Norwegian Exports to China .....................................................31
Table 5: Effects of Sanctions on Norwegian Exports to China by Year .......................................33
Table 6: Effects of Sanctions on Norwegian Exports to China with Control Group .....................34
Table 7: Effects of Sanctions on Norwegian Goods Exports to China ..........................................39
Table 8: Effects of Sanctions on Norwegian Salmon Exports to China ........................................40
Table 9: Effects of Sanctions on Norwegian Salmon Exports to China by Year ..........................41
Table 10: Effects of Sanctions on Chinese Exports to Norway .....................................................42

1
1 Introduction On October 8, 2010, Liu Xiaobo was awarded the Nobel Peace Prize for “his long and non-violent
struggle for fundamental human rights in China.” (Nobel Media AB 2014a). China reacted with
anger at the prize and its endorsement by the Norwegian government, calling it a serious attack on
its internal affairs (BBC 2010). Following this, China froze political relations with Norway and
restricted trade in order to show its dissatisfaction. For a small country like Norway this can be
quite threatening and damaging. Consequently, there were many stories in the media of how
Norwegian exports to China was suffering from the sanctions. Particularly salmons export were
said to be hurt (Krekling and Kolstadbråten 2012; Milne 2013; Lewis 2011). However, there were
also reports saying that Norwegian exports did not suffer much from the sanctions (Baker and
Fermann 2016; Chen and Garcia 2016).
The aim of this thesis was to uncover to what extent Norwegian exports suffered as a result
of China’s sanctions. While there have been several studies looking at this previously (Sverdrup-
Thygeson 2016; Kolstad 2016; Chen and Garcia 2016), my thesis contributes to the existing
literature by offering a new approach and more comprehensive insight. This thesis is the first to
adopt the gravity model of international trade in order to examine this case, which I believe will
be better able to evaluate the effect of the sanctions than previous studies have done. To my
knowledge, it is also the first study to analyze the effects on Norwegian exports of salmon and
other products using econometric methods.1 Further, as the other research studies were published
before the sanctions were ended in December 2016, I believe this thesis will can give a better
evaluation of the effects of the sanctions due to having newer data available. By employing the
gravity model as a theoretical framework, I used STATA to test different regressions to see which
one can better explain the effects of the sanctions. The focus was on overall exports, as well as
exports from certain industries. This was combined with theory on economic sanctions. Based on
the stated research focus, the research question has been set as:
To what extent did the sanctions China imposed on Norway after the Nobel Peace Prize award in
2010 affect Norwegian exports to China?
1 Kolstad (2016) studied the effects on overall seafood export from Norway to China

2
The economic expansion of China during the last decades makes this research question particularly
relevant. China is now the world’s second largest economy and an important trading partner for
Norway. Thus, losing access to the Chinese market could be detrimental to the economic growth
of Norway. Even though it is likely that Norway would be able to compensate for the loss by
exporting more to other countries, the Chinese market can offer a huge protentional for growth,
which can be even more important for Norway in the future. Figure 1 and Figure 2 show the
importance of trade with China for Norway.
Source: Author’s own processing based on data from CEPII
From Figure 1 it can be seen that Norway in 2016 exported goods to China for around 3 billion
U.S. dollars (USD) and imported goods from China for almost 8 billion USD. Figure 2 shows that
in 2016 more than 3 percent of Norway’s exports went to China while more than 10 percent of
Norway’s imports were from China. As China’s economy keep growing at very high rates, and as
Norway is in the process of negotiating a free trade agreement with China, these figures can be
expected to increase further. Therefore, Sino-Norwegian trade relations is an important subject to
study. While Figure 1 shows that Norwegian exports to China increased after 2010, it is not

3
possible to directly observe what would have happened had China not imposed the sanctions. By
employing a fixed-effect approach in the regressions, my method should be better able to account
for this and see if Norwegian exports are lower than in the case without the sanctions.
In order to answer the research question, the following hypotheses were set:
Hypothesis 1: The sanctions imposed by China did not have a significant effect on overall
Norwegian exports to China.
Hypothesis 2: The sanctions imposed by China had a significantly negative effect on Norwegian
salmon exports to China.
Significantly in these hypotheses means statistically significant to at least the ten percent-level. It
was decided to look at the effects of the sanctions on overall Norwegian exports to China as this
gives an overview of the total effects of the sanctions. As most of the media reports focused on the
effects on salmon exports, it was also decided to consider salmon more thoroughly.
The thesis will start by providing some background information on the Nobel Peace Prize
and China’s reaction to the 2010 Nobel Peace Prize before presenting an overview of the history
of the Sino-Norwegian political and economic relationship since the founding of the People’s
Republic of China in 1949. Next, the theory on economic sanctions will be discussed, including
what economic sanctions are and whether or not they can be considered a useful foreign policy
tool. This will be followed by a brief review of the literature discussing the effect of economic
sanctions and an analysis of China’s sanctions policy. The practical part will include theoretical
background for the gravity model and description of the data. Then, the methodology will be
explained and the results will be presented. The thesis will finish with a discussion of the findings
and their implication for the Sino-Norwegian relationship and China’s sanctions policy before
offering a conclusion.

4
2 Background
2.1 The Nobel Peace Prize
The Nobel Peace Prize, along with the Nobel prizes in physics, chemistry, medicine and literature,
was created at the request of the will of Alfred Nobel, a Swedish inventor who had become very
rich from inventing the dynamite. The prize should be awarded to “the person who shall have done
the most or the best work for fraternity between nations, the abolition or reduction of standing
armies and for the holding and promotion of peace congresses.” (The Norwegian Nobel Institute
2018). The will requested that a committee of five people chosen by the Norwegian Parliament
would be responsible for selecting a worthy candidate. These people are supposed to have no
involvement in Norwegian politics. Thus, the Norwegian government is not a part of choosing
who will be awarded the prize. Since 1977, in order to make the prize less political, members of
the Norwegian government and parliament have not been allowed in the committee (Nobel Media
AB 2018a). However, the five committee members are still selected by the largest Norwegian
political parties, and there is a tradition that the Norwegian government endorses the winning
candidate of the prize. Candidates can be nominated by any qualified nominator, including
members of national governments and national assemblies of any sovereign state and university
professors in selected fields (Nobel Media AB 2018b).
2.2 China’s Response to the 2010 Nobel Peace Prize
In 2010, Liu Xiaobo was awarded the Nobel Peace Prize for his fight for human rights in China.
China, which had already threatened with consequences should Liu be awarded the prize,
expressed anger towards the award and the Norwegian government’s support of it, blaming
Norway for interfering in its internal affairs (BBC 2010). In China, Liu was regarded as a dissident
trying to undermine the position of the ruling Communist Party, and he had been sentenced to 11
years in jail for this in December 2009. As he was jailed, he was not allowed to attend the Nobel
Peace Prize ceremony in December 2010 (Rønneberg 2012). Following the Nobel Peace Prize
award, China canceled all planned political meetings with Norwegian officials, as well as the Free
Trade Agreement talks. Until the normalization of relations in December 2016, there was no

5
political contact between higher ranked officials of Norway and China. It was further reported that
it became more difficult for Norwegians to get visa for China (Sverdrup-Thygeson 2016).
Additionally, Norwegian exporters of salmon suddenly met new obstacles, including “stricter
testing and inspection procedures and longer customs-clearance time” (Chen and Garcia 2016, p.
32). Exporters from other countries did not face these problems. Norwegian companies in other
industries were also experiencing new difficulties in doing business in China. However, China did
never officially impose any economic sanctions against Norway (Rønneberg 2012). In 2011, the
Standing Committee on Finance and Economic Affairs of the Norwegian Parliament canceled their
trip to China as Chinese officials refused to meet them (Trøite 2011). Despite this, meetings
between lower ranked officials continued as normal (Rønneberg 2012). In order to normalize
relations, China wanted the Norwegian government to apologize for the Nobel Peace Prize award
to Liu Xiaobo. However, Norway maintained that the Nobel Committee is independent and that
the Norwegian government was not responsible for awarding the prize (Morison 2011).
2.3 History of the Sino-Norwegian Economic and Political Relationship since
1949
On October 1, 1949 Mao Zedong proclaimed the founding of the People’s Republic of China and
thus started a new chapter in Chinese history. The new China was to be a single-party state headed
by the Communist Party of China. The Party had roots in Marxism-Leninism, but was heavily
influenced by Mao Zedong Thought, which due to China’s mostly rural population focused more
on peasants than industry workers. Since the 1980s, due to its economic reforms and opening up
by Deng Xiaoping, China has experienced tremendous growth rates and is now the second largest
economy in the world, with the economic focus shifting from the countryside to the cities (Fairbank
and Goldman 2006).
During the Mao era (1949-1976), there were very limited relations between Norway and
China. While Norway recognized the People’s Republic of China as early as January 7, 1950,
which was earlier than most other Western countries, diplomatic relations were first established
on October 5, 1954, mostly due to tensions over the Korean War. Norway signed a cultural
agreement with China in 1963 and was the first Western country to do so. As relations between
China and the West thawed in the 1970s, the exchange of visits between Norway and China
6
increased, and developed into frequent high-level visits in the 1980s. Economic relations properly
started in 1980 with the signing of the Agreement on Economic, Industrial and Technological
Cooperation between Norway and China and the establishment of the Sino-Norwegian Mixed
Committee of Economy and Trade. Bilateral trade increased constantly from the middle 1980s.
Norway’s main imports from China were ships, textiles and garments, mechanical and electrical
products, shoes, suitcases and bags, while the main exports were crude oil, mechanical and
electrical products, fertilizers, building and mining machines, loading and unloading equipment,
and iron ore. Since 1985, Norway has provided China with government concessional loans to
finance projects such as telecommunications, urban construction and environmental protection
(Embassy of the People’s Republic of China in the Kingdom of Norway 2018).
Later, Norway and China signed agreements on cooperation in science and technology and
environmental protection, and established programs for cultural and educational exchanges. The
University of Oslo has long had exchange agreements with elite universities in China, such as
Peking University and Tsinghua University in Beijing and Fudan University in Shanghai
(University of Oslo 2018) and China established a Confucius Institute in Bergen in 2007 (Bergen
Konfutse Institutt 2018). These have contributed to making it easier for Norwegian students to
learn more about China. Fudan University established its own Nordic Centre in 1995 to foster
collaboration between Chinese and Nordic students and researchers (Nordic Centre 2018). Norway
has had formal human rights dialogue with China since 1997, parts of which were allowed to
continue after 2010 (Ministry of Foreign Affairs 2010).
Despite tensions after the Dalai Lama was awarded the Nobel Peace Prize in 1989, Sino-
Norwegian relations were robust during the 1990s and 2000s, with increasing trade and relations
(Sverdrup-Thygeson 2016). In January 2000, Norway and China reached an agreement causing
Norway to support China’s admittance into the World Trade Organization (WTO) (Embassy of
the People’s Republic of China in the Kingdom of Norway 2018). According to Norwegian
economist Øystein Dørum (2012), the economic boom in China after its 2001 admission into the
WTO significantly contributed to the Norwegian economic expansion in the same period,
particularly as a result of higher oil prices. In 2008, Norway became one of the first European
nations to start negotiating a free trade agreement with China, having eight rounds of talk before
Liu Xiaobo received the Nobel Peace Prize in October 2010 (MOFCOM 2018).

7
As mentioned, after Liu Xiaobo was awarded the Peace Prize, all political contact between
Norway and China at higher levels stopped, and the relationship was said to be “frozen”. When
the Dalai Lama visited Norway in 2014, the Norwegian government refused to meet him, despite
having done so on many earlier occasions, such as in 1989, 1994, 1996, 2000 and 2001 (Remen et
al. 2014). However, relations were not completely severed, as Norway supported the admission of
China as an observer in the Artic council in 2013 and was accepted as one of the founders of the
Asian Infrastructure Investment Bank in 2015 (Lohne 2016). In December 2016, Norway and
China finally normalized their relationship and reestablished diplomatic and political ties. They
also agreed to resume negotiations on the free trade agreement (Reuters 2016). In April 2017,
Norwegian Prime Minister Erna Solberg visited China, the first high-level Norwegian politician
to do so since the 2010 Nobel Peace Prize award (Regjeringen 2017). Despite relations being
normalized, there are still some areas where Norway is left out. In April 2018, a Norwegian
journalist, who had previously been the Norwegian newspaper Aftenposten’s correspondent in
China, was denied visa for China as a part of the delegation of Norway’s Minister for Science and
Higher Education (Glomnes 2018). Norway is still not included in the 72- and 144-hour visa-free
transit schemes, which allows passport holders from 53 countries (including most of Europe) to
stay 72 or 144 hours in selected Chinese cities without a visa if they are transiting to another
country. However, Norway is included in the list of 59 countries that can get 30-day visa-free stay
on the Chinese island of Hainan from May 1, 2018 (Travel China Guide 2018).

8
3 Current State of Research and Knowledge
3.1 Sanctions Theory
To properly discuss sanctions, it is first important to define what economic sanctions are. The
think-tank Council on Foreign Relations defines it as “the withdrawal of customary trade and
financial relations for foreign and security policy purposes. They may be comprehensive,
prohibiting commercial activity with regard to an entire country, […] or they may be targeted,
blocking transactions of and with particular businesses, groups, or individuals.” (Masters 2017).
The Collins English Dictionary (2012) defines economic sanctions as “any actions taken by one
nation or group of nations to harm the economy of another nation or group, often to force a political
change.” Economist Hossein Askari (2003, p. 77) uses a streamlined version of a generally
accepted definition by Daoudi and Dajani (1983), saying that “[e]conomic sanctions are coercive
measures imposed by one country, or coalition of countries, against another country, its
government or individual entities therein, to bring about a change in behavior or policies.” The
main point is that an economic sanction aims to force a change in policy or behavior in a foreign
country by harming its economic interests. As argued by Robert A. Pape (1997), economic
sanctions can work either directly, by the government submitting because it considers resisting is
not worth the price, or indirectly, by making the citizens demand that the government complies in
order to end the harmful sanctions. The magnitude of economic sanctions can be measured by the
target country’s loss of GNP over time.
There are several types of economic sanctions. The first is to impose a tariff on one or more
imported goods from the targeted country. A second option is to impose a quota, meaning to put
an upper limit to how much of a good can be imported from or exported to the targeted country.
More severe is to impose an embargo, which means that a country forbid trade between itself and
the targeted country in one or more goods. In some cases, a full embargo can be imposed,
completely shutting off trade between the two countries. Yet another type is non-tariff barriers.
They aim to restrict the import of certain goods from a targeted country, for example by claiming
there are health or licensing issues. Finally, a country can declare freezes and seizures of assets of
individuals or companies from the targeted country that are in the sanctioning country. Sanctions
can be imposed unilaterally, meaning that there is only one sanctioning country, or multilaterally,
9
meaning that there are more sanctioning countries. Multilateral sanctions will often have larger
effects due to many countries participating, but unilateral sanctions by large economies such as the
United States (US), the European Union (EU) or China can still be quite harmful for the targeted
country (Radcliffe 2016). In addition to economic sanctions, there are several other types of
sanctions that are used. These include revoking visas of diplomats, forbidding certain individuals
or groups of entering the country, military sanctions such as arms embargos or terminating military
assistance or training, and cultural sanctions like banning athletes or artists from international
events and competitions (Bossuyt 2012).
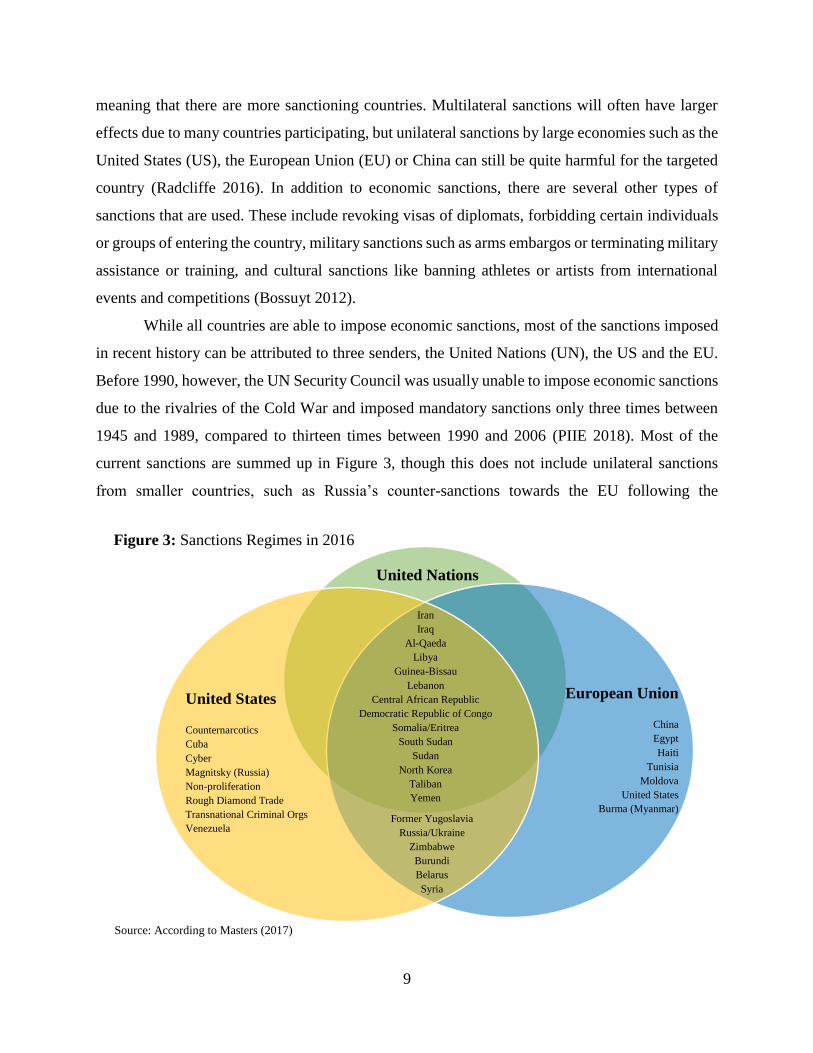
While all countries are able to impose economic sanctions, most of the sanctions imposed
in recent history can be attributed to three senders, the United Nations (UN), the US and the EU.
Before 1990, however, the UN Security Council was usually unable to impose economic sanctions
due to the rivalries of the Cold War and imposed mandatory sanctions only three times between
1945 and 1989, compared to thirteen times between 1990 and 2006 (PIIE 2018). Most of the
current sanctions are summed up in Figure 3, though this does not include unilateral sanctions
from smaller countries, such as Russia’s counter-sanctions towards the EU following the
United Nations
United States
Counternarcotics
Cuba
Cyber
Magnitsky (Russia)
Non-proliferation
Rough Diamond Trade
Transnational Criminal Orgs
Venezuela
Iran
Iraq
Al-Qaeda
Libya
Guinea-Bissau
Lebanon
Central African Republic
Democratic Republic of Congo
Somalia/Eritrea
South Sudan
Sudan
North Korea
Taliban
Yemen
Former Yugoslavia
Russia/Ukraine
Zimbabwe
Burundi
Belarus
Syria
European Union
China
Egypt
Haiti
Tunisia
Moldova
United States
Burma (Myanmar)
Figure 3: Sanctions Regimes in 2016
Source: According to Masters (2017)

10
annexation of Crimea (Herszenhorn 2017). As can be seen, most of the targets are autocratic or
dictatorial countries, often developing, as well as some failed states and non-state actors.
The central questions regarding economic sanctions are the following: Do economic
sanctions work? Why do countries impose economic sanctions? What can be considered one of
the most influential works in answering the first question is a study by Hufbauer, Schott and Elliot
(often abbreviated HSE) from 1990. They identified 115 cases of economic sanctions between
1914 and 1990, and found 40 of them to be successful, meaning that they achieved the desired
policy change in the targeted country, corresponding to a success rate of 34 percent. This, they
argued, was much higher than previously thought and was sufficiently high for economic sanctions
to be considered a useful alternative to military force or coercion. Morgan, Bapat and Kobayashi
(2014) found that, while using a restrictive definition of success, 51 percent of multilateral
sanctions and 31 percent of unilateral sanction were successful. They argue that this suggests that
sanctions backed by more countries are more effective, but they do not attempt to say whether
economic sanctions are preferred to military action. While HSE would likely consider this as a
fairly high success rate, others, such as Shin, Choi and Luo (2016, p. 486-487) argue that this
shows that “economic coercion is an ineffective foreign policy tool”. David A. Baldwin (1985, p.
372), on the other hand, even goes as far a claiming that imposing sanctions is a success in itself,
saying that “to make the target […] attempt pay a price for non-compliance is to be at least partially
successful.”
Several researchers have argued that economic sanctions are generally ineffective, among
them Robert A. Pape. He argues that the study by HSE is seriously flawed and he considers only
5 of HSE’s 40 successes to actually have been successful, with the rest mostly being settled by
force, not settled at all, or not being economic sanctions in the first place. He thus claims that
instead of having a 34 percent success rate, economic sanctions have a success rate of only 4
percent, making them a relatively useless tool in foreign policy (Pape 1997). It is also interesting
to note that Hufbauer et al. (the authors behind HSE) in their 2007 book found that only 13 out of
more than 200 cases of economic sanctions since 1914 achieved the goal of the sanctioning
countries, again suggesting a very low success rate. The more known examples of failed economic
sanctions include the decade-long UN sanctions against Iraq during the 1990s, and the US
sanctions against Cuba since 1960 (Hovi 2001, p. 509).
11
However, Hovi (2001) argues that the conclusion reached by Pape (1997) and by HSE
(1990) are flawed and that they only consider cases where economic sanctions were already
unlikely to succeed, which is after they are imposed. Pape claims that economic sanctions have to
fulfill three criteria on order to be considered successful. First, “the target state conceded to a
significant part of the coercer’s demands; [second,] economic sanctions were threatened or actually
applied before the target’s change of behavior; [and third,] no more-credible explanation exists for
the target’s change of behavior.” (Pape 1997, p. 97). Yet, Hovi (2001) argues that there are three
stages of economic sanctions: Before they are threatened; after they are threatened; and after they
are imposed. As such, he expands the second criteria made by Pape. Hovi further argues that
economic sanctions are more likely to succeed in the earlier stages, particularly before they are
even threatened. His argument is that before a country decides whether or not to perform an action,
it considers if it is likely or not that foreign countries will respond negatively, including with
economic sanctions. At this stage, it is possible that many countries reconsider their actions, and
do not perform actions that might lead to economic sanctions. If the country still performs the
action, it probably expects some form of threats of retaliation. However, when reaching this second
stage, the country is likely prepared for sanctions. Submitting to pressure from threats will make
the country’s government lose face both internationally and domestically, which can weaken its
position. Not all threats are made public, though, and those that are not might have a higher chance
of succeeding, as the government is not losing face by complying. One reason for submitting can
be that the target country underestimated the chances of getting economic sanctions against it or
the magnitude of the sanctions. If the target country’s government did not bow to threats and
sanctions are imposed, the government again risks losing face by complying. However, it is still
possible that the target country will comply, again because it underestimated the sanctions, or that
possible interest groups in the country that are affected by the sanctions are fighting for the
government to comply.
There have been suggested other reasons why economic sanctions are often not working.
One reason can be that the demands of the sanctioning country is very hard to meet, and that it is
costlier to comply than to allow the sanctions. Shin et al. (2016) state that target countries are likely
to comply only when the economic cost for not doing so is very high. Pape (1997), on the other
hand, claims that there is no support in the data showing that higher economic losses for the target
state increases the chance of compliance. Another argument is made by Kaempfer and Lowenberg

12
(1992, p. 21) who claim that “as long as both the demand for and the supply of internationally
trade goods is sufficiently elastic, little economic hardship will be induced in the target country by
sanctions.” As long as the target country can find other places to import from or export to, it is
unlikely that economic sanctions will bring much harm. This can often be the case with unilateral
sanctions. Furthermore, most sanctions target autocratic regimes, but economic sanctions are more
likely to harm the general populace than the ruling class. Since the general populace has little
influence on policy in these countries in the first place, it is unlikely that economic sanctions will
make the government comply. Next, it is not always easy to sustain economic sanctions for too
long. This is because in addition to the target country, the sanctioning country might also face
some costs, particularly industries that were already doing business in the target country. As such,
interest groups in the sanctioning country can use their influence to limit or cancel the sanctions
(Hovi 2001). Lastly, modern states are not as fragile as before, and the rise of nationalism makes
countries and their people more willing to endure economic hardship rather than give up their
national interests. Thus, economic sanctions can increase the governments legitimacy and make
them less likely to comply to foreign demand, the exact opposite of the intended effect (Pape
1997). As to when economic sanctions might succeed, Pape (1997, p. 109) argues this can happen
in “disputes involving minor issues that do not affect the target country’s territory, security, wealth,
or the regime’s domestic security”, or when the target country is heavily reliant on the sanctioning
country.
If economic sanctions are not successful, why are they still used? One reason is that
compared to other foreign policy tools, such as military force, economic sanctions are perceived
to be less costly for the sanctioning country. Amy Pond (2017) argues that few policy makers
expect economic sanctions to be effective, but that when facing human rights abuses in other
countries, citizens will demand that some action is taken. The government will thus impose
sanctions in order to appease the public, even if the sanctions will be mostly symbolic. However,
such sanctions can actually make life worse for people, as the general populace in the target state
is likely to be hit harder by the sanctions, and there is little chance that the government will do
anything to improve human rights. Pape (1998, p. 77) seems to agree with Pond, saying that
governments want to “rescue their own prestige or their state’s international reputation”. He even
claims that countries can use economic sanctions as a stepping stone in order to justify military
intervention, and that by giving peace a chance one will “disarm criticism of the use of force later.”

13
Hovi (2001) adds some more explanation, first claiming that some countries can overestimate the
effect of economic sanctions, hoping that they will be effective when in fact they will not, and thus
impose them even when they will likely fail. More common, however, is that countries despite
knowing that the sanctions will likely fail, will impose them in order to make the threat of future
sanctions more credible. If sanctions are not imposed just because they are deemed to be
ineffective, other countries will know that even if they do not submit to the threat of sanctions,
there is little chance that any sanctions will be imposed anyway. This seems to be supported by
Jonathan Masters (2017) of the think-tank Council on Foreign Relations, who claims that even
though the sanctions against Russia after the annexation of Crimea were unlikely to succeed,
inaction could have been worse, as it would show that there is little consequence of military
aggression.
3.2 Literature Review
There exists a substantial literature on the effects of economic sanctions. As already seen, the
question of whether or not economic sanctions are successful in forcing a policy change has been
discussed for a long time, with evidence suggesting that most imposed sanctions fail to achieve
the desired outcome. While most research on the impact of economic sanctions have focused on
the humanitarian effects, more researchers are now studying the economic impact of sanctions, for
example the effects of economic sanctions on trade or economic growth.
Neuenkirch and Neumeier (2015) assessed the economic impact of sanctions imposed by
the UN and the US. They found that UN sanctions on average decreased the target country’s per
capita GDP growth rate by more than 2 percentage points annually, and as they on average lasted
10 years, they led to a total decrease of 25.5 percent in the target country’s GDP per capita. On the
other hand, US sanctions on average decreased the target country’s GDP growth by 0.75-1
percentage point, and lasted on average 7 years, resulting in a total decrease of 13.4 percent of
GDP. Evenett (2002) estimated the effect of the Western sanctions imposed on the South African
Apartheid regime on their bilateral trade with South Africa and found that the US sanctions were
the most effective, reducing bilateral imports by a third. Hufbauer et al. (2007) produced similar
results, by using a large sample of economic sanctions and gravity models they found that
economic sanctions significantly reduced bilateral trade between the imposing country and the

14
target country. Haidar (2017) examined the effects of the sanctions imposed on Iran in 2008 and
found that two-thirds of non-oil exports were just redirected to non-sanctioning countries, which
even led to increased aggregate non-oil exports for Iran. However, Iranian exporters had to lower
the price of their products in order to compete and therefore suffered some economic losses. Lee
(2018) looked at the economic sanctions imposed on North Korea since the middle 1990s, and
found that the economic activity in the capital, trade hubs near China, and manufacturing cities in
North Korea increased. This was probably because China did not join in imposing the sanctions.
Lee further found that the sanctions were likely to mainly harm the already impoverished
countryside. Similar results were found by Shehabaldin and Laughlin (1999), who analyzed the
sanctions imposed on Iraq after the invasion of Kuwait, and by Afesorgbor and Mahadevan (2016).
In both papers they concluded that economic sanctions primarily harmed the poorer population
and thus increased income inequality in the target country.
Another approach was taken by Besedeš et al. (2017), who studied the effect of financial
sanctions on cross-border capital flows. They based their study on financial sanctions imposed by
Germany between 2005 and 2014, and found that financial flows fell in both directions. However,
sanctions imposed by only the EU, as opposed to those imposed by the UN, were not very effective
as the target country increased trade with other countries instead.
3.3 China’s Sanctions Policy
Like most large and powerful economies, China has imposed unilateral sanctions on other
countries. This is despite China officially being against economic sanctions and China has on
several occasions used its veto in the UN Security Council to block them. China is even more
vocally critical of unilateral sanctions, particularly those imposed by the US. In 2012 Chinese
Foreign Ministry Spokesperson Hong Lei said that “China is always against one country's
unilateral sanctions on another country”. However, James Reilly (2012, p. 121) argues that since
1949, “Chinese leaders have repeatedly politicized economic relations”. China’s use of sanctions
has increased during the last decade as its economic and political position has grown stronger.
China’s usage of sanctions is quite different from that of the US. While the US often
justifies its economic sanctions (both unilateral and multilateral) as upholding human rights and
nonproliferation, China justifies its sanctions as protecting its national interests. For China, this

15
usually means the issues of Tibet and Taiwan, as well as protecting against any danger towards
the Communist Party’s rule. In recent time, China’s maritime interests, particularly its claims in
the East and South China Seas, have been lifted up to become one of its core national interests
(Reilly 2012). Additionally, China rarely announces that it imposes sanctions on other countries,
which is in stark contrast to the habits of the US and the EU. Even though using economic sanctions
as a policy instrument is generally prohibited by the WTO, of which China is a member, the fact
that China does not announce its sanctions or formalize them through law makes it hard for other
countries to prove that China is employing sanctions. Thus, China reduces potential legal
challenges at the WTO (Chen and Garcia 2016).
Typical sanction types utilized by China include stalling imports at the border, thus making
them rot or go bad in the case of fresh food, freezing political and business meetings, stopping
investments or purchases, or encouraging consumer boycotts in China. In the words of Reilly
(2012, p. 123), China’s sanctions are “more bark than bite”, instead signaling that it will get worse
if the target country does not back down or apologize to China. Furthermore, China is still
dependent on many imports for its economic growth and imposing economic sanctions could thus
also hurt the Chinese economy. As high economic growth is important for the Communist Party’s
legitimacy, it is likely that the Chinese leadership wants to avoid such measures. In order to
understand China’s use of economic sanctions, the following paragraphs review some of the
sanctions China has imposed or threatened in the past.
Vietnam 1975-1978: During the 1970s China was worried about the improving relationship
between Vietnam and the Soviet Union, which after 1960 had been considered as China’s rival.
Additionally, China and Vietnam had disputing territorial claims in the South China Sea and China
was unhappy with how Chinese nationals were treated in Vietnam. Vietnam had long been a friend
and ally of China, and China had been providing aid to Vietnam for a long time. In order to get
Vietnam back under the Chinese sphere of influence, China used a wide range of economic
sanctions, such as suspending the preferential trade agreement, imposing quotas on exports and
imports and withdrawing aid. However, this was not enough to make Vietnam back down, possibly
due to the sensitivity of the disputed issues, as well as increasing nationalism in Vietnam (Path
2012).
France 1992: France planned to sell 60 Mirage fighter jets and 1,000 missiles to Taiwan in
1992. China reacted by closing the French consulate in Guangzhou and halting many planned

16
business deals, including a plan to buy six passenger planes from France-based Airbus (Los
Angeles Times 1992). While France did not back down and later completed the sale, this was the
last time any European country sold arms to Taiwan on a major scale (Reilly 2012). Interestingly,
China did not impose sanctions on the US, which the same year announced it would sell Taiwan
150 fighter jets, probably due to the US having more power to retaliate (Los Angeles Times 1992).
Japan 2005: In 2005 the Japanese Prime Minister Junichiro Koizumi visited the Yasukuni
Shrine in Tokyo, a shrine dedicated to fallen Japanese soldiers, including several Class-A war
criminals who were conducting criminal acts towards Chinese during the Second World War
(Reilly 2012). Furthermore, the same year Japan published a new history textbook for students that
whitewashed Japan’s wartime atrocities, such as the Nanjing Massacre where Japanese troops
massacred tens or hundreds of thousands of Chinese civilians in 1937. China reacted to this by
encouraging anti-Japanese demonstrations and boycotts of Japanese products (Watts 2005).
South China Sea 2007-2008: China started to threaten foreign oil companies which were
cooperating with Vietnam to extract oil in disputed areas in the South China Sea. In 2007 China
warned British Petroleum of economic consequences if they did not halt their work in the disputed
waters, which was based on a contract with the Vietnamese government. A similar warning was
given to American ExxonMobil in 2008. While British Petroleum withdrew in 2009, likely due to
Chinese pressure, ExxonMobil did not do so, and even signed additional contracts with Vietnam
in the disputed area (Fravel 2011).
France 2008: After pro-Tibet protesters disrupted the Olympic torch relay in Paris and
criticized China over Tibet and human rights in 2008, Chinese officials called for boycotts against
the French retail chain Carrefour. At the time, the boycotts were largely ineffective (Jacobs 2008).
However, when it was later announced that French President Nicolas Sarkozy would meet the
Dalai Lama, China reacted harsher. China postponed an EU-China summit which was to be held
in Paris and got it moved to Prague, froze a large order of 150 planes from Airbus and made two
Chinese trade delegations drop their travel plans to France. Chinese Premier Wen Jiaobao decided
to avoid France in his tour of Europe in 2009 (Reilly 2012). Even though Sarkozy did meet with
Dalai Lama in 2008, one year later he declared that France recognizes Tibet as a part of China,
thus starting to normalize relations (Blanchard 2009).
United States 2010: The US sold military equipment to Taiwan worth around $6.4 billion
in 2010, which prompted voiced opposition from China. Although China threatened to impose

17
economic sanctions on the US companies engaged in arms deliveries to Taiwan, no sanctions were
actually imposed (Reilly 2012).
Japan 2010: In a dispute involving the Diaoyu/Senkaku islands in 2010 Japan arrested a
Chinese fishing trawler captain that collided with a Japanese Coast Guard vessel. Subsequently,
China blocked all export of rare earth minerals to Japan, minerals that are crucial in the production
of many hi-tech products. As China controlled 93 percent of rare earth mineral deposits, it was
difficult for Japan to find replacements (Bradsher 2010). While Japan quickly released the captain
after China halted the exports, it took close to two months before China resumed exports. However,
Japan made no concessions over the territorial claims (Reilly 2012).
The Philippines 2012: Another territorial dispute flared up between China and the
Philippines in 2012 during a standoff between a Philippine warship and Chinese fishing vessels
near the Scarborough Shoal in the South China Sea, an area claimed by both countries. China
reacted by halting banana imports from the Philippines, claiming the restrictions were due to health
reasons. This was very damaging for the Philippines, which sees bananas as one of its most
important export goods and China as its biggest export market (Higgins 2012). Additionally, many
Chinese travel agencies cancelled their trips to the Philippines, whose tourist industry heavily
relies on Chinese tourists (Reilly 2012). In the end, the Philippines withdrew its ships, saying it
was due to stormy weather. The Chinese ships remained (Mullen 2013).
South Korea 2016-2017: South Korea’s decision to deploy THAAD, a US anti-missile
system, on its territory in 2016 greatly angered China. While South Korea argued it was a defensive
measure against an increasingly aggressive North Korea, China was worried that the system’s
radar could penetrate into Chinese territory, allowing the US to use it to spy on China. Even though
China did not formally impose economic sanctions, business dealing of many South Korean
companies in China suffered, including Hyundai, Kia and Lotte, who all experienced their sales in
China plummet to the ground. Furthermore, China banned tour groups from traveling to South
Korea (Mullen 2017). South Korean soap operas were removed from Chinese TV screens and K-
pop stars were unofficially unwelcomed in China (Kim and Blanchard 2017). However, South
Korea’s important electronics industry was not targeted, possibly due to this harming China as
well (Mullen 2017). After one year, South Korean President Moon Jae-in was forced to give in,
thus accepting military constraints and restrictions on future deals with the US and Japan
(Volodzko 2017).

18
North Korea 2017: While the US and other Western countries have been imposing
economic sanctions on North Korea for a long time, China long refused to join, fearing it could
lead to a collapse of the North Korean government, an ally of China. As the North Korean nuclear
weapons program intensified, in 2017 China joined the UN Security Council in imposing new
sanctions, including bans on exports of iron, coal, lead, seafood and textiles from North Korea.
Thus, China’s export to North Korea fell with 16 percent and its imports from North Korea fell by
over 60 percent (Bloomberg News 2017). While North Korea in 2018 agreed to end its nuclear
weapons program, it is unclear to what extent China’s economic sanctions contributed to this. It is
further uncertainty around whether or not North Korea will deliver (Ripley and McKirdy 2018).
Looking at all these sanctions imposed by China, it seems clear that they were imposed as
a result of what China perceived as a threat to its national security, not because China wanted to
force regime change or human rights improvements in foreign countries, as is usually the case with
Western economic sanctions. Even the case of North Korea can be attributed to national security,
as China was getting increasingly worried about its nuclear weapons program. On the other hand,
China refused to upgrade existing sanctions against Iran, as well as North Korea prior to 2017,
claiming them to be ineffective. Additionally, it seems that China rarely goes for extensive
economic sanctions in many areas, instead preferring to use targeted sanctions to force the target
country to comply. Targeted sanctions reduce the chance that China will hurt its own economy.
Tong Zhao (2010) argues that China’s own experience shows that comprehensive and intensive
sanctions are usually not effective, while sanctions targeting specific industries, companies or
products have a higher chance of producing a desired result. Most of China’s unilateral sanctions
were imposed on countries where the political leaders were planning to meet the Dalai Lama.
Fuchs and Klann (2013) found what they called the “Dalai Lama Effect”, saying that meetings
between heads-of-state or government members and the Dalai Lama result in an average fall of
exports from the receiving country to China by 16.9 percent. However, this was not the case if the
Dalai Lama only met with lower ranked officials. Furthermore, it was only after Hu Jintao
succeeded as president in 2002 that there was any significant effect, suggesting that China is
getting less tolerant of the Dalai Lama as it has gotten stronger economically. There is little
evidence to suggest that current president Xi Jinping is more tolerant regarding the Dalai Lama
issue, and as the examples of South Korea and North Korea show, Xi is also using economic
sanctions as a tool in his foreign policy.
19
4 The Model and Empirics
4.1 The Gravity Model
This thesis uses the gravity model of international trade in order to analyze the effects of the
sanctions on Norwegian exports to China. The gravity model is useful for assessing bilateral trade
relations as it allows analyzing trade data at the aggregate level, as well as at the industry level. At
the basic level, the gravity model states that the larger an economy is the more it will trade,
meaning that trade between two large economies will generally be larger than between two smaller
economies or between a large and a small economy. This relationship was originally discovered
by Jan Tinbergen in 1962, who proposed a model based on Newton’s universal law of gravitation.
Just as Newton’s law states that the force of gravity between two objects increases with their mass
and decreases with the distance between them, Tinbergen argues that economies trade more with
each other the larger they are, and trade less the further away from each other they are. The gravity
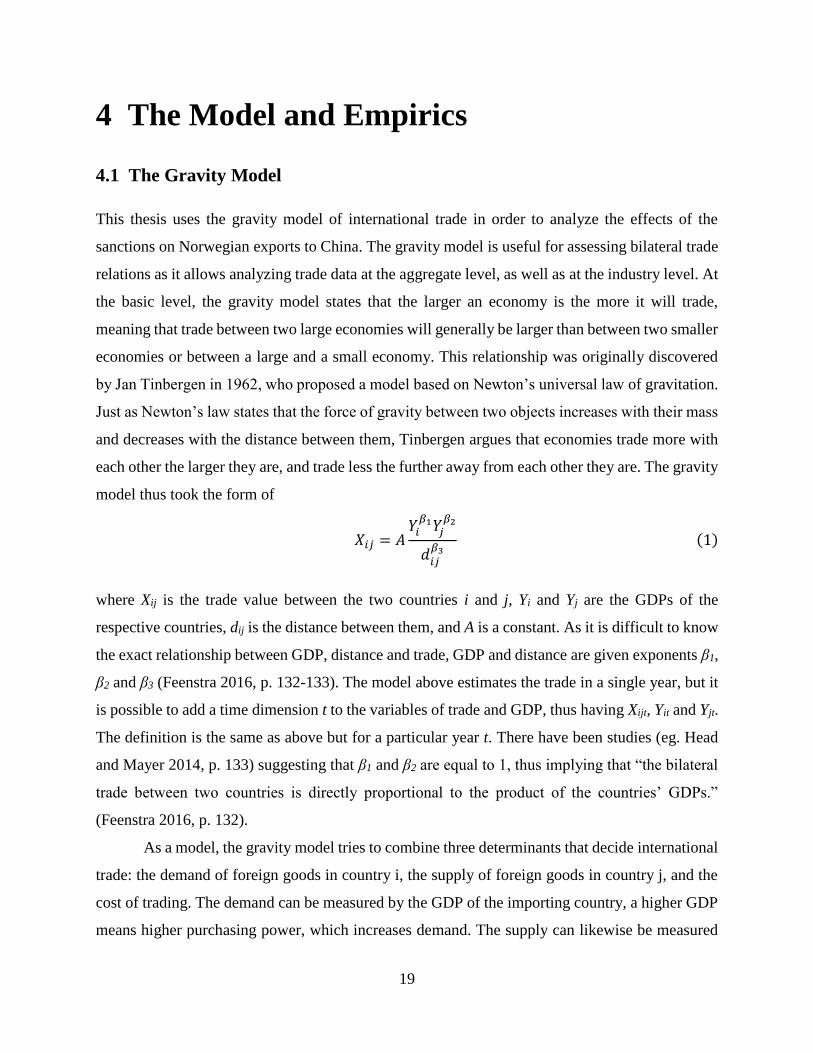
model thus took the form of
𝑋𝑖𝑗 = 𝐴𝑌𝑖
𝛽1𝑌𝑗𝛽2
𝑑𝑖𝑗𝛽3
(1)
where Xij is the trade value between the two countries i and j, Yi and Yj are the GDPs of the
respective countries, dij is the distance between them, and A is a constant. As it is difficult to know
the exact relationship between GDP, distance and trade, GDP and distance are given exponents β1,
β2 and β3 (Feenstra 2016, p. 132-133). The model above estimates the trade in a single year, but it
is possible to add a time dimension t to the variables of trade and GDP, thus having Xijt, Yit and Yjt.
The definition is the same as above but for a particular year t. There have been studies (eg. Head
and Mayer 2014, p. 133) suggesting that β1 and β2 are equal to 1, thus implying that “the bilateral
trade between two countries is directly proportional to the product of the countries’ GDPs.”
(Feenstra 2016, p. 132).
As a model, the gravity model tries to combine three determinants that decide international
trade: the demand of foreign goods in country i, the supply of foreign goods in country j, and the
cost of trading. The demand can be measured by the GDP of the importing country, a higher GDP
means higher purchasing power, which increases demand. The supply can likewise be measured

20
by the GDP of the exporting country, a higher GDP means more output and thus more goods and
services to sell, which increases supply. Lastly, the distance can be used as a measurement for
trade costs, which can be divided into shipping costs and transaction costs. The further away the
countries are, generally the higher these costs will be. Shipments between countries that are
geographically close take shorter time than between countries which are further away from each
other. Further, geographical proximity often means more familiarity with the other country’s laws,
institutions and language, in addition to close countries having more similar tastes. All this implies
that countries will trade more with other countries that are geographically close, and less with those
further away (Winters and Wang 1994). However, it should be noted that distance is much less
costly today than it was when the gravity model was first introduced, but it is still believed to be
an important factor.
A long-time criticism towards the gravity model was that is lacked a proper theoretical
foundation. Leamer and Levinsohn (1995, p. 1387) criticized it saying that it “lack[s] a theoretical
underpinning so that once the facts are out, it is not clear what to make of them.” On the other
hand, Deardorff (1998) criticized that there are too many theories behind it, and that it cannot be
used to distinguish between different theories, as the Heckscher-Ohlin model, increasing returns
to scale, Ricardian models and more all can be used to derive the gravity model. However, Taplin
(1967, p. 442) recognized the empirical strength of the model, arguing it was able to “identify
extreme cases of artificial barriers to trade, the role of distance and the effects of membership in
various customs union and trade preference groups”. van Bergeijk and Brakman (2010, p. 1)
claimed that while the model might be simple, it has been very successful from an empirical point
of view. The gravity model helped fix the “missing trade” problem of the Heckscher-Ohlin model,
which due to not taking distance into account predicted a much higher trade than was actually
observed (Head and Mayer 2014, p. 135).
During the last decades there have been several attempts at providing a theoretical
foundation. To begin with, there are some underlying assumptions. The first is that the importing
country will spend a share of it’s expenditure on goods from a given exporting country, and that
this share depends on the exporting country’s capability to export to a given destination. The
second is that there will be market-clearing for the exporting country (Head and Mayer 2014, p.
139). Feenstra (2016) starts with a monopolistic competition model. Then, all firms are producing
slightly differentiated products and countries will be exporting these varieties of differentiated

21
products to another. Assuming that it is costless to change the variety a firm is producing, all firms
will produce different varieties in order to maximize profits. Thus, all firms and countries will
completely specialize in a unique set of products. Additionally, each country’s population has
similar preferences. The consequence is that expenditure on each good, including foreign goods,
is proportional to the consumers’ income, and since consumers are assumed to be equal, the
expenditure on each good is also proportional to a country’s GDP. When considering that distance
between countries increases trade costs, consumers will demand less of a good that is from a
country further away, meaning lower imports. This is exactly as the gravity model above predicts.
4.2 Data
The data used in this thesis is collected from Centre d'Etudes Prospectives et d'Informations
Internationales (CEPII), a French research center producing studies, research, databases and
analyses on the world economy and its evolution. It has gained recognition as a trustworthy source
of international economics data and is part of the network coordinated by the Economic Policy
Planning, an institution attached to the French Prime Minister. CEPII’s work is aimed at “private
and public decision-makers, international institutions, economists, civil society, and the media”
(CEPII 2018a). In this thesis two of CEPII’s datasets are used; the BACI dataset, which includes
data on bilateral trade flows, and the Gravity dataset, which includes data useful for gravity model
estimates.
The BACI dataset gives accurate bilateral trade figures down to the product level. The
original data is provided by the United Nations Statistical Division’s COMTRADE database.
BACI is then “constructed using an original procedure that reconciles the declarations of the
exporter and the importer.” (CEPII 2018b). Because import values are reported using
INCOTERMS 2010 rule CIF – Cost, Insurance & Freight, and export values are reported using
INCOTERMS 2010 rule FOB – Free on Board, the CIF costs are estimated and subtracted from
the reported import values in order to calculate the FOB import values. As there can be differences
in countries’ reliability of reporting, the countries’ reliability is measured by how far their reports
are from the computed FOB import values. The reliability of a country is then used as a weight in
the reconciliation of bilateral trade flows that are reported in each end. “This harmonization
procedure enables to extend considerably the number of countries for which trade data are

22
available, as compared to the original dataset” (CEPII 2018b). Using the HS 6-digit product
disaggregation, BACI provides bilateral values and quantities of exports for more than 200
countries. Value of trade is reported in thousands of USD and quantity is reported in tons. For each
observation, or trade flow, the year, exporter, importer, value, quantity and HS6 product code are
reported. BACI has data on trade flows from 1995 to 2016, however, for the purpose of this thesis
it was decided to only use the data from 2003 to 2016. The BACI dataset from 2003 to 2016 has
more than 100,000,000 observations, of which 16,554 observations are trade flows from Norway
to China. When collapsing the dataset to get total export from one country to another for a given
year the dataset has 360,533 observations, of which 14 observations are trade flows from Norway
to China (CEPII 2018b).
The Gravity dataset includes the most important variables for calculations using the gravity
model, such as GDP, population and distance. The values for GDP and population are mainly
collected from the World Bank Development Indicators (CEPII 2018c). To calculate the distance
between two countries, each country is given a specific coordinate decided by the population
distribution in the respective country. By taking the biggest cities in a country and finding the
central point between them, while weighing the size of the cities, one coordinate that reflects its
economic activity can be given to each country. One can for example imagine that the coordinate
for Norway would be quite far south in the country, where most of the economic activity is
concentrated, as opposed to the geographical center which is much farther north. For each country-
pair, the distance between them is the distance between these coordinates (Mayer and Zignago
2011). The Gravity dataset includes data from 1948 to 2015. The Gravity dataset from 2003 to
2015 has 634,060 observations, of which 13 observations are trade flows from Norway to China
(CEPII 2018c).
The statistical software STATA was used for conducting analyses and computing
regressions. STATA is commonly used in economics and was chosen for this thesis due to its
availability and user-friendliness.
As the Gravity dataset did not include data on trade flows, in order to calculate the gravity
model, it had to be merged with the BACI dataset. All intra-country trade was dropped from the
Gravity dataset, as it does not match the data in the BACI dataset and is not relevant to the
calculation of the gravity model. Additionally, the years 1948-2002 were dropped from the Gravity
dataset and the year 2016 was dropped from the BACI dataset. However, the Gravity dataset has

23
many more country-pairs than the BACI dataset, due to including country-pairs that do not trade
or trade very little, for example Western Sahara and Christmas Island. After merging, the trade
flows for these country-pairs were considered missing, however, this is not a problem for the
regression, as these trade flows are not significant.
From the data available, there are some interesting findings. The most important
Norwegian exports to China before 2010, based on the value of the exports, can be seen in Table
1. Here HS4 codes are used instead of HS6 codes, as the HS4 codes are broader and thus able to
give a clearer picture of the trade flows.
Table 1: Norwegian Export Goods to China, 2003-20102
HS4
code
Share of trade
(%)
Description
1 2709 9.89 Petroleum oil and oils obtained from bituminous minerals; crude
2 0303 9.01 Fish; frozen (excluding fish fillets)
3 7502 7.51 Nickel; unwrought
4 2924 6.46 Carboxamide-function compounds; amide-function compounds of
carbonic acid
5 3105 5.62 Fertilizers; mineral or chemical, containing 2 or 3 of the elements
nitrogen, phosphorus, potassium; other fertilizers; goods of chapter
31 in tablets or packages of gross weight not exceeding 10kg
6 8413 3.44 Pumps; for liquids, whether or not fitted with measuring device,
liquid elevators
7 8430 3.44 Moving, grading, levelling, scraping, excavating, tamping,
compacting, extracting or boring machinery, for earth, minerals, or
ores; pile drivers and extractors; snow ploughs and snow blowers
8 2516 3.13 Granite, porphyry, basalt, sandstone, other monumental and building
stone, whether or not roughly trimmed, cut, by sawing etc, into
blocks or slabs of a rectangular (including square) shape
9 8479 2.93 Machinery and mechanical appliances; having individual functions
10 8431 2.54 Machinery parts; used solely or principally with the machinery of
heading no. 8425 to 8430
2 Using the BACI dataset for 2003-2010

24
In a similar way, the most important Norwegian exports to China from 2011 can be found. This is
shown in Table 2:
Table 2: Norwegian Export Goods to China, 2011-20163
HS4
code
Share of trade
(%)
Description
1 2924 13.14 Carboxamide-function compounds; amide-function compounds
of carbonic acid
2 0303 10.03 Fish; frozen (excluding fish fillets)
3 7502 6.92 Nickel; unwrought
4 3105 6.18 Fertilizers; mineral or chemical, containing 2 or 3 of the elements
nitrogen, phosphorus, potassium; other fertilizers; goods of
chapter 31 in tablets or packages of gross weight not exceeding
10kg
5 2709 2.99 Petroleum oil and oils obtained from bituminous minerals; crude
6 9032 2.94 Regulating or controlling instruments and apparatus; automatic
type
7 2707 2.72 Oils and other products of the distillation of high temperature
coal tar; similar products in which the weight of the aromatic
constituents exceeds that of the non-aromatic constituents
8 8431 2.58 Machinery parts; used solely or principally with the machinery of
heading no. 8425 to 8430
9 8479 2.38 Machinery and mechanical appliances; having individual
functions
10 2516 2.35 Granite, porphyry, basalt, sandstone, other monumental and
building stone, whether or not roughly trimmed, cut, by sawing
etc, into blocks or slabs of a rectangular (including square) shape
While there are some small changes, the tables show that there was little difference in what Norway
was exporting to China before and after the Nobel Peace Prize was awarded in 2010.
3 Using the BACI dataset for 2011-2016
25
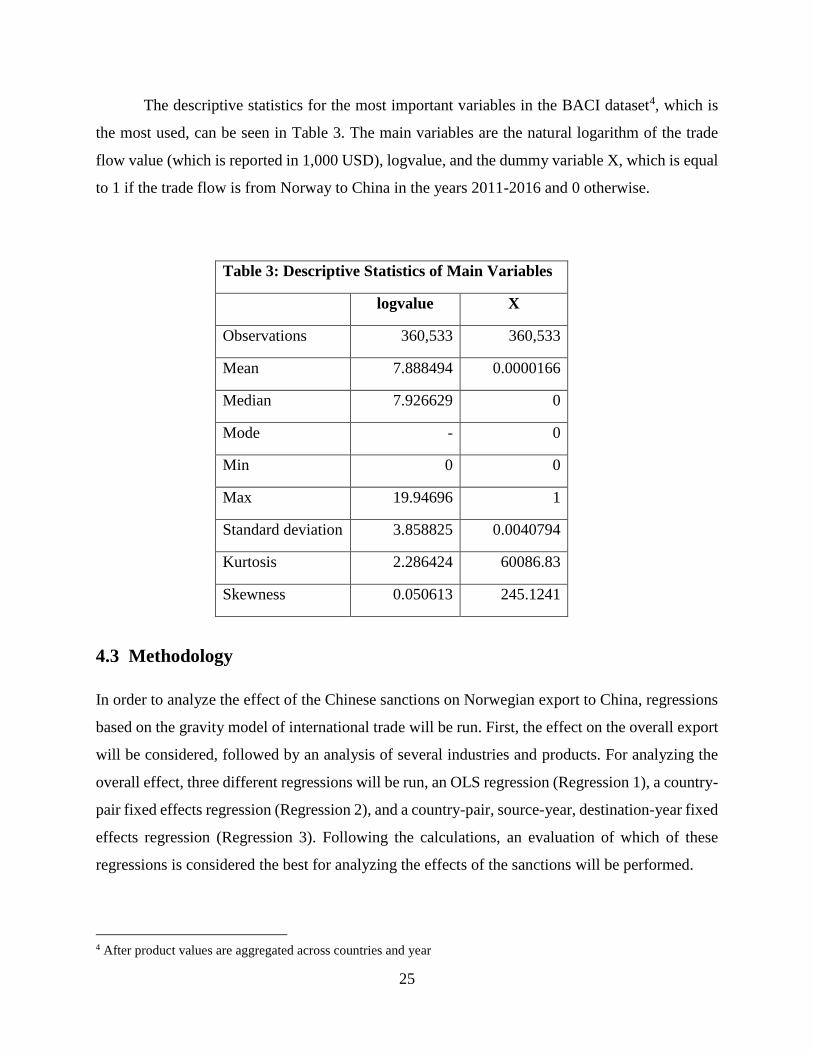
The descriptive statistics for the most important variables in the BACI dataset4, which is
the most used, can be seen in Table 3. The main variables are the natural logarithm of the trade
flow value (which is reported in 1,000 USD), logvalue, and the dummy variable X, which is equal
to 1 if the trade flow is from Norway to China in the years 2011-2016 and 0 otherwise.
Table 3: Descriptive Statistics of Main Variables
logvalue X
Observations 360,533 360,533
Mean 7.888494 0.0000166
Median 7.926629 0
Mode - 0
Min 0 0
Max 19.94696 1
Standard deviation 3.858825 0.0040794
Kurtosis 2.286424 60086.83
Skewness 0.050613 245.1241
4.3 Methodology
In order to analyze the effect of the Chinese sanctions on Norwegian export to China, regressions
based on the gravity model of international trade will be run. First, the effect on the overall export
will be considered, followed by an analysis of several industries and products. For analyzing the
overall effect, three different regressions will be run, an OLS regression (Regression 1), a country-
pair fixed effects regression (Regression 2), and a country-pair, source-year, destination-year fixed
effects regression (Regression 3). Following the calculations, an evaluation of which of these
regressions is considered the best for analyzing the effects of the sanctions will be performed.
4 After product values are aggregated across countries and year

26
The OLS regression (Regression 1) is the simplest of the three regressions, and the one that
most closely resemble the original gravity equation. OLS is based on the lines of best fit used to
show the relationship between trade and GDP or trade and distance. For the OLS estimates to be
statistically useful, these conditions are necessary: The error terms must have a mean of zero and
be uncorrelated to the explanatory variables, the error terms must be independently and identically
distributed, and the explanatory variables cannot be a linear combination of other explanatory
variables. If these conditions are fulfilled, the OLS estimates will be consistent, unbiased and
efficient (Shepherd 2016, p. 17). In order to go from the gravity equation (Equation 1) to OLS, one
needs simply to take the natural logarithm of both sides. Due to the laws of logarithms, the terms
can then be split into additive terms. The OLS regression thus takes the following form:
𝑙𝑛𝑦𝑖𝑗𝑡 = 𝛼 + 𝛽1𝑙𝑛𝑌𝑖𝑡 + 𝛽2𝑙𝑛𝑌𝑗𝑡 + 𝛾𝑙𝑛𝑑𝑖𝑗 + 𝜂𝑋𝑖𝑗𝑡 + 𝜀𝑖𝑗𝑡 (2)
where yijt is the value of the export from country i to country j in year t, Yit is the GDP of the
exporting country i in year t, Yjt is the GDP of the importing country j in year t, dij is the distance
between country i and country j, Xijt is a dummy for the sanctions which is equal to 1 if the trade
flow is from Norway to China in the years 2011-2015 and 0 otherwise, α is a constant, and εijt is
the error term. β1, β2, γ and η are parameters. The parameter of interest is η, as this shows the effect
of the sanctions. Finally, the regression, along with all the following regressions, will use robust
standard errors, which means that it will allow heteroscedastic standard errors. This is important
because it is possible that the variables have different variances over different observation points,
something which will not be accounted for by using normal standard errors. Even though the Nobel
Peace Prize was awarded in 2010, it was announced on October 8, which the ceremony itself being
on December 10. Thus, it is unlikely that any sanctions China imposed had much effect before
2011, which is why the dummy variable for the sanctions is set to 2011 and later. However, while
the OLS regression is simple, it is more prone to bias than the other regressions. One problem is
that since the logarithm of zero is not defined, observations with no trade flows (value of zero)
will be omitted, leading to loss of information, which again can lead to biased estimates. However,
this is also a problem for Regression 2 and Regression 3. Another disadvantage is that many
observable and unobservable factors are not included. While it is possible to add dummy variables
for the observable factors, such as common land border, common language, former colonial
relationship, trade agreements and so on, this can be a quite tedious process. Regression 1 was

27
based on data from both the Gravity dataset and the BACI dataset and will therefore include the
years 2003-2015.
There are several ways to improve the result. One is to use an instrumental variable (IV)
approach, but one then faces the difficulty of finding a valid and strong instrument. Head and
Mayer (2014, p. 162) argues that in lacking a plausible instrument, the best method is to rely on
country-pair fixed effects. They claim that this “forces identification to come from within the
dimension of the data.” Technically, fixed effects are a range of dummy variables that equal 1 for
the country-pair in question and 0 otherwise. When considering panel data, this accounts for all
sources of observed and unobserved heterogeneity that are constant for the given country-pairs
across time. Using a country-pair fixed effect estimation leads to Regression 2, which takes the
following form:
𝑙𝑛𝑦𝑖𝑗𝑡 = 𝛼𝑙𝑛𝑌𝑖𝑡 + 𝛽𝑙𝑛𝑌𝑗𝑡 + 𝛾𝑖𝑗 + 𝜂𝑋𝑖𝑗𝑡 + 𝜀𝑖𝑗𝑡 (3)
where yijt is the value of the export from country i to country j in year t, Yit is the GDP of the
exporting country i in year t, Yjt is the GDP of the importing country j in year t, γij is the country-
pair fixed effect, Xijt is a dummy for the sanctions which is equal to 1 if the trade flow is from
Norway to China in the years 2011-2015 and 0 otherwise, and εijt is the error term. α, β and η are
parameters. The parameter of interest is η, as this shows the effect of the sanctions. The advantage
of using fixed effects is that they can capture the variation within country-pairs to help identify
causal relationships. Firstly, the fixed effect model includes most observable variables that are
excluded from the OLS, such as dummy variables for common borders, common language and
trade agreements, without the need to consider which variables to include and which not to.
Importantly, distance is no longer reported as an independent variable, but is included in the fixed
effect. Secondly, it also includes unobservable variables such as multilateral resistance terms, or
relative trade costs, as long as they are time constant. As these are relative values, they are not
reported by any trade authority and are thus not observable. Failing to take multilateral resistance
terms into account can overstate bilateral trade elasticities (Behar and Nelson 2012). Using the
fixed effect estimation will also provide consistent estimates for the gravity model (Shepherd 2016,
p. 23). Like Regression 1, Regression 2 also uses data from both the Gravity dataset and the BACI
dataset and includes the years 2003-2015.

28
In addition to using country-pair fixed effects, it is possible to add source-year and
destination-year fixed effects. Like in the previous regression, these fixed effects will account for
all factors that are specific to the exporting country and importing country respectively, such as
GDP. This leads to Regression 3, which takes the following form:
𝑙𝑛𝑦𝑖𝑗𝑡 = 𝛼𝑖𝑡 + 𝛽𝑗𝑡 + 𝛾𝑖𝑗 + 𝜂𝑋𝑖𝑗𝑡 + 𝜀𝑖𝑗𝑡 (4)
where yijt is the value of the export from country i to country j in year t, αit is the source-year fixed
effect, βjt is the destination-year fixed effect, γij is the country-pair fixed effect, Xijt is a dummy for
the sanctions which is equal to 1 if the trade flow is from Norway to China in the years 2011-2016
and 0 otherwise, and εijt is the error term. η is a parameter and shows the effect of the sanctions.
Unlike Regression 2, Regression 3 captures the variation not only within country-pairs, but also
within countries themselves, allowing for more observable and unobservable factors to be
accounted for. Additionally, as Regression 3 does not include variables for GDP or distance, it
does not use data from the Gravity dataset but only from the BACI dataset. It therefore includes
the years 2003-2016, one more year than Regression 1 and Regression 2. Regressions 1-3 were
used to test Hypothesis 1.
To check the robustness of the results, several methods were used. The first was a modified
version of Regression 3, but splitting the X variable into parts, one for each year in the BACI
dataset, 2003-2016. This was to check if the sanctions only lasted for the whole period or only a
short period, and also to see if there is a significant difference before and after 2010. The regression
takes the following form:
𝑙𝑛𝑦𝑖𝑗𝑡 = 𝛼𝑖𝑡 + 𝛽𝑗𝑡 + 𝛾𝑖𝑗 + 𝜂3𝑋3𝑖𝑗 + 𝜂4𝑋4𝑖𝑗 + 𝜂5𝑋5𝑖𝑗 + 𝜂6𝑋6𝑖𝑗 + 𝜂7𝑋7𝑖𝑗 + 𝜂8𝑋8𝑖𝑗 + 𝜂9𝑋9𝑖𝑗 +
𝜂10𝑋10𝑖𝑗 + 𝜂11𝑋11𝑖𝑗 + 𝜂12𝑋12𝑖𝑗 + 𝜂13𝑋13𝑖𝑗 + 𝜂14𝑋14𝑖𝑗 + 𝜂15𝑋15𝑖𝑗 + 𝜂16𝑋16𝑖𝑗 + 𝜀𝑖𝑗𝑡 (5)
where yijt is the value of the export from country i to country j in year t, αit is the source-year fixed
effect, βjt is the destination-year fixed effect, γij is the country-pair fixed effect, X3ij is a dummy
which is equal to 1 if the trade flow is from Norway to China in the year 2003 and 0 otherwise,
X4ij is the same for 2004, and so on until 2016, and εijt is the error term. η3, η4,..., η16 are parameters
and show the effect of the sanctions in the given year.

29
The second method employed to check the robustness was to consider a control group. This
wass done by having Norway and four other similar countries as the only exporters, and China and
four other similar countries as the only importers. All other observations were disregarded. For the
countries similar to Norway, the other Nordic countries, Denmark, Sweden, Finland and Iceland,
were chosen due to their proximity in size, geographical position and economic policy. Finding
countries similar to China was much more difficult, ultimately India, Indonesia, Vietnam and the
Philippines were chosen. The reason for these countries being chosen is that they are all relatively
geographically close to another, as well as all being developing countries with a large population.
By using Regression 3, the effect of the sanctions was tested again on this group of countries.
However, many international trade sanctions do not target all trade between the countries
involved, but rather specific industries or sectors, such as China’s restrictions on Philippine
bananas in 2012 (Asia Sentinel 2012) or the US’ import quota on Cuban sugar in 1960 (Wolfe
2010). As China did not formally impose sanctions on Norwegian exports in 2010, no industry or
product was formally targeted either. Despite this, particularly Norwegian salmon export was
being singled out by the media as having been hit hard by the sanctions. This thesis therefore
analyzed the effect of the sanctions on chemicals, crude petroleum, machinery, salmon, and
seafood excluding salmon. These industries and products were chosen due to their importance for
Norwegian exports, together accounting for more than 60 percent of Norwegian exports to China
in 2016. While salmon stood for a very low share of Norwegian export to China, its media attention
made it worthwhile to analyze. These regressions tested Hypothesis 2.
Chemicals in this thesis means cyclic amides (HS6 292429) and fertilizers (HS6 310520),
which together accounts for almost all of Norway’s export of chemicals to China. Chemicals were
the most valuable of Norway’s exports to China from 2011 to 2016. Machinery (all HS6 codes
starting with 84 and 85) was from 2011 to 2016 the second most valuable export, while crude
petroleum (HS6 270900) was the fifth most valuable export. Due to several types of seafood being
among Norway’s main export to China, including mackerel, cod and haddock, these are grouped
together, and this group contains all seafood (HS6 starting with 03) other than salmon (fresh: HS6
030212; frozen: HS6 030322). For each of these industries and products, the thesis evaluated how
important the Chinese market is for Norwegian exporters and to what extent the sanctions had an
effect. The effects of the sanctions on these industries and products were estimated by using
Regression 3. Any significant results were tested for robustness.
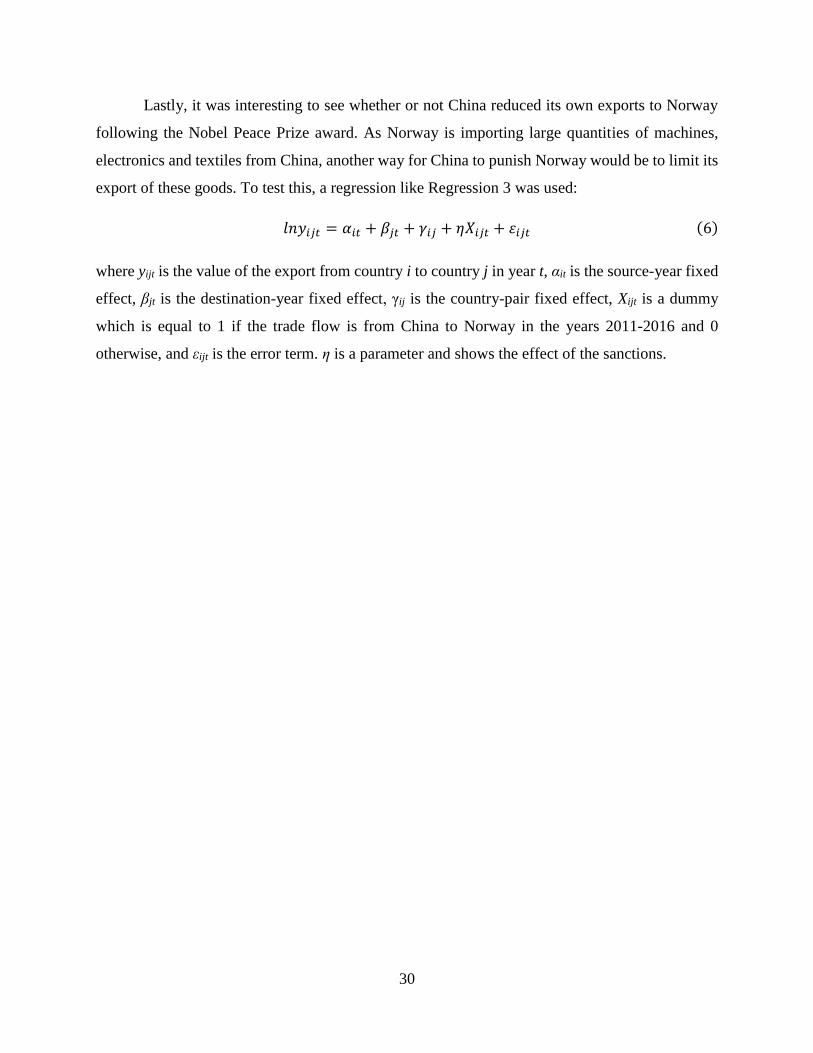
30
Lastly, it was interesting to see whether or not China reduced its own exports to Norway
following the Nobel Peace Prize award. As Norway is importing large quantities of machines,
electronics and textiles from China, another way for China to punish Norway would be to limit its
export of these goods. To test this, a regression like Regression 3 was used:
𝑙𝑛𝑦𝑖𝑗𝑡 = 𝛼𝑖𝑡 + 𝛽𝑗𝑡 + 𝛾𝑖𝑗 + 𝜂𝑋𝑖𝑗𝑡 + 𝜀𝑖𝑗𝑡 (6)
where yijt is the value of the export from country i to country j in year t, αit is the source-year fixed
effect, βjt is the destination-year fixed effect, γij is the country-pair fixed effect, Xijt is a dummy
which is equal to 1 if the trade flow is from China to Norway in the years 2011-2016 and 0
otherwise, and εijt is the error term. η is a parameter and shows the effect of the sanctions.

31
5 Emprical Findings
5.1 Results and Robustness
5.1.1 Effects on the Overall Norwegian Economy
Three different regressions were used in order to analyze the effects of the sanctions on Norwegian
exports to China. The results are shown in Table 4:
Table 4: Effects of Sanctions on Norwegian Exports to China
Dependent variable = Natural logarithm of Trade Value
(1) (2) (3)
Variables Regression 1 Regression 2 Regression 3
Sanctions 2011-2016 0.386*** -0.276*** -0.239*
(0.051) (0.078) (0.122)
log distance -1.343***
(0.005) log GDP exporter 1.147*** 0.399***
(0.002) (0.015) log GDP importer 0.881*** 0.769***
(0.002) (0.014) constant -29.681***
(0.087)
Year fixed effect YES Country-pair fixed effect YES YES
Source-year fixed effect YES
Destination-year fixed effect YES
Observations 276,921 274,862 357,243
R-squared 0.648 0.908 0.910
Robust standard errors in parenthesis *** p<0.01 ** p<0.05 * p<0.1
The result from the OLS regression (Regression 1) was unexpected, as it indicates that the
sanctions increased Norway’s export to China. As discussed earlier, the OLS regression faces
several problems and may not be considered reliable in this case. Its R-squared of 0.648 means
that it can explain around 65% of the variation of the data, which is much less than the other two

32
regressions. Regression 2 and Regression 3 provide similar results to each other. They both report
a negative coefficient for the sanctions dummy, which is in line with what was expected, though
Regression 2 shows a somewhat larger effect. Their R-squareds mean they are both able to explain
more than 90% of the variation in the data, mostly due to including many more variables. While
Regression 2 is significant at the one percent-level, Regression 3 is only significant at the ten
percent-level, but they both indicate that the sanctions had a negative effect on Norwegian exports
to China after 2010. As for which regression method is the better, Regression 3 has a higher R-
squared than Regression 2, and due to including more fixed effects, it controls for more observable
and unobservable variables than Regression 2. Additionally, Regression 3 has many more
observations that the other two regressions, which is partly because it includes one more year, but
also because the Gravity dataset, which is used for Regression 1 and Regression 2, has many values
as missing, which leads to those observations being disregarded during the regression. Because of
this, Regression 3 was considered the most suitable regression method and was the basis for the
other regressions in this thesis. The result from Regression 3 shows that, as a result of the sanctions,
Norwegian exports to China between 2011 and 2016 were 215 percent lower than what they would
have been had China not imposed any sanctions. This corresponds to a potential loss of 5.5 billion
USD for Norwegian exporters in this period.
To check the robustness of the results, first a modified version of Regression 3 with yearly
effect dummies was used. This can be seen in Table 5.
5 1-exp(-0.239)=0.212

33
Table 5: Effects of Sanctions on Norwegian Exports to China by Year
Dependent variable = Natural logarithm of Trade Value
(4)
Variables Regression 3, by year
2003 0.347**
(0.159)
2004 0.260*
(0.156)
2005 -0.249*
(0.146)
2006 0
(omitted)
2007 -0.293**
(0.137)
2008 -0.151
(0.143)
2009 0.251*
(0.140)
2010 0.047
(0.129)
2011 -0.061
(0.133)
2012 -0.479***
(0.136)
2013 -0.389***
(0.135)
2014 -0.119
(0.144)
2015 -0.085
(0.138)
2016 -0.139
(0.146)
Country-pair fixed effect YES
Source-year fixed effect YES
Destination-year fixed effect YES
Observations 357,243
R-squared 0.910
Robust standard errors in parenthesis
*** p<0.01 ** p<0.05 * p<0.1
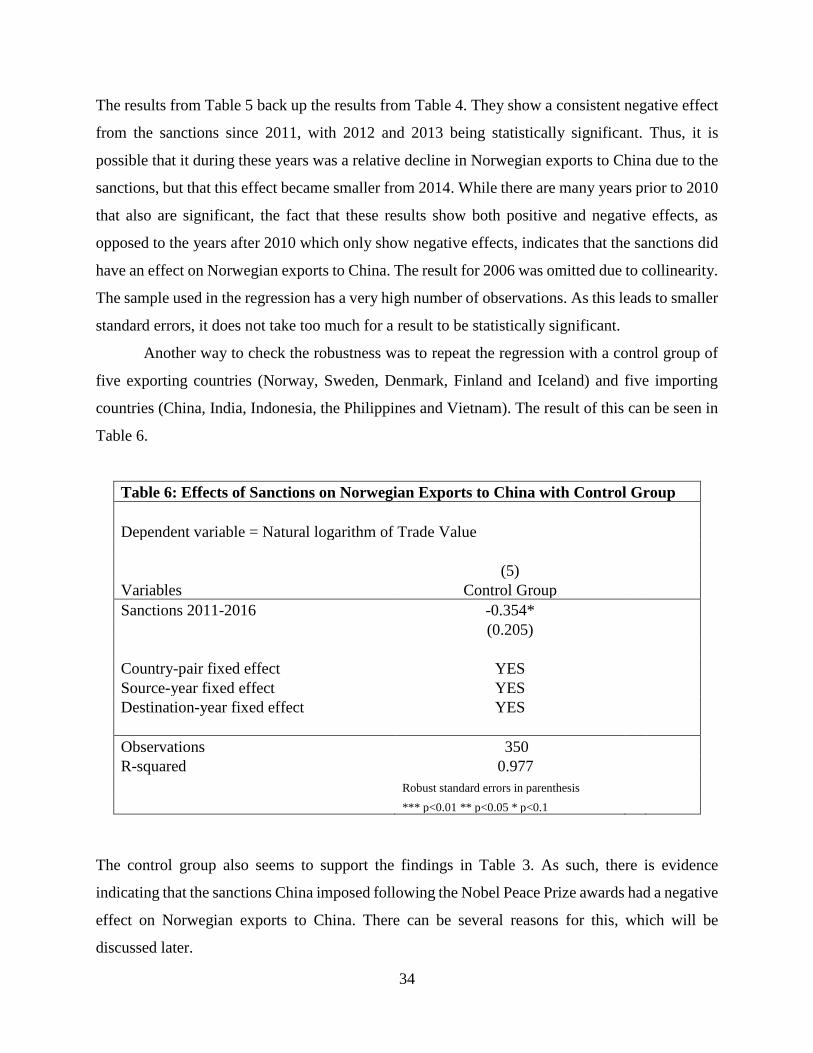
34
The results from Table 5 back up the results from Table 4. They show a consistent negative effect
from the sanctions since 2011, with 2012 and 2013 being statistically significant. Thus, it is
possible that it during these years was a relative decline in Norwegian exports to China due to the
sanctions, but that this effect became smaller from 2014. While there are many years prior to 2010
that also are significant, the fact that these results show both positive and negative effects, as
opposed to the years after 2010 which only show negative effects, indicates that the sanctions did
have an effect on Norwegian exports to China. The result for 2006 was omitted due to collinearity.
The sample used in the regression has a very high number of observations. As this leads to smaller
standard errors, it does not take too much for a result to be statistically significant.
Another way to check the robustness was to repeat the regression with a control group of
five exporting countries (Norway, Sweden, Denmark, Finland and Iceland) and five importing
countries (China, India, Indonesia, the Philippines and Vietnam). The result of this can be seen in
Table 6.
Table 6: Effects of Sanctions on Norwegian Exports to China with Control Group
Dependent variable = Natural logarithm of Trade Value
(5) Variables Control Group
Sanctions 2011-2016 -0.354*
(0.205)
Country-pair fixed effect YES Source-year fixed effect YES Destination-year fixed effect YES
Observations 350 R-squared 0.977
Robust standard errors in parenthesis
*** p<0.01 ** p<0.05 * p<0.1
The control group also seems to support the findings in Table 3. As such, there is evidence
indicating that the sanctions China imposed following the Nobel Peace Prize awards had a negative
effect on Norwegian exports to China. There can be several reasons for this, which will be
discussed later.

35
5.1.2 Effects on Individual Industries or Products
While there is evidence to suggest that the sanctions had a significant effect on Norwegian exports
to China as a whole, it is possible that certain industries or products were affected more than others,
or that some were left unaffected. This thesis analyzed the effects on chemicals, crude petroleum,
machinery, salmon, and seafood excluding salmon. These are all important export articles for
Norway, and the following figures will show how important the Chinese market is for Norway’s
export of these goods:
Source: Author’s own processing based on data from CEPII
Figure 4 shows the share of the Norwegian chemicals exports that is sent to China. As seen, China
is a very important market for Norwegian chemicals. Though there was a fall in the share of
Norwegian chemicals going to China in 2010, there has been an upwards trend since then, spiking
at about 50 percent in 2015. This trend ended in 2016 with a small reduction, but China is still the
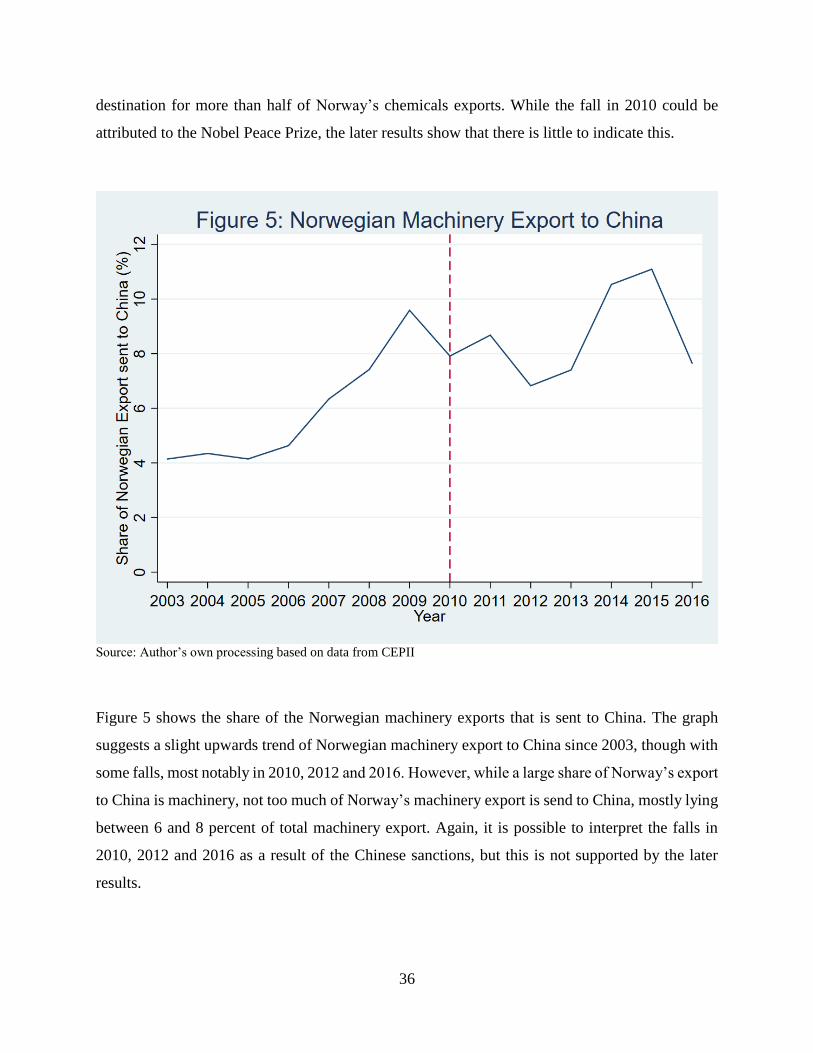
36
destination for more than half of Norway’s chemicals exports. While the fall in 2010 could be
attributed to the Nobel Peace Prize, the later results show that there is little to indicate this.
Source: Author’s own processing based on data from CEPII
Figure 5 shows the share of the Norwegian machinery exports that is sent to China. The graph
suggests a slight upwards trend of Norwegian machinery export to China since 2003, though with
some falls, most notably in 2010, 2012 and 2016. However, while a large share of Norway’s export
to China is machinery, not too much of Norway’s machinery export is send to China, mostly lying
between 6 and 8 percent of total machinery export. Again, it is possible to interpret the falls in
2010, 2012 and 2016 as a result of the Chinese sanctions, but this is not supported by the later
results.

37
Source: Author’s own processing based on data from CEPII
Figure 6 shows the share of the Norwegian oil exports that is sent to China. Crude oil is alongside
gas Norway’s most important export good. Norwegian crude oil export to China has been heavily
fluctuating since 2003, with nothing being exported in 2008, 2012 and 2013. Despite a large
increase in 2016, China remains a fairly insignificant market for Norwegian oil, with less than 1.5
percent of Norway’s oil exports going to China. Imposing sanctions on oil from Norway would
likely be very ineffective as a means to punish Norway, and there is no indication that any such
sanctions were imposed.
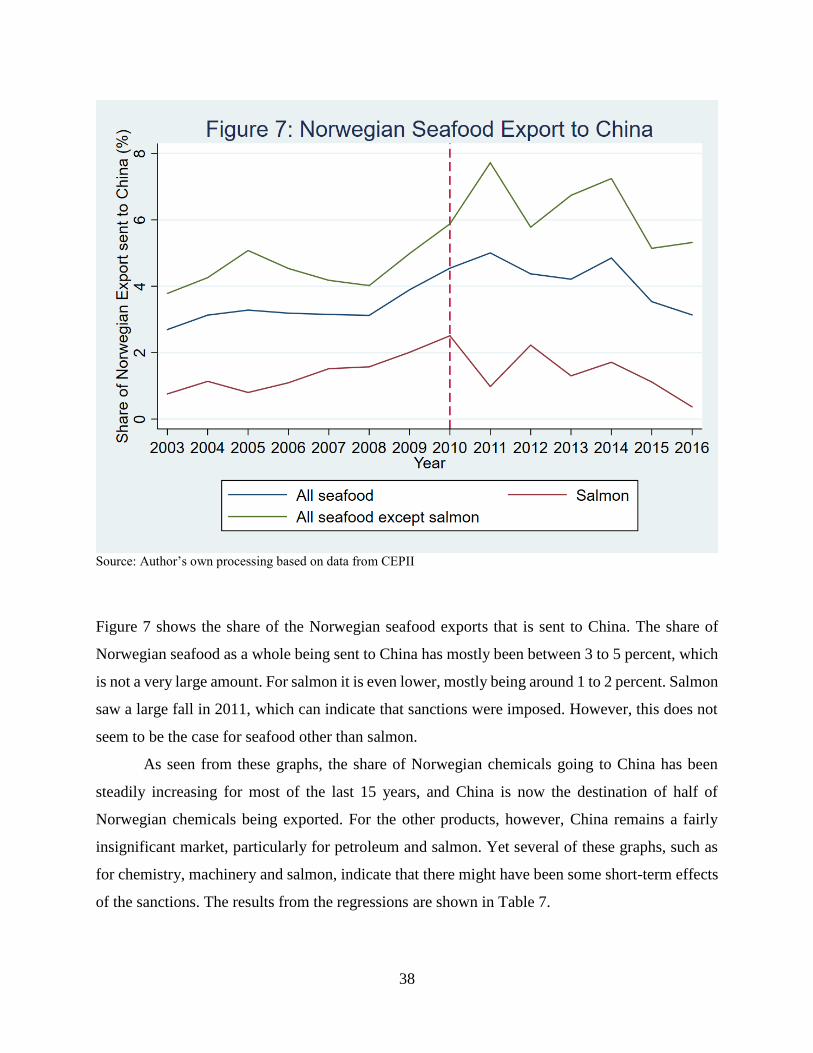
38
Source: Author’s own processing based on data from CEPII
Figure 7 shows the share of the Norwegian seafood exports that is sent to China. The share of
Norwegian seafood as a whole being sent to China has mostly been between 3 to 5 percent, which
is not a very large amount. For salmon it is even lower, mostly being around 1 to 2 percent. Salmon
saw a large fall in 2011, which can indicate that sanctions were imposed. However, this does not
seem to be the case for seafood other than salmon.
As seen from these graphs, the share of Norwegian chemicals going to China has been
steadily increasing for most of the last 15 years, and China is now the destination of half of
Norwegian chemicals being exported. For the other products, however, China remains a fairly
insignificant market, particularly for petroleum and salmon. Yet several of these graphs, such as
for chemistry, machinery and salmon, indicate that there might have been some short-term effects
of the sanctions. The results from the regressions are shown in Table 7.

39
Table 7: Effects of Sanctions on Norwegian Goods Exports to China
Dependent variable = Natural logarithm of Trade Value
(6) (7) (8) (9) (10)
Variables Chemicals Machinery Oil Salmon Seafood
Sanctions 2011-2016 0.094 0.081 -0.513 -1.971*** -0.130
(0.277) (0.157) (0.498) (0.577) (0.187)
Country-pair fixed effect YES YES YES YES YES
Source-year fixed effect YES YES YES YES YES
Destination-year fixed effect YES YES YES YES YES
Observations 38,100 253,934 13,053 11,351 94,080
R-squared 0.806 0.908 0.902 0.875 0.866
Robust standard errors in parenthesis
*** p<0.01 ** p<0.05 * p<0.1
The results show that there is no statistically significant proof that chemicals, machinery, oil or
seafood in general was hit by the sanctions. While the results for oil and seafood are negative, their
standard errors are large. Salmon, on the other hand, gives a significant reduction in exports as a
result of the sanctions. However, this includes both fresh/chilled and frozen salmon. Therefore, the
effect of the sanctions was tested on both types, as seen in Table 8.
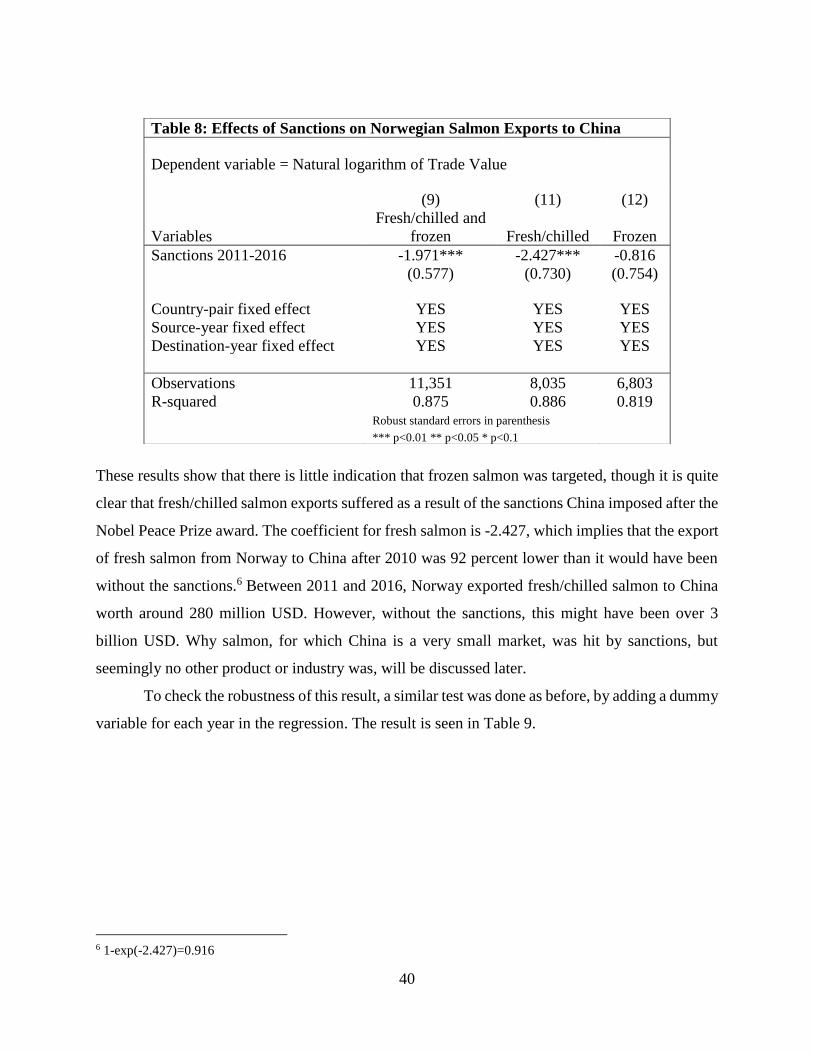
40
These results show that there is little indication that frozen salmon was targeted, though it is quite
clear that fresh/chilled salmon exports suffered as a result of the sanctions China imposed after the
Nobel Peace Prize award. The coefficient for fresh salmon is -2.427, which implies that the export
of fresh salmon from Norway to China after 2010 was 92 percent lower than it would have been
without the sanctions.6 Between 2011 and 2016, Norway exported fresh/chilled salmon to China
worth around 280 million USD. However, without the sanctions, this might have been over 3
billion USD. Why salmon, for which China is a very small market, was hit by sanctions, but
seemingly no other product or industry was, will be discussed later.
To check the robustness of this result, a similar test was done as before, by adding a dummy
variable for each year in the regression. The result is seen in Table 9.
6 1-exp(-2.427)=0.916
Table 8: Effects of Sanctions on Norwegian Salmon Exports to China
Dependent variable = Natural logarithm of Trade Value
(9) (11) (12)
Variables
Fresh/chilled and
frozen Fresh/chilled Frozen
Sanctions 2011-2016 -1.971*** -2.427*** -0.816
(0.577) (0.730) (0.754)
Country-pair fixed effect YES YES YES
Source-year fixed effect YES YES YES
Destination-year fixed effect YES YES YES
Observations 11,351 8,035 6,803
R-squared 0.875 0.886 0.819
Robust standard errors in parenthesis
*** p<0.01 ** p<0.05 * p<0.1

41
Table 9: Effects of Sanctions on Norwegian Salmon Exports to China by Year
Dependent variable = Natural logarithm of Trade Value
(13)
Variables Salmon, by year
2003 -1.12
(1.262)
2004 0.251
(1.152)
2005 0
(omitted)
2006 -0.098
(1.257)
2007 0.398
(0.126)
2008 0.442
(1.161)
2009 0.351
(1.278)
2010 0.630
(1.213)
2011 -2.249**
(1.139)
2012 -0.845
(1.212)
2013 -1.856*
(1.102)
2014 -1.810*
(1.062)
2015 -2.875**
(1.393)
2016 -4.134***
(1.184)
Country-pair fixed effect YES
Source-year fixed effect YES
Destination-year fixed effect YES
Observations 8,035
R-squared 0.886
Robust standard errors in parenthesis
*** p<0.01 ** p<0.05 * p<0.1

42
The results from all years after 2010, apart from 2012, are statistically significant. The reason for
2012 not being significant can be that exports in salmon rebounded and came close to the level
from 2010 again. None of the results from 2010 or before are statistically significant, and while
the result from 2005 was omitted due to collinearity, this suggests that the method used correctly
estimates the effects of the sanctions. The fact that all the dummies after 2010 have a negative
coefficient is in support of the result from before and indicates that Norwegian export of salmon
to China was hit by sanctions after the 2010 Nobel Peace Prize award.
5.1.3 Effects on China’s Export to Norway
As mentioned, it could also be possible for China to punish Norway by limiting its own exports to
Norway. As Norway is a fairly small market for China, this would likely not have brought much
harm to Chinese exporters. This was tested with a similar regression to Regression 3, and the
results can be seen in Table 10.
Table 10: Effects of Sanctions on Chinese Exports to Norway
Dependent variable = Natural logarithm of Trade Value
(14) Variables Chinese exports
Sanctions 2011-2016 -0.187
(0.118)
Country-pair fixed effect YES Source-year fixed effect YES Destination-year fixed effect YES
Observations 357,243 R-squared 0.910
Robust standard errors in parenthesis
*** p<0.01 ** p<0.05 * p<0.1

43
While the regression indicates a negative effect, meaning that China’s exports to Norway fell after
2010, the result is not statistically significant. As such there is little proof that China was trying to
punish Norway in this way.
5.1.4 Econometric concerns
It is possible that other factors than the sanctions imposed by China could have had an effect on
the bilateral trade between Norway and China. These include changes in the exchange rates, the
global shipping crisis, the Chinese economy’s transition to the “New Normal”, the recent demand
and price fall of minerals, the oil crisis, and China’s new trade agreements with Southeast Asian
countries. The thesis gives a brief overview of how these could affect the trade and assess whether
or not they are already accounted for in the model used.
Currency exchange rates tells how much of one currency one must pay in order to buy
another currency. An appreciation, or increase, in a country’s exchange rate means that it needs to
pay less for other countries’ currencies, and thus for their products. It can therefore boost import.
On the other hand, it also makes foreign countries having to pay more for the country’s exports,
which might lead to a fall in exports. In the period since 2010, both the Norwegian krone and the
Chinese yuan have seen changes in their exchange rate. The krone is heavily reliant on the oil
price, as such, the huge fall in the oil price in 2014 led to a massive depreciation of the krone
(Jensen 2016). In contrast, the Chinese yuan – which many politicians and experts claim was long
undervalued – has been slowing appreciating for a long time, despite a devaluation by the Chinese
government in August 2015 (Rothko Research 2016). Both of these events would make Norwegian
products cheaper in China, which would likely increase exports. Thus, this could offset a potential
fall in exports as a result of sanctions. As long as changes in the exchange rate affect all of a
country’s trading partner this should already be accounted for in Regression 3, as part of the
source-year and destination-year fixed effects. It should therefore not affect the sanction
coefficient. However, if the Norwegian krone appreciated or depreciated in relation to the Chinese
yuan, but not in relation to other currencies, this would not be captured by the model, and could
be a problem. Figure 8 shows the development of the Norwegian krone in relation to the Chinese
yuan and a basket of other currencies.

44
Source: Author’s own processing based on data from Norges Bank (2018).
The trade-weighted effective exchange rate index (TWI) is an index showing the value of the
Norwegian krone measured against a weighted average of the currencies of 25 of Norway’s most
important trading partners. An increasing index value represents a depreciation of the Norwegian
krone. 100 CNY shows how much 100 Chinese yuan are worth in Norwegian kroner. As can be
seen, the Chinese yuan has mostly been following the TWI since 2010 but appreciated at the end
of 2014. This would make Norwegian goods cheaper to buy in China, which would often lead to
increased exports from Norway to China. As this is not accounted for in the model, it might make
it underestimate the trade loss. Nonetheless, it does not affect the fact that Sino-Norwegian trade
relations did suffer as a result of the Nobel Peace Prize award.
A global shipping crisis, which peaked in 2016 when the South Korean Hanjin company
bankrupted, saw many shipping companies around the world bankrupting from 2015 and onwards.
This resulted in it being more difficult to ship goods, especially fresh food such as salmon, thus
potentially reducing exports (Barry 2016). Because this was affecting Norway’s trade with all
overseas countries, it should be included in the model as part of the source-year effect.
In May 2014, Chinese President Xi Jinping introduced the phrase “New Normal” when
describing the next phase of China’s economic development. As China’s economic growth had
0.00
20.00
40.00
60.00
80.00
100.00
120.00
140.00
160.00Ja
nuar
y 1
, 20
05
June
1, 2
00
5
No
vem
ber
1, 2
00
5
Ap
ril
1, 2
00
6
Sep
tem
ber
1, 2
00
6
Feb
ruar
y 1
, 2
00
7
July
1,
20
07
Dec
emb
er 1
, 20
07
May
1, 2
00
8
Oct
ober
1, 2
00
8
Mar
ch 1
, 2
00
9
Au
gu
st 1
, 2
00
9
Jan
uar
y 1
, 20
10
June
1, 2
01
0
No
vem
ber
1, 2
01
0
Ap
ril
1, 2
01
1
Sep
tem
ber
1, 2
01
1
Feb
ruar
y 1
, 2
01
2
July
1,
20
12
Dec
emb
er 1
, 20
12
May
1, 2
01
3
Oct
ober
1, 2
01
3
Mar
ch 1
, 2
01
4
Au
gu
st 1
, 2
01
4
Jan
uar
y 1
, 20
15
June
1, 2
01
5
No
vem
ber
1, 2
01
5
Ap
ril
1, 2
01
6
Sep
tem
ber
1, 2
01
6
Figure 8: Value of the Norwegian Krone
TWI 100 CNY

45
been steadily declining for several years, the “New Normal” will see a slower but more sustainable
economic growth. China will try to move its economy from being driven by investments to being
driven by innovation. As such, China will have a lower demand for goods spurring economic
growth, such as chemicals, machinery and raw materials (China Daily 2017). As these goods
account for a very large part of Norway’s exports to China, it would seem likely that China would
reduce its imports from Norway, regardless of the 2010 Nobel Peace Prize award. However, this
should already be captured by the model through the destination-year fixed effect, as this effect is
specific to China.
Starting in the summer of 2014, the international crude oil price started falling, from $115
a barrel to less than $35 a barrel in January 2016. This was largely fueled by the huge increase in
supply of American shale oil, which due to new technology and the high oil price had started
becoming profitable (Rogoff 2016; Kilian 2015). Because crude oil is a very large part of Norway’s
export, also to China, this would mean that the value of Norway’s exports to China would decrease.
As the oil price fall is specific to Norway (and other oil-producing countries) it should already be
included in the model as a source-year effect.
Furthermore, during the last years, international prices for metals and minerals have fallen
significantly. This is mainly because the slowing growth of China is causing it to reduce its
demand, and China stood for a large portion of the demand for these raw materials (Sanderson
2015). As Norway is exporting several metals and minerals, such as aluminum, nickel and copper,
also to China, this lowers the value of Norway’s exports to China, in the same way as for crude
oil. Like crude oil, this should also already be included in the model as a source-year fixed effect.
On January 1, 2010, the ASEAN7-China Free Trade Area came into effect. It was at the
time the world’s third largest free trade area (Gooch 2009). This could make it cheaper for China
to import goods from the ASEAN countries, and as a result, it might have reduced its imports from
countries such as Norway. While most of Norwegian exports to China are not competing with
those of ASEAN, some products such as minerals and crude oil are. On the other hand, tariffs
between ASEAN and China were already quite small. While the effect of this Free Trade Area is
not captured by the fixed effects of the model, it is unlikely that it had a significant effect on Sino-
Norwegian trade.
7 Association of Southeast Asian Nations, consisting of Thailand, Laos, Cambodia, Vietnam, Myanmar, Malaysia,
Singapore, Brunei, Indonesia and the Philippines

46
5.2 Discussion of Findings
The findings in this thesis indicate that Norwegian exports to China as a whole were affected
negatively by the sanctions China imposed after the Nobel Peace Prize award in 2010. This is in
contrast to what was predicted in Hypothesis 1, which assumed that exports on the aggregate level
were not affected by the sanctions, and thus Hypothesis 1 is rejected. The results indicate that, as
a consequence of the sanctions China imposed, Norwegian exports to China after 2010 were 21
percent, or 5.5 billion USD, lower than they might have been if not for the sanctions. Fresh/chilled
salmon was the only product or industry that was found to be clearly hit by the sanctions, which is
also suggested in a report from Statistics Norway in September 2011 (all salmon mentioned
hereafter will be fresh or chilled). The reason why there was a significant negative result for overall
exports but not for any individual product or industry other than salmon is probably because the
trade in individual products and industries has a much higher variation over time, which makes it
difficult to get any statistically significant results. While it seems that no other industry than salmon
was specifically targeted by China, it is possible that Chinese firms were more reluctant to do
business with Norwegian firms following the freezing of political relations, as well as Norwegian
firms being more reluctant to do business in China, as it could be possible that China would impose
further sanctions. In order to avoid this uncertainty, Norwegian and Chinese firms might have
found it safer to find other trading partners. This is not to say that Norwegian exports to China
decreased following the sanctions, as exports from 2010 to 2014 still rose with more than 33
percent. However, following 2014 Norwegian exports to China started falling again and in 2016
they were back to the same level as 2010, though it is hard to say how much of this was a result of
the sanctions, as Table 5 (p. 33) does not give significant results from the sanctions for these years.
From the results, it seems that Norwegian salmon export to China suffered as a result of
the sanctions. Salmon exports to China fell by around 63 percent between 2010 and 2011, meaning
a loss of 48 million USD, but in 2012 they were back to 95 percent of the level in 2010. While this
suggests that the effects of the sanctions were quite short-lived, it should be noted that China
actually increased its salmon import by almost 50 percent during these two years. As such,
Norway, which had controlled 80 percent of the Chinese salmon market prior to the Nobel Peace
Prize award, saw its market share drop to around 50 percent in 2012. This fall continued after
2012, as can be seen in Figure 9. The results indicate that Norwegian export of salmon to China
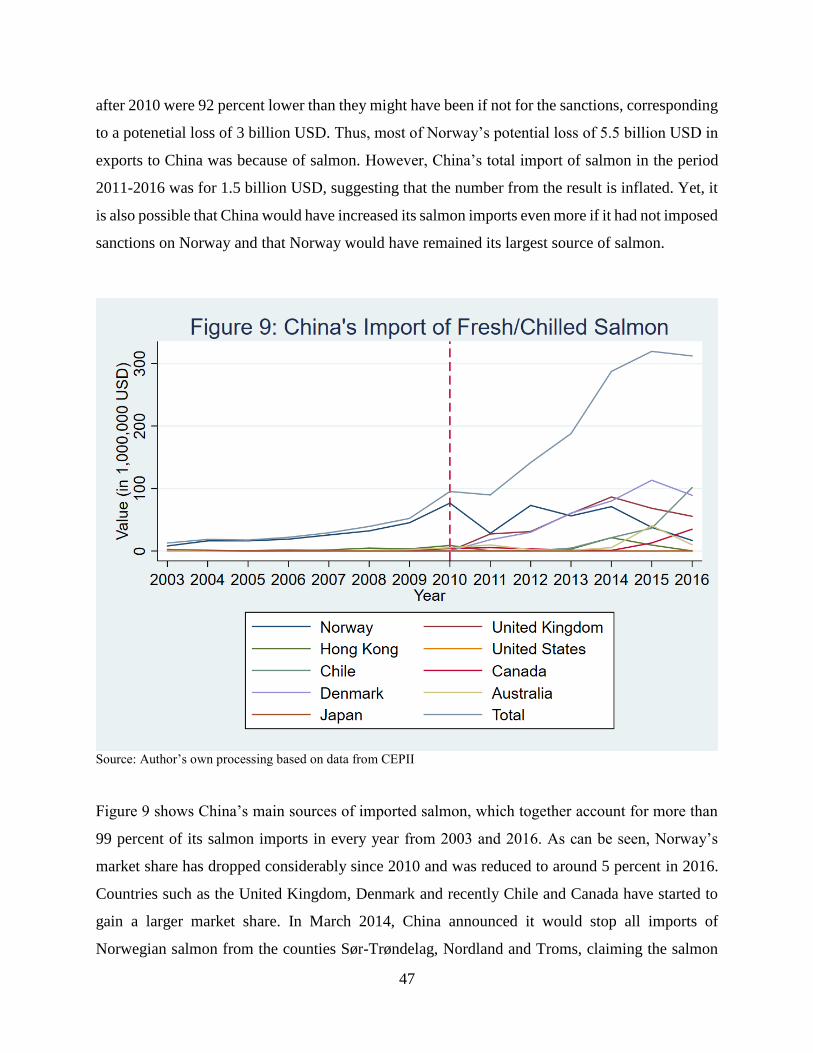
47
after 2010 were 92 percent lower than they might have been if not for the sanctions, corresponding
to a potenetial loss of 3 billion USD. Thus, most of Norway’s potential loss of 5.5 billion USD in
exports to China was because of salmon. However, China’s total import of salmon in the period
2011-2016 was for 1.5 billion USD, suggesting that the number from the result is inflated. Yet, it
is also possible that China would have increased its salmon imports even more if it had not imposed
sanctions on Norway and that Norway would have remained its largest source of salmon.
Source: Author’s own processing based on data from CEPII
Figure 9 shows China’s main sources of imported salmon, which together account for more than
99 percent of its salmon imports in every year from 2003 and 2016. As can be seen, Norway’s
market share has dropped considerably since 2010 and was reduced to around 5 percent in 2016.
Countries such as the United Kingdom, Denmark and recently Chile and Canada have started to
gain a larger market share. In March 2014, China announced it would stop all imports of
Norwegian salmon from the counties Sør-Trøndelag, Nordland and Troms, claiming the salmon

48
was infected by a disease. Exporters from other Norwegian counties would have to test their
salmons to control for any sign of this disease, otherwise they would not be allowed to export to
China (Lysvold 2015). The same was not applied to exporters from other countries, and Norwegian
exporters claimed China had no documentation proving that this disease was found in Norwegian
salmon (Chen and Garcia 2016). While a solution was reached in April the same year so that
Norwegian salmon could be sent to China, this did not include salmon from the three
aforementioned counties (Mikalsen 2015). However, as suggested by Chen and Garcia (2016), the
official trade data are not fully reliable regarding Norwegian export of salmon to China after 2010.
They claim that Norwegian salmon was sent to Hong Kong or Vietnam and then re-exported to
China (Figure 10).
Source: Author’s own processing based on data from CEPII
Figure 10 shows trade in salmon between Norway, Hong Kong, Vietnam and China. Most notable
is the huge increase of Norwegian export to Vietnam after 2010. Yet, there is no increase in the

49
export of salmon from Vietnam to China, which in fact is zero for all years except 2016, and even
then is marginal. The data does not show that Vietnam increased its salmon export to any other
country either. As it is very unlikely that Vietnamese consumers suddenly increased their
consumption of salmon 27-fold between 2010 and 2013, and yet more from 2013 to 2016, the most
likely solution is that Norwegian salmon was sent to Vietnam and then smuggled into China, as
claimed by Chen and Garcia (2016). Assuming this to be true, Norwegian salmon export to China
was higher than ever during this period. While Hong Kong could also have served as a gateway
into China, there is little indication that Hong Kong was used, as the increase in salmon export to
Hong Kong was within what one could expect from Hong Kongese consumers’ demand. Chen and
Garcia (2016) further claim that several of the fisheries in the United Kingdom and Denmark are
owned by Norwegian companies, and that these firms simply shifted their source of export to
China from Norway to elsewhere, as salmon from other countries, despite being owned by
Norwegian companies, was not targeted by the sanctions. As shown in Figure 11, the sanctions
did not seem to affect the overall salmon industry in Norway in any notable way.
Source: Author’s own processing based on data from CEPII

50
Figure 11 shows that China is a fairly insignificant market for Norwegian salmon and that the
salmon industry does not seem to have suffered noteworthy losses since the introduction of the
sanctions. This indicates that China’s economic sanctions towards Norwegian salmon was
ineffective. As argued before, unilateral sanctions can often be ineffective, as it may be easy for
the target country to shift its exports to other countries. However, without the sanctions, it is
possible that Norway would have been able to have a much larger share of the Chinese market
than it does today, a loss that potentially can be quite large due to the size of the Chinese economy.
Based on the presented results, Hypothesis 2, which assumed that Norwegian exports of salmon
was affected by the sanctions, is approved.
If unilateral economic sanctions often are not effective, why did China employ them? First
of all, it should be examined if China’s response actually could be considered economic sanctions.
As previously established, economic sanctions aim to force a change in policy or behavior in a
foreign country by harming its economic interests. There is little doubt that this was the case of
the restrictions on salmon imports. Moreover, ending the free trade agreement talks and stopping
Chinese trade delegations from going to Norway could also fall within the scope of economic
sanctions, as these measures too aimed at harming Norway’s economic interests in order to force
a policy change. Like the cases of Chinese unilateral sanctions discussed earlier, the economic
sanctions imposed on Norway after the Nobel Peace Prize award of 2010 were quite limited in
their scope, instead mostly targeting a specific industry. As for why the salmon industry was
specifically targeted, it is possible that this was because it is an important industry to Norway and
therefore China hoped the salmon industry would pressure the Norwegian government into
complying with China’s demand. Furthermore, the high trade complementarity between Norway
and China meant that targeting most other industries could hurt China as well, as products such as
chemicals and machinery are important for China’s economic growth. Additionally, it is quite easy
to impose restriction on food imports by claiming they pose a health risk, without actually having
to prove it, which makes legal challenges at the WTO difficult.
The aim of China was not to force Norway to revoke the Nobel Peace Prize, as they knew
this would not be possible. Instead, it is likely that China wanted a form of response from Norway
saying that Norway apologized and would not interfere in China’s internal affairs. As discussed
earlier, the continued dominance of the Communist Party is one of China’s most important goals,
and legitimizing Liu Xiaobo, who wanted more democracy and human rights in China, could risk
51
undermining the Party, as well as causing increased unrest in China. Thus, China wanted to make
an example out of Norway so that other countries would not want to threaten China’s core interests
in the future. When Norway and China in December 2016 agreed to normalize relations, Norway
also agreed to the following in a signed document:
“The Norwegian Government fully respects China's development path and social system,
and highly commends its historic and unparalleled development that has taken place. The
Norwegian Government reiterates its commitment to the one-China policy, fully respects China's
sovereignty and territorial integrity, attaches high importance to China's core interests and major
concerns, will not support actions that undermine them, and will do its best to avoid any future
damage to the bilateral relations.” (Xinhua 2016).
Together with the Norwegian government’s refusal to meet the Dalai Lama when he visited
Oslo in 2014, these terms makes it likely that the economic sanctions imposed by China were a
success, as they invoked the desired response from Norway. However, it is also possible that
politcal pressure played an important role.
The case of China’s economic sanctions on Norway fits well together with the other cases
of Chinese unilateral sanctions. There is little indication that China wanted to harm the Norwegian
economy considerably or harm the long-term relations between Norway and China. Evidence of
this can be seen in the development of Chinese investments in Norway, which according to
Gåsemyr and Sverdrup-Thygeson (2017) did not see a large change as a result of the sanctions.
While some smaller investments might have been suppressed, several major investments were
completed during the period of the sanctions. However, Sverdrup-Thygeson (2016) still argues
that the diplomatic conflict between Norway and China after 2010 is unprecedented in China’s
recent relations with Western countries. This might be because the position of the Communist
Party is even more important to China than its other core interests. Additionally, this was not the
first time Norway had angered China, as the Dalai Lama was awarded the Nobel Peace Prize in
1989 (Nobel Media AB 2014b). The Nobel Peace Prize award is widely covered globally by media
and many foreign government representatives attend the ceremony. When given to Chinese
dissidents it thus makes China lose face internationally. Therefore, it is likely that China wanted
to punish Norway hard to make sure something similar would not happen again in the future, as
well as to pose as a warning for other countries. It seems that China has little trouble using its
economic might against other countries if the government feels its core interests are threatened.
52
6 Conclusion
By using the gravity model of international trade as a theoretical framework, this thesis examined
to what extent there was an effect of the economic sanctions China imposed on Norway after the
Nobel Peace Prize award to Chinese dissident Liu Xiaobo in 2010. The analysis provides evidence
that the sanctions significantly affected Norwegian exports to China, with the exports being 21
percent, or 5.5 billion USD, lower than what might have been the case without the sanctions. While
the exports continued to rise after 2010, they did not rise as much as might have been the case
without the sanctions. This was probably due to the uncertain business environment created by the
sanctions, which made Norwegian and Chinese companies seek alternative markets in fear of new
or prolonged sanctions. Additionally, there is evidence that fresh/chilled salmon was targeted
specifically by the sanctions, with import procedures for Norwegian salmon becoming stricter and
more time-consuming. As a result, export of Norwegian salmon to China dropped significantly
after 2010, falling 60 percent between 2010 and 2011. Even though the salmon exports quickly
rebounded, with only slightly less being exported in 2012 than in 2010, Norwegian companies
exporting salmon were missing out on opportunities to expand. Norwegian companies had
controlled almost the whole Chinese market in 2010, but their market share quickly fell, and by
2016 it was down to five percent. Thus, the results of the thesis indicate that Norwegian
fresh/chilled salmon exports were 92 percent, or 3 billion USD, lower than they might have been
without the sanctions. The data suggests that large amounts of Norwegian salmon was exported to
Vietnam and then smuggled into China after 2010. As such Norway still had a large share of the
market, but it is difficult to prove exactly how much salmon was re-exported to China via Vietnam.
Furthermore, it is likely that entering the Chinese market via Vietnam is a more cumbersome and
less profitable way for Norwegian companies.
Seen from the perspective of China’s sanctions policy, the sanctions imposed on Norway
after 2010 fit well into China’s foreign policy strategy. China primarily uses economic sanctions
against countries that threaten its core interests, which was the case of the 2010 Nobel Peace Prize.
Due to the importance of Liu Xiaobo for China, as well as this being the second time the Nobel
Peace Prize was given to a Chinese dissident, China decided to impose harsher sanctions on
Norway in order to send a clear message to prevent other countries to interfere with China’s core
interests and internal matters in the future.
53
As this thesis was written before trade data from 2017 was available it was not possible to
examine the effects of the normalization of the relationship between Norway and China in
December 2016. This could be an interesting topic to study. Future research could also investigate
how the salmon was sent to China via Vietnam and analyze the recent development of Norwegian
salmon exports to other countries. Finally, I hope this thesis can be an important contribution to
the research on China’s sanctions policy and China’s use of its economic power in its foreign
policy.
54
References
Afesorgbor, S. K. and Mahadevan, R. (2016). The Impact of Economic Sanctions on Income
Inequality of Target States. World Development. 83, 1-11.
Asia Sentinel. (2012). The China-Philippine Banana War. Asia Sentinel [online]. June 6. Available
at: https://www.asiasentinel.com/society/the-china-philippine-banana-war/ [Accessed March 8,
2018].
Askari, H. (2003). Economic Sanctions: Examining Their Philosophy and Efficacy. Westport, CT:
Praeger.
Baker, S. and Fermann, G. (2016). Kinas to ansikter (In Norwegian, China’s two faces) [online].
Gemini.no. Available at: https://gemini.no/kronikker/kinas-to-ansikter/ [Accessed April 28, 2018].
Baldwin, D. A. (1985). Economic Statecraft. Princeton, NJ: Princeton University Press.
Barry, M. (2016). Hanjin Sinks: A Look at the Global Shipping Crisis. Aberdeen Essentials
[online]. November 4. Available at: http://www.aberdeenessentials.com/opspro-essentials/hanjin-
sinks-a-look-at-the-global-shipping-crisis/ [Accessed April 8, 2018].
BBC (2010). China's Nobel anger as Liu Xiaobo awarded peace prize. BBC [online]. October 8.
Available at: http://www.bbc.com/news/world-asia-pacific-11505164 [Accessed May 1, 2018].
Behar, A. and Nelson, B. D. (2012). Trade Flows, Multilateral Resistance, and Firm
Heterogeneity. IMF Working Paper No. 12/297 [online]. International Monetary Fund. Available
at: https://www.imf.org/external/pubs/ft/wp/2012/wp12297.pdf [Accessed April 6, 2018].
Bergen Konfutse Institutt (2018). Bergen Konfutse Institutt. Available at: http://www.konfutse.no
[Accessed February 6, 2018].
Besedeš, T., Goldbach, S. and Nitsch, V. (2017). You’re banned! The effect of sanctions on
German cross-border financial flows. Economic Policy. 32(90), 263-318.
Blanchard, B. (2009). China warns France against award for Dalai Lama. Reuters [online]. May
9. Available at: https://www.reuters.com/article/us-china-france-dalai/china-warns-france-
against-award-for-dalai-lama-idUSTRE5461YF20090507 [Accessed April 24, 2018].
Bloomberg News (2017). China Upholding UN Sanctions Against North Korea, Trade Figures
Show. Bloomberg News [online]. November 24. Available at:
https://www.bloomberg.com/news/articles/2017-11-24/china-upholds-un-sanctions-against-
north-korea-trade-data-show [Accessed April 24, 2018].

55
Bossuyt, M. (2012). The adverse consequences of economic sanctions on the enjoyment of human
rights. Ohchr.org [online]. Available at:
http://www.ohchr.org/Documents/Events/WCM/MarcBossuyt_WorkshopUnilateralCoerciveSem
inar.pdf [Accessed April 11, 2018].
Bradsher, K. (2010). Amid Tension, China Blocks Vital Exports to Japan. The New York Times
[online]. September 22. Available at:
https://www.nytimes.com/2010/09/23/business/global/23rare.html [Accessed April 24, 2018].
CEPII (2018a). About CEPII [online]. CEPII. Available at:
http://www.cepii.fr/CEPII/en/cepii/cepii.asp [Accessed March 4, 2018].
CEPII (2018b). BACI [online]. CEPII. Available at:
http://www.cepii.fr/CEPII/en/bdd_modele/presentation.asp?id=1 [Accessed March 4, 2018].
CEPII (2018c) Gravity [online]. CEPII. Available at:
http://www.cepii.fr/CEPII/en/bdd_modele/presentation.asp?id=8 [Accessed March 4, 2018].
Chen, X. and Garcia R. J. (2016). Economic sanctions and trade diplomacy: Sanction-busting
strategies market distortion and efficacy of China’s restrictions on Norwegian salmon imports.
China Information. 30(1), 29-57.
China Daily (2017). New normal in economic development. China Daily [online]. October 5.
Available at: http://www.chinadaily.com.cn/china/19thcpcnationalcongress/2017-
10/05/content_32869258.htm [Accessed April 7, 2018].
Daoudi, M. S. and Dajani, M. S. (1983). Economic Sanctions: Ideals and Experiences. London:
Routledge.
Deardorff, A. (1998). Determinants of Bilateral Trade: Does Gravity Work in a Neoclassical
World? In J. Frankel (ed.) The Regionalization of the World Economy. Chicago: University of
Chicago Press. pp. 7-32.
Dørum, Ø. (2012). Hva betyr Kinas vekst for norsk økonomi? (In Norwegian, What does China’s
growth means for the Norwegian economy?). In J. I. Bekkevold & H. Kristoffersen (eds.) Kinas
økonomi (In Norwegian, China’s Economy). Oslo: Gyldendal Akademisk. pp. 19–42.
Economic sanctions (2012). In: Collins English Dictionary. Available at:
https://www.collinsdictionary.com/dictionary/english/economic-sanctions [accessed April 18,
2018].
Embassy of the People’s Republic of China in the Kingdom of Norway (2018). China and Norway
[online]. Embassy of the People’s Republic of China in the Kingdom of Norway. Available at:
http://no.china-embassy.org/eng/zngx/t110722.htm [Accessed January 4, 2018].

56
Evenett, S. J. (2002). The impact of economic sanctions on South African exports. Scottish Journal
of Political Economy. 49(5), 557-573.
Fairbank, J. K. and Goldman, M. (2006). China: A new history. 2nd enl. ed. Cambridge, MA:
Belknap Press of Harvard University Press.
Feenstra, R. C. (2016). Advanced International Trade: Theory and Evidence. 2nd ed. Princeton,
NJ: Princeton University Press.
Fravel, M. T. (2011). China’s Strategy in the South China Sea. Contemporary Southeast Asia.
33(3), 292-319.
Fuchs, A. and Klann, N-H. (2013). Paying a visit: The Dalai Lama effect on international trade.
Journal of International Economics. 91(1), 164-177.
Glomnes, L. M. (2018). Aftenposten-journalist Kristoffer Rønneberg får ikke visum til Kina (In
Norwegian, Aftenposten journalist Kristoffer Rønneberg not getting visa to China). Aftenposten
[online]. April 13. Available at: https://www.aftenposten.no/verden/i/7lg4LK/Aftenposten-
journalist-Kristoffer-Ronneberg-far-ikke-visum-til-Kina [Accessed April 13, 2018].
Gooch, L. (2009). Asia Free-Trade Zone Raises Hopes, and Some Fears About China. New York
Times [online]. December 31. Available at:
https://www.nytimes.com/2010/01/01/business/global/01trade.html [Accessed April 8, 2018].
Gåsemyr, H. J. and Sverdrup-Thygeson, B. (2017). Chinese Investments in Norway: A Typical
Case despite Special Circumstances. In J. Seaman, M. Huotari and M. Otero-Iglesias (eds.)
Chinese Investment in Europe: A Country-Level Approach. ETNC Report, December 2017
[online]. Paris: French Institute of International Relations. Available at:
https://www.ifri.org/sites/default/files/atoms/files/etnc_reports_2017_final_20dec2017.pdf
[Accessed April 28, 2018].
Haidar, J. I. (2017). Sanctions and export deflection: evidence from Iran. Economic Policy. 32(90),
319-355.
Head, K. and Mayer T. (2014). Gravity equations: Workhorse, toolkit, and cookbook. In E.
Helpman, K. Rogoff and G. Gopinath (eds.) Handbook of International Economics, Vol 4. Oxford:
North Holland, pp. 131-195.
Herszenhorn, D. M. (2017). Putin extends counter-sanctions against EU. Politico [online]. June
30. Available at: https://www.politico.eu/article/putin-extends-counter-sanctions-against-eu/
[Accessed May 7, 2018].
Higgins, A. (2012). In Philippines, banana growers feel effect of South China Sea dispute. The
Washington Post [online]. June 10. Available at:
https://www.washingtonpost.com/world/asia_pacific/in-philippines-banana-growers-feel-effect-

57
of-south-china-sea-
dispute/2012/06/10/gJQA47WVTV_story.html?noredirect=on&utm_term=.82decf890ece
[Accessed April 24, 2018].
Hong, L. (2012). Foreign Ministry Spokesperson Hong Lei's Regular Press Conference on June
21, 2012 [online]. Permanent Mission of the People’s Republic of China to the UN. Available at:
http://www.china-un.org/eng/fyrth/t945296.htm [Accessed April 23, 2018].
Hovi, J. (2001). Hvorfor økonomiske sanksjoner virker – tross alt (In Norwegian, Why economic
sanctions work – after all). Internasjonal politikk. 59(4), 509-524.
Hufbauer, G. C., Schott, J. J. and Elliot, K. A. (1990). Economic Sanctions Reconsidered: History
and Current Policy. 2nd ed. Washington, DC: Institute for International Economics.
Hufbauer, G. C., Schott, J. J., Elliot, K. A. and Oegg, B. (2007). Economic Sanctions
Reconsidered. 3rd ed. Washington, DC: Institute for International Economics.
Jacobs, A. (2008). Anti-French Boycott Falters in China. The New York Times [online]. May 2.
Available at: https://www.nytimes.com/2008/05/02/world/asia/02china.html [Accessed April 24,
2018].
Jensen, S. (2016). Utfordringer for norsk økonomi (In Norwegian, Challenges for the Norwegian
economy) [online]. The Government of Norway. Available at:
https://www.regjeringen.no/no/aktuelt/utfordringer-for-norsk-okonomi/id2474237/ [Accessed
April 7, 2018].
Kaempfer W. H. and Lowenberg, A. D. (1992). International Economic Sanctions. Boulder, CO:
Westview.
Kilian, L. (2015). How has the shale oil affected the global oil price? World Economic Forum
[online]. January 14. Available at: https://www.weforum.org/agenda/2015/01/how-has-shale-oil-
affected-the-global-oil-price/ [Accessed April 27, 2018].
Kim, C. and Blanchard, B. (2017). China, South Korea agree to mend ties after THAAD standoff.
Reuters [online]. October 31. Available at: https://www.reuters.com/article/us-northkorea-
missiles/china-south-korea-agree-to-mend-ties-after-thaad-standoff-idUSKBN1D003G
[Accessed on April 24, 2018].
Kolstad, I. (2016). Too big to fault? Effects of the 2010 Nobel Peace Prize on Norwegian exports
to China and foreign policy. CMI Working Paper 2016: 3 [online]. Bergen: Chr. Michelsen
Institute. Available at: https://www.cmi.no/publications/5805-too-big-to-fault [Accessed January
4, 2018].

58
Krekling, D. V. and Kolstadbråten, I. M. (2012). Slik straffer Kina Norge (In Norwegian, This is
how China punishes Norway). NRK [online]. June 12. Available at:
https://www.nrk.no/norge/slik-straffer-kina-norge-1.8195289 [Accessed May 4, 2018].
Leamer, E. E. and Levinsohn, J. (1995). International trade theory: the evidence. In G. M.
Grossman and K. Rogoff (eds.) Handbook of International Economics, vol 3. Amsterdam: North
Holland, pp. 1339-1394.
Lee, Y. S. (2018). International isolation and regional inequality: Evidence from sanctions on
North Korea. Journal of Urban Economics. 103, 34-51.
Lewis, M. (2011). Norway's salmon rot as China takes revenge for dissident's Nobel Prize.
Independent [online]. October 5. Available at:
https://www.independent.co.uk/news/world/europe/norways-salmon-rot-as-china-takes-revenge-
for-dissidents-nobel-prize-2366167.html [Accessed May 4, 2018].
Lohne, J. (2016). Statssekretær i UD hilste på Kinas president Xi Jinping (In Norwegian, State
Secretary from Ministry of Foreign Affairs met China’s president Xi Jinping). Aftenposten
[online]. January 17. Available at: https://www.aftenposten.no/verden/i/L3A1/Statssekretar-i-UD-
hilste-pa-Kinas-president-Xi-Jinping [Accessed January 5, 2018].
Los Angeles Times (1992). China Shutting French Consulate Over Reported Jet Sale. Los Angeles
Times [online]. December 24. Available at: http://articles.latimes.com/1992-12-24/news/mn-
3575_1_china-french-sale [Accessed on April 24, 2018].
Lysvold, S. (2015). Kina innfører nye restriksjoner på import av norsk laks (In Norwegian, China
imposes new restrictions on import of Norwegian salmon), NRK [online]. March 18. Available at:
https://www.nrk.no/nordland/kina-innforer-nye-restriksjoner-pa-import-av-norsk-laks-
1.12267803 [Accessed April 30, 2018].
Masters, J. (2017) What Are Economic Sanctions? [online]. Council on Foreign Relations.
Available at: https://www.cfr.org/backgrounder/what-are-economic-sanctions [Accessed April
10, 2018].
Mayer, T. and Zignago, S. (2011). Notes on CEPII’s distances measures: The GeoDist database.
CEPII Working Paper 2011-25 [online]. Paris: Centre d'Études Prospectives et d'Informations
Internationales. Available at: http://www.cepii.fr/PDF_PUB/wp/2011/wp2011-25.pdf [Accessed
March 4, 2018].
Mikalsen, K. (2015). Nå kan Norge igjen selge laks til Kina (In Norwegian, Now Norway can sell
salmon to China again). Aftenposten [online]. April 17. Available at:
https://www.aftenposten.no/okonomi/i/wQxG/Na-kan-Norge-igjen-selge-laks-til-Kina [Accessed
April 30, 2018].
59
Milne, R. (2013). Norway sees Liu Xiaobo’s Nobel Prize hurt salmon exports to China. Financial
Times [online]. August 15. Available at: https://www.ft.com/content/ab456776-05b0-11e3-8ed5-
00144feab7de [Accessed May 4, 2018].
MOFCOM (2018). China-Norway FTA [online]. Ministry of Commerce of the People’s Republic
of China. Available at: http://fta.mofcom.gov.cn/topic/ennorway.shtml [Accessed January 4,
2018].
Morgan, T. C., Bapat, N. and Kobayashi, Y. (2014). Threat and imposition of economic sanctions
1945–2005: Updating the TIES dataset. Conflict Management and Peace Science. 31(5), 541-558.
Morison, O. (2011). China wants Norway to say sorry. Barents Observer [online]. May 5.
Available at: http://barentsobserver.com/en/norway/china-wants-norway-say-sorry [Accessed
May 8, 2018].
Mullen, J. (2013). Philippines takes territorial fight with China to international tribunal. CNN
[online]. January 23. Available at: https://edition.cnn.com/2013/01/22/world/asia/philippines-
china-territorial-dispute/index.html [Accessed May 8, 2018].
Mullen, J. (2017). China can squeeze its neighbors when it wants. Ask South Korea. CNN Money
[online]. August 30. Available at: http://money.cnn.com/2017/08/30/news/economy/china-
hyundai-south-korea-thaad/index.html [Accessed April 24, 2018].
Neuenkirch, M. and Neumeier, F. (2015). The impact of UN and US economic sanctions on GDP
growth. European Journal of Political Economy. 40, 110-125.
Nobel Media AB (2014a). The Nobel Peace Prize for 2010 [online]. Nobelprize.org. Available at:
https://www.nobelprize.org/nobel_prizes/peace/laureates/2010/press.html [Accessed February 6,
2018].
Nobel Media AB (2014b). The Nobel Peace Prize for 1989 [online]. Nobelprize.org. Available at:
https://www.nobelprize.org/nobel_prizes/peace/laureates/1989/ [Accessed February 6, 2018].
Nobel Media AB (2018a). The Nobel Peace Prize [online]. Nobelprize.org. Available at:
https://www.nobelprize.org/nobel_prizes/peace/ [Accessed February 6, 2018].
Nobel Media AB (2018b). Nomination and Selection of Peace Prize Laureates [online].
Nobelprize.org. Available at: https://www.nobelprize.org/nomination/peace/ [Accessed May 8,
2018].
Nordic Centre (2018). Nordic Centre. Available at: http://www.nordiccentre.net/ [Accessed
February 6, 2018].
Norges Bank (2018). Valutakurser (In Norwegian, Exchange rates) [online]. Norges Bank.
Available at: https://www.norges-bank.no/Statistikk/Valutakurser/ [Accessed April 27, 2018].

60
Norwegian Ministry of Foreign Affairs (2010). Norway's human rights dialogue with China
[online]. Norwegian Ministry of Foreign Affairs. Available at:
https://www.regjeringen.no/en/historical-archive/Stoltenbergs-2nd-Government/Ministry-of-
Foreign-Affairs/tema-og-redaksjonelt-innhold/temasider/2011/hr_dialogue_china/id447061/
[Accessed January 4, 2018].
Pape, R. A. (1997). Why Economic Sanctions Do Not Work. International Security. 22(2), 90-
136.
Pape, R. A. (1998). Why Economic Sanctions Still Do Not Work. International Security. 23(1),
66-77.
Path, K. (2012). China's Economic Sanctions against Vietnam, 1975–1978. The China Quarterly.
212, 1040-1058.
PIIE (2018). Summary of Economic Sanctions Episodes, 1914-2006 [online]. Peterson Institute
for International Economics. Available at: https://piie.com/summary-economic-sanctions-
episodes-1914-2006 [Accessed April 13, 2018].
Pond, A. (2017). Economic Sanctions and Demand for Protection. Journal of Conflict Resolution.
61(5), 1073-1094.
Radcliffe, B. (2016). How Economic Sanctions Work [online]. Investopedia. Available at:
https://www.investopedia.com/articles/economics/10/economic-sanctions.asp [Accessed April
11, 2018].
Reilly, J. (2012). China’s Unilateral Sanctions. The Washington Quarterly. 35(4), 121-133.
Regjeringen (2017). Statsministeren i Shanghai (In Norwegian: The Prime Minister in Shanghai)
[online]. The Government of Norway. Available at:
https://www.regjeringen.no/no/aktuelt/statsministeren-i-shanghai/id2549225/ [Accessed April 10,
2018].
Remen, A. C., Aanensen, K, Hotvedt, S. K. and Mon, S. T. (2014). Dalai Lama: Dere representerer
folket (In Norwegian, The Dalai Lama: You represent the people). NRK [online]. May 9. Available
at: https://www.nrk.no/norge/dalai-lama-pa-stortinget-1.11706626 [Accessed April 10, 2018].
Reuters (2016). Norway, China normalize ties after Nobel Peace Prize row. Reuters [online].
December 19. Available at: https://www.reuters.com/article/us-norway-china/norway-china-
normalize-ties-after-nobel-peace-prize-row-idUSKBN1480R4 [Accessed April 10, 2018].
Ripley, W. and McKirdy, E. (2018). Kim Jong Un: North Korea no longer needs nuclear tests.
CNN [online]. April 22. Available at: https://edition.cnn.com/2018/04/20/asia/north-korea-closes-
nuclear-site/index.html [Accessed May 9, 2018].
61
Rogoff, K. (2016). What’s behind the drop in oil prices? World Economic Forum [online]. March
2. Available at: https://www.weforum.org/agenda/2016/03/what-s-behind-the-drop-in-oil-prices/
[Accessed April 27, 2018].
Rothko Research (2016). Quick Review of the Chinese Yuan History [online]. Rothko Research
Ltd. Available at: https://rothkoresearch.com/2016/06/08/quick-review-of-the-chinese-yuan-
history/ [Accessed April 27, 2018].
Rønneberg, K. (2012). ‘Om vi svetter I UD nå? Neida.’ (In Norwegian: ‘Are we sweating in the
Foreign Minstry now? Not at all.’). Aftenposten [online]. June 30. Available at:
https://www.aftenposten.no/norge/i/b5qO5/Om-vi-svetter-i-UD-na-Neida#.UaTJYZzEnwk
[Accessed January 5, 2018].
Sanderson, H. (2015). Metals prices fall to multiyear lows. Financial Times [online]. November
23. Available at: https://www.ft.com/content/1329bbc0-91d3-11e5-94e6-c5413829caa5
[Accessed April 8, 2018].
Shehabaldin, A. and Laughlin, W. M. (1999). Economic sanctions against Iraq: Human and
economic costs. The International Journal of Human Rights. 3(4), 1-18.
Shepherd, B. (2016). The Gravity Model of International Trade: A User Guide (An updated
version). United Nations publication [online]. Bangkok: UNESCAP. Available at:
http://www.unescap.org/sites/default/files/GravityUserGuide-REVISED-02.pdf [Accessed April
6, 2018].
Shin, G., Choi, S-W. and Luo, S. (2016). Do economic sanctions impair target economies?
International Political Science Review. 37(4), 485-499.
Skivenes, I. (2011). No Nobel effect yet [online]. Statistics Norway. Available at:
https://www.ssb.no/en/utenriksokonomi/artikler-og-publikasjoner/no-nobel-effect-yet [Accessed
April 29, 2018].
Sverdup-Thygeson, B. (2016). Norden og Kina: «Forbrytelse og straff» Forholdet mellom Norge
og Kina (In Norwegian, Northern Europe and China: «Crime and Punishment» The relationship
between Norway and China). Internasjonal Politikk. 74(3), 1–12.
Taplin, G. B. (1967). Models of World Trade. IMF Staff Papers No. 14, pp. 433-455.
The Norwegian Nobel Institute (2018): Nobel Committee [online]. The Norwegian Nobel Institute.
Available at: https://www.nobelpeaceprize.org/no/Organisasjon/Den-Norske-Nobelkomite
[Accessed February 6, 2018].
Travel China Guide (2018). Travel China Guide. Available at: https://www.travelchinaguide.com/
[Accessed April 19, 2018].
62
Trøite, J. K. (2011). Finanskomiteen avlyser Kina-tur på grunn av fredsprisbråket (In Norwegian,
The Standing Committee on Finance and Economic Affairs cancels China trip due to Peace Prize
row). NRK [online]. December 1. Available at: https://www.nrk.no/norge/finanskomiteen-avlyser-
kina-tur-1.7898327 [Accessed April 10, 2018].
University of Oslo (2018). Utvekslingsavtaler med universiteter i Kina (In Norwegian, Exchange
agreements with universities in China) [online]. University of Oslo. Available at:
http://www.uio.no/studier/utveksling/avtaler/asia/kina/ [Accessed February 6, 2018].
van Bergeijk, P. A. G. and Brakman, S (2010). The Gravity Model in International Trade:
Advances and Applications. Cambridge: Cambridge University Press.
Volodzko, D. J. (2017). China wins its war against South Korea’s US THAAD missile shield –
without firing a shot. South China Morning Post [online]. November 18. Available at:
http://www.scmp.com/week-asia/geopolitics/article/2120452/china-wins-its-war-against-south-
koreas-us-thaad-missile [Accessed on April 24, 2018].
Watts, J. (2005). Violence flares as the Chinese rage at Japan. The Guardian [online]. April 17.
Available at: https://www.theguardian.com/world/2005/apr/17/china.japan [Accessed on April 24,
2018].
Winters, L. A. and Wang, Z. K. (1994). Eastern Europe’s international trade. Manchester:
Manchester University Press.
Wolfe, L. R. (2010). Cold War Havana: Prelude to American Sanctions [online]. Cold War Studies.
Available at: https://coldwarstudies.com/2010/12/13/cold-war-havana-prelude-to-american-
sanctions/ [Accessed March 8, 2018].
Xinhua (2016). Full Text: Statement of China and Norway on normalization of bilateral relations.
Xinhua [online]. December 19. Available at: http://www.xinhuanet.com/english/2016-
12/19/c_135917147.htm [Accessed May 2, 2018].