Embed Size (px)
Citation preview

1
June 2014
SARAS – Investor Presentation

24/06/2014 Saras SpA 2
Important Notice
Saras Group’s Annual Financial Results and information are audited.
In order to give a better representation of the Group’s operating performance, and in line with the standard practice in the oil industry, the operating results (EBITDA and EBIT) and the Net Result are provided also with an evaluation of oil inventories based on the LIFO methodology (and not only according to FIFO methodology adopted by IFRS). The LIFO methodology does not include revaluations and write downs and it combines the most recent costs with the most recent revenues, thus providing a clearer picture of current operating profitability. Furthermore, for the same reason, non-recurring items and the change in “fair value” of the derivative instruments are also excluded, both from the operating results and from the Net Result. Operating results and Net Result calculated as above are called respectively “comparable” and “adjusted” and they are not subject to audit or limited review.
Certain statements contained in this presentation are based on the belief of the Company, as well as factual assumptions made by any information available to the Company. In particular, forward-looking statements concerning the Company’s future results of operations, financial condition, business strategies, plans and objectives, are forecasts and quantitative targets that involve known and unknown risks, uncertainties and other important factors that could cause the actual results and condition of the Company to differ materially from that expressed by such statements. This presentation has been prepared solely by the company.
DISCLAIMER
• Saras Group Overview
• Market Overview
• Business Segments
• Appendix

24/06/2014 Saras SpA 4
Overview of Saras Businesses
Refining1
• One of the largest high complexity refineries in the Mediterranean Sea
• 300k barrels per day of refining capacity (about 15% of Italy’s refining capacity)
• 250 kb/d FCC equivalent capacity
• More than 80% of production is of medium and light distillates
Power Generation2
• The largest liquid fuel gasification plant in the world (IGCC)
• 575 MW of installed power - conversion of heavy refining residues into clean gas
• Electricity production of approximately 4.3 - 4.4 TWh
• CIP6 tariff until 2021
Wind Energy4
• Wind farm with capacity of 96 MW in Ulassai (Sardinia)
Supply & Trading, Marketing
3
• ~150 crude cargoes supplied every year from wide range of crude sources
• Marketing activities in Italy and Spain
• 11% wholesale market share in Italy with reference to the sales of diesel/gasoil, 7% wholesale market share in Spain
• 112 retail stations in Spain
• Balanced and differentiated portfolio on sales, not only a FOB player
Other Activities5
• Presence in industrial engineering services for the oil sector
– Environmental monitoring and protection, industrial efficiency (Sartec, 141 employees)
• Gas exploration activities
– Two site permits for exploration in Sardinia (Eleonora and Igia)

24/06/2014 Saras SpA 5
52.05% 20.99%
2.26%24.71%
"COMPANY-RELATED HOLDERS" OJSC ROSNEFTEGAZ
ASSICURAZIONI GENERALI OTHER HOLDERS
Saras history and Shareholders’ structure
SARAS HISTORY
� 1962: Saras founded by Mr. Angelo Moratti
� ‘70s: Third party Processing Agreements
� ‘80s: Increase in conversion
capacity
� ’90s: Environment, new technologies and wholesale marketing
� Early 2000s: Further investments in
conversion and Power business
� 2005: Renewables
(Wind)
� 2006: Listing on Italian stock
exchange
� 2007- 09: Upgrades for
conversion, environmental and prod. quality purposes
� “Company-Related Holders” include:
� Gian Marco Moratti S.a.p.a. 25.011%
� Massimo Moratti S.a.p.a. 25.011%
� Stocks in Treasury 2.024%
� 2013: Rosneft purchase a 21% stakein Saras
� 2013: Group reorganization through contribution in kind of the Refining business from Saras to its subsidiary Sarlux
SHAREHOLDERS’ STRUCTURE (as 5th may 2014)

24/06/2014 Saras SpA 6
Saras Group: Main Events in 2013
Change in Shareholding Structure
On April 23rd the company Angelo Moratti SapA, Mr. Gian Marco Moratti and Mr. Massimo Moratti completed the sale of 13.70% of the issued share capital of Saras SpA to Rosneft JV Projects SA, an indirect 100% subsidiary of Rosneft. Subsequently, on June 14th the voluntary partial public tender offer, made by Rosneft JV Projects SA, for 7.29% of the issued share capital of Saras SpA was successfully completed. In light of the significant stake of Saras SpA purchased by Rosneft, on May 14th Mr. Igor Ivanovich Sechin was appointed director of the Board of Saras SpA. Among his various other roles, Mr. Sechin is also President and Chairman of the Management Board of Rosneft, and he can bring his important contribution to the activities of Saras Board, thanks to his extensive expertise in the oil sector, and his deep knowledge of the international markets.
Saras-Rosneft JV
On June 21st 2013, the President and Chairman of the Management Board of JSC NK Rosneft, Mr. Igor Sechin, and the CEO of Saras SpA Mr. Massimo Moratti, signed the agreement for the establishment of a 50/50 JV aimed at exploiting the potential of each party, respectively in the upstream and in the downstream segments. The recent announcement of Rosneft’s intention to purchase Morgan Stanley's oil commodity trading business, further reinforces the programmes for the development of the commercial activities, posing a new dimension to the joint initiative of Rosneft and Saras.
Corporate Restructuring
On July 1st 2013 a corporate restructuring came to completion and the Refining segment of business held by Saras SpA was successfully transferred to its subsidiary Sarlux Srl, in order to concentrate in a single company all the industrial activities carried out in the Sarroch industrial site, achieving organizational and operational synergies and efficiencies. At the end of the reorganization, Saras strengthened its coordination role within the Group, while still retaining direct control over the activities related to supply & trading of crude oil and refined products. The project was implemented through the contribution in kind from Saras SpA to Sarlux Srl of all the assets and liabilities strictly connected with the Refining segment of business. The sworn appraisal, required by Art.2465 of the Civil Code, prepared by two independent statutory auditors, assessed that the economic value of the business segment consigned to Sarlux Srl is at least equal to the book value of the Refining assets and liabilities.

24/06/2014 Saras SpA 7
Saras Group: Key Financial Highlights
Gearing: Net Debt / Equity
EUR million 2011 2012 2013
Revenues 11,037 11,889 11,230
EBITDA reported 394.3 176.0 71.7
EBITDA comparable1 267.8 219.7 115.5
EBIT reported 181.0 (68.1) (354.2)
EBIT comparable1 54,5 11.6 (77.9)
Net Financial Expenses (61.6) (51.9) (29.4)
Profit before Taxes 119.4 (120.0) (383.6)
Net Income reported 58.8 (88.6) (271.1)
Adjustments (76.5) 54.9 186.9
Adjusted2 Net Income (17.7) (33.7) (84.1)
Net Financial Position (653) (218) (8)
Net Debt / EBITDA reported
1. Calculated using IFRS accounting principles, deducting non recurring items, change of the fair value of derivative instruments, and based on LIFO methodology (which does not include devaluation & revaluation of oil inventories)
2. Adjusted for differences between LIFO and FIFO inventories net of taxes, change of derivatives fair value net of taxes, and non-recurring items net of taxes
(**) (**) 2013 EBIT impacted by write-off of CIP6/92 contract (EUR 232 ml) due to new calculation methodology required by Leg. Decree 69/2013
(*) (*) 2012 Results revised according to IAS 19

24/06/2014 Saras SpA 8
Saras Group: Key Financial Highlights
(*)(*)
(**)(**)
(*) Other net liabilities are mainly composed by Deferred Income posted by Sarlux (and related to the contract with GSE for the sale of the electricity produced),
net tax liabilities, provisions for employee benefits and by other net current liabilities.
Non current
assets
1,521Equity
921
Other net
liabilities
582
Net Debt
8
Trade and other
payables
1,606
Inventories
926
Trade
Receivables
671
USES of FUNDS SOURCES
Consolidated Balance Sheet as at 31.12.2013
(EUR million)
Non current
assets
1,724 Equity
1,197
Other net
liabilities
657
Net Debt
218
Trade and other
payables
1,394
Inventories
921
Trade
Receivables
820
USES of FUNDS SOURCES
Consolidated Balance Sheet as at 31.12.2012
(EUR million)

24/06/2014 Saras SpA 9
12 20 27 12 10 319 17
108
177 182244
93 65 97 87
9
1146
57
5 58 4
1
2
2
4
214
5 2
130
210
257
317
129105
119 110
0
50
100
150
200
250
300
350
2006 2007 2008 2009 2010 2011 2012 2013M
€
POWER GENERATION REFINING
MARKETING WIND & OTHER ACTIVITIES
Saras Group: CAPEX and Dividend Policy
CAPEX BY BUSINESS SEGMENT
DIVIDEND POLICY
Dividend Payout:
between 40% and
60% of Adjusted
Net Income
(*) Wind segment
CAPEX included
from 2008, since the
business was not
fully consolidated in
previous years
(*)

24/06/2014 Saras SpA 10
31%
30%
14%
25%
Bank Guarantees Short Term Loans
M/L Term Loans Factoring
Saras Group: Debt Profile
LONG-TERM DEBT MATURITY PROFILE (as of 31st December 2013)
NOTE: all debt is unsecured, except for Sardeolica’s (Project Financing)
Group Credit lines
� Total credit lines of the Group amount to about EUR 3.0 billion (of which EUR 0.7 billion committed)
9 6 4 20
250
26 31
29
56
28
34 38
283
76
28
0
50
100
150
200
250
300
2013 2014 2015 2016 2017
M€
SARAS Group: Long term Debt Maturity Profile
M/L Sardeolica M/L Saras Energia Bond M/L Loans SARAS SpA
29 23 20
250 250
145113
84
28
431
390
106
300
0
50
100
150
200
250
300
350
400
450
500
Dec-13 Dec-14 Dec-15 Dec-16 Dec-17
M€
SARAS Group: Long term Debt Outstanding
M/L Sardeolica M/L Saras Energia Bond M/L Loans SARAS SpA

24/06/2014 Saras SpA 11
Saras Group: Risk Management Activity
(*)(*)
(**)(**)
Risk of changes in prices and cash flows
To mitigate the risks arising from oil prices variations (which impact on the refining margins and on the oil stock value), the company enters into derivative contracts in commodities, which involve the forward buying and selling of crude oil and products.
Exchange rate risk
To reduce both its exchange rate risk in future transactions and the risk inherent in assets and liabilities denominated ina different currency to the functional currency of each entity, the company sets up derivative instruments which consist of the forward buying and selling of foreign currencies (US dollars). Transactions expressed in currencies other than US dollars are not significant and could only have a very low impact on the results for the year.
Interest rate risk
The risks relating to changes in cash flows caused by changes in interest rates arise from loans. The main loan agreements outstanding have been entered into at variable market rates. The company’s policy is to use derivative instruments to reduce the risk of changes in interest cash flows.
Credit risk
The market in which the company operates mainly consists of multinational companies operating in the oil industry. Transactions entered into are generally settled in very quickly and are often guaranteed by prime leading banks. Furthermore, loans are systematically and promptly monitored on a daily basis by the Finance department. This risk is minimal and does not constitute a significant variable in the business in which the company operates.
Risks of interruption of production
The complexity and modularity of its systems limit the negative effects of unscheduled shutdowns. The safety plans in place (which are continuously improved) reduce any risks of accident to a minimum: in addition Saras has a major programme of insurance cover in place to offset such risks.

• Saras Group Overview
• Market Overview
• Business Segments
• Appendix

24/06/2014 Saras SpA 13
Source: IHS 2014
� Saras refinery has the 3rd highest Nelson Complexity Index (10.3) among large EU refiners
� Majority of recently shutdown refineries had low complexity and small distillation capacity (less than 100,000 bl/day)
� Refineries under the red spotted line will continue to face the hardest competitive pressure
Market Overview: Competitive positioning – Nelson Complexity Index
SARAS
Average
capacity
Average complexity index
Nelson Complexity Index (NCI): describes a measure of the secondary conversion capacity of a petroleum refinery relative to the primary distillation capacity. It was developed by Wilbur L. Nelson in a series of articles that appeared in the Oil & Gas Journal from 1960 to 1961. The NCI assigns a complexity factor to each major piece of refinery equipment based on its complexity and cost in comparison to crude distillation, which is assigned a complexity factor of 1.0. The complexity of each piece of refinery equipment is then calculated by multiplying its complexity factor by its throughput ratio as a percentage of crude distillation capacity. Adding up the complexity values assigned to each piece of equipment, including crude distillation, determines a refinery’s complexity on the NCI
24/06/2014 Saras SpA 14
Market Overview – Outlook for Crude Oil supply
US Crude Oil
� A lift of the US export ban for crude oil would reduce the spread between Brent and WTI prices
� Higher WTI prices in the US would in turn reduce product crack spreads, closing arbitrage opportunities to Europe
� Benefits for EU refiners should be twofold: lower US product exports, and larger availability of light sweet grades
Crude Oil from Other Regions
� Several crude oil producing and exporting countries are currently forced out of the market, due to geopolitical reasons
� Renewed availability of Libyan and Iranian crude oils, will eventually normalize and de-risk oil markets
� Heavy-light price differentials should widen again, with greater benefits for the complex and flexible refineries

24/06/2014 Saras SpA 15
Market Overview – Outlook for EU Products Demand
� Middle distillates demand is forecast to increase from about 52% of total product demand in 2012 to 59% by 2030
� Gasoline demand over the same period is projected to fall from 13% down to 8%
� The decline in gasoline demand is likely to have a significant impact on several European refiners, resulting in the rationalisation of some gasoline-making facilities, especially in inland markets
with few export opportunities
� Despite the projected increases in hydrocracking capacity, the continued rise in European demand for middle distillates is forecast to result in continued volumes of net imports for both jet/kerosene and gasoil and dieselSource: IHS 2014
Source: IHS 2014

• Saras Group Overview
• Market Overview
• Business Segments
• Financials
• Appendix

24/06/2014 Saras SpA 17
Refining Segment – Key Financial Performance
EUR million 2011 2012 2013
EBITDA 123.7 (91.2) (153.6)
Comparable(*) EBITDA (9.9) (61.2) (127.5)
EBIT 13.5 (197.0) (261.0)
Comparable(*) EBIT (120.1) (167.0) (234.9)
CAPEX 64.6 97.0 87.1
REFINERY RUNS
Thousand tons 14,006 13,309 12,980
Million barrels 102.2 97.2 94.8
Thousand barrels/day 280 265 260
EMC benchmark (1.1) 0.9 (1.2)
Saras refining margin 2.8 2.1 1.5
(*) Comparable figures are not subject to Audit
EBITDA Comparable (by segment)
-10
-61
-128
4532 34
219 227
182
14 20 230 2.4 4.2
-150
-100
-50
0
50
100
150
200
250
2011 2012 2013
EU
R m
illi
on
Refining Marketing Power Wind Other activities

24/06/2014 Saras SpA 18
Refinery margins: (comparable Refining EBITDA + Fixed Costs) / Refinery Crude Runs in the periodIGCC margin: (Power Gen. EBITDA + Fixed Costs) / Refinery Crude Runs in the periodEMC benchmark: margin calculated by EMC (Energy Market Consultants) based on a crude slate made of 50% Urals and 50% Brent
Refining segment – Historical Margins for Refining and IGCC

24/06/2014 Saras SpA 19
Refining Segment - Saras Key Differentiating Factors

24/06/2014 Saras SpA 20
1
3 CDU
(Crude Distillation Unit)
2 VDU
(Vacuum Distillation Unit)
2 MHC(Mild Hydro
Cracking)
1 FCC(Fluid Catalytic Cracker)
Heavy distillates
T1
T2
T3
V1
V2
Heavy residue
MHC1
MHC2
FCC
2 REFORMERSCCR
TAR
1 VSB
(Visbreaker)VSB
3 GASIFIERS
G1G2 G3 SYNGAS
3 GAS-STEAM TURBINES
ELECTRICITY
4 UNITS FOR GASOIL DESULPHURIZATION
DIESEL
Hydrogen
Hyd
rog
en
CRUDE OIL
Atmospheric and Vacuum distillation Conversion units Desulphurization & finishing
Virgin Naphtha
IGCC Power plant
Ste
am
1 ETHERIFICATION
GASOLINE1 GASOLINE DESULPHURISATION
1 ALKYLATION
Refining Segment – Simplified Refinery and IGCC Scheme
� Saras leading position stems from 5 competitive advantages: size, complexity, integration, flexibility and location
ReformingPolimeri

24/06/2014 Saras SpA 21
� Geographic location in the centre of the Mediterranean sea allows easier and cheaper crude oil procurement:
� Reduced transportation costs
� Enhanced flexibility of supply
� Enjoy recent trends in crude oil availability
LOCATION AT THE HEART OF MAIN CRUDE OIL ROUTES…
Origins of Crude purchased
(2013)
Refining Segment – Crude Supply
Origins of Crude purchased
(2010)
Ability to process large variety of crude

24/06/2014 Saras SpA 22
…AND CLOSE TO THE MAIN MARKETS FOR REFINED OIL PRODUCTS
� Structural shortage of middle distillates in MED
� Saras is close to Italian coasts, South of France, North Africa and Med Spain
� Structural surplus of gasoline in Europe
� Italian Islands are favourite suppliers of growing markets in North Africa and Middle East
Total product Sales by geography
(2013)
Refining Segment – Product Sales
Total product Sales by geography
(2010)
Flexibility in logistics and in capturing new markets

24/06/2014 Saras SpA 23
14.6 15.5 13.3 14.3 14.0
� Gasoil: Desulfurisation capacity and H2 availability allows for more than 80% of production at 10ppm (rest of the pool is mainly 0.1%S)
� Gasoline: Petchem integration generates a large part of production as low Benzene/Aromatics
� Fuel oil: Negligible HSFO production, LSFO mainly for internal consumption or local market
� Special products: Upgraded to petrochemical market value (propylene, aromatics, waxy dist.)
Refining Segment - High Quality Product Slate
20
40
60
80
100
0
201220112010200920082007
13.3 MMt
Product Slate
Consumption and Loss TAR Fuel Oil & Others
Middle Distillates Naptha + Gasoline LPG
13.0
2013

24/06/2014 Saras SpA 24
Power Generation Segment – Key Financial Performance
EUR million 2011 2012 2013
Comparable(*) EBITDA 219.2 226.8 182.4
Comparable(*) EBIT 139.9 147.0 109.5
EBITDA IT GAAP 115.8 178.3 184.8
EBIT IT GAAP 71.3 133.2 131.2
CAPEX 31.2 8.7 16.9
ELECTRICITY PRODUCTION MWh/1000 4,012 4,194 4,217
POWER TARIFF €cent/kWh 10.6 12.2 11.9
POWER IGCC MARGIN $/bl 4.3 4.2 3.8
(*) Comparable figures are not subject to Audit
EBITDA Comparable (by segment)
-10
-61
-128
4532 34
219 227
182
14 20 230 2.4 4.2
-150
-100
-50
0
50
100
150
200
250
2011 2012 2013
EU
R m
illi
on
Refining Marketing Power Wind Other activities

24/06/2014 Saras SpA 25
2005 2006 2007 2008 2009 2010 2011 2012 2013
Brent DTD 54.5 65.4 72.7 97.7 62.0 79.7 111.4 111.6 108,6
USD / EUR
Forex1.245 1.256 1.370 1.471 1.395 1.326 1.392 1.285 1.328
Power Generation Segment - The CIP6 / 92 Power Tariff
� Sarlux economics based on attractive regulated tariff (CIP6/92 tariff)
� 20-year sale contract with National Grid operator (GSE) and priority of dispatching,
until 2021
� The tariff had 3 components:
• Capex + Opex: inflation indexed and valid until 2021
• Fuel Cost: valid until 2021, indexed to oil prices until 2013, and indexed to gas prices starting from 2014
• Incentive Fee: indexed to inflation, and valid only for the first 8 years of production (Apr 2001 – Apr 2009)
� Full reimbursement of CO2 costs for the entire duration of the CIP6/92 contract
• D.M. 2nd Dec 2009 offers a framework for negotiating an early exit from CIP6/92 scheme, on a voluntary basis. Saras is currently evaluating its options
Eur cent / KWhour
Fuel (Indexed to Brent)
Incentive (until Apr. 2009)
Capex + Opex (Indexed to Inflation)
Average Italian Electricity Price (1)
1.The Italian average electricity price (PUN) can be found on the GME website at: www.mercatoelettrico.org
CIP6/92 Power Tariff vs. Italian Electricity price

24/06/2014 Saras SpA 26
Marketing Segment – Key Financial Performance
EUR million 2011 2012 2013
EBITDA 37.4 18.0 16.0
Comparable(*) EBITDA 44.5 31.7 33.7
EBIT 25.2 (29.8) 7.6
Comparable(*) EBIT 32.3 19.8 25.3
CAPEX 4.8 8.2 3.7
SALES (THOUSAND TONS)
ITALY 2,367 2,210 2,342
SPAIN 1,791 1,584 1,310
TOTAL 4,158 3,794 3,652
(*) Comparable figures are not subject to Audit
EBITDA Comparable (by segment)
-10
-61
-128
4532 34
219 227
182
14 20 230 2.4 4.2
-150
-100
-50
0
50
100
150
200
250
2011 2012 2013
EU
R m
illi
on
Refining Marketing Power Wind Other activities

24/06/2014 Saras SpA 27
Spain: Saras Energia
Spain wholesale• 112k m3 distillates storage in
Cartagena • ~8% share of wholesale market
Spain retail• 114 service stations
– ~70% fully owned– ~30% long term leased
• ~280k m3 sold (2011)
• Mainly located in the Med tributary, with CLH Depots regional support
• 200kt/year biodiesel plant
Main logistics flowsItaly:
Arcola Petrolifera
Arcola La Spezia (owned)• 200k m3 storage for diesel
and gasoline• ~11% share of wholesale market• Sea Terminal for up to 50kt DWT
vessels• Logistics available for bunkering
activitiesTransfer depots network (3rd party)• Logistics efficiently covers all richest
Northern regions and majority of the center
• Monthly supply to Genova, La Spezia, Livorno, Roma, Napoli, Ravenna, Venezia and Trieste
• Strong position in La Spezia, Napoli, Ravenna, Trieste
Reaching retailers• I.e. resellers, unbranded service
stations, supermarket chains, etc…
Cartagena
Barcelona
Valencia
Gasoil/ GasolineOwned depot
Third parties depot
Palma
Sarroch
Arcola
Oristano
Roma
Ravenna
Venezia
Livorno
Genova
Trieste
Napoli
Lacchiarella
Arquata
Sales (kt)
2008 2009 2010 2011 2012 2013
ITALY 1,176 1,239 1,731 2,367 2,210 2,342
Sales (kt)
2008 2009 2010 2011 2012 2013
SPAIN 2,845 2,733 2,535 1,791 1,584 1,310
Marketing - Overview of the Italian and Spanish Wholesale
An Integrated MED Market Player Offering Integrated Services

24/06/2014 Saras SpA 28
Wind Segment – Key Financial Performance
EUR million 2011 2012 2013
Comparable(*) EBITDA 14.0 20.0 22.7
Comparable(*) EBIT 3.8 9.7 18.3
ELECTRICITY PRODUCTION MWh 140,897 171,050 197,042
POWER TARIFF €cent/kWh 7.5 7.1 5.7
GREEN CERTIFICATES €cent/kWh 8.0 8.0 8.9
(*) Comparable figures are not subject to Audit
EBITDA Comparable (by segment)
-10
-61
-128
4532 34
219 227
182
14 20 230 2.4 4.2
-150
-100
-50
0
50
100
150
200
250
2011 2012 2013
EU
R m
illi
on
Refining Marketing Power Wind Other activities

24/06/2014 Saras SpA 29
Wind Segment
Ulassai Wind FarmSardinia
� 96 MW (48 Vestas aero-generators), with
production of approx. 190,000 MWh per year
� Operations started at the end of 2005
� Green Certificates granted until 2016, then feed-in premium tariff until 2018 (same value
as Green Certificates)
� seven more years of feed-in premium tariff (2025) on the last units installed (about 10% of total production)
Sardeolica
ULASSAI WIND FARM

• Saras Group Overview
• Market Overview
• Business Segments
• Appendix
24/06/2014 Saras SpA 31
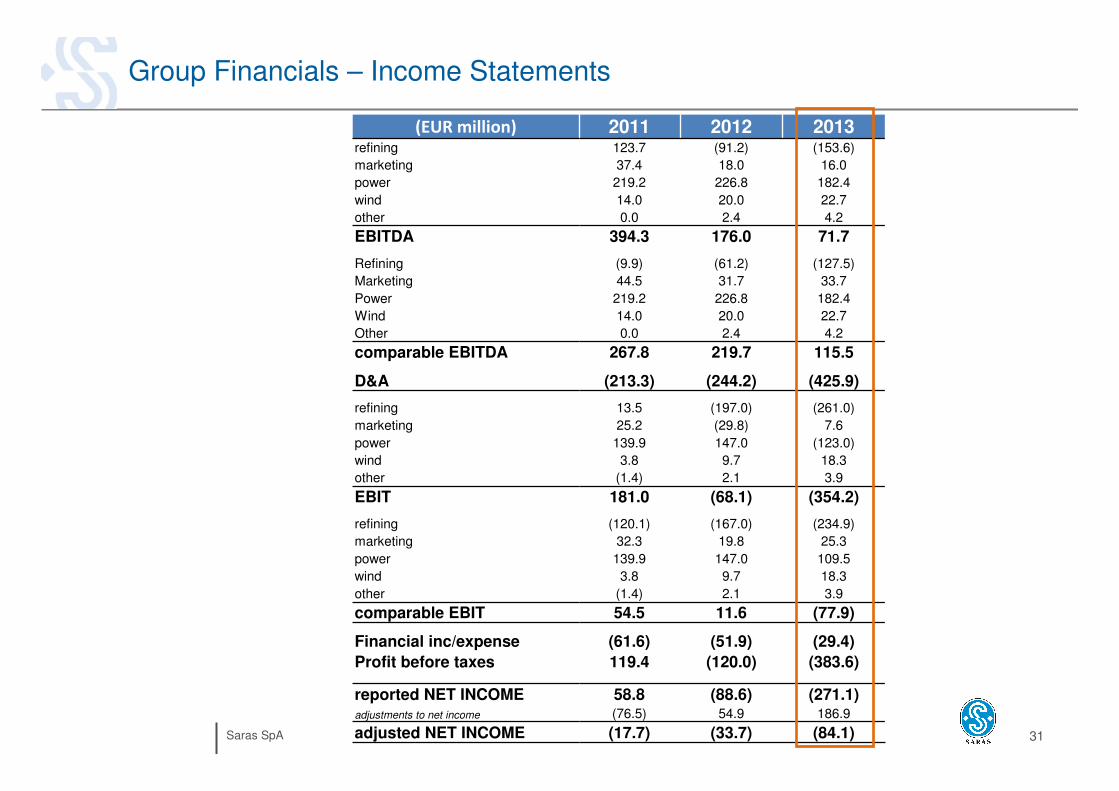
Group Financials – Income Statements
(EUR million) 2011 2012 2013refining 123.7 (91.2) (153.6)
marketing 37.4 18.0 16.0
power 219.2 226.8 182.4
wind 14.0 20.0 22.7
other 0.0 2.4 4.2
EBITDA 394.3 176.0 71.7
Refining (9.9) (61.2) (127.5)
Marketing 44.5 31.7 33.7
Power 219.2 226.8 182.4
Wind 14.0 20.0 22.7
Other 0.0 2.4 4.2
comparable EBITDA 267.8 219.7 115.5
D&A (213.3) (244.2) (425.9)
refining 13.5 (197.0) (261.0)
marketing 25.2 (29.8) 7.6
power 139.9 147.0 (123.0)
wind 3.8 9.7 18.3
other (1.4) 2.1 3.9
EBIT 181.0 (68.1) (354.2)
refining (120.1) (167.0) (234.9)
marketing 32.3 19.8 25.3
power 139.9 147.0 109.5
wind 3.8 9.7 18.3
other (1.4) 2.1 3.9
comparable EBIT 54.5 11.6 (77.9)
Financial inc/expense (61.6) (51.9) (29.4)
Profit before taxes 119.4 (120.0) (383.6)
reported NET INCOME 58.8 (88.6) (271.1)adjustments to net income (76.5) 54.9 186.9
adjusted NET INCOME (17.7) (33.7) (84.1)

24/06/2014 Saras SpA 32
Group Financials – Balance Sheet
(EUR million) 2011 2012 2013
Current assets 2,348 2,209 2,288
Cash and other cash equivalents 173 342 545
Other current assets 2,175 1,867 1,743
Non current assets 1,804 1,731 1,526
TOTAL ASSETS 4,153 3,940 3,814
Non interest bear liabilities 2,043 2,183 2,340
Interest bear liabilities 827 560 553
Equity 1,283 1,197 921
TOTAL LIABILITIES + EQUITY 4,153 3,940 3,814

24/06/2014 Saras SpA 33
Group Financials – Cash Flow Statement
(EUR million) 2011 2012 2013
A - Cash and cash equivalents at the beginning of the period 80.8 139.3 303.0
B - Cash flow generated from/(used in) operating activities (8.8) 534.3 321.9
Profit / (Loss) from operating activities before changes of WC 372.2 130.1 16.3
Changes of WC (381.0) 404.3 305.6
C - Cash flow from/(to) investment activities (79.4) (52.9) (63.5)
(Investments) in tangible and intangible assets (105.0) (105.5) (106.7)
Other flows 25.6 52.5 43.2
D - Cash generated from/(used in) financing activities 146.8 (317.4) (54.5)
Increase/(Decrease) in medium/long-term borrowings 0.0 172.0 0.0
Other flows 146.8 (489.4) (54.5)
E - Cashflow for the period (B+C+D) 58.5 164.0 203.9
F - Net Cash from disposals 0.0 (0.4) 0.0
G - Cash and cash equivalents at the end of the period 139.3 303.0 506.8