Embed Size (px)
Citation preview

REPORT

ORNUSUB/94-SV044/1
DESICCANT-BASED PRECONDITIONING MARKET ANALYSIS
J. Fischer SEMCO, Inc.
A. Hallstrom, P.E. The Trane Company, Division of American Standard
J. Sand Oak Ridge National Laboratory
June 2000
Prepared by SEMCO, Inc.
for OAK RIDGE NATIONAL LABORATORY
Oak Ridge, Tennessee 3783 l-6285 managed by
UT-Battelle, LLC for the
U.S. Department of Energy under Contract No. DE-AC05-OOOR22725


,_ CONTENTS
TABLES .,................................................................................................................,.................,..... v
1. INTRODUCTION: TASK 1 MARKET STUDY . . . . . . . . . . . . . . . . . . . . . . . . . . . . . . . . . . . . . . . . . . . . . . . . . . . . . . . . . . . . . . . . . . . . . . . 1 1.1 PURPOSE OF THIS OUTDOOR AIR PRECONDITIONING
MARKET EVALUATION‘ . . . . . . . . . . . . . . . . . . . . . . . . . . . . . . . . . . . . . . . . . . . . . . . . . . . . . . . . . . . . . . . . . . . . . . . . . . . . . . . . . . . . . . . . . . . . . . . 1 1.2 PRELIMINARY POSITIONS AND ASSUMPTIONS
CONCERNING THIS STUDY . . . . . . . . . . . . . . . . . . . . . . . . . . . . . . . . . . . . . . . . . . . . . . . . . . . . . . . . . . . . . . . . . . . . . . . . . . . . . . . . . . . . . . . . 1
2. ANALYSIS.. ................................................................................................................................ 4 2.1 PERFORMANCE ANALYSES.. ...................................................................................... .4 2.2 COST ANALYSES.. .......................................................................................................... 8
3. RESULTS.. ................................................................................................................................ 11 3.1 MODELING RESULTS .................................................................................................. 1 1 3.2 PAYBACK AND COST ANALYSES ............................................................................ 12 3.3 SIZE OF POTENTIAL MARKET ANALYSIS FOR SOAHUs.. ................................... 12 3.4 OVERALL ENERGY IMPACT ANALYSIS FOR SOAHUs ........................................ 15 3.5 SURVEY RESULTS ....................................................................................................... 15
4. CONCLUSIONS . . . . . . . . . . . . . . . . . . . . . . . . . . . . . . . . . . . . . . . . . . . . . . . . . . . . . . . . . . . . . . . . . . . . . . . . . . . . . . . . . . . . . . . . . . . . . . . . . . . . . . . . . . . . . . . . . . . . . . . 19
APPENDIX A. Sample Energy Bin Analysis Sheets for each SOAHU Approach
APPENDIX B. Detailed Specialized Outdoor Air Handling Unit Modeling inputs and Results for Atlanta and Desiccant-Based Cooling Modeling Data for Houston, Minneapolis, New York, and Orlando
APPENDIX C. Modeled Energy Costs for Selected Cities at Different Levels of Dehumidification
APPENDIX D. Sample Customer Survey Sheet
APPENDIX E. Final Market Segment Analysis Sheets
. . . 111


TABLES
1. Markets and cities investigated for outdoor air preconditioning . . . . . . . . . . . . . . . . . . . . . . . . . . . . . . . . . . . . . . . . . . . . . . . . . 7 2. Utility costs (1994) of electricity and gas for the regions analyzed in this study . . . . . . . . . . . . . . . . . . . . . . . 7 3. Impact of new ASHRAE weather data on a 20,000-cfm system in Atlanta . . . . . . . . . . . . . . . . . . . . . . . . . . . . . . . . 8 4. Selling price and physical dimensions of various preconditioning approaches
at different airflow capacities . . . . . . . . ..*........................................................................................... 9 5. Simple payback of various preconditioning approaches at different airflow
capacities . . . . . . . . . . . . . . . . . . . . . . . . . . . . . . . . . . . . . . . . . . . . . . . . . . . . . . . . . . . . . . . . . . . . . . . . . . . . . . . . . . . . . . . . . . . . . . . . . . . . . . . . . . . . . . . . . . . . . . . . . . . . . . . . . . . 10 6. Size of potential outdoor air preconditioning market, segmented by application
(all of the United States) . . . . . . . . . . . . . . . . . . . . . . . . . . . . . . . . . . . . . . . . . . . . . . . . . . . . . . . . . . . . . . . . . . . . . . . . . . . . . . . . . . . . . . . . . . . . . . . . . . . . . . . . . . . . 13 7. Business potential for various preconditioning products, segmented by market . . . . . . . . . . . . . . . . . . . . . . 14 8. Business potential for various preconditioning products, segmented by market . . . . . . . . . . . . . . . . . . . . . . 16 9. Survey responses for office buildings, nursing homes/hospitals, operating
rooms, research labs, and fast-food restaurants . . . . . . . . . . . . . . . . . . . . . . . . . . . . . . . . . . . . . . . . . . . . . . . . . . . . . . . . . . . . . . . . . . . . . . . . . 17 IO. Survey responses for retail stores, hotels/dormitories, classrooms,
and theaters/auditoriums. . . . . . . . . . . . . . . . . . . . . . . . . . . . . . . . . . . . . . . . . . . . . . . . . . . . . . . . . . . . . . . . . . . . . . . . . . . . . . . . . . . . . . . . . . . . . . . . . . . . . . . . . . . . 18
V


1. INTRODUCTION: TASK 1 MARKET STUDY
1.1 PURPOSE OF THIS OUTDOOR AIR PRECONDITIONING MARKET EVALUATION
The primary purpose of this phase 1 marketing evaluation is to define the markets and applications that would best benefit from a design approach that uses a specialized outdoor air-handling unit (SOAHU) to “decouple” (or separate) the latent load associated with the outdoor air (or outdoor and space loads) from the sensible (cooling) load. This approach would allow down-sized conventional cooling equipment to handle the indoor sensible load. It can result in better humidity control and reduced energy consumption without significantly increasing the project first cost.
Key objectives include establishing the following:
.
.
.
.
.
.
Which markets and applications will embrace an SOAHU approach? Which of the preconditioning system configurations identified in this study would most likely be used in each market?
Which SOAHU benefits are most important to the individual markets, and are these benefits quantifiable and important enough to justify a first-cost premium to the facility owner?
Which markets are best served by desiccant systems, both heat-regenerated and non-regenerated (total energy recovery) and why (Task l)? Which desiccant system configurations need to be offered to effectively serve these markets (i.e., component arrangement, sizes, performance, construction, size, and price) (Task 2)?
What is the estimated annual sales volume potential that could be targeted with a line of desiccant-based preconditioning products, both regenerated and non-regenerated?
What are the current sales estimates of various SOAHU designs?
Which market drivers (ASHRAE 62-89, new weather data, re-evaporation from direct expansion (DX) cooling coils, moisture storage within structures, demand reduction, dry ductwork, improved humidity control, etc.) are most important to the justification of the SOAHU approach? What training tools are most required to convey this to the field?
Which desiccant-based cooling (DBC) system configuration shows the most promise to current heating, ventilation, and air-conditioning (HVAC) equipment manufacturers? The involvement of HVAC manufacturers may be crucial in construction of a laboratory prototype that may incorporate conventionally available hardware components. [Such a laboratory prototype is to be built as part of this total program (Phase 2)].
1.2 PRELIMINARY POSITIONS AND ASSUMPTIONS CONCERNING THIS STUDY
Only outdoor air preconditioning systems will be considered in this evaluation. The mass market required to justify a product introduction by one of the major HVAC equipment manufacturers was considered to be an important consideration in assessing the market potential of desiccant systems to handle outdoor air latent loads.
All available methods of handling this latent load must be evaluated against the merits of the regenerated desiccant system approach (DBC), because such an analysis will surely be done by the marketplace on a job-by job-basis. Only the markets that clearly benefit from the DBC approach and are justifiable without utility rebates will be considered viable markets in this study.
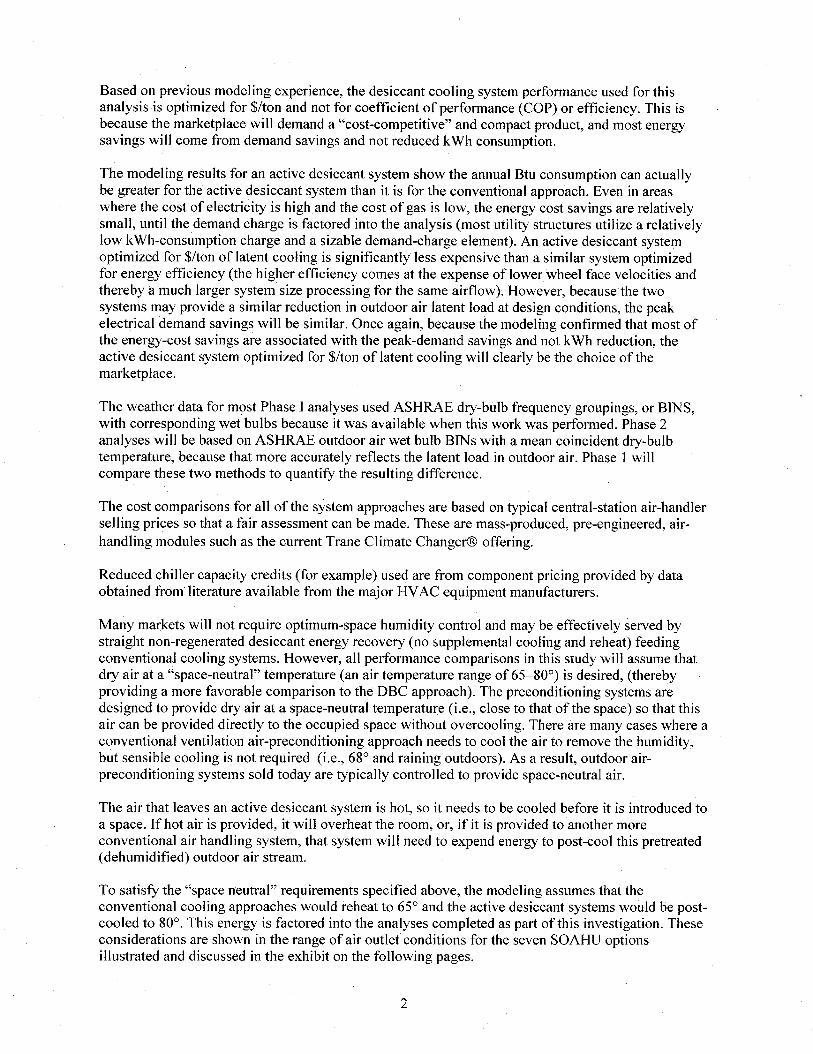
Based on previous modeling experience, the desiccant cooling system performance used for this analysis is optimized for $/ton and not for coefficient of performance (COP) or efficiency. This is because the marketplace will demand a “cost-competitive” and compact product, and most energy savings will come from demand savings and not reduced kWh consumption.
The modeling results for an active desiccant system show the annual Btu consumption can actually be greater for the active desiccant system than it is for the conventional approach. Even in areas where the cost of electricity is high and the cost of gas is low, the energy cost savings are relatively small, until the demand charge is factored into the analysis (most utility structures utilize a relatively low kWh-consumption charge and a sizable demand-charge element). An active desiccant system optimized for $/ton of latent cooling is significantly less expensive than a similar system optimized for energy efficiency (the higher efficiency comes at the expense of lower wheel face velocities and thereby a much larger system size processing for the same airflow). However, because the two systems may provide a similar reduction in outdoor air latent load at design conditions, the peak electrical demand savings will be similar. Once again, because the modeling confirmed that most of the energy-cost savings are associated with the peak-demand savings and not kWh reduction, the active desiccant system optimized for $/ton of latent cooling will clearly be the choice of the marketplace.
The weather data for most Phase I analyses used ASHRAE dry-bulb frequency groupings, or BINS, with corresponding wet bulbs because it was available when this work was performed. Phase 2 analyses will be based on ASHRAE outdoor air wet bulb BINS with a mean coincident dry-bulb temperature, because that more accurately reflects the latent load in outdoor air. Phase 1 will compare these two methods to quantify the resulting difference.
The cost comparisons for all of the system approaches are based on typical central-station air-handler selling prices so that a fair assessment can be made. These are mass-produced, pre-engineered, air- handling modules such as the current Trane Climate Changer@ offering.
Reduced chiller capacity credits (for example) used are from component pricing provided by data obtained from literature available from the major HVAC equipment manufacturers.
Many markets will not require optimum-space humidity control and may be effectively served by straight non-regenerated desiccant energy recovery (no supplemental cooling and reheat) feeding conventional cooling systems. However, all performance comparisons in this study will assume that dry air at a “space-neutral” temperature (an air temperature range of 65-80”) is desired, (thereby providing a more favorable comparison to the DBC approach). The preconditioning systems are designed to provide dry air at a space-neutral temperature (i.e., close to that of the space) so that this air can be provided directly to the occupied space without overcooling. There are many cases where a conventional ventilation air-preconditioning approach needs to cool the air to remove the humidity, but sensible cooling is not required (i.e., 68” and raining outdoors). As a result, outdoor air- preconditioning systems sold today are typically controlled to provide space-neutral air.
The air that leaves an active desiccant system is hot, so it needs to be cooled before it is introduced to a space. If hot air is provided, it will overheat the room, or, if it is provided to another more conventional air handling system, that system will need to expend energy to post-cool this pretreated (dehumidified) outdoor air stream.
To satisfy the “space neutral” requirements specified above, the modeling assumes that the conventional cooling approaches would reheat to 65” and the active desiccant systems would be post- cooled to 80”. This energy is factored into the analyses completed as part of this investigation. These considerations are shown in the range of air outlet conditions for the seven SOAHU options illustrated and discussed in the exhibit on the following pages.
2

The projected size of the overall market and percentage allo&uion to SOAHU equipment and the various approaches come from market information provided by surveys of the major HVAC manufacturers and input from the marketing questionnaires provided to select consulting engineers, owners, sales offices, and SEMCO in-house and field sales staff.
All analyses assume that the DBC systems will be reliable and will perform as modeled, to eliminate the barrier of considering an unknown technology.
3

2. ANALYSIS
As stated previously, the primary purpose of this marketing evaluation is to define the markets and applications that would best benefit from a design approach that uses an SOAHU to decouple the latent load associated with the outdoor air (or outdoor and space loads). This could allow down-sized conventional cooling equipment to handle the indoor sensible load. A further objective is to determine which of the available SOAHU approaches would most often be used in each market segment. Finally, based on the needs of the market segments showing the most promise for regenerated DBC systems, this analysis attempts to determine what the product offering needs to be and how much business potential ($/year) exists for the technology.
2.1 PERFORMANCE ANALYSES
This investigation studied seven SOAHU approaches for decoupling outdoor air loads. These approaches are described briefly, including simple schematics, in the exhibit “Preconditioning Approaches Analyzed by this Study.” They include conventional cooling with reheat, conventional cooling with sensible recovery to provide free reheat, two total recovery approaches using non- regenerated desiccant wheels, and three approaches using regenerated desiccant wheels. Table 1 summarizes the nine markets investigated for each approach. It also lists the six cities chosen for analysis and the reasons they were selected. Table 2 lists the energy costs used for each city selected; these were obtained from a report sponsored by the Gas Research Institute that lists 1995 electric and gas rates.
Models were prepared for each SOAHU approach to allow for a comparison at different operating conditions, in different climates, and for different energy costs. Appendix A gives sample energy BIN analysis sheets for each SOAHU approach; for 2500-cfm, 7500-cfm, and 20,000-cfm systems; and for each of these city locations. Appendix B presents more detailed illustrations of each of the modeling applications for the Atlanta area. Also included in Appendix B are modeling data for the DBC approach for locations in Houston, Minneapolis, New York, and Orlando; these data highlight the impact that weather and energy cost have on performance of this option.
Results of this modeling for differing levels of pre-conditioning dehumidification are summarized as Cases I through 4 in Appendix C. Case 1’ assumes preconditioning outdoor air to 50 grains, Case 2 to 65 grains, and Case 3 to 45 grains. Each of these cases assumes a consistent cost of energy. Case 4 was prepared based on delivering 50-grain air but uses the actual energy cost for each individual city.
In the second phase of this study, the new dew point weather data will be used to complete the final energy analyses for the most promising markets. For this study, dry bulb BINS with mean coincident wet bulb data were generally used. This provides a conservative estimate because it understates both the humidity content and enthalpy of the outdoor air volumes. In Appendix B, there are two examples of analyses for the conventional cooling/reheat, dual total energy wheel, and DBC approaches that use the new dew point weather data for Atlanta (see Appendix B). The impacts of using these design dew point data are summarized in Table 3.
To keep a consistent comparison in Table 3, all regeneration and reheat that is not available from a source of waste heat is provided by a boiler burning gas at an efficiency level of 78%. The second conventional system showing a run-around heat exchanger system is the most efficient way of using conventional cooling without desiccants. An example utilizing DX dehumidification and condenser reheat was not considered because the performance of the cooling system would have to be compromised to provide the amount of heat necessary for an all-outdoor-air application. This would make comparisons of energy efficiency impossible, because it could not provide the same supply conditions chosen for the analysis. More important, the run-around example provides a more energy- efficient option, and therefore a good complement to the conventional approach, using vapor- compression DX for dehumidification with hot-water reheat (still a very common approach).
4
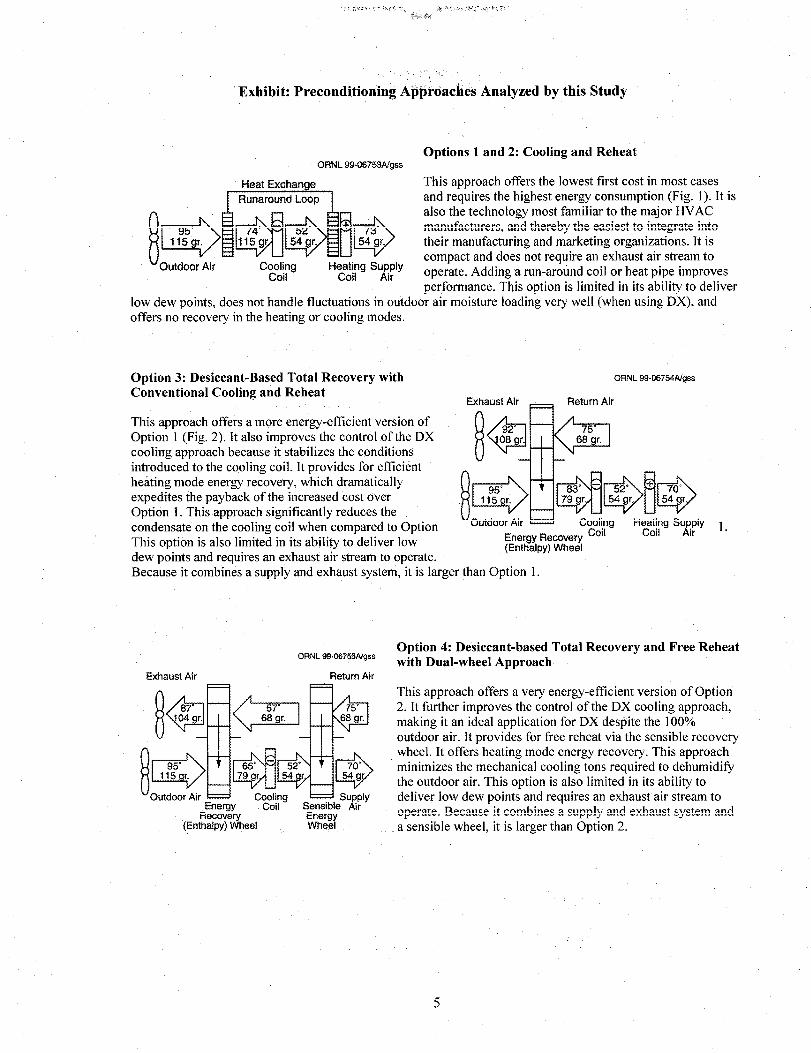
Exhibit: Preconditioning AppNaches Analyzed by this Study
Options 1 and 2: Cooling and Reheat ORNL 99dX753Algss
Heat Exchange This approach offers the lowest first cost in most cases and requires the highest energy consumption (Fig. 1). It is also the technology most familiar to the major HVAC manufacturers, and thereby the easiest to integrate into their manufacturing and marketing organizations. It is compact and does not require an exhaust air stream to operate. Adding a run-around coil or heat pipe improves performance. This option is limited in its ability to deliver
low dew points, does not handle fluctuations in outdoor air moisture loading very well (when using DX), and offers no recovery in the heating or cooling modes.
Option 3: Desiccant-Based Total Recovery with Conventional Cooling and Reheat
ORNL 99-067SVgss
Othaust Air F====l Return Air
This approach offers a more energy-efficient version of Option 1 (Fig. 2). It also improves the control of the DX cooling approach because it stabilizes the cpnditions introduced to the cooling coil. It provides for efficient heking mode energy recovery, which dramatically expedites the payback of the increased cost over Option 1. This approach significantly reduces the condensate on the cooling coil when compared to Option This option is also limited in its ability to deliver low dew points and requires an exhaust air stream to operate. Because it combines a supply and exhaust system, it is larger than Option 1.
Exhaust Air
ORNL 99.05755ivgss
Return Air
104 r. UG” --I I I-’ -III-
(Enthalpy) Wheel Whea
Option 4: Desiccant-based Total Recovery and Free Reheat with Dual-wheel Approach
This approach dffers a very energy-efficient version of Option 2. It further improves the control of the DX cooling approach, making it an ideal application for DX despite the 100% outdoor air. It provides for free reheat via the sensible recovery wheel. It offers heating mode energy recovery. This approach minimizes the mechanical cooling tons required to dehumidify the outdoor air. This option is also limited in its ability to deliver low dew points and requires an exhaust air stream to operate. Because it combines a supply and exhaust system and a sensible wheel, it is larger than Option 2.
5

Option 5: Heat-Regenerated Desiccant-Based Coqling Approach
This approach uses gas, steam, or waste heat to regenerate a desiccant dehumidification wheel, which eliminates the need for conventional cooling to remove moisture from outdoor air streams. A sensible energy wheel removes most of the heat added by the regeneration process and uses this heat to minimize the amount of regeneration energy required. This option can provide, in some climates, drier air than possible with conventional 95
cooling approaches. Other advantages, such as dry cooling coils, a $15 r.
airborne pollutant removal, improved economizer operation due Outdoor Air Desiccant
to indirect evaporative cooling and reduced energy consumption Dehumidi&.tion (Actwe) Wheel
over Option 1 are common. An exhaust air stream is beneficial but not required for this approach, which is a key advantage over Options 2 and 3.
This option requires a more complex control system for optimization than do the previous approaches. Because the face velocities through the desiccant wheel need to be moderate to recognize the desired performance, the units are very large compared to Option 1. Because raw outdoor air is introduced to the dehumidification wheel, the heat generated is significant, making the second wheel essential.
Exhaust Atr
Dehumidrfication (Active) Wheel
Option 6: Heat-Regenerated Desiccant-Based Cooling and Desiccant-Based Recovery Wheel Hybrid Approach 1
This approach uses gas, steam, or waste heat to regenerate a desiccant dehumidification wheel, which eliminates the need for conventional cooling to remove moisture from outdoor air streams. Because much drier air is introduced to the desiccant wheel than in the case of Option 4, much less heat is added to the supply air stream, making conventional post-cooling (e.g., from cooling tower water) feasible. Much lower dew points are possible, and this system is more energy efficient than Option 4. Advantages such as dry cooling coils, airborne pollutant
removal, improved economizer operation as a result of indirect evaporative cooling, and reduced energy consumption over Option 1 are common. Full benefits of heating-mode total energy recovery are recognized. The secondary evaporative cooler, which is very important for Option 4, is eliminated with this approach. From the standpoint of maintenance and IAQ concerns, this is an advantage. An exhaust air stream is required for this approach. The same challenges listed for Option 4 above apply.
Option 7: Heat-Regenerated Desiccant-Based Cooling and Desiccant-Based Recovery Wheel Hybrid Approach 2
This approach combines the best of Options 4 and 5 by integrating an additional sensible wheel after the dehumidification wheel to reduce the sensible load added by adsorption and, at the same time, reduce the regeneration energy requirement. This system provides a very high COP and low operating cost. This approach will be evaluated primarily for this reason.
Exhaust Air Return n Regeneration
Air Secondary Outdoor As
EMgy Desiccant Recover Dehumidification
(Enthalpy) heel WY (Active) Wheel Wheel
Once again, advantages such as dry cooling coils, airborne pollutant removal, improved economizer operation due to indirect evaporative cooling and reduced energy consumption over Option 1 are common. Full benefits of heating mode total energy recovery are recognized. An exhaust air stream is required for this approach. The same challenges listed for Option 4 above apply. Size and first cost are the big obstacles with this approach; however, it is very appropriate for designs where energy efficiency is most important and for combining with engine-driven chillers, for example, where waste heat is available and dry coils are desired.
6

Table 1. Markets and cities investigated for outdoor air preconditioning
Applications-markets Cities investigated for energy analysis
1. Hospital operating rooms
2. Nursing homes and hospital areas
other than operating rooms
3. Research laboratories
4. Quick service restaurants
5. Retail stores
6. Hotels, high-rise apartments,
dormitories
7. School and university classrooms
8. Movie theaters and auditoriums
9. Office buildings
1. Hot/humid, high-electric, moderate-gas costs (b)
2. Hot/humid, moderate-electric, moderate-gas costs (c, d)
3. Moderate humidity, high-electric, moderate-gas costs (b, e)
4. Moderate humidity, moderate-electric, moderate-gas
costs (a)
5. Cities representative of different parts of the country:
(a) Minneapolis, MN
(b) Orlando, FL
(b) New York, NY
(c) Atlanta, GA
(d) Houston, TX
(e) Los Angeles, CA
In the Conclusions (Sect. 4), energy savings for each approach are combined with the projected market potential to provide an estimate of the overall energy reduction for the United States if SOAHU systems were to be applied to only a portion of new construction and renovation projects annually.
7

2.2 COST ANALYSES
To compare the various SOAHU approaches, the relative cost differences must be known. Given that the conventional cooling equipment is already mass-produced, while DBC systems are still custom built, the current cost to the market for these technologies does not allow for a meaningful comparison. To do so, Table 4 was created using sales prices for commercially produced, central- station air-handling units provided by one of the major HVAC manufacturers to project what the selling price to the market would be if all products were mass-produced. The cost of the chiller and cooling tower required for each preconditioning approach is shown enclosed in parentheses, and the
total system cost (air handler + chiller + cooling tower) is shown in bold. Table 4 shows the cost for each approach at three airflow capacities and provides the approximate physical dimensions of the air handling unit in inches for each system.
Table 5 combines the energy analyses completed with the cost information provided by Table 4 to show the simple payback period if systems with various sizes were applied in Atlanta.
8

8 E

0

This investigation has provided a substantial amount of valuable information. The combination of the numerous energy analyses completed for the various SOAHU approaches, the equipment cost projections, the market size analyses, and the market survey conducted by SEMCO provide a fairly clear picture of where the opportunities for regenerated DBC systems exist.
3.1 MODELING RESULTS
The results of the modeling are summarized in Tables 3-5 (Sect. 2), by the Summary Sheets for Preconditioning Approaches in Appendix A, and by Cases 1-4 in Appendix C. The more important findings with respect to the market for regenerated desiccant systems include the following:
1. In general, if dry, space-neutral temperature air is desired (i.e., the basis of this investigation) and if an exhaust air path is available, the dual-wheel total-energy recovery (non-regenerated desiccant wheel) approach is by far the most desirable because it provides the highest energy savings. It is very cost-effective in that it also provides wintertime humidification.
2. If first cost is most important, and if maintaining humidity below 70% and above 20% is an acceptable design parameter, then desiccant preconditioning by single total-energy wheel (non- regenerated) is by far the most economical solution, provided there is access to an exhaust air path.
3. Where an exhaust air path is not accessible, the DBC approach may provide an attractive solution, depending on the hours of operation, demand charge, availability of waste energy or gas cost, and the importance of humidity control.
4. If a DBC system is to be applied to process humid outdoor air (120-l 40 grains) and supply it at 50-60 grains, the latent load is so significant that an oversized DBC system is required (very low face velocities across the wheels), making it a high-cost alternative. In such applications, combining total energy recovery with desiccant dehumidification makes sense.
5. If the DBC approach is used without access to a return air path, the energy savings projected by the sample modeling are significantly reduced because (1) the winter heat recovery is lost, and (2) more energy is required for regeneration because the inlet air contains a higher humidity content, and (3) the temperature entering the sensible wheel on the secondary side is much warmer, resulting in hotter air leaving the supply side of the system. Without access to the exhaust air path, the savings listed in this investigation for the DBC approach are reduced by approximately 50%.
6. If weather data that more accurately reflect the humidity content of outdoor air (wet bulb BINS with corresponding mean coincident dry bulb temperatures) are used to complete energy analyses, compared with the dry bulb BINS used for most of this investigation, the energy consumption estimates for the conventional approach increase by approximately 6%, the DBC energy consumption estimates decrease by approximately 1 O%, and the total energy recovery estimates remain approximately the same (see Table 3).
7. The demand charges are a very significant portion of the cooling season energy savings for the DBC approach. The winter humidification savings are significant for the total energy recovery approach, especially in the cool, less-humid climates.
11

3.2 PAYBACK AND COST ANALYSES
Table 4 (Sect. 2) summarizes the projected selling price for the various SOAHUs assuming they were built using mass-produced, pre-engineered air-handling units for commercial buildings.
Table 5 (Sect. 2) uses these costs and the energy cost analyses to project a simple payback based on chiller and cooling tower costs of $500/tan. Some of the more important results from these analyses are these:
1. The small systems (2500-cfm) had payback periods ranging from 0.5 to 2.5 years, while the large systems had an immediate payback. This highlights one of the most important aspects of comparing air-side approaches, which is that the cost of the chillers required to solve ventilation air pretreatment problems is very high compared with the air-side solutions.
2. Size of the SOAHU is a very important factor in the design process. All SOAHU systems were similar in size, except for the conventional cooling and reheat systems, which were significantly smaller (proving a significant advantage).
The $500/tori figure was selected as a very “conservative” number. This number includes the chiller, the cooling tower, piping, insulation, and incremental installation costs. Clearly, increasing it slightly would decrease the payback period resulting from the use of active desiccant systems. Decreasing it would extend the payback periods of the active desiccant systems. The $500/tori value was chosen in collaboration with Trane as a figure that would result in a fair analysis.
3.3 SIZE OF POTENTIAL MARKET FOR SOAHUs
Table 6 was prepared from information obtained from F. W. Dodge marketing forecasts (http://www.mag.fwdodge.com) for the year 1994. This table combines the information provided by ASHRAE standard 62-l 989 with annual construction and renovation starts for the markets studied. The average size of each facility was taken from the DOE 1992 survey of Building Characteristics. Table 6 shows the potential market size for SOAHU systems by market and in total. The Final Market Analysis sheets provide these numbers based on evaluations made for each SOAHU approach for a given market. The percentage of the overall market potential listed for a given SOAHU approach is a subjective determination based on feedback from users and specifiers.
Appendix D provides a sample of the survey sheet used to weight the various market drivers. (The responses to the questions asked by the survey are summarized in Sect. 4 and tabulated in Tables 9 and 10 at the end of this section.) Factors such as importance of humidity control, first cost, energy efficiency, size of equipment, and required dew points from the SOAHU system helped in completing the subjective evaluation.
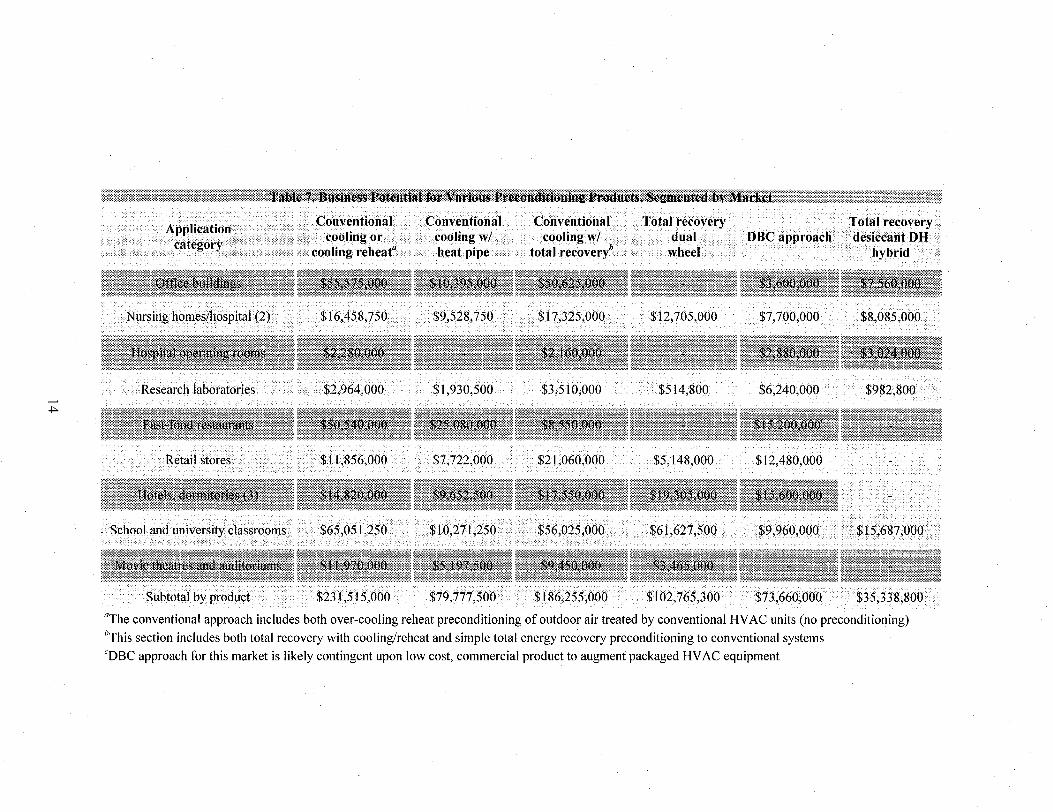
Appendix E includes nine “Final Market Segment Analysis” sheets. These sheets are used in the next section to summarize the opportunity for regenerated DBC approaches, as well as other approaches investigated for the various market segments. These sheets provide a brief summary of the benefits ’ offered to the market by preconditioning, as well as a brief conclusion regarding the desiccant-based approaches investigated. Table 7 summarizes the information provided by the individual Final Market Segment Analysis sheets, showing the projected sales potential for each approach presented for each market.
The more important results from these analyses include the following:
12


: ‘,
1. i.;; .,
The overall market potential for’pr&onditionin& outdoor air with SOAHUs is substantial ($725,000,000 annually).
2. The largest market potential by far is the school market ($223,000,00O/year, 3 1% of total market potential).
3. Table 7 projects the potential sales volume by SOAHU approach and projects that the majority of the sales dollars will continue to go with conventional cooling approaches (with or without reheat). The next largest potentials are projected for single-wheel total energy recovery, dual- wheel total energy recovery, conventional cooling with heat pipe, and DBC, respectively.
4. The combined DBC and DBC hybrid market potential is estimated at approximately $109,000,000 annually (15% of total market opportunity).
3.4 OVERALL ENERGY IMPACT ANALYSIS FOR SOAHUs
Assuming that the Final Market Segment Analysis Sheets (Appendix E) accurately reflect the * breakdown of SOAHU utilization by market; and assuming that ASHRAE 62-l 989 is followed in the
future; and, for simplicity, assuming that all SOAHUs are operated continuously, their use, compared with conventional over-cooling and reheat approaches, could reduce overall energy usage by 0.032 quads (32 x IO’* Btu) annually (Table 8). This figure is only for new construction and renovation projects on an annual basis. It also reflects the use of a SOAHU approach other than conventional cooling in approximately 48% of these buildings.
3.5 SURVEY RESULTS
A significant amount of data was collected as part of the survey. The results are summarized in Tables 9 and 10. The more important findings with respect to the markets for regenerated desiccant systems include the following:
1. The vast majority of the respondenti listed first cost as most important for almost all markets. Energy efficiency was always listed last. (This would agree with the percentage of high- efficiency equipment sold by the major I-WAC suppliers).
2. Only one market, hospital operating rooms, needed supply air dew points that were lower than could be accomplished with a conventional cooling coil.
3. DX equipment is the most often used in all markets except nursing homes, hospitals, and research laboratories. Most respondents are aware that maintaining the desired indoor humidity levels with conventional DX systems processing a significant amount of outdoor air is not possible in many markets and locations.
4. In most cases, the respondents thought that space humidity levels needed to be controlled to a maximum of 70% and a minimum of 20%, and that there are benefits to be recognized by controlling the humidity in the occupied spaces. Most felt that the conditions would preferably range between 60% and 30%, but few felt that the market would pay a significant premium to maintain this range.
5. In all cases but fast-food restaurants and research laboratories, access to air to be used for recovery or the secondary side of a DBC system was available at least 50% of the time.
15

Table 8. Annual estimated energy savings projected for the preconditioning approaches analyzed (new construction and renovations, assumes continuous operation, reflects results of final market segment
analysis, uses Atlanta weather data and energy costs)
Outdoor air Energy Energy savings, Energy savings,
Preconditioning system CFM
preconditioned, savings/CFM, all markets all markets
approach estimate of total excluding combined
combined
demand’ ($/year) (Million
market BTU/year)
Conventional cooling w/ run around recovery’
Total energy wheel WI cooling & reheath
Dual wheel total energy recovery’
Dual wheel desiccant based (DBC)’
Desiccant dehumidification-total
recovery hybrid’
48,350,OOO
82,780,OOO
31,141,ooo
1 X,41 5,000
8,413,800
$0.13
$0.67
$1.43
$0.95
$0.74
Annual total
$35295,500
$55,462,600
$44,53 1,630
$17,494,250
$6,226,2 12
$159,010,192
(with demand savings:
$190,000,000)
7,059,100
11,092,520
8,906,326
3,498,850
1,245,242
3 1,802,038
0.032 quadrillion BTU/year
“Savings estimate use Atlanta DB bin data, assume continuous supply of outdoor air, and only new construction/renovation projects for 1995 prqjected by “Final Market Segment Analysis” are considered. ‘The cost of operating this system is compared against a conventional over-cooling/reheat system conditioning outdoor air to 65 degrees/50 grains during the cooling season and 65 degrees and 35 grains during the heating season. ‘The cost of operating this system is compared against a conventional cooling system without reheat conditioning outdoor air to 51 degrees/50 grains during the cooling season and 65 degrees and 35 grains during the heating season. ‘Had the new dewpoint weather data been used, savings would have been approximately 10% greater than shown
16


n l-poor, 2=fair, 3=good ’ Provided low-cost commercial product available to this cost-conscious market.
~,

A number of important conclusions can be drawn as a result of this broad, first-phase market evaluation. The more important conclusions include the following:
1. A very significant market opportunity will exist for SOAHUs as more construction and renovation projects are designed to incorporate the recommendations made by the ASHRAE 62-1989 standard. Based on this investigation, the total potential market is currently $725,000,000 annually (see Table 6, Sect. 3). Based on the market evaluations completed, it is estimated that approximately $398,000,000 (55%) of this total market could be served by DBC systems if they were made cost-effective through mass production.
Approximately $306,000,000 (42%) of the total can be served by a non-regenerated, desiccant- based total recovery approach, based on the information provided by this investigation. Approximately $92,000,000 (13%) can be served by a regenerated desiccant-based cooling approach (see Table 7, Sect. 3).
2. A projection of the market selling price of various desiccant-based SOAHU systems was prepared using prices provided by Trane for central-station, air-handling modules currently manufactured. The wheel-component pricing was added to these components by SEMCO. This resulted in projected pricing for these systems that is significantly less than that currently offered by custom suppliers (see Table 4, Sect. 2). Estimated payback periods for all SOAHU approaches were quite short when compared with conventional over-cooling and reheat systems. Actual paybacks may vary significantly depending on site-specific considerations.
3. In comparing cost vs benefit of each SOAHU approach, it is critical that the total system design be evaluated. For example, the cost premium of a DBC system is very significant when compared to a conventional air handling system, yet the reduced chiller, boiler, cooling tower, and other expense often equals or exceeds this premium, resulting in a rapid payback period while providing significant energy savings (see Table 5, Sect. 2).
4. The survey conducted as part of this investigation provided several key positions that impact the likely use of one SOAHU approach vs another. The more important ones included these:
. Most projects are designed using DX systems and the agreement by most interviewed that such systems cannot control humidity while processing the continuous outdoor air quantities required by the ASHRAE IAQ standard provides the single most significant market driver for using a SOAHU approach.
l First cost was almost always viewed as more important that energy efficiency and environmental conditions by those surveyed.
. There is a wide difference in opinion regarding the need to control humidity in spaces when they are unoccupied, and regarding the level at which the space humidity needs to be controlled during both occupied and unoccupied modes. ’
l Currently, little value is placed on the ability to maintain a dry cooling coil.
l Wintertime humidification, provided by the desiccant-based recovery wheel, is considered a significant benefit.
. With the exception of fast-food restaurants and research laboratories, .an exhaust air path can be made available for recovery or for the secondary side of a DBC system.
* 19

5. The most promising opportunities for regenerated desiccant approaches based on market need were determined to be hospital operating rooms, nursing homes and hospitals, and research laboratories. These markets offer approximately $29,000,000 annually in sales potential for DBC and DBC/total energy recovery hybrid systems.
The hospital operating room market was determined to be the only market investigated that required a dew point below that obtainable with conventional chilled water cooling coils. Nursing homes, hospital bed areas, and research laboratories share the advantage of being less sensitive to project first cost, requiring continuous operation of the outdoor air systems, having a need for humidity control, showing interest in operating dry cooling coils, often having access to low-cost steam for regeneration, and needing features offered only by non-unitary equipment.
To effectively serve these markets, an institutional grade SOAHU needs to be offered. It would include dual wall construction, high-efficiency filtration, backward-curve airfoil fans, good access for maintenance, options for a variety of coils and humidifiers, and controls designed to work with industry standards.
6. The most promising opportunities for regenerated desiccant approaches based on annual sales potential were determined to be hotels and dormitories, retail stores, and school facilities. These markets offer approximately $53,727,000 annually in sales potential for DBC and DBC/total energy recovery hybrid systems.
The potential for regenerated desiccant systems in retail stores reflects the conditioning of outdoor air to stores that combine food sales and retail, in addition to a portion of large retail facilities using gas-engine cooling in high-demand cost areas. Such facilities as supermarkets and ice rinks have proven offer a significant market potential to desiccant dehumidification systems, yet since they process recirculated air and benefit from the refrigeration loads (ice rinks or freezer loads) and not loads associated with outdoor air or the interior space conditions, these markets were not included in this investigation. (If they were, it is projected that they could add an additional $15 to $25 million annually to the regenerated desiccant-based SOAHU approaches).
The potential for regenerated desiccant systems in hotels/dormitories reflects the conditioning of outdoor air to these facilities, most likely the corridors, to control humidity in order to avoid moisture problems. The hotel industry has established that humidity problems result in very significant replacement and maintenance costs each year. The regenerated desiccant systems would likely be used where access to an exhaust air path is limited.
The comparison of outdoor air preconditioning systems shows that passive desiccant systems clearly provide the highest energy savings and lowest first cost. This is a result of the consistent availability of a cool, dry exhaust air path that is perfect for the “total recovery” option. Also, schools need to process large quantities of ventilation air at very high outdoor-air humidity levels (130 grains), dehumidify it, typically to 50 to 55 grains, and provide it to the conditioned space at 65 to 70”. This perfectly fits the capability of the passive-desiccant, dual-wheel system. The active system cannot provide this 75- to SO-grain reduction in a single pass across an active wheel. In addition, the air supplied would be very warm and would require significant post- cooling.
Therefore, the market opportunity for active desiccant systems in schools is limited to “advanced system designs” using waste heat, engine chillers, ice systems, or areas where electrical demand charges are extremely high. In these applications, where designers feel that there is a benefit provided by operating a dry coil, the active systems may also find acceptance despite the significant first-cost premium.
20
These markets are far more cost-sensitive than the’hosbital, nursing home, and research facility markets mentioned earlier. Although the benefits of the technology would allow a percentage of these markets to be served by the same institutional-grade products required by facilities such as hospitals and nursing homes, the construction of the equipment for these markets would have to be more of a unitary, rooftop design in order to gain maximum market penetration.
7. Fast-food restaurants offer a significant potential for regenerated desiccant systems. The kitchen exhaust creates a need for makeup air. The loads within the space are variable and often result in high latent-to-sensible ratios. The hours of operation are high, and gas is always available. However, since these markets are very much driven by first cost, market acceptance will likely depend on a low-cost, commercial-grade product that could be easily coupled with the packaged HVAC units currently used.
8. The investigation concluded that if an exhaust air path is available, the non-regenerated desiccant total recovery approach will almost always be the SOAHU of choice. It typically provides more energy savings at a lower cost than regenerated desiccant systems. It is often more capable of handling the extreme humidity conditions encountered by some environments (120 to 150 grains). It provides winter humidification that makes it a year-round device applicable to most climates. It allows customers and engineers to continue using familiar conventional cooling technologies. It also eliminates the need for evaporative coolers, viewed as a maintenance item and a potential contributor to poor indoor air quality.
For applications where careful humidity control is not a requirement (most markets), unitary systems can usually be coupled with a single-wheel, non-regenerated, desiccant-based total energy recovery preconditioning systems to meet the needs of the application.
9. Energy analyses completed using weather data that more accurately reflect outdoor air humidity content show the cost of operating conventional cooling systems to be approximately 6% higher than estimates using the traditional dry bulb BIN information. Total energy recovery system operating costs remained approximately the same, while those of regenerated desiccant systems are reduced by approximately 10% (assuming that there is an exhaust air path available for the secondary side of the system) (Table 5, Sect. 2).
10. A very significant amount of energy would be saved in the United States annually should the SOAHU projections made by this investigation occur. Assuming that the systems are operated 50% of the time on average for all markets, a reduction of 0.016 quads per year would be expected (0.032 quadrillion Btu/year if operated continuously). This is projected energy consumption savings compared with using conventional cooling and conventional cooling/reheat systems, using steam heat for the heating mode.
Based on the information resulting from this investigation, the most attractive markets are the following:
l Nursing homes . Hospitals (patient areas and operating rooms) . Hotels/dormitories . School and university classrooms
The estimated sales opportunity for active desiccant systems at full market penetration, based upon the market investigation, amounts to approximately $63,000,000 annually for the four market segments identified. This business potential appears large enough to merit a serious consideration of technology integration by the major HVAC manufacturers.
21

GRNL/Sub/94-SVO44ll
INTERNAL DISTRIBUTION
1. J. E. Christian 8-29. J. R Sand 2. G. E. Courville 30. A. Schaffhauser 3. T. R Curlee 3 1. R. B. Shelton 4. R. C. Devault 32. E. A. Vineyard I 5. P. D. Fairchild 33. Laboratory Records-RC 6. M. A. Karnitz 34. Central Research Library 7. C. 1. Moser 35-36. OSTI
EXTERNAL DISTRIBUTION
37. 38. 39.
40.
41.
42.
43.
44. 45.
46. 47. 48. 49.
50. 51.
52.
53. 54;
55.
56.
57. 58. 59.
Lilia A. Abron, PEER Consultants, 1460 Gulf Blvd., Apt. 1103, Cleat-water, FL 33767 Joel Anderson, Mississippi Valley Gas Company, P.O. Box 3348, Jackson, MS 39207 Ren Anderson, National Renewable Energy Laboratory, 16 17 Cole Blvd., Golden, CO 80401- 3393 ,Frank Ballistreri, Reliant Energy-Minnegasco, P.O. Box 59038,15th Floor, 800 LaSalle Ave., Minneapolis, MN 55459-0038 Douglas Bauer, Commission on Engineering and Technical Systems, National Research Council, Harris 280,200l Wisconsin Ave. NW, Washington, D.C., 20007 John C. Brady, Mechanical Engineering, ATS&R, 8501 Golden Valley Rd., #300, ~Mitmeapolis, MN 55427 Paul L. Brillhart, University of Illinois-Chicago, Energy Resources Center, 1223 SEO, 842 West Taylor St., Chicago, lL 60607-7022 Thorn Clemens, Desicair Sales Manager, ATS, 1572 Tilco Dr., Fredrick, MD 21,701 Susan L. Cutter, Hazards Research Laboratory, Department of Geography, University of South Carolina, Columbia, SC 20208 John Fischer, SEMCO, Inc., 737 Terrell Crossing, Marietta, GA 30067 R. Fiskum, U.S. Department of Energy, EE-42, SE-036/Forrestal, Washington, D.C. 20585 P. W. Garland, UT-Battelle, LLC, 901 D St. SW, Suite 900, Washington, DC20024 Arthur D. Hallstrom, Air Handling Systems, The Trane Company, 1500 Mercer Rd., Lexington, KY 405 11 Lew Harriman, Mason-Grant Consulting, P.O. Box 6547,57 South St., Portsmouth, NH 03802 Stephen G. Hildenbrand, Environmental Sciences Division, Oak Ridge National Laboratory, P.O. Box 2008, Oak Ridge, TN 378316037 Keith Hodge, Department of Mechanical Engineering, 210 Carpenter Engineering Bldg., P.O. Drawer ME, Mississippi State, MS 39762-5925 John Kelly, IGT, 1700 S. Mount Prospect Rd., Des Plaines, IL 60018-l 804 Douglas R Kosar, Gas Research Institute, 8600 West Bryn Mawr Ave., Chicago, IL 6063 l- 3562 Tony Occhionero, American Gas Cooling Center, 400 N. Capitol St., NW, Washington, D.C. 20001 P. Richard Rittelmann, Burt Hill Kosar Rittelmann Associates, 400.Morgan Center, Butler, PA 16001-5977 Mike Schell, Telaire, 6489 Calle Reale, Goleta, CA 93 117 David Sin&ins, Munters Corporation, P.O. Box 640, Amesbury, MA 0 19 13 Steven Slayzak, Center for Buildings and Thermal Systems, National Renewable Energy Laboratory, 1617 Cole Blvd., Golden, CO 80401-3393


60. Richard S. Sweetser, EXERGY Partners Corp., 12020 Meadowville Court, Herndon, VA 20170
61. C. Michael Walton, Department of Civil Engineering, University of Texas at Austin, Austin, TX 78712-1076
62. William M. Worek, University of Illinois-Chicago, Energy Resources Center, 851 S. Morgan St., 1207 SEO, Chicago, IL 60607-7054
63. Jaroslav Wurm,.Director of Space Conditioning Research, IGT, 1700 S. Mount Prospect Rd., Des Plaines, IL 60018-l 804


APPENDIX A
SAMPLE ENERGY BIN ANALYSIS SHEETS FOR EACH SOAHU APPROACH ’

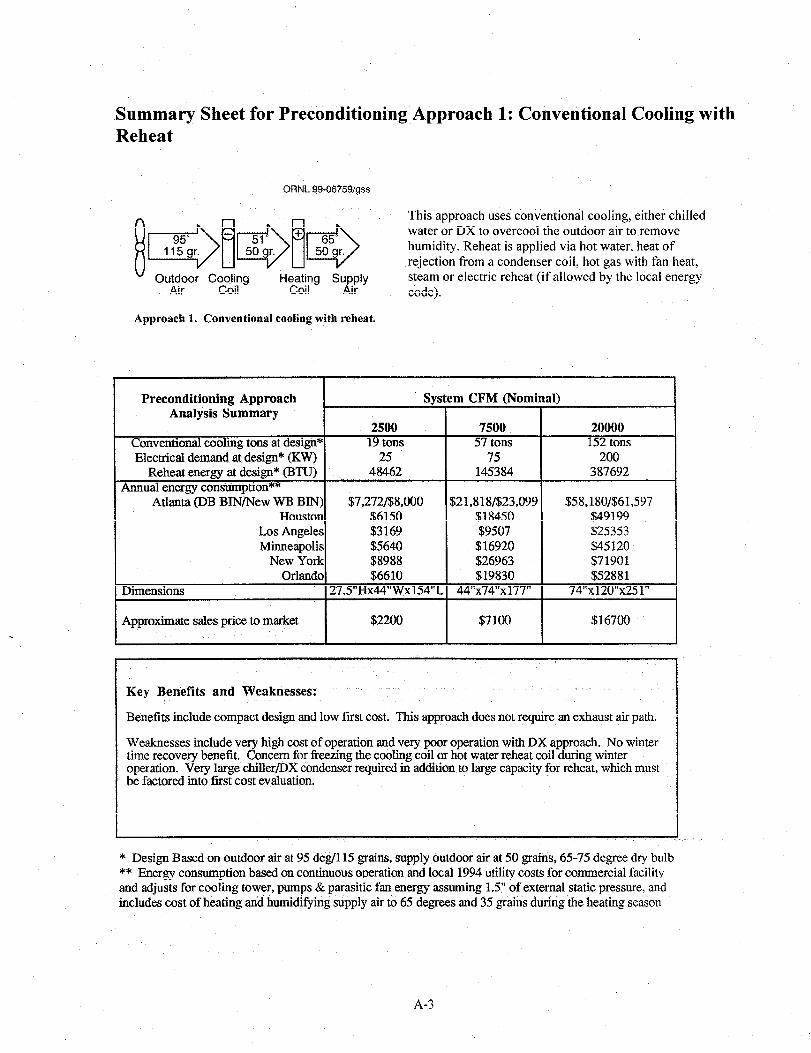
Summary Sheet for Preconditioning Approach 1: Converitional Cooling with Reheat
ORNL 99-06759&s
This approach uses conventional cooling, either chilled water or DX to overcool the outdoor air to remove humidity. Reheat is applied via hot water, heat of rejection from a condenser coil, hot gas with fan heat, steam or electric reheat (if allowed by the local energy code).
Approach 1. Conventional cooling with reheat.
Preconditioning Approach System CFM (Nominal) Analysis Summary
2500 7500 20000 Conventional cooling tons at design* 19 tons 57 tons 152 tons Electrical demand at design* (KW) 25 75 200
Reheat energy at design* (BTU) 48462 145384 387692 Annual energy consuinption**
Atlanta (DB BIN/New WB BIN) $7,272/$8,000 $21,818/$23,099 $58,180/$61,597 Houston $6150 $18450 $49199
Los Angeles $3165, $9507 $25353 Minneapolis $5640 $16920 $45120
New York $89 88 $26963 $71901 Orlando $6610 $19830 $52881
Dimensions 27,5”Hx44”Wx154”L 44”~74”~177” 74”x12O”x251”
Approximate sales price to market $2200 $7100 $16700
Key Be&fits and Weaknesses:
Benefits include compact design and low first cost. This approach does not require an exhaust air path.
Weaknesses include very high cost of operation and very poor operation with DX approach. No winter time recovery benefit. Concern for freezing the cooling coil or hot water reheat coil during winter operation. Very large chiller/DX condenser required in addition to large capacity for reheat, which must be factored into first cost evaluation.
* Design Based on outdoor air at 95 dcg/l15 grains, supply outdoor air at 50 grains, 65-75 degree dry bulb ** Energy consumption based on continuous operation and local 1994 utility costs for commercial facility and adjusts for cooling tower, pumps & parasitic fan energy assuming 1.5” of external static pressure, and includes cost of heating and humidifying supply air to 65 degrees and 35 grains during the heating season
A-3

Summary Sheet for Preconditioning Approach 2: Conventional Cooling with Run-around Recovery
ORNL 99-0676O/gss
t-lest Exchange
Runaround Loop This approach uses conventional cooling, either chilled water, or DX to overcool the outdoor air to remove humidity. Reheat is applied via the integration of a run- around coil, heat pipe, or plate exchanger and assisted, in some cases, with additional hot water, steam, or electric heat.
Approach 2. Conventional cooling with ruuaround recovery reheat.
Preconditioning Approach System CFM (Nominal) Analysis Summary ! :
2500 7500 20000 Conventional cooling tons at design* 15.5 tons 46.5 tons 124 tons Electrical demand at design* (KW) 21 63 169
Reheat energy at design* (BTU) 0 0 0 Annual energy consumption**
Atlanta $5263 $15790 $42106 Hous ton $4615 $13844 $36918
Los Angeles $2518 $7555 $20147 Minneapolis $5097 $15291 $40777
New York $6992 $20976 $55937 Orlando $3826 $11479 $30611
Dimensions 55”J3x44”wx141”L 88”X74”X193” 148”x120”x260” _‘,
Approximate sales price to market $4000 $12150 $31000
Key Benefits and Weaknesses:
Bcncfits include compact design (at lower airflows) and relatively low first cost. This approach does not require an exhaust air path. It is less energy consuming that a conventional over cooling with reheat system and it reduces the required cooling capacity (modestly) and reheating source (significantly).
Weaknesses include high pressure losses associated with two wet components. No winter time benefit to this approach despite the horsepower penalty year round. This often offsets much of the cooling season savings. The temperature leaving the unit is too cool on many overcast, humid days (ie: 72 degress and raining) so additional reheat is often required. ‘Ibis approach does not stabilize coil entering conditions well enough over various outdoor air conditions to allow DX to be utilized effectively.
* Design Based on outdoor air at 95 de@115 grains, supply outdoor air at 50 grains, 65-75 degree dry bulb ** Energy consumption based on continuous operation and local 1994 utility costs for commercial facility and adjusts for cooling tower, pumps & parasitic fan energy assuming 1.5” of external static pressure, and includes cost of heating and humidifying supply air to 65 degrees and 35 grains during the heating season
A-4

Summary Sheet for Preconditibning Approach 3: Dessicant Total Energy Recovery with Cooling/Reheat
ORNL WO6761/gss
This approach uses a total energy wheel to precool and predehumidify the outdoor air delivered to a conventional cooling coil, either chilled water, or DX, to overcool the outdoor air to remove humidity. Reheat is applied via hot water, steam, or electric.
Approach 3. Total recovery and conventional cooling
with reheat.
Preconditioning Approach Analysis Summary
Conventional cooling tons at design* Electrical demand at design* (KW)
Reheat energy at design* (BTU) Annual energy consumption**
Atlanta Houston
Los Angeles Minneapolis
New York
System CFM (Nominal)
2500 7500 20000 11 tons 34 tons 90 tons
16 48 128 48462 145384 387692
$5381 $16142 $43046 $4891 $14673 $39127 $4226 $12678 $33808 $3151 $9452 $25205 $5217 $15651 $41735
Dimensions Orlando $5202 $15605 $41614
55”Hx44”Wx171”L 88”~74”~194” 148”~120”~268”
Approximate sales price to market I
$7015 I
$16783 I
$37275 I
I I I I .“,
Key Benefits and Weaknesses
Benefits include a significant reduction in operating cost over approach 1, as well as reduction in refrigeration tons required. The total energy wheel provides more consistent outdoor air conditions to the cooling coil making the use of DX more functional. The energy recovery wheel also provides very significant wintertime energy savings as well as free humidification. It protects the coils during winter operation, Peak demand is cut significantly.
Weaknesses include higher cost than option 1 and a larger size since it is an exhaust as well as supply unit. Biggest weakness is that it needs an exhaust air volume to tinction.
* Design Based on outdoor air at 95 deg/l15 grains, supply outdoor air at 50 grains, 65-75 degree dry bulb ** Energy consumption based on continuous operation and local 1994 utility costs for commercial faiility and adjusts for cooling tower, pumps & parasitic fan energy assuming 1.5” of external static pressure, and includes cost of heating and humidifying supply air to 65 degrees and 35 grains during the heating season
A-5

Summary Sheet for Preconditioning Approach 4: Dual-Wheel Total Energy Recovery
ORNL 99-06762/gss
Exhaust Air Return Air
This approach uses two energy recovery wheels, one sensible and one latent, and a cooling coil to provide the same conditions as approach 3, except the sensible wheel provides free reheat and provides precooled air to to the return side of the total wheel, significantly reducing the required conventional cooling capacity.
Approach 4. Dual wheel total recovery configuration.
Preconditioning Approach System CFM (Nominal) Analysis Summary
2500 7500 20000 Conventional cooling tons at design* 7 tons 21 tons 56 tons Electrical demand at design* (KW) 11 33 88
Reheat energy at design* (BTU) 0 0 0 nnual energy consumption**
Atlanta (DB BIN/New WB BIN) $3.366/$3,383 $10,098/$10,147 $26,928/$27,060 Houston $2587 $7762 $20698
Los Angeles $1906 $5717 $15246 Minneapolis $1981 $5942 $15845
New York $3367 $10100 !§26Y33 Orlando $2776 $8328 $22209
imensions 55”Hx44”Wx188”L 88”x74”~211” 148”x12O”x285”
pproximate sales price to market $11100 $24750 $53650
Key Benefits and Weaknesses:
Benefits include a very significant reduction in operating cost over options 1,2 and 3, as well as tbe greatest reduction in refrigeration tons required. The sensible wheel provides the required reheat without allocating any energy source for this benefit since the heat comes from the space sensible load. This approach provides the most consistent outdoor air conditions to the cooling coil making it ideally suited for cost effective DX cooling. The energy recovery wheel also provides very significant wintertime aergy savings as well as free humidification. It protects the coils during winter operation. Peak demand is cut significantly.
Weaknesses include slightly higher cost than options l-3 for the system (although reduced cooling and heating plant often offset this difference) and a larger size since it incorporates two wheels. Biggest weakness is that it needs an exhaust air volume to operate.
* Design Based on outdoor air at 95 degIl15 grains, supply outdoor air at 50 grains, 65-75 degree dry bulb ** Energy consumption based on continuous operation and local 1994 utility costs for commercial facility and adjusts for cooling tower, pumps & parasitic fan energy assuming 1.5” of external static pressure, and includes cost of heating and humidifying supply air to 65 degrees and 35 grains during the heating season
.
A-6

Summary Sheet for Preconditioning Approach 5: Dual-wheel Dessicant-based Cooling atid Post Cooling
ORNL 99.09763A/gs
Dehumidification (Active) Wheel
Approach 5. Dun1 wheel drsiceant-based cooling.
This approach uses two wheels, a dehumidification, and sensible recovery wheel to provide dry air at a moderate temperature. Heat is used to regenerate the dehumidification wheel once it has adsorbed moisture from the outdoor airstream. An evaporative cooler is usually required to enhance the cooling effect associated with the sensible wheel. Modest post cooling is often required during peak conditions.
Preconditioning Approach System CFM (Nominal) Analysis Summary
2500 7500 20000 Conventional cooling tons at design* 4 tons 12 tons 32 tons Electrical demand..at design* (KW) 7 21 57
Reheat energy at design* (BTU) 159875 479 625 1279000 Annual energy consumption**
Atlanta (DB BIN/New WB BIN) $4,433/$4072 $13,298/$12,216 $35,463/$32,573 Houston $4718 $14154 .$37744
Los Angeles $3925 $11774, $31397 Minneapolis $3542 $10626 $28336
New York $4948 $14843 $39582 Orlando $6308 $18925 $50466
Dimensions 55”Hx44”W-x188”L 88”~74”~211” 148”x12O”x285”
Approximate sales price to market $14700 $30215 $64838
. . _. ._
Key Benefits and Weaknesses:
Benefits include the ability to shift the cooling load from bigb cost electricity to low cost gas. To provide air that is drier (ii some cases) than obtainable with conventional cooling systems. Key advantage over desiccant based recovery wheels is that a return airstream is not necessary, although helpful. No wet cooling coils in this system.
Weaknesses include bigber cost than previous options. The size of the system is quite large due to the two wheel arrangement operating at moderate face velocities. Often requires the evaporative cooler for economics, yet it can be a bigb maintenance item and is avoided in some applications.
I * Design Based on outdoor air at 95 de&l 15 grains, supply outdoor air at 50 grains, 65-75 degree dry bulb ** Energy consumption based on continuous operation and local 1994 utility costs for commercial facility and adjusts for cooling tower, pumps & parasitic fan energy assuming 1.5” of external static prcssurc, and includes cost of heating and humidifying supply air to 65 degrees and 35 grains during the heating season
A-7

Summary Sheet for Preconditioning Approach 6: Dessicant Dehumidification-Total Recovery Hybrid
ORNL 9%06764/gss
Exhaust Air This approach combines the best of total recovery with the best of dehumidification wheel performance. The total energy wheel removes much of the moisture and precools the outdoor air, which is then introduced to a dehumidification wheel to remove only the remaining moisture desired.
Energy Desiccant Recovery Dehumidification
(Enthalpy) Wheel (Active) Wheel Water
Approach 6. Desiccant tlel~umidiiticrtion-total weowry hybrid.
Preconditioning Approach System CFM (Nominal) Analysis Summary
25Ufl 7500 20000 Conventional cooling tons at design* 6 tons 17 tons 4.5 tons Electrical demand at design* (KW) 9 28 73
Reheat energy at design* (BTU) 78125 234375 625000 Annual energy consumption**
Atlanta $4264 $12792 $34113 Houston $3455 $10365 $27640
Los Angeles $2857 $8571 $22856 Minneapolis $2661 $7983 $21288
New York $4442 $13327 $35538 Orlando $4592 $13777 $36738
Dimensions 55”Hx44”Wx203”L 88”~74”~226” 148”x120”x300”
Approximate sales price to market $15750 $31350 $67850
L t
Key Benefits and Weaknesses:
Benefits include the ability to shift the cooling load from high cost electricity to low cost gas. To provide air that is much drier than obtainabie with conventional cooling systems, No wet cooling coils in this system. Since the DH wheel does less work than in option 5, the temperature leaving the desiccant is far more moderate, allowing the sensible recovery wheel to be replaced with a tower or conventional cooling coil. The energy efficiency (COP) when compared to option 5 is much improved if free post cooling is available or not required. Air much drier than possible with option 5 is produced using ihis approach. This approach also provides for latent recovery in the winter as well as summer.
Weaknesses include those listed for option 5 plus the fact that a return air stream is required for the total energy recokery wheel portion of the design.
I * Design Based on outdoor air at 95 de@1 15 grains, supply outdoor air at 50 grains, 65-75 dcgrcc dry bulb
I
** Energy consumption based on continuous operation and local 1994 utility costs for commercial facility and adjusts for cooling tower, pumps & parasitic fan energy assuming 1.5” of external static pressure, and includes cost of heating and humidifying supply air to 65 degrees and 35 grains during the heating season
A-8

Summary Sheet for Preconditioning Approach 7: Dual-wheel Dessicant- based Cooling-Total Recovery E@tkd
ORNL 99.067Wgss
Energy Desiccant Recovery Dehumidification
(Enthalpy) Wheel (Active) Wheel
Approach 7. Dual wheel desiccant-based cooling-total tecwery hybrid.
This approach combines the best of total recovery with the best of dessicant-based cooling performance. The total energy wheel removes much of the moisture and precools the outdoor air, which is then introduced to a dehumidification wheel to remove only the remaining moisture desired. The added sensible wheel eliminates the need for post cooling at most conditions while reducing the regeneration energy consumption.
Preconditioning Approach System CFM (Nominal) Analysis Summary
25OU 75uu 2uuuu Conventional cooling tons at design* 2 tons 6.5 tons 17 tons Electrical demand at design* (KW) 6 17 45
Reheat energy at design* (BTU) 70000 21OooQ 560000 Annual energy consumption**
Atlanta $3158 $9474 $25264 Houston $3030 $9091 $24242
Los Angeles $2506 $7517 $20045 Minneapolis $2334 $7001 $18669
New York $3573 $10719 $285 84 Orlando $3924 $11772 $3 1392
Dimensions 55”Hx44”Wx235”L 88”x74”~258” 148”xl2O”x332”
Approximate sales price to market $20500 $39300 $84200
Key Benefits and Weaknesses:
Benefits include the ability to shift the cooling load from high cost electricity to low cost gas. To provide air that is much drier than obtainable with conventional cooling systems. No wet cooling coils in this system. Since the DH wheel does less work than in option 5, the temperature leaving the desiccant is far more moderate, allowing the sensible recovery wheel to replace the tower water or conventional cooling coil. The energy efficiency (COP) when compared to option 5&6 is much unproved.
Weaknesses include those listed for option 5 plus the fact that a return air stream is required for the total energy recovery wheel portion of the design Due to the three wheels involved, space is very often a problem and the cost is at a premium of over other approaches.
I * Design Based on outdoor air at 95 deg/ll5 grains, supply outdoor air at 50 grains, 65-75 degree dry bulb ** Energy consumption based on continuous operation and local 1994 utility costs for commercial facility and adjusts for cooling tower, pumps & parasitic fan energy assuming 1.5” of external static pressure, and includes cost of heating and humidifying supply air to 65 degrees and 35 grains during the heating season
A-9


APPENDIX B
DETAILED SPECIALIZED OUTDOOR AIR HANDLING UNIT (SOAHU) MODELING INPUTS AND RESULTS FOR ATLANTA
and DESSICANT-BASED COOLING MODELING DATA FOR HOUSTON,
MINNEAPOLIS, NEW YORK, AND ORLANDO

LOCATION:
W G
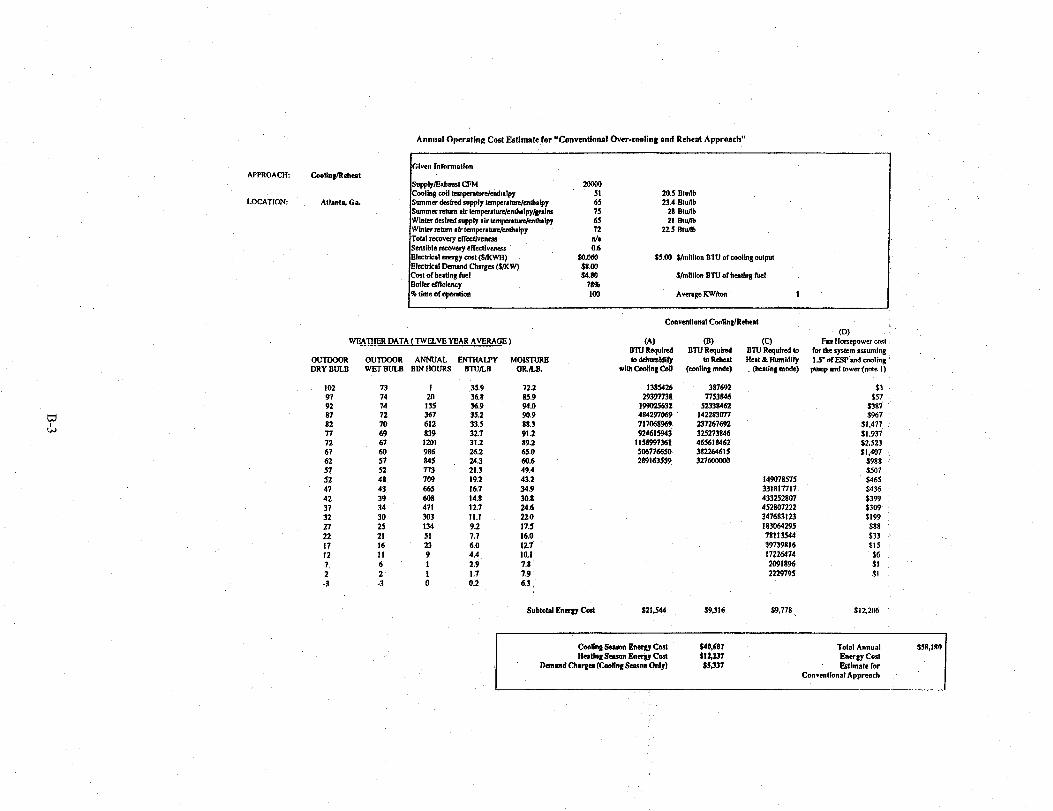
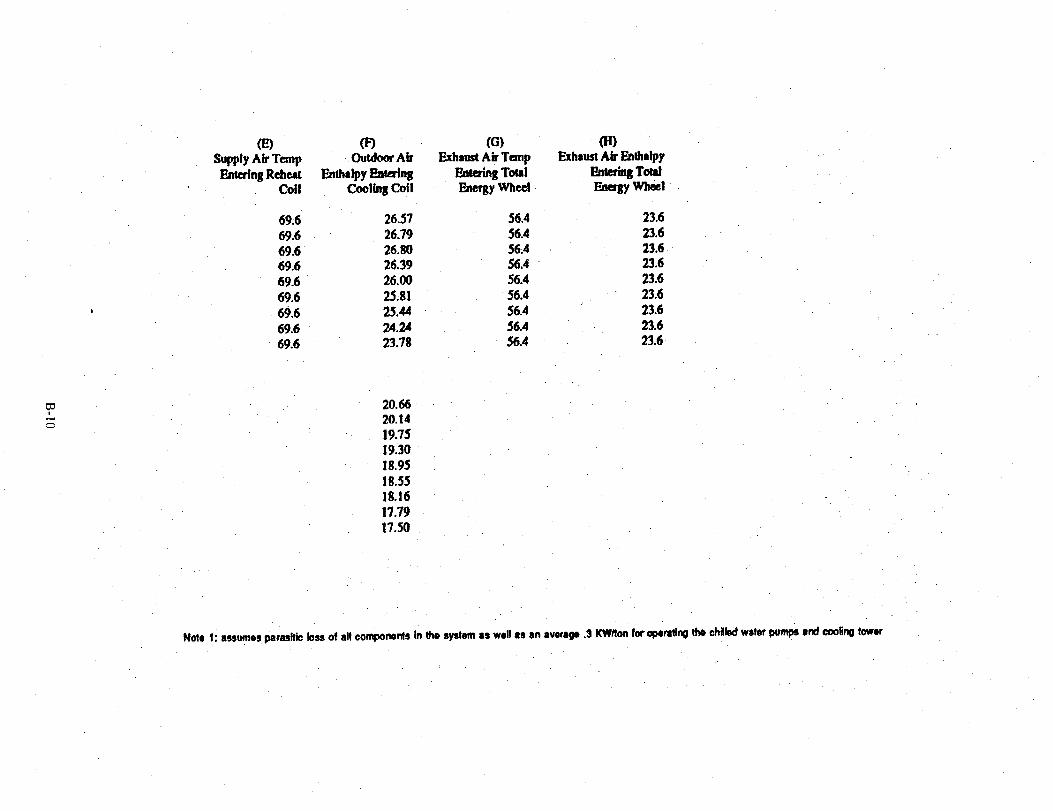
Annual Operating Cost Estimate for “Conventionnt Over-coating and Reheal Apprmach”
Coolbg/rtDhent
AIlnnIa, Ga.
zom 51 65 15 65 12
Q/s 0.6
scmn Jmm wao
78% ml
20.5 Bturlb 23.4 Btwlb
26 Blwlb 21 muml
22.5 Blwlh
s5.00 S/million BTU Of eOalfn6 wlp”t
Shnlllion BTU of tldq M
Avmge KWlIon 1
WFATIIER DATA ( TWEVE YEAR AVERAGE )
OUTDOOR OUTfXOR AMAL ENIIIALPY DRY BULB WET BULB BIN HOURS BlUhR
102 73 I 35.9 97 14 20 36.8 92 135 36.9 81 367 35.2 a2 70 612 33.5 n 69 a39 32.7 72 67 12oI 31.2 61 986 26.2 62 z 845 ?A.3 51 52 773 21.3 52 48 709 19.2 47 43 665 16.7 42 39 608 14.8 37 34 471 12.7 32 30 303 11.1 n 25 134 9.2 22 21 51 1.1 11 16 23 6.0 12 11 9 4.4
7. 6 1 2.9 2 2 1.7
-3 -3 0.2
72.2 859 94.0 90.9 88.3 91.2 89.2 65.0 64I.6 49.4 43.2 34.9 30.8 24.6 22.0 17.5 16.0 111 IO.1 7.a 1.9 6.3
SubtoW Ennag Cosl 521.544 S9.316
Convcnttmrl Conlin6lRebeat
(D) (A) (B) (Cl FM Iimquwu uxl
NtU Rqkd BTU Required BTU RquImd to for the. ryslenl lssl!mblS 0 d&mddify tOR.?h.M Hetidl Humidify 1.5’ of FSP.md awlin
with Coolini( Cdl (cooling mode) Butin8modc) pamp and mw?r(nM I)
1385426 387692 29397138 7l53846
199025632 52330462 484297%9 142283DTl 717068969 237261692 924615943‘ 325273846
1156997361 465616462 505176650 302264611 289163559 3216CW00
f49!378575 331817717 433252807 4S2807222 347683123 183064295 78113W 39739816 17226474 20918% 2229795
s9.778
1387 $967
$1.477 51.937 52.523 Jl.407
SIRS $507 $465 5436 5399 3309 $199
$88 533 $15
:; $1
512.206
Cdinp Seam Ene~ Cast $40,667 Hutlng Season energy cosi SI2J37
Demand CYmrga (Co&g Scuon Only) $5337
T&l Annual Energy Cost Estimate for
ConventIonal Approach

W b
WPATliERDATA(lWELVRYEARAVERAGE)
OVTMOR OVlWOR ANNUAL EKT"ALFY MOlSDJRB DRY alhE WETBULB BlNtIOURs BNNI fJRna.
87
:i ia 15 14 72 69 67 66 64 62 61
78.3 76.5 14.S 12.5 70.5 60.1 665 64.5 62.5 60.5 sa.5 56.5 545
26 111 405 634
:: 363 314 378 311 321 4ns 316 347 316 326 344 346 278 230 21s IS1 320 30s
13": 78 3s
41.2 39.3 37.4 35.1 36.0 32.4 mm 29.3 27.9 26.6 2S.2 24.0 72.8 21.6 20.5 19.4 18.4 17.4 16.4 IS.5 14.6 13.7 12.1 Il.4 95 1.9 6.2 4.1
40408019 167493~39 6168rnW 8662S4398 9426118% 6iZOt%S6 33712u369 297@0839 2S24.84113
129.5 118.6 111.6 108.4 102.3 935 86.7 t2.0 76.0 611.8 635 38.6 S2.4 48.6 44413 402 382 54.9 31.8 36.4 21.7 23.6 20.6 24.1
lfmol929 1396s3311 127226101 ntdiziz
IrnllWOO 4?03%46
ls7ois38s 2457%523 ry1F-49231 222147692 I40732?48 iw%923 14650692 12om.301 126l73383 15701538S 1451?230a
51.191 Si.71S S1.923 $1,294
SW4 SW2 $621 $4458 $424 s4*1 iG2 5221 3241
59 52.5 51 so.5 5s 48.5 n 50 48 4s 43 42
:: 27 29. 17 12
46.5 445 42.5 405 38.5 365 32.5 29 24 20 IS 12
am
21461432 59016631
1032Km42 143762035 1464173% 14s9o.al7 ISBBw129 151982627 350374886 3kaM40
19.1 243820712 16.9 209167173 13.7 133431286 12.1 65131216
j214 $226 sn7 5182 SISI Sldl $119 $210 5199 $121
$91 $51 $23

Annual Operating Cost Estimate for “Conventional Over-cooling, Run-Around Recovery, Reheal Approach”
ch Inronnatim APPROACII: CmHngt7tehral
wilh Ron-Around. SupplyIFJlhsusI CFM ZcGilo fkmlblc Recovery Cooliag csil krving air kmpwsomlenU~lpy 51 20.5 eturlb
summa desired supply Ia%lpntw~uMlpy 65 23.4 Bltib LOCATION: A~tatr. Ce Summa Nlaa nb kmperrtow.Jen6mlpylgnins 75 28 Btwlb
Wintn desired supply air IempemooclenUI~lpy 65 21 &lb w hla mhlm lb tmlpemnrreltnlbr1py 12 22.5 l3twlh Suoibk rscavcry cffeectfvmar 0.6 Smsibk. teawery tRec6vmesr 0.6 El&kM mer#y east (S/KWlf) SO.060 55.00 S/milliin Blu cd cooling mput lzhwrid lkmmd chuges &9w sB.w tit of beaCing rwl $4.80 S/million BTU al buting rual B&r dlickncy 78% 46 rime 0rLlpentim 100 Awqc KWlbm I
WEAlHEft DATA ( IWlXVE YEAR AVERAGE )
OUTDOOR DRY BULB
102 m in 81 82 77 72
Ii 57 52 41 42 37 32 27 22 17 12 7 2 -3
OllTDCOR Ah’NUAL ENTHALPY MOISTUKE wEI‘BULB BLN HOURS BTUK~E GR.hB.
73 74 74 72 70 69 67
1 35.9 20. 36.8 135 36.9 361 35.2 612 33.5 839 32.1 1261 31.2 986 26.2 845 24.3 773 21.3 709 19.2
72.2 85.9 94.0 90.9 88.3 91.2 89.2 65.0 60.6 49.4 43.2 34.9 30.11 24.6 22.0 17-5 16.0 12.7 10.1 7.8 1.9 6.3
52 4 43 39 34 30 25 21 16 Ii 6 2 -3
665 16.7 6m 14.8 471 12.7 303 11.1 134 9.2
. 51 7.1 23 6.0 9 4.4 1 2.9 I 1.1 0 0.2
0) (A) @I 0 Fu, iloncpawcr CMI
BTU Rquivd LITU Rqubed BTU Rquircd I0 for Ihe syskm assuming la debamidiry to R&xl Flu! & Humidify 1J”of ESP md cooling
with Cooling Coil (cooling mode) (lwling made) pump md towu(note I)
867026 19029738
129041632 313669549 471191849 64vo65m 830133201 36231969Q 166766359
$14.381 $1.631 s9,ln $lZ.519
0 0 0 0 0 0
46561846 120140368 17316ocmo
14W78575 331817117 433252007 452807222 547683123 183664295 78113544 39739816 17226474 20918% 2229795
$2 &I7
5320 $814
$1.290 $1.749 $2.371 $1.378 $1.045
$724 $664 1623 $570
i% .- $126
SC3 122
$8 51 $I
Coolinp Sepcon Enqy Cast s25.019 Healing Scam Energy Cost S13J91
Demand Cbs~es (Cooling Seawn Only) $3,796
Total Annual EnagyC.w~ @slimale ror
C~nsenlianal Approach with Run-amund Smsihle Reenvery
542,166

(El 0 Supply Ab Tanp Outdoor Air
Entering Reheal Emhrlpy Entaing Coil Cmling Coil
15 IS IS
12.6 69.6 66.6 63.6
30.13 31.07 31.12 29.98 29.05 29.00 28.18 23.91 22.72

Annual Operating Cost Estimale for “Total Recovery with Conventional Cooling and Reheat”
civ- tttr0ormnti0n APPROACII: CocdlnSn\ehal
rilh Tots1 f&qy Supplyfihwst CFM 2ocuJ Recovuy CmlinSoOU k.“btS lirU”IparPw 51 26.5 Lnwlb
slmlms dezbcd supply ‘cmpentllMul6ulpy 65 23.4 Btwlb LOCATION: Allanlq Or ~ summa Ielm sir km+wNn-e!enlb11py/Smim 75 28 lltwlh
Winter dcshd supply air LcmpartienLhatpy 65 21 llwlb Whwnmmrl?klnpentlpy 72 225 &u/lb
Towi reeoveq elT.wiveness 0.76 0.75 Pmxwre ion/ride Ekctskol w%y cosl (SKWH) 50.044 $5.66 with BTU 0r mOilnB ~~~~~~ EkcLrM Demand CbuSes ~SKN’I SB.00 colt orku6nS n~ei 34.80 S,‘mllllon BN of hutInS 61~1 Boils cmckncy 78% % time 0rapemh 100 Awage KWh I
OUlDOOR DRY BULB
102 97 92 81 a2 n 72 67 62 57 52 47 42 37 32 27 22
t: 7 2 -3
OX WEA7?llB DATA ( TWMrFLVE YEAR AVERAGE ) (A) on (Cl FM llnscpwa cost
BlU Rauirsd BTU Reaubed BTU Rwuimd 10 far lb8 4skn1 usmins OUTDWR ANNUAL EhTtlAWY ucNsnJRe lo-, tD pcaicwl Hut & tiddiry WET mJLB BIN HOURS BTU/LB GRhB. wllb 6dnQldill~lml *I (cwlhl~ rlwdd Oleuing mode)
73 I 35.9. 74 a0 36.8 74 135 36.9 72 367 35.2 70 612 33.5 69 839 32.7 67 1201 31.2
: 986 645 26.2 24.3 52 n3 21.3
72.2 845502 387692 85.9 l73lY57 7753t.46 94.0 117U21152 52336462 90.9 304502297 142283!377 88.3 466652.553 237267692
48 109 f9.2 43 665 16.7 as 608 14.8 30.8 34 471 12.7 24.6 30 303 Il.1 220 2s l3d 9.2 17.5 21 51 7.7 16.0 16 23 6.0 12.7 11 9 4.4 10.1 6 I 2.9 7.8 2 I 1.7 7.9 -3 0 0.2 6.3
91.2 652314826 325273646 89.2 S93792367 465618462 65.0 505SlSoxl 362264615 66.6 2S099Mw)o 3276imm 49.4 43.2 34.9
2ao05289 46719116 435.977% 263092+1 12038789 6512171 295050.9
370517 403612
Subtokl Enay CM 516.333 $9316 $782 $13,1W
$2
SE s8nI
$1.303 $1.765 St.466 Sf.6R3 $1.225
* $724 5604 6623 $570
El $126
se3 $22
$8 01 $1
Cooling Scum Energy Cti s3sJ41 Hdn;seMon Enay cc4 WJ95
Dnmd Chages (Coolin SIlson Only) 53311

(El 0 Supply air tanprature ‘Outdoor Air
Entering Reheat Enthrlpy &&itl~ Coil &Oh8 COti
29.89 30.12 30.13 29.12 29.32 29.14 28.77 26.20 24.30 22.22 2s.70 21.10 20.66 20.14 19.75 19.30 18.95 18.55 18.16 17.79 17.!50
Note 1: sssumes paradic loss ol dl eompof~~ts In th system 8~ welt IS rn 8~~800 .3 i(WRon fof *orsting th chitbd w&r pumps and cooling to&

Ammel Opcmling Cost Eslimale for “Dual wheel T&al Rtfovery/Convcnllonal Coolin@ensihle Recovery Reheal Approach”
APPROACH: COOfinpiOU~l whed Tohl Rn
wtStndbk Ra Rebal
LOCATION: AuPnlm.Ca.
OIJTDDOR DRY BULB
WEATiiEX DATA (TWELVE YEAR AVERAGE )
OUTDDDR ANNUAL ENnLuF.Y MOlsluw WBTBULB BlNHOURS B77JlLB GRh.B.
73 I 74 lo 74 135 n 367 10 612 69 839 61 1201 60 986 57 845 52 773 48 709 43 6.55 39 608 ?d 471 30 303 25 134 11 51 I6 13 11 9 6 I 1 1 .3 0
35.9 36.8 36.9 35.2 33.5 32.7 31.2 16.1 14.3 11.3 19.2 16.7 14.6 12.7 11.1 9.2 7.7 6.0 4.4 29 1.7 0.1
72.2 115.9 94.0 s-3.9 lJ.9.3 91.2 89.1 65.0 60.6 49.4 43.2
2: 24.6 12.0 17.5 16.0 I27 10.1 7.8 7.9 6.3
102 97
w 92 & 87
81 n 72 67 62 s7 52 47 42 37 32 11 11 I7 11 7 1 -3
(A) BTU Riquirul w 6dmidify
4th cnalr~CoR
11322933 76571617
194539486 3Bxll1327 4ao9lw7 333941311 332Bl2977 249lool27
SlOSll SO
0 0 0 0 0 0
Q BTU Rqubtd to Heal & Hddify
Bcniq mde)
24005289 46719118 435R77% 263W77 11038789 6511171 295050.3 370517 403612
naz $12.998
--J Fan llo~~cpowe~ cost
for La*yslm Issuming 1.5’ of IiSP and cmlirq
prmpmdtowr(noreI)
s2 539
$167 $705
tl.141 51.545 51.152 t1.607 51.325
5869 3791 $748 $684 5530 $341 St.51
557 526 $10
$1 $1
Ceolin# Beawn Enqy cmt s19394 Halbl;~Eaag.TCml 64,997
Danand Cbrrpcs (Caalln( Samn Only) $2,637 Total Annual energy Cosl
F~Iimrtc for Dual Wheel TOIPI Recovery/Sensible Rec.Rehut
526,926
03 0 Supply Air Tcmp OutdoarAk &Wring Reheat &thr tpy &t&g
Coil Cooling Coil
69.6 26.57 69.6 26.79 69.6 26.80 69.6 26.39 69.6 26.00 69.6 25.81
b 69.6 25.44 69.6 24.24 69.6 23.78
m 2-h 0
20.66 20.14
19.715 19.30 18.95 18.55 18.16 17.79 17.50
((3 0 ‘I Exhaust Air Tamp Exhaust Air Enthrlpy
Earcring Total EilltdlgTOtd Energy wheel %?tgywheel
56.4 56.4 ,56.4 56.4 56.4 56.4 56.4 56.4 56.4
I.6 I.6 I.6 1.6 8.6 .6 .6 .6 .6
Note 1: assumes parasftii bss of all component, in the system IS wall as m awngo .3 KWRon for oprmting the chikf water pum& and cc&g tower

Annual OpenIinB Cod Eslimnlc for “Trsditianml Desiccant Bawd Cooling Approach”
r I
2.5.8 Bwlb 28 Blwlb 21 BtUnb
225 hv7b
0.7s hum Lmdslde s5.00 shnillkn B?u of coollq output
6s orbbn
62.5: Wd Bulb
Drskml Bawd Cmllr Awmwh
WEAllIPJt DATA (TWELVE YEAR AVERAGE )
OIllDOOR OulDooR ANNUAL ENTHALPY M01srIJRE DRY BULB WEF BULB BlNlIOLIRS BTU&B GRILB.
u2 77 72 67 62 57 s2 47 42 37 32 27 22 17 I2 7 2 4
13 1 74 20 74 135 72 367 70
.69 67 60 ::
48 43 39 34 30 25 21 16 II 6 2 -3
612 a39 tint 986 us 7l3
E 606 471 303 Ha 51 23 9 1 I. 0
35.9 36.8 36.9 33.2 33.5 32.7 31.2 26.2 24.3 21.3 19.2 16.7 14.8 12.7 11.1 9.2 7.7 6.0 4.4 29 1.7 0.2
72.2 85.9 9b.0 90.9 88.3 91.2 89.2 63.0 60.6 49.4 43.2 349 30.8 2416 22.0 17.5
818994 29253 17646139 ‘1031930
lIESI 7264936 3063?5129 7833683 5422wu 0 7623S1215 0 974532660 0 912927148 0 731744120 0
25881688 85223639 77619173 48859324 21387517 11620802
Sl 530
$202 S.550 5918
51.258 SI.801 $1.479 51.267 51,159 s1.063
5997 S912 s7w 5454 $201
ii: $13
Sl
16.0 127 IO.1 SZ31610
::; 648916 673% $1
6.3
Suhloki smrp cad $19.686 581 5970 SIJ.l27
Told Annud Energy Cosl
TraditionsI D&cant Bad CC”#btg Approach
$35,463

0 Humidity Qmins
J31bd11g DH Wheel
72.2 its.9
;: 88.3 91.2 89.2 65.0 60.6
0 Tempartum Entmiag DH
whed
102.0 35.9 126.8 97.0 36.8 131.9 92.0 36.9 132.5 87.0 35.2 124.9 82.0 33.5 119.0 77.0 32.1 116.4 72.0 31.2 108.9 67.0 26.2 09.4 62.0 x3 81.1
SO 50
tl JO SO 50
itl
190 63.8 2Ml 63.8 200 63.t 190 63.11 190 63.8 190 63.1 175 63.8 170 63.1 160 63.8
30.8 24.6 22.0 17.5 16.0 12.7 10.1 7.8 1.9
42.0 14.8 37.0 12.7 32.0 Ii.1 27.0 9.2 22.0 1.1 17.0 6.0 12.0 4.4 7.0 2.9 2.0 1.7
Q (M) Tanpml~re Tanpa~um Leaving
to Regalenliall salaible wkei coil To Cooling Coil
114.2 118.3 116.7 112.7 108.0 105.9 99.9
76 77
;: 75 74 73 69 67
&I 63 62 61 60 59 58
Bi). hlhalpy
Leaving Sensible wheel
20.6 19.4 i&i! 17.8 17.4. ‘. 16.6 16.0 15.4 15.1

Annual Operating Cost Esllmate for “Debumidifkmliotbhlal Rcrorery Hybrid Approach”
mooocfm
: 75 65 72
1 0.76
SMmo
WEATHER DATA ( %‘ELVE YEAR AWRAt?E ) (A) @I (0 Fen ii&&wer cast BN Rqubaa BTUReqhd BN Required to rOfcbc~~ktn~mingg
OUNOOR OUlTZOR ANNUAL EMtiALPY MOISNRR to ddxmnldKy OPactCCd Heat & Hmnhliry 1.S5’ofEsPmdcoolin~ DRY BULB WFTBULR BJNHOIJRS BNhB 0R.ll.B. with &lltmmKimiaa SiKd (cnol~ mode) omtillgmoda) plmlpMdtwer(notel)
102 97
73 74
:: 70 69 67
iit 52 4s 43 39 34 30 25 21
I
2” -3
I 35.9 m 36.8
72.2 8S.9 94.0 9x9 8r3.3 91.2 89.2 65.0 60.6 49.4 43.2 34.9 30.11 M.6 22.0 173 16.0 12.7 10.1 7.8. 7.9 63
514080 11037m 79maai
348026 109w22 739113520
20112Ss70 335391958 45w93g77 6S8179316 YO353710 463022034
$1
92 a7 a2 77 72 6? 62 n
135 36.9 361 351.2 207339960
337750366 4947413520 7082OS600 S81424480 S30220600
.324 5164 $447 $746
s1,022 St.463 51.201 $1.030
$942 52 47 42 37 32 27 22 17 12
: -3
611 33.S 839 327 1201 31.2 986 26.2 a45 24.3 773 21.3 7ts 19.2 665 16.7 boI) 14.1 4771 12.7 303 11.1 13l 9.2 Sl 7.7 23 6.0 9 4.4 1 2.9 I 1.7 0 0.2
19354883 4326rnLiO 41425492 2.539991 I 1 I703398 6369139 2897763 36x49 39927s
$741 $574 $369 $163
562 528 $11
.W&Id Eneqy Cad 513,717 u29

Ibfnidity&ns t3wingJm
WhcLl
66.7 81.5 30.0 100.4 so’ 170 70.0 80.3 30.2 101.3 so 170 72.0 79.1 30.2 101.4 so 170 71.2 77.9 29.8 98.8 so 160 70.6 76.7 29.4 %.9 50 15s 71.3 75.5 29.3 %.2 so 155 70.8 74.3 28.9 94.3 so IS0 65.0 73.1 27.7 89.3. so 145 63.9 71.9 27.2 87.6 so 145
33,2 31.7 31.1 30.6 29.7 28.9 . 28.3 27.7 27.7
'64.8 63.6 62.4 61.2 60.0 58.8 57.6 56.4 55.2
20.7 20.2 19.8 19.4 19.0 18.6 18.2 17.8 17.5
Now: assumes pomstttc toss for dt compenrnts h Iho syslmrr welt as an avmnga .3KW/bn fcr cqoraling the chttld wator~pumpr ml opmt’ng rho ding tower

Annual Operating Cost Estimate for “Total Remvyy with Traditionnl DBC Approach”
GJJYIXMR DRY UUJB
wEA~‘JB% DATA ( TWJWE YEAR AVERAGE)
OIrrIY2oR ANNUAL ENNALPY M01snlR0 WErBlJLE BMHOURs BN/7.0 GRhB.
JM
2 87 c2 77 12 67
z; 52 47
if 32 n 22 17 12
: -3
73 1 74 20 14 14 n 367 70 612 69 839 61 1201 : 9%
84s 32 773 48 709 43 665 39 c&3 34 471 30 303 25 134 21 51 I6 23 II 9 6 1 2 1 -3 0
33.9 MI 36.9 35.2 33.5 32.7 31.2 26.2 24.3 21.3 19.2 16.7 14.8 12.7 11.1 9.2 ‘1.7 6.0 4.4 2.9 7.8 1.7 7.9 0.2 63
722 85.9 Y.0 90.9 ml.3 91.2 89.2 6S.O 60.6 49.4 43.2 34.9 30.8 24.6 22.0 17s 168 127 10.1
632W 129471 13234249 2848165 89362033 18109S76
2220742s9 36637429 3s6sllw8 21582239 493933715 mm72 6794S2J 17 0 %osss%4 0 493s15367 0
513,0&i $401
$2
0 43262080 41425492 25399911 117033911 6369159 2897763
36m9 39m5
$34 szza $619
51.032 51.415 $2.026 31.663 Sl.425 51,304 Sl.l% $1.122 51.026
$795 WI 5226 $86 t39 $15
$461 $14.768
Totd Annusl Enaw cmt
lbtim~tr for Told Recovery with Tndftknal DIJC Approach
830,486

66.7 81.5 30.0 100.4 70.0 80.3 30.2 101.3 72.0 79.1 30.2 tot.4 71.2 77.9 29.8 98.8 70.6 76.7 29.4 %.9 71.3 75.5 29.3 96.2 70.8 74.3 28.9 94.3 65.0 .73.1 27.7 89.3 63.9 71.9 n.2 87.6
? z 33.2
31.7 31.1 30.0 29.7 28.9. 28.3 27.7 27.7
0 Tempamme Ewing DH
wheel
‘64.8 20.7 63.6 20.2 62.4 19.8 61.2 19.4 60.0 19.0 58.8 18.6 57.6 18.2. 56.4 17.8 55.2 17.5
.
.
170 170 170 160 155 1s I50 145 145

W L -.I
OUIDOOR DltYBlnB
DUl7XYOR ANNUAL IM’IIALF-Y WRTBUIJI BINIIDURS BlvilB
73,s ‘lb.3 74s 72.5 70.3 63.5
ii: 623 60.1 S8.3 36s 54.1 3l.S 5o.S 435 4b.S US 42s 46.5 38.3
2: l9
ii IS 12
26 Ill 40s
E 373 363 374 379 311 327 40s 376 347 376 326 344 346 278
:s 111
ifi
f: 78 3s
412 39.3 S7.4 3x7 34.0 32.4 37.1 29.3 27.9 'lb.6 2.52 241) 21.8 21.6 2fl.S 19.4 Ill.4 17.4 lb.4 IS.3 14.6 13.7 12.1 Il.4
;: 6.2 4.7
WR477lE.R DATA (‘IWELW YE4R AWIAGI? )
MolsnJu6 GRM.
a M 13 73 73 74
ii 67
ii 62 61 59 a SJ n 54 4, 4i 43 Q
ii 27; 12 17 II
129.S 118.6 111.6 108.4 lCQ.3 93s M.7 an 760 68.8 63s SD.6 52.4 lad 44D ii: 2 z 23.6 20.6 24.1 19.9 16.9 13.7 12.1
171m3b 6368301S
23444814S 343Ibmbb 391 bM93s 2fMSS113 lSnbSS43 1sn4olOb 14nSlYn lOmlS9S9 lU323UI32 1169SO659 9874%w3
SlIpI
0 0 0 0 0
i
: S722767
11639610 lmM327 lbS2bl63 14lWl27 7735S41
$353
3t.z fEn7
t1.222 SIP40 51.048
$636 $447 3637 SSlO 3323 3631 sS71 5390 $423 3347 5387 53119 $313 3259 $242
:z $341
g
$39
S13,IY

W L
69.6 69.6 69.6 69.6 69.6 69.6 69.6 69.6 69.6 69.6 69.6 69.6 69.6
27.64 27.38 26.93 26.51 26.11 25.72 25.35 24.99 24.65 24.32 24.01 23.7 I 23.42 23.14 22-87
00 22.61 22.37 2213 21.89 21.67 21d5 21.24 20.84 20.68 20.23 19.84 19.43 19*08
23.6 23.6 23.6 23.6 23.6 23.6. 23.6 23.6 23.6 23.6 23.6 23.6 23.6

APPROACR DnkcDa1 BMfbCeolk~
Typkdca*rrlb9
LocAnoN: A(la&Gh Nrr ASBARAR Weatkr Data
IDlO dm
751 &lb 28 Balb 65 21 Bhvlb omka
as Bwlb MS Rqmd& 0.7s - Louhfdc
S3.00 Sblllhw BTU of mdiq O!J~Y.II
s/mlnionB7uof~gl
WeAllllQ DiTA (TWRLVt3TMRAWRAOR) (4 BllJRaplind
OUfOCQR WlMOR ANNUAL RM’HALPY MOElURE w-4 DRY BULB W6Yl3Ulll BtNtKNJR9 BTU/U CR&B. rbhddmmYlfkdtmvkd
7s
; 69 67 66 64 62
725 76.1 74s 72s m.s b8.S 6b.S 64.3 62.3 M.S St3 36.1
2: es 46.S 4b.S 44.S 42.S 40s 365 3b.S 3l.3 29 24 26 1s 12
26 Ill 40s
E S73
2 378 311 327 40s 376
iii 326 344 96.
27 21s It3 326 M3
:z
:1:
41.2 39.3 37A 35.7
2: 332 29.3 27.9 26.6
ii:: 12.1 21.6 20.5 19.4 11.4 17.4 16.4 1s.s 14.6 13.7 12.1 11.4 95 7.9 6.2 4.7
129,s 116.6 III.6 ma.4 102.3 933 86.7 0.0 76.0 61.8 OS SE.6 S2A 48.0 449 402 30 24.9 31.8
z 23.6 20.6 il.1 19.8 16.9 13.7 12.1
31Ml872 141999325 S419Mlb2 w2242sb3 897187340 s26716w 299191449 3oY7mss 29tmxA 2ow9o930
im4nt9 tuDsmst
$17,4S6
W L W
BT”t&Cd toIMckel
m@rmadc) 4OBSb4
136as96 37921669 40344%7
0 0 0 0
: 0 0 0
mm
0 0 0 0
962733: 26211449 4l24Ua90
10)867OlS 97717% 7923569s 74255970 50126RI7 25412436
SL7S6
339 mb
E st.164
$6.59
:?I $561
E wn
:E %b4 1489 SSlb ss19 3417 334s Sm. S271 mm 34s4 $276 an7 5117 is2
Sll,S49
129,s 118.6 III.6 108.4 1023 93,s 86.7 82.0 16.0 63.3 63.5 58.6‘ s2.4 48.0 da.0 40.2 38.2 34.9 31.6 30.4 27.7. 23.6 20.6 24.1 19.6 16.9 13.7 12.1

871) El 78.0 751) 741) 72.0 69.0 676 66.0 641) 626 611) 596 576 55~
29 40.0 4m 43b 426 37d 328 276 22.0 171) 12.0
41.2 39.3 374 35.7 34.0 32.4 30.8 29.3 27.9 26.6 25.2 24.0 22.8 21.6 205 19.4 18.4 17A lb.4 153 14.6 13.7 12.1 11.4 95 7.9 62 4.7
155.9 M&s 141.7 134.7 125.2 Iis2 1m.4 101.3 94.7 87.s 83.7 75.3 67.5
m
cookf 63.8 63.8 63.8 63.8 63.8 63.8 63.8 63.8 63.8 63.8 63.8 63.8 63.8
Q tw 0 Tcmparhue TempmLtwiq -bY
toRqtamtion saBibtewbtd ImmSatdbk COlt ToCaoliq Cdl wheel
1375 82 131.5 81 126.1 12o.s z 112.9 76 NM.9 74
iti fi
88.3 82.8 z 71.3 67 73.0 66.7 ii 24.9
: 23.4 24.1
69 22.7 2 .21.7 22.3
: 21.1 20.7
2 20.2 19.3 63 18.8 64 19.1 : 17.5 18.2
61 16.8 m 16.3

APFROACH: lhdmn: Brad Cmllnz
Typical Conti~w~tlorr
LOCATION: llouston,Tu.
OUTDOOR DRY BULB
102
CR 97
tL z 82 77 72 67 62 57 52 47 42 37
:: 22 17 I2 7 2
-3
Annual Operating Cost E&n&c for “Traditional Dcsiccent Based Cooling Approach”
2mm crm 50 75 75
2 1
so.02 $8.00 $3.40
7as 1Kl
IOOM) eon
25.8 Bwlb 28 Bmnb 65 62.5 21 Blwlb GdlS Wet Rulh
225 Btwlb 1.25 Re#en side 0.75 Rcsrum Loss/side
$292 wmillim BN of cocJiig owpul
S/miilian BTU of he&q fuel
Avcyqe KWlton 1 0.65 Ftmsurt. Low/side
WBAIIIFR DATA t TWELVE TRAR AVERAGE ) (A) BN Rmubrd
OUIMX)R ANNUAL EMHALPY MOIS’IURB (0 6rhidiry WEf BULB BINHOURS BTU/LB GR.hB. wllb ddmmidifi~tal vhael
tr 70 75 78 74 72 65 63 58 53 ,I 43 as 54 SO 25 20 15
II 6 2 -3
1 #‘
304 025 292
1550 1272 964 722 555 550 460 221 1a6 27 25
7 2
9 I I 0
39.6 95.6 40.6 109.9 40.7 ll8,l 38.8 114.6 37.0 110.3 35.3 107.2 320 94.2 28.3 7s.3 24.9 64.7 21.9 53.1 19.2 43.2 16.7 34.9 14.8 30.8 127 a.6 11.1 22.0 9.2 17.5 7.4 13.7 5.7 10.6 4.4 10.1 2.9 7.8 1.7 7.9 0.2 6.3
794760 40996759
331917159 65a799#5 9473o9090
159061140 1252102344 919641799 679182958 5M96122
521.853
Cooling &mm Energy Cad $33,787 Hulhlg Scuan Energy cast SUss
Demand Clmrgu (Cmtiq Benson Only) $1599
(B) 0 BN Required BTlJRqniredto
loPoatcml Heu & HumYify e=bl d) @e*Un8 mode)
95370 5239370
41293421 629442.40
0 0 0 0 0 0
13664510 33655985 22286693
9115546 3218120 1086986 5231610
648916 675197
$320 no5 51,667
SYl $780
51.338 51.119
$843 5684 $584 $507 $402 $281 5163
z 56
ii $I $1
Tois1 Annual Baler&y cost
Tmditlonal D&cant Based Cooling Approach
531,744

Annual Opcmtlng Cost Estimate for “Traditlmml Dcslccmt Bnrcd Cooling Approach”
APPROACHz D*kWlt BnedCoaNq
Typical Conflgnradan
LOCATKIN: Minneapolis Mn.
T” 75 75 S 72
I 0.8
so.034 $8.47 $4.10
78% 106
l00GQ ctm
253 Btwlb 2a Bhlnb 65 62.5 21 Btib G&M Wet Bulb
225 BhJlb 1.25 ReSm side 0.75 Resmm Lea/side
$2.83 $/dllim, BTU Ot&!i”S Output
SImillion BN otbuting Iw
Avera@ KW/ton I 0.65 Frusm Lawbide
WEABlER DATA ( TWUVB YE4R AVERAGE ) (A) BTGRU@d
OUlWJOR OIJIDOOR ANNUAL Et4IHALpY MOlStURB 0-m DRY BULB WET BULB BWHOURS BTU/LB GRJLB. wilb debwldl~lma wheel
102 80 0 97 72 . 92 74 SO 87 7t 122 112 68 285 77 $6 442 12 67
ii 52 47 42 37 32 27 22 I7
83 813 28.2 60 702 26.2
12 11 313 1 6 242 i 1 190 -3 -* 260
426 38.7 36.9 34.3 31.9 30.4
23.7 21.3 18.7 16.7 14.4 12.7 Il.1 9.2 7.7 6.0 4.4 2.9 1.4 -1.1
114.6 91.6 Pa.0 85.5 78.0 76.2 70.2 65.0 566 49.4 39.9 34.9 27.9 ti.6 22.0 17.5 c. 16.0 127 IO.1 7.8 6.0 -26
Subtotal Enr.r&y Cost H3.371 $14 saw $7.415
0 8121255
411731966 123944741 2401(122% 371822314 528096930 636W8933 606aO5830
0 0 a
(B) BN Reqwbed
l4PostCoDl &Oti~~ I”&)
0 745372
297lll7 1369629
0 0 0
i . 0
. . 0
(0 F~lr Ito~~epowa cost BN Required to. for the syskm usuming Heal k Hlddlty
Dmllblg mode) 1.5’ of ESP and ccalinS
pump and tow?? (note I)
$0 57
*ii: $242 5376 ss21 $597 6591 $522 $469
0 E
1672782,” $A469 5555
215491497 so2 199150893 l914906Ml iFi 181943768 5266 157037655 $206 134796520 $161 231776920 $221
Total Annusl 528,336 Energy cosl
Tndilioml Desiccant Bused Cooling Approach I

Annual Operating Cost Estimate for “Traditional Daieeant Based Cooling Approach”
APPROACH: Dcsicanl Bawd Cmliq
TJ& Cmfipntion
#CATION: New York, NY.
SupplylRegenmtion cm 2unDcfm sctmma dabEd Npply gnbl kvel % summa dmbcd supply Iem~lbllpy 75 slmmm reum al? mnlpmhlrrlroulllpy~ bun 75 wmlu duhed supply air tanpennv~m~tpy 65 wbllcb Imum rir Impa~l~thDlpy 72 Rbllddillah wkcl &wasure lolr t Semible mcwav e.NeuSvmar Od
lolwo cm,
25.8 BPUlb 28 Btnnb II Bm/lb
225 Btib I.25 R-m ride 0.75 RmlaE lpsrldds
65 GlXiW
62.5 We4 Bulb
Rkdrlol me~casl *Kunt) SO.030 54.17 UmillhmBN otoxlto~wtpnt fzkaw rklnmd cbrga (sxwl s23.50 Caddbutthnl 56.26 Wllion BN ofhubg fuel Belkr cmbacy 78% %hnsdepmuon lo0 AvcngsKwlm 1
0.65 l’msm Lms/dde
Desk+ Bawd Cooling Appmh
WE43’?lER DATA ( lwaVB YBAR AVRRAGE ) W BTU Rewired
OUIDOOR ANNUAL fBvmALPY MoIsTuRB todcaumiditY WEf BULB BlNHOURS BTU/LB GRJLB. WP deblnddl~lhm vlnd
75 0 7) 0 74 10 74 I? 71 (90 80 378 Q7 60* 65 812
37.7 30.7 36.9 36.9 34.4 32.7 31.2 29.7 26.2 23.7 20.8 18.7 16.2 14.4 12.3 10.7 11.8 7.0 5.7 4.1 28 1.4
83.6 97.6
0 0
(0) 09 (c) FMtiWWpOW.YEorl
BN Requkd BN Raqubwl (0 for lba cynm assuming t0PDRCOOl He,% & ?hddity 1.9 OmSP l d cooling
(moHnllmods) ‘lK4liigmoa) pumpmdlova(nole1) OUTDOGR DRY BULB
67 82 77 72 67 62 57 52 47 42 31 32 27 22 I7 12 7 2 -3
94.0 102.2 93.6 91.2 891 87.6 73.1 64.6 53.7 47.8 39.7 35.8 29.9 27.3 22.9 19.3 18.4 IS.8 IS.6 13.7
I6679555 82143236
tm4654 343467698 493352088 656827468 823946901 6ms4286 S6875S57t
0
102247,” 5186132 2413707
0 0 0 0 0
so $0
524 5%
$245 5472 j766
s1.015 $1.011
S%S SBl?l $861
0 $858
969258870 $957
$1,047 II8428936 $785 107540179 $456
86678198 $277 5OS27695 $146 25831091 $64
9147060 til 1198130 $2
536 8.103 $10.928
Tolal Annual 539,582 Bnergg cost
Tr~dilional Dekemt Bacd Cmling Appmach
I

LOCATION: Orlmda, Fh.
Annual Operating Cost Estimate km “Tmdi:ionrl Dcsiccmt Based Cootin~ Approach”
loocu3 cfm
25.8 BWlb 28 Btwlb 65 62.5 II Bwlb GnilM Wet Rulb
225 Btwlb 1.23 Rqm sick 0.75 Rsssmn Lms/side
$292 Shnillbm BIU OrmallnR output
Shinii BN of hcJtbl# rueI
Avengs KWfm 1 0.65 Rumm Ladride
WFATHER DATA (IWJLVE YEAR AVERAGR 1 W (B) CC) BlURequbed BntRC9ldrrd BTURequLred to * 6rblmu6lfy loPC.ltQd HutsHumMify
DRY BULB WIjl’BULB BINHOURS BTU/LB wllb deblmdml*thaa wbed (cdhlg mw @J@=W
12 67 62 57 52 47
:t 32
Sb (44
5-3 $02 4b 4Ob 43 265 Jb t4* 35 51 29 22 25 5
38.6 38.7 36.9 35.2 34.4 31.9 28.2 24.9 21.9
9.2
97.6 94.0 90.9 93.6 86.1 70.2 56.6 45.1 35.3 27.0 20.0 14.1 11.6 9.7
3691419 198970734 645211236 M6726391
1640171688 1605631032 1003596632 mu3878
3412% ;8261623 39342885 u249aO5 25965906
0 0 0
988615385 14354148 30378428 201757%
9111353 1430488
03 Fa Iforsqxvcr cost
In tba synml asstmlblg 1.5’ of @SP md aolin
pmnpmdtower(note I)
$1:: $579 5878
fl.502 Sl.502
5965 $738 5527 $357 S232 SIZE
$52 $19
$3
$7.656
Total Annual Energy Cmt
Trsdilimml Desiccant Based Cooling Appro~~ch
$50,466
APPENDIX C
MODELED ENERGY COSTS FOR SELECTED CITIES AT DIFFERENT LEVELS OF DEHUMIDIFICATION

Case 1
Estimated Energy Consumption by Preconditioning Approach for Various Cities Conditions: Case 1 l Provide 7,500 cfm of preconditioned outdoor air at 50 grains, (a dewpoint of 48 degrees) at a temperature between 65 an l Energy costs at $.06/kwh utilization, $8/KW demand and gas at $.48/therm l Hours of operation used as shown, either continuous or 12 h/day, 5 days/week.
Atlanta Houston Los Angeles Minneapolis New York Orlando
Preconditioning System Approach
24 h 12h 24 h 12h 24 h 12h 24 h 12h 24 h 12h 24 h 12h 7 days 5 days 7 days 5 days 7 days 5 days 7 days 5 days 7 days 5 days 7 days 5 days
Conventional Cooling w/Reheat $21,818 $11,269 $29,090 $15,127 $13,227 $6,878 $21,640 $11,253 $20,115 $14,081 528,810 $14,981
Conventional Cooling Around Recovery w'Run- $15,790 58,113 520,370 58,759 510,580 54,549 518,730 $8,054 $17,097 $8,719 $19,390 $8,338
Total Energy Wheel w/Cooling & Reheat
516,142 $8,058 $20,390 $9,991 $9,390 54,601 511,980 55,870 512,070 58,208 $21,210 $10,393
Dual-Wheel Total Energy Recovery $10,098 $5,323 $12,280 $6,508 $7,150 $3,790 $8,670 $4,595 $8,290 $5,803 $13,290 57,044
Dual-Wheel Desiccant-Based w/Post Cooling $16,125 55,810 $24,920 $6,095 512,350 53,239 $15,080 $4,825 $14,750 $8,343 $22,025 $7,813
Desiccant Dehumidification--Total Recovery Hybrid
514,250 $5,280 $22,010 $4,425 $10,910 $3,786 513,330 53,574 510,820 $5,798 $20,340 $5,660
Dual-Wheel DBC--Total Recovery Hybrid 510,780 54,562 $13,658 54,205 57,835 $3,726 $9,690 $3,520 $8,190 $6,859 $12,560 $5,238
75 degrees
C-l

Case 2 Estimated Energy Consumption by Preconditioning Approach for Various Cities Conditions: Case 2 l Provide 7,500 cfm of preconditioned outdoor air at 65 grains, (a 55 degree dewpoint) at a temperature between 65 and 75 degrees l Energy costs at $.06/kwh utilization, $8/KW demand and gas at $.48/therm . Hnlmx nf nnoratinn IICP~~ ac ahnwn pithor cnntinlmlla nr 17 h/&v A rlnvalw~ek
..“I._ “. 1 “.I..“.. I”“.. I” -..-- . . . . -.*.*-. ““..m...“““” “. ._ ..~“” , ” “” “* . . -“..
Atlanta Houston Los Angeles Minneapolis New York Orlando
Preconditioning !.
System Approach
24 h 12h 24 h 12h 24 h 12h 24 h 12h 24 h 12h 24 h 12h
7 days 5 days 7 days 5 days 7 days 5 days 7 days 5 days 7 days 5 days 7 days 5 days
:onventional Cooling w/Reheat $16,938 $11,269 $22,374 $11,634 $9,233 $4,801 $18,155 $9,441 $16,385 $11,470 $21,290 $11,071
:onventional Cooling w/Run-around lecovery $13,527 $8,113 $16,109 $6,927 $7,202 $3,097 $16,632 $7,152 $14,747 $7,521 $15,896 $6,835
otal Energy Wheel w/Cooling & leheat $11,262 $8,058 $15,214 $7,455 $6,135 $3,006 $8,976 $4,398 $9,012 $6,128 $15,062 $7,380
$ : ?;,I : ..( i: )?
rual-wheel Total Energy Recovery $7,336 $5,323 $8,430 $4,468 $4,905 $2,600 $6,812 $3,610 $6,155 $4,309 $9,161 $4,855
kral-wheel Desiccant Based (DBC) r/Post Cooling $14,880 $5,810 $22,988 $6,095 $11,398 $3,239 $12,642 $4,825 $13,619 $8,343 $20,324 $7,813
resiccant Dehumidification - Total lecovery Hybrid $10,983 $5,280 $15,595 $4,425 $6,435 $3,786 $8,250 $3,574 $7,862 $5,798 $14,125 $5,660
kral-wheel DBC - Total Recovery lybrid $7,636 $4,562 $8,905 $4,205 $5,469 $3,726 $6,610 $3,520 $6,280 $6,859 $8,100 $5,238
c-2

Case 3 Estimated Energy Consumption by Preconditioning Approach for Various Cities Conditions: Case 3 l Provide 7,500 cfm of preconditioned outdoor air at 45 grains, (a 45 degree dewpoint), at a temperature between 65 and 75 degrees l Energy costs at $.06/kwh utilization, $8/KW demand and gas at $.48/therm . Hours of ooeration used as shown. either continuous or 12 hldav. 5 davslweek
Atlanta Houston Los Angeles Minneapolis New York Orlando
Preconditioning
System Approach
24 h 12h 24 h 24 h 24 h 12h 24 h 12h 24 h 12h 24 h 12h
7 days 5 days 7 days 7 days 7 days 5 days 7 days 5 days 7 days 5 days 7 days 5 days
Conventional Cooling w/Reheat $26,946 $11,269 $35,986 $18,710 $17,480 $9,090 $25,173. $13,090 $23,670 $16,569 $36,659 $19,063
>onventional Cooling w/Run-around ?ecovery $19,142 $8,113 $24,826 $10,675 $12,236 $5,261 $20,411 $8,777 $18,936 $9,657 $23,079 $9,924
Total Energy Wheel w/Cooling & 3eheat $21,272 $8,058 $29,144 $14,281 $11,190 $5,483 $17,269 $8,462 $16,279 $11,070 $30,129 $14,763
Xal-wheel Total Energy Recovery $12,686 55,323 518,820 $9,975 56,915 53,665 $10,290 $5,454 $8,995 $6,297 $17,205 $9,119
Dual-wheel Desiccant Based (DBC) N/Post Cooling $18,750 $5,810 $28,967 $6,095 $14,363 $3,239 $17,545 $4,825 $17,160 $8,343 $25,610 $7,813
Desiccant Dehumidification - Total ?ecovery Hybrid $15,579 $5,280 $24,062 $4,425 $11,790 $3,786 $14;580 $3,574 $11,830 $5,798 $22,625 $5,660
)ual-wheel DBC - Total Recovery iybrid $11,250 $4,562 $14,846 $4,205 $8,514 $3,726 $10,529 $3,520 $8,655 $6,859 $13,650 $5,238
c-3

Case 4 Estimated Energy Consumption by Preconditioning Approach for Various Cities Conditions: Case 4 l Provide 7,500 cfm of preconditioned outdoor air at 50 grains, at a temperature between 65 and 75 degrees l Energy costs used are 1994 actual rates for the cities listed, electric rates based on acommercial customer with a 500+ KW demand l See City Selection secl kta
Preconditioning
System Approach
tia
T
In ;;nIsociatecl ezo:,, d
Los Angeles Minneapolis New York Orlando
Conventional Cooling w/Reheat
Conventional Cooling w/Run-aroun Recovery
Total Energy Wheel w/Cooling ( Reheat
Dual-wheel Total Energy Recovery
Dual-wheel Desiccant Based (DBC w/Post Cooling
Desiccant Dehumidification - Tot: Recovery Hybrid
Dual-wheel DBC - Total Recover Hybrid
24 h 12h 24 h 12h
7 days 5 days 7 days 5 days
$21,818 $11,269 $18,450 $9,594
$8,113 $13,844 $5,953
$16,142 $8,058 $14,673 $7,190
$10,098 $5,323 $7,762 $4,114
$13,298 $5,810 $14,154 $6,095
$5,280 / $10,365 / $4,425
$4,562 1 $9,091 1 $4,205
24 h
7 days
$9,507
$7,555
$12,678
$8,571
12h 24 h
5 days 7 days
+ $4,944 $16,920
56,212 $9,452 I
12h
5 days
$8,798
$6,575
$4,631
$4,825
$3,520
$20,976 $10,698
-r $15,651 $10,643
I 510,100 $7,070
$14,843 $8,343
*
$13,327 $5,798
$10,719 $6,859
24 h
7 days
$19,830
$11,479
$15,605
$8,328
$18,925
$13,777
$11,772
12h
5 days
$10,312
$4,936
$7,646
$7,813
$5,660
$5,238
c-4


APPENDIX D
SAMPLE CUSTOMER SURVEY SHEET


Retail Stores (Example)
Sample application Evaluation Questionnaire:
The purpose of this questionnaire is to help identify the market need and eventual acceptance of outdoor air, desiccant based, preconditioning approaches. Each application will be assessed using a questionnaire similar to this one, and these questionnaires will be answered internally, by field sales of both Trane and Semco, and by qualified and cooperative consulting engineers and owners.
Sample Questions:
1) How important is humidity control in this application?
a. Not important b. Somewhat important c. Very important
2) In your opinion, it is important to maintain the space relative humidity below the following level during the cooling season for this application?
a. 50% b. 60%~. 70% d. No maximum required
3) In your opinion, it is important to maintain the space relative humidity at at least the following level during the heating season for this application?
a. 50% b. 30% c. 20% d. No minimum required
4) In your opinion, is it important to maintain these levels during evenings and weekends, as well as during the day?
a. Yes b. No c. Not applicable
5) What is the percentage of total system airflow that is typically outdoor air in this application?
a. O-20% b. 20-30% c. 30-50% d. More than 50%
6) In your opinion, when designing for this application for either new construction or renovations, the ASHRAE 62-89 guidelines will be followed, (including the outdoor air
D-3
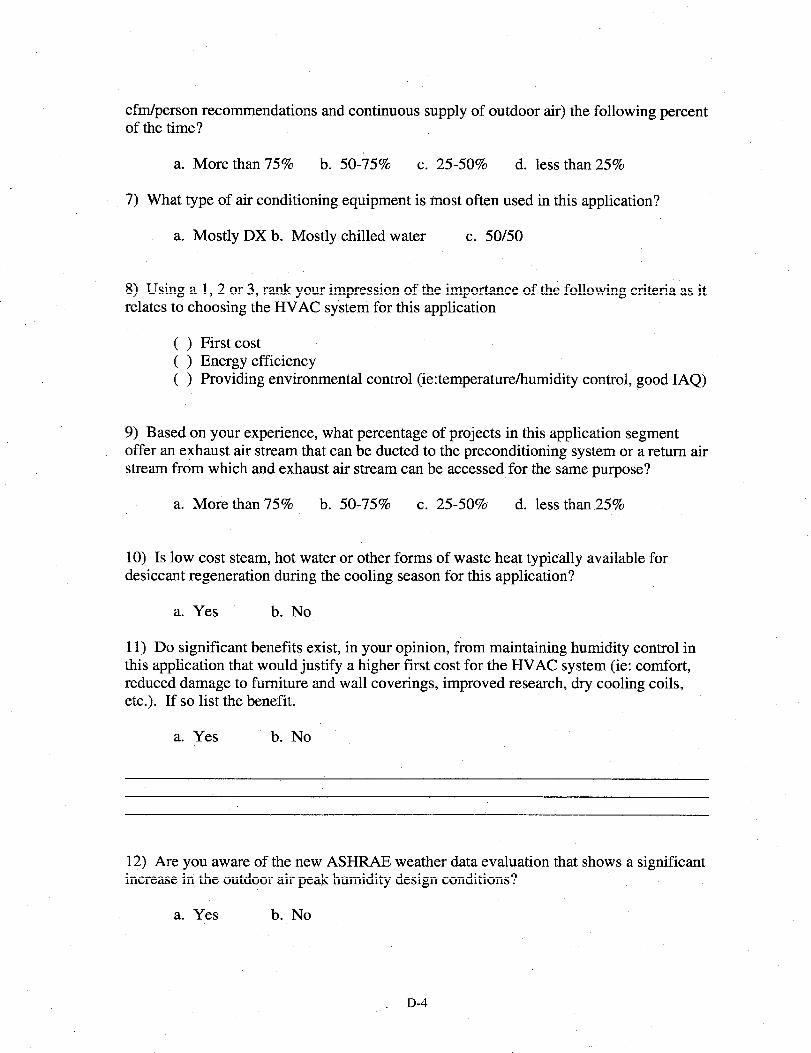
cfm/person recommendations and continuous supply of outdoor air) the following percent of the time?
a. More than 75% b. 50-75% c. 25-50% d. less than 25%
7) What type of air conditioning equipment is most often used in this application?
a. Mostly DX b. Mostly chilled water c. 50/50
8) Using a 1, 2 or 3, rank your impression of the importance of the following criteria as it relates to choosing the HVAC system for this application
( ) First cost ( ) Energy efficiency ( ) Providing environmental control (ie:temperature/humidity control, good IAQ)
9) Based on your experience, what percentage of projects in this application segment offer-an exhaust air stream that can be ducted to the preconditioning system or a return air stream from which and exhaust air stream can be accessed for the same purpose?
a. More than 75% b. 50-75% c. 25-50% d. less than 25%
10) Is low cost steam, hot water or other forms of waste heat typically available for desiccant regeneration during the cooling season for this application?
a. Yes b. No
11) Do significant benefits exist, in your opinion, from maintaining humidity control in this application that would justify a higher first cost for the HVAC system (ie: comfort, reduced damage to furniture and wall coverings, improved research, dry cooling coils, etc.). If so list the benefit.
a. Yes b. No
12) Are you aware of the new ASHFWE weather data evaluation that shows a significant increase in the outdoor air peak humidity design conditions?
a. Yes b. No
. D-4

13) Is there a significant benefit to this application to have pollutants that may exist in the outdoor air removed from the outdoor air prior to being introduced into the facility?
a. Yes b. No
14) If you have had a previous experience with a desiccant wheel system (dehumidification or recovery) how would you rate it? (Only respond to personal experience please).
a. Positive b. Negative c. Not applicable
D-5


P APPENDIX E FINAL MARKET SEGMENT ANALYSIS SHEETS


Final Market Segment Analysis: Office Buildings
Benefits provided by preconditioning The increased outdoor air loads associated with ASHRAE 62-89 of outdoor air loads cau increase project fist cost and operating cost significantly.
Preconditioning can cut demand charges significantly, reduce energy consumption, provide acceptable humidity control, and help conventional heat pumps and DX units perform with constant outdoor air loads. Removing outdoor air pollutants and providing low duct RH may be significant benefits in the future.
Potential market for this application using some type of preconditioning (Estimates for 1996)
$127,755,000 per year*
Total outdoor air CPM for segment 56,000,000 CPM
Preconditioning Approach Rank Likelihood % of Estimated $ Estimated Market of Utilization Available Market Potential
Conventional Cooling w/Reheat 1 65 55,575,ooo
Conventional w/Heat Pipe 3 7 10,395,000
Conventional with Total Recovery 2 25 50,625,OOO
Total Recovery Dual Wheel 6 0
DBC approach S 1 3,600,OOO
Hybrid Total Recovery 4 2 Desiccant Dehumidification approach
7,560,OOO
Hybrid Total Recovery 7 0 DBC approach
l Conclusions and Comments Regarding the Desiccant Based Preconditioning Market:
Of the 28,000 buildings constructed each year, only 200 are 4 stories or greater. Only these 200 would likely prove opportunities for DBC preconditioning. Gas is seldom available on rooftops of high-rise facilities. Unless dry ductwork .and coils are mandated, conventional cooling/recovery will likely be used for this application. The exception will be buildings located were dcmaud charges are high, where an exhaust air path is unobtainable, where the existing cooling capacity is fully utilized and where outdoor air flow needs to be increased (i.e. accommodate ASHRAB 62-19gY); Ofiic&desigtied’tii~th ice storage .- and super cold air distribution are viable applications for hybrid recovery/desiccant dehumidification. When ASHRfW62-1989 is integrated into an office environment, even for small office buildings, non-regenerated desiccant total energy recovery wheels appears by far the method of choice
E-3

Final Market Segment Analysis: Hospital Operating Rooms
Benefits provided by preconditioning Operating rooms need to have humidity controlled for antiseptic of outdoor air loads reasons. With the advent of AIDS, more protective gear is -
worn by the medical staff. This, in conjunction with heat generated by medical machinery, require conditions of 65-68 degrees for comfort. Relative humidity must still be controlled at approximately SO% RH which is not easily accomplished with conventional refrigeration
Potential market for this application $10,344,d00 per year* using some type of preconditioning (Eslimatcs for 1996) * ( assumes 30% of market needs dew-points below SO degrees)
Tolal outdoor air CPM for segment 4,800,000 cm
Preconditioning Approach Rank Likelihood % of Estimated $ Estimated Market of Utilization Available Market Potential
Conventional Cooling w/Reheat 1 50 $2,280,000
Conventional w/Heat Pipe S 0
Conventional with Total Recovery 2 20 $2,160,000
Total Recovery Dual Wheel 7 0
DBC approach 4 15 $2,8X0,000
Hybrid Total Recovery 3 15 $3,024,000 :siccant Dehumidification approach
Hybrid Total Recovery 6 0 DBC approach
l Conclusions and Comments Regarding the Desiccant Based Preconditioning Market:
The driver causing the hospital to maintain humidity conditions is the surgeon, therefore significant, The surgeons insurance, liability and reputation may ride on controlling space conditions. Awareness of this appears is on the rise. Hospital facilities also typically have low cost steam available during the cooling season for desiccant regeneration. This is not a cost sensitive market and would likely pay a premium for both environmental control and energy efficiency. The requirements of the desiccant equipment would ideaBy accommodate high efficiency filters, heatinglcoolmg coils, dual wall institutional construction, high pressure blowers and controls. Key benefits offered by desiccants include desired humidity control, dry ductwork, dry final filters (a big problem for hospital ORs). Hours of operation are continuous so energy savings analyses are maximized.
E-4

Final Market Segment Analysis: School Classrooms
Benefits provided by preconditioning The increased outdoor air loads associated with ASHRAE 62-89 ,, _ of outdoor air loads can increase project fist cost and operating cost significantly.
Preconditioning can cut demand charges and energy consumption, assure acceptable humidity control, and help conventional heat pumps and DX units perform with constant outdoor air loads. Neutral temperature, dry air is beneflclal in classrooms due to the changing load associated with people and desire to use packaged equipment controlled via temperature in each classroom.
Potential market for this application using some type of preconditioning (Estimates for lYY6)
$222,979,500 per year*
* ( assumes all bulhiings comply with ASHRAE 62-89)
Total outdoor air CPM for segment 124,500,000 CPM
Preconditioning Approach Rank Likelihood of Utilization
Conventional Cooling w/Reheat
Conventional w/ Heat Pipe
Conventional with Total Recovery
Total Recovery Dual Wheel
DBC approach
Hybrid Total Recovery Desiccant Dehumidification approach
Hybrid Total Recovery DI3C approach
% of Estimated 4vailable Market
50
10
20
15
2
3
0
l Conclusions and Comments Regarding the Desiccant Based Preconditioning Market:
$ Estimated Market Potential
$59,137,500
$20,542,500
$56,025,000
$61,627,500
$Y,Y60,000
$15,687,000
Due to the high exchange rate of outdoor air in schools, there is almost always access to an exhaust air path. Since packaged cooling equipment is most often used, humidity control is critical in humid environments. The dew points required by a school project are easily obtained with conventional cooling, controlling the humidity is the problem. Regenerated desiccant systems provide dry, warm air to the school (ie: 90-95 degrees at 50 grains on a typical design day). The dual wheel energy recovery approach provides the same dehumidification yet at the desired 68 degrees, allowing the conventional I-WAC system to be down-sized It also provides heating mode recovery and humidification which is important. In non-humid climates conventional single wheel desiccant based total recovery is most appropriate. Maintenance in schools is limited, evaporative coolers and gas burners are viewed as too troublesome. If schools embrace the benefits of dry coils, regenerated desiccant wheel systems will be feasible.
E-5

Final Market Segment Analysis: Nursing Homes/Hospitals
Benefits provided by preconditioning Nursing homes and hospital bed areas need large quantities of of outdoor air loads outdoor air for health and odor maintenance. Preconditioning
allows for better humidity control with the use of conventional packaged equipment. Condensate can be reduced or eliminated on the coils and down the duct. Final filters can be kept dry if all of the latent load is handled with the outdoor air. As with hospital operating rooms, the likelihood of reinfection is greatly reduced if space relative humidity is controlled.
Potential market for this application using some type of preconditioning (Estimates for 1996)
$71,802,500 per year*
* ( assumes all buildings comply with ASHRAE 62-89)
Total outdoor air CPM for segment 13,750,oOO CPM
Preconditioning Approach Rank LJcehhood of Utilization
Conventional Cooling w/Reheat 1
Conventional w/Heat Pipe 3
Conventional with Total Recovery 2
Total Recovery Dual wheel 4
DBC approach 5
Hybrid Total Recovery 6 Desiccant Dehumidification approach
Hybrid Total Recovery 7 DBC approach
% of Estimated $ Estimated Market Available Market Potential
45 16,458,750
15 9,52X,750
20 17,325,OOO
10 12,705,OOO
5 7,700,000
5 8,085,OOO
0
l Conclusions and Comments Regarding the Desiccant Based Preconditioning Market:
General hospital and nursing home areas do not have the same stringent humidity requirements as operating rooms. Odors associated with humidity problems, comfort, and dry filters and ductwork are the main drivers for regenerated desiccant systems for this application. Waste steam is often available.
Where an exhaust air path is not available and the climate is humid, a good opportunity exists for some type of regenerated desiccant approach. This market is not as cost sensitive as most and maintenance is usually not an impediment. Nursing homes are promising for preconditioning since the occupants like dry, warm air and IAQ is an important factor in deciding on one nursing home over another.
E-6

Final Market Segment Analysis: Research Laboratories
Benefits provided by preconditioning of outdoor air loads
Research laboratories often require a sign&ant amount of outdoor air to replace that exhausted through hoods. Often humidity control is very important and the mnnber of air changes used can meet the sensible load with moderate temperature ah. As a result, over cooling and reheat is often used. Preconditioning can reduce energy consumption significantly and improve humidity control.
Potential market for this application using some type of preconditioning (Estimates for 1496)
Total outdoor air CPM for segment
$16,142.100 per year*
* ( assumes 50% chemical/50% biological and other labs)
7,800,OOO CFM
Preconditioning Approach Rank Likelihood % of Estimated $ Estimated Market of Utilization Available Market Potential
Conventional Cooling w/Reheat 1 40 $2,964,000
Conventional w/Heat Pipe 4 15 $1930,500
Conventional with Total Recovery 2 20 $3,510,000
Total Recovery Dual Wheel 6 2 $514,800
DBC approach 3 20 $6,240,&O
Hybrid Total Recovery 5 3 $982,800 Desiccant Dehumidification approach
Hybrid Total Recovery 7 0 DBC approach
l Conclusions and Comments Regarding the Desiccant Based Preconditioning Market:
Research laboratqies that are located where dem.t@ charges are high and there are a large number of hours per year where dehumidification is needed (humid climate), then a regenerated desiccant approach becomes justifiable. Low cost steam is often available for regeneration which is a plus. The co-sorption of pollutants is a significant benefit to many laboratory facilities. In this market, energy efficiency and system performance usually is more important than first cost. Some laboratories have a need for humidity conditions drier than obtainable from conventional cooling approaches. Non-regenerated desiccant total recovery is often avoided due to the contaminants in the exhaust airstream or the lack of a central exhaust location (ie: numerous exhaust fans)
E-7

Final Market Segment Analysis: Fast Food Restaurants
Benefits provided by preconditioning The exhaust air required in the kitchen and the use of packaged of outdoor air loads equipment makes maintaining humidity within fast food
restaurants very difficult in humid regions. Preconditioning outdoor air solves this problem. Increased outdoor air is also required if these facilities try to accommodate smokers. Wash down of the floors and cooking adds significant latent load to these spaces which cannot be effectively handled with packaged equipment.
Potential m’arket for this application using some type of preconditioning (Estimates for 1996)
Total outdoor air CPM for segment
$110,960,000 per year*
* ( assumes all buildings comply with ASHRAE 62-89)
20,000,000 CFM
Preconditioning Approach Rank Likelihood % of Estimated $ Estimated Market of Utilization Available Market Potential
Conventional Cooling w/Reheat 1 70 56,430,OOO
Conventional w/Heat Pipe 2 20 28,010,OOO
Conventional with Total Recovery 4 5 9,550,ooo
Total Recovery Dual Wheel 5 0
DBC approach 3 5 16,970,OOO
Hybrid Total Recovery 6 0 Desiccant Dehumidihcation approach
Hybrid Total Recovery DBC approach
7 0
Conclusions and Comments Regarding the Desiccant Based Preconditioning Market:
Since there is seldom a return air path available in a fast food restaurant, recovery is not a viable option except in larger restaurants designed to relieve cigarette smoke. In humid climates, a market for some type of DBC exists, but the product would have to be very low cost and require minimal routine maintenance. A successful product would likely be a module to augment a packaged HVAC product. The product would have to be regenerated with a gas burner or with energy released by a DX evaporator coil.
E-8

Final Market Segment Analysis: Retail Stores
i
Benefits provided by preconditioning The increased outdoor air loads associated with ASHRAE 62-89 of outdoor air Ioads can inGrease project fist cost and operating cost significantly.
Preconditioning can cut demand charges significantly, assure acceptable humidity control in humid climates, and help conventional packaged units perform with constant outdoor air loads. Removing additional moisture to deal with humidity storage within the goods displayed in the facility may be a key benefit.
Potential market for this application using some type ofpreconditioning (Estimates for 1996)
Total outdoor air CPM for segment
$58,266,000 per year*
* ( assumes all buildings comply with ASHRAB 62-89)
31,200,OOO CPM
11,856,OOO
7,722,OOO
21,060,OOO
Preconditioning Approach Rank Likelihood % of Estimated of Utilization 4vailable Market
Conventional Cooling w/ Reheat 1 40
Conventional w/ Heat Pipe 4 15
Conventional with Total Recovery 2 30
Total Recovery Dual Wheel 5 5
DB C approach 3 10
Hybrid Total Recovery 6 0 Desiccant Dehumidification approach
Hybrid Total Recovery 7 0 DBC approach
l Conclusions and Comments Regarding the Desiccant Based Preconditioning Market:
5,148,OOO
12,480,OOO
$ Estimated Market Potential
Superstores” offer the most potential for regenerated desiccant products in this market since they integrate both retail and food store functions u@er,one roof.. Regenerated desiccant systems provide a significant benefit to food stores that have freezer casings since lower dew-points result in fewer defrost cycles, lower operating costs and improved shopper comfort. Large retail stores (ie: Bloomingdale’s) benefit from desiccant preconditioning since the large quantity of goods (ie. clothing) act as a moisture sink, making humidity control extremely difficult. Small shopping malls and retail stores without freezer arcas would likely incorporate a non-regenerated desiccant approach combined with a unitary package AC unit. Note that for most retail stores designed to accommodate the ASHRAB 62-89 standard, the exhaust air is available Tom the return air path. Also note that supermarket applications process both outdoor and return air, so market number is larger than shown above for regenerated DBC in retail stores.
E-9

Final Market Segment Analysis: Hotels and Dormitories
Benefits provided by preconditioning The exhaust air from bathrooms needs to be replaced making of outdoor air loads some of these facilities high outdoor air applications. Often the
humidity associated with showers is very high for the conventional room air-conditioners to handle. Preconditioning outdoor air to handle these fluctuating loads provides benefits to comfort, energy efficiency and limits microbial and moisture damage resulting in a significant cost savings to this market segment.
Potential market for this application using some type of preconditioning (Estimates for lYY6)
$76,927,500 per year*
* ( assumes all buildings comply with ASHRAB 62-89)
Total outdo& air CPM for segment 39,000,000 cm
Preconditioning Approach Rank Likelihood % of Estimated $ Estimated Market ,of Utilization Available Market Potential
Conventional Cooling w/Reheat 1 40 $14,820,000
Conventional w/Heat Pipe 4 15 $Y,652,5W
Conventional with Total Recovery 2 20 $17,550,000
Total Recovery Dual Wheel 3 15 $1Y,305,000
DBC approach 5 10 $15,600,000
Hybrid Total Recovery 6 0 Desiccant Dehumidification approach
Hybrid Total Recovery 7 0 DBC approach
l Conclusions and Comments Regarding the Desiccant Based Preconditioning Market:
The market for regenerated desiccant preconditioning is limited to large facilities located in humid climates and where a return/exhaust air path is not available for non-regenerated desiccant based recovery. Humidity conditions can be controlled as desired with the total recovery dual wheel approach which also utilizes conventional cooling technology and provides heating mode recovery, important for almost all applications. Humidity control is important for this market, independent of the method used to obtain it, since the hotel industry spends a significant amount on refurbishment to rooms and corridors annually due to humidity and microbial problems.
E-10
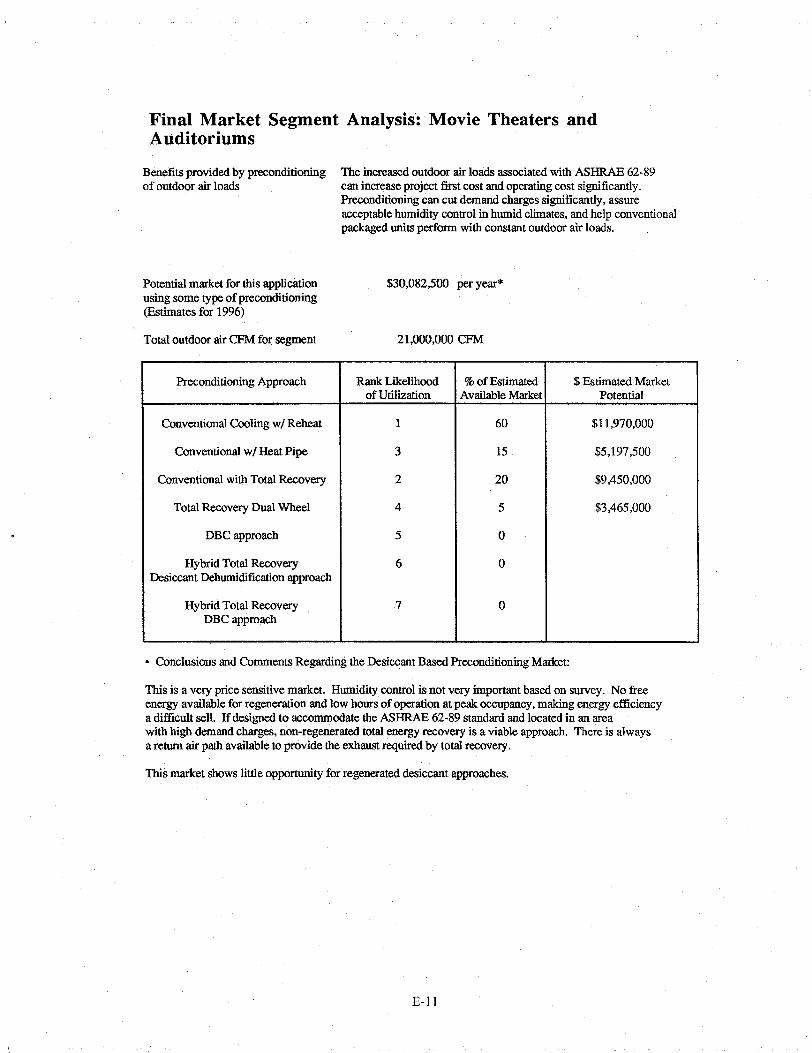
Final Market Segment Analysis: Movie Theaters and Auditoriums
Benefits provided by preconditioning The increased outdoor air loads associated with ASHRAB 62-89 of outdoor air loads can increase project fit cost and operating cost significantly.
Preconditioning can cut demand charges significantly, assure acceptable humidity control in humid cliiates, and help conventional packaged units perform with constant outdoor air loads.
Potential market for this application using some type of preconditioning (F&imates for 1996)
$30,082,500 per year*
Total outdoor air CPM for segment 21,000,000 CPM
Preconditioning Approach Rank Likelihood % of Estimated $ Es timatcd Market of Utilization Available Market Potential
Conventional Cooling w/Reheat 1 60 $11,970,000
Conventional w/ Heat Pipe 3 15 $5,197,500
Conventional with Total Recovery 2 20 $9,450,000
Total Recovery Dual Wheel 4 5 $3,465,000
DBC approach 5 0
Hybrid Total Recovery 6 0 Desiccant Dehumidification approach
Hybrid Total Recovery 7 0 DBC approach
l Conclusions and Comments Regarding the Desiccant Based Preconditioning Market:
This is a very price sensitive market. Humidity control is not very important based on survey. No free energy available for regeneration and low hours of operation at peak occupancy, making energy efficiency a difficult sell. If designed to accommodate the ASHRAB 62-89 standard and located in an area with high demand charges, non-regenerated total energy recovery is a viable approach. There is always a return ah- path available to provide the exhaust required by total recovery.
This market shows little opportunity for regenerated desiccant approaches.
E-l 1

E-12

37. 38. 39.
40.
42.
43.
44. 45.
46. 47. 48. 49.
50. 51.
52.
53. 54.
55.
56.
57. 58. 59.
ORNL/Sub/94-SV044/1
INTERNAL DISTRIBUTION . .
1. J. E. Christian 8-29. J. R. Sand 2. G. E. Courville 30. A. Schaffhauser 3. T. R. Curlee 3 1. R. B: Shelton 4. R. C. Devault 32. E. A. Vineyard 5. P. D. Fairchild 33. Laboratory Records-RC 6. M. A. Karnitz 34. Central Research Library 7. C. I. Moser 35-36. OSTI
EXTERNAL DISTRIBUTION
Lilia A. Abron, PEER Consultants, 1460 Gulf Blvd., Apt. 1103, Clearwater, FL 33767 Joel Anderson, Mississippi Valley Gas Company, P.O. Box 3348, Jackson, MS 39207 Ren Anderson, National Renewable Energy Laboratory, 1617 Cole Blvd., Golden, CO 80401-3393 Frank Ballistreri, Reliant Energy-Minnegasco, P.O. Box 59038, 15th Floor, 800 LaSalle Ave., Minneapolis, MN 55459-0038 Douglas Bauer, Commission on Engineering and Technical Systems, National Research Council, Harris 280, 2001 Wisconsin Ave. NW, Washington, D.C., 20007 John C. Brady, Mechanical Engineering, ATS&R, 8501 Golden Valley Rd., #300, Minneapolis, MN 55427 Paul L. Brillhart, University of Illinois-Chicago, Energy Resources Center, 1223 SEO, 842 West Taylor St., Chicago, IL 60607-7022 Thorn Clemens, Desicair Sales Manager, ATS, 1572 Tilco Dr., Fredrick, MD 21701 Susan L. Cutter, Hazards Research Laboratory, Department of Geography, University of South Carolina, Columbia, SC 20208 John Fischer, SEMCO, Inc., 737 Terre11 Crossing, Marietta, GA 30067 R. Fiskurn, U.S. Department of Energy, EE-42,5E-036/Forrestal, Washington, D.C. 20585 P. W. Garland, UT-Battelle, LLC, 901 D St. SW, Suite 900, Washington, D.C. 20024 Arthur D. Hallstrom, Air Handling Systems, The Trane Company, 1500 Mercer Rd., Lexington, KY 405 11 Lew Harriman, Mason-Grant Consulting, P.O. Box 6547, 57 South St., Portsmouth, NH 03802 Stephen G. Hildenbrand, Environmental Sciences Division, Oak Ridge National Laboratory, P.O. Box 2008, Oak Ridge, TN 3783 I-6037 Keith Hodge, Department of Mechanical Engineering, 2 10 Carpenter Engineering Bldg., P.O. Drawer ME, Mississippi State, MS 39762-5925 John Kelly, IGT, 1700 S. Mount Prospect Rd., Des Plaines, IL 60018-l 804 Douglas R. Kosar, Gas Research Institute, 8600 West Bryn Mawr Ave., Chicago, IL 6063 l-3 562 Tony Occhionero, American Gas Cooling Center, 400 N. Capitol St., NW, Washington, D.C. 20001 P. Richard Rittelmann, Burt Hill Kosar Rittelmann Associates, 400 Morgan Center, Butler, PA 1600 1-5977 Mike Schell, Telaire, 6489 Calle Reale, Goleta, CA 93 117 David Simkins, Munters Corporation, P.O. Box 640, Amesbury, MA 0 19 13 Steven Slayzak, Center for Buildings and Thermal Systems, National Renewable Energy Laboratory, 1617 Cole Blvd., Golden, CO 80401-3393