Embed Size (px)
Citation preview

Longitudinal Instability Studies at
1====1The submitted manuscript has been authored SURF II Storage Ring at NISTby a contractor of the U S Government
Awordin@v, the U. S. Government r~t.+n. .I nonexclusive, royalty-free Iicen* to Dublish I
-._, ,.. “
‘X rWoduce the published form of thiscontribution, or allow others to dO SO, fOrU. S. Governmem puw=.
Abstract
LS-268
the
Advanced
K. C.
Photon
HarkayandN.S. Sereno
Source, Argonne National
July 27, 1998
Measurements of the longitudinal instability observed in the storage ring at theSynchrotronsUltraviolet Radiation Facility (SURF II) at the National Institute of Standardsand Technology (NET) were performed to understand the mechanism driving the instabil-ity. The instability, studied in depth by Ralcowsky and others [1][2], manifests itself inbroad resonance features in the horizontal and verticaI motion spectrum of the synchrotronslight from DC to a few kHz [3]. Also observed are multiple synchrotrons harmonics thatmodulate the revolution harmonics; these are characteristic of longitudinal phase oscilla-tions. These spectral features of the motion are found to be correlated with the periodiclengthening and shortening of the bunch length on time scales from -0.1 rns to 20 ms,depending on machine and radio-frequency (@ system parameters. In this report, thegrowth rate of the instability is determined from measurements using an rf pickup elee-trode. The measured growth rates are compared to computed growth rates Ilom an analyt-ical model. Recommendations are made regarding options to control or mitigate theinstability. In light of upgrade plans for SURF III, a few comments are presented about thebeam lifetime.
1.0 Introduction
Beam instabilities are intensity-dependent collective effects that arise as a result ofthe electromagnetic wake fields generated by the beam as it interacts with its environment.Coherent oscillations appear above some threshold current when the induced wake fieldforces overwhelm the natural synchrotronsradiation darnping of the electron beam [4]. Theoscillation amplitude grows exponentially in time until either the beam is lost or nonlin-earities in the system limit the growth. Such nonlinear fluctuations are extremely difficultto characterize; instead, the approach is to establish the instability risetime while themotion is in the linear regime. The instability risetime is one of the basic input designparameters for an active feedback system used to control the instability. Finally, if one candetermine which subsystem or structure in the vacuum chamber is likely to be the drivingsource of the instability, passive damping techniques maybe implemented to reduce thesize of the wake fields. It is common to refer to the machine coupling impedance, which isthe frequency-domain equivalent of the wake field.
Longitudhal lnstsbdityStudies st the SURF 11StorageRingat NIST 1

DISCLAIMER
This report was prepared as an account of work sponsoredby an agency of the United States Government. Neither theUnited States Government nor any agency thereof, nor anyof their employees, make any warranty, express or implied,or assumes any legal liability or responsibility for theaccuracy, completeness, or usefulness of any information,apparatus, product, or process disclosed, or represents thatits use would not infringe privately owned rights. Referenceherein to any specific commercial product, process, orservice by trade name, trademark, manufacturer, orotherwise does not necessarily constitute or imply itsendorsement, recommendation, or favoring by the UnitedStates Government or any agency thereof. The views andopinions of authors expressed herein do not necessarilystate or reflect those of the United States Government orany agency thereof.

DISCLAIMER
Portions of this document may be illegiblein electronic image products. Images areproduced from the best available originaldocument.

..
2.0 SURF II Storage Ring Operational Setup
The measurements were carried out on the SURF II weak-focusing storage ring onthe last two days of the August 1997 run using standard operating parameters. The nomi-nal machine parameters are listed in Table 1. Time constraints permitted varying only alimited number of operating conditions in order to induce and observe the instability. Themachine was typically filled to< 150 mA in two equally filled bunches and ramped to anenergy of 256 MeV, at which time the bunch length is about 1 ns (fwhm).
TABLE 1. Nominal SURF-II Storage Ring Parameters
Energy
Cwcumferenw
Bending field, max.
Field index
Harmonic number
Rf frequency
Synchro@on frequency
Rf gap voltage
Synchrotrons rad. energy losshurn
Damping time, longitudinal
Damping time, transverse
Bunch length, fwhm
Horizontal, vertical tune
Dispersion/
Momentum compaction
256
5.267
1.2
0.59
2
113.8
330
10
0.456
12.8
13.9
1
0.640,0.768
2.044
2.44
MeV
m
T
MHz
kHz
kV
keV
Ins
m
ns
m
Assuming that the instability in SURF II is caused by the interaction of the beamwith an electromagnetic wake field, we expect to observe the instability at a threshold cur-rent that depends on various machine parameters. Beam-excited higher-order modes(HOMS) in the rfcavities area common source of coupling impedance; therefore, thepresent studies focused on measuring the risetime of the instability as a function of beamcurrent and rf system parameters. If the oscillation amplitude of the collective motion doessaturate due to nonlinearities [5], it is possible that this could result in noise fluctuations ofthe kind seen at low frequencies ador the microwave signals seen at high frequencies [6].This view is supported qualitatively by the correlation between the time dependence of thesynchotron oscillations and the low-frequency fluctuations observed during this machinestudy period. Discussion of the microwave emissions is beyond the scope of this paper.
3.0 Beam Monitoring Diagnostic
Figure 1 shows the time evolution for the instability as observed on a capacitivepickup beam monitor electrode (BME) located in the SURF II storage ring vacuum cham-ber. The “Q probe;’ as it is otherwise known, is a 2-inch-long section of rectangular S-
Longitudinallnstsb@ Studiesat the SURF11StorageRingat NIST 2,

.
band waveguide. The waveforms in Fig. 1 were acquired using a Hewlett Packard (HP)54542A 2 Gs/s sampling scope. The two plots show the amplitude variation in the BMEsignal for two different values of the beam current and rf phase; more will be said aboutthis later. For a Gaussian bunch, the voltage induced on the BME is given by [7],
‘(’)=s1’’’(-27)-’’’(-:$}(1)
where o(t) is the rms bunch length, which typically varies with time when the beam isunstable, eN is the charge in the bunch and Z~ffis the effective BME transmission lineimpedance. The above signal shape repeats in SURF II at twice the revolution period of 1/ffi (harmonic number of 2), There are two time scales of interest in Eq. (1). The first is afast time scale defined by the parameter ~, which represents the time it takes a signal topropagate the length of the electrode (- 0.17 ns for the SURF II BME). The second timescale is implicitly defined by the variation of the bunch length parameter, o(t). In Fig. 1,the amplitude variation of the BME signals is a result of therms bunch length change dueto the instability. This motion is observed to vary with a broad period of between 15 and19 ms depending on machine parameters.
Maximum amplitude in the figure corresponds to a minimum bunch length. Whenthe instability occurs, the bunch length varies on a time scale that is long compared to timescales defined by the bunch length and revolution time, but is comparable to the radiationdarnping time of 13 ms, given in Table 1. When the beam intensity is high, there is addi-tional structure within the broad periodicity (Fig. lb), and there is an associated variationin the growth rates of the synchrotrons sideband power, discussed in the next section.
unstable 256.41 MeV 6.75 mA W 131.0 Wf 10 kV unstable 256.3 MeV 114 mA Orf 54.2 W 10 kV0.8~, ,,, ,,, .,. ,,, ,,, ,,, .L, ,,, ,,, ,,, ,,, ,
“ Flrl’1’l I’19
>
:0
ii
o
0.6
0.4t
0.2
0.0
-0,2
-0.4I
>
o
-o.8~ -~10 20 30 40 50 60 0 10 20 40
time ms time ms
a. b.
FIGURE 1. Time domain BME signal when the instability is active at two different storedcurrents: (a) 6.9 mA and (b) 114 mA. The vertical scales are not the same.
Qualitatively, the low-frequency horizontal and vertical spectra taken by observingthe synchrotrons light can be described in terms of the instability [3]. As the bunch length
LongitudinalInstabilityStudiesat the SURF11StorageRhg at NIST 3

..
and hence energy spread fluctuates under the influence of the instability, the horizontalbeam size is modulated due to the large dispersion (-2 m). For the case of the verticalplane, residual dispersion and/or coupling in the machine result in the observed motion.
4.0 Instability Growth Rate and Frequency ShiftMeasurements
The instability threshold was found to be very sensitive to the phase between theradio-frequency (@ generator and the rf accelerating cavity. A phase shifter allows thisphase to be changed. The phase shifter was installed after the papers of Refs. [1][2]. Atspecific values of the phase, the instability could be excited with as little as 7 mA of beam,albeit less severely than at higher currents (Fig. 1.) A likely explanation for this is that thebeam-excited HOMS couple out of the cavity into the rf drive transmission line. Becausethe line is matched only at the fimdamental rf frequency, the HOMS can be reflected backinto the cavity and, depending on the rf phase, the HOM fields may add constructively atthe gap and be large enough to drive the beam. Rf bench measurements of the cavity-trans-mission line system were performed and show a large contribution at the gap of the HOMat approximately 342 MHz; these results are discussed in Section 5. Another observationis that the beam could be stabilized by reducing the rf voltage from 10 kV to 8 kV, whichincreases the nonlinearity of motions of a given amplitude inside the rf bucket (qurdita-tively observed in [1].)
The instability signature was measured in the frequency domain by recording theBME signal using an HP 89441A Vector Signal Analyzer (VSA). The capture buffer fea-ture of the VSA provides a signal spectrum as a function of time by acquiring along sam-ple and then performing a fast Fourier transform on a series of subsamples of a givenlength. The instability manifests itself as amplitude growth and a frequency shift of certainsynchrotrons sidebands around primarily the even revolution harmonics. A total of sevensets of data were acquired for various settings of the rf phase angle and beam current whilekeeping the beam energy and rf voltage constant. The machine conditions for thesedatasets are listed in Table 2. The phase shifter position is uncalibrated. The beam energywas 256.3 MeV for machine conditions 1-4 and 256.6 MeV for conditions 5-7. Timedomain waveforms were also acquired using the HP 54542A sampling scope.
TABLE 2. SURF U Machine Conditiona for Captured Spectral DataSets
Machine beam rf phase center freq rev harm stable orcondition current rfvoltage shiiter unstable?
(InA) (kV) (deg) (MHz) (2x rf harm)
1 113 10 54.2 113.846 2 u
2 -1oo 10 54.2 113.846 2 u
3 -94 10 54.2 569.230 10 u
4 88 10 68.8 569.230 10 s
5 83 9.7 89.6 341.538 6 u’
6 78 9.8 89.6 398.461 7 u7 76 9.8 89.6 626.153 11 u
LongitudinalInstabilityStudiesat the SURF11StorageRhg at NET 4
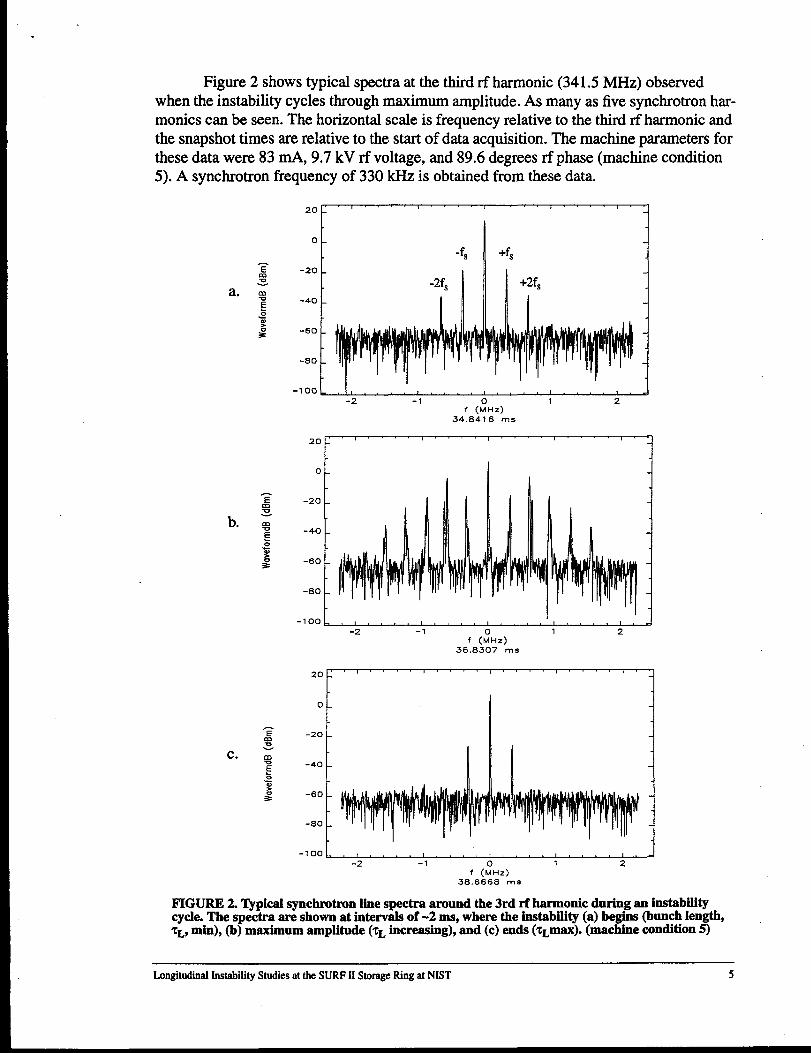
Figure 2 shows typical spectra at the third rf harmonic (341.5 MHz) observedwhen the instability cycles through maximum amplitude. As many as five synchrotronshar-monics can be seen. The horizontal scale is frequency relative to the third rf harmonic andthe snapshot times are relative to the start of data acquisition. The machine parameters forthese data were 83 rnA, 9.7 kV rf voltage, and 89.6 degrees rf phase (machine condition5). A synchrotrons frequency of 330 kHz is obtained from these data.
0 -
F -20 .g
a. mz -40 .
~
g
*-60 .
-80 -
-1001 II # , ! 1 I-2 -1 1 2
f (iHz)
34.8416 ms
f (Mtiz)
36.8307 ms
-1OOL t , f , # J-2 -1 0 1 2
f (tdiiz)
38.6668 ms
FIGURE 2. ‘&pical synchrotrons lime spectra around the 3rd rf harmonic during an instabilitycycle. The spectra are shown at intervals of -2 ms, where the instability (a) begins (bunch length,~L, rein), (b) maximum amplitude (TLincreasing), and (c) ends (tLmt@. (machine condition 5)
Lmgitudinsl InstabilityStudiesat the SURFII StorageRingat NIST 5
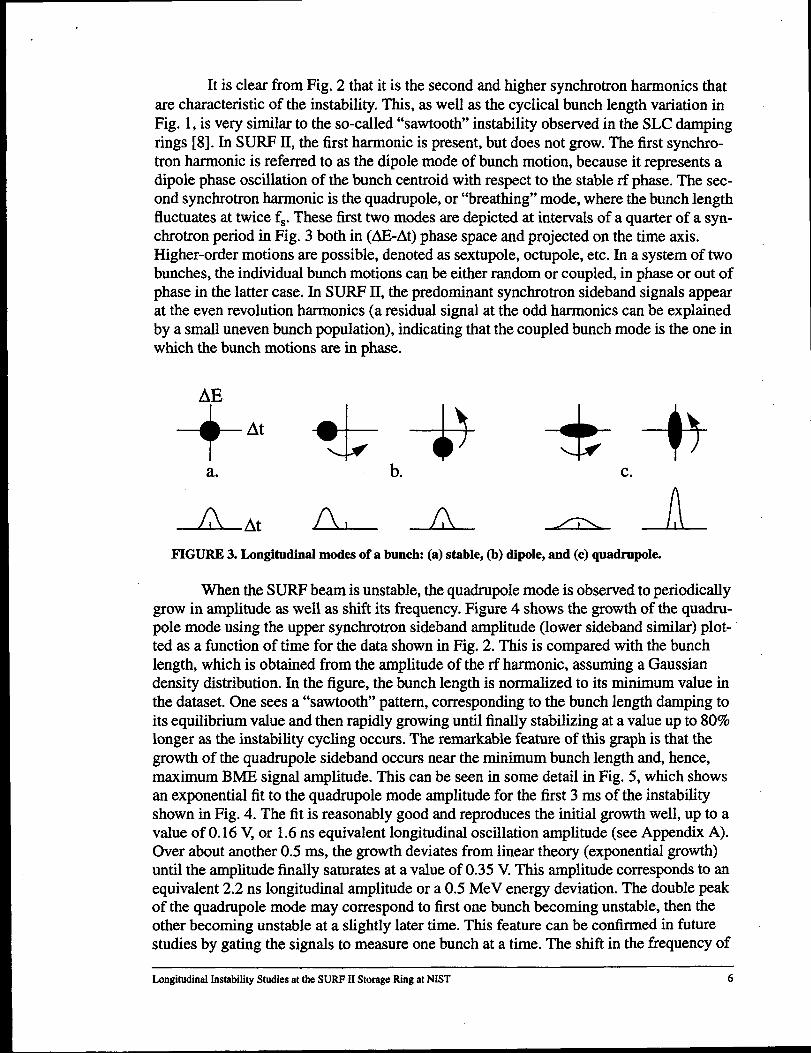
It is clear from Fig, 2 that it is the second and higher synchrotronsharmonics thatare characteristic of the instability. This, as well as the cyclical bunch length variation inFig. 1, is very similar to the so-called “sawtooth” instability observed in the SLC dampingrings [8]. In SURF II, the first harmonic is present, but does not grow. The first synchro-tronsharmonic is referred to as the dipole mode of bunch motion, because it represents adipole phase oscillation of the bunch centroid with respect to the stable rf phase. The sec-ond synchrotronsharmonic is the quadruple, or “breathing” mode, where the bunch lengthfluctuates at twice f~.These first two modes are depicted at intervals of a quarter of a syn-chrotronsperiod in Fig. 3 both in (AE-At) phase space and projected on the time axis.Higher-order motions are possible, denoted as sextupole, octupole, etc. In a system of twobunches, the individual bunch motions can be either random or coupled, in phase or out ofphase in the latter case. In SURF II, the predominant synchrotrons sideband signals appearat the even revolution harmonics (a residual signal at the odd harmonics can be explainedby a small uneven bunch population), indicating that the coupled bunch mode is the one inwhich the bunch motions are in phase.
+“ d= +a. b. c.
FIGURE 3. Longitudinal modes of a bunch: (a) stable, (b) dipole, and (c) quadruple.
When the SURF beam is unstable, the quadruple mode is observed to periodicallygrow in amplitude as well as shift its frequency. Figure 4 shows the growth of the quadru-ple mode using the upper synchrotrons sideband amplitude (lower sideband similar) plot-ted as a function of time for the data shown in Fig. 2. This is compared with the bunchlength, which is obtained from the amplitude of the rf harmonic, assuming a Gaussiandensity distribution. In the figure, the bunch length is normalized to its minimum value inthe dataset. One sees a “sawtooth” pattern, corresponding to the bunch length damping toits equilibrium value and then rapidly growing until finally stabilizing at a value up to 80%longer as the instability cycling occurs. The remarkable feature of this graph is that thegrowth of the quadruple sideband occurs near the minimum bunch length and, hence,maximum BME signal amplitude. This can be seen in some detail in Fig. 5, which showsan exponential fit to the quadruple mode amplitude for the first 3 ms of the instabilityshown in Fig. 4. The fit is reasonably good and reproduces the initial growth well, up to avalue of 0.16 V, or 1.6 ns equivalent longitudinal oscillation amplitude (see Appendix A).Over about another 0.5 ms, the growth deviates from linear theory (exponential growth)until the amplitude finally saturates at a value of 0.35 V. This amplitude corresponds to anequivalent 2.2 ns longitudinal amplitude or a 0.5 MeV energy deviation. The double peakof the quadruple mode may correspond to first one bunch becoming unstable, then theother becoming unstable at a slightly later time. This feature can be confirmed in futurestudies by gating the signals to measure one bunch at a time. The shift in the frequency of
LongitudinalInstabilityStudiesat the SURF11StorageRingat NIST 6

the quadruple mode is shown in Fig. 6, starting almost immediately as the amplitudegrows. This shift can be explained by the nordinearities in the potential produced by the rfand any wake fields. Again, only the upper sideband is shown.
Upper Synchrotrons Harm 2 and Normalized Bunch Length vs Time
1.8A -1
1 ..I
o 5 10 15 20 25 30 35 40TimePosition (ins)
FIGURE 4. Growth of the quadruple synchrotrons harmonic with time (machine condition 5).
0.4 _’I 1 r 1 Data
o
0 Fit
o .T 0.3 . GrowthRote = 4.212 l/ins
!O/
G3
.=~o/
{0.2 -
j o
mw)
,4,/’
LQJ 0.1 - ,/’
&3
/
6’”’0-
0.0< +..+...*.@-’.-@--e””””
I I I I
1.0 1.5 2.0 2.5 3.0TimePosition (ins)
FIGURE 5. Exponential fit of quadruple mode for the first instability cycle of Fig. 4.
LongitudinalInstabilityStudiesst the SURFHStoragsRingst NIST 7

Upper Synchrotrons Horm 2 Freq and Normalized Bunch Length vs Time
1.8A -1
10 1-
0
-10
-20
-30
-40
-50 I
o 5 10 15 20 25 30 35 40TimePosition (ins)
FIGURE 6. Frequency shift of the quadrupde synchrotrons harmonic with time (machinecondition 5).
5.0 Analysis
The growth rates for the quadruple mode were computed and are plotted in Fig. 7.Only the even revolution harmonic spectral data were used (machine conditions 1,2, and5). The variation in beam intensity and bunch length (peak current) at the onset of theinstability can account for the spread. This is especially true for lower beam currents (i.e.,machine condition 5). The presence of two clusters of values, one around 4.5 lcHz and asmaller one around 14.5 lcHz, is more difficult to explain. The higher growth ratesoccurred for higher beam currents (machine condition 1). The Fig. 8 data (which isderived from the time domain data in Fig. lb) shows that for high beam currents the varia-tion in growth rates is very large. The saturation level in equivalent longitudinal amplitudeof the quadruple mode in this case ranges between 2.4 and 3.7 ns, and the bunch lengthgrows much more rapidly in two of the three cycles. There is speculation that the instabil-ity may lead to micro-bunching, driving the local peak current to very high values, whichmay give rise to the higher growth rates.
It is notable that the dipole harmonic does not grow when the instability occurs.The dipole mode was not seen at all for the unstable machine conditions 1-4. When the rfphase was changed for machine condition 4, the bunch length became stable, and thedipole mode was clearly seen but with a slow fluctuation, shown in Fig. 9. The quadrupleharmonic amplitude remained constant at -15 dB compared to the rf harmonic. The dipolemode, whether induced deliberately by rf noise or resulting from the choice of rf phase, iseither benign or unrelated to the bunch length fluctuation.
LongitudinalInstabilityStudiesat the SURF11StorageRmg at NIST 8

3.5 .
3.0 -
2.5 -
2.0 -
1.5 -
1.0 _
0.5 .
0.0 .
4.01 I I I t t I r
L1 ! I I I { I L2 4 6 8 10 12 14 16
growthRate (l/ins)
FIGURE 7. Histogram of growth rates of quadruple mode.
Upper Synchrotrons Harm 2 ond Normalized Bunch Length vs Time
L Jo 5 10 15 20 25
TimePosition (ins)
FIGURE 8. Growth of the quadruple synchrotrons harmonic with time under the same conditionsas in Fig. lb (machine condition 1).
LongitudinalInstabilityStudiesst the SURFII StomgsRingat NIST 9

Upper Synchrotrons Harm 1 and Normalized Bunch Length vs Timer ,
1.020 .
1.015 .
1.010 .
1.005 -
1.000 -
0 5 10 15 20 25TimePosition (ins)
I Io 5 10 15 20 25
TimePosition (ins)
FIGURE 9. Fluctuation of the dipole synchrotrons harmonic when the beam was most stable(machine condition 4).
The driving impedance giving rise to the measured growth rates can be estimated.We assume a time-dependence of exp(jrnt). If the instability is driven by a narrowband(high Q) resonance, such as an rfcavity HOM, the growth rate, rm, is given by [9][10]
rm =f#MDFm(A@)R
V,.cos(j)~Bh s ‘(2)
where I is the total current, M is the number of bunches, Ds1 for a high-Q resonance, B isthe bunching factor (ratio of full bunch length to bunch separation), $’ = sin-l ( U/Vr.)is the synchronous rf phase angle, and Rs is the shunt impedance for the HOM, Fm is abunch form factor, of order unity, that is related to the Bessel fimctions, Jm, and dependson the bunch length. This form factor accounts for the fact that as the bunch shortens, itgenerates appreciable frequency components at higher frequencies, thus increasing thecoupling efficiency to a HOM. The other variables are given in Table 1. Using I = 100 mA,CosQs= 0.9990, h = 2, and B = 2TLf~f = 0.23, and the worst-case growth rate of 15kHz, solving Eq. 2 for the effective driving impedance, we obtain
RSFm=O.14KhI rm s21cs2..
Rf cavity HOMS are the most likely source of coupling impedance of this magni-tude in the SURF vacuum chamber. According to the standard coupled-bunch instabilitytheory [9][10], a resonance condition must be satisfied between one or more HOM fre-quencies, f~o~, and the harmonics (p = 1,2, 3,...) of the rf frequency, fti; harmonics
LongitudinalMaMity Studiesat the SURF11StoregeRing st NIST 10

(n= O, 1) of the revolution frequency, frev;and harmonics (m = 1,2, 3,..,) of the synchro-tronsfrequency, f~:
fHOM = Pf ,f k ‘f ,ev k ‘f. . (3)
The quality factor, Q, of the HOM determines whether its shunt impedance is sufficient todrive the beam if the HOM frequency is close to satisfying Eq. (3).
The SURF rf cavity is a quarter-wave, folded transmission line resonant structure.The original National Bureau of Standards (NBS) SURF drawings 3-C-1035, 3-C-1038,and 3-C- 1039 were used to define the cavity geometry. The code MAFIA [11] was used tocalculate the fields and shunt impedances for the fundamental and HOMS. For simplicity,the cavity was assumed to be straight and the length was adjusted to obtain a fundamentalfrequency close to 113.8 MHz, shown in Fig. 10a. The equivalent circuit and fields areshown schematically in Figs. 10b and 10c, respectively. The shunt impedance, unloadedQ, and ratio &/QO computed by MAFIA are given in Table 3 for the fundamental and firstseveral longitudinal (TM) modes of the rf cavity. It should be noted that the unloaded Qdoes not take into account the loading by the input coupler.
b. lLi
~L ~1SHORTEDEND
OPENEND
FIGURE 10. (a) Geometry (dimenaiona in meters), (b) equivalent transmission line [12], aad (c)field patterna for a quarter-wave, coaxial cavity resonator.
LongitudinalInstabilityStudiesat the SURF11StorageRingat NIST 11

The rf bench measurement results are also given in Table 3. The HOM frequenciesand loaded Q’s were obtained by measuring the transmission coefficients between theinput coupler and a loop probe at the gap. Given that the ratio R/Q is assumed constant, theloaded shunt impedance R~ is obtained.
TABLE 3. SURF II Rf Cavity Fundamental and HOMS: Comparison of MAFIA Calculations(left) and Rf Bench Measurements (right)
rfreq(MHz)
114.06
341.96
569.43
796.25
1022.16
1246.85
1469.88
%
(m36
21
17
15
14
14
14
Qo
2120
3620
4720
5560
6360
7000
7370
WQO($2)
17.0
5.8
3.6
2.7
2.2
2.0
1.9
freq QL(MHz)
113.8 680
342.0 540
571.8 190
797.5 230
1027 143
1257 193
1462
RL
(kQ)
12
3.1
0.7
0.6
0.3
0.4
The frequency of the 342 MHz mode is close to satisfying Eq. (3) (p=3, n=O,m=2). More importantly, its shunt impedance is high: 25% of the fundamental impedanceas observed in the rf cavity bench measurements. The bunch length need not couple verystrongly to this mode to give rise to an effective impedance of 2 Ml An additional correla-tion is given by the regular intervals noted earlier (about 53 deg at 7 rnA) in the rf source-to-cavity phase that produced the most unstable bunch motion. This is likely correlatedwith one or more HOMS whose wavelength and effective transmission line length arerelated, giving a peak field at the gap. This effect was qualitatively verified by transmis-sion coefficient measurements of the cavity-transmission line system. Another means ofsearching for the driving source is measuring the beam-driven HOM spectrum directly inthe cavity assuming the cavity probe couples appreciably to the mode. These calculationsand measurements show a strong correlation, but do not establish cause and effect.
6.0 Recommendations
The observations in SURF II are consistent with a short bunch producing sufficientresponse at one or more rf cavity HOM frequencies to generate wake fields that drive theinstability. Bench measurements of the rf system, characterizing both the cavity and trans-mission line, were performed and a preliminary analysis supports the conclusion above. Ifa HOM damper can be implemented before SURF III is commissioned, fi.wtherstudiesmay be undertaken with beam to test its effectiveness. The addition of pickups and/orstriplines is recommended to allow the option of implementing a feedback system at alater time, in the event that passive damping proves insufficient.
6.1 HOM damping
Passive darnping is an option if a HOM is driving the beam instability, and thereare a variety of possible designs. One broadband option for SURF would be to insert a
Longitudinal[notabilityStudiesat the SURF11StorageRingat NIST 12

band-pass filter in series in the rf transmission line and a band-reject filter in parallel witha load to ground. A schematic is shown in Fig. 11. Any reflection of the fundamental willpass as before, but any HOM-reflected power will be dissipated in the load. The HOMSclosest in frequency to the fundamental should couple fairly well to the input coupler. Anexperiment in which the effect on the instability is observed with and without the dampershould quickly veri~ whether rf cavity HOMS are responsible. If further darnping isrequired, a pickup loop or flap can be pIaced in the rf cavity to optimize coupling to theHOM depending on the field pattern (see Fig. 10c) and minimize coupling to the fimda-mental, if possible. A tuned circuit is then used to reject fundamental power and passHOM power into a load. Examples of such a narrowband HOM damper using tuned cir-cuits and either inductive or capacitive coupling maybe found in [13].
ii
FIGURE 11. Broadband HOM damper schematic.
6.2 Longitudinal feedback system
Active damping can be pursued in the event that passive damping of HOMS doesnot eliminate the longitudinal coupled-bunch oscillations. The basic feedback system con-sists of a longitudinal kicker and pickup, bandpass filter, 90-degree phase shifter, mixer,and rf power amplifier. The pickup detects longitudinal bunch motion as a phase error atthe relevant harmonic of the synchrotrons frequency, and the bandpass filter acts to elimi-nate the large revolution harmonic signals. The pickup signal is sent to the phase shifter,which acts to produce a signal proportional to the energy error that is 90 degrees out ofphase with the detected signal. The energy error signal is mixed with an appropriate multi-ple of the rf frequency and is passed to the rf power amplifier whose output is applied tothe kicker. The rfpower amplifier would need to cover a minimum bandwidth equal to halfthe revolution frequency (57 MHz) so as to be able to suppress any synchrotrons sidebandsexcited by the instability. The amplifier would also need to operate at a center frequencywhere the kicker has a large enough response so that the kicker will be able to impress themaximum energy kick required for damping the beam.
To estimate the power and gain requirements of such a feedback system, weassume a matched stripline kicker/pickup pair with center frequency 500 MHz, bandwidthof-200 MHz, and length 15 cm. The choice of striplines is primarily dictated by ease offit within the existing SURF vacuum chamber while providing more than enough band-width to detect the relevant instability beam signals. The required maximum kicker volt-age is given by [14],
LongitudinallnstabMy Studiesat the SURF11StorsgeRing at NIST 13
l— .—

(4)
where E is the beam energy (up to 400 MeV SURF III upgrade), T is the revolution period,Zr is the instability risetime, ~1 is the longitudinal kicker constant (- 1 for a striplinekicker), and &~aXis the maximum relative energy deviation the kicker is required to pro-duce. The maximum power required by the kicker is given by
V&Pk=2z ,
0(5)
where 20 is the input impedance of the stripline kicker (typically 50 Cl). Eqs. (4) and (5)show that the maximum power required to drive the kicker is determined by the machineparameters that give the fastest instability nsetime and the maximum energy deviation.From Fig. 9, the fastest risetime observed is 67 ps.
An estimate of the maximum amplifier output power necessary to correct a givenrelative energy deviation is obtained from the machine dispersion. We assume that itwould be desirable to be able to correct a horizontal position deviation of 0.5 mm (approx-imately l/6th the horizontal spot size) due to energy change of the centroid of the bunch.With a machine dispersion of 2 m, the maximum energy deviation &~a -0.00025. Usingthese numbers in Eqs. (4) and (5) give a maximum broadband power requirement of 30Watts (45 dBm). The minimum system gain required depends on the signal levels presentat the pickup as well as various cable and component losses in the feedback system. FromFig. 2 the quadruple synchrotrons sidebands are first barely visible at approximately -60dBm. The feedback system design must carefully take into account the noise floor level soas to amplify the small signals present at the onset of the instability.
In SURF II an amplifier was used to increase the lifetime by driving a verticalstripline pair with white noise of 14 MHz bandwidth centered on the vertical tune line. Amore sophisticated feedback system could be used to damp (or anti-damp) the transversedegrees of freedom since stripline pairs can also be used to detect as well as induce tram-verse motion. Configuring such a feedback system to anti-damp in the vertical plane couldsimilarly be used to increase the beam lifetime by increasing the vertical emittance viaphase-space filamentation. Finally, since the ring is so small and the dispersion so large, itmay be possible to damp longitudinally by kicking the beam in one of the transversedegrees of freedom. This scheme is based on the fact that the path length difference in oneturn for a kicked beam is substantially longer than that for the reference orbit.
7.0 Lifetime
Operational experience at SURF shows the lifetime is much improved on drivingthe beam vertically with broadband noise. Lifetimes were typically short: c 1 hour for thehighest currents. When broadband noise was added to the beam using vertical electrodesdriven by an rf amplifier, lifetimes increased to about 2 hours at the highest stored beamcurrents of around 150 mA (360 mA-hr). Bunch lengthening also improves the lifetime by
LongitudinalInstabilityStudiesat the SURFII StorageRingat NIST 14

reducing the peak current. While the instability effectively causes the bunch length toblow up, it does so in an uncontrolled manner, and is thus a less than ideai means ofimproving the lifetime. Implementation of a longitudinal feedback system is likely todegrade the lifetime since the bunch length will damp to its minimum, equilibrium value.An advantage, however, is that the feedback system can be used to precisely control thebunch length. Trade-off studies can be performed to calculate how the total lifetimechanges as a function of beam energy, beam current, bunch length, vacuum pressure (nom-inally 2 nTorr) and rf voltage, including the effects of gas scattering, Touschek effect, andquantum fluctuations.
In the absence of driven noise, using a typical measured bunch length of 1 ns(fwhm) and using the nominal machine parameters of Table 1, the lifetime for 100 mA iscalculated to be 0.9 hrs. This agrees well with the observation. The lifetime is dominatedby the Touschek effect when the rf voltage is 210 kV. If the beam is stable and damps to itsnatural value of 0.8 ns, the lifetime becomes 0.7 hrs. Doubling the rf voltage gives 1.2 hrs(damped z~ = 0.5 ns). Increasing the beam energy to 400 MeV, keeping 20 kV rf voltage,gives 2.3 hrs (%L= 0.7 ns). Doubling the beam current to 200 mA for the latter case gives alifetime of 1.2 hrs, and deliberately increasing the bunch length to 1 ns gives 1.7 hrs. Driv-ing the beam vertically should improve on all these lifetimes.
8.0 Summary
Measurements of the so-called “Rakowsky” instability long observed in the stor-age ring at the SURF II were performed. ‘Ikvofeatures of the instability were studied undervarying machine operating conditions: the sawtooth-like incoherent damping and growthof the bunch length and the time evolution of the coherent, multiple synchrotrons harmon-ics that modulate the revolution harmonics. The latter are characteristic of longitudinalphase oscillations. Instability growth rates up to15 kHz were measured for the quadruplemode, resulting in an estimated driving impedance of 2 I&l This magnitude, and thestrong dependence of the instability on the phase match between the rf transmitter and thecavity, makes it highly likely that beam-excited rf cavity HOMS are driving the instability.Bench measurements of the rf cavity and transmission line qualitatively confirm thishypothesis. A simple, passive HOM damping scheme is suggested, which was used suc-cessfully at the Advanced Photon Source positron accumulator ring under the suspectedHOM/coupled bunch instability scenario. Recommendations are also made to develop afeedback system to control the instability. Furthermore, the addition of beam pickups andstriplines are suggested to allow implementation at a later time, if desired. Qualitatively, acorrelation is observed between the longitudinal phase oscillations observed near the rffrequency and both the low frequency noise and the microwave bursts. The matter is underinvestigation; a detailed discussion is beyond the scope of this report.
9.0 Acknowledgments
The authors thank J. Galayda, S. Milton, M. Borland, and Y. Kang for insightfulcomments and suggestions, and A. Nassiri for assistance with the rf bench measurements.
LongitudinalInstaMity Studiesat the SURF11StorageRingat NIST 15

The hospitality and assistance of the staff at NIST, especially C. Clark, J. Dehrner, A.Hamilton, L. Huey, T. Lucatorto, and B. Madden, is greatly appreciated.
10.0 References
[1] G. Rakows~, “Coherent SynchrotronsRelaxation Oscillation in an Electron Storage Ring;’ IEEE Trans.Nucl. Sci., NS-32, No. 5,2377 (Oct. 1985).
[2] G. Rakowsky and L. Hughey, “SURF’s Up at NBS: A Progress Repo~” IEEE Trans. Nucl. Sci., NS-26,No. 3,3845 (Jun. 1979).
[3] F. Guzman, G. Fraser, and T. Saito, “Frequency Analysis of the Photon Beam Instability at SURF II<NIST internal report.
[4] Several texts: D. Edwards and M. Syphers, ~ Accele_John Wiley & Sons (1993); A. Chao, -S of CMlective B~v Acc~
. . . . .
~, John Wiley& Sons (1993); H. Wkdemann, _ Ace-r Phv@ Springer-Verlag (1993);H. Wkdemann, - Acce~, Spnnger-Verlag (1995); B. ZXter and S. Kheifets,
, World Scientific (1998).
[5] S. Krinsky, “Saturation of a Longitudinal Instability due to Nonlinearities of the Wake Field: Proc. 1985Particle Accel. Conf., 2320 (May 1985).
[6] R. Madden and T. Lucatorto, private communication.
[7]R.E. Shafer, “Beam Position Monitoring AIP Conf. Proc. 249,601 (1992).
[8]See,for example (includes a good list of refs.): R. Baartman and M. D’Yachkov, “Simulations of Saw-tooth Instability; Proc. 1995 ParticleAccel.Conf.,3119 (1996).
[9] A. Hofmann, “Single-Beam Collective Phenomena -Longitudinal; CERN 77-13, Proc TheoreticalAspects of the Behavior of Beams in Accelerators and Storage Rings, Erice (NOV1976).
[10] J. L. LaClare, “Bunched Beam Coherent Instabilities;’ CERN Accel School Proc., CERN 87-03,264(Sept. 1985).
[11] “MAFIA Users Guide: LANL Note LA-UR-90-1307 (NOV1989).
[12] R. Brtartman and S. Koscielniak, “Introduction to Rf Systems in Accelerators: course notes, U.S. Parti-cle Accelerator School, Florida State University, (Jan 1993).
[13] D. Wkhnan and K. Harkay, “HOM RF Cavity Dampers for Suppressing Coupled Bunch Instabilities inthe Fermilab Booster: Proc. 1993 IEEE Particle Accel. Conf., 3258 (1993).
[14] J. Galayda, “Feedback Control of Multibunch Instabilities: AIP proc 249, U.S. Particle AcceleratorSchool, 679-680 (1989).
11.0 Appendix A: Amplitudes of Unstable Oscillations
The amplitudes of the synchrotronsoscillations of a beam are extracted from thespectrum using a Fourier analysis of the time domain signal. The spectral lines for a sta-tionary beam are given by [9]
00 ‘T
so(a))= 27UZ ~ 6(0)- pM@rev)JJo(pMo,evt)fo(t)tdt ,
P =- 0
(6)
LongitudinallnstabMy Studiesat the SURF11StorageRhg at NIST 16
-.

where I is the beam current, Z is the detector impedance, p is an index, M = 2 is the totalnumber of bunches, Jo is a Bessel function, f. is the stationary particle distribution,assumed to be Gaussian, and z is the oscillation amplitude. In a stable beam, spectral linesappear only at harmonics of the rf frequency, o) = pJ401rev.Uneven bunch populationgives rise to an amplitude-modulation signal at harmonics of the revolution frequency, butthis will not be derived here. The integral in Eq. (6) is a form factor, Fo, giving the enve-lope of the amplitudes of the rfharmonics. In the case of a perturbed beam, the spectrum isthat of a signal phase modulated at specific rotation harmonics, n, and is given by
p,m .-w o
where m is the synchrotrons mode number (see Fig. 3), OPn = (pit-f+n)corev,n = 0,1 isthe coupled-bunch mode index (bunch motions in phase and out-of-phase, respectively),C?mis defined in eqn. 2, and fm is the perturbed particle distribution. The integral in Eq.(7) is the form factor, Fm, giving the envelope of the amplitudes of the mti synchrotronssidebands.
Using o ~>>(m~~ + fl~) and n&
= O,the spectra in Eqs. (6) and (7) maybe com-pared at nearly e same frequencies. It is then possible to extract from these spectra theoscillation amplitude by taking the ratio, whereby the beam current and detector imped-ance drop out, leaving simply the ratio of the form factors: F@m. The difference between
the amplitudes of the rf harmonic and the synchrotrons sideband in the power spectra isgiven by the log of the square of the ratio of F#m, evaluated at o = plf~r,,, z (in Fig.2, for example). The form factors are evaluated numerically, and the amplitudes are foundin Table 4. The equivalent energy deviation is found using the relationAt = (a/2n$~)AE/E, where u = 2.44 is the momentum compaction.
TABLE 4. Average, Measured SynchrotrolI I
machine I Icondition mode at saturation
1 quadruple 3.7,2.4
4 dipole 2.3
5 quadruple 2.20
Mode Amplitud
linear limit
3.2,2.1
1.25
1.6
!a (ns)
LongitudinalInstabilityStudiesat the SURF 11StorageRingat NIST 17