Embed Size (px)
Citation preview

UNCLASSIFIED
UNCLASSIFIED
AECD-3454
Subject Category: PHYSICS
U N I T E D STATES A T O M I C E N E R G Y C O M M I S S I O N
HEAT GENERATION IN IRRADIATED URANIUM
By S. Untermyer J . T. Weills
February 25, 1952
Argonne National Laboratory Chicago 80, Illinois
T e c h n i c a l I n f o r m a t i o n S e r v i c e , O a k R i d g e , T e n n e s s e e
0

DISCLAIMER
This report was prepared as an account of work sponsored by an agency of the United States Government. Neither the United States Government nor any agency Thereof, nor any of their employees, makes any warranty, express or implied, or assumes any legal liability or responsibility for the accuracy, completeness, or usefulness of any information, apparatus, product, or process disclosed, or represents that its use would not infringe privately owned rights. Reference herein to any specific commercial product, process, or service by trade name, trademark, manufacturer, or otherwise does not necessarily constitute or imply its endorsement, recommendation, or favoring by the United States Government or any agency thereof. The views and opinions of authors expressed herein do not necessarily state or reflect those of the United States Government or any agency thereof.

DISCLAIMER Portions of this document may be illegible in electronic image products. Images are produced from the best available original document.

\
Date Declassified: October 21, I952.
Other Issues of this report may bear the Number AHL-kj^O.
The Atomic Energy Commistton makes no representation or warranty as to the accuracy or usefulness of the Information or statements contained In this report, or that the use of any Information, apparatus, method or preceu disclosed In this report may not Infringe private I y«wned rights. The Commission assumes no liability with respect to the use of, or for damages resulting from the use of, any Information, apparatus, method or proceu disclosed In this report.
This report has been reproduced directly from the best available copy.
Beproduction of this Information is encouraged by the United States Atcmlc llnergy Comtnlsslon. Arrangements for your republlcatlcn of this document in whole or in part should be made with the author and the organization he represents.
Issuance of this document does not constitute authority for declassification of classified material of the same or similar content and title by the same authors.
Printed in USA, Price 20 cents. Available from the Office of Technical Services, Department of Commerce, Washington 25, D. C.
ABC, Oak Ridge, Temi.

ARGONNE NATIONAL LABORATORY P . O. Box 5207
Chicago 80, Illinois
HEAT GENERATION IN IRRADIATED URANIUM
by
S. Untermyer and J. T. Weills
Feb rua ry 25, 1952
Operated by The Universi ty of Chicago under
Contract W-31-109-eng-38
1-2


HEAT GENERATION IN IRRADIATED URANIUM
This r epor t p re sen t s data on the heat generated in i r rad ia ted uranium. Resul ts a r e presented both as curves and formulae. Data cover the range between 10"* and lO' seconds.
Heat is produced in uranixim from the following causes after a chain react ion is stopped:
1. F i s s ions from delay neutrons 2. Decay of radioact ive fission products 3. Decay of U-239 and Np-239.
The f i r s t i tem becomes insignificant within a few minutes after i r radia t ion . The las t i tem is an appreciable fraction of shutdown heating with natura l uranivim fuel. The re su l t s given in the r epo r t do not include a delay neutron contribution since this factor depends upon a par t i cu la r r eac to r situation.
Determination of decay heating can be made in two ways:
1. Radiochemical; by measur ing the nxunber and energy of dis integrat ions such as repor ted in re fe rences 3, 4, 5, 6, 9, 10, 11, 12.
2. Ca lo r ime t r i c ; by measur ing heat produced by radioact ive decay such as repor ted in r e f e r ences 2, 7, 8, 9, 13.
Accurate ca lo r ime t r i c data extend from lO'* to 5 x lO' seconds after shutdown, including new information given in Appendix I. At shor te r t imes , data obtained in this manner a r e inaccurate due to the rmal lags in a p p a r a tus . At longer t imes , the sensi t ivi ty of the equipment is too low.
For long t imes after shutdown, up to 10® seconds , the total beta and gamma decay heating for fissiori products and Np-239 has been calculated using radiochemical decay data. This is repor ted in Appendix II by E. P . Steinberg.
At shor t t i m e s , from l / l O to 20 seconds , only gannma data a r e available ( re fe rences 5, 6, l l ) . These data a r e inconsis tent in the range 0-3 seconds. Reference 6 has been used in this r epor t as the main source over this range .

In order to utilize decay heating data, the heat rate must be given a relationship to irradiation time and decay time. By considering fission product decay as a statistical process , Wigner and Way ( l ) derived expressions which lead to formulae of the type:
| 5 . = A | T 3 - ^ - ( T O + T 3 ) - ^ | (1)
where Tg = Time in seconds since operation TQ = Operation time in seconds P s = Rate of heat generation during shutdown PQ = Rate of heat generation during operation A, C are constants
Since it has been found that such formulae represent data quite well, it is convenient and customary to use formulae of this general type.
However, since the formulae as represented above are based on satistical methods, there exist t imes so short or so long that the radioactive fission products are too few to be treated by these methods and cor rections are required to extend the range to these t imes. A modification to equation (l) to fit experimental data over the entire available range is given below:
P P
S.= 0 . I | ( T S + 10)-''-2- 0.87(Ts + 2 x l O - ^ - ^ l - O . l / ( T g + TQ + lO)""-' -0.87
(TS + TO + 2 x lO^)-''-^! (2)
Heat from decay of U-239 and Np-239 is included. This formula is plotted on Figure I and can be seen to agree quite well with experimental measurements of references 2, 6, 8, 9, and 10. It is expected that the curves have the following accuracy:
Under 1 second - large error 1 to 10^ seconds - ± 50% 10^ to, 10* seconds - ± 30% 10* to 10' seconds - +10% 10* to 10' seconds - t 50%
Equation (2) gives values about 22 per cent higher than found by summing fission product heating from individual yields, energies , and half l ives (Appendix 2). This is believed to be good agreement with calorimetric data considering the fundamental uncertainties involved. The shape of equation (2) for long times after shutdown follows the slope of the

radiochemical data closely, deviating about 7 'per cent. Equation (2) in the differential form was used for the compar ison:
d (Ps /Po) d T .
= 0.02 U T - + 10)-*-2 -0.87(T„ + 2 x lO')-*-^ (3)
An additional se t of cu rves . F igure 2, has been p repared for pure U-235. Contributions from U-239 and Np-239 have been subtracted from equation (l) using the following express ions :
Fo r the heat produced by U-239 decay -
P(U-239) = 0.0025.
-/ Ts \ /TV^+ To\ ' \2040/ _ \ Z64U~}
- e
For the heat produced by Np-239 decay -
P(Np-239L Q^PP^3 \290,000] \290.000j ^
(4)
(5)
where P(U-239) = ra t e of heat generat ion due to U-239 P(Np-239)= ra t e of heat generat ion due to Np-239
Recent data on Np-239 decay modes (see Appendix 2) indicate that the constant in equation (S) may be as high as 0.0023. The curves of Figure 2 a r e therefore believed to be conservat ive for the range of t ime over Np-239 decay.
"Calorimetric data on heat generation in i r rad ia ted uranium have been extended t o shorter and longer t imes. In extending these data, the shape of the d i f fe ren t ia l curves was adjusted to coincide with radioactive decay measurements. Different ia l data on radibactive decay eufter long cooling periods were based on appendix I I , while data for very short periods were based on Eef. 6, ajid on supplementary measurements (not reported) which indicated that the shortest l ived f i s s ioa products had an effect ive h a l f - l i f e of approximately 6 seconds.
The curves for na tura l uranium are based on i r r ad ia t ions in reactors where the conversion r a t i o was about 0 .8 . "

REFERENCES
Page
(1) E, P . Wigner and K. Way, Pape r 43, National Nuclear Energy Se r i e s , Div. IV, Vol, 9 (New York: McGraw - Hill Book Co. , 1951) 4
(2) R. A. Day and C. V. Cannon, Paper 41, ibid 3, 4
(3) L. B. Borst, Paper 34, ibid 3
(4) E. L. Brady and A. Turkevich, CL-697-VIII-C-4 3
(5) L. D. P. King, J. A. Hoffman, P. B. Moon, and R. Perry, L.A» 253A (Dec. 7, 1945) 3
(6) N. Sugarman, S. Katcoff, B. Finkle , N. Elliott , and J. D. Knight, Pape r 37, National Nuclear Energy Se r i e s , Div IV, Vol. 9 (New York: McGraw - Hill Book Co., 195l) 3, 4
(7) W, K, Alexander, HW 10349 3
(8) W. K. Alexander, HW 7917 3, 4
(9) S, Untermyer , Appendix I (herein) 3, 4
(10) J. D. Knight, Pape r 38, National Nuclear Energy S e r i e s ,
Div. IV, Vol. 9 (New York: McGraw - Hill Book Co., 195l). . 3, 4
(11) J. D. BroUey and M. S, Livingston, LA-1188 (jan. 15, 195l) . 3
(12) E. P . Steinberg, Appendix II (herein) 3
(13) S. E. Beall , ORNL-1075 3

or H

t 0 a 11
10 r l a 5 6 7 8 O a 3.S '3 4 s a I B » a 3X3
rT;:z;j~jq:3i^^giX^j:r3:.:::]£:^ r - i p ^ .|:^-; •- --f x l ? 5 J RACTJON PF OPERATW&JpWfft^-^^4 f 4 T * - M 0 )
1 a' i as J « -, o r 8 a e 7 • » • l a a. s o 8 ' * * » 7 e • 2 * 3 (4 s e
i(TUiiv+io)"--
FI6.2 , — " ...-JZ^^JI^,
.08t<TM-Ti+^^ia% -4oa6b^2Mor'i-r.0013e^a»o,ooa'T ^1 .
CURVES ARE FOR VAftious VALUES OF TO/IRRADIATION T I M E
FOR ESTIMATE OF —^ FOR APOINT (TOUTS,) SUBTRACT^ AT \ + T „
1-
SMUT-DOWN HEAT PRODUCTION IN u'
13 APPENDIX I - A
(l) A Ca lo r imet r i c Measurenment of F i ss ion Product Heating in a Uranixim Rod
Abs t rac t
Apparatus was developed to m e a s u r e the ra t io : Heat Product ion after i r rad ia t ion for a 1 inch d iamete r uranitim
Heat Product ion during i r rad ia t ion rod. At shor t t imes after i r radia t ion , the t he rma l lag of the appara tus did not pe rmi t re l iable m e a s u r e m e n t s , so auxil iary d e terminat ions were made based on beta - gamina act iv i t ies .
These measu remen t s ignore escape of g a m m a s from the slug, and they include decay energy due to neutron capture in U-238.
Exper imenta l Method
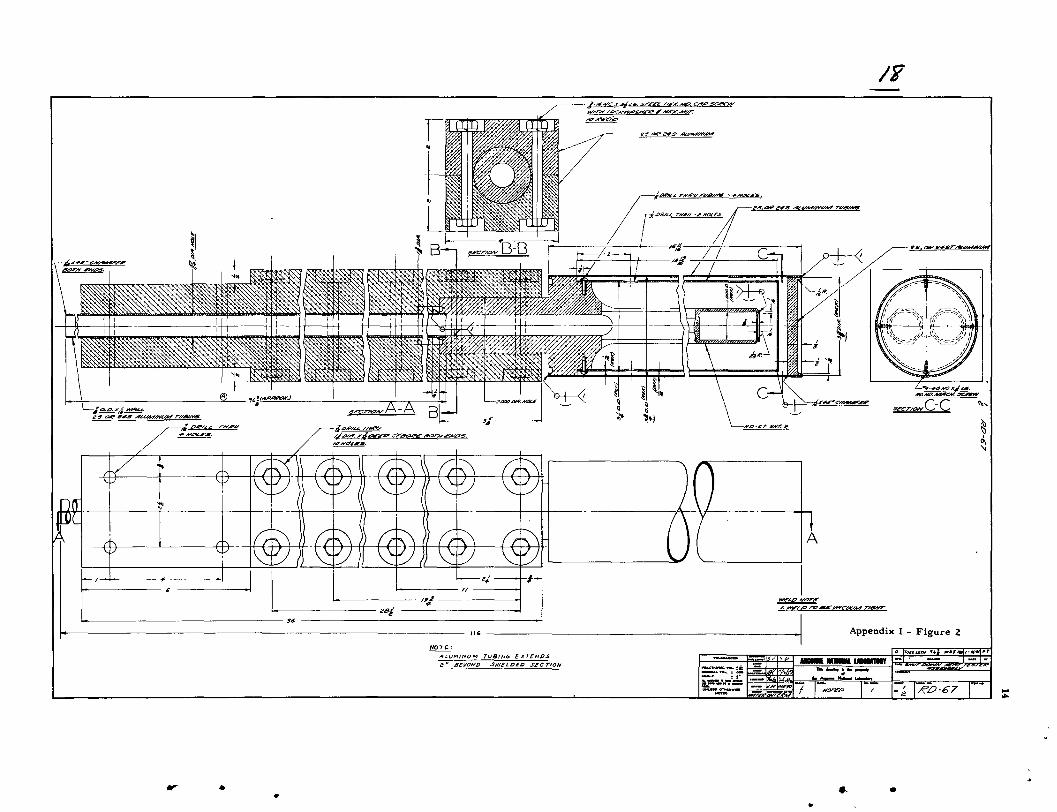
A piece of uranium rod was mounted on one of the prongs of an aluminum fork. The other prong contained a piece of lead.
Heat generated in the uranium, or lead, was conducted along the prongs of the fork, to the point where the prongs joined the large the rma l m a s s , which absorbed the heat from the appara tus .
The prongs of the fork were polished, to minimize loss of heat by radiation, and were further enclosed f i r s t by a polished aluminum radiation shield, and finally, in a vacuum chamber .
The ent i re assennbly was then placed in the "goa t -hole" of C P - 3 ' in a the rmal neutron flux of about 3 x 1 0 inches.
Iron wi res were threaded into the aluminunn prongs near the point where the uranium and lead samples were attached. These wi res fornned differential thermo-couple junctions, and the E .M.F . of the junctions indicated the t e tnpera tu re difference between the two prongs . If all the heat was removed by conduction along the prongs , then the E.M.F, from the i ron wi re s would indicate the difference in heat production between a uranium lump and a s imi la r lump of lead. A schematic a r r angemen t of this appara tus is shown on Figure 1, and drawings of the actual experinnental setup a r e shown on F igures 2 and 3. It can be seen that 1 inch dianneter s lugs were used in these t e s t s . A megavac pump was used to provide about 20 mic ron vacuum in the chamber .

10
The iron wi res were brought out to a sensi t ive galvanome te r (O.l/i/nniTi on a 50 cm scale) . By the use of suitable r e s i s t o r s , the sensit ivi ty of the galvanometer could be varied by a factor of 10.
The readings of the galvanometer were taken, both during pile operat ion and at var ious t imes after shutdown, following o p e r a tion for var ious per iods . „ , ,. Galvanometer reading after shutdown , , ^ , The ra t io , 7: -? 1 :r-—^3 = r^— » ^^is calculated.
Galvanometer reading during operat ion Resul ts a r e shown on F igure 4. After co r rec t ions were applied, this
, . , , . , Heat production after shutdown rat io gave the des i red r e su l t of--—-—-—-—— :; -. —
Heat production during operat ion During operat ion, the galvanometer read about 4300 nnm
equivalent deflection. Since this galvanometer could not be read c loser than 1 m m , an e r r o r in reading of 0.023 per cent of full power would be expected. Even l a rge r e r r o r s might resu l t from spurious E.M.F,*s at junctions, and so forth. Every effort was made to reduce junction e r r o r s by the rma l insulation and choice of nna-t e r i a l s , yet it is est imated that e r r o r s as large as 0,05 per cent a r e poss ible , due to these causes .
Correc t ions to Measu remen t s
Three types of cor rec t ions mus t be applied to m e a s u r e ments :
(1) Thermal Lag - During the initial period after shutdown, the apparatus will read "high" until the t empera tu re gradients in the in the prongs attain the equi l ibr ium value. The e r r o r due to thermal lag s e e m s to have a "half life" of about 5 nninutes. An at tempt was miade to el iminate some of this e r r o r by making a run after 10 minutes i r radia t ion , and subtract ing the resu l t s of this run from the r e su l t s of other runs , al l of which used exposures of at l eas t 5 days duration.
Prev ious m e a s u r e m e n t s have shown that the heat 30 m i n utes after shutdown is less than 20 per cent as much for 10 minutes exposure as for 5 day exposure . For longer t i m e s , and longer ex p o s u r e s , this method of cor rec t ion is somewhat bet ter , however, as shown on Figure 5; cor rec t ions during the f i rs t two hours operat ion a r e l a rge , and resu l t s a r e correspondingly uncer ta in .
(2) Correc t ion for Intermit tent Pi le Opera t ion - Since C P - 3 ' normal ly operated only about 5 days each week, a cor rec t ion had to be applied to convert r e su l t s to a continuous operat ion bas i s .

The pile nornnally operated 5 days continuously before shut down, so the cor rec t ions applied to the long lived decay products only. To compensate for this in termi t tent operat ion, the r e s u l t s from long exposures were increased , so that the difference between the heat production, and heat production for 5 day exposure , was augmented by a factor of 7 /5 . In genera l , this cor rec t ion is so smal l that it could not introduce se r ious e r r o r s into r e su l t s .
(3) Correc t ion for Gamma Ray Escape and Capture — A fraction of the gannma rays escape , and do not heat the rod. Thus, r e su l t s a r e typical of a 1 inch rod, but higher values would be e x pected for thicker rods . This cor rec t ion might amount to 20 per cent m o r e heat short ly after shutdown, with thicker rods . The c o r rect ion becomes smal l at la te r t i m e s , as gammas beconne softer, and a sma l l e r portion escape . No at tempt was made to apply this cor rec t ion to r e s u l t s . Similar ly , it was assumed that heating of lead slug by the pile gammas was comparable to heating of the uranium slug by pile gammas . This is cer ta inly not t r ue , but since both slugs a r e fairly thick to mos t gammas , the lead slug does se rve to reduce e r r o r due to pile gamma heating. That this e r r o r is smal l was indicated by the 10 minute exposure curve , which dropped down toward zero as expected. If many pile gannmas were p resen t , an effect on this curve would be observed. Moreover , it was found that physically rennoving the appara tus fronn the pile did not change shutdown readings; thus pile gammas do not appear to have nnuch effect on r e su l t s .
Results
F igure 5 shows resu l t s obtained with i r rad ia t ions of 16 hours , 5 days , and 3 months. These resu l t s have been cor rec ted for t he rma l lag and for internnittent pile operat ion.

APPENDIX I - B
(2) Radioactive Decay of F i ss ion Produc t s
Supplementary measurennents were made to de te rmine the shape of the fission product decay curves for the period between 20 seconds and 10 hours after shutdown. Samples were indicated in the C P - 3 ' ' rabbi t , and activity was measu red with an ion chamber and a record ing vibrat ing reed e l ec t rome te r . Beta activity was measu red using smal l , unshielded sannples, while gamma activity was m e a s u r e d using a 6 mnn Fe shield. U-235 was used for shor t i r rad ia t ions (2 seconds exposure) . For longer i r rad ia t ions , and longer t i m e s , na tura l u ran ium samples were used. These were exposed wrapped in 2 mi l na tura l uranium foils, so that the major surface contribution to resonance absorpt ion of U-238 was el iminated.
Various exposures were connbined into a single se t of curves for 30 minutes exposure , one curve represen t ing gannmas, the other represent ing be tas . Assurriing these curves represen ted equal heat production at 30 seconds after shutdown, the curves were added, and normal ized to ca lo r ime t r i c data at s eve ra l hours after shutdown. In this way, the shape of the fission product hea t ing curve short ly after shutdown was determined. Resul ts a r e shown on Figure 6.
It is in teres t ing to observe the "bulge" on the beta decay curve at 23 ininutes (corresponding to the decay of U-239). This "bulge" evidently cor responds to about 20 per cent of the total heat generat ion at this t ime. The beginning of a la ter "bulge" in the beta decay curve is also evident. This probably r e su l t s fronn the decay of Np-239 (2*3 day). It appears that this activity inay be responsible for a large fraction of the total heat production at 2*3 days after shutdown.
In this exper iment , it was assumed that beta and gamnna energ ies were substantially constant. For this r eason , r esu l t s may be considerably in e r r o r .

>
n
a
TO C
GALVANOMETER \ HEAT SINK
\
VACUUM
VACUUM
ALUMINUM
Fe WIRE
Fe WIRE
RADIATION SHIELD
f 1 b 1
^ 1 Pb 1
NU-G-292-A ijj
/F

- ^
^44S* CHAMrC/t.
-••s-
*J2 f OS3S) i>XIL I TMM -H-
3£Cr/0N'B B'
n >/x/wvy.'v^yyv>-y^yw
'JVx/jr^jrjyy/jf/vjvn
J v/ew 'cf
Appendix I - Figure 3
%

- 20
^fc "» k«
1 s
s s LA
^ ^ ^ N
k
\ ^,
\ \ v \ i \1 \
\
t
^ \ \ jX \
^ ) \ \
V \
V
\ * \ ^
1
\ \ \ \ \ ^
V 0 \
, \ p \
\
\ \ v, ^
\
^
0
k ^
M l ^
SI
A,
0
^
s, ^
PE
f>
")
R
r
^
T
^
I
1 ^
IC
V
V «>
•^~.
xV> »s, X
•M
w
*, *«,
5 C J A Y S l
Wi
16 HR^, n P F R A T l O N
L k S
TTW
s
k iH
b
k
^
K
I
MOS OPERATION!
k 1 1 '•""•"""sj
• • •
WH \ ^
, > s
••• [
;
^ ••
•
1 1
• ^ V
VYS
•««
1
"" ~
1 1 1 1
^ s, *».
1
1 1 4 SINCE SCRA
1 1
• 1
• • ^ ~
103 10" TIME - SEC ">» I0« l o '
FISSION
APPENDIX FIG. 4
PRODUCT HEATING
1
CALORIMETRIC DATA
Appendix I - Figure 4

A »
%
i •
I \ 1
i
A
• •
I k .
*, • » ^
^
. 1
^
"
"-jj
s
^
.
V
\
r-»
X •
1
a-w
^
I
\
APPENDIX 1 FIG. 5
RESULTS OF CALORIMETRIC MEASUREMENTS
•
X
(
• ''*><,, ^
^
s* ^*
,
•V-
"S.
K > * X If
> h ^
«^ X
*» .
'-^
16 HRS OPERATION
^
X
•US
*^
X • XI
>
«»
• <
I
X XI ^
>
K
<
»^
X •* X V
RESULTS OF CALORIMETRIC MEASUREMENTS CORRECTED FOR THERMAL LAG AND FOR INTERMITTANT PILE OPERATION. NOTE: THERMAL LAG CORRECTION IS NOT RELIABLE FOR THE FIRST HOUR AFTER SHUTDOWN. . 3 MONTH DATA - CORRECTED TO CONTINDUS
IRRADIATION X 5 DAY DATA A 16 HR DATA
- 3 MONTH CURVE - 5 DAY CURVE
16 HR CURVE
V
X x
<
^
^
1 'S
X
' ^ s ^
. . . > •
- • • •
•
*xN»0(««r X ^
•••
X
5 DAYS
»
••
• •
' 1 OPERATION
1 1
^ *. s>. ^
3 MOS OPERATION*'
10^ TIME - SECONDS NU-G- 293-8
Appendix I - Figure 5
to"

0
"^ =:
'
.
'—
..
-~
_-'
..«
"~ **
^
^ • « •
-.^ '
. " ^
^ v ^
S
.
•v
V
s
APPENDIX 1 FIG. 6
SHAPE OF CURVES OF B-?'ACTIVITY AFTER 30 MIN EXPOSURE
ir.i
^
x V,
k
• v
S
s>
"
s
<,,
^ s
H
k \ s
X N,
\
\
^ s.
V
S
\
\
s.
-239 HALF-LI Ft (B EMMITTER)J
i n 3
V
\ ,
S
\ ,
s
'""
^
V >
\
s. \
\
\
V V
V \
s.
\
s \
s
s s
"
k
\ s
N. \
\ , \
\ ^ \ \ \
m 4
\ \
\
I
V \ \
^ A
\
\ \
>
If
V N \ ,
V
\
^ s
s vt s
1
\
to5
• •
-
1 TIME - SEC
NU-G-294-B
Appendix I - Figure 6

APPENDIX II
POWER DECAY OF FISSION PRODUCTS
(Instantaneous i r radia t ion , I day-5 yea r s decay)
by
E. P , Steinberg, Argonne National Labora to ry
The power dissipation of g ros s fission products has been ca l culated as a function of t ime (from one day to five yea r s ) after the i r ins tantaneous production. The calculat ions a re based on the relat ive act ivi t ies of all fission product nuclides which contribute >1 per cent of the total activity at any t ime as calculated from their known half l ives , genetic re la t ionships , and fission y ie lds . Such a compilation of the activity of fission products is given by Hunter and Ballou (Report ADC-65) and these data were used in the present ca lcula t ions .
The determinat ion of the energy per disintegrat ion for each of the fission products is based on the best available information on the i r decay schemes and beta and gamma e n e r g i e s . The average beta energy was taken to be 0.4 Ejj^g^jj. Since many internal conversion coefficients have not been determined as yet, it was felt advisable to include the e~ and X- r ay energies in the total gamma disintegration energy, that i s , the decay is represen ted as taking place 100 per cent by gamma emiss ion . This, of course , has no effect on the total energy of disintegration but only on the pa r t i cu la r division of the total into the fraction emitted as e lec t rons and the fraction emitted as e lect romagnet ic radiat ion. In these calculat ions, then, the form e r is somewhat sma l l e r and the la t ter somewhat l a rge r than the c o r r e s ponding t rue fraction.
During the i r radia t ion of normal U with neutrons , the capture in U-238, giving r i s e to U-239 and subsequently Np-239 and Pu-239 r ep re sen t s a significant addition to the activity of the fission products of U-235. The decay schenne of 2•3d Np-239 has not yet been completely elucidated; however, on the basis of spec t romete r data taken in this l abora tory Fcf. J . Huizenga, L. Magnusson, M. Freedman and F . Wagner, Phys . Rev. 84, 1264 (1951)] and information received from J. J . Rowland of Brookhaven National Laboratory , the following decay data was utilized: beta rays of 0.719 Mev (3 per cent), 0.651 Mev (2.5 per cent), 0.441 Mev (56 per cent), 0.336 Mev (38 per cent) and gamma rays of 0.277 Mev (94 per cent), 0.067 Mev (2.5 per cent), and 0.105 Mev (38 per cent) . These data give an average beta energy of 0.165 Mev and a total gamma energy of 0.302 Mev. A value of 0.9 for aj,(U-238)/a£(U-235) was used in the calculation of the initial Np-239 activity.

x^
The calculations are presented in tabular form giving the total fission product plus Np-239 watts/fission and the derivative of the fraction of operating power as a function of shutdown t ime.
Shutdown T i m e (sec)
8.64
2.16
4 .32
8.64
2.16
4 .32
8.64
2.16
3.16
6.32
9.48
1.264
1.58
X 10*
X 10 '
X 1 0 '
X 10 '
X 10*
X 10*
X 10*
X 10'
X 10'
X 10'
X 10'
X 10"
X 10 '
Total W a t t s / F i s s i o n
(F . P . + Np-239)
6.80 X 1 0 " "
2.43 X 1 0 - "
1.03 X 10-»'
3.78 X 10⁻²°
1.10 X 1 0 - "
4.77 X 1 0 - "
1.88 X 1 0 - "
4 .75 X 1 0 - "
2.51 X 1 0 - "
7.97 X 10⁻²³
3.92 X 1 0 - "
2.46 X 1 0 - "
1.82 X 1 0 - "
' ^ dT^''^^ ( - ^ - ' ^
2.12 X 10"'
7.57 X 1 0 - '
3 .22 X 1 0 - '
1.18 X 1 0 - '
3.44 X 10-»°
1.49 X 10->°
5.88 X 10-^'
1.48 X lO-' i
7.82 X 10-^2
2.49 X 10⁻¹²
1.22 X 1 0 - "
7.68 X 1 0 - "
5.67 X 1 0 - "