Embed Size (px)
Citation preview
Y-12
OAK RIDGEY-12
PLANTNWIS MEASUREMENTS FOR
URANIUM METAL ANNULAR CASTINGS
I
J. K. MattinglyT. E. ValentineJ. T. Mihalczo
Nuclear Materials Management andStorage Program OffIce
March 13,1998
Prepared by theOak Ridge Y-12 Plant
Oak Ridge, Tennessee 37831managed by
Lockheed Martin Energy Systems, Inc.for the
MANAGED BY U.S. DEPARTMENT OF ENERGY
LOCKHEED MARTIN ENERGY SYSTEMS, INC. under contract DE-AC05-840R21400FOR THE UNITED STATESDEPARTMENT OF ENERG-Y
..— ——

DISCLAIMER
Portions of this document may be illegiblein electronic image products. Images areproduced from the best available originaldocument.
.--. .— ..-. ..

DISCLAIMERThis report was prepared as an account of work sponsored by an agencyof the United States government. Neither the United States Governmentnor any agency thereof, nor any of their employees, makes any warranty,express or implied, or assumes any legaI liability or responsibility for theaccuracy, completeness, or usefulness of any information, apparatus,produc~ or process disclosed, or represents that its use would notinfringe privately owned rights. Reference herein to any specificcommercial productj process, or service by trade name, trademarkmanufacturer, or otherwise, does not necessarily constitute or imply itsendorsement recommendation, or favoring by the United StatesGovernment or any agency thereof. The views and opinions of authorsexpressed herein do not necessarily state or reflect those of the UnitedStates Government or any agency thereof.
COPYRIGHT NOTICEThe submitted manuscript has been authored by a contractor of the U.S.Government under contract DE-AC05-840R21400. Accordingly, the U.S.Government retains a paid-up, nonexclusive, irrevocable, worldwidelicense to publish or reproduce the published form of this contribution,prepare derivative works, distribute copies to the public, and performpublicly and display publicly, or allow others to do so, for U.S.Government purposes.
—.. --——-. -— ..---— .... . -r-r-r. , ., .-. . . . . . .= .—

NWIS MEASUREMENTS FOR URANIUM METAL ANNULAR CASTINGS
T. E. Valentine
J. K. Mattingly
J. T. MihdCZO
Oak Ridge National Laboratory’P.O. BOX 2008
Oak Ridge, Tennessee 37831(423) 574-5577 -
March 13,1998
“Managed by Lockheed Martin Energy Research Corporation for the U.S. Department of Energy undercontract DE-AC05-960R22464/

Contents
LIST OF FIGURES ............................................................................................................... ii
LIST OF TABLES ......... ... . ... .. .. ... .. .. ... . ... ... .. .. ... .. .. ... .. ... ... .. .. .. .. ... .. .. .. .. ... .. .. .. .. .. .. .. .. .. .. . ... . .. .. .. . iv
1.
2.
3.
4.
5.
6.
7.
8.
INTRODUCTION ............................................................................................................ 1
2S2CF-SOIJRCE-DRIVENNOISE ANALYSIS MEASUREMENT ................................ 1
2.1
2.2
2.3
2.4
2.5
Auto-and Cross-correlation Functions ...................................................................... 2
Auto and Cross Power Spectral Densities ................................................................ 5
Coherence ................................................................................................................ 7
Ratio of Spectral Densities ........................................................................................ 8
Count Probability Distribution Function .................................................................. 9
NWIS PROCESSOR AND ELECTRONICS ...................................................................13
3.1 System Overview ......................................................................................................13
3.2 2S2CfSource Electronics ............................................................................................14
3.3 Detection System ......................................................................................................15
3.4 Data Acquisition Components ..................................................................................16
DESCRIPTION OF UIL4NIUM METAL CAST~GS ...................................................17
DESCRIPTION OF MEASUREMENTS WITH CASTINGS OF VARYINGENRICHMENT ...............................................................................................................19
RESULTS OF MEASUREMENTS WITH CASTINGS OF VARYINGENRICHMENT ..............................................................................................................21
6.1
6.2
6.3
Time-Dependent Signatures ......................................................................................21
Spectral Signatures ....................................................................................................27
Count Probability Distribution Function ..................................................................33
SUMMARY ......................................................................................................................36
REFERENCES .................................................................................................................37
i
List of Figures
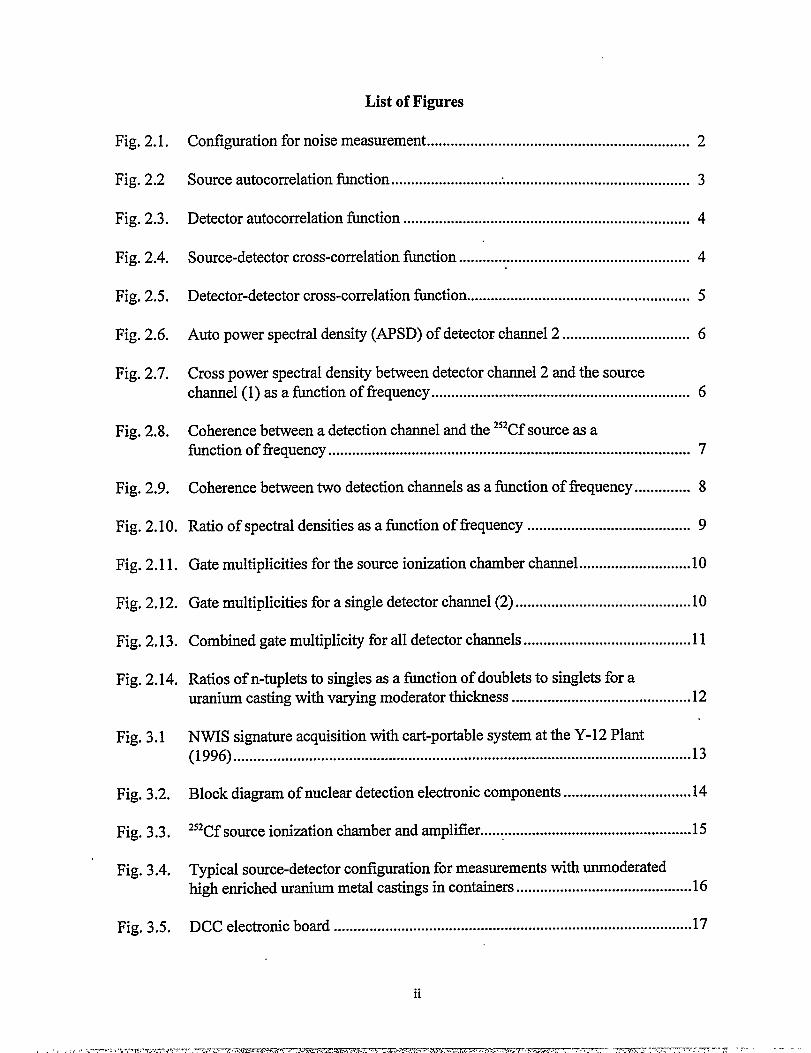
Fig. 2.1. Conf@ration for noise measurement .................................................................. 2
Fig. 2.2 Source autocorrelation fimction ........................................................................... 3
Fig. 2.3. Detector autocorrelation fiction ........................................................................ 4
Fig. 2.4. Source-detector cross-correlation fimction .......................................................... 4
Fig. 2.5. Detector-detector cross-correlation function ........................................................ 5
Fig. 2.6. Auto power spectral density (APSD) of detector channel 2 ................................ 6
Fig.2.7. Cross power spectid demi@betieen detector chmel2adtiesomcechannel (1) as a function of frequency ................................................................. 6
Fig. 2.8. Coherence between a detection channel and the 252Cfsource as afunction of frequency ........................................................................................... 7
Fig. 2.9. Coherence between two detection channels as a fimction of frequency .............. 8
Fig. 2.10. Ratio of spectral densities as a fi.mctionof frequency ......................................... 9
Fig. 2.11. Gate multiplicities for the source ionization chamber channel ............................10
Fig. 2.12. Gate multiplicities for a single detector channel (2) ............................................10
Fig. 2.13. Combined gate multiplicity for all detector channels ..........................................11
Fig. 2.14. Ratios of n-tuplets to singles as a fimction of doublets to singlets for auranium casting with varying moderator thickness .............................................12
Fig. 3.1 NWIS signature acquisition with cart-portable system at the Y-12 Plant(1996) ...................................................................................................................13
Fig. 3.2. Block diagram of nuclear detection electronic components ................................14
Fig. 3.3. 252Cfsource ionization chamber and amplifier .....................................................15
Fig. 3.4. Typical source-detector configuration for measurements with unmoderatedhigh enriched uranium metal castings in containers ............................................16
Fig. 3.5. DCC electronic board ..........................................................................................17
ii
, ..-_,.: ,.,....mw.,7=7,...,,--7-.-!-,=--7r.m.wm%-m,T--- 3-. -,.=-TZ.-.TY3”3Z.-Z-+’?,. ..->-xv. ... ... . ..- ,.. -- .. ‘.. -.--.Y -’ -- -=- -—- -

List of Figures (Cent’d.)
Fig. 4.1. High enriched uranium metal annular casting .....................................................17
Fig. 4.2. Uranium metal casting in steel container .............................................................18
Fig. 5.1. Sketch of top view of measurement configuration with annular casting .............19
Fig. 5.2. Sketch of side view of measurement configuration with annular casting ............2O
Fig. 6.1. Detector autocorrelation function [2,2] for uranium metal castings ....................22
Fig. 6.2. Integral of detector autocorrelation fiction [2,2]) for uranium metalcastings as a fbnction of 235Umass .......................................................................23
Fig. 6.3. Source-detector cross-correlation [1,2] for uranium metal castings ....................23
Fig. 6.4. Integral of source-detector cross-correlation [1,2] as a function of235Umass for uranium metal castings ..................................................................25
Fig. 6.5. Detector-detector cross-correlation [2,3]) for uranium metal castings ................25
Fig. 6.6. Integral of detector-detector cross-correlation [2,3] vs ‘5U mass .......................26
Fig. 6.7. Detector auto power spectral densities [2,2] as a fimction of frequencyfor annular uranium metal castings ......................................................................27
Fig. 6.8. Source-detector cross power spectral densities [1,2] as a fimction offrequency for annular uranium metal castings .....................................................28
Fig. 6.9. Detector-detector cross power spectral densities [2,3] as a fimction offrequency for annular uranium metal c@ings .....................................................29
Fig. 6.10. Source-detector coherence [1,2] as a fimction of frequency for annularuranium metal castings of varying enrichment of 235Umass ...............................30
Fig. 6.11. Source-detector coherence [1,2] vs ‘5U mass of annular metal castings .............31
Fig. 6.12. Detector-detector coherence function [2,3]) for uranium metaI castings .............32
Fig. 6.13. Extrapolated low-frequency detector-detector coherence [2,3] vs235Umass for uranium metal casting ....................................................................33
...111
..- —,... .-. -.--,-- -----r-.----r.z- .,, . . . . . . . .. —--- ., ...77-. . . . . . .. . . . . ..— —— ~..... —.— -. -

List of Tables
Table 2.1.
Table 4.1.
Table 6.1.
Table 6.2.
Table 6.3.
Table 6.4.
Table 6.5.
Table 6.6.
Table 6.7.
Table 6.8.
Ratios of combined count probability distributions for all detectorsfor an HEU-metal casting with 3-in. of moderator ...........................................12
Annular uranium metal castings ........................................................................18
Integral of detector autocorrelation functions and sensitivity coefficientsfor annular uranium metal castings ...................................................................22
Integral of source-detector correlation fimctions and sensitivity coefficientsfor annular uranium metal castings ...................................................................24
Integral of detector-detector cross-correlation fictions and sensitivitycoefficients for annular uranium metal castings ...............................................26
Extrapolated low-frequency source-detector coherence values forannular uranium metal castings ........................................................................30
Extrapolated low-frequency coherence values for annular uranium metalcylinders ............................................................................................................32
Measured count probability distribution values and average counts perblock for annular uranium metal castings .........................................................34
Count moments and sensitivity coefficients for annular uranium metalcastings ..............................................................................................................34
Difference between measured count probability distribution values andPoisson-distributed values ................................................................................35
.
iv
.--.-. --.--.,. . “. --——— -—-- ,.,. —.e-e- —.

This report describesdifferent enrichments
1. INTRODUCTION
measurements performed with annular uranium metal castings ofto investigate the use of 252Cf-source-driven noise analysis
measurements’ as a means to quanti~ the amount of special nuclear material (SNM) in-thecasting. This work in FY 97 was sponsored by the Oak Ridge Y-12 Plant and the DOE OffIceof Technology Development Programs. Previous measurements2 and calculational studies3have shown that many of the signatures obtained from the source-driven measurement arevery sensitive to fissile mass. Measurements were pefiormed to assess the applicability ofthis method to standard annular uranium metal castings at the Oak Ridge Y-12 plant underverification by the International Atomic Energy Agency (IAEA) using the Nuclear WeaponsIdentification System (NWIS) processor. Before the measurements with differentenrichments, a limited study of source-detector-casting moderator configurations wasperformed to enhance the correlated information. These configurations consisted of a castingwith no reflector and with various thicknesses of polyethylene reflectors up to 10.16 cm in2.54 cm steps. The polyethylene moderator thickness of 7.62 cm was used for measurementswith castings of different enrichments reported here. The sensitivity of the measuredparameters to fissile mass was investigated using four castings each with a differentenrichment. The high sensitivity of this measurement method to fissile mass and to othermaterial and cotilgurations provides some advantages over existing safegu&ds methods.
The report is organized in the following manner. A detailed description of the measurementmethodology is provided along with a description of the NWIS hardware used to pefiorm themeasurements. Preliminary results are presented for a variety of time-and frequency-analysissignatures that demonstrates the sensitivity of the measured parameter to fissile mass.However, these preliminary results do not represent an optimized measurement configurationbut are intended to demonstrate possible applications of this ‘method. The results aresummarized and recommendations for fiture work are provided.
2. 252CF-SOURCE-DRIVEN NOISE ANALYSIS MEASUREMENT
The 252Cf-source-drivennoise analysis method evolved as a combination of randomly pulsedneutron measurements5 and Rossi-cx measurements. The 252Cfso~ce is used to fitiateevents in the fissile material and the subsequent emission of neutrons and gamma rays fromthe fissile system are measured with two or more detectors. A typical configuration for thismeasurement is shown in Fig. 2.1, The 252Cfsource is contained within an ionization chamberand provides a pulse for each spontaneous fission event. The source ionization chamber istypically designated as detector #l and the radiation detectors are designated as #2, #3, #4,etc. The pulses from the source and detectors are acquired over time into time bins, typically512 or 1024 time bins. The source and detector signals are then correlated with each other toobtain a wide variety of time and frequency analysis parameters. The N,WIS processorperforms the correlations in the time domain and uses the fhst Fourier transform to obtain thefrequency analysis parameters. In addition, the NWIS processor acquires the number of times
1 I
..- --,...—. -.— ~-. -. - =--,.-.-e - --— . . - -- ----- . -,, - . ., -.Y.. -..—. . . — . . ~

m pulses occur in a time interval or block of data. From these values, the moments orreduced moments of the count events as well as the Feynrnan variance can be obtained. Adetailed description of the NWIS processor is provided in section 3. The correlation of thesource “tith the detector is equivalent to the pulsed neutron measurement or differentialdieaway with an accelerator. The correlation of a detector with itself is termed a detectorautocorrelation and is equivalent to the single detector Rossi-cxmeasurement. The correlationbetween detectors is equivalent to the two detector Rossi-a measurement. By Fouriertransforming the correlation functions one obtains the frequency analysis parameters.
252C f
fissile assembly
source
●
●
Fig. 2.1. Configuration for noise measurement.
2.1 AUTO-AND CROSS-CORRELATION FUNCTIONS
The signatures obtained from the described measurement configuration involve all two-channel combinations (i.e., Ic!22, l&3, 2&3, etc.) including signatures that correlate anindividual signal with itself (i.e., I&l, 2&2, 3&3, etc.). These signatures are acquired in thetime domain using the NWIS processor. In the time domain the correlations betweendifferent signals are termed cross-correlation functions and those correlations involving asingle signal are termed autocorrelation functions. Likewise, in the frequency domain, thecorrelation signatures between different signals are termed cross-power spectral densities(CPSDS), while those involving the same signal twice are termed autopower spectraldensities (APSDS). The correlation signatures and frequency signatures have the followingproperties.
The autocorrelation functions are denoted as”RII, .R22, R33, etc. The autoconelation of thesource, RI I, is proportional to the source strength while the detector autocorrelationfhnctions R22, R33, etc. are equivalent to the single detector Rossi+x measurement. A plot ofthe source autocorrelation function is given in Fig. 2.2 This plot has three unique features: adelta function at time zero, a time period in which there are no correlated counts, and a regionof constant correlated counts. The delta fimction at lag zero occurs because the individualspontaneous fission events of the 252Cfsource are independent of each other which means thatcorrelations can only occur at zero lag. The time width of the region in which there are no
2
———.-—--— —. .— —— ———. .. . . . . . .

correlated counts is the dead time for the source signal processing electronics.7 When a pulseis received from the source signal, the processor cannot acquire another pulse before the endof the dead time period. The region in which the source correlation function is a constantresult because of the average source spontaneous fission rate. Although the spontaneousfission events are not related, an “accidental” correlation will occur if more than one sourcefission occurs in the time period of the data block. An example of the detector autocorrelationfhnction for random counting is provided in Fig. 2.3 and exhibits some of the same featuresas the source autocorrelation fiction. The detector autocorrelation fimction should exhibitan exponential decrease in the region Oto 20 ns, but does not exhibit an exponential decaydue to the random source used for this data acquisition. The detector autocorrelationfunctions for fissile systems are dependent on source induced and inherent fission events andbackground radiation. The source-detector cross-correlations R12, R13, etc. are equivalent tothe pulsed neutron measurement (differential diewaway). and are mainly dependent on theinduced fission rate in and transmission rate through the system. An example of the source-detector cross-correlation fimction is given in Figure 2.4. The source-detector correlationfiction consists of two major components: a peak due to directly transmitted gamma raysfrom the 252Cfsource and a peak due to scattered gamma rays, transmitted and scatteredneutrons, and prompt neutrons and gamma rays from fission. The accidental correlations arethe result of the average counting rate of the source and detectors per time interval. Thebetween-detector cross-correlation fimctions are denoted as R23, R24, etc. and indicate theamount of correlated information between the two detectors. The between-detectorcorrelations depend on both source-induced and inherent fission occurring in the system. Anexample of the between-detector correlation fhnction is given in Figure 2.5. This fhnction isessentially symmetric as a function of time. The peak at time time Ois
IREALCOIWIOENCE
1.E-01
1.E-02
1.E-(k3-,ACCIDEtWALS
1.E-04 -,
1.E-C5-,
DEADIME
I.E-00 .0 5 10 15 20 25 3 35 40 45 50
DELAYFOLLOWINGCF.252FISSION(NSEC)
Fig. 2.2. Source autocorreiation function.
3
--, - ------—. ------ .m.. ./’ * —.—. . .. . . . . . . --r .-. . . . -c..mw— --- — —-—-— -

I,E41
1.E-02
1.E.03
l,E-04
1.E.05
l...........[ ..........................ACCIDENTALS
I,E-06DEADTIME
o 5 10 15 20 25 30 35 40 45 50
DELAYFOUOWING DETECTOR2COUNT(t/SEC)
Fig. 2.3. Detector autocorrelation function.
: ITRANSMlllEDIn~ GAMMAS
z~ ACCIDENTALS
s8
1.E-05 .Io 5 10 15 m 25 30 35 40 45 50
DELAYFOUOWNG CF-262FISSION(NSEQ
Fig. 2.4. Source-detector cross-correlation function.
4
. ... . —-,.--”——- —.-V-- —. . . . . ., ---- I

I,E-03 -
zovi
2.xqL~
!7! 1.E-04 -.m
51-2a00i-ZIllaG~0~~ 1.E-05 --~z
E$
ACCIDENTALS. . . . . . . . . . . . . . . . . . . . . . . . . . . . . . . . . . . . . . . . . . . . . . . . . . . . . . . . . . . . . . . . . . . . . . . . . . . . . . . . . . . . . . . . . . . . . . . . . .
aIYou
-50 -40 -30 -20 -lo 0 10 20 3a 40 50
DELAY FOLLOWINGDETECTOR2 COUNT (NSEC)
Fig. 2.5. Detector-detector cross-correlation function.
mainly the result of coincident gamma rays from fission in both detectors. Beyond -5 ns thetime dependence can exhibit an exponential decrease if the source activity is high enough.The accidental correlations are the result of the average count rate of the detectors per timeinterval. The detector autocorrelation fimctions, the source-detector cross-correlationfi,mctions, and the between-detector cross-correlation functions are all “differential” die-awaymeasurements that are used to determine the decay of prompt neutron fission chains in thesystem. This prompt time decay can be obscured if the accidental correlations are high;consequently, frequency analysis methods were investigated to overcome this difficulty. TheFourier transforms of the autocorrelation fictions are termed autopower spectral densitieswhile the Fourier transforms of the cross-correlation fictions are termed cross-powerspectral densities.
2.2 AUTO AND CROSS POWER SPECTRAL DENSITIES
The source auto spectrum GI~ is simply a measure of the fission source strength. Thedetector auto power spectral densities G22, G33, etc. area measure of the source-induced andinherent fission rate of the system and the background rate and are proportional to thedetector count rate. The source-detector cross-spectra G~2, G~3, etc. are a measure ofcounting events in the detectors correlated with fission events in the source. Consequently,the source-detector cross-spectra indicates the amount of source-induced fission occurring inthe system. The detector cross-spectra G23, G24, etc. are a measure of the events in one
5

detector correlated with events in another detector, so their magnitudes indicate the amountof both source-induced and inherent fission occurring in the system analyzed. Plots of G2Zand G,z are given in Figs. 2.6 and 2.7.
-.
l-i
0.01 -!1 10 100 1000
FREQUENCY(MHZ)
I.E-Cl
1.E-04
Fig. 2.6. Auto power spectral density (APSD) of detector channel 2.
.
*
I.E+OO I.E+OI 1.E+02 1.E+03
FREQUENCY (MHZ)
Fig. 2.7. Cross power spectral density between detector channel 2 an; the sourcechannel (1) as a function of frequency.
6
.. -,,.., -.,-,~ ,.-—n c’- -. ~,=, , ,,, _. ,x....... ,,...!...<,, !.,.. ?ZT7=-T- . .. . --- . . .,._ ——. — . .

2.3 COHERENCE
The coherence, y;, is another usefi.d signature. It is the fraction of common information in
two channels; it is real; and it varies
Measurements
between Oand 1. The coherence is defined as
Gu 2Y;.= —
Gii GJ “(2.1)
are readily performed with NWIS where ~~ is much lower than 104
(Ref. 8). The coherence usually decreases with frequency since there is less correlated signalat high frequency for the CPSDS. Typical coherence values as a function of frequency aregiven in Fig. 2.8 and 2.9.
1.E-02
1.E-03
qzIlloR 1.E-04(Y
+g
1.E-05
1.E-06
I.E+OI 1.E+02 1.E+03
FREQUENCY (MHZ)
Fig. 2.8. Coherence between a detection channel and.the 252Cfsource as afunction of frequency.
7
-n-,, , ,, ,.. -,z--m -. , , , ,T=.’f-vn .. . . . . . . .. .. .. ’7... .,, -., ,, ./. ..2WT-=---- . . . . . . . -7—— ——

? loE-03 -&Illc)zw&wz
~ 1.E-04 -
1.E-05
I.E+OI 1.E+02 1.E+-03
FREQUENCY (MHZ)
Fig.2.9. Coherence beWeen Wodetection channels asafunction of frequency.
2.4 IUiTIO OF SPECTRAL DENSITIES
In previous time domain measurements (Ref. 9), it was realized that a measured parameterindependent of the detection efficiency could be obtained from measurements if both cross-correlation functions between detectors and between detectors and the 252Cfsource weremeasured simultaneously. The frequency analysis equivalent of this early time analysisexpression is the following ratio of spectral densities.
Rlz (o) =G;2 (o) GIS(o)
Gll (co) Gn (o)(2.2)
where * denotes complex conjugation. In this expression detection efficiencies appear inboth the numerator and denominator and cancel much in the same way as in beta-gammacoincidence counting methods to obtain the neutron flux in fission reactors. This has lead toa signature which is easily reproduced. Measurements performed 9 years apart with uraniummetal cylinders yielded essentially the same value of R(co) even though different sources anddetectors were used (Ref. 10). In fact, measurement with detectors sensitive only to gammarays yields the same result as that for detectors sensitive only to neutrons. This ratio is alsoindependent of uncorrelated background which also makes it more usefid. A plot of this ratiofor an unreflected casting is shown in Fig. 2.10 where the ratio decreases with frequency untilit is near O at 100 MHz. The magnitude of the ratio of spectral densities can be showntheoretically to obey the following relationship,
8
, -.,.—. , -.-—-I—-7-7 .,,,—.-...77*-- -- . .7.777-_.. T. 7__ ... .. ,=--- .. ..”. y~—--->~—— —r- —
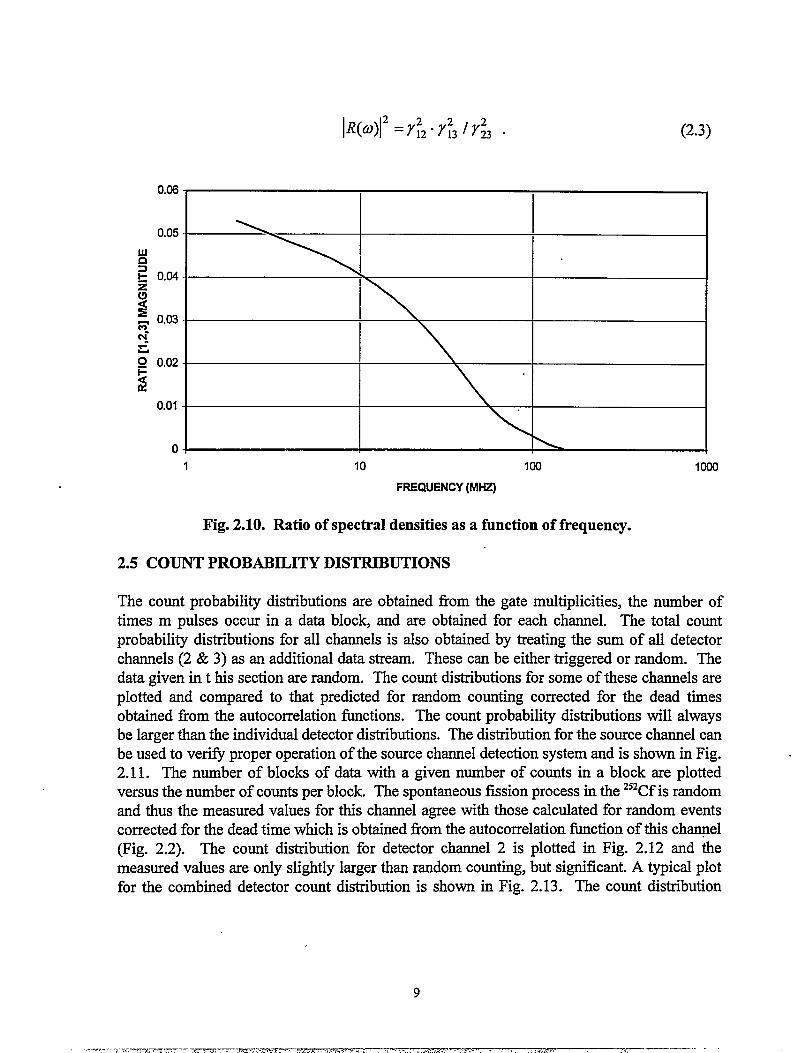
IR((I))12= Y;2“Y:3 I Y; . (2.3)
O.(X3
0.05
o (3.(J2i=s
0.01
0
1 10 100 1000
FREQUENCY (MHZ)
Fig. 2.10. Ratio of spectral densities as a function of frequency.
2.5 COUNT PROBABILITY DISTRIBUTIONS
The count probability distributions are obtained from the gate multiplicities, the number oftimes m pulses occur in a data block, and are obtained for each channel. The total countprobability distributions for all channels is also obtained by treating the sum of all detectorchannels (2 & 3) as an additional data stream. These can be either triggered or random. Thedata given in t his section are random. The count distributions for some of these channels areplotted and compared to that predicted for random counting corrected for the dead timesobtained from the autocorrelation fhnctions. The count probability distributions will alwaysbe larger than the individual detector distributions. The distribution for the source channel canbe used to veri@ proper operation of the source channel detection system and is shown in Fig.2.11. The number of blocks of data with a given number of counts in a block are plottedversus the number of counts per block. The spontaneous fission process in the 252Cfis randomand thus the measured values for this channel agree with those calculated for random eventscorrected for the dead time which is obtained from the autocorrelation function of this ch~el(Fig. 2.2). The count distribution for detector channel 2 is plotted in Fig. 2.12 and themeasured values are only slightly larger than random counting, but significant. A typical plotfor the combined detector count distribution is shown in Fig. 2.13. The count distribution
I
9
,..,, . . .,...—.,=. ——.flm— ---~-v.-. ... ...... . .. ,,.?,. .,,.,. ,-m.-. . .... .... ...... .——.

fi.00E+09
1.00E+08 --,
1.00E+07 --
~ 1.00E+06 --0
~ 1.00E+05 --
~ 1.00E+Q4 --
~ 1.00E+03 --z~ 1.00E+02 --
IJIOE+OI --
I.00E+OO --
I.00E-01
o 1 2 3 4 5 6 7 8 9
COUNT8 PER BLOCK
Fig. 2.11. Gate multiplicities for the source ionization chamber channel.
1.00E+08
1.00E@7
1.00E+06
1.00E+05
1.00E+04
1.00E+03
1.00E+02
1.00E+OI
I.00E+OO
I.00E-01
.
0 1 2 3 4
COUNTS PER BLOCK
Fig. 2.12. Gate multiplicities for a single detector channel (2).
10
,-.,r - .--r---- -.-.-=---W, .. .,,. . ,...7--- ,., . +,....-.’.. .s. ., . . . -.. .-.

.
1,00E+09
1000E+08 --
l,00E+07 --
1.00E+06 --
~ I,00E+05 --
~ 1.00E+04 --
~ I,00E+03 --
~ 1.00E+02 --
~ 1.00E+Ol --
; I.00E+OO --
~ I.00E-01 --
z 1.00E-02 --
1.00E-03 --
1.00E-04 --
1.00E-05 --
1.00E-06 T
o 1 2 3 4 5 6 7 8 9 10
COUNTS PER ❑LOCK
Fig. 2.13. Combined gate multiplicity for all detector channels.
obtained from the sum of detectors (Fig. 2.13) is considerably larger than that for a singledetector and has count events as high as 10. For comparison purposes, the values should beexpressed in terms of probabilities so that comparisons made do not depend on the number ofblocks in a measurement. From these, the Feynman variance can be obtained as
(~– E2 ) i; where c is the number of counts per data bloclq also the measurements or
reduced moments.
The ratios of probabilities, triples/singles, quadruples/singles, quintuples/singles are plottedas a function of the doubles/singles ratio in Fig. 2.14. To show the usefidness of this type ofplot, data have been included for the casting with no moderator around it 2.5 in. and 5.1 in.thick. Since there is less fission without moderator, the ratios are generally smaller thanthose with a moderator. For higher order ratios (greater than 6/1) the statistical uncertainty islarge. The ratios for the casting with 7.62 cm polyethylene reflector are given in Table 2.1.
11 I

Tab1e2.1 Ratios ofcombined countprobability distributions for all detectors for
an HEU-metal casting with 3-in. of moderator.
Ratio to singles Value1
2/1 , I 1.92E-01
I 3/1 I 2.74E-02
I 4/1 I 3.87E-03
I 5/1 I 5.49E-04
I 6/1 I 8.03E-05
I 7/1 I 1.24E-05
I 8/1 ! 1.95E-06
I 9/1 I 2.73E-07
3/11.00E-02--
4),4
4/11.00E-03--
1I.
5/11.00E-04-- A.
fi6/1
1.00E-05?$.
I ,10/1 I 2.27E-08I 1
6,32E-02 8.66E-02 1.13E-01
DOUBLETS PER SINGLET
Fig. 2.14. Ratios of n-tuplets to singles as a function of doublets to singletsfor a uranium casting with varying moderator thickness. (O,2.5, and 5.1 cmthick with no moderator the doublets to singlets ratio is 6.32 x 10⁻².)
12
,.,...e..:,--~e-7-,-7 , r -,>, .,.. . r-sc$n!rT. <- . . .nm7-rN5m7’’-777--.--7 r~ -.~n~———---- ,>~ . . ..— .- . .- -->. <. ,T--r . .,

3. NWIS PROCESSOR AND ELECTRONICS
This section provides a brief discussion of the electronics components of the NuclearWeapons Identification System (NWIS). This description begins with anoverview of theconilguration of NWIS and then provides a brief description of each component. A briefdescription of the electronics components, the data acquisition process, and the dataprocessing is discussed in the following sections.
3.1 SYSTEM OVERVIEW
As previously stated the measurements requires the use of a 252Cfsource contained in anionization chamber, radiation detectors, detector electronics, data processing boards, and acomputer for data acquisition and display. A photograph of a typical NWIS1l configuration isshown in Fig. 3.1 deployed around a container with weapons component. The source islocated on one side of the container and the detectors are located on the other side of thecontainer. The source and detector signals are sent to electronic modules for processing andthen the signals are sent to the data processing components for data acquisition. A blockdiagram of the configuration is shown in Fig. 3.2.
Fig. 3.1. NWIS signature acquisition with cart-portable systemat the Y-12 plant (1996).
13
,-, .. .-.’-m,,T”-r----m—-...xxT—qT———.,.,-y.-=,-, ,,,...,-= .--=,.=,,, , .-.,.>.,> (... .... . ..-— —r.-<...-, .,.

DET 1
DET 2
DET 3
DET 4
DET 5
Cf Ion Chamber;-------~iti----------! Nom :
HV LV CFD Qw ~ ~ 1. Cable lengths between CFD andE DCC are adjustable in short
w?” : increments O-4 feet.
4 ? ‘?’Q ‘mY :2. HV, LV, CFDS and Dela are
, dinstalled in NIM Bin on e cart~ 3. * Cf and Detectors placed .
appmprfatety near item to bemeasured.
1! ! 4. Cables between PMT bases and:-_--, ,------CFDS can be 25 or 50 feet long.
PMT BASE: :--------------- ”---------------:
COMPUTER :
4
w 1PMT BASE
NT
?
“! L5ii! ~
: ‘ -----------------
- -“c
1
D:w uT
-
PMT BASE HV CFI
w
4 ?7’1
l122aNlL
OST= Oelaciwawo = mak adis8rwPMT = Ph-doMuN@erTutaHV = Hbh Vola@LV=Lcw VolleW
, ---------- cm= ccoswllFradlon ~ofOCC = OaIa Ca$im ad Co-bn Mcdub
Fig. 3.2. Block diagram of nuclear detection electronic components.
3.2 252CFsomcE ELECTRONICS
A photograph of the source ionization chamber and its amplifier is shown in Fig. 3.3. The252Cf-source ionization chamber produces an electrical pulse each time the source emitsneutrons and gamma rays.12 An amplifier is used to increase the amplitude (size) of the pulsefrom the source ionization chamber. The amplifier is referred to as a high-gain fast amplifier.The high-gain fiist amplifier requires a high voltage (IN) and a low voltage (LV) supply asinputs to the amplifier and produces an electrical pulse as output. The commercially availablepower supply is a HV power supply and is used to supply power to the source high-gain fmtamplifier. The HV is passed through the amplifier to the plates of the ionization chamber.The output of the source high-gain fmt amplifier is input to a commercially availableconstant fraction discriminator (CFD). The CFD eliminates unwanted pulses and produces anoutput pulse that has constant amplitude and adjustable width. The output of the constantfraction discriminator is input to a delay module, which is used to control the arrival time ofpulses from the source to the data processor. The present configuration of these electroniccomponents is shown schematically in Fig. 3.2. The CFD and the delay module are containedwithin a commercially available nuclear instrument module (NM) bin that supplies power tothese components. An assortment of commercially available cables and connectors are usedto connect the source to the electronic components and the data acquisition components.
14
.. -- -’77-r-,-- --7.T5!-,Z ,,..-.—. 1,.4. .!,. . . . * \ .-%- .? > . . , + ? t -TX”— 7 ——

Fig. 3.3. 252Cfsource ionization chamber and amplMer.
3.3 DETECTION SYSTEM
The detectors are commercially available organic plastic scintillators that are used to measurefast neutrons and gamma rays. A photograph of the detectors is shown inFig. 3.4. The detectors for these experiments are numbered as follows: detectors 2 and 3 arethe bottom of the 2x2 array of detectors with detector 3 visible in the photograph withdetector 2 behind it in the photograph. Similarly, detector 5 is on top of 3 and is visible inthe photograph. Detector 4 is behind it with only its top surface visible. Neutrons andgamma rays interact within the detector and produce light. The light is converted to anelectrical pulse using a commercially available photo-multiplier tube (PMT) and a PMT basethat provides power to the PMT. A commercially available high voltage power supply isused to power the PMT base. The output of the PMT base is sent to a constant fractiondiscriminator (CFD), which eliminates unwanted pulses and produces an output pulse thathas constant amplitude and adjuskible width. The constant fraction discriminator has fourindependent inputs and outputs. The output of the CFD is sent to the data processor. Theconilguration of these electronic components is shown schematically in the block diagram ofFig. 3.2. The constant fraction discriminator is located within a nuclear instrument module(NIM) bin that supplies power to the components. ~ assortment of cables and connectorsare used to connect the detectors to the processing electronics and to the data acquisitioncomponents.

.
-..
“’l,.. -:,,,, ,.. ,.t:,5,:;” ., ..’ ,..
.;l. ,
,,, ., -., ,-. . .
Fig.3.4. Typical source-detector configuration formeasurementswith unmoderated high enriched uranium metal castings in containers.
3,4 DATA ACQUISITION COMPONENTS
The data acquisition components are comprised of two electronic boards that are installed ina commercially available computer. The data capture and compression (DCC) module islocated on one of the electronics boards and is used to acquire the signals from the constantfraction discriminators. A photograph of this module is shown in Fig. 3.5. The output of theDCC module is sent to a data processing component that sends the data to the computer. TheDCC module requires the use of a separate power supply. The DCC module and the dataprocessing module are referred to as a board set. These boards are designed by OIOIL andcommercially fabricated with commercially available electronic components except for theprocessor chip which is especially designed and fabricated by a commercial chip maker.
16
-,.. ..=. m,r .,~- .—.—.-.7.--.,-,,7.,m——..-.—---- -mm-m—,- ,..- ....... ..> —— —.-. ——----

Fig. 3.5. DCC electronic board.
4. DESCRIPTION OF URANIUM METAL CASTINGS
All of the annular castings were geometrically the same and had an 8.89-cm ID, a 12.7-cmOD and a length of-15.24 cm. A photograph of a casting is provided in Fig. 4.1 in a steeltray. All castings were contained in stainless steel cans that had 15.6-cm OD and were 22.4cm tall with a O.15-cm wall thickness as shown in Fig. 4.2. The enrichment, net mass,uranium mass. fraction, and uranium mass for each casting is provided in Table 4.1. Thedensity of the 93.15 VVWO ‘5U enriched casting is 18.76 g/cm3, and the density of the othercastings will be slightly more due to the increased amount of ‘*U in the casting. Thesecastings are comprised almost entirely of uranium but do have a small amount of impuritiessuch as oxygen, carbon, nitrogen, etc. Each of these castings contains about the same amountof impurities. Enrichment was essentially the only parameter that was changed from onecasting to another.
Fig. 4.1. High enriched uranium metal annular casting.
17
,—- -- --.n— .. . ..- ,. ~= mm . ...y.m... —r.- ——; _ ,+ ‘... . .. . ..... . —,- —

.
Fig. 4.2. Uranium metal casting in steel container.
Table 4.1. Annular uranium metal castings
Enrichment Net mass kg U/kg metal Uranium mass(Wt%23*U) (kg) (kg)
93.15 17.646 0.99932 17.634
90.03 17.672 0.99932 17.660
84.97 17.47 0.99914 17.455
80.09 17.457 0.99926 17.444
18
-!-.. .“.-—-.u?,. .-m,.., vxF-mvr7-- ~. ‘—_.—
5. DESCRIPTION OF MEASUREMENTS WITH CASTINGSOF VARYING ENRICHMENT
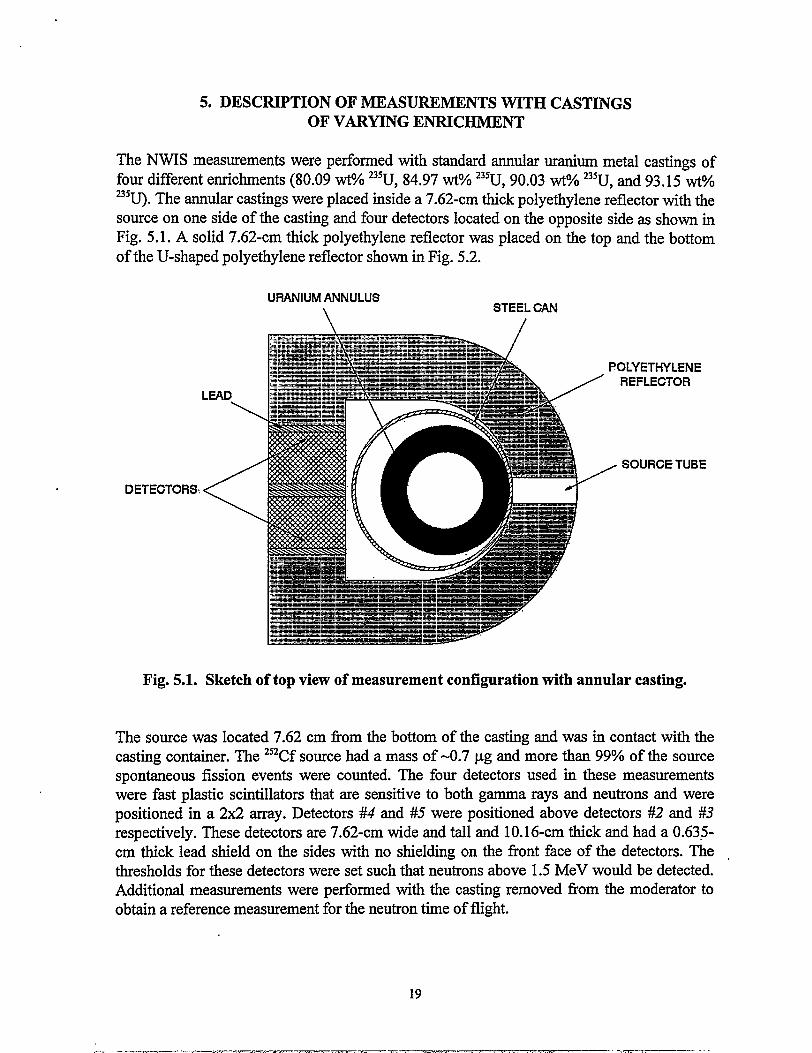
The NWIS measurements were performed with standard annular uranium metal castings offour different enrichments (80.09 wt% 235U,84.97 W% 235U,90.03 wt% 235U,and 93.15 wt%235U).The annular castings were placed inside a 7.62-cm thick polyethylene reflector with thesource on one side of the casting and four detectors located on the opposite side as shown inFig. 5.1. A solid 7.62-cm thick polyethylene reflector was placed on the top and the bottomof the U-shaped polyethylene reflector shown in Fig. 5.2.
URANIUM ANNULUS\ STEEL CAN
OLYETHYLENEREFLECTOR
SOURCE TUBE
DETECTORS.
Fig. 5.1. Sketch of top view of measurement configuration with annular casting.
The source was located 7.62 cm from the bottom of the casting and was in contact with thecasting container. The 252Cfsource had a mass of-0.7 ~g and more than 99% of the sourcespontaneous fission events were counted. The four detectors used in these measurementswere fast plastic scintillators that are sensitive to both gamma rays and neutrons and werepositioned in a 2x2 array. Detectors #4 and #5 were positioned above detectors #2 and #3respectively. These detectors are 7.62-cm wide and tall and 10.16-cm thick and had a 0.63.5-cm thick lead shield on the sides with no shielding on the front face of the detectors. Thethresholds for these detectors were set such that neutrons above 1.5 MeV would be detected.Additional measurements were petiormed with the casting removed from the moderator toobtain a reference measurement for the neutron time of flight.
19
———— ——— —————-. ——.. —

I
DETECTORS
URANIUM ANNULUS STEEL CAN
,POLYETHYLENEREFLECTOR
SOURCE TUBE
Fig. 5.2. Sketch of side view of measurement configuration with annular casting.
20
., ... . -.... rr— ~ ~.= —T.,. . . . . . , ,. ~, ... ..--— —.- -—— ———---

6. RESULTS OF MEASUREMENTS WITH CASTINGSOF VARYING ENRICHMENT
As previously described, the time-dependent detector responses obtained from themeasurements are used to generate a variety of correlation fictions that are Fouriertr~sformed to obtain their respective frequency spectra. This sections presents many of thep~ameters obtained from these measurements in both the time and frequency domain, showsthe functional dependence of many of the measured time or frequency fimctions, and showsplots of some of the parameters with 235Umass or enrichment. These measurements withvarying enrichments were as described in Fig. 6.1 and 6.2 with 7.62 cm.-thick polyethylene.
6.1 TIME-DEPENDENT SIGNATURES
In the measurements, both auto and cross-correlation functions are generated’ from the “measured time responses. The cross-correlation fimctions are Iypically normalized to thesource count rate to remove their dependence on the source. The background subtractedcorrelation fimctions are actually covariance functions because the accidental correlationshave been removed. Covariance fictions are generated from the correlation functions byremoving accidental correlation rates of the detectors, that is subtracting the product of thedetector count rates per time interval for two detection signals that tie correlated. Thecovariance fictions are independent of counts due to background radiation although theiruncertainties are noted. The detector autocorrelation fimctions should be sensitive to fissilemass. As an example one of the detector autocorrelation fimctions is shown inFig. 6.1. This correlation fhnction exhibits an exponential decrease in the region 40 to 80 ns,but does not exhibit an exponential decay prior to 20 ns due to the dead time of the detectionsystem as shown in Fig. 6.1. As can be seen from this figure, the time-dependentautocorrelation fiction has a slight dependence on fissile mass. The detector auto-correlation fimctions were integrated over time to obtain the total correlated counts for thedetectors and are presented in Table 6.1 along with the sensitivity coefficient for theintegrals. The integral of the total correlated counts increases as fissile mass increases. Theintegral of the autocorrelation fi.mctions increases approximately 13% from 13.97 to 16.43 kgof 235U.
A plot of the integral of one of the detector autocorrelation functions is given in Fig. 6.2 andis a linear fimction of ‘5U mass. The sensitivity of the integral of the autocorrelation functionto fissile mass was determined by dividing the slope of a linear fit to the data by the averagevalue of the integral of the autocorrelation fiction. This sensitivity coefficient is thederivative of the logarithm of the linear fit. The sensitivity coefficients for the integral of thedetector autocorrelation iimctions are approximately 0.06 per kg ‘5U.
A comparison of a source-detector cross-correlation function for the different mass castingsis shown in Fig. 6.3. The source-detector cross-correlation fiction is sensitiv~ to fissile massas evident in Fig. 6.3. The directly transmitted gamma rays are not very sensitive to the fissilemass because gamma ray attenuation is predominately due to atomic raetier than nuclear
21

1.00E-05
4
1.00E-07-
El+16.43 KG U-235
+ 15.9 KG lJ.235
-14.83 KG U-235* 13.97 KG U-235
20 30 40 50 60 70 80 90 100DELAY FOLLOWING DETECTOR 2 COUNT (NSEC)
Fig. 6.1. Detector autocorrelation function [2Q] for uranium metal castings.
Table 6.1. Integral of detector autocorrelation functions andfor annular uranium metal castings
sensitivity coei%cients
~5U mass (kg) Rzz R~~ R44 %s “
13.97 8.25E-02 8.36E-02 7.68E-02 7.64E-0214.83 8.70E-02 8.43E-02 8.09E-02 7.67E-02
15.90 9.17E-02 9.41E-02 8.47E-02 8.52E-02
16.43 9.59E-02 9.72E-02 8.83E-02 8.78E-02
Sensitivi@ 0.0580 0.0665 0.0538 0.0613Coefficient
‘Sensitivity coefficient is AR/Arn/~ where m is in kilograms and’~ is the average as afimction of mass.
22
——.——.—--— —— —-—- .———..—— .-. ..— —-— ——————- —

9.8E-02 -
9.6E42 -T w
9.4E.02 -
9.2E-02 -
9.OE-02-
8.8E472-,
8.6E.02 -,
8.4E-02-
8.2E-02 --
8.OE.02~
13.5 14.0 14.5 15.0 15.5 16.0 16.5 17.0
U-235 MA33 (KG)
Fig. 6.2. Integral of detector autocorrelation functiori [22]for uranium metal castings as a function of ‘SU mass.
1.00E-02
n+ 16.43 KG U235+ 15.9 KG U235
+ 14.63 KG LL235
* 13.97 KG U-235
o 10 20 30 40 50 60 70 347 w 100
DELAYED FOLLOWING CF-262 FIS610N (NSEC)
Fig. 6.3. Source-detector cross-correlation [1,2] for uranium metal castings.
23,.
. .. .. . - —-- -—— ‘--, -------- ..y, - --=—.,”. ,.

interactions and should not be sensitive to the enrichment. On the other hand the second peakis comprised mainly of transmitted, scattered, and fission produced neutrons that are sensitiveby increases for lag times greater than 20 ns. Below 20 ns, the second peak is dominateddirectly transmitted neutrons and secondary gamma rays that are not strongly dependent onfissile mass. All of the source-detector correlation fi.mctions exhibit the same behavior. Theintegrals of the source-detector correlation functions over time are given in Table 6.2. Theintegral of the source-detector correlation fiction changes approximately 12V0from 13.97 to16.43 kg of 235U.
Table 6.2. Integral of source-detector correlation functions and sensitivity coefilcientsfor annular uranium metal castings
235UMass (kg) R12 Rl~ Rld R1~13.97 1.57E-02 1.58E-02 1.42E-02 1.42E-02”14.83 1.60E-02 1.53E-02 1.43E-02 1.34E-0215.90 1.72E-02 1.77E-02 1.56E-02 1.57E-0216.43 1.79E-02 1.80E-02 1.61E-02 1.60E-02
Sensitivity 0.0549 0.0658 0.0555 0.0629Coefficient’
‘Sensitivity coefficient is AR/&n/R where m is in kilograms and R is the average as ailmction of mass.
A plot of the integral of one of the source-detector cross-correlation fimctions is given inFig. 6.4 and is a linear I?mction of 235Umass. The sensitivity of the integral of theautocorrelation function to fissile mass was determined by dividing the slope of a linear fit tothe data by the average value of the integral of the autocomelation fimction. This sensitivitycoefficient is the derivative of the logarithm of the linear fit. The sensitivity coefficients forthe integral of the detector autocorrelation functions are approximately 0.06. The source-detector correlation fimctions have essentially the same sensitivity as the detectorautocorrelation functions.
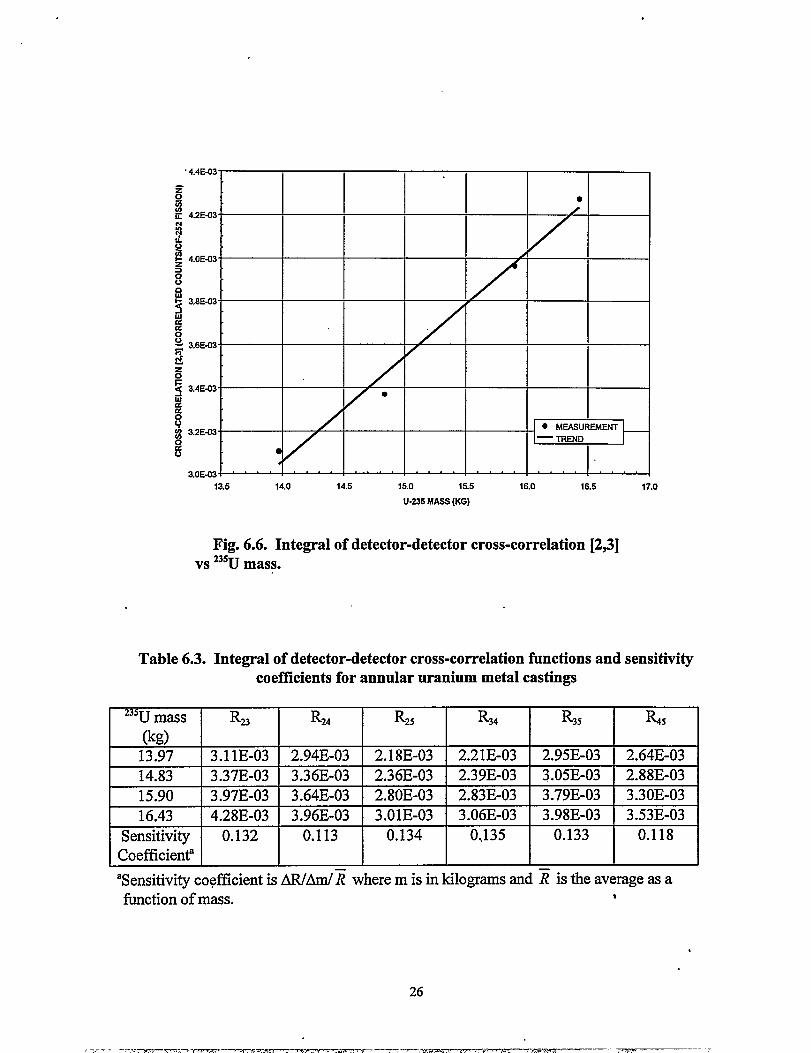
The detector-detector correlation fimctions are also sensitive to fissile mass as shown inFig. 6.5. The detector-detector correlation function values increase as fissile mass increases.This is due to the increase in fission in the system as fissile mass increases. The detector-detector correlation fi.mctions are symmetric as a fi.mction of time. The detector-detectorcorrelation functions were integrated over time and the results are presented in Table 6.3.The integral of the detector-detector cross-correlation fiction increases approximately 25%to 27V0 as the 235Umass increases from 13.97 to 16.43 kg. A plot of the integral ofthedetector-detector cross-correlation fimction is given in Fig. 6.6 and indicates that thisintegral varies linearly with fissile mass. The sensitivity coefficient for the integral of thedetector-detector correlation function as a fimction of mass is approximately 0.13 which istwice as large as the sensitivity for the detector autocorrelation and the source;detectorcorrelation.
24 I
7.- , -Y-,v=r— ,, ,.-,.mc.p~-. ,.., . . ,.= — .T, ,,
------ , -. -=,..
.- ——. — ... . —.. . I

I,85E-02
1.80E-02
1.75E.02
1.70E42
1.65E.02
1.EOE-02
1S5E-02
1.50E.02
13.5 14.0 14.5 15.0 15.5 16.0 16.5 17.0
U-235 MASS(KG)
Fig. 6.4. Integral of source-detector cross-correlation [1,2]as a function of 235U mass for uranium metal castings.
-100 -so -60 40 -20 0 20 40 60
DELAY FOLLOWING DETECTOR 2 COUNT (NSEC)
Detector-detector cross-correlation [23] for uranium
25
U+16.43 KG U-235
+ 15.9 KG U-235
+ 14.S3 KG U-235
+ 13.97 KG U-235
80 100
metal castings.
T13.5 14.0 14.5 15.0 15.5 16.0 16.5 17.0
U.235 MASS(KG)
Fig.6.6. Integral ofdetector-detector cross-correlationvs ‘5U mass.
[23]
Table6.3. Integral ofdetector-detectorcross-correlation functions andcoefllcients for annular uranium metal castings
sensitivity
(kg)13.97 3.llE-03 2.94E-03 2.18E-03 2.21E-03 2.95E-03 2.64E-0314.83 3.37E-03 3.36E-03 2.36E-03 2.39E-03 3.05E-03 2.88E-0315.90 3.97E-03 3.64E-03 2.80E-03 2.83E-03 3.79E-03 3.30E-03
16.43 4.28E-03 3.96E-03 3.OIE-03 3.06E-03 3.98E-03 3.53E-03
Sensitivity 0.132 0.113 0.134 0..135 0.133 0.118Coefficient’
aSensitivity coefficient is AR/Am/~ where misinkilogramsand~ istheaverage asafimction of mass. 1
26
, ... . . —-. . ---- . ... .m——. . . . ..—-- - —— . .
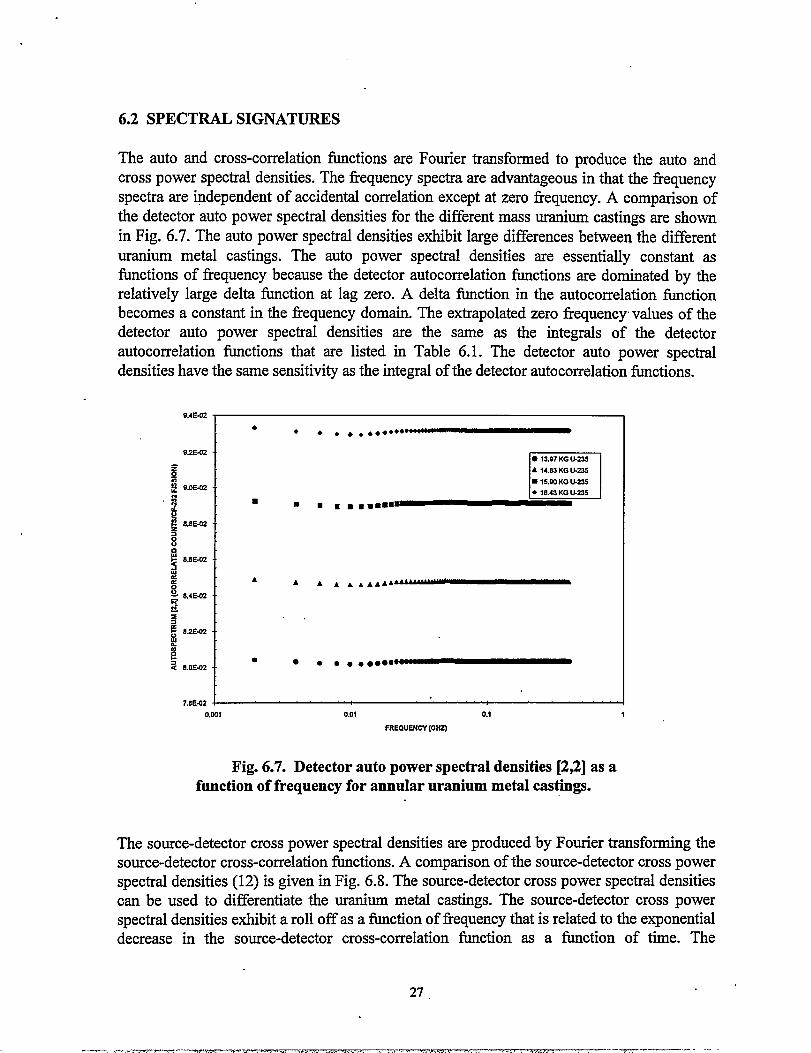
6.2 SPECTRAL SIGNATURES
The auto and cross-correlation fictions are Fourier transformed to produce the auto andcross power spectral densities. The frequency spectra are advantageous in that the frequencyspectra are independent of accidental correlation except at zero frequency. A comparison ofthe detector auto power spectral densities for the different mass uranium castings are shownin Fig. 6.7. The auto power spectral densities exhibit large differences between the differenturanium metal castings. The auto power spectral densities are essentially constant asfunctions of frequency because the detector autocorrelation fictions are dominated by therelatively large delta function at lag zero. A delta function in the autocorrelation fhnctionbecomes a constant in the frequency domain. The extrapolated zero frequency values of thedetector auto power spectral densities are the same as the integrals of the detectorautocorrelation fbnctions that are listed in Table 6.1. The detector auto power spectraldensities have the same sensitivity as the integral of the detector autocorrelation fimctions.
9.4E-02 I (
7.8E.02 +
r● 1S.97KG &23S
A 14.82 KG &22S
■ 15.S0KG 11-22S
● 16.U KG U-235
■ ■ m ■ mm=~~g
AA A A hAAA~
0.001 0.01 0.1 1FREQUENCY (Gt12)
Fig. 6.7. Detector auto power spectral densities [22] as afunction of frequency for annular uranium metal cast@gs.
The source-detector cross power spectral densities are produced by Fourier transforming thesource-detector cross-correlation fimctions. A comparison of the source-detector cross powerspectral densities (12) is given in Fig. 6.8. The source-detector cross power spectral densitiescan be used to differentiate the uranium metal castings. The source-detector cross powerspectral densities exhibit a roll off as a fimction of frequency that is related to the exponentialdecrease in the source-detector cross-correlation fimction as a function of time. The
27.
.—- .. . -.— —--. —--- . . . - - ———-—-. --- --

extrapolated zero frequency values of the source-detector cross power spectral densities arethe same as the integrals of the source-detector cross-correlation fhnctions that are listed inTable 6.2. The source-detector cross power spectral densities have the same sensitivity as theintegral of the source-detector cross-correlation functions.
1.8E-02 -
z~ 1.6E-02
“n
● 13.97 KG U-235
m 4 A 14.83 KG U-235
: m = 15.90 KG u.=
$ 1.4E-02 -. 4● ● .16.43KG U-235ma
%
E t::.Zj 1.2E-02 .00
b::eb:;.
p 1.OE-02 -:
6%&n.
sO 8.OE-03~q
$ 6.OE-03
g
~ 4.OE.03-
~z 2.OE.03-v
O.OE+W.O.cal 0.01 0.1
FREQUENCY(GNZ)
Fig. 6.8. Source-detector cross power spectral densities [14]a function of frequency for annular uranium metal castings.
1
as
The detector-detector cross power spectral densities are produced by Fourier transforming @edetector-detector cross-correlation functions. A comparison of the detector-detector crosspower spectral densities (23) is given in Fig. 6.9. The detector-detector cross power spectraldensities can be used to differentiate the uranium metal castings. The roll off as a fi.mction offrequency in the detector-detector cross power spectral densities is due to the exponentialdecrease in the detector-detector cross-correlation functions as a fiction of time. Theextrapolated zero frequency values of the detector-detector cross power spectral densities arethe same as the integrals of the detector-detector cross-correlation fi.mctions that are listed inTable 6.3. The detector-detector cross power spectral densities have the same sensitivity asthe integral of the detector-detector cross-correlation fimctions.
28
----- --—. ,.- —- .—.-———...--a-,~ ....- — ..T ---- , T- ,.. ___ . . -TT.----—— -

t
A
●A
●
A
●
AA
● A●
●
n● 13.97 KG U-23SA 14.33 KG U-23S■ 15.S0 KG U-235
+ 16.43 KGU-225●
0.001 0.01 0.1 1
FREQUENCY(GHZ)
Fig. 6.9. Detector-detector cross power spectral densities [23]as a function of frequency for annular uranium metal castings.
Additional frequency spectra are generated from the auto and cross power spectral densities.The coherence is defined as the fraction of common information between two signals. Thecoherence is expressed mathematically as ~ij = lGfi12/GfiGiwhere GU is the cross powerspectral densities between signals i and j and Giiand Gj are the auto power spectral densitiesof signals i and j. Source-detector coherence values and detector-detector coherence valueswere calculated from the auto and cross power spectral densities. A comparison of thesource-detector coherence fimction (12) is given in Fig. 6.10. The source-detector coherencefunctions can be used to differentiate the uranium metal castings. The extrapolated lowfrequency values of the source-detector coherence values are given in Table 6.4 and plottedas a function of ‘5U mass in Fig. 6.11. The coherence values for the 14.83 kg ‘5U castingdeviates from the others. The sensitivity coefficient for the source-detector coherencefimctions is approximately 0.06. The coherence values are sensitive to background.
.. - ---- . . . ... . .-r-p— . > ,xT —--- .--m.-. ., - ,,

2.5E.113
2.0EU3
1.OE-03
5.0E44
O.OE+OO
n● 13.97KGU-235● A 14.@3KGU-235■ ■ 15.92KGU-235
f● 16.43KGU-235
●
0.001 0.01 0.1 1
FREQUEHCY(GHZ)
Fig. 6.10. Source-detector coherence [12] as a function of frequency for‘ annular uranium metal castings of varying enrichment of ‘5U mass.
Table 6.4. Extrapolated low-frequency source-detector coherence values forannular uranium metal castings
235Umass (kg) r,, I“*3 fM ?,5
13.97 2.99E-03 . 2.98E-03 2.62E-03 2.62E-03’14.83 2.93E-03 2.77E-03 2.53E-03 2.33E-0315.90 3.22E-03 3.31E-03 2.87E-03 2.88E-0316.43 3.34E-03 3.35E-03 2.94E-03 2.90E-03
Sensitivity 0.0509 0.0642 0.0563 0.0634Coefficient?
— —‘Sensitivity coefficient is AR/Am/R where m is in kilograms and R is the average as afhnction of mass.
30
-~-m-wr— ,, .,.., -,--72 ..... . . r.. -. .. ., . .. ..*.. ., -——

.
The detector-detector coherence fhnctions were calculated from the detector-detector crosspower spectral densities and detector auto power spectral densities. The detector-detectorcoherence function (23) for the different castings is plotted in Fig. 6.12. The detector-detectorcoherence”functions exhibit a linear trend as a fimction of fissile mass as shown in Fig. 6.13.The extrapolated low 12equencyvalues of the detector-detector coherence values are given inTable 6.5. The sensitivity coefficient for the source-detector coherence fimctions isapproximately O.13.
Fig. 6.11.
3.40E-03 -
3.33E413- ●
3.30EU3 -“
3.25E.CG-,
3.2UEU3-
3.15EU3 -,
3.IOE.CG-
3.05EJJ3-,
3.WE-CG-
295E.U3 -●
429JE-03 -
ZS5EU3 v13.5 14.0 14.5 15.0 15.5 16.0 10.5 17.0
U-236MASS(KG)
Source-detector coherence [14] vs ‘5U mass of annular metal castings.
31
. ----- . . --c. >T-.—, - .—— . .-. _ ,.. ,.-5 T-7,mr —- —-v . -?T7cr-Tz?, ~. - ,, .. ,Ii.,, . . .r.

Table 6.5. Extrapolated low-frequency coherence values forannular uranium metal cylinders
23SUmass ?23 ?24 IL ?34 l’% ?45
(kg)13.97 1.40E-03 1.36E-03 7.54E-04 7.62E-04 1.36E-03 1.18E-03
14.83 1.55E-03 1.60E-03 8.33E-04 8.41E-04 1.44E-03 1.34E-03
15.90 1.82E-03 1.70E-03 1.00E-03 1.OIE-03 1.79E-03 1.50E-03
16.43 1.96E-03 1.85E-03 1.08E-03 1.09E-03 1.86E-03 1.61E-03
Sensitivity 0.138 0.113 0.148 0.148 0.137 0.120Coefilcient’
‘Sensitivity coefllcient is AFUArn/~ where m is in kilograms and ~ is the average as afimction of mass.
1.8E.03
1.6E-03
1.4EU3
12E.03
s’~~ l.OE~uzwa+ 8.oE-04
86.OE.04
4.oE-Oi
2.OE-C4
O.OE+W
● E● 13.97KGU-235A 14.83 KG U-235
m●
m 15.W KG U-235
● 16.43 KG U-2359+
A me
● Am*
A●
8*
● A~..An
.A;
.A ;
● A ●
● A%●Ame
0.001 0.01 0.1 1.
FREQUENCY(GHZj
Fig. 6.12. Detector-detector coherence function [23] foruranium metal castings.
.
32
-- * .-,-7,- .7-?7(?-. ”-7-- --z.v-ro,.?- rvw, ..--.? ..T,-. ,r -T--- <\ .*,. ,,,--7 ,,y..-.my, . . . , .,&.+- .R—-- --- - .,

20E-03 -
●
1,9E.03-
1.8E-03-,
1.7E-03-w&u
; 1.6E-U3- /$
;1.5E-03.
1.4E-03-4 r
1.3E-m -
13.5 14.0 14.s 15.0 15.5 l&o 16.5 17.0
U-235MASS(KG)
Fig. 6.13. Extrapolated low-frequency detector-detector coherence[23] vs “U mass for uranium metal casting.
.
6.3 COUNT PROBABILITY DISTR@UTION FUNCTION
The count probability distribution fimction is determined from the detection events per block.The distribution is determined by measuring the number of times n counts occur in a block ofdata in each detector. The total number of detection events for all detectors for each datablock is also collected. The block of data consists of 512 time intervals that are 1 ns wide.The count probability distribution values for the combined detector responses for thedifferent annular uranium metal castings are listed in Table 6.6. As expected the probabilityfor zero detector counts decreases as the mass increase because the average counts per blockincreases as mass increases. The probability of 1, 2, 3, etc. counts per block increases as thefissile mass increases. The difference between the probability of obtaining six counts variesmore than a factor of two for an enrichment change from 80 to 93.15V0which corresponds toamass change from 13.97 to 16.43 kg of ‘5U.
33 I
--- -m- , ----------- -.’—. -m.. -—— . . . . . . ,-, . . . . . . . .. ...’--- .-,.y — .- . . I

Table 6.6. Measured count probabili& distribution values andaverage counts perblock for annular uranium metal castings
count ‘“U mass (kg)number
13.97 14.83 15.90 16.430 9.375E-Ola 9.359E-01 9.312E-01 9.289E-011 5.762E-02 5.898E-02 6.283E-02 6.474E-022 4.431E-03 4.703E-03 5.372E-03 5.706E-033 3.713E-04 4. 157E-04 5.074E-04 5.587E-04
‘4 3.052E-05 3.673E-05 4.840E-05 5.51OE-O55 2.503E-06 3.135E-06 4.501E-06 5.299E-066 2.130E-07 3.040E-07 4.600E-07 5.660E-07
‘Obtained from the sum of all four detectors.
The moments of the counts per block are presented in Table 6.7. The combined detectorcounts per block increase as the Ilssile mass increases. The average rate per block increasesapproximately 13°A for a mass increase from 13.97 kg to 16.43 kg ‘“U. However, thesensitivity coefficient for the average counts per block is approximately 0.06 and isessentially the same as the detector autocorrelation functions. The sensitivity coefficients forthe detector count moments increases as the order of the moments increases.
Table 6.7. Count moments and sensitivity coefficients forannular uranium metal castings
235Umass (kg) counts counts 2 counts 3 counts 413.97 0.068 0.079 0.105 0.168
14.83 0.070 0.082 0.111 0.180
15.90 0.075 ~ 0.090 0.123 0.206
16.43 0.078 0.094 0.130 0.219
Sensitivity 0.059 0.069 0.086 0.110Coefficient’
‘Sensitivity coefficient is AR/Am/~ where m is in kilograms and ~ is the average as afimction of mass.
The higher moments for the detector counts are due to the induced fission in the system. Thisis demonstrated by subtracting the value of the distribution obtained from a strictly Poissondistribution with the same average counts per block. The difference between the measured
34
,.,.=, .—-.-....,. ,. -mm ,. ., . ., -., m-.-s ,- —-. ——---=,=- ,., > . . . .. . . . ,=.. ..- ————— -...-, ——— -

distribution and the Poisson distribution is given in Table 6.8. As expected, the Poissondistribution has a higher probability of zero events than the measured distribution while themeasured distribution has higher probabilities than the Poisson distribution for events greaterthan zero.
Table 6.8. Difference beWeenmeasured count probabili@ distibutionvaluesand Poisson-distributed values
count I 235Umass (kg)number
13.97 I 14.83 I 15.90 I 16.43
0 -6.23E-02 -6.40E-02 -6.86E-02 -7.09E-02
1 5.75E-02 5.88E-02 6.27E-02 6.46E-02
2 4.43E-03 4.70E-03 5.37E-03 5.71E-03
3 3.71E-04 4.16E-04 5.07E-04 5.59E-04
4 3.05E-05 3.67E-05 4.84E-05 5.51E-05
5 2.50E-06 3.14E-06 4.50E-06 5.30E-066 2.13E-07 3.04E-07 4.60E-07 5.66E-07
35
.,... !, . T+r- 7 -T-T 7--- ---- . .- F?iT7-rT.Y-T-n=m, -.7Y 7 -– .- ... ., KT?7L- . . J .,,- . ,... L,..-— ,- ——

70 SUMMARY
These measurements have demonstrated the sensitivity of several of the measured parametersobtained from the source-driven noise analysis measurement. This measurement method canbe used to quanti@ the amount of fissile material for uranium casting components. Thedetector auto power spectral densities, the source-detector cross power spectral densities, andthe detector-detector cross power spectral densities can be related directly to fissile mass. Thedetector-detector cross power spectral densities are a factor of two more sensitive to fissilemass than the detector auto power spectral densities or the source-detector cross power “spectral densities. The frequency spectra also have increased sensitivity over the moments ofthe count distributions. These measurements were with a very limited number of uraniummetal castings and were the first attempt to evaluate this as a method for NDA of the standardY-12 uranium metal casting. Additional meastiements should be periiormed to evaluate the -capability of this NWIS methodology for conventional NDA. Additional measurements canbe used to obtain calibration curves and to optimize the measurement configuration forhighest sensitivity.
Improved measurement methods with NWIS employing higher order statistics with highersensitivities to ‘5U mass have been developed and evaluated theoretically.13 The theoreticalanalysis has confhned the higher sensitivity to mass and measurements should be performedwith these castings using these higher order statistics with their enhanced sensitivity to fissilemass. These higher order correlation measurements with their increased sensitivity to fissilemass should be more useful for quantification of the mass of fissile materials.
36
-- ,- .- ---3=. -..— - . .x-..77Y!T.3!TrTr ,.-= -T-7-- -.-,... ..=-., ... ,, ..—,%.!. . ..>.’,——- .
8. REFERENCES
1. J. T. Mihalczo, V. K. Par6, G. L. Ragan, M. V. Mathis, and G. C. Tillett, “Determinationof Reactivity from Power Spectral Density Measurements with Californium-252,” Nucl.Sci. Eng., 66,29-59 (1978).
2. J. T. Mihalczo and T. E. Valentine, “Calculational Verification and Process ControlApplications Utilizing the High Sensitivity of Noise Measurement Parameters to FissileSystem Conf@ration,” Nucl. Sci. Eng., 121,286-300 (1995).
3. T. E. Valentine, J. T. Mihalczo, and P. E. Koehler, “Calculated NWIS Signatures forEnriched Uranium Metal;’ Proceedings of the 36th. Annual Meeting of Institute ofNuclear Materials Management, Palm Desert, Californi% Vol. XXIV, 388-393 (1995).
4. J. E. Breeding, J. A. Mullens, G. W. Turner, T. E. Valentine, J. A. McEvers,J. T. Mihalczo, and T. A. Gafford, “New NWIS Processor For Fissile System.Verification,” Institute of Nuclear Materials Management Meeting, Phoenix, Arizon%July 20-24,1997.
5. J. T. Mihalczo, “The Use of 252Cfas a Randomly Pulsed Neutron Source for PromptNeutron Decay Measurements’ Nucl. Sci. Eng., 41,296 (1970).
6. J. D. Orndoff, “Prompt Neutron Periods of Metal Critical Assemblies,” Nuclear Scienceand Engineering, Vol. 2, p. 450, 1957.
7. M. J. PaulUs, J. T. Mihalczo, T. E. Valentine, J. A. Mullens, J. E. Breeding, T. Uckan,J. K. Mattingly, G. Turner, M. C. Smith, and J. A. McEvers, “A Novel Method forDetermining Pulse Counting Circuitry Dead Time Using the Nuclear WeaponsInspection System,” Nuclear Science Symposium (1997).
8. J. T. Mihalczo, V. K. Par6, E. D. Blakeman, B. Damiano, T. E. Valentine, L. D. Phillips,R. B. Bonner, D. B. Bopp, T. R. Chilcoat, J. DeClue, E. P: Elliott, G. D. Hackett,N. W. Hill, D. J. Nypaver, L. H. Thacker, W. T. Thomas, J. A. Williams, and .R. E. Zumstein, “NWIS Signatures for Confirmatory Measurements with B33 Trainers,”Journal ofNuclear Materials Management Vol. 25,3,64-80 (June 1997).
9. J. T. Mihalczo, “New Method for Meas~ement of the Effective Fraction of DelayedNeutrons from Fission~’ Nucl. Sci. Eng., 46,147 (1971).
10. J. T. Mihalczo, W. T. King, and E. D. BIakem~ “Subcriticality Measurements forCoupled Uranium Metal Cylinders Using the 252Cf-Source-DrivenNeutron NoiseAnalysis Method; Nucl. Sci. Eng., 95,1-13 (1987).

11. T. E. Valentine, J. T. Mihalczo, and J. A. Mullens, “NWIS Signatures For Identificationof Weapons Components at the Oak Ridge Y-12 Plant,” Institute of Nuclear MaterialsManagement Meeting, Phoenix, Arizon~ July 20-24,1997.
12. M. M. Chiles, J. T. Mihalczo, and C. E. Fowler, “Small, Annular, Double-Contained252CfFission Chamber for Source-Driven Subcriticality Measurements:’ Institute ofElectrical and Electronics Engineers Nuclear Science Symposium, Orlando, Florid%October 27-31,1992, LEEE Trans. Nucl. Sci., 40,816-18 (1993).
13. J. K. Mattingly, “High Order Statistical Signatures fiorn Source-Driven Measurements ofSubcritical Fissile Systems~’ Y/LB-15,966, R2, doctoral dissertdion, University ofTennessee, Knoxville, May 1998.
\
38
..— —.= ..- ....., >,m-, *,. . . . “>..+.TL--e, -,,.+— —--=%-, . . . . . ,,,.. . .. . . ---
— .- .—

Distribution:
Recipients as designated by the author plus:
Y-12 Plant Records Services (3) 9711-5, MS-8169[Includes 2 copies for.OSTI and 1 copy for Central Files]
Note: Zkis distribution page should not be included in the copy of your document(abstract, visuals, article, etc.) submitted to ajournal or technical society.
my-——— .,.,-,V. . . . . . ~-m.~v -.isJr-zm.T<-,7.7 -,: --.x?= -.7---- . ..T.V.-.-,W ., -T.—- -.32-, I