Embed Size (px)
Citation preview

MCCULLOUGH RESEARCH
ROBERT F. MCCULLOUGH, JR.
PRINCIPAL
6123 REED COLLEGE PLACE ● PORTLAND ● OREGON ● 97202 ● 503-777-4616 ● [email protected]
Date: February 15, 2017 To: McCullough Research Clients From: Robert McCullough Jacob Gellman Charles Noble Xian Ng Ted Sand Subject: Replacing the Columbia Generating Station with Renewable Energy Abstract: This report estimates the savings to Northwest ratepayers by permanently
closing the Columbia Generating Station (CGS) nuclear power plant and re-placing it with wind and solar energy, for which prices have dramatically fallen. The net present value benefit of replacing CGS with renewable re-sources is estimated to be between $261.2 million and $530.7 million over the period March 2017 through June 2026.
In June 2016, it was reported that the 2,200 MW Diablo Canyon nuclear plant, located in Southern California, will close both its units by 2025. A major factor for Pacific Gas & Elec-tric’s (PG&E) agreement to this decision is the economics of the aging plant: the operating costs associated with nuclear power are simply too high compared with the low market cost of electricity. The announced closure of these two units will leave one nuclear plant on the West Coast. In the Pacific Northwest, approximately 200 miles from Seattle and Portland, the Columbia Gen-erating Station (CGS) nuclear plant provides the Bonneville Power Administration (BPA) with the most expensive power in its generation portfolio. Since 2008, the plant has had operating and incremental costs far above market alternatives. In 2013, McCullough Research published a 216-page study recommending the replacement of the aging CGS with less expensive market supplies.1 In turn, Energy Northwest, the operator of CGS, commissioned a study arguing that if natural gas prices rose to $5.30/mmbtu, CGS
1 McCullough, Robert, et al. “Economic Analysis of the Columbia Generating Station.” McCullough Re-search. December 2013. <http://www.mresearch.com/pdfs/541.pdf>.

MCCULLOUGH RESEARCH
Replacing the Columbia Generating Station with Renewable Energy February 15, 2017 Page 2 ________________
would appear cost effective compared to new natural gas plants.2 There was little support for such a high natural gas price forecast. Instead, natural gas prices continued to decline as the worldwide surplus expanded. Prices did not exceed $3.00/mmbtu between January 2015 and November 2016.3 At the time, the recommendation of McCullough Research was for BPA to issue a Request for Proposals (RFP) to replace CGS, within the existing BPA contract, with lower-priced re-sources.4 The case for issuing an RFP is even stronger today, as CGS costs have increased. Further, the widely-publicized decline in solar and wind prices now makes it probable that CGS could be replaced entirely with renewable resources and still deliver a cost reduction to Pacific Northwest customers. Once thought to be too expensive, renewables are becoming a viable option for utilities, as demonstrated by the recent decision in California to replace Dia-blo Canyon Nuclear Station’s output with renewables. Experience in integrating these variable resources has grown.5 Indeed, as renewable energy standards in the Pacific Northwest, California, and other Western states require additional variable resources, inflexible baseload plants, including nuclear and coal plants, will become increasingly problematic. Renewable portfolio standards (RPS) have mandated increases in utilities’ mix of renewable resources. Oregon’s Renewable Energy Act of 2007, which estab-lished its RPS, was updated in 2016 to require 50% of generation from renewables by 2040.6 Washington passed its RPS, Initiative 937, by ballot in 2006. It requires utilities serving more than 25,000 customers to generate at least 15% of their energy from renewables by 2020.7 California’s RPS mandates 50% renewable energy by 2030. Both Oregon and California have increased the initially legislated standards over time. Using renewable energy cost estimates from the financial advisory firm Lazard, and comparing them against Energy Northwest’s own projected cost of power, the net present value benefit
2 IHS CERA. “Columbia Generating Station: Economic assessment.” Prepared for Energy Northwest. No-vember 2013. Accessed December 20, 2016. <https://www.energy-northwest.com/ourenergyprojects/Co-lumbia/Documents/Energy%20Northwest_FINAL.PDF>. See pages 9 and 12. 3 U.S. Energy Information Administration (EIA). “Henry Hub Natural Gas Spot Price.” Accessed January 20, 2016. <https://www.eia.gov/dnav/ng/hist/rngwhhdM.htm>. 4 McCullough, Robert, et al. “Economic Analysis of the Columbia Generating Station.” McCullough Re-search. December 2013. <http://www.mresearch.com/pdfs/541.pdf>. See page 7. 5 Lazar, Jim. “Teaching the ‘Duck’ to Fly, Second Edition.” The Regulatory Assistance Project. February 2016. Accessed December 20, 2016. <http://www.raponline.org/wp-content/uploads/2016/05/rap-lazar-teachingtheduck2-2016-feb-2.pdf>. 6 This applies to investor-owned utilities, municipal utilities, cooperative utilities, and retail suppliers. See: Da-tabase of State Incentives for Renewable Energy (DSIRE). “Renewable Portfolio Standard: Oregon”. June 7, 2016. Accessed December 20, 2016. <http://programs.dsireusa.org/system/program/detail/2594>. 7 Database of State Incentives for Renewable Energy (DSIRE). “Renewable Portfolio Standard: Washington”. November 19, 2015. Accessed December 20, 2016. <http://programs.dsireusa.org/system/program/de-tail/2350>.

MCCULLOUGH RESEARCH
Replacing the Columbia Generating Station with Renewable Energy February 15, 2017 Page 3 ________________
of replacing CGS with a solar and wind portfolio is estimated to be $261.2 million over the period March 2017 through June 2026.8,9,10 This is a conservative estimate, as the benefit could be significantly higher. Since 2007, CGS’s actual cost of power has been 19.2% higher than the projections set out in Energy Northwest Long Range Plans; when accounting for this discrepancy, the net present value benefit of replacing CGS with solar and wind power could be as high as $530.7 million for the same period. See Figure 1. Based on Energy Northwest’s own Long Range Plans, the future operating costs at CGS will continue to exceed both market prices and various projected solar and wind prices.11,12 The relationship between Energy Northwest’s Long Range Plans and forecasted cost of wind and solar resources is illustrated in Figure 1, including a CGS cost forecast adjusted for historical underestimates of Energy Northwest costs.
8 Lazard. “Levelized Cost of Energy Analysis – Version 10.0.” December 15, 2016. Accessed December 20, 2016. <https://www.lazard.com/media/438038/levelized-cost-of-energy-v100.pdf>. This calculation uses the median cost, with federal tax credits, for utility-scale solar and onshore wind, at $42.50 and $31/MWh, re-spectively. See page 4 of the Lazard report. Integration costs of $3.75/MWh and $1.13/MWh for wind and solar, respectively, are added. Lazard’s numbers reflect real levelization – the operating and financing costs of the project increase with inflation. 9 Energy Northwest. “Finance and Long-Range Planning.” Accessed December 20, 2016. <https://www.en-ergy-northwest.com/whoweare/finance/Pages/default.aspx>. 10 The assumed discount rate for this calculation is 13%. This is the discount rate that Bonneville Power Ad-ministration (BPA) uses for power investments. This is a conservative discount rate; a higher discount rate fa-vors Energy Northwest. See: BPA. “FOIA #BPA-2015-01602-F.” Freedom of Information Act (FOIA) re-quest, Rose Anderson, Research Associate, McCullough Research. October 19, 2015. Accessed December 20, 2016. <https://www.bpa.gov/news/FOIA/2015/15-01602/BPA-2015-01602-FResponse.pdf>. 11 Energy Northwest. “Finance and Long-Range Planning.” Accessed February 7, 2017. <https://www.en-ergy-northwest.com/whoweare/finance/Pages/default.aspx>. At the time of writing, this is the most recent finalized Long Range Plan, as the 2017 Long Range Plan is listed in draft format. 12 Lazard. “Levelized Cost of Energy Analysis – Version 10.0.” December 15, 2016. Accessed December 20, 2016. <https://www.lazard.com/media/438038/levelized-cost-of-energy-v100.pdf>. See page 4.

MCCULLOUGH RESEARCH
Replacing the Columbia Generating Station with Renewable Energy February 15, 2017 Page 4 ________________
Figure 1: CGS Long Range Plan Compared to Renewables Prices
In light of this changing landscape, this report assesses CGS’s place on the Pacific Northwest grid, finding it would be cost-effective to replace CGS with carbon-free energy. Unlike past analyses, this report finds that additional natural gas generation is not necessary in a replace-ment scenario, given that strategies to manage load shaping have improved. Nor is a reliance on the spot market necessary, as long-term resources can be acquired to serve firm loads. Other agencies have identified a variety of cost-effective solutions; the Northwest Power and Conservation Council’s Seventh Power Plan suggests that the least cost, least risk alternatives for meeting the region’s needs are combinations of load control and energy efficiency.13 Our review indicates that CGS could be closed as soon as the planned refueling outage in May 2017, at significant savings to Northwest ratepayers. If it is believed that CGS’s power must be replaced to maintain resource adequacy, we suggest that BPA issue an RFP to assess whether Energy Northwest can replace CGS with carbon-free resources, beginning as early as the refueling outage in May 2019. Under the current BPA rate case, CGS’s generation is pri-marily designated for public power. By replacing CGS with less expensive resources within the existing contract, the benefits would primarily flow to public power.
13 Northwest Power and Conservation Council. “Seventh Power Plan.” February 25, 2016. Accessed Decem-ber 20, 2016. <https://www.nwcouncil.org/energy/powerplan/7/plan/>.
$25.00
$30.00
$35.00
$40.00
$45.00
$50.00
$55.00
$60.00
$65.00
Mar
-17
Jul-
17
No
v-1
7
Mar
-18
Jul-
18
No
v-1
8
Mar
-19
Jul-
19
No
v-1
9
Mar
-20
Jul-
20
No
v-2
0
Mar
-21
Jul-
21
No
v-2
1
Mar
-22
Jul-
22
No
v-2
2
Mar
-23
Jul-
23
No
v-2
3
Mar
-24
Jul-
24
No
v-2
4
Mar
-25
Jul-
25
No
v-2
5
Mar
-26
Do
llars
Per
Meg
awat
t-H
our
(2016 d
olla
rs)
Fiscal Year 2016 Columbia Generating Station Long Range Plan
Fiscal Year 2016 Columbia Generating Station Long Range Plan Adjusted For Past Experience
Onshore Wind Median With Tax Credits and Integration
Utility Scale Solar Median With Tax Credits and Integration

MCCULLOUGH RESEARCH
Replacing the Columbia Generating Station with Renewable Energy February 15, 2017 Page 5 ________________
Contents I. The Falling Cost of Renewables .......................................................................................... 7
A. Developments in Utility-Scale Solar ............................................................................... 10
B. Developments in Onshore Wind .................................................................................... 13
II. CGS: Generation, Planned Outages, Forced Outages .................................................... 15
A. CGS Operating Costs vs. Market Prices ........................................................................ 18
B. Life Expectancy of the Columbia Generating Station ................................................. 23
III. CGS Costs Compared to Solar and Wind ........................................................................ 25
IV. Integration of Renewables .................................................................................................. 27
A. Capacity Contribution ....................................................................................................... 27
B. Load Shape ......................................................................................................................... 32
C. Renewable Resource Quality ........................................................................................... 38
V. Conclusion 41
Appendix A. Life expectancy of the Columbia Generating Station ........................................... 43
Figures Figure 1: CGS Long Range Plan Compared to Projected Renewables Prices ............................ 4 Figure 2: Indexed Cost Reductions Since 2008 ............................................................................... 7 Figure 3: NREL Comparison of Lazard, EIA, and NREL LCOE .............................................. 9 Figure 4: Levelized Cost of Energy for Solar (Lazard Historical Estimates) ............................ 12 Figure 5: Levelized Cost of Energy for Wind (Lazard Historical Estimates) ........................... 14 Figure 6: CGS Daily Generation ...................................................................................................... 16 Figure 7: Percent of DCPP Generation Needed by PG&E’s Utility Bundled Customers in Each Hour in 2030: Reference Case ............................................................................................... 17 Figure 8: U.S. Market Hubs .............................................................................................................. 19 Figure 9: CGS Cost of Power Compared to Mid-C Market Price .............................................. 20 Figure 10: CGS Long Range Plan Compared to Forward Market Prices .................................. 22 Figure 11: CGS Projected Costs Compared to NW Council Mid-C Projections ..................... 23 Figure 12: CGS Costs versus LCOE of Wind and Solar ............................................................. 27 Figure 13: Milligan Presentation on WECC Rule of Thumb for Renewable Capacity Value 28 Figure 14: PacifiCorp Study of Wind and Solar Capacity Contribution .................................... 29 Figure 15: NERC Forecast on NWPP Peak Season Demand, Resources, and Reserve Mar-gins ....................................................................................................................................................... 30 Figure 16: PNUCC Northwest Region Requirements and Resources – Winter Peak ............. 31 Figure 17: BPA Generation and Load, July 6-12, 2015 ................................................................ 33 Figure 18: Portland General Electric Slide on Loss of Load Expectation (LOLE) for Year 2021 ...................................................................................................................................................... 35 Figure 19: PacifiCorp Resource Capacity Factors Compared to Loss of Load Probability (LOLP) ................................................................................................................................................ 36
MCCULLOUGH RESEARCH
Replacing the Columbia Generating Station with Renewable Energy February 15, 2017 Page 6 ________________
Figure 20: Montana Wind Generation, 2013-2015 ....................................................................... 37 Figure 21: WECC Renewable Generation: Nameplate Capacity and Standard Deviation of Energy Generation ............................................................................................................................. 37 Figure 22: Annual Average Wind Speeds at 80-meter Height for WA, OR, MT, and ID ...... 38 Figure 23: Pacific Northwest Solar Resource Quality .................................................................. 40 Figure 24: BPA Transmission Service Requests by Technology................................................. 41 Figure 25: Age Distribution of the World’s Nuclear Reactors .................................................... 45 Figure 26: Reasons for Nuclear Plant Closures ............................................................................. 46 Figure 27: Nuclear Plant Chance of Closure by Age .................................................................... 47
Tables Table 1: Lazard LCOE for Selected Renewable and Conventional Generation ........................ 8 Table 2: Lazard Overnight Capital Cost for Installation of Conventional and Renewable En-ergy Sources ........................................................................................................................................ 10 Table 3: Expected Lifespan of a Nuclear Plant ............................................................................. 24 Table 4: Pacific Northwest Thermal Generators by Age, Larger than 50 MW ........................ 25 Table 5: Recent and Announced Nuclear Plant Closures ............................................................ 44 Table 6: Demographic Table for World’s Nuclear Reactors ....................................................... 47 Table 7: Expected Lifespan of a Nuclear Plant ............................................................................. 48
MCCULLOUGH RESEARCH
Replacing the Columbia Generating Station with Renewable Energy February 15, 2017 Page 7 ________________
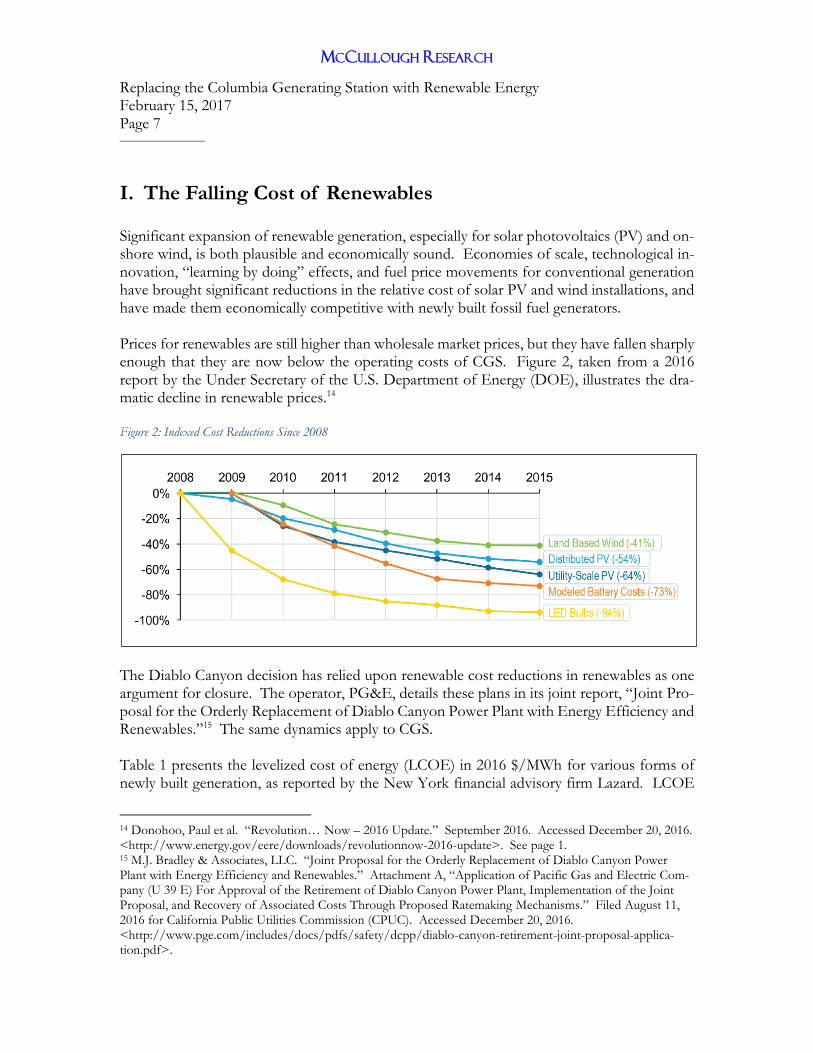
I. The Falling Cost of Renewables Significant expansion of renewable generation, especially for solar photovoltaics (PV) and on-shore wind, is both plausible and economically sound. Economies of scale, technological in-novation, “learning by doing” effects, and fuel price movements for conventional generation have brought significant reductions in the relative cost of solar PV and wind installations, and have made them economically competitive with newly built fossil fuel generators. Prices for renewables are still higher than wholesale market prices, but they have fallen sharply enough that they are now below the operating costs of CGS. Figure 2, taken from a 2016 report by the Under Secretary of the U.S. Department of Energy (DOE), illustrates the dra-matic decline in renewable prices.14 Figure 2: Indexed Cost Reductions Since 2008
The Diablo Canyon decision has relied upon renewable cost reductions in renewables as one argument for closure. The operator, PG&E, details these plans in its joint report, “Joint Pro-posal for the Orderly Replacement of Diablo Canyon Power Plant with Energy Efficiency and Renewables.”15 The same dynamics apply to CGS. Table 1 presents the levelized cost of energy (LCOE) in 2016 $/MWh for various forms of newly built generation, as reported by the New York financial advisory firm Lazard. LCOE
14 Donohoo, Paul et al. “Revolution… Now – 2016 Update.” September 2016. Accessed December 20, 2016. <http://www.energy.gov/eere/downloads/revolutionnow-2016-update>. See page 1. 15 M.J. Bradley & Associates, LLC. “Joint Proposal for the Orderly Replacement of Diablo Canyon Power Plant with Energy Efficiency and Renewables.” Attachment A, “Application of Pacific Gas and Electric Com-pany (U 39 E) For Approval of the Retirement of Diablo Canyon Power Plant, Implementation of the Joint Proposal, and Recovery of Associated Costs Through Proposed Ratemaking Mechanisms.” Filed August 11, 2016 for California Public Utilities Commission (CPUC). Accessed December 20, 2016. <http://www.pge.com/includes/docs/pdfs/safety/dcpp/diablo-canyon-retirement-joint-proposal-applica-tion.pdf>.

MCCULLOUGH RESEARCH
Replacing the Columbia Generating Station with Renewable Energy February 15, 2017 Page 8 ________________
compares the cost of new generating resources over the financial and technological lifetime of the project, averaged on a per MWh basis. Table 1: Lazard LCOE for Selected Renewable and Conventional Generation
Technology LCOE, 2016 $/MWh16
Utility-Scale Solar PV (crystalline) $39.00-49.00
Utility-Scale Solar PV (thin film) $36.00-44.00
Onshore Wind $14.00-48.00
Nuclear $97.00-136.00
Gas Combined Cycle $48.00-78.00
Coal $60.00-143.00
The drop in renewables costs has largely been due to economies of scale. The Joint Institute for Strategic Energy Analysis, a partnership between the U.S. DOE and several academic in-stitutions, comments that renewable generation technologies “have zero fuel costs and rela-tively small variable operation and maintenance costs, so their LCOEs are roughly propor-tionate to estimated capital costs and the cost of financing.”17 The estimates are thus suggestive for renewable energy in the Pacific Northwest, since capital costs largely do not vary by location and can be purchased on the global market. For renew-ables, the key LCOE input that varies nationally is the capacity factor, which is based on re-gional resource quality. 18 Lazard’s LCOE for utility-scale solar assumes between 21% and 32% capacity factor, while the onshore wind estimates assume 38% to 55% capacity factor. In its Seventh Power Plan, the Northwest Power and Conservation Council assumes 32% and 40% capacity factor for wind in the Columbia Basin and in Montana, respectively.19 Solar capacity factor is assumed at 26% in Southern Idaho and 19% in Western Washington. Port-land General Electric, in its 2016 Integrated Resource Plan (IRP), models solar with a 24%
16 Lazard. “Levelized Cost of Energy Analysis – Version 10.0.” December 15, 2016. Accessed December 20, 2016. <https://www.lazard.com/media/438038/levelized-cost-of-energy-v100.pdf>. See page 2 for unsubsi-dized estimates and page 4 for values including federal tax subsidies. 17 Stark, Camila et al. “Renewable Electricity: Insights for the Coming Decade.” Joint Institute for Strategic Energy Analysis. February 2015. Accessed December 20, 2016. <http://www.nrel.gov/docs/fy15osti/63604.pdf>. 18 Within the region, other location-based costs include siting, licensing, and transmission. If CGS were termi-nated there could be a significant reduction in transmission-related costs for new renewables, especially if paired with increased energy efficiency measures that would reduce the strain of existing transmission. 19 Northwest Power and Conservation Council. “Seventh Power Plan.” February 25, 2016. Accessed Decem-ber 20, 2016. <https://www.nwcouncil.org/energy/powerplan/7/plan/>. See Appendix H, pages H-23 and H-27.
MCCULLOUGH RESEARCH
Replacing the Columbia Generating Station with Renewable Energy February 15, 2017 Page 9 ________________
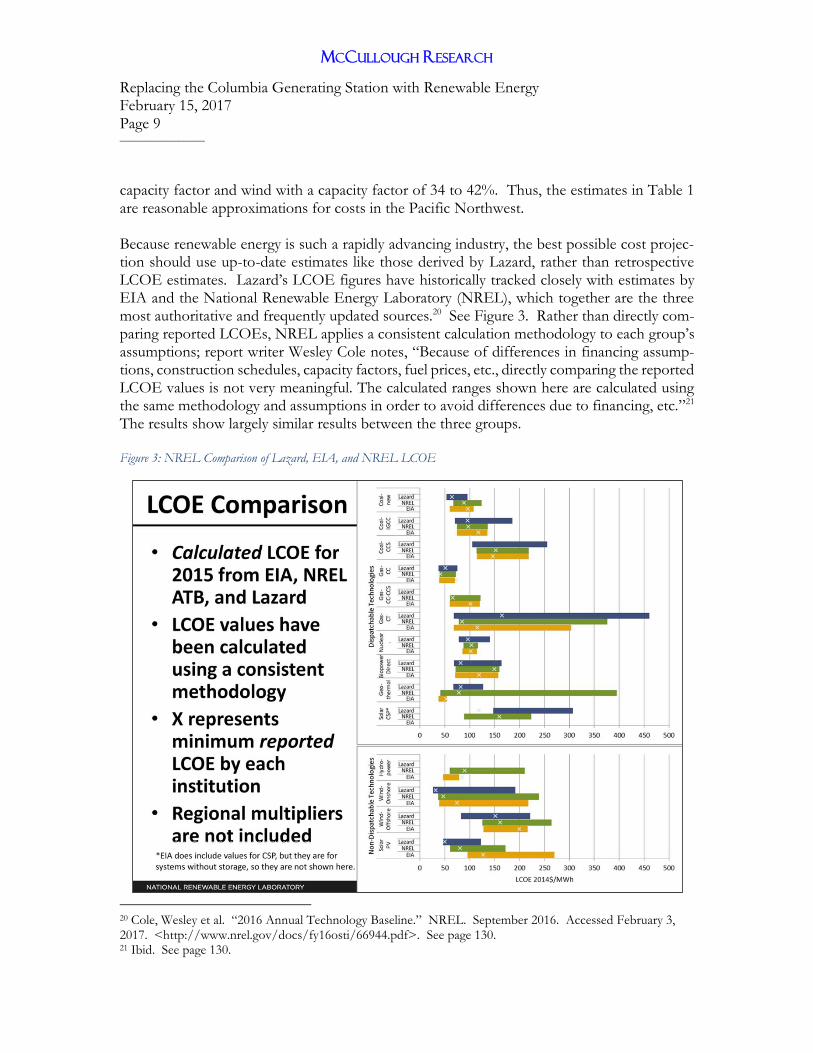
capacity factor and wind with a capacity factor of 34 to 42%. Thus, the estimates in Table 1 are reasonable approximations for costs in the Pacific Northwest. Because renewable energy is such a rapidly advancing industry, the best possible cost projec-tion should use up-to-date estimates like those derived by Lazard, rather than retrospective LCOE estimates. Lazard’s LCOE figures have historically tracked closely with estimates by EIA and the National Renewable Energy Laboratory (NREL), which together are the three most authoritative and frequently updated sources.20 See Figure 3. Rather than directly com-paring reported LCOEs, NREL applies a consistent calculation methodology to each group’s assumptions; report writer Wesley Cole notes, “Because of differences in financing assump-tions, construction schedules, capacity factors, fuel prices, etc., directly comparing the reported LCOE values is not very meaningful. The calculated ranges shown here are calculated using the same methodology and assumptions in order to avoid differences due to financing, etc.”21 The results show largely similar results between the three groups. Figure 3: NREL Comparison of Lazard, EIA, and NREL LCOE
20 Cole, Wesley et al. “2016 Annual Technology Baseline.” NREL. September 2016. Accessed February 3, 2017. <http://www.nrel.gov/docs/fy16osti/66944.pdf>. See page 130. 21 Ibid. See page 130.

MCCULLOUGH RESEARCH
Replacing the Columbia Generating Station with Renewable Energy February 15, 2017 Page 10 ________________
Importantly, LCOE does not generally consider integration costs for variable resources. BPA’s solar integration costs are approximately $2.52/kW-year, while wind integration costs are $14.76/kW-year.22 In this report, those integration charges are added to Lazard’s LCOE when calculating the net present value benefit of replacing CGS. Another cost consideration is transmission. Currently, Energy Northwest, the operator of CGS, does not pay for trans-mission, as BPA buys all of its power at cost under the original WPPSS 2 agreement.23 This report recommends replacing CGS’s output with renewables under the current institutional framework between BPA and Energy Northwest, which would avert transmission costs and assure savings primarily for public power agencies. The capital costs for solar PV and wind installation are already lower than those for new coal or nuclear generation, and are approaching those of natural gas. Table 2 presents estimates of the overnight capital cost for installing a number of renewable and conventional generation types, as reported by Lazard. Table 2: Lazard Overnight Capital Cost for Installation of Conventional and Renewable Energy Sources
Technology Capital cost, 2016 $/kW24
Utility-Scale Solar PV $1,300.00-1,450.00
Wind $1,250.00-1,700.00
Nuclear $5,400.00-8,200.00
Gas Combined Cycle $1,000.00-1,300.00
Coal $3,000.00-8,400.00
A. Developments in Utility-Scale Solar
The majority of growth in solar PV generation in recent years has been at a utility-scale. Na-tionally, utility-scale generation grew from only 157 GWh in 2009 to 23,232 GWh in 2015, representing two-thirds of all solar PV generation in 2015.25
22 Northwest Power and Conservation Council. “Seventh Power Plan.” February 25, 2016. Accessed Decem-ber 20, 2016. <https://www.nwcouncil.org/energy/powerplan/7/plan/>. See Appendix H. 23 Washington Public Power Supply System Nuclear Project No. 2 Agreement executed by the United States Department of the Interior acting by and through the Bonneville Power Administrator and Washington Public Power Supply System. October 5, 1970. 24 Lazard. “Levelized Cost of Energy Analysis – Version 10.0.” December 15, 2016. Accessed December 20, 2016. <https://www.lazard.com/media/438038/levelized-cost-of-energy-v100.pdf>. 25 EIA. “Electric Power Monthly with Data for June 2016.” August 24, 2016. Accessed December 20, 2016. <http://www.eia.gov/electricity/monthly/>.

MCCULLOUGH RESEARCH
Replacing the Columbia Generating Station with Renewable Energy February 15, 2017 Page 11 ________________
In Oregon, Washington, Idaho, and Montana, solar PV had a total installed capacity of 18.4 MW in 2009, but grew to 109.2 MW in 2015.26 The BPA Interconnection Queue is a strong indicator of the market’s readiness to transition to renewable electricity. Of the transmission service requests processed since 2011, there are 3,020 MW of solar resources in queue.27 See Figure 24. The cost of solar generation fell dramatically in the 2010-2016 period. According to the annual analysis conducted by Lazard, utility-scale solar PV’s median LCOE fell from $161 to $42.50/MWh over this period, a 73.6% drop. 28 Lazard estimates the LCOE for utility-scale solar PV in 2016 to be between $36 and $49/MWh based on scheduled tax policy and standard assumptions on financing.29 Research from the Lawrence Berkeley National Laboratory finds that recently signed Power Purchase Agreements (PPAs) for solar PV at $50/MWh are economically sound, even when unsubsidized.30 In its annual review of solar technology, the group cites a substantial reduction in the price of utility-scale solar installations for power purchase agreements (PPA):
“PPA Prices: Driven by lower installed project prices and improving capacity factors, levelized PPA prices for utility-scale PV have fallen dramatically over time, by $20-$30/MWh per year on average from 2006 through 2013, with a smaller price decline of ~$10/MWh per year evident in the 2014 and 2015 samples. Most PPAs in the 2015 sample—including many outside of California and the Southwest—are priced at or below $50/MWh levelized (in real 2015 dollars), with a few priced as aggressively as ~$30/MWh. Even at these low price levels, PV may still find it difficult to compete with existing gas-fired generation, given how low natural gas prices (and gas price expectations) have fallen over the past year. When stacked up against new gas-fired generation (i.e., including the recovery of up-front capital costs), PV looks more attrac-tive—and in either case can also provide a hedge against possible future in-creases in fossil fuel costs.”31
26 Renewable Northwest Project. “Renewable Energy Projects.” Accessed December 20, 2016. <http://www.rnp.org/project_map>. 27 BPA. “Interconnection Request Queue.” Accessed December 20, 2016. <https://www.bpa.gov/transmis-sion/doing%20business/interconnection/pages/default.aspx>. 28 Lazard. “Levelized Cost of Energy Analysis – Version 10.0.” December 15, 2016. Accessed December 20, 2016. <https://www.lazard.com/media/438038/levelized-cost-of-energy-v100.pdf>. 29 Ibid., page 4. Figures stated in 2015 dollars. 30 Bolinger, Mark et al. “Is $50/MWh Solar for Real? Falling Project Prices and Rising Capacity Factors Drive Utility-Scale PV Toward Economic Competitiveness.” Ernest Orlando Lawrence Berkeley National Labora-tory. May 2015. Accessed December 20, 2016. <https://emp.lbl.gov/sites/all/files/lbnl-183129_0.pdf>. 31 Bolinger, Mark and Seel, Joachim. “Utility-Scale Solar 2015: An Empirical Analysis of Project Cost, Perfor-mance, and Pricing Trends in the United States.” Lawrence Berkeley National Laboratory, U.S. Department of Energy. August 2016. Accessed December 20, 2016. <https://emp.lbl.gov/sites/all/files/lbnl-1006037_re-port.pdf>. See page ii.

MCCULLOUGH RESEARCH
Replacing the Columbia Generating Station with Renewable Energy February 15, 2017 Page 12 ________________
The technology for utility-scale solar is based on two major approaches: crystalline silicon (“c-SI”) and thin film (“CdTE”). There are numerous reasons why the efficiency and cost effec-tiveness of solar has improved in recent years. Mark Bolinger and Joachim Seel, the report writers, cite technological improvement, especially the rapid increase in solar tracking technol-ogy. They note that 70% of capacity added in 2015 used tracking technology.32 Solar equip-ment costs have also declined in price due to improvements in manufacturing costs.33 There is a continuing efficiency competition between the two major solar technologies. Again, Bolinger and Seel report that the efficiencies of the two approaches are currently comparable.34 Figure 4 shows changes in Lazard’s cost estimates since 2010. Figure 4: Levelized Cost of Energy for Utility-Scale Solar (Lazard Historical Estimates)
32 Ibid., page 5, page ii. 33 Chung, Donald et al. “U.S. Photovoltaic Prices and Cost Breakdowns: Q1 2015 Benchmarks for Residential, Commercial, and Utility-Scale Systems.” NREL. 2015. Accessed December 20, 2016. <http://www.nrel.gov/docs/fy15osti/64746.pdf>. See pages iv and 2. 34 Bolinger, Mark and Seel, Joachim. “Utility-Scale Solar 2015: An Empirical Analysis of Project Cost, Perfor-mance, and Pricing Trends in the United States.” Lawrence Berkeley National Laboratory, U.S. Department of Energy. August 2016. Accessed December 20, 2016. <https://emp.lbl.gov/sites/all/files/lbnl-1006037_re-port.pdf>. See page 5.
$188.00
$179.00
$112.00
$82.00
$66.00 $57.00
$49.00
$134.00
$89.00 $76.00
$71.00 $56.00
$41.00 $36.00
$161.00
$134.00
$94.00
$76.50
$61.00
$49.00
$42.50
$-
$20.00
$40.00
$60.00
$80.00
$100.00
$120.00
$140.00
$160.00
$180.00
$200.00
2010 2011 2012 2013 2014 2015 2016
Do
llars
Per
Meg
awat
t-H
our,
no
min
al d
olla
rs
Date of Estimate
MCCULLOUGH RESEARCH
Replacing the Columbia Generating Station with Renewable Energy February 15, 2017 Page 13 ________________
Idaho has already expanded its solar energy capacity, having signed contracts for 461 MW of power in 2015.35,36 See Section IV-C for a discussion of solar potential in the Pacific North-west. Locating solar plants around facilities scheduled to close, such as Boardman and Cen-tralia, or even a decommissioned CGS, would address access to transmission. Recent developments in storage also suggest renewables may be a viable alternative to con-ventional gas peaker plants. Solar PV generation already has a lower LCOE than that of gas peakers, estimated at $165-217/MWh; as Lazard notes, “utility-scale solar is becoming a more economically viable peaking energy product in many key, high population areas of the U.S.”37 Pumped hydro and battery storage present a means to add the requisite dispatchability to use renewable generation as a peaker option. Already, Southern California Edison Co. has picked a battery storage option to replace a 100 MW gas peaker in 2021.38 In Washington, the 1,200 MW JD Pool Pumped Hydroelectric Project, which could be built for $2.5 billion, could store excess energy during periods of overgeneration and provide peaking during periods of low wind and sun.39 These figures would give the project a favorable overnight capital cost of approximately $2084/kW. In California, the proposed GreenGenStorage pumped hydroelec-tric project has a potential capacity between 380 MW and 1,140 MW, and is currently in the permitting process.40
B. Developments in Onshore Wind
Wind generation is a more mature technology compared to solar PV. In 2015, wind generation in the U.S. totaled 190,927 GWh, representing 4.7% of all electricity generation.41 In recent years the cost of onshore wind generation has also declined steeply, if less dramatically, than that of solar PV generation. According to the annual analysis by Lazard, the midpoint of
35 These solar additions in Idaho were for qualifying facilities under PURPA –the cost of the resources were below Idaho Power’s calculated avoided costs. 36 Idaho Power. “Connections.” March 2015. Accessed December 20, 2016. <https://www.ida-hopower.com/pdfs/NewsCommunity/news/customerConnection/201503.pdf>. See page 2. 37 Lazard. “Levelized Cost of Energy Analysis – Version 10.0.” December 15, 2016. Accessed December 20, 2016. <https://www.lazard.com/media/438038/levelized-cost-of-energy-v100.pdf>. See page 7. 38 Fialka, John. “World’s Largest Storage Battery Will Power Los Angeles.” Scientific American. July 7 2016. Accessed December 20, 2016. <http://www.scientificamerican.com/article/world-s-largest-storage-battery-will-power-los-angeles/>. 39 Roach, John. “For Storing Electricity, Utilities Are Turning to Pumped Hydro.” Yale Environment 360. November 24, 2015. Accessed December 20, 2016. <http://e360.yale.edu/feature/for_storing_electric-ity_utilities_are_turning_to_pumped_hydro/2934/>. 40 Renewable Energy World. “FERC Seeks Input on App for 1,140-MW GreenGenStorage Pumped Storage Hydro Project.” October 11, 2016. Accessed December 20, 2016. <http://www.renewableener-gyworld.com/articles/2016/10/ferc-seeks-input-on-app-for-1-140-mw-greengenstorage-pumped-storage-hy-dro-project.html>. 41 EIA. “Electric Power Monthly with Data for June 2016.” August 24, 2016. Accessed December 20, 2016. <http://www.eia.gov/electricity/monthly/>.

MCCULLOUGH RESEARCH
Replacing the Columbia Generating Station with Renewable Energy February 15, 2017 Page 14 ________________
onshore wind’s LCOE fell from $87.50 to $31.00/MWh over the 2010-2016 period, a 65% decline.42 Figure 5: Levelized Cost of Energy for Onshore Wind (Lazard Historical Estimates)
In Oregon, Washington, Idaho, and Montana, onshore wind had a total installed capacity of 4,253.55 MW in 2009, and grew to 7,866.95 MW in 2015.43 Since 2011, there are 2,766 MW of wind resources in BPA’s Interconnection queue.44 See Figure 24. Table 1 compares LCOE estimates for renewable and conventional generation technologies. Lazard estimates the LCOE for wind generation at $14.00 to $48.00/MWh including sched-uled tax credits, giving a midpoint of $31.00/MWh. This competes favorably with new nu-clear, which was estimated at $97.00 to $136.00/MWh in 2016 dollars. Onshore wind is com-petitive with conventional fossil fuel generation technologies, with an LCOE lower than that
42 Lazard. “Levelized Cost of Energy Analysis – Version 10.0.” December 15, 2016. Accessed December 20, 2016. <https://www.lazard.com/media/438038/levelized-cost-of-energy-v100.pdf>. 43 Renewable Northwest Project. “Renewable Energy Projects.” Accessed December 20, 2016. <http://www.rnp.org/project_map>. 44 BPA. “Interconnection Request Queue.” Accessed December 20, 2016. <https://www.bpa.gov/transmis-sion/doing%20business/interconnection/pages/default.aspx>.
$110.00
$79.00 $82.00
$85.00
$67.00 $63.00
$48.00
$65.00
$30.00 $26.00
$23.00
$14.00 $14.00 $14.00
$87.50
$54.50 $54.00 $54.00
$40.50
$38.50
$31.00
$-
$20.00
$40.00
$60.00
$80.00
$100.00
$120.00
2010 2011 2012 2013 2014 2015 2016
Do
llars
Per
Meg
awat
t-H
our,
no
min
al d
olla
rs
Date of Estimate

MCCULLOUGH RESEARCH
Replacing the Columbia Generating Station with Renewable Energy February 15, 2017 Page 15 ________________
of combined cycle natural gas generation, according to Lazard. Capital costs for wind instal-lation have fallen significantly in recent years and are approaching the costs for conventional generation technologies. Several high-profile wind projects have been commissioned or are proposed in the Pacific Northwest. These include the 124.5 MW Goshen Wind Farm in Idaho, the 120 MW Coyote Crest Wind Farm in Washington, the 240 MW Roscoe Flats Wind Farm in Montana, the 189 MW Rim Rock Wind Farm in Montana, and the 165 MW Wild Horse Wind Farm in Wash-ington. Wind generation and solar PV have some characteristics in common. Both wind and solar generation avert fuel price risk, but are limited by the availability of wind and sunlight. Section IV-B discusses strategies to integrate renewables into the grid and manage load shaping. These strategies include expansion of demand management capability, energy efficiency, storage technology such as battery and pumped hydroelectric storage, better alignment of generating resources with peak demand, and diversification of generation portfolios. In the future, ex-panded transmission infrastructure may connect uncorrelated or negatively correlated loads across large geographic distances, such as from Montana to Western Oregon and Washington, which will diversify the timing of renewable generation.45 See Sections IV-B and IV-C.
II. CGS: Generation, Planned Outages, Forced Outages Between July 2006 and June 2016, CGS generated roughly 8.3 million MWh. Based on a nameplate capacity rating of 1,190 MW, CGS had a capacity factor of approximately 0.85 for this period. During the July 2006 to June 2016 period, CGS lost nearly 282,000 MWh of generation due to planned maintenance outages, over 2.6 million MWh for fueling outages, more than 339,000 MWh for unplanned non-dispatch outages, and 188,000 MWh for dispatch outages.46,47,48 See Figure 6.
45 Mai, Trieu et al. “Renewable Electricity Futures Study.” NREL. 2012. Accessed December 20, 2016. <http://www.nrel.gov/analysis/re_futures/>. See pages A-16 to A-17. 46 Energy Northwest. “Request for Public Record 2013-49: Hourly generation for WNP-2 from 2000 to the present.” Request by Rose Anderson, Research Associate, McCullough Research. September 16, 2013. 47 Energy Northwest. “Request for Public Record 2015-03: Net hourly generation for WNP-2 from 09/01/2013 to the present.” Request by Ramon Cabauatan, Research Associate, McCullough Research. Feb-ruary 5, 2015. 48 U.S. Nuclear Regulatory Commission (NRC). “Power Reactor Status Reports.” Accessed December 20, 2016. <http://www.nrc.gov/reading-rm/doc-collections/event-status/reactor-status/>.

MCCULLOUGH RESEARCH
Replacing the Columbia Generating Station with Renewable Energy February 15, 2017 Page 16 ________________
Figure 6: CGS Daily Generation
CGS is classified as a baseload resource, although its actual operations require periodic clo-sures for repair – sometimes for prolonged periods – and refueling. Unplanned outages, such as the one experienced for a week in December 2016, can be tripped in an instant and cause an extended loss of 1,190 MW of electric generation at times that are least opportune for the overall system. Nevertheless, as a baseload resource, CGS is expected to run at relatively constant levels throughout the day and year. Because of its limited flexibility, CGS’s generation on the Mid-Columbia market can be poorly timed, leading to competition for transmission westward to loads. Load balancing was a factor in PG&E’s decision to close Diablo Canyon. PG&E projected that, by 2030, much of the output at Diablo Canyon would be unnecessary. This was especially true for the spring and summer, when renewables generate at a high level.49,50 See Figure 7.
49 M.J. Bradley & Associates, LLC. “Joint Proposal for the Orderly Replacement of Diablo Canyon Power Plant with Energy Efficiency and Renewables.” 2, “Diablo Canyon Power Plant Need Analysis,” filed August 11, 2016 for California Public Utilities Commission (CPUC). Accessed December 20 2016. 50 “Application of Pacific Gas and Electric Company (U 39 E) For Approval of the Retirement of Diablo Can-yon Power Plant, Implementation of the Joint Proposal, and Recovery of Associated Costs Through Proposed Rate-making Mechanisms.” Filed August 11, 2016 for California Public Utilities Commission (CPUC). Ac-cessed December 20, 2016. <http://www.pge.com/includes/docs/pdfs/safety/dcpp/diablo-canyon-retire-ment-joint-proposal-application.pdf>.
0
5000
10000
15000
20000
25000
30000
MW
h
MCCULLOUGH RESEARCH
Replacing the Columbia Generating Station with Renewable Energy February 15, 2017 Page 17 ________________
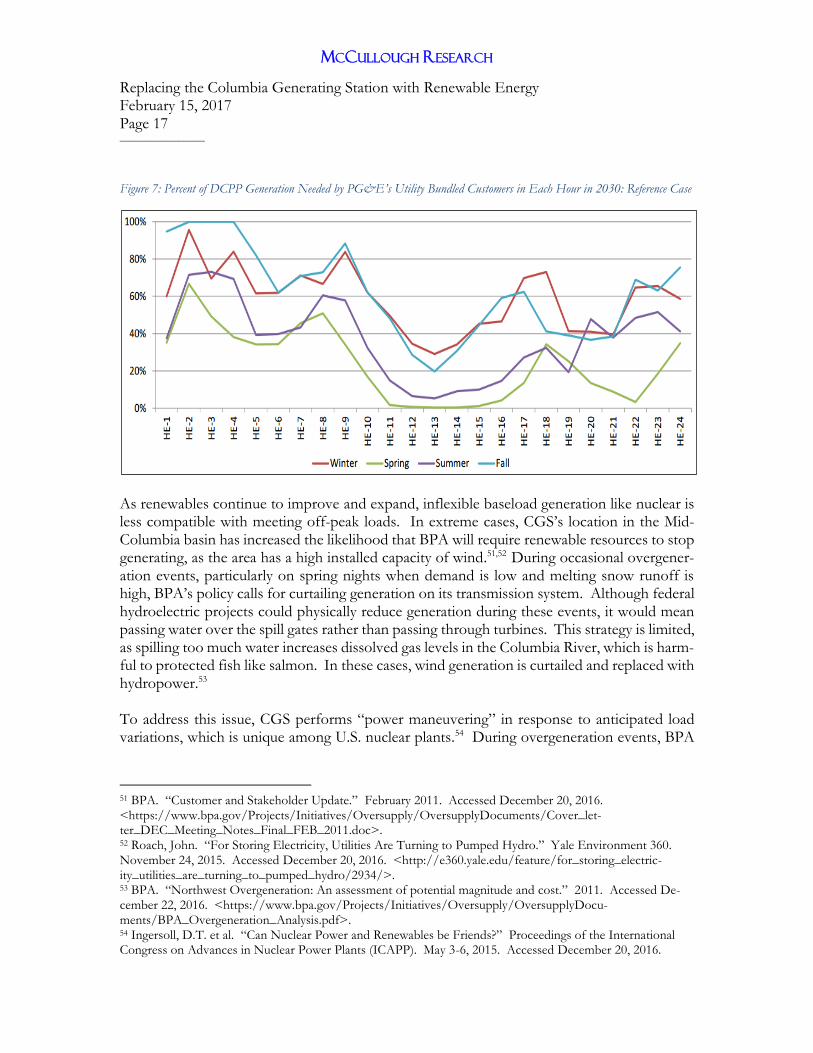
Figure 7: Percent of DCPP Generation Needed by PG&E’s Utility Bundled Customers in Each Hour in 2030: Reference Case
As renewables continue to improve and expand, inflexible baseload generation like nuclear is less compatible with meeting off-peak loads. In extreme cases, CGS’s location in the Mid-Columbia basin has increased the likelihood that BPA will require renewable resources to stop generating, as the area has a high installed capacity of wind.51,52 During occasional overgener-ation events, particularly on spring nights when demand is low and melting snow runoff is high, BPA’s policy calls for curtailing generation on its transmission system. Although federal hydroelectric projects could physically reduce generation during these events, it would mean passing water over the spill gates rather than passing through turbines. This strategy is limited, as spilling too much water increases dissolved gas levels in the Columbia River, which is harm-ful to protected fish like salmon. In these cases, wind generation is curtailed and replaced with hydropower.53 To address this issue, CGS performs “power maneuvering” in response to anticipated load variations, which is unique among U.S. nuclear plants.54 During overgeneration events, BPA
51 BPA. “Customer and Stakeholder Update.” February 2011. Accessed December 20, 2016. <https://www.bpa.gov/Projects/Initiatives/Oversupply/OversupplyDocuments/Cover_let-ter_DEC_Meeting_Notes_Final_FEB_2011.doc>. 52 Roach, John. “For Storing Electricity, Utilities Are Turning to Pumped Hydro.” Yale Environment 360. November 24, 2015. Accessed December 20, 2016. <http://e360.yale.edu/feature/for_storing_electric-ity_utilities_are_turning_to_pumped_hydro/2934/>. 53 BPA. “Northwest Overgeneration: An assessment of potential magnitude and cost.” 2011. Accessed De-cember 22, 2016. <https://www.bpa.gov/Projects/Initiatives/Oversupply/OversupplyDocu-ments/BPA_Overgeneration_Analysis.pdf>. 54 Ingersoll, D.T. et al. “Can Nuclear Power and Renewables be Friends?” Proceedings of the International Congress on Advances in Nuclear Power Plants (ICAPP). May 3-6, 2015. Accessed December 20, 2016.

MCCULLOUGH RESEARCH
Replacing the Columbia Generating Station with Renewable Energy February 15, 2017 Page 18 ________________
issues requests that CGS operate at partial power. Such requests require 12 hours of notice for CGS to reduce to 85% power, 48 hours for a reduction to 65% power, and 72 hours for a full shutdown.55 However, this rampdown rate, while useful for seasonal adustments, is not adequate for day-to-day load variability. The challenges associated with surpluses of renewable generation will intensify, absent the closure of baseload thermal plants. D.T. Ingersoll et al. write in the Proceedings of the International Congress on Advances in Nuclear Power Plants (ICAPP), “An increasing wind generating capacity in the BPA network may also introduce new load-shaping requirements at CGS.”56 These rampdowns add to maintenance costs by creating additional thermal stresses. The output of CGS is less flexible and is not well-timed to meet regional needs. Further, it is not cost-competitive with market prices in the Pacific Northwest.
A. CGS Operating Costs vs. Market Prices
CGS’s primary challenges are its operating and maintenance costs, poor location in the Mid-Columbia market, scale of operations, and age.57,58 Most nuclear plants use “twin” reactors, which assures economies of scale and operation. However, other nuclear power reactors un-der construction next to CGS in the 1970s and 80s were cancelled, due to cost overruns and the lack of need for their generation, leaving only one unit to operate. In 1999, the Administrator of BPA and the Chief Executive Officer of Energy Northwest agreed that the plant could be closed if it did not meet a biennial “rate test.” The rate test compares the value of the plant’s output to its cost of operations over the next four years. BPA wrote:
“BPA intends to subject CGS operating costs to a market test biennially, test-ing whether market value of the CGS output recovers annual operating costs of the plant. BPA intends to solicit input on the precise nature of this market test in a public process this year.
<http://www.nuscalepower.com/images/our_technology/NuScale-Integration-with-Renewa-bles_ICAPP15.pdf>. See page 2. 55 Ibid., page 2. 56 Ibid., page 2. 57 The Hanford location places the plant at the center of the Mid-Columbia (Mid-C) market. It is also at the center of a vast expansion of renewable resources. The surplus in energy at this location can overwhelm trans-mission capacity to loads on the I-5 corridor and force prices to levels below zero. 58 CGS was designed in the 1970s. It is now in its thirty-third year of its original expected design life of forty years. While there is nothing impossible about operating an aging nuclear power station, ongoing capital costs and required upgrades make these plants uneconomic. The rash of recent nuclear plant closure announce-ments in New York, Massachusetts, Michigan, California, and Nebraska reflects the cost of maintaining vintage plant in the face of more cost-effective alternatives.
MCCULLOUGH RESEARCH
Replacing the Columbia Generating Station with Renewable Energy February 15, 2017 Page 19 ________________
“Likewise, […] BPA intends to re-evaluate plant termination if operating costs are projected to exceed revenues achievable at market prices by more than the termination costs.”59
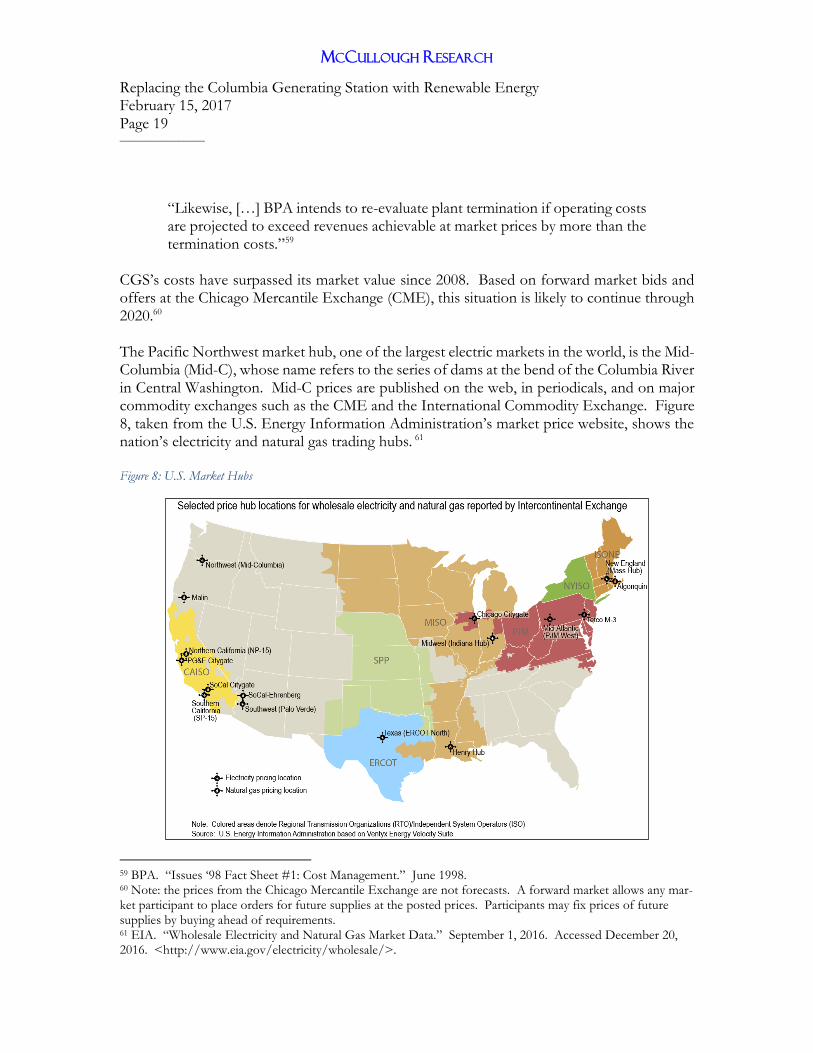
CGS’s costs have surpassed its market value since 2008. Based on forward market bids and offers at the Chicago Mercantile Exchange (CME), this situation is likely to continue through 2020.60 The Pacific Northwest market hub, one of the largest electric markets in the world, is the Mid-Columbia (Mid-C), whose name refers to the series of dams at the bend of the Columbia River in Central Washington. Mid-C prices are published on the web, in periodicals, and on major commodity exchanges such as the CME and the International Commodity Exchange. Figure 8, taken from the U.S. Energy Information Administration’s market price website, shows the nation’s electricity and natural gas trading hubs. 61 Figure 8: U.S. Market Hubs
59 BPA. “Issues ‘98 Fact Sheet #1: Cost Management.” June 1998. 60 Note: the prices from the Chicago Mercantile Exchange are not forecasts. A forward market allows any mar-ket participant to place orders for future supplies at the posted prices. Participants may fix prices of future supplies by buying ahead of requirements. 61 EIA. “Wholesale Electricity and Natural Gas Market Data.” September 1, 2016. Accessed December 20, 2016. <http://www.eia.gov/electricity/wholesale/>.

MCCULLOUGH RESEARCH
Replacing the Columbia Generating Station with Renewable Energy February 15, 2017 Page 20 ________________
In December 2013, McCullough Research predicted that CGS would not be able to meet a rate test for the period through 2017. While the full four years have not yet passed, the first three years have proven the prediction correct. Energy Northwest publishes its cost of power, in cents per kWh, in its Annual Reports and Long Range Plans.62 The figure includes fuel, O&M, and capital costs. In FY 2015 and 2016, CGS had a cost of power at $50.50 and $36.50/MWh, respectively. Figure 9 compares the cost of CGS power to the Mid-C market price using Energy Northwest’s historical costs. Figure 9: CGS Cost of Power Compared to Mid-C Market Price
Between July 1, 2012 and February 6, 2016, CGS cost approximately $663.5 million more than its output would have been valued at market prices. This figure was calculated by taking daily production from CGS and multiplying against corresponding peak and off-peak market prices sourced from Platts Megawatt Daily.63 Historical CGS costs were taken from the 2016 Energy
62 Energy Northwest. “2016 Annual Report.” Accessed December 24, 2016. <https://www.energy-north-west.com/whoweare/finance/Documents/2016%20Energy%20Northwest%20Annual%20Report.pdf>. See page 24. 63 Platts. “Megawatt Daily.” <http://www.platts.com/products/megawatt-daily>.
$-
$10.00
$20.00
$30.00
$40.00
$50.00
$60.00
Jul-
12
Sep
-12
No
v-1
2
Jan
-13
Mar
-13
May
-13
Jul-
13
Sep
-13
No
v-1
3
Jan
-14
Mar
-14
May
-14
Jul-
14
Sep
-14
No
v-1
4
Jan
-15
Mar
-15
May
-15
Jul-
15
Sep
-15
No
v-1
5
Jan
-16
Mar
-16
May
-16
Jul-
16
Sep
-16
No
v-1
6
Jan
-17
Do
llars
Per
Meg
awat
t-H
our
CGS Cost of Power Mid-C Price

MCCULLOUGH RESEARCH
Replacing the Columbia Generating Station with Renewable Energy February 15, 2017 Page 21 ________________
Northwest Annual Report, while the company’s projected costs were used for Fiscal Year 2017.64,65 Recent technological changes in oil and natural gas exploration have created a glut in both markets, driving down prices for electric power. This is because the highest variable cost power plants operating on any hour tend to set the wholesale market prices. On most hours, those resources are natural gas fueled units. As a result, wholesale electric market prices today are highly correlated with natural gas prices, and the falling natural gas prices have driven current and forward electric market prices lower.66 Energy Northwest provides its own forecasted cost of generation for future periods in its Long Range Plan.67 This allows one to calculate the rate test for the future, by comparing the costs set out in CGS Long Range Plan with forward market prices. The net present value of CGS’s excess cost relative to the market is over $641.1 million over the period March 2017 through December 2022.68 Still, the savings from closing CGS would likely be greater than the simple values in the Energy Northwest Long Range Plan. First, the region would avoid the expense of creating additional spent nuclear fuel to store until a long-term storage facility is found. Second, it would avoid additional nuclear decommissioning costs, which are escalating at a rate faster than inflation, by addressing them today, rather than in the future. Finally, and most importantly, the fore-casts in the previous Long Range Plans have tended to be underestimates. Since 2007 the forecasts have underestimated actual expenses by an average of 19.2%.69 If the current fore-cast reflects the tendency shown since 2007, the actual cost excesses relative to Mid-C prices would be over $818.5 million between March 2017 and December 2022.
64 Energy Northwest. “2016 Annual Report.” Accessed December 27, 2016. <https://www.energy-north-west.com/whoweare/finance/Documents/2016%20Energy%20Northwest%20Annual%20Report.pdf>. See page 24. 65 Energy Northwest. “Fiscal Year 2016 Columbia Generating Station Long Range Plan.” Accessed February 6, 2017. <https://www.energy-north-west.com/whoweare/finance/Documents/2016%20Budget%20Docu-ments/Final%202016%20CGS%20Long%20Range%20Plan.pdf>. At the time of writing, this is the most re-cent finalized Long Range Plan, as the 2017 Long Range Plan is listed in draft format. 66 Platts. “Megawatt Daily.” <http://www.platts.com/products/megawatt-daily>. 67 Energy Northwest. “Fiscal Year 2016 Columbia Generating Station Long Range Plan.” Accessed February 7, 2017. <https://www.energy-north-west.com/whoweare/finance/Documents/2016%20Budget%20Docu-ments/Final%202016%20CGS%20Long%20Range%20Plan.pdf>. At the time of writing, this is the most re-cent finalized Long Range Plan, as the 2017 Long Range Plan is listed in draft format. 68 This figure is calculated by taking the difference between CGS’s forecasted operating costs in the Energy Northwest Long Range Plan and Mid-C forward prices published on CME, adjusted for peak and off-peak prices. The MWh of generation between January 2017 and December 2021 are assumed to be equal to the av-erage monthly MWh of generation between June 2006 and June 2016. Note that forward prices are not equiva-lent to future spot prices. Accessed February 9, 2017. 69 This figure is computed by averaging the percent difference between actual CGS cost of power and the costs projected in each Energy Northwest Long Range Plan since 2007.

MCCULLOUGH RESEARCH
Replacing the Columbia Generating Station with Renewable Energy February 15, 2017 Page 22 ________________
Figure 10: CGS Long Range Plan Compared to Forward Market Prices
An alternative estimate of future Mid-C prices comes from the Northwest Power and Con-servation Council’s Seventh Power Plan.70 The Council provides a wide range of projections for the Mid-C market based on fuel price assumptions. Its median projection is shown in Figure 11. By those estimates, CGS will cost approximately $801 million more than what the market will be worth between Fiscal Years 2017 and 2026, stated in 2016 dollars. When ad-justing for Energy Northwest’s historical underestimates of its costs, the cost overruns would be approximately $1.5 billion more than the market worth over the same period.
70 Northwest Power and Conservation Council. “Seventh Power Plan.” February 25, 2016. Accessed January 6, 2017. <https://www.nwcouncil.org/energy/powerplan/7/plan/>.
$-
$10.00
$20.00
$30.00
$40.00
$50.00
$60.00
$70.00
Mar
-17
Jun
-17
Sep
-17
Dec
-17
Mar
-18
Jun
-18
Sep
-18
Dec
-18
Mar
-19
Jun
-19
Sep
-19
Dec
-19
Mar
-20
Jun
-20
Sep
-20
Dec
-20
Mar
-21
Jun
-21
Sep
-21
Dec
-21
Mar
-22
Jun
-22
Sep
-22
Dec
-22
Do
llars
Per
Meg
awat
t-H
our
Fiscal Year 2016 Columbia Generating Station Long Range Plan
Fiscal Year 2016 Columbia Generating Station Long Range Plan Adjusted For Past Experience
CME Mid-Columbia Forward Prices

MCCULLOUGH RESEARCH
Replacing the Columbia Generating Station with Renewable Energy February 15, 2017 Page 23 ________________
Figure 11: CGS Projected Costs Compared to NW Council Mid-C Projections
CGS has failed the established rate test for the past four years and will likely fail the market test for the foreseeable future.
B. Life Expectancy of the Columbia Generating Station
In June 2015, McCullough Research wrote in Public Utilities Fortnightly about the longevity of nuclear reactors using a demographic model of the world’s plants. The article questioned recent claims that aging reactors could continue operating to an age of sixty years, as was stated by Matthew Wald in the New York Times in late 2014.71 More recently, in response to President Obama’s Clean Power Plan, CNBC reported that many utilities are preparing bids to extend the operating licenses of nuclear plants for up to eighty years.72
71 Wald, Matthew. “E.P.A. Wrestles with Role of Nuclear Plants in Carbon Emission Rules.” The New York Times. December 25, 2014, P. B3. Accessed December 23, 2016. <http://www.ny-times.com/2014/12/26/business/energy-environment/epa-wrestles-with-role-of-nuclear-plants-in-carbon-emission-rules-.html>. 72 Mullaney, Tim. “No more nukes? How about another 80 years of them.” CNBC. July 16, 2015. Accessed December 23, 2016. <http://www.cnbc.com/2015/07/16/no-more-nukes-how-about-another-80-years-of-them.html>.
$-
$10.00
$20.00
$30.00
$40.00
$50.00
$60.00
$70.00
2017 2018 2019 2020 2021 2022 2023 2024 2025 2026
Do
llars
Per
Meg
awat
t-H
our
(2016 d
olla
rs)
Fiscal Year 2016 Columbia Generating Station Long Range Plan
Fiscal Year 2016 Columbia Generating Station Long Range Plan Adjusted For Past Experience
NW Council Mid-C Projection: Medium
MCCULLOUGH RESEARCH
Replacing the Columbia Generating Station with Renewable Energy February 15, 2017 Page 24 ________________
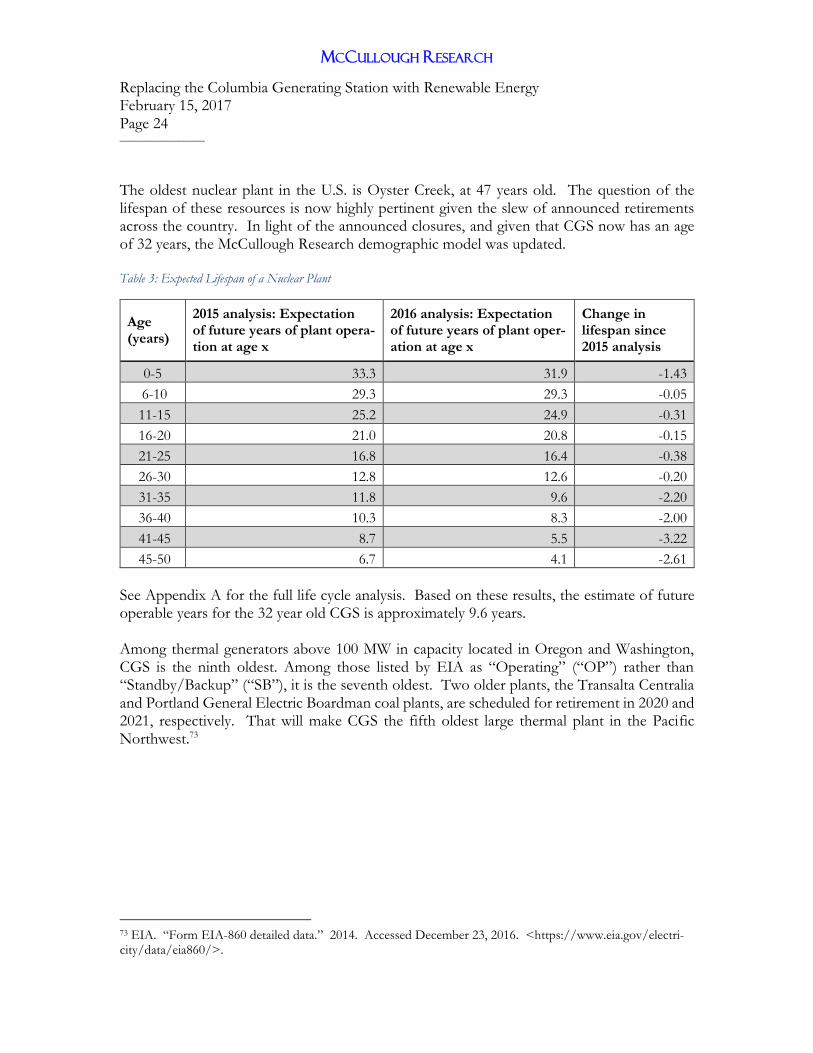
The oldest nuclear plant in the U.S. is Oyster Creek, at 47 years old. The question of the lifespan of these resources is now highly pertinent given the slew of announced retirements across the country. In light of the announced closures, and given that CGS now has an age of 32 years, the McCullough Research demographic model was updated. Table 3: Expected Lifespan of a Nuclear Plant
Age (years)
2015 analysis: Expectation of future years of plant opera-tion at age x
2016 analysis: Expectation of future years of plant oper-ation at age x
Change in lifespan since 2015 analysis
0-5 33.3 31.9 -1.43
6-10 29.3 29.3 -0.05
11-15 25.2 24.9 -0.31
16-20 21.0 20.8 -0.15
21-25 16.8 16.4 -0.38
26-30 12.8 12.6 -0.20
31-35 11.8 9.6 -2.20
36-40 10.3 8.3 -2.00
41-45 8.7 5.5 -3.22
45-50 6.7 4.1 -2.61
See Appendix A for the full life cycle analysis. Based on these results, the estimate of future operable years for the 32 year old CGS is approximately 9.6 years. Among thermal generators above 100 MW in capacity located in Oregon and Washington, CGS is the ninth oldest. Among those listed by EIA as “Operating” (“OP”) rather than “Standby/Backup” (“SB”), it is the seventh oldest. Two older plants, the Transalta Centralia and Portland General Electric Boardman coal plants, are scheduled for retirement in 2020 and 2021, respectively. That will make CGS the fifth oldest large thermal plant in the Pacific Northwest.73
73 EIA. “Form EIA-860 detailed data.” 2014. Accessed December 23, 2016. <https://www.eia.gov/electri-city/data/eia860/>.

MCCULLOUGH RESEARCH
Replacing the Columbia Generating Station with Renewable Energy February 15, 2017 Page 25 ________________
Table 4: Pacific Northwest Thermal Generators by Age, Larger than 50 MW
Utility Name Plant Name State Technology Status Nameplate
Capacity (MW)
In-Service Year
TransAlta Centralia Gen
Transalta Centralia Generation
WA Conventional Steam Coal
OP 1459.8 1972
Portland General Electric
Beaver OR Natural Gas Fired Combined Cycle
OP 586.2 1974
Portland General Electric
Boardman OR Conventional Steam Coal
OP 642.2 1980
Puget Sound Energy Inc
Frederickson WA Natural Gas Fired Combustion Turbine
SB 177.8 1981
Puget Sound Energy Inc
Whitehorn WA Natural Gas Fired Combustion Turbine
OP 169.2 1981
Puget Sound Energy Inc
Fredonia WA Natural Gas Fired Combustion Turbine
SB 258.2 1984
Energy Northwest
Columbia Generating Station
WA Nuclear OP 1200 1984
III. CGS Costs Compared to Solar and Wind As discussed in Section II-A, CGS costs exceed Mid-C prices. In addition, the plant’s energy is not competitive with projected renewable prices. On both a $/MWh LCOE basis and a $/kW capital cost basis, renewables are close to or already competitive with conventional generation. See Tables 1 and 2. Wind and solar PV face no fuel cost risk and do not emit greenhouse gases, while certain types of conventional generation are affected by fuel price volatility. Wind and solar PV represent an important and growing fraction of electricity generation. Going forward, it is likely that wind and solar PV will continue to overtake existing coal and nuclear generation in terms of economic viability. Considerations such as, but not limited to, dispatchability, load balancing and storage, new transmission infrastructure, and curtailment become increasingly important as the fraction of renewable generation increases. Nevertheless, studies from the NREL suggest that increasing the share of renewable generation to as much as 80% by 2050 is economically viable and
MCCULLOUGH RESEARCH
Replacing the Columbia Generating Station with Renewable Energy February 15, 2017 Page 26 ________________
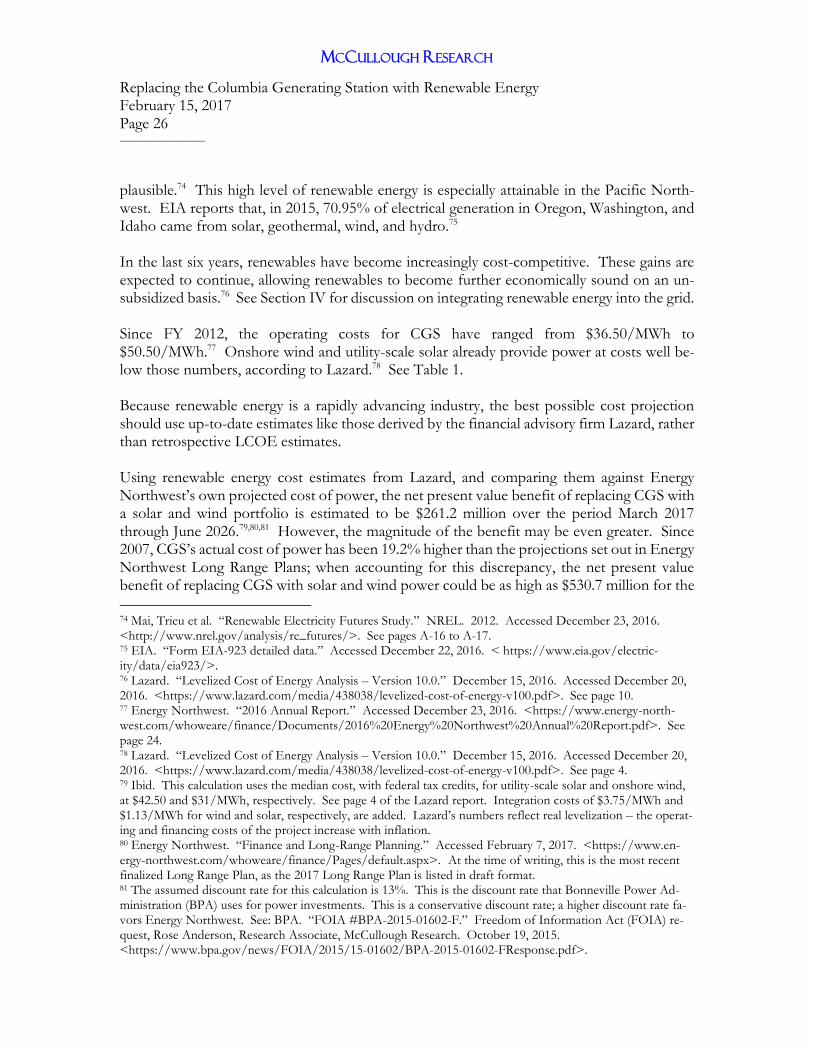
plausible.74 This high level of renewable energy is especially attainable in the Pacific North-west. EIA reports that, in 2015, 70.95% of electrical generation in Oregon, Washington, and Idaho came from solar, geothermal, wind, and hydro.75 In the last six years, renewables have become increasingly cost-competitive. These gains are expected to continue, allowing renewables to become further economically sound on an un-subsidized basis.76 See Section IV for discussion on integrating renewable energy into the grid. Since FY 2012, the operating costs for CGS have ranged from $36.50/MWh to $50.50/MWh.77 Onshore wind and utility-scale solar already provide power at costs well be-low those numbers, according to Lazard.78 See Table 1. Because renewable energy is a rapidly advancing industry, the best possible cost projection should use up-to-date estimates like those derived by the financial advisory firm Lazard, rather than retrospective LCOE estimates. Using renewable energy cost estimates from Lazard, and comparing them against Energy Northwest’s own projected cost of power, the net present value benefit of replacing CGS with a solar and wind portfolio is estimated to be $261.2 million over the period March 2017 through June 2026.79,80,81 However, the magnitude of the benefit may be even greater. Since 2007, CGS’s actual cost of power has been 19.2% higher than the projections set out in Energy Northwest Long Range Plans; when accounting for this discrepancy, the net present value benefit of replacing CGS with solar and wind power could be as high as $530.7 million for the
74 Mai, Trieu et al. “Renewable Electricity Futures Study.” NREL. 2012. Accessed December 23, 2016. <http://www.nrel.gov/analysis/re_futures/>. See pages A-16 to A-17. 75 EIA. “Form EIA-923 detailed data.” Accessed December 22, 2016. < https://www.eia.gov/electric-ity/data/eia923/>. 76 Lazard. “Levelized Cost of Energy Analysis – Version 10.0.” December 15, 2016. Accessed December 20, 2016. <https://www.lazard.com/media/438038/levelized-cost-of-energy-v100.pdf>. See page 10. 77 Energy Northwest. “2016 Annual Report.” Accessed December 23, 2016. <https://www.energy-north-west.com/whoweare/finance/Documents/2016%20Energy%20Northwest%20Annual%20Report.pdf>. See page 24. 78 Lazard. “Levelized Cost of Energy Analysis – Version 10.0.” December 15, 2016. Accessed December 20, 2016. <https://www.lazard.com/media/438038/levelized-cost-of-energy-v100.pdf>. See page 4. 79 Ibid. This calculation uses the median cost, with federal tax credits, for utility-scale solar and onshore wind, at $42.50 and $31/MWh, respectively. See page 4 of the Lazard report. Integration costs of $3.75/MWh and $1.13/MWh for wind and solar, respectively, are added. Lazard’s numbers reflect real levelization – the operat-ing and financing costs of the project increase with inflation. 80 Energy Northwest. “Finance and Long-Range Planning.” Accessed February 7, 2017. <https://www.en-ergy-northwest.com/whoweare/finance/Pages/default.aspx>. At the time of writing, this is the most recent finalized Long Range Plan, as the 2017 Long Range Plan is listed in draft format. 81 The assumed discount rate for this calculation is 13%. This is the discount rate that Bonneville Power Ad-ministration (BPA) uses for power investments. This is a conservative discount rate; a higher discount rate fa-vors Energy Northwest. See: BPA. “FOIA #BPA-2015-01602-F.” Freedom of Information Act (FOIA) re-quest, Rose Anderson, Research Associate, McCullough Research. October 19, 2015. <https://www.bpa.gov/news/FOIA/2015/15-01602/BPA-2015-01602-FResponse.pdf>.
MCCULLOUGH RESEARCH
Replacing the Columbia Generating Station with Renewable Energy February 15, 2017 Page 27 ________________
same period. This value assumes a replacement for each MWh generated by CGS, without respect to load balancing and dispatching. Section IV discusses strategies for integrating re-newable energy into the grid. Figure 12: CGS Costs versus LCOE of Wind and Solar
IV. Integration of Renewables In response to falling prices and renewable portfolio requirements, use of renewables is growing in the Pacific Northwest. Utilities face challenges in integrating these resources. As the portfolio of intermittent power increases, the most valuable current resources to retain will be those with the greatest operational flexibility.
A. Capacity Contribution
One concern with replacing nuclear energy with renewables is the variable and less predictable nature of solar and wind power. The Western Electricity Coordinating Council (WECC) uses a “Rule of Thumb” to evaluate the effects of wind and solar power on resource adequacy and loss of load expectation (LOLE).
$25.00
$30.00
$35.00
$40.00
$45.00
$50.00
$55.00
$60.00
$65.00
Mar
-17
Jul-
17
No
v-1
7
Mar
-18
Jul-
18
No
v-1
8
Mar
-19
Jul-
19
No
v-1
9
Mar
-20
Jul-
20
No
v-2
0
Mar
-21
Jul-
21
No
v-2
1
Mar
-22
Jul-
22
No
v-2
2
Mar
-23
Jul-
23
No
v-2
3
Mar
-24
Jul-
24
No
v-2
4
Mar
-25
Jul-
25
No
v-2
5
Mar
-26
Do
llars
Per
Meg
awat
t-H
our
(2016 d
olla
rs)
Fiscal Year 2016 Columbia Generating Station Long Range Plan
Fiscal Year 2016 Columbia Generating Station Long Range Plan Adjusted For Past Experience
Onshore Wind Median With Tax Credits and Integration
Utility Scale Solar Median With Tax Credits and Integration
MCCULLOUGH RESEARCH
Replacing the Columbia Generating Station with Renewable Energy February 15, 2017 Page 28 ________________
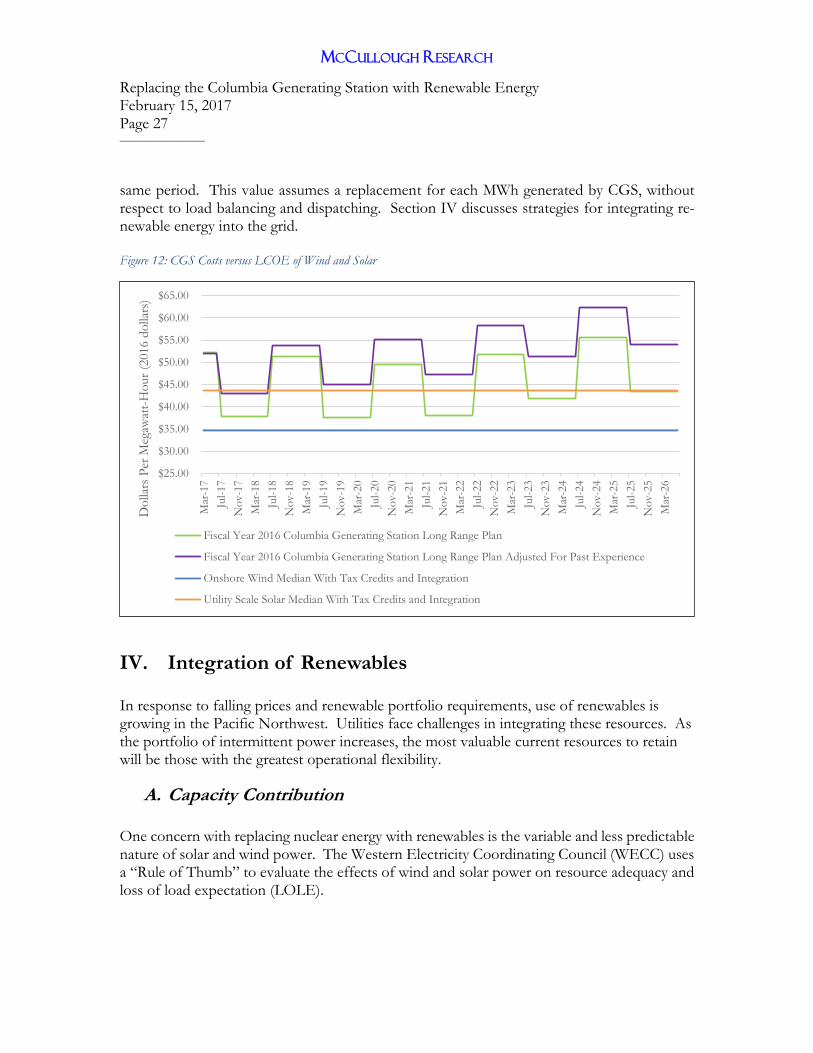
Michael Milligan of the NREL summarized capacity valuations across the WECC in a recent presentation for the agency.82 Figure 13: Milligan Presentation on WECC Rule of Thumb for Renewable Capacity Value
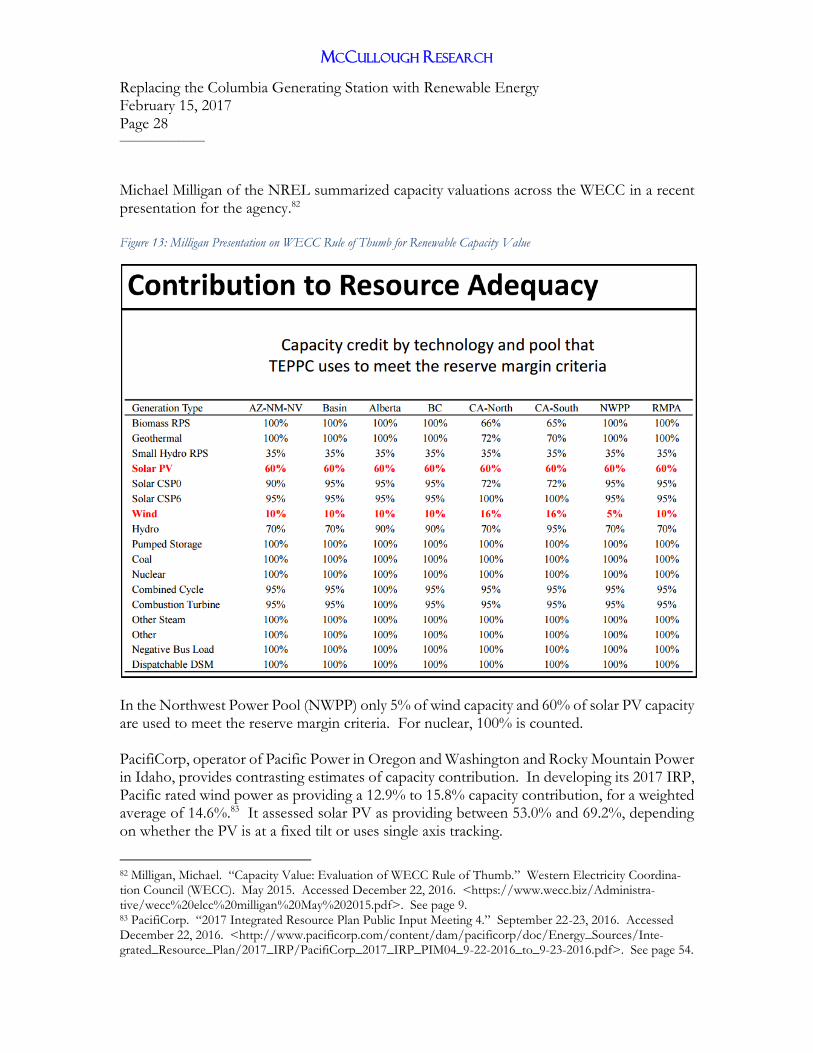
In the Northwest Power Pool (NWPP) only 5% of wind capacity and 60% of solar PV capacity are used to meet the reserve margin criteria. For nuclear, 100% is counted. PacifiCorp, operator of Pacific Power in Oregon and Washington and Rocky Mountain Power in Idaho, provides contrasting estimates of capacity contribution. In developing its 2017 IRP, Pacific rated wind power as providing a 12.9% to 15.8% capacity contribution, for a weighted average of 14.6%.83 It assessed solar PV as providing between 53.0% and 69.2%, depending on whether the PV is at a fixed tilt or uses single axis tracking.
82 Milligan, Michael. “Capacity Value: Evaluation of WECC Rule of Thumb.” Western Electricity Coordina-tion Council (WECC). May 2015. Accessed December 22, 2016. <https://www.wecc.biz/Administra-tive/wecc%20elcc%20milligan%20May%202015.pdf>. See page 9. 83 PacifiCorp. “2017 Integrated Resource Plan Public Input Meeting 4.” September 22-23, 2016. Accessed December 22, 2016. <http://www.pacificorp.com/content/dam/pacificorp/doc/Energy_Sources/Inte-grated_Resource_Plan/2017_IRP/PacifiCorp_2017_IRP_PIM04_9-22-2016_to_9-23-2016.pdf>. See page 54.
MCCULLOUGH RESEARCH
Replacing the Columbia Generating Station with Renewable Energy February 15, 2017 Page 29 ________________
Figure 14: PacifiCorp Study of Wind and Solar Capacity Contribution
These figures exceed the WECC estimates, which in comparison undervalue solar and wind resource capacity as experienced by Northwest utilities. In planning resources, Portland General Electric assesses the Effective Load Carrying Capa-bility (ELCC), which is the amount of incremental load that a resource can dependably and reliably serve.84 In its 2016 IRP, the company calculated marginal ELCC values for Pacific Northwest wind, Montana wind, and Central Oregon solar power. The marginal ELCC for the first 100 MW of Pacific Northwest wind is approximately 17%, a number that declines to nearly 7% at 600 MW of installation; the average for the 600 MW would be 11.3%.85 Solar power had a marginal ELCC of approximately 27% for the first 100 MW, declining to near 6% at the 600 MW mark; the average for the 600 MW would be 14.3%.86 The NERC 2016 Long-Term Reliability Assessment reports that the NWPP will exceed its reference margin level through 2026.87 Under the 2005 Energy Policy Act, NERC and its
84 Portland General Electric. “2016 Integrated Resource Plan.” November 15, 2016. Accessed January 25, 2017. <https://www.portlandgeneral.com/our-company/energy-strategy/resource-planning/integrated-re-source-planning>. 85 Ibid., page 127. 86 Ibid., page 127. 87 North American Electric Reliability Corporation (NERC). “2016 Long-Term Reliability Assessment.” De-cember 2016. Accessed February 2, 2017. <http://www.nerc.com/pa/RAPA/ra/Reliability%20Assessments%20DL/2016%20Long-Term%20Reliability%20Assessment.pdf>.
MCCULLOUGH RESEARCH
Replacing the Columbia Generating Station with Renewable Energy February 15, 2017 Page 30 ________________
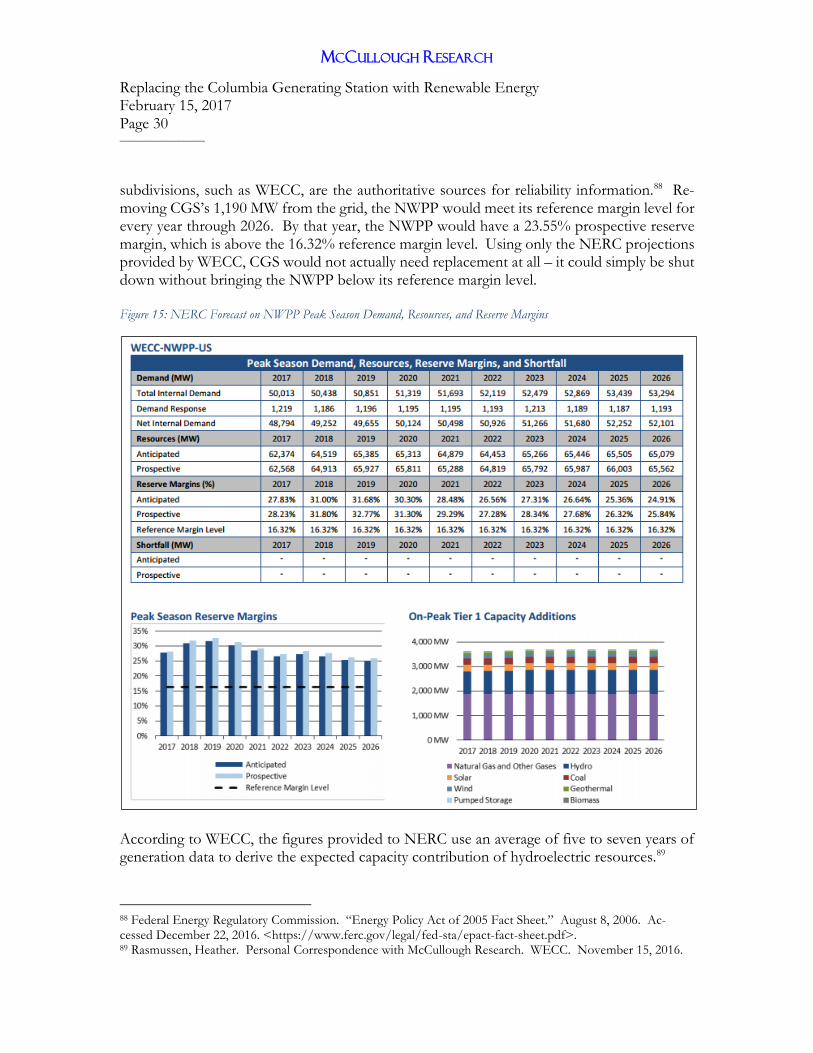
subdivisions, such as WECC, are the authoritative sources for reliability information.88 Re-moving CGS’s 1,190 MW from the grid, the NWPP would meet its reference margin level for every year through 2026. By that year, the NWPP would have a 23.55% prospective reserve margin, which is above the 16.32% reference margin level. Using only the NERC projections provided by WECC, CGS would not actually need replacement at all – it could simply be shut down without bringing the NWPP below its reference margin level. Figure 15: NERC Forecast on NWPP Peak Season Demand, Resources, and Reserve Margins
According to WECC, the figures provided to NERC use an average of five to seven years of generation data to derive the expected capacity contribution of hydroelectric resources.89
88 Federal Energy Regulatory Commission. “Energy Policy Act of 2005 Fact Sheet.” August 8, 2006. Ac-cessed December 22, 2016. <https://www.ferc.gov/legal/fed-sta/epact-fact-sheet.pdf>. 89 Rasmussen, Heather. Personal Correspondence with McCullough Research. WECC. November 15, 2016.

MCCULLOUGH RESEARCH
Replacing the Columbia Generating Station with Renewable Energy February 15, 2017 Page 31 ________________
More conservatively, other resource adequacy assessments base the expected hydroelectric generation and capacity on the 1937 water year, to account for worst-case critical water con-ditions. Those resource adequacy assessments do not project the same surpluses as the as-sessments by NERC. The Pacific Northwest Utilities Conference Committee (PNUCC), for example, projects increasing regional winter peak capacity deficits for the years 2017 through 2026.90 Figure 16: PNUCC Northwest Region Requirements and Resources – Winter Peak
Similarly, BPA uses the 1937 water year for its analysis, resulting in lower estimates of hydro-electric capacity. BPA’s White Book projects that by 2020 the region will have surplus capacity of only 908 MW in the month of January, which is the first time in its analysis that the region’s surplus would fall below 1,190 MW, the nameplate capacity of CGS.91 By the following year, 2021, BPA projects a capacity deficit in the month of January, at -911 MW.
90 Pacific Northwest Utilities Conference Committee (PNUCC). “Northwest Regional Forecast of Power Loads and Resources, 2017 through 2026.” April 2016. Accessed December 22, 2016. <http://www.pnucc.org/sites/default/files/file-uploads/2016%20NRF%20Final.pdf>. See page 12. 91 BPA. “2015 Pacific Northwest Loads and Resources Study.” January 2016. Accessed December 22, 2016. <https://www.bpa.gov/power/pgp/whitebook/2015/2015_WBK-TechnicalAppendixVol2-CapacityAnalysis.pdf>. See pages 347-357.

MCCULLOUGH RESEARCH
Replacing the Columbia Generating Station with Renewable Energy February 15, 2017 Page 32 ________________
However, based on BPA’s analysis, the region will still hold surplus capacity in other months during those years. These are times when CGS’s generation is less necessary; yet, because it is a baseload resource with must-run requirements, it continually runs during these times of ca-pacity surplus. Sections IV-B and IV-C discuss strategies to target capacity additions for the seasons with the highest resource need. Nevertheless, given the limited lifetime expectancy of CGS, discussed in Section II-B, it is most probable that the plant will close within the current ten-year planning horizon.
B. Load Shape
The variable timing of solar and wind power poses challenges for utilities. Solar power is in-herently intermittent; however, its daytime generation correlates with higher loads, which is an advantage. The challenges posed by wind intermittency are more complex. Columbia River Gorge wind speeds rise and fall rapidly as storm fronts pass, and during some periods of the year the wind blows more strongly at night. To address this issue, utility planning now favors flexible generation to balance loads. In a report on adapting the grid to variable resources, Jim Lazar of the Regulatory Assistance Project summarizes:
“Previously, the utility’s role was to procure a least-cost mix of baseload, in-termediate, and peaking power plants to serve a predictable load shape. To-day, utilities have to balance a combination of variable generation power sources, both central and distributed, together with dispatchable power sources, to meet a load that will be subject to influence and control through a combination of policies, pricing options, and programmatic offerings.”92
In light of this changing landscape, the inflexible baseload generation of CGS disadvantages the Northwest grid. This was the case for Diablo Canyon, as discussed in Section II, where operators found that the plant generated at times of the day when its energy was not needed. Lazar’s report recommends retirement of baseload resources with high off-peak must-run requirements.93 During some spring nights, CGS already poses problems with overgenera-tion, contributing to generation curtailment on BPA’s system.94
92 Lazar, Jim. “Teaching the ‘Duck’ to Fly, Second Edition.” Regulatory Assistance Project. February 2016. Accessed December 22, 2016. <http://www.raponline.org/wp-content/uploads/2016/05/rap-lazar-teach-ingtheduck2-2016-feb-2.pdf>. See page 6. 93 Ibid., page 43. 94 Hydroworld. “FERC approves formula for BPA curtailment of wind generation in favor of excess hydro.” October 24, 2014. Accessed January 26, 2017. <http://www.hydroworld.com/articles/2014/10/ferc-ap-proves-formula-for-bpa-curtailment-of-wind-generation-in-favor-of-excess-hydro.html>.

MCCULLOUGH RESEARCH
Replacing the Columbia Generating Station with Renewable Energy February 15, 2017 Page 33 ________________
Figure 17 shows BPA’s total generation and load for the period between July 6 and July 12, 2015.95 It indicates a rapid increase in wind generation on July 10, as thermal generation ramped down by almost 1,000 MW compared to the day prior, and hydroelectric generators allowed less water through turbines. CGS, which requires 12 hours of notice to power down to 85% power, cannot respond to rapid changes in generation or market prices.96 Figure 17: BPA Generation and Load, July 6-12, 2015
Storage in the natural gas and hydro systems, along with energy storage additions that may be considered, help manage these events efficiently and economically. Hydroelectric generators may let reservoirs fill to store potential energy, allowing other renewable sources like wind to generate. The Northwest Power and Conservation Council, in an August 2016 report, notes how a wind resource “can provide an effective system capacity that is greater than its name-plate capacity by generating during light load hours to replace hydroelectric generation. This increases the amount of water available during peak load hours, which can increase the hydro-electric system’s peaking capability.”97
95 BPA. “Wind Generation & Total Load in the BPA Balancing Authority.” Accessed December 22, 2016. <https://transmission.bpa.gov/business/operations/wind/>. 96 Ingersoll, D.T. et al. “Can Nuclear Power and Renewables be Friends?” Proceedings of the International Congress on Advances in Nuclear Power Plants (ICAPP). May 3-6, 2015. Accessed December 22, 2016. <http://www.nuscalepower.com/images/our_technology/NuScale-Integration-with-Renewa-bles_ICAPP15.pdf>. See page 2. 97 Fazio, John. “System Capacity Contribution of Montana Wind Resources.” August 2, 2016. Accessed De-cember 22, 2016. <http://www.nwcouncil.org/media/7150484/3.pdf>. See page 1.
0
1000
2000
3000
4000
5000
6000
7000
8000
9000
10000
MW
Total Wind Generation Total Load
Total Hydro Generation Total Thermal Generation

MCCULLOUGH RESEARCH
Replacing the Columbia Generating Station with Renewable Energy February 15, 2017 Page 34 ________________
Several larger-scale storage technologies continue to develop, including batteries, flywheel technology, and pumped storage hydro. In Washington, the 1,200 MW JD Pool Pumped Hydroelectric Project, if built, could be strategically surrounded by wind turbines to store and release energy at desirable times.98 Further load shaping strategies include demand response, control of electric water heaters to reduce peak demand, or conversion of air conditioning to ice storage.99 In the long run, these policies will be useful in balancing the grid with significant renewable generation at lowest cost. To address timing, Lazar suggests utilities prioritize developing renewable generation that meets peak loads.100 On a daily and a seasonal scale, this strategy will address the times of the day with the highest LOLE. Portland General Electric sees its highest LOLE in July, August, December, and January.101 The summer LOLE could be mitigated using solar resources, which generate the most dur-ing the summer months.
98 Roach, John. “For Storing Electricity, Utilities Are Turning to Pumped Hydro.” Yale Environment 360. November 24, 2015. Accessed December 22, 2016. <http://e360.yale.edu/feature/for_storing_electric-ity_utilities_are_turning_to_pumped_hydro/2934/>. 99 Lazar, Jim. “Teaching the ‘Duck’ to Fly, Second Edition.” Regulatory Assistance Project. February 2016. Accessed December 22, 2016. <http://www.raponline.org/wp-content/uploads/2016/05/rap-lazar-teach-ingtheduck2-2016-feb-2.pdf>. 100 Ibid., page 13. 101 Portland General Electric. “2016 Integrated Resource Plan.” November 15, 2016. Accessed January 25, 2017. <https://www.portlandgeneral.com/our-company/energy-strategy/resource-planning/integrated-re-source-planning>. See page 120.

MCCULLOUGH RESEARCH
Replacing the Columbia Generating Station with Renewable Energy February 15, 2017 Page 35 ________________
Figure 18: Portland General Electric Loss of Load Expectation (LOLE) Before Capacity Auctions for Year 2021
Similarly, PacificCorp notes how solar capacity contributions rise during summer months. July and August are two of the months with Pacific’s highest loss of load probability (LOLP).102 In developing its 2017 IRP, the company notes how LOLP have a “high coinci-dence with solar capacity factors.”
102 PacifiCorp. “2017 Integrated Resource Plan Public Input Meeting 4.” September 22-23, 2016. Accessed December 22, 2016. <http://www.pacificorp.com/content/dam/pacificorp/doc/Energy_Sources/Inte-grated_Resource_Plan/2017_IRP/PacifiCorp_2017_IRP_PIM04_9-22-2016_to_9-23-2016.pdf>. See pages 55-57.
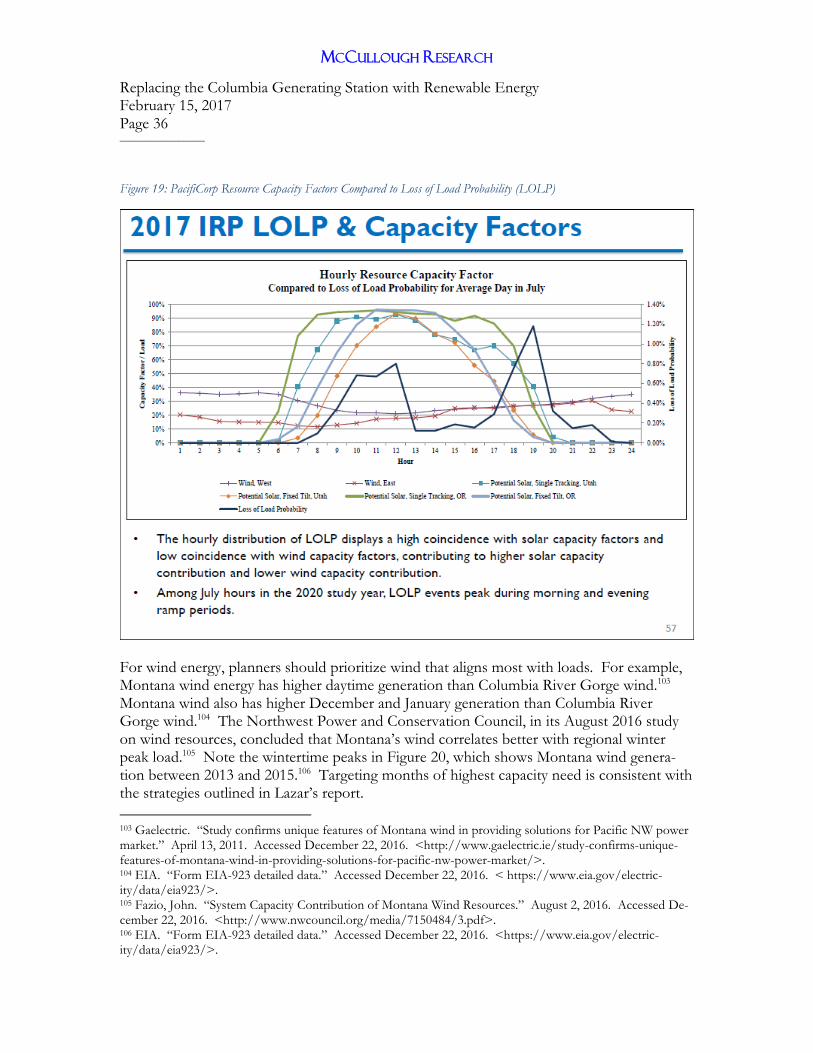
MCCULLOUGH RESEARCH
Replacing the Columbia Generating Station with Renewable Energy February 15, 2017 Page 36 ________________
Figure 19: PacifiCorp Resource Capacity Factors Compared to Loss of Load Probability (LOLP)
For wind energy, planners should prioritize wind that aligns most with loads. For example, Montana wind energy has higher daytime generation than Columbia River Gorge wind.103 Montana wind also has higher December and January generation than Columbia River Gorge wind.104 The Northwest Power and Conservation Council, in its August 2016 study on wind resources, concluded that Montana’s wind correlates better with regional winter peak load.105 Note the wintertime peaks in Figure 20, which shows Montana wind genera-tion between 2013 and 2015.106 Targeting months of highest capacity need is consistent with the strategies outlined in Lazar’s report.
103 Gaelectric. “Study confirms unique features of Montana wind in providing solutions for Pacific NW power market.” April 13, 2011. Accessed December 22, 2016. <http://www.gaelectric.ie/study-confirms-unique-features-of-montana-wind-in-providing-solutions-for-pacific-nw-power-market/>. 104 EIA. “Form EIA-923 detailed data.” Accessed December 22, 2016. < https://www.eia.gov/electric-ity/data/eia923/>. 105 Fazio, John. “System Capacity Contribution of Montana Wind Resources.” August 2, 2016. Accessed De-cember 22, 2016. <http://www.nwcouncil.org/media/7150484/3.pdf>. 106 EIA. “Form EIA-923 detailed data.” Accessed December 22, 2016. <https://www.eia.gov/electric-ity/data/eia923/>.

MCCULLOUGH RESEARCH
Replacing the Columbia Generating Station with Renewable Energy February 15, 2017 Page 37 ________________
Figure 20: Montana Wind Generation, 2013-2015
Much like a financial portfolio, diversifying the renewable resource mix on a geographical basis reduces the risk of intermittency. For solar and wind resources in WECC, EIA monthly generation data indicates the impact of increased technological and geographical di-versity. See Figure 21.107 Figure 21: WECC Renewable Generation: Nameplate Capacity and Standard Deviation of Energy Generation
107 Ibid.
0
50,000
100,000
150,000
200,000
250,000
300,000
MW
h
MT WND
-
5,000
10,000
15,000
20,000
25,000
30,000
35,000
-
200,000
400,000
600,000
800,000
1,000,000
1,200,000
1,400,000
1,600,000
1,800,000
2,000,000
2006 2007 2008 2009 2010 2011 2012 2013 2014 2015
Nam
epla
te C
apac
ity
(MW
)
En
ergy
Sta
nd
ard
Dev
iati
on
(M
Wh
)
Total MWh SD Total MW
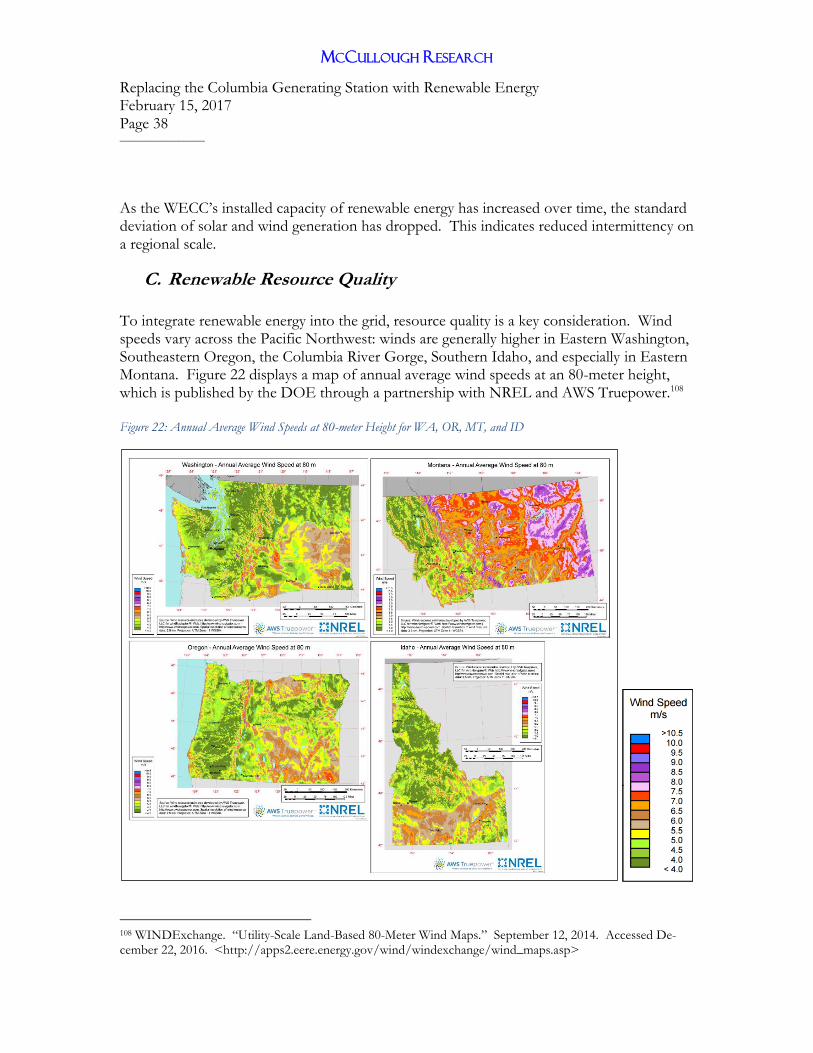
MCCULLOUGH RESEARCH
Replacing the Columbia Generating Station with Renewable Energy February 15, 2017 Page 38 ________________
As the WECC’s installed capacity of renewable energy has increased over time, the standard deviation of solar and wind generation has dropped. This indicates reduced intermittency on a regional scale.
C. Renewable Resource Quality
To integrate renewable energy into the grid, resource quality is a key consideration. Wind speeds vary across the Pacific Northwest: winds are generally higher in Eastern Washington, Southeastern Oregon, the Columbia River Gorge, Southern Idaho, and especially in Eastern Montana. Figure 22 displays a map of annual average wind speeds at an 80-meter height, which is published by the DOE through a partnership with NREL and AWS Truepower.108 Figure 22: Annual Average Wind Speeds at 80-meter Height for WA, OR, MT, and ID
108 WINDExchange. “Utility-Scale Land-Based 80-Meter Wind Maps.” September 12, 2014. Accessed De-cember 22, 2016. <http://apps2.eere.energy.gov/wind/windexchange/wind_maps.asp>
MCCULLOUGH RESEARCH
Replacing the Columbia Generating Station with Renewable Energy February 15, 2017 Page 39 ________________
Given high average wind speeds in Montana, strategic expansion of wind generation would be a boon to the greater region’s renewables footprint. Montana wind has high daytime and counter-seasonal generation, which contrasts with other Northwest areas such as the Colum-bia River Gorge.109 Harnessing this resource would allow wind to better match the region’s energy demand. Several high-profile wind installations are in development in Montana, such as the 300 MW Clearwater Energy project in Rosebud County, and the proposed 235 MW Jawbone project in Wheatland County.110,111 Even with Montana’s high potential wind generation, one major challenge is constrained transmission. Transmission capacity is often filled by conventional generation sources, leav-ing little room for new renewable generation.112 Still, as energy policy at the federal and state levels continues to require cleaner energy mixes, including Oregon’s 2016 legislation to pro-hibit use of out-of-state coal by 2030, coal plants have announced a string of closures, such as a partial shutdown of Montana’s 2,100 MW Colstrip coal plant.113,114 As these plants shut down, transmission lines will have greater room to transport energy generated from renewa-ble resources. Like wind energy, solar resources should also be thought out at the regional scale. While the Northwest is generally known for its rain and overcast skies, some areas have higher poten-tial solar generation. This is particularly true for Southern Idaho and Central to Southeast Oregon.115
109 Gaelectric. “Study confirms unique features of Montana wind in providing solutions for Pacific NW power market.” April 13, 2011. Accessed December 22, 2016. <http://www.gaelectric.ie/study-confirms-unique-features-of-montana-wind-in-providing-solutions-for-pacific-nw-power-market/>. 110 Lutey, Tom. “Montana's largest wind farm quietly develops northeast of Colstrip.” Billings Gazette. April 17, 2016. Accessed December 22, 2016. <http://billingsgazette.com/news/state-and-regional/mon-tana/montana-s-largest-wind-farm-quietly-develops-northeast-of-colstrip/article_35f5dee1-175c-57f6-b778-dd9054bb8238.html>. 111 Gaelectric. “North America Projects: Jawbone.” Accessed December 22, 2016. <http://www.gaelec-tric.ie/north-america-projects/jawbone/>. 112 Gray, Bryce. “New renewable energy projects may find opportunity in old transmission lines.” High Coun-try News. April 28, 2016. Accessed December 22, 2016. <http://www.hcn.org/articles/opportunity-for-re-newables-in-transmission-lines-wind-colstrip>. 113 Theriault, Denis C. “Kate Brown has signed Oregon's historic, contentious anti-coal bill.” The Oregonian. March 10, 2016. Accessed December 22, 2016. <http://www.oregonlive.com/politics/in-dex.ssf/2016/03/kate_brown_will_sign_contentio.html>. 114 The Associated Press. “Colstrip coal plant in Montana agrees to close 2 units.” The Olympian. July 12, 2016. Accessed December 22, 2016. <http://www.theolympian.com/news/local/article89173287.html>. 115 Bolinger, Mark and Seel, Joachim. “Utility-Scale Solar 2015: An Empirical Analysis of Project Cost, Perfor-mance, and Pricing Trends in the United States.” Lawrence Berkeley National Laboratory, U.S. Department of Energy. August 2016. Accessed December 20, 2016. <https://emp.lbl.gov/sites/all/files/lbnl-1006037_re-port.pdf>.

MCCULLOUGH RESEARCH
Replacing the Columbia Generating Station with Renewable Energy February 15, 2017 Page 40 ________________
Figure 23: Pacific Northwest Solar Resource Quality
Again, a major challenge with siting solar power in Southeastern Oregon and Southern Idaho is transmission. However, as solar prices continue to drop, solar facilities will provide competitively priced power when located near existing power plants, including CGS, regard-less of annual solar potential. This would obviate transmission issues due to better access to existing power lines. Idaho has significantly expanded its solar energy capacity, having signed contracts for 461 MW of power in 2015.116 Meanwhile, a 50 MW installation is underway in Malheur County, OR.117 As costs continue to decrease, this area could expect to see more development in the future.118
116 Idaho Power. “Connections.” March 2015. Accessed December 22, 2016. <https://www.ida-hopower.com/pdfs/NewsCommunity/news/customerConnection/201503.pdf>. See page 2. 117 Meyer, Larry. “Solar farms being built.” The Argus Observer. April 8, 2016. Accessed December 22, 2016. <http://www.argusobserver.com/news/solar-farms-being-built/article_f2be1394-fdad-11e5-9611-93572daf65df.html>. 118 Jensen, Peter. “Congress renews tax incentive for solar energy.” Idaho Mountain Express. December 25, 2015. Accessed December 22, 2016. <http://www.mtexpress.com/news/environment/congress-renews-tax-incentive-for-solar-energy/article_3bd7862a-aa87-11e5-b8a6-4b2c7da81e6a.html>.

MCCULLOUGH RESEARCH
Replacing the Columbia Generating Station with Renewable Energy February 15, 2017 Page 41 ________________
At a regional level, the BPA Interconnection Queue is a strong indicator of the market’s read-iness to transition to renewable electricity.119 Of the transmission service requests processed since 2011, there are 3,020 MW of solar resources in queue and 2,766 MW of wind resources in queue. Both of those resources are comparable to the natural gas requests, which total 2,902 MW of capacity. Transmission requests for renewables are nearly double natural gas requests.
Figure 24: BPA Transmission Service Requests by Technology
While not all of these resources will be built, it is a strong sign of the shift in the market and the availability of cost effective alternatives. There is compelling evidence that sufficient re-newable resources are available to replace the energy from CGS at lower cost. Careful selec-tion will limit the challenge and cost of integrating these variable resources.
V. Conclusion When PG&E surveyed its options for maintaining or replacing Diablo Canyon, it found that an old, expensive nuclear plant was no longer competitive. Cheaper renewable technologies were available, and the inflexible generation of Diablo Canyon did not meet customers’ needs. The same appears to be true for CGS. The plant has not been competitive with the market
119 BPA. “Interconnection Request Queue.” Accessed December 22, 2016. <https://www.bpa.gov/transmis-sion/doing%20business/interconnection/pages/default.aspx>.
0
1000
2000
3000
4000
5000
6000
7000
2011 2012 2013 2014 2015 2016
Meg
awat
ts i
n Q
ueu
e
Year
Wind
Wave
Solar
Natural Gas
Hydro
Geothermal
Energy Storage
Combined cycle
Biofueled

MCCULLOUGH RESEARCH
Replacing the Columbia Generating Station with Renewable Energy February 15, 2017 Page 42 ________________
since 2008, and projections suggest it will not be competitive with the Mid-C market or re-newables for much of its remaining useful life. Energy Northwest has justified the continued operation of CGS based on unusually high projections of future natural gas prices. Given the extensive documentation of the falling cost of renewable resources, it is highly probable that a zero-carbon option will be less costly than CGS, and a near certainty that a combination of energy efficiency, demand management, market purchases, and renewable ac-quisitions will be the less expensive, lower risk option. McCullough Research calculates that the net present value benefit of replacing CGS with a solar and wind portfolio is between $261.2 and $530.7 million over the period March 2017 through June 2026. Our review indicates that CGS could be closed as soon as the planned refueling outage in May 2017, yielding significant savings to Northwest ratepayers. If it is believed for the purpose of maintaining prudent reserves that CGS’s power must be replaced, we advise that BPA issue an RFP to assess whether Energy Northwest can replace CGS with carbon-free resources, beginning as early as the following refueling outage in May 2019. If the bids come in below the cost of operating CGS, BPA may choose to replace CGS at lower cost and risk, as this analysis suggests.

MCCULLOUGH RESEARCH
Replacing the Columbia Generating Station with Renewable Energy February 15, 2017 Page 43 ________________
Appendix A. Life expectancy of the Columbia Generating Sta-tion In June 2015, McCullough Research wrote in Public Utilities Fortnightly about the longevity of nuclear reactors using a demographic model of the world’s nuclear plants. The article ques-tioned recent claims that aging reactors could continue operating to an age of sixty years, as was stated by Matthew Wald in the New York Times in late 2014.120 More recently, in response to President Obama’s Clean Power Plan, CNBC reported that many utilities are preparing bids to extend the operating licenses of nuclear plants for up to eighty years.121 Few thermal power plants last sixty to eighty years, and nuclear facilities face unique heat and radiation stresses not present in other generating stations. The question of the lifespan of these resources is now highly pertinent given the slew of announced retirements, as well as subsidies to prevent plant closures, across the country. In light of the announced closures, and given that CGS now has an age of 32 years, the McCullough Research demographic model was updated. In December 2016, Exelon prevented the early retirement of its Clinton and Quad Cities nu-clear plants after Illinois Governor Bruce Rauner signed a bill that will provide $235 million per year in ratepayer subsidies to keep the plants running for ten years.122 New York recently agreed to provide nearly $500 million a year in nuclear subsidies to prevent the shutdown of reactors across the state for up to 13 years.123 The most recent plants to schedule retirement are the Palisades Nuclear Plant in Michigan, which will begin decommission in 2018, and In-dian Point in New York, which will close by 2021.124,125
120 Wald, Matthew. “E.P.A. Wrestles with Role of Nuclear Plants in Carbon Emission Rules.” The New York Times. December 25, 2014, P. B3. Accessed December 22, 2016. <http://www.ny-times.com/2014/12/26/business/energy-environment/epa-wrestles-with-role-of-nuclear-plants-in-carbon-emission-rules-.html>. 121 Mullaney, Tim. “No more nukes? How about another 80 years of them.” CNBC. July 16, 2015. Accessed December 22, 2016. <http://www.cnbc.com/2015/07/16/no-more-nukes-how-about-another-80-years-of-them.html>. 122 Maloney, Peter. “Updated: Illinois Gov. Rauner signs Exelon nuclear legislation.” Utility Dive. December 7, 2016. Accessed December 29, 2016. <http://www.utilitydive.com/news/updated-illinois-gov-rauner-signs-exelon-nuclear-legislation/431803/>. 123 McGeehan, Patrick. “New York State Aiding Nuclear Plants with Millions in Subsidies.” New York Times. August 1, 2016. Accessed December 22, 2016. <http://www.nytimes.com/2016/08/02/nyregion/new-york-state-aiding-nuclear-plants-with-millions-in-subsidies.html>. 124 Lersten, Andrew. “Palisades to close in 2018.” The Herald Palladium. December 9, 2016. Accessed De-cember 29, 2016. <http://www.heraldpalladium.com/news/local/palisades-to-close-in/article_a2d368a7-30c7-593d-9c6d-e5ca61da195c.html>. 125 Lee, Vivian; McGeehan, Patrick. “Indian Point Nuclear Power Plant to Close by 2021.” New York Times. January 6, 2017. Accessed January 6, 2017. <http://www.nytimes.com/2017/01/06/nyregion/indian-point-nuclear-power-plant-shutdown.html>.

MCCULLOUGH RESEARCH
Replacing the Columbia Generating Station with Renewable Energy February 15, 2017 Page 44 ________________
Table 5 lists the recent and announced nuclear power plant closures.126 Table 5: Recent and Announced Nuclear Plant Closures
Year Name State
2013 Crystal River 3 Florida
2013 San Onofre 2 California
2013 San Onofre 3 California
2013 Kewaunee Wisconsin
2014 Vermont Yankee Vermont
2016 Fort Calhoun Nebraska
2018 Palisades Michigan
2019 Pilgrim Massachusetts
2019 Oyster Creek New Jersey
2020 Indian Point 2 New York
2021 Indian Point 3 New York
2024 Diablo Canyon 1 California
2025 Diablo Canyon 2 California
The recent trend in plant closures has been chiefly for economic reasons – plants cannot compete with the low marginal cost of natural gas and renewable units. Entergy, the operator for Palisades, Pilgrim, and Indian Point, for example, cites low current and projected wholesale energy prices as reasons for closing these plants, along with its earlier closure of Vermont Yankee. These plants have undoubtedly reached the end of their economic lifespans – but the persistent calls for nuclear subsidies are cause to consider their theoretical technological lifespans. The world’s oldest operating nuclear reactor, located in Döttingen, Switzerland, is 47 years old.127 The oldest U.S. reactor is Oyster Creek, also at 47 years old, and is scheduled to shut down by 2019. R.E. Ginna and Nine Mile Point Unit 1, both in New York, are also 47 years of age. The International Atomic Energy Agency (IAEA) provides statistics on the age of the world’s nuclear reactors.128
126 Plumer, Brad. “California is on the verge of closing its last nuclear plant. Is that really a good idea?” Vox. June 21, 2016. Accessed December 22, 2016. <http://www.vox.com/2016/6/21/11989030/diablo-canyon-nuclear-close>. 127 International Atomic Energy Agency (IAEA). “Operational Reactors by Age.” Power Reactor Information System. Accessed December 22, 2016. <http://www.iaea.org/PRIS/WorldStatistics/OperationalByAge.aspx>. 128 IAEA. “Operational Reactors by Age.” Power Reactor Information System. Accessed December 22, 2016. <http://www.iaea.org/PRIS/WorldStatistics/OperationalByAge.aspx>.

MCCULLOUGH RESEARCH
Replacing the Columbia Generating Station with Renewable Energy February 15, 2017 Page 45 ________________
Figure 25: Age Distribution of the World’s Nuclear Reactors
The 2016 IAEA annual reference on nuclear power catalogues the reasons for which nuclear reactors have closed in the past.129 Of the 123 nuclear reactors that have decommissioned, the majority simply reached the end of their economic or technological lifespan.
129 IAEA. “Nuclear Power Reactors in the World 2016 Edition,” IAEA Scientific and Technical Publications, May 2016. <http://www-pub.iaea.org/books/IAEABooks/11079/Nuclear-Power-Reactors-in-the-World>. Ac-cessed December 22, 2016. See Table 17, “Reactors in decommissioning process or decommissioned,” which reports decommissioned reactors as of December 31, 2015. This does not include reactors in long term shut-down, which is found in Table 15.

MCCULLOUGH RESEARCH
Replacing the Columbia Generating Station with Renewable Energy February 15, 2017 Page 46 ________________
Figure 26: Reasons for Nuclear Plant Closures
The industry does not have a standard methodology to determine the remaining lifetime of a given nuclear plant still in operation. Most assume that the existing Nuclear Regulatory Com-mission (NRC) license constitutes a prediction of the expected lifetime. While it is true that nuclear plants in the U.S. cannot operate without an NRC license, licensure does not guarantee operability. Most nuclear reactors that have permanently shut down have done so before their licenses expired. New Jersey’s Oyster Creek, for example, is licensed to operate through 2029 but is scheduled to close in 2019.130 The model we chose for estimating the life expectancy of reactors follows the methods for human demographic estimates: The primary determinant of life expectancy is the survival rate for a specific cohort.
130 The Associated Press. “Oyster Creek nuclear plant to close down 10 years earlier than planned.” NJ.com. December 8, 2010. Accessed December 22, 2016. <http://www.nj.com/news/index.ssf/2010/12/oys-ter_creek_nuclear_plant_to_1.html>.
The technology or process being used became obsolete
8%
The process was no longer profitable
22%
Changes in licensing requirements
5%
After an operating incident
4%
Other technological reasons
8%Other economical
reasons11%
Public acceptance or political reasons
12%
After major component failure or
deterioration11%
Other reasons19%

MCCULLOUGH RESEARCH
Replacing the Columbia Generating Station with Renewable Energy February 15, 2017 Page 47 ________________
Figure 27: Nuclear Plant Chance of Closure by Age
The data come from Tables 14 through 17 of the IAEA’s annual reference on the world’s nuclear reactors, which was published in May 2016, and then updated to reflect more recently announced retirements. See Figure 27. A standard life table from demographic analysis for the world’s nuclear reactors is shown in Table 6. Table 6: Demographic Table for World’s Nuclear Reactors
y = 0.0124e0.0644x
0.00%
10.00%
20.00%
30.00%
40.00%
50.00%
60.00%
70.00%
80.00%
90.00%
100.00%
0 10 20 30 40 50 60 70
Ch
ance
of
Clo
sure
Five Year Cohort

MCCULLOUGH RESEARCH
Replacing the Columbia Generating Station with Renewable Energy February 15, 2017 Page 48 ________________
Like standard demographic tables, the chance of mortality increases with age. The cumulative survival rate is the product of survival rates for the current cohort and earlier cohorts. Thus, for the 36-40-year cohort, approximately 41% of all reactors have closed, which is determined by adding all of the entries in the column “Probability of retirement…” for all cohorts begin-ning with 0-5 years and ending with 36-40. An estimated value has been used for the cohorts from ages 51 through 65, based on the equation in the graph “Nuclear Plant Chance of Closure by Age.” The pessimistic survival rate in the 51-55 cohort reflects the fact that no nuclear plants have stayed in operation past 50 years. Since the 2015 analysis, the expected lifespan of nuclear reactors has decreased markedly, es-pecially for older plants. Table 7: Expected Lifespan of a Nuclear Plant
Age (years)
2015 analysis: Expectation of future years of plant opera-tion at age x
2016 analysis: Expectation of future years of plant oper-ation at age x
Change in lifespan since 2015 analysis
0-5 33.3 31.9 -1.43
6-10 29.3 29.3 -0.05
11-15 25.2 24.9 -0.31
16-20 21.0 20.8 -0.15
21-25 16.8 16.4 -0.38
26-30 12.8 12.6 -0.20
31-35 11.8 9.6 -2.20
36-40 10.3 8.3 -2.00
41-45 8.7 5.5 -3.22
45-50 6.7 4.1 -2.61
Using the expected lifespans in the demographic table, the operable lifetime of a given nuclear plant may be estimated. The expected future operable years for CGS, which is 32 years old, is approximately 9.6 years, whereas the expected number of years for the R.E. Ginna Power Station (Ontario, NY), which is 47 years old, is just over four years. This analysis has important policy implications. Subsidizing a plant near the end of its prob-able lifespan is a doubtful investment. If subsidies are required, they should be prioritized for the plants most likely to continue operating and providing benefits in the long-term.