Embed Size (px)
Citation preview

International Journal of Education, Learning and Development
Vol.4, No.5, pp.48-76, June 2016
___Published by European Centre for Research Training and Development UK (www.eajournals.org)
48 SSN 2054-6297(Print), ISSN 2054-6300(Online
The Education Reform in Morocco through the Emergency Plan (2009-2012) And Its
Impact on Schooling
Mohammed Elazami Elhassani1, Anouar Alami2*, Moncef Zaki3, Mohammed Faoubar4
and Btissame Haouzi5
1Assistant Professor of Education Regional Centre of Training and Education (CRMEF), Fez-
Meknes Region (Morocco) 2Professor of Organic Chemistry (Organic Chemistry Lab (LCO)), Interdisciplanary
Laboratory of Research in Didactics of Sciences and Technology, Faculty of Sciences Dhar
El Mahraz –Sidi Mohammed Ben Abdellah University, Fez, (Morocco) 3Professor of Mathematics, Department of Mathematics, Interdisciplanary Laboratory of
Research in Didactics of Sciences and Technology, Sidi Mohammed Ben Abdellah
University, Faculty of Sciences Dhar El Mahraz –, Fez, (Morocco) 4Professor of Sociology, Sociology Department, Laboratory of Social Development, Sidi
Mohamed Ben Abdellah University, Faculty of Arts and Humanities Dhar El Mahraz, Fez
(Morocco) 4BS. Consulting, Fez (Morocco)
ABSTRACT: The study analyzes the situation of education since the implementation of the
educational reforms in 1999, by focusing on the National Chart for Education and on
different programs undertaken to activate the reform process for better schooling and social
equity among all. The study aims to see how far these goals were achieved, the reasons
behind the reform’s fall (2000-2009), in addition to the general overview of the education
system in Morocco after the Emergency Plan. The following study focuses on analyzing the
educational system in Morocco during and after the Emergency Plan period, especially at
first through monitoring schooling ratios in Primary, Elementary and secondary cycles,
secondly, identifying some schooling quality indicators and thirdly analyzing the profitability
ratios on one hand and school drop out on the other hand, in order to evaluate the
effectiveness of the educational system and the approved reforms. Summary of results is
improved both quantitative indicators during the years of the completion of the emergency
plan and after the implementation of the program, especially in primary and secondary wire
and to a lesser degree in secondary qualifying wire, have reached enrollment rates in
primary education, 99% and above in the total urban and rural areas and 98% in rural areas
the two mediums reached 100% in urban areas, and exceeded enrollment ratios Balaaadada
85% total of the two mediums urban and village did this ratio exceeds 66% in rural areas,
and approached alerted schooling Baltohela than 60%, as recorded 58.5% total of the two
mediums, but the rest of schooling in this corps world rates Karoui very low with an 27% e.
but despite this national effort to the day the qualitative indicators are all, or almost, in a
recession or collapse.
KEYWORDS: Emergency Plan, Schooling Indicators, Vocational Education, Schooling
Ratios, School Drop Out.

International Journal of Education, Learning and Development
Vol.4, No.5, pp.48-76, June 2016
___Published by European Centre for Research Training and Development UK (www.eajournals.org)
49 SSN 2054-6297(Print), ISSN 2054-6300(Online
INTRODUCTION
The Educational System in Morocco has undergone many reforms. Since 1999, the referential
text of the National Chart for Education & Training, has been launched , which is considered
as the political and pedagogical framework to reform the school system and the informal
trainings as well, and due to the lack of the official reform of 1985 to achieve the desired
goal, especially at generalizing schooling, adjusting people with the changing social work
dispatching and solving the school languages issue, in addition to training teachers and
reforming the administration. For all these reasons, it seems necessary for educators to set a
new reform in mid nineties with the objective to fix the errors that resulted from the previous
reform plan of 1985. So, what is the new Reform?
The education reform in Morocco is a project that has been mainly under the guidance of
foreign political and economic forces. The World Bank, for example has written a report on
education and training in the twenty first century in Morocco in 1995, in which it outlines the
difficulties and weaknesses of the Moroccan schooling system. The report also called for a
reform and a more productive system able to sustain social development, and especially
fighting illiteracy, the lack of pedagogical content, the absence of qualified people, school
drop outs and the adjustment of schooling with the rapid changes in technology.
The intervention of the World Bank doesn’t only involve diagnosis and guidance (World
Bank report, 1995); it goes beyond to a more political control through financing these reform
projects. Therefore, it is necessary to study the effects of foreign dynamics on the current
educational reform knowing that it goes in parallel with the evolution of the Moroccan
society: even with the increase of the schooling demand, the integration of teachers, the
results remain unsatisfying due to a crowded schooling system, and also to unqualifying
students and their ability to get jobs. The increase of unemployment is far from the goals
stated by the Development of Human Capital and those of the schooling system ا
(HAMDAOUI, J., 2006). Thus, it is necessary to review all the mechanisms of counseling,
knowledge and teaching methods, with the emphasis on the planning methods, experience
and the acquisition of knowledge and skills by those involved. We have to look at our
educational system in the context of a comprehensive system aiming for the future and able
to achieve more results according to social, cultural and technological changes (National
committee on educational affairs, 1996, p123).
In the same context, the new educational reform reflected the opening of the government to
political forces within the society. The Constitution of 1992 and 1997 has been reviewed to
include the expansion of the government and parliament powers. Thus, and based on free and
fair elections, the achievements done on Human Rights, the need to have a political
alternative of power (ELRHAZI 0.2001) seems appropriate. An alternative Government has
been formed on March 18th, 1998 in which the National Chart for Education & Training has
been consented between the Government and the Opposition to reform the schooling system
in Morocco.
The Theorical context
If all these factors have contributed to implement a New Educational Reform, what are the
main characteristics?

International Journal of Education, Learning and Development
Vol.4, No.5, pp.48-76, June 2016
___Published by European Centre for Research Training and Development UK (www.eajournals.org)
50 SSN 2054-6297(Print), ISSN 2054-6300(Online
- Characteristics:
A. Compatibility: the Government has implemented the New Reform of 1985 called the
Primary Education System, which didn’t involve the political and civil parties. The New
Reform in the opposite was characterized from the beginning and under the World Bank
guidance by having all the political and unions represented in the Parliament with some of
the educational, religious and social actors forming a committee of 350 members. The
Government rebutted the results and started a new committee called (the National
Committee on Educational Affairs, 1996, p.127) in reference to a letter addressed by the
King on March 8th, 1999. The new Committee which members represented all the
political, unionists, scientific and religious actors, envisioned a new educational system
capable of alleviating challenges of the Millennium by adopting a clear and structured
methodology based on individual and group efforts, interactive listening, responsible and
open dialogue to build the future and achieve a maximum result (MEZIANE BELFKIH,
2002).
Even though we noticed compatibility among political actors to participate in the
implementation of a new education reform, we can tell that it didn’t involve all the actors
of civil society. As limited as it is, the positive goal of this consensus consists on the fact
all the actors have contributed on unifying views on the principles and main foundations
of the New Reform. To be part of this reform, teachers, educators and administrators have
to be involved in order to be successful (BERDOUZI, 2000, p.14).
So it was noted that the interest of these groups by the new reform is much stronger than
the one for the former reform 1985, and that their willingness to be involved is growing
more.
Some forms of the new reform have been implemented such as improving male and
female educators’ financial conditions, generalizing and supporting schooling, and
redesigning curriculums and school manuals.
B. Mode: the most distinctive characteristics of the new reform is its comprehensive
approach, it’s not about one component as updating a department, or reviewing a course
in elementary or secondary school, or integrating a specific educational program, on the
opposite, it’s an ambitious reform project which main goal is to restructure the
educational system.
Therefore, the National Chart includes two main components: a section containing basic
principles, which is constituted of main goals, principles, rights and duties of partners, a
national effort to make this project a success. The second section of the chart contains six
areas divided to nineteen supporting pillars. Despite the confusion between the concept of
the reform and the changes mentioned in the National Chart, the areas of the reform,
(The Kingdom of Morocco, National Charter for Education and Training, 1999) are:
The first area: the spread of education and linking it to its economic environment
The second area: the pedagogical strategy
The third area: the increase of the quality of education and training.
Fourth area: the focus on Human Resources, training, evaluation of recruitment
and incentives policies.
Fifth Domain: management.
Sixth field: Partnership and financing.

International Journal of Education, Learning and Development
Vol.4, No.5, pp.48-76, June 2016
___Published by European Centre for Research Training and Development UK (www.eajournals.org)
51 SSN 2054-6297(Print), ISSN 2054-6300(Online
If the six areas were arranged vertically to make education for everyone, then working
transversally remains the only condition to avoid selectivity when applying the National
Chart.
The National committee working on education issues as listed on the final report of the
chart (1995) was clear and more democratic in discussing the main principles of the
education system reform through two characteristics:
A clear statement on equal educational offers and linking "democratization of
education and the democratization of society politically, socially and culturally”.
(National Committee on Educational Affairs, 1996, p.126).
A precise identification of the desired development.
Link planning with the development of economical and social infrastructures
(National Committee on Educational Affairs, 1996, p.124).
The New National Chart of 1999 doesn’t use the concept of development to reform the
education system and build the society culturally and socio economically; instead it uses
the concept of renaissance in an ideological perspective reconciling tradition and
modernity, meaning that the real change has to be part of an overall development of the
country (article 4). The same text mentions the economic growth instead of the concept
“development” (article 5), based on the idea that economic growth starts with a good
mastery of technology and sciences, and that will help Morocco be among developed
countries in terms of the role of technology and sciences in any economic development.
The concept of “development” is only mentioned in article 10, as the university becomes
the main driving force to development, by insisting on its scientific aspect from a
technical perspective rather than political; social or economic side.
The ability to achieve and apply the 19th pillars of the reform requires a strong national
and political management from the government and from all the political and societal
actors. Thus, an effective strategy that allows finding creative solutions and measures
capable of processing the articles in the chart into reality. Such reform raises multiple
questions about whether the government and society are able to fund and structure this
reform. Especially, since the decentralization adopted in the Chart is derived from
administrative and territorial decentralization, which are still very limited, and at last the
willingness to review and monitor public funds management and legislation mechanisms.
C. Application: the evolution in the application of the National Chart of Education &
Training is mostly linked to adopting an effective educational strategy represented by
elite who adheres to the reform and development objectives. This strategy is considered
as a "set of principles and standards that govern the education sector Activity”, guide its
movement within multiples interactions with others institutions and control decision
making operations and its application.” MAHMOUD MOUHAMED, 2010).
Therefore, with the approval of the Parliament since 2001, a series of laws were passed
for Primary Education, Private education, exams and Human Resources…this effort
wasn’t enough, because the main goals of the reform consist on facing the bureaucratic
resistance especially from administrative leaders – the decision makers, and insisting on a
more selective and partial approach used for political, self interest, or on legal ways to
apply the reform. The same case was emphasized by the researcher MOHAMMED
BERDOUZI through two aspects: the simulated and the sectorial considered both as two

International Journal of Education, Learning and Development
Vol.4, No.5, pp.48-76, June 2016
___Published by European Centre for Research Training and Development UK (www.eajournals.org)
52 SSN 2054-6297(Print), ISSN 2054-6300(Online
contradictory phenomenons to enforce reform (BERDOUZI, 2010, p 10 – 12 – 13). The
financing is another factor to implement the reform, because it can slower its execution.
A continuous effort is noted to convert the chart into laws, decrees and regulatory
decisions that match the main chart. Thus, these laws must translate the reform’s
objectives, be open to reviews and respect the deadlines imposed by the chart. To do so,
the leaders have to be replaced, which can’t be done because they still control the
educational system especially at the headquarters.
The transition phase is what the Ministry of Education is using to justify the difficulties of
transitioning from what we have to new reforms and how to implement them. Despite the
lack of resources, there is a common elitist reasoning that aims to control the application
of the reforms.( The Kingdom of Morocco, A Guide Legislative and Regulatory Texts,
2002 -1998).
- It should be noted that the issuance of such laws, decrees and decisions is not enough.
There are more announcements that have been made. However it’s necessary to choose
the best ways to implement and provide the conditions to execute these laws. Other
reference and orientation documents also tackled some of the components related to
education and were considered as the white Book which is stated as a reference to
programs review, manuals, student guide, and school books manuals etc...(The Kingdom
of Morocco, White Book, 2002).
There is no doubt that the conversion of the National educational Chart into applicable
laws and procedures within various areas of the schooling system from 2009-2000,
requires the participation of a selected members capable of implementing an educational
policy based on good planning, organization, funding, evaluation and review.
The whole project has known some confusion and slowdown despite the announcement
done to consider 2005 as an important station for the implementation of the requirements
of National Education Chart (The Kingdom of Morocco, The Strategic Framework for the
Development of the Educational System, 2005).
The challenge set by the Government to accept financial and technical support from
foreign parties such as The World Bank to set an educational strategy plan, and then the
development of a strategic framework through the activation of an intermediate plan, and
the Canadian support PROCADEM since 2006 has led to reinforce the institutional
capacities of the educational system and activate the decentralization by focusing on
communication, and participative management.
The administrative staff has benefited from this support at the headquarter, regionally and
locally. At the end of the decade, it seems clear that the implementation of the reform has
to start from an educational strategy based on selection and experiments, knowing that the
desired results haven’t been achieved yet as stated in the chart, in Primary education,
informal schooling, school tutoring, drop out, curriculums, languages, evaluation systems
and setting a decentralized strategy.
The whole reform process didn’t have a clear and consistent strategy especially at finding
a way to implement the reform. The 2005 strategic plan supported by the World Bank as
mentioned earlier hasn’t been executed and the Ministry of education couldn’t clarify the
reasons why. In addition, we note a split in roles between the state which is represented

International Journal of Education, Learning and Development
Vol.4, No.5, pp.48-76, June 2016
___Published by European Centre for Research Training and Development UK (www.eajournals.org)
53 SSN 2054-6297(Print), ISSN 2054-6300(Online
by the Higher Commission for Education (2006) and the Government which is the
executive member of the reform. Thus, the statistics announced by the Higher
Commission for Education in her 2008 annual report, reflected a poor result compared to
the objectives and the administrative and financial efforts intended to implement the
reform.
So, it becomes clear that both the school and the university couldn’t fulfill their
responsibilities at best, which is translated by a poor ratio of the system’s internal
profitability", the increase of non attendance to schools and the lack of capacity learning
of students(...) and despite the high spending in education, the educational system
couldn’t achieve the desired results (Supreme Education Council, 2008).
The Higher Education Council in his 2008 annual report stated that if the net percentage
of schooling in Primary education reached 94% in 2007, The National Education, in 2007
showed only 50% of students who were capable of continuing their education up to
secondary. For example, in the 2006 -2007 school year, about 80 000 students
discontinued their school for reasons other than expulsion or failure.
Based on the above indicators, the report showed the poor results of the reform and the
lack to implement it. This pushes the government to set a procedural approach program to
get through this crisis and then the elaboration of the Emergency program 2009 -2012.
Since 2003, many national, Arab and international reports shed the light on this new
educational system in Morocco. We will explain in detail the results of these reports and
their content.
The World Bank Report «the undertaken Path. The Education Reform in the Middle
East and North Africa
There are three components of the reform:
1- sculpt and design the framework that guarantee a right use of it
2- offer incentives to improve performance
3- public auditing to ensure that education is a public affair and serve the people
‘interest.
The report indicates that those countries concerned are to change their educational
systems to decrease unemployment and improve schooling, and are in need to various
methods such as design, motivation and incentives and social responsibility mechanisms.
Those systems if implemented have to change the relationship between the labor market
and the training according to the report. only three countries ( Jordan, Tunisia, Lebanon)
have achieved an improvement in education and especially for educators, compared to
other countries like Morocco, Algeria who use archaic systems ( the World Bank, Report
on Education in the Middle East and North Africa, 2008, p.11-12). The report also asks
those countries to implement a reform in education and technology set in a highly
competitive way, and involving young adults with high qualifications.
The report presents an indicator for results of fourteen countries including achievements
done in terms of accessing schools, quality of education in the first three periods.

International Journal of Education, Learning and Development
Vol.4, No.5, pp.48-76, June 2016
___Published by European Centre for Research Training and Development UK (www.eajournals.org)
54 SSN 2054-6297(Print), ISSN 2054-6300(Online
According to the general indicator, Jordan comes first after Kuwait, then Tunisia in the
Seventh place, while Morocco was ranked 11th. ( the World Bank, Report on Education
Reform in the Middle East and North Africa, 2008, p.17).
D. The Emergency Plan: a new way of a reform
The Emergency Plan is far from being a new reform of education, its a strategic
procedure issued from different areas of the reform as stated in the National Chart of
Education and Training. The first area which is the effective enforcement of schooling as
cited in article 24-30. The second area concerns empowering initiatives and excellence in
article 122- 123-124. The third area talks about the horizontal problematic of the
educational system as mentioned in article 134-135-136 and 144-145-146-147-148. The
fourth area which concerns the tools and mechanisms to achieve and succeed are found in
article 164 to 168.
The whole education reform in Morocco has been centered on main factors such as the
lack of a comprehensive policy that includes programs and plans with concise goals and
strategies capable of transforming the National Chart of education into reality. The
Emergency Plan was the challenge set by the Government to save and speed up the
reform operations.
The Emergency Plan was set by Moroccan and foreign experts in 2008 and includes four
areas:
The enforcement of schooling to the age of 15. Ten projects were created related to
this.
Empowerment and motivation in secondary schools and universities with four projects
Encounter the horizontal problematic of the educational system
The means to ensure the success of the Emergency Plan and it includes two projects.
The Emergency Plan with its new methodology focuses on:
Setting an ambitious and very defined program
Focusing on a participative vision
Involving qualified people
Setting a close follow up strategy
Putting a foundation to manage change and communication (the Kingdom of
Morocco. emergency Plan, 2009).
The first area which talks about setting a defined program with specific goals and in
which some projects have been planned is more serious in terms of the technical part of
the project and how to deal with the administrative and educational area of it. The issue
here is combining projects like school counseling with renovation and construction work,
and equipments. The technical training provided to the project managers at a regional and
local level was very limited.
The second area about the participative vision, the adopted strategy was unclear. Thus,
every academy gave a special consideration through limiting the participation or adopting
a more abroad one. However, generalizing the Emergency Plan all over academies has

International Journal of Education, Learning and Development
Vol.4, No.5, pp.48-76, June 2016
___Published by European Centre for Research Training and Development UK (www.eajournals.org)
55 SSN 2054-6297(Print), ISSN 2054-6300(Online
been linked to selecting project managers and members, coordinators at the headquarter,
locally and regionally.
The fourth area about setting a close follow up, no procedures has been planned. No
effective action also for the fifth area. And the last one, no terms were put down based on
institutional evaluation.
The question now is to speed up the emergency plan in order to get first results in a short
term. That is a crucial factor to avoid the failure of the projects and the loss of employee
motivation. It will also contribute to add more credibility to the processed methodology
and encourage sponsors to commit and support the project.
Its important to note that meeting deadlines and respecting the time allowed to achieve
these projects, has become a crucial factor for the functioning of any project, and
therefore, ensure a high professionalism in a global world.
The same factor pushes all the parties involved in the reform to be more motivated and
work hard to ensure efficiency. There is no doubt if done in a transparent way, in which
powers are delegated properly, and training is ensured for top management and
participants, the results should be positive.
Some departments demand a rapid processing, such as planning, reporting and execution,
while its not advised to speed up work in quantitative areas as teaching methods, manuals,
programs, evaluations and training.
Here is a highlight of the overall emergency plan projects:
The first area: the enforcement of schooling up to 15 years
Ten projects are in effect:
Project n 1: Development of primary education
Project 2: Expanding the offer of mandatory schooling
Project 3: push educational institutions to become qualified to have students
Project 4: Equal chances for a mandatory education
Project 5: fight the phenomena of failing and dropout
Project 6: development of gender approach in the education and training system
Project 7: special attention for children with special needs
Project 8: focus on acquiring knowledge and core skills
Project 9: improving the quality of school life
Project 10: establish the School of respect
The second area involves encouraging entrepreneurship and excellence in secondary,
vocational and university and includes:
Project 11: prepare the educational offer in the secondary education
Project 12: encourage excellence
Project 13: Improve educational offer in Higher Education
Project 14: encourage scientific research
The third area involves the horizontal problematic in the education system and it includes
7 projects:

International Journal of Education, Learning and Development
Vol.4, No.5, pp.48-76, June 2016
___Published by European Centre for Research Training and Development UK (www.eajournals.org)
56 SSN 2054-6297(Print), ISSN 2054-6300(Online
Project 15: Support qualified employees
Project 16: Support all tracking and evaluation mechanisms for educators
Project 17: guide the management of Human Resources for the education & Training
system
Project 18: continue to apply decentralization and restructuration of the ministry of
education
Project 19: Planning and management of education and training system
Project 20: master Languages
Project 21: effective setting of information and orientation
The Fourth area involves the means of success:
Project 22: provide a permanent funding
Project 23: keep an open communication about the school
The strategic context for the development of the educational system of 2005 has
monitored the following elements:
Evaluate the situation of the education on many levels and track the difficulties and all
the opportunities
The critical areas to develop the educational system , future plans and funding
The strategic goals and priorities at every schooling level
An action plan over a medium term divided into measures, procedures and execution
of the action plan
Coordinate, follow up, measure and evaluate the strategic planning
This strategic planning was aimed to be implemented according to regional planning to
develop the education sector. Few questions were raised about the causes of not adopting
an action plan, the reasons why no funds were allocated and why it wasn’t part of the
Emergency Plan of 2009/2012.
There is no doubt that a critical assessment of the achievements made within ten years is
an important factor for the implementation of the Emergency Plan (The Kingdom of
Morocco, Emergency Plan, 2009).
There is a certain organic link when comparing the Emergency Plan’s directives and the
Higher Council of Education reports, the latter insists on orienting and structuring the
Ministry of Education’s policy. The 2008 Annual report focuses on three important areas
where 24 projects should be realized:
1. Equal opportunities through setting mandatory schooling of Moroccan kids up to 15
years
2. Independence and excellence in education in post primary and secondary and in
professional training
3. Primary horizontal issues
These areas are discussed in the Emergency Plan. The first area consists on fighting drop
out from schools, and focus on developing skills and basic acquired knowledge in Early
education, Primary, and secondary education. The second area involves funding
educational projects in secondary education and deepens the independency in universities
and scientific research and develops professional training. The third area consists on
International Journal of Education, Learning and Development
Vol.4, No.5, pp.48-76, June 2016
___Published by European Centre for Research Training and Development UK (www.eajournals.org)
57 SSN 2054-6297(Print), ISSN 2054-6300(Online
encouraging educators to be more involved, set Good Governance and insists on language
learning.
To explain further these challenges, no planning for possible solutions was done to
correct the following issues:
The language of instruction
The Governance issue
The difficulties related to the teaching job
The inefficiency of pedagogical models and the difficulty of adjustment
Low financial resources
The lack of a vision related to the education and training system
The negative effects left by the deficiency in the reform
METHODOLOGY
The reform plan was set by the political, economical, national and international powers after
a thorough report about the Education and Training system in Morocco. The report discussed
in details the lack and difficulties encountered by the education system in Morocco, and
required that system to be more productive, efficient and able to support development.
The report focuses first on assessing the education system in Morocco through and after the
Emergency Plan, especially through observing schooling rates in primary, elementary and
secondary education. Secondly, the report cites some indicators of quality in education, and
thirdly, analyzes the percentages of profitability and those related to school drop out. Lastly,
the reform shed the light on the higher education situation and it characteristics.
To reach our objective in this study, we relied on the analytical methodology. The official
statistics of the Ministry of National Education of Morocco ( The Kingdom of Morocco,
Statistical Reports of Education, 2012-2013) has helped in showing the progress of the
quantitative indicators of the education system such as the number of students, the schooling
rates in primary, elementary and secondary levels from 205-2006 to 2012-2013, the
qualitative indicators such as the ratio of students per room, the ratio of students per
classroom, the ratio of students per teacher from 2005-2006 to 2012-2013, the ratio of school
drop out and discontinued schooling for the 2012-2013 school year. It should be noted that,
the method of calculating the percentage of girls solarization, divide the number of girls
enrolled in different environments (urban, rural and total) on total girls each medium.
RESULTS
The Quantitative indicators for the Education and Training System in Morocco
Primary Education

International Journal of Education, Learning and Development
Vol.4, No.5, pp.48-76, June 2016
___Published by European Centre for Research Training and Development UK (www.eajournals.org)
58 SSN 2054-6297(Print), ISSN 2054-6300(Online
Table 1: The Number of Primary students during 2013 year depending on the type of
education
According to Table 1, the traditional primary education represents more than half of the
primary education components, although it’s not generalized in rural areas. The modern
primary education is ranked second with 25.7% while the public primary education
represents only 9.5%.
Table 2: the development of the number schooled in Primary Education
2012-13 2011-
12 2010-11 2009-10 2008-09 2007-08 2006-07
685307 682701 740196 673759 721835 669365 550507 Total The
national
total 293823 290284 302155 284019 305610 278243 277582 Girls
209021 207732 211048 216021 228151 223153 272752 Total Rural area
65542 62798 64389 66378 69503 63504 85076 Girls
Graphic 1 : Percenatge d'évolution scolarisation brut enseignement primaire
Percentage Number
64,9% 444516 Traditional Primary
Education
25,7% 176022 The modern Primary
Education
9,4% 64769 Rrimary Public
Education

International Journal of Education, Learning and Development
Vol.4, No.5, pp.48-76, June 2016
___Published by European Centre for Research Training and Development UK (www.eajournals.org)
59 SSN 2054-6297(Print), ISSN 2054-6300(Online
According to Table 2 and graphic 1, there is a huge difference between rural, urban areas and
their total in the Primary Education. There is an important percentage of boys in primary
education especially in urban areas, compared to a low percentage of girls in rural areas.
Elementary Education
Table 3: The New enrolled students in grade 1 by age ( public - private)
According to Table 3,
the most important
category of new
enrolled students
are at the age of 6 (more than 71%), and 10% are for new students age 7 and 8.
Table 4: The Distribution of Elementary students by age
Number
3,% Less than 6 years
83,0% 6-11 years
13,1% 12-14 years
0,9% 15-17 years
Table 4 indicates some important facts, the average age range of 6 to 11 reached 83% while
the percentage of more than 11 years old Elementary students is 14%.
Table 5: The Distribution of Elementary teachers in public schools by age
Percentage Number
14,1% 17829 Less than 30 years
31,6% 39957 30-39 years
23,0% 29082 40-49 years
The Table shows that 1/3 of Elementary teachers are between the age of 30 and 49, which is
considered as the best performance age if accompanied by trainings.
Percentage Number
17,5% 110222 0 years and less
71,4% 449472 6 years
8,4% 53925 7 years
2,7% 16896 7 years and up

International Journal of Education, Learning and Development
Vol.4, No.5, pp.48-76, June 2016
___Published by European Centre for Research Training and Development UK (www.eajournals.org)
60 SSN 2054-6297(Print), ISSN 2054-6300(Online
Table 6: The Development of schooling ratios for age 6 to 11 (Public and Private)
2012-13 2011-12 2010-11 2009-10 2008-09 2007-08 2006-07
3466420 3399622 3407599 3353414 3262903 3283246 3306606 Total The
national
total 1683414 1650011 1651949 1622452 1575273 1571750 1576947 Girls
1883668 1841061 1841250 1772643 1696811 1713101 1735849 Total Urban area
922394 901703 902068 869020 833365 840015 851701 Girls
3466420 1558561 1568151 1580771 1572019 1570145 1570757 Total Rural area
1683414 748308 749881 753432 741908 731735 725246 Girls
Table 7: The Development of schooling ratios for age 6 to 11 (Public and Private)
2012-
13
2011-
12
2010-
11
2009-
10
2008-
09
2007-
08
2006-
07
2005-
06
99,6% 97,9% 97,5% 94,8% 91,6% 91,4% 90,7% 89,0% Total The
national
total 99,1% 97,0% 96,3% 93,5% 89,9% 89,1% 88,0% 86,3% Girls
100,0
% 99,7% 99,4% 95,7% 91,7% 93,4% 94,0% 93,2% Total
Urban
area 100,0
% 98,9% 98,7% 95,1% 91,4% 93,0% 93,6% 92,6% Girls
97,9% 95,9% 95,4% 93,9% 91,5% 89,4% 87,5% 84,9% Total Rural
area 97,7% 94,8% 93,6% 91,7% 88,3% 85,0% 82,4% 80,0% Girls
According to Table 7, we notice a remarkable change in schooling ratios for age 6-11 during
2005-2006 school years to 2012-2013. There is also an increase of 10 Points between 2005
and 2013 for schooling ratios for age 6 – 11 in rural and urban areas. When comparing
schooling for boys and girls with the same age during 2005-2006 school year, we notice a big
difference compared to other school years.
Secondary - Preparatory Education
Table 8: The New enrolled students in First year of Secondary cycle by age (Public &
Private)
Percentage Number
8,2% 42235 66 years and less
48,5% 249805 12 years
23,3% 120010 13 years
12,0% 61807 14 years
8,0% 41206 60 years and up

International Journal of Education, Learning and Development
Vol.4, No.5, pp.48-76, June 2016
___Published by European Centre for Research Training and Development UK (www.eajournals.org)
61 SSN 2054-6297(Print), ISSN 2054-6300(Online
There is an important number of new enrolled students age 12 (more than 48%), the
percentage of 43% goes for students age 13, 14 and 15.
Chart 9: The Distribution of Public Secondary education students by age
Percentage Number
0,8% 12502 Less than 12 years
62,3% 973544 12-14 years
33,6% 525057 15-17 years
3,3% 51568 18 years and up
Table 9 shows the age category of 12-14 contributes with more than 62% of the total of
students in public secondary education. In addition to students aged 15-17. We can conclude
that an important percentage of these students are between 15 and 17.
Chart 10: The distribution of Public Secondary Education teachers by age
Number Percentage
9038 16,15% Less than 30 years
12774 22,80% 30-39 years
13405 24,00% 40-49 years
13713 24,50% 50-55 years
7034 12,55% 56 years or more
Table 10 shows that more than 1/3 of teachers in Public Secondary Education are between 30
and 49 which indicate their high performance at that age if they are trained in a permanent
way.
Table 11: The Development of the number of students - age category 12-14 (Public &
Private)
2012-13 2011-12 2010-11 2009-10 2008-09 2007-08 2006-07
1518508 1507905 1442763 1397873 1328003 1368900 1365532 Total The
national
total 702753 693924 659743 636104 599876 619977 613165 Girls
968771 961083 928504 900371 849082 897497 902572 Total Urban
area 469174 465129 460501 435897 409074 433583 434986 Girls
549737 546822 513412 497502 478921 471403 462960 Total Rural area
233579 228795 1442763 1397873 1328003 183346 1365532 Girls

International Journal of Education, Learning and Development
Vol.4, No.5, pp.48-76, June 2016
___Published by European Centre for Research Training and Development UK (www.eajournals.org)
62 SSN 2054-6297(Print), ISSN 2054-6300(Online
Table 12: The Development of schooling ratios for age 12-14 (Public & Private)
2012-
13
2011-
12
2010-
11
2009-
10 2008-09
2007-
08
2006-
07
2005-
06
85,1% 83,7% 79,1% 75,4% 70,2% 71,3% 69,6% 68,1% Total The
national
total 80,1% 78,3% 73,5% 69,8% 64,8% 65,5% 63,7% 62,1% Girls
101,4% 100,8% 97,4% 93,7% 87,4% 91,9% 90,7% 88,5% Total Urban
area 99,2% 98,5% 95,0% 91,5% 85,5% 89,7% 88,4% 86,1% Girls
66,3% 64,5% 59,1% 55,8% 52,1% 49,9% 47,9% 47,2% Total Rural
area 57,8% 55,3% 49,6% 46,1% 42,7% 39,9% 37,9% 37,3% Girls
Table 12 shows a noticeable development for schooling ratios for age 12-14 during 2005-
2006 to 2012-2013 school year. There is an increase of schooling ratios for students age 12 -
14 with 17 Points more between 2005 and 2013 in rural and urban areas. Even though, we
notice a 40 points in difference between these two areas. There also a difference in schooling
for boys and girls for the same age category in 2005-2006. The same difference is still
registered until now.
Secondary Education: Qualifying
Table 13: The New enrolled students in the Common Qualifying Core
Percentage Number
4,0% 11046 14 years and less
43,7% 119571 15 years
24,4% 66950 16 years
15,2% 41624 17 years
12.7% 34637 18 years and up
Table 13 shows a significant number of new enrolled students aged 15 ( more than 40%), and
53% for students aged 16, 17, 18 and up.
Table 14: The Distribution of Public Secondary Qualifying students by age for 2012-
2013
Percentage Number
1,23% 11150 Less than 15 years
58,41% 528627 15-17 years
40,36% 365274 18 years and up

International Journal of Education, Learning and Development
Vol.4, No.5, pp.48-76, June 2016
___Published by European Centre for Research Training and Development UK (www.eajournals.org)
63 SSN 2054-6297(Print), ISSN 2054-6300(Online
Table 14 shows that the age category of 15-17 contributes with more than 58% of the total of
students in this cycle, there‘s also a significant percentage of students aged 18 and up who
contributes with more than 40%.
Table 15: The Distribution of Public Secondary Qualifying teachers by age in 2012-2013
Percentage Number
12,7% 5535 Less than 30 years
26.20% 11372 30-39 years
28,90% 12530 40-49 years
23,50% 10190 50-55 years
8,7% 3765 56 years and up
More than 1/3 of these teachers are aged between 30 and 49, which is as one of the
advantages of the Education System, considering them in their best age to perform.
Table 16: The Development of the number of Qualifying Secondary students ( Public &
Private)
2012-13 2011-
12
2010-
11
2009-
10
2008-
09
2007-
08 2006-07
983515 960503 921527 861516 784935 713633 681369 Total The
national
total 469854 460035 447724 424052 386310 346556 327737 Girls
867797 855927 825779 773284 704328 644006 620904 Total Urban
area 424505 419130 410087 388708 353849 319319 304931 Girls
115718 104576 95748 88232 80607 69927 60465 Total Rural
area 45349 40905 37637 35344 32461 27237 22806 Girls
Table 17: The Development of schooling for students age 15-17 ( Public & Private)
2012-
13
2011-
12
2010-
11
2009-
10 2008-09
2007-
08
2006-
07
2005-
06
58,5% 55,4% 52,8% 50,4% 49,9% 48,1% 47,4% 46,0% Total The
national
total 53,4% 46,3% 50,3% 48,2% 45,6% 43,0% 42,3% 40,7% Girls
86,2% 83,3% 80,5% 77,4% 76,0% 74,0% 66,5% 71,8% Total Urban
area 83,1% 80,1% 77,7% 75,3% 73,5% 71,2% 69,3% 67,6% Girls
27,0% 24,2% 22,3% 21,1% 21,8% 20,4% 22,3% 18,6% Total Rural
area 18,8% 16,3% 14,9% 14,1% 14,9% 13,6% 13,1% 11,9% Girls
International Journal of Education, Learning and Development
Vol.4, No.5, pp.48-76, June 2016
___Published by European Centre for Research Training and Development UK (www.eajournals.org)
64 SSN 2054-6297(Print), ISSN 2054-6300(Online
Table 17 shows significant schooling ratios for students aged 15-17 during the 2005-2006
school year until 2012-2013, which represent more than 12 points between 2005 and 2013 in
rural and urban areas. However, there is still a difference between the two areas with more
than 50 points. There also a difference in schooling for boys and girls for the same age
category in 2005-2006. The same difference is still registered until now.
The Qualitative indicators to measure the Education & Training system Quality
Primary Education
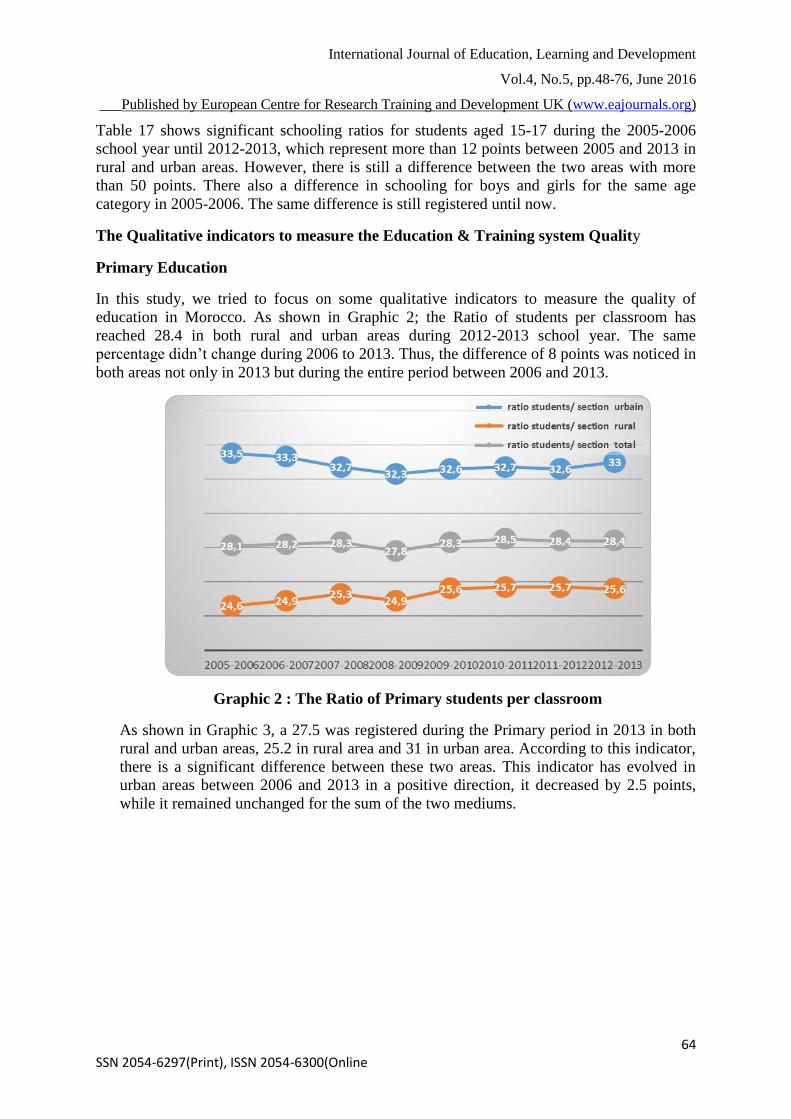
In this study, we tried to focus on some qualitative indicators to measure the quality of
education in Morocco. As shown in Graphic 2; the Ratio of students per classroom has
reached 28.4 in both rural and urban areas during 2012-2013 school year. The same
percentage didn’t change during 2006 to 2013. Thus, the difference of 8 points was noticed in
both areas not only in 2013 but during the entire period between 2006 and 2013.
Graphic 2 : The Ratio of Primary students per classroom
As shown in Graphic 3, a 27.5 was registered during the Primary period in 2013 in both
rural and urban areas, 25.2 in rural area and 31 in urban area. According to this indicator,
there is a significant difference between these two areas. This indicator has evolved in
urban areas between 2006 and 2013 in a positive direction, it decreased by 2.5 points,
while it remained unchanged for the sum of the two mediums.

International Journal of Education, Learning and Development
Vol.4, No.5, pp.48-76, June 2016
___Published by European Centre for Research Training and Development UK (www.eajournals.org)
65 SSN 2054-6297(Print), ISSN 2054-6300(Online
Graphic 3: Number of students’ ratio who fail according to levels for the
2012-2013 school year (Public Primary education)
A 10.60% was registered for students who failed Primary classes in both areas with 12.25%
in rural area.
Preparatory Secondary cycle
For the Preparatory cycle, the Ratio of students per classroom has reached 38 in both rural
and urban areas in 2012-2013 as shown in Graphic 4. This indicator has evolved considerably
in a negative way during the period of 2006 to 2013 with 2 points of both areas, while there ‘s
only 1 point difference between the two of them during the period of 2006 to 2013.
Graphic 4: The Ratio of Preparatory students per classroom
As shown in Graphic 5, 26 were registered during 2012-2013 school year for both areas, 25
in rural area and 26 in urban area. The indicator reflects a difference of less than 1.5 point in
both rural and urban areas. This indicator has evolved considerably in a negative way during
the period of 2006 to 2013 with 2.5 points in urban area.
International Journal of Education, Learning and Development
Vol.4, No.5, pp.48-76, June 2016
___Published by European Centre for Research Training and Development UK (www.eajournals.org)
66 SSN 2054-6297(Print), ISSN 2054-6300(Online
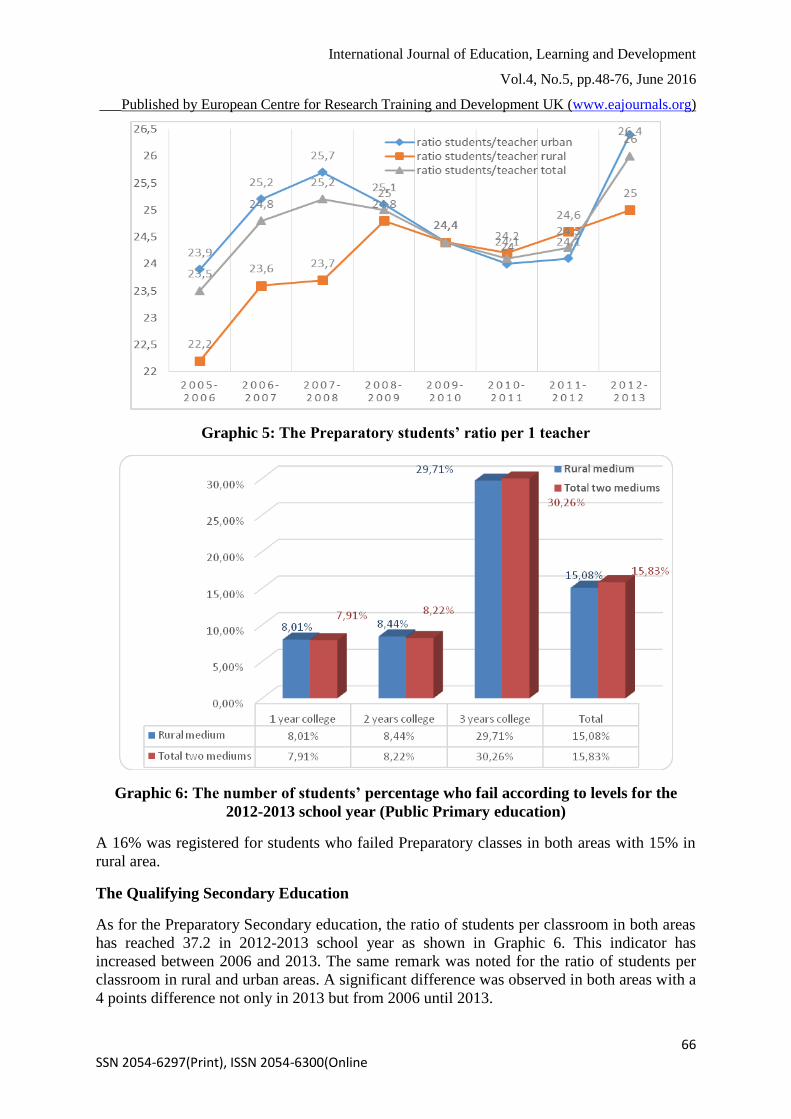
Graphic 5: The Preparatory students’ ratio per 1 teacher
Graphic 6: The number of students’ percentage who fail according to levels for the
2012-2013 school year (Public Primary education)
A 16% was registered for students who failed Preparatory classes in both areas with 15% in
rural area.
The Qualifying Secondary Education
As for the Preparatory Secondary education, the ratio of students per classroom in both areas
has reached 37.2 in 2012-2013 school year as shown in Graphic 6. This indicator has
increased between 2006 and 2013. The same remark was noted for the ratio of students per
classroom in rural and urban areas. A significant difference was observed in both areas with a
4 points difference not only in 2013 but from 2006 until 2013.

International Journal of Education, Learning and Development
Vol.4, No.5, pp.48-76, June 2016
___Published by European Centre for Research Training and Development UK (www.eajournals.org)
67 SSN 2054-6297(Print), ISSN 2054-6300(Online
Graphic 7: The Secondary students’ ratio per classroom
As shown in Graphic 7, 21 were registered during 2012-2013 school year for both areas, and
19 in rural area. The indicator reflects a difference of 2 point in both rural and urban areas in
2012-2013.
Graphic 8: The Secondary students’ percentage per teacher

International Journal of Education, Learning and Development
Vol.4, No.5, pp.48-76, June 2016
___Published by European Centre for Research Training and Development UK (www.eajournals.org)
68 SSN 2054-6297(Print), ISSN 2054-6300(Online
Graphic 9: The percentage of students who failed according to their level for 2012-2013
school year (Public Qualifying Secondary education)
For students who failed Preparatory classes in both areas, an important percentage of 15.18%,
16.18% and 16.32% was registered.
Graphic 10: Drop out from school percentage for 2012-2013 school year
The Drop out from school ratio was significantly high in Preparatory classes with an increase
of 11% and 9% for the Qualifying Secondary classes.
International Journal of Education, Learning and Development
Vol.4, No.5, pp.48-76, June 2016
___Published by European Centre for Research Training and Development UK (www.eajournals.org)
69 SSN 2054-6297(Print), ISSN 2054-6300(Online
DISCUSSION
Based on these results about the organization, documentation and analysis of a set of
quantitative indicators of the educational system, such as the number of students in the three
cycles, including primary education, indicators on measuring the quality of the education
system such as the ratio of students per classroom, the students ratio per class and per teacher,
and the ratio of drop out schooling, we will try to explain and analyze further these results.
The Traditional Primary Education represents a significant part, more than half of the
Primary Education components, even though it’s not generalized in rural areas, which is an
indicator that this sector hasn’t been updated to shape the child’s personality which creates a
disparity in terms of skills and competences acquired by Moroccan children. Thus, the
traditional Primary Education which doesn’t apply programs using the scientific training of
skills is usually found in rural and urban areas with poor population. While the modern
Primary education is attended by rich kids.
There is also a huge difference in enrollment in Primary between the two areas. A significant
percentage for boys is noticed especially in urban areas while girls schooling remains low in
rural areas, which affects the Gender Approach and encouraging girls schooling later.
For Primary Education, a significant ratio of new enrolled students have the ageof 6 years (
more than 71%), a 10% is registered for students aged 7 and 8 years old which affects
negatively the Emergency Plan goals of reaching 100% enrollment ratio for students aged 6
years old.
The age group of 6-11 represents 83% while 14% is registered for Primary education students
aged 11. It can be explained as follow:
A late enrollment of new students at the age of 8 or 9 years old.
A failing rate during the Primary cycle
As for schooling rates recorded in this cycle, a significant increase of 10 points in schooling
was noticed for age group of 6-11 during the 2005-2006 school year to 2012-2013 (between
2005 and 2013) for both areas.
When comparing Boys and Girls’ schooling, we notice a difference during 2005-2006 school
year, the same difference decreases within school years until it becomes even in the last year.
All these positive outcomes are the result of seven projects of the First part of the Emergency
Plan which requires a mandatory schooling up to 15 years of age.As for the Preparatory
cycle, an important number of new enrolled students are aged 12 (more than 48%), students
age 13, 14 and 15 represent a 43% ratio, which impacts negatively on the Emergency Plan’s
objective to reach 85% of students’ enrollment with age 12-14.
The age group between 12 and 14 of age represents 62% of the total of Public Preparatory
Secondary students, there’s also other age categories ranging between 15-17 and 18. It can be
concluded that there is a significant ratio of students age 15 to 18 which can be explained by:
A late enrollment of new students at the age of 8 or 9 years old.
A failing rate during the Preparatory Secondary cycle
International Journal of Education, Learning and Development
Vol.4, No.5, pp.48-76, June 2016
___Published by European Centre for Research Training and Development UK (www.eajournals.org)
70 SSN 2054-6297(Print), ISSN 2054-6300(Online
For the age category of 12-14 in Preparatory cycle during the 2005-2006 school year until
2012-2013, we notice an increase of more than 15 points (between 2005 and 2013) in both
areas. However there is a 40 points difference registered between rural and urban areas.
When comparing Boys and Girls’ schooling, we notice a difference during 2005-2006 school
year, the same difference is still registered up to 2016 which requires an additional effort to
reach the desired level. The positive progress noted in schooling ratios in the Preparatory
cycle is maily due to the Emergency Plans’ projects.
As for the Qualifying Secondary cycle, an important number of new enrolled students are
aged 15 ( more than 40%), and 52% is registered for school age 16, 17 and 18, which reflects
negatively on the Emergency plan’s objectives with a schooling ratio of 65% for age 15-17.
While the age category 15-17, they contribute with 58% from the total of students in this
cycle, and there’s also the age category 18 and up who register a 40% ratio.
For the age category of 15-17 in Qualifying cycle during the 2005-2006 school year until
2012-2013, we notice an increase of more than 12 points (between 2005 and 2013) in both
areas. However there is a 50 points difference registered between rural and urban areas.
When comparing Boys and Girls’ schooling, we notice a difference during 2005-2006 school
year, the same difference is still registered up to 2016 which requires an additional effort to
reach the desired level. The positive progress noted in schooling ratios in the Qualifying
cycle is mainly due to the Emergency Plans’ projects.
As for the three cycles, we notice that more than 1/3 of teachers are aged between 30 and 49
year old, which is a positive indicator of the high performance at this age if accompanied by
continuous training.
We will study some quantitative schooling indicators for the three cycles, especially those
concerning the ratio of students per classroom in Primary education cycle in rural and urban
areas. A 28.4 was registered during 2012-2013 school year. The same indicator didn’t
undergo any changes during the period of 2006 to 2013. The same ratio was registered for the
total of students per classroom in both areas. However, there is a difference of 8 points
between the two areas between 2006 and 2013. There are many factors related to population
density in cities; migration to cities and the high percentage of enrollment in cities compared
to rural areas.
For the 33 ratio registered in urban areas, during 2012-2013 school year, it doesn’t reflect the
real image of crowded Primary schools in urban areas, there are more than 45 students per
classroom which impact negatively the quality of school performance in Primary education in
Morocco.
We also noted a 27.5 ratio of students enrolled in Primary education in 2013 for areas, 25.2 in
rural areas and 31 in urban areas. There is a huge difference between these two areas with a
certain progress shown between 2006 and 2013. If we compare these ratios with the ones
from other countries, we notice that Morocco is ranked 72 compared to Tunisia ranked 17,
Cape Verde, Algeria and Egypt ranked 23rd. Morocco remains very far compared with Gulf
and European countries (World Bank, 2013).

International Journal of Education, Learning and Development
Vol.4, No.5, pp.48-76, June 2016
___Published by European Centre for Research Training and Development UK (www.eajournals.org)
71 SSN 2054-6297(Print), ISSN 2054-6300(Online
There also a difference registered in both areas with 6 points during 2012-2013 school year, it
increased to 8 points in 2005-2006. This difference is attributed to the same factors
mentioned earlier for the students ratio per classroom.
For the Preparatory cycle, the students' ratio per classroom has reached 38 in both areas
during the 2012-2013 school year as shown in Model 4. This indicator has been developed in
a negative way during 2006 and 2013 with 2 points for the total of the two areas. While the
difference is 1,5 points during 2006 and 2013. This is due to these schools were built in areas
close to urban areas.
For the ratios registered in urban areas which reprsents 38 during 2012 and 2013 school year
doesnt reflect the real situation of crowded schools in urban areas, with more than 50
students per classroom, which impacts negatively the quality of school performance in
Morocco.
For the students / teachers ratio, we have registered 26 in Preparatory during 2012 and 2013
school year as shown in Model 5 in both urban and rural areas, and 25 in rural areas and
approximatively 26 in urban areas. There is a difference of less than 1,5 points between the
two areas. This indicator has been developed in a negative way for both areas between 2006
and 2013 by an increase of 2.5 points from 2006 to 2013.
For the Preparatory Secondary cycle, the students' per classroom ratio has reached 37.2 in
both areas during 2012-2013 school year. This indicator has shown a 1 point increase during
the period of 2006 to 2013. The same remark was noted for the ratio of students per
classroom in rural and urban areas. However, ther is a 4 points difference shown not only in
2013 but during the entire period between 2006 qnd 2013. Many factors led to this results, for
example the density of population in cities, the migration from rural areas to cities and the
increase of schooling demand in urban areas compared to rural areas.
For the ratio registered in urban areas, it has reached 37.7, this number doesnt reflect the real
situation of crowded schools in urban areas with 54 students per classroom, which impacts
negatively on the quality of school performance in Qualifying Secondary education in
Morocco.
Implication to Research and Practice
Because the main goal of the Government is to give more autonomy to regions, the education
sector prevail to build a foundation based on solidarity and proximity (AL FARHI, A, 2014),
and to provide adjustments in the working methods adopted by the Government. To
implement good local governance, and work within networks at local, regional, national and
international levels, resources have to be exploited at their best. Universities and cultural
centers have to be places that produce and spread knowledge, dream makers and those that
protect public interest.
The internet for example, which is considered a good example for a non centralized system,
do not obey to the public authorities control or censure. The social growth of the internet and
the changes in creating institutions, constitute a huge issue, the situation now in universities
doesn’t seem appropriate to adapt to the evolution in information and communication
technology, but will be eligible for that in the case of restructuration.

International Journal of Education, Learning and Development
Vol.4, No.5, pp.48-76, June 2016
___Published by European Centre for Research Training and Development UK (www.eajournals.org)
72 SSN 2054-6297(Print), ISSN 2054-6300(Online
To help design the education system framework in Morocco, we propose few ideas according
to five themes:
1. Jobs and Tasks: they are defined based on services provided by the educational
system through institutions to all educators.
2. Educational resources: involves all the necessary resources needed to accomplish
these tasks. For example, knowledge and skills inspired from society and how to
implement them in school manuals, programs, educational tools, buildings,
equipments and social and psychological support.
3. Human Resources: involves providing sufficient employees, train them, motivate,
evaluate, delegate and ensure their participation into the Reform Plan.
4. Good Governance and Financing: is all about administrative and educational
management, implementing the concept of autonomy in managing institutions,
continue activating centralized and decentralized system, implement the principles
of advanced regionalization, data systems, decision making policies, follow up
and monitoring, in addition to funding, financial acquisitions and managing
partnerships.
5. Working mechanisms: involve services provided to educators as below:
Services: are the school areas, school environment (family, social and
economic environment, partnerships, Delegation department, other
institutions…), lessons, homework, applied programs, integrated activities,
sports, acquired skills, school planning, school projects, class assignment,
student’s personal project, pedagogical chart, curriculum, performance of
educators and technical staff, partners contribution, methods and available
educational materials.
Placement of data includes the reference manual for skills and jobs,
qualification of educators, school curriculum (school manuals, supplement
guides, teaching methods)…legislative and regulatory texts (specialization and
tasks), pre-requisites, national reference for quality.
Monitoring: is about evaluating educators and administrative staff’s
performance, permanent monitoring, exams, quality control…
Setting : is all about solving all issues related to quality, alternatives solutions,
managing disparities, establish a trusting environment, training, rewards,
changing tasks, using the available educational resources, pedagogical
support,
Coordination: involves dispatching educational resources, educator’s
placement and the use of back up
Organization: includes dispatching educators and new staff, acquisition and
distribution of equipments, school supply, unifying and improving school
curriculum and all adopted teaching methods, investing in hard cover and
digital references, supplement budget and preventive maintenance…

International Journal of Education, Learning and Development
Vol.4, No.5, pp.48-76, June 2016
___Published by European Centre for Research Training and Development UK (www.eajournals.org)
73 SSN 2054-6297(Print), ISSN 2054-6300(Online
Evaluation: includes schedules, teachers’ planning, school project(outcome),
challenges, educational profitability
Supervision: involves provisional school map, educational infrastructures,
school performance indicators ( success/Failure/ discontinuing schooling rate),
conferences and school seminars, school project(preparation), applied
research, pedagogical innovation, provisional maintenance
Applied research by choosing appropriate theme related to the Regional,
African and Euro-Mediterranean environment.
CONCLUSION
Education is considered one of the most important issues in Morocco, starting with The
Primary education until higher education. In this study, we tried to analyze all the statistics,
the Education system and the educational quality indicators in Morocco through
implementing the Emergency Plan as a way of Reform. We have relied on an analytical,
organizational methodology, based on official statistics of the National Education Ministry in
Morocco (the Kingdom of Morocco, Statistical Reports of Education, 2012- 2013). The
report indicates the progress of the quantitative indicators, such as the number of students in
schools, the schooling ratios in the three cycles from 2005-2006 school year to 2012-2013,
the progress of the qualitative indicators as the students per classroom ratio, the students per
class ratio and the students per teacher ratio from 2005 to 2013, there is also the drop out
ratio in schools in 2012-2013.
All these indicators have been conducted to evaluate the internal situation of the education
and training system in Morocco and the achievement done during and after the Emergency
Plan.
The most important conclusions given in the study are the centralization issue and the gap
between the quantitative efforts done in years, especially during and after the Emergency
Plan the education system. The problem is not in the scarcity of funds spent on schools, but
it’s in the non conformity of the material effort and the expected output.
Ten years ago, many educational institutions were created in all regions in Morocco, with a
30% increase, while the ratio of the number of students per classroom remained 28 students
for Primary education from 2005 to 2013, and 45 students per classroom in urban areas. The
same thing observed in Preparatory and Qualifying cycles.
As a conclusion, all the quantitative indicators during and after the implementation of the
Emergency Plan, especially in Primary and Preparatory cycles, not excluding Secondary
Qualifying cycle, the percentage of schooling in Primary education has reached 99% in both
areas, 98% in rural areas and 100% in urban areas. The schooling ratio in Preparatory
exceeded 85% in both areas, and 66% in rural areas. The schooling ratio in Qualthe exempt
of some educatorsifying education has reached 60%, with 85% of the total of both areas.
While the schooling ratio in rural areas remained low with 27%, and the increase of qualified
teachers’ ratio, age 30 to 49 in the three cycles, we still notice a certain stagnation and a
breakdown of these indicators.

International Journal of Education, Learning and Development
Vol.4, No.5, pp.48-76, June 2016
___Published by European Centre for Research Training and Development UK (www.eajournals.org)
74 SSN 2054-6297(Print), ISSN 2054-6300(Online
In addition to all these indicators, there is the drop out from schools which is considered the
worse. More than 300 000 students were reported every year.
In the report of The Cooperation and Development Organisation (OCDE, PISA, 2012),
among 65 countries, Morocco has been ignored totally, which reflects the real situation of the
Education system in Morocco. Another report about the level of acquired knowledge for
students in Grade 4 in 2011 based on the results of the International study (Marti. & Mullis,
2013), in which many developed and undeveloped countries have participated. The report
shows that “ Upper skills in Morocco didn’t exceed 1 or 2% while the lower referential skills
didn’t reach 21% in reading and 15% in Sciences”.
To rebuild the educational system in Morocco according to the Qualitative indicators, we
should allow the use of more innovative methods such as the web.
Here are some of the issues encountered which the Emergency Plan didn’t pay attention or
couldn’t solve:
The lack of a strategic plan over a medium tem to solve the structural problems of
the educational system
The absence of clear practical procedures to implement the Emergency Plan
The lack to monitor what has been achieved through the Emergency Plan and
benefit from it strength
The fall back to old practices instead of focusing on new projects
The work at the integration pedagogy has been stopped without finding an
alternative
All trainings have been suspended for all categories, and the decision makers are
the headquarter.
The excessive centralization in decision making
Precipitated decision making with a lack of vision and giving alternatives ( private
education for example)
A significant decrease in 2013 budget for a number of projects
The Budget for academies ( for investment) has decreased considerably which
will impact construction projects, accreditation and extending schooling offer
The exempt of some educators from passing the Professional Qualification
Certificate
The status for the aggregate still encounter some problems
The allocations for working in far areas haven’t been released yet
The lack of new structure for regional academies
Future Research
To give a futuristic dimension to this study, and to achieve satisfactory results , Morocco has
to design and renovate the educational system for the upcoming thirty years, the reform
should be based on the cultural and development backgrounds of the country, and the
strategic mechanisms inspired from the most innovative countries, especially in education.
The reform also has to take into consideration the Human and the nation development
according to the values, directions and competencies set by Morocco.
Based on the need to recreate balance between all these challenges in a democratic way, we
can propose to build an educational system that reflects the nation’s values and can fulfill

International Journal of Education, Learning and Development
Vol.4, No.5, pp.48-76, June 2016
___Published by European Centre for Research Training and Development UK (www.eajournals.org)
75 SSN 2054-6297(Print), ISSN 2054-6300(Online
everyone’s desire within one vision and a clear strategy, in addition to regions capable to
have the necessary means to bring up all their potential.
The vision consists in enforcing our educational system with values which guarantee the
involvement of all parties in society, in order to build a more democratic nation based on a
participative strategy along with other executive strategies at a regional level.
We will propose further studies with an analytical approach of the Quality indicators realized
during and after the Emergency Plan, especially the success ratios results for Primary,
Preparatory and Secondary education, and the continuing education ratios, which will show
the effects of the Emergency Plan on success and performance rate in schools.
BIBLIOGRAPHY
ALFARHI, A.,(2014),Moroccan educational system between the prospects of advanced
regionalization and the requirements of good governance, International Journal of
Educational specialist, Vol.3, number7, Mohammed V University, Faculty of Science
Educatio, Rabat, Morocco.
BERDOUZI, M., (2000), Renovate the teaching of the charter acts, Rabat Morocco renewal,
p10-14.
HAMDAOUI, J., (2006), Issues of education and teaching, Sherfate series, number 19, First
Edition, p105-107.
Elrhazi, F. (2001), bicameralism and instrument of parliamentary work, Alternation and
democratic transition Konrad Adenauer foundation, p 116,117.
Mahmoud Mohamed, A., (2010), Educational policy performance analysis, Egyptian Library
for Publishing and Distribution, Almanssoura, Egypt, The first edition, p3.
Martin, M.O. & Mullis, I.V.S. (Eds.). (2013). Chestnut Hill, MA: TIMSS & PIRLS
International Study Center, Boston College.
MEZIANE BELFKIH, A., (2002), Magazine, the world of education, number 12, p7.
National committee on educational affairs, (1996), Magazine, the world of education, The
first number, p 123-127
OCDE, PISA, (2012), Savoirs et savoir-faire des élèves : Performance des élèves en
mathématiques, en compréhension de l’écrit et en sciences.
Supreme Education Council, (2008), The status of education and training system and its
prospects, annual report, p27.
The Kingdom of Morocco, (1999), Special Committee for Education and Training, National
Charter for Education and Training, p6-8.
The Kingdom of Morocco, Ministry of National Education, (2008), Directorate of Legal
Affairs, A guide legislative and regulatory texts, Official Bulletin, p3-13.
The Kingdom of Morocco, Ministry of National Education, (2002), White Book, Tests of
Educational and directives adopted in the revision of educational curricula.
The Kingdom of Morocco, Ministry of National Education, (2005), Strategic and Statistics
and Planning Directorate, The strategic framework for the development of the
educational system.
The Kingdom of Morocco, (2009), Emergency program, Provide program report
compositional, p1-2.
The Kingdom of Morocco, Ministry of National Education, (2005), Strategic, Statistics, and
Planning Directorate, Statictical Reports of Education, 2012-2013.
International Journal of Education, Learning and Development
Vol.4, No.5, pp.48-76, June 2016
___Published by European Centre for Research Training and Development UK (www.eajournals.org)
76 SSN 2054-6297(Print), ISSN 2054-6300(Online
The World Bank, (2008), Report on Education Reform in the Middle East and North Africa,
p11-17.
The World Bank report, (1995), About education and training in the twenty-first century
Kingdom of Morocco, p130-137
The World Bank, (2013), See link,
http://data.albankaldawli.org/indicator/SE.PRM.ENRL.TC.ZS.


![Comparative Pharmacokinetics of Cisplatin and Three ...cancerres.aacrjournals.org/content/canres/47/23/6297.full.pdf · [CANCER RESEARCH 47, 6297-6301, December 1, 1987] Comparative](https://img.dokumen.tips/doc/110x75/5ad43b4c7f8b9a571e8bf2ae/comparative-pharmacokinetics-of-cisplatin-and-three-cancer-research-47-6297-6301.jpg)