Embed Size (px)
Citation preview
1005
AJCS 11(08):1005-1015 (2017) ISSN:1835-2707 doi: 10.21475/ajcs.17.11.08.pne510
Integration of quantitative and qualitative descriptors for genetic diversity studies of
watermelon accessions
Mariana Neto Rosa Lima
1,2*, Manoel Abilio de Queiróz
2, Anne Emanuelle Flor da Silva Oliveira
2,
Izaias da Silva Lima Neto1, Ronaldo Simão de Oliveira
3
1Centro de Ciências Agrárias, Universidade Federal do Vale do São Francisco – UNIVASF, Rodovia BR 407,
KM 119, Lote 543 PSNC, s/n, C1, CEP 56300-990, Petrolina-PE, Brazil 2Departamento de Tecnologias e Ciências Sociais, Universidade do Estado da Bahia - UNEB, Av. Edgard
Chastinet, s/n, São Geraldo, CEP 48900-000, Juazeiro-BA, Brazil 3Departamento de Ciências Biológicas, Universidade Estadual de Feira de Santana - UEFS, Avenida
Transnordestina, S/N. Novo Horizonte, CEP 44036-900 Feira de Santana-BA, Brazil
*Corresponding author: [email protected]
Abstract
Most of genetic diversity studies are based only on quantitative descriptors. The aim of this study was to apply different analysis
strategies with quantitative and qualitative descriptors to identify which is the most suitable to integrate descriptors for genetic
diversity studies of watermelon (Citrullus lanatus) germplasm using different assays. A total of 20 watermelon accessions were
evaluated in the State of Rio Grande do Norte and two commercial cultivars were used as witness (control) (Crimson Sweet and
Charleston Gray) in two cultivation seasons (2014/2015), using 49 descriptors, in which 26 were quantitative and 23 were
qualitative. The genetic diversity of the accessions was obtained using eight analysis strategies that combined the Mahalanobis
Distance, Average Standardized Euclidean Distance (SED), and Weighted Average Euclidean Distance, followed by groupings using
the Tocher optimization method. A wide morphological variability was observed between and within accessions. The eight different
strategies of genetic dissimilarity analyses resulted in 36 different groups. The clustering strategy, by which dissimilarity between
accessions calculated using SED (quantitative descriptors) and WED (qualitative descriptors) is the most suitable for integrating
quantitative and qualitative descriptors in genetic diversity studies of watermelon germplasm.
Keywords: Citrullus lanatus, multivariate analysis, dissimilarity measures, genetic diversity, landraces.
Abbreviations: ANOVA_Analysis of variance, MD_Mahalanobis Distance, SED_Average Standardized Euclidean Distance,
WED_Weighted Average Euclidean Distance.
Introduction
The success of crop improvement programs depends on the
existence and knowledge of the variability of the species of
interest. Characterization and agronomic evaluation are
essential steps in germplasm management as they comprise a
detailed description of accessions regarding morphological,
agronomic, molecular traits and reaction to diseases among
others. Characterization is performed by applying descriptors
that aid in defining, sorting and identifying the individuals of
species and these descriptors might be divided into two
groups: quantitative and qualitative (Cruz et al., 2011).
Quantitative descriptors are real-scale, measurable
characteristics such as fruit mass and soluble solids. They are
generally polygenic and highly influenced by the
environment; nonetheless, they are of great interest due to
their economic importance (Cruz et al., 2011; Crossa and
Franco, 2004). Qualitative descriptors do not have
quantitative values and might be binary or multi-categorical
(defined by several categories or classes), i.e., they play a
role in the classification of individuals, e.g. pulp color and
fruit shape (Sudré et al., 2006). They are not influenced by
the environment, have mono or oligogenic genetic control,
and practical, low-cost application, with no sophisticated
equipment requirements (Rodrigues et al., 2010). However,
they can be subjective, requiring an adequate training of
evaluators. Aside from providing information on accessions,
the use of descriptors allows for checking between-accession
genetic diversity and is very helpful in accession’s
conservation and use. These analyses help to identify parents
to be used in crop improvement programs (Cruz et al., 2011).
They also allow for identifying groups with higher similarity
on one side, emphasizing the need for new samples and the
existence of duplicates on the other, which might be
eliminated, reducing costs and workforce required for the
conservation of accessions (Gonçalves et al., 2008). Genetic
diversity is obtained through dissimilarity measures.
Different methods might be employed and the choice of
method depends on the type of descriptor, data collection
method and the objectives of the researcher. For quantitative
descriptors, Average Standardized Euclidean Distance (SED)
and Mahalanobis Distance (MD) are the most frequently used
methods (Mohhamadi and Prasanna, 2003). SED might be
obtained through individual observations of accessions
without the need for experiments that involve experimental
designs. One application is the analysis of data derived from
the multiplication of accessions. In these experiments, a large
number of plants are cultivated in the field. To facilitate this
AU
STR
ALI
AN
JO
UR
NA
L O
F C
RO
P S
CIE
NC
E |
SUB
MIT
TED
: 2
5-J
AN
-20
17
| R
EVIS
ED:
21
-JU
N-2
01
7 |
AC
CEP
TED
: 2
9-J
UN
-20
17
1006
study, accessions are cultivated in continuous rows without
using experimental designs. During plant development and
after fruit harvest, it is possible to collect a large amount of
information and genetic diversity is obtained using SED.
However, SED considers neither the correlation between
the traits studied nor experiment precision. When information
derived from experimental assays is available, it is possible to
obtain a residual dispersion matrix and the mean of traits.
This information allows for estimating the Mahalanobis
Distance (Cruz et al., 2012) since this method considers
experimental error, this dissimilarity measure is influenced
by the same factors that affect the error.
Hence, the more precise the trait estimation is, the lower is
its residual variance, and consequently, the higher its
contribution to the dissimilarity measure. However, in studies
with germplasm, there might be high within-accession
variations in traits, mainly with alogamous species, e.g.
cucurbits. Such variations contribute to increase of residual
variance, and consequently, to reduce the weight of certain
variables in estimates of dissimilarity measures and might
thus hinder accession differentiation.
There are also several methods to obtain dissimilarity
measures for qualitative descriptors. One example is the
Weighted Average Euclidean Distance (WED), which is used
when accessions show high variability of multicategorical
traits and when this variability has been quantified (Cruz et
al., 2011).
Although both types of descriptors are indicated for the
characterization of accessions, quantitative descriptors have
been a priority due to their economic importance, easy
measurement and data analysis. However, the exclusive use
of this type of descriptor not always allows for a good
separation of accessions. Syafii et al. (2015) studied the
genetic diversity of maize accessions using quantitative
descriptors based on Euclidean Distance. Syafii et al. (2009)
and Rocha et al. (2009) characterized tomato accessions
based on quantitative descriptors and calculated between-
accession dissimilarity using the Mahalanobis Distance. By
performing cluster analysis, these authors obtained clusters
comprised by a large number of accessions. The use of
qualitative descriptors combined with quantitative descriptors
might improve the discrimination between accessions.
A survey of publications on vegetable genetic resources
conducted by Sudré et al. (2007) revealed that qualitative
data are poorly exploited in genetic diversity analyses and are
frequently analyzed only by descriptive statistical procedures.
In addition, when dissimilarity measures are calculated based
on these descriptors, no joint analysis of qualitative and
quantitative data is performed, especially in characterizations
of more than one assay, which limits the interpretation of
results.
Neitzkeet al. (2010) and Bento et al. (2007) characterized
pepper accessions using qualitative and quantitative
descriptors. However, the analysis of genetic diversity was
performed separately for each set of descriptors, resulting in
different clusters. Therefore, joint data analysis is required to
obtain a better indication of the potential for preserved
variability in germplasm banks (Torres et al., 2015; Sarkar et
al., 2011).
Joint analysis of quantitative and qualitative descriptors
might be performed using three methods. The first one is the
conversion of descriptors into one single pattern. Quantitative
traits might be converted into binary or multi-categorical
qualitative descriptors using different methods. After being
transformed, they might be analyzed together with qualitative
descriptors and the dissimilarity matrix might be obtained
using the adequate methodologies for this type of trait
(Martins et al., 2012). However, this method changes the
nature of descriptors and their discriminating potential is thus
decreased.
The second method is to adopt one single dissimilarity
measure for all types of variables or different dissimilarity
measures that have the same defining interval, e.g. Gower's
Index (Cruz et al., 2011; Pavoine et al., 2009; Mohhamadi
and Prasanna, 2003; Gower, 1971). However, for multi-
categorical qualitative variables, this index disregards the
frequency of each class, i.e., it does not consider the existing
within-accession variability.
The third alternative is to subdivide variables into groups
(quantitative and binary, or multi-categorical qualitative
descriptors) so that the most suitable dissimilarity measure is
used for each group. With this procedure, several
dissimilarity matrices are obtained, which might be analyzed
separately or generate a joint dissimilarity matrix, whose
elements are given by the mean of dissimilarities obtained
through each dataset (Cruz et al., 2011). An improvement of
this method is to use the sum of matrices, instead of the
mean, as the latter might conceal the actual divergence
between accessions.
Thus, the aim of this study was to apply different statistical
analyses for quantitative and qualitative descriptors, using
data on watermelon [Citrullus lanatus (Thunb.) Matsum &
Nakai] accessions characterized in different assays to identify
the most suitable analysis to integrate descriptors in genetic
diversity studies.
Results and Discussion
Variability in watermelon accessions
A wide morphological variability was observed between and
within the accessions studied. Four descriptors did not meet
ANOVA assumptions: two in experiment 1 (cotyledon width
and pulp yield) and two in experiment 2 (seed emergence and
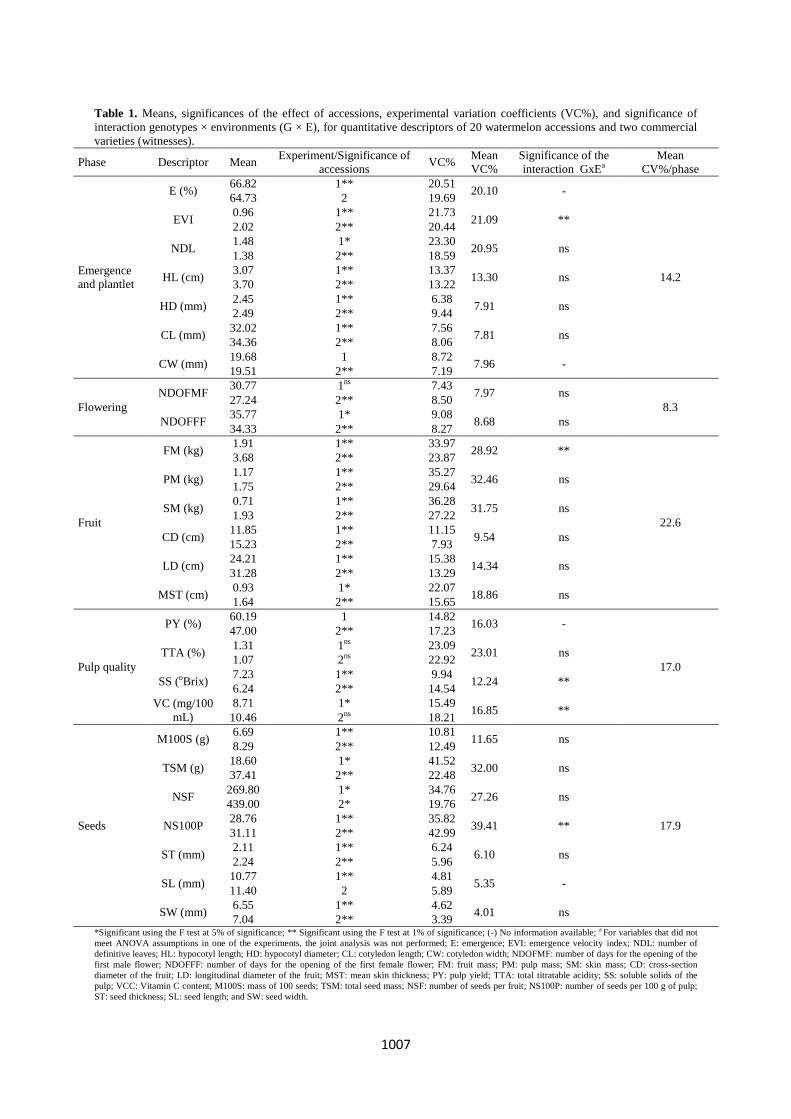
length). Of the 24 quantitative descriptors submitted to
ANOVA in each experiment, a significant between-accession
difference was observed for 22 descriptors (Table 1). The
ratio between the highest and the lowest mean square showed
homogeneity of residual variances (Cruz et al., 2012);
therefore, we performed a joint analysis of experiments. In
this regard, there was a significant effect of the interaction
genotype × environment on five of the quantitative variables,
by which performing the joint analysis was possible (Table
1). However, as our objective was also to evaluate the
clustering pattern of different strategies in each experiment,
we also performed the separate analysis of variance. Mean
variation coefficient (VC) was 17.8% in experiment 1 and
16.3% in experiment 2 (Table 1). High variation coefficients
are typically found in morphological characterization
experiments of watermelon accessions (Oliveira et al., 2008;
Silva et al., 2006). This might be explained by the nature of
quantitative traits, which are more sensitive to environmental
variations (Rodrigues et al., 2010), but also by the existence
of genetic variation within accessions. Fruit descriptors were
the ones with the highest VC's (Table 1). Syafii et al. (2008)
also observed high VC's for fruit traits, which might indicate
that significant between-accession differences are more
difficult to detect. The most uniform quantitative descriptors
were seed descriptors (seed length, width, and thickness),
indicating that these characteristics are the most uniform
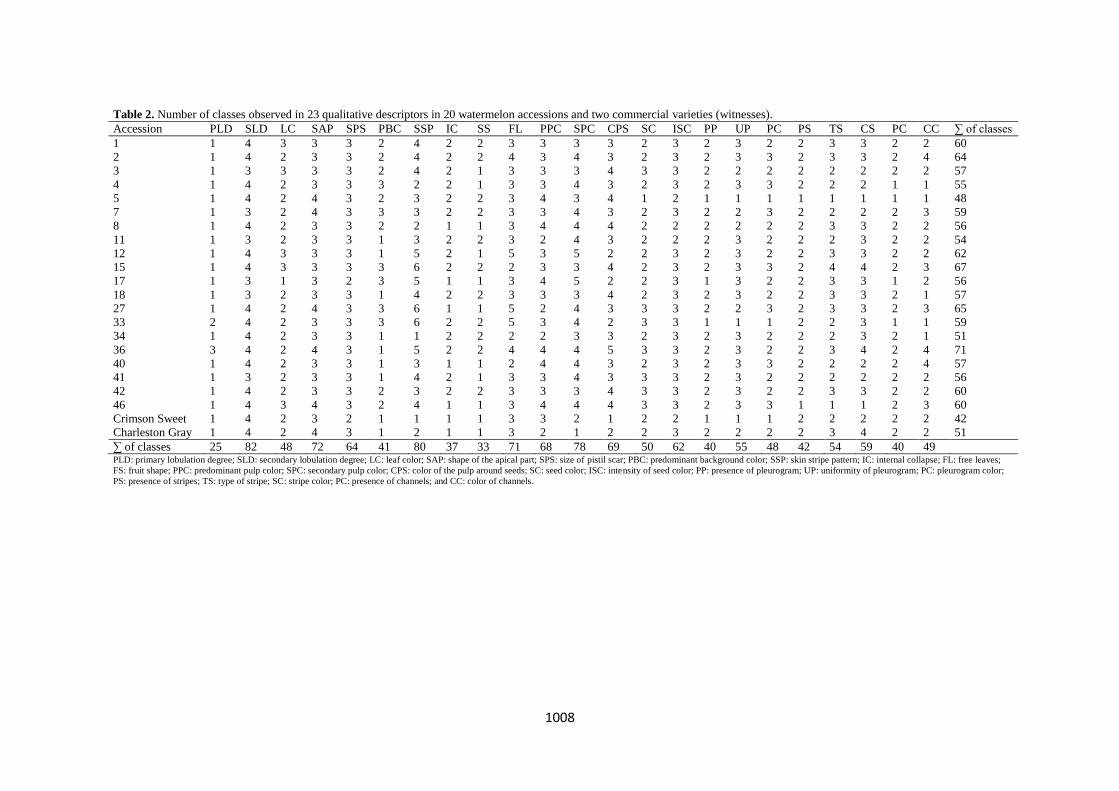
among accessions. Regarding qualitative descriptors, all of
them showed polymorphism between and within accessions
and also between the commercial varieties (witnesses) (Table
2). This variation might be influenced by different factors,
1007
Table 1. Means, significances of the effect of accessions, experimental variation coefficients (VC%), and significance of
interaction genotypes × environments (G × E), for quantitative descriptors of 20 watermelon accessions and two commercial
varieties (witnesses).
Phase Descriptor Mean Experiment/Significance of
accessions VC%
Mean
VC%
Significance of the
interaction GxEa
Mean
CV%/phase
Emergence
and plantlet
E (%) 66.82 1** 20.51
20.10 -
14.2
64.73 2 19.69
EVI 0.96 1** 21.73
21.09 ** 2.02 2** 20.44
NDL 1.48 1* 23.30
20.95 ns 1.38 2** 18.59
HL (cm) 3.07 1** 13.37
13.30 ns 3.70 2** 13.22
HD (mm) 2.45 1** 6.38
7.91 ns 2.49 2** 9.44
CL (mm) 32.02 1** 7.56
7.81 ns 34.36 2** 8.06
CW (mm) 19.68 1 8.72
7.96 - 19.51 2** 7.19
Flowering
NDOFMF 30.77 1ns 7.43
7.97 ns
8.3 27.24 2** 8.50
NDOFFF 35.77 1* 9.08
8.68 ns 34.33 2** 8.27
Fruit
FM (kg) 1.91 1** 33.97
28.92 **
22.6
3.68 2** 23.87
PM (kg) 1.17 1** 35.27
32.46 ns 1.75 2** 29.64
SM (kg) 0.71 1** 36.28
31.75 ns 1.93 2** 27.22
CD (cm) 11.85 1** 11.15
9.54 ns 15.23 2** 7.93
LD (cm) 24.21 1** 15.38
14.34 ns 31.28 2** 13.29
MST (cm) 0.93 1* 22.07
18.86 ns 1.64 2** 15.65
Pulp quality
PY (%) 60.19 1 14.82
16.03 -
17.0
47.00 2** 17.23
TTA (%) 1.31 1ns 23.09
23.01 ns 1.07 2ns 22.92
SS (oBrix) 7.23 1** 9.94
12.24 ** 6.24 2** 14.54
VC (mg/100
mL)
8.71 1* 15.49 16.85 **
10.46 2ns 18.21
Seeds
M100S (g) 6.69 1** 10.81
11.65 ns
17.9
8.29 2** 12.49
TSM (g) 18.60 1* 41.52
32.00 ns 37.41 2** 22.48
NSF 269.80 1* 34.76
27.26 ns 439.00 2* 19.76
NS100P 28.76 1** 35.82
39.41 ** 31.11 2** 42.99
ST (mm) 2.11 1** 6.24
6.10 ns 2.24 2** 5.96
SL (mm) 10.77 1** 4.81
5.35 - 11.40 2 5.89
SW (mm) 6.55 1** 4.62
4.01 ns 7.04 2** 3.39
*Significant using the F test at 5% of significance; ** Significant using the F test at 1% of significance; (-) No information available; a For variables that did not
meet ANOVA assumptions in one of the experiments, the joint analysis was not performed; E: emergence; EVI: emergence velocity index; NDL: number of
definitive leaves; HL: hypocotyl length; HD: hypocotyl diameter; CL: cotyledon length; CW: cotyledon width; NDOFMF: number of days for the opening of the
first male flower; NDOFFF: number of days for the opening of the first female flower; FM: fruit mass; PM: pulp mass; SM: skin mass; CD: cross-section
diameter of the fruit; LD: longitudinal diameter of the fruit; MST: mean skin thickness; PY: pulp yield; TTA: total titratable acidity; SS: soluble solids of the
pulp; VCC: Vitamin C content; M100S: mass of 100 seeds; TSM: total seed mass; NSF: number of seeds per fruit; NS100P: number of seeds per 100 g of pulp;
ST: seed thickness; SL: seed length; and SW: seed width.
1008
Table 2. Number of classes observed in 23 qualitative descriptors in 20 watermelon accessions and two commercial varieties (witnesses).
Accession PLD SLD LC SAP SPS PBC SSP IC SS FL PPC SPC CPS SC ISC PP UP PC PS TS CS PC CC ∑ of classes
1 1 4 3 3 3 2 4 2 2 3 3 3 3 2 3 2 3 2 2 3 3 2 2 60
2 1 4 2 3 3 2 4 2 2 4 3 4 3 2 3 2 3 3 2 3 3 2 4 64
3 1 3 3 3 3 2 4 2 1 3 3 3 4 3 3 2 2 2 2 2 2 2 2 57
4 1 4 2 3 3 3 2 2 1 3 3 4 3 2 3 2 3 3 2 2 2 1 1 55
5 1 4 2 4 3 2 3 2 2 3 4 3 4 1 2 1 1 1 1 1 1 1 1 48
7 1 3 2 4 3 3 3 2 2 3 3 4 3 2 3 2 2 3 2 2 2 2 3 59
8 1 4 2 3 3 2 2 1 1 3 4 4 4 2 2 2 2 2 2 3 3 2 2 56
11 1 3 2 3 3 1 3 2 2 3 2 4 3 2 2 2 3 2 2 2 3 2 2 54
12 1 4 3 3 3 1 5 2 1 5 3 5 2 2 3 2 3 2 2 3 3 2 2 62
15 1 4 3 3 3 3 6 2 2 2 3 3 4 2 3 2 3 3 2 4 4 2 3 67
17 1 3 1 3 2 3 5 1 1 3 4 5 2 2 3 1 3 2 2 3 3 1 2 56
18 1 3 2 3 3 1 4 2 2 3 3 3 4 2 3 2 3 2 2 3 3 2 1 57
27 1 4 2 4 3 3 6 1 1 5 2 4 3 3 3 2 2 3 2 3 3 2 3 65
33 2 4 2 3 3 3 6 2 2 5 3 4 2 3 3 1 1 1 2 2 3 1 1 59
34 1 4 2 3 3 1 1 2 2 2 2 3 3 2 3 2 3 2 2 2 3 2 1 51
36 3 4 2 4 3 1 5 2 2 4 4 4 5 3 3 2 3 2 2 3 4 2 4 71
40 1 4 2 3 3 1 3 1 1 2 4 4 3 2 3 2 3 3 2 2 2 2 4 57
41 1 3 2 3 3 1 4 2 1 3 3 4 3 3 3 2 3 2 2 2 2 2 2 56
42 1 4 2 3 3 2 3 2 2 3 3 3 4 3 3 2 3 2 2 3 3 2 2 60
46 1 4 3 4 3 2 4 1 1 3 4 4 4 3 3 2 3 3 1 1 1 2 3 60
Crimson Sweet 1 4 2 3 2 1 1 1 1 3 3 2 1 2 2 1 1 1 2 2 2 2 2 42
Charleston Gray 1 4 2 4 3 1 2 1 1 3 2 1 2 2 3 2 2 2 2 3 4 2 2 51
∑ of classes 25 82 48 72 64 41 80 37 33 71 68 78 69 50 62 40 55 48 42 54 59 40 49 PLD: primary lobulation degree; SLD: secondary lobulation degree; LC: leaf color; SAP: shape of the apical part; SPS: size of pistil scar; PBC: predominant background color; SSP: skin stripe pattern; IC: internal collapse; FL: free leaves;
FS: fruit shape; PPC: predominant pulp color; SPC: secondary pulp color; CPS: color of the pulp around seeds; SC: seed color; ISC: intensity of seed color; PP: presence of pleurogram; UP: uniformity of pleurogram; PC: pleurogram color;
PS: presence of stripes; TS: type of stripe; SC: stripe color; PC: presence of channels; and CC: color of channels.
1009
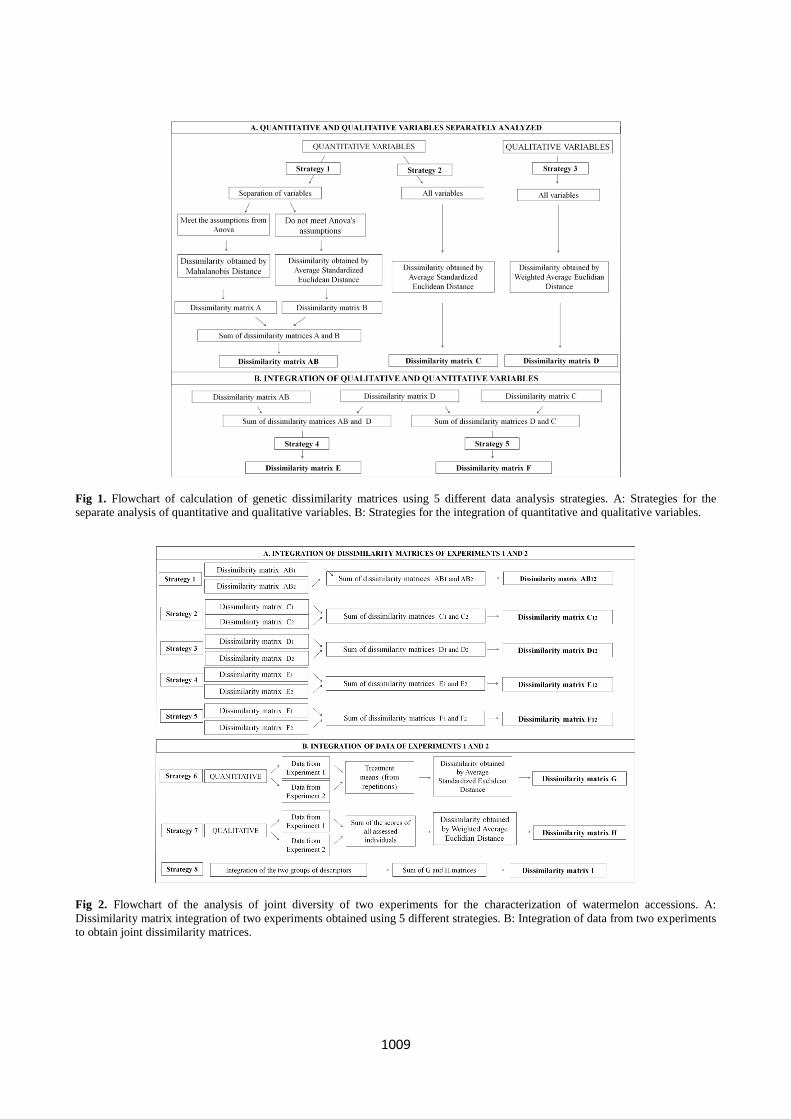
Fig 1. Flowchart of calculation of genetic dissimilarity matrices using 5 different data analysis strategies. A: Strategies for the
separate analysis of quantitative and qualitative variables. B: Strategies for the integration of quantitative and qualitative variables.
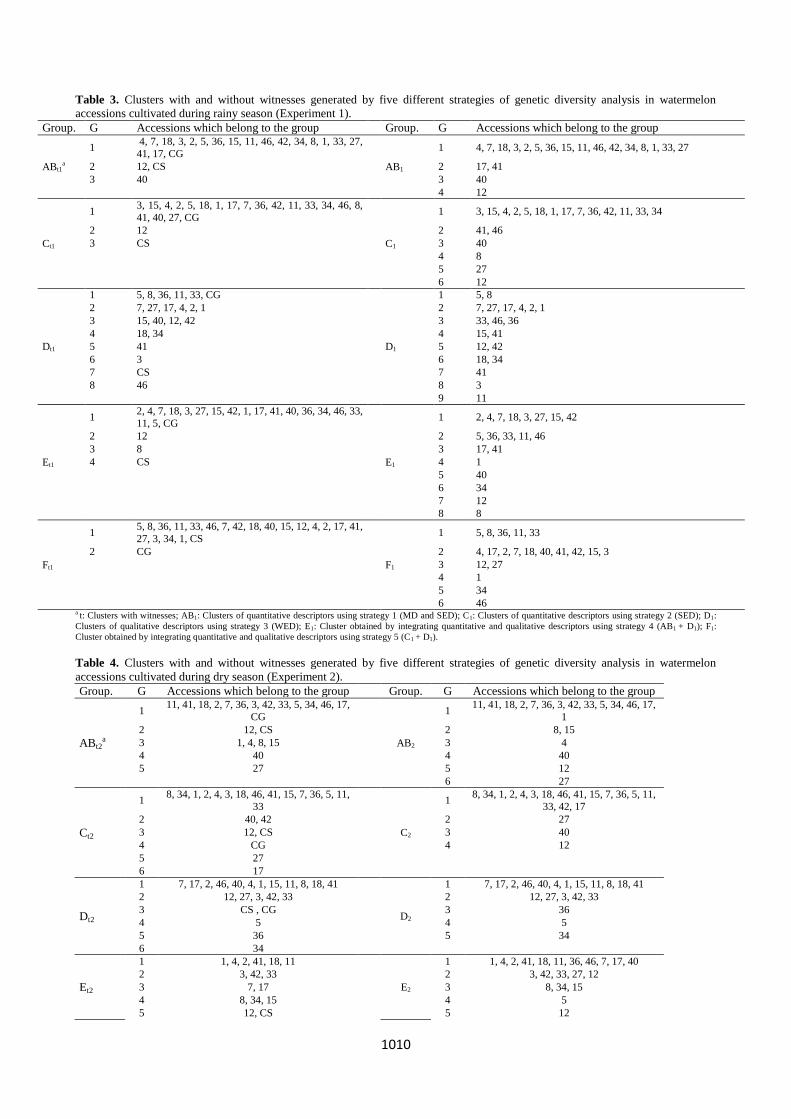
Fig 2. Flowchart of the analysis of joint diversity of two experiments for the characterization of watermelon accessions. A:
Dissimilarity matrix integration of two experiments obtained using 5 different strategies. B: Integration of data from two experiments
to obtain joint dissimilarity matrices.
1010
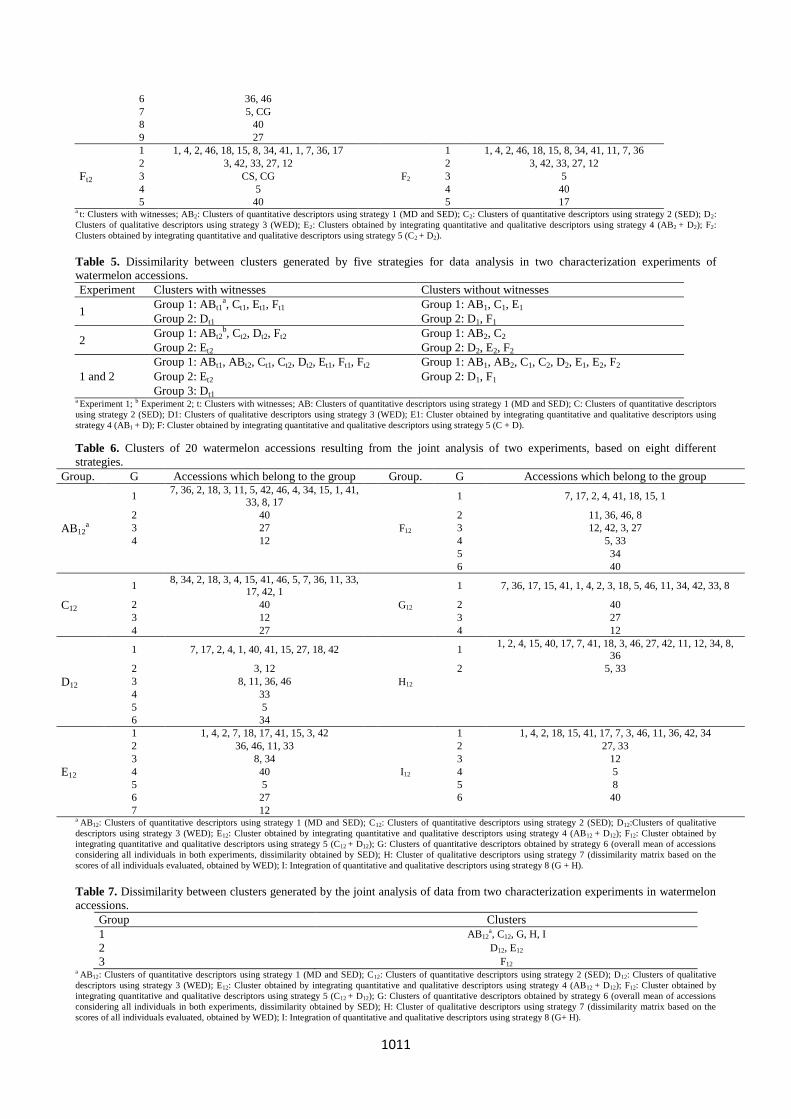
Table 3. Clusters with and without witnesses generated by five different strategies of genetic diversity analysis in watermelon
accessions cultivated during rainy season (Experiment 1).
Group. G Accessions which belong to the group Group. G Accessions which belong to the group
ABt1a
1 4, 7, 18, 3, 2, 5, 36, 15, 11, 46, 42, 34, 8, 1, 33, 27,
41, 17, CG
AB1
1 4, 7, 18, 3, 2, 5, 36, 15, 11, 46, 42, 34, 8, 1, 33, 27
2 12, CS
2 17, 41
3 40
3 40
4 12
Ct1
1 3, 15, 4, 2, 5, 18, 1, 17, 7, 36, 42, 11, 33, 34, 46, 8,
41, 40, 27, CG
C1
1 3, 15, 4, 2, 5, 18, 1, 17, 7, 36, 42, 11, 33, 34
2 12
2 41, 46
3 CS
3 40
4 8
5 27
6 12
Dt1
1 5, 8, 36, 11, 33, CG
D1
1 5, 8
2 7, 27, 17, 4, 2, 1
2 7, 27, 17, 4, 2, 1
3 15, 40, 12, 42
3 33, 46, 36
4 18, 34
4 15, 41
5 41
5 12, 42
6 3
6 18, 34
7 CS
7 41
8 46
8 3
9 11
Et1
1 2, 4, 7, 18, 3, 27, 15, 42, 1, 17, 41, 40, 36, 34, 46, 33,
11, 5, CG
E1
1 2, 4, 7, 18, 3, 27, 15, 42
2 12
2 5, 36, 33, 11, 46
3 8
3 17, 41
4 CS
4 1
5 40
6 34
7 12
8 8
Ft1
1 5, 8, 36, 11, 33, 46, 7, 42, 18, 40, 15, 12, 4, 2, 17, 41,
27, 3, 34, 1, CS
F1
1 5, 8, 36, 11, 33
2 CG
2 4, 17, 2, 7, 18, 40, 41, 42, 15, 3
3 12, 27
4 1
5 34
6 46 a t: Clusters with witnesses; AB1: Clusters of quantitative descriptors using strategy 1 (MD and SED); C1: Clusters of quantitative descriptors using strategy 2 (SED); D1:
Clusters of qualitative descriptors using strategy 3 (WED); E1: Cluster obtained by integrating quantitative and qualitative descriptors using strategy 4 (AB1 + D1); F1:
Cluster obtained by integrating quantitative and qualitative descriptors using strategy 5 (C1 + D1).
Table 4. Clusters with and without witnesses generated by five different strategies of genetic diversity analysis in watermelon
accessions cultivated during dry season (Experiment 2).
Group. G Accessions which belong to the group
Group. G Accessions which belong to the group
ABt2a
1 11, 41, 18, 2, 7, 36, 3, 42, 33, 5, 34, 46, 17,
CG
AB2
1 11, 41, 18, 2, 7, 36, 3, 42, 33, 5, 34, 46, 17,
1
2 12, CS
2 8, 15
3 1, 4, 8, 15
3 4
4 40
4 40
5 27
5 12
6 27
Ct2
1 8, 34, 1, 2, 4, 3, 18, 46, 41, 15, 7, 36, 5, 11,
33
C2
1 8, 34, 1, 2, 4, 3, 18, 46, 41, 15, 7, 36, 5, 11,
33, 42, 17
2 40, 42
2 27
3 12, CS
3 40
4 CG
4 12
5 27
6 17
Dt2
1 7, 17, 2, 46, 40, 4, 1, 15, 11, 8, 18, 41
D2
1 7, 17, 2, 46, 40, 4, 1, 15, 11, 8, 18, 41
2 12, 27, 3, 42, 33
2 12, 27, 3, 42, 33
3 CS , CG
3 36
4 5
4 5
5 36
5 34
6 34
Et2
1 1, 4, 2, 41, 18, 11
E2
1 1, 4, 2, 41, 18, 11, 36, 46, 7, 17, 40
2 3, 42, 33
2 3, 42, 33, 27, 12
3 7, 17
3 8, 34, 15
4 8, 34, 15
4 5
5 12, CS
5 12
1011
6 36, 46
7 5, CG
8 40
9 27
Ft2
1 1, 4, 2, 46, 18, 15, 8, 34, 41, 1, 7, 36, 17
F2
1 1, 4, 2, 46, 18, 15, 8, 34, 41, 11, 7, 36
2 3, 42, 33, 27, 12
2 3, 42, 33, 27, 12
3 CS, CG
3 5
4 5
4 40
5 40
5 17 a t: Clusters with witnesses; AB2: Clusters of quantitative descriptors using strategy 1 (MD and SED); C2: Clusters of quantitative descriptors using strategy 2 (SED); D2:
Clusters of qualitative descriptors using strategy 3 (WED); E2: Clusters obtained by integrating quantitative and qualitative descriptors using strategy 4 (AB2 + D2); F2:
Clusters obtained by integrating quantitative and qualitative descriptors using strategy 5 (C2 + D2).
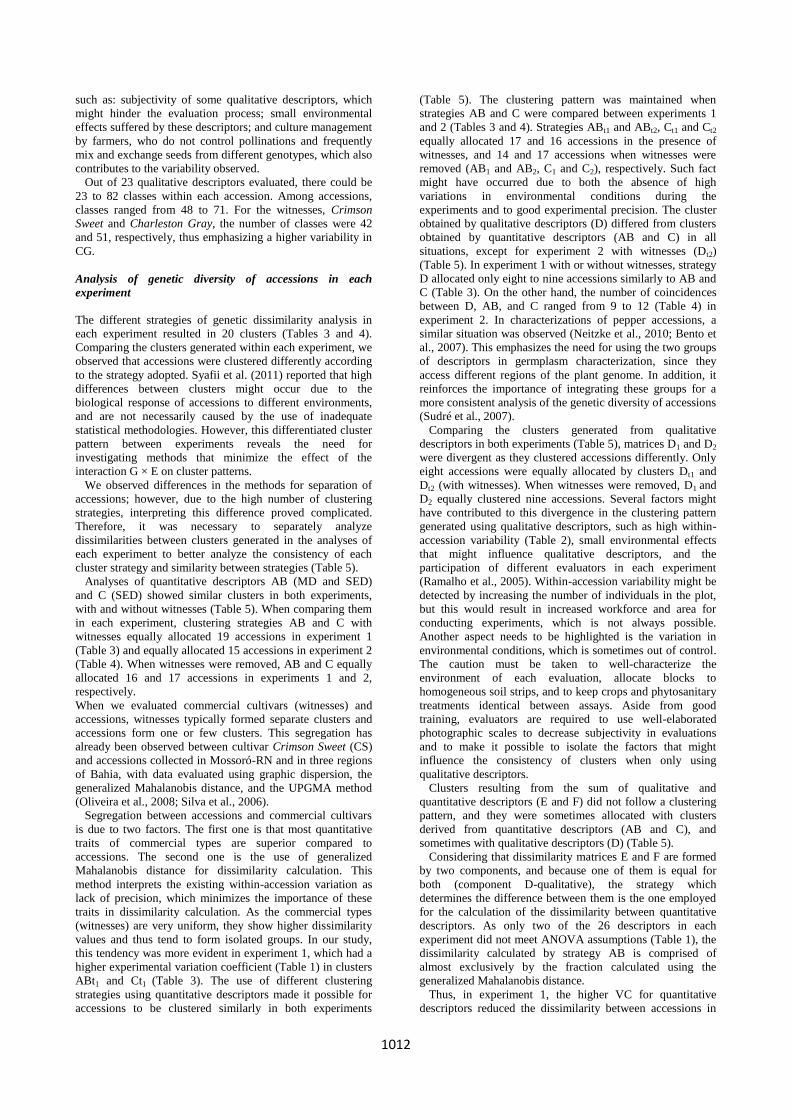
Table 5. Dissimilarity between clusters generated by five strategies for data analysis in two characterization experiments of
watermelon accessions.
Experiment Clusters with witnesses Clusters without witnesses
1 Group 1: ABt1
a, Ct1, Et1, Ft1 Group 1: AB1, C1, E1
Group 2: Dt1 Group 2: D1, F1
2 Group 1: ABt2
b, Ct2, Dt2, Ft2 Group 1: AB2, C2
Group 2: Et2 Group 2: D2, E2, F2
1 and 2
Group 1: ABt1, ABt2, Ct1, Ct2, Dt2, Et1, Ft1, Ft2 Group 1: AB1, AB2, C1, C2, D2, E1, E2, F2
Group 2: Et2 Group 2: D1, F1
Group 3: Dt1 a Experiment 1; b Experiment 2; t: Clusters with witnesses; AB: Clusters of quantitative descriptors using strategy 1 (MD and SED); C: Clusters of quantitative descriptors
using strategy 2 (SED); D1: Clusters of qualitative descriptors using strategy 3 (WED); E1: Cluster obtained by integrating quantitative and qualitative descriptors using
strategy 4 (AB1 + D); F: Cluster obtained by integrating quantitative and qualitative descriptors using strategy 5 (C + D).
Table 6. Clusters of 20 watermelon accessions resulting from the joint analysis of two experiments, based on eight different
strategies.
Group. G Accessions which belong to the group
Group. G Accessions which belong to the group
AB12a
1 7, 36, 2, 18, 3, 11, 5, 42, 46, 4, 34, 15, 1, 41,
33, 8, 17
F12
1 7, 17, 2, 4, 41, 18, 15, 1
2 40
2 11, 36, 46, 8
3 27
3 12, 42, 3, 27
4 12
4 5, 33
5 34
6 40
C12
1 8, 34, 2, 18, 3, 4, 15, 41, 46, 5, 7, 36, 11, 33,
17, 42, 1
G12
1 7, 36, 17, 15, 41, 1, 4, 2, 3, 18, 5, 46, 11, 34, 42, 33, 8
2 40
2 40
3 12
3 27
4 27
4 12
D12
1 7, 17, 2, 4, 1, 40, 41, 15, 27, 18, 42
H12
1 1, 2, 4, 15, 40, 17, 7, 41, 18, 3, 46, 27, 42, 11, 12, 34, 8,
36
2 3, 12
2 5, 33
3 8, 11, 36, 46
4 33
5 5
6 34
E12
1 1, 4, 2, 7, 18, 17, 41, 15, 3, 42
I12
1 1, 4, 2, 18, 15, 41, 17, 7, 3, 46, 11, 36, 42, 34
2 36, 46, 11, 33
2 27, 33
3 8, 34
3 12
4 40
4 5
5 5
5 8
6 27
6 40
7 12 a AB12: Clusters of quantitative descriptors using strategy 1 (MD and SED); C12: Clusters of quantitative descriptors using strategy 2 (SED); D12:Clusters of qualitative
descriptors using strategy 3 (WED); E12: Cluster obtained by integrating quantitative and qualitative descriptors using strategy 4 (AB12 + D12); F12: Cluster obtained by
integrating quantitative and qualitative descriptors using strategy 5 (C12 + D12); G: Clusters of quantitative descriptors obtained by strategy 6 (overall mean of accessions
considering all individuals in both experiments, dissimilarity obtained by SED); H: Cluster of qualitative descriptors using strategy 7 (dissimilarity matrix based on the
scores of all individuals evaluated, obtained by WED); I: Integration of quantitative and qualitative descriptors using strategy 8 (G + H).
Table 7. Dissimilarity between clusters generated by the joint analysis of data from two characterization experiments in watermelon
accessions.
Group Clusters
1 AB12a, C12, G, H, I
2 D12, E12
3 F12 a AB12: Clusters of quantitative descriptors using strategy 1 (MD and SED); C12: Clusters of quantitative descriptors using strategy 2 (SED); D12: Clusters of qualitative
descriptors using strategy 3 (WED); E12: Cluster obtained by integrating quantitative and qualitative descriptors using strategy 4 (AB12 + D12); F12: Cluster obtained by
integrating quantitative and qualitative descriptors using strategy 5 (C12 + D12); G: Clusters of quantitative descriptors obtained by strategy 6 (overall mean of accessions
considering all individuals in both experiments, dissimilarity obtained by SED); H: Cluster of qualitative descriptors using strategy 7 (dissimilarity matrix based on the
scores of all individuals evaluated, obtained by WED); I: Integration of quantitative and qualitative descriptors using strategy 8 (G+ H).
1012
such as: subjectivity of some qualitative descriptors, which
might hinder the evaluation process; small environmental
effects suffered by these descriptors; and culture management
by farmers, who do not control pollinations and frequently
mix and exchange seeds from different genotypes, which also
contributes to the variability observed.
Out of 23 qualitative descriptors evaluated, there could be
23 to 82 classes within each accession. Among accessions,
classes ranged from 48 to 71. For the witnesses, Crimson
Sweet and Charleston Gray, the number of classes were 42
and 51, respectively, thus emphasizing a higher variability in
CG.
Analysis of genetic diversity of accessions in each
experiment
The different strategies of genetic dissimilarity analysis in
each experiment resulted in 20 clusters (Tables 3 and 4).
Comparing the clusters generated within each experiment, we
observed that accessions were clustered differently according
to the strategy adopted. Syafii et al. (2011) reported that high
differences between clusters might occur due to the
biological response of accessions to different environments,
and are not necessarily caused by the use of inadequate
statistical methodologies. However, this differentiated cluster
pattern between experiments reveals the need for
investigating methods that minimize the effect of the
interaction G × E on cluster patterns.
We observed differences in the methods for separation of
accessions; however, due to the high number of clustering
strategies, interpreting this difference proved complicated.
Therefore, it was necessary to separately analyze
dissimilarities between clusters generated in the analyses of
each experiment to better analyze the consistency of each
cluster strategy and similarity between strategies (Table 5).
Analyses of quantitative descriptors AB (MD and SED)
and C (SED) showed similar clusters in both experiments,
with and without witnesses (Table 5). When comparing them
in each experiment, clustering strategies AB and C with
witnesses equally allocated 19 accessions in experiment 1
(Table 3) and equally allocated 15 accessions in experiment 2
(Table 4). When witnesses were removed, AB and C equally
allocated 16 and 17 accessions in experiments 1 and 2,
respectively.
When we evaluated commercial cultivars (witnesses) and
accessions, witnesses typically formed separate clusters and
accessions form one or few clusters. This segregation has
already been observed between cultivar Crimson Sweet (CS)
and accessions collected in Mossoró-RN and in three regions
of Bahia, with data evaluated using graphic dispersion, the
generalized Mahalanobis distance, and the UPGMA method
(Oliveira et al., 2008; Silva et al., 2006).
Segregation between accessions and commercial cultivars
is due to two factors. The first one is that most quantitative
traits of commercial types are superior compared to
accessions. The second one is the use of generalized
Mahalanobis distance for dissimilarity calculation. This
method interprets the existing within-accession variation as
lack of precision, which minimizes the importance of these
traits in dissimilarity calculation. As the commercial types
(witnesses) are very uniform, they show higher dissimilarity
values and thus tend to form isolated groups. In our study,
this tendency was more evident in experiment 1, which had a
higher experimental variation coefficient (Table 1) in clusters
ABt1 and Ct1 (Table 3). The use of different clustering
strategies using quantitative descriptors made it possible for
accessions to be clustered similarly in both experiments
(Table 5). The clustering pattern was maintained when
strategies AB and C were compared between experiments 1
and 2 (Tables 3 and 4). Strategies ABt1 and ABt2, Ct1 and Ct2
equally allocated 17 and 16 accessions in the presence of
witnesses, and 14 and 17 accessions when witnesses were
removed (AB1 and AB2, C1 and C2), respectively. Such fact
might have occurred due to both the absence of high
variations in environmental conditions during the
experiments and to good experimental precision. The cluster
obtained by qualitative descriptors (D) differed from clusters
obtained by quantitative descriptors (AB and C) in all
situations, except for experiment 2 with witnesses (Dt2)
(Table 5). In experiment 1 with or without witnesses, strategy
D allocated only eight to nine accessions similarly to AB and
C (Table 3). On the other hand, the number of coincidences
between D, AB, and C ranged from 9 to 12 (Table 4) in
experiment 2. In characterizations of pepper accessions, a
similar situation was observed (Neitzke et al., 2010; Bento et
al., 2007). This emphasizes the need for using the two groups
of descriptors in germplasm characterization, since they
access different regions of the plant genome. In addition, it
reinforces the importance of integrating these groups for a
more consistent analysis of the genetic diversity of accessions
(Sudré et al., 2007).
Comparing the clusters generated from qualitative
descriptors in both experiments (Table 5), matrices D1 and D2
were divergent as they clustered accessions differently. Only
eight accessions were equally allocated by clusters Dt1 and
Dt2 (with witnesses). When witnesses were removed, D1 and
D2 equally clustered nine accessions. Several factors might
have contributed to this divergence in the clustering pattern
generated using qualitative descriptors, such as high within-
accession variability (Table 2), small environmental effects
that might influence qualitative descriptors, and the
participation of different evaluators in each experiment
(Ramalho et al., 2005). Within-accession variability might be
detected by increasing the number of individuals in the plot,
but this would result in increased workforce and area for
conducting experiments, which is not always possible.
Another aspect needs to be highlighted is the variation in
environmental conditions, which is sometimes out of control.
The caution must be taken to well-characterize the
environment of each evaluation, allocate blocks to
homogeneous soil strips, and to keep crops and phytosanitary
treatments identical between assays. Aside from good
training, evaluators are required to use well-elaborated
photographic scales to decrease subjectivity in evaluations
and to make it possible to isolate the factors that might
influence the consistency of clusters when only using
qualitative descriptors.
Clusters resulting from the sum of qualitative and
quantitative descriptors (E and F) did not follow a clustering
pattern, and they were sometimes allocated with clusters
derived from quantitative descriptors (AB and C), and
sometimes with qualitative descriptors (D) (Table 5).
Considering that dissimilarity matrices E and F are formed
by two components, and because one of them is equal for
both (component D-qualitative), the strategy which
determines the difference between them is the one employed
for the calculation of the dissimilarity between quantitative
descriptors. As only two of the 26 descriptors in each
experiment did not meet ANOVA assumptions (Table 1), the
dissimilarity calculated by strategy AB is comprised of
almost exclusively by the fraction calculated using the
generalized Mahalanobis distance.
Thus, in experiment 1, the higher VC for quantitative
descriptors reduced the dissimilarity between accessions in
1013
E1, allocating them to the same group as AB1 and C1. Since
Euclidean distance suffers a much lower influence of within-
accession variation, cluster F1 was allocated together with
D1. The lower variation in experiment 2 allocated clusters E2,
F2, and D2 to the same group (Table 5). This means that in
experiments with a lower experimental variation coefficient,
the use of average Standardized Euclidean distance tends to
equally cluster accessions as opposed to the Mahalanobis
Distance.
Joint analysis of experiments
With the purpose of obtaining a cluster that contemplates
both assays, the joint analysis of experiments resulted in eight
dissimilarity matrices and 16 clusters (presence and absence
of witnesses). Again, witnesses influenced clustering patterns
and, knowing that this tendency has already been observed in
other studies (Oliveira et al., 2008; Silva et al., 2007; Souza
et al., 2004), we performed analysis interpretation without
witnesses to better visualize the between-accession variability
in this study (Table 6).
Similarly to separate experiments, there was variation in
group and accession allocation inside clusters. Interpreting
this wide variation was easier when we performed the study
of dissimilarity between these clusters using the method by
Cole-Rodgers et al. (1997), forming three groups (Table 7).
Some patterns already observed in separate analyses, where
maintained in the joint analysis of experiments. Thus, when
we analyzed the clusters generated by the quantitative
matrices AB12 and C12 without witnesses, we observed that
they remained allocated to the same group. The cluster
resulting from matrix G (obtained by using the average
Standardized Euclidean Distance applied to the overall means
of quantitative variables from both experiments) was also
allocated to the same group of matrices AB12 and C12. Cluster
H was allocated to the same group, despite the fact that it
resulted from a matrix that integrates only qualitative data.
Cluster D12 also maintained the same pattern observed in
separate experiments, and it was allocated to a different
group. It is worth noting that by using qualitative descriptors,
there was a variation in clusters between experiment 1 and
experiment 2 (Table 5), whether due to within-accession
variations to the characterization environment, and/or to the
low interaction between these factors. In this setting, D12,
which derived from the sum of matrices generated in separate
experiments, contemplates these effects and corrects this
influence as it discriminates accessions inside each
experimental condition and sums up this dissimilarity, unlike
matrix H.
Matrices that integrate quantitative and qualitative data of
both experiments are represented by the letters E, F, and I.
These matrices generated different clustering patterns of
accessions, since each one was allocated to separate groups.
Matrix I results from the sum of matrices G (quantitative) and
H (qualitative) and was allocated together with the group of
predominantly quantitative descriptors. However, matrices G
and H did not contemplate the environmental effect. In other
words, the relative performance of accessions according to
environmental variations was concealed, as matrix G results
from the overall mean of quantitative variables in assays and
matrix H considers all individuals evaluated as if they were in
one single experiment. It is important to emphasize that 19%
of quantitative descriptors showed significant genotype x
environment interaction (Table 1), which explains the
inconsistencies present in the clustering patterns that used
these strategies.
To mitigate the effect of the interaction G × E on quantitative
data and potential influences that already reported for
qualitative data, matrices E and F stood out as important
alternatives. However, some observations are in place, as
clusters generated by these matrices (E12 and F12) were also
allocated to different groups.
In cluster E12 (AB12 + D12), the dissimilarity of quantitative
data was obtained using MD. As previously explained in the
separate analysis, this methodology considers within-
accession variability with no precision, reducing the
importance of these variables in total dissimilarity, causing
E12 to be allocated to the same group of qualitative
descriptors represented by D12. Therefore, this strategy was
not the most suitable one for this set of accessions, with high
within-accession variability (Table 1). However, for a set of
uniform accessions, e.g. autogamous plants or endogamous
strains of alogamous or mixed plants, this is the most suitable
strategy as it weighs each variable according to the precision,
by which it was evaluated.
In cluster F12 (C12 + D12), quantitative data dissimilarity
was obtained using SED. Although this dissimilarity measure
does not consider the precision of data collected (Cruz et al.,
2011), matrix F12 contemplates the interaction G × E, since it
results from the sum of the matrices obtained for each
experiment. Moreover, in each experiment, the means of
quantitative data derive from experiments with local control,
which also reduces the environmental effect in each
experiment.
Thus, the cluster generated by matrix F12 was the most
suitable one for the group of accessions studied. Although
this dissimilarity measure (SED) is indicated for experiments
without experimental designs (Cruz et al., 2012; Mohhamadi
and Prasanna, 2003), a design with local control is
recommended for watermelon germplasm characterization
with high within-accession variability. This is mainly in order
to obtain means that are less influenced by the environment,
and the use of SED is recommended to obtain a dissimilarity
matrix between accessions.
The strategy F is typically used in accession diversity in
principal component analysis (PCA), which shows
advantages as it allows obtaining dissimilarity matrices based
on both quantitative and qualitative descriptors using the
most suitable methods (SED and WED) for each type of
descriptor. In addition, Tocher's clustering allows for the
partitioning of genotypes when the number of groups to be
formed is not previously known, which also decreases
subjectivity in the graphical analysis (PCA) of diversity.
For a better insight into what defines each group, a detailed
study of the cluster generated by matrix F12 will allow for the
morphoagronomic characteristics. These accessions collected
from the State of Rio Grande do Sul which to be well
documented and subsidize their use in crop improvement
programs. In addition, it shall allow for identifying groups
with higher similarity; thus, emphasizing the need for new
samples and the existence of replicates, which might be
eliminated to reduce costs and the workforce required for the
conservation of accessions (Cruz et al., 2011; Marim et al.,
2009).
Strategy F might be used for the study of genetic diversity in
other cucurbit species, such as melon and pumpkin, which
might also show high within-accession genetic variability
(Santos, 2015; Lima Neto, 2013; Priori et al., 2012; Buso et
al., 2004; Silva et al., 1997).

1014
Materials and Methods
Cultivation site and season
The experiments were conducted at the Experimental Field of
the Department of Technology and Social Sciences of the
State University of Bahia (DTCS/UNEB) in the municipality
of Juazeiro – BA (09º 24’ 50” S; 40º 30’ 10” W; 368 m of
altitude) in randomized blocks with three replicates, during
two seasons: rainy, from December 2014 to March 2015
(97.0 mm of total rainfall) and dry, from April to July 2015
(38.0 mm of total rainfall). A total of 20 watermelon
accessions collected in the State of Rio Grande do Norte,
with two commercial cultivars as witnesses, Crimson Sweet
(Feltrin Sementes Ltda.) and Charleston Gray (Sementes do
Vale Ltda), were evaluated (Supplementary Table 1).
Technical recommendations for this culture in the region
have been adopted.
Descriptors evaluated
A total of 49 descriptors (26 quantitative and 23 qualitative)
were applied and subdivided according to the phenological
phases of the culture (Supplementary Table 2). In the
seedlings phase, there were seven descriptors: emergence
percentage, emergence velocity index, number of definitive
leaves, hypocotyl length and diameter, cotyledon length and
diameter. Two descriptors in the vegetative phase: degree of
primary and secondary lobulation of the leaf and leaf color.
Two in the reproductive phase: number of days for the
opening of the first male flower and of the female flower.
Twenty descriptors related to fruit: fruit mass, skin mass,
pulp mass, mean skin thickness, cross-section and
longitudinal diameter of the fruit, pulp yield, titratable
acidity, soluble solids, vitamin C content, shape of the apical
part, size of the pistil scar, predominant background color,
skin strip pattern, internal collapse, presence of free seeds,
fruit shape, predominant pulp color, secondary pulp color,
and color of the pulp around the seeds. Seventeen descriptors
related to seed: mass of 100 seeds, total seed mass, total
number of seeds, seed length, width, and thickness, number
of seeds in 100 g of pulp, color and intensity of seed color,
presence, evenness and color of pleurogram, presence, type,
and color of strips, presence and color of channels.
Statistical analyses
Statistical analyses were performed using the Genes Software
for Genetics and Statistics (Cruz, 2013). Initially, we
observed normality and homogeneity of quantitative
variables; those that did not meet the assumptions of analysis
of variance (ANOVA) were transformed. Variables that did
not meet assumptions even after transformation were
discarded from the analysis of variance. Separate and Joint
analyses of variance were performed for both experiments.
Genetic diversity of accessions was obtained using eight
different strategies, which varied according to the nature of
the variable, whether or not they met ANOVA assumptions,
and separate or joint analysis of the experiments. The term
“strategy” refers to a group of statistical procedures used to
analyze data.
Separate analysis of experiments
Dissimilarity matrices between accessions were obtained
using five different strategies for each experiment. For
quantitative variables, two strategies were used based on
whether they met ANOVA assumptions or not.
In strategy 1, the analysis of variance was performed for
quantitative variables with normal distribution. For these
variables, dissimilarity matrix A was obtained by using the
Mahalanobis Distance (MD). For variables that did not meet
ANOVA assumptions, dissimilarity matrix B was obtained
using the Average Standardized Euclidean Distance (SED).
Afterwards, matrices A and B were summed up, resulting in
matrix AB. In strategy 2, there was no separation of
quantitative variables and dissimilarity matrix C was obtained
using SED (Figure 1).
For qualitative variables, we used the method of Weighted
Average Euclidean Distance (WED) to obtain dissimilarity
matrix D, and this process was called Strategy 3.
The interaction between different types of descriptors
(quantitative and qualitative) was performed as follows
(Figure 1); using the sum of matrices AB and D, resulting in
dissimilarity matrix E (Strategy 4), and by the sum of
matrices C and D, resulting in dissimilarity matrix F
(Strategy 5). Although joint dissimilarity matrix is reportedly
obtained by taking the average of individual dissimilarities
(Cruz et al., 2011), we applied the sum of individual
matrices. This is because one inconvenience of using the
mean of matrices is that the discriminating potential of
accessions in each individual matrix might be concealed by
their mean and there is a risk of obtaining a cluster pattern
that is not compatible with the genetic diversity of
accessions.
After obtaining each dissimilarity matrix (AB, C, D, E, and
F), we generated two clusters, with and without witnesses,
using Tocher's optimization method (Cruz et al., 2012).
Joint analysis of experiments
The joint analysis of experiments was performed using two
methods. The first one was the sum of dissimilarity matrices
of each strategy in both experiments, resulting in matrices:
AB1 + AB2 = AB12; C1 + C2 = C12; D1 + D2 = D12 ; AB12 +
D12 = E12; C12 + D12 = F12 (Figure 2).
The second joint analysis of experiments was performed by
directly integrating the data from both experiments. First for
quantitative traits, the overall average was obtained for the
accessions considering all individuals in both experiments.
After that, genetic distances were obtained using SED,
resulting in dissimilarity matrix G (Strategy 6).
For qualitative data, dissimilarity matrix H was obtained
using WED based on scores of all individuals analyzed
(Strategy 7). Finally, the integration of qualitative and
quantitative data was obtained by the sum of matrices G and
H, generating dissimilarity matrix I (Strategy 8). In the joint
analyses, clusters were also formed, with and without
witnesses, using Tocher's optimization method (Figure 2).
A total of 36 clusters were obtained through the eight
strategies. To facilitate the interpretation of these results, the
dissimilarity between different clusters was calculated using
the analysis of multicategorical descriptors with binary
pattern proposed by Cole-Rodgers et al. (1997):
𝑑𝑖𝑖′ = 1
𝑣∑
𝑏𝑗 + 𝑐𝑗
𝑎𝑗 + 𝑏𝑗 + 𝑐𝑗 + 𝑑𝑗
𝑣
𝑗=1
Where: 𝑎𝑗 and 𝑑𝑗 are the number of agreements types 1-1 and
0-0 for the jth variable, respectively; 𝑏𝑗 and 𝑐𝑗 are the number
of disagreements types 1-0 and 0-1 for the jth variables,
respectively.
1015
Each cluster represented a treatment and each group
represented a multicategorical variable with 22 or 20 classes
for treatments with or without witnesses, respectively. Hence,
when an accession belonged to a group, it was scored 1, and
if it were absent, it was scored 0. After data tabulation, we
performed dissimilarity and cluster analyses using Tocher's
method for clusters of each experiment separately and for
those derived from the joint analysis.
Conclusion
The sum of matrices obtained by the Average Standardized
Euclidean Distance and Weighted Average Euclidean
Distance is the most suitable strategy for the integration of
quantitative and qualitative descriptors of watermelon
accessions, respectively. The matrices obtained through this
strategy in different assays must be summed up, so that one
single matrix is obtained for studies of genetic diversity in
watermelon germplasm.
Acknowledgments
The authors thank the technical and administrative staff of the
State University of Bahia. The first author thank the
Foundation for Research Support of the State of Bahia for
granting scholarship.
References
Bento CS, Sudré CP, Rodrigues R, Riva EM, Pereira MG (2007)
Descritores qualitativos e multicategóricos na estimativa da
variabilidade fenotípica entre acessos de pimentas. Scientia
Agraria. 8(2):149-156.
Buso GLC, Nass LL, Marques ADA, Lopes CA, Buso JÁ
(2004) Avaliação de genótipos de melão, visando identificar
fontes de resistência a Acidovorax avenae subsp. citrulli.
Brasília: Embrapa Recursos Genéticos e Biotecnologia,
Comunicado Técnico. 116.
Cole-Rodgers P, Smith DW, Bosland PW (1997) A novel
statistical approach to analyze genetic resource evaluations
using Capsicum as an example. Crop Sci. 37:1000-1002.
Crossa J, Franco J (2004) Statistical methods for classifying
genotypes. Euphytica. 137 (1):19-37.
Cruz CD, Ferreira FM, Pessoni LA (2011) Biometria aplicada ao
estudo da diversidade genética. Suprema, Visconde do Rio
Branco. 620.
Cruz CD, Regazzi AJ, Carneiro PCS (2012) Modelos
biométricos aplicados ao melhoramento genético. UFV,
Viçosa. 514.
Cruz CD (2013) Genes: a software package for analysis in
experimental statistics and quantitative genetics. Acta Sci-
Agron. 35 (3):271-276.
Gonçalves LSA, Rodrigues R, Amaral Júnior AD, Karasawa M,
Sudré CP (2008) Comparison of multivariate statistical
algorithms to cluster tomato heirloom accessions. Genet Mol
Res. 7 (4):1289-1297.
Gower JCA (1971) A general coefficient of similarity and some
of its properties. Biometrics. 27:857-871.
Lima Neto IS (2013) Pré-melhoramento de abóbora (Cucurbita
moschata Duch.) visando biofortificação em carotenóides.
Tese (Doutorado em Fitotecnia) - Universidade Federal de
Viçosa, Viçosa, MG.
Marim BG, Silva DJH, Carneiro PCS, Miranda GV, Mattedi AP,
Caliman FRB (2009) Variabilidade genética e importância
relativa de caracteres em acessos de germoplasma de
tomateiro. Pesqui Agropecu Bras. 44:1283-1290.
Martins FA, Carneiro PCS, Silva DJH, Cruz CD, Carneiro JES
(2012) Integração de dados em estudos de diversidade genética
de tomateiro. Pesqui Agropecu Bras. 46 (11):1496-1502.
Mohammadi AS, Prasanna BM (2003) Analysis of genetic
diversity in crop plants: salient statistical tools and
considerations. Crop Sci. 43 (4):1235-1248.
Neitzke RS, Barbierri RL, Rodrigues, WF, Corrêa IV, Carvalho
FIF (2010) Dissimilaridade genética entre acessos de pimenta
com potencial ornamental. Hortic Bras. 28:47-53.
Oliveira RA, Nunes GHDS, Oliveira DA, Guimarães IP (2008)
Divergência genética entre acessos de melancia coletados no
Rio Grande do Norte. Revista Brasileira de Ciências Agrárias.
3 (3):213-217.
Pavoine S, Vallet J, Dufour AB, Gachet S, Daniel H (2009) On
the challenge of treating various types of variables: application
for improving the measurement of functional diversity. Oikos.
118 (3):391-402.
Priori D, Barbieri RL, Castro CM, Oliveira AC, Vilella JC,
Mistura CC (2012) Caracterização molecular de variedades
crioulas de abóboras com marcadores microssatélites. Hortic
Bras. 30:499-506.
Ramalho MAP, Ferreira DF, Oliveira AC (2005)
Experimentação em genética e melhoramento de plantas, 2 ed.
UFLA, Lavras. 322.
Rocha MC, Gonçalves LSA, Corrêa FM, Rodrigues R, Silva SL,
Abboud ACDS, Carmo MGFD (2009) Descritores
quantitativos na determinação da divergência genética entre
acessos de tomateiro do grupo cereja. Cienc Rural. 39 (3):664-
670.
Rodrigues R, Bento CS, Silva MGM, Sudré CP (2010)
Atividades de caracterização e avaliação em bancos de
germoplasma. In: Pereira TNS (ed) Germoplasma:
conservação, manejo e uso no melhoramento de plantas. UFV,
Viçosa. 25.
Santos SS (2015) Diversidade genética entre e dentro de acessos
de melão da agricultura tradicional do Estado do Maranhão.
Dissertação (Mestrado em Horticultura Irrigada) -
Universidade do Estado da Bahia, Juazeiro, BA.
Sarkar RK, Rao AR, Wahi SD, Bhat KVA (2011) Comparative
performance of clustering procedures for mixture of qualitative
and quantitative data–an application to black gram. Plant Genet
Resour-C. 9 (4):523-527, 2011.
Silva MAS, Ramos SRR, Queiroz MA (1997) Avaliação
preliminar de 24 acessos de melão (Cucumis melo). Trabalho
apresentado no 9o Congresso Brasileiro de Genética, Maceió,
Universidade Federal de Alagoas, 1997.
Silva ML, Queiroz MA, Ferreira MAJF, Buso GSC (2006)
Caracterização morfológica e molecular de acessos de
melancia. Hortic Bras. 24:405-409.
Silva ML, Queiroz MA, Ferreira MAJDF, Aragão CA (2007)
Variabilidade genética de acessos de melancia coletados em
três regiões do estado da Bahia. Rev Caatinga. 20 (4):93-100.
Souza FF, Queiroz MA (2004) Avaliação de caracteres
morfológicos úteis na identificação de plantas poliplóides de
melancia. Hortic Bras. 22 (3):516-520.
Sudré CP, Cruz CD, Rodrigues R, Riva EM, Amaral Júnior AT,
Silva DJH, Pereira TNS (2006) Variáveis multicategóricas na
determinação da divergência genética entre acessos de pimenta
e pimentão. Hortic Bras. 24 (1):88-93.
Sudré CP, Leonardedecz E, Rodrigues R, Amaral Júnior AT,
Moura MDC, Gonçalves, LS (2007) Genetic resources of
vegetable crops: a survey in the Brazilian germplasm
collections pictured through papers published in the journals of
the Brazilian Society for Horticultural Science. Hortic Bras. 25
(4):496-503.
Syafii M, Cartika I, Ruswandi D (2015) Multivariate Analysis of
Genetic Diversity among some Maize Genotypes under Maize-
Albizia Cropping System in Indonesia. Asian Journal of Crop
Science 7 (4):244-255.
Torres FE, Valle CBD, Lempp B, Teodoro PE, Rigon JPG,
Ribeiro LP, Corrêa CCG, Luz Júnior RAA (2015) Estimativa
da divergência entre ecótipos de braquiária baseada em
descritores quantitativos e qualitativos. Cienc Rural. 45
(3):485-491.


